Fathom Digital Manufacturing Corporation - Ordinary Shares (FATH)
Filed: 20 Mar 24, 7:15am
Exhibit (c)(ii) Confidential Discussion Materials Prepared by: Prepared for: The Special Committee of the Board of Directors Duff & Phelps Opinions Practice of Fathom Digital Manufacturing Corporation December 23, 2023 Private and Confidential The information contained herein is of a confidential nature and is intended for the exclusive use of the persons or firm to whom it is furnished by us. Reproduction, publication, or dissemination of portions hereof may not be made without prior approval of Kroll, LLC.

Duff & Phelps Disclaimer • The following pages contain material that is being provided by Kroll, LLC (“Duff & Phelps”), operating through its Duff & Phelps Opinions Practice, to the special committee (the “Special Committee”) of the board of directors (the “Board of Directors”) of Fathom Digital Manufacturing Corporation (“Fathom” or the “Company”) (solely in their capacity as members of the Board of Directors), pursuant to an engagement letter dated November 27, 2023 (the “Engagement Letter”) in connection with the offer received from CORE on November 22, 2023 (the “Offer”). • The accompanying material was compiled and prepared on a confidential basis for the sole use of the Special Committee in connection with its consideration of the Offer and not with a view toward public disclosure and may not be disclosed, summarized, reproduced, disseminated or quoted from or otherwise referred to, in whole or in part, without the prior written consent of Duff & Phelps, unless otherwise provided for in the Engagement Letter. • Because these materials were prepared for use in the context of a presentation to the Special Committee, who are familiar with the business and affairs of the Company, neither Duff & Phelps, nor any of its legal or financial advisors or accountants, takes any responsibility for the accuracy or completeness of any of the material set forth herein if used by persons other than the Special Committee. Duff & Phelps undertakes no responsibility to update the materials after the date hereof. • These materials are not intended to represent an opinion, but rather to serve as discussion materials for the Special Committee to review, and includes information that may form a portion of a basis upon which Duff & Phelps may render an opinion with respect to the Offer. Any such opinion will be provided in a separate writing and be signed by Duff & Phelps. • These materials (i) do not address the merits of the Offer versus any alternative strategy or transaction, (ii) do not address any transaction related to the Offer, and (iii) are not a recommendation as to how the Special Committee should vote or act with respect to any matters relating to the Offer, or whether to accept the Offer or any related transaction. • The information utilized in preparing the analyses contained herein was obtained from the Company and public sources. Duff & Phelps relied on the accuracy, completeness, and fair presentation of all information, data, advice, opinions and representations obtained from public sources or provided to it from private sources, including the Company’s management, and did not independently verify such information. • No selected public company presented herein is directly comparable to Fathom. Duff & Phelps does not have access to non-public information regarding the selected public companies it considered, and none of those companies are identical to Fathom or its lines of business. Accordingly, a complete comparative analysis cannot be limited to such a quantitative review of the selected companies and would involve complex considerations and judgments concerning differences in financial and operating characteristics of such companies, as well as other factors that could affect their value relative to Fathom. • Nothing contained herein should be construed as tax, legal, regulatory, or accounting advice. 2 Confidential
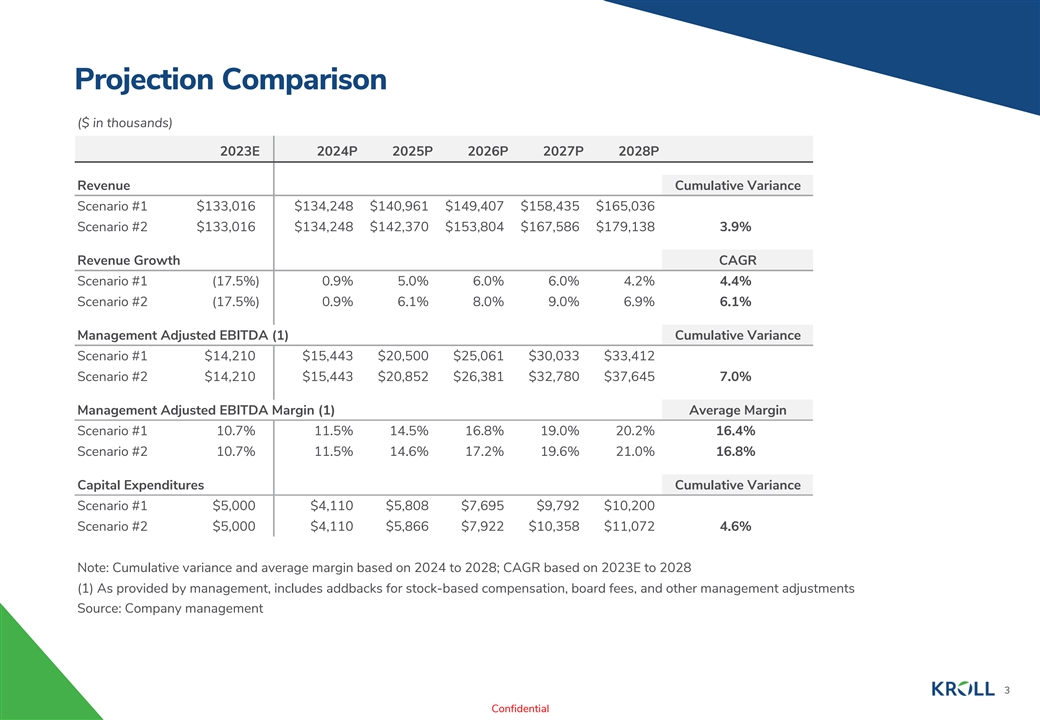
Projection Comparison ($ in thousands) 2023E 2024P 2025P 2026P 2027P 2028P Revenue Cumulative Variance Scenario #1 $133,016 $134,248 $140,961 $149,407 $158,435 $165,036 Scenario #2 $133,016 $134,248 $142,370 $153,804 $167,586 $179,138 3.9% Revenue Growth CAGR Scenario #1 (17.5%) 0.9% 5.0% 6.0% 6.0% 4.2% 4.4% Scenario #2 (17.5%) 0.9% 6.1% 8.0% 9.0% 6.9% 6.1% Management Adjusted EBITDA (1) Cumulative Variance Scenario #1 $14,210 $15,443 $20,500 $25,061 $30,033 $33,412 Scenario #2 $14,210 $15,443 $20,852 $26,381 $32,780 $37,645 7.0% Management Adjusted EBITDA Margin (1) Average Margin Scenario #1 10.7% 11.5% 14.5% 16.8% 19.0% 20.2% 16.4% Scenario #2 10.7% 11.5% 14.6% 17.2% 19.6% 21.0% 16.8% Capital Expenditures Cumulative Variance Scenario #1 $5,000 $4,110 $5,808 $7,695 $9,792 $10,200 Scenario #2 $5,000 $4,110 $5,866 $7,922 $10,358 $11,072 4.6% Note: Cumulative variance and average margin based on 2024 to 2028; CAGR based on 2023E to 2028 (1) As provided by management, includes addbacks for stock-based compensation, board fees, and other management adjustments Source: Company management 3 Confidential
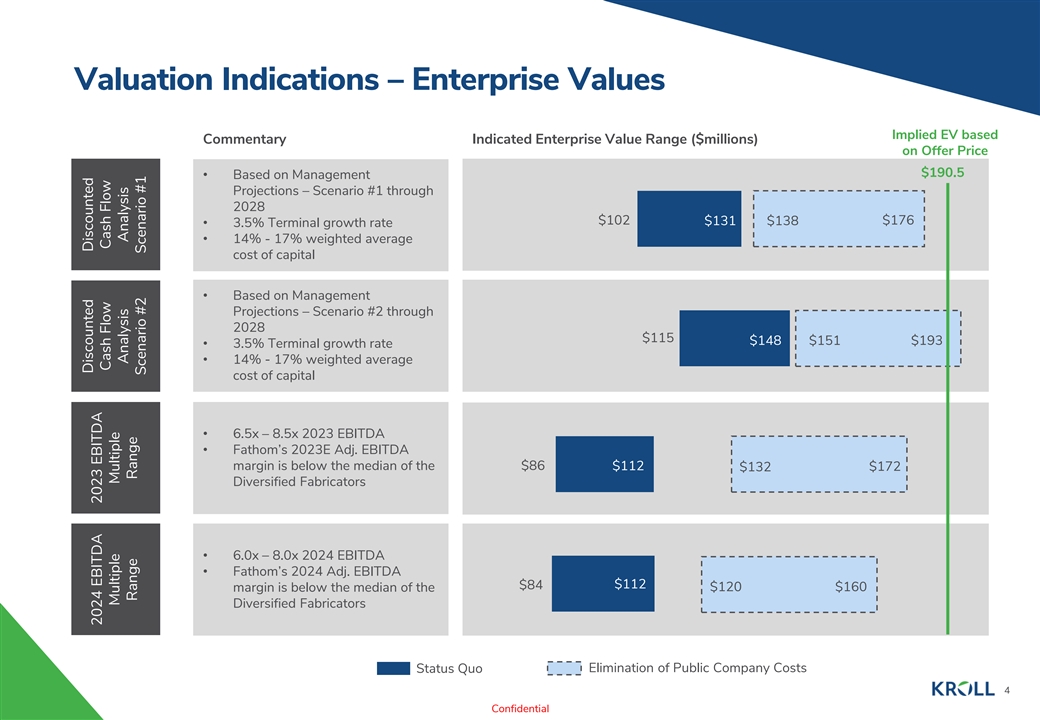
Valuation Indications – Enterprise Values Implied EV based Commentary Indicated Enterprise Value Range ($millions) on Offer Price $190.5 • Based on Management Projections – Scenario #1 through 2028 $102 $131 $138 $176 • 3.5% Terminal growth rate • 14% - 17% weighted average cost of capital • Based on Management Projections – Scenario #2 through 2028 $115 $148 $151 $193 • 3.5% Terminal growth rate • 14% - 17% weighted average cost of capital • 6.5x – 8.5x 2023 EBITDA • Fathom’s 2023E Adj. EBITDA margin is below the median of the $86 $112 $172 $132 Diversified Fabricators • 6.0x – 8.0x 2024 EBITDA • Fathom’s 2024 Adj. EBITDA $84 $112 margin is below the median of the $120 $160 Diversified Fabricators Elimination of Public Company Costs Status Quo 4 Confidential Discounted Discounted 2024 EBITDA 2023 EBITDA Cash Flow Cash Flow Multiple Multiple Analysis Analysis Range Range Scenario #2 Scenario #1

Valuation Indications – Stock Price Share Price Commentary Indicated Stock Price 1-Day Prior Offer Price $4.31 $4.50 • Based on Management Projections – Scenario #1 through 2028 • 3.5% Terminal growth rate $0.27 $2.82 $0.01 $0.49 • 14% - 17% weighted average cost of capital • Based on Management Projections – Scenario #2 through 2028 $0.05 • 3.5% Terminal growth rate $0.95 $1.10 $5.22 • 14% - 17% weighted average cost of capital • 6.5x – 8.5x 2023 EBITDA • Fathom’s 2023E Adj. EBITDA $2.28 $0.01 $0.05 $0.30 margin is below the median of the Diversified Fabricators $0.04 • 6.0x – 8.0x 2024 EBITDA • Fathom’s 2024 Adj. EBITDA $0.10 $0.10 $0.59 margin is below the median of the Diversified Fabricators Elimination of Public Company Costs Status Quo 5 Confidential Discounted Discounted 2024 EBITDA 2023 EBITDA Cash Flow Cash Flow Multiple Multiple Analysis Analysis Range Range Scenario #2 Scenario #1
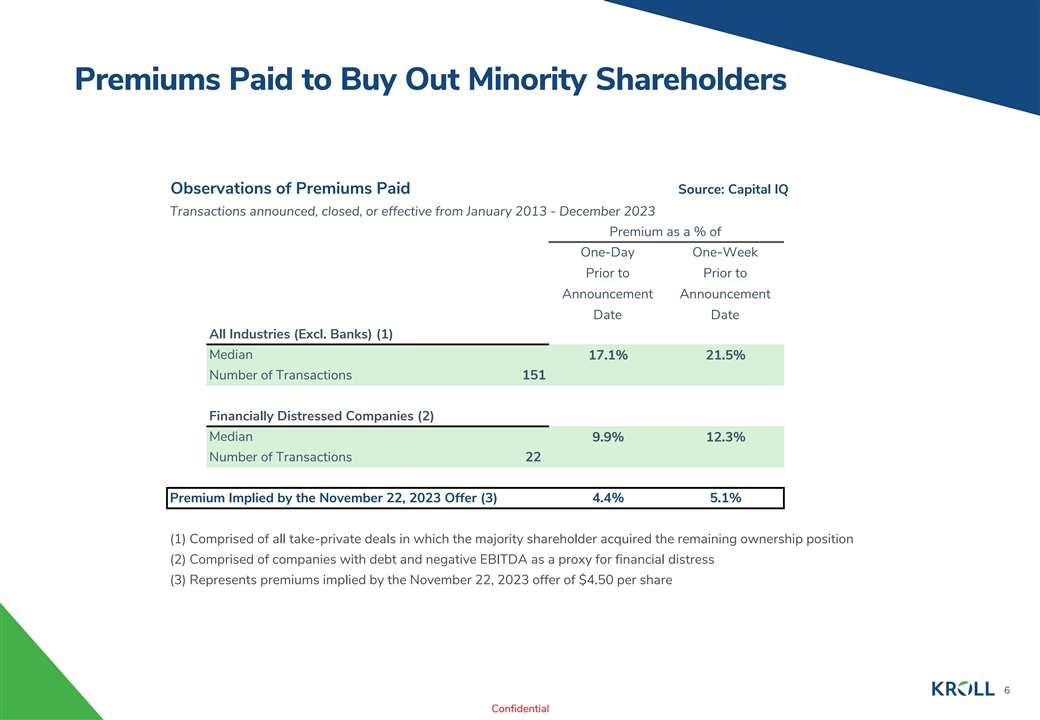
Premiums Paid to Buy Out Minority Shareholders Observations of Premiums Paid Source: Capital IQ Transactions announced, closed, or effective from January 2013 - December 2023 Premium as a % of One-Day One-Week Prior to Prior to Announcement Announcement Date Date All Industries (Excl. Banks) (1) Median 17.1% 21.5% Number of Transactions 151 Financially Distressed Companies (2) Median 9.9% 12.3% Number of Transactions 22 Premium Implied by the November 22, 2023 Offer (3) 4.4% 5.1% (1) Comprised of all take-private deals in which the majority shareholder acquired the remaining ownership position (2) Comprised of companies with debt and negative EBITDA as a proxy for financial distress (3) Represents premiums implied by the November 22, 2023 offer of $4.50 per share 6 Confidential
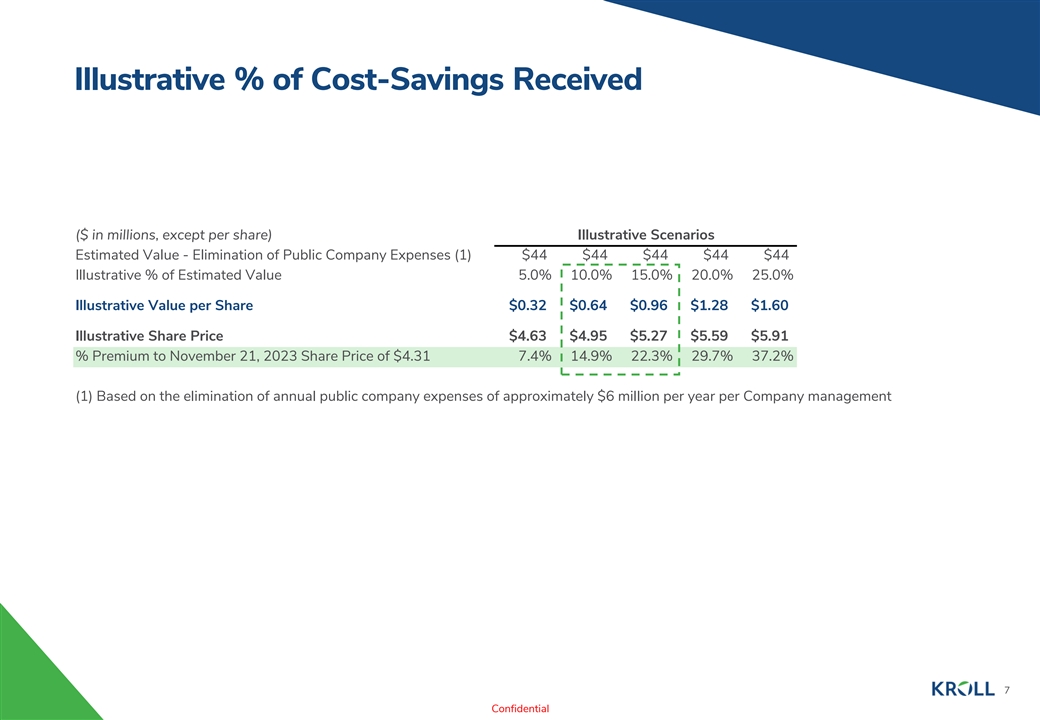
Illustrative % of Cost-Savings Received ($ in millions, except per share) Illustrative Scenarios Estimated Value - Elimination of Public Company Expenses (1) $44 $44 $44 $44 $44 Illustrative % of Estimated Value 5.0% 10.0% 15.0% 20.0% 25.0% Illustrative Value per Share $0.32 $0.64 $0.96 $1.28 $1.60 Illustrative Share Price $4.63 $4.95 $5.27 $5.59 $5.91 % Premium to November 21, 2023 Share Price of $4.31 7.4% 14.9% 22.3% 29.7% 37.2% (1) Based on the elimination of annual public company expenses of approximately $6 million per year per Company management 7 Confidential

Appendix 8
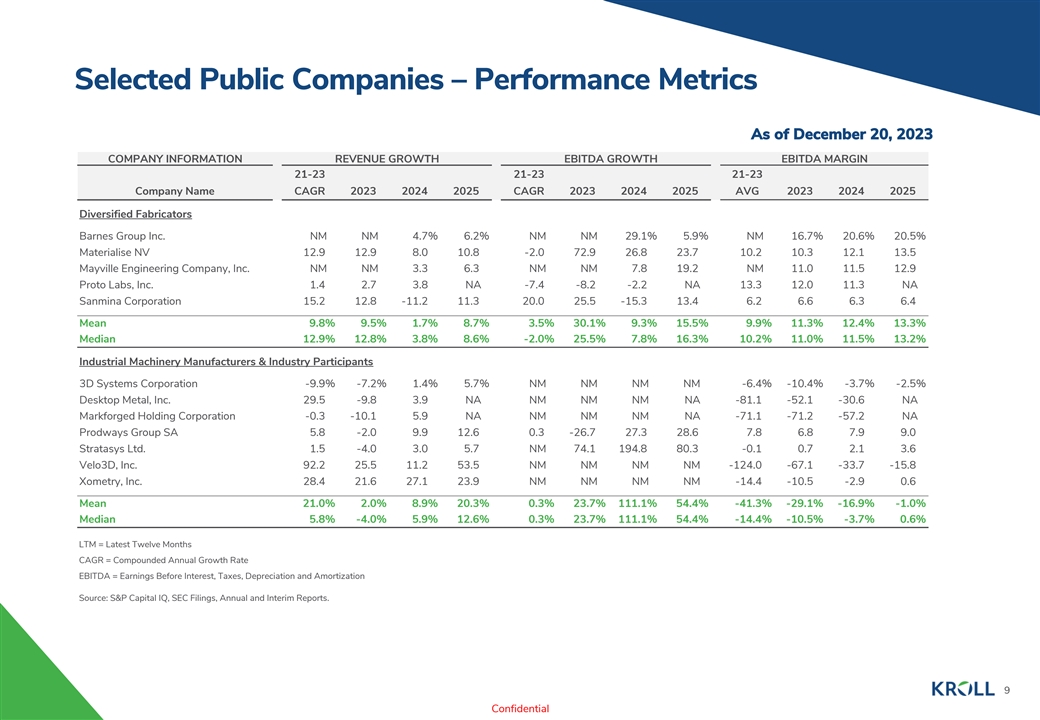
Selected Public Companies Analysis Selected Public Companies – Performance Metrics As of December 20, 2023 Selected Public Companies Analysis For Rank Charts (% of Revenue) COMPANY INFORMATION REVENUE GROWTH EBITDA GROWTH EBITDA MARGIN As of December 20, 2023 21-23 21-23 21-23 For Rank Charts (% of Revenue) COMP CA oNY mpa INFO ny Nam RMA e TION CAGR REVENUE 2023 GR2024 OWTH 2025 CAGR EB 2023 ITDA GR2024 OWTH 2025 AVG EB 2023 ITDA MA2024 RGIN 2025 21-23 21-23 21-23 Diversified Fabricators Company Name CAGR 2023 2024 2025 CAGR 2023 2024 2025 AVG 2023 2024 2025 Barnes Group Inc. NM NM 4.7% 6.2% NM NM 29.1% 5.9% NM 16.7% 20.6% 20.5% Diversified Fabricators Materialise NV 12.9 12.9 8.0 10.8 -2.0 72.9 26.8 23.7 10.2 10.3 12.1 13.5 May Barnv eils leGr Enginee oup Inc. ring Company, Inc. N NM M N NM M 3.3 4.7% 6 6.3 .2% N NM M N NM M 29 7.8 .1% 19 5.9 .2% N NM M 16 11.7% .0 20 11.6 .5% 12 20.9 .5% Materialise NV 12.9 12.9 8.0 10.8 -2.0 72.9 26.8 23.7 10.2 10.3 12.1 13.5 Proto Labs, Inc. 1.4 2.7 3.8 NA -7.4 -8.2 -2.2 NA 13.3 12.0 11.3 NA Mayville Engineering Company, Inc. NM NM 3.3 6.3 NM NM 7.8 19.2 NM 11.0 11.5 12.9 Sanmina Corporation 15.2 12.8 -11.2 11.3 20.0 25.5 -15.3 13.4 6.2 6.6 6.3 6.4 Proto Labs, Inc. 1.4 2.7 3.8 NA -7.4 -8.2 -2.2 NA 13.3 12.0 11.3 NA Mean 9.8% 9.5% 1.7% 8.7% 3.5% 30.1% 9.3% 15.5% 9.9% 11.3% 12.4% 13.3% Sanmina Corporation 15.2 12.8 -11.2 11.3 20.0 25.5 -15.3 13.4 6.2 6.6 6.3 6.4 Median 12.9% 12.8% 3.8% 8.6% -2.0% 25.5% 7.8% 16.3% 10.2% 11.0% 11.5% 13.2% Mean 9.8% 9.5% 1.7% 8.7% 3.5% 30.1% 9.3% 15.5% 9.9% 11.3% 12.4% 13.3% Industrial Machinery Manufacturers & Industry Participants Median 12.9% 12.8% 3.8% 8.6% -2.0% 25.5% 7.8% 16.3% 10.2% 11.0% 11.5% 13.2% 3D Systems Corporation -9.9% -7.2% 1.4% 5.7% NM NM NM NM -6.4% -10.4% -3.7% -2.5% Industrial Machinery Manufacturers & Industry Participants Desktop Metal, Inc. 29.5 -9.8 3.9 NA NM NM NM NA -81.1 -52.1 -30.6 NA Mark 3D Sys fortem geds Hold Corp ing C oration orporation - -0.3 9.9% -10 -7.2 .1% 5.9 1.4% 5.7 NA % N NM M N NM M N NM M N NA M -71 -6.4% .1 - -10 71.4% .2 -57 -3.7 .2% -2.5 NA % P Dr e od skway top Me s Gr tal ou , In p c. SA 29 5.8 .5 - -9.8 2.0 9.9 3.9 12 NA .6 0.3 NM -26 N.7 M 27 N.3 M 28 NA .6 -81 7.8 .1 -52 6.8 .1 -30 7.9 .6 9.0 NA St Mark ratasy forg s eLtd d Hold . ing Corporation -1.5 0.3 -10 -4.0 .1 5.9 3.0 5.7 NA N NM M 74 N.1 M 194.8 NM 80 NA .3 -71 -0.1 .1 -71 0.7 .2 -57 2.1 .2 3.6 NA Prodways Group SA 5.8 -2.0 9.9 12.6 0.3 -26.7 27.3 28.6 7.8 6.8 7.9 9.0 Velo3D, Inc. 92.2 25.5 11.2 53.5 NM NM NM NM -124.0 -67.1 -33.7 -15.8 Stratasys Ltd. 1.5 -4.0 3.0 5.7 NM 74.1 194.8 80.3 -0.1 0.7 2.1 3.6 Xometry, Inc. 28.4 21.6 27.1 23.9 NM NM NM NM -14.4 -10.5 -2.9 0.6 Velo3D, Inc. 92.2 25.5 11.2 53.5 NM NM NM NM -124.0 -67.1 -33.7 -15.8 Mean 21.0% 2.0% 8.9% 20.3% 0.3% 23.7% 111.1% 54.4% -41.3% -29.1% -16.9% -1.0% Xometry, Inc. 28.4 21.6 27.1 23.9 NM NM NM NM -14.4 -10.5 -2.9 0.6 Median 5.8% -4.0% 5.9% 12.6% 0.3% 23.7% 111.1% 54.4% -14.4% -10.5% -3.7% 0.6% Mean 21.0% 2.0% 8.9% 20.3% 0.3% 23.7% 111.1% 54.4% -41.3% -29.1% -16.9% -1.0% Fathom (Analyst Projections) -6.8% -18.0% 0.7% NA -35.1% -41.3% 9.1% NA 15.8% 10.6% 11.5% NA Median 5.8% -4.0% 5.9% 12.6% 0.3% 23.7% 111.1% 54.4% -14.4% -10.5% -3.7% 0.6% LTM = Latest Twelve Months Fathom (Analyst Projections) -6.8% -18.0% 0.7% NA -35.1% -41.3% 9.1% NA 15.8% 10.6% 11.5% NA CAGR = Compounded Annual Growth Rate EBITDA = Earnings Before Interest, Taxes, Depreciation and Amortization LTM = Latest Twelve Months CAGR = Compounded Annual Growth Rate Source: S&P Capital IQ, SEC Filings, Annual and Interim Reports. EBITDA = Earnings Before Interest, Taxes, Depreciation and Amortization Source: S&P Capital IQ, SEC Filings, Annual and Interim Reports. 9 Confidential
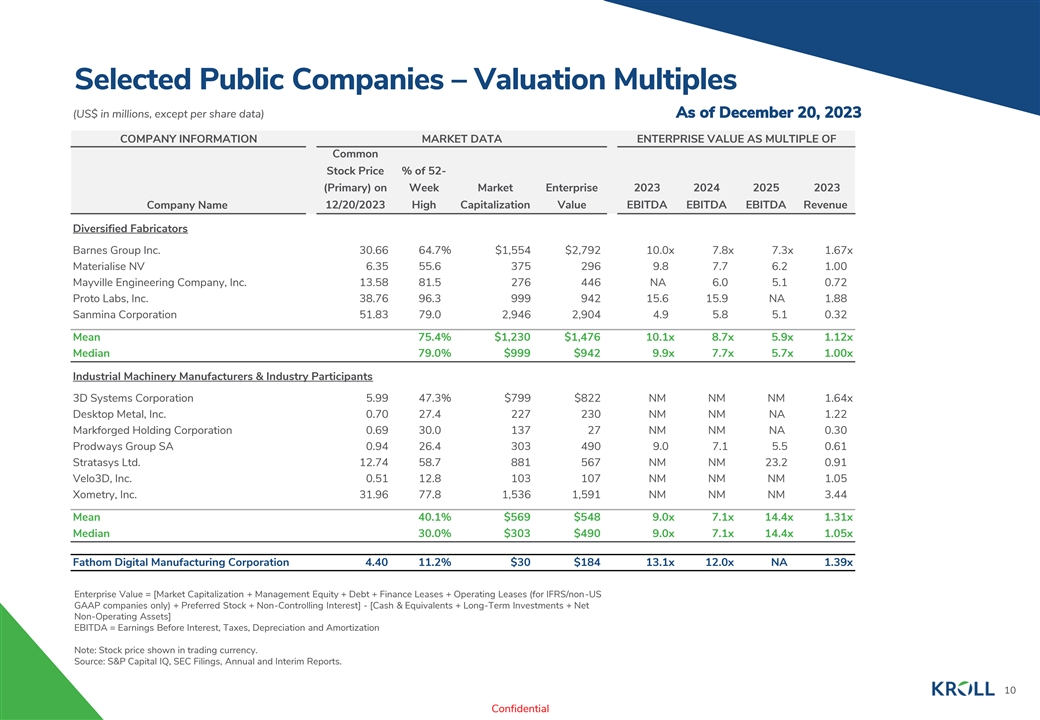
Selected Public Companies – Valuation Multiples Selected Public Companies Analysis (US$ in millions, except per share data) As of December 20, 2023 COMPANY INFORMATION MARKET DATA ENTERPRISE VALUE AS MULTIPLE OF Common Stock Price % of 52- (Primary) on Week Market Enterprise 2023 2024 2025 2023 Company Name 12/20/2023 High Capitalization Value EBITDA EBITDA EBITDA Revenue Diversified Fabricators Barnes Group Inc. 30.66 64.7% $1,554 $2,792 10.0x 7.8x 7.3x 1.67x Materialise NV 6.35 55.6 375 296 9.8 7.7 6.2 1.00 Mayville Engineering Company, Inc. 13.58 81.5 276 446 NA 6.0 5.1 0.72 Proto Labs, Inc. 38.76 96.3 999 942 15.6 15.9 NA 1.88 Sanmina Corporation 51.83 79.0 2,946 2,904 4.9 5.8 5.1 0.32 Mean 75.4% $1,230 $1,476 10.1x 8.7x 5.9x 1.12x Median 79.0% $999 $942 9.9x 7.7x 5.7x 1.00x Industrial Machinery Manufacturers & Industry Participants 3D Systems Corporation 5.99 47.3% $799 $822 NM NM NM 1.64x Desktop Metal, Inc. 0.70 27.4 227 230 NM NM NA 1.22 Markforged Holding Corporation 0.69 30.0 137 27 NM NM NA 0.30 Prodways Group SA 0.94 26.4 303 490 9.0 7.1 5.5 0.61 Stratasys Ltd. 12.74 58.7 881 567 NM NM 23.2 0.91 Velo3D, Inc. 0.51 12.8 103 107 NM NM NM 1.05 Xometry, Inc. 31.96 77.8 1,536 1,591 NM NM NM 3.44 Mean 40.1% $569 $548 9.0x 7.1x 14.4x 1.31x Median 30.0% $303 $490 9.0x 7.1x 14.4x 1.05x Fathom Digital Manufacturing Corporation 4.40 11.2% $30 $184 13.1x 12.0x NA 1.39x Enterprise Value = [Market Capitalization + Management Equity + Debt + Finance Leases + Operating Leases (for IFRS/non-US GAAP companies only) + Preferred Stock + Non-Controlling Interest] - [Cash & Equivalents + Long-Term Investments + Net Non-Operating Assets] EBITDA = Earnings Before Interest, Taxes, Depreciation and Amortization Note: Stock price shown in trading currency. Source: S&P Capital IQ, SEC Filings, Annual and Interim Reports. 10 Confidential

Volume (thousands) Trading Analysis Fathom Digital Manufacturing Corporation - Trading History December 20, 2022 to December 20, 2023 $40.00 100.00 90.00 June 23, 2023 $35.00 Fathom is dropped from April 4, 2023 the Russell 3000 80.00 Fathom Receives November 24, 2023 $30.00 Notice of CORE Industrial Partners 70.00 Noncompliance non-binding proposal to with the NYSE’s $25.00 acquire remining 37.23% August 14, 2023 Continued Listing 60.00 stake in Fathom Digital Standard Fathom reports Manufacturing is earning for second $20.00 50.00 announced Quarter 40.00 $15.00 30.00 $10.00 20.00 $5.00 10.00 $0.00 0.00 Fathom Digital Manufacturing Corporation - Historical Daily Trading Volume Two-Week Average 4,649 One-Month Average 8,465 Six-Month Average 6,639 % of Shares Outstanding 0.1% % of Shares Outstanding 0.2% % of Shares Outstanding 0.2% % of Float 0.3% % of Float 0.5% % of Float 0.4% Shares Outstanding 3,507,080 Float 1,778,750 11 Confidential Share Price
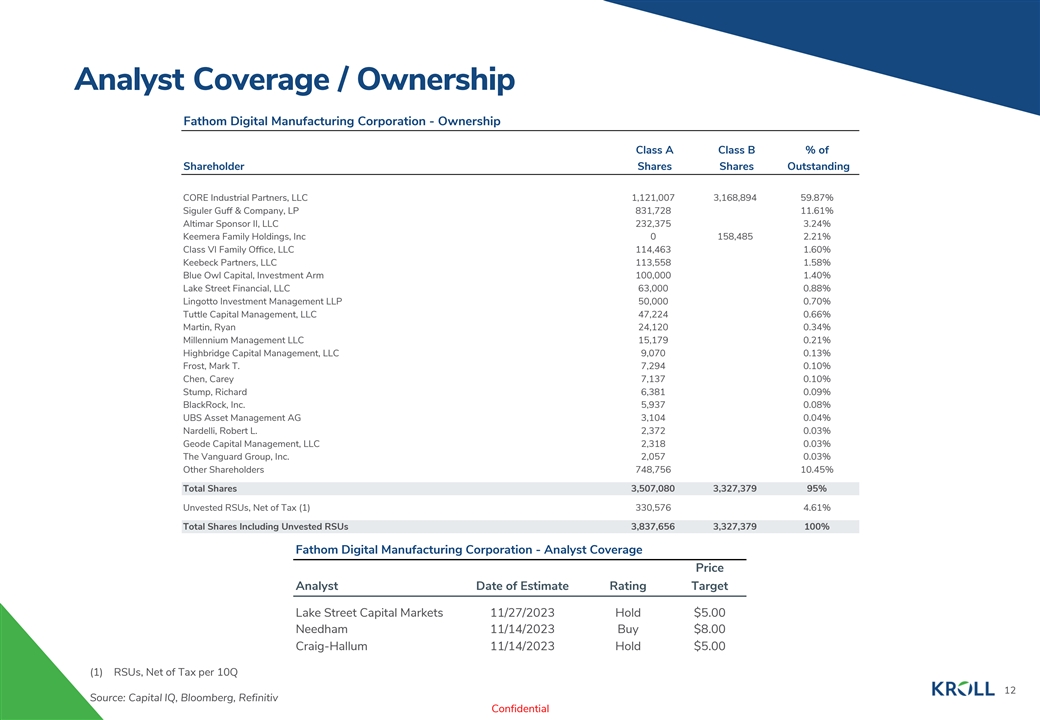
Analyst Coverage / Ownership Fathom Digital Manufacturing Corporation - Ownership Class A Class B % of Shareholder Shares Shares Outstanding CORE Industrial Partners, LLC 1,121,007 3,168,894 59.87% Siguler Guff & Company, LP 831,728 11.61% Altimar Sponsor II, LLC 232,375 3.24% Keemera Family Holdings, Inc 0 158,485 2.21% Class VI Family Office, LLC 114,463 1.60% Keebeck Partners, LLC 113,558 1.58% Blue Owl Capital, Investment Arm 100,000 1.40% Lake Street Financial, LLC 63,000 0.88% Lingotto Investment Management LLP 50,000 0.70% Tuttle Capital Management, LLC 47,224 0.66% Martin, Ryan 24,120 0.34% Millennium Management LLC 15,179 0.21% Highbridge Capital Management, LLC 9,070 0.13% Frost, Mark T. 7,294 0.10% Chen, Carey 7,137 0.10% Stump, Richard 6,381 0.09% BlackRock, Inc. 5,937 0.08% UBS Asset Management AG 3,104 0.04% Nardelli, Robert L. 2,372 0.03% Geode Capital Management, LLC 2,318 0.03% The Vanguard Group, Inc. 2,057 0.03% Other Shareholders 748,756 10.45% Total Shares 3,507,080 3,327,379 95% Unvested RSUs, Net of Tax (1) 330,576 4.61% Total Shares Including Unvested RSUs 3,837,656 3,327,379 100% Fathom Digital Manufacturing Corporation - Analyst Coverage Price Analyst Date of Estimate Rating Target Lake Street Capital Markets 11/27/2023 Hold $5.00 Needham 11/14/2023 Buy $8.00 Craig-Hallum 11/14/2023 Hold $5.00 (1) RSUs, Net of Tax per 10Q 12 Source: Capital IQ, Bloomberg, Refinitiv Confidential
Efforts to Sell the Company 2022 Project Baseball • It is Duff & Phelps’ understanding that during the second half of 2022, the Company and its advisors, JP Morgan and Stifel, undertook a formal review of strategic alternatives which resulted in a decision to pursue a full sale of the Company. This review followed an unsolicited preliminary indication of interest by Blackstone Tactical Opportunities during the summer of 2022 (which ultimately did not result in any formal proposal). • The Company’s advisors performed outreach to 15 to 20 financial sponsors to gauge their interest in a potential purchase of the business. The financial sponsor targets were identified based on a number of factors including but not limited to those with sufficient scale and expertise in the industrial technology and rapid prototyping industry. • Despite management having conducted a number of formal presentations with potential buyers, the process did not result in any formal indications of interests or verbal offers to buy the Company or otherwise participate in an equity recapitalization of the business. • Per JP Morgan, market feedback as to reasons for the lack of buyer interest included: • Recent declines in Fathom’s financial performance; • Concerns about Fathom’s future financial performance given lack of visibility with regard thereto; • Concerns about a lack of differentiation, lack of IP, and limited ability for customer retention/stickiness; • Relative valuation – a discrepancy between the Company’s publicly traded valuation and the perceived intrinsic/fundamental value of the Company – no pathway on valuation. 13 Confidential