UNITED STATES
SECURITIES AND EXCHANGE COMMISSION
Washington, D.C. 20549
Amendment No.2 to FORM 20-F
(Mark One)
| [X] | | REGISTRATION STATEMENT PURSUANT TO SECTION 12(b) OR 12(g) OF THE SECURITIES EXCHANGE ACT OF 1934 |
OR
| [ ] | | REGISTRATION STATEMENT PURSUANT TO SECTION 13 OR 15(d) OF THE SECURITIES EXCHANGE ACT OF 1934 |
For the fiscal year ended December 31, 2020
OR
| [ ] | | TRANSITION REPORT PURSUANT TO SECTION 13 OR 15(d) OF THE SECURITIES EXCHANGE ACT OF 1934 |
For the transition period from to
OR
| [ ] | | SHELL COMPANY REPORT PURSUANT TO SECTION 13 OR 15(d) OF THE SECURITIES EXCHANGE ACT OF 1934 |
Date of event requiring this shell company report _______________
Commission file number: 001-39001
Engage BDR Ltd
(Exact Name of Registrant as Specified in Its Charter)
N/A
(Translation of Registrant’s Name Into English)
Australia
(Jurisdiction of Incorporation or Organization)
Scottish House Level 4
90 William Street
Melbourne Victoria 300
Australia
(Address of Principal Executive Offices)
Mr. Ted Dhanik Executive Chairman
8581 Santa Monica Blvd. #12
West Hollywood, California
90069
ted@engage-bdr.com
(310) 954-0751
(Name, Telephone, E-mail and/or Facsimile number and Address of Company Contact Person)
Securities registered or to be registered pursuant to Section 12(b) of the Act:
| Title of each class | | Trading symbol(s) | | Name of each exchange on which registered |
| Ordinary Shares, no par value | | To be registered | | The Nasdaq Stock Market LLC (to be applied for) |
Securities registered or to be registered pursuant to Section 12(g) of the Act:
None
(Title of Class)
Securities for which there is a reporting obligation pursuant to Section 15(d) of the Act:
None
(Title of Class)
Indicate the number of outstanding shares of each of the issuer’s classes of capital or common stock as of the close of the period covered by the registration statement:
As of December 31, 2020, there were 2,370,744,548 ordinary shares issued and outstanding, AU$0.0060 per ordinary share.
As of December 31, 2019, there were 712,394,973 ordinary shares issued and outstanding, AU$0.022 per ordinary share.
Indicate by check mark if the registrant is a well-known seasoned issuer, as defined in Rule 405 of the Securities Act.
[ ] Yes [X] No
If this report is an annual or transition report, indicate by check mark if the registrant is not required to file reports pursuant to Section 13 or 15(d) of the Securities Exchange Act of 1934.
[ ] Yes [X] No
Note – Checking the box above will not relieve any registrant required to file reports pursuant to Section 13 or 15(d) of the Securities Exchange Act of 1934 from their obligations under those Sections.
Indicate by check mark whether the registrant (1) has filed all reports required to be filed by Section 13 or 15(d) of the Securities Exchange Act of 1934 during the preceding 12 months (or for such shorter period that the registrant was required to file such reports), and (2) has been subject to such filing requirements for the past 90 days.
[ ] Yes [X] No
Indicate by check mark whether the registrant has submitted electronically every Interactive Data File required to be submitted pursuant to Rule 405 of Regulation S-T (§232.405 of this chapter) during the preceding 12 months (or for such shorter period that the registrant was required to submit such files).
[X] Yes [ ] No
Indicate by check mark whether the registrant is a large accelerated filer, an accelerated filer, a non-accelerated filer, or an emerging growth company. See definition of “large accelerated filer,” “accelerated filer,” and “emerging growth company” in Rule 12b-2 of the Exchange Act.
| Large accelerated filer [ ] | Accelerated filer [ ] | Non-accelerated filer [X] | Emerging growth company [X] |
If an emerging growth company that prepares its financial statements in accordance with U.S. GAAP, indicate by check mark if the registrant has elected not to use the extended transition period for complying with any new or revised financial accounting standards† provided pursuant to Section 13(a) of the Exchange Act. [ ]
† The term “new or revised financial accounting standard” refers to any update issued by the Financial Accounting Standards Board to its Accounting Standards Codification after April 5, 2012.
Indicate by check mark whether the registrant has filed a report on and attestation to its management’s assessment of the effectiveness of its internal control over financial reporting under Section 404(b) of the Sarbanes-Oxley Act (15 U.S.C. 7262(b)) by the registered public accounting firm that prepared or issued its audit report.
[ ]
Indicate by check mark which basis of accounting the registrant has used to prepare the financial statements included in this filing:
| U.S. GAAP [ ] | International Financial Reporting Standards as issued by the International Accounting Standards Board [X] | Other [ ] |
If “Other” has been checked in response to the previous question, indicate by check mark which financial statement item the registrant has elected to follow.
[ ] Item 17 [ ] Item 18
If this is an registration statement, indicate by check mark whether the registrant is a shell company (as defined in Rule 12b-2 of the Exchange Act).
[ ] Yes [X] No
(APPLICABLE ONLY TO ISSUERS INVOLVED IN BANKRUPTCY PROCEEDINGS DURING THE PAST FIVE YEARS)
Indicate by check mark whether the registrant has filed all documents and reports required to be filed by Sections 12, 13 or 15(d) of the Securities Exchange Act of 1934 subsequent to the distribution of securities under a plan confirmed by a court.
[ ] Yes [ ] No
TABLE OF CONTENTS
INTRODUCTION
Unless otherwise indicated or the context otherwise requires, references in this registration statement on Form 20-F to:
| ● | “Engage BDR,” the “Company,” “we,” “us” and “our” refer to Engage BDR and its subsidiaries. |
| ● | “$ refers to the legal currency of Australia and “US$” or “U.S. Dollars” refers to the legal currency of the United States. |
| ● | We have made rounding adjustments to some of the figures included in this registration statement. Accordingly, numerical figures shown as totals in some tables may not be an arithmetic aggregation of the figures that preceded them. |
| ● | Our functional currency is the Australian dollar. All monetary amounts are presented in Australian dollars unless otherwise specified. As of December 31, 2020 and December 31, 2019, the currency exchange rate from Austrialian dollars to U.S. dollars was: $1.00 = US$0.77 and $1.00=U.S.$0.70, respectively. |
FORWARD-LOOKING STATEMENTS
This registration statement on Form 20-F contains forward-looking statements that reflect our current expectations and views of future events. Known and unknown risks, uncertainties and other factors, including those listed under “Item 3. Key Information—D. Risk Factors”, may cause our actual results, performance or achievements to be materially different from those expressed or implied by the forward-looking statements.
You can identify some of these forward-looking statements by words or phrases such as “may,” “will,” “expect,” “anticipate,” “aim,” “estimate,” “intend,” “plan,” “believe,” “is/are likely to,” “potential,” “continue” or other similar expressions. We have based these forward-looking statements largely on our current expectations and projections about future events that we believe may affect our financial condition, results of operations, business strategy and financial needs. Factors that could cause our actual results, performance or achievements to be materially different from those expressed or implied by the forward-looking statements, include, but are not limited to, the factors summarized below:
| ● | We face risks related to health epidemics, severe weather conditions and other outbreaks, in particular, the current escalating coronavirus pandemic. |
| ● | We operate in a highly competitive market and the size and resources of many of our competitors may allow them to compete more effectively than we can, preventing us from achieving profitability; |
| ● | If we are not able to adequately protect our proprietary intellectual property and information, and protect against third party claims that we are infringing on their intellectual property rights, our results of operations could be adversely affected; and |
You should read this registration statement and the documents that we refer to in this registration statement and have filed as exhibits to this registration statement completely and with the understanding that our actual future results may be materially different from what we expect. Other sections of this registration statement discuss factors which could adversely impact our business and financial performance. Moreover, we operate in an evolving environment. New risk factors emerge from time to time and it is not possible for our management to predict all risk factors, nor can we assess the impact of all factors on our business or the extent to which any factor, or combination of factors, may cause actual results to differ materially from those contained in any forward-looking statements. We qualify all of our forward-looking statements by these cautionary statements.
You should not rely upon forward-looking statements as predictions of future events. The forward-looking statements made in this registration statement relate only to events or information as of the date on which the statements are made in this registration statement. Except as required by law, we undertake no obligation to update or revise publicly any forward-looking statements, whether as a result of new information, future events or otherwise, after the date on which the statements are made or to reflect the occurrence of unanticipated events.
PART I
ITEM 1. IDENTITY OF DIRECTORS, SENIOR MANAGEMENT AND ADVISERS
| Information on directors | | |
| Name: | | Mr Ted Dhanik, age 44 |
| Title: | | Co-Founder, Executive Chairman and Chief Executive Officer (appointed 14 December 2017) |
| Experience and expertise: | | Ted Dhanik is one of the co-founders of engage:BDR LLC. He serves as Chief Executive |
| | | Officer overseeing corporate development, strategic marketing, sales and business development, and product strategy. |
| | | |
| | | From 2003 to 2008, Ted worked with MySpace.com developing strategic marketing initiatives. He worked very closely with founders Chris DeWolfe and Tom Anderson and was responsible for launching the brand in its early days through a combination of on and offline campaigns. Ted also worked in business development at LowerMyBills.com until its acquisition by Experian. Ted was also an integral part of the development and launch of the consumer lending program at NexTag Corporation. |
| | | |
| | | He has worked for, or been a partner at, several other companies in business development, sales, and managerial positions, including Xoriant Corporation, Atesto Technologies, Brigade Solutions, Beyond.com/Cybersource Corporation and Merrill Corporation. |
| | | |
| | | Ted also advises a number of technology startups including Fighter, LottoGopher and Schizo Pictures and is an active mentor at Los Angeles-based startup accelerator Start Engine. He is passionate about being a thought leader in the industry and he is regularly published in leading publications. |
| | | |
| | | He regularly contributes to discussions about industry standards and achieving positive change, sitting on IAB committees including the Anti-fraud Workgroup, Anti-malware Workgroup, Traffic of Good intent Task Force, Programmatic Counsel, Digital Video Committee, Mobile Advertising Committee and Performance Marketing Committee. |
| | | |
| Other current directorships: | | Nil |
| Former directorships (last 3 years): | | Nil |
| Interests in shares: | | 97,681,498 fully paid ordinary shares |
| Interests in options: | | Nil |
| Interests in rights: | | 10,000,000 |
| Name: | | Mr Kurtis Rintala, age 50 |
| Title: | | Co-Founder, Executive Director and Chief Operating Officer |
| Experience and expertise: | | Kurtis Rintala was one of the co-founders of engage:BDR LLC. and serves as the Chief |
| | | Operating Officer for the Group overseeing day-to-day operations and leading the execution of the strategic direction of the Group. |
| | | |
| | | Kurtis is responsible for establishing policies that promote the Group culture and vision. He sets comprehensive goals for performance and growth and encourages optimum performance and dedication. He evaluates performance by analysing and interpreting data and metrics. |
| | | |
| | | Kurtis began his career in the technology industry in 2003 as an early member of the successful internet startup, LowerMyBills.com. |
| | | |
| Other current directorships: | | Nil |
| Former directorships (last 3 years): | | Nil |
| Interests in shares: | | 47,717,391 fully paid ordinary shares |
| Interests in options: | | Nil |
| Interests in rights: | | 4,000,000 |
| | | |
| Name: | | Mr Tom Anderson, age 50 |
| Title: | | Non-Executive Director |
| Experience and expertise: | | Tom Anderson was appointed to the Board of the Group as a Non Executive Director to provide the Group with the benefit of his wide ranging expertise in social media and innovative product design and to assist to steer the Group’s future growth strategy. |
| | | |
| | | Prior to joining the engage:BDR, Tom founded and served as President of MySpace, simultaneously inventing “social media” while revolutionizing the music industry. After its launch in 2003, MySpace became the #1 most visited site on the web quickly, surpassing companies such as Google, Yahoo and Amazon. At its peak, Nielsen Net Ratings reported that MySpace captured more than 10% of all minutes spent online. |
| | | |
| | | By the time Anderson left the company in 2009, he had amassed more than 350 million friends on MySpace, making him the first and still ultimately the biggest “influencer” of all time. His MySpace profile photo, which he never changed and still uses to this day is estimated to have been viewed more times than any single photograph in history. |
| | | |
| | | Before retiring in 2009, TIME Magazine included Tom among its list of the 100 most influential people in the world, and Barbara Walters named him one of her 10 Most Fascinating People. |
| | | |
| | | Since retiring, Tom has become an internationally recognised photographer, traveling to more than 40 countries in pursuit of his passion. Tom’s photos have appeared in countless magazines, newspapers, and websites. He now also has a keen interest in architecture and has designed a number of homes. He splits his time between his homes in Las Vegas, Hawaii and Los Angeles. |
| | | |
| | | Prior to his entrepreneurial and creative pursuits, Tom graduated with the Departmental Citation in English and Rhetoric at the University of California at Berkeley and later completed a Masters in Film & Critical Studies at UCLA. |
| | | |
| Other current directorships: | | Nil |
| Former directorships (last 3 years): | | Nil |
| Interests in shares: | | 1,500,000 fully paid ordinary shares |
| Interests in options: | | 5,700,000 |
| Interests in rights: | | Nil |
| Name: | | Mr Darian Pizem, age 38 |
| Title: | | Non-Executive Director |
| Experience and expertise: | | Darian Pizem is the Co-Founder and current CEO of Blockbuster Ventures based in Sydney. |
| | | Blockbuster is a blockchain development company that assists companies in the development of blockchain technology, real-time deployment, commercialisation, and other cost-saving measures. |
| | | |
| | | In addition, Mr. Pizem is the founder of Australian based company, Lunnna Ventures. Lunnna Ventures assists in the launching of start-up businesses in a variety of industries, ranging from healthcare to finance. Lunnna assists Company’s through all stages of the businesses development, cycle from the initial idea phase through to branding, partnerships and funding. |
| | | |
| | | Prior to founding his two businesses, Mr. Pizem worked as a Channel Partner for Australia’s DX Solutions, an ICT solutions and delivery service provider. DX specialties in automation, performance equipment, security and penetration testing, DevOps and Cloud solutions, BI and Analysis and Network E2E and B2B capabilities. |
| | | |
| | | Mr. Pizem has over 15 years of experience in the tech industry, working to promote company growth, innovation, and driving new ideas and concepts. He has a strong background in software ventures, with a focus on marketing, operations and management. |
| | | |
| Other current directorships: | | Nil |
| Former directorships (last 3 years): | | Nil |
| Interests in shares: | | Nil |
| Interest in options: | | 5,700,000 |
| Interest in rights: | | Nil |
| | | |
| Name: | | Mr Robert Antulov, age 57 |
| Title: | | Non-Executive Director |
| Experience and expertise: | | Robert (Rob) Antulov is a Partner at boutique Australian corporate advisory firm Jacanda |
| | | Capital, where he provides advice to clients in the technology and media sectors on trade sales, acquisitions and equity growth capital raisings. |
| | | |
| | | Based in Sydney, Rob is a highly accomplished Director with experience in public, private and not for profit enterprises, primarily in the tech and media sectors. He has extensive digital media expertise with strong capabilities in the implementation of technology-oriented growth strategies, most recently in digital media, programmatic advertising and online marketplaces. Rob also brings to engage:BDR specific M&A skills, having participated in over forty corporate transactions as either principal or advisor. |
| | | |
| | | Previous corporate experience has included senior executive roles with Fairfax, Coca-Cola and Booz & Co (now PwC Strategy&). His entrepreneurial activity includes co-founding a sports digital media business, co-founding a number of ecommerce and SaaS businesses and providing mentoring and Advisory Board guidance to numerous entrepreneurs and their ventures. |
| | | |
| | | Rob has a Bachelor of Engineering Degree (Elect) from the University of Western Australia, an MBA from the Australian Graduate School of Management at UNSW and has completed additional postgraduate studies in the USA at the Kellogg School of Management, North Western University. |
| | | |
| Other current directorships: | | Nil |
| Former directorships (last 3 years): | | Director, Snakk Limited (NXT: SNK) - January 2016 to October 2018 |
| Interests in shares: | | 665,500 fully paid ordinary shares |
| Interests in options: | | 5,700,000 |
| Interests in rights: | | Nil |
ITEM 2. OFFER STATISTICS AND EXPECTED TIMETABLE
Not applicable.
ITEM 3. KEY INFORMATION
A. Selected Financial Data
The following table presents the selected consolidated financial information for our business. You should read the following information in conjunction with Item 5 “Operating and Financial Review and Prospects” below. The following data for the years ended
December 31, 2018, 2019 and 2020 and as of December 31, 2018, 2019 and 2020 have been derived from our audited consolidated financial statements for those years, which were prepared in accordance with IFRS, and should be read in conjunction with those statements, which are included in this registration statement beginning on page F-1.
Selected Consolidated Balance Sheet Data:
| | | December 31, | | | December 31, | | | December 31, | |
| | | 2020 | | | 2019 | | | 2018 | |
| Total current assets | | $ | 9,174,755 | | | $ | 11,757,644 | | | $ | 4,971,591 | |
| Total assets | | | 14,898,824 | | | | 16,928,674 | | | | 9,296,515 | |
| Total current liabilities | | | 6,144,812 | | | | 12,991,432 | | | | 15,799,602 | |
| Total liabilities | | | 6,232,157 | | | | 13,021,004 | | | | 15,905,362 | |
| Total shareholders’ equity | | | 8,666,667 | | | | 3,907,670 | ) | | | (6,608,847 | ) |
| Total liabilities and shareholders’ equity | | $ | 14,898,824 | | | $ | 16,928,674 | | | $ | 9,296,515 | |
Selected Consolidated Statements of Operations Data:
| | | For the Years Ended December 31, | |
| | | 2020 | | | 2019 | | | 2018 | |
| REVENUES | | | 15,398,413 | | | | 17,079,118 | | | | 11,443,935 | |
| COST OF REVENUES | | | (9,420,757 | ) | | | (7,794,937 | ) | | | (5,632,553 | ) |
| GROSS PROFIT | | | 5,977,656 | | | | 9,284,181 | | | | 5,811,382 | |
| OPERATING EXPENSES: | | | | | | | | | | | | |
| Selling (Advertising and Marketing expense) | | | (138,984 | ) | | | (109,301 | ) | | | (269,667 | ) |
| General and administrative (Employee and contractor costs) | | | (7,976,461 | ) | | | (7,659,589 | ) | | | (11,388,219 | ) |
| Research and development | | | | | | | | | | | | |
| Total operating expenses | | | (8,115,445 | ) | | | (7,768,890 | ) | | | (11,657,886 | ) |
| INCOME FROM OPERATIONS | | | (2,137,789 | ) | | | 1,515,291 | | | | (5,846,504 | ) |
| OTHER INCOME (EXPENSE) | | | | | | | | | | | | |
| Interest income | | | | | | | | | | | | |
| Interest expense (Depreciation and amortization) | | | (861,467 | ) | | | (882,335 | ) | | | (2,615,491 | ) |
| Other finance expenses | | | (2,046,850 | ) | | | (1,598,286 | ) | | | (362,681 | ) |
| Other (expense) income, net | | | (1,834,921 | ) | | | (378,099 | ) | | | (2,014,451 | ) |
| Total other income, net | | | (4,743,238 | ) | | | (2,858,720 | ) | | | (4,992,623 | ) |
| INCOME BEFORE INCOME TAXES | | | (6,881,027 | ) | | | (1,343,429 | ) | | | (10,839,127 | ) |
| PROVISION FOR INCOME TAXES | | | | | | | | | | | (1,071 | ) |
| NET INCOME | | | (6,881,027 | ) | | | (1,343,429 | ) | | | (10,840,198 | ) |
| OTHER COMPREHENSIVE INCOME (LOSS) | | | - | | | | (77,977 | ) | | | (511,767 | ) |
| Foreign currency translation adjustment | | | (975,579 | ) | | | (688,546 | ) | | | (313,039 | ) |
| COMPREHENSIVE INCOME | | | (7,856,606 | ) | | | (2,109,952 | ) | | | (11,665,004 | ) |
| Basic and diluted | | | (0.55 | ) | | | (0.26 | ) | | | (4.03 | ) |
| EARNINGS PER SHARE | | | | | | | | | | | | |
| Basic and diluted | | | | | | | | | | | | |
Selected Consolidated Cash Flow Data:
| | | For the Years Ended December 31, | |
| | | 2020 | | | 2019 | | | 2018 | |
| Net cash (used in) provided by operating activities | | | (464,142 | ) | | | (3,790,254 | ) | | | (8,594,304 | ) |
| Net cash provided by (used in) investing activities | | | (1,577,376 | ) | | | (1,780,383 | ) | | | (663,051 | ) |
| Net cash (used in) provided by financing activities | | | 3,495,431 | | | | 7,093,332 | | | | 2,461,699 | |
| EFFECT OF EXCHANGE RATE ON CASH | | | (298,841 | ) | | | (11,298 | ) | | | (158,962 | ) |
| NET CHANGE IN CASH AND CASH EQUIVALENTS | | | 1,453,913 | | | | 1,522,695 | ) | | | (6,795,656 | ) |
| Cash paid for income tax | | | | | | | | | | | | |
| Cash paid for interest | | | | | | | | | | | | |
| Cash and cash equivalents | | | 1,831,673 | | | | 320,276 | | | | 7,274,894 | |
| Restricted cash | | | | | | | | | | | | |
| Total cash, cash equivalents, and restricted cash shown in the consolidated statements of cash flows | | | 2,986,745 | | | | 1,831,673 | | | | 320,276 | |
B. Capitalization and Indebtedness
Not applicable.
C. Reasons for the Offer and Use of Proceeds
Not applicable.
D. Risk Factors
Risks Related to Our Business
An investment in our ordinary shares involves a high degree of risk. You should carefully consider the following information about these risks, together with the other information appearing elsewhere in this registration statement, before deciding to invest in our ordinary shares. The occurrence of any of the following risks could have a material adverse effect on our business, financial condition, results of operations and future growth prospects. In these circumstances, the market price of our ordinary shares could decline, and you may lose all or part of your investment.
We have a limited operating history. There is no assurance that our future operations will result in profitable revenues. If we cannot generate sufficient revenues to operate profitably, we may suspend or cease operations.
Given our limited operating history, there can be no assurance that we can build our business such that we can earn a significant profit or any profit at all. The future of our business will depend upon our ability to obtain and retain customers and when needed, obtain sufficient financing and support from creditors, while we strive to achieve and maintain profitable operations. The likelihood of success must be considered in light of the problems, expenses, difficulties, complications and delays encountered in connection with the operations that we undertake. There is no history upon which to base any assumption that our business will prove to be successful, and there is significant risk that we will not be able to generate the sales volumes and revenues necessary to achieve profitable operations. To the extent that we cannot achieve our plans and generate revenues which exceed expenses on a consistent basis, our business, results of operations, financial condition and prospects will be materially adversely affected.
Our management team has limited public company experience. We have never operated as a public company in the United States. Our entire management team, as well as other company personnel, will need to devote substantial time to compliance, and may not effectively or efficiently manage our transition into a public company. If we are unable to effectively comply with the regulations applicable to public companies or if we are unable to produce accurate and timely financial statements, which may result in material misstatements in our financial statements or possible restatement of financial results, our stock price may be materially adversely affected, and we may be unable to maintain compliance with the listing requirements of Nasdaq. Any such failures could also result in litigation or regulatory actions by the SEC or other regulatory authorities, loss of investor confidence, delisting of our securities, harm to our reputation and diversion of financial and management resources from the operation of our business, any of which could materially adversely affect our business, financial condition, results of operations and growth prospects. Additionally, the failure of a key employee to perform in his or her current position could result in our inability to continue to grow our business or to implement our business strategy.
We operate in a highly competitive market and the size and resources of many of our competitors may allow them to compete more effectively than we can, preventing us from achieving profitability.
The market for our products is highly competitive. Competition may result in pricing pressures, reduced profit margins or lost market share, or a failure to grow our market share, any of which could substantially harm its business and results of operations. We compete with other companies who are focused on building their brands across multiple product and consumer categories. Across our business, we face competitors who are constantly monitoring and attempting to anticipate consumer tastes and trends, seeking ideas which will appeal to consumers and introducing new products that compete with our products for consumer acceptance and purchase. Many of our competitors have significant competitive advantages, including longer operating histories, larger and broader customer bases, less-costly production, more established relationships with a broader set of suppliers, greater brand recognition and greater financial, research and development, marketing, distribution and other resources than we do.
In addition to existing competitors, the barriers to entry for new participants in the entertainment industry and in the consumer products industry are low, and the increasing importance of digital media, and the heightened connection between digital media and consumer interest, has further increased the ability for new participants to enter our markets, and has broadened the array of companies we may compete with. New participants with a popular product idea or entertainment property can gain access to consumers and become a significant source of competition for our products in a very short period of time. These existing and new competitors may be able to respond more rapidly than us to changes in consumer preferences. Our competitors’ products may achieve greater market acceptance than our products and potentially reduce demand for our products, lower our revenues and lower our profitability.
Our future success depends on our ability to retain key executives and to attract, retain and motivate qualified personnel.
We are highly dependent on the principal members of our executive team listed in this report, the loss of whose services may adversely impact the achievement of our objectives. Recruiting and retaining other qualified employees for our business, including scientific and technical personnel, will also be critical to our success. Competition for skilled personnel is intense and the turnover rate can be high. We may not be able to attract and retain personnel on acceptable terms given the competition among numerous companies for individuals with similar skill sets. The inability to recruit or loss of the services of any executive or key employee could adversely affect our business.
We will need to expand our organization, and we may experience difficulties in managing this growth, which could disrupt our operations.
As of December 31, 2020, we had employees, all of which were full-time employees. As our company matures, we expect to expand our employee base to increase our sales and marketing department. Future growth would impose significant additional responsibilities on our management, including the need to identify, recruit, maintain, motivate and integrate additional employees, consultants and contractors. Also, our management may need to divert a disproportionate amount of its attention away from our day-to- day activities and devote a substantial amount of time to managing these growth activities. We may not be able to effectively manage the expansion of our operations, which may result in weaknesses in our infrastructure, give rise to operational mistakes, loss of business opportunities, loss of employees and reduced productivity among remaining employees. Future growth could require significant capital expenditures and may divert financial resources from other projects, such as the development of our existing or future product candidates. If our management is unable to effectively manage our growth, our expenses may increase more than expected, our ability to generate and grow revenue could be reduced, and we may not be able to implement our business strategy. Our future financial performance and our ability to commercialize our product candidates, if approved, and compete effectively will depend, in part, on our ability to effectively manage any future growth.
We face risks related to health epidemics, severe weather conditions and other outbreaks, in particular, the current escalating coronavirus pandemic.
In recent years, there have been outbreaks of epidemics in various countries. Recently, there was an outbreak of a novel strain of coronavirus (COVID-19), which has spread rapidly to many parts of the world. The outbreak has resulted in quarantines, travel restrictions, and the temporary closure of stores and facilities throughout the world. In March 2020, the World Health Organization declared COVID- 19 a pandemic.
Our results of operations will likely be adversely, and may be materially, affected, to the extent that the COVID-19 or any other epidemic harms the Chinese and global economy in general. Any potential impact to our results will depend on, to a large extent, future developments and new information that may emerge regarding the duration and severity of the COVID-19 outbreak and the actions taken by government authorities and other entities to contain the COVID-19 outbreak or treat its impact, almost all of which are beyond our control. Potential impacts include, but are not limited to, the following:
| ● | temporary closure of offices, travel restrictions or suspension of services of our customers and suppliers have negatively affected, and could continue to negatively affect, the demand for our services; |
| ● | our customers may require additional time to pay us or fail to pay us at all, which could significantly increase the amount of accounts receivable and require us to record additional allowances for doubtful accounts; |
| ● | the business operations of our distributors have been and could continue to be negatively impacted by the outbreak, which may negatively impact our distribution channel, or result in loss of customers or disruption of our services, which may in turn materially adversely affect our financial condition and operating results; and |
| ● | any disruption of our supply chain, logistics providers or customers could adversely impact our business and results of operations. |
Because of the uncertainty surrounding the COVID-19 outbreak, the financial impact related to the outbreak cannot be reasonably estimated at this time, but our consolidated results for the full year 2020 may be adversely affected.
In general, our business could be adversely affected by the effects of epidemics, including, but not limited to, COVID-19, avian influenza, severe acute respiratory syndrome (SARS), the influenza A virus, Ebola virus, severe weather conditions such as a snowstorm, flood or hazardous air pollution, or other outbreaks. In response to an epidemic, severe weather conditions, or other outbreaks, government and other organizations may adopt regulations and policies that could lead to severe disruption to our daily operations, including temporary closure of our offices and other facilities. These severe conditions may cause us and/or our partners to make internal adjustments, including but not limited to, temporarily closing down business, limiting business hours, and setting restrictions on travel and/or visits with clients and partners for a prolonged period of time. Various impacts arising from severe conditions may cause business disruption, resulting in material, adverse impact to our financial condition and results of operations.
Risks Related to Intellectual Property
If we are unable to adequately protect our intellectual property rights, or if we are accused of infringing on the intellectual property rights of others, our competitive position could be harmed or we could be required to incur significant expenses to enforce or defend our rights.
Our commercial success will depend in part on our success in obtaining and maintaining issued patents, trademarks and other intellectual property rights and protecting our proprietary technology. If we do not adequately protect our intellectual property and proprietary technology, competitors may be able to use our technologies or the goodwill we have acquired in the marketplace and erode or negate any competitive advantage we may have, which could harm our business and ability to achieve profitability.
We cannot provide any assurances that any of our patents have, or that any of our pending patent applications that mature into issued patents will include, claims with a scope sufficient to protect our products, any additional features we develop for our products or any new products. Other parties may have developed technologies that may be related or competitive to our system, may have filed or may file patent applications and may have received or may receive patents that overlap or conflict with our patent applications, either by claiming the same methods or devices or by claiming subject matter that could dominate our patent position. Our patent position may involve complex legal and factual questions, and, therefore, the scope, validity and enforceability of any patent claims that we may obtain cannot be predicted with certainty. Patents, if issued, may be challenged, deemed unenforceable, invalidated or circumvented. Proceedings challenging our patents could result in either loss of the patent or denial of the patent application or loss or reduction in the scope of one or more of the claims of the patent or patent application. In addition, such proceedings may be costly. Thus, any patents that we may own may not provide any protection against competitors. Furthermore, an adverse decision in an interference proceeding can result in a third party receiving the patent right sought by us, which in turn could affect our ability to commercialize our products.
Though an issued patent is presumed valid and enforceable, its issuance is not conclusive as to its validity or its enforceability and it may not provide us with adequate proprietary protection or competitive advantages against competitors with similar products. Competitors could purchase our products and attempt to replicate some or all of the competitive advantages we derive from our development efforts, willfully infringe our intellectual property rights, design around our patents, or develop and obtain patent protection for more effective technologies, designs or methods. We may be unable to prevent the unauthorized disclosure or use of our technical knowledge or trade secrets by consultants, suppliers, vendors, former employees and current employees.
Our ability to enforce our patent rights depends on our ability to detect infringement. It may be difficult to detect infringers who do not advertise the components that are used in their products. Moreover, it may be difficult or impossible to obtain evidence of infringement in a competitor’s or potential competitor’s product. We may not prevail in any lawsuits that we initiate and the damages or other remedies awarded if we were to prevail may not be commercially meaningful.
In addition, proceedings to enforce or defend our patents could put our patents at risk of being invalidated, held unenforceable or interpreted narrowly. Such proceedings could also provoke third parties to assert claims against us, including that some or all of the claims in one or more of our patents are invalid or otherwise unenforceable. If any of our patents covering our products are invalidated or found unenforceable, or if a court found that valid, enforceable patents held by third parties covered one or more of our products, our competitive position could be harmed or we could be required to incur significant expenses to enforce or defend our rights.
The degree of future protection for our proprietary rights is uncertain, and we cannot ensure that:
| ● | any of our patents, or any of our pending patent applications, if issued, will include claims having a scope sufficient to protect our products; |
| | |
| ● | any of our pending patent applications will issue as patents; |
| | |
| ● | we will be able to successfully commercialize our products on a substantial scale, if approved, before our relevant patents we may have expire; |
| | |
| ● | we were the first to make the inventions covered by each of our patents and pending patent applications; |
| | |
| ● | we were the first to file patent applications for these inventions; |
| | |
| ● | others will not develop similar or alternative technologies that do not infringe our patents; any of our patents will be found to ultimately be valid and enforceable; |
| | |
| ● | any patents issued to us will provide a basis for an exclusive market for our commercially viable products, will provide us with any competitive advantages or will not be challenged by third parties; |
| | |
| ● | we will develop additional proprietary technologies or products that are separately patentable; or |
| | |
| ● | our commercial activities or products will not infringe upon the patents of others. |
We rely, in part, upon unpatented trade secrets, unpatented know-how and continuing technological innovation to develop and maintain our competitive position. Further, our trade secrets could otherwise become known or be independently discovered by our competitors.
Litigation or other proceedings or third party claims of intellectual property infringement could require us to spend significant time and money and could prevent us from selling our products or affect our stock price.
Our commercial success will depend in part on not infringing the patents or violating the other proprietary rights of others. Significant litigation regarding patent rights occurs in our industry. Our competitors in both the United States and abroad, many of which have substantially greater resources and have made substantial investments in patent portfolios and competing technologies, may have applied for or obtained or may in the future apply for and obtain, patents that will prevent, limit or otherwise interfere with our ability to make, use and sell our products. We do not always conduct independent reviews of patents issued to third parties. In addition, patent applications can be pending for many years before issuance, or unintentionally abandoned patents or applications can be revived, so there may be applications of others now pending or recently revived patents of which we are unaware. These applications may later result in issued patents, or the revival of previously abandoned patents, that will prevent, limit or otherwise interfere with our ability to make, use or sell our products. Third parties may, in the future, assert claims that we are employing their proprietary technology without authorization, including claims from competitors or from non-practicing entities that have no relevant product revenue and against whom our own patent portfolio may have no deterrent effect. As we continue to commercialize our products in their current or updated forms, launch new products and enter new markets, we expect competitors may claim that one or more of our products infringe their intellectual property rights as part of business strategies designed to impede our successful commercialization and entry into new markets. The large number of patents, the rapid rate of new patent applications and issuances, the complexities of the technology involved, and the uncertainty of litigation may increase the risk of business resources and management’s attention being diverted to patent litigation. We have, and we may in the future, receive letters or other threats or claims from third parties inviting us to take licenses under, or alleging that we infringe, their patents.
Moreover, we may become party to future adversarial proceedings regarding our patent portfolio or the patents of third parties. Patents may be subjected to opposition, post-grant review or comparable proceedings lodged in various foreign, both national and regional, patent offices. The legal threshold for initiating litigation or contested proceedings may be low, so that even lawsuits or proceedings with a low probability of success might be initiated. Litigation and contested proceedings can also be expensive and time-consuming, and our adversaries in these proceedings may have the ability to dedicate substantially greater resources to prosecuting these legal actions than we can. We may also occasionally use these proceedings to challenge the patent rights of others. We cannot be certain that any particular challenge will be successful in limiting or eliminating the challenged patent rights of the third party.
Any lawsuits resulting from such allegations could subject us to significant liability for damages and invalidate our proprietary rights.
Any potential intellectual property litigation also could force us to do one or more of the following:
| ● | stop making, selling or using products or technologies that allegedly infringe the asserted intellectual property; |
| | |
| ● | lose the opportunity to license our technology to others or to collect royalty payments based upon successful protection and assertion of our intellectual property rights against others; incur significant legal expenses; |
| | |
| ● | pay substantial damages or royalties to the party whose intellectual property rights we may be found to be infringing; |
| | |
| ● | pay the attorney’s fees and costs of litigation to the party whose intellectual property rights we may be found to be infringing; |
| | |
| ● | redesign those products that contain the allegedly infringing intellectual property, which could be costly, disruptive and infeasible; and |
| | |
| ● | attempt to obtain a license to the relevant intellectual property from third parties, which may not be available on reasonable terms or at all, or from third parties who may attempt to license rights that they do not have. |
Any litigation or claim against us, even those without merit, may cause us to incur substantial costs, and could place a significant strain on our financial resources, divert the attention of management from our core business and harm our reputation. If we are found to infringe the intellectual property rights of third parties, we could be required to pay substantial damages (which may be increased up to three times of awarded damages) and/or substantial royalties and could be prevented from selling our products unless we obtain a license or are able to redesign our products to avoid infringement. Any such license may not be available on reasonable terms, if at all, and there can be no assurance that we would be able to redesign our products in a way that would not infringe the intellectual property rights of others. We could encounter delays in product introductions while we attempt to develop alternative methods or products. If we fail to obtain any required licenses or make any necessary changes to our products or technologies, we may have to withdraw existing products from the market or may be unable to commercialize one or more of our products.
If we are unable to protect the confidentiality of our trade secrets, our business and competitive position could be harmed.
In addition to patent protection, we also rely upon copyright and trade secret protection, as well as non-disclosure agreements with our employees, consultants and third parties, to protect our confidential and proprietary information. In addition to contractual measures, we try to protect the confidential nature of our proprietary information using commonly accepted physical and technological security measures. Such measures may not, for example, in the case of misappropriation of a trade secret by an employee or third party with authorized access, provide adequate protection for our proprietary information. Our security measures may not prevent an employee or consultant from misappropriating our trade secrets and providing them to a competitor, and recourse we take against such misconduct may not provide an adequate remedy to protect our interests fully. Unauthorized parties may also attempt to copy or reverse engineer certain aspects of our products that we consider proprietary. Enforcing a claim that a party illegally disclosed or misappropriated a trade secret can be difficult, expensive and time-consuming, and the outcome is unpredictable. Even though we use commonly accepted security measures, trade secret violations are often a matter of state law, and the criteria for protection of trade secrets can vary among different jurisdictions. In addition, trade secrets may be independently developed by others in a manner that could prevent legal recourse by us. If any of our confidential or proprietary information, such as our trade secrets, were to be disclosed or misappropriated, or if any such information was independently developed by a competitor, our business and competitive position could be harmed.
Third parties may assert ownership or commercial rights to inventions we develop.
Third parties may in the future make claims challenging the inventorship or ownership of our intellectual property. We incorporate licensed technology in some of our products. Any infringement claims or lawsuits, even if not meritorious, could be expensive and time consuming to defend, divert management’s attention and resources, require us to redesign our products and services, if feasible, require us to pay royalties or enter into licensing agreements in order to obtain the right to use necessary technologies, and/or may materially disrupt the conduct of our business.
In addition, we may face claims by third parties that our agreements with employees, contractors or consultants obligating them to assign intellectual property to us are ineffective or in conflict with prior or competing contractual obligations of assignment, which could result in ownership disputes regarding intellectual property we have developed or will develop and interfere with our ability to capture the commercial value of such intellectual property. Litigation may be necessary to resolve an ownership dispute, and if we are not successful, we may be precluded from using certain intellectual property or may lose our exclusive rights in that intellectual property. Either outcome could harm our business and competitive position.
Our computer systems and operations may be vulnerable to security breaches.
We expect that the cloud-based applications embedded in our toys will be an important foundation for establishing our company as a leading source of technology. For that reason, among others, the safety of our network and our secure transmission of information over the internet will be essential to our operations and our services. Our network and our computer infrastructure are potentially vulnerable to physical breaches or to the introduction of computer viruses, abuse of use and similar disruptive problems and security breaches that could cause loss (both economic and otherwise), interruptions, delays or loss of services to our users. It is possible that advances in computer capabilities or new technologies could result in a compromise or breach of the technology we use to protect user transaction data. A party that is able to circumvent our security systems could misappropriate proprietary information, cause interruptions in our operations or utilize our network without authorization. Security breaches also could damage our reputation and expose us to a risk of loss, litigation and possible liability. We cannot guarantee you that our security measures will prevent security breaches.
Risks Related to our Ordinary Shares
An active trading market for our ordinary shares may not be sustained.
Our ordinary shares are being listed on Nasdaq in conjunction with this prospectus, and we cannot assure you that an active trading market for our ordinary shares will be sustained or maintained. The lack of an active trading market may impair the value of your shares and your ability to sell your shares at the time you wish to sell them. An inactive trading market may also impair our ability to raise capital by selling shares of our ordinary shares and enter into strategic partnerships or acquire other complementary products, technologies or businesses by using shares of our ordinary shares as consideration. In addition, if we fail to satisfy exchange continued listing standards, we could be de-listed, which would have a negative effect on the price of our ordinary shares.
We expect that the price of our ordinary shares will fluctuate substantially and you may not be able to sell your shares at or above the price you purchased the shares at.
The market price of our ordinary shares is likely to be highly volatile and may fluctuate substantially due to many factors, including:
| | ● | the volume and timing of sales of our products; |
| | | |
| | ● | the introduction of new products or product enhancements by us or others in our industry; |
| | | |
| | ● | disputes or other developments with respect to our or others’ intellectual property rights; |
| | | |
| | ● | our ability to develop, obtain regulatory clearance or approval for, and market new and enhanced products on a timely basis; |
| | | |
| | ● | product liability claims or other litigation; |
| | | |
| | ● | quarterly variations in our results of operations or those of others in our industry; |
| | | |
| | ● | media exposure of our products or of those of others in our industry; |
| | | |
| | ● | changes in governmental regulations or in reimbursement; |
| | | |
| | ● | changes in earnings estimates or recommendations by securities analysts; and |
| | | |
| | ● | general market conditions and other factors, including factors unrelated to our operating performance or the operating performance of our competitors. |
In recent years, the stock markets generally have experienced extreme price and volume fluctuations that have often been unrelated or disproportionate to the operating performance of those companies. Broad market and industry factors may significantly affect the market price of our ordinary shares, regardless of our actual operating performance.
In addition, in the past, class action litigation has often been instituted against companies whose securities have experienced periods of volatility in market price. Securities litigation brought against us following volatility in our stock price, regardless of the merit or ultimate results of such litigation, could result in substantial costs, which would hurt our financial condition and operating results and divert management’s attention and resources from our business.
Our ordinary shares are considered to be penny stock. Trading in penny stocks has certain restrictions and these restrictions could negatively affect the price and liquidity of our ordinary shares.
Our ordinary shares trade below $5.00 per share. The SEC has adopted regulations which generally define a “penny stock” to be any equity security that has a market price of less than $5.00 per share, subject to certain exceptions. As a result, our ordinary shares are considered “penny stock”. A penny stock is subject to rules that impose additional sales practice requirements on broker/dealers who sell securities to persons other than established Members and accredited investors. For transactions covered by these rules, the broker/dealer must make a special suitability determination for the purchase of these securities. In addition, a broker/dealer must receive the purchaser’s written consent to the transaction prior to the purchase and must also provide certain written disclosures to the purchaser. Consequently, the “penny stock” rules may restrict the ability of broker/dealers to sell our ordinary shares, and may negatively affect the ability of holders of shares of our ordinary shares to resell them. These disclosures require you to acknowledge that you understand the risks associated with buying penny stocks and that you can absorb the loss of your entire investment. Penny stocks generally do not have a very high trading volume. Consequently, the price of the stock is often volatile and you may not be able to buy or sell the stock when you want to.
We incur significant additional costs as a result of being a public company, which may adversely affect our business, financial condition and results of operations.
As a public company, we incur significant additional costs associated with corporate governance requirements that apply to us as a public company, including rules and regulations of the SEC, under the Sarbanes-Oxley Act, the Dodd-Frank Wall Street Reform and Consumer Protection Act of 2010, and the Exchange Act, as well as the rules of Nasdaq. Compliance with these rules and regulations will significantly increase our accounting, legal and financial compliance costs and make some activities more time-consuming. We also expect these rules and regulations could make it more expensive for us to obtain and maintain directors’ and officers’ liability insurance. As a result, it may be more difficult for us to attract and retain qualified persons to serve on our board of directors or as executive officers. Accordingly, such increases in costs incurred as a result of becoming a public company may adversely affect our business, financial condition and results of operations.
Our disclosure controls and procedures may not prevent or detect all errors or acts of fraud.
We are subject to the periodic reporting requirements of the Exchange Act. We designed our disclosure controls and procedures to provide reasonable assurance that information we must disclose in reports we file or submit under the Exchange Act is accumulated and communicated to management, and recorded, processed, summarized and reported within the time periods specified in the rules and forms of the SEC. We believe that any disclosure controls and procedures, no matter how well-conceived and operated, can provide only reasonable, not absolute, assurance that the objectives of the control system are met.
These inherent limitations include the realities that judgments in decision-making can be faulty, and that breakdowns can occur because of simple error or mistake. Additionally, controls can be circumvented by the individual acts of some persons, by collusion of two or more people or by an unauthorized override of the controls. Accordingly, because of the inherent limitations in our control system, misstatements due to error or fraud may occur and not be detected.
Because we do not anticipate paying any cash dividends on our capital stock in the foreseeable future, capital appreciation, if any, will be your sole source of gain.
We have never declared or paid cash dividends. We currently intend to retain all of our future earnings, if any, to finance the growth and development of our business. As a result, capital appreciation, if any, of our ordinary shares will be your sole source of gain for the foreseeable future.
Securities analysts may not publish favorable research or reports about our business or may publish no information at all, which could cause our stock price or trading volume to decline.
The trading market for our ordinary shares is influenced to some extent by the research and reports that industry or financial analysts publish about us and our business. We do not control these analysts. As a newly public company, we may be slow to attract research coverage and the analysts who publish information about our ordinary shares will have had relatively little experience with us or our industry, which could affect their ability to accurately forecast our results and could make it more likely that we fail to meet their estimates. If any of the analysts who cover us provide inaccurate or unfavorable research or issue an adverse opinion regarding our stock price, our stock price could decline. If one or more of these analysts cease coverage of us or fail to publish reports covering us regularly, we could lose visibility in the market, which in turn could cause our stock price or trading volume to decline and result in the loss of all or a part of your investment in us.
We qualify as a foreign private issuer and, as a result, we are not be subject to U.S. proxy rules and are subject to Exchange Act reporting obligations that permit less detailed and less frequent reporting than that of a U.S. domestic public company.
We report under the Exchange Act as a non-U.S. company with foreign private issuer status. Because we qualify as a foreign private issuer under the Exchange Act, we are exempt from certain provisions of the Exchange Act that are applicable to U.S. domestic public companies, including (i) the sections of the Exchange Act regulating the solicitation of proxies, consents or authorizations in respect of a security registered under the Exchange Act; (ii) the sections of the Exchange Act requiring insiders to file public reports of their stock ownership and trading activities and liability for insiders who profit from trades made in a short period of time; and (iii) the rules under the Exchange Act requiring the filing with the SEC of quarterly reports on Form 10-Q containing unaudited financial and other specified information, or current reports on Form 8-K upon the occurrence of specified significant events. In addition, our officers, directors and principal shareholders are exempt from the reporting and “short-swing” profit recovery provisions of Section 16 of the Exchange Act and the rules thereunder. Therefore, our shareholders may not know on a timely basis when our officers, directors and principal shareholders purchase or sell our ordinary shares. In addition, foreign private issuers are not required to file their registration statement on Form 20-F until 120 days after the end of each fiscal year, while U.S. domestic issuers that are accelerated filers are required to file their registration statement on Form 10-K within 75 days after the end of each fiscal year. Foreign private issuers also are exempt from Regulation Fair Disclosure, aimed at preventing issuers from making selective disclosures of material information. As a result of the above, you may not have the same protections afforded to shareholders of companies that are not foreign private issuers.
If we lose our status as a foreign private issuer, we would be required to comply with the Exchange Act reporting and other requirements applicable to U.S. domestic issuers, which are more detailed and extensive than the requirements for foreign private issuers. We may also be required to make changes in our corporate governance practices in accordance with various SEC and Nasdaq rules. The regulatory and compliance costs to us under U.S. securities laws if we are required to comply with the reporting requirements applicable to a U.S. domestic issuer may be significantly higher than the cost we would incur as a foreign private issuer. As a result, we expect that a loss of foreign private issuer status would increase our legal and financial compliance costs and would make some activities highly time consuming and costly. We also expect that if we were required to comply with the rules and regulations applicable to U.S. domestic issuers, it would make it more difficult and expensive for us to obtain and maintain directors’ and officers’ liability insurance, and we may be required to accept reduced coverage or incur substantially higher costs to obtain coverage. These rules and regulations could also make it more difficult for us to attract and retain qualified members of our board of directors.
As a foreign private issuer, we are permitted to adopt certain home country practices in relation to corporate governance matters that differ significantly from Nasdaq corporate governance listing standards. These practices may afford less protection to shareholders than they would enjoy if we complied fully with corporate governance listing standards.
As a foreign private issuer, we are permitted to take advantage of certain provisions in the Nasdaq rules that allow us to follow our home country law for certain governance matters. Certain corporate governance practices in our home country, the Cayman Islands, may differ significantly from corporate governance listing standards. Currently, we do not plan to rely on home country practice with respect to our corporate governance. However, if we choose to follow home country practice in the future, our shareholders may be afforded less protection than they would otherwise enjoy under the Nasdaq corporate governance listing standards applicable to U.S. domestic issuers.
We may lose our foreign private issuer status in the future, which could result in significant additional costs and expenses.
As discussed above, we are a foreign private issuer, and therefore, we are not required to comply with all of the periodic disclosure and current reporting requirements of the Exchange Act. The determination of foreign private issuer status is made annually on the last business day of an issuer’s most recently completed second fiscal quarter. We would lose our foreign private issuer status if, for example, more than 50% of our ordinary shares are directly or indirectly held by residents of the United States and we fail to meet additional requirements necessary to maintain our foreign private issuer status. If we lose our foreign private issuer status on this date, we will be required to file with the SEC periodic reports and registration statements on U.S. domestic issuer forms, which are more detailed and extensive than the forms available to a foreign private issuer. We will also have to mandatorily comply with U.S. federal proxy requirements, and our officers, directors and principal shareholders will become subject to the short-swing profit disclosure and recovery provisions of Section 16 of the Exchange Act. In addition, we will lose our ability to rely upon exemptions from certain corporate governance requirements under the Nasdaq rules. As a U.S. listed public company that is not a foreign private issuer, we will incur significant additional legal, accounting and other expenses that we will not incur as a foreign private issuer, and accounting, reporting and other expenses in order to maintain a listing on a U.S. securities exchange.
ITEM 4. INFORMATION ON THE COMPANY
Principal activities
engage:BDR is an internet-based marketplace platform and associated technology solution provider. engage:BDR’s proprietary technology is used to optimise the sale of advertising inventory from digital publishers (websites and apps) to advertisers and their agents (brands, agencies and advertising platforms). The ability to optimise the inventory from digital publishers to advertisers and their agents allows engage:BDR to play an active role in managing the ad exchange platform.
engage:BDR allows digital publishers to monetise their available advertising space by making the inventory available to multiple advertisers, as well as providing various related technologies designed to help publishers create additional incremental revenue streams. engage:BDR’s ad exchange platform also allows publishers to sell space for video advertising on webpages that do not have video content. The company was formed on August 17,2017 in Melbourne, Australia.
Dividends
There were no dividends paid, recommended or declared during the current or previous financial year.
Review of operations
The loss for the consolidated entity after providing for income tax amounted to $6,881,027 31 December 2020 (31 December 2019: loss of $1,343,429).
Programmatic display, native and video advertising sales
The Group’s Programmatic advertising sales includes selling display, native and video advertising inventory through the Group’s digital auctioning technology to platforms and marketplaces. The Group developed this product to replace the traditional Non-Programmatic display advertising channel. The adoption of programmatic display advertising sales has proven to be extremely successful in 2020 and opened additional revenue opportunities from the same clients, largely because programmatic buying and selling of advertising is much more efficient and significantly more cost effective to operate, thus increasing the Group’s overall operating and gross profit margins.
The Group’s proprietary programmatic technology significantly increases the Group’s operating margins by reducing payroll and associated sales commissions. With the rapid adoption of programmatic buying, brands, agencies and digital media buyers have moved their budgets to auction-based buying, in contrast to buying from salespeople, individual RFP (request for proposal) and insertion orders. This behavioral change has made the marketplace much more efficient, significantly reducing the staff overhead required to sell advertising in the traditional way.
Advertising buyers, through the Group’s programmatic platform, are essentially bidding for advertising inventory in real time in dynamic auctions, which occur in milliseconds while the relevant mobile or CTV app content is loading. This new engage:BDR format has created significant barriers to entry for new companies looking to enter the digital advertising arena. Companies must realistically own and develop their own proprietary technology to be able to participate in the rapidly developing programmatic advertising ecosystem as licensing third party technologies is cost-prohibitive. engage:BDR has developed its own real-time auctioning and bidding technologies which provide it with a significant competitive advantage. engage:BDR has established thousands of direct publisher relationships which is a key differentiator and competitive advantage for the Group in an ecosystem which is experiencing inventory quality issues, brokers and middlemen.
Adcel, our mobile app buyer mediation platform now fully supports Connected TV (CTV) app monetization through ads and has begun onboarding Connected TV app supply. Connected TV apps that live both on televisions and mobile devices (ad supported streaming video applications) have grown in adoption significantly by consumers who are “cord cutting” (eliminating traditional cable subscriptions) in favor of streaming content and the ability to access content anywhere they are, simply by logging into their streaming service. Accessing supply for CTV is essentially the same as any standard display, video or native inventory and is sold to advertisers in the same fashion as traditional online video ads are sold, through real time bidding. The allure of CTV for advertisers is the opportunity to deliver highly targeted ads to a captive audience across all the screens in their household, versus traditional TV ads; where scale, targeting and pricing efficiency are limited.
As EngageBDR’s entrance into CTV is met with competition, our primary sales strategy is powerful technology combined with quicker payments in comparison to our competitors. A common pain point by publishers historically has been slow payment terms from their monetization partners; net 60+ is commonplace. When working directly with agencies, net 120+. This places significant constraints on publishers who are faced with limited capital to scale their businesses; the inability to pay writers and for content production inhibits growth. EngageBDR’s net zero payment terms allow publishers to get paid immediately upon receipt of their invoice, giving EngageBDR negotiation leverage when setting placement cost, volume availability and positioning in the publisher’s monetization waterfall; allowing us to gain preferential opportunities and incentive to integrate.
EngageBDR’s programmatic advertising inventory is comprised of advertising space which is also commonly referred to as “ad placements” across a publisher’s website or mobile/connected television application. The ad placements are created by the publisher with an and integrated into their site to allow for monetization of their site or apps.
EngageBDR accesses this inventory through a number of different integration methods, ranging from direct JavaScript ad tag placement within the publisher’s ad-server, auction style programmatic header bidding integrations, or direct integrations with the publisher’s ad mediation technology (RTB). All the aforementioned integration types will require a contract to be negotiated prior to engaging in an integration and transacting on their inventory. Upon completion of an integration with a publisher through any of the strategies previously mentioned, EngageBDR will begin to present the publisher’s supply to our advertisers and buyers.
As our publishers receive site visitors, EngageBDR is sent requests to show ads to those visitors in real time. Upon receipt of this ad request, EngageBDR examines the bid request to determine if the user’s location, behavioral profile, time of day, device type, operating systems etc, fit existing targeting parameters set forth by our advertisers. If all conditions are met, EngageBDR will submit a bid price that we are willing to pay, typically within 120MS or less from receiving the initial request. Upon winning the auction, EngageBDR will serve our advertiser’s ad and will bill the advertiser for the served ad impression based on first or second price auction dictated by the publisher.
Collaborative Marketing revenue is all revenue received from our influencer marketing platform Iconic Reach. Programmatic revenue is all revenue that comes from our programmatic marketing platform known as Rexer. EngageBDR’s mobile app and CTV platform Adcel works with our programmatic platform Rexer to help distribute available supply to programmatic buyers who have integrated with Rexer. The relationship between Adcel and Rexer is that Rexer serves as a demand source (buyer) of Adcel’s supply. When ad inventory is available on Adcel, an ad request is sent to all of Adcel’s buyer’s in real time, one of which is Rexer. Rexer will then present this ad request to it’s proprietary programmatic buyers as an opportunity to bid on an ad slot to help Adcel publishers better sell through their available advertising inventory.

Influencer Marketing
The Group launched its social influencer marketing platform in 2017. It dedicated engineering and account management resources to further develop and refine its technology and client base in 2019. The Group brought in incremental revenue through this platform and further diversification of the Group’s product and service offering. The group paused IconicReach efforts in March 2020, in light of the COVID-19 pandemic and reallocated those resources to its programmatic advertising exchange. The Group anticipates IconicReach to continue to be paused for 2021 and plans to reallocate resources to IconicReach in 2022.
Mobile and Connected Television (CTV) App Ads
The Group expects continued growth in supply and demand integration onboarding specifically within AdCel for 2021, as AdCel's technology has matured to a stage in which it is capable of monetizing inventory across ConnectedTV Apps. In addition to its core competency of App monetization across mobile devices. AdCel is one of the first demand agnostic mediation technologies available for ConnectedTV publishers in the market, solving an inherent problem in the ConnectedTV ecosystem. AdCel enables publishers the unique ability to mediate multiple sources of demand in one platform, utilizing intelligent personalization powered by the AdCel machine learning algorithm to maximize yield and minimize human error and time spent performing manual optimization. As supply and demand partnerships are established and integrated by sales and engineering, revenue is expected to steadily ramp throughout the course of the year. AdCel will continue to focus onboarding significant volumes of new ConnectedTV and mobile App publishers through the group's NetZero payment product, enabling publisher payments the same day the group is invoiced.
Significant changes in the state of affairs
On 17 January 2020, the Company issued 26,975,464 fully paid ordinary shares at $0.017 (1.7 cents) per share in accordance with the terms and conditions of the Convertible Securities Purchase Agreement (Agreement) with Alto Opportunity Master Fund SPC - Segregated Master Portfolio B (Alto). The Company was required to issue replenishment Collateral Shares under the Agreement. On 3 March 2020, the Company issued 30,420,738 replenishment fully paid ordinary shares at $0.013 (1.3 cents) per share in accordance with the terms and conditions of the Agreement with Alto.
On 13 March 2020, the Company announced a further drawdown of a zero coupon convertible amortising security (ZCS) with a face value of US$450,000 at an issue price of US$382,500. The ZCS was issued to Alto pursuant to the Agreement. The ZCS is secured with a maturity of 31 May 2021.
The ZCS is convertible at the election of Alto at the rate of one fully paid ordinary share for every A$0.35 (35 cents) of the face value converted, at the US$/A$ exchange rate published by the Reserve Bank of Australia on the day before the conversion.
On 1 April 2020, the Company issued 38,412,579 fully paid ordinary shares for settlement of outstanding creditor balances at a deemed issue price of $0.017 (1.7 cents) per share.
On 1 April 2020, the Company issued 107,500,000 Performance Rights as approved in the General Meeting on 18 March 2020. The Performance Rights were issued in accordance with the Company's Options and Performance Rights Plan.
Furthermore, on 1 April 2020 the Company also issued 17,100,000 unlisted options as approved in the General Meeting on 18 March 2020. The options were split into three equal tranches with the following terms:
| ● | Exercise price of $0.0201, vesting upon issue, with an expiry of 3 years after date of issue; |
| ● | Exercise price of $0.0217, vesting 12 months after issue, with an expiry of 3 years after date of issue; and |
| ● | Exercise price of $0.0233, vesting 24 months after issue, with an expiry of 3 years after date of issue. |
The options were issued in accordance with the Company's Options and Performance Rights Plan.
On 27 April 2020, the Company issued 82,000,000 ordinary shares with a nil issue price following achievement of performance hurdles and conversion of performance rights held by executive directors and employees of the Company.
On 7 May 2020, the Company issued 32,123,198 replenishment fully paid ordinary shares at $0.01 (1 cent) per share in accordance with the terms and conditions of the Agreement with Alto.
On 11 June 2020, the Company issued 40,423,775 replenishment fully paid ordinary shares at $0.006 (0.6 cents) per share in accordance with the terms and conditions of the Agreement with Alto.
Furthermore, the Company also issued 30,000,000 fully paid ordinary shares for settlement of outstanding creditor balances at a deemed issue price of $0.008 (0.8 cents) per share.
On 18 June 2020, the Company issued 38,259,130 replenishment fully paid ordinary shares at $0.004 (0.4 cents) per share in accordance with the terms and conditions of the Agreement with Alto.
On 17 July 2020, the Company issued 52,730,441 fully paid ordinary shares at $0.004 (0.4 cents) per share in accordance with the terms and conditions of the Convertible Securities Purchase Agreement (Agreement) with Alto Opportunity Master Fund SPC - Segregated Master Portfolio B (Alto).
On 17 July 2020, the Company also issued 55,736,356 fully paid ordinary shares for settlement of outstanding creditor balances at a deemed issue price of $0.008 (0.8 cents) per share.
On 28 July 2020, the Company issued 62,646,249 replenishment fully paid ordinary shares at $0.004 (0.4 cents) per share in accordance with the terms and conditions of the Agreement with Alto.
In addition, on 28 July 2020 the Company also issued 61,939,034 fully paid ordinary shares for settlement of outstanding creditor balances at a deemed issue price of $0.009 (0.9 cents) per share.
On 14 August 2020, the Company issued 293,921,246 fully paid ordinary shares at an issue price of $0.0073 (0.73 cents) per share to professional and sophisticated investors in relation to the Placement as announced on 11 August 2020.
On 21 August 2020, the Company issued 80,318,305 replenishment fully paid ordinary shares at $0.005 (0.5 cents) per share in accordance with the terms and conditions of the Agreement with Alto.
On 11 September 2020, the Company issued 85,254,184 replenishment fully paid ordinary shares at $0.005 (0.5 cents) per share in accordance with the terms and conditions of the Agreement with Alto.
On 1 December 2020, the Company has issued 430,888,917 fully paid ordinary shares at an issue price of $0.0055 (0.55 cents) per share to professional and sophisticated investors in relation to Placement announced on 25 November 2020.
On 16 December 2020, the Company issued 216,299,959 SPP shares under the Share Purchase Plan which was announced on 25 November 2020. The Company issued the SPP shares at $0.0055 (0.55 cents) raising $1,189,650.
There were no other significant changes in the state of affairs of the consolidated entity during the financial year.
Matters subsequent to the end of the financial year
No matter or circumstance has arisen since 31 December 2020 that has significantly affected, or may significantly affect the consolidated entity's operations, the results of those operations, or the consolidated entity's state of affairs in future financial years.
Likely developments and expected results of operations
Growth of programmatic and mobile app (AdCel) ad revenues the proprietary platforms
With AdCel being one of the first platforms to offer a solution focused for ConnectedTV app mediation and with a number of partnerships both established and in the queue. The Group expects to grow programmatic ConnectedTV and mobile app ad revenues steadily and significantly throughout 2021. These revenues are no longer dependent on third party technologies as they were previously. As a result of our ability to directly represent a publisher's supply through AdCel's mediation, the Group will have the most optimized supply path to a publisher's inventory; creating cost efficiency, and the ability to generate greater scale for the Group's clients. Lastly, this optimized supply path will be key in attracting new demand partnership integrations for AdCel and will provide differentiation in the market stemming from buyers interested in cost efficiency, scale, and unduplicated supply opportunities. As these supply and demand partnerships are integrated by the engineering teams, the revenue is expected to grow steadily throughout the year.
Continued growth of programmatic display, native and video revenue
The Group also expects to see continued growth of its programmatic display, native and video businesses. Through monetisation of existing partnerships and creation of new ones, the Group expects to be able to significantly scale revenue while maintaining its lower cost operations. This enables optimisation of the Group’s existing relationships and the ability to attract new buyers and sellers.
Growth of influencer marketing revenue
The Group brought in incremental revenue through this platform. The Group paused Iconic Reach efforts in March 2020, in light of the COVID-19 pandemic and reallocated resources. The Group anticipates continuing to be paused for the year 2021 and plans to revisit in 2022. Iconic Reach is a self service marketplace which allows brands to collaborate with social media influencers across Tik Tok, Instagram, Youtube, Snapchat and Facebook. Iconic Reach enables brands to partner with powerful, relevant influencers who fit their campaign initiatives through a self service interface, allowing influencers to be sorted by content categories, audience authenticity, reach, location and cost to help eliminate the guesswork involved in contracting with influencers. Iconic Reach bills brands a margin on top of the influencer’s cost for use of the platform. Revenues are received from the advertisers.
1440 influencers joined / 2 new brand beta clients joined in 2020
Environmental regulation
The consolidated entity is not subject to any significant environmental regulation under Australian Commonwealth or State law.
ITEM 4A. UNRESOLVED STAFF COMMENTS
None.
ITEM 5. OPERATING AND FINANCIAL REVIEW AND PROSPECTS
You should read the following discussion and analysis of our financial condition and results of operations in conjunction with our consolidated financial statements and the related notes included elsewhere in this registration statement on Form 20-F. This discussion may contain forward-looking statements based upon current expectations that involve risks and uncertainties. Our actual results may differ materially from those anticipated in these forward-looking statements as a result of various factors, including those set forth under “Item 3. Key Information—D. Risk Factors” or in other parts of this registration statement on Form 20-F.
A. Operating results
Results of Operations
Comparison of Years Ended December 31, 2020 and December 31, 2019
| | | For the Years ended December 31, | |
| | | 2020 | | | 2019 | | | Change | | | Percentage Change | |
| Revenues | | | 15,398,413 | | | | 17,079,118 | | | | (1,680,705 | ) | | | -10 | % |
| Cost of revenues | | | (9,420,757 | ) | | | (7,794,937 | ) | | | 1,625,820 | | | | 21 | % |
| Gross profit | | | 5,977,656 | | | | 9,284,181 | | | | (3,306,525 | ) | | | -36 | % |
| Selling expenses | | | (138,984 | ) | | | (109,301 | ) | | | 29,683 | | | | -27 | % |
| General and administrative expenses | | | (7,976,461 | ) | | | (7,659,589 | ) | | | 316,872 | | | | -4 | % |
| Research and development | | | | | | | | | | | | | | | | |
| Income from operations | | | (2,137,789 | ) | | | 1,515,291 | | | | 3,653,080 | | | | -241 | % |
| Other income, net | | | (4,743,238 | ) | | | (2,858,720 | ) | | | 1,884,518 | | | | -65 | % |
| Provision for income taxes | | | | | | | | | | | | | | | | |
| Net income | | | (6,881,027 | ) | | | (1,343,429 | ) | | | (5,537,598 | ) | | | 412 | % |
Revenues
Our revenues from 2020 over 2019 decreased by $1,680,705 or 10% as a result of COVID-19. Advertisers reserving their spend due to the unknowns with the economy.
Cost of Revenues
Our cost of revenues from 2020 over 2019 increased by $1,625,820 or 21% as a result of onboarding new publishers for a diverse inventory to accommodate advertisers for the unknown of COVID-19.
Gross Profit
Our gross profit from 2020 over 2019 decreased by $3,306,525 or 36% as a result of COVID-19 unknown factors to the economy. Advertisers reserve on spend while onboarding publishers for a diversity of inventory to accommodate the possibilities of their spend.
Operating Expenses
Our operating expenses from 2020 over 2019 decreased by $346,555 or 31% as a result of adjustments made to adapt to COVID-19 working remotely.
Other income, net
Our other income, net from 2020 over 2019 decreased by $1,884,518 or 65% as a result of revenue loss due to COVID-19.
Income tax expense
Our income tax from 2020 over 2019 remained the same no tax.
Net income
Our net income from 2020 over 2019 decreased by 5,537,598 or 412% as a result of loss of revenue due to the uncertainties of COVID-19. Advertisers holding their spend and minimal advertising being used.
Comparison of Years Ended December 31, 2019 and December 31, 2018
| | | For the Years ended December 31, | |
| | | 2019 | | | 2018 | | | Change | | | Percentage Change | |
| Revenues | | | 17,079,118 | | | | 11,443,935 | | | | 5,635,183 | | | | 49 | % |
| Cost of revenues | | | (7,794,937 | ) | | | (5,632,553 | ) | | | 2,162,384 | | | | 38 | % |
| Gross profit | | | 9,284,181 | | | | 5,811,382 | | | | 3,472,799 | | | | 60 | % |
| Selling expenses | | | (109,301 | ) | | | (269,667 | ) | | | (160,366 | ) | | | 59 | % |
| General and administrative expenses | | | (7,659,589 | ) | | | (11,388,219 | ) | | | (3,811,900 | ) | | | 33 | % |
| Research and development | | | | | | | | | | | | | | | | |
| Income from operations | | | 1,515,291 | | | | (5,846,504 | ) | | | 7,445,065 | | | | 126 | % |
| Other income, net | | | (2,858,720 | ) | | | (4,992,623 | ) | | | (2,050,633 | ) | | | 42 | % |
| Provision for income taxes | | | | | | | (1,071 | ) | | | (1,071 | ) | | | 100 | % |
| Net income | | | (1,343,429 | ) | | | (10,840,198 | ) | | | (9,496,769 | ) | | | 88 | % |
Revenues
Our revenues from 2019 over 2018 increased by $5,635,183 or 49%. Prioritized the focus of growing programmatic business (REXER). Brought on more supply to gain more traffic for customers to increase volume.
Cost of Revenues
Our cost of revenues from 2019 over 2018 increased by $2,162,384 or 38% as a result of onboarding of new vendors. The prioritization of programmatic business needed to have the supply to increase our volume and monetize more.
Gross Profit
Our gross profit from 2019 over 2018 increased by $3,472,799 or 60% the prioritization of programmatic business increasing our supply and monetize the traffic for customers.
Operating Expenses
Our operating expenses from 2019 over 2018 decreased by $3,972,266 or 92% as a result of reduction of operational expenses such as reduction in rent space. We minimize staff which in turn reduced the employee/contractor costs from 2018.
Other income, net
Our other income, net from 2019 over 2018 decreased by $2,050,633 or 42% as a result of reclassification from other income to cost of revenue.
Income tax expense
Our income tax from 2019 over 2018 decreased by $(1,071) or 100% as a result of not income tax as it relates to local tax.
Net income
Our net income from 2019 over 2018 increased by 9,496,769 or 88% as a result of reduction of operational costs ex. employee/ contractor costs. The increase in revenue and monetization of prioritizing REXER traffic.
B. Liquidity and capital resources
Liquidity risk
Prudent liquidity risk management implies maintaining sufficient cash and ensuring that all term deposits can be converted to funds in accordance with forecast cash usage. Due to the dynamic nature of the underlying business, flexibility in funding is maintained by ensuring ready access to the cash reserves of the business.
The ongoing maintenance of the Group’s policy is characterized by ongoing cash flow forecast analysis and detailed budgeting processes which, is directed at providing a sound financial positioning for the Group’s operations and financial management activities. In addition, the Group monitors both the debt and equity markets for additional funding opportunities.
Statement of cash flows
| | | For the Years Ended December 31, | |
| | | 2020 | | | 2019 | | | 2018 | |
| Net cash (used in) provided by operating activities | | | (464,142 | ) | | | (3,790,254 | ) | | | (8,594,304 | ) |
| Net cash provided by (used in) investing activities | | | (1,577,376 | ) | | | (1,780,383 | ) | | | (663,051 | ) |
| Net cash (used in) provided by financing activities | | | 3,495,431 | | | | 7,093,332 | | | | 2,461,699 | |
| EFFECT OF EXCHANGE RATE ON CASH | | | (298,841 | ) | | | (11,298 | ) | | | (158,962 | ) |
| NET CHANGE IN CASH AND CASH EQUIVALENTS | | | 1,453,913 | | | | 1,522,695 | ) | | | (6,795,656 | ) |
| Cash paid for income tax | | | | | | | | | | | | |
| Cash paid for interest | | | | | | | | | | | | |
| Cash and cash equivalents | | | 1,831,673 | | | | 320,276 | | | | 7,274,894 | |
| Restricted cash | | | | | | | | | | | | |
| Total cash, cash equivalents, and restricted cash shown in the consolidated statements of cash flows | | | 2,986,745 | | | | 1,831,673 | | | | 320,276 | |
Operating Activities: 2018 had the most operational expenses relating to employee/contractor costs and main operations such as rent, etc. Our staff count was at our highest in relation to these periods in 2018. Revenue and cost of revenues was not substantial enough to offset those costs. 2019 the reduction of staff personnel took place to cut back costs. Revenue prioritization focus brought on more supply (Cost of Revenue) to monetize and traffic to increase volume. 2020 the share-based payments and increased in finance costs. We factor our receivables and which in turn was the decrease in trade and other receivables.
Investing Activities: In all three periods the contributor to this category was our capitalized software. Each year the projects differ, and the time allocated to each.
Financing Activities: 2018 was the initial convertible note at the later part of the year. The initial drawdown was made in November 2018. 2019 repayments were made, and additional drawdown made. Once the repayment was completed a second convertible note was issued. 2020 repayments were made an additional drawdown from the second convertible note. The second half of the year capital raises were successful which were the majority of the financing activity.
During the year ended 31 December 2020, the Group improved its net asset position by settling legacy creditors by a way of share issues. The Group also raised additional capital through a share purchase plan from existing professional and sophisticated investors and zero coupon convertible amortising securities (“ZCSs”) (Refer to note 14). As at the date of this report the directors have assessed that the Group continues to comply with the covenants set under its financing arrangements with its debtor factoring facility and those set by Alto Capital.
Notwithstanding the above the Directors consider the going concern basis to be appropriate giving consideration to:
● Confidence in raising capital as needed;
● Confidence in achieving the group’s forecast revenues and positive operating cash flow in 2021 through continued completion of planned integrations onto the group’s programmatic advertising platform;
● The ability of the Group to settle ZCS note and outstanding creditors via share issue, instead of cash payments;
● Repayment of some or all of secured related party loan receivables;
● The Group’s ability, if required, to seek the support from its founders and major shareholders for the further injection of capital; and
● Its ability to exercise control over discretionary operational cash outflows.
The convertible notes have been repaid in full and extinguished. With the latest capital raises and the overwhelming response, the confidence to do more if need be is possible. Our current working capital is sufficient as noted in the latest financial statements from 2020. Our forecasted revenues are set to be increased and reaching our positive operating cash flow continue to be on target. COVID-19 had advertisers reserving their cash and as we are in the 2nd quarter of 2021 we have seen that projections as to revenue we are moving in a positive direction.
(i) Financial arrangements
The Group had the following borrowing facilities at the end of the reporting period.
| | | Drawn | | | Undrawn | | | Total | |
| 2020 | | $ | | | $ | | | $ | |
| | | | | | | | | | |
| Fixed rate | | | | | | | | | | | | |
| Debtor factoring borrowings (a) | | | 1,904,104 | | | | - | | | | 1,904,104 | |
| Convertible notes (b) | | | 271,814 | | | | 37,173,006 | | | | 37,444,820 | |
| | | | | | | | | | | | | |
| | | | 2,175,918 | | | | 37,173,006 | | | | 39,348,924 | |
| (a) | The Group has an arrangement with a third party to provide an asset backed credit line against trade receivables which are up to 180 days old. Under this arrangement, advances are recorded against certain receivables balances which are factored under the facility. All amounts invoiced are in US Dollars. This arrangement has no expiration date with an interest rate of 8.00%. |
| (b) | Convertible notes were issued on 13 March 2020. Face value of drawn portion is US$450,000 (AU$584,264). The face value of total undrawn is US$28,840,000 (AU$37,444,820). The convertible notes expire on 31 May 2021. |
| | | Drawn | | | Undrawn | | | Total | |
| 2019 | | $ | | | $ | | | $ | |
| | | | | | | | | | |
| Fixed rate | | | | | | | | | | | | |
| Debtor factoring borrowings (a) | | | 4,213,186 | | | | - | | | | 4,213,186 | |
| Convertible notes (b) | | | 2,497,859 | | | | 34,970,026 | | | | 37,467,885 | |
| | | | | | | | | | | | | |
| | | | 6,711,045 | | | | 34,970,026 | | | | 41,681,071 | |
| (a) | During the period, the Group entered into an arrangement with a third party to provide an asset backed credit line against trade receivables which are up to 180 days old. Under this arrangement, advances are recorded against certain receivables balances which are factored under the facility. All amounts invoiced are in US Dollars. This arrangement has no expiration date with an interest rate of 8.00%. |
| (b) | Convertible notes were issued on 19 September 2019. Face value of drawn portion is US$2,060,000 (AU$2,940,336). The face value of total undrawn is US$28,840,000 (AU$41,164,716). The convertible notes expire on 30 November 2020. |
| | Drawn | | | Undrawn | | | Total | |
| 2018 | | $ | | | $ | | | $ | |
| | | | | | | | | | |
| Fixed rate | | | | | | | | | | | | |
| Loan Notes* | | | 880,938 | | | | 1,064,468 | | | | 1,945,406 | |
| Convertible notes | | | - | | | | 4,798,991 | | | | 4,798,991 | |
| | | | | | | | | | | | | |
| Total | | | 880,938 | | | | 5,863,459 | | | | 6,744,397 | |
* Loan notes were issued on 20 November 2018. On 29 January 2019, a resolution was passed during a shareholder general meeting to issue convertible securities in replacement of the Loan notes. As of 31 December 2019 these have been fully paid.
(ii) Maturities of financial liabilities
The following table summarises the maturity profile of the Group’s financial liabilities based on contractual undiscounted payments.
| | | Less than 6 months | | | Between 6 to
12 months | | | Between 1 and
2 years | | | Between 2 and
3 years | | | Remaining contractual
maturities | |
| | | $ | | | $ | | | $ | | | $ | | | $ | |
| Consolidated – 2020 | | | | | | | | | | | | | | | | | | | | |
| Trade and other payables | | | 3,647,691 | | | | - | | | | - | | | | - | | | | 3,647,691 | |
| Credit card liabilities | | | 2,906 | | | | - | | | | - | | | | - | | | | 2,906 | |
| Borrowings - Due to factor* | | | 1,904,104 | | | | - | | | | - | | | | - | | | | 1,904,104 | |
| Convertible notes payable** | | | 214,050 | | | | - | | | | - | | | | - | | | | 214,050 | |
| Borrowings (principal) - Promissory notes | | | 15,893 | | | | - | | | | - | | | | - | | | | 15,893 | |
| Current portion of lease liability | | | 78,927 | | | | 78,927 | | | | - | | | | - | | | | 157,854 | |
| Non-current portion of lease liability | | | - | | | | - | | | | 87,345 | | | | - | | | | 87,345 | |
| Borrowings – Other | | | 135,546 | | | | | | | | | | | | | | | | 135,546 | |
| Total non-derivatives | | | 5,999,117 | | | | 78,927 | | | | 87,345 | | | | - | | | | 6,165,389 | |
| * | Borrowings represent the advances recorded against certain receivables balances which are factored under the facility. |
| ** | Convertible notes were issued on 13 March 2020. Face value of drawn portion is US$450,000 (AU$584,264). The face value of total undrawn is US$28,840,000 (AU$37,444,820). The convertible notes expire on 31 May 2021. |
| | | Less than 6 months | | | Between 6 to
12 months | | | Between 1 and
2 years | | | Between 2 and
3 years | | | Remaining contractual
maturities | |
| | $ | | | $ | | | $ | | | $ | | | $ | |
| Consolidated – 2019 | | | | | | | | | | | | | | | |
| Trade and other payables | | | 5,882,586 | | | | - | | | | - | | | | - | | | | 5,882,586 | |
| Credit card liabilities | | | 13,852 | | | | - | | | | - | | | | - | | | | 13,852 | |
| Borrowings - Due to factor* | | | 4,216,126 | | | | - | | | | - | | | | - | | | | 4,216,126 | |
| Convertible notes payable** | | | 1,424,527 | | | | 949,684 | | | | - | | | | - | | | | 2,374,211 | |
| Borrowings (principal) - Promissory notes | | | 55,349 | | | | - | | | | - | | | | - | | | | 55,349 | |
| Borrowings – Other | | | 148,512 | | | | | | | | | | | | | | | | 148,512 | |
| Total non-derivatives | | | 11,740,952 | | | | 949,684 | | | | - | | | | - | | | | 12,690,636 | |
| * | Borrowings represent the advances recorded against certain receivables balances which are factored under the facility. |
| ** | Convertible note balance comprised of the principal and interest payable the Group entered in on 19 September 2019. The convertible note expires on 18 November 2020. |
| | | Less than 6 months | | | Between 6 and
12 months | | | Between 1 and
2 years | | | Between 2 and
3 years | | | Remaining
contractual maturities | |
| | | $ | | | $ | | | $ | | | $ | | | $ | |
| Consolidated – 2018 | | | | | | | | | | | | | | | | | | | | |
| Trade and other payables | | | 11,357,346 | | | | 2,892 | | | | - | | | | - | | | | 11,360,238 | |
| Credit card liabilities | | | 441,173 | | | | - | | | | - | | | | - | | | | 441,173 | |
| Borrowings - Due to factor | | | 1,048,731 | | | | - | | | | - | | | | - | | | | 1,048,731 | |
| Borrowings (principal) - Promissory notes | | | 668,770 | | | | - | | | | - | | | | - | | | | 668,770 | |
| Loan notes | | | 880,938 | | | | - | | | | - | | | | - | | | | 880,938 | |
| Deferred payable | | | 1,055,057 | | | | | | | | | | | | | | | | 1,055,057 | |
| Total non-derivatives | | | 15,452,015 | | | | 2,892 | | | | - | | | | - | | | | 15,454,907 | |
(iii) Fair value of financial instruments
Unless otherwise stated, the carrying amounts of financial instruments reflect their fair value.
Capital management strategy
The Group’s policy is to maintain a capital structure for the business which ensures sufficient liquidity, provides support for business operations, maintains shareholder confidence and positions the business for future growth. The Group manages its capital structure and makes adjustments in light of changes in economic conditions.
The ongoing maintenance of the Group’s policy is characterised by ongoing cash flow forecast analysis and detailed budgeting processes which, combined with continual development of banking relationships, is directed at providing a sound financial positioning for the Group’s operations and financial management activities.
The Group has an ASX-imposed restriction of 15% of total share capital per annum on the amount of share capital it can issue under a placement, which may be increased by a further 10% under a special resolution put to shareholders at its general meetings.
Capital Expenditures
In the years ended December 31, 2020, 2019 and 2018, our capital expenditures were mainly used for our working capital requirements such as staff costs, sales and marketing expenses and research and development costs. We have not had any material commitments for capital expenditures for the last three financial years. We plan to continue to make capital expenditures to meet the needs that result from the expected growth of our business.
C. Research and development, patents and licenses, etc.
Research costs are expensed as incurred. An intangible asset arising from development expenditure on an internal project is recognized only when the Company can demonstrate the technical feasibility of completing the intangible asset so that it will be available for use or sale, its intention to complete and its ability to use or sell the asset, how the asset will generate future economic benefits, the availability of resources to complete the development and the ability to measure reliably the expenditure attributable to the intangible asset during its development.
D. Trend information
Other than as described elsewhere in this registration statement, we are not aware of any trends, uncertainties, demands, commitments or events that are reasonably likely to have a material adverse effect on our revenue, income from continuing operations, profitability, liquidity or capital resources, or that would cause our reported financial information not necessarily to be indicative of future operation results or financial condition.
EngageBDR’s focus on Connected Television is prompted by numerous shifts in consumer attention as traditional cable subscriptions are falling, and consumers are leaning towards lower cost streaming television platforms, such as Netflix, Hulu, Pluto.TV and more. The need to be able to reach these consumers remains important to brands who were previously marketing to through traditional TV advertising campaigns.
As brands are shifting their budgets towards buying connected TV supply, they are recognizing the increase in performance over traditional TV by way of being able to target consumers by their IP addresses and devices within their households. The ability to deliver advertising campaigns to a much more targeted audience has fueled tremendous growth in CTV for the past few years, with the expectation that CTV will grow to an $18 billion dollar market by 2024.

Additionally, According to a November 2020 poll from the Interactive Advertising Bureau (IAB), 60% of US advertisers planned to shift ad dollars from linear TV to either CTV or OTT in 2021. Among those planning to do this, 81% cited targeting and efficiency as a reason, while 55% pointed to incremental reach. As of 2021, Nearly 79% of people in the United States use streaming services to watch TV.
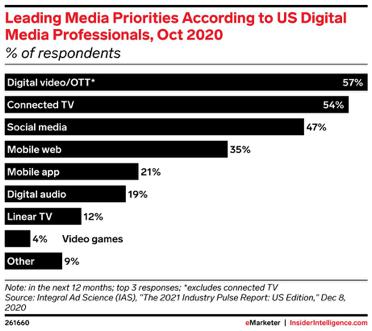
E. Off-balance sheet arrangements
We have no off-balance sheet arrangements including arrangements that would affect our liquidity, capital resources, market risk support and credit risk support or other benefits.
F. Tabular disclosure of contractual obligations
As of December 31, 2020, the future minimum payments under certain of our contractual obligations were as follows:
| | | Payments Due By Period | |
| Contractual obligations | | Total | | | Less than 1 year | | | 1 – 3 years | | | 3 – 5 years | | | More than 5 years | |
| Loan obligations | | | 5,920,190 | | | | 5,920,190 | | | | | | | | | | | | | |
| Operating lease obligations | | | 245,199 | | | | 157,854 | | | | 87,345 | | | | | | | | | |
| Other payables -related party | | | | | | | | | | | | | | | | | | | | |
| Long-term debt obligations* | | | | | | | | | | | | | | | | | | | | |
| Total | | | 6,165,389 | | | | 6,078,044 | | | | 87,345 | | | | | | | | | |
| * | Represent future value of long-term debt obligations. |
G. Safe harbor
See “Forward-Looking Statements” on page iii of this registration statement.
ITEM 6. DIRECTORS, SENIOR MANAGEMENT AND EMPLOYEES
A. Directors and Senior Management
See disclosure above in this report for directors.
Youqi Li (Chief Technology Officer)
Youqi Li
Chief Technology Officer -
Youqi Li is the Chief Technology Officer at engage:BDR. In his role, he leads the engineering team in Research and Development, planning and execution of the product roadmap, and forecasting technical direction of the organization.
Youqi has over ten years of experience in software development and six years of experience within the digital advertising industry. He joined engage:BDR in its early stages and helped to build the engineering team from the ground up. Prior to that, he worked in multiple startups and research centers, which helped him develop agile and open-minded technical expertise.
Youqi received his Master’s Degree in Computer Science from the University of Southern California.
Engage BDR April 2010 - Present
Andy Dhanik (Chief Revenue Officer)
Andy Dhanik is Chief Revenue Officer for engage:BDR. In his role, he oversees all teams responsible for operational processes including on-boarding and management of clients and campaigns, ongoing maintenance of advertising campaigns across all platforms, managing the campaign management team in optimizations, providing strategic product-specific insight to advertisers, and strategically aligning client needs with internal production teams to innovate and release products that provide value and performance for clients.
Engage BDR March 2011- Present
Denys Kravchenko (Chief Technology Officer - AdCel)
Denys Kravchenko
Chief Technology Officer Adcel
15+ years of experience in engineering, product architecture, big data analysis, business development and strategic expansion.
Currently is responsible for shaping the company’s overall strategic technology direction, including oversight of day-to-day technology and engineering operations at AdCel by engageBDR.
Previously, helped to grow Lovetime.com, the largest dating website in South-Eastern Asia with an audience of 5 million unique users. NetPromoter one-stop service for all things SEO.
Managed teams of 40+ people of back-end/front-end/QA engineers, designers and data scientists. Lead SEOPult Ukraine. By 2012, grew from 0 to $54mm in revenue in 3 years, with 536,000 web sites relying on their technology, and over 17mm keywords used to run SEOPult’s automated SEO platform
Appontops Corp Feb 2015 - May 2019
The Argon Group Oct 2017 - Aug 2018
Acel Oct 2016 - Present
Engage BDR SVP Mobile Aug - 2018 - Present
Ted Dhanik and Andy Dhanik are brothers.
B. Compensation
Employment Agreements, Director Agreements and Indemnification Agreements
Service agreements
Remuneration and other terms of employment for key management personnel are formalised in service agreements. Details of these agreements are as follows:
| Name: | | Ted Dhanik |
| Title: | | Executive Chairman and Chief Executive Officer |
| Agreement commenced: | | 14 December 2017 |
| Term of agreement: | | 3 years subject to re-election at any relevant Company Annual General Meeting. |
| Details: | | The fee payable to Director is to be USD$330,000 plus statutory superannuation entitlements per annum from the commencement date. Such fees to be reviewed on each anniversary of the agreement or whenever determined by the Board. |
| | | |
| | | Where for any reason the fees owing to the Director for the services of the Director are not paid for any period of the engagement, or where there are any fees or monies outstanding to Director, the Company will accrue those fees and Director may at its sole option agree for those fees to be paid in the form of fully paid ordinary shares in the Company, subject at all times to the Company obtaining all necessary regulatory and shareholder approvals. |
| | | |
| | | The Director may resign at any time by given written notice to the Company. |
| | | |
| Name: | | Kurtis Rintala |
| Title: | | Executive Director and Chief Operating Officer |
| Agreement commenced: | | 14 December 2017 |
| Term of agreement: | | 3 years subject to re-election at any relevant Company Annual General Meeting. |
| Details: | | The fee payable to Director is to be USD$235,000 plus statutory superannuation entitlements per annum from the commencement date. Such fees to be reviewed on each anniversary of the agreement or whenever determined by the Board. |
| | | |
| | | Where for any reason the fees owing to the Director for the services of the Director are not paid for any period of the engagement, or where there are any fees or monies outstanding to Director, the Company will accrue those fees and Director may at its sole option agree for those fees to be paid in the form of fully paid ordinary shares in the Company, subject at all times to the Company obtaining all necessary regulatory and shareholder approvals. |
| | | |
| | | The Director may resign at any time by given written notice to the Company. |
| | | |
| Name: | | Darian Pizem |
| Title: | | Non-Executive Director |
| Agreement commenced: | | 30 October 2018 |
| Term of agreement: | | 3 years subject to re-election at any relevant Company Annual General Meeting. |
| Details: | | The fee payable to Director is to be AUD$40,000 plus statutory superannuation entitlements per annum from the commencement date. Such fees to be reviewed on each anniversary of the agreement or whenever determined by the Board. |
| | | |
| | | Where for any reason the fees owing to the Director for the services of the Director are not paid for any period of the engagement, or where there are any fees or monies outstanding to Director, the Company will accrue those fees and Director may at its sole option agree for those fees to be paid in the form of fully paid ordinary shares in the Company, subject at all times to the Company obtaining all necessary regulatory and shareholder approvals. |
| | | |
| | | The Director may resign at any time by given written notice to the Company. |
| | | |
| Name: | | Tom Anderson |
| Title: | | Non-Executive Director |
| Agreement commenced: | | 17 August 2017 |
| Term of agreement: | | 3 years subject to re-election at any relevant Company Annual General Meeting. |
Details: | | The fee payable to Director is to be USD$45,000 plus statutory superannuation entitlements per annum from the commencement date. Such fees to be reviewed on each anniversary of the agreement or whenever determined by the Board. |
| | | |
| | | Where for any reason the fees owing to the Director for the services of the Director are not paid for any period of the engagement, or where there are any fees or monies outstanding to Director, the Company will accrue those fees and Director may at its sole option agree for those fees to be paid in the form of fully paid ordinary shares in the Company, subject at all times to the Company obtaining all necessary regulatory and shareholder approvals. |
| | | |
| | | The Director may resign at any time by given written notice to the Company. |
| Name: | | Robert Antulov |
| Title: | | Non-Executive Director |
| Agreement commenced: | | 23 November 2018 |
| Term of agreement: | | 3 years subject to re-election at any relevant Company Annual General Meeting. |
| Details: | | The fee payable to Director is to be AUD$40,000 plus statutory superannuation entitlements per annum from the commencement date. Such fees to be reviewed on each anniversary of the agreement or whenever determined by the Board. |
| | | |
| | | Where for any reason the fees owing to the Director for the services of the Director are not paid for any period of the engagement, or where there are any fees or monies outstanding to Director, the Company will accrue those fees and Director may at its sole option agree for those fees to be paid in the form of fully paid ordinary shares in the Company, subject at all times to the Company obtaining all necessary regulatory and shareholder approvals. |
| | | |
| | | The Director may resign at any time by given written notice to the Company. |
| | | |
| Name: | | Youqi Li |
| Title: | | Chief Technology Officer |
| Agreement commenced: | | 27 August 2015; no agreement to file in exhibit. |
| Term of agreement: | | Ongoing |
| Details: | | Mr Li receives an remuneration package including salary and pension of AUD$249,785 (USD$175,000) per annum. Payment of a benefit on early termination by the Group without cause is equal to 2 months’ base salary. |
| | | |
| | | Notice period - 6 months |
| | | |
| Name: | | Andy Dhanik |
| Title: | | Chief Revenue Officer |
| Agreement commenced: | | 1 March 2014 |
| Term of agreement: | | Ongoing |
| Details: | | Mr Dhanik receives an remuneration package including salary and pension of AUD$249,785 (USD$175,000) per annum. Payment of a benefit on early termination by the Group without cause is equal to 2 months’ base salary. |
| | | |
| Notice period - 6 months | | |
| | | |
| Name: | | Denys Kravchenko |
| Title: | | Chief Technology Officer (AdCel) |
| Agreement commenced: | | 27 July 2018 |
| Term of agreement: | | Ongoing |
| Details: | | Mr Kravchenko receives an remuneration package including salary and pension of AUD$256,922 (USD$180,000) per annum. Payment of a benefit on early termination by the Group without cause is equal to 2 months’ base salary. |
| | | |
| | | Notice period - 6 months |
Key management personnel have no entitlement to termination payments in the event of removal for misconduct.
Compensation of Director and Executive Officers Remuneration report (audited)
The remuneration report details the key management personnel remuneration arrangements for the Group, in accordance with the requirements of the Corporations Act 2001 and its Regulations.
Key management personnel are those persons having authority and responsibility for planning, directing and controlling the activities of the entity, directly or indirectly, including all directors.
The remuneration report is set out under the following main headings:
| ● | Principles used to determine the nature and amount of remuneration |
| ● | Details of remuneration |
| ● | Service agreements |
| ● | Share-based compensation |
| ● | Additional information |
| ● | Additional disclosures relating to key management personnel |
Principles used to determine the nature and amount of remuneration
The objective of the Group’s executive reward framework is to ensure reward for performance is competitive and appropriate for the results delivered. The framework aligns executive reward with the achievement of strategic objectives and the creation of value for shareholders, and it is considered to conform to the market best practice for the delivery of reward. The Board of Directors (‘the Board’) ensures that executive reward satisfies the following key criteria for good reward governance practices:
| ● | competitiveness and reasonableness |
| ● | acceptability to shareholders |
| ● | performance linkage / alignment of executive compensation |
| ● | Transparency |
The Board is responsible for determining and reviewing remuneration arrangements for its directors and executives. The performance of the Group depends on the quality of its directors and executives. The remuneration philosophy is to attract, motivate and retain high performance and high quality personnel.
The Board has structured an executive remuneration framework that is market competitive and complementary to the reward strategy of the Group.
The reward framework is designed to align executive reward to shareholders’ interests. The Board has considered that it should seek to enhance shareholders’ interests by:
| ● | having net profit as a core component of plan design |
| ● | focusing on sustained growth in shareholder wealth, consisting of dividends and growth in share price, and delivering constant or increasing return on assets as well as focusing the executive on key non-financial drivers of value |
| ● | attracting and retaining high calibre executives |
Additionally, the reward framework should seek to enhance executives’ interests by:
| ● | rewarding capability and experience |
| ● | reflecting competitive reward for contribution to growth in shareholder wealth |
| ● | providing a clear structure for earning rewards |
In accordance with best practice corporate governance, the structure of non-executive director and executive director remuneration is separate.
Non-executive directors remuneration
Fees and payments to non-executive directors reflect the demands and responsibilities of their role. Non-executive directors’ fees and payments are reviewed annually by the Board. The Board may, from time to time, receive advice from independent remuneration consultants to ensure non-executive directors’ fees and payments are appropriate and in line with the market.
Executive remuneration
The Group aims to reward executives based on their position and responsibility, with a level and mix of remuneration which has both fixed and variable components.
The executive remuneration and reward framework has four components:
| ● | base pay and non-monetary benefits |
| ● | short-term performance incentives |
| ● | share-based payments |
| ● | other remuneration such as superannuation and long service leave The combination of these comprises the executive’s total remuneration. |
Fixed remuneration, consisting of base salary and non-monetary benefits, is reviewed annually by the Board based on individual and business unit performance, the overall performance of the Group and comparable market remunerations.
Executives may receive their fixed remuneration in the form of cash or other fringe benefits where it does not create any additional costs to the consolidated entity and provides additional value to the executive.
The short-term incentives (‘STI’) program is designed to align the targets of the business units with the performance hurdles of executives. STI payments are granted to executives based on specific annual targets and key performance indicators (‘KPI’s’) being achieved. KPI’s include profit contribution, customer satisfaction, leadership contribution and product management.
In prior year, share based payments (in Engage BDR LLC) had been issued to executives and a non-executive director, which were prior to the IPO. These were issued in respect of services performed for the Group. Refer to Note 30 of the financial report contained within this Registration statement for further details. All Directors and key management personnel did not receive any share based payments in 2018 financial year.
Details of remuneration
The key management personnel of the Group consisted of the following directors and key management personnel:
| ● | Ted Dhanik (Executive Chairman and Chief Executive Officer) |
| ● | Kurtis Rintala (Executive Director and Chief Operating Officer) |
| ● | Tom Anderson (Non-Executive Director) |
| ● | Darian Pizem (Non-Executive Director) |
| ● | Robert Antulov (Non-Executive Director) |
| ● | Youqi Li (Chief Technology Officer) |
| ● | Andy Dhanik (Chief Revenue Officer) |
| ● | Denys Kravchenko (Chief Technology Officer - AdCel) |
Amounts of remuneration
Details of the remuneration of key management personnel of the Group are set out in the following tables.
| | | Short-term benefits | | | Post-
employment | | | Share- | | | | |
| | | Cash salary and fees | | | Commission
/bonus (a) | | | Non-monetary | | | benefits
Defined-
contribution
plan | | | based Payments
Equity-settled | | | Total | |
| 2020 | | $ | | | $ | | | $ | | | $ | | | $ | | | $ | |
| | | | | | | | | | | | | | | | | | | |
| Non-Executive Directors: | | | | | | | | | | | | | | | | | | | | | | | | |
| Tom Anderson | | | 61,998 | | | | - | | | | - | | | | - | | | | 32,920 | | | | 94,918 | |
| Robert Antulov | | | 40,000 | | | | - | | | | - | | | | - | | | | 32,920 | | | | 72,920 | |
| Darian Pizem | | | 40,767 | | | | - | | | | - | | | | - | | | | 32,920 | | | | 73,687 | |
| | | | | | | | | | | | | | | | | | | | | | | | | |
| Executive Directors: | | | | | | | | | | | | | | | | | | | | | | | | |
| Ted Dhanik (a) (c) | | | 477,188 | | | | 400,000 | | | | 93,041 | | | | - | | | | 754,000 | | | | 1,724,229 | |
| Kurtis Rintala (c) | | | 339,815 | | | | - | | | | 1,070 | | | | - | | | | 221,640 | | | | 562,525 | |
| | | | | | | | | | | | | | | | | | | | | | | | | |
| Other Key Management Personnel: | | | | | | | | | | | | | | | | | | | | | | | | |
| Youqi Li (c) | | | 253,054 | | | | - | | | | 535 | | | | - | | | | 104,000 | | | | 357,589 | |
| Andy Dhanik (b) | | | 274,494 | | | | 98,545 | | | | - | | | | - | | | | 160,000 | | | | 533,039 | |
| Denys Kravchenko (c) | | | 260,284 | | | | - | | | | - | | | | - | | | | 184,000 | | | | 444,284 | |
| | | | 1,747,600 | | | | 498,545 | | | | 94,646 | | | | - | | | | 1,522,400 | | | | 3,863,191 | |
| (a) | Bonus award of $400,000 to Mr. Ted Dhanik was made for 2020. This bonus was an offset against part of loan accounts. Loan items were special exertions from the board to compensate the Executives for significantly reduced payroll in 2011 and 2013 and applied to outstanding loan balances with no cash paid. |
| | |
| (b) | Commissions are earned by Mr. Andy Dhanik based on performance to goal. Generally, these performance goals are driven by sales targets and gross profit maximization. Sales and gross margin targets are based on forecasts. Actual performance to goal is compared to arrive at an “Achieved” percentage which is used to determine which Tier of payout they will receive. < 50% is given a 0% payout tier, 51-69% is given a 50% payout tier, 70-79% is given a 70% payout tier, 80-89% is given a 80% payout tier, 90-99% is given a 90% payout tier, and 100% is given a 100% payout tier. The payout tier is then multiplied by the result of dividing the maximum payout amount by the target to arrive at a “Payout Percentage”. The payout percentage is then multiplied by the actual achieved result to arrive at the dollar amount of the payout. |
| (c) | During the year 2020 payroll expenses were recognised as software capitalisation. These costs were related to the developmental costs to projects to deliver future economic benefit to the Group. For T. Dhanik and K. Rintala costs of US$172,735 (AU$224,273) each were capitalised. For Y.Li US$147,116 (AU$191,010) was capitalised. For D.Kravchenko a total of US$143,814 (AU$186,723) was capitalised. |
| | | Short-term benefits | | | Post-
employment | | | Share- | | | | |
| | | Cash salary and fees | | | Commission
/bonus (a) | | | Non-monetary | | | benefits
Defined-
contribution
plan | | | based Payments
Equity-settled | | | Total | |
| 2019 | | $ | | | $ | | | $ | | | $ | | | $ | | | $ | |
| | | | | | | | | | | | | | | | | | | |
| Non-Executive Directors: | | | 64,015 | | | | - | | | | - | | | | - | | | | - | | | | 64,015 | |
| Tom Anderson | | | | | | | | | | | | | | | - | | | | - | | | | | |
| Robert Antulov | | | 40,000 | | | | - | | | | - | | | | - | | | | - | | | | 40,000 | |
| Darian Pizem | | | 58,599 | | | | - | | | | - | | | | - | | | | - | | | | 58,599 | |
| | | | | | | | | | | | | | | | | | | | | | | | | |
| Executive Directors: | | | | | | | | | | | | | | | | | | | | | | | | |
| Ted Dhanik (a) | | | 337,789 | | | | 340,664 | | | | - | | | | - | | | | - | | | | 678,453 | |
| Kurtis Rintala | | | 337,789 | | | | - | | | | - | | | | - | | | | - | | | | 337,789 | |
| | | | | | | | | | | | | | | | | | | | | | | | | |
| Other Key Management Personnel: | | | | | | | | | | | | | | | | | | | | | | | | |
| Youqi Li | | | 241,483 | | | | - | | | | - | | | | - | | | | 87,228 | | | | 328,711 | |
| Andy Dhanik (b) | | | 251,545 | | | | - | | | | - | | | | - | | | | 150,243 | | | | 401,788 | |
| Denys Kravchenko | | | 264,775 | | | | - | | | | - | | | | - | | | | 43,614 | | | | 308,389 | |
| | | | 1,595,995 | | | | 340,664 | | | | - | | | | - | | | | 281,085 | | | | 2,217,744 | |
| (a) | Bonus award of $340,664 to Mr. Ted Dhanik was made for 2019. This bonus was an offset against part of loan accounts. Loan items were special exertions from the board to compensate the Executives for significantly reduced payroll in 2011 and 2013 and applied to outstanding loan balances with no cash paid. |
| (b) | Commissions are earned by Mr. Andy Dhanik based on performance to goal. Generally, these performance goals are driven by sales targets and gross profit maximization. Sales and gross margin targets are based on forecasts. Actual performance to goal is compared to arrive at an “Achieved” percentage which is used to determine which Tier of payout they will receive. < 50% is given a 0% payout tier, 51-69% is given a 50% payout tier, 70-79% is given a 70% payout tier, 80-89% is given a 80% payout tier, 90-99% is given a 90% payout tier, and 100% is given a 100% payout tier. The payout tier is then multiplied by the result of dividing the maximum payout amount by the target to arrive at a “Payout Percentage”. The payout percentage is then multiplied by the actual achieved result to arrive at the dollar amount of the payout. |
Share-based compensation
Issue of shares
Details of shares issued to directors and other key management personnel as part of compensation during the year ended 31 December 2020 are set out below:
| Name | | Date | | Shares | | | Deemed Issue price | | | $AUD | |
| | | | | | | | | | | | |
| Ted Dhanik | | 27 April 2020 | | | 40,000,000 | | | $ | 0.0160 | | | | 640,000 | |
| Kurtis Rintala | | 27 April 2020 | | | 11,000,000 | | | $ | 0.0160 | | | | 176,000 | |
| Youqi Li | | 27 April 2020 | | | 6,500,000 | | | $ | 0.0160 | | | | 104,000 | |
| Andy Dhanik | | 27 April 2020 | | | 10,000,000 | | | $ | 0.0160 | | | | 160,000 | |
Details of shares issued to directors and other key management personnel as part of compensation during the year ended 31 December 2019 are set out below:
| Name | | Date | | Shares | | | Deemed Issue price | | | $AUD | |
| | | | | | | | | | | | |
| Youqi Li | | 7 May 2019 | | | 681,857 | | | $ | 0.042 | | | | 28,638 | |
| Youqi Li | | 9 August 2019 | | | 868,244 | | | $ | 0.034 | | | | 29,520 | |
| Youqi Li | | 20 December 2019 | | | 1,321,353 | | | $ | 0.022 | | | | 29,070 | |
| Andy Dhanik | | 19 March 2019 | | | 680,072 | | | $ | 0.031 | | | | 21,082 | |
| Andy Dhanik | | 8 April 2019 | | | 449,886 | | | $ | 0.047 | | | | 21,145 | |
| Andy Dhanik | | 18 April 2019 | | | 426,354 | | | $ | 0.049 | | | | 20,891 | |
| Andy Dhanik | | 7 May 2019 | | | 511,393 | | | $ | 0.042 | | | | 21,479 | |
| Andy Dhanik | | 10 July 2019 | | | 335,970 | | | $ | 0.043 | | | | 14,447 | |
| Andy Dhanik | | 9 August 2019 | | | 651,183 | | | $ | 0.034 | | | | 22,140 | |
| Andy Dhanik | | 20 December 2019 | | | 1,321,353 | | | $ | 0.022 | | | | 29,070 | |
| Denys Kravchenko | | 7 May 2019 | | | 340,929 | | | $ | 0.042 | | | | 14,319 | |
| Denys Kravchenko | | 9 August 2019 | | | 434,122 | | | $ | 0.034 | | | | 14,760 | |
| Denys Kravchenko | | 20 December 2019 | | | 660,673 | | | $ | 0.022 | | | | 14,535 | |
Options
The terms and conditions of each grant of options over ordinary shares affecting remuneration of directors and other key management personnel in the year ended 31 December 2020 are set out below:
| Name | | Number of options granted | | | Grant date | | Vesting date and exercisable date | | Expiry date | | Exercise Price | | | Fair Value per option at grant date | |
| | | | | | | | | | | | | | | | |
| Tom Anderson | | | 1,900,000 | | | 18-Mar-20 | | 18-Mar-20 | | 01-Apr-23 | | $ | 0.0201 | | | $ | 0.0077 | |
| Tom Anderson | | | 1,900,000 | | | 18-Mar-20 | | 18-Mar-21 | | 01-Apr-23 | | $ | 0.0217 | | | $ | 0.0080 | |
| Tom Anderson | | | 1,900,000 | | | 18-Mar-20 | | 18-Mar-22 | | 01-Apr-23 | | $ | 0.0233 | | | $ | 0.0084 | |
| Robert Antulov | | | 1,900,000 | | | 18-Mar-20 | | 18-Mar-20 | | 01-Apr-23 | | $ | 0.0201 | | | $ | 0.0077 | |
| Robert Antulov | | | 1,900,000 | | | 18-Mar-20 | | 18-Mar-21 | | 01-Apr-23 | | $ | 0.0217 | | | $ | 0.0080 | |
| Robert Antulov | | | 1,900,000 | | | 18-Mar-20 | | 18-Mar-22 | | 01-Apr-23 | | $ | 0.0233 | | | $ | 0.0084 | |
| Darian Pizem | | | 1,900,000 | | | 18-Mar-20 | | 18-Mar-20 | | 01-Apr-23 | | $ | 0.0201 | | | $ | 0.0077 | |
| Darian Pizem | | | 1,900,000 | | | 18-Mar-20 | | 18-Mar-21 | | 01-Apr-23 | | $ | 0.0217 | | | $ | 0.0080 | |
| Darian Pizem | | | 1,900,000 | | | 18-Mar-20 | | 18-Mar-22 | | 01-Apr-23 | | $ | 0.0233 | | | $ | 0.0084 | |
The options listed above with the vesting date of 18 March 2020 vested immediately upon issue.
The options listed above with vesting dates of 18 March 2021 and 18 March 2022 remain unvested at the date of this report and will vest provided that the respective option holders meet service conditions.
Options granted carry no dividend or voting rights.
There were no options over ordinary shares granted to or vested by directors and other key management personnel as part of compensation during the year ended 31 December 2019.
There were no options over ordinary shares granted to or vested by directors and other key management personnel as part of compensation during the year ended 31 December 2018.
Additional information
The earnings of the consolidated entity for the five years to 31 December 2020 are summarised below:
| | | | 2020 | | | | 2019 | | | | 2018 | | | | 2017 | | | | 2016* | |
| | | | $ | | | | $ | | | | $ | | | | $ | | | | $ | |
| Sales revenue | | | 15,398,413 | | | | 17,079,118 | | | | 11,443,935 | | | | 13,135,970 | | | | 21,845,216 | |
| Operating profit/(loss) | | | (1,396,924 | ) | | | 1,604,732 | | | | (6,286,229 | ) | | | (7,098,066 | ) | | | (1,455,961 | ) |
| Loss before income tax expense | | | (6,881,027 | ) | | | (1,343,429 | ) | | | (10,839,127 | ) | | | (9,583,419 | ) | | | (2,927,728 | ) |
| Loss after income tax expense | | | (6,881,027 | ) | | | (1,343,429 | ) | | | (10,840,198 | ) | | | (10,566,001 | ) | | | (3,671,811 | ) |
| * | The financial result represents engage:BDR LLC’s operating result for the year. |
Additional disclosures relating to key management personnel
Shareholding
The number of shares in the company held during the financial year by each director and other members of key management personnel of the consolidated entity, including their personally related parties, is set out below:
2020
| | | Balance at the start of the year | | | Received as part of
remuneration | | | Additions | | | Disposals | | | Balance at the end of the year | |
| Ordinary shares | | | | | | | | | | | | | | | | | | | | |
| Ted Dhanik | | | 57,681,498 | | | | 40,000,000 | | | | - | | | | - | | | | 97,681,498 | |
| Kurtis Rintala | | | 36,717,391 | | | | 11,000,000 | | | | - | | | | - | | | | 47,717,391 | |
| Tom Anderson | | | 1,500,000 | | | | - | | | | - | | | | - | | | | 1,500,000 | |
| Robert Antulov | | | 665,500 | | | | - | | | | - | | | | - | | | | 665,500 | |
| Youqi Li | | | 4,371,454 | | | | 6,500,000 | | | | - | | | | - | | | | 10,871,454 | |
| Andy Dhanik | | | 3,196,211 | | | | 10,000,000 | | | | - | | | | - | | | | 13,196,211 | |
| Denys Kravchenko | | | 1,435,727 | | | | - | | | | - | | | | - | | | | 1,435,727 | |
| | | | 105,567,781 | | | | 67,500,000 | | | | - | | | | - | | | | 173,067,781 | |
Loans to key management personnel and their related parties
As at 31 December 2020 the Group recognised a loan receivable for funds payable by Mr Ted Dhanik (USD$1,035,277; AUD$1,344,166) (2019: USD$1,191,163; AUD$1,700,204) and Mr Andy Dhanik (USD$65,277; AUD$93,173) (2019: USD$65,277; AUD$93,173).
From 1 July 2019, Loans to directors and key management personnel were charged interest at a simple interest rate of 5% per annum, calculated monthly. This interest rate is consistent with local interest rates charged for secured personal debt. For the year ended 31 December 2020, loans given to Mr Ted Dhanik and Mr Andy Dhanik accrued an interest of AUD$89,666 and AUD$4,720 respectively. The loans made to both directors and key management personnel are repayable by 31 August 2021. These have been disclosed as current receivables. $1,984,869 outstanding loans are secured against each individuals’ shareholding and will be settled in cash. All loans were approved by the Board of Directors of the Group.
This concludes the remuneration report, which has been audited.
Shares under option
Unissued ordinary shares of the Company under option at the date of this report are as follows:
| Grant date | | Expiry date | | Exercise price | | | Number under option | |
| | | | | | | | | |
| 29 January 2019 | | 26 January 2022 | | $ | 0.0520 | | | | 8,676,093 | |
| 25 September 2019 | | 30 September 2022 | | $ | 0.0260 | | | | 13,750,000 | |
| 18 March 2020 | | 01 April 2023 | | $ | 0.0201 | | | | 5,700,000 | |
| 18 March 2020 | | 01 April 2023 | | $ | 0.0217 | | | | 5,700,000 | |
| 18 March 2020 | | 01 April 2023 | | $ | 0.0233 | | | | 5,700,000 | |
| | | | | | | | | | 39,526,093 | |
No person entitled to exercise the options had or has any right by virtue of the option to participate in any share issue of the Company or of any other body corporate.
Shares issued on the exercise of options
There were no ordinary shares of engage:BDR Limited issued on the exercise of options during the year ended 31 December 2020 and up to the date of this report.
Indemnity and insurance of officers
During the financial year, the Group maintained an insurance policy which indemnifies the directors and officers of the Group in respect of any liability incurred in connection with the performance of their duties as directors or officers of the Group to the extent permitted by the Corporations Act 2001. The Group’s insurers have prohibited disclosure of the amount of the premium payable and the level of indemnification under the insurance contract.
The Group has not paid any insurance premiums in respect of any past or present directors or auditors, other than as required by law.
C. Board practices
Meetings of directors
The number of meetings of the company’s Board of Directors (‘the Board’) held during the year ended 31 December 2020, and the number of meetings attended by each director were:
| | | Full Board | |
| | | Attended | | | Held | |
| | | | | | | |
| Ted Dhanik | | | 10 | | | | 10 | |
| Kurtis Rintala | | | 10 | | | | 10 | |
| Tom Anderson | | | 5 | | | | 10 | |
| Darian Pizem | | | 10 | | | | 10 | |
| Robert Antulov | | | 10 | | | | 10 | |
Held: represents the number of meetings held during the time the director held office.
D. Employees
Our employee information is set forth below.
2018-34 Employees
Accounting Dept-6 employees
Sales & Mktg-14 employees
Technology-8 employees
Operations-3 employees
Executive-2 employees
Ad Operations-1 employee
2019-22 Employees
Accounting Dept-5 employees
Sales & Mktg-6 employees
Technology-7 employees
Operations-1 employees
Executive-2 employees
Ad Operations-1 employee
2020-19 Employees
Accounting Dept-3 employees
Sales & Mktg-6 employees
Technology-6 employees
Operations-1 employees
Executive-2 employees
Ad Operations-1 employee
All employees are located in the USA.
Change in number of employees is due to workforce optimization and COVID-19.
No labor unions and we do not employee temporary employees. Our employee relations are deemed good.
E. Share ownership
Additional disclosures relating to key management personnel
Shareholding
The number of shares in the company held during the financial year by each director and other members of key management personnel of the consolidated entity, including their personally related parties, is set out below:
2019
| | | Balance at the start of the year | | | Received as part of remuneration | | | Additions | | | Disposals | | | Balance at the end of the year | |
| Ordinary shares | | | | | | | | | | | | | | | | | | | | |
| Ted Dhanik | | | 55,949,870 | | | | - | | | | - | | | | - | | | | 55,949,870 | |
| Kurtis Rintala | | | 35,217,391 | | | | - | | | | - | | | | - | | | | 35,217,391 | |
| Tom Anderson | | | 1,500,000 | | | | - | | | | - | | | | - | | | | 1,500,000 | |
| Robert Antulov | | | 665,500 | | | | - | | | | - | | | | - | | | | 665,500 | |
| Youqi Li | | | 1,500,000 | | | | 2,871,454 | | | | - | | | | - | | | | 4,371,454 | |
| Andy Dhanik | | | 3,000,000 | | | | 4,376,211 | | | | - | | | | (4,180,000 | ) | | | 3,196,211 | |
| Denys Kravchenko | | | 2,885,904 | | | | 1,435,727 | | | | - | | | | (2,885,904 | ) | | | 1,435,727 | |
| | | | 100,718,665 | | | | 8,683,392 | | | | - | | | | (7,065,904 | ) | | | 102,336,153 | |
Loans to key management personnel and their related parties
As at 31 December 2019 the Group recognised a loan receivable for funds payable by Mr Ted Dhanik (USD$1,191,163; AUD$1,700,204) (2018: USD$1,313,754; AUD$1,864,598) and Mr Andy Dhanik (USD$65,277; AUD$93,173) (2018: USD$71,060; AUD$100,855).
From 1 July 2019, Loans to directors and key management personnel were charged interest at a simple interest rate of 5% per annum, calculated monthly. This interest rate is consistent with local interest rates charged for secured personal debt. For the year ended 31 December 2019, loans given to Mr Ted Dhanik and Mr Andy Dhanik accrued an interest of AUD$35,708 and AUD$1,815 respectively. The loans made to both directors and key management personnel are repayable by 31 August 2020. These have been disclosed as current receivables. $1,267,785 outstanding loans are secured against each individuals’ shareholding and will be settled in cash. All loans were approved by the Board of Directors of the Group.
The following table sets forth information with respect to the beneficial ownership of our ordinary shares as of November 10, 2020 for:
| | ● | each beneficial owner of 5% or more of our outstanding ordinary shares; |
| | | |
| | ● | each of our directors and executive officers; and |
| | | |
| | ● | all of our directors and executive officers as a group. |
Beneficial ownership is determined in accordance with the rules of the SEC. These rules generally attribute beneficial ownership of securities to persons who possess sole or shared voting power or investment power with respect to those securities and include ordinary shares issuable upon the exercise of options that are immediately exercisable or exercisable within 60 days of the date of this registration statement. Percentage ownership calculations are based on ordinary shares outstanding as November , 2020.
Except as otherwise indicated, all of the shares reflected in the table are ordinary shares and all persons listed below have sole voting and investment power with respect to the shares beneficially owned by them, subject to applicable community property laws. The information is not necessarily indicative of beneficial ownership for any other purpose.
Except as otherwise indicated in the table below, addresses of our directors, executive officers and named beneficial owners are in care of Engage BDR, at our corporate offices.
| Name of Beneficial Owner | | Number of Shares Beneficially Owned | | | Percentage of Shares Beneficially Owned | |
| 5% or Greater Shareholders: | First Round Capital LLC (1) | | | 97,681,498 | | | | 5.67 | |
| | | | | | | | | | |
| Directors and Executive Officers: | | | | | | | | | |
| | Ted Dhanik | | | 97,681,498 | | | | 5.67 | |
| | Kurtis Rintala | | | 47,717,391 | | | | 2.77 | |
| | Andy Dhanik | | | 11,896,211 | | | | 0.69 | |
| | Youqi Li | | | 10,871,454 | | | | 0.63 | |
| | Tom Anderson | | | 1,500,000 | | | | 0.09 | |
| | Denys Kravchenko | | | 1,435,727 | | | | 0.08 | |
| | Robert Antulov | | | 665,500 | | | | 0.04 | |
| All current directors and executive officers as a group (8 persons) | | | | | | | | |
Ted Dhanik controls First Round Capital LLC Ted Dhanik owns 100% Address: 415 N. Benton Ave MT 59601; total shares 97,681,498
ITEM 7. MAJOR SHAREHOLDERS AND RELATED PARTY TRANSACTIONS
A. MAJOR SHAREHOLDERS
Please refer to Item 6.E. “Directors, Senior Management and Employees—Share Ownership.”
As of December 31, 2020, there were 2,370,744,548 ordinary shares issued and outstanding, AU$0.0060 per ordinary share.
As of December 31, 2019, there were 712,394,973 ordinary shares issued and outstanding, AU$0.022 per ordinary share.
B. Related Party Transactions
During the last three years, we have engaged in the following transactions with our directors, executive officers or holders of more than 5% of our outstanding share capital and their affiliates, which we refer to as our related parties:
Additional disclosures relating to key management personnel
Shareholding
2020
The number of shares in the company held during the financial year by each director and other members of key management personnel of the consolidated entity, including their personally related parties, is set out below:
| | | Balance at the start of the year | | | Received as part of
remuneration | | | Additions | | | Disposals | | | Balance at the end of the year | |
| Ordinary shares | | | | | | | | | | | | | | | |
| Ted Dhanik | | | 57,681,498 | | | | 40,000,000 | | | | - | | | | - | | | | 97,681,498 | |
| Kurtis Rintala | | | 47,717,391 | | | | 11,000,000 | | | | - | | | | - | | | | 47,717,391 | |
| Tom Anderson | | | 1,500,000 | | | | - | | | | - | | | | - | | | | 1,500,000 | |
| Robert Antulov | | | 665,500 | | | | - | | | | - | | | | - | | | | 665,500 | |
| Youqi Li | | | 4,371,454 | | | | 6,500,000 | | | | - | | | | - | | | | 10,871,454 | |
| Andy Dhanik | | | 3,196,211 | | | | 10,000,000 | | | | - | | | | - | | | | 13,196,211 | |
| Denys Kravchenko | | | 1,435,727 | | | | - | | | | - | | | | - | | | | 1,435,727 | |
| | | | 105,567,781 | | | | 67,500,000 | | | | - | | | | - | | | | 173,067,781 | |
2019
The number of shares in the company held during the financial year by each director and other members of key management personnel of the consolidated entity, including their personally related parties, is set out below:
| | | Balance at the start of the year | | | Received as part of
remuneration | | | Additions | | | Disposals | | | Balance at the end of the year | |
| Ordinary shares | | | | | | | | | | | | | | | |
| Ted Dhanik | | | 55,949,870 | | | | - | | | | - | | | | - | | | | 55,949,870 | |
| Kurtis Rintala | | | 35,217,391 | | | | - | | | | - | | | | - | | | | 35,217,391 | |
| Tom Anderson | | | 1,500,000 | | | | - | | | | - | | | | - | | | | 1,500,000 | |
| Robert Antulov | | | 665,500 | | | | - | | | | - | | | | - | | | | 665,500 | |
| Youqi Li | | | 1,500,000 | | | | 2,871,454 | | | | - | | | | - | | | | 4,371,454 | |
| Andy Dhanik | | | 3,000,000 | | | | 4,376,211 | | | | - | | | | (4,180,000 | ) | | | 3,196,211 | |
| Denys Kravchenko | | | 2,885,904 | | | | 1,435,727 | | | | - | | | | (2,885,904 | ) | | | 1,435,727 | |
| | | | 100,718,665 | | | | 8,683,392 | | | | - | | | | (7,065,904 | ) | | | 102,336,153 | |
2018
The number of shares in the company held during the financial year by each director and other members of key management personnel of the consolidated entity, including their personally related parties, is set out below:
| | | Balance at the start of the year | | | Received as part of
remuneration | | | Additions | | | Disposals | | | Balance at the end of the year | |
| Ordinary shares | | | | | | | | | | | | | | | | | | | | |
| Ted Dhanik | | | 55,949,870 | | | | - | | | | - | | | | - | | | | 55,949,870 | |
| Kurtis Rintala | | | 35,217,391 | | | | - | | | | - | | | | - | | | | 35,217,391 | |
| Tom Anderson | | | 1,500,000 | | | | - | | | | - | | | | - | | | | 1,500,000 | |
| Robert Antulov | | | - | | | | - | | | | 665,500 | | | | - | | | | 665,500 | |
| Bruce McMenamin | | | 25,000 | | | | | | | | 78,125 | | | | (103,125 | ) | | | - | |
| Ron Phillips | | | 40,000 | | | | | | | | 37,500 | | | | (77,500 | ) | | | - | |
| Kevin Kwok | | | 6,450,000 | | | | | | | | | | | | (6,450,000 | ) | | | - | |
| Youqi Li | | | 1,500,000 | | | | - | | | | - | | | | (1,500,000 | ) | | | - | |
| Sarah Wetzel | | | 1,125,000 | | | | | | | | | | | | (1,125,000 | ) | | | - | |
| Andy Dhanik | | | 3,000,000 | | | | - | | | | - | | | | - | | | | 3,000,000 | |
| Mona Jalali | | | 1,500,000 | | | | - | | | | - | | | | (1,500,000 | ) | | | - | |
| | | | 106,307,261 | | | | - | | | | 781,125- | | | | (10,755,625 | ) | | | 96,332,761 | |
Loans to key management personnel and their related parties
As at 31 December 2019 the Group recognised a loan receivable for funds payable by Mr Ted Dhanik (USD$1,191,163; AUD$1,700,204) (2018: USD$1,313,754; AUD$1,864,598) and Mr Andy Dhanik (USD$65,277; AUD$93,173) (2018: USD$71,060; AUD$100,855).
From 1 July 2019, Loans to directors and key management personnel were charged interest at a simple interest rate of 5% per annum, calculated monthly. This interest rate is consistent with local interest rates charged for secured personal debt. For the year ended 31 December 2019, loans given to Mr Ted Dhanik and Mr Andy Dhanik accrued an interest of AUD$35,708 and AUD$1,815 respectively. The loans made to both directors and key management personnel are repayable by 31 August 2020. These have been disclosed as current receivables. $1,267,785 outstanding loans are secured against each individuals’ shareholding and will be settled in cash. All loans were approved by the Board of Directors of the Group.
Loans to/from related parties
The following balances are outstanding at the reporting date in relation to loans with related parties:
2020
| | | Consolidated | |
| | | 2020 | | | 2019 | |
| | | $ | | | $ | |
| Beginning of the year | | | 2,311,510 | | | | 2,229,032 | |
| Loans advanced | | | 197,603 | | | | 337,503 | |
| Bonus awarded to key management personnel offset against loan balances | | | (400,000 | ) | | | (337,127 | ) |
| Interest charged | | | 101,200 | | | | 78,285 | |
| Exchange difference | | | (225,444) | | | | 3,817 | |
| | | | 1,984,869 | | | | 2,311,510 | |
| | | Consolidated | |
| | | 2019 | | | 2018 | |
| | | $ | | | $ | |
| Beginning of the year | | | 2,229,032 | | | | 2,277,582 | |
| Loans advanced | | | 337,503 | | | | 329,432 | |
| Bonus awarded to key management personnel offset against loan balances | | | (337,127 | ) | | | (672,582 | ) |
| Interest charged | | | 78,285 | | | | 63,025 | |
| Exchange difference | | | 3,817 | | | | 231,575 | |
| | | | 2,311,510 | | | | 2,229,032 | |
Terms and conditions
From 1 July 2019, Loans to directors and key management personnel were charged interest at a simple interest rate of 5% per annum, calculated monthly. This interest rate is consistent with local interest rates charged for secured personal debt. The loans made to both directors and key management personnel are repayable by 31 August 2020. These have been disclosed as current receivables. $1,267,785 outstanding loans are secured against each individuals’ shareholding and will be settled in cash. All loans were approved by the Board of Directors of the Group.
Policies and Procedures for Related Party Transactions
Our board of directors has created an audit committee which is tasked with review and approval of all related party transactions.
Employment Agreements, Director Agreements and Indemnification Agreements
See above in this registration statement.
C. Interests of Experts and Counsel
Not applicable.
ITEM 8. FINANCIAL INFORMATION
A. Consolidated Statements and Other Financial Information
See “Item 18. Financial Statements” for our audited consolidated financial statements filed as part of this registration statement.
A.7 Legal Proceedings
We are not currently a party to any legal or arbitration proceedings, including those relating to bankruptcy, receivership or similar proceedings and those involving any third party, nor any governmental proceedings pending or known to be contemplated, that in the opinion of our management would have a material adverse effect on our business or that may have, or have had in the recent past, significant effects on our financial position or profitability. However, from time to time, we may be involved in legal proceedings or be subject to claims arising out of our operations. Amounts accrued, as well as the total amount of reasonably possible losses with respect to such matters, individually and in the aggregate, are not deemed to be material to the consolidated financial statements.
A.8 Dividend Policy
Engage BDR has never declared or paid a dividend, and we do not anticipate declaring or paying dividends in the foreseeable future. We intend to retain all available funds and any future earnings to fund the development and expansion of our business.
B. Significant Changes
We have not experienced any significant changes since the date of our audited consolidated financial statements included in this registration statement.
ITEM 9. THE OFFER AND LISTING
A. Offering and Listing Details
Our ordinary shares are to be subject to an application listed on the Nasdaq Capital Market under the symbol “_____”. Prior to that date, there was no public trading market for our ordinary shares in the U.S.
B. Plan of Distribution
Not applicable.
C. Markets
Our ordinary shares have been listed on since under the symbol.
D. Selling Shareholders
Not applicable.
E. Dilution
Not applicable.
F. Expenses of the Issue
Not applicable.
ITEM 10. ADDITIONAL INFORMATION
A. Share Capital
Not applicable.
B. Memorandum and Articles of Association
Please see the EN1 Constitution (Exhibit 1.1).
The company must hold an annual general meeting (AGM) at least once in a calendar year and within 5 months after the end of the financial year. The business of the AGM is to consider the annual financial report, election of directors, appointment of the auditor, and etc. The annual financial report, directors’ report, and auditor’s report must be laid before the AGM.
Ordinary Shares
All of our outstanding ordinary shares are fully paid and non-assessable.
Issuance of Shares and Changes to Capital
Our board of directors has general and unconditional authority to allot, grant options over, offer or otherwise deal with or dispose of any unissued shares in our capital without the approval of our shareholders (whether forming part of the original or any increased share capital), either at a premium or at par, with or without preferred, deferred or other special rights or restrictions, whether in regard to dividend, voting, return of capital or otherwise and to such persons, on such terms and conditions, and at such times as the directors may decide, but so that no share shall be issued at a discount, except in accordance with the provisions of the Australian Companies Law. We will not issue bearer shares.
We may, subject to the provisions of the Australian Companies Law, our amended and restated memorandum and articles of association, the SEC and Nasdaq, from time to time by shareholders resolution passed by a simple majority of the voting rights entitled to vote at a general meeting: increase our capital by such sum, to be divided into shares of such amounts, as the relevant resolution shall prescribe; consolidate and divide all or any of our share capital into shares of larger amount than our existing shares; convert all or any of its paid up shares into stock and reconvert that stock into paid up shares of any denomination; sub-divide our existing shares, or any of them, into shares of smaller amounts than is fixed pursuant to our amended and restated memorandum and articles of association; and cancel any shares which at the date of the passing of the resolution have not been taken or agreed to be taken by any person, and diminish the amount of our share capital by the amount of the shares so cancelled.
We may also, subject to the provisions of the Australian Companies Law, our amended and restated memorandum and articles of association, the SEC and Nasdaq: issue shares on terms that they are to be redeemed or are liable to be redeemed; purchase our own shares (including any redeemable shares); and make a payment in respect of the redemption or purchase of our own shares in any manner authorized by the Companies Law, including out of our capital.
Dividends
Directors may pay dividends as they see fit.
Voting and Meetings
Each member has one vote. A resolution put to the vote at a meeting of the members must be decided on a show of hands unless a poll is demanded.
Transfers of Shares
A member wishing to sell any shares must give notice to company secretary containing an irrevocable offer to sell and stating the number and class of shares which the member wishes to sell and the price which the member is willing to accept for them.
Liquidation
If the company is wound up, the liquidator may, with the sanction of a special resolution, divide among the members in kind the whole or any part of the property of the company and may for that purpose set such value as the liquidator considers fair upon any property to be so divided and may determine how the division is to be carried out as between the members or different classes of members.
Inspection of Books and Records
A director is entitled to inspect the records of the company at all reasonable times. A member other than a director does not have the right to inspect any company document except as provided by the Constitution, by law or authorized by the directors or by the company in general meeting.
Register of Shareholders
The company must keep a register of members.
Preferred Shares
Our board of directors is empowered to designate and issue from time to time one or more classes or series of preferred shares and to fix and determine the relative rights, preferences, designations, qualifications, privileges, options, conversion rights, limitations and other special or relative rights of each such class or series so authorized. Such action could adversely affect the voting power and other rights of the holders of our ordinary shares or could have the effect of discouraging any attempt by a person or group to obtain control of us.
C. Material Contracts
We have not entered into any material contracts other than in the ordinary course of business and other than those described in “Item 4. Information on the Company” or elsewhere in this registration statement on Form 20-F.
D. Exchange Controls
None.
E. Taxation
Passive Foreign Investment Company Consequences
In general, a corporation organized outside the United States will be treated as a PFIC for any taxable year in which either (1) at least 75% of its gross income is “passive income” (the “PFIC income test”), or (2) on average at least 50% of its assets, determined on a quarterly basis, are assets that produce passive income or are held for the production of passive income (the “PFIC asset test”). Passive income for this purpose generally includes, among other things, dividends, interest, royalties, rents, and gains from the sale or exchange of property that gives rise to passive income. Assets that produce or are held for the production of passive income generally include cash, even if held as working capital or raised in a public offering, marketable securities, and other assets that may produce passive income. Generally, in determining whether a non-U.S. corporation is a PFIC, a proportionate share of the income and assets of each corporation in which it owns, directly or indirectly, at least a 25% interest (by value) is taken into account.
Although PFIC status is determined on an annual basis and generally cannot be determined until the end of a taxable year, based on the nature of our current and expected income and the current and expected value and composition of our assets, we do not presently expect to be a PFIC for our current taxable year or the foreseeable future. However, there can be no assurance given in this regard because the determination of whether we are or will become a PFIC is a fact-intensive inquiry made on an annual basis that depends, in part, upon the composition of our income and assets. In addition, there can be no assurance that the IRS will agree with our conclusion or that the IRS would not successfully challenge our position.
If we are a PFIC in any taxable year during which a U.S. Holder owns our ordinary shares, the U.S. Holder could be liable for additional taxes and interest charges under the “PFIC excess distribution regime” upon (1) a distribution paid during a taxable year that is greater than 125% of the average annual distributions paid in the three preceding taxable years, or, if shorter, the U.S. Holder’s holding period for our ordinary shares, and (2) any gain recognized on a sale, exchange or other disposition, including a pledge, of our ordinary shares, whether or not we continue to be a PFIC. Under the PFIC excess distribution regime, the tax on such distribution or gain would be determined by allocating the distribution or gain ratably over the U.S. Holder’s holding period for our ordinary shares. The amount allocated to the current taxable year (i.e., the year in which the distribution occurs or the gain is recognized) and any year prior to the first taxable year in which we are a PFIC will be taxed as ordinary income earned in the current taxable year. The amount allocated to other taxable years will be taxed at the highest marginal rates in effect for individuals or corporations, as applicable, to ordinary income for each such taxable year, and an interest charge, generally applicable to underpayments of tax, will be added to the tax.
If we are a PFIC for any year during which a U.S. Holder holds our ordinary shares, we must generally continue to be treated as a PFIC by that holder for all succeeding years during which the U.S. Holder holds such ordinary shares, unless we cease to meet the requirements for PFIC status and the U.S. Holder makes a “deemed sale” election with respect to our ordinary shares. If the election is made, the U.S. Holder will be deemed to sell our ordinary shares it holds at their fair market value on the last day of the last taxable year in which we qualified as a PFIC, and any gain recognized from such deemed sale would be taxed under the PFIC excess distribution regime. After the deemed sale election, the U.S. Holder’s ordinary shares would not be treated as shares of a PFIC unless we subsequently become a PFIC.
If we are a PFIC for any taxable year during which a U.S. Holder holds our ordinary shares and one of our non-United States subsidiaries is also a PFIC (i.e., a lower-tier PFIC), such U.S. Holder would be treated as owning a proportionate amount (by value) of the shares of the lower-tier PFIC and would be taxed under the PFIC excess distribution regime on distributions by the lower-tier PFIC and on gain from the disposition of shares of the lower-tier PFIC even though such U.S. Holder would not receive the proceeds of those distributions or dispositions. Any of our non-United States subsidiaries that have elected to be disregarded as entities separate from us or as partnerships for U.S. federal income tax purposes would not be corporations under U.S. federal income tax law and accordingly, cannot be classified as lower-tier PFICs. However, non-United States subsidiaries that have not made the election may be classified as a lower-tier PFIC if we are a PFIC during your holding period and the subsidiary meets the PFIC income test or PFIC asset test. Each U.S. Holder is advised to consult its tax advisors regarding the application of the PFIC rules to any of our non-United States subsidiaries.
If we are a PFIC, a U.S. Holder will not be subject to tax under the PFIC excess distribution regime on distributions or gain recognized on our ordinary shares if a valid “mark-to-market” election is made by the U.S. Holder for our ordinary shares. An electing U.S. Holder generally would take into account as ordinary income each year, the excess of the fair market value of our ordinary shares held at the end of such taxable year over the adjusted tax basis of such ordinary shares. The U.S. Holder would also take into account, as an ordinary loss each year, the excess of the adjusted tax basis of such ordinary shares over their fair market value at the end of the taxable year, but only to the extent of the excess of amounts previously included in income over ordinary losses deducted as a result of the mark-to-market election. The U.S. Holder’s tax basis in our ordinary shares would be adjusted to reflect any income or loss recognized as a result of the mark-to-market election. Any gain from a sale, exchange or other disposition of our ordinary shares in any taxable year in which we are a PFIC would be treated as ordinary income and any loss from such sale, exchange or other disposition would be treated first as ordinary loss (to the extent of any net mark-to-market gains previously included in income) and thereafter as capital loss. If, after having been a PFIC for a taxable year, we cease to be classified as a PFIC because we no longer meet the PFIC income or PFIC asset test, the U.S. Holder would not be required to take into account any latent gain or loss in the manner described above and any gain or loss recognized on the sale or exchange of the ordinary shares would be classified as a capital gain or loss.
A mark-to-market election is available to a U.S. Holder only for “marketable stock.” Generally, stock will be considered marketable stock if it is “regularly traded” on a “qualified exchange” within the meaning of applicable U.S. Treasury regulations. A class of stock is regularly traded during any calendar year during which such class of stock is traded, other than in de minimis quantities, on at least 15 days during each calendar quarter.
Our ordinary shares are marketable stock as long as they remain listed on the Nasdaq Capital Market and are regularly traded. A mark- to-market election will not apply to the ordinary shares for any taxable year during which we are not a PFIC, but will remain in effect with respect to any subsequent taxable year in which we become a PFIC. Such election will not apply to any of our non-U.S. subsidiaries. Accordingly, a U.S. Holder may continue to be subject to tax under the PFIC excess distribution regime with respect to any lower-tier PFICs notwithstanding the U.S. Holder’s mark-to-market election for the ordinary shares.
Except for stamp duties which may be applicable on instruments executed in or brought within the jurisdiction of the Cayman Islands, no stamp duty, capital duty, registration or other issue or documentary taxes are payable in the Cayman Islands on the creation, issuance or delivery of the ordinary shares. The Cayman Islands currently have no form of income, corporate or capital gains tax and no estate duty, inheritance tax or gift tax. There are currently no Cayman Islands’ taxes or duties of any nature on gains realized on a sale, exchange, conversion, transfer or redemption of the ordinary shares. Payments of dividends and capital in respect of the ordinary shares will not be subject to taxation in the Cayman Islands and no withholding will be required on the payment of interest and principal or a dividend or capital to any holder of the ordinary shares, nor will gains derived from the disposal of the ordinary shares be subject to Cayman Islands income or corporation tax as the Cayman Islands currently have no form of income or corporation taxes.
The tax consequences that would apply if we are a PFIC would also be different from those described above if a U.S. Holder were able to make a valid qualified electing fund, or “QEF”, election. As we do not expect to provide U.S. Holders with the information necessary for a U.S. Holder to make a QEF election, prospective investors should assume that a QEF election will not be available.
The U.S. federal income tax rules relating to PFICs are very complex. U.S. Holders and prospective U.S. investors are strongly urged to consult their own tax advisors with respect to the impact of PFIC status on the purchase, ownership and disposition of our ordinary shares, the consequences to them of an investment in a PFIC, any elections available with respect to the ordinary shares and the IRS information reporting obligations with respect to the purchase, ownership and disposition of ordinary shares of a PFIC.
Distributions
Subject to the discussion above under “- Passive Foreign Investment Company Consequences,” a U.S. Holder that receives a distribution with respect to our ordinary shares generally will be required to include the gross amount of such distribution in gross income as a dividend when actually or constructively received to the extent of the U.S. Holder’s pro rata share of our current and/or accumulated earnings and profits (as determined under U.S. federal income tax principles). To the extent a distribution received by a U.S. Holder is not a dividend because it exceeds the U.S. Holder’s pro rata share of our current and accumulated earnings and profits, it will be treated first as a tax-free return of capital and reduce (but not below zero) the adjusted tax basis of the U.S. Holder’s ordinary shares. To the extent the distribution exceeds the adjusted tax basis of the U.S. Holder’s ordinary shares, the remainder will be taxed as capital gain. Because we may not account for our earnings and profits in accordance with U.S. federal income tax principles, U.S. Holders should expect all distributions to be reported to them as dividends.
Distributions on our ordinary shares that are treated as dividends generally will constitute income from sources outside the United States for foreign tax credit purposes and generally will constitute passive category income. Such dividends will not be eligible for the “dividends received’’ deduction generally allowed to corporate shareholders with respect to dividends received from U.S. corporations. Dividends paid by a “qualified foreign corporation’’ to certain non-corporate U.S. Holders may be are eligible for taxation at a reduced capital gains rate rather than the marginal tax rates generally applicable to ordinary income provided that a holding period requirement (more than 60 days of ownership, without protection from the risk of loss, during the 121-day period beginning 60 days before the ex- dividend date) and certain other requirements are met. Each U.S. Holder is advised to consult its tax advisors regarding the availability of the reduced tax rate on dividends to its particular circumstances. However, if we are a PFIC for the taxable year in which the dividend is paid or the preceding taxable year (see discussion above under “- Passive Foreign Investment Company Consequences’’), we will not be treated as a qualified foreign corporation, and therefore the reduced capital gains tax rate described above will not apply.
Dividends will be included in a U.S. Holder’s income on the date of the depositary’s receipt of the dividend. The amount of any dividend income paid in Cayman Islands dollars will be the U.S. dollar amount calculated by reference to the exchange rate in effect on the date of receipt, regardless of whether the payment is in fact converted into U.S. dollars. If the dividend is converted into U.S. dollars on the date of receipt, a U.S. Holder should not be required to recognize foreign currency gain or loss in respect to the dividend income. A U.S. Holder may have foreign currency gain or loss if the dividend is converted into U.S. dollars after the date of receipt.
A non-United States corporation (other than a corporation that is classified as a PFIC for the taxable year in which the dividend is paid or the preceding taxable year) generally will be considered to be a qualified foreign corporation with respect to any dividend it pays on ordinary shares that are readily tradable on an established securities market in the United States.
Information Reporting and Backup Withholding
U.S. Holders may be required to file certain U.S. information reporting returns with the IRS with respect to an investment in our ordinary shares, including, among others, IRS Form 8938 (Statement of Specified Foreign Financial Assets). As described above under “Passive Foreign Investment Company Consequences”, each U.S. Holder who is a shareholder of a PFIC must file an registration statement containing certain information. U.S. Holders paying more than $100,000 for our ordinary shares may be required to file IRS Form 926 (Return by a U.S. Transferor of Property to a Foreign Corporation) reporting this payment. Substantial penalties may be imposed upon a U.S. Holder that fails to comply with the required information reporting.
Dividends on and proceeds from the sale or other disposition of our ordinary shares may be reported to the IRS unless the U.S. Holder establishes a basis for exemption. Backup withholding may apply to amounts subject to reporting if the holder (1) fails to provide an accurate U.S. taxpayer identification number or otherwise establish a basis for exemption, or (2) is described in certain other categories of persons. However, U.S. Holders that are corporations generally are excluded from these information reporting and backup withholding tax rules.
Backup withholding is not an additional tax. Any amounts withheld under the backup withholding rules generally will be allowed as a refund or a credit against a U.S. Holder’s U.S. federal income tax liability if the required information is furnished by the U.S. Holder on a timely basis to the IRS.
U.S. Holders and prospective investors should consult their own tax advisors regarding the backup withholding tax and information reporting rules.
U.S. HOLDERS AND PROSPECTIVE INVESTORS ARE URGED TO CONSULT THEIR OWN TAX ADVISORS ABOUT THE TAX CONSEQUENCES TO THEM OF AN INVESTMENT IN OUR ORDINARY SHARES IN LIGHT OF THEIR INDIVIDUAL CIRCUMSTANCES.
F. Dividends and Paying Agents
Not applicable.
G. Statement by Experts
Not applicable.
H. Documents on Display
As a “foreign private issuer,” we are subject to periodic reporting and other informational requirements of the Exchange Act that are applicable to foreign private issuers, and under those requirements file reports and other information with the SEC, including registration statements on Form 20-F and reports on Form 6-K. Specifically, we are required to file annually a Form 20-F no later than four months after the close of each fiscal year.
You may review a copy of the registration statement, including exhibits and any schedule filed therewith, and any other reports or other information, and obtain copies of such materials at the SEC’s Public Reference Room at 100 F Street, N.E., Washington, D.C. 20549. You may obtain information on the operation of the Public Reference Room by calling the SEC at 1-800-SEC-0330. The SEC maintains a website at http://www.sec.gov that contains reports, proxy and information statements and other information regarding issuers, like us, that file electronically with the SEC.
We maintain a website at http://www.engagebdr.com. Information contained on, or that can be accessed through, our website is not a part of, and shall not be incorporated by reference into, this registration statement.
I. Subsidiary Information
| | | | | Ownership interest | |
| Name | | Principal place of business / Country of incorporation | | 2020 % | | | 2019 % | |
| | | | | | | | | | | |
| engage:BDR LLC | | United States of America | | | 100 | % | | | 100 | % |
| Tiveo LLC* | | United States of America | | | 100 | % | | | 100 | % |
| AdCel LLC | | United States of America | | | 100 | % | | | 100 | % |
| | | | | Ownership interest | |
| Name | | Principal place of business / Country of incorporation | | 2019 % | | | 2018 % | |
| | | | | | | | | | | |
| engage:BDR LLC | | United States of America | | | 100 | % | | | 100 | % |
| Tiveo LLC* | | United States of America | | | 100 | % | | | 100 | % |
| AdCel LLC | | United States of America | | | 100 | % | | | 100 | % |
| * | Tiveo LLC is a wholly owned subsidiary of engage:BDR LLC. |
ITEM 11. QUANTITATIVE AND QUALITATIVE DISCLOSURES ABOUT MARKET RISK
Not applicable.
ITEM 12. DESCRIPTION OF SECURITIES OTHER THAN EQUITY SECURITIES
A. Debt Securities
Not applicable.
B. Warrants and Rights
Not applicable.
C. Other Securities
Not applicable.
D. American Depositary Shares
Not applicable.
PART II
ITEM 13. DEFAULTS, DIVIDEND ARREARAGES AND DELINQUENCIES
None.
ITEM 14. MATERIAL MODIFICATIONS TO THE RIGHTS OF SECURITY HOLDERS AND USE OF PROCEEDS
Material Modifications to the Rights of Security Holders
See “Item 10. Additional Information—B. Memorandum and Articles of Association” for a description of the rights of securities holders, which remain unchanged.
Use of Proceeds
Not applicable.
ITEM 15. CONTROLS AND PROCEDURES
Disclosure Controls and Procedures
Under the supervision and with the participation of our management, including our chief executive officer and our chief financial officer, we carried out an evaluation of the effectiveness of our disclosure controls and procedures, which is defined in Rules 13a-15(e) of the Exchange Act, as of the end of the period covered by this registration statement. Based upon that evaluation, our management, with the participation of our chief executive officer and chief financial officer, has concluded that, due to the material weaknesses and significant deficiencies described below under “Changes in Internal Control Over Financial Reporting”, as of the end of the period covered by this registration statement, our disclosure controls and procedures were not effective in ensuring that the information required to be disclosed by us in this registration statement is recorded, processed, summarized and reported to them for assessment, and required disclosure is made within the time period specified in the rules and forms of the SEC.
Management’s Registration statement on Internal Control over Financial Reporting and Attestation Report of Registered Public Accounting Firm
This registration statement does not include a report of management’s assessment regarding internal control over financial reporting or an attestation report of the Company’s independent registered public accounting firm due to a transition period established by rules of the Securities and Exchange Commission for newly public companies.
Changes in Internal Control Over Financial Reporting
None.
ITEM 16A. AUDIT COMMITTEE FINANCIAL EXPERT
Our board of directors has determined that __________, an independent director, under the standards set forth under the Nasdaq Capital Market corporate governance requirements and Rule 10A-3 under the Exchange Act, and the chair of our audit committee, is an audit committee financial expert.
ITEM 16B. CODE OF ETHICS
We have adopted a Code of Business Conduct and Ethics applicable to all of our directors and employees, including our principal executive officer, principal financial officer, principal accounting officer or controller, or persons performing similar functions, which is a “code of ethics” as defined in Item 16B of Form 20-F promulgated by the SEC and as required by the Nasdaq rules. The full text of the Code of Business Conduct and Ethics is posted on our website at ___________________. Information contained on, or that can be accessed through, our website does not constitute a part of this registration statement and is not incorporated by reference herein. We will provide a copy of the Code of Business Conduct and Ethics without charge upon request by mail or by telephone. If we make any amendment to the Code of Business Conduct and Ethics or grant any waivers, including any implicit waiver, from a provision of the Code of Business Conduct and Ethics, we will disclose the nature of such amendment or waiver on our website to the extent required by the rules and regulations of the SEC.
ITEM 16C. PRINCIPAL ACCOUNTANT FEES AND SERVICES
The following table sets forth the aggregate fees by categories specified below in connection with certain professional services rendered by our principal external auditor, for the periods indicated.
| | | For the year ended | |
| | | December 31, | |
| | | 2020 | | | 2019 | |
| Audit fees (1) | | $ | 69,650 | | | $ | 50,000 | |
| Audit-related fees (2) | | | - | | | | | |
| Tax fees(3) | | | 22,209 | | | | - | |
| | | For the year ended | |
| | | December 31, | |
| | | 2019 | | | 2018 | |
| Audit fees (1) | | $ | 50,000 | | | $ | 70,000 | |
| Audit-related fees (2) | | | - | | | | | |
| Tax fees(3) | | | - | | | | - | |
| (1) | “Audit fees” represents the aggregate fees billed for each of the fiscal years listed for professional services rendered by our principal accounting firm for the audit of our annual financial statements or services that are normally provided by the auditors in connection with statutory and regulatory filings or engagements. |
| (2) | “Audit-related fees” represents the aggregate fees billed for professional services rendered by our principal accounting firm for the assurance and related services, which mainly included the audit and review of financial statements and are not reported under “Audit Fees” above. |
| | |
| (3) | “Tax fees” represents the aggregate fees billed for professional services rendered by our principal accounting firm for tax compliance, tax advice and tax planning. |
The policy of our audit committee is to pre-approve all audit and non-audit services including audit services, audit-related services, tax services and other services as described above.
ITEM 16D. EXEMPTIONS FROM THE LISTING STANDARDS FOR AUDIT COMMITTEES
Not applicable
ITEM 16E. PURCHASES OF EQUITY SECURITIES BY THE ISSUER AND AFFILIATED PURCHASERS
Not applicable
ITEM 16F. CHANGE OF AUDITOR
Auditor appointed on January 20, 2020. The reasoning for a change of auditor was due to cost. The new audit firm is a reduction in cost by 28%. The change of cost was from AU$70,000 to AU$50,000. No disagreements. The previous firm was BDO who was appointed on January 29, 2019. Ernst and Young was the auditor beginning in 2016.
Engagement of the active auditor occurred in November of 2019. Audit team has audited the following periods ending on December 31, 2018, 2019 and 2020. The team in order to give audit report had to do 2018 for verification of opening balances and comparisons.
ITEM 16G. CORPORATE GOVERNANCE
As an Australian company seeking to be listed on the Nasdaq Capital Market, we are subject to the Nasdaq corporate governance listing standards. The Nasdaq rules permit a foreign private issuer like us to follow the corporate governance practices of its home country. Certain corporate governance practices in Australia, which is our home country, may differ significantly from the Nasdaq corporate governance listing standards. Currently, we do not plan to rely on home country practice with respect to our corporate governance. However, if we choose to follow home country practice in the future, our shareholders may be afforded less protection than they otherwise would enjoy under the Nasdaq corporate governance listing standards applicable to U.S. domestic issuers.
ITEM 16H. MINE SAFETY DISCLOSURE
Not applicable.
PART III
ITEM 17. FINANCIAL STATEMENTS
We have elected to provide financial statements pursuant to Item 18.
These financial statements also comply with International Financial Reporting Standards as issued by the International Accounting Standards Board ('IASB').
ITEM 18. FINANCIAL STATEMENTS


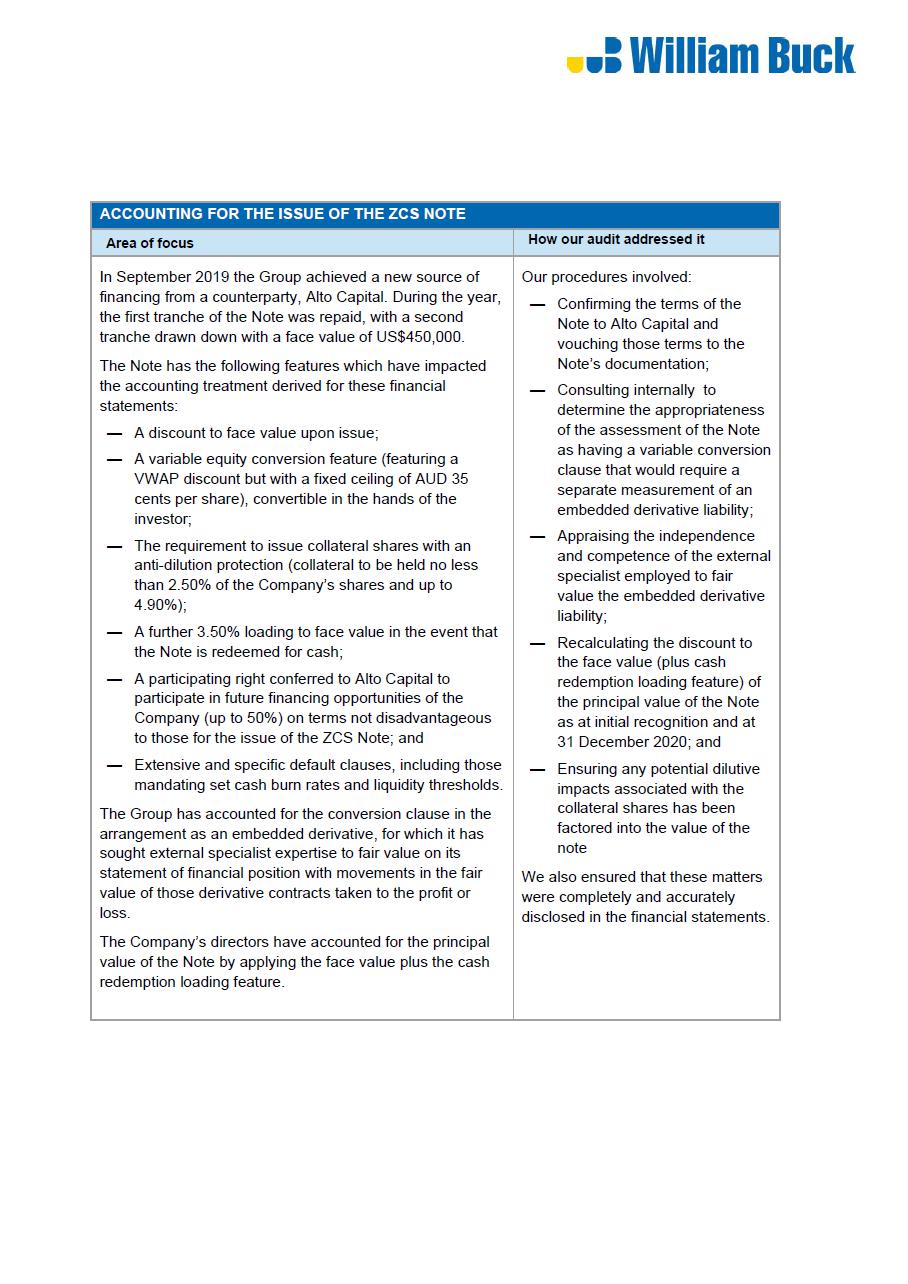


engage:BDR Limited
Appendix 4E
Preliminary final report
1. Company details
| Name of entity: | | engage:BDR Limited |
| ABN: | | 621 160 585 |
| Reporting period: | | For the year ended 31 December 2020 |
| Previous period: | | For the year ended 31 December 2019 |
2. Results for announcement to the market
| | | | | | | | | | $ | |
| | | | | | | | | | | |
| Revenues from ordinary activities | | down | | | 9.8 | % | | to | | | 15,398,413 | |
| | | | | | | | | | | | | |
| EBITDA/Operating profit/(loss) | | down | | | 187.0 | % | | | | | (1,396,924 | ) |
| | | | | | | | | | | | | |
| Loss from ordinary activities after tax attributable to the owners of engage:BDR Limited | | up | | | 412.2 | % | | to | | | (6,881,027 | ) |
| | | | | | | | | | | | | |
| Loss for the year attributable to the owners of engage:BDR Limited | | up | | | 412.2 | % | | to | | | (6,881,027 | ) |
Dividends
There were no dividends paid, recommended or declared during the current financial period.
Comments
The loss for the consolidated entity after providing for income tax amounted to $6,881,027 (31 December 2019: $1,343,429).
3. Net tangible assets
| | | Reporting period | | | Previous period | |
| | | Cents | | | Cents | |
| | | | | | | | | |
| Net tangible assets per ordinary security | | | 0.14 | | | | (0.21 | ) |
4. Control gained over entities
Not applicable.
5. Loss of control over entities
Not applicable.
6. Dividends
Current period
There were no dividends paid, recommended or declared during the current financial period.
Previous period
There were no dividends paid, recommended or declared during the previous financial period.
engage:BDR Limited
Appendix 4E
Preliminary final report
7. Dividend reinvestment plans
Not applicable.
8. Details of associates and joint venture entities
Not applicable.
9. Foreign entities
Details of origin of accounting standards used in compiling the report:
engage:BDR LLC, Tiveo LLC and AdCel LLC are wholly owned subsidiaries of engage:BDR Limited. These entities are incorporated and domiciled in the US. Accounting standards have been consistently applied to these foreign entities.
10. Audit qualification or review
Details of audit/review dispute or qualification (if any):
The financial statements have been audited and an unmodified opinion has been issued.
11. Attachments
Details of attachments (if any):
The Registration statement of engage:BDR Limited for the year ended 31 December 2020 is attached.
12. Signed
| Signed |  | | Date: 26 February 2021 |
| | | | |
| | Ted Dhanik | | |
| | Executive Chairman | | |
engage:BDR Limited
ABN 621 160 585
Registration statement - 31 December 2020
engage:BDR Limited
Contents
31 December 2020
engage:BDR Limited
Corporate directory
31 December 2020
| Directors | | Mr Ted Dhanik |
| | | Mr Kurtis Rintala |
| | | Mr Tom Anderson |
| | | Mr Darian Pizem |
| | | Mr Robert Antulov |
| | | |
| Company secretary | | Ms Melanie Leydin |
| | | |
| Registered office | | Scottish House |
| | | Level 4 |
| | | 90 William Street |
| | | Melbourne Victoria 3000 Australia |
| | | Telephone: +61 3 9692 7222 |
| | | |
| Principal place of business | | 8581 Santa Monica Boulevard |
| | | #12 |
| | | West Hollywood |
| | | California 90069 USA |
| | | Telephone +1 310 954 0751 |
| | | |
| Share register | | Computershare Investor Services Pty Limited |
| | | Yarra Falls, 452 Johnston Street |
| | | Abbotsford, VIC 3067 |
| | | Telephone: +61 3 9415 5000 |
| | | Fax: +61 3 9473 2500 |
| | | |
| Auditor | | William Buck Audit (Vic) Pty Ltd |
| | | Level 20, 181 William Street |
| | | Melbourne VIC 3000 |
| | | Australia |
| | | |
| Stock exchange listing | | engage:BDR Limited securities are listed on the Australian Securities Exchange (ASX code: EN1 and EN1O). |
| | | |
| Website | | engagebdr.com |
| | | |
engage:BDR Limited
Directors' report
31 December 2020
The Directors present their report, together with the financial report of engage:BDR Limited comprising engage:BDR Limited (referred to hereafter as the ‘Company’ or ‘parent entity’) and the entities it controlled at the end of, or during, the year ended 31 December 2020 (referred to hereafter as ‘engage:BDR’ or the ‘Group’).
Directors
The following persons were directors of engage:BDR Limited during the whole of the financial year and up to the date of this report, unless otherwise stated:
Mr Ted Dhanik (Co-Founder and Executive Chairman)
Mr Kurtis Rintala (Co-Founder and Executive Director)
Mr Tom Anderson (Non-Executive Director)
Mr Darian Pizem (Non-Executive Director)
Mr Robert Antulov (Non-Executive Director)
Principal activities
engage:BDR is an internet-based marketplace platform and associated technology solution provider. engage:BDR’s proprietary technology is used to optimise the sale of advertising inventory from digital publishers (websites and apps) to advertisers and their agents (brands, agencies and advertising platforms). The ability to optimise the inventory from digital publishers to advertisers and their agents allows engage:BDR to play an active role in managing the ad exchange platform.
engage:BDR allows digital publishers to monetise their available advertising space by making the inventory available to multiple advertisers, as well as providing various related technologies designed to help publishers create additional incremental revenue streams. engage:BDR’s ad exchange platform also allows publishers to sell space for video advertising on webpages that do not have video content.
Dividends
There were no dividends paid, recommended or declared during the current or previous financial year.
Review of operations
The loss for the consolidated entity after providing for income tax amounted to $6,881,027 (31 December 2019: loss of $1,343,429).
The Group’s operating result this year was adversely affected by the Covid 19-related global reduction in advertising spend, which resulted in a fall in revenues, while additional underlying delivery and administrative costs were incurred to support the Group’s repositioning process.
The Group’s loss was also affected by increases in non-recurrent, non-cash expenses, including losses on impairment of shares held in trust and costs of share-based payments.
Programmatic display, native and video advertising sales
The Group’s Programmatic advertising sales includes selling display, native and video advertising inventory through the Group’s digital auctioning technology to platforms and marketplaces. The adoption of programmatic display advertising sales has proven to be extremely successful in 2020 and opened additional revenue opportunities from the same clients, largely because programmatic buying and selling of advertising is much more efficient and significantly more cost effective to operate, thus increasing the Group’s overall operating and gross profit margins.
The Group’s proprietary programmatic technology significantly increases the Group’s operating margins by reducing payroll and associated sales commissions. With the rapid adoption of programmatic buying, brands, agencies and digital media buyers have moved their budgets to auction-based buying, in contrast to buying from salespeople, individual RFP (request for proposal) and insertion orders. This behavioural change has made the marketplace much more efficient, significantly reducing the staff overhead required to sell advertising in the traditional way. Per eMarketer, nearly 84.5% of display advertising was sold programmatically in 2020. The significant growth in 2020 was fuel primarily by an increase in programmatic mobile app inventory consumption as also cited by e-marketer. https://www.emarketer.com/content/us-programmatic-display-spending-will-grow-spite-of-recession. Additionally, the company’s new opportunity to service connected TV buyers is met with significant demand, with nearly 35% of buyers moving budgets from non-programmatic to programmatic buying of connected TV in 2020 alone. In 2021, per eMarketer, programmatic connected TV spend is expected to grow 52.9% over 2020. https://www.emarketer.com/content/us-programmatic-digital-display-advertising-outlook-2021
engage:BDR Limited
Directors’ report
31 December 2020
Advertising buyers, through the Group’s programmatic platform, are essentially bidding for advertising inventory in real time in dynamic auctions, which occur in milliseconds while the relevant mobile or CTV app content is loading. This new engage:BDR format has created significant barriers to entry for new companies looking to enter the digital advertising arena. Companies must realistically own and develop their own proprietary technology to be able to participate in the rapidly developing programmatic advertising ecosystem as licensing third party technologies is cost-prohibitive. engage:BDR has developed its own real-time auctioning and bidding technologies which provide it with a significant competitive advantage. engage:BDR has established thousands of direct publisher relationships which is a key differentiator and competitive advantage for the Group in an ecosystem which is experiencing inventory quality issues, brokers and middlemen.
Influencer Marketing
The Group launched its social influencer marketing platform in 2017. It dedicated engineering and account management resources to further develop and refine its technology and client base in 2019. The Group brought in incremental revenue through this platform and further diversification of the Group’s product and service offering. The group paused IconicReach efforts in March 2020, in light of the COVID-19 pandemic and reallocated those resources to its programmatic advertising exchange. The Group anticipates IconicReach to continue to be paused for 2021 and plans to reallocate resources to IconicReach in 2022
Mobile and Connected Television (CTV) App Ads
The Group expects continued growth in supply and demand integration onboarding specifically within AdCel for 2021, as AdCel’s technology has matured to a stage in which it is capable of monetizing inventory across ConnectedTV Apps. In addition to its core competency of App monetization across mobile devices. AdCel is one of the first demand agnostic mediation technologies available for ConnectedTV publishers in the market, solving an inherent problem in the ConnectedTV ecosystem. AdCel enables publishers the unique ability to mediate multiple sources of demand in one platform, utilizing intelligent personalization powered by the AdCel machine learning algorithm to maximize yield and minimize human error and time spent performing manual optimization. As supply and demand partnerships are established and integrated by sales and engineering, revenue is expected to steadily ramp throughout the course of the year. AdCel will continue to focus onboarding significant volumes of new ConnectedTV and mobile App publishers through the group’s NetZero payment product, enabling publisher payments the same day the group is invoiced. This and other integrations refer to suppliers to direct server integrations to the publisher’s ad mediation platform, These are known as RTB (Real Time Bidding) connections. These are programmatic integrations to access supply from a set of publishers. When integrating with a mediation/supply side platform, engineers from both teams perform technical integrations to allow our platforms to query and respond to each other in real time using a universal framework knows as OpenRTB protocol. All integrations are formal partnerships and subject to contracting with each one.
Significant changes in the state of affairs
On 17 January 2020, the Company issued 26,975,464 fully paid ordinary shares at $0.017 (1.7 cents) per share in accordance with the terms and conditions of the Convertible Securities Purchase Agreement (Agreement) with Alto Opportunity Master Fund SPC - Segregated Master Portfolio B (Alto). The Company was required to issue replenishment Collateral Shares under the Agreement. On 3 March 2020, the Company issued 30,420,738 replenishment fully paid ordinary shares at $0.013 (1.3 cents) per share in accordance with the terms and conditions of the Agreement with Alto.
On 13 March 2020, the Company announced a further drawdown of a zero coupon convertible amortising security (ZCS) with a face value of US$450,000 at an issue price of US$382,500. The ZCS was issued to Alto pursuant to the Agreement. The ZCS is secured with a maturity of 31 May 2021.
The ZCS is convertible at the election of Alto at the rate of one fully paid ordinary share for every A$0.35 (35 cents) of the face value converted, at the US$/A$ exchange rate published by the Reserve Bank of Australia on the day before the conversion.
On 1 April 2020, the Company issued 38,412,579 fully paid ordinary shares for settlement of outstanding creditor balances at a deemed issue price of $0.017 (1.7 cents) per share.
On 1 April 2020, the Company issued 107,500,000 Performance Rights as approved in the General Meeting on 18 March 2020. The Performance Rights were issued in accordance with the Company’s Options and Performance Rights Plan.
Furthermore, on 1 April 2020 the Company also issued 17,100,000 unlisted options as approved in the General Meeting on 18 March 2020. The options were split into three equal tranches with the following terms:
| ● | Exercise price of $0.0201, vesting upon issue, with an expiry of 3 years after date of issue; |
| ● | Exercise price of $0.0217, vesting 12 months after issue, with an expiry of 3 years after date of issue; and |
| ● | Exercise price of $0.0233, vesting 24 months after issue, with an expiry of 3 years after date of issue. |
engage:BDR Limited
Directors’ report
31 December 2020
The options were issued in accordance with the Company’s Options and Performance Rights Plan.
On 27 April 2020, the Company issued 82,000,000 ordinary shares with a nil issue price following achievement of performance hurdles and conversion of performance rights held by executive directors and employees of the Company.
On 7 May 2020, the Company issued 32,123,198 replenishment fully paid ordinary shares at $0.01 (1 cent) per share in accordance with the terms and conditions of the Agreement with Alto.
On 11 June 2020, the Company issued 40,423,775 replenishment fully paid ordinary shares at $0.006 (0.6 cents) per share in accordance with the terms and conditions of the Agreement with Alto.
Furthermore, the Company also issued 30,000,000 fully paid ordinary shares for settlement of outstanding creditor balances at a deemed issue price of $0.008 (0.8 cents) per share.
On 18 June 2020, the Company issued 38,259,130 replenishment fully paid ordinary shares at $0.004 (0.4 cents) per share in accordance with the terms and conditions of the Agreement with Alto.
On 17 July 2020, the Company issued 52,730,441 fully paid ordinary shares at $0.004 (0.4 cents) per share in accordance with the terms and conditions of the Convertible Securities Purchase Agreement (Agreement) with Alto Opportunity Master Fund SPC - Segregated Master Portfolio B (Alto).
On 17 July 2020, the Company also issued 55,736,356 fully paid ordinary shares for settlement of outstanding creditor balances at a deemed issue price of $0.008 (0.8 cents) per share.
On 28 July 2020, the Company issued 62,646,249 replenishment fully paid ordinary shares at $0.004 (0.4 cents) per share in accordance with the terms and conditions of the Agreement with Alto.
In addition, on 28 July 2020 the Company also issued 61,939,034 fully paid ordinary shares for settlement of outstanding creditor balances at a deemed issue price of $0.009 (0.9 cents) per share.
On 14 August 2020, the Company issued 293,921,246 fully paid ordinary shares at an issue price of $0.0073 (0.73 cents) per share to professional and sophisticated investors in relation to the Placement as announced on 11 August 2020.
On 21 August 2020, the Company issued 80,318,305 replenishment fully paid ordinary shares at $0.005 (0.5 cents) per share in accordance with the terms and conditions of the Agreement with Alto.
On 11 September 2020, the Company issued 85,254,184 replenishment fully paid ordinary shares at $0.005 (0.5 cents) per share in accordance with the terms and conditions of the Agreement with Alto.
On 1 December 2020, the Company has issued 430,888,917 fully paid ordinary shares at an issue price of $0.0055 (0.55 cents) per share to professional and sophisticated investors in relation to Placement announced on 25 November 2020.
On 16 December 2020, the Company issued 216,299,959 SPP shares under the Share Purchase Plan which was announced on 25 November 2020. The Company issued the SPP shares at $0.0055 (0.55 cents) raising $1,189,650.
There were no other significant changes in the state of affairs of the consolidated entity during the financial year.
Matters subsequent to the end of the financial year
No matter or circumstance has arisen since 31 December 2020 that has significantly affected, or may significantly affect the consolidated entity’s operations, the results of those operations, or the consolidated entity’s state of affairs in future financial years.
engage:BDR Limited
Directors’ report
31 December 2020
Likely developments and expected results of operations
The organization’s focus for 2021 will be centered around support for Connected TV and building technological solutions for suppliers and advertisers within that space as well as procuring desktop web-based supply.
For Connected TV suppliers, we intend to build a proprietary mediation technology focused on maximizing yield from ads sold on a publisher’s inventory. This platform will help Connected TV publishers identify buyers, campaigns, and verticals most in demand for their supply and to be able to optimize content to fit their monetization patterns.
In addition to this, the pandemic has prompted a paradigm shift in behavior across the internet, to where more people are using their laptop and desktop computers due to working from home. This has prompted an increased demand for desktop web inventory from our buyers. Our team will remain focused on sourcing desktop-based web inventory alongside of Connected TV for 2021.
Growth of programmatic and mobile app (AdCel) ad revenues the proprietary platforms
With AdCel being one of the first platforms to offer a solution focused for ConnectedTV app mediation and with a number of partnerships both established and in the queue. The Group expects to grow programmatic ConnectedTV and mobile app ad revenues steadily and significantly throughout 2021. These revenues are no longer dependent on third party technologies as they were previously. As a result of our ability to directly represent a publisher’s supply through AdCel’s mediation, the Group will have the most optimized supply path to a publisher’s inventory; creating cost efficiency, and the ability to generate greater scale for the Group’s clients. Lastly, this optimized supply path will be key in attracting new demand partnership integrations for AdCel and will provide differentiation in the market stemming from buyers interested in cost efficiency, scale, and unduplicated supply opportunities. As these supply and demand partnerships are integrated by the engineering teams, the revenue is expected to grow steadily throughout the year.
Continued growth of programmatic display, native and video revenue
The Group also expects to see continued growth of its programmatic display, native and video businesses. Through monetisation of existing partnerships and creation of new ones, the Group expects to be able to significantly scale revenue while maintaining its lower cost operations. This enables optimisation of the Group’s existing relationships and the ability to attract new buyers and sellers.
Growth of influencer marketing revenue
The Group brought in incremental revenue through this platform. The Group paused Iconic Reach efforts in March 2020, in light of the COVID-19 pandemic and reallocated resources. The Group anticipates continuing to be paused for the year 2021 and plans to revisit in 2022.
Environmental regulation
The consolidated entity is not subject to any significant environmental regulation under Australian Commonwealth or State law.
engage:BDR Limited
Directors’ report
31 December 2020
| Information on directors | | |
| | | |
| Name: | | Mr Ted Dhanik |
| Title: | | Co-Founder, Executive Chairman and Chief Executive Officer (appointed 14 December 2017) |
| Experience and expertise: | | Ted Dhanik is one of the co-founders of engage:BDR LLC. He serves as Chief Executive Officer overseeing corporate development, strategic marketing, sales and business development, and product strategy. From 2003 to 2008, Ted worked with MySpace.com developing strategic marketing initiatives. He worked very closely with founders Chris DeWolfe and Tom Anderson and was responsible for launching the brand in its early days through a combination of on and offline campaigns. Ted also worked in business development at LowerMyBills.com until its acquisition by Experian. Ted was also an integral part of the development and launch of the consumer lending program at NexTag Corporation. He has worked for, or been a partner at, several other companies in business development, sales, and managerial positions, including Xoriant Corporation, Atesto Technologies, Brigade Solutions, Beyond.com/Cybersource Corporation and Merrill Corporation. Ted also advises a number of technology startups including Fighter, LottoGopher and Schizo Pictures and is an active mentor at Los Angeles-based startup accelerator Start Engine. He is passionate about being a thought leader in the industry and he is regularly published in leading publications. He regularly contributes to discussions about industry standards and achieving positive change, sitting on IAB committees including the Anti-fraud Workgroup, Anti-malware Workgroup, Traffic of Good intent Task Force, Programmatic Counsel, Digital Video Committee, Mobile Advertising Committee and Performance Marketing Committee. |
| Other current directorships: | | Nil |
| Former directorships (last 3 years): | | Nil |
| Interests in shares: | | 97,681,498 fully paid ordinary shares |
| Interests in options: | | Nil |
| Interests in rights: | | 10,000,000 |
| | | |
| Name: | | Mr Kurtis Rintala |
| Title: | | Co-Founder, Executive Director and Chief Operating Officer |
| Experience and expertise: | | Kurtis Rintala was one of the co-founders of engage:BDR LLC. and serves as the Chief Operating Officer for the Group overseeing day-to-day operations and leading the execution of the strategic direction of the Group. Kurtis is responsible for establishing policies that promote the Group culture and vision. He sets comprehensive goals for performance and growth and encourages optimum performance and dedication. He evaluates performance by analysing and interpreting data and metrics. Kurtis began his career in the technology industry in 2003 as an early member of the successful internet startup, LowerMyBills.com. |
| Other current directorships: | | Nil |
| Former directorships (last 3 years): | | Nil |
| Interests in shares: | | 47,717,391 fully paid ordinary shares |
| Interests in options: | | Nil |
| Interests in rights: | | 4,000,000 |
engage:BDR Limited
Directors’ report
31 December 2020
| Name: | | Mr Tom Anderson |
| Title: | | Non-Executive Director |
| Experience and expertise: | | Tom Anderson was appointed to the Board of the Group as a Non-Executive Director to provide the Group with the benefit of his wide ranging expertise in social media and innovative product design and to assist to steer the Group’s future growth strategy. Prior to joining the engage:BDR, Tom founded and served as President of MySpace, simultaneously inventing “social media” while revolutionizing the music industry. After its launch in 2003, MySpace became the #1 most visited site on the web quickly, surpassing companies such as Google, Yahoo and Amazon. At its peak, Nielsen Net Ratings reported that MySpace captured more than 10% of all minutes spent online. By the time Anderson left the company in 2009, he had amassed more than 350 million friends on MySpace, making him the first and still ultimately the biggest “influencer” of all time. His MySpace profile photo, which he never changed and still uses to this day is estimated to have been viewed more times than any single photograph in history. Before retiring in 2009, TIME Magazine included Tom among its list of the 100 most influential people in the world, and Barbara Walters named him one of her 10 Most Fascinating People. Since retiring, Tom has become an internationally recognised photographer, traveling to more than 40 countries in pursuit of his passion. Tom’s photos have appeared in countless magazines, newspapers, and websites. He now also has a keen interest in architecture and has designed a number of homes. He splits his time between his homes in Las Vegas, Hawaii and Los Angeles. Prior to his entrepreneurial and creative pursuits, Tom graduated with the Departmental Citation in English and Rhetoric at the University of California at Berkeley and later completed a Masters in Film & Critical Studies at UCLA. |
| Other current directorships: | | Nil |
| Former directorships (last 3 years): | | Nil |
| Special responsibilities | | Member of Nomination & Remuneration Committee |
| Interests in shares: | | 1,500,000 fully paid ordinary shares |
| Interests in options: | | 5,700,000 |
| Interests in rights: | | Nil |
engage:BDR Limited
Directors’ report
31 December 2020
| Name: | | Mr Darian Pizem |
| Title: | | Non-Executive Director |
| Experience and expertise: | | Darian Pizem is the Co-Founder and current CEO of Blockbuster Ventures based in Sydney. Blockbuster is a blockchain development company that assists companies in the development of blockchain technology, real-time deployment, commercialisation, and other cost-saving measures. In addition, Mr. Pizem is the founder of Australian based company, Lunnna Ventures. Lunnna Ventures assists in the launching of start-up businesses in a variety of industries, ranging from healthcare to finance. Lunnna assists companies through all stages of the businesses development, cycle from the initial idea phase through to branding, partnerships and funding. Prior to founding his two businesses, Mr. Pizem worked as a Channel Partner for Australia’s DX Solutions, an ICT solutions and delivery service provider. DX specialties in automation, performance equipment, security and penetration testing, DevOps and Cloud solutions, BI and Analysis and Network E2E and B2B capabilities. Mr. Pizem has over 15 years of experience in the tech industry, working to promote company growth, innovation, and driving new ideas and concepts. He has a strong background in software ventures, with a focus on marketing, operations and management. |
| Other current directorships: | | Nil |
| Former directorships (last 3 years): | | Nil |
| Special responsibilities | | Member of Nomination & Remuneration Committee |
| Interests in shares: | | Nil |
| Interests in options: | | 5,700,000 |
| Interests in rights: | | Nil |
| | | |
| Name: | | Mr Robert Antulov |
| Title: | | Non-Executive Director |
| Experience and expertise: | | Robert (Rob) Antulov is a Partner at boutique Australian corporate advisory firm Jacanda Capital, where he provides advice to clients in the technology and media sectors on trade sales, acquisitions and equity growth capital raisings. Based in Sydney, Rob is a highly accomplished Director with experience in public, private and not for profit enterprises, primarily in the tech and media sectors. He has extensive digital media expertise with strong capabilities in the implementation of technology-oriented growth strategies, most recently in digital media, programmatic advertising and online marketplaces. Rob also brings to engage:BDR specific M&A skills, having participated in over forty corporate transactions as either principal or advisor. Previous corporate experience has included senior executive roles with Fairfax, Coca-Cola and Booz & Co (now PwC Strategy&). His entrepreneurial activity includes co-founding a sports digital media business, co-founding a number of ecommerce and SaaS businesses and providing mentoring and Advisory Board guidance to numerous entrepreneurs and their ventures. Rob has a Bachelor of Engineering Degree (Elect) from the University of Western Australia, an MBA from the Australian Graduate School of Management at UNSW and has completed additional postgraduate studies in the USA at the Kellogg School of Management, North Western University. |
| Other current directorships: | | Nil |
| Former directorships (last 3 years): | | Director, Snakk Limited (NXT: SNK) - January 2016 to October 2018 |
| Special responsibilities | | Chairman of Nomination & Remuneration Committee |
| Interests in shares: | | 665,500 fully paid ordinary shares |
| Interests in options: | | 5,700,000 |
| Interests in rights: | | Nil |
engage:BDR Limited
Directors' report
31 December 2020
‘Other current directorships’ quoted above are current directorships for listed entities only and excludes directorships of all other types of entities, unless otherwise stated.
‘Former directorships (last 3 years)’ quoted above are directorships held in the last 3 years for listed entities only and excludes directorships of all other types of entities, unless otherwise stated.
Company secretary
Ms. Melanie Leydin
Melanie Leydin holds a Bachelor of Business majoring in Accounting and Corporate Law. Ms Leydin is a member of the Institute of Chartered Accountants, Fellow of the Governance Institute of Australia and is a Registered Company Auditor. Ms Leydin graduated from Swinburne University in 1997, became a Chartered Accountant in 1999 and since February 2000 has been the principal of Leydin Freyer. The practice provides outsourced company secretarial and accounting services to public and private companies across a host of industries including but not limited to the resources, technology, bioscience, biotechnology, and health sectors.
Ms Leydin has over 25 years’ experience in the accounting profession and over 15 years as a Company Secretary. Ms Leydin has extensive experience in relation to public company responsibilities, including ASX and ASIC compliance, control and implementation of corporate governance, statutory financial reporting, reorganisation of Companies and shareholder relations.
Meetings of directors
The number of meetings of the company’s Board of Directors (‘the Board’) and of each Board committee held during the year ended 31 December 2020, and the number of meetings attended by each director were:
| | | Full Board | | | Nomination and remuneration | |
| | | Held | | | Attended | | | Held | | | Attended | |
| | | | | | | | | | | | | |
| Ted Dhanik | | | 10 | | | | 10 | | | | - | | | | - | |
| Kurtis Rintala | | | 10 | | | | 10 | | | | - | | | | - | |
| Tom Anderson | | | 10 | | | | 5 | | | | 2 | | | | 1 | |
| Darian Pizem | | | 10 | | | | 10 | | | | 2 | | | | 2 | |
| Robert Antulov | | | 10 | | | | 10 | | | | 2 | | | | 2 | |
Held: represents the number of meetings held during the time the director held office or was a member of the relevant committee.
Remuneration report (audited)
The remuneration report details the key management personnel remuneration arrangements for the Group, in accordance with the requirements of the Corporations Act 2001 and its Regulations.
Key management personnel are those persons having authority and responsibility for planning, directing and controlling the activities of the entity, directly or indirectly, including all directors.
The remuneration report is set out under the following main headings:
| ● | Principles used to determine the nature and amount of remuneration |
| ● | Details of remuneration |
| ● | Service agreements |
| ● | Share-based compensation |
| ● | Additional information |
| ● | Additional disclosures relating to key management personnel |
engage:BDR Limited
Directors' report
31 December 2020
Principles used to determine the nature and amount of remuneration
The objective of the Group’s executive reward framework is to ensure reward for performance is competitive and appropriate for the results delivered. The framework aligns executive reward with the achievement of strategic objectives and the creation of value for shareholders, and it is considered to conform to the market best practice for the delivery of reward. The Board of Directors (‘the Board’) ensures that executive reward satisfies the following key criteria for good reward governance practices:
| ● | competitiveness and reasonableness |
| ● | acceptability to shareholders |
| ● | performance linkage / alignment of executive compensation |
| ● | transparency |
The Board is responsible for determining and reviewing remuneration arrangements for its directors and executives. The performance of the Group depends on the quality of its directors and executives. The remuneration philosophy is to attract, motivate and retain high performance and high quality personnel.
The Board has structured an executive remuneration framework that is market competitive and complementary to the reward strategy of the Group.
The reward framework is designed to align executive reward to shareholders’ interests. The Board has considered that it should seek to enhance shareholders’ interests by:
| ● | having net profit as a core component of plan design |
| ● | focusing on sustained growth in shareholder wealth, consisting of dividends and growth in share price, and delivering constant or increasing return on assets as well as focusing the executive on key non-financial drivers of value |
| ● | attracting and retaining high calibre executives |
Additionally, the reward framework should seek to enhance executives’ interests by:
| ● | rewarding capability and experience |
| ● | reflecting competitive reward for contribution to growth in shareholder wealth |
| ● | providing a clear structure for earning rewards |
In accordance with best practice corporate governance, the structure of non-executive director and executive director remuneration is separate.
Non-executive directors remuneration
Fees and payments to non-executive directors reflect the demands and responsibilities of their role. Non-executive directors’ fees and payments are reviewed annually by the Board. The Board may, from time to time, receive advice from independent remuneration consultants to ensure non-executive directors’ fees and payments are appropriate and in line with the market.
Executive remuneration
The Group aims to reward executives based on their position and responsibility, with a level and mix of remuneration which has both fixed and variable components.
The executive remuneration and reward framework has four components:
| ● | base pay and non-monetary benefits |
| ● | short-term performance incentives |
| ● | share-based payments |
| ● | other remuneration such as superannuation and long service leave |
The combination of these comprises the executive’s total remuneration.
Fixed remuneration, consisting of base salary and non-monetary benefits, is reviewed annually by the Board based on individual and business unit performance, the overall performance of the Group and comparable market remunerations.
Executives may receive their fixed remuneration in the form of cash or other fringe benefits where it does not create any additional costs to the consolidated entity and provides additional value to the executive.
The short-term incentives (‘STI’) program is designed to align the targets of the business units with the performance hurdles of executives. STI payments are granted to executives based on specific annual targets and key performance indicators (‘KPI’s’) being achieved. KPI’s include profit contribution, customer satisfaction, leadership contribution and product management.
engage:BDR Limited
Directors' report
31 December 2020
Details of remuneration
The key management personnel of the Group consisted of the following directors and key management personnel:
| ● | Ted Dhanik (Executive Chairman and Chief Executive Officer) |
| ● | Kurtis Rintala (Executive Director and Chief Operating Officer) |
| ● | Tom Anderson (Non-Executive Director) |
| ● | Darian Pizem (Non-Executive Director) |
| ● | Robert Antulov (Non-Executive Director) |
| ● | Youqi Li (Chief Technology Officer) |
| ● | Andy Dhanik (Chief Revenue Officer) |
| ● | Denys Kravchenko (Chief Technology Officer - AdCel) |
Amounts of remuneration
Details of the remuneration of key management personnel of the Group are set out in the following tables.
| | | Short-term benefits | | | Post- employment benefits | | | Share- based | | | | |
| | | Cash salary and fees | | | Commission /bonus - cash | | | Bonus - non-cash (a) | | | Health benefits | | | Defined- contribution plan | | | payments Equity- settled | | | Total | |
| 2020 | | $ | | | $ | | | $ | | | $ | | | $ | | | $ | | | $ | |
| | | | | | | | | | | | | | | | | | | | | | |
| Non-Executive Directors: | | | | | | | | | | | | | | | | | | | | | | | | | | | | |
| Tom Anderson | | | 61,998 | | | | - | | | | - | | | | - | | | | - | | | | 32,920 | | | | 94,918 | |
| Robert Antulov | | | 40,000 | | | | - | | | | - | | | | - | | | | - | | | | 32,920 | | | | 72,920 | |
| Darian Pizem | | | 40,767 | | | | - | | | | - | | | | - | | | | - | | | | 32,920 | | | | 73,687 | |
| | | | | | | | | | | | | | | | | | | | | | | | | | | | | |
| Executive Directors: | | | | | | | | | | | | | | | | | | | | | | | | | | | | |
| Ted Dhanik (a) (c) | | | 477,188 | | | | - | | | | 400,000 | | | | 93,041 | | | | - | | | | 754,000 | | | | 1,724,229 | |
| Kurtis Rintala (c) | | | 339,815 | | | | - | | | | - | | | | 1,070 | | | | - | | | | 221,640 | | | | 562,525 | |
| | | | | | | | | | | | | | | | | | | | | | | | | | | | | |
| Other Key Management Personnel: | | | | | | | | | | | | | | | | | | | | | | | | | | | | |
| Youqi Li (c) | | | 253,054 | | | | - | | | | - | | | | 535 | | | | - | | | | 104,000 | | | | 357,589 | |
| Andy Dhanik (b) | | | 274,494 | | | | 98,545 | | | | - | | | | - | | | | - | | | | 160,000 | | | | 533,039 | |
| Denys Kravchenko (c) | | | 260,284 | | | | - | | | | - | | | | - | | | | - | | | | 184,000 | | | | 444,284 | |
| | | | 1,747,600 | | | | 98,545 | | | | 400,000 | | | | 94,646 | | | | - | | | | 1,522,400 | | | | 3,863,191 | |
| (a) | Bonus award of $400,000 to Mr. Ted Dhanik was made for 2020. This bonus was an offset against part of loan accounts. Loan items were special exertions from the board to compensate the Executives for significantly reduced payroll in 2011 and 2013 and applied to outstanding loan balances with no cash paid. |
| (b) | Commissions are earned by Mr. Andy Dhanik based on performance to goal. Generally, these performance goals are driven by sales targets and gross profit maximization. Sales and gross margin targets are based on forecasts. Actual performance to goal is compared to arrive at an “Achieved” percentage which is used to determine which Tier of payout they will receive. < 50% is given a 0% payout tier, 51-69% is given a 50% payout tier, 70-79% is given a 70% payout tier, 80-89% is given a 80% payout tier, 90-99% is given a 90% payout tier, and 100% is given a 100% payout tier. The payout tier is then multiplied by the result of dividing the maximum payout amount by the target to arrive at a “Payout Percentage”. The payout percentage is then multiplied by the actual achieved result to arrive at the dollar amount of the payout. During the period, commissions of $98,545 were earned by A. Dhanik. |
| (c) | During the year 2020 payroll expenses were recognised as software capitalisation. These costs were related to the developmental costs to projects to deliver future economic benefit to the Group. For T. Dhanik and K. Rintala costs of US$172,735 (AU$224,273) each were capitalised. For Y.Li US$147,116 (AU$191,010) was capitalised. For D.Kravchenko a total of US$143,814 (AU$186,723) was capitalised. |
engage:BDR Limited
Directors' report
31 December 2020
| | | Short-term benefits | | | Post- employment benefits | | | Share- based | | | | |
| | | Cash salary and fees | | | Commission /bonus - cash | | | Bonus - non-cash (a) | | | Other allowances | | | Defined- contribution plan | | | payments Equity- settled | | | Total | |
| 2019 | | $ | | | $ | | | $ | | | $ | | | $ | | | $ | | | $ | |
| | | | | | | | | | | | | | | | | | | | | | | | | | | | | |
| Non-Executive Directors: | | | | | | | | | | | | | | | | | | | | | | | | | | | | |
| Tom Anderson | | | 64,015 | | | | - | | | | - | | | | - | | | | - | | | | - | | | | 64,015 | |
| Robert Antulov | | | 40,000 | | | | - | | | | - | | | | - | | | | - | | | | - | | | | 40,000 | |
| Darian Pizem | | | 58,599 | | | | - | | | | - | | | | - | | | | - | | | | - | | | | 58,599 | |
| | | | | | | | | | | | | | | | | | | | | | | | | | | | | |
| Executive Directors: | | | | | | | | | | | | | | | | | | | | | | | | | | | | |
| Ted Dhanik (a) (b) | | | 337,789 | | | | - | | | | 340,664 | | | | - | | | | - | | | | - | | | | 678,453 | |
| Kurtis Rintala (b) | | | 337,789 | | | | - | | | | - | | | | - | | | | - | | | | - | | | | 337,789 | |
| | | | | | | | | | | | | | | | | | | | | | | | | | | | | |
| Other Key Management Personnel: | | | | | | | | | | | | | | | | | | | | | | | | | | | | |
| Youqi Li (b) | | | 241,483 | | | | - | | | | - | | | | - | | | | - | | | | 87,228 | | | | 328,711 | |
| Andy Dhanik | | | 251,545 | | | | - | | | | - | | | | - | | | | - | | | | 150,243 | | | | 401,788 | |
| Denys Kravchenko (b) | | | 264,775 | | | | - | | | | - | | | | - | | | | - | | | | 43,614 | | | | 308,389 | |
| | | | 1,595,995 | | | | - | | | | 340,664 | | | | - | | | | - | | | | 281,085 | | | | 2,217,744 | |
| (a) | Bonus award of $340,664 to Mr. Ted Dhanik was made for 2019. This bonus was an offset against part of loan accounts. Loan items were special exertions from the board to compensate the Executives for significantly reduced payroll in 2011 and 2013 and applied to outstanding loan balances with no cash paid. |
| (b) | During the year 2019 payroll expenses were recognised as software capitalisation. These costs were related to the developmental costs to projects to deliver future economic benefit to the Group. For T. Dhanik and K. Rintala costs of US$84,753 (AU$120,972) each were capitalised. For Y.Li US$134,247 (AU$191,617) was capitalised. For D.Kravchenko a total of US$185,239 (AU$264,401) was capitalised. |
The proportion of remuneration linked to performance and the fixed proportion are as follows:
| | | Fixed remuneration | | | STI - sales commission/ bonus | | | Share based payments | |
| Name | | 2020 | | | 2019 | | | 2020 | | | 2019 | | | 2020 | | | 2019 | |
| | | | | | | | | | | | | | | | | | | |
| Non-Executive Directors: | | | | | | | | | | | | | | | | | | | | | | | | |
| Tom Anderson | | | 65 | % | | | 100 | % | | | - | | | | - | | | | 35 | % | | | - | |
| Robert Antulov | | | 55 | % | | | 100 | % | | | - | | | | - | | | | 45 | % | | | - | |
| Darian Pizem | | | 55 | % | | | 100 | % | | | - | | | | - | | | | 45 | % | | | - | |
| | | | | | | | | | | | | | | | | | | | | | | | | |
| Executive Directors: | | | | | | | | | | | | | | | | | | | | | | | | |
| Ted Dhanik | | | 33 | % | | | 100 | % | | | 23 | % | | | - | | | | 44 | % | | | - | |
| Kurtis Rintala | | | 61 | % | | | 100 | % | | | - | | | | - | | | | 39 | % | | | - | |
| | | | | | | | | | | | | | | | | | | | | | | | | |
| Other Key Management Personnel: | | | | | | | | | | | | | | | | | | | | | | | | |
| Youqi Li* | | | 71 | % | | | 73 | % | | | - | | | | - | | | | 29 | % | | | 27 | % |
| Andy Dhanik | | | 52 | % | | | 63 | % | | | 18 | % | | | 37 | % | | | 30 | % | | | - | |
| Denys Kravchenko* | | | 59 | % | | | 86 | % | | | - | | | | - | | | | 41 | % | | | 14 | % |
| * | These employees are considered as key management personnel for 2020 financial year in accordance with AASB 124. |
engage:BDR Limited
Directors' report
31 December 2020
Service agreements
Remuneration and other terms of employment for key management personnel are formalised in service agreements. Details of these agreements are as follows:
| Name: | | Ted Dhanik |
| Title: | | Executive Chairman and Chief Executive Officer |
| Agreement commenced: | | 14 December 2017 |
| Term of agreement: | | 3 years subject to re-election at any relevant Company Annual General Meeting. |
| Details: | | The fee payable to Director is to be USD$330,000 per annum. Such fees to be reviewed on each anniversary of the agreement or whenever determined by the Board. Where for any reason the fees owing to the Director for the services of the Director are not paid for any period of the engagement, or where there are any fees or monies outstanding to Director, the Company will accrue those fees and Director may at its sole option agree for those fees to be paid in the form of fully paid ordinary shares in the Company, subject at all times to the Company obtaining all necessary regulatory and shareholder approvals. The Director may resign at any time by given written notice to the Company. |
| Name: | | Kurtis Rintala |
| Title: | | Executive Director and Chief Operating Officer |
| Agreement commenced: | | 14 December 2017 |
| Term of agreement: | | 3 years subject to re-election at any relevant Company Annual General Meeting. |
| Details: | | The fee payable to Director is to be USD$235,000 per annum from the commencement date. Such fees to be reviewed on each anniversary of the agreement or whenever determined by the Board. Where for any reason the fees owing to the Director for the services of the Director are not paid for any period of the engagement, or where there are any fees or monies outstanding to Director, the Company will accrue those fees and Director may at its sole option agree for those fees to be paid in the form of fully paid ordinary shares in the Company, subject at all times to the Company obtaining all necessary regulatory and shareholder approvals. The Director may resign at any time by given written notice to the Company. |
| Name: | | Darian Pizem |
| Title: | | Non-Executive Director |
| Agreement commenced: | | 30 October 2018 |
| Term of agreement: | | 3 years subject to re-election at any relevant Company Annual General Meeting. |
| Details: | | The fee payable to Director is to be AUD$40,000 per annum including applicable statutory superannuation entitlements from the commencement date. Such fees to be reviewed on each anniversary of the agreement or whenever determined by the Board. Where for any reason the fees owing to the Director for the services of the Director are not paid for any period of the engagement, or where there are any fees or monies outstanding to Director, the Company will accrue those fees and Director may at its sole option agree for those fees to be paid in the form of fully paid ordinary shares in the Company, subject at all times to the Company obtaining all necessary regulatory and shareholder approvals. The Director may resign at any time by given written notice to the Company. |
engage:BDR Limited
Directors' report
31 December 2020
| Name: | | Robert Antulov |
| Title: | | Non-Executive Director |
| Agreement commenced: | | 23 November 2018 |
| Term of agreement: | | 3 years subject to re-election at any relevant Company Annual General Meeting. |
| Details: | | The fee payable to Director is to be AUD$40,000 including applicable statutory superannuation entitlements per annum from the commencement date. Such fees to be reviewed on each anniversary of the agreement or whenever determined by the Board. Where for any reason the fees owing to the Director for the services of the Director are not paid for any period of the engagement, or where there are any fees or monies outstanding to Director, the Company will accrue those fees and Director may at its sole option agree for those fees to be paid in the form of fully paid ordinary shares in the Company, subject at all times to the Company obtaining all necessary regulatory and shareholder approvals. The Director may resign at any time by given written notice to the Company. |
| Name: | | Youqi Li |
| Title: | | Chief Technology Officer |
| Agreement commenced: | | 27 August 2015 |
| Term of agreement: | | Ongoing |
| Details: | | Mr Li receives an remuneration package including salary and pension of AUD$249,785 (USD$175,000) per annum. Payment of a benefit on early termination by the Group without cause is equal to 2 months’ base salary. Notice period - 6 months |
| Name: | | Andy Dhanik |
| Title: | | Chief Revenue Officer |
| Agreement commenced: | | 1 March 2014 |
| Term of agreement: | | Ongoing |
| Details: | | Mr Dhanik receives an remuneration package including salary and pension of AUD$249,785 (USD$175,000) per annum. Payment of a benefit on early termination by the Group without cause is equal to 2 months’ base salary. Notice period - 6 months |
| Name: | | Denys Kravchenko |
| Title: | | Chief Technology Officer (AdCel) |
| Agreement commenced: | | 27 July 2018 |
| Term of agreement: | | Ongoing |
| Details: | | Mr Kravchenko receives an remuneration package including salary and pension of AUD$256,922 (USD$180,000) per annum. Payment of a benefit on early termination by the Group without cause is equal to 2 months’ base salary. Notice period - 6 months |
engage:BDR Limited
Directors' report
31 December 2020
| Name: | | Tom Anderson |
| Title: | | Non-Executive Director |
| Agreement commenced: | | 17 August 2017 |
| Term of agreement: | | 3 years subject to re-election at any relevant Company Annual General Meeting. |
| Details: | | The fee payable to Director is USD$45,000 per annum from the commencement date. Such fees to be reviewed on each anniversary of the agreement or whenever determined by the Board.
Where for any reason the fees owing to the Director for the services of the Director are not paid for any period of the engagement, or where there are any fees or monies outstanding to Director, the Company will accrue those fees and Director may at its sole option agree for those fees to be paid in the form of fully paid ordinary shares in the Company, subject at all times to the Company obtaining all necessary regulatory and shareholder approvals.
The Director may resign at any time by given written notice to the Company. |
Key management personnel have no entitlement to termination payments in the event of removal for misconduct.
Share-based compensation
Issue of shares
Details of shares issued to directors and other key management personnel as part of compensation during the year ended 31 December 2020 are set out below. These shares were issued upon the conversion of performance rights:
| Name | | Date | | Shares | | | Deemed Issue price | | | $AUD | |
| | | | | | | | | | | | |
| Ted Dhanik | | 27-Apr-20 | | | 40,000,000 | | | $ | 0.0160 | | | | 640,000 | |
| Kurtis Rintala | | 27-Apr-20 | | | 11,000,000 | | | $ | 0.0160 | | | | 176,000 | |
| Youqi Li | | 27-Apr-20 | | | 6,500,000 | | | $ | 0.0160 | | | | 104,000 | |
| Andy Dhanik | | 27-Apr-20 | | | 10,000,000 | | | $ | 0.0160 | | | | 160,000 | |
Options
The terms and conditions of each grant of options over ordinary shares affecting remuneration of directors and other key management personnel in this financial year or future reporting years are as follows:
| | | Number | | | | | Vesting | | | | | | | Fair value | |
| | | of | | | | | date and | | | | | | | per option | |
| Name | | options granted | | | Grant date | | exercisable date | | Expiry date | | Exercise price | | | at grant date | |
| | | | | | | | | | | | | | | | |
| Tom Anderson | | | 1,900,000 | | | 18-Mar-20 | | 18-Mar-20 | | 01-Apr-23 | | $ | 0.0201 | | | $ | 0.0077 | |
| Tom Anderson | | | 1,900,000 | | | 18-Mar-20 | | 18-Mar-21 | | 01-Apr-23 | | $ | 0.0217 | | | $ | 0.0080 | |
| Tom Anderson | | | 1,900,000 | | | 18-Mar-20 | | 18-Mar-22 | | 01-Apr-23 | | $ | 0.0233 | | | $ | 0.0084 | |
| Robert Antulov | | | 1,900,000 | | | 18-Mar-20 | | 18-Mar-20 | | 01-Apr-23 | | $ | 0.0201 | | | $ | 0.0077 | |
| Robert Antulov | | | 1,900,000 | | | 18-Mar-20 | | 18-Mar-21 | | 01-Apr-23 | | $ | 0.0217 | | | $ | 0.0080 | |
| Robert Antulov | | | 1,900,000 | | | 18-Mar-20 | | 18-Mar-22 | | 01-Apr-23 | | $ | 0.0233 | | | $ | 0.0084 | |
| Darian Pizem | | | 1,900,000 | | | 18-Mar-20 | | 18-Mar-20 | | 01-Apr-23 | | $ | 0.0201 | | | $ | 0.0077 | |
| Darian Pizem | | | 1,900,000 | | | 18-Mar-20 | | 18-Mar-21 | | 01-Apr-23 | | $ | 0.0217 | | | $ | 0.0080 | |
| Darian Pizem | | | 1,900,000 | | | 18-Mar-20 | | 18-Mar-22 | | 01-Apr-23 | | $ | 0.0233 | | | $ | 0.0084 | |
The options listed above with the vesting date of 18 March 2020 vested immediately upon issue.
The options listed above with vesting dates of 18 March 2021 and 18 March 2022 remain unvested at the date of this report and will vest provided that the respective option holders meet service conditions.
Options granted carry no dividend or voting rights.
engage:BDR Limited
Directors' report
31 December 2020
The number of options over ordinary shares granted to and vested by directors and other key management personnel as part of compensation during the year ended 31 December 2020 are set out below:
| | | Number of | | | Number of | | | Number of | | | Number of | |
| | | options | | | options | | | options | | | options | |
| | | granted | | | granted | | | vested | | | vested | |
| | | during the | | | during the | | | during the | | | during the | |
| | | year | | | year | | | year | | | year | |
| Name | | 2020 | | | 2019 | | | 2020 | | | 2019 | |
| | | | | | | | | | | | | |
| Tom Anderson | | | 5,700,000 | | | | - | | | | 1,900,000 | | | | - | |
| Robert Antulov | | | 5,700,000 | | | | - | | | | 1,900,000 | | | | - | |
| Darian Pizem | | | 5,700,000 | | | | - | | | | 1,900,000 | | | | - | |
Values of options over ordinary shares granted, exercised and lapsed for directors and other key management personnel as part of compensation during the year ended 31 December 2020 are set out below:
| | | Value of | | | Value of | | | Value of | | | Remuneration | |
| | | options | | | options | | | options | | | consisting of | |
| | | granted | | | exercised | | | lapsed | | | options | |
| | | during the | | | during the | | | during the | | | for the | |
| | | year | | | year | | | year | | | year | |
| Name | | $ | | | $ | | | $ | | | % | |
| | | | | | | | | | | | | |
| Tom Anderson | | | 45,790 | | | | - | | | | - | | | | 35 | % |
| Robert Antulov | | | 45,790 | | | | - | | | | - | | | | 45 | % |
| Darian Pizem | | | 45,790 | | | | - | | | | - | | | | 45 | % |
Details of options over ordinary shares granted, vested and lapsed for directors and other key management personnel as part of compensation during the year ended 31 December 2020 are set out below:
| | | | | | | Number of | | | Value of | | | Value of | | | Number of | | | Value of | |
| | | Grant | | Vesting | | options | | | options | | | options | | | options | | | options | |
| Name | | date | | date | | granted | | | granted | | | vested | | | lapsed | | | lapsed | |
| | | | | | | | | | | | $ | | | | $ | | | | | | | | $ | |
| | | | | | | | | | | | | | | | | | | | | | | | | |
| Tom Anderson | | 18-Mar-20 | | Various | | | 5,700,000 | | | | 45,790 | | | | 32,920 | | | | - | | | | - | |
| Robert Antulov | | 18-Mar-20 | | Various | | | 5,700,000 | | | | 45,790 | | | | 32,920 | | | | - | | | | - | |
| Darian Pizem | | 18-Mar-20 | | Various | | | 5,700,000 | | | | 45,790 | | | | 32,920 | | | | - | | | | - | |
engage:BDR Limited
Directors' report
31 December 2020
Performance rights
The terms and conditions of each grant of performance rights over ordinary shares affecting remuneration of directors and other key management personnel in this financial year or future reporting years are as follows. The performance rights issued during the year ended 31 December 2020 in eight vesting milestones with an expiry date of 1 April 2023.
The vesting milestones were as follows:
| (1) | A 30% increase in audited operating revenue stated in an audited consolidated annual financial report of the Group (being the Company and its controlled entities) for a period up to and including the 2021 financial year (a “Future Report”) over the audited revenue stated in the last audited consolidated annual financial report of the Company and its controlled entities (being the audited financial report for the year ended 31 December 2018) (“Base Report”). |
| (2) | A 25% increase in audited gross profit (and/or reduction in gross loss) stated in a Future Report over the audited gross profit (loss) stated in the Base Report). |
| (3) | A 50% increase in audited earnings before interest, tax, depreciation and amortisation (EBITDA) (and/or reduction in a negative EBITDA) stated in a Future Report over the audited net profit (loss) before tax stated in the Base Report). |
| (4) | A 50% increase in audited net assets (and/or reduction in the net deficiency of assets if net assets are less than zero) stated in a Future Report over the audited net assets (deficiency) stated in the Base Report). |
| (5) | A 50% increase in the market capitalisation (number of ordinary shares on issue multiplied by the 20 day VWAP for days on which shares of the Company traded on ASX) up to and including the twentieth (20th) day on which shares of the Company traded on ASX after the release of the Future Report for the 2021 financial year, over the market capitalisation (calculated using the 20 day VWAP for days on which shares of the Company traded on ASX) on any prior day. |
| (6) | A 30% improvement in AdCel revenue |
| (7) | AdCel DSP annual revenue of at least $2,000,000 |
| (8) | A 15% improvement in gross profit |
Vesting milestones 1 to 4 were achieved during the half year, as a result, 67,500,000 fully paid ordinary shares were issued on conversion of the performance rights by relevant directors and other key management personnel.
| | | | | | | | | | | | | | | | Fair value | |
| | | Number of | | | | | Applicable | | | | | | | | per right | |
| Name | | rights granted | | | Grant date | | Vesting milestone(s) | | | Expiry date | | Conversion price | | | at grant date | |
| | | | | | | | | | | | | | | | | |
| Ted Dhanik | | | 10,000,000 | | | 18-Mar-20 | | | 5 | | | 01-Apr-23 | | $ | 0.0000 | | | $ | 0.0141 | |
| Ted Dhanik | | | 40,000,000 | | | 18-Mar-20 | | | 1, 2, 3, 4 | | | 01-Apr-23 | | $ | 0.0000 | | | $ | 0.0160 | |
| Kurtis Rintala | | | 4,000,000 | | | 18-Mar-20 | | | 5 | | | 01-Apr-23 | | $ | 0.0000 | | | $ | 0.0141 | |
| Kurtis Rintala | | | 11,000,000 | | | 18-Mar-20 | | | 1, 2, 3, 4 | | | 01-Apr-23 | | $ | 0.0000 | | | $ | 0.0160 | |
| Youqi Li | | | 6,500,000 | | | 18-Mar-20 | | | 1, 2, 3 | | | 01-Apr-23 | | $ | 0.0000 | | | $ | 0.0160 | |
| Andy Dhanik | | | 10,000,000 | | | 18-Mar-20 | | | 1, 2, 3 | | | 01-Apr-23 | | $ | 0.0000 | | | $ | 0.0160 | |
| Denys Kravchenko | | | 11,500,000 | | | 18-Mar-20 | | | 6, 7, 8 | | | 01-Apr-23 | | $ | 0.0000 | | | $ | 0.0160 | |
Performance rights granted carry no dividend or voting rights.
The number of performance rights over ordinary shares granted to and vested by directors and other key management personnel as part of compensation during the year ended 31 December 2020 are set out below:
| | | Number of | | | Number of | | | Number of | | | Number of | |
| | | rights | | | rights | | | rights | | | rights | |
| | | granted | | | granted | | | vested | | | vested | |
| | | during the | | | during the | | | during the | | | during the | |
| | | year | | | year | | | year | | | year | |
| Name | | 2020 | | | 2019 | | | 2020 | | | 2019 | |
| | | | | | | | | | | | | |
| Ted Dhanik | | | 50,000,000 | | | | - | | | | 40,000,000 | | | | - | |
| Kurtis Rintala | | | 15,000,000 | | | | - | | | | 11,000,000 | | | | - | |
| Youqi Li | | | 6,500,000 | | | | - | | | | 6,500,000 | | | | - | |
| Andy Dhanik | | | 10,000,000 | | | | - | | | | 10,000,000 | | | | - | |
| Denys Kravchenko | | | 11,500,000 | | | | - | | | | - | | | | - | |
engage:BDR Limited
Directors' report
31 December 2020
Values of performance rights over ordinary shares granted, vested and lapsed for directors and other key management personnel as part of compensation during the year ended 31 December 2020 are set out below:
| | | Value of | | | Value of | | | Value of | | | Remuneration | |
| | | rights | | | rights | | | rights | | | consisting of | |
| | | granted | | | vested | | | lapsed | | | rights | |
| | | during the | | | during the | | | during the | | | for the | |
| | | year | | | year | | | year | | | year | |
| Name | | $ | | | $ | | | $ | | | % | |
| | | | | | | | | | | | | |
| Ted Dhanik | | | 754,100 | | | | 640,000 | | | | - | | | | 44 | % |
| Kurtis Rintala | | | 221,640 | | | | 176,000 | | | | - | | | | 39 | % |
| Youqi Li | | | 104,000 | | | | 104,000 | | | | - | | | | 29 | % |
| Andy Dhanik | | | 160,000 | | | | 160,000 | | | | - | | | | 30 | % |
| Denys Kravchenko | | | 184,000 | | | | - | | | | - | | | | 41 | % |
Additional information
The earnings of the consolidated entity for the five years to 31 December 2020 are summarised below:
| | | | 2020 | | | | 2019 | | | | 2018 | | | | 2017 | | | | 2016* | |
| | | | $ | | | | $ | | | | $ | | | | $ | | | | $ | |
| | | | | | | | | | | | | | | | | | | | | |
| Sales revenue | | | 15,398,413 | | | | 17,079,118 | | | | 11,443,935 | | | | 13,135,970 | | | | 21,845,216 | |
| Operating profit/(loss) | | | (1,396,924 | ) | | | 1,604,732 | | | | (6,286,229 | ) | | | (7,098,066 | ) | | | (1,455,961 | ) |
| Loss before income tax expense | | | (6,881,027 | ) | | | (1,343,429 | ) | | | (10,839,127 | ) | | | (9,583,419 | ) | | | (2,927,728 | ) |
| Loss after income tax expense | | | (6,881,027 | ) | | | (1,343,429 | ) | | | (10,840,198 | ) | | | (10,566,001 | ) | | | (3,671,811 | ) |
| * | The financial result represents engage:BDR LLC’s operating result for the year. |
Additional disclosures relating to key management personnel
Shareholding
The number of shares in the company held during the financial year by each director and other members of key management personnel of the consolidated entity, including their personally related parties, is set out below:
| | | Balance at | | | Received | | | | | | | | | Balance at | |
| | | the start of | | | as part of | | | | | | | | | the end of | |
| | | the year | | | remuneration* | | | Additions | | | Disposals** | | | the year | |
| Ordinary shares | | | | | | | | | | | | | | | |
| Ted Dhanik | | | 57,681,498 | | | | 40,000,000 | | | | - | | | | - | | | | 97,681,498 | |
| Kurtis Rintala | | | 36,717,391 | | | | 11,000,000 | | | | - | | | | - | | | | 47,717,391 | |
| Tom Anderson | | | 1,500,000 | | | | - | | | | - | | | | - | | | | 1,500,000 | |
| Robert Antulov | | | 665,500 | | | | - | | | | - | | | | - | | | | 665,500 | |
| Youqi Li | | | 4,371,454 | | | | 6,500,000 | | | | - | | | | - | | | | 10,871,454 | |
| Andy Dhanik | | | 3,196,211 | | | | 10,000,000 | | | | - | | | | - | | | | 13,196,211 | |
| Denys Kravchenko | | | 1,435,727 | | | | - | | | | - | | | | - | | | | 1,435,727 | |
| | | | 105,567,781 | | | | 67,500,000 | | | | - | | | | - | | | | 173,067,781 | |
| * | Shares issued upon conversion of vested performance rights |
| ** | Includes movements representing person’s holding when they ceased to be a member of key management personnel |
engage:BDR Limited
Directors' report
31 December 2020
Option holding
The number of options over ordinary shares in the Group held during the financial year by each director and other members of key management personnel of the Group, including their closely related entities, is set out below:
| | | Balance at | | | | | | | | | Expired/ | | | Balance at | |
| | | the start of | | | | | | | | | forfeited/ | | | the end of | |
| | | the year | | | Granted | | | Exercised | | | other* | | | the year | |
| Options over ordinary shares | | | | | | | | | | | | | | | | | | | | |
| Tom Anderson | | | - | | | | 5,700,000 | | | | - | | | | - | | | | 5,700,000 | |
| Robert Antulov | | | - | | | | 5,700,000 | | | | - | | | | - | | | | 5,700,000 | |
| Darian Pizem | | | - | | | | 5,700,000 | | | | - | | | | - | | | | 5,700,000 | |
| | | | - | | | | 17,100,000 | | | | - | | | | - | | | | 17,100,000 | |
| * | Movements represent person’s holding when they ceased to be a member of key management personnel |
| | | | | | | | | Balance at | |
| | | Vested and | | | Vested and | | | the end of | |
| | | exercisable | | | unexercisable | | | the year | |
| Options over ordinary shares | | | | | | | | | | | | |
| Tom Anderson | | | 1,900,000 | | | | - | | | | 1,900,000 | |
| Robert Antulov | | | 1,900,000 | | | | - | | | | 1,900,000 | |
| Darian Pizem | | | 1,900,000 | | | | - | | | | 1,900,000 | |
| | | | 5,700,000 | | | | - | | | | 5,700,000 | |
Performance rights holding
The number of performance rights over ordinary shares in the company held during the financial year by each director and other members of key management personnel of the consolidated entity, including their personally related parties, is set out below:
| | | Balance at | | | | | | | | | Expired/ | | | Balance at | |
| | | the start of | | | | | | Vested and | | | forfeited/ | | | the end of | |
| | | the year | | | Granted | | | converted | | | other | | | the year | |
| Performance rights over ordinary shares | | | | | | | | | | | | | | | | | | | | |
| Ted Dhanik | | | - | | | | 50,000,000 | | | | (40,000,000 | ) | | | - | | | | 10,000,000 | |
| Kurtis Rintala | | | - | | | | 15,000,000 | | | | (11,000,000 | ) | | | - | | | | 4,000,000 | |
| Youqi Li | | | - | | | | 6,500,000 | | | | (6,500,000 | ) | | | - | | | | - | |
| Andy Dhanik | | | - | | | | 10,000,000 | | | | (10,000,000 | ) | | | - | | | | - | |
| Denys Kravchenko | | | - | | | | 11,500,000 | | | | - | | | | - | | | | 11,500,000 | |
| | | | - | | | | 93,000,000 | | | | (67,500,000 | ) | | | - | | | | 25,500,000 | |
Loans to key management personnel and their related parties
As at 31 December 2020 the Group recognised a loan receivable for funds payable by Mr Ted Dhanik (USD$1,035,277; AUD$1,344,166) (2019: USD$1,191,163; AUD$1,700,204) and Mr Andy Dhanik (USD$65,277; AUD$93,173) (2019: USD$65,277; AUD$93,173).
From 1 July 2019, Loans to directors and key management personnel were charged interest at a simple interest rate of 5% per annum, calculated monthly. This interest rate is consistent with local interest rates charged for secured personal debt. For the year ended 31 December 2020, loans given to Mr Ted Dhanik and Mr Andy Dhanik accrued an interest of AUD$89,666 and AUD$4,720 respectively. The loans made to both directors and key management personnel are repayable by 31 August 2021. These have been disclosed as current receivables. $1,984,869 outstanding loans are secured against each individuals’ shareholding and will be settled in cash. All loans were approved by the Board of Directors of the Group.
engage:BDR Limited
Directors' report
31 December 2020
This concludes the remuneration report, which has been audited.
Shares under option
Unissued ordinary shares of the Company under option at the date of this report are as follows:
| | | | | Exercise | | | Number | |
| Grant date | | Expiry date | | price | | | under option | |
| | | | | | | | | |
| 29-Jan-19 | | 26-Jan-22 | | $ | 0.0520 | | | | 8,676,093 | |
| 25-Sep-19 | | 30-Sep-22 | | $ | 0.0260 | | | | 13,750,000 | |
| 18-Mar-20 | | 01-Apr-23 | | $ | 0.0201 | | | | 5,700,000 | |
| 18-Mar-20 | | 01-Apr-23 | | $ | 0.0217 | | | | 5,700,000 | |
| 18-Mar-20 | | 01-Apr-23 | | $ | 0.0233 | | | | 5,700,000 | |
| | | | | | | | | | | |
| | | | | | | | | | 39,526,093 | |
No person entitled to exercise the options had or has any right by virtue of the option to participate in any share issue of the Company or of any other body corporate.
Shares under performance rights
Unissued ordinary shares of engage:BDR Limited under performance rights at the date of this report are as follows:
| | | | | Conversion | | | Number | |
| Grant date | | Expiry date | | price | | | under rights | |
| | | | | | | | | |
| 18-Mar-20 | | 01-Apr-23 | | $ | 0.0000 | | | | 25,500,000 | |
No person entitled to exercise the performance rights had or has any right by virtue of the performance right to participate in any share issue of the company or of any other body corporate.
Shares issued on the exercise of options
There were no ordinary shares of engage:BDR Limited issued on the exercise of options during the year ended 31 December 2020 and up to the date of this report.
Shares issued on the exercise of performance rights
The following ordinary shares of engage:BDR Limited were issued during the year ended 31 December 2020 and up to the date of this report on the exercise of performance rights granted:
| | | Conversion | | | Number of | |
| Date performance rights granted | | price | | | shares issued | |
| | | | | | | | | |
| 18-Mar-20 | | $ | 0.0000 | | | | 82,000,000 | |
Indemnity and insurance of officers
During the financial year, the Group maintained an insurance policy which indemnifies the directors and officers of the Group in respect of any liability incurred in connection with the performance of their duties as directors or officers of the Group to the extent permitted by the Corporations Act 2001. The Group’s insurers have prohibited disclosure of the amount of the premium payable and the level of indemnification under the insurance contract.
The Group has not paid any insurance premiums in respect of any past or present directors or auditors, other than as required by law.
Indemnity and insurance of auditor
The company has not, during or since the end of the financial year, indemnified or agreed to indemnify the auditor of the company or any related entity against a liability incurred by the auditor.
engage:BDR Limited
Directors' report
31 December 2020
During the financial year, the company has not paid a premium in respect of a contract to insure the auditor of the company or any related entity.
Proceedings on behalf of the Group
As at the date of this report, there are no leave applications or proceedings brought on behalf of the Group under section 237 of the Corporations Act 2001.
Non-audit services
Details of the amounts paid or payable to the auditor for non-audit services provided during the financial year by the auditor are outlined in note 19 to the financial statements.
The directors are satisfied that the provision of non-audit services during the financial year, by the auditor (or by another person or firm on the auditor’s behalf), is compatible with the general standard of independence for auditors imposed by the Corporations Act 2001.
The directors are of the opinion that the services as disclosed in note 19 to the financial statements do not compromise the external auditor’s independence requirements of the Corporations Act 2001 for the following reasons:
| ● | all non-audit services have been reviewed and approved to ensure that they do not impact the integrity and objectivity of the auditor; and |
| ● | none of the services undermine the general principles relating to auditor independence as set out in APES 110 Code of Ethics for Professional Accountants (including Independence Standards) issued by the Accounting Professional and Ethical Standards Board, including reviewing or auditing the auditor’s own work, acting in a management or decision-making capacity for the company, acting as advocate for the company or jointly sharing economic risks and rewards. |
Officers of the Company who are former partners of William Buck Audit (Vic) Pty Ltd
There are no officers of the Company who are former partners of William Buck Audit (Vic) Pty Ltd.
Auditor’s independence declaration
A copy of the auditor’s independence declaration as required under section 307C of the Corporations Act 2001 is set out immediately after this Directors’ report.
Rounding
All values in the Directors’ report have been rounded off the dollar ($) in accordance with Corporations Instrument 2016/191, issued by the Australian Securities and Investments Commission.
This report is made in accordance with a resolution of Directors, pursuant to section 298(2)(a) of the Corporations Act 2001.
On behalf of the Directors
 | |
| Ted Dhanik | |
| Co-Founder and Executive Chairman | |
| | |
| 26 February 2021 | |
engage:BDR Limited
Auditor's independence declaration

AUDITOR’S INDEPENDENCE DECLARATION UNDER SECTION 307C OF THE CORPORATIONS ACT 2001 TO THE DIRECTORS OF ENGAGE:BDR LIMITED
I declare that, to the best of my knowledge and belief during the year ended 31 December 2020 there have been:
| — | no contraventions of the auditor independence requirements as set out in the Corporations Act 2001 in relation to the audit; and |
| | |
| — | no contraventions of any applicable code of professional conduct in relation to the audit. |
 | |
| William Buck Audit (Vic) Pty Ltd | |
| ABN 59 116 151 136 | |
 | |
| N.S. Benbow | |
| Director | |
Melbourne, 26th February 2021


engage:BDR Limited
Statement of profit or loss and other comprehensive income
For the year ended 31 December 2020
| | | | | | Consolidated | |
| | | Note | | | 2020 | | | 2019 | |
| | | | | | | $ | | | | $ | |
| Revenue from contracts with customers | | 5 | | | | 15,398,413 | | | | 17,079,118 | |
| Cost of sales | | | | | | (9,420,757 | ) | | | (7,794,937 | ) |
| | | | | | | 5,977,656 | | | | 9,284,181 | |
| Other income | | 5 | | | | 740,865 | | | | 89,441 | |
| | | | | | | | | | | | |
| Expenses | | | | | | | | | | | |
| Employee and contractor costs | | 6 | | | | (2,829,407 | ) | | | (2,684,608 | ) |
| Operations and administration expense | | 7 | | | | (5,147,054 | ) | | | (4,974,981 | ) |
| Advertising and marketing expense | | | | | | (138,984 | ) | | | (109,301 | ) |
| | | | | | | | | | | | |
| EBITDA Operating profit/(loss) | | | | | | (1,396,924 | ) | | | 1,604,732 | |
| | | | | | | | | | | | |
| Depreciation and amortisation expense | | | | | | (861,467 | ) | | | (882,335 | ) |
| Impairment losses | | 10 | | | | (856,342 | ) | | | (140,004 | ) |
| Share based payment expense | | | | | | (1,719,444 | ) | | | (327,536 | ) |
| Finance costs | | | | | | (2,046,850 | ) | | | (1,598,286 | ) |
| | | | | | | | | | | | |
| Loss before income tax expense | | | | | | (6,881,027 | ) | | | (1,343,429 | ) |
| | | | | | | | | | | | |
| Income tax expense | | | | | | - | | | | - | |
| | | | | | | | | | | | |
| Loss after income tax expense for the year attributable to the owners of engage:BDR Limited | | | | | | (6,881,027 | ) | | | (1,343,429 | ) |
| | | | | | | | | | | | |
| Other comprehensive loss | | | | | | | | | | | |
| | | | | | | | | | | | |
| Items that will not be reclassified subsequently to profit or loss | | | | | | | | | | | |
| Loss on the revaluation of equity instruments at fair value through other comprehensive income, net of tax | | | | | | - | | | | (77,977 | ) |
| | | | | | | | | | | | |
| Items that may be reclassified subsequently to profit or loss | | | | | | | | | | | |
| Exchange differences on translation of foreign operations | | | | | | (975,579 | ) | | | (688,546 | ) |
| | | | | | | | | | | | |
| Other comprehensive loss for the year, net of tax | | | | | | (975,579 | ) | | | (766,523 | ) |
| | | | | | | | | | | | |
| Total comprehensive loss for the year attributable to the owners of engage:BDR Limited | | | | | | (7,856,606 | ) | | | (2,109,952 | ) |
| | | | | | Cents | | | Cents | |
| | | | | | | | | | |
| Basic earnings per share | | 24 | | | | (0.55 | ) | | | (0.26 | ) |
| Diluted earnings per share | | 24 | | | | (0.55 | ) | | | (0.26 | ) |
The above statement of profit or loss and other comprehensive income should be read in conjunction with the accompanying notes
engage:BDR Limited
Statement of financial position
As at 31 December 2020
| | | | | | Consolidated | |
| | | Note | | | 2020 | | | 2019 | |
| | | | | | $ | | | $ | |
| | | | | | | | | | | | |
| Assets | | | | | | | | | | | |
| | | | | | | | | | | | |
| Current assets | | | | | | | | | | | |
| Cash and cash equivalents | | 8 | | | | 2,986,745 | | | | 1,831,673 | |
| Trade and other receivables | | 9 | | | | 3,243,521 | | | | 5,786,531 | |
| Investments in equity instruments | | | | | | 47,179 | | | | 51,692 | |
| Prepaid expenses | | | | | | 579,982 | | | | 392,622 | |
| Related party receivables | | 20 | | | | 1,984,869 | | | | 2,311,510 | |
| Other assets | | 10 | | | | 332,459 | | | | 1,383,616 | |
| Total current assets | | | | | | 9,174,755 | | | | 11,757,644 | |
| | | | | | | | | | | | |
| Non-current assets | | | | | | | | | | | |
| Property, plant and equipment | | | | | | 157,617 | | | | 268,811 | |
| Right-of-use assets | | | | | | 305,504 | | | | 401,619 | |
| Capitalised software costs | | 11 | | | | 3,920,558 | | | | 3,032,083 | |
| Goodwill | | 12 | | | | 1,340,390 | | | | 1,468,517 | |
| Total non-current assets | | | | | | 5,724,069 | | | | 5,171,030 | |
| | | | | | | | | | | | |
| Total assets | | | | | | 14,898,824 | | | | 16,928,674 | |
| | | | | | | | | | | | |
| Liabilities | | | | | | | | | | | |
| | | | | | | | | | | | |
| Current liabilities | | | | | | | | | | | |
| Trade and other payables | | 13 | | | | 3,650,587 | | | | 5,896,438 | |
| Borrowings | | 14 | | | | 2,316,896 | | | | 6,791,258 | |
| Lease liabilities | | | | | | 157,854 | | | | 222,218 | |
| Contract liabilities | | | | | | 19,475 | | | | 81,518 | |
| Total current liabilities | | | | | | 6,144,812 | | | | 12,991,432 | |
| | | | | | | | | | | | |
| Non-current liabilities | | | | | | | | | | | |
| Lease liabilities | | | | | | 87,345 | | | | 29,572 | |
| Total non-current liabilities | | | | | | 87,345 | | | | 29,572 | |
| | | | | | | | | | | | |
| Total liabilities | | | | | | 6,232,157 | | | | 13,021,004 | |
| | | | | | | | | | | | |
| Net assets | | | | | | 8,666,667 | | | | 3,907,670 | |
| | | | | | | | | | | | |
| Equity | | | | | | | | | | | |
| Issued capital | | 15 | | | | 47,790,463 | | | | 35,582,304 | |
| Share based payment reserve | | | | | | 732,254 | | | | 603,739 | |
| Equity investment reserve | | | | | | (2,441,343 | ) | | | (2,441,343 | ) |
| Foreign currency translation reserve | | | | | | (1,762,886 | ) | | | (787,307 | ) |
| Accumulated losses | | | | | | (35,651,821 | ) | | | (29,049,723 | ) |
| | | | | | | | | | | | |
| Total equity | | | | | | 8,666,667 | | | | 3,907,670 | |
The above statement of financial position should be read in conjunction with the accompanying notes
engage:BDR Limited
Statement of changes in equity
For the year ended 31 December 2020
| | | Issued capital | | | Share based payment reserve | | | Equity investment reserve | | | Foreign currency translation reserve | | | Accumulated losses | | | Total equity | |
| Consolidated | | $ | | | $ | | | $ | | | $ | | | $ | | | $ | |
| | | | | | | | | | | | | | | | | | | |
| Balance at 1 January 2019 | | | 20,025,656 | | | | 3,533,918 | | | | (2,363,366 | ) | | | (98,761 | ) | | | (27,706,294 | ) | | | (6,608,847 | ) |
| | | | | | | | | | | | | | | | | | | | | | | | | |
| Loss after income tax expense for the year | | | - | | | | - | | | | - | | | | - | | | | (1,343,429 | ) | | | (1,343,429 | ) |
| Other comprehensive income for the year, net of tax | | | - | | | | - | | | | (77,977 | ) | | | (688,546 | ) | | | - | | | | (766,523 | ) |
| | | | | | | | | | | | | | | | | | | | | | | | | |
| Total comprehensive income for the year | | | - | | | | - | | | | (77,977 | ) | | | (688,546 | ) | | | (1,343,429 | ) | | | (2,109,952 | ) |
| | | | | | | | | | | | | | | | | | | | | | | | | |
| Transactions with owners in their capacity as owners: | | | | | | | | | | | | | | | | | | | | | | | | |
| Contributions of equity, net of transaction costs (note 15) | | | 12,334,314 | | | | - | | | | - | | | | - | | | | - | | | | 12,334,314 | |
| Share-based payments (note 25) | | | - | | | | 292,155 | | | | - | | | | - | | | | - | | | | 292,155 | |
| Transfer of legacy investor options to issued capital | | | 3,222,334 | | | | (3,222,334 | ) | | | - | | | | - | | | | - | | | | - | |
| | | | | | | | | | | | | | | | | | | | | | | | | |
| Balance at 31 December 2019 | | | 35,582,304 | | | | 603,739 | | | | (2,441,343 | ) | | | (787,307 | ) | | | (29,049,723 | ) | | | 3,907,670 | |
| | | Issued capital | | | Share based payment reserve | | | Equity investment reserve | | | Foreign currency translation reserve | | | Accumulated losses | | | Total equity | |
| Consolidated | | $ | | | $ | | | $ | | | $ | | | $ | | | $ | |
| | | | | | | | | | | | | | | | | | | |
| Balance at 1 January 2020 | | | 35,582,304 | | | | 603,739 | | | | (2,441,343 | ) | | | (787,307 | ) | | | (29,049,723 | ) | | | 3,907,670 | |
| | | | | | | | | | | | | | | | | | | | | | | | | |
| Loss after income tax expense for the year | | | - | | | | - | | | | - | | | | - | | | | (6,881,027 | ) | | | (6,881,027 | ) |
| Other comprehensive income for the year, net of tax | | | - | | | | - | | | | - | | | | (975,579 | ) | | | - | | | | (975,579 | ) |
| | | | | | | | | | | | | | | | | | | | | | | | | |
| Total comprehensive income for the year | | | - | | | | - | | | | - | | | | (975,579 | ) | | | (6,881,027 | ) | | | (7,856,606 | ) |
| | | | | | | | | | | | | | | | | | | | | | | | | |
| Transactions with owners in their capacity as owners: | | | | | | | | | | | | | | | | | | | | | | | | |
| Contributions of equity, net of transaction costs (note 15) | | | 10,896,159 | | | | - | | | | - | | | | - | | | | - | | | | 10,896,159 | |
| Share-based payments (note 25) | | | - | | | | 1,719,444 | | | | - | | | | - | | | | - | | | | 1,719,444 | |
| Shares issued on exercise of performance rights | | | 1,312,000 | | | | (1,312,000 | ) | | | - | | | | - | | | | - | | | | - | |
| Transfers to accumulated losses for expired or lapsed share-based payments | | | - | | | | (278,929 | ) | | | - | | | | - | | | | 278,929 | | | | - | |
| | | | | | | | | | | | | | | | | | | | | | | | | |
| Balance at 31 December 2020 | | | 47,790,463 | | | | 732,254 | | | | (2,441,343 | ) | | | (1,762,886 | ) | | | (35,651,821 | ) | | | 8,666,667 | |
The above statement of changes in equity should be read in conjunction with the accompanying notes
engage:BDR Limited
Statement of cash flows
For the year ended 31 December 2020
| | | | | | Consolidated | |
| | | Note | | | 2020 | | | 2019 | |
| | | | | | $ | | | $ | |
| Cash flows from operating activities | | | | | | | | | | | |
| Loss before income tax expense for the year | | | | | | (6,881,027 | ) | | | (1,343,429 | ) |
| | | | | | | | | | | | |
| Adjustments for: | | | | | | | | | | | |
| Depreciation and amortisation | | | | | | 861,467 | | | | 882,335 | |
| Share-based payments | | | | | | 1,719,444 | | | | 327,536 | |
| Impairment losses | | | | | | 856,342 | | | | 140,004 | |
| Accrued finance charges | | | | | | 2,059,919 | | | | 1,598,286 | |
| Executive bonuses used to offset related party debt | | | | | | 400,000 | | | | 337,127 | |
| Interest income from related party debt | | | | | | (69,224 | ) | | | (78,285 | ) |
| | | | | | | | | | | | |
| | | | | | | (1,053,079 | ) | | | 1,863,574 | |
| | | | | | | | | | | | |
| Change in operating assets and liabilities: | | | | | | | | | | | |
| (Increase)/decrease in trade and other receivables | | | | | | 2,543,010 | | | | (3,760,393 | ) |
| (Increase)/decrease in prepayments | | | | | | (187,360 | ) | | | (174,922 | ) |
| Decrease in trade and other payables | | | | | | (1,098,390 | ) | | | (1,045,034 | ) |
| Increase in contract liabilities | | | | | | (62,043 | ) | | | 81,518 | |
| | | | | | | | | | | | |
| | | | | | | 142,138 | | | | (3,035,257 | ) |
| Finance charges paid | | | | | | (606,280 | ) | | | (754,997 | ) |
| | | | | | | | | | | | |
| Net cash used in operating activities | | | | | | (464,142 | ) | | | (3,790,254 | ) |
| | | | | | | | | | | | |
| Cash flows from investing activities | | | | | | | | | | | |
| Proceeds from release of security deposits | | | | | | - | | | | 28,567 | |
| Capitalised software development | | | | | | (1,577,376 | ) | | | (1,471,447 | ) |
| Loans to related parties (shareholders) | | | | | | - | | | | (337,503 | ) |
| | | | | | | | | | | | |
| Net cash used in investing activities | | | | | | (1,577,376 | ) | | | (1,780,383 | ) |
| | | | | | | | | | | | |
| Cash flows from financing activities | | | | | | | | | | | |
| Proceeds from capital raises | | 15 | | | | 5,705,164 | | | | 702,784 | |
| Cost of capital raise | | | | | | (434,535 | ) | | | (8,222 | ) |
| Proceeds from borrowings | | | | | | 1,241,802 | | | | 8,092,379 | |
| Repayment of borrowings | | | | | | (2,786,629 | ) | | | (1,336,444 | ) |
| Repayment of lease liabilities | | | | | | (230,371 | ) | | | (357,165 | ) |
| | | | | | | | | | | | |
| Net cash from financing activities | | | | | | 3,495,431 | | | | 7,093,332 | |
| | | | | | | | | | | | |
| Net increase in cash and cash equivalents | | | | | | 1,453,913 | | | | 1,522,695 | |
| Cash and cash equivalents at the beginning of the financial year | | | | | | 1,831,673 | | | | 320,276 | |
| Effects of exchange rate changes on cash and cash equivalents | | | | | | (298,841 | ) | | | (11,298 | ) |
| | | | | | | | | | | | |
| Cash and cash equivalents at the end of the financial year | | 8 | | | | 2,986,745 | | | | 1,831,673 | |
The above statement of cash flows should be read in conjunction with the accompanying notes
engage:BDR Limited
Notes to the financial statements
31 December 2020
Note 1. General information
The financial report is a general purpose financial report which covers engage:BDR Limited, (the ‘parent’ or the ‘Company’) and its 100% owned subsidiaries, engage:BDR LLC, Tiveo LLC (‘Tiveo’; a wholly-owned subsidiary of engage:BDR LLC) and AdCel LLC collectively referred to as ‘the Group’ or ‘engage:BDR’. The financial report is for the year ended 31 December 2020 and is presented in Australian Dollars (‘AUD’). All values in the financial report have been rounded off to the nearest dollar ($) in accordance with Legislative Instrument 2016/191, issued by the Australian Securities and Investments Commission.
engage:BDR Limited is a listed public company limited by shares, incorporated and domiciled in Australia. Its registered office and principal place of business are:
| Registered office | | Principal place of business |
| | | |
| Scottish House | | 8581 Santa Monica Boulevard |
| Level 4 | | #12 |
| 90 William Street | | West Hollywood |
| Melbourne Victoria 3000 | | California 90069 |
| Australia | | USA |
A description of the nature of the Group’s operations and its principal activities are included in the Directors’ report, which is not part of the financial report.
The financial statements were authorised for issue, in accordance with a resolution of directors, on 26 February 2021. The directors have the power to amend and reissue the financial statements.
Note 2. Significant accounting policies
The principal accounting policies adopted in the preparation of the financial statements are set out either in the respective notes or below. These policies have been consistently applied to all the years presented, unless otherwise stated.
Basis of preparation
These general purpose financial statements have been prepared in accordance with Australian Accounting Standards and Interpretations issued by the Australian Accounting Standards Board (‘AASB’) and the Corporations Act 2001, as appropriate for for-profit oriented entities. These financial statements also comply with International Financial Reporting Standards as issued by the International Accounting Standards Board (‘IASB’).
Historical cost convention
The financial statements have been prepared under the historical cost convention, except for, where applicable, the revaluation of financial assets and derivative financial liabilities at fair value through profit or loss.
Critical accounting estimates
The preparation of the financial statements requires the use of certain critical accounting estimates. It also requires management to exercise its judgement in the process of applying the consolidated entity’s accounting policies. The areas involving a higher degree of judgement or complexity, or areas where assumptions and estimates are significant to the financial statements, are disclosed in note 3.
Parent entity information
In accordance with the Corporations Act 2001, these financial statements present the results of the consolidated entity only. Supplementary information about the parent entity is disclosed in note 21.
Principles of consolidation
The consolidated financial statements incorporate the assets and liabilities of all subsidiaries of engage:BDR Limited (‘company’ or ‘parent entity’) as at 31 December 2020 and the results of all subsidiaries for the year then ended. engage:BDR Limited and its subsidiaries together are referred to in these financial statements as the ‘consolidated entity’.
engage:BDR Limited
Notes to the financial statements
31 December 2020
Note 2. Significant accounting policies (continued)
Subsidiaries are all those entities over which the consolidated entity has control. The consolidated entity controls an entity when the consolidated entity is exposed to, or has rights to, variable returns from its involvement with the entity and has the ability to affect those returns through its power to direct the activities of the entity. Subsidiaries are fully consolidated from the date on which control is transferred to the consolidated entity. They are de-consolidated from the date that control ceases.
Intercompany transactions, balances and unrealised gains on transactions between entities in the consolidated entity are eliminated. Unrealised losses are also eliminated unless the transaction provides evidence of the impairment of the asset transferred. Accounting policies of subsidiaries have been changed where necessary to ensure consistency with the policies adopted by the consolidated entity.
The acquisition of subsidiaries is accounted for using the acquisition method of accounting. A change in ownership interest, without the loss of control, is accounted for as an equity transaction, where the difference between the consideration transferred and the book value of the share of the non-controlling interest acquired is recognised directly in equity attributable to the parent.
Where the consolidated entity loses control over a subsidiary, it derecognises the assets including goodwill, liabilities and non-controlling interest in the subsidiary together with any cumulative translation differences recognised in equity. The consolidated entity recognises the fair value of the consideration received and the fair value of any investment retained together with any gain or loss in profit or loss.
Going concern
The financial report has been prepared on a going concern basis, which takes into account the loss after income tax of $6,881,027 (2019: $1,343,429) and negative operating cash flows of $464,142 for the year ended 31 December 2020 (2019: $3,790,254).
These conditions give rise to a material uncertainty that may cast significant doubt about the group’s ability to continue as a going concern.
During the year ended 31 December 2020, the Group improved its net asset position by settling legacy creditors by a way of share issues. The Group also raised additional capital through a share purchase plan from existing professional and sophisticated investors and zero coupon convertible amortising securities (“ZCSs”) (Refer to note 14). As at the date of this report the directors have assessed that the Group continues to comply with the covenants set under its financing arrangements with its debtor factoring facility and those set by Alto Capital.
Notwithstanding the above the Directors consider the going concern basis to be appropriate giving consideration to:
| ● | Confidence in raising capital as needed; |
| ● | Confidence in achieving the group’s forecast revenues and positive operating cash flow in 2021 through continued completion of planned integrations onto the group’s programmatic advertising platform; |
| ● | The ability of the Group to settle ZCS note and outstanding creditors via share issue, instead of cash payments; |
| ● | Repayment of some or all of secured related party loan receivables; |
| ● | The Group’s ability, if required, to seek the support from its founders and major shareholders for the further injection of capital; and |
| ● | Its ability to exercise control over discretionary operational cash outflows. |
Accordingly, the financial statements have been prepared on a going concern basis.
Should the Group be unable to continue as a going concern, it may be required to realise its assets and extinguish its liabilities other than in ordinary course of business, and at amounts that differ from those stated in the Financial Statements. The financial statements do not include any adjustments related to the recoverability and classification of recorded assets amounts or to the amounts and classification of liabilities that might be necessarily incurred should the consolidated entity not continue as a going concern.
| engage:BDR Limited |
| Notes to the financial statements |
| 31 December 2020 |
Note 2. Significant accounting policies (continued)
Foreign currency translation
The functional currency of each of the entities in the Group is the currency of the primary economic environment in which each of the entities operate, which is US Dollars (‘USD’) for engage:BDR LLC and AdCel LLC. The financial report is presented in Australian Dollars (‘AUD’) which is the functional currency of the Parent, engage:BDR Limited and presentation currency of the Group.
Foreign currency transactions and balances
Transactions in foreign currencies are initially recorded by the Group’s entities at their respective functional currency spot rates at the date the transaction first qualifies for recognition.
Monetary assets and liabilities denominated in foreign currencies are translated at the functional currency spot rates of exchange at the reporting date.
Differences arising on settlement or translation of monetary items are recognised in profit or loss with the exception of monetary items that are designated as part of the hedge of the Group’s net investment of a foreign operation. These are recognised in OCI until the net investment is disposed of, at which time, the cumulative amount is reclassified to profit or loss. Tax charges and credits attributable to exchange differences on those monetary items are also recorded in OCI.
Non-monetary items that are measured in terms of historical cost in a foreign currency are translated using the exchange rates at the dates of the initial transaction. Non-monetary items measured at fair value in a foreign currency are translated using the exchange rates at the date when the fair value is determined. The gain or loss arising on translation of non-monetary items measured at fair value is treated in line with the recognition of the gain or loss on the change in fair value of the item (i.e., translation differences on items whose fair value gain or loss is recognised in OCI or profit or loss are also recognised in OCI or profit or loss, respectively).
Translation
The assets and liabilities of subsidiaries with a functional currency other than AUD (being the presentation currency of the Group) are translated into AUD at the exchange rate at the reporting date and the statement of comprehensive income is translated at the average exchange rate for the period. On consolidation, exchange differences arising from the translation of these subsidiaries are recognised in other comprehensive income and accumulated in the foreign currency translation reserve. On disposal of a foreign operation, the component of other comprehensive income relating to that particular foreign operation is recognised in the statement of profit or loss.
New Accounting Standards and Interpretations not yet mandatory or early adopted
Australian Accounting Standards and Interpretations that have recently been issued or amended but are not yet mandatory, have not been early adopted by the Group for the registration statementing period ended 31 December 2020. The Group has not yet assessed the impact of these new or amended Accounting Standards and Interpretations.
Note 3. Critical accounting judgements, estimates and assumptions
The preparation of the financial statements requires management to make judgements, estimates and assumptions that affect the reported amounts in the financial statements. Management continually evaluates its judgements and estimates in relation to assets, liabilities, contingent liabilities, revenue and expenses. Management bases its judgements, estimates and assumptions on historical experience and on other various factors, including expectations of future events, management believes to be reasonable under the circumstances. The resulting accounting judgements and estimates will seldom equal the related actual results. The judgements, estimates and assumptions that have a significant risk of causing a material adjustment to the carrying amounts of assets and liabilities (refer to the respective notes) within the next financial year are discussed below.
Share-based payment transactions
The Group measures the cost of equity-settled transactions with employees by reference to the fair value of the equity instruments at the date at which they are granted. The fair value is determined by using either the Binomial or Black-Scholes model taking into account the terms and conditions upon which the instruments were granted. The accounting estimates and assumptions relating to equity-settled share-based payments would have no impact on the carrying amounts of assets and liabilities within the next registration statementing period but may impact profit or loss and equity.
| engage:BDR Limited |
| Notes to the financial statements |
| 31 December 2020 |
Note 3. Critical accounting judgements, estimates and assumptions (continued)
Capitalisation of software costs
Distinguishing the research and development phases of software projects and determining whether the recognition requirements for the capitalisation of development costs are met, requires judgement. Expenditure during the research phase of a project is recognised as an expense when incurred. Development costs are capitalised only when technical feasibility studies identify that the project is expected to deliver future economic benefits and these benefits can be measured reliably. Determining the feasibility of the project and the likelihood of the project delivering future economic benefits, which can be measured reliably, is a significant management estimate and judgement.
Capitalised development costs have a finite useful life and are amortised on a systematic basis based on the future economic benefits over the useful life of the project, typically between 3 and 10 years, and are considered for impairment, based on the presence of indicators, at each reporting date.
After capitalisation, the Group assesses, on an annual basis, whether there is an indication that capitalised costs may be impaired. If any indication exists, the Group estimates the asset’s recoverable amount, which is the higher of the asset’s or cash generating unit (‘CGU’)’s fair value less cost of disposal and its value in use. The Group assesses that each capitalised intangible asset, representing each software project, does not generate cash inflows that are largely independent of those from other assets so has determined the recoverable amount at CGU level. The CGU to which the intangible assets are allocated has been identified as the Group as a whole.
Allowance for expected credit losses
The allowance for expected credit losses assessment requires a degree of estimation and judgement. It is based on the lifetime expected credit loss, grouped based on days overdue, and makes assumptions to allocate an overall expected credit loss rate for each group. These assumptions include recent sales experience and historical collection rates. The recoverability of related party loans are also assessed. The balances are being paid down in accordance with the terms and conditions. The loans are secured against each individuals’ shareholding.
Goodwill
The Group tests annually, or more frequently if events or changes in circumstances indicate impairment, whether goodwill has suffered any impairment, in accordance with the accounting policy stated in note 12. The test will be on a multiple of income approach and market cap approach. The recoverable amounts of cash-generating units have been determined based on fair value less costs approach, by comparing of the market capitalisation of the Group to its net assets, adjusted for control premium.
Impairment of non-financial assets other than goodwill and other indefinite life intangible assets
The Group assesses impairment of non-financial assets other than goodwill and other indefinite life intangible assets at each reporting date by evaluating conditions specific to the Group and to the particular asset that may lead to impairment. If an impairment trigger exists, the recoverable amount of the asset is determined. This involves fair value less costs of disposal or value-in-use calculations, which incorporate a number of key estimates and assumptions.
Recovery of deferred tax assets
Deferred tax assets are recognised for deductible temporary differences only if the Group considers it is probable that future taxable amounts will be available to utilise those temporary differences and losses. The directors have determined that the losses to date do not validate the requirement to book any DTA for carry forward losses and will consider the recognition of DTAs in future periods.
Valuation of embedded derivatives on convertible notes
The Group entered into an agreement with Alto Opportunity Master Fund SPC - Segregated Master Portfolio B (“Alto”) for the issue of zero coupon convertible amortising securities (“ZCSs”). The fair value of the embedded derivative was determined in line with AASB 132 and AASB 9. The future share price of the Group was projected using a Geometric Brownian Motion model for each possible trading day of the amortisation period, with the volatility of each step representing the daily volatility of the Group’s share price over the last year from the valuation date.
A Monte Carlo simulation of 40,000 simulations was conducted for the Geometric Brownian Motion model to obtain theoretical share prices for each amortisation period. This was used to determine the Conversion Discount between the closing share price and the conversion price. The average Conversion Discount represents the fair value of the embedded derivative.
| engage:BDR Limited |
| Notes to the financial statements |
| 31 December 2020 |
Note 4. Operating segments
The Group has assessed that its operations comprise of one reportable segment, being programmatic and collaborative marketing trading.
Geographic information
| | | Consolidated | |
| | | 2020 | | | 2019 | |
| | | $ | | | $ | |
| | | | | | | |
| Australia | | | - | | | | 438 | |
| United State of America | | | 13,844,107 | | | | 15,994,144 | |
| Other* | | | 1,554,306 | | | | 1,084,536 | |
| | | | | | | | | |
| Total revenue from contract with customers | | | 15,398,413 | | | | 17,079,118 | |
| * | No other single country represents greater than 10% of the Group’s total revenue. |
Major customers
Below is a summary of revenues from major customers where the transactions with each individual customer exceed 10% or more of the Group’s total revenue.
| | | Consolidated | |
| | | 2020 | | | 2019 | |
| | | $ | | | $ | |
| | | | | | | |
| Customer and segment | | | | | | | | |
| Customer A - Programmatic [1] | | | 10,705,921 | | | | 14,349,414 | |
| [1] | This party is actually a clearing house/platform which processes the Group’s transactions with thousands of underlying end customers of the Group’s services. It is not, in substance, an end user nor service provision-related customer of the Group and the Group is not dependent upon this party for generation the Group’s revenues. |
Accounting policy for operating segments
Operating segments are reported in a manner consistent with internal reporting provided to the chief operating decision makers, who provide the strategic direction and management oversight of the Group in terms of monitoring results and approving strategic planning for the business.
Note 5. Revenue from contracts with customers and Other income
(a) Revenue from contracts with customers
| | | Consolidated | |
| | | 2020 | | | 2019 | |
| | | | | | | |
| Revenue from contracts with customers - Rendering of services | | | 15,398,413 | | | | 17,079,118 | |
| engage:BDR Limited |
| Notes to the financial statements |
| 31 December 2020 |
Note 5. Revenue from contracts with customers (continued)
Disaggregation of revenue
The disaggregation of revenue from contracts with customers is as follows:
| | | Consolidated | |
| | | 2020 | | | 2019 | |
| | | $ | | | $ | |
| | | | | | | |
| Programmatic | | | 15,307,615 | | | | 16,429,753 | |
| Collaborative Marketing | | | 90,798 | | | | 649,365 | |
| | | | | | | | | |
| | | | 15,398,413 | | | | 17,079,118 | |
| | | | | | | | | |
| Geographical regions | | | | | | | | |
| Australia | | | - | | | | 438 | |
| United States of America | | | 13,844,107 | | | | 15,994,144 | |
| Other* | | | 1,554,306 | | | | 1,084,536 | |
| | | | | | | | | |
| | | | 15,398,413 | | | | 17,079,118 | |
| | | | | | | | | |
| Timing of revenue recognition | | | | | | | | |
| Services rendered at a point in time | | | 15,398,413 | | | | 17,079,118 | |
* No other single country represents greater than 10% of the Group’s total revenue.
Accounting policy for revenue from contracts with customers
Revenue is measured at the fair value of the consideration received or receivable. Amounts disclosed as revenue are net of any allowances, duties and taxes paid.
Rendering of services
The Group is an internet-based marketplace platform and associated technology solution provider. The Group’s proprietary technology is used to facilitate the sale of advertising inventory from digital publishers (websites and apps) to advertisers and their agents (brands, agencies and advertising platforms). The Group allows digital publishers to monetise their available advertising space by making the inventory available to multiple advertisers, as well as providing various technologies designed to help publishers create incremental streams of revenue. An example of this technology would be the Group’s OutStream advertising unit, which allows publishers to sell space for video advertising on webpages that do not have video content.
Revenue is recognised at an amount that reflects the consideration to which the Group is expected to be entitled in exchange for transferring goods or services to a customer. For each contract with a customer, the Group:
| ● | Identifies the contract with a customer |
| ● | Identifies the performance obligations in the contract |
| ● | Determines the transaction price |
| ● | Allocates the transaction price to the separate performance obligations |
| ● | Recognises revenue when the performance obligation is satisfied in a manner that depicts the transfer to the customer of the services provided. |
All contracts with customers are standardised and satisfy the criteria of transaction approval, identification of each party’s rights, payment terms, commercial substance, and probable collection based on the customer’s ability and intention to pay. There are no material contracts with customers where there are multiple goods or services promised in which they are distinct and separable in both context and considering other readily available resources. The Group does not offer variable pricing, no significant financing portion, no non-cash consideration, no return rights, and no material lag between collection of monies and delivery of service. The Group does not offer bundled pricing on services provided separately where delivery and settlement is not consistent. The Group does not offer customized goods, receive refundable upfront fees, nor have arrangements where performance obligations are settled over an extended period of time rather than a point in time
In recording revenue, the Group evaluates whether they are the principal (i.e., report revenues on a gross basis) or agent (i.e., report revenues on a net basis). The Group provides advertisers and their agents to purchase and place advertising inventory on publishers’ sites. The Group’s performance obligation is facilitating the sale of advertising space and ensuring its placement on the website. The proprietary technology developed and used by the Group counts all bid attempts, tracks the winning bids, and ensures the delivery of the advertisement. All of these data points are used to ensure proper satisfaction of performance obligations. The Group reports the sales of advertising revenues for advertising inventory on a gross basis, that is, the amounts they expect to be entitled to. Amounts paid to suppliers are recorded as cost of sales. Where we are the principal, the Group controls the advertising inventory before it is transferred to its customers. Control is evidenced by the Group’s sole ability to monetise the advertising inventory before it is transferred to its customers, and is further supported by the Group being primarily responsible to its customers and having a level of discretion in establishing pricing.
| engage:BDR Limited |
| Notes to the financial statements |
| 31 December 2020 |
Note 5. Revenue from contracts with customers (continued)
In recording revenue, the Group evaluates whether they are the principal (i.e., report revenues on a gross basis) or agent (i.e., report revenues on a net basis). The Group provides advertisers and their agents to purchase and place advertising inventory on publishers’ sites. The Group’s performance obligation is facilitating the sale of advertising space and ensuring its placement on the website. The proprietary technology developed and used by the Group counts all bid attempts, tracks the winning bids, and ensures the delivery of the advertisement. All of these data points are used to ensure proper satisfaction of performance obligations. The Group reports the sales of advertising revenues for advertising inventory on a gross basis, that is, the amounts they expect to be entitled to. Amounts paid to suppliers are recorded as cost of sales. Where we are the principal, the Group controls the advertising inventory before it is transferred to its customers. Control is evidenced by the Group’s sole ability to monetise the advertising inventory before it is transferred to its customers, and is further supported by the Group being primarily responsible to its customers and having a level of discretion in establishing pricing.
The Group recognises contract liabilities for consideration received in advance of services provided. Where a customer prepays any portion of a contract, the Group records such prepayments as trade and other payables in the statement of financial position. Prepayments are paid for approximately one month of contract cost in advance, with specific insertion orders allocated to a prepaid amount. These sums will not be recognised as revenue until all obligations pursuant to that insertion order contract have been fulfilled by the Group and approved by the counterparty. The amounts received upfront are not refundable. Revenue for prepayments is recognised only after all performance obligations related to the contract with customers is satisfied.
(b) Other income
Other income comprises the following:
| | | Consolidated | |
| | | 2020 | | | 2019 | |
| | | $ | | | $ | |
| | | | | | | |
| Government grant income | | | 631,182 | | | | - | |
| Other | | | 109,683 | | | | 89,441 | |
| | | | | | | | | |
| | | | 740,865 | | | | 89,441 | |
The Government grant income included in Other income was in respect of a loan forgiven by the government to provide support for payroll expenditure during the COVID-19 pandemic. The loan was to be forgiven when certain expenditure levels had been reached for payroll and other operating expenditure. There was no additional government grants or assistance from which the entity benefitted during the period, and there are no further conditions attached to the grant.
Accounting policy for government grants income
A forgivable loan from government is treated as a government grant when there is reasonable assurance that the entity will meet the terms of forgiveness for the loan. The grant is recognised as income on a systematic and rational basis over the periods necessary to match them with the related costs.
Note 6. Employee and contractor costs
| | | Consolidated | |
| | | 2020 | | | 2019 | |
| | | $ | | | $ | |
| | | | | | | |
| Salary costs | | | 2,480,347 | | | | 2,747,590 | |
| Defined contribution plan (401(k)) | | | 3,037 | | | | 2,336 | |
| Other payroll-related expenses | | | 346,023 | | | | (65,318 | ) |
| | | | | | | | | |
| Total employee and contractor costs | | | 2,829,407 | | | | 2,684,608 | |
| engage:BDR Limited |
| Notes to the financial statements |
| 31 December 2020 |
Note 6. Employee and contractor costs (continued)
Accounting policy for employee benefits
Wages and salaries, vested sick leave and short-term employee benefits are current liabilities included in employee benefits, measured at the undiscounted amount that the Group expects to pay as a result of the unused entitlement.
Wages, salaries, annual and long service leave
Provision is made for the Group’s liability for employee benefits arising from services rendered by employees to the end of the reporting period. Employee benefits that are expected to be settled within one year have been measured at the amounts expected to be paid when the liability is settled.
Changes in the measurement of the liability are recognised in profit or loss in the Statement of Comprehensive Income. Employee benefits are presented as current liabilities in the Statement of Financial Position if the Group does not have an unconditional right to defer settlement of the liability for at least 12 months after the reporting date.
Defined contribution schemes
The Group has a defined contribution savings plan as defined in subsection 401(k) of the United States Internal Revenue Code. This plan covers substantially all employees who meet minimum age and service requirements and allows participants to defer a portion of their annual compensation. Group contributions to the plan may be made at the discretion of the Board of Directors.
Note 7. Operations and administration expense
| | | Consolidated | |
| | | 2020 | | | 2019 | |
| | | $ | | | $ | |
| | | | | | | |
| Technology infrastructure and software costs | | | 1,811,486 | | | | 1,464,075 | |
| Legal and accounting expense | | | 1,467,910 | | | | 1,201,274 | |
| Technical and corporate development expense | | | 654,434 | | | | 593,797 | |
| Bad debt expense | | | 320,735 | | | | 296,404 | |
| Travel expenses | | | 238,698 | | | | 396,086 | |
| Office maintenance and associated expenses | | | 236,885 | | | | 339,433 | |
| Municipal and other taxes | | | - | | | | 65,067 | |
| Insurance expense | | | 313,441 | | | | 487,208 | |
| Other operations and administration expenses | | | 103,465 | | | | 131,637 | |
| | | | | | | | | |
| | | | 5,147,054 | | | | 4,974,981 | |
Note 8. Current assets - cash and cash equivalents
| | | Consolidated | |
| | | 2020 | | | 2019 | |
| | | $ | | | $ | |
| | | | | | | |
| Cash at bank | | | 2,986,745 | | | | 1,831,673 | |
Accounting policy for cash and cash equivalents
Cash and cash equivalents includes cash on hand, deposits held at call with financial institutions, other short-term, highly liquid investments with original maturities of three months or less that are readily convertible to known amounts of cash and which are subject to an insignificant risk of changes in value.
| engage:BDR Limited |
| Notes to the financial statements |
| 31 December 2020 |
Note 9. Current assets - trade and other receivables
| | | Consolidated | |
| | | 2020 | | | 2019 | |
| | | $ | | | $ | |
| | | | | | | |
| Trade receivables [1] | | | 3,897,416 | | | | 6,230,040 | |
| Less: Allowance for expected credit losses | | | (709,434 | ) | | | (459,615 | ) |
| | | | 3,187,982 | | | | 5,770,425 | |
| | | | | | | | | |
| Other receivables | | | 55,539 | | | | 16,106 | |
| | | | | | | | | |
| | | | 3,243,521 | | | | 5,786,531 | |
[1] In the prior period, the Group entered into an arrangement with a third party to provide an asset backed credit line against trade receivables which are up to 180 days old (refer note 14). Under this arrangement, advances are recorded against certain receivables balances which are factored under the facility. All amounts invoiced are in US Dollars. In accordance with AASB 9 Financial Instruments: Recognition and Measurement, an evaluation is performed to establish whether, substantially, all the risks and rewards have been transferred to the factoring provider. Where the Group concludes this is not the case, the portion of the financial assets corresponding to the Group’s continuous involvement continues to be recognised. When all the risk and rewards are not considered to be transferred, the amount is kept on the balance sheet. Based upon management’s assessment, the Group believes that it has retained risk and rewards, and therefore has not derecognized any financial assets.
Transfer of trade receivables
The Group has retained the credit risk associated with the trade receivables, due to the obligation to repurchase from the factoring company any receivables that are deemed uncollectible, and therefore the risks and rewards of the asset reside with the Group. The total carrying amount (which is approximate to fair value) of the trade receivables transferred subject to factoring arrangement is $1,904,104 (December 2019: $4,213,186). This arrangement has no expiration date with an interest rate of 8.00%.
Allowance for expected credit losses
The ageing of the receivables and allowance for expected credit losses provided for above are as follows:
| | | Expected credit loss rate | | | Carrying amount | | | Allowance for expected credit losses | |
| Consolidated | | 2020 | | | 2019 | | | 2020 | | | 2019 | | | 2020 | | | 2019 | |
| | | % | | | % | | | $ | | | $ | | | $ | | | $ | |
| | | | | | | | | | | | | | | | | | | |
| Not overdue | | | 1 | % | | | 1 | % | | | 1,918,797 | | | | 4,018,586 | | | | 19,696 | | | | 40,186 | |
| 0 to 30 days | | | 5 | % | | | 5 | % | | | 955,803 | | | | 1,690,047 | | | | 48,325 | | | | 84,502 | |
| 31 to 60 days | | | 16 | % | | | 15 | % | | | 138,922 | | | | 10,231 | | | | 22,302 | | | | 1,535 | |
| 61 to 90 days | | | 35 | % | | | 30 | % | | | 39,605 | | | | 34,433 | | | | 14,047 | | | | 10,330 | |
| Over 91 days | | | 72 | % | | | 68 | % | | | 844,289 | | | | 476,743 | | | | 605,064 | | | | 323,062 | |
| | | | | | | | | | | | | | | | | | | | | | | | | |
| | | | | | | | | | | | 3,897,416 | | | | 6,230,040 | | | | 709,434 | | | | 459,615 | |
The average age of the Group’s trade receivables is 133 days (2019: 133 days).
In determining the recoverability of a trade receivable, the Group considers any recent history of payments and the status of the projects to which the debt relates. No payment terms have been renegotiated. The concentration of credit risk is limited due to the customer base being large and unrelated. Accordingly, the Directors believe that there is no further provision required in excess of the provision for doubtful debts.
| engage:BDR Limited |
| Notes to the financial statements |
| 31 December 2020 |
Note 9. Current assets - trade and other receivables (continued)
Movements in the allowance for expected credit losses are as follows:
| | | Consolidated | |
| | | 2020 | | | 2019 | |
| | | $ | | | $ | |
| | | | | | | |
| Opening balance | | | (459,615 | ) | | | (489,173 | ) |
| Impairment recognised during the year | | | (289,947 | ) | | | (321,205 | ) |
| Amounts written off as uncollectible | | | - | | | | 364,392 | |
| Exchange difference | | | 40,128 | | | | (13,629 | ) |
| | | | | | | | | |
| Closing balance | | | (709,434 | ) | | | (459,615 | ) |
Fair value of receivables
Fair value of receivables at period end is considered to be the same as receivables net of the allowance for impairment.
Accounting policy for trade and other receivables
Trade receivables are initially recognised at fair value and subsequently measured at amortised cost using the effective interest method, less any allowance for expected credit losses. Trade receivables are generally due for settlement within 30 days.
The Group has applied the simplified approach to measuring expected credit losses, which uses a lifetime expected loss allowance. To measure the expected credit losses, trade receivables have been grouped based on days overdue.
Other receivables are recognised at amortised cost, less any allowance for expected credit losses.
Note 10. Current assets - other assets
| | | Consolidated | |
| | | 2020 | | | 2019 | |
| | | $ | | | $ | |
| | | | | | | |
| Security deposits | | | 32,459 | | | | 35,564 | |
| Shares held in trust* | | | 300,000 | | | | 1,348,052 | |
| | | | | | | | | |
| | | | 332,459 | | | | 1,383,616 | |
*Shares held in trust refers to fully paid ordinary shares issued to a third party which is to be used for settlement of creditor obligations of the Group. The fair value of shares held in trust is determined with reference to the number of outstanding shares multiplied by the spot price at report date. During the period, management recognised an impairment charge of $856,342 to reflect the fair value of the outstanding shares at 31 December 2020.
Note 11. Non-current assets - capitalised software costs
| | | Consolidated | |
| | | 2020 | | | 2019 | |
| | | $ | | | $ | |
| | | | | | | |
| Capitalised software costs | | | 8,540,044 | | | | 7,628,752 | |
| Less: Accumulated amortisation | | | (4,619,486 | ) | | | (4,596,669 | ) |
| | | | | | | | | |
| | | | 3,920,558 | | | | 3,032,083 | |
| engage:BDR Limited |
| Notes to the financial statements |
| 31 December 2020 |
Note 11. Non-current assets - capitalised software costs (continued)
Reconciliations
Reconciliations of the written down values at the beginning and end of the current and previous financial year are set out below:
| | | Capitalised software costs | | | Total | |
| Consolidated | | $ | | | $ | |
| | | | | | | |
| Balance at 1 January 2019 | | | 2,519,265 | | | | 2,519,265 | |
| Additions | | | 1,461,157 | | | | 1,461,157 | |
| Exchange differences | | | 4,124 | | | | 4,124 | |
| Amortisation expense | | | (952,463 | ) | | | (952,463 | ) |
| | | | | | | | | |
| Balance at 31 December 2019 | | | 3,032,083 | | | | 3,032,083 | |
| Additions | | | 1,577,376 | | | | 1,577,376 | |
| Exchange differences | | | (264,738 | ) | | | (264,738 | ) |
| Amortisation expense | | | (424,163 | ) | | | (424,163 | ) |
| | | | | | | | | |
| Balance at 31 December 2020 | | | 3,920,558 | | | | 3,920,558 | |
Software costs are capitalised only when technical feasibility studies identify that the project is expected to deliver future economic benefit and these benefits can be measured reliably. The development costs have finite useful lives typically between 3 and 10 years, with a weighted average of 3 years (2019: 3 years). Impairment of capitalised software costs is considered at each reporting period.
The review of the business did not identify any impairment of any intangible assets following consideration of indicators of impairment under AASB 136. As at the year ended 31 December 2020, the remaining intangible assets were determined to be deriving positive cash flows related to the identifiable intangible assets and will continue to be amortised in accordance with the Group accounting policy.
Accounting policy for capitalised software costs
Research costs are expensed as incurred. An intangible asset arising from development expenditure on an internal project is recognised only when the Group can demonstrate the technical feasibility of completing the intangible asset so that it will be available for use or sale, its intention to complete and its ability to use or sell the asset, how the asset will generate future economic benefits, the availability of resources to complete the development and the ability to measure reliably the expenditure attributable to the intangible asset during its development.
Capitalised software costs are amortised on a straight-line basis over the period of their expected benefit, being their finite life of 3- 10 years.
Note 12. Non-current assets – goodwill
| | | Consolidated | |
| | | 2020 | | | 2019 | |
| | | $ | | | $ | |
| | | | | | | |
| Goodwill | | | 1,340,390 | | | | 1,468,517 | |
| engage:BDR Limited |
| Notes to the financial statements |
| 31 December 2020 |
Note 12. Non-current assets - goodwill (continued)
In assessing for impairment, the Directors considered goodwill in the context of the Group having one cash-generating unit, being Ad media. On that basis, they have assessed impairment applying the fair value less costs to sell method, using a revenue multiples approach, coupled with a market capitalisation approach. In making this assessment, the Directors note the following:
On a revenue multiples approach, the Directors sought to determine the enterprise value of the Group, utilising revenue multiples provided by an independent expert.
A revenue multiple of 2.1x as determined by the independent expert was applied to the Group’s revenue to derive an enterprise valuation of $37,110,175. This was then compared to the goodwill balance of the group of $1,340,390
Using a market capitalisation approach, the following was noted:
| ● | Market capitalisation of the group as at 31 December 2020 was $14,224,467. |
| ● | 20% control premium was factored into the analysis, then compared with net assets of $8,666,667. |
It was concluded that the fair value less cost to sell was greater than the net assets in the cash generating unit, thus no impairment was recognised for the year ending 31 December 2020. No reasonable or likely change in any of the assumptions applied in examining the recoverable value of the Group as at report date would result in any impairment.
Accounting policy for goodwill
Goodwill arises on the acquisition of a business. Goodwill is not amortised. Instead, goodwill is tested annually for impairment, or more frequently if events or changes in circumstances indicate that it might be impaired, and is carried at cost less accumulated impairment losses. Impairment losses on goodwill are taken to profit or loss and are not subsequently reversed.
Note 13. Current liabilities - trade and other payables
| | | Consolidated | |
| | | 2020 | | | 2019 | |
| | | $ | | | $ | |
| | | | | | | |
| Trade payables | | | 2,969,577 | | | | 4,949,747 | |
| Credit card liabilities | | | 2,906 | | | | 13,852 | |
| Accrued expenses | | | 371,532 | | | | 705,517 | |
| Accrued payroll liabilities | | | - | | | | 19,527 | |
| Bonus and commissions payable | | | 221,468 | | | | 112,255 | |
| Accrued municipal tax | | | 85,104 | | | | 95,540 | |
| | | | | | | | | |
| | | | 3,650,587 | | | | 5,896,438 | |
Refer to note 16 for further information on financial instruments.
Accounting policy for trade and other payables
Trade accounts payable and other creditors represent liabilities for goods and services provided to the Group prior to the end of the financial year and which are unpaid. The amounts are unsecured and are measured subsequently at amortised cost using the EIR method. Payment terms vary by creditor but are typically 60 days.
| engage:BDR Limited |
| Notes to the financial statements |
| 31 December 2020 |
Note 14. Current liabilities - borrowings
| | | Consolidated | |
| | | 2020 | | | 2019 | |
| | | $ | | | $ | |
| | | | | | | |
| Debtor factoring borrowings | | | 1,904,104 | | | | 4,213,186 | |
| Convertible notes payable | | | 214,050 | | | | 1,516,403 | |
| Embedded derivative on convertible notes | | | 47,303 | | | | 857,808 | |
| Other borrowings | | | 151,439 | | | | 203,861 | |
| | | | | | | | | |
| | | | 2,316,896 | | | | 6,791,258 | |
Refer to note 16 for further information on financial instruments.
On 23 September 2019, the Company entered into an agreement with Alto Opportunity Master Fund SPC – Segregated Master Portfolio B (“the Investor”) for the issue of zero coupon convertible amortising securities (“ZCSs”), under an initial drawdown and up to 7 further drawdowns.
On 25 September 2019 the Company undertook the initial drawdown of a ZCS with a face value of US$2,060,000 (approximately A$3,038,000 000 at the exchange rate at drawdown date) and an issue price of US$1,750,000 (approximately A$2,580,000 at the exchange rate at drawdown date). The ZCS has a maturity of one year after drawdown.
On 25 September 2019, the Company issued 28.5 million new collateral shares to Alto as security for the ZCS. As at 31 December 2020, this initial drawdown has been repaid in full by the Company, via a cash payment of US$50,000 (A$70,343) and also via the exercise of 225,461,241 collateral shares with a total value of US$1,632,334 (A$2,445,965), based on a share allocation price equal to 85% of the average of the 2 lowest daily VWAPs for the preceding 20 trading days
During the year, the Company undertook a further drawdown of ZCS with a face value of US$450,000, at an issue price of US$382,500. The ZCS is secured with a maturity of 31 May 2021. Repayments totalling $302,500 have been made during the period, via cash payments of US$262,500 (A$367,748) and also via the exercise of 13,738,151 shares with a total value of US$40,000 (A$54,953), based on the share allocation price described above.
Accounting policy for borrowings
Loans and borrowings are initially recognised at the fair value of the consideration received, net of transaction costs. They are subsequently measured at amortised cost using the effective interest method.
Accounting policy for convertible notes
During the period the Group issued convertible notes with conversion clauses that were variable. At initial recognition an embedded derivative is recognised on the statement of financial position at fair value and that embedded derivative is subsequently recorded at its fair value thereafter, with changes in fair value going through to the statement of profit or loss and other comprehensive income. The difference between the consideration received (net of costs) and the embedded derivative is reflected in the principal value of the convertible note liability. The underlying debt principal is amortised back to its face value at maturity, net of transaction costs, using the effective interest rate method.
Note 15. Equity - issued capital
| | | Consolidated | |
| | | 2020 | | | 2019 | | | 2020 | | | 2019 | |
| | | Shares | | | Shares | | | $ | | | $ | |
| | | | | | | | | | | | | |
| Ordinary shares - fully paid | | | 2,370,744,548 | | | | 712,394,973 | | | | 47,790,463 | | | | 35,582,304 | |
| engage:BDR Limited |
| Notes to the financial statements |
| 31 December 2020 |
Note 15. Equity - issued capital (continued)
Movements in ordinary share capital
| Details | | | | | No. of Shares | | | $ | |
| | | | | | | | | | |
| Balance | | 1 January 2019 | | | | 288,604,744 | | | | 20,025,656 | |
| Share issued for purchase plan | | | | | | 25,099,423 | | | | 702,784 | |
| Shares issued as collateral for loan note | | | | | | 30,400,000 | | | | - | |
| Shares issued to convertible note holders | | | | | | 120,825,721 | | | | 2,825,962 | |
| Shares issued for consulting fees | | | | | | 2,589,300 | | | | 74,054 | |
| Shares issued for outstanding creditors | | | | | | 225,233,705 | | | | 6,922,317 | |
| Shares issued for AdCel acquisition | | | | | | 10,657,140 | | | | 1,055,057 | |
| Shares issued for settlement of employee bonuses | | | | | | 8,984,940 | | | | 234,135 | |
| Collateral shares exercised | | | | | | - | | | | 528,227 | |
| Transfer from share based payment reserve | | | | | | - | | | | 3,222,334 | |
| Cost of capital raising | | | | | | - | | | | (8,222 | ) |
| | | | | | | | | | | | |
| Balance | | 31 December 2019 | | | | 712,394,973 | | | | 35,582,304 | |
| Shares issued under placement | | | | | | 724,810,163 | | | | 4,515,514 | |
| Shares issued under Share Purchase Plan | | | | | | 216,299,959 | | | | 1,189,650 | |
| Shares issued as collateral for loan note | | | | | | 449,151,484 | | | | - | |
| Collateral shares exercised - ZCS | | | | | | - | | | | 3,729,174 | |
| Shares issued for outstanding creditors | | | | | | 186,087,969 | | | | 1,896,356 | |
| Shares issued on exercise of performance rights | | | | | | 82,000,000 | | | | 1,312,000 | |
| Costs of capital | | | | | | - | | | | (434,535 | ) |
| | | | | | | | | | | | |
| Balance | | 31 December 2020 | | | | 2,370,744,548 | | | | 47,790,463 | |
Ordinary shares
Ordinary shares entitle the holder to participate in dividends and the proceeds on the winding up of the company in proportion to the number of and amounts paid on the shares held. The fully paid ordinary shares have no par value and the company does not have a limited amount of authorised capital.
On a show of hands every member present at a meeting in person or by proxy shall have one vote and upon a poll each share shall have one vote.
Share buy-back
There is no current on-market share buy-back.
Accounting policy for issued capital
Ordinary shares are classified as equity.
Incremental costs directly attributable to the issue of new shares or options are shown in equity as a deduction, net of tax, from the proceeds.
Note 16. Financial instruments
Financial risk management objectives
This note explains the Group’s financial risk management and how the exposure to these risks affects the Group’s future financial performance.
The Group’s risk management is carried out by the senior management through delegation from the Board of Directors. Risk management programmes and practices are employed to mitigate the potential adverse effects of these exposures on the results of the Group.
| engage:BDR Limited |
| Notes to the financial statements |
| 31 December 2020 |
Note 16. Financial instruments (continued)
The Group holds the following financial instruments:
| | | Consolidated | |
| | | 2020 | | | 2019 | |
| | | $ | | | $ | |
| | | | | | | |
| Financial assets | | | | | | | | |
| Cash and cash equivalents | | | 2,986,745 | | | | 1,831,673 | |
| Trade and other receivables | | | 3,243,521 | | | | 5,786,531 | |
| Related party receivables | | | 1,984,869 | | | | 2,311,518 | |
| Investments in equity instruments | | | 47,179 | | | | 51,692 | |
| Total | | | 8,262,314 | | | | 9,981,414 | |
| | | | | | | | | |
| Financial liabilities | | | | | | | | |
| Trade and other payables - current | | | 3,647,691 | | | | 5,882,586 | |
| Credit card liabilities | | | 2,906 | | | | 13,852 | |
| Current portion of lease liability | | | 157,854 | | | | 222,218 | |
| Non-current portion of lease liability | | | 87,345 | | | | 29,572 | |
| Borrowings - due to factor - current | | | 1,904,104 | | | | 4,213,186 | |
| Borrowings - current | | | 151,439 | | | | 203,861 | |
| Convertible notes payable | | | 214,050 | | | | 1,516,403 | |
| Embedded derivative on convertible notes | | | 47,303 | | | | 857,808 | |
| Total | | | 6,212,692 | | | | 12,939,486 | |
Market risk
Foreign currency risk
Foreign currency risk is the risk that the fair value or future cash flows of an exposure will fluctuate because of changes in foreign exchange rates. The Group’s exposure to changes in foreign exchange rates is due to the functional currency of the Group being USD and the presentation currency being AUD.
With the exception of financial assets worth A$152,521 and financial liabilities worth A$673,224 denominated in AUD, all other financial assets and liabilities of the Group were denominated in USD.
There is no material sensitivity to the profit and loss arising from changes in foreign exchange rates, given translation differences are accounted for in the foreign currency reserves.
Interest rate risk
Interest rate risk is the risk that the fair value or future cash flows of a financial instrument will fluctuate because of changes in market interest rates. Management has deemed that interest rate risk is not significant for the Group due to the majority of the Group’s financial assets and liabilities being fixed rate and due to the short maturities on all of the individual tranches comprising the debtor factoring facility, which at 31 December had a fixed interest rate of 8%, did not represent a material interest rate exposure.
Credit risk
Credit risk is a risk that a counterparty will default on its contractual obligations resulting in a financial loss to the Group.
The Group faces primary credit risk from potential default on receivables by payment from customers. The credit risk on financial assets of the Group which have been recognised in the Statement of Financial Position is the carrying amount net of any provision for doubtful debts.
The maximum exposure to credit risk by class of recognised financial assets at the end of the reporting period is equivalent to the carrying amount as presented in the Statement of Financial Position.
The credit risk from related parties is the same as external parties (refer note 20).
Generally, trade receivables are written off where there is no reasonable expectation of recovery. Indicators of this include the failure of a debtor to engage in a repayment plan, failure to communicate with the Group, and no meaningful negotiations as a result of legal action.
| engage:BDR Limited |
| Notes to the financial statements |
| 31 December 2020 |
Note 16. Financial instruments (continued)
Liquidity risk
Prudent liquidity risk management implies maintaining sufficient cash and ensuring that all term deposits can be converted to funds in accordance with forecast cash usage. Due to the dynamic nature of the underlying business, flexibility in funding is maintained by ensuring ready access to the cash reserves of the business.
The ongoing maintenance of the Group’s policy is characterized by ongoing cash flow forecast analysis and detailed budgeting processes which, is directed at providing a sound financial positioning for the Group’s operations and financial management activities. In addition, the Group monitors both the debt and equity markets for additional funding opportunities.
(i) Financial arrangements
The Group had the following borrowing facilities at the end of the reporting period.
| | | Drawn | | | Undrawn | | | Total | |
| 2020 | | $ | | | $ | | | $ | |
| | | | | | | | | | |
| Fixed rate | | | | | | | | | | | | |
| Debtor factoring borrowings (a) | | | 1,904,104 | | | | - | | | | 1,904,104 | |
| Convertible notes (b) | | | 271,814 | | | | 37,173,006 | | | | 37,444,820 | |
| | | | | | | | | | | | | |
| | | | 2,175,918 | | | | 37,173,006 | | | | 39,348,924 | |
| (a) | The Group has an arrangement with a third party to provide an asset backed credit line against trade receivables which are up to 180 days old. Under this arrangement, advances are recorded against certain receivables balances which are factored under the facility. All amounts invoiced are in US Dollars. This arrangement has no expiration date with an interest rate of 8.00%. |
| (b) | Convertible notes were issued on 13 March 2020. Face value of drawn portion is US$450,000 (AU$584,264). The face value of total undrawn is US$28,840,000 (AU$37,444,820). The convertible notes expire on 31 May 2021. |
| | | Drawn | | | Undrawn | | | Total | |
| 2019 | | $ | | | $ | | | $ | |
| | | | | | | | | | |
| Fixed rate | | | | | | | | | | | | |
| Debtor factoring borrowings (a) | | | 4,213,186 | | | | - | | | | 4,213,186 | |
| Convertible notes (b) | | | 2,497,859 | | | | 34,970,026 | | | | 37,467,885 | |
| | | | | | | | | | | | | |
| Total | | | 6,711,045 | | | | 34,970,026 | | | | 41,681,071 | |
| (a) | During the period, the Group entered into an arrangement with a third party to provide an asset backed credit line against trade receivables which are up to 180 days old. Under this arrangement, advances are recorded against certain receivables balances which are factored under the facility. All amounts invoiced are in US Dollars. This arrangement has no expiration date with an interest rate of 8.00%. |
| (b) | Convertible notes were issued on 19 September 2019. Face value of drawn portion is US$2,060,000 (AU$2,940,336). The face value of total undrawn is US$28,840,000 (AU$41,164,716). The convertible notes expire on 30 November 2020. |
| engage:BDR Limited |
| Notes to the financial statements |
| 31 December 2020 |
Note 16. Financial instruments (continued)
(ii) Maturities of financial liabilities
The following table summarises the maturity profile of the Group’s financial liabilities based on contractual undiscounted payments.
| | | Less than 6 months | | | Between 6 to 12 months | | | Between 1 and 2 years | | | Between 2 and 3 years | | | Remaining contractual maturities | |
| Consolidated - 2020 | | $ | | | $ | | | $ | | | $ | | | $ | |
| | | | | | | | | | | | | | | | |
| Trade and other payables | | | 3,647,691 | | | | - | | | | - | | | | - | | | | 3,647,691 | |
| Credit card liabilities | | | 2,906 | | | | - | | | | - | | | | - | | | | 2,906 | |
| Borrowings - Due to factor* | | | 1,904,104 | | | | - | | | | - | | | | - | | | | 1,904,104 | |
| Convertible notes payable** | | | 214,050 | | | | - | | | | - | | | | - | | | | 214,050 | |
| Borrowings (principal) - Promissory notes | | | 15,893 | | | | - | | | | - | | | | - | | | | 15,893 | |
| Borrowings - Other | | | 135,546 | | | | - | | | | - | | | | - | | | | 135,546 | |
| Current portion of lease liability | | | 78,927 | | | | 78,927 | | | | - | | | | - | | | | 157,854 | |
| Non-current portion of lease liability | | | - | | | | - | | | | 87,345 | | | | - | | | | 87,345 | |
| Total non-derivatives | | | 5,999,117 | | | | 78,927 | | | | 87,345 | | | | - | | | | 6,165,389 | |
| * | Borrowings represent the advances recorded against certain receivables balances which are factored under the facility. |
| ** | Convertible notes were issued on 13 March 2020. Face value of drawn portion is US$450,000 (AU$584,264). The face value of total undrawn is US$28,840,000 (AU$37,444,820). The convertible notes expire on 31 May 2021. |
| | | Less than 6 months | | | Between 6 to 12 months | | | Between 1 and 2 years | | | Between 2 and 3 years | | | Remaining contractual maturities | |
| Consolidated - 2019 | | $ | | | $ | | | $ | | | $ | | | $ | |
| | | | | | | | | | | | | | | | |
| Trade and other payables | | | 5,882,586 | | | | - | | | | - | | | | - | | | | 5,882,586 | |
| Credit card liabilities | | | 13,852 | | | | - | | | | - | | | | - | | | | 13,852 | |
| Borrowings - Due to factor* | | | 4,216,126 | | | | - | | | | - | | | | - | | | | 4,216,126 | |
| Convertible notes payable** | | | 1,424,527 | | | | 949,684 | | | | - | | | | - | | | | 2,374,211 | |
| Borrowings (principal) - Promissory notes | | | 55,349 | | | | - | | | | - | | | | - | | | | 55,349 | |
| Borrowings - Other | | | 148,512 | | | | - | | | | - | | | | - | | | | 148,512 | |
| Current portion of lease liability | | | 111,109 | | | | 111,109 | | | | 29,572 | | | | - | | | | 251,790 | |
| Total non-derivatives | | | 11,852,061 | | | | 1,060,793 | | | | 29,572 | | | | - | | | | 12,942,426 | |
| * | Borrowings represent the advances recorded against certain receivables balances which are factored under the facility. |
| ** | Convertible note balance comprised of the principal and interest payable the Group entered in on 19 September 2019. The convertible note expires on 18 November 2020. |
(iii) Fair value of financial instruments
Unless otherwise stated, the carrying amounts of financial instruments reflect their fair value.
Capital management strategy
The Group’s policy is to maintain a capital structure for the business which ensures sufficient liquidity, provides support for business operations, maintains shareholder confidence and positions the business for future growth. The Group manages its capital structure and makes adjustments in light of changes in economic conditions.
The ongoing maintenance of the Group’s policy is characterised by ongoing cash flow forecast analysis and detailed budgeting processes which, combined with continual development of banking relationships, is directed at providing a sound financial positioning for the Group’s operations and financial management activities.
The Group has an ASX-imposed restriction of 15% of total share capital per annum on the amount of share capital it can issue under a placement, which may be increased by a further 10% under a special resolution put to shareholders at its general meetings.
| engage:BDR Limited |
| Notes to the financial statements |
| 31 December 2020 |
Note 17. Fair value measurement
The Group’s assets and liabilities, measured or disclosed at fair value, using a three level hierarchy, based on the lowest level of input that is significant to the entire fair value measurement, being:
| ● | Level 1: Quoted prices (unadjusted) in active markets for identical assets or liabilities that the entity can access at the measurement date; |
| ● | Level 2: Inputs other than quoted prices included within Level 1 that are observable for the asset or liability, either directly or indirectly |
| ● | Level 3: Unobservable inputs for the asset or liability |
With the exception of embedded derivatives which is measured using level 2 inputs (refer note 3), all other major financial assets and liabilities are measured using level 1 inputs.
Accounting policy for fair value measurement
When an asset or liability, financial or non-financial, is measured at fair value for recognition or disclosure purposes, the fair value is based on the price that would be received to sell an asset or paid to transfer a liability in an orderly transaction between market participants at the measurement date; and assumes that the transaction will take place either: in the principal market; or in the absence of a principal market, in the most advantageous market.
Fair value is measured using the assumptions that market participants would use when pricing the asset or liability, assuming they act in their economic best interests. For non-financial assets, the fair value measurement is based on its highest and best use. Valuation techniques that are appropriate in the circumstances and for which sufficient data are available to measure fair value, are used, maximising the use of relevant observable inputs and minimising the use of unobservable inputs.
Assets and liabilities measured at fair value are classified into three levels, using a fair value hierarchy that reflects the significance of the inputs used in making the measurements. Classifications are reviewed at each reporting date and transfers between levels are determined based on a reassessment of the lowest level of input that is significant to the fair value measurement.
For recurring and non-recurring fair value measurements, external valuers may be used when internal expertise is either not available or when the valuation is deemed to be significant. External valuers are selected based on market knowledge and reputation. Where there is a significant change in fair value of an asset or liability from one period to another, an analysis is undertaken, which includes a verification of the major inputs applied in the latest valuation and a comparison, where applicable, with external sources of data.
Note 18. Key management personnel disclosures
Directors
The following persons were directors of engage:BDR Limited during the financial year:
| Mr Ted Dhanik (Executive Chairman and Chief Executive Officer) |
| Mr Kurtis Rintala (Executive Director and Chief Operating Officer) |
| Mr Tom Anderson (Non-Executive Director) |
| Mr Darian Pizem (Non-Executive Director) |
| Mr Robert Antulov (Non-Executive Director) |
Other key management personnel
The following persons also had the authority and responsibility for planning, directing and controlling the major activities of the consolidated entity, directly or indirectly, during the financial year:
| Mr Youqi Li (Chief Technology Officer) |
| Mr Andy Dhanik (Chief Revenue Officer) |
| Mr Denys Kravchenko (Chief Technology Officer - AdCel) |
| engage:BDR Limited |
| Notes to the financial statements |
| 31 December 2020 |
Note 18. Key management personnel disclosures (continued)
Compensation
The aggregate compensation made to directors and other members of key management personnel of the consolidated entity is set out below:
| | | Consolidated | |
| | | 2020 | | | 2019 | |
| | | $ | | | $ | |
| | | | | | | |
| Short-term employee benefits | | | 2,340,791 | | | | 1,936,659 | |
| Share-based payments | | | 1,522,400 | | | | 281,085 | |
| | | | | | | | | |
| | | | 3,863,191 | | | | 2,217,744 | |
Note 19. Remuneration of auditors
During the financial year the following fees were paid or payable for services provided by William Buck Audit (Vic) Pty Ltd, the auditor of the company:
| | | Consolidated | |
| | | 2020 | | | 2019 | |
| | | $ | | | $ | |
| | | | | | | |
| Audit services - William Buck Audit (Vic) Pty Ltd | | | | | | | | |
| Audit or review of the financial statements | | | 69,650 | | | | 50,000 | |
| | | | | | | | | |
| Other services - William Buck Audit (Vic) Pty Ltd | | | | | | | | |
| Preparation of the tax return and other services | | | 22,209 | | | | - | |
| | | | | | | | | |
| | | | 91,859 | | | | 50,000 | |
Note 20. Related party transactions
Parent entity
engage:BDR Limited is the parent entity.
Subsidiaries
Interests in subsidiaries are set out in note 22.
Key management personnel
Disclosures relating to key management personnel are set out in note 18 and the remuneration report included in the directors’ report.
| engage:BDR Limited |
| Notes to the financial statements |
| 31 December 2020 |
Note 20. Related party transactions (continued)
Loans to/from related parties
The following balances are outstanding at the reporting date in relation to loans with related parties:
| | | Consolidated | |
| | | 2020 | | | 2019 | |
| | | $ | | | $ | |
| | | | | | | |
| Beginning of the year | | | 2,311,510 | | | | 2,229,032 | |
| Loans advanced | | | 197,603 | | | | 337,503 | |
| Bonus awarded to key management personnel offset against loan balances | | | (400,000 | ) | | | (337,127 | ) |
| Interest charged | | | 101,200 | | | | 78,285 | |
| Exchange difference | | | (225,444 | ) | | | 3,817 | |
| | | | | | | | | |
| | | | 1,984,869 | | | | 2,311,510 | |
Terms and conditions
From 1 July 2019, Loans to directors and key management personnel were charged interest at a simple interest rate of 5% per annum, calculated monthly. This interest rate is consistent with local interest rates charged for secured personal debt. The loans made to both directors and key management personnel are repayable by 31 August 2021. These have been disclosed as current receivables. $1,984,869 outstanding loans are secured against each individuals’ shareholding and will be settled in cash. All loans were approved by the Board of Directors of the Group.
Note 21. Parent entity information
Set out below is the supplementary information about the parent entity.
Statement of profit or loss and other comprehensive income
| | | Parent | |
| | | 2020 | | | 2019 | |
| | | $ | | | $ | |
| | | | | | | |
| Loss after income tax | | | (3,908,562 | ) | | | (2,112,289 | ) |
| | | | | | | | | |
| Total comprehensive income | | | (3,908,562 | ) | | | (2,112,289 | ) |
Statement of financial position
| | | Parent | |
| | | 2020 | | | 2019 | |
| | | $ | | | $ | |
| | | | | | | |
| Total current assets | | | 159,573 | | | | 48,244 | |
| | | | | | | | | |
| Total assets | | | 159,573 | | | | 4,353,895 | |
| | | | | | | | | |
| Total current liabilities | | | 662,763 | | | | 2,887,568 | |
| | | | | | | | | |
| Total liabilities | | | 662,763 | | | | 2,887,568 | |
| | | | | | | | | |
| Equity | | | | | | | | |
| Issued capital | | | 47,790,463 | | | | 35,582,304 | |
| Share based payment reserve | | | 732,254 | | | | 603,739 | |
| Equity investment reserve | | | (2,441,343 | ) | | | (2,441,343 | ) |
| Accumulated losses | | | (46,584,564 | ) | | | (32,278,373 | ) |
| | | | | | | | | |
| Total equity/(deficiency) | | | (503,190 | ) | | | 1,466,327 | |
| engage:BDR Limited |
| Notes to the financial statements |
| 31 December 2020 |
Note 21. Parent entity information (continued)
Guarantees entered into by the parent entity in relation to the debts of its subsidiaries
The parent entity had no guarantees in relation to the debts of its subsidiaries as at 31 December 2020 (2019: None).
Contingent liabilities
The parent entity had no contingent liabilities as at 31 December 2020 (2019: None).
Capital commitments - Property, plant and equipment
The parent entity had no capital commitments for property, plant and equipment as at 31 December 2020 (2019: None).
Significant accounting policies
The accounting policies of the parent entity are consistent with those of the consolidated entity, as disclosed in note 2, except for the following:
| ● | Investments in subsidiaries are accounted for at cost, less any impairment, in the parent entity. |
| ● | Investments in associates are accounted for at cost, less any impairment, in the parent entity. |
| ● | Dividends received from subsidiaries are recognised as other income by the parent entity and its receipt may be an indicator of an impairment of the investment. |
Note 22. Interests in subsidiaries
The consolidated financial statements incorporate the assets, liabilities and results of the following subsidiaries in accordance with the accounting policy described in note 2:
| | | | | Ownership interest | |
| | | Principal place of business / | | 2020 | | | 2019 | |
| Name | | Country of incorporation | | % | | | % | |
| | | | | | | | | |
| engage:BDR LLC | | United States of America | | | 100 | % | | | 100 | % |
| Tiveo LLC* | | United States of America | | | 100 | % | | | 100 | % |
| AdCel LLC | | United States of America | | | 100 | % | | | 100 | % |
| * | Tiveo LLC is a wholly owned subsidiary of engage:BDR LLC. |
Note 23. Events after the reporting period
No matter or circumstance has arisen since 31 December 2020 that has significantly affected, or may significantly affect the consolidated entity’s operations, the results of those operations, or the consolidated entity’s state of affairs in future financial years.
Note 24. Earnings per share
| | | Consolidated | |
| | | 2020 | | | 2019 | |
| | | $ | | | $ | |
| | | | | | | |
| Loss after income tax attributable to the owners of engage:BDR Limited | | | (6,881,027 | ) | | | (1,343,429 | ) |
| | | Number | | | Number | |
| | | | | | | |
| Weighted average number of ordinary shares used in calculating basic earnings per share | | | 1,244,831,077 | | | | 515,130,862 | |
| | | | | | | | | |
| Weighted average number of ordinary shares used in calculating diluted earnings per share | | | 1,244,831,077 | | | | 515,130,862 | |
| engage:BDR Limited |
| Notes to the financial statements |
| 31 December 2020 |
Note 24. Earnings per share (continued)
| | | Cents | | | Cents | |
| | | | | | | |
| Basic earnings per share | | | (0.55 | ) | | | (0.26 | ) |
| Diluted earnings per share | | | (0.55 | ) | | | (0.26 | ) |
Accounting policy for earnings per share
Basic earnings per share
Basic earnings per share is calculated by dividing the profit attributable to the owners of engage:BDR Limited, excluding any costs of servicing equity other than ordinary shares, by the weighted average number of ordinary shares outstanding during the financial year, adjusted for bonus elements in ordinary shares issued during the financial year.
Diluted earnings per share
Diluted earnings per share adjusts the figures used in the determination of basic earnings per share to take into account the after income tax effect of interest and other financing costs associated with dilutive potential ordinary shares and the weighted average number of shares assumed to have been issued for no consideration in relation to dilutive potential ordinary shares.
As the Group incurred a loss for the period under review and in the prior year, potential ordinary shares, being options to acquire ordinary shares, are considered non-dilutive and therefore not included in the diluted earnings per share calculation.
Note 25. Share-based payments
Options
During the 2020 financial year the Group issued 17,100,000 unlisted options to non-executive directors pursuant to the Company’s Options and Performance Rights Plan (“Plan”). The options were issued in three tranches with an expiry date of 1 April 2023:
| ● | Tranche 1 - 5,700,000 options vesting immediately on issue, exercisable at $0.0201 (2.01 cents) per option; |
| ● | Tranche 2 - 5,700,000 options vesting on 18 March 2021, exercisable at $0.0217 (2.17 cents) per option; and |
| ● | Tranche 3 - 5,700,000 options vesting on 18 March 2022, exercisable at $0.0233 (2.33 cents) per option. |
Set out below are summaries of outstanding options, including options granted under the Plan:
2020
| | | | | | | | Balance at | | | | | | | | | Expired/ | | | Balance at | |
| | | | | Exercise | | | the start of | | | | | | | | | forfeited/ | | | the end of | |
| Grant date | | Expiry date | | price | | | the year | | | Granted | | | Exercised | | | other | | | the year | |
| | | | | | | | | | | | | | | | | | | | | |
| 14/12/2017 | | 14/12/2020 | | $ | 0.2500 | | | | 29,999,993 | | | | - | | | | - | | | | (29,999,993 | ) | | | - | |
| 29/01/2019 | | 26/01/2022 | | $ | 0.0520 | | | | 8,676,093 | | | | - | | | | - | | | | - | | | | 8,676,093 | |
| 08/03/2019 | | 22/12/2020 | | $ | 0.2500 | | | | 4,000,000 | | | | - | | | | - | | | | (4,000,000 | ) | | | - | |
| 25/09/2019 | | 30/09/2022 | | $ | 0.0260 | | | | 13,750,000 | | | | - | | | | - | | | | - | | | | 13,750,000 | |
| 18/03/2020 | | 01/04/2023 | | $ | 0.0201 | | | | - | | | | 5,700,000 | | | | - | | | | - | | | | 5,700,000 | |
| 18/03/2020 | | 01/04/2023 | | $ | 0.0217 | | | | - | | | | 5,700,000 | | | | - | | | | - | | | | 5,700,000 | |
| 18/03/2020 | | 01/04/2023 | | $ | 0.0233 | | | | - | | | | 5,700,000 | | | | - | | | | - | | | | 5,700,000 | |
| | | | | | | | | | 56,426,086 | | | | 17,100,000 | | | | - | | | | (33,999,993 | ) | | | 39,526,093 | |
| Weighted average exercise price | | $ | 0.1650 | | | $ | 0.0220 | | | $ | 0.0000 | | | $ | 0.2500 | | | $ | 0.0298 | |
| engage:BDR Limited |
| Notes to the financial statements |
| 31 December 2020 |
Note 25. Share-based payments (continued)
2019
| | | | | | | | Balance at | | | | | | | | | Expired/ | | | Balance at | |
| | | | | Exercise | | | the start of | | | | | | | | | forfeited/ | | | the end of | |
| Grant date | | Expiry date | | price | | | the year | | | Granted | | | Exercised | | | other | | | the year | |
| | | | | | | | | | | | | | | | | | | | | |
| 14/12/2017 | | 14/12/2020 | | $ | 0.2500 | | | | 29,999,993 | | | | - | | | | - | | | | - | | | | 29,999,993 | |
| 29/01/2019 | | 26/01/2022 | | $ | 0.0520 | | | | - | | | | 8,676,093 | | | | - | | | | - | | | | 8,676,093 | |
| 08/03/2019 | | 22/12/2020 | | $ | 0.2500 | | | | - | | | | 4,000,000 | | | | - | | | | - | | | | 4,000,000 | |
| 25/09/2019 | | 30/09/2022 | | $ | 0.0260 | | | | - | | | | 13,750,000 | | | | - | | | | - | | | | 13,750,000 | |
| | | | | | | | | | 29,999,993 | | | | 26,426,093 | | | | - | | | | - | | | | 56,426,086 | |
| Weighted average exercise price | | $ | 0.2500 | | | $ | 0.0680 | | | $ | 0.0000 | | | $ | 0.0000 | | | $ | 0.1650 | |
Set out below are the options exercisable at the end of the financial year:
| | | | | 2020 | | | 2019 | |
| Grant date | | Expiry date | | Number | | | Number | |
| | | | | | | | | |
| 14/12/2017 | | 14/12/2020 | | | - | | | | 29,999,993 | |
| 29/01/2019 | | 26/01/2022 | | | 8,676,093 | | | | 8,676,093 | |
| 08/03/2019 | | 22/12/2020 | | | - | | | | 4,000,000 | |
| 25/09/2019 | | 30/09/2022 | | | 13,750,000 | | | | 13,750,000 | |
| 18/03/2020 | | 01/04/2023 | | | 17,100,000 | | | | - | |
| | | | | | | | | | | |
| | | | | | 39,526,093 | | | | 56,426,086 | |
Performance rights
During the 2020 financial year, Company issued 107,500,000 performance rights to key management personnel and employees pursuant to the Company’s Options and Performance Rights Plan. The performance rights were issued in eight tranches, each with different vesting milestones, all with an expiry date of 1 April 2023 and will a $Nil exercise/conversion price:
| | | | | | | | | | Balance at the | | | | | | | | | Expired/ | | | Balance at | |
| Tranche | | | | | | Exercise | | | start of | | | Rights | | | Converted | | | forfeited/ | | | the end of | |
| number: | | Grant date | | Expiry date | | price | | | the year | | | granted | | | to shares | | | other | | | the year | |
| | | | | | | | | | | | | | | | | | | | | | | |
| (1) | | 18/03/2020 | | 01/04/2023 | | $ | 0.00 | | | | - | | | | 34,500,000 | | | | (34,500,000 | ) | | | - | | | | - | |
| (2) | | 18/03/2020 | | 01/04/2023 | | $ | 0.00 | | | | - | | | | 15,500,000 | | | | (15,500,000 | ) | | | - | | | | - | |
| (3) | | 18/03/2020 | | 01/04/2023 | | $ | 0.00 | | | | - | | | | 20,000,000 | | | | (20,000,000 | ) | | | - | | | | - | |
| (4) | | 18/03/2020 | | 01/04/2023 | | $ | 0.00 | | | | - | | | | 12,000,000 | | | | (12,000,000 | ) | | | - | | | | - | |
| (5) | | 18/03/2020 | | 01/04/2023 | | $ | 0.00 | | | | - | | | | 14,000,000 | | | | - | | | | - | | | | 14,000,000 | |
| (6) | | 18/03/2020 | | 01/04/2023 | | $ | 0.00 | | | | - | | | | 5,000,000 | | | | - | | | | - | | | | 5,000,000 | |
| (7) | | 18/03/2020 | | 01/04/2023 | | $ | 0.00 | | | | - | | | | 5,500,000 | | | | - | | | | - | | | | 5,500,000 | |
| (8) | | 18/03/2020 | | 01/04/2023 | | $ | 0.00 | | | | - | | | | 1,000,000 | | | | - | | | | - | | | | 1,000,000 | |
| | | | | | | | | | | | | | | | | | | | | | | | | | | | | |
| | | | | | | | | | | | - | | | | 107,500,000 | | | | (82,000,000 | ) | | | - | | | | 25,500,000 | |
| engage:BDR Limited |
| Notes to the financial statements |
| 31 December 2020 |
Note 25. Share-based payments (continued)
The vesting milestones for each Tranche were as follows:
| (1) | A 30% increase in audited operating revenue stated in an audited consolidated annual financial report of the Group (being the Company and its controlled entities) for a period up to and including the 2021 financial year (a “Future Report”) over the audited revenue stated in the last audited consolidated annual financial report of the Company and its controlled entities (being the audited financial report for the year ended 31 December 2018) (“Base Report”). |
| (2) | A 25% increase in audited gross profit (and/or reduction in gross loss) stated in a Future Report over the audited gross profit (loss) stated in the Base Report). |
| (3) | A 50% increase in audited earnings before interest, tax, depreciation and amortisation (EBITDA) (and/or reduction in a negative EBITDA) stated in a Future Report over the audited net profit (loss) before tax stated in the Base Report). |
| (4) | A 50% increase in audited net assets (and/or reduction in the net deficiency of assets if net assets are less than zero) stated in a Future Report over the audited net assets (deficiency) stated in the Base Report). |
| (5) | A 50% increase in the market capitalisation (number of ordinary shares on issue multiplied by the 20 day VWAP for days on which shares of the Company traded on ASX) up to and including the twentieth (20th) day on which shares of the Company traded on ASX after the release of the Future Report for the 2021 financial year, over the market capitalisation (calculated using the 20 day VWAP for days on which shares of the Company traded on ASX) on any prior day. |
| (6) | A 30% improvement in AdCel revenue |
| (7) | AdCel DSP annual revenue of at least $2,000,000 |
| (8) | A 15% improvement in gross profit |
Vesting milestones 1 to 4 were achieved during the half year, as a result, 82,000,000 fully paid ordinary shares were issued on conversion of the performance rights.
There were no performance rights granted or outstanding in the prior period.
For the options granted during the current financial year, the valuation model inputs used to determine the fair value at the grant date, are as follows:
| Grant date | | Expiry date | | Share price
at grant date | | | Exercise
price | | | Expected
volatility | | | Dividend
yield | | | Risk-free
interest rate | | | Fair value
at grant date | |
| | | | | | | | | | | | | | | | | | | | | |
| 18/03/2020 | | 01/04/2023 | | $ | 0.0160 | | | $ | 0.0201 | | | | 100.00 | % | | | - | | | | 0.50 | % | | $ | 0.0077 | |
| 18/03/2020 | | 01/04/2023 | | $ | 0.0160 | | | $ | 0.0217 | | | | 100.00 | % | | | - | | | | 0.50 | % | | $ | 0.0080 | |
| 18/03/2020 | | 01/04/2023 | | $ | 0.0160 | | | $ | 0.0233 | | | | 100.00 | % | | | - | | | | 0.50 | % | | $ | 0.0084 | |
For the performance rights granted during the current financial year, the valuation model inputs used to determine the fair value at the grant date, are as follows. Note - in the following table:
- the inputs in the first row were used to determine the fair value of the 93,500,000 performance rights to which vesting milestones 1, 2, 3, 4, 6, 7, and 8 applied; and
- the inputs in the second row were used to determine the fair value of the 14,000,000 performance rights to which vesting milestone 5 applied.
The fair value of the 14,000,000 performance rights to which vesting milestone 5 applies (Milestone 5 Rights) is different to the fair value of the other 93,500,000 performance rights valued, despite both sets of rights having the same valuation model inputs, as the Milestone 5 Rights have a market vesting condition, whereas the other rights do not have a market vesting condition.
| Grant date | | Expiry date | | Share price
at grant date | | | Exercise
price | | | Expected
volatility | | | Dividend
yield |
|
| Risk-free
interest rate |
|
| Fair value
at grant date |
|
| | | | | | | | | | | | | | | | | | | | | |
| 18/03/2020 | | 01/04/2023 | | $ | 0.0160 | | | $ | 0.0000 | | | | 100.00 | % | | | - | | | | 0.50 | % | | $ | 0.0160 | |
| 18/03/2020 | | 01/04/2023 | | $ | 0.0160 | | | $ | 0.0000 | | | | 100.00 | % | | | - | | | | 0.50 | % | | $ | 0.0141 | |
Note 26. Contingent assets and liabilities
The Directors are not aware of any contingent assets or contingent liabilities as at 31 December 2020 (2019: Nil)
| engage:BDR Limited |
| Directors’ declaration |
| 31 December 2020 |
In the directors’ opinion:
| ● | the attached financial statements and notes comply with the Corporations Act 2001, the Accounting Standards, the Corporations Regulations 2001 and other mandatory professional reporting requirements; |
| | |
| ● | the attached financial statements and notes comply with International Financial Reporting Standards as issued by the International Accounting Standards Board as described in note 2 to the financial statements; |
| | |
| ● | the attached financial statements and notes give a true and fair view of the consolidated entity’s financial position as at 31 December 2020 and of its performance for the financial year ended on that date; and |
| | |
| ● | there are reasonable grounds to believe that the company will be able to pay its debts as and when they become due and payable. |
The directors have been given the declarations required by section 295A of the Corporations Act 2001.
Signed in accordance with a resolution of directors made pursuant to section 295(5)(a) of the Corporations Act 2001.
On behalf of the directors

Ted Dhanik
Co-Founder and Executive Chairman
26 February 2021
| engage:BDR Limited |
| Shareholder information |
| 31 December 2020 |
The shareholder information set out below was applicable as at 24 February 2021.
Distribution of equity securities
Analysis of number of equity security holders by size of holding:
| | | Number of holders of ordinary shares | | | % units | | | Number of holders of unlisted options expiring 26 January 2022, exercisable at $0.052 | | | % units | | | Number of holders of unlisted options expiring 30 September 2022, exercisable at $0.026 | | | % units | |
| | | | | | | | | | | | | | | | | | | |
| 1 to 1,000 | | | 53 | | | | - | | | | - | | | | - | | | | - | | | | - | |
| 1,001 to 5,000 | | | 47 | | | | 0.01 | | | | - | | | | - | | | | - | | | | - | |
| 5,001 to 10,000 | | | 175 | | | | 0.07 | | | | - | | | | - | | | | - | | | | - | |
| 10,001 to 100,000 | | | 1,022 | | | | 2.14 | | | | - | | | | - | | | | - | | | | - | |
| 100,001 and over | | | 1,515 | | | | 97.78 | | | | 1 | | | | 100.00 | | | | 1 | | | | 100.00 | |
| | | | | | | | | | | | | | | | | | | | | | | | | |
| | | | 2,812 | | | | 100.00 | | | | 1 | | | | 100.00 | | | | 1 | | | | 100.00 | |
| | | | | | | | | | | | | | | | | | | | | | | | | |
| Holding less than a marketable parcel | | | 1,120 | | | | | | | | - | | | | | | | | - | | | | | |
| | | Number of holders of unlisted options expiring 1 April 2023 | | | % units | | | Number of holders of Performance Rights | | | % units | | | Number of holders of unlisted zero coupon convertible amortising securities issued at USD$382,500 and with a current face value of USD$72,500 | | | % units | |
| | | | | | | | | | | | | | | | | | | |
| 1 to 1,000 | | | - | | | | - | | | | - | | | | - | | | | 1 | | | | 100.00 | |
| 1,001 to 5,000 | | | - | | | | - | | | | - | | | | - | | | | - | | | | - | |
| 5,001 to 10,000 | | | - | | | | - | | | | - | | | | - | | | | - | | | | - | |
| 10,001 to 100,000 | | | - | | | | - | | | | - | | | | - | | | | - | | | | - | |
| 100,001 and over | | | 3 | | | | 100.00 | | | | 3 | | | | 100.00 | | | | - | | | | - | |
| | | | | | | | | | | | | | | | | | | | | | | | | |
| | | | 3 | | | | 100.00 | | | | 3 | | | | 100.00 | | | | 1 | | | | 100.00 | |
| | | | | | | | | | | | | | | | | | | | | | | | | |
| Holding less than a marketable parcel | | | - | | | | | | | | - | | | | | | | | - | | | | | |
| engage:BDR Limited |
| Shareholder information |
| 31 December 2020 |
Equity security holders
Twenty largest quoted equity security holders
The names of the twenty largest security holders of quoted equity securities are listed below:
| | | Ordinary shares | |
| | | | | | % of total | |
| | | | | | shares | |
| | | Number held | | | issued | |
| | | | | | | |
| FIRST ROUND CAPITAL LLC | | | 97,681,498 | | | | 4.12 | |
| WINS ASSET MANAGEMENT PTY LTD (WINS A/C) | | | 73,500,000 | | | | 3.10 | |
| SAMUEL BAILLIEU HORDERN | | | 54,000,000 | | | | 2.28 | |
| MR KENNETH KWAN | | | 52,529,242 | | | | 2.22 | |
| VIRIATHUS CAPITAL PTY LTD (VIRIATHUS LLC NOMINEE A/C) | | | 50,000,000 | | | | 2.11 | |
| MR KURTIS RINTALA | | | 47,717,391 | | | | 2.01 | |
| MRS ELIZABETH ANNE MACRAE | | | 41,831,827 | | | | 1.76 | |
| ANTHONY PHILLIP HORDERN | | | 36,000,000 | | | | 1.52 | |
| BNP PARIBAS NOMINEES PTY LTD (IB AU NOMS RETAILCLIENT DRP) | | | 35,619,398 | | | | 1.50 | |
| YUCAJA PTY LTD (THE YOEGIAR FAMILY A/C) | | | 35,030,427 | | | | 1.48 | |
| GHJC PTY LIMITED | | | 32,090,156 | | | | 1.35 | |
| CITICORP NOMINEES PTY LIMITED | | | 30,719,759 | | | | 1.30 | |
| MR SHAO-LI HUANG | | | 30,000,000 | | | | 1.27 | |
| MR PETER KARAS | | | 29,000,000 | | | | 1.22 | |
| GHC NOMINEES PTY LTD (JEFFCO A/C) | | | 24,363,951 | | | | 1.03 | |
| ALTO OPPORTUNITY MASTER FUND + SPC (SEGREGATED MASTER PORT B A/C) | | | 22,919,703 | | | | 0.97 | |
| JOY ELAINE HORDERN | | | 20,739,726 | | | | 0.87 | |
| MR GARY WAYNE BRADY + MRS VIKASHNI LATA BRADY | | | 20,000,000 | | | | 0.84 | |
| MR TRISTAN ALEXANDER | | | 16,116,213 | | | | 0.68 | |
| MR GEOFFREY MARK COTTLE | | | 15,500,000 | | | | 0.65 | |
| | | | | | | | | |
| | | | 765,359,291 | | | | 32.28 | |
Unquoted equity securities
| | | Number | | | Number | |
| | | on issue | | | of holders | |
| | | | | | | |
| Unlisted listed options expiring 30 January 2022, exercisable at $0.052 | | | 8,676,093 | | | | 1 | |
| Unlisted listed options expiring 30 September 2022, exercisable at $0.026 | | | 13,750,000 | | | | 1 | |
| Unlisted listed options expiring 1 April 2023, exercisable at $0.0201 | | | 5,700,000 | | | | 3 | |
| Unlisted listed options expiring 1 April 2023, exercisable at $0.0217 | | | 5,700,000 | | | | 3 | |
| Unlisted listed options expiring 1 April 2023, exercisable at $0.0223 | | | 5,700,000 | | | | 3 | |
| Unlisted zero coupon convertible amortising securities (Series B) issued at USD$382,500 and with a current face value of US$72,500 | | | 1 | | | | 1 | |
The following persons hold 20% or more of unquoted equity securities:
| Name | | Class | | Number held | |
| | | | | | |
| CST Capital Pty Ltd (CST Investments Fund A/C) | | Unlisted options expiring 30 January 2022, exercisable at $0.052 | | | 8,676,093 | |
| Alto Opportunity Master Fund + SPC (Segregated Master Port B A/C) | | Unlisted options expiring 30 September 2022, exercisable at $0.026 | | | 13,750,000 | |
| Alto Opportunity Master Fund + SPC (Segregated Master Port B A/C) | | Unlisted zero coupon convertible amortising securities (Series B) issued at USD$382,500 and with a current face value of US$72,500 | | | 1 | |
Substantial holders
There are no substantial holders in the company.
| engage:BDR Limited |
| Shareholder information |
| 31 December 2020 |
Voting rights
Ordinary shares
On a show of hands every member present at a meeting in person or by proxy shall have one vote and upon a poll each share shall have one vote.
Other securities
Other classes of securities issued by the Company do not carry voting rights.
Annual General Meeting
Engage:BDR Limited advises that its Annual General Meeting will be held on or about Tuesday, 25 May 2021. The time and other details relating to the meeting will be advised in the Notice of Meeting to be sent to all Shareholders and released to ASX immediately upon despatch.
The Closing date for receipt of nomination for the position of Director is Tuesday, 6 April 2021. Any nominations must be received in writing no later than 5.00pm (Melbourne time) on Tuesday, 6 April 2021 at the Company’s Registered Office.
The Company notes that the deadline for nominations for the position of Director is separate to voting on Director elections. Details of the Directors to be elected will be provided in the Company’s Notice of Annual General Meeting in due course.
Corporate Governance Statement
The Company’s 2020 Corporate Governance Statement has been released to ASX on this day and is available on the Company’s website at: https://engagebdr.com/board-management-and-corporate-governance/
On-market buy-back
There is no current on-market buy-back.

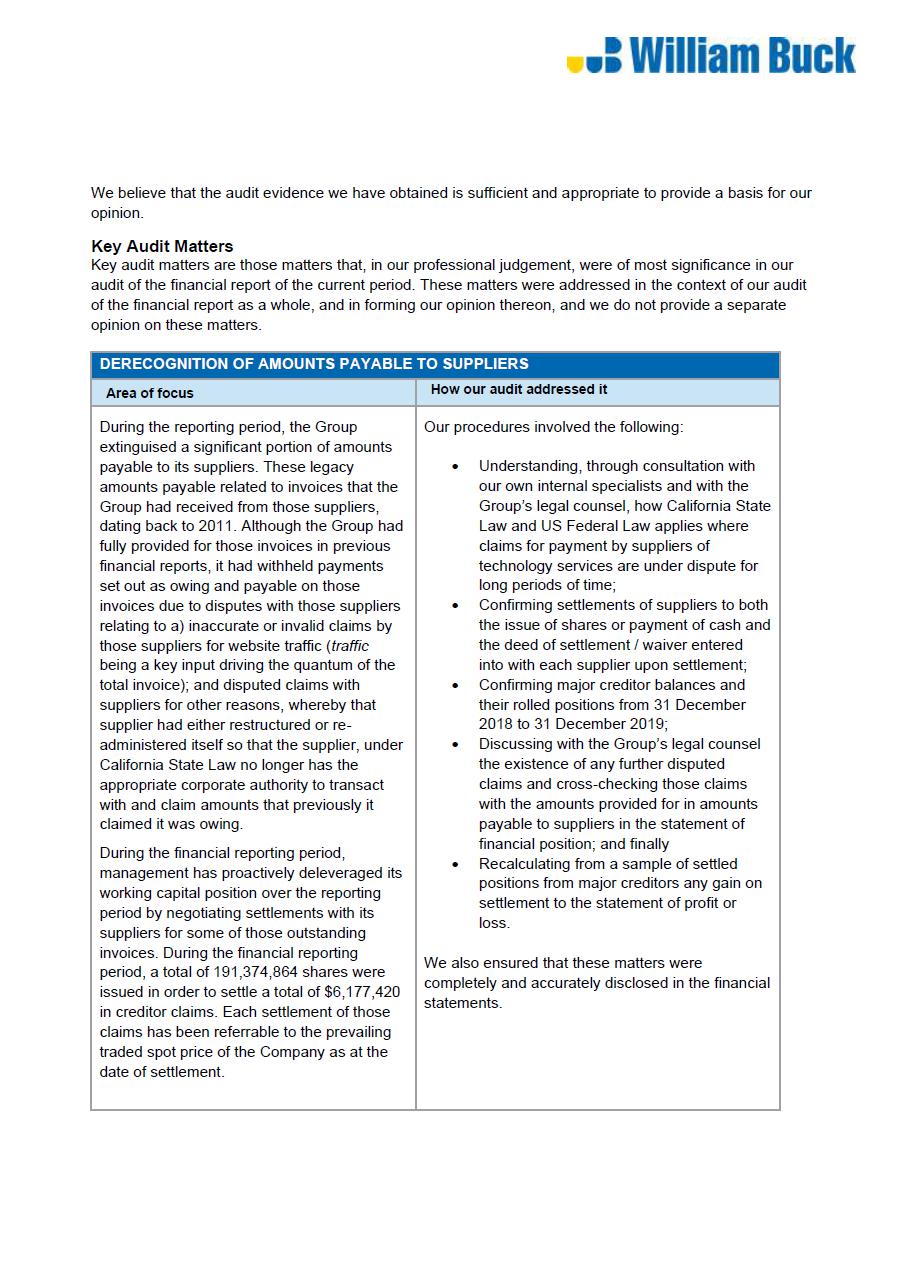
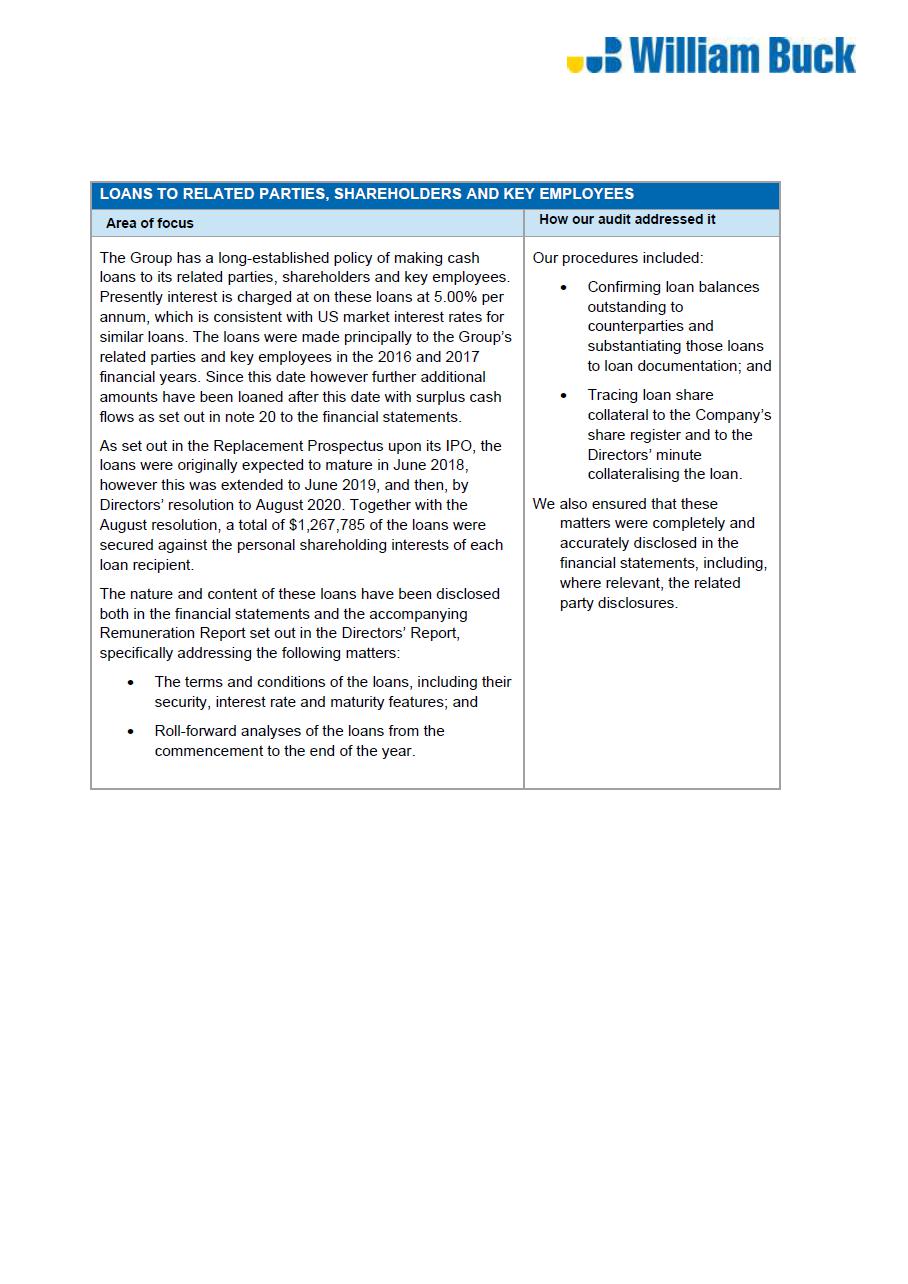


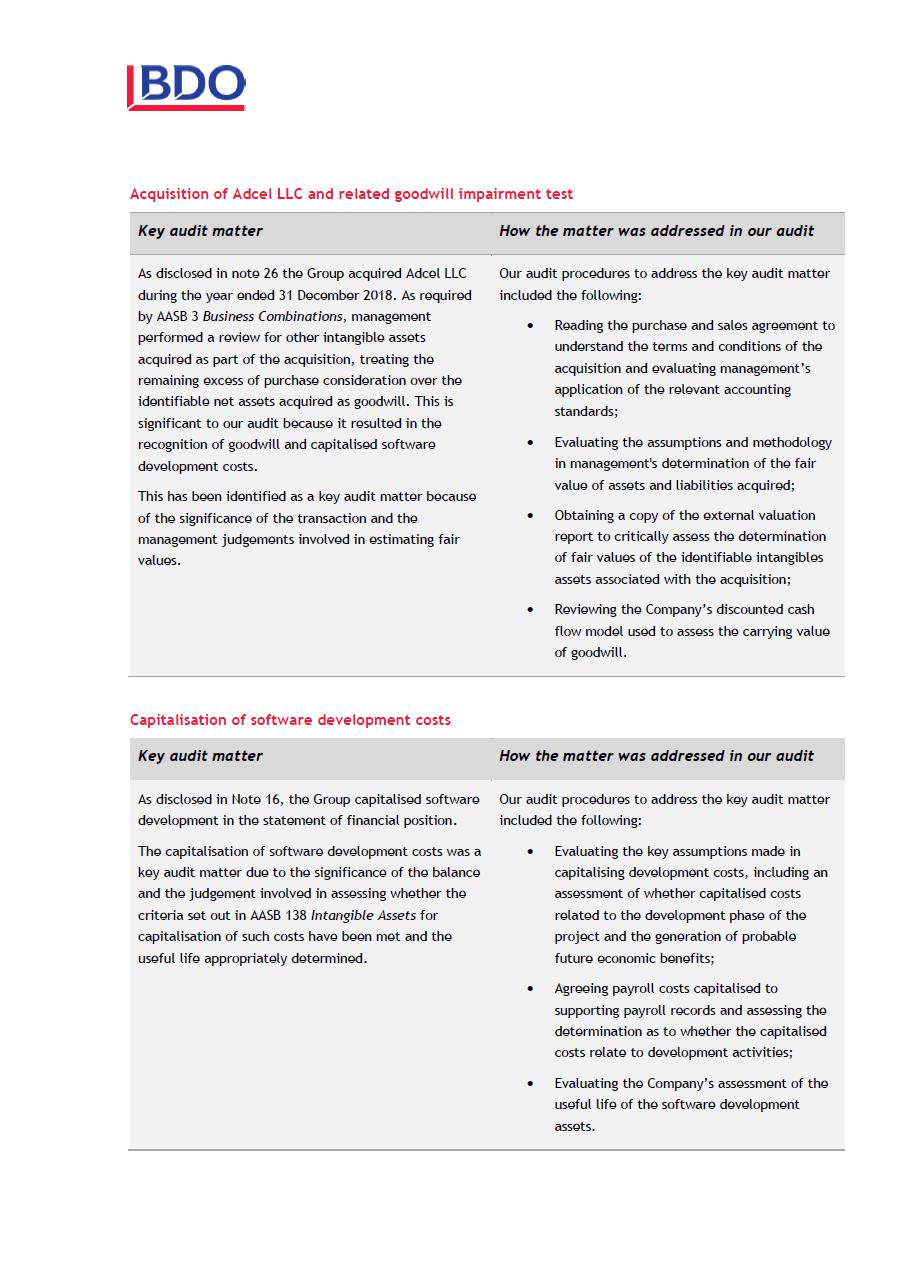


engage:BDR Limited
ABN 621 160 585
Registration statement - 31 December 2019
engage:BDR Limited
Contents
31 December 2019
engage:BDR Limited
Corporate directory
31 December 2019
| Directors | | Mr Ted Dhanik |
| | | Mr Kurtis Rintala |
| | | Mr Tom Anderson |
| | | Mr Darian Pizem |
| | | Mr Robert Antulov |
| | | |
| Company secretary | | Ms Melanie Leydin |
| | | |
| Registered office | | Scottish House |
| | | Level 4 |
| | | 90 William Street |
| | | Melbourne Victoria 3000 |
| | | Australia |
| | | |
| Principal place of business | | 8439 W Sunset Boulevard |
| | | Suite 302 |
| | | West Hollywood |
| | | California 90069 |
| | | USA |
| | | |
| Share register | | Computershare Investor Services Pty Limited |
| | | Yarra Falls, 452 Johnston Street |
| | | Abbotsford, VIC 3067 |
| | | Telephone: +61 3 9415 5000 |
| | | Fax: +61 3 9473 2500 |
| | | |
| Auditor | | William Buck Audit (Vic) Pty Ltd |
| | | Level 20, 181 William Street |
| | | Melbourne VIC 3000 |
| | | Australia |
| | | |
| Stock exchange listing | | engage:BDR Limited securities are listed on the Australian Securities Exchange (ASX code: EN1 and EN1O). |
| | | |
| Website | | engagebdr.com |
| | | |
| Corporate Governance Statement | | The Company’s 2018 Corporate Governance Statement has been released to ASX on 20 March 2020 and is available on the Company’s website. |
engage:BDR Limited
Directors’ report
31 December 2019
The Directors present their report, together with the financial report of engage:BDR Limited comprising engage:BDR Limited (referred to hereafter as the ‘Company’ or ‘parent entity’) and the entities it controlled at the end of, or during, the year ended 31 December 2019 (referred to hereafter as ‘engage:BDR’ or the ‘Group’).
Directors
The following persons were directors of engage:BDR Limited during the whole of the financial year and up to the date of this report, unless otherwise stated:
Mr Ted Dhanik (Co-Founder and Executive Chairman)
Mr Kurtis Rintala (Co-Founder and Executive Director)
Mr Tom Anderson (Non-Executive Director)
Mr Darian Pizem (Non-Executive Director)
Mr Robert Antulov (Non-Executive Director)
Principal activities
engage:BDR is an internet-based marketplace platform and associated technology solution provider. engage:BDR’s proprietary technology is used to optimise the sale of advertising inventory from digital publishers (websites and apps) to advertisers and their agents (brands, agencies and advertising platforms). The ability to optimise the inventory from digital publishers to advertisers and their agents allows engage:BDR to play an active role in managing the ad exchange platform.
engage:BDR allows digital publishers to monetise their available advertising space by making the inventory available to multiple advertisers, as well as providing various related technologies designed to help publishers create additional incremental revenue streams. engage:BDR’s ad exchange platform also allows publishers to sell space for video advertising on webpages that do not have video content.
Dividends
There were no dividends paid, recommended or declared during the current or previous financial year.
Review of operations
The loss for the consolidated entity after providing for income tax amounted to $1,343,429 (31 December 2018: loss of $10,840,198).
Non-programmatic display advertising sales
The Group’s non-progammatic display advertising sales was tag-based, traditionally sold and managed banner advertising campaigns run for direct advertisers. This was the Group’s first product, initially launched in 2009 and was discontinued in 2019. The Group notes that this part of the Group’s revenue stream was planned to and has ceased to continue as advertising buyers continue to migrate their business to more efficient and cost-effective programmatic buying. engage:BDR is expecting to be able to deliver significantly increased trading margins as a consequence of the move to a fully automated operation during 2020.
Programmatic display, native and video advertising sales
The Group’s Programmatic advertising sales includes selling display, native and video advertising inventory through the Group’s digital auctioning technology to platforms and marketplaces. The Group developed this product to replace the traditional Non-Programmatic display advertising channel. The adoption of programmatic display advertising sales has proven to be extremely successful in 2019 and opened additional revenue opportunities from the same clients, largely because programmatic buying and selling of advertising is much more efficient and significantly more cost effective to operate, thus increasing the Group’s overall operating and gross profit margins.
The Group’s proprietary programmatic technology significantly increases the Group’s operating margins by reducing payroll and associated sales commissions. With the rapid adoption of programmatic buying, brands, agencies and digital media buyers have moved their budgets to auction-based buying, in contrast to buying from salespeople, individual RFP (request for proposal) and insertion orders. This behavioural change has made the marketplace much more efficient, significantly reducing the staff overhead required to sell advertising in the traditional way.
engage:BDR Limited
Directors’ report
31 December 2019
Advertising buyers, through the Group’s programmatic platform, are essentially bidding for advertising inventory in real time in dynamic auctions, which occur in milliseconds while the relevant mobile or CTV app content is loading. This new engage:BDR format has created significant barriers to entry for new companies looking to enter the digital advertising arena. Companies must realistically own and develop their own proprietary technology to be able to participate in the rapidly developing programmatic advertising ecosystem as licensing third party technologies is cost-prohibitive. engage:BDR has developed its own real-time auctioning and bidding technologies which provide it with a significant competitive advantage. engage:BDR has established thousands of direct publisher relationships which is a key differentiator and competitive advantage for the Group in an ecosystem which is experiencing inventory quality issues, brokers and middlemen.
Non-programmatic video advertising sales
The Group’s non-programmatic video advertising sales included selling video inventory through tag-based technology to direct advertisers, platforms and marketplaces. The Group significantly increased revenue per customer by integrating the video channel with the display buyers and sellers and opening business on the display ad side to customers that were originally integrating into the video business. Management notes that the programmatic video sales has eclipse the non-programmatic video revenue stream, as planned, in 2019. As a result, the non-programmatic video revenue stream has been discontinued.
Influencer Marketing
The Group launched its social influencer marketing platform in 2017. It dedicated engineering and account management resources to further develop and refine its technology and client base in 2019. The Group brought in incremental revenue through this platform and further diversification of the Group’s product and service offering. With Instagram influencers, TikTok, YouTube, Facebook and SnapChat becoming extremely popular, new marketing channels for advertisers and platform efficiencies are required to scale this new form of media. IconicReach, engage:BDR’s Instagram influencer self-serve platform, is focused on being the largest marketplace focused on advertiser-supplied creative, creating a scalable and efficient revenue stream for micro and macro influencers with large audiences. The Group anticipates that several thousand influencers and at least 25 brands will join the IconicReach platform in 2020.
Mobile and Connected Television (CTV) App Ads
The Group expects to grow mobile and CTV app (AdCel) ad revenues significantly in 2020. This revenue is no longer dependent on third party technologies compared with prior mobile and CTV app advertising revenues because of the Group’s acquisition of AdCel in 2018. As the supply and demand partnerships are integrated by the engineering teams, the revenue is expected to steadily grow throughout the year. AdCel is focused on boarding significant volumes of new app publishers, primarily through the Group’s NetZero payments product, which enables publisher payments the same day the Group is invoiced.
Significant changes in the state of affairs
On 21 January 2019 the Company announced that two new recently signed integrations, Third Presence and AcuityAds, had gone live. These integrations refer to these suppliers to direct server integrations to the publisher’s ad mediation platform, These are known as RTB (Real Time Bidding) connections. These are programmatic integrations to access supply from a set of publishers. When integrating with a mediation/supply side platform, engineers from both teams perform technical integrations to allow our platforms to query and respond to each other in real time using a universal framework knows as OpenRTB protocol. All integrations are formal partnerships and subject to contracting with each one.
On 25 January 2019, the Company issued 25,099,423 fully paid ordinary shares to professional and sophisticated investors at a price of $0.028 (2.8 cents) per share, raising a total of $702,784 before costs of issue.
On 29 January 2019, the Company issued:
| ● | 625,000 unlisted convertible notes issued at USD$0.90 per Note with a face value of USD$1.00 per Note. Notes are secured with a Maturity date of 19 November 2019. The Notes are convertible at the lesser of AUD0.09 (9 cents) converted into USD, and a market share price-derived amount. These convertible notes replaced the 625,000 Loan Notes outstanding from the Loan Note issue made in November 2018; |
| ● | 1,900,000 fully paid ordinary shares at a deemed issue price of $0.06 (6 cents) per share as the remaining security for the convertible notes; |
| ● | 8,676,093 unlisted options exercisable at $0.052, expiring 26 January 2022. |
On 30 January 2019, the Company issued 13,471,396 fully paid ordinary shares on conversion of 106,188 convertible notes at a conversion price of $0.011 (1.1 cents) per share.
engage:BDR Limited
Directors’ report
31 December 2019
On 4 February 2019, the Company issued 9,028,597 fully paid ordinary shares on conversion of 85,052 convertible notes at a conversion price of $0.013 (1.3 cents) per share.
On 18 February 2019, the Company issued 7,498,236 fully paid ordinary shares on conversion of 92,500 convertible notes at a conversion price of $0.018 (1.8 cents) per share.
On 18 February 2019 the Company announced a new integration, Comcast Freewheel.
On 25 February 2019 the Company announced two new integrations, MobFox and Chalk Digital.
On 28 February 2019, the Company issued the following:
| ● | 589,300 fully paid ordinary shares to a consultant in lieu of consulting fees at a deemed issue price of $0.051 (5.1 cents) per share; |
| ● | 2,000,000 fully paid ordinary shares to a consultant in lieu of consulting fees at a deemed issue price of $0.022 (2.2 cents) per share; |
| ● | 18,607,945 fully paid ordinary shares for settlement of outstanding creditor balances at a deemed issue price of $0.021 (2.1 cents) per share. |
On 8 March 2019, the Company issued the following:
| ● | 10,657,140 fully paid ordinary shares to satisfy the deferred consideration at 31 December 2018 for the Company’s acquisition of AdCel LLC as per the Company’s announcement on 30 July 2018, at a deemed issued price of $0.22 (22 cents) per share; |
| ● | 4,000,000 listed options as consideration for corporate advisory services, exercisable at $0.25 (25 cents) per option by 22 December 2020. |
On 18 March 2019, the Company issued the following:
| ● | 11,347,597 fully paid ordinary shares on conversion of 117,500 unlisted convertible notes at a conversion price of $0.015 (1.5 cents) per share; |
| ● | 12,467,980 fully paid ordinary shares for settlement of outstanding creditor balances at a deemed issue price of $0.031 (3.1 cents) per share. |
On 20 March 2019, the Company issued 17,719,531 fully paid ordinary shares on conversion of 188,760 unlisted convertible notes at a conversion price of $0.015 (1.5 cents) per share.
On 2 April 2019, the Company issued the following:
| ● | 800,000 unlisted convertible notes issued at USD$0.90 per Note with a face value of USD$1.00 per Note. Notes are secured with a maturity date of 30 January 2020. The Notes are convertible at the lesser of: |
| | - 92% of the lowest daily VWAP during the five trading days prior to the date of a conversion notice in respect to those Series 2 Notes being given to the Company, rounded down to the nearest $0.001; and |
| | - 130% of the five day VWAP during the five trading days prior to the date of issue of the Notes. |
| ● | 3,300,034 fully paid ordinary shares with a deemed issue price of $0.015 (1.5 cents) per share, upon conversion of 35,000 unlisted Series 1 convertible notes; |
| ● | 10,889,034 fully paid ordinary shares with a deemed issue price of $0.031 (3.1 cents) per share, upon conversion of 240,000 unlisted Series 2 convertible notes; |
| ● | 14,959,756 fully paid ordinary shares with a deemed issue price of $0.041 (4.1 cents) per share in relation to settlement of outstanding creditor balances. |
On 5 April 2019, the Company issued 13,220,706 fully paid ordinary shares with a deemed issue price of $0.034 (3.4 cents) per share, upon conversion of 320,000 unlisted Series 2 convertible notes.
engage:BDR Limited
Directors’ report
31 December 2019
On 8 April 2019, the Company issued the following:
| ● | 800,000 unlisted Series 3 convertible notes issued at $0.90 per Note with a face value of USD$1.00 per Note. Notes are secured with a maturity date of 8 April 2020. The Notes are convertible at the lesser of: |
| | - 92% of the lowest daily VWAP during the five trading days prior to the date of a conversion notice in respect of those Series 3 Notes being given to the Company, rounded down to the nearest $0.001; and |
| | - 130% of the five day VWAP during the five trading days prior to the date of issue of the Notes. |
| ● | 749,810 fully paid ordinary shares with a deemed price of $0.047 (4.7 cents) per share, for settlement of outstanding liabilities. |
On 17 April 2019, the Company announced that it has deployed Facebook advertising as part of its paid social strategy. Advertisements on Facebook utilise users’ unique profiles as targeting metrics to allow brands to reach their most appropriate potential customers. As announced on 11 February 2019, the Company targeted a launch in Q3 of this year for this product. Management is pleased to report, that due to customer demand, the first phase of this product has gone live significantly ahead of schedule.
On 18 April 2019, the Company issued the following:
| ● | 7,504,000 fully paid ordinary shares with a deemed issue price of $0.039 (3.9 cents) per share, upon conversion of 140,000 unlisted Series 2 convertible notes and 70,000 unlisted Series 3 convertible notes; |
| ● | 1,136,945 fully paid ordinary shares with a deemed issue price of $0.049 (4.9 cents) per share in relation to settlement of outstanding liabilities; |
| ● | 15,602,041 fully paid ordinary shares with a deemed issue price of $0.049 (4.9 cents) per share in relation to settlement of outstanding creditor balances. |
On 23 April 2019, the Company announced that IconicReach has expanded its influencer marketing to the video sharing app, TikTok. IconicReach will be starting its first TikTok campaign with influencers in the music space, with the intent of creating a viral dance contest by well-known artists.
On 7 May 2019, the Company issued the following:
| ● | 6,241,616 fully paid ordinary shares with a deemed issue price of $0.039 (3.9 cents) per share, upon conversion of 170,000 unlisted Series 3 convertible notes; |
| ● | 19,165,736 fully paid ordinary shares with a deemed issue price of $0.042 (4.2 cents) per shares, in relation to settlement of outstanding creditors and liability balances. |
On 17 May 2019, the Company issued 7,255,000 fully paid ordinary shares with a deemed issue price of $0.028 (2.8 cents) per share, upon conversion of 70,000 unlisted Series 2 convertible notes and 70,000 unlisted Series 3 convertible notes.
On 31 May 2019, the Company issued the following:
| ● | 8,967,567 fully paid ordinary shares with a deemed issue price of $0.03 (3 cents) per share, upon conversion of 185,000 unlisted Series 3 convertible notes; |
| ● | 8,607,926 fully paid ordinary shares with a deemed issue price of $0.042 (4.2 cents) per share, in relation to settlement of outstanding creditor balances. |
On 14 June 2019, the Company issued the following:
| ● | 4,382,407 fully paid ordinary shares with a deemed issue price of $0.033 (3.3 cents) per share, upon conversion of 30,000 unlisted Series 2 convertible notes and 70,000 unlisted Series 3 convertible notes; |
| ● | 8,563,860 fully paid ordinary shares with a deemed issue price of $0.038 (3.8 cents) per share, in relation to settlement of outstanding creditor balances. |
On 10 July 2019, the Company issued 8,399,240 fully paid ordinary shares for settlement of creditor balances and settlement of outstanding liabilities at a deemed issue price of $0.043 (4.3 cents) per share.
On 9 August 2019, the Company issued the following:
| ● | 9,767,745 fully paid ordinary shares with a deemed issue price of $0.034 (3.4 cents) per share, in relation to settlement of outstanding creditor balances; |
| ● | 3,038,854 fully paid ordinary shares with a deemed issue price of $0.034 (3.4 cents) per share, in relation to settlement of employee bonuses. |
engage:BDR Limited
Directors’ report
31 December 2019
On 30 August 2019, the Company issued 12,397,104 fully paid ordinary shares for settlement of outstanding creditor balances at a deemed issue price of $0.03 (3 cents) per share.
On 23 September 2019, the Company announced an agreement with Alto Opportunity Master Fund SPC - Segregated Master Portfolio B (“Alto”) for the issue of zero coupon convertible amortising securities (“ZCSs”).
The Agreement is structured as an initial drawdown (tranche) with the potential for a further 7 drawdowns. If the conditions for all 7 subsequent tranches to be drawn down are satisfied (including the Investor agreeing to proceed with the individual tranches – see further below), the total potential face value amount would be US$30.9 million and the aggregate issue price before costs would be approximately US$26.25 million assuming the initial drawdown is US$1,750,000.
On 25 September 2019, the Company issued the following:
| ● | 28,500,000 fully paid ordinary shares at a deemed issue price of $0.025 (2.5 cents) per share to Alto in accordance with the Convertible Securities Purchase Agreement; |
| | |
| ● | 13,750,000 unlisted options exercisable at $0.026 (2.6 cents) expiring on 30 September 2022. The options were vested immediately on issue; |
| | |
| ● | Unlisted ZCS issued at USD$1,750,000 at a face value of USD$2,060,000. The ZCS is secured, with a maturity date of 30 November 2020. |
On 7 November 2019, the Company issued 10,391,461 fully paid ordinary shares for settlement of outstanding creditor balances at a deemed issue price of $0.027 (2.7 cents) per share.
On 22 November 2019, the Company issued 18,590,229 fully paid ordinary shares for settlement of outstanding creditor balances at a deemed issue price of $0.021 (2.1 cents) per share.
On 20 December 2019, the Company issued the following:
| ● | 31,967,080 fully paid ordinary shares with a deemed issue price of $0.022 (2.2 cents) per share, in relation to settlement of outstanding creditor balances; |
| ● | 5,946,086 fully paid ordinary shares with a deemed issue price of $0.022 (2.2 cents) per share, in relation to settlement of employee bonuses. |
On 30 December 2019, the Company issued 33,858,947 fully paid ordinary shares for settlement of outstanding creditor balances at a deemed issue price of $0.02 (2 cents) per share.
There were no other significant changes in the state of affairs of the consolidated entity during the financial year.
Matters subsequent to the end of the financial year
On 17 January 2020, the consolidated entity issued 26,975,464 fully paid ordinary shares (Collateral Shares) to Alto at a deemed issue price of $0.017 (1.7 cents) per share.
On 3 March 2020, the consolidated entity issued 30,420,738 fully paid ordinary shares (Collateral Shares) to Alto at a deemed issue price of $0.013 (1.3 cents) per share.
On 13 March 2020, the consolidated entity announced a drawdown of a zero coupon convertible amortising security (“ZCS”) with a face value of US$450,000 at an issue price of US$382,500. The ZCS was issued to Alto Opportunity Master Fund SPC - Segregated Master Portfolio B pursuant to the purchase agreement for ZCS announced by the Company on 23 September 2019.
No other matter or circumstance has arisen since 31 December 2019 that has significantly affected, or may significantly affect the consolidated entity’s operations, the results of those operations, or the consolidated entity’s state of affairs in future financial years.
engage:BDR Limited
Directors’ report
31 December 2019
Likely developments and expected results of operations
Growth of programmatic and mobile app (AdCel) ad revenues the proprietary platforms
As a consequence of the fact that the Group’s platform is now completed and a number of partnerships have been established, the Group expects to grow programmatic and mobile app (AdCel) ad revenues significantly in 2020. This revenue is no longer dependent on third party technologies compared with prior video advertising revenues. In addition, the gross margins expected to be achieved by the Group are likely to increase significantly as the Group is focused on the quality of ad inventory, yielding the constant adjustments of costs of goods sold to publishers. In addition to the growth of the programmatic and mobile app businesses will enable much quicker scale and greater revenue per client (and shorter ramp-up periods). As the supply and demand partnerships are integrated by the engineering teams, the revenue is expected to steadily grow throughout the year.
Continued growth of programmatic display, native and video revenue
The Group also expects to see continued growth of its programmatic display, native and video businesses. Through monetisation of existing partnerships and creation of new ones, the Group expects to be able to significantly scale revenue while maintaining its lower cost operations. This enables optimisation of the Group’s existing relationships and the ability to attract new buyers and sellers.
Growth of influencer marketing revenue
The Group launched its social influencer marketing platform in mid-2017. It brought in additional incremental revenue through this platform and further diversification of the Group’s product and service offering. With Instagram, TikTok, Facebook, YouTube and SnapChat influencers becoming extremely popular, new marketing channels for advertisers and platform efficiencies are required to scale this new form of media. IconicReach, engage:BDR’s Instagram influencer full- and self-serve platform, is focused on being the largest marketplace focused on advertiser-supplied creative, creating a scalable and efficient revenue stream for micro and macro influencers with large audiences. The Group anticipates that several thousand influencers and at least 25 brands will join the IconicReach platform in 2020.
Environmental regulation
The consolidated entity is not subject to any significant environmental regulation under Australian Commonwealth or State law.
engage:BDR Limited
Directors’ report
31 December 2019
Information on directors
| Name: | | Mr Ted Dhanik |
| Title: | | Co-Founder, Executive Chairman and Chief Executive Officer (appointed 14 December 2017) |
| Experience and expertise: | | Ted Dhanik is one of the co-founders of engage:BDR LLC. He serves as Chief Executive Officer overseeing corporate development, strategic marketing, sales and business development, and product strategy. |
| | | |
| | | From 2003 to 2008, Ted worked with MySpace.com developing strategic marketing initiatives. He worked very closely with founders Chris DeWolfe and Tom Anderson and was responsible for launching the brand in its early days through a combination of on and offline campaigns. Ted also worked in business development at LowerMyBills.com until its acquisition by Experian. Ted was also an integral part of the development and launch of the consumer lending program at NexTag Corporation. |
| | | |
| | | He has worked for, or been a partner at, several other companies in business development, sales, and managerial positions, including Xoriant Corporation, Atesto Technologies, Brigade Solutions, Beyond.com/Cybersource Corporation and Merrill Corporation. |
| | | |
| | | Ted also advises a number of technology startups including Fighter, LottoGopher and Schizo Pictures and is an active mentor at Los Angeles-based startup accelerator Start Engine. He is passionate about being a thought leader in the industry and he is regularly published in leading publications. |
| | | |
| | | He regularly contributes to discussions about industry standards and achieving positive change, sitting on IAB committees including the Anti-fraud Workgroup, Anti-malware Workgroup, Traffic of Good intent Task Force, Programmatic Counsel, Digital Video Committee, Mobile Advertising Committee and Performance Marketing Committee. |
| Other current directorships: | | Nil |
| Former directorships (last 3 years): | | Nil |
| Interests in shares: | | 57,681,498 fully paid ordinary shares |
| Interests in options: | | Nil |
| Interests in rights: | | Nil |
| | | |
| Name: | | Mr Kurtis Rintala |
| Title: | | Co-Founder, Executive Director and Chief Operating Officer |
| Experience and expertise: | | Kurtis Rintala was one of the co-founders of engage:BDR LLC. and serves as the Chief Operating Officer for the Group overseeing day-to-day operations and leading the execution of the strategic direction of the Group. |
| | | |
| | | Kurtis is responsible for establishing policies that promote the Group culture and vision. He sets comprehensive goals for performance and growth and encourages optimum performance and dedication. He evaluates performance by analysing and interpreting data and metrics. |
| | | |
| | | Kurtis began his career in the technology industry in 2003 as an early member of the successful internet startup, LowerMyBills.com. |
| Other current directorships: | | Nil |
| Former directorships (last 3 years): | | Nil |
| Interests in shares: | | 36,717,391 fully paid ordinary shares |
| Interests in options: | | Nil |
| Interests in rights: | | Nil |
engage:BDR Limited
Directors’ report
31 December 2019
| Name: | | Mr Tom Anderson |
| Title: | | Non-Executive Director |
| Experience and expertise: | | Tom Anderson was appointed to the Board of the Group as a Non Executive Director to provide the Group with the benefit of his wide ranging expertise in social media and innovative product design and to assist to steer the Group’s future growth strategy. |
| | | |
| | | Prior to joining the engage:BDR, Tom founded and served as President of MySpace, simultaneously inventing “social media” while revolutionizing the music industry. After its launch in 2003, MySpace became the #1 most visited site on the web quickly, surpassing companies such as Google, Yahoo and Amazon. At its peak, Nielsen Net Ratings reported that MySpace captured more than 10% of all minutes spent online. |
| | | |
| | | By the time Anderson left the company in 2009, he had amassed more than 350 million friends on MySpace, making him the first and still ultimately the biggest “influencer” of all time. His MySpace profile photo, which he never changed and still uses to this day is estimated to have been viewed more times than any single photograph in history. |
| | | |
| | | Before retiring in 2009, TIME Magazine included Tom among its list of the 100 most influential people in the world, and Barbara Walters named him one of her 10 Most Fascinating People. |
| | | |
| | | Since retiring, Tom has become an internationally recognised photographer, traveling to more than 40 countries in pursuit of his passion. Tom’s photos have appeared in countless magazines, newspapers, and websites. He now also has a keen interest in architecture and has designed a number of homes. He splits his time between his homes in Las Vegas, Hawaii and Los Angeles. |
| | | |
| | | Prior to his entrepreneurial and creative pursuits, Tom graduated with the Departmental Citation in English and Rhetoric at the University of California at Berkeley and later completed a Masters in Film & Critical Studies at UCLA. |
| Other current directorships: | | Nil |
| Former directorships (last 3 years): | | Nil |
| Interests in shares: | | 1,500,000 fully paid ordinary shares |
| Interests in options: | | Nil |
| Interests in rights: | | Nil |
engage:BDR Limited
Directors’ report
31 December 2019
| Name: | | Mr Darian Pizem |
| Title: | | Non-Executive Director |
| Experience and expertise: | | Darian Pizem is the Co-Founder and current CEO of Blockbuster Ventures based in Sydney. Blockbuster is a blockchain development company that assists companies in the development of blockchain technology, real-time deployment, commercialisation, and other cost-saving measures. |
| | | |
| | | In addition, Mr. Pizem is the founder of Australian based company, Lunnna Ventures. Lunnna Ventures assists in the launching of start-up businesses in a variety of industries, ranging from healthcare to finance. Lunnna assists Company’s through all stages of the businesses development, cycle from the initial idea phase through to branding, partnerships and funding. |
| | | |
| | | Prior to founding his two businesses, Mr. Pizem worked as a Channel Partner for Australia’s DX Solutions, an ICT solutions and delivery service provider. DX specialties in automation, performance equipment, security and penetration testing, DevOps and Cloud solutions, BI and Analysis and Network E2E and B2B capabilities. |
| | | |
| | | Mr. Pizem has over 15 years of experience in the tech industry, working to promote company growth, innovation, and driving new ideas and concepts. He has a strong background in software ventures, with a focus on marketing, operations and management. |
| Other current directorships: | | Nil |
| Former directorships (last 3 years): | | Nil |
| Interests in shares: | | Nil |
| | | |
| Name: | | Mr Robert Antulov |
| Title: | | Non-Executive Director |
| Experience and expertise: | | Robert (Rob) Antulov is a Partner at boutique Australian corporate advisory firm Jacanda Capital, where he provides advice to clients in the technology and media sectors on trade sales, acquisitions and equity growth capital raisings. |
| | | |
| | | Based in Sydney, Rob is a highly accomplished Director with experience in public, private and not for profit enterprises, primarily in the tech and media sectors. He has extensive digital media expertise with strong capabilities in the implementation of technology-oriented growth strategies, most recently in digital media, programmatic advertising and online marketplaces. Rob also brings to engage:BDR specific M&A skills, having participated in over forty corporate transactions as either principal or advisor. |
| | | |
| | | Previous corporate experience has included senior executive roles with Fairfax, Coca-Cola and Booz & Co (now PwC Strategy&). His entrepreneurial activity includes co-founding a sports digital media business, co-founding a number of ecommerce and SaaS businesses and providing mentoring and Advisory Board guidance to numerous entrepreneurs and their ventures. |
| | | |
| | | Rob has a Bachelor of Engineering Degree (Elect) from the University of Western Australia, an MBA from the Australian Graduate School of Management at UNSW and has completed additional postgraduate studies in the USA at the Kellogg School of Management, North Western University. |
| Other current directorships: | | Nil |
| Former directorships (last 3 years): | | Director, Snakk Limited (NXT: SNK) - January 2016 to October 2018 |
| Interests in shares: | | 665,500 fully paid ordinary shares |
| Interests in options: | | Nil |
‘Other current directorships’ quoted above are current directorships for listed entities only and excludes directorships of all other types of entities, unless otherwise stated.
‘Former directorships (last 3 years)’ quoted above are directorships held in the last 3 years for listed entities only and excludes directorships of all other types of entities, unless otherwise stated.
engage:BDR Limited
Directors’ report
31 December 2019
Company secretary
Ms. Melanie Leydin (appointed on 11 July 2019)
Ms Leydin has 25 years’ experience in the accounting profession including 13 years in the Corporate Secretarial professions and is a company secretary and finance officer for a number of entities listed on the Australian Securities Exchange. She is a Chartered Accountant and a Registered Company Auditor. Since February 2000, she has been the principal of Leydin Freyer, specialising in outsourced company secretarial and financial duties.
Mr. Justin Mouchacca (resigned on 11 July 2019)
Mr Mouchacca holds a Bachelor of Business majoring in Accounting. Justin became a Chartered Accountant in 2011 and since July 2013 has been a principal of chartered accounting firm, Leydin Freyer Corp Pty Ltd, specialising in outsourced company secretarial and financial duties. Justin has over 11 years’ experience in the accounting profession including 5 years in the Corporate Secretarial professions and is a company secretary and finance officer for a number of entities listed on the Australian Securities Exchange.
Meetings of directors
The number of meetings of the company’s Board of Directors (‘the Board’) held during the year ended 31 December 2019, and the number of meetings attended by each director were:
| | | Full Board |
| | | Attended | | Held |
| | | | | |
| Ted Dhanik | | 7 | | 7 |
| Kurtis Rintala | | 7 | | 7 |
| Tom Anderson | | 2 | | 7 |
| Darian Pizem | | 7 | | 7 |
| Robert Antulov | | 7 | | 7 |
Held: represents the number of meetings held during the time the director held office.
Remuneration report (audited)
The remuneration report details the key management personnel remuneration arrangements for the Group, in accordance with the requirements of the Corporations Act 2001 and its Regulations.
Key management personnel are those persons having authority and responsibility for planning, directing and controlling the activities of the entity, directly or indirectly, including all directors.
The remuneration report is set out under the following main headings:
| ● | Principles used to determine the nature and amount of remuneration |
| ● | Details of remuneration |
| ● | Service agreements |
| ● | Share-based compensation |
| ● | Additional information |
| ● | Additional disclosures relating to key management personnel |
Principles used to determine the nature and amount of remuneration
The objective of the Group’s executive reward framework is to ensure reward for performance is competitive and appropriate for the results delivered. The framework aligns executive reward with the achievement of strategic objectives and the creation of value for shareholders, and it is considered to conform to the market best practice for the delivery of reward. The Board of Directors (‘the Board’) ensures that executive reward satisfies the following key criteria for good reward governance practices:
| ● | competitiveness and reasonableness |
| ● | acceptability to shareholders |
| ● | performance linkage / alignment of executive compensation |
| ● | transparency |
engage:BDR Limited
Directors’ report
31 December 2019
The Board is responsible for determining and reviewing remuneration arrangements for its directors and executives. The performance of the Group depends on the quality of its directors and executives. The remuneration philosophy is to attract, motivate and retain high performance and high quality personnel.
The Board has structured an executive remuneration framework that is market competitive and complementary to the reward strategy of the Group.
The reward framework is designed to align executive reward to shareholders’ interests. The Board has considered that it should seek to enhance shareholders’ interests by:
| ● | having net profit as a core component of plan design |
| ● | focusing on sustained growth in shareholder wealth, consisting of dividends and growth in share price, and delivering constant or increasing return on assets as well as focusing the executive on key non-financial drivers of value |
| ● | attracting and retaining high calibre executives |
Additionally, the reward framework should seek to enhance executives’ interests by:
| ● | rewarding capability and experience |
| ● | reflecting competitive reward for contribution to growth in shareholder wealth |
| ● | providing a clear structure for earning rewards |
In accordance with best practice corporate governance, the structure of non-executive director and executive director remuneration is separate.
Non-executive directors remuneration
Fees and payments to non-executive directors reflect the demands and responsibilities of their role. Non-executive directors’ fees and payments are reviewed annually by the Board. The Board may, from time to time, receive advice from independent remuneration consultants to ensure non-executive directors’ fees and payments are appropriate and in line with the market.
Executive remuneration
The Group aims to reward executives based on their position and responsibility, with a level and mix of remuneration which has both fixed and variable components.
The executive remuneration and reward framework has four components:
| ● | base pay and non-monetary benefits |
| ● | short-term performance incentives |
| ● | share-based payments |
| ● | other remuneration such as superannuation and long service leave |
The combination of these comprises the executive’s total remuneration.
Fixed remuneration, consisting of base salary and non-monetary benefits, is reviewed annually by the Board based on individual and business unit performance, the overall performance of the Group and comparable market remunerations.
Executives may receive their fixed remuneration in the form of cash or other fringe benefits where it does not create any additional costs to the consolidated entity and provides additional value to the executive.
The short-term incentives (‘STI’) program is designed to align the targets of the business units with the performance hurdles of executives. STI payments are granted to executives based on specific annual targets and key performance indicators (‘KPI’s’) being achieved. KPI’s include profit contribution, customer satisfaction, leadership contribution and product management.
In prior year, share based payments (in Engage BDR LLC) had been issued to executives and a non-executive director, which were prior to the IPO. These were issued in respect of services performed for the Group. Refer to Note 30 of the financial report contained within this Registration statement for further details. All Directors and key management personnel did not receive any share based payments in 2018 financial year.
engage:BDR Limited
Directors’ report
31 December 2019
Details of remuneration
The key management personnel of the Group consisted of the following directors and key management personnel:
| ● | Ted Dhanik (Executive Chairman and Chief Executive Officer) |
| ● | Kurtis Rintala (Executive Director and Chief Operating Officer) |
| ● | Tom Anderson (Non-Executive Director) |
| ● | Darian Pizem (Non-Executive Director) |
| ● | Robert Antulov (Non-Executive Director) |
| ● | Youqi Li (Chief Technology Officer) |
| ● | Andy Dhanik (Chief Revenue Officer) |
| ● | Denys Kravchenko (Chief Technology Officer - AdCel) |
Amounts of remuneration
Details of the remuneration of key management personnel of the Group are set out in the following tables.
| | | Short-term benefits | | | Post-employment | | | Share-based | | | | |
| | | Cash salary and fees | | | Commission /bonus (a) | | | Non-monetary | | | benefits Defined-
contribution plan | | | payments Equity-settled | | | Total | |
| 2019 | | $ | | | $ | | | $ | | | $ | | | $ | | | $ | |
| | | | | | | | | | | | | | | | | | | |
| Non-Executive Directors: | | | | | | | | | | | | | | | | | | | | | | | | |
| Tom Anderson | | | 64,015 | | | | - | | | | - | | | | - | | | | - | | | | 64,015 | |
| Robert Antulov | | | 40,000 | | | | - | | | | - | | | | - | | | | - | | | | 40,000 | |
| Darian Pizem | | | 58,599 | | | | - | | | | - | | | | - | | | | - | | | | 58,599 | |
| | | | | | | | | | | | | | | | | | | | | | | | | |
| Executive Directors: | | | | | | | | | | | | | | | | | | | | | | | | |
| Ted Dhanik (a) | | | 337,789 | | | | 340,664 | | | | - | | | | - | | | | - | | | | 678,453 | |
| Kurtis Rintala | | | 337,789 | | | | - | | | | - | | | | - | | | | - | | | | 337,789 | |
| | | | | | | | | | | | | | | | | | | | | | | | | |
| Other Key Management Personnel: | | | | | | | | | | | | | | | | | | | | | | | | |
| Youqi Li | | | 241,483 | | | | - | | | | - | | | | - | | | | 87,228 | | | | 328,711 | |
| Andy Dhanik (b) | | | 251,545 | | | | - | | | | - | | | | - | | | | 150,243 | | | | 401,788 | |
| Denys Kravchenko | | | 264,775 | | | | - | | | | - | | | | - | | | | 43,614 | | | | 308,389 | |
| | | | 1,595,995 | | | | 340,664 | | | | - | | | | - | | | | 281,085 | | | | 2,217,744 | |
| (a) | Bonus award of $340,664 to Mr. Ted Dhanik was made for 2019. This bonus was an offset against part of loan accounts. Loan items were special exertions from the board to compensate the Executives for significantly reduced payroll in 2011 and 2013 and applied to outstanding loan balances with no cash paid. |
| (b) | Commissions are earned by Mr. Andy Dhanik based on performance to goal. Generally, these performance goals are driven by sales targets and gross profit maximization. Sales and gross margin targets are based on forecasts. Actual performance to goal is compared to arrive at an “Achieved” percentage which is used to determine which Tier of payout they will receive. < 50% is given a 0% payout tier, 51-69% is given a 50% payout tier, 70-79% is given a 70% payout tier, 80-89% is given a 80% payout tier, 90-99% is given a 90% payout tier, and 100% is given a 100% payout tier. The payout tier is then multiplied by the result of dividing the maximum payout amount by the target to arrive at a “Payout Percentage”. The payout percentage is then multiplied by the actual achieved result to arrive at the dollar amount of the payout. |
engage:BDR Limited
Directors’ report
31 December 2019
| | | Short-term benefits | | | Post-employment | | | Share-based | | | | |
| | | Cash salary and fees | | | Commission /bonus | | | Non-monetary | | | benefits Defined-
contribution plan | | | payments Equity-settled | | | Total | |
| 2018 | | $ | | | $ | | | $ | | | $ | | | $ | | | $ | |
| | | | | | | | | | | | | | | | | | | |
| Non-Executive Directors: | | | | | | | | | | | | | | | | | | | | | | | | |
| Bruce McMenamin (a) | | | 36,828 | | | | - | | | | - | | | | - | | | | - | | | | 36,828 | |
| Ron Phillips (b) | | | 40,326 | | | | - | | | | - | | | | - | | | | - | | | | 40,326 | |
| Robert Antulov (c) | | | 1,973 | | | | - | | | | - | | | | - | | | | - | | | | 1,973 | |
| Darian Pizem (d) | | | 4,822 | | | | - | | | | - | | | | - | | | | - | | | | 4,822 | |
| | | | | | | | | | | | | | | | | | | | | | | | | |
| Executive Directors: | | | | | | | | | | | | | | | | | | | | | | | | |
| Ted Dhanik (f) | | | 288,155 | | | | 361,251 | | | | 6,163 | | | | 1,810 | | | | - | | | | 657,379 | |
| Kurtis Rintala (f) | | | 294,850 | | | | 318,678 | | | | 7,233 | | | | - | | | | - | | | | 620,761 | |
| | | | | | | | | | | | | | | | | | | | | | | | | |
| Other Key Management Personnel: | | | | | | | | | | | | | | | | | | | | | | | | |
| Andy Dhanik (e) | | | 234,322 | | | | 251,059 | | | | 6,223 | | | | - | | | | - | | | | 491,604 | |
| | | | 901,276 | | | | 930,988 | | | | 19,619 | | | | 1,810 | | | | - | | | | 1,853,693 | |
| (a) | Mr McMenamin resigned on 30 October 2018 |
| (b) | Mr Phillips resigned on 23 November 2018. |
| (c) | Mr Antulov was appointed on 23 November 2018. |
| (d) | Mr Pizem was appointed on 30 October 2018. |
| (e) | Commissions are earned by Mr Andy Dhanik based on performance to goal. Generally, these performance goals are driven by sales targets and gross profit maximization. Sales and gross margin targets are based on forecasts. Actual performance to goal is compared to arrive at an “Achieved” percentage which is used to determine which Tier of payout they will receive. < 50% is given a 0% payout tier, 51-69% is given a 50% payout tier, 70-79% is given a 70% payout tier, 80-89% is given a 80% payout tier, 90-99% is given a 90% payout tier, and 100% is given a 100% payout tier. The payout tier is then multiplied by the result of dividing the maximum payout amount by the target to arrive at a “Payout Percentage”. The payout percentage is then multiplied by the actual achieved result to arrive at the dollar amount of the payout. |
| (f) | Bonus awards of $361,251 to Mr Ted Dhanik, $318,678 to Mr Kurtis Rintala were agreed to be made on 20 December 2018 in recognition of past additional or special exertions on behalf of the Company since their respective commencements as Directors. These bonuses were off set against part of loan accounts. As a result no cash payments were made by the Company. |
engage:BDR Limited
Directors’ report
31 December 2019
The proportion of remuneration linked to performance and the fixed proportion are as follows:
| | | Fixed remuneration | | | STI - sales commission | | | Share based payments | |
| Name | | 2019 | | | 2018 | | | 2019 | | | 2018 | | | 2019 | | | 2018 | |
| | | | | | | | | | | | | | | | | | | |
| Non-Executive Directors: | | | | | | | | | | | | | | | | | | | | | | | | |
| Tom Anderson | | | 100 | % | | | 100 | % | | | - | | | | - | | | | - | | | | - | |
| Bruce McMenamin | | | - | | | | 100 | % | | | - | | | | - | | | | - | | | | - | |
| Ron Phillips | | | - | | | | 100 | % | | | - | | | | - | | | | - | | | | - | |
| Robert Antulov | | | 100 | % | | | 100 | % | | | - | | | | - | | | | - | | | | - | |
| Darian Pizem | | | 100 | % | | | 100 | % | | | - | | | | - | | | | - | | | | - | |
| | | | | | | | | | | | | | | | | | | | | | | | | |
| Executive Directors: | | | | | | | | | | | | | | | | | | | | | | | | |
| Ted Dhanik | | | 100 | % | | | 100 | % | | | - | | | | - | | | | - | | | | - | |
| Kurtis Rintala | | | 100 | % | | | 100 | % | | | - | | | | - | | | | - | | | | - | |
| | | | | | | | | | | | | | | | | | | | | | | | | |
| Other Key Management Personnel: | | | | | | | | | | | | | | | | | | | | | | | | |
| Youqi Li* | | | 73 | % | | | - | | | | - | | | | - | | | | 27 | % | | | - | |
| Andy Dhanik | | | 63 | % | | | 48 | % | | | - | | | | 52 | % | | | 37 | % | | | - | |
| Denys Kravchenko* | | | 86 | % | | | - | | | | - | | | | - | | | | 14 | % | | | - | |
| * | These employees are considered as key management personnel for 2019 financial year in accordance with AASB 124. |
Service agreements
Remuneration and other terms of employment for key management personnel are formalised in service agreements. Details of these agreements are as follows:
| Name: | | Ted Dhanik |
| Title: | | Executive Chairman and Chief Executive Officer |
| Agreement commenced: | | 14 December 2017 |
| Term of agreement: | | 3 years subject to re-election at any relevant Company Annual General Meeting. |
| Details: | | The fee payable to Director is to be USD$235,000 plus statutory superannuation entitlements per annum from the commencement date. Such fees to be reviewed on each anniversary of the agreement or whenever determined by the Board. |
| | | |
| | | Where for any reason the fees owing to the Director for the services of the Director are not paid for any period of the engagement, or where there are any fees or monies outstanding to Director, the Company will accrue those fees and Director may at its sole option agree for those fees to be paid in the form of fully paid ordinary shares in the Company, subject at all times to the Company obtaining all necessary regulatory and shareholder approvals. |
| | | |
| | | The Director may resign at any time by given written notice to the Company. |
engage:BDR Limited
Directors’ report
31 December 2019
| Name: | | Kurtis Rintala |
| Title: | | Executive Director and Chief Operating Officer |
| Agreement commenced: | | 14 December 2017 |
| Term of agreement: | | 3 years subject to re-election at any relevant Company Annual General Meeting. |
| Details: | | The fee payable to Director is to be USD$235,000 plus statutory superannuation entitlements per annum from the commencement date. Such fees to be reviewed on each anniversary of the agreement or whenever determined by the Board. |
| | | |
| | | Where for any reason the fees owing to the Director for the services of the Director are not paid for any period of the engagement, or where there are any fees or monies outstanding to Director, the Company will accrue those fees and Director may at its sole option agree for those fees to be paid in the form of fully paid ordinary shares in the Company, subject at all times to the Company obtaining all necessary regulatory and shareholder approvals. |
| | | |
| | | The Director may resign at any time by given written notice to the Company. |
| | | |
| Name: | | Darian Pizem |
| Title: | | Non-Executive Director |
| Agreement commenced: | | 30 October 2018 |
| Term of agreement: | | 3 years subject to re-election at any relevant Company Annual General Meeting. |
| Details: | | The fee payable to Director is to be AUD$40,000 plus statutory superannuation entitlements per annum from the commencement date. Such fees to be reviewed on each anniversary of the agreement or whenever determined by the Board. |
| | | |
| | | Where for any reason the fees owing to the Director for the services of the Director are not paid for any period of the engagement, or where there are any fees or monies outstanding to Director, the Company will accrue those fees and Director may at its sole option agree for those fees to be paid in the form of fully paid ordinary shares in the Company, subject at all times to the Company obtaining all necessary regulatory and shareholder approvals. |
| | | |
| | | The Director may resign at any time by given written notice to the Company. |
| | | |
| Name: | | Robert Antulov |
| Title: | | Non-Executive Director |
| Agreement commenced: | | 23 November 2018 |
| Term of agreement: | | 3 years subject to re-election at any relevant Company Annual General Meeting. |
| Details: | | The fee payable to Director is to be AUD$40,000 plus statutory superannuation entitlements per annum from the commencement date. Such fees to be reviewed on each anniversary of the agreement or whenever determined by the Board. |
| | | |
| | | Where for any reason the fees owing to the Director for the services of the Director are not paid for any period of the engagement, or where there are any fees or monies outstanding to Director, the Company will accrue those fees and Director may at its sole option agree for those fees to be paid in the form of fully paid ordinary shares in the Company, subject at all times to the Company obtaining all necessary regulatory and shareholder approvals. |
| | | |
| | | The Director may resign at any time by given written notice to the Company. |
| | | |
| Name: | | Youqi Li |
| Title: | | Chief Technology Officer |
| Agreement commenced: | | 27 August 2015 |
| Term of agreement: | | Ongoing |
| Details: | | Mr Li receives an remuneration package including salary and pension of AUD$249,785 (USD$175,000) per annum. Payment of a benefit on early termination by the Group without cause is equal to 2 months’ base salary. |
| | | |
| | | Notice period - 6 months |
engage:BDR Limited
Directors’ report
31 December 2019
| Name: | | Andy Dhanik |
| Title: | | Chief Revenue Officer |
| Agreement commenced: | | 1 March 2014 |
| Term of agreement: | | Ongoing |
| Details: | | Mr Dhanik receives an remuneration package including salary and pension of AUD$249,785 (USD$175,000) per annum. Payment of a benefit on early termination by the Group without cause is equal to 2 months’ base salary. |
| | | |
| | | Notice period - 6 months |
| | | |
| Name: | | Denys Kravchenko |
| Title: | | Chief Technology Officer (AdCel) |
| Agreement commenced: | | 27 July 2018 |
| Term of agreement: | | Ongoing |
| Details: | | Mr Kravchenko receives an remuneration package including salary and pension of AUD$256,922 (USD$180,000) per annum. Payment of a benefit on early termination by the Group without cause is equal to 2 months’ base salary. |
| | | |
| | | Notice period - 6 months |
Key management personnel have no entitlement to termination payments in the event of removal for misconduct.
Share-based compensation
Issue of shares
Details of shares issued to directors and other key management personnel as part of compensation during the year ended 31 December 2019 are set out below:
| Name | | Date | | Shares | | | Deemed Issue price | | | $AUD | |
| | | | | | | | | | | | |
| Youqi Li | | 7 May 2019 | | | 681,857 | | | $ | 0.042 | | | | 28,638 | |
| Youqi Li | | 9 August 2019 | | | 868,244 | | | $ | 0.034 | | | | 29,520 | |
| Youqi Li | | 20 December 2019 | | | 1,321,353 | | | $ | 0.022 | | | | 29,070 | |
| Andy Dhanik | | 19 March 2019 | | | 680,072 | | | $ | 0.031 | | | | 21,082 | |
| Andy Dhanik | | 8 April 2019 | | | 449,886 | | | $ | 0.047 | | | | 21,145 | |
| Andy Dhanik | | 18 April 2019 | | | 426,354 | | | $ | 0.049 | | | | 20,891 | |
| Andy Dhanik | | 7 May 2019 | | | 511,393 | | | $ | 0.042 | | | | 21,479 | |
| Andy Dhanik | | 10 July 2019 | | | 335,970 | | | $ | 0.043 | | | | 14,447 | |
| Andy Dhanik | | 9 August 2019 | | | 651,183 | | | $ | 0.034 | | | | 22,140 | |
| Andy Dhanik | | 20 December 2019 | | | 1,321,353 | | | $ | 0.022 | | | | 29,070 | |
| Denys Kravchenko | | 7 May 2019 | | | 340,929 | | | $ | 0.042 | | | | 14,319 | |
| Denys Kravchenko | | 9 August 2019 | | | 434,122 | | | $ | 0.034 | | | | 14,760 | |
| Denys Kravchenko | | 20 December 2019 | | | 660,673 | | | $ | 0.022 | | | | 14,535 | |
Options
There were no options over ordinary shares issued to directors and other key management personnel as part of compensation that were outstanding as at 31 December 2019.
There were no options over ordinary shares granted to or vested by directors and other key management personnel as part of compensation during the year ended 31 December 2019.
engage:BDR Limited
Directors’ report
31 December 2019
Additional information
The earnings of the consolidated entity for the five years to 31 December 2019 are summarised below:
| | | 2019 | | | 2018 | | | 2017 | | | 2016* | | | 2015* | |
| | | $ | | | $ | | | $ | | | $ | | | $ | |
| | | | | | | | | | | | | | | | |
| Sales revenue | | | 17,079,118 | | | | 11,443,935 | | | | 13,135,970 | | | | 21,845,216 | | | | 36,919,027 | |
| Operating profit/(loss) | | | 1,604,732 | | | | (6,286,229 | ) | | | (7,098,066 | ) | | | (1,455,961 | ) | | | (2,491,012 | ) |
| Loss before income tax expense | | | (1,343,429 | ) | | | (10,839,127 | ) | | | (9,583,419 | ) | | | (2,927,728 | ) | | | (3,302,832 | ) |
| Loss after income tax expense | | | (1,343,429 | ) | | | (10,840,198 | ) | | | (10,566,001 | ) | | | (3,671,811 | ) | | | (3,302,832 | ) |
| * | The financial result represents engage:BDR LLC’s operating result for the year. |
Additional disclosures relating to key management personnel
Shareholding
The number of shares in the company held during the financial year by each director and other members of key management personnel of the consolidated entity, including their personally related parties, is set out below:
| | | Balance at
the start of
the year | | | Received
as part of
remuneration | | | Additions | | | Disposals | | | Balance at
the end of
the year | |
| Ordinary shares | | | | | | | | | | | | | | | | | | | | |
| Ted Dhanik | | | 55,949,870 | | | | - | | | | - | | | | - | | | | 55,949,870 | |
| Kurtis Rintala | | | 35,217,391 | | | | - | | | | - | | | | - | | | | 35,217,391 | |
| Tom Anderson | | | 1,500,000 | | | | - | | | | - | | | | - | | | | 1,500,000 | |
| Robert Antulov | | | 665,500 | | | | - | | | | - | | | | - | | | | 665,500 | |
| Youqi Li | | | 1,500,000 | | | | 2,871,454 | | | | - | | | | - | | | | 4,371,454 | |
| Andy Dhanik | | | 3,000,000 | | | | 4,376,211 | | | | - | | | | (4,180,000 | ) | | | 3,196,211 | |
| Denys Kravchenko | | | 2,885,904 | | | | 1,435,727 | | | | - | | | | (2,885,904 | ) | | | 1,435,727 | |
| | | | 100,718,665 | | | | 8,683,392 | | | | - | | | | (7,065,904 | ) | | | 102,336,153 | |
Loans to key management personnel and their related parties
As at 31 December 2019 the Group recognised a loan receivable for funds payable by Mr Ted Dhanik (USD$1,191,163; AUD$1,700,204) (2018: USD$1,313,754; AUD$1,864,598) and Mr Andy Dhanik (USD$65,277; AUD$93,173) (2018: USD$71,060; AUD$100,855).
From 1 July 2019, Loans to directors and key management personnel were charged interest at a simple interest rate of 5% per annum, calculated monthly. This interest rate is consistent with local interest rates charged for secured personal debt. For the year ended 31 December 2019, loans given to Mr Ted Dhanik and Mr Andy Dhanik accrued an interest of AUD$35,708 and AUD$1,815 respectively. The loans made to both directors and key management personnel are repayable by 31 August 2020. These have been disclosed as current receivables. $1,267,785 outstanding loans are secured against each individuals’ shareholding and will be settled in cash. All loans were approved by the Board of Directors of the Group.
This concludes the remuneration report, which has been audited.
engage:BDR Limited
Directors’ report
31 December 2019
Shares under option
Unissued ordinary shares of the Company under option at the date of this report are as follows:
| Grant date | | Expiry date | | Exercise price | | | Number under option | |
| | | | | | | | | |
| 14 December 2017 | | 14 December 2020 | | $ | 0.250 | | | | 29,999,993 | |
| 8 March 2019 | | 22 December 2020 | | $ | 0.250 | | | | 4,000,000 | |
| 29 January 2019 | | 26 January 2022 | | $ | 0.052 | | | | 8,676,093 | |
| 25 September 2019 | | 30 September 2022 | | $ | 0.026 | | | | 13,750,000 | |
| | | | | | | | | | | |
| | | | | | | | | | 56,426,086 | |
No person entitled to exercise the options had or has any right by virtue of the option to participate in any share issue of the Company or of any other body corporate.
Shares issued on the exercise of options
There were no ordinary shares of engage:BDR Limited issued on the exercise of options during the year ended 31 December 2019 and up to the date of this report.
Indemnity and insurance of officers
During the financial year, the Group maintained an insurance policy which indemnifies the directors and officers of the Group in respect of any liability incurred in connection with the performance of their duties as directors or officers of the Group to the extent permitted by the Corporations Act 2001. The Group’s insurers have prohibited disclosure of the amount of the premium payable and the level of indemnification under the insurance contract.
The Group has not paid any insurance premiums in respect of any past or present directors or auditors, other than as required by law.
Indemnity and insurance of auditor
The company has not, during or since the end of the financial year, indemnified or agreed to indemnify the auditor of the company or any related entity against a liability incurred by the auditor.
During the financial year, the company has not paid a premium in respect of a contract to insure the auditor of the company or any related entity.
Proceedings on behalf of the Group
As at the date of this report, there are no leave applications or proceedings brought on behalf of the Group under section 237 of the Corporations Act 2001.
Non-audit services
There were no non-audit services provided during the financial year by the current auditor.
Officers of the Company who are former partners of William Buck Audit (Vic) Pty Ltd
There are no officers of the Company who are former partners of William Buck Audit (Vic) Pty Ltd.
Auditor’s independence declaration
A copy of the auditor’s independence declaration as required under section 307C of the Corporations Act 2001 is set out immediately after this Directors’ report.
engage:BDR Limited
Directors’ report
31 December 2019
Restatement of prior year comparative balances
The settlement of amount owing to legacy creditors were previously disclosed as other income. This has been reclassified as an offset against cost of sales in 2019 financial year. As such, the settlement amount of $3,264,585 were credited against cost of sales in the statement of profit or loss and other comprehensive income. The comparative numbers have been restated. $1,485,384 was credited against cost of sales and a corresponding adjustment was made to other income.
Rounding
All values in the Directors’ report have been rounded off the dollar ($) in accordance with Corporations Instrument 2016/191, issued by the Australian Securities and Investments Commission.
This report is made in accordance with a resolution of Directors, pursuant to section 298(2)(a) of the Corporations Act 2001.
On behalf of the Directors
| | |
| Ted Dhanik | |
| Co-Founder and Executive Chairman | |
20 March 2020
engage:BDR Limited
Auditor’s independence declaration

AUDITOR’S INDEPENDENCE DECLARATION UNDER SECTION 307C OF THE CORPORATIONS ACT 2001 TO THE DIRECTORS OF ENGAGE:BDR LIMITED
I declare that, to the best of my knowledge and belief during the year ended 31 December
2019 there have been:
| — | no contraventions of the auditor independence requirements as set out in the Corporations Act 2001 in relation to the audit; and |
| | |
| — | no contraventions of any applicable code of professional conduct in relation to the audit. |
 | |
| William Buck Audit (Vic) Pty Ltd | |
| ABN 59 116 151 136 | |
 | |
| N.S. Benbow | |
| Director | |
Melbourne, 20 March 2020


engage:BDR Limited
Statement of profit or loss and other comprehensive income
For the year ended 31 December 2019
| | | | | Consolidated | |
| | | Note | | 2019 | | | 2018 | |
| | | | | $ | | | $ | |
| | | | | | | | | |
| Revenue from contracts with customers | | 5 | | | 17,079,118 | | | | 11,443,935 | |
| Cost of sales | | | | | (7,794,937 | ) | | | (5,632,553 | ) |
| | | | | | 9,284,181 | | | | 5,811,382 | |
| | | | | | | | | | | |
| Other income | | | | | 89,441 | | | | 113,765 | |
| | | | | | | | | | | |
| Expenses | | | | | | | | | | |
| Employee and contractor costs | | 6 | | | (2,684,608 | ) | | | (5,997,039 | ) |
| Operations and administration expense | | 7 | | | (4,891,711 | ) | | | (5,391,180 | ) |
| Advertising and marketing expense | | | | | (109,301 | ) | | | (269,667 | ) |
| Other expenses | | | | | (83,270 | ) | | | (553,490 | ) |
| | | | | | | | | | | |
| Operating profit/(loss) | | | | | 1,604,732 | | | | (6,286,229 | ) |
| | | | | | | | | | | |
| Depreciation and amortisation expense | | | | | (882,335 | ) | | | (2,615,491 | ) |
| Impairment losses | | | | | (140,004 | ) | | | (1,290,445 | ) |
| Share based payment expense | | | | | (327,536 | ) | | | (284,281 | ) |
| Finance costs | | | | | (1,598,286 | ) | | | (362,681 | ) |
| | | | | | | | | | | |
| Loss before income tax expense | | | | | (1,343,429 | ) | | | (10,839,127 | ) |
| | | | | | | | | | | |
| Income tax expense | | | | | - | | | | (1,071 | ) |
| | | | | | | | | | | |
| Loss after income tax expense for the year attributable to the owners of engage:BDR Limited | | | | | (1,343,429 | ) | | | (10,840,198 | ) |
| | | | | | | | | | | |
| Other comprehensive loss | | | | | | | | | | |
| | | | | | | | | | | |
| Items that will not be reclassified subsequently to profit or loss | | | | | | | | | | |
| Loss on the revaluation of equity instruments at fair value through other comprehensive income, net of tax | | | | | (77,977 | ) | | | (511,767 | ) |
| | | | | | | | | | | |
| Items that may be reclassified subsequently to profit or loss | | | | | | | | | | |
| Exchange differences on translation of foreign operations | | | | | (688,546 | ) | | | (313,039 | ) |
| | | | | | | | | | | |
| Other comprehensive loss for the year, net of tax | | | | | (766,523 | ) | | | (824,806 | ) |
| | | | | | | | | | | |
| Total comprehensive loss for the year attributable to the owners of engage:BDR Limited | | | | | (2,109,952 | ) | | | (11,665,004 | ) |
| | | | | Cents | | | Cents | |
| | | | | | | | | |
| Basic loss per share | | 24 | | | (0.26 | ) | | | (4.03 | ) |
| Diluted loss per share | | 24 | | | (0.26 | ) | | | (4.03 | ) |
The above statement of profit or loss and other comprehensive income should be read in conjunction with the accompanying notes
engage:BDR Limited
Statement of financial position
As at 31 December 2019
| | | | | Consolidated | |
| | | Note | | 2019 | | | 2018 | |
| | | | | $ | | | $ | |
| Assets | | | | | | | | | | |
| | | | | | | | | | | |
| Current assets | | | | | | | | | | |
| Cash and cash equivalents | | 8 | | | 1,831,673 | | | | 320,276 | |
| Trade and other receivables | | 9 | | | 5,786,531 | | | | 2,026,138 | |
| Investments in equity instruments | | | | | 51,692 | | | | 114,314 | |
| Prepaid expenses | | | | | 392,622 | | | | 281,831 | |
| Related party receivables | | 20 | | | 2,311,510 | | | | 2,229,032 | |
| Other assets | | 10 | | | 1,383,616 | | | | - | |
| Total current assets | | | | | 11,757,644 | | | | 4,971,591 | |
| | | | | | | | | | | |
| Non-current assets | | | | | | | | | | |
| Investments in equity instruments | | | | | - | | | | 50,640 | |
| Property, plant and equipment | | | | | 268,811 | | | | 299,497 | |
| Right-of-use assets | | | | | 401,619 | | | | - | |
| Capitalised software costs | | 11 | | | 3,032,083 | | | | 2,519,265 | |
| Goodwill | | 12 | | | 1,468,517 | | | | 1,455,522 | |
| Total non-current assets | | | | | 5,171,030 | | | | 4,324,924 | |
| | | | | | | | | | | |
| Total assets | | | | | 16,928,674 | | | | 9,296,515 | |
| | | | | | | | | | | |
| Liabilities | | | | | | | | | | |
| | | | | | | | | | | |
| Current liabilities | | | | | | | | | | |
| Trade and other payables | | 13 | | | 5,896,438 | | | | 12,447,393 | |
| Borrowings | | 14 | | | 6,791,258 | | | | 2,598,440 | |
| Lease liabilities | | | | | 222,218 | | | | 292,285 | |
| Employee benefits | | | | | - | | | | 52,410 | |
| Contract liabilities | | | | | 81,518 | | | | 409,074 | |
| Total current liabilities | | | | | 12,991,432 | | | | 15,799,602 | |
| | | | | | | | | | | |
| Non-current liabilities | | | | | | | | | | |
| Lease liabilities | | | | | 29,572 | | | | 105,760 | |
| Total non-current liabilities | | | | | 29,572 | | | | 105,760 | |
| | | | | | | | | | | |
| Total liabilities | | | | | 13,021,004 | | | | 15,905,362 | |
| | | | | | | | | | | |
| Net assets/(liabilities) | | | | | 3,907,670 | | | | (6,608,847 | ) |
| | | | | | | | | | | |
| Equity | | | | | | | | | | |
| Issued capital | | 15 | | | 35,582,304 | | | | 20,025,656 | |
| Share based payment reserve | | | | | 603,739 | | | | 3,533,918 | |
| Equity investment reserve | | | | | (2,441,343 | ) | | | (2,363,366 | ) |
| Foreign currency translation reserve | | | | | (787,307 | ) | | | (98,761 | ) |
| Accumulated losses | | | | | (29,049,723 | ) | | | (27,706,294 | ) |
| | | | | | | | | | | |
| Total equity/(deficiency) | | | | | 3,907,670 | | | | (6,608,847 | ) |
The above statement of financial position should be read in conjunction with the accompanying notes
engage:BDR Limited
Statement of changes in equity
For the year ended 31 December 2019
| | | Issued capital | | | Share based payment reserve | | | Equity investment reserve | | | Foreign currency translation reserve | | | Accumulated losses | | | Total deficiency in equity | |
| Consolidated | | $ | | | $ | | | $ | | | $ | | | $ | | | $ | |
| | | | | | | | | | | | | | | | | | | |
| Balance at 1 January 2018 | | | 15,665,594 | | | | 3,533,918 | | | | - | | | | 214,278 | | | | (18,717,695 | ) | | | 696,095 | |
| | | | | | | | | | | | | | | | | | | | | | | | | |
| Adjustment for change in accounting policy | | | - | | | | - | | | | (1,851,599 | ) | | | - | | | | 1,851,599 | | | | - | |
| | | | | | | | | | | | | | | | | | | | | | | | | |
| Balance at 1 January 2018 - restated | | | 15,665,594 | | | | 3,533,918 | | | | (1,851,599 | ) | | | 214,278 | | | | (16,866,096 | ) | | | 696,095 | |
| | | | | | | | | | | | | | | | | | | | | | | | | |
| Loss after income tax expense for the year | | | - | | | | - | | | | - | | | | - | | | | (10,840,198 | ) | | | (10,840,198 | ) |
| Other comprehensive income for the year, net of tax | | | - | | | | - | | | | (511,767 | ) | | | (313,039 | ) | | | - | | | | (824,806 | ) |
| | | | | | | | | | | | | | | | | | | | | | | | | |
| Total comprehensive income for the year | | | - | | | | - | | | | (511,767 | ) | | | (313,039 | ) | | | (10,840,198 | ) | | | (11,665,004 | ) |
| | | | | | | | | | | | | | | | | | | | | | | | | |
| Transactions with owners in their capacity as owners: | | | | | | | | | | | | | | | | | | | | | | | | |
| Contributions of equity, net of transaction costs (note 15) | | | 4,360,062 | | | | - | | | | - | | | | - | | | | - | | | | 4,360,062 | |
| | | | | | | | | | | | | | | | | | | | | | | | | |
| Balance at 31 December 2018 | | | 20,025,656 | | | | 3,533,918 | | | | (2,363,366 | ) | | | (98,761 | ) | | | (27,706,294 | ) | | | (6,608,847 | ) |
| | | Issued capital | | | Share based payment reserve | | | Equity investment reserve | | | Foreign currency translation reserve | | | Accumulated losses | | | Total equity | |
| Consolidated | | $ | | | $ | | | $ | | | $ | | | $ | | | $ | |
| | | | | | | | | | | | | | | | | | | |
| Balance at 1 January 2019 | | | 20,025,656 | | | | 3,533,918 | | | | (2,363,366 | ) | | | (98,761 | ) | | | (27,706,294 | ) | | | (6,608,847 | ) |
| | | | | | | | | | | | | | | | | | | | | | | | | |
| Loss after income tax expense for the year | | | - | | | | - | | | | - | | | | - | | | | (1,343,429 | ) | | | (1,343,429 | ) |
| Other comprehensive income for the year, net of tax | | | - | | | | - | | | | (77,977 | ) | | | (688,546 | ) | | | - | | | | (766,523 | ) |
| | | | | | | | | | | | | | | | | | | | | | | | | |
| Total comprehensive income for the year | | | - | | | | - | | | | (77,977 | ) | | | (688,546 | ) | | | (1,343,429 | ) | | | (2,109,952 | ) |
| | | | | | | | | | | | | | | | | | | | | | | | | |
| Transactions with owners in their capacity as owners: | | | | | | | | | | | | | | | | | | | | | | | | |
| Contributions of equity, net of transaction costs (note 15) | | | 12,334,314 | | | | - | | | | - | | | | - | | | | - | | | | 12,334,314 | |
| Share-based payments (note 25) | | | - | | | | 292,155 | | | | - | | | | - | | | | - | | | | 292,155 | |
| Transfer of legacy investor options to issued capital | | | 3,222,334 | | | | (3,222,334 | ) | | | - | | | | - | | | | - | | | | - | |
| | | | | | | | | | | | | | | | | | | | | | | | | |
| Balance at 31 December 2019 | | | 35,582,304 | | | | 603,739 | | | | (2,441,343 | ) | | | (787,307 | ) | | | (29,049,723 | ) | | | 3,907,670 | |
The above statement of changes in equity should be read in conjunction with the accompanying notes
engage:BDR Limited
Statement of cash flows
For the year ended 31 December 2019
| | | | | Consolidated | |
| | | Note | | 2019 | | | 2018 | |
| | | | | | $ | | | | $ | |
| Cash flows from operating activities | | | | | | | | | | |
| Loss before income tax expense for the year | | | | | (1,343,429 | ) | | | (10,839,127 | ) |
| | | | | | | | | | | |
| Adjustments for: | | | | | | | | | | |
| Depreciation and amortisation | | | | | 882,335 | | | | 2,615,491 | |
| Share-based payments | | | | | 327,536 | | | | 712,205 | |
| Impairment losses | | | | | 140,004 | | | | 1,290,445 | |
| Accrued finance charges | | | | | 1,598,286 | | | | 362,681 | |
| Executive bonuses used to offset related party debt | | | | | 337,127 | | | | 679,929 | |
| Interest income from related party debt | | | | | (78,285 | ) | | | (63,025 | ) |
| | | | | | | | | | | |
| | | | | | 1,863,574 | | | | (5,241,401 | ) |
| | | | | | | | | | | |
| Change in operating assets and liabilities: | | | | | | | | | | |
| (Increase)/decrease in trade and other receivables | | | | | (3,760,393 | ) | | | 852,300 | |
| (Increase)/decrease in prepayments | | | | | (174,922 | ) | | | 276,958 | |
| Decrease in trade and other payables | | | | | (1,045,034 | ) | | | (4,235,367 | ) |
| Increase in contract liabilities | | | | | 81,518 | | | | - | |
| | | | | | | | | | | |
| | | | | | (3,035,257 | ) | | | (8,347,510 | ) |
| Finance charges paid | | | | | (754,997 | ) | | | (245,723 | ) |
| Income taxes paid | | | | | - | | | | (1,071 | ) |
| | | | | | | | | | | |
| Net cash used in operating activities | | | | | (3,790,254 | ) | | | (8,594,304 | ) |
| | | | | | | | | | | |
| Cash flows from investing activities | | | | | | | | | | |
| Proceeds from release of security deposits | | | | | 28,567 | | | | - | |
| Purchase of property, plant and equipment | | | | | - | | | | (42,910 | ) |
| Capitalised software development | | | | | (1,471,447 | ) | | | (405,829 | ) |
| Loans to related parties (shareholders) | | | | | (337,503 | ) | | | (329,432 | ) |
| Acquisition of subsidiary - cash acquired | | | | | - | | | | 115,120 | |
| | | | | | | | | | | |
| Net cash used in investing activities | | | | | (1,780,383 | ) | | | (663,051 | ) |
| | | | | | | | | | | |
| Cash flows from financing activities | | | | | | | | | | |
| Proceeds from capital raises | | 15 | | | 702,784 | | | | 2,211,700 | |
| Cost of capital raise | | | | | (8,222 | ) | | | (120,000 | ) |
| Proceeds from borrowings | | | | | 8,092,379 | | | | 1,150,983 | |
| Repayment of borrowings | | | | | (1,336,444 | ) | | | (87,138 | ) |
| Repayment of lease liabilities | | | | | (357,165 | ) | | | (693,846 | ) |
| | | | | | | | | | | |
| Net cash from financing activities | | | | | 7,093,332 | | | | 2,461,699 | |
| | | | | | | | | | | |
| Net increase/(decrease) in cash and cash equivalents | | | | | 1,522,695 | | | | (6,795,656 | ) |
| Cash and cash equivalents at the beginning of the financial year | | | | | 320,276 | | | | 7,274,894 | |
| Effects of exchange rate changes on cash and cash equivalents | | | | | (11,298 | ) | | | (158,962 | ) |
| | | | | | | | | | | |
| Cash and cash equivalents at the end of the financial year | | 8 | | | 1,831,673 | | | | 320,276 | |
The above statement of cash flows should be read in conjunction with the accompanying notes
engage:BDR Limited
Notes to the financial statements
31 December 2019
Note 1. General information
The financial report is a general purpose financial report which covers engage:BDR Limited, (the ‘parent’ or the ‘Company’) and its 100% owned subsidiaries, engage:BDR LLC, Tiveo LLC (‘Tiveo’; a wholly-owned subsidiary of engage:BDR LLC) and AdCel LLC collectively referred to as ‘the Group’ or ‘engage:BDR’. The financial report is for the year ended 31 December 2019 and is presented in Australian Dollars (‘AUD’). All values in the financial report have been rounded off to the nearest dollar ($) in accordance with Legislative Instrument 2016/191, issued by the Australian Securities and Investments Commission.
engage:BDR Limited is a listed public company limited by shares, incorporated and domiciled in Australia. Its registered office and principal place of business are:
| Registered office | | Principal place of business |
| | | |
| Scottish House | | 8439 W Sunset Boulevard |
| Level 4 | | Suite 302 |
| 90 William Street | | West Hollywood |
| Melbourne Victoria 3000 | | California 90069 |
| Australia | | USA |
A description of the nature of the Group’s operations and its principal activities are included in the Directors’ report, which is not part of the financial report.
The financial statements were authorised for issue, in accordance with a resolution of directors, on 20 March 2020. The directors have the power to amend and reissue the financial statements.
Note 2. Significant accounting policies
The principal accounting policies adopted in the preparation of the financial statements are set out either in the respective notes or below. These policies have been consistently applied to all the years presented, unless otherwise stated.
Basis of preparation
These general purpose financial statements have been prepared in accordance with Australian Accounting Standards and Interpretations issued by the Australian Accounting Standards Board (‘AASB’) and the Corporations Act 2001, as appropriate for for-profit oriented entities. These financial statements also comply with International Financial Reporting Standards as issued by the International Accounting Standards Board (‘IASB’).
Historical cost convention
The financial statements have been prepared under the historical cost convention, except for, where applicable, the revaluation of financial assets and derivative financial liabilities at fair value through profit or loss.
Critical accounting estimates
The preparation of the financial statements requires the use of certain critical accounting estimates. It also requires management to exercise its judgement in the process of applying the consolidated entity’s accounting policies. The areas involving a higher degree of judgement or complexity, or areas where assumptions and estimates are significant to the financial statements, are disclosed in note 3.
Parent entity information
In accordance with the Corporations Act 2001, these financial statements present the results of the consolidated entity only. Supplementary information about the parent entity is disclosed in note 21.
Principles of consolidation
The consolidated financial statements incorporate the assets and liabilities of all subsidiaries of engage:BDR Limited (‘company’ or ‘parent entity’) as at 31 December 2019 and the results of all subsidiaries for the year then ended. engage:BDR Limited and its subsidiaries together are referred to in these financial statements as the ‘consolidated entity’.
engage:BDR Limited
Notes to the financial statements
31 December 2019
Note 2. Significant accounting policies (continued)
Subsidiaries are all those entities over which the consolidated entity has control. The consolidated entity controls an entity when the consolidated entity is exposed to, or has rights to, variable returns from its involvement with the entity and has the ability to affect those returns through its power to direct the activities of the entity. Subsidiaries are fully consolidated from the date on which control is transferred to the consolidated entity. They are de-consolidated from the date that control ceases.
Intercompany transactions, balances and unrealised gains on transactions between entities in the consolidated entity are eliminated. Unrealised losses are also eliminated unless the transaction provides evidence of the impairment of the asset transferred. Accounting policies of subsidiaries have been changed where necessary to ensure consistency with the policies adopted by the consolidated entity.
The acquisition of subsidiaries is accounted for using the acquisition method of accounting. A change in ownership interest, without the loss of control, is accounted for as an equity transaction, where the difference between the consideration transferred and the book value of the share of the non-controlling interest acquired is recognised directly in equity attributable to the parent.
Where the consolidated entity loses control over a subsidiary, it derecognises the assets including goodwill, liabilities and non-controlling interest in the subsidiary together with any cumulative translation differences recognised in equity. The consolidated entity recognises the fair value of the consideration received and the fair value of any investment retained together with any gain or loss in profit or loss.
Going concern
The financial report has been prepared on a going concern basis, which takes into account the net current liabilities of $1,233,788 and negative operating cash flows of $3,790,254 for the year ended 31 December 2019.
These conditions give rise to a material uncertainty that may cast significant doubt about the group’s ability to continue as a going concern.
During the year ended 31 December 2019, the Group improved its net asset position by settling legacy creditors by a way of share issues. The Group also raised additional working capital through a share purchase plan from existing professional and sophisticated investors and zero coupon convertible amortising securities (“ZCSs”) (Refer to note 14). As at the date of this report the directors have assessed that the Group continues to comply with the covenants set under its financing arrangements with its debtor factoring facility and those set by Alto Capital.
Notwithstanding the above the Directors consider the going concern basis to be appropriate giving consideration to:
| ● | Confidence in raising capital as needed; |
| ● | Confidence in achieving the group’s forecast revenues and positive operating cash flow in 2020 through continued completion of planned integrations onto the group’s programmatic advertising platform and growth of the Iconic Reach business; |
| ● | The ability of the Group to settle ZCS note and outstanding creditors via share issue, instead of cash payments; |
| ● | Repayment of some or all of secured related party loan receivables; |
| ● | The Group’s ability, if required, to seek the support from its founders and major shareholders for the further injection of capital; and |
| ● | Its ability to exercise control over discretionary operational cash outflows. |
Accordingly, the accounts have been prepared on a going concern basis.
Should the Group be unable to continue as a going concern, it may be required to realise its assets and extinguish its liabilities other than in ordinary course of business, and at amounts that differ from those stated in the Financial Statements. The financial statements do not include any adjustments related to the recoverability and classification of recorded assets amounts or to the amounts and classification of liabilities that might be necessarily incurred should the consolidated entity not continue as a going concern.
engage:BDR Limited
Notes to the financial statements
31 December 2019
Note 2. Significant accounting policies (continued)
Foreign currency translation
The functional currency of each of the entities in the Group is the currency of the primary economic environment in which each of the entities operate, which is US Dollars (‘USD’) for engage:BDR LLC and AdCel LLC. The financial report is presented in Australian Dollars (‘AUD’) which is the functional currency of the Parent, engage:BDR Limited and presentation currency of the Group.
Foreign currency transactions and balances
Transactions in foreign currencies are initially recorded by the Group’s entities at their respective functional currency spot rates at the date the transaction first qualifies for recognition.
Monetary assets and liabilities denominated in foreign currencies are translated at the functional currency spot rates of exchange at the reporting date.
Differences arising on settlement or translation of monetary items are recognised in profit or loss with the exception of monetary items that are designated as part of the hedge of the Group’s net investment of a foreign operation. These are recognised in OCI until the net investment is disposed of, at which time, the cumulative amount is reclassified to profit or loss. Tax charges and credits attributable to exchange differences on those monetary items are also recorded in OCI.
Non-monetary items that are measured in terms of historical cost in a foreign currency are translated using the exchange rates at the dates of the initial transaction. Non-monetary items measured at fair value in a foreign currency are translated using the exchange rates at the date when the fair value is determined. The gain or loss arising on translation of non-monetary items measured at fair value is treated in line with the recognition of the gain or loss on the change in fair value of the item (i.e., translation differences on items whose fair value gain or loss is recognised in OCI or profit or loss are also recognised in OCI or profit or loss, respectively).
Translation
The assets and liabilities of subsidiaries with a functional currency other than AUD (being the presentation currency of the Group) are translated into AUD at the exchange rate at the reporting date and the statement of comprehensive income is translated at the average exchange rate for the period. On consolidation, exchange differences arising from the translation of these subsidiaries are recognised in other comprehensive income and accumulated in the foreign currency translation reserve. On disposal of a foreign operation, the component of other comprehensive income relating to that particular foreign operation is recognised in the statement of profit or loss.
New standards, interpretations and amendments adopted by the Group
AASB 16 Leases
AASB 16 is applicable for registration statementing periods commencing on or after 1 January 2019. As from 1 January 2019, the Group has adopted AASB 16 in respect to Leases. AASB 16 supersedes AASB 117 Leases and eliminates the classifications of operating leases and finance leases. Subject to exceptions, a ‘Right-of-Use’ asset and a related lease liability will be recognised in the statement of financial position at the commencement date of a lease. The right-of-use asset is measured at cost, which comprises the initial amount of the lease liability, adjusted for, as applicable, any lease payments made at or before the commencement date net of any lease incentives received, any initial direct costs incurred, and, except where included in the cost of inventories, an estimate of costs expected to be incurred for dismantling and removing the underlying asset, and restoring the site or asset. The lease liability is initially recognised at the present value of the non-cancellable lease payments to be made over the term of the lease, discounted using the interest rate implicit in the lease or, if that rate cannot be readily determined, the consolidated entity’s incremental borrowing rate. Lease payments comprise of fixed payments less any lease incentives receivable, variable lease payments that depend on an index or a rate, amounts expected to be paid under residual value guarantees, exercise price of a purchase option when exercise of the option is reasonably certain to occur, and any anticipated termination penalties. The variable lease payments that do not depend on an index or a rate are expensed in the period in which they are incurred. The exceptions to AASB 16 relate to short-term leases of 12 months or less and leases of low-value assets (such as personal computers and small office furniture), where an accounting choice exists whereby either a right-of-use asset is recognised or lease payments are expensed to profit or loss as incurred.
engage:BDR Limited
Notes to the financial statements
31 December 2019
Note 2. Significant accounting policies (continued)
The unwind of the financial charge on the lease liability and the depreciation of the leased asset are recognised in the statement of comprehensive income. Expenses in respect of leases include depreciation of the right-of-use and interest expense in respect of the lease liability. Right-of-use assets are depreciated on a straight-line basis over the unexpired period of the lease or the estimated useful life of the asset, whichever is the shorter. Where the consolidated entity expects to obtain ownership of the leased asset at the end of the lease term, the depreciation is over its estimated useful life. Right-of-use assets are subject to impairment or adjusted for any premeasurement of lease liabilities. Lease liabilities are measured at amortised cost using the effective interest method. The carrying amounts are remeasured if there is a change in the following: future lease payments arising from a change in an index or a rate used; residual guarantee; lease term; certainty of a purchase option and termination penalties. When a lease liability is remeasured, an adjustment is made to the corresponding right-of-use asset, or to profit or loss if the carrying amount of the right-of-use asset is fully written down.
The Group has applied the modified retrospective method of adoption with the date of initial application at 1 January 2019, and therefore the comparative information has not been restated and continues to be reported under the preceding standard, AASB 117. On transition to AASB 16, the Group recognised an additional $281,229 of right-of-use assets and $281,229 of lease liabilities. The Group has recognised a depreciation charge during the period of $64,515 in relation to depreciation of the right-of-use asset, and additional finance costs of $5,324 due to interest expense on the lease liability.
When measuring lease liabilities, the Group discounted the lease payments using an estimated incremental borrowing rate date of initial application of AASB 16. The rate applied was 5.50%.
AASB Interpretation 23 Uncertainty over Income Tax Treatments
Interpretation 23 requires the assessment of whether the effect of uncertainty over income tax treatments should be included in the determination of taxable profit (tax loss), tax bases, unused tax losses, unused tax credits and tax rates. The Interpretation outlines the requirements to determine whether an entity considers uncertain tax treatments separately, the assumptions an entity makes about the examination of tax treatments by taxation authorities, ho w an entity determines taxable profit (tax loss), tax bases, unused tax losses, unused tax credits and tax rates and how an entity considers changes in facts and circumstances.
The Group has adopted Interpretation 23 from 1 January 2019, based on an assessment of whether it is ‘probable’ that a taxation authority will accept an uncertain tax treatment. This assessment takes into account that for certain jurisdictions in which the Group operates, a local tax authority may seek to open a company’s books as far back as inception of the Group. Where it is probable, the Group has determined tax balances consistently with the tax treatment used or planned to be used in its income tax filings. Where the Group has determined that it is not probable that the taxation authority will accept an uncertain tax treatment, the most likely amount or the expected value has been used in determining taxable balances (depending on which method is expected to better predict the resolution of the uncertainty). There has been no impact from the adoption of Interpretation 23 in this reporting period.
New Accounting Standards and Interpretations not yet mandatory or early adopted
Australian Accounting Standards and Interpretations that have recently been issued or amended but are not yet mandatory, have not been early adopted by the Group for the registration statementing period ended 31 December 2019. The Group has not yet assessed the impact of these new or amended Accounting Standards and Interpretations.
Note 3. Critical accounting judgements, estimates and assumptions
The preparation of the financial statements requires management to make judgements, estimates and assumptions that affect the reported amounts in the financial statements. Management continually evaluates its judgements and estimates in relation to assets, liabilities, contingent liabilities, revenue and expenses. Management bases its judgements, estimates and assumptions on historical experience and on other various factors, including expectations of future events, management believes to be reasonable under the circumstances. The resulting accounting judgements and estimates will seldom equal the related actual results. The judgements, estimates and assumptions that have a significant risk of causing a material adjustment to the carrying amounts of assets and liabilities (refer to the respective notes) within the next financial year are discussed below.
engage:BDR Limited
Notes to the financial statements
31 December 2019
Note 3. Critical accounting judgements, estimates and assumptions (continued)
Classification of settlement of amount owing to creditors
The settlement of amount owing to legacy creditors were previously disclosed as other income. This has been reclassified as an offset against cost of sales in 2019 financial year. As such, the settlement amount of $3,264,585 were credited against cost of sales in the statement of profit or loss and other comprehensive income. The comparative numbers have been restated. $1,485,384 was credited against cost of sales and a corresponding adjustment was made to other income.
Share-based payment transactions
The Group measures the cost of equity-settled transactions with employees by reference to the fair value of the equity instruments at the date at which they are granted. The fair value is determined by using either the Binomial or Black-Scholes model taking into account the terms and conditions upon which the instruments were granted. The accounting estimates and assumptions relating to equity-settled share-based payments would have no impact on the carrying amounts of assets and liabilities within the next registration statementing period but may impact profit or loss and equity.
Capitalisation of software costs
Distinguishing the research and development phases of software projects and determining whether the recognition requirements for the capitalisation of development costs are met, requires judgement. Expenditure during the research phase of a project is recognised as an expense when incurred. Development costs are capitalised only when technical feasibility studies identify that the project is expected to deliver future economic benefits and these benefits can be measured reliably. Determining the feasibility of the project and the likelihood of the project delivering future economic benefits, which can be measured reliably, is a significant management estimate and judgement.
Capitalised development costs have a finite useful life and are amortised on a systematic basis based on the future economic benefits over the useful life of the project, typically between 3 and 10 years, and are considered for impairment, based on the presence of indicators, at each reporting date.
After capitalisation, the Group assesses, on an annual basis, whether there is an indication that capitalised costs may be impaired. If any indication exists, the Group estimates the asset’s recoverable amount, which is the higher of the asset’s or cash generating unit (‘CGU’)’s fair value less cost of disposal and its value in use. The Group assesses that each capitalised intangible asset, representing each software project, does not generate cash inflows that are largely independent of those from other assets so has determined the recoverable amount at CGU level. The CGU to which the intangible assets are allocated has been identified as the Group as a whole.
Allowance for expected credit losses
The allowance for expected credit losses assessment requires a degree of estimation and judgement. It is based on the lifetime expected credit loss, grouped based on days overdue, and makes assumptions to allocate an overall expected credit loss rate for each group. These assumptions include recent sales experience and historical collection rates. The recoverability of related party loans are also assessed. The balances are being paid down in accordance with the terms and conditions. The loans are secured against each individuals’ shareholding.
Goodwill
The Group tests annually, or more frequently if events or changes in circumstances indicate impairment, whether goodwill has suffered any impairment, in accordance with the accounting policy stated in note 12. The recoverable amounts of cash-generating units have been determined based on fair value less costs approach, by comparing of the market capitalisation of the Group to its net assets, adjusted for control premium.
Impairment of non-financial assets other than goodwill and other indefinite life intangible assets
The Group assesses impairment of non-financial assets other than goodwill and other indefinite life intangible assets at each reporting date by evaluating conditions specific to the Group and to the particular asset that may lead to impairment. If an impairment trigger exists, the recoverable amount of the asset is determined. This involves fair value less costs of disposal or value-in-use calculations, which incorporate a number of key estimates and assumptions.
Recovery of deferred tax assets
Deferred tax assets are recognised for deductible temporary differences only if the Group considers it is probable that future taxable amounts will be available to utilise those temporary differences and losses. The directors have determined that the losses to date do not validate the requirement to book any DTA for carry forward losses and will consider the recognition of DTAs in future periods.
engage:BDR Limited Notes to the financial statements 31 December 2019 |
Note 3. Critical accounting judgements, estimates and assumptions (continued)
Valuation of embedded derivatives on convertible notes
The Group entered into an agreement with Alto Opportunity Master Fund SPC - Segregated Master Portfolio B (“Alto”) for the issue of zero coupon convertible amortising securities (“ZCSs”). The fair value of the embedded derivative was determined in line with AASB 132 and AASB 9. The future share price of the Group was projected using a Geometric Brownian Motion model for each possible trading day of the amortisation period, with the volatility of each step representing the daily volatility of the Group’s share price over the last year from the valuation date.
A Monte Carlo simulation of 40,000 simulations was conducted for the Geometric Brownian Motion model to obtain theoretical share prices for each amortisation period. This was used to determine the Conversion Discount between the closing share price and the conversion price. The average Conversion Discount represents the fair value of the embedded derivative.
Note 4. Operating segments
In previous year the Group had assessed its operations to comprise of two reportable segments – being programmatic and collaborative marketing trading. However, due to the similar nature and characteristics of these operations, and the fact that they are reported together to the chief operating decision maker (with the only distinction made upon reporting being the split in revenue by programmatic and collaborative marketing) they have been combined and shown together (refer note 5).
Geographic information
| | | Consolidated | |
| | | 2019 | | | 2018 | |
| | | $ | | | $ | |
| | | | | | | |
| Australia | | | 438 | | | | 365 | |
| United State of America | | | 15,994,144 | | | | 10,640,639 | |
| Other* | | | 1,084,536 | | | | 802,931 | |
| | | | | | | | | |
| Total revenue from contract with customers | | | 17,079,118 | | | | 11,443,935 | |
| * | No other single country represents greater than 10% of the Group’s total revenue. |
Major customers
Below is a summary of revenues from major customers where the transactions with each individual customer exceed 10% or more of the Group’s total revenue.
| | | Consolidated | |
| | | 2019 | | | 2018 | |
| | | $ | | | $ | |
| | | | | | | |
| Customer and segment | | | | | | | | |
| Customer A - Programmatic | | | 14,349,414 | | | | 8,959,984 | |
Accounting policy for operating segments
Operating segments are reported in a manner consistent with internal reporting provided to the chief operating decision makers, who provide the strategic direction and management oversight of the Group in terms of monitoring results and approving strategic planning for the business.
Note 5. Revenue from contracts with customers
| | | Consolidated | |
| | | 2019 | | | 2018 | |
| | | | | | | | | |
| Revenue from contracts with customers - Rendering of services | | | 17,079,118 | | | | 11,443,935 | |
engage:BDR Limited Notes to the financial statements 31 December 2019 |
Note 5. Revenue from contracts with customers (continued)
Disaggregation of revenue
The disaggregation of revenue from contracts with customers is as follows:
| | | Consolidated | |
| | | 2019 | | | 2018 | |
| | | $ | | | $ | |
| | | | | | | |
| Programmatic | | | 16,429,753 | | | | 9,899,458 | |
| Collaborative marketing | | | 649,365 | | | | 1,544,477 | |
| | | | | | | | | |
| | | | 17,079,118 | | | | 11,443,935 | |
| | | | | | | | | |
| Geographical regions | | | | | | | | |
| Australia | | | 438 | | | | 365 | |
| United States of America | | | 15,994,144 | | | | 10,640,639 | |
| Other* | | | 1,084,536 | | | | 802,931 | |
| | | | | | | | | |
| | | | 17,079,118 | | | | 11,443,935 | |
| | | | | | | | | |
| Timing of revenue recognition | | | | | | | | |
| Services rendered at a point in time | | | 17,079,118 | | | | 11,443,935 | |
*No other single country represents greater than 10% of the Group’s total revenue.
Accounting policy for revenue from contracts with customers
Revenue is measured at the fair value of the consideration received or receivable. Amounts disclosed as revenue are net of any allowances, duties and taxes paid.
Rendering of services
The Group is an internet-based marketplace platform and associated technology solution provider. The Group’s proprietary technology is used to facilitate the sale of advertising inventory from digital publishers (websites and apps) to advertisers and their agents (brands, agencies and advertising platforms). The Group allows digital publishers to monetise their available advertising space by making the inventory available to multiple advertisers, as well as providing various technologies designed to help publishers create incremental streams of revenue. An example of this technology would be the Group’s OutStream advertising unit, which allows publishers to sell space for video advertising on webpages that do not have video content.
Revenue is recognised at an amount that reflects the consideration to which the Group is expected to be entitled in exchange for transferring goods or services to a customer. For each contract with a customer, the Group:
| ● | Identifies the contract with a customer |
| ● | Identifies the performance obligations in the contract |
| ● | Determines the transaction price |
| ● | Allocates the transaction price to the separate performance obligations |
| ● | Recognises revenue when the performance obligation is satisfied in a manner that depicts the transfer to the customer of the services provided. |
All contracts with customers are standardised and satisfy the criteria of transaction approval, identification of each party’s rights, payment terms, commercial substance, and probable collection based on the customer’s ability and intention to pay. There are no material contracts with customers where there are multiple goods or services promised in which they are distinct and separable in both context and considering other readily available resources. The Group does not offer variable pricing, no significant financing portion, no non-cash consideration, no return rights, and no material lag between collection of monies and delivery of service. The Group does not offer bundled pricing on services provided separately where delivery and settlement is not consistent. The Group does not offer customized goods, receive refundable upfront fees, nor have arrangements where performance obligations are settled over an extended period of time rather than a point in time
| engage:BDR Limited |
| Notes to the financial statements |
| 31 December 2019 |
Note 5. Revenue from contracts with customers (continued)
In recording revenue, the Group evaluates whether they are the principal (i.e., report revenues on a gross basis) or agent (i.e., report revenues on a net basis). The Group provides advertisers and their agents to purchase and place advertising inventory on publishers’ sites. The Group’s performance obligation is facilitating the sale of advertising space and ensuring its placement on the website. The proprietary technology developed and used by the Group counts all bid attempts, tracks the winning bids, and ensures the delivery of the advertisement. All of these data points are used to ensure proper satisfaction of performance obligations. The Group reports the sales of advertising revenues for advertising inventory on a gross basis, that is, the amounts they expect to be entitled to. Amounts paid to suppliers are recorded as cost of sales. Where we are the principal, the Group controls the advertising inventory before it is transferred to its customers. Control is evidenced by the Group’s sole ability to monetise the advertising inventory before it is transferred to its customers, and is further supported by the Group being primarily responsible to its customers and having a level of discretion in establishing pricing.
The Group recognises contract liabilities for consideration received in advance of services provided. Where a customer prepays any portion of a contract, the Group records such prepayments as trade and other payables in the statement of financial position. Prepayments are paid for approximately one month of contract cost in advance, with specific insertion orders allocated to a prepaid amount. These sums will not be recognised as revenue until all obligations pursuant to that insertion order contract have been fulfilled by the Group and approved by the counterparty. The amounts received upfront are not refundable. Revenue for prepayments is recognised only after all performance obligations related to the contract with customers is satisfied.
Note 6. Employee and contractor costs
| | | Consolidated | |
| | | 2019 | | | 2018 | |
| | | $ | | | $ | |
| | | | | | | |
| Salary costs | | | 2,747,590 | | | | 5,609,135 | |
| Defined contribution plan (401(k)) | | | 2,336 | | | | 39,054 | |
| Other payroll-related expenses | | | (65,318 | ) | | | 348,850 | |
| | | | | | | | | |
| Total employee and contractor costs | | | 2,684,608 | | | | 5,997,039 | |
Accounting policy for employee benefits
Wages and salaries, vested sick leave and short-term employee benefits are current liabilities included in employee benefits, measured at the undiscounted amount that the Group expects to pay as a result of the unused entitlement.
Wages, salaries, annual and long service leave
Provision is made for the Group’s liability for employee benefits arising from services rendered by employees to the end of the reporting period. Employee benefits that are expected to be settled within one year have been measured at the amounts expected to be paid when the liability is settled.
Changes in the measurement of the liability are recognised in profit or loss in the Statement of Comprehensive Income. Employee benefits are presented as current liabilities in the Statement of Financial Position if the Group does not have an unconditional right to defer settlement of the liability for at least 12 months after the reporting date.
Defined contribution schemes
The Group has a defined contribution savings plan as defined in subsection 401(k) of the United States Internal Revenue Code. This plan covers substantially all employees who meet minimum age and service requirements and allows participants to defer a portion of their annual compensation. Group contributions to the plan may be made at the discretion of the Board of Directors.
| engage:BDR Limited |
| Notes to the financial statements |
| 31 December 2019 |
Note 7. Operations and administration expense
| | | Consolidated | |
| | | 2019 | | | 2018 | |
| | | $ | | | $ | |
| | | | | | | |
| Technology infrastructure and software costs | | | 1,464,075 | | | | 1,049,672 | |
| Legal and accounting expense | | | 1,201,274 | | | | 1,105,685 | |
| Technical and corporate development expense | | | 593,797 | | | | 656,921 | |
| Bad debt expense | | | 296,404 | | | | 461,063 | |
| Travel expenses | | | 396,086 | | | | 648,799 | |
| Office and other rental expenditure | | | 339,433 | | | | 565,261 | |
| Municipal and other taxes | | | 65,067 | | | | 150,337 | |
| Insurance expense | | | 487,208 | | | | 479,807 | |
| Other operations and administration expenses | | | 48,367 | | | | 273,635 | |
| | | | | | | | | |
| | | | 4,891,711 | | | | 5,391,180 | |
Note 8. Current assets - cash and cash equivalents
| | | Consolidated | |
| | | 2019 | | | 2018 | |
| | | $ | | | $ | |
| | | | | | | | | |
| Cash at bank | | | 1,831,673 | | | | 320,276 | |
Accounting policy for cash and cash equivalents
Cash and cash equivalents includes cash on hand, deposits held at call with financial institutions, other short-term, highly liquid investments with original maturities of three months or less that are readily convertible to known amounts of cash and which are subject to an insignificant risk of changes in value.
Note 9. Current assets - trade and other receivables
| | | Consolidated | |
| | | 2019 | | | 2018 | |
| | | $ | | | $ | |
| | | | | | | |
| Trade receivables [1] | | | 6,230,040 | | | | 2,387,919 | |
| Less: Allowance for expected credit losses | | | (459,615 | ) | | | (489,173 | ) |
| | | | 5,770,425 | | | | 1,898,746 | |
| | | | | | | | | |
| Other receivables | | | 16,106 | | | | 127,392 | |
| | | | | | | | | |
| | | | 5,786,531 | | | | 2,026,138 | |
[1] During the period, the Group entered into an arrangement with a third party to provide an asset backed credit line against trade receivables which are up to 180 days old (refer note 14). Under this arrangement, advances are recorded against certain receivables balances which are factored under the facility. All amounts invoiced are in US Dollars. In accordance with AASB 9 Financial Instruments: Recognition and Measurement, an evaluation is performed to establish whether, substantially, all the risks and rewards have been transferred to the factoring provider. Where the Group concludes this is not the case, the portion of the financial assets corresponding to the Group’s continuous involvement continues to be recognised. When all the risk and rewards are not considered to be transferred, the amount is kept on the balance sheet. Based upon management’s assessment, the Group believes that it has retained risk and rewards, and therefore has not derecognized any financial assets.
engage:BDR Limited Notes to the financial statements 31 December 2019 |
Note 9. Current assets - trade and other receivables (continued)
Transfer of trade receivables
The Group has retained the credit risk associated with the trade receivables, due to the obligation to repurchase from the factoring company any receivables that are deemed uncollectible, and therefore the risks and rewards of the asset reside with the Group. The total carrying amount (which is approximate to fair value) of the trade receivables transferred subject to factoring arrangement is $4,213,186 (December 2018: $1,048,731). This arrangement has no expiration date with an interest rate of 8.00%.
Allowance for expected credit losses
The ageing of the receivables and allowance for expected credit losses provided for above are as follows:
| | | Expected credit loss rate | | | Carrying amount | | | Allowance for expected credit losses | |
| | | 2019 | | | 2018 | | | 2019 | | | 2018 | | | 2019 | | | 2018 | |
| Consolidated | | % | | | % | | | $ | | | $ | | | $ | | | $ | |
| | | | | | | | | | | | | | | | | | | |
| Not overdue | | | 1 | % | | | 1 | % | | | 4,018,586 | | | | 1,532,827 | | | | 40,186 | | | | 15,328 | |
| 0 to 30 days | | | 5 | % | | | 5 | % | | | 1,690,047 | | | | 82,235 | | | | 84,502 | | | | 4,112 | |
| 31 to 60 days | | | 15 | % | | | 11 | % | | | 10,231 | | | | 41,950 | | | | 1,535 | | | | 4,615 | |
| 61 to 90 days | | | 30 | % | | | 30 | % | | | 34,433 | | | | 49,365 | | | | 10,330 | | | | 14,810 | |
| Over 91 days | | | 68 | % | | | 65 | % | | | 476,743 | | | | 681,542 | | | | 324,185 | | | | 443,002 | |
| | | | | | | | | | | | | | | | | | | | | | | | | |
| | | | | | | | | | | | 6,230,040 | | | | 2,387,919 | | | | 460,738 | | | | 481,867 | |
The average age of the Group’s trade receivables is 133 days (2018: 173 days).
In determining the recoverability of a trade receivable, the Group considers any recent history of payments and the status of the projects to which the debt relates. No payment terms have been renegotiated. The concentration of credit risk is limited due to the customer base being large and unrelated. Accordingly, the Directors believe that there is no further provision required in excess of the provision for doubtful debts
Movements in the allowance for expected credit losses are as follows:
| | | Consolidated | |
| | | 2019 | | | 2018 | |
| | | $ | | | $ | |
| | | | | | | |
| Opening balance | | | (489,173 | ) | | | (340,655 | ) |
| Impairment recognised during the year | | | (321,205 | ) | | | (461,063 | ) |
| Amounts written off as uncollectible | | | 364,392 | | | | 355,996 | |
| Exchange difference | | | (13,629 | ) | | | (43,451 | ) |
| | | | | | | | | |
| Closing balance | | | (459,615 | ) | | | (489,173 | ) |
Fair value of receivables
Fair value of receivables at period end is considered to be the same as receivables net of the allowance for impairment.
Accounting policy for trade and other receivables
Trade receivables are initially recognised at fair value and subsequently measured at amortised cost using the effective interest method, less any allowance for expected credit losses. Trade receivables are generally due for settlement within 30 days.
The Group has applied the simplified approach to measuring expected credit losses, which uses a lifetime expected loss allowance. To measure the expected credit losses, trade receivables have been grouped based on days overdue.
Other receivables are recognised at amortised cost, less any allowance for expected credit losses.
| engage:BDR Limited |
| Notes to the financial statements |
| 31 December 2019 |
Note 10. Current assets - other assets
| | | Consolidated | |
| | | 2019 | | | 2018 | |
| | | $ | | | $ | |
| | | | | | | |
| Security deposits | | | 35,564 | | | | - | |
| Shares held in trust* | | | 1,348,052 | | | | - | |
| | | | | | | | | |
| | | | 1,383,616 | | | | - | |
*Share held in trust refers to fully paid ordinary shares issued to a third party which is to be used for settlement of creditor obligations of the Group.
Note 11. Non-current assets - capitalised software costs
| | | Consolidated | |
| | | 2019 | | | 2018 | |
| | | $ | | | $ | |
| | | | | | | |
| Capitalised software costs | | | 7,628,752 | | | | 6,158,244 | |
| Less: Accumulated amortisation | | | (4,596,669 | ) | | | (3,638,979 | ) |
| | | | | | | | | |
| | | | 3,032,083 | | | | 2,519,265 | |
Reconciliations
Reconciliations of the written down values at the beginning and end of the current and previous financial year are set out below:
| | | Capitalised software costs | | | Non-compete clause | | | Total | |
| Consolidated | | $ | | | $ | | | $ | |
| | | | | | | | | | |
| Balance at 1 January 2018 | | | 3,543,983 | | | | 429,777 | | | | 3,973,760 | |
| Additions | | | 585,277 | | | | - | | | | 585,277 | |
| Additions through business combinations | | | 1,142,040 | | | | - | | | | 1,142,040 | |
| De-recognition of ineligible projects | | | (153,470 | ) | | | - | | | | (153,470 | ) |
| Exchange differences | | | 326,532 | | | | - | | | | 326,532 | |
| Impairment of assets | | | (999,029 | ) | | | (291,417 | ) | | | (1,290,446 | ) |
| Amortisation expense | | | (1,926,068 | ) | | | (138,360 | ) | | | (2,064,428 | ) |
| | | | | | | | | | | | | |
| Balance at 31 December 2018 | | | 2,519,265 | | | | - | | | | 2,519,265 | |
| Additions | | | 1,461,157 | | | | - | | | | 1,461,157 | |
| Exchange differences | | | 4,124 | | | | - | | | | 4,124 | |
| Amortisation expense | | | (952,463 | ) | | | - | | | | (952,463 | ) |
| | | | | | | | | | | | | |
| Balance at 31 December 2019 | | | 3,032,083 | | | | - | | | | 3,032,083 | |
Software costs are capitalised only when technical feasibility studies identify that the project is expected to deliver future economic benefit and these benefits can be measured reliably. The development costs have finite useful lives typically between 3 and 10 years, with a weighted average of 3 years (2018: 3 years). Impairment of capitalised software costs is considered at each reporting period.
The review of the business did not identify any impairment of any intangible assets following consideration of indicators of impairment under AASB 136. As at the year ended 31 December 2019, the remaining intangible assets were determined to be deriving positive cash flows related to the identifiable intangible assets and will continue to be amortised in accordance with the Group accounting policy.
| engage:BDR Limited |
| Notes to the financial statements |
| 31 December 2019 |
Note 11. Non-current assets - capitalised software costs (continued)
Accounting policy for capitalised software costs
Research costs are expensed as incurred. An intangible asset arising from development expenditure on an internal project is recognised only when the Group can demonstrate the technical feasibility of completing the intangible asset so that it will be available for use or sale, its intention to complete and its ability to use or sell the asset, how the asset will generate future economic benefits, the availability of resources to complete the development and the ability to measure reliably the expenditure attributable to the intangible asset during its development.
Capitalised software costs are amortised on a straight-line basis over the period of their expected benefit, being their finite life of 3- 10 years.
Note 12. Non-current assets - goodwill
| | | Consolidated | |
| | | 2019 | | | 2018 | |
| | | $ | | | $ | |
| | | | | | | | | |
| Goodwill | | | 1,468,517 | | | | 1,455,522 | |
In assessing for impairment, the Directors considered goodwill in the context of the Group having one cash-generating unit, being Ad media. On that basis, they have assessed impairment applying the fair value less costs to sell method. In making this assessment, the Directors note the following:
| ● | Market capitalisation of the group as at 31 December 2019 was $15,672,689. |
| ● | 20% control premium was factored into the analysis, then compared with net assets of $3,410,208. |
It was concluded that the fair value less cost to sell was greater than the net assets in the cash generating unit, thus no impairment was recognised for the year ending 31 December 2019.
Accounting policy for goodwill
Goodwill arises on the acquisition of a business. Goodwill is not amortised. Instead, goodwill is tested annually for impairment, or more frequently if events or changes in circumstances indicate that it might be impaired, and is carried at cost less accumulated impairment losses. Impairment losses on goodwill are taken to profit or loss and are not subsequently reversed.
Note 13. Current liabilities - trade and other payables
| | | Consolidated | |
| | | 2019 | | | 2018 | |
| | | $ | | | $ | |
| | | | | | | |
| Trade payables | | | 4,949,747 | | | | 9,115,785 | |
| Credit card liabilities | | | 13,852 | | | | 441,173 | |
| Accrued expenses | | | 705,517 | | | | 1,243,575 | |
| Accrued payroll liabilities | | | 19,527 | | | | 237,757 | |
| Bonus and commissions payable | | | 112,255 | | | | 238,696 | |
| Accrued municipal tax | | | 95,540 | | | | 115,350 | |
| Deferred consideration payable for acquisition of business | | | - | | | | 1,055,057 | |
| | | | | | | | | |
| | | | 5,896,438 | | | | 12,447,393 | |
Refer to note 16 for further information on financial instruments.
Accounting policy for trade and other payables
Trade accounts payable and other creditors represent liabilities for goods and services provided to the Group prior to the end of the financial year and which are unpaid. The amounts are unsecured and are measured subsequently at amortised cost using the EIR method. Payment terms vary by creditor but are typically 60 days.
| engage:BDR Limited |
| Notes to the financial statements |
| 31 December 2019 |
Note 14. Current liabilities - borrowings
| | | Consolidated | |
| | | 2019 | | | 2018 | |
| | | $ | | | $ | |
| | | | | | | |
| Debtor factoring borrowings | | | 4,213,186 | | | | 2,598,440 | |
| Convertible notes payable | | | 1,516,403 | | | | - | |
| Embedded derivative on convertible notes | | | 857,808 | | | | - | |
| Other borrowings | | | 203,861 | | | | - | |
| | | | | | | | | |
| | | | 6,791,258 | | | | 2,598,440 | |
Refer to note 16 for further information on financial instruments.
On 23 September 2019, the Company entered into an agreement with Alto Opportunity Master Fund SPC – Segregated Master Portfolio B (“the Investor”) for the issue of zero coupon convertible amortising securities (“ZCSs”), under an initial drawdown and up to 7 further drawdowns.
On 25 September 2019 the Company undertook the initial drawdown of a ZCS with a face value of US$2,060,000 (approximately A$3,038,000 000 at the exchange rate at drawdown date) and an issue price of US$1,750,000 (approximately A$2,580,000 at the exchange rate at drawdown date). The ZCS has a maturity of one year after drawdown.
On 25 September 2019, the Company issued 28.5 million new collateral shares to Alto as security for the ZCS.
During the half year ended, the Company made two instalment repayments of the ZCS, one by a cash payment of US$176,817 (A$260,000) and one by a transfer of 16,372,594, from the balance of collateral shares, with a total value of US$176,817 (A$295,000), based on a share allocation price equal to 85% of the average of the 2 lowest daily VWAPs for the preceding 20 trading days.
During the period the Group issued convertible notes with conversion clauses that were variable. At initial recognition an embedded derivative is recognised on the statement of financial position at fair value and that embedded derivative is subsequently recorded at its fair value thereafter, with changes in fair value going through to the statement of profit or loss and other comprehensive income. The difference between the consideration received (net of costs) and the embedded derivative is reflected in the principal value of the convertible note liability. The underlying debt principal is amortised back to its face value at maturity, net of transaction costs, using the effective interest rate method.
Note 15. Equity - issued capital
| | | Consolidated | |
| | | 2019 | | | 2018 | | | 2019 | | | 2018 | |
| | | Shares | | | Shares | | | $ | | | $ | |
| | | | | | | | | | | | | | | | | |
| Ordinary shares - fully paid | | | 712,394,973 | | | | 288,604,744 | | | | 35,582,304 | | | | 20,025,656 | |
engage:BDR Limited
Notes to the financial statements
31 December 2019
Note 15. Equity - issued capital (continued)
Movements in ordinary share capital
| Details | | Shares | | | $ | |
| | | | | | | |
| Balance as at 1 January 2018 | | | 249,699,958 | | | | 15,665,594 | |
| Shares issued to convertible note holders – principal and interest | | | 2,745,721 | | | | 431,612 | |
| Shares issued to convertible note holders – additional | | | 484,539 | | | | 124,882 | |
| Shares issued during capital raise, net of fees | | | 12,500,000 | | | | 1,880,000 | |
| Shares issued for consulting fees | | | 2,250,000 | | | | 360,000 | |
| Shares issued during Share Purchase Plan | | | 1,294,375 | | | | 204,350 | |
| Shares issued in relation to AdCel acquisition | | | 11,071,951 | | | | 1,007,013 | |
| Shares issued to AdCel executives | | | 5,458,200 | | | | 352,205 | |
| Share issued as collateral for Loan note | | | 3,100,000 | | | | - | |
| | | | | | | | | |
| Balance as at 31 December 2018 | | | 288,604,744 | | | | 20,025,656 | |
| Share issued for purchase plan | | | 25,099,423 | | | | 702,784 | |
| Shares issued as collateral for loan note | | | 30,400,000 | | | | - | |
| Shares issued to convertible note holders | | | 120,825,721 | | | | 2,825,962 | |
| Shares issued for consulting fees | | | 2,589,300 | | | | 74,054 | |
| Shares issued for outstanding creditors | | | 225,233,705 | | | | 6,922,317 | |
| Shares issued for AdCel acquisition | | | 10,657,140 | | | | 1,055,057 | |
| Shares issued for settlement of employee bonuses | | | 8,984,940 | | | | 234,135 | |
| Collateral shares exercised | | | - | | | | 528,227 | |
| Transfer from share based payment reserve | | | - | | | | 3,222,334 | |
| Cost of capital raising | | | - | | | | (8,222 | ) |
| | | | | | | | | |
| Balance as at 31 December 2019 | | | 712,394,973 | | | | 35,582,304 | |
Ordinary shares
Ordinary shares entitle the holder to participate in dividends and the proceeds on the winding up of the company in proportion to the number of and amounts paid on the shares held. The fully paid ordinary shares have no par value and the company does not have a limited amount of authorised capital.
On a show of hands every member present at a meeting in person or by proxy shall have one vote and upon a poll each share shall have one vote.
Share buy-back
There is no current on-market share buy-back.
Accounting policy for issued capital
Ordinary shares are classified as equity.
Incremental costs directly attributable to the issue of new shares or options are shown in equity as a deduction, net of tax, from the proceeds.
Note 16. Financial instruments
Financial risk management objectives
This note explains the Group’s financial risk management and how the exposure to these risks affects the Group’s future financial performance.
The Group’s risk management is carried out by the senior management through delegation from the Board of Directors. Risk management programmes and practices are employed to mitigate the potential adverse effects of these exposures on the results of the Group.
engage:BDR Limited
Notes to the financial statements
31 December 2019
Note 16. Financial instruments (continued)
The Group holds the following financial instruments:
| | | Consolidated | |
| | | 2019 | | | 2018 | |
| | | $ | | | $ | |
| | | | | | | |
| Financial assets | | | | | | | | |
| Cash and cash equivalents | | | 1,831,673 | | | | 320,276 | |
| Trade and other receivables | | | 5,786,531 | | | | 2,026,441 | |
| Related party receivables | | | 2,311,518 | | | | 2,637,326 | |
| Investments in equity instruments | | | 51,692 | | | | 114,314 | |
| Total | | | 9,981,414 | | | | 5,098,357 | |
| | | | | | | | | |
| Financial liabilities | | | | | | | | |
| Trade and other payables - current | | | 5,882,586 | | | | 10,305,181 | |
| Credit card liabilities | | | 13,852 | | | | 441,173 | |
| Current portion of lease liability | | | 222,218 | | | | 292,285 | |
| Non-current portion of lease liability | | | 29,572 | | | | 105,760 | |
| Borrowings - due to factor - current | | | 4,213,186 | | | | 1,048,731 | |
| Borrowings - current | | | 203,861 | | | | 1,549,708 | |
| Convertible notes payable | | | 1,516,403 | | | | - | |
| Embedded derivative on convertible notes | | | 857,808 | | | | - | |
| Deferred payable | | | - | | | | 1,055,057 | |
| Total | | | 12,939,486 | | | | 14,797,895 | |
Market risk
Foreign currency risk
Foreign currency risk is the risk that the fair value or future cash flows of an exposure will fluctuate because of changes in foreign exchange rates. The Group’s exposure to changes in foreign exchange rates is due to the functional currency of the Group being USD and the presentation currency being AUD.
With the exception of financial assets worth AUD$35,223 and financial liabilities worth AUD$2,887,568 denominated in $AUD and other currencies, all other financial assets and liabilities of the Group were denominated in $USD.
There is no material sensitivity to the profit and loss arising from changes in foreign exchange rates, given translation differences are accounted for in the foreign currency translation reserves.
Interest rate risk
Interest rate risk is the risk that the fair value or future cash flows of a financial instrument will fluctuate because of changes in market interest rates. Management has deemed that interest rate risk is not significant for the Group due to the majority of the Group’s financial assets and liabilities being fixed rate.
Credit risk
Credit risk is a risk that a counterparty will default on its contractual obligations resulting in a financial loss to the Group.
The Group faces primary credit risk from potential default on receivables by payment from customers. The credit risk on financial assets of the Group which have been recognised in the Statement of Financial Position is the carrying amount net of any provision for doubtful debts.
The maximum exposure to credit risk by class of recognised financial assets at the end of the reporting period is equivalent to the carrying amount as presented in the Statement of Financial Position.
The credit risk from related parties is the same as external parties (refer note 20).
Generally, trade receivables are written off where there is no reasonable expectation of recovery. Indicators of this include the failure of a debtor to engage in a repayment plan, failure to communicate with the Group, and no meaningful negotiations as a result of legal action.
engage:BDR Limited
Notes to the financial statements
31 December 2019
Note 16. Financial instruments (continued)
Liquidity risk
Prudent liquidity risk management implies maintaining sufficient cash and ensuring that all term deposits can be converted to funds in accordance with forecast cash usage. Due to the dynamic nature of the underlying business, flexibility in funding is maintained by ensuring ready access to the cash reserves of the business.
The ongoing maintenance of the Group’s policy is characterized by ongoing cash flow forecast analysis and detailed budgeting processes which, is directed at providing a sound financial positioning for the Group’s operations and financial management activities. In addition, the Group monitors both the debt and equity markets for additional funding opportunities.
(i) Financial arrangements
The Group had the following borrowing facilities at the end of the reporting period.
| | | Drawn | | | Undrawn | | | Total | |
| 2019 | | $ | | | $ | | | $ | |
| | | | | | | | | | |
| Fixed rate | | | | | | | | | | | | |
| Debtor factoring borrowings (a) | | | 4,213,186 | | | | - | | | | 4,213,186 | |
| Convertible notes (b) | | | 2,497,859 | | | | 34,970,026 | | | | 37,467,885 | |
| | | | | | | | | | | | | |
| | | | 6,711,045 | | | | 34,970,026 | | | | 41,681,071 | |
| (a) | | During the period, the Group entered into an arrangement with a third party to provide an asset backed credit line against trade receivables which are up to 180 days old. Under this arrangement, advances are recorded against certain receivables balances which are factored under the facility. All amounts invoiced are in US Dollars. This arrangement has no expiration date with an interest rate of 8.00%. |
| (b) | | Convertible notes were issued on 19 September 2019. Face value of drawn portion is US$2,060,000 (AU$2,940,336). The face value of total undrawn is US$28,840,000 (AU$41,164,716). The convertible notes expire on 30 November 2020. |
| | | Drawn | | | Undrawn | | | Total | |
| 2018 | | $ | | | $ | | | $ | |
| | | | | | | | | | |
| Fixed rate | | | | | | | | | | | | |
| Loan Notes* | | | 880,938 | | | | 1,064,468 | | | | 1,945,406 | |
| Convertible notes | | | - | | | | 4,798,991 | | | | 4,798,991 | |
| | | | | | | | | | | | | |
| Total | | | 880,938 | | | | 5,863,459 | | | | 6,744,397 | |
* Loan notes were issued on 20 November 2018. On 29 January 2019, a resolution was passed during a shareholder general meeting to issue convertible securities in replacement of the Loan notes. As of 31 December 2019 these have been fully paid.
engage:BDR Limited
Notes to the financial statements
31 December 2019
Note 16. Financial instruments (continued)
(ii) Maturities of financial liabilities
The following table summarises the maturity profile of the Group’s financial liabilities based on contractual undiscounted payments.
| | | Less than 6 months | | | Between 6 to 12 months | | | Between 1 and 2 years | | | Between 2 and 3 years | | | Remaining contractual maturities | |
| Consolidated - 2019 | | $ | | | $ | | | $ | | | $ | | | $ | |
| | | | | | | | | | | | | | | | |
| Trade and other payables | | | 5,882,586 | | | | - | | | | - | | | | - | | | | 5,882,586 | |
| Credit card liabilities | | | 13,852 | | | | - | | | | - | | | | - | | | | 13,852 | |
| Borrowings - Due to factor* | | | 4,216,126 | | | | - | | | | - | | | | - | | | | 4,216,126 | |
| Convertible notes payable** | | | 1,424,527 | | | | 949,684 | | | | - | | | | - | | | | 2,374,211 | |
| Borrowings (principal) - Promissory notes | | | 55,349 | | | | - | | | | - | | | | - | | | | 55,349 | |
| Borrowings - Other | | | 148,512 | | | | - | | | | - | | | | - | | | | 148,512 | |
| Total non-derivatives | | | 11,740,952 | | | | 949,684 | | | | - | | | | - | | | | 12,690,636 | |
| * | | Borrowings represent the advances recorded against certain receivables balances which are factored under the facility. |
| ** | | Convertible note balance comprised of the principal and interest payable the Group entered in on 19 September 2019. The convertible note expires on 18 November 2020. |
| | | Less than 6 months | | | Between 6 and 12 months | | | Between 1 and 2 years | | | Between 2 and 3 years | | | Remaining contractual maturities | |
| Consolidated - 2018 | | $ | | | $ | | | $ | | | $ | | | $ | |
| | | | | | | | | | | | | | | | |
| Trade and other payables | | | 11,357,346 | | | | 2,892 | | | | - | | | | - | | | | 11,360,238 | |
| Credit card liabilities | | | 441,173 | | | | - | | | | - | | | | - | | | | 441,173 | |
| Borrowings - Due to factor | | | 1,048,731 | | | | - | | | | - | | | | - | | | | 1,048,731 | |
| Borrowings (principal) - Promissory notes | | | 668,770 | | | | - | | | | - | | | | - | | | | 668,770 | |
| Loan notes | | | 880,938 | | | | - | | | | - | | | | - | | | | 880,938 | |
| Deferred payable | | | 1,055,057 | | | | - | | | | - | | | | - | | | | 1,055,057 | |
| Total non-derivatives | | | 15,452,015 | | | | 2,892 | | | | - | | | | - | | | | 15,454,907 | |
(iii) Fair value of financial instruments
Unless otherwise stated, the carrying amounts of financial instruments reflect their fair value.
Capital management strategy
The Group’s policy is to maintain a capital structure for the business which ensures sufficient liquidity, provides support for business operations, maintains shareholder confidence and positions the business for future growth. The Group manages its capital structure and makes adjustments in light of changes in economic conditions.
The ongoing maintenance of the Group’s policy is characterised by ongoing cash flow forecast analysis and detailed budgeting processes which, combined with continual development of banking relationships, is directed at providing a sound financial positioning for the Group’s operations and financial management activities.
The Group has an ASX-imposed restriction of 15% of total share capital per annum on the amount of share capital it can issue under a placement, which may be increased by a further 10% under a special resolution put to shareholders at its general meetings.
Note 17. Fair value measurement
The Group’s assets and liabilities, measured or disclosed at fair value, using a three level hierarchy, based on the lowest level of input that is significant to the entire fair value measurement, being:
engage:BDR Limited
Notes to the financial statements
31 December 2019
Note 17. Fair value measurement (continued)
| ● | Level 1: Quoted prices (unadjusted) in active markets for identical assets or liabilities that the entity can access at the measurement date; |
| ● | Level 2: Inputs other than quoted prices included within Level 1 that are observable for the asset or liability, either directly or indirectly |
| ● | Level 3: Unobservable inputs for the asset or liability |
With the exception of embedded derivatives which is measured using level 2 inputs (refer note 3), all other major financial assets and liabilities are measured using level 1 inputs.
Accounting policy for fair value measurement
When an asset or liability, financial or non-financial, is measured at fair value for recognition or disclosure purposes, the fair value is based on the price that would be received to sell an asset or paid to transfer a liability in an orderly transaction between market participants at the measurement date; and assumes that the transaction will take place either: in the principal market; or in the absence of a principal market, in the most advantageous market.
Fair value is measured using the assumptions that market participants would use when pricing the asset or liability, assuming they act in their economic best interests. For non-financial assets, the fair value measurement is based on its highest and best use. Valuation techniques that are appropriate in the circumstances and for which sufficient data are available to measure fair value, are used, maximising the use of relevant observable inputs and minimising the use of unobservable inputs.
Assets and liabilities measured at fair value are classified into three levels, using a fair value hierarchy that reflects the significance of the inputs used in making the measurements. Classifications are reviewed at each reporting date and transfers between levels are determined based on a reassessment of the lowest level of input that is significant to the fair value measurement.
For recurring and non-recurring fair value measurements, external valuers may be used when internal expertise is either not available or when the valuation is deemed to be significant. External valuers are selected based on market knowledge and reputation. Where there is a significant change in fair value of an asset or liability from one period to another, an analysis is undertaken, which includes a verification of the major inputs applied in the latest valuation and a comparison, where applicable, with external sources of data.
Note 18. Key management personnel disclosures
Directors
The following persons were directors of engage:BDR Limited during the financial year:
| Mr Ted Dhanik (Executive Chairman and Chief Executive Officer) | | |
| Mr Kurtis Rintala (Executive Director and Chief Operating Officer) | | |
| Mr Tom Anderson (Non-Executive Director) | | |
| Mr Darian Pizem (Non-Executive Director) | | |
| Mr Robert Antulov (Non-Executive Director) | | |
Other key management personnel
The following persons also had the authority and responsibility for planning, directing and controlling the major activities of the consolidated entity, directly or indirectly, during the financial year:
| Mr Youqi Li (Chief Technology Officer) | | |
| Mr Andy Dhanik (Chief Revenue Officer) | | |
| Mr Denys Kravchenko (Chief Technology Officer - AdCel) | | |
engage:BDR Limited
Notes to the financial statements
31 December 2019
Note 18. Key management personnel disclosures (continued)
Compensation
The aggregate compensation made to directors and other members of key management personnel of the consolidated entity is set out below:
| | | Consolidated | |
| | | 2019 | | | 2018 | |
| | | $ | | | $ | |
| | | | | | | |
| Short-term employee benefits | | | 1,936,659 | | | | 1,851,883 | |
| Share-based payments | | | 281,085 | | | | - | |
| 401(k) withholding | | | - | | | | 1,810 | |
| | | | | | | | | |
| | | | 2,217,744 | | | | 1,853,693 | |
Note 19. Remuneration of auditors
During the financial year the following fees were paid or payable for services provided by William Buck Audit (Vic) Pty Ltd, the auditor of the company:
| | | Consolidated | |
| | | 2019 | | | 2018 | |
| | | $ | | | $ | |
| | | | | | | |
| Audit services - William Buck Audit (Vic) Pty Ltd (2018: BDO East Coast Partnership) | | | | | | | | |
| Audit or review of the financial statements | | | 50,000 | | | | 70,000 | |
Note 20. Related party transactions
Parent entity
engage:BDR Limited is the parent entity.
Subsidiaries
Interests in subsidiaries are set out in note 22.
Key management personnel
Disclosures relating to key management personnel are set out in note 18 and the remuneration report included in the directors’ report.
Loans to/from related parties
The following balances are outstanding at the reporting date in relation to loans with related parties:
| | | Consolidated | |
| | | 2019 | | | 2018 | |
| | | $ | | | $ | |
| | | | | | | |
| Beginning of the year | | | 2,229,032 | | | | 2,277,582 | |
| Loans advanced | | | 337,503 | | | | 329,432 | |
| Bonus awarded to key management personnel offset against loan balances | | | (337,127 | ) | | | (672,582 | ) |
| Interest charged | | | 78,285 | | | | 63,025 | |
| Exchange difference | | | 3,817 | | | | 231,575 | |
| | | | | | | | | |
| | | | 2,311,510 | | | | 2,229,032 | |
engage:BDR Limited
Notes to the financial statements
31 December 2019
Note 20. Related party transactions (continued)
Terms and conditions
From 1 July 2019, Loans to directors and key management personnel were charged interest at a simple interest rate of 5% per annum, calculated monthly. This interest rate is consistent with local interest rates charged for secured personal debt. The loans made to both directors and key management personnel are repayable by 31 August 2020. These have been disclosed as current receivables. $1,267,785 outstanding loans are secured against each individuals’ shareholding and will be settled in cash. All loans were approved by the Board of Directors of the Group.
Note 21. Parent entity information
Set out below is the supplementary information about the parent entity.
Statement of profit or loss and other comprehensive income
| | | Parent | |
| | | 2019 | | | 2018 | |
| | | $ | | | $ | |
| | | | | | | |
| Loss after income tax | | | (16,464,271 | ) | | | (15,694,070 | ) |
| | | | | | | | | |
| Total comprehensive income | | | (16,464,271 | ) | | | (15,694,070 | ) |
Statement of financial position
| | | Parent | |
| | | 2019 | | | 2018 | |
| | | $ | | | $ | |
| | | | | | | |
| Total current assets | | | 48,244 | | | | 192,541 | |
| | | | | | | | | |
| Total assets | | | 6,795,238 | | | | 192,541 | |
| | | | | | | | | |
| Total current liabilities | | | 2,887,568 | | | | 2,209,371 | |
| | | | | | | | | |
| Total liabilities | | | 2,887,568 | | | | 2,209,371 | |
| | | | | | | | | |
| Equity | | | | | | | | |
| Issued capital | | | 35,582,304 | | | | 13,485,689 | |
| Share based payment reserve | | | 603,739 | | | | 311,583 | |
| Accumulated losses | | | (32,278,373 | ) | | | (15,814,102 | ) |
| | | | | | | | | |
| Total equity/(deficiency) | | | 3,907,670 | | | | (2,016,830 | ) |
Guarantees entered into by the parent entity in relation to the debts of its subsidiaries
The parent entity had no guarantees in relation to the debts of its subsidiaries as at 31 December 2019 (2018: None).
Contingent liabilities
The parent entity had no contingent liabilities as at 31 December 2019 (2018: None).
Capital commitments - Property, plant and equipment
The parent entity had no capital commitments for property, plant and equipment as at 31 December 2019 (2018: None).
Significant accounting policies
The accounting policies of the parent entity are consistent with those of the consolidated entity, as disclosed in note 2, except for the following:
| ● | Investments in subsidiaries are accounted for at cost, less any impairment, in the parent entity. |
| ● | Investments in associates are accounted for at cost, less any impairment, in the parent entity. |
| ● | Dividends received from subsidiaries are recognised as other income by the parent entity and its receipt may be an indicator of an impairment of the investment. |
engage:BDR Limited
Notes to the financial statements
31 December 2019
Note 22. Interests in subsidiaries
The consolidated financial statements incorporate the assets, liabilities and results of the following subsidiaries in accordance with the accounting policy described in note 2:
| | | | | Ownership interest | |
| | | Principal place of business / | | 2019 | | | 2018 | |
| Name | | Country of incorporation | | % | | | % | |
| | | | | | | | | |
| engage:BDR LLC | | United States of America | | | 100 | % | | | 100 | % |
| Tiveo LLC* | | United States of America | | | 100 | % | | | 100 | % |
| AdCel LLC | | United States of America | | | 100 | % | | | 100 | % |
| * | | Tiveo LLC is a wholly owned subsidiary of engage:BDR LLC. |
Note 23. Events after the reporting period
On 17 January 2020, the consolidated entity issued 26,975,464 fully paid ordinary shares (Collateral Shares) to Alto at a deemed issue price of $0.017 (1.7 cents) per share.
On 3 March 2020, the consolidated entity issued 30,420,738 fully paid ordinary shares (Collateral Shares) to Alto at a deemed issue price of $0.013 (1.3 cents) per share.
On 13 March 2020, the consolidated entity announced a drawdown of a zero coupon convertible amortising security (“ZCS”) with a face value of US$450,000 at an issue price of US$382,500. The ZCS was issued to Alto Opportunity Master Fund SPC - Segregated Master Portfolio B pursuant to the purchase agreement for ZCS announced by the Company on 23 September 2019.
No other matter or circumstance has arisen since 31 December 2019 that has significantly affected, or may significantly affect the consolidated entity’s operations, the results of those operations, or the consolidated entity’s state of affairs in future financial years.
engage:BDR Limited
Notes to the financial statements
31 December 2019
Note 24. Earnings per share
| | | Consolidated | |
| | | 2019 | | | 2018 | |
| | | $ | | | $ | |
| | | | | | | | | |
| Loss after income tax attributable to the owners of engage:BDR Limited | | | (1,343,429 | ) | | | (10,840,198 | ) |
| | | Number | | | Number | |
| | | | | | | |
| Weighted average number of ordinary shares used in calculating basic earnings per share | | | 515,130,862 | | | | 269,188,212 | |
| | | | | | | | | |
| Weighted average number of ordinary shares used in calculating diluted earnings per share | | | 515,130,862 | | | | 269,188,212 | |
| | | Cents | | | Cents | |
| | | | | | | |
| Basic loss per share | | | (0.26 | ) | | | (4.03 | ) |
| Diluted loss per share | | | (0.26 | ) | | | (4.03 | ) |
Accounting policy for earnings per share
Basic earnings per share
Basic earnings per share is calculated by dividing the profit attributable to the owners of engage:BDR Limited, excluding any costs of servicing equity other than ordinary shares, by the weighted average number of ordinary shares outstanding during the financial year, adjusted for bonus elements in ordinary shares issued during the financial year.
engage:BDR Limited
Notes to the financial statements
31 December 2019
Note 24. Earnings per share (continued)
Diluted earnings per share
Diluted earnings per share adjusts the figures used in the determination of basic earnings per share to take into account the after income tax effect of interest and other financing costs associated with dilutive potential ordinary shares and the weighted average number of shares assumed to have been issued for no consideration in relation to dilutive potential ordinary shares.
As the Group incurred a loss for the period under review and in the prior year, potential ordinary shares, being options to acquire ordinary shares, are considered non-dilutive and therefore not included in the diluted earnings per share calculation.
Note 25. Share-based payments
During the 2019 financial year, the Group issued the following share options:
| ● | | 8,676,093 unlisted options to corporate advisors exercisable at $0.052, expiring 29 January 2022. The options were vested immediately on issue; |
| ● | | 4,000,000 listed options as consideration for corporate advisory services, exercisable at $0.25 (25 cents) per option by 22 December 2020. The options were vested immediately on issue; |
| ● | | 13,750,000 unlisted options exercisable at $0.026 (2.6 cents) expiring on 30 September 2022. The options were vested immediately on issue. |
Set out below are summaries of options granted under the plan:
| 2019 | | | | | | | | | | | | | | | | | | | | |
| | | | | | | | Balance at | | | | | | | | | Expired/ | | | Balance at | |
| | | | | Exercise | | | the start of | | | | | | | | | forfeited/ | | | the end of | |
| Grant date | | Expiry date | | price | | | the year | | | Granted | | | Exercised | | | other | | | the year | |
| | | | | | | | | | | | | | | | | | | | | |
| 14/12/2017 | | 14/12/2020 | | $ | 0.250 | | | | 29,999,993 | | | | - | | | | - | | | | - | | | | 29,999,993 | |
| 29/01/2019 | | 26/01/2022 | | $ | 0.052 | | | | - | | | | 8,676,093 | | | | - | | | | - | | | | 8,676,093 | |
| 08/03/2019 | | 22/12/2020 | | $ | 0.250 | | | | - | | | | 4,000,000 | | | | - | | | | - | | | | 4,000,000 | |
| 25/09/2019 | | 30/09/2022 | | $ | 0.026 | | | | - | | | | 13,750,000 | | | | - | | | | - | | | | 13,750,000 | |
| | | | | | | | | | 29,999,993 | | | | 26,426,093 | | | | - | | | | - | | | | 56,426,086 | |
| Weighted average exercise price | | $ | 0.250 | | | $ | 0.068 | | | | - | | | | - | | | $ | 0.165 | |
| 2018 | | | | | | | | | | | | | | | | | | | | |
| | | | | | | | Balance at | | | | | | | | | Expired/ | | | Balance at | |
| | | | | Exercise | | | the start of | | | | | | | | | forfeited/ | | | the end of | |
| Grant date | | Expiry date | | price | | | the year | | | Granted | | | Exercised | | | other | | | the year | |
| | | | | | | | | | | | | | | | | | | | | |
| 14/12/2017 | | 14/12/2020 | | $ | 0.250 | | | | - | | | | 29,999,993 | | | | - | | | | - | | | | 29,999,993 | |
| | | | | | | | | | - | | | | 29,999,993 | | | | - | | | | - | | | | 29,999,993 | |
| Weighted average exercise price | | | - | | | $ | 0.250 | | | | - | | | | - | | | $ | 0.250 | |
Set out below are the options exercisable at the end of the financial year:
| | | | | 2019 | | | 2018 | |
| Grant date | | Expiry date | | Number | | | Number | |
| | | | | | | | | |
| 14/12/2017 | | 14/12/2020 | | | 29,999,993 | | | | 29,999,993 | |
| 29/01/2019 | | 26/01/2022 | | | 8,676,093 | | | | - | |
| 08/03/2019 | | 22/12/2020 | | | 4,000,000 | | | | - | |
| 25/09/2019 | | 30/09/2022 | | | 13,750,000 | | | | - | |
| | | | | | | | | | | |
| | | | | | 56,426,086 | | | | 29,999,993 | |
engage:BDR Limited
Notes to the financial statements
31 December 2019
Note 25. Share-based payments (continued)
For the options granted during the current financial year, the valuation model inputs used to determine the fair value at the grant date, are as follows:
| | | | | Share price | | | Exercise | | | Expected | | | Dividend | | | Risk-free | | | Fair value | |
| Grant date | | Expiry date | | at grant date | | | price | | | volatility | | | yield | | | interest rate | | | at grant date | |
| | | | | | | | | | | | | | | | | | | | | |
| 29/01/2019 | | 26/01/2022 | | $ | 0.038 | | | $ | 0.052 | | | | - | | | | - | | | | - | | | $ | 0.015 | |
| 08/03/2019 | | 22/12/2022 | | $ | 0.019 | | | $ | 0.250 | | | | - | | | | - | | | | - | | | $ | 0.001 | |
| 25/09/2019 | | 30/09/2022 | | $ | 0.023 | | | $ | 0.026 | | | | - | | | | - | | | | - | | | $ | 0.011 | |
During the 2019 financial year, the Group issued fully paid ordinary shares to employees and contractors (refer note 15), the spot price ranging between $0.021 (2.1 cents) and $0.051 (5.1 cents) was used to determine the equity value.
Accounting policy for share-based payments
The Group provides benefits to employees in the form of share-based payment transactions, whereby employees render services in exchange for shares or rights over shares. The Group has issued shares to directors and employees for the year ended 31 December 2019 as compensation and has issued shares to a third parties in lieu of services provided.
The cost of share-based payments is measured by reference to the fair value of options at the date at which they are granted. The fair value of options granted is determined by using the Monte Carlo simulation or the binomial option valuation model. The assumptions and models used for estimating fair value for share-based payment transactions are disclosed above.
For employee related share based payments, the fair value of options is recognised as an employee benefit expense with a corresponding increase in equity. The fair value is measured at grant date and recognised over the period during which the employee becomes conditionally entitled to the option.
For third party share based payments, the fair value of options is recognised as being a deduction from the initial public offering proceeds raised, with a corresponding increase in equity.
If the non-vesting condition is within the control of the consolidated entity or employee, the failure to satisfy the condition is treated as a cancellation. If the condition is not within the control of the consolidated entity or employee and is not satisfied during the vesting period, any remaining expense for the award is recognised over the remaining vesting period, unless the award is forfeited.
If equity-settled awards are cancelled, it is treated as if it has vested on the date of cancellation, and any remaining expense is recognised immediately. If a new replacement award is substituted for the cancelled award, the cancelled and new award is treated as if they were a modification.
Note 26. Contingent assets and liabilities
The Directors are not aware of any contingent assets or contingent liabilities as at 31 December 2019 (2018: Nil)
Note 27. Changes to unaudited Preliminary Financial Report
On 28 February 2020, the Group released its unaudited preliminary financial report for the year ended 31 December 2019. Upon finalisation of the audit, due to the complexity of the share facility, an adjustment has been made to increase shares held in trust. Consequentially adjustments have been made to impairment losses and foreign currency translation reserve. The Group also made an reallocation between right-of-use assets and property, plant and equipment.
engage:BDR Limited
Notes to the financial statements
31 December 2019
Note 27. Changes to unaudited Preliminary Financial Report (continued)
The tables below summaries the impact to statement of profit or loss and other comprehensive income and statement of financial position:
| | | Unaudited | | | | | | Audited | |
| | | Appendix 4E | | | Adjustment | | | final report | |
| Statement of profit or loss and other comprehensive income (condensed) | | $ | | | $ | | | $ | |
| | | | | | | | | | |
| Operating profit | | | 1,604,732 | | | | - | | | | 1,604,732 | |
| Depreciation and amortisation expense | | | (882,335 | ) | | | - | | | | (882,335 | ) |
| Impairment losses | | | - | | | | (140,004 | ) | | | (140,004 | ) |
| Share based payment expense | | | (327,536 | ) | | | - | | | | (327,536 | ) |
| Finance costs | | | (1,598,286 | ) | | | - | | | | (1,598,286 | ) |
| Loss after income tax expense | | | (1,203,425 | ) | | | (140,004 | ) | | | (1,343,429 | ) |
| | | | | | | | | | | | | |
| Other comprehensive loss | | | | | | | | | | | | |
| Loss on the revaluation of equity instruments at fair value through other comprehensive income, net of tax | | | (77,977 | ) | | | - | | | | (77,977 | ) |
| Exchange differences on translation of foreign operations | | | (1,326,012 | ) | | | 637,466 | | | | (688,546 | ) |
| Other comprehensive loss for the year, net of tax | | | (1,403,989 | ) | | | 637,466 | | | | (766,523 | ) |
| | | | | | | | | | | | | |
| Total comprehensive loss for the year | | | (2,607,414 | ) | | | 497,462 | | | | (2,109,952 | ) |
| | | Appendix 4E | | | Adjustment | | | Audited final report | |
| | | Cents | | | Cents | | | Cents | |
| | | | | | | | | | |
| Basic loss per share | | | (0.23 | ) | | | (0.03 | ) | | | (0.26 | ) |
| Diluted loss per share | | | (0.23 | ) | | | (0.03 | ) | | | (0.26 | ) |
engage:BDR Limited
Notes to the financial statements
31 December 2019
Note 27. Changes to unaudited Preliminary Financial Report (continued)
| | | Unaudited | | | | | | Audited | |
| | | Appendix 4E | | | Adjustments | | | financial report | |
| Statement of financial position (condensed) | | $ | | | $ | | | $ | |
| | | | | | | | | | |
| Assets | | | | | | | | | | | | |
| Cash and cash equivalents | | | 1,831,673 | | | | - | | | | 1,831,673 | |
| Trade and other receivables | | | 5,786,531 | | | | - | | | | 5,786,531 | |
| Investment in equity instruments | | | 51,692 | | | | - | | | | 51,692 | |
| Prepaid expenses | | | 392,622 | | | | - | | | | 392,622 | |
| Related party receivables | | | 2,311,510 | | | | - | | | | 2,311,510 | |
| Other assets | | | 886,154 | | | | 497,462 | | | | 1,383,616 | |
| Property, plant and equipment | | | - | | | | 268,811 | | | | 268,811 | |
| Right-of-use assets | | | 670,430 | | | | (268,811 | ) | | | 401,619 | |
| Intangibles | | | 3,032,083 | | | | - | | | | 3,032,083 | |
| Goodwill | | | 1,468,517 | | | | - | | | | 1,468,517 | |
| Total assets | | | 16,431,212 | | | | 497,462 | | | | 16,928,674 | |
| | | | | | | | | | | | | |
| Total current liabilities | | | 12,991,432 | | | | - | | | | 12,991,432 | |
| Total non-current liabilities | | | 29,572 | | | | - | | | | 29,572 | |
| Total liabilities | | | 13,021,004 | | | | - | | | | 13,021,004 | |
| | | | | | | | | | | | | |
| Net assets | | | 3,410,208 | | | | 497,462 | | | | 3,907,670 | |
| | | | | | | | | | | | | |
| Equity | | | | | | | | | | | | |
| Issued capital | | | 35,582,304 | | | | - | | | | 35,582,304 | |
| Share based payment reserve | | | 603,739 | | | | - | | | | 603,739 | |
| Equity investment reserve | | | (2,441,343 | ) | | | - | | | | (2,441,343 | ) |
| Foreign currency translation reserve | | | (1,424,773 | ) | | | 637,466 | | | | (787,307 | ) |
| Accumulated losses | | | (28,909,719 | ) | | | (140,004 | ) | | | (29,049,723 | ) |
| Total Equity | | | 3,410,208 | | | | 497,462 | | | | 3,907,670 | |
engage:BDR Limited
Directors’ declaration
31 December 2019
In the directors’ opinion:
| ● | the attached financial statements and notes comply with the Corporations Act 2001, the Accounting Standards, the Corporations Regulations 2001 and other mandatory professional reporting requirements; |
| ● | the attached financial statements and notes comply with International Financial Reporting Standards as issued by the International Accounting Standards Board as described in note 2 to the financial statements; |
| ● | the attached financial statements and notes give a true and fair view of the consolidated entity’s financial position as at 31 December 2019 and of its performance for the financial year ended on that date; and |
| ● | there are reasonable grounds to believe that the company will be able to pay its debts as and when they become due and payable. |
The directors have been given the declarations required by section 295A of the Corporations Act 2001.
Signed in accordance with a resolution of directors made pursuant to section 295(5)(a) of the Corporations Act 2001.
On behalf of the directors
| | |
| Ted Dhanik | |
| Co-Founder and Executive Chairman | |
| | |
| 20 March 2020 | |
engage:BDR Limited
Independent auditor’s report to the members of engage:BDR Limited
[This page has intentionally been left blank for the insertion of page one of the independent auditor’s report]
engage:BDR Limited
Independent auditor’s report to the members of engage:BDR Limited
[This page has intentionally been left blank for the insertion of page two of the independent auditor’s report]
engage:BDR Limited
Independent auditor’s report to the members of engage:BDR Limited
[This page has intentionally been left blank for the insertion of page three of the independent auditor’s report]
engage:BDR Limited
Independent auditor’s report to the members of engage:BDR Limited
[This page has intentionally been left blank for the insertion of page four of the independent auditor’s report]
engage:BDR Limited
Independent auditor’s report to the members of engage:BDR Limited
[This page has intentionally been left blank for the insertion of page five of the independent auditor’s report]
engage:BDR Limited
Independent auditor’s report to the members of engage:BDR Limited
[This page has intentionally been left blank for the insertion of page six of the independent auditor’s report]
engage:BDR Limited
Independent auditor’s report to the members of engage:BDR Limited
[This page has intentionally been left blank for the insertion of page seven of the independent auditor’s report]
engage:BDR Limited
Shareholder information
31 December 2019
The shareholder information set out below was applicable as at 18 March 2020.
Distribution of equitable securities
Analysis of number of equitable security holders by size of holding:
| | | Number of holders of ordinary shares | | | % units | | | Number of holders of listed options over ordinary shares | | | % units | | | Number of holders of unlisted options expiring 30 January 2022, exercisable at $0.052 | | | % units | | | Number of holders of unlisted options expiring 30 September 2022, exercisable at $0.026 | | | % units | | | Number of holder of unlisted zero coupon convertible amortising securities issued at USD$1,750,000 at a current face value of USD$1,339,000 | | | % units | | | Number of holder of unlisted zero coupon convertible amortising securities issued at USD$382,500 at a current face value of USD$450,000 | | | % units | |
| | | | | | | | | | | | | | | | | | | | | | | | | | | | | | | | | | | | | |
| 1 to 1,000 | | | 51 | | | | | | | | - | | | | - | | | | 1 | | | | 100 | | | | 1 | | | | 100 | | | | 1 | | | | 100 | | | | 1 | | | | 100 | |
| 1,001 to 5,000 | | | 51 | | | | 0.02 | | | | 224 | | | | 3.29 | | | | - | | | | - | | | | - | | | | - | | | | - | | | | - | | | | - | | | | - | |
| 5,001 to 10,000 | | | 201 | | | | 0.25 | | | | 299 | | | | 6.10 | | | | - | | | | - | | | | - | | | | - | | | | - | | | | - | | | | - | | | | - | |
| 10,001 to 100,000 | | | 1,043 | | | | 5.41 | | | | 263 | | | | 17.46 | | | | - | | | | - | | | | - | | | | - | | | | - | | | | - | | | | - | | | | - | |
| 100,001 and over | | | 577 | | | | 94.31 | | | | 40 | | | | 73.15 | | | | - | | | | - | | | | - | | | | - | | | | - | | | | - | | | | - | | | | - | |
| | | | | | | | | | | | | | | | | | | | | | | | | | | | | | | | | | | | | | | | | | | | | | | | | |
| | | | 1,923 | | | | 100 | | | | 826 | | | | 100 | | | | 1 | | | | 100 | | | | 1 | | | | 100 | | | | 1 | | | | 100 | | | | 1 | | | | 100 | |
| | | | | | | | | | | | | | | | | | | | | | | | | | | | | | | | | | | | | | | | | | | | | | | | | |
| Holding less than a marketable parcel | | | 814 | | | | | | | | - | | | | | | | | - | | | | | | | | - | | | | | | | | | | | | | | | | | | | | - | |
engage:BDR Limited
Shareholder information
31 December 2019
Equity security holders
Twenty largest quoted equity security holders
The names of the twenty largest security holders of quoted equity securities are listed below:
| | | Ordinary shares | |
| | | | | | % of total | |
| | | | | | shares | |
| | | Number held | | | issued | |
| | | | | | | |
| First Round Capital LLC | | | 57,681,498 | | | | 7.49 | |
| Mr Kenneth Kwan | | | 52,529,242 | | | | 6.82 | |
| Alto Opportunity Master Fund + SPC (Segregated Master Port B A/C) | | | 36,852,539 | | | | 4.79 | |
| Mr Kurtis Rintala | | | 36,717,391 | | | | 4.77 | |
| Mrs Elizabeth Anne Macrae | | | 28,200,000 | | | | 3.66 | |
| GHJC Pty Ltd | | | 26,399,799 | | | | 3.43 | |
| Wippit Holdings Pty Ltd | | | 20,500,000 | | | | 2.66 | |
| Hoi An Investment Pty Ltd | | | 18,207,746 | | | | 2.37 | |
| Citicorp Nominees Pty Limited | | | 17,050,068 | | | | 2.21 | |
| Argon Blockchain Holdings | | | 15,210,302 | | | | 1.98 | |
| GHC Nominees Pty Ltd (Jeffco A/C) | | | 13,500,198 | | | | 1.75 | |
| Mr Geoffrey Mark Cottle | | | 12,575,000 | | | | 1.63 | |
| Mr Abdulaziz Saleh Alrajhi | | | 9,341,647 | | | | 1.21 | |
| Dr David James Walland | | | 7,200,000 | | | | 0.94 | |
| J P Morgan Nominees Australia Pty Limited | | | 7,197,777 | | | | 0.94 | |
| Neweconomy Com Au Nominees Pty Limited (900 Account) | | | 7,002,187 | | | | 0.91 | |
| RCL Run Capital Limited | | | 6,518,789 | | | | 0.85 | |
| Mr David Anthony Weir | | | 6,376,900 | | | | 0.83 | |
| Mr Benchun Zhou | | | 6,193,018 | | | | 0.80 | |
| Coffee Camp Pty Ltd (Coffee Camp A/C) | | | 6,098,807 | | | | 0.79 | |
| | | | | | | | | |
| | | | 391,352,908 | | | | 50.83 | |
engage:BDR Limited
Shareholder information
31 December 2019
| | | Listed options over ordinary shares | |
| | | | | | % of total | |
| | | | | | options | |
| | | Number held | | | issued | |
| | | | | | | |
| Bellaire Capital Pty Ltd (Bellaire Capital Invest A/C) | | | 4,000,000 | | | | 11.76 | |
| GHJC Pty Ltd | | | 2,226,921 | | | | 6.55 | |
| Mr Jorgen Ulrik Jorgensen | | | 1,682,634 | | | | 4.95 | |
| Mr Colin Richard Korn | | | 1,509,236 | | | | 4.44 | |
| Vesterbo Pty Ltd (J Jorgensen Super Fund A/C) | | | 1,117,366 | | | | 3.29 | |
| Clarksons Boathouse Pty Ltd (Clarkson Super Fund A/C) | | | 1,075,000 | | | | 3.16 | |
| Mr Henry Christopher Ponniah | | | 1,072,003 | | | | 3.15 | |
| Mr Christopher John Girling + Ms Yvette Louise Clark (Moloscyg Superannuation A/C) | | | 1,065,650 | | | | 3.13 | |
| Mr Girish Mallesara Hiriyannagowda | | | 1,060,939 | | | | 3.12 | |
| Mr Luke Steven Schembri | | | 1,001,111 | | | | 2.94 | |
| Mr Jeffrey William Cozens | | | 1,000,000 | | | | 2.94 | |
| Conrad Joseph Lawrence Goodger | | | 801,260 | | | | 2.36 | |
| Sean Anthony Mulligan + Anya Rebecca Mulligan (S & A Mulligan Super A/C) | | | 800,000 | | | | 2.35 | |
| Wine Guru Australia Pty Ltd (Donela Family A/C) | | | 730,754 | | | | 2.15 | |
| Michael James Dixon | | | 711,706 | | | | 2.09 | |
| Mr Ernie Aljin Abella | | | 358,429 | | | | 1.05 | |
| Mr John Antony Thomas | | | 326,000 | | | | 0.96 | |
| Mr Patrick Gerard Durkin | | | 300,000 | | | | 0.88 | |
| Ajava Holdings Pty Ltd | | | 290,000 | | | | 0.85 | |
| Mr Kevin Daniel Leary + Mrs Helen Patricia Leary (Kevin & Helen Leary S/F A/C) | | | 250,000 | | | | 0.74 | |
| Rubenstein Family Investments Pty Ltd (Rubenstein Family A/C) | | | 250,000 | | | | 0.74 | |
| | | | | | | | | |
| | | | 21,629,009 | | | | 63.61 | |
Unquoted equity securities
| | | Number | | | Number | |
| | | on issue | | | of holders | |
| | | | | | | |
| Unlisted listed options expiring 30 January 2022, exercisable at $0.052 | | | 8,676,093 | | | | 1 | |
| Unlisted listed options expiring 30 September 2022, exercisable at $0.026 | | | 13,750,000 | | | | 1 | |
| Unlisted zero coupon convertible amortising securities issued at USD$1,750,000 at a current face value of US$1,339,000 | | | 1 | | | | 1 | |
| Unlisted zero coupon convertible amortising securities (Series B) issued at USD$382,500 at a current face value of US$450,000 | | | 1 | | | | 1 | |
The following persons hold 20% or more of unquoted equity securities:
| Name | | Class | | Number held | |
| | | | | | |
| CST Capital Pty Ltd (CST Investments Fund A/C) | | Unlisted options expiring 30 January 2022, exercisable at $0.052 | | | 8,676,093 | |
| Alto Opportunity Master Fund + SPC (Segregated Master Port B A/C) | | Unlisted options expiring 30 September 2022, exercisable at $0.026 | | | 13,750,000 | |
| Alto Opportunity Master Fund + SPC (Segregated Master Port B A/C) | | Unlisted zero coupon convertible amortising securities issued at USD$1,750,000 at a current face value of US$1,339,000 | | | 1 | |
| Alto Opportunity Master Fund + SPC (Segregated Master Port B A/C) | | Unlisted zero coupon convertible amortising securities (Series B) issued at USD$382,500 at a current face value of US$450,000 | | | 1 | |
engage:BDR Limited
Shareholder information
31 December 2019
Substantial holders in the company are set out below:
| | | Ordinary shares | |
| | | | | | % of total | |
| | | | | | shares | |
| | | Number held | | | issued | |
| | | | | | | |
| First Round Capital LLC | | | 57,681,498 | | | | 7.49 | |
| Mr Kenneth Kwan | | | 52,529,242 | | | | 6.82 | |
Voting rights
Ordinary shares
On a show of hands every member present at a meeting in person or by proxy shall have one vote and upon a poll each share shall have one vote.
Other securities
Other classes of securities issued by the Company do not carry voting rights.
Annual General Meeting
Engage:BDR Limited advises that its Annual General Meeting will be held on or about Friday 29 May 2020. The time and other details relating to the meeting will be advised in the Notice of Meeting to be sent to all Shareholders and released to ASX immediately upon despatch.
The Closing date for receipt of nomination for the position of Director is Wednesday 8 April 2020. Any nominations must be received in writing no later than 5.00pm (Melbourne time) on Wednesday, 8 April 2020 at the Company’s Registered Office.
The Company notes that the deadline for nominations for the position of Director is separate to voting on Director elections. Details of the Director’s to be elected will be provided in the Company’s Notice of Annual General Meeting in due course.
Corporate Governance Statement
The Company’s 2019 Corporate Governance Statement has been released to ASX on this day and is available on the Company’s website at: https://engagebdr.com/investor-center/board-management-and-corporate-governance/
ITEM 19. EXHIBITS
SIGNATURES
The registrant hereby certifies that it meets all of the requirements for filing on Form 20-F and that it has duly caused and authorized the undersigned to sign this registration statement on its behalf.
| | ENGAGE BDR Ltd |
| | | |
| | By: | /s/ Ted Dhanik |
Date: June 8, 2021