Exhibit 99.1
PART I
ITEM 1. BUSINESS
Unless otherwise indicated or the context otherwise requires, references in this section to “we,” “our,” “us,” “XBP Europe, “the Company” and similar terms are to XBP Europe Inc. and its subsidiaries before the Business Combination, and to XBP Europe Holdings, Inc. following consummation of the Business Combination, except where the context requires otherwise.
Overview
We are a pan-European integrator of bills, payments and related solutions and services seeking to enable digital transformation of our clients. We believe our business ultimately advances digital transformation, improves market-wide liquidity by expediting payments, and encourages sustainable business practices.
Our solutions and services serve clients of varying sizes in multiple industries, and across public and private sectors. Our larger reporting segment is the Bills & Payments segment where revenue stems from transactions processed by our products and services, including bill and payments processing, from our locations or from client locations. In 2023, this revenue stream generated approximately $122 million (approximately 73% of total revenues). Our other reporting segment is the Technology segment where revenue stems from the sale of recurring and perpetual software licenses and related maintenance, professional services, and sale of hardware solutions and related maintenance, which represented the remainder of our revenue or $45 million (27% of total revenues) in 2023.
In total, we serve over 2,000 clients across Europe (including a smaller number in the Middle East and Africa). Our client concentration is relatively low, with the top 10 clients accounting for 26% of our revenue in each of 2023 and 2022, and the top 100 clients accounting for 76.3% and 73.8% of revenue in 2023 and 2022, respectively. For the fiscal year ended December 31, 2023, we generated $167 million of revenue.
We process several hundred million payment transactions annually. This volume is achieved using a hybrid of our cloud-based infrastructure and platforms, which enables us to deploy our business solutions to clients across the European market, and also to the Middle East and Africa (together with Europe, “EMEA”), where we have a smaller number of clients. Our physical footprint spans 15 countries and 32 locations. We host our products both on our own and our client premises and as a SaaS offering in the cloud. These offerings, along with several hybrid solutions are available to clients based on their needs and preferences. We offer a flexible model when it comes to our licenses, whereby clients can choose among licenses covering a maximum number of transactions, multi-year term licenses with renewal options, perpetual licenses or per user subscriptions. Our flexible deployment model has attracted many leading banking and financial institutions, including some of the largest in Europe. Among these institutions is Finanz Informatik (“FI”), the
1
IT service provider of the Savings Banks Finance Group, a German financial institution with approximately $3.0 trillion in business volume and more than 50 million end-customers.
We intend to enhance and expand our product and service offerings by adding emerging standards to our bills and payments solutions, such as our Request to Pay and Confirmation of Payee offerings, which should position us as one of the few companies within the broader open banking initiative that can offer solutions across industries. Since the Closing, we have expanded our offering to include XBP Omnidirect, a cloud-based communication management platform, and Reaktr.ai, our cyber-security, data modernization and cloud management business unit which is powered by AI, both of which are covered in more detail below, and which aim to expand our solution stack among the existing and new client base, thereby resulting in higher value client relationships.
We offer an industry-agnostic and cross-departmental suite of products, which centers around finance and accounting (“F&A”) solutions and services and is comprised of the XBP Platform, Request to Pay, enterprise information management, robotic process automation, Digital Mailroom, business process management and workflow automation, and integrated communication services. We also offer industry specific solutions for banking and financial services. Since the COVID-19 pandemic has changed the way people and businesses operate, we have rolled out a suite of Work From Anywhere (“WFA”) applications with enterprise software for connectivity and productivity to better enable remote work.
Industry-agnostic and Cross-departmental Solutions
XBP Platform — exchange for bills and payments
The XBP platform provides a secured network, allowing billers, consumers and businesses to communicate and transact utilizing a modern technology stack that can connect to any client system without significant capital investments by new clients. Business-to-business (“B2B”) billers are able to communicate with payers electronically, offering transparency and simplified reconciliations. By structuring and linking data across disparate client systems, our XBP platform can be rapidly implemented using each client’s existing infrastructure and in-country settlement processes. This product allows payers to receive their bills in a single place, with analytics, alerts and several payment options. Downstream processes can be integrated with actionable data that is offered as a value-added service.
2
The XBP platform payment solutions enable consolidation of inbound payment channels and data continuity to enhance treasury management. Among other things, the product offers integrated receivables dashboards, multi-channel bill presentment and payment, reconciliation, exception and dispute management, ageing analytics, collections management, and targeted engagements.
Through the introduction of the XBP platform for small and medium sized businesses (“SMB”), clients are able to access our XBP web portal and leverage rich features to organize their bills, initiate communication and manage account receivables (“AR”) effectively, all designed to improve liquidity by expediting payments. We also use the XBP platform as the tool to support our ERP data consolidation offering, for which we see a market demand and which we will be offering our clients beginning in 2024. Any enterprise which has more than one ERP system likely faces challenges in consolidating the data from multiple ERPs, which is time consuming, prone to errors, and delays reporting and decision-making. We use our robotic process automation (“RPA”) suite, along with off the shelf ERP connectors to extract data from multiple ERPs, and feed it into XBP for clients to have one consolidated view without data being compromised or delayed due to manual handling.
Our accounts payable (“AP”) solution enables clients to simplify the complexities of supplier onboarding and management through a user-friendly user-interface (“UI”). Our AP solution can be integrated with our Digital Mailroom technology, which is able to process both digital and non-digital (e.g., paper) data. The AP solution process begins by initiating a requisition. Once approved, the requisition moves to procurement, where bids are solicited from an approved supplier network. We believe that supporting our clients by making our supplier network available may be a key differentiator in enabling a complete AP solution. Our AP solution also records receipt of goods and invoices and performs three-way matching digitally. Exceptions are processed and once approved in accordance with the client’s processes, the purchase is recorded in the client’s ERP system, so that it can be paid. We then use our system to generate and deliver a payment file in the format the bank needs so that a payment can be processed. Some of our clients also authorize us to process the payment on their behalf. Additionally, we deploy advanced AI-enabled solutions to decipher complex invoices and provide forecasts and insights into legacy accounting platforms.
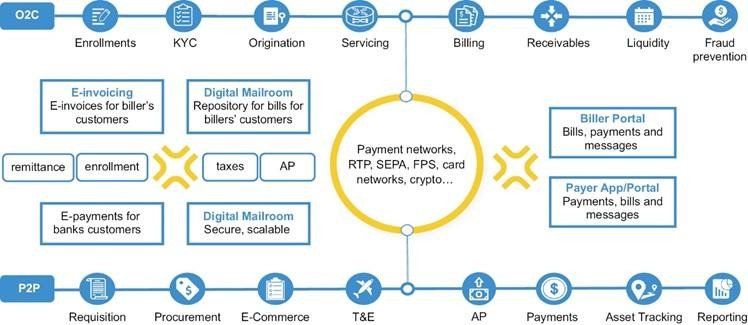
Plug and play solutions across the Procure-to-Pay (P2P) and Order-to-Cash (O2C) cycle to simplify and personalize user experience, optimize treasury management, and facilitate compliance while reducing administrative cost.
3
Request To Pay (RTP)
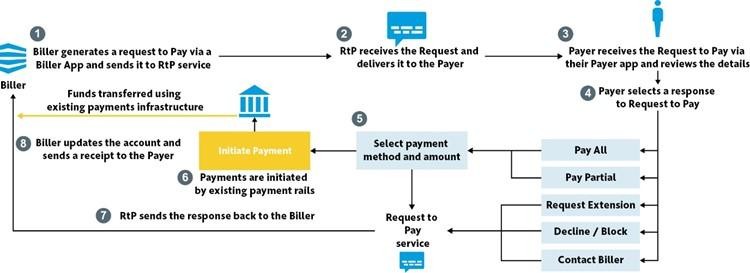
Our consistent focus on innovation in the open banking space allowed us to become one of the first market participants to develop an approved Request to Pay (“RTP”) solution for the UK market. This product was developed in cooperation with a key partner, Mastercard, and was approved by the UK’s regulatory body, Pay.UK in 2020. Meanwhile, the post-Brexit European Union is advancing its own RTP solution known as “R2P”, through the Single European Payment Area (“SEPA”) framework, sponsored by the European Payments Council (the “EPC”). Whether in the United Kingdom or EU, RTP/R2P enables billers to make payment requests and allows payers to act on such requests through a secure, unified messaging service that provides end-to-end audit trails for billers and facilitates two-way communication throughout the payment process. The solution is designed to help reduce the number of late payments by allowing the payer to exercise more options, including opening a line of communication regarding the amount, frequency and time of payment. According to a study by the Euro Banking Association, RTP has multiple potential uses, which include POS (point of sale) transactions, e-commerce, e-invoicing, and recurring payments. The benefits across these use cases are multifold and include: improved liquidity management, reduction of payment defaults, avoidance of credit card fees and reduced reliance on cash by enabling a low cost real time account to account transfer.
Enterprise Information Management
Our enterprise information management (“EIM”) solutions consume and organize large amounts of data across multiple formats and store the information in cloud-enabled proprietary platforms. We also gather transaction data from enterprise systems for hosting. The collected, extracted data is usually used to complete a client-mandated process, and is then made available to our clients and their end-consumers for a period of time in return for an access fee as part of the hosting service. We use this suite of solutions extensively in our digital transformation projects.
Robotic Process Automation
We have been at the forefront of using RPA. Our deployment model for RPA is desktop automation, followed by server level automation if the usage is reaching its capacity. We have built up a large library of RPA rules by both industry and client embedded into our solution suite. We view RPA as a step towards the automation of processes in instances where application programming interfaces (“APIs”) do not exist. An example of this is old legacy systems, which may only be accessed through UI that were intended for a human operator to access. In these instances, RPAs will allow a bot to mimic human interaction.
Digital Mailroom Solutions
We are one of the leading providers of digital mailroom and records digitization solutions and often handle the entire mailroom operation for our clients. Our digital mailroom product, called DMR, employs our technology and uses either our or a client’s infrastructure to process mailroom transactions. The end-to-end digital mailroom accommodates
4
inputs from paper, fax, emails and other electronic data. We also offer recorded voice, image, microfiche and video input channels. Users of DMR are able to view any of these inputs the same way they view emails in their inbox. The versatility of DMR means that it is used as both a module inside the XBP platform and as part of our WFA suite. The UI also connects to our other offerings, such as the Drysign e-signature platform, shipping and receiving services with digital receipt, and delivery and routing to our intelligent lockers offering.
We offer DMR for enterprise-wide deployment to captive mailrooms of clients, mailrooms outsourced to the Company and others. DMR is also suitable for business locations with no dedicated mailroom, such as a client’s front desk and can function as a virtual address solution, enabling businesses to acquire desirable addresses to support their evolution without needing to invest in additional physical office locations. Digital mailroom solutions are available as SaaS, BpaaS or as enterprise licenses. Our largest DMR deployment is with the German Savings Banks Finance Group, to which over 50 million users have access.
Business Process Management and Intelligent Workflow Automation
We have built extensive workflow automation and case management platforms for business process management, which can be leveraged to use our EIM engines. These platforms are designed to integrate popular databases and enterprise systems and are offered across three user categories: enterprise class (10,000 or more users or tasks), interdepartmental class (collaboration across departments), and case-management (off the shelf workflow automation platform which can be customized). Most of our deployments of the workflow automation suite are with banking clients in Germany and the United Kingdom and we typically use our platforms Plexus for more complex deployments, and Beats for off-the shelf workflows.
Integrated Communications
Our comprehensive multi-channel integrated communications solutions help clients communicate with other businesses or their clients. This suite of solutions can link through several channels, including email, print and mail, SMS, web, voice, and chat. Our solutions and services can be expanded to include design and marketing, selection of optimal engagement and least cost routing for mission critical communications. The cost of bills, statements, enrollments, client support, targeted marketing, mass notifications, reprographics, and regulatory notices can each be evaluated using these solutions. We also partner with clients to promote digital migration and improve user experience and help reduce, and even eliminate inefficient, wasteful communications.
Banking and Financial Industry Solutions and Services
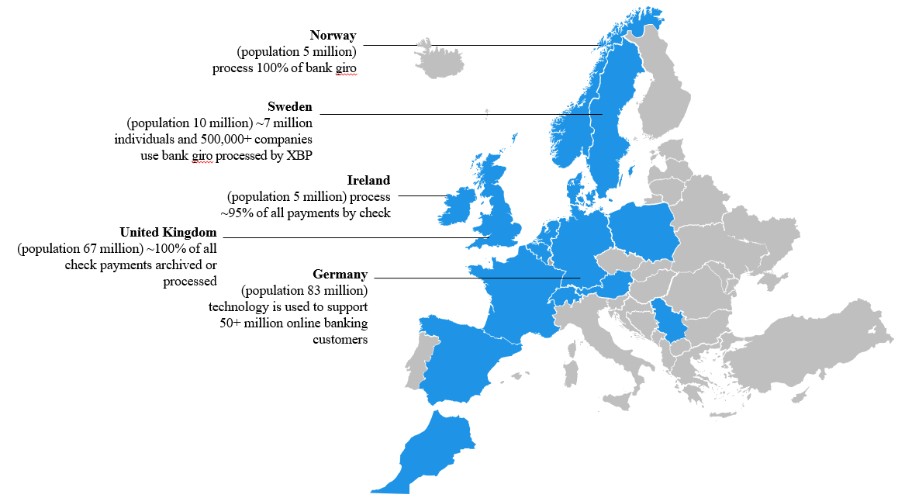
XBP Europe is one of the largest non-bank processors of payments in Europe, having processed several hundred million payment transactions in 2023. Our banking and financial industry offerings include solutions for payment processing and payment enablement, mortgage enrollment, lending and loan management, confirmation of payee, know your client (“KYC”), anti-money laundering, governance, compliance and information management solutions and accounted for approximately 51% of revenue in 2023. We can provide these services as an end-to-end solution or as an augmentation of existing banking processes. We may also offer them as a technology license or through our employees who service clients.
We handle a variety of payment channels in addition to checks and credit cards, including Real Time Payments (called Faster Payments in the UK), SEPA, Bank Giro in the Nordics and other payment networks. We perform these services on behalf of banks or our other clients. Open banking is changing the regulatory environments in many of the Company’s markets, which are beginning to permit non-bank payment processors to connect to the payment networks directly. We operate core and mission critical payments services for a number of banks in Europe. These banks look to us to manage the payment infrastructure (software, hardware and hosting), the process design, the operational aspects of the services, payment scheme compliance (to the in-country interbank clearing schemes) and the application of the appropriate governance processes covering this heavily regulated industry. The bank clients outsource functions from their payments infrastructure and operations to us, and we then manage the end-to-end design, build, test and operate aspects of the payments processes using our in-house resources, software and know-how. We have internal policies and
5
procedures that conform to the standards required by banks and regulators for such sensitive and crucial activities and to comply with local laws and regulations.
The services that we provide are for certain services so critical to the banks’ core operational activities that they are exempt from value added tax. As part of our services, our staff and systems collect and aggregate outgoing payments, initiate and process payments, check those payments for validity and compliance, and submit them directly to the national interbank payments networks to which we are directly connected. Similarly, when payments are arriving (incoming requests for payment), our systems and staff validate them, perform anti-fraud checks (rejecting fraudulent payments) and make payment decisions if funds are available and the account credentials are met. Post-settlement, the time after a payment has been made, we operate systems and services that handle payment queries or errors.
Cross-border Payments
As well as domestic payments, we operate foreign currency services for five banks in the United Kingdom and Ireland. These services are more complex than domestic payments as they require us to comply with international sanctions regimes (e.g., OFAC) and involve many more regulations, rules and downstream processes including exchange rate charging tariffs.
Digitization of Checks
We provide mobile and remote deposit technologies to our banking and financial services clients. For example, when the United Kingdom transitioned from traditional check processing to an image-based clearing system (“ICS”) in 2017, to speed up the settlement of checks, XBP Europe and Vocalink (now part of Mastercard) were selected to jointly build and run the infrastructure of this new inter-bank clearing system. Today, all checks in the United Kingdom are processed via ICS. Separately, we have delivered ICS compliant services to seven of the nineteen participant banks in the United Kingdom and have been working to upgrade their mobile and remote deposit capabilities.
Confirmation of Payee
Payments in the United Kingdom and the European Union are moving toward real time account-to-account payments, which is expected to shift transactional volumes from traditional services such as card schemes, and batch-based payments such as direct debit. This move is largely driven by regulation, in part due to cost and speed benefits. Both the United Kingdom and the European Union payments regulators have encouraged the adoption of so-called overlay services that provide greater benefits to end users and reduced opportunities for fraud. Two of these overlays are RTP, which is described above, and Confirmation of Payee (“CoP”) and we are part of a select few in the industry that has adopted and deployed both of these services.
CoP is a service that verifies the payee’s bank account name and details before transmitting payments. This is a standard mandated by Pay.UK and conforms to the security requirements of open banking. CoP acts as an additional layer of payment protection and warns against sending payments to any non-verified payee account. This serves to transfer the fraud liability to the payer should the payer ignore any warnings. These validations help reduce the risk of payments to the wrong account holder, subsequent payment investigations and adjustment costs, and losses from, among other things, fraud. We were among the first service providers to launch a live client on our CoP service with the Co-operative Bank in 2020. We have since implemented the product with additional bank clients.
Mortgage and loan management
To improve the speed and provide cost efficiencies within a compliant mortgage and lending completion process, our proprietary mortgage and loan management solutions enable lenders to originate and service loans with greater efficiency by automating the entire mortgage lifecycle, from origination to submission and post-completion disbursements.
6
XBP Omnidirect
Following the Closing, we have begun offering XBP Omnidirect, a cloud-based platform that provides enterprise level client communication management centered around a digital storefront. In the Omnidirect storefront, clients manage all their printing, fulfillment, composition, marketing campaign needs, and do so for both internal and external purposes. As a result, the platform effectively transforms inventory management to become online based, but equally important, clients directly control multiple other channels, including marketing and fulfillment.
Cybersecurity, Data Modernization and Cloud management, and generative AI – Reaktr.ai
In January 2024, we announced the formation of Reaktr.ai, a business unit aimed at addressing the evolving needs of our clients in the cybersecurity, data modernization and cloud management, and generative AI spaces. With the constant threat of cybersecurity attacks, our clients’ operations are in need of robust fortification. Digital transformation is a broad subject, however all digital transformations have a common denominator, which is data modernization. Our data modernization solutions enable clients’ data to be cloud ready. In cases where clients are cloud ready but have not yet migrated or are considering whether to adopt a hybrid approach, Reaktr.ai is designed to advise on the right solution and to undertake the transition and subsequent management of the digital data. All of these solutions are complemented by AI-powered platforms which supplement operations to provide a competitive edge. We intend to invest in the expansion of local European talent for Reaktr.ai and to go to market over the course of 2024.
Overview of Revenues
Our two reportable segments are Bills & Payments and Technology. These segments are comprised of significant business units that align our products and services with how we manage our business, approach our key markets and interact with our clients based on their respective industries.
| ● | Bills and Payments: The Bills & Payments business unit primarily focuses on optimizing how bills and payments are processed by businesses of all sizes and industries. The Company offers automation of AP and AR processes and through an integrated platform, seeks to integrate buyers and suppliers across Europe. This business unit also includes our digital transformation revenue, which is both project based and recurring. |
| ● | Technology: The Technology business unit primarily focuses on sales of recurring and perpetual software licenses and related maintenance, hardware solutions and related maintenance and professional services. |
History and Development of Our Company
XBP Europe, Inc. was incorporated in Delaware on September 28, 2022 to facilitate the Business Combination. On November 30, 2023, following the Closing of the Business Combination, it became a wholly owned subsidiary of XBP Europe Holdings, Inc. (the “Company” or “XBP Europe”) and its shares started trading on the Nasdaq Stock Market under the ticker “XBP” and its warrants started trading on the Nasdaq Stock Market under the ticker symbol “XBPEW”. Together with its subsidiaries, the Company constitutes a collection of entities, which have comprised the core European business of ETI since the 1995 merger between Texas-based BancTec, Inc. and Recognition International, Inc. The Company’s subsidiaries and predecessor entities have been serving clients in the European marketplace for over 45 years. In 2018, through the acquisitions of Asterion International and Drescher Full-Service Versand, ETI further expanded its geographic and client reach across Europe.
Key Business Strategies
The Company’s business strategy aims to accelerate clients’ digital transformation through deployment of software and operations automation techniques, hosted on cloud. The Company’s overarching goal is to provide the highest value and lowest cost of ownership to its clients. The Company attempts to accomplish this by building scalable
7
systems that are used by its employees to deliver business process automation services across Europe. The key elements of the Company’s growth strategy are described below:
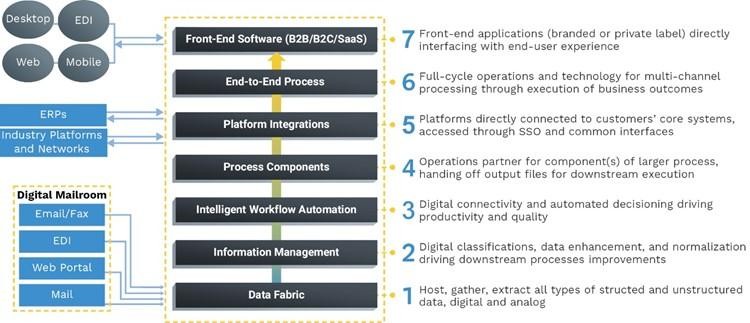
| ● | Expand Penetration of Solution Stack Across Client Base. We seek to move up in what we call “the seven layers of technology enabled solutions and services stack,” climbing the value chain of our clients from discrete services to end-to-end processes through use of front-end enterprise software. We believe continued deployment of our single sign on portals with on-demand applications will drive expansion of our front-end software (B2B/B2C/SaaS) and integrated offerings thereby enabling us to cross and up-sell within our existing client base. |
| ● | Expand XBP network of buyers and suppliers. We processed several hundred million payment transactions in 2023. The transactions we process touch tens of millions of consumers, buyers and suppliers across Europe, and present a significant opportunity to connect many more of them. We intend to expand the scope and scale of services we offer by leveraging the integration value our existing network provides as it endeavors to further connect buyers and suppliers to communicate and transact digitally. |
| ● | Work-from-Anywhere (WFA) enablement – We believe the modern workforce will continue to become more globalized, dynamic and distributed, demanding applications that support digital workflows, remote connectivity, productivity optimization and flexible facilities. We plan to continue expanding our WFA suite of enterprise software to meet the evolving needs of our clients and their employees. |
| ● | Pursue new client opportunities. We plan to continue to develop new long-term, strategic client relationships, especially where we have an opportunity to deliver a wide range of our capabilities and can have a meaningful impact on our clients’ business outcomes. For example, we plan to leverage the solutions we have already introduced in some European markets, like CoP or RTP (which we have introduced in the United Kingdom), and offer them to clients in other European markets. |
| ● | Capitalize on our enhanced scale and operating capacity. We intend to utilize our pan-European scale and track record of success to strengthen our ability to bid on new opportunities. We plan to dedicate additional resources to expand our range of service offerings and pursue additional cross-selling opportunities. We will also look to use our scale and operations expertise to improve utilization of our assets. |
| ● | Government Frameworks and Tenders. We are currently part of multiple government networks across a number of European countries and intend to intensify our presence and participation in such networks to utilize our pan-European scale and capacity to bid on new government and public agency led technology and |
8
| infrastructure opportunities. We plan to dedicate additional sales leadership resources to expand our presence and range of service offerings to government projects. |
| ● | Reaktr.ai - Taking the AI Plunge. Reaktr.AI was created as a direct result of the needs of our clients to fortify their operations and help them accelerate their digital transformation by serving as the data modernization and cloud migration partner, all of which are complemented by AI powered platforms. We have begun our outreach to clients and have commenced the investment cycle needed to make this a core offering of ours. |
Clients
We serve over 2,000 clients across a variety of industries. Our clients are among the leading companies in their respective industries, and many of them are recurring clients that have maintained long-term relationships with us and our predecessor companies.
We have successfully leveraged our relationships with clients to offer extended value chain services. We believe that clients are turning to us due to a demonstrated ability to work on large-scale projects, past performance and record of delivery, and deep domain expertise accumulated from years of experience in key verticals. We believe our stable and significant base of clients and long-term relationships can contribute to predictable revenues.
The Company maintains a strong mix of diversified clients with low client concentration. No single client accounted for more than 6% of 2023 or 2022 revenue and the top 10 clients only accounted for 26% of our 2023 and 2022 revenue, respectively, and the top 100 clients accounted for 76.3% and 73.8% of revenue in 2023 and 2022, respectively.
Intellectual Property
We deploy a combination of proprietary knowledge platforms and applications, as well as generally available third-party licensed software. We have a worldwide, non-exclusive, fully paid perpetual irrevocable intellectual property license with ETI and its worldwide subsidiaries pursuant to which we have access to all of the intellectual property in existence at November 29, 2023 of ETI and its subsidiaries for use in the EMEA region on an exclusive basis. Until such time as we are no longer an affiliate of ETI, we may also employ any intellectual property improvements developed by ETI. We believe that the intellectual property we have at our disposal is a competitive strength.
Our platforms aim to enhance information management and workflow processes through automation and process optimization to minimize labor requirements or to improve labor performance. Our decisioning engines have been built with years of deep domain expertise, incorporating hundreds of thousands of client and industry specific rules which enable efficiency and lower cost preparation and decisioning of transactions. Our business processes and implementation methodologies are confidential and proprietary and include trade secrets that are important to our business.
Our licensed intellectual properties are generally governed by written agreements of varying duration, including some with fixed terms that are subject to renewal based on mutual agreement, and some are perpetual in nature. Generally, each agreement may be further extended, and we have historically been able to renew most existing agreements before they expire. We expect these and other similar agreements to be extended so long as it is mutually advantageous to both parties at the time of renewal.
Competition
Our competitors include both large and small businesses, as well as global companies. Such competitors broadly fall into the following categories:
| (a) | Bills and payments aggregators and processors, multinational companies providing data aggregation, information management and workflow automation; |
9
| (b) | Consulting, discrete process and platform integration service providers; |
| (c) | Platform and front-end software providers; |
| (d) | BPO companies; and |
| (e) | Niche local providers in specific verticals and/or geographies. |
We believe the principal competitive factors in providing our solutions include platforms, industry specific knowledge, quality, reliability and security of service, and price.
Regulation and Compliance
We operate across numerous jurisdictions and provide client solutions in a number of fields, any number of which could be subject to regulation in the future. We are subject to the general legal framework in such jurisdictions. Whilst we provide support to clients in highly regulated industries, including banking, healthcare, insurance and utilities, which in some cases will result in the clients placing contractual obligations on us to comply with certain rules and regulations applicable to those industries in the performance of its services, currently there are no industry-specific licenses or authorizations required for us to provide such services.
However, we believe that the current regulatory environment in many geographies presents opportunities for growth as many geographies allow non-bank payment processes to connect directly to payment networks through the open banking initiative. In connection with accessing such opportunities and expanding our business we may choose to opt into certain regulatory frameworks, or may be required to comply with new or existing regulations, any of which may impact our business operations and practices. We may, in the future, decide to subject ourselves to regulation to expand our service offerings. We partnered with Mastercard to develop an approved RTP solution for the United Kingdom market, which was approved by Pay.UK in 2020. In addition, the post-Brexit European Union is advancing R2P, which could be subject to regulation from the EPC.
There has been increased public attention regarding the use of personal information and data transfer, accompanied by legislation and regulations intended to strengthen data protection, information security and consumer and personal privacy. The law in these areas continues to develop and the changing nature of privacy laws in the European Union and elsewhere could impact us processing of personal information of our employees and processing of personal information on behalf of our clients. In the European Union the comprehensive GDPR went into effect in May 2018. The GDPR has introduced significant privacy-related changes for companies operating both in and outside the European Union. We have resources dedicated to compliance with existing and emerging laws and regulations. We also rely on outside experts and licensed technologies to help supplement our knowledge and resource base and to validate and audit our processes.
Human Capital
We consider our employees to be the foundation for our growth and success.
As of December 31, 2023, we had approximately 1,500 total employees (of which approximately 190 are part-time employees) across 16 countries (14 across Europe and in Morocco, as well as the U.S., where our chief executive officer and chief financial officer are located). Our employee count fluctuates from time to time based upon the timing and duration of client engagements. Our senior leadership team has extensive experience with business process management, and while we have grown through a number of acquisitions, we have retained an experienced and cohesive leadership team.
10
We are fully committed to developing and fostering a culture of diversity and inclusion, and understand that our ability to attract, train, and retain talented individuals from all backgrounds and perspectives is key to our continued success.
| ● | Diversity and inclusion. We continue to focus on the hiring, retention, and advancement of women and underrepresented populations. Recently, we have been expanding our efforts to recruit and hire world-class diverse talent, and identifying strategic partners to accelerate our inclusion and diversity programs. |
| ● | Compensation and benefits. We offer a complete set of benefits for our employees, including competitive base salaries and bonus opportunities. In addition, we expect to establish an equity incentive plan through which we will use targeted equity-based grants with vesting conditions to attract and retain personnel. |
| ● | Health, safety, and wellness. We are committed to the health, safety and wellness of our employees. In response to the COVID-19 pandemic, we implemented significant changes in the best interest of our employees and the communities in which we operate, by having the vast majority of our employees work from home, while implementing additional safety measures for employees continuing critical on-site work. |
| ● | Talent development. We invest significant resources to develop the talent needed to continue to be a leader in our industry. We deliver numerous training opportunities, provide rotational assignment opportunities, have expanded our focus on continuous learning and development, and implemented industry leading methodologies to manage performance, provide feedback and develop talent. Our talent development programs provide employees with the resources they need to help achieve their career goals, build management skills and lead their organizations. |
| ● | Building connections. We believe that building connections between our employees, their families, and our communities creates a more meaningful, fulfilling and enjoyable workplace. We are active and involved in the communities in which our employees live and work, and we promote a culture of volunteering and giving back. |
We locate our operation centers in areas where the value proposition it offers is attractive relative to other local opportunities, resulting in an engaged educated multi-lingual workforce that is able to make a meaningful global contribution from their local marketplace. Our platforms enable rapid learning and facilitate knowledge transfer among employees, reducing training time, and allowing employees to increase their skills and leadership capabilities with the goal of creating a long-term funnel of talent to support our growth.
Controlled Company
For purposes of the Nasdaq Listing Rule, the Company is a “controlled company.” Under the Nasdaq rules, controlled companies are companies of which more than 50% of the voting power for the election of directors is held by an individual, a group, or another company. ETI, through its ownership of BTC International, owns a majority of the Company’s issued and outstanding Common Stock.
Available Information
Our website address is www.xbpeurope.com. We are not including the information provided on our website as a part of, or incorporating it by reference into, this Annual Report. We make available free of charge (other than an investor’s own internet access charges) through our website our annual reports on Form 10-K, quarterly reports on Form 10-Q, current reports on Form 8-K, and amendments to these reports, as soon as reasonably practicable after we electronically file such material with, or furnish such material to, the Securities and Exchange Commission (the “SEC”). In addition, we make available our code of ethics entitled “Global Code of Ethics and Business Conduct” free of charge through our website. We have posted on our website all disclosures that are required by law or Nasdaq listing standards concerning any amendments to, or waivers from, any provision of our code of ethics.
11
The SEC maintains an internet site that contains reports, proxy and information statements and other information regarding issuers that file electronically with the SEC at www.sec.gov. The information contained on the websites referenced in this Annual Report is not incorporated by reference into this filing.
PART II
ITEM 7. MANAGEMENT’S DISCUSSION AND ANALYSIS OF FINANCIAL CONDITION AND RESULTS OF OPERATIONS
Unless otherwise noted, this Management’s Discussion and Analysis of Financial Condition and Results of Operations relates solely to our continuing operations and does not include the operations of our certain on-demand printing operations. See “Pending Divestiture” below and Note 3 - Discontinued Operations of the notes to consolidated financial statements for additional information about the disposable group.
Forward Looking Statements
The following Management’s Discussion and Analysis of Financial Condition and Results of Operations should be read in conjunction with a review of the other Items included in this Annual Report and our December 31, 2023 Consolidated Financial Statements included elsewhere in this report. Certain statements contained in this “Management’s Discussion and Analysis of Financial Condition and Results of Operations” may be deemed to be forward-looking statements. See “Special Note Regarding Forward-Looking Statements.”
Overview
The Company is a pan-European integrator of bills, payments and related solutions and services seeking to enable digital transformation of our clients. The Company serves over 2,000 clients of varying sizes and across multiple industries and geographies. We believe our business ultimately advances digital transformation, improves market-wide liquidity, and encourages sustainable business practices.
The Company’s digital foundation was developed to deliver fully outsourced solutions to address current and evolving client needs. The Company hosts its products both on client premises and as a SaaS offering in the cloud. These offerings, along with several hybrid solutions are available to clients based on the client’s needs and preferences. When distributing its licenses, the Company offers a flexible model, whereby clients may choose among licenses covering a maximum number of transactions, multi-year term licenses with flexible renewal options, perpetual licenses, or per user subscriptions.
The Company’s primary source of revenue stems from transactions processed by its products, including bills and payments processing and constitutes the dominant part of revenue in our larger, Bills & Payments reporting segment. Other sources of revenue include the sale of recurring software licenses and professional services, perpetual software licenses, as well as hardware solutions and related maintenance and constitute our other Technology reporting segment. The Company offers an industry-agnostic and cross-departmental suite of products, which center around finance and accounting (“F&A”) solutions and services comprised of the XBP Platform, Request to Pay, enterprise information management, Digital Mailroom, business process management and workflow automation, and integrated communication services. The Company also offers core industry solutions for the banking and financial services sector, and has, as a consequence of the COVID-19 pandemic, rolled out a suite of Work From Anywhere (“WFA”) applications with enterprise software for connectivity and productivity to enable remote work.
The continued success of the Company’s business is driven by its people. Its operation centers are located in areas where the value proposition the Company offers is attractive relative to other local opportunities, resulting in an engaged, educated multi-lingual workforce that is able to make a meaningful global contribution from their local marketplace. As of December 31, 2023, the Company had approximately 1,500 employees (of which 190 were part-time employees) across 16 countries (14 across Europe and in Morocco as well as the U.S., where our chief executive officer and chief financial officer are located).
12
History
XBP Europe, Inc. was incorporated in Delaware on September 28, 2022 to facilitate the Business Combination. On November 30, 2023, following the closing of the Business Combination, it became a wholly owned subsidiary of XBP Europe Holdings, Inc. (the “Company” or “XBP Europe”) and its shares started trading on the Nasdaq Stock Market under the ticker “XBP” and its warrants started trading on the Nasdaq Stock Market under the ticker symbol “XBPEW”. Together with its subsidiaries, the Company constitutes a collection of entities, which have comprised the core European business of ETI since the 1995 merger between Texas-based BancTec, Inc. and Recognition International, Inc. The Company’s subsidiaries and predecessor entities have been serving clients in the European marketplace for over 45 years. In 2018, through the acquisitions of Asterion International and Drescher Full-Service Versand, ETI further expanded its geographic and client reach across Europe.
Recent developments
Merger Agreement
On October 9, 2022, XBP Europe, Inc. entered into the Merger Agreement with CF VIII, BTC International and Merger Sub. Pursuant to the Merger Agreement, Merger Sub, a newly formed subsidiary of CF VIII, merged with and into XBP Europe, Inc., with XBP Europe, Inc. surviving the Merger.
The Merger was accounted for as a reverse recapitalization, in accordance with GAAP. Under this method of accounting, CF VIII was treated as the “acquired” company for financial reporting purposes. Accordingly, the Merger was treated as the equivalent of the Company issuing stock for the net assets of CF VIII, accompanied by a recapitalization. The net assets of CF VIII were stated at historical cost, with no goodwill or other intangible assets recorded. Operations prior to the Merger were those of the Company.
As a consequence of the Merger, XBP Europe Holdings, Inc. became the successor to CF VIII, which required the Company to hire additional personnel and implement procedures and processes to address public company regulatory requirements and customary practices. The Company expects to incur additional expenses as a public company for, among other things, directors’ and officers’ liability insurance, director fees and additional internal and external accounting and legal and administrative resources, including increased audit and legal fees.
Pending Divestiture
During the third quarter of 2024, certain on-demand printing operations of the Company met the criteria to be disclosed as discontinued operations in the third quarter of fiscal year 2024. See Note 3 - Discontinued Operations of the notes to consolidated financial statements for additional information on discontinued operations.
Key Factors Affecting Company’s Business
The Company believes that its performance and future success depend upon several factors that present significant opportunities for us but also pose risks and challenges including those discussed below and in the section of this Annual Report titled “Risk Factors.”
Investment in Technology
The Company’s revenue growth depends heavily upon its ability to ensure a timely flow of competitive products, services and technologies to the marketplace while also leveraging its domain expertise. Through regular and sustained investment, licensing of intellectual property and acquisition of third-party businesses and technology, the Company continues to develop new knowledge platforms, applications and supporting service bundles that enhance and expand its existing suite of services. These efforts will require the Company to invest significant financial and other resources.
13
Acquiring new clients
The Company plans to continue developing new long-term, strategic client relationships, particularly where there is an opportunity to deliver a wide range of capabilities that have a meaningful impact on clients’ business outcomes. As such, the Company plans to leverage the solutions it has already introduced in some European markets, like Confirmation of Payee or Request To Pay, that are part of its XBP platform, and offer them to clients in other European markets as well as solutions and products within its F&A offering such as the ERP data consolidation solution. With the launch of XBP Omnidirect and Reaktr.ai, we are looking to expand our client base. Additionally, the Company continues to evaluate becoming a registered payment service provider to supplement its existing solutions and services. The Company believes there is a long-term opportunity to expand in these markets to serve new clients.
The Company’s ability to attract new clients also depends on a number of factors, including the effectiveness and pricing of its products, its competitors’ offerings, and successfully executing its marketing efforts. Acquisition of new clients is expected to have a positive impact on the Company’s long-term profitability and operations.
Expanding the Company’s relationships with existing clients
In addition to acquiring new clients, the Company intends to continue retaining existing clients and pursue cross-selling and up-selling opportunities. With an existing base of over 2,000 clients, the Company believes there are meaningful opportunities to offer a bundled suite of services and to be a “one-stop-shop” for its clients’ bills and payments automation and broader digital transformation journeys.
The Company’s ability to influence clients to process more transactions and payments on its platforms has a direct impact on its revenue. As such, the Company offers a full suite of solutions by bundling integrated accounts payable and receivables, payment solutions, F&A services, master data management, reporting analytics along with integrated communication services for enterprise and small and medium businesses.
Our Segments
Our two reportable segments are Bills & Payments and Technology. These segments are comprised of significant strategic business units that align our products and services with how we manage our business, approach our key markets and interact with our clients based on their respective industries.
Bills and Payments: The Bills & Payments business unit primarily focuses on optimizing how bills and payments are processed by businesses of all sizes and industries. The Company offers automation of AP and AR processes and through an integrated platform, seeks to integrate buyers and suppliers across Europe. This business unit also includes our digital transformation revenue, which is both project based and recurring.
Technology: The Technology business unit primarily focuses on sales of recurring and perpetual software licenses and related maintenance, hardware solutions and related maintenance and professional services.
Key Performance Indicators
We use a variety of operational and financial measures to assess our performance. Among the measures considered by our management are the following:
| ● | Revenue by segment; |
| ● | Gross profit by segment; and |
| ● | Adjusted EBITDA (which is a non-GAAP financial measure). |
14
Revenue by segment
We analyze our revenue by comparing actual monthly revenue to internal projections and prior periods across our operating segments in order to assess performance, identify potential areas for improvement, and determine whether segments are meeting management’s expectations.
Gross profit by segment
The Company defines Gross Profit as revenue less cost of revenue (exclusive of depreciation and amortization). The Company uses Gross Profit by segment to assess financial performance at the segment level.
Non-GAAP Financial Measures
To supplement its financial data presented on a basis consistent with GAAP, this Annual Report contains certain non-GAAP financial measures, including EBITDA and Adjusted EBITDA. The Company has included these non-GAAP financial measures because they are financial measures used by management to evaluate the Company’s core operating performance and trends, to make strategic decisions regarding the allocation of capital and new investments. These measures exclude certain expenses that are required under GAAP. The Company excludes these items because they are non-recurring or non-cash expenses that are determined based in part on the Company’s underlying performance.
EBITDA and Adjusted EBITDA
We define EBITDA as net income (loss), plus taxes, interest expense, and depreciation and amortization. We define Adjusted EBITDA as EBITDA plus restructuring and related expenses, related party management fee and royalties, foreign exchange gains or losses, changes in fair value of warrant liability, and non-recurring transaction costs incurred in connection with the Business Combination.
Note Regarding Non-GAAP Financial Measures
EBITDA and Adjusted EBITDA are not financial measures presented in accordance with GAAP. We believe that the presentation of these non-GAAP financial measures will provide useful information to investors in assessing our financial performance and results of operations as our board of directors and management use EBITDA and Adjusted EBITDA to assess our financial performance, because it allows them to compare our operating performance on a consistent basis across periods by removing the effects of our capital structure (such as varying levels of interest expense), asset base (such as depreciation and amortization) and items outside the control of our management team. Net income/loss is the GAAP measure most directly comparable to EBITDA and Adjusted EBITDA. Our non-GAAP financial measures should not be considered as alternatives to the most directly comparable GAAP financial measure. Each of these non-GAAP financial measures has important limitations as analytical tools because they exclude some but not all items that affect the most directly comparable GAAP financial measures. These non-GAAP financial measures are not required to be uniformly applied, are not audited and should not be considered in isolation or as substitutes for results prepared in accordance with GAAP. Because EBITDA and Adjusted EBITDA may be defined differently by other companies in our industry, our definitions of these non-GAAP financial measures may not be comparable to similarly titled measures of other companies, thereby diminishing their utility.
15
The following tables present a reconciliation of EBITDA and Adjusted EBITDA to our net loss from continuing operations, the most directly comparable GAAP measure, for the years ended December 31, 2023 and 2022:
| | | | | | |
| | Year Ended December 31, | ||||
(dollars in thousands) | | 2023 |
| 2022 | ||
Net loss from continuing operations | | $ | (5,568) | | $ | (3,873) |
Income tax expense | | | 606 | |
| 2,562 |
Interest expense including related party interest expense, net | | | 7,006 | |
| 2,943 |
Depreciation and amortization | | | 2,944 | |
| 3,625 |
EBITDA from continuing operations | | | 4,988 | |
| 5,257 |
Restructuring and related expenses(1) | | | 5,053 | |
| 1,869 |
Employee litigation matter(2) | | | 1,431 | | | 267 |
Related party management fee and royalties(3) | | | 1,330 | |
| 4,907 |
Foreign exchange losses, net | | | 599 | |
| 1,175 |
Changes in fair value of warrant liability | | | (597) | | | — |
Transaction Fees(4) | | | 2,970 | |
| 3,595 |
Adjusted EBITDA from continuing operations | | $ | 15,774 | | $ | 17,070 |
| (1) | Adjustment represents costs associated with restructuring, including employee severance and vendor and lease termination costs. |
| (2) | Represents litigation settlement and associated expenses incurred in connection with the Company subsidiary litigation. See Note 15 - Commitments and Contingencies for more details. |
| (3) | Primarily represents management fee incurred in exchange for services, which included provision of legal, human resources, corporate finance, and marketing support. The management services agreement was terminated in connection with the Business Combination and was replaced by the related party service fee pursuant to the Services Agreement which reduced the fee and modified the services provided. |
| (4) | Represents transaction costs incurred as part of the Business Combination. |
The following tables present a reconciliation of EBITDA and Adjusted EBITDA to our net loss from discontinued operations, the most directly comparable GAAP measure, for the years ended December 31, 2023 and 2022:
| | | | | | |
| | Year Ended December 31, | ||||
(dollars in thousands) | | 2023 |
| 2022 | ||
Net loss from discontinued operations, net of income taxes | | $ | (5,479) | | $ | (4,056) |
Income tax expense | | | — | | | — |
Interest expense, net | | | 189 | |
| 95 |
Depreciation and amortization | | | 907 | |
| 765 |
EBITDA from discontinued operations | | | (4,383) | |
| (3,196) |
Restructuring and related expenses(1) | | | 187 | |
| 111 |
Related party service fees and royalties(2) | | | 25 | | | 494 |
Foreign exchange losses (gains), net | | | (5) | |
| 8 |
Adjusted EBITDA from discontinued operations | | $ | (4,176) | | $ | (2,583) |
| (1) | Adjustment represents costs associated with restructuring related to employee severance. |
| (2) | Primarily represents management fee incurred in exchange for services, which included provision of legal, human resources, corporate finance and marketing support. The management services agreement was terminated in connection with the Business Combination and was replaced by the related party service fee pursuant to the Services Agreement which reduced the fee and modified the services provided. |
16
Key Components of Revenue and Expenses
Revenue
The Company earns revenue from transactions processed using its products and services. In addition, the Company also sells recurring and perpetual software licenses, as well as maintenance and other professional services. Licensing options are flexible and clients can purchase a license covering a maximum number of transactions, multi-year term licenses with flexible renewal options and per-user subscriptions. The Company derives a majority of its revenue from transactions processing as well as from the sale of licenses and technology implementation services.
Related party revenue — Related party revenue consists of sales of the above products or services to related parties.
Costs and Expenses
Cost of revenue — Cost of revenue consists primarily of salaries and employee benefits, including performance bonuses, facility costs and cost of products.
Related party cost of revenue — Related party cost of revenue consists of the cost of the products or services purchased or acquired from related parties, plus a related party transfer pricing markup.
Selling, general and administrative expenses — Selling, general and administrative expenses consist primarily of administrative personnel and officers’ salaries and benefits including performance bonuses, legal and audit expenses, insurance, operating lease expenses (mainly facilities and vehicles) and other facility costs.
Related party expenses — Related party expenses primarily consist of the shared service cost, service fee, royalties and related party management fee which was replaced by the related party service fee in connection with the Business Combination.
Depreciation and amortization — Depreciation and amortization of intangible assets expenses consist of depreciation of property and equipment and amortization of client relationship asset.
Interest expense, net — Interest expense consists of interest related to pensions, debt, and finance leases.
Related party interest expense — Related party interest expense consists of interest incurred on amounts due to related parties.
Foreign exchange losses, net — Foreign exchange losses, net is comprised of losses and gains due to foreign currency remeasurement that are netted together for reporting purposes.
Changes in fair value of warrant liability – Changes in fair value of warrant liability represents the mark-to-market fair value adjustments to the outstanding Private Warrants issued as part of the consummation of the Business Combination. The change in fair value of Private Warrants is primarily the result of the change in the underlying stock price of our stock used in the Black-Scholes option pricing model. The warrant liability is remeasured at the end of each subsequent reporting period.
Pension income, net — Pension income, net consists of expected return on employee benefit plan assets, amortization of prior service cost and amortization of net loss.
Income tax expense — Income taxes consist primarily of income taxes related to federal, and foreign jurisdictions in which the Company conducts its business. The Company maintains a full valuation allowance on net deferred tax assets for its U.S. federal taxes and certain foreign and state taxes as the Company has concluded that it is not more likely than not that the deferred assets will be utilized.
17
Results of Operations
Year Ended December 31, 2023 Compared to Year Ended December 31, 2022 (US dollars in thousands)
| | | | | | |
| | Years Ended December 31, | ||||
|
| 2023 |
| 2022 | ||
Revenue: |
| |
|
| |
|
Bills and Payments | | $ | 110,458 | | $ | 115,733 |
Technology | |
| 44,719 | |
| 43,634 |
Revenue, net (including related party revenue of $0.2 million and $0.1 million, respectively) | |
| 155,177 | |
| 159,367 |
Cost of revenue: | |
| | |
|
|
Bills and Payments | |
| 95,572 | |
| 95,660 |
Technology | |
| 19,738 | |
| 22,490 |
Total cost of revenue (including related party cost of revenue of $0.1 million and $0.5 million, respectively, exclusive of depreciation and amortization) | |
| 115,310 | |
| 118,150 |
Selling, general and administrative expenses (exclusive of depreciation and amortization) | |
| 31,173 | |
| 27,773 |
Related party expense | |
| 4,633 | |
| 7,816 |
Depreciation and amortization | |
| 2,944 | |
| 3,625 |
Operating profit | |
| 1,117 | |
| 2,003 |
Interest expense, net | |
| 5,035 | |
| 2,968 |
Related party interest expense/(income), net | |
| 1,971 | |
| (25) |
Foreign exchange losses, net | |
| 599 | |
| 1,175 |
Changes in fair value of warrant liability | | | (597) | | | — |
Pension income, net | |
| (929) | |
| (804) |
Net loss before income taxes | |
| (4,962) | |
| (1,311) |
Income tax expense | |
| 606 | |
| 2,562 |
Net loss from continuing operations | | $ | (5,568) | | $ | (3,873) |
For the purposes of trend analysis, constant currency refers to the prevailing rate of the US dollar against relevant currencies for the year ended December 31, 2022.
Revenue
For the year ended December 31, 2023, our revenue on a consolidated basis decreased by $4.2 million, or 2.6%, to $155.2 million (including related party revenue of $0.2 million) from $159.4 million (including related party revenue of $0.1 million) for the year ended December 31, 2022. On a constant currency basis, revenue declined by $5.5 million, or 3.4%, offset by the positive impact of foreign currency accounting for $1.2 million or 0.7%.
Bills & Payments and Technology segments constituted 71.2%, and 28.8%, respectively, of our total revenue for the year ended December 31, 2023, compared to 72.6%, and 27.4%, respectively, for the year ended December 31, 2022. The revenue changes by reporting segment were as follows:
Bills & Payments — Net revenue attributable to bills and payments segment was $110.5 million for the year ended December 31, 2023 compared to $115.7 million for the year ended December 31, 2022. The revenue decline of $5.3 million, or 4.6%, is primarily attributable to completion of one time projects, lower volumes and client contract end, offset by the positive impact of newly won business. On a constant currency basis, revenue declined by $6.1 million, or 5.3%, offset by the positive impact of foreign currency accounting for a $0.8 million or 0.7%.
Technology — For the year ended December 31, 2023, revenue attributable to the Technology segment increased by $1.1 million, or 2.5%, to $44.7 million from $43.6 million for the year ended December 31, 2022. The revenue increase in the Technology segment was largely due to a higher volume of software licenses sold and a increase
18
in technology implementation and professional services revenue. On a constant currency basis, revenue increased by $0.7 million, or 1.7%, with a positive impact of foreign currency accounted for $0.4 million or 0.8%.
Cost of Revenue
For the year ended December 31, 2023, the cost of revenue decreased by $2.8 million (including decrease in related party cost of $0.4 million), or 2.4%, compared to the year ended December 31, 2022. Total cost of revenue decreased by $4.2 million or 3.6% on a constant currency basis, offset by the positive impact of foreign currency of $1.4 million or 1.2%, when compared to the cost of revenue for the year ended December 31, 2022.
In the Bills & Payments segment, cost of revenue decrease by $0.1 million or 0.1%. On a constant currency basis, cost of revenue at Bills & Payments segment declined by $1.2 million, or 1.3%, offset by the positive impact of foreign currency of 1.2% or $1.1 million.
The cost of revenue in the Technology segment decreased by $2.8 million, or 12.2%, primarily due to the change in the revenue mix within the Technology segment. On a constant currency basis, cost of revenue at the Technology segment decreased by $3.0 million, or 13.4%, offset by the foreign currency impact accounting for $0.3 million or 1.2%.
The increase in cost of revenues as a percent of revenue on a consolidated basis was primarily due to an increase in cost of supplies for resale and external services. Cost of revenue for the year ended December 31, 2023 was 74.3% of revenue compared to 74.1% of revenue for the year ended December 31, 2022.
Selling, General and Administrative Expenses
Selling, general and administrative expenses (“SG&A expenses”) increased by $3.4 million, or 12.2%, to $31.2 million for the year ended December 31, 2023, compared to $27.8 million for the year ended December 31, 2022. The increase was primarily attributable to transaction expenses incurred in connection with the Business Combination and restructuring expenses, partially offset by reduced operating lease and facility expenses for the year ended December 31, 2023 relative to the year ended December 31, 2022. SG&A expenses increased as a percentage of revenue to 20.1% for the year ended December 31, 2023 as compared to 17.4% for the year ended December 31, 2022.
Related Party Expenses
Related party expense was $4.6 million for the year ended December 31, 2023 compared to $7.8 million for the year ended December 31, 2022. The decrease was primarily driven by a decrease in the management fee. On October 9, 2022, the management fee was terminated in connection with the execution of the Merger Agreement and was replaced by the related party service fee which reduced the fees and modified the services provided.
Depreciation and Amortization
Total depreciation and amortization expense was $2.9 million and $3.6 million for the years ended December 31, 2023 and 2022, respectively. The decrease in total depreciation and amortization expense by $0.7 million was primarily due to a reduction in depreciation expense as a result of the expiration of the lives of assets acquired in prior periods and decrease in intangibles amortization expense due to end of the useful lives for certain intangible assets during the year ended December 31, 2023 compared to the year ended December 31, 2022.
Interest Expense
Interest expense was $5.0 million for the year ended December 31, 2023, compared to $3.0 million for the year ended December 31, 2022, largely due to higher pension interest cost and an increase in borrowing costs due to an increase in relevant borrowing reference rates during the year ended December 31, 2023 compared to the year ended December 31, 2022.
19
Related Party Interest Expense/Income, Net
Related party interest expense, net was $2.0 million for the year ended December 31, 2023 compared to related party interest income, net of $25 thousand for the year ended December 31, 2022. The increase in the related party interest expense, net was due to an elimination of a related party interest receivable as required by the Ultimate Parent Support Agreement during the prior year.
Foreign Exchange Losses, net
Foreign exchange losses were $0.6 million for the year ended December 31, 2023 compared to foreign exchange losses of $1.2 million for the year ended December 31, 2022, primarily due to a higher unrealized foreign exchange losses, partially offset by lower realized foreign exchange losses for the year ended December 31, 2023 compared to the year ended December 31, 2022.
Changes in fair value of warrant liability
The change in fair value of warrant liability during the year ended December 31, 2023 was a income of $0.6 million. The change in fair value of warrant liability resulted from the remeasurement of the Private Warrant liability between November 29, 2023 and the end of the reporting period, December 31, 2023.
Pension Income, net
Pension income, net was $0.9 million for the year ended December 31, 2023 compared to pension income, net of $0.8 million for the year ended December 31, 2022. The increase in income was primarily due to an increase in pension-related income recorded in the year ended December 31, 2023.
Income Tax Expense
The Company had an income tax expense of $0.6 million for the year ended December 31, 2023 compared to an income tax expense of $2.6 million for the year ended December 31, 2022. The decrease in tax expense over prior year is largely due to decrease in profitability in France.
Liquidity and Capital Resources
Overview
At December 31, 2023 and 2022 cash and cash equivalents totalled $6.5 million and $7.4 million, respectively.
The Company currently expects to spend approximately $1.5 million to $2.5 million on total capital expenditures over the next twelve months. The Company will continue to evaluate additional capital expenditure needs that may arise.
As of December 31, 2023, and in comparison to December 31, 2022, total debt decreased by $2.4 million primarily due to repayments of term loans, and due to the entry into the Amended Factoring Agreement on September 15, 2023, which resulted in an off-balance sheet treatment of the Secured Borrowing Facility.
The Company has utilized COVID-19 relief measures in various European jurisdictions, including permitted deferrals of certain payroll, social security and value added taxes. At the end of the fourth quarter 2023, the Company paid a significant portion of these deferred payroll taxes, social security and value added taxes. The remaining balance of deferred payroll taxes, social security and value added taxes will be paid by April 2027, or later, as per deferment timeline as established by local laws and regulations.
The Company believes the current cash, cash equivalents and cash flows from financing activities, including the reduction in cash used in principal repayment on borrowings under factoring arrangement, are sufficient to meet the
20
Company’s working capital and capital expenditure requirements for a period of at least twelve months. To the extent existing cash, cash from operations, and amounts available for borrowing are insufficient to fund future activities, the Company may need to raise additional capital. The Company may require funding for a variety of reasons, including, but not limited to, cost overruns for reasons outside of its control and it may experience slower sales than anticipated. If the Company’s current cash on hand is not sufficient to meet its financing requirements for the next twelve months, it may have to raise funds to allow it to continue to operate its business and execute on its business plan. The Company cannot be certain that funding will be available on acceptable terms or at all particularly given the amount of Company securities being offered, the terms of such securities and the potential duration of any offering. To the extent that the Company raises additional funds by issuing equity securities, its stockholders may experience significant dilution. Any debt financing, if available, may involve restrictive covenants that may impact the Company’s ability to conduct business or return capital to investors. If the Company is unable to raise additional capital on acceptable terms, it may have to significantly scale back, delay or discontinue certain businesses, restrict its operations or obtain funds by entering into agreements on unattractive terms.
Cash Flows
Our consolidated statements of cash flows include cash flows related to the disposable group. Significant non-cash items and capital expenditures of discontinued operations related to our disposable group are presented separately in Note 3 - Discontinued Operations of the notes to consolidated financial statements in this Annual Report.
The following table summarizes our cash flows for the years indicated:
| | | | | | |
| | Year Ended December 31, | ||||
(dollars in thousands) |
| 2023 |
| 2022 | ||
Net cash used in operating activities |
| $ | (1,535) | | $ | 9,890 |
Net cash used in investing activities | | | (2,669) | |
| (6,366) |
Net cash provided by (used in) financing activities | | | (305) | |
| (1,329) |
Effect of exchange rates on cash and cash equivalents | | | 3,941 | |
| 2,369 |
Net increase (decrease) in cash and cash equivalents | | | (568) | |
| 4,562 |
Analysis of Cash Flow Changes between the years ended December 31, 2023 and 2022
Operating Activities — Net cash used in operating activities was $1.5 million for the year ended December 31, 2023, compared to net cash provided in operating activities of $9.9 million for the year ended December 31, 2022. The decrease of $11.4 million in cash provided by operating activities was largely due to a higher net loss driven by transaction expenses, inflows related to accounts receivable and accrued expenses and other liabilities, both of which were partially offset by higher outflows from accounts payable.
Investing Activities — Net cash used in investing activities was $2.7 million for the year ended December 31, 2023, compared to net cash used in investing activities of $6.4 million for the year ended December 31, 2022. The decrease of $3.7 million in cash used in investing activities was a result of a purchase of the Company’s Irish headquarters in Dublin, Ireland, which took place during the year ended December 31, 2022.
The cash outflow of $2.7 million in investing activities for the year ended December 31, 2023was primarily due to additions to property, plant and equipment in 2023.
Financing Activities — Net cash used in financing activities was $0.3 million for the year ended December 31, 2023, compared to net cash used in financing activities of $1.3 million for the year ended December 31, 2022.The decrease of $1.0 million in cash used in financing activities for the year ended December 31, 2023was primarily due to proceeds from the Business Combination offset by repayments under the securitization facility.
21
Indebtedness
Secured Borrowing Facility
On August 25, 2020, certain entities entered into an agreement wherein amounts due from clients were pledged to a third party, in exchange for a borrowing facility in amounts up to a total of €31.0 million (the “Secured Borrowing Facility”). The proceeds from the Secured Borrowing Facility were determined by the amounts invoiced to our clients. The amounts due from clients were recorded in accounts receivable and the amount due to the third party as a liability, presented under “Current portion of long-term debt” on the consolidated balance sheets. The cost of the Secured Borrowing Facility was 0.10% of newly assigned receivables with minimum of €0.1 million in annual fees and the Secured Borrowing Facility bore interest at Euribor rate plus 0.70% on the unpaid principal amount. The Company incurred interest expenses of $0.6 million and $0.3 million for the years ended December 31, 2023 and 2022, respectively, related to the Secured Borrowing Facility. As of December 31, 2023 and 2022, the outstanding balances payable under the Secured Borrowing Facility were $0.1 million and $3.7 million, respectively.
On September 15, 2023, the relevant entities entered into an amendment to the Secured Borrowing Facility (the “Amended Factoring Agreement”) to convert the existing arrangement into a non-recourse factoring program wherein an unrelated third party (the “Factor”) shall provide financing to certain subsidiaries of the Company by purchase of certain approved and partially approved accounts receivables (as defined in the Amended Factoring Agreement) up to a maximum amount of €15.0 million while assuming the risk of non-payment on the purchased accounts receivables up to the level of approval. The relevant entities shall have no continuing involvement in the transferred accounts receivable, other than collection and administrative responsibilities and, once sold, the accounts receivable shall no longer be available to satisfy creditors of the relevant entities.
The Company accounted for the transactions under the Amended Factoring Agreement as a sale under ASC 860, Transfers and Servicing, and treats it as an off-balance sheet arrangement. Net funds received from the transfers reflect the face value of the account less a fee, which is recorded as an increase to cash and a reduction to accounts receivable outstanding in the consolidated balance sheets. The Company reports the cash flows attributable to the sale of account receivables to the Factor and the cash receipts from collections made on behalf of and paid to the Factor under the Amended Factoring Agreement, on a net basis as trade accounts receivables in cash flows from operating activities in the Company’s consolidated statements of cash flows.
During the year ended December 31, 2023, the Company factored accounts receivable invoices totaling approximately $6.8 million pursuant to the Amended Factoring Agreement, representing the face value of the invoices. The Company recognizes factoring costs upon disbursement of funds. The Company incurred a loss on sale of accounts receivables including expenses pursuant to the Amended Factoring Agreement totaling approximately $0.3 million for the year ended December 31, 2023, which is presented in selling, general and administrative expenses (exclusive of depreciation and amortization) on the consolidated statements of operations.
2019 Credit Agreement
In October 2019,a wholly-owned UK subsidiary of XBP Europe (the "UK Subsidiary”) entered into a secured credit agreement (the "2019 Credit Agreement”) fora £9.0 million Secured Credit Facility (the "Secured Credit Facility”)consisting of (i)a secured Term Loan A facility in an aggregate principal amount of £2.0 million (the "Term Loan A Facility”), (ii)a secured Term Loan B facility in an aggregate principal amount of £2.0 million (the "Term Loan B Facility”),and (iii)a secured revolving credit facility in an aggregate principal amount of £5.0 million (the "Revolving Credit Facility”). On December 21, 2022, the UK Subsidiary amended its 2019 Credit Agreement, allowing the UK Subsidiary to affirm to extend the maturity of Term Loan A Facility and Term Loan B Facility to October 31, 2024 subject to compliance with financial covenants. On February 9, 2023, the UK Subsidiary amended its 2019 Credit Agreement, allowing the UK Subsidiary to extend the maturity of the Revolving Credit Facility to October 31, 2024 subject to compliance with financial covenants. On October 29, 2023, the maturity of the Revolving Credit Facility was extended to January 31, 2025. On March 14, 2024 the maturity was further extended to April 30, 2025. As of December 31, 2023, the outstanding balance of the Term Loan A Facility, the Term Loan B Facility, and the Revolving Credit Facility was approximately $1.9 million, $0.4 million, and $6.4 million, respectively. As of December 31, 2022, the
22
outstanding balance of the Term Loan A Facility, the Term Loan B Facility, and the Revolving Credit Facility was approximately $1.9 million, $1.0 million, and $6.0 million, respectively.
The 2019 Credit Agreement contains financial covenants including, but not limited to (a) a Combined Cash flow Coverage Ratio, which measures the ratio of (i) Combined Cash flow and (ii) Debt Service defined as finance charges in addition to mandatory repayments in respect to the 2019 Credit Agreement, (b) Combined Interest Coverage Ratio, which measures the ratio of (i) Combined EBITDA to (ii) Combined Finance Charges, (c) a Combined Total Net Leverage Ratio, which measures the ratio of (i) Combined Net Indebtedness in respect to the last day of the most recent period to (ii) EBITDA, (d) Guaranteed Intragroup Balances, (e) the Loan to Market Value defined as the Facility A Loan outstanding to the market value of the property in each case, as defined in the 2019 Credit Agreement. The term “Combined” refers to the UK Subsidiary and its wholly-owned subsidiaries.
The 2019 Credit Agreement and indenture governing the Secured Credit Facility contains limitations on the ability of the UK subsidiary to effect mergers and change of control events as well as certain other limitations, including limitations on: (i) the declaration and payment of dividends or other restricted payments (ii) substantial changes of the general nature of the business, (iii) acquisition of a company, (iv) enter a joint venture, (v) or effect a dormant subsidiary to commence trading or cease to satisfy the criteria of a dormant subsidiary.
The UK Subsidiary’s obligations under the 2019 Credit Agreement are jointly and severally guaranteed by certain of its existing and future direct and indirectly wholly owned subsidiaries. The 2019 Credit Agreement and the 2022 Committed Facility Agreement (defined below) contain cross default provisions which relate to the UK Subsidiary and its subsidiaries, but not any other entities within the consolidated group.
At inception, borrowings under the Secured Credit Facility bore interest at a rate per annum equal to the LIBOR plus the applicable margin of 2%, 2.5%, and 3% per annum for the Term Loan A Facility, the Term Loan B Facility, and the Revolving Credit Facility respectively. Effective October 29, 2021, borrowings under the Revolving Credit Facility bore interest at a rate per annum equal to the SONIA plus the applicable margin of 3%. Effective December 31, 2021, borrowings under the Term Loan A Facility and the Term Loan B Facility bore interest at a rate per annum equal to the SONIA plus the applicable margin of 2% and 2.5%, respectively.
In June 2020, the UK Subsidiary entered into an amendment to the 2019 Credit Agreement, to provide an additional aggregate principal amount of £4.0 million under a credit agreement (the “Revolving Working Capital Loan Facility” or “2020 Credit Agreement”) together with Revolving Credit Facility (the “Revolving Credit Facilities”). At the inception of the Revolving Working Capital Loan Facility, the borrowing bore an interest rate per annum equal to the LIBOR plus the applicable margin of 3.5% per annum. Effective December 31, 2022, borrowings under the Revolving Working Capital Loan Facility bore interest at a rate per annum equal to the SONIA plus the applicable margin of 3.5%.
The Revolving Working Capital Loan Facility matures on January 31, 2025 subject to compliance with financial covenants (the term was extended on October 29, 2023). On March 14, 2024 the maturity was further extended to April 30, 2025. As of December 31, 2023 and 2022, the Revolving Working Capital Loan Facility had an outstanding principal balance of $6.4million and $4.8million, respectively.
As of December 31, 2023, the Company had $11.4 million in outstanding principal balance and less than $0.1 million available for additional borrowings under the Revolving Credit Facilities to the extent the Company’s compliance with financial covenants permits such borrowings
As of December 31, 2023 and 2022, the UK Subsidiary was in compliance with all affirmative and negative covenants under the 2019 Credit Agreement, including any financial covenants, pertaining to its financing arrangements.
2022 Committed Facility Agreement
In May 2022, the UK Subsidiary entered into a committed facility agreement (the “2022 Committed Facility Agreement”) with HSBC, which includes a term loan for £1.4 million to be used in refinancing a property owned by XBP Europe in Dublin, Ireland (the “Property”). At inception of the 2022 Committed Facility Agreement, the
23
borrowing bore an interest rate equal to 3.5% per annum in addition to the Bank of England Base Rate. The maturity of the 2022 Committed Facility Agreement is May 2027. As of December 31, 2023 and 2022, the 2022 Committed Facility Agreement had an outstanding balance of $1.5 million and $1.6 million, respectively.
The 2022 Committed Facility Agreement contains financial covenants including, but not limited to (a) a Combined Debt Service Coverage Ratio, which measures the cash flow less dividends, net capital expenditure, and taxation relative to the debt service for that relevant period, (b) interest cover, which measures EBITDA relative to the aggregate of (i) interest charges and (ii) interest element of finance leases in any relevant period, (c) Total Net Debt to EBITDA, which measures the total net debt relative to EBITDA for any relevant period, and (d) loan to market value, which measures the loan as a percentage of the aggregate market value of The Property. The term “Combined” refers to the UK subsidiary and its wholly-owned subsidiaries.
As of December 31, 2023 and 2022, the UK Subsidiary was in compliance with all affirmative and negative covenants under the 2022 Committed Facility Agreement, including any financial covenants pertaining to its financing arrangements. The Company continually monitors its compliance with such covenants. The Company believes it will remain in compliance with all such covenants for the next twelve months; however, due to the inherent uncertainty, management’s estimates of the achievement of its financial covenants may change in the future.
Changes to Covenant Ratios and Compliance
The Company is not aware of any changes in the required covenant ratio under the 2019 Credit Agreement or the 2022 Committed Facility Agreement at future compliance dates. The Company continually monitors its compliance with the covenants. The Company believes it will remain in compliance with all such covenants for the next 12 months based on the expected future performance; however, due to the inherent uncertainty, management’s estimates of the achievement of its financial covenants may change in the future. The Company believes there are multiple mechanisms available to the Company in case of non-compliance with the provisions of any of its debt covenants, which would ensure ongoing sufficient liquidity for the Company, including but not limited to, entering into bona fide negotiations with its lenders to amend the existing facilities as appropriate, refinancing existing credit facilities with alternative providers of capital or curing any potential breaches.
Restructuring Activities
In the fourth quarter of 2023, the Company’s management approved a restructuring plan to realign the Company’s business and strategic priorities by rightsizing its workforce in certain regions. Costs and liabilities associated with management-approved restructuring activities are recognized when they are incurred. One-time employee termination costs are recognized at the time of communication to employees, unless future service is required, in which case the costs are recognized ratably over the future service period. Ongoing employee termination benefits are recognized as a liability when it is probable that a liability exists and the amount is reasonably estimable. Restructuring charges are recognized as an operating expense within the consolidated statements of operations for the year ended December 31, 2023 and related liabilities are recorded within accrued compensation and benefits on the consolidated balance sheets as of December 31, 2023. The Company periodically evaluates and, if necessary, adjusts its estimates based on currently available information.
Potential Future Transactions
We may, from time to time, explore and evaluate possible strategic transactions, which may include joint ventures, as well as business combinations or the acquisition or disposition of assets. In order to pursue certain of these opportunities, additional funds will likely be required. Subject to applicable contractual restrictions, to obtain such financing, we may seek to use cash on hand, or we may seek to raise additional debt or equity financing through private placements or through underwritten offerings. There can be no assurance that we will enter into additional strategic transactions or alliances, nor do we know if we will be able to obtain the necessary financing for transactions that require additional funds on favourable terms, if at all. In addition, pursuant to the Registration Rights Agreement that we entered into in connection with the closing of the Business Combination, certain of our stockholders have the right to demand underwritten offerings of our Common Stock. We may from time to time in the future explore, with certain of those
24
stockholders the possibility of an underwritten public offering of our Common Stock held by those stockholders. There can be no assurance as to whether or when an offering may be commenced or completed, or as to the actual size or terms of the offering.
Critical Accounting Estimates
The preparation of financial statements requires the use of judgments and estimates. The critical accounting policies are described below to provide a better understanding of how the Company develops its assumptions and judgments about future events and related estimations and how they can impact the Company’s financial statements. A critical accounting estimate is one that requires subjective or complex estimates and assessments and is fundamental to the Company’s results of operations. The Company bases its estimates on historical experience and on various other assumptions it believes to be reasonable according to the current facts and circumstances, the results of which form the basis for making judgments about the carrying values of assets and liabilities that are not readily apparent from other sources. The Company believes the current assumptions, judgments and estimates used to determine amounts reflected in the combined financial statements are appropriate; however, actual results may differ under different conditions. This discussion and analysis should be read in conjunction with the Company’s financial statements and related notes included elsewhere in this Annual Report.
Goodwill and other intangible assets: Goodwill and other intangible assets are initially recorded at their fair values. Goodwill represents the excess of the purchase price of acquisitions over the fair value of the net assets acquired. Goodwill and other intangible assets not subject to amortization are tested for impairment annually or more frequently if events or changes in circumstances indicate that the asset might be impaired. Intangible assets with finite useful lives are amortized either on a straight-line basis over the asset’s estimated useful life or on a basis that reflects the pattern in which the economic benefits of the intangible assets are realized.
Benefit Plan Accruals: The Company has defined benefit plans in the UK, Germany, Norway and France under which participants earn a retirement benefit based upon a formula set forth in the respective plans. The Company records annual amounts relating to its pension plans based on calculations that incorporate various actuarial and other assumptions, including discount rates, mortality, assumed rates of return, and compensation increases. The Company reviews its assumptions on an annual basis and makes modifications to the assumptions based on current rates and trends when it is appropriate to do so.
Impairment of goodwill, long-lived and other intangible assets: Long-lived assets, such as property and equipment and finite-lived intangible assets are evaluated for impairment whenever events or changes in circumstances indicate that their carrying value may not be recoverable. Recoverability is measured by a comparison of their carrying amount to the estimated undiscounted cash flows to be generated by those assets. If the undiscounted cash flows are less than the carrying amount, the Company records impairment losses for the excess of the carrying value over the estimated fair value. Fair value is determined, in part, by the estimated cash flows to be generated by those assets. The Company’s cash flow estimates are based upon, among other things, historical results adjusted to reflect the Company’s best estimate of future market rates, and operating performance. Development of future cash flows also requires us to make assumptions and to apply judgment, including timing of future expected cash flows, using the appropriate discount rates, and determining salvage values. The estimate of fair value represents the Company’s best estimates of these factors, and is subject to variability. Assets are generally grouped at the lowest level of identifiable cash flows, which is the reporting unit level for us. Changes to the key assumptions related to future performance and other economic factors could adversely affect the impairment valuation.
The Company conducts its annual goodwill impairment tests on October 1 of each year, or more frequently if indicators of impairment exist. When performing the annual impairment test, the Company has the option of performing a qualitative or quantitative assessment to determine if an impairment has occurred. If a qualitative assessment indicates that it is more likely than not that the fair value of a reporting unit is less than its carrying amount, the Company would be required to perform a quantitative impairment test for goodwill. A quantitative test requires comparison of fair value of the reporting unit to its carrying value, including goodwill. The Company uses a combination of the Guideline Public Company Method of the Market Approach and the Discounted Cash Flow Method of the Income Approach to determine the reporting unit fair value. For the Guideline Public Company Method, the Company’s annual impairment test utilizes
25
valuation multiples of publicly traded peer companies. For the Discounted Cash Flow Method, the annual impairment test utilizes discounted cash flow projections using market participant weighted average cost of capital calculation. If the fair value of goodwill at the reporting unit level is less than its carrying value, an impairment loss is recorded for the amount by which a reporting unit’s carrying amount exceeds its fair value, limited to the total amount of goodwill allocated to that reporting unit.
Application of the goodwill impairment test requires judgment, including the identification of reporting units, allocation of assets and liabilities to reporting units, and determination of fair value. The determination of reporting unit fair value is sensitive to the amount of Revenue and EBITDA generated by us, as well as the Revenue and EBITDA market multiples used in the calculation. Additionally, the fair value is sensitive to changes in the valuation assumptions such as expected income tax rate, risk-free rate, asset beta, and various risk premiums. Unanticipated changes, including immaterial revisions, to these assumptions could result in a provision for impairment in a future period. Given the nature of these evaluations and their application to specific assets and time frames, it is not possible to reasonably quantify the impact of changes in these assumptions.
Warrants: The Company accounts for the warrants as either equity-classified or liability-classified instruments based on an assessment of the warrant’s specific terms and applicable authoritative guidance in Financial Accounting Standards Board (“FASB”) ASC 480, Distinguishing Liabilities from Equity (“ASC 480”) and ASC 815, Derivatives and Hedging (“ASC 815”). The assessment considers whether the warrants are freestanding financial instruments pursuant to ASC 480, meet the definition of a liability pursuant to ASC 480, and whether the warrants meet all of the requirements for equity classification under ASC 815, including whether the warrants are indexed to Company’s own shares of common stock and whether the warrant holders could potentially require “net cash settlement” in a circumstance outside of the Company’s control, among other conditions for equity classification. This assessment, which requires the use of professional judgment, is conducted at the time of warrant issuance and as of each subsequent quarterly period end date while the warrants are outstanding. For issued or modified warrants that meet all of the criteria for equity classification, the warrants are required to be recorded as a component of equity at the time of issuance.
We determined upon further review of the warrant agreements, that while Public Warrants meet the definition of a derivative, they meet the equity scope exception in ASC 815 to be classified in stockholders’ deficit and are not subject to remeasurement provided that the warrants continue to meet the criteria for equity classification.
Similarly, Private Warrants meet the definition of a derivative, however they don’t meet the equity scope exception in ASC 815 and are subject to remeasurement. Private Warrant liability shall be measured at fair value on transaction closing date, with changes in fair value each period recognized in the consolidated statements of operations.
Revenue: The Company accounts for revenue in accordance with ASC 606. A performance obligation is a promise in a contract to transfer a distinct good or service to the client, and is the unit of account in ASC 606. Revenue is measured as the amount of consideration the Company expects to receive in exchange for transferring goods or providing services. The contract transaction price is allocated to each distinct performance obligation and recognized as revenue when, or as, the performance obligation is satisfied. All of the Company’s material sources of revenue are derived from contracts with clients, primarily relating to the provision of business and transaction processing services within each of the segments. The Company does not have any significant extended payment terms, as payment for invoices issued is received shortly after goods are delivered or services are provided. Refer to Note 4 — Basis of Presentation and Summary of Significant Accounting Policies to our audited consolidated financial statements as of and for the years ended December 31, 2023 and 2022 contained elsewhere in this Annual Report for additional information regarding the Company’s revenue recognition policy.
Income Taxes: We account for income taxes by using the asset and liability method. We account for income taxes regarding uncertain tax positions and recognize interest and penalties related to uncertain tax positions in income tax benefit/(expense) in the consolidated statements of operations.
Deferred income taxes are recognized on the tax consequences of temporary differences by applying enacted statutory tax rates applicable in future years to differences between the financial statement carrying amounts and the tax bases of existing assets and liabilities, as determined under tax laws and rates. A valuation allowance is provided when it
26
is more likely than not that all or some portion of the deferred tax assets will not be realized. In the event the Company determines that it would be able to realize deferred tax assets that have valuation allowances established, an adjustment to the net deferred tax assets would be recognized as a component of income tax expense through continuing operations.
We engage in transactions (such as acquisitions) in which the tax consequences may be subject to uncertainty and examination by the varying taxing authorities. Significant judgment is required by us in assessing and estimating the tax consequences of these transactions. While our tax returns are prepared and based on our interpretation of tax laws and regulations, in the normal course of business the tax returns are subject to examination by the various taxing authorities. Such examinations may result in future assessments of additional tax, interest and penalties. For purposes of our income tax provision, a tax benefit is not recognized if the tax position is not more likely than not to be sustained based solely on its technical merits. Considerable judgment is involved in determining which tax positions are more likely than not to be sustained.
Emerging Growth Company Status
The JOBS Act provides that a company can choose not to take advantage of the extended transition period and comply with the requirements that apply to non-emerging growth companies, and any such election to not take advantage of the extended transition period is irrevocable.
The Company is an “emerging growth company” as defined in Section 2(a) of the Securities Act and has elected to take advantage of the benefits of the extended transition period for new or revised financial accounting standards, although it may decide to early adopt such new or revised accounting standards to the extent permitted by such standards. This may make it difficult or impossible to compare the Company’s financial results with the financial results of another public company that is either not an emerging growth company or is an emerging growth company that has chosen not to take advantage of the extended transition period exemptions because of the potential differences in accounting standards used.
Recently Adopted and Recently Issued Accounting Pronouncements
See Note 4—Basis of Presentation and Summary of Significant Accounting Policies to the consolidated financial statements included in Item 8 of this Report.
Internal Controls and Procedures
As a publicly traded company, we are required to comply with the SEC’s rules implementing Section 302 and 404 of the Sarbanes Oxley Act, which require management to certify financial and other information in our quarterly and annual reports and provide an annual management report on the effectiveness of controls over financial reporting. However, as we completed the Business Combination on November 29, 2023, it was not possible for us to conduct an assessment of the accounting acquirer’s internal control over financial reporting in the period between the consummation date of the reverse acquisition and the date of management’s assessment of internal control over financial reporting required by Item308(a) of Regulation S-K. As such, in accordance with the guidance provided in Section 215.02 of the SEC’s Compliance and Disclosure Interpretations, we have not included management’s report on internal controls over financial reporting in this report. We will be required to provide such a report in our annual report for the year ending December 31, 2024.
27
ITEM 8. FINANCIAL STATEMENTS AND SUPPLEMENTARY DATA
FINANCIAL STATEMENTS AND SUPPLEMENTARY DATA
The following financial statements are included herein:
28
Report of Independent Registered Public Accounting Firm
To the Board of Directors and Stockholders
of XBP Europe Holdings, Inc. and Subsidiaries:
Opinion on the Financial Statements
We have audited the accompanying consolidated balance sheets of XBP Europe Holdings, Inc. and Subsidiaries (the “Company”) as of December 31, 2023 and 2022, and the related statements of operations, comprehensive loss, stockholders’ deficit, and cash flows for the years then ended, and the related notes, (collectively referred to as the “financial statements”). In our opinion, the financial statements present fairly, in all material respects, the financial position of the Company as of December 31, 2023 and 2022, and the results of its operations and its cash flows for the years then ended in conformity with accounting principles generally accepted in the United States of America.
Basis for Opinion
These financial statements are the responsibility of the Company's management. Our responsibility is to express an opinion on the Company's financial statements based on our audits. We are a public accounting firm registered with the Public Company Accounting Oversight Board (United States) ("PCAOB") and are required to be independent with respect to the Company in accordance with the U.S. federal securities laws and the applicable rules and regulations of the Securities and Exchange Commission and the PCAOB.
We conducted our audits in accordance with the standards of the PCAOB and in accordance with auditing standards generally accepted in the United States of America. Those standards require that we plan and perform the audits to obtain reasonable assurance about whether the financial statements are free of material misstatement, whether due to error or fraud. The Company is not required to have, nor were we engaged to perform, an audit of its internal control over financial reporting. As part of our audits, we are required to obtain an understanding of internal control over financial reporting but not for the purpose of expressing an opinion on the effectiveness of the Company's internal control over financial reporting. Accordingly, we express no such opinion.
Our audits included performing procedures to assess the risks of material misstatement of the financial statements, whether due to error or fraud, and performing procedures that respond to those risks. Such procedures included examining, on a test basis, evidence regarding the amounts and disclosures in the financial statements. Our audits also included evaluating the accounting principles used and significant estimates made by management, as well as evaluating the overall presentation of the financial statements. We believe that our audits provide a reasonable basis for our opinion.
/s/ UHY LLP
We have served as the Company’s auditor since 2022.
Sterling Heights, Michigan
April 1, 2024 (except for the effects of the discontinued operations described in Notes 1 and 3, to which date is February 14, 2025)
29
XBP Europe Holdings, Inc.
For the years ended December 31, 2023 and 2022
(in thousands of United States dollars except share and per share amounts)
| | | | | | |
| | | | | | |
| | December 31, | ||||
|
| 2023 |
| 2022 | ||
ASSETS |
| |
|
| |
|
Current assets |
| |
|
| |
|
Cash and cash equivalents | | $ | 6,537 | | $ | 7,417 |
Accounts receivable, net of allowance for credit losses of $1,183 and $824, respectively | |
| 30,238 | |
| 34,476 |
Inventories, net | |
| 4,045 | |
| 3,833 |
Prepaid expenses and other current assets | |
| 6,550 | |
| 7,950 |
Related party note receivable | | | — | | | 13,266 |
Current assets held for sale | |
| 2,497 | |
| 3,073 |
Total current assets | |
| 49,867 | |
| 70,015 |
Property, plant and equipment, net of accumulated depreciation of $39,876 and $41,915, respectively | |
| 12,811 | |
| 12,743 |
Operating lease right-of-use assets, net | |
| 5,206 | |
| 3,892 |
Goodwill | |
| 22,823 | |
| 21,975 |
Intangible assets, net | |
| 1,498 | |
| 1,529 |
Deferred income tax assets | |
| 6,811 | |
| 7,055 |
Other noncurrent assets | | | 705 | | | 1,680 |
Noncurrent assets held for sale | |
| 3,018 | |
| 3,952 |
Total assets | | $ | 102,739 | | $ | 122,841 |
| | | | | | |
LIABILITIES AND STOCKHOLDERS’ DEFICIT | |
|
| |
|
|
LIABILITIES | |
|
| |
|
|
Current liabilities | |
|
| |
|
|
Accounts payable | | $ | 13,281 | | $ | 14,759 |
Related party payables | |
| 13,012 | |
| 32,323 |
Accrued liabilities | |
| 23,850 | |
| 23,472 |
Accrued compensation and benefits | |
| 16,267 | |
| 12,782 |
Customer deposits | |
| 323 | |
| 697 |
Deferred revenue | |
| 6,004 | |
| 5,660 |
Current portion of finance lease liabilities | |
| 91 | |
| 228 |
Current portion of operating lease liabilities | |
| 1,562 | |
| 1,449 |
Current portion of long-term debts | | | 3,863 | | | 4,604 |
Current liabilities held for sale | |
| 3,818 | |
| 5,916 |
Total current liabilities | |
| 82,071 | |
| 101,890 |
Related party notes payable | |
| 1,542 | |
| 11,164 |
Long-term debt, net of current maturities | |
| 12,763 | |
| 14,446 |
Finance lease liabilities, net of current portion | |
| 23 | |
| 129 |
Pension liabilities | |
| 12,208 | |
| 16,076 |
Operating lease liabilities, net of current portion | |
| 3,785 | |
| 2,355 |
Other long-term liabilities | | | 1,635 | | | 1,575 |
Noncurrent liabilities held for sale | |
| 1,280 | |
| 2,138 |
Total liabilities | | $ | 115,307 | | $ | 149,773 |
Commitments and Contingencies (Note 15) | |
|
| |
|
|
| | | | | | |
STOCKHOLDERS’ DEFICIT | |
|
| |
|
|
Preferred stock, par value of $0.0001 per share; 10,000,000 shares authorized; none issued and outstanding as of December 31, 2023 and December 31, 2022, respectively | |
| — | |
| — |
Common Stock, par value of $0.0001 per share; 200,000,000 shares authorized; 30,166,102 and nil shares issued and outstanding as of December 31, 2023 and December 31, 2022, respectively | |
| 30 | |
| — |
Net parent investment | | | — | | | (5,845) |
Additional paid in capital | |
| — | |
| — |
Accumulated deficit | |
| (11,339) | |
| — |
Accumulated other comprehensive loss: | |
|
| |
|
|
Foreign currency translation adjustment | |
| (1,416) | |
| (17,789) |
Unrealized pension actuarial gains, net of tax | |
| 157 | |
| (3,298) |
Total accumulated other comprehensive loss | |
| (1,259) | |
| (21,087) |
Total stockholders’ deficit | |
| (12,568) | |
| (26,932) |
Total liabilities and stockholders’ deficit | | $ | 102,739 | | $ | 122,841 |
The accompanying notes are an integral part of these consolidated financial statements.
30
XBP Europe Holdings, Inc.
Consolidated Statements of Operations
For the years ended December 31, 2023 and 2022
(in thousands of United States dollars except share and per share amounts)
| | | | | |
| | | | | |
| Year ended December 31, | ||||
| 2023 |
| 2022 | ||
Revenue, net | $ | 154,943 | | $ | 159,224 |
Related party revenue, net |
| 234 | |
| 143 |
Cost of revenue (exclusive of depreciation and amortization) |
| 115,234 | |
| 117,639 |
Related party cost of revenue |
| 76 | |
| 511 |
Selling, general and administrative expenses (exclusive of depreciation and amortization) |
| 31,173 | |
| 27,773 |
Related party expense |
| 4,633 | |
| 7,816 |
Depreciation and amortization |
| 2,944 | |
| 3,625 |
Operating profit |
| 1,117 | |
| 2,003 |
Other expense (income), net |
|
| |
| |
Interest expense, net |
| 5,035 | |
| 2,968 |
Related party interest expense/(income), net |
| 1,971 | |
| (25) |
Foreign exchange losses, net |
| 599 | |
| 1,175 |
Changes in fair value of warrant liability |
| (597) | |
| — |
Pension income, net |
| (929) | |
| (804) |
Net loss before income taxes |
| (4,962) | |
| (1,311) |
Income tax expense |
| 606 | |
| 2,562 |
Net loss from continuing operations | | (5,568) | | | (3,873) |
Net loss from discontinued operations, net of income taxes | | (5,479) | | | (4,056) |
Net loss | $ | (11,047) | | $ | (7,929) |
Loss per share: |
|
|
|
|
|
Basic and diluted - continuing operations | $ | (0.25) | | $ | (0.18) |
Basic and diluted - discontinued operations | | (0.24) | | | (0.18) |
Basic and diluted | $ | (0.49) | | $ | (0.36) |
The accompanying notes are an integral part of these consolidated financial statements.
31
XBP Europe Holdings, Inc.
Consolidated Statements of Comprehensive Loss
For the years ended December 31, 2023 and 2022
(in thousands of United States dollars)
| | | | | |
| | | | | |
| Year ended December 31, | ||||
| 2023 |
| 2022 | ||
Net loss | $ | (11,047) | | $ | (7,929) |
Other comprehensive income (loss), net of tax |
|
| |
|
|
Foreign currency translation adjustments |
| (2,995) | |
| 444 |
Unrealized pension actuarial gains, net of tax |
| 3,455 | |
| 7,083 |
Total other comprehensive loss, net of tax | $ | (10,587) | | $ | (402) |
The accompanying notes are an integral part of these consolidated financial statements.
32
XBP Europe Holdings, Inc.
Consolidated Statements of Stockholders’ Deficit
For the years ended December 31, 2023 and 2022
(in thousands of United States dollars except share and per share amounts)
| | | | | | | | | | | | | | | | | | | | | | | |
| | | | | | | | | | | | | Accumulated Other | | | | | | | ||||
| | | | | | | | | | | | | Comprehensive Loss | | | | | | | ||||
| | | | | | | | | | | | | | | | Unrealized | | | | | | | |
| | | | | | | | | | | | | Foreign | | Pension | | | | | | | ||
| | | | | | | | | | | | | Currency | | Actuarial | | | | | | | ||
| | Common Stock | | Additional | | Net Parent | | Translation |
| Gains (Losses), | | Accumulated | | Total | |||||||||
|
| Shares |
| Amount |
| Paid in Capital |
| Investment |
| Adjustment |
| net of tax |
| Deficit |
| Deficit | |||||||
Balances at January 1, 2022 |
| — | | $ | — | | $ | — | | $ | 2,084 | | $ | (18,233) | | $ | (10,381) | | $ | — | | $ | (26,530) |
Net loss January 1, 2022 to December 31, 2022 |
| — | |
| — | |
| — | |
| — | |
| — | |
| — | |
| — | |
| — |
Classification adjustment | | — | |
| — | |
| — | |
| (7,929) | |
| — | |
| — | |
| — | | | (7,929) |
Foreign currency translation adjustment |
| — | |
| — | |
| — | |
| — | |
| 444 | |
| — | |
| — | |
| 444 |
Net unrealized pension actuarial gains, net of tax |
| — | |
| — | |
| — | |
| — | |
| — | |
| 7,083 | |
| — | |
| 7,083 |
Balances at December 31, 2022 |
| — | | $ | — | | $ | — | | $ | (5,845) | | $ | (17,789) | | $ | (3,298) | | $ | — | | $ | (26,932) |
Net loss January 1, 2023 to November 29, 2023 |
| — | |
| — | |
| — | |
| (13,120) | |
| — | |
| — | |
| — | |
| (13,120) |
Classification adjustment | | — | |
| — | |
| — | |
| (19,368) | |
| 19,368 | |
| — | |
| — | | | — |
Issuance of common stock to Cantor and others | | 8,363,413 | |
| 8 | |
| 6,512 | |
| — | |
| — | |
| — | |
| — | | | 6,520 |
Issuance of common stock to BTC International | | 21,802,689 | |
| 22 | |
| (6,215) | |
| 38,333 | |
| — | |
| — | |
| (13,412) | | | 18,728 |
Transaction costs related to the Merger | | — | |
| — | |
| (297) | |
| — | |
| — | |
| — | |
| — | | | (297) |
Net income November 30, 2023 to December 31, 2023 | | — | |
| — | |
| — | |
| — | |
| — | |
| — | |
| 2,073 | | | 2,073 |
Foreign currency translation adjustment |
| — | |
| — | |
| — | |
| — | |
| (2,995) | |
| — | |
| — | |
| (2,995) |
Net unrealized pension actuarial gains, net of tax |
| — | |
| — | |
| — | |
| — | |
| — | |
| 3,455 | |
| — | |
| 3,455 |
Balances at December 31, 2023 |
| 30,166,102 | | $ | 30 | | $ | — | | $ | — | | $ | (1,416) | | $ | 157 | | $ | (11,339) | | $ | (12,568) |
The accompanying notes are an integral part of these consolidated financial statements
33
XBP Europe Holdings, Inc.
Consolidated Statements of Cash Flows
For the years ended December 31, 2023 and 2022
(in thousands of United States dollars)
| | | | | |
| Years ended December 31, | ||||
| 2023 |
| 2022 | ||
Cash flows from operating activities | | | | | |
Net loss | $ | (11,047) | | $ | (7,929) |
Adjustments to reconcile net loss to net cash used in operating activities: | | | |
|
|
Depreciation | | 3,467 | |
| 3,779 |
Amortization of intangible assets | | 384 | |
| 616 |
Credit loss expense | | 343 | |
| 181 |
Changes in fair value of warrant liability | | (597) | | | — |
Unrealized foreign currency losses (gains) | | (616) | |
| 1,550 |
Loss on sale of property, plant and equipment | | — | |
| 82 |
Change in deferred income taxes | | (422) | |
| 1,668 |
| | | | | |
Change in operating assets and liabilities | | | |
| |
Accounts receivable | | 5,990 | |
| (3,369) |
Inventories | | (58) | |
| (688) |
Prepaid expense and other assets | | 2,123 | |
| 4,253 |
Accounts payable | | (2,417) | |
| 3,834 |
Related parties payable | | (843) | |
| 14,073 |
Accrued expenses and other liabilities | | 2,629 | |
| (7,727) |
Deferred revenue | | 67 | |
| 510 |
Customer deposits | | (538) | |
| (943) |
Net cash used in operating activities | | (1,535) | |
| 9,890 |
| | | | | |
Cash flows from investing activities | |
| |
|
|
Purchase of property, plant and equipment | | (2,330) | |
| (6,366) |
Cash paid for costs of fulfilling a contract | | (339) | | | — |
Net cash used in investing activities | | (2,669) | |
| (6,366) |
| | | | | |
Cash flows from financing activities | |
| |
|
|
Borrowings under secured borrowing facility | | 87,635 | |
| — |
Principal repayment on borrowings under secured borrowing facility | | (91,662) | |
| — |
Borrowings under Revolving Credit Facility | | — | | | 123,079 |
Repayment under Revolving Credit Facility | | | | | (124,291) |
Principal payments on long-term obligations | | (920) | | | (828) |
Proceeds from Secured Credit Facility | | 223 | |
| 1,732 |
Principal payments on finance leases | | (786) | |
| (1,021) |
Proceeds from Business Combination, net of transaction expenses | | 5,205 | |
| — |
Net cash provided by (used in) financing activities | | (305) | |
| (1,329) |
Effect of exchange rates on cash and cash equivalents | | 3,941 | |
| 2,369 |
Net increase (decrease) in cash and cash equivalents | | (568) | |
| 4,562 |
| | | | | |
Cash and equivalents, beginning of period, including cash from discontinued operations | | 7,473 | |
| 2,910 |
Cash and equivalents, end of period, including cash from discontinued operations | $ | 6,905 | | $ | 7,473 |
| | | | | |
Supplemental cash flow data: |
|
| |
|
|
Income tax payments, net of refunds received |
| 1,059 | |
| 1,288 |
Interest paid |
| 1,798 | |
| 3,028 |
The accompanying notes are an integral part of these consolidated financial statements.
34
XBP Europe Holdings, Inc.
Notes to the Consolidated Financial Statements
(in thousands of United States dollars except share and per share amounts)
1.General
XBP Europe Holdings, Inc. (the “Company” or “XBP Europe”) is a pan-European integrator of bills, payments and related solutions and services seeking to enable digital transformation of businesses. The Company’s name — “XBP” — stands for “exchange for bills and payments” and reflects the Company’s strategy to facilitate connections between buyers and suppliers to optimize clients’ bills and payments and related digitization processes. XBP believes its business ultimately advances digital transformation, improves market-wide liquidity, and encourages sustainable business practices.
The Company provides business process management solutions with proprietary software suites and deep domain expertise, serving as a technology and operations partner for its clients’ strategic journeys and streamlining their complex, disconnected payment processes. The Company serves over 2,000 clients across Europe, the Middle East and Africa (“EMEA”). The Company’s client relationships span multiple industries, including banking, healthcare, insurance, and the public sector. The Company is able to deploy its solutions to clients in any EMEA market due to its cloud-based structure. Its physical footprint spans 15 countries with 32 locations.
Classification Adjustment
In preparing the condensed combined and consolidated financial statements for the three and six months ended June 30, 2023, the Company determined that net parent investment should be reduced by $18.9 million with an offsetting increase to foreign currency translation adjustment in the same amount, in order to conform carve-out financial statements of XBP Europe, Inc. to the transaction parameters of the Merger Agreement. Accordingly, the consolidated balance sheets as of December 31, 2023 and statement of stockholders’ deficit for the year ended December 31, 2023 were adjusted for this reclass.
Merger/Business Combination with CF Acquisition Corp. VIII
On October 9, 2022, XBP Europe, Inc. entered into an Agreement and Plan of Merger ("Merger Agreement”) with CF Acquisition Corp. VIII, a special purpose acquisition company ("CFVIII”), whereby the business combination will be accounted for as a reverse capitalization in accordance with Financial Accounting Standards Board’s Accounting Standards Codification Topic 805, Business Combinations ("ASC805”). Under this method of accounting, CF VIII will be treated as the "acquired” company for financial reporting purposes with XBP Europe surviving as a direct wholly-owned subsidiary of CF VIII.
On November 29, 2023 (the "Closing Date”), the Company consummated the Business Combination pursuant to the Merger Agreement. On the Closing Date, the registrant changed its name from CF Acquisition Corp. VIII to XBP Europe Holdings, Inc.
Divesture
During the third quarter of fiscal year 2024, the Company determined that its certain on-demand printing operations met the criteria to be classified as a discontinued operation, and, as a result, disposable group’s historical financial results are reflected in the Company’s consolidated financial statements as discontinued operations, and assets and liabilities were retrospectively reclassified as assets and liabilities held for sale. See Note 3 - Discontinued Operations of the notes to consolidated financial statements.
2.Reverse Recapitalization
As discussed in Note 1, on November 29, 2023, the Company consummated a business combination pursuant to the Merger Agreement. The Business Combination was accounted for as a Reverse Recapitalization, rather than a
35
business combination, for financial accounting and reporting purposes. Accordingly, XBP Europe was deemed the accounting acquirer (and legal acquiree) and CF VIII was treated as the accounting acquiree (and legal acquirer). Under this method of accounting, the reverse recapitalization was treated as the equivalent of XBP Europe issuing stock for the net assets of CF VIII, accompanied by a recapitalization. XBP Europe has been determined to be the accounting acquirer based on evaluation of the following facts and circumstances:
| ● | XBP Europe pre-combination stockholder has the majority of the voting power in the post-Business Combination company; |
| ● | XBP Europe’s stockholder has the ability to appoint a majority of the Company’s board of directors; |
| ● | XBP Europe’s management team is the management team of the post-Business Combination company; |
| ● | XBP Europe’s prior operations is comprised of the ongoing operations of the post-Business Combination company; |
| ● | XBP Europe is the larger entity based on historical revenues and business operations; and |
| ● | The post-Business Combination company has assumed XBP Europe’s operating name. |
The net assets of CF VIII are stated at historical cost, with no incremental goodwill or other intangible assets recorded for the effects of the Business Combination. The consolidated assets, liabilities, and results of operations prior to the Business Combination are those of XBP Europe. The shares and corresponding capital amounts and earnings per share available for common stockholders, prior to the Business Combination, have been retroactively restated.
Upon closing of the Business Combination, the Company received net proceeds of $5.2 million from the Business Combination.
Transaction costs consist of directors and officers liability insurance cost, legal and professional fees, and other fees relating to the consummation of the Business Combination. The Company incurred $3.3 million in transaction costs relating to the Merger for the year ended December 31, 2023, $0.3 million of which was recorded to additional paid-in capital and the remaining $3.0 million was expensed.
Immediately after giving effect to the Business Combination, there were 30,166,102 shares of Common Stock outstanding, 6,249,980 Public Warrants outstanding and 385,000 Private Warrants outstanding. See Note 17 – Warrants and Note 18 – Stockholders’ Deficit for more details.
3.Discontinued Operations
During the third quarter of 2024, certain on-demand printing operations of the Company met the criteria for classification as held for sale and accordingly, was measured at the lower of their carrying value or its fair value less costs to sell. The Company determined that the held for sale disposal group has met the criteria to be disclosed as discontinued operations as it represents a significant strategic shift that will have a major effect on the Company’s operations and financial results.
The results of the disposal group are presented as discontinued operations in the consolidated statements of operations and, as such, have been excluded from both continuing operations and segment results for all periods presented. Further, the Company has reclassified the assets and liabilities of the disposal group as assets and liabilities held for sale in the consolidated balance sheets for all periods presented. The consolidated statements of cash flows are presented on a consolidated basis for both continuing operations and discontinued operations. Unless otherwise noted, reference within the notes to consolidated financial statements relates to continuing operations.
36
The financial results of the disposal group are presented as net loss from discontinued operations, net of income taxes on the Company’s consolidated statements of operations. The following table presents the major components of financial results of the Company’s disposable group for the periods presented:
| | | | | | |
| | Year ended December 31, | ||||
(dollars in thousands) |
| 2023 |
| 2022 | ||
Revenue, net | | $ | 11,393 | | $ | 21,125 |
Cost of revenue (exclusive of depreciation and amortization) | |
| 12,222 | |
| 18,636 |
Selling, general and administrative expenses (exclusive of depreciation and amortization) | |
| 3,509 | |
| 4,918 |
Related party expense | |
| 50 | |
| 759 |
Depreciation and amortization | |
| 907 | |
| 765 |
Operating loss | |
| (5,295) | |
| (3,953) |
Other expense, net | |
|
| |
|
|
Interest expense, net | |
| 189 | |
| 95 |
Foreign exchange losses (gains), net | |
| (5) | |
| 8 |
Net loss from discontinued operations before income taxes | |
| (5,479) | |
| (4,056) |
Income tax expense | |
| — | |
| — |
Net loss from discontinued operations, net of income taxes | | $ | (5,479) | | $ | (4,056) |
37
The following table represents the aggregated carrying amounts of classes of assets and liabilities that are classified as discontinued operations on the consolidated balance sheets for the periods presented:
| | | | | | |
| | | | | | |
| | December 31, | | December 31, | ||
(dollars in thousands) |
| 2023 |
| 2022 | ||
ASSETS |
| |
| | |
|
Current assets |
| |
| | |
|
Cash and cash equivalents | | $ | 368 | | $ | 55 |
Accounts receivable, net of allowance for credit losses of $89 and $105, respectively | |
| 557 | |
| 1,501 |
Inventories, net | |
| 695 | |
| 693 |
Prepaid expenses and other current assets | |
| 877 | |
| 824 |
Total current assets held for sale | | $ | 2,497 | | $ | 3,073 |
| | | | | | |
Property, plant and equipment, net of accumulated depreciation of $3,114 and $ 2,714, respectively | | $ | 1,188 | | $ | 1,877 |
Operating lease right-of-use assets, net | |
| 1,659 | |
| 1,956 |
Goodwill | |
| 87 | |
| 87 |
Deferred income tax assets | | | 50 | | | — |
Other noncurrent assets | | | 34 | | | 32 |
Total noncurrent assets held for sale | | $ | 3,018 | | $ | 3,952 |
| | | | | | |
LIABILITIES | |
|
| |
|
|
Current liabilities | |
|
| |
|
|
Accounts payable (including related party of $ 339 and $335, respectively) | | $ | 1,472 | | $ | 2,439 |
Accrued liabilities | |
| 892 | |
| 1,252 |
Accrued compensation and benefits | |
| 315 | |
| 619 |
Customer deposits | |
| 213 | |
| 364 |
Current portion of finance lease liabilities | |
| 547 | |
| 530 |
Current portion of operating lease liabilities | |
| 379 | |
| 347 |
Current portion of long-term debts | | | — | | | 365 |
Total current liabilities held for sale | | $ | 3,818 | | $ | 5,916 |
| | | | | | |
Finance lease liabilities, net of current portion | | | — | | | 529 |
Operating lease liabilities, net of current portion | |
| 1,280 | |
| 1,609 |
Total noncurrent liabilities held for sale | | $ | 1,280 | | $ | 2,138 |
The following table presents significant non-cash items and capital expenditures of discontinued operations for the periods presented:
| | | | | | |
| | Year ended December 31, | ||||
(dollars in thousands) |
| 2023 |
| 2022 | ||
Depreciation |
| $ | 907 | | $ | 765 |
Credit loss expense (income) | | | (16) | | | (16) |
Unrealized foreign currency losses (gains) |
| | (5) | | | 8 |
Purchase of property, plant and equipment |
| $ | 173 | | $ | 87 |
4.Basis of Presentation and Summary of Significant Accounting Policies
Basis of Presentation
Throughout the period covered till the Closing date of the Business Combination, the Company operated as part of ETI. Consequently, stand-alone financial statements have not historically been prepared for the Company. The
38
accompanying consolidated financial statements have been prepared from ETI’s historical accounting records and are presented on a stand-alone basis as if the Company’s operations had been conducted independently from ETI. The consolidated financial statements and related notes to the consolidated financial statements have been prepared in accordance with generally accepted accounting principles in the United States (“U.S. GAAP”) and in accordance with the rules and regulations of the Securities and Exchange Commission (“SEC”).
The consolidated statements of operations include all revenues and costs directly attributable to XBP Europe, including costs for facilities, functions and services used by XBP Europe. Costs for certain functions and services such as accounting, finance and IT delivered by subsidiaries of ETI are directly charged to XBP Europe based on specific identification when possible or based on a reasonable allocation driver such as net sales, headcount, usage or other allocation methods. Current and deferred income taxes have been determined based on the stand-alone results of XBP Europe. However, because the Company filed as part of ETI’s tax group in certain jurisdictions, the Company’s actual tax balances may differ from those reported. The Company’s portion of its domestic and certain income taxes for jurisdictions outside the United States are deemed to have been settled in the period the related tax expense was recorded.
All intercompany transactions and balances within the Company have been eliminated. The consolidated financial statements of the Company include assets and liabilities that have been determined to be specifically identifiable or otherwise attributable to the Company. Transactions with affiliated companies owned by ETI or its subsidiaries which are not a part of the Company are reflected as related party transactions.
All of the allocations and estimates in the consolidated financial statements are based on assumptions that management of ETI believes are reasonable. However, the consolidated financial statements included herein may not be indicative of the financial position, results of operations, and cash flows of the Company in the future or if the Company had been a separate, stand-alone entity during the periods presented.
Actual costs that would have been incurred if XBP Europe had been a stand-alone Company would depend on multiple factors, including organizational structure and strategic decisions.
Certain comparative amounts for prior year have been reclassified to conform to the financial statement presentation as of and for the year ended December 31, 2023.
Use of Estimates in Preparation of the Consolidated Financial Statements
Estimates and judgments relied upon in preparing these consolidated financial statements include revenue recognition for multiple element arrangements, allowance for credited losses, inventory obsolescence costs, income taxes, depreciation, amortization, employee benefits, contingencies, goodwill, intangible assets, right of use assets and obligation, pension obligations, pension assets, and asset and liability valuations. The Company regularly assesses these estimates and records changes in estimates in the period in which they become known. The Company bases its estimates on historical experience and various other assumptions that the Company believes to be reasonable under the circumstances. Actual results could differ from those estimates.
Segment Reporting
The Company consists of two segments:
| 1. | The Bills & Payments business unit primarily focuses on optimizing how bills and payments are processed by businesses of all sizes and industries. It offers automation of AP and AR processes and through its platform, XBP, seeks to integrate buyers and suppliers across Europe. This business unit also includes the Company’s digital transformation revenue, which is both project based and recurring. |
| 2. | The Technology business unit primarily focuses on sales of recurring software licenses and related maintenance, hardware solutions and related maintenance and professional services. |
39
Cash and Cash Equivalents
Cash and cash equivalents include cash deposited with financial institutions and liquid investments with original maturity dates equal to or less than three months. All bank deposits and money market accounts are considered cash and cash equivalents.
Accounts Receivable and Allowance for Expected Credit Losses
Accounts receivable are carried at the original invoice amount less an estimate made for credit losses. Revenue that has been earned but remains unbilled at the end of the period is recorded as a component of accounts receivable, net. The Company specifically analyzes accounts receivable mainly based on customer type and related aging schedules, historical collection experience, current and future economic and market conditions to estimate the probability of default in the future when evaluating the adequacy of its allowance for expected credit losses. The Company writes off accounts receivable balances against the allowance for expected credit losses, net of any amounts recorded in deferred revenue, when it becomes probable that the receivable will not be collected.
Inventories
Inventories primarily include heavy-duty scanners and related parts, toner, paper stock, envelopes and postage supplies. Inventories are stated at the lower of cost or net realizable values and include the cost of raw materials, labor, and purchased subassemblies. Cost is determined using the weighted average method.
Property, Plant and Equipment
Property, plant, and equipment are recorded at cost less accumulated depreciation. Depreciation is computed using the straight-line method (which approximates the use of the assets) over the estimated useful lives of the assets. When these assets are sold or otherwise disposed of, the asset and related depreciation is relieved, and any gain or loss is included in the consolidated statements of operations for the period of sale or disposal. Leasehold improvements are amortized over the lease term or the useful life of the asset, whichever is shorter. Repair and maintenance costs are expensed as incurred.
Intangible Assets
Customer Relationships
Customer relationship intangible assets represent customer contracts and relationships obtained as part of acquired businesses. Customer relationship values are estimated by evaluating various factors including historical attrition rates, contractual provisions and customer growth rates, among others. The estimated average useful lives of customer relationships range from 4 to 16 years depending on facts and circumstances. These intangible assets are primarily amortized straight-line over the estimated useful life. The Company evaluates the remaining useful life of intangible assets on an annual basis to determine whether events and circumstances warrant a revision to the remaining useful life.
Developed Technology
The Company has acquired various developed technologies embedded in its technology platform. Developed technology is an integral asset to the Company in providing solutions to customers and is recorded as an intangible asset. The Company amortizes developed technology on a straight-line basis over the estimated useful life, which is typically 5 to 8.5 years.
40
Capitalized Software Costs
The Company capitalizes certain costs incurred to develop software products to be sold, leased or otherwise marketed after establishing technological feasibility in accordance with ASC section 985-20, Software — Costs of Software to Be Sold, Leased, or Marketed, and the Company capitalizes costs to develop or purchase internal-use software in accordance with ASC section 350-40, Intangibles — Goodwill and Other — Internal-Use Software. Significant estimates and assumptions include determining the appropriate period over which to amortize the capitalized costs based on estimated useful lives and estimating the marketability of the commercial software products and related future revenues. The Company amortizes capitalized software costs on a straight-line basis over the estimated useful life, which is typically 5 years.
Outsourced Contract Costs
Costs of outsourcing contracts, including costs incurred for bid and proposal activities, are generally expensed as incurred. However, certain costs incurred upon initiation of an outsourcing contract are deferred and expensed on a straight-line basis over the estimated contract term, which is typically 3 to 5 years. These costs represent incremental external costs or certain specific internal costs that are directly related to the contract acquisition or fulfillment activities and can be separated into two principal categories: contract commissions and set-up/fulfillment costs. Contract fulfillment costs are capitalized only if they are directly attributable to a specifically anticipated future contract; represent the enhancement of resources that will be used in satisfying a future performance obligation (the services under the anticipated contract); and are expected to be recovered.
Impairment of Long-Lived Assets
The Company reviews the recoverability of its long-lived assets, including finite-lived trade names, trademarks, customer relationships, developed technology, capitalized software costs, outsourced contract costs, acquired software, workforce, and property, plant and equipment, when events or changes in circumstances occur that indicate that the carrying value of the asset may not be recoverable. The assessment of possible impairment is based on the ability to recover the carrying value of the asset from the expected future cash flows (undiscounted and without interest charges) of the related operations. If these cash flows are less than the carrying value of such assets, an impairment loss is recognized for the difference between estimated fair value and carrying value. The primary measure of fair value is based on discounted cash flows based in part on the financial results and the expectation of future performance.
The Company did not record any impairment related to its property, plant, and equipment, customer relationships, developed technology, capitalized software cost or outsourced contract costs for the years ended December 31, 2023 and 2022.
Goodwill
Goodwill represents the excess purchase price over tangible and intangible assets acquired less liabilities assumed arising from business combinations. Goodwill is generally allocated to reporting units based upon relative fair value (taking into consideration other factors such as synergies) when an acquired business is integrated into multiple reporting units. The Company’ reporting units are at the operating segment level, for which discrete financial information is prepared and regularly reviewed by management. When a business within a reporting unit is disposed of, goodwill is allocated to the disposed business using the relative fair value method.
The Company conducts its annual goodwill impairment tests on October 1st of each year, or more frequently if indicators of impairment exist. When performing the annual impairment test, the Company has the option of performing a qualitative or quantitative assessment to determine if an impairment has occurred. If a qualitative assessment indicates that it is more likely than not that the fair value of a reporting unit is less than its carrying amount, the Company would be required to perform a quantitative impairment analysis for goodwill. The quantitative analysis requires a comparison of the fair value of the reporting unit to its carrying value, including goodwill. If the carrying value of the reporting unit exceeds its fair value, an impairment loss is recognized in an amount equal to that excess, limited to the total amount of goodwill allocated to that reporting unit. The Company uses a combination of the Guideline Public Company Method of
41
the Market Approach and the Discounted Cash Flow Method of the Income Approach to determine the reporting unit fair value. Refer to Note 10- Intangible Assets and Goodwill for additional discussion of goodwill.
Benefit Plan Accruals
The Company has defined benefit plans in the UK, Germany, Norway and France under which participants earn a retirement benefit based upon a formula set forth in the respective plans. The Company records annual amounts relating to its pension plans based on calculations that incorporate various actuarial and other assumptions, including discount rates, mortality, assumed rates of return, and compensation increases. The Company reviews its assumptions on an annual basis and makes modifications to the assumptions based on current rates and trends when it is appropriate to do so.
Leases
The Company determines if a contract is, or contains, a lease at contract inception. Operating leases are included in operating lease right-of-use (“ROU”) assets, current portion of operating lease liabilities and operating lease liabilities, net of current portion in the consolidated balance sheet. Finance leases are included in property, plant and equipment, current portion of finance lease liabilities and finance lease liabilities, net of current portion in the consolidated balance sheet.
ROU assets represent the right to use an underlying asset for the lease term and lease liabilities represent the obligation to make lease payments arising from the lease. ROU assets and lease liabilities are recognized at the commencement date based on the present value of lease payments over the lease term. In addition, ROU assets include initial direct costs incurred by the lessee as well as any lease payments made at or before the commencement date and exclude lease incentives. As most of the Company’ leases do not provide an implicit rate, the Company uses its incremental borrowing rate based on the information available at the commencement date in determining the present value of lease payments. The implicit rate in the lease is used when readily determinable. Lease terms include options to extend or terminate the lease when it is reasonably certain that the Company will exercise that option. Leases with a term of one year or less are not recorded on the balance sheet.
Finance lease ROU assets are amortized over the lease term or the useful life of the asset, whichever is shorter. The amortization of finance lease ROU assets is recorded in depreciation expense in the consolidated statements of operations. For operating leases, expense is recognized for lease payments on a straight-line basis over the lease term.
Warrants
The Company accounts for the warrants as either equity-classified or liability-classified instruments based on an assessment of the warrant’s specific terms and applicable authoritative guidance in Financial Accounting Standards Board (“FASB”) ASC 480, Distinguishing Liabilities from Equity (“ASC 480”) and ASC 815, Derivatives and Hedging (“ASC 815”). The assessment considers whether the warrants are freestanding financial instruments pursuant to ASC 480, meet the definition of a liability pursuant to ASC 480, and whether the warrants meet all of the requirements for equity classification under ASC 815, including whether the warrants are indexed to Company’s own shares of common stock and whether the warrant holders could potentially require “net cash settlement” in a circumstance outside of the Company’s control, among other conditions for equity classification. This assessment, which requires the use of professional judgment, is conducted at the time of warrant issuance and as of each subsequent quarterly period end date while the warrants are outstanding. For issued or modified warrants that meet all of the criteria for equity classification, the warrants are required to be recorded as a component of equity at the time of issuance.
The Company determined upon further review of the warrant agreements, that while Public Warrants meet the definition of a derivative, they meet the equity scope exception in ASC 815 to be classified in stockholders’ deficit and are not subject to remeasurement provided that the warrants continue to meet the criteria for equity classification.
42
Similarly, Private Warrants meet the definition of a derivative, however they don’t meet the equity scope exception in ASC 815 and are subject to remeasurement. Private Warrant liability shall be measured at fair value on transaction closing date, with changes in fair value each period recognized in the consolidated statements of operations.
Held for Sale
The Company classifies assets as held-for-sale (“disposal group”) in the period when all of the relevant criteria to be classified as held for sale are met. These criteria include management’s commitment to sell the disposal group in its present condition and the sale being deemed probable of being completed within one year. Assets held for sale are reported at the lower of their carrying value or fair value less cost to sell. The fair values of disposal groups are estimated using accepted valuation techniques, including indicative listing prices. The Company considers historical experience, guidance received from third parties, and all information available at the time the estimates are made to derive fair value. Any loss resulting from the measurement is recognized in the period when the held for sale criteria are met. The Company assesses the fair value of a disposal group, less any costs to sell, each reporting period it remains classified as held for sale and reports any subsequent changes as an adjustment to the carrying value of the disposal group, as long as the new carrying value does not exceed the initial carrying value of the disposal group. Assets held-for-sale are not amortized or depreciated.
Revenue Recognition
The Company accounts for revenue in accordance with ASC 606, Revenue from Contracts with Customers. A performance obligation is a promise in a contract to transfer a distinct good or service to the customer and is the unit of account in ASC 606. Revenue is measured as the amount of consideration that is expected to receive in exchange for transferring goods or providing services. The contract transaction price is allocated to each distinct performance obligation and recognized as revenue when, or as, the performance obligation is satisfied. All of the Company’s material sources of revenue are derived from contracts with customers, primarily relating to the provision of business and transaction processing services and sales of recurring software licenses and professional services within each of the Company’s segments. The Company does not have any significant extended payment terms, as payment for invoices issued is received shortly after goods are delivered or services are provided.
Nature of Services
The primary performance obligations are to stand ready to provide various forms of business processing services, consisting of a series of distinct services that are substantially the same and have the same pattern of transfer over time, and accordingly are combined into a single performance obligation. The Company’s promise to its customers is typically to perform an unknown or unspecified quantity of tasks and the consideration received is contingent upon the customers’ use (i.e., number of transactions processed, requests fulfilled, etc.); as such, the total transaction price is variable. The variable fees are allocated to the single performance obligation charged to the distinct service period in which the Company performs the service.
Revenue from the sale of recurring software licenses is recognized ratably over the contractual term, unless perpetual licenses are granted or a noncancelable license is granted for a nonrefundable fee, which are recognized at a point in time. Professional services revenue consists of implementation services for new customers, or implementations of new products for existing customers. Professional services are typically sold on a time-and-materials basis and billed monthly based on actual hours incurred.
Revenue from the sale of hardware solutions is recognized on a point in time basis and related maintenance are recognized ratably over the contractual term.
43
Disaggregation of Revenues
The following tables disaggregate revenue from contracts by geographic region for the years ended December 31, 2023 and 2022:
| | | | | | |
| | | | | | |
| | Year ended December 31, | ||||
(dollars in thousands) |
| 2023 |
| 2022 | ||
France | | $ | 57,746 | | $ | 66,054 |
Germany | |
| 34,578 | |
| 35,334 |
United Kingdom | |
| 35,579 | |
| 32,061 |
Sweden | |
| 17,575 | |
| 17,640 |
Other | |
| 9,465 | |
| 8,135 |
Total Revenue, net | | $ | 154,943 | | $ | 159,224 |
Contract Balances
The following table presents contract assets, contract liabilities and contract costs recognized at December 31, 2023 and 2022:
| | | | | | |
| | December 31, | ||||
(dollars in thousands) |
| 2023 |
| 2022 | ||
Accounts receivable, net | | $ | 30,238 | | $ | 34,476 |
Deferred revenues | |
| 6,004 | |
| 5,660 |
Customer deposits | |
| 323 | |
| 697 |
Costs to obtain and fulfill a contract | | $ | 350 | | $ | 44 |
Accounts receivable, net includes $10.8 million and $9.0 million as of December 31, 2023 and 2022, respectively, representing amounts not billed to customers. Unbilled receivables are accrued and represent work performed in accordance with the terms of contracts with customers.
Deferred revenues relate to payments received in advance of performance under a contract. A significant portion of this balance relates to maintenance contracts or other service contracts where the Company received payments for upfront conversions or implementation activities which do not transfer a service to the customer but rather are used in fulfilling the related performance obligations that transfer over time. The advance consideration received from customers is deferred over the contract term. The Company recognized revenue of $6.3 million during the year ended December 31, 2023 that had been deferred as of December 31, 2022.
Costs incurred to obtain and fulfill contracts are deferred and presented as part of intangible assets, net and expensed on a straight-line basis over the estimated benefit period. These costs represent incremental external costs or certain specific internal costs that are directly related to the contract acquisition or fulfillment and can be separated into two principal categories: contract commissions and fulfillment costs. Applying the practical expedient in ASC 340-40-25-4, the incremental costs of obtaining contracts are recognized as an expense when incurred if the amortization period would have been one year or less. These costs are included in selling, general and administrative expenses. The effect of applying this practical expedient was not material.
Customer deposits consist primarily of amounts received from customers in advance for postage. These advanced postage deposits are used to cover the costs associated with postage, with the corresponding postage revenue being recognized as services are performed.
Performance Obligations
At the inception of each contract, the Company assesses the goods and services promised in the Company’s contracts and identifies each distinct performance obligation. The majority of the Company’s contracts have a single performance obligation, as the promise to transfer the individual goods or services is not separately identifiable from
44
other promises in the contracts. For the majority of the Company’s business and transaction processing service contracts, revenues are recognized as services are provided based on an appropriate input or output method, typically based on the related labor or transactional volumes.
Certain of the Company’s contracts have multiple performance obligations, including contracts that combine software implementation services with post-implementation customer support. For contracts with multiple performance obligations, the Company allocates the contract’s transaction price to each performance obligation using the best estimate of the standalone selling price of each distinct good or service in the contract. The primary method used to estimate standalone selling price is the expected cost plus a margin approach, under which the Company estimates the expected costs of satisfying a performance obligation and adds an appropriate margin for that distinct good or service. The adjusted market approach is also used whereby the Company estimates the price that customers in the market would be willing to pay. In assessing whether to allocate variable consideration to a specific part of the contract, the Company considers the nature of the variable payment and whether it relates specifically to its efforts to satisfy a specific part of the contract. Certain of the Company’s software implementation performance obligations are satisfied at a point in time, typically when customer acceptance is obtained.
When evaluating the transaction price, the Company analyzes, on a contract-by-contract basis, all applicable variable considerations. The nature of the Company’s contracts gives rise to variable consideration, including volume discounts, contract penalties, and other similar items that generally decrease the transaction price. These amounts are estimated based on the expected amount to be provided to customers and reduce revenues recognized. The Company does not anticipate significant changes to the Company’s estimates of variable consideration.
Reimbursements from customers, such as postage costs, are included in revenue, while the related costs are included in cost of revenue.
Transaction Price Allocated to the Remaining Performance Obligations
In accordance with optional exemptions available under ASC 606, the Company did not disclose the value of unsatisfied performance obligations for (a) contracts with an original expected length of one year or less, and (b) contracts for which variable consideration relates entirely to an unsatisfied performance obligation, which comprise the majority of the Company’s contracts. The Company has certain non-cancellable contracts where a fixed monthly fee is received in exchange for a series of distinct services that are substantially the same and have the same pattern of transfer over time, with the corresponding remaining performance obligations as of December 31, 2023 in each of the future periods below:
| | | |
(dollars in thousands) |
| | |
2024 | | $ | 5,822 |
2025 | |
| 53 |
2026 | |
| 32 |
2027 and thereafter | |
| 97 |
Total | | $ | 6,004 |
Advertising
Advertising costs are expensed as incurred. Advertising expense for the years ended December 31, 2023 and 2022 were $0.1 million and $0.2 million, respectively.
Research and Development
Research and development costs are expensed as incurred. Research and development expenses for the years ended December 31, 2023 and 2022 were $0.9 million and $1.1 million, respectively.
45
Restructuring Charges
Costs and liabilities associated with management-approved restructuring activities are recognized when they are incurred. One-time employee termination costs are recognized at the time of communication to employees, unless future service is required, in which case the costs are recognized ratably over the future service period. Ongoing employee termination benefits are recognized as a liability when it is probable that a liability exists and the amount is reasonably estimable. Restructuring charges are recognized as an operating expense within the consolidated statements of operations and related liabilities are recorded within accrued compensation and benefits on the consolidated balance sheets. The Company periodically evaluates and, if necessary, adjusts its estimates based on currently available information.
The liability for the restructuring charge associated with an exit or disposal activity is measured initially at its fair value. Restructuring charges for the years ended December 31, 2023 and 2022 were $4.3 million and $0.3 million, respectively.
Income Taxes
The Company accounts for income taxes by using the asset and liability method. The Company accounts for income taxes regarding uncertain tax positions and recognized interest and penalties related to uncertain tax positions in income tax expense in the consolidated statements of operations.
Deferred income taxes are recognized on the tax consequences of temporary differences by applying enacted statutory tax rates applicable in future years to differences between the financial statement carrying amounts and the tax bases of existing assets and liabilities, as determined under tax laws and rates. A valuation allowance is provided when it is more likely than not that all or some portion of the deferred tax assets will not be realized. The Company did not consider future book income as a source of taxable income when assessing if a portion of the deferred tax assets are more likely than not to be realized. However, scheduling the reversal of existing deferred tax liabilities indicated that a portion of the deferred tax assets are likely to be realized. Therefore, partial valuation allowances were established against a portion of the Company’ deferred tax assets. In the event the Company determines that it would be able to realize deferred tax assets that have valuation allowances established, an adjustment to the net deferred tax assets would be recognized as a component of income tax expense through continuing operations.
The Company engages in transactions (i.e. acquisitions) in which the tax consequences may be subject to uncertainty and examination by the varying taxing authorities. Therefore, judgment is required by the Company in assessing and estimating the tax consequences of these transactions. While the Company’s tax returns are prepared and based on the Company’ interpretation of tax laws and regulations, in the normal course of business the tax returns are subject to examination by the various taxing authorities. Such examinations may result in future assessments of additional tax, interest and penalties. For purposes of the Company’s income tax provision, a tax benefit is not recognized if the tax position is not more likely than not to be sustained based solely on its technical merits. Considerable judgment is involved in determining which tax positions are more likely than not to be sustained. Refer to Note 13 — Income Taxes for further information.
Loss Contingencies
The Company reviews the status of each significant matter, if any, and assesses its potential financial exposure considering all available information including, but not limited to, the impact of negotiations, settlements, rulings, advice of legal counsel and other updated information and events pertaining to a particular matter. If the potential loss from any claim or legal proceeding is considered probable and the amount can be reasonably estimated, the Company accrues a liability for the estimated loss. Judgment is required in both the determination of probability and the determination as to whether an exposure is reasonably estimable. Because of uncertainties related to loss contingencies, accruals are based on the best information available at the time. As additional information becomes available, the Company reassesses the potential liability related to its pending claims and litigation and may revise its estimates. These revisions in the estimates of the potential liabilities could have a material impact on the results of operations and financial position of the Company. The Company’s liabilities exclude any estimates for legal costs not yet incurred associated with handling these matters.
46
Foreign Currency Translation
The Company has determined all international subsidiaries’ functional currency is the local currency. These assets and liabilities are translated at exchange rates in effect at the balance sheet date while income and expense amounts are translated at average exchange rates during the period. The resulting foreign currency translation adjustments are disclosed as a separate component of other comprehensive loss.
Included as foreign exchange losses, net in the consolidated statements of operations are net exchange loss of $0.6 million and $1.2 million for the years ended December 31, 2023 and 2022, respectively.
Net Loss per Share
Earnings per share (“EPS”) is computed by dividing net loss by the weighted average number of shares of common stock outstanding during the period, excluding the effects of any potentially dilutive securities. Diluted EPS gives effect to the potential dilution that could occur if securities or other contracts to issue common stock were exercised or converted into common stock, using the more dilutive of the two-class method and if-converted method in the period of earnings. The two-class method is an earnings allocation method that determines earnings per share (when there are earnings) for common stock and participating securities. The if-converted method assumes all convertible securities are converted into common stock. Diluted EPS excludes all dilutive potential shares of common stock if their effect is anti-dilutive.
As the Company experienced net losses for the periods presented, the Company did not include the effect of 6,634,980 shares of Common Stock issuable upon exercise of 6,634,980 warrants sold in the IPO and Private Placement and issued in connection with completion of the Business Combination, in the calculation of diluted loss per share for the years ended December 31, 2023 and 2022, because their effects were anti-dilutive.
The components of basic and diluted EPS are as follows:
| | | | | | |
| | Year Ended December 31, | ||||
(dollars in thousands, except share and per share amounts) | | 2023 |
| 2022 | ||
Net loss from continuing operations attributable to common stockholders (A) | | $ | (5,568) | | $ | (3,873) |
Net loss from discontinued operations attributable to common stockholders (B) | | | (5,479) | | | (4,056) |
Net loss attributable to common stockholders (C) | | $ | (11,047) | | $ | (7,929) |
| | | | | | |
Weighted average common shares outstanding – basic and diluted (D) | |
| 22,535,920 | |
| 21,802,689 |
Loss Per Share: | |
|
| |
|
|
Basic and diluted - continuing operations (A/D) | | $ | (0.25) | | $ | (0.18) |
Basic and diluted - discontinued operations (B/D) | | | (0.24) | | | (0.18) |
Basic and diluted (C/D) | | $ | (0.49) | | $ | (0.36) |
Fair Value Measurements
The Company records the fair value of assets and liabilities in accordance with ASC 820, Fair Value Measurement (“ASC 820”). ASC 820 defines fair value as the price received to sell an asset or paid to transfer a liability in an orderly transaction between market participants at the measurement date and in the principal or most advantageous market for that asset or liability. The fair value should be calculated based on assumptions that market participants would use in pricing the asset or liability, not on assumptions specific to the entity.
In addition to defining fair value, ASC 820 expands the disclosure requirements around fair value and establishes a fair value hierarchy for valuation inputs. The hierarchy prioritizes the inputs into three levels based on the extent to which inputs used in measuring fair value are observable in the market. Each fair value measurement is
47
reported in one of the three levels, which is determined by the lowest level input that is significant to the fair value measurement in its entirety. These levels are:
Level 1 — quoted prices (unadjusted) in active markets for identical assets or liabilities.
Level 2 — quoted prices for similar assets and liabilities in active markets or inputs that are observable for the asset or liability, either directly or indirectly through market corroboration, for substantially the full term of the financial instrument.
Level 3 — unobservable inputs reflecting management’s own assumptions about the inputs used in pricing the asset or liability at fair value.
Refer to Note 14 — Employee Benefit Plans and Note 16 — Fair Value Measurement for further discussion.
Concentration of Credit Risk
Financial instruments that potentially subject the Company to concentration of credit risk consist primarily of cash and cash equivalents and trade receivables. The Company maintains its cash and cash equivalents and certain other financial instruments with highly rated financial institutions and limits the amount of credit exposure with any one financial institution. From time to time, the Company assesses the credit worthiness of its customers. Credit risk on trade receivables is minimized because of the large number of entities comprising the Company’s client base and their dispersion across many industries and geographic areas. The Company generally has not experienced any material losses related to receivables from any individual customer or groups of customers. The Company does not require collateral. Due to these factors, no additional credit risk beyond amounts provided for collection losses is believed by management to be probable in the Company’s accounts receivable, net. The Company does not have any significant customers that account for 10% or more of the total combined revenues.
Recently Adopted Accounting Pronouncements
Effective January 1, 2023, the Company adopted Accounting Standards Update ("ASU”) no. 2016-13, Financial Instruments — Credit Losses (Topic 326): Measurement of Credit Losses on Financial Instruments, to replace the incurred loss impairment methodology undercurrent GAAP with a methodology that reflects expected credit losses and requires consideration of a broader range of reasonable and supportable information to inform credit loss estimates. The Company is required to use a forward-looking expected credit loss model for accounts receivables, loans, and other financial instruments. This ASU along with related additional clarificatory guidance in the ASU No. 2019-05,"Financial Instruments — Credit Losses (Topic 326)” and ASU No. 2019-11,"Codification Improvements to Topic 326, Financial Instruments — Credit Losses”, was also adopted. Adoption of the standard was applied using a modified retrospective approach through a cumulative-effect adjustment to retained earnings as of the effective date. The Company has performed its analysis of the impact on its financial instruments that are within the scope of this guidance, primarily cash and cash equivalents, restricted cash and accounts receivable, based on class of financing receivables which share the same or similar risk characteristics such as customer type and geographic location, among others. For accounts receivable, the Company applied this methodology using aging schedules reflecting how long the receivables have been outstanding, historical collection experience, current and future economic and market conditions. There was no impact to the Company’s opening retained earnings or its consolidated balance sheet upon adoption and as a result, the balances presented for December 31, 2022, which were derived under the incurred loss model, are comparable to December 31, 2023.
48
The following table describes the changes in the allowance for expected credit losses for the year ended December 31, 2023 (all related to accounts receivables):
| | | |
| | December 31, | |
(dollars in thousands) |
| 2023 | |
Balance at January 1, 2023 of the allowance for expected credit losses | | $ | 824 |
Change in the provision for expected credit losses for the period | |
| 359 |
Balance at December 31, 2023 of the allowance for expected credit losses | |
| 1,183 |
In September 2022, the FASB issued ASU 2022-04, Liabilities — Supplier Finance Programs (Subtopic 405-50): Disclosure of Supplier Finance Program Obligations. This ASU requires that a buyer in a supplier finance program disclose the key terms of supplier finance programs, the amount of obligations outstanding at the end of the reporting period that the entity has confirmed as valid to the finance provider, where these obligations are recorded in the balance sheet, and a roll forward of the obligations. The new standard is effective for fiscal years beginning after December 15, 2022, on a retrospective basis, including interim periods within those fiscal years. Effective January 1, 2023, the Company adopted this standard. The adoption of this standard did not have a material impact on the consolidated financial statements.
Effective January 1, 2023, the Company adopted ASU no. 2021-08, Business Combinations (Topic 805): Accounting for Contract Assets and Contract Liabilities from Contracts with Customers. The ASU amends ASC 805 to add contract assets and contract liabilities to the list of exceptions to the recognition and measurement principles that apply to business combinations and to require that an entity (acquirer) recognize and measure contract assets and contract liabilities acquired in a business combination in accordance with Topic 606. While primarily related to contract assets and contract liabilities that were accounted for by the acquiree in accordance with ASC 606, the amendments also apply to contract assets and contract liabilities from other contracts to which the provisions of Topic 606 apply, such as contract liabilities from the sale of non financial assets within the scope of Subtopic 610-20. The ASU was applied prospectively. The adoption had no material impact on the Company’s consolidated results of operations, cash flows, financial position or disclosures.
Recently Issued Accounting Pronouncements
In March 2023, FASB issued ASU2023-01, Leases (Topic 842): Common Control Arrangements. The FASB-issued guidance clarifies the accounting for leasehold improvements associated with common control leases by requiring that leasehold improvements associated with common control leases be amortized by the lessee over the useful life of the leasehold improvements to the common control group (regardless of the lease term),as long as the lessee controls the use of the underlying asset through a lease. Additionally, leasehold improvements associated with common control leases should be accounted for as a transfer between entities under common control through an adjustment to equity, if, and when, the lessee no longer controls the use of the underlying asset. The amendments in this ASU are effective for annual and interim periods beginning after December 15, 2023. The Company is currently evaluating the impact that adopting this standard will have on its consolidated financial statements.
In October 2023, the FASB issued ASU No. 2023-06, Disclosure Improvements-Codification Amendments in Response to the SEC’s Disclosure Update and Simplification Initiative, which modifies the disclosure and presentation requirements of a variety of US GAAP codification topics by aligning them with the SEC Regulation S-X or S-K, which are rules about the form and content of financial reports. The provisions of this ASU are contingent upon when the SEC removes the related disclosure provisions from Regulation S-X and S-K. This guidance is effective for the Company no later than June 30, 2027 and is not expected to have a material impact on the Company’s consolidated financial statements.
In November 2023, the FASB issued ASU No. 2023-07, Segment Reporting (Topic 280): Improvements to Reportable Segment Disclosures, which requires retrospective disclosure of significant segment expenses and other segment items on an annual and interim basis. Additionally, it requires disclosure of the title and position of the Chief Operating Decision Maker ("CODM”). This ASU is effective for fiscal years beginning after December 15, 2023, and
49
for interim periods within fiscal years beginning after December 15, 2024, with early adoption permitted. The Company is currently evaluating the impact that adopting this standard will have on its consolidated financial statements.
In December 2023, the FASB issued ASU No. 2023-09, Income Taxes (Topic 740): Improvements to Income Tax Disclosures, which requires an annual tabular effective tax rate reconciliation disclosure including information for specified categories and jurisdiction levels, as well as, disclosure of income taxes paid, net of refunds received, disaggregated by federal, state/local, and significant foreign jurisdiction. This ASU is effective for fiscal years beginning after December 15, 2024, with early adoption permitted. The Company is currently evaluating the impact that adopting this standard will have on its consolidated financial statements.
5.Inventories
Inventories, net consist of the following:
| | | | | | |
| | December 31, | ||||
(dollars in thousands) |
| 2023 |
| 2022 | ||
Finished goods | | $ | 5,892 | | $ | 5,533 |
Allowance for obsolescence | |
| (1,847) | |
| (1,700) |
Total inventories, net | | $ | 4,045 | | $ | 3,833 |
Finished goods inventory includes $1.8 million and $1.7 million of allowance for obsolescence as of December 31, 2023 and 2022, respectively. The Company’s allowance for obsolescence is based on a policy developed by historical experience and management judgment.
6.Accounts Receivable
Accounts receivable, net consist of the following:
| | | | | | |
| | December 31, | ||||
(dollars in thousands) |
| 2023 |
| 2022 | ||
Billed receivables | | $ | 20,584 | | $ | 26,269 |
Unbilled receivables | |
| 10,837 | |
| 9,031 |
Less: Allowance for credit losses | |
| (1,183) | |
| (824) |
Total accounts receivable, net | | $ | 30,238 | | $ | 34,476 |
Unbilled receivables represent balances recognized as revenue that have not been billed to the customer. The Company allowance for doubtful accounts is based on a policy developed by historical experience and management judgment. Adjustments to the allowance for credit losses may occur based on market conditions or specific client circumstances.
The following table describes the changes in the allowance for expected credit losses for the years ended December 31, 2023 and 2022 (all related to accounts receivables):
| | | | | | |
| | December 31, | ||||
(dollars in thousands) | | 2023 |
| 2022 | ||
Balance at January 1, of the allowance for expected credit losses | | $ | 824 | | $ | 1,325 |
Change in the provision for expected credit losses for the period | |
| 359 | |
| (501) |
Balance at December 31, of the allowance for expected credit losses | | $ | 1,183 | | $ | 824 |
50
7.Prepaid Expenses and Other Current Assets
Prepaid expenses and other current assets consist of the following:
| | | | | | |
| | December 31, | ||||
(dollars in thousands) |
| 2023 |
| 2022 | ||
Prepaid postage | | $ | 1,924 | | $ | 1,801 |
Government receivables | |
| 1,600 | |
| 3,545 |
Prepaid maintenance | |
| 525 | |
| 390 |
Deposits | | | 492 | | | — |
Prepaid insurance | | | 150 | | | 605 |
Deferred stock issuance costs | | | — | | | 478 |
Other prepaids | |
| 1,859 | |
| 1,131 |
Total prepaid expenses and other current assets | | $ | 6,550 | | $ | 7,950 |
8.Leases
The Company leases numerous facilities in Europe. The Company facilities house general offices, sales offices, service locations, and production facilities. Substantially all of the Company’s operations facilities are leased under long-term leases with varying expiration dates, except for the 2 owned locations. The Company regularly obtains various machinery, equipment, vehicles and furniture on leases. The machinery and equipment leases mainly include leasing of computers, servers, other IT equipment, mailing system, production equipment, generators, office equipment, printers, copiers and miscellaneous warehouse equipment.
The Company’s ROU assets and lease liabilities as of December 31, 2023 and 2022 recorded on the consolidated balance sheets are as follows:
| | | | | | |
| | December 31, | ||||
Consolidated balance sheets location (dollars in thousands) |
| 2023 |
| 2022 | ||
Operating Lease |
| |
|
| |
|
Operating lease right-of-use assets, net | | $ | 5,206 | | $ | 3,892 |
Current portion of operating lease liabilities | |
| 1,562 | |
| 1,449 |
Operating lease liabilities, net of current position | |
| 3,785 | |
| 2,355 |
Finance Lease | |
|
| |
|
|
Finance lease right-of-use assets, net (included in Property, plant and equipment, net) | |
| 55 | |
| 1,345 |
Current portion of finance lease liabilities | |
| 91 | |
| 227 |
Finance lease liabilities, net of current portion | |
| 23 | |
| 129 |
Supplemental consolidated balance sheet information related to leases is as follows:
| | | | | |
| | December 31, | | ||
|
| 2023 |
| 2022 |
|
Weighted-average remaining lease term |
|
|
|
| |
Operating Leases |
| 2.58 |
| 2.46 | |
Finance leases |
| 0.17 |
| 1.09 | |
| | | | | |
Weighted-average discount rate |
|
|
|
| |
Operating Leases |
| 9.5 | % | 6.5 | % |
Finance leases |
| 2.1 | % | 5.3 | % |
The interest on financing lease liabilities was less than $0.02 million and Nil for each of the years ended December 31, 2023 and 2022, respectively. The amortization expense on finance lease ROU assets was $0.1 million and $0.2 million for the years ended December 31, 2023 and 2022, respectively.
51
Maturities of finance and operating lease liabilities based on lease term for the next five years are as follows:
| | | | | | |
| | Finance | | Operating | ||
(dollars in thousands) |
| Leases |
| Leases | ||
2024 | | $ | 105 | | $ | 2,269 |
2025 | |
| 15 | |
| 1,969 |
2026 | |
| — | |
| 1,390 |
2027 | | | — | | | 1,157 |
2028 | |
| — | |
| 127 |
Total lease payments | |
| 120 | |
| 6,912 |
Less: Imputed interest | |
| (6) | |
| (1,565) |
Present value of lease liabilities | | $ | 114 | | $ | 5,347 |
Combined rental expense for all operating leases was $5.4 million and $4.9 million for the years ended December 31, 2023 and 2022, respectively.
The following table summarizes the cash paid and related right-of-use operating finance or operating lease recognized for the years ended December 31, 2023 and 2022.
| | | | | | |
(dollars in thousands) |
| 2023 |
| 2022 | ||
Cash paid for amounts included in the measurement of lease liabilities: | | | | | | |
Operating cash flows from operating leases | | $ | 2,707 | | $ | 3,851 |
Financing cash flows from finance leases | |
| 251 | |
| 471 |
Right-of-use lease assets obtained in the exchange for lease liabilities: | | |
| |
|
|
Operating leases | | $ | 4,786 | | $ | 34 |
Finance leases | |
| — | |
| 104 |
9.Property, Plant and Equipment, Net
Property, plant, and equipment, which include assets recorded under finance leases, are stated at cost less accumulated depreciation, and amortization, and consist of the following:
| | | | | | | | |
| | | | | | | | |
|
| Expected Useful Lives | | December 31, | ||||
(dollars in thousands) |
| (in Years) |
| 2023 |
| 2022 | ||
Buildings and improvements |
| 7 – 40 | | $ | 9,115 | | $ | 8,788 |
Leasehold improvements |
| Shorter of life of improvement or lease term | |
| 686 | |
| 945 |
Machinery and equipment |
| 5 – 15 | |
| 7,033 | |
| 5,970 |
Computer equipment and software |
| 3 – 8 | |
| 26,324 | |
| 29,442 |
Furniture and Fixtures |
| 5 – 15 | |
| 7,765 | |
| 7,805 |
Finance lease right-of use assets |
| Shorter of life of the asset or lease term | |
| 1,764 | |
| 1,709 |
| | | |
| 52,687 | |
| 54,659 |
Less: Accumulated depreciation and amortization | | | |
| (39,876) | |
| (41,916) |
Total property, plant and equipment, net | | | | $ | 12,811 | | $ | 12,743 |
Depreciation expense related to property, plant and equipment was $2.6 million and $3.0 million for the years ended December 31, 2023 and 2022, respectively.
52
10.Intangible Assets and Goodwill
Intangible Assets
Intangible assets are stated at cost or acquisition-date fair value less accumulated amortization and consists of the following:
| | | | | | | | | | | |
| | Weighted | | | | | | | | | |
| | Average | | December 31, 2023 | |||||||
| | Remaining | | Gross | | | | | | | |
| | Useful Life | | Carrying | | Accumulated | | Intangible Asset, | |||
(dollars in thousands) |
| (in Years) |
| Amount (a) |
| Amortization |
| net | |||
Customer relationships |
| 3.0 | | $ | 3,145 | | $ | (1,997) | | $ | 1,148 |
Outsource contract costs |
| 1.0 | |
| 768 | |
| (418) | |
| 350 |
Total intangibles, net | | | | $ | 3,913 | | $ | (2,415) | | $ | 1,498 |
| | | | | | | | | | | |
| | Weighted | | | | | | | | | |
| | Average | | December 31, 2022 | |||||||
| | Remaining | | Gross | | | | | | | |
| | Useful Life | | Carrying | | Accumulated | | Intangible Asset, | |||
(dollars in thousands) |
| (in Years) |
| Amount (a) |
| Amortization |
| net | |||
Customer relationships |
| 4.0 | | $ | 3,049 | | $ | (1,564) | | $ | 1,485 |
Outsource contract costs |
| 1.5 | |
| 449 | |
| (405) | |
| 44 |
Total intangibles, net | | | | $ | 3,498 | | $ | (1,669) | | $ | 1,529 |
| (a) | Amounts include intangibles acquired in business combinations and asset acquisitions |
Aggregate amortization expense related to intangibles was $0.4 million and $0.6 million for the years ended December 31, 2023 and 2022, respectively.
Estimated intangibles amortization expense for the three years consists of the following:
| | | |
| | Estimated | |
| | Amortization | |
(dollars in thousands) |
| Expenses | |
2024 | | $ | 734 |
2025 | |
| 384 |
2026 | | | 380 |
Total | | $ | 1,498 |
Goodwill
The Company’s operating segments are significant strategic business units that align its products and services with how it manages its business, approach the markets and interacts with customers. The Company is organized into two segments: Bills and Payments and Technology (See Note 22 – Segment Information).
Goodwill by reporting segment consists of the following:
| | | | | | | | | | | | | | | | | | |
| | Balances at | | | | | | | | | | | Currency | | Balances at | |||
| | January 1, | | | | | | | | | | | Translation | | December 31, | |||
(dollars in thousands) |
| 2023 |
| Additions |
| Disposals |
| Impairments |
| Adjustments |
| 2023 | ||||||
Bills and Payments | | $ | 9,602 | | $ | — | | $ | — | | $ | — | | $ | 369 | | $ | 9,971 |
Technology | |
| 12,373 | |
| — | |
| — | |
| — | |
| 479 | |
| 12,852 |
Total | | $ | 21,975 | | $ | — | | $ | — | | $ | — | | $ | 848 | | $ | 22,823 |
53
| | | | | | | | | | | | | | | | | | |
| | Balances at | | | | | | | | | | | Currency | | Balances at | |||
| | January 1, | | | | | | | | | | | Translation | | December 31, | |||
(dollars in thousands) |
| 2022 |
| Additions |
| Disposals |
| Impairments |
| Adjustments |
| 2022 | ||||||
Bills and Payments | | $ | 10,360 | | $ | — | | $ | — | | $ | — | | $ | (758) | | $ | 9,602 |
Technology | |
| 13,505 | |
| — | |
| — | |
| — | |
| (1,132) | |
| 12,373 |
Total | | $ | 23,866 | | $ | — | | $ | — | | $ | — | | $ | (1,890) | | $ | 21,975 |
The Company tests for goodwill impairment at the reporting unit level on October 1 of each year and between annual tests if a triggering event indicates the possibility of an impairment. The Company monitors changing business conditions as well as industry and economic factors, among others, for events which could trigger the need for an interim impairment analysis.
In connection with the completion of the annual impairment tests as of October 1, 2023 and 2022, the Company recorded no impairment charge to goodwill.
11.Accrued Liabilities
Accrued liabilities consist of the following:
| | | | | | |
| | | | | | |
| | December 31, | ||||
(dollars in thousands) |
| 2023 |
| 2022 | ||
Accrued taxes (exclusive of income taxes) | | $ | 5,892 | | $ | 10,125 |
Accrued employee related expenses | | | 3,697 | |
| 377 |
Accrued legal reserve for pending litigation | |
| 3,097 | |
| 3,945 |
Accrued professional and legal fees | |
| 4,171 | |
| 827 |
Accrued postage and shipping | | | 2,635 | |
| 1,980 |
Accrued facility related expenses | | | 797 | |
| — |
Other accruals | | | 3,561 | |
| 6,218 |
Total accrued liabilities | | $ | 23,850 | | $ | 23,472 |
12.Debt
Secured Borrowing Facility
On August 25, 2020, certain entities entered into an agreement wherein amounts due from clients were pledged to a third party, in exchange for a borrowing facility in amounts up to a total of €31.0 million (the “Secured Borrowing Facility”). The proceeds from the Secured Borrowing Facility were determined by the amounts invoiced to the Company’s clients. The amounts due from clients were recorded in accounts receivable and the amount due to the third party as a liability, presented under the current portion of long-term debt on the consolidated balance sheets. The cost of the Secured Borrowing Facility was 0.10% of newly assigned receivables with minimum of €0.1 million in annual fees and the Secured Borrowing Facility bore interest at Euribor rate plus 0.70% on the unpaid principal amount. During the years ended December 31, 2023 and 2022, the Company incurred interest expense of $0.6 million and $0.3 million, respectively, related to the Secured Borrowing Facility. As of December 31, 2023 and 2022, the outstanding balances payable under the Secured Borrowing Facility were $0.1 million and $4.1 million, respectively.
On September 15, 2023, the relevant entities entered into an amendment to the Secured Borrowing Facility (the “Amended Factoring Agreement”) to convert the existing arrangement into a non-recourse factoring program wherein an unrelated third party (the “Factor”) shall provide financing to certain subsidiaries of the Company by purchase of certain approved and partially approved accounts receivables (as defined in the Amended Factoring Agreement) up to a maximum amount of €15.0 million while assuming the risk of non-payment on the purchased accounts receivables up to the level of approval. The relevant entities shall have no continuing involvement in the transferred accounts receivable, other than collection and administrative responsibilities and, once sold, the accounts receivable shall no longer be available to satisfy creditors of the relevant entities.
54
The Company accounted for the transactions under the Amended Factoring Agreement as a sale under ASC 860, Transfers and Servicing, and treats it as an off-balance sheet arrangement. Net funds received from the transfers reflect the face value of the account less a fee, which is recorded as an increase to cash and a reduction to accounts receivable outstanding in the consolidated balance sheets. The Company reports the cash flows attributable to the sale of account receivables to the Factor and the cash receipts from collections made on behalf of and paid to the Factor under the Amended Factoring Agreement, on a net basis as trade accounts receivables in cash flows from operating activities in the Company’s consolidated statements of cash flows.
As of December 31, 2023, the Company’s outstanding factored accounts receivable amounted to $6.8 million pursuant to the Amended Factoring Agreement, representing the face value of the invoices. The Company recognizes factoring costs upon disbursement of funds. The Company incurred a loss on sale of accounts receivables including expenses pursuant to the Amended Factoring Agreement totaling approximately $0.3 million for the year ended December 31, 2023, which is presented in selling, general and administrative expenses (exclusive of depreciation and amortization) on the consolidated statements of operations.
2019 Credit Agreement
In October 2019, a wholly-owned UK subsidiary of XBP Europe (the “UK Subsidiary”) entered into a secured credit agreement (the “2019 Credit Agreement”) with HSBC UK Bank plc (“HSBC”) for a £9.0 million Secured Credit Facility (the “Secured Credit Facility”) consisting of (i) a secured Term Loan A facility in an aggregate principal amount of £2.0 million (the “Term Loan A Facility”), (ii) a secured Term Loan B facility in an aggregate principal amount of £2.0 million (the “Term Loan B Facility”), and (iii) a secured revolving credit facility in an aggregate principal amount of £5.0 million (the “Revolving Credit Facility”). On December 21, 2022, the UK Subsidiary amended its 2019 Credit Agreement, allowing the UK Subsidiary to affirm to extend the maturity of Term Loan a Facility and Term Loan B Facility to October 31, 2024 subject to compliance with financial covenants. On February 9, 2023, the UK Subsidiary amended its 2019 Credit Agreement, allowing the UK Subsidiary to extend the maturity of the Revolving Credit Facility to October 31, 2024 subject to compliance with financial covenants. On October 29, 2023, the maturity of the Revolving Credit Facility has since been extended to January 31, 2025. On March 14, 2024, the maturity was further extended to April 30, 2025. As of December 31, 2023, the outstanding balance of the Term Loan A Facility, the Term Loan B Facility, and the Revolving Credit Facility was approximately $1.9 million, $0.4 million, and $6.4 million, respectively. As of December 31, 2022, the outstanding balance of the Term Loan A Facility, the Term Loan B Facility, and the Revolving Credit Facility was approximately $1.9 million, $1.0 million, and $6.0 million, respectively.
The 2019 Credit Agreement contains financial covenants including, but not limited to (a) a Combined Cash flow Coverage Ratio, which measures the ratio of (i) Combined Cash flow and (ii) Debt Service defined as finance charges in addition to mandatory repayments in respect to the 2019 Credit Agreement, (b) Combined Interest Coverage Ratio, which measures the ratio of (i) Combined EBITDA to (ii) Combined Finance Charges, (c) a Combined Total Net Leverage Ratio, which measures the ratio of (i) Combined Net Indebtedness in respect to the last day of the most recent period to (ii) EBITDA, (d) Guaranteed Intragroup Balances, (e) the Loan to Market Value defined as the Facility A Loan outstanding to the market value of the property in each case, as defined in the 2019 Credit Agreement. The term “Combined” refers to the UK Subsidiary and its wholly-owned subsidiaries.
The 2019 Credit Agreement and indenture governing the Secured Credit Facility contains limitations on the ability of the UK subsidiary to effect mergers and change of control events as well as certain other limitations, including limitations on: (i) the declaration and payment of dividends or other restricted payments (ii) substantial changes of the general nature of the business, (iii) acquisition of a company, (iv) enter a joint venture, (v) or effect a dormant subsidiary to commence trading or cease to satisfy the criteria of a dormant subsidiary.
The UK Subsidiary’s obligations under the 2019 Credit Agreement are jointly and severally guaranteed by certain of its existing and future direct and indirectly wholly owned subsidiaries. The 2019 Credit Agreement and the 2022 Committed Facility Agreement (defined below) contain cross default provisions which relate to the UK Subsidiary and its subsidiaries, but not any other entities within the consolidated group.
55
At inception, borrowings under the Secured Credit Facility bore interest at a rate per annum equal to the LIBOR plus the applicable margin of 2%, 2.5%, and 3% per annum for the Term Loan A Facility, the Term Loan B Facility, and the Revolving Credit Facility respectively. Effective October 29, 2021, borrowings under the Revolving Credit Facility bore interest at a rate per annum equal to the Sterling Overnight Index Average (“SONIA”) plus the applicable margin of 3%. Effective December 31, 2021, borrowings under the Term Loan A Facility and the Term Loan B Facility bore interest at a rate per annum equal to the SONIA plus the applicable margin of 2% and 2.5%, respectively.
In June 2020, the UK Subsidiary entered into an amendment to the 2019 Credit Agreement, to provide an additional aggregate principal amount of £4.0 million under a credit agreement (the “Revolving Working Capital Loan Facility” or “2020 Credit Agreement”) together with Revolving Credit Facility (the “Revolving Credit Facilities”). At the inception of the Revolving Working Capital Loan Facility, the borrowing bore an interest rate per annum equal to the LIBOR plus the applicable margin of 3.5% per annum. Effective December 31, 2022, borrowings under the Revolving Working Capital Loan Facility bore interest at a rate per annum equal to the SONIA plus the applicable margin of 3.5%.
The Revolving Working Capital Loan Facility matures on January 31, 2025 subject to compliance with financial covenants (the term was extended on October 29, 2023). On March 14, 2024 the maturity was further extended to April 30, 2025. During the year ended December 31, 2023 and 2022, the Revolving Working Capital Loan Facility had an outstanding principal balance of $6.4 million and $4.8 million, respectively.
As of December 31, 2023, the Company had $11.4 million in outstanding principal balance and less than $0.1 million available for additional borrowings under the Revolving Credit Facilities to the extent the Company’s compliance with financial covenants permits such borrowings.
As of December 31, 2023 and 2022, the UK Subsidiary was in compliance with all affirmative and negative covenants under the 2019 Credit Agreement, including any financial covenants, pertaining to its financing arrangements.
2022 Committed Facility Agreement
In May 2022, the UK Subsidiary entered into a committed facility agreement (the “2022 Committed Facility Agreement”) with HSBC, which includes a term loan for £1.4 million to be used in refinancing a property owned by XBP Europe in Dublin, Ireland (the “Property”). At inception of the 2022 Committed Facility Agreement, the borrowing bore an interest rate equal to 3.5% per annum in addition to the Bank of England Base Rate. The maturity of the 2022 Committed Facility Agreement is May 2027. As of December 31, 2023 and 2022, the 2022 Committed Facility Agreement had an outstanding balance of $1.5 million and $1.6 million, respectively.
The 2022 Committed Facility Agreement contains financial covenants including, but not limited to (a) a Combined Debt Service Coverage Ratio, which measures the cash flow less dividends, net capital expenditure, and taxation relative to the debt service for that relevant period, (b) interest cover, which measures EBITDA relative to the aggregate of (i) interest charges and (ii) interest element of finance leases in any relevant period, (c) Total Net Debt to EBITDA, which measures the total net debt relative to EBITDA for any relevant period, and (d) loan to market value, which measures the loan as a percentage of the aggregate market value of the Property. The term “Combined” refers to the UK subsidiary and its wholly-owned subsidiaries.
As of December 31, 2023 and 2022, the UK Subsidiary was in compliance with all affirmative and negative covenants under the 2022 Committed Facility Agreement, including any financial covenants pertaining to its financing arrangements. The Company continually monitors its compliance with such covenants. The Company believes it will remain in compliance with all such covenants for the next twelve months; however, due to the inherent uncertainty, management’s estimates of the achievement of its financial covenants may change in the future.
56
Debt Outstanding
As of December 31, 2023, and 2022, the following debt instruments were outstanding:
| | | | | | |
| | December 31, | | December 31, | ||
(dollars in thousands) |
| 2023 |
| 2022 | ||
Term loan | | | 3,785 | | | 4,489 |
Revolving Credit Facility | | | — | | | 10,852 |
Revolvers | | | 12,767 | | | — |
Secured borrowings under Securitization Facility | |
| 74 | |
| 3,710 |
Total debt | |
| 16,626 | |
| 19,051 |
Less: Current portion of long-term debt | |
| 3,863 | |
| 4,605 |
Long-term debt, net of current maturities | | $ | 12,763 | | $ | 14,446 |
As of December 31, 2023, maturities of long-term debt are as follows:
| | | |
(dollars in thousands) |
| Maturity | |
2024 | | $ | 3,863 |
2025 | |
| 11,605 |
2026 | |
| 178 |
2027 | | | 980 |
Total debt | |
| 16,626 |
Less: Unamortized discount and debt issuance costs | |
| 55 |
Total maturities of long-term debt | | $ | 16,571 |
13.Income Taxes
The income tax provision consists of the following:
| | | | | | |
| | Years ended December 31, | ||||
(In thousands) |
| 2023 |
| 2022 | ||
Current income taxes | | | | | | |
Federal |
| $ | — | | $ | — |
State | | | — | |
| — |
Foreign | | | 1,028 | |
| 1,653 |
Total Current |
| $ | 1,028 | | $ | 1,653 |
| | | | | | |
Deferred income taxes | | | | | | |
Federal |
| $ | — | | $ | — |
State | | | — | |
| — |
Foreign | | | (422) | |
| 909 |
Total Deferred |
| $ | (422) | | $ | 909 |
Total income tax provision |
| $ | 606 | | $ | 2,562 |
The following represents the domestic and foreign components of loss before income tax provision:
| | | | | | |
| | Years ended December 31, | ||||
(In thousands) |
| 2023 |
| 2022 | ||
U.S. | | $ | (3,199) | | $ | — |
Foreign | | | (1,765) | |
| (1,311) |
Total | | $ | (4,964) | | $ | (1,311) |
At December 31, 2023, gross deferred tax assets totaled approximately $28.4 million while gross deferred tax liabilities totaled approximately $1.7 million. Deferred income taxes reflect the net of temporary differences between the
57
carrying amount of assets and liabilities for financial reporting and income tax purposes. The company has gross US NOLs of $1.6 million and gross foreign NOLs of $81.9 million. Applying jurisdictional tax rates, the total tax-effected US and foreign NOLs are $0.3 million and $19.9 million, respectively. The US NOLs do not expire. The amount of foreign NOLs expiring beginning in 2024 is $7.8 million gross or $1.9 million tax-effected. The remaining foreign NOLs do not expire.
Significant components of the Company’s deferred taxes assets (liabilities) are as follows:
| | | | | | |
| | Years ended December 31, | ||||
(In thousands) |
| 2023 |
| 2022 | ||
Deferred income tax assets: | | | | | | |
Property, plant, and equipment | | $ | 638 | | $ | 228 |
Defined benefit liability | |
| 3,431 | |
| 4,214 |
Bad debt reserve | |
| 192 | |
| 163 |
Inventories | |
| 168 | |
| 160 |
Accrued liabilities | |
| 2,312 | |
| 2,125 |
Accrued pension liabilities | |
| 716 | |
| 699 |
Operating lease liabilities | |
| 1,183 | |
| 258 |
Net operating loss | |
| 19,718 | |
| 16,758 |
Total deferred income tax assets | | $ | 28,358 | | $ | 24,605 |
| | | | | | |
Deferred income tax liabilities: | |
| | | | |
Operating lease right of use assets | | $ | (1,141) | | $ | (280) |
Intangible assets | |
| (550) | |
| (777) |
Total deferred income tax liabilities | | $ | (1,691) | | $ | (1,057) |
| | | | | | |
Valuation allowance | |
| (19,856) | |
| (16,493) |
Total net deferred income tax assets | | $ | 6,811 | | $ | 7,055 |
A reconciliation of the significant differences between the federal statutory income tax and the effective income tax on pretax loss is as follows:
| | | | | | |
| | Years ended December 31, | ||||
(In thousands) |
| 2023 |
| 2022 | ||
Tax expense at statutory rate | | $ | (1,042) | | $ | (275) |
Foreign rate difference | |
| (1,625) | |
| (426) |
Return to provision adjustments | |
| (624) | |
| 399 |
Rate change | |
| (924) | |
| (561) |
Change in valuation allowance | |
| 4,117 | |
| 2,296 |
Permanent differences | |
| (75) | |
| 1,129 |
Unrecognized tax benefits | |
| 684 | |
| — |
Other | |
| 95 | |
| — |
Income tax expense | | $ | 606 | | $ | 2,562 |
The Company believes that based upon the range of data reviewed, no uncertain tax positions have been identified for the years ended December 31, 2023 and 2022.
On August 16, 2022, the Inflation Reduction Act (the IRA) was signed into law in the U.S. Among other changes, the IRA introduced a corporate minimum tax on certain corporations with average adjusted financial statement income over a three-tax year period in excess of $1.0 billion and an excise tax on certain stock repurchases by certain covered corporations for taxable years beginning after December 31, 2022 and several tax incentives to promote clean energy. Based on the Company’s current analysis and pending future guidance to be issued by Treasury, the Company does not believe these provisions will have a material impact on the Company’s consolidated financial statements.
58
The Company adopted the provision of accounting for uncertainty in income taxes in the Topic of the ASC 740. ASC 740 clarifies the accounting for uncertain tax positions in the Company's financial statements and prescribes a recognition threshold and measurement attribute for financial statement disclosure of tax positions taken or expected to be taken on tax returns. The total amount of unrecognized tax benefits, exclusive of interest and penalties, is $0.7 million at December 31, 2023.There are no unrecognized tax benefits at December 31, 2022. No interest and penalties have been recognized since the liability can be settled with net operating losses.
Total amounts of unrecognized tax benefits as of December 31, are as follows (in thousands):
| | | | | | |
| | Years ended December 31, | ||||
(In thousands) |
| 2023 |
| 2022 | ||
Unrecognized tax benefits—January 1, | | $ | — | | $ | — |
Gross increases—tax positions in prior period | |
| 684 | |
| — |
Gross decreases—tax positions in prior period | |
| — | |
| — |
Gross increases—tax positions in current period | |
| — | |
| — |
Settlement | |
| — | |
| — |
Lapse of statute of limitations | |
| — | |
| — |
Unrecognized tax benefits—December 31, | | $ | 684 | | $ | — |
14.Employee Benefit Plans
U.K. Pension Plan
Two of the Company’s subsidiaries in the United Kingdom provide pension benefits to certain retirees and eligible dependents. Employees eligible for participation included all full-time regular employees who were more than three years from retirement prior to October 2001. A retirement pension or a lump-sum payment may be paid dependent upon length of service at the mandatory retirement age. The Company accrues the cost of these benefits over the service lives of the covered employees based on an actuarial calculation. The Company uses a December 31 measurement date for this plan. No new employees are registered under this plan and the pension obligation for the existing participants of the plan is calculated based on actual salary of the participants at the earlier of two dates, the participants leaving the Company or December 31, 2015. The expected rate of return assumptions for plan assets relate solely to the UK plan and are based mainly on historical performance achieved over a long period of time (15 to 20 years) encompassing many business and economic cycles.
German Pension Plan
XBP Europe’s subsidiaries in Germany, Exela Technologies ECM Solutions GmbH, provides pension benefits to certain retirees. Employees eligible for participation include all employees who started working for the Company or its predecessors prior to September 30, 1987 and have finished a qualifying period of at least 10 years. The Company accrues the cost of these benefits over the service lives of the covered employees based on an actuarial calculation. The Company uses a December 31 measurement date for this plan. The German pension plan is an unfunded plan and therefore has no plan assets. No new employees are registered under this plan and the participants who are already eligible to receive benefits under this plan are no longer employees of the Company.
Norway Pension Plan
The Company’s subsidiary in Norway provides pension benefits to eligible retirees and eligible dependents. Employees eligible for participation include all employees who were more than three years from retirement prior to March 2018. The Company accrues the cost of these benefits over the service lives of the covered employees based on an actuarial calculation. The Company uses a December 31 measurement date for this plan. No new employees are registered under this plan and the pension obligation for the existing participants of the plan is calculated based on actual salary of the participants at the earlier of two dates, the participants leaving the Company or April 30, 2018.
59
Asterion Pension Plan
In 2018, Exela Technologies Holding GmbH (through the Asterion Business Combination), acquired the obligation to provide pension benefits to eligible retirees and eligible dependents. Employees eligible for participation included all full-time regular employees who were more than three years from retirement prior to July 2003. A retirement pension or a lump-sum payment may be paid dependent upon length of service at the mandatory retirement age. The Company accrues the cost of these benefits over the service lives of the covered employees based on an actuarial calculation. The Company uses a December 31 measurement date for this plan. No new employees are registered under this plan and the pension obligation for the existing participants of the plan is calculated based on actual salary of the participants at the earlier of two dates, the participants leaving the Company or April 10, 2018.
Funded Status
The change in benefit obligations, the change in the fair value of the plan assets and the funded status of the Company’s pension plans (except for the German pension plan which is unfunded) and the amounts recognized in the Company’s consolidated financial statements are as follows:
| | | | | | |
| | Year Ended December 31, | ||||
(dollars in thousands) |
| 2023 |
| 2022 | ||
Change in Benefit Obligation: | | | | | | |
Benefit obligation at beginning of period | | $ | 61,770 | | $ | 117,582 |
Service cost | |
| 37 | |
| 53 |
Interest cost | |
| 3,050 | |
| 1,910 |
Actuarial gain | |
| (1,019) | |
| (44,748) |
Plan curtailment | |
| — | |
| 149 |
Benefits paid | |
| (2,577) | |
| (1,915) |
Foreign-exchange rate changes | |
| 3,028 | |
| (11,261) |
Benefit obligation at end of year | | $ | 64,289 | | $ | 61,770 |
| | | | | | |
Change in Plan Assets: | | | | | | |
Fair value of plan assets at beginning of period | | $ | 45,694 | | $ | 90,225 |
Actual (loss) return on plan assets | |
| 3,559 | |
| (36,818) |
Employer contributions | |
| 2,993 | |
| 2,862 |
Benefits paid | |
| (2,473) | |
| (1,818) |
Foreign-exchange rate changes | |
| 2,308 | |
| (8,757) |
Fair value of plan assets at end of year | |
| 52,081 | |
| 45,694 |
Funded status at end of year | | $ | (12,208) | | $ | (16,076) |
| | | | | | |
Net amount recognized in the Consolidated Balance Sheets: | | | | | | |
Pension liability, net(a) | | $ | (12,208) | | $ | (16,076) |
Amounts recognized in accumulated other comprehensive loss, net of tax consist of: | | | | | | |
Net actuarial loss (gain) | |
| (3,331) | |
| (6,959) |
Net prior service costs | |
| (124) | |
| (124) |
Net amount recognized in accumulated comprehensive loss, net of tax | | $ | (3,455) | | $ | (7,083) |
| | | | | | |
Plans with underfunded or non-funded accumulated benefit obligation: | | | | | | |
Aggregate projected benefit obligation | | $ | 64,289 | | $ | 61,770 |
Aggregate accumulated benefit obligation | | $ | 64,289 | | $ | 61,770 |
Aggregate fair value of plan assets | | $ | 52,081 | | $ | 45,694 |
| (a) | Combined balance of $12.2 million as of December 31, 2023 includes pension liabilities (assets) of $10.1 million, $1.6 million, $1.5 million and ($1.0) million under UK, Asterion, German and Norway pension plans, respectively. Combined balance of $16.1 million as of December 31, 2022 includes pension liabilities of $13.7 million, $1.7 million, $1.2 million and $(0.5) million under UK, Asterion, German and Norway pension plans, respectively. |
60
Tax Effect on Accumulated Other Comprehensive Loss
As of December 31, 2023, and 2022, the Company had actuarial (gain) loss of $(0.2) million and $ 3.3 million, respectively, which is net of a deferred tax benefit of $1.3 million and $1.9 million for December 31, 2023, and 2022, respectively.
Pension and Postretirement Expense
The components of the net periodic benefit cost are as follows:
| | | | | | |
| | Year ended December 31, | ||||
(dollars in thousands) |
| 2023 |
| 2022 | ||
Service cost | | $ | 37 | | $ | 53 |
Interest cost | |
| 3,050 | |
| 1,910 |
Expected return on plan assets | |
| (2,717) | |
| (2,856) |
Amortization | | | | | | |
Amortization of prior service cost | |
| 124 | |
| 273 |
Amortization of net loss | |
| 1,664 | |
| 1,768 |
Net periodic benefit cost | | $ | 2,158 | | $ | 1,148 |
The Company records pension interest cost within Interest expense, net. Expected return on plan assets, amortization of prior service costs, and amortization of net losses are recorded within pension income, net. Service cost is recorded within cost of revenue.
Valuation
The Company uses the corridor approach and projected unit credit method in the valuation of its defined benefit plans for the UK, Germany, and Norway respectively. The corridor approach defers all actuarial gains and losses resulting from variances between actual results and economic estimates or actuarial assumptions. For defined benefit pension plans, these unrecognized gains and losses are amortized when the net gains and losses exceed 10% of the greater of the market-related value of plan assets or the projected benefit obligation at the beginning of the year. The amount in excess of the corridor is amortized over 15 years. Similarly, the Company used the Projected Unit Credit Method for the German Plan, and evaluated the assumptions used to derive the related benefit obligations consisting primarily of financial and demographic assumptions including commencement of employment, biometric decrement tables, retirement age, staff turnover. The projected unit credit method determines the present value of the Company’s defined benefit obligations and related service costs by taking into account each period of service as giving rise to an additional unit of benefit entitlement and measures each unit separately in building up the final obligation. Benefit is attributed to periods of service using the plan’s benefit formula, unless an employee’s service in later years will lead to a materially higher of benefit than in earlier years, in which case a straight-line basis is used.
61
The following tables set forth the principal actuarial assumptions used to determine benefit obligation and net periodic benefit costs:
| | | | | | | | | | | | | | | | | |
|
| December 31, |
| ||||||||||||||
|
| 2023 |
| 2022 |
| 2023 |
| 2022 |
| 2023 |
| 2022 |
| 2023 |
| 2022 |
|
(dollars in thousands) | | UK | | Germany | | Norway | | Asterion |
| ||||||||
Weighted-average assumptions used to determine benefit obligations: | | | | | | | | | | | | | | | | | |
Discount rate | | 4.80 | % | 5.00% | % | 3.16 | % | 3.80% | % | 3.10 | % | 3.00% | % | 3.16 | % | 3.80% | % |
Rate of compensation increase | | N/A |
| N/A |
| N/A |
| N/A |
| 3.50 | % | 3.50 | % | N/A |
| N/A | |
Weighted-average assumptions used to determine net periodic benefit costs: | | | | | | | | | | | | | | | | | |
Discount rate | | 5.00 | % | 1.80% | % | 3.16 | % | 3.80% | % | 3.00 | % | 3.00% | % | 3.16 | % | 3.80% | % |
Expected asset return | | 5.87 | % | 3.45% | % | N/A | | N/A |
| 4.45 | % | 4.15% | % | 3.16 | % | 3.80% | % |
Rate of compensation increase | | N/A |
| N/A |
| N/A |
| N/A |
| 3.50 | % | 3.50 | % | N/A |
| N/A | |
The Germany plan is an unfunded plan and therefore has no plan assets. The expected rate of return assumptions for plan assets are based mainly on historical performance achieved over a long period of time (10 to 20 years) encompassing many business and economic cycles. Adjustments, upward and downward, may be made to those historical returns to reflect future capital market expectations; these expectations are typically derived from expert advice from the investment community and surveys of peer company assumptions.
The Company assumed a weighted average expected long-term rate of return on plan assets for the UK scheme of 5.64%. The Company long-term expected rate of return on cash is determined by reference to UK government 10 year bond yields at the balance sheet dates. The long-term expected return on bonds is determined by reference to corporate bond yields at the balance sheet dates. The long-term expected rate of return on equities and diversified growth funds is based on the rate of return on UK long dated government bonds with an allowance for out-performance. The long-term expected rate of return on the liability driven investments holdings is determined by reference to UK government 20 year bond yields at the balance sheet dates.
The discount rate assumption was developed considering the current yield on an investment grade non-gilt index with an adjustment to the yield to match the average duration of the index with the average duration of the plan’s liabilities. The index utilized reflected the market’s yield requirements for these types of investments.
The inflation rate assumption was developed considering the difference in yields between a long-term government stocks index and a long-term index-linked stocks index. This difference was modified to consider the depression of the yield on index-linked stocks due to the shortage of supply and high demand, the premium for inflation above the expectation built into the yield on fixed-interest stocks and the government’s target rate for inflation (CPI) at 2.5%. The assumptions used are the best estimates chosen from a range of possible actuarial assumptions which, due to the time scale covered, may not necessarily be borne out in practice.
Plan Assets
The investment objective for the UK plan is to earn, over moving fifteen to twenty year periods, the long-term expected rate of return, net of investment fees and transaction costs, to satisfy the benefit obligations of the plan, while at the same time maintaining sufficient liquidity to pay benefit obligations and proper expenses, and meet any other cash needs, in the short-to medium-term.
62
The Company’s investment policy related to the UK defined benefit plan is to continue to maintain investments in government gilts and highly rated bonds as a means to reduce the overall risk of assets held in the fund. No specific targeted allocation percentages have been set by category, but are set at the direction and discretion of the plan trustees. The weighted average allocation of plan assets by asset category is as follows:
| | | | | |
|
| Year Ended December 31, |
| ||
| | 2023 |
| 2022 |
|
U.K. and other international equities |
| 27.3 | % | 27.1 | % |
U.K. government and corporate bonds |
| 5.1 |
| 5.5 | |
Diversified growth fund |
| 15.1 |
| 18.4 | |
Liability driven investments |
| 50.9 |
| 44.3 | |
Multi-asset credit fund |
| 1.6 |
| 4.7 | |
Total |
| 100.0 | % | 100.0 | % |
The following tables set forth, by category and within the fair value hierarchy, the fair value of the Company’s pension assets at December 31, 2023 and 2022:
| | | | | | | | | | | | |
|
| December 31, 2023 | ||||||||||
(dollars in thousands) | | Total |
| Level 1 |
| Level 2 |
| Level 3 | ||||
Asset Category: | | | | | | | | | | | | |
Cash | | $ | 941 | | $ | 941 | | $ | — | | $ | — |
Equity funds: | | | | |
|
| |
|
| |
|
|
U.K. | |
| 13,297 | |
| — | |
| 13,297 | |
| — |
Fixed income securities: | | | | |
|
| |
|
| |
|
|
Corporate bonds/U.K. Gilts | |
| 2,671 | |
| — | |
| 2,671 | |
| — |
Other investments: | |
|
| |
|
| |
|
| |
|
|
Diversified growth fund | |
| 7,846 | |
| — | |
| 7,846 | |
| — |
Liability driven investments | |
| 26,488 | |
| — | |
| 26,488 | |
| — |
Multi-asset credit fund | |
| 838 | |
| — | |
| 838 | |
| — |
Total fair value | | $ | 52,081 | | $ | 941 | | $ | 51,140 | | $ | — |
| | | | | | | | | | | | |
|
| December 31, 2022 | ||||||||||
(dollars in thousands) | | Total |
| Level 1 |
| Level 2 |
| Level 3 | ||||
Asset Category: |
| |
|
| |
|
| |
|
| |
|
Cash | | $ | 932 | | $ | 932 | | $ | — | | $ | — |
Equity funds: | |
| | |
|
| |
|
| |
|
|
U.K. | |
| 11,400 | |
| — | |
| 11,400 | |
| — |
Fixed income securities: | |
| | |
|
| |
|
| |
|
|
Corporate bonds/U.K. Gilts | |
| 2,529 | |
| — | |
| 2,529 | |
| — |
Other investments: | |
|
| |
|
| |
|
| |
|
|
Diversified growth fund | |
| 8,417 | |
| — | |
| 8,417 | |
| — |
Liability driven investments | |
| 20,258 | |
| — | |
| 20,258 | |
| — |
Multi-asset credit fund | |
| 2,158 | |
| — | |
| 2,158 | |
| — |
Total fair value | | $ | 45,694 | | $ | 932 | | $ | 44,762 | | $ | — |
The plan assets are categorized as follows, as applicable:
Level 1 — quoted prices (unadjusted) in active markets for identical assets or liabilities.
Level 2 — quoted prices for similar assets and liabilities in active markets or inputs that are observable for the asset or liability, either directly or indirectly through market corroboration, for substantially the full term of the financial instrument.
63
Level 3 — unobservable inputs reflecting management’s own assumptions about the inputs used in pricing the asset or liability at fair value.
Employer Contributions
XBP Europe’s funding of employer contributions is based on governmental requirements and differs from those methods used to recognize pension expense. The Company made contributions of $3.0 million and $2.9 million to its pension plans during the years ended December 31, 2023 and 2022, respectively. The Company has fully funded the pension plans for 2023 based on current plan provisions. The Company expects to contribute $2.7 million to the pension plans during 2024, based on current plan provisions.
Estimated Future Benefit Payments
The estimated future pension benefit payments expected to be paid to plan participants are as follow:
| | | |
|
| Estimated | |
| | Benefit | |
(dollars in thousands) | | Payments | |
Year ended December 31, | | | |
2024 | | $ | 2,161 |
2025 | |
| 2,781 |
2026 | |
| 2,800 |
2027 | |
| 3,122 |
2028 | |
| 3,537 |
2029 – 2033 | |
| 18,062 |
Total | | $ | 32,463 |
15.Commitments and Contingencies
Litigation
The Company is, from time to time, involved in certain legal proceedings, inquiries, claims and disputes, which arise in the ordinary course of business. Although management cannot predict the outcomes of these matters, management does not believe these actions will have a material, adverse effect on the Company’s consolidated balance sheets, consolidated statements of operations or consolidated statements of cash flows.
Adverse Arbitration Order
In April 2020, one of the Company’s Nordic subsidiaries commenced an arbitration in Finland against a customer alleging breach of contract and other damages in connection with an outsourcing services agreement and transition services agreement executed in 2017. In September 2020, the customer submitted counterclaims against the Company in an aggregate amount in excess of €10.0 million. Following an expedited arbitration, in late November 2020, the arbitrator awarded the customer approximately $13.0 million in the aggregate for the counterclaimed damages and costs. The Company filed an application to annul the award in late January 2021with the relevant court asserting ,among other bases, that the arbitrator violated due process and procedural rules by disallowing the Company’s witness and expert testimony and maintaining the expedited format following the assertion of significant counterclaims which would ordinarily have required the application of normal rather than expedited rules. On May 28, 2021, the parties entered into a settlement agreement resolving this dispute for a total of $8.9 million including the reimbursement of certain third party charges. As of December 31, 2023 and 2022, there was a net outstanding balance of $0.9 million and $1.6million, respectively, for this matter included in accrued liabilities on the consolidated balance sheets.
64
Company Subsidiary Litigation
A group of 71 former employees brought a claim against a subsidiary of XBP Europe related to their dismissal resulting from the closure of two production sites in France in 2020. The employees filed complaints with the Labor Court on June 9, 2022. Conciliation hearings at the Labor Court were held on September 27, 2022, December 13, 2022, March 7, 2023, September 5, 2023 and November 14, 2023.
In March 2023, 67 claimants (after the in principle settlement was agreed with the first 4 claimants) filed an application for summary proceedings in respect of part of the claim for a total claim of $1.1 million. The summary proceedings hearing was held on April 11, 2023 and the court issued its decision on May 9, 2023 upholding all of the plaintiffs’ claims for a total amount of $1.1 million, however the court’s decision does not increase the Company’s anticipated exposure for the overall claim.
The Company has appealed against the decision (and paid the amount of $1.1 million on November 10, 2023 pending the appeal), the appeal hearing was scheduled for appeal hearing was scheduled for March 7, 2024 and has been rescheduled for April 8, 2024.
The substantive hearing was held on February 16, 2024 and a decision was made at the end of June 2024.
The Company is in settlement discussions with plaintiff’s counsel. As of March 22, 2024, the Company reached a number of in principle settlements with a certain number of claimants. The settlement negotiations for the remaining claimants are ongoing simultaneously with the court proceedings although there is no certainty the in principle settlements or ongoing negotiations will result in settlement agreements. The Company accrued $2.2 million in accrued liabilities on the consolidated balance sheets as of December 31, 2023 and 2022, based on the estimate of the range of possible losses.
Contract-Related Contingencies
The Company has certain contingent obligations that arise in the ordinary course of providing services to its customers. These contingencies are generally the result of contracts that require the Company to comply with certain performance measurements or the delivery of certain services to customers by a specified deadline. The Company believes the adjustments to the transaction price, if any, under these contract provisions will not result in a significant revenue reversal or have a material adverse effect on the Company’s consolidated balance sheets, consolidated statements of operations, consolidated statement of comprehensive loss or consolidated statements of cash flows.
16.Fair Value Measurement
Fair Value of Financial Instruments
The carrying amount of assets and liabilities including cash and cash equivalents, accounts receivable, accounts payable and current portion of long-term debt approximated their fair value as of December 31, 2023 and 2022, due to the relative short maturity of these instruments. The fair values of the Company’s loans and receivables under the factoring arrangement entered into by subsidiaries of the Company are equal to the carrying values. Property and equipment, intangible assets, capital lease obligations, and goodwill are not required to be re-measured to fair value on a recurring basis. These assets are evaluated for impairment if certain triggering events occur. If such evaluation indicates that impairment exists, the respective asset is written down to its fair value.
As of December 31, 2023, the Company determined the fair value of Private Warrants’ liability as less than $0.1 million, respectively, included in the other long-term liabilities in the consolidated balance sheets under Level 3 fair value measurement using the Black-Scholes option pricing model.
The significant unobservable inputs used in the fair value of the Private Warrants liability are assumptions related to the inputs of exercise price, fair value of the underlying common stock, risk-free interest rate, expected term, expected volatility, and expected dividend yield. Significant increases (decreases) in the discount rate would have
65
resulted in a lower (higher) fair value measurement. Significant increases (decreases) in the forecasted financial information would have resulted in a higher (lower) fair value measurement. For all significant unobservable inputs used in the fair value measurement of the Level 3 liabilities, a change in one of the inputs would not necessarily result in a directionally similar change in the fair value.
The following table reconciles the beginning and ending balances of net assets and liabilities classified as Level 3:
| | | |
| | December 31, | |
(dollars in thousands) | | 2023 | |
Balance at beginning of period | | $ | 647 |
Change in the fair value of the private warrants liability | |
| (597) |
Balance at end of period | | $ | 50 |
17.Warrants
As of December 31, 2023, the Company had the following common stock warrants outstanding:
| | | | | | | | |
|
| Warrants |
| Exercise Price |
| Issuance Date |
| Expiration |
Private Placement Warrants |
| 135,000 |
| 11.50 |
| 3/11/2021 |
| 11/29/2028 |
Forward Purchase Warrants |
| 250,000 |
| 11.50 |
| 3/11/2021 |
| 11/29/2028 |
Public Warrants |
| 6,249,980 |
| 11.50 |
| 3/11/2021 |
| 11/29/2028 |
Total |
| 6,634,980 |
|
|
|
|
|
|
Public Warrants
The Public Warrants qualify for the derivative scope exception under ASC 815 and are therefore classified as equity on the consolidated balance sheets. They may only be exercised for a whole number of shares at a price of $11.50. No fractional shares will be issued upon exercise of the Public Warrants. The Public Warrants are currently exercisable and will expire five years from the completion of the Business Combination or earlier upon redemption or liquidation.
The Company may redeem the outstanding Public Warrants if the price per share of common stock equals or exceeds $18.00 (except as described with respect to the Private Placement Warrants and Forward Purchase Warrants):
| ● | in whole and not in part; |
| ● | at a price of $0.01 per Warrant; |
| ● | upon not less than 30 days’ prior written notice of redemption to each warrant holder; and |
| ● | if, and only if, the closing price of the Common stock equals or exceeds $18.00 per share (as adjusted) for any of 20 trading days within a 30-trading day period commencing once the Warrants become exercisable and ending three trading days before the Company sends the notice of redemption to the warrant holders. |
If and when the Public Warrants become redeemable by the Company, the Company may not exercise its redemption right if the issuance of shares of Common Stock upon exercise of the Public Warrants is not exempt from registration or qualification under applicable state blue sky laws or the Company is unable to effect such registration or qualification.
66
Private Warrants
The Private Warrants are identical to the Public Warrants, except that so long as they are held by Cantor or any Permitted Transferees, as applicable, the Private Warrants (i) may be exercised for cash or on a cashless basis, (ii) may not be transferred, assigned or sold until thirty (30) days after the completion by the Company of an initial Business Combination, and (iii) shall not be redeemable by the Company,
Upon exercise of each of the Public Warrants and Private Warrants, the exercise price and number of shares of Common Stock issuable may be adjusted in certain circumstances including in the event of a stock dividend, a consolidation, combination, reverse stock split or reclassification of shares of Common Stock.
18.Stockholders’ Deficit
Preferred Stock — The Company is authorized to issue 10,000,000 shares of preferred stock with a par value of $0.0001 per share. As of December 31, 2023, there were no shares of preferred stock issued or outstanding.
Common Stock — The Company is authorized to issue 200,000,000 shares of Common stock with a par value of $0.0001 per share. Each holder of Common Stock will be entitled to one (1) vote in person or by proxy for each share of the Common Stock. The holders of shares of Common Stock will not have cumulative voting rights. As of December 31, 2023, there were 30,166,102 shares of Common stock issued and outstanding, respectively.
19.Restructuring
The Company periodically takes actions to improve operating efficiencies, typically in connection with rationalizing the cost structure of the Company. The Company’s footprint and headcount reductions and organizational integration actions relate to discrete, unique restructuring events, primarily reflected in approved plans for reductions in force.
In the fourth quarter of 2023, the Company’s management approved a restructuring plan to realign the Company’s business and strategic priorities by rightsizing its workforce in certain regions.
The Company’s restructuring activity and balance of the restructuring liability is as follows:
| | | | | | |
|
| December 31, | ||||
(dollars in thousands) | | 2023 |
| 2022 | ||
Balance at January 1, | | $ | 2,036 | | $ | 4,237 |
Restructuring charges | |
| 4,297 | |
| 267 |
Payment of benefits | |
| (1,066) | |
| (2,468) |
Balance at December 31, | | $ | 5,267 | | $ | 2,036 |
As of December 31, 2023 and 2022, the current portion of the restructuring liability was $5.3 million and $2.0 million respectively, and was included in accrued compensation and benefits in the consolidated balance sheets.
20.Related Parties
The components of related party expense in the consolidated statements of operations are summarized as follows:
| | | | | | |
|
| Years ended December 31, | ||||
(dollars in thousands) | | 2023 |
| 2022 | ||
Related party shared services | | $ | 3,515 | | $ | 4,051 |
Related party royalty | |
| 631 | |
| 631 |
Related party service fee | |
| 487 | |
| 3,134 |
Total related party expense | | $ | 4,633 | | $ | 7,816 |
67
Historically, the Company has been managed and operated in the ordinary course of business with other affiliates of ETI. Accordingly, certain shared costs have been allocated to the Company and reflected as expenses in the consolidated financial statements.
Sales of Products and Services
During the historical periods presented, the Company sold products and services to non-XBP Europe subsidiaries of ETI. Revenue, net in the consolidated statements of operations include sales to affiliates of ETI of $0.2 million and $0.1 million for the years ended December 31, 2023 and 2022, respectively.
Purchases
During the historical periods presented, the Company purchased high-speed scanners and related products from non-XBP Europe subsidiaries of ETI. These purchases totaled $1.0 million and $5.3 million for the years ended December 31, 2023 and 2022, respectively.
Shared Service Center Costs
The historical costs and expenses reflected in the Company’s financial statements include costs for certain shared service functions historically provided by the non-XBP Europe subsidiaries of the Company’s parent, ETI, including, but not limited to accounting and finance, IT and business process operations. Where possible, these charges were allocated based on full-time equivalents (FTE’s), formal agreements between XBP Europe and subsidiaries of ETI, or other allocation methodologies that Management determined to be a reasonable reflection of the utilization of services provided or the benefit received by XBP Europe and all costs of operating XBP Europe during the periods presented.
The allocated shared service expenses and general corporate expenses for the years ended December 31, 2023 and 2022 were $3.5 million and $4.1 million, respectively, and are included in the related party expenses in the consolidated statements of operations.
In the opinion of management of ETI and the Company, the expense and cost allocations have been determined on a basis considered to be a reasonable reflection of the utilization of services provided or the benefit received by the Company during the years ended December 31, 2023 and 2022. The amounts that would have been, or will be incurred, on a stand-alone basis could differ from the amounts allocated due to economies of scale, difference in management judgment, a requirement for more or fewer employees or other factors. Management does not believe, however, that it is practicable to estimate what these expenses would have been had the Company operated as an independent entity, including any expenses associated with obtaining any of these services from unaffiliated entities. In addition, the future results of operations, financial position and cash flows could differ materially from the historical results presented herein.
Royalty Expenses
During the historical periods presented, subsidiaries of the Company’s parent, ETI, charged royalty fees for allowing the Company to use tradenames and trademarks owned by subsidiaries of ETI. The Company incurred royalty expense of $0.6 million and $0.6 million for the years ended December 31, 2023 and 2022, respectively, included in related party expense within the consolidated statements of operations.
Service Fee
During the historical periods presented, subsidiaries of ETI provided management services to the Company in exchange for a management fee. These management services included provision of legal, human resources, corporate finance, and marketing support. The management fee was calculated based on a weighted average of total external revenue, headcount and total assets attributable to the Company. On October 9, 2022 the management fee was terminated when the Merger Agreement was entered into and was replaced by the related party service fee pursuant to
68
the Services Agreement, which reduced the fee and modified the services provided. Services provided under Annex A of the Services Agreement include sales of certain hardware, operations delivery, finance, accounting, human resource and technology support services. The Company incurred total fees of $0.5 million and $3.1 million for the years ended December 31, 2023 and 2022, respectively.
Note Receivable
The Company entered into an Intercompany Loan Agreement with an affiliate of ETI on January 1, 2016, where the Company agreed to lend up to €20 million to the affiliate. The related party note receivable had a six year term with the option to extend for an additional one year term and bore annual interest of 9.5%, due at the end of the term. On January 1, 2023, the Company amended its Intercompany Loan Agreement, extending the maturity of the Intercompany Loan Agreement to December 31, 2023. In accordance with the Ultimate Parent Support Agreement, related party note receivable was eliminated at Closing against related party payables with a residual amount recorded to additional paid-in capital. The consolidated balance sheets included $0 and $13.3 million for the related party note receivable as of December 31, 2023 and 2022, respectively. The consolidated statements of operations included $0 and $1.3 million of related party interest income for the years ended December 31, 2023 and 2022, respectively.
Notes Payable
The Company entered into three Intercompany Loan Agreements with an affiliate of ETI, in September 2009 and May 2010, whereby the affiliate of ETI agreed to lend up to £9.3 million to the Company (“related party notes payable”). The related party notes payable which were denominated in Great British pounds accrued interest daily at the one-month LIBOR rate for United States dollar deposits in the London interbank market plus four percentage points. These notes had an original maturity date of one year (which was extended by the lender for one additional year on each anniversary of the notes) and were assigned by the lender to another affiliate of ETI and amended with an effective date of December 1, 2012. The amendment amended (a) the interest rate to a fixed rate of 4% plus LIBOR for the remainder of 2012, 12% for 2013 and 13.5% thereafter, (b) extended the term of the agreement to December 31, 2024, and (c) denominated the notes in United States dollars. In accordance with the Ultimate Parent Support Agreement, related party notes payable were eliminated at closing with a corresponding impact to additional paid-in capital. As a result, the consolidated balance sheets included $0 and $11.2 million for the related party notes payable as of December 31, 2023 and 2022, respectively. The consolidated statements of operations included related party interest expense of $1.4 million and $1.5 million for the years ended December 31, 2023 and 2022, respectively, in the related party interest expense, net.
Further, the Company entered into another four Intercompany Loan Agreements (“new related party notes payable”) with affiliates of ETI, three of the notes are dated September 4, 2023 (and subsequently amended on September 15, 2023) and one note is dated September 15, 2023. The new related party notes payable have a ten year term and bear annual interest of 6.0%, due at the end of the term. The consolidated balance sheets included $1.5million new related party notes payable as of December 31, 2023. The consolidated statements of operations included less than $0.1 million, of related party interest expense for the year ended December 31, 2023 in the related party interest expense, net.
21.Segment Information
The Company’s operating segments are significant strategic business units that align its products and services with how it manages its business, approaches the markets and interacts with its clients. The Company is organized into two segments: Bills and Payments and Technology.
Bills and Payments
The Bills & Payments business unit primarily focuses on optimizing how bills and payments are processed by businesses of all sizes and industries. It offers automation of Accounts Payable (“AP”) and Accounts Receivables (“AR”) processes and through its platform, XBP, seeks to integrate buyers and suppliers across Europe. This business unit also includes the Company’s digital transformation revenue, which is both project based and recurring.
69
Technology
The Technology business unit primarily focuses on sales of recurring software licenses and related maintenance, hardware solutions and related maintenance and professional services.
The chief operating decision maker reviews segment profit to evaluate operating segment performance and determine how to allocate resources to operating segments. "Segment profit” is defined as revenue less cost of revenue (exclusive of depreciation and amortization). The Company does not allocate Selling, general, and administrative expenses, depreciation and amortization, interest expense and foreign exchange losses, net. The Company manages assets on a total company basis, not by operating segment, and therefore asset information and capital expenditures by operating segments are not presented. A reconciliation of segment profit to net loss before income taxes is presented below
In accordance with applicable accounting guidance, the results of the disposable group are presented as discontinued operations in the consolidated statements of operations and, as such, have been excluded from both continuing operations and segment results for all periods presented. See Note 3 - Discontinued Operations of the notes to consolidated financial statements.
A reconciliation of segment profit to net loss before income taxes is presented below.
| | | | | | | | | |
|
| Year ended December 31, 2023 | |||||||
(dollars in thousands) | | Bills & Payments |
| Technology |
| Total | |||
Revenue, net (including related party revenue of $0.2 million) | | $ | 110,458 | | $ | 44,719 | | $ | 155,177 |
Cost of revenue (including related party cost of revenue of $0.0 million, exclusive of depreciation and amortization) | |
| 95,572 | |
| 19,738 | |
| 115,310 |
Segment profit | |
| 14,886 | |
| 24,981 | |
| 39,867 |
Selling, general and administrative expenses (exclusive of depreciation and amortization) | | | | |
| | |
| 31,173 |
Related party expense | | | | | | | |
| 4,633 |
Depreciation and amortization | | | | | | | |
| 2,944 |
Interest expense, net | | | | | | | |
| 5,035 |
Related party interest expense, net | | | | |
|
| |
| 1,971 |
Foreign exchange losses, net | | | | |
|
| |
| 599 |
Changes in fair value of warrant liability | | | | |
|
| |
| (597) |
Pension income, net | | | | |
|
| |
| (929) |
Net loss before income taxes | | | | |
|
| | $ | (4,962) |
| | | | | | | | | |
|
| Year ended December 31, 2022 | |||||||
(dollars in thousands) | | Bills & Payments |
| Technology |
| Total | |||
Revenue, net (including related party revenue of $0.1 million) | | $ | 115,733 | | $ | 43,634 | | $ | 159,367 |
Cost of revenue (including related party cost of revenue of $0.5 million, exclusive of depreciation and amortization) | |
| 95,660 | |
| 22,490 | |
| 118,150 |
Segment profit | |
| 20,073 | |
| 21,144 | |
| 41,217 |
Selling, general and administrative expenses (exclusive of depreciation and amortization) | | | | |
|
| |
| 27,773 |
Related party expense | | | | | | | |
| 7,816 |
Depreciation and amortization | | | | |
|
| |
| 3,625 |
Interest expense, net | | | | |
|
| |
| 2,968 |
Related party interest income, net | | | | |
|
| |
| (25) |
Foreign exchange losses, net | | | | |
|
| |
| 1,175 |
Pension income, net | | | | |
|
| |
| (804) |
Net income before income taxes | | | | |
|
| | $ | (1,311) |
70