
Second Quarter 2023 Financial Results Call August 17, 2023 CONFIDENTIAL & PRIVATE
2 Safe Harbor Statement This presentation and any accompany ing oral presentation includes f orward-looking statements within the meaning of Section 27A of the Securities Act of 1933, as amended, Section 21E of the Securities Exchange Act of 1934, as amended, and the saf e harbor prov isions of the U.S. Private Securities Litigation Reform Act of 1995, that relate to our current expectations and views of future events. All statements other than statements of historical facts contained in this presentation, including our 2023 outlook, are forward-looking statements. These statements represent our opinions, expectations, beliefs, intentions, estimates or strategies regarding the future, which may not be realized. In some cases, you can identify forward-looking statements by terms such as “believe,” “may,” “estimate,” “continue,” “anticipate,” “intend,” “should,” “plan,” “expect,” “predict,” “potential,” “could,” “will,” “would,” “ongoing,” “future” or the negative of these terms or other similar expressions that are intended to identify forward-looking statements, although not all forward-looking statements contain these identifying words. Forward-looking statements are based largely on our current expectations and projections about future events and financial trends that we believe may affect our financial condition, results of operations, business strategy, short-term and long-term business operations and objectives and financial needs. These forward-looking statements involve known and unknown risks, uncertainties, contingencies, changes in circumstances that are difficult to predict and other important factors that may cause our actual results, performance or achievements to be materially and/or significantly different from any future results, performance or achievements expressed or implied by the forward-looking statement. Such risks uncertainties, contingencies, and changes in circumstances are discussed under “Item 3. Key Information - Risk Factors” in our annual report filed on Form 20 -F for the year ended December 31, 2022 with the US Securities and Exchange Commission (the “SEC”) on March 23, 2023, and our other filings with the SEC as such factors may be updated from time to time. Moreover, we operate in a very competitive and rapidly changing environment. New risks emerge from time to time. It is not possible for our management to predict all risks, nor can we assess the impact of all factors on our business or the extent to which any factor, or combination of factors, may cause actual results to differ materially from those contained in any forward -looking statements we may make. In light of these risks, uncertainties and assumptions, the forward-looking events and circumstances discussed in this presentation may not occur and actual results could differ materially and adversely from those anticipated or implied in the forward-looking statements. We caution you therefore against relying on these forward-looking statements, and we qualify all of our f orward-looking statements by these cautionary statements. The f orward-looking statements included in this presentation are made only as of the date hereof . Although we believ e that the expectations ref lected in the f orward-looking statements are reasonable, we cannot guarantee that the f uture results, lev els of activity, perf ormance or events and circumstances reflected in the forward-looking statements will be achieved or occur. Moreover, neither we nor our advisors nor any other person assumes responsibility for the accuracy and completeness of the forward -looking statements. Neither we nor our advisors undertake any obligation to revise, supplement or update any forward-looking statements for any reason after the date of this presentation to conform these statements to actual results or to changes in our expectations, even if new information becomes available in th e future, except as may be required by law. You should read this presentation with the understanding that our actual future results, levels of activity, performance and events and circumstances may be materially different from what we expect. Unless otherwise indicated, inf ormation contained in this presentation concerning our industry , competitiv e position and the markets in which we operate is based on inf ormation f rom independent industry and research organizations, other third-party sources and management estimates. Management estimates are derived from publicly available information released by independent industry analysts and other third-party sources, as well as data from our internal research, and are based on assumptions made by us upon reviewing such data, and our experience in, and knowledge of, such industry and markets, which we believe to be reasonable. In addition, projections, ass umptions and estimates of the future performance of the industry in which we operate and our f uture perf ormance are necessarily subject to uncertainty and risk due to a variety of factors, including those described above. These and other factors could cause results to differ materially from those expressed in the estimates made by independent parties and by us. Industry publications, research, surveys and studies generally state that the information they contain has been obtained from sources believed to be reliable, but that the accuracy and completeness of such information is not guaranteed. Forecasts and other forward-looking information obtained from these sources are subject to the same qualifications and uncertainties as the other forward-looking statements in this presentation. The trademarks included herein are the property of the owners thereof and are used f or ref erence purposes only . Non-IFRS Financial Measures - Management uses sev eral f inancial measures, both IFRS and non-IFRS f inancial measures, in analy zing and assessing the ov erall perf ormance of the business and f or making operational decisions. Adjusted Operating Expense is a non-IFRS measure def ined as operating expense excluding the f air v alue gain or loss related to contingent consideration. Adjusted Operating Prof it is a non-IFRS f inancial measure def ined as operating prof it excluding the f air v alue gain or loss related to the contingent consideration. Adjusted Net Income is a non-IFRS f inancial measure def ined as net income attributable to equity holders excluding the f air v alue gain or loss related to contingent consideration and unwinding of def erred consideration. Adjusted net income per diluted share is a non- IFRS financial measure defined as adjusted net income attributable to equity holders divided by the diluted weighted average number of common shares outstanding. EBITDA is a non-IFRS f inancial measure def ined as earnings excluding interest, income tax charge, depreciation, and amortization. Adjusted EBITDA is a non-IFRS f inancial measure def ined as EBITDA adjusted to exclude the ef f ect of non-recurring items, signif icant non- cash items, share-based payment expense and other items that our board of directors believes do not reflect the underlying performance of the business. Adjusted EBITDA Margin is a non-IFRS measure defined as Adjusted EBITDA as a percentage of revenue. We believe EBITDA, Adjusted EBITDA and Adjusted EBITDA Margin are useful to our management team as a measure of comparative operating performance from period to period as those measures remove the effect of items not directly resulting from our core operations including effects that are generated by differences in capital structure, depreciation, tax effects and non-recurring events. While we use EBITDA, Adjusted EBITDA and Adjusted EBITDA Margin as tools to enhance our understanding of certain aspects of our financial performance, we do not believe that EBITDA, Adjusted EBITDA and Adjusted EBITDA Margin are substitutes for, or superior to, the information provided by IFRS results. As such, the presentation of EBITDA, Adjusted EBITDA and Adjus ted EBITDA Margin is not intended to be considered in isolation or as a substitute for any measure prepared in accordance with IFRS. The primary limitations associated with the use of EBITDA, Adjusted EBITDA and Adjusted EBITDA Margin as compared to IFRS results are that EBITDA, Adjusted EBITDA and Ad justed EBITDA Margin as we define them may not be comparable to similarly titled measures used by other companies in our industry and that EBITDA, Adjusted EBITDA and Adjusted EBITDA Margin may exclude financial information that some investors may consider important in evaluating our performance. With regards to forward-looking non-IFRS guidance, we are not able to reconcile the forward looking non-IFRS Adjusted EBITDA measure to the closest corresponding IFRS measure without unreasonable efforts because we are unable to predict the ultimate outcome of certain significant items including, but not limited to, fair value movements, share-based payments for future awards, acquisition-related expenses and certain financing and tax items. Free Cash Flow is a non-IFRS f inancial measure def ined as cash f low f rom operating activ ities less capital expenditures, or CAPEX. We believ e Free Cash Flow is usef ul to our management as a measure of f inancial perf ormance as it measures our ability to generate additional cash from our operations. While we use Free Cash Flow as a tool to enhance our understanding of certain aspects of our financ ial performance, we do not believe that Free Cash Flow is a substitute for, or superior to, the information provided by IFRS metrics. As such, the presentation of Free Cash Flow is not intended to be considered in isolation or as a substitute for any measure prepared in accordance with IFRS. The primary limitation associated with the use of Free Cash Flow as compared to IFRS metrics is that Free Cash Flow does no t represent residual cash flows available for discretionary expenditures due to the f act that the measure does not deduct the pay ments required f or debt serv ice and other obligations or pay ments made f or business acquisitions. Free Cash Flow as we def ine it also may not be comparable to similarly titled measures used by other companies in the online gambling affiliate industry. For more inf ormation about non-IFRS inf ormation in this presentation, see the tables at the end of this presentation under “Appendix: Financial Tables” f or reconciliations to the comparable IFRS numbers .
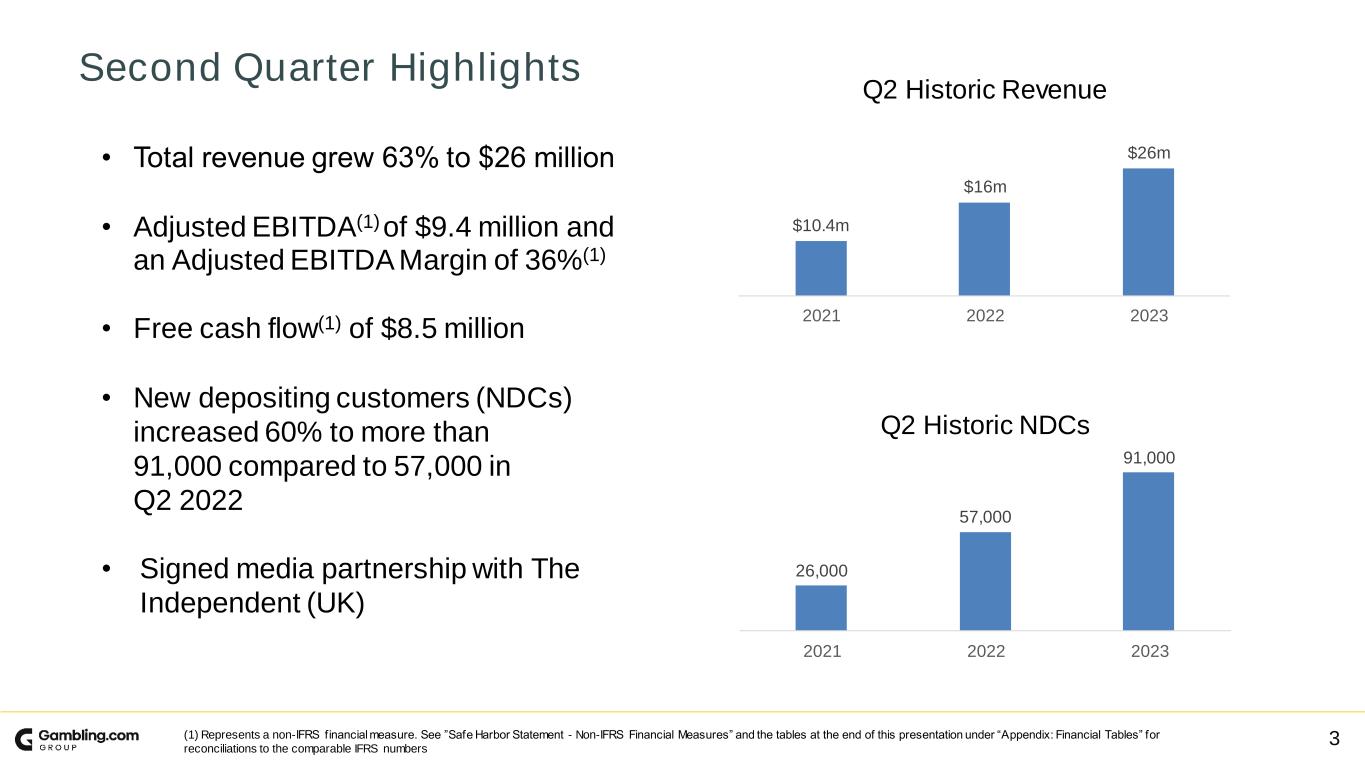
3 Second Quarter Highlights (1) Represents a non-IFRS financial measure. See ”Safe Harbor Statement - Non-IFRS Financial Measures” and the tables at the end of this presentation under “Appendix: Financial Tables” for reconciliations to the comparable IFRS numbers • Total revenue grew 63% to $26 million • Adjusted EBITDA(1)of $9.4 million and an Adjusted EBITDA Margin of 36%(1) • Free cash flow(1) of $8.5 million • New depositing customers (NDCs) increased 60% to more than 91,000 compared to 57,000 in Q2 2022 • Signed media partnership with The Independent (UK) $10.4m $16m $26m 2021 2022 2023 Q2 Historic Revenue 26,000 57,000 91,000 2021 2022 2023 Q2 Historic NDCs

4 Second Quarter Drivers • North American revenue grew 115% to $13.4 million • UK and Ireland revenue increased 25% year- over-year • Strength in I-casino in North America and Europe continued • Outperformance of the North American sports business

5 Q2 2023 Financial Results(1) (1) This table contains non-IFRS financial measures. See ”Safe Harbor Statement - Non-IFRS Financial Measures” and the tables at the end of this presentation under “Appendix: Financial Tables” for reconciliations to the comparable IFRS numbers. IH/2023 2023 2022 Change Revenue (millions) $26.0 $15.9 63% Cost of Sales (millions) $0.9 $0.5 81% Operating Expense (millions) $24.3 $17.7 38% Operating Profit (millions) $0.7 $(2.2) 133% Net Income (millions) $0.3 $0.1 396% Net Income per Diluted Share $0.01 $0.00 100% Net Income Margin (% of Revenue) 1% —% Adjusted Net Income (millions) $6.5 $3.1 113% Adjusted Net Income per Diluted Share $0.17 $0.08 113% Adjusted EBITDA (millions) $9.4 $3.6 161% Adjusted EBITDA Margin (% of Revenue) 36% 23% Cash from Operations (millions) $4.6 $3.5 36% Free Cash Flow (millions) $8.5 $2.8 202% New Depositing Customers (thousands) 91 57 60%
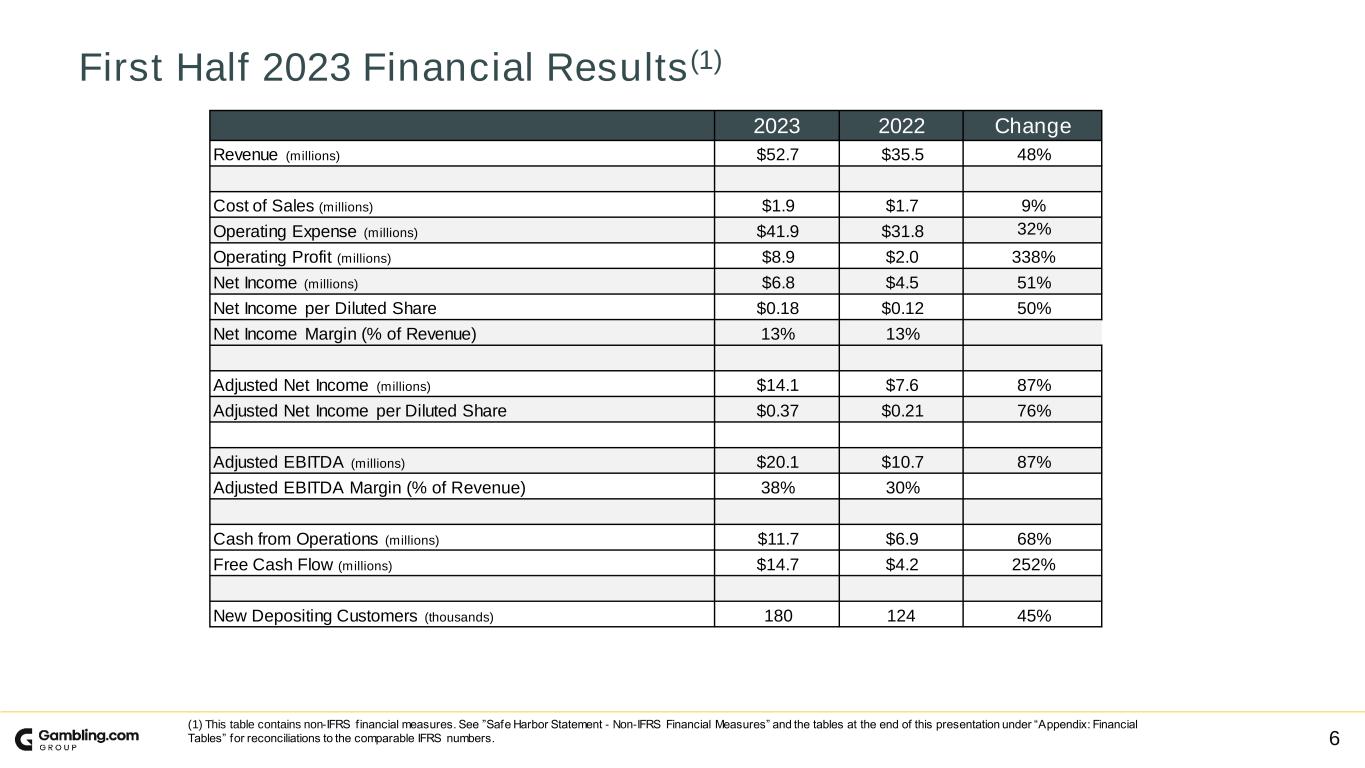
6 First Half 2023 Financial Results(1) (1) This table contains non-IFRS financial measures. See ”Safe Harbor Statement - Non-IFRS Financial Measures” and the tables at the end of this presentation under “Appendix: Financial Tables” for reconciliations to the comparable IFRS numbers. 2023 2022 Change Revenue (millions) $52.7 $35.5 48% Cost of Sales (millions) $1.9 $1.7 9% Operating Expense (millions) $41.9 $31.8 32% Operating Profit (millions) $8.9 $2.0 338% Net Income (millions) $6.8 $4.5 51% Net Income per Diluted Share $0.18 $0.12 50% Net Income Margin (% of Revenue) 13% 13% Adjusted Net Income (millions) $14.1 $7.6 87% Adjusted Net Income per Diluted Share $0.37 $0.21 76% Adjusted EBITDA (millions) $20.1 $10.7 87% Adjusted EBITDA Margin (% of Revenue) 38% 30% Cash from Operations (millions) $11.7 $6.9 68% Free Cash Flow (millions) $14.7 $4.2 252% New Depositing Customers (thousands) 180 124 45%
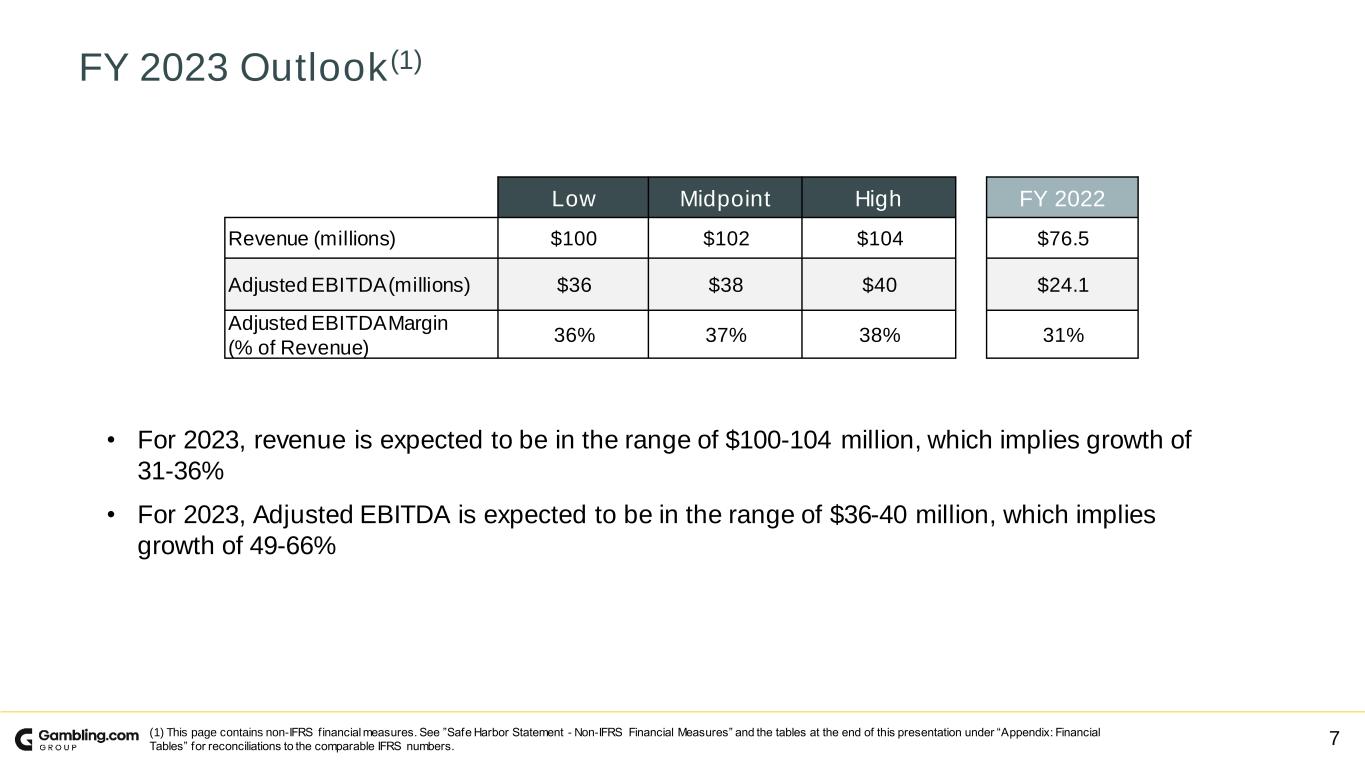
7 FY 2023 Outlook(1) • For 2023, revenue is expected to be in the range of $100-104 million, which implies growth of 31-36% • For 2023, Adjusted EBITDA is expected to be in the range of $36-40 million, which implies growth of 49-66% Low Midpoint High FY 2022 Revenue (millions) $100 $102 $104 $76.5 Adjusted EBITDA (millions) $36 $38 $40 $24.1 Adjusted EBITDA Margin (% of Revenue) 36% 37% 38% 31% (1) This page contains non-IFRS financial measures. See ”Safe Harbor Statement - Non-IFRS Financial Measures” and the tables at the end of this presentation under “Appendix: Financial Tables” for reconciliations to the comparable IFRS numbers.

8CONFIDENTIAL & PRIVATE Appendix: Financial Tables
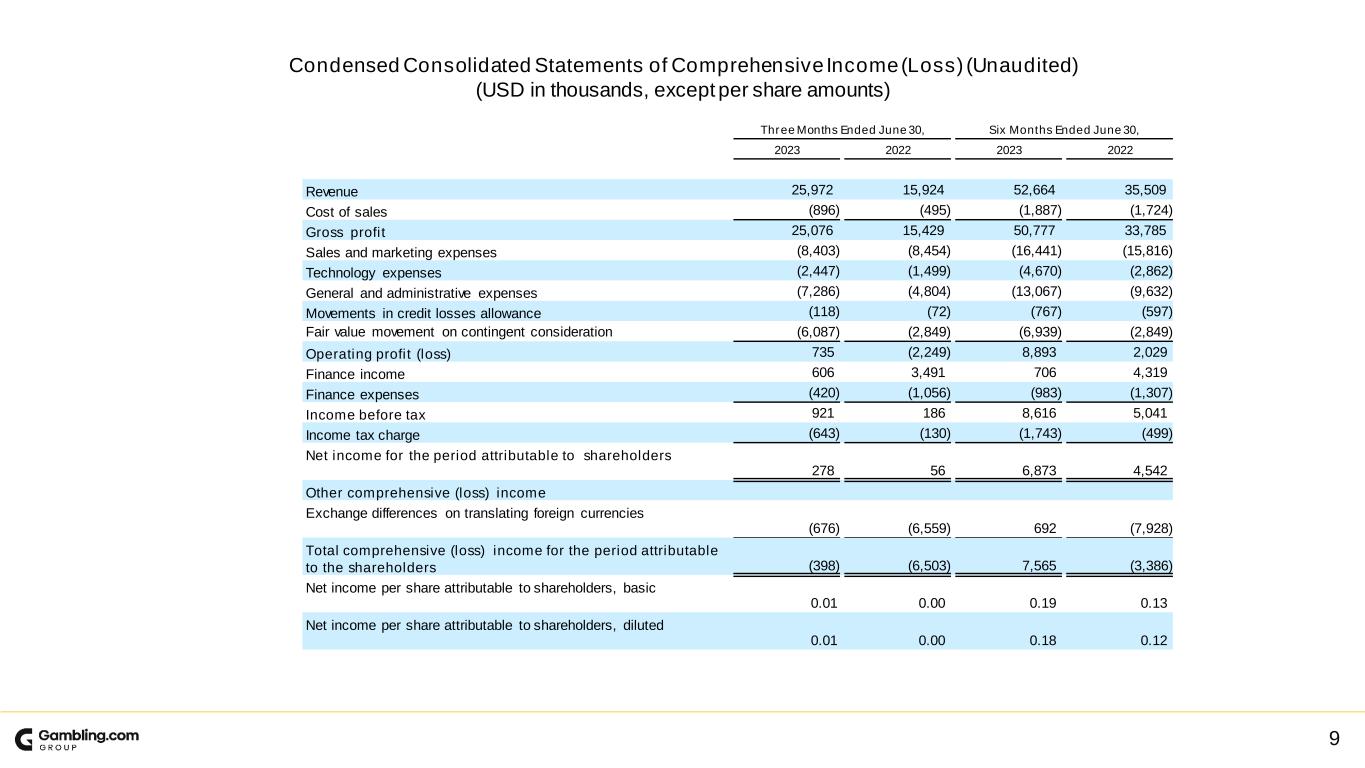
9 Condensed Consolidated Statements of Comprehensive Income (Loss) (Unaudited) (USD in thousands, except per share amounts) Three Months Ended June 30, Six Months Ended June 30, 2023 2022 2023 2022 Revenue 25,972 15,924 52,664 35,509 Cost of sales (896) (495) (1,887) (1,724) Gross profit 25,076 15,429 50,777 33,785 Sales and marketing expenses (8,403) (8,454) (16,441) (15,816) Technology expenses (2,447) (1,499) (4,670) (2,862) General and administrative expenses (7,286) (4,804) (13,067) (9,632) Movements in credit losses allowance (118) (72) (767) (597) Fair value movement on contingent consideration (6,087) (2,849) (6,939) (2,849) Operating profit (loss) 735 (2,249) 8,893 2,029 Finance income 606 3,491 706 4,319 Finance expenses (420) (1,056) (983) (1,307) Income before tax 921 186 8,616 5,041 Income tax charge (643) (130) (1,743) (499) Net income for the period attributable to shareholders 278 56 6,873 4,542 Other comprehensive (loss) income Exchange differences on translating foreign currencies (676) (6,559) 692 (7,928) Total comprehensive (loss) income for the period attributable to the shareholders (398) (6,503) 7,565 (3,386) Net income per share attributable to shareholders, basic 0.01 0.00 0.19 0.13 Net income per share attributable to shareholders, diluted 0.01 0.00 0.18 0.12

10 Condensed Consolidated Statements of Financial Position (USD in thousands) June 30th, 2023 June 30th, 2022 Non-current assets Property and equipment 805 714 Right-of-use assets 1,615 1,818 Intangible assets 89,928 88,521 Deferred compensation cost — 29 Deferred tax asset 6,220 5,832 Total non-current assets 98,568 96,914 Current assets Trade and other receivables 13,249 12,222 Inventories 13 75 Cash and cash equivalents 31,311 29,664 Total current assets 44,573 41,961 Total assets 143,141 138,875 EQUITY AND LIABILITIES Equity Share capital — — Capital reserve 73,952 63,723 Share options and warrants reserve 6,009 4411 Foreign exchange translation reserve (6,383) (7,075) Retained earnings 33,271 26,398 Total equity 105,742 87,109 Non-current liabilities Other payables — 290 Deferred consideration — 4,774 Contingent consideration — 11,297 Lease liability 1,347 1,518 Deferred tax liability 2,212 2,179 Total non-current liabilities 3,559 20,058 Current liabilities Trade and other payables 6,896 6,342 Deferred income 1,784 1,692 Deferred consideration 23,380 2,800 Contingent consideration — 19,378 Other liability 282 226 Lease liability 542 554 Income tax payable 956 716 Total current liabilities 33,840 31,708 Total liabilities 37,399 51,766 Total equity and liabilities 143,141 138,875
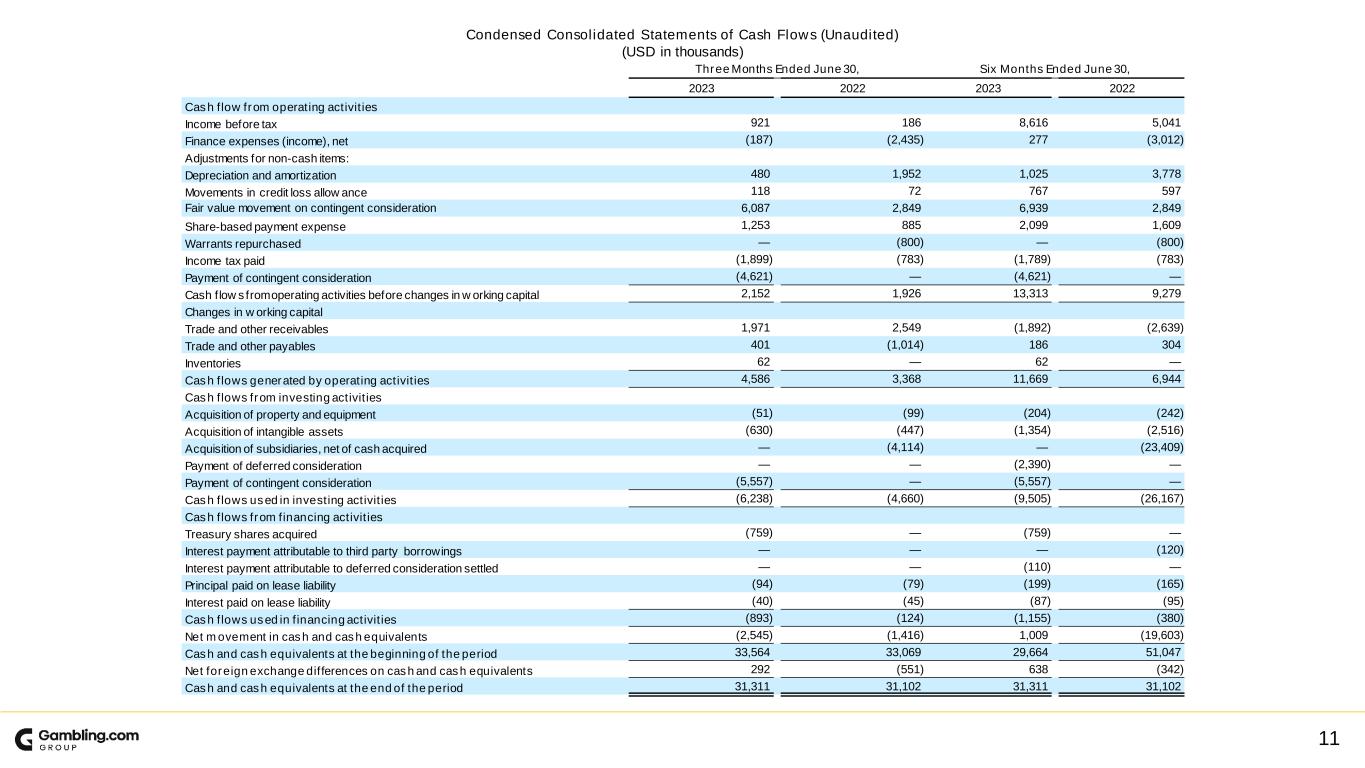
11 Condensed Consolidated Statements of Cash Flows (Unaudited) (USD in thousands) Three Months Ended June 30, Six Months Ended June 30, 2023 2022 2023 2022 Cash flow from operating activities Income before tax 921 186 8,616 5,041 Finance expenses (income), net (187) (2,435) 277 (3,012) Adjustments for non-cash items: Depreciation and amortization 480 1,952 1,025 3,778 Movements in credit loss allow ance 118 72 767 597 Fair value movement on contingent consideration 6,087 2,849 6,939 2,849 Share-based payment expense 1,253 885 2,099 1,609 Warrants repurchased — (800) — (800) Income tax paid (1,899) (783) (1,789) (783) Payment of contingent consideration (4,621) — (4,621) — Cash flow s from operating activities before changes in w orking capital 2,152 1,926 13,313 9,279 Changes in w orking capital Trade and other receivables 1,971 2,549 (1,892) (2,639) Trade and other payables 401 (1,014) 186 304 Inventories 62 — 62 — Cash flows generated by operating activities 4,586 3,368 11,669 6,944 Cash flows from investing activities Acquisition of property and equipment (51) (99) (204) (242) Acquisition of intangible assets (630) (447) (1,354) (2,516) Acquisition of subsidiaries, net of cash acquired — (4,114) — (23,409) Payment of deferred consideration — — (2,390) — Payment of contingent consideration (5,557) — (5,557) — Cash flows used in investing activities (6,238) (4,660) (9,505) (26,167) Cash flows from financing activities Treasury shares acquired (759) — (759) — Interest payment attributable to third party borrowings — — — (120) Interest payment attributable to deferred consideration settled — — (110) — Principal paid on lease liability (94) (79) (199) (165) Interest paid on lease liability (40) (45) (87) (95) Cash flows used in financing activities (893) (124) (1,155) (380) Net movement in cash and cash equivalents (2,545) (1,416) 1,009 (19,603) Cash and cash equivalents at the beginning of the period 33,564 33,069 29,664 51,047 Net foreign exchange differences on cash and cash equivalents 292 (551) 638 (342) Cash and cash equivalents at the end of the period 31,311 31,102 31,311 31,102

12 Earnings Per Share Three Months Ended June 30, Six Months Ended June 30, 2023 2022 2023 2022 (in thousands USD, except for share and per share data, unaudited) (in thousands USD, except for share and per share data, unaudited) Net income for the period attributable to shareholders 278 56 6,873 4,542 Weighted-average number of ordinary shares, basic 37,082,794 35,443,258 36,757,214 35,176,469 Net income per share attributable to shareholders, basic 0.01 0 0.19 0.13 Net income for the period attributable to shareholders 278 56 6,873 4,542 Weighted-average number of ordinary shares, diluted 38,462,183 36,534,091 38,123,560 36,608,017 Net income per share attributable to shareholders, diluted 0.01 0.00 0.18 0.12
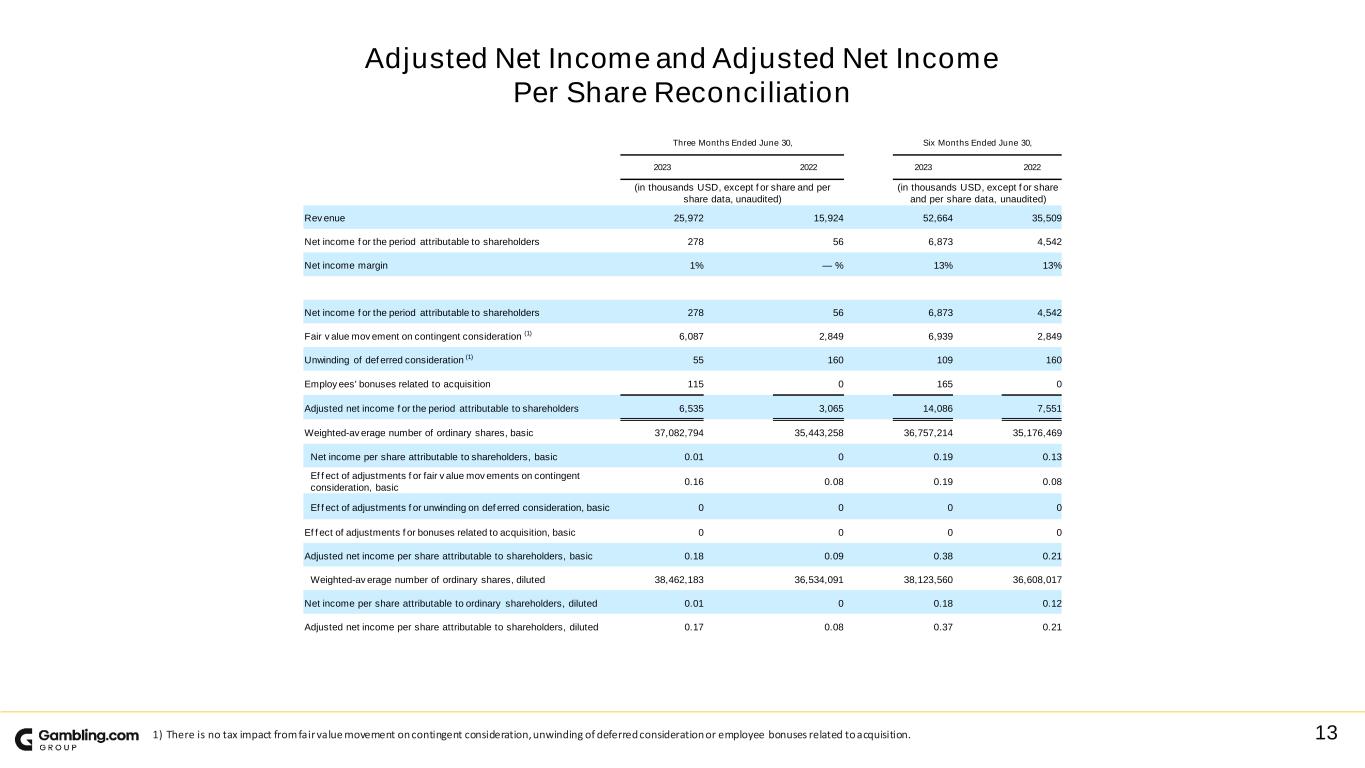
13 Adjusted Net Income and Adjusted Net Income Per Share Reconciliation 1) There is no tax impact from fair value movement on contingent consideration, unwinding of deferred consideration or employee bonuses related to acquisition. Three Months Ended June 30, Six Months Ended June 30, 2023 2022 2023 2022 (in thousands USD, except f or share and per share data, unaudited) (in thousands USD, except f or share and per share data, unaudited) Rev enue 25,972 15,924 52,664 35,509 Net income f or the period attributable to shareholders 278 56 6,873 4,542 Net income margin 1% — % 13% 13% Net income f or the period attributable to shareholders 278 56 6,873 4,542 Fair v alue mov ement on contingent consideration (1) 6,087 2,849 6,939 2,849 Unwinding of def erred consideration (1) 55 160 109 160 Employ ees' bonuses related to acquisition 115 0 165 0 Adjusted net income f or the period attributable to shareholders 6,535 3,065 14,086 7,551 Weighted-av erage number of ordinary shares, basic 37,082,794 35,443,258 36,757,214 35,176,469 Net income per share attributable to shareholders, basic 0.01 0 0.19 0.13 Ef f ect of adjustments f or fair v alue mov ements on contingent consideration, basic 0.16 0.08 0.19 0.08 Ef f ect of adjustments f or unwinding on def erred consideration, basic 0 0 0 0 Ef f ect of adjustments f or bonuses related to acquisition, basic 0 0 0 0 Adjusted net income per share attributable to shareholders, basic 0.18 0.09 0.38 0.21 Weighted-av erage number of ordinary shares, diluted 38,462,183 36,534,091 38,123,560 36,608,017 Net income per share attributable to ordinary shareholders, diluted 0.01 0 0.18 0.12 Adjusted net income per share attributable to shareholders, diluted 0.17 0.08 0.37 0.21

14 EBITDA and Adjusted EBITDA Reconciliation n/m = not meaningful 1. The acquisition costs are related to the business combinations of the Group. Three Months Ended June 30, Change Six Months Ended June 30, Change 2023 2022 % 2023 2022 % (in thousands USD, unaudited) (in thousands USD, unaudited) Net income for the period attributable to shareholders 278 56 396 % 6,873 4,542 51 % Add back (deduct): Interest expenses on borrowings 44 185 (76) % 87 355 (75) % Income tax charge 643 130 395 % 1,743 499 249 % Depreciation expense 63 44 43 % 120 87 38 % Amortization expense 417 1,908 (78) % 905 3,691 (75) % EBITDA 1,445 2,323 (38) % 9,728 9,174 6 % Share-based payment expense 1,253 885 42 % 2,099 1,609 30 % Unwinding of deferred consideration 55 160 (66) % 109 160 (32) % Fair value movement on contingent consideration 6,087 2,849 114 % 6,939 2,849 144 % Foreign currency translation losses (gains), net (303) (2,833) (89) % 24 (3,606) (101) % Secondary offering related costs 733 — 100 % 733 — 100 % Other finance results 18 53 (66) % 57 79 (28) % Acquisition related costs (1) 21 180 (88) % 243 454 (46) % Employees' bonuses related to acquisition 115 — 100 % 165 — 100 % Adjusted EBITDA 9,424 3,617 161 % 20,097 10,719 87 %

15 Adjusted EBITDA Margin Reconciliation Three Months Ended June 30, Change Six Months Ended June 30, Change 2023 2022 % 2023 2022 % (in thousands USD, unaudited) (in thousands USD, unaudited) Revenue 25,972 15,924 63 % 52,664 35,509 48 % Adjusted EBITDA 9,424 3,617 161 % 20,097 10,719 87 % Adjusted EBITDA Margin 36 % 23 % 38 % 30 %
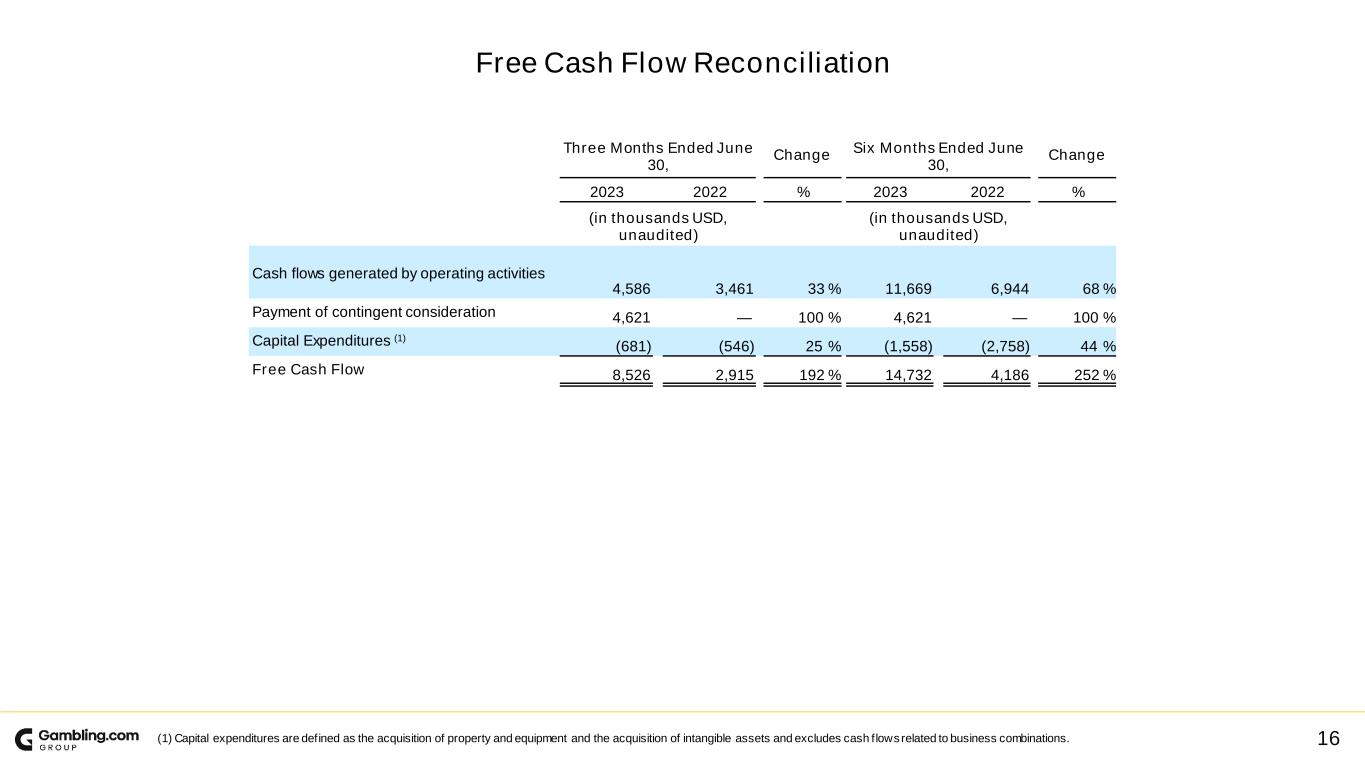
16 Free Cash Flow Reconciliation (1) Capital expenditures are defined as the acquisition of property and equipment and the acquisition of intangible assets and excludes cash flows related to business combinations. Three Months Ended June 30, Change Six Months Ended June 30, Change 2023 2022 % 2023 2022 % (in thousands USD, unaudited) (in thousands USD, unaudited) Cash flows generated by operating activities 4,586 3,461 33 % 11,669 6,944 68 % Payment of contingent consideration 4,621 — 100 % 4,621 — 100 % Capital Expenditures (1) (681) (546) 25 % (1,558) (2,758) 44 % Free Cash Flow 8,526 2,915 192 % 14,732 4,186 252 %


