Exhibit 99.2
Dear Shareholder,
I am excited to share the progress we’ve made in our third quarter, which marks our second earnings since going public in June. We beat our Q3 guidance, we’re raising Q4, and as a result, are positioned to deliver a very strong 2021.
In Q3, we delivered strong performance on all measures, while also closing our acquisition of Connexity, our largest acquisition to date. As a reminder, our Q3 guidance included one month of Connexity performance, and I’m happy to share that we beat those expectations.
Our growth in Q3 was strong. We grew Revenues 17% versus the same quarter last year. Gross Profit grew 20%, ex-TAC Gross Profit grew 22%, and Adjusted EBITDA was $40 million. At the same time, we are delivering solid cash conversion, and for 2020 and 2021 combined, our average is expected to be 60% conversion from Adjusted EBITDA to free cash flow.
Looking at the remainder of 2021, we are raising our guidance for Q4 as we expect our business to continue its strong performance. As a result, we are increasing our full year 2021 guidance, and now expect revenues to grow approximately 15% year-over-year, ex-TAC Gross Profit to increase 34 to 35% year over year to $512 to $515 million for the full year, and Adjusted EBITDA to increase 64 to 66% to $174 to $177 million.
I’m also encouraged by our business momentum. We announced partnerships such as NBC Sports, who launched our High Impact placements, which means we’re expanding our presence to mid-article, homepage and other highly visible placements which brands and agencies love. These High Impact placements are key drivers for our video initiatives, which help grow our yield and become a bigger revenue driver for publishers. Another exciting partnership is an exclusive content recommendation partnership in Hong Kong with Line Today, the WhatsApp of APAC.
We also announced a partnership with Xiaomi as part of Taboola News. Xiaomi is one of the largest Android OEM manufacturers in the world, and they are integrating a feed of news on their devices. Taboola News is our version of Apple News, but only for Android devices. This is where we take our publisher partners to other canvases where users spend their time. This is also open web-friendly. When people click on Taboola News, we send them to the publisher site, versus Apple News, which keeps them within Apple’s walled garden.
This quarter, there was a lot of discussion in the market on privacy, iOS changes and IDFA. We did not see an impact from these changes on our business. Taboola’s yield keeps growing through our ability to leverage contextual signals due to our hard-coded integrations with 9,000 publishers, through which we reach 500M active users a day. This is important now, and will become even more important over time, as advertisers look for alternatives to the walled gardens.
1
There also has been a lot in the news about supply chain challenges faced by some manufacturers and businesses. We did not see an impact in Q3 from supply chain on our advertising revenue overall, given our diverse advertiser base. Additionally, in Q4, we do not expect supply chain challenges to impact our business outlook, including Connexity, as reflected in our raised expectations. In fact, Connexity is beating our expectations for their performance since closing the deal.
Mission & Strategy
As we are still new to some public investors, I want to summarize our business, strategy, roadmap and what drives our success. Taboola powers recommendations for the open web, helping people discover things they may like.
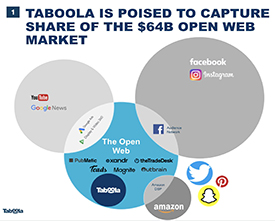
The open web, as many of you know, is the term for all the websites, publishers, and apps that aren’t Facebook, Amazon, Google, Apple, or the like. The open web is really important, even essential, because it’s free and diverse and doesn’t belong to any one giant company. It belongs to everyone. Think about every website you love — every blog, game, app on a mobile device, or connected TV, and so much more that lives outside of the walled gardens. That’s where Taboola fits.
In our core business, where we reach 500M people every day, Taboola has established long-term partnerships with some of the top publishers and digital properties in the world, while attracting more than 13,000 advertisers who work directly with us to reach consumers in a brand-safe environment.
Recommending something that a user may like at the right time and the right place is a significant technological challenge. We have a proprietary deep learning recommendation engine that is able to infer what a user might be interested in based on context (and is not third-party cookie reliant), and knowledge of what other users have liked in similar circumstances. Think of our unique data as a “curiosity graph” — people who read this also read and/or clicked on that. This allows us to model people’s interests as they browse the open web. A lot of the time, it’s a more authentic view of reality versus what social networks provide. People tell social networks about themselves based on how they wish others to view them, but they read about things they really care about, and are curious about.
2
*Google Search Revenue
The acquisition of Connexity strengthens our data, pairing our readership data with purchasing data that can make our AI better, yield grow, and advertisers more successful.
The open web is a $64B market, growing 10 to 15% a year. As the web evolves into high impact, native and personalized formats of advertising, very similar to Instagram, TikTok or WeChat, we believe Taboola has an opportunity to be a meaningful growth driver to publishers and advertisers.
Strategically, over the next 5-10 years, our path forward is to expand in two directions:
| ● | ‘Recommend Anything.’ This is a way for us to diversify what we recommend, and to grow our yield for publishers, which helps us become even more competitive. Over time, we want to recommend apps, games, and other types of verticals. We are making great advancements here with our high impact, mid-article product innovation that brings with it more premium demand, such as video. This is key to attracting more agencies to our platform, and the brand name advertisers that they work with. |
We attained in Q3 Trustworthy Accountability Group (TAG) brand safety certification that confirms to advertisers that Taboola has rigorous standards and has taken proactive steps to reduce brand safety risk. TAG is an organization that works to increase trust and transparency in digital advertising. We also announced a new partnership with DoubleVerify (DV) that makes available directly within the Taboola Ads console DV’s pre-bid brand safety and suitability targeting technology - this will provide our advertiser partners control over the quality of where their ads are placed.
When it comes to Recommending Anything, Connexity was our biggest bet as a part of our strategy, to get to recommend products — read more below on how we’re progressing, and our near to long term plans around it.
| ● | ‘Recommend Anywhere.’ This is where we’re continuing our expansion to recommend wherever people might be — digital canvases like the Android devices I mentioned above with Taboola News, connected TVs, automobiles, audio devices and more. We’re seeing good momentum here. We recently announced that Taboola News continues to scale and now drives an average of more than 220 million monthly engagements on editorial content through mobile device and OEM partnerships. This represents an increase of more than 270 percent year-over-year. (Q2 2020 vs Q2 2021) |
3
This strategy connects to our winning aspiration, as it drives our flywheel. The more publishers we get, the more reach we have, the more types of recommendations we support, our yield gets stronger, and as such our competitive advantage is higher. More below on yield specifically.
Taboola & Connexity: bringing eCommerce to the open web
We closed the transaction to acquire Connexity on September 1st. We’re working on the integration of the two companies, and we remain very optimistic about the business. On the back of a strong Q3, we are feeling confident about the performance of our combined business in Q4 and beyond. And Connexity is beating our expectations since we closed.
With this acquisition, we took a giant leap towards Recommending Anything, and are set to transform the Open Web through greater product and e-Commerce recommendations. We expect that in the coming years, one-third of open web publisher revenue will be e-Commerce.
We can now make this a reality for our publishers and digital property partners, while also giving merchants a platform outside of walled gardens where they can leverage genuine interest, and intent, to sell their products. No other player in our space can make this claim, and I think that will be true for years to come.
The reason this is important is because when users have intent, the yield has the potential to be exponentially higher. You can see the comparison between one minute on Google and 15 minutes on Facebook:
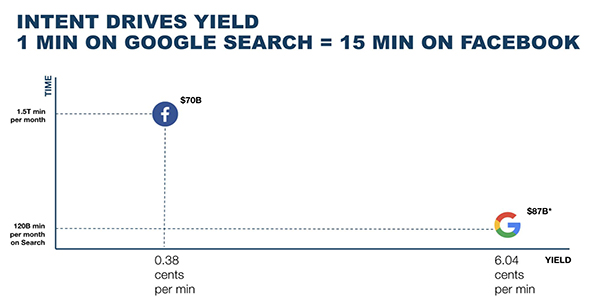
*Google Search Revenue
We intend to use Connexity’s technology to help our publishers increase the portion of traffic on their site where there is high intent, bringing merchants to that traffic.
4
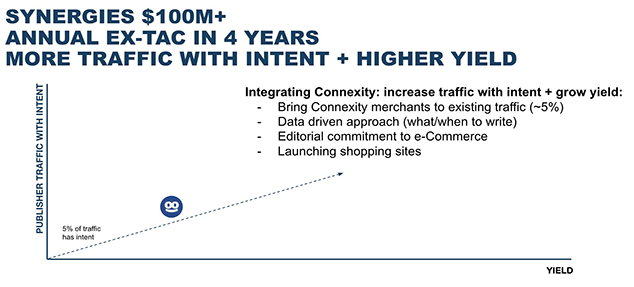
We see tremendous synergies, and a potential $100M+ in annual ex-TAC Gross Profit within four years, as a result of the Connexity acquisition. Importantly, this means significant new revenues for our publisher partners, making us even more competitive as publishers consider a partner that can help them grow revenue, engagement, and audience. And now, we can also offer our publishers commerce.
Before joining Taboola, Connexity was already one of the largest e-Commerce media platforms on the open web, with over one million monthly transaction events supported by direct relationships with over 1,600 merchants, such as Walmart, Wayfair, Skechers, Macy’s, eBay and Otto. Connexity reaches more than 100 million unique shoppers per month, via relationships with premium publishers including Condé Nast, DotDash, Hearst, Vox Media, Meredith, and News Corp Australia. Together we have more relationships, more scale, and are even stronger.
Since the acquisition closed, we have worked through the details of our integration and synergy capture plans, and we are even more confident in our future success after a deep dive with the team.
5
When I think of our competitive advantage in the commerce/affiliate space, there are 4 things that are unique to us:
| ● | Strong relationships with publishers (who want to break into e-Commerce) who consistently upgrade their integrations with us, as we present new solutions to their needs. |
| ● | Strong relationships with advertisers, retailers, and merchants, built on the foundation of our high-performing, scaled network. |
| ● | Unique readership and purchase data, to guide our publisher partners’ editorial strategies. Most publishers I talk to don’t know where to start, and what content to write. We have the data to know what content should be written so it feels authentic to their brand. |
| ● | The ability to drive audiences to our publisher partners. Taboola reaches 500M people a day, and provides positive ROI traffic. |
I would also invite those who want to learn more about our e-Commerce strategy with Connexity to visit our Investor Relations website, to view the replay of our event.
Growing Yield
Yield = the amount of revenue per 1,000 impressions (also known as Revenue Per Mille / RPM).
In our industry, and for us, yield/RPM is a key driver of our business. As we have explained, approximately 60% of our growth comes from growing our existing publisher relationships, and a significant portion of that is the result of growing yield.

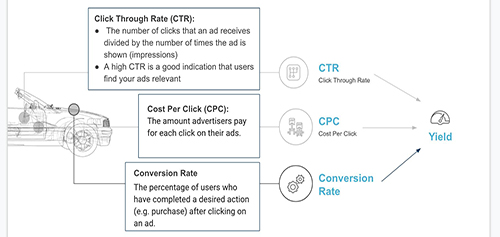
The focus on yield/RPM is true for the open web, but interestingly, this is similar to driving a race car. You might think that the driver of a race car should focus only on the speedometer to win a race. But, in actuality, the driver focuses on revolutions per minute (RPM), and car manufacturers put RPM in the center of the dashboard to make sure the driver knows what to track. Focus on RPM — win the race. Not the speedometer, not the engine temperature, just RPM.

The open web is the same. CTR is like a speedometer, and yield/RPM is what matters. Yield is built off of 3 parameters and only when the multiplication of the 3 goes up, yield goes up. The 3 are Click-Through-Rate (CTR), Cost Per Click (CPC) and Conversion Rate (CVR). None of these should be looked at in isolation, as it could be detrimental if singly maximized. For instance, CTR can be maximized by prioritizing an aggressive class of ads that are highly clickable, however, the price paid per click (CPC) by those advertisers won’t be competitive, yielding a lower outcome. Likewise, if CVR goes down, an advertiser will lower their CPC so they achieve their target cost per conversion. That’s why optimizing for CPC alone, or maximizing CTR alone, or ignoring CVR, won’t drive yield growth and would be a failing strategy.
6
We optimize for yield, not for CTR, not for CPC, not for conversion — but for all of all of them combined.
Introducing SmartBid Dimensions: “Autonomous Driving Experience” for Advertisers
One of the biggest efforts to drive growth for yield is through our investment in SmartBid AI technology, which takes CPC bidding to a new level.
You can think of SmartBid as a self-driving car, making real-time bidding decisions automatically, 24x7, and more accurately than the best human campaign manager. Setting bid amounts manually was not only a tedious process for advertisers, but also resulted in low campaign performance. SmartBid determines the optimal bid for every ad, at any moment, by predicting the likelihood of a conversion, for example making a purchase online. To accurately predict the likelihood of conversion, we use AI and an enormous set of data on past behaviors we track across our network. SmartBid makes up roughly 85% of our revenue, or in other words, the vast majority of our advertisers use SmartBid.
This quarter, I’m excited to share SmartBid’s newest innovation, Dimensions. Up until now, as is common in our industry, SmartBid would optimize for CPC based on the performance of a publisher. This means that if a publisher performed better for a certain advertiser, the CPC would increase, and vice versa, if the publisher did not perform well. Dimensions allow SmartBid to use AI to look at 40 different signals (or ‘dimensions’) in addition to the publisher, such as time of day, day of week, platform, geographic location and more. Our new ability to factor in those dimensions at scale results in strong campaign performance, and since SmartBid is fully automated, it also saves advertisers the time they had to spend on manual bidding. For advertisers, it’s having an autonomous driving experience, one hand on the wheel, but the car is kind of driving itself.
Marina Gandlin, R&D Team Leader, Algorithms, from our engineering team wrote a post about SmartBid Dimensions, available on our blog.
7
Our People
You can copy anything, but you cannot copy a company’s culture. That is why being first to market is irrelevant, and being the best is the only thing that matters. We believe our culture is what makes us so strong — and it’s top of mind for me, and us, especially now as we move forward with our integration plans alongside Connexity’s team.
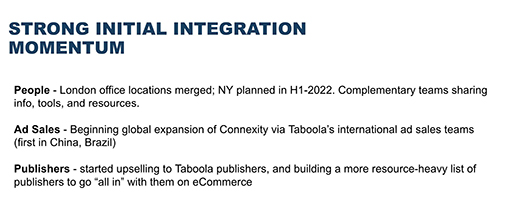
Our acquisition of Connexity increased our headcount to just over 1,700 people. We completed integrating our London offices already. We expect to integrate our New York offices in H1 of 2022, and to retain Connexity’s Santa Monica office to expand our presence in California.
We’re also continuing to grow our internal headcount, and are committed to diversity, equity and inclusion (DEI) as we recruit. One of the benefits of working from home is that it allows us to look at the world more broadly when thinking of diversity as a topic we care about. As a reminder, our goal through 2025 is for 45% of all future promotions and hires into leadership will be women or people of color.
In Q3 of this year, we supported several DEI initiatives around the globe, including, Latinx heritage month and LGBTQ+ history month in October with educational activities around the world.
Financial Performance
I’ll close by talking about our Q3 financials which, as stated earlier, came in above our guidance and gives us the confidence to raise our guidance for Q4 and full year. Gross Profit and ex-TAC Gross Profit both grew over 20% versus Q3 2020 and our Ratio of Adjusted EBITDA to ex-TAC Gross Profit came in over 31%, meaning we were a “rule of 50” business this quarter. We are seeing continued good progress in the business - winning new business, executing on our Recommend Anything and Recommend Anywhere growth initiatives and realizing very good yield expansion.
Below are the results of Q3 versus our guidance. Note that all Q3 figures below include one month of Connexity results and that we have determined that we will account for the full Connexity business on a net revenue basis going forward. Thus Q3 Revenues Guidance has been adjusted to reflect the new accounting policy for Connexity - our previous guidance was $338 to $342 million, which was reduced by $7 million to reflect the accounting change.
| (dollars in millions) | Q3 2021 | Year-over-Year Growth | Q3 2021 Guidance |
| Revenues | $338.8 | 16.6% | $331 to $3351 |
| Gross Profit | $107.7 | 20.2% | $101 to $103 |
| ex-TAC Gross Profit* | $126.9 | 21.6% | $122 to $124 |
Net Income2 | $17.3 | 3.6% | $(7) to $(5) |
| Adjusted EBITDA* | $39.7 | (0.6%) | $36 to $37 |
1Guidance range adjusted to reflect our accounting for Connexity’s Revenues on a net revenue basis, excluding TAC.
2Includes share-based compensation expense of $20 million, higher year-over-year driven by being public, in Q3 2021 compared to $6.5 million in Q3 2020
8
New business contributed 47% and existing business contributed 53% of the growth in Revenues. Gains in yield drove much of the growth of our existing base and was the primary reason for our outperformance. As we state frequently, our profitable growth reflects the strength of our business model that includes:
| ● | long term and exclusive publisher partnerships (contracts) with guaranteed supply |
| ● | direct relationships with advertisers, strongly tilted to performance advertisers that are uniquely resilient |
| ● | A context-aware, AI-powered recommendation engine (that doesn’t rely on third party cookies) |
| ● | Our scale, and in our industry, scale matters - driving competitive advantage. |
Our Q3 performance gives us confidence to raise our Q4 expectations and full year guidance. The table below includes our current guidance for full year 2021 compared to our previous guidance:
Full Year 2021 (dollars in millions) | Increased Guidance | Year-over-Year Growth | Previous Guidance |
| Revenues | $1,363 to $1,367 | 15% | $1,351 to $1,3591 |
| Gross Profit | $427 to $430 | 34% to 35% | $418 to $424 |
| ex-TAC Gross Profit | $512 to $515 | 34% to 35% | $503 to $509 |
| Adjusted EBITDA | $174 to $177 | 64% to 66% | $168 to $171 |
1Guidance range adjusted to reflect our accounting for Connexity’s Revenues on a net revenue basis, excluding TAC
For a complete look at our updated full year and Q4 guidance and Q3 results, please see our Q3 2021 earnings press release, which was furnished to the SEC and also posted on Taboola’s website today at https://investors.taboola.com.
* * *
These are exciting times, we’re growing in a predictable way, and I’m convinced the world deserves a company that sits side-by-side to Google, FB, and Amazon - exclusively focused on the open web, driving growth to journalism, small business and giving people a free internet which they love. That’s where Taboola fits, and with Connexity, it gives us more capabilities to grow, and win.
I’m looking forward to our upcoming earnings call and engaging with investors in the coming months, where I will do my best to answer any questions you may have.
Kind regards,
-- Adam Singolda
Founder and CEO
9
Note regarding Connexity change to Net Revenue accounting
Prior to our acquisition of Connexity in September 2021, Connexity recorded a portion of its revenues on a gross basis, before traffic acquisition costs, and a portion on a net basis, after traffic acquisition costs. After we acquired Connexity, we determined that we will account for Connexity’s revenues on a net basis beginning on the September 1, 2021 acquisition date. This change has no impact on Connexity’s gross profit, ex-TAC Gross Profit, net income (loss) or Adjusted EBITDA but results in lower revenues compared to Connexity’s pre-acquisition accounting presentation. This change is reflected in our Q3 2021 actual results and in our guidance presented today for Q3, Q4 and full year 2021, all of which have been adjusted for the adoption of net revenue accounting compared to the corresponding prior guidance.
*About Non-GAAP Financial Information
This release includes ex-TAC Gross Profit, Adjusted EBITDA, Ratio of Adjusted EBITDA to ex-TAC Gross Profit and Free Cash Flow, which are non-GAAP financial measures. These non-GAAP financial measures are not measures of financial performance in accordance with GAAP and may exclude items that are significant in understanding and assessing the Company’s financial results. Therefore, these measures should not be considered in isolation or as an alternative to revenues, gross profit, net income, cash flows from operations or other measures of profitability, liquidity or performance under GAAP. You should be aware that the Company’s presentation of these measures may not be comparable to similarly-titled measures used by other companies.
The Company believes non-GAAP financial measures provide useful information to management and investors regarding future financial and business trends relating to the Company. The Company believes that the use of these measures provides an additional tool for investors to use in evaluating operating results and trends and in comparing the Company’s financial measures with other similar companies, many of which present similar non-GAAP financial measures to investors. Non-GAAP financial measures are subject to inherent limitations because they reflect the exercise of judgments by management about which items are excluded or included in calculating them. Please refer to the appendix at the end of this press release for reconciliations to the most directly comparable measures in accordance with GAAP.
Note Regarding Forward-Looking Statements
Certain statements in this release are forward-looking statements. Forward-looking statements generally relate to future events including future financial or operating performance of Taboola.com Ltd. (the “Company”). In some cases, you can identify forward-looking statements by terminology such as “may”, “should”, “expect”, “intend”, “will”, “estimate”, “anticipate”, “believe”, “predict”, “potential” or “continue”, or the negatives of these terms or variations of them or similar terminology. Such forward-looking statements are subject to risks, uncertainties, and other factors which could cause actual results to differ materially from those expressed or implied by such forward looking statements.
10
These forward-looking statements are based upon estimates and assumptions that, while considered reasonable by the Company and its management, are inherently uncertain. Uncertainties and risk factors that could affect the Company’s future performance and cause results to differ from the forward-looking statements in this press release include, but are not limited to: the ability to recognize the anticipated benefits of the recent acquisition of Connexity and the business combination between the Company and ION Acquisition Corp. 1 Ltd. (together, the “Business Combinations”), which may be affected by, among other things, competition, the ability of the Company to grow and manage growth profitably, maintain relationships with customers and retain its management and key employees; the Company’s ability to successfully integrate the Connexity acquisition; costs related to the Business Combinations; changes in applicable laws or regulations; the Company’s estimates of expenses and profitability and underlying assumptions with respect to accounting presentations and purchase price and other adjustments; ability to attract new digital properties and advertisers; ability to meet minimum guarantee requirements in contracts with digital properties; intense competition in the digital advertising space, including with competitors who have significantly more resources; ability to grow and scale the Company’s ad and content platform through new relationships with advertisers and digital properties; ability to secure high quality content from digital properties; ability to maintain relationships with current advertiser and digital property partners; ability to make continued investments in the Company’s AI-powered technology platform; the need to attract, train and retain highly-skilled technical workforce; changes in the regulation of, or market practice with respect to, “third party cookies” and its impact on digital advertising; continued engagement by users who interact with the Company’s platform on various digital properties; the impact of the ongoing COVID-19 pandemic; reliance on a limited number of partners for a significant portion of the Company’s revenue; changes in laws and regulations related to privacy, data protection, advertising regulation, competition and other areas related to digital advertising; ability to enforce, protect and maintain intellectual property rights; and risks related to the fact that we are incorporated in Israel and governed by Israeli law; and other risks and uncertainties set forth in the section entitled “Risk Factors” and “Cautionary Note Regarding Forward-Looking Statements” in the Company’s registration statements on Form F-1 as amended and filed on September 30, 2021 and on Form F-4 filed on April 30, 2021, and in subsequent filings with the Securities and Exchange Commission (“SEC”).
Nothing in this release should be regarded as a representation by any person that the forward-looking statements set forth herein will be achieved or that any of the contemplated results of such forward-looking statements will be achieved. You should not place undue reliance on these forward-looking statements, which speak only as of the date they were made. The Company undertakes no duty to update these forward-looking statements except as may be required by law.
11
APPENDIX: Non-GAAP Reconciliation
RECONCILIATION OF GAAP TO NON-GAAP FINANCIAL MEASURES FOR Q3 2021
(Unaudited)
The following table provides a reconciliation of Revenues to ex-TAC Gross Profit.
Three Months Ended September 30, | Nine Months Ended September 30, | |||||||||||||||
| 2021 | 2020 | 2021 | 2020 | |||||||||||||
| (unaudited) | (unaudited) | |||||||||||||||
| (dollars in thousands) | (dollars in thousands) | |||||||||||||||
Revenues | $ | 338,768 | $ | 290,585 | $ | 970,790 | $ | 837,599 | ||||||||
Traffic acquisition cost | 211,899 | 186,288 | 621,137 | 565,449 | ||||||||||||
Other cost of revenues | 19,184 | 14,701 | 52,224 | 45,674 | ||||||||||||
Gross Profit | $ | 107,685 | $ | 89,596 | $ | 297,429 | $ | 226,476 | ||||||||
Add back: Other cost of revenues | 19,184 | 14,701 | 52,224 | 45,674 | ||||||||||||
ex-TAC Gross Profit | $ | 126,869 | $ | 104,297 | $ | 349,653 | $ | 272,150 | ||||||||
12
The following table provides a reconciliation of Net income (loss) to Adjusted EBITDA.
Three Months Ended September 30, | Nine Months Ended September 30, | |||||||||||||||
| 2021 | 2020 | 2021 | 2020 | |||||||||||||
| (unaudited) | (unaudited) | |||||||||||||||
| (dollars in thousands) | (dollars in thousands) | |||||||||||||||
| Net income (loss) | $ | 17,296 | $ | 16,688 | $ | (25,533 | ) | $ | 5,740 | |||||||
| Adjusted to exclude the following: | ||||||||||||||||
| Financial expenses, net | (13,960 | ) | 844 | (13,077 | ) | 1,050 | ||||||||||
| Tax expenses | (3,460 | ) | 4,009 | 6,699 | 13,137 | |||||||||||
| Depreciation and amortization | 13,160 | 8,021 | 30,050 | 26,848 | ||||||||||||
| Share-based compensation expenses(1) | 19,940 | 6,520 | 103,594 | 11,013 | ||||||||||||
| M&A costs(2) | 5,918 | 3,973 | 11,507 | 15,412 | ||||||||||||
| Holdback compensation expenses | 840 | - | 840 | - | ||||||||||||
| Adjusted EBITDA | $ | 39,734 | $ | 40,055 | $ | 114,080 | $ | 73,200 | ||||||||
1For the 2021 periods, a substantial majority is Share-based compensation expenses related to going public.
2 For 2020 periods, represents costs associated with the proposed strategic transaction with Outbrain Inc.which we elected not to consummate, and for 2021 periods, relates to the acquisition of ION Acquisition Corp. 1 Ltd., acquisition of Connexity and going public.
13
We calculate Ratio of Net income (loss) to Gross profit as Net income (loss) divided by Gross profit. We calculate Ratio of Adjusted EBITDA to ex-TAC Gross Profit, a non-GAAP measure, as Adjusted EBITDA divided by ex-TAC Gross Profit. We believe that the Ratio of Adjusted EBITDA to ex-TAC Gross Profit is useful because TAC is what we must pay digital properties to obtain the right to place advertising on their websites, and we believe focusing on ex-TAC Gross Profit better reflects the profitability of our business. The following table reconciles Ratio of Net income (loss) to Gross Profit and Ratio of Adjusted EBITDA to ex-TAC Gross Profit for the period shown.
Three Months Ended September 30, | Nine Months Ended September 30, | |||||||||||||||
| 2021 | 2020 | 2021 | 2020 | |||||||||||||
| (unaudited) | (unaudited) | |||||||||||||||
| (dollars in thousands) | (dollars in thousands) | |||||||||||||||
| Gross profit | $ | 107,685 | $ | 89,596 | $ | 297,429 | $ | 226,476 | ||||||||
| Net income (loss) | $ | 17,296 | $ | 16,688 | $ | (25,533 | ) | $ | 5,740 | |||||||
| Ratio of Net income (loss) to Gross profit | 16.1 | % | 18.6 | % | -8.6 | % | 2.5 | % | ||||||||
| ex-TAC Gross Profit | $ | 126,869 | $ | 104,297 | $ | 349,653 | $ | 272,150 | ||||||||
| Adjusted EBITDA | $ | 39,734 | $ | 40,055 | $ | 114,080 | $ | 73,200 | ||||||||
| Ratio of Adjusted EBITDA Margin to ex-TAC Gross Profit | 31.3 | % | 38.4 | % | 32.6 | % | 26.9 | % | ||||||||
14
The following table provides a reconciliation of Net cash provided by operating activities to Free Cash Flow.
Three Months Ended September 30, | Nine Months Ended September 30, | |||||||||||||||
| 2021 | 2020 | 2021 | 2020 | |||||||||||||
| (unaudited) | (unaudited) | |||||||||||||||
| (dollars in thousands) | (dollars in thousands) | |||||||||||||||
| Net cash provided by operating activities | $ | 26,573 | $ | 33,776 | $ | 40,553 | $ | 81,618 | ||||||||
| Purchases of property and equipment, including capitalized platform costs | (7,099 | ) | (3,046 | ) | (28,774 | ) | (13,680 | ) | ||||||||
| Free Cash Flow | $ | 19,474 | $ | 30,730 | $ | 11,779 | $ | 67,938 | ||||||||
15
APPENDIX: Non-GAAP Reconciliation
RECONCILIATION OF GAAP TO NON-GAAP FINANCIAL MEASURES FOR Q4 2021 and FULL YEAR 2021 GUIDANCE
(Unaudited)
The following table provides a reconciliation of Gross Profit to ex-TAC Gross Profit.
| Q4 2021 | FY 2021 | |||||||
| (unaudited) | ||||||||
| (dollars in millions) | ||||||||
| Revenues | $ | 392 - $396 | $ | 1,363- $1,367 | ||||
| Traffic acquisition cost | $ | (159 - $161 | ) | $ | (850 - $853 | ) | ||
| Other cost of revenues | $ | (32 - $34 | ) | $ | (84 - $86 | ) | ||
| Gross Profit | $ | 129 - $132 | $ | 427 - $430 | ||||
| Add back: Other cost of revenues | $ | 32 - $34 | $ | 84 - $86 | ||||
| ex-TAC Gross Profit | $ | 163 - $165 | $ | 512 - $515 | ||||
16