Exhibit 99.2
Dear Shareholder,
I’m excited to say we finished the year with a record Q4, and record 2021. Taboola is growing fast, our EBITDA margin is 30%+, we are generating cash, and there is meaningful momentum in the market:
| | ● | Q4 Revenues were $408M, ex-TAC Gross Profit $169M, Adjusted EBITDA $65M. |
| | ● | Ex-TAC Gross Profit growth of 54% over Q4 2020 and 22% pro forma with Connexity**. |
| | ● | Exceeded our full year 2021 guidance, growing ex-TAC Gross Profit to $519M. |
| | ● | When going public, we guided for 16% ex-TAC growth over full year 2020. In actuality, ex-TAC grew 36%, and 25% on a pro forma basis. |
| | ● | Strong Adjusted EBITDA margin in 2021 of 35%. |
We have always set our sights on profitable growth and our team is excited to have outperformed by delivering numbers north of 30% in two of the key metrics we track, ex-TAC Gross Profit growth (what is left for us after we pay our publishers), and also adjusted EBITDA.
2021 was a milestone year for us. We went public on June 30th and completed the largest acquisition in our history — Connexity. We brought new products to market and won meaningful partnerships all around the world. We demonstrated our differentiation, why we win, as well as established the value of having long term, exclusive publisher partnerships given the predictability it provides us as a business. We did all of this while delivering a “beat and raise” each quarter.
We’re raising our 2022 guidance. We expect Revenues of $1.67B, ex-TAC Gross Profit of $665M, and Adjusted EBITDA of $204M (each at the midpoint of our guidance). This guidance represents an Ex-TAC growth rate of 28% over last year, and 16% on a pro forma basis, with a 30-32% Ratio of Adjusted EBITDA to ex-TAC Gross Profit. | 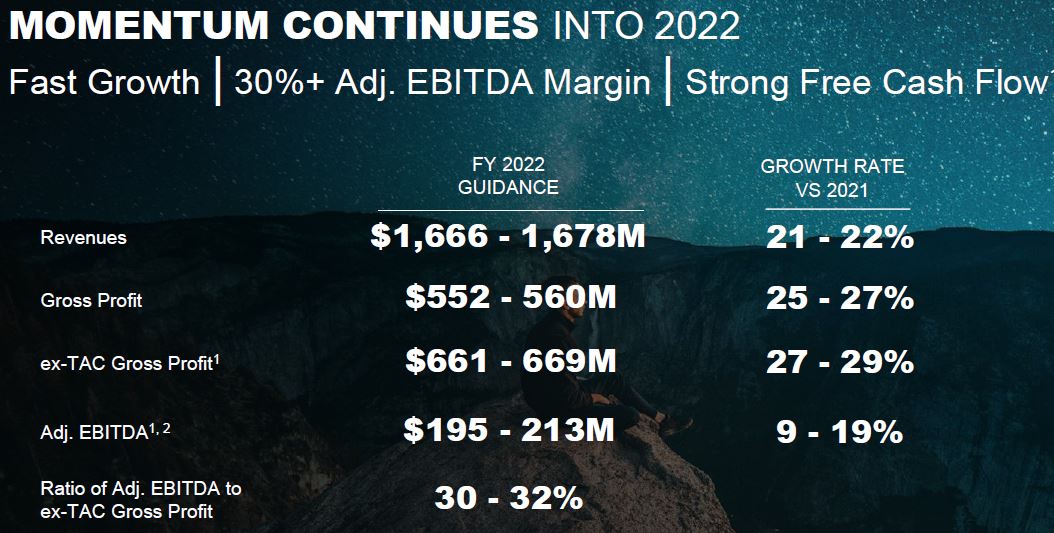 |
We’re over 1,850 people strong today, operating in 22 countries. It’s hard to hire top talent, but it’s a focus for the entire company as well as investing in our people’s productivity and wellbeing.
Taboola exists because there are only 24 hours in a day. The average person makes north of 30,000 decisions a day, and recommendation engines like Taboola help people make decisions that impact their lives, whatever they may be — what to read, what to listen to, what to buy. Our mission is to power recommendations for the Open Web, anywhere outside of walled gardens. Over time, we aim to ensure everything will be personalized, powered by Taboola. Think Amazon’s “people who buy this also buy” but powered by Taboola; for content, products and services; and everywhere in the Open Web outside of walled gardens (Amazon, Facebook, Google). The Open Web is a $64B market, and we have differentiated offerings that help us win business fast, and profitably.
You’ve used us before. If you’ve ever been to a website or an app you love like CNBC, or ESPN, BBC, The Independent or El Mundo —Taboola recommends more content from the site you’re on, as well as from elsewhere around the web. People click on Taboola 30 billion times a year, half of it is to read and watch more editorial content, and the other half is sponsored by advertisers.
Now more than 15,000 advertisers work with Taboola to reach users in the Open Web in the right context — when they’re reading about something they care about. We reach about 500 million people every day, it’s safe to advertise with us, and we’re effective. Following the acquisition of Connexity, we are also a leader in powering e-Commerce recommendations, driving more than 1 million monthly transactions. Leading brands including Walmart, Macy’s, Wayfair, Skechers and eBay are among key customers.
A bit about our integration with Connexity. We made progress on three fronts:
| 1. | People - lots of excitement, merging our sales/comms systems, starts feeling like we’re one. |
| 2. | Advertisers - momentum in selling Connexity by Taboola starting in China and soon into US. |
| 3. | Publishers - cross-selling Connexity offering to Taboola publishers in EMEA and APAC. |
Over the past year, the Open Web has begun to transition from its addiction to tracking user data, and is shifting to contextual targeting. I’m encouraged by where the industry is going. It's safer for users, and contextual advertising is a source of our strength. Advertisers can reach users on Taboola based on their reading preferences — what makes them curious, what interests them, what they’ve watched and read — not just what “they told social networks about themselves.” This is the future.
As I reflect on 2021, there are three important things on my mind as it relates to our business, I’ll share highlights of those, and later in the letter I’ll expand on each:
| 1. | Win business because we’re differentiated in the marketplace. |
| 2. | Operate in a $64B market, and we have significant growth opportunities. |
| 3. | Strong, predictable financial model. |
1. Win business because we’re differentiated in the marketplace
Many companies in the advertising space offer ads to publishers, but the truth is that nobody looks forward to seeing an advertisement. We don’t just offer ads. When publishers work with us, we empower their entire organization to grow their audience, empower their editorial team and drive revenue growth. This powers the amazing content which readers love to experience.
We’ve taken a product-led approach, investing $100M a year in a unique platform that differentiates us in the marketplace. Publishers that work with us get more than just revenue. Chief editors, product leadership, audience development teams, and eCommerce teams all choose Taboola, and thanks to that we’re able to win long term, exclusive partnerships with some of the most amazing publisher partners in the world.
Here are a few of those investments that took place in 2021. I’ll describe what those are, and why our clients and partners chose Taboola because of them.
SmartBid Dimensions AI optimizes campaigns on advertisers’ behalf.
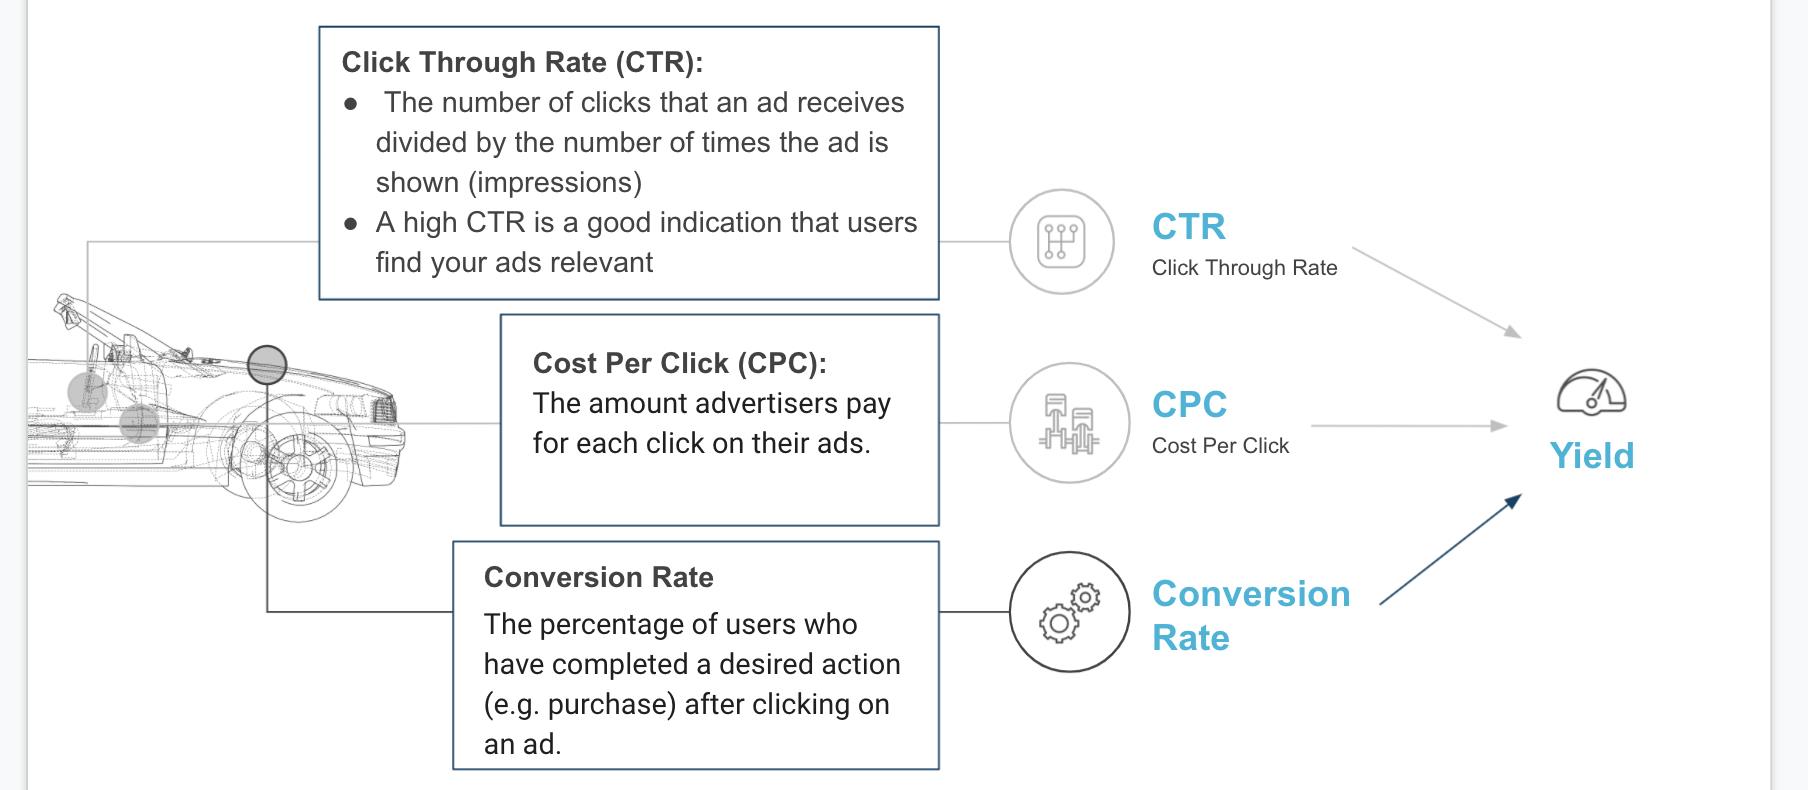
Advertisers choose Taboola because our technology/AI works. Last quarter we announced SmartBid’s newest innovation, Dimensions. Dimensions allow SmartBid to use AI to look at 40 different signals (or ‘dimensions’) in addition to the publisher, such as time of day, day of week, platform, geographic location and more. Our new ability to factor in those dimensions at scale results in strong campaign performance, and since SmartBid is fully automated, it also saves advertisers the time they had to spend on manual bidding.
High Impact Placements support brand and agencies’ growth, and partners like NBC Sports, Future, Reach, Sinclair and more choose us for it.
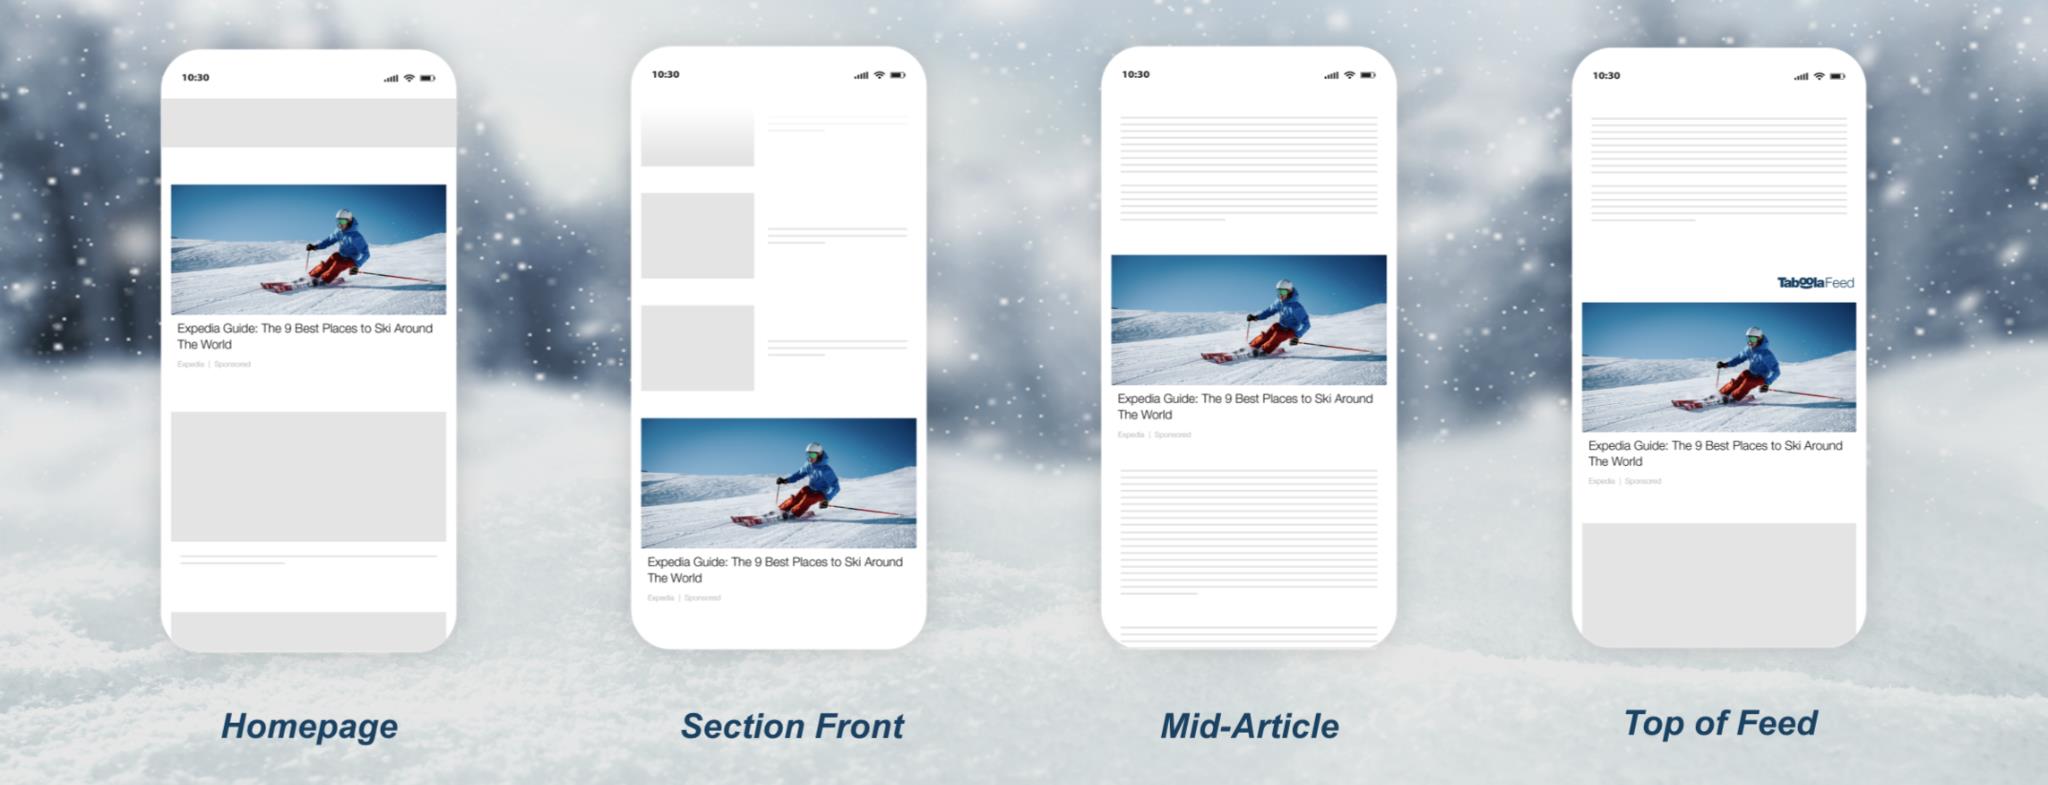
We launched our High Impact Placements to capture new mid-article inventory, which brands love, and resulted in us expanding business with many of our partners. Brands and agencies are now able to appear in Taboola placements that are prominent, and allow for various formats like video, or large visuals. It gives brands and agencies the ability to track other things like viewability and completion rates, and is supported by partnerships with the likes of DoubleVerify, Moat, IAS and others.
“Homepage For You” and Newsroom empower editorial teams, drive growth in engagement and audience, and win partnerships like McClatchy, NDTV and AP.
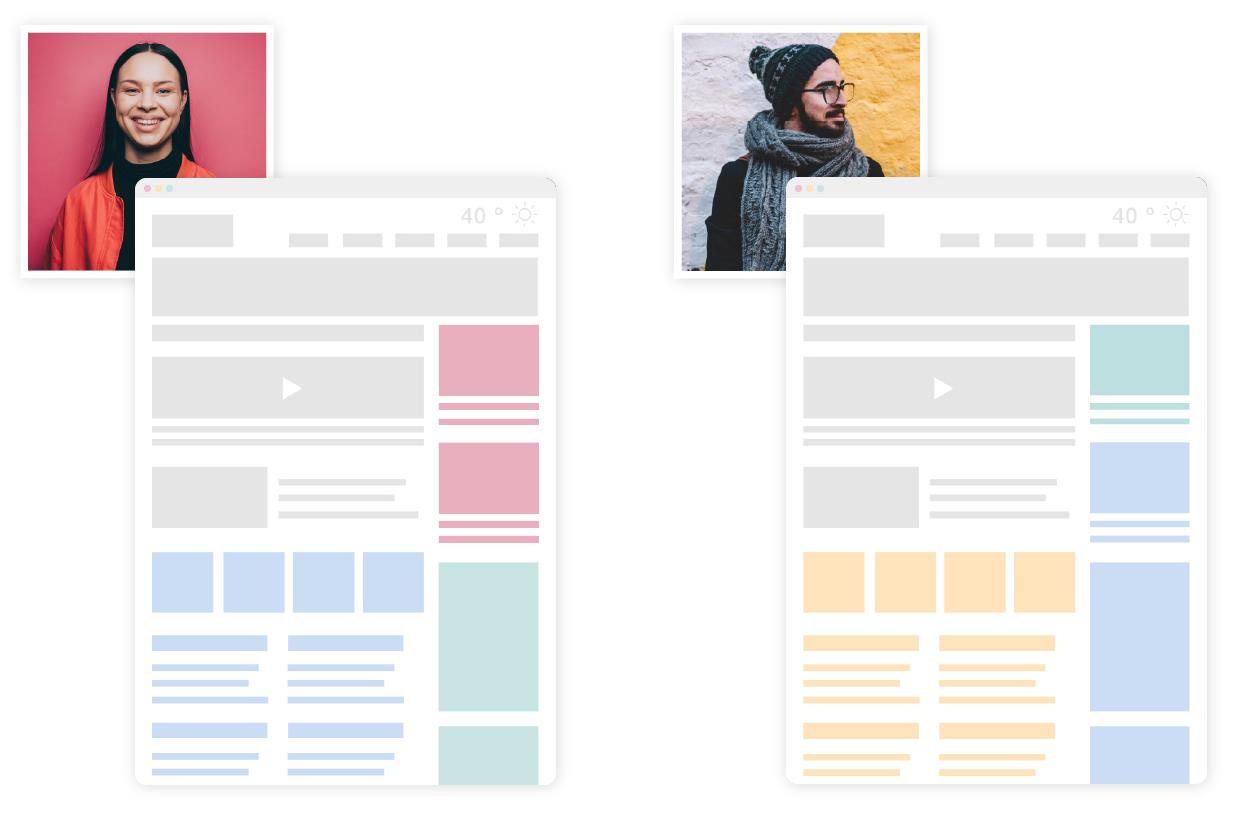
We’ve been investing in Newsroom, which is our editorial technology that helps writers and editors to A/B test creatives, and find insights to fuel their editorial strategies for the past five years. Recently, we’ve expanded Newsroom to include the ability to empower homepage editors, and act on the data and insights to personalize the homepage using AI, we call it HomePage For You. This new offering has been shown to drive more than a 30% increase in CTRs and has been adopted already by leading publishers. NDTV valued it so much that they signed a 10 year partnership with us.
Taboola News drives audience growth by distributing publishers' content to mobile devices.
In 2021, we signed groundbreaking partnerships with Samsung Brazil and Xiaomi global, two of the largest Android OEM manufacturers in the world, to integrate a feed of news on their devices. Think “Apple News,” but for Android devices. I will provide further updates on our progress here in the next section.
Content moderation teams keep our publishers, advertisers, and the Open Web safe.
We are committed to being a leader in content moderation. Today, we have a dedicated moderation team of 50 employees that review every new advertisement. I’m convinced that our process, policies and human approach are one of the best in our space. Our policies are public, local, and relevant to the market they are enforced in. We regularly interact with local reporters and authorities to constantly learn and improve.
New Bidder Technology & Momentum
As I look at the last year, we have had a tremendous amount of momentum, winning partnerships like BBC, Hearst, Penske Media, LINE Today Hong Kong, Le Figaro. We’ve also announced exciting news as we signed a new agreement with Microsoft, lasting to July 2024, allowing both Microsoft and Taboola to look for even faster growth as part of a new bidder technology which Microsoft has supported us in the design of.
As a reminder, about 40% of our growth comes from new wins, and 60% is from existing accounts.
All this sets the foundation that will enable us to grow in 2022 …..and far beyond.
2. Operate in a $64B market, and we have significant growth opportunities
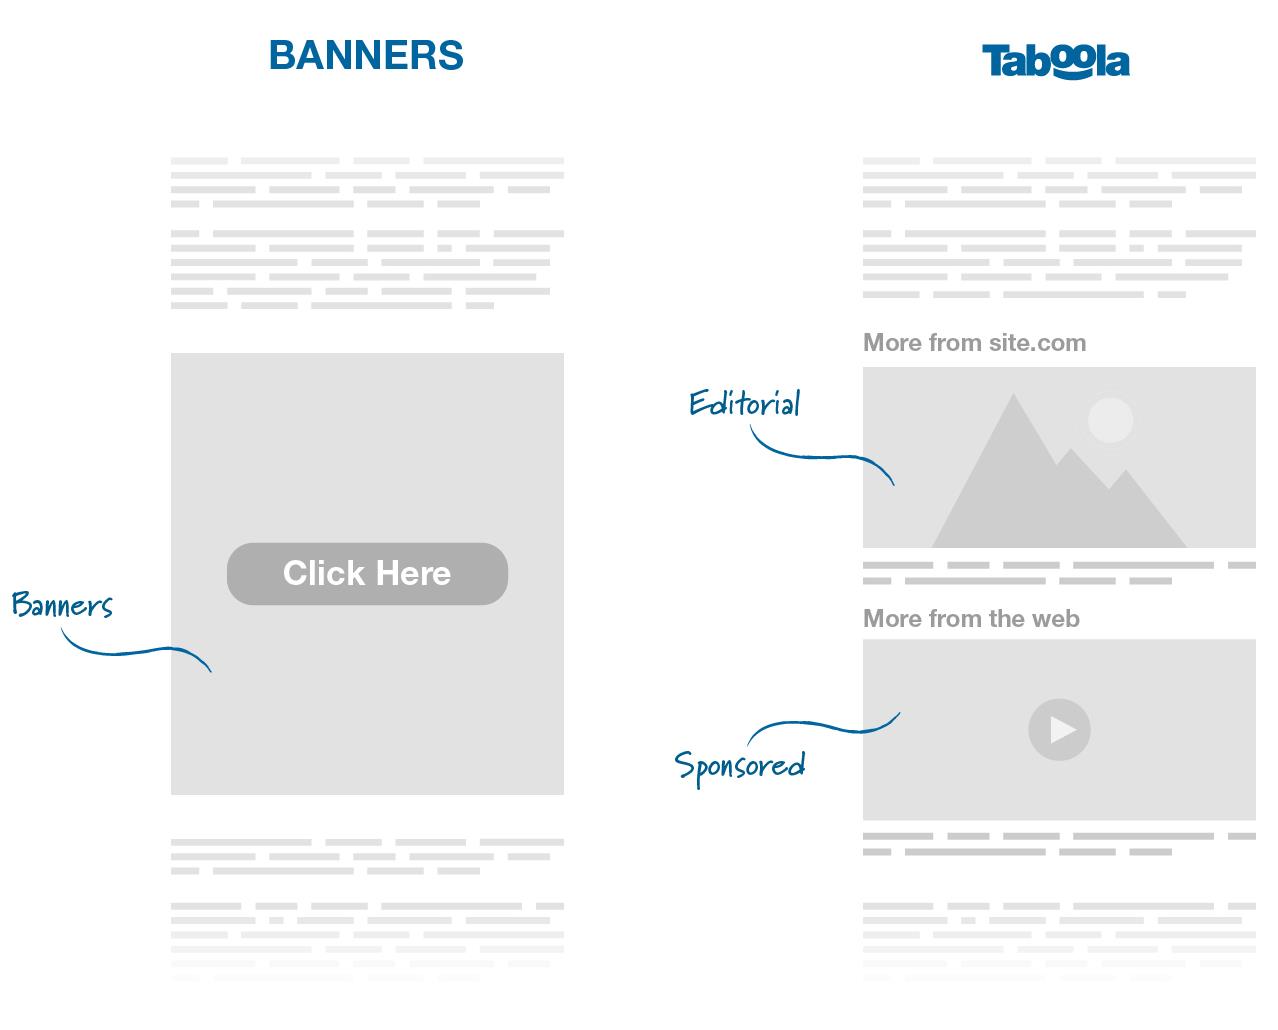
In our core markets, the Open Web is still monetized using traditional ads, which provide limited value to users. Nobody opens their browser looking for a great banner — while people do actually interact with Google ads, or Amazon ads which do a great job of recommending what the user wants.
On Amazon, some of the product recommendations are organic, and some are sponsored — but they are all relevant. Taboola's advertising experiences are similar to Amazon, or Google’s in the sense that they offer both editorial recommendations, as well as paid advertising. I think a lot of the $64B market should look like Amazon, and we can power it.
Taboola offers more than just traditional advertising products — we offer users a mix of editorial recommendations, bundled with paid recommendations, all natively rendered. When you go to search on Google, some of the results are organic, and some are paid — but they’re all related to what you want to do next.
When you buy a product on Amazon, some of the recommendations to other products are organic, and some are paid, but they’re all related to what you want to buy next. When you surf the web, some of what Taboola recommends you is editorial content from the site that you’re on, some are recommendations from around the web and all are relevant to what you may want to discover next.
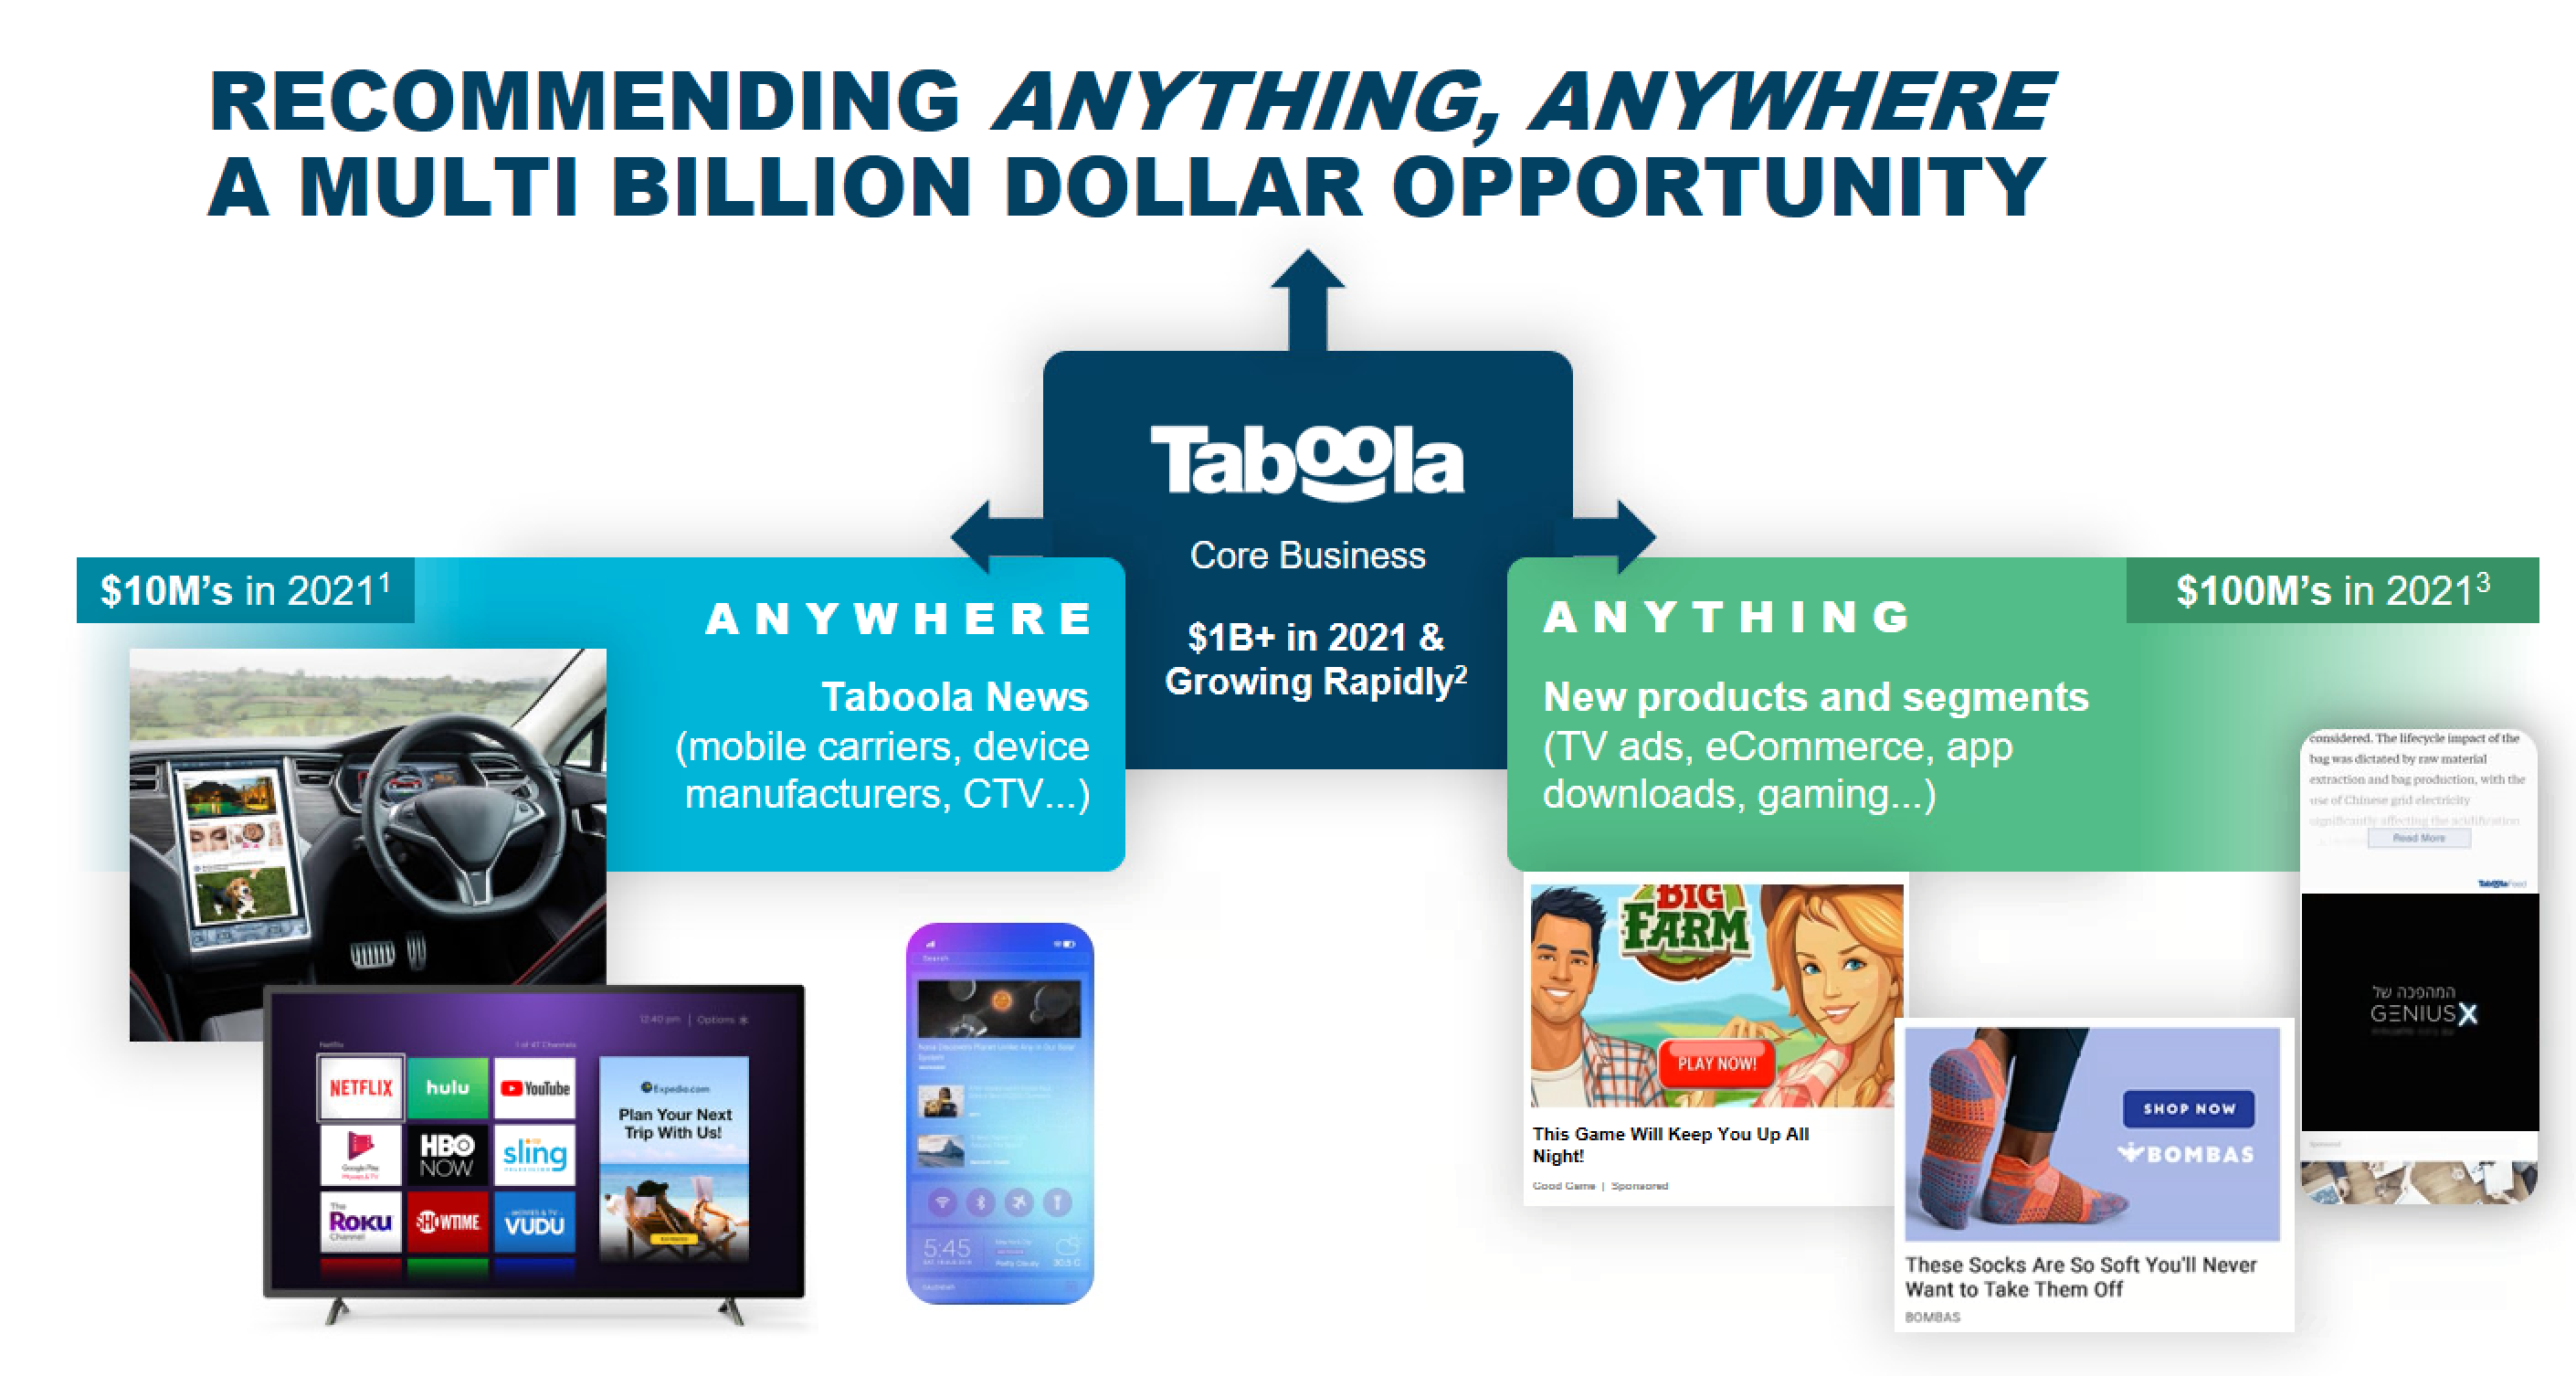
We’re not stopping there — over the next 10-20 years, Taboola will recommend anything, and be anywhere. Our aspirations are to be on every connected TV, on every mobile device, and in every car. Much like how some cars now come with Spotify for music, cars should be shipped with Taboola inside for local and national news, or for podcast recommendations.
We see tremendous opportunities to grow in new ways — to take our contextual signals, our AI and our data superpower to new places, to disrupt the traditional advertising ecosystem and capture a larger share of the $64 billion Open Web market.
As we think about the future, we want to keep diversifying what we recommend, as well as make sure we are integrated anywhere people spend their time. This is the foundation of our ‘Recommend Anything’ and ‘Recommend Anywhere’ strategy.
‘Recommend Anything.’ This is a way for us to diversify what we recommend, and to grow our yield for publishers, which helps us become even more competitive. Over time, we want to recommend audio, apps, games, and other types of verticals. A meaningful amount of our ex-TAC Gross Profit, about 30%, is from high value segments, 15% comes from e-Commerce and 15% comes from brands and agencies.
| ● | Recommending more e-Commerce. We expect that in the coming years, one-third of Open Web publisher revenue will be e-Commerce and with the acquisition of Connexity in 2021, we are set to transform the Open Web through greater product and e-Commerce recommendations. | 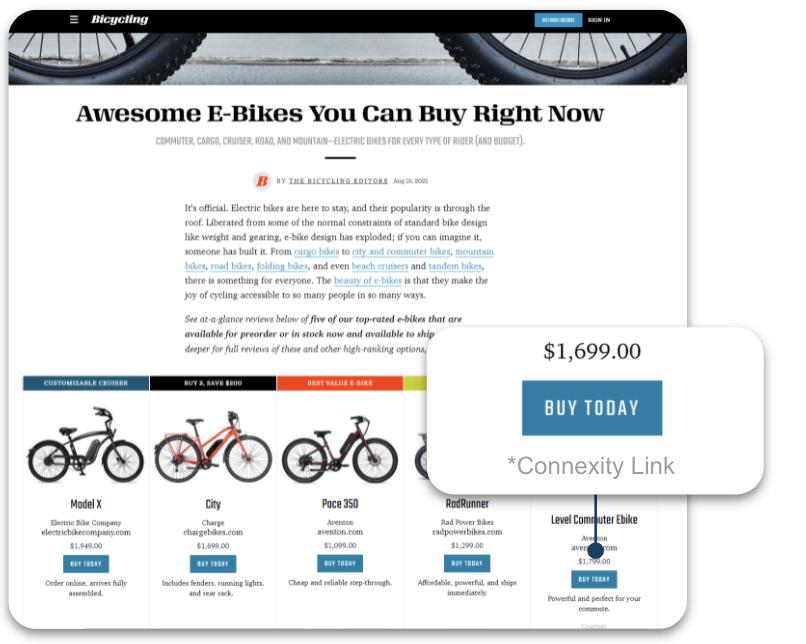 |
| | | |
| | Connexity is one of the largest e-Commerce media platforms on the Open Web with one million monthly transaction events supported by direct relationships with over 1,600 merchants, such as Walmart, Wayfair, Skechers, Macy’s, eBay and Otto. We reach more than 100 million unique shoppers per month, via relationships with premium publishers including Condé Nast, DotDash, Hearst, Vox Media, Meredith, and News Corp Australia. With Connexity we have more relationships, more scale and commerce revenue is now over 15% of our total ex-TAC Gross Profit. |
● | Recommending more with brands and agencies. There’s a huge opportunity for us as the market moves away from traditional banner ads towards in-feed native advertising, which is contextually meaningful to what the user is engaged with at a particular moment on a website. |  |
| | |
| | With our high impact, mid-article product innovation we are bringing a more organic, native advertising solution into areas traditionally monetized through banners. This brings with it more premium demand, such as video. This is key to attracting more agencies to our platform, and the brand name advertisers that they work with. |
‘Recommend Anywhere.’ We should be recommending wherever people might be — digital canvases like Android devices, connected TVs, automobiles, audio devices and more. Our first foray into ‘Anywhere’ has been delivering recommendations to mobile devices through our Taboola News platform, our version of Apple News, but only for Android devices.
2021 was a breakout year for Taboola News — we announced partnerships with two of the largest Android OEM manufacturers in the world, Samsung in Brazil and Xiaomi globally, to integrate a feed of news on their devices. Taboola News now drives an average of more than 400 million monthly engagements on editorial content through mobile device and OEM partnerships. This represents an increase of more than 125% year-over-year. (Q4 2020 vs Q4 2021)
3. Taboola has a strong, predictable financial model
We grow fast, over 30% year-over-year in ex-TAC Gross Profit in 2021, and 28% expected in 2022 at the midpoint of our guidance. We have historically generated predictable Adjusted EBITDA margins of 30%+, which converts to positive free cash flow at a healthy rate. Our predictability is driven by long term contracts with publishers that average to approximately 3 years, on a revenue weighted basis, and which give us visibility to core business growth, providing us a solid foundation to invest and grow in new areas. Our balance sheet is strong with positive net cash, and we intend to continue growing and generating cash as we strengthen our leadership position in the market.
The evidence of our value to our partners and clients, and the strength of our business, can be seen in our financials and in our track record. Our business model is built to drive profitable growth while generating cash, and our goal is to be a Rule of 40 business (ex-TAC growth + Adjusted EBITDA margin > 40%). We achieved that in 2021 (in fact we were a rule of 50 business), and our plans call for it again in 2022. The mid-point of our 2022 guidance is $1.67B in revenues, 28% ex-TAC gross profit growth and Adjusted EBITDA of $204M at a margin of 30.7%.
Taboola is a two sided marketplace, we have direct relationships with both publishers and advertisers, and those relationships are unique and special. Let me explain what is special here, and why it grants us a good predictable view of our financials and business.
Most companies who provide advertising solutions to publishers rely on programmatic channels to bring dollars, and they try to be less dependant on it. They call it “Supply Path Optimization,” and it means that they want less companies between them and the advertiser or client. It means they are not the ones optimizing for the advertiser, and they’re not sure if the advertiser will keep buying. With Taboola, we behave a lot more like Google, Amazon and Meta, where the vast majority of our revenue, about 90%, comes from advertisers who work with us directly. Those advertisers use SmartBid AI to optimize their campaigns, they use our self-serve tools, best practices, new ad formats, data to succeed, and we know who they are. We on-board them, we grow their business, it works.
On the other side, when comparing Taboola to other companies that are mainly demand oriented, and programmatic, our main advantage is that we don’t buy inventory and hope that the inventory we have now will be here tomorrow. We work with publishers, exclusively and long-term. That means that as an advertiser working with Taboola, you’re one step away from the publisher, and there is consistency in the people you get to reach. In many ways, Taboola to the advertiser is much more like a consumer company. You can think of us as “one big global publisher,” we have guaranteed supply, and we reach 500M every single day.
In early 2021, when we started our journey to be a public company we presented to the investment community our “PIPE” projections for 2021 and 2022. The table below shows how our 2021 results and our 2022 guidance stack up against those initial expectations.
(dollars in millions) | | 2021 Actuals | | | 2021 PIPE Projection | | | Actuals % Above PIPE | | | 2022 Guidance | | | 2022 PIPE Projection | |
Revenues | | $1,378 | | | $1,277 | | | | 8 | % | | $1,666 - $1,678 | | | $1,450 | |
Gross Profit | | $441 | | | $365 | | | | 21 | % | | $552 - $560 | | | $419 | |
ex-TAC Gross Profit
| | $519
| | | $445
| | | | 17
| %
| | $661 - $669
| | | $516
| |
Adjusted EBITDA | | $179 | | | $127 | | | | 41 | % | | $195 - $213 | | | $143 | |
Especially in today’s market, the fact that we grew ex-TAC Gross Profit 30%+ last year on a reported basis and 25% on a pro forma basis, generated $179M in Adjusted EBITDA, have a strong balance sheet, and we generate cash gives us the resources to keep innovating.
Financial Performance
I’ll close by talking about our Q4 2021 financials which, as stated earlier, came in above our guidance, and give us the confidence to raise our guidance for 2022. Gross Profit and ex-TAC Gross Profit both grew over 50% versus Q4 2020 and our Ratio of Adjusted EBITDA to ex-TAC Gross Profit came in at 38.6%, comfortably above our target to be a “rule of 40” business. We are seeing continued good progress in the business — winning new business, executing on our ‘Recommend Anything’ and ‘Recommend Anywhere’ growth initiatives, and realizing very good yield expansion.
Below are the results of Q4 versus our guidance.
(dollars in millions) | Q4 2021 | Year-over-Year Growth | Q4 2021 Guidance |
Revenues | $408 | 16% | $392 to $396 |
Gross Profit | $144 | 54% | $129 to $132 |
ex-TAC Gross Profit* | $169 | 54% | $163 to $165 |
Adjusted EBITDA* | $65 | 98% | $61 to $63 |
New business contributed 38% and existing business contributed 62% of the growth in Revenues. Gains in yield and the inclusion of Connexity drove much of the growth of our existing base.
As mentioned, our Q4 performance gives us confidence to raise our 2022 guidance. The table below includes our current guidance for full year 2022 compared to our previous guidance:
Full Year 2022 (dollars in millions) | | Increased Guidance | | | Year-over-Year Growth | | | Previous Guidance | |
Revenues | |
| $1,666 - $1,678 | | | | 21% - 22% |
| | $1,588 - $1,633 | |
Gross Profit | |
| $552 - $560 |
|
|
| 25% - 27% |
|
| $530 - $550 | |
ex-TAC Gross Profit | |
| $661 - $669 | | | | 27% - 29% |
| | $645 - $665 | |
Adjusted EBITDA | |
| $195 - $213 | | | | 9% - 19% |
| | $193 - $213 | |
Non-GAAP Net Income
| | | $119 - $129
| | | | NA
| | | NA | |
For a complete look at our updated full year and Q1 2022 guidance, please see our Q4 2021 earnings press release, which was furnished to the SEC and also posted on Taboola’s website today at https://investors.taboola.com.
* * *
We’re kicking off 2022 on the back of a strong 2021, and we’re energized to keep innovating on the product front, and work with incredible partners all over the world. Our mission is build a recommendations engine for the Open Web, side by side to Google, Amazon and Meta and as a public company, we’re well positioned to keep investing in fulfilling that mission over the next decades.
I’m looking forward to our upcoming earnings call and engaging with investors in the coming months, where I’ll do my best to answer any questions you may have.
Kind regards,
-- Adam Singolda
Founder & CEO Taboola
*About Non-GAAP Financial Information
This release includes ex-TAC Gross Profit, Adjusted EBITDA, Ratio of Adjusted EBITDA to ex-TAC Gross Profit and Free Cash Flow, which are non-GAAP financial measures. These non-GAAP financial measures are not measures of financial performance in accordance with GAAP and may exclude items that are significant in understanding and assessing the Company’s financial results. Therefore, these measures should not be considered in isolation or as an alternative to revenues, gross profit, net income, cash flows from operations or other measures of profitability, liquidity or performance under GAAP. You should be aware that the Company’s presentation of these measures may not be comparable to similarly-titled measures used by other companies.
The Company believes non-GAAP financial measures provide useful information to management and investors regarding future financial and business trends relating to the Company. The Company believes that the use of these measures provides an additional tool for investors to use in evaluating operating results and trends and in comparing the Company’s financial measures with other similar companies, many of which present similar non-GAAP financial measures to investors. Non-GAAP financial measures are subject to inherent limitations because they reflect the exercise of judgments by management about which items are excluded or included in calculating them. Please refer to the appendix at the end of this press release for reconciliations to the most directly comparable measures in accordance with GAAP.
**About Pro Forma With Connexity Information
This release includes historical and projected pro forma information for ex-TAC Gross Profit. The pro forma information presents the pro forma effect of the Connexity acquisition as if it had been completed on January 1, 2020. The pro forma information is unaudited, is provided as supplemental information only and is subject to the limitations contained under the heading “Unaudited Pro Forma Condensed Combined Financial Information” in our Prospectus dated September 2, 2021, as amended, forming part of our Registration Statement on Form F-1 filed with the Securities and Exchange Commission.
Note Regarding Forward-Looking Statements
Certain statements in this release are forward-looking statements. Forward-looking statements generally relate to future events including future financial or operating performance of Taboola.com Ltd. (the “Company”). In some cases, you can identify forward-looking statements by terminology such as “may”, “should”, “expect”, “intend”, “will”, “estimate”, “anticipate”, “believe”, “predict”, “potential” or “continue”, or the negatives of these terms or variations of them or similar terminology. Such forward-looking statements are subject to risks, uncertainties, and other factors which could cause actual results to differ materially from those expressed or implied by such forward looking statements.
These forward-looking statements are based upon estimates and assumptions that, while considered reasonable by the Company and its management, are inherently uncertain. Uncertainties and risk factors that could affect the Company’s future performance and cause results to differ from the forward-looking statements in this press release include, but are not limited to: the ability to recognize the anticipated benefits of the recent acquisition of Connexity and the business combination between the Company and ION Acquisition Corp. 1 Ltd. (together, the “Business Combinations”), which may be affected by, among other things, competition, the ability of the Company to grow and manage growth profitably, maintain relationships with customers and retain its management and key employees; the Company’s ability to successfully integrate the Connexity acquisition; costs related to the Business Combinations; changes in applicable laws or regulations; the Company’s estimates of expenses and profitability and underlying assumptions with respect to accounting presentations and purchase price and other adjustments; ability to attract new digital properties and advertisers; ability to meet minimum guarantee requirements in contracts with digital properties; intense competition in the digital advertising space, including with competitors who have significantly more resources; ability to grow and scale the Company’s ad and content platform through new relationships with advertisers and digital properties; ability to secure high quality content from digital properties; ability to maintain relationships with current advertiser and digital property partners; ability to make continued investments in the Company’s AI-powered technology platform; the need to attract, train and retain highly-skilled technical workforce; changes in the regulation of, or market practice with respect to, “third party cookies” and its impact on digital advertising; continued engagement by users who interact with the Company’s platform on various digital properties; the impact of the ongoing COVID-19 pandemic; reliance on a limited number of partners for a significant portion of the Company’s revenue; changes in laws and regulations related to privacy, data protection, advertising regulation, competition and other areas related to digital advertising; ability to enforce, protect and maintain intellectual property rights; and risks related to the fact that we are incorporated in Israel and governed by Israeli law; and other risks and uncertainties set forth in the section entitled “Risk Factors” and “Cautionary Note Regarding Forward-Looking Statements” in the Company’s registration statements on Form F-1 as amended and filed on September 30, 2021, and in subsequent filings with the Securities and Exchange Commission (“SEC”).
Nothing in this release should be regarded as a representation by any person that the forward-looking statements set forth herein will be achieved or that any of the contemplated results of such forward-looking statements will be achieved. You should not place undue reliance on these forward-looking statements, which speak only as of the date they were made. The Company undertakes no duty to update these forward-looking statements except as may be required by law.
APPENDIX: Non-GAAP Reconciliation
RECONCILIATION OF GAAP TO NON-GAAP FINANCIAL MEASURES FOR Q4 AND FULL YEARS 2021 AND 2020
(Unaudited)
The following table provides a reconciliation of Revenues to ex-TAC Gross Profit.
| | | Three months ended December 31, | | | Year ended December 31, | |
| | | 2021 | | | 2020 | | | 2021 | | | 2020 | |
| | | Unaudited | | | Unaudited | |
| | | (dollars in thousands) | | | (dollars in thousands) | |
Revenues | | $ | 407,668 | | | $ | 351,294 | | | $ | 1,378,458 | | | $ | 1,188,893 | |
Traffic acquisition cost | | | 238,458 | | | | 241,092 | | | | 859,595 | | | | 806,541 | |
Other cost of revenues | | | 25,568 | | | | 17,181 | | | | 77,792 | | | | 62,855 | |
Gross Profit | | $ | 143,642 | | | $ | 93,021 | | | $ | 441,071 | | | $ | 319,497 | |
Add back: Other cost of revenues | | | 25,568 | | | | 17,181 | | | | 77,792 | | | | 62,855 | |
ex-TAC Gross Profit | | $ | 169,210 | | | $ | 110,202 | | | $ | 518,863 | | | $ | 382,352 | |
The following table provides a reconciliation of Net income (loss) to Adjusted EBITDA.
| | | Three months ended December 31, | | | Year ended December 31, | |
| | | 2021 | | | 2020 | | | 2021 | | | 2020 | |
| | | Unaudited | | | Unaudited | |
| | | (dollars in thousands) | | | (dollars in thousands) | |
Net income (loss) | | $ | 585 | | | $ | 2,753 | | | $ | (24,948 | ) | | $ | 8,493 | |
Adjusted to exclude the following: | | | | | | | | | | | | | | |
Financial expenses (income), net | | | 1,783 | | | | 1,703 | | | | (11,293 | ) | | | 2,753 | |
Tax expenses | | | 16,277 | | | | 1,810 | | | | 22,976 | | | | 14,947 | |
Depreciation and amortization | | | 23,061 | | | | 7,109 | | | | 53,111 | | | | 33,957 | |
Share-based compensation expenses(1) | | | 20,641 | | | | 17,264 | | | | 124,235 | | | | 28,277 | |
M&A costs(2) | | | 154 | | | | 2,354 | | | | 11,661 | | | | 17,766 | |
Holdback compensation expenses(3) | | | 2,882 | | | | - | | | | 3,722 | | | | - | |
Adjusted EBITDA | | $ | 65,383 | | | $ | 32,993 | | | $ | 179,464 | | | $ | 106,193 | |
1For the 2021 periods, a substantial majority is Share-based compensation expenses related to going public.
2 For 2020 periods, represents costs associated with the proposed strategic transaction with Outbrain Inc.which we elected not to consummate, and for 2021 periods, relates to the acquisition of ION Acquisition Corp. 1 Ltd., acquisition of Connexity and going public.
3 Represents share based compensation due to holdback of Taboola ordinary shares issuable under compensatory arrangements relating to Connexity acquisition.
We calculate Ratio of Net income (loss) to Gross profit as Net income (loss) divided by Gross profit. We calculate Ratio of Adjusted EBITDA to ex-TAC Gross Profit, a non-GAAP measure, as Adjusted EBITDA divided by ex-TAC Gross Profit. We believe that the Ratio of Adjusted EBITDA to ex-TAC Gross Profit is useful because TAC is what we must pay digital properties to obtain the right to place advertising on their websites, and we believe focusing on ex-TAC Gross Profit better reflects the profitability of our business. The following table reconciles Ratio of Net income (loss) to Gross Profit and Ratio of Adjusted EBITDA to ex-TAC Gross Profit for the period shown.
| | | Three months ended December 31, | | | Year ended December 31, | |
| | | 2021 | | | 2020 | | | 2021 | | | 2020 | |
| | | Unaudited | | | Unaudited | |
| | | (dollars in thousands) | | | (dollars in thousands) | |
Gross profit | | $ | 143,642 | | | $ | 93,021 | | | $ | 441,071 | | | $ | 319,497 | |
Net Income (loss) | | $ | 585 | | | $ | 2,753 | | | $ | (24,948 | ) | | $ | 8,493 | |
Ratio of Net income (loss) to Gross profit | | | 0.4 | % | | | 3.0 | % | | | (5.7 | %) | | | 2.7 | % |
ex-TAC Gross Profit | | $ | 169,210 | | | $ | 110,202 | | | $ | 518,863 | | | $ | 382,352 | |
Adjusted EBITDA | | $ | 65,383 | | | $ | 32,993 | | | $ | 179,464 | | | $ | 106,193 | |
Ratio of Adjusted EBITDA Margin to ex-TAC Gross Profit | | | 38.6 | % | | | 29.9 | % | | | 34.6 | % | | | 27.8 | % |
The following table provides a reconciliation of Net cash provided by operating activities to Free Cash Flow.
| | | Three months ended December 31, | | | Year ended December 31, | |
| | | 2021 | | | 2020 | | | 2021 | | | 2020 | |
| | | Unaudited | | | Unaudited | |
| | | (dollars in thousands) | | | (dollars in thousands) | |
Net cash provided by operating activities | | $ | 22,968 | | | $ | 57,469 | | | $ | 63,521 | | | $ | 139,087 | |
Purchases of property and equipment, including capitalized platform costs | | | (10,296 | ) | | | (4,094 | ) | | | (39,070 | ) | | | (17,774 | ) |
Free Cash Flow | | $ | 12,672 | | | $ | 53,375 | | | $ | 24,451 | | | $ | 121,313 | |
APPENDIX: Non-GAAP Reconciliation
RECONCILIATION OF GAAP TO NON-GAAP FINANCIAL MEASURES FOR Q1 2022 AND FULL YEAR 2022 GUIDANCE
(Unaudited)
The following table provides a reconciliation of Gross Profit to ex-TAC Gross Profit.
| | | | Q1 2022 | | | FY 2022 | |
| | | Unaudited | |
| | | (dollars in millions) | |
Revenues | |
| $353 - $359 | | |
| $1,666- $1,678 | |
| Traffic acquisition cost | |
| ($218 - $222 | ) | | | ($1,003 - $1,011 | ) |
| Other cost of revenues | |
| ($25 - $27 | ) | | | ($106 - $112 | ) |
Gross Profit | |
| $108 - $112 | | |
| $552 - $560 | |
| Add back: Other cost of revenues | |
| $25 - $27 | | |
| $106 - $112 | |
ex-TAC Gross Profit | |
| $134 - $138 | | |
| $661 - $669 | |