Exhibit 99.2
Dear Shareholder,
Two years ago, in March of 2020, we experienced the pandemic, which caused a global panic that was bad for many businesses, including for our advertiser business. Yields went down significantly overnight. Somewhere towards the end of Q1 this year, as the war in Ukraine began, we started seeing similar dynamics on a smaller scale with our advertisers in Europe, which affected our yields all around the world. More than 30% of our revenue is out of Europe, and we have many advertisers out of Europe that buy globally. We felt it when the war began.
That said, the first quarter of 2022 was strong, we beat on ex-TAC and Adjusted EBITDA and were in guidance for gross revenue. We won new deals, expanded relationships, launched new products, and made progress in capturing more of the $64 billion Open Web advertising market. We delivered 31% ex-TAC gross profit growth over Q1 of last year. This demonstrates the strength of our business while also reflecting the hard work of our team and the value of having long-term, exclusive publisher partnerships. Financial highlights:
| ● | Ex-TAC Gross Profit and Adjusted EBITDA are the key non-GAAP metrics we use to measure our business and we beat both of them |
| ● | Ex-TAC Gross Profit of $138.2M exceeded our guidance range of $134 to $138M, growing 31% over Q1 2021 and 8.4% pro forma with our acquisition of Connexity** |
| ● | Adjusted EBITDA of $34.9M exceeded our guidance range of $32 to $34M. We’re managing costs well while maintaining investments in future growth engines |
| ● | Q1 Revenues were $354.7M, within the guidance range of $353 to $359M |
| ● | Non-GAAP Net Income was $21.9M, exceeding our guidance range of $12 to $14M, and we also reported net income of $3.9M |
While our Q1 performance was encouraging, we are adjusting full year 2022 guidance based on a more conservative forward view. There are two factors. The main factor is the economic uncertainty caused by the war in Ukraine, which affected our advertising business in Europe (more than 30% of our revenue in 2021) and global yields. The second factor is the launch of our bidder, which is now live and off to a good start, but behind plan. We are lowering our full year 2022 guidance ranges on ex-TAC Gross Profit to $595M to $615M, and Adjusted EBITDA to $152M to $160M.
I’m obviously not happy about having to adjust guidance, especially after a strong Q1. Our new guidance factors in both of these two one time events, we don’t want to do this again. The fundamentals of our business are strong, we are profitable, generating cash, we have technological advantages, our team is passionate and our intention is to keep meeting & beating our clients, partners and investors’ expectations.
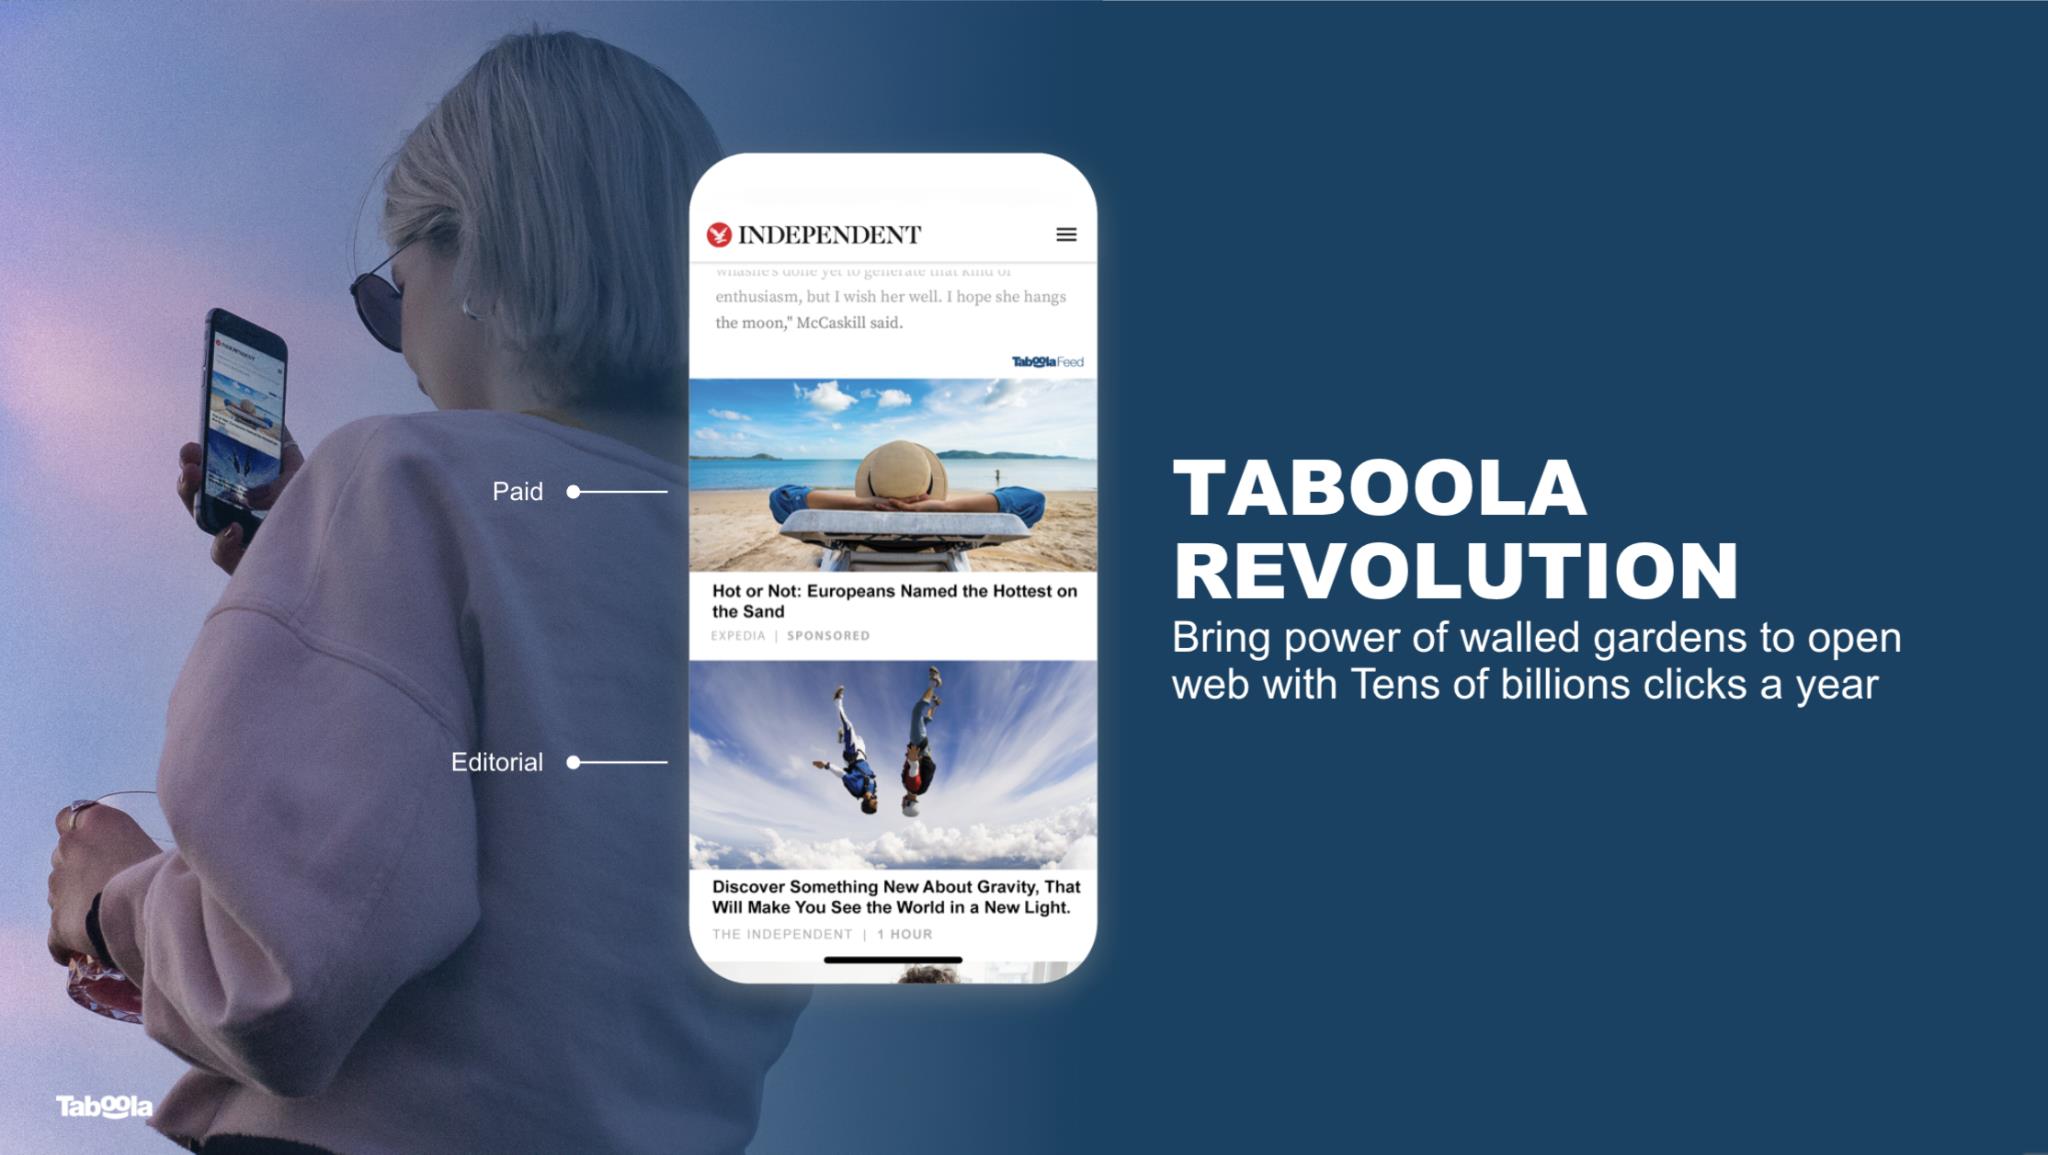
Looking beyond those two events, the business is seeing a lot of momentum in all the things we like. We're profitably growing, and I am bullish on our opportunities to liberate the open web ($64B market) from tens of billions of banners into relevant, personalized experiences, bringing the power of the walled gardens to the open web. There is endless room to grow on our journey to replace advertising experiences invented 30 years ago, with Taboola. I’m focusing Taboola on trying to achieve something I believe only walled gardens (Amazon, Google, Snap, Facebook) have ever achieved, which is building a technology that was adapted by a huge amount of performance advertisers. Imagine every business over time, big or small, being able to buy Taboola and succeed. Our budget assumes that we will ramp up our engineering team working on performance advertising such that in two years, we will 4x that team. There is a huge upside for us here.
I’m excited to see our OEM partners scaling fast with Taboola News, which is becoming an increasingly meaningful part of our business, given its fast growth and scale.
We also see a very strong pipeline with publishers thanks to our investment in tech, and because our partnerships mean “more than revenue” to our partners. I see both new partnerships and renewals, often with significant expansions. To give a few examples, Penske Media Corporation, a leading independent global media company that reaches a monthly audience of more than 310 million readers, owner of 20 digital and print brands, including Variety, Rolling Stone and WWD, is a new win that just launched. Another example is Ströeer, one of our top 5 revenue publishers globally, who just extended with us for 5 years. Associated Press also renewed in Q1, Altice renewed, and many others.
We are using our High Impact Placements to replace banner ads and expand our share in the tens of billions of dollars banner ad market, and we’re making good progress. I’m encouraged about where we are, and our future.
First Quarter Business Highlights
Publishers in Q1 continued to choose Taboola for three reasons: audience, engagement and monetization. In Q1 we signed deals with companies like Associated Press, Insider, Altice News, E! Online and international sites such as Ciaopeople, Krone.at, Webedia and more. This includes new wins, as well as renewals where we extended exclusive partnerships while expanding the work we do with those partners.
On the privacy front, we recently announced an expansion of Taboola’s Trust Portfolio, where we work with brand safety leaders, including IAS, DoubleVerify, NewsGuard, TAG, and IAB UK. We review 64M items a year to help keep the internet safe. We believe we are a leader in content review and safety, and these partnerships are critical to demonstrating our commitment to a safe, privacy protected web as well as towards expanding our work with brands and agencies.
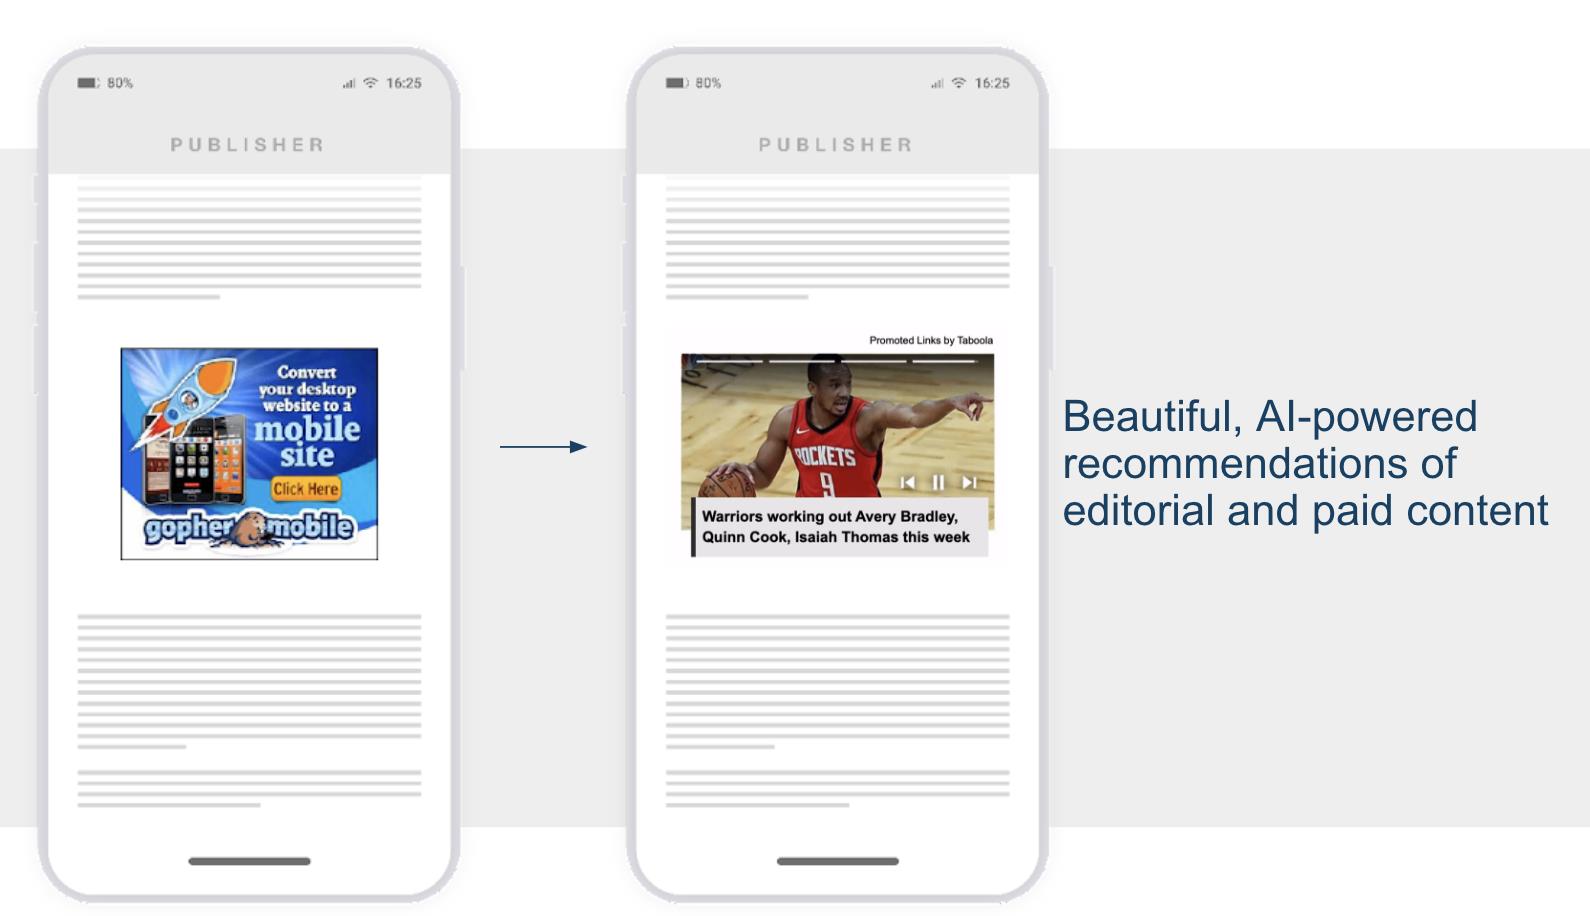
I spoke at our Investor Day about how we have a real chance at replacing tens of billions of dollars' worth of banners ads with relevant, personalized advertising experiences to capture more of the $64B Open Web market, and I’m seeing good momentum there. Publishers are replacing banners with Taboola recommendations that include both their own editorial content, as well as paid ads. We refer to those integrations as High Impact Placements (HIP), where publishers place Taboola in areas like mid-article and the homepage, as part of Taboola’s Homepage For You; and brands and agencies pay a premium for that. Brands and agencies contributed approximately 15% of Q1 ex-TAC Gross Profit. | | |
We’re also seeing good headway in e-Commerce, which comprised approximately 15% of ex-TAC Gross Profit in Q1. It’s been a little over half a year since we closed the Connexity acquisition and we are making steady progress — cross-signing advertisers, including e-commerce in new publisher deals, merging offices and most importantly, coming together as one team. To share a personal example on the power of e-Commerce, I just bought two strollers and a trampoline for our backyard. I bought both of them with the support of articles on Reviewed.com, and WiredCutter.com of The New York Times (full disclosure; both our partners). What an amazing experience— it was reviewed in a comprehensive way by professionals, as well as dozens of consumers, and trust me I know very little about safe trampolines for toddlers. It was so great; I read about them, I clicked to buy one straight from the merchant, and everybody won. I’m convinced this is the future of e-Commerce, and the Open Web.
I will spend the rest of the letter going deeper on a few areas.
Converting $10’s of Billions Banner Market To Personalized Recommendations, Bringing The Power Of Walled Gardens To The Open Web
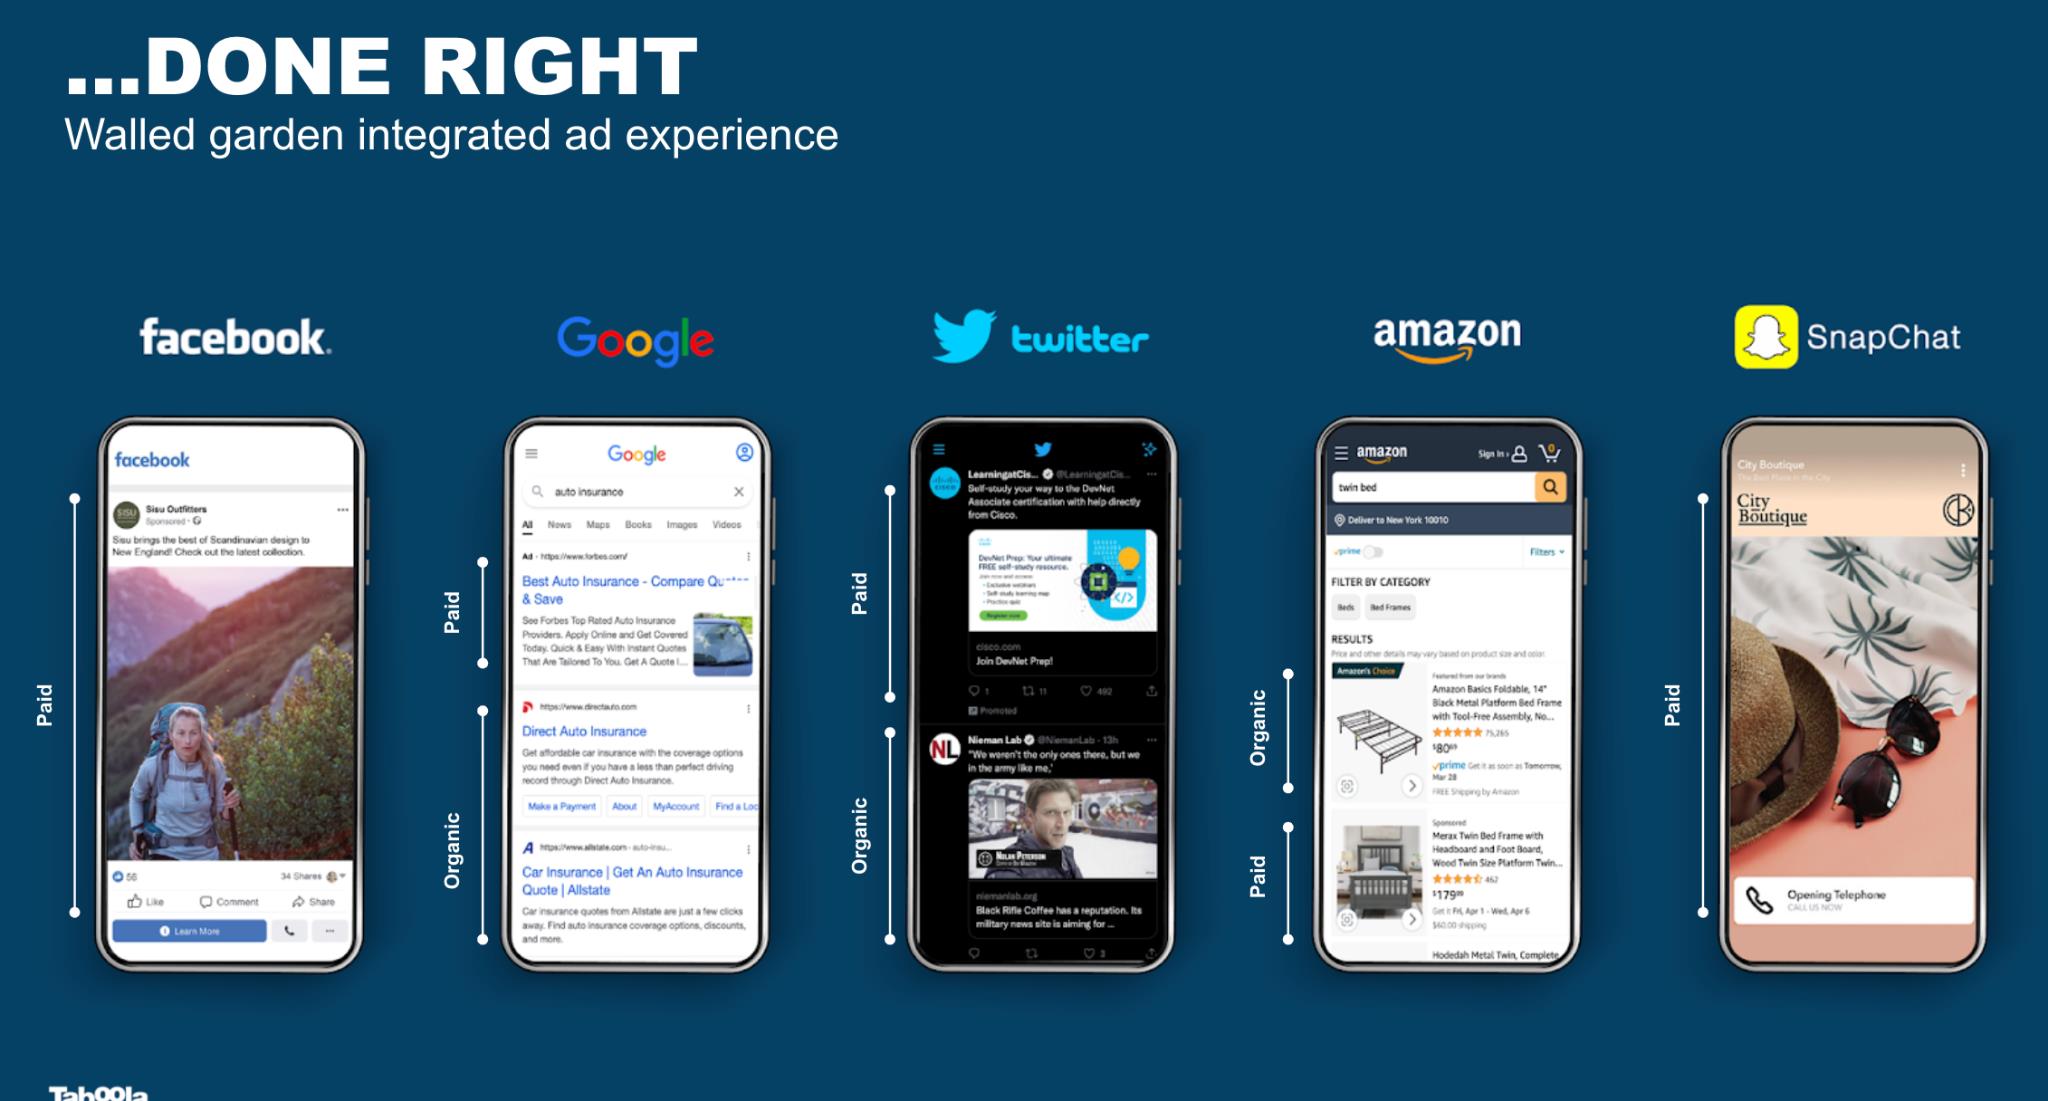
Most of the $64 billion Open Web advertising market is made up of banners — the same advertising format invented 30 years ago. That’s not the case for walled gardens. They've already moved on to an integrated, relevant, personalized, advertising experience. They figured that out years ago. None of them has shown you a banner to build trillions of dollars in market cap. Some Facebook posts are organic from your friends, and some are paid for by advertisers. Same with Google, some search results are organic, and some are paid. Same for Twitter (well, we’ll see what Elon does :-)). Same for Amazon, which is perhaps one of the largest recommendation companies in the world. Some of the “products you may like” are organic, and some sponsored. Same with Snap. It’s only the Open Web that still has banners, and that will change, powered by Taboola. We want to bring relevant, editorial and paid experiences to many more pages on the Open Web. | | |
Mark Zuckerberg on Meta’s recent earnings call said, “I think that people will increasingly turn to AI-based Discovery Engines to entertain them, teach them things, and connect them with people who share their interests.” I'm convinced that 10 years from now on the Open Web, every time you open a browser, an app on your phone, or your connected TV, all of those moments will be relevant, personalized, integrated, native ad experiences. | | |
Building Long-Term Publisher Relationships
This past quarter, I wrote a letter on our blog celebrating the many publisher partners that have been with us for a decade. 2007 marked our founding, but the year 2012 was when this Taboola-shaped rocket ship really took off. Those years are also when we first established relationships, and friendships, with many of the publishers who have been working with us for a decade or more.
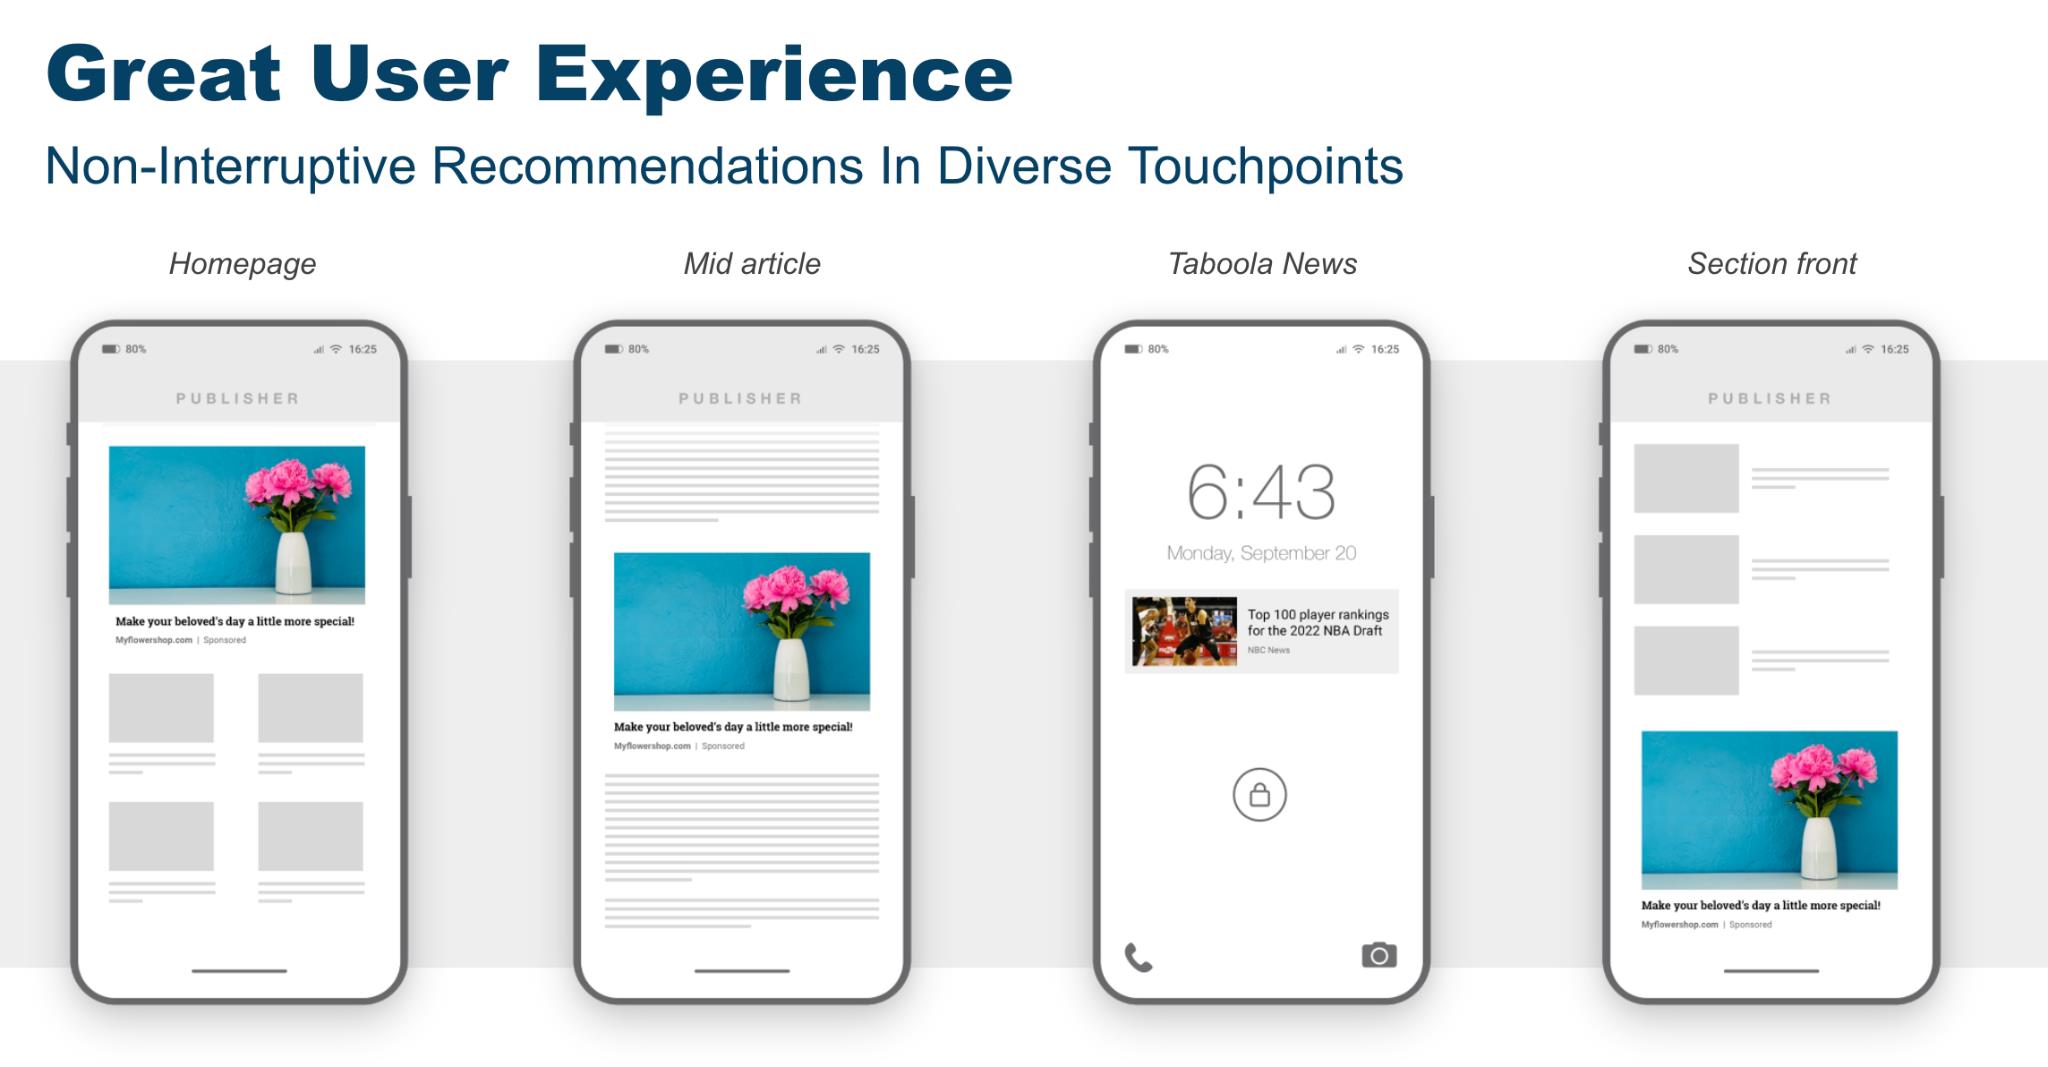
It’s now been 10 years, and so many of our publisher partners have been with us since then, or renewed with us for five or more years. The main reason publishers keep working with us for a decade or more is because of our win-win culture. We listen and invest in things they care about. While money matters, it’s no longer enough, people want less vendors and more partners. That’s the company we set out to build years ago, to be the Open Web company, that is exclusively focused on what can make publishers successful, and what can help advertisers succeed outside of walled gardens. Together, we’ve built a great user experience, where publishers integrate us on every single page (homepage, section front, mid-article and more) exclusively, for a long time, while top OEMs use Taboola News as their version of “Apple News.”
| | |
That strategy is hard because we need to do something most companies in the advertising space don’t usually do — and that’s to go beyond advertising. It means building software that our publishers would enjoy, and that goes beyond just making revenue. At the end of the day, publishers’ competition is not other publishers — it’s the walled gardens who are fighting for their users’ attention.
Beyond our core, where we’re driving revenue for publishers, think of Taboola managing three speed boats. Each of them can be meaningful to us financially, and all of them matter to our partners. These are also unique to us, which helps us win those special partnerships.
| (1) | Newsroom & Homepage For You: We recently launched Homepage For You as part of Newsroom, which is our editorial suite for writers and editors that enables our publishers to bring the power of AI to every single homepage on the internet. We’re seeing real traction here, with publishers like Miami Herald (McClatchy), NDTV, The Independent, Synacore, Diarios Associados, and others using it. In fact, this topic was recently covered in a Digiday article that explained how leaders including The Washington Post, New York Times are doing it, as well as why Taboola’s HomePage For You is key for personalization. |
| (2) | E-commerce with Connexity: We help publishers know what to write, how to connect with retailers, and make e-Commerce a bigger contributor to their business. |
| (3) | Taboola News: Our long-term vision is to enable large numbers of Android phones, connected cars, audio devices, smart watches, fridges and other smart appliances to bring our publishers partners to an engaged audience. |
Our drive to go beyond results in long-term, exclusive relationships with premium publishers — Axel Springer’s Insider, NDTV, Future PLC, NBCUniversal, Siamsport, Weather Channel, Bloomberg, Gannett, Fox Local Television, Tribune Digital, DailyKos, Meredith TV, CBSi, Disqus (now Zeta), Cox Media Group, and more.
In Q1 we continued our journey with our partners, and our deal wins included:
| ● | Multiyear deal with Altice News where Taboola will exclusively power recommendations across their award-winning local, national and international news sites that include its News 12 Networks, Cheddar News and i24NEWS brands. |
| ● | Five-year renewal with E! Online that takes our relationship to 7.5 years and makes us their exclusive third-party provider of mid article video. The deal showcases the strength of our platform while expanding our partnership with new high-quality supply through our high impact, mid article product solution and also includes testing of our Taboola Stories feature. |
| ● | Three-year renewal with Insider, an Axel Springer property, a top 10 US publisher for us (by revenue) that brings us to 10 years together, making us one of their longest-standing tech partners. Since the partnership began, Insider has seen double-digit growth in both engagement of recirculated content and revenue. |
| ● | Three-year deal with AP, one of the most trusted publishers in the world, to power recommendations and reader insights with Taboola Newsroom. |
| ● | Wins globally with a number of international news sites, many of them competitive wins, including Le Point in France, Ciaopeople in Italy, KapanLagi Youniverse in Indonesia. |
Winning in e-Commerce
Along with the demos at Investor Day, the e-Commerce with Connexity presentation may have been some of the most appreciated event content. As publishers lean more into e-Commerce we are well-positioned through a number of unique advantages:
| 1. | Long-standing relationships with blue-chip retailers (10+ years on average) that span the range of retail categories. |
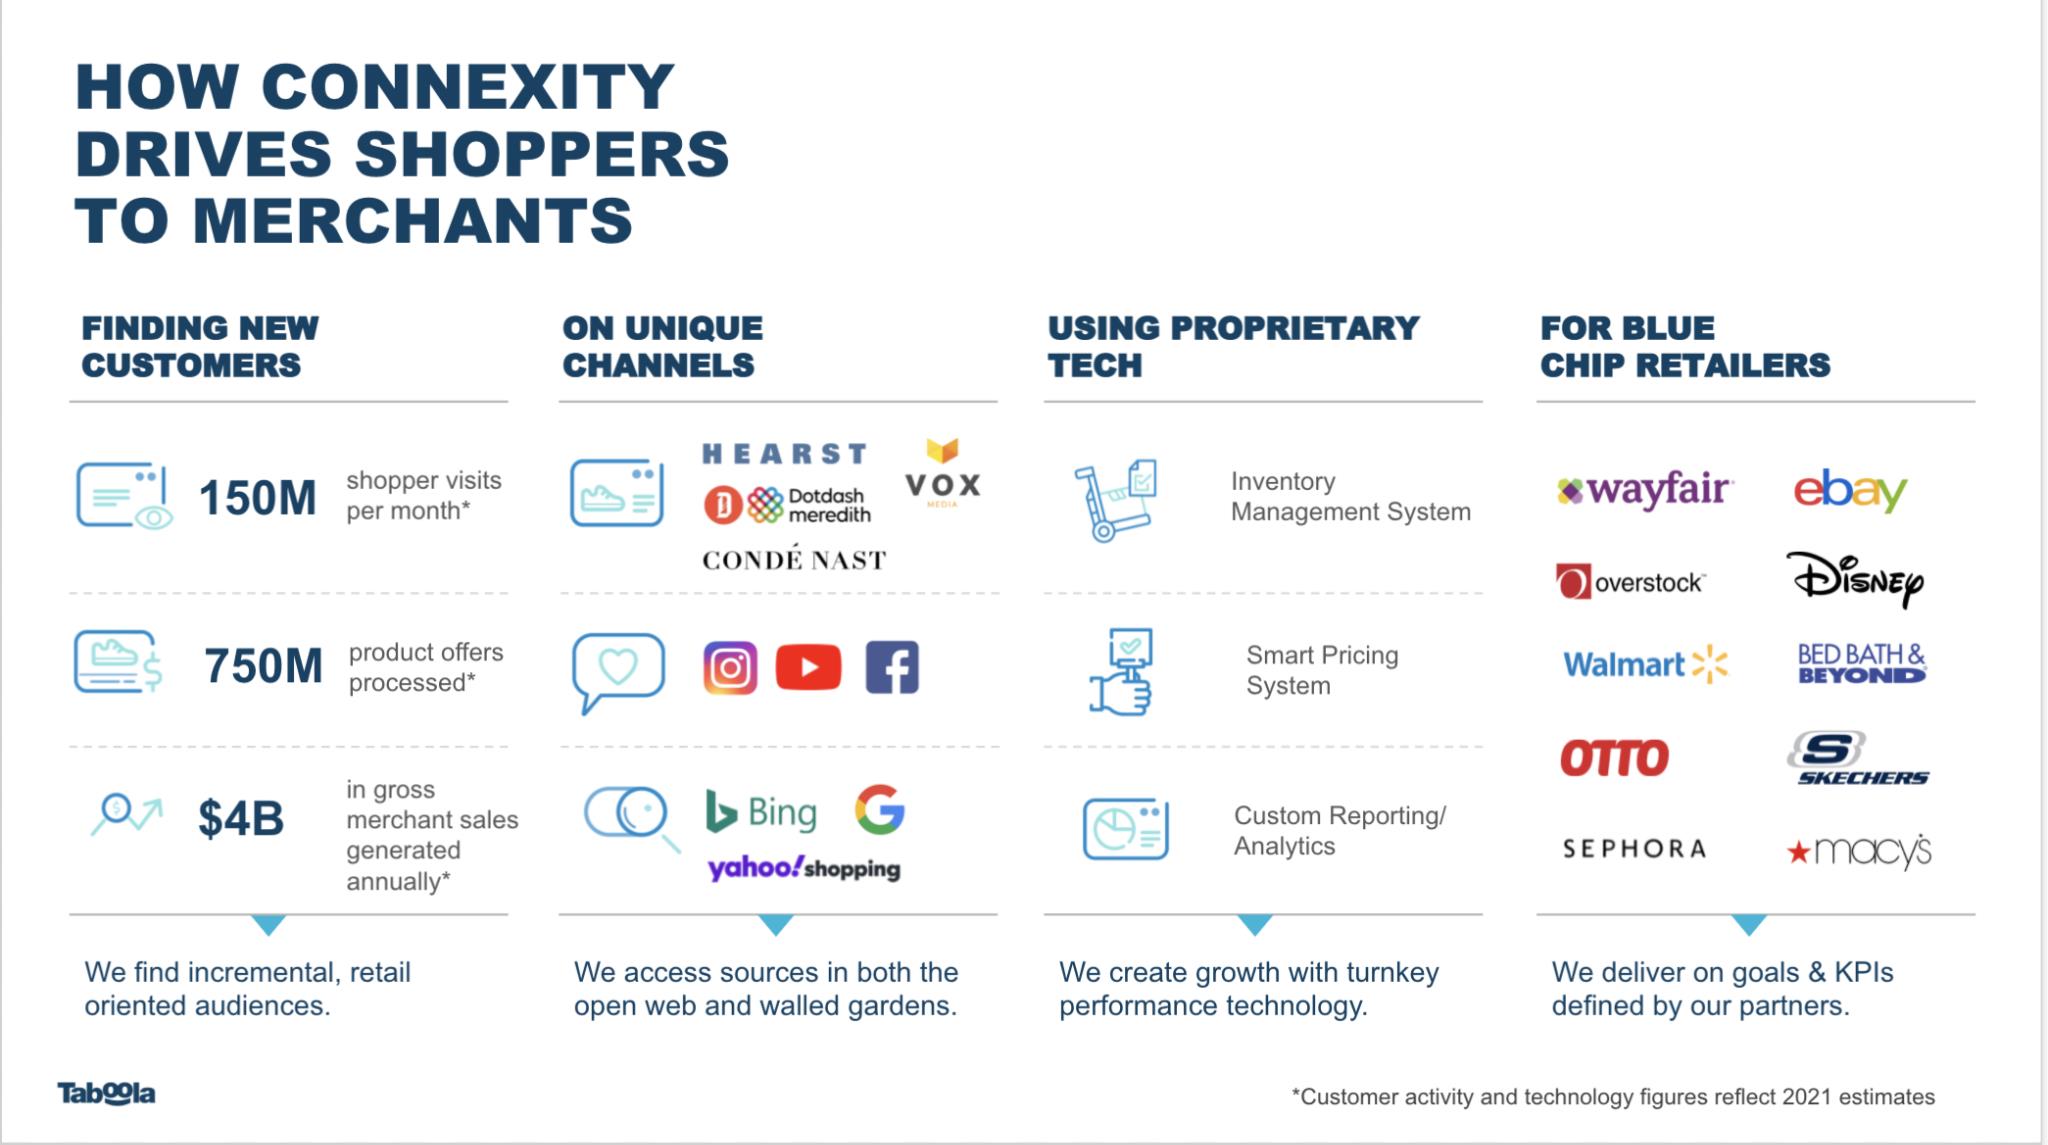
| 2. | Scale that really matters to retailers, including 150 million monthly shoppers and $4 billion in gross merchandise sales (GMS) on an annualized basis. Many retailers tell us that we're their single largest source of traffic outside of their direct campaigns in Google, Bing and Facebook. |
| 3. | Unique channels where we gain access to consumers through direct partnerships with premium publishers, access to audiences within search channels and on social media through our own influencer marketing platform (Shop Your Likes). |
| 4. | Proprietary technology built over the last 20 years that includes: |
| a. | Our inventory management platform that ingests over 30,000 feeds (750 million offers) on a daily basis to ensure latest in-stock and pricing information, as well as tracking links across offers, and to signal to our downstream partners what they’ll potentially be paid if you're using the content from our feeds. |
| b. | Our smart pricing system that helps dimensionalize all of the clicks within our network and make sure that we're pricing each click based on what it's worth. |
| c. | Our customer reporting and analytics system. We have a lot of retail data, we know what products consumers are clicking on, and we know what consumers are transacting on. We're able to package all that data and feed that back into our smart pricing system to be able to make better decisions on pricing. |
We also continue to progress on synergies, highlighted below are a few recent updates:
| ● | Expansion of Connexity Publisher Solution in APAC and EMEA is making headway as we expand Connexity’s commerce monetization solution to 14 new countries. Our teams are trained and actively pitching several new partnerships per week. |
| ● | Success with Taboola Ad sales in selling Connexity’s advertiser solution. We’ve spoken previously of the success we’re seeing out of China, signing multiple new advertisers. Within the US, a new retail vertical sales team is in place, trained, and has begun pitching Connexity e-Commerce. |
| ● | Leveraging Taboola’s supply network for Connexity advertisers is also taking off. Within the US, 54 merchants have given consent to move forward with the Taboola pixel. Within Europe, we’ve built a robust pipeline of over 200, consisting of both new prospects and existing merchants. |
Financial Performance
I’ll close by talking about our Q1 2022 financials. Ex-TAC Gross Profit grew 31% versus Q1 2021 and our Ratio of Adjusted EBITDA to ex-TAC Gross Profit was 25%, once again making us a rule of “50” business. On a pro forma basis which assumes we had Connexity’s results in Q1 2021, our ex-TAC Gross Profit grew 8.4% which was consistent with our expectations — as noted in our last earnings call, Q1 2022 presented a challenging comparison because ex-TAC Gross Profit grew 54% year over year in Q1 2021.
Below are the results of Q1 versus our guidance.
(dollars in millions) | | Q1 2022 Actuals | | | Year-over-Year Growth | | | Q1 2022 Guidance | |
Revenues | | $ | 354.7 | | | | 17 | % | |
| $353 to $359 | |
Gross profit | | $ | 112.0 | | | | 25 | % | |
| $108 to $112 | |
ex-TAC Gross Profit* | | $ | 138.2 | | | | 31 | % | |
| $134 to $138 | |
Adjusted EBITDA* | | $ | 34.9 | | | | 4 | % | |
| $32 to $34 | |
Non-GAAP Net Income* | | $ | 21.9 | | | | -4 | % | |
| $12 to $14 | |
New business contributed 7% and existing business contributed 10% of the growth in Revenues. Yield and the inclusion of Connexity drove much of the growth of our existing base. Adjusted EBITDA exceeded our guidance and grew at a lower rate than revenue, as we made planned investments in the business as well as incurred public company costs and a return to more normal operating expenses post COVID.
Our core business is relatively immune to macroeconomic effects because it is performance oriented and diversified across a large advertiser base. However, we do have an exposure to Europe (more than 30% of our revenue in 2021) and we have many advertisers out of Europe buying globally, which created yield pressure. We’re also seeing a negative impact due to currency exchange rates, primarily the US Dollar to Euro exchange rate. Our new bidder is now live on Microsoft and is off to a good start, but still behind plan. We also plan on integrating it on other platforms via header bidding soon, which should provide meaningful upside.
Full Year 2022 (dollars in millions) | | Guidance (as of 05/12/22) | | | Year over Year Growth | | | Previous Guidance (as of 2/22/22) | |
Revenues | | $ | 1,499 -$1,539 | | | | 9% - 12 | % | | $ | 1,666 - $1,678 | |
Gross Profit | | $ | 485 - $505 | | | | 10% - 15 | % | | $ | 552 - $560 | |
ex-TAC Gross Profit* | | $ | 595 - $615 | | | | 15% - 19 | % | | $ | 661 - $669 | |
Adjusted EBITDA* | | $ | 152 - $160 | | | | (15)% - (11) | %
| | $ | 195 - $213 | |
Non-GAAP Net Income* | | $ | 83 - $91 | | | | (24)% - (16) | % | | $ | 111 - $129 | |
Our guidance assumes continuing headwinds from the war in Ukraine, inflation, and currency exchange rates, which lead us to adopt a conservative stance on guidance. Our guidance assumes that these headwinds do not worsen and cause economic conditions to deteriorate or otherwise significantly reduce advertiser demand.
For more information on our Q1 results, our updated full year and Q2 2022 guidance, please see our Q1 2022 earnings press release, which was furnished to the SEC and also posted on Taboola’s website today at https://investors.taboola.com.
* * *
As I said earlier, I’m not happy about having to adjust guidance, especially after a strong Q1. I can tell the fundamentals are strong, we’re profitable, generating cash, our tech investment helps us win incredible partnerships, and the team is energized to fulfill our mission to build the largest open web company in the world, side by side with Google (search), Meta (social), and Amazon (commerce).
I’m looking forward to our upcoming earnings call and engaging with investors in the coming months, where I’ll do my best to answer any questions you may have.
Kind regards,
-- Adam Singolda
Founder & CEO Taboola
*About Non-GAAP Financial Information
This letter includes ex-TAC Gross Profit, Adjusted EBITDA, Ratio of Adjusted EBITDA to ex-TAC Gross Profit, Free Cash Flow, Non-GAAP Net Income and Non-GAAP EPS diluted, which are non-GAAP financial measures. These non-GAAP financial measures are not measures of financial performance in accordance with GAAP and may exclude items that are significant in understanding and assessing the Company’s financial results. Therefore, these measures should not be considered in isolation or as an alternative to revenues, gross profit, net income, cash flows from operations or other measures of profitability, liquidity or performance under GAAP. You should be aware that the Company’s presentation of these measures may not be comparable to similarly-titled measures used by other companies.
Non-GAAP Net Income and Non-GAAP EPS diluted are presented to provide insight into our Q1 results, and Non-GAAP Net Income is also presented to provide insight into our projected future results, in each case excluding fair value revaluation of warrants liability, share-based compensation expenses, M&A costs, amortization of acquired intangibles and related income tax effects. The type of adjustments made may vary from period to period.
The Company believes non-GAAP financial measures provide useful information to management and investors regarding future financial and business trends relating to the Company. The Company believes that the use of these measures provides an additional tool for investors to use in evaluating operating results and trends and in comparing the Company’s financial measures with other similar companies, many of which present similar non-GAAP financial measures to investors. Non-GAAP financial measures are subject to inherent limitations because they reflect the exercise of judgments by management about which items are excluded or included in calculating them. Please refer to the appendix at the end of this letter for reconciliations to the most directly comparable measures in accordance with GAAP.
**About Pro Forma With Connexity Information
This letter includes historical and projected pro forma information for ex-TAC Gross Profit. The pro forma information presents the pro forma effect of the Connexity acquisition as if it had been completed on January 1, 2020. The pro forma information is unaudited, is provided as supplemental information only and is subject to the limitations contained under the heading “Unaudited Pro Forma Condensed Combined Financial Information” in our Prospectus forming part of our Registration Statement on Form F-1/A filed on April 13, 2022, as it may be amended from time to time, filed with the Securities and Exchange Commission.
Note Regarding Forward-Looking Statements
Certain statements in this letter are forward-looking statements. Forward-looking statements generally relate to future events including future financial or operating performance of Taboola.com Ltd. (the “Company”). In some cases, you can identify forward-looking statements by terminology such as “may”, “should”, “expect”, “guidance”, “intend”, “will”, “estimate”, “anticipate”, “believe”, “predict”, “target”, “potential” or “continue”, or the negatives of these terms or variations of them or similar terminology. Such forward-looking statements are subject to risks, uncertainties, and other factors which could cause actual results to differ materially from those expressed or implied by such forward looking statements.
These forward-looking statements are based upon estimates and assumptions that, while considered reasonable by the Company and its management, are inherently uncertain. Uncertainties and risk factors that could affect the Company’s future performance and cause results to differ from the forward-looking statements in this letter include, but are not limited to: the ability to recognize the anticipated benefits of the recent acquisition of Connexity and the business combination between the Company and ION Acquisition Corp. 1 Ltd. (together, the “Business Combinations”), which may be affected by, among other things, competition, the ability of the Company to grow and manage growth profitably, maintain relationships with customers and retain its management and key employees; the Company’s ability to successfully integrate the Connexity acquisition; costs related to the Business Combinations; changes in applicable laws or regulations; the Company’s estimates of expenses and profitability and underlying assumptions with respect to accounting presentations and purchase price and other adjustments; ability to attract new digital properties and advertisers; ability to meet minimum guarantee requirements in contracts with digital properties; intense competition in the digital advertising space, including with competitors who have significantly more resources; ability to grow and scale the Company’s ad and content platform through new relationships with advertisers and digital properties; ability to secure high quality content from digital properties; ability to maintain relationships with current advertiser and digital property partners; ability to make continued investments in the Company’s AI-powered technology platform; the need to attract, train and retain highly-skilled technical workforce; changes in the regulation of, or market practice with respect to, “third party cookies” and its impact on digital advertising; continued engagement by users who interact with the Company’s platform on various digital properties; the impact of the ongoing COVID-19 pandemic; reliance on a limited number of partners for a significant portion of the Company’s revenue; changes in laws and regulations related to privacy, data protection, advertising regulation, competition and other areas related to digital advertising; ability to enforce, protect and maintain intellectual property rights; and risks related to the fact that we are incorporated in Israel and governed by Israeli law; and other risks and uncertainties set forth in the Company’s Annual Report on Form 20-F for the year ended December 31, 2021 under Item 3.D. “Information About the Company - Risk Factors,” the Company’s Registration Statement on Form F-1/A filed on April 13, 2022, as it may be amended or supplemented from time to time, under the sections entitled “Cautionary Note Regarding Forward-looking Statements” and “Risk Factors,” and in the Company’s subsequent filings with the Securities and Exchange Commission.
Nothing in this letter should be regarded as a representation by any person that the forward-looking statements set forth herein will be achieved or that any of the contemplated results of such forward-looking statements will be achieved. You should not place undue reliance on these forward-looking statements, which speak only as of the date they were made. The Company undertakes no duty to update these forward-looking statements except as may be required by law.
APPENDIX: Non-GAAP Reconciliation
RECONCILIATION OF GAAP TO NON-GAAP FINANCIAL MEASURES
FOR Q1 2022 AND 2021
(Unaudited)
The following table provides a reconciliation of revenues to ex-TAC Gross Profit.
| | | Three months ended March 31, | |
| | | 2022 | | | 2021 | |
| | | Unaudited | |
| | | (dollars in thousands) | |
| Revenues | | $ | 354,726 | | | $ | 302,950 | |
Traffic acquisition cost | | | 216,498 | | | | 197,036 | |
Other cost of revenues | | | 26,198 | | | | 16,415 | |
Gross profit | | $ | 112,030 | | | $ | 89,499 | |
Add back: Other cost of revenues | | | 26,198 | | | | 16,415 | |
| ex-TAC Gross Profit | | $ | 138,228 | | | $ | 105,914 | |
The following table provides a reconciliation of net income to Adjusted EBITDA.
| | | Three months ended March 31, | |
| | | 2022 | | | 2021 | |
| | | Unaudited | |
| | | (dollars in thousands) | |
| Net income | | $ | 3,888 | | | $ | 18,587 | |
Adjusted to exclude the following: | | | | | | |
Financial expenses (income), net | | | (11,195 | ) | | | 798 | |
Tax expenses (income) | | | (392 | ) | | | 2,237 | |
Depreciation and amortization | | | 22,676 | | | | 8,244 | |
Share based compensation expenses (1) | | | 17,039 | | | | 5,131 | |
M&A costs | | | 50 | | | | (1,454 | ) |
Holdback compensation expenses (2) | | | 2,790 | | | | - | |
| Adjusted EBITDA | | $ | 34,856 | | | $ | 33,543 | |
1For the Q1 2022 period, a substantial majority relates to equity awards issued in connection with going public.
2 Represents share based compensation due to holdback of Taboola ordinary shares issuable under compensatory arrangements relating to Connexity acquisition.
We calculate Ratio of net Income to gross profit as net income divided by gross profit. We calculate Ratio of Adjusted EBITDA to ex-TAC Gross Profit, a non-GAAP measure, as Adjusted EBITDA divided by ex-TAC Gross Profit. We believe that the Ratio of Adjusted EBITDA to ex-TAC Gross Profit is useful because TAC is what we must pay digital properties to obtain the right to place advertising on their websites, and we believe focusing on ex-TAC Gross Profit better reflects the profitability of our business. The following table reconciles Ratio of net income to gross profit and Ratio of Adjusted EBITDA to ex-TAC Gross Profit for the period shown.
| | | Three months ended March 31, | |
| | | 2022 | | | 2021 | |
| | | Unaudited | |
| | | (dollars in thousands) | |
Gross profit | | $ | 112,030 | | | $ | 89,499 | |
Net income | | $ | 3,888 | | | $ | 18,587 | |
Ratio of net income to gross profit | | | 3.5 | % | | | 20.8 | % |
| | | | | | | | | |
ex-TAC Gross Profit | | $ | 138,228 | | | $ | 105,914 | |
Adjusted EBITDA | | $ | 34,856 | | | $ | 33,543 | |
Ratio of Adjusted EBITDA margin to ex-TAC Gross Profit | | | 25.2 | % | | | 31.7 | % |
The following table provides a reconciliation of net Income to Non-GAAP Net Income.
| | | Three months ended March 31, | |
| | | 2022 | | | 2021 | |
| | | Unaudited | |
| | | (dollars in thousands) | |
| Net income | | $ | 3,888 | | | $ | 18,587 | |
Amortization of acquired intangibles | | | 15,780 | | | | 639 | |
Share based compensation expenses (1) | | | 17,039 | | | | 5,131 | |
M&A costs | | | 50 | | | | (1,454 | ) |
Holdback compensation expenses (2) | | | 2,790 | | | | - | |
Revaluation of Warrants | | | (14,042 | ) | | | - | |
Income tax effects | | | (3,626 | ) | | | (101 | ) |
| Non-GAAP Net Income | | $ | 21,879 | | | $ | 22,802 | |
1 For the Q1 2022 period, a substantial majority relates to equity awards issued in connection with going public.
2 Represents share based compensation due to holdback of Taboola ordinary shares issuable under compensatory arrangements relating to Connexity acquisition.
The following table provides a reconciliation of EPS diluted to Pro forma Non-GAAP EPS diluted.
| | | Three months ended March 31, | |
| | | 2022 | | | 2021 | |
| | | Unaudited | |
| EPS diluted (1) | | $ | 0.015 | | | $ | 0.169 | |
Add (Subtract): | | | | | | | | |
| Amortization of acquired intangibles | | | 0.061 | | | | 0.002 | |
| Share based compensation expenses (2) | | | 0.066 | | | | 0.020 | |
| M&A costs | | | 0.000 | | | | (0.006 | ) |
| Holdback compensation expenses (3) | | | 0.011 | | | | 0.000 | |
| Revaluation of Warrants | | | (0.054 | ) | | | 0.000 | |
| Income tax effects | | | (0.014 | ) | | | 0.000 | |
| Pro forma adjustment (4) | | | -- | | | | (0.097 | ) |
| Pro forma Non-GAAP EPS diluted (5) | | $ | 0.085 | | | $ | 0.088 | |
1 The weighted-average shares used in this computation for the three months ended March 31, 2022 and 2021 is 260,036,934 and 75,131,828, respectively. Outstanding shares increased significantly year-over-year as a result of the Company going public.
2 For the Q1 2022 period, a substantial majority relates to equity awards issued in connection with going public.
3 Represents share based compensation due to holdback of Taboola ordinary shares issuable under compensatory arrangements relating to Connexity acquisition.
4 Pro forma net income for the three months ended March 31, 2021, includes an adjustment to add $5,915 of undistributed earnings previously allocated to participating securities assuming these securities converted to ordinary shares as of January 1, 2021.
5 The Pro Forma Non-GAAP EPS is presented only for the three months ended March 31, 2021 assuming Taboola went public and consummated the related transactions as of January 1, 2021. The weighted-average shares used to calculate Pro Forma Non-GAAP EPS diluted for the three months ended March 31, 2021 is 259,307,085, and includes giving effect to 121,472,152 Taboola legacy preferred shares, 30,471,516 shares issues to ION Public shareholders, 13,500,000 shares issued to PIPE investors, 8,419,608 shares and equity grants in connection with going public and 10,311,981 from options and restricted shares units by application of treasury stock method.
The following table provides a reconciliation of net cash provided by (used in) operating activities to Free Cash Flow.
| | | Three months ended March 31, | |
| | | 2022 | | | 2021 | |
| | | Unaudited | |
| | | (dollars in thousands) | |
| Net cash provided by (used in) operating activities | | $ | 8,123 | | | $ | (9,103 | ) |
Purchases of property and equipment, including capitalized internal-use software | | | (6,902 | ) | | | (5,537 | ) |
| Free Cash Flow | | $ | 1,221 | | | $ | (14,640 | ) |
APPENDIX: Non-GAAP Reconciliation
RECONCILIATION OF GAAP TO NON-GAAP FINANCIAL MEASURES FOR Q2 2022 AND FULL YEAR 2022 GUIDANCE
(Unaudited)
The following table provides a reconciliation of gross profit to ex-TAC Gross Profit.
| | | Q2 2022 | | | FY 2022 | |
| | | (Unaudited) | |
| | | (dollars in millions) | |
Revenues | |
| $325 - $345 | | |
| $1,499- $1,539 | |
| Traffic acquisition cost | |
| $(193 - $203 | ) | |
| $(904 - $924 | ) |
| Other cost of revenues | |
| $(27 - $29 | ) | |
| $(110 - $116 | ) |
Gross Profit | |
| $104 - $114 | | |
| $485 - $505 | |
| Add back: Other cost of revenues | |
| $27 - $29 | | |
| $110 - $116 | |
ex-TAC Gross Profit | |
| $132 - $142 | | |
| $595 - $615 | |