Exhibit 99.1

INVESTOR PRESENTATION
2 Certain statements in this presentation are forward-looking statements, including our Q2 and full-year 2022 guidance. Forward-looking statements generally relate to future events including future financial or operating performance of Taboola.com Ltd. (the “Company”). In some cases, you can identify forward-looking statements by terminology such as “may”, “should”, “expect”,”guidance”, “intend”, “will”, “estimate”, “anticipate”, “believe”, “predict”,”target”, “potential” or “continue”, or the negatives of these terms or variations of them or similar terminology. Such forward-looking statements are subject to risks, uncertainties, and other factors which could cause actual results to differ materially from those expressed or implied by such forward looking statements. These forward-looking statements are based upon estimates and assumptions that, while considered reasonable by the Company and its management, are inherently uncertain. Uncertainties and risk factors that could affect the Company’s future performance and cause results to differ from the forward-looking statements in this press release include, but are not limited to: the ability to recognize the anticipated benefits of the recent acquisition of Connexity and the business combination between the Company and ION Acquisition Corp. 1 Ltd. (together, the “Business Combinations”), which may be affected by, among other things, competition, the ability of the Company to grow and manage growth profitably, maintain relationships with customers and retain its management and key employees; the Company’s ability to successfully integrate the Connexity acquisition; costs related to the Business Combinations; changes in applicable laws or regulations; the Company’s estimates of expenses and profitability and underlying assumptions with respect to accounting presentations and purchase price and other adjustments; ability to attract new digital properties and advertisers; ability to meet minimum guarantee requirements in contracts with digital properties; intense competition in the digital advertising space, including with competitors who have significantly more resources; ability to grow and scale the Company’s ad and content platform through new relationships with advertisers and digital properties; ability to secure high quality content from digital properties; ability to maintain relationships with current advertiser and digital property partners; ability to make continued investments in the Company’s AI-powered technology platform; the need to attract, train and retain highly-skilled technical workforce; changes in the regulation of, or market practice with respect to, “third party cookies” and its impact on digital advertising; continued engagement by users who interact with the Company’s platform on various digital properties; the impact of the ongoing COVID-19 pandemic; reliance on a limited number of partners for a significant portion of the Company’s revenue; changes in laws and regulations related to privacy, data protection, advertising regulation, competition and other areas related to digital advertising; ability to enforce, protect and maintain intellectual property rights; and risks related to the fact that we are incorporated in Israel and governed by Israeli law; and other risks and uncertainties set forth in the Company’s Annual Report on Form 20-F for the year ended December 31, 2021 under Item 3.D. “Information About the Company - Risk Factors,” the Company’s Registration Statement on Form F-1/A filed on April 13, 2022, as it may be amended or supplemented from time to time, under the sections entitled “Cautionary Note Regarding Forward-looking Statements” and “Risk Factors,” and in the Company’s subsequent filings with the Securities and Exchange Commission (“SEC”).Nothing in this presentation should be regarded as a representation by any person that the forward-looking statements set forth herein will be achieved or that any of the contemplated results of such forward-looking statements will be achieved. You should not place undue reliance on these forward-looking statements, which speak only as of the date they were made. The Company undertakes no duty to update these forward-looking statements except as may be required by law. Forward-Looking Statements - Disclaimer Non-GAAP Financial Measures This Presentation includes ex-TAC Gross Profit, Adjusted EBITDA, Ratio of Adjusted EBITDA to ex-TAC Gross Profit, Free Cash Flow, Non-GAAP Net Income and Non-GAAP EPS Diluted, which are non-GAAP financial measures. These non-GAAP financial measures are not measures of financial performance in accordance with GAAP and may exclude items that are significant in understanding and assessing the Company’s financial results. Therefore, these measures should not be considered in isolation or as an alternative to revenues, gross profit, net income, cash flows from operations or other measures of profitability, liquidity or performance under GAAP. You should be aware that the Company’s presentation of these measures may not be comparable to similarly-titled measures used by other companies.Non-GAAP Net Income and Non-GAAP EPS diluted are presented to provide insight into our Q1 results, and Non-GAAP Net Income is also presented to provide insight into our projected future results, in each case excluding fair value revaluation of warrants liability, share-based compensation expenses, M&A costs, amortization of acquired intangibles and related income tax effects. The type of adjustments made may vary from period to period.The Company believes non-GAAP financial measures provide useful information to management and investors regarding future financial and business trends relating to the Company. The Company believes that the use of these measures provides an additional tool for investors to use in evaluating operating results and trends and in comparing the Company’s financial measures with other similar companies, many of which present similar non-GAAP financial measures to investors. Non-GAAP financial measures are subject to inherent limitations because they reflect the exercise of judgments by management about which items are excluded or included in calculating them. Please refer to the appendix at the end of this presentation for reconciliations to the most directly comparable measures in accordance with GAAP. Industry and Market Data In this presentation, the Company relies on and refer to certain information and statistics obtained from third-party sources, which it believes to be reliable. The Company has not independently verified the accuracy or completeness of any such third-party information. You are cautioned not to give undue weight to such industry and market data.This presentation may include trademarks, service marks, trade names and copyrights of other companies, which are the property of their respective owners. Solely for convenience, some of the trademarks, service marks, trade names and copyrights referred to in this Presentation may be listed without the TM, SM, (c) or (r) symbols, but the Company will assert, to the fullest extent under applicable law, the right of the applicable owners, if any, to these trademarks, service marks, trade names and copyrights. About Pro Forma With Connexity Information This presentation includes historical and projected pro forma information for ex-TAC Gross Profit. The pro forma information presents the pro forma effect of the Connexity acquisition as if it had been completed on January 1, 2021. The pro forma information is unaudited, is provided as supplemental information only and is subject to the limitations contained under the heading “Unaudited Pro Forma Condensed Combined Financial Information” in our Prospectus forming part of our Registration Statement on Form F-1/A filed on April 13, 2022, as it may be amended from time to time, filed with the Securities and Exchange Commission.
TODAY’S PRESENTERS ADAM SINGOLDAFOUNDER & CEO STEPHEN WALKERCFO Founded Taboola over 13 years agoHas led the company as its CEO ever since 7+ years at TaboolaLed several of Idealab's portfolio companies, including Perfect MarketPrior experience at Disney & General Electric

AGENDA Capturing Share of $64B Ad Market & Taboola Overview Q1 Updates & Momentum Taboola’s Differentiation and Why We Win 1 2 3 Financial Update 4

POWERING RECOMMENDATIONS FOR THE OPEN WEB HELPING PEOPLE DISCOVER THINGS THEY MAY LIKE
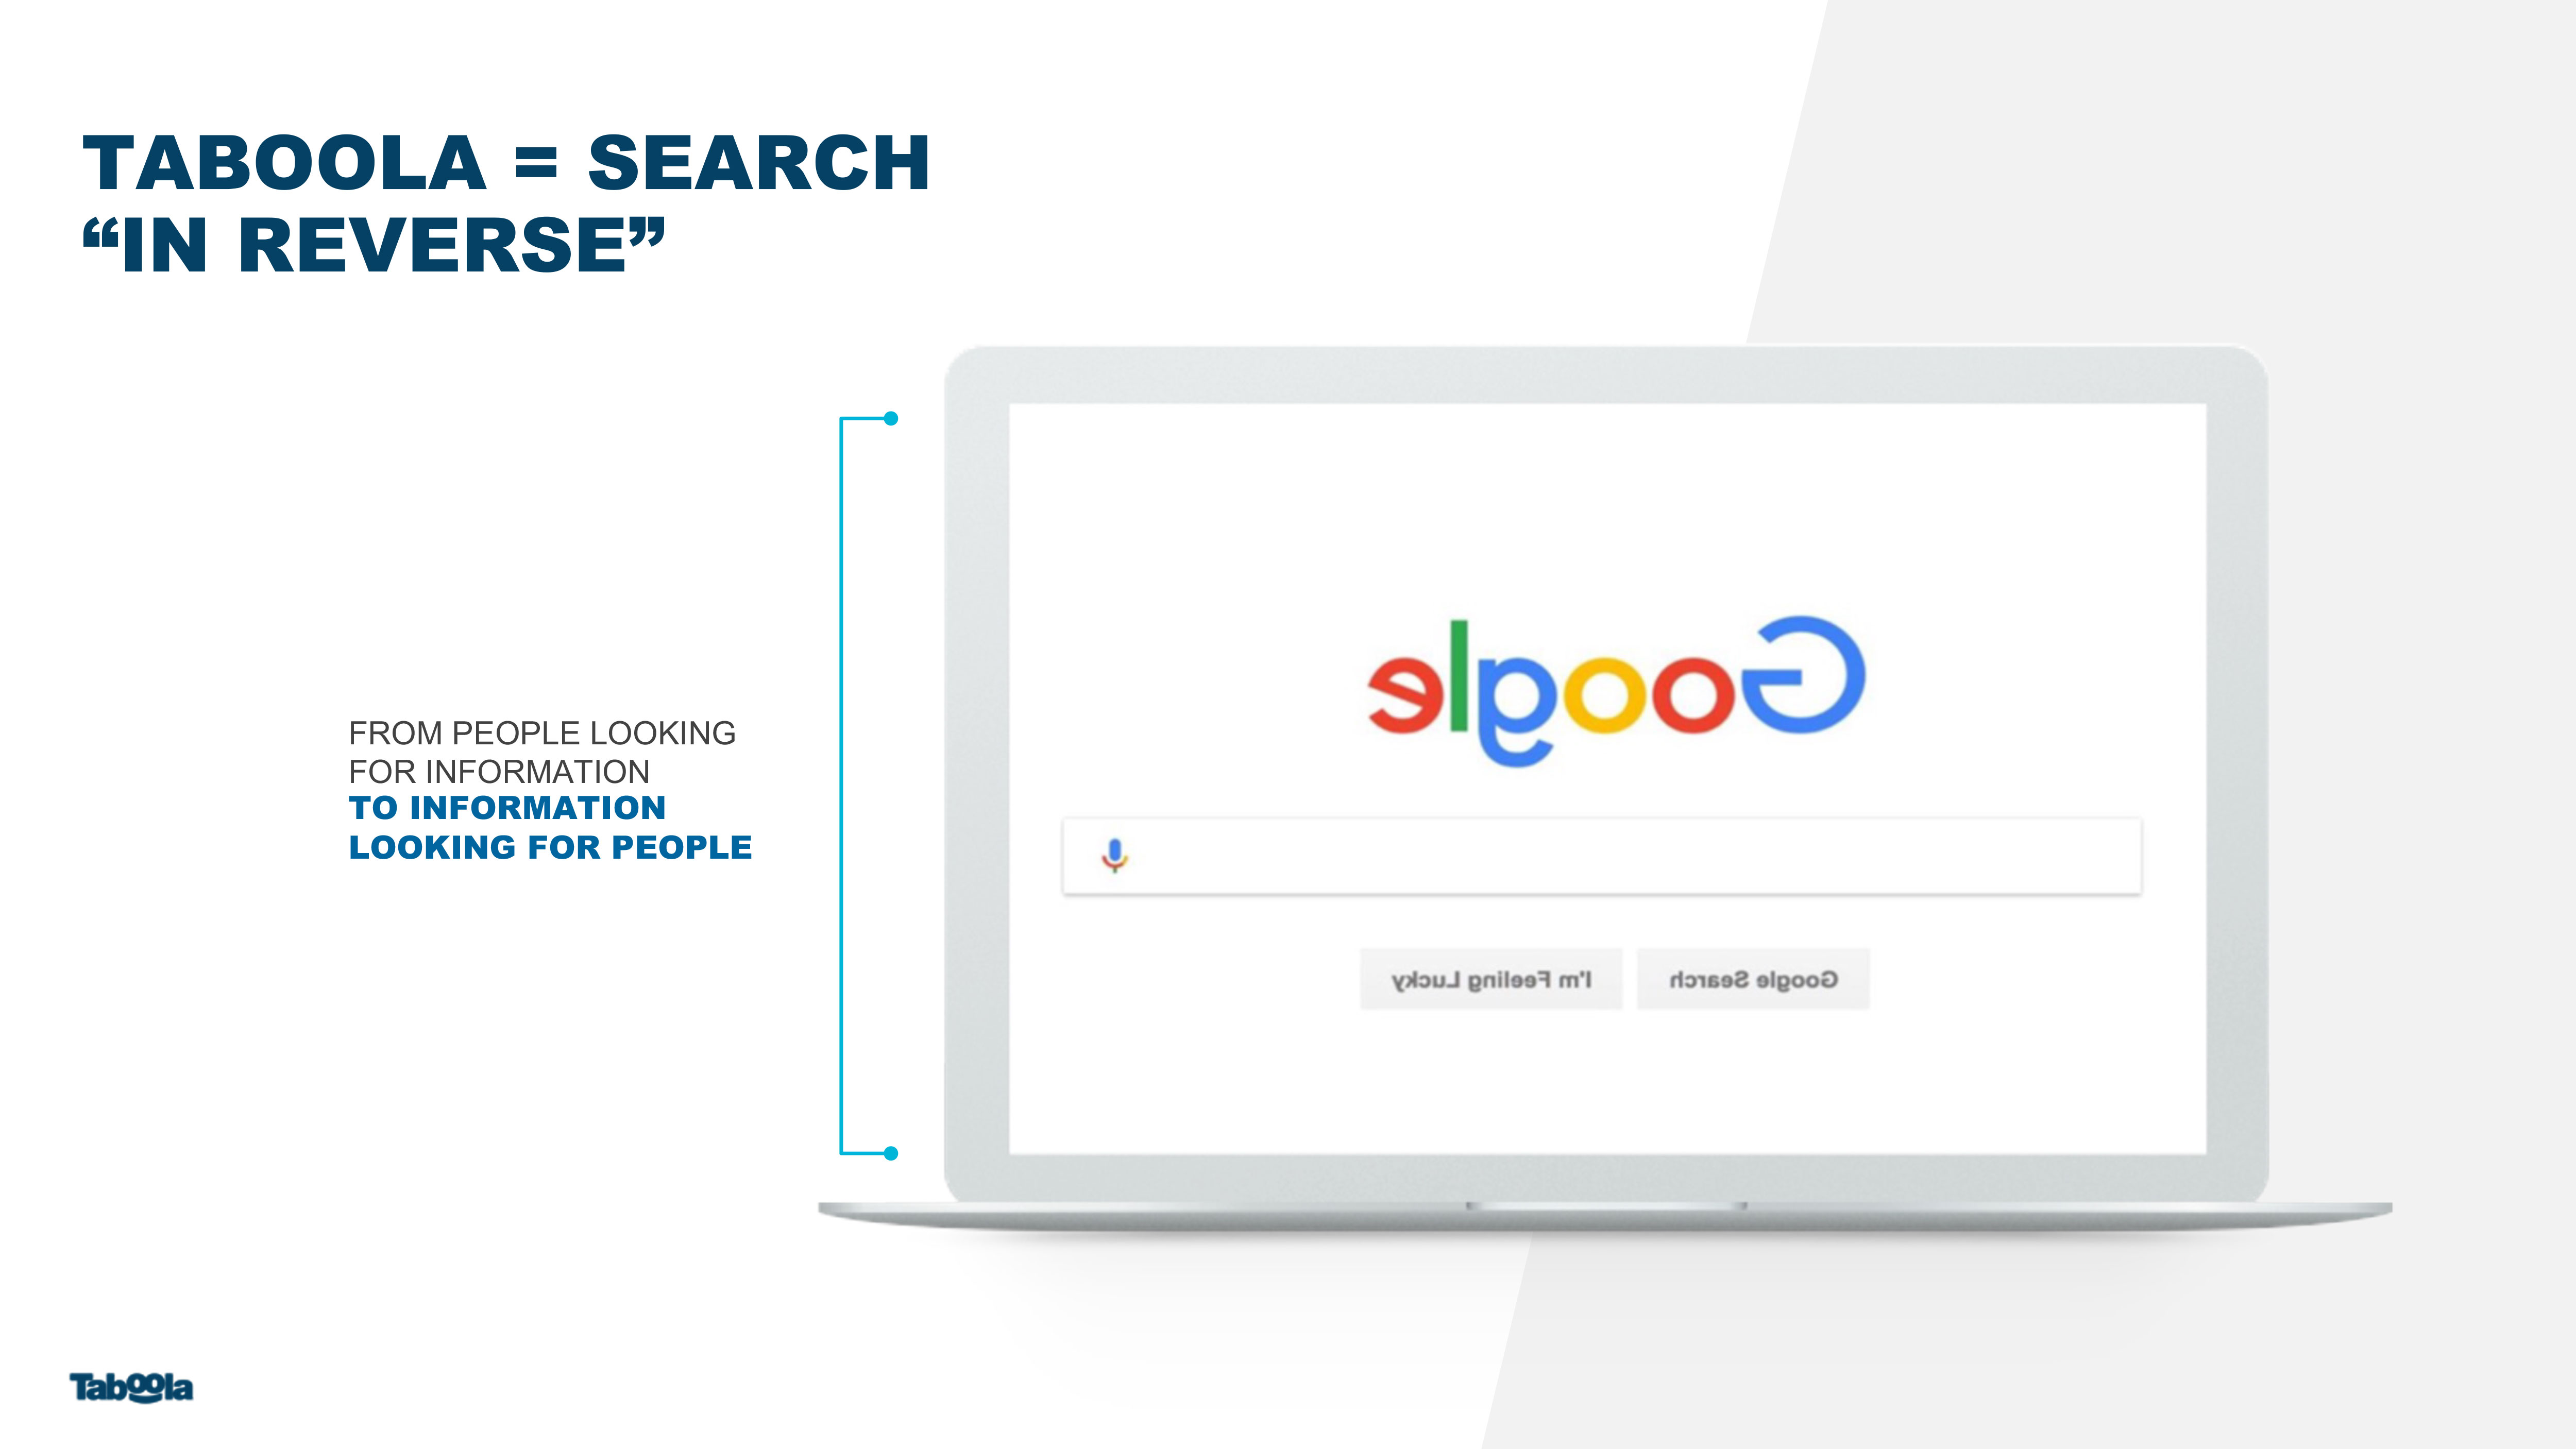
TABOOLA = SEARCH “IN REVERSE” FROM PEOPLE LOOKING FOR INFORMATION TO INFORMATION LOOKING FOR PEOPLE
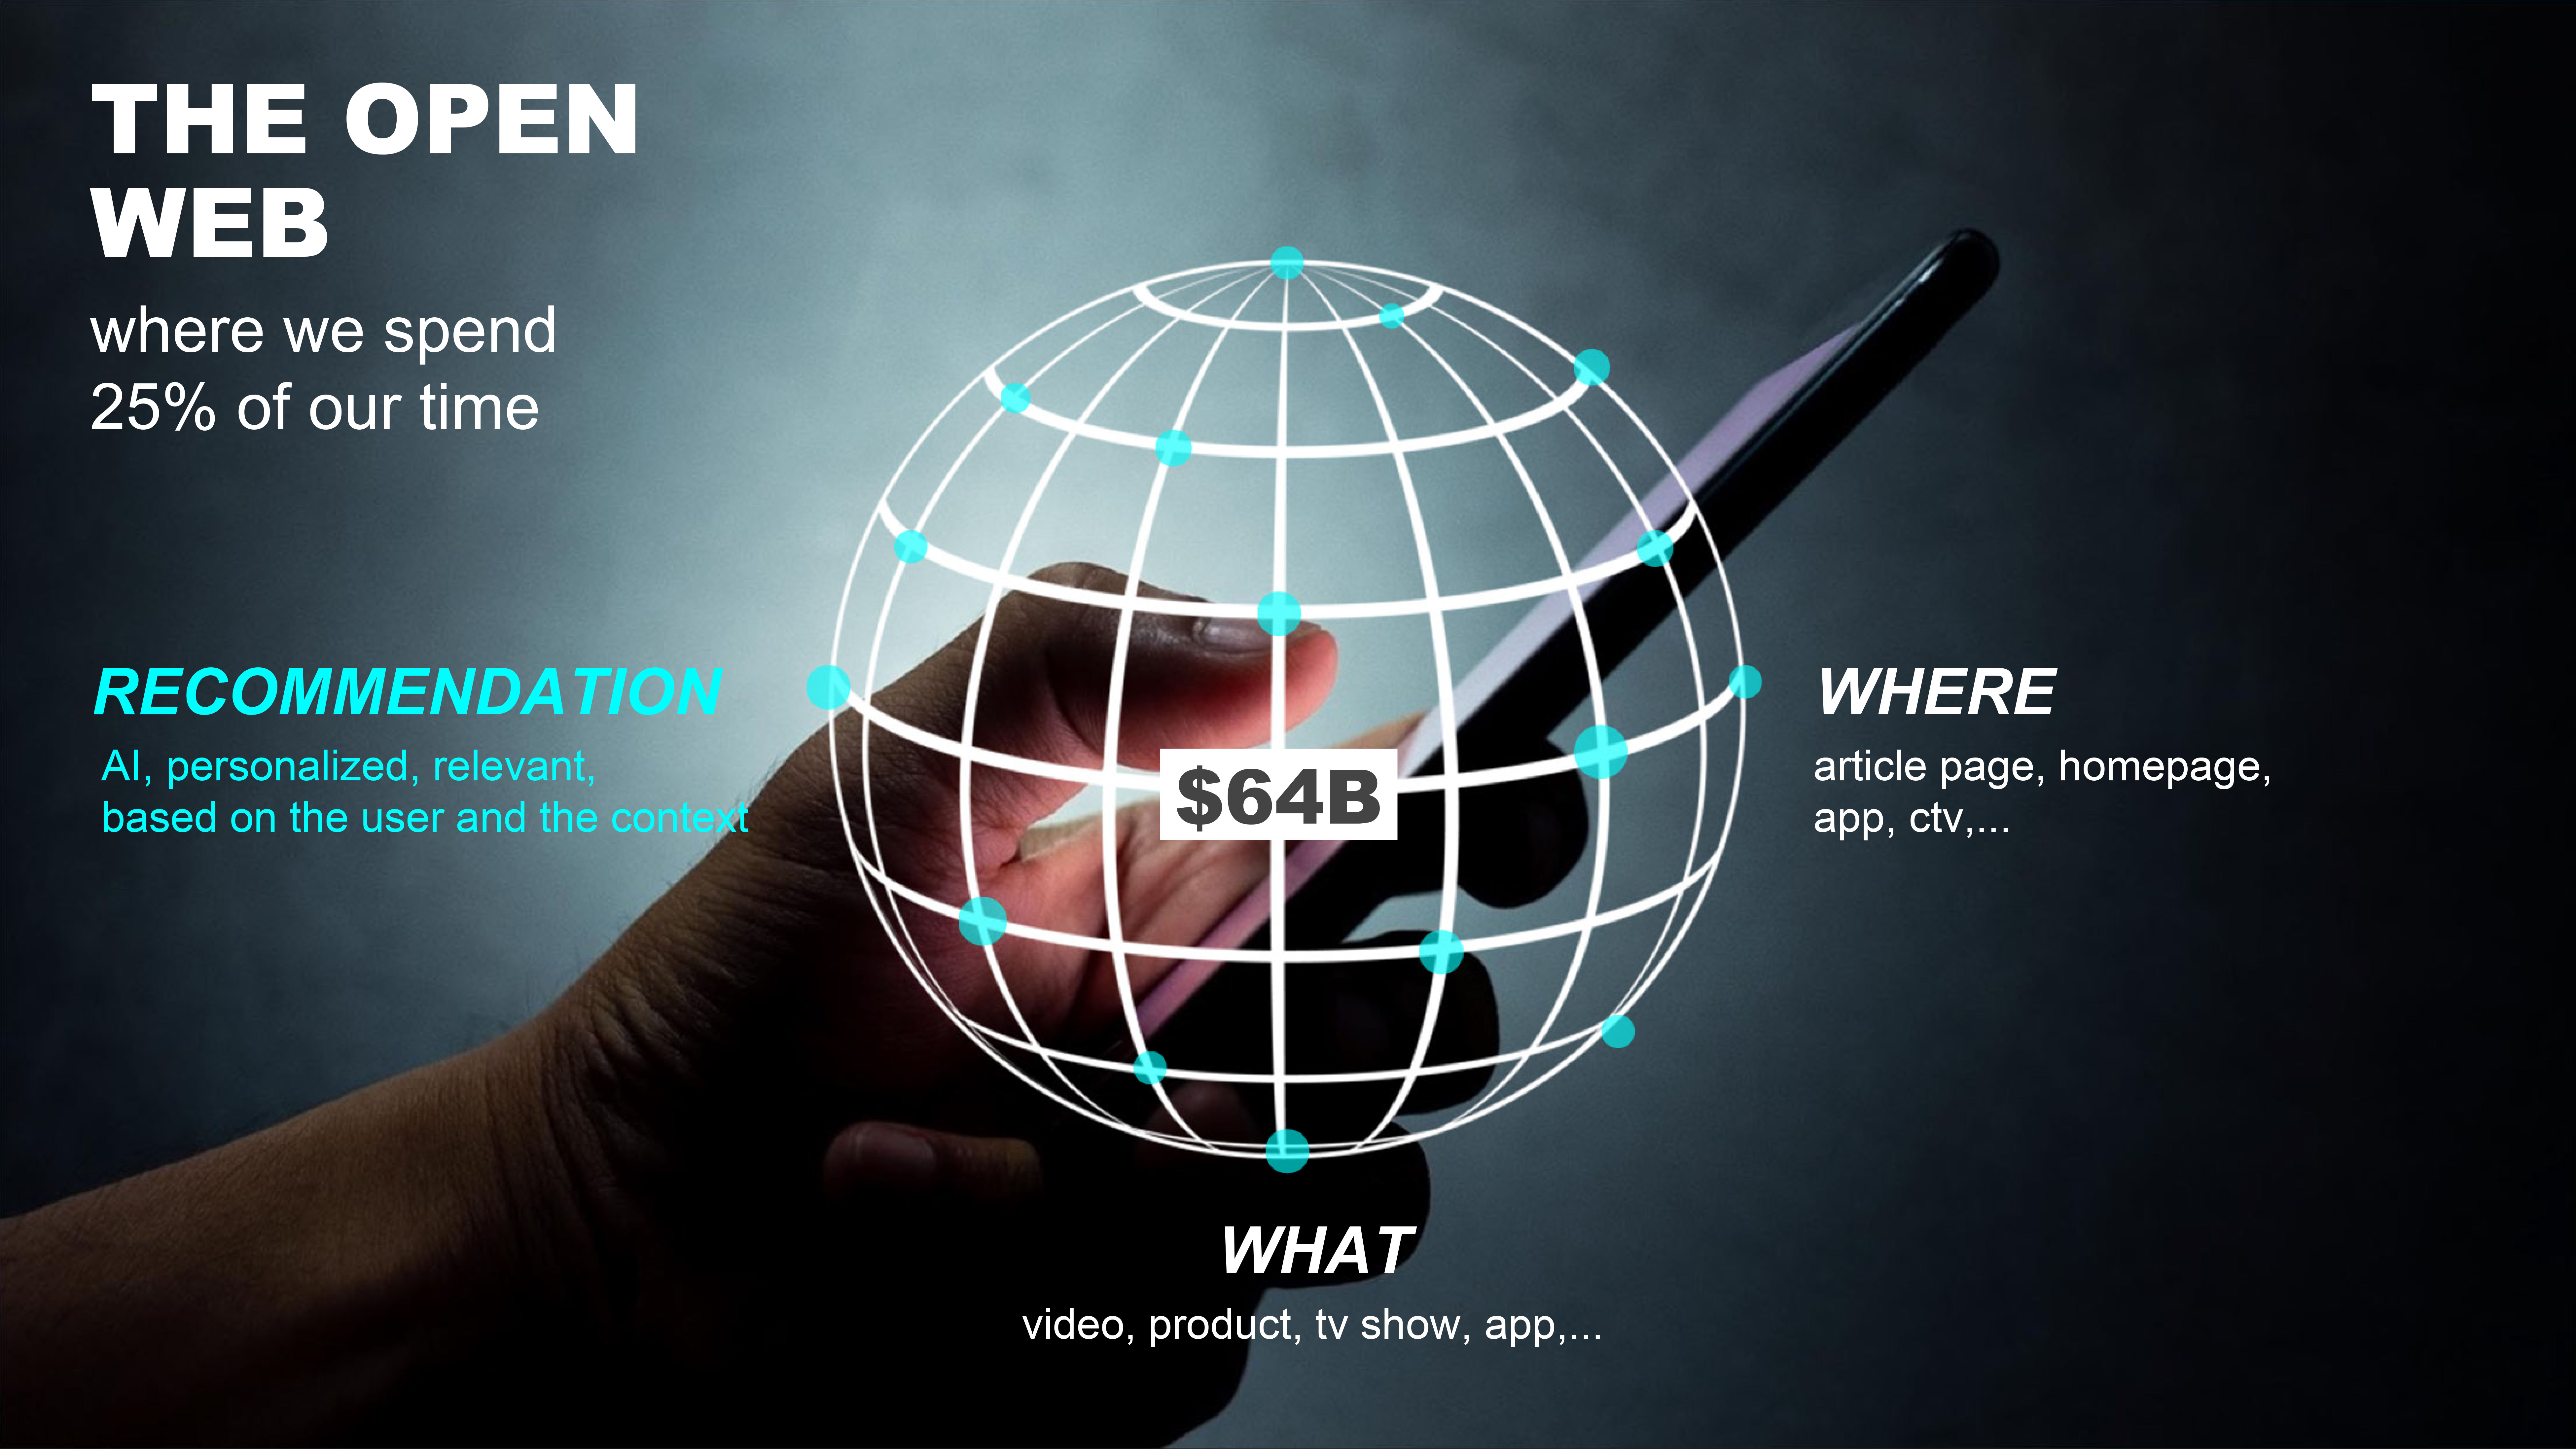
THE OPEN WEB where we spend 25% of our time $64B WHAT video, product, tv show, app,... WHERE article page, homepage, app, ctv,... RECOMMENDATION AI, personalized, relevant, based on the user and the context

DONE WRONG...

...DONE RIGHT Walled garden integrated ad experience Paid Organic Paid Organic Organic Paid Paid Paid

TABOOLA REVOLUTION Bring power of walled gardens to open web with Tens of billions clicks a year Paid Editorial

(BUT) OPEN WEB TODAY IS NOT PERSONALIZED

ROCKETENGINE (AI) Deep Learning since 2017$100M Annual R&D Spend1Editorial recommendations Paid recommendations SmartBid Source: Company data, see slide titled “Key 2022 Model Assumptions”

ROCKET FUEL NASA/MAF/Steven Seipel 500M+ DAU ContextTens of billions clicks a year Curiosity graph(“people who read this also do this”) 90% of revenue direct(pixel on page) Source: Company data

TECH DIFFERENTIATION 10 years partnerships, trust
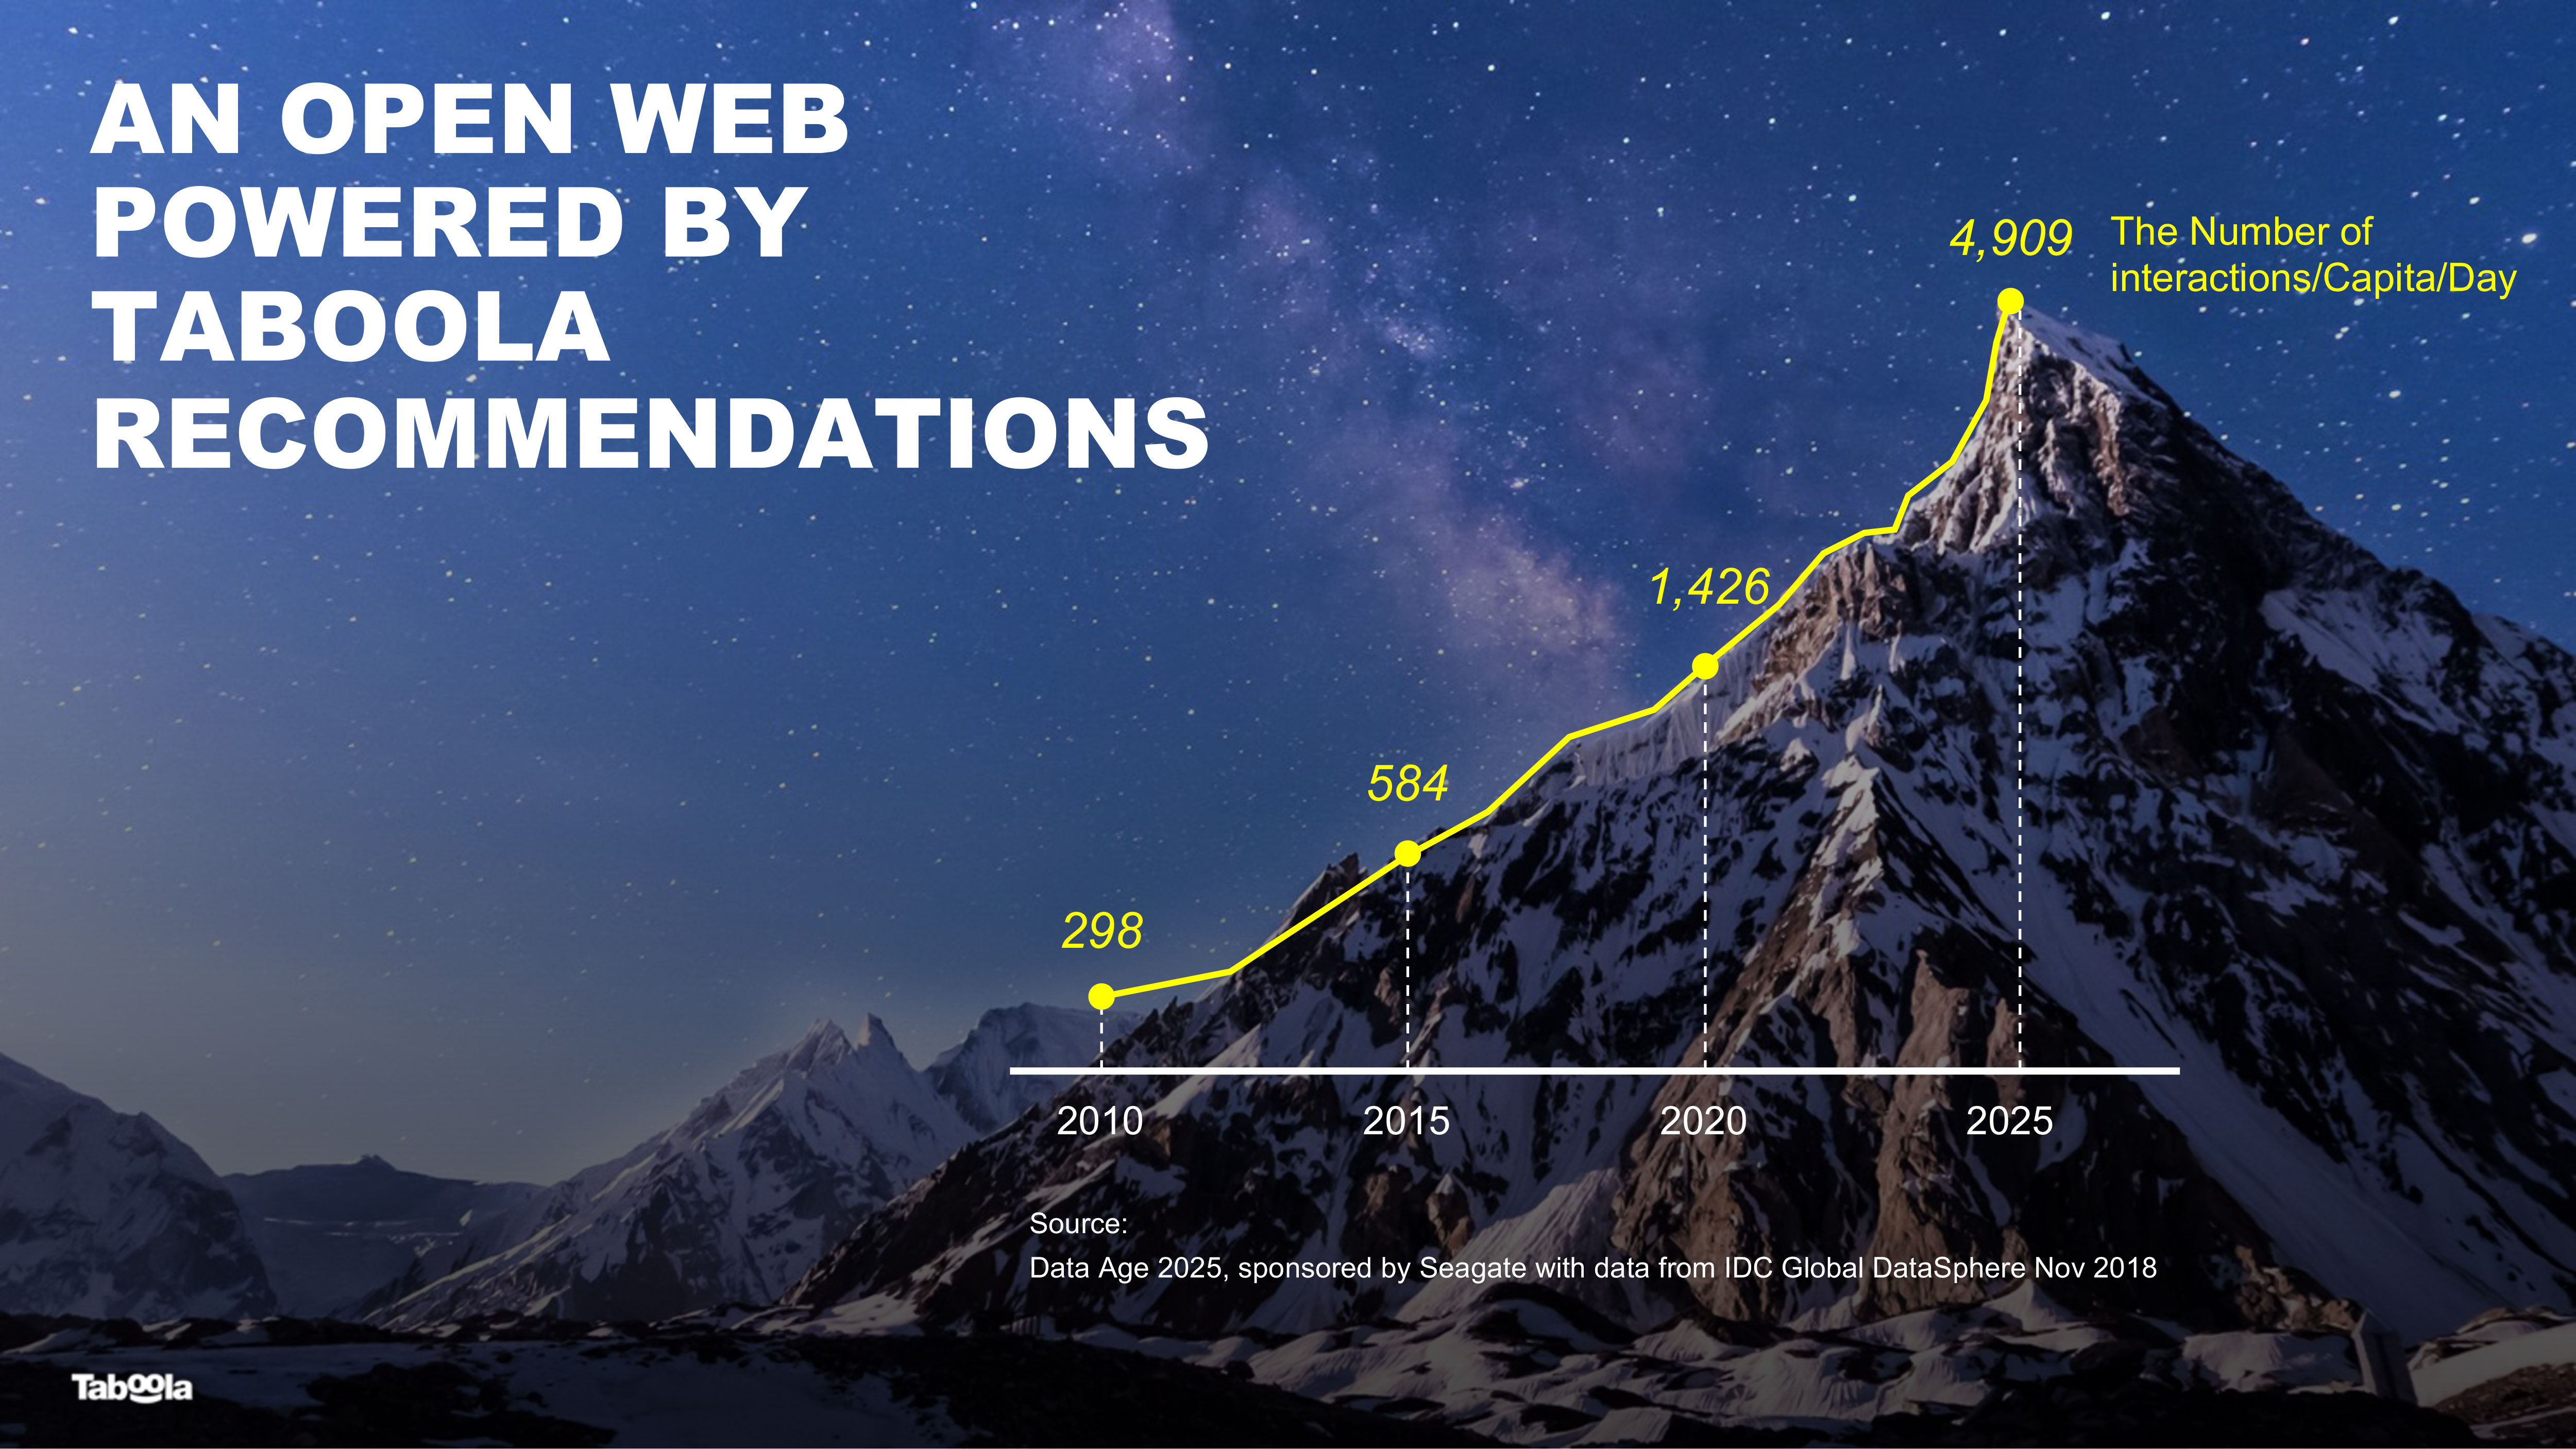
AN OPEN WEB POWERED BYTABOOLA RECOMMENDATIONS 298 584 1,426 4,909 2010 2015 2020 2025 Source: Data Age 2025, sponsored by Seagate with data from IDC Global DataSphere Nov 2018 The Number of interactions/Capita/Day

Over the next 3 years WE EXPECT TO CROSS $1B EX-TAC MAINTAINING OUR MARGINS


AGENDA Capturing Share of $64B Ad Market & Taboola Overview Q1 Updates & Momentum Taboola’s Differentiation and Why We Win 1 2 3 Financial Update 4
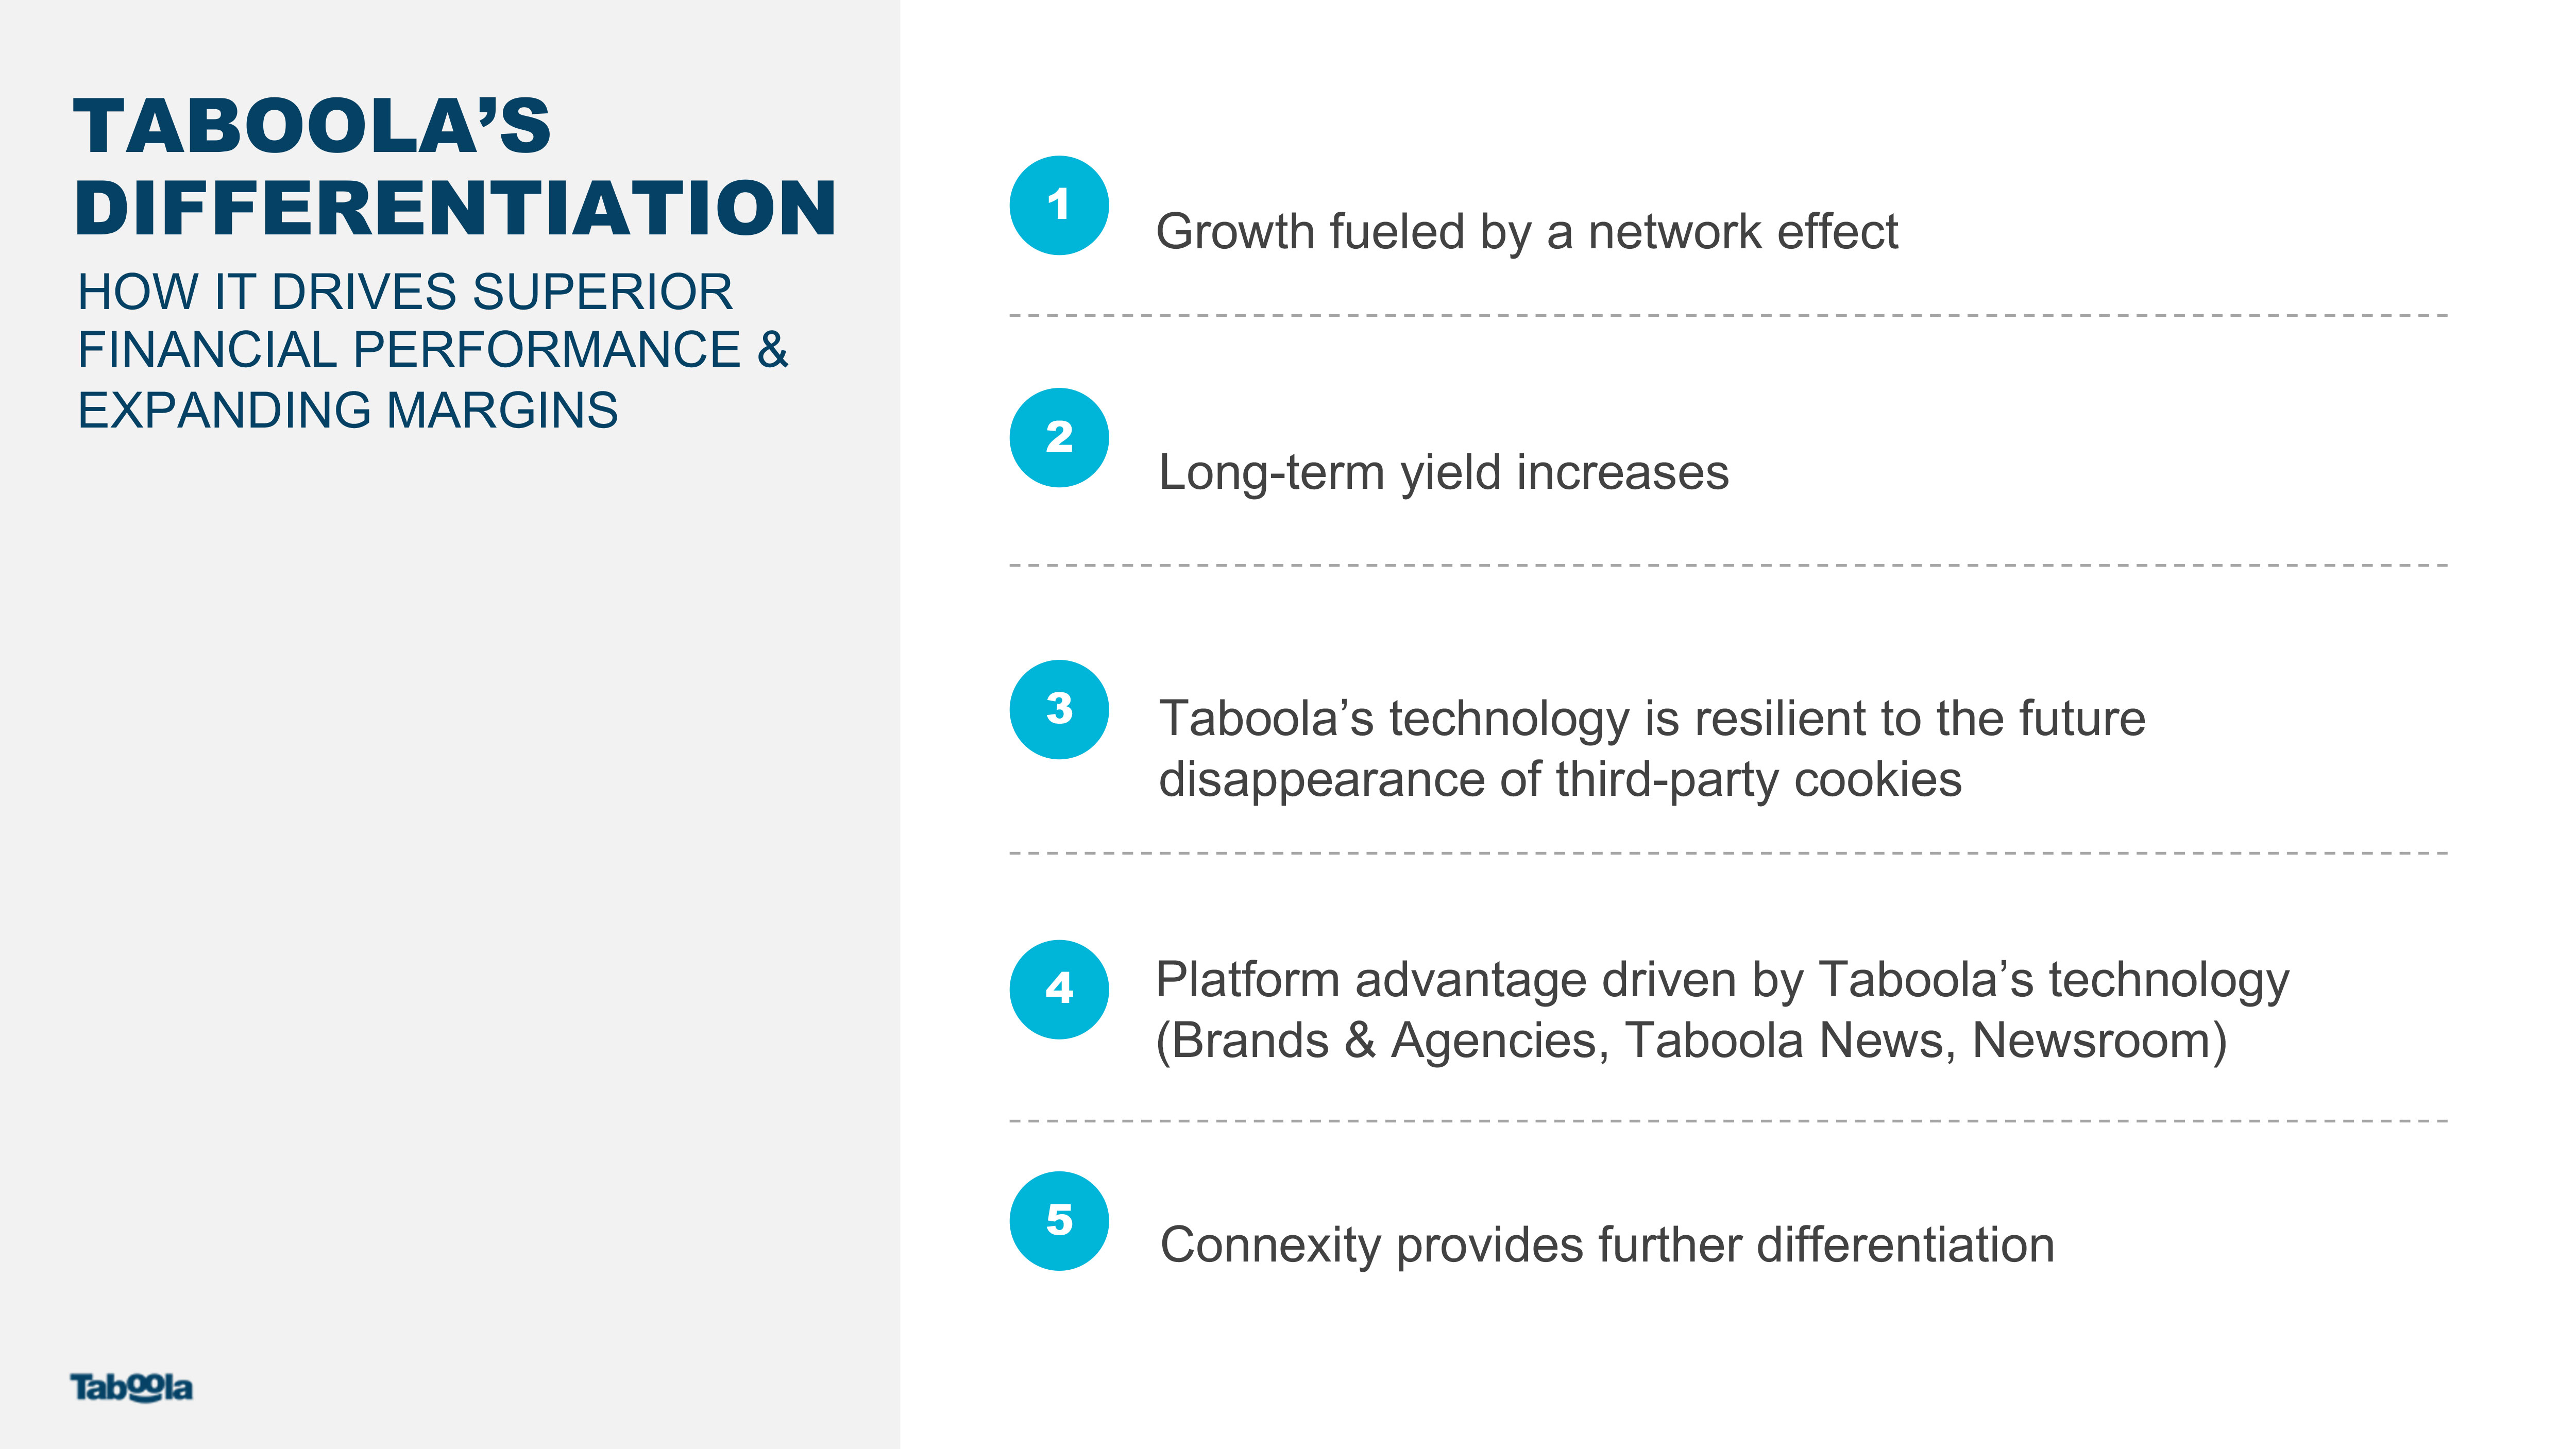
TABOOLA’S DIFFERENTIATION Growth fueled by a network effectLong-term yield increasesTaboola’s technology is resilient to the future disappearance of third-party cookiesPlatform advantage driven by Taboola’s technology (Brands & Agencies, Taboola News, Newsroom) Connexity provides further differentiation 1 2 3 4 HOW IT DRIVES SUPERIOR FINANCIAL PERFORMANCE & EXPANDING MARGINS 5
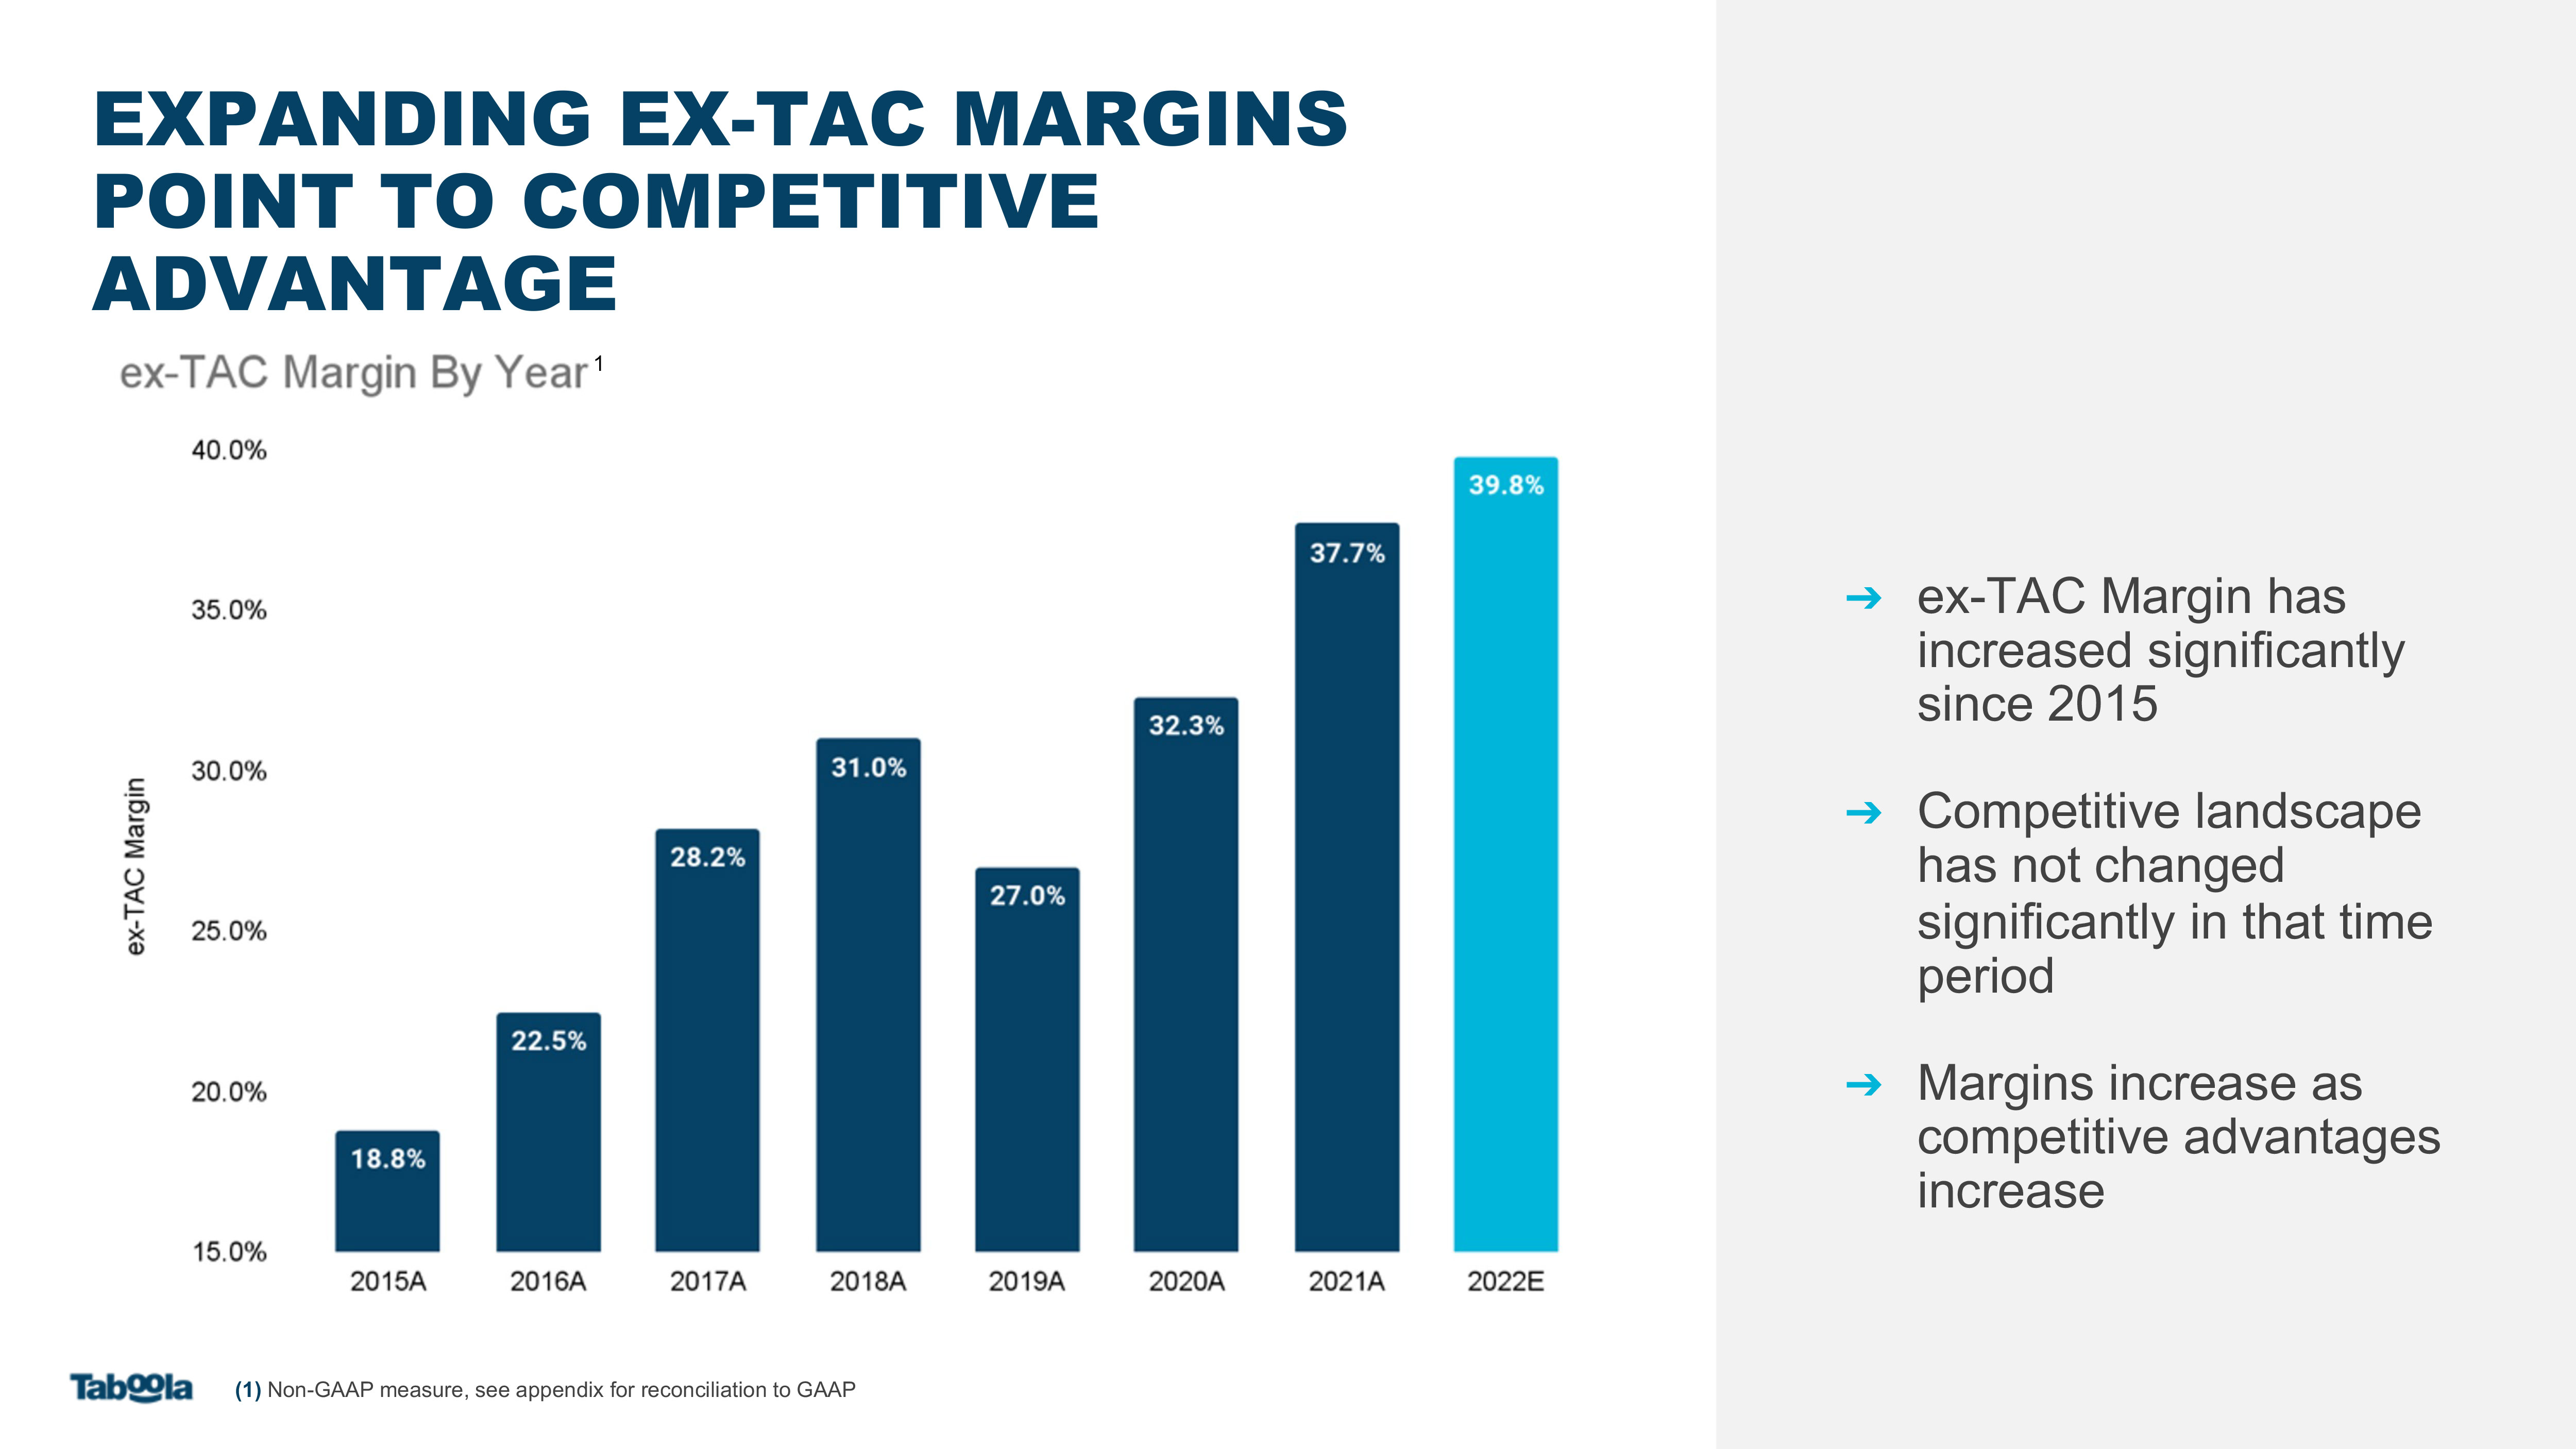
ex-TAC Margin has increased significantly since 2015Competitive landscape has not changed significantly in that time periodMargins increase as competitive advantages increase 1 1 (1) Non-GAAP measure, see appendix for reconciliation to GAAP EXPANDING EX-TAC MARGINS POINT TO COMPETITIVE ADVANTAGE

More Publisher Partners More Users Reached More Frequently More Data Generated Higher Yield Better Targeting Drives Better Results for Advertisers GROWTH WITH A BUILT-IN NETWORK EFFECT SCALE MATTERSIN OUR INDUSTRY 1

WHAT MAKES UP YIELD Click Through Rate (CTR):The number of clicks that an ad receives divided by the number of times the ad is shown (impressions)A high CTR is a good indication that users find your ads relevant Cost Per Click (CPC):The amount advertisers pay for each click on their ads. Conversion Rate:The percentage of users who have completed a desired action (e.g. purchase) after clicking on an ad. CTR Click Through Rate CPC Cost Per Click ConversionRate YIELD 2
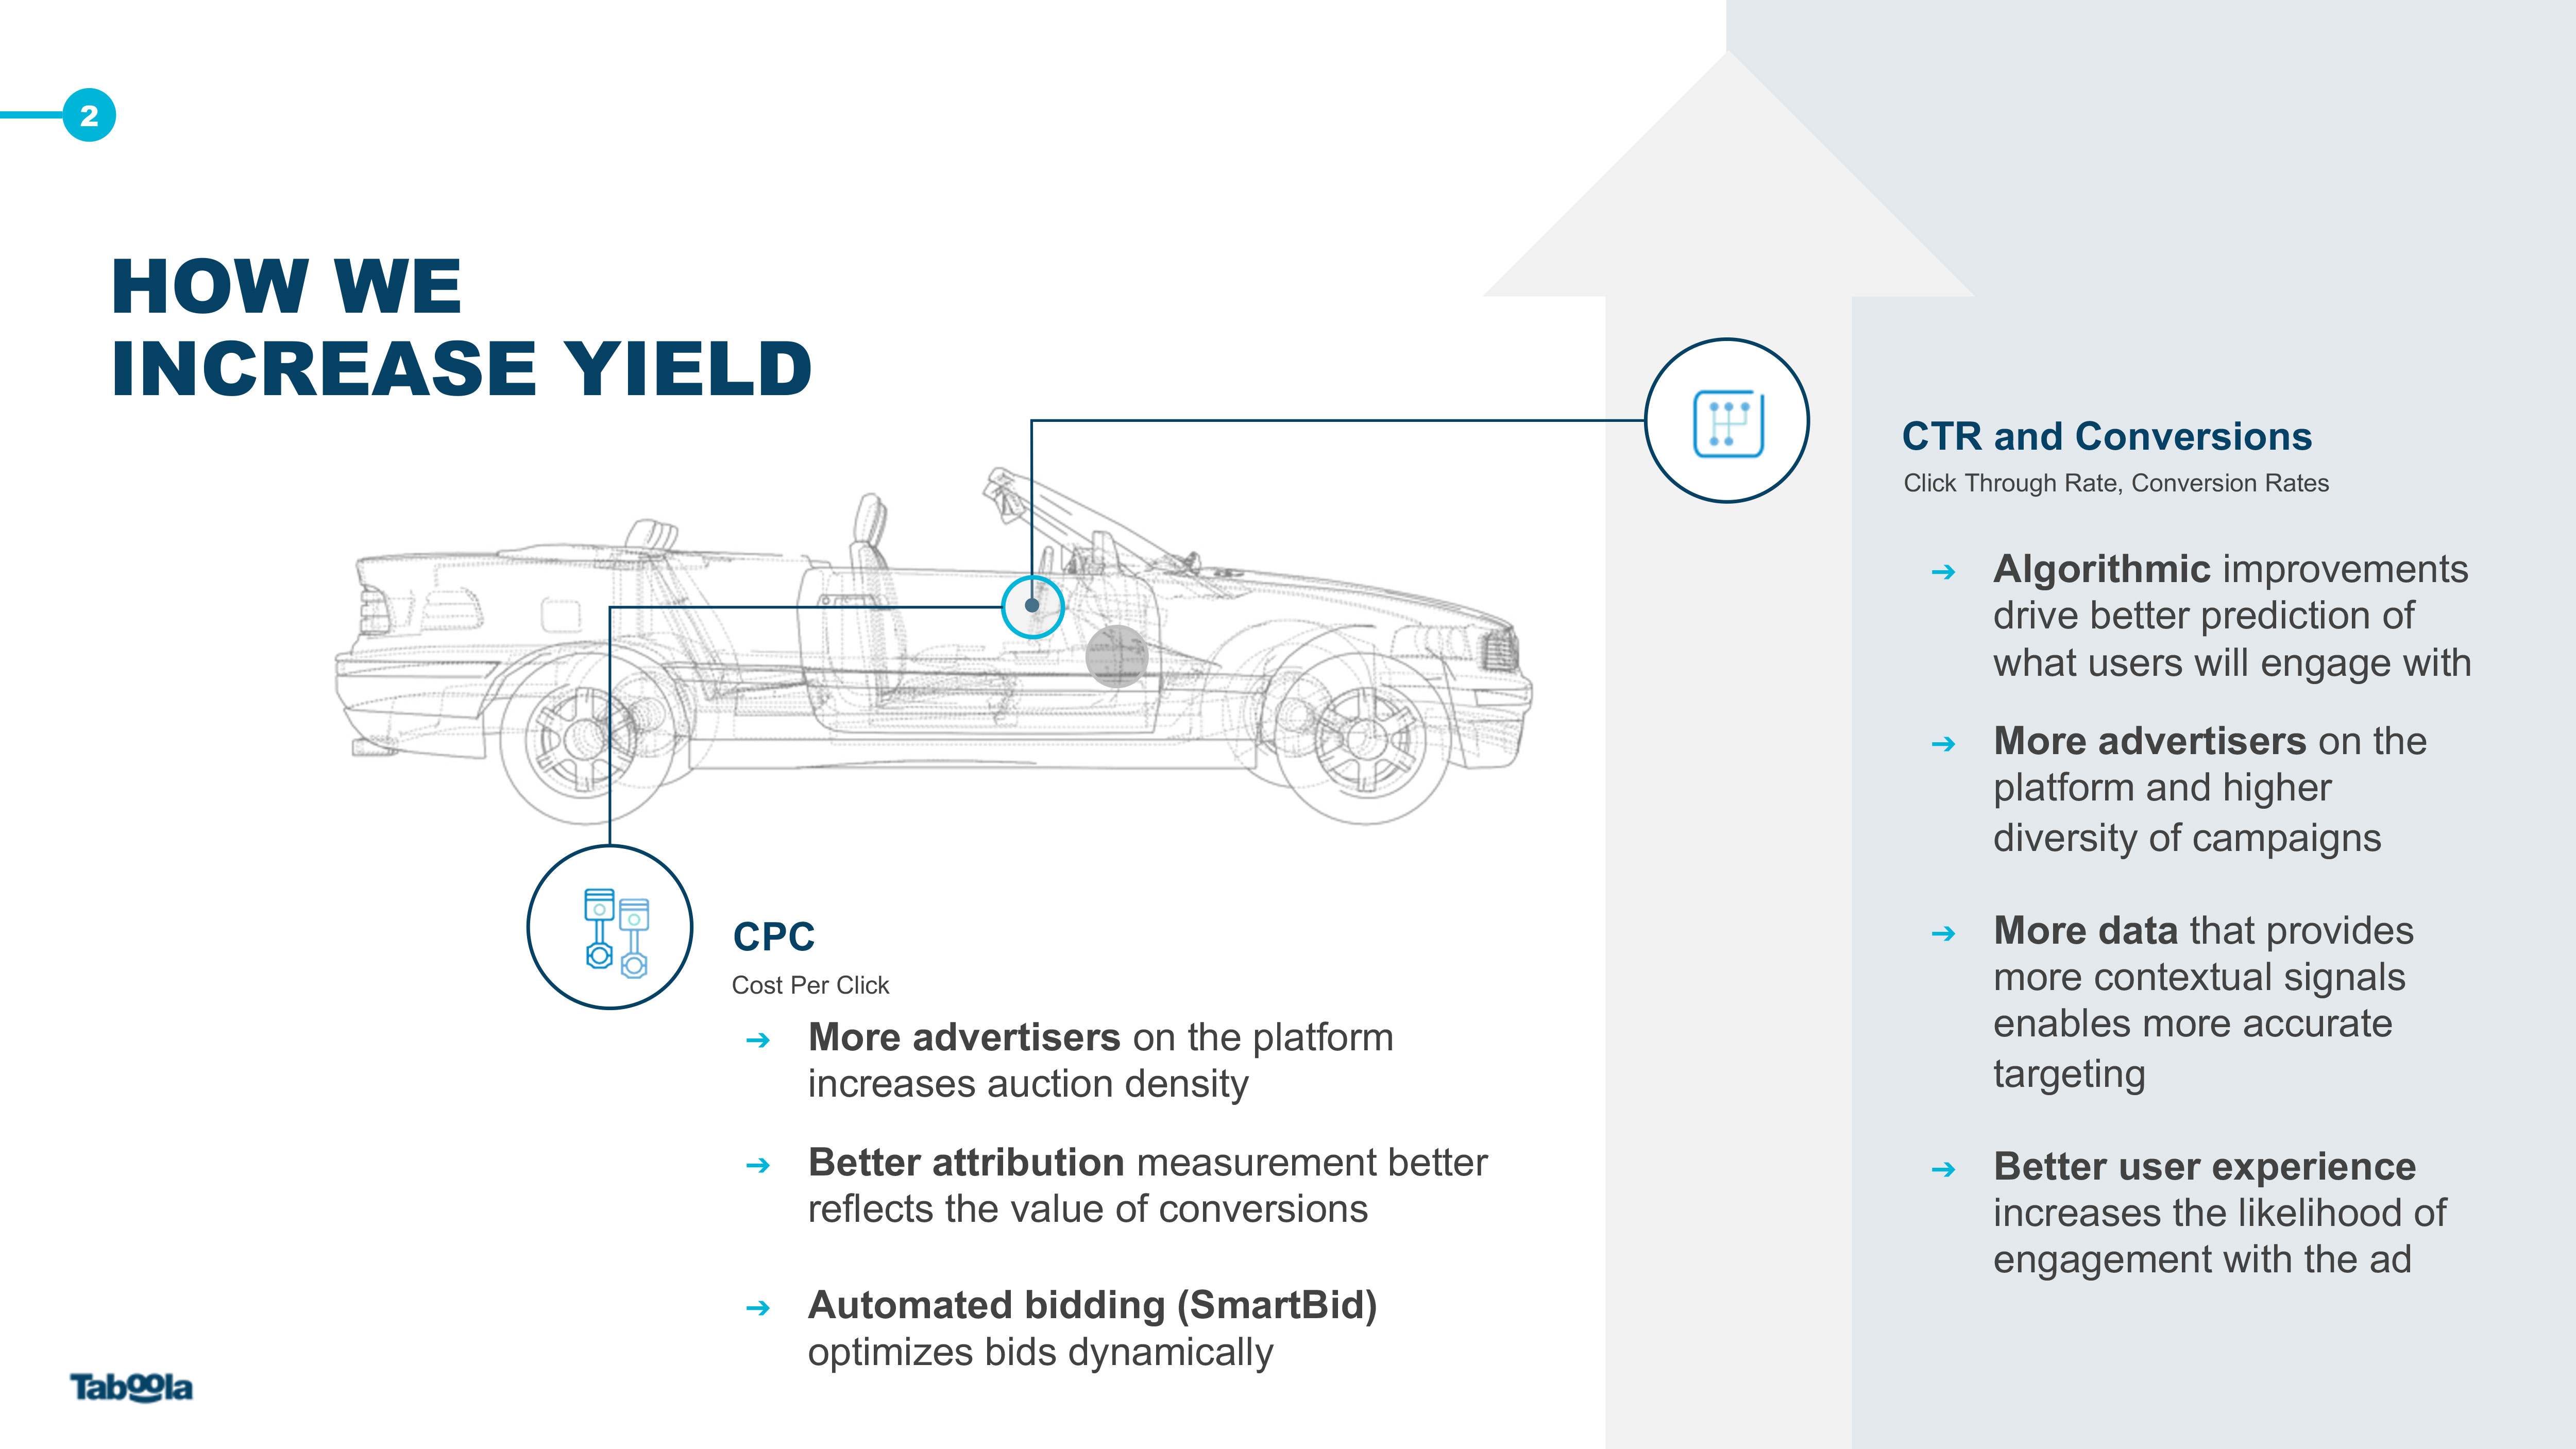
CTR and Conversions Click Through Rate, Conversion Rates CPC Cost Per Click HOW WE INCREASE YIELD Algorithmic improvements drive better prediction of what users will engage withMore advertisers on the platform and higher diversity of campaignsMore data that provides more contextual signals enables more accurate targetingBetter user experience increases the likelihood of engagement with the ad More advertisers on the platform increases auction densityBetter attribution measurement better reflects the value of conversionsAutomated bidding (SmartBid) optimizes bids dynamically 2

(1) Source: Company data. Clicks represent total clicks on Taboola recommendations, including paid advertisements (“sponsored content”) and editorial ("organic") content Taboola’s strong yield performance despite 3rd party cookies being blocked in the industry for years: Apple started blocking 3rd party cookies in 2017 Firefox, Edge, etc are also blocking 3rd party cookies GDPR launched in 2018 CCPA launched in 2019IDFA launched April, 2021 TABOOLA TECH IS BUILT FOR A COOKIE-LESS, IDFA/ ATT WORLD Taboola has its own1st party cookie –recommending personalized editorial content enables serving our own 1st party identifier Unique readership context –deep access to the context of the page, allowing advertisers to target context (vs. “3rd party cookie behavior”) People clickon Taboola recommendationstens of billions oftimes a year1 –re-hashing Taboola identifier across websites 3
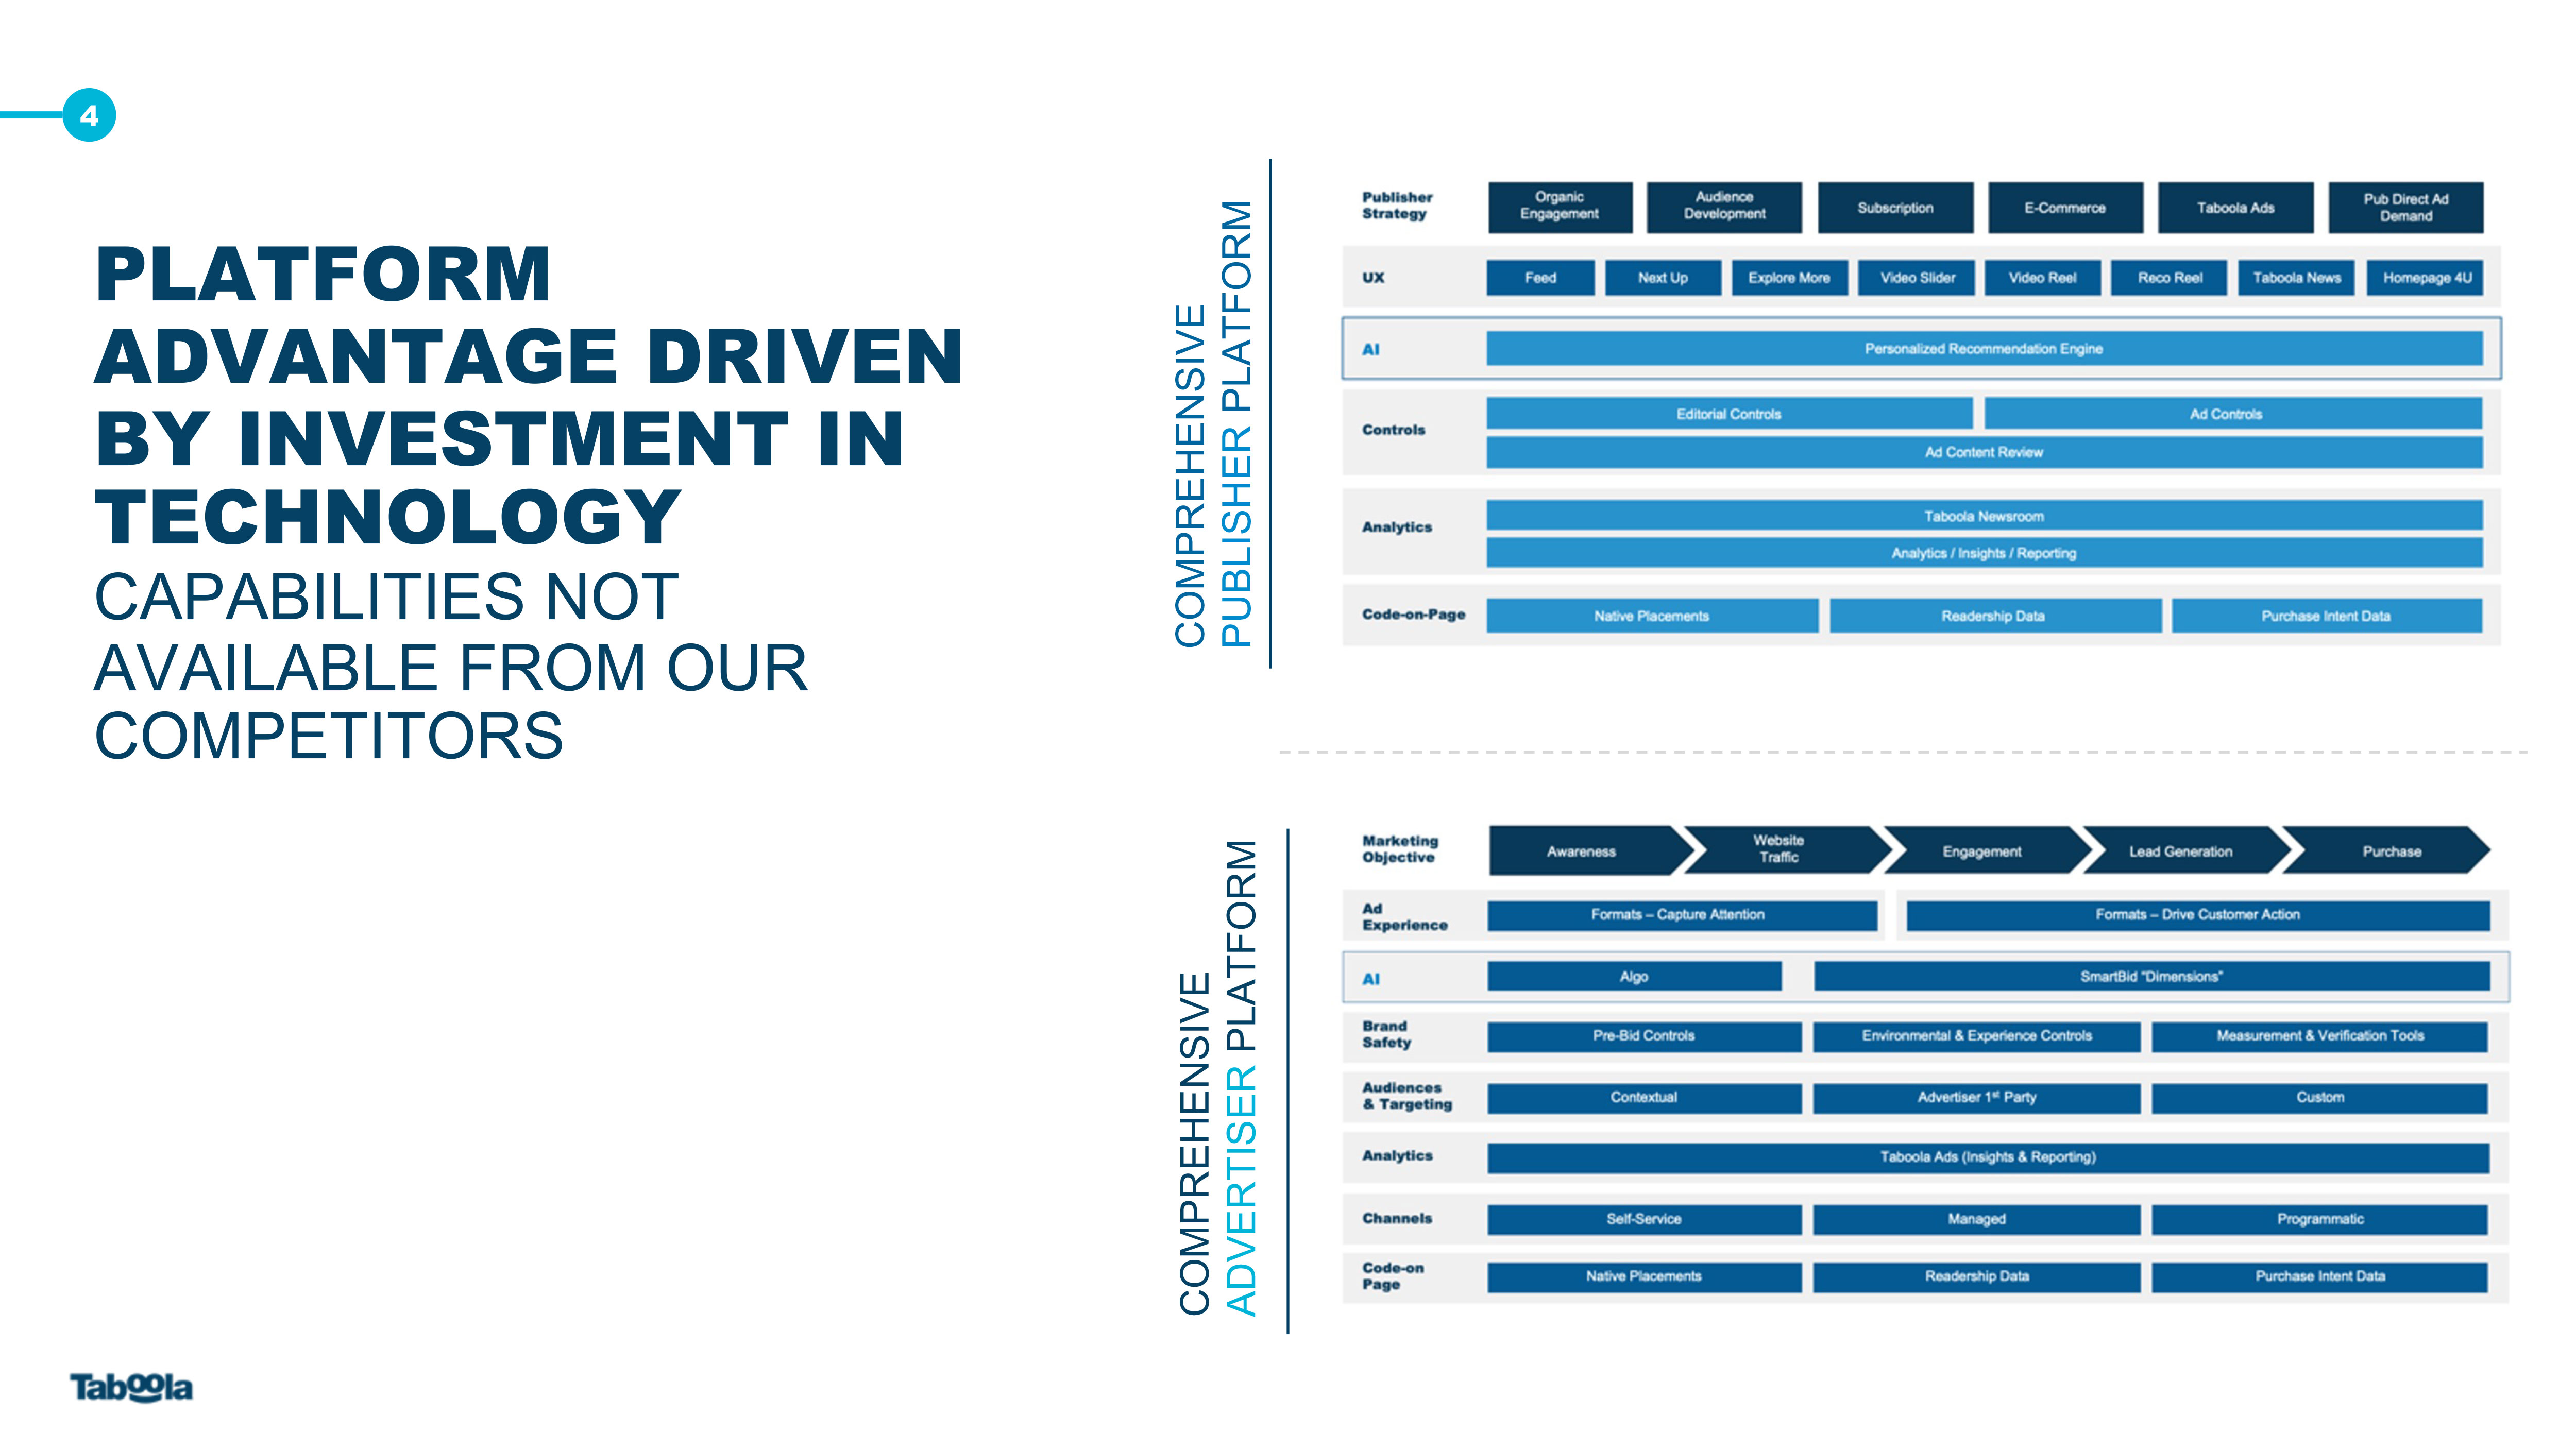
COMPREHENSIVE PUBLISHER PLATFORM PLATFORM ADVANTAGE DRIVEN BY INVESTMENT IN TECHNOLOGYCAPABILITIES NOT AVAILABLE FROM OUR COMPETITORS COMPREHENSIVE ADVERTISER PLATFORM 4
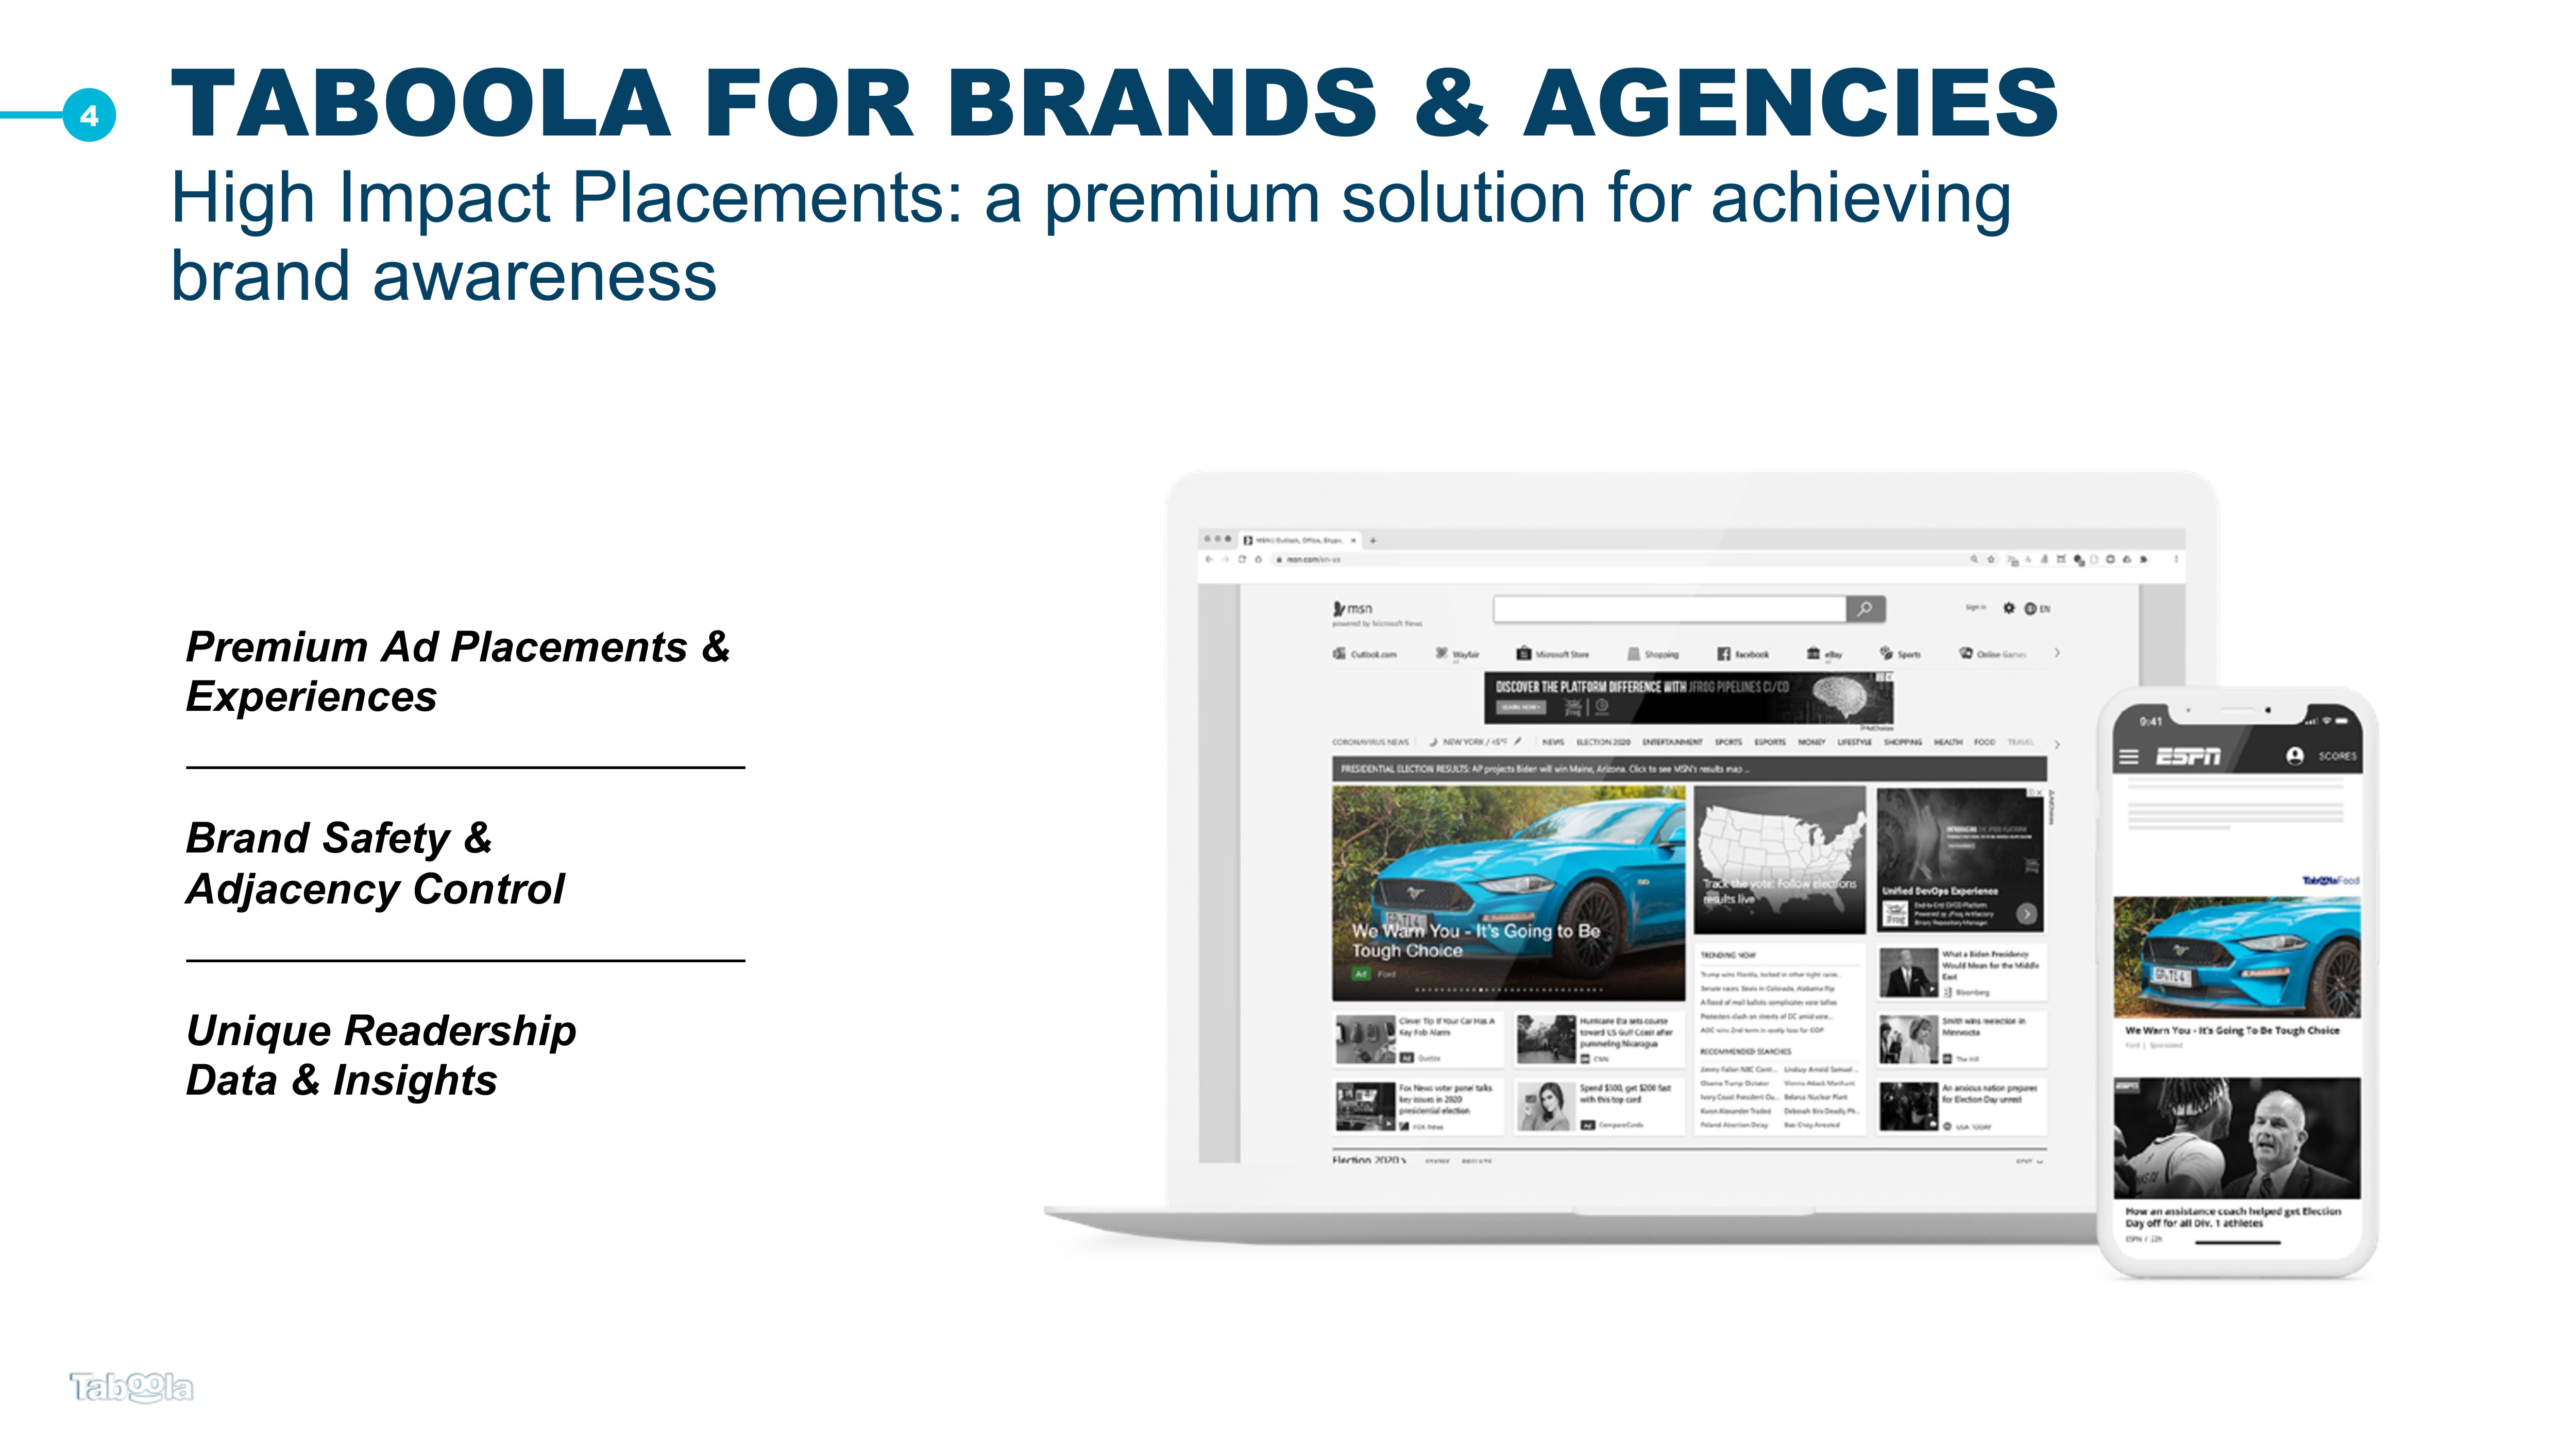
TABOOLA FOR BRANDS & AGENCIESHigh Impact Placements: a premium solution for achieving brand awareness Premium Ad Placements & Experiences Brand Safety & Adjacency Control Unique Readership Data & Insights 4
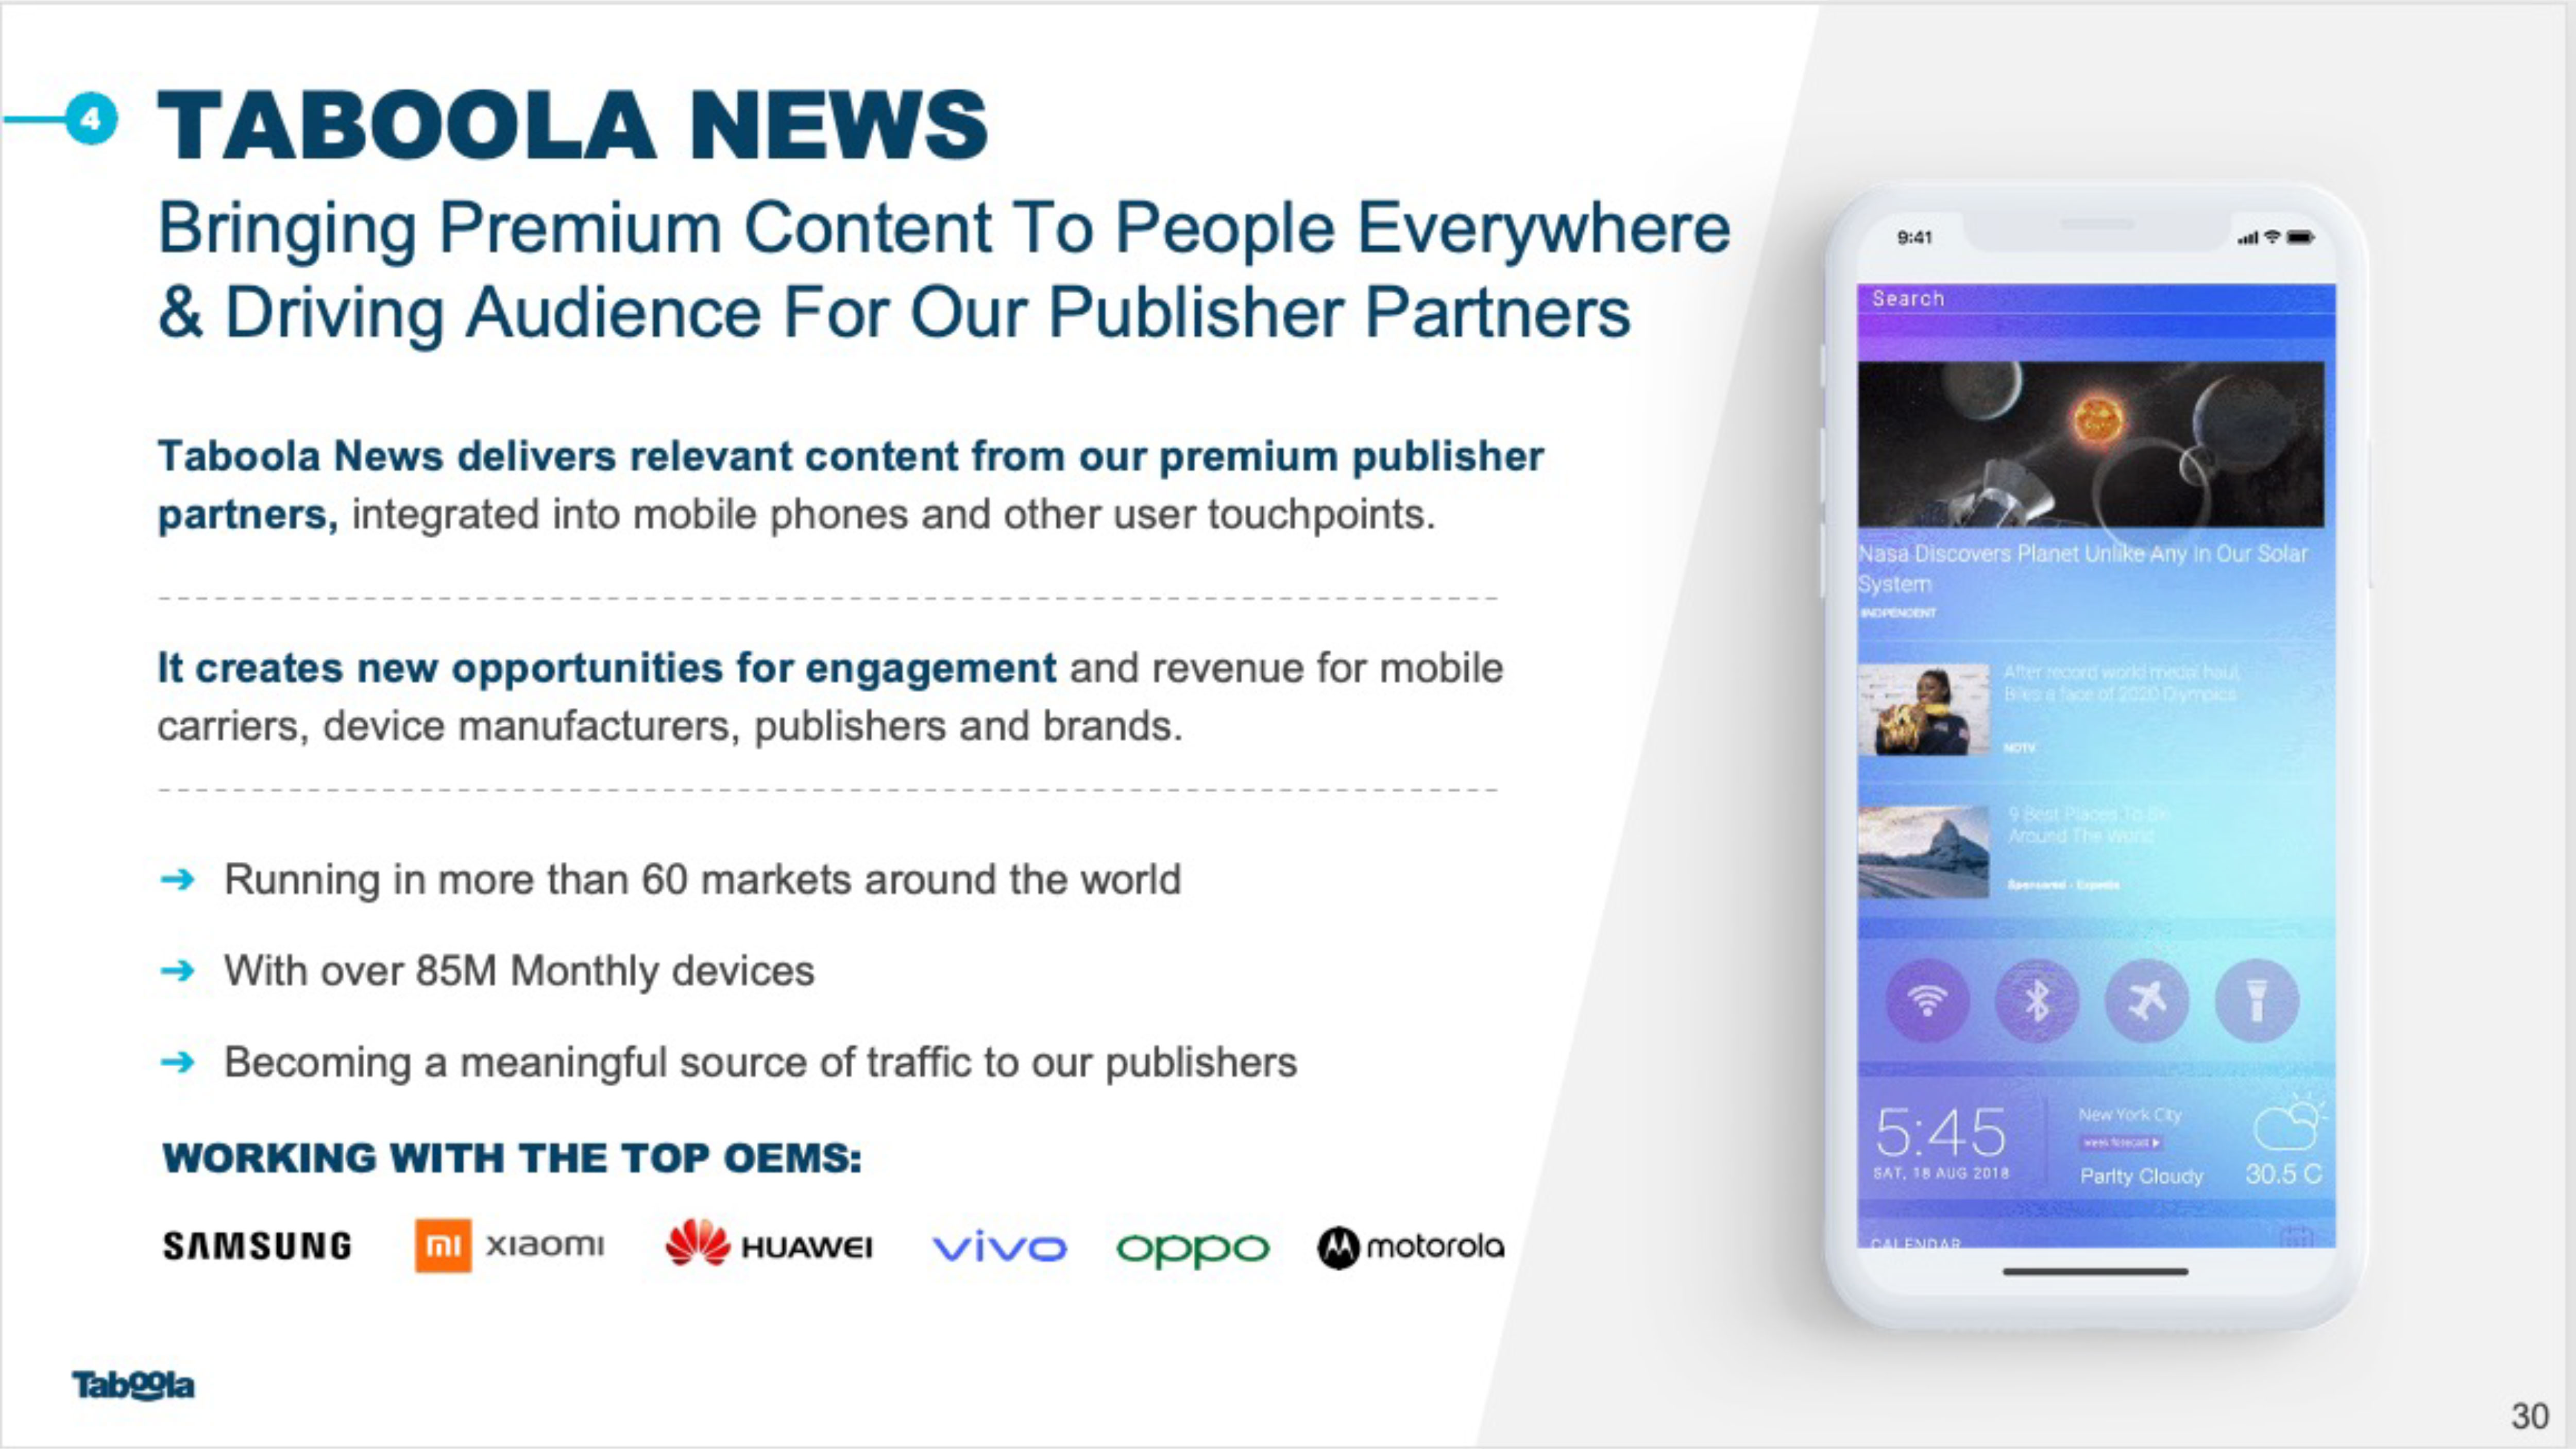
TABOOLA NEWS Bringing Premium Content To People Everywhere & Driving Audience For Our Publisher Partners Taboola News delivers relevant content from our premium publisher partners, integrated into mobile phones and other user touchpoints.It creates new opportunities for engagement and revenue for mobile carriers, device manufacturers, publishers and brands. 30 Running in more than 60 markets around the world With over 85M Monthly devicesBecoming a meaningful source of traffic to our publishers WORKING WITH THE TOP OEMS: 4
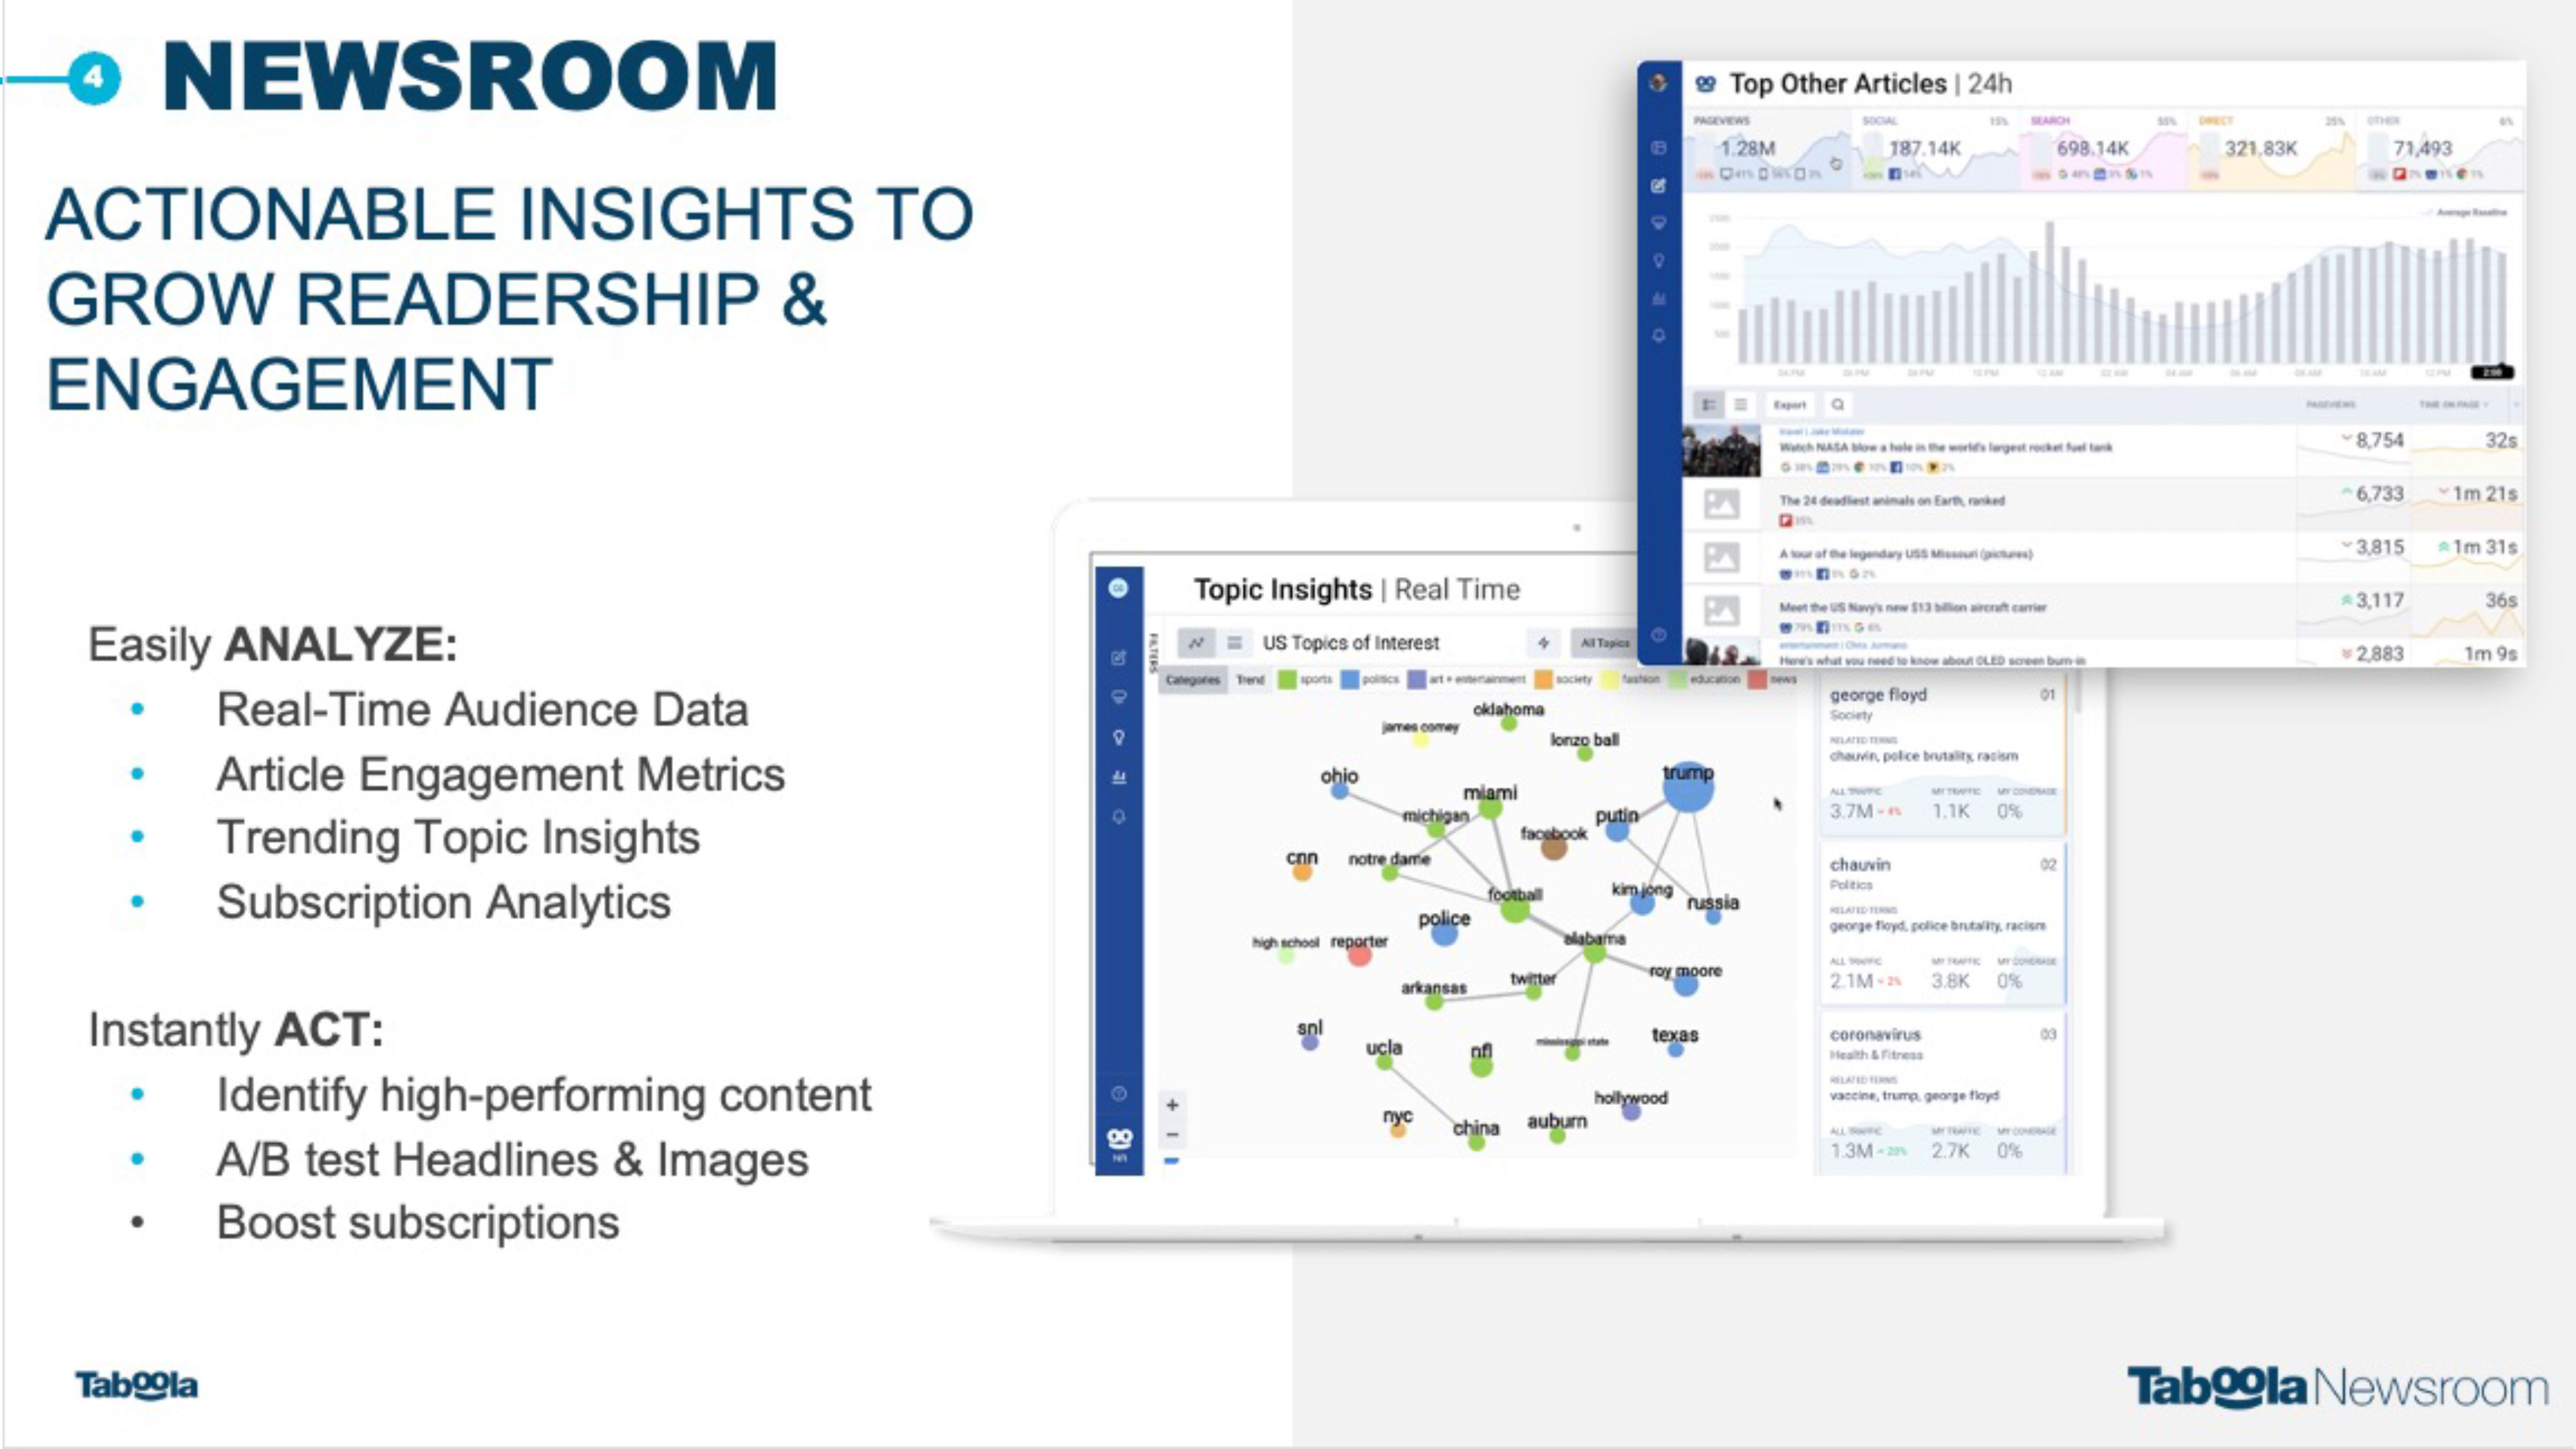
Easily ANALYZE: Real-Time Audience Data Article Engagement MetricsTrending Topic InsightsSubscription AnalyticsInstantly ACT:Identify high-performing content A/B test Headlines & ImagesBoost subscriptions ACTIONABLE INSIGHTS TO GROW READERSHIP & ENGAGEMENT 4 NEWSROOM

Must-know information, hand-curated by editors Personalized recommendations, powered by editor-enhanced algo FOR ALL FOR YOU 4

1/3 OPEN WEB PUBLISHER REVENUE Source: Company Estimates. 1/3 OF OPEN WEB PUBLISHER REVENUE WILL BE E-COMMERCE 5

5 CONNEXITY FURTHERS OUR COMPETITIVEADVANTAGE INTRINSIC VALUE OF BUSINESSSignificant expansion of our addressable TAM with long runway of growthSYNERGIESTremendous opportunity to leverage our scale, combined relationships and Connexity’s e-commerce market maker capabilities STRATEGIC VALUE⅓ of Open Web Publisher Revenue will be e-commerce1 and Taboola with Connexity is uniquely differentiated 1 Company estimates.
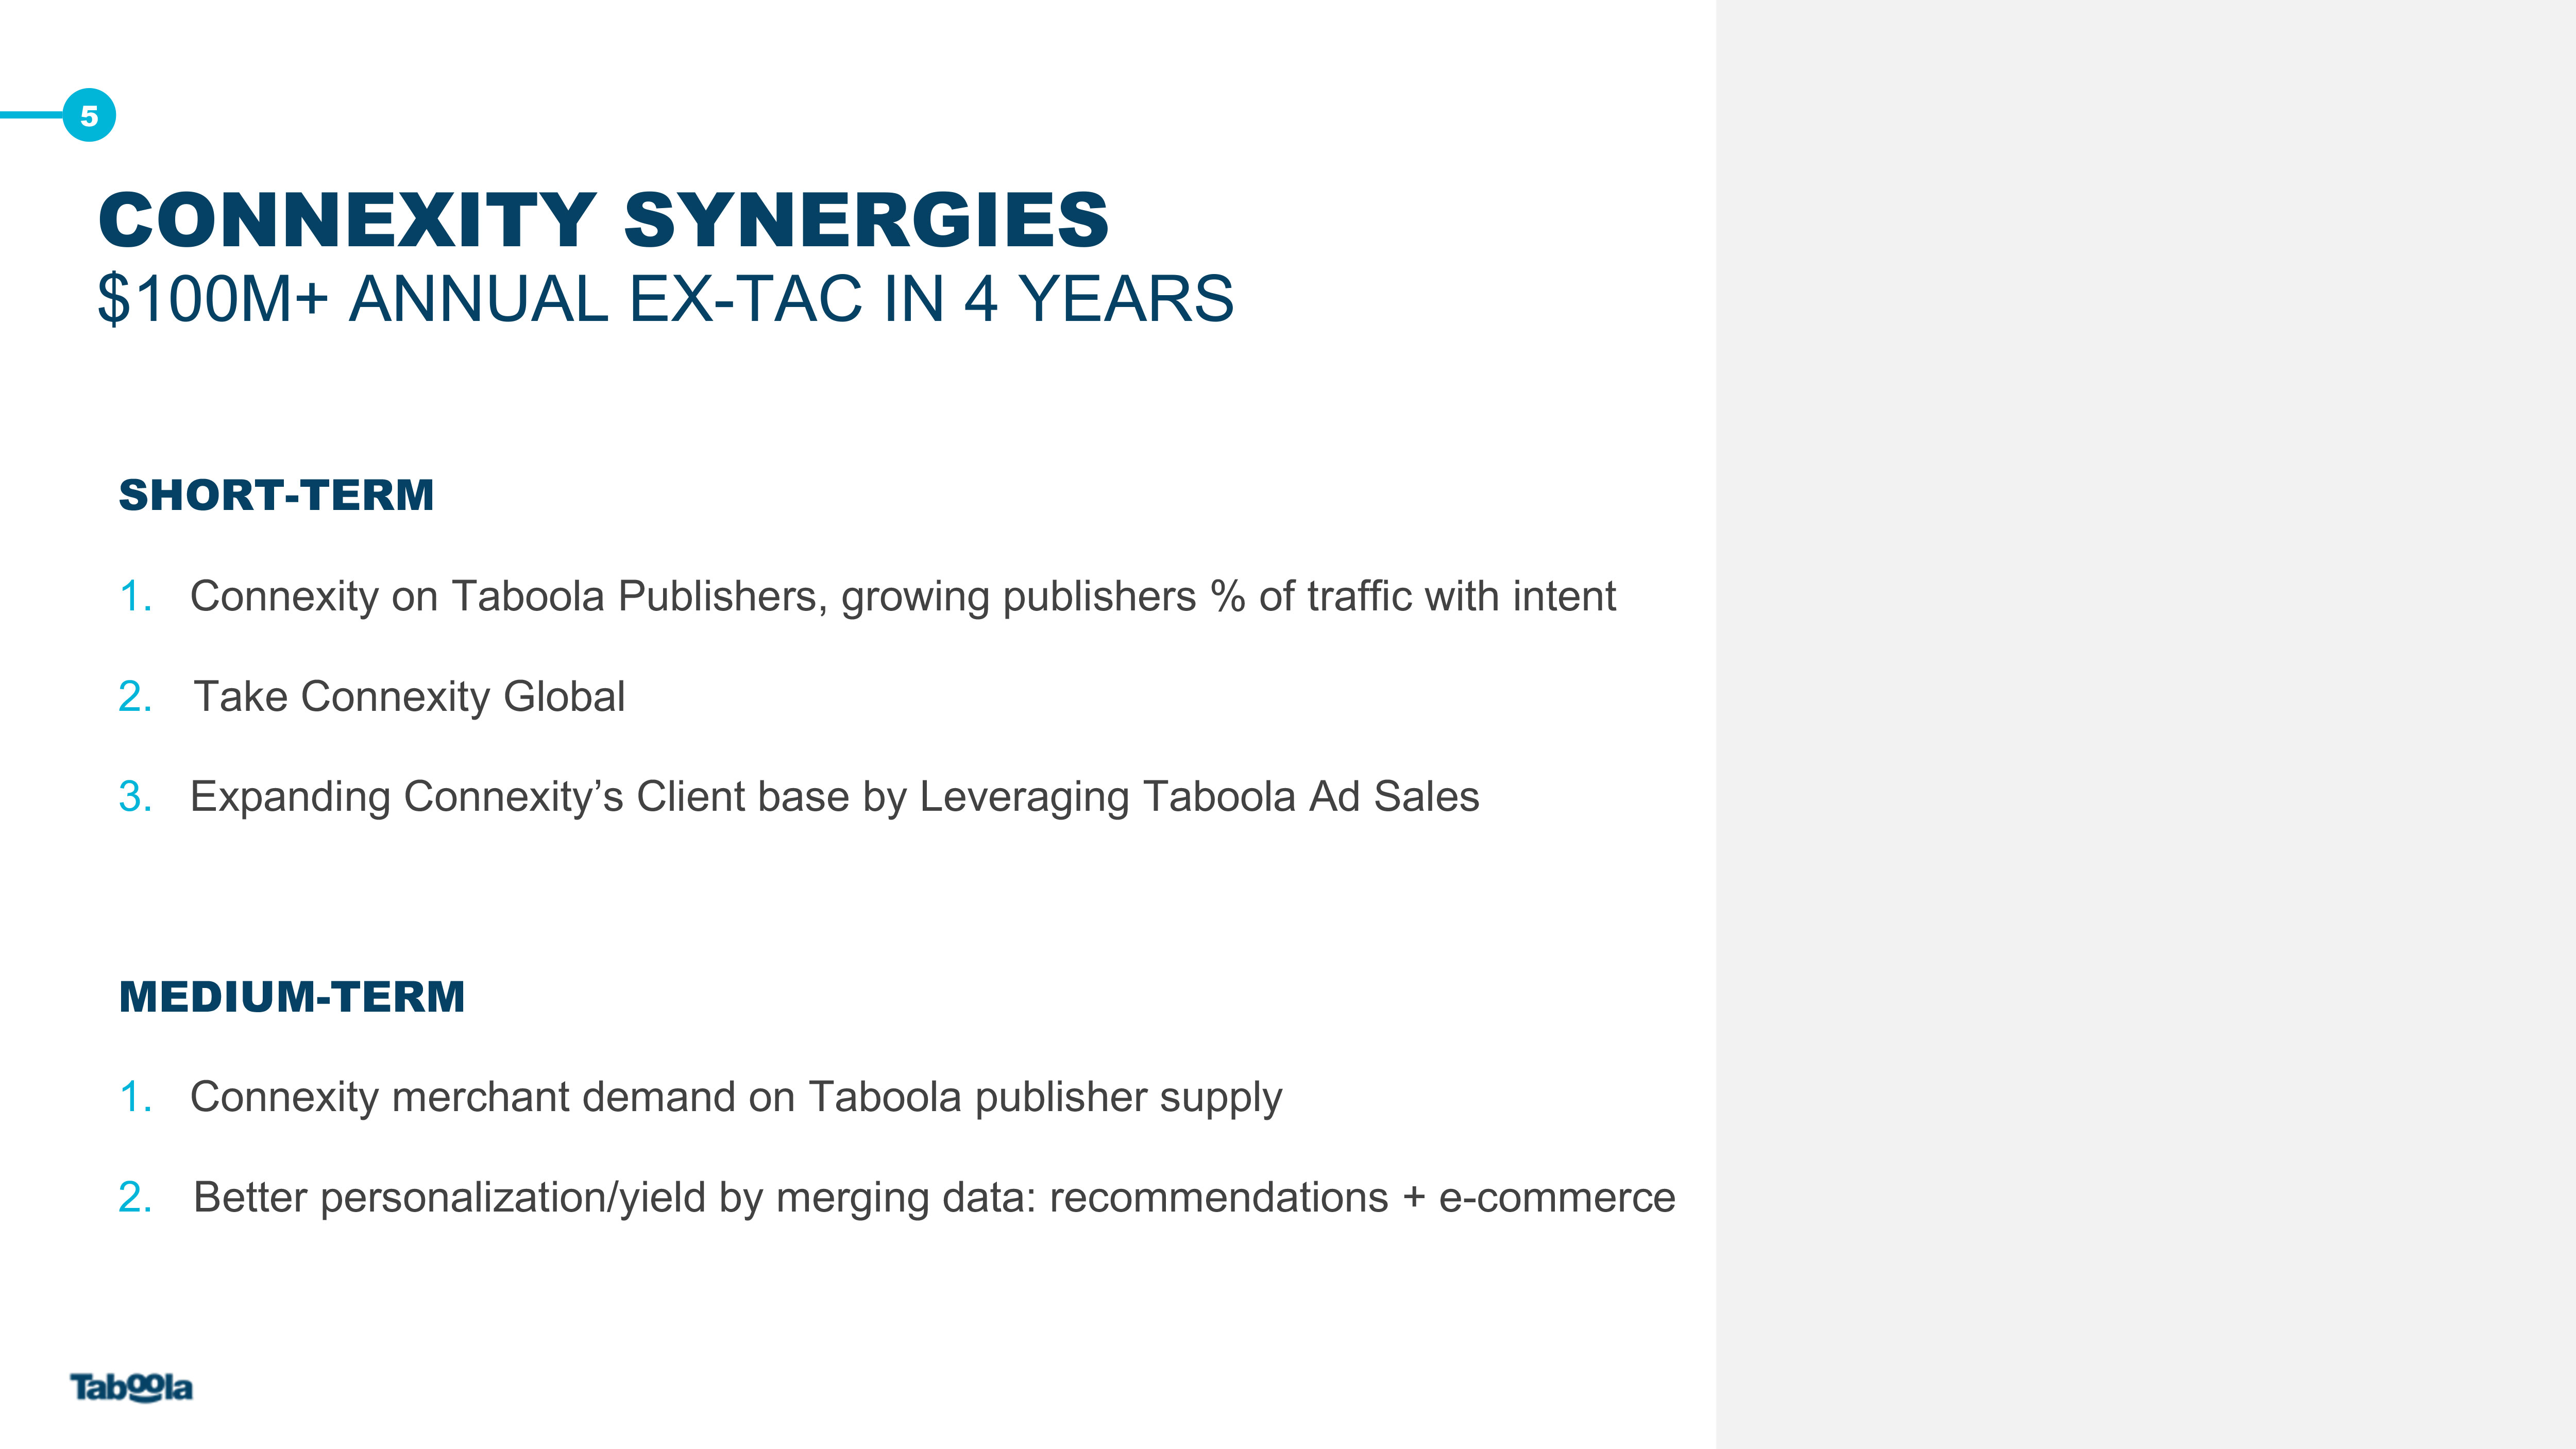
5 CONNEXITY SYNERGIES$100M+ ANNUAL EX-TAC IN 4 YEARS SHORT-TERMConnexity on Taboola Publishers, growing publishers % of traffic with intentTake Connexity Global Expanding Connexity’s Client base by Leveraging Taboola Ad SalesMEDIUM-TERMConnexity merchant demand on Taboola publisher supply Better personalization/yield by merging data: recommendations + e-commerce

AGENDA Capturing Share of $64B Ad Market & Taboola Overview Q1 Updates & Momentum Taboola’s Differentiation and Why We Win 1 2 3 Financial Update 4

Q1 2022 IN REVIEW - capturing more of the $64 billion ad market Renewing and building new long term relationshipsMultiyear deals with Altice News, AP, Le Point in France, Ciaopeople in Italy, KapanLagi Youniverse in Indonesia.Five year renewal with E! Online, now their exclusive third party provider of mid article video. Renewal with Insider, an Axel Springer property, a top 10 US publisher (by revenue) that brings us to 10 years together. Launching new productsRoll-out of HomePage For You, bringing personalization to the Homepage to drive more than a 30 increase in CTRsLaunched new bidder technology, beginning within Microsoft

$1,378M Revenues $519M ex-TAC Gross Profit1 2021 (1) Non-GAAP measures, see appendix for reconciliation to GAAP $179M Adj. EBITDA1 $1,277M $445M ORIGINAL PIPE EXPECTATIONS $127M 16% 36%2 GROWTH RATE 69% $441M Gross Profit $365M 38% CONSISTENTLY EXCEEDED 2021 FINANCIAL EXPECTATIONS (2) Pro Forma ex-TAC growth of 25%, above original PIPE Expectation of 16% growth

(1) Non-GAAP measures, see appendix for reconciliation to GAAP. We calculate Adjusted EBITDA as Net income (loss) before net financial expenses, income tax expenses/ benefit and depreciation and amortization, further adjusted to exclude share-based compensation and other noteworthy income and expense items such as certain merger or acquisition related costs, which may vary from period-to-period. Revenues ex-TAC Gross Profit1 Adj. EBITDA1, 2 Gross Profit $1,499 - 1,539M $595 - 615M FY 2022 GUIDANCE $152 - 160M 9 - 12% 15 - 19% GROWTH RATE VS 2021 $485 - 505M 10 - 15% Q1 BEAT. STRONG FUNDAMENTALS IN 2022 $1.5B REVENUE | $150M+ AEBITDA | STRONG CASH FLOW Ratio of Adj. EBITDA to ex-TAC Gross Profit 25.5 - 26% (1) Non-GAAP measures, see appendix for reconciliation to GAAP(2) We calculate Adjusted EBITDA as Net income (loss) before net financial expenses, income tax expenses/ benefit and depreciation and amortization, further adjusted to exclude share-based compensation and other noteworthy income and expense items such as certain merger or acquisition related costs, which may vary from period-to-period.

AGENDA Capturing Share of $64B Ad Market & Taboola Overview Q1 Updates & Momentum Taboola’s Differentiation and Why We Win 1 2 3 Financial Update 4
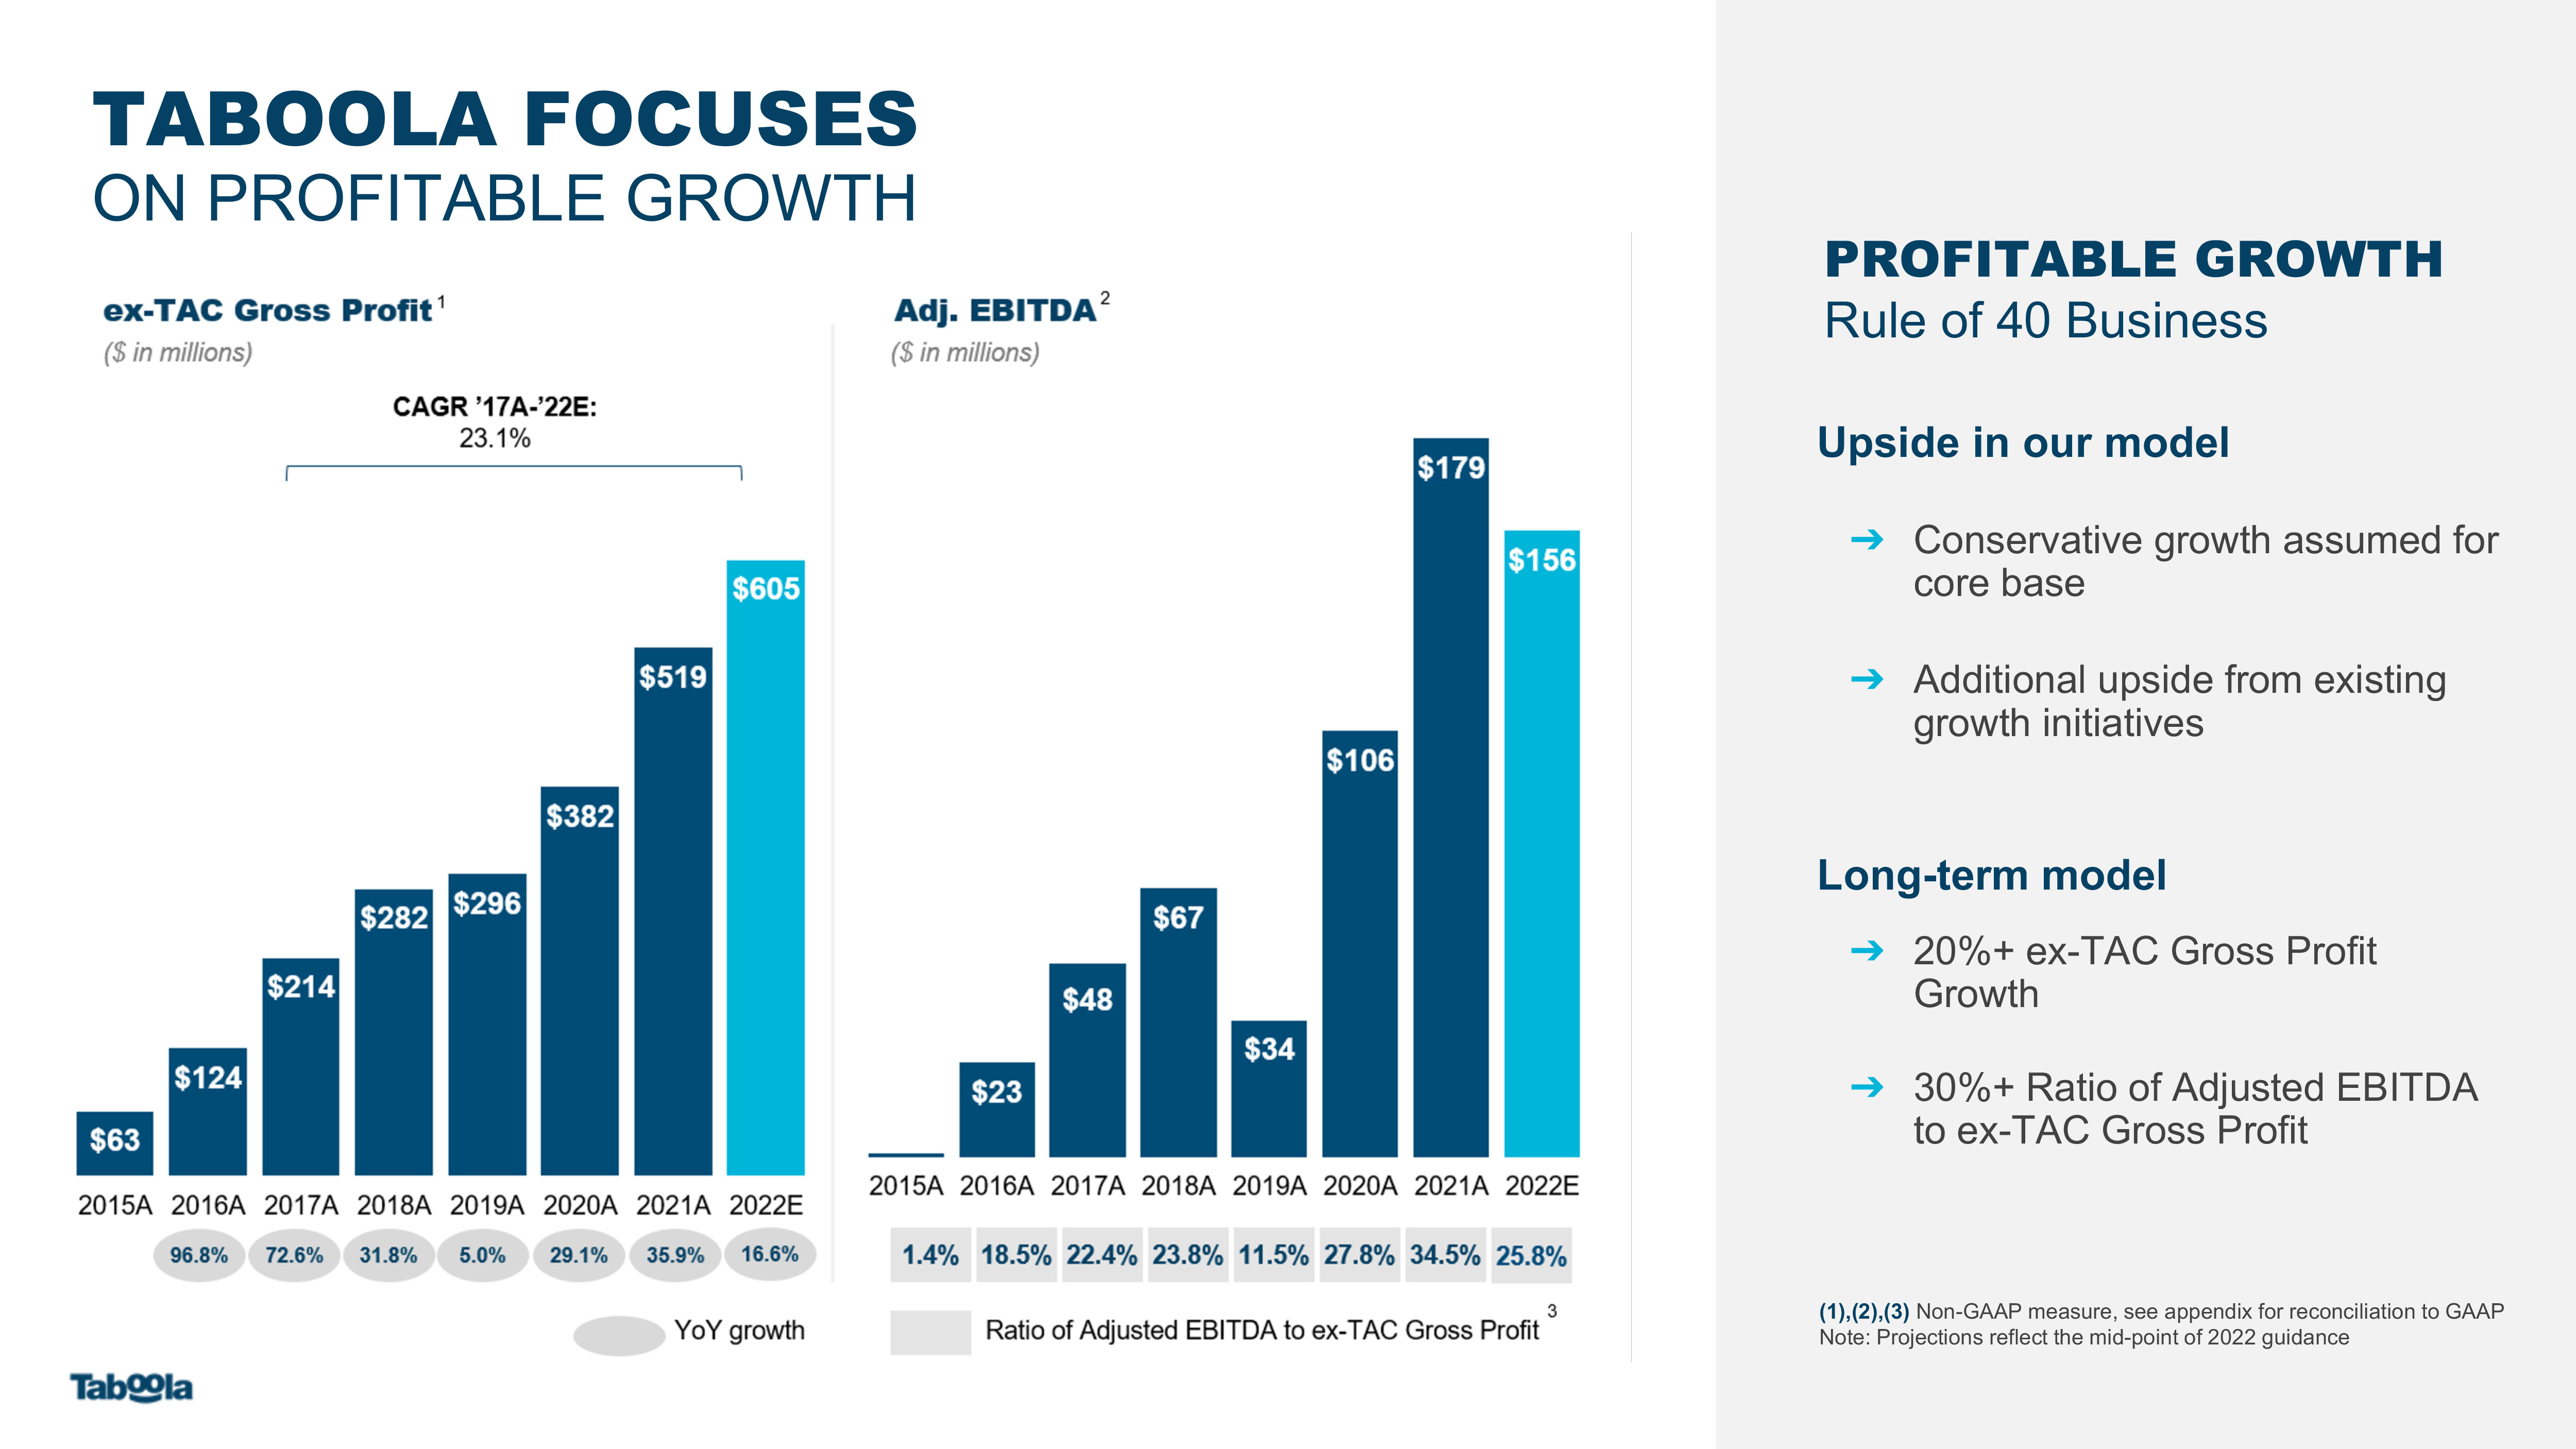
TABOOLA FOCUSES ON PROFITABLE GROWTH Upside in our modelConservative growth assumed for core baseAdditional upside from existing growth initiativesLong-term model20%+ ex-TAC Gross Profit Growth30%+ Ratio of Adjusted EBITDA to ex-TAC Gross Profit (1),(2),(3) Non-GAAP measure, see appendix for reconciliation to GAAPNote: Projections reflect the mid-point of 2022 guidance PROFITABLE GROWTH Rule of 40 Business
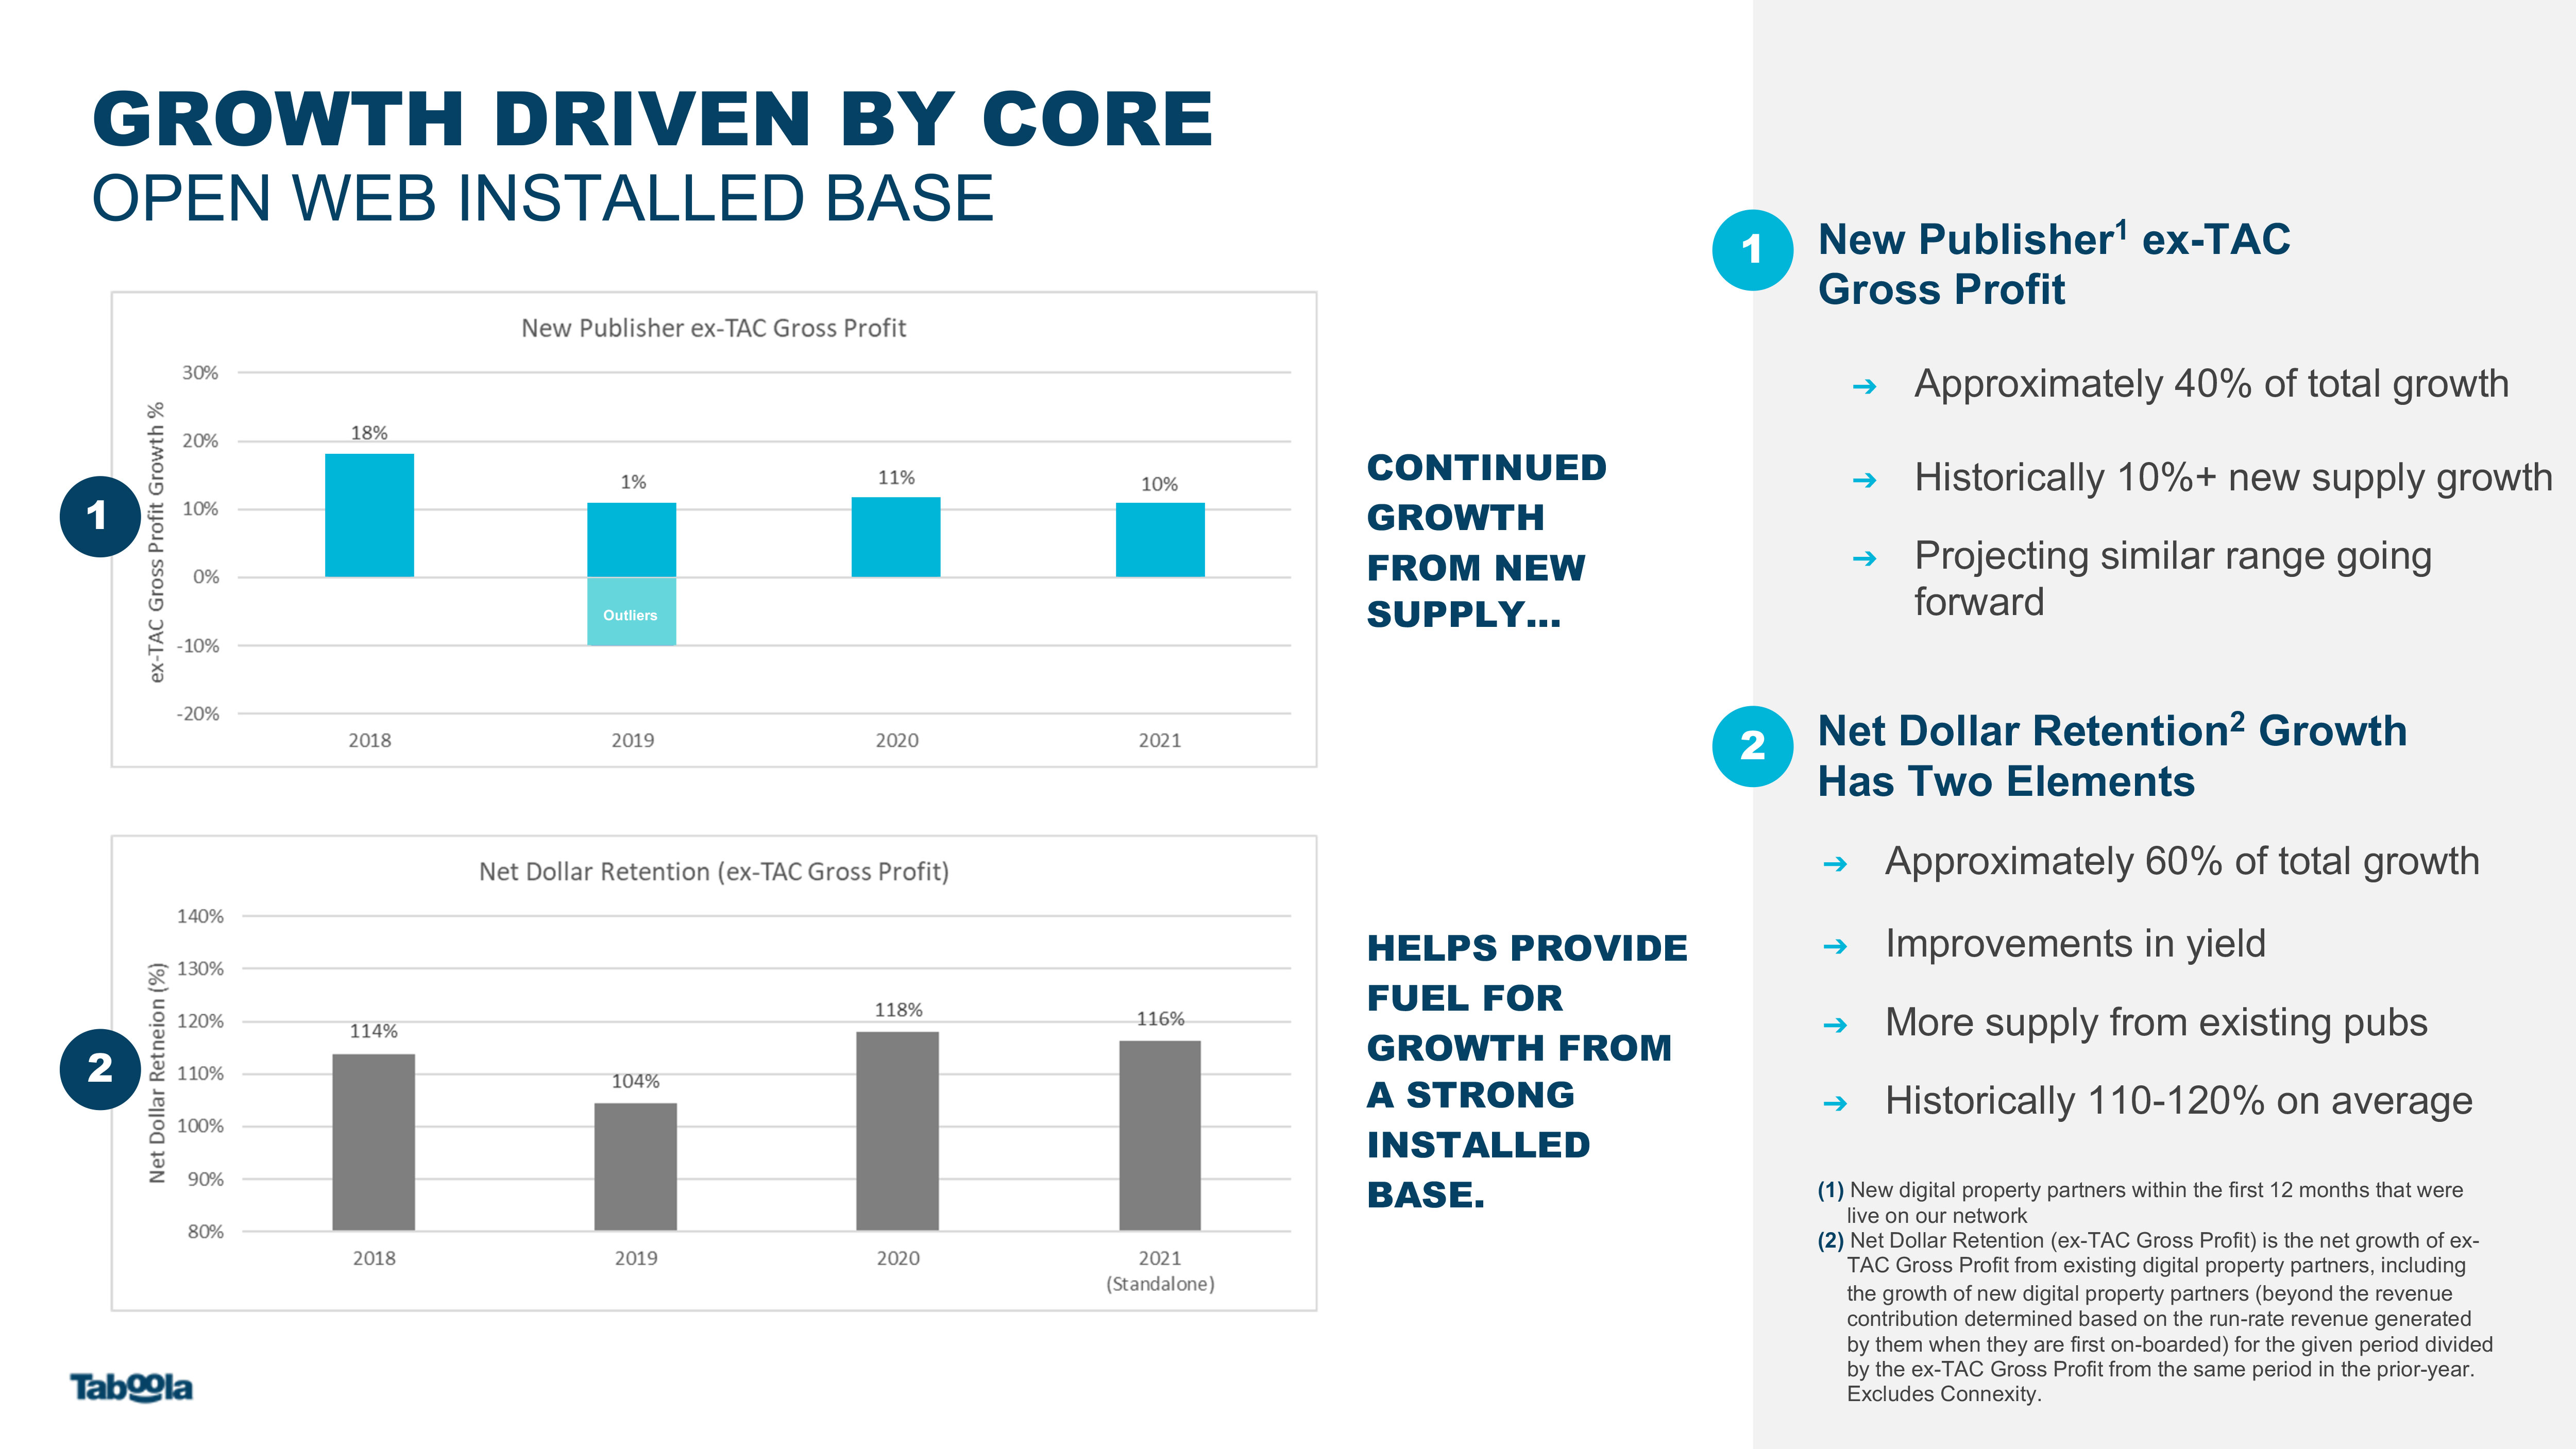
CONTINUED GROWTH FROM NEW SUPPLY... HELPS PROVIDE FUEL FOR GROWTH FROM A STRONG INSTALLED BASE. (1) New digital property partners within the first 12 months that were live on our network(2) Net Dollar Retention (ex-TAC Gross Profit) is the net growth of ex- TAC Gross Profit from existing digital property partners, including the growth of new digital property partners (beyond the revenue contribution determined based on the run-rate revenue generated by them when they are first on-boarded) for the given period divided by the ex-TAC Gross Profit from the same period in the prior-year. Excludes Connexity. Outliers New Publisher1 ex-TAC Gross ProfitApproximately 40% of total growthHistorically 10%+ new supply growthProjecting similar range going forward 1 2 Net Dollar Retention2 Growth Has Two Elements Approximately 60% of total growthImprovements in yieldMore supply from existing pubs Historically 110-120% on average 1 2 GROWTH DRIVEN BY CORE OPEN WEB INSTALLED BASE Outliers

Core Business $1B+ in 2021 &Growing Rapidly2 A N Y T H I N G $100M’s in 20213 $10M’s in 20211 A N Y W H E R E New products and segments (TV ads, eCommerce, app downloads, gaming...) Taboola News (mobile carriers, device manufacturers, CTV...) (1)(2)(3)Source: Company data, Revenues(3) Includes Connexity This Game Will Keep You Up All Night!Good Game | Sponsored GROWTH PROJECTIONS BASED PRIMARILY ON CORE BUSINESS - ANYTHING, ANYWHERE GROWTH INITIATIVES PROVIDE UPSIDE
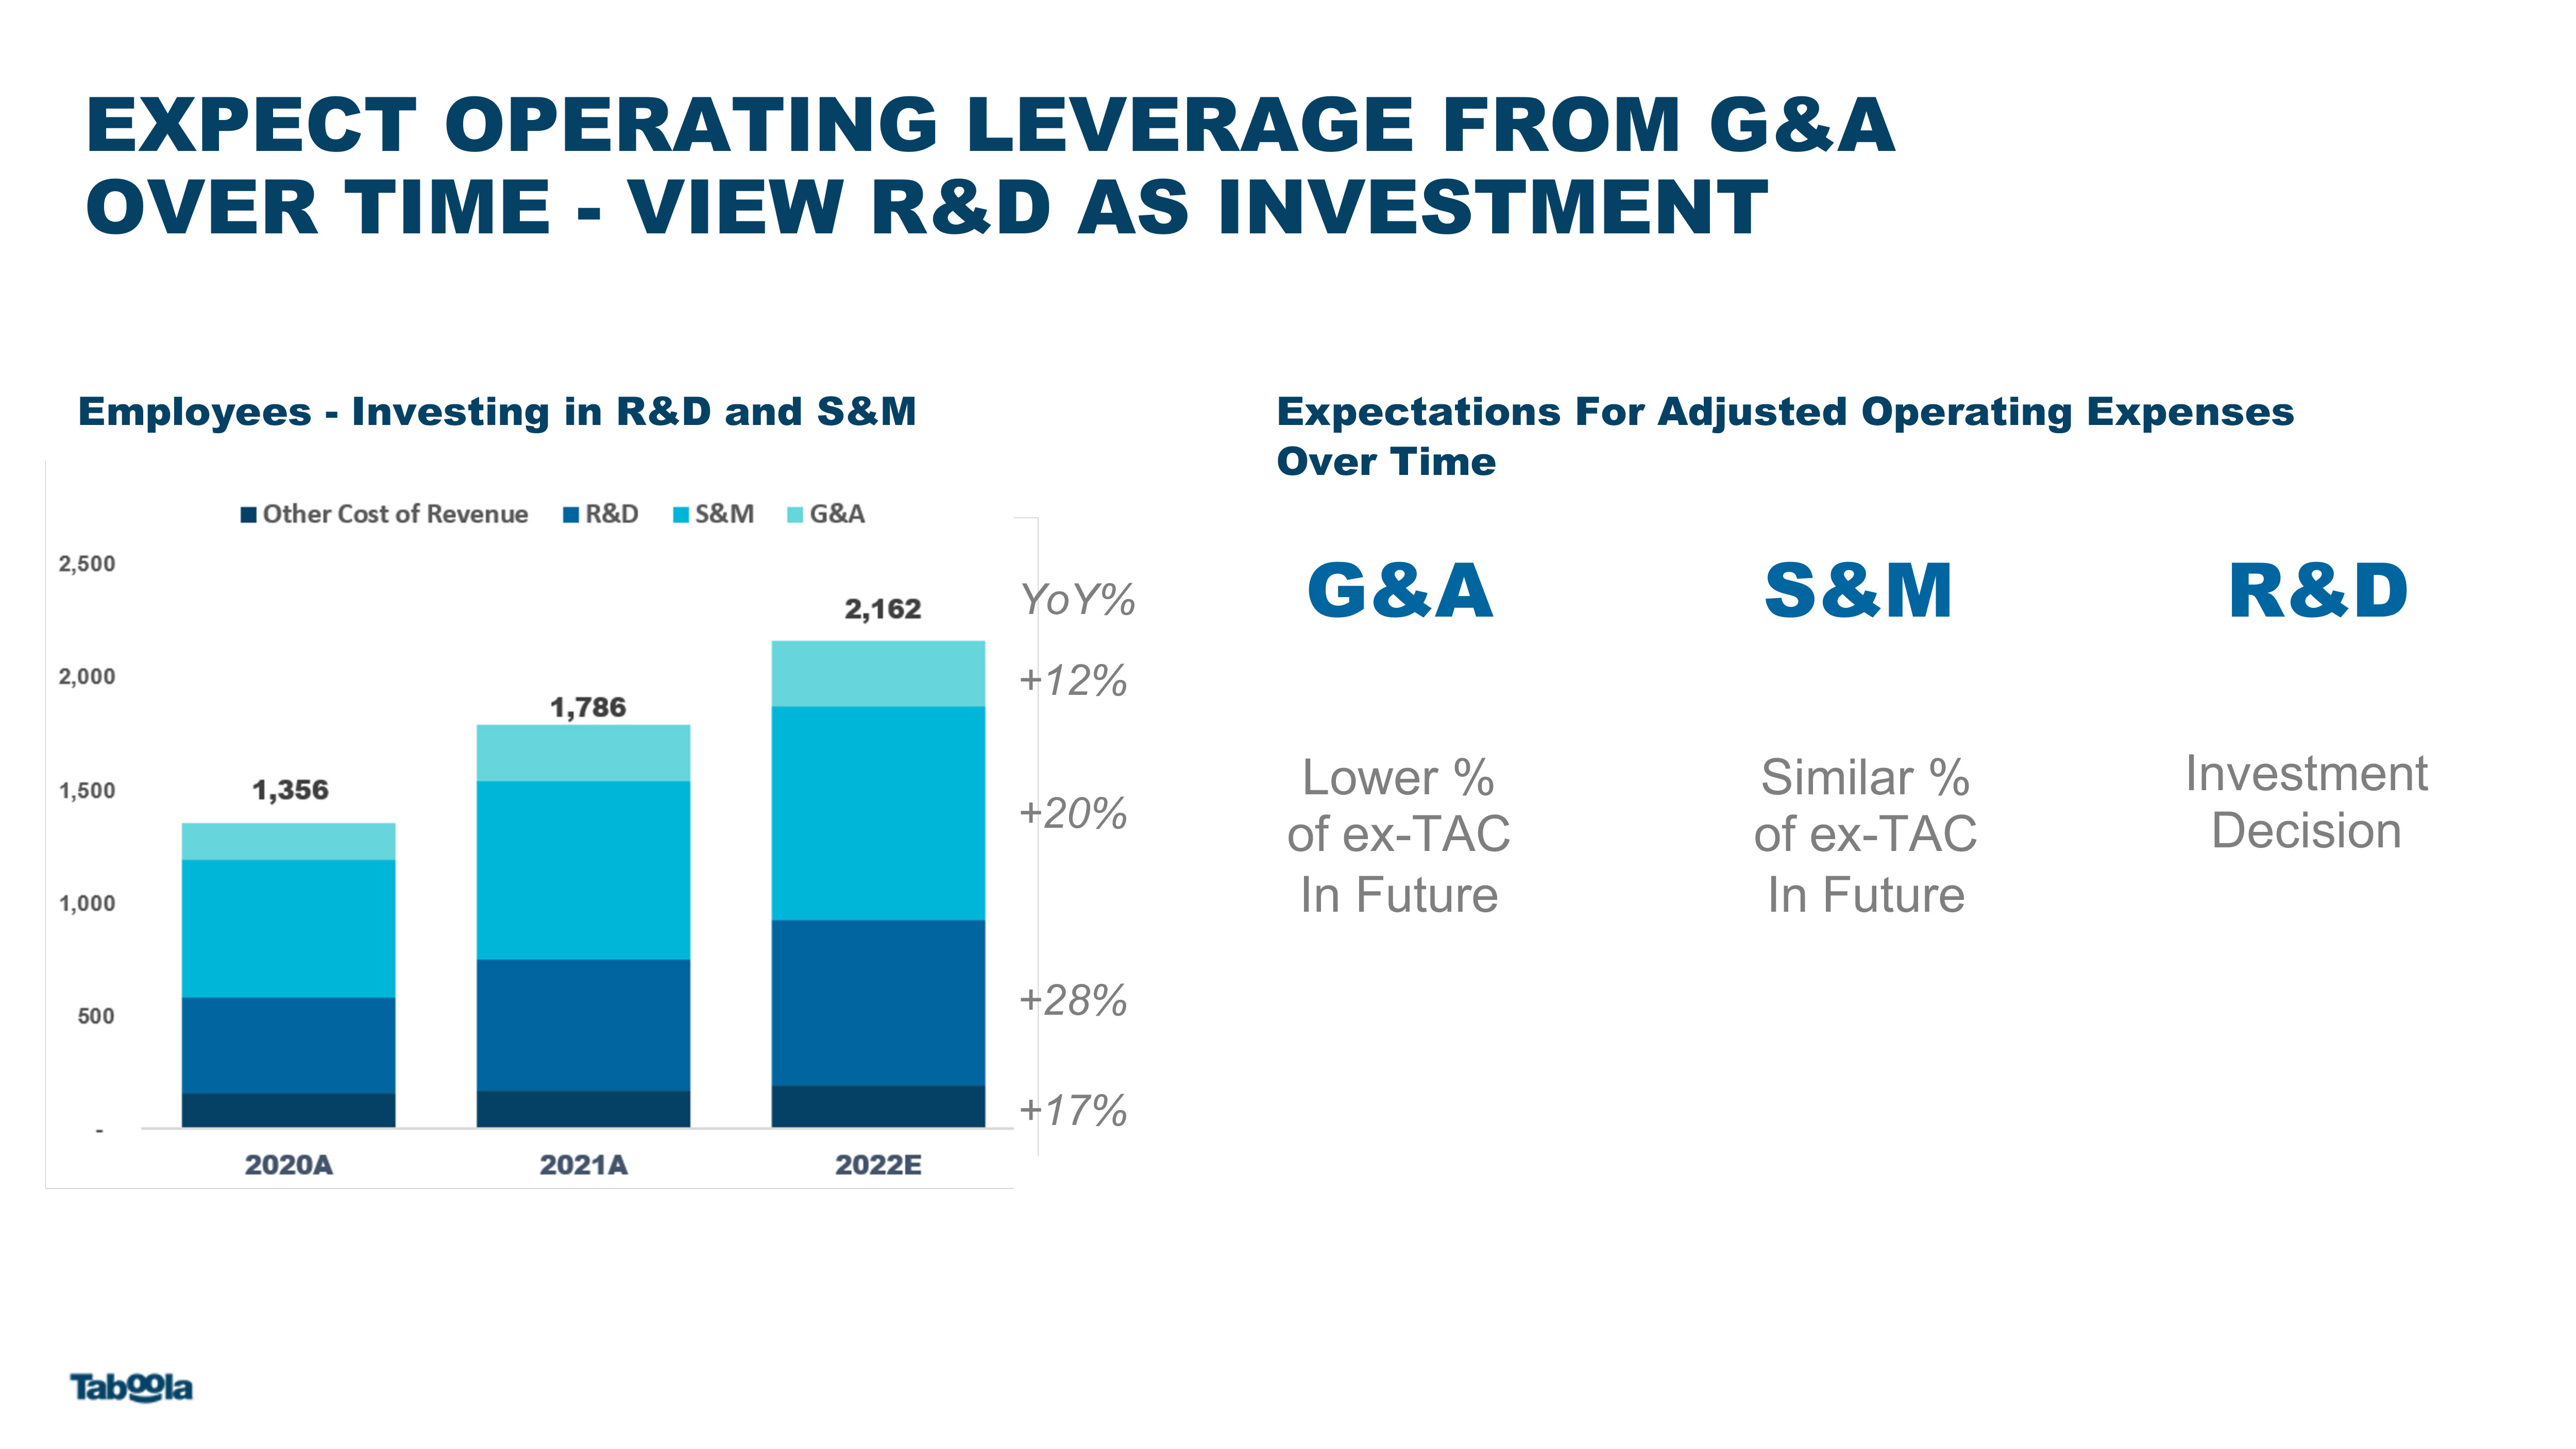
EXPECT OPERATING LEVERAGE FROM G&A OVER TIME - VIEW R&D AS INVESTMENT Employees - Investing in R&D and S&M Expectations For Adjusted Operating Expenses Over Time +28% +20% +17% +12% YoY% R&D S&M G&A Lower % of ex-TAC In Future Similar % of ex-TAC In Future Investment Decision

STRONG FINANCIAL PROFILE2022 ESTIMATES ARE GUIDANCE MIDPOINTS HIGH PROFITABILITY FAST GROWING STRONG BALANCE SHEET GENERATING CASH FLOW 23% 25.8% $319M $146M $605M 2022E ex-TAC1 $156M 2022E Adj. EBITDA2 $32M Q1 2022 Net Cash3 Strong Positive Free Cash Flow Generation Five Year Compounded ex-TAC Growth Rate4 2022 Adjusted EBITDAMargin %2 Q1 2022 Cash Balance5 Free Cash Flow Cumulative in 2020 and 2021 Non-GAAP measure; see appendix for reconciliation to GAAP Non-GAAP measure; see Note in appendix regarding Adjusted EBITDA Reconciliation. Non-GAAP measure; calculated as March 31, 2022 Cash, cash equivalents and short-term deposits and restricted cash of $319 million minus long-term loan (including current portion) of $288 million. The Company’s current estimate of minimum cash and cash equivalents needed for working capital is $80-100 million. This estimate is only one factor considered in evaluating capital allocation and is subject to change at any time without notice.Growth Rate includes actual results for 2017-2021 plus 2022E results based on the midpoint of guidance.Cash, cash equivalents, short-term deposits and short-term restricted cash
Thank you. 46

APPENDIX
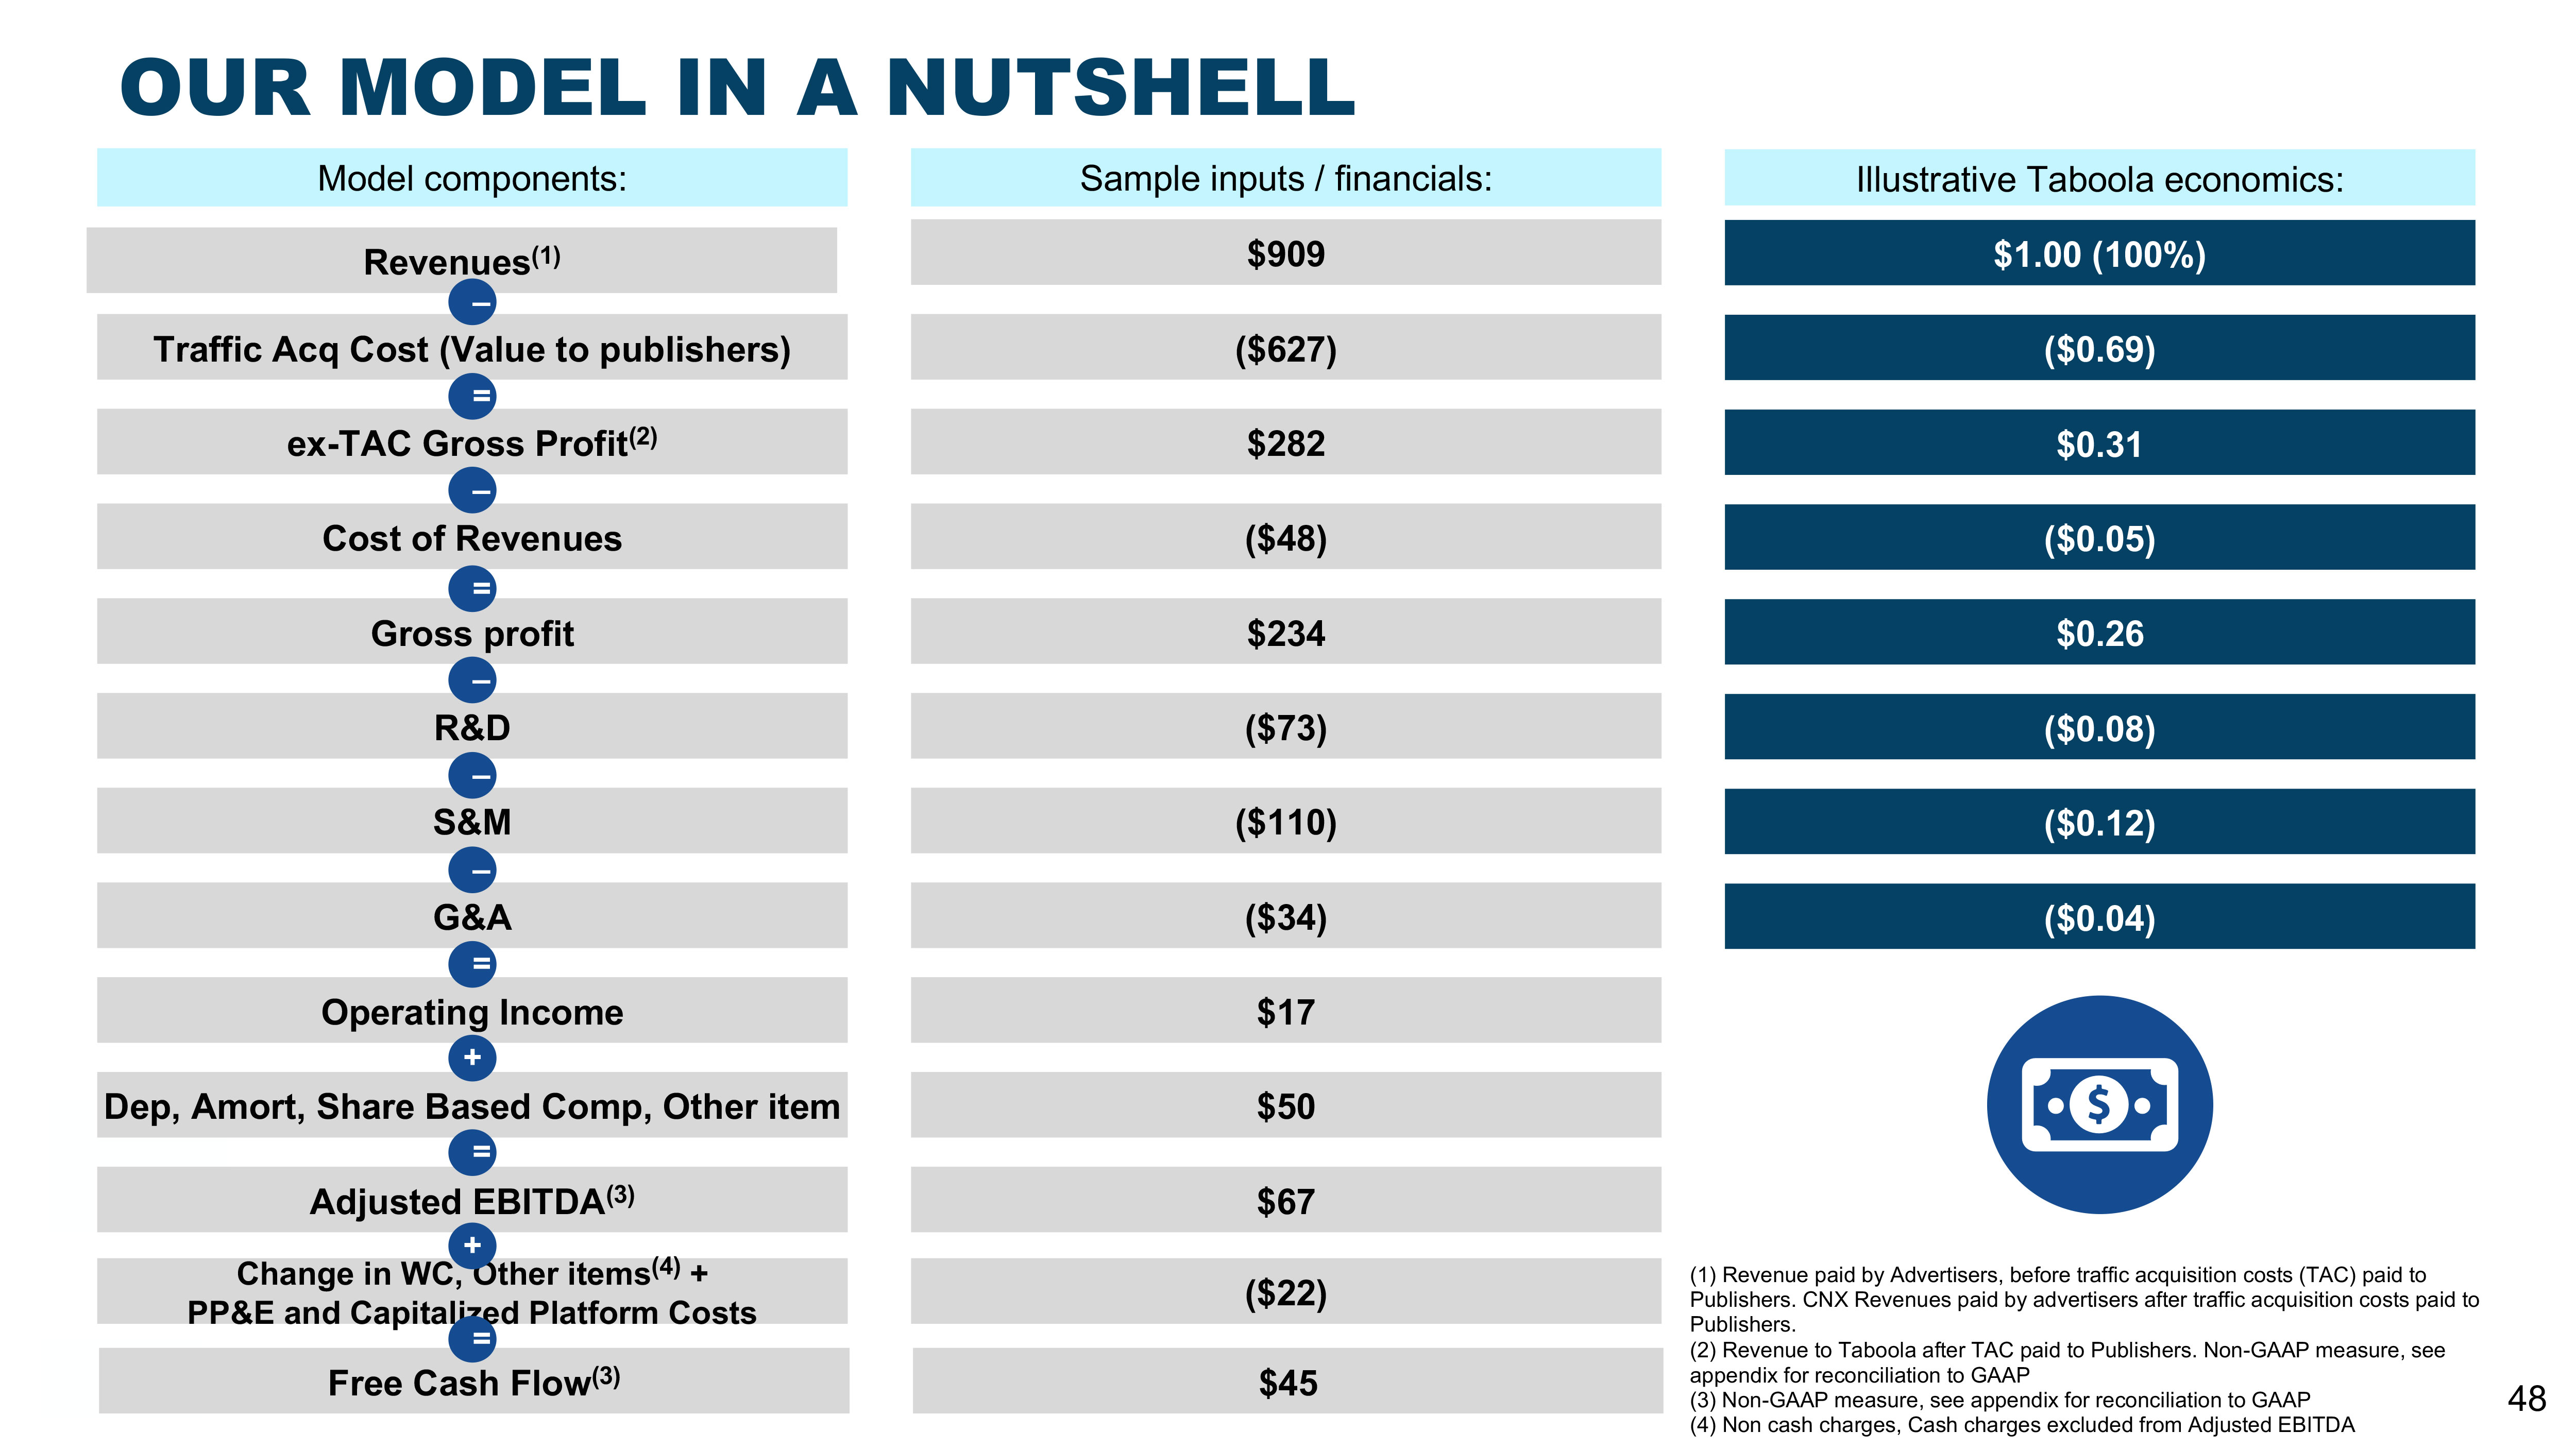
OUR MODEL IN A NUTSHELL 48 Revenues(1) Traffic Acq Cost (Value to publishers) ex-TAC Gross Profit(2) Cost of Revenues Gross profit R&D S&M G&A Operating Income $909 ($627) $282 ($48) $234 ($73) ($110) ($34) $17 $1.00 (100%) ($0.69) $0.31 ($0.05) $0.26 ($0.08) ($0.12) ($0.04) – = – = – – – = Model components: Sample inputs / financials: Illustrative Taboola economics: (1) Revenue paid by Advertisers, before traffic acquisition costs (TAC) paid to Publishers. CNX Revenues paid by advertisers after traffic acquisition costs paid to Publishers.(2) Revenue to Taboola after TAC paid to Publishers. Non-GAAP measure, see appendix for reconciliation to GAAP(3) Non-GAAP measure, see appendix for reconciliation to GAAP(4) Non cash charges, Cash charges excluded from Adjusted EBITDA 48 Adjusted EBITDA(3) $67 Dep, Amort, Share Based Comp, Other item $50 + = Change in WC, Other items(4) + PP&E and Capitalized Platform Costs ($22) Free Cash Flow(3) $45 + =
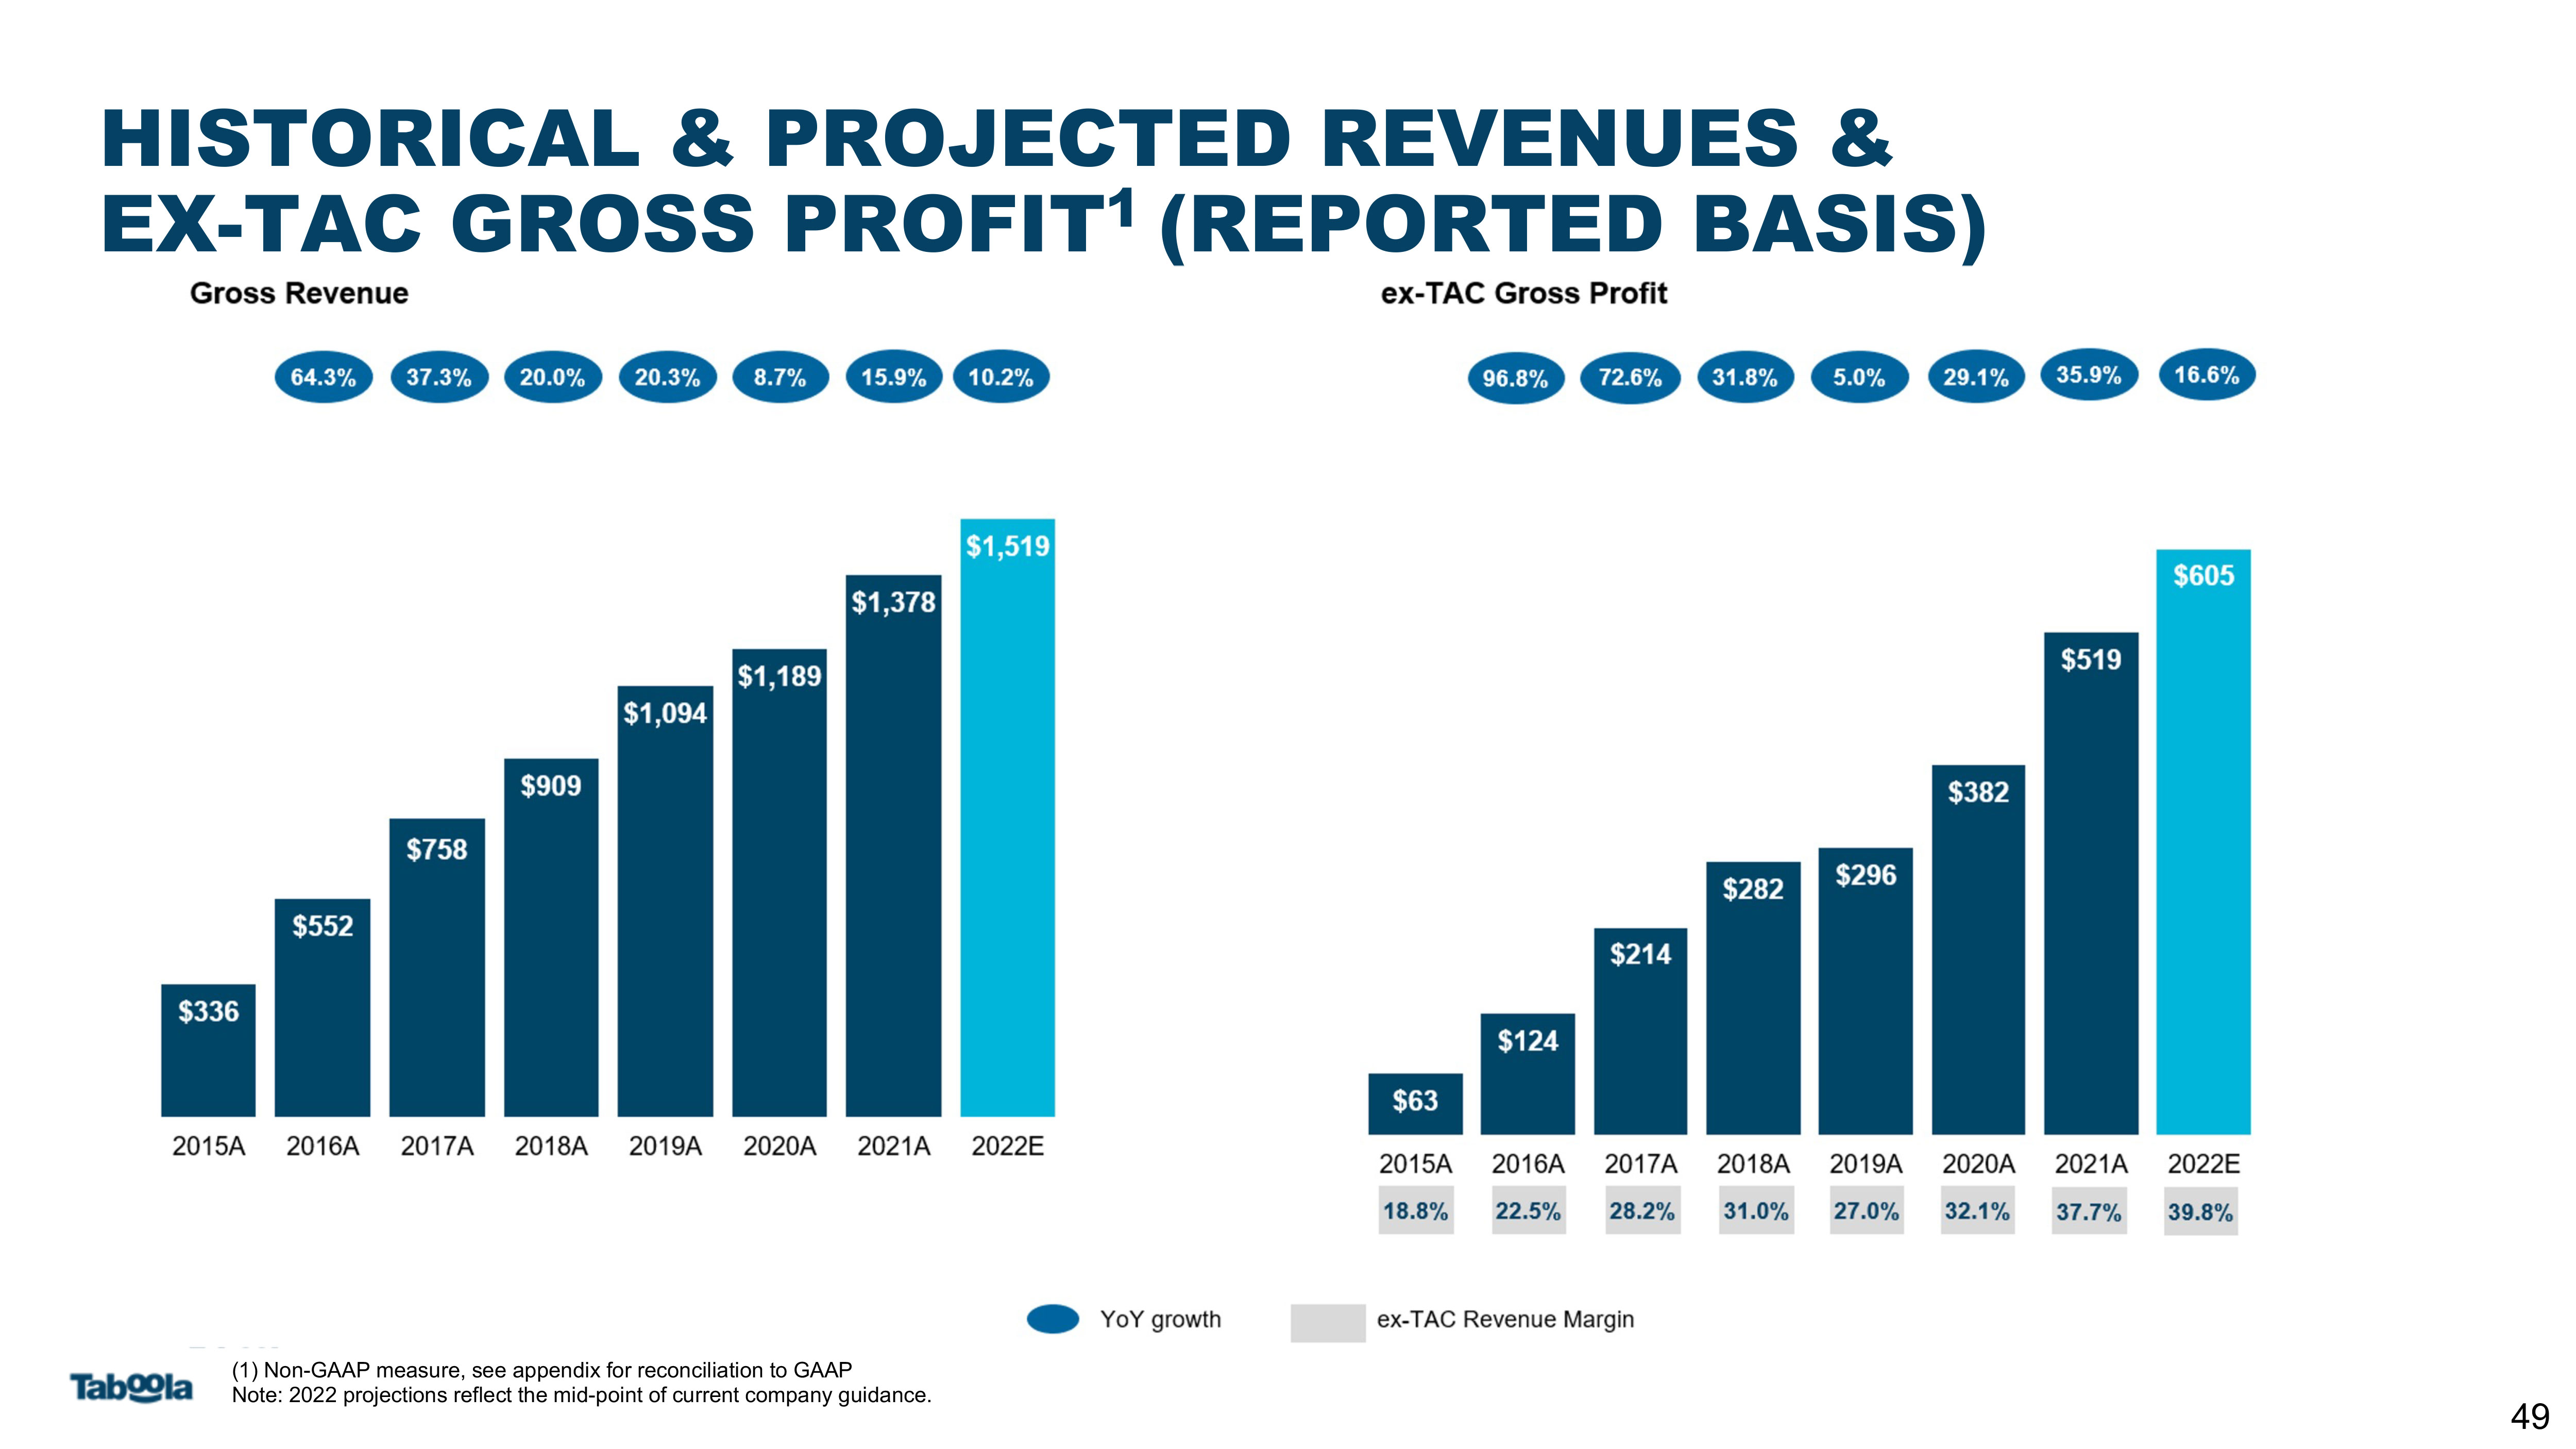
HISTORICAL & PROJECTED REVENUES & EX-TAC GROSS PROFIT1 (REPORTED BASIS) 49 (1) Non-GAAP measure, see appendix for reconciliation to GAAPNote: 2022 projections reflect the mid-point of current company guidance.
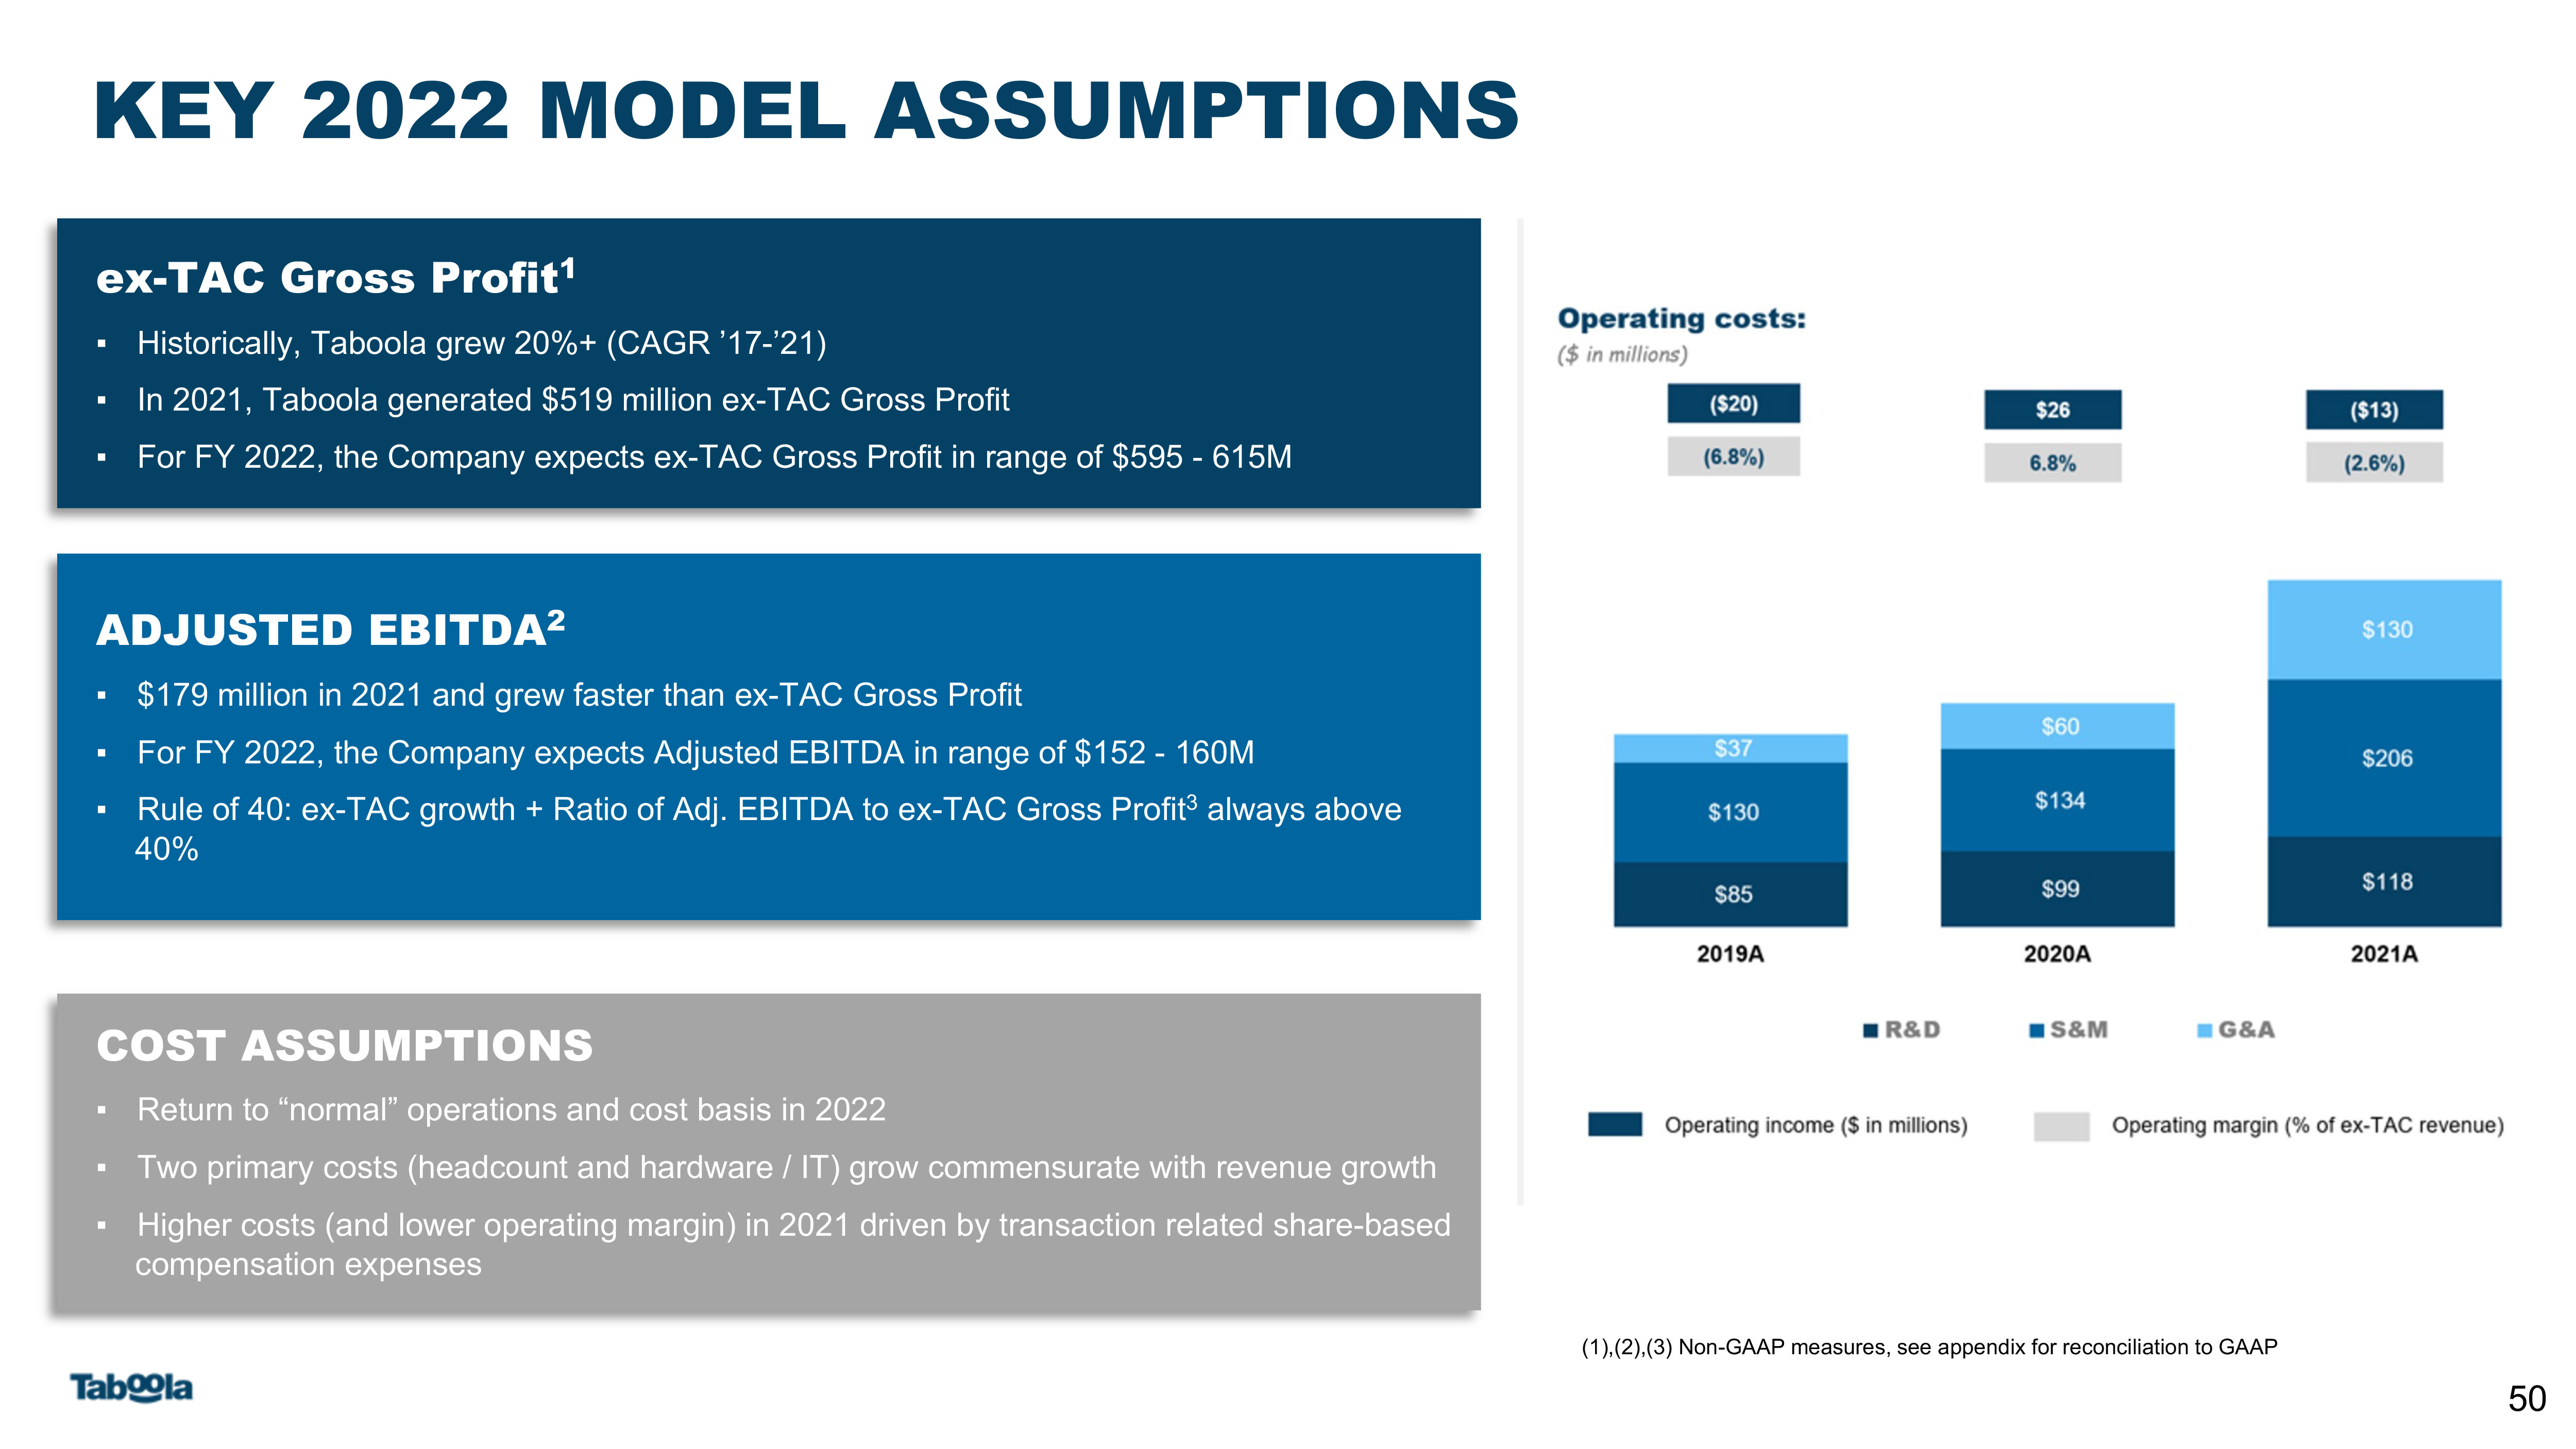
KEY 2022 MODEL ASSUMPTIONS ex-TAC Gross Profit1Historically, Taboola grew 20%+ (CAGR ’17-’21) In 2021, Taboola generated $519 million ex-TAC Gross Profit For FY 2022, the Company expects ex-TAC Gross Profit in range of $595 - 615M ADJUSTED EBITDA2$179 million in 2021 and grew faster than ex-TAC Gross Profit For FY 2022, the Company expects Adjusted EBITDA in range of $152 - 160MRule of 40: ex-TAC growth + Ratio of Adj. EBITDA to ex-TAC Gross Profit3 always above 40% COST ASSUMPTIONSReturn to “normal” operations and cost basis in 2022Two primary costs (headcount and hardware / IT) grow commensurate with revenue growthHigher costs (and lower operating margin) in 2021 driven by transaction related share-based compensation expenses (1),(2),(3) Non-GAAP measures, see appendix for reconciliation to GAAP 50

SELECTED GAAP AND NON-GAAP METRICS 51 1 2 (1)Non-GAAP measures, see appendix for reconciliation to GAAPNote: 2022 projections reflect the midpoint of current company guidance. 2 1 2 (1) (1)

(1) Non-GAAP measure, see appendix for reconciliation to GAAP FY 2022 GUIDANCE 52 1 2 2 1 2 (1) 1

ADDITIONAL MODELING ASSUMPTIONS Interest expense of approximately $3.5M per quarter associated with $300M term loan related to the Connexity acquisitionShare based compensation of $128M in 2021 unusually high as a result of going public triggering event, 2022 estimated at $80MDepreciation & Amortization of $53M in 2021; increase related to Connexity Purchase Price Accounting allocation, 2022 estimated at $93MCAPEX estimated to be $39M in 2022 and includes investments in property and equipment, leasehold improvements and capitalized softwareFree Cash Flow expected to be 60% of Adjusted EBITDA in long-term models 53
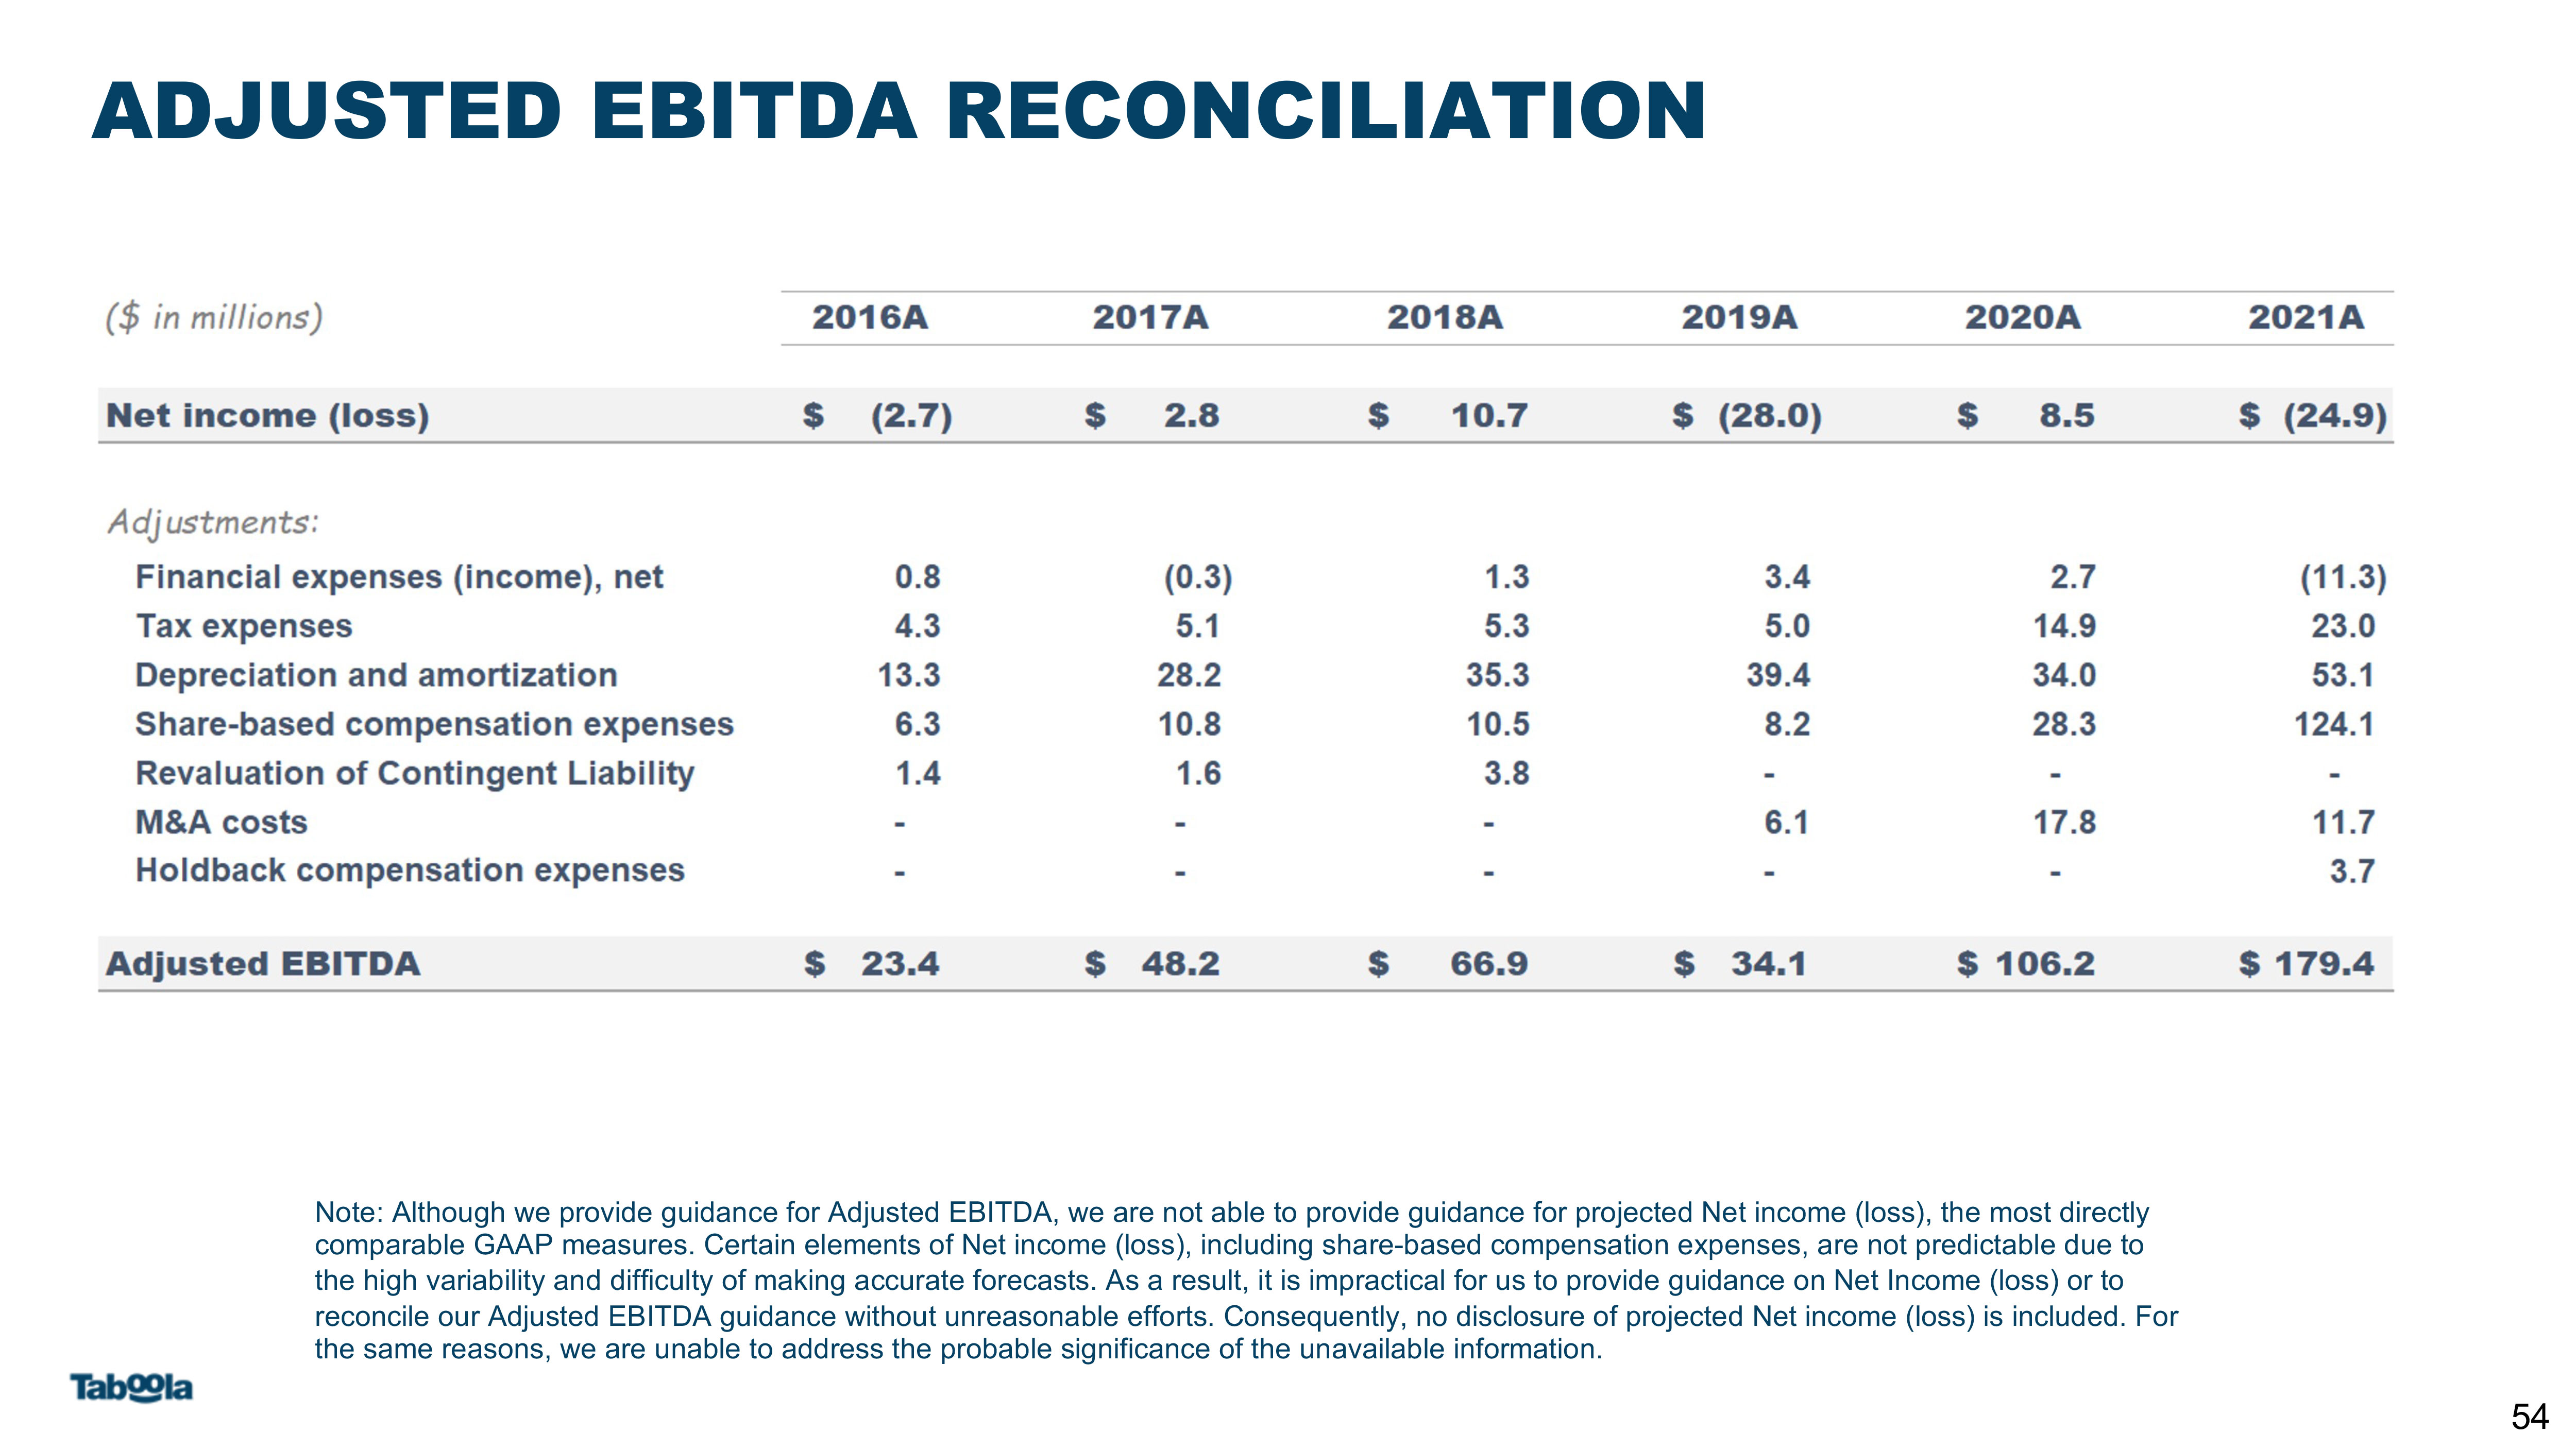
ADJUSTED EBITDA RECONCILIATION 54 Note: Although we provide guidance for Adjusted EBITDA, we are not able to provide guidance for projected Net income (loss), the most directly comparable GAAP measures. Certain elements of Net income (loss), including share-based compensation expenses, are not predictable due to the high variability and difficulty of making accurate forecasts. As a result, it is impractical for us to provide guidance on Net Income (loss) or to reconcile our Adjusted EBITDA guidance without unreasonable efforts. Consequently, no disclosure of projected Net income (loss) is included. For the same reasons, we are unable to address the probable significance of the unavailable information.
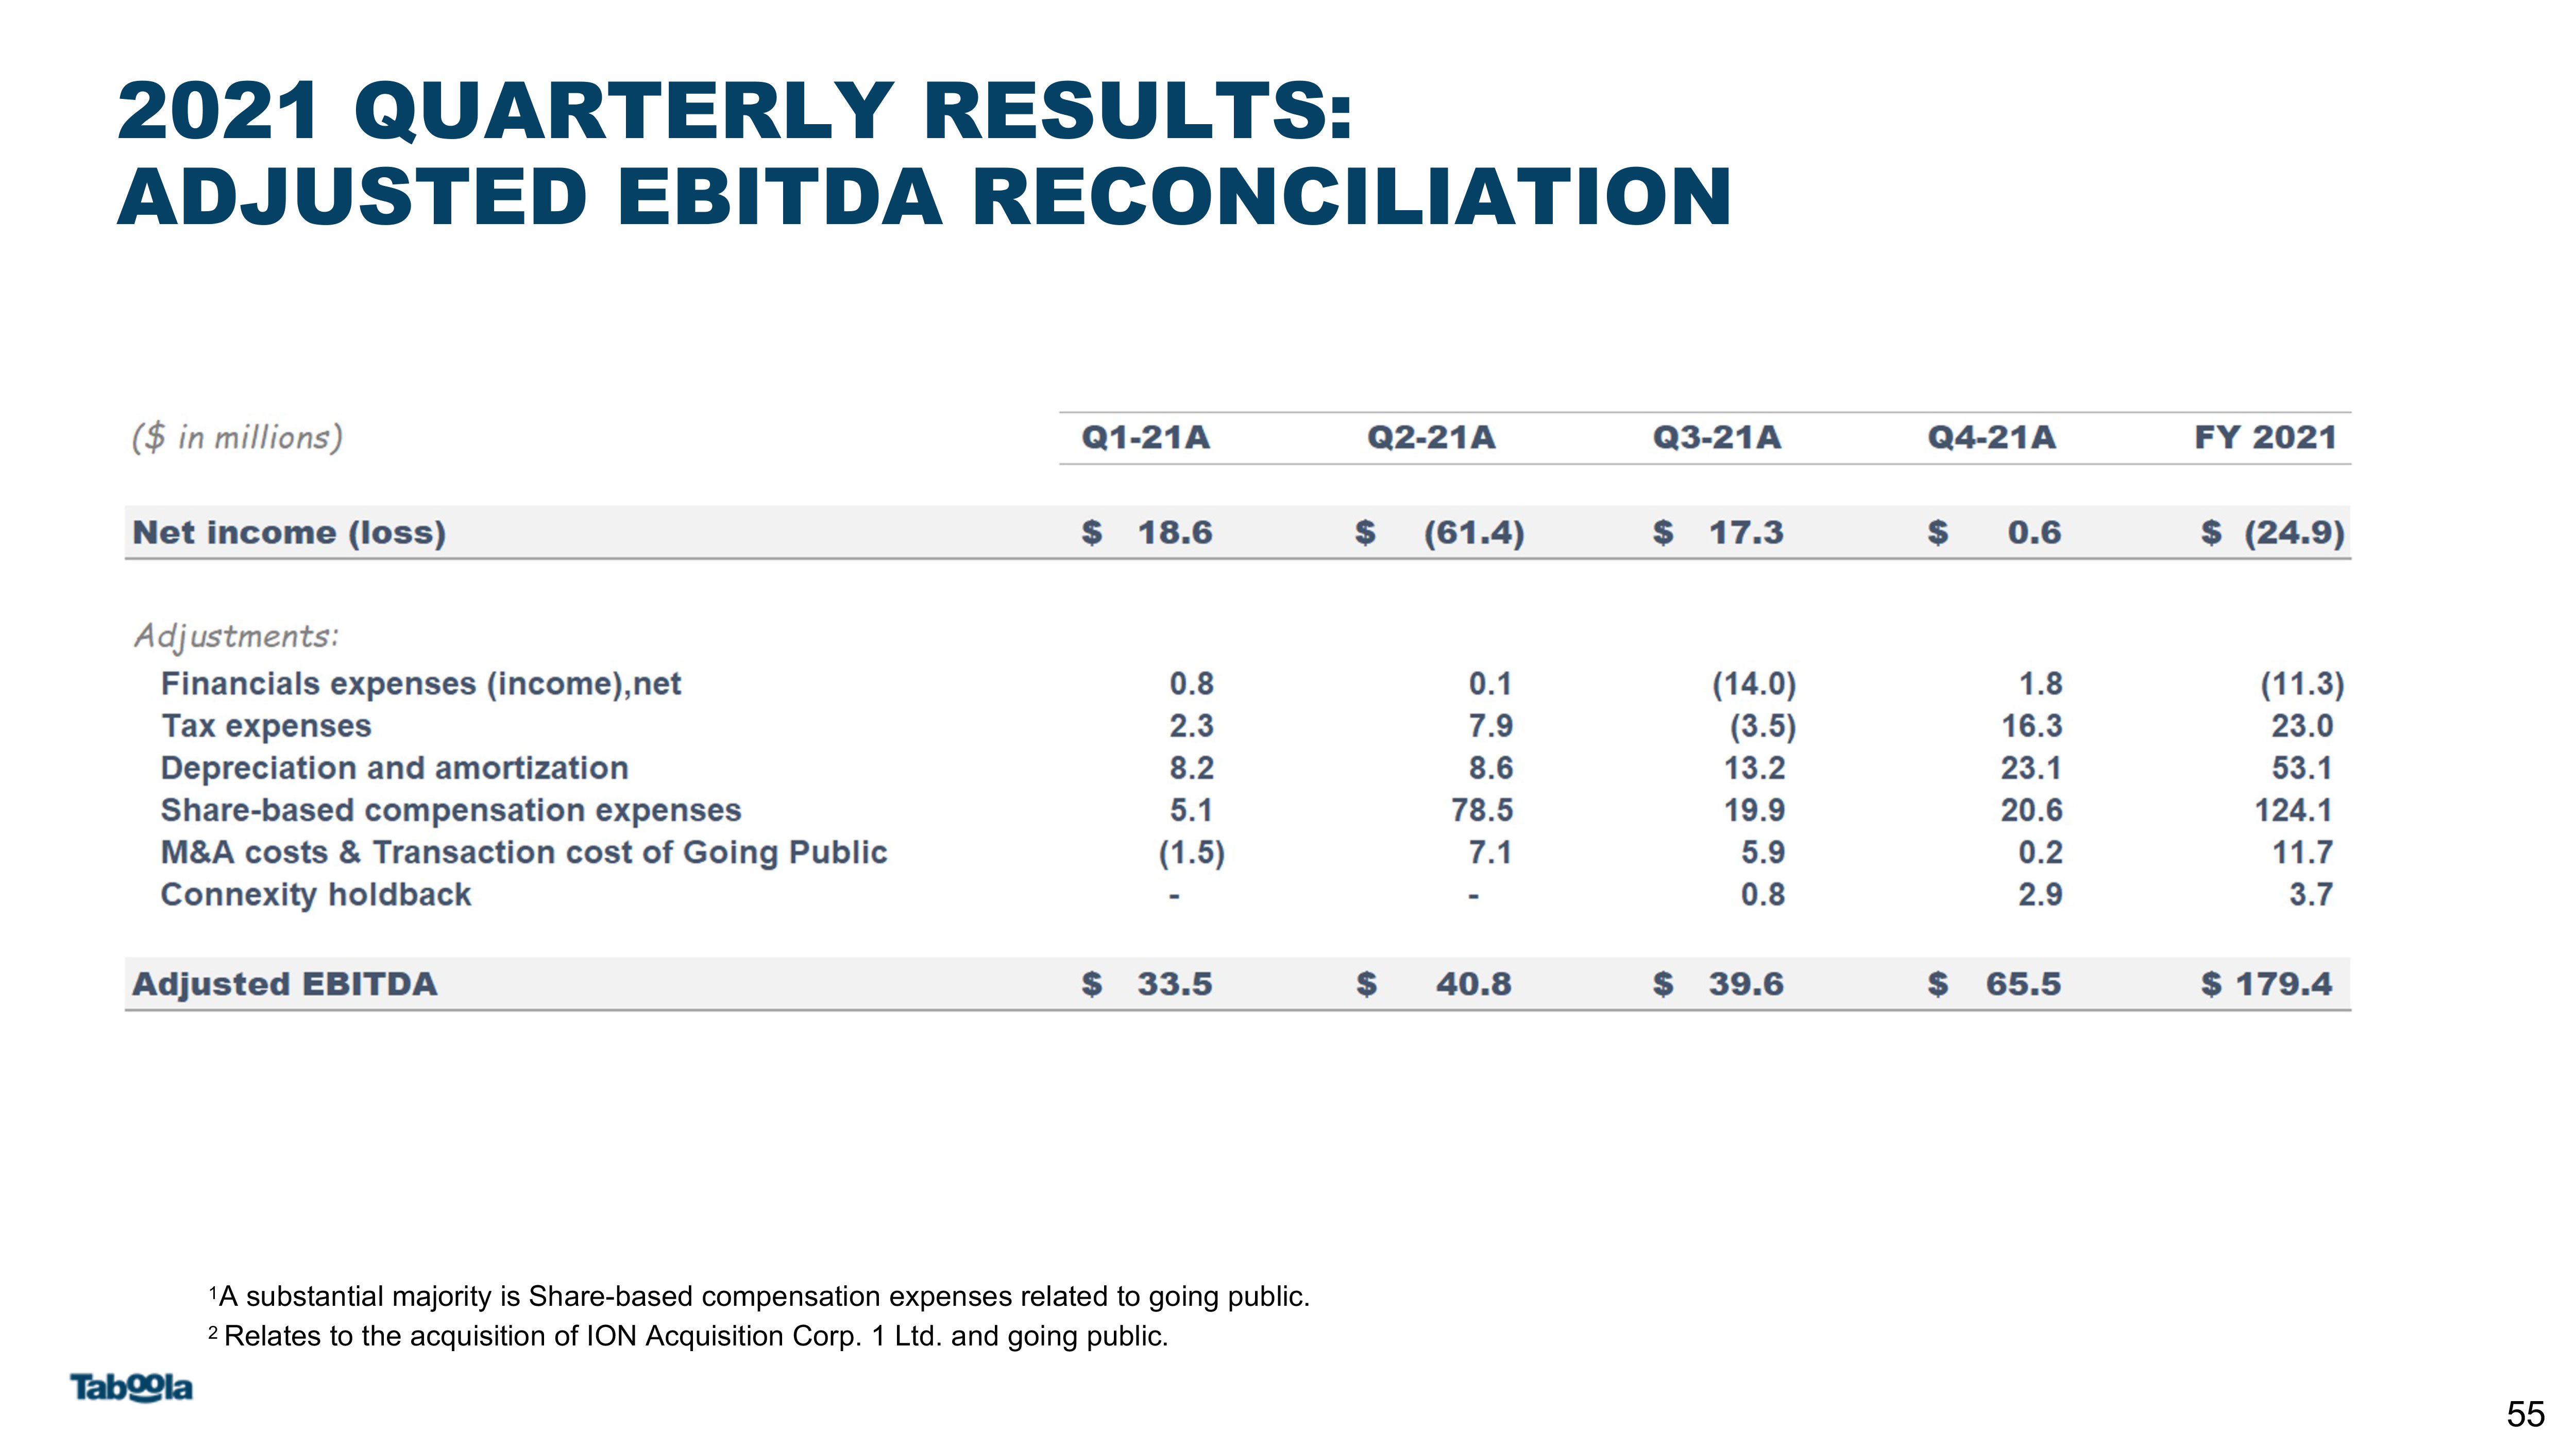
2021 QUARTERLY RESULTS:ADJUSTED EBITDA RECONCILIATION 55 1A substantial majority is Share-based compensation expenses related to going public.2 Relates to the acquisition of ION Acquisition Corp. 1 Ltd. and going public. 1 2
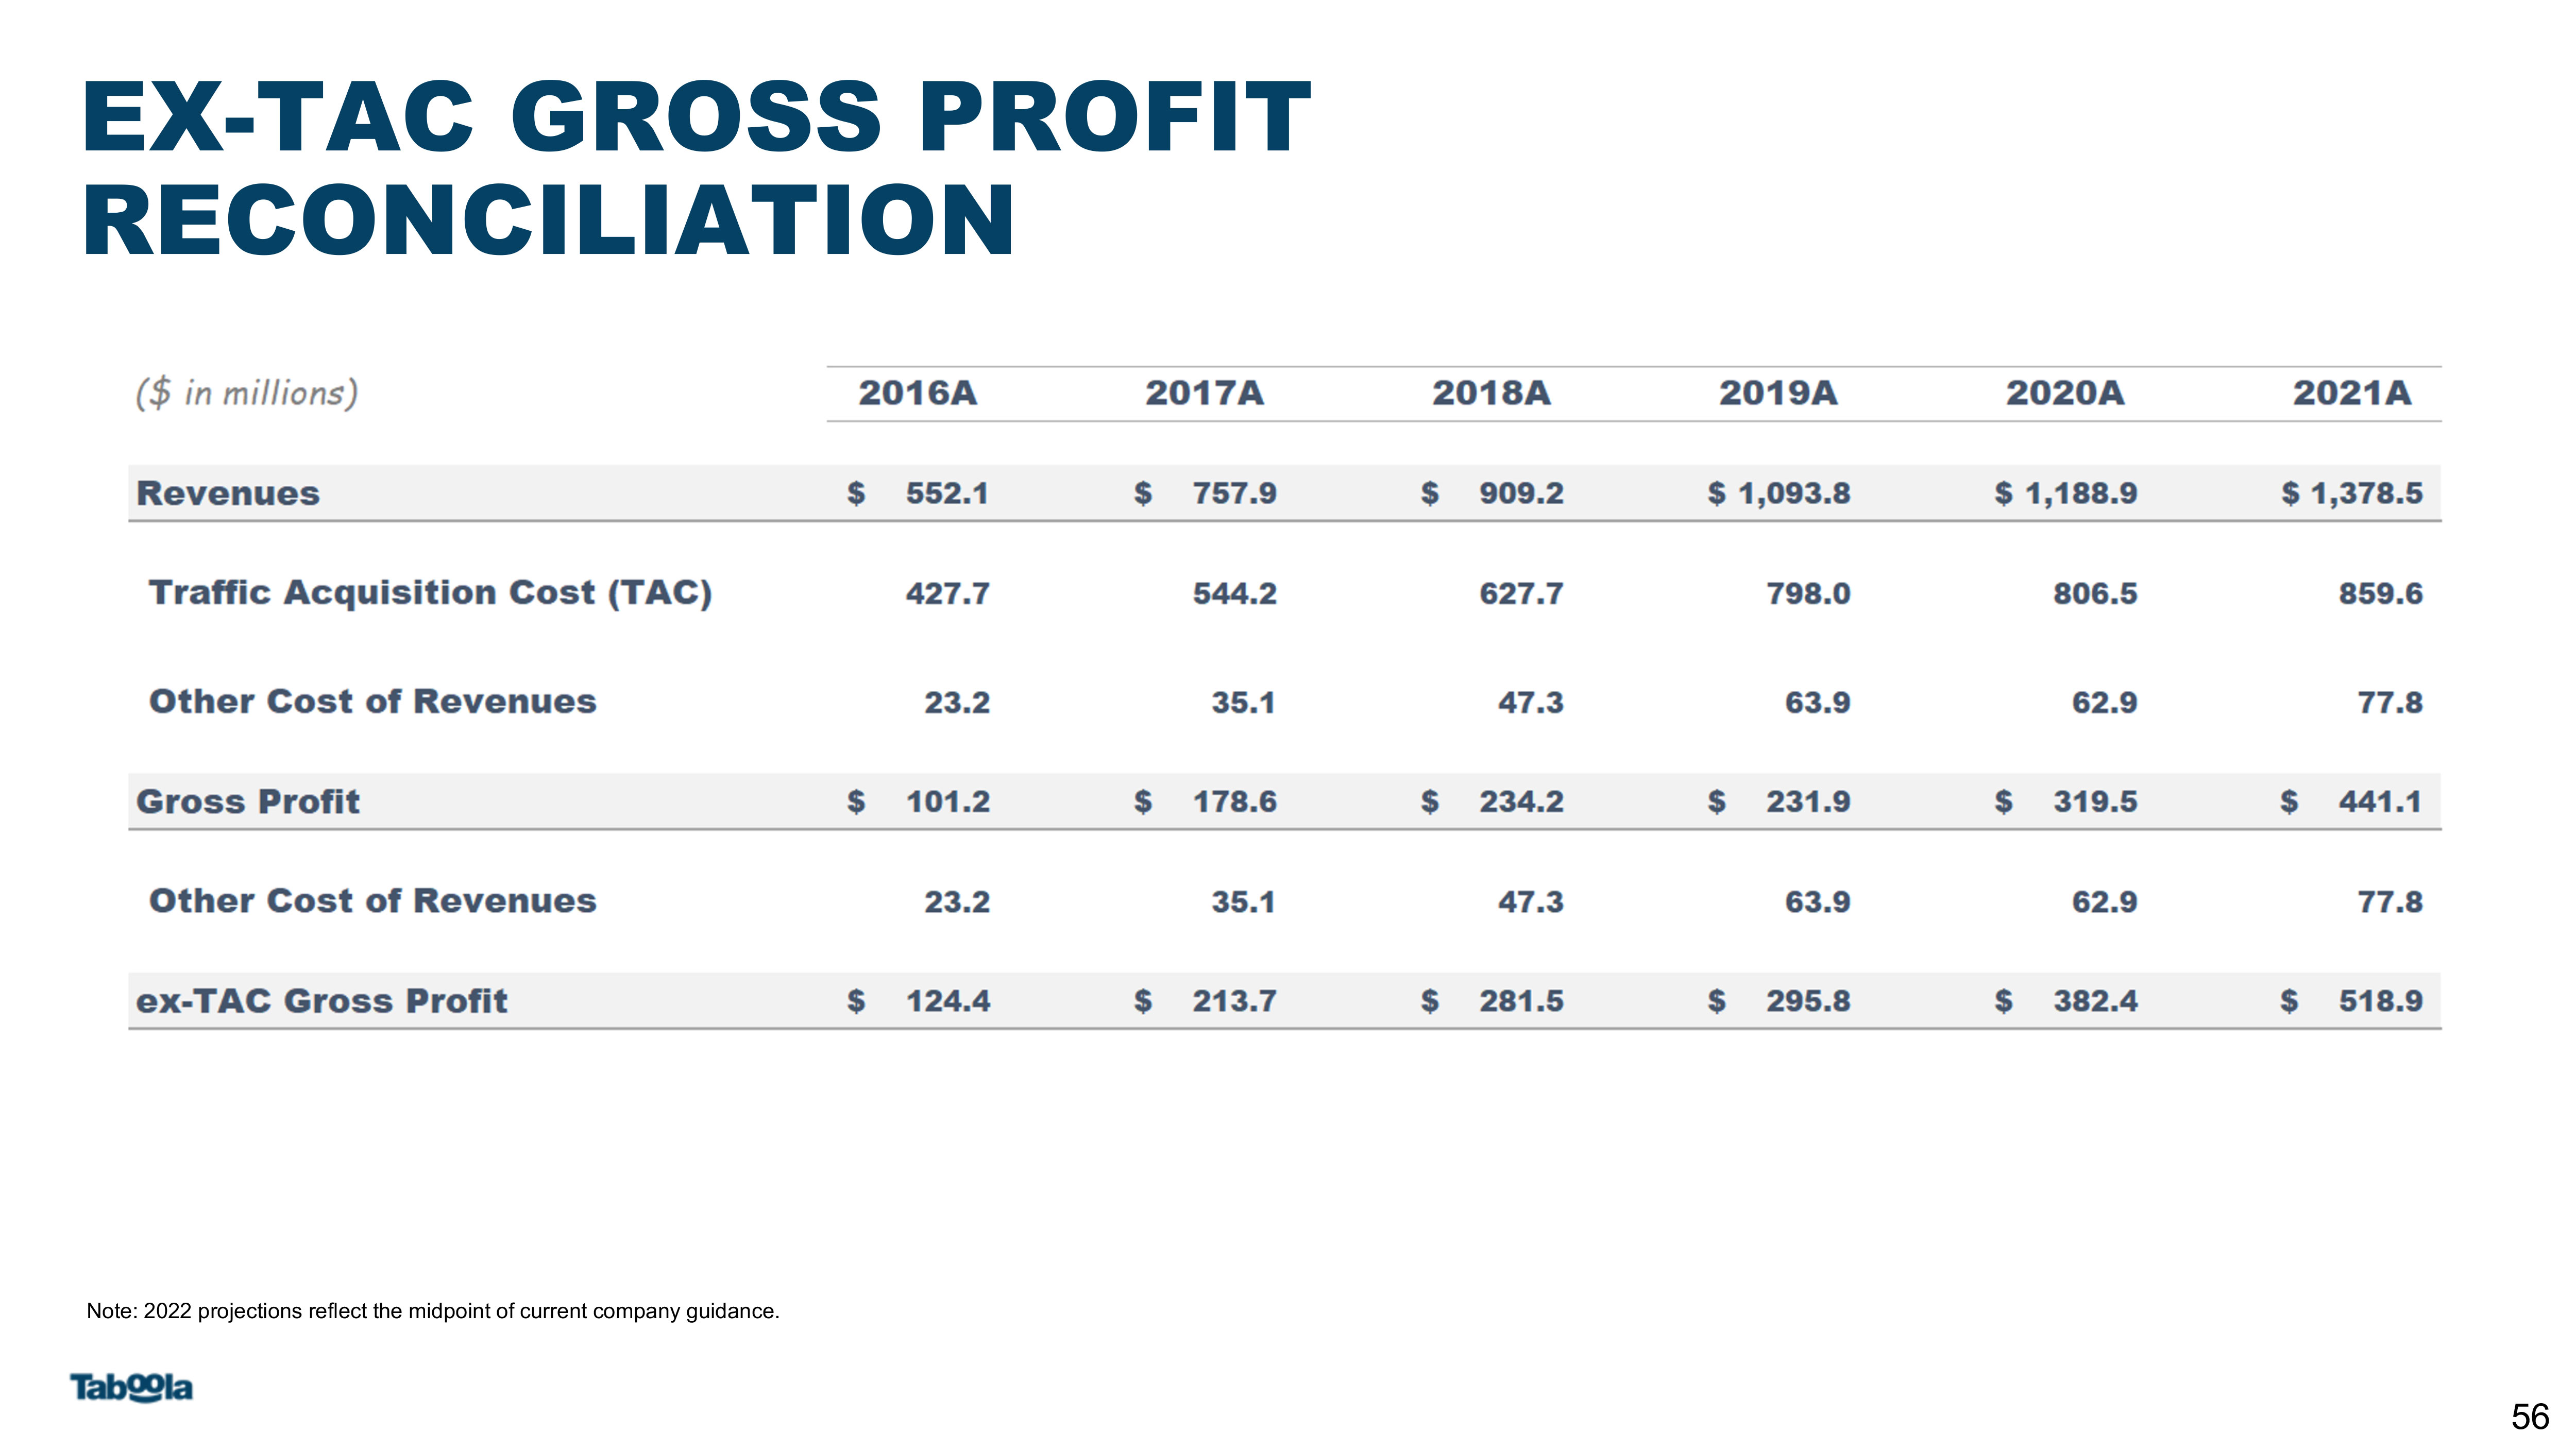
EX-TAC GROSS PROFIT RECONCILIATION 56 Note: 2022 projections reflect the midpoint of current company guidance.

RATIO OF ADJUSTED EBITDA TO EX-TAC GROSS PROFIT RECONCILIATION 57
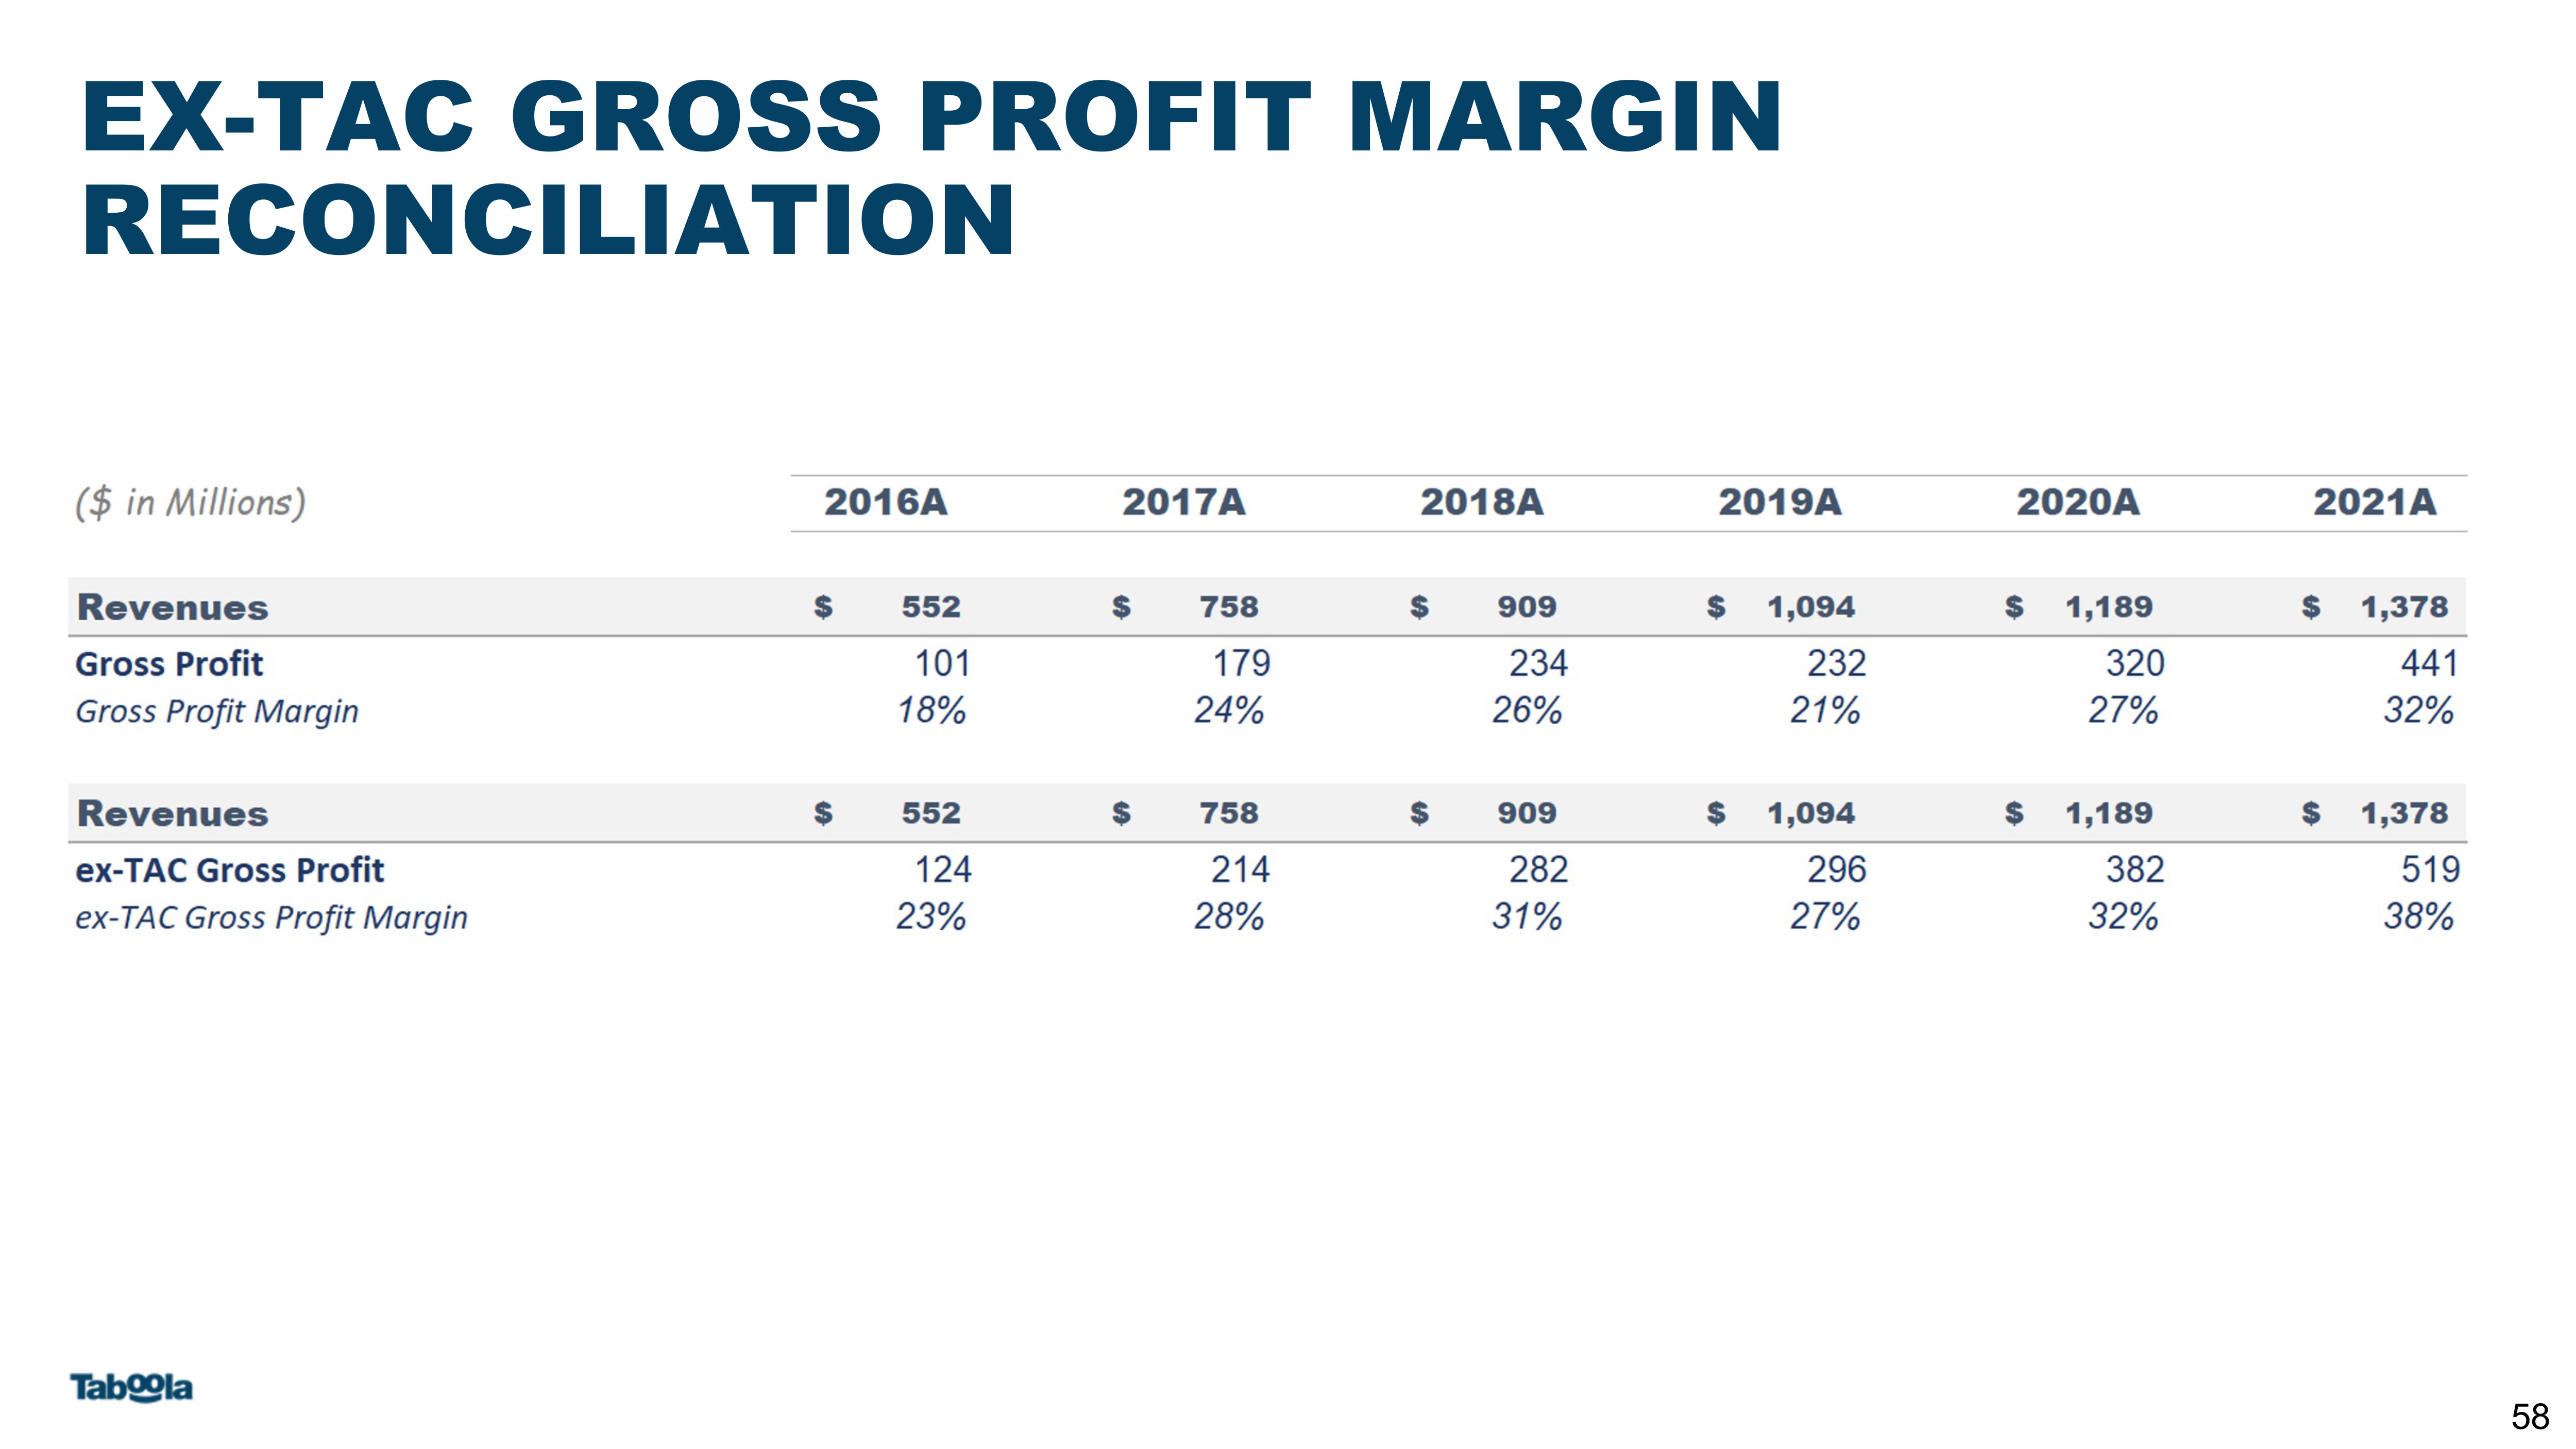
EX-TAC GROSS PROFIT MARGIN RECONCILIATION 58
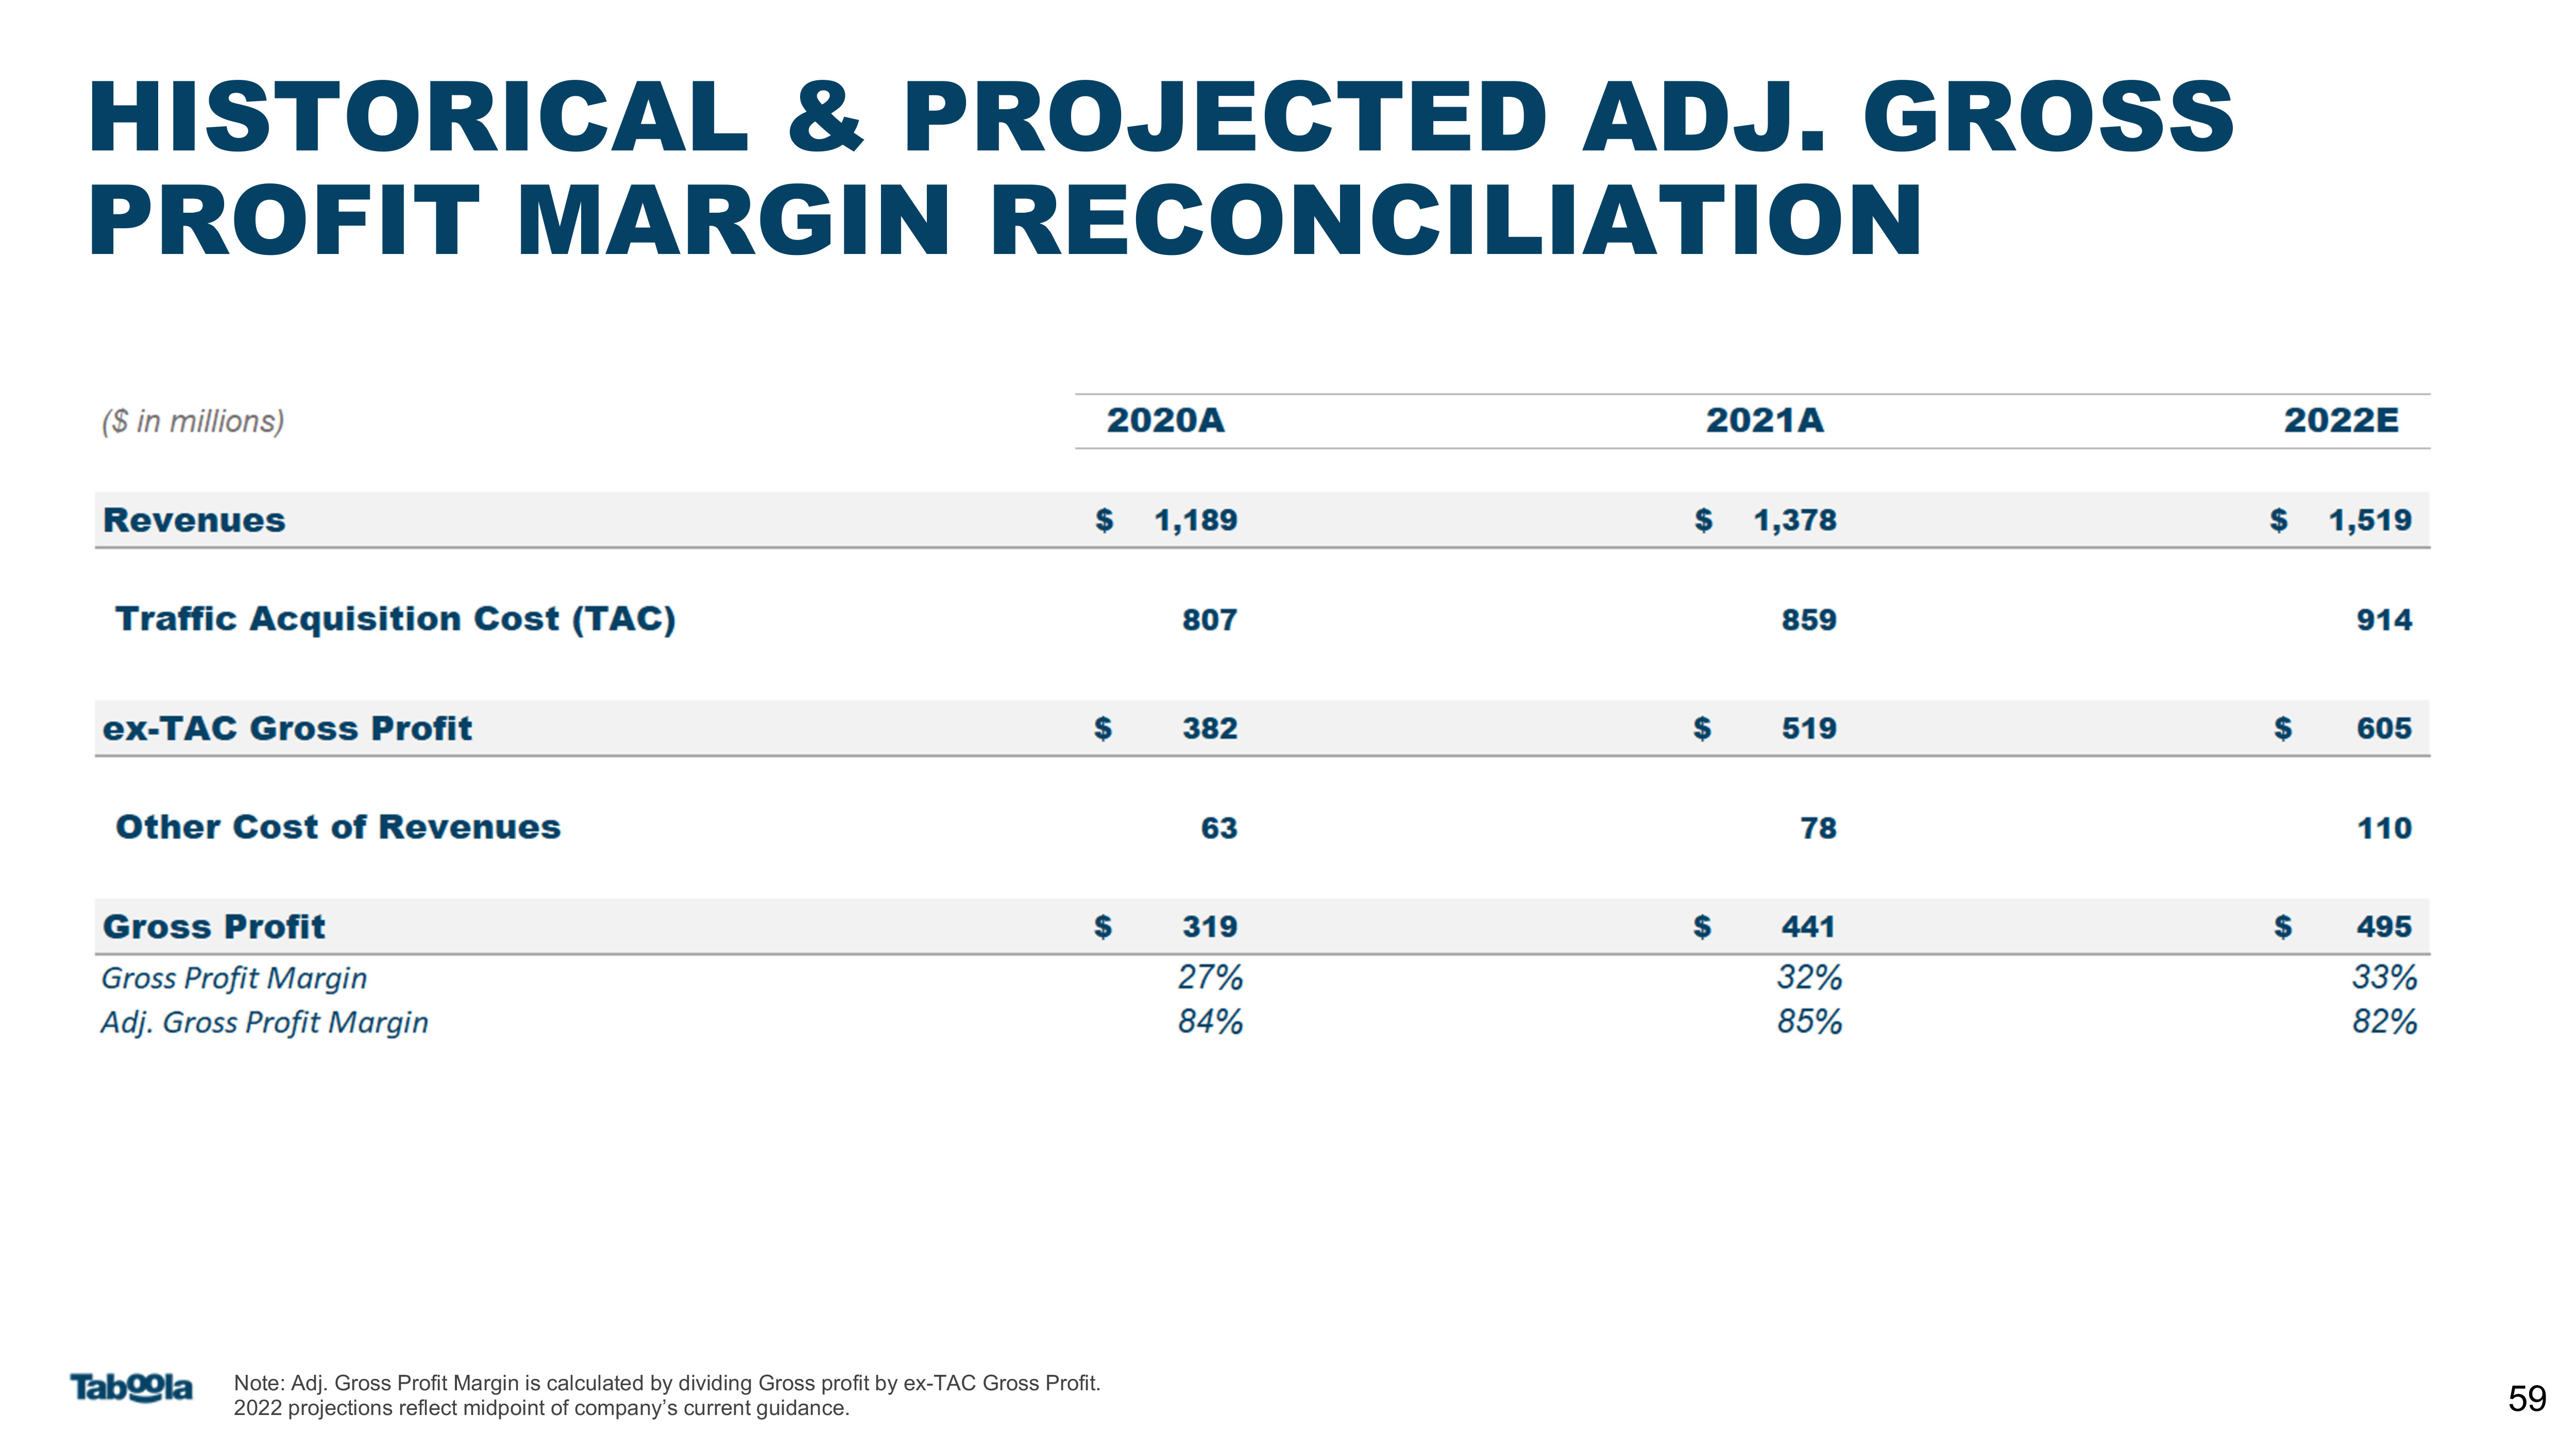
HISTORICAL & PROJECTED ADJ. GROSS PROFIT MARGIN RECONCILIATION Note: Adj. Gross Profit Margin is calculated by dividing Gross profit by ex-TAC Gross Profit. 2022 projections reflect midpoint of company’s current guidance. 59
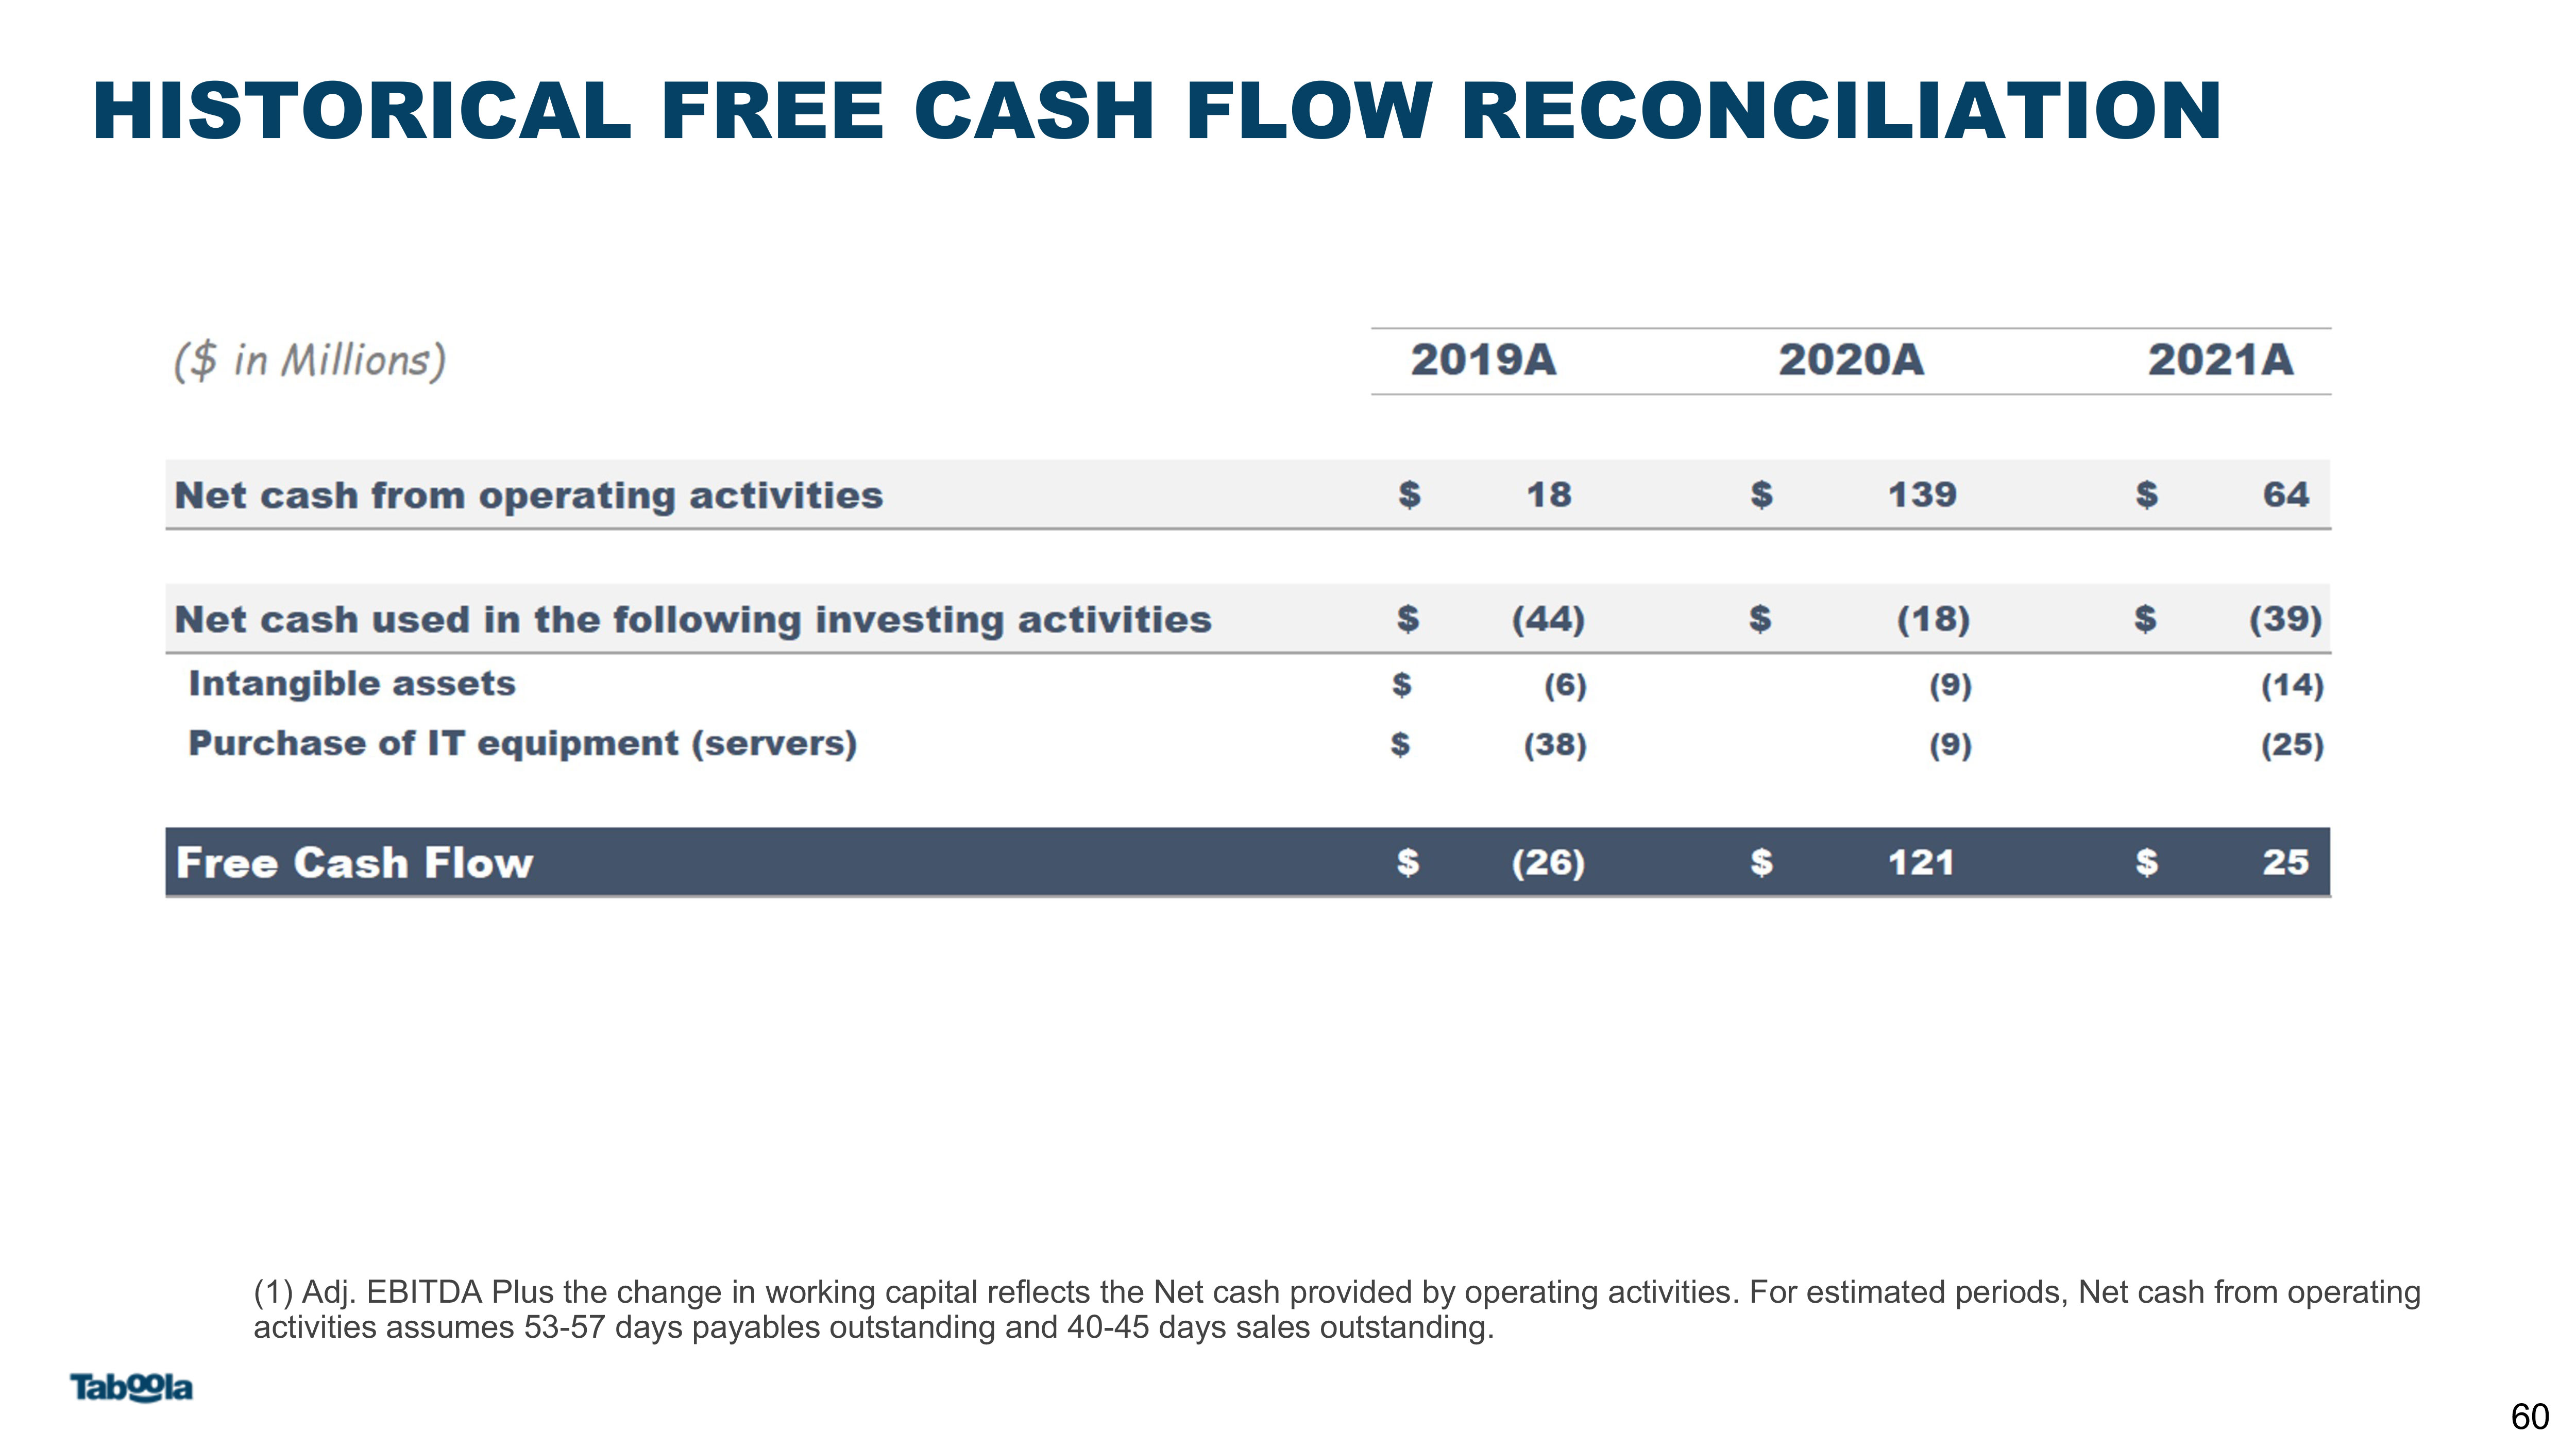
HISTORICAL FREE CASH FLOW RECONCILIATION (1) Adj. EBITDA Plus the change in working capital reflects the Net cash provided by operating activities. For estimated periods, Net cash from operating activities assumes 53-57 days payables outstanding and 40-45 days sales outstanding. 60 1
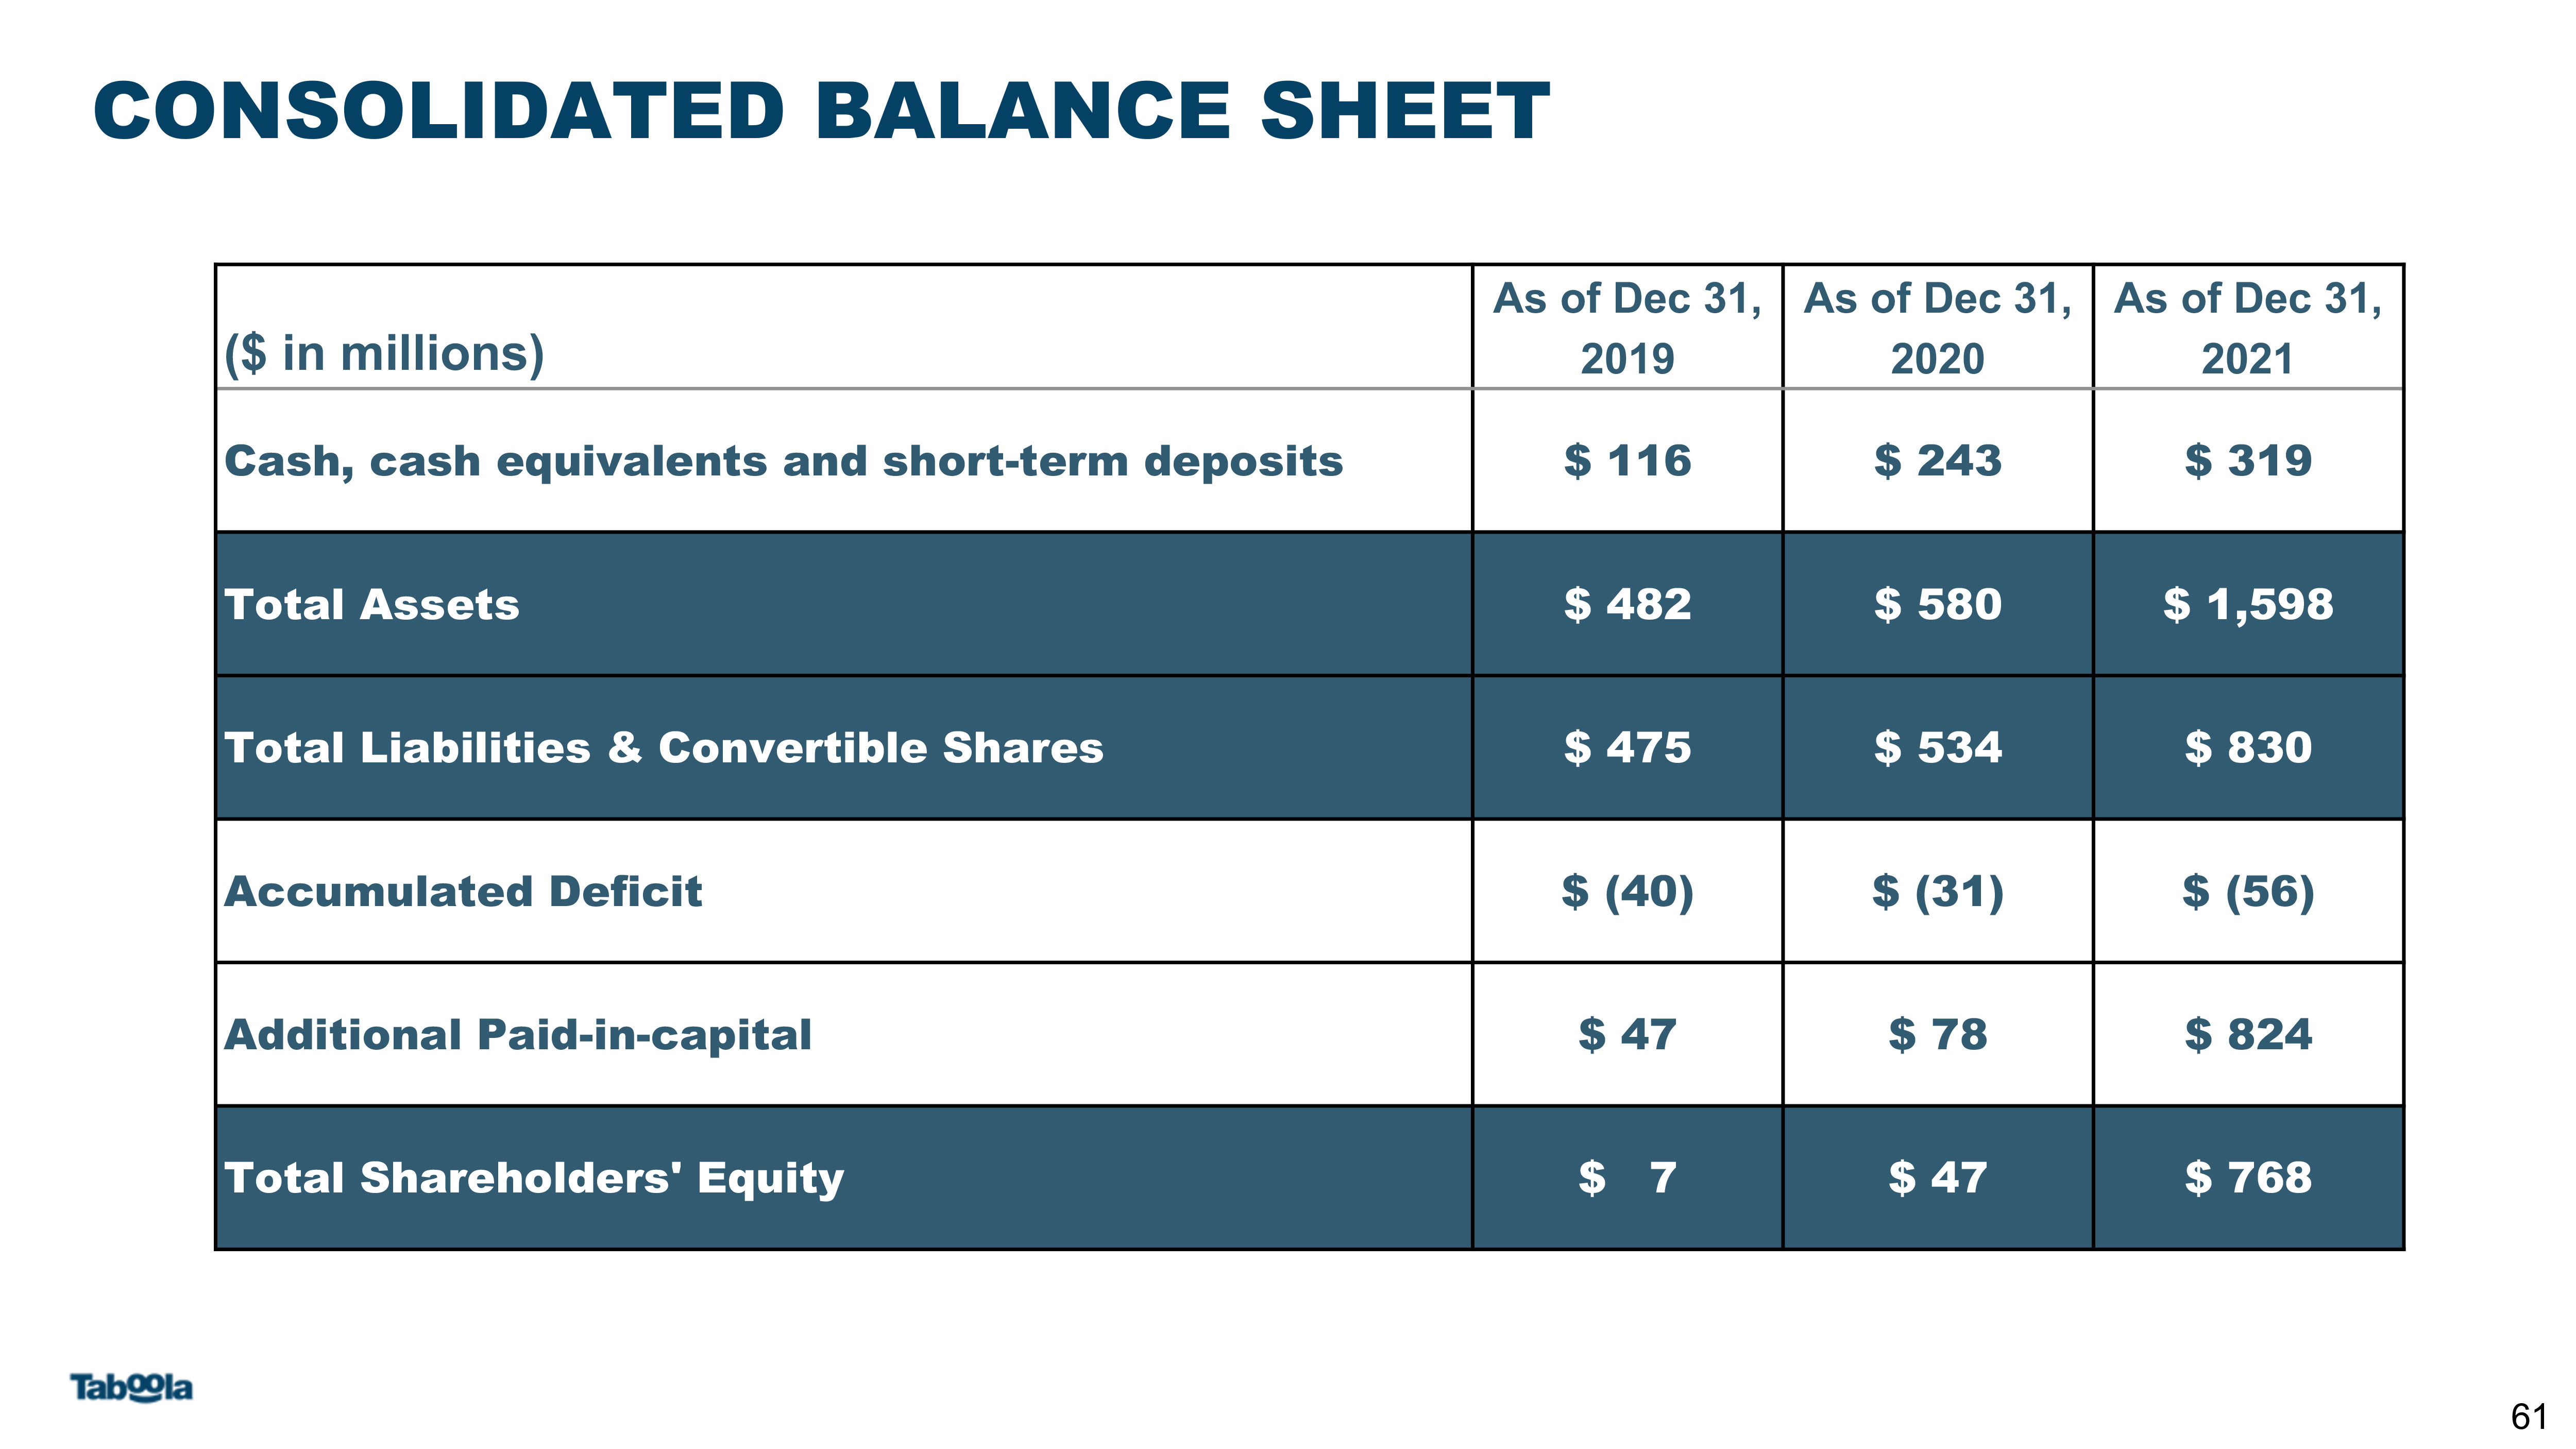
CONSOLIDATED BALANCE SHEET ($ in millions) As of Dec 31, 2019 As of Dec 31, 2020 As of Dec 31, 2021 Cash, cash equivalents and short-term deposits $ 116 $ 243 $ 319 Total Assets $ 482 $ 580 $ 1,598 Total Liabilities & Convertible Shares $ 475 $ 534 $ 830 Accumulated Deficit $ (40) $ (31) $ (56) Additional Paid-in-capital $ 47 $ 78 $ 824 Total Shareholders' Equity $ 7 $ 47 $ 768 61
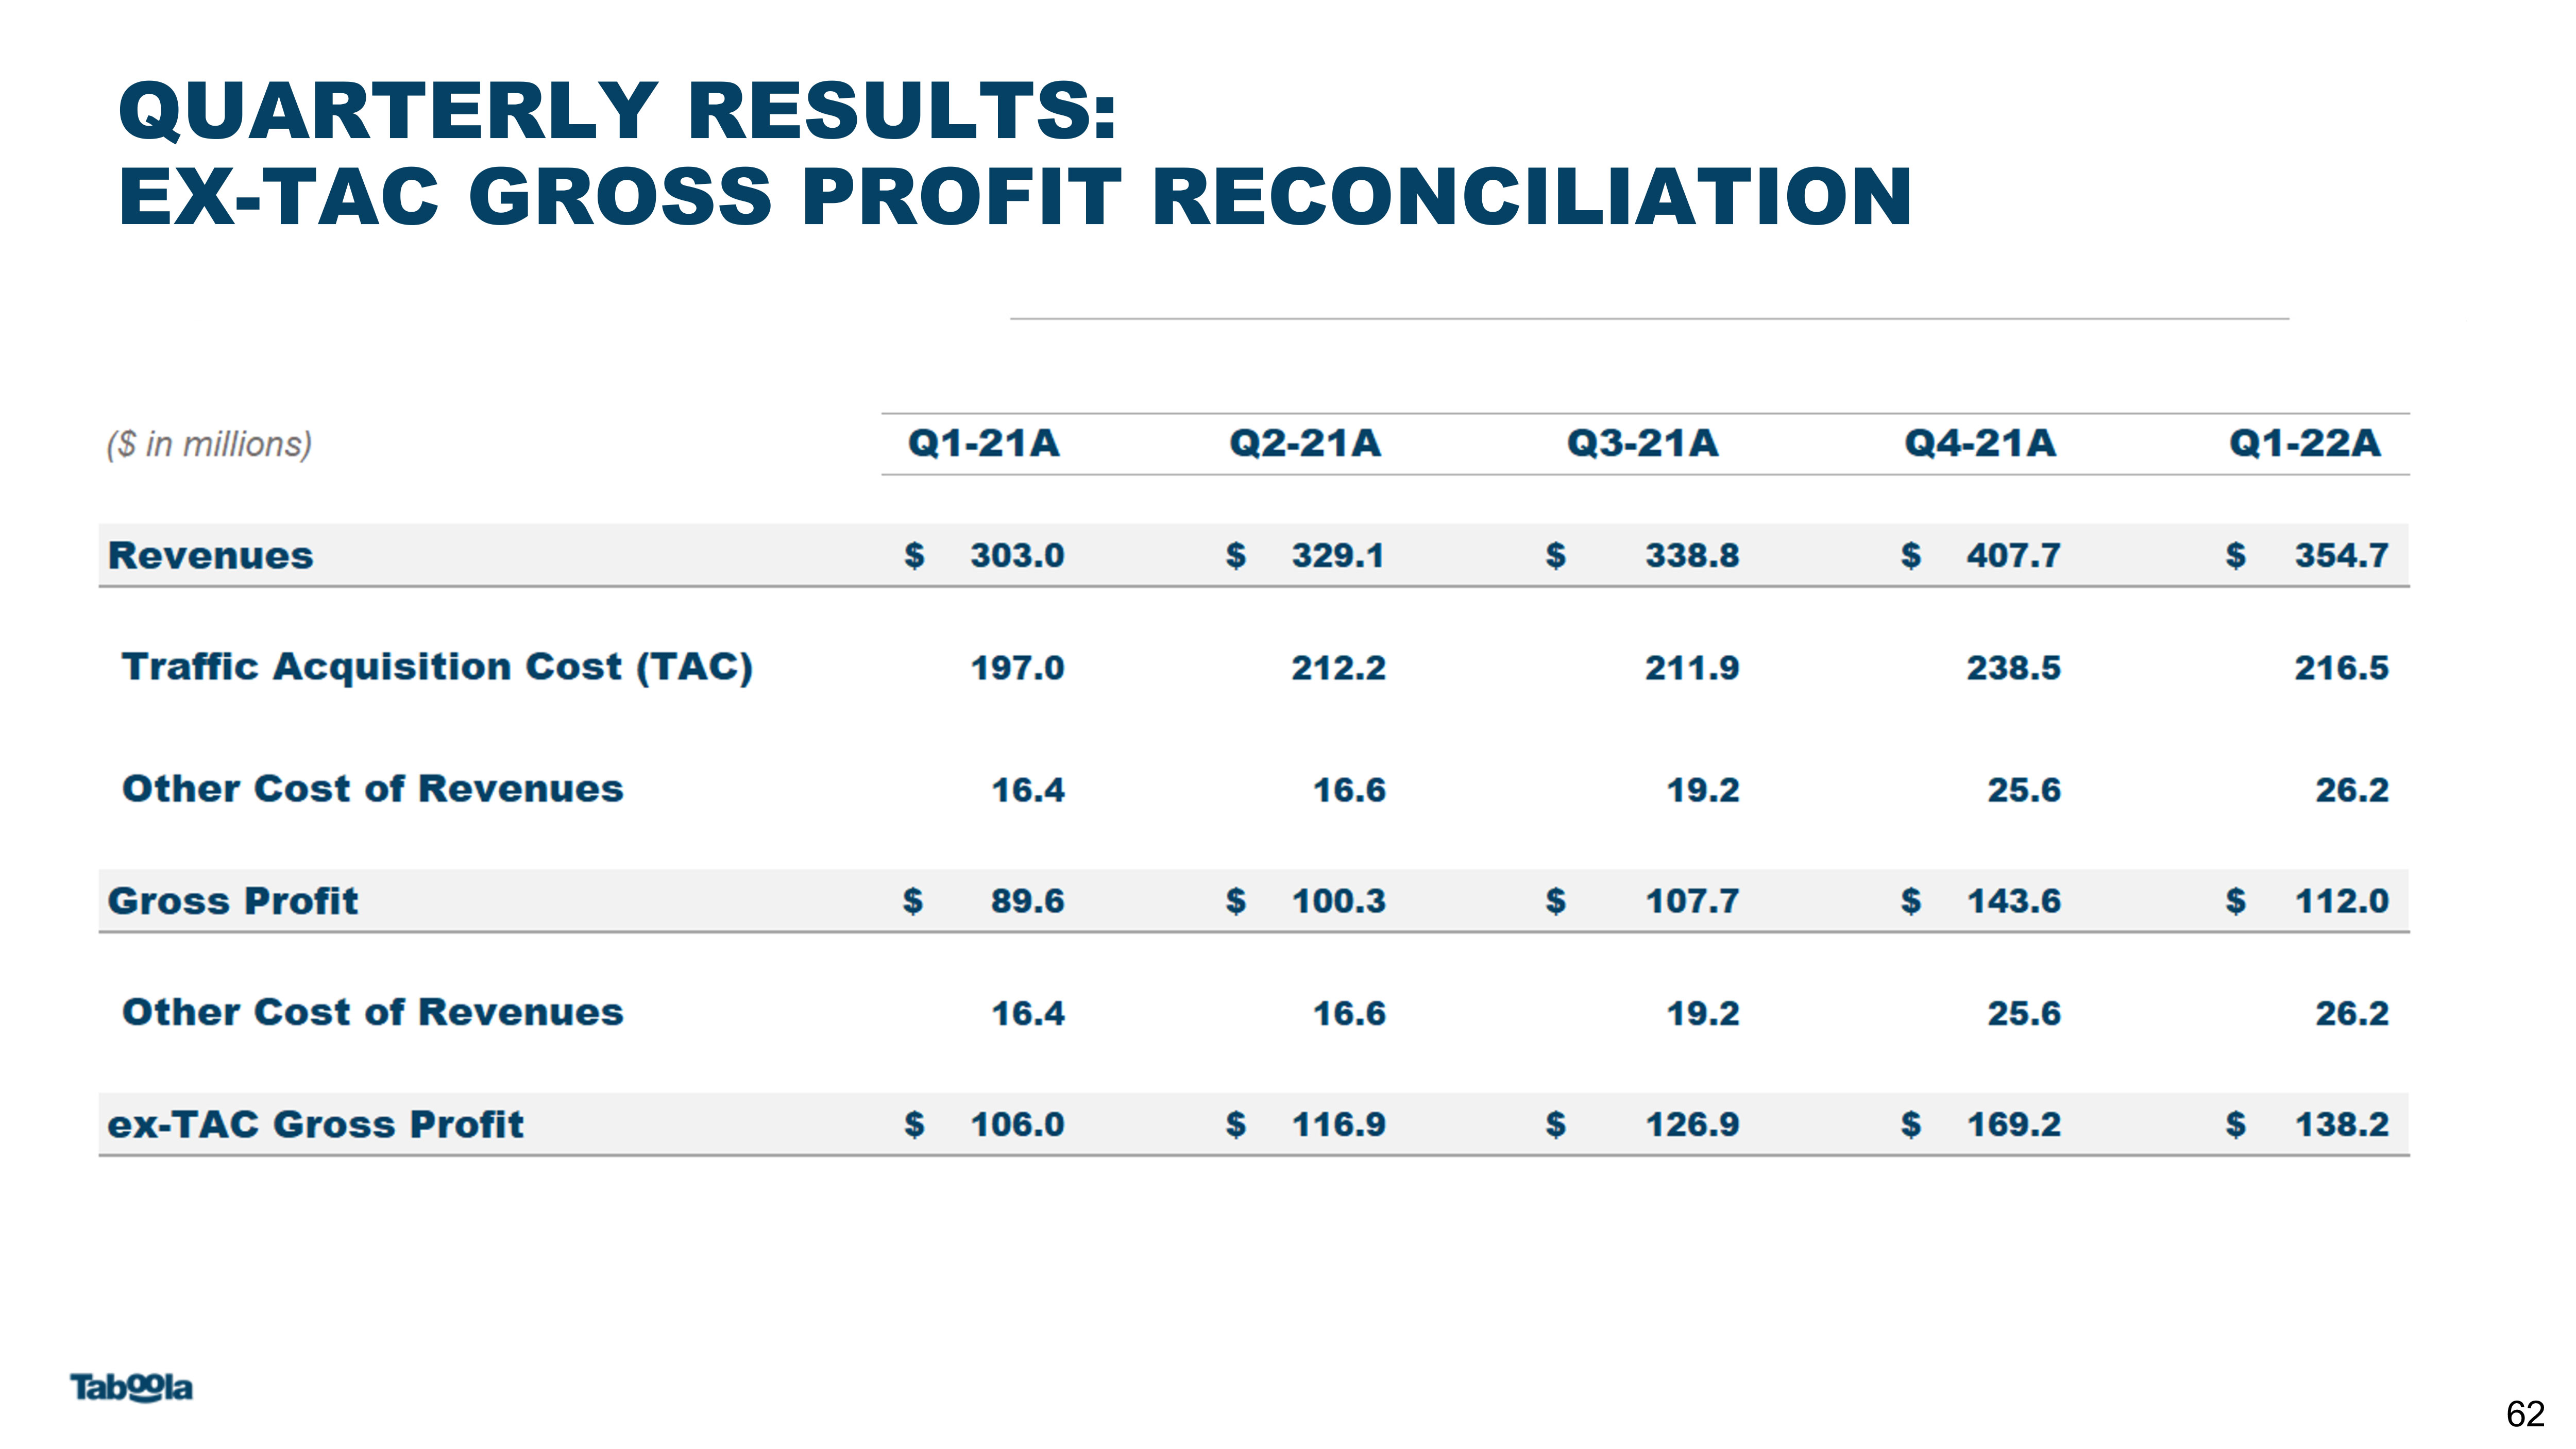
QUARTERLY RESULTS:EX-TAC GROSS PROFIT RECONCILIATION 62
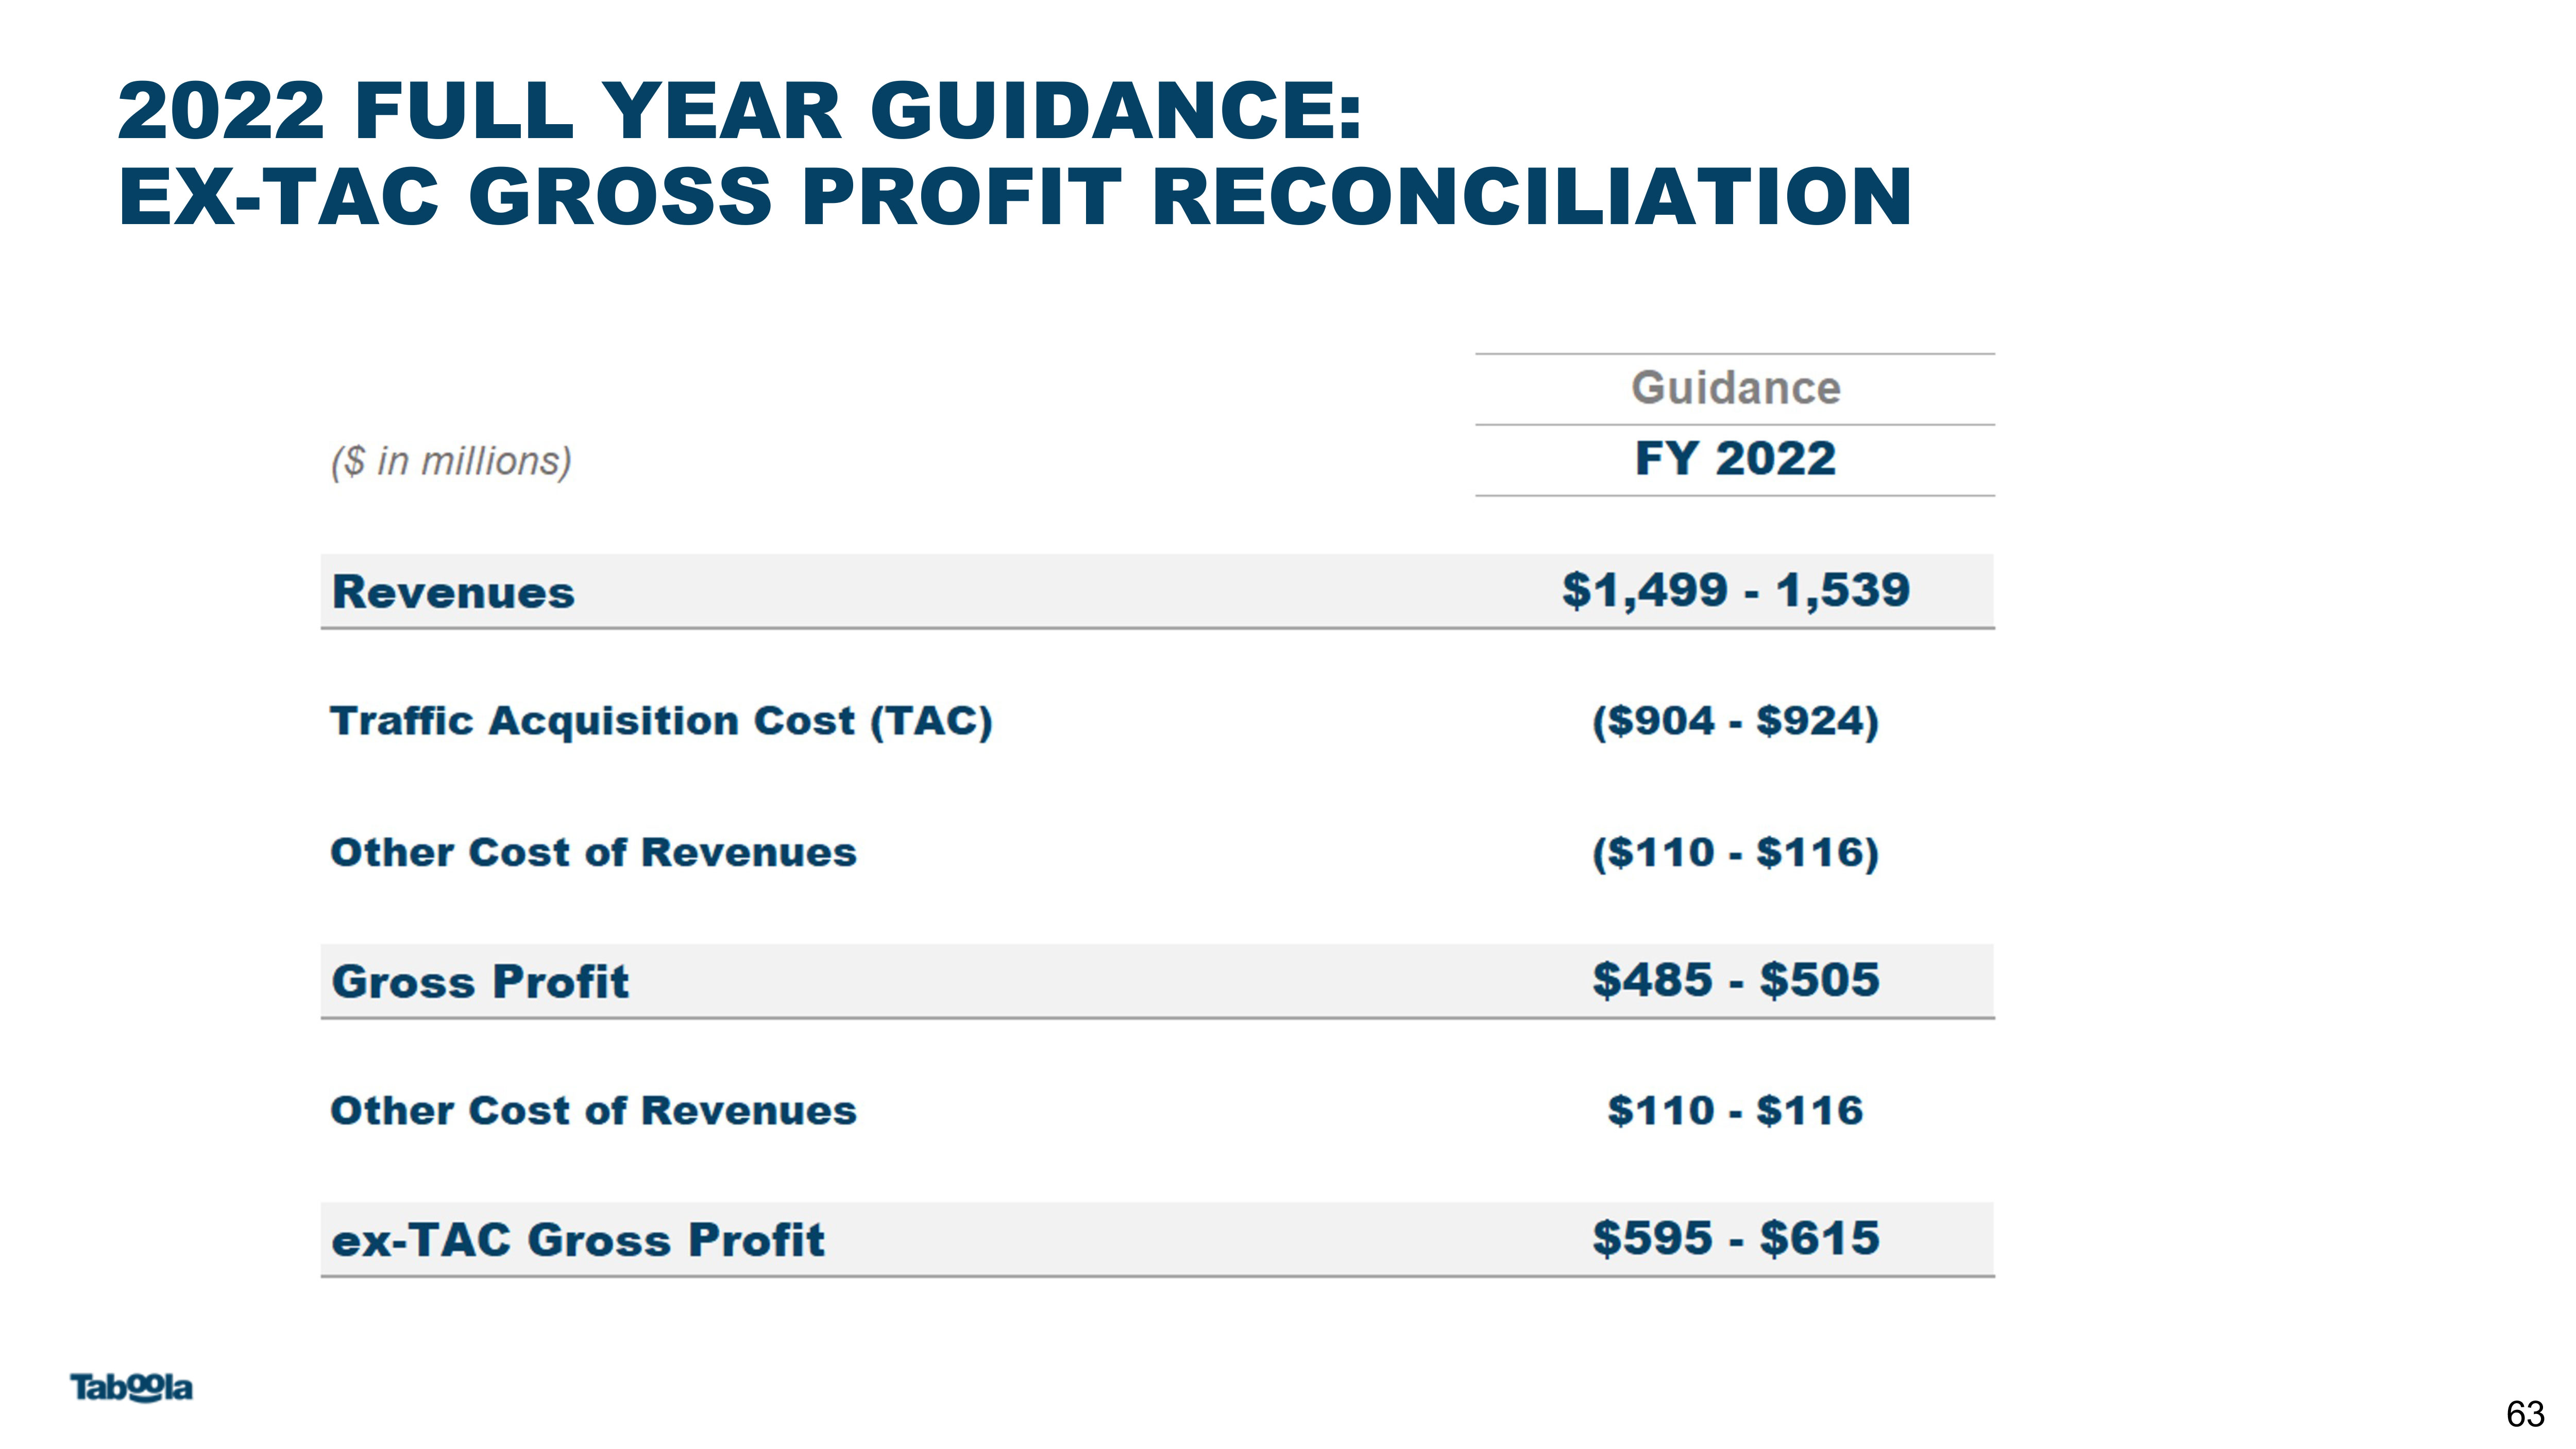
2022 FULL YEAR GUIDANCE:EX-TAC GROSS PROFIT RECONCILIATION 63

THANK YOU!