Dear Shareholder,
On June 30th, we reached our one year anniversary as a public company. It’s been a year of significant achievement: we won numerous new, and renewed large, partnerships with publishers; we acquired Connexity to uniquely position us in e-Commerce; we launched new products like Homepage For You, Smartbid Dimensions and the bidder on Microsoft; and we realized hyper growth in our Taboola News offering. I feel good about our progress as it relates to our strategy.
Our financial performance has been solid. Q2 results were strong, we beat the high end of our guidance for ex-TAC and Adjusted EBITDA. We’re reiterating our 2022 full year guidance. While we have seen softness in advertising in the U.S. since last quarter, at the same time we are benefiting from the diversity of our business and are seeing strength in our e-Commerce business, more than expected, as well as Taboola News. Looking at the back half of the year, we feel optimistic about some of the tailwinds in the business, including that this is an election year in the U.S. and the World Cup, which have historically driven good advertising budgets as well as traffic surges.
Given the challenging macro environment, we’re taking measures to lower our operating expenses, prioritizing things that are key, and spending less on others. Our financials, cash flow generation, and culture allow us to keep working hard on our growth engines while also coming out stronger on the other side of this. As a result, adjusted EBITDA exceeded our guidance.
Second quarter financial highlights included:
| | ● | Ex-TAC Gross Profit of $143.2M exceeded our guidance range of $132 to $142M, grew 22.5% over Q2 2021 (25.4% on a constant currency basis*) and 4.7% pro forma with Connexity** (7.1% on a constant currency basis*). |
| ● | Adjusted EBITDA of $34.2M exceeded our guidance range of $23 to $28M. |
| ● | Q2 Revenues were $342.7M, at the higher end of our guidance range of $325 to $345M |
| ● | Non-GAAP Net Income was $15.8M, and exceeded our guidance range of $6 to $11M (we reported a GAAP net loss of $5.0M) |
On the business front, we’re seeing good momentum.
Publisher momentum is strong: our publisher share gains and pipelines are the strongest they have been in some time. We recently won incredible partnerships like PMC, Gray, Fox Sports, Time.com, and others. Looking at the sports vertical as an example, we now work with ESPN, Fox Sports, NBC Sports, CBS Sports, USAToday Sports and others, which give our advertisers great verticalized reach and value when choosing to work with Taboola.
Taboola News to cross $50M run rate and is growing: As a reminder, this is our “Apple News” product but for Android devices. We work with incredible partners such as Samsung and Xiaomi. We’re integrated on iPads across airports in the US surfacing news, and one day I believe we’ll be integrated with cars, audio devices and more. We’re seeing financially meaningful three-digit growth, and it will cross $50M in revenues this year for the first time. It’s also worth mentioning that beyond the financials, we expect publishers to deepen their relationship with us, as we’ll be able to send them more meaningful traffic from our OEM partners.
e-Commerce Advertiser success is on the rise: the core business of Connexity, helping e-Commerce advertisers get scale on the open web, is an area of strength. We’re hard at work on our synergies, with the biggest one being running Connexity merchant campaigns on Taboola’s massive supply, which is in early testing.
There are many things that will drive growth for Taboola, but there are three we’ve identified that can supercharge our growth, as well as our competitive advantage:
| ● | Performance advertiser success: Our core advertiser base is performance advertisers and with SmartBid we took a step forward with them. We think there is a significant opportunity to dramatically improve our advertiser business by being able to consistently deliver return on ad spend at scale. We have a detailed product roadmap that will deliver on this goal, and allow us to get into new advertiser verticals with big ROI. |
| ● | Bidder/header-bidder technology, going after display inventory: After we launched last quarter on Microsoft, we’ve been testing the bidder on numerous publishers in Q2, and have seen encouraging results. We’re still early, but with our first-party data and direct relationships with publishers and advertisers we should have a meaningful advantage in that space, which is estimated to be tens of billions of dollars in TAM. |
| ● | E-commerce penetration: Despite the macro back-drop, our e-commerce offerings continue to deliver good results. I’ll expand on this in our business highlights. |
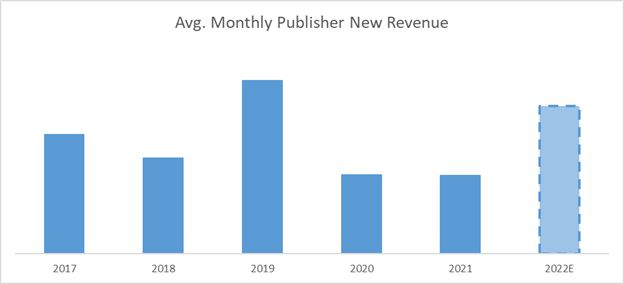
Positive Trends in Publisher New Business
We are seeing great success on our publisher pipeline this year, second only to 2019. The chart below shows recent history along with 2022’s monthly new revenue supply projection.
Many of our new publisher wins this year have been in a competitive scenario, which validates that publishers appreciate Taboola’s investment in R&D, driving value for the entire publisher organization going far beyond “revenue.” Some wins include Gray Television, Penske Media, Time.com, FoxSports, Metropoles, Prensa Ibérica, AFPBB, Jagran, Thairath, Tenki and others.
We’ve also seen many of our existing incredible partners re-choosing Taboola and renewing with us, for example, Cox Media Group, Insider Media News Group, Ströer Content Group and others.
When looking at how fast we grew monthly average new revenue in 2022, it’s roughly twice as much, versus how much we’ve grown on average over the last two years. Our churn is also running better than expected.
Update on our eCommerce progress, and Bidder Tech
You’ve all used Connexity before. If you ever thought about what to buy for your kitchen, or a product you were debating buying for your kids, chances are you read about those products on a publisher using Connexity, and you bought it from a retailer buying from Connexity.
Our e-commerce business is essentially one hundred percent performance based. Our advertisers measure exactly what happens after someone clicks through and goes to a retailer’s website. We run a two-sided marketplace where we have both technology and relationships on both sides: with publisher and retail advertisers. This example shows articles that speak to products people consider buying, and Connexity surfaces links to buy those products.
We provide a turnkey way for publishers to engage their consumers in a shopping experience. It could be commerce-oriented editorial content, top 10 list articles with product reviews, or it could be a shopping marketplace that they’ve created. We’re integrated with them so that we can track performance down to a very granular level and therefore optimize.
On the advertiser (retailer) side, our solution is a cost-effective way to reach and convert new customers and drive sales at scale. We’re also directly integrated into retailer systems, so we can see and provide a feedback loop on exactly what happened. That’s why retail companies like Wayfair, Walmart and eBay work with us. We work with the big retailers, and we also have awesome smaller ones — our system supports the full range. We bring scale, and our tech is designed to hit their performance goals, like return on ad spend, cost of sale or any other ROI target, in a way that doesn’t require a lot of work for them. We call it an automated managed service. They give us their budget for the month or the quarter (roughly 50% of which is uncapped), they tell us their ROI goals, they give us a product feed, and then we go do the work. We’re on track to drive over $5 billion in gross merchandise sales for our retailer partners this year.
We believe e-Commerce will be a third of advertising revenue of the Open Web, think of the electric car industry, eCommerce is the battery. And this trend is shown in our numbers, during these challenging times, we’re seeing Connexity beating our expectations and being resilient to the recession. People might not buy a home because of a high mortgage rate, or decide not to buy a new car, those are big ticket items. We have readership data that shows people still want to buy products, purchase new experiences, and have fun.
Consumers have become better online shoppers through the pandemic and those new behaviors aren’t going to change. In fact, in this environment they are more focused than ever on finding the best product to fit their needs and the best value in their purchases.
Bidder technology new supply opportunity - $1B+ opportunity
We have a significant opportunity to increase our share of the $64 billion Open Web market, a market still dominated by banners. As I have highlighted before, we have numerous strategies to convert the market to more native Taboola advertising formats through offerings such as High Impact Placements and Homepage for You.
When we don’t replace banners with a Taboola recommendation unit, thanks to our partnership with Microsoft, we can now bid into display inventory and win a portion of that inventory. There are many bidders out there we compete with, good ones. Our advantage is three-fold:
| 1. | Unique CPC advertiser demand: 90% of our revenue is from our own advertisers |
| 2. | Unique first-party data: We might see a user interact with us in a bottom of the article unit, see what they read and click on, and then bid on them on a banner placement on the homepage |
| 3. | Unique AI tech: We’re using years of deep learning investment, and now we have a team focused exclusively on bidding in the open web, perfecting our performance. |
We’ve begun piloting the bidder outside Microsoft in Q2, and seeing encouraging results. On a handful of publishers we’re trending to generate a few millions of dollars this year, and as a reminder, we work with about 9,000 publishers.
I like this opportunity because not only is this a meaningful financial opportunity for us, it makes Taboola a bigger share of wallet for our publishers, and more strategic to our partners.
Financial Performance
I’ll close by talking about our Q2 2022 financials. Ex-TAC Gross Profit grew 22.5% versus Q2 2021 and our Ratio of Adjusted EBITDA to ex-TAC Gross Profit was 23.9%. On a pro forma basis, which assumes we had Connexity’s results in Q2 2021, our ex-TAC Gross Profit grew 4.7% or 7.1% at constant currency.
Below are the results of Q2 versus our guidance.
| (dollars in millions) | | Q2 2022 Actuals | | | Year-over-Year Growth | | | Q2 2022 Guidance | |
| Revenues | | $ | 342.7 | | | | 4.1 | % | | $ | 325 to $345 | |
| Gross profit | | $ | 116.4 | | | | 16.1 | % | | $
| 104 to $114 | |
| ex-TAC Gross Profit* | | $ | 143.2 | | | | 22.5 | % | | $ | 132 to $142 | |
| Adjusted EBITDA* | | $ | 34.2 | | | | -16.3 | % | | $
| 23 to $28 | |
| Non-GAAP Net Income* | | $ | 15.8 | | | | -31.2 | % | | $ | 6 to $11 | |
New business contributed 7% while existing business had a (2%) impact on growth in Revenues. New business and the inclusion of Connexity drove much of the growth. Existing business was lower as yield in the quarter was pressured by advertising demand softness. Adjusted EBITDA exceeded our guidance as we favorably balanced managing costs more tightly while also making long-term value driving investments in the business.
Full Year 2022 (dollars in millions) | | Guidance (as of 08/09/22) | | | Guidance (as of 05/12/22) | |
Revenues | | $ | 1,434 -$1,474 | | | $ | 1,499 -$1,539 | |
Gross profit | | $ | 485 - $505 | | | $ | 485 - $505 | |
ex-TAC Gross Profit* | | $ | 595 - $615 | | | $ | 595 - $615 | |
Adjusted EBITDA* | | $ | 152 - $160 | | | $ | 152 - $160 | |
Non-GAAP Net Income* | | $ | 83 - $91 | | | $ | 83 - $91 | |
We feel good about holding our guidance for the year on ex-TAC, and Adjusted EBITDA which are the main metrics we focus on. Our guidance assumes continued weakness in the macro environment and the related lower advertising demand we experienced throughout the second quarter at current levels. Our guidance does not assume a further weakening of demand or a departure from our normal fourth quarter seasonality, which we anticipate to be bolstered by elections in the U.S., the World Cup and stronger e-commerce.
For more information on our Q2 results, our updated full year and Q3 2022 guidance, please see our Q2 2022 earnings press release, which was furnished to the SEC and also posted on Taboola’s website today at https://investors.taboola.com.
* * *
Despite some challenging macro economic factors that are having an impact on our business, I am happy that our fundamentals are strong, we’re on track to meet our full year ex-TAC revenue and Adjusted EBITDA expectations, our tech investment is helping us win new publisher partnerships at record rates, and the team is energized to fulfill our mission to build the largest open web company in the world, side by side with Google (search), Meta (social), Amazon (commerce).
I’m looking forward to our upcoming earnings call and engaging with investors in the coming months, where I’ll do my best to answer any questions you may have.
Kind regards,
-- Adam Singolda
Founder & CEO Taboola
*About Non-GAAP Financial Information
This letter includes ex-TAC Gross Profit, ex-TAC Gross Profit growth on a constant currency basis, Adjusted EBITDA, Ratio of Adjusted EBITDA to ex-TAC Gross Profit, Free Cash Flow, Non-GAAP Net Income, Non-GAAP EPS basic and diluted and IPO Pro forma Non-GAAP EPS basic and diluted, which are non-GAAP financial measures. These non-GAAP financial measures are not measures of financial performance in accordance with GAAP and may exclude items that are significant in understanding and assessing the Company’s financial results. Therefore, these measures should not be considered in isolation or as an alternative to revenues, gross profit, net loss, cash flows from operations or other measures of profitability, liquidity or performance under GAAP. You should be aware that the Company’s presentation of these measures may not be comparable to similarly-titled measures used by other companies.
This quarter the Company is introducing certain constant currency information, which is a non-GAAP metric.The Company believes the inclusion of constant currency information is useful because it permits investors to better understand Taboola’s underlying performance without the effects of currency exchange rate fluctuations. The Company calculates constant currency by using the prior period’s currency exchange rates and applying them to current period results.
The Company believes non-GAAP financial measures provide useful information to management and investors regarding future financial and business trends relating to the Company. The Company believes that the use of these measures provides an additional tool for investors to use in evaluating operating results and trends and in comparing the Company’s financial measures with other similar companies, many of which present similar non-GAAP financial measures to investors. Non-GAAP financial measures are subject to inherent limitations because they reflect the exercise of judgments by management about which items are excluded or included in calculating them. Please refer to the appendix at the end of this letter for reconciliations to the most directly comparable measures in accordance with GAAP.
**About Pro Forma With Connexity Information
This letter includes historical and projected pro forma information for ex-TAC Gross Profit. The pro forma information presents the pro forma effect of the Connexity acquisition as if it had been completed on January 1, 2020. The pro forma information is unaudited, is provided as supplemental information only and is subject to the limitations contained under the heading “Unaudited Pro Forma Condensed Combined Financial Information” in our Prospectus dated September 2, 2021, as amended, forming part of our Registration Statement on Form F-1 filed with the Securities and Exchange Commission.
Note Regarding Forward-Looking Statements
Certain statements in this letter are forward-looking statements. Forward-looking statements generally relate to future events including future financial or operating performance of Taboola.com Ltd. (the “Company”). In some cases, you can identify forward-looking statements by terminology such as “may”, “should”, “expect”, “guidance”, “intend”, “will”, “estimate”, “anticipate”, “believe”, “predict”, “target”, “potential” or “continue”, or the negatives of these terms or variations of them or similar terminology. Such forward-looking statements are subject to risks, uncertainties, and other factors which could cause actual results to differ materially from those expressed or implied by such forward looking statements.
These forward-looking statements are based upon estimates and assumptions that, while considered reasonable by the Company and its management, are inherently uncertain. Uncertainties and risk factors that could affect the Company’s future performance and cause results to differ from the forward-looking statements in this letter include, but are not limited to: the ability to recognize the anticipated benefits of the recent acquisition of Connexity and the business combination between the Company and ION Acquisition Corp. 1 Ltd. (together, the “Business Combinations”), which may be affected by, among other things, competition, the ability of the Company to grow and manage growth profitably, maintain relationships with customers and retain its management and key employees; the Company’s ability to successfully integrate the Connexity acquisition; costs related to the Business Combinations; changes in applicable laws or regulations; the Company’s estimates of expenses and profitability and underlying assumptions with respect to accounting presentations and purchase price and other adjustments; ability to attract new digital properties and advertisers; ability to meet minimum guarantee requirements in contracts with digital properties; intense competition in the digital advertising space, including with competitors who have significantly more resources; ability to grow and scale the Company’s ad and content platform through new relationships with advertisers and digital properties; ability to secure high quality content from digital properties; ability to maintain relationships with current advertiser and digital property partners; ability to make continued investments in the Company’s AI-powered technology platform; the need to attract, train and retain highly-skilled technical workforce; changes in the regulation of, or market practice with respect to, “third party cookies” and its impact on digital advertising; continued engagement by users who interact with the Company’s platform on various digital properties; the impact of the ongoing COVID-19 pandemic; reliance on a limited number of partners for a significant portion of the Company’s revenue; changes in laws and regulations related to privacy, data protection, advertising regulation, competition and other areas related to digital advertising; ability to enforce, protect and maintain intellectual property rights; and risks related to the fact that we are incorporated in Israel and governed by Israeli law; and other risks and uncertainties set forth in the Company’s Annual Report on Form 20-F for the year ended December 31, 2021 under Item 3.D. “Information About the Company - Risk Factors,” the Company’s Registration Statement on Form F-1/A filed on April 13, 2022, as it may be amended or supplemented from time to time, under the sections entitled “Cautionary Note Regarding Forward-looking Statements” and “Risk Factors,” and in the Company’s subsequent filings with the Securities and Exchange Commission.
Nothing in this letter should be regarded as a representation by any person that the forward-looking statements set forth herein will be achieved or that any of the contemplated results of such forward-looking statements will be achieved. You should not place undue reliance on these forward-looking statements, which speak only as of the date they were made. The Company undertakes no duty to update these forward-looking statements except as may be required by law.
APPENDIX: Non-GAAP Reconciliation
RECONCILIATION OF GAAP TO NON-GAAP FINANCIAL MEASURES FOR THE THREE AND SIX MONTHS ENDED JUNE 30, 2022 AND 2021
(Unaudited)
The following table provides a reconciliation of revenues to ex-TAC Gross Profit.
| | | Three months ended June 30, | | | Six months ended June 30, | |
| | | 2022 | | | 2021 | | | 2022 | | | 2021 | |
| | | Unaudited | |
| | | (dollars in thousands) | |
| Revenues | | $ | 342,695 | | | $ | 329,072 | | | $ | 697,421 | | | $ | 632,022 | |
| Traffic acquisition cost | | | 199,486 | | | | 212,202 | | | | 415,984 | | | | 409,238 | |
| Other cost of revenues | | | 26,848 | | | | 16,625 | | | | 53,046 | | | | 33,040 | |
| Gross profit | | $ | 116,361 | | | $ | 100,245 | | | $ | 228,391 | | | $ | 189,744 | |
| Add back: Other cost of revenues | | | 26,848 | | | | 16,625 | | | | 53,046 | | | | 33,040 | |
| ex-TAC Gross Profit | | $ | 143,209 | | | $ | 116,870 | | | $ | 281,437 | | | $ | 222,784 | |
The following table provides a reconciliation of net loss to Adjusted EBITDA.
| | | Three months ended June 30, | | | Six months ended June 30, | |
| | | 2022 | | | 2021 | | | 2022 | | | 2021 | |
| | | Unaudited | |
| | | (dollars in thousands) | |
| Net loss | | $ | (5,021 | ) | | $ | (61,416 | ) | | $ | (1,133 | ) | | $ | (42,829 | ) |
| Adjusted to exclude the following: | | | | | | | | | | | | |
| Finance income (expenses), net | | | (4,764 | ) | | | 85 | | | | (15,959 | ) | | | 883 | |
| Tax expenses (income) | | | 234 | | | | 7,922 | | | | (158 | ) | | | 10,159 | |
| Depreciation and amortization | | | 22,813 | | | | 8,646 | | | | 45,489 | | | | 16,890 | |
| Share-based compensation expenses (1) | | | 17,640 | | | | 78,523 | | | | 34,679 | | | | 83,654 | |
| M&A costs | | | 474 | | | | 7,042 | | | | 524 | | | | 5,588 | |
| Holdback compensation expenses (2) | | | 2,792 | | | | — | | | | 5,582 | | | | — | |
| Adjusted EBITDA | | $ | 34,168 | | | $ | 40,802 | | | $ | 69,024 | | | $ | 74,345 | |
1 For the Q2 2021 period, a substantial majority is share-based compensation expenses related to going public.
2 Represents share based compensation due to holdback of Taboola ordinary shares issuable under compensatory arrangements relating to Connexity acquisition.
We calculate Ratio of net loss to gross profit as net loss divided by gross profit. We calculate Ratio of Adjusted EBITDA to ex-TAC Gross Profit, a non-GAAP measure, as Adjusted EBITDA divided by ex-TAC Gross Profit. We believe that the Ratio of Adjusted EBITDA to ex-TAC Gross Profit is useful because TAC is what we must pay digital properties to obtain the right to place advertising on their websites, and we believe focusing on ex-TAC Gross Profit better reflects the profitability of our business. The following table reconciles Ratio of net loss to gross profit and Ratio of Adjusted EBITDA to ex-TAC Gross Profit for the period shown.
| | | Three months ended June 30, | | | Six months ended June 30, | |
| | | 2022 | | | 2021 | | | 2022 | | | 2021 | |
| | | Unaudited | |
| | | (dollars in thousands) | |
| Gross profit | | $ | 116,361 | | | $ | 100,245 | | | $ | 228,391 | | | $ | 189,744 | |
| Net loss | | $ | (5,021 | ) | | $ | (61,416 | ) | | $ | (1,133 | ) | | $ | (42,829 | ) |
| Ratio of net loss to gross profit | | | (4.3 | %) | | | (61.3 | %) | | | (0.5 | %) | | | (22.6 | %) |
| | | | | | | | | | | | | | | | | |
| ex-TAC Gross Profit | | $ | 143,209 | | | $ | 116,870 | | | $ | 281,437 | | | $ | 222,784 | |
| Adjusted EBITDA | | $ | 34,168 | | | $ | 40,802 | | | $ | 69,024 | | | $ | 74,345 | |
| Ratio of Adjusted EBITDA margin to ex-TAC Gross Profit | | | 23.9 | % | | | 34.9 | % | | | 24.5 | % | | | 33.4 | % |
The following table provides a reconciliation of net loss to Non-GAAP Net Income.
| | | Three months ended June 30, | | | Six months ended June 30, | |
| | | 2022 | | | 2021 | | | 2022 | | | 2021 | |
| | | Unaudited | |
| | | (dollars in thousands) | |
| Net loss | | $ | (5,021 | ) | | $ | (61,416 | ) | | $ | (1,133 | ) | | $ | (42,829 | ) |
| Amortization of acquired intangibles | | | 15,828 | | | | 639 | | | | 31,608 | | | | 1,278 | |
| Share-based compensation expenses (1) | | | 17,640 | | | | 78,523 | | | | 34,679 | | | | 83,654 | |
| M&A costs | | | 474 | | | | 7,042 | | | | 524 | | | | 5,588 | |
| Holdback compensation expenses (2) | | | 2,792 | | | | — | | | | 5,582 | | | | — | |
| Revaluation of Warrants | | | (11,958 | ) | | | — | | | | (26,000 | ) | | | — | |
| Exchange rate loss (income), net (3) | | | 2,490 | | | | (393 | ) | | | 2,706 | | | | 1,545 | |
| Income tax effects | | | (6,451 | ) | | | (1,444 | ) | | | (10,077 | ) | | | (1,545 | ) |
| Non-GAAP Net Income | | $ | 15,794 | | | $ | 22,951 | | | $ | 37,889 | | | $ | 47,691 | |
| | | | | | | | | | | | | | | | | |
| Non-GAAP EPS basic | | $ | 0.063 | | | $ | 0.473 | | | $ | 0.152 | | | $ | 1.029 | |
| Non-GAAP EPS diluted | | $ | 0.063 | | | $ | 0.090 | | | $ | 0.151 | | | $ | 0.187 | |
1 For the Q2 2021 period, a substantial majority is share-based compensation expenses related to going public.
2 Represents share based compensation due to holdback of Taboola ordinary shares issuable under compensatory arrangements relating to Connexity acquisition.
3 Represents income or loss related to the remeasurement of monetary assets and liabilities to the Company's functional currency using exchange rates in effect at the end of the reporting period.
The following table provides a reconciliation of the number of shares used to calculate GAAP EPS to IPO Pro forma Non-GAAP EPS basic and diluted.
| | | Three months ended June 30, | | | Six months ended June 30, | |
| | | 2022 | | | 2021 | | | 2022 | | | 2021 | |
| | | Unaudited | |
| GAAP weighted-average shares used to compute net loss per share, basic | | | 250,777,915 | | | | 48,518,124 | | | | 249,095,931 | | | | 46,351,830 | |
| Add: Non-GAAP adjustment for ordinary shares issued in connection with going public | | | — | | | | 172,271,362 | | | | — | | | | 172,992,588 | |
| IPO Pro forma Non-GAAP weighted-average shares used to compute net income per share, basic | | | 250,777,915 | | | | 220,789,486 | | | | 249,095,931 | | | | 219,344,418 | |
| | | | | | | | | | | | | | | | | |
| GAAP weighted-average shares used to compute net loss per share, diluted | | | 250,777,915 | | | | 48,518,124 | | | | 249,095,931 | | | | 46,351,830 | |
| Add: Non-GAAP adjustment for ordinary shares issued in connection with going public | | | — | | | | 172,271,362 | | | | — | | | | 172,992,588 | |
| Add: Dilutive ordinary share equivalents | | | 443,063 | | | | 35,592,019 | | | | 1,562,609 | | | | 35,562,170 | |
| IPO Pro forma Non-GAAP weighted-average shares used to compute net income per share, diluted | | | 251,220,978 | | | | 256,381,505 | | | | 250,658,540 | | | | 254,906,588 | |
| | | | | | | | | | | | | | | | | |
| IPO Pro forma Non-GAAP EPS, basic (1)(2) | | $ | 0.063 | | | $ | 0.104 | | | $ | 0.152 | | | $ | 0.217 | |
| IPO Pro forma Non-GAAP EPS, diluted (1)(2) | | $ | 0.063 | | | $ | 0.090 | | | $ | 0.151 | | | $ | 0.187 | |
1 IPO Pro forma net income for the three and six months ended June 30, 2021, includes an adjustment to add $6,029 and $11,944, respectively, of undistributed earnings previously allocated to participating securities, assuming these securities converted to ordinary shares, in each case, as of January 1, 2021.
2 IPO Pro Forma Non-GAAP EPS basic and diluted is presented only for the three and six months ended June 30, 2021 assuming Taboola went public and consummated the related transactions, in each case, as of January 1, 2021.
The following table provides a reconciliation of net cash provided by operating activities to Free Cash Flow.
| | | Three months ended June 30, | | | Six months ended June 30, | |
| | | 2022 | | | 2021 | | | 2022 | | | 2021 | |
| | | Unaudited | |
| | | (dollars in thousands) | |
| Net cash provided by operating activities | | $ | 2,084 | | | $ | 23,083 | | | $ | 10,207 | | | $ | 13,980 | |
| Purchases of property and equipment, including capitalized internal-use software | | | (9,350 | ) | | | (16,138 | ) | | | (16,252 | ) | | | (21,675 | ) |
| Free Cash Flow | | $ | (7,266 | ) | | $ | 6,945 | | | $ | (6,045 | ) | | $ | (7,695 | ) |
APPENDIX: Non-GAAP Reconciliation
RECONCILIATION OF GAAP TO NON-GAAP FINANCIAL MEASURES FOR Q3 2022 AND FULL YEAR 2022 GUIDANCE
(Unaudited)
The following table provides a reconciliation of gross profit to ex-TAC Gross Profit.
| | | Q3 2022 | | | FY 2022 | |
| | | Unaudited | |
| | | (dollars in millions) | |
Revenues | | $ | 311 - $331 | | | $ | 1,434 - $1,474 | |
Traffic acquisition cost | | $ | (191 - $201 | ) | | $ | (839 - $859 | ) |
| Other cost of revenues | | $ | (29 - $31 | ) | | $ | (110 - $116 | ) |
| Gross profit | | $ | 91 - $101 | | | $ | 485 - $505 | |
| Add back: Other cost of revenues | | $ | 29 - $31 | | | $ | 110 - $116 | |
| ex-TAC Gross Profit | | $ | 120 - $130 | | | $ | 595 - $615 | |