Exhibit 99.2
Dear Shareholder,
Our financial performance has been solid in Q3—we beat or came near the high end of our guidance on all metrics. We’re holding our annual Adjusted EBITDA guidance for 2022 at $152-$160M while generating strong cash flow. Lastly, due to continued softness in advertising, and to be cautious, we decided to lower 2022 Revenue guidance by 4%, and ex-TAC guidance by 6%.
Despite everything that’s going on in the world, we’re not anticipating a decline in ex-TAC this year versus last year. Q4 is always a high performing quarter, and historically a strong quarter for e-Commerce, as well as this year the potential positive effect of The World Cup. However, we’re not counting on the World Cup in our forecasts, given uncertainties in the market.
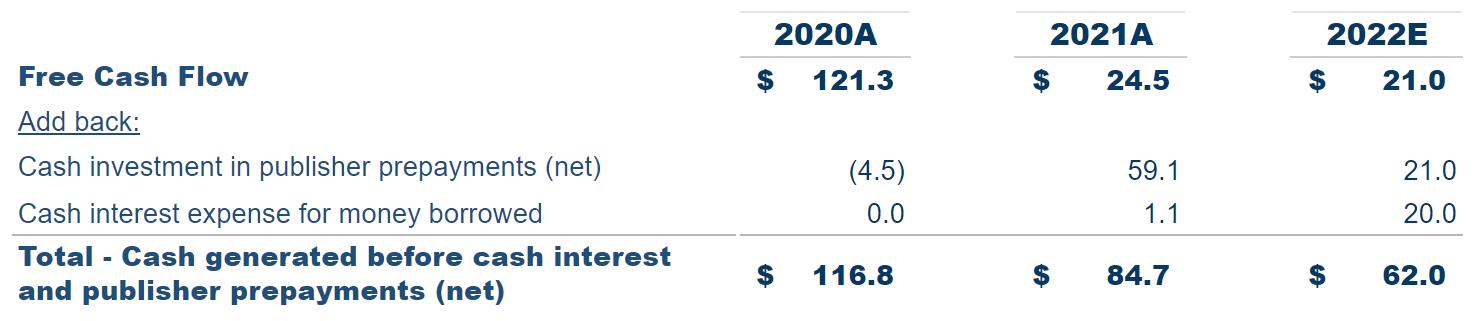
This year we expect to pay publishers ~$21M in net pre-payments and to pay $20M of cash interest on our long-term debt. We expect to generate $58-66M of cash during this year before factoring in these two items, and $17-25M of Free Cash Flow after adding them in. Internally, when we look at our Free Cash Flow, we add back publisher prepayments and cash interest payments because publisher prepayments are an investment in our business we consistently earn back, and over time will become insignificant to none. Cash interest payments are a capital structure decision.
Taking a step back, I look at times like these as an opportunity for good companies to become even stronger. We’re profitable, we’re generating cash, we have the right priorities— performance advertising, e-Commerce and header bidding (to increase our share of the display advertising market)—each of which could generate hundreds of millions of dollars in coming years.
Our fundamentals are strong in our core market. We’re winning a lot more than we’re losing, and it’s expensive to take our business. We recently signed with BuzzFeed / HuffingtonPost, we signed Mopo in Germany, Terra in Brazil, and Cyzo in Japan. These are all exciting wins, and I’m proud of our product and business teams. Last but not least, our culture is strong, and it’s during times like these that companies are measured for their ability to execute and gain market share.
We adjusted our cost structure a few months back, and I can tell you, we’re committed to executing our strategy of being a profitable growth company. Our track record demonstrates our ability to succeed in this strategy.
Our third-quarter financial highlights included:
| ● | Ex-TAC Gross Profit of $129.3M which was near the high end of our guidance range of $120 to $130M, and grew 1.9% over Q3 2021 and 5.7% on a constant currency basis. |
| ● | Adjusted EBITDA of $24.2M exceeded our guidance range of $11 to $17M. |
| ● | Q3 Revenues were $332.5M, which exceeded our guidance range of $311 to $331M. |
| ● | Non-GAAP Net Income (loss) was $10.2M, and exceeded our guidance range of ($8) to ($2M) (we reported a GAAP Net loss of $26.0M). |
Recommending Anything, Anywhere
Our core fundamentals on the supply side of our business continue to be strong.
We win publisher deals because of our technology investment. We’ve spent more than a decade building a core product for publishers that goes beyond “revenue,” which publishers appreciate, since we provide value to their entire organization—editorial, audience and revenue teams.
Our advertisers see Taboola as a real opportunity to diversify outside of the walled gardens, especially with the privacy challenges social companies now face. I expect millions of advertisers will look for a new place they can scale and rely on outside of search and social.
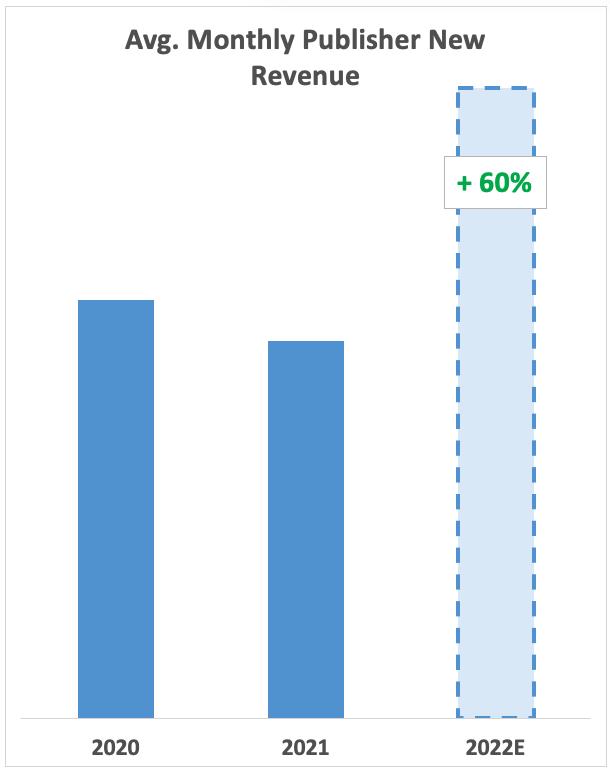
Our core business is strong. We’re seeing fast growth in new supply (graph below), and lower churn rates than we would usually expect. Our exclusive, long-term relationships with our publisher partners gives us predictability in the supply we can access, which has allowed us to build a strong advertising business, now made up of 15,000 advertising clients.
This core business typically grows 20%+ on average year over year (YOY) at a 30%+ conversion to Adjusted EBITDA, and converts 50%+ to Free Cash Flow. Taboola is only ~$1.4 billion out of a $64 billion open web advertising market—and while we’re a big player in the space, there’s plenty of room for growth.
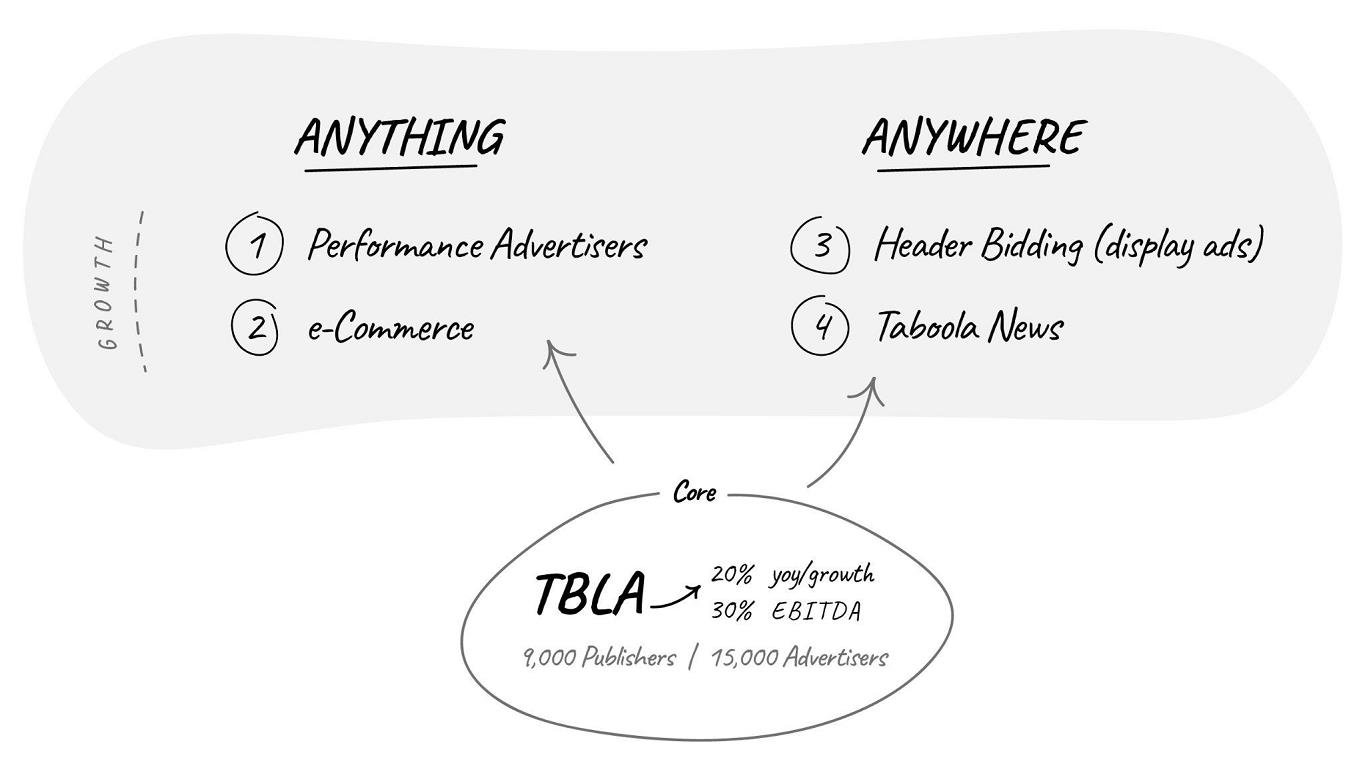
When I think about our future, and as discussed at our investor day earlier this year—our path to $1B in ex-TAC, which implies $300M+ in Adjusted EBITDA, with roughly $150M of Free Cash Flow, includes a few things we’re focused on as part of our strategy to recommend Anything, Anywhere to supercharge our core growth. Each of the four initiatives below can generate hundreds of millions of dollars to Taboola in years to come—performance advertising, e-Commerce, header bidding (display ads), and Taboola News.
Recommend Anything
| 1. | Driving continuous improvement in performance advertising: This helps us make different types of advertisers successful. We’re investing heavily in our product for performance advertisers, having quadrupled the number of engineers dedicated to those initiatives. |
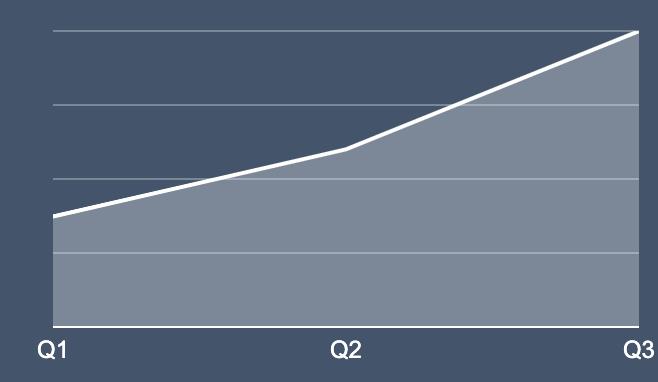
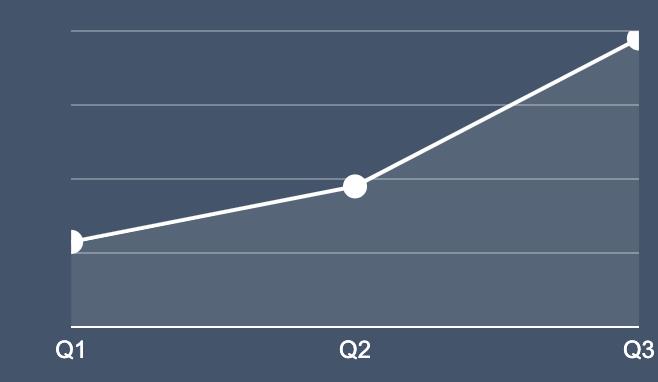
| 2. | Scaling our e-Commerce business to be a third of ours and our partners’ revenue: This is a good business, and while retailers want to be on trusted publisher sites all day long, it does take time for publishers to build this business. They need to create content, build an audience, and match that audience with the right e-Commerce demand. However, once publishers get up and running, they never give it up, and we believe a third of all of our publishers’ revenue will become e-Commerce driven. Additionally, as part of our synergies with Connexity, we’re seeing solid momentum with DCO, which was one of the strongest growth engines for social companies. |
Number of Live DCO advertisers
DCO Revenue (Media Spend)
Recommend Anywhere
We’re focused on two areas where our recommendation engine is used outside of our core business.
| 1. | Header Bidding, which allows us to tap into the multi-billion dollar display market. We have momentum and are now live on 50+ sites: We’re the recommendation engine for 9,000 publisher partners, and our code on page gives us access to unique first-party data. This is something that’s unique to us in comparison with traditional advertising companies. |
We estimate that our existing 9,000 publishers are generating between $20 to $30 billion in display revenue, and there’s high demand from publishers who want to join our header bidding beta. We’re already seeing strong results—5 to 10% win rates—which allows us to support our publishers with display revenue, grow our wallet share, pay our publishers more, make our advertisers more successful, and potentially generate hundreds of millions of dollars using our unique first-party data and AI. This includes Microsoft, where we’ve seen good performance since launching this April.
| 2. | Integrate into Android devices, Audio devices, Automobile, and more via Taboola News: When I think about the future, I think everyone will be fighting for users' attention and “time,” As such, integrating recommendation engines across devices, and other touch points will be a huge part of the future, and how kids will discover information. |
We have licensing agreements with the top publishers in the world, the AI to predict what people want to discover next, and the monetization machine to generate revenue from it. We’re convinced that on the back of Apple News on iPhones, or Amazon’s voice-based news on Alexa, every phone, car, and device will have news-as-a-service to engage users. For our publishers, this is an incredible opportunity because it's a way to drive traffic and loyal readers (much like Google SEO). Taboola News is growing by triple digits, and is on track to generate $50 million in revenue this year.
Q3 Financial Performance
Let me finish by sharing our financial results. Below are the results of Q3 versus our guidance.
(dollars in millions) | | Q3 2022 Actuals | | | Year-over-Year Change | | | Q3 2022 Guidance | |
Revenues | |
| $332.5 | | | (1.9%) |
| | $311 to $331 | |
Gross profit | |
| $102.7 | | | (4.6%) |
| | $91 to $101 | |
ex-TAC Gross Profit* | |
| $129.3 | | | (1.9%) |
| | $120 to $130 | |
Adjusted EBITDA* | |
| $24.2 | | | (39.2%) |
| | $11 to $17 | |
Non-GAAP Net Income* | |
| $10.2 | | | (78.9%) |
| | ($8) to ($2) | |
New business contributed 7% to growth while existing business had an (8%) impact on the decline in Revenues. This is symptomatic of the weak macroeconomic climate and softer advertiser demand we are seeing. Having said that, the growth of new supply is encouraging and should drive further gains in the future as advertising markets recover. Adjusted EBITDA exceeded our guidance as we benefited from cost management initiatives that we started in Q2.
In terms of expectations for the full year, here is a summary of our revised guidance:
| (dollars in millions) | | Guidance (as of 11/09/22) | | | Guidance (as of 08/09/22) | |
| Revenues | | $1,388 - $1,404 | | | $1,434 - $1,474 | |
| Gross profit | | $458 - $470 | | | $485 - $505 | |
| ex-TAC Gross Profit* | | $564 - $576 | | | $595 - $615 | |
| Adjusted EBITDA* | | $152 - $160 | | | $152 - $160 | |
| Non-GAAP Net Income* | | $83 - $91 | | | $83 - $91 | |
We feel good about holding our guidance for the year on Adjusted EBITDA due to our aggressive management of expenses, though we are lowering our full year guidance for Revenues by 4% and ex-TAC Gross Profit by 6% due to the continued weakness in the macro environment. Our guidance does not assume a further weakening of demand or a departure from our normal fourth quarter seasonality.
Finally, I wanted to share more details on how we look at cash flow internally. As I mentioned previously, when we look at our cash flow internally, in addition to looking at Free Cash Flow, we also look at how much cash we generate before we invest some of it in publisher pre-payments and before we pay the interest on our long-term debt. We calculate cash investment in publisher prepayments (net) for a specific measurement period as the gross amount of cash publisher prepayments we made in that measurement period minus the amortization of publisher prepayments that were included in traffic acquisition cost during that measurement period, which were the result of cash publisher prepayments made in that measurement period and previous periods. Below is a table that summarizes this internal view, including both Free Cash Flow and our cash flow before those other items. Note that in 2020, publisher prepayments were actually a source of cash because we were amortizing previous prepayments at a higher rate than we were issuing new prepayments. For a more complete explanation of how our publisher prepayments work, please look at our Investor Presentation, which has a numeric example.
For more information on our Q3 results and our full year and Q4 2022 guidance, please see our Q3 2022 earnings press release, which was furnished to the SEC and also posted on Taboola’s website today at https://investors.taboola.com.
* * *
The world is going through a lot, and it has an effect on our business as much as anyone. I personally feel more focused than ever, and energetic about Taboola’s future to become the leading recommendation engine for the open web, and our ability to change the way consumers discover information outside of walled gardens anywhere they may be.
Our fundamentals, the metrics our management team is tracking every day, are strong, perhaps the strongest they have ever been. Our culture is strong. We have a strong EBITDA, we are generating cash and we have growth engines that can double and triple Taboola—e-Commerce, header bidding, performance advertising and Taboola News.
I’m looking forward to our upcoming earnings call and engaging with investors in the coming months, where I’ll do my best to answer any questions you may have.
Kind regards,
-- Adam Singolda
Founder & CEO Taboola
*About Non-GAAP Financial Information
This letter includes ex-TAC Gross Profit, ex-TAC Gross Profit growth on a constant currency basis, Adjusted EBITDA, Ratio of Adjusted EBITDA to ex-TAC Gross Profit, Free Cash Flow, Non-GAAP Net Income, Non-GAAP EPS basic and diluted and IPO Pro forma Non-GAAP EPS basic and diluted, which are non-GAAP financial measures. These non-GAAP financial measures are not measures of financial performance in accordance with GAAP and may exclude items that are significant in understanding and assessing the Company’s financial results. Therefore, these measures should not be considered in isolation or as an alternative to revenues, gross profit, earnings per share, net income (loss), cash flows from operations or other measures of profitability, liquidity or performance under GAAP. You should be aware that the Company’s presentation of these measures may not be comparable to similarly-titled measures used by other companies.
This letter includes certain constant currency information, which is a non-GAAP metric.The Company believes the inclusion of constant currency information is useful because it permits investors to better understand Taboola’s underlying performance without the effects of currency exchange rate fluctuations. The Company calculates constant currency by using the prior period’s currency exchange rates and applying them to current period results.
The Company believes non-GAAP financial measures provide useful information to management and investors regarding future financial and business trends relating to the Company. The Company believes that the use of these measures provides an additional tool for investors to use in evaluating operating results and trends and in comparing the Company’s financial measures with other similar companies, many of which present similar non-GAAP financial measures to investors. Non-GAAP financial measures are subject to inherent limitations because they reflect the exercise of judgments by management about which items are excluded or included in calculating them. Please refer to the appendix at the end of this letter for reconciliations to the most directly comparable measures in accordance with GAAP.
**About Pro Forma With Connexity Information
This letter includes historical and projected pro forma information for ex-TAC Gross Profit. The pro forma information presents the pro forma effect of the Connexity acquisition as if it had been completed on January 1, 2021. The pro forma information is unaudited, is provided as supplemental information only and is subject to the limitations contained under the heading “Unaudited Pro Forma Condensed Combined Financial Information” in our Prospectus dated September 29, 2022, as amended, forming part of our Registration Statement on Form F-3 filed with the Securities and Exchange Commission.
***About Cash Investment in Publisher Prepayments (Net)
We calculate cash investment in publisher prepayments (net) for a specific measurement period as the gross amount of cash publisher prepayments we made in that measurement period minus the amortization of publisher prepayments that were included in traffic acquisition cost during that measurement period, which were the result of cash publisher prepayments made in that measurement period and previous periods.
Note Regarding Forward-Looking Statements
Certain statements in this letter are forward-looking statements. Forward-looking statements generally relate to future events including future financial or operating performance of Taboola.com Ltd. (the “Company”). In some cases, you can identify forward-looking statements by terminology such as “may”, “should”, “expect”, “guidance”, “intend”, “will”, “estimate”, “anticipate”, “believe”, “predict”, “target”, “potential” or “continue”, or the negatives of these terms or variations of them or similar terminology. Such forward-looking statements are subject to risks, uncertainties, and other factors which could cause actual results to differ materially from those expressed or implied by such forward looking statements.
These forward-looking statements are based upon estimates and assumptions that, while considered reasonable by the Company and its management, are inherently uncertain. Uncertainties and risk factors that could affect the Company’s future performance and cause results to differ from the forward-looking statements in this letter include, but are not limited to: the ability to recognize the anticipated benefits of the recent acquisition of Connexity and the business combination between the Company and ION Acquisition Corp. 1 Ltd. (together, the “Business Combinations”), which may be affected by, among other things, competition, the ability of the Company to grow and manage growth profitably, maintain relationships with customers and retain its management and key employees; the Company’s ability to successfully integrate the Connexity acquisition; costs related to the Business Combinations; changes in applicable laws or regulations; the Company’s estimates of expenses and profitability and underlying assumptions with respect to accounting presentations and purchase price and other adjustments; ability to attract new digital properties and advertisers; ability to meet minimum guarantee requirements in contracts with digital properties; intense competition in the digital advertising space, including with competitors who have significantly more resources; ability to grow and scale the Company’s ad and content platform through new relationships with advertisers and digital properties; ability to secure high quality content from digital properties; ability to maintain relationships with current advertiser and digital property partners; ability to make continued investments in the Company’s AI-powered technology platform; the need to attract, train and retain highly-skilled technical workforce; changes in the regulation of, or market practice with respect to, “third party cookies” and its impact on digital advertising; continued engagement by users who interact with the Company’s platform on various digital properties; the impact of the ongoing COVID-19 pandemic; reliance on a limited number of partners for a significant portion of the Company’s revenue; changes in laws and regulations related to privacy, data protection, advertising regulation, competition and other areas related to digital advertising; ability to enforce, protect and maintain intellectual property rights; and risks related to the fact that we are incorporated in Israel and governed by Israeli law; and other risks and uncertainties set forth in the Company’s Annual Report on Form 20-F for the year ended December 31, 2021 under Item 3.D. “Information About the Company - Risk Factors,” the Company’s Registration Statement on Form F-3 filed on September 29, 2022, as it may be amended or supplemented from time to time, under the sections entitled “Cautionary Note Regarding Forward-looking Statements” and “Risk Factors,” and in the Company’s subsequent filings with the Securities and Exchange Commission.
Nothing in this letter should be regarded as a representation by any person that the forward-looking statements set forth herein will be achieved or that any of the contemplated results of such forward-looking statements will be achieved. You should not place undue reliance on these forward-looking statements, which speak only as of the date they were made. The Company undertakes no duty to update these forward-looking statements except as may be required by law.
APPENDIX: Non-GAAP Reconciliation
RECONCILIATION OF GAAP TO NON-GAAP FINANCIAL MEASURES FOR THE THREE AND NINE MONTHS ENDED SEPTEMBER 30, 2022 AND 2021
(Unaudited)
The following table provides a reconciliation of revenues to ex-TAC Gross Profit.
| | | Three months ended September 30, | | | Nine months ended September 30, | |
| | | 2022 | | | 2021 | | | 2022 | | | 2021 | |
| | | Unaudited | |
| | | (dollars in thousands) | |
| Revenues | | $ | 332,462 | | | $ | 338,768 | | | $ | 1,029,883 | | | $ | 970,790 | |
| Traffic acquisition cost | | | 203,125 | | | | 211,899 | | | | 619,109 | | | | 621,137 | |
| Other cost of revenues | | | 26,649 | | | | 19,184 | | | | 79,695 | | | | 52,224 | |
| Gross profit | | $ | 102,688 | | | $ | 107,685 | | | $ | 331,079 | | | $ | 297,429 | |
| Add back: Other cost of revenues | | | 26,649 | | | | 19,184 | | | | 79,695 | | | | 52,224 | |
| ex-TAC Gross Profit | | $ | 129,337 | | | $ | 126,869 | | | $ | 410,774 | | | $ | 349,653 | |
The following table provides a reconciliation of Operating loss to Adjusted EBITDA.
| | | Three months ended September 30, | | | Nine months ended September 30, | |
| | | 2022 | | | 2021 | | | 2022 | | | 2021 | |
| | | Unaudited | |
| | | (dollars in thousands) | |
| Operating loss | | $ | (21,450 | ) | | $ | (124 | ) | | $ | (38,700 | ) | | $ | (31,911 | ) |
| Adjusted to exclude the following: | | | | | | | | | | | | |
| Depreciation and amortization | | | 23,222 | | | | 13,160 | | | | 68,711 | | | | 30,050 | |
| Share-based compensation expenses (1) | | | 15,937 | | | | 19,940 | | | | 50,616 | | | | 103,594 | |
| Restructuring expenses (2) | | | 3,383 | | | | — | | | | 3,383 | | | | — | |
| Holdback compensation expenses (3) | | | 2,773 | | | | 840 | | | | 8,355 | | | | 840 | |
| M&A costs | | | 292 | | | | 5,918 | | | | 816 | | | | 11,507 | |
| Adjusted EBITDA | | $ | 24,157 | | | $ | 39,734 | | | $ | 93,181 | | | $ | 114,080 | |
1 For the nine months ended September 30, 2021, a substantial majority is share-based compensation expenses related to going public.
2 Costs associated with the Company’s cost restructuring program implemented in September 2022.
3 Represents share based compensation due to holdback of Taboola Ordinary shares issuable under compensatory arrangements relating to Connexity acquisition.
We calculate Ratio of net income (loss) to gross profit as net income (loss) divided by gross profit. We calculate Ratio of Adjusted EBITDA to ex-TAC Gross Profit, a non-GAAP measure, as Adjusted EBITDA divided by ex-TAC Gross Profit. We believe that the Ratio of Adjusted EBITDA to ex-TAC Gross Profit is useful because TAC is what we must pay digital properties to obtain the right to place advertising on their websites, and we believe focusing on ex-TAC Gross Profit better reflects the profitability of our business. The following table reconciles Ratio of net income (loss) to gross profit and Ratio of Adjusted EBITDA to ex-TAC Gross Profit for the period shown.
| | | Three months ended September 30, | | | Nine months ended September 30, | |
| | | 2022 | | | 2021 | | | 2022 | | | 2021 | |
| | | Unaudited | |
| | | (dollars in thousands) | |
| Gross profit | | $ | 102,688 | | | $ | 107,685 | | | $ | 331,079 | | | $ | 297,429 | |
| Net income (loss) | | $ | (26,026 | ) | | $ | 17,296 | | | $ | (27,159 | ) | | $ | (25,533 | ) |
| Ratio of net income (loss) to gross profit | | | (25.3 | %) | | | 16.1 | % | | | (8.2 | %) | | | (8.6 | %) |
| | | | | | | | | | | | | | | | | |
| ex-TAC Gross Profit | | $ | 129,337 | | | $ | 126,869 | | | $ | 410,774 | | | $ | 349,653 | |
| Adjusted EBITDA | | $ | 24,157 | | | $ | 39,734 | | | $ | 93,181 | | | $ | 114,080 | |
| Ratio of Adjusted EBITDA margin to ex-TAC Gross Profit | | | 18.7 | % | | | 31.3 | % | | | 22.7 | % | | | 32.6 | % |
The following table provides a reconciliation of net income (loss) to Non-GAAP Net Income.
| | | Three months ended September 30, | | | Nine months ended September 30, | |
| | | 2022 | | | 2021 | | | 2022 | | | 2021 | |
| | | Unaudited | |
| | | (dollars in thousands) | |
| Net income (loss) | | $ | (26,026 | ) | | $ | 17,296 | | | $ | (27,159 | ) | | $ | (25,533 | ) |
| Amortization of acquired intangibles | | | 15,983 | | | | 5,908 | | | | 47,591 | | | | 7,186 | |
| Share-based compensation expenses (1) | | | 15,937 | | | | 19,940 | | | | 50,616 | | | | 103,594 | |
| Restructuring expenses (2) | | | 3,383 | | | | — | | | | 3,383 | | | | — | |
| Holdback compensation expenses (3) | | | 2,773 | | | | — | | | | 8,355 | | | | — | |
| M&A costs | | | 292 | | | | 5,918 | | | | 816 | | | | 11,507 | |
| Revaluation of Warrants | | | (988 | ) | | | — | | | | (26,988 | ) | | | — | |
| Exchange rate (income) loss, net (4) | | | 347 | | | | 1,974 | | | | 3,053 | | | | 3,519 | |
| Income tax effects | | | (1,486 | ) | | | (2,737 | ) | | | (11,563 | ) | | | (4,282 | ) |
| Non-GAAP Net Income | | $ | 10,215 | | | $ | 48,299 | | | $ | 48,104 | | | $ | 95,991 | |
| | | | | | | | | | | | | | | | | |
| Non-GAAP EPS basic | | $ | 0.04 | | | $ | 0.21 | | | $ | 0.19 | | | $ | 0.89 | |
| Non-GAAP EPS diluted | | $ | 0.04 | | | $ | 0.19 | | | $ | 0.19 | | | $ | 0.68 | |
1 For the nine months ended September 30, 2021, a substantial majority is share-based compensation expenses related to going public.
2 Costs associated with the Company’s cost restructuring program implemented in September 2022.
3 Represents share based compensation due to holdback of Taboola Ordinary shares issuable under compensatory arrangements relating to Connexity acquisition.
4 Represents income or loss related to the remeasurement of monetary assets and liabilities to the Company's functional currency using exchange rates in effect at the end of the reporting period.
The following table provides a reconciliation of the number of shares used to calculate GAAP EPS to IPO Pro forma Non-GAAP EPS basic and diluted.
| | | Three months ended September 30, | | | Nine months ended September 30, | |
| | | 2022 | | | 2021 | | | 2022 | | | 2021 | |
| | | Unaudited | |
| GAAP weighted-average shares used to compute net income (loss) per share, basic | | | 255,160,597 | | | | 229,024,803 | | | | 251,865,831 | | | | 107,884,927 | |
| Add: Non-GAAP adjustment for Ordinary shares issued in connection with going public | | | — | | | | — | | | | — | | | | 114,313,773 | |
| IPO Pro forma Non-GAAP weighted-average shares used to compute net income per share, basic | | | 255,160,597 | | | | 229,024,803 | | | | 251,865,831 | | | | 222,198,700 | |
| | | | | | | | | | | | | | | | | |
| GAAP weighted-average shares used to compute net income (loss) per share, diluted | | | 255,160,597 | | | | 259,262,529 | | | | 251,865,831 | | | | 107,884,927 | |
| Add: Non-GAAP adjustment for Ordinary shares issued in connection with going public | | | — | | | | — | | | | — | | | | 114,313,773 | |
| Add: Dilutive Ordinary share equivalents | | | 870,513 | | | | — | | | | 2,358,472 | | | | 33,980,786 | |
| IPO Pro forma Non-GAAP weighted-average shares used to compute net income per share, diluted | | | 256,031,110 | | | | 259,262,529 | | | | 254,224,303 | | | | 256,179,486 | |
| | | | | | | | | | | | | | | | | |
| IPO Pro forma Non-GAAP EPS, basic (1) | | $ | 0.040 | | | $ | 0.211 | | | $ | 0.191 | | | $ | 0.432 | |
| IPO Pro forma Non-GAAP EPS, diluted (1) | | $ | 0.040 | | | $ | 0.186 | | | $ | 0.189 | | | $ | 0.375 | |
1 IPO Pro Forma Non-GAAP EPS basic and diluted is presented only for the three and nine months ended September 30, 2021 assuming Taboola went public and consummated the related transactions in each case as of January 1, 2021. Therefore the Non-GAAP net income does not include any adjustments of undistributed earnings previously allocated to participating securities, assuming these securities converted to Ordinary shares in each case as of January 1, 2021.
The following table provides a reconciliation of net cash provided by operating activities to Free Cash Flow.
| | | Three months ended September 30, | | | Nine months ended September 30, | |
| | | 2022 | | | 2021 | | | 2022 | | | 2021 | |
| | | Unaudited | |
| | | (dollars in thousands) | |
| Net cash provided by operating activities | | $ | 23,219 | | | $ | 26,573 | | | $ | 33,426 | | | $ | 40,553 | |
| Purchases of property and equipment, including capitalized internal-use software | | | (12,224 | ) | | | (7,099 | ) | | | (28,476 | ) | | | (28,774 | ) |
| Free Cash Flow | | $ | 10,995 | | | $ | 19,474 | | | $ | 4,950 | | | $ | 11,779 | |
APPENDIX: Non-GAAP Guidance Reconciliation
RECONCILIATION OF GAAP TO NON-GAAP FINANCIAL MEASURES FOR Q4 2022 AND FULL YEAR 2022 GUIDANCE
(Unaudited)
The following table provides a reconciliation of projected gross profit to ex-TAC Gross Profit.
| | | | Q4 2022 | | | FY 2022 | |
| | | Unaudited | |
| | | (dollars in millions) | |
| Revenues | | $ | 358 - $374 | | | $ | 1,388 - $1,404 | |
| Traffic acquisition cost | | $ | (205 - $209 | ) | | $ | (824 - $828 | ) |
| Other cost of revenues | | $ | (25 - $26 | ) | | $ | (105 - $107 | ) |
| Gross profit | | $ | 127 - $139 | | | $ | 458 - $470 | |
| Add back: Other cost of revenues | | $ | 25 - $26 | | | $ | 105 - $107 | |
| ex-TAC Gross Profit | | $ | 153 - $165 | | | $ | 564 - $576 | |
Although we provide a projection for Free Cash Flow, we are not able to provide a projection for net cash provided by operating activities, the most directly comparable GAAP measure. Certain elements of net cash provided by operating activities, including taxes and timing of collections and payments, are not predictable therefore projecting an accurate forecast is difficult. As a result, it is impractical for us to provide projections on net cash provided by operating activities or to reconcile our Free Cash Flow projections without unreasonable efforts. Consequently, no disclosure of projected net cash provided by operating activities is included. For the same reasons, we are unable to address the probable significance of the unavailable information.