Exhibit 99.2
Dear Shareholder,
We had strong performance in Q2, beating the high end of our guidance across all metrics. We achieved $123.1M in ex-TAC Gross Profit, $15.7M in Adjusted EBITDA and $7.8M in Free Cash Flow.
We’re raising the midpoint of our full year 2023 guidance across all metrics. As we’re getting closer to 2024, we still expect a step change in next year’s financial performance, with over $200M of Adjusted EBITDA and over $100M in Free Cash Flow in 2024. This is with our Yahoo integration being fully live for only part of the year.
We’re outpacing our expectations on eCommerce, which now represents nearly 20% of ex-TAC (up from 15%). I believe eCommerce will continue to be a key part of our business as users are looking to make decisions that matter to them based on information from publishers they trust and as Retail Media dollars are growing and advertisers are looking for places to spend those dollars.
I’m also happy to share that Taboola News, our version of Apple News, which is integrated into Android devices from Samsung, Xiaomi and others, is continuing to experience rocketship growth, and will approach $100M in revenue this year (from over $50M in 2022). I love this business because first, we built it organically and it shows that Taboola continues to be a startup of startups, redefining our dreams. Second, this has high synergy to our core business, as publishers are getting a growing volume of traffic from us at a time when Generative AI is threatening to limit Search traffic for publishers.
When looking at our core business, yields are fairly stable and we assume they’ll stay like this throughout this year and 2024. We’re seeing strong momentum with continued growth in our publisher partnerships and innovations for advertisers. Publishers are demanding less vendors and more true partners as they chart their growth, diversify their revenue, empower their editorial teams and battle the walled garden platforms’ neverending changes. This is where Taboola is unique, addressing those objectives in a win/win culture.
This quarter, we’ve signed many new publisher partnerships with some of the biggest names in news. This includes new wins like Nexstar Media, Barstool Sports, G/O Media, Cambium Media, Futura, and A Cidade On. We also renewed many long term partnerships like Time, Disney, Unidad Editorial, BBC, One India, The Print and Bangkok Post.
It’s easy for advertisers to buy Search and Social Media ads, but very complicated to buy on the open web as it’s highly fragmented. There is a huge opportunity here for Taboola to become the first “must buy” channel in the open web. With our understanding of nearly 600M daily active users, not relying on 3rd party cookies, and technology innovations such as Max Conversions, Target CPA and Generative AI -- we can break that glass ceiling, and become the first partner of choice for advertisers in the open web.
We remain (laser) focused on our four key priorities, each representing a $1B opportunity for us – Yahoo, Performance Advertising, eCommerce and Bidding (Microsoft and other digital properties). Let me elaborate on them.
We are progressing nicely in phase 1 and are on schedule to enter phase 2 in H2. We’re focusing a lot of our energy on advertisers' migration success, both those who buy today from Yahoo native directly and those who buy through Yahoo DSP. There is a huge opportunity for both Yahoo and Taboola here to bring both companies' advertisers into the mix, make them even more successful and drive yield expansion over time.
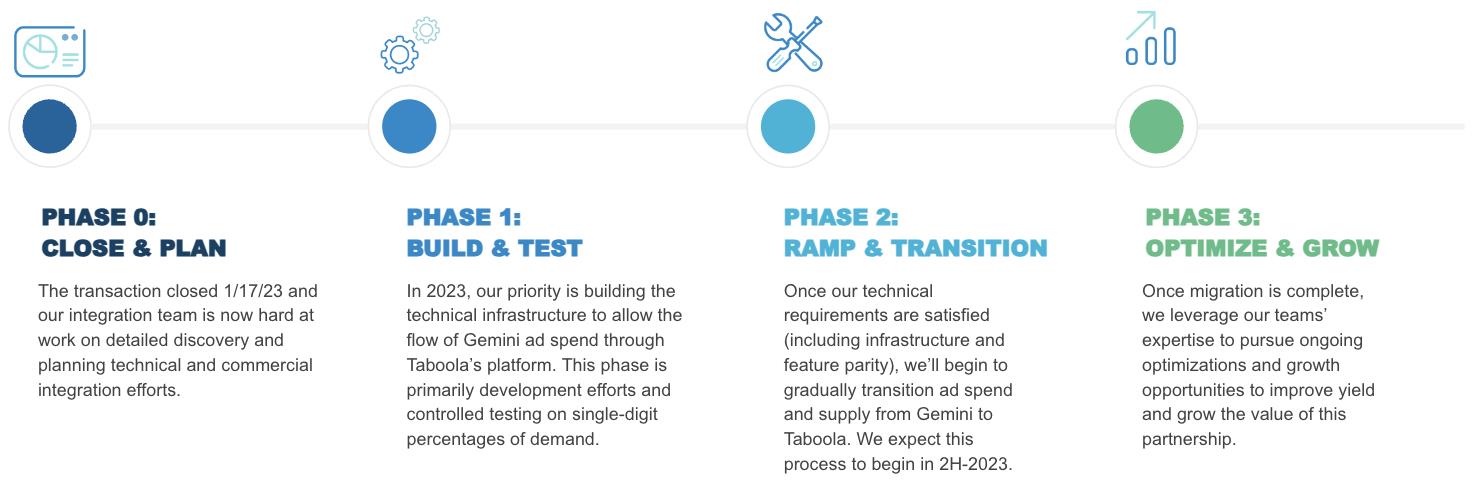
I’m happy to report that certain Yahoo international markets are now live with Taboola where there were fewer advertisers to transition. This is part of us testing and evaluating advertisers’ performance in preparation for the U.S. market ramping in 2024. There is a lot more work to be done to get the U.S. up and running, between infrastructure development, migration of thousands of advertisers, and connecting our data pipes so we can create even better contextual segments. Early advertisers' performance in these pilot markets verify our assumption that Yahoo is an incredible source of supply for advertisers. As of now, this has an immaterial impact on our financials, but it’s exciting to see the performance we’re able to drive, even at a small scale.
As a reminder, the vast majority of Taboola’s revenues come from advertisers who buy from Taboola directly, using our own AI called SmartBid. About 10% of our revenues come from programmatic partners such as Google, TTD, Criteo, Amazon, and others.
Our two main objectives are to get new advertisers to be successful when they try Taboola, and to get existing advertisers to stay with us and spend more as measured by net dollar retention (NDR).
One of our biggest areas of focus on the tech side is “bidding strategies”, which is how to help advertisers, new and existing, to better succeed with us using automated, algorithmic based, buying methods. I talked in the previous quarter about Target-CPA, allowing advertisers to set a goal for how much a conversion (lead, purchase, app install) is worth to them and Taboola will be looking for users who meet that threshold. As a continuation of that bidding strategy, we have been spending a lot of our energy on Maximize Conversions, which is the default bidding strategy for companies like Google or Meta. It allows an advertiser to evolve from placing “CPC” (price per click), and sharing their acquisition goal, to basically give Taboola a budget, and let us try to get as many consumers as we can to convert at the most affordable acquisition price. Then the advertiser can set a Target-CPA, and scale as much as possible, under the desired cost. This was tested by dozens of advertisers during Q2, we’ve seen encouraging results and I’m excited to share that Max Conversion as well as Target CPA went to General Availability (GA) this week. I suspect that more than 50% of our revenue in 2024 will be using Maximize Conversions/Target-CPA as a bidding strategy. Imagine a future where advertisers buying from Taboola don’t need to “guess a CPC”, but rather just share their goal and our AI will do the rest.
We’re not stopping here, early 2024 we aim to bring to market Target ROAS/Max-Revenue bidding strategy, that will take into consideration not only the likelihood for a conversion but also the expected ROI for the advertiser.
I’m very excited about our investment in Generative AI. I think it will impact many industries, and we’re deep investing into how it can affect advertisers' success. Brands all around the world have used the technology to generate content and copy for ad creative, such as titles, images and headlines. The biggest benefits for them have been reducing their time spent on generating ad creative and producing high performing creative assets for their campaigns.
Of the brands using our Generative AI technology, 80% ran multiple campaigns and in testing, select brands have more than doubled the click through rate for their campaigns when measured against evergreen campaigns.
Our investments into growing our eCommerce offerings via technology and through Connexity and Skimlinks are paying off – eCommerce is now nearly 20% of our ex-TAC, and we beat our budget again in Q2 as we did in Q1. We see outstanding merchant retention and increasing budgets, validating the value clients get when buying from us. Connexity is also starting to pick up momentum in Europe, which we are encouraged by.
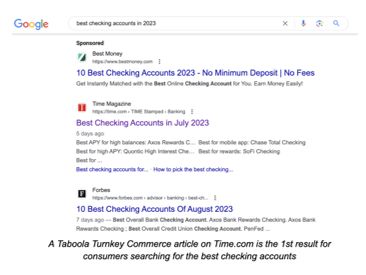
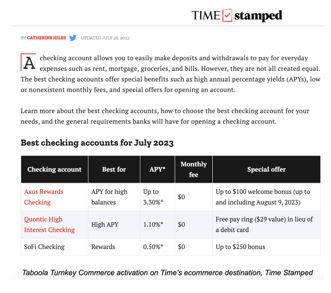
We previously announced the introduction of Taboola Turnkey Commerce, an “ecommerce in a box” solution for publishers and we’ve already seen great publishers like TIME and Advance Local adopt it. With it, Taboola does all of the work for the publishers, from using our data to know which content makes sense for us to write on behalf of the publisher, to driving traffic to it, and of course monetizing it with relationships with merchants and service providers.
Taboola Turnkey Commerce is meant to connect publishers’ expertise with consumers, to drive monetization and we’re seeing clear signs that it’s working. A simple Google search for “Best Checking Accounts in 2023” leads consumers directly to Taboola’s Turnkey Commerce activation on TIME.com – it’s the 1st organic result as seen in the accompanying image.
Consumers who search for this phrase are clearly invested in opening a checking account, and when they arrive at TIME’s page, they can compare options. If and when they click on one of TIME’s editorial suggestions, both TIME and Taboola benefit. Our revenue model here is the same as the rest of our business, every time revenue is being made - we share it with the publisher.
Bidding into “display inventory”
We estimate that the 8,000+ publishers in our core business generate display revenues of ~$20-25B a year. We think that we can access our publishers’ display inventory with our Header Bidding solution, and win about 5-10% of the auctions given our advantage in AI, first party data and other data. This will make us even more valuable partners for our publishers, increasing our payments to them as well as our share of wallet, while providing our advertisers with even more scale.
Especially as cookies on Chrome are about to be deprecated, based on our experience with Apple ITP, we anticipate this to be a source of strength for our bidder given our access to first party data.
We have 3 areas where we bid: (1) Microsoft/MSN - this launched in April of last year; (2) publisher partners using our core solutions where we have first party advantage; and (3) publishers not currently using our core solutions where we have unique demand but not first party advantage. We believe that as Yahoo launches, we’ll be able to also partner with Yahoo on bidding as well.
I’m happy to report that our investments here are panning out, Microsoft’s Q2 of 2023 was higher than Q2 of 2022 and we expect Microsoft Q3 to be meaningfully bigger than Q3 2022. As we said in April last year, we expect that moving to bidding with Microsoft, who helped us design this product initially, will make our partnership a growing one - and it’s happening.
Beyond Microsoft, we are excited to continue expanding our bidding technology across the open web to bring Taboola’s demand to our publisher partners at scale. In Q2, we doubled down on our efforts and are now live on over 100 sites across our global network of publisher partners. As we continue to scale, we are laser focused on fine tuning our technology and algorithms, leveraging our ongoing investment in R&D and Operations of our bidder platform.
Let me finish by sharing our financial results for Q2 ‘23. We saw strong financial performance in the quarter and beat the high end of our guidance on all metrics. This performance was driven by strength in our eCommerce, bidding and Taboola News businesses, as well as fairly stable yields in our core business. We are also pleased that we have been able to control costs and, as a result, have exceeded our implied guidance for Adjusted EBITDA margins.
| (dollars in millions) | | Q2 2023 Actuals | | | Q2 2023 Guidance | |
| Revenues | | $ | 332.0 | | | $296 - $322 | |
| Gross profit | | $ | 97.1 | | | $78 - $88 | |
| ex-TAC Gross Profit* | | $ | 123.1 | | | $105 - $115 | |
| Adjusted EBITDA* | | $ | 15.7 | | | ($4) - $6 |
|
| Non-GAAP Net Income (Loss)* | | $ | (1.4 | ) | | ($26) - ($16) |
|
Q3 and FY 2023, 2024 Guidance
Below is our Q3 2023, full year 2023 and 2024 guidance. Our outlook assumes that the online advertising market will continue at current levels, but does not significantly get better or worsen. It also assumes continued investment in our key company priorities of Yahoo, Performance Advertising, Bidding and eCommerce. We expect to have positive Free Cash Flow in 2023. We also believe our investments will start to show returns in 2024 and we expect to generate at least $200M in Adjusted EBITDA and $100M in Free Cash Flow in 2024, despite it being a partial year for Yahoo.
| | | Q3 2023 Guidance | | | FY 2023 Guidance | |
| | | Unaudited | |
| | | (dollars in millions) | |
| Revenues | | $331 - $357 | | | $1,438 - $1,469 | |
| Gross profit | | $83 - $95 | | | $420 - $436 | |
| ex-TAC Gross Profit* | | $112 - $124 | | | $531 - $546 | |
| Adjusted EBITDA* | | ($2) - $10 | | | $73 - $80 | |
| Non-GAAP Net Income (Loss)* | | ($20) - ($8) | | | $5 - $10 | |
For more information on our Q2 results, Q3 2023 and FY23 guidance, please see our Q2 2023 earnings press release, which was furnished to the SEC and also posted on Taboola’s website today at https://investors.taboola.com.
* * *
These are exciting times for us at Taboola, and in the industry. Never before did I feel as strongly that we can build the first large scale, “must buy” open web company, helping advertisers truly scale and spend dollars on trusted publishers, grow journalism, versus mainly buying search and social. I just came back from an offsite in London with my team, and started it by saying - this is not a strategy offsite, we know exactly what we need to do.
I’m energized by where we are on our journey, we have a lot to execute on but the force is with us. I’m bullish about our future and look forward to interacting with many of you over the next few weeks.
Kind regards,
-- Adam Singolda
Founder & CEO Taboola
*About Non-GAAP Financial Information
This letter includes ex-TAC Gross Profit, Adjusted EBITDA, Free Cash Flow and Non-GAAP Net Income (Loss), which are non-GAAP financial measures. These non-GAAP financial measures are not measures of financial performance in accordance with GAAP and may exclude items that are significant in understanding and assessing the Company’s financial results. Therefore, these measures should not be considered in isolation or as an alternative to revenues, gross profit,net income (loss), cash flows from operations or other measures of profitability, liquidity or performance under GAAP. You should be aware that the Company’s presentation of these measures may not be comparable to similarly-titled measures used by other companies.
The Company believes non-GAAP financial measures provide useful information to management and investors regarding future financial and business trends relating to the Company. The Company believes that the use of these measures provides an additional tool for investors to use in evaluating operating results and trends and in comparing the Company’s financial measures with other similar companies, many of which present similar non-GAAP financial measures to investors. Non-GAAP financial measures are subject to inherent limitations because they reflect the exercise of judgments by management about which items are excluded or included in calculating them. Please refer to the appendix at the end of this letter for reconciliations to the most directly comparable measures in accordance with GAAP.
**About Cash Investment in Publisher Prepayments (Net)
We calculate cash investment in publisher prepayments (net) for a specific measurement period as the gross amount of cash publisher prepayments we made in that measurement period minus the amortization of publisher prepayments that were included in traffic acquisition cost during that measurement period, which were the result of cash publisher prepayments made in that measurement period and previous periods.
Note Regarding Forward-Looking Statements
Certain statements in this letter are forward-looking statements. Forward-looking statements generally relate to future events including future financial or operating performance of Taboola.com Ltd. (the “Company”). In some cases, you can identify forward-looking statements by terminology such as “may”, “should”, “expect”, “guidance”, “intend”, “will”, “estimate”, “anticipate”, “believe”, “predict”, “target”, “potential” or “continue”, or the negatives of these terms or variations of them or similar terminology. Such forward-looking statements are subject to risks, uncertainties, and other factors which could cause actual results to differ materially from those expressed or implied by such forward looking statements.
These forward-looking statements are based upon estimates and assumptions that, while considered reasonable by the Company and its management, are inherently uncertain. Uncertainties and risk factors that could affect the Company’s future performance and cause results to differ from the forward-looking statements in this letter include, but are not limited to: the Company’s ability to grow and manage growth profitably, maintain relationships with customers and retain its management and key employees; the Company’s ability to successfully integrate the Connexity acquisition; changes in applicable laws or regulations; the Company’s estimates of expenses and profitability and underlying assumptions with respect to accounting presentations and purchase price and other adjustments; the extent to which we will voluntarily prepay additional long-term debt or buyback any of our Ordinary shares pursuant to authority granted by the Company’s Board of Directors, which may depend upon market and economic conditions; other business opportunities and priorities; and, with respect to the buyback of our Ordinary shares, the availability of sufficient continuing authority being approved and re-approved as necessary by the Tel Aviv District Court Economic Department to permit share buybacks (and our continued use of a net issuance mechanism to satisfy tax withholding obligations related to equity-based compensation on behalf of our directors, officers and other employees) or other factors; the Company’s ability to transition to and fully launch the native advertising service for Yahoo on the currently anticipated schedule or at all; the timing and amount of any margin, profitability, cash flow or other financial contributions resulting from the integration of Yahoo with our service; the risk that the Yahoo integration results in a decline in the Company’s financial performance during the preparation and roll out of the new service and beyond; the ability to generate or achieve the financial results, including the increase in Adjusted EBITDA and Free Cash Flow in 2024 or our expected revenue run-rate once Yahoo is live, in each case to the levels assumed in this letter or at all; ability to transform the Company into an alternative to the walled gardens in the Open Web; the ability to become the largest open web advertising company in the world by revenue; ability to attract new digital properties and advertisers; ability to meet minimum guarantee requirements in contracts with digital properties; intense competition in the digital advertising space, including with competitors who have significantly more resources; ability to grow and scale the Company’s ad and content platform through new relationships with advertisers and digital properties; ability to secure high quality content from digital properties; ability to maintain relationships with current advertiser and digital property partners; ability to make continued investments in the Company’s AI-powered technology platform; the need to attract, train and retain highly-skilled technical workforce; changes in the regulation of, or market practice with respect to, “third party cookies” and its impact on digital advertising; continued engagement by users who interact with the Company’s platform on various digital properties; reliance on a limited number of partners for a significant portion of the Company’s revenue; changes in laws and regulations related to privacy, data protection, advertising regulation, competition and other areas related to digital advertising; ability to enforce, protect and maintain intellectual property rights; and risks related to the fact that we are incorporated in Israel and governed by Israeli law; and other risks and uncertainties set forth in the Company’s Annual Report on Form 10-K for the year ended December 31, 2022 under Part 1, Item 1A “Risk Factors” and in the Company’s subsequent filings with the Securities and Exchange Commission.
Nothing in this letter should be regarded as a representation by any person that the forward-looking statements set forth herein will be achieved or that any of the contemplated results of such forward-looking statements will be achieved. You should not place undue reliance on these forward-looking statements, which speak only as of the date they were made. The Company undertakes no duty to update these forward-looking statements except as may be required by law.
APPENDIX: Non-GAAP Reconciliation
RECONCILIATION OF GAAP TO NON-GAAP FINANCIAL MEASURES FOR THE THREE AND SIX MONTHS ENDED JUNE 30, 2023 AND 2022 (Unaudited)
The following table provides a reconciliation of revenues to ex-TAC Gross Profit.
| | | Three months ended June 30, | | | Six months ended June 30, | |
| | | 2023 | | | 2022 | | | 2023 | | | 2022 | |
| | | (dollars in thousands) | |
| Revenues | | $ | 332,004 | | | $ | 342,695 | | | $ | 659,690 | | | $ | 697,421 | |
| Traffic acquisition cost | | | 208,870 | | | | 199,486 | | | | 420,816 | | | | 415,984 | |
| Other cost of revenues | | | 26,077 | | | | 26,848 | | | | 52,225 | | | | 53,046 | |
| Gross profit | | $ | 97,057 | | | $ | 116,361 | | | $ | 186,649 | | | $ | 228,391 | |
| Add back: Other cost of revenues | | | 26,077 | | | | 26,848 | | | | 52,225 | | | | 53,046 | |
| ex-TAC Gross Profit | �� | $ | 123,134 | | | $ | 143,209 | | | $ | 238,874 | | | $ | 281,437 | |
The following table provides a reconciliation of net income (loss) to Adjusted EBITDA.
| | | Three months ended June 30, | | | Six months ended June 30, | |
| | | 2023 | | | 2022 | | | 2023 | | | 2022 | |
| | | (dollars in thousands) | |
| Net loss | | $ | (31,314 | ) | | $ | (5,021 | ) | | $ | (62,627 | ) | | $ | (1,133 | ) |
| Adjusted to exclude the following: | | | | | | | | | | | | |
| Finance (income) expenses, net | | | 3,827 | | | | (4,764 | ) | | | 6,981 | | | | (15,959 | ) |
| Income tax (benefit) expenses | | | 2,487 | | | | 234 | | | | 1,848 | | | | (158 | ) |
| Depreciation and amortization | | | 22,792 | | | | 22,813 | | | | 45,393 | | | | 45,489 | |
| Share-based compensation expenses | | | 13,890 | | | | 17,640 | | | | 27,417 | | | | 34,679 | |
| Holdback compensation expenses (1) | | | 2,645 | | | | 2,792 | | | | 5,200 | | | | 5,582 | |
| M&A and other costs (2) | | | 1,334 | | | | 474 | | | | 1,571 | | | | 524 | |
| Adjusted EBITDA | | $ | 15,661 | | | $ | 34,168 | | | $ | 25,783 | | | $ | 69,024 | |
1 Represents share-based compensation due to holdback of Taboola Ordinary shares issuable under compensatory arrangements relating to Connexity acquisition.
2 Includes one-time costs related to the Commercial agreement.
The following table provides a reconciliation of net income (loss) to Non-GAAP Net Income (loss).
| | | Three months ended June 30, | | | Six months ended June 30, | |
| | | 2023 | | | 2022 | | | 2023 | | | 2022 | |
| | | (dollars in thousands) | |
| Net loss | | $ | (31,314 | ) | | $ | (5,021 | ) | | $ | (62,627 | ) | | $ | (1,133 | ) |
| Amortization of acquired intangibles | | | 15,962 | | | | 15,828 | | | | 31,931 | | | | 31,608 | |
| Share-based compensation expenses | | | 13,890 | | | | 17,640 | | | | 27,417 | | | | 34,679 | |
| Holdback compensation expenses (1) | | | 2,645 | | | | 2,792 | | | | 5,200 | | | | 5,582 | |
| M&A and other costs (2) | | | 1,334 | | | | 474 | | | | 1,571 | | | | 524 | |
| Revaluation of Warrants | | | 702 | | | | (11,958 | ) | | | (974 | ) | | | (26,000 | ) |
| Foreign currency exchange rate losses (gains) (3) | | | (663 | ) | | | 2,490 | | | | (234 | ) | | | 2,706 | |
| Income tax effects | | | (3,962 | ) | | | (6,451 | ) | | | (7,791 | ) | | | (10,077 | ) |
| Non-GAAP Net Income (Loss) | | $ | (1,406 | ) | | $ | 15,794 | | | $ | (5,507 | ) | | $ | 37,889 | |
1 Represents share-based compensation due to holdback of Taboola Ordinary shares issuable under compensatory arrangements relating to Connexity acquisition.
2 Includes one-time costs related to the Commercial agreement.
3 Represents income or loss related to the remeasurement of monetary assets and liabilities to the Company's functional currency using exchange rates in effect at the end of the reporting period.
The following table provides a reconciliation of net cash provided by operating activities to Free Cash Flow.
| | | Three months ended June 30, | | | Six months ended June 30, | |
| | | 2023 | | | 2022 | | | 2023 | | | 2022 | |
| | | (dollars in thousands) | |
| Net cash provided by operating activities | | $ | 11,598 | | | $ | 2,084 | | | $ | 29,122 | | | $ | 10,207 | |
| Purchases of property and equipment, including capitalized internal-use software | | | (3,828 | ) | | | (9,350 | ) | | | (10,178 | ) | | | (16,252 | ) |
| Free Cash Flow | | $ | 7,770 | | | $ | (7,266 | ) | | $ | 18,944 | | | $ | (6,045 | ) |
APPENDIX: Non-GAAP Guidance Reconciliation
RECONCILIATION OF GAAP TO NON-GAAP FINANCIAL MEASURES FOR Q3 2023 AND FULL YEAR 2023 GUIDANCE
(Unaudited)
The following table provides a reconciliation of projected gross profit to ex-TAC Gross Profit.
| | | Q3 2023 Guidance | | | FY 2023 Guidance | |
| | | Unaudited | |
| | | (dollars in millions) | |
| Revenues | | $331 - $357 | | | $1,438 - $1,469 | |
| Traffic acquisition cost | | ($220) - ($234) |
| | ($907) - ($923) | |
| Other cost of revenues | | ($29) - ($29) | | | ($110) - ($111) | |
| Gross profit | | $83 - $95 | | | $420 - $436 | |
| Add back: Other cost of revenues | | ($29) - ($29) | | | ($110) - ($111) | |
| ex-TAC Gross Profit | | $112 - $124 | | | $531 - $546 | |
Although we provide a projection for Free Cash Flow, we are not able to provide a projection for net cash provided by operating activities, the most directly comparable GAAP measure. Certain elements of net cash provided by operating activities, including taxes and timing of collections and payments, are not predictable therefore projecting an accurate forecast is difficult. As a result, it is impractical for us to provide projections on net cash provided by operating activities or to reconcile our Free Cash Flow projections without unreasonable efforts. Consequently, no disclosure of projected net cash provided by operating activities is included. For the same reasons, we are unable to address the probable significance of the unavailable information.
APPENDIX: Assumptions: If Yahoo Were On Taboola Network For FY 2022
All numbers are management estimates based on the following assumptions and sources:
| ● | Revenue baseline is equal to the expected FY 2022 financials for TBLA at guidance midpoint (66% of combined Revenues) + FY 2022 expected financials for Yahoo Native supply* that will be serviced by TBLA (34% of combined Revenues) |
| ● | Revenue uplift on Yahoo supply from improved yield due to the application of Taboola technology and data |
| ● | Revenue uplift on stand-alone Taboola supply from improved yield due to advertiser demand from Yahoo and additional data |
| ● | Operating expenses based on bottom up model of resources needed to support deal |
| ● | Assumes no ramp up time - numbers assume Yahoo is part of Taboola network from the beginning of 2022 and assumes uplifts and operating expenses start from the beginning of the year |
* Yahoo Q1 to Q3 2022