
Speakers: McKeel Hagerty | Chief Executive Officer Frederick J. Turcotte | SVP & Chief Financial Officer
HAGERTY Q1 2022 | 2 FORWARD LOOKING STATEMENTS / NON-GAAP FINANCIAL MEASURES This presentation contains forward-looking statements within the meaning of the Private Securities Litigation Reform Act of 1995. Forward-looking statements include all statements that are not historical facts. These forward- looking statements reflect our current expectations and projections with respect to our expected future business and financial performance, including, among other things: (i) expected operating results, such as revenue growth and increases in earned premium; (ii) changes in the market for our products and services; (iii) our plans to expand market share, including planned investments and partnerships; (iv) anticipated business objectives; and (v) the strength of our business model. These statements may be preceded by, followed by, or include the words “aim,” “anticipate,” “believe,” “estimate,” “expect,” “forecast,” “future,” “goal”, “intend,” “likely,” “outlook,” “plan,” “potential,” “project,” “seek,” “target,” “can,” “could,” “may,” “should,” “would,” “will,” the negatives thereof and other words and terms of similar meaning. A number of factors could cause actual results or outcomes to differ materially from those indicated by these forward-looking statements. These factors include, but are not limited to: (i) our ability to compete effectively within its industry and attract and retain members; (ii) our dependence on a limited number of insurance distribution and underwriting carrier partners; (iii) our ability to prevent, monitor and detect fraudulent activity, including our reliance on a limited number of payment processing services; (iv) disruptions, interruptions, outages with our technology platforms or third-party services; (v) the limited operating history of some or our membership products and the success of any new insurance programs and products; (iv) adverse impacts from the COVID-19 pandemic and current and future variants of the virus; (vii) the cyclical nature of the insurance business and our ability to collect vehicle usage and driving data; (viii) unexpected increases in the frequency or severity of claims; (ix) compliance with the numerous laws and regulations applicable to our business, including state, federal, and foreign laws relating to insurance and rate increases, privacy, the internet and accounting matters; (x) whether investors or securities analysts view our stock structure unfavorably, particularly our dual-class structure; (xi) the fact that we are a controlled company; and (xii) other risks and uncertainties indicated from time to time in documents we file or will file with the Securities and Exchange Commission (the “SEC”). The forward-looking statements herein represent our judgment as of the date of this release and we disclaim any intent or obligation to publicly update or review any forward-looking statement, whether as a result of new information, future developments, or otherwise. This presentation should be read in conjunction with the information included in the our filings with the SEC and press releases. Understanding the information contained in these filings is important in order to fully understand our reported financial results and our business outlook for future periods. In addition, this presentation contains certain “non-GAAP financial terms”. The non-GAAP measures are presented for supplemental informational purposes only. Reconciliations to the most directly comparable financial measure calculated and presented in accordance with GAAP are provided in the appendix to this presentation.
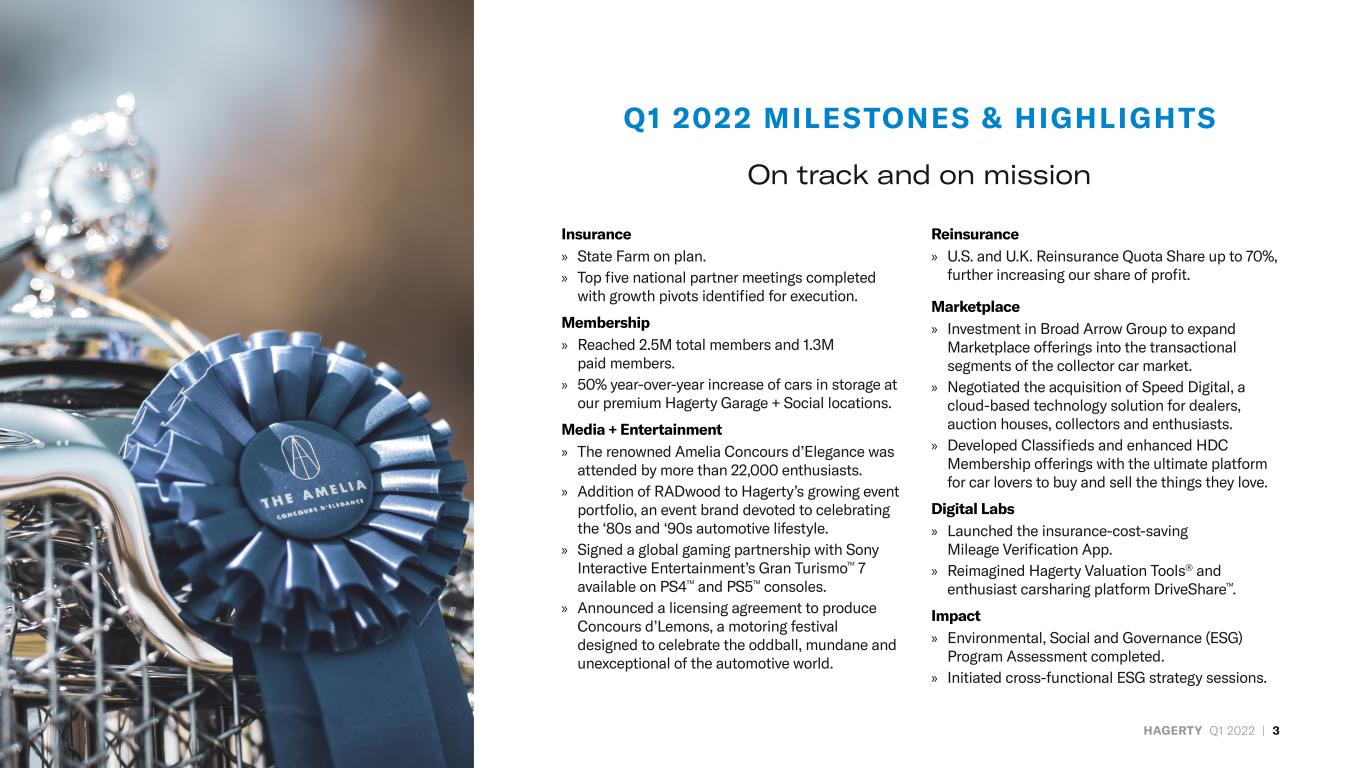
HAGERTY Q1 2022 | 3 Q1 2022 MILESTONES & HIGHLIGHTS On track and on mission Insurance » State Farm on plan. » Top five national partner meetings completed with growth pivots identified for execution. Membership » Reached 2.5M total members and 1.3M paid members. » 50% year-over-year increase of cars in storage at our premium Hagerty Garage + Social locations. Media + Entertainment » The renowned Amelia Concours d’Elegance was attended by more than 22,000 enthusiasts. » Addition of RADwood to Hagerty’s growing event portfolio, an event brand devoted to celebrating the ‘80s and ‘90s automotive lifestyle. » Signed a global gaming partnership with Sony Interactive Entertainment’s Gran Turismo™ 7 available on PS4™ and PS5™ consoles. » Announced a licensing agreement to produce Concours d’Lemons, a motoring festival designed to celebrate the oddball, mundane and unexceptional of the automotive world. Reinsurance » U.S. and U.K. Reinsurance Quota Share up to 70%, further increasing our share of profit. Marketplace » Investment in Broad Arrow Group to expand Marketplace offerings into the transactional segments of the collector car market. » Negotiated the acquisition of Speed Digital, a cloud-based technology solution for dealers, auction houses, collectors and enthusiasts. » Developed Classifieds and enhanced HDC Membership offerings with the ultimate platform for car lovers to buy and sell the things they love. Digital Labs » Launched the insurance-cost-saving Mileage Verification App. » Reimagined Hagerty Valuation Tools® and enthusiast carsharing platform DriveShare™. Impact » Environmental, Social and Governance (ESG) Program Assessment completed. » Initiated cross-functional ESG strategy sessions.

HAGERTY Q1 2022 | 4 All financial comparisons are on a year-over-year basis unless otherwise noted. *See Appendix for additional information regarding these non-GAAP financial measures. $155M Written Premium 16% ↑ 41% Loss Ratio 0% $37M Contribution Margin* 20% ↑ $.04 Adjusted Earnings Per Share* $168M Total Revenue 30% ↑ 727k HDC Paid Member Count 9% ↑ $134 Revenue per Paid Member 21% ↑ 89% Retention 1% ↓ ($6M) Adjusted EBITDA* 673% ↓ ($13M) Operating Income (Loss) 155% ↓ $.33 Basic Earnings (Loss) Per Share $16M Net Income (Loss) 332% ↑ GROWTH PERSISTENCE PROFITABILIT Y Q1 2022 CONSOLIDATED FINANCIAL HIGHLIGHTS
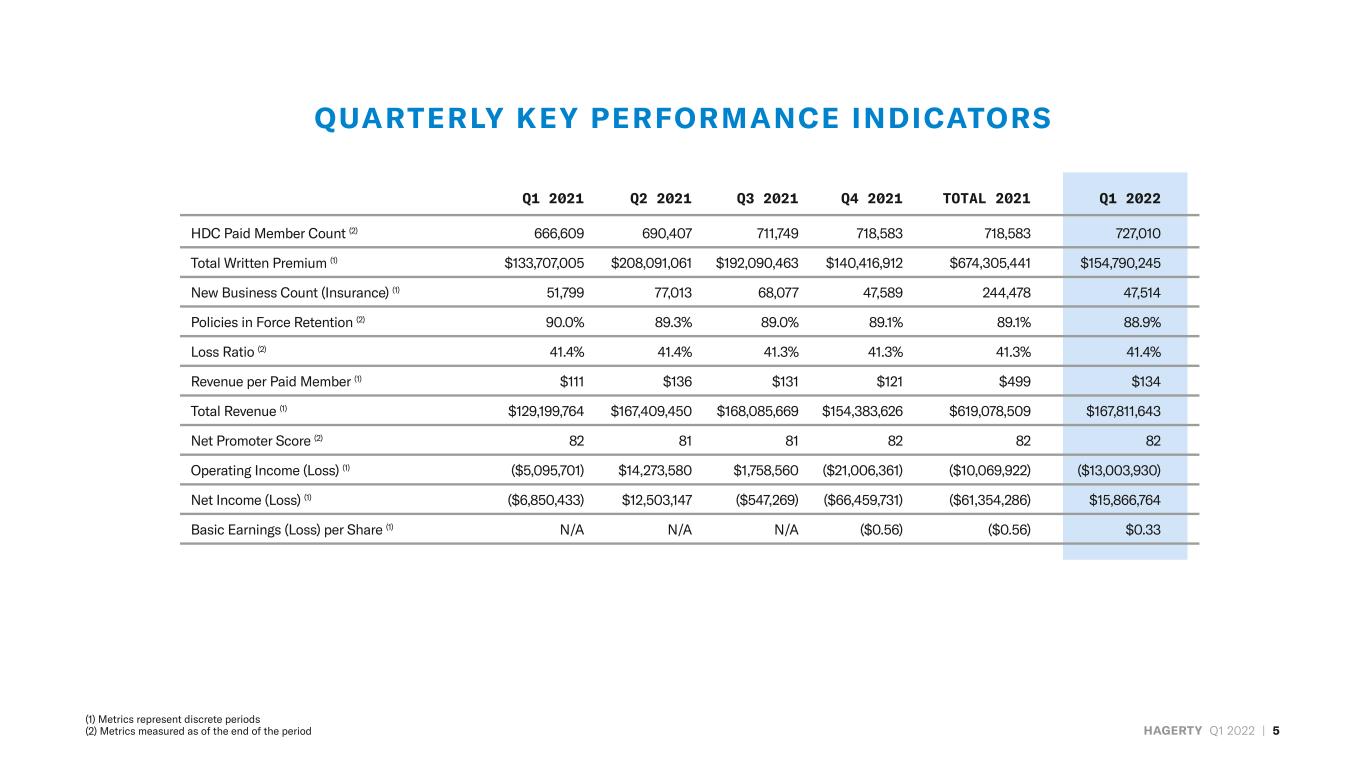
HAGERTY Q1 2022 | 5 QUARTERLY KEY PERFORMANCE INDICATORS Q1 2021 Q2 2021 Q3 2021 Q4 2021 TOTAL 2021 Q1 2022 HDC Paid Member Count (2) 666,609 690,407 711,749 718,583 718,583 727,010 Total Written Premium (1) $133,707,005 $208,091,061 $192,090,463 $140,416,912 $674,305,441 $154,790,245 New Business Count (Insurance) (1) 51,799 77,013 68,077 47,589 244,478 47,514 Policies in Force Retention (2) 90.0% 89.3% 89.0% 89.1% 89.1% 88.9% Loss Ratio (2) 41.4% 41.4% 41.3% 41.3% 41.3% 41.4% Revenue per Paid Member (1) $111 $136 $131 $121 $499 $134 Total Revenue (1) $129,199,764 $167,409,450 $168,085,669 $154,383,626 $619,078,509 $167,811,643 Net Promoter Score (2) 82 81 81 82 82 82 Operating Income (Loss) (1) ($5,095,701) $14,273,580 $1,758,560 ($21,006,361) ($10,069,922) ($13,003,930) Net Income (Loss) (1) ($6,850,433) $12,503,147 ($547,269) ($66,459,731) ($61,354,286) $15,866,764 Basic Earnings (Loss) per Share (1) N/A N/A N/A ($0.56) ($0.56) $0.33 (1) Metrics represent discrete periods (2) Metrics measured as of the end of the period
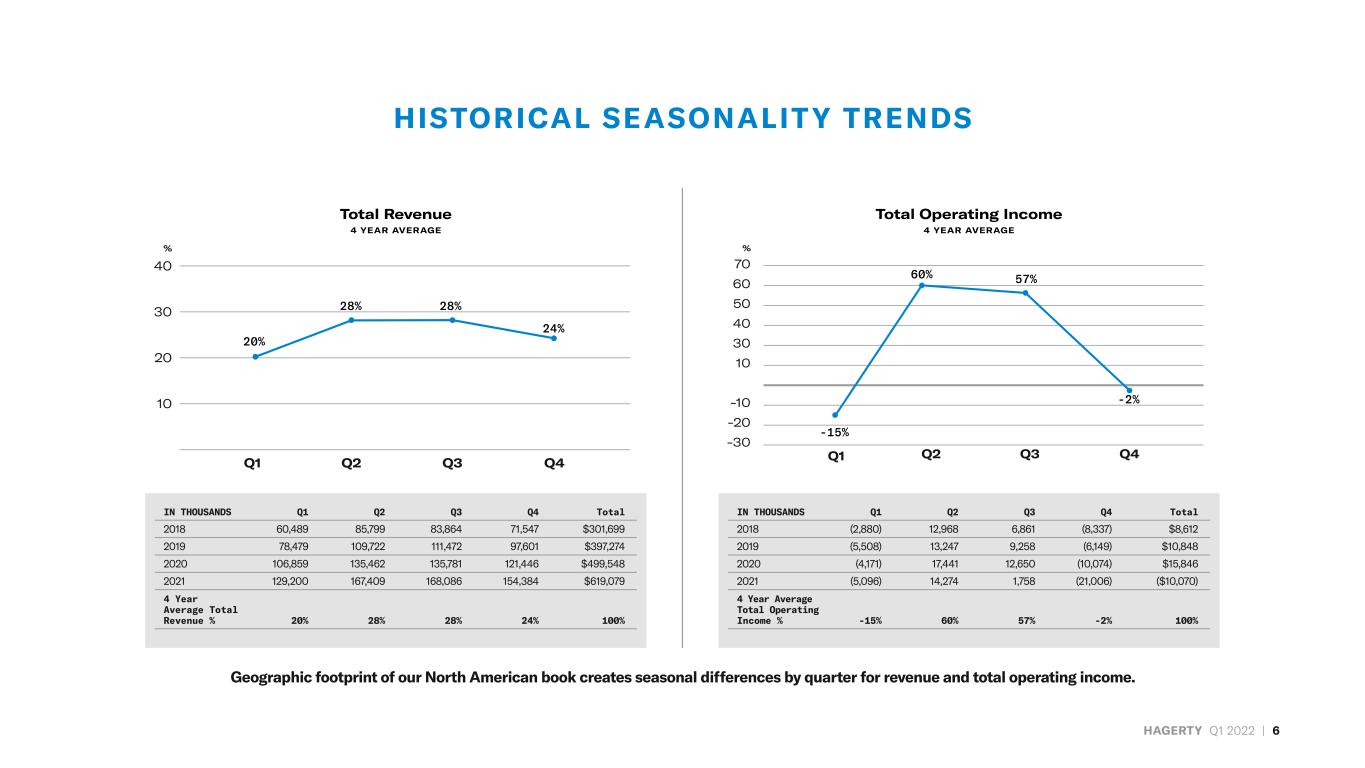
HAGERTY Q1 2022 | 6 HISTORICAL SEASONALIT Y TRENDS 40 30 20 10 % Q1 Q2 Q3 Q4 70 60 50 40 30 10 -10 -20 -30 % Q1 Q2 Q3 Q4 Total Revenue 4 YEAR AVERAGE 20% -15% 24% -2% 28% 60% 28% 57% Total Operating Income 4 YEAR AVERAGE IN THOUSANDS Q1 Q2 Q3 Q4 Total 2018 60,489 85,799 83,864 71,547 $301,699 2019 78,479 109,722 111,472 97,601 $397,274 2020 106,859 135,462 135,781 121,446 $499,548 2021 129,200 167,409 168,086 154,384 $619,079 4 Year Average Total Revenue % 20% 28% 28% 24% 100% IN THOUSANDS Q1 Q2 Q3 Q4 Total 2018 (2,880) 12,968 6,861 (8,337) $8,612 2019 (5,508) 13,247 9,258 (6,149) $10,848 2020 (4,171) 17,441 12,650 (10,074) $15,846 2021 (5,096) 14,274 1,758 (21,006) ($10,070) 4 Year Average Total Operating Income % -15% 60% 57% -2% 100% Geographic footprint of our North American book creates seasonal differences by quarter for revenue and total operating income.
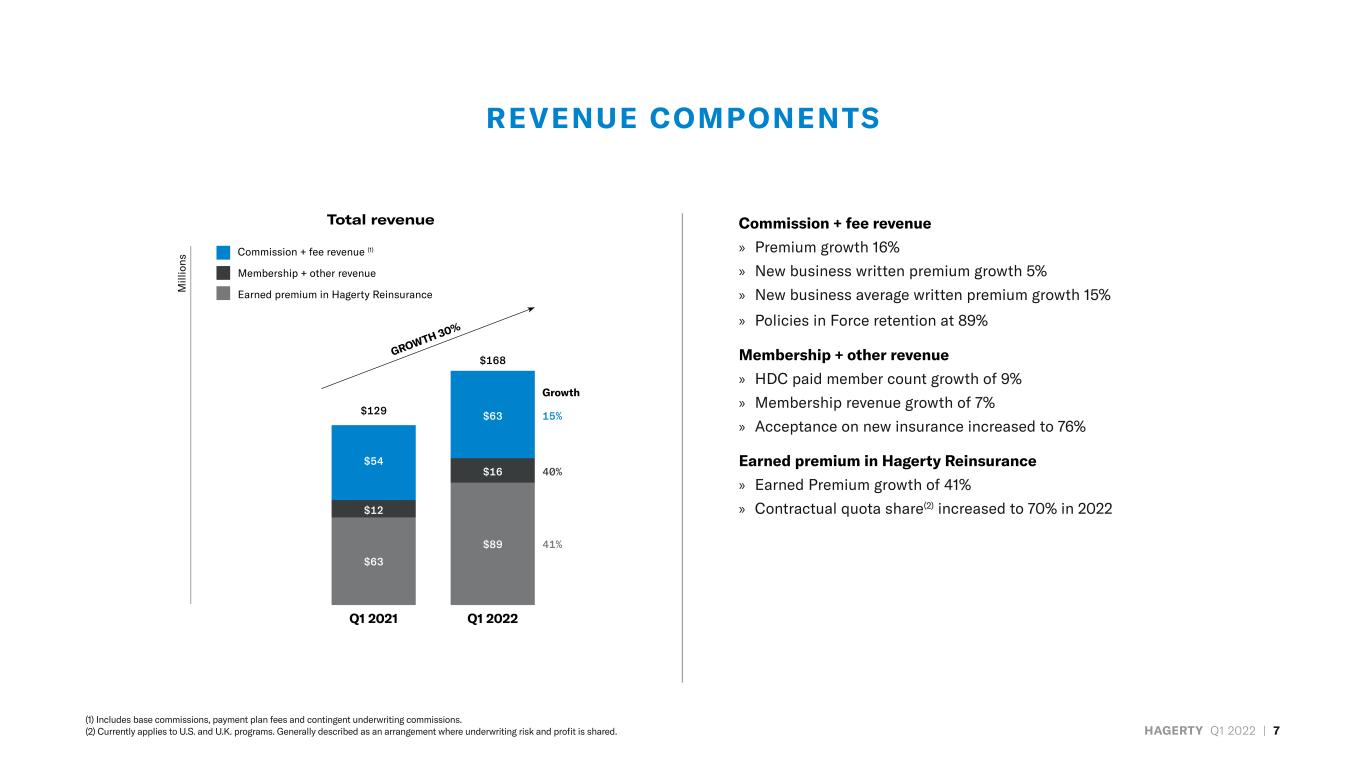
HAGERTY Q1 2022 | 7 REVENUE COMPONENTS Total revenue Commission + fee revenue » Premium growth 16% » New business written premium growth 5% » New business average written premium growth 15% » Policies in Force retention at 89% Membership + other revenue » HDC paid member count growth of 9% » Membership revenue growth of 7% » Acceptance on new insurance increased to 76% Earned premium in Hagerty Reinsurance » Earned Premium growth of 41% » Contractual quota share(2) increased to 70% in 2022 (1) Includes base commissions, payment plan fees and contingent underwriting commissions. (2) Currently applies to U.S. and U.K. programs. Generally described as an arrangement where underwriting risk and profit is shared. GROWTH 30% $129 $63 $12 $54 15% 40% 41% $168 $89 $16 $63 M ill io ns Q1 2021 Q1 2022 Commission + fee revenue (1) Membership + other revenue Earned premium in Hagerty Reinsurance Growth

HAGERTY Q1 2022 | 8 EARNINGS ANALYSIS Net Income Adjusted EBITDA M ill io ns ($7) $1 Q1 2021 Q1 2022 $16 ($6) GAAP Net Income (Loss) includes substantial pre-revenue costs related to scaling infrastructure, newly–developed digital platforms and legacy systems, human resources and occupancy to accommodate our alliance with State Farm and potentially other distribution partnerships as well as to further develop our Marketplace transactional platform. Q1 2021 $7.0M | Q1 2022 $9.3M (not included in Adjusted EBITDA) ADDITIONAL NON-RECURRING INVESTMENTS FOR GROWTH *See Appendix for additional information regarding these non-GAAP financial measures. EBITDA Adjustments IN THOUSANDS Q1 2021 Q1 2022 Net Income (Loss) ($6,851) $15,866 Interest and Other (Income) Expense 437 684 Income Tax Expense 1,318 2,030 Depreciation and Amortization 4,371 7,147 Changes in Fair Value of Warrant Liabilities - (31,686) Accelerated Vesting of Incentive Plans - - Net (Gain) Loss From Asset Disposals 1,764 - Other Non-Recurring (Gains) Losses - - Adjusted EBITDA $1,039 ($5,959)
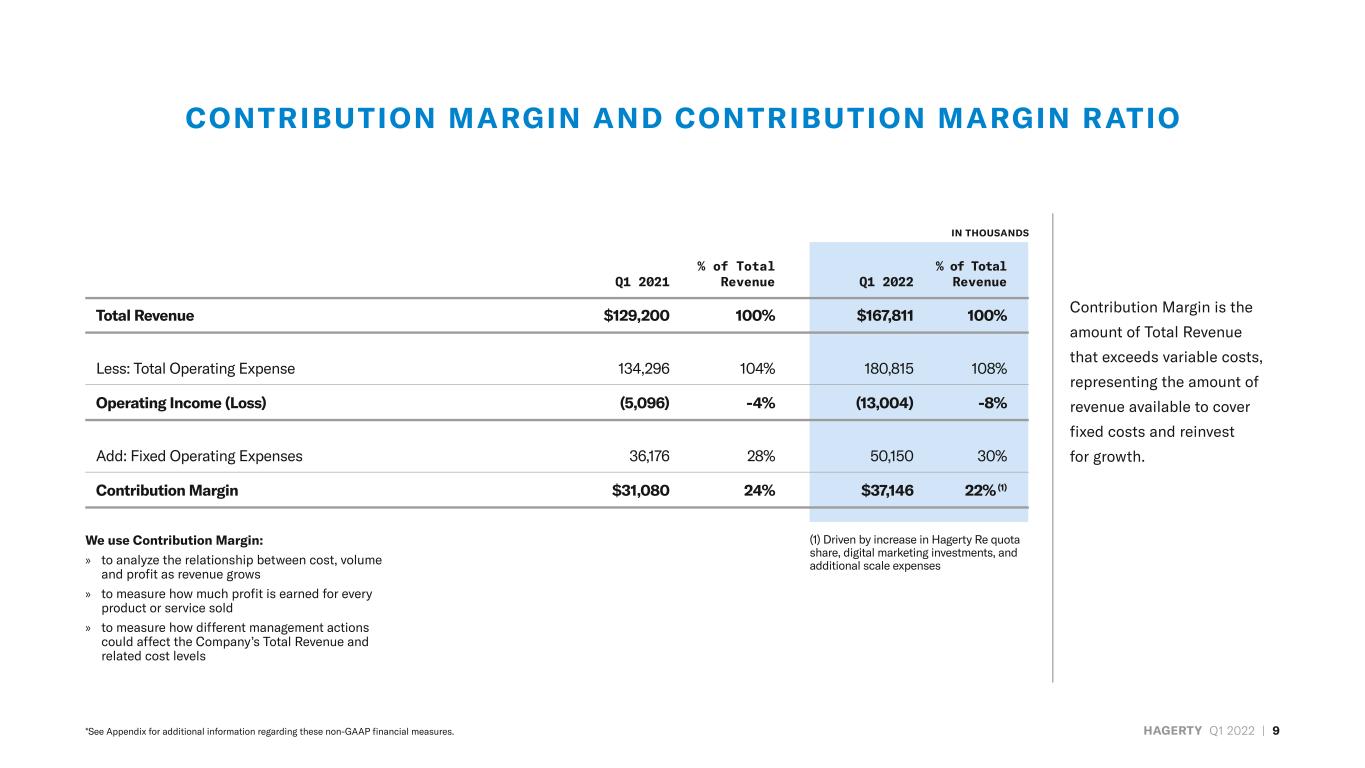
HAGERTY Q1 2022 | 9 CONTRIBUTION MARGIN AND CONTRIBUTION MARGIN RATIO Contribution Margin is the amount of Total Revenue that exceeds variable costs, representing the amount of revenue available to cover fixed costs and reinvest for growth. % of Total % of Total Q1 2021 Revenue Q1 2022 Revenue Total Revenue $129,200 100% $167,811 100% Less: Total Operating Expense 134,296 104% 180,815 108% Operating Income (Loss) (5,096) -4% (13,004) -8% Add: Fixed Operating Expenses 36,176 28% 50,150 30% Contribution Margin $31,080 24% $37,146 22% (1) *See Appendix for additional information regarding these non-GAAP financial measures. We use Contribution Margin: » to analyze the relationship between cost, volume and profit as revenue grows » to measure how much profit is earned for every product or service sold » to measure how different management actions could affect the Company’s Total Revenue and related cost levels IN THOUSANDS (1) Driven by increase in Hagerty Re quota share, digital marketing investments, and additional scale expenses

Q1 2022 Update

HAGERT Y + STATE FARM PARTNERSHIP Poised and ready for Q4 launch » Digital and technology team entering into testing phase » No change in expected timing of policy launch – end of 2022 » Up to 75% HDC adoption rate on new insurance policies » Anticipated average annual revenue per customer: $85-$110 HAGERTY Q1 2022 | 11

HAGERTY Q1 2022 | 12 HAGERT Y + SPEED DIGITAL Speed Digital is a cloud-based technology solution provider for dealers, auction houses, collectors, and enthusiasts. The acquisition of Speed Digital augments Hagerty’s portfolio of marketplace offerings which are designed to help members buy, sell, and rent collector cars. Speed Digital software processed approximately $1.5 billion in collector car sales in 2021 and the overall network of websites received more than 300 million page views during that same period. Currently the platform lists almost eight thousand vehicles for sale by Speed Digital network dealers. Speed Digital’s key products include: » Dealer Accelerate, a subscription-based software service that helps more than 200 dealers manage collector cars in inventory for sale. » Motorious.com, an online marketplace featuring dealer-verified collector cars for sale, as well as content about vintage and exotic cars. » Auction Accelerate, featuring software built specifically for collector car auction companies. » Private Collection, digital asset management software developed for the nuances of managing collector cars. HAGERTY
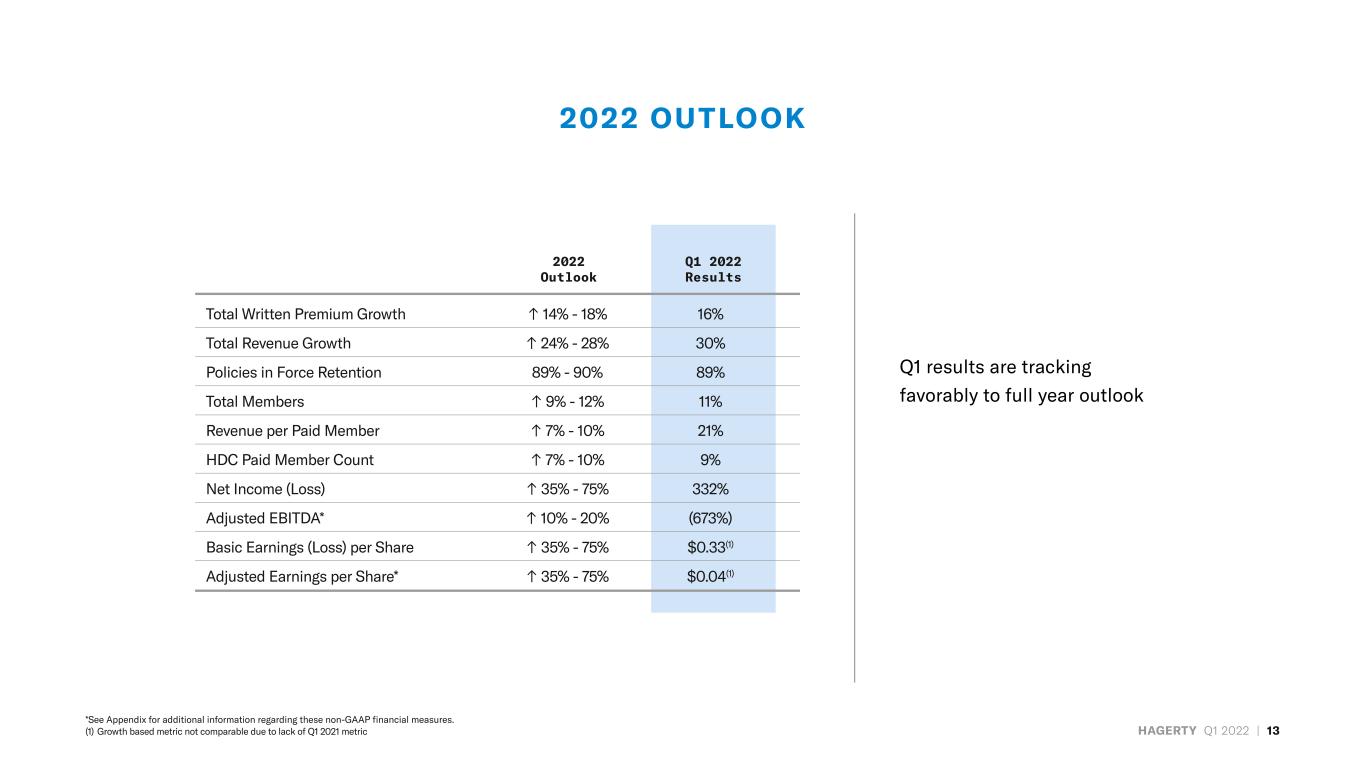
HAGERTY Q1 2022 | 13 2022 OUTLOOK Q1 results are tracking favorably to full year outlook Total Written Premium Growth ↑ 14% - 18% 16% Total Revenue Growth ↑ 24% - 28% 30% Policies in Force Retention 89% - 90% 89% Total Members ↑ 9% - 12% 11% Revenue per Paid Member ↑ 7% - 10% 21% HDC Paid Member Count ↑ 7% - 10% 9% Net Income (Loss) ↑ 35% - 75% 332% Adjusted EBITDA* ↑ 10% - 20% (673%) Basic Earnings (Loss) per Share ↑ 35% - 75% $0.33(1) Adjusted Earnings per Share* ↑ 35% - 75% $0.04(1) Q1 2022 Results 2022 Outlook *See Appendix for additional information regarding these non-GAAP financial measures. (1) Growth based metric not comparable due to lack of Q1 2021 metric
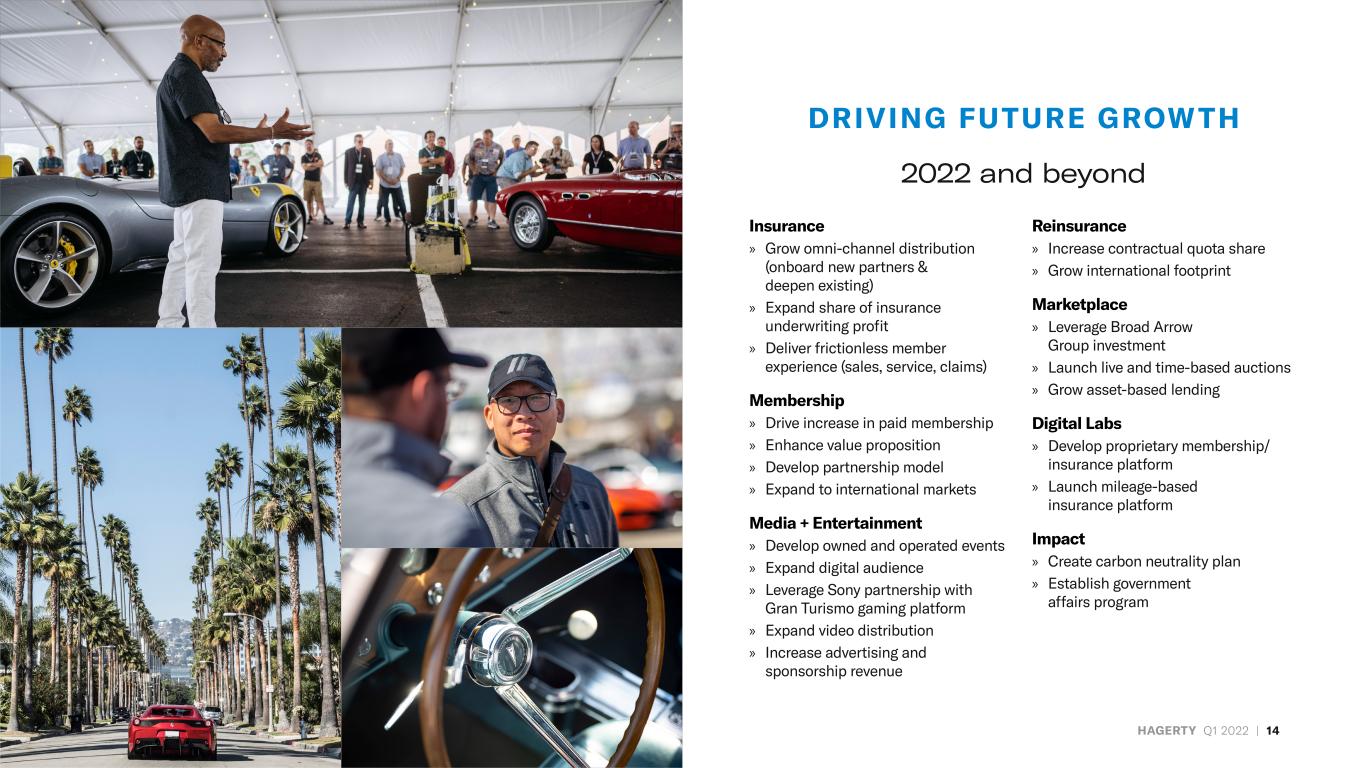
HAGERTY Q1 2022 | 14 DRIVING FUTURE GROWTH Insurance » Grow omni-channel distribution (onboard new partners & deepen existing) » Expand share of insurance underwriting profit » Deliver frictionless member experience (sales, service, claims) Membership » Drive increase in paid membership » Enhance value proposition » Develop partnership model » Expand to international markets Media + Entertainment » Develop owned and operated events » Expand digital audience » Leverage Sony partnership with Gran Turismo gaming platform » Expand video distribution » Increase advertising and sponsorship revenue Reinsurance » Increase contractual quota share » Grow international footprint Marketplace » Leverage Broad Arrow Group investment » Launch live and time-based auctions » Grow asset-based lending Digital Labs » Develop proprietary membership/ insurance platform » Launch mileage-based insurance platform Impact » Create carbon neutrality plan » Establish government affairs program 2022 and beyond
APPENDIX

HAGERTY Q1 2022 | 16 KEY PERFORMANCE INDICATORS + SUPPLEMENTAL FINANCIAL INFORMATION Q1 2021 Q1 2022 HDC Paid Member Count 666,609 727,010 Total Written Premium $133,707,005 $154,790,245 New Business Count (Insurance) 51,799 47,514 Policies in Force Retention 90.0% 88.9% Loss Ratio 41.4% 41.4% Revenue per Paid Member $111 $134 Total Revenue $129,199,764 $167,811,643 Net Promoter Score 82 82 Operating Income (Loss) ($5,095,701) ($13,003,930) Contribution Margin* $31,080,037 $37,146,432 Net Income (Loss) ($6,850,433) $15,866,764 Basic Earnings (Loss) per Share N/A $0.33 Adjusted EBITDA* $1,039,523 ($5,959,110) Adjusted EPS* N/A $0.04 *See Appendix for additional information regarding these non-GAAP financial measures.

HAGERTY Q1 2022 | 17 HISTORICAL SEASONALIT Y TRENDS | SUPPLEMENTAL DETAIL 250 200 150 100 50 MILLIONS Q1 Q1Q2 Q2 Q2 Q2Q3 Q3 Q3 Q3Q4 Q4 Q4 Q4Q1Q1 2018 2019 2020 2021 90 80 70 60 50 40 30 20 10 THOUSANDS Q1 Q1Q2 Q2 Q2 Q2Q3 Q3 Q3 Q3Q4 Q4 Q4 Q4Q1Q1 2018 2019 2020 2021 Total Written Premium New Business Count (Insurance) IN THOUSANDS Q1 Q2 Q3 Q4 Total 2018 82,514 137,943 123,385 86,621 $430,463 2019 96,732 158,501 142,030 99,747 $497,010 2020 112,421 184,423 163,520 117,870 $578,234 2021 133,707 208,091 192,090 140,417 $674,305 4 Year Average Total Written Premium % 19% 32% 29% 20% 100% Q1 Q2 Q3 Q4 Total 2018 32,610 56,729 51,795 35,356 176,490 2019 36,848 62,842 57,426 37,585 194,701 2020 41,510 70,622 73,619 50,914 236,665 2021 51,799 77,013 68,077 47,589 244,478 4 Year Average New Business Count % 19% 32% 29% 20% 100%

HAGERTY Q1 2022 | 18 SUPPLEMENTAL FINANCIAL INFORMATION Total Member Count U.S. Q1 2021 Q1 2022 Insurance Only 418,826 447,473 Insurance + HDC 590,182 640,239 HDC Standalone 25,509 29,271 Total Paid 1,034,517 1,116,983 Q1 2021 Q1 2022 U.S. 989,204 1,139,099 Canada 67,253 74,526 Total 1,056,457 1,213,625 Canada Q1 2021 Q1 2022 Insurance Only 77,110 79,890 Insurance + HDC 48,644 54,424 HDC Standalone 2,274 3,076 Total Paid 128,028 137,390 Q1 2021 Q1 2022 Total Member Count: 2,219,002 2,467,998 US 2,023,721 2,256,082 Canada 195,281 211,916 Total Q1 2021 Q1 2022 Insurance Only 495,936 527,363 Insurance + HDC 638,826 694,663 HDC Standalone 27,783 32,347 Total Paid 1,162,545 1,254,373 Total HDC Paid Members 666,609 727,010 Paid Membership Counts Guest Membership Counts Total Membership Counts
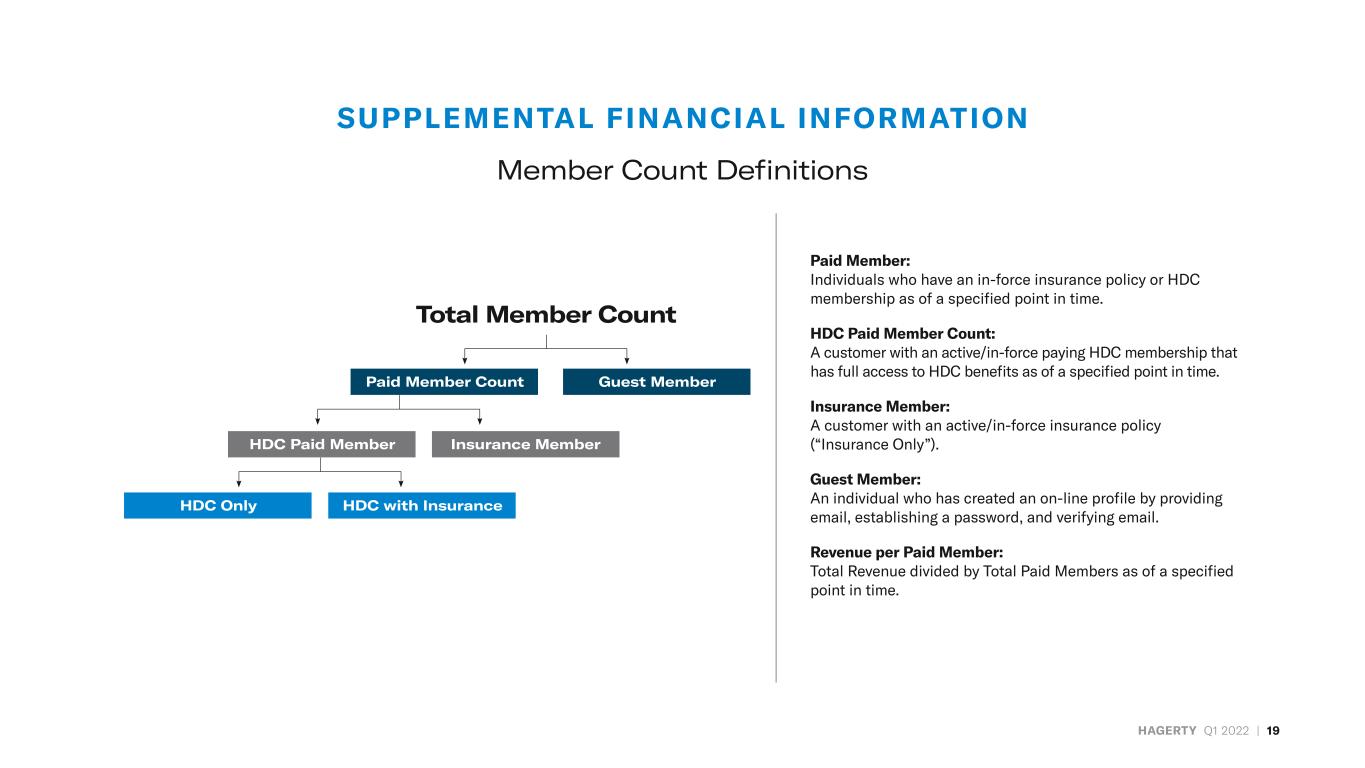
HAGERTY Q1 2022 | 19 SUPPLEMENTAL FINANCIAL INFORMATION Member Count Definitions Paid Member: Individuals who have an in-force insurance policy or HDC membership as of a specified point in time. HDC Paid Member Count: A customer with an active/in-force paying HDC membership that has full access to HDC benefits as of a specified point in time. Insurance Member: A customer with an active/in-force insurance policy (“Insurance Only”). Guest Member: An individual who has created an on-line profile by providing email, establishing a password, and verifying email. Revenue per Paid Member: Total Revenue divided by Total Paid Members as of a specified point in time. Total Member Count Guest MemberPaid Member Count Insurance MemberHDC Paid Member HDC with InsuranceHDC Only

HAGERTY Q1 2022 | 20 RECONCILIATION OF NON-GAAP METRICS Net Income (Loss) to Adjusted EBITDA Q1 2021 Q1 2022 Net Income (Loss) ($6,851) $15,866 Interest and Other (Income) Expense 437 684 Income Tax Expense 1,318 2,030 Depreciation and Amortization 4,371 7,147 Changes in Fair Value of Warrant Liabilities - (31,686) Accelerated Vesting of Incentive Plans - - Net (Gain) Loss From Asset Disposals 1,764 - Other Non-Recurring (Gains) Losses - - Adjusted EBITDA $1,039 ($5,959) Adjusted EBITDA We define Adjusted EBITDA as net income (loss) (the most directly comparable GAAP measure) before interest, income taxes, and depreciation and amortization (EBITDA), adjusted to exclude changes in fair value of warrant liabilities, gains and losses from asset disposals and certain other non-recurring gains and losses. We present Adjusted EBITDA because we consider it to be an important supplemental measure of our performance and believe it is frequently used by securities analysts, investors, and other interested parties in the evaluation of companies in our industry. Our management uses Adjusted EBITDA: as a measurement of operating performance of our business on a consistent basis, as it removes the impact of items not directly resulting from our core operations; for planning purposes, including the preparation of our internal annual operating budget and financial projections; to evaluate the performance and effectiveness of our operational strategies; to evaluate our capacity to expand our business; as a performance factor in measuring performance under our executive compensation plan; and as a preferred predictor of core operating performance, comparisons to prior periods and competitive positioning. By providing this non-GAAP financial measure, together with a reconciliation to the most directly comparable GAAP measure, we believe we are enhancing investors’ understanding of our business and our results of operations, as well as assisting investors in evaluating how well we are executing our strategic initiatives. However, Adjusted EBITDA has limitations as an analytical tool, and should not be considered in isolation, or as an alternative to, or a substitute for net income (loss) or other financial statement data presented in our condensed consolidated financial statements as indicators of financial performance. Some of these limitations include: Adjusted EBITDA does not reflect our cash expenditures, or future requirements for capital expenditures, or contractual commitments; Adjusted EBITDA does not reflect changes in, or cash requirements for, our working capital needs; Adjusted EBITDA does not reflect the interest expense, or the cash requirements necessary to service interest or principal payments on our debt; Adjusted EBITDA does not reflect our tax expense or the cash requirements to pay our taxes; and although depreciation and amortization are non-cash charges, the assets being depreciated and amortized will often have to be replaced in the future and such measures does not reflect any cash requirements for such replacements; and other companies in our industry may calculate Adjusted EBITDA differently than we do, limiting its usefulness as a comparative measure. Due to these limitations, Adjusted EBITDA should not be considered in isolation, or as an alternative to, or a substitute for net income (loss) or other financial statement data presented in our condensed consolidated financial statements as indicators of financial performance. IN THOUSANDS

HAGERTY Q1 2022 | 21 RECONCILIATION OF NON-GAAP METRICS Operating Income (Loss) to Contribution Margin Contribution Margin and Contribution Margin Ratio We define Contribution Margin as total revenue less operating expense adding back our fixed operating expenses such as depreciation and amortization, general and administrative costs and shared service salaries and benefits expenses. We define Contribution Margin Ratio as Contribution Margin divided by total revenue. We present Contribution Margin and Contribution Margin Ratio because we consider them to be important supplemental measures of our performance and believe that these non-GAAP financial measures are useful to investors for period-to-period comparisons of our business and in understanding and evaluating our operating results. We caution investors that Contribution Margin and Contribution Margin Ratio are not recognized measures under GAAP and should not be considered in isolation or as a substitute for, or superior to, the financial information prepared and presented in accordance with GAAP, and that Contribution Margin and Contribution Margin Ratio, as we define them, may be defined or calculated differently by other companies. In addition, both Contribution Margin and Contribution Margin Ratio have limitations as analytical tools because they exclude certain significant recurring expenses of our business. Our management uses Contribution Margin and Contribution Margin Ratio to: analyze the relationship between cost, volume and profit as revenue grows; measure how much profit is earned for any product or service sold; and measure how different management actions could affect the Company’s total revenue and related cost levels. % of Total % of Total Q1 2021 Revenue Q1 2022 Revenue Total Revenue $129,200 100% $167,811 100% Less: Total Operating Expense 134,296 104% 180,815 108% Operating Income (Loss) (5,096) -4% (13,004) -8% Add: Fixed Operating Expenses 36,176 28% 50,150 30% Contribution Margin $31,080 24% $37,146 22% (1) IN THOUSANDS (1) Driven by increase in Hagerty Re quota share, digital marketing investments, and additional scale expenses
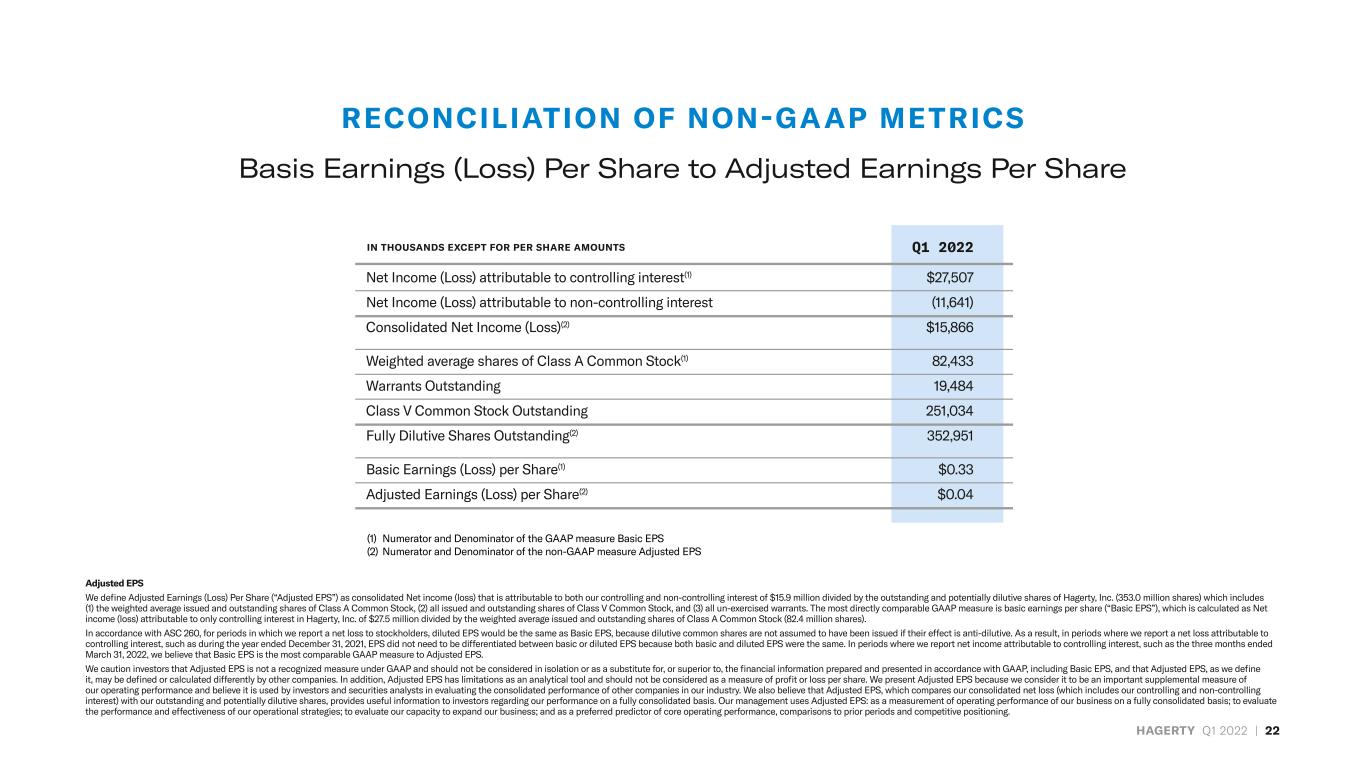
HAGERTY Q1 2022 | 22 RECONCILIATION OF NON-GAAP METRICS Basis Earnings (Loss) Per Share to Adjusted Earnings Per Share Q1 2022 Net Income (Loss) attributable to controlling interest(1) $27,507 Net Income (Loss) attributable to non-controlling interest (11,641) Consolidated Net Income (Loss)(2) $15,866 Weighted average shares of Class A Common Stock(1) 82,433 Warrants Outstanding 19,484 Class V Common Stock Outstanding 251,034 Fully Dilutive Shares Outstanding(2) 352,951 Basic Earnings (Loss) per Share(1) $0.33 Adjusted Earnings (Loss) per Share(2) $0.04 IN THOUSANDS EXCEPT FOR PER SHARE AMOUNTS (1) Numerator and Denominator of the GAAP measure Basic EPS (2) Numerator and Denominator of the non-GAAP measure Adjusted EPS Adjusted EPS We define Adjusted Earnings (Loss) Per Share (“Adjusted EPS”) as consolidated Net income (loss) that is attributable to both our controlling and non-controlling interest of $15.9 million divided by the outstanding and potentially dilutive shares of Hagerty, Inc. (353.0 million shares) which includes (1) the weighted average issued and outstanding shares of Class A Common Stock, (2) all issued and outstanding shares of Class V Common Stock, and (3) all un-exercised warrants. The most directly comparable GAAP measure is basic earnings per share (“Basic EPS”), which is calculated as Net income (loss) attributable to only controlling interest in Hagerty, Inc. of $27.5 million divided by the weighted average issued and outstanding shares of Class A Common Stock (82.4 million shares). In accordance with ASC 260, for periods in which we report a net loss to stockholders, diluted EPS would be the same as Basic EPS, because dilutive common shares are not assumed to have been issued if their effect is anti-dilutive. As a result, in periods where we report a net loss attributable to controlling interest, such as during the year ended December 31, 2021, EPS did not need to be differentiated between basic or diluted EPS because both basic and diluted EPS were the same. In periods where we report net income attributable to controlling interest, such as the three months ended March 31, 2022, we believe that Basic EPS is the most comparable GAAP measure to Adjusted EPS. We caution investors that Adjusted EPS is not a recognized measure under GAAP and should not be considered in isolation or as a substitute for, or superior to, the financial information prepared and presented in accordance with GAAP, including Basic EPS, and that Adjusted EPS, as we define it, may be defined or calculated differently by other companies. In addition, Adjusted EPS has limitations as an analytical tool and should not be considered as a measure of profit or loss per share. We present Adjusted EPS because we consider it to be an important supplemental measure of our operating performance and believe it is used by investors and securities analysts in evaluating the consolidated performance of other companies in our industry. We also believe that Adjusted EPS, which compares our consolidated net loss (which includes our controlling and non-controlling interest) with our outstanding and potentially dilutive shares, provides useful information to investors regarding our performance on a fully consolidated basis. Our management uses Adjusted EPS: as a measurement of operating performance of our business on a fully consolidated basis; to evaluate the performance and effectiveness of our operational strategies; to evaluate our capacity to expand our business; and as a preferred predictor of core operating performance, comparisons to prior periods and competitive positioning.

Never Stop Driving


