
Investor Presentation Q2 2024 SPEAKERS: McKeel Hagerty | Chief Executive Officer and Chairman Patrick McClymont | Chief Financial Officer
HAGERTY Q2 2024 | 2 FORWARD LOOKING STATEMENTS / NON-GAAP FINANCIAL MEASURES This presentation contains statements that constitute “forward-looking statements” within the meaning of the Private Securities Litigation Reform Act of 1995. Forward-looking statements include all statements that are not historical facts. These forward-looking statements reflect our current expectations and projections with respect to our expected future business and financial performance, including, among other things: (i) expected operating results, such as revenue growth and financial position; (ii) changes in the market for our products and services; (iii) our plans to expand market share, including planned investments and partnerships; (iv) anticipated business objectives; and (v) the strength of our business model. These statements may be preceded by, followed by, or include the words “anticipate,” “believe,” “envision,” “estimate,” “expect,” “forecast,” “future,” “goal,” “intend,” “likely,” “outlook,” “plan,” “potential,” “project,” “seek,” “target,” “can,” “could,” “may,” “should,” “would,” “will,” the negatives thereof and other words and terms of similar meaning. A number of factors could cause actual results or outcomes to differ materially from those indicated by these forward-looking statements. These factors include, among other things, our ability to: (i) compete effectively within our industry and attract and retain insurance policyholders and paid HDC members; (ii) maintain key strategic relationships with our insurance distribution and underwriting carrier partners; (iii) prevent, monitor and detect fraudulent activity; (iv) manage risks associated with disruptions, interruptions, outages or other issues with our technology platforms or our use of third-party services; (v) accelerate the adoption of our membership products as well as any new insurance programs and products we offer; (vi) manage the cyclical nature of the insurance business, including through any periods of recession, economic downturn or inflation; (vii) address unexpected increases in the frequency or severity of claims; (viii) comply with the numerous laws and regulations applicable to our business, including state, federal, and foreign laws relating to insurance and rate increases, privacy, the internet and accounting matters; (ix) manage risks associated with being a controlled company; and (x) successfully defend any litigation, government inquiries and investigations. The forward-looking statements herein represent our judgment as of the date of this release and we disclaim any intent or obligation to publicly update or review any forward-looking statement, whether as a result of new information, future developments, or otherwise. This presentation should be read in conjunction with the information included in our filings with the SEC and press releases. Understanding the information contained in these filings is important in order to fully understand our reported financial results and our business outlook for future periods. In addition, this presentation contains certain “non-GAAP financial measures”. The non-GAAP measures are presented for supplemental informational purposes only. These financial measures are not recognized measures under GAAP and should not be considered in isolation or as a substitute for, or superior to, the financial information prepared and presented in accordance with GAAP. Reconciliations to the most directly comparable financial measure calculated and presented in accordance with GAAP are provided in the appendix to this presentation.
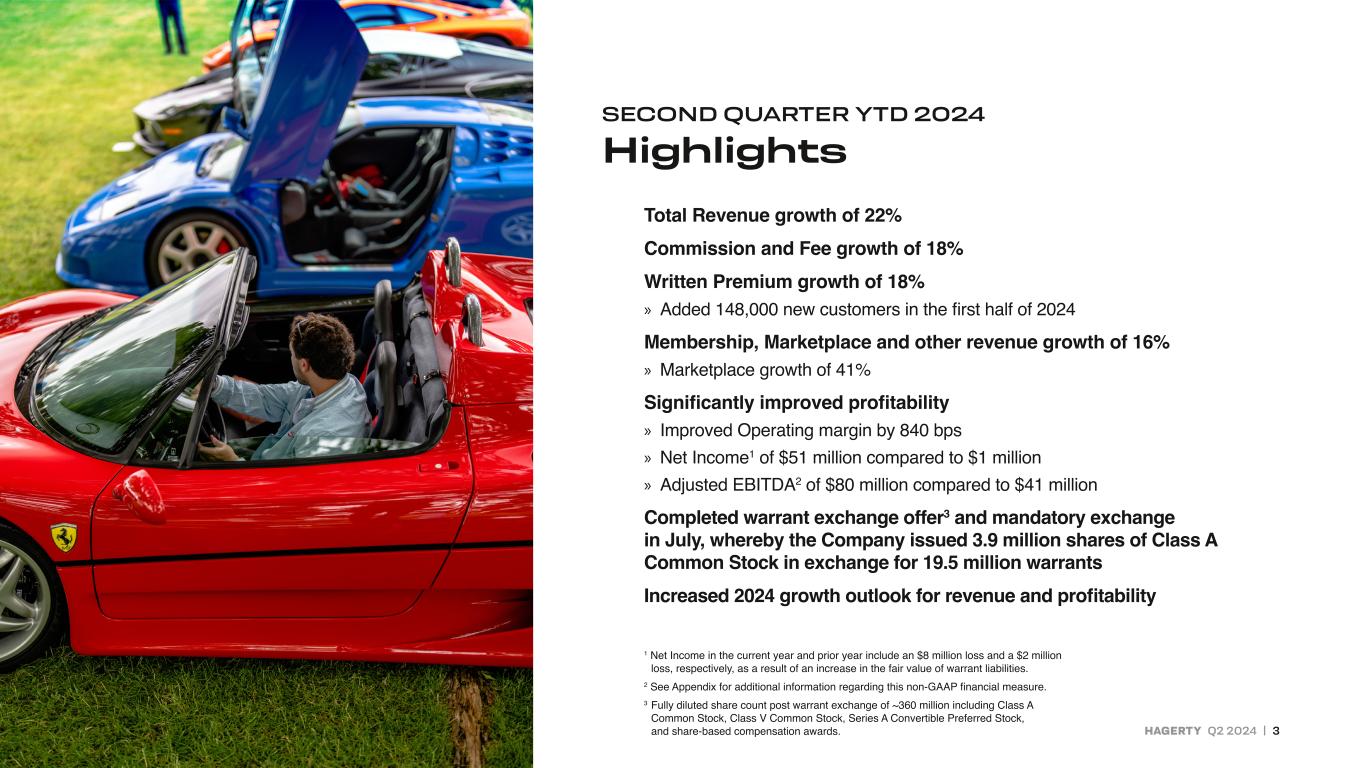
HAGERTY Q2 2024 | 3 SECOND QUARTER YTD 2024 Highlights Total Revenue growth of 22% Commission and Fee growth of 18% Written Premium growth of 18% » Added 148,000 new customers in the first half of 2024 Membership, Marketplace and other revenue growth of 16% » Marketplace growth of 41% Significantly improved profitability » Improved Operating margin by 840 bps » Net Income1 of $51 million compared to $1 million » Adjusted EBITDA2 of $80 million compared to $41 million Completed warrant exchange offer3 and mandatory exchange in July, whereby the Company issued 3.9 million shares of Class A Common Stock in exchange for 19.5 million warrants Increased 2024 growth outlook for revenue and profitability 1 Net Income in the current year and prior year include an $8 million loss and a $2 million loss, respectively, as a result of an increase in the fair value of warrant liabilities. 2 See Appendix for additional information regarding this non-GAAP financial measure. 3 Fully diluted share count post warrant exchange of ~360 million including Class A Common Stock, Class V Common Stock, Series A Convertible Preferred Stock, and share-based compensation awards.

2024 Priorities Deliver sustained top-line momentum with continued margin expansion KEY 2024 BUSINESS PRIORITIES INCLUDE: » Further improve loyalty to drive renewals and referrals. » Enhance member experience in a cost effective and efficient way. » Build Hagerty Marketplace into the most trusted and preferred place to buy, sell and finance collector cars. » Expand insurance offerings, particularly in the post-1980s collectible space. HAGERTY Q2 2024 | 4

HAGERTY Q2 2024 | 5 Business Process Re-engineering Driving Sustained Margin Expansion 1 See Appendix for additional information regarding this non-GAAP financial information. 2024 Began to implement changes to business processes to drive sustained reductions in cost to acquire and cost to serve » Marketing efforts powering efficient customer acquisition. » Improve efficiency of our member service center focused on reducing handle times and freeing up existing resources for continued growth in new members. » Adding resources to claims team to optimize spend and reduce losses. » Operating income margins expanded by another 840 bps in the first half of 2024 compared to 2023, equating to two year margin expansion of 1100 bps. » Increased first half Net Income by $41 million and Adjusted EBITDA1 by $70 million compared to the first half of 2022.
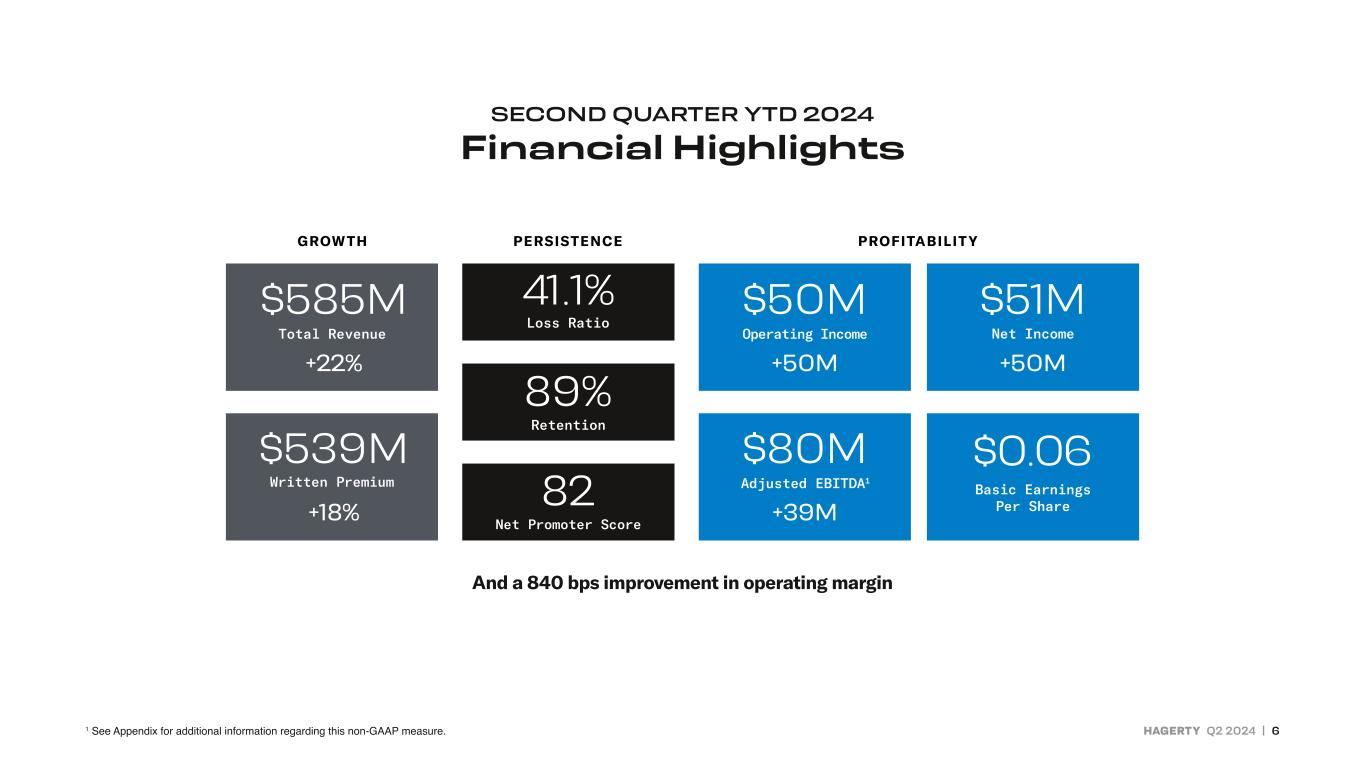
HAGERTY Q2 2024 | 6 And a 840 bps improvement in operating margin $585M +22% +50M +50M +18% +39M $539M 41.1% 89% 82 $50M $80M $51M $0.06 SECOND QUARTER YTD 2024 Financial Highlights 1 See Appendix for additional information regarding this non-GAAP measure.

HAGERTY Q2 2024 | 7 Q2 YTD $261 $313 $24 $158 $110 $27 $127 $129 $480 $585 $245 $50 $185 $218 $58 $309 17% 18% 14% 16% 24% 26% Growth Growth 2023 2024 2023 2024 20% growth 22% growth Strong double-digit gains TOTAL REVENUE SECOND QUARTER YTD 2024 HIGHLIGHTS Commission + fee revenue (+18%) » Written premium growth of 18% » Policies in Force retention of 89% Membership, marketplace + other revenue (+16%) » Membership revenue growth of 7% » Marketplace revenue growth of 41% Earned premium in Hagerty Re (+26%) » Contractual quota share2 ~80% in 2024 Revenue Components 1 Includes base commissions, payment plan fees and contingent underwriting commissions. 2 Currently applies to U.S. classic auto programs. Generally described as an arrangement where underwriting risk and profit is shared proportionately.
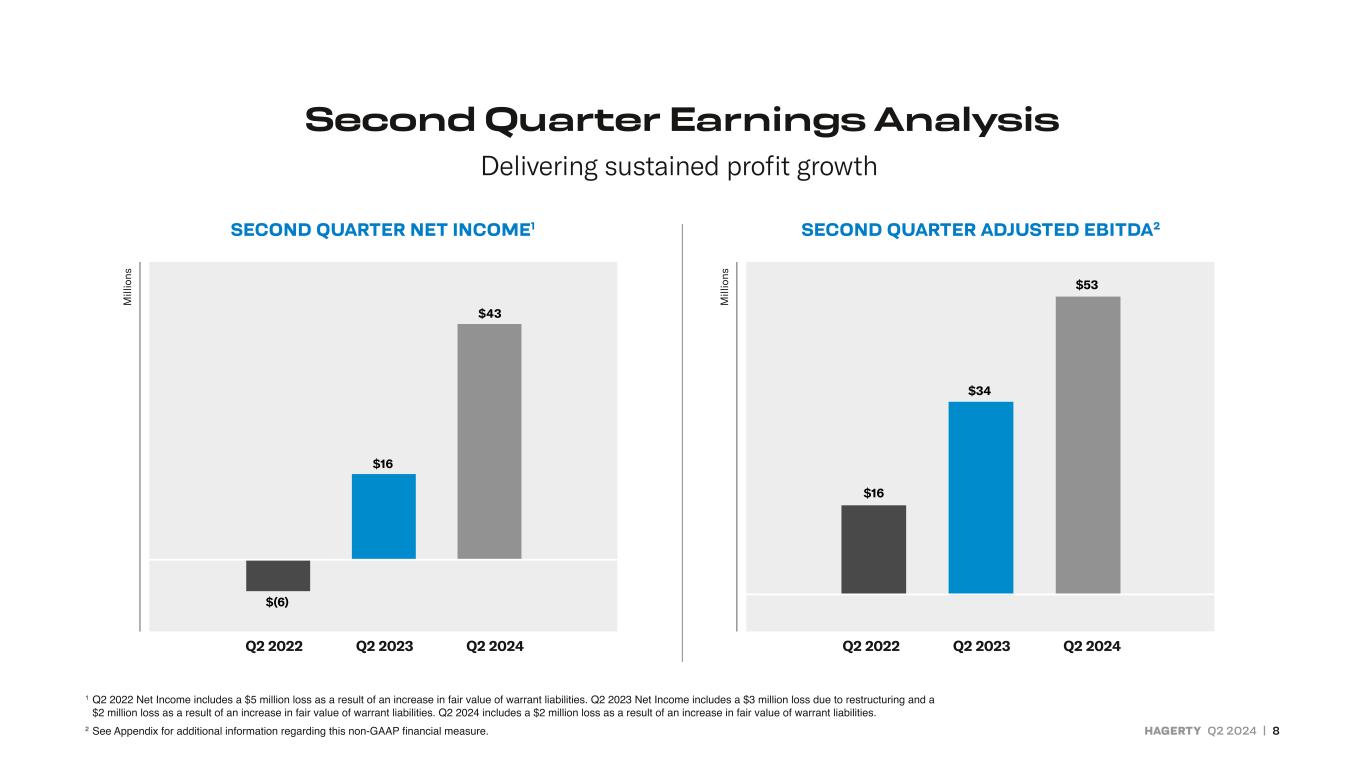
HAGERTY Q2 2024 | 8 $16 $34 $53 $(6) $16 $43 Q2 2022 Q2 2022Q2 2023 Q2 2023Q2 2024 Q2 2024 Delivering sustained profit growth Second Quarter Earnings Analysis SECOND QUARTER NET INCOME1 SECOND QUARTER ADJUSTED EBITDA2 1 Q2 2022 Net Income includes a $5 million loss as a result of an increase in fair value of warrant liabilities. Q2 2023 Net Income includes a $3 million loss due to restructuring and a $2 million loss as a result of an increase in fair value of warrant liabilities. Q2 2024 includes a $2 million loss as a result of an increase in fair value of warrant liabilities. 2 See Appendix for additional information regarding this non-GAAP financial measure.
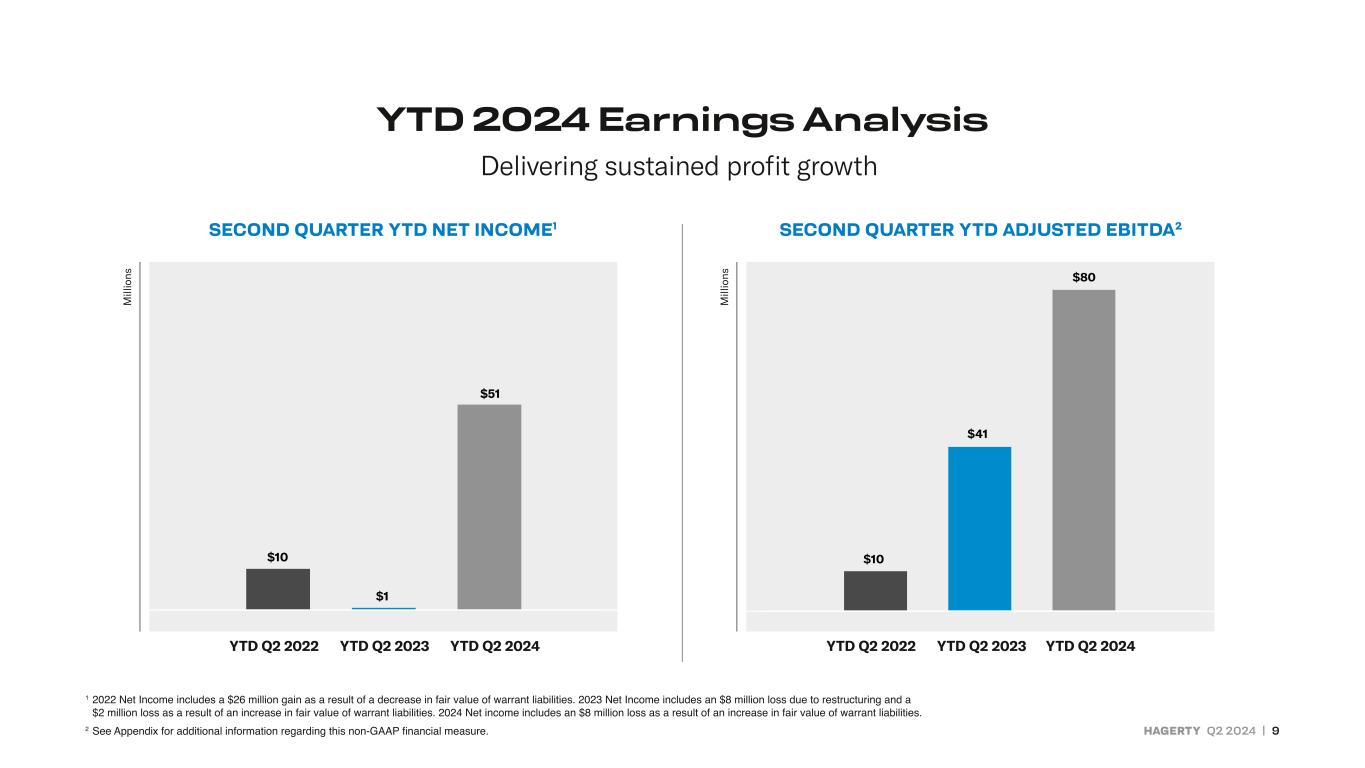
HAGERTY Q2 2024 | 9 $41 $80 $10$10 $1 $51 YTD Q2 2022 YTD Q2 2022YTD Q2 2023 YTD Q2 2023YTD Q2 2024 YTD Q2 2024 Delivering sustained profit growth YTD 2024 Earnings Analysis SECOND QUARTER YTD NET INCOME1 SECOND QUARTER YTD ADJUSTED EBITDA2 1 2022 Net Income includes a $26 million gain as a result of a decrease in fair value of warrant liabilities. 2023 Net Income includes an $8 million loss due to restructuring and a $2 million loss as a result of an increase in fair value of warrant liabilities. 2024 Net income includes an $8 million loss as a result of an increase in fair value of warrant liabilities. 2 See Appendix for additional information regarding this non-GAAP financial measure.
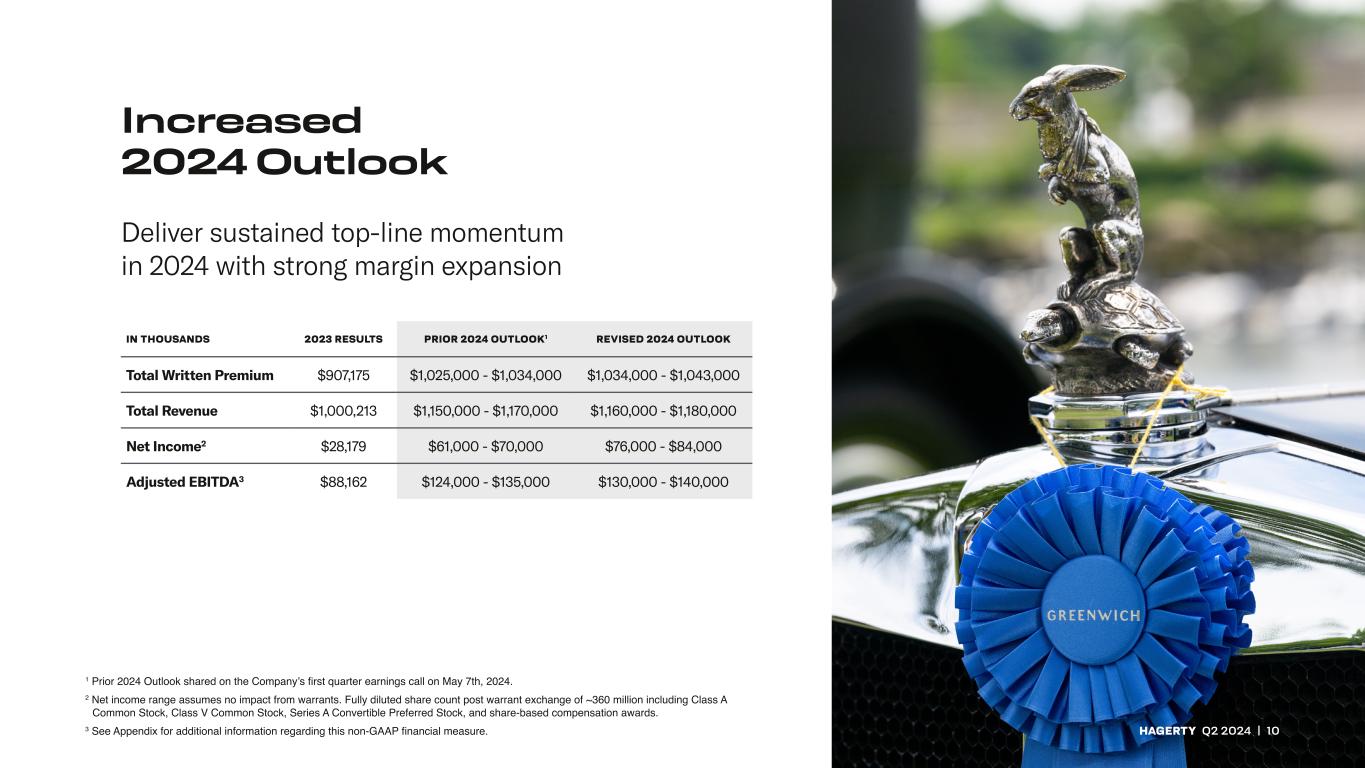
HAGERTY Q2 2024 | 10 IN THOUSANDS 2023 RESULTS PRIOR 2024 OUTLOOK1 REVISED 2024 OUTLOOK Total Written Premium $907,175 $1,025,000 - $1,034,000 $1,034,000 - $1,043,000 Total Revenue $1,000,213 $1,150,000 - $1,170,000 $1,160,000 - $1,180,000 Net Income2 $28,179 $61,000 - $70,000 $76,000 - $84,000 Adjusted EBITDA3 $88,162 $124,000 - $135,000 $130,000 - $140,000 1 Prior 2024 Outlook shared on the Company’s first quarter earnings call on May 7th, 2024. 2 Net income range assumes no impact from warrants. Fully diluted share count post warrant exchange of ~360 million including Class A Common Stock, Class V Common Stock, Series A Convertible Preferred Stock, and share-based compensation awards. 3 See Appendix for additional information regarding this non-GAAP financial measure. Increased 2024 Outlook Deliver sustained top-line momentum in 2024 with strong margin expansion

APPENDIX
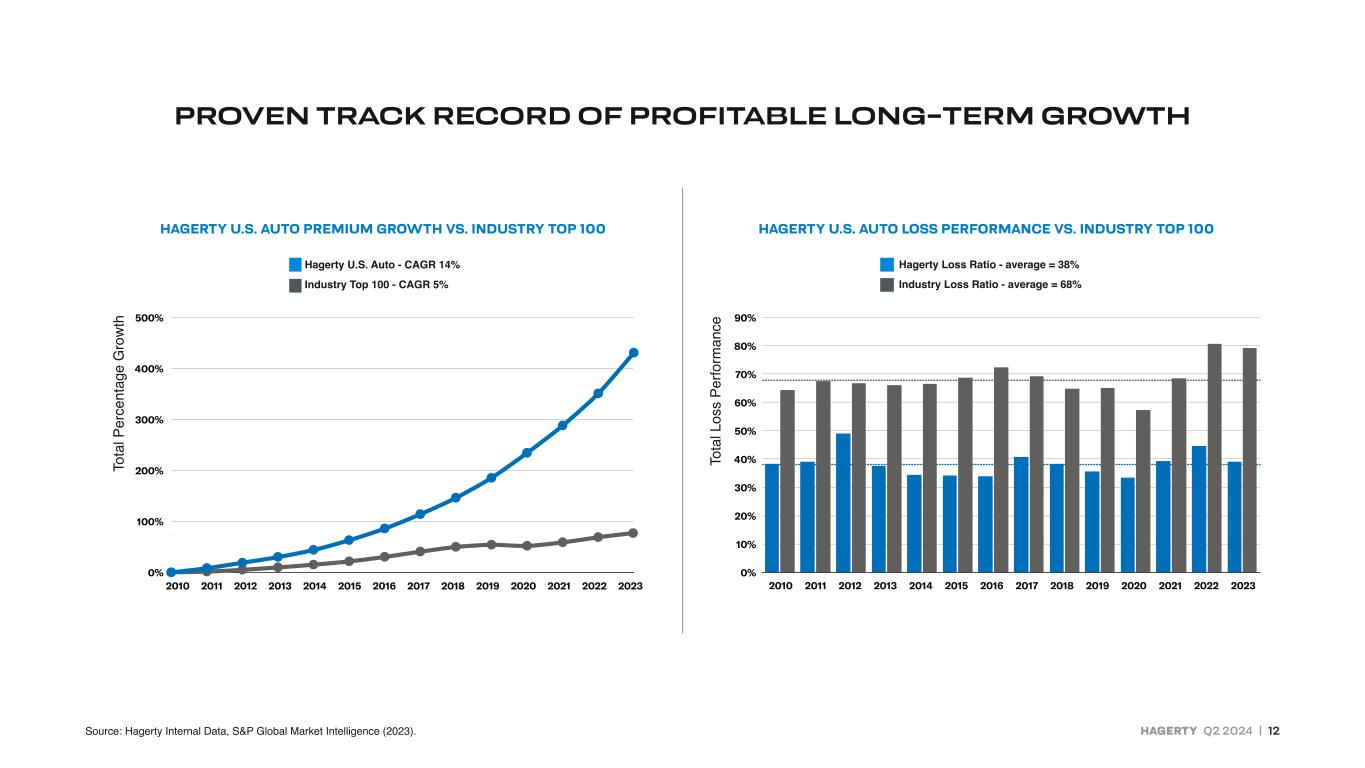
HAGERTY Q2 2024 | 12 To ta l L os s Pe rfo rm an ce 0% 100% 200% 300% 400% 500% 2010 2011 2012 2013 2014 2015 2016 2017 2018 2019 2020 2021 2022 2023 0% 10% 20% 30% 40% 50% 60% 70% 80% 90% 2010 2011 2012 2013 2014 2015 2016 2017 2018 2019 2020 2021 2022 2023 To ta l P er ce nt ag e G ro w th 0% 100% 200% 300% 400% 500% 2010 2011 2012 2013 2014 2015 2016 2017 2018 19 2020 021 022 2023 0% 10% 20% 30% 40% 50% 60% 70% 80% 90% 2010 2011 2012 2013 2014 2015 2016 2017 2018 19 2020 021 2022 2023 PROVEN TRACK RECORD OF PROFITABLE LONG-TERM GROWTH Hagerty U.S. Auto - CAGR 14% Industry Top 100 - CAGR 5% Hagerty Loss Ratio - average = 38% Industry Loss Ratio - average = 68% HAGERTY U.S. AUTO PREMIUM GROWTH VS. INDUSTRY TOP 100 HAGERTY U.S. AUTO LOSS PERFORMANCE VS. INDUSTRY TOP 100 Source: Hagerty Internal Data, S&P Global Market Intelligence (2023).
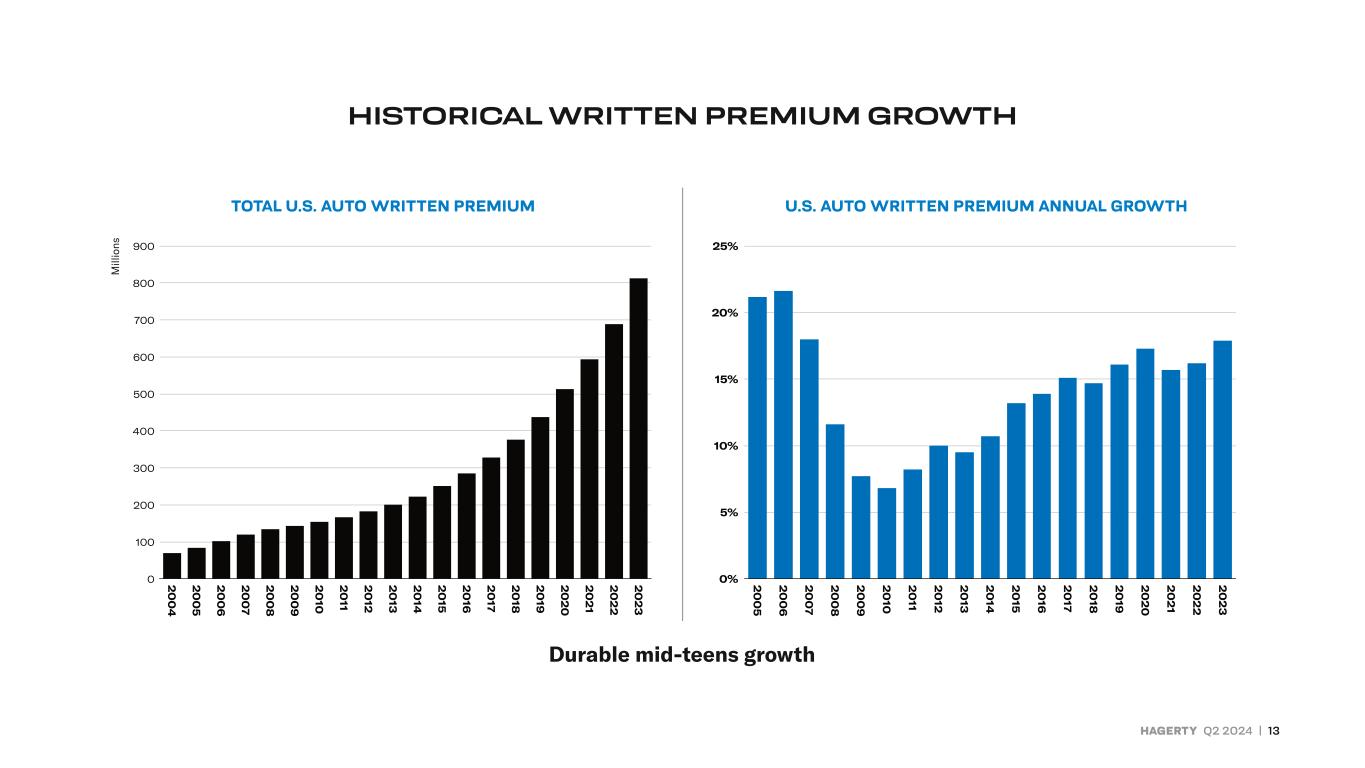
HAGERTY Q2 2024 | 13 0 100 200 300 400 500 600 700 800 900 2 0 0 4 2 0 0 5 2 0 0 6 2 0 0 7 2 0 0 8 2 0 0 9 2 0 10 2 0 11 2 0 12 2 0 13 2 0 14 2 0 15 2 0 16 2 0 17 2 0 18 2 0 19 2 0 2 0 2 0 2 1 2 0 2 2 2 0 2 3 0% 5% 10% 15% 20% 25% 2 0 0 5 2 0 0 6 2 0 0 7 2 0 0 8 2 0 0 9 2 0 10 2 0 11 2 0 12 2 0 13 2 0 14 2 0 15 2 0 16 2 0 17 2 0 18 2 0 19 2 0 2 0 2 0 2 1 2 0 2 2 2 0 2 3 Total U.S. Auto Written Premium U.S. Auto Written Premium Annual Growth 0 1 0 2 0 3 0 4 0 5 0 6 0 7 0 8 0 9 0 2 0 0 4 2 0 0 5 2 0 0 6 2 0 0 7 2 0 0 8 2 0 0 9 2 0 10 2 0 11 2 0 12 2 0 13 2 0 14 2 0 15 2 0 16 2 0 17 2 0 18 2 0 19 2 0 2 0 2 0 2 1 2 0 2 2 2 0 2 3 0% 5% 10% 15% 20% 25% 2 0 0 5 2 0 0 6 2 0 0 7 2 0 0 8 2 0 0 9 2 0 10 2 0 11 2 0 12 2 0 13 2 0 14 2 0 15 2 0 16 2 0 17 2 0 18 2 0 19 2 0 2 0 2 0 2 1 2 0 2 2 2 0 2 3 Total U.S. Auto Written Premium U.S. Auto Written Premium A nual Growth HISTORICAL WRITTEN PREMIUM GROWTH Durable mid-teens growth TOTAL U.S. AUTO WRITTEN PREMIUM U.S. AUTO WRITTEN PREMIUM ANNUAL GROWTH

HAGERTY Q2 2024 | 14 WRITTEN PREMIUM GROWTH FUELED BY NEW MEMBERS Strong and growing New Business Count Global New Business Count 0 50,000 100,000 150,000 200,000 250,000 300,000 2014 2015 2016 2017 2018 2019 2020 2021 2022 2023

HAGERTY Q2 2024 | 15 0 200,000 400,000 600,000 800,000 1,000,000 1,200,000 1,400,000 1,600,000 2012 2013 2014 2015 2016 2017 2018 2019 2020 2021 2022 2023 7% annual growth in pre 1980s 18% annual growth in post 1980s ~13% ~2% Pre 1980 Vehicle Count Type Total Market (cars, mm) Collectible Vehicles by CohortHagerty Penetration and U.S. Auto Insured Vehicle Count Hagerty Penetration Pre 1980 Vehicles 11.2 13.3% Post 1980 Vehicles 35.2 1.7% Total ~46.3 4.5% Post 1980 Vehicle Count POST 1980 VEHICLES BECOMING MORE IMPACTFUL FOR GROWTH
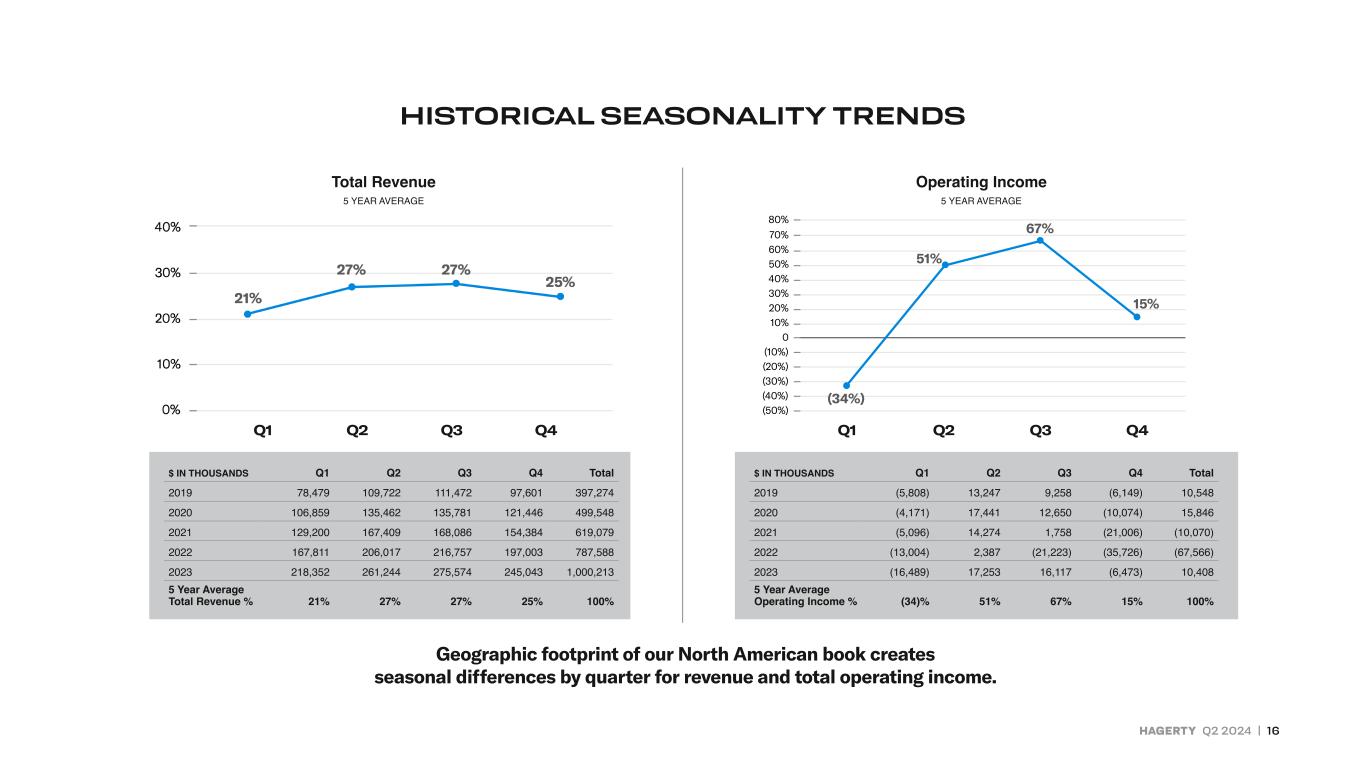
HAGERTY Q2 2024 | 16 Total Revenue 5 YEAR AVERAGE Operating Income 5 YEAR AVERAGE $ IN THOUSANDS Q1 Q2 Q3 Q4 Total 2019 78,479 109,722 111,472 97,601 397,274 2020 106,859 135,462 135,781 121,446 499,548 2021 129,200 167,409 168,086 154,384 619,079 2022 167,811 206,017 216,757 197,003 787,588 2023 218,352 261,244 275,574 245,043 1,000,213 5 Year Average Total Revenue % 21% 27% 27% 25% 100% $ IN THOUSANDS Q1 Q2 Q3 Q4 Total 2019 (5,808) 13,247 9,258 (6,149) 10,548 2020 (4,171) 17,441 12,650 (10,074) 15,846 2021 (5,096) 14,274 1,758 (21,006) (10,070) 2022 (13,004) 2,387 (21,223) (35,726) (67,566) 2023 (16,489) 17,253 16,117 (6,473) 10,408 5 Year Average Operating Income % (34)% 51% 67% 15% 100% (34%) 51% 67% 15% 70% 80% 60% 50% 40% 30% 20% 10% 0 (10%) (20%) (30%) (40%) (50%) HISTORICAL SEASONALITY TRENDS Q1 Q2 Q3 Q4 Q1 Q2 Q3 Q4 Geographic footprint of our North American book creates seasonal differences by quarter for revenue and total operating income.
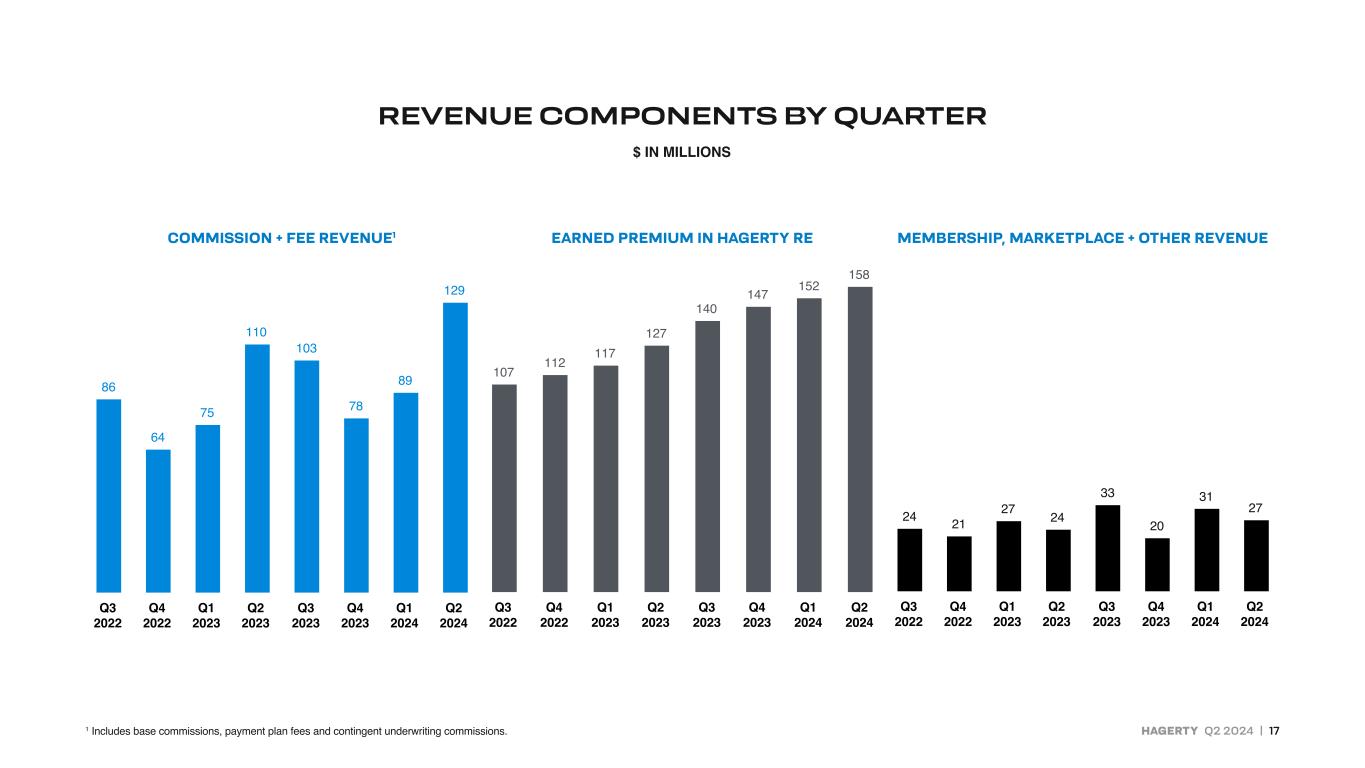
HAGERTY Q2 2024 | 17 REVENUE COMPONENTS BY QUARTER $ IN MILLIONS 107 112 117 127 140 147 152 158 Q3 2022 Q4 2022 Q1 2023 Q2 2023 Q3 2023 Q4 2023 Q1 2024 Q2 2024 86 64 75 110 103 78 89 129 Q3 2022 Q4 2022 Q1 2023 Q2 2023 Q3 2023 Q4 2023 Q1 2024 Q2 2024 24 21 27 24 33 20 31 27 Q3 2022 Q4 2022 Q1 2023 Q2 2023 Q3 2023 Q4 2023 Q1 2024 Q2 2024 COMMISSION + FEE REVENUE1 EARNED PREMIUM IN HAGERTY RE MEMBERSHIP, MARKETPLACE + OTHER REVENUE 1 Includes base commissions, payment plan fees and contingent underwriting commissions.
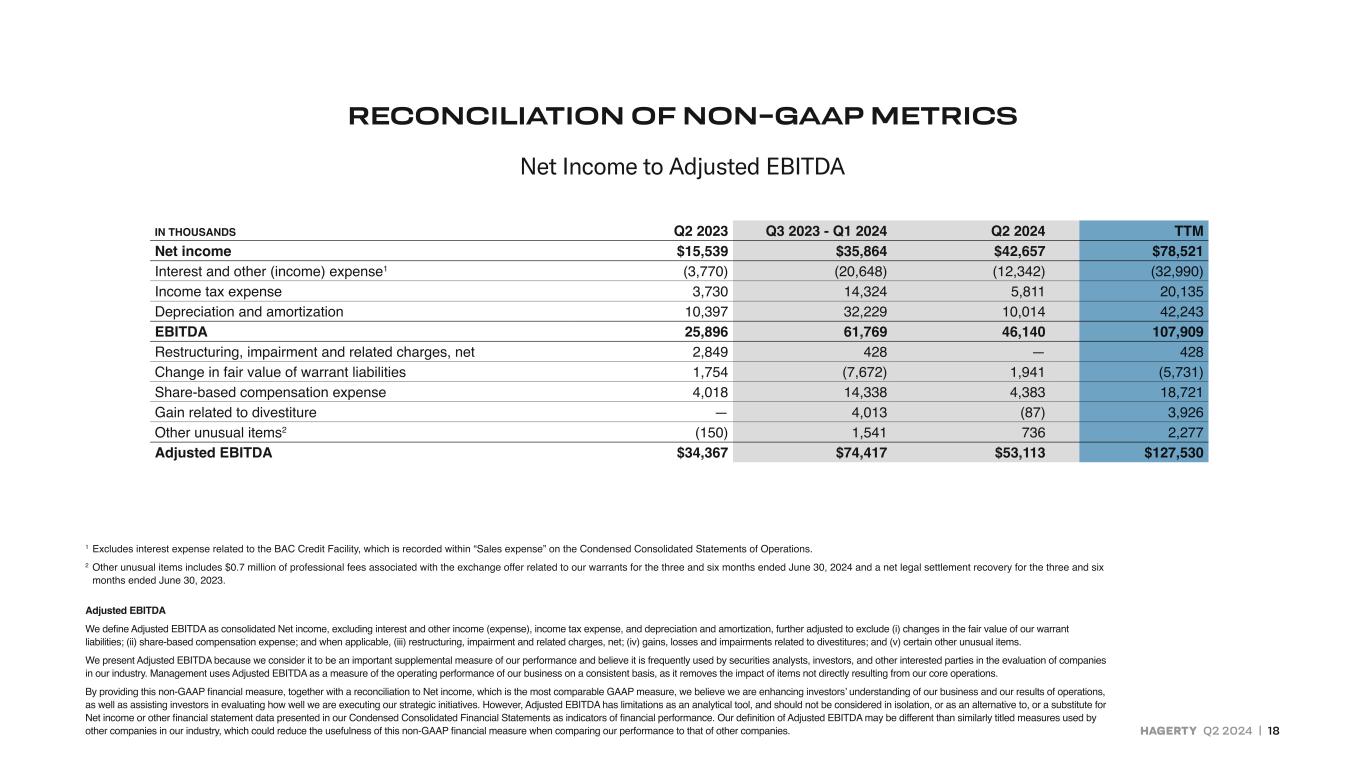
HAGERTY Q2 2024 | 18 IN THOUSANDS Q2 2023 Q3 2023 - Q1 2024 Q2 2024 TTM Net income $15,539 $35,864 $42,657 $78,521 Interest and other (income) expense1 (3,770) (20,648) (12,342) (32,990) Income tax expense 3,730 14,324 5,811 20,135 Depreciation and amortization 10,397 32,229 10,014 42,243 EBITDA 25,896 61,769 46,140 107,909 Restructuring, impairment and related charges, net 2,849 428 — 428 Change in fair value of warrant liabilities 1,754 (7,672) 1,941 (5,731) Share-based compensation expense 4,018 14,338 4,383 18,721 Gain related to divestiture — 4,013 (87) 3,926 Other unusual items2 (150) 1,541 736 2,277 Adjusted EBITDA $34,367 $74,417 $53,113 $127,530 RECONCILIATION OF NON-GAAP METRICS Net Income to Adjusted EBITDA 1 Excludes interest expense related to the BAC Credit Facility, which is recorded within “Sales expense” on the Condensed Consolidated Statements of Operations. 2 Other unusual items includes $0.7 million of professional fees associated with the exchange offer related to our warrants for the three and six months ended June 30, 2024 and a net legal settlement recovery for the three and six months ended June 30, 2023. Adjusted EBITDA We define Adjusted EBITDA as consolidated Net income, excluding interest and other income (expense), income tax expense, and depreciation and amortization, further adjusted to exclude (i) changes in the fair value of our warrant liabilities; (ii) share-based compensation expense; and when applicable, (iii) restructuring, impairment and related charges, net; (iv) gains, losses and impairments related to divestitures; and (v) certain other unusual items. We present Adjusted EBITDA because we consider it to be an important supplemental measure of our performance and believe it is frequently used by securities analysts, investors, and other interested parties in the evaluation of companies in our industry. Management uses Adjusted EBITDA as a measure of the operating performance of our business on a consistent basis, as it removes the impact of items not directly resulting from our core operations. By providing this non-GAAP financial measure, together with a reconciliation to Net income, which is the most comparable GAAP measure, we believe we are enhancing investors’ understanding of our business and our results of operations, as well as assisting investors in evaluating how well we are executing our strategic initiatives. However, Adjusted EBITDA has limitations as an analytical tool, and should not be considered in isolation, or as an alternative to, or a substitute for Net income or other financial statement data presented in our Condensed Consolidated Financial Statements as indicators of financial performance. Our definition of Adjusted EBITDA may be different than similarly titled measures used by other companies in our industry, which could reduce the usefulness of this non-GAAP financial measure when comparing our performance to that of other companies.

HAGERTY Q2 2024 | 19 IN THOUSANDS (EXCEPT PER SHARE AMOUNTS) Q2 2024 Q2 2023 YTD 2024 YTD 2023 Numerator: Net income available to Class A Common Stockholders1 $7,912 $2,388 $4,955 $305 Accretion of Series A Convertible Preferred Stock 1,839 — 3,677 — Undistributed earnings allocated to Series A Convertible Preferred Stock 627 17 395 1 Net income attributable to non-controlling interest 32,279 13,134 41,829 208 Consolidated net income 42,657 15,539 50,856 514 Change in fair value of warrant liabilities 1,941 1,754 8,081 2,269 Adjusted consolidated net income2 $44,598 $17,293 $58,937 $2,783 Denominator: Weighted-average shares of Class A Common Stock Outstanding - basic1 85,687 84,371 85,171 83,820 Total potentially dilutive shares outstanding: Non-controlling interest units 255,368 255,499 255,368 255,499 Series A Convertible Preferred Stock, on an as-converted basis 6,785 6,785 6,785 6,785 Total unissued share-based compensation awards 8,228 7,022 8,228 7,022 Total warrants outstanding3 3,876 19,484 3,876 19,484 Potentially dilutive shares outstanding 274,257 288,790 274,257 288,790 Fully dilutive shares outstanding2 359,944 373,161 359,428 372,610 Basic Earnings per Share1 $0.09 $0.03 $0.06 $— Adjusted Earnings per Share2 $0.12 $0.05 $0.16 $0.01 Basic Earnings Per Share to Adjusted Earnings Per Share RECONCILIATION OF NON-GAAP METRICS 1 Numerator and Denominator of the GAAP measure Basic EPS. 2 Numerator and Denominator of the non-GAAP measure Adjusted EPS. 3 For the three and six months ended June 30, 2024, the dilutive impact of the outstanding warrants included in the calculation of Adjusted EPS represents the number of Class A Common Stock shares issued in relation to the warrant exchange transaction that closed in July 2024. Adjusted EPS We define Adjusted Earnings Per Share (“Adjusted EPS”) as consolidated Net income, less changes in the fair value of our warrant liabilities, divided by our outstanding and total potentially dilutive securities, which includes (i) the weighted average issued and outstanding shares of Class A Common Stock; (ii) all issued and outstanding non-controlling interest units of THG; (iii) all issued and outstanding shares of our Series A Convertible Preferred Stock on an as-converted basis; (iv) all unissued share-based compensation awards; and (v) all unexercised warrants. The most directly comparable GAAP measure to Adjusted EPS is basic earnings per share (“Basic EPS”), which is calculated as Net income available to Class A Common Stockholders divided by the weighted average number of Class A Common Stock shares outstanding during the period. We caution investors that Adjusted EPS is not a recognized measure under GAAP and should not be considered in isolation or as a substitute for, or superior to, the financial information prepared and presented in accordance with GAAP, including Basic EPS, and that Adjusted EPS, as we define it, may be defined or calculated differently by other companies. In addition, Adjusted EPS has limitations as an analytical tool and should not be considered as a measure of profit or loss per share.
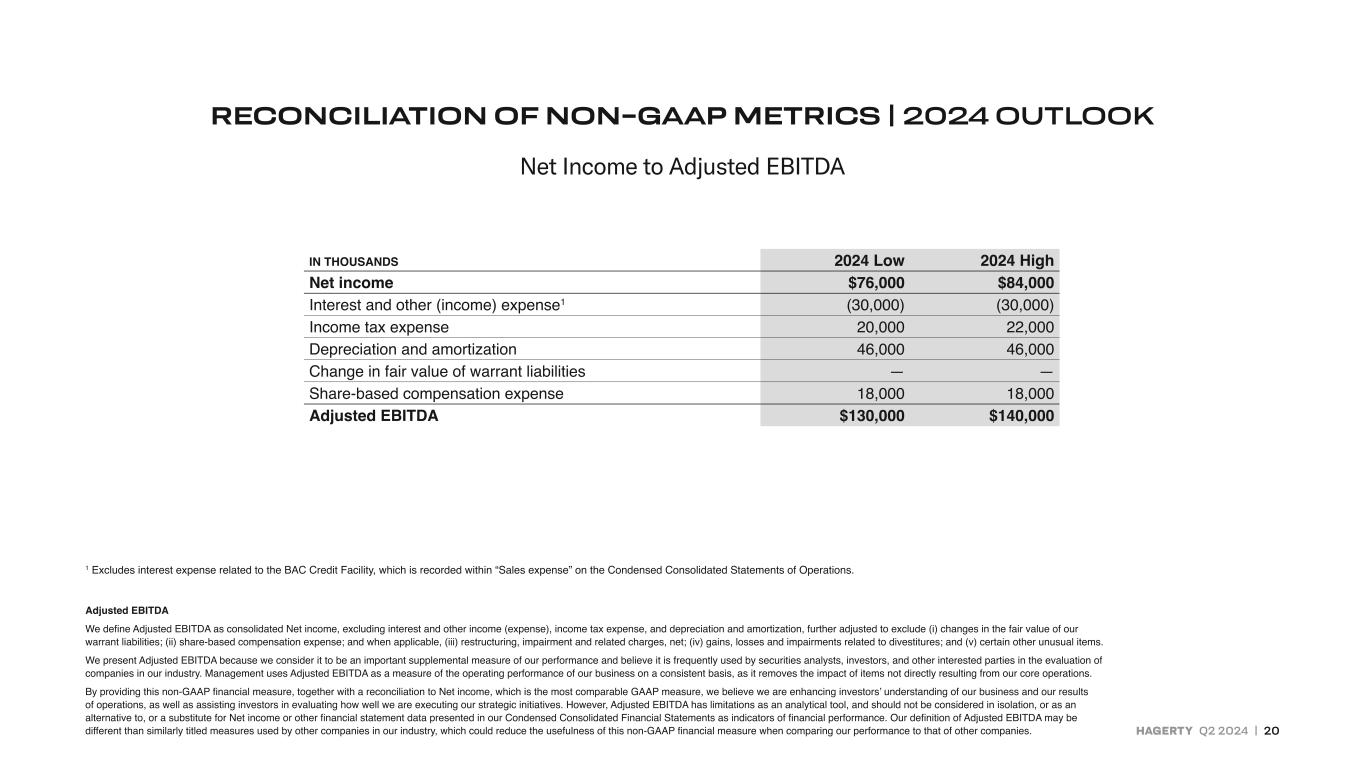
HAGERTY Q2 2024 | 20 IN THOUSANDS 2024 Low 2024 High Net income $76,000 $84,000 Interest and other (income) expense1 (30,000) (30,000) Income tax expense 20,000 22,000 Depreciation and amortization 46,000 46,000 Change in fair value of warrant liabilities — — Share-based compensation expense 18,000 18,000 Adjusted EBITDA $130,000 $140,000 Net Income to Adjusted EBITDA RECONCILIATION OF NON-GAAP METRICS | 2024 OUTLOOK 1 Excludes interest expense related to the BAC Credit Facility, which is recorded within “Sales expense” on the Condensed Consolidated Statements of Operations. Adjusted EBITDA We define Adjusted EBITDA as consolidated Net income, excluding interest and other income (expense), income tax expense, and depreciation and amortization, further adjusted to exclude (i) changes in the fair value of our warrant liabilities; (ii) share-based compensation expense; and when applicable, (iii) restructuring, impairment and related charges, net; (iv) gains, losses and impairments related to divestitures; and (v) certain other unusual items. We present Adjusted EBITDA because we consider it to be an important supplemental measure of our performance and believe it is frequently used by securities analysts, investors, and other interested parties in the evaluation of companies in our industry. Management uses Adjusted EBITDA as a measure of the operating performance of our business on a consistent basis, as it removes the impact of items not directly resulting from our core operations. By providing this non-GAAP financial measure, together with a reconciliation to Net income, which is the most comparable GAAP measure, we believe we are enhancing investors’ understanding of our business and our results of operations, as well as assisting investors in evaluating how well we are executing our strategic initiatives. However, Adjusted EBITDA has limitations as an analytical tool, and should not be considered in isolation, or as an alternative to, or a substitute for Net income or other financial statement data presented in our Condensed Consolidated Financial Statements as indicators of financial performance. Our definition of Adjusted EBITDA may be different than similarly titled measures used by other companies in our industry, which could reduce the usefulness of this non-GAAP financial measure when comparing our performance to that of other companies.


