Exhibit 99.2
204 137 108 Investor Presentation August 2022 Copyright © 2022 Verde Clean Fuels DRAFT as of 3/16/22 CENAQ Energy Corp.
2 204 137 108 DISCLAIMER FORWARD - LOOKING STATEMENTS All statements other than statements of historical facts contained in this presentation (this “Presentation”) are forward - looking statements . Forward - looking statements may generally be identified by the use of words such as “believe,” “may,” “will,” “estimate,” “continue,” “anticipate,” “intend,” “expect,” “should,” “would,” “plan,” “project,” “forecast,” “predict,” “potential,” “seem,” “seek,” “future,” “outlook,” “target” or other similar expressions that predict or indicate future events or trends or that are not statements of historical matters . These forward - looking statements include, but are not limited to, statements regarding estimates and forecasts of other financial and performance metrics, projections of market opportunity and market share . These statements are based on various assumptions, whether or not identified in this Presentation, and on the current expectations of Bluescape Clean Fuels Intermediate Holdings, LLC’s (“Bluescape Intermediate” or the “Company”) and CENAQ Energy Corp . ’s (“CENAQ”) management and are not predictions of actual performance . These forward - looking statements are provided for illustrative purposes only and are not intended to serve as, and must not be relied on by any investor as a guarantee, an assurance, a prediction or a definitive statement of fact or probability . Actual events and circumstances are difficult or impossible to predict and may differ from assumptions, and such differences may be material . Many actual events and circumstances are beyond the control of Bluescape Intermediate and CENAQ . These forward - looking statements are subject to a number of risks and uncertainties, including changes in domestic and foreign business, market, financial, political and legal conditions ; the inability of the parties to successfully or timely consummate the potential business combination between Bluescape Intermediate and CENAQ and related transactions (the “Proposed Business Combination”), including the risk that any required regulatory approvals are not obtained, are delayed or are subject to unanticipated conditions that could adversely affect the combined company or the expected benefits of the Proposed Business Combination or that the approval of the stockholders of CENAQ or the stockholders of Bluescape Intermediate is not obtained ; the failure to realize the anticipated benefits of the Proposed Business Combination ; risks relating to the uncertainty of the projected financial information with respect to Bluescape Intermediate ; risks related to the rollout of Bluescape Intermediate’s business and the timing of expected business milestones ; the effects of competition on Bluescape Intermediate’s business ; the amount of redemption requests made by CENAQ’s public stockholders ; the ability of CENAQ or the combined company to issue equity or equity - linked securities or obtain debt financing in connection with the Proposed Business Combination or in the future and those factors discussed in CENAQ’s final prospectus dated August 12 , 2021 and its Annual Report on Form 10 - K for the fiscal year ended December 31 , 2021 under the heading “Risk Factors,” and other documents of CENAQ filed, or to be filed, with the Securities and Exchange Commission (“SEC”) . If any of these risks materialize or CENAQ’s or Bluescape Intermediate’s assumptions prove incorrect, actual results could differ materially from the results implied by these forward - looking statements . There may be additional risks that neither CENAQ nor Bluescape Intermediate presently know or that CENAQ and Bluescape Intermediate currently believe are immaterial that could also cause actual results to differ from those contained in the forward - looking statements . In addition, forward - looking statements reflect CENAQ’s and Bluescape Intermediate’s expectations, plans or forecasts of future events and views as of the date of this Presentation . CENAQ and Bluescape Intermediate anticipate that subsequent events and developments will cause CENAQ’s and Bluescape Intermediate’s assessments to change . However, while CENAQ and Bluescape Intermediate may elect to update these forward - looking statements at some point in the future, CENAQ and Bluescape Intermediate specifically disclaim any obligation to do so . These forward - looking statements should not be relied upon as representing CENAQ’s and Bluescape Intermediate’s assessments as of any date subsequent to the date of this Presentation . Accordingly, undue reliance should not be placed upon the forward - looking statements . Neither Bluescape Intermediate, CENAQ, nor any of their respective affiliates have any obligation to update this Presentation . INDUSTRY AND MARKET DATA Although all information and opinions expressed in this Presentation, including market data and other statistical information, were obtained from sources believed to be reliable and are included in good faith, Bluescape Intermediate and CENAQ have not independently verified the information and make no representation or warranty, express or implied, as to its accuracy or completeness . Some data is also based on the good faith estimates of Bluescape Intermediate and CENAQ, which are derived from their respective reviews of internal sources as well as the independent sources described above . This Presentation contains preliminary information only, is subject to change at any time and, is not, and should not be assumed to be, complete or to constitute all the information necessary to adequately make an informed decision regarding your engagement with Bluescape Intermediate and CENAQ . USE OF PROJECTIONS This Presentation contains projected financial information with respect to Bluescape Intermediate . Such projected financial information constitutes forward - looking information, and is for illustrative purposes only and should not be relied upon as necessarily being indicative of future results . The assumptions and estimates underlying such financial forecast information are inherently uncertain and are subject to a wide variety of significant business, economic, competitive and other risks and uncertainties that could cause actual results to differ materially from those contained in the prospective financial information . See “Forward - Looking Statements” paragraph above . Actual results may differ materially from the results contemplated by the financial forecast information contained in this Presentation, and the inclusion of such information in this Presentation should not be regarded as a representation by any person that the results reflected in such forecasts will be achieved . Neither CENAQ’s nor Bluescape Intermediate’s independent auditors have audited, reviewed, compiled or performed any procedures with respect to the projections for the purpose of their inclusion in this Presentation, and accordingly, neither of them expressed an opinion or provided any other form of assurance with respect thereto for the purpose of this Presentation . IMPORTANT INFORMATION FOR INVESTORS AND SHAREHOLDERS If the Proposed Business Combination is pursued, CENAQ will file a proxy statement and other relevant documents with the SEC . Stockholders and other interested persons are urged to read the proxy statement and any other relevant documents filed with the SEC when they become available because they will contain important information about CENAQ, Bluescape Intermediate and the Proposed Business Combination . Stockholders will be able to obtain a free copy of the proxy statement (when filed), as well as other filings containing information about CENAQ, Bluescape Intermediate and the Proposed Business Combination, without charge, at the SEC’s website located at www . sec . gov . PARTICIPANTS IN SOLICITATION CENAQ, Bluescape Intermediate and their directors and executive officers and other persons may be deemed to be participants in the solicitations of proxies from CENAQ’s stockholders in respect of the Proposed Business Combination and the other matters set forth in the proxy statement . Information regarding CENAQ’s directors and executive officers is available in its Annual Report on Form 10 - K for the fiscal year ended December 31 , 2021 . Additional information regarding the participants in the proxy solicitation and a description of their direct and indirect interests, by security holdings or otherwise, will be contained in the proxy statement relating to the Proposed Business Combination when it becomes available . FINANCIAL INFORMATION ; NON - GAAP FINANCIAL MEASURES The financial information and data contained in this Presentation is unaudited and does not conform to Regulation S - X promulgated under the Securities Act of 1933 , as amended . Accordingly, such information and data may not be included in, may be adjusted in or may be presented differently in, the proxy statement to be filed by CENAQ with the SEC . Some of the financial information and data contained in this Presentation, such as EBIT, EBITDA and EBITDA Margin, have not been prepared in accordance with United States generally accepted accounting principles (“GAAP”) . CENAQ and Bluescape Intermediate believe these non - GAAP measures of financial results provide useful information to management and investors regarding certain financial and business trends relating to Bluescape Intermediate’s financial condition and results of operations . Bluescape Intermediate’s management uses these non - GAAP measures for trend analyses, for purposes of determining management incentive compensation and for budgeting and planning purposes . CENAQ and Bluescape Intermediate believe that the use of these non - GAAP financial measures provides an additional tool for investors to use in evaluating projected operating results and trends in and in comparing Bluescape Intermediate’s financial measures with other similar companies, many of which present similar non - GAAP financial measures to investors . Management does not consider these non - GAAP measures in isolation or as an alternative to financial measures determined in accordance with GAAP . The principal limitation of these non - GAAP financial measures is that they exclude significant expenses and income that are required by GAAP to be recorded in Bluescape Intermediate’s financial statements . In addition, they are subject to inherent limitations as they reflect the exercise of judgments by management about which expense and income are excluded or included in determining these non - GAAP financial measures . In order to compensate for these limitations, management presents non - GAAP financial measures in connection with GAAP results . TRADEMARKS AND TRADE NAMES Bluescape Intermediate and CENAQ own or have rights to various trademarks, service marks and trade names that they use in connection with the operation of their respective businesses . This Presentation also contains trademarks, service marks and trade names of third parties, which are the property of their respective owners . The use or display of third parties’ trademarks, service marks, trade names or products in this Presentation is not intended to, and does not imply, a relationship with Bluescape Intermediate or CENAQ, or an endorsement or sponsorship by or of Bluescape Intermediate or CENAQ . Solely for convenience, the trademarks, service marks and trade names referred to in this Presentation may appear with the ®, TM or SM symbols, but such references are not intended to indicate, in any way, that Bluescape Intermediate or CENAQ will not assert, to the fullest extent under applicable law, their rights or the right of the applicable licensor to these trademarks, service marks and trade names . RISK FACTORS For a description of the risks relating to an investment in Bluescape Intermediate, including in business and operations, we refer you to “Risk Factors” in the Appendix to this Presentation .

3 204 137 108 Introducing Today’s Speakers Ernie Miller Chief Executive Officer J. Russell Porter Chief Executive Officer CENAQ Energy Corp. John Doyle Chief Technology Officer
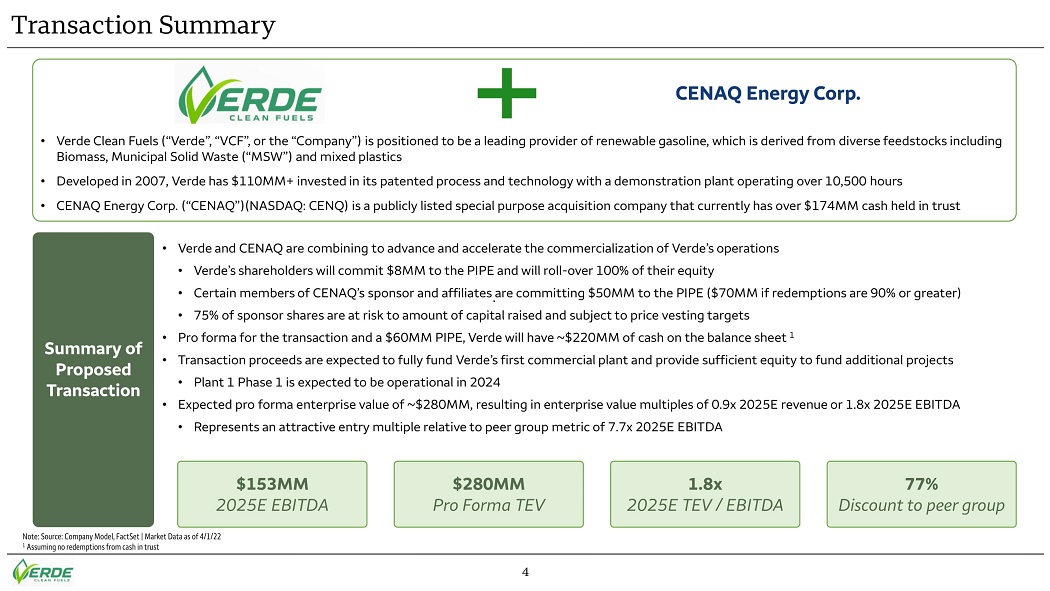
4 204 137 108 • Verde and CENAQ are combining to advance and accelerate the commercialization of Verde’s operations • Verde’s shareholders will commit $8MM to the PIPE and will roll - over 100% of their equity • Certain members of CENAQ’s sponsor and affiliates are committing $50MM to the PIPE ($70MM if redemptions are 90% or greater) • 75% of sponsor shares are at risk to amount of capital raised and subject to price vesting targets • Pro forma for the transaction and a $60MM PIPE, Verde will have ~$220MM of cash on the balance sheet 1 • Transaction proceeds are expected to fully fund Verde’s first commercial plant and provide sufficient equity to fund addition al projects • Plant 1 Phase 1 is expected to be operational in 2024 • Expected pro forma enterprise value of ~$280MM, resulting in enterprise value multiples of 0.9x 2025E revenue or 1.8x 2025E E BIT DA • Represents an attractive entry multiple relative to peer group metric of 7.7x 2025E EBITDA Transaction Summary $280MM Pro Forma TEV 1.8x 2025E TEV / EBITDA $153MM 2025E EBITDA 77% Discount to peer group Note: Source: Company Model, FactSet | Market Data as of 4/1/22 1 Assuming no redemptions from cash in trust CENAQ Energy Corp. • Verde Clean Fuels (“Verde”, “VCF”, or the “Company”) is positioned to be a leading provider of renewable gasoline, which is d eri ved from diverse feedstocks including Biomass, Municipal Solid Waste (“MSW”) and mixed plastics • Developed in 2007, Verde has $110MM+ invested in its patented process and technology with a demonstration plant operating ove r 1 0,500 hours • CENAQ Energy Corp. (“CENAQ”)(NASDAQ: CENQ) is a publicly listed special purpose acquisition company that currently has over $ 174 MM cash held in trust Summary of Proposed Transaction

5 204 137 108 Today’s Discussion Why Renewable Gasoline? Why Verde? Why Invest in CENAQ ’s PIPE?

6 204 137 108 Why Renewable Gasoline? Renewable Gasoline Reduces Lifecycle Emissions by over 67% Compared to Traditional Gasoline 3 Gasoline Demand Remains Strong Over Time Despite Electric Vehicle (“EV”) Adoption 2 Gasoline Accounts for More than 20% of U.S. Energy - related CO 2 Emissions 1 • Transportation represents 37% of total U.S. energy - related CO 2 emissions • Gasoline represents 56% of total transportation emissions; 2.3x Diesel, 4x Aviation • EV’s are only 1% of 2021 U.S. fleet and 24% of projected 2035 U.S. fleet • Despite aggressive EV penetration forecasts, the EIA predicts 2035 gasoline demand of 94% of 2019 levels • Renewable gasoline is a better carbon reduction answer than EVs in the near and long - term • Approximately 292MM tons of MSW generated annually, which can create ~25 billion gallons of renewable gasoline 1 Renewable Gasoline is Readily Adoptable With No Changes in Consumer Behavior 4 • 268MM internal combustion engine (ICE) vehicles can rapidly de - carbonize transportation • Uses existing gasoline infrastructure (compared to ~$1.2 trillion investment for EV) Source: BloombergNEF, Company Model, EIA – “2022 Annual Energy Outlook” and EIA – “U.S. Energy - related Carbon Dioxide Emissions , 2020” (December 2021 Report) | National Overview: Facts and Figures on Materials, Wastes, and Recycling | US EPA | 1 Assumes 60% of MSW is cellulosic and 1 ton of cellulosic MSW creates 140 gallons of gasoline

7 204 137 108 Transportation is the Largest U.S. Energy - related Emitter of CO 2 Transportation 37% Industrial 28% Residential 19% Commercial 16% 2019: Energy - related CO 2 Emissions (%) 1,086 468 261 109 0 400 800 1,200 Gasoline Diesel Jet Fuel All Other Fuels 2019 Transportation Emissions (MM Tons CO 2 ) 6% 14% 24% 56% Verde’s Solution to Decarbonize U.S. Transportation Market VCF offers a solution to address the largest source of energy - related greenhouse gas emissions in the U.S. Transportation Accounts for 37% of Total Energy - related CO 2 Emissions Gasoline Accounts for 56% of Total Transportation Emissions – ~20% of Total Emissions Source: EIA – “2022 Annual Energy Outlook” and EIA – “U.S. Energy - related Carbon Dioxide Emissions, 2020” (December 2021 Report ) 1 5,144 MM Tons CO 2
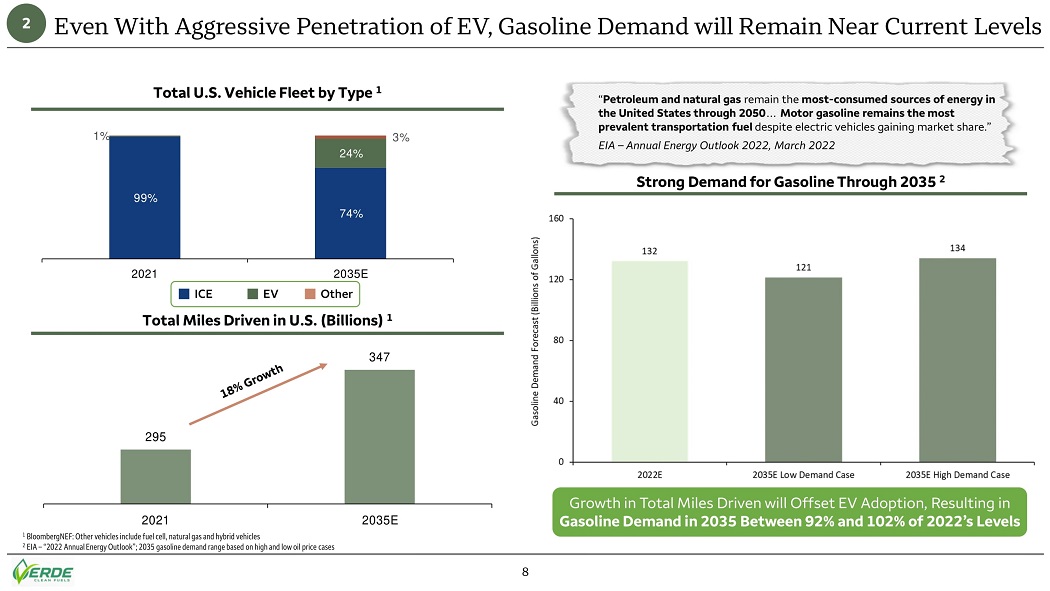
8 204 137 108 99% 74% 1% 24% 3% 2021 2035E Strong Demand for Gasoline Through 2035 2 Even With Aggressive Penetration of EV, Gasoline Demand will Remain Near Current Levels 1 BloombergNEF: Other vehicles include fuel cell, natural gas and hybrid vehicles 2 EIA – “2022 Annual Energy Outlook”; 2035 gasoline demand range based on high and low oil price cases “ Petroleum and natural gas remain the most - consumed sources of energy in the United States through 2050 … Motor gasoline remains the most prevalent transportation fuel despite electric vehicles gaining market share.” EIA – Annual Energy Outlook 2022, March 2022 Growth in Total Miles Driven will Offset EV Adoption, Resulting in Gasoline Demand in 2035 Between 92% and 102% of 2022’s Levels 2 295 347 2021 2035E Total U.S. Vehicle Fleet by Type 1 Total Miles Driven in U.S. (Billions) 1 ICE Other EV
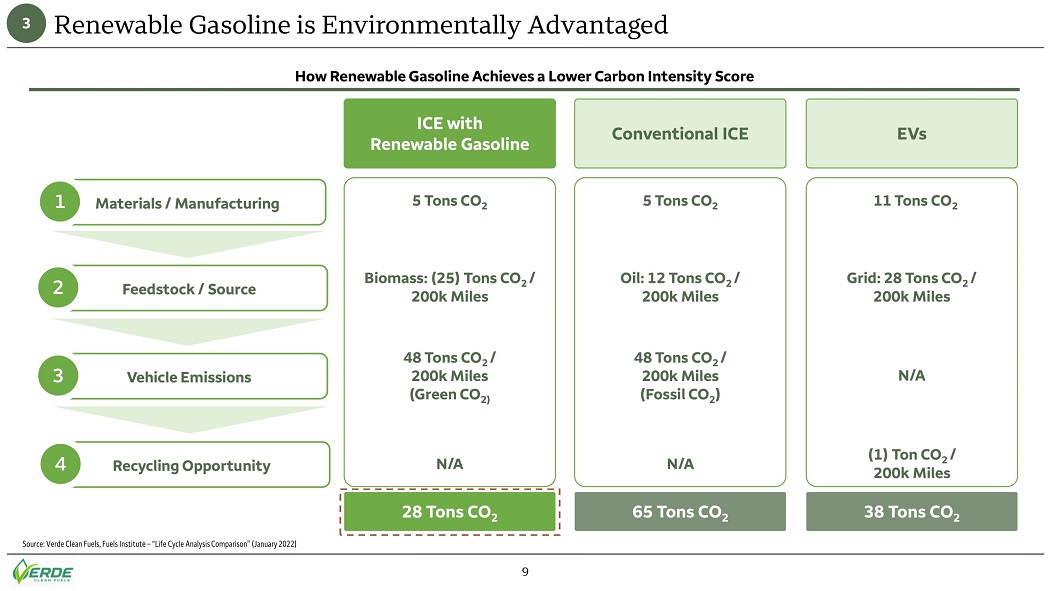
9 204 137 108 Renewable Gasoline is Environmentally Advantaged Source: Verde Clean Fuels, Fuels Institute – “Life Cycle Analysis Comparison” (January 2022) 3 How Renewable Gasoline Achieves a Lower Carbon Intensity Score Materials / Manufacturing 1 Feedstock / Source 2 Vehicle Emissions 3 Recycling Opportunity 4 Conventional ICE Oil: 12 Tons CO 2 / 200k Miles 5 Tons CO 2 48 Tons CO 2 / 200k Miles (Fossil CO 2 ) N/A 65 Tons CO 2 EVs Grid: 28 Tons CO 2 / 200k Miles 11 Tons CO 2 N/A (1) Ton CO 2 / 200k Miles 38 Tons CO 2 ICE with Renewable Gasoline Biomass: (25) Tons CO 2 / 200k Miles 5 Tons CO 2 48 Tons CO 2 / 200k Miles (Green CO 2) N/A 28 Tons CO 2

10 204 137 108 Fuels Institute – Life Cycle Analysis Comparison Renewable Gasoline is Environmentally Advantaged Materials & Manufacturing Emissions 2 Well - to - Wheels 3 Source: BloombergNEF, EIA – “2022 Annual Energy Outlook”, EPA – “National Overview: Facts and Figures on Materials, Wastes and Recycling”, EPA – “Landfill Methane Outreach Program” Landfill and Project Database, Volvo – “Carbon Footprint Report, Battery E lectric XC40 Recharge and the XC40 ICE” 1 See page 37 for more detailed analysis 2 Materials & Manufacturing Emissions includes Recycling 3 Well - to - Wheels (“WTW”) defined as Well - to - Tank (“WTT”) plus Tank - to - Wheels (“TTW”) Renewable Gasoline is an Immediate Solution to a Long - term Problem Conservative grid assumptions show renewable gasoline provides lower carbon profile than BEV’s… 3 Volvo Carbon Footprint Report 1 7 …and even with aggressive grid assumptions, renewable gasoline provides lower carbon profile than BEV’s over the long - term Verde’s analysis of independent studies indicates renewable gasoline would have the most carbon benefit for transportation 26% 39%
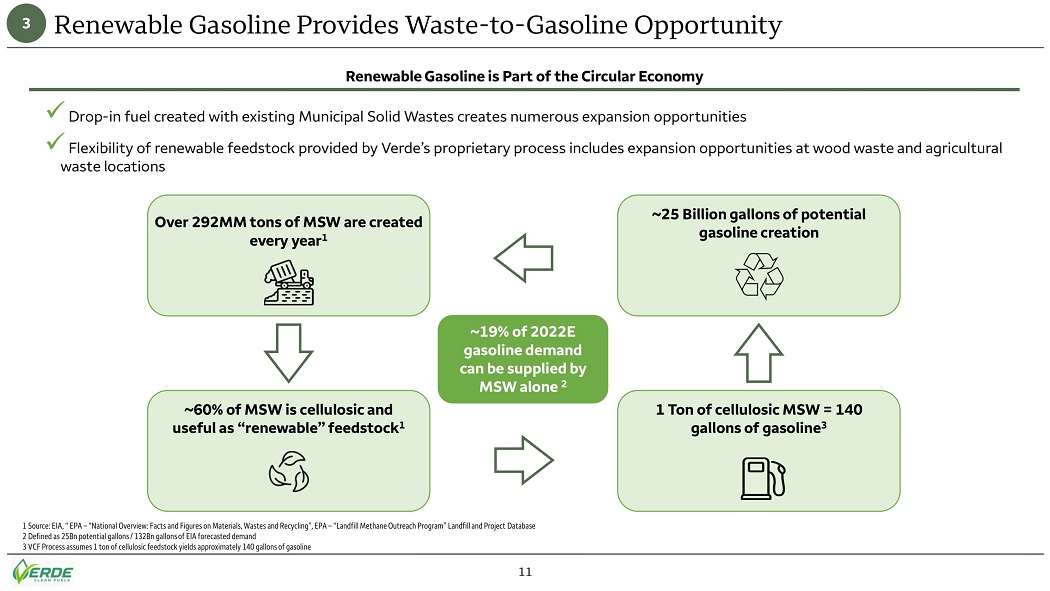
11 204 137 108 ~60% of MSW is cellulosic and useful as “renewable” feedstock 1 Over 292MM tons of MSW are created every year 1 x Drop - in fuel created with existing Municipal Solid Wastes creates numerous expansion opportunities x Flexibility of renewable feedstock provided by Verde’s proprietary process includes expansion opportunities at wood waste and ag ricultural waste locations Renewable Gasoline Provides Waste - to - Gasoline Opportunity 1 Source: EIA, “ EPA – “National Overview: Facts and Figures on Materials, Wastes and Recycling”, EPA – “Landfill Methane Outrea ch Program” Landfill and Project Database 2 Defined as 25Bn potential gallons / 132Bn gallons of EIA forecasted demand 3 VCF Process assumes 1 ton of cellulosic feedstock yields approximately 140 gallons of gasoline 3 Renewable Gasoline is Part of the Circular Economy ~19% of 2022E gasoline demand can be supplied by MSW alone 2 1 Ton of cellulosic MSW = 140 gallons of gasoline 3 ~25 Billion gallons of potential gasoline creation
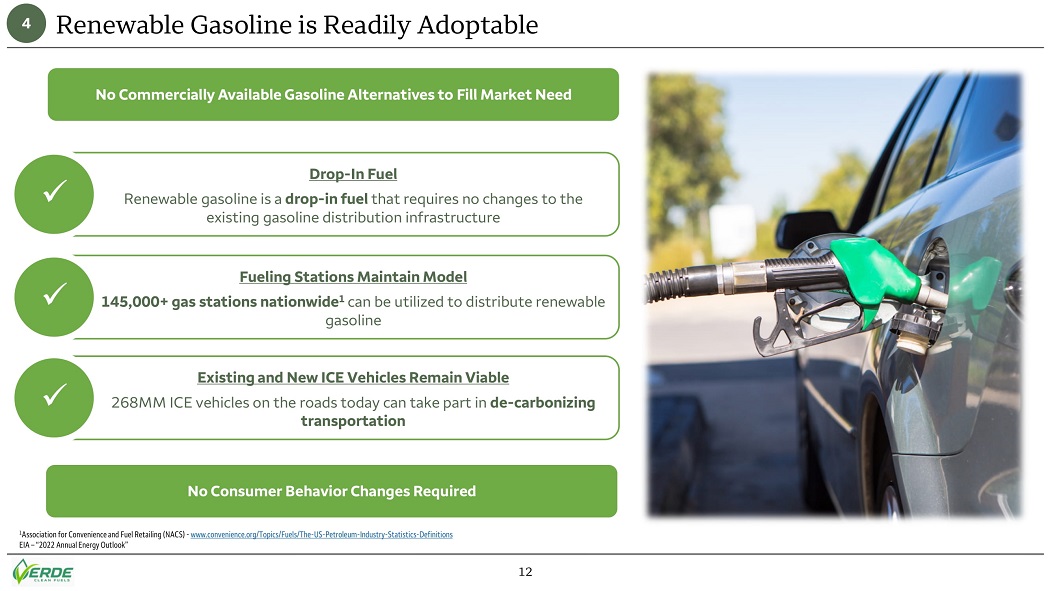
12 204 137 108 Renewable Gasoline is Readily Adoptable 1 Association for Convenience and Fuel Retailing (NACS) - www.convenience.org/Topics/Fuels/The - US - Petroleum - Industry - Statistics - Definitions EIA – “2022 Annual Energy Outlook” 4 Drop - In Fuel Renewable gasoline is a drop - in fuel that requires no changes to the existing gasoline distribution infrastructure Fueling Stations Maintain Model 145,000+ gas stations nationwide 1 can be utilized to distribute renewable gasoline Existing and New ICE Vehicles Remain Viable 268MM ICE vehicles on the roads today can take part in de - carbonizing transportation x x x No Commercially Available Gasoline Alternatives to Fill Market Need No Consumer Behavior Changes Required
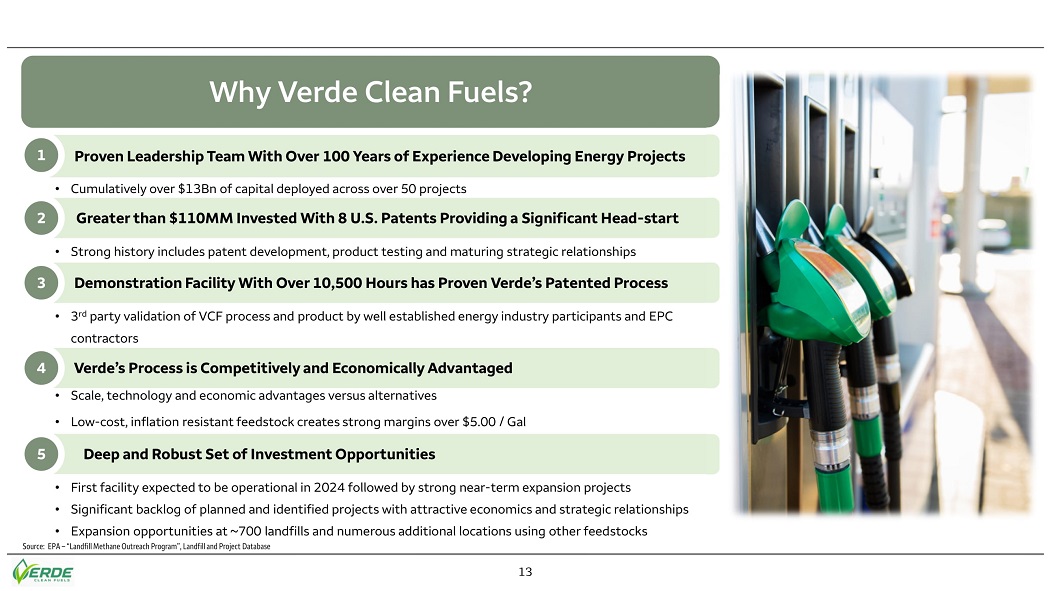
13 204 137 108 Why Verde Clean Fuels? Deep and Robust Set of Investment Opportunities 5 Demonstration Facility With Over 10,500 Hours has Proven Verde’s Patented Process 3 Greater than $110MM Invested With 8 U.S. Patents Providing a Significant Head - start 2 Proven Leadership Te am With Over 100 Years of Experience Developing Energy Projects 1 • Cumulatively over $13Bn of capital deployed across over 50 projects • Strong history includes patent development, product testing and maturing strategic relationships • 3 rd party validation of VCF process and product by well established energy industry participants and EPC contractors • First facility expected to be operational in 2024 followed by strong near - term expansion projects • Significant backlog of planned and identified projects with attractive economics and strategic relationships • Expansion opportunities at ~700 landfills and numerous additional locations using other feedstocks Source: EPA – “Landfill Methane Outreach Program”, Landfill and Project Database Verde’s Process is Competitively and Economically Advantaged 4 • Scale, technology and economic advantages versus alternatives • Low - cost, inflation resistant feedstock creates strong margins over $5.00 / Gal TBU: PDS submission - green Photoshop
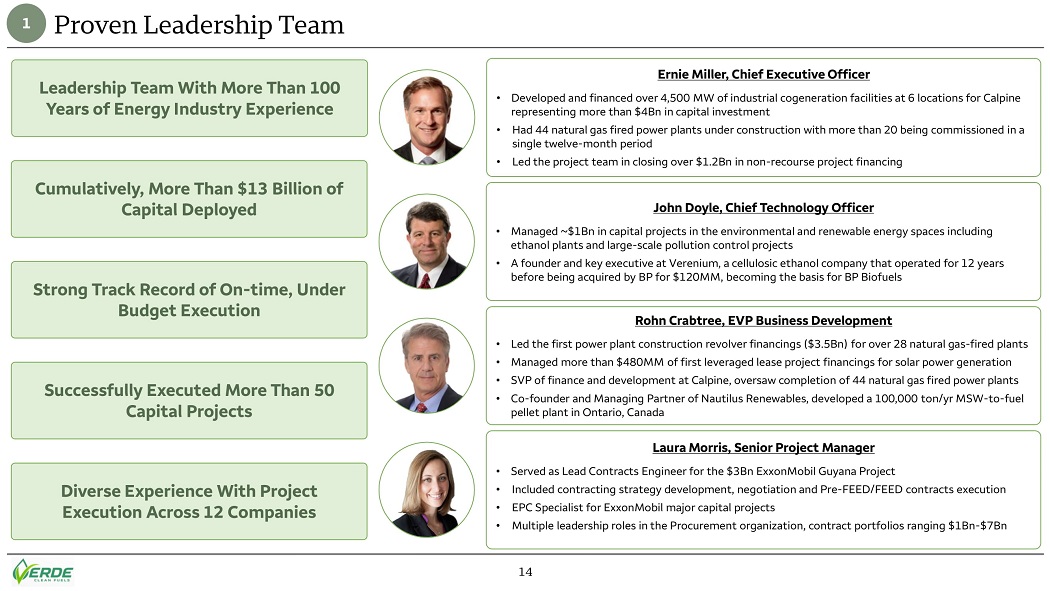
14 204 137 108 Proven Leadership Team Ernie Miller, Chief Executive Officer • Developed and financed over 4,500 MW of industrial cogeneration facilities at 6 locations for Calpine representing more than $4Bn in capital investment • Had 44 natural gas fired power plants under construction with more than 20 being commissioned in a single twelve - month period • Led the project team in closing over $1.2Bn in non - recourse project financing 1 Leadership Team With More Than 100 Years of Energy Industry Experience Strong Track Record of On - time, Under Budget Execution Successfully Executed More Than 50 Capital Projects Diverse Experience With Project Execution Across 12 Companies Cumulatively, More Than $13 Billion of Capital Deployed John Doyle, Chief Technology Officer • Managed ~$1Bn in capital projects in the environmental and renewable energy spaces including ethanol plants and large - scale pollution control projects • A founder and key executive at Verenium, a cellulosic ethanol company that operated for 12 years before being acquired by BP for $120MM, becoming the basis for BP Biofuels Rohn Crabtree, EVP Business Development • Led the first power plant construction revolver financings ($3.5Bn) for over 28 natural gas - fired plants • Managed more than $480MM of first leveraged lease project financings for solar power generation • SVP of finance and development at Calpine, oversaw completion of 44 natural gas fired power plants • Co - founder and Managing Partner of Nautilus Renewables, developed a 100,000 ton/yr MSW - to - fuel pellet plant in Ontario, Canada Laura Morris, Senior Project Manager • Served as Lead Contracts Engineer for the $3Bn ExxonMobil Guyana Project • Included contracting strategy development, negotiation and Pre - FEED/FEED contracts execution • EPC Specialist for ExxonMobil major capital projects • Multiple leadership roles in the Procurement organization, contract portfolios ranging $1Bn - $7Bn

15 204 137 108 Strategic Relationships Leader in the Development of Renewable Gasoline Foundation Built: 2007 – 2013 • Founded in 2007 as Primus Green Energy • Initial research and development phase • Process Trademarked as STG+® Demonstration Facility and Technology: 2013 – 2015 • Core patents approved • Demonstration facility constructed and commissioned Proven Process: 2015 – 2022 • Over 10,500 hours of demonstration plant operations • Established Methanol and Gasoline FEED programs • Process proven and verified through multiple independent firms • Rebranded as Verde Clean Fuels • Combined existing 3 rd party gasification technology with VCF’s STG+ process Ready for Commercialization: 2022+ • First facility FEED in - progress • PIPE / De - SPAC capitalizes business for commercialization plan • Multiple established partnerships to continue development of future projects $110MM+ Invested With 8 U.S. Patents Providing a Significant Head - start 2007 2013 2015 2022+ 2 National Oil Company

16 204 137 108 Demonstration Facility has Proven Verde’s Patented Process • Over 10,500 operational hours • Multiple operational campaigns of on - spec RBOB gasoline • Reactor designs, gas velocity, process configurations, and control system representative of full - scale plant • Operable commercial design at lower volume • Technical confirmation of commercial scale - up Proven Design Allows for: x Confirmation of process technology by multiple independent firms x EPC contracts will include performance guarantees backed by liquidated damages x Process is insurable through performance related insurance contracts x Holds 8 US patents that were developed over 15 years Proven Process Proven Product Demonstration Facility Streamlined Transition from Demonstration to Commercialization “E3 is of the opinion that the [VCF] process has been proven at the Hillsborough Demonstration Plant, and there is low technology risk since all the major components have evolved from prior, well - proven and commercialized technologies.” E3 Consulting – Independent Engineer’s Report, Verde Marcellus Methanol Project, 2018 “[VCF’s] STG+ technology is clearly superior to conventional MTG technologies for these smaller scale plants.” The World Bank, Global Gas Flaring Reduction Partnership 3 x Lifecycle Study Confirms Verde CI Score x Fuel Testing is Completed x Engine and Driving Program in Process National Oil Company
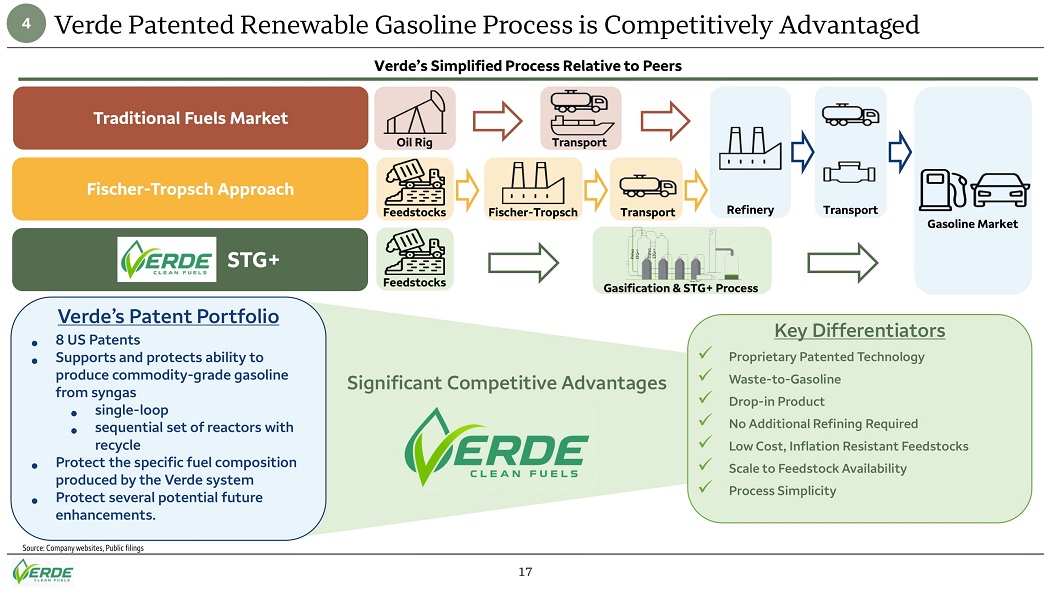
17 204 137 108 Verde’s Patent Portfolio • 8 US Patents • Supports and protects ability to produce commodity - grade gasoline from syngas • single - loop • sequential set of reactors with recycle • Protect the specific fuel composition produced by the Verde system • Protect several potential future enhancements. Feedstocks Verde Patented Renewable Gasoline Process is Competitively Advantaged Verde’s Simplified Process Relative to Peers Traditional Fuels Market Fischer - Tropsch Approach STG+ Primus STG+ © Primus STG+ © Primus STG+ © Gasification & STG+ Process Feedstocks Refinery Oil Rig Fischer - Tropsch Gasoline Market Transport Transport Transport Source: Company websites, Public filings Significant Competitive Advantages Key Differentiators x Proprietary Patented Technology x Waste - to - Gasoline x Drop - in Product x No Additional Refining Required x Low Cost, Inflation Resistant Feedstocks x Scale to Feedstock Availability x Process Simplicity 4
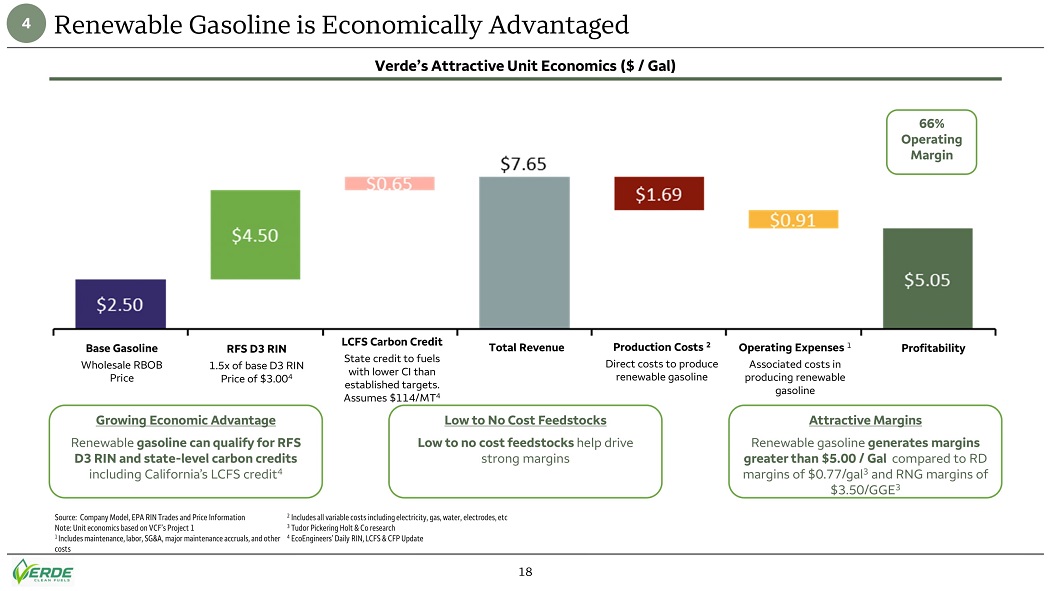
18 204 137 108 Attractive Margins Renewable gasoline generates margins greater than $5.00 / Gal compared to RD margins of $0.77/gal 3 and RNG margins of $3.50/GGE 3 Low to No Cost Feedstocks Low to no cost feedstocks help drive strong margins Renewable Gasoline is Economically Advantaged Growing Economic Advantage Renewable gasoline can qualify for RFS D3 RIN and state - level carbon credits including California’s LCFS credit 4 Source: Company Model, EPA RIN Trades and Price Information Note: Unit economics based on VCF’s Project 1 1 Includes maintenance, labor, SG&A, major maintenance accruals, and other costs 2 Includes all variable costs including electricity, gas, water, electrodes, etc 3 Tudor Pickering Holt & Co research 4 EcoEngineers’ Daily RIN, LCFS & CFP Update LCFS Carbon Credit State credit to fuels with lower CI than established targets. Assumes $114/MT 4 Base Gasoline Wholesale RBOB Price RFS D3 RIN 1.5x of base D3 RIN Price of $3.00 4 Total Revenue Production Costs 2 Direct costs to produce renewable gasoline Operating Expenses 1 Associated costs in producing renewable gasoline Profitability Verde’s Attractive Unit Economics ($ / Gal) 66% Operating Margin 4

19 204 137 108 Strong Economic Profile Buffered from Feedstock Inflationary Costs Project 1 IRR Sensitivity Levered IRR: 37% Base Case Metrics $3.00 / Gal 1 $131MM $2.50 / Gal $1.69 / Gal $10.00 / Ton Source: Company Model 1 Assumes RIN pricing multiplier of 1.5x RINs (Decrease) / Increase Capex Increase / (Decrease) Production Costs Increase / (Decrease) RBOB (Decrease) / Increase Feedstock Costs Increase / (Decrease) +/ - 20% Adjustment +/ - 500% Adjustment +/ - 40% Adjustment +/ - 20% adjustment +/ - 20% adjustment 4 +$0.60 / Gal ($0.60 / Gal) +$50MM ($50MM) ($0.50 / Gal) +$0.50 / Gal +$0.30 / Gal ($0.30 / Gal) +$40.00 / Ton ($40.00 / Ton)
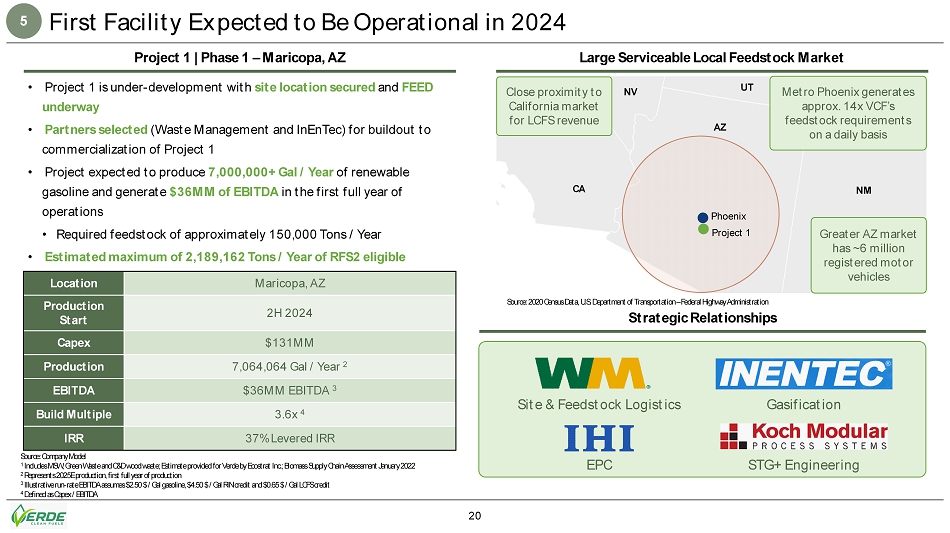
20 204 137 108 First Facility Expected to Be Operational in 2024 Source: Company Model 1 Includes MSW, Green Waste and C&D wood waste; Estimate provided for Verde by Ecostrat Inc.; Biomass Supply Chain Assessment J an uary 2022 2 Represents 2025E production, first full year of production 3 Illustrative run - rate EBITDA assumes $2.50 $ / Gal gasoline, $4.50 $ / Gal RIN credit and $0.65 $ / Gal LCFS credit 4 Defined as Capex / EBITDA • Project 1 is under - development with site location secured and FEED underway • Partners selected (Waste Management and InEnTec) for buildout to commercialization of Project 1 • Project expected to produce 7,000,000+ Gal / Year of renewable gasoline and generate $36MM of EBITDA in the first full year of operations • Required feedstock of approximately 150,000 Tons / Year • Estimated maximum of 2,189,162 Tons / Year of RFS2 eligible feedstock generated within 75 - mile supply basin of project 1 Project 1 | Phase 1 – Maricopa, AZ Strategic Relationships Site & Feedstock Logistics Gasification Large Serviceable Local Feedstock Market CA AZ NV UT CO NM Phoenix Project 1 Metro Phoenix generates approx. 14x VCF’s feedstock requirements on a daily basis Greater AZ market has ~6 million registered motor vehicles Source: 2020 Census Data, U.S. Department of Transportation – Federal Highway Administration Location Maricopa, AZ Production Start 2H 2024 Capex $131MM Production 7,064,064 Gal / Year 2 EBITDA $36MM EBITDA 3 Build Multiple 3.6x 4 IRR 37% Levered IRR 5 Close proximity to California market for LCFS revenue EPC STG+ Engineering
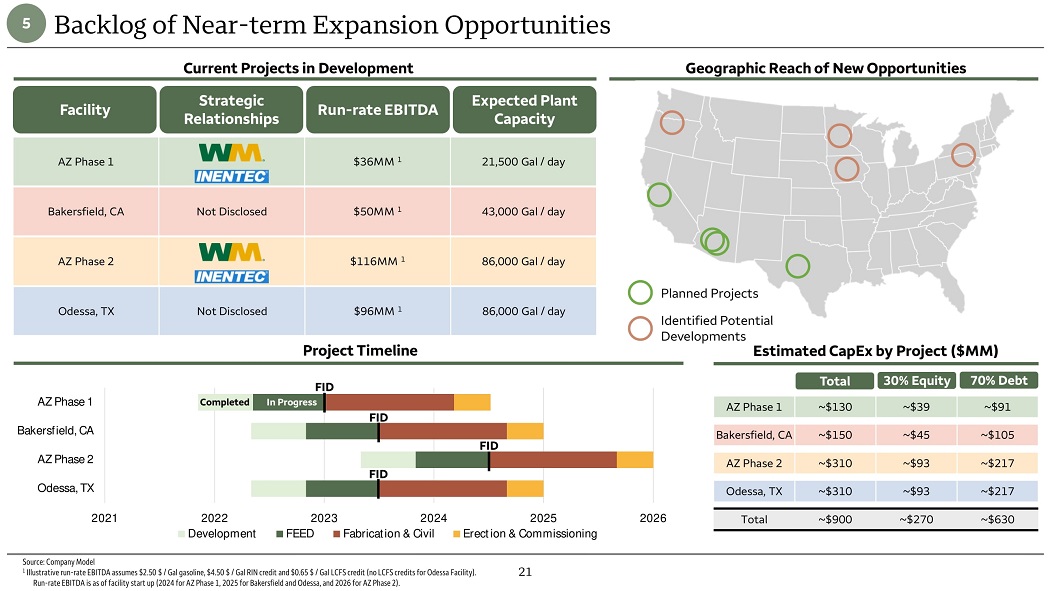
21 204 137 108 2021 2022 2023 2024 2025 2026 AZ Phase 1 Bakersfield, CA AZ Phase 2 Odessa, TX Development FEED Fabrication & Civil Erection & Commissioning AZ Phase 1 $36MM 1 21,500 Gal / day Bakersfield, CA Not Disclosed $50MM 1 43,000 Gal / day AZ Phase 2 $116MM 1 86,000 Gal / day Odessa, TX Not Disclosed $96MM 1 86,000 Gal / day Current Projects in Development Geographic Reach of New Opportunities Project Timeline Backlog of Near - term Expansion Opportunities Facility Strategic Relationships Run - rate EBITDA Expected Plant Capacity Source: Company Model 1 Illustrative run - rate EBITDA assumes $2.50 $ / Gal gasoline, $4.50 $ / Gal RIN credit and $0.65 $ / Gal LCFS credit (no LCFS cr edits for Odessa Facility). Run - rate EBITDA is as of facility start up (2024 for AZ Phase 1, 2025 for Bakersfield and Odessa, and 2026 for AZ Phase 2 ). Estimated CapEx by Project ($MM) FID FID FID FID AZ Phase 1 ~$130 ~$39 ~$91 Bakersfield, CA ~$150 ~$45 ~$105 AZ Phase 2 ~$310 ~$93 ~$217 Odessa, TX ~$310 ~$93 ~$217 Total 30% Equity 70% Debt Total ~$900 ~$270 ~$630 In Progress Completed Planned Projects Identified Potential Developments 5
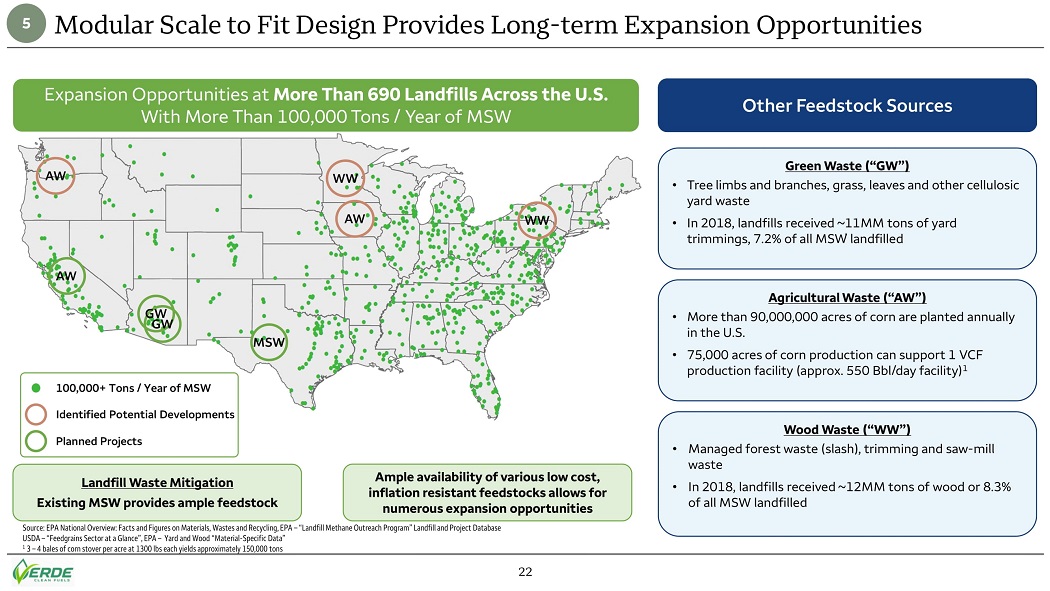
22 204 137 108 Modular Scale to Fit Design Provides Long - term Expansion Opportunities Expansion Opportunities at More Than 690 Landfills Across the U.S. With More Than 100,000 Tons / Year of MSW Source: EPA National Overview: Facts and Figures on Materials, Wastes and Recycling, EPA – “Landfill Methane Outreach Program” L andfill and Project Database USDA – “Feedgrains Sector at a Glance”, EPA – Yard and Wood “Material - Specific Data” 1 3 – 4 bales of corn stover per acre at 1300 lbs each yields approximately 150,000 tons Other Feedstock Sources Agricultural Waste (“AW”) • More than 90,000,000 acres of corn are planted annually in the U.S. • 75,000 acres of corn production can support 1 VCF production facility (approx. 550 Bbl/day facility) 1 Green Waste (“GW”) • Tree limbs and branches, grass, leaves and other cellulosic yard waste • In 2018, landfills received ~11MM tons of yard trimmings, 7.2% of all MSW landfilled Wood Waste (“WW”) • Managed forest waste (slash), trimming and saw - mill waste • In 2018, landfills received ~12MM tons of wood or 8.3% of all MSW landfilled 5 Landfill Waste Mitigation Existing MSW provides ample feedstock Ample availability of various low cost, inflation resistant feedstocks allows for numerous expansion opportunities 100,000+ Tons / Year of MSW Identified Potential Developments AW MSW Planned Projects AW WW AW WW GW GW

23 204 137 108 Why Invest in CENAQ’s PIPE? Win - Win Valuation that is Compelling for both SPAC Shareholders and PIPE Investors 3 Strong Growth and Economic Profile 2 Pure - play Renewable Gasoline Public Investment Opportunity 1 • Opportunity to invest in a proprietary technology, targeting renewable gasoline markets on a commercial scale with diverse renewable feedstock options • Creates a distributed network of facilities scaled to fit local feedstock supply • Allows an optimal capital deployment of ~$150 – $350 million per project compared to ~$1+ billion for traditional refining, Fischer - Tropsh, and other processes • Process efficiency and low operating costs generate strong economics and projected levered IRRs of over 35% • Project returns not sensitive to feedstock costs • Projected EBITDA and revenue CAGRs of more than 300% from 2024 to 2026 with margins ~50% • Pro forma enterprise value of $280MM represents large discount to peers, with 1.8x 2025E EBITDA multiple compared to peer median of 7.7x, representing a 77% discount relative to peers • Valuation structured for post - combination success, with significant upside for SPAC shareholders and PIPE investors Source: Company Model, Factset | Market data as of 4/1/22 TBU: PDS submission - green Photoshop

24 204 137 108 Pure - play Renewable Gasoline Public Investment Opportunity Comparable Universe Key Criteria Defining Best Comps Renewable Natural Gas Peers Renewable Diesel Peers Biofuel Peers • Adjacent industries within the broader renewables landscape with emphasis on Energy Transition • Large addressable markets • High - growth financial profile • Similar Feedstock / Waste - to - value • No perfect public comparable company • Investors will prioritize RNG companies, Renewable Diesel companies and Biofuel companies • Market will focus on near and long - term growth, margin profile and project execution 1

25 204 137 108 EBITDA Margin 50% 50% 51% $25 $308 $524 2024E 2025E 2026E $13 $153 $269 2024E 2025E 2026E Verde’s Initial Four Projects Expected to Add Significant Revenue and EBITDA Scale EBITDA ($MM) Revenue ($MM) Source: Company Model 2 2026E Annual Revenue from VCF’s First Four Projects Strong EBITDA Growth in - line With Revenue Growth Due to Stable Margins
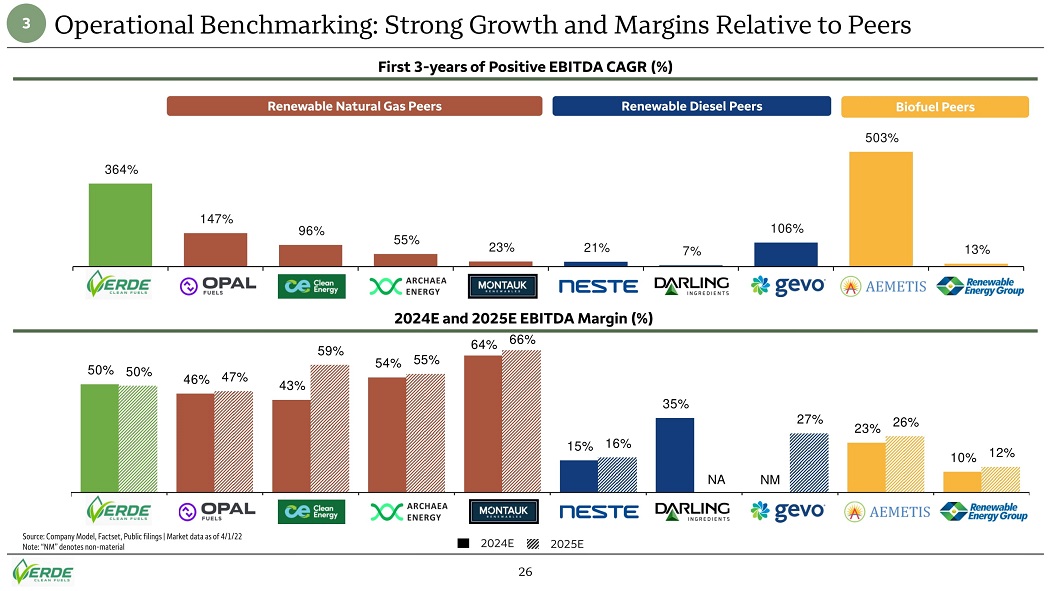
26 204 137 108 364% 147% 96% 55% 23% 21% 7% 106% 503% 13% BCF OPL CLNE LFG MNTK NESTE DAR GEVO AMTX REGI 50% 46% 43% 54% 64% 15% 35% NM 23% 10% 50% 47% 59% 55% 66% 16% NA 27% 26% 12% BCF OPL CLNE LFG MNTK NESTE DAR GEVO AMTX REGI Operational Benchmarking: Strong Growth and Margins Relative to Peers Source: Company Model, Factset, Public filings | Market data as of 4/1/22 Note: “NM” denotes non - material Renewable Natural Gas Peers Renewable Diesel Peers 2025E 2024E First 3 - years of Positive EBITDA CAGR (%) 2024E and 2025E EBITDA Margin (%) Biofuel Peers 3

1 75% (3.2MM) of the 4.3MM potential Sponsor and Anchor Investor Shares are subject to vesting price targets at $15 and $18 / s ha re. 2 Illustrative pro forma ownership excludes the impact of Public Warrants, Sponsor Warrants, and VCF Existing Equityholders Equ it y Earnout. 3 Certain members of CENAQ Sponsor LLC or its affiliates will commit to purchase up to $70MM in the PIPE offering (which can be r educed incrementally down to $50MM if redemptions are between approximately 90% and approximately 78% or lower) | Bluescape Energy Partners will commit t o p urchase $8MM in the PIPE offering 4 Used to repay equity contribution by Bluescape Energy Partners incurred during the execution of the deal in an amount not to ex ceed $10MM. $1.25MM accumulated through March 31, 2022. 5 Assumes no redemptions Illustrative Sources & Uses Illustrative Pro Forma Valuation Illustrative Pro Forma Ownership 2 Verde’s Compelling Valuation • VCF will combine with CENAQ at a pro forma enterprise value of $280MM • Represents attractive relative valuation of 1.8 x 2025E EBITDA • VCF Shareholders rollover 100% of VCF equity for 46.5% equity in pro forma company • Aligns incentives of VCF, PIPE and CENAQ Shareholders • Aligned Sponsor incentives with 75% of Sponsor Shares subject to being earned, and if earned, subject to price targets 1 Summary of Proposed Transaction Sources ($ millions) CENAQ SPAC Cash in Trust 5 $174 PIPE 3 60 VCF Equity Rollover 225 Total Sources $459 Uses Total VCF Consideration $225 Cash to Balance Sheet 220 Transaction Fees 13 VCF Debt Paydown 4 1 Total Uses $459 ($ millions) Share Price $10.00 Pro Forma Shares Outstanding (MM) 50 Pro Forma Equity Value $500 Plus: Pro Forma Debt - Less: Pro Forma Cash 220 Pro Forma Enterprise Value $280 3 5 27 34% 10% 9% Sponsor & Anchor 47%
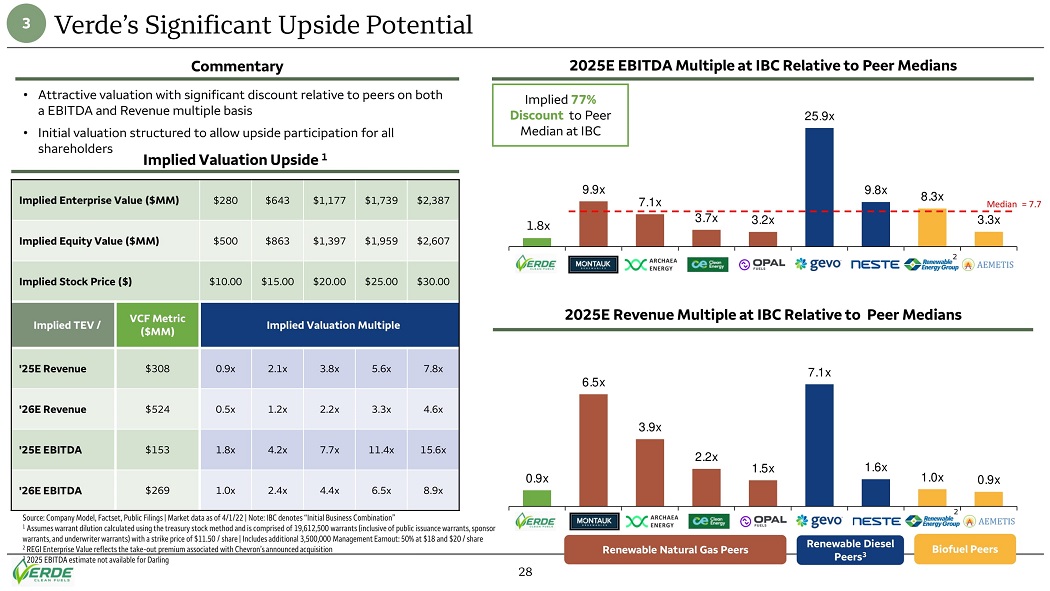
28 204 137 108 1.9x 9.9x 7.1x 3.7x 3.2x 25.9x 9.8x 8.3x 3.3x BCF MNTK LFG CLNE OPL GEVO NESTE REGI AMTX 0.9x 6.5x 3.9x 2.2x 1.5x 7.1x 1.6x 1.0x 0.9x BCF MNTK LFG CLNE OPL GEVO NESTE REGI AMTX Verde’s Significant Upside Potential Implied 77% Discount to Peer Median at IBC Implied Valuation Upside 1 • Attractive valuation with significant discount relative to peers on both a EBITDA and Revenue multiple basis • Initial valuation structured to allow upside participation for all shareholders 2025E Revenue Multiple at IBC Relative to Peer Medians Implied Enterprise Value ($MM) $280 $643 $1,177 $1,739 $2,387 Implied Equity Value ($MM) $500 $863 $1,397 $1,959 $2,607 Implied Stock Price ($) $10.00 $15.00 $20.00 $25.00 $30.00 Implied TEV / VCF Metric ($MM) Implied Valuation Multiple '25E Revenue $308 0.9x 2.1x 3.8x 5.6x 7.8x '26E Revenue $524 0.5x 1.2x 2.2x 3.3x 4.6x '25E EBITDA $153 1.8x 4.2x 7.7x 11.4x 15.6x '26E EBITDA $269 1.0x 2.4x 4.4x 6.5x 8.9x Commentary 2025E EBITDA Multiple at IBC Relative to Peer Medians 3 Source: Company Model, Factset, Public Filings | Market data as of 4/1/22 | Note: IBC denotes “Initial Business Combination” 1 Assumes warrant dilution calculated using the treasury stock method and is comprised of 19,612,500 warrants (inclusive of pub li c issuance warrants, sponsor warrants, and underwriter warrants) with a strike price of $11.50 / share | Includes additional 3,500,000 Management Earnout: 50 % at $18 and $20 / share 2 REGI Enterprise Value reflects the take - out premium associated with Chevron’s announced acquisition 3 2025 EBITDA estimate not available for Darling 2 2 Median = 7.7 Renewable Natural Gas Peers Renewable Diesel Peers 3 Biofuel Peers 1.8x
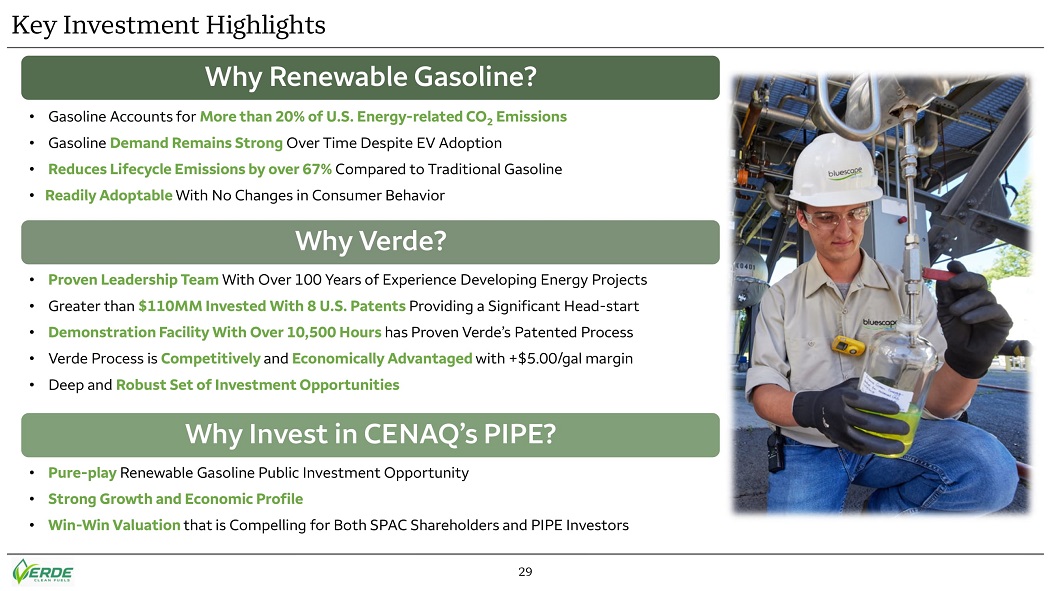
29 204 137 108 Key Investment Highlights Why Renewable Gasoline? Why Verde? Why Invest in CENAQ’s PIPE? • Gasoline Accounts for More than 20% of U.S. Energy - related CO 2 Emissions • Gasoline Demand Remains Strong Over Time Despite EV Adoption • Reduces Lifecycle Emissions by over 67% Compared to Traditional Gasoline • Readily Adoptable With No Changes in Consumer Behavior • Proven Leadership Team With Over 100 Years of Experience Developing Energy Projects • Greater than $110MM Invested With 8 U.S. Patents Providing a Significant Head - start • Demonstration Facility With Over 10,500 Hours has Proven Verde’s Patented Process • Verde Process is Competitively and Economically Advantaged with +$5.00/gal margin • Deep and Robust Set of Investment Opportunities • Pure - play Renewable Gasoline Public Investment Opportunity • Strong Growth and Economic Profile • Win - Win Valuation that is Compelling for Both SPAC Shareholders and PIPE Investors
30 204 137 108 Appendix

31 204 137 108 Verde’s Patented Process Verde’s Solution Presents an Attractive Opportunity for Investors Ability to Invest in a Differentiated, High Growth Energy Transition Company at an Attractive Valuation Verde Clean Fuels Renewable Gasoline is Addressing a Significant Challenge in Decarbonizing Transportation The Opportunity The Solution Biomass Mixed Plastics Solid MSW Syngas Production Verde STG+ © Verde STG+ © Verde STG+ © Renewable Unleaded Gasoline • Renewable gasoline from biomass feedstock • 67% lifecycle carbon emissions reduction compared to traditional gasoline • Over 15 years of development and more than $110MM of capital invested • Proven technology verified by multiple independent firms; 8 U.S. patents • Fully operable modular commercial design demonstration facility • Modular, drop - in solution that leverages existing gasoline distribution infrastructure • Experienced leadership team with track - record of deploying capital and project management MSW Expansion Opportunities Throughout the U.S. • Compelling valuation with significant upside potential, 1.8x 2025E EBITDA multiple compared to peer median of 7.7x • One of the first pure - play renewable gasoline producers at commercial scale • Low - cost feedstock generates strong unit economics over $5.00 / Gal for scaled commercialization 1 • Opportunity to expand to ~700 MSW locations throughout the U.S. • Circular Economy Company facilitating U.S. Energy Independence and Energy Transition • Supports ESG investing through long - term landfill diversion and further eliminating methane/CO 2 emissions sources Source: Company Model, BloombergNEF, EIA – “Energy Annual Outlook 2022”, EPA – “2021 Automotive Trends Report”, EPA – “Landfill Methane Outreach Program”, Landfill and Project Database, Factset | Market data as of 4/1/22 1 Assumes Product Revenue of $7.65 / Gal, Production Costs of $1.69 / Gal and Operating Expense of $0.91 / Gal 100,000+ Tons / Year MSW Landfill Opportunities
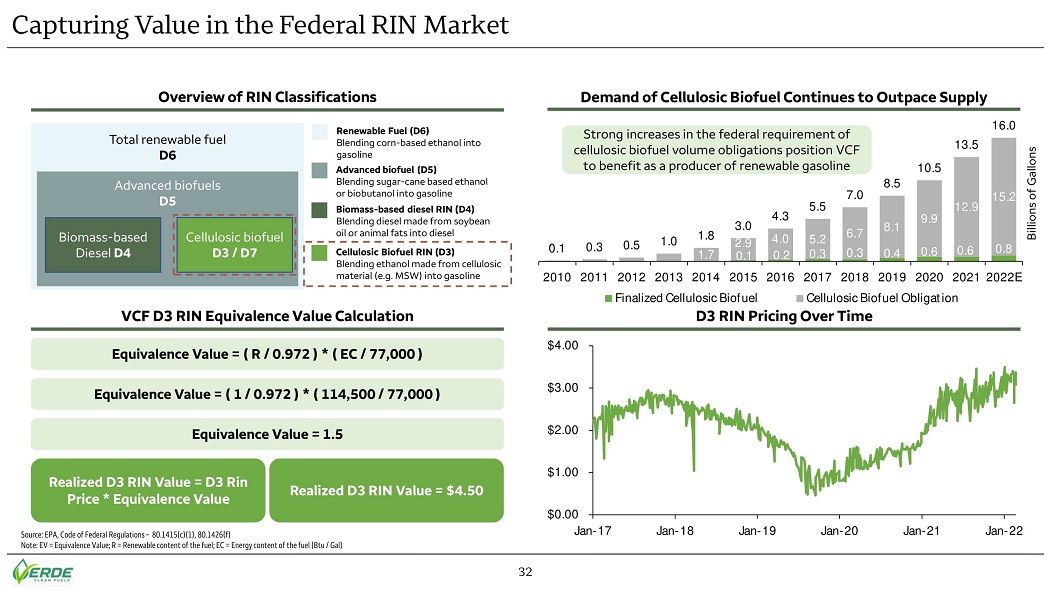
32 204 137 108 0.1 0.2 0.3 0.3 0.4 0.6 0.6 0.8 1.7 2.9 4.0 5.2 6.7 8.1 9.9 12.9 15.2 0.1 0.3 0.5 1.0 1.8 3.0 4.3 5.5 7.0 8.5 10.5 13.5 16.0 2010 2011 2012 2013 2014 2015 2016 2017 2018 2019 2020 2021 2022E Finalized Cellulosic Biofuel Cellulosic Biofuel Obligation $0.00 $1.00 $2.00 $3.00 $4.00 Jan-17 Jan-18 Jan-19 Jan-20 Jan-21 Jan-22 Capturing Value in the Federal RIN Market D3 RIN Pricing Over Time Demand of Cellulosic Biofuel Continues to Outpace Supply Strong increases in the federal requirement of cellulosic biofuel volume obligations position VCF to benefit as a producer of renewable gasoline Billions of Gallons Overview of RIN Classifications Total renewable fuel D6 Advanced biofuels D5 Cellulosic biofuel D3 / D7 Biomass - based Diesel D4 Cellulosic Biofuel RIN (D3) Blending ethanol made from cellulosic material (e.g. MSW) into gasoline Biomass - based diesel RIN (D4) Blending diesel made from soybean oil or animal fats into diesel Advanced biofuel (D5) Blending sugar - cane based ethanol or biobutanol into gasoline Renewable Fuel (D6) Blending corn - based ethanol into gasoline Source: EPA, Code of Federal Regulations – 80.1415(c)(1), 80.1426(f) Note: EV = Equivalence Value; R = Renewable content of the fuel; EC = Energy content of the fuel (Btu / Gal) VCF D3 RIN Equivalence Value Calculation Equivalence Value = ( R / 0.972 ) * ( EC / 77,000 ) Equivalence Value = ( 1 / 0.972 ) * ( 114,500 / 77,000 ) Equivalence Value = 1.5 Realized D3 RIN Value = D3 Rin Price * Equivalence Value Realized D3 RIN Value = $4.50
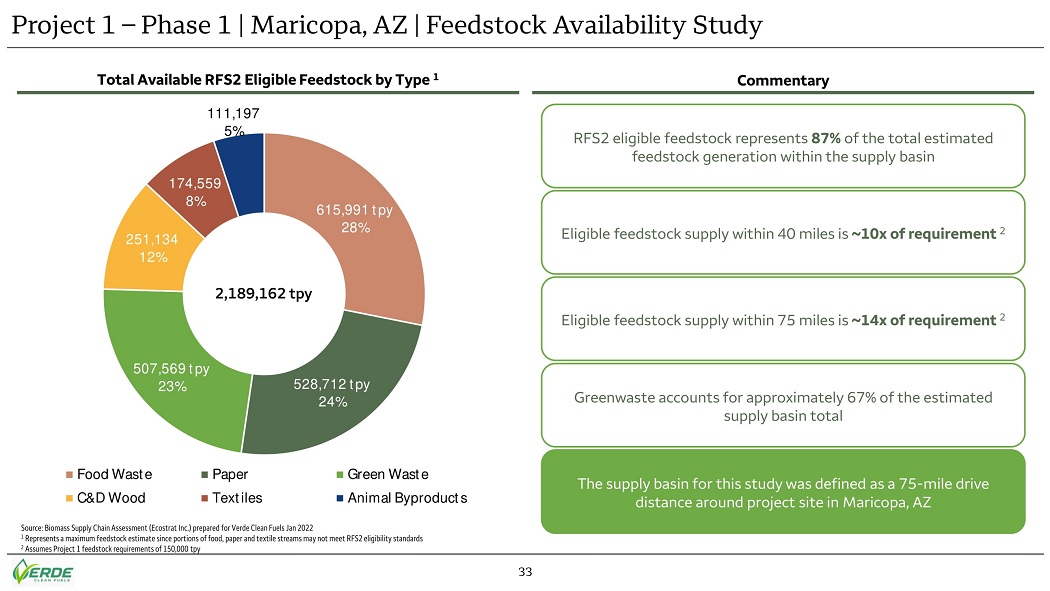
33 204 137 108 Project 1 – Phase 1 | Maricopa, AZ | Feedstock Availability Study Total Available RFS2 Eligible Feedstock by Type 1 615,991 tpy 28% 528,712 tpy 24% 507,569 tpy 23% 251,134 12% 174,559 8% 111,197 5% Food Waste Paper Green Waste C&D Wood Textiles Animal Byproducts Commentary Source: Biomass Supply Chain Assessment (Ecostrat Inc.) prepared for Verde Clean Fuels Jan 2022 1 Represents a maximum feedstock estimate since portions of food, paper and textile streams may not meet RFS2 eligibility stand ar ds 2 Assumes Project 1 feedstock requirements of 150,000 tpy 2,189,162 tpy The supply basin for this study was defined as a 75 - mile drive distance around project site in Maricopa, AZ Eligible feedstock supply within 75 miles is ~14x of requirement 2 RFS2 eligible feedstock represents 87% of the total estimated feedstock generation within the supply basin Greenwaste accounts for approximately 67% of the estimated supply basin total Eligible feedstock supply within 40 miles is ~10x of requirement 2

34 204 137 108 Unique Feedstock Dynamics Many Competing Processes Use Feedstocks that Have Value in Other Applications Verde Clean Fuels Utilizes Feedstocks that are Abundant, Low Cost, and Inflation Resistant Competing Technologies VCF Biomass Mixed Plastics Municipal Solid Waste • Feedstocks such as MSW and Separated Yard Waste are typically disposed of at a cost ($40 - $50/ton) – currently has no value • VCF has partnered with Waste Management for project locations and feedstock logistics • Flexibility of design allows VCF’s syngas - to - gasoline process to pair with virtually any front - end process that produces syngas allowing for a very wide variety of feedstock opportunities – MSW, plastics, Agricultural Waste, Wood Waste, and others • Other technologies utilize feedstocks that have value in other applications putting pressure on supply and causing price increases • Many renewable diesel processes, for example, use corn or soybean derived feedstocks which can be subject to inflation and supply shortages • Competing processes are often only economic at a scale that requires supply from a very large area meaning that logistics of supply are more complex and expensive Source: Company Model, BloombergNEF, EIA – “Energy Annual Outlook 2022”, EPA – “2021 Automotive Trends Report”, EPA – “Landfill Methane Outreach Program”, Landfill and Project Database, Factset | Market data as of 4/1/22 1 Assumes Product Revenue of $7.65 / Gal, Production Costs of $1.69 / Gal and Operating Expense of $0.91 / Gal
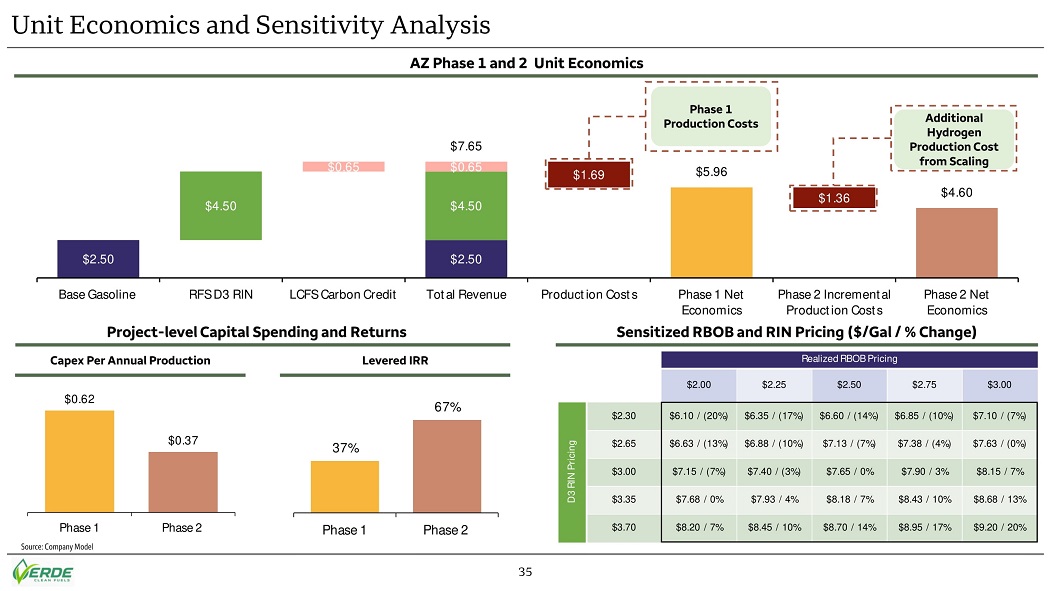
35 204 137 108 Unit Economics and Sensitivity Analysis AZ Phase 1 and 2 Unit Economics Project - level Capital Spending and Returns $2.50 $2.50 $4.50 $4.50 $0.65 $0.65 $7.65 $1.69 $5.96 $1.36 $4.60 Base Gasoline RFS D3 RIN LCFS Carbon Credit Total Revenue Production Costs Phase 1 Net Economics Phase 2 Incremental Production Costs Phase 2 Net Economics Realized RBOB Pricing $2.00 $2.25 $2.50 $2.75 $3.00 $2.30 $6.10 / (20%) $6.35 / (17%) $6.60 / (14%) $6.85 / (10%) $7.10 / (7%) $2.65 $6.63 / (13%) $6.88 / (10%) $7.13 / (7%) $7.38 / (4%) $7.63 / (0%) $3.00 $7.15 / (7%) $7.40 / (3%) $7.65 / 0% $7.90 / 3% $8.15 / 7% $3.35 $7.68 / 0% $7.93 / 4% $8.18 / 7% $8.43 / 10% $8.68 / 13% $3.70 $8.20 / 7% $8.45 / 10% $8.70 / 14% $8.95 / 17% $9.20 / 20% D3 RIN Pricing Phase 1 Production Costs Additional Hydrogen Production Cost from Scaling Sensitized RBOB and RIN Pricing ($/Gal / % Change) Source: Company Model $0.62 $0.37 Phase 1 Phase 2 37% 67% Phase 1 Phase 2 Capex Per Annual Production Levered IRR

36 204 137 108 x Building a Commercial Demonstration Plant is costly and difficult to fund. Most companies try to skip this step, jumping from Pi lot Scale to Commercial Project x Verde Clean Fuels has funded, built, and operated a first - class Commercial Demonstration Facility to further develop its process and minimize scale up risk Managing Scale Up and Project Execution Why We Built a Demo Plant Lab Scale x Pilot Scale x Commercial Demonstration x Commercial Project 50x Scale - up 274x Scale - up State - of - the - art facility… … yields valuable process data • Fully mimics the Verde commercial process, including all recycle lines • Demo design is a scale down of a commercial plant; Key variables of gas velocity and bed length are 1:1 scale • Scale up ranges are consistent with those typically found in the chemical and oil & gas industries for similar processes • Heavily instrumented, generates large quantities of recorded data • Demo performance demonstrated that the process is robust and predictable • Data feeds VCF commercial plant process models • Models are tuned to actual demo plant performance Source: Verde Clean Fuels
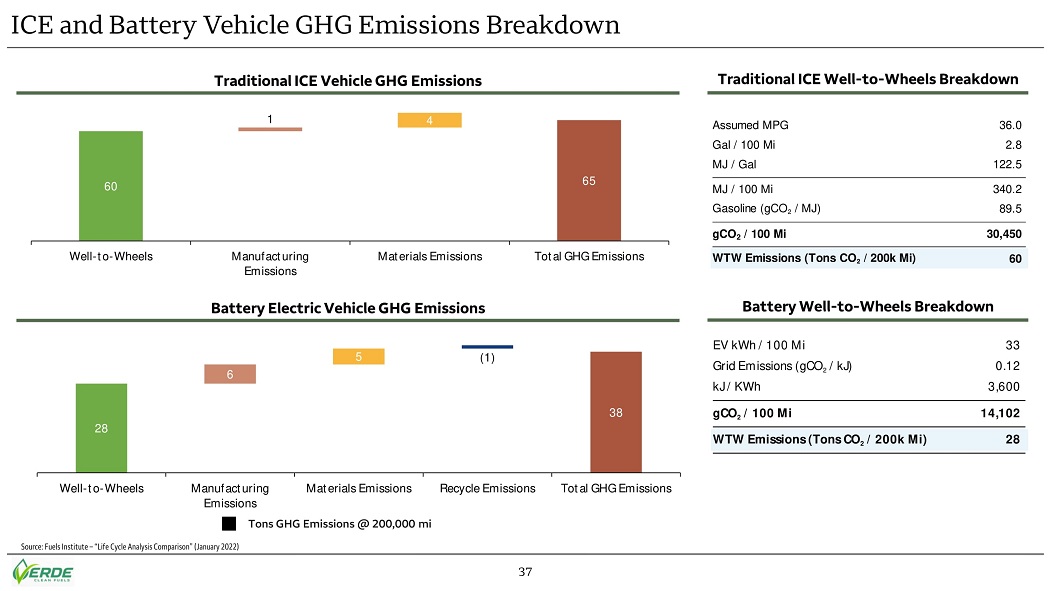
37 204 137 108 ICE and Battery Vehicle GHG Emissions Breakdown Tons GHG Emissions @ 200,000 mi Traditional ICE Well - to - Wheels Breakdown Traditional ICE Vehicle GHG Emissions Source: Fuels Institute – “Life Cycle Analysis Comparison” (January 2022) Battery Electric Vehicle GHG Emissions Battery Well - to - Wheels Breakdown 60 30 30 1 4 65 Well-to-Wheels Manufacturing Emissions Materials Emissions Total GHG Emissions 28 28 28 28 6 6 6 5 5 (1) 38 Well-to-Wheels Manufacturing Emissions Materials Emissions Recycle Emissions Total GHG Emissions
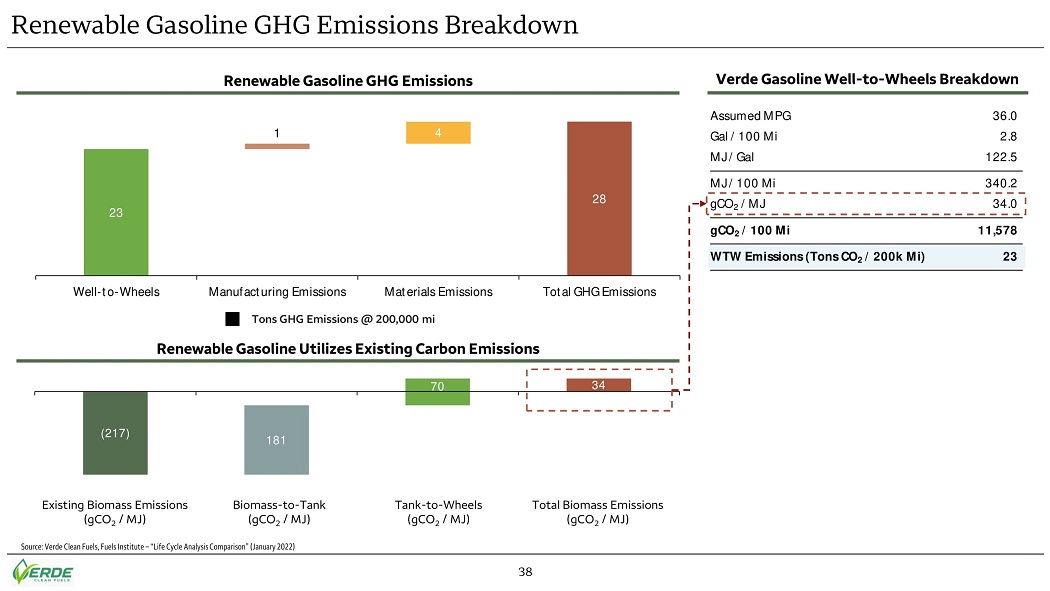
38 204 137 108 23 23 23 1 4 28 Well-to-Wheels Manufacturing Emissions Materials Emissions Total GHG Emissions (217) 181 70 34 Existing Biomass Emissions (gCO2 / MJ) Biomass-to-Tank Tank-to-Wheels Biomass Emissions (gCO2 / MJ) Renewable Gasoline GHG Emissions Breakdown Tons GHG Emissions @ 200,000 mi Verde Gasoline Well - to - Wheels Breakdown Renewable Gasoline GHG Emissions Source: Verde Clean Fuels, Fuels Institute – “Life Cycle Analysis Comparison” (January 2022) Renewable Gasoline Utilizes Existing Carbon Emissions Biomass - to - Tank (gCO 2 / MJ) Existing Biomass Emissions (gCO 2 / MJ) Tank - to - Wheels (gCO 2 / MJ) Total Biomass Emissions (gCO 2 / MJ)
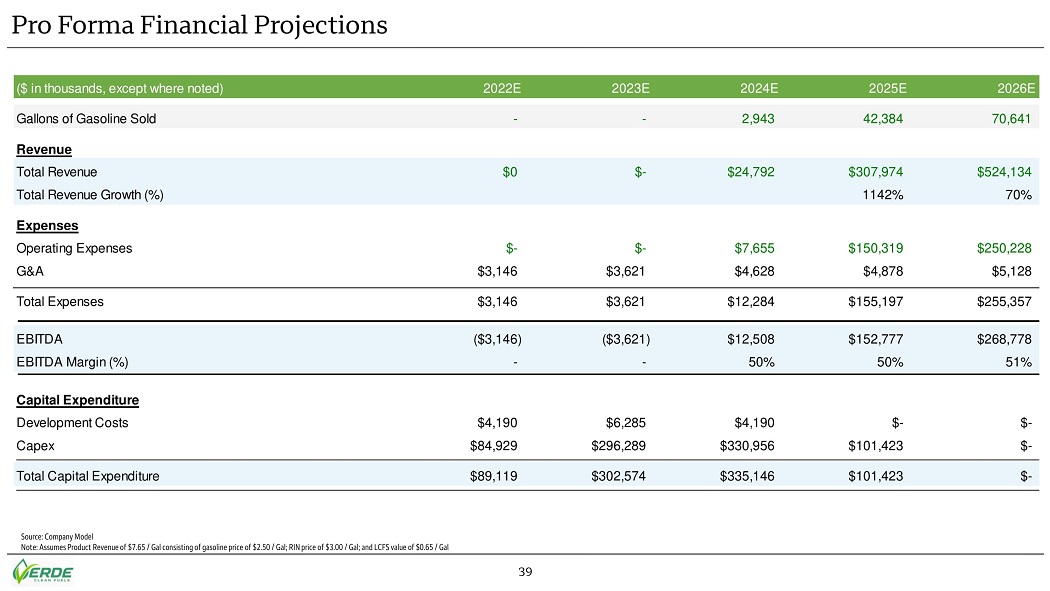
39 204 137 108 Pro Forma Financial Projections Source: Company Model Note: Assumes Product Revenue of $7.65 / Gal consisting of gasoline price of $2.50 / Gal; RIN price of $3.00 / Gal; and LCFS val ue of $0.65 / Gal ($ in thousands, except where noted) 2022E 2023E 2024E 2025E 2026E Gallons of Gasoline Sold - - 2,943 42,384 70,641 Revenue Total Revenue $0 $- $24,792 $307,974 $524,134 Total Revenue Growth (%) 1142% 70% Expenses Operating Expenses $- $- $7,655 $150,319 $250,228 G&A $3,146 $3,621 $4,628 $4,878 $5,128 Total Expenses $3,146 $3,621 $12,284 $155,197 $255,357 EBITDA ($3,146) ($3,621) $12,508 $152,777 $268,778 EBITDA Margin (%) - - 50% 50% 51% Capital Expenditure Development Costs $4,190 $6,285 $4,190 $- $- Capex $84,929 $296,289 $330,956 $101,423 $- Total Capital Expenditure $89,119 $302,574 $335,146 $101,423 $-

40 204 137 108 Verde’s U.S. Patents Title Description Patent Number Date Issued Single - Loop Octane Enrichment Covers a system for making high octane fuel; the system includes a single loop system, e.g., the system of US Patent No. 9,169,166 or US Patent No. 9,670,416, for making medium octane fuel, and an octane enrichment reactor. The outlet of the single loop system contains medium octane fuel and is connected to the inlet of the octane enrichment reactor. The octane enrichment reactor contains a zeolite forming catalyst and a transalkylation catalyst. 10,808,179 10/20/2020 Novel Configuration in Single - Loop Synfuel Generation Covers a system for making fuel by combining the third and fourth reactors of the MTGH process into a single reactor. The system contains three reactors instead of the four reactors of US Patent No. 9,169,166. 9,670,416 06/06/2017 Single Loop Multistage Fuel Production Covers a method for converting synthesis gas to fuel using Primus’ MTGH process. The process passes synthesis gas through four reactors in series and recycling unreacted synthesis gas to the first reactor. No removal or separation is affected between the reactors. 8,686,206 04/01/2014 Novel Fuel Composition Covers a fuel composition containing at least 99.5% of aromatics and paraffins. The paraffins consists of normal or branched C4 - C7 paraffins and C6 - C8 single cyclic ring paraffins 8,569,554 10/29/2013 Novel Fuel Composition Covers a method for controlling the aromatics to paraffins ratio in Primus’ MTGH process by varying the total flow rate of synthesis gas to the first reactor. 8,722,951 05/13/2014 Novel Configuration in Single - Loop Synfuel Generation Covers a method for making fuel from synthesis gas by combining the third and fourth reactors of the MTGH process into a single reactor. In this process, the synthesis gas is passed through three reactors instead of the four reactors of US Patent No. 8,686,206. 10,214,694 02/26/2019 Single - Loop Octane Enrichment Covers a process for producing high octane fuel at a recovery of about 50% - 90% of the feed. The process involves passing medium octane fuel through an octane enrichment reactor containing a zeolite forming catalyst and a transalkylation catalyst. The o ctane enrichment reactor is also maintained at an H2 concentration of about 20 - 50 molar %. 10,450,512 10/22/2019 Single - Loop Multistage Fuel Production Covers the system for making fuel using Primus’ MTGH process. The system contains four reactors in series, and a separator to separate the fuel product from water and unreacted synthesis gas. The unreacted synthesis gas is recycled to the first reactor. 9,169,166 10/27/2015

41 204 137 108 Risks Relating to Bluescape Intermediate • Our commercial success depends on our ability to develop and operate production facilities for the commercial production of renewable gasoline . • Our limited history makes it difficult to evaluate our business and prospects and may increase the risks associated with your investment . • Our management has identified conditions that raise substantial doubt about our ability to continue as a going concern . • We may be unable to qualify for existing federal and state level low - carbon fuel credits and the carbon credit markets may not develop as quickly or efficiently as we anticipate or at all . • In order to construct new commercial production facilities, we typically face a long and variable design, fabrication, and construction development cycle that requires significant resource commitments and may create fluctuations in whether and when revenue is recognized, and may have an adverse effect on our business . • We have entered into relatively new markets for renewables, including renewable natural gas, renewable gasoline and biofuel . These new markets are highly volatile and have significant risk associated with current market conditions . • Fluctuations in the price of product inputs, including renewable feedstocks, natural gas and other feedstocks, may affect our cost structure . • Fluctuations in petroleum prices and customer demand patterns may reduce demand for renewable fuels and bio - based chemicals . A prolonged environment of low petroleum prices or reduced demand for renewable fuels or biofuels could have a material adverse effect on our long - term business prospects, financial condition and results of operations . • We may face substantial competition from companies with greater resources and financial strength, which could adversely affect our performance and growth . • Our proposed growth projects may not be completed or, if completed, may not perform as expected . Our project development activities may consume a significant portion of our management’s focus, and if not successful, reduce our profitability . • We may not be able to develop, maintain and grow strategic relationships, identify new strategic relationship opportunities, or form strategic relationships, in the future . • We may acquire or invest in additional companies, which may divert our management’s attention, result in additional dilution to our stockholders, and consume resources that are necessary to sustain our business . • Fluctuations in the price and availability of energy to power our facilities may harm our performance . • We may be subject to liabilities and losses that may not be covered by insurance . • Renewable gasoline has not previously been used as a commercial fuel in significant amounts, its use subjects us to product liability risks and we may become subject to product liability claims, which could harm our financial condition and liquidity if we are not able to successfully defend or insure against such claims . • Liabilities and costs associated with hazardous materials, contamination and other environmental conditions may require us to conduct investigations or remediation or expose us to other liabilities, both of which may adversely impact our operations and financial condition . • Our operations, and future planned operations, are subject to certain environmental health and safety laws or permitting requirements, which could result in increased compliance costs or additional operating costs and restrictions . Failure to comply with such laws and regulations could result in substantial fines or other limitations that could adversely impact our financial results or operations . • Increased focus on sustainability or other ESG matters could impact our operations . • Failure of third parties to manufacture quality products or provide reliable services in accordance with schedules, prices, quality and volumes that are acceptable to us could cause delays in developing and operating our commercial production facilities, which could damage our reputation, adversely affect our partner relationships or adversely affect our growth . • We may be unable to successfully perform under future supply and distribution agreements to provide our renewable gasoline, which could harm our commercial prospects . • Third parties on whom we may rely for transportation services are subject to complex federal, state and other laws that could adversely affect our operations . • Our business and operations may be significantly disrupted upon the occurrence of a catastrophic event, information technology system failures or cyberattack . • Our facilities and processes may fail to produce renewable gasoline at the volumes, rates and costs we expect . • We may in the future use hedging arrangements to mitigate certain risks, but the use of such derivative instruments could have a material adverse effect on our results of operations . • Business interruptions, including those related to the widespread outbreak of an illness, pandemic (such as COVID - 19 ), adverse weather conditions, manmade problems such as terrorism and other catastrophic events, may have an adverse impact on our business and results of operations . • Even if we are successful in completing the first commercial production facility and consistently producing renewable gasoline on a commercial scale, we may not be successful in commencing and expanding commercial operations to support the growth of our business . • We are a development stage company with a history of net losses, we are currently not profitable and we may not achieve or maintain profitability . If we incur substantial losses, we may have to curtail our operations, which may prevent us from successfully operating and expanding our business . • Our actual costs may be greater than expected in developing our commercial production facilities or growth projects, causing us to realize significantly lower profits or greater losses . • Disruption in the supply chain, including increases in costs, shortage of materials or other disruption of supply, or in the workforce could materially adversely affect our business . • We may not be able to obtain, or comply with terms and conditions for, government grants, loans, and other incentives for which we may apply for in the future, which may limit our opportunities to expand our business . • We may expand our operations globally, which would subject us to anti - corruption, anti - bribery, anti - money laundering, trade compliance, economic sanctions and similar laws, and non - compliance with such laws may subject us to criminal or civil liability and harm our business, financial condition and/or results of operations . We may also be subject to governmental export and import controls that could impair our ability to compete in international markets or subject us to liability if we violate the controls . • Failure to protect our intellectual property, inability to enforce our intellectual property rights or loss of our intellectual property rights through costly litigation or administrative proceedings, could adversely affect our ability to compete and our business . • Agreements containing confidentiality provisions and restrictive covenants with employees, consultants and other third - parties may not adequately prevent disclosures of trade secrets and other proprietary information . • Obtaining and maintaining our patent protection depends on compliance with various procedural, documentary, fee payment and other requirements imposed by governmental patent agencies, and our patent protection could be reduced or eliminated for non - compliance with these requirements . • Changes in patent law could diminish the value of patents in general, thereby impairing our ability to protect our technology . • We may be subject to intellectual property rights claims by third parties, which could be costly to defend, could require us to pay significant damages and, if we are unsuccessful in defending such claims, could limit our ability to use certain technologies and compete . • We may be subject to claims that our employees, consultants or independent contractors have wrongfully used or disclosed confidential information or alleged trade secrets of third parties or competitors or are in breach of noncompetition or non - solicitation agreements with our competitors or their former employers . • Our business and prospects depend significantly on our ability to build our brand . We may not succeed in continuing to establish, maintain, and strengthen our brand, and our brand and reputation could be harmed by negative publicity regarding our company or products . • If we fail to comply with our obligations under license or technology agreements with third parties or are unable to license rights to use technologies on reasonable terms, we may be required to pay damages and could potentially lose license rights that are critical to our business . • Our projections are subject to significant risks, assumptions, estimates and uncertainties, including assumptions regarding adoption of renewable fuels . As a result, our projected revenues, market share, expenses and profitability may differ materially from our expectations in any given quarter or fiscal year . • If our estimates or judgments relating to our critical accounting policies prove to be incorrect or financial reporting standards or interpretations change, our operating results could be adversely affected . • Inflation may adversely affect us by increasing costs of our business . • Our industry and its technologies are rapidly evolving and may be subject to unforeseen changes and developments in alternative technologies may adversely affect the demand for renewable gasoline . If we fail to make the right investment decisions in our technologies and products, we may be at a competitive disadvantage . • Concerns regarding the environmental impact of renewable gasoline production could affect public policy which could impair our ability to operate at a profit and substantially harm our revenues and operating margins . • We have identified a material weakness in our internal control over financial reporting . If we are unable to develop and maintain an effective system of internal control over financial reporting, we may not be able to accurately report our financial results in a timely manner, which may adversely affect investor confidence in us and materially and adversely affect our business and operating results, and we may face litigation as a result . • If we lose key personnel, including key management personnel, or are unable to attract and retain additional personnel, it could delay our development and harm our research, make it more difficult to pursue partnerships or develop our own products or otherwise have a material adverse effect on our business . • O ur management team has limited experience in operating a public company . • We will incur significant increased expenses and administrative burdens as a public company, which could have an adverse effect on our business, financial condition and results of operations . • The requirements of being a public company may strain Verde Clean Fuels’ resources, divert management’s attention and affect its ability to attract and retain qualified board members and officers . • From time to time, we may be involved in litigation, regulatory actions or government investigations and inquiries, which could have an adverse impact on our profitability and consolidated financial position . • Verde Clean Fuels may need to raise additional funds and these funds may not be available when needed .