
SEPTEMBER 30, 2022 WOLFE RESEARCH UTILITIES, MIDSTREAM & CLEAN ENERGY CONFERENCE
Safe Harbor Statement 2 New slide This presentation contains statements which, to the extent they are not statements of historical or present fact, constitute “fo rward - looking statements” under the securities laws. These forward - looking statements are intended to provide management’s current expectations or plans for our future operating and financial performa nce , business prospects, outcomes of regulatory proceedings, market conditions, and other matters, based on what we believe to be reasonable assumptions and on information currently available t o u s. Forward - looking statements can be identified by the use of words such as “believe,” “expect,” “expectations,” “plans,” “strategy ,” “prospects,” “estimate,” “project,” “target,” “anticipate,” “will,” “should,” “see,” “guidance,” “outlook,” “confident” and other words of similar meaning. The absence of such words, expressions or state men ts, however, does not mean that the statements are not forward - looking. In particular, express or implied statements relating to future earnings, cash flow, results of operations, uses of cas h, tax rates and other measures of financial performance, future actions, conditions or events, potential future plans, strategies or transactions of DT Midstream, and other statements that are not h ist orical facts, are forward - looking statements. Forward - looking statements are not guarantees of future results and conditions, but rather are subject to numerous assumptions, risks, and uncertainties that may cause actual future results to be materially different from those contemplated, projected, estimated, or budgeted. Many factors may impact forward - looking stateme nts of DT Midstream including, but not limited to, the following: changes in general economic conditions; competitive conditions in our industry; global supply chain disruptions; actions take n b y third - party operators, processors, transporters and gatherers; changes in expected production from Southwestern Energy Company and/or its affiliates, Antero Resources Corporation and/or its affili ate s and other third parties in our areas of operation; demand for natural gas gathering, transmission, storage, transportation and water services; the availability and price of natural gas to the con sum er compared to the price of alternative and competing fuels; competition from the same and alternative energy sources; our ability to successfully implement our business plan; our ability to complet e o rganic growth projects on time and on budget; our ability to complete acquisitions; the price and availability of debt and equity financing; restrictions in our existing and any future credit fac ili ties and indentures; energy efficiency and technology trends; changing laws regarding cyber security and data privacy and any cyber security threat or event; operating hazards, environmental risks, and ot her risks incidental to gathering, storing and transporting natural gas; changes in environmental laws, regulations or enforcement policies, including laws and regulations relating to climate change an d greenhouse gas emissions; natural disasters, adverse weather conditions, casualty losses and other matters beyond our control; the impact of outbreaks of illnesses, epidemics and pandemi cs, including the COVID - 19 pandemic and the economic effects of the pandemic; the ongoing conflict between Russia and Ukraine, including resulting commodity price volatility and risk of cyber - base d attacks; increases in interest rates; the impact of inflation on our business; labor relations and markets, including the ability to attract, hire and retain key employee and contract personnel; la rge customer defaults; changes in tax status, as well as changes in tax rates and regulations; intent to develop low carbon business opportunities and deploy greenhouse gas reducing technologies; the eff ect s of existing and future laws and governmental regulations; changes in insurance markets impacting costs and the level and types of coverage available; the timing and extent of changes in commodit y p rices; the suspension, reduction or termination of our customers’ obligations under our commercial agreements; disruptions due to equipment interruption or failure at our facilities, or third - pa rty facilities on which our business is dependent; the effects of future litigation; the qualification of the spin - off of DT Midstream from DTE Energy ("the Spin - Off") as a tax - free distribution; the a llocation of tax attributes from DTE Energy in accordance with the agreement that governs the respective rights, responsibilities and obligations of DTE Energy and DT Midstream after the Spin - Off with resp ect to all tax matters; our ability to achieve the benefits that we expect to achieve as an independent publicly traded company; and the risks described in our Annual Report on Form 10 - K for the year ended December 31, 2021 and our reports and registration statements filed from time to time with the SEC. The above list of factors is not exhaustive. New factors emerge from time to time. We cannot predict what factors may arise o r h ow such factors may cause actual results to vary materially from those stated in forward - looking statements, see the discussion under the section entitled “Risk Factors” in our Annual Report for the year ended December 31, 2021, filed with the SEC on Form 10 - K and any other reports filed with the SEC . Given the uncertainties and risk factors that could cause our actual results to differ materially from those contained in a ny forward - looking statement, you should not put undue reliance on any forward - looking statements. Any forward - looking statements speak only as of the date on which such statements are made. We are under no obligation to, and e xpressly disclaim any obligation to, update or alter our forward - looking statements, whether as a result of new information, subsequent events or otherwise.
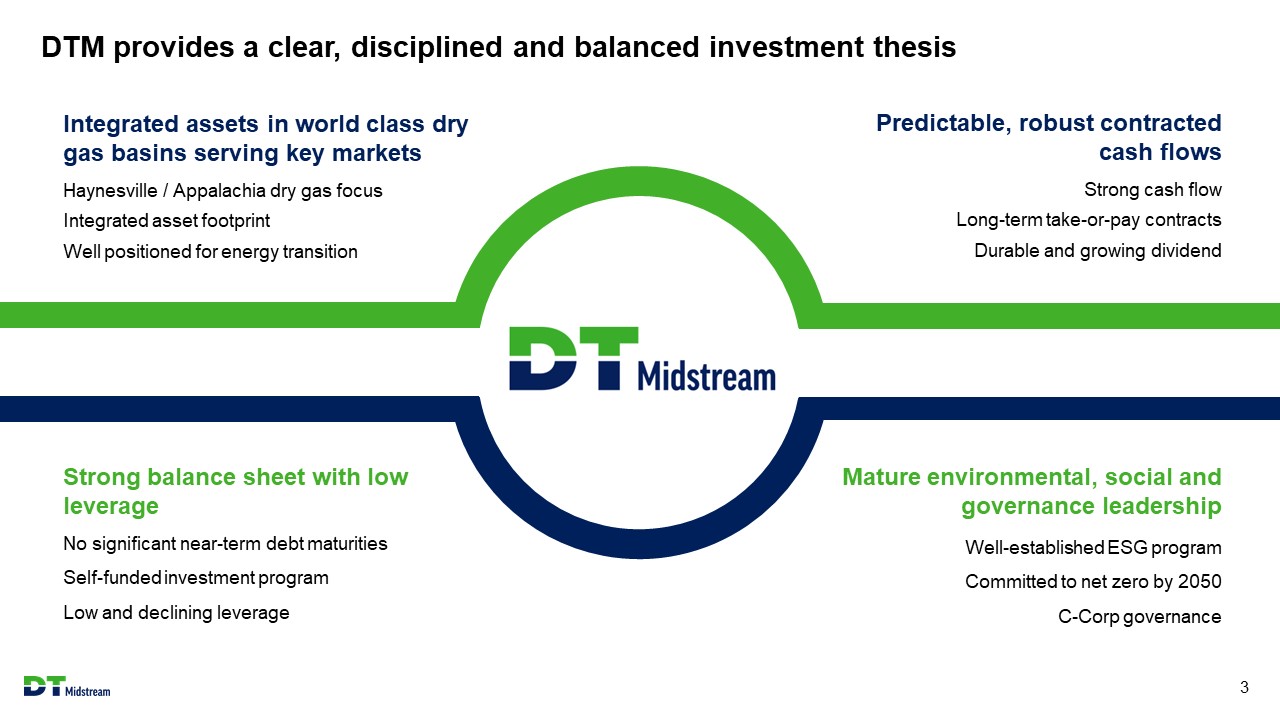
DTM provides a clear, disciplined and balanced investment thesis 3 Mature environmental, social and governance leadership Well - established ESG program Committed to net zero by 2050 C - Corp governance Strong balance sheet with low leverage No significant near - term debt maturities Self - funded investment program Low and declining leverage Predictable, robust contracted cash flows Strong cash flow Long - term take - or - pay contracts Durable and growing dividend Integrated assets in world class dry gas basins serving key markets Haynesville / Appalachia dry gas focus Integrated asset footprint Well positioned for energy transition

Integrated assets in world class basins

1. Definition and reconciliation of adjusted EBITDA (non - GAAP) to net income included in the appendix 2. Subject to regulatory approvals, including the expiration or termination of the waiting period under the Hart - Scott - Rodino Act, and other customary closing conditions 3. Subject to close timing and other customary adjustments 5 Increased ownership in a premier natural gas asset serving key demand markets Transaction overview • Entered into an agreement to acquire National Grid’s 26.25% ownership interest in Millennium Pipeline • ~$552 million purchase price represents a 10x multiple of 2023 Adjusted EBITDA 1 • Immediately accretive - financing via cash on hand and existing revolving credit facility drawings • Expected to close in Q4 2022 2 bringing DTM’s total ownership to 52.5% • $12 to $14 million incremental Adjusted EBITDA contribution expected in 2022 3 Asset details • ~263 miles of pipeline with ~2 Bcf /d capacity (~1.2 Bcf /d east / ~0.8 Bcf /d west) • DTM is a founding developer and owner since the pipeline in - service date in 2008 • Fully - contracted under long - term take - or - pay agreements with credit worthy customers • Robust market (Algonquin, Columbia, Empire, Tennessee Gas, EGTS) and supply (Bluestone, Stagecoach, Laser) connectivity New England markets New York City Other DTM assets

6 Immediately accretive transaction that is consistent with core investment thesis DTM investment thesis Millennium Pipeline acquisition Predictable, robust contracted cash flows x Fully - contracted under long - term take - or - pay agreements x High credit quality customers including investment grade utilities Integrated assets in world class dry gas basins serving key markets x Gas supply directly through DTM’s Bluestone Pipeline and Susquehanna Gathering assets x Delivers Northeast Marcellus and Utica gas to utility and power plant markets across New York State and New England Strong balance sheet with low leverage x Financing with cash on hand and existing revolving credit facility x Immediately accretive transaction x Committed to 4x leverage ratio ceiling Mature environmental, social and governance leadership x Newly built pipe and best - in - class operational practices provide superior emissions profile x Evaluating opportunities to further reduce pipeline emissions
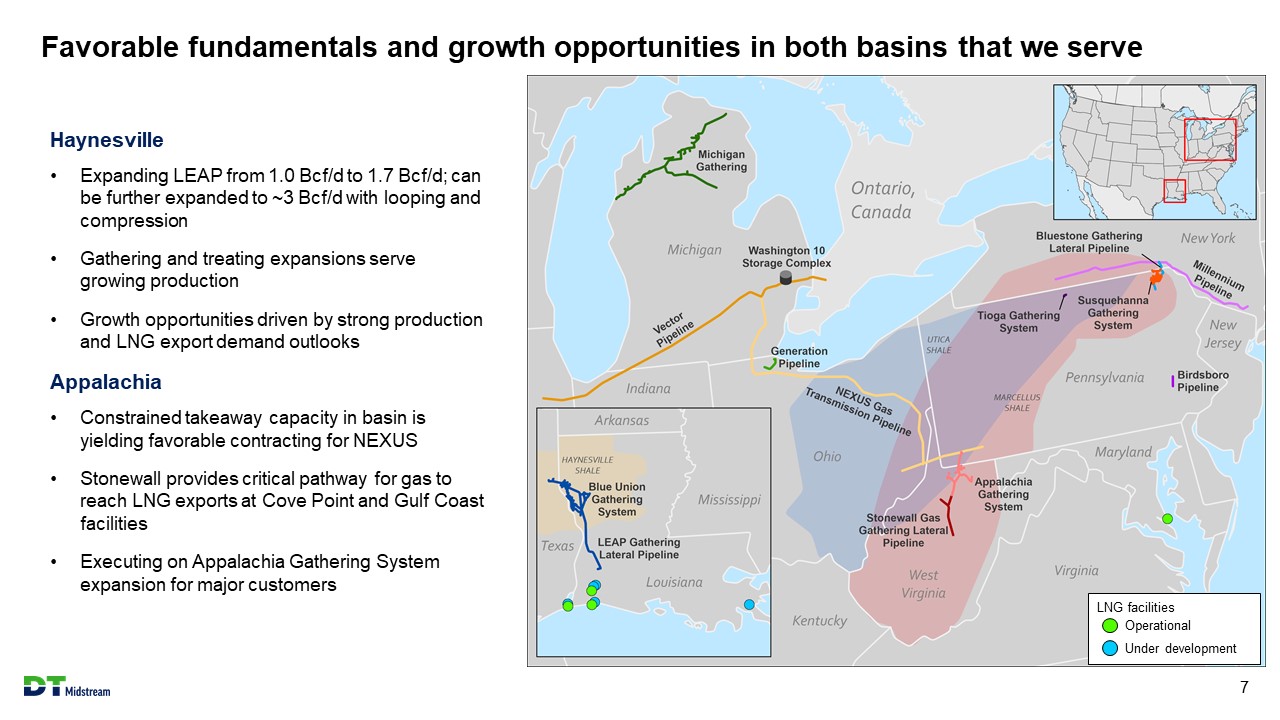
Favorable fundamentals and growth opportunities in both basins that we serve 7 Haynesville • Expanding LEAP from 1.0 Bcf /d to 1.7 Bcf /d; can be further expanded to ~3 Bcf /d with looping and compression • Gathering and treating expansions serve growing production • Growth opportunities driven by strong production and LNG export demand outlooks Appalachia • Constrained takeaway capacity in basin is yielding favorable contracting for NEXUS • Stonewall provides critical pathway for gas to reach LNG exports at Cove Point and Gulf Coast facilities • Executing on Appalachia Gathering System expansion for major customers LNG facilities Operational Under development
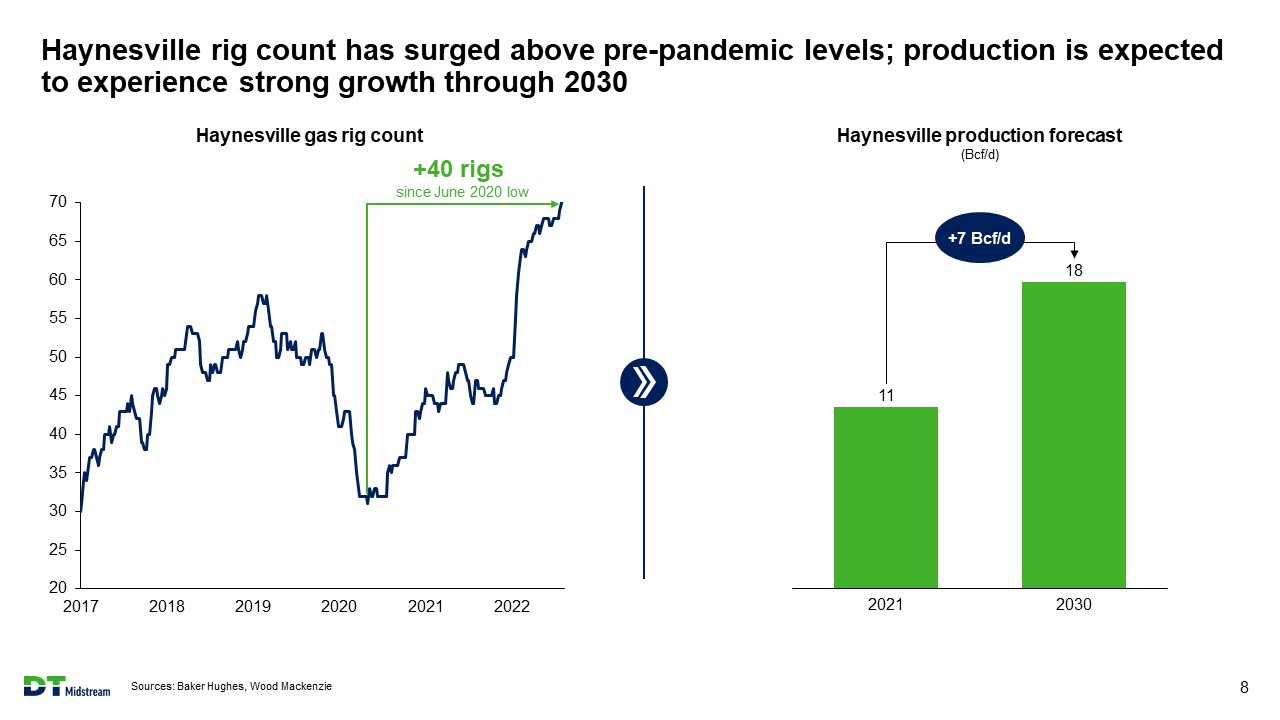
20 25 30 35 40 45 50 55 60 65 70 2017 2018 2019 2020 2021 2022 Haynesville rig count has surged above pre - pandemic levels; production is expected to experience strong growth through 2030 Sources: Baker Hughes, Wood Mackenzie 8 +40 rigs since June 2020 low Haynesville gas rig count Haynesville production forecast ( Bcf /d) 11 18 2021 2030 +7 +7 Bcf /d

DTM has significant exposure to growing LNG export demand 1. Represents growth from annual average level in 2021 Source: Wood Mackenzie 9 US LNG exports ( Bcf /d) 0 4 8 12 16 20 24 2021 2022 2028 2025 2024 2023 2026 2027 2029 2030 Sabine Pass Cameron Driftwood Plaquemines Calcasieu Pass Golden Pass Cove Point Corpus Christi Freeport Elba Island DTM assets currently provide ~2 Bcf /d of access to LNG export terminals and are well - positioned to serve growing demand ~8 Bcf /d of Louisiana Gulf Coast area LNG export growth through 2030 1 +13 Bcf /d Cove Point LNG Gulf Coast LNG corridor LNG export terminals that can be served via DTM assets LNG facilities Operational Under development

Reached final investment decision on Haynesville system phase 2 expansion; expanding LEAP from 1.0 Bcf /d to 1.7 Bcf /d 10 Capital efficient, lower - risk expansion provides timely access to growing LNG demand Phase 1: Increasing LEAP capacity by 30% and Blue Union gathering capacity by 25% • On - track and on - budget; critical long - lead equipment has been ordered • Project will provide ~0.5 Bcf /d incremental gathering and treating capacity 1 and ~0.3 Bcf /d of incremental LEAP capacity to Gillis Phase 2: Increasing LEAP capacity by 40% 2 • Expansion includes 0.4 Bcf /d of incremental LEAP capacity • Expected in - service in Q1 2024 Active commercial discussions underway for phase 3 expansion • LEAP can be further expanded to ~3 Bcf /d with looping and compression 1. Includes 0.5 Bcf /d gathering capacity expansion and 0.4 Bcf /d treating capacity expansion of Blue Union system 2. Represents 40% increase from original LEAP capacity of 1.0 Bcf /d Haynesville / LA Gulf Coast DTM pipeline assets DTM treating plants LNG facilities Expansion build New electric compression Operational Under development Increasing LEAP capacity by 70% First - of - its - kind carbon neutral “wellhead to water” service offering
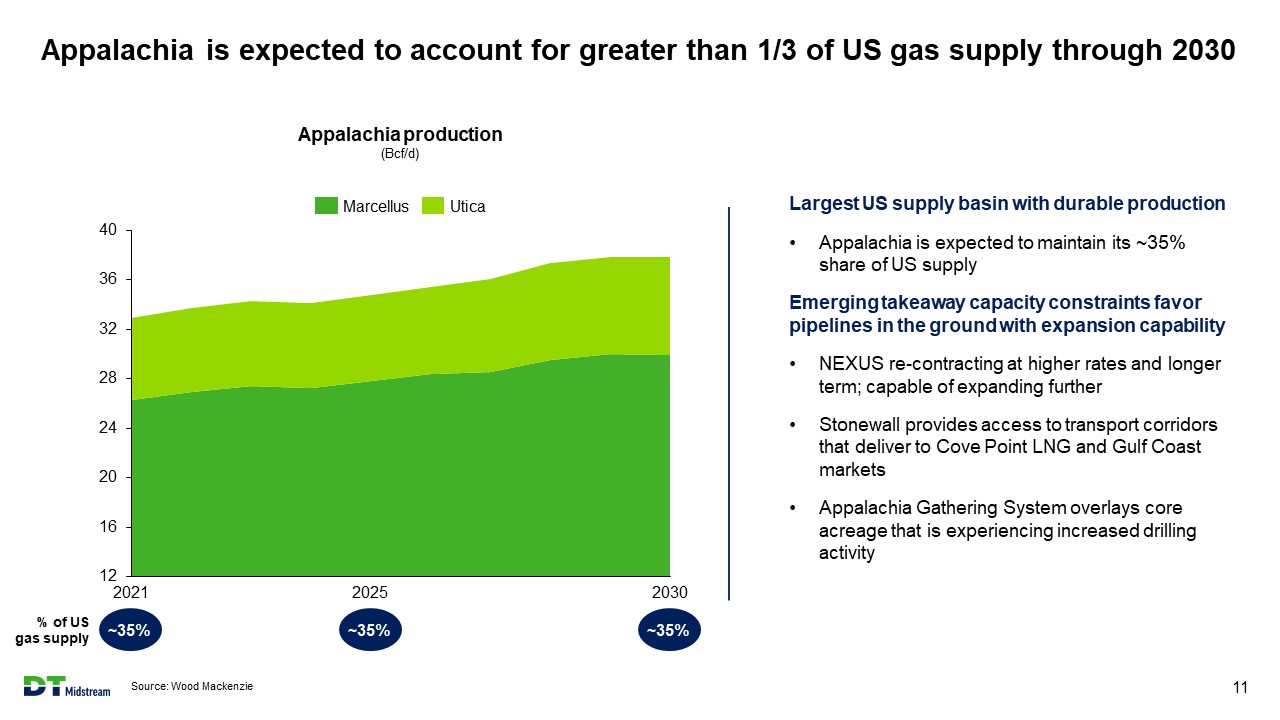
Appalachia is expected to account for greater than 1/3 of US gas supply through 2030 Source: Wood Mackenzie 11 12 16 20 24 28 32 36 40 2030 2021 2025 Appalachia production ( Bcf /d) Marcellus Utica Largest US supply basin with durable production • Appalachia is expected to maintain its ~35% share of US supply Emerging takeaway capacity constraints favor pipelines in the ground with expansion capability • NEXUS re - contracting at higher rates and longer term; capable of expanding further • Stonewall provides access to transport corridors that deliver to Cove Point LNG and Gulf Coast markets • Appalachia Gathering System overlays core acreage that is experiencing increased drilling activity % of US gas supply ~35% ~35% ~35%
Predictable cash flows supported by strong balance sheet
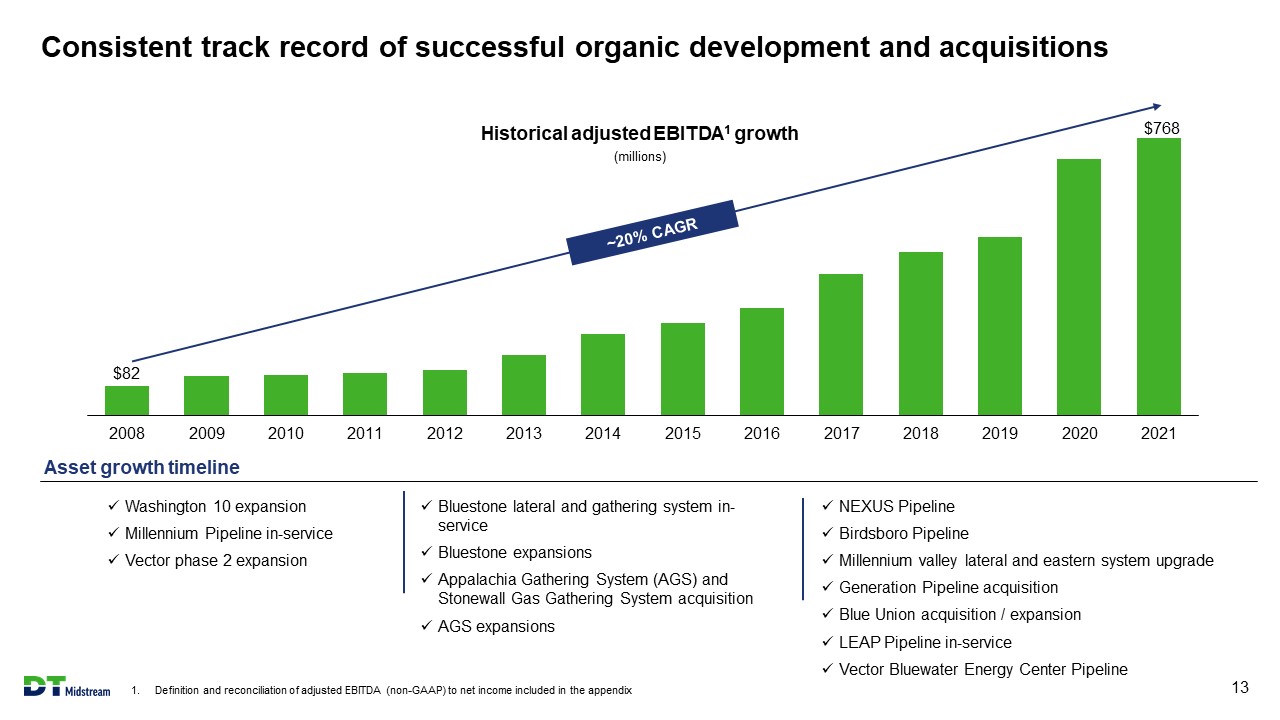
Consistent track record of successful organic development and acquisitions 1. Definition and reconciliation of adjusted EBITDA (non - GAAP) to net income included in the appendix 13 $82 $ 768 2008 2009 2010 2011 2012 2013 2014 2015 2016 2017 2018 2019 2020 2021 x Washington 10 expansion x Millennium Pipeline in - service x Vector phase 2 expansion x Bluestone lateral and gathering system in - service x Bluestone expansions x Appalachia Gathering System (AGS) and Stonewall Gas Gathering System acquisition x AGS expansions x NEXUS Pipeline x Birdsboro Pipeline x Millennium valley lateral and eastern system upgrade x Generation Pipeline acquisition x Blue Union acquisition / expansion x LEAP Pipeline in - service x Vector Bluewater Energy Center Pipeline Historical adjusted EBITDA 1 growth (millions) Asset growth timeline
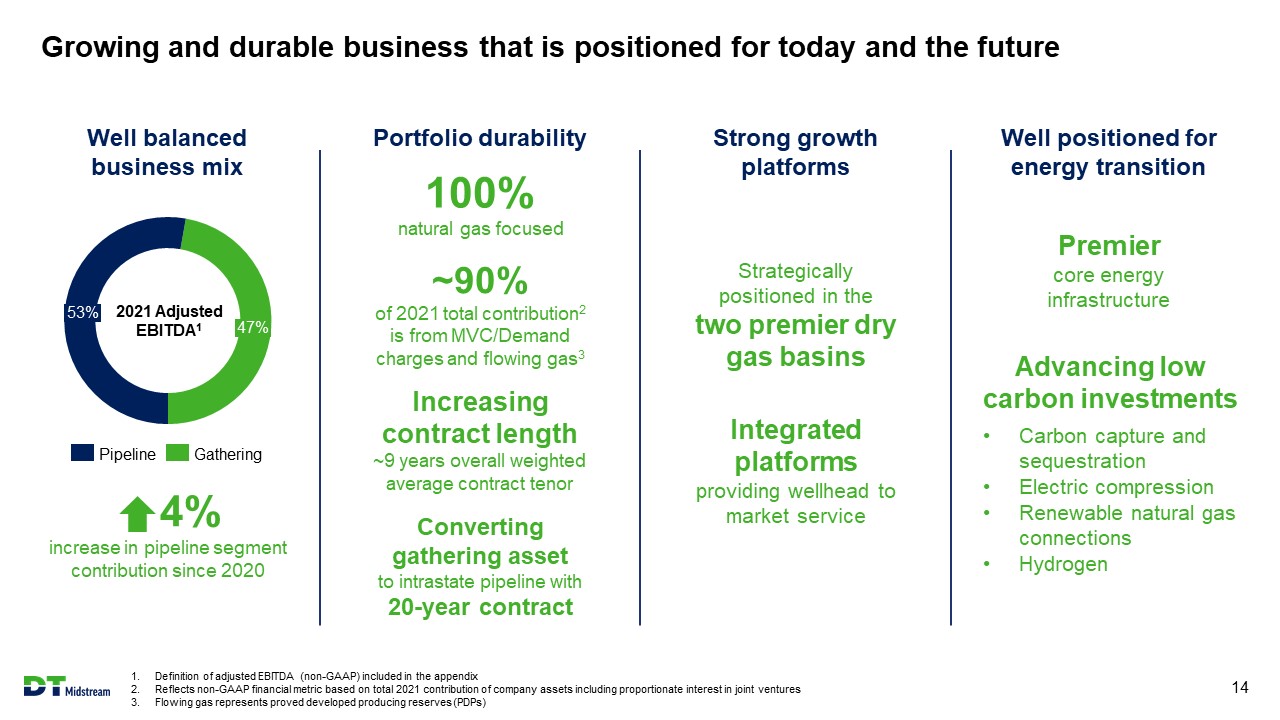
Growing and durable business that is positioned for today and the future 1. Definition of adjusted EBITDA (non - GAAP) included in the appendix 2. Reflects non - GAAP financial metric based on total 2021 contribution of company assets including proportionate interest in joint ventures 3. Flowing gas represents proved developed producing reserves (PDPs) 14 47% 53% Pipeline Gathering Strong growth platforms Strategically positioned in the two premier dry gas basins Integrated platforms providing wellhead to market service Well positioned for energy transition Premier core energy infrastructure Advancing low carbon investments • Carbon capture and sequestration • Electric compression • Renewable natural gas connections • Hydrogen 2021 Adjusted EBITDA 1 4% increase in pipeline segment contribution since 2020 Well balanced business mix Portfolio durability 100% natural gas focused Increasing contract length ~9 years overall weighted average contract tenor ~90% of 2021 total contribution 2 is from MVC/Demand charges and flowing gas 3 Converting gathering asset to intrastate pipeline with 20 - year contract
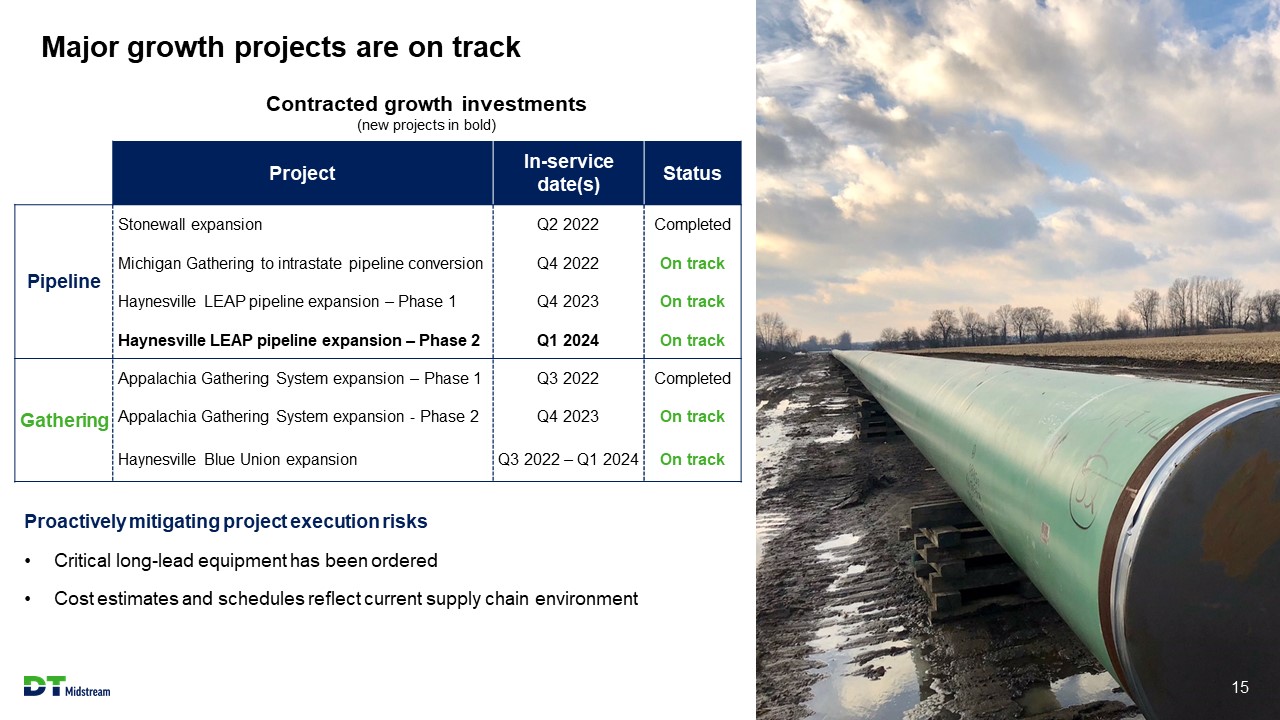
Major growth projects are on track 15 Project In - service date(s) Status Pipeline Stonewall expansion Q2 2022 Completed Michigan Gathering to intrastate pipeline conversion Q4 2022 On track Haynesville LEAP pipeline expansion – Phase 1 Q4 2023 On track Haynesville LEAP pipeline expansion – Phase 2 Q1 2024 On track Gathering Appalachia Gathering System expansion – Phase 1 Q3 2022 Completed Appalachia Gathering System expansion - Phase 2 Q4 2023 On track Haynesville Blue Union expansion Q3 2022 – Q1 2024 On track Contracted growth investments (new projects in bold) Proactively mitigating project execution risks • Critical long - lead equipment has been ordered • Cost estimates and schedules reflect current supply chain environment
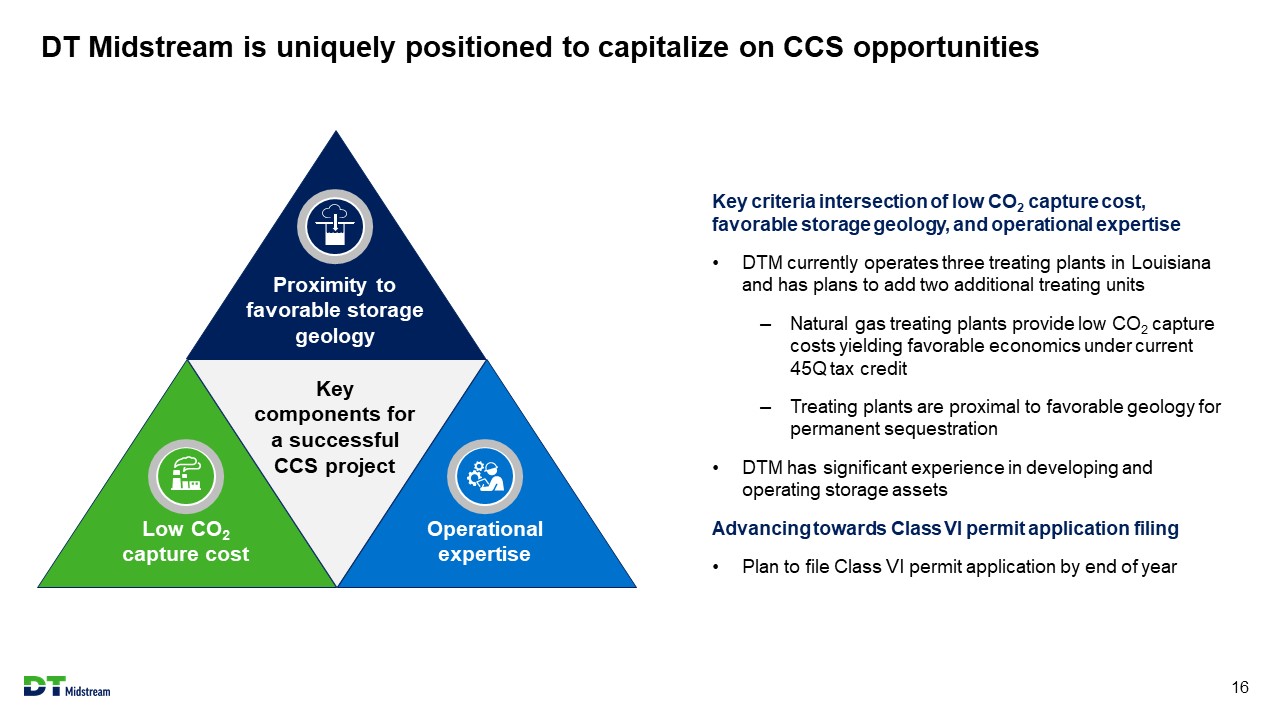
DT Midstream is uniquely positioned to capitalize on CCS opportunities 16 Key criteria intersection of low CO 2 capture cost, favorable storage geology, and operational expertise • DTM currently operates three treating plants in Louisiana and has plans to add two additional treating units – Natural gas treating plants provide low CO 2 capture costs yielding favorable economics under current 45Q tax credit – Treating plants are proximal to favorable geology for permanent sequestration • DTM has significant experience in developing and operating storage assets Advancing towards Class VI permit application filing • Plan to file Class VI permit application by end of year Low CO 2 capture cost Proximity to favorable storage geology Key components for a successful CCS project Operational expertise
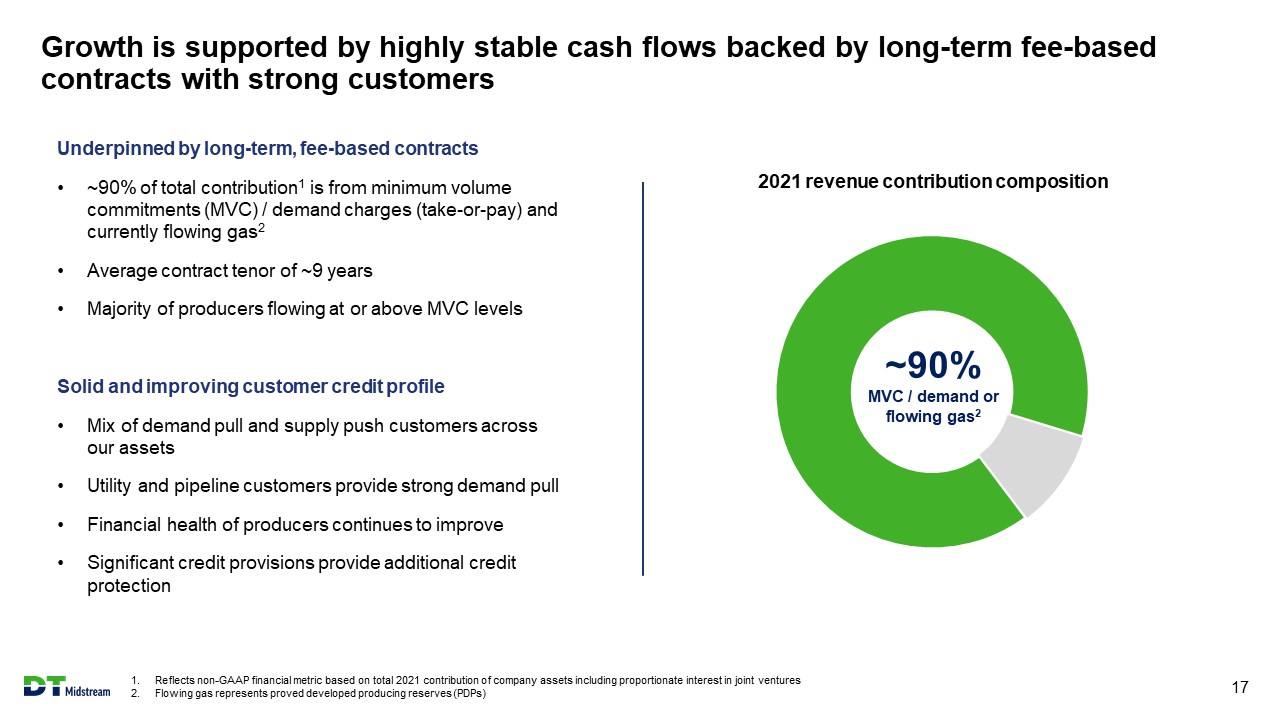
Growth is supported by highly stable cash flows backed by long - term fee - based contracts with strong customers 1. Reflects non - GAAP financial metric based on total 2021 contribution of company assets including proportionate interest in joint ventures 2. Flowing gas represents proved developed producing reserves (PDPs) 17 2021 revenue contribution composition ~90% MVC / demand or flowing gas 2 Underpinned by long - term, fee - based contracts • ~90% of total contribution 1 is from minimum volume commitments (MVC) / demand charges (take - or - pay) and currently flowing gas 2 • Average contract tenor of ~9 years • Majority of producers flowing at or above MVC levels Solid and improving customer credit profile • Mix of demand pull and supply push customers across our assets • Utility and pipeline customers provide strong demand pull • Financial health of producers continues to improve • Significant credit provisions provide additional credit protection

Financial strength is supported by strong balance sheet with a weighted average debt maturity of 8 years 18 1. $719 million availability - reflects $750 million RCF less $31 million of letters of credit issued as of June 30, 2022 2. Represents net debt to trailing twelve months adjusted EBITDA as of June 30, 2022 Maintaining flexible, well - capitalized balance sheet • $3.1 billion in long - term debt – $0.4 billion term loan B due 2028 – $1.1 billion senior notes due 2029 – $1.0 billion senior notes due 2031 – $0.6 billion senior notes due 2032 • $750 million committed revolver 1 • $345 million of cash on hand as of June 30, 2022 • Current leverage ratio of 3.6x 2 with targeted ceiling of 4x • Strategic goal is to achieve a corporate investment grade rating Capital instruments S&P Moody’s Fitch Senior secured BBB - Baa2 BBB - Senior unsecured BB+ Ba2 BB+ $0.4 $1.1 $1.0 $0.6 2022 2023 2024 2025 2026 2027 2028 2029 2030 2031 2032 Debt maturity profile (billions) 8 years - weighted average debt maturity Issuer ratings
Mature environmental, social and governance leadership
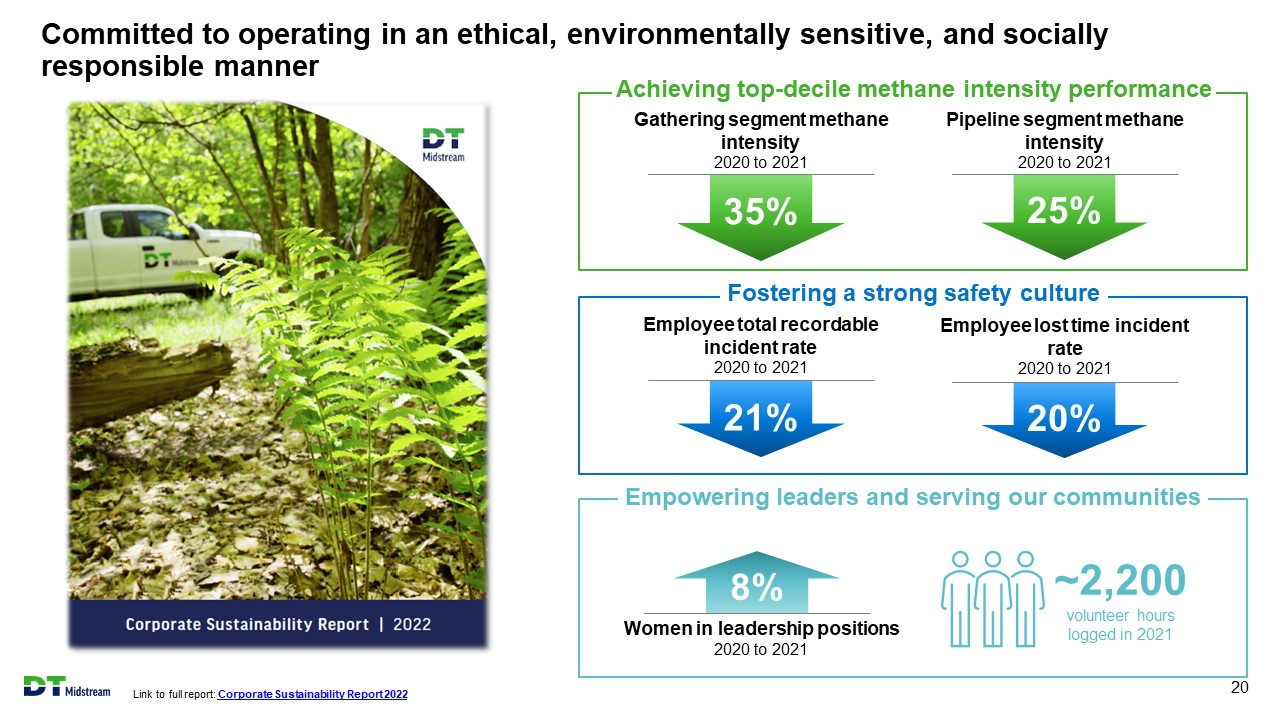
Committed to operating in an ethical, environmentally sensitive, and socially responsible manner Link to full report: Corporate Sustainability Report 2022 20 35% Gathering segment methane intensity 2020 to 2021 Pipeline segment methane intensity 2020 to 2021 25% Achieving top - decile methane intensity performance 21% Employee total recordable incident rate 2020 to 2021 Employee lost time incident rate 2020 to 2021 20% Fostering a strong safety culture Women in leadership positions 2020 to 2021 8% ~2,200 volunteer hours logged in 2021 Empowering leaders and serving our communities
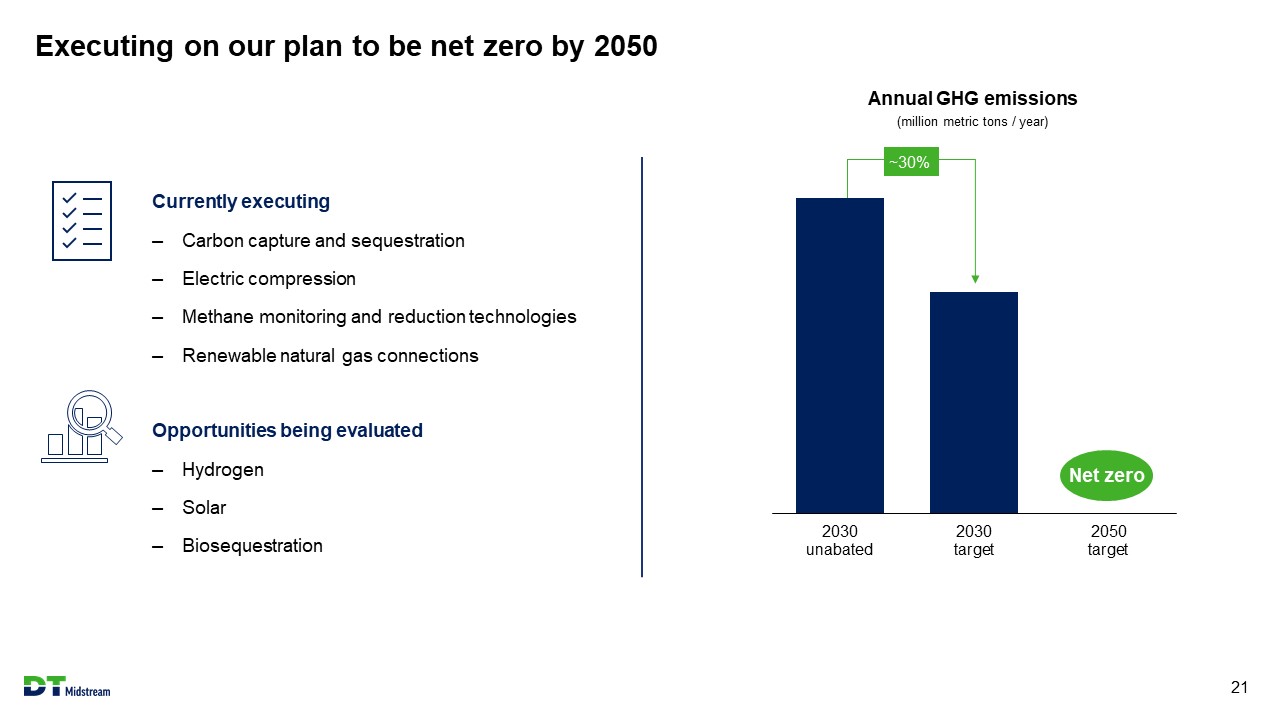
Executing on our plan to be net zero by 2050 21 Currently executing – Carbon capture and sequestration – Electric compression – Methane monitoring and reduction technologies – Renewable natural gas connections Opportunities being evaluated – Hydrogen – Solar – Biosequestration 2030 unabated 2030 target 2050 target ~30% Net zero Annual GHG emissions (million metric tons / year)
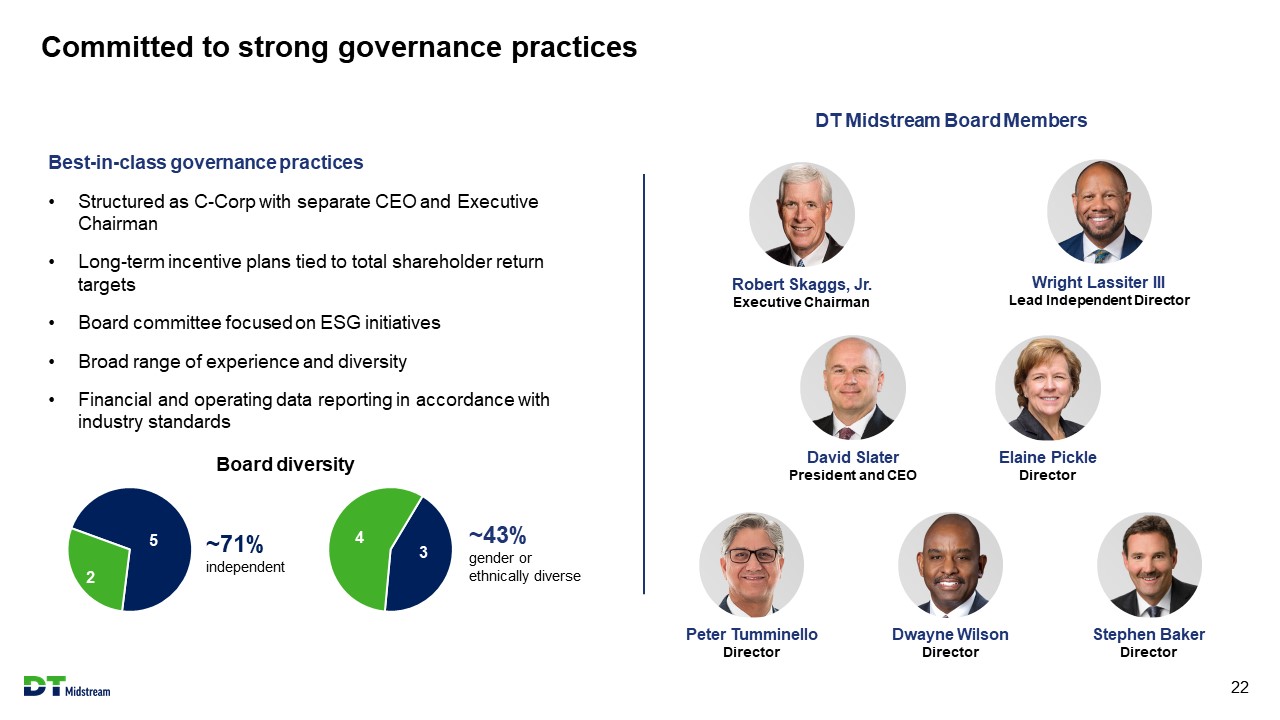
Committed to strong governance practices 22 Best - in - class governance practices • Structured as C - Corp with separate CEO and Executive Chairman • Long - term incentive plans tied to total shareholder return targets • Board committee focused on ESG initiatives • Broad range of experience and diversity • Financial and operating data reporting in accordance with industry standards Board diversity ~71% independent 5 2 3 4 ~43% gender or ethnically diverse Robert Skaggs, Jr. Executive Chairman Wright Lassiter III Lead Independent Director David Slater President and CEO Elaine Pickle Director Stephen Baker Director Peter Tumminello Director Dwayne Wilson Director DT Midstream Board Members
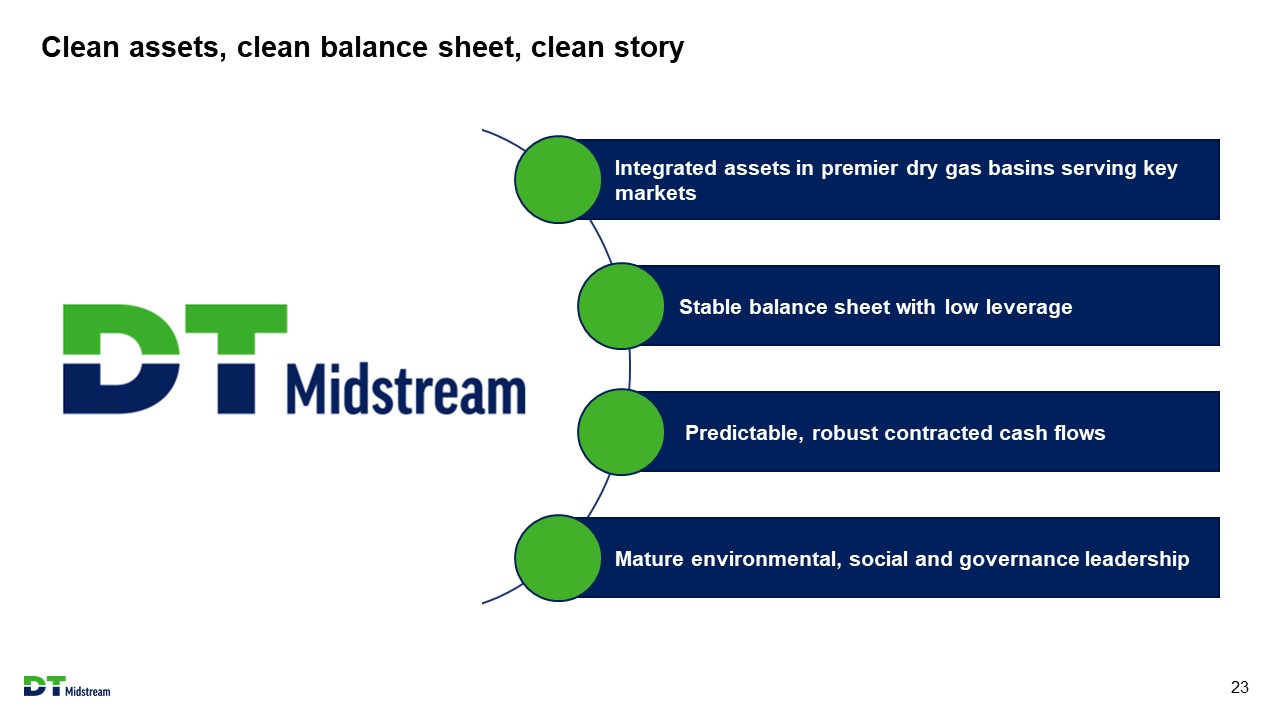
Integrated assets in premier dry gas basins serving key markets Stable balance sheet with low leverage Predictable, robust contracted cash flows Mature environmental, social and governance leadership Clean assets, clean balance sheet, clean story 23

Appendix
Adjusted EBITDA and distributable cash flow (DCF) are non - GAAP measures 25 New slide Adjusted EBITDA is defined as GAAP net income attributable to DT Midstream before expenses for interest, taxes, depreciation and amortization, and loss from financing activities, further adjusted to include our proportional share of net income from our equity method investees (excluding taxes, depreciat ion and amortization), and to exclude certain items we consider non - routine. We believe Adjusted EBITDA is useful to us and external users of our financial statements in understanding our operating results and the ongoing performance of our underlying business because it allows our management and investors to have a better understanding of our actual operat ing performance unaffected by the impact of interest, taxes, depreciation, amortization and non - routine charges noted in the table below. We believe the presentation of Adjusted EBIT DA is meaningful to investors because it is frequently used by analysts, investors and other interested parties in our industry to evaluate a company’s operating perform anc e without regard to items excluded from the calculation of such measure, which can vary substantially from company to company depending on accounting methods, book value of assets, capital structure and the method by which assets were acquired, among other factors. We use Adjusted EBITDA to assess our performance by reportable segment and a s a basis for strategic planning and forecasting. Distributable Cash Flow (DCF) is calculated by deducting earnings from equity method investees, depreciation and amortization attributable to noncontrollin g interests, cash interest expense, maintenance capital investment (as defined below), and cash taxes from, and adding interest expense, income tax expe nse , depreciation and amortization, certain items we consider non - routine and dividends and distributions from equity method investees to, Net Income Attributable to DT Midstream. M aintenance capital investment is defined as the total capital expenditures used to maintain or preserve assets or fulfill contractual obligations that do not generate increm ent al earnings. We believe DCF is a meaningful performance measurement because it is useful to us and external users of our financial statements in estimating the ability of our assets to generate cash earnings after servicing our debt, paying cash taxes and making maintenance capital investments, which could be used for discretionary purposes such as common stock di vid ends, retirement of debt or expansion capital expenditures. Adjusted EBITDA and DCF are not measures calculated in accordance with GAAP and should be viewed as a supplement to and not a substitute for the resu lts of operations presented in accordance with GAAP. There are significant limitations to using Adjusted EBITDA and DCF as a measure of performance, including the inability to analyze the effect of certain recurring and non - recurring items that materially affect our net income or loss. Additionally, because Adjusted EBITDA a nd DCF exclude some, but not all, items that affect net income and are defined differently by different companies in our industry, Adjusted EBITDA and DCF do not intend to represent net income attributable to DT Midstream, the most comparable GAAP measure, as an indicator of operating performance and are not necessarily comparable to similarly titled meas ure s reported by other companies. Reconciliation of net income attributable to DT Midstream to Adjusted EBITDA or DCF as projected for full - year 2022 is not provi ded. We do not forecast net income as we cannot, without unreasonable efforts, estimate or predict with certainty the components of net income. These components, net of tax, may include, but are not limited to, impairments of assets and other charges, divestiture costs, acquisition costs, or changes in accounting principles. All of these components cou ld significantly impact such financial measures. At this time, management is not able to estimate the aggregate impact, if any, of these items on future period reported earnings. Acc ord ingly, we are not able to provide a corresponding GAAP equivalent for Adjusted EBITDA or DCF.

Reconciliation of net income attributable to DT Midstream to Adjusted EBITDA 26 New slide (millions) 2008 2021 Net income attributable to DT Midstream $ 38 $ 307 Plus: Interest expense 7 112 Plus: Income tax expense 24 104 Plus: Depreciation and amortization 5 166 Plus: EBTDA from equity method investees 1 31 174 Plus: Adjustments for non - routine items 2 - 39 Less: Interest income (1) (4) Less: Earnings from equity method investees (22) (126) Less: Depreciation and amortization attributable to noncontrolling interests - (4) Adjusted EBITDA $ 82 $ 768 1. Includes share of our equity method investees’ earnings before taxes, depreciation and amortization, which we refer to as “EBTDA.” A reconciliation of earnings from equity method investees to EBTDA from equity method investees follows: 2008 2021 Earnings from equity method investees $ 22 $ 126 Plus: Depreciation and amortization from equity method investees 9 48 EBTDA from equity method investees $ 31 $ 174 2. Adjusted EBITDA calculation excludes certain items we consider non - routine. For the year ended December 31, 2021, adjustments for non - routine items included (i) $19 million loss on notes receivable and (ii) 20 million of separation related transaction costs.