
THIRD QUARTER 2022 EARNINGS CALL OCTOBER 28, 2022 DT Midstream
Safe Harbor Statement This presentation contains statements which, to the extent they are not statements of historical or present fact, constitute "forward looking statements" under the securities laws. These forward-looking statements are intended to provide management's current expectations or plans for our future operating and financial performance, business prospects, outcomes of regulatory proceedings, market conditions, and other matters, based on what we believe to be reasonable assumptions and on information currently available to us. Forward-looking statements can be identified by the use of words such as "believe," "expect," "expectations," "plans," "strategy," "prospects," "estimate," "project," "target," "anticipate," "will," "should," "see," "guidance," "outlook," "confident" and other words of similar meaning. The absence of such words, expressions or statements, however, does not mean that the statements are not forward-looking. In particular, express or implied statements relating to future earnings, cash flow, results of operations, uses of cash, tax rates and other measures of financial performance, future actions, conditions or events, potential future plans, strategies or transactions of DT Midstream, and other statements that are not historical facts, are forward-looking statements. Forward-looking statements are not guarantees of future results and conditions, but rather are subject to numerous assumptions, risks, and uncertainties that may cause actual future results to be materially different from those contemplated, projected, estimated, or budgeted. Many factors may impact forward looking-statements of DT Midstream including, but not limited to, the following: changes in general economic conditions, including increases in interest rates and the impact of inflation on our business; competitive conditions in our industry; global supply chain disruptions; actions taken by third-party operators, processors, transporters and gatherers; changes in expected production from Southwestern Energy Company and/or its affiliates, Antero Resources Corporation and/or its affiliates and other third parties in our areas of operation; demand for natural gas gathering, transmission, storage, transportation and water services; the availability and price of natural gas to the consumer compared to the price of alternative and competing fuels; competition from the same and alternative energy sources; our ability to successfully implement our business plan; our ability to complete organic growth projects on time and on budget; our ability to complete acquisitions; the price and availability of debt and equity financing; restrictions in our existing and any future credit facilities and indentures; energy efficiency and technology trends; changing laws regarding cyber security and data privacy, and any cyber security threat or event; operating hazards, environmental risks, and other risks incidental to gathering, storing and transporting natural gas; changes in environmental laws, regulations or enforcement policies, including laws and regulations relating to climate change and greenhouse gas emissions; natural disasters, adverse weather conditions, casualty losses and other matters beyond our control; the impact of outbreaks of illnesses, epidemics and pandemics, and any related economic effects; the ongoing conflict between Russia and Ukraine, including resulting commodity price volatility and risk of cyber-based attacks; labor relations and markets, including the ability to attract, hire and retain key employee and contract personnel; large customer defaults; changes in tax status, as well as changes in tax rates and regulations; ability to develop low carbon business opportunities and deploy greenhouse gas reducing technologies; the effects of existing and future laws and governmental regulations; changes in insurance markets impacting costs and the level and types of coverage available; the timing and extent of changes in commodity prices; the suspension, reduction or termination of our customers' obligations under our commercial agreements; disruptions due to equipment interruption or failure at our facilities, or third-party facilities on which our business is dependent; the effects of future litigation; the qualification of the spin off of DT Midstream from DTE Energy ("the Spin Off") as a tax free distribution; the allocation of tax attributes from DTE Energy in accordance with the agreement that governs the respective rights, responsibilities and obligations of DTE Energy and DT Midstream after the Spin Off with respect to all tax matters; our ability to achieve the benefits that we expect to achieve as an independent publicly traded company; and the risks described in our Annual Report on Form 10-K for the year ended December 31, 2021 and our reports and registration statements filed from time to time with the SEC. The above list of factors is not exhaustive. New factors emerge from time to time. We cannot predict what factors may arise or how such factors may cause actual results to vary materially from those stated in forward-looking statements, see the discussion under the section entitled "Risk Factors" in our Annual Report for the year ended December 31, 2021, filed with the SEC on Form 10-K and any other reports filed with the SEC. Given the uncertainties and risk factors that could cause our actual results to differ materially from those contained in any forward-looking statement, you should not put undue reliance on any forward-looking statements. Any forward-looking statements speak only as of the date on which such statements are made. We are under no obligation to, and expressly disclaim any obligation to, update or alter our forward-looking statements, whether as a result of new information, subsequent events or otherwise. DT Midstream 2

Third quarter 2022 accomplishments Strong financial performance Delivered net income of $113 million and Adjusted EBITDA1 of $207 million Raising 2022 Adjusted EBITDA guidance to $ 810 - 825 million due to strong base business performance and Millennium Pipeline acquisition uplift Increasing 2023 Adjusted EBITDA early outlook to $865 - $905 million due to Millennium Pipeline acquisition uplift Reached final investment decision on phase 3 Haynesville system expansion 200 MMcf/d incremental LEAP expansion Combined with phase 1 and 2 expansions, LEAP capacity will increase by 90%, from 1.0 Bcf/d to 1.9 Bcf/d Advancing carbon capture and sequestration (CCS) project in Louisiana Expect to file Class VI permit application by the end of November Increased ownership in a premier natural gas asset with Millennium Pipeline acquisition Strong demand-pull pipeline that is fully-contracted under long-term take-or-pay agreements with high credit quality customers Immediately accretive transaction that accelerates growth plan 1. Definition and reconciliation of Adjusted EBITDA (non-GAAP) to net income included in the appendix Washington 10 Storage Field DT Midstream 3

Strong sequential quarterly results driven by growth from key assets Segment Adjusted EBITDA1 (millions) $191 $105 $86 Q1 2022 $205 $116 $89 Q2 2022 $207 $115 $92 Q3 2022 Gathering Pipeline Pipeline Higher revenues on LEAP due to increased short-term rates Higher contribution from NEXUS due to improved contracting Gathering Higher Blue Union system volumes due to capacity expansion 1. Definition and reconciliation of Adjusted EBITDA (non-GAAP) to net income included in the appendix DT Midstream 4
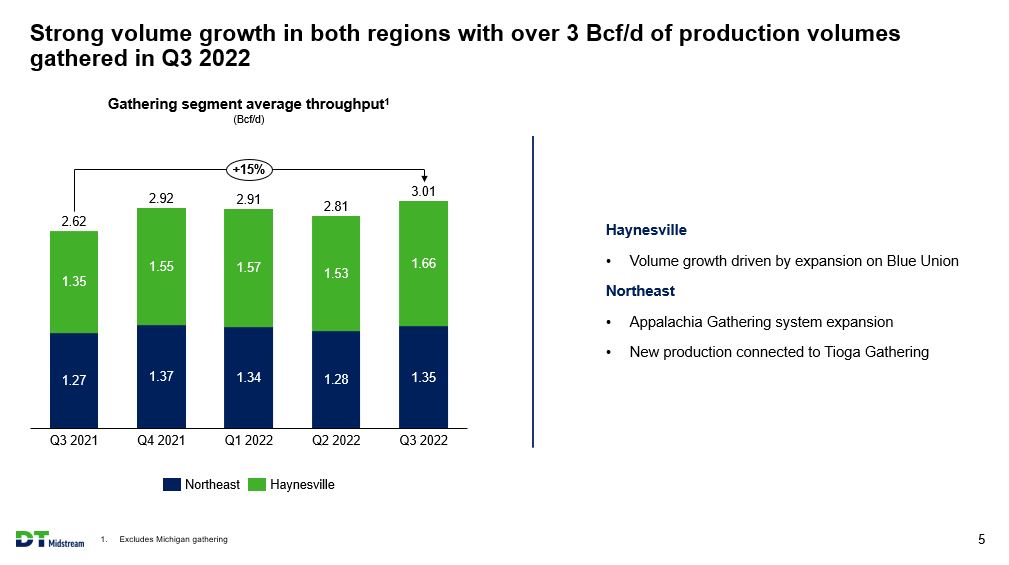
Strong volume growth in both regions with over 3 Bcf/d of production volumes gathered in Q3 2022 Gathering segment average throughput1 (Bcf/d) +15% 2.62 1.35 1.27 Q3 2021 2.91 1.55 1.37 Q4 2021 2.91 1.57 1.34 Q1 2022 2.81 1.53 1.28 Q2 2022 3.01 1.66 1.35 Q3 2022 Northeast Haynesville Haynesville Volume growth driven by expansion on Blue Union Northeast Appalachia Gathering system expansion New production connected to Tioga Gathering 1. Excludes Michigan gathering DT Midstream 5

Increasing 2022 Adjusted EBITDA guidance and 2023 early outlook, representing over 20% growth from 2021 original guidance Increased 2022 guidance Strong base business performance across both segments and regions Includes uplift from Millennium Pipeline acquisition Raised 2023 early outlook Full-year Millennium Pipeline acquisition uplift of ~$55 million 2023 guidance will be provided on our year-end call and will include an update to the base business Adjusted EBITDA1 (millions) 920 880 840 800 760 720 680 640 600 560 Original guidance Guidance increase $710 - $750 2021 original guidance $810 - $825 $770 - $810 2022 guidance $865 - $905 $810 - $850 2023 early outlook Growth from 2021 original guidance ~12% ~21% 1. Definition and reconciliation of Adjusted EBITDA (non-GAAP) to net income included in the appendix DT Midstream 6

Quarterly financial results Three months ended (millions, except EPS September 30, 2022 June 30, 2022 Key drivers Adjusted EBITDA1 Pipeline segment Gathering segment Operating Earnings2 Operating EPS2 Distributable Cash Flow3 Growth Capital4 Maintenance capital $207 $115 $92 $88 $0.90 $186 $112 $8 $205 $116 $89 $79 $0.80 $139 $33 $4 Higher LEAP revenues and NEXUS contribution in Q3 2022 Higher revenues on Blue Union in Q3 2022 Financing activities in Q2 2022 Interest payment in Q2 2022 Timing of growth investments 1. Definition and reconciliation of Adjusted EBITDA (non-GAAP) to net income included in the appendix 2. Definition and reconciliation of Operating Earnings and Operating Earnings per Share (non-GAAP) to reported earnings included in the appendix; EPS calculation based on average share count of approximately 97 million shares outstanding - diluted 3. Definition and reconciliation of Distributable Cash Flow (non GAAP) included in the appendix 4. Growth Capital includes contribution to equity method investees DT Midstream 7
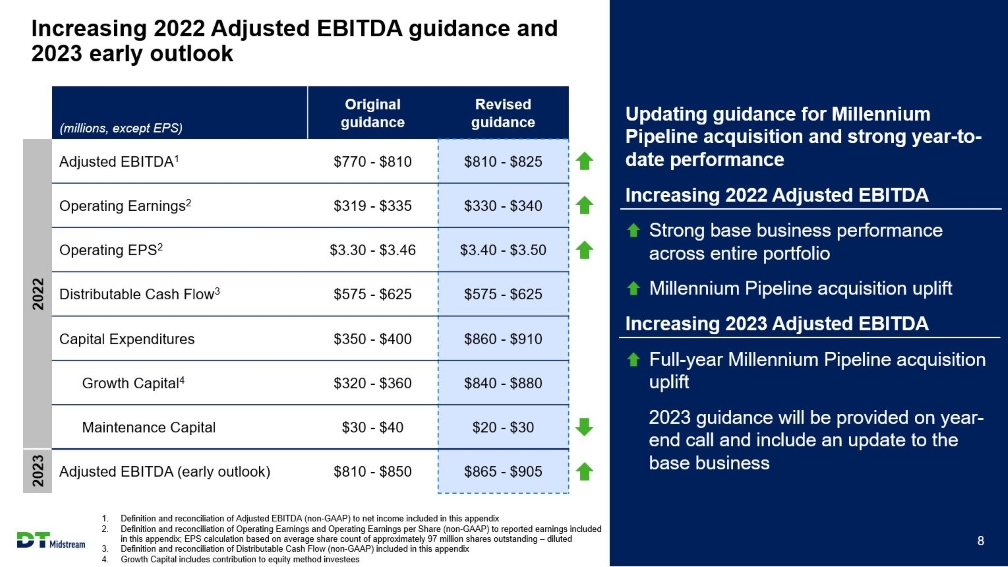
Increasing 2022 Adjusted EBITDA guidance and 2023 early outlook (millions, except EPS) Original guidance Revised guidance 2022 2023 Adjusted EBITDA1 Operating Earnings2 Operating EPS2 Distributable Cash Flow3 Capital Expenditures Growth Capital4 Maintenance Capital Adjusted EBITDA (early outlook) $770 - $810 $319 - $335 $3.30 - $3.46 $575 - $625 $350 - $400 $320 - $360 $30 - $40 $810 - $850 $810 - $825 $330 - $340 $3.40 - $3.50 $575 - $625 $860 - $910 $840 - $880 $20 - $30 $865 - $905 Updating guidance for Millennium Pipeline acquisition and strong year-to-date performance Increasing 2022 Adjusted EBITDA Strong base business performance across entire portfolio Millennium Pipeline acquisition uplift Increasing 2023 Adjusted EBITDA Full-year Millennium Pipeline acquisition uplift 2023 guidance will be provided on year-end call and include an update to the base business 1. Definition and reconciliation of Adjusted EBITDA (non-GAAP) to net income included in this appendix 2. Definition and reconciliation of Operating Earnings and Operating Earnings per Share (non-GAAP) to reported earnings included in this appendix; EPS calculation based on average share count of approximately 97 million shares outstanding - diluted 3. Definition and reconciliation of Distributable Cash Flow (non-GAAP) included in this appendix 4. Growth Capital includes contribution to equity method investees DT Midstream 8

Increasing LEAP capacity to 1.9 Bcf/d with phase 3 expansion Capital efficient, lower-risk expansions provides timely access to growing LNG demand New Phase 3 Haynesville system expansion will provide 200 MMcf/d of incremental LEAP capacity Project in-service in Q3 2024 Active commercial discussions underway for phase 4 expansion LEAP can be expanded up to ~3 Bcf/d with looping and compression Haynesville / LA Gulf Coast DTM pipeline assets DTM treating plants Blue Union expansion build New electric compression LNG facilities Operational Under development +90% increase in LEAP capacity Contracted LEAP capacity (Bcf/d) Current Phase 1 expansion Phase 2 expansion Phase 3 expansion Total Full expansion opportunity 1.0 0.3 0.4 0.2 1.9 3.0 In-service Q4 2023 Q1 2024 Q3 2024 DT Midstream 9
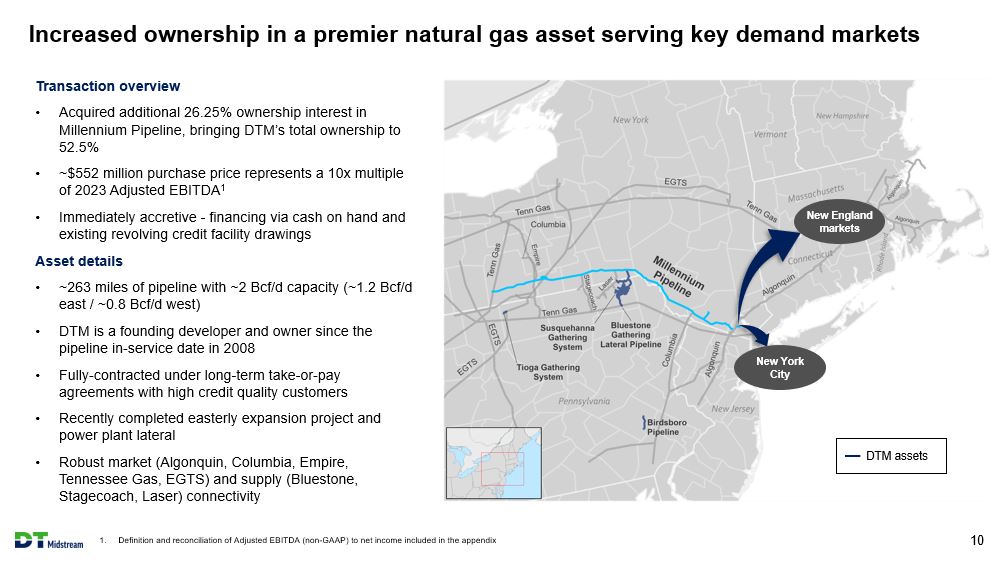
Increased ownership in a premier natural gas asset serving key demand markets Transaction overview Acquired additional 26.25% ownership interest in Millennium Pipeline, bringing DTM's total ownership to 52.5% ~$552 million purchase price represents a 10x multiple of 2023 Adjusted EBITDA1 Immediately accretive - financing via cash on hand and existing revolving credit facility drawings Asset details ~263 miles of pipeline with ~2 Bcf/d capacity (~1.2 Bcf/d east / ~0.8 Bcf/d west) DTM is a founding developer and owner since the pipeline in-service date in 2008 Fully-contracted under long-term take-or-pay agreements with high credit quality customers Recently completed easterly expansion project and power plant lateral Robust market (Algonquin, Columbia, Empire, Tennessee Gas, EGTS) and supply (Bluestone, Stagecoach, Laser) connectivity New England markets New York City Other DTM assets 1. Definition and reconciliation of adjusted EBITDA (non-GAAP) to net income included in the appendix DT Midstream 10
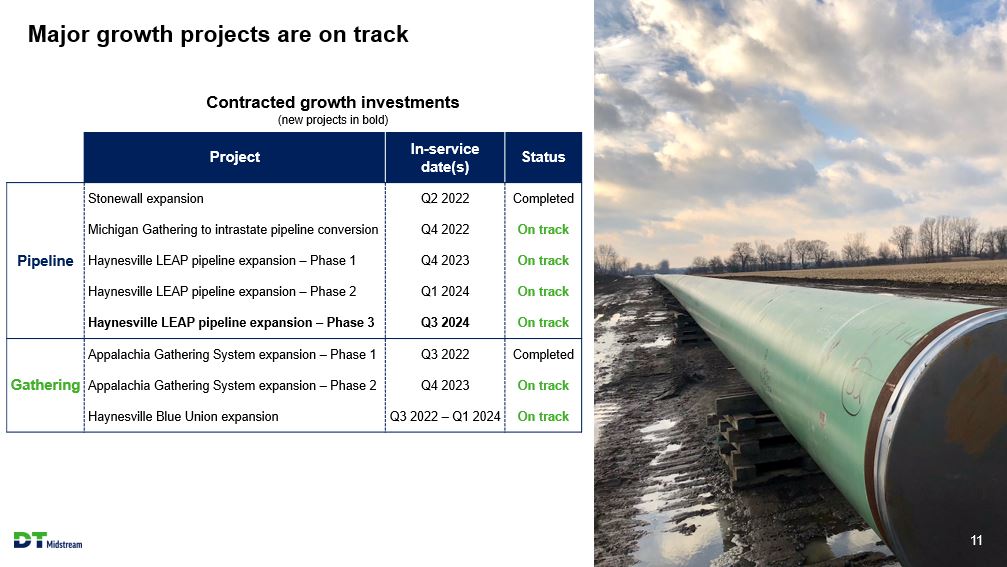
Major growth projects are on track Contracted growth investments (new projects in bold) Project In-service date(s) Status Pipeline Gathering Stonewall expansion Michigan Gathering to intrastate pipeline conversion Haynesville LEAP pipeline expansion - Phase 1 Haynesville LEAP pipeline expansion - Phase 2 Haynesville LEAP pipeline expansion - Phase 3 Appalachia Gathering System expansion Appalachia Gathering System expansion - Phase 2 Haynesville Blue Union expansion Q2 2022 Q4 2022 Q4 2023 Q1 2024 Q3 2024 Q3 2022 Q4 2023 Q3 2022 - Q1 2024 Completed On track On track On track On track Completed On track On track DT Midstream 11
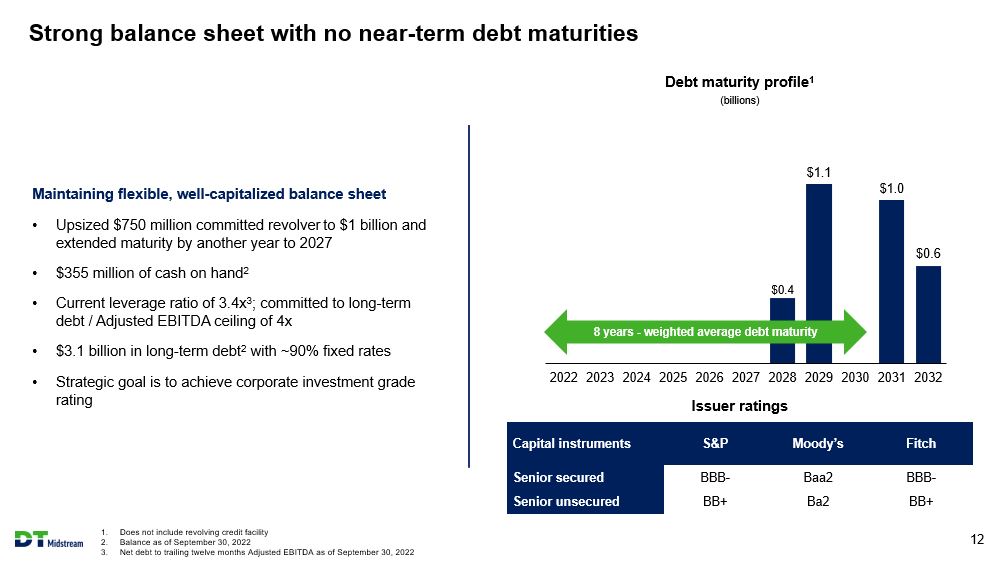
Strong balance sheet with no near-term debt maturities Maintaining flexible, well-capitalized balance sheet Upsized $750 million committed revolver to $1 billion and extended maturity by another year to 2027 $355 million of cash on hand2 Current leverage ratio of 3.4x3; committed to long-term debt / Adjusted EBITDA ceiling of 4x 3.1 billion in long term-debt2 with ~90% fixed rates Strategic goal is to achieve corporate investment grade rating Debt maturity profile1 (billions) 8 years - weighted average debt maturity $0.4 $1.1 $1.0 $0.6 2022 2023 2024 2025 2026 2027 2028 2029 2030 2031 2032 Issuer ratings Capital instruments S&P Moody's Fitch Senior secured Senior unsecured BBB- BB+ Baa2 Ba2 BBB- BB+ 1. Does not include revolving credit facility 2. Balance as of September 30, 2022 3. Net debt to trailing twelve months Adjusted EBITDA as of September 30, 2022 DT Midstream 12

Committed to a leading environmental, social and governance program Environmental Targeting net zero greenhouse gas emissions by 2050 and a 30% reduction by 2030 Continuing to advance CCS opportunity in Louisiana Advancing hydrogen development opportunities with strategic partnership Joined Appalachian Energy Future in Q3 2022 Social Established $4 million charitable fund for community investment Implemented talent management program that seeks diverse and creative talent Continue to strengthen safety standards and protocols based on industry best practices. Governance Strong C-Corp governance with separate Chairman and CEO Independent and diverse board Long-term incentive plans tied to total shareholder return Board sub-committee focused on ESG DT Midstream 13

Clean assets, clean balance sheet, clean story DT Midstream Integrated assets in premier dry gas basins serving key markets Stable balance sheet with low leverage Predictable, robust contracted cash flows Mature environmental, social and governance leadership DT Midstream 14

Appendix DT Midstream

DTM assets are supporting growing LNG export demand Cove Point LNG Gulf Coast LNG corridor LNG facilities Operational Under development DTM assets currently provide ~2 Bcf/d of access to LNG export terminals and are well positioned to serve growing demand US LNG exports (Bcf/d) 24 20 16 12 8 4 0 +13 Bcf/d ~8 Bcf/d of Louisiana Gulf Coast area LNG export growth through 20301 2021 2022 2023 2024 2025 2026 2027 2028 2029 2030 Sabine Pass Cameron Calcasieu Pass Golden Pass Plaquemines Driftwood Cove Point Corpus Christi Freeport Elba Island LNG export terminals that can be served via DTM assets 1. Represents growth from annual average level in 2021 Source: Wood Mackenzie DT Midstream 16
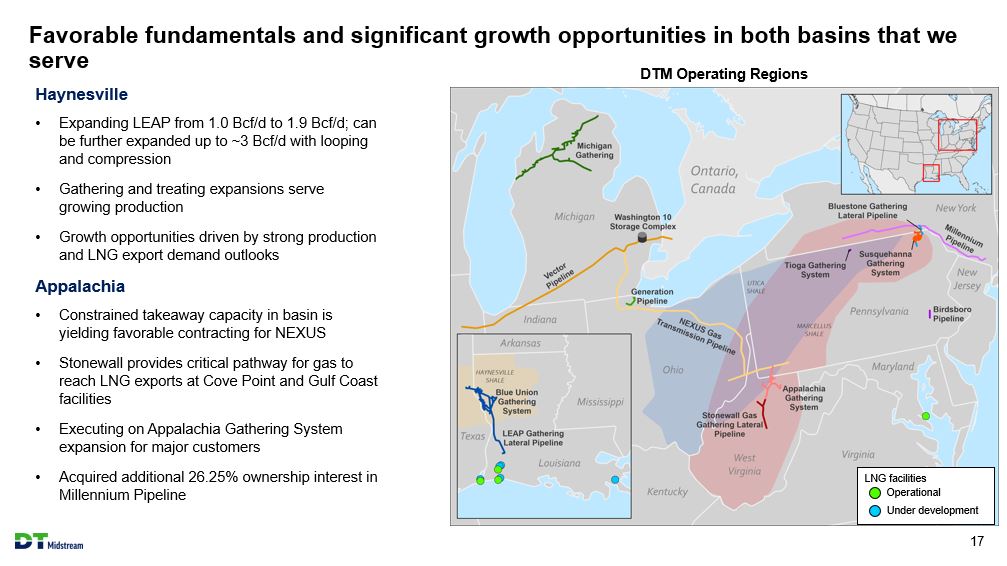
Favorable fundamentals and significant growth opportunities in both basins that we serve Haynesville Expanding LEAP from 1.0 Bcf/d to 1.9 Bcf/d; can be further expanded up to ~3 Bcf/d with looping and compression Gathering and treating expansions serve growing production Growth opportunities driven by strong production and LNG export demand outlooks Appalachia Constrained takeaway capacity in basin is yielding favorable contracting for NEXUS Stonewall provides critical pathway for gas to reach LNG exports at Cove Point and Gulf Coast facilities Executing on Appalachia Gathering System expansion for major customers Acquired additional 26.25% ownership interest in Millennium Pipeline DTM Operating Regions LNG facilities Operational Under development DT Midstream 17
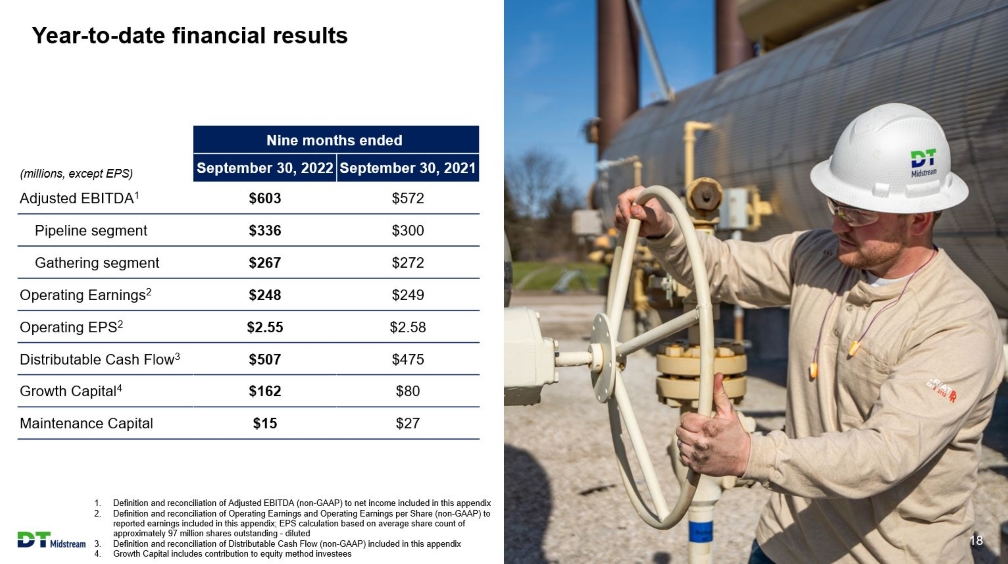
Year-to-date financial results Nine months ended (millions, except EPS September 30, 2022 September 30, 2021 Adjusted EBITDA1 Pipeline segment Gathering segment Operating Earnings2 Operating EPS2 Distributable Cash Flow3 Growth Capital4 Maintenance Capital $603 $336 $267 $248 $2.55 $507 $163 $15 $572 $300 $272 $249 $2.58 $475 $80 $27 1. Definition and reconciliation of Adjusted EBITDA (non-GAAP) to net income included in this appendix 2. Definition and reconciliation of Operating Earnings and Operating Earnings per Share (non-GAAP) to reported earnings included in this appendix; EPS calculation based on average share count of approximately 97 million shares outstanding - diluted 3. Definition and reconciliation of Distributable Cash Flow (non-GAAP) included in this appendix 4. Growth Capital includes contribution to equity method investees DT Midstream 18
Adjusted EBITDA and Distributable Cash Flow (DCF) are non-GAAP measures Adjusted EBITDA is defined as GAAP net income attributable to DT Midstream before expenses for interest, taxes, depreciation and amortization, and loss from financing activities, further adjusted to include our proportional share of net income from our equity method investees (excluding taxes, depreciation and amortization), and to exclude certain items we consider non-routine. We believe Adjusted EBITDA is useful to us and external users of our financial statements in understanding our operating results and the ongoing performance of our underlying business because it allows our management and investors to have a better understanding of our actual operating performance unaffected by the impact of interest, taxes, depreciation, amortization and non-routine charges noted in the table below. We believe the presentation of Adjusted EBITDA is meaningful to investors because it is frequently used by analysts, investors and other interested parties in our industry to evaluate a company's operating performance without regard to items excluded from the calculation of such measure, which can vary substantially from company to company depending on accounting methods, book value of assets, capital structure and the method by which assets were acquired, among other factors. We use Adjusted EBITDA to assess our performance by reportable segment and as a basis for strategic planning and forecasting. Distributable Cash Flow (DCF) is calculated by deducting earnings from equity method investees, depreciation and amortization attributable to noncontrolling interests, cash interest expense, maintenance capital investment (as defined below), and cash taxes from, and adding interest expense, income tax expense, depreciation and amortization, certain items we consider non-routine and dividends and distributions from equity method investees to, Net Income Attributable to DT Midstream. Maintenance capital investment is defined as the total capital expenditures used to maintain or preserve assets or fulfill contractual obligations that do not generate incremental earnings. We believe DCF is a meaningful performance measurement because it is useful to us and external users of our financial statements in estimating the ability of our assets to generate cash earnings after servicing our debt, paying cash taxes and making maintenance capital investments, which could be used for discretionary purposes such as common stock dividends, retirement of debt or expansion capital expenditures. Adjusted EBITDA and DCF are not measures calculated in accordance with GAAP and should be viewed as a supplement to and not a substitute for the results of operations presented in accordance with GAAP. There are significant limitations to using Adjusted EBITDA and DCF as a measure of performance, including the inability to analyze the effect of certain recurring and non-recurring items that materially affect our net income or loss. Additionally, because Adjusted EBITDA and DCF exclude some, but not all, items that affect net income and are defined differently by different companies in our industry, Adjusted EBITDA and DCF do not intend to represent net income attributable to DT Midstream, the most comparable GAAP measure, as an indicator of operating performance and are not necessarily comparable to similarly titled measures reported by other companies. Reconciliation of net income attributable to DT Midstream to Adjusted EBITDA or DCF as projected for full-year 2022 is not provided. We do not forecast net income as we cannot, without unreasonable efforts, estimate or predict with certainty the components of net income. These components, net of tax, may include, but are not limited to, impairments of assets and other charges, divestiture costs, acquisition costs, or changes in accounting principles. All of these components could significantly impact such financial measures. At this time, management is not able to estimate the aggregate impact, if any, of these items on future period reported earnings. Accordingly, we are not able to provide a corresponding GAAP equivalent for Adjusted EBITDA or DCF. DT Midstream 19
Operating Earnings and Operating Earnings per share are non-GAAP measures Use of Operating Earnings Information - Operating Earnings exclude non-recurring items, certain mark-to-market adjustments and discontinued operations. DT Midstream management believes that Operating Earnings provide a more meaningful representation of the Company's earnings from ongoing operations and uses Operating Earnings as the primary performance measurement for external communications with analysts and investors. Internally, DT Midstream uses Operating Earnings to measure performance against budget and to report to the Board of Directors. In this presentation, DT Midstream provides guidance for future period Operating Earnings. It is likely that certain items that impact the company's future period reported results will be excluded from operating results. A reconciliation to the comparable future period reported earnings is not provided because it is not possible to provide a reliable forecast of specific line items (i.e., future non-recurring items, certain mark-to-market adjustments and discontinued operations). These items may fluctuate significantly from period to period and may have a significant impact on reported earnings. DT Midstream 20
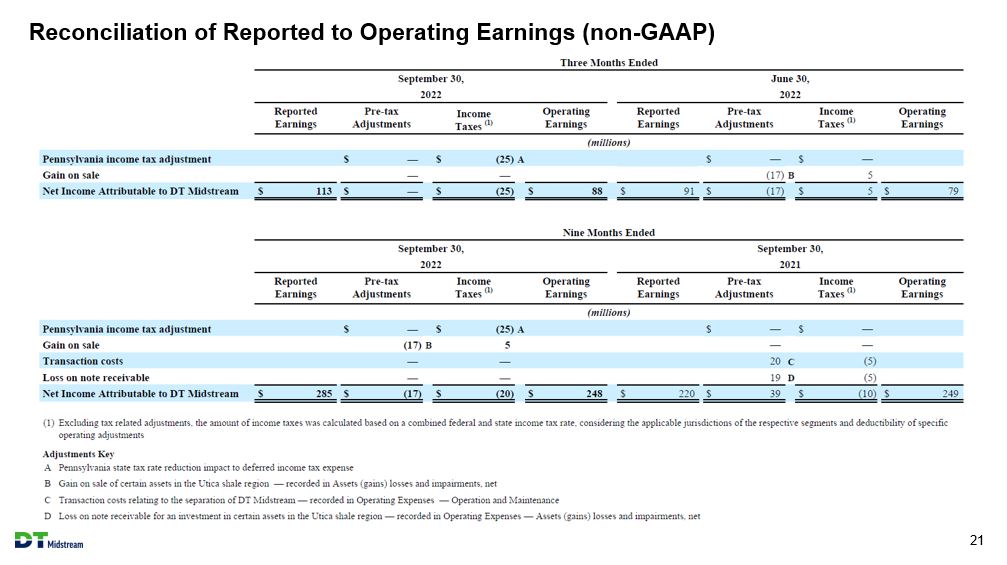
Reconciliation of Reported to Operating Earnings (non-GAAP) Three Months Ended September 30, 2022 June 30, 2022 Reported Earnings Pre-tax Adjustments Income Taxes(1) Operating Earnings Reported Earnings Pre-tax Adjustments Income Taxes (l) Operating Earnings (millions) Pennsylvania income tax adjustment Gain on sale Net Income Attributable to DT Midstream $ 113 $ - - $ - $ (25) A - $ (25) $ 88 $ 91 $ - (17) B $ (17) $ - 5 $ 5 $ 79 Nine Months Ended September 30, 2022 September 30, 2021 Reported Earnings Pre-tax Adjustments Income Taxes (l) Operating Earnings Reported Earnings Pre-tax Adjustments Income Taxes (l) Operating Earnings (millions) Pennsylvania income tax adjustment Gain on sale Transaction costs Loss on note receivable Net Income Attributable to DT Midstream $ 285 $ - (17) B - $ (17) $ (25) A 5 - $ (20) $ 248 $ 220 $ - - 20 C 19 D $ 39 $ - - (5) (5) $ (10) $ 249 (1) Excluding tax related adjustments, the amount of income taxes was calculated based on a combined federal and state income tax rate, considering the applicable jurisdictions of the respective segments and deductibility of specific operating adjustments Adjustments Key A Pennsylvania state tax rate reduction impact to deferred income tax expense B Gain on sale of certain assets in the Utica shale region -- recorded in Assets (gains) losses and impairments, net C Transaction costs relating to the separation of DT Midstream -- recorded in Operating Expenses -- Operation and Maintenance D Loss on note receivable for an investment in certain assets in the Utica shale region -- recorded in Operating Expenses - Assets (gains) losses and impairments, net DT Midstream 21
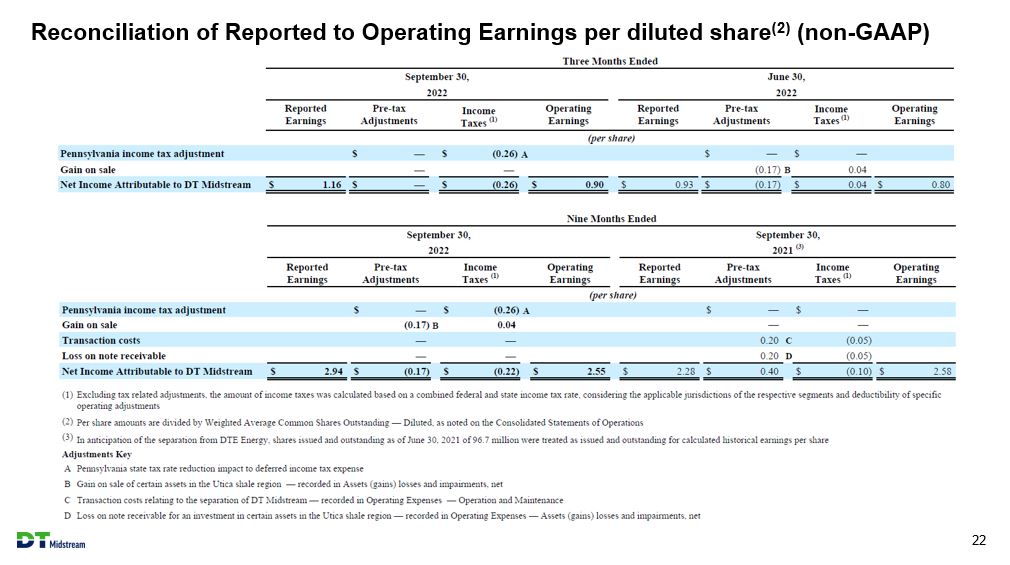
Reconciliation of Reported to Operating Earnings per diluted share(2) (non-GAAP) Three Months Ended September 30, 2022 June 30, 2022 Reported Earnings Pre-tax Adjustments Income Taxes (1) Operating Earnings Reported Earnings Pre-tax Adjustments Income Taxes(1) Operating Earnings (per share) Pennsylvania income tax adjustment $ - $ (0.26) A $ - $ - Gain on sale - (0.17) B 0.04 Net Income Attributable to DT Midstream $ 1.16 $ - $ (0.26) $ 0.90 $ 0.93 $ (0.17) $ 0.04 $ 0.80 Nine Months Ended September 30, 2022 September 30, 2021 (3) Reported Earnings Pre-tax Adjustments Income Taxes (1) Operating Earnings Reported Earnings Pre-tax Adjustments Income Taxes (1) Operating Earnings (per share) Pennsylvania income tax adjustment $ - $ (0.26) A $ - $ - Gain on sale (0.17) B 0.04 - Transaction costs - 0.20 C (0.05) Loss on note receivable - 0.20 D (0.05) Net Income Attributable to DT Midstream $ 2.94 $ (0.17) $ (0.22) $ 2.55 $ 2.28 $ 0.40 $ (0.10) $ 2.58 (1) Excluding tax related adjustments, the amount of income taxes was calculated based on a combined federal and state income tax rate, considering the applicable jurisdictions of the respective segments and deductibility of specific operating adjustments (2) per share amounts are divided by Weighted Average Common Shares Outstanding - Diluted, as noted on the Consolidated Statements of Operations (3) In anticipation of the separation from DTE Energy, shares issued and outstanding as of June 30, 2021 of 96.7 million were treated as issued and outstanding for calculated historical earnings per share Adjustments Key A Pennsylvania sate tax rate reduction impact to deferred income tax expense B Gain on sale of certain assets in the Utica shale region -- recorded in Assets (gains) losses and impairments, net C Transaction costs relating to the separation of DT Midstream -- recorded in Operating Expenses -- Operation and Maintenance D Loss on note receivable from an investment in certain assets in the Utica shale region -- recorded in Operating Expenses -- Assets (gains) losses and impairments, net DT Midstream 22
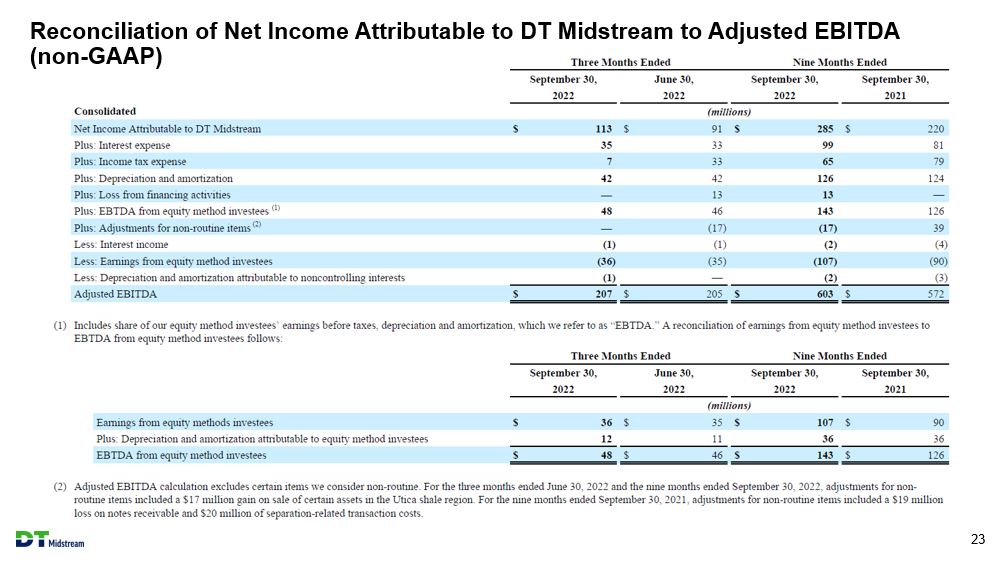
Reconciliation of Net Income Attributable to DT Midstream to Adjusted EBITDA (non-GAAP) Three Months Ended Nine Months Ended September 30, 2022 June 30, 2022 September 30, 2022 September 30, 2021 Consolidated (millions) Net Income Attributable to DT Midstream $113 $91 $285 $220 Plus: Interest expense 35 33 99 81 Plus: Income tax expense 7 33 65 79 Plus: Depreciation and amortization 42 42 126 124 Plus: Loss from financing activities - 13 13 - Plus: EBTDA from equity method investees (1) 48 46 143 126 Plus: Adjustments for non-routine items (2) - (17) (17) 39 Less: Interest income (1) (1) (2) (4) Less: Earnings from equity method investees (36) (35) (107) (90) Less: Depreciation and amortization attributable to noncontrolling interests (1) - (2) (3) Adjusted EBITDA $207 $205 $603 $572 (1) Includes share of our equity method investee's earnings before taxes, depreciation and amortization, which we refer to as "EBTDA." A reconciliation of earnings from equity method investees to EBTDA from equity method investees follows: Three Months Ended Nine Months Ended September 30, 2022 June 30, 2022 September 30, 2022 September 30, 2021 (millions) Earnings from equity methods investees $36 $35 $107 $90 Plus: Depreciation and amortization attributable to equity method investees 12 11 36 36 EBTDA from equity method investees $48 $46 $143 $126 (2) Adjusted EBITDA calculation excludes certain items we consider non-routine. For the three months ended June 30, 2022 and the nine months ended September 30, 2022, adjustments for non-routine items included a $17 million gain on sale of certain assets in the Utica shale region. For the nine months ended September 30, 2021, adjustments for non-routine items included a $19 million loss on notes receivable and $20 million of separation-related transaction costs. DT Midstream 23
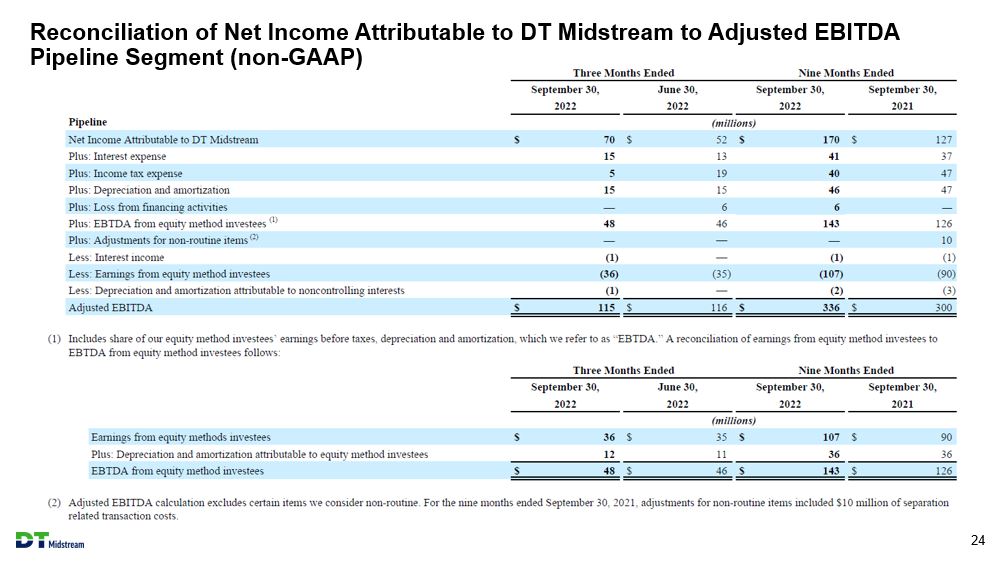
Reconciliation of Net Income Attributable to DT Midstream to Adjusted EBITDA Pipeline Segment (non-GAAP) Three Months Ended Nine Months Ended September 30, 2022 June 30, 2022 September 30, 2022 September 30, 2021 Pipeline (millions) Net Income Attributable to DT Midstream $70 $52 $170 $127 Plus: Interest expense 15 13 41 37 Plus: Income tax expense 5 19 40 47 Plus: Depreciation and amortization 15 15 46 47 Plus: Loss from financing activities -- 6 6 -- Plus: EBTDA from equity method investees (1) 48 46 143 126 Plus: Adjustments for non-routine items (2) -- -- 10 Less: Interest income (1) -- (1) (1) Less: Earnings from equity method investees (36) (35) (107) (90) Less: Depreciation and amortization attributable to noncontrolling interests (1) -- (2) (3) Adjusted EBITDA $115 $116 $336 $300 (1) Includes share of our equity method investees' earnings before taxes, depreciation and amortization, which we refer to as "EBTDA." A reconciliation of earnings from equity method investees to EBTDA from equity method investees follows: Three Months Ended Nine Months Ended September 30, 2022 June 30, 2022 September 30, 2022 September 30, 2021 (millions) Earnings from equity methods investees $36 $35 $107 $90 Plus: Depreciation and amortization attributable to equity method investees 12 11 36 36 EBTDA from equity method investees $48 $46 $143 $126 (2) Adjusted EBITDA calculation excludes certain items we consider non-routine. For the nine months ended September 30, 2021, adjustments for non-routine items included $10 million of separation related transaction costs. DT Midstream 24
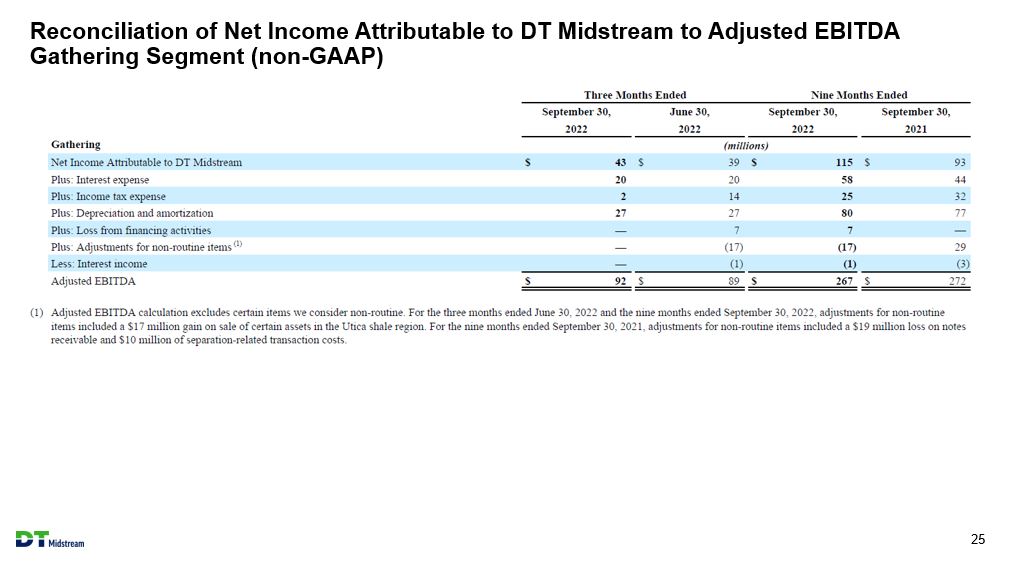
Reconciliation of Net Income Attributable to DT Midstream to Adjusted EBITDA Gathering Segment (non-GAAP) Three Months Ended Nine Months Ended September 30, 2022 June 30, 2022 September 30, 2022 September 30, 2021 (millions) Gathering Net Income Attributable to DT Midstream $43 $39 $115 $93 Plus: Interest expense 20 20 58 44 Plus: Income tax expense 2 14 25 32 Plus: Depreciation and amortization 27 27 80 77 Plus: Loss from financing activities -- 7 7 -- Plus: Adjustments for non-routine items(1) -- (17) (17) 29 Less: Interest income -- (1) (1) (3) Adjusted EBITDA $92 $89 $267 $272 (1) Adjusted EBITDA calculation excludes certain items we consider non-routine. For the three months ended June 30, 2022 and the nine months ended September 30, 2022, adjustments for non-routine items included a $17 million gain on sale of certain assets in the Utica shale region. For the nine months ended September 30, 2021, adjustments for non-routine items included a $19 million loss on notes receivable and $10 million of separation-related transaction costs. DT Midstream 25

Reconciliation of Net Income Attributable to DT Midstream to Distributable Cash Flow (non-GAAP) Three Months Ended Nine Months Ended September 30, 2022 June 30, 2022 September 30, 2022 September 30, 2021 (millions) Net Income Attributable to DT Midstream $113 $91 $285 $220 Plus: Interest expense 35 33 99 81 Plus: Income tax expense 7 33 65 79 Plus: Depreciation and amortization 42 42 126 124 Plus: Loss from financing activities -- 13 13 -- Plus: Adjustments for non-routine items (1) -- (17) (17) 39 Less: Earnings from equity method investees (36) (35) (107) (90) Less: Depreciation and amortization attributable to noncontrolling interests (1) -- (2) (3) Plus: Dividends and distributions from equity method investees 40 38 128 104 Less: cash interest expense (4) (49) (59) (50) Less: Cash taxes (2) (6) (9) (2) Less: Maintenance capital investment (2) (8) (4) (15) (27) Distributable Cash Flow $186 $139 $507 $475 (1) Adjusted EBITDA calculation excludes certain items we consider non-routine. For the three months ended June 30, 2022 and the nine months ended September 30, 2022, adjustments for non-routine items included a $17 million gain on sale of certain assets in the Utica shale region. For the nine months ended September 30, 2021, adjustments for non-routine items included a $19 million loss on notes receivable and $20 million of separation-related transaction costs. (2) Maintenance capital investment is defined as the total capital expenditures used to maintain or preserve assets or fulfill contractual obligations that do not generate incremental earnings. DT Midstream 26