united states
securities and exchange commission
washington, d.c. 20549
form n-csr
certified shareholder report of registered management
investment companies
| Investment Company Act file number | 811-23631 |
| Tactical Investment Series Trust |
| (Exact name of registrant as specified in charter) |
| 11726 Seven Gables Road, Cincinnati, OH | 45249 |
| (Address of principal executive offices) | (Zip code) |
| Capitol Services, Inc. |
| 1675 South State Street, Suite B, Dover, DE 19901 |
| (Name and address of agent for service) |
| Registrant’s telephone number, including area code: | 833-974-3787 |
| Date of fiscal year end: | 12/31 |
| Date of reporting period: | 12/31/2021 |
ITEM 1. REPORTS TO SHAREHOLDERS.
| | | |
| | | |
| | | |
| |  | |
| | | |
| | | |
| | TFA Tactical Income Fund | |
| | (fka Tactical Conservative Allocation Fund) | |
| | Class A: TFALX | |
| | Class I: TFAZX | |
| | | |
| | | |
| | Tactical Moderate Allocation Fund | |
| | Class A: TFAMX | |
| | Class I: TFAUX | |
| | | |
| | | |
| | Tactical Growth Allocation Fund | |
| | Class A: TFAEX | |
| | Class I: TFAFX | |
| | | |
| | | |
| | TFA Quantitative Fund | |
| | Class I: TFAQX | |
| | | |
| | | |
| | TFA Multidimensional Tactical Fund | |
| | Class I: TFADX | |
| | | |
| | | |
| | TFA AlphaGen Growth Fund | |
| | Class I: TFAZX | |
| | | |
| | | |
| | TACTICAL INVESTMENT SERIES TRUST | |
| | | |
| | | |
| | | |
| | | |
| | Annual Report | |
| | | |
| | December 31, 2021 | |
| | | |
| | | |
| | | |
| | | |
| | 1-833-974-3787 | |
| | www.tfafunds.com | |
| | | |
| | | |
| | | |
SHAREHOLDER LETTER
DECEMBER 31, 2021 (UNAUDITED)
Dear Shareholders,
I am pleased to present you with the third annual report for the TFA family of tactically managed mutual funds, including the TFA Tactical Income Fund (formerly Tactical Conservative Allocation Fund), Tactical Moderate Allocation Fund, Tactical Growth Allocation Fund, TFA Multidimensional Tactical Fund, TFA Quantitative Fund, and TFA AlphaGen Growth Fund. This report covers the twelve months from January 1, 2021 through December 31, 2021.
We believe that every portfolio should include an allocation to actively managed mutual funds that seek to achieve their investment objectives by positioning portfolios to search out opportunities in the market while managing the risks of negative market environments. Such an approach carries a higher degree of management skills compared to a passive, buy-and-hold approach. Tactical Fund Advisors utilizes a flexible universe of tactical investing strategies and methodologies derived from a team of experienced and highly capable active investment managers.
For the year ending December 31, 2021, the TFA Tactical Income Fund Class I shares returned 5.82%, the Tactical Moderate Allocation Fund Class I shares returned 11.89%, while the Tactical Growth Allocation Fund Class I shares returned 16.18%. The TFA Multidimensional Tactical Fund Class I shares returned 11.02%, while the TFA Quantitative Fund Class I shares also returned 11.02%. The TFA AlphaGen Growth Fund Class I shares were launched on August 23, 2021 and returned 1.80% for the period.
In our prior letter to shareholders, we highlighted how multiple vaccine rollouts as well as ongoing monetary and fiscal support continued to push markets higher into the end of the 2020, despite slowing economic growth. During the first quarter of 2021, the transfer of power in Washington, the acceleration of Covid-19 vaccinations, a major stimulus/relief bill, significant economic improvement, and a surge in interest rates combined to push major stock indices higher and bond prices lower. Markets continued higher in the second quarter due to the continued re-opening of the economy and corresponding strong economic data and a dramatic decline in the spread of Covid-19 due to the global vaccination efforts. Interest rates continued moving lower despite inflation becoming one of the biggest issues during the quarter. During the third quarter, the stock market continued its relentless rise until September broke the market’s 8-month winning streak. In addition to being overdue and within the most difficult seasonal period, a series of previously ignored worries came to the fore, including the $20 billion Evergrande debt default in China, another US debt ceiling showdown, the rise of Covid-19 Delta variant and ever-present concerns over Federal Reserve policy and the attendant outlook on inflation and growth. Despite these worries, a stronger than expected earnings season pushed the S&P 500® Index to new highs in October despite ongoing supply chain issues. Markets cooled in November as inflation fears gripped the market and the Covid-19 Omicron variant caused a massive surge in Covid infections. As fears began to ebb about the seriousness of Omicron, the markets delivered a surge in time for the holidays.
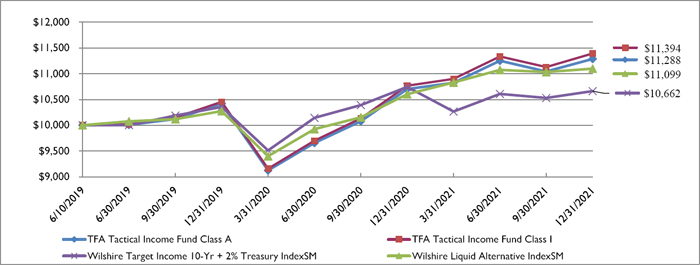
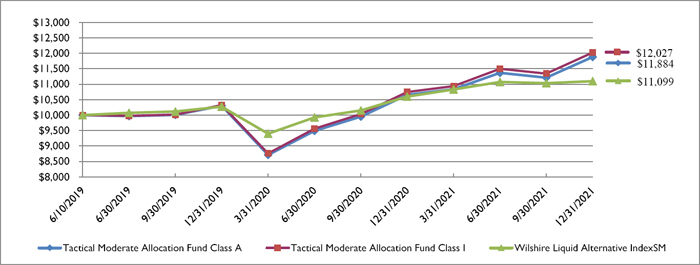
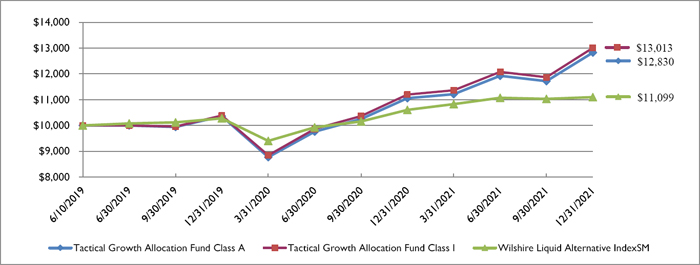
The TFA Tactical Income Fund’s 5.82% return for the year ending December 31, 2021 outperformed the -0.77% return of the benchmark Wilshire Target Income 10-yr Treasury +2% Index, as well as the 4.70% return of the prior benchmark Wilshire Liquid Alternatives Index. The 11.89% return of the Tactical Moderate Allocation Fund, and 16.18% return of the Tactical Growth Allocation Fund outperformed the 4.70% return of the benchmark Wilshire Liquid Alternatives Index. The outperformance of the funds can be attributed to the risk-targeted management approach, which provided exposure to class-leading equity and fixed-income holdings for the year, as well as the Funds’ strategy diversification approach that utilizes equities, fixed income and derivatives in order to achieve the desired exposure to specific asset classes for each fund.
SHAREHOLDER LETTER
DECEMBER 31, 2021 (UNAUDITED)
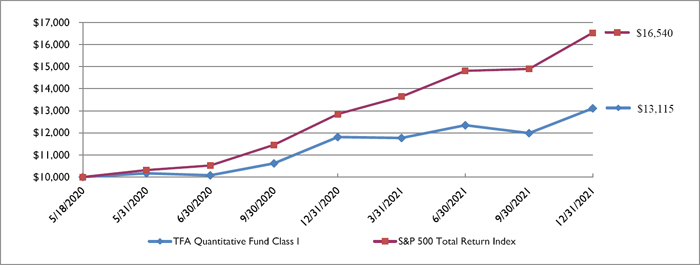
The TFA Quantitative Fund’s 11.02% return for the period ending December 31, 2021 underperformed the 28.71% return of the benchmark S&P 500 Total Return Index. The underperformance was largely the result of a deterioration in technical indicators causing the fund to remain underinvested while the markets marched forward. Changes to the management strategy made in the fourth quarter, allowing the fund to invest in 1.5x leveraged Russell 2000 and 2x leveraged Nasdaq 100 funds, contributed to its most successful quarter, but the fund still underperformed its S&P 500 Index for the year. At the end of December, the sub-adviser Potomac Advisor was notified that two additional sub-advisers were to be added to the fund and that Potomac’s percentage of assets it managed would be reduced. We look forward to 2022 with the two new sub-advisers.
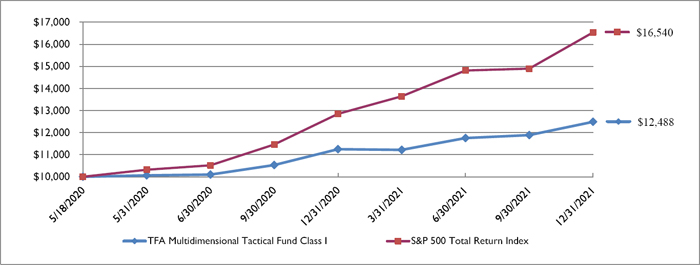
The TFA Multidimensional Tactical Fund’s 11.02% return for the period ending December 31, 2021 underperformed the 28.71% return of the benchmark S&P 500 Total Return Index, which is the fund’s primary benchmark. We believe it is important to recognize that the Multidimensional strategy maintains a constant allocation of approximately 15% to Fixed Income markets. In addition, it should be noted that the sub-advisor’s management strategy focuses on stock market segments outside of the S&P 500. Although such an approach has proved successful in the past, the management strategy did not keep pace with the S&P 500 Index benchmark for the year. We are working with the sub-advisor to upgrade the portfolio after the first of the year.
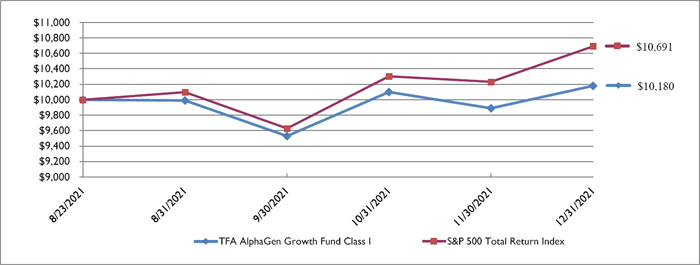
The TFA AlphaGen Growth Fund was launched in the third quarter of 2021. For the period August 23 through December 31, 2021, the fund’s 1.80% return underperformed the 6.91% return of the S&P 500 Total Return Index for the same period. The launch coincided with the start of the first meaningful correction in stock prices of the year, which lasted into early October. The risk mitigation strategies utilized by management resulted in the fund being underinvested during the brief rally that ensued. In addition, the fund’s global diversification and exposure to the fixed income market contributed to the fund lagging the S&P 500 Index for the four-month period.
Both the stock and bond markets have begun the new year in a corrective mode as investors appear to reprice assets for the higher inflation and interest rate environment expected to dominate 2022. Thus, we believe employing tactical strategies designed to not only participate in the upside but also to preserve capital during severely negative market cycles is more important than ever.
Thank you for being a shareholder in the TFA family of mutual funds and we wish you a healthy 2022.
Sincerely,
Drew K. Horter, President/CEO
Tactical Fund Advisors
SHAREHOLDER LETTER
DECEMBER 31, 2021 (UNAUDITED)
Performance figures represent past performance which is not predictive of future performance. Investment return and principal value will fluctuate so that your shares, when redeemed, may be worth more or less than their original cost.
The performance data quoted here represents past performance. For more current performance information, please call toll-free 1-800-869-1679 or visit our website, www.tfafunds.com. Current performance may be lower or higher than the performance data quoted above. Past performance is no guarantee of future results. The investment return and principal value of an investment in the investment adviser has contractually agreed to reduce its fees and/or absorb expenses until at least April 30, 2023, to ensure that net annual, operating expenses of the Class A Shares and Class I Shares will not exceed 2.14% and 1.89% respectively, subject to the possible recoupment from the Fund within three years after the fees have been waived or reimbursed. Please review the Fund prospectus for more information regarding the Fund’s fees and expenses.
| TFA Tactical Income Fund (fka Tactical Conservative Allocation Fund) |
PORTFOLIO REVIEW (Unaudited)
December 31, 2021
Average Annual Total Return through December 31, 2021*, as compared to its benchmark:
| | One | Since |
| | Year | Inception (a) |
| TFA Tactical Income Fund - Class A | 5.47% | 4.85% |
| TFA Tactical Income Fund - Class I | 5.82% | 5.23% |
| Wilshire Target Income 10-Yr + 2% Treasury IndexSM ** | -0.77% | 3.07% |
| Wilshire Liquid Alternative IndexSM *** | 4.70% | 4.16% |
| * | The performance data quoted here represents past performance. Current performance may be lower or higher than the performance data quoted above. Investment return and principal value will fluctuate, so that shares, when redeemed, may be worth more or less than their original cost. The returns shown do not reflect the deduction of taxes that a shareholder would pay on Fund distributions or on the redemptions of Fund shares. Past performance is no guarantee of future results. Performance figures for periods greater than 1 year are annualized. The Fund’s manager has contractually agreed to waive fees and/or reimburse expenses of the Fund to the extent necessary to limit operating expenses (excluding front-end or contingent deferred loads, taxes, leverage interest, borrowing interest, brokerage commissions, expenses incurred in connection with any merger or reorganization, dividend expenses on securities sold short, underlying fund fees and expenses or extraordinary expenses such as litigation) at 2.14% and 1.89% for Class A shares and Class I shares, respectively, through April 30, 2023. Per the Fund’s most recent prospectus, total annual Fund estimated expenses after waivers are 2.35% and 2.10% for Class A shares and Class I shares, respectively. Without waiver the expense ratios are 2.47%, and 2.22% for Class A shares and Class I shares, respectively. For performance information current to the most recent month-end, please call toll-free 1-833-974-3787. |
| ** | Effective October 26, 2021, the Fund’s primary benchmark was changed to the Wilshire Target Income 10-Year Treasury +2% Plus IndexSM. The Wilshire Target Income 10-Year Treasury +2% Plus IndexSM measures an investment strategy that provides broad exposure to income-producing asset classes, using a universe of ETFs with the goal of achieving an annualized target income yield in excess of the U.S. 1-Year Treasury plus two percent. The index uses an optimization approach which aims to minimize overall portfolio risk while meeting the stated yield target. Investors cannot invest directly in an index. |
| *** | The Wilshire Liquid Alternative IndexSM measures the collective performance of the five Wilshire Liquid Alternative strategies that make up the Wilshire Liquid Alternative Universe. The Wilshire Liquid Alternative Index (WLIQA) is designed to provide a broad measure of the liquid alternative market by combining the performance of the Wilshire Liquid Alternative Equity Hedge IndexSM (WLIQAEH), Wilshire Liquid Alternative Global Macro IndexSM (WLIQAGM), Wilshire Liquid Alternative Relative Value IndexSM (WLIQARV), Wilshire Liquid Alternative Multi-Strategy IndexSM (WLIQAMS), and Wilshire Liquid Alternative Event Driven IndexSM (WLIQAED). Investors cannot invest directly in an index. |
| (a) | Inception date June 10, 2019 |
Comparison of the Change in Value of a $10,000 Investment
| Holdings by Sector | | % of Net Assets | |
| Exchange-Traded Funds | | | | |
| Fixed Income | | | 89.2 | % |
| Equity | | | 2.6 | % |
| Short-Term Investments | | | 13.6 | % |
| Other / Cash & Cash Equivalents | | | -5.4 | % |
| | | | 100.0 | % |
Please refer to the Schedule of Investments in this annual report for a detailed listing of the Fund’s holdings.
| Tactical Moderate Allocation Fund |
PORTFOLIO REVIEW (Unaudited)
December 31, 2021
Average Annual Total Return through December 31, 2021*, as compared to its benchmark:
| | One | Since |
| | Year | Inception (a) |
| Tactical Moderate Allocation Fund - Class A | 11.50% | 6.98% |
| Tactical Moderate Allocation Fund - Class I | 11.89% | 7.48% |
| Wilshire Liquid Alternative IndexSM ** | 4.70% | 4.16% |
| * | The performance data quoted here represents past performance. Current performance may be lower or higher than the performance data quoted above. Investment return and principal value will fluctuate, so that shares, when redeemed, may be worth more or less than their original cost. The returns shown do not reflect the deduction of taxes that a shareholder would pay on Fund distributions or on the redemptions of Fund shares. Past performance is no guarantee of future results. Performance figures for periods greater than 1 year are annualized. The Fund’s manager has contractually agreed to waive fees and/or reimburse expenses of the Fund to the extent necessary to limit operating expenses (excluding front-end or contingent deferred loads, taxes, leverage interest, borrowing interest, brokerage commissions, expenses incurred in connection with any merger or reorganization, dividend expenses on securities sold short, underlying fund fees and expenses or extraordinary expenses such as litigation) at 2.14% and 1.89% for Class A shares and Class I shares, respectively, through April 30, 2023. Per the Fund’s most recent prospectus, total annual Fund estimated expenses after waivers are 2.31% and 2.06% for Class A shares and Class I shares, respectively. Without waiver the expense ratios are 2.38%, and 2.13% for Class A shares and Class I shares, respectively. For performance information current to the most recent month-end, please call toll-free 1-833-974-3787. |
| ** | The Wilshire Liquid Alternative IndexSM measures the collective performance of the five Wilshire Liquid Alternative strategies that make up the Wilshire Liquid Alternative Universe. The Wilshire Liquid Alternative Index (WLIQA) is designed to provide a broad measure of the liquid alternative market by combining the performance of the Wilshire Liquid Alternative Equity Hedge IndexSM (WLIQAEH), Wilshire Liquid Alternative Global Macro IndexSM (WLIQAGM), Wilshire Liquid Alternative Relative Value IndexSM (WLIQARV), Wilshire Liquid Alternative Multi-Strategy IndexSM (WLIQAMS), and Wilshire Liquid Alternative Event Driven IndexSM (WLIQAED). Investors cannot invest directly in an index. |
| (a) | Inception date June 10, 2019 |
Comparison of the Change in Value of a $10,000 Investment
| Holdings by Sector | | % of Net Assets | |
| Exchange-Traded Funds | | | | |
| Fixed Income | | | 37.0 | % |
| Mixed Allocation | | | 32.3 | % |
| Equity | | | 18.6 | % |
| Software | | | 0.3 | % |
| Insurance | | | 0.3 | % |
| Internet Media & Services | | | 0.3 | % |
| Retail-Consumer Staples | | | 0.2 | % |
| Semiconductors | | | 0.2 | % |
| Technology Hardware | | | 0.2 | % |
| Medical Equipment & Devices | | | 0.2 | % |
| Short-Term Investments | | | 14.9 | % |
| Other / Cash & Cash Equivalents | | | -4.5 | % |
| | | | 100.0 | % |
Please refer to the Schedule of Investments in this annual report for a detailed listing of the Fund’s holdings.
| Tactical Growth Allocation Fund |
PORTFOLIO REVIEW (Unaudited)
December 31, 2021
Average Annual Total Return through December 31, 2021*, as compared to its benchmark:
| | One | Since |
| | Year | Inception (a) |
| Tactical Growth Allocation Fund - Class A | 16.02% | 10.23% |
| Tactical Growth Allocation Fund - Class I | 16.18% | 10.84% |
| Wilshire Liquid Alternative IndexSM ** | 4.70% | 4.16% |
| * | The performance data quoted here represents past performance. Current performance may be lower or higher than the performance data quoted above. Investment return and principal value will fluctuate, so that shares, when redeemed, may be worth more or less than their original cost. The returns shown do not reflect the deduction of taxes that a shareholder would pay on Fund distributions or on the redemptions of Fund shares. Past performance is no guarantee of future results. Performance figures for periods greater than 1 year are annualized. The Fund’s manager has contractually agreed to waive fees and/or reimburse expenses of the Fund to the extent necessary to limit operating expenses (excluding front-end or contingent deferred loads, taxes, leverage interest, borrowing interest, brokerage commissions, expenses incurred in connection with any merger or reorganization, dividend expenses on securities sold short, underlying fund fees and expenses or extraordinary expenses such as litigation) at 2.14% and 1.89% for Class A shares and Class I shares, respectively, through April 30, 2023. Per the Fund’s most recent prospectus, total annual Fund estimated expenses are 2.30% and 2.05% for Class A shares and Class I shares, respectively. For performance information current to the most recent month-end, please call toll-free 1-833-974-3787. |
| ** | The Wilshire Liquid Alternative IndexSM measures the collective performance of the five Wilshire Liquid Alternative strategies that make up the Wilshire Liquid Alternative Universe. The Wilshire Liquid Alternative Index (WLIQA) is designed to provide a broad measure of the liquid alternative market by combining the performance of the Wilshire Liquid Alternative Equity Hedge IndexSM (WLIQAEH), Wilshire Liquid Alternative Global Macro IndexSM (WLIQAGM), Wilshire Liquid Alternative Relative Value IndexSM (WLIQARV), Wilshire Liquid Alternative Multi-Strategy IndexSM (WLIQAMS), and Wilshire Liquid Alternative Event Driven IndexSM (WLIQAED). Investors cannot invest directly in an index. |
| (a) | Inception date June 10, 2019 |
Comparison of the Change in Value of a $10,000 Investment
| Holdings by Sector | | % of Net Assets | |
| Exchange-Traded Funds | | | | |
| Equity | | | 48.0 | % |
| Fixed Income | | | 21.5 | % |
| Mixed Allocation | | | 8.5 | % |
| Software | | | 1.4 | % |
| Insurance | | | 1.3 | % |
| Internet Media & Services | | | 1.3 | % |
| Retail-Consumer Staples | | | 1.0 | % |
| Medical Equipment & Devices | | | 0.8 | % |
| Semiconductors | | | 0.8 | % |
| Technology Hardware | | | 0.8 | % |
| Short-Term Investments | | | 13.9 | % |
| Other / Cash & Cash Equivalents | | | 0.7 | % |
| | | | 100.0 | % |
Please refer to the Schedule of Investments in this annual report for a detailed listing of the Fund’s holdings.
PORTFOLIO REVIEW (Unaudited)
December 31, 2021
Average Annual Total Return through December 31, 2021*, as compared to its benchmark:
| | One | Since |
| | Year | Inception (a) |
| TFA Quantitative Fund - Class I | 11.02% | 18.20% |
| S&P 500 Total Return Index ** | 28.71% | 36.38% |
| Wilshire Liquid Alternative IndexSM *** | 4.70% | 8.66% |
| * | The performance data quoted here represents past performance. Current performance may be lower or higher than the performance data quoted above. Investment return and principal value will fluctuate, so that shares, when redeemed, may be worth more or less than their original cost. The returns shown do not reflect the deduction of taxes that a shareholder would pay on Fund distributions or on the redemptions of Fund shares. Past performance is no guarantee of future results. Performance figures for periods greater than 1 year are annualized. The Fund’s manager has contractually agreed to waive fees and/or reimburse expenses of the Fund to the extent necessary to limit operating expenses (excluding front-end or contingent deferred loads, taxes, leverage interest, borrowing interest, brokerage commissions, expenses incurred in connection with any merger or reorganization, dividend expenses on securities sold short, underlying fund fees and expenses or extraordinary expenses such as litigation) at 1.89% for Class I shares, through April 30, 2023. Per the Fund’s most recent prospectus, total annual Fund estimated expenses is 2.85% for Class I shares. For performance information current to the most recent month-end, please call toll-free 1-833-974-3787. |
| ** | The S&P 500 Total Return Index, a registered trademark of McGraw-Hill Co., Inc., is a market capitalization-weighted index of 500 widely held common stocks. Investors cannot invest directly in an index. |
| *** | The Wilshire Liquid Alternative IndexSM measures the collective performance of the five Wilshire Liquid Alternative strategies that make up the Wilshire Liquid Alternative Universe. The Wilshire Liquid Alternative Index (WLIQA) is designed to provide a broad measure of the liquid alternative market by combining the performance of the Wilshire Liquid Alternative Equity Hedge IndexSM (WLIQAEH), Wilshire Liquid Alternative Global Macro IndexSM (WLIQAGM), Wilshire Liquid Alternative Relative Value IndexSM (WLIQARV), Wilshire Liquid Alternative Multi-Strategy IndexSM (WLIQAMS), and Wilshire Liquid Alternative Event Driven IndexSM (WLIQAED). Investors cannot invest directly in an index. |
| (a) | Inception date May 18, 2020 |
Comparison of the Change in Value of a $10,000 Investment
| Holdings by Sector | | % of Net Assets | |
| Open End Funds | | | | |
| Mixed Allocation | | | 61.5 | % |
| Equity | | | 41.2 | % |
| Short-Term Investments | | | 14.7 | % |
| Other / Cash & Cash Equivalents | | | -17.4 | % |
| | | | 100.0 | % |
Please refer to the Schedule of Investments in this annual report for a detailed listing of the Fund’s holdings.
| TFA Multidimensional Tactical Fund |
PORTFOLIO REVIEW (Unaudited)
December 31, 2021
Average Annual Total Return through December 31, 2021*, as compared to its benchmark:
| | One | Since |
| | Year | Inception (a) |
| TFA Multidimensional Tactical Fund - Class I | 11.02% | 14.68% |
| S&P 500 Total Return Index ** | 28.71% | 36.38% |
| Wilshire Liquid Alternative IndexSM *** | 4.70% | 8.66% |
| * | The performance data quoted here represents past performance. Current performance may be lower or higher than the performance data quoted above. Investment return and principal value will fluctuate, so that shares, when redeemed, may be worth more or less than their original cost. The returns shown do not reflect the deduction of taxes that a shareholder would pay on Fund distributions or on the redemptions of Fund shares. Past performance is no guarantee of future results. Performance figures for periods greater than 1 year are annualized. The Fund’s manager has contractually agreed to waive fees and/or reimburse expenses of the Fund to the extent necessary to limit operating expenses (excluding front-end or contingent deferred loads, taxes, leverage interest, borrowing interest, brokerage commissions, expenses incurred in connection with any merger or reorganization, dividend expenses on securities sold short, underlying fund fees and expenses or extraordinary expenses such as litigation) at 1.89% for Class I shares, through April 30, 2023. Per the Fund’s most recent prospectus, total annual Fund estimated expenses is 1.79% for Class I shares. For performance information current to the most recent month-end, please call toll-free 1-833-974-3787. |
| ** | The S&P 500 Total Return Index, a registered trademark of McGraw-Hill Co., Inc., is a market capitalization-weighted index of 500 widely held common stocks. Investors cannot invest directly in an index. |
| *** | The Wilshire Liquid Alternative IndexSM measures the collective performance of the five Wilshire Liquid Alternative strategies that make up the Wilshire Liquid Alternative Universe. The Wilshire Liquid Alternative Index (WLIQA) is designed to provide a broad measure of the liquid alternative market by combining the performance of the Wilshire Liquid Alternative Equity Hedge IndexSM (WLIQAEH), Wilshire Liquid Alternative Global Macro IndexSM (WLIQAGM), Wilshire Liquid Alternative Relative Value IndexSM (WLIQARV), Wilshire Liquid Alternative Multi-Strategy IndexSM (WLIQAMS), and Wilshire Liquid Alternative Event Driven IndexSM (WLIQAED). Investors cannot invest directly in an index. |
| (a) | Inception date May 18, 2020 |
Comparison of the Change in Value of a $10,000 Investment
| Holdings by Sector | | % of Net Assets | |
| Exchange-Traded Funds | | | | |
| Fixed Income | | | 23.0 | % |
| Biotech & Pharma | | | 12.0 | % |
| Technology Hardware | | | 9.8 | % |
| Transportation & Logistics | | | 9.8 | % |
| Cable & Satellite | | | 7.3 | % |
| Internet Media & Services | | | 7.2 | % |
| Entertainment Content | | | 4.8 | % |
| Medical Equipment & Devices | | | 4.8 | % |
| Semiconductors | | | 4.8 | % |
| Technology Services | | | 4.8 | % |
| Short-Term Investments | | | 7.3 | % |
| Other / Cash & Cash Equivalents | | | 4.4 | % |
| | | | 100.0 | % |
Please refer to the Schedule of Investments in this annual report for a detailed listing of the Fund’s holdings.
PORTFOLIO REVIEW (Unaudited)
December 31, 2021
Average Annual Total Return through December 31, 2021*, as compared to its benchmark:
| | Since
Inception (a) |
| TFA AlphaGen Growth Fund - Class I | 1.80% |
| S&P 500 Total Return Index ** | 6.91% |
| * | The performance data quoted here represents past performance. Current performance may be lower or higher than the performance data quoted above. Investment return and principal value will fluctuate, so that shares, when redeemed, may be worth more or less than their original cost. The returns shown do not reflect the deduction of taxes that a shareholder would pay on Fund distributions or on the redemptions of Fund shares. Past performance is no guarantee of future results. Performance figures for periods greater than 1 year are annualized. The Fund’s manager has contractually agreed to waive fees and/or reimburse expenses of the Fund to the extent necessary to limit operating expenses (excluding front-end or contingent deferred loads, taxes, leverage interest, borrowing interest, brokerage commissions, expenses incurred in connection with any merger or reorganization, dividend expenses on securities sold short, underlying fund fees and expenses or extraordinary expenses such as litigation) at 1.89% for Class I shares, through April 30, 2023. Per the Fund’s most recent prospectus, total annual Fund estimated expenses is 2.16% for Class I shares. For performance information current to the most recent month-end, please call toll-free 1-833-974-3787. |
| ** | The S&P 500 Total Return Index, a registered trademark of McGraw-Hill Co., Inc., is a market capitalization-weighted index of 500 widely held common stocks. Investors cannot invest directly in an index. |
| (a) | Inception date August 23, 2021 |
Comparison of the Change in Value of a $10,000 Investment
| Holdings by Sector | | % of Net Assets | |
| Exchange-Traded Funds | | | | |
| Equity | | | 67.9 | % |
| Fixed Income | | | 12.5 | % |
| Short-Term Investments | | | 19.9 | % |
| Other / Cash & Cash Equivalents | | | -0.3 | % |
| | | | 100.0 | % |
Please refer to the Schedule of Investments in this annual report for a detailed listing of the Fund’s holdings.
| TFA TACTICAL INCOME FUND |
| SCHEDULE OF INVESTMENTS |
| December 31, 2021 |
| Shares | | | | | Fair Value | |
| | | | | EXCHANGE-TRADED FUNDS — 91.8% | | | | |
| | | | | EQUITY - 2.6% | | | | |
| | 20,400 | | | iShares Mortgage Real Estate ETF | | $ | 704,004 | |
| | | | | | | | | |
| | | | | FIXED INCOME - 89.2% | | | | |
| | 111,780 | | | Direxion Daily 20 Year Plus Treasury Bull 3x | | | 3,145,489 | |
| | 26,970 | | | Invesco Emerging Markets Sovereign Debt Portfolio | | | 710,660 | |
| | 8,160 | | | Invesco Senior Loan ETF | | | 180,336 | |
| | 12,830 | | | ISHARES 0-5 Year TIPS Bond ETF | | | 1,358,440 | |
| | 15,850 | | | iShares 1-3 Year Treasury Bond ETF | | | 1,355,809 | |
| | 10,000 | | | iShares 1-5 Year Investment Grade Corporate Bond ETF(a) | | | 538,800 | |
| | 6,815 | | | iShares 20+ Year Treasury Bond ETF | | | 1,009,915 | |
| | 42,010 | | | iShares 7-10 Year Treasury Bond ETF | | | 4,831,150 | |
| | 6,160 | | | iShares Agency Bond ETF | | | 721,767 | |
| | 9,380 | | | iShares Core International Aggregate Bond ETF | | | 511,491 | |
| | 17,890 | | | iShares Core U.S. Aggregate Bond ETF | | | 2,040,891 | |
| | 18,820 | | | iShares ESG Aware USD Corporate Bond ETF | | | 513,598 | |
| | 5,550 | | | iShares iBoxx $ High Yield Corporate Bond ETF | | | 482,906 | |
| | 3,600 | | | iShares iBoxx $ Investment Grade Corporate Bond ETF | | | 477,072 | |
| | 4,350 | | | iShares JPMorgan USD Emerging Markets Bond ETF | | | 474,411 | |
| | 600 | | | iShares Short Treasury Bond ETF(b) | | | 66,252 | |
| | 23,360 | | | iShares TIPS Bond ETF | | | 3,018,112 | |
| | 19,390 | | | iShares US Treasury Bond ETF | | | 517,325 | |
| | 31,000 | | | PGIM Ultra Short Bond ETF(a) | | | 1,534,190 | |
| | 8,350 | | | Vanguard Total International Bond Index Fund, ETF SHARES | | | 460,586 | |
| | | | | | | | 23,949,200 | |
| | | | | | | | | |
| | | | | TOTAL EXCHANGE-TRADED FUNDS (Cost $24,875,297) | | | 24,653,204 | |
| | | | | | | | | |
| Shares | | | | | Fair Value | |
| | | | | SHORT-TERM INVESTMENTS — 13.6% | | | | |
| | | | | MONEY MARKET FUNDS - 13.6% | | | | |
| | 495 | | | Fidelity Government Portfolio, CLASS I, 0.01%(c) | | | 495 | |
| | 3,659,112 | | | First American Treasury Obligations Fund, Class X, 0.01%(c) | | | 3,659,112 | |
| | | | | TOTAL MONEY MARKET FUNDS (Cost $3,659,607) | | | 3,659,607 | |
| | | | | TOTAL SHORT-TERM INVESTMENTS (Cost $3,659,607) | | | 3,659,607 | |
| | | | | | | | | |
See accompanying notes which are an integral part of these financial statements.
| TFA TACTICAL INCOME FUND |
| SCHEDULE OF INVESTMENTS (Continued) |
| December 31, 2021 |
| Contracts(d) | | | | | Counterparty | | Expiration Date | | Exercise Price | | | Notional Value | | | Fair Value | |
| | | | | INDEX OPTIONS PURCHASED - 1.1% | | | | | | | | | | | | | | | | |
| | | | | CALL OPTIONS PURCHASED - 1.1% | | | | | | | | | | | | | | | | |
| | 15 | | | SPDR S&P 500 ETF Trust | | StoneX | | 01/21/2022 | | $ | 415 | | | $ | 622,500 | | | $ | 91,635 | |
| | 25 | | | SPDR S&P 500 ETF Trust | | StoneX | | 03/18/2022 | | | 440 | | | | 1,100,000 | | | | 104,550 | |
| | 10 | | | SPDR S&P 500 ETF Trust | | StoneX | | 06/17/2022 | | | 434 | | | | 434,000 | | | | 53,175 | |
| | 10 | | | SPDR S&P 500 ETF Trust | | StoneX | | 09/16/2022 | | | 442 | | | | 442,000 | | | | 52,705 | |
| | | | | TOTAL CALL OPTIONS PURCHASED (Cost - $150,373) | | | | | 302,065 | |
| | | | | | | | | | | | | | | | | | | | | |
| | | | | TOTAL INDEX OPTIONS PURCHASED (Cost - $150,373) | | | | | 302,065 | |
| | | | | | | | | | | | | | | | | | | | | |
| | | | | TOTAL INVESTMENTS - 106.5% (Cost $28,685,277) | | | | $ | 28,614,876 | |
| | | | | CALL OPTIONS WRITTEN - (0.1)% (Proceeds - $10,910) | | | | | (33,200 | ) |
| | | | | PUT OPTIONS WRITTEN - (0.1)% (Proceeds - $143,308) | | | | | (35,250 | ) |
| | | | | LIABILITIES IN EXCESS OF OTHER ASSETS - (6.3)% | | | | | (1,701,551 | ) |
| | | | | NET ASSETS - 100.0% | | | | | | | | | | | | | | $ | 26,844,875 | |
| | | | | | | | | | | | | | | | | | | | | |
| Contracts(d) | | | | | Counterparty | | Expiration Date | | Exercise Price | | | Notional Value | | | Fair Value | |
| | | | | WRITTEN INDEX OPTIONS - (0.2)% | | | | | | |
| | | | | CALL OPTIONS WRITTEN- (0.1)% | | | | | | |
| | 10 | | | SPDR S&P 500 ETF Trust | | StoneX | | 06/17/2022 | | $ | 484 | | | $ | 484,000 | | | $ | 16,980 | |
| | 10 | | | SPDR S&P 500 ETF Trust | | StoneX | | 09/16/2022 | | | 500 | | | | 500,000 | | | | 16,220 | |
| | | | | TOTAL CALL OPTIONS WRITTEN (Proceeds - $10,910) | | | | | 33,200 | |
| | | | | | | | | | | | | | | | | | | | | |
| | | | | PUT OPTIONS WRITTEN - (0.1)% | | | | | | |
| | 15 | | | SPDR S&P 500 ETF Trust | | StoneX | | 01/21/2022 | | $ | 415 | | | $ | 622,500 | | | $ | 540 | |
| | 25 | | | SPDR S&P 500 ETF Trust | | StoneX | | 03/18/2022 | | | 440 | | | | 1,100,000 | | | | 14,100 | |
| | 10 | | | SPDR S&P 500 ETF Trust | | StoneX | | 06/17/2022 | | | 403 | | | | 403,000 | | | | 7,990 | |
| | 10 | | | SPDR S&P 500 ETF Trust | | StoneX | | 09/16/2022 | | | 400 | | | | 400,000 | | | | 12,620 | |
| | | | | TOTAL PUT OPTIONS WRITTEN (Proceeds - $143,308) | | | | | 35,250 | |
| | | | | | | | | | | | | | | | | | | | | |
| | | | | TOTAL INDEX OPTIONS WRITTEN (Proceeds - $154,218) | | | | $ | 68,450 | |
| ETF | - Exchange-Traded Fund |
| (a) | All or a portion of the security is held as collateral for written options. |
| (b) | Non-income producing security. |
| (c) | Rate disclosed is the seven day effective yield as of December 31, 2021. |
| (d) | Each option contract allows the holder of the option to purchase or sell 100 shares of the underlying security. |
See accompanying notes which are an integral part of these financial statements.
| TACTICAL MODERATE ALLOCATION FUND |
| SCHEDULE OF INVESTMENTS |
| December 31, 2021 |
| Shares | | | | | Fair Value | |
| | | | | COMMON STOCKS — 2.7% | | | | |
| | | | | AEROSPACE & DEFENSE - 0.1% | | | | |
| | 135 | | | Lockheed Martin Corporation | | $ | 47,980 | |
| | | | | | | | | |
| | | | | BANKING - 0.1% | | | | |
| | 874 | | | Bank OZK | | | 40,667 | |
| | | | | | | | | |
| | | | | BIOTECH & PHARMA - 0.2% | | | | |
| | 329 | | | Johnson & Johnson | | | 56,282 | |
| | | | | | | | | |
| | | | | E-COMMERCE DISCRETIONARY - 0.2% | | | | |
| | 18 | | | Amazon.com, Inc.(a) | | | 60,018 | |
| | | | | | | | | |
| | | | | INSURANCE - 0.3% | | | | |
| | 293 | | | Assurant, Inc. | | | 45,667 | |
| | 204 | | | Berkshire Hathaway, Inc., Class B(a) | | | 60,996 | |
| | | | | | | | 106,663 | |
| | | | | INTERNET MEDIA & SERVICES - 0.3% | | | | |
| | 20 | | | Alphabet, Inc., Class A(a) | | | 57,941 | |
| | 134 | | | Meta Platforms, Inc., Class A(a) | | | 45,071 | |
| | | | | | | | 103,012 | |
| | | | | MEDICAL EQUIPMENT & DEVICES - 0.2% | | | | |
| | 139 | | | ResMed, Inc. | | | 36,206 | |
| | 60 | | | West Pharmaceutical Services, Inc. | | | 28,141 | |
| | | | | | | | 64,347 | |
| | | | | OIL & GAS PRODUCERS - 0.1% | | | | |
| | 907 | | | Ovintiv, Inc. | | | 30,566 | |
| | | | | | | | | |
| | | | | RETAIL - CONSUMER STAPLES - 0.2% | | | | |
| | 55 | | | Costco Wholesale Corporation | | | 31,224 | |
| | 358 | | | Walmart, Inc. | | | 51,799 | |
| | | | | | | | 83,023 | |
| | | | | RETAIL - DISCRETIONARY - 0.1% | | | | |
| | 336 | | | Ross Stores, Inc. | | | 38,398 | |
| | | | | | | | | |
See accompanying notes which are an integral part of these financial statements.
| TACTICAL MODERATE ALLOCATION FUND |
| SCHEDULE OF INVESTMENTS (Continued) |
| December 31, 2021 |
| Shares | | | | | Fair Value | |
| | | | | COMMON STOCKS — 2.7% (Continued) | | | | |
| | | | | SEMICONDUCTORS - 0.2% | | | | |
| | 466 | | | Microchip Technology, Inc. | | $ | 40,570 | |
| | 90 | | | NVIDIA Corporation | | | 26,470 | |
| | | | | | | | 67,040 | |
| | | | | SOFTWARE - 0.3% | | | | |
| | 46 | | | Adobe, Inc.(a) | | | 26,085 | |
| | 247 | | | Microsoft Corporation | | | 83,071 | |
| | | | | | | | 109,156 | |
| | | | | TECHNOLOGY HARDWARE - 0.2% | | | | |
| | 374 | | | Apple, Inc. | | | 66,411 | |
| | | | | | | | | |
| | | | | TECHNOLOGY SERVICES - 0.2% | | | | |
| | 380 | | | Global Payments, Inc. | | | 51,368 | |
| | | | | | | | | |
| | | | | | | | | |
| | | | | TOTAL COMMON STOCKS (Cost $747,444) | | | 924,931 | |
| | | | | | | | | |
| Shares | | | | | Fair Value | |
| | | | | EXCHANGE-TRADED FUNDS — 88.0% | | | | |
| | | | | ALTERNATIVE - 0.1% | | | | |
| | 350 | | | First Trust ETF III-First Trust Long/Short Equity ETF | | | 18,260 | |
| | | | | | | | | |
| | | | | EQUITY - 18.6% | | | | |
| | 508 | | | Direxion Russell 1000 Value Over Growth ETF | | | 30,119 | |
| | 369 | | | First Trust Capital Strength ETF | | | 31,199 | |
| | 433 | | | First Trust NASDAQ Technology Dividend Index Fund | | | 27,214 | |
| | 226 | | | FlexShares Global Quality Real Estate Index Fund | | | 16,751 | |
| | 930 | | | Invesco DB Commodity Index Tracking Fund, N(a) | | | 19,325 | |
| | 162 | | | Invesco S&P 500 Equal Weight | | | 27,505 | |
| | 722 | | | Invesco S&P 500 Equal Weight Real Estate ETF | | | 30,505 | |
| | 239 | | | Invesco S&P 500 Equal Weight Utilities Portfolio | | | 27,285 | |
| | 402 | | | Invesco S&P 500 Low Volatility ETF | | | 27,589 | |
| | 137 | | | iShares DJ US Consumer | | | 27,425 | |
| | 645 | | | iShares MSCI Global Metals & Mining Producers ETF | | | 27,490 | |
| | 650 | | | iShares S&P 500 Growth ETF | | | 54,386 | |
See accompanying notes which are an integral part of these financial statements.
| TACTICAL MODERATE ALLOCATION FUND |
| SCHEDULE OF INVESTMENTS (Continued) |
| December 31, 2021 |
| Shares | | | | | Fair Value | |
| | | | | EXCHANGE-TRADED FUNDS — 88.0% (Continued) | | | | |
| | | | | EQUITY - 18.6% (Continued) | | | | |
| | 589 | | | O’Shares US Quality Dividend ETF | | $ | 27,430 | |
| | 1,080 | | | ProShares Ultra QQQ(a) | | | 96,142 | |
| | 1,320 | | | ProShares Ultra Russell2000(a) | | | 73,286 | |
| | 180 | | | ProShares Ultra S&P500 | | | 26,347 | |
| | 320 | | | SPDR Dow Jones Global Real Estate ETF | | | 18,090 | |
| | 920 | | | Vanguard FTSE All-World ex-US ETF | | | 56,378 | |
| | 710 | | | Vanguard FTSE Developed Markets ETF | | | 36,253 | |
| | 490 | | | Vanguard FTSE Emerging Markets ETF | | | 24,235 | |
| | 80 | | | Vanguard Growth ETF | | | 25,672 | |
| | 130 | | | Vanguard Large-Cap ETF | | | 28,733 | |
| | 20,461 | | | Vanguard Mega Cap Growth ETF(a) | | | 5,335,409 | |
| | 160 | | | Vanguard Mid-Cap ETF | | | 40,763 | |
| | 90 | | | Vanguard Real Estate ETF | | | 10,441 | |
| | 140 | | | Vanguard Russell 2000 ETF | | | 12,573 | |
| | 1,430 | | | Vanguard Total Stock Market ETF | | | 345,258 | |
| | 190 | | | Vanguard Value ETF | | | 27,951 | |
| | | | | | | | 6,531,754 | |
| | | | | FIXED INCOME - 37.0% | | | | |
| | 892 | | | First Trust Enhanced Short Maturity ETF | | | 53,342 | |
| | 899 | | | iShares 20+ Year Treasury Bond ETF | | | 133,223 | |
| | 39,801 | | | iShares Convertible Bond ETF(a) | | | 3,549,452 | |
| | 2,439 | | | iShares Core International Aggregate Bond ETF | | | 132,999 | |
| | 310 | | | iShares Core U.S. Aggregate Bond ETF | | | 35,365 | |
| | 4,895 | | | iShares ESG Aware USD Corporate Bond ETF | | | 133,585 | |
| | 1,400 | | | iShares TIPS Bond ETF | | | 180,880 | |
| | 5,043 | | | iShares US Treasury Bond ETF | | | 134,547 | |
| | 20,000 | | | PGIM Ultra Short Bond ETF(b) | | | 989,800 | |
| | 89,855 | | | SPDR Bloomberg Convertible Securities ETF | | | 7,454,370 | |
| | 110 | | | Vanguard Long-Term Bond | | | 11,321 | |
| | 240 | | | Vanguard Short-Term Bond ETF | | | 19,399 | |
| | 990 | | | Vanguard Total Bond Market ETF | | | 83,903 | |
| | 630 | | | Vanguard Total International Bond Index Fund, ETF SHARES | | | 34,751 | |
| | | | | | | | 12,946,937 | |
| | | | | | | | | |
See accompanying notes which are an integral part of these financial statements.
| TACTICAL MODERATE ALLOCATION FUND |
| SCHEDULE OF INVESTMENTS (Continued) |
| December 31, 2021 |
| Shares | | | | | Fair Value | |
| | | | | EXCHANGE-TRADED FUNDS — 88.0% (Continued) | | | | |
| | | | | MIXED ALLOCATION - 32.3% | | | | |
| | 107,904 | | | HCM Defender 100 Index ETF(a) | | $ | 6,082,548 | |
| | 113,041 | | | HCM Defender 500 Index ETF(a) | | | 5,221,364 | |
| | | | | | | | 11,303,912 | |
| | | | | | | | | |
| | | | | TOTAL EXCHANGE-TRADED FUNDS (Cost $30,156,450) | | | 30,800,863 | |
| | | | | | | | | |
| Shares | | | | | Fair Value | |
| | | | | SHORT-TERM INVESTMENTS — 14.9% | | | | |
| | | | | MONEY MARKET FUNDS - 14.9% | | | | |
| | 25 | | | Fidelity Government Portfolio, CLASS I, 0.01%(c) | | | 25 | |
| | 5,220,769 | | | First American Treasury Obligations Fund, Class X, 0.01%(c) | | | 5,220,769 | |
| | | | | TOTAL MONEY MARKET FUNDS (Cost $5,220,794) | | | 5,220,794 | |
| | | | | | | | | |
| | | | | TOTAL SHORT-TERM INVESTMENTS (Cost $5,220,794) | | | 5,220,794 | |
| Contracts(d) | | | | | Counterparty | | Expiration Date | | Exercise Price | | | Notional Value | | | Fair Value | |
| | | | | INDEX OPTIONS PURCHASED - 0.4% | | |
| | | | | CALL OPTIONS PURCHASED - 0.4% | | |
| | 20 | | | SPDR S&P 500 ETF Trust | | StoneX | | 01/21/2022 | | $ | 466 | | | $ | 932,000 | | | $ | 24,540 | |
| | 15 | | | SPDR S&P 500 ETF Trust | | StoneX | | 06/17/2022 | | | 435 | | | | 652,500 | | | | 79,725 | |
| | 10 | | | SPDR S&P 500 ETF Trust | | StoneX | | 03/18/2022 | | | 457 | | | | 457,000 | | | | 27,370 | |
| | | | | TOTAL CALL OPTIONS PURCHASED (Cost - $83,769) | | | | | 131,635 | |
| | | | | | | | | | | | | | | | | | | | | |
| | | | | PUT OPTIONS PURCHASED - 0.0%(e) | | | | | | |
| | 20 | | | SPDR S&P 500 ETF Trust | | StoneX | | 01/21/2022 | | $ | 415 | | | $ | 830,000 | | | $ | 720 | |
| | 10 | | | SPDR S&P 500 ETF Trust | | StoneX | | 03/18/2022 | | | 420 | | | | 420,000 | | | | 3,800 | |
| | | | | TOTAL PUT OPTIONS PURCHASED (Cost - $13,836) | | | | | 4,520 | |
| | | | | | | | | | | | | | | | | | | | | |
| | | | | TOTAL INDEX OPTIONS PURCHASED (Cost - $97,605) | | | | | 136,155 | |
| | | | | | | | | | | | | | | | | | | | | |
| | | | | TOTAL INVESTMENTS – 106.0% (Cost $36,222,293) | | | | $ | 37,082,743 | |
| | | | | CALL OPTIONS WRITTEN - (0.1)% (Proceeds - $17,599) | | | | | (28,680 | ) |
| | | | | PUT OPTIONS WRITTEN – (0.1)% (Proceeds - $71,144) | | | | | | (24,490 | ) |
| | | | | LIABILITIES IN EXCESS OF OTHER ASSETS - (5.8)% | | | | | (2,033,352 | ) |
| | | | | NET ASSETS - 100.0% | | | | $ | 34,996,221 | |
| | | | | | | | | | | | | | | | | | | | | |
See accompanying notes which are an integral part of these financial statements.
| TACTICAL MODERATE ALLOCATION FUND |
| SCHEDULE OF INVESTMENTS (Continued) |
| December 31, 2021 |
| Contracts(d) | | | | | Counterparty | | Expiration Date | | Exercise Price | | | Notional Value | | | Fair Value | |
| | | | | WRITTEN INDEX OPTIONS - (0.1)% | | | |
| | | | | CALL OPTIONS WRITTEN- (0.1)% | | |
| | 15 | | | SPDR S&P 500 ETF Trust | | StoneX | | 06/17/2022 | | $ | 485 | | | $ | 727,500 | | | $ | 24,570 | |
| | 10 | | | SPDR S&P 500 ETF Trust | | StoneX | | 03/18/2022 | | | 499 | | | | 499,000 | | | | 3,010 | |
| | 20 | | | SPDR S&P 500 EFT Trust | | StoneX | | 01/21/2022 | | | 490 | | | | 980,000 | | | | 1,100 | |
| | | | | TOTAL CALL OPTIONS WRITTEN (Proceeds - $17,599) | | | | | 28,680 | |
| | | | | | | | | | | | | | | | | | | | | |
| | | | | PUT OPTIONS WRITTEN - (0.1)% | | | | | | |
| | 15 | | | SPDR S&P 500 ETF Trust | | StoneX | | 06/17/2022 | | $ | 390 | | | $ | 585,000 | | | $ | 10,020 | |
| | 10 | | | SPDR S&P 500 ETF Trust | | StoneX | | 03/18/2022 | | | 457 | | | | 457,000 | | | | 8,390 | |
| | 20 | | | SPDR S&P 500 EFT Trust | | StoneX | | 01/21/2022 | | | 466 | | | | 932,000 | | | | 6,080 | |
| | | | | TOTAL PUT OPTIONS WRITTEN (Proceeds - $71,144) | | | | | 24,490 | |
| | | | | | | | | | | | | | | | | | | | | |
| | | | | TOTAL INDEX OPTIONS WRITTEN (Proceeds - $88,743) | | | | $ | 53,170 | |
| ETF | - Exchange-Traded Fund |
| (a) | Non-income producing security. |
| (b) | All or a portion of the security is held as collateral for written options. |
| (c) | Rate disclosed is the seven day effective yield as of December 31, 2021. |
| (d) | Each option contract allows the holder of the option to purchase or sell 100 shares of the underlying security. |
| (e) | Percentage rounds to less than 0.1%. |
See accompanying notes which are an integral part of these financial statements.
| TACTICAL GROWTH ALLOCATION FUND |
| SCHEDULE OF INVESTMENTS |
| December 31, 2021 |
| Shares | | | | | Fair Value | |
| | | | | COMMON STOCKS — 11.4% | | | | |
| | | | | AEROSPACE & DEFENSE - 0.6% | | | | |
| | 992 | | | Lockheed Martin Corporation | | $ | 352,567 | |
| | | | | | | | | |
| | | | | BANKING - 0.5% | | | | |
| | 6,396 | | | Bank OZK | | | 297,606 | |
| | | | | | | | | |
| | | | | BIOTECH & PHARMA - 0.7% | | | | |
| | 2,413 | | | Johnson & Johnson | | | 412,792 | |
| | | | | | | | | |
| | | | | E-COMMERCE DISCRETIONARY - 0.7% | | | | |
| | 122 | | | Amazon.com, Inc.(a) | | | 406,790 | |
| | | | | | | | | |
| | | | | INSURANCE - 1.3% | | | | |
| | 2,150 | | | Assurant, Inc. | | | 335,099 | |
| | 1,499 | | | Berkshire Hathaway, Inc., Class B(a) | | | 448,200 | |
| | | | | | | | 783,299 | |
| | | | | INTERNET MEDIA & SERVICES - 1.3% | | | | |
| | 146 | | | Alphabet, Inc., Class A(a) | | | 422,968 | |
| | 985 | | | Meta Platforms, Inc., Class A(a) | | | 331,305 | |
| | | | | | | | 754,273 | |
| | | | | MEDICAL EQUIPMENT & DEVICES - 0.8% | | | | |
| | 1,025 | | | ResMed, Inc. | | | 266,992 | |
| | 448 | | | West Pharmaceutical Services, Inc. | | | 210,116 | |
| | | | | | | | 477,108 | |
| | | | | OIL & GAS PRODUCERS - 0.4% | | | | |
| | 6,648 | | | Ovintiv, Inc. | | | 224,038 | |
| | | | | | | | | |
| | | | | RETAIL - CONSUMER STAPLES - 1.0% | | | | |
| | 408 | | | Costco Wholesale Corporation | | | 231,622 | |
| | 2,624 | | | Walmart, Inc. | | | 379,666 | |
| | | | | | | | 611,288 | |
| | | | | RETAIL - DISCRETIONARY - 0.5% | | | | |
| | 2,461 | | | Ross Stores, Inc. | | | 281,243 | |
See accompanying notes which are an integral part of these financial statements.
TACTICAL GROWTH ALLOCATION FUND
SCHEDULE OF INVESTMENTS (Continued)
December 31, 2021
| Shares | | | | | Fair Value | |
| | | | | COMMON STOCKS — 11.4% (Continued) | | | | |
| | | | | SEMICONDUCTORS - 0.8% | | | | |
| | 3,414 | | | Microchip Technology, Inc. | | $ | 297,223 | |
| | 664 | | | NVIDIA Corporation | | | 195,289 | |
| | | | | | | | 492,512 | |
| | | | | SOFTWARE - 1.4% | | | | |
| | 342 | | | Adobe, Inc.(a) | | | 193,935 | |
| | 1,815 | | | Microsoft Corporation | | | 610,420 | |
| | | | | | | | 804,355 | |
| | | | | TECHNOLOGY HARDWARE - 0.8% | | | | |
| | 2,741 | | | Apple, Inc. | | | 486,719 | |
| | | | | | | | | |
| | | | | TECHNOLOGY SERVICES - 0.6% | | | | |
| | 2,785 | | | Global Payments, Inc. | | | 376,476 | |
| | | | | | | | | |
| | | | | | | | | |
| | | | | TOTAL COMMON STOCKS (Cost $5,537,625) | | | 6,761,066 | |
| | | | | | | | | |
| Shares | | | | | Fair Value | |
| | | | | EXCHANGE-TRADED FUNDS — 78.4% | | | | |
| | | | | ALTERNATIVE - 0.4% | | | | |
| | 4,900 | | | First Trust ETF III-First Trust Long/Short Equity | | | 255,633 | |
| | | | | | | | | |
| | | | | EQUITY – 48.0% | | | | |
| | 1,800 | | | Communication Services Select Sector SPDR Fund | | | 139,824 | |
| | 990 | | | Consumer Discretionary Select Sector SPDR Fund | | | 202,396 | |
| | 1,246 | | | Direxion Russell 1000 Value Over Growth ETF | | | 73,874 | |
| | 4,920 | | | Financial Select Sector SPDR Fund | | | 192,126 | |
| | 906 | | | First Trust Capital Strength ETF | | | 76,602 | |
| | 1,063 | | | First Trust NASDAQ Technology Dividend Index Fund | | | 66,810 | |
| | 529 | | | FlexShares Global Quality Real Estate Index Fund | | | 39,209 | |
| | 660 | | | Health Care Select Sector SPDR Fund | | | 92,987 | |
| | 740 | | | Industrial Select Sector SPDR Fund | | | 78,299 | |
| | 12,315 | | | Invesco DB Commodity Index Tracking Fund, N(a) | | | 255,905 | |
| | 398 | | | Invesco S&P 500 Equal Weight | | | 67,573 | |
| | 1,773 | | | Invesco S&P 500 Equal Weight Real Estate ETF | | | 74,910 | |
| | | | | | | | | |
See accompanying notes which are an integral part of these financial statements.
| TACTICAL GROWTH ALLOCATION FUND |
| SCHEDULE OF INVESTMENTS (Continued) |
| December 31, 2021 |
| Shares | | | | | Fair Value | |
| | | | | EXCHANGE-TRADED FUNDS — 78.4% (Continued) | | | | |
| | | | | EQUITY – 48.0% (Continued) | | | | |
| | 588 | | | Invesco S&P 500 Equal Weight Utilities Portfolio | | $ | 67,128 | |
| | 986 | | | Invesco S&P 500 Low Volatility ETF | | | 67,669 | |
| | 4,186 | | | iShares Core MSCI Emerging Markets ETF | | | 250,574 | |
| | 337 | | | iShares DJ US Consumer | | | 67,461 | |
| | 1,582 | | | iShares MSCI Global Metals & Mining Producers ETF | | | 67,425 | |
| | 12,140 | | | iShares S&P 500 Growth ETF | | | 1,015,754 | |
| | 5,499 | | | iShares Semiconductor ETF | | | 2,982,218 | |
| | 1,447 | | | O’Shares US Quality Dividend ETF | | | 67,387 | |
| | 74,723 | | | ProShares Ultra QQQ(a) | | | 6,651,841 | |
| | 27,040 | | | ProShares Ultra Russell2000(a) | | | 1,501,261 | |
| | 22,054 | | | ProShares Ultra S&P500 | | | 3,228,044 | |
| | 4,450 | | | SPDR Dow Jones Global Real Estate ETF | | | 251,559 | |
| | 2,000 | | | SPDR S&P 500 ETF Trust | | | 949,920 | |
| | 2,250 | | | Technology Select Sector SPDR Fund | | | 391,208 | |
| | 19,844 | | | Vanguard FTSE All-World ex-US ETF | | | 1,216,040 | |
| | 9,520 | | | Vanguard FTSE Developed Markets ETF | | | 486,091 | |
| | 11,303 | | | Vanguard FTSE Emerging Markets ETF | | | 559,046 | |
| | 1,800 | | | Vanguard Growth ETF | | | 577,620 | |
| | 2,650 | | | Vanguard Large-Cap ETF | | | 585,703 | |
| | 3,260 | | | Vanguard Mid-Cap ETF | | | 830,550 | |
| | 4,464 | | | Vanguard Russell 2000 ETF | | | 400,912 | |
| | 17,270 | | | Vanguard Total Stock Market ETF | | | 4,169,669 | |
| | 4,090 | | | Vanguard Value ETF | | | 601,680 | |
| | | | | | | | 28,347,275 | |
| | | | | FIXED INCOME - 21.5% | | | | |
| | 2,191 | | | First Trust Enhanced Short Maturity ETF | | | 131,022 | |
| | 56,261 | | | iShares 1-5 Year Investment Grade Corporate Bond ETF(b) | | | 3,031,343 | |
| | 2,206 | | | iShares 20+ Year Treasury Bond ETF | | | 326,907 | |
| | 5,988 | | | iShares Core International Aggregate Bond ETF | | | 326,526 | |
| | 4,320 | | | iShares Core U.S. Aggregate Bond ETF | | | 492,826 | |
| | 12,015 | | | iShares ESG Aware USD Corporate Bond ETF | | | 327,889 | |
| | 4,660 | | | iShares TIPS Bond ETF | | | 602,072 | |
| | 12,378 | | | iShares US Treasury Bond ETF | | | 330,245 | |
| | 72,000 | | | PGIM Ultra Short Bond ETF(b) | | | 3,563,280 | |
See accompanying notes which are an integral part of these financial statements.
| TACTICAL GROWTH ALLOCATION FUND |
| SCHEDULE OF INVESTMENTS (Continued) |
| December 31, 2021 |
| Shares | | | | | | | | | | | | | Fair Value | |
| | | | | EXCHANGE-TRADED FUNDS — 78.4% (Continued) | | | | |
| | | | | FIXED INCOME - 21.5% (Continued) | | | | | | | | | | | | |
| | 41,400 | | | Vanguard Short-Term Corporate Bond ETF | | $ | 3,364,164 | |
| | 2,495 | | | Vanguard Total Bond Market ETF | | | 211,451 | |
| | | | | | | | | | | | | | | | 12,707,725 | |
| | | | | MIXED ALLOCATION - 8.5% | | | | |
| | 49,239 | | | HCM Defender 100 Index ETF(a) | | | 2,775,602 | |
| | 49,025 | | | HCM Defender 500 Index ETF(a) | | | 2,264,465 | |
| | | | | | | | | | | | | | | | 5,040,067 | |
| | | | | | | | | | | | | | | | | |
| | | | | TOTAL EXCHANGE-TRADED FUNDS (Cost $43,491,712) | | | 46,350,700 | |
| | | | | | | | | | | | | | | | | |
| Principal | | | | | Coupon Rate | | | | | | | |
| Amount ($) | | | | | (%) | | | Maturity | | | Fair Value | |
| | | | | CORPORATE BONDS — 0.5% | | | | | | | | | | | | |
| | | | | BANKING — 0.5% | | | | | | | | | | | | |
| | 300,000 | | | HSBC Holdings PLC | | | 2.6500 | | | | 01/05/22 | | | | 300,019 | |
| | | | | | | | | | | | | | | | | |
| | | | | TOTAL CORPORATE BONDS (Cost $300,015) | | | | | | | | | | | 300,019 | |
| | | | | | | | | | | | | | | | | |
| Shares | | | | | | | | | | | | | Fair Value | |
| | | | | SHORT-TERM INVESTMENTS — 13.9% | | | | | | | | | | | | |
| | | | | MONEY MARKET FUNDS - 13.9% | | | | | | | | | | | | |
| | 738 | | | Fidelity Government Portfolio, CLASS I, 0.01%(c) | | | | | | | | | | | 738 | |
| | 8,207,507 | | | First American Treasury Obligations Fund, Class X, 0.01%(c) | | | | | | | | | | | 8,207,507 | |
| | | | | TOTAL MONEY MARKET FUNDS (Cost $8,208,245) | | | | | | | | | | | 8,208,245 | |
| | | | | | | | | | | | | | | | | |
| | | | | TOTAL SHORT-TERM INVESTMENTS (Cost $8,208,245) | | | | | | | | | | | 8,208,245 | |
| Contracts(d) | | | | | Counterparty | | Expiration Date | | Exercise Price | | | Notional Value | | | Fair Value | |
| | | | | INDEX OPTIONS PURCHASED - 2.2% | | | | | | | | | | | | | | | | |
| | | | | CALL OPTIONS PURCHASED - 2.1% | | | | | | | | | | | | | | | | |
| | 25 | | | SPDR S&P 500 ETF Trust | | StoneX | | 02/18/2022 | | $ | 447 | | | $ | 1,117,500 | | | $ | 81,950 | |
| | 25 | | | SPDR S&P 500 ETF Trust | | StoneX | | 03/18/2022 | | | 420 | | | | 1,050,000 | | | | 148,075 | |
| | 30 | | | SPDR S&P 500 ETF Trust | | StoneX | | 06/17/2022 | | | 423 | | | | 1,269,000 | | | | 187,155 | |
| | 20 | | | SPDR S&P 500 ETF Trust | | StoneX | | 06/17/2022 | | | 424 | | | | 848,000 | | | | 123,070 | |
| | 20 | | | SPDR S&P 500 ETF Trust | | StoneX | | 06/17/2022 | | | 434 | | | | 868,000 | | | | 106,350 | |
| | 20 | | | SPDR S&P 500 ETF Trust | | StoneX | | 01/21/2022 | | | 468 | | | | 936,000 | | | | 21,500 | |
| | 10 | | | SPDR S&P 500 ETF Trust | | StoneX | | 02/18/2022 | | | 446 | | | | 446,000 | | | | 33,370 | |
| | 15 | | | SPDR S&P 500 ETF Trust | | StoneX | | 02/18/2022 | | | 463 | | | | 694,500 | | | | 29,715 | |
See accompanying notes which are an integral part of these financial statements.
| TACTICAL GROWTH ALLOCATION FUND |
| SCHEDULE OF INVESTMENTS (Continued) |
| December 31, 2021 |
| Contracts(d) | | | | | Counterparty | | | Expiration Date | | Exercise Price | | | Notional Value | | Fair Value | |
| | | | | INDEX OPTIONS PURCHASED - 2.2% (Continued) | | | | | | | | | | | |
| | | | | CALL OPTIONS PURCHASED - 2.1% (Continued) | | | | | | | | | | | |
| | 25 | | | SPDR S&P 500 ETF Trust | | | StoneX | | | 01/21/2022 | | $ | 469 | | | $ | 1,172,500 | | $ | 24,475 | |
| | 35 | | | SPDR S&P 500 ETF Trust | | | StoneX | | | 06/17/2022 | | | 468 | | | | 1,638,000 | | | 95,025 | |
| | 23 | | | SPDR S&P 500 ETF Trust | | | StoneX | | | 09/16/2022 | | | 433 | | | | 995,900 | | | 137,230 | |
| | 20 | | | SPDR S&P 500 ETF Trust | | | StoneX | | | 09/16/2022 | | | 434 | | | | 868,000 | | | 117,760 | |
| | 15 | | | SPDR S&P 500 ETF Trust | | | StoneX | | | 09/16/2022 | | | 435 | | | | 652,500 | | | 87,158 | |
| | 20 | | | SPDR S&P 500 ETF Trust | | | StoneX | | | 09/16/2022 | | | 470 | | | | 940,000 | | | 66,200 | |
| | | | | TOTAL CALL OPTIONS PURCHASED (Cost - $727,896) | | | | | | | | | 1,259,033 | |
| | | | | | | | | | | | | | | | | | | | | | |
| | | | | PUT OPTIONS PURCHASED - 0.1% | | | | | | | | | | |
| | 45 | | | SPDR S&P 500 ETF Trust | | | StoneX | | | 01/21/2022 | | $ | 420 | | | $ | 1,890,000 | | $ | 1,890 | |
| | 50 | | | SPDR S&P 500 ETF Trust | | | StoneX | | | 02/18/2022 | | | 425 | | | | 2,125,000 | | | 9,850 | |
| | 20 | | | SPDR S&P 500 ETF Trust | | | StoneX | | | 03/31/2022 | | | 445 | | | | 890,000 | | | 15,460 | |
| | 15 | | | SPDR S&P 500 ETF Trust | | | StoneX | | | 06/17/2022 | | | 410 | | | | 615,000 | | | 13,110 | |
| | 20 | | | SPDR S&P 500 ETF Trust | | | StoneX | | | 06/17/2022 | | | 415 | | | | 830,000 | | | 18,940 | |
| | | | | TOTAL PUT OPTIONS PURCHASED (Cost - $94,094) | | | | | | | | | | 59,250 | |
| | | | | | | | | | | | | | | | | | | | | | |
| | | | | TOTAL INDEX OPTIONS PURCHASED (Cost - $821,990) | | | | | | | | | | 1,318,283 | |
| | | | | | | | | | | | | | | | | | | | | | |
| | | | | TOTAL INVESTMENTS - 106.4% (Cost $58,359,587) | | | | | | | | | $ | 62,938,313 | |
| | | | | CALL OPTIONS WRITTEN - (0.3)% (Proceeds - $102,323) | | | | | | | | | | (172,969 | ) |
| | | | | PUT OPTIONS WRITTEN - (0.5)% (Proceeds - $639,326) | | | | | | | | | | (286,985 | ) |
| | | | | LIABILITIES IN EXCESS OF OTHER ASSETS - (5.6)% | | | | | | | | | | (3,343,656 | ) |
| | | | | NET ASSETS - 100.0% | | | | | | | | | $ | 59,134,703 | |
| Contracts(d) | | | | | Counterparty | | | Expiration Date | | Exercise Price | | | Notional Value | | Fair Value | |
| | | | | WRITTEN INDEX OPTIONS - (0.8)% | | | | | | | | | | |
| | | | | CALL OPTIONS WRITTEN - (0.3)% | | | | | | | | | | |
| | 20 | | | SPDR S&P 500 ETF Trust | | StoneX | | | 06/17/2022 | | $ | 500 | | | $ | 1,000,000 | | $ | 18,600 | |
| | 45 | | | SPDR S&P 500 ETF Trust | | StoneX | | | 06/17/2022 | | | 505 | | | | 2,272,500 | | | 34,200 | |
| | 20 | | | SPDR S&P 500 ETF Trust | | StoneX | | | 06/17/2022 | | | 520 | | | | 1,040,000 | | | 7,580 | |
| | 45 | | | SPDR S&P 500 ETF Trust | | StoneX | | | 01/21/2022 | | | 496 | | | | 2,232,000 | | | 1,080 | |
| | 50 | | | SPDR S&P 500 ETF Trust | | StoneX | | | 02/18/2022 | | | 497 | | | | 2,485,000 | | | 6,750 | |
| | 20 | | | SPDR S&P 500 ETF Trust | | StoneX | | | 03/31/2022 | | | 484 | | | | 968,000 | | | 19,620 | |
| | 20 | | | SPDR S&P 500 ETF Trust | | StoneX | | | 06/17/2022 | | | 503 | | | | 1,006,000 | | | 16,260 | |
| | 23 | | | SPDR S&P 500 ETF Trust | | StoneX | | | 09/16/2022 | | | 510 | | | | 1,173,000 | | | 25,979 | |
| | 35 | | | SPDR S&P 500 ETF Trust | | StoneX | | | 09/16/2022 | | | 515 | | | | 1,802,500 | | | 34,720 | |
| | 20 | | | SPDR S&P 500 ETF Trust | | StoneX | | | 09/16/2022 | | | 540 | | | | 1,080,000 | | | 8,180 | |
| | | | | TOTAL CALL OPTIONS WRITTEN (Proceeds - $102,323) | | | | | | | | | 172,969 | |
| | | | | | | | | | | | | | | | | | | | | |
| | | | | PUT OPTIONS WRITTEN - (0.5)% | | | | | | | | | | |
| | 25 | | | SPDR S&P 500 ETF Trust | | StoneX | | | 02/18/2022 | | $ | 447 | | | $ | 1,117,500 | | $ | 9,525 | |
| | 25 | | | SPDR S&P 500 ETF Trust | | StoneX | | | 03/18/2022 | | | 400 | | | | 1,000,000 | | | 6,150 | |
See accompanying notes which are an integral part of these financial statements.
| TACTICAL GROWTH ALLOCATION FUND |
| SCHEDULE OF INVESTMENTS (Continued) |
| December 31, 2021 |
| Contracts(d) | | | | | | | | | | | | | | | | | |
| (continued) | | | | | Counterparty | | | Expiration Date | | Exercise Price | | | Notional Value | | | Fair Value | |
| | | | | WRITTEN INDEX OPTIONS - (0.8)% | | | | | | | | | | | | |
| | | | | PUT OPTIONS WRITTEN - (0.5)% (Continued) | | | | | | | | | | | | |
| | 20 | | | SPDR S&P 500 ETF Trust | | | StoneX | | | 06/17/2022 | | $ | 385 | | | $ | 770,000 | | | $ | 12,620 | |
| | 30 | | | SPDR S&P 500 ETF Trust | | | StoneX | | | 06/17/2022 | | | 390 | | | | 1,170,000 | | | | 20,040 | |
| | 20 | | | SPDR S&P 500 ETF Trust | | | StoneX | | | 06/17/2022 | | | 408 | | | | 816,000 | | | | 17,200 | |
| | 25 | | | SPDR S&P 500 ETF Trust | | | StoneX | | | 01/21/2022 | | | 469 | | | | 1,172,500 | | | | 8,950 | |
| | 20 | | | SPDR S&P 500 ETF Trust | | | StoneX | | | 01/21/2022 | | | 468 | | | | 936,000 | | | | 6,820 | |
| | 10 | | | SPDR S&P 500 ETF Trust | | | StoneX | | | 02/18/2022 | | | 446 | | | | 446,000 | | | | 3,650 | |
| | 15 | | | SPDR S&P 500 ETF Trust | | | StoneX | | | 02/18/2022 | | | 463 | | | | 694,500 | | | | 8,910 | |
| | 20 | | | SPDR S&P 500 ETF Trust | | | StoneX | | | 03/31/2022 | | | 375 | | | | 750,000 | | | | 3,860 | |
| | 35 | | | SPDR S&P 500 ETF Trust | | | StoneX | | | 06/17/2022 | | | 468 | | | | 1,638,000 | | | | 72,450 | |
| | 58 | | | SPDR S&P 500 ETF Trust | | | StoneX | | | 09/16/2022 | | | 405 | | | | 2,349,000 | | | | 78,010 | |
| | 20 | | | SPDR S&P 500 ETF Trust | | | StoneX | | | 09/16/2022 | | | 435 | | | | 870,000 | | | | 38,800 | |
| | | | | TOTAL PUT OPTIONS WRITTEN (Proceeds - $639,326) | | | | | | | | | | | 286,985 | |
| | | | | | | | | | | | | | | | | | | | | | | |
| | | | | TOTAL INDEX OPTIONS WRITTEN (Proceeds - $741,649) | | | | $ | 459,954 | |
ETF - Exchange-Traded Fund
PLC - Public Limited Company
| (a) | Non-income producing security. |
| (b) | All or a portion of the security is held as collateral for written options. |
| (c) | Rate disclosed is the seven day effective yield as of December 31, 2021. |
| (d) | Each option contract allows the holder of the option to purchase or sell 100 shares of the underlying security. |
See accompanying notes which are an integral part of these financial statements.
| TFA QUANTITATIVE FUND |
| SCHEDULE OF INVESTMENTS |
| December 31, 2021 |
| Shares | | | | | Fair Value | |
| | | | | OPEN END FUNDS — 102.7% | | | | |
| | | | | EQUITY - 41.2% | | | | |
| | 21,348 | | | Rydex Nasdaq 100 2X Strategy Fund, Class H | | $ | 10,243,266 | |
| | 18,946 | | | Rydex Russell 2000 2x Strategy Fund, Class H (a) | | | 4,152,136 | |
| | | | | | | | 14,395,402 | |
| | | | | MIXED ALLOCATION - 61.5% | | | | |
| | 148,725 | | | Rydex Series Trust - Nova Fund, Investor Class (a) | | | 21,510,087 | |
| | | | | | | | | |
| | | | | | | | | |
| | | | | TOTAL OPEN END FUNDS (Cost $35,000,000) | | | 35,905,489 | |
| Shares | | | | | Fair Value | |
| | | | | SHORT-TERM INVESTMENTS — 14.7% | | | | |
| | | | | MONEY MARKET FUNDS – 14.7% | | | | |
| | 2,092,108 | | | First American Treasury Obligations Fund, Class X, 0.01%(b) | | | 2,092,108 | |
| | 3,055,026 | | | Rydex U.S. Government Money Market Fund, Money Market Class, 0.00%(b) | | | 3,055,026 | |
| | | | | TOTAL MONEY MARKET FUNDS (Cost $5,147,134) | | | 5,147,134 | |
| | | | | | | | | |
| | | | | TOTAL SHORT-TERM INVESTMENTS (Cost $5,147,134) | | | 5,147,134 | |
| | | | | | | | | |
| | | | | TOTAL INVESTMENTS - 117.4% (Cost $40,147,134) | | $ | 41,052,623 | |
| | | | | LIABILITIES IN EXCESS OF OTHER ASSETS - (17.4)% | | | (6,100,023 | ) |
| | | | | NET ASSETS - 100.0% | | $ | 34,952,600 | |
| (a) | Affiliated Company – Tactical Growth Allocation Fund holds in excess of 5% of outstanding voting securities of this security. |
| (b) | Rate disclosed is the seven day effective yield as of December 31, 2021. |
See accompanying notes which are an integral part of these financial statements.
| TFA MULTIDIMENSIONAL TACTICAL FUND |
| SCHEDULE OF INVESTMENTS |
| December 31, 2021 |
| Shares | | | | | Fair Value | |
| | | | | COMMON STOCKS — 91.7% | | | | |
| | | | | BEVERAGES - 2.5% | | | | |
| | 4,130 | | | PepsiCo, Inc. | | $ | 717,423 | |
| | | | | | | | | |
| | | | | BIOTECH & PHARMA - 12.0% | | | | |
| | 12,080 | | | AstraZeneca plc - ADR | | | 703,660 | |
| | 7,857 | | | BioMarin Pharmaceutical, Inc.(a) | | | 694,166 | |
| | 9,820 | | | Gilead Sciences, Inc. | | | 713,030 | |
| | 7,695 | | | Sarepta Therapeutics, Inc.(a) | | | 692,935 | |
| | 53,660 | | | Viatris, Inc. | | | 726,020 | |
| | | | | | | | 3,529,811 | |
| | | | | CABLE & SATELLITE - 7.3% | | | | |
| | 1,112 | | | Charter Communications, Inc., Class A(a) | | | 724,990 | |
| | 14,400 | | | Comcast Corporation, Class A | | | 724,752 | |
| | 25,221 | | | Liberty Global plc, Class A(a) | | | 699,631 | |
| | | | | | | | 2,149,373 | |
| | | | | E-COMMERCE DISCRETIONARY - 2.4% | | | | |
| | 206 | | | Amazon.com, Inc.(a) | | | 686,874 | |
| | | | | | | | | |
| | | | | ENTERTAINMENT CONTENT - 4.8% | | | | |
| | 20,480 | | | Fox Corporation - Class B | | | 701,850 | |
| | 3,860 | | | Take-Two Interactive Software, Inc.(a) | | | 685,999 | |
| | | | | | | | 1,387,849 | |
| | | | | FOOD - 2.4% | | | | |
| | 10,701 | | | Mondelez International, Inc., Class A | | | 709,583 | |
| | | | | | | | | |
| | | | | HEALTH CARE FACILITIES & SERVICES - 2.4% | | | | |
| | 8,948 | | | Henry Schein, Inc.(a) | | | 693,738 | |
| | | | | | | | | |
| | | | | INTERNET MEDIA & SERVICES - 7.2% | | | | |
| | 246 | | | Alphabet, Inc., Class A(a) | | | 712,672 | |
| | 297 | | | Booking Holdings, Inc.(a) | | | 712,571 | |
| | 2,020 | | | Meta Platforms, Inc., Class A(a) | | | 679,427 | |
| | | | | | | | 2,104,670 | |
See accompanying notes which are an integral part of these financial statements.
| TFA MULTIDIMENSIONAL TACTICAL FUND |
| SCHEDULE OF INVESTMENTS (Continued) |
| December 31, 2021 |
| Shares | | | | | Fair Value | |
| | | | | COMMON STOCKS — 91.7% (Continued) | | | | |
| | | | | LEISURE FACILITIES & SERVICES - 2.4% | | | | |
| | 7,476 | | | Caesars Entertainment, Inc.(a) | | $ | 699,230 | |
| | | | | | | | | |
| | | | | MEDICAL EQUIPMENT & DEVICES - 4.8% | | | | |
| | 5,283 | | | Quidel Corporation(a) | | | 713,152 | |
| | 2,600 | | | Repligen Corporation(a) | | | 688,584 | |
| | | | | | | | 1,401,736 | |
| | | | | METALS & MINING - 2.4% | | | | |
| | 6,776 | | | Royal Gold, Inc. | | | 712,903 | |
| | | | | | | | | |
| | | | | PUBLISHING & BROADCASTING - 2.4% | | | | |
| | 30,939 | | | News Corporation, CLASS A | | | 690,249 | |
| | | | | | | | | |
| | | | | RENEWABLE ENERGY - 4.7% | | | | |
| | 3,687 | | | Enphase Energy, INC.(a) | | | 674,500 | |
| | 2,484 | | | SolarEdge Technologies, Inc.(a) | | | 696,936 | |
| | | | | | | | 1,371,436 | |
| | | | | SEMICONDUCTORS - 4.8% | | | | |
| | 10,049 | | | ON Semiconductor Corporation(a) | | | 682,528 | |
| | 3,900 | | | QUALCOMM, Inc. | | | 713,193 | |
| | | | | | | | 1,395,721 | |
| | | | | SOFTWARE - 2.4% | | | | |
| | 1,919 | | | Fortinet, Inc.(a) | | | 689,689 | |
| | | | | | | | | |
| | | | | TECHNOLOGY HARDWARE - 9.8% | | | | |
| | 5,300 | | | Garmin Ltd. | | | 721,702 | |
| | 7,799 | | | NetApp, Inc. | | | 717,430 | |
| | 10,568 | | | Western Digital Corporation(a) | | | 689,139 | |
| | 1,212 | | | Zebra Technologies Corporation, Class A(a) | | | 721,383 | |
| | | | | | | | 2,849,654 | |
| | | | | TECHNOLOGY SERVICES - 4.8% | | | | |
| | 9,474 | | | Amdocs Ltd. | | | 709,034 | |
| | 2,854 | | | Automatic Data Processing, Inc. | | | 703,739 | |
| | | | | | | | 1,412,773 | |
See accompanying notes which are an integral part of these financial statements.
| TFA MULTIDIMENSIONAL TACTICAL FUND |
| SCHEDULE OF INVESTMENTS (Continued) |
| December 31, 2021 |
| Shares | | | | | Fair Value | |
| | | | | COMMON STOCKS — 91.7% (Continued) | | | | |
| | | | | TRANSPORTATION & LOGISTICS - 9.8% | | | | |
| | 18,596 | | | CSX Corporation | | $ | 699,210 | |
| | 5,276 | | | Expeditors International of Washington, Inc. | | | 708,514 | |
| | 3,512 | | | J.B. Hunt Transport Services, Inc. | | | 717,853 | |
| | 2,020 | | | Old Dominion Freight Line, Inc. | | | 723,927 | |
| | | | | | | | 2,849,504 | |
| | | | | WHOLESALE - DISCRETIONARY - 2.4% | | | | |
| | 1,283 | | | Pool Corporation | | | 726,178 | |
| | | | | | | | | |
| | | | | | | | | |
| | | | | TOTAL COMMON STOCKS (Cost $25,911,557) | | | 26,778,394 | |
| | | | | | | | | |
| Shares | | | | | Fair Value | |
| | | | | EXCHANGE-TRADED FUNDS — 23.0% | | | | |
| | | | | FIXED INCOME - 23.0% | | | | |
| | 8,300 | | | iShares 1-3 Year Treasury Bond ETF | | | 709,982 | |
| | 4,700 | | | iShares 20+ Year Treasury Bond ETF | | | 696,493 | |
| | 5,500 | | | iShares 3-7 Year Treasury Bond ETF | | | 707,685 | |
| | 6,100 | | | iShares 7-10 Year Treasury Bond ETF | | | 701,500 | |
| | 3,077 | | | iShares Agency Bond ETF | | | 360,532 | |
| | 8,300 | | | iShares iBoxx $ High Yield Corporate Bond ETF | | | 722,183 | |
| | 5,300 | | | iShares iBoxx $ Investment Grade Corporate Bond ETF | | | 702,356 | |
| | 6,600 | | | iShares JPMorgan USD Emerging Markets Bond ETF | | | 719,796 | |
| | 6,508 | | | iShares MBS ETF | | | 699,154 | |
| | 24,996 | | | SPDR Bloomberg Barclays International Treasury Bond ETF | | | 706,636 | |
| | | | | | | | 6,726,317 | |
| | | | | | | | | |
| | | | | TOTAL EXCHANGE-TRADED FUNDS (Cost $6,733,396) | | | 6,726,317 | |
| | | | | | | | | |
| Shares | | | | | Fair Value | |
| | | | | SHORT-TERM INVESTMENTS — 7.3% | | | | |
| | | | | MONEY MARKET FUNDS - 7.3% | | | | |
| | 2,033,637 | | | Fidelity Government Portfolio, CLASS I, 0.01%(b) | | | 2,033,637 | |
See accompanying notes which are an integral part of these financial statements.
| TFA MULTIDIMENSIONAL TACTICAL FUND |
| SCHEDULE OF INVESTMENTS (Continued) |
| December 31, 2021 |
| Shares | | | | | Fair Value | |
| | | | | SHORT-TERM INVESTMENTS — 7.3% (Continued) | | | | |
| | | | | MONEY MARKET FUNDS - 7.3% (Continued) | | | | |
| | 92,268 | | | First American Treasury Obligations Fund, Class X, 0.01%(b) | | $ | 92,268 | |
| | | | | TOTAL MONEY MARKET FUNDS (Cost $2,125,905) | | | 2,125,905 | |
| | | | | | | | | |
| | | | | TOTAL SHORT-TERM INVESTMENTS (Cost $2,125,905) | | | 2,125,905 | |
| | | | | | | | | |
| | | | | TOTAL INVESTMENTS – 122.0% (Cost $34,770,858) | | $ | 35,630,616 | |
| | | | | LIABILITIES IN EXCESS OF OTHER ASSETS - (22.0)% | | | (6,418,164 | ) |
| | | | | NET ASSETS - 100.0% | | $ | 29,212,452 | |
ADR - American Depositary Receipt
ETF - Exchange-Traded Fund
LTD - Limited Company
PLC - Public Limited Company
| (a) | Non-income producing security. |
| (b) | Rate disclosed is the seven day effective yield as of December 31, 2021. |
See accompanying notes which are an integral part of these financial statements.
| TFA ALPHAGEN GROWTH FUND |
| SCHEDULE OF INVESTMENTS |
| December 31, 2021 |
| Shares | | | | | Fair Value | |
| | | | | EXCHANGE-TRADED FUNDS — 80.4% | | | | |
| | | | | EQUITY - 67.9% | | | | |
| | 4,560 | | | Communication Services Select Sector SPDR Fund | | $ | 354,221 | |
| | 2,530 | | | Consumer Discretionary Select Sector SPDR Fund | | | 517,233 | |
| | 6,850 | | | Consumer Staples Select Sector SPDR Fund | | | 528,204 | |
| | 12,490 | | | Financial Select Sector SPDR Fund | | | 487,735 | |
| | 5,360 | | | Health Care Select Sector SPDR Fund | | | 755,170 | |
| | 1,860 | | | Industrial Select Sector SPDR Fund | | | 196,807 | |
| | 900 | | | Invesco QQQ Trust Series 1 | | | 358,065 | |
| | 22,590 | | | iShares India 50 ETF | | | 1,068,733 | |
| | 13,120 | | | iShares MSCI USA Min Vol Factor ETF | | | 1,061,408 | |
| | 4,660 | | | iShares U.S. Real Estate ETF | | | 541,212 | |
| | 58,410 | | | ProShares Ultra QQQ(a) | | | 5,199,658 | |
| | 69,130 | | | ProShares Ultra Russell2000(a) | | | 3,838,098 | |
| | 17,230 | | | ProShares Ultra S&P500 | | | 2,521,955 | |
| | 6,200 | | | SPDR S&P 500 ETF Trust | | | 2,944,752 | |
| | 8,360 | | | Technology Select Sector SPDR Fund | | | 1,453,553 | |
| | 48,890 | | | Ultra Dow30 Proshares | | | 3,911,200 | |
| | 34,800 | | | Vanguard FTSE All-World ex-US ETF | | | 2,132,544 | |
| | 20,500 | | | Vanguard FTSE Emerging Markets ETF | | | 1,013,930 | |
| | 3,500 | | | Vanguard Growth ETF | | | 1,123,150 | |
| | 5,200 | | | Vanguard Large-Cap ETF | | | 1,149,304 | |
| | 6,400 | | | Vanguard Mid-Cap ETF | | | 1,630,528 | |
| | 900 | | | Vanguard Real Estate ETF | | | 104,409 | |
| | 7,900 | | | Vanguard Russell 2000 ETF | | | 709,499 | |
| | 28,700 | | | Vanguard Total Stock Market ETF | | | 6,929,327 | |
| | 8,100 | | | Vanguard Value ETF | | | 1,191,591 | |
| | | | | | | | 41,722,286 | |
| | | | | FIXED INCOME - 12.5% | | | | |
| | 17,230 | | | iShares 20+ Year Treasury Bond ETF | | | 2,553,314 | |
| | 15,200 | | | iShares Short Treasury Bond ETF(a) | | | 1,678,384 | |
| | 19,380 | | | iShares TIPS Bond ETF | | | 2,503,896 | |
| | 600 | | | Vanguard Long-Term Bond | | | 61,752 | |
| | 1,200 | | | Vanguard Short-Term Bond ETF | | | 96,996 | |
| | 7,800 | | | Vanguard Total Bond Market ETF | | | 661,050 | |
See accompanying notes which are an integral part of this schedule of investments.
| TFA ALPHAGEN GROWTH FUND |
| SCHEDULE OF INVESTMENTS (Continued) |
| December 31, 2021 |
| Shares | | | | | Fair Value | |
| | | | | EXCHANGE-TRADED FUNDS — 80.4% (Continued) | | | | |
| | | | | FIXED INCOME - 12.5% (Continued) | | | | |
| | 2,900 | | | Vanguard Total International Bond Index Fund, ETF SHARES | | $ | 159,964 | |
| | | | | | | | 7,715,356 | |
| | | | | | | | | |
| | | | | TOTAL EXCHANGE-TRADED FUNDS (Cost $48,211,953) | | | 49,437,642 | |
| | | | | | | | | |
| Shares | | | | | Fair Value | |
| | | | | SHORT-TERM INVESTMENTS — 19.9% | | | | |
| | | | | MONEY MARKET FUNDS - 19.9% | | | | |
| | 1,767 | | | Fidelity Government Portfolio, CLASS I, 0.01%(b) | | | 1,767 | |
| | 12,209,649 | | | First American Treasury Obligations Fund, Class X, 0.01%(b) | | | 12,209,649 | |
| | | | | TOTAL MONEY MARKET FUNDS (Cost $12,211,416) | | | 12,211,416 | |
| | | | | | | | | |
| | | | | TOTAL SHORT-TERM INVESTMENTS (Cost $12,211,416) | | | 12,211,416 | |
| | | | | | | | | |
| | | | | TOTAL INVESTMENTS - 100.3% (Cost $60,423,369) | | $ | 61,649,058 | |
| | | | | LIABILITIES IN EXCESS OF OTHER ASSETS - (0.3)% | | | (202,444 | ) |
| | | | | NET ASSETS - 100.0% | | $ | 61,446,614 | |
ETF - Exchange-Traded Fund
| (a) | Non-income producing security. |
| (b) | Rate disclosed is the seven day effective yield as of December 31, 2021. |
See accompanying notes which are an integral part of this schedule of investments.
| Statements of Assets and Liabilities |
| December 31, 2021 |
| | | TFA Tactical
Income Fund | | | Tactical Moderate
Allocation Fund | | | Tactical Growth
Allocation Fund | |
| Assets: | | | | | | | | | |
| Investments in Securities: | | | | | | | | | | | | |
| Unaffiliated Investments at Value (Cost $28,685,277, $36,222,293 and $58,359,587, respectively) | | $ | 28,614,876 | | | $ | 37,082,743 | | | $ | 62,938,313 | |
| Cash held at custodian | | | 18,962 | | | | 1,560 | | | | 18,711 | |
| Deposits with broker for options | | | 19,004 | | | | 52,032 | | | | 126,820 | |
| Receivable for Fund shares sold | | | 99,290 | | | | 63,102 | | | | 66,196 | |
| Dividends and interest receivable | | | 2,036 | | | | 2,024 | | | | 14,415 | |
| Other Receivable | | | — | | | | 943 | | | | 20,845 | |
| Prepaid expenses and other assets | | | 25,492 | | | | 21,433 | | | | 20,948 | |
| Total Assets | | | 28,779,660 | | | | 37,223,837 | | | | 63,206,248 | |
| | | | | | | | | | | | | |
| Liabilities: | | | | | | | | | | | | |
| Written Options at Value (Premiums received $154,218, $88,743 and $741,649, respectively) | | | 68,450 | | | | 53,170 | | | | 459,954 | |
| Payables: | | | | | | | | | | | | |
| Payable for Fund shares repurchased | | | 1,763,520 | | | | 2,049,801 | | | | 3,395,509 | |
| Management fees payable | | | 35,512 | | | | 53,001 | | | | 120,540 | |
| Distribution (12b-1) fees payable | | | 63 | | | | 40 | | | | 31 | |
| Accrued expenses and other liabilities | | | 67,240 | | | | 71,604 | | | | 95,511 | |
| Total Liabilities | | | 1,934,785 | | | | 2,227,616 | | | | 4,071,545 | |
| Net Assets | | $ | 26,844,875 | | | $ | 34,996,221 | | | $ | 59,134,703 | |
| | | | | | | | | | | | | |
| Net Assets Consist of: | | | | | | | | | | | | |
| Paid In Capital | | $ | 27,180,108 | | | $ | 34,076,808 | | | $ | 54,242,110 | |
| Distributable Earnings (Losses) | | | (335,233 | ) | | | 919,413 | | | | 4,892,593 | |
| Net Assets | | $ | 26,844,875 | | | $ | 34,996,221 | | | $ | 59,134,703 | |
| | | | | | | | | | | | | |
| Net Asset Value Per Share: | | | | | | | | | | | | |
| Class A Shares: | | | | | | | | | | | | |
| | | | | | | | | | | | | |
| Net Assets | | $ | 26,587 | | | $ | 1,188 | | | $ | 1,283 | |
| Shares outstanding (unlimited number of shares authorized with no par value) | | | 2,790 | | | | 117 | | | | 118 | |
| Net asset value (Net Assets ÷ Shares Outstanding), offering price, and redemption price per share | | $ | 9.53 | | | $ | 10.15 | | | $ | 10.87 | |
| | | | | | | | | | | | | |
| Class I Shares: | | | | | | | | | | | | |
| | | | | | | | | | | | | |
| Net Assets | | $ | 26,818,288 | | | $ | 34,995,033 | | | $ | 59,133,420 | |
| Shares outstanding (unlimited number of shares authorized with no par value) | | | 2,786,416 | | | | 3,406,204 | | | | 5,350,349 | |
| Net asset value (Net Assets ÷ Shares Outstanding), offering price, and redemption price per share | | $ | 9.62 | | | $ | 10.27 | | | $ | 11.05 | |
The accompanying notes are an integral part of these financial statements.
| Statements of Assets and Liabilities (Continued) |
| December 31, 2021 |
| | | TFA Quantitative
Fund | | | TFA
Multidimensional
Tactical Fund | | | TFA AlphaGen
Growth Fund | |
| Assets: | | | | | | | | | |
| Unaffiliated Investments at Value (Cost $15,147,134, $34,770,858 and $60,423,369, respectively) | | $ | 15,390,400 | | | $ | 35,630,616 | | | $ | 61,649,058 | |
| Affiliated Investments at Value (Cost $25,000,000, $0 and $0, respectively) | | | 25,662,223 | | | | — | | | | — | |
| Cash held at custodian | | | 83,048 | | | | 3,588 | | | | — | |
| Receivable for securities sold | | | — | | | | 764,532 | | | | — | |
| Receivable for Fund shares sold | | | 33,214 | | | | 33,378 | | | | 37,121 | |
| Dividends and interest receivable | | | 30 | | | | 15,141 | | | | 10,275 | |
| Other Receivable | | | 2,019 | | | | 2,755 | | | | 49,685 | |
| Prepaid expenses and other assets | | | 21,360 | | | | 23,641 | | | | 7,622 | |
| Total Assets | | | 41,192,294 | | | | 36,473,651 | | | | 61,753,761 | |
| | | | | | | | | | | | | |
| Liabilities: | | | | | | | | | | | | |
| Payables: | | | | | | | | | | | | |
| Payable for investments purchased | | | — | | | | 696,461 | | | | — | |
| Payable for Fund shares repurchased | | | 6,116,054 | | | | 6,450,699 | | | | 170,746 | |
| Management fees payable | | | 47,861 | | | | 38,751 | | | | 65,858 | |
| Accrued expenses and other liabilities | | | 75,779 | | | | 75,288 | | | | 70,543 | |
| Total Liabilities | | | 6,239,694 | | | | 7,261,199 | | | | 307,147 | |
| Net Assets | | $ | 34,952,600 | | | $ | 29,212,452 | | | $ | 61,446,614 | |
| | | | | | | | | | | | | |
| Net Assets Consist of: | | | | | | | | | | | | |
| Paid In Capital | | $ | 32,902,021 | | | $ | 28,437,915 | | | $ | 60,418,053 | |
| Distributable Earnings | | | 2,050,579 | | | | 774,537 | | | | 1,028,561 | |
| Net Assets | | $ | 34,952,600 | | | $ | 29,212,452 | | | $ | 61,446,614 | |
| | | | | | | | | | | | | |
| Net Asset Value Per Share: | | | | | | | | | | | | |
| Class I Shares: | | | | | | | | | | | | |
| | | | | | | | | | | | | |
| Net Assets | | $ | 34,952,600 | | | $ | 29,212,452 | | | $ | 61,446,614 | |
| Shares outstanding (unlimited number of shares authorized with no par value) | | | 3,360,763 | | | | 3,140,696 | | | | 6,056,411 | |
| Net asset value (Net Assets ÷ Shares Outstanding), offering price, and redemption price per share | | $ | 10.40 | | | $ | 9.30 | | | $ | 10.15 | |
The accompanying notes are an integral part of these financial statements.
| Statements of Operations |
| For the year ended December 31, 2021 |
| | | TFA Tactical
Income Fund | | | Tactical
Moderate
Allocation Fund | | | Tactical
Growth
Allocation Fund | |
| Investment Income: | | | | | | | | | |
| Dividends | | $ | 505,032 | | | $ | 524,657 | | | $ | 625,601 | |
| Interest | | | 3,486 | | | | 22,129 | | | | 17,472 | |
| Total Investment Income | | | 508,518 | | | | 546,786 | | | | 643,073 | |
| | | | | | | | | | | | | |
| Expenses: | | | | | | | | | | | | |
| Advisory Fees | | | 379,943 | | | | 468,904 | | | | 764,912 | |
| Administration Fees | | | 80,350 | | | | 102,403 | | | | 159,632 | |
| Transfer Agent and Accounting Fees | | | 42,480 | | | | 43,782 | | | | 50,841 | |
| Audit Fees | | | 13,857 | | | | 13,858 | | | | 13,858 | |
| Legal Fees | | | 19,437 | | | | 19,437 | | | | 20,121 | |
| Custody Fees | | | 17,322 | | | | 16,979 | | | | 17,259 | |
| Shareholder Servicing Fees | | | 35,734 | | | | 42,431 | | | | 58,304 | |
| Trustee Fees | | | 16,820 | | | | 16,017 | | | | 18,905 | |
| Distribution Plan (12b-1) Fees - Class A | | | 65 | | | | 4 | | | | 6 | |
| Printing and Mailing Expense | | | 8,975 | | | | 11,662 | | | | 11,479 | |
| Miscellaneous Fees | | | 5,469 | | | | 6,107 | | | | 5,147 | |
| Insurance Fees | | | 1,009 | | | | 1,092 | | | | 1,237 | |
| Interest Fees | | | 29 | | | | — | | | | — | |
| Professional Fees | | | 783 | | | | 755 | | | | 1,145 | |
| Registration Fees | | | 23,910 | | | | 24,585 | | | | 24,200 | |
| Total Expenses | | | 646,183 | | | | 768,016 | | | | 1,147,046 | |
| Fees Waived by the Adviser | | | (57,508 | ) | | | (40,525 | ) | | | — | |
| Fees Recouped by the Adviser | | | — | | | | — | | | | 29,493 | |
| Fees Voluntarily Waived by Administrator | | | (27,285 | ) | | | (35,769 | ) | | | (52,809 | ) |
| Net Expenses | | | 561,390 | | | | 691,722 | | | | 1,123,730 | |
| | | | | | | | | | | | | |
| Net Investment Loss | | | (52,872 | ) | | | (144,936 | ) | | | (480,657 | ) |
| | | | | | | | | | | | | |
| Realized Gain (Loss) on: | | | | | | | | | | | | |
| Unaffiliated Investments | | | 3,740,706 | | | | 5,447,177 | | | | 7,464,634 | |
| Capital Gain Distributions from Investment Companies | | | 7,044 | | | | 169,117 | | | | 64 | |
| Reimbursement from Advisor for Compliance Loss (see note 4) | | | — | | | | 943 | | | | 20,845 | |
| Short Sales | | | (2,459 | ) | | | (9,429 | ) | | | (42,263 | ) |
| Written Options | | | 336,281 | | | | 577,187 | | | | 1,048,463 | |
| Net Realized Gain on Investments, Short Sales and Options | | | 4,081,572 | | | | 6,184,995 | | | | 8,491,743 | |
| | | | | | | | | | | | | |
| Net Change in Unrealized Appreciation (Depreciation) on: | | | | | | | | | | | | |
| Unaffiliated Investments | | | (2,224,982 | ) | | | (1,732,220 | ) | | | 860,875 | |
| Written Options | | | (192,366 | ) | | | (152,679 | ) | | | (4,023 | ) |
| Net Change in Unrealized Appreciation (Depreciation) on Investments and Options | | | (2,417,348 | ) | | | (1,884,899 | ) | | | 856,852 | |
| | | | | | | | | | | | | |
| Realized and Unrealized Gain on Investments and Options | | | 1,664,224 | | | | 4,300,096 | | | | 9,348,595 | |
| | | | | | | | | | | | | |
| Net Increase in Net Assets Resulting from Operations | | $ | 1,611,352 | | | $ | 4,155,160 | | | $ | 8,867,938 | |
The accompanying notes are an integral part of these financial statements.
| Statements of Operations (Continued) |
| For the year/period ended December 31, 2021 |
| | | TFA Quantitative
Fund | | | TFA
Multidimensional
Tactical Fund | | | TFA AlphaGen
Growth Fund * | |
| Investment Income: | | | | | | | | | | | | |
| Dividends from Unaffiliated Investments (including foreign tax withholdings $0, $0 and $121) | | $ | 174,574 | | | $ | 481,694 | | | $ | 374,044 | |
| Dividends from Affiliated Investments | | | 381,560 | | | | — | | | | — | |
| Total Investment Income | | | 556,134 | | | | 481,694 | | | | 374,044 | |
| | | | | | | | | | | | | |
| Expenses: | | | | | | | | | | | | |
| Advisory Fees | | | 588,938 | | | | 687,281 | | | | 294,000 | |
| Administration Fees | | | 124,339 | | | | 153,963 | | | | 24,659 | |
| Transfer Agent and Accounting Fees | | | 43,049 | | | | 45,387 | | | | 8,195 | |
| Audit Fees | | | 13,810 | | | | 13,810 | | | | 13,978 | |
| Legal Fees | | | 13,549 | | | | 11,949 | | | | 10,304 | |
| Custody Fees | | | 11,500 | | | | 24,787 | | | | 3,612 | |
| Shareholder Servicing Fees | | | 41,186 | | | | 50,242 | | | | 14,667 | |
| Trustee Fees | | | 12,370 | | | | 14,854 | | | | 5,316 | |
| Printing and Mailing Expense | | | 9,306 | | | | 9,028 | | | | 3,384 | |
| Miscellaneous Fees | | | 4,811 | | | | 5,512 | | | | 3,250 | |
| Insurance Fees | | | 743 | | | | 919 | | | | 369 | |
| Overdraft Fees | | | — | | | | 2,164 | | | | — | |
| Interest Fees | | | — | | | | 14,387 | | | | — | |
| Professional fees | | | 919 | | | | 873 | | | | 1,153 | |
| Registration Fees | | | 23,869 | | | | 24,931 | | | | 1,753 | |
| Total Expenses | | | 888,389 | | | | 1,060,087 | | | | 384,640 | |
| Fees Recouped by the Adviser | | | 1,943 | | | | 2,674 | | | | — | |
| Fees Voluntarily Waived by Administrator | | | (43,297 | ) | | | (56,715 | ) | | | — | |
| Net Expenses | | | 847,035 | | | | 1,006,046 | | | | 384,640 | |
| | | | | | | | | | | | | |
| Net Investment Loss | | | (290,901 | ) | | | (524,352 | ) | | | (10,596 | ) |
| | | | | | | | | | | | | |
| Realized Gain (Loss) on: | | | | | | | | | | | | |
| Unaffiliated Investments | | | 1,401,030 | | | | 6,926,876 | | | | (3,670 | ) |
| Affiliated Investments | | | 3,843,195 | | | | — | | | | — | |
| Reimbursement from Advisor for Compliance Loss (see note 4) | | | 148,640 | | | | — | | | | 49,685 | |
| Short Sales | | | — | | | | 26,065 | | | | (49,790 | ) |
| Net Realized Gain (Loss) on Investments, Short Sales and Options | | | 5,392,865 | | | | 6,952,941 | | | | (3,775 | ) |
| | | | | | | | | | | | | |
| Net Change in Unrealized Appreciation (Depreciation) on: | | | | | | | | | | | | |
| Unaffiliated Investments | | | (538,676 | ) | | | (476,139 | ) | | | 1,225,689 | |
| Affiliated Investments | | | 187,579 | | | | — | | | | — | |
| Net Change in Unrealized Appreciation (Depreciation) on Investments, Short Sales and Options | | | (351,097 | ) | | | (476,139 | ) | | | 1,225,689 | |
| | | | | | | | | | | | | |
| Realized and Unrealized Gain on Investments and Options | | | 5,041,768 | | | | 6,476,802 | | | | 1,221,914 | |
| | | | | | | | | | | | | |
| Net Increase in Net Assets Resulting from Operations | | $ | 4,750,867 | | | $ | 5,952,450 | | | $ | 1,211,318 | |
| * | For the period August 23, 2021 (commencement of investment operations) through December 31, 2021. |
The accompanying notes are an integral part of these financial statements.
Statements of Changes in Net Assets
| | | Year | | | Year | |
| | | Ended | | | Ended | |
| | | 12/31/2021 | | | 12/31/2020 | |
| Increase (Decrease) in Net Assets From Operations: | | | | | | | | |
| Net Investment Loss | | $ | (52,872 | ) | | $ | (123,334 | ) |
| Net Realized Gain on Unaffiliated Investments | | | 3,740,706 | | | | 685,365 | |
| Capital Gain Distributions from Investment Companies | | | 7,044 | | | | 10,386 | |
| Net Realized Loss on Short Sales | | | (2,459 | ) | | | — | |
| Net Realized Gain (Loss) on Written Options | | | 336,281 | | | | (805,303 | ) |
| Net Change in Unrealized Appreciation (Depreciation) on Investments | | | (2,224,982 | ) | | | 1,046,225 | |
| Net Change in Unrealized Appreciation (Depreciation) on Written Options | | | (192,366 | ) | | | 205,895 | |
| Net Increase in Net Assets Resulting from Operations | | | 1,611,352 | | | | 1,019,234 | |
| | | | | | | | | |
| Distributions to Shareholders from: | | | | | | | | |
| Class A | | | (3,861 | ) | | | (281 | ) |
| Class I | | | (4,093,653 | ) | | | (328,701 | ) |
| Total Distributions | | | (4,097,514 | ) | | | (328,982 | ) |
| | | | | | | | | |
| Capital Share Transactions: | | | | | | | | |
| Proceeds from Shares Sold | | | 23,982,001 | | | | 17,386,688 | |
| Proceeds from Reinvestment of Distributions | | | 4,097,514 | | | | 328,982 | |
| Cost of Shares Redeemed | | | (30,311,058 | ) | | | (29,548,676 | ) |
| Net Decrease from Capital Shares Transactions | | | (2,231,543 | ) | | | (11,833,006 | ) |
| | | | | | | | | |
| Total Decrease | | | (4,717,705 | ) | | | (11,142,754 | ) |
| | | | | | | | | |
| Net Assets | | | | | | | | |
| Beginning of Year | | | 31,562,580 | | | | 42,705,334 | |
| | | | | | | | | |
| End of Year | | $ | 26,844,875 | | | $ | 31,562,580 | |
| | | | | | | | | |
| Capital Share Transactions: | | | | | | | | |
| Shares Sold | | | 2,188,171 | | | | 1,785,604 | |
| Shares Reinvested | | | 420,518 | | | | 31,124 | |
| Shares Redeemed | | | (2,800,531 | ) | | | (2,944,710 | ) |
| Net Decrease in Outstanding Shares of the Fund | | | (191,842 | ) | | | (1,127,982 | ) |
The accompanying notes are an integral part of these financial statements.
| Tactical Moderate Allocation Fund |
Statements of Changes in Net Assets
| | | Year | | | Year | |
| | | Ended | | | Ended | |
| | | 12/31/2021 | | | 12/31/2020 | |
| Increase (Decrease) in Net Assets From Operations: | | | | | | | | |
| Net Investment Loss | | $ | (144,936 | ) | | $ | (180,522 | ) |
| Net Realized Gain (Loss) on Unaffiliated Investments | | | 5,447,177 | | | | (454,971 | ) |
| Capital Gain Distributions from Investment Companies | | | 169,117 | | | | 8,348 | |
| Net Realized Gain on Reimbursement from Advisor for Compliance Loss | | | 943 | | | | — | |
| Net Realized Loss on Short Sales | | | (9,429 | ) | | | — | |
| Net Realized Gain (Loss) on Written Options | | | 577,187 | | | | (349,330 | ) |
| Net Change in Unrealized Appreciation (Depreciation) on Unaffiliated Investments | | | (1,732,220 | ) | | | 565,308 | |
| Net Change in Unrealized Appreciation (Depreciation) on Written Options | | | (152,679 | ) | | | 75,524 | |
| Net Increase (Decrease) in Net Assets Resulting from Operations | | | 4,155,160 | | | | (335,643 | ) |
| | | | | | | | | |
| Distributions to Shareholders from: | | | | | | | | |
| Class A | | | (163 | ) | | | (14 | ) |
| Class I | | | (5,128,135 | ) | | | (328,313 | ) |
| Total Distributions | | | (5,128,298 | ) | | | (328,327 | ) |
| | | | | | | | | |
| Capital Share Transactions: | | | | | | | | |
| Proceeds from Shares Sold | | | 22,517,202 | | | | 14,937,026 | |
| Proceeds from Reinvestment of Distributions | | | 5,128,212 | | | | 328,312 | |
| Cost of Shares Redeemed | | | (29,848,341 | ) | | | (50,518,018 | ) |
| Net Decrease from Capital Shares Transactions | | | (2,202,927 | ) | | | (35,252,680 | ) |
| | | | | | | | | |
| Total Decrease | | | (3,176,065 | ) | | | (35,916,650 | ) |
| | | | | | | | | |
| Net Assets | | | | | | | | |
| Beginning of Year | | | 38,172,286 | | | | 74,088,936 | |
| | | | | | | | | |
| End of Year | | $ | 34,996,221 | | | $ | 38,172,286 | |
| | | | | | | | | |
| Capital Share Transactions: | | | | | | | | |
| Shares Sold | | | 1,996,712 | | | | 1,535,123 | |
| Shares Reinvested | | | 497,756 | | | | 30,885 | |
| Shares Redeemed | | | (2,677,991 | ) | | | (5,172,060 | ) |
| Net Decrease in Outstanding Shares of the Fund | | | (183,523 | ) | | | (3,606,052 | ) |
The accompanying notes are an integral part of these financial statements.
| Tactical Growth Allocation Fund |
Statements of Changes in Net Assets
| | | Year | | | Year | |
| | | Ended | | | Ended | |
| | | 12/31/2021 | | | 12/31/2020 | |
| Increase (Decrease) in Net Assets From Operations: | | | | | | | | |
| Net Investment Loss | | $ | (480,657 | ) | | $ | (261,711 | ) |
| Net Realized Gain on Unaffiliated Investments | | | 7,464,634 | | | | 1,858,597 | |
| Capital Gain Distributions from Investment Companies | | | 64 | | | | 3,789 | |
| Net Realized Gain on Reimbursement from Advisor for Compliance Loss | | | 20,845 | | | | — | |
| Net Realized Loss on Short Sales | | | (42,263 | ) | | | — | |
| Net Realized Gain (Loss) on Written Options | | | 1,048,463 | | | | (378,820 | ) |
| Net Change in Unrealized Appreciation on Unaffiliated Investments | | | 860,875 | | | | 1,903,280 | |
| Net Change in Unrealized Appreciation (Depreciation) on Written Options | | | (4,023 | ) | | | 157,450 | |
| Net Increase in Net Assets Resulting from Operations | | | 8,867,938 | | | | 3,282,585 | |
| | | | | | | | | |
| Distributions to Shareholders from: | | | | | | | | |
| Class A | | | (143 | ) | | | (158 | ) |
| Class I | | | (6,843,809 | ) | | | (2,258,198 | ) |
| Total Distributions | | | (6,843,952 | ) | | | (2,258,356 | ) |
| | | | | | | | | |
| Capital Share Transactions: | | | | | | | | |
| Proceeds from Shares Sold | | | 37,817,728 | | | | 23,769,166 | |
| Proceeds from Reinvestment of Distributions | | | 6,843,952 | | | | 2,258,356 | |
| Cost of Shares Redeemed | | | (37,926,900 | ) | | | (32,658,715 | ) |
| Net Increase (Decrease) from Capital Shares Transactions | | | 6,734,780 | | | | (6,631,193 | ) |
| | | | | | | | | |
| Total Increase (Decrease) | | | 8,758,766 | | | | (5,606,964 | ) |
| | | | | | | | | |
| Net Assets | | | | | | | | |
| Beginning of Year | | | 50,375,937 | | | | 55,982,901 | |
| | | | | | | | | |
| End of Year | | $ | 59,134,703 | | | $ | 50,375,937 | |
| | | | | | | | | |
| Capital Share Transactions: | | | | | | | | |
| Shares Sold | | | 3,252,404 | | | | 2,365,882 | |
| Shares Reinvested | | | 618,802 | | | | 211,457 | |
| Shares Redeemed | | | (3,233,814 | ) | | | (3,264,808 | ) |
| Net Increase (Decrease) in Outstanding Shares of the Fund | | | 637,392 | | | | (687,469 | ) |
The accompanying notes are an integral part of these financial statements.
Statements of Changes in Net Assets
| | | Year | | | For the | |
| | | Ended | | | Period Ended * | |
| | | 12/31/2021 | | | 12/31/2020 | |
| Increase (Decrease) in Net Assets From Operations: | | | | | | | | |
| Net Investment Loss | | $ | (290,901 | ) | | $ | (370,914 | ) |
| Net Realized Gain on Unaffiliated Investments | | | 1,401,030 | | | | 5,292,817 | |
| Net Realized Gain on Affiliated Investments | | | 3,843,195 | | | | — | |
| Net Realized Gain on Reimbursement from Advisor for Compliance Loss | | | 148,640 | | | | — | |
| Net Change in Unrealized Appreciation (Depreciation) on Unaffiliated Investments | | | (538,676 | ) | | | 1,256,586 | |
| Net Change in Unrealized Appreciation on Affiliated Investments | | | 187,579 | | | | — | |
| Net Increase in Net Assets Resulting from Operations | | | 4,750,867 | | | | 6,178,489 | |
| | | | | | | | | |
| Distributions to Shareholders from: | | | | | | | | |
| Class I | | | (6,986,183 | ) | | | (1,893,972 | ) |
| Total Distributions | | | (6,986,183 | ) | | | (1,893,972 | ) |
| | | | | | | | | |
| Capital Share Transactions: | | | | | | | | |
| Proceeds from Shares Sold | | | 30,136,595 | | | | 45,583,540 | |
| Proceeds from Reinvestment of Distributions | | | 6,986,183 | | | | 1,893,839 | |
| Cost of Shares Redeemed | | | (41,349,098 | ) | | | (10,347,660 | ) |
| Net Increase (Decrease) from Capital Shares Transactions | | | (4,226,320 | ) | | | 37,129,719 | |
| | | | | | | | | |
| Total Increase (Decrease) | | | (6,461,636 | ) | | | 41,414,236 | |
| | | | | | | | | |
| Net Assets | | | | | | | | |
| Beginning of Year/Period | | | 41,414,236 | | | | — | |
| | | | | | | | | |
| End of Year/Period | | $ | 34,952,600 | | | $ | 41,414,236 | |
| | | | | | | | | |
| Capital Share Transactions: | | | | | | | | |
| Shares Sold | | | 2,543,427 | | | | 4,466,041 | |
| Shares Reinvested | | | 671,748 | | | | 168,191 | |
| Shares Redeemed | | | (3,521,493 | ) | | | (967,151 | ) |
| Net Increase (Decrease) in Outstanding Shares of the Fund | | | (306,318 | ) | | | 3,667,081 | |
| * | For the period May 18, 2020 (commencement of investment operations) through December 31, 2020. |
The accompanying notes are an integral part of these financial statements.
| TFA Multidimensional Tactical Fund |
Statements of Changes in Net Assets
| | | Year | | | For the | |
| | | Ended | | | Period Ended * | |
| | | 12/31/2021 | | | 12/31/2020 | |
| Increase (Decrease) in Net Assets From Operations: | | | | | | | | |
| Net Investment Loss | | $ | (524,352 | ) | | $ | (157,087 | ) |
| Net Realized Gain on Investments | | | 6,926,876 | | | | 4,037,915 | |
| Net Realized Gain on Securities Sold Short | | | 26,065 | | | | 7,063 | |
| Net Change in Unrealized Appreciation (Depreciation) on Investments | | | (476,139 | ) | | | 1,335,897 | |
| Net Increase in Net Assets Resulting from Operations | | | 5,952,450 | | | | 5,223,788 | |
| | | | | | | | | |
| Distributions to Shareholders from: | | | | | | | | |
| Class I | | | (7,787,998 | ) | | | (2,613,703 | ) |
| Total Distributions | | | (7,787,998 | ) | | | (2,613,703 | ) |
| | | | | | | | | |
| Capital Share Transactions: | | | | | | | | |
| Proceeds from Shares Sold | | | | | | | | |
| Class I | | | 24,393,487 | | | | 59,965,114 | |
| Proceeds from Reinvestment of Distributions | | | | | | | | |
| Class I | | | 7,787,998 | | | | 2,613,541 | |
| Cost of Shares Redeemed | | | | | | | | |
| Class I | | | (55,257,163 | ) | | | (11,065,062 | ) |
| Net Increase (Decrease) from Capital Shares Transactions | | | (23,075,678 | ) | | | 51,513,593 | |
| | | | | | | | | |
| Total Increase (Decrease) | | | (24,911,226 | ) | | | 54,123,678 | |
| | | | | | | | | |
| Net Assets | | | | | | | | |
| Beginning of Year/Period | | | 54,123,678 | | | | 0 | |
| | | | | | | | | |
| End of Year/Period | | $ | 29,212,452 | | | $ | 54,123,678 | |
| | | | | | | | | |
| Capital Share Transactions: | | | | | | | | |
| Shares Sold | | | 2,192,102 | | | | 5,852,152 | |
| Shares Reinvested | | | 837,419 | | | | 245,865 | |
| Shares Redeemed | | | (4,936,624 | ) | | | (1,050,218 | ) |
| Net Increase (Decrease) in Outstanding Shares of the Fund | | | (1,907,103 | ) | | | 5,047,799 | |
| * | For the period May 18, 2020 (commencement of investment operations) through December 31, 2020. |
The accompanying notes are an integral part of these financial statements.
Statement of Changes in Net Assets
| | | For the | |
| | | Period Ended * | |
| | | 12/31/2021 | |
| Increase (Decrease) in Net Assets From Operations: | | | | |
| Net Investment Loss | | $ | (10,596 | ) |
| Net Realized Loss on Investments | | | (3,670 | ) |
| Net Realized Gain on Reimbursement from Advisor for Compliance Loss | | | 49,685 | |
| Net Realized Loss on Short Sales | | | (49,790 | ) |
| Net Change in Unrealized Appreciation on Investments | | | 1,225,689 | |
| Net Increase in Net Assets Resulting from Operations | | | 1,211,318 | |
| | | | | |
| Distributions to Shareholders from: | | | | |
| Class I | | | (182,757 | ) |
| Total Distributions | | | (182,757 | ) |
| | | | | |
| Capital Share Transactions: | | | | |
| Proceeds from Shares Sold | | | 76,832,124 | |
| Proceeds from Reinvestment of Distributions | | | 182,757 | |
| Cost of Shares Redeemed | | | (16,596,828 | ) |
| Net Increase from Capital Shares Transactions | | | 60,418,053 | |
| | | | | |
| Total Increase | | | 61,446,614 | |
| | | | | |
| Net Assets | | | | |
| Beginning of Period | | | — | |
| | | | | |
| End of Period | | $ | 61,446,614 | |
| | | | | |
| Capital Share Transactions: | | | | |
| Shares Sold | | | 7,687,076 | |
| Shares Reinvested | | | 18,006 | |
| Shares Redeemed | | | (1,648,671 | ) |
| Net Increase in Outstanding Shares of the Fund | | | 6,056,411 | |
| * | For the period August 23, 2021 (commencement of investment operations) through December 31, 2021. |
The accompanying notes are an integral part of these financial statements.
| TFA Tactical Income Fund |
| Class A |
| Financial Highlights |
| Selected data for a share outstanding throughout the year/period. |
| | | Year | | | Year | | | For the | |
| | | Ended | | | Ended | | | Period Ended (c) | |
| | | 12/31/2021 | | | 12/31/2020 | | | 12/31/2019 | |
| | | | | | | | | | | | | |
| Net Asset Value at Beginning of Year/Period | | $ | 10.53 | | | $ | 10.36 | | | $ | 10.00 | |
| | | | | | | | | | | | | |
| Income From Investment Operations: | | | | | | | | | | | | |
| Net Investment Income (Loss) * (g) | | | (0.04 | ) | | | (0.06 | ) | | | 0.05 | |
| Net Gain on Securities (Realized and Unrealized) | | | 0.60 | | | | 0.34 | | | | 0.37 | |
| Total from Investment Operations | | | 0.56 | | | | 0.28 | | | | 0.42 | |
| | | | | | | | | | | | | |
| Distributions: | | | | | | | | | | | | |
| Net Investment Income | | | — | | | | (0.01 | ) | | | (0.02 | ) |
| Realized Gains | | | (1.56 | ) | | | (0.10 | ) | | | (0.04 | ) |
| Total from Distributions | | | (1.56 | ) | | | (0.11 | ) | | | (0.06 | ) |
| | | | | | | | | | | | | |
| Net Asset Value, at End of Year/Period | | $ | 9.53 | | | $ | 10.53 | | | $ | 10.36 | |
| | | | | | | | | | | | | |
| Total Return ** | | | 5.47 | % | | | 2.71 | % | | | 4.21 | % (b) |
| | | | | | | | | | | | | |
| Ratios/Supplemental Data: | | | | | | | | | | | | |
| Net Assets at End of Year/Period (Thousands) | | $ | 27 | | | $ | 27 | | | $ | 30 | |
| Before Waivers | | | | | | | | | | | | |
| Ratio of Expenses to Average Net Assets (d)(e)(h) | | | 2.46 | % | | | 2.56 | % | | | 2.30 | % (a) |
| Ratio of Net Investment Income (Loss) to Average Net Assets (g) | | | (0.69 | )% | | | (1.02 | )% | | | 0.58 | % (a) |
| After Waivers | | | | | | | | | | | | |
| Ratio of Expenses to Average Net Assets (d)(f)(h) | | | 2.17 | % | | | 2.14 | % | | | 2.00 | % (a) |
| Ratio of Net Investment Income (Loss) to Average Net Assets (g) | | | (0.39 | )% | | | (0.61 | )% | | | 0.89 | % (a) |
| Portfolio Turnover Rate | | | 568.18 | % | | | 1316.84 | % | | | 674.08 | % (b) |
| | | | | | | | | | | | | |
| * | Per share net investment income (loss) has been determined on the basis of average shares outstanding during the period. |
| ** | Total return in the above table represents the rate that the investor would have earned or lost on an investment in the Fund assuming reinvestment of dividends. |
| (c) | For the period June 10, 2019 (commencement of investment operations) through December 31, 2019. |
| (d) | Expenses include 0.09%, 0.15% and 0.01% of administrative fees which were voluntarily waived by the predecessor administrator for the year/period ended December 31, 2021, December 31, 2020 and December 31, 2019, respectively. |
| (e) | Expenses before waivers (excluding interest expense of 0.00%, 0.01% and 0.00%) was 2.46%, 2.55% and 2.30% for year/period ended 2021, 2020 and 2019, respectively. |
| (f) | Expenses after waivers (excluding interest expense of 0.00%, 0.01% and 0.00%) was 2.17%, 2.13% and 2.00% for year/period ended 2021, 2020 and 2019, respectively. |
| (g) | Recognition of net investment income (loss) by the Fund is affected by the timing of the declaration of dividends by the underlying investment companies in which the Fund invests. The ratio does not include net investment income (loss) of the underlying investment companies in which the Fund invests. |
| (h) | Does not include expenses of the investment companies in which the Fund invests. |
The accompanying notes are an integral part of these financial statements.
| TFA Tactical Income Fund |
| Class I |
| Financial Highlights |
| Selected data for a share outstanding throughout the year/period. |
| | | Year | | | Year | | | For the | |
| | | Ended | | | Ended | | | Period Ended (c) | |
| | | 12/31/2021 | | | 12/31/2020 | | | 12/31/2019 | |
| | | | | | | | | | | | | |
| Net Asset Value at Beginning of Year/Period | | $ | 10.59 | | | $ | 10.39 | | | $ | 10.00 | |
| | | | | | | | | | | | | |
| Income From Investment Operations: | | | | | | | | | | | | |
| Net Investment Income (Loss) * (g) | | | (0.02 | ) | | | (0.04 | ) | | | 0.03 | |
| Net Gain on Securities (Realized and Unrealized) | | | 0.61 | | | | 0.35 | | | | 0.42 | |
| Total from Investment Operations | | | 0.59 | | | | 0.31 | | | | 0.45 | |
| | | | | | | | | | | | | |
| Distributions: | | | | | | | | | | | | |
| Net Investment Income | | | — | | | | (0.01 | ) | | | (0.02 | ) |
| Realized Gains | | | (1.56 | ) | | | (0.10 | ) | | | (0.04 | ) |
| Total from Distributions | | | (1.56 | ) | | | (0.11 | ) | | | (0.06 | ) |
| | | | | | | | | | | | | |
| Net Asset Value, at End of Year/Period | | $ | 9.62 | | | $ | 10.59 | | | $ | 10.39 | |
| | | | | | | | | | | | | |
| Total Return ** | | | 5.71 | % (i) | | | 2.99 | % | | | 4.55 | % (b) |
| | | | | | | | | | | | | |
| Ratios/Supplemental Data: | | | | | | | | | | | | |
| Net Assets at End of Year/Period (Thousands) | | $ | 26,818 | | | $ | 31,535 | | | $ | 42,675 | |
| Before Waivers | | | | | | | | | | | | |
| Ratio of Expenses to Average Net Assets (d)(e)(h) | | | 2.21 | % | | | 2.30 | % | | | 1.86 | % (a) |
| Ratio of Net Investment Income (Loss) to Average Net Assets (g) | | | (0.47 | )% | | | (0.77 | )% | | | 0.48 | % (a) |
| After Waivers | | | | | | | | | | | | |
| Ratio of Expenses to Average Net Assets (d)(f)(h) | | | 1.92 | % | | | 1.89 | % | | | 1.75 | % (a) |
| Ratio of Net Investment Income (Loss) to Average Net Assets (g) | | | (0.18 | )% | | | (0.36 | )% | | | 0.59 | % (a) |
| Portfolio Turnover Rate | | | 568.18 | % | | | 1316.84 | % | | | 674.08 | % (b) |
| | | | | | | | | | | | | |
| * | Per share net investment income (loss) has been determined on the basis of average shares outstanding during the period. |
| ** | Total return in the above table represents the rate that the investor would have earned or lost on an investment in the Fund assuming reinvestment of dividends. |
| (c) | For the period June 10, 2019 (commencement of investment operations) through December 31, 2019. |
| (d) | Expenses include 0.09%, 0.15% and 0.09% of administrative fees which were voluntarily waived by the predecessor administrator for the year/period ended December 31, 2021, December 31, 2020 and December 31, 2019, respectively. |
| (e) | Expenses before waivers (excluding interest expense of 0.00%, 0.01% and 0.00%) was 2.21%, 2.29% and 1.86% for year/period ended 2021, 2020 and 2019, respectively. |
| (f) | Expenses after waivers (excluding interest expense of 0.00%, 0.01% and 0.00%) was 1.92%, 1.88% and 1.75% for year/period ended 2021, 2020 and 2019, respectively. |
| (g) | Recognition of net investment income (loss) by the Fund is affected by the timing of the declaration of dividends by the underlying investment companies in which the Fund invests. The ratio does not include net investment income (loss) of the underlying investment companies in which the Fund invests. |
| (h) | Does not include expenses of the investment companies in which the Fund invests. |
| (i) | Includes adjustments in accordance with accounting principles generally accepted in the United States of America and, consequently, the net asset value for financial reporting purposes and the returns based upon those net asset values may differ from the net asset values and returns for shareholder transactions. |
The accompanying notes are an integral part of these financial statements.
| Tactical Moderate Allocation Fund |
| Class A |
| Financial Highlights |
| Selected data for a share outstanding throughout the year/period. |
| | | Year | | | Year | | | For the | |
| | | Ended | | | Ended | | | Period Ended (c) | |
| | | 12/31/2021 | | | 12/31/2020 | | | 12/31/2019 | |
| | | | | | | | | | | | | |
| Net Asset Value at Beginning of Year/Period | | $ | 10.57 | | | $ | 10.29 | | | $ | 10.00 | |
| | | | | | | | | | | | | |
| Income From Investment Operations: | | | | | | | | | | | | |
| Net Investment Income (Loss) * (g) | | | (0.10 | ) | | | (0.10 | ) | | | 0.02 | |
| Net Gain on Securities (Realized and Unrealized) | | | 1.26 | (j) | | | 0.47 | | | | 0.29 | |
| Total from Investment Operations | | | 1.16 | | | | 0.37 | | | | 0.31 | |
| | | | | | | | | | | | | |
| Distributions: | | | | | | | | | | | | |
| Net Investment Income | | | — | | | | — | + | | | (0.02 | ) |
| Realized Gains | | | (1.58 | ) | | | (0.09 | ) | | | — | |
| Total from Distributions | | | (1.58 | ) | | | (0.09 | ) | | | (0.02 | ) |
| | | | | | | | | | | | | |
| Net Asset Value, at End of Year/Period | | $ | 10.15 | | | $ | 10.57 | | | $ | 10.29 | |
| | | | | | | | | | | | | |
| Total Return ** | | | 11.29 | % (i)(j) | | | 3.62 | % | | | 3.05 | % (b) |
| | | | | | | | | | | | | |
| Ratios/Supplemental Data: | | | | | | | | | | | | |
| Net Assets at End of Year/Period (Thousands) | | $ | 1 | | | $ | 2 | | | $ | 35 | |
| Before Waivers | | | | | | | | | | | | |
| Ratio of Expenses to Average Net Assets (d)(f)(h) | | | 2.38 | % | | | 2.32 | % | | | 4.66 | % (a) |
| Ratio of Net Investment Loss to Average Net Assets (g) | | | (0.98 | )% | | | (1.26 | )% | | | (2.31 | )% (a) |
| After Waivers | | | | | | | | | | | | |
| Ratio of Expenses to Average Net Assets (e)(f)(h) | | | 2.17 | % | | | 2.08 | % | | | 2.00 | % (a) |
| Ratio of Net Investment Income (Loss) to Average Net Assets (g) | | | (0.90 | )% | | | (1.03 | )% | | | 0.36 | % (a) |
| Portfolio Turnover Rate | | | 346.41 | % | | | 1308.86 | % | | | 911.79 | % (b) |
| | | | | | | | | | | | | |
| * | Per share net investment income (loss) has been determined on the basis of average shares outstanding during the period. |
| ** | Total return in the above table represents the rate that the investor would have earned or lost on an investment in the Fund assuming reinvestment of dividends. |
| + | Amount calculated is less than $0.005. |
| (c) | For the period June 10, 2019 (commencement of investment operations) through December 31, 2019. |
| (d) | Expenses before waivers (excluding interest expense of 0.00%, 0.01% and 0.00%) was 2.38%, 2.31% and 4.66% for year/period ended 2021, 2020 and 2019, respectively. |
| (e) | Expenses after waivers (excluding interest expense of 0.00%, 0.01% and 0.00%) was 2.17%, 2.07% and 2.00% for year/period ended 2021, 2020 and 2019, respectively. |
| (f) | Expenses include 0.10%, 0.15% and 0.04% of administrative fees which were voluntarily waived by the predecessor administrator for the year/period ended December 31, 2021, December 31, 2020 and December 31, 2019, respectively. |
| (g) | Recognition of net investment income (loss) by the Fund is affected by the timing of the declaration of dividends by the underlying investment companies in which the Fund invests. The ratio does not include net investment income (loss) of the underlying investment companies in which the Fund invests. |
| (h) | Does not include expenses of the investment companies in which the Fund invests. |
| (i) | Includes adjustments in accordance with accounting principles generally accepted in the United States of America and, consequently, the net asset value for financial reporting purposes and the returns based upon those net asset values may differ from the net asset values and returns for shareholder transactions. |
| (j) | In 2021, 0.00% of the fund’s total return consists of a voluntary reimbursement by the adviser for a realized investment loss due to an investment not meeting the fund’s investment restrictions. Excluding these items, total return would have been 11.29%. |
The accompanying notes are an integral part of these financial statements.
| Tactical Moderate Allocation Fund |
| Class I |
| Financial Highlights |
| Selected data for a share outstanding throughout the year/period. |
| | | Year | | | Year | | | For the | |
| | | Ended | | | Ended | | | Period Ended (c) | |
| | | 12/31/2021 | | | 12/31/2020 | | | 12/31/2019 | |
| | | | | | | | | | | | | |
| Net Asset Value at Beginning of Year/Period | | $ | 10.63 | | | $ | 10.30 | | | $ | 10.00 | |
| | | | | | | | | | | | | |
| Income From Investment Operations: | | | | | | | | | | | | |
| Net Investment Income (Loss) * (g) | | | (0.04 | ) | | | (0.04 | ) | | | 0.03 | |
| Net Gain on Securities (Realized and Unrealized) | | | 1.26 | (i) | | | 0.46 | | | | 0.29 | |
| Total from Investment Operations | | | 1.22 | | | | 0.42 | | | | 0.32 | |
| | | | | | | | | | | | | |
| Distributions: | | | | | | | | | | | | |
| Net Investment Income | | | — | | | | — | + | | | (0.02 | ) |
| Realized Gains | | | (1.58 | ) | | | (0.09 | ) | | | — | |
| Total from Distributions | | | (1.58 | ) | | | (0.09 | ) | | | (0.02 | ) |
| | | | | | | | | | | | | |
| Net Asset Value, at End of Year/Period | | $ | 10.27 | | | $ | 10.63 | | | $ | 10.30 | |
| | | | | | | | | | | | | |
| Total Return ** | | | 11.78 | % (i)(j) | | | 4.11 | % | | | 3.25 | % (b) |
| | | | | | | | | | | | | |
| Ratios/Supplemental Data: | | | | | | | | | | | | |
| Net Assets at End of Year/Period (Thousands) | | $ | 34,995 | | | $ | 38,171 | | | $ | 74,054 | |
| Before Waivers | | | | | | | | | | | | |
| Ratio of Expenses to Average Net Assets (d)(f)(h) | | | 2.13 | % | | | 2.27 | % | | | 1.82 | % (a) |
| Ratio of Net Investment Income (Loss) to Average Net Assets (g) | | | (0.61 | )% | | | (0.79 | )% | | | 0.40 | % (a) |
| After Waivers | | | | | | | | | | | | |
| Ratio of Expenses to Average Net Assets (e)(f)(h) | | | 1.92 | % | | | 1.88 | % | | | 1.75 | % (a) |
| Ratio of Net Investment Income (Loss) to Average Net Assets (g) | | | (0.40 | )% | | | (0.40 | )% | | | 0.47 | % (a) |
| Portfolio Turnover Rate | | | 346.41 | % | | | 1308.86 | % | | | 911.79 | % (b) |
| | | | | | | | | | | | | |
| * | Per share net investment income (loss) has been determined on the basis of average shares outstanding during the period. |
| ** | Total return in the above table represents the rate that the investor would have earned or lost on an investment in the Fund assuming reinvestment of dividends. |
| + | Amount calculated is less than $0.005. |
| (c) | For the period June 10, 2019 (commencement of investment operations) through December 31, 2019. |
| (d) | Expenses before waivers (excluding interest expense of 0.00%, 0.01% and 0.00%) was 2.13%, 2.26% and 1.82% for year/period ended 2021, 2020 and 2019, respectively. |
| (e) | Expenses after waivers (excluding interest expense of 0.00%, 0.01% and 0.00%) was 1.92%, 1.87% and 1.75% for year/period ended 2021, 2020 and 2019, respectively. |
| (f) | Expenses include 0.10%, 0.15% and 0.04% of administrative fees which were voluntarily waived by the predecessor administrator for the year/period ended December 31, 2021, December 31, 2020 and December 31, 2019, respectively. |
| (g) | Recognition of net investment income (loss) by the Fund is affected by the timing of the declaration of dividends by the underlying investment companies in which the Fund invests. The ratio does not include net investment income (loss) of the underlying investment companies in which the Fund invests. |
| (h) | Does not include expenses of the investment companies in which the Fund invests. |
| (i) | In 2021, 0.00% of the fund’s total return consists of a voluntary reimbursement by the adviser for a realized investment loss due to an investment not meeting the fund’s investment restrictions. Excluding these items, total return would have been 11.78%. |
| (j) | Includes adjustments in accordance with accounting principles generally accepted in the United States of America and, consequently, the net asset value for financial reporting purposes and the returns based upon those net asset values may differ from the net asset values and returns for shareholder transactions. |
The accompanying notes are an integral part of these financial statements.
| Tactical Growth Allocation Fund |
| Class A |
| Financial Highlights |
| Selected data for a share outstanding throughout the year/period. |
| | | Year | | | Year | | | For the | |
| | | Ended | | | Ended | | | Period Ended (c) | |
| | | 12/31/2021 | | | 12/31/2020 | | | 12/31/2019 | |
| | | | | | | | | | | | | |
| Net Asset Value at Beginning of Year/Period | | $ | 10.55 | | | $ | 10.35 | | | $ | 10.00 | |
| | | | | | | | | | | | | |
| Income From Investment Operations: | | | | | | | | | | | | |
| Net Investment Income (Loss) * (g) | | | (0.13 | ) | | | (0.11 | ) | | | 0.02 | |
| Net Gain on Securities (Realized and Unrealized) | | | 1.81 | (i) | | | 0.80 | | | | 0.34 | |
| Total from Investment Operations | | | 1.68 | | | | 0.69 | | | | 0.36 | |
| | | | | | | | | | | | | |
| Distributions: | | | | | | | | | | | | |
| Net Investment Income | | | — | | | | — | + | | | (0.01 | ) |
| Realized Gains | | | (1.36 | ) | | | (0.49 | ) | | | — | |
| Total from Distributions | | | (1.36 | ) | | | (0.49 | ) | | | (0.01 | ) |
| | | | | | | | | | | | | |
| Net Asset Value, at End of Year/Period | | $ | 10.87 | | | $ | 10.55 | | | $ | 10.35 | |
| | | | | | | | | | | | | |
| Total Return ** | | | 15.91 | % (i)(j) | | | 6.73 | % | | | 3.62 | % (b) |
| | | | | | | | | | | | | |
| Ratios/Supplemental Data: | | | | | | | | | | | | |
| Net Assets at End of Year/Period (Thousands) | | $ | 1 | | | $ | 4 | | | $ | 31 | |
| Before Waivers | | | | | | | | | | | | |
| Ratio of Expenses to Average Net Assets (d)(f)(h) | | | 2.20 | % | | | 2.29 | % | | | 4.55 | % (a) |
| Ratio of Net Investment Loss to Average Net Assets (g) | | | (1.22 | )% | | | (1.30 | )% | | | (2.24 | )% (a) |
| After Waivers | | | | | | | | | | | | |
| Ratio of Expenses to Average Net Assets (e)(f)(h)(i) | | | 2.16 | % | | | 2.08 | % | | | 2.00 | % (a) |
| Ratio of Net Investment Income (Loss) to Average Net Assets (g) | | | (1.14 | )% | | | (1.09 | )% | | | 0.31 | % (a) |
| Portfolio Turnover Rate | | | 381.43 | % | | | 1548.86 | % | | | 929.77 | % (b) |
| | | | | | | | | | | | | |
| * | Per share net investment income (loss) has been determined on the basis of average shares outstanding during the period. |
| ** | Total return in the above table represents the rate that the investor would have earned or lost on an investment in the Fund assuming reinvestment of dividends. |
| + | Amount calculated is less than $0.005. |
| (c) | For the period June 10, 2019 (commencement of investment operations) through December 31, 2019. |
| (d) | Expenses before waivers (excluding interest expense of 0.00%, 0.01% and 0.00%) was 2.25%, 2.28% and 4.55% for year/period ended 2021, 2020 and 2019, respectively. |
| (e) | Expenses after waivers (excluding interest expense of 0.00%, 0.01% and 0.00%) was 2.16%, 2.07% and 2.00% for year/period ended 2021, 2020 and 2019, respectively. |
| (f) | Expenses include 0.09%, 0.15% and 0.04% of administrative fees which were voluntarily waived by the predecessor administrator for the year/period ended December 31, 2021, December 31, 2020 and December 31, 2019, respectively. |
| (g) | Recognition of net investment income by the Fund is affected by the timing of the declaration of dividends by the underlying investment companies in which the Fund invests. The ratio does not include net investment income (loss) of the underlying investment companies in which the Fund invests. |
| (h) | Does not include expenses of the investment companies in which the Fund invests. |
| (i) | In 2021, 0.01% of the fund’s total return consists of a voluntary reimbursement by the adviser for a realized investment loss due to an investment not meeting the fund’s investment restrictions. Excluding these items, total return would have been 15.90%. |
| (j) | Includes adjustments in accordance with accounting principles generally accepted in the United States of America and, consequently, the net asset value for financial reporting purposes and the returns based upon those net asset values may differ from the net asset values and returns for shareholder transactions. |
The accompanying notes are an integral part of these financial statements.
| Tactical Growth Allocation Fund |
| Class I |
| Financial Highlights |
| Selected data for a share outstanding throughout the year/period. |
| | | Year | | | Year | | | For the | |
| | | Ended | | | Ended | | | Period Ended (c) | |
| | | 12/31/2021 | | | 12/31/2020 | | | 12/31/2019 | |
| | | | | | | | | | | | | |
| Net Asset Value at Beginning of Year/Period | | $ | 10.69 | | | $ | 10.37 | | | $ | 10.00 | |
| | | | | | | | | | | | | |
| Income From Investment Operations: | | | | | | | | | | | | |
| Net Investment Income (Loss) * (g) | | | (0.09 | ) | | | (0.05 | ) | | | 0.02 | |
| Net Gain on Securities (Realized and Unrealized) | | | 1.81 | (j) | | | 0.86 | | | | 0.36 | |
| Total from Investment Operations | | | 1.72 | | | | 0.81 | | | | 0.38 | |
| | | | | | | | | | | | | |
| Distributions: | | | | | | | | | | | | |
| Net Investment Income | | | — | | | | — | + | | | (0.01 | ) |
| Realized Gains | | | (1.36 | ) | | | (0.49 | ) | | | — | |
| Total from Distributions | | | (1.36 | ) | | | (0.49 | ) | | | (0.01 | ) |
| | | | | | | | | | | | | |
| Net Asset Value, at End of Year/Period | | $ | 11.05 | | | $ | 10.69 | | | $ | 10.37 | |
| | | | | | | | | | | | | |
| Total Return ** | | | 16.08 | % (j) | | | 7.87 | % (b) | | | 3.83 | % (b) |
| | | | | | | | | | | | | |
| Ratios/Supplemental Data: | | | | | | | | | | | | |
| Net Assets at End of Year/Period (Thousands) | | $ | 59,133 | | | $ | 50,372 | | | $ | 55,952 | |
| Before Waivers | | | | | | | | | | | | |
| Ratio of Expenses to Average Net Assets (d)(f)(h) | | | 1.95 | % | | | 2.18 | % | | | 1.87 | % (a) |
| Ratio of Net Investment Income (Loss) to Average Net Assets (g) | | | (0.86 | )% | | | (0.82 | )% | | | 0.19 | % (a) |
| After Waivers | | | | | | | | | | | | |
| Ratio of Expenses to Average Net Assets (e)(f)(h) | | | 1.91 | % (i) | | | 1.89 | % | | | 1.76 | % (a) |
| Ratio of Net Investment Income (Loss) to Average Net Assets (g) | | | (0.82 | )% | | | (0.54 | )% | | | 0.30 | % (a) |
| Portfolio Turnover Rate | | | 381.43 | % | | | 1548.86 | % | | | 929.77 | % (b) |
| | | | | | | | | | | | | |
| * | Per share net investment income (loss) has been determined on the basis of average shares outstanding during the period. |
| ** | Total return in the above table represents the rate that the investor would have earned or lost on an investment in the Fund assuming reinvestment of dividends. |
| + | Amount calculated is less than $0.005. |
| (c) | For the period June 10, 2019 (commencement of investment operations) through December 31, 2019. |
| (d) | Expenses before waivers (excluding interest and dividend expense of 0.00%, 0.01% and 0.01%) was 1.95%, 2.17% and 1.86% for year/period ended 2021, 2020 and 2019, respectively. |
| (e) | Expenses after waivers (excluding interest and dividend expense of 0.00%, 0.01% and 0.01%) was 1.91%, 1.88% and 1.75% for year/period ended 2021, 2020 and 2019, respectively. |
| (f) | Expenses include 0.09%, 0.15% and 0.03% of administrative fees which were voluntarily waived by the predecessor administrator for the year/period ended December 31, 2021, December 31, 2020 and December 31, 2019, respectively. |
| (g) | Recognition of net investment income by the Fund is affected by the timing of the declaration of dividends by the underlying investment companies in which the Fund invests. The ratio does not include net investment income (loss) of the underlying investment companies in which the Fund invests. |
| (h) | Does not include expenses of the investment companies in which the Fund invests. |
| (i) | Includes recapture of 0.05% during the year. |
| (j) | In 2021, 0.01% of the fund’s total return consists of a voluntary reimbursement by the adviser for a realized investment loss due to an investment not meeting the fund’s investment restrictions. Excluding these items, total return would have been 16.07%. |
The accompanying notes are an integral part of these financial statements.
| TFA Quantitative Fund |
| Class I |
| Financial Highlights |
| Selected data for a share outstanding throughout the year/period. |
| | | Year | | | For the | |
| | | Ended | | | Period Ended (a) | |
| | | 12/31/2021 | | | 12/31/2020 | |
| | | | | | | | | |
| Net Asset Value at Beginning of Year/Period | | $ | 11.29 | | | $ | 10.00 | |
| | | | | | | | | |
| Income From Investment Operations: | | | | | | | | |
| Net Investment Loss * (d) | | | (0.08 | ) | | | (0.11 | ) |
| Net Gain on Securities (Realized and Unrealized) | | | 1.32 | (e) | | | 1.92 | |
| Total from Investment Operations | | | 1.24 | | | | 1.81 | |
| | | | | | | | | |
| Distributions: | | | | | | | | |
| Net Investment Income | | | — | | | | — | |
| Realized Gains | | | (2.13 | ) | | | (0.52 | ) |
| Total from Distributions | | | (2.13 | ) | | | (0.52 | ) |
| | | | | | | | | |
| Net Asset Value, at End of Year/Period | | $ | 10.40 | | | $ | 11.29 | |
| | | | | | | | | |
| Total Return ** | | | 11.02 | % (e) | | | 18.13 | % (c) |
| | | | | | | | | |
| Ratios/Supplemental Data: | | | | | | | | |
| Net Assets at End of Year/Period (Thousands) | | $ | 34,953 | | | $ | 41,414 | |
| Before Waivers | | | | | | | | |
| Ratio of Expenses to Average Net Assets (f) | | | 1.96 | % | | | 2.06 | % (b) |
| Ratio of Net Investment Loss to Average Net Assets (d) | | | (0.73 | )% | | | (1.83 | )% (b) |
| After Waivers | | | | | | | | |
| Ratio of Expenses to Average Net Assets (f)(g) | | | 1.87 | % (h) | | | 1.91 | % (b) |
| Ratio of Net Investment Loss to Average Net Assets (d)(g) | | | (0.64 | )% | | | (1.68 | )% (b) |
| Portfolio Turnover Rate | | | 1238.51 | % | | | 963.53 | % (c) |
| | | | | | | | | |
| * | Per share net investment income (loss) has been determined on the basis of average shares outstanding during the period. |
| ** | Total return in the above table represents the rate that the investor would have earned or lost on an investment in the Fund assuming reinvestment of dividends. |
| (a) | For the period May 18, 2020 (commencement of investment operations) through December 31, 2020. |
| (d) | Recognition of net investment loss by the Fund is affected by the timing of the declaration of dividends by the underlying investment companies in which the Fund invests. The ratio does not include net investment income (loss) of the underlying investment companies in which the Fund invests. |
| (e) | In 2021, 0.35% of the fund total return consists of a voluntary reimbursement by the adviser for a realized investment loss due to an investment not meeting the fund’s investment restrictions. Excluding this item, total return would have been 10.66%. |
| (f) | Does not include expenses of the investment companies in which the Fund invests. |
| (g) | Expenses include 0.10%, and 0.15% of administrative fees which were voluntarily waived by the predecessor administrator during the year/period ended December 31, 2021 and December 31, 2020, respectively. |
| (h) | Includes recapture of less than 0.005% during the year. |
The accompanying notes are an integral part of these financial statements.
| TFA Multidimensional Tactical Fund |
| Class I |
| Financial Highlights |
| Selected data for a share outstanding throughout the year/period. |
| | | Year | | | For the | |
| | | Ended | | | Period Ended (a) | |
| | | 12/31/2021 | | | 12/31/2020 | |
| | | | | | | | | |
| Net Asset Value at Beginning of Year/Period | | $ | 10.72 | | | $ | 10.00 | |
| | | | | | | | | |
| Income From Investment Operations: | | | | | | | | |
| Net Investment Loss * (e) | | | (0.11 | ) | | | (0.04 | ) |
| Net Gain on Securities (Realized and Unrealized) | | | 1.29 | | | | 1.28 | |
| Total from Investment Operations | | | 1.18 | | | | 1.24 | |
| | | | | | | | | |
| Distributions: | | | | | | | | |
| Net Investment Income | | | — | | | | — | |
| Realized Gains | | | (2.60 | ) | | | (0.52 | ) |
| Total from Distributions | | | (2.60 | ) | | | (0.52 | ) |
| | | | | | | | | |
| Net Asset Value, at End of Year/Period | | $ | 9.30 | | | $ | 10.72 | |
| | | | | | | | | |
| Total Return ** | | | 11.02 | % | | | 12.48 | % (c) |
| | | | | | | | | |
| Ratios/Supplemental Data: | | | | | | | | |
| Net Assets at End of Year/Period (Thousands) | | $ | 29,212 | | | $ | 54,124 | |
| Before Waivers | | | | | | | | |
| Ratio of Expenses to Average Net Assets (d)(f) | | | 2.01 | % | | | 2.04 | % (b) |
| Ratio of Net Investment Loss to Average Net Assets (e) | | | (1.10 | )% | | | (0.75 | )% (b) |
| After Waivers | | | | | | | | |
| Ratio of Expenses to Average Net Assets (d)(f)(g)(h) | | | 1.91 | % (i) | | | 1.89 | % (b) |
| Ratio of Net Investment Loss to Average Net Assets (e)(g) | | | (0.99 | )% | | | (0.60 | )% (b) |
| Portfolio Turnover Rate | | | 1598.83 | % | | | 934.35 | % (c) |
| | | | | | | | | |
| * | Per share net investment income (loss) has been determined on the basis of average shares outstanding during the period. |
| ** | Total return in the above table represents the rate that the investor would have earned or lost on an investment in the Fund assuming reinvestment of dividends. |
| (a) | For the period May 18, 2020 (commencement of investment operations) through December 31, 2020. |
| (d) | Includes interest expense on securities sold short of 0.03% and 0.02% for the year ended December 31, 2021 and period May 18, 2020 (commencement of investment operations) through December 31, 2020. |
| (e) | Recognition of net investment income by the Fund is affected by the timing of the declaration of dividends by the underlying investment companies in which the Fund invests. The ratio does not include net investment income (loss) of the underlying investment companies in which the Fund invests. |
| (f) | Does not include expenses of the investment companies in which the Fund invests. |
| (g) | Expenses include 0.11%, and 0.15% of administrative fees which were voluntarily waived by the predecessor administrator during the year/period ended December 31, 2021 and December 31, 2020, respectively. |
| (h) | Expenses after waivers (excluding overdraft expense of 0.00% and 0.00% and interest expense of 0.03% and 0.02%) was 1.88% and 1.87% for year/period ended 2021 and 2020, respectively. |
| (i) | Includes recapture of 0.01% during the year. |
The accompanying notes are an integral part of these financial statements.
| TFA AlphaGen Growth Fund |
| Class I |
| Financial Highlights |
| Selected data for a share outstanding throughout the period. |
| | | For the | |
| | | Period Ended (a) | |
| | | 12/31/2021 | |
| | | | | |
| Net Asset Value at Beginning of Period | | $ | 10.00 | |
| | | | | |
| Income From Investment Operations: | | | | |
| Net Investment Loss * (d) | | | (— | ) + |
| Net Gain on Securities (Realized and Unrealized) | | | 0.18 | (f) |
| Total from Investment Operations | | | 0.18 | |
| | | | | |
| Distributions: | | | | |
| Net Investment Income | | | — | |
| Realized Gains | | | (0.03 | ) |
| Total from Distributions | | | (0.03 | ) |
| | | | | |
| Net Asset Value, at End of Period | | $ | 10.15 | |
| | | | | |
| Total Return ** | | | 1.80 | % (c)(f) |
| | | | | |
| Ratios/Supplemental Data: | | | | |
| Net Assets at End of Period (Thousands) | | $ | 61,447 | |
| Before Waivers | | | | |
| Ratio of Expenses to Average Net Assets (e) | | | 1.69 | % (b) |
| Ratio of Net Investment Income (Loss) to Average Net Assets (d) | | | (0.05 | )% (b) |
| After Waivers | | | | |
| Ratio of Expenses to Average Net Assets (e) | | | 1.69 | % (b) |
| Ratio of Net Investment Income (Loss) to Average Net Assets (d) | | | (0.05 | )% (b) |
| Portfolio Turnover Rate | | | 304.56 | % (c) |
| | | | | |
| * | Per share net investment loss has been determined on the basis of average shares outstanding during the period. |
| ** | Total return in the above table represents the rate that the investor would have earned or lost on an investment in the Fund assuming reinvestment of dividends. |
| + | Amount calculated is less than $0.005. |
| (a) | For the period August 23, 2021 (commencement of investment operations) through December 31, 2021. |
| (d) | Recognition of net investment loss by the Fund is affected by the timing of the declaration of dividends by the underlying investment companies in which the Fund invests. The ratio does not include net investment loss of the underlying investment companies in which the Fund invests. |
| (e) | Does not include expenses of the investment companies in which the Fund invests. |
| (f) | In 2021, 0.10% of the fund total return consists of a voluntary reimbursement by the adviser for a realized investment loss due to an investment not meeting the fund’s investment restrictions. Excluding this item, total return would have been 1.70%. |
The accompanying notes are an integral part of these financial statements.
NOTES TO FINANCIAL STATEMENTS
DECEMBER 31, 2021
The TFA Tactical Income Fund (fka Tactical Conservative Allocation Fund) (“Tactical Fund”), Tactical Moderate Allocation Fund (“Moderate Fund”), Tactical Growth Allocation Fund (“Growth Fund”), TFA Quantitative Fund (“Quantitative Fund”), TFA Multidimensional Tactical Fund (“Multidimensional Fund”) and TFA AlphaGen Growth Fund (“AlphaGen Fund”), (each a “Fund” and collectively, the “Funds”) are organized as diversified series of the Tactical Investment Series Trust (the “Trust”). The Trust is an open-end investment company established under the laws of Delaware. The Trust is authorized to issue an unlimited number of shares of beneficial interest of separate series without par value. The Funds are the only series currently authorized by the Board of Trustees (the “Board” or “Trustees”). The Tactical, Moderate and Growth Funds commenced investment operations on June 10, 2019. The Quantitative and Multidimensional Funds commenced investment operations on May 18, 2020. The AlphaGen Fund commenced investment operations on August 23, 2021.
Each Fund commenced operations (excluding AlphaGen Fund), on August 23, 2021, as a result of a Reorganization (Note 16) in which each Fund assumed all of the assets and liabilities of its respective Predecessor Fund, per the below table. Each Fund has substantially similar investment strategies as its Predecessor Fund. Each Fund has adopted the historical performance of its respective Predecessor Fund.
| Predecessor Fund (“Predecessor Fund(s)”) | | | New Fund (“New Fund(s)”) |
| Tactical Conservative Allocation Fund | | → | TFA Tactical Income Fund (fka |
| | | | Tactical Conservative Allocation Fund) |
| Tactical Moderate Allocation Fund | | → | Tactical Moderate Allocation Fund |
| Tactical Growth Allocation Fund | | → | Tactical Growth Allocation Fund |
| TFA Quantitative Fund | | → | TFA Quantitative Fund |
| TFA Multidimensional Tactical Fund | | → | TFA Multidimensional Tactical Fund |
NOTES TO FINANCIAL STATEMENTS (CONTINUED)
DECEMBER 31, 2021
The adviser to the Funds is Tactical Fund Advisors, LLC (the “Adviser”). The sub-advisers to the Funds are as follows (each a “Sub-Adviser” and collectively the “Sub-Advisers”):
| Fund | Sub-Adviser |
| Tactical Fund | Exceed Advisory, LLC |
| | Synergy Asset Management, LLC |
| | Heritage Capital Advisors. LLC |
| | Anchor Capital Management Group, Inc. (removed August 23, 2021) |
| | Tuttle Capital Management, LLC (removed August 23, 2021) |
| Moderate Fund | Exceed Advisory, LLC |
| | Synergy Asset Management, LLC |
| | Heritage Capital Advisors. LLC |
| | Howard Capital Management, Inc. (added August 26, 2021) |
| | Anchor Capital Management Group, Inc. (removed August 23, 2021) |
| | Tuttle Capital Management, LLC (removed August 23, 2021) |
| Growth Fund | Exceed Advisory, LLC |
| | Synergy Asset Management, LLC |
| | Heritage Capital Advisors. LLC |
| | Howard Capital Management, Inc. (added August 26, 2021) |
| | Anchor Capital Management Group, Inc. (removed August 23, 2021) |
| | Tuttle Capital Management, LLC (removed August 23, 2021) |
| Quantitative Fund | Potomac Advisors, Inc. |
| Multidimensional Fund | Preston Wealth Advisors, LLC |
| AlphaGen Fund | Heritage Capital Advisors. LLC |
Each Fund offers two classes of shares: Class A shares and Class I shares. Each class differs as to distribution fees, such that Class I shares have no distribution fees. See Note 4 and 5 to the financial statements for further information regarding the fees for each Class of shares offered by the Funds. Currently, Class A shares are not issued for the Quantitative Fund, Multidimensional Fund and AlphaGen Fund.
The primary investment objective of each of the Funds is as follows:
| Tactical Fund | high current income relative to the Fund’s benchmark, with a secondary objective of capital preservation |
| Moderate Fund | capital appreciation. |
| Growth Fund | capital appreciation. |
| Quantitative Fund | capital appreciation. |
| Multidimensional Fund | capital appreciation. |
| AlphaGen Fund | capital appreciation. |
| 2. | SIGNIFICANT ACCOUNTING POLICIES |
The following is a summary of each Fund’s significant accounting policies. These policies are in conformity with accounting principles generally accepted in the United States of America (“GAAP”).
NOTES TO FINANCIAL STATEMENTS (CONTINUED)
DECEMBER 31, 2021
As an investment company, as defined in Financial Accounting Standards Board (“FASB”) Accounting Standards Update (“ASU”) 2013-08, the Funds follow accounting and reporting guidance under FASB Accounting Standards Codification Topic 946, “Financial Services – Investment Companies.”
SECURITY VALUATIONS: All investments in securities are recorded at their estimated fair value, as described in Note 3.
SECURITY TRANSACTION TIMING: For financial reporting purposes, investment transactions are accounted for on the trade date. Dividend income and distributions to shareholders are recognized on the ex-dividend date. Non-cash dividend income is recorded at fair market value of the securities received. Interest income is recognized on an accrual basis. The Funds use the specific identification method in computing gain or loss on sale of investment securities. Discounts and premiums on securities purchased are accreted or amortized over the life of the respective securities using the effective interest method. Withholding taxes on foreign dividends have been provided for in accordance with each Funds’ understanding of the appropriate country’s rules and tax rates.
FEDERAL INCOME TAXES: The Funds make no provision for federal income or excise tax. The Funds have qualified and intend to qualify each year as regulated investment companies (“RIC”) under subchapter M of the Internal Revenue Code of 1986, as amended, by complying with the requirements applicable to RICs and by distributing substantially all of their taxable income. The Funds also intend to distribute sufficient net investment income and net capital gains, if any, so that they will not be subject to excise tax on undistributed income and gains. If the required amount of net investment income or gains is not distributed, the Funds could incur a tax expense. Therefore, no federal income tax or excise provision is required.
The Funds recognize the tax benefits of uncertain tax positions only when the position is more likely than not to be sustained, assuming examination by tax authorities. Management has analyzed the Funds’ tax positions and concluded that no liability for unrecognized tax benefits should be recorded related to uncertain tax positions taken on returns filed for open tax year/period (2019 and 2020) or expected to be taken on each Fund’s 2021 tax returns. The Funds identify their major tax jurisdiction as U.S. Federal, however the Funds are not aware of any tax positions for which it is reasonably possible that the total amounts of unrecognized tax benefits will change materially in the next 12 months.
The Funds recognize interest and penalties, if any, related to unrecognized tax benefits as income tax expense in the Statement of Operations. During the year/period ended December 31, 2021, the Funds did not incur any interest or penalties.
DISTRIBUTIONS TO SHAREHOLDERS: Each Fund typically distributes substantially all of its net investment income and realized gains in the form of dividends and taxable capital gains to its shareholders. The Funds intend to distribute dividends and
NOTES TO FINANCIAL STATEMENTS (CONTINUED)
DECEMBER 31, 2021
capital gains at least annually. Distributions to shareholders, which are determined in accordance with income tax regulations, are recorded on the ex-dividend date. The treatment for financial reporting purposes of distributions made to shareholders during the year from net investment income or net realized capital gains may differ from their ultimate treatment for federal income taxes purposes. These differences are caused primarily by differences in the timing of the recognition of certain components of income, expense or realized capital gain for federal income tax purposes. Where such differences are permanent in nature, they are reclassified in the components of the net assets based on their ultimate characterization for federal income tax purposes. Any such reclassifications will have no effect on net assets, results of operations or net asset value (“NAV”) per share of a Fund.
SHORT SALES: The Funds may sell a security it does not own in anticipation of a decline in the fair value of that security. When the Fund sells a security short, it must borrow the security sold short and deliver it to the broker-dealer through which it made the short sale. A gain, limited to the price at which the Fund sold the security short, or a loss, unlimited in size, will be recognized upon the termination of a short sale. The Fund is liable for any dividends or interest payable on securities while those securities are in a short position. Such amounts are recorded on the ex-dividend date as a dividend or interest expense.
USE OF ESTIMATES: The preparation of financial statements in conformity with GAAP requires management to make estimates and assumptions that affect the reported amounts of assets and liabilities and disclosure of contingent assets and liabilities at the date of the financial statements and the reported amounts of increases and decreases in net assets from operations during the reporting period. Actual results could differ from those estimates.
OPTIONS: The Funds may invest in put and call options. When a Fund writes an option, an amount equal to the premium received by a Fund is recorded as a liability and is subsequently adjusted to the current fair value of the option written. Premiums received from writing options that expire unexercised are treated by a Fund on the expiration date as realized gains. The difference between the premium and the amount paid on effecting a closing purchase transaction, including brokerage commissions, is also treated as a realized gain, or, if the premium is less than the amount paid for the closing purchase transaction, as a realized loss. If a call option is exercised, the premium is added to the proceeds from the sale of the underlying security or currency in determining if a Fund has a realized gain or loss. If a put option is exercised, the premium reduces the cost basis of the securities purchased by a Fund. A Fund as writer of an option bears the market risk of an unfavorable change in the price of the security underlying the written option.
The Funds may utilize call and put options to attempt to protect against possible changes in the market value of securities held in or to be purchased for a Fund’s portfolio and to generate income or gain for a Fund. The ability of a Fund to successfully utilize options will depend on the Adviser’s ability to predict pertinent market movements, which cannot
NOTES TO FINANCIAL STATEMENTS (CONTINUED)
DECEMBER 31, 2021
be assured. The Funds will comply with applicable regulatory requirements when implementing these techniques and instruments. See Note 7 for additional disclosures related to derivative instruments.
EXPENSES: Expenses incurred by the Trust that do not relate to a specific fund of the Trust will be allocated to the individual funds based on each fund’s relative net assets or another appropriate basis (as determined by the Trustees).
SHARE CLASS ACCOUNTING: Investment income, common expenses and realized/unrealized gains (losses) on investments are allocated to the two classes of shares of the Tactical, Moderate and Growth Funds on the basis of the daily net assets of each class. Fees relating to a specific class are charged directly to that share class.
SHARE VALUATION: Each Fund’s NAV is calculated once daily for each class of shares, at the close of regular trading hours on the New York Stock Exchange (the “NYSE”) (generally 4:00 p.m. Eastern time) on each day the NYSE is open. The net assets are determined by totaling the value of all portfolio securities, cash and other assets held by a Fund, and subtracting from that total all liabilities, including accrued expenses. The total net assets for each class, are divided by the total number of shares outstanding for each class, to determine the NAV of each share.
Processes and Structure
The Board has adopted guidelines for valuing securities including in circumstances in which market quotes are not readily available and has delegated to the Adviser the responsibility for determining fair value prices, subject to review by the Board.
Fair Value Pricing Policy
The Board has adopted guidelines for fair value pricing and has delegated to the Adviser the responsibility for determining fair value prices, subject to oversight by the Board. If market quotations are not readily available, the security will be valued at fair value (the amount which the owner might reasonably expect to receive for the security upon its current sale) as determined in good faith by the Adviser (“Fair Value Pricing”), subject to oversight by the Board. The Adviser must use reasonable diligence in determining whether market quotations are readily available. If, for example, the Adviser determines that one source of market value is unreliable, the Adviser must diligently seek market quotations from other sources, such as other brokers or pricing services, before concluding that market quotations are not available. Fair Value Pricing is not permitted when market quotations are readily available.
Fixed income securities generally are valued using market quotations provided by a pricing service. If the Adviser decides that a price provided by the pricing service does not accurately reflect the fair market value of the securities, when prices are not readily available from a pricing service, or when restricted or illiquid securities are being valued, securities are valued at fair value as determined in good faith by the Adviser, in
NOTES TO FINANCIAL STATEMENTS (CONTINUED)
DECEMBER 31, 2021
conformity with guidelines adopted by and subject to review of the Board. Short term investments in fixed income securities with maturities of less than 60 days when acquired, or which subsequently are within 60 days of maturity, may be valued by using the amortized cost method of valuation, when the Board has determined that it will represent fair value.
Fair Value Measurements
GAAP defines fair value as the price that each Fund would receive to sell an asset or pay to transfer a liability in an orderly transaction between market participants at the measurement date and also establishes a framework for measuring fair value, and a three-level hierarchy for fair value measurements based upon the transparency of inputs to the valuation of an asset or liability. The three-tier hierarchy seeks to maximize the use of observable market data and minimize the use of unobservable inputs and to establish classification of fair value measurements for disclosure purposes. Inputs refer broadly to the assumptions that market participants would use in pricing the asset or liability, including assumptions about risk. Inputs may be observable or unobservable. Observable inputs are inputs that reflect the assumptions market participants would use in pricing the asset or liability developed based on market data obtained from sources independent of the reporting entity. Unobservable inputs are inputs that reflect each Fund’s own assumptions about the assumptions market participants would use in pricing the asset or liability developed based on the best information available in the circumstances.
Equity securities (domestic and foreign common stocks and exchange-traded funds/notes) – Securities traded on a national securities exchange (or reported on the NASDAQ national market) are stated at the last reported sales price on the day of valuation. To the extent these securities are actively traded, and valuation adjustments are not applied, they are categorized in Level 1 of the fair value hierarchy. Certain foreign securities may be fair valued using a pricing service that considers the correlation of the trading patterns of the foreign security to the intraday trading in the U.S. markets for investments such as American Depositary Receipts, financial futures, exchange-traded funds, and the movement of the certain indexes of securities based on a statistical analysis of the historical relationship and that are categorized in Level 2. Preferred stock and other equities traded on inactive markets or valued by reference to similar instruments are also categorized in Level 2.
Valuation of Fund of Funds – The Funds may invest in portfolios of open-end or closed-end investment companies (the “Underlying Funds”). The Underlying Funds value securities in their portfolios for which market quotations are readily available at their market values (generally the last reported sale price) and all other securities and assets at their fair value based upon the methods established by the board of directors of the Underlying Funds. The shares of many closed-end investment companies, after their initial public offering, frequently trade at a price per share, which is different than the net asset value per share. The difference represents a market premium or market discount of such shares. There can be no assurances that the market discount or market premium on shares of any closed end investment company purchased by a Fund will not change.
NOTES TO FINANCIAL STATEMENTS (CONTINUED)
DECEMBER 31, 2021
Derivative instruments (put and call options) – Under normal circumstances, options are valued at the closing bid and ask quotations on the valuation date. On days when the closing market quotations are not considered to be reflective of fair value, options will be valued at the average of the bid and ask quotations on the valuation date. These securities will be categorized in Level 2 of the fair value hierarchy if valued at other than closing price.
Fixed income securities (corporate bonds) – The fair value of fixed income securities is estimated using various techniques, which may consider recently executed transactions in securities of the issuer or comparable issuers, market price quotations (when observable), bond spreads, fundamental data relating to the issuer, and credit default swap spreads adjusted for any basis difference between cash and derivative instruments. Although most fixed income securities are categorized in Level 2 of the fair value hierarchy, in instances when lower relative weight is placed on transaction prices, quotations, or similar observable inputs, they are categorized in Level 3.
Money market funds – Money market funds are generally priced at the ending NAV provided by the service agent of the money market fund. The money market funds will be categorized as Level 1 within the fair value hierarchy.
Hierarchy of Fair Value Inputs
The Funds utilize various methods to measure the fair value of most of their investments on a recurring basis. GAAP establishes a hierarchy that prioritizes inputs to valuation techniques used to measure fair value. The three levels of inputs are as follows:
| ● | Level 1. Unadjusted quoted prices in active markets for identical assets or liabilities that the Fund has the ability to access. |
| ● | Level 2. Observable inputs other than quoted prices included in Level 1 that are observable for the asset or liability either directly or indirectly. These inputs may include quoted prices for the identical instrument on an inactive market, prices for similar instruments, interest rates, prepayment speeds, credit risk, yield curves, default rates, and similar data. |
| ● | Level 3. Unobservable inputs for the asset or liability to the extent that relevant observable inputs are not available, representing the Funds’ own assumptions about the assumptions that a market participant would use in valuing the asset or liability, and that would be based on the best information available. |
The availability of observable inputs can vary from security to security and is affected by a wide variety of factors, including, for example, the type of security, whether the security is new and not yet established in the marketplace, the liquidity of markets, and other characteristics particular to the security. To the extent that valuation is based on models or inputs that are less observable or unobservable in the market, the determination of fair value requires more judgment. Accordingly, the degree of judgment exercised in determining fair value is greatest for instruments categorized in Level 3.
NOTES TO FINANCIAL STATEMENTS (CONTINUED)
DECEMBER 31, 2021
The inputs used to measure fair value may fall into different levels of the fair value hierarchy. In such cases, for disclosure purposes, the level in the fair value hierarchy within which the fair value measurement falls in its entirety is determined based on the lowest level input that is significant to the fair value measurement in its entirety.
The inputs or methodology used for valuing securities are not necessarily an indication of the risk associated with investing in the security.
The following tables present information about each Fund’s investments measured at fair value as of December 31, 2021, by major security type:
| Tactical Fund |
| | | Financial Instruments—Assets | |
| Categories | | Level 1 | | | Level 2 | | | Level 3 | | | Fair Value | |
| | | | | | | | | | | | | |
| Exchange-Traded Funds | | $ | 24,653,204 | | | $ | — | | | $ | — | | | $ | 24,653,204 | |
| Money Market Funds | | | 3,659,607 | | | | — | | | | — | | | | 3,659,607 | |
| Purchased Options | | | 196,185 | | | | 105,880 | | | | — | | | | 302,065 | |
| Total | | $ | 28,508,996 | | | $ | 105,880 | | | $ | — | | | $ | 28,614,876 | |
| | | | | | | | | | | | | | | | | |
| | | Financial Instruments—Liabilities | |
| Categories | | Level 1 | | | Level 2 | | | Level 3 | | | Fair Value | |
| | | | | | | | | | | | | |
| Written Options | | $ | (43,480 | ) | | $ | (24,970 | ) | | $ | — | | | $ | (68,450 | ) |
| Total | | $ | (43,480 | ) | | $ | (24,970 | ) | | $ | — | | | $ | (68,450 | ) |
| | | | | | | | | | | | | | | | | |
| Moderate Fund |
| | | Financial Instruments—Assets | |
| Categories | | Level 1 | | | Level 2 | | | Level 3 | | | Fair Value | |
| | | | | | | | | | | | | | | | | |
| Common Stock * | | $ | 924,931 | | | $ | — | | | $ | — | | | $ | 924,931 | |
| Exchange-Traded Funds | | | 30,800,863 | | | | — | | | | — | | | | 30,800,863 | |
| Money Market Funds | | | 5,220,794 | | | | — | | | | — | | | | 5,220,794 | |
| Purchased Options | | | 136,155 | | | | — | | | | — | | | | 136,155 | |
| Total | | $ | 37,082,743 | | | $ | — | | | $ | — | | | $ | 37,082,743 | |
| | | | | | | | | | | | | | | | | |
| | | Financial Instruments—Liabilities | |
| Categories | | Level 1 | | | Level 2 | | | Level 3 | | | Fair Value | |
| | | | | | | | | | | | | |
| Written Options | | $ | (53,170 | ) | | $ | — | | | $ | — | | | $ | (53,170 | ) |
| Total | | $ | (53,170 | ) | | $ | — | | | $ | — | | | $ | (53,170 | ) |
NOTES TO FINANCIAL STATEMENTS (CONTINUED)
DECEMBER 31, 2021
| Growth Fund |
| | | Financial Instruments—Assets | |
| Categories | | Level 1 | | | Level 2 | | | Level 3 | | | Fair Value | |
| | | | | | | | | | | | | | | | | |
| Common Stock * | | $ | 6,761,066 | | | $ | — | | | $ | — | | | $ | 6,761,066 | |
| Exchange-Traded Funds | | | 46,350,700 | | | | — | | | | — | | | | 46,350,700 | |
| Corporate Bonds | | | — | | | | 300,019 | | | | — | | | | 300,019 | |
| Money Market Funds | | | 8,208,245 | | | | — | | | | — | | | | 8,208,245 | |
| Purchased Options | | | 464,536 | | | | 853,747 | | | | — | | | | 1,318,283 | |
| Total | | $ | 61,784,547 | | | $ | 1,153,766 | | | $ | — | | | $ | 62,938,313 | |
| | | | | | | | | | | | | | | | | |
| | | Financial Instruments—Liabilities | |
| Categories | | Level 1 | | | Level 2 | | | Level 3 | | | Fair Value | |
| | | | | | | | | | | | | |
| Written Options | | $ | (250,055 | ) | | $ | (209,899 | ) | | $ | — | | | $ | (459,954 | ) |
| Total | | $ | (250,055 | ) | | $ | (209,899 | ) | | $ | — | | | $ | (459,954 | ) |
| | | | | | | | | | | | | | | | | |
| Quantitative Fund |
| | | Financial Instruments—Assets | |
| Categories | | Level 1 | | | Level 2 | | | Level 3 | | | Fair Value | |
| | | | | | | | | | | | | | | | | |
| Open-End Funds | | $ | 35,905,489 | | | $ | — | | | $ | — | | | $ | 35,905,489 | |
| Money Market Funds | | | 5,147,134 | | | | — | | | | — | | | | 5,147,134 | |
| Total | | $ | 41,052,623 | | | $ | — | | | $ | — | | | $ | 41,052,623 | |
| | | | | | | | | | | | | | | | | |
| Multidimensional Fund |
| | | Financial Instruments—Assets | |
| Categories | | Level 1 | | | Level 2 | | | Level 3 | | | Fair Value | |
| | | | | | | | | | | | | | | | | |
| Common Stocks * | | $ | 26,778,394 | | | $ | — | | | $ | — | | | $ | 26,778,394 | |
| Exchange-Traded Funds | | | 6,726,317 | | | | — | | | | — | | | | 6,726,317 | |
| Money Market Funds | | | 2,125,905 | | | | — | | | | — | | | | 2,125,905 | |
| Total | | $ | 35,630,616 | | | $ | — | | | $ | — | | | $ | 35,630,616 | |
| | | | | | | | | | | | | | | | | |
| AlphaGen Fund |
| | | Financial Instruments—Assets | |
| Categories | | Level 1 | | | Level 2 | | | Level 3 | | | Fair Value | |
| | | | | | | | | | | | | | | | | |
| Exchange-Traded Funds | | $ | 49,437,642 | | | $ | — | | | $ | — | | | $ | 49,437,642 | |
| Money Market Funds | | | 12,211,416 | | | | — | | | | — | | | | 12,211,416 | |
| Total | | $ | 61,649,058 | | | $ | — | | | $ | — | | | $ | 61,649,058 | |
During the year ended December 31, 2021, there were no transfers between Level 3 in the Funds. The Funds did not hold any Level 3 securities during the period presented.
| * | Industry classifications of these categories are detailed on each Fund’s Schedule of Investments. |
NOTES TO FINANCIAL STATEMENTS (CONTINUED)
DECEMBER 31, 2021
| 4. | RELATED PARTY TRANSACTIONS |
INVESTMENT ADVISER: Under the terms of a management agreement between the Trust and the Adviser, with respect to the Funds (the “Agreement”), the Adviser, subject to the oversight of the Board, provides investment advice as its deems advisable and will furnish a continuous investment program for the Funds consistent with each Fund’s investment objective and policies. As compensation for its management services, each Fund is obligated to pay the Adviser a fee computed and accrued daily and paid monthly at an annual rate of 1.30% of the average daily net assets of each Fund. The Adviser delegates daily management of the Funds assets to multiple sub-advisers. The Adviser is responsible for the overall management of the Funds, supervision of the sub-advisers, and for determining the amount of each Fund’s assets that each sub-adviser will manage. The Adviser, not the Funds, pays each sub-adviser.
The Agreement continues for an initial term of two years and is renewed annually thereafter, provided that continuance is approved at least annually by specific approval of the Board or by vote of the holders of a majority of the outstanding voting securities of a Fund. In either event, it must also be approved by a majority of the Trustees who are neither parties to the agreement nor interested persons as defined in the Investment Company Act of 1940, as amended (the “1940 Act”), at a meeting called for the purpose of voting on such approval. The Agreement may be terminated at any time without the payment of any penalty by the Board or by vote of a majority of the outstanding voting securities of the Funds on not more than 60 days, written notice to the Adviser. In the event of its assignment, the Agreement will terminate automatically.
From May 1, 2020 through May 28, 2021, the Adviser contractually agreed to reduce its fees and to reimburse expenses to ensure that total annual Fund operating expenses after fee waiver and reimbursement (exclusive of any front-end or contingent deferred loads, taxes, leverage interest, borrowing interest, brokerage commissions, expenses incurred in connection with any merger or reorganization, dividend expense on securities sold short, acquired (underlying) fund fees and expenses or extraordinary expenses such as litigation) will not exceed 2.20% of the average daily net assets attributable to the Class A shares and 1.95% for the Class I shares. As of May 28, 2021, the Adviser has contractually agreed to reduce its fees and to reimburse expenses, at least through April 30, 2023 to ensure that total annual Fund operating expenses after fee waiver and reimbursement (exclusive of any front-end or contingent deferred loads, taxes, leverage interest, borrowing interest, brokerage commissions, expenses incurred in connection with any merger or reorganization, dividend expense on securities sold short, acquired (underlying) fund fees and expenses or extraordinary expenses such as litigation) will not exceed 2.14% of the average daily net assets attributable to the Class A shares and 1.89% for the Class I shares of each Fund. These fee waivers and expense reimbursements are subject to possible recoupment from each Fund within three years of the date on which the waiver or reimbursement occurs, if such recoupment can be achieved within the lesser
NOTES TO FINANCIAL STATEMENTS (CONTINUED)
DECEMBER 31, 2021
of the foregoing expense limits or the expense limits in place at the time of recoupment. This agreement may be terminated only by the Board, on 60 days, written notice to the Adviser.
For the year ended December 31, 2021, the Adviser earned $379,943 in advisory fees from the Tactical Fund. During the year ended December 31, 2021, the Adviser waived fees of $57,508. As of December 31, 2021, the Tactical Fund owed the Adviser $35,512.
For the year ended December 31, 2021, the Adviser earned $468,904 in advisory fees from the Moderate Fund. During the year ended December 31, 2021, the Adviser waived fees of $40,525 and recouped fees of $0. As of December 31, 2021, the Moderate Fund owed the Adviser $53,001.
For the year ended December 31, 2021, the Adviser earned $764,912 in advisory fees from the Growth Fund. During the year ended December 31, 2021, the Adviser waived fees of $0 and recouped $29,493. As of December 31, 2021, the Growth Fund owed the Adviser $120,540.
For the year ended December 31, 2021, the Adviser earned $588,938 in advisory fees from the Quantitative Fund. During the year ended December 31, 2021, the Adviser recouped fees of $1,943. As of December 31, 2021, the Quantitative Fund owed the Adviser $47,861.
For the year ended December 31, 2021, the Adviser earned $687,281 in advisory fees from the Multidimensional Fund. During the year ended December 31, 2021, the Adviser recouped fees of $2,674. As of December 31, 2021, the Multidimensional Fund owed the Adviser $38,751.
For the period ended December 31, 2021, the Adviser earned $294,000 in advisory fees from the AlphaGen Fund. During the period ended December 31, 2021 the Adviser waived fees of $0 and recouped $0. As of December 31, 2021, the AlphaGen Fund owed the Adviser $65,858.
Advisory fees waived and/or reimbursed expenses that may be subject to potential recoupment by the Adviser as follows:
| | | Tactical Fund | | | Moderate Fund | | | Growth Fund | |
| Recoverable Through | | Amount
Recoverable | | | Amount
Recoverable | | | Amount
Recoverable | |
| December 31, 2022 | | $ | 4,147 | | | $ | 12,614 | | | $ | — | |
| December 31, 2023 | | $ | 90,908 | | | $ | 107,059 | | | $ | 60,061 | |
| December 31, 2024 | | $ | 57,508 | | | $ | 40,525 | | | $ | — | |
For the year ended December 31, 2021, there were several instances of violations of Section 12(d)(1) of the 1940 Act relating to TFA’s and the sub-advisors’ pre-trade compliance processes. Although most of the violations were cured with minimal net gains to
NOTES TO FINANCIAL STATEMENTS (CONTINUED)
DECEMBER 31, 2021
shareholders, one violation resulted in a loss of $148,640 to the Quantitative Fund; resulting in the Advisor reimbursing the Fund for the losses.
For the year ended December 31, 2021, the Moderate, Growth and AlphaGen Funds oversold positions causing losses of $943, $20,845 and $49,685 to the Funds, respectively. Howard Capital Management. Inc. reimbursed each Fund on January 14, 2022.
ADMINISTRATION AND COMPLIANCE SERVICES: Prior to August 20, 2021, Collaborative Fund Services, LLC (“CFS”) served as the Funds’ Administrator and provided compliance services to the Funds. CFS was paid an annual fee of 0.35% of the Funds’ average daily net assets. Greg Skidmore is the President of CFS and was an Interested Trustee of Collaborative Investment Series Trust. CFS contracted with Empirical Administration, LLC (“Empirical”) to assist with Fund administration and compliance services. Brandon Pokersnik is the owner/President of Empirical, and also an employee of MSS, the Funds’ former transfer agent. Mr. Pokersnik also serves as an officer of the Collaborative Investment Series Trust.
From August 21, 2021 to November 12, 2021, Northern Lights Compliance Services (“NLCS”) provided compliance services to the Funds, including serving as the Funds’ chief compliance officer. For the period August 21, 2021 through November 12, 2021, NLCS earned $5,628 for its compliance services.
Effective November 13, 2021, Calfee Strategic Solutions (“Calfee”) served as the chief compliance officer of the Trust. For the period November 13, 2021 through December 31, 2021, Calfee earned $8,003 for its compliance services.
For the period ended August 20, 2021, CFS earned $63,665 for administration services from the Tactical Fund. For the period ended August 20, 2021, CFS voluntary waived $27,285 of fees earned.
For the period ended August 20, 2021, CFS earned $83,462 for administration services from the Moderate Fund. For the period ended August 20, 2021, CFS voluntary waived $35,769 of fees earned.
For the period ended August 20, 2021, CFS earned $123,221 for administration services from the Growth Fund. For the period ended August 20, 2021, CFS voluntary waived $52,809 of fees earned.
For the period ended August 20, 2021, CFS earned $101,026 for administration services from the Quantitative Fund. For the period ended August 20, 2021, CFS voluntary waived $43,297 of fees earned.
For the period ended August 20, 2021, CFS earned $132,336 for administration services from the Multidimensional Fund. For the period ended August 20, 2021, CFS voluntary waived $56,715 of fees earned.
NOTES TO FINANCIAL STATEMENTS (CONTINUED)
DECEMBER 31, 2021
TRANSFER AGENT AND FUND ACCOUNTANT: Prior to August 23, 2021, Brandon Pokersnik, the Funds’ CCO and Secretary is an employee of MSS. MSS received $11.50 per shareholder for transfer agency services. For its services as fund accountant, MSS received an annual fee from the Funds based on the average net assets of each Fund.
As of August 23, 2021, the Funds have entered into a Distribution Agreement with Ultimus Fund Distributors, LLC (the “Distributor” or “UFD”) whereby UFD provides distribution services to the Funds. For the provision of these services, the Adviser has agreed to pay UFD customary fees for the Funds. In addition, certain affiliates of UFD provide services to the Funds as follows:
Ultimus Fund Solutions, LLC (“Ultimus”) – Ultimus, an affiliate of the Distributor, provides sub-administration, fund accounting and transfer agent services to the Fund. Pursuant to a separate servicing agreement with Ultimus, the Adviser pays Ultimus customary fees for providing sub-administration, fund accounting and transfer agent services to the Fund. Certain officers of the Trust are also officers of Ultimus and are not paid any fees directly by the Adviser for serving in such capacities.
BluGiant, LLC (“BluGiant”), BluGiant, an affiliate of Ultimus and the Distributor, provides EDGAR conversion and filing services as well as print management services for the Fund on an ad-hoc basis. For the provision of these services, BluGiant receives customary fees from the Adviser.
| 5. | DISTRIBUTION (12B-1) PLAN AND SHAREHOLDER SERVICING FEES |
The Trust, on behalf of the Funds, has adopted a distribution plan in accordance with Rule 12b-1 (“Distribution Plan”) under the 1940 Act for the Class A shares. Pursuant to the Distribution Plan, each Fund compensates for services rendered and expenses borne in connection with activities primarily intended to result in the sale of the Fund’s Class A shares. The Distribution Plan provides that a Fund may pay annually up to 0.25% of the average daily net assets of the Fund’s Class A. For the period January 1, 2021 through August 23, 2021, Arbor Court Capital, LLC acted as the distributor and was an affiliated entity of MSS. For the period ended August 23, 2021, the Funds accrued $43, $2, and $5 for Class A of Tactical Fund, Moderate Fund, and Growth Fund, respectively. Ultimus Fund Distributors, LLC acted as the distributor for the period August 23, 2021 through December 31, 2021. For the period August 23, 2021 through December 31, 2021, the Funds accrued $22, $2, and $1 for Class A of Tactical Fund, Moderate Fund, and Growth Fund, respectively.
Shareholder servicing fees may be paid in addition to the Rule 12b-1 fees and any sales charges. These payments are generally made to financial intermediaries that provide shareholder or administrative services, or marketing support. Certain administrative fees, such as sub-transfer agency or sub-administrative fees, may be payable by a Fund. Marketing support may include access to sales meetings, sales representatives and
NOTES TO FINANCIAL STATEMENTS (CONTINUED)
DECEMBER 31, 2021
financial intermediary management representatives, inclusion of a Fund on a sales list, including a preferred or select sales list, or other sales programs.
| 6. | INVESTMENT TRANSACTIONS |
Tactical Fund
For the year ended December 31, 2021, purchases and sales of investment securities other than U.S. Government obligations, short-term investments and derivatives for the Tactical Fund aggregated $145,649,328 and $148,685,470, respectively. Purchases and sales of U.S. Government obligations aggregated $0 and $0, respectively.
Moderate Fund
For the year ended December 31, 2021, purchases and sales of investment securities other than U.S. Government obligations, short-term investments and derivatives for the Moderate Fund aggregated $110,278,764 and $112,120,199, respectively. Purchases and sales of U.S. Government obligations aggregated $0 and $0, respectively.
Growth Fund
For the year ended December 31, 2021, purchases and sales of investment securities other than U.S. Government obligations, short-term investments and derivatives for the Growth Fund aggregated $199,562,710 and $192,551,450, respectively. Purchases and sales of U.S. Government obligations aggregated $0 and $0, respectively.
Quantitative Fund
For the year ended December 31, 2021, purchases and sales of investment securities other than U.S. Government obligations and short-term investments for the Quantitative Fund aggregated $467,190,069 and $475,936,295, respectively.
Multidimensional Fund
For the year ended December 31, 2021, purchases and sales of investment securities other than U.S. Government obligations and short-term investments for the Multidimensional Fund aggregated $713,623,606 and $728,150,235, respectively.
AlphaGen Fund
For the period ended December 31, 2021, purchases and sales of investment securities other than U.S. Government obligations and short-term investments for the AlphaGen Fund aggregated $184,534,831 and $136,366,558, respectively.
| 7. | DERIVATIVE TRANSACTIONS |
The notional value of the derivative instruments outstanding as of December 31, 2021 as disclosed in the Schedules of Investments and the amounts realized and changes in unrealized gains and losses on derivative instruments during the year as disclosed above and within the Statements of Operations serve as indicators of the volume of derivative activity of the Funds.
NOTES TO FINANCIAL STATEMENTS (CONTINUED)
DECEMBER 31, 2021
As of December 31, 2021, the following financial derivative instruments are included in Investment in Securities at Value (assets) and Written Options at Value (liabilities) in the Statement of Assets and Liabilities:
| TFA Tactical Income Fund |
| Assets | | Equity Index Contracts | |
| Call Options Purchased | | $ | 302,065 | |
| Total Assets | | $ | 302,065 | |
| | | | | |
| Liabilities | | Equity Index Contracts | |
| Call Options Written | | $ | (33,200 | ) |
| Put Options Written | | | (35,250 | ) |
| Total Liabilities | | $ | (68,450 | ) |
| | | | | |
| Tactical Moderate Allocation Fund |
| Assets | | Equity Index Contracts | |
| Call Options Purchased | | $ | 131,635 | |
| Put Options Purchased | | | 4,520 | |
| Total Assets | | $ | 136,155 | |
| | | | | |
| Liabilities | | Equity Index Contracts | |
| Call Options Written | | $ | (28,680 | ) |
| Put Options Written | | | (24,490 | ) |
| Total Liabilities | | $ | (53,170 | ) |
| | | | | |
| Tactical Growth Allocation Fund |
| Assets | | Equity Index Contracts | |
| Call Options Purchased | | $ | 1,259,033 | |
| Put Options Purchased | | | 59,250 | |
| Total Assets | | $ | 1,318,283 | |
| | | | | |
| Liabilities | | Equity Index Contracts | |
| Call Options Written | | $ | (172,969 | ) |
| Put Options Written | | | (286,985 | ) |
| Total Liabilities | | $ | (459,954 | ) |
NOTES TO FINANCIAL STATEMENTS (CONTINUED)
DECEMBER 31, 2021
For the year ended December 31, 2021, financial derivative instruments had the following effect on the Statement of Operations:
Financial
Investment
Type | | Location | | Realized
Gain/
(Loss) | | | Location | | Unrealized
Gain/
(Loss) | |
| |
| Tactical Fund |
| Options Written | | Net Realized Gain on Written Options | | $ | 336,281 | | | Net Change in Unrealized Appreciation (Depreciation) on Written Options | | $ | (192,366 | ) |
| Options Purchased | | Net Realized Gain on Unaffiliated Investments | | $ | 490,215 | | | Net Change in Unrealized Appreciation (Depreciation) on Unaffiliated Investments | | $ | (153,835 | ) |
| | | | | | | | | | | | | |
| Moderate Fund |
| Options Written | | Net Realized Gain on Written Options | | $ | 577,187 | | | Net Change in Unrealized Appreciation (Depreciation) on Written Options | | $ | (152,679 | ) |
| Options Purchased | | Net Realized Gain on Unaffiliated Investments | | $ | 1,491,029 | | | Net Change in Unrealized Appreciation (Depreciation) on Unaffiliated Investments | | $ | (473,463 | ) |
| | | | | | | | | | | | | |
| Growth Fund |
| Options Written | | Net Realized Gain on Written Options | | $ | 1,048,463 | | | Net Change in Unrealized Appreciation (Depreciation) on Written Options | | $ | (4,023 | ) |
| Options Purchased | | Net Realized Gain on Unaffiliated Investments | | $ | 1,546,533 | | | Net Change in Unrealized Appreciation (Depreciation) on Unaffiliated Investments | | $ | (175,606 | ) |
NOTES TO FINANCIAL STATEMENTS (CONTINUED)
DECEMBER 31, 2021
The selling of written call options may tend to reduce the volatility of a Fund because the premiums received from selling the options will reduce any losses on the underlying securities, but only by the amount of the premiums. However, selling the options may also limit a Fund’s gain on the underlying securities. Written call options expose a Fund to minimal counterparty risk since they are exchange-traded and the exchange’s clearing house guarantees the options against default.
The Funds engage in option transactions involving individual securities and stock indexes. An option involves either: (a) the right or the obligation to buy or sell a specific instrument at a specific price until the expiration date of the option; or (b) the right to receive payments or the obligation to make payments representing the difference between the closing price of a stock index and the exercise price of the option expressed in dollars times a specified multiple until the expiration date of the option. The Funds may purchase and write options. Options are sold (written) on securities and stock indexes. The purchaser of an option on a security pays the seller (the writer) a premium for the right granted but is not obligated to buy or sell the underlying security. The purchaser of an option on a stock index pays the seller a premium for the right granted, and in return the seller of such an option is obligated to make the payment. A writer of an option may terminate the obligation prior to expiration of the option by making an offsetting purchase of an identical option. Options are traded on organized exchanges and in the over-the-counter market. To cover the potential obligations involved in writing options, a Fund will either: (a) own the underlying security, or in the case of an option on a market index, will hold a portfolio of stocks substantially replicating the movement of the index; or (b) a Fund will segregate with the custodian high grade liquid assets sufficient to purchase the underlying security or equal to the market value of the stock index option, marked to market daily.
The purchase of options limits a Fund’s potential loss to the amount of the premium paid and can afford a Fund the opportunity to profit from favorable movements in the price of an underlying security to a greater extent than if transactions were affected in the security directly. However, the purchase of an option could result in a Fund losing a greater percentage of its investment than if the transaction were affected directly. When a Fund writes a call option, it will receive a premium, but it will give up the opportunity to profit from a price increase in the underlying security above the exercise price as long as its obligation as a writer continues, and it will retain the risk of loss should the price of the security decline. When a Fund writes a put option, it will assume the risk that the price of the underlying security or instrument will fall below the exercise price, in which case a Fund may be required to purchase the security or instrument at a higher price than the market price of the security or instrument. In addition, there can be no assurance that a Fund can affect a closing transaction on a particular option it has written. Further, the total premium paid for any option may be lost if a Fund does not exercise the option.
The Funds engage in option transactions involving securities and stock indices in order to gain exposure to particular securities or markets, in connection with hedging transactions, or to try to enhance returns. Options require additional skills and techniques beyond normal portfolio management. The Funds use of options involves risk that such
NOTES TO FINANCIAL STATEMENTS (CONTINUED)
DECEMBER 31, 2021
instruments may not work as intended due to unanticipated developments, especially in abnormal market conditions, or if the Adviser makes an error in judgment, or other causes. The use of options may magnify the increase or decrease in the performance of a Fund, and may also subject a Fund to higher price volatility.
The premiums paid for the options represent the cost of the investment and the options are valued daily at their closing price. The Funds recognize a realized gain or loss when the option is sold or expired. Option holdings within a Fund, which may include put options and call options, are subject to loss of value with the passage of time and may experience a total loss of value upon expiration. With options, there is minimal counterparty risk to each Fund since they are exchange traded.
| 8. | CAPITAL SHARE TRANSACTIONS |
At December 31, 2021, there were unlimited shares authorized at no par value for the Funds. Transactions in capital for the year/period ended December 31, 2021, and year/period ended December 31, 2020 were as follows:
| Tactical Fund |
| Institutional Class | | January 1, 2021
through December 31, 2021 | | | January 1, 2020
through December 31, 2020 | |
| | | Shares | | | Amount | | | Shares | | | Amount | |
| Shares Sold | | | 2,187,870 | | | $ | 23,978,701 | | | | 1,784,771 | | | $ | 17,377,982 | |
| Shares Reinvested | | | 420,117 | | | | 4,093,653 | | | | 31,097 | | | | 328,701 | |
| Shares Redeemed | | | (2,800,035 | ) | | | (30,305,733 | ) | | | (2,943,490 | ) | | | (29,535,926 | ) |
| Net Decrease | | | (192,048 | ) | | $ | (2,233,379 | ) | | | (1,127,622 | ) | | $ | (11,829,243 | ) |
| | | | | | | | | | | | | | | | | |
Tactical Fund |
| Class A | | January 1, 2021
through December 31, 2021 | | | January 1, 2020
through December 31, 2020 | |
| | | Shares | | | Amount | | | Shares | | | Amount | |
| Shares Sold | | | 301 | | | $ | 3,300 | | | | 833 | | | $ | 8,706 | |
| Shares Reinvested | | | 401 | | | | 3,861 | | | | 27 | | | | 281 | |
| Shares Redeemed | | | (496 | ) | | | (5,325 | ) | | | (1,220 | ) | | | (12,750 | ) |
| Net Increase/(Decrease) | | | 206 | | | $ | 1,836 | | | | (360 | ) | | $ | (3,763 | ) |
| | | | | | | | | | | | | | | | | |
| Moderate Fund |
| Institutional Class | | January 1, 2021
through December 31, 2021 | | | January 1, 2020
through December 31, 2020 | |
| | | Shares | | | Amount | | | Shares | | | Amount | |
| Shares Sold | | | 1,996,712 | | | $ | 22,517,202 | | | | 1,534,715 | | | $ | 14,932,812 | |
| Shares Reinvested | | | 497,740 | | | | 5,128,048 | | | | 30,884 | | | | 328,298 | |
| Shares Redeemed | | | (2,677,940 | ) | | | (29,847,799 | ) | | | (5,168,444 | ) | | | (50,480,349 | ) |
| Net Decrease | | | (183,488 | ) | | $ | (2,202,549 | ) | | | (3,602,845 | ) | | $ | (35,219,239 | ) |
NOTES TO FINANCIAL STATEMENTS (CONTINUED)
DECEMBER 31, 2021
| Moderate Fund |
| Class A | | January 1, 2021
through December 31, 2021 | | | January 1, 2020
through December 31, 2020 | |
| | | Shares | | | Amount | | | Shares | | | Amount | |
| Shares Sold | | | — | | | $ | — | | | | 408 | | | $ | 4,214 | |
| Shares Reinvested | | | 16 | | | | 164 | | | | 1 | | | | 14 | |
| Shares Redeemed | | | (51 | ) | | | (542 | ) | | | (3,616 | ) | | | (37,669 | ) |
| Net Decrease | | | (35 | ) | | $ | (378 | ) | | | (3,207 | ) | | $ | (33,441 | ) |
| | | | | | | | | | | | | | | | | |
| Growth Fund |
| Institutional Class | | January 1, 2021
through December 31, 2021 | | | January 1, 2020
through December 31, 2020 | |
| | | Shares | | | Amount | | | Shares | | | Amount | |
| Shares Sold | | | 3,252,185 | | | $ | 37,815,312 | | | | 2,362,454 | | | $ | 23,733,523 | |
| Shares Reinvested | | | 618,789 | | | | 6,843,809 | | | | 211,442 | | | | 2,258,198 | |
| Shares Redeemed | | | (3,233,366 | ) | | | (37,921,955 | ) | | | (3,258,700 | ) | | | (32,594,458 | ) |
| Net Increase/(Decrease) | | | 637,608 | | | $ | 6,737,166 | | | | (684,804 | ) | | $ | (6,602,737 | ) |
| | | | | | | | | | | | | | | | | |
| Growth Fund |
| Class A | | January 1, 2021
through December 31, 2021 | | | January 1, 2020
through December 31, 2020 | |
| | | Shares | | | Amount | | | Shares | | | Amount | |
| Shares Sold | | | 219 | | | $ | 2,416 | | | | 3,428 | | | $ | 35,643 | |
| Shares Reinvested | | | 13 | | | | 143 | | | | 15 | | | | 158 | |
| Shares Redeemed | | | (448 | ) | | | (4,945 | ) | | | (6,108 | ) | | | (64,257 | ) |
| Net Decrease | | | (216 | ) | | $ | (2,386 | ) | | | (2,665 | ) | | $ | (28,456 | ) |
| | | | | | | | | | | | | | | | | |
| Quantitative Fund |
| Class I | | January 1, 2021
through December 31, 2021 | | | May 18, 2020
(commencement of
investment operations)
through December 31, 2020 | |
| | | Shares | | | Amount | | | Shares | | | Amount | |
| Shares Sold | | | 2,543,427 | | | $ | 30,136,595 | | | | 4,466,041 | | | $ | 45,583,540 | |
| Shares Reinvested | | | 671,748 | | | | 6,986,183 | | | | 168,191 | | | | 1,893,839 | |
| Shares Redeemed | | | (3,521,493 | ) | | | (41,349,098 | ) | | | (967,151 | ) | | | (10,347,660 | ) |
| Net Increase/(Decrease) | | | (306,318 | ) | | $ | (4,226,320 | ) | | | 3,667,081 | | | $ | 37,129,719 | |
NOTES TO FINANCIAL STATEMENTS (CONTINUED)
DECEMBER 31, 2021
| Multidimensional Fund |
| Class I | | January 1, 2021
through December 31, 2021 | | | May 18, 2020
(commencement of
investment operations)
through December 31, 2020 | |
| | | Shares | | | Amount | | | Shares | | | Amount | |
| Shares Sold | | | 2,192,102 | | | $ | 24,393,487 | | | | 5,852,152 | | | $ | 59,965,114 | |
| Shares Reinvested | | | 837,419 | | | | 7,787,998 | | | | 245,865 | | | | 2,613,541 | |
| Shares Redeemed | | | (4,936,624 | ) | | | (55,257,163 | ) | | | (1,050,218 | ) | | | (11,065,062 | ) |
| Net Decrease | | | (1,907,103 | ) | | $ | (23,075,678 | ) | | | 5,047,799 | | | $ | 51,513,593 | |
| | | | | | | | | | | | | | | | | |
| AlphaGen Fund | |
| Class I | | August 23, 2021 (commencement of
investment operations)
through December 31, 2021 | | | | | | | |
| | | Shares | | | Amount | | | | | | | |
| Shares Sold | | | 7,687,076 | | | $ | 76,832,124 | | | | | | | | | |
| Shares Reinvested | | | 18,006 | | | | 182,757 | | | | | | | | | |
| Shares Redeemed | | | (1,648,671 | ) | | | (16,596,828 | ) | | | | | | | | |
| Net Increase | | | 6,056,411 | | | $ | 60,418,053 | | | | | | | | | |
| 9. | COMMITMENTS AND CONTINGENCIES |
In the normal course of business, the Funds may enter into contracts that may contain a variety of representations and warranties and provide general indemnifications. The Funds’ maximum exposure under these arrangements is dependent on future claims that may be made against a Fund and, therefore, cannot be estimated; however, management considers the risk of loss from such claims to be remote.
Tactical Fund
For Federal Income Tax purposes, the cost of investments owned at December 31, 2021 is $28,698,179. As of December 31, 2021, the gross unrealized appreciation on a tax basis totaled $15,367 and the gross unrealized depreciation totaled $(167,120) for a net unrealized depreciation of $(151,753).
Moderate Fund
For Federal Income Tax purposes, the cost of investments owned at December 31, 2021 is $36,265,357. As of December 31, 2021, the gross unrealized appreciation on a tax basis totaled $896,023 and the gross unrealized depreciation totaled $(131,807) for a net unrealized appreciation of $764,216.
Growth Fund
For Federal Income Tax purposes, the cost of investments owned at December 31, 2021 is $58,364,485. As of December 31, 2021, the gross unrealized appreciation on a tax
NOTES TO FINANCIAL STATEMENTS (CONTINUED)
DECEMBER 31, 2021
basis totaled $4,860,421 and the gross unrealized depreciation totaled $(746,547) for a net unrealized appreciation of $4,113,874.
Quantitative Fund
For Federal Income Tax purposes, the cost of investments owned at December 31, 2021 is $40,552,985. As of December 31, 2021, the gross unrealized appreciation on a tax basis totaled $905,489 and the gross unrealized depreciation totaled $(405,851) for a net unrealized appreciation of $499,638.
Multidimensional Fund
For Federal Income Tax purposes, the cost of investments owned at December 31, 2021 is $35,948,044. As of December 31, 2021, the gross unrealized appreciation on a tax basis totaled $859,758 and the gross unrealized depreciation totaled $(1,177,186) for a net unrealized depreciation of $(317,428).
AlphaGen Fund
For Federal Income Tax purposes, the cost of investments owned at December 31, 2021 is $61,720,982. As of December 31, 2021, the gross unrealized appreciation on a tax basis totaled $1,225,689 and the gross unrealized depreciation totaled $(1,297,613) for a net unrealized depreciation of $(71,924).
The difference between the book cost and tax cost of investments of each Fund represents disallowed wash sales for tax purposes and return of capital from underlying investments.
Each Fund’s distributable earnings on a tax basis is determined only at the end of each fiscal year. As of December 31, 2021, each Fund’s most recent fiscal year end, the components of distributable earnings on a tax basis were as follows:
| | | Undistributed | | | Undistributed | | | Other | | | Unrealized | | | Total | |
| | | Ordinary | | | Long-Term | | | Book/Tax | | | Appreciation/ | | | Accumulated | |
| Portfolio | | Income | | | Capital Gains | | | Differences | | | (Depreciation) | | | Earnings/(Deficits) | |
| Tactical Fund | | $ | 49,278 | | | $ | — | | | $ | (232,758 | ) | | $ | (151,753 | ) | | $ | (335,233 | ) |
| Moderate Fund | | | 58,516 | | | | 169,125 | | | | (72,444 | ) | | | 764,216 | | | | 919,413 | |
| Growth Fund | | | 1,102,654 | | | | 197,442 | | | | (521,377 | ) | | | 4,113,874 | | | | 4,892,593 | |
| Quantitative Fund | | | 1,550,941 | | | | — | | | | — | | | | 499,638 | | | | 2,050,579 | |
| Multidimensional Fund | | | 1,091,965 | | | | — | | | | — | | | | (317,428 | ) | | | 774,537 | |
| AlphaGen Fund | | | 1,097,781 | | | | 2,704 | | | | — | | | | (71,924 | ) | | | 1,028,561 | |
| | | | | | | | | | | | | | | | | | | | | |
| | | Paid | | | | |
| | | In | | | Accumulated | |
| Portfolio | | Capital | | | Earnings (Losses) | |
| Tactical Fund | | $ | (1 | ) | | $ | 1 | |
| Moderate Fund | | | (2,248 | ) | | | 2,248 | |
| Quantitative Fund | | | (1,378 | ) | | | 1,378 | |
| Multidimensional Fund | | | 1 | | | | (1 | ) |
For the year ended December 31, 2021, the Moderate Fund utilized capital loss carryforwards of $320,138 in short-term capital losses and $7,171 in long-term capital losses.
NOTES TO FINANCIAL STATEMENTS (CONTINUED)
DECEMBER 31, 2021
For the year ended December 31, 2021, the cumulative deferred losses on straddles were $232,758 for the Tactical Fund. For the year ended December 31, 2021, the cumulative deferred losses on straddles were $72,444 for the Moderate Fund. For the year ended December 31, 2021, the cumulative deferred losses on straddles were $521,377 for the Growth Fund.
For the year ended December 31, 2021, the Tactical Fund paid a short-term capital gain distribution of $2,716,180.
For the year ended December 31, 2021, the Tactical Fund paid a long-term capital gain distribution of $1,381,334.
For the year ended December 31, 2020, the Tactical Fund paid an ordinary income distribution of $328,982.
For the year ended December 31, 2021, the Moderate Fund paid a short-term capital gain distribution of $3,703,740.
For the year ended December 31, 2021, the Moderate Fund paid long-term capital gain distribution of $1,424,558.
For the year ended December 31, 2020, the Moderate Fund paid an ordinary income distribution of $328,327.
For the year ended December 31, 2021, the Growth Fund paid a short-term capital gain distribution of $5,038,224.
For the year ended December 31, 2021, the Growth Fund paid long-term capital gain distribution of $1,805,728.
For the year ended December 31, 2020, the Growth Fund paid an ordinary income distribution of $2,253,292 and a long-term capital gain distribution of $5,064.
For the year ended December 31, 2021, the Quantitative Fund paid a short-term capital gain distribution of $5,988,284.
For the year ended December 31, 2021, the Quantitative Fund paid long-term capital gain distribution of $997,899.
During the period May 18, 2020 (commencement of investment operations) through December 31, 2020, the Quantitative Fund paid a short-term capital gain distribution of $0.52172 per share for a total of $1,893,972.
NOTES TO FINANCIAL STATEMENTS (CONTINUED)
DECEMBER 31, 2021
For the year ended December 31, 2021, the Multidimensional Fund paid a short-term capital gain distribution of $7,787,998.
During the period May 18, 2020 (commencement of investment operations) through December 31, 2020, the Multidimensional Fund paid a short-term capital gain distribution of $0.52394 per share for a total of $2,613,703.
During the period August 23, 2021 (commencement of investment operations) through December 31, 2021, the AlphaGen Fund paid a short-term capital gain distribution of $182,757.
The beneficial ownership, either directly or indirectly, of more than 25% of the voting securities of a fund creates a presumption of control of the fund, under Section 2(a)(9) of the 1940 Act. As of December 31, 2021, TD Ameritrade, Inc. held approximately 88% of the voting securities of the Tactical Fund, 93% of the voting securities of the Moderate Fund, 94% of the voting securities of the Growth Fund, 92% of the voting securities of the Quantitative Fund, 88% of the voting securities of the Multidimensional Fund and 93% of the voting securities of the AlphaGen Fund and may be deemed to control the Funds.
Overall market risks may also affect the value of each Fund. Factors such as domestic economic growth and market conditions, interest rate levels and political events affect the securities markets. Local, regional or global events such as war, acts of terrorism, the spread of infectious illness or other public health issue, recessions and depressions, or other events could have a significant impact on a Fund and its investments and could result in increased premiums or discounts to the Fund’s NAV, and may impair market liquidity, thereby increasing liquidity risk. The Funds could lose money over short periods due to short-term market movements and over longer periods during more prolonged market downturns. During a general market downturn, multiple asset classes may be negatively affected. Changes in market conditions and interest rates can have the same impact on all types of securities and instruments.
An outbreak of infectious respiratory illness caused by a novel coronavirus known as COVID-19 was first detected in China in December 2019 and has now been detected globally. This coronavirus has resulted in travel restrictions, closed international borders, enhanced health screenings at ports of entry and elsewhere, disruption of and delays in healthcare service preparation and delivery, prolonged quarantines, cancellations, supply chain disruptions, and lower consumer demand, as well as general concern and uncertainty. The impact of COVID-19, and other infectious illness outbreaks that may arise in the future, could adversely affect the economies of many nations or the entire global economy, individual issuers and capital markets in ways that cannot necessarily be foreseen. In addition, the impact of infectious illnesses in emerging market countries may
NOTES TO FINANCIAL STATEMENTS (CONTINUED)
DECEMBER 31, 2021
be greater due to generally less established healthcare systems. Public health crises caused by the COVID-19 outbreak may exacerbate other pre-existing political, social and economic risks in certain countries or globally. The duration of the COVID-19 outbreak and its effects cannot be determined with certainty.
| 13. | UNDERLYING INVESTMENTS IN OTHER INVESTMENT COMPANIES |
The Quantitative Fund currently invests a significant portion of its assets in the Rydex Nasdaq 100 2x Strategy Fund and the Rydex Series Trust – Nova Fund (collectively the “Rydex Funds”). The Quantitative Fund may redeem its investment from Rydex Funds at any time if the Adviser determines that it is in the best interest of the Quantitative Fund and their shareholders to do so. The performance of the Quantitative Fund will be directly affected by the performance of the Rydex Funds. The financial statements of the Rydex Funds, including their schedule of investments, can be found at the Securities and Exchange Commission’s website, www.sec.gov, and should be read in conjunction with the Quantitative Fund’s financial statements. As of December 31, 2021, the percentage of the Quantitative Fund’s net assets invested in Rydex Nasdaq 100 2x Strategy Fund was 29.31% and in Rydex Series Trust – Nova Fund was 61.54%.
| 14. | INVESTMENTS IN AFFILIATED COMPANIES |
An affiliated company is a company in which the Fund has ownership of at least 5% of the voting securities. Companies which are affiliates of the Quantitative Fund at December 31, 2021 are noted in the Fund Schedule of Investments. Transactions during the year with companies which are affiliates are as follows:
Quantitative Fund
| | | | | | Share | | | | | | | | | Net Change in | | | | | | | | | Share | | | | |
| | | Market Value | | | Balance at | | | | | | | | | Unrealized | | | Realized | | | Market Value | | | Balance at | | | Dividends | |
| | | at December | | | December | | | | | | | | | Appreciation/ | | | Gains | | | at December | | | December | | | Credited to | |
| Description | | 31, 2020 | | | 31, 2020 | | | Purchases | | | Sales Proceeds | | | (Depreciation) | | | (Losses) | | | 31, 2021 | | | 31, 2021 | | | Income | |
| Rydex Russell 2000 2x Strategy Fund, Class H | | $ | — | | | | — | | | $ | 29,449,999 | | | $ | (25,919,254 | ) | | $ | 152,136 | | | $ | 469,255 | | | $ | 4,152,136 | | | | 18,946 | | | $ | — | |
| | | | | | | | | | | | | | | | | | | | | | | | | | | | | | | | | | | | | |
| Rydex Series Trust - Nova Fund, Investor Class | | | 19,897,094 | | | | 179,528 | | | | 260,555,502 | | | | (262,351,892 | ) | | | 35,443 | | | | 3,373,940 | | | | 21,510,087 | | | | 148,725 | | | | 381,560 | |
| | | | | | | | | | | | | | | | | | | | | | | | | | | | | | | | | | | | | |
| Total | | $ | 19,897,094 | | | | 179,528 | | | $ | 290,005,501 | | | $ | (288,271,146 | ) | | $ | 187,579 | | | $ | 3,843,195 | | | $ | 25,662,223 | | | | 167,671 | | | $ | 381,560 | |
| 15. | CHANGE IN INDEPENDENT PUBLIC ACCOUNTANT |
On February 22, 2021, the Trust, by action of the Audit Committee of the Board, approved BBD, LLP (“BBD”) to serve as the independent registered public accounting firm to audit the financial statements of the new Funds for the fiscal year ending December 31, 2021. Previously, Cohen & Company, Ltd. (“Cohen”) served as the independent registered public accounting firm to the predecessor Funds.
Cohen’s report on the financial statements for the predecessor Funds for the fiscal year ended December 31, 2020 contained no adverse opinion or disclaimer of opinion, nor was it qualified or modified as to uncertainty, audit scope, or accounting principles. During such fiscal year and the interim period of January 1, 2021 through February 22,
NOTES TO FINANCIAL STATEMENTS (CONTINUED)
DECEMBER 31, 2021
2021 (the “Interim Period”) there were no (i) disagreements with Cohen on any matter of accounting principles or practices, financial statement disclosure, or auditing scope or procedure, which disagreements, if not resolved to the satisfaction of Cohen, would have caused it to make reference to the subject matter of the disagreements in connection with its reports on the Fund’s financial statements for such year, nor (ii) “reportable events” of the kinds described in Item 304(a)(1)(v) of Regulation S-K under the Securities Exchange Act of 1934, as amended.
During the fiscal year ended December 31, 2020 and the Interim Period, neither the Funds nor anyone on behalf of the Funds had consulted BBD, LLP on items that concerned (a) the application of accounting principles to a specified transaction, either completed or proposed, or the type of audit opinion that might be rendered on the Fund’s financial statements, or (b) the subject of a disagreement (as defined in paragraph (a)(1)(iv) of Item 304 of Regulation S-K and related instructions) or reportable events (as described in paragraph (a)(1)(v) of Item 304 of Regulation S-K). The selection of BBD does not reflect any disagreements or dissatisfaction by the Funds, the Board, or the Audit Committee with the performance of Cohen.
The Tactical, Moderate, Growth, Quantitative and Multidimensional Funds (the “Predecessor Funds”), each a series of Collaborative Investment Series Trust, were reorganized each into a newly created series of Tactical Investment Series Trust (the “Reorganization”) effective close of business August 20, 2021, pursuant to an Agreement and Plan of Reorganization dated May 28, 2021. The Reorganization was approved by the shareholders of the Predecessor Funds at a meeting held on June 24, 2021. Upon the closing of the Reorganization, all the assets and liabilities of each Predecessor Fund were transferred to the respective new fund in exchange for shares of such new fund, which shares were then be distributed pro rata to each Predecessor Fund’s shareholders. The Reorganization was treated as a tax-free reorganization for federal income tax purposes and, accordingly, the basis of the assets transferred reflect the historical basis of the assets as of the date of the Reorganization. The Adviser paid the costs of the reorganization of the Funds.
| Predecessor Fund | | | New Fund |
| Tactical Conservative Allocation Fund | | → | Tactical Conservative Allocation Fund |
| Net Assets $36,134,579 shares 3,296,573 | | | Net Assets $36,134,579 shares 3,296,573 |
| | | | |
| Tactical Moderate Allocation Fund | | → | Tactical Moderate Allocation Fund |
| Net Assets $35,103,727 shares 3,130,432 | | | Net Assets $35,103,727 shares 3,130,432 |
| | | | |
| Tactical Growth Allocation Fund | | → | Tactical Growth Allocation Fund |
| Net Assets $59,413,089 shares 5,069,265 | | | Net Assets $59,413,089 shares 5,069,265 |
| | | | |
| TFA Quantitative Fund | | → | TFA Quantitative Fund |
| Net Assets $51,509,916 shares 4,270,743 | | | Net Assets $51,509,916 shares 4,270,743 |
| | | | |
| TFA Multidimensional Tactical Fund | | → | TFA Multidimensional Tactical Fund |
| Net Assets $63,012,813 shares 5,534,964 | | | Net Assets $63,012,813 shares 5,534,964 |
NOTES TO FINANCIAL STATEMENTS (CONTINUED)
DECEMBER 31, 2021
Management has evaluated the impact of all subsequent events on the Funds through the issuance of these financial statements and has noted no other events requiring disclosure or recognition besides the details noted below:
Effective February 22, 2022, M3Sixty Fund Administration, LLC, has replaced Ultimus Fund Solutions, LLC. as the Trust’s sub-fund administrator, fund accountant, transfer agent and dividend distribution agent. The Board also approved Matrix 360 Distributors, LLC as the Trust principal underwriter, effective February 22, 2022, replacing Ultimus Fund Distributors, LLC.

REPORT OF INDEPENDENT REGISTERED PUBLIC ACCOUNTING FIRM
To the Board of Trustees of Tactical Investment Series Trust and the Shareholders of TFA Tactical Income Fund, Tactical Moderate Allocation Fund, Tactical Growth Allocation Fund, TFA Quantitative Fund, TFA Multidimensional Tactical Fund and TFA AlphaGen Growth Fund
Opinion on the Financial Statements
We have audited the accompanying statements of assets and liabilities of TFA Tactical Income Fund (formerly known as Tactical Conservative Allocation Fund), Tactical Moderate Allocation Fund, Tactical Growth Allocation Fund, TFA Quantitative Fund, TFA Multidimensional Tactical Fund and TFA AlphaGen Growth Fund, each a series of shares of beneficial interest in Tactical Investment Series Trust (the “Funds”), including the schedules of investments, as of December 31, 2021, and the related statements of operations and changes in net assets, and the financial highlights for the year then ended, except for TFA AlphaGen Growth Fund, in which the related statements of operations and changes in net assets, and the financial highlights are for the period August 23, 2021 (commencement of operations) through December 31, 2021 and the related notes (collectively referred to as the “financial statements”). In our opinion, the financial statements present fairly, in all material respects, the financial position of the Funds as of December 31, 2021, and the results of their operations, the changes in their net assets and their financial highlights for the year or period then ended, in conformity with accounting principles generally accepted in the United States of America. For TFA Tactical Income Fund, Tactical Moderate Allocation Fund and Tactical Growth Allocation Fund, the statements of changes in net assets and the financial highlights for the year ended December 31, 2020 were audited by other auditors, whose report dated March 11, 2021, expressed an unqualified opinion on such financial statements and financial highlights. For TFA Tactical Income Fund, Tactical Moderate Allocation Fund and Tactical Growth Allocation Fund, the financial highlights for the period from June 10, 2019 (commencement of operations) through December 31, 2019 were audited by other auditors, whose report dated February 24, 2020, expressed an unqualified opinion on those financial highlights. For TFA Quantitative Fund and TFA Multidimensional Tactical Fund, the statements of changes in net assets and the financial highlights for the period May 18, 2020 (commencement of operations) through December 31, 2020 were audited by other auditors, whose report dated March 1, 2021, expressed an unqualified opinion on such financial statements and financial highlights
Basis for Opinion
These financial statements are the responsibility of the Funds’ management. Our responsibility is to express an opinion on the Funds’ financial statements based on our audits. We are a public accounting
firm registered with the Public Company Accounting Oversight Board (United States) (“PCAOB”) and are required to be independent with respect to the Funds in accordance with the U.S. federal securities law and the applicable rules and regulations of the Securities and Exchange Commission and the PCAOB.
We conducted our audits in accordance with the standards of the PCAOB. Those standards require that we plan and perform the audits to obtain reasonable assurance about whether the financial statements are free of material misstatement, whether due to error or fraud. The Funds are not required to have, nor were we engaged to perform, an audit of their internal control over financial reporting. As part of our audits we are required to obtain an understanding of internal control over financial reporting but not for the purpose of expressing an opinion on the effectiveness of the Funds’ internal control over financial reporting. Accordingly, we express no such opinion.
Our audits included performing procedures to assess the risk of material misstatement of the financial statements, whether due to error or fraud, and performing procedures that respond to those risks. Such procedures included examining, on a test basis, evidence regarding the amounts and disclosures in the financial statements. Our procedures included confirmation of securities owned as of December 31, 2021 by correspondence with the custodian, brokers, or by other appropriate auditing procedures where replies from brokers were not received. Our audits also included evaluating the accounting principles used and significant estimates made by management, as well as evaluating the overall presentation of the financial statements. We believe that our audits provide a reasonable basis for our opinion.

BBD, LLP
We have served as the auditor of one or more of the Funds in Tactical Investment Series Trust since 2021.
Philadelphia, Pennsylvania
March 17, 2022
EXPENSE ILLUSTRATION
DECEMBER 31, 2021 (UNAUDITED)
Expense Example
As a shareholder of the Funds, you incur ongoing costs which typically consist of management fees and other Fund expenses. This Example is intended to help you understand your ongoing costs (in dollars) of investing in the Fund(s) and to compare these costs with the ongoing costs of investing in other mutual funds.
The Example is based on an investment of $1,000 invested at the beginning of the period and held during the entire six month period, July 1, 2021 through December 31, 2021.
Actual Expenses
The first line of each table below provides information about actual account values and actual expenses. You may use the information in this line, together with the amount you invested, to estimate the expenses that you paid over the period. Simply divide your account value by $1,000 (for example, an $8,600 account value divided by $1,000 = 8.6), then multiply the result by the number in the first line under the heading entitled “Expenses Paid During the Period” to estimate the expenses you paid on your account during this period.
Hypothetical Example for Comparison Purposes
The second line of each table below provides information about hypothetical account values and hypothetical expenses based on each Fund’s actual expense ratio and an assumed rate of return of 5% per year before expenses, which is not the Fund’s actual return. The hypothetical account values and expenses may not be used to estimate the actual ending account balance or expenses you paid for the period. You may use this information to compare the ongoing costs of investing in these Funds and other funds. To do so, compare this 5% hypothetical example with the 5% hypothetical examples that appear in the shareholder reports of the other funds.
EXPENSE ILLUSTRATION (CONTINUED)
DECEMBER 31, 2021 (UNAUDITED)
TFA Tactical Income Fund (fka Tactical Conservative Allocation Fund) - Class A
| | Beginning
Account Value | Ending
Account Value | Expenses Paid
During the Period* |
| | July 1, 2021 | December 31, 2021 | July 1, 2021 to
December 31, 2021 |
| | | | |
| Actual | $1,000.00 | $1,003.20 | $10.96 |
| Hypothetical | | | |
| (5% Annual Return before expenses) | $1,000.00 | $1,014.27 | $11.02 |
| * | Expenses are equal to the Fund’s annualized expense ratio of 2.17%, multiplied by the average account value over the period, multiplied by 184/365 (to reflect the one-half year period). |
TFA Tactical Income Fund (fka Tactical Conservative Allocation Fund) - Class I
| | Beginning
Account Value | Ending
Account Value | Expenses Paid
During the Period* |
| | July 1, 2021 | December 31, 2021 | July 1, 2021 to
December 31, 2021 |
| | | | |
| Actual | $1,000.00 | $1,005.00 | $9.71 |
| Hypothetical | | | |
| (5% Annual Return before expenses) | $1,000.00 | $1,015.52 | $9.77 |
| * | Expenses are equal to the Fund’s annualized expense ratio of 1.92%, multiplied by the average account value over the period, multiplied by 184/365 (to reflect the one-half year period). |
Tactical Moderate Allocation Fund - Class A
| | Beginning
Account Value | Ending
Account Value | Expenses Paid
During the Period* |
| | July 1, 2021 | December 31, 2021 | July 1, 2021 to
December 31, 2021 |
| | | | |
| Actual | $1,000.00 | $1,045.40 | $11.19 |
| Hypothetical | | | |
| (5% Annual Return before expenses) | $1,000.00 | $1,014.26 | $11.02 |
| * | Expenses are equal to the Fund’s annualized expense ratio of 2.17%, multiplied by the average account value over the period, multiplied by 184/365 (to reflect the one-half year period). |
EXPENSE ILLUSTRATION (CONTINUED)
DECEMBER 31, 2021 (UNAUDITED)
Tactical Moderate Allocation Fund - Class I
| | Beginning
Account Value | Ending
Account Value | Expenses Paid
During the Period* |
| | July 1, 2021 | December 31, 2021 | July 1, 2021 to
December 31, 2021 |
| | | | |
| Actual | $1,000.00 | $1,045.80 | $9.89 |
| Hypothetical | | | |
| (5% Annual Return before expenses) | $1,000.00 | $1,015.53 | $9.75 |
| * | Expenses are equal to the Fund’s annualized expense ratio of 1.92%, multiplied by the average account value over the period, multiplied by 184/365 (to reflect the one-half year period). |
Tactical Growth Allocation Fund - Class A
| | Beginning
Account Value | Ending
Account Value | Expenses Paid
During the Period* |
| | July 1, 2021 | December 31, 2021 | July 1, 2021 to
December 31, 2021 |
| | | | |
| Actual | $1,000.00 | $1,075.60 | $11.30 |
| Hypothetical | | | |
| (5% Annual Return before expenses) | $1,000.00 | $1,014.32 | $10.96 |
| * | Expenses are equal to the Fund’s annualized expense ratio of 2.16%, multiplied by the average account value over the period, multiplied by 184/365 (to reflect the one-half year period). |
Tactical Growth Allocation Fund - Class I
| | Beginning Account Value | Ending
Account Value | Expenses Paid
During the Period* |
| | July 1, 2021 | December 31, 2021 | July 1, 2021 to
December 31, 2021 |
| | | | |
| Actual | $1,000.00 | $1,077.20 | $10.00 |
| Hypothetical | | | |
| (5% Annual Return before expenses) | $1,000.00 | $1,015.58 | $9.70 |
| * | Expenses are equal to the Fund’s annualized expense ratio of 1.91%, multiplied by the average account value over the period, multiplied by 184/365 (to reflect the one-half year period). |
EXPENSE ILLUSTRATION (CONTINUED)
DECEMBER 31, 2021 (UNAUDITED)
TFA Quantitative Fund - Class I
| | Beginning
Account Value | Ending
Account Value | Expenses Paid
During the Period* |
| | July 1, 2021 | December 31, 2021 | July 1, 2021 to
December 31, 2021 |
| | | | |
| Actual | $1,000.00 | $1,062.20 | $9.72 |
| Hypothetical | | | |
| (5% Annual Return before expenses) | $1,000.00 | $1,015.78 | $9.50 |
| * | Expenses are equal to the Fund’s annualized expense ratio of 1.87%, multiplied by the average account value over the period, multiplied by 184/365 (to reflect the one-half year period). |
TFA Multidimensional Tactical Fund - Class I
| | Beginning
Account Value | Ending
Account Value | Expenses Paid
During the Period* |
| | July 1, 2021 | December 31, 2021 | July 1, 2021 to
December 31, 2021 |
| | | | |
| Actual | $1,000.00 | $1,062.70 | $9.91 |
| Hypothetical | | | |
| (5% Annual Return before expenses) | $1,000.00 | $1,015.60 | $9.68 |
| * | Expenses are equal to the Fund’s annualized expense ratio of 1.91%, multiplied by the average account value over the period, multiplied by 184/365 (to reflect the one-half year period). |
TFA AlphaGen Growth Fund - Class I
| | Beginning
Account Value | Ending
Account Value | Expenses Paid
During the Period |
| | July 1, 2021 | December 31, 2021 | July 1, 2021 to
December 31, 2021 |
| | | | |
| Actual | $1,000.00 | $1,018.00 | $8.59* |
| Hypothetical | | | |
| (5% Annual Return before expenses) | $1,000.00 | $1,011.80 | $6.05** |
| * | Expenses are equal to the Fund’s annualized expense ratio of 1.69%, multiplied by the average account value over the period (August 23, 2021-Dcecember 31, 2021), multiplied by 130/365 (to reflect the number of days in the period). |
| ** | Expenses are equal to the Fund’s annualized expense ratio of 1.69%, multiplied by the average account value over the period (July 1, 2021-Dcecember 31, 2021), multiplied by 184/365 (to reflect the one-half year period). |
ADDITIONAL INFORMATION
DECEMBER 31, 2021 (UNAUDITED)
PORTFOLIO HOLDINGS
The Funds file their complete schedule of investments with the Securities and Exchange Commission (“SEC”) for the first and third quarters of each fiscal year as an exhibit to its reports on Form N-PORT. The Form N-PORT filing must be made within 60 days of the end of the quarter. The Fund’s Form N-PORT is available on the SEC’s web site at http://www.sec.gov. You may also obtain copies by calling the Funds at 1-833-974-3787, free of charge.
PROXY VOTING
The Funds’ proxy voting policies, procedures and voting records relating to common stock securities in each Fund’s investment portfolio are available without charge, upon request, by calling the Funds’ toll-free telephone number 1-833-974-3787. The Funds will send this information within three business days of receipt of the request, by first class mail or other means designed to ensure prompt delivery. The Funds’ proxy information is also available on the SEC’s website at http://www.sec.gov. Information regarding how the Fund(s) voted proxies relating to portfolio securities for the most recent twelve month period ended June 30 is available without charge, upon request by calling 1-833-974-3787 or referring to the SEC’s web site at www.sec.gov.
LIQUIDITY RISK MANAGEMENT PROGRAM
The Funds have adopted and implemented a written liquidity risk management program as required by Rule 22e-4 (the “Liquidity Rule”) under the Investment Company Act. The program is reasonably designed to assess and manage the Funds’ liquidity risk, taking into consideration, among other factors, the Funds’ investment strategy and the liquidity of its portfolio investments during normal and reasonably foreseeable stressed conditions; its short and long-term cash flow projections; and its cash holdings and access to other funding sources.
During the fiscal year ended December 31, 2021, the Trust’s Liquidity Risk Management Program Committee (the “Committee”) reviewed the Funds’ investments and determined that the Funds held adequate levels of cash and highly liquid investments to meet shareholder redemption activities in accordance with applicable requirements. Accordingly, the Committee concluded that (i) the Funds’ liquidity risk management program is reasonably designed to prevent violations of the Liquidity Rule and (ii) the Funds’ liquidity risk management program has been effectively implemented.
ADDITIONAL INFORMATION
DECEMBER 31, 2021 (UNAUDITED)
ADVISORY RENEWAL AGREEMENT
Tactical Fund Advisors, LLC Adviser to TFA Tactical Income Fund, Tactical Moderate Allocation Fund, Tactical Growth Allocation Fund, TFA Quantitative Fund, TFA Multidimensional Tactical Fund and TFA AlphaGen Growth Fund (each a “Fund” and, collectively, the “Funds”)*
At an in-person meeting held on November 12, 2021 of the Board of Trustees (the “Trustees” or the “Board”) of the Tactical Investment Series Trust (the “Trust”), the Trustees, including a majority of the Trustees who are not “interested persons,” as that term is defined in the Investment Company Act of 1940, as amended, of the Trust (the “Independent Trustees”), discussed the reconsideration of the approval of an investment advisory agreement (the “Advisory Agreement”) between Tactical Fund Advisors, LLC (“TFA”) and the Trust, with respect to the Funds. In considering the approval of the Advisory Agreement, the Board received materials specifically relating to the Advisory Agreement.
The Trustees were advised by independent legal counsel of their fiduciary obligations in approving the Advisory Agreement. The Board noted that it had requested and received such information from TFA as it deemed reasonably necessary to evaluate the terms of the Advisory Agreement and to determine whether the Advisory Agreement is in the best interests of the Funds and their shareholders. The Trustees, all of whom are independent, considered guidance from their independent legal counsel and their own business judgment in evaluating the Advisory Agreement, and were advised by their independent legal counsel throughout the process. In considering the approval of the Advisory Agreement, the Board, including the Independent Trustees, did not identify any particular information that was most relevant to its consideration to approve the Advisory Agreement and each Trustee may have afforded different weight to the various factors. The Board considered a variety of factors in its analysis, including those discussed in the summary below.
Nature, Extent and Quality of Services. In considering the approval of the Advisory Agreement with TFA, the Board considered numerous factors regarding the nature, extent, and quality of services provided by TFA to the Funds, including information on TFA’s financial condition and resources; the qualifications, backgrounds and responsibilities of its key professionals; and its succession plan. The Board noted that the Trust and TFA employ a “manager of managers” structure, whereby TFA is responsible for selecting sub-advisers (subject to Board approval), allocating each Fund’s assets among them, and overseeing the sub-advisers’ daily management of the Funds’ assets. The Board reviewed the services TFA provides, including its coordination of services for the Funds among the Funds’ service providers, its efforts to promote the Funds and assist in their distribution, and its processes for the due diligence review, selection, and oversight of sub-advisers, including the enhancements to such processes being implemented. The Trustees also reviewed information provided regarding risk
ADDITIONAL INFORMATION
DECEMBER 31, 2021 (UNAUDITED)
management and compliance and regulatory matters, including an updated compliance assessment of TFA by the Trust’s CCO. Following a consideration of the foregoing information as well as further information provided by TFA (e.g., descriptions of its business and its Form ADV), and further discussion, the Board concluded that the quality, extent, and nature of the services provided by TFA were satisfactory and adequate for the Funds.
Performance of the Funds and TFA. The Board reviewed performance information that TFA provided for each Fund compared to the performance of (a) funds in a peer group (the “Peer Group”), which is a relevant sub-set of funds in the Fund’s Morningstar category, (b) the Fund’s Morningstar category average for the one-year and since inception periods ended September 30, 2021 (the “one-year and since inception periods”), as applicable, and (c) the Fund’s benchmark index. The Board noted that TFA does not manage any accounts other than the Funds.
TFA Tactical Income Fund: The Board noted TFA has been the adviser to the TFA Tactical Income Fund (formerly the Tactical Conservative Allocation Fund) since its inception on June 10, 2019. The Board further noted that Exceed Advisory, LLC (“Exceed”), Synergy Financial Management, LLC (“Synergy”), and Heritage Capital Management, Inc. (“Heritage”) each sub-advise a portion of the TFA Tactical Income Fund. The Board noted that the TFA Tactical Income Fund had outperformed its Morningstar category average and benchmark index, but underperformed its Peer Group average for the one-year and since inception periods.
Tactical Moderate Allocation Fund: The Board noted TFA has been the adviser to the Tactical Moderate Allocation Fund since its inception on June 10, 2019. The Board further noted that Exceed, Synergy, Heritage, and Howard Capital Management, Inc. (“Howard”) each sub-advise a portion of the Tactical Moderate Allocation Fund. The Board noted that the Tactical Moderate Allocation Fund had outperformed its Morningstar category average and benchmark index for the one-year and since inception periods. The Board further noted the Tactical Moderate Allocation Fund outperformed its Peer Group category average for the one-year period, but slightly underperformed the Peer Group category average for the since inception period ended September 30, 2021.
Tactical Growth Allocation Fund: The Board noted TFA has been the adviser to the Tactical Growth Allocation Fund since its inception on June 10, 2019. The Board further noted that Exceed, Synergy, Heritage, and Howard each sub-advised a portion of the Tactical Growth Allocation Fund since inception. The Board noted that the Tactical Growth Allocation Fund outperformed both the Morningstar and Peer Group category averages and its benchmark index for the one-year and since inception periods.
ADDITIONAL INFORMATION
DECEMBER 31, 2021 (UNAUDITED)
TFA Quantitative Fund: The Board noted that TFA has been the adviser to the TFA Quantitative Fund since its inception on May 18, 2020. The Board noted that Potomac Advisors, Inc. has sub-advised the TFA Quantitative Fund since inception. The Board noted the TFA Quantitative Fund underperformed the Morningstar category averages but outperformed its Peer Group category averages and benchmark index for the one-year and since inception periods.
TFA Multidimensional Tactical Fund: The Board noted that TFA has been the adviser to the TFA Multidimensional Tactical Fund since its inception on May 18, 2020. The Board further noted that Preston Wealth Advisors, LLC has sub-advised the TFA Multidimensional Tactical Fund since inception. The Board noted that the TFA Multidimensional Tactical Fund underperformed both the Morningstar and Peer Group category averages and benchmark index for the one-year and since inception periods.
TFA AlphaGen Growth Fund: The Board noted that TFA has been the adviser to the TFA AlphaGen Growth Fund since its inception on August 23, 2021. The Board further noted that Heritage has sub-advised the TFA AlphaGen Growth Fund since inception. The Board noted that the TFA AlphaGen Growth Fund is newly formed and as such does not have a performance record at this time.
Costs of the Services Provided and Profits Realized. In this regard, the Board considered TFA’s staffing, personnel, and methods of operating; the financial condition and resources of TFA, and the level of commitment to the Funds by TFA and its affiliates; the asset levels of the Funds; and the overall expenses of the Funds. The Board evaluated each Fund’s advisory fee, noting that the advisory fee of 1.30% and net expense ratio for each Fund is higher than the respective Fund’s Peer Group averages but within the range of those presented, except for the TFA Multidimensional Tactical Fund which has the highest advisory fee and net expense ratio of its Peer Group but also the smallest level of assets. The Board took into consideration that the higher expense ratios are attributable, in part, to the relatively small size of the Funds and noted that the asset size of each of the Funds is significantly lower than the majority of the Funds in its Peer Group, in many cases by a significant margin. The Board considered that the Funds have not yet achieved economies of scale to offset their high operational expenses at this time. The Board also took into consideration that TFA has contractually agreed to limit the Fund’s expenses until at least April 30, 2023, to the benefit of the Funds’ shareholders. The Board considered the profitability of the Adviser with respect to each Fund. Following these comparisons and upon additional consideration and discussion of the foregoing, the Board concluded that the advisory fees were within an acceptable range in light of the services to be rendered by TFA that the profitability and fees to be paid to TFA were fair and reasonable.
ADDITIONAL INFORMATION
DECEMBER 31, 2021 (UNAUDITED)
Economies of Scale. The Board considered the extent to which economies of scale would be realized as each Fund grows and whether fee levels reflect a reasonable sharing of economies of scale for the benefit of Fund investors. The Board noted that breakpoints may be an appropriate way for TFA to share its economies of scale if a Fund experiences substantial asset growth; however, the Board recognized that no Fund had yet reached an asset level where TFA could realize significant economies of scale. The Board observed that economies of scale is not a primary factor at this time but will be considered in the future as Fund asset levels grow.
Benefits Derived. The Board noted that TFA indicated that it may benefit from its affiliation with Tactical Fund Services, LLC, the Trust’s administrator. The Board considered that TFA does not have any soft dollar arrangements in place. Following further consideration and discussion, the Board concluded that the benefits to be derived by TFA from managing the Funds were satisfactory.
Conclusion. Based on all the information considered and the conclusions reached, the Board determined that the terms of the Advisory Agreement are fair and reasonable, and that the approval of the continuance of the Advisory Agreement is in the best interests of each Fund.
*Due to the timing of the contract renewal schedule, these deliberations may or may not relate to the current performance results of the Funds.
Howard Capital Management, LLC Sub-Adviser to Tactical Moderate Allocation Fund (“Tactical Moderate”) and Tactical Growth Allocation Fund (“Tactical Growth”) (collectively the “Funds”)
At an in-person meeting held on August 25, 2021 of the Board of Trustees (the “Trustees” or the “Board”) of the Tactical Investment Series Trust (the “Trust”), the Trustees, including a majority of the Trustees who are not “interested persons,” as that term is defined in the Investment Company Act of 1940, as amended, of the Trust (the “Independent Trustees”) discussed the approval of a sub-advisory agreement (the “Sub-Advisory Agreement”) between Tactical Fund Advisors, LLC (the “Adviser”) and Howard Capital Management, LLC (“Howard”), with respect to the Funds. In considering the approval of the Sub-Advisory Agreement, the Board received materials specifically relating to the Sub-Advisory Agreement.
The Trustees were advised by independent legal counsel of their fiduciary obligations in approving the Sub-Advisory Agreement. The Board noted that it had requested and received such information from Howard as it deemed reasonably necessary to evaluate the terms of the Sub-Advisory Agreement and to determine whether the Sub-Advisory Agreement is in the best interests of Tactical Moderate and Tactical Growth and their shareholders. The Trustees considered guidance from counsel to the Trust and their own
ADDITIONAL INFORMATION
DECEMBER 31, 2021 (UNAUDITED)
business judgment in evaluating the Sub-Advisory Agreement. The Independent Trustees were advised by their independent legal counsel throughout the process. In considering the approval of the Sub-Advisory Agreement, the Board, including the Independent Trustees, did not identify any particular information that was most relevant to its consideration to approve the Sub-Advisory Agreement and each Trustee may have afforded different weight to the various factors. The Board considered a variety of factors in its analysis, including those discussed in the summary below.
Nature, Extent and Quality of Services. In considering the approval of the Sub-Advisory Agreement, the Board considered the nature, extent, and quality of the services to be provided by Howard under the Sub-Advisory Agreement. The Board considered the investment strategies and techniques Howard will use in managing Tactical Moderate and Tactical Growth, its investment decision-making process, and sources of information to be relied upon generally by Howard in providing portfolio management services to each Fund; the qualifications, backgrounds and responsibilities of its key professionals; and its financial condition. The Board also considered information provided regarding Howard’s trading and brokerage practices and compliance program. Following a consideration of the foregoing information as well as further information provided by Howard (e.g., descriptions of its business and its Form ADV), the Board concluded that the quality, extent, and nature of the services to be provided by Howard were satisfactory and adequate for Tactical Moderate and Tactical Growth.
Performance. The Board considered the performance of Howard during the past year in managing mutual funds with investment objectives and strategies similar to Tactical Moderate and Tactical Growth and found it be satisfactory.
Costs of the Services to Be Provided and Profits to Be Realized. The Board considered that Howard’s proposed sub-advisory fee for managing Tactical Moderate and Tactical Growth is lower than the management fee it receives from mutual funds it manages with similar investment objectives and strategies. The Trustees noted that Howard represented that the proposed sub-advisory fees are lower than they otherwise would be due to the efficiencies achieved through its management of the three similarly managed mutual funds. The Board evaluated the reasonableness of the fee split between the Adviser and Howard and the respective services provided by each to Tactical Moderate and Tactical Growth and noted that the sub-advisory fee was negotiated at arm’s-length between the Adviser and Howard. The Trustees also considered the projected profitability of Howard in connection with its management of Tactical Moderate and Tactical Growth. After considering the nature, quality, and extent of the Howard’s services, and such services relative to the Adviser’s services to Tactical Moderate and Tactical Growth, the Board concluded that the proposed sub-advisory fee and Howard’s projected profitability was reasonable.
ADDITIONAL INFORMATION
DECEMBER 31, 2021 (UNAUDITED)
Economies of Scale. The Board considered the extent to which economies of scale would be realized as Tactical Moderate and Tactical Growth each grow and whether fee levels reflect a reasonable sharing of economies of scale for the benefit of each Fund’s investors. The Board recognized that Tactical Moderate and Tactical Growth had each not yet reached an asset level where significant economies of scale could be realized. The Board observed that economies of scale will be considered in the future as the asset levels of Tactical Moderate and Tactical Growth grow.
Benefits To Be Derived. The Board noted that Howard identified gaining experience as a sub-adviser as an indirect benefit from its relationship with Tactical Moderate and Tactical Growth, and that such experience may facilitate other opportunities to provide sub-advisory services. The Board considered that Howard will not enter into any soft dollar arrangements with broker-dealers that would otherwise benefit Howard. Following further consideration and discussion, the Board concluded that the benefits to be derived by Howard from managing Tactical Moderate and Tactical Growth were satisfactory.
Conclusion. Based on all the information considered and the conclusions reached, the Board, including all of the Independent Trustees, determined that the terms of the Sub-Advisory Agreement were fair and reasonable, and that the approval of the Sub-Advisory Agreement for an initial two-year term was in the best interests of Tactical Moderate and Tactical Growth and their shareholders.
Potomac Advisors, Inc. Sub-Adviser to TFA Quantitative Fund*
At an in-person meeting held on March 29, 2021 of the Board of Trustees (the “Trustees” or the “Board”) of the Tactical Investment Series Trust (the “Trust”), the Trustees, including a majority of the Trustees who are not “interested persons,” as that term is defined in the Investment Company Act of 1940, as amended, of the Trust (the “Independent Trustees”) discussed the approval of a sub-advisory agreement (the “Potomac Investment Sub-Advisory Agreement”) between Tactical Fund Advisors, LLC (the “Adviser”) and Potomac Advisors, Inc (the “Sub-Advisor”), with respect to the TFA Quantitative Fund (the “Quantitative Fund”). In considering the approval of the Potomac Investment Sub-Advisory Agreement, the Board received materials specifically relating to the Potomac Investment Sub-Advisory Agreement.
The Trustees were advised by counsel to the Trust of their fiduciary obligations in approving the Potomac Investment Sub-Advisory Agreement. The Trustees considered guidance from counsel to the Trust and their own business judgment in evaluating the Potomac Investment Sub-Advisory Agreement. In considering the approval of the Potomac Investment Sub-Advisory Agreement, the Board, including the Independent Trustees, did not identify any particular information that was most relevant to its consideration to approve the Potomac Investment Sub-Advisory Agreement and each
ADDITIONAL INFORMATION
DECEMBER 31, 2021 (UNAUDITED)
Trustee may have afforded different weight to the various factors. The Board considered a variety of factors in its analysis, including those discussed in the summary below.
Nature, Extent and Quality of Services. In considering the approval of the Potomac Investment Sub-Advisory Agreement, the Board considered the nature, extent, and quality of the services of the Sub-Adviser under the Potomac Investment Sub-Advisory Agreement. The Board considered the Sub-Adviser’s prior performance; the background of the investment professionals servicing the Quantitative Fund; and the Sub-Adviser’s reputation, resources, and investment approach. The Board also considered information provided regarding the structure of portfolio manager compensation, trading and brokerage practices, soft dollar usage, risk management and compliance matters. The Board concluded that the services provided by the Sub-Adviser were satisfactory.
Performance. The Board noted that the Adviser has been the investment adviser to the Predecessor Fund since its inception on May 18, 2020 and that the Sub-Adviser has sub-advised a portion of the Predecessor Fund since inception. The Board noted that the Predecessor Fund has not been operational for full calendar year and reviewed its performance since its inception.
Fees and Expenses. The Board considered the sub-advisory fee schedule and noted that the Sub-Adviser represented that the fees it charges to comparable advisers to engage its services are generally higher than the Sub-Adviser’s fee for sub-advising the Quantitative Fund. The Board noted that the fee schedule was negotiated between the Adviser and the Sub-Adviser and was identical to the Sub-Adviser’s fee schedule for the Predecessor Fund. The Board also evaluated the reasonableness of the fee split between the Adviser and the Sub-Adviser and the respective services provided by each to the Quantitative Fund. After considering the nature, quality, and extent of the Sub-Adviser’s services, and such services relative to the Adviser’s services to the Quantitative Fund, the Board concluded that the proposed sub-advisory fee was reasonable.
Profitability. The Board then considered information provided regarding the Sub-Adviser’s estimated profitability for its services to the Quantitative Fund. The Board noted that the sub-advisory fee was negotiated between the Adviser and the Sub-Adviser and the estimated profitability of the Sub-Adviser in connection with the management of the Quantitative Fund’s assets was reasonable given the nature, extent, and quality of the services provided.
Economies of Scale. The Board considered the extent to which economies of scale would be realized as the Quantitative Fund grows and whether fee levels reflect a reasonable sharing of economies of scale for the benefit of Fund investors. The Board recognized that the Quantitative Fund had not yet reached an asset level where significant economies of scale could be realized. The Board observed that economies of scale will be considered in the future as the asset levels of the Quantitative Fund grow.
ADDITIONAL INFORMATION
DECEMBER 31, 2021 (UNAUDITED)
Conclusion. Based on all the information considered and the conclusions reached, the Board, including all of the Independent Trustees, determined that the terms of the Potomac Investment Sub-Advisory Agreement are fair and reasonable, and that the approval of the Potomac Investment Sub-Advisory Agreement for an initial two-year term is in the best interests of the Quantitative Fund.
*Due to the timing of the contract renewal schedule, these deliberations may or may not relate to the current performance results of the Quantitative Fund.
| TRUSTEES & OFFICERS |
| DECEMBER 31, 2021 (UNAUDITED) |
| |
The following tables provide information about Board and the senior officers of the Trust. Information about each Trustee is provided below and includes each person’s: name, address, age (as of the date of the Funds’ most recent fiscal year end), present position(s) held with the Trust, principal occupations for the past five years. Unless otherwise noted, the business address of each person listed below is c/o Ultimus Fund Solutions, LLC, P.O. Box 46707, Cincinnati, Ohio 45246-0707. Unless otherwise noted, each officer is elected annually by the Board.
The following table provides information regarding each Trustee who is not an “interested person” of the Trust, as defined in the 1940 Act.
Name
Address
and Year of
Birth | Position(s)
Held with
the Fund | Term of
Office/Length
of Time
Served | Principal Occupation(s)
During Past 5
Years | Number of
Portfolios in
Fund
Complex1
Overseen by
Trustee | Other
Directorships
Held by Trustee
During Past 5
Years2 |
Matthew Brennan
Birth Year: 1961 | Trustee | Indefinite/ February 2021- present | Chief Executive Officer and Managing Member, Ohio Heavy Equipment Leasing, LLC, d/b/a Loveland Excavating and Paving, Inc. (1996 - present); Owner, SkyFly Aviation Services, LLC (2019 – present) | 6 | None |
Richard M. Curry
Birth Year: 1939 | Trustee | Indefinite/ February 2021 - present | Independent Life and Health Insurance Adviser, Curry Moore & Associates (2014 – present); Adjunct Professor of Investments, The University of Cincinnati (2005 – present) | 6 | None |
Peter Baden
Birth Year: 1964 | Trustee | Indefinite/ February 2021 – present | Chief Investment Officer, Genoa Asset Management (2020 – present); Chief Investment Officer, Ross Sinclaire Asset Management (2005 – 2020) | 6 | None |
| 1 | The “Fund Complex” consists of the Tactical Investment Series Trust. |
| 2 | Only includes directorships held within the past 5 years in a company with a class of securities registered pursuant to Section 12 of the Securities Exchange Act of 1934 or subject to the requirements of Section 15(d) of the Securities Exchange Act of 1934, or any company registered as an investment company under the 1940 Act. |
| TRUSTEES & OFFICERS |
| DECEMBER 31, 2021 (UNAUDITED) (CONTINUED) |
| |
The following table provides information regarding each officer of the Trust.
Name,
Address
and Year
of Birth | Position(s)
Held with
the Fund | Term of
Office/
Length of
Time
Served | Principal Occupation(s) During
Past 5 Years | Other Directorships
Held by Trustee
During Past 5 Years1 |
Drew K. Horter2
Birth Year: 1955 | President
Interested Trustee | January 2021-present
January 2021 – November 2021 | President, Tactical Fund Advisors, LLC (2019 – present); President and Chief Investment Strategist, Horter Investment Management, LLC (1991 – present) | None |
Stephanie Shearer
Birth Year: 1979 | Secretary | Since February 2021 | Manager of Legal Administration, Ultimus Fund Solutions, LLC (since 2018); Senior Paralegal, Gemini Fund Services, LLC (from 2013 - 2018) | None |
Brian Curley
Birth Year: 1970_ | Treasurer | Since March 2021 | Vice President, Ultimus Fund Solutions, LLC | None |
Leslie Green
Birth Year: 1988 | Chief Compliance Officer | Indefinite/ since November 2021 | Chief Compliance Officer, Calfee Halter & Griswold (since 2021); Chief Compliance Officer, Eagle Realty Group (2017-2021); Senior Compliance Manager, Touchstone Investments (2012 - 2017) | None |
Christine Palermo
Birth Year: 1976 | Assistant Treasurer | Indefinite/ since March 2021 | Manager – Fund Administration, Gemini Fund Services, LLC | N/A |
Jared Lahman
Birth Year: 1986 | Anti-Money Laundering Compliance Officer | Indefinite/ since February 2021 | Compliance Analyst II, Northern Lights Compliance Services, LLC (2019 – present); Manager of Fund Accounting, Gemini Fund Services (2016 – 2019) | N/A |
Eric Kane
Birth Year: 1981 | Assistant Secretary | Indefinite/ since February 2021 | Vice President and Managing Counsel, Ultimus Fund Solutions (2020 – present); Vice President and Counsel, Legal Administration, Gemini Fund Services (2017 – 2020); Assistant Vice President and Staff Attorney, Legal Administration, Gemini Fund Services (2013 – 2017) | N/A |
| 1 | Only includes directorships held within the past 5 years in a company with a class of securities registered pursuant to Section 12 of the Securities Exchange Act of 1934 or subject to the requirements of Section 15(d) of the Securities Exchange Act of 1934, or any company registered as an investment company under the 1940 Act. |
The Funds’ Statement of Additional Information includes additional information about the Trustees and is available free of charge, upon request, by calling toll-free at 1-833-974-3787.
PRIVACY NOTICE
TACTICAL INVESTMENT SERIES TRUST
| FACTS | WHAT DOES TACTICAL INVESTMENT SERIES TRUST DO WITH YOUR PERSONAL INFORMATION? |
| Why? | Financial companies choose how they share your personal information. Federal law gives consumers the right to limit some, but not all sharing. Federal law also requires us to tell you how we collect, share, and protect your personal information. Please read this notice carefully to understand what we do. |
| What? | The types of personal information we collect and share depends on the product or service that you have with us. This information can include: ● Social Security number and wire transfer instructions ● account transactions and transaction history ● investment experience and purchase history When you are no longer our customer, we continue to share your information as described in this notice. |
| How? | All financial companies need to share customers’ personal information to run their everyday business. In the section below, we list the reasons financial companies can share their customers’ personal information; the reasons Tactical Investment Series Trust chooses to share; and whether you can limit this sharing. |
| Reasons we can share your personal information: | Does Tactical
Investment Series
Trust share
information? | Can you
limit this
sharing? |
| For our everyday business purposes - such as to process your transactions, maintain your account(s), respond to court orders and legal investigations, or report to credit bureaus. | YES | NO |
| For our marketing purposes - to offer our products and services to you. | NO | We don’t share |
| For joint marketing with other financial companies. | NO | We don’t share |
| For our affiliates’ everyday business purposes - information about your transactions and records. | NO | We don’t share |
| For our affiliates’ everyday business purposes - information about your credit worthiness. | NO | We don’t share |
| For nonaffiliates to market to you | NO | We don’t share |
| QUESTIONS? | Call 1-(833) 974-3787 |
PRIVACY NOTICE
TACTICAL INVESTMENT SERIES TRUST
| What we do: |
How does Tactical
Investment Series
Trust protect my
personal information? | To protect your personal information from unauthorized access and use, we use security measures that comply with federal law. These measures include computer safeguards and secured files and buildings. Our service providers are held accountable for adhering to strict policies and procedures to prevent any misuse of your nonpublic personal information. |
How does Tactical
Investment Series
Trust collect my
personal
information? | We collect your personal information, for example, when you ● open an account or deposit money ● direct us to buy securities or direct us to sell your securities ● seek advice about your investments We also collect your personal information from others, such as credit bureaus, affiliates, or other companies. |
Why can’t I limit all
sharing? | Federal law gives you the right to limit only: ● sharing for affiliates’ everyday business purposes – information about your creditworthiness. ● affiliates from using your information to market to you. ● sharing for nonaffiliates to market to you. State laws and individual companies may give you additional rights to limit sharing. |
| Definitions |
| Affiliates | Companies related by common ownership or control. They can be financial and nonfinancial companies. ● Tactical Investment Series Trust does not share with our affiliates. |
| Nonaffiliates | Companies not related by common ownership or control. They can be financial and nonfinancial companies. ● Tactical Investment Series Trust does not share with nonaffiliates so they can market to you. |
| Joint marketing | A formal agreement between nonaffiliated financial companies that together market financial products or services to you. ● Tactical Investment Series Trust isn’t jointly market. |
| |
| |
| |
| |
| |
| |
| |
| Investment Adviser |
| Tactical Fund Advisors, LLC |
| |
| |
| |
| Sub-Advisers |
| Exceed Advisory, LLC |
| Heritage Capital Advisors, LLC |
| Howard Capital Management, Inc. |
| Potomac Advisors, Inc. |
| Preston Wealth Advisors, LLC |
| Synergy Financial Management, LLC |
| |
| |
| |
| Distributor |
| Ultimus Fund Distributors, LLC |
| |
| |
| |
| Transfer and Dividend Disbursing Agent |
| Ultimus Fund Distributors, LLC |
| |
| |
| |
| Custodian |
| U.S. Bank N.A. |
| |
| |
| |
| Legal Counsel |
| Strauss Troy, Co., LPA |
| |
| |
| |
| Independent Registered Public Accounting Firm |
| BBD, LLP |
| |
| |
| |
| Fund Administrator |
| Ultimus Fund Solutions, LLC |
| |
| |
| |
| |
| |
| |
| |
| This report is provided for the general information of TFA Tactical Income Fund (fka Tactical Conservative Allocation Fund), Tactical Moderate Allocation Fund and Tactical Growth Allocation Fund shareholders. It is not authorized for distribution unless preceded or accompanied by an effective prospectus, which contains more complete information about the Funds. |
| |
ITEM 2. CODE OF ETHICS.
| (a) | The registrant has, as of the end of the period covered by this report, adopted a code of ethics that applies to the registrant’s principal executive officer, principal financial officer, and principal accounting officer or controller, or persons performing similar functions, regardless of whether these individuals are employed by the registrant or a third party. |
| (b) | During the period covered by this report, there were no amendments to any provision of the code of ethics. |
| (c) | During the period covered by this report, there were no waivers or implicit waivers of a provision of the code of ethics. |
ITEM 3. AUDIT COMMITTEE FINANCIAL EXPERT.
The registrant’s Board of Trustees has determined that it does not have an audit committee financial expert serving on its audit committee. At this time, the registrant believes that the experience provided by each member of the audit committee together offer the registrant adequate oversight for the registrant’s level of financial complexity.
ITEM 4. PRINCIPAL ACCOUNTANT FEES AND SERVICES.
| (a) | Audit Fees. The aggregate fees billed for each of the last two fiscal years for professional services rendered by the registrant’s principal accountant for the audit of the registrant’s annual financial statements or services that are normally provided by the accountant in connection with statutory and regulatory filings or engagements for those fiscal years are as follows: |
| 2021 | | | 2020 | |
| $ | 40,000 | | | $ | 55,000 | |
| (b) | Audit-Related Fees. There were no fees billed in each of the last two fiscal years for assurances and related services by the principal accountant that are reasonably related to the performance of the audit of the registrant’s financial statements and are not reported under paragraph (a) of this item. |
| (c) | Tax Fees. The aggregate fees billed in each of the last two fiscal years for professional services rendered by the principal accountant for tax compliance are as follows: |
| 2021 | | | 2020 | |
| $ | 15,000 | | | $ | 15,000 | |
| (d) | All Other Fees. The aggregate fees billed in each of the last two fiscal years for products and services provided by the registrant’s principal accountant, other than the services reported in paragraphs (a) through (c) of this item were $0 and $0 for the fiscal years ended December 31, 2021 and 2020 respectively. |
| (e)(1) | The audit committee does not have pre-approval policies and procedures. Instead, the audit committee or audit committee chairman approves on a case-by-case basis each audit or non-audit service before the principal accountant is engaged by the registrant. |
| (e)(2) | There were no services described in each of paragraphs (b) through (d) of this Item that were approved by the audit committee pursuant to paragraph (c)(7)(i)(C) of Rule 2-01 of Regulation S-X. |
| (f) | Not applicable. The percentage of hours expended on the principal accountant’s engagement to audit the registrant’s financial statements for the most recent fiscal year that were attributed to work performed by persons other than the principal accountant’s full-time, permanent employees was zero percent (0%). |
| (g) | All non-audit fees billed by the registrant’s principal accountant for services rendered to the registrant for the fiscal years ended December 31, 2021 and 2020 respectively are disclosed in (b)-(d) above. There were no audit or non-audit services performed by the registrant’s principal accountant for the registrant’s adviser. |
ITEM 5. AUDIT COMMITTEE OF LISTED REGISTRANTS.
Not applicable
ITEM 6. SCHEDULE OF INVESTMENT
Included in annual report to shareholders filed under item 1 of this form.
ITEM 7. DISCLOSURE OF PROXY VOTING POLICIES AND PROCEDURES FOR CLOSED-END MANAGEMENT INVESTMENT COMPANIES.
Not applicable Fund is an open-end management investment company
ITEM 8. PORTFOLIO MANAGERS OF CLOSED-END MANAGEMENT INVESTMENT COMPANIES
Not applicable Fund is an open-end management investment company
ITEM 9. PURCHASES OF EQUITY SECURITIES BY CLOSED-END MANAGEMENT INVESTMENT COMPANY AND AFFILIATED PURCHASERS.
Not applicable Fund is an open-end management investment company
ITEM 10. SUBMISSION OF MATTERS TO A VOTE OF SECURITY HOLDERS.
Not applicable at this time.
ITEM 11. CONTROLS AND PROCEDURES.
| (a) | The registrant’s principal executive and principal financial officers, or persons performing similar functions, have concluded that the registrant’s disclosure controls and procedures (as defined in Rule 30a-3(c) under the 1940 Act, are effective, as of a date within 90 days of the filing date of this report, based on the evaluation of these controls and procedures required by Rule 30a-3(b) under the 1940 Act and Rule 15d-15(b) under the Securities Exchange Act of 1934, as amended. |
| (b) | There were no changes in the registrant’s internal control over financial reporting (as defined in Rule 30a-3(d) under the 1940 Act) that occurred during the period covered by this report that have materially affected, or are reasonably likely to materially affect, the registrant’s internal control over financial reporting. |
ITEM 12. DISCLOSURE OF SECURITIES LENDING ACTIVITIES FOR CLOSED-END MANAGEMENT INVESTMENT COMPANIES. Not applicable to open-end investment companies.
ITEM 13. EXHIBITS
| (a)(3) | Not applicable for open-end investment companies. |
SIGNATURES
Pursuant to the requirements of the Securities Exchange Act of 1934 and the Investment Company Act of 1940, the registrant has duly caused this report to be signed on its behalf by the undersigned, thereunto duly authorized.
Tactical Investment Series Trust
| By Drew Horter | /s/ Drew Horter |
| Principal Executive Officer/President |
| Date: March 18, 2022 | |
Pursuant to the requirements of the Securities Exchange Act of 1934 and the Investment Company Act of 1940, this report has been signed below by the following person on behalf of the registrant and in the capacities and on the date indicated.
| By Brian Curley | /s/ Brian Curley |
| Principal Financial Officer/Treasurer |
| Date: March 18, 2022 | |