UNITED STATES
SECURITIES AND EXCHANGE COMMISSION
Washington, D.C. 20549
SECURITIES AND EXCHANGE COMMISSION
Washington, D.C. 20549
FORM N-CSR
CERTIFIED SHAREHOLDER REPORT OF REGISTERED
MANAGEMENT INVESTMENT COMPANIES
Investment Company Act file number 811-23710
Milliman Variable Insurance Trust
(Exact name of Registrant as specified in charter)
(Exact name of Registrant as specified in charter)
71 South Wacker Drive, 31st Floor
Chicago, IL 60606
(Address of principal executive offices) (Zip code)
(Address of principal executive offices) (Zip code)
Ehsan Sheikh
71 South Wacker Drive, 31st Floor
Chicago, IL 60606
(Name and address of agent for service)
(Name and address of agent for service)
(312) 726-0677
Registrant's telephone number, including area code
Date of fiscal year end: December 31, 2023
Date of reporting period: December 31, 2023
Item 1. Reports to Stockholders.
(a) Annual Report

Milliman Variable Insurance Trust
Milliman Hedged Equity Funds
Annual Report
December 31, 2023
The following series of Milliman Variable Insurance Trust are presented in this annual report:
Milliman – Capital Group Hedged U.S. Growth Fund
Milliman – Capital Group Hedged U.S. Income and Growth Fund
TABLE OF CONTENTS
Milliman Variable Insurance Trust
Management Discussion of Fund Performance
December 31, 2023 (Unaudited)
About the Milliman Hedged Equity Funds
Investment Adviser: Milliman Financial Risk Management LLC (“Milliman”) serves as investment adviser to the Miliman - Capital Group Hedged U.S. Growth Fund and Milliman – Capital Group Hedged U.S. Income and Growth Fund (each a “Fund” and together, the “Funds”).
Investment Sub- Adviser: Capital International, Inc. (the “Sub-Adviser”) serves as investment sub-adviser to each Fund solely with respect to the provision of the Investable Universe. The Sub-Adviser does not have responsibility for the day-to-day management of the Fund’s portfolio nor review and oversight of the Fund’s investment strategy.
Despite investors’ fears of a recession, resilient corporate earnings and an apparent end to the Federal Reserve’s interest rate hikes led stocks to a strong rally in 2023. Uncertainty took over on several occasions throughout the year as a mix of concerns over the Fed’s policy, inflation, and potential softness in the job market took center stage. Equity markets tumbled as a response, but moved on to strong rallies immediately following these episodes, especially in Q4.
Overall, Growth stocks outperformed the broader market in 2023, producing large positive returns in response to an investor shift in focus from rising interest rates to increasingly confident expectations of rate cuts in 2024, as well as buzz fueled by the economic prospects of artificial intelligence (“AI”) technology. Meanwhile, Value stocks also performed strongly in 2023, but to a more moderate degree, boosted by resilient consumer spending and stable employment. Stock market indices rebounded from the 2022 bear market with Nasdaq 100 rising 54.97%, S&P 500 rising 25.97%, and the blue-chip Dow Jones Industrial Average (DJIA) trailing behind with a more modest return of 15.93% (all in total return terms and for 2023 full calendar year).
Milliman - Capital Group Hedged U.S. Growth Fund
Strategy and Benchmark Composition
The Fund seeks to achieve its investment objective by primarily investing its assets in a combination of common stocks (to provide long equity exposure) and derivatives (to create a hedge against the Fund’s downside equity exposure).
The Sub- Adviser provides to Milliman a weighted list of those common stocks of companies that the Sub-Adviser believes can provide long-term growth of capital (the “Investable Universe”). The Fund invests in some or all of the common stocks contained in the Investable Universe.
In seeking to create a hedge against the Fund’s downside equity exposure, Milliman purchases and sells over-the-counter (“OTC”) options on some or all of the common stocks contained in the Investable Universe (the “Buffer Hedging Strategy”). The Buffer Hedging Strategy is intended to provide a hedge against any losses that the Fund incurs that are greater than 5% but less than 20% of the Fund’s equity exposure (the “Buffer Range”). In addition, implementation of the Buffer Hedging Strategy could result in the Fund foregoing some of the upside returns on its long equity exposure because the options contracts used to effect the Buffer Hedging Strategy will limit the Fund’s potential upside returns, thus resulting in a “Cap.” The resulting Cap will impact the Fund until Milliman resets the options contracts (i.e., closes out existing options contracts and transacts in new options contracts) to achieve the Buffer Hedging Strategy, at which time a new Cap will result. Milliman typically resets
1
Milliman Variable Insurance Trust
Management Discussion of Fund Performance
December 31, 2023 (Unaudited)
the options contracts and updates the Fund’s equity holdings quarterly.
Benchmark: S&P 500 Price Index – A market capitalization weighted benchmark index which tracks the price performance of 500 of the largest publicly traded stocks listed on U.S. exchanges. Please note that an investor cannot invest directly in an index.
Fund Performance
The Milliman - Capital Group Hedged U.S. Growth Fund returned 9.30% from its inception on February 10, 2023, to the end of the year. This underperformed the benchmark, the S&P 500 Price Index, which rose 16.61% during this same period. Stocks in the technology, communications, and consumer cyclical sectors were the largest contributors to the Fund’s positive return, reflecting resilient consumer spending in 2023. Option hedges detracted from performance in Q2 and Q4, when stock returns exceeded the Fund’s Cap.
Other contributors to the Fund’s return were stock selection in industrials and communication. Overweighting of healthcare stocks and financial services stock selection were detractors compared to the Fund’s benchmark.
Milliman - Capital Group Hedged U.S. Income and Growth Fund
Strategy and Benchmark Composition
The Fund seeks to achieve its investment objective by primarily investing its assets in a combination of common stocks (to provide long equity exposure) and derivatives (to create a hedge against the Fund’s downside equity exposure).
The Sub- Adviser provides to Milliman a weighted list of those common stocks of companies that the Sub-Adviser believes can provide long-term growth of capital (the “Investable Universe”). The Fund invests in some or all of the common stocks contained in the Investable Universe.
In seeking to create a hedge against the Fund’s downside equity exposure, Milliman purchases and sells over-the-counter (“OTC”) options on some or all of the common stocks contained in the Investable Universe (the “Buffer Hedging Strategy”). The Buffer Hedging Strategy is intended to provide a hedge against any losses that the Fund incurs that are greater than 5% but less than 20% of the Fund’s equity exposure (the “Buffer Range”). In addition, implementation of the Buffer Hedging Strategy could result in the Fund foregoing some of the upside returns on its long equity exposure because the options contracts used to effect the Buffer Hedging Strategy will limit the Fund’s potential upside returns, thus resulting in a “Cap.” The resulting Cap will impact the Fund until Milliman resets the options contracts (i.e., closes out existing options contracts and transacts in new options contracts) to achieve the Buffer Hedging Strategy, at which time a new Cap will result. Milliman typically resets the options contracts and updates the Fund’s equity holdings quarterly.
Benchmark: S&P 500 Price Index – A market capitalization weighted benchmark index which tracks the price performance of 500 of the largest publicly traded stocks listed on U.S. exchanges. Please note that an investor cannot invest directly in an index.
2
Milliman Variable Insurance Trust
Management Discussion of Fund Performance
December 31, 2023 (Unaudited)
Fund Performance
The Milliman - Capital Group Hedged U.S. Income and Growth Fund returned 5.93% from its inception on February 10, 2023, to the end of the year. This underperformed the benchmark, the S&P 500 Price Index, which rose 16.61% during this same period. Stocks in the technology sector were the biggest contributor to the Fund’s positive return, along with communication and financial services sectors. Option hedges detracted from performance in Q2 and Q4, when stock returns exceeded the Fund’s Cap.
Other contributors to the Fund’s return were stock selection in the technology and financial services sectors, whereas consumer cyclical stock selection and technology sector underweighting were detractors compared to the benchmark.
The results shown are historical, for informational purposes only, and do not guarantee future results.
The analysis is prepared as of a particular date and time and does not reflect subsequent changes or variations in the market or changes in any and all other relevant factors.
The recipient should not construe any of the material contained herein as legal, regulatory, tax, accounting or other advice. The recipient should not act on any information in this document without consulting its legal, regulatory, tax, accounting and other advisors. Information herein has been obtained from sources we believe to be reliable but neither Milliman Financial Risk Management LLC (“Milliman FRM”) nor its parents, subsidiaries or affiliates warrant its completeness or accuracy. No responsibility can be accepted for errors of facts obtained from third parties.
The materials in this document represent the opinion of the authors at the time of authorship; they may change, and are not representative of the views of Milliman FRM or its parents, subsidiaries, or affiliates. Milliman FRM does not certify the information, nor does it guarantee the accuracy and completeness of such information. Use of such information is voluntary and should not be relied upon unless an independent review of its accuracy and completeness has been performed. Materials may not be reproduced without the express consent of Milliman FRM. Milliman Financial Risk Management LLC is an SEC-registered investment advisor and subsidiary of Milliman, Inc.
3
Milliman - Capital Group Hedged U.S. Growth Fund
December 31, 2023 (Unaudited)
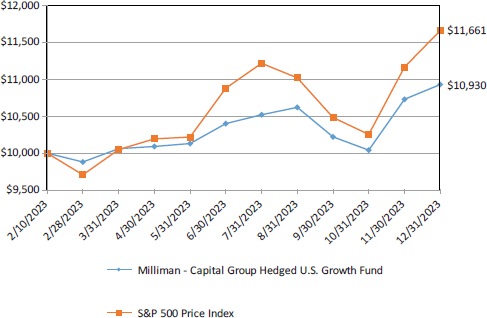
The following graph illustrates the value, as of December 31, 2023, of a hypothetical $10,000 investment made on February 10, 2023 (commencement of operations) in Class 3 Shares of the Milliman - Capital Group Hedged U.S. Growth Fund compared to the S&P 500 Price Index.
Growth of a Hypothetical $10,000 Investment
at December 31, 2023
Total Returns as of December 31, 2023 | ||||
Since Inception (a) | ||||
| Milliman - Capital Group Hedged U.S. Growth Fund | 9.30 | % | ||
| S&P 500 Price Index | 16.61 | % | ||
| (a) | Inception date is February 10, 2023. |
Performance data quoted represents past performance, which is no guarantee of future results. Investment return and principal value will fluctuate so that an investor’s shares, when redeemed, may be worth more or less than their original cost. The total return shown assumes the reinvestment of all distributions. Earnings from variable annuity contracts and variable life insurance policies compound tax-free until withdrawn, so no adjustments were made for income taxes. Performance reflects applicable fee waivers and/or expense limitations in effect during the periods shown and, in their absence, performance would have been lower. The performance information does not include insurance company separate account fees and variable annuity or variable life contract charges and if these fees and charges were included, then performance would have been lower. Current performance may be lower or higher than the performance shown above. For the most recent performance, please visit www. millimanfunds.com.
S&P 500 Price Index – A market capitalization weighted benchmark index which tracks the price performance of 500 of the largest publicly traded stocks listed on U.S. exchanges. Please note that an investor cannot invest directly in an index.
4
Milliman - Capital Group Hedged U.S. Income and Growth Fund
Fund Performance
December 31, 2023 (Unaudited)
The following graph illustrates the value, as of December 31, 2023, of a hypothetical $10,000 investment made on February 10, 2023 (commencement of operations) in Class 3 Shares of the Milliman - Capital Group Hedged U.S. Income and Growth Fund compared to the S&P 500 Price Index.
Growth of a Hypothetical $10,000 Investment
at December 31, 2023

Total Returns as of December 31, 2023 | ||||
Since Inception (a) | ||||
| Milliman - Capital Group Hedged U.S. Income and Growth Fund | 5.93 | % | ||
| S&P 500 Price Index | 16.61 | % | ||
| (a) | Inception date is February 10, 2023. |
Performance data quoted represents past performance, which is no guarantee of future results. Investment return and principal value will fluctuate so that an investor’s shares, when redeemed, may be worth more or less than their original cost. The total return shown assumes the reinvestment of all distributions. Earnings from variable annuity contracts and variable life insurance policies compound tax-free until withdrawn, so no adjustments were made for income taxes. Performance reflects applicable fee waivers and/or expense limitations in effect during the periods shown and, in their absence, performance would have been lower. The performance information does not include insurance company separate account fees and variable annuity or variable life contract charges and if these fees and charges were included, then performance would have been lower. Current performance may be lower or higher than the performance shown above. For the most recent performance, please visit www. millimanfunds.com.
S&P 500 Price Index – A market capitalization weighted benchmark index which tracks the price performance of 500 of the largest publicly traded stocks listed on U.S. exchanges. Please note that an investor cannot invest directly in an index.
5
Milliman Variable Insurance Trust
Expense Example For the Period Ended
December 31, 2023 (Unaudited)
Each Fund sells its shares to insurance company separate accounts funding variable annuity contracts and variable life insurance policies and other qualified investors. The tables below do not include any fees or sales charges imposed by your variable product.
As a Fund shareholder, you incur ongoing costs, including management fees; distribution and/or service (“12b-1”) fees; and other Fund expenses. These Examples are intended to help you understand your ongoing costs (in dollars) of investing in a Fund and to compare these costs with the ongoing costs of investing in other mutual funds.
The Examples are based on an investment of $1,000 invested at the beginning of the period and held for the entire period from July 1, 2023 to December 31, 2023.
Actual Expenses
The following table provides information about actual account values and actual expenses. You may use the information in this table, together with the amount you invested, to estimate the expenses you paid over the period. Simply divide your account value by $1,000 (for example, an $8,600 account value divided by $1,000 equals 8.6), then multiply the result by the number in the applicable line under the heading titled “Expenses Paid During the Period” to estimate the expenses you paid on your account during the period.
Hypothetical Example for Comparison Purposes
The following table provides information about hypothetical account values and hypothetical expenses based on the Funds’ actual expense ratios and an assumed rate of return of 5% per year before expenses, which are not the Funds’ actual returns. The hypothetical account values and expenses may not be used to estimate the actual ending account balance or expenses you paid for the period. You may use this information to compare the ongoing costs of investing in the Funds with other funds. To do so, compare this 5% hypothetical example with the 5% hypothetical examples that appear in the shareholder reports of other funds.
Please note that the expenses shown in the tables are meant to highlight your ongoing costs only. The Funds do not charge transaction fees, such as sales charges (loads), redemption fees, or exchange fees. Therefore, the table below is useful in comparing the ongoing costs only and will not help you determine the relative total costs of owning different funds. The Funds’ expenses shown in the tables reflect fee waivers and reimbursements in effect.
Beginning Account Value | Ending Account Value | Annualized Expense Ratio | Expenses Paid During the Period(a) | |||
| Milliman - Capital Group Hedged U.S. Growth Fund# | ||||||
| Actual | $1,000.00 | $1,051.00 | 1.09% | $ | 5.63 | |
| Hypothetical (assuming 5% return before expenses) | 1,000.00 | 1,019.71 | 1.09% | 5.55 | ||
| Milliman - Capital Group Hedged U.S. Income and Growth Fund# | ||||||
| Actual | 1,000.00 | 1,049.90 | 1.09% | 5.63 | ||
| Hypothetical (assuming 5% return before expenses) | 1,000.00 | 1,019.71 | 1.09% | 5.55 | ||
| # | Class 3 shares |
| (a) | Expenses are equal to the Funds’ annualized expense ratios, multiplied by the average account value over the period, multiplied by 184/365 (to reflect the six-month period). |
6
Milliman - Capital Group Hedged U.S. Growth Fund
December 31, 2023
| Shares | Value | |||||||
| COMMON STOCKS - 104.97% | ||||||||
| Communication Services - 8.64% | ||||||||
| Alphabet, Inc. - Class C (a) | 939 | $ | 132,334 | |||||
| Meta Platforms, Inc. - Class A (a) | 207 | 73,270 | ||||||
| Netflix, Inc. (a) | 121 | 58,912 | ||||||
| Take-Two Interactive Software, Inc. (a) | 118 | 18,992 | ||||||
| 283,508 | ||||||||
| Consumer Discretionary - 20.84% | ||||||||
| Airbnb, Inc. - Class A (a) | 217 | 29,542 | ||||||
| Amazon.com, Inc. (a) | 795 | 120,791 | ||||||
| Burlington Stores, Inc. (a) | 249 | 48,426 | ||||||
| Caesars Entertainment, Inc. (a) | 466 | 21,846 | ||||||
| Churchill Downs, Inc. | 362 | 48,845 | ||||||
| Darden Restaurants, Inc. | 173 | 28,424 | ||||||
| DoorDash, Inc. - Class A (a) | 259 | 25,613 | ||||||
| DR Horton, Inc. | 220 | 33,436 | ||||||
| Floor & Decor Holdings, Inc. - Class A (a) | 311 | 34,695 | ||||||
| Hilton Worldwide Holdings, Inc. | 455 | 82,851 | ||||||
| Marriott International, Inc. - Class A | 168 | 37,886 | ||||||
| NIKE, Inc. - Class B | 291 | 31,594 | ||||||
| Starbucks Corp. | 282 | 27,075 | ||||||
| Tesla, Inc. (a) | 86 | 21,369 | ||||||
| TopBuild Corp. (a) | 109 | 40,794 | ||||||
| Williams-Sonoma, Inc. | 132 | 26,635 | ||||||
| YETI Holdings, Inc. (a) | 461 | 23,871 | ||||||
| 683,693 | ||||||||
| Consumer Staples - 3.38% | ||||||||
| Costco Wholesale Corp. | 43 | 28,383 | ||||||
| Dollar Tree, Inc. (a) | 175 | 24,859 | ||||||
| Philip Morris International, Inc. | 611 | 57,483 | ||||||
| 110,725 | ||||||||
| Energy - 1.38% | ||||||||
| EOG Resources, Inc. | 375 | 45,356 | ||||||
| Financials - 3.12% | ||||||||
| First Republic Bank | 303 | 12 | ||||||
| LPL Financial Holdings, Inc. | 87 | 19,803 | ||||||
| MSCI, Inc. | 86 | 48,646 | ||||||
| S&P Global, Inc. | 77 | 33,920 | ||||||
| 102,381 | ||||||||
| Health Care - 22.17% | ||||||||
| Abbott Laboratories | 976 | 107,428 | ||||||
| agilon health, Inc. (a) | 1,659 | 20,820 | ||||||
| Alnylam Pharmaceuticals, Inc. (a) | 210 | 40,196 | ||||||
| BioMarin Pharmaceutical, Inc. (a) | 374 | 36,061 | ||||||
| Dexcom, Inc. (a) | 173 | 21,468 | ||||||
| Edwards Lifesciences Corp. (a) | 259 | 19,749 | ||||||
| Eli Lilly & Co. | 131 | 76,363 | ||||||
| Insulet Corp. (a) | 116 | 25,170 | ||||||
| IQVIA Holdings, Inc. (a) | 125 | 28,923 | ||||||
| Penumbra, Inc. (a) | 97 | 24,399 | ||||||
| Revvity, Inc. | 411 | 44,926 | ||||||
| Stryker Corp. | 169 | 50,609 | ||||||
| Thermo Fisher Scientific, Inc. | 130 | 69,003 | ||||||
| UnitedHealth Group, Inc. | 215 | 113,191 | ||||||
| Zoetis, Inc. | 247 | 48,750 | ||||||
| 727,056 | ||||||||
The accompanying notes are an integral part of these financial statements.
7
Milliman - Capital Group Hedged U.S. Growth Fund
Schedule of Investments (Continued)
December 31, 2023
| Shares | Value | |||||||
| Industrials - 15.38% | ||||||||
| AMETEK, Inc. | 162 | $ | 26,712 | |||||
| Carrier Global Corp. | 883 | 50,728 | ||||||
| Ceridian HCM Holding, Inc. (a) | 501 | 33,627 | ||||||
| Copart, Inc. (a) | 1,171 | 57,379 | ||||||
| Old Dominion Freight Line, Inc. | 167 | 67,690 | ||||||
| RTX Corp. | 729 | 61,338 | ||||||
| Saia, Inc. (a) | 39 | 17,091 | ||||||
| TransDigm Group, Inc. | 111 | 112,288 | ||||||
| United Rentals, Inc. | 78 | 44,727 | ||||||
| Woodward, Inc. | 242 | 32,943 | ||||||
| 504,523 | ||||||||
| Information Technology - 27.08% (b) | ||||||||
| Adobe, Inc. (a) | 77 | 45,938 | ||||||
| Apple, Inc. | 244 | 46,977 | ||||||
| Applied Materials, Inc. | 241 | 39,059 | ||||||
| Autodesk, Inc. (a) | 125 | 30,435 | ||||||
| Broadcom, Inc. | 117 | 130,601 | ||||||
| EPAM Systems, Inc. (a) | 83 | 24,679 | ||||||
| First Solar, Inc. (a) | 141 | 24,291 | ||||||
| Marvell Technology, Inc. | 537 | 32,386 | ||||||
| Micron Technology, Inc. | 731 | 62,384 | ||||||
| Microsoft Corp. | 646 | 242,922 | ||||||
| NVIDIA Corp. | 75 | 37,142 | ||||||
| Palo Alto Networks, Inc. (a) | 166 | 48,950 | ||||||
| Salesforce, Inc. (a) | 250 | 65,785 | ||||||
| ServiceNow, Inc. (a) | 80 | 56,519 | ||||||
| 888,068 | ||||||||
| Materials - 1.97% | ||||||||
| Albemarle Corp. | 209 | 30,196 | ||||||
| Linde PLC | 84 | 34,500 | ||||||
| 64,696 | ||||||||
| Real Estate - 1.01% | ||||||||
| Equinix, Inc. | 41 | 33,021 | ||||||
| TOTAL COMMON STOCKS (Cost$2,925,459) | 3,443,027 | |||||||
| Contracts | Notional Amount | |||||||||||
| PURCHASED OPTIONS - 0.06% (c) | ||||||||||||
| OVER-THE-COUNTER PUT OPTIONS - 0.06% | ||||||||||||
| Milliman - Capital Group Growth Basket, Counterparty: Bank of America, Expires 2/12/2024, Strike Price $9,500.00 (a)(d) | 310 | $ | 3,422,662 | 1,699 | ||||||||
| TOTAL PURCHASED OPTIONS (Cost$43,400) | 1,699 | |||||||||||
| Total Investments (Cost $2,968,859) - 105.03% | 3,444,726 | |||||||||||
| Liabilities in Excess of Other Assets - (5.03)% | (164,803 | ) | ||||||||||
| TOTAL NET ASSETS - 100.00% | $ | 3,279,923 | ||||||||||
Percentages are stated as a percent of net assets.
The Global Industry Classification Standard (GICS®) was developed by and/or is the exclusive property of MSCI, Inc. and Standard & Poor’s Financial Services LLC (“S&P”). GICS is a service mark of MSCI and S&P and has been licensed for use by U.S. Bancorp Fund Services, LLC.
| (a) | Non-income producing security. |
| (b) | Amount represents investments in a particular sector. No industry within this sector represented more than 25% of the Fund’s total assets at the time of investment. |
| (c) | Purchased option contracts are held in connection with corresponding written option contracts. |
The accompanying notes are an integral part of these financial statements.
8
Milliman - Capital Group Hedged U.S. Growth Fund
Schedule of Investments (Continued)
December 31, 2023
| (d) | Comprised of a proprietary basket of securities. The underlying components of the basket as of December 31, 2023 are shown below: |
| Security Name | Number of Shares | Notional Amount | % of Total Notional Amount | |||||||||
| Microsoft Corp. | 642 | $241,487 | 7.05 | % | ||||||||
| Alphabet, Inc. – Class C | 935 | 131,806 | 3.85 | % | ||||||||
| Broadcom, Inc. | 116 | 129,657 | 3.79 | % | ||||||||
| Amazon.com, Inc. | 789 | 119,858 | 3.50 | % | ||||||||
| UnitedHealth Group, Inc. | 214 | 112,418 | 3.28 | % | ||||||||
| TransDigm Group, Inc. | 110 | 111,625 | 3.26 | % | ||||||||
| Abbott Laboratories | 970 | 106,817 | 3.12 | % | ||||||||
| Hilton Worldwide Holdings, Inc. | 452 | 82,331 | 2.41 | % | ||||||||
| Eli Lilly & Co. | 130 | 75,656 | 2.21 | % | ||||||||
| Meta Platforms, Inc. – Class A | 205 | 72,718 | 2.12 | % | ||||||||
| Thermo Fisher Scientific, Inc. | 129 | 68,631 | 2.01 | % | ||||||||
| Old Dominion Freight Line, Inc. | 166 | 67,260 | 1.97 | % | ||||||||
| Salesforce, Inc. | 249 | 65,531 | 1.91 | % | ||||||||
| Micron Technology, Inc. | 730 | 62,258 | 1.82 | % | ||||||||
| RTX Corp. | 728 | 61,226 | 1.79 | % | ||||||||
| Netflix, Inc. | 120 | 58,272 | 1.70 | % | ||||||||
| Philip Morris International, Inc. | 608 | 57,243 | 1.67 | % | ||||||||
| Copart, Inc. | 1,167 | 57,174 | 1.67 | % | ||||||||
| ServiceNow, Inc. | 74 | 51,938 | 1.52 | % | ||||||||
| Carrier Global Corp. | 880 | 50,541 | 1.48 | % | ||||||||
| Stryker Corp. | 168 | 50,457 | 1.47 | % | ||||||||
| Palo Alto Networks, Inc. | 165 | 48,783 | 1.43 | % | ||||||||
| Zoetis, Inc. | 246 | 48,506 | 1.42 | % | ||||||||
| Churchill Downs, Inc. | 359 | 48,398 | 1.42 | % | ||||||||
| MSCI, Inc. | 85 | 48,241 | 1.41 | % | ||||||||
| Burlington Stores, Inc. | 247 | 48,012 | 1.40 | % | ||||||||
| Apple, Inc. | 242 | 46,610 | 1.36 | % | ||||||||
| Adobe, Inc. | 77 | 45,694 | 1.34 | % | ||||||||
| EOG Resources, Inc. | 374 | 45,196 | 1.32 | % | ||||||||
| United Rentals, Inc. | 78 | 44,579 | 1.30 | % | ||||||||
| Revvity, Inc. | 406 | 44,419 | 1.30 | % | ||||||||
| TopBuild Corp. | 109 | 40,659 | 1.19 | % | ||||||||
| Alnylam Pharmaceuticals, Inc. | 208 | 39,866 | 1.16 | % | ||||||||
| Applied Materials, Inc. | 240 | 38,915 | 1.14 | % | ||||||||
| Marriott International, Inc. – Class A | 167 | 37,571 | 1.10 | % | ||||||||
| NVIDIA Corp. | 75 | 37,291 | 1.09 | % | ||||||||
| BioMarin Pharmaceutical, Inc. | 371 | 35,760 | 1.04 | % | ||||||||
| Floor & Decor Holdings, Inc. – Class A | 308 | 34,409 | 1.01 | % | ||||||||
| Linde PLC | 83 | 34,113 | 1.00 | % | ||||||||
| S&P Global, Inc. | 76 | 33,571 | 0.98 | % | ||||||||
| Ceridian HCM Holding, Inc. | 497 | 33,389 | 0.98 | % | ||||||||
| DR Horton, Inc. | 219 | 33,330 | 0.97 | % | ||||||||
| Woodward, Inc. | 241 | 32,817 | 0.96 | % | ||||||||
| Equinix, Inc. | 40 | 32,617 | 0.95 | % | ||||||||
| Marvell Technology, Inc. | 536 | 32,351 | 0.95 | % | ||||||||
| NIKE, Inc. – Class B | 290 | 31,460 | 0.92 | % | ||||||||
| Autodesk, Inc. | 124 | 30,150 | 0.88 | % | ||||||||
| Albemarle Corp. | 207 | 29,880 | 0.87 | % | ||||||||
| Airbnb, Inc. – Class A | 216 | 29,420 | 0.86 | % | ||||||||
| IQVIA Holdings, Inc. | 124 | 28,733 | 0.84 | % | ||||||||
| Top 50 Holdings | 2,949,644 | 86.18 | % | |||||||||
| Other Securities | 473,018 | 13.82 | % | |||||||||
| Total Underlying Positions | $3,422,662 | 100.00 | % | |||||||||
The accompanying notes are an integral part of these financial statements.
9
Milliman - Capital Group Hedged U.S. Growth Fund
Schedule of Investments (Continued)
December 31, 2023
SCHEDULE OF OPTIONS WRITTEN
December 31, 2023
| Strike | Notional | |||||||||||||||||
| Description | Expiration | Price | Contracts | Amount | Value | |||||||||||||
| Over-the-Counter Call Options | ||||||||||||||||||
| Milliman - Capital Group Growth Basket, Counterparty: Bank of America (a) | 2/12/2024 | $ | 10,490.00 | 310 | $ | (3,422,662 | ) | $ | (204,039 | ) | ||||||||
| Over-the-Counter Put Options | ||||||||||||||||||
| Milliman - Capital Group Growth Basket, Counterparty: Bank of America (a) | 2/12/2024 | 8,000.00 | 310 | (3,422,662 | ) | (164 | ) | |||||||||||
| TOTAL OPTIONS WRITTEN (Premiums Received $43,400) | $ | (204,203 | ) | |||||||||||||||
| (a) | Comprised of a proprietary basket of securities. The underlying components of the basket as of December 31, 2023 are shown in the Schedule of Investments. |
The accompanying notes are an integral part of these financial statements.
10
Milliman - Capital Group Hedged U.S. Growth Fund
Schedule of Investments (Concluded)
December 31, 2023
The following is a summary of the fair valuations according to the inputs used as of December 31, 2023 in valuing the Fund’s assets and liabilities (see Note 2 in Notes to Financial Statements):
| Level 1 | Level 2 | Level 3 | Total | |||||||||||||
| Assets | ||||||||||||||||
| Common Stocks | $ | 3,443,027 | $ | – | $ | – | $ | 3,443,027 | ||||||||
| Purchased Options | – | 1,699 | – | 1,699 | ||||||||||||
| Total Assets | $ | 3,443,027 | $ | 1,699 | $ | – | $ | 3,444,726 | ||||||||
| Liabilities | ||||||||||||||||
| Options Written | $ | – | $ | 204,203 | $ | – | $ | 204,203 | ||||||||
| Total Liabilities | $ | – | $ | 204,203 | $ | – | $ | 204,203 | ||||||||
Portfolio Holdings Summary
| % of Net | ||||
| Asset Type | Assets | |||
| Common Stocks | 104.97 | % | ||
| Purchased Options | 0.06 | |||
| Total Investments | 105.03 | |||
| Written Options | (6.23 | ) | ||
| Assets in Excess of Other Liabilities | 1.20 | |||
| Net Assets | 100.00 | % | ||
The accompanying notes are an integral part of these financial statements.
11
Milliman - Capital Group Hedged U.S. Income and Growth Fund
Schedule of Investments
December 31, 2023
| Shares | Value | |||||||
| COMMON STOCKS - 103.18% | ||||||||
| Communication Services - 7.34% | ||||||||
| Alphabet, Inc. - Class A (a) | 603 | $ | 84,233 | |||||
| Comcast Corp. - Class A | 2,514 | 110,239 | ||||||
| Meta Platforms, Inc. - Class A (a) | 109 | 38,582 | ||||||
| 233,054 | ||||||||
| Consumer Discretionary - 8.61% | ||||||||
| Darden Restaurants, Inc. | 310 | 50,933 | ||||||
| General Motors Co. | 952 | 34,196 | ||||||
| Home Depot, Inc. | 300 | 103,964 | ||||||
| Lennar Corp. - Class A | 271 | 40,390 | ||||||
| Yum! Brands, Inc. | 336 | 43,902 | ||||||
| 273,385 | ||||||||
| Consumer Staples - 5.91% | ||||||||
| Archer-Daniels-Midland Co. | 690 | 49,832 | ||||||
| Keurig Dr Pepper, Inc. | 1,103 | 36,752 | ||||||
| Philip Morris International, Inc. | 777 | 73,100 | ||||||
| Target Corp. | 196 | 27,914 | ||||||
| 187,598 | ||||||||
| Energy - 6.48% | ||||||||
| Baker Hughes Co. | 945 | 32,300 | ||||||
| Chevron Corp. | 313 | 46,687 | ||||||
| ConocoPhillips | 396 | 45,964 | ||||||
| EOG Resources, Inc. | 281 | 33,987 | ||||||
| Pioneer Natural Resources Co. | 208 | 46,775 | ||||||
| 205,713 | ||||||||
| Financials - 13.07% | ||||||||
| BlackRock, Inc. | 72 | 58,450 | ||||||
| Capital One Financial Corp. | 265 | 34,747 | ||||||
| CME Group, Inc. | 301 | 63,391 | ||||||
| Discover Financial Services | 268 | 30,123 | ||||||
| Intercontinental Exchange, Inc. | 224 | 28,768 | ||||||
| JPMorgan Chase & Co. | 554 | 94,235 | ||||||
| Marsh & McLennan Cos., Inc. | 557 | 105,535 | ||||||
| 415,249 | ||||||||
| Health Care - 20.65% | ||||||||
| Abbott Laboratories | 305 | 33,571 | ||||||
| AbbVie, Inc. | 283 | 43,857 | ||||||
| CVS Health Corp. | 807 | 63,721 | ||||||
| Danaher Corp. | 180 | 41,641 | ||||||
| Elevance Health, Inc. | 76 | 35,839 | ||||||
| Eli Lilly & Co. | 150 | 87,438 | ||||||
| Gilead Sciences, Inc. | 648 | 52,494 | ||||||
| Humana, Inc. | 82 | 37,540 | ||||||
| Johnson & Johnson | 425 | 66,615 | ||||||
| Pfizer, Inc. | 1,679 | 48,338 | ||||||
| UnitedHealth Group, Inc. | 275 | 144,779 | ||||||
| 655,833 | ||||||||
| Industrials - 11.10% | ||||||||
| Boeing Co. (a) | 146 | 38,056 | ||||||
| Caterpillar, Inc. | 163 | 48,194 | ||||||
| CSX Corp. | 1,349 | 46,770 | ||||||
| Honeywell International, Inc. | 150 | 31,457 | ||||||
| L3Harris Technologies, Inc. | 145 | 30,540 | ||||||
| Lockheed Martin Corp. | 116 | 52,576 | ||||||
| Norfolk Southern Corp. | 112 | 26,475 | ||||||
| Northrop Grumman Corp. | 157 | 73,497 | ||||||
The accompanying notes are an integral part of these financial statements.
12
Milliman - Capital Group Hedged U.S. Income and Growth Fund
Schedule of Investments (Continued)
December 31, 2023
| Shares | Value | |||||||
| Veralto Corp | 62 | $ | 5,100 | |||||
| 352,665 | ||||||||
| Information Technology - 22.26% | ||||||||
| Apple, Inc. | 403 | 77,589 | ||||||
| Applied Materials, Inc. | 272 | 44,083 | ||||||
| Broadcom, Inc. | 243 | 271,249 | ||||||
| Intel Corp. | 1,435 | 72,109 | ||||||
| Microsoft Corp. | 644 | 242,170 | ||||||
| 707,200 | ||||||||
| Materials - 3.92% | ||||||||
| Celanese Corp. | 297 | 46,145 | ||||||
| Linde PLC | 112 | 46,000 | ||||||
| LyondellBasell Industries NV - Class A | 343 | 32,612 | ||||||
| 124,757 | ||||||||
| Real Estate - 1.21% | ||||||||
| Extra Space Storage, Inc. | 240 | 38,479 | ||||||
| Utilities - 2.63% | ||||||||
| Constellation Energy Corp. | 324 | 37,872 | ||||||
| Sempra | 612 | 45,735 | ||||||
| 83,607 | ||||||||
| TOTAL COMMON STOCKS (Cost $2,869,311) | 3,277,540 | |||||||
| Contracts | Notional Amount | |||||||||||
| PURCHASED OPTIONS - 0.10% (b) | ||||||||||||
| OVER-THE-COUNTER PUT OPTIONS - 0.10% | ||||||||||||
| Milliman - Capital Group Income and Growth Basket: Counterparty: Bank of America, Expires 2/12/2024, Strike Price $9,500.00 (a)(c) | 301 | $ | 3,254,689 | 3,242 | ||||||||
| TOTAL PURCHASED OPTIONS (Cost$24,381) | 3,242 | |||||||||||
| Total Investments (Cost $2,893,692) - 103.28% | 3,280,782 | |||||||||||
| Liabilities in Excess of Other Assets - (3.28)% | (104,215 | ) | ||||||||||
| TOTAL NET ASSETS - 100.00% | $ | 3,176,567 | ||||||||||
Percentages are stated as a percent of net assets.
The Global Industry Classification Standard (GICS®) was developed by and/or is the exclusive property of MSCI, Inc. and Standard & Poor’s Financial Services LLC (“S&P”). GICS is a service mark of MSCI and S&P and has been licensed for use by U.S. Bancorp Fund Services, LLC.
| (a) | Non-income producing security. |
| (b) | Purchased option contracts are held in connection with corresponding written option contracts. |
The accompanying notes are an integral part of these financial statements.
13
Milliman - Capital Group Hedged U.S. Income and Growth Fund
Schedule of Investments (Continued)
December 31, 2023
(c) Comprised of a proprietary basket of securities. The underlying components of the basket as of December 31, 2023 are shown below:
| % of Total Notional | ||||||||||||
| Security Name | Number of Shares | Notional Amount | Amount | |||||||||
| Broadcom, Inc. | 242 | $270,149 | 8.31 | % | ||||||||
| Microsoft Corp. | 640 | 240,499 | 7.39 | % | ||||||||
| UnitedHealth Group, Inc. | 272 | 143,460 | 4.41 | % | ||||||||
| Comcast Corp. – Class A | 2,498 | 109,540 | 3.37 | % | ||||||||
| Marsh & McLennan Cos., Inc. | 553 | 104,787 | 3.23 | % | ||||||||
| Home Depot, Inc. | 298 | 103,285 | 3.17 | % | ||||||||
| JPMorgan Chase & Co. | 549 | 93,402 | 2.87 | % | ||||||||
| Eli Lilly & Co. | 148 | 86,191 | 2.65 | % | ||||||||
| Alphabet, Inc. – Class A | 600 | 83,793 | 2.57 | % | ||||||||
| Apple, Inc. | 400 | 76,994 | 2.36 | % | ||||||||
| Philip Morris International, Inc. | 773 | 72,701 | 2.24 | % | ||||||||
| Northrop Grumman Corp. | 155 | 72,652 | 2.23 | % | ||||||||
| Intel Corp. | 1,429 | 71,827 | 2.21 | % | ||||||||
| Johnson & Johnson | 422 | 66,151 | 2.03 | % | ||||||||
| CVS Health Corp. | 798 | 63,006 | 1.94 | % | ||||||||
| CME Group, Inc. | 299 | 62,883 | 1.93 | % | ||||||||
| BlackRock, Inc. | 71 | 57,911 | 1.78 | % | ||||||||
| Lockheed Martin Corp. | 116 | 52,427 | 1.61 | % | ||||||||
| Gilead Sciences, Inc. | 642 | 52,014 | 1.60 | % | ||||||||
| Darden Restaurants, Inc. | 308 | 50,607 | 1.55 | % | ||||||||
| Archer-Daniels-Midland Co. | 687 | 49,625 | 1.52 | % | ||||||||
| Caterpillar, Inc. | 162 | 47,817 | 1.47 | % | ||||||||
| Pfizer, Inc. | 1,663 | 47,866 | 1.47 | % | ||||||||
| Chevron Corp. | 311 | 46,424 | 1.43 | % | ||||||||
| CSX Corp. | 1,341 | 46,499 | �� | 1.43 | % | |||||||
| Pioneer Natural Resources Co. | 206 | 46,418 | 1.42 | % | ||||||||
| ConocoPhillips | 394 | 45,778 | 1.41 | % | ||||||||
| Celanese Corp. | 294 | 45,679 | 1.40 | % | ||||||||
| Linde PLC | 111 | 45,666 | 1.40 | % | ||||||||
| Sempra | 606 | 45,310 | 1.39 | % | ||||||||
| Applied Materials, Inc. | 271 | 43,854 | 1.35 | % | ||||||||
| Yum! Brands, Inc. | 334 | 43,583 | 1.34 | % | ||||||||
| AbbVie, Inc. | 280 | 43,456 | 1.34 | % | ||||||||
| Danaher Corp. | 178 | 41,270 | 1.27 | % | ||||||||
| Lennar Corp. | 269 | 40,125 | 1.23 | % | ||||||||
| Meta Platforms, Inc. – Class A | 108 | 38,341 | 1.18 | % | ||||||||
| Boeing Co. | 145 | 37,835 | 1.17 | % | ||||||||
| Extra Space Storage, Inc. | 239 | 38,242 | 1.17 | % | ||||||||
| Constellation Energy Corp. | 323 | 37,723 | 1.16 | % | ||||||||
| Humana, Inc. | 82 | 37,573 | 1.15 | % | ||||||||
| Keurig Dr Pepper, Inc. | 1,098 | 36,585 | 1.12 | % | ||||||||
| Elevance Health, Inc. | 75 | 35,441 | 1.09 | % | ||||||||
| Capital One Financial Corp. | 262 | 34,401 | 1.06 | % | ||||||||
| General Motors Co. | 948 | 34,063 | 1.05 | % | ||||||||
| EOG Resources, Inc. | 280 | 33,916 | 1.04 | % | ||||||||
| Abbott Laboratories | 303 | 33,356 | 1.02 | % | ||||||||
| LyondellBasell Industries NV – Class A | 340 | 32,356 | 0.99 | % | ||||||||
| Baker Hughes Co. | 937 | 32,012 | 0.98 | % | ||||||||
| Honeywell International, Inc. | 149 | 31,232 | 0.96 | % | ||||||||
| L3Harris Technologies, Inc. | 144 | 30,406 | 0.93 | % | ||||||||
| Top 50 Holdings | 3,137,131 | 96.39 | % | |||||||||
| Other Securities | 117,558 | 3.61 | % | |||||||||
| Total Underlying Positions | $3,254,689 | 100.00 | % | |||||||||
The accompanying notes are an integral part of these financial statements.
14
Milliman - Capital Group Hedged U.S. Income and Growth Fund
Schedule of Investments (Continued)
December 31, 2023
SCHEDULE OF OPTIONS WRITTEN
December 31, 2023
| Description | Expiration | Strike Price | Contracts | Notional Amount | Value | |||||||||||||
| Over-the-Counter Call Options | ||||||||||||||||||
| Milliman - Capital Group Income and Growth Basket: Counterparty: Bank of America (a) | 2/12/2024 | $ | 10,410.00 | 301 | $ | (3,254,689 | ) | $ | (148,363 | ) | ||||||||
| Over-the-Counter Put Options | ||||||||||||||||||
| Milliman - Capital Group Income and Growth Basket: Counterparty: Bank of America (a) | 2/12/2024 | 8,000.00 | 301 | (3,254,689 | ) | (114 | ) | |||||||||||
| TOTAL OPTIONS WRITTEN (Premiums Received $24,381) | $ | (148,477 | ) | |||||||||||||||
| (a) | Comprised of a proprietary basket of securities. The underlying components of the basket as of December 31, 2023 are shown in the Schedule of Investments. |
The accompanying notes are an integral part of these financial statements.
15
Milliman - Capital Group Hedged U.S. Income and Growth Fund
Schedule of Investments (Concluded)
December 31, 2023
The following is a summary of the fair valuations according to the inputs used as of December 31, 2023 in valuing the Fund’s assets and liabilities (see Note 2 in Notes to Financial Statements):
| Level 1 | Level 2 | Level 3 | Total | |||||||||||||
| Assets | ||||||||||||||||
| Common Stocks | $ | 3,277,540 | $ | – | $ | – | $ | 3,277,540 | ||||||||
| Purchased Options | – | 3,242 | – | 3,242 | ||||||||||||
| Total Assets | $ | 3,277,540 | $ | 3,242 | $ | – | $ | 3,280,782 | ||||||||
| Liabilities | ||||||||||||||||
| Options Written | $ | – | $ | 148,477 | $ | – | $ | 148,477 | ||||||||
| Total Liabilities | $ | – | $ | 148,477 | $ | – | $ | 148,477 | ||||||||
Portfolio Holdings Summary
| % of Net | ||||
| Asset Type | Assets | |||
| Common Stocks | 103.18 | % | ||
| Purchased Options | 0.10 | |||
| Total Investments | 103.28 | |||
| Written Options | (4.67 | ) | ||
| Assets in Excess of Other Liabilities | 1.39 | |||
| Net Assets | 100.00 | % | ||
The accompanying notes are an integral part of these financial statements.
16
Milliman Variable Insurance Trust
Statements of Assets and Liabilities
December 31, 2023
Milliman - Capital Group Hedged U.S. Growth Fund | Milliman - Capital Group Hedged U.S. Income and Growth Fund | ||||||||
| Assets: | |||||||||
| Investments, at value (a) | $ | 3,444,726 | $ | 3,280,782 | |||||
| Cash and cash equivalents | 69,965 | 73,791 | |||||||
| Dividends and interest receivable | 2,474 | 3,350 | |||||||
| Due from Advisor, net | 13,340 | 13,131 | |||||||
| Deferred offering costs | 4,511 | 4,502 | |||||||
| Total Assets | 3,535,016 | 3,375,556 | |||||||
| Liabilities: | |||||||||
| Options written, at value (b) | 204,203 | 148,477 | |||||||
| Distribution fees payable | 1,987 | 1,937 | |||||||
| Payable to Trustees | 2,103 | 2,085 | |||||||
| Professional fees payable | 25,028 | 24,989 | |||||||
| Other liabilities | 21,772 | 21,501 | |||||||
| Total Liabilities | 255,093 | 198,989 | |||||||
| Commitments and Contingencies (Note 5) | — | — | |||||||
| Net Assets | $ | 3,279,923 | $ | 3,176,567 | |||||
| Net Assets Consist of: | |||||||||
| Paid-in capital | $ | 2,998,306 | $ | 3,036,593 | |||||
| Total distributable earnings/(accumulated deficit) | 281,617 | 139,974 | |||||||
| Net Assets | $ | 3,279,923 | $ | 3,176,567 | |||||
| Class 3 | |||||||||
| Net assets | $ | 3,279,923 | $ | 3,176,567 | |||||
| Shares of beneficial interest outstanding (unlimited shares authorized with par value of $0.001 per share) | 300,001 | 303,527 | |||||||
| Net asset value, offering price and redemption price per share | $ | 10.93 | $ | 10.47 | |||||
| (a) | Cost of investments | $ | 2,968,859 | $ | 2,893,692 | ||||
| (b) | Premiums received | 43,400 | 24,381 | ||||||
The accompanying notes are an integral part of these financial statements.
17
Milliman Variable Insurance Trust
Milliman - Capital Group Hedged U.S. Growth Fund | Milliman - Capital Group Hedged U.S. Income and Growth Fund | |||||||
Period February 10, 2023(a) to December 31, 2023 | �� | Period February 10, 2023(a) to December 31, 2023 | ||||||
| Investment Income: | ||||||||
| Dividends | $ | 27,488 | $ | 63,493 | ||||
| Interest | 1,717 | 2,015 | ||||||
| Total Investment Income | 29,205 | 65,508 | ||||||
| Expenses: | ||||||||
| Investment advisory fees | 20,994 | 20,433 | ||||||
| Accounting and administration fees | 50,980 | 50,377 | ||||||
| Custody fees | 4,343 | 2,833 | ||||||
| Transfer agent fees | 5,353 | 5,346 | ||||||
| Distribution service fees | 6,816 | 6,634 | ||||||
| Professional fees and expenses | 32,797 | 32,652 | ||||||
| Trustees fees and expenses | 2,845 | 2,846 | ||||||
| Organizational costs | 3,573 | 3,573 | ||||||
| Offering costs | 35,653 | 35,652 | ||||||
| Other expenses | 6,778 | 6,778 | ||||||
| Total Expenses | 170,132 | 167,124 | ||||||
| Waivers/expense reimbursement by Advisor | (140,414 | ) | (138,199 | ) | ||||
| Net Expenses | 29,718 | 28,925 | ||||||
| Net Investment Income/(Loss) | (513 | ) | 36,583 | |||||
| Realized and Unrealized Gain/(Loss): | ||||||||
| Net realized gain/(loss) on: | ||||||||
| Investments | (85,416 | ) | (98,705 | ) | ||||
| Options written | 51,969 | (24,315 | ) | |||||
| Net realized gain/(loss) | (33,447 | ) | (123,020 | ) | ||||
| Net change in unrealized appreciation/(depreciation) on: | ||||||||
| Investments | 475,867 | 387,090 | ||||||
| Options written | (160,803 | ) | (124,096 | ) | ||||
| Net change in unrealized appreciation/(depreciation) | 315,064 | 262,994 | ||||||
| Net realized and unrealized gain/(loss) | 281,617 | 139,974 | ||||||
| Net Increase/(Decrease) in Net Assets From Operations | $ | 281,104 | $ | 176,557 | ||||
(a) Commencement of operations
The accompanying notes are an integral part of these financial statements.
18
Milliman Variable Insurance Trust
Statements of Changes in Net Assets
Milliman - Capital Group Hedged U.S. Growth Fund | Milliman - Capital Group Hedged U.S. Income and Growth Fund | |||||||
Period February 10, 2023(a) to | Period February 10, 2023(a) to | |||||||
| December 31, | December 31, | |||||||
| 2023 | 2023 | |||||||
| Operations: | ||||||||
| Net Investment income/(loss) | $ | (513 | ) | $ | 36,583 | |||
| Net realized gain/(loss) | (33,447 | ) | (123,020 | ) | ||||
| Net change in unrealized appreciation/(depreciation) | 315,064 | 262,994 | ||||||
| Net Increase/(Decrease) in Net Assets Resulting from Operations | 281,104 | 176,557 | ||||||
| Distributions to Shareholders: | ||||||||
| Distributions to shareholders | – | (36,583 | ) | |||||
| Tax return of capital to shareholders | – | (196 | ) | |||||
| Total distributions to shareholders | – | (36,779 | ) | |||||
| Capital Share Transactions:(b) | ||||||||
| Proceeds from shares sold | 3,053,804 | 3,000,010 | ||||||
| Reinvestments | – | 36,779 | ||||||
| Cost of shares redeemed | (54,985 | ) | – | |||||
| Net Increase/(Decrease) in Net Assets from Capital Share Transactions | 2,998,819 | 3,036,789 | ||||||
| Total Increase/(Decrease) in Net Assets | 3,279,923 | 3,176,567 | ||||||
| Net Assets: | ||||||||
| Beginning of the period | – | – | ||||||
| End of the period | $ | 3,279,923 | $ | 3,176,567 | ||||
| Change in Shares Outstanding:(b) | ||||||||
| Shares sold | 305,223 | 300,001 | ||||||
| Shares reinvested | – | 3,526 | ||||||
| Shares redeemed | (5,222 | ) | – | |||||
| Net Increase/(Decrease) | 300,001 | 303,527 | ||||||
| (a) | Commencement of Operations |
| (b) | Class 3 |
The accompanying notes are an integral part of these financial statements.
19
Milliman Variable Insurance Trust
| Per Share Operating Performance (for a share outstanding throughout each period) | Ratios/Supplemental Data: | |||||||||||||||||||||||||||||||||||||
| Investment Operations: | Distributions: | Ratio to Average Net Assets of: (a) | ||||||||||||||||||||||||||||||||||||
| Net Asset Value, Beginning of Period | Net investment income/ (loss) (b) | Net realized and unrealized gain/(loss) | Total From Investment Operations | From net investment income | Total Distributions | Net Asset Value, End of Period | Total return (c) | Net assets, end of period (000) | Expenses, gross | Expenses, net (d) | Net investment income/ (loss) | Portfolio turnover rate (e) | ||||||||||||||||||||||||||
| Milliman - Capital Group Hedged U.S. Growth Fund | ||||||||||||||||||||||||||||||||||||||
| For the period 2/10/23 (f) - 12/31/23 | $ | 10.00 | (0.00 | )(g) | 0.93 | 0.93 | – | – | $ | 10.93 | 9.30 | % | $ | 3,280 | 6.24 | % | 1.09 | % | (0.02 | )% | 32 | % | ||||||||||||||||
| Milliman - Capital Group Hedged U.S. Income and Growth Fund | ||||||||||||||||||||||||||||||||||||||
| For the period 2/10/23 (f) - 12/31/23 | $ | 10.00 | 0.12 | 0.47 | 0.59 | (0.12 | ) | (0.12 | )(h) | $ | 10.47 | 5.93 | % | $ | 3,177 | 6.30 | % | 1.09 | % | 1.38 | % | 22 | % | |||||||||||||||
| (a) | Annualized for periods less than one year. |
| (b) | Net investment income/(loss) per share has been calculated based on average shares outstanding during the period. |
| (c) | Total return is based on the change in net asset value of a share during the period, assumes reinvestment of dividends and distributions at net asset value and is not annualized for periods less than one year. Total return reflects waivers/reimbursements by the manager. Performance would have been lower had the waivers/reimbursements not been in effect. Total return does not include fees, charges, or expenses imposed by the variable annuity and life insurance contracts for which the Funds serve as an underlying investment vehicle. If total return had taken these into account, performance would have been lower. |
| (d) | Net expenses reflect fee waivers and expense reimbursements by the Advisor. |
| (e) | Not annualized for periods less than one year. |
| (f) | Commencement of operations. |
| (g) | Amount represents less than $0.005 per share. |
| (h) | A portion of total distributions amounting to less than $0.005 per share is return of capital. |
The accompanying notes are an integral part of these financial statements.
20
Milliman Variable Insurance Trust
December 31, 2023
1. ORGANIZATION
Milliman Variable Insurance Trust (the “Trust”) was organized under the laws of the state of Delaware as a Delaware statutory trust on November 2, 2020, and is registered with the U.S. Securities and Exchange Commission (“SEC”) under the Investment Company Act of 1940, as amended (the “1940 Act”), as an open-end management investment company. As of December 31, 2023, the Trust consisted of 3 operational series, two of which are presented herein (each, a “Fund” and together, the “Funds”). The remaining series is presented in a separate report. Each of the Funds is classified as non-diversified under the 1940 Act. Each Fund offers shares only to insurance company separate accounts funding variable annuity contracts and variable life insurance policies and other qualified investors. All shares of the Funds have equal rights and privileges. As of December 31, 2023, only Class 3 shares were offered, which have no front-end sales load, deferred sales charge, or redemption fee.
The Funds and their respective commencement dates are as follows:
| Commencement of | ||
| Name | Operations | |
| Milliman - Capital Group Hedged U.S. Growth Fund | February 10, 2023 | |
| Milliman - Capital Group Hedged U.S. Income and Growth Fund | February 10, 2023 |
The Milliman - Capital Group Hedged U.S. Growth Fund’s investment objective is to provide long-term growth of capital, while also seeking to provide a hedge against downside equity exposure.
The Milliman - Capital Group Hedged U.S. Income and Growth Fund's investment objective is to produce income and provide long-term growth of capital, while also seeking to provide a hedge against downside equity exposure.
Each Fund seeks to achieve its investment objective by primarily investing its assets in a combination of common stocks (to provide long equity exposure) and derivatives (to create a hedge against the Fund’s downside equity exposure).
2. SIGNIFICANT ACCOUNTING POLICIES
The following is a summary of significant accounting policies consistently followed by each Fund in the preparation of its financial statements. These policies are in conformity with U.S. generally accepted accounting principles (“GAAP”). The Trust is an investment company and follows accounting and reporting guidance under Financial Accounting Standards Board (“FASB”) Accounting Standards Codification (“ASC”) Topic 946, Financial Services – Investment Companies.
Use of Estimates
The preparation of financial statements in conformity with GAAP requires management to make estimates and assumptions that affect the reported amount of assets and liabilities and disclosure of contingent assets and liabilities, as well as reported amounts of increases and decreases in net assets from operations during the reporting period. Actual results could differ from those estimates.
Computation of Net Asset Value
The net asset values (“NAV”) of the Funds are determined as of the close of regular trading on the New York Stock Exchange (“NYSE”) (generally 4:00 p.m. ET) on each business day the NYSE is open for regular trading. If the NYSE closes early on a valuation day, the Funds shall determine NAV as of that time.
The Board of Trustees of the Trust (the “Board”) has adopted Pricing and Valuation Procedures (“Valuation Procedures”) to be used for valuing all securities and other assets held by the Funds, including those for which market quotations are not readily available or are deemed not be reliable. The Board has designated Milliman Financial Risk Management LLC (“Milliman”) as the valuation designee, which has established a pricing committee comprised of representatives of Milliman (the “Pricing Committee”) to provide input to Milliman in making fair value determinations in accordance with the Valuation Procedures.
Equity securities, including shares of exchange-traded Funds (“ETFs”), listed on any national or foreign exchange (excluding
21
Milliman Variable Insurance Trust
Notes to Financial Statements
December 31, 2023
the Nasdaq National Market (“Nasdaq”) and the London Stock Exchange Alternative Investment Market (“AIM”)) will be valued at the last sale price on the exchange on which they are principally traded, or, for Nasdaq and AIM securities, the official closing price. Securities traded on more than one securities exchange are valued at the last sale price or official closing price, as applicable, at the close of the exchange representing the principal market for such securities.
Exchange-traded options, including FLexible EXchange® Options (“FLEX Options”), are valued at a market-based price provided by the exchange on which the options contract is traded at the official close of that exchange’s trading date. If the exchange on which the options contract is traded is unable to provide a market price, exchange-traded options prices will be provided by a model-pricing provider. Over-the-counter options (“OTC Options”), including certain binary options, are valued at the mean of the most recent bid and asked price, if available, or otherwise at their closing bid price. Otherwise, the value of an options contract will be determined by the Pricing Committee in accordance with the Valuation Procedures.
Fixed income securities will generally be valued using a third-party pricing service vendor (a “Pricing Service”). Fixed income securities having a remaining maturity of 60 days or less when purchased will be valued at cost adjusted for amortization of premiums and accretion of discounts, provided the Pricing Committee has determined that the use of amortized cost is an appropriate reflection of fair value given market and issuer specific conditions existing at the time of the determination.
Open-end investment companies, with the exception of ETFs, are valued at their respective NAVs.
The Funds’ accounting agent may obtain all market quotations used in valuing securities from a Pricing Service. If no quotation can be obtained from a Pricing Service, then the Funds’ accounting agent will contact the Pricing Committee. The Pricing Committee will then attempt to obtain one or more broker quotes for the security or other asset daily and will value the security or other asset accordingly. If no quotation is available from either a Pricing Service, or one or more brokers, or if the Pricing Committee has reason to question the reliability or accuracy of a quotation supplied or the use of amortized cost, the value of any portfolio security or other asset held by a Fund for which reliable market quotations are not readily available will be determined by Milliman in a manner that most appropriately reflects fair market value of the security or other asset on the valuation date.
The Trust follows the authoritative guidance (GAAP) for fair value measurements, which established a framework for measuring fair value and a hierarchy for inputs and techniques used in measuring fair value that maximizes the use of observable inputs and minimizes the use of unobservable inputs and techniques by requiring that the most observable inputs be used when available. The guidance established three tiers of inputs that may be used to measure fair value as follows:
| Level 1 - | Unadjusted quoted prices in active markets for identical assets or liabilities that the Funds have the ability to access. |
| Level 2 - | Observable inputs other than quoted prices included in Level 1 that are observable for the asset or liability, either directly or indirectly. These inputs may include quoted prices for the identical instrument on an inactive market, prices for similar instruments, interest rates, prepayment speeds, credit risk, yield curves, default rates and similar data. |
| Level 3 - | Unobservable inputs for the asset or liability, to the extent relevant observable inputs are not available, representing the Funds’ own assumptions about the assumptions a market participant would use in valuing the asset or liability, and would be based on the best information available. |
The inputs used to value the Funds’ investments at December 31, 2023, are summarized at the end of each Fund’s Schedule of Investments. The inputs or techniques used for valuing securities are not necessarily an indication of the risk associated with investing in those securities.
22
Milliman Variable Insurance Trust
Notes to Financial Statements
December 31, 2023
Cash and Cash Equivalents
Cash and cash equivalents include amounts held in interest-bearing demand deposit accounts with the Funds’ custodian.
Organizational and Offering Costs
Organizational and offering costs directly attributable to a series of the Trust are charged to that series, such as certain registration fees, while expenses which are attributable to more than one series are allocated among the respective series on a pro rata basis.
Organizational costs are expensed as incurred and include costs of forming the Funds and servicing agreements. Offering costs are recorded as a deferred asset and are amortized on a straight-line basis for a period of twelve months upon commencement of operations of each Fund. Offering costs include legal fees pertaining to the preparation, review and filing of each Fund’s initial registration statement with the SEC, and printing, mailing or other distribution charges related to each Fund’s prospectus and statement of additional information. Organizational costs and offering costs are subject to the Funds' Expense Limitation Agreement (See Note 5).
Investment Transactions, Investment Income and Expenses
Investment transactions are accounted for on a trade date basis for financial reporting purposes. Realized gains and losses from investment transactions are recorded on an identified cost basis. Dividend income, if any, is recognized on the ex-dividend date. Interest income, including accretion of discounts and amortization of premiums, is recognized on an accrual basis using the effective yield method.
Expenses are accrued daily. Expenses of the Trust, which are directly identifiable to a specific series, are applied to that series. Expenses which are not identifiable to a specific series are allocated in such a manner as deemed equitable, taking into consideration the nature and type of expense.
Distributions to Shareholders
Distributions to shareholders are recorded on the ex-dividend date. The Funds intend to pay out dividends from their net investment income, if any, annually. Distributions of net realized capital gains, if any, will be declared and paid at least annually by the Funds. The Funds may periodically make reclassifications among certain of its capital accounts as a result of the recognition and characterization of certain income and capital gain distributions determined annually in accordance with federal tax regulations which may differ from GAAP. Distributions that exceed earnings and profits for tax purposes are reported as a return of capital.
3. DERIVATIVES
Disclosures about derivative instruments are intended to improve financial reporting for derivative instruments by enabling investors to understand how and why an entity uses derivatives, how derivatives are accounted for, and how derivative instruments affect an entity’s results of operations and financial position.
In seeking to create a hedge against a Fund’s downside equity exposure, Milliman primarily intends to purchase and sell either OTC options and/or FLEX Options on common stocks and/or indices or ETFs representing those common stocks. OTC options are traded and privately negotiated in the OTC market and are subject to counterparty risk of the writer of the options contract. Many counterparties to OTC options are financial institutions, such as banks and broker-dealers, and their creditworthiness (and ability to pay or perform) may be negatively impacted by factors affecting financial institutions generally. FLEX Options are options contracts that trade on an exchange but provide an investor with the ability to customize key contract terms like strike price, style and expiration date, while achieving price discovery (i.e., determining market prices) in competitive, transparent auctions markets and avoiding the counterparty exposure of OTC options positions. Like traditional exchange-traded options, FLEX Options are guaranteed for settlement by the OCC, a market clearinghouse that guarantees performance by counterparties to certain derivatives contracts. Milliman is not restricted in its use of OTC or exchange-traded options and may use either type to achieve the Funds’ principal investment strategies.
23
Milliman Variable Insurance Trust
Notes to Financial Statements
December 31, 2023
The Funds will purchase and sell call and put options. In general, put options give the holder (i.e., the buyer) the right to sell an asset (or deliver the cash value of the underlying asset) and the seller (i.e., the writer) of the put has the obligation to buy the asset (or receive cash value of the underlying asset) at a certain defined price. Call options give the holder (i.e., the buyer) the right to buy an asset (or receive cash value of the underlying asset) and the seller (i.e., the writer) the obligation to sell the asset (or deliver cash value of the underlying asset) at a certain defined price.
When a Fund purchases an option, an amount equal to the premium paid by the Fund is recorded as an investment and is subsequently adjusted to the current value of the option purchased. If an option expires on the stipulated expiration date or if the Fund enters into a closing sale transaction, a gain or loss is realized. If a call option is exercised, the cost of the security acquired is increased by the premium paid for the call or, if cash-settled, a gain or loss is realized. If a put option is exercised, a gain or loss is realized from the sale of the underlying security, or the transfer of the relative cash amount if cash-settled, and the proceeds are decreased by the premium originally paid.
When a Fund writes an option, an amount equal to the premium received by the Fund is recorded as a liability and is subsequently adjusted to the current value of the option written. Premiums received from writing options that expire unexercised are treated by the Fund on the expiration date as realized gain from written options. The difference between the premium and the amount paid on effecting a closing purchase transaction, including brokerage commissions, is also treated as a realized gain, or if the premium is less than the amount paid for the closing purchase transaction, as a realized loss. If a call option written by the Fund is exercised, the premium received is added to the proceeds from the sale of the underlying security, or the transfer of the relevant cash amount if cash-settled, in determining whether the Fund has a realized a gain or loss. If a put option written by the Fund is exercised, the premium received reduces the cost basis of the securities purchased by the Fund if physical delivery is required, or the corresponding cash amount if cash-settled. The Fund, as a writer of an option, bears the market risk of an unfavorable change in the price of the asset underlying the written option. Risk of loss on written options may exceed amounts recognized on the Statements of Assets and Liabilities.
The following tables summarize derivatives held by the Fund and their impact on the Funds’ results of operations.
The location and value of derivative instruments on the Statements of Assets and Liabilities as December 31, 2023, was as follows:
| Location | Equity Risk | Total | ||||||||
| Milliman - Capital Group Hedged U.S. Growth Fund | ||||||||||
| Assets - Purchased options | Investments, at value | $ | 1,699 | $ | 1,699 | |||||
| Liabilities - Written options | Options written, at value | $ | 204,203 | $ | 204,203 | |||||
| Milliman - Capital Group Hedged U.S. Income and Growth Fund | ||||||||||
| Assets - Purchased options | Investments, at value | $ | 3,242 | $ | 3,242 | |||||
| Liabilities - Written options | Options written, at value | $ | 148,477 | $ | 148,477 | |||||
24
Milliman Variable Insurance Trust
Notes to Financial Statements
December 31, 2023
The location and effect of derivative instruments on the Statements of Operations for the period ended December 31, 2023 was as follows:
| Realized Gain/(Loss) on Derivatives Recognized in Income | ||||||||||
| Milliman - Capital Group Hedged U.S. Growth Fund | Location | Equity Risk | Total | |||||||
| Purchased options | Investments | $ | (178,068 | ) | $ | (178,068 | ) | |||
| Written options | Written Options | 51,969 | 51,969 | |||||||
| $ | (126,099 | ) | $ | (126,099 | ) | |||||
| Milliman - Capital Group Hedged U.S. Income and Growth Fund | ||||||||||
| Purchased options | Investments | $ | (118,529 | ) | $ | (118,529 | ) | |||
| Written options | Written Options | (24,315 | ) | (24,315 | ) | |||||
| $ | (142,844 | ) | $ | (142,844 | ) | |||||
| Change in Unrealized Appreciation/(Depreciation) on Derivatives Recognized in Income | ||||||||||
| Milliman - Capital Group Hedged U.S. Growth Fund | Location | Equity Risk | Total | |||||||
| Purchased options | Investments | $ | (41,701 | ) | $ | (41,701 | ) | |||
| Written options | Written Options | (160,803 | ) | (160,803 | ) | |||||
| $ | (202,504 | ) | $ | (202,504 | ) | |||||
| Milliman - Capital Group Hedged U.S. Income and Growth Fund | ||||||||||
| Purchased options | Investments | $ | (21,140 | ) | $ | (21,140 | ) | |||
| Written options | Written Options | (124,096 | ) | (124,096 | ) | |||||
| $ | (145,236 | ) | $ | (145,236 | ) | |||||
The notional amounts of derivative instruments outstanding relative to each Fund’s net assets as of period end and the amounts of net realized gain (loss) and net change in unrealized appreciation (depreciation) on financial derivative instruments during the period, as disclosed in the Schedules of Investments, serve as indicators of the volume of financial derivative activity for the Funds.
Because OTC options are not guaranteed for settlement by a clearing broker, they are generally considered to have greater counterparty risk than exchange-traded options, such as FLEX Options, which are issued and guaranteed for settlement by the Options Clearing Corporation (“OCC”) and their clearing houses (“clearing members”) rather than a bank or a broker. To the extent the Fund uses FLEX Options, although clearing members guarantee performance of their clients’ obligations to the clearing house, there is a risk that the assets of the Fund might not be fully protected in the event of the clearing member’s bankruptcy, as the Fund would be limited to recovering only a pro rata share of all available funds segregated on behalf of the clearing member’s customers for the relevant account class. The use of certain derivatives involves leverage, which can cause the Fund’s portfolio to be more volatile than if the portfolio had not been leveraged. Leverage can significantly magnify the effect of price movements of the reference asset, disproportionately increasing the Fund’s losses and reducing the Fund’s opportunities for gains when the reference asset changes in unexpected ways. In some instances, such leverage could result in losses that exceed the original amount invested.
In order to better define its contractual rights and to secure rights to help the Funds mitigate their counterparty risk, the Funds may enter into International Swaps and Derivatives Association, Inc. Master Agreements (“ISDA Master Agreements”) or similar agreement with derivative contract counterparties. An ISDA Master Agreement is a bilateral agreement between the Fund and a counterparty that governs over-the-counter derivatives and foreign currency exchange contracts and typically contains, among other things, collateral posting items and netting provisions in the event of a default or termination event. Under an ISDA Master Agreement, the Fund may, under certain circumstances, offset with the counterparty certain derivative financial instrument payables and/or receivables with collateral held and/or posted and create one single net payment. The provisions of an ISDA Master Agreement typically permit a single net payment in the event of default (close-out) netting including the bankruptcy or insolvency of the counterparty. However, bankruptcy
25
Milliman Variable Insurance Trust
Notes to Financial Statements
December 31, 2023
or insolvency laws of a particular jurisdiction may impose restrictions on or prohibitions against the right of offset in bankruptcy, insolvency or other events.
For financial reporting purposes, the Funds do not offset derivative assets and derivative liabilities that are subject to netting arrangements in the Statements of Assets and Liabilities.
At December 31, 2023, derivative assets and liabilities subject to offsetting provisions were as follows:
Milliman - Capital Group Hedged U.S. Growth Fund
| Counterparty | Gross Value of Derivative Assets | Derivatives Available for Offset(1) | Non-Cash Collateral Received(1) | Cash Collateral Received(1) | Net Exposure of Derivative Assets(2) | ||||||||||||||||
| Bank of America | $ | 1,699 | $ | (1,699 | ) | $ | - | $ | - | $ | - | ||||||||||
| Counterparty | Gross Value of Derivative Liabilities | Derivatives Available for Offset(1) | Non-Cash Collateral Received(1) | Cash Collateral Received(1) | Net Exposure of Derivative Liabilities(2) | ||||||||||||||||
| Bank of America | $ | 204,203 | $ | (1,699 | ) | $ | - | $ | - | $ | 202,504 | ||||||||||
Milliman - Capital Group Hedged U.S. Income and Growth Fund
| Counterparty | Gross Value of Derivative Assets | Derivatives Available for Offset(1) | Non-Cash Collateral Received(1) | Cash Collateral Received(1) | Net Exposure of Derivative Assets(2) | ||||||||||||||||
| Bank of America | $ | 3,242 | $ | (3,242 | ) | $ | - | $ | - | $ | - | ||||||||||
| Counterparty | Gross Value of Derivative Liabilities | Derivatives Available for Offset(1) | Non-Cash Collateral Received(1) | Cash Collateral Received(1) | Net Exposure of Derivative Liabilities(2) | ||||||||||||||||
| Bank of America | $ | 148,477 | $ | (3,242 | ) | $ | - | $ | - | $ | 145,235 | ||||||||||
| (1) | Excess of collateral is not shown for financial reporting purposes. |
| (2) | Net exposure represents the receivable due from or payable due to the counterparty in the event of default. |
4. FEDERAL TAXES INFORMATION
No provision for federal income taxes has been made, as it is each Fund’s policy to comply with the Subchapter M provision of the Internal Revenue Code of 1986, as amended, and to distribute to shareholders each year, all of its taxable income and realized gains.
Each Fund files U.S. federal, state, and local tax returns as required. The Fund’s tax returns are subject to examination by the relevant tax authorities until expiration of the applicable statute of limitations, which is generally three years after the tax returns are filed. The Funds recognize interest and penalties, if any, related to unrecognized tax benefits as income tax expense on the Statements of Operations. The Funds do not have any unrecognized tax benefits or uncertain tax positions that would require a provision for income tax. Accordingly, the Funds did not incur any interest or penalties for the period ended December 31, 2023.
For financial reporting purposes, any permanent differences resulting from different book and tax treatment are reclassified between distributable earnings and paid-in capital in the period that the differences arise. These differences are primarily due to net operating losses. Results of operations and net assets are not affected by these reclassifications. As of December 31, 2023, the following reclassifications were made on the applicable Funds’ Statements of Assets and Liabilities for permanent differences:
26
Milliman Variable Insurance Trust
Notes to Financial Statements
December 31, 2023
Distributable Earnings/ (Accumulated Deficit) | Paid-In Capital | |||||||
| Milliman - Capital Group Hedged U.S. Growth Fund | $ | 513 | $ | (513 | ) | |||
At December 31, 2023, the cost of investments, including derivatives, and unrealized appreciation/(depreciation) for federal income tax purposes for each Fund were as follows:
Cost of Investments | Gross Unrealized Appreciation | Gross Unrealized Depreciation | Net Unrealized Appreciation/ (Depreciation) | |||||||||||||
| Milliman - Capital Group Hedged U.S. Growth Fund | $ | 2,925,459 | $ | 642,842 | $ | (327,778 | ) | $ | 315,064 | |||||||
| Milliman - Capital Group Hedged U.S. Income and Growth Fund | 2,869,311 | 484,556 | (221,562 | ) | 262,994 | |||||||||||
For the period ended December 31, 2023, the tax character of distributions by the applicable Funds, was as follows:
| Distributions paid from: | ||||||||||||||||
Ordinary Income | Long-Term Capital Gains | Net Return of Capital | Total Distributions Paid | |||||||||||||
| Milliman - Capital Group Hedged U.S. Income and Growth Fund | $ | 36,583 | – | $ | 196 | $ | 36,779 | |||||||||
As of December 31, 2023, the components of distributable earnings/(accumulated deficit) on a tax basis were as follows:
Undistributed Ordinary Income | Undistributed Long-Term Capital Gains | Capital Loss Carryforwards | Other Loss Deferrals | Net Unrealized Appreciation/ (Depreciation) | Total Distributable Earnings/ (Accumulated Deficit) | |||||||||||||||||||
| Milliman - Capital Group Hedged U.S. Growth Fund | $ | – | $ | – | $ | (33,447 | ) | $ | – | $ | 315,064 | $ | 281,617 | |||||||||||
| Milliman - Capital Group Hedged U.S. Income and | ||||||||||||||||||||||||
| Growth Fund | – | – | (123,020 | ) | – | 262,994 | 139,974 | |||||||||||||||||
Capital loss carryforwards represent realized losses that may be carried forward for an unlimited period and applied against future capital gains for U.S. federal income tax purposes. Such capital loss carryforwards will retain their character as either short-term or long-term capital losses. As of December 31, 2023, the tax character of the applicable Funds’ capital loss carryforwards was as follows:
| Short-Term | Long-Term | Total Capital Loss Carryforwards | ||||||||||
| Milliman - Capital Group Hedged U.S. Growth Fund | $ | (33,447 | ) | $ | – | $ | (33,447 | ) | ||||
| Milliman - Capital Group Hedged U.S. Income and Growth Fund | (123,020 | ) | – | (123,020 | ) | |||||||
5. ADVISORY FEES AND OTHER AGREEMENTS
The Trust has an Investment Advisory Agreement with Milliman to furnish investment advisory services to the Funds. Pursuant to the Investment Advisory Agreement, Milliman is entitled to receive, on a monthly basis, an annual advisory fee equal to 0.77% of each Fund's average daily net assets.
Capital International, Inc. (the “Sub-Adviser”) serves as investment sub-adviser to each Fund. Under the Investment Sub-Advisory Agreement (the “Sub-Advisory Agreement”) with Milliman, the Sub-Adviser provides to Milliman a list of
27
Milliman Variable Insurance Trust
Notes to Financial Statements
December 31, 2023
securities that comprise a Fund’s Investable Universe. That list is comprised of a portfolio of securities representing the Sub-Adviser’s recommendations to Milliman as to the common stocks and/or cash or cash equivalents on which Milliman could purchase for a Fund. The Sub-Adviser does not have responsibility for the day-to-day management of the Funds’ portfolios nor review and oversight of the Funds’ investment strategies. Rather, Milliman will make determinations on which common stocks to purchase and derivatives to transact based upon industry weightings, market capitalizations, and other financial characteristics of the common stocks contained in the Investable Universe. Milliman will also make determinations on which common stocks to purchase and derivatives to transact based on Milliman’s evaluation of the market liquidity of those common stocks and derivatives. Pursuant to the terms of the Sub-Advisory Agreement, the Sub-Adviser may remove stocks from, and/or add stocks to, the list, which may result in Milliman selling stocks that have been removed or purchasing stocks that have been added to the list, as well as resetting some of the derivatives positions. For services provided under the Sub-Advisory Agreement, Milliman pays the Sub-Adviser a fee out of the advisory fee Milliman receives from each Fund.
Milliman has contractually agreed to waive advisory fees and/or reimburse expenses to the extent necessary to limit each Fund’s total annual Fund operating expenses (which include any offering and organizational expenses, but exclude taxes, interest, brokerage fees and commissions, Rule 12b-1 fees, acquired fund fees and expenses, short-sale dividend expenses, and extraordinary or non-routine expenses not incurred in the ordinary course of each Fund’s business) to 0.84% of each Fund's average daily net assets (the “Expense Limitation Agreement”) until at least April 29, 2024. During its term, the Expense Limitation Agreement cannot be terminated or amended to increase the applicable limit without approval of the Board. Milliman may recoup from each Fund any advisory fees waived or expenses reimbursed pursuant to the applicable Expense Limitation Agreement for a period of three years from the date on which such waiver or reimbursement occurred; provided, however, that such recoupment shall not be made if it would cause the Fund’s total annual Fund operating expenses to exceed the lesser of (a) the expense limitation in effect at the time of the reimbursement, or (b) the expense limitation in effect at the time of recoupment, if any. No amounts were recouped during the period ended December 31, 2023. As of December 31, 2023, the amounts eligible for recoupment and the year of expiration are as follows:
| Recovery Expiring in: | ||||||||
| 2026 | Total | |||||||
| Milliman - Capital Group Hedged U.S. Growth Fund | $ | 140,414 | $ | 140,414 | ||||
| Milliman - Capital Group Hedged U.S. Income and Growth Fund | 138,199 | 138,199 | ||||||
U.S. Bancorp Fund Services, LLC d/b/a U.S. Bank Global Fund Services, a subsidiary of U.S. Bancorp, serves as each Fund’s fund accountant, administrator, and transfer agent pursuant to certain fund accounting servicing, fund administration servicing and transfer agent servicing agreements. U.S. Bank National Association, a subsidiary of U.S. Bancorp, serves as the Funds’ custodian pursuant to a custody agreement. Foreside Fund Services, LLC (the “Distributor”) serves as the Funds’ distributor pursuant to a distribution agreement.
The Trust has adopted a Distribution Plan under Rule 12b-1 (“Rule 12b-1 Plan”) of the 1940 Act with respect to each Fund’s Class 3 shares. The Rule 12b-1 Plan permits each Fund to pay the Distributor, as the Funds’ principal underwriter, for expenses associated with the distribution of Class 3 shares of the Funds. Under the Rule 12b-1 Plan, the Distributor is paid an annual fee of 0.25% of the average daily net assets of Class 3 shares. All Rule 12b-1 Plan payments received by the Distributor shall be used solely for distribution-related expenses and shall not be retained as profit by the Distributor. Accordingly, no compensation is payable by the Funds to the Distributor for such distribution services. However, Milliman has entered into an agreement with the Distributor under which it makes payments to the Distributor in consideration for its services under the distribution agreement. The payments made by Milliman to the Distributor do not represent an additional expense to the Funds or their shareholders.
Certain employees of Foreside Fund Officer Services, LLC, an affiliate of the Distributor, serve as Treasurer and Principal Financial Officer and Chief Compliance Officer and Anti-Money Laundering Officer to the Trust.
28
Milliman Variable Insurance Trust
Notes to Financial Statements
December 31, 2023
Certain Trustees and Officers of the Trust are also Officers or employees of Milliman, and during their terms of office, receive no compensation from the Funds.
6. INVESTMENT TRANSACTIONS
Purchases and sales of investments, excluding short-term obligations and U.S. Government Securities, for the period ended December 31, 2023, were as follows:
| Purchases | Sales | |||||||
| Milliman - Capital Group Hedged U.S. Growth Fund | $ | 3,839,212 | $ | 1,006,405 | ||||
| Milliman - Capital Group Hedged U.S. Income and Growth Fund | 3,507,953 | 657,899 | ||||||
7. BENEFICIAL OWNERSHIP
The beneficial ownership, either directly or indirectly, of more than 25% of the voting securities of a Fund creates a presumption of control of that Fund, under Section 2(a)(9) of the 1940 Act. As of December 31, 2023, American General Life Insurance Company directly owned 100% of the outstanding shares of each Fund.
8. RISKS
The Funds could lose money over short periods due to short-term market movements and over longer periods during more prolonged market downturns. Assets may decline in value due to factors affecting financial markets generally or particular asset classes or industries represented in the markets. The value of options or other assets may also decline due to general market conditions, economic trends or events that are not specifically related to the issuer of the security or other asset, or due to factors that affect a particular issuer, country, region, market, industry, sector or asset class.
The principal risks of investing in the Funds are described more fully in the Funds’ prospectus.
9. GUARANTEES AND INDEMNIFICATIONS
In the normal course of business, the Funds enter into contracts with service providers that contain general indemnification clauses. The Funds’ maximum exposure under these arrangements is unknown, as this would involve future claims that may be made against the Funds that have not yet occurred.
10. SUBSEQUENT EVENTS
Management has evaluated events and transactions for potential recognition or disclosure through the date the financial statements were issued and has determined that no additional items require recognition or disclosure.
29
Milliman Variable Insurance Trust
Report of Independent Registered Public Accounting Firm
To the Shareholders and Board of Trustees of Milliman Variable Insurance Trust
Opinion on the Financial Statements
We have audited the accompanying statements of assets and liabilities, including the schedules of investments and schedules of options written, of Milliman - Capital Group Hedged U.S. Growth Fund and Milliman - Capital Group Hedged U.S. Income and Growth Fund (the “Funds”), each a series of Milliman Variable Insurance Trust, as of December 31, 2023, and the related statements of operations, the statements of changes in net, the related notes, and the financial highlights for the period from February 10, 2023 (commencement of operations) through December 31, 2023 (collectively referred to as the “financial statements”). In our opinion, the financial statements present fairly, in all material respects, the financial position of each of the Funds as of December 31, 2023, and the results of their operations, the changes in net assets, and the financial highlights for the period from February 10, 2023 (commencement of operations) through December 31, 2023, in conformity with accounting principles generally accepted in the United States of America.
Basis for Opinion
These financial statements are the responsibility of the Funds’ management. Our responsibility is to express an opinion on the Funds’ financial statements based on our audits. We are a public accounting firm registered with the Public Company Accounting Oversight Board (United States) (“PCAOB”) and are required to be independent with respect to the Funds in accordance with the U.S. federal securities laws and the applicable rules and regulations of the Securities and Exchange Commission and the PCAOB.
We conducted our audits in accordance with the standards of the PCAOB. Those standards require that we plan and perform the audit to obtain reasonable assurance about whether the financial statements are free of material misstatement whether due to error or fraud.
Our audits included performing procedures to assess the risks of material misstatement of the financial statements, whether due to error or fraud, and performing procedures that respond to those risks. Such procedures included examining, on a test basis, evidence regarding the amounts and disclosures in the financial statements. Our procedures included confirmation of securities owned as of December 31, 2023, by correspondence with the custodian and broker. Our audits also included evaluating the accounting principles used and significant estimates made by management, as well as evaluating the overall presentation of the financial statements. We believe that our audits provide a reasonable basis for our opinion.
We have served as the auditor for one or more Funds in the Trust since 2021.
COHEN & COMPANY, LTD.
Cleveland, Ohio
February 16, 2024
30
Milliman Variable Insurance Trust
Additional Information (Unaudited)
December 31, 2023
1. INFORMATION ABOUT PROSPECTUS
This report has been prepared for shareholders and may be distributed to others only if preceded or accompanied by a current prospectus. Investors should consider the investment objective and policies, risk considerations, charges and ongoing expenses of an investment carefully before investing. The prospectus contains this and other information relevant to an investment in the respective Fund. Please read the Prospectus carefully before investing. A copy of the Prospectus may be obtained without charge by writing to the Trust’s Distributor, or by calling toll free at 1–855–700–7959 or visiting www.millimanfunds.com.
2. PROXY VOTING POLICIES AND PROCEDURE
The Trust’s Proxy Voting Policies and Procedures are available without charge, upon request, by calling 1–855–700–7959 and on the SEC’s website at www.sec.gov. Information relating to how each Fund voted proxies relating to portfolio securities held during each year ended June 30 is also available on the SEC’S website at www.sec.gov.
3. INFORMATION ABOUT PORTFOLIO SECURITIES
Each Fund’s complete schedule of portfolio holdings for the first and third quarters is filed with the SEC on Part F of Form N-PORT. The Trust’s Part F of Form N-PORT is available without charge, upon request, by calling 1-855-700-7959, or on the SEC’s website at www.sec.gov. The Trust’s Part F of Form N-PORT may be reviewed and copied at the SEC’s Public Reference Room in Washington, DC. Information on the operation of the Public Reference Room may be obtained by calling 1-800-SEC-0330.
31
Milliman Variable Insurance Trust
Trustees and Officers (Unaudited)
December 31, 2023
Name, Address and Year of Birth | Position with the Trust | Length of Time Served | Principal Occupation(s) During Past 5 Years | Number of Portfolios in Fund Complex Overseen by Trustee or Officer | Other Directorships Held by Trustee or Officer in the Past Five Years |
| Independent Trustees(a) | |||||
| Eric Berg 71 South Wacker Drive, 31st Floor, Chicago, IL 60606 (1958) | Trustee | Since July 2021 | Owner of With You in Mind (independent analysis and research firm for insurance, asset management and wealth-management topics) since 2019; Chief Financial Officer of Midwest Holding Inc. (insurance and asset management company) in 2022; Chief Financial Officer of Aviva India from 2018 to 2019; Investment Banker at Macquarie Capital from 2016 to 2018. | 3 | None |
| Nicholas Dalmaso 71 South Wacker Drive, 31st Floor, Chicago, IL 60606 (1965) | Lead Independent Trustee | Since July 2021 | Founder/CEO of Sound Capital Holdings, Sound Capital Distributors (a FINRA registered Broker/Dealer) and Sound Capital Solutions (an Investment Advisor) since 2020; General Counsel of EquityBee Inc. (fintech company) since 2023; General Counsel of M1 Holdings Inc. and M1 Finance LLC (FINRA registered Broker/Dealer) from 2014 to 2021; Chief Compliance Officer of M1 Finance LLC from 2014 to 2019. | 3 | Chair of Destra Capital Management Investment Company Boards (4 portfolios) since 2010; Director of the Flaherty and Crumrine Boards (5 NYSE listed portfolios) since 2024; Independent Director of Keno/Kozie Associates (IT Consulting) from 2016 to 2018. |
| Daniel Ross Hayes 71 South Wacker Drive, 31st Floor, Chicago, IL 60606 (1957) | Trustee | Since July 2021 | Director, Treasurer and Investment Committee Chair of ShoreRivers,Inc. (non-profit clean water advocacy corporation) since 2017. | 3 | None |
| Colleen McKenna-Tucker 71 South Wacker Drive, 31st Floor, Chicago, IL 60606 (1970) | Trustee | Since September 2021 | Executive Director of International Insurance Society (membership organization for the risk and insurance industry) since 2004. | 3 | None |
32
Milliman Variable Insurance Trust
Trustees and Officers (Unaudited)
December 31, 2023
| Interested Trustee & Officer | |||||
| Adam Schenck (b) 71 South Wacker Drive, 31st Floor, Chicago, IL 60606 (1981) | Chair of the Board, President and Interested Trustee | Since November 2020 | Principal Managing Director – Head of Fund Services of Milliman Financial Risk Management LLC since 2005. | 3 | None |
| Officers | |||||
| Arthur W. Jasion 71 South Wacker Drive, 31st Floor, Chicago, IL 60606 (1965) | Treasurer and Principal Financial Officer | Since July 2021 | Senior Principal Consultant and Fund Principal Financial Officer of Foreside Management Services, LLC since 2020; Partner, Ernst & Young LLP from 2012 to 2020. | N/A | N/A |
| Roger Pries 71 South Wacker Drive, 31st Floor, Chicago, IL 60606 (1965) | Chief Compliance Officer and Anti–Money Laundering Officer | Since July 2021 | Fund Chief Compliance Officer of Foreside Fund Officer Services, LLC since 2019; Compliance Officer from 2016 to 2019 and Operational Risk Manager/Vice President from 2007 to 2016 at Citi Fund Services. | N/A | N/A |
| Ehsan Sheikh 71 South Wacker Drive, 31st Floor, Chicago, IL 60606 (1987) | Secretary and Chief Legal Officer | Since July 2021 | Senior Counsel of Milliman Financial Risk Management LLC since 2017, Associate Counsel from 2014 to 2017. | N/A | N/A |
| (a) | The Trustees of the Trust who are not "interested persons", as defined under Section 2(a)(19)of the 1940 Act, of the Trust. |
| (b) | Adam Schenck is an "interested person", as defined by the 1940 Act, of the Trust because of his employment by Milliman. |
The Statement of Additional Information includes additional information about the Trustees and is available upon request, without charge, by calling 1–855–700–7959.
33
INVESTMENT ADVISER
Milliman Financial Risk Management LLC
71 S. Wacker Drive, 31st Floor
Chicago, IL 60606
ADMINISTRATOR, FUND ACCOUNTANT & TRANSFER AGENT
U.S. Bancorp Fund Services, LLC
615 East Michigan Street
Milwaukee, WI 53202
DISTRIBUTOR
Foreside Fund Services, LLC
Three Canal Plaza
Portland, ME 04101
CUSTODIAN
U.S. Bank, N.A.
1555 North RiverCenter Drive, Suite 302
Milwaukee, WI 53212
LEGAL COUNSEL
Stradley Ronon Stevens & Young LLP
191 North Wacker Drive, Suite 1601
Chicago, IL 60606
and
2005 Market Street, Suite 2600
Philadelphia, PA 19103
INDEPENDENT REGISTERED PUBLIC ACCOUNTING FIRM
Cohen & Company, Ltd.
1350 Euclid Avenue, Suite 800
Cleveland, Ohio 44115

Milliman Variable Insurance Trust
Milliman Money Market Fund
Annual Report
December 31, 2023
TABLE OF CONTENTS
Attachment
Goldman Sachs Variable Insurance Trust – Goldman Sachs Government Money Market Fund Annual Report December 31, 2023
Milliman Variable Insurance Trust
Expense Example For the Period Ended
December 31, 2023 (Unaudited)
The Milliman Money Market Fund (the “Fund”) sells its shares to insurance company separate accounts funding variable annuity contracts and variable life insurance policies and other qualified investors. The table below does not include any fees or sales charges imposed by your variable product.
As a Fund shareholder, you incur ongoing costs, including management fees; distribution and/or service (“12b-1”) fees; and other Fund expenses. These Examples are intended to help you understand your ongoing costs (in dollars) of investing in the Fund and to compare these costs with the ongoing costs of investing in other mutual funds.
The Examples are based on an investment of $1,000 invested at the beginning of the period and held for the entire period from July 1, 2023 to December 31, 2023.
Actual Expenses
This section of the following table provides information about actual account values and actual expenses. You may use the information in this table, together with the amount you invested, to estimate the expenses you paid over the period. Simply divide your account value by $1,000 (for example, an $ 8,600 account value divided by $1,000 equals 8.6), then multiply the result by the number in the applicable line under the heading titled “Expenses Paid During the Period” to estimate the expenses you paid on your account during the period.
Hypothetical Example for Comparison Purposes
This section of the following table provides information about hypothetical account values and hypothetical expenses based on the Fund’s actual expense ratio and an assumed rate of return of 5% per year before expenses, which is not the Fund’s actual return. The hypothetical account values and expenses may not be used to estimate the actual ending account balance or expenses you paid for the period. You may use this information to compare the ongoing costs of investing in the Fund with other funds. To do so, compare this 5% hypothetical example with the 5% hypothetical examples that appear in the shareholder reports of other funds.
Please note that the expenses shown in the table are meant to highlight your ongoing costs only. The Fund does not charge transaction fees, such as sales charges (loads), redemption fees, or exchange fees. Therefore, the table below is useful in comparing the ongoing costs only and will not help you determine the relative total costs of owning different funds. The Fund’s expenses shown in the table reflect fee waivers and reimbursements in effect.
| Beginning Account Value | Ending Account Value | Annualized Expense Ratio* | Expenses Paid During the Period(a) | |
| Milliman Money Market Fund# | ||||
| Actual | $1,000.00 | $1,026.30 | 0.43% | $2.20 |
| Hypothetical (assuming a 5% return before expenses) | $1,000.00 | $1,023.04 | 0.43% | $2.19 |
| # | Class 3 shares |
| * | Expense ratio reflects the aggregate expenses of the Fund and the Master Fund in which the Fund invests. |
| (a) | Expenses are equal to the Fund’s annualized net expense ratio, multiplied by the average account value over the period, multiplied by 184/365 (to reflect the six-month period). |
1
Milliman Money Market Fund
December 31, 2023
| Shares | Value | |||||||
| INVESTMENT COMPANIES - 99.55% | ||||||||
| Goldman Sachs Variable Insurance Trust - Goldman Sachs Government Money Market Fund, Institutional Shares, 5.28% (a)(b) | 346,457 | $ | 346,457 | |||||
| TOTAL INVESTMENT COMPANIES (Cost $346,457) | 346,457 | |||||||
| Total Investments (Cost $346,457) - 99.55% | 346,457 | |||||||
| Assets in Excess of Other Liabilities - 0.45% | 1,564 | |||||||
| TOTAL NET ASSETS - 100.00% | $ | 348,021 | ||||||
Percentages are stated as a percent of net assets.
| (a) | 7-day net yield |
| (b) | The Milliman Money Market Fund (the “Fund”) pursues its investment objective by investing all of its investable assets in Institutional Shares of the Goldman Sachs Government Money Market Fund (the “Portfolio”), a series of the Goldman Sachs Variable Insurance Trust (see Note 1 in Notes to Financial Statements). |
The accompanying notes are an integral part of these financial statements.
2
Milliman Variable Insurance Trust
Statement of Assets and Liabilities
December 31, 2023
| Milliman Money Market Fund | ||||
| Assets: | ||||
| Investment in Portfolio (cost $346,457) | $ | 346,457 | ||
| Cash | 18,183 | |||
| Dividends receivable | 1,469 | |||
| Due from Advisor, net | 25,720 | |||
| Total Assets | 391,829 | |||
| Liabilities: | ||||
| Payable for fund shares redeemed | 163 | |||
| Distribution fees payable | 175 | |||
| Payable to Trustees | 2,029 | |||
| Professional fees payable | 22,631 | |||
| Other liabilities | 18,810 | |||
| Total Liabilities | 43,808 | |||
| Net Assets | $ | 348,021 | ||
| Net Assets Consist of: | ||||
| Paid-in capital | $ | 348,012 | ||
| Total distributable earnings/(accumulated deficit) | 9 | |||
| Net Assets | $ | 348,021 | ||
| Class 3 | ||||
| Net assets | $ | 348,021 | ||
| Shares of beneficial interest outstanding (unlimited shares authorized with par value of $0.001 per share) | 348,012 | |||
| Net asset value, offering price and redemption price per share | $ | 1.00 | ||
The accompanying notes are an integral part of these financial statements.
3
Milliman Variable Insurance Trust
| Milliman Money Market Fund | ||||
| Year Ended December 31, 2023 | ||||
| Investment Income: | ||||
| Dividends from Portfolio | $ | 13,411 | ||
| Interest | 828 | |||
| Total Investment Income | 14,239 | |||
| Expenses: | ||||
| Investment advisory fees | 80 | |||
| Accounting and administration fees | 54,459 | |||
| Custody fees | 662 | |||
| Transfer agent fees | 6,017 | |||
| Distribution service fees | 664 | |||
| Professional fees and expenses | 31,183 | |||
| Trustees fees and expenses | 2,791 | |||
| Offering costs | 201 | |||
| Other expenses | 2,661 | |||
| Total Expenses | 98,718 | |||
| Waivers/expense reimbursement by Advisor | (98,054 | ) | ||
| Net Expenses | 664 | |||
| Net Investment Income | 13,575 | |||
| Net Increase in Net Assets From Operations | $ | 13,575 | ||
The accompanying notes are an integral part of these financial statements.
4
Milliman Variable Insurance Trust
Statements of Changes in Net Assets
| Milliman Money Market Fund | ||||||||
| Year Ended December 31, 2023 | Period January 10, 2022(a) to December 31, 2022 | |||||||
| Operations: | ||||||||
| Net investment income | $ | 13,575 | $ | 3,943 | ||||
| Net Increase in Net Assets Resulting from Operations | 13,575 | 3,943 | ||||||
| Distributions to Shareholders:(b) | ||||||||
| Distributions to shareholders | (13,568 | ) | (3,941 | ) | ||||
| Capital Share Transactions:(b) | ||||||||
| Proceeds from shares sold | 388,916 | 1,903,069 | ||||||
| Reinvestments | 13,576 | 3,891 | ||||||
| Cost of shares redeemed | (257,797 | ) | (1,703,643 | ) | ||||
| Net Increase/(Decrease) in Net Assets from Capital Share Transactions | 144,695 | 203,317 | ||||||
| Total Increase/(Decrease) in Net Assets | 144,702 | 203,319 | ||||||
| Net Assets: | ||||||||
| Beginning of the period | 203,319 | — | ||||||
| End of the period | $ | 348,021 | $ | 203,319 | ||||
| Change in Shares Outstanding:(b) | ||||||||
| Shares sold | 388,916 | 1,903,069 | ||||||
| Shares reinvested | 13,576 | 3,891 | ||||||
| Shares redeemed | (257,797 | ) | (1,703,643 | ) | ||||
| Net Increase/(Decrease) | 144,695 | 203,317 | ||||||
(a) Commencement of Operations
(b) Class 3
The accompanying notes are an integral part of these financial statements.
5
Milliman Variable Insurance Trust
| Per Share Operating Performance (for a share outstanding throughout each period) | Ratios/Supplemental Data: | |||||||||||||||||||||||||||||||||||
| Ratio to Average Net Assets of: (a) | ||||||||||||||||||||||||||||||||||||
| Net Asset Value, Beginning of Period | Net investment income | Distributions from Net Investment Income | Net Asset Value, End of Period | Total return (b) | Net assets, end of period (000) | Expenses, gross (c) | Expenses, net (c)(d) | Net investment income | ||||||||||||||||||||||||||||
| Milliman Money Market Fund | ||||||||||||||||||||||||||||||||||||
| For the year ended 12/31/23 | $ | 1.00 | 0.05 | (0.05 | ) | $ | 1.00 | 5.21 | % | $ | 348 | 37.15 | % | 0.25 | % | 5.11 | % | |||||||||||||||||||
| For the period 1/10/22 (e) - 12/31/22 | $ | 1.00 | 0.02 | (0.02 | ) | $ | 1.00 | 1.64 | % | $ | 203 | 47.12 | % | 0.21 | % | 1.93 | % | |||||||||||||||||||
| (a) | Annualized for periods less than one year. |
| (b) | Total return is based on the change in net asset value of a share during the period, assumes reinvestment of dividends and distributions at net asset value and is not annualized for periods less than one year. Total return reflects waivers/reimbursements by the Advisor. Performance would have been lower had the waivers/reimbursements not been in effect. Total return does not include fees, charges, or expenses imposed by the variable annuity and life insurance contracts for which the Fund serves as an underlying investment vehicle. If total return had taken these into account, performance would have been lower. |
| (c) | Ratios of expenses to average net assets do not include expenses of the Portfolio in which the Fund invests. Including these expenses, the expense ratios before waivers/reimbursements and net of waivers/reimbursements would be approximately 37.35% and 0.43%, and 47.32% and 0.38% for the periods ended December 31, 2023 and December 31, 2022, respectively. |
| (d) | Net expenses reflect fee waivers and expense reimbursements by the Advisor. |
| (e) | Commencement of operations. |
The accompanying notes are an integral part of these financial statements.
6
Milliman Variable Insurance Trust
December 31, 2023
1. Organization
Milliman Variable Insurance Trust (the “Trust”) was organized under the laws of the state of Delaware as a Delaware statutory trust on November 2, 2020, and is registered with the U.S. Securities and Exchange Commission (“SEC”) under the Investment Company Act of 1940, as amended (the “1940 Act”), as an open-end management investment company. As of December 31, 2023, the Trust consisted of 3 operational series. This report pertains to the Milliman Money Market Fund (the “Fund”). The remaining series are presented in a separate report. The Fund is classified as diversified under the 1940 Act. The Fund offers shares only to insurance company separate accounts funding variable annuity contracts and variable life insurance policies and other qualified investors. All shares of the Fund have equal rights and privileges. As of December 31, 2023, only Class 3 shares were offered, which have no front-end sales load, deferred sales charge, or redemption fee. The Fund commenced operations on January 10, 2022.
The Fund seeks to maximize current income to the extent consistent with the preservation of capital and the maintenance of liquidity by investing exclusively in high quality money market instruments.
The Fund pursues its investment objective by investing all of its investable assets in Institutional Shares of the Goldman Sachs Government Money Market Fund (the “Portfolio”), a series of the Goldman Sachs Variable Insurance Trust, which is a Delaware statutory trust registered under the 1940 Act as an open-end management investment company. This structure is sometimes called a “master/feeder” structure. The Portfolio has the same investment objective and substantially similar investment policies as the Fund and, therefore, is subject generally to the same risks as the Fund. The Portfolio seeks to achieve its investment objective by investing only in “government securities,” as such term is defined or interpreted under the 1940 Act, and repurchase agreements collateralized by such securities. “Government securities” generally are securities issued or guaranteed by the United States or certain U.S. government agencies or instrumentalities. The percentage of the Portfolio owned by the Fund as of December 31, 2023 was 0.01%. The financial statements of the Portfolio, including the Schedule of Investments, are included elsewhere in this report and should be read in conjunction with the Fund’s financial statements.
At a meeting held on November 14, 2023, the Board of Trustees of the Trust (the “Board”) approved a Plan of Liquidation for the Fund, which provided for the complete liquidation of the Fund and the redemption of the Fund’s outstanding shares. Effective upon the open of business on November 15, 2023, the Fund was closed to new investments, including from new insurance company separate accounts or other qualified investors and additional purchases from existing insurance company separate accounts or other qualified investors. The liquidation will be completed on or around February 28, 2024.
2. Significant Accounting Policies
The following is a summary of significant accounting policies consistently followed by the Fund in the preparation of its financial statements. These policies are in conformity with U.S. generally accepted accounting principles (“GAAP”). The Trust is an investment company and follows accounting and reporting guidance under Financial Accounting Standards Board (“FASB”) Accounting Standards Codification (“ASC”) Topic 946, Financial Services – Investment Companies. For accounting and financial reporting purposes, the Fund is treated as a fund-of-funds.
Use of Estimates
The preparation of financial statements in conformity with GAAP requires management to make estimates and assumptions that affect the reported amount of assets and liabilities and disclosure of contingent assets and liabilities, as well as reported amounts of increases and decreases in net assets from operations during the reporting period. Actual results could differ from those estimates.
Computation of Net Asset Value
The Fund determines its NAV per share as of the close of regular trading on the New York Stock Exchange (the “Exchange”) (generally 4:00 p.m., Eastern time) on each business day the Exchange is open for regular trading. If the Exchange closes early on a valuation day, the Fund shall determine NAV as of that time. The NAV per share of the Fund is calculated by dividing the value of the Fund’s total assets, less its liabilities (including accrued expenses), by the number of shares outstanding. Because the Fund currently invests all of its investable assets in the Portfolio, its assets consist primarily of
7
Milliman Variable Insurance Trust
Notes to Financial Statements
December 31, 2023
an interest in the Portfolio. The value of this interest will depend on the value of the assets of the Portfolio and its liabilities and expenses. In accordance with Rule 2a-7 under the 1940 Act, each of the Fund and the Portfolio seeks to maintain a stable price of $1.00 per share by using the amortized cost method to value portfolio securities and rounding the share value to the nearest cent.
Valuation
Shares of the Portfolio held by the Fund are valued at NAV as reported by the Portfolio.
The Trust follows the authoritative guidance (GAAP) for fair value measurements, which established a framework for measuring fair value and a hierarchy for inputs and techniques used in measuring fair value that maximizes the use of observable inputs and minimizes the use of unobservable inputs and techniques by requiring that the most observable inputs be used when available. The guidance established three tiers of inputs that may be used to measure fair value as follows:
| Level 1 - | Unadjusted quoted prices in active markets for identical assets or liabilities that the Fund has the ability to access. |
| Level 2 - | Observable inputs other than quoted prices included in Level 1 that are observable for the asset or liability, either directly or indirectly. These inputs may include quoted prices for the identical instrument on an inactive market, prices for similar instruments, interest rates, prepayment speeds, credit risk, yield curves, default rates and similar data. |
| Level 3 - | Unobservable inputs for the asset or liability, to the extent relevant observable inputs are not available, representing the Fund’s own assumptions about the assumptions a market participant would use in valuing the asset or liability, and would be based on the best information available. |
As of December 31, 2023, the value of the Fund’s investment in the Portfolio was determined based on Level 1 inputs. The inputs or techniques used for valuing securities are not necessarily an indication of the risk associated with investing in those securities.
Offering Costs
Offering costs directly attributable to a series of the Trust are charged to that series, such as certain registration fees, while expenses which are attributable to more than one series are allocated among the respective series on a pro rata basis.
Offering costs are recorded as a deferred asset and are amortized on a straight-line basis for a period of twelve months upon commencement of operations of the Fund. Offering costs include legal fees pertaining to the preparation, review and filing of the Fund’s prospectus and statement of additional information. Offering costs are subject to the Fund’s Expense Limitation Agreement (See Note 4).
Investment Transactions, Investment Income and Expenses
Investment transactions are accounted for on a trade date basis for financial reporting purposes. Realized gains and losses from investment transactions are recorded on an identified cost basis. Dividend income is recognized on the ex-dividend date. Interest income, including accretion of discounts and amortization of premiums, is recognized on an accrual basis using the effective yield method.
Expenses are accrued daily. Expenses of the Trust, which are directly identifiable to a specific series, are applied to that series. Expenses which are not identifiable to a specific series are allocated in such a manner as deemed equitable, taking into consideration the nature and type of expense.
In addition to the advisory fees and other expenses reflected on the Statement of Operations, the Fund indirectly bears the investment management fees and other expenses of the Portfolio in which it invests.
8
Milliman Variable Insurance Trust
Notes to Financial Statements
December 31, 2023
Distributions to Shareholders
Distributions to shareholders are recorded on the ex-dividend date. All or substantially all of the Fund’s net investment income will be declared as a dividend daily. Dividends will normally be declared daily as of 4:00 p.m., Eastern time, as a dividend and distributed monthly. Distributions will be reinvested as of the last calendar day of each month. Cash distributions normally will be paid on or about the first business day of each month. Net short-term capital gains, if any, will be distributed in accordance with federal income tax requirements and may be reflected in the Fund’s daily distributions. Distributions of net realized capital gains, if any, will be declared and paid at least annually by the Fund.
3. Federal Taxes Information
There is no provision for federal income taxes, as it is the Fund’s policy to comply with the Subchapter M provision of the Internal Revenue Code of 1986, as amended, and to distribute to shareholders each year all of its taxable income and realized gains.
The Fund files U.S. federal, state, and local tax returns as required. The Fund’s tax returns are subject to examination by the relevant tax authorities until expiration of the applicable statute of limitations, which is generally three years after the tax returns are filed. The Fund recognizes interest and penalties, if any, related to unrecognized tax benefits as income tax expense on the Statement of Operations. The Fund does not have any unrecognized tax benefits or uncertain tax positions that would require a provision for income tax. Accordingly, the Fund did not incur any interest or penalties for the period ended December 31, 2023.
For financial reporting purposes, any permanent differences resulting from book and tax treatment are reclassified between distributable earnings and paid-in capital in the period that the differences arise. Results of operations and net assets are not affected by these reclassifications. As of December 31, 2023, there were no such reclassifications.
As of December 31, 2023, the cost of investments for federal tax purposes was $346,457 and there was no unrealized appreciation or depreciation.
For the year ended December 31, 2023 and the period ended December 31, 2022, the tax character of distributions by the Fund was as follows:
| Ordinary Income | Total Distributions Paid | ||||||||
| 2023 | $ | 13,568 | $ | 13,568 | |||||
| 2022 | 3,941 | 3,941 | |||||||
As of December 31, 2023, the components of distributable earnings on a tax basis were as follows:
| Undistributed Ordinary Income | Total Distributable Earnings | |||||
| $ | 9 | $ | 9 | |||
4. Advisory Fees and Other Agreements
The Trust has an Investment Advisory Agreement with Milliman Financial Risk Management LLC (“Milliman”) to furnish investment advisory services to the Fund. Pursuant to the Investment Advisory Agreement, Milliman is entitled to receive, on a monthly basis, an annual advisory fee equal to 0.03% of the Fund’s average daily net assets. However, Milliman has contractually agreed to waive its management fee until at least April 29, 2024. This contract cannot be terminated or modified without the consent of the Board.
9
Milliman Variable Insurance Trust
Notes to Financial Statements
December 31, 2023
Milliman has contractually agreed to waive advisory fees and/or reimburse expenses to the extent necessary to limit the Fund’s total annual Fund operating expenses (which include net expenses of the Portfolio and offering and organizational expenses of the Fund, but exclude taxes, interest, brokerage fees and commissions, acquired fund fees and expenses, and extraordinary or non-routine expenses not incurred in the ordinary course of the Fund’s business) to 0.43% of the Fund’s average daily net assets (the “Expense Limitation Agreement”) until at least April 29, 2024. During its term, the Expense Limitation Agreement cannot be terminated or amended to increase the applicable limit without approval of the Board.
Milliman has also agreed to voluntarily waive fees and/or reimburse expenses of the Fund to avoid a negative yield. Such yield waivers and reimbursements are voluntary and could be modified or terminated at any time at the discretion of Milliman without notice.
Milliman may not recoup any advisory fees waived or expenses reimbursed pursuant to the above agreements.
U.S. Bancorp Fund Services, LLC d/b/a U.S. Bank Global Fund Services, a subsidiary of U.S. Bancorp, serves as the Fund’s fund accountant, administrator, and transfer agent pursuant to certain fund accounting servicing, fund administration servicing and transfer agent servicing agreements. U.S. Bank National Association, a subsidiary of U.S. Bancorp, serves as the Fund’s custodian pursuant to a custody agreement. Foreside Fund Services, LLC (the “Distributor”) serves as the Fund’s distributor pursuant to a distribution agreement.
The Trust has adopted a Distribution Plan under Rule 12b-1 (“Rule 12b-1 Plan”) of the 1940 Act with respect to the Fund’s Class 3 shares. The Rule 12b-1 Plan permits the Fund to pay the Distributor, as the Fund’s principal underwriter, for expenses associated with the distribution of Class 3 shares of the Fund. Under the Rule 12b-1 Plan, the Distributor is paid an annual fee of 0.25% of the average daily net assets of Class 3 shares. All Rule 12b-1 Plan payments received by the Distributor shall be used solely for distribution-related expenses and shall not be retained as profit by the Distributor. Accordingly, no compensation is payable by the Fund to the Distributor for such distribution services. However, Milliman has entered into an agreement with the Distributor under which it makes payments to the Distributor in consideration for its services under the distribution agreement. The payments made by Milliman to the Distributor do not represent an additional expense to the Fund or its shareholders.
Certain employees of Foreside Fund Officer Services, LLC, an affiliate of the Distributor, serve as Treasurer and Principal Financial Officer and Chief Compliance Officer and Anti-Money Laundering Officer to the Trust.
Certain Trustees and Officers of the Trust are also Officers or employees of Milliman, and during their terms of office, receive no compensation from the Fund.
5. Beneficial Ownership
The beneficial ownership, either directly or indirectly, of more than 25% of the voting securities of the Fund creates a presumption of control of the Fund, under Section 2(a)(9) of the 1940 Act. As of December 31, 2023, American International Group (AIG) and Milliman owned 69.5% and 30.5% of the outstanding shares of the Fund, respectively.
6. Risks
The Portfolio, and therefore the Fund, could lose money over short periods due to short-term market movements and over longer periods during more prolonged market downturns. Assets may decline in value due to factors affecting financial markets generally or particular asset classes or industries represented in the markets. The value of a security or other asset may also decline due to general market conditions, economic trends or events that are not specifically related to the issuer of the security or other asset, or due to factors that affect a particular issuer, country, region, market, industry, sector or asset class.
The principal risks of investing in the Fund and the Portfolio are described more fully in the Fund’s prospectus.
7. Guarantees and Indemnifications
In the normal course of business, the Fund enters into contracts with service providers that contain general indemnification clauses. The Fund’s maximum exposure under these arrangements is unknown, as this would involve future claims that may be made against the Fund that have not yet occurred.
10
Milliman Variable Insurance Trust
Notes to Financial Statements
December 31, 2023
8. Subsequent Events
Management has evaluated events and transactions for potential recognition or disclosure through the date the financial statements were issued and has determined that no additional items require recognition or disclosure.
11
Milliman Variable Insurance Trust
Report of Independent Registered Public Accounting Firm
To the Shareholders and Board of Trustees of Milliman Variable Insurance Trust
Opinion on the Financial Statements
We have audited the accompanying statement of assets and liabilities, including the schedule of investments, of Milliman Money Market Fund (the “Fund”), a series of Milliman Variable Insurance Trust, as of December 31, 2023, the related statement of operations for the year ended December 31, 2023, and the statements of changes in net assets, the related notes, and the financial highlights for the year ended December 31, 2023 and the period from January 10, 2022 (commencement of operations) through December 31, 2022 (collectively referred to as the “financial statements”). In our opinion, the financial statements present fairly, in all material respects, the financial position of the Fund as of December 31, 2023, the results of its operations for the year ended December 31, 2023, and the changes in net assets and the financial highlights for the year ended December 31, 2023 and the period from January 10, 2022 (commencement of operations) through December 31, 2022 in conformity with accounting principles generally accepted in the United States of America.
Basis for Opinion
These financial statements are the responsibility of the Fund’s management. Our responsibility is to express an opinion on the Fund’s financial statements based on our audits. We are a public accounting firm registered with the Public Company Accounting Oversight Board (United States) (“PCAOB”) and are required to be independent with respect to the Fund in accordance with the U.S. federal securities laws and the applicable rules and regulations of the Securities and Exchange Commission and the PCAOB.
We conducted our audits in accordance with the standards of the PCAOB. Those standards require that we plan and perform the audit to obtain reasonable assurance about whether the financial statements are free of material misstatement whether due to error or fraud.
Our audits included performing procedures to assess the risks of material misstatement of the financial statements, whether due to error or fraud, and performing procedures that respond to those risks. Such procedures included examining, on a test basis, evidence regarding the amounts and disclosures in the financial statements. Our procedures included confirmation of securities owned as of December 31, 2023, by correspondence with the custodian and brokers. Our audits also included evaluating the accounting principles used and significant estimates made by management, as well as evaluating the overall presentation of the financial statements. We believe that our audits provide a reasonable basis for our opinion.
We have served as the auditor for one or more Funds in the Trust since 2021.

COHEN & COMPANY, LTD.
Cleveland, Ohio
February 22, 2024
12
Milliman Variable Insurance Trust
Additional Information (Unaudited)
December 31, 2023
1. INFORMATION ABOUT PROSPECTUS
This report has been prepared for shareholders and may be distributed to others only if preceded or accompanied by a current prospectus. Investors should consider the investment objective and policies, risk considerations, charges and ongoing expenses of an investment carefully before investing. The prospectus contains this and other information relevant to an investment in the Fund. Please read the Prospectus carefully before investing. A copy of the Prospectus may be obtained without charge by writing to the Trust’s Distributor, or by calling toll free at 1–855–700–7959 or visiting www.millimanfunds.com.
2. PROXY VOTING POLICIES AND PROCEDURE
The Trust’s Proxy Voting Policies and Procedures are available without charge, upon request, by calling 1–855–700–7959 and on the SEC’s website at www.sec.gov. Information relating to how each Fund voted proxies relating to portfolio securities held during each year ended June 30 is also available on the SEC’s website at www.sec.gov.
3. INFORMATION ABOUT PORTFOLIO SECURITIES
The Fund’s Form N-MFP, which had information about the Fund and its holdings, is available without charge: (i) upon request, by calling 1-855-700-7959; (ii) on the SEC’s website at www.sec.gov; and (iii) on the Fund’s website at www. millimanfunds.com.
13
Milliman Variable Insurance Trust
Trustees and Officers (Unaudited)
December 31, 2023
| Name, Address and Year of Birth | Position with the Trust | Length of Time Served | Principal Occupation(s) During Past 5 Years | Number of Portfolios in Fund Complex Overseen by Trustee or Officer | Other Directorships Held by Trustee or Officer in the Past Five Years |
| Independent Trustees(a) | |||||
| Eric Berg 71 South Wacker Drive, 31st Floor, Chicago, IL 60606 (1958) | Trustee | Since July 2021 | Owner of With You in Mind (independent analysis and research firm for insurance, asset management and wealth-management topics) since 2019; Chief Financial Officer of Midwest Holding Inc. (insurance and asset management company) in 2022; Chief Financial Officer of Aviva India from 2018 to 2019; Investment Banker at Macquarie Capital from 2016 to 2018. | 3 | None |
| Nicholas Dalmaso 71 South Wacker Drive, 31st Floor, Chicago, IL 60606 (1965) | Lead Independent Trustee | Since July 2021 | Founder/CEO of Sound Capital Holdings, Sound Capital Distributors (a FINRA registered Broker/Dealer) and Sound Capital Solutions (an Investment Advisor) since 2020; General Counsel of EquityBee Inc. (fintech company) since 2023; General Counsel of M1 Holdings Inc. and M1 Finance LLC (FINRA registered Broker/ Dealer) from 2014 to 2021; Chief Compliance Officer of M1 Finance LLC from 2014 to 2019. | 3 | Chair of Destra Capital Management Investment Company Boards (4 portfolios) since 2010; Director of the Flaherty and Crumrine Boards (5 NYSE listed portfolios) since 2024; Independent Director of Keno/Kozie Associates (IT Consulting) from 2016 to 2018. |
| Daniel Ross Hayes 71 South Wacker Drive, 31st Floor, Chicago, IL 60606 (1957) | Trustee | Since July 2021 | Director, Treasurer and Investment Committee Chair of ShoreRivers,Inc. (non-profit clean water advocacy corporation) since 2017. | 3 | None |
| Colleen McKenna-Tucker 71 South Wacker Drive, 31st Floor, Chicago, IL 60606 (1970) | Trustee | Since September 2021 | Executive Director of International Insurance Society (membership organization for the risk and insurance industry) since 2004. | 3 | None |
14
Milliman Variable Insurance Trust
Trustees and Officers (Unaudited)
December 31, 2023
| Interested Trustee & Officer | |||||
| Adam Schenck (b) 71 South Wacker Drive, 31st Floor, Chicago, IL 60606 (1981) | Chair of the Board, President and Interested Trustee | Since November 2020 | Principal Managing Director – Head of Fund Services of Milliman Financial Risk Management LLC since 2005. | 3 | None |
| Officers | |||||
| Arthur W. Jasion 71 South Wacker Drive, 31st Floor, Chicago, IL 60606 (1965) | Treasurer and Principal Financial Officer | Since July 2021 | Senior Principal Consultant and Fund Principal Financial Officer of Foreside Management Services, LLC since 2020; Partner, Ernst & Young LLP from 2012 to 2020. | N/A | N/A |
| Roger Pries 71 South Wacker Drive, 31st Floor, Chicago, IL 60606 (1965) | Chief Compliance Officer and Anti–Money Laundering Officer | Since July 2021 | Fund Chief Compliance Officer of Foreside Fund Officer Services, LLC since 2019; Compliance Officer from 2016 to 2019 and Operational Risk Manager/Vice President from 2007 to 2016 at Citi Fund Services. | N/A | N/A |
| Ehsan Sheikh 71 South Wacker Drive, 31st Floor, Chicago, IL 60606 (1987) | Secretary and Chief Legal Officer | Since July 2021 | Senior Counsel of Milliman Financial Risk Management LLC since 2017, Associate Counsel from 2014 to 2017. | N/A | N/A |
| (a) | The Trustees of the Trust who are not “interested persons”, as defined under Section 2(a)(19)of the 1940 Act, of the Trust. |
| (b) | Adam Schenck is an “interested person”, as defined by the 1940 Act, of the Trust because of his employment by Milliman. |
The Statement of Additional Information includes additional information about the Trustees and is available upon request, without charge, by calling 1–855–700–7959.
15
INVESTMENT ADVISER
Milliman Financial Risk Management LLC
71 S. Wacker Drive, 31st Floor
Chicago, IL 60606
ADMINISTRATOR, FUND ACCOUNTANT & TRANSFER AGENT
U.S. Bancorp Fund Services, LLC
615 East Michigan Street
Milwaukee, WI 53202
DISTRIBUTOR
Foreside Fund Services, LLC
Three Canal Plaza
Portland, ME 04101
CUSTODIAN
U.S. Bank, N.A.
1555 North RiverCenter Drive, Suite 302
Milwaukee, WI 53212
LEGAL COUNSEL
Stradley Ronon Stevens & Young LLP
191 North Wacker Drive, Suite 1601
Chicago, IL 60606
and
2005 Market Street, Suite 2600
Philadelphia, PA 19103
INDEPENDENT REGISTERED PUBLIC ACCOUNTING FIRM
Cohen & Company, Ltd.
1350 Euclid Avenue, Suite 800
Cleveland, Ohio 44115

Goldman Sachs Government Money Market Fund
TABLE OF CONTENTS
| Fund Basics | 1 |
| Schedule of Investments | 6 |
| Financial Statements | 11 |
| Financial Highlights | 14 |
| Notes to Financial Statements | 15 |
| Report of Independent Registered Public Accounting Firm | 21 |
| Other Information | 22 |
| Effective January 24, 2023, open-end mutual funds and exchange traded funds will be required to provide shareholders with streamlined annual and semi-annual shareholder reports (“Tailored Shareholder Reports”). Funds will be required to prepare a separate Tailored Shareholder Report for each share class of a fund that highlights key information to investors. Other information, including financial statements, will no longer appear in a fund’s shareholder report, but will be available online, delivered free of charge upon request, and filed with the SEC on a semi-annual basis on Form N-CSR. The new requirements have a compliance date of July 24, 2024. |
| You could lose money by investing in the Fund. Although the Fund seeks to preserve the value of your investment at $1.00 per share, it cannot guarantee it will do so. An investment in the Fund is not a bank account or a deposit of the bank and is not insured or guaranteed by the Federal Deposit Insurance Corporation or any other government agency. The Fund’s sponsor is not required to reimburse the Fund for losses, and you should not expect that the sponsor will provide financial support to the Fund at any time, including during periods of market stress. |
GOLDMAN SACHS VARIABLE INSURANCE TRUST GOVERNMENT MONEY MARKET FUND
Portfolio Management Discussion and Analysis
Below, the Goldman Sachs Money Market Portfolio Management Team discusses the Goldman Sachs Variable Insurance Trust — Goldman Sachs Government Money Market Fund’s (the “Fund") performance and positioning for the 12-month period ended December 31, 2023 (the “Reporting Period”).
How did the Fund perform during the Reporting Period?
The Fund’s Institutional Shares’ standardized 7-day current yield was 5.25% and their standardized 7-day effective yield was 5.38% as of December 31, 2023. The Institutional Shares’ one-month simple average yield was 5.25% as of December 31, 2023. The Institutional Shares’ 7-day distribution yield as of December 31, 2023 was 5.27%.
The Fund’s Service Shares’ standardized 7-day current yield was 5.00% and their standardized 7-day effective yield was 5.12% as of December 31, 2023. The Service Shares’ one-month simple average yield was 5.00% as of December 31, 2023. The Service Shares’ 7-day distribution yield as of December 31, 2023 was 5.02%.
The yields represent past performance. Past performance does not guarantee future results. Current performance may be lower or higher than the performance quoted above.
Yields will fluctuate as market conditions change. The yield quotations more closely reflect the current earnings of the Fund than total return quotations.
What economic and market factors most influenced the money markets as a whole during the Reporting Period?
During the Reporting Period, the money markets were most influenced by Federal Reserve (“Fed”) policy and the outlook for the U.S. economy.
In the first quarter of 2023, when the Reporting Period began, the Fed continued tightening monetary policy, raising the targeted federal funds (“fed funds”) rate twice—by 25 basis points in both February and March. (A basis point is 1/100th of a percentage point.) In mid-March, Silicon Valley Bank and Signature Bank failed, marking the largest U.S. regional bank failure since the 2008 financial crisis. That same month, the Swiss government brokered a deal for UBS to purchase Credit Suisse, which was on the brink of collapse. During the quarter overall, a tight labor market and firm inflation supported the U.S. dollar, though economic growth headwinds from tighter financial and credit conditions led to dovish monetary policy expectations, weighing on the currency. (Dovish tends to suggest lower interest rates; opposite of hawkish.)
In the second quarter of 2023, the Fed raised the fed funds rate by another 25 basis points at its May policy meeting and signaled a willingness to pause on further rate actions, as U.S. inflation had started to moderate. Also in May, First Republic Bank was seized by the Federal Deposit Insurance Corporation and sold to JPMorgan Chase. In early June, the resolution of U.S. debt ceiling negotiations, coupled with the easing of banking sector stress, improved investor sentiment overall. Fed policymakers left interest rates unchanged at their June meeting, though Fed Chair Jerome Powell suggested hiking rates “at consecutive meetings is not off the table.” The Fed’s June dot plot showed a median projection of two additional rate hikes in 2023. (The Fed’s dot plot shows the interest rate projections of the members of the Federal Open Market Committee.)
During the third quarter of 2023, Fed officials hiked the fed funds rate by an additional 25 basis points at their July policy meeting but remained on hold at their September meeting. Resilient U.S. economic data and market expectations that policy rates would stay higher for longer pushed up the 10-year U.S. Treasury yield, which hit 4.63% on September 27th—its highest level since 2007. In August, Fitch Ratings downgraded long-term U.S. sovereign debt from AAA to AA+, reflecting U.S. governance and medium-term fiscal challenges. Subsequently, Moody’s Investors Service took ratings action on 27 U.S. banks in response to profitability concerns, low regulatory capital among regional banks compared to larger banks and global peers, and potential losses on loans (particularly for those with large commercial real estate exposure). The U.S. labor market remained strong, continuing to make progress toward rebalancing itself from pandemic-era extremes. Inflation eased overall, but there was a reacceleration in some key components. Nevertheless, the U.S. remained on a disinflationary path, supporting market expectations that the Fed may have reached the end of its current interest rate hiking cycle.
The fourth quarter of 2023 marked an important inflection point. In October, U.S. Treasury yields rose to multi-year highs, with the 10-year U.S. Treasury yield briefly breaching 5% for the first time since 2007. The increase was driven, in our view, by better than previously anticipated U.S. economic growth prospects, which dampened market expectations for Fed interest rate cuts in 2024. The
1
GOLDMAN SACHS VARIABLE INSURANCE TRUST GOVERNMENT MONEY MARKET FUND
Fed left the fed funds rate unchanged in October, as tighter financial conditions, led by higher long-term interest rates, alleviated the need, as determined by the Fed, for further policy tightening. November 2023 saw the greatest easing of U.S. financial conditions in any month during the previous 40 years. The easing was largely the result of a significant drop in interest rates, with the 10- year U.S. Treasury yield falling approximately 51 basis points during the month. Weaker inflation data and ongoing disinflation trends suggested the Fed might have reached the peak of its monetary policy tightening cycle. At their November meeting, Fed policymakers left the fed funds rate unchanged in a range between 5.25% and 5.50%. At its December meeting, the Fed again left the target range for the fed funds rate unchanged. Meeting minutes indicated that Fed policymakers viewed the fed funds rate as “likely at or near its peak for this tightening cycle.” There were also comments in the minutes on inflation progress to date and the Fed’s inflation outlook, risks to economic growth from keeping rates too high, and how long the policy rate might need to remain restrictive. Perhaps most significantly, the Fed indicated that three interest rate cuts were possible in 2024.
In this environment, the yields of taxable money market funds increased. Investments in U.S. taxable money market funds rose during the Reporting Period, from approximately $4.5 trillion to $5.7 trillion, according to iMoneyNet. U.S. tax-exempt money market fund investments increased during the Reporting Period from $108 billion to $122 billion, according to iMoneyNet.
Yields rose along the money market yield curve, as the Fed raised the fed funds rate and tightened monetary policy. (Yield curve is a spectrum of interest rates based on maturities of varying lengths.) That said, the money market yield curve inverted during the Reporting Period. (In an inverted yield curve, shorter-term yields are higher than longer-term yields.) At the start of the Reporting Period, six-month and one-year yields were modestly above that of the very front-end, or short-term end, of the curve. As the Reporting Period progressed, the middle segment of the yield curve rose well above the one-year segment, though this inversion eased slightly toward the end of the Reporting Period.
Money market funds overall remained a viable investment for investors seeking stability, liquidity and yield amid ongoing uncertainty and elevated volatility in the financial markets broadly.
During the Reporting Period, the Securities & Exchange Commission (“SEC”) adopted changes to the rules that govern money market funds. While some of these changes have already taken effect, the remaining changes will take effect either by April 2, 2024 or October 2, 2024.
1. Effective October 2, 2023, institutional and retail money market funds were no longer permitted to temporarily restrict redemptions (a “redemption gate”) and/or impose a liquidity fee on redemptions (up to 2%) if the applicable fund’s portfolio liquidity fell below the required minimums. Government money market funds are exempt from requirements relating to these redemption gates and/or liquidity fees.
2. Effective April 2, 2024, institutional and retail money market funds will be permitted to impose a discretionary liquidity fee on redemptions (up to 2%), if the applicable fund’s board of trustees (or its delegate) determines that it is in the best interests of the fund to do so. Government money market funds will continue to be exempt from requirements relating to these discretionary liquidity fees. Institutional and retail money market funds may choose to rely on this modified discretionary liquidity fee framework prior to April 2, 2024.
3. Effective April 2, 2024, all money market funds will be required to increase their minimum levels of daily and weekly liquid assets from 10% and 30%, respectively, to 25% and 50%, respectively.
4. Effective October 2, 2024, institutional money market funds will be required to impose a mandatory liquidity fee on redemptions, if the applicable fund experiences total daily net redemptions that exceed 5% of net assets, unless the fee is de minimis (i.e., less than 1 basis point of the value of the shares redeemed). Government and retail money market funds will be exempt from these requirements.
What key factors were responsible for the Fund’s performance during the Reporting Period?
The Fund’s yields increased during the Reporting Period, largely because of the economic and market factors discussed above. The Fund remained highly liquid throughout.
The Fund continued to be flexibly guided by shifting marketing conditions, and we positioned the Fund to seek to take advantage of the Fed’s monetary policy. During the Reporting Period, the Fund’s positioning along the money market yield curve and in specific securities was predicated on market expectations around interest rates and Fed rate hikes and/or pauses in the near term. The overall strategy of the Fund shifted as the Reporting Period progressed from shorter weighted average maturities and weighted average life to longer weighted average maturities and weighted average life, as we sought to take advantage of the gradually shifting monetary policy actions of the Fed.
Indeed, duration management and positioning play a key role in our management philosophy. (Duration is a measure of a fund’s sensitivity to changes in interest rates.) That said, it should be noted that regardless of interest rate conditions, we manage the Fund consistently. Our investment approach has always been tri-fold—to seek preservation of capital, daily liquidity and maximization of yield potential. We manage interest, liquidity and credit risk daily. Whether interest rates are historically low, high or in-between, we intend to continue to use our actively managed approach to provide the best possible return within the framework of the Fund’s guidelines and objectives.
2
GOLDMAN SACHS VARIABLE INSURANCE TRUST GOVERNMENT MONEY MARKET FUND
How did you manage the Fund’s weighted average maturity during the Reporting Period?
On December 31, 2022, the Fund’s weighted average maturity was 6 days. At any given time, the Fund’s decisions around weighted average maturity positioning are based on how market interest rates compare with our near-term expectations, including supply dynamics and monetary policy. At the end of the Reporting Period, the Fund’s weighted average maturity was 51 days. Lengthening weighted average maturities, albeit within historical ranges, during the Reporting Period was additive to Fund performance overall given the slowing rate increases and then pauses of the Fed—and as easing began to be priced into the market.
Throughout the Reporting Period, we focused on U.S. government agency repurchase agreements, U.S. Treasuries, U.S. government agency securities, U.S. Treasury repurchase agreements and floating rate, or variable rate, demand notes when and where we saw what we considered to be attractive opportunities. The Fund primarily held instruments with an effective maturity of one year or less.
The weighted average maturity of a money market fund is a measure of its price sensitivity to changes in interest rates. Also known as effective maturity, weighted average maturity measures the weighted average of the maturity date of bonds held by the Fund taking into consideration any available maturity shortening features. A Fund’s weighted average maturity is an average of the effective maturities of all securities held in the portfolio, weighted by each security’s percentage of net assets. This must not exceed 60 days, as calculated under SEC Rule 2a-7.
How did you manage the Fund’s weighted average life during the Reporting Period?
During the Reporting Period, we managed the weighted average life of the Fund between 39 days and 116 days. The weighted average life of the Fund was 40 days as of December 31, 2022 and was 113 days on December 31, 2023. The weighted average life of a money market fund is a measure of a money market fund’s price sensitivity to changes in liquidity and/or credit risk.
Under amendments to SEC Rule 2a-7 that became effective in May 2010, the maximum allowable weighted average life of a money market fund is 120 days. While one of the goals of the SEC’s money market fund rule is to reinforce conservative investment practices across the money market fund industry, our security selection process has long emphasized conservative investment choices.
How was the Fund invested during the Reporting Period?
The Fund had investments in U.S. government agency repurchase agreements, U.S. Treasury securities, U.S. government agency securities, U.S. Treasury repurchase agreements and floating rate, or variable rate, demand notes during the Reporting Period.
Adding most to Fund performance during the Reporting Period tended to be its floating rate exposure and its overnight repurchase agreement positions—as well as its shorter duration position, especially during the first half of the Reporting Period when rates were rising more significantly. Conversely, the Fund’s fixed rate positions, albeit a modest percentage of Fund assets, detracted from performance during the Reporting Period.
Throughout, we stayed true to our investment discipline, favoring liquidity and high quality credits over added yield. The primary focal points for our team are consistently managing interest rate risk and credit risk. We were able to navigate interest rate risk by adjusting the Fund’s weighted average maturity longer or shorter as market conditions shifted and to mitigate potential credit risk by buying high quality, creditworthy names, strategies which added to the Fund’s performance during the Reporting Period. Throughout the Reporting Period, we managed the Fund’s allocations to different sub-sectors of the money market depending on their relative value. We also adapted a flexible approach to our duration management and positioning so that we could take advantage of opportunities wherever they may arise.
Did you make any changes in the Fund’s portfolio during the Reporting Period?
We made adjustments to the Fund’s weighted average maturity, weighted average life and specific security type composition allocations based on then-current market conditions, our near-term view, and anticipated and actual Fed monetary policy statements. As interest rates were rising, we tended to focus on Treasury floating rate securities and shorter-duration securities, when applicable. Then, as Fed statements and economic data shifted, we changed our allocation strategy for the Fund accordingly. More specifically, later in the Reporting Period, we extended the Fund’s weighted average maturity and weighted average life to extend the Fund’s duration positioning given our shifting outlook on interest rates. We implemented this strategy by reducing the Fund’s allocation to Treasury floating rate securities and overnight repurchase agreements.
Were there any changes to the Fund’s portfolio management team during the Reporting Period?
There were no changes to the Fund’s portfolio management team during the Reporting Period.
What is the Fund’s tactical view and strategy for the months ahead?
At the end of the Reporting Period, with inflationary pressures subsiding, U.S. economic data had begun to support the possibility of a soft landing. (A soft landing, in economics, is a cyclical downturn that avoids recession. It typically describes attempts by central banks to raise interest rates just enough to stop an economy from overheating and experiencing high inflation, without causing a significant increase in unemployment, or a hard landing.) In our view, the Fed had reached an inflection point with respect to policy rates, and we believed it was likely the Fed would begin to lower rates in the first half of 2024.
3
GOLDMAN SACHS VARIABLE INSURANCE TRUST GOVERNMENT MONEY MARKET FUND
Market liquidity concerns at the end of the Reporting Period centered on the Fed’s quantitative tightening (that is, reduction in the size of its balance sheet), the Fed’s reverse repo (“RRP”) facility and the continued large issuance of Treasury securities across all maturities—which, collectively, remove a significant amount of cash from the U.S. monetary system. (Through the RRP facility, the Fed borrows from financial entities, including money market mutual funds.)
Looking ahead, our strategy continues to be flexibly guided by shifting market conditions, positioning the Fund and its duration to seek to take advantage of anticipated interest rate movements or lack thereof. As always, we intend to continue to use our actively managed approach to seek the best possible return within the framework of the Fund’s investment guidelines and objectives. In addition, we will continue to manage interest, liquidity and credit risk daily.
We will, of course, continue to closely monitor economic data, Fed policy, and any shifts in the money market yield curve, as we strive to strategically navigate the interest rate environment.
4
FUND BASICS
| FUND COMPOSITION † |
Security Type
(Percentage of Net Assets)

| † | The Fund is actively managed and, as such, its portfolio composition may differ over time. The percentage shown for each investment category reflects the value (based on amortized cost) of investments in that category as a percentage of net assets. Figures in the above chart may not sum to 100% due to the exclusion of other assets and liabilities. |
For more information about your Fund, please refer to www.GSAMFUNDS.com. There, you can learn more about your Fund’s investment strategies, holdings, and performance.
5
GOLDMAN SACHS VARIABLE INSURANCE TRUST GOVERNMENT MONEY MARKET FUND
December 31, 2023
| Principal Amount | Interest Rate | Maturity Date | Amortized Cost | |||||||||
| U.S. Government Agency Obligations - 18.4% | ||||||||||||
| Federal Farm Credit Banks Funding Corp. | ||||||||||||
| $ | 400,000 | 4.947 | % | 01/12/24 | $ | 399,432 | ||||||
| Federal Farm Credit Banks Funding Corp. (FEDL01 + 0.075%) | ||||||||||||
| 1,300,000 | 5.412 | (a) | 09/13/24 | 1,299,331 | ||||||||
| Federal Farm Credit Banks Funding Corp. (FEDL01 + 0.140%) | ||||||||||||
| 700,000 | 5.470 | (a) | 09/17/24 | 699,995 | ||||||||
| 200,000 | 5.472 | (a) | 11/14/24 | 199,966 | ||||||||
| 751,000 | 5.473 | (a) | 05/19/25 | 750,678 | ||||||||
| Federal Farm Credit Banks Funding Corp. (FEDL01 + 0.150%) | ||||||||||||
| 1,040,000 | 5.480 | (a) | 09/26/25 | 1,040,000 | ||||||||
| Federal Farm Credit Banks Funding Corp. (FEDL01 + 0.155%) | ||||||||||||
| 1,728,000 | 5.485 | (a) | 06/27/25 | 1,728,000 | ||||||||
| Federal Farm Credit Banks Funding Corp. (Prime Rate - 3.000%) | ||||||||||||
| 1,818,000 | 5.501 | (a) | 03/22/24 | 1,817,921 | ||||||||
| 1,200,000 | 5.501 | (a) | 01/24/25 | 1,199,939 | ||||||||
| 2,078,000 | 5.500 | (a) | 07/28/25 | 2,078,000 | ||||||||
| Federal Farm Credit Banks Funding Corp. (Prime Rate - 3.005%) | ||||||||||||
| 1,585,000 | 5.495 | (a) | 02/10/25 | 1,584,949 | ||||||||
| Federal Farm Credit Banks Funding Corp. (Prime Rate - 3.020%) | ||||||||||||
| 1,514,000 | 5.480 | (a) | 09/08/25 | 1,514,000 | ||||||||
| Federal Farm Credit Banks Funding Corp. (Prime Rate - 3.040%) | ||||||||||||
| 1,768,000 | 5.460 | (a) | 06/18/25 | 1,768,000 | ||||||||
| Federal Farm Credit Banks Funding Corp. (SOFR + 0.060%) | ||||||||||||
| 500,000 | 5.467 | (a) | 04/29/24 | 499,854 | ||||||||
| 500,000 | 5.469 | (a) | 07/22/24 | 499,726 | ||||||||
| Federal Farm Credit Banks Funding Corp. (SOFR + 0.090%) | ||||||||||||
| 946,000 | 5.490 | (a) | 03/07/25 | 946,000 | ||||||||
| Federal Farm Credit Banks Funding Corp. (SOFR + 0.110%) | ||||||||||||
| 3,842,000 | 5.510 | (a) | 03/11/25 | 3,842,000 | ||||||||
| Federal Farm Credit Banks Funding Corp. (SOFR + 0.115%) | ||||||||||||
| 993,000 | 5.515 | (a) | 12/03/24 | 993,000 | ||||||||
| Federal Farm Credit Banks Funding Corp. (SOFR + 0.125%) | ||||||||||||
| 2,690,000 | 5.525 | (a) | 02/04/25 | 2,690,000 | ||||||||
| 1,043,000 | 5.525 | (a) | 02/10/25 | 1,043,000 | ||||||||
| 5,863,000 | 5.525 | (a) | 03/24/25 | 5,863,000 | ||||||||
| Federal Farm Credit Banks Funding Corp. (SOFR + 0.130%) | ||||||||||||
| 1,561,000 | 5.530 | (a) | 08/13/25 | 1,561,000 | ||||||||
| Federal Farm Credit Banks Funding Corp. (SOFR + 0.135%) | ||||||||||||
| 1,654,000 | 5.535 | (a)�� | 04/29/25 | 1,654,103 | ||||||||
| 850,000 | 5.535 | (a) | 06/03/25 | 850,000 | ||||||||
| Federal Farm Credit Banks Funding Corp. (SOFR + 0.140%) | ||||||||||||
| 1,978,000 | 5.542 | (a) | 11/26/24 | 1,977,487 | ||||||||
| 1,781,000 | 5.543 | (a) | 11/26/24 | 1,780,538 | ||||||||
| 2,699,000 | 5.540 | (a) | 08/22/25 | 2,699,000 | ||||||||
| Federal Farm Credit Banks Funding Corp. (SOFR + 0.145%) | ||||||||||||
| 2,117,000 | 5.545 | (a) | 04/28/25 | 2,117,000 | ||||||||
| 686,000 | 5.545 | (a) | 06/27/25 | 686,000 | ||||||||
| Federal Farm Credit Banks Funding Corp. (SOFR + 0.150%) | ||||||||||||
| 1,173,000 | 5.550 | (a) | 01/03/25 | 1,173,000 | ||||||||
| 807,000 | 5.550 | (a) | 02/14/25 | 807,000 | ||||||||
| 1,661,000 | 5.550 | (a) | 05/27/25 | 1,661,000 | ||||||||
| 2,003,000 | 5.550 | (a) | 12/15/25 | 2,003,000 | ||||||||
| Federal Farm Credit Banks Funding Corp. (SOFR + 0.155%) | ||||||||||||
| 2,100,000 | 5.555 | (a) | 04/05/24 | 2,099,989 | ||||||||
| 2,482,000 | 5.555 | (a) | 02/10/25 | 2,482,000 | ||||||||
| 1,989,000 | 5.556 | (a) | 09/15/25 | 1,988,831 | ||||||||
| 3,220,000 | 5.555 | (a) | 11/28/25 | 3,220,000 | ||||||||
| 2,463,000 | 5.555 | (a) | 12/01/25 | 2,463,000 | ||||||||
| Principal Amount | Interest Rate | Maturity Date | Amortized Cost | |||||||||
| U.S. Government Agency Obligations– (continued) | ||||||||||||
| Federal Farm Credit Banks Funding Corp. (SOFR + 0.160%) | ||||||||||||
| $ | 476,000 | 5.560 | %(a) | 01/30/25 | $ | 476,000 | ||||||
| 768,000 | 5.560 | (a) | 04/10/25 | 768,000 | ||||||||
| 2,306,000 | 5.560 | (a) | 07/21/25 | 2,306,000 | ||||||||
| 3,323,000 | 5.560 | (a) | 08/04/25 | 3,323,000 | ||||||||
| 756,000 | 5.560 | (a) | 10/27/25 | 756,000 | ||||||||
| 1,554,000 | 5.560 | (a) | 11/03/25 | 1,554,000 | ||||||||
| Federal Farm Credit Banks Funding Corp. (SOFR + 0.165%) | ||||||||||||
| 2,871,000 | 5.565 | (a) | 06/27/24 | 2,870,945 | ||||||||
| 3,442,000 | 5.565 | (a) | 02/06/25 | 3,442,000 | ||||||||
| 5,626,000 | 5.565 | (a) | 08/14/25 | 5,626,000 | ||||||||
| Federal Farm Credit Banks Funding Corp. (SOFR + 0.170%) | ||||||||||||
| 1,909,000 | 5.570 | (a) | 01/23/25 | 1,909,000 | ||||||||
| Federal Farm Credit Banks Funding Corp. (SOFR + 0.180%) | ||||||||||||
| 4,300,000 | 5.580 | (a) | 10/16/24 | 4,300,000 | ||||||||
| 2,350,000 | 5.578 | (a) | 12/19/24 | 2,350,187 | ||||||||
| 2,100,000 | 5.580 | (a) | 12/19/24 | 2,100,168 | ||||||||
| 2,500,000 | 5.580 | (a) | 01/03/25 | 2,500,000 | ||||||||
| 5,337,000 | 5.580 | (a) | 01/17/25 | 5,337,000 | ||||||||
| 4,794,000 | 5.580 | (a) | 03/07/25 | 4,794,000 | ||||||||
| 784,000 | 5.577 | (a) | 04/28/25 | 784,282 | ||||||||
| Federal Farm Credit Banks Funding Corp. (SOFR + 0.190%) | ||||||||||||
| 2,400,000 | 5.590 | (a) | 11/25/24 | 2,400,000 | ||||||||
| 5,300,000 | 5.590 | (a) | 12/27/24 | 5,300,000 | ||||||||
| Federal Farm Credit Banks Funding Corp. (SOFR + 0.195%) | ||||||||||||
| 1,804,000 | 5.595 | (a) | 06/02/25 | 1,804,000 | ||||||||
| Federal Farm Credit Banks Funding Corp. (SOFR + 0.200%) | ||||||||||||
| 427,000 | 5.595 | (a) | 12/05/24 | 427,257 | ||||||||
| Federal Home Loan Bank | ||||||||||||
| 1,490,000 | 4.945 | 01/12/24 | 1,487,883 | |||||||||
| 3,857,000 | 5.059 | 02/06/24 | 3,838,659 | |||||||||
| 65,000 | 5.060 | 02/06/24 | 64,691 | |||||||||
| 4,212,000 | 5.070 | 02/06/24 | 4,191,971 | |||||||||
| 4,000,000 | 5.092 | 02/08/24 | 3,979,818 | |||||||||
| 2,035,000 | 5.093 | 02/09/24 | 2,024,462 | |||||||||
| 18,400,000 | 5.340 | 04/23/24 | 18,400,000 | |||||||||
| 2,980,000 | 5.407 | 04/25/24 | 2,930,347 | |||||||||
| 4,324,000 | 5.422 | 04/25/24 | 4,251,954 | |||||||||
| 20,990,000 | 5.330 | 04/26/24 | 20,990,000 | |||||||||
| 19,510,000 | 5.340 | 04/26/24 | 19,510,000 | |||||||||
| 13,150,000 | 5.370 | 05/21/24 | 13,150,000 | |||||||||
| 6,905,000 | 5.300 | 05/22/24 | 6,905,000 | |||||||||
| 15,210,000 | 5.360 | 06/11/24 | 15,210,000 | |||||||||
| 9,505,000 | 5.375 | 06/11/24 | 9,505,000 | |||||||||
| 6,595,000 | 5.490 | 07/15/24 | 6,595,000 | |||||||||
| 6,620,000 | 5.520 | 07/15/24 | 6,620,000 | |||||||||
| 10,305,000 | 5.500 | 07/19/24 | 10,305,000 | |||||||||
| 9,800,000 | 5.620 | 07/30/24 | 9,800,000 | |||||||||
| 8,260,000 | 5.550 | 08/12/24 | 8,260,000 | |||||||||
| 8,220,000 | 5.620 | 08/26/24 | 8,220,000 | |||||||||
| 1,750,000 | 5.245 | 10/25/24 | 1,678,656 | |||||||||
| 1,750,000 | 5.243 | 10/31/24 | 1,677,293 | |||||||||
| Federal Home Loan Bank (SOFR + 0.060%) | ||||||||||||
| 200,000 | 5.469 | (a) | 07/01/24 | 199,901 | ||||||||
| Federal Home Loan Bank (SOFR + 0.075%) | ||||||||||||
| 400,000 | 5.480 | (a) | 03/01/24 | 399,954 | ||||||||
| Federal Home Loan Bank (SOFR + 0.095%) | ||||||||||||
| 9,345,000 | 5.495 | (a) | 03/13/25 | 9,345,000 | ||||||||
| 6 | The accompanying notes are an integral part of these financial statements. |
GOLDMAN SACHS VARIABLE INSURANCE TRUST GOVERNMENT MONEY MARKET FUND
| Principal Amount | Interest Rate | Maturity Date | Amortized Cost | |||||||||
| U.S. Government Agency Obligations– (continued) | ||||||||||||
| Federal Home Loan Bank (SOFR + 0.115%) | ||||||||||||
| $ | 4,910,000 | 5.515 | %(a) | 11/06/24 | $ | 4,910,000 | ||||||
| Federal Home Loan Bank (SOFR + 0.120%) | ||||||||||||
| 4,755,000 | 5.520 | (a) | 01/03/25 | 4,755,000 | ||||||||
| 9,465,000 | 5.520 | (a) | 04/17/25 | 9,465,000 | ||||||||
| Federal Home Loan Bank (SOFR + 0.125%) | ||||||||||||
| 4,755,000 | 5.525 | (a) | 02/03/25 | 4,755,000 | ||||||||
| 4,045,000 | 5.525 | (a) | 03/24/25 | 4,045,000 | ||||||||
| 1,895,000 | 5.525 | (a) | 05/28/25 | 1,895,000 | ||||||||
| Federal Home Loan Bank (SOFR + 0.130%) | ||||||||||||
| 9,145,000 | 5.530 | (a) | 05/09/25 | 9,145,000 | ||||||||
| Federal Home Loan Bank (SOFR + 0.135%) | ||||||||||||
| 4,755,000 | 5.535 | (a) | 05/02/25 | 4,755,000 | ||||||||
| Federal Home Loan Bank (SOFR + 0.140%) | ||||||||||||
| 4,735,000 | 5.540 | (a) | 08/25/25 | 4,735,000 | ||||||||
| Federal Home Loan Bank (SOFR + 0.150%) | ||||||||||||
| 3,600,000 | 5.550 | (a) | 02/23/24 | 3,600,000 | ||||||||
| 5,185,000 | 5.550 | (a) | 05/28/25 | 5,185,000 | ||||||||
| 5,085,000 | 5.550 | (a) | 06/06/25 | 5,085,000 | ||||||||
| 470,000 | 5.550 | (a) | 09/02/25 | 470,000 | ||||||||
| Federal Home Loan Bank (SOFR + 0.155%) | ||||||||||||
| 4,575,000 | 5.555 | (a) | 07/08/25 | 4,575,000 | ||||||||
| 6,495,000 | 5.555 | (a) | 08/21/25 | 6,495,000 | ||||||||
| 4,325,000 | 5.555 | (a) | 08/22/25 | 4,325,000 | ||||||||
| 3,320,000 | 5.555 | (a) | 09/26/25 | 3,320,000 | ||||||||
| 2,365,000 | 5.555 | (a) | 11/14/25 | 2,365,000 | ||||||||
| 3,850,000 | 5.555 | (a) | 12/08/25 | 3,850,000 | ||||||||
| Federal Home Loan Bank (SOFR + 0.160%) | ||||||||||||
| 4,000,000 | 5.560 | (a) | 02/03/25 | 4,000,000 | ||||||||
| 7,980,000 | 5.560 | (a) | 07/10/25 | 7,980,000 | ||||||||
| 6,790,000 | 5.560 | (a) | 07/14/25 | 6,790,000 | ||||||||
| 2,920,000 | 5.560 | (a) | 07/25/25 | 2,920,000 | ||||||||
| 1,785,000 | 5.560 | (a) | 08/08/25 | 1,785,000 | ||||||||
| Federal Home Loan Bank (SOFR + 0.165%) | ||||||||||||
| 4,010,000 | 5.565 | (a) | 01/17/25 | 4,010,000 | ||||||||
| Federal Home Loan Bank (SOFR + 0.190%) | ||||||||||||
| 14,400,000 | 5.590 | (a) | 11/22/24 | 14,400,000 | ||||||||
| Federal Home Loan Mortgage Corp. | ||||||||||||
| 7,387,000 | 5.400 | 06/11/24 | 7,387,000 | |||||||||
| 7,387,000 | 5.380 | 06/12/24 | 7,387,000 | |||||||||
| Federal National Mortgage Association | ||||||||||||
| 9,894,000 | 5.600 | 07/31/24 | 9,894,000 | |||||||||
| U.S. International Development Finance Corp. (3 Mo. U.S. T-Bill + 0.000%) | ||||||||||||
| 550,000 | 5.520 | (a) | 09/15/26 | 550,000 | ||||||||
| 1,875,000 | 5.520 | (a) | 03/15/30 | 1,875,000 | ||||||||
| 3,131,798 | 5.520 | (a) | 12/15/33 | 3,131,798 | ||||||||
| TOTAL U.S. GOVERNMENT AGENCY OBLIGATIONS | $ | 468,187,965 | ||||||||||
| U.S. Treasury Obligations - 22.5% | ||||||||||||
| United States Treasury Bills | ||||||||||||
| 7,972,200 | 5.392 | 01/18/24 | 7,952,304 | |||||||||
| 17,667,000 | 5.457 | 01/25/24 | 17,604,454 | |||||||||
| 334,600 | 5.458 | 01/25/24 | 333,415 | |||||||||
| 267,500 | 5.459 | 01/25/24 | 266,553 | |||||||||
| 152,700 | 5.460 | 01/25/24 | 152,159 | |||||||||
| 731,900 | 5.462 | 01/25/24 | 729,309 | |||||||||
| 11,053,400 | 5.473 | 02/01/24 | 11,002,716 | |||||||||
| 2,339,100 | 5.527 | 02/13/24 | 2,324,139 | |||||||||
| Principal Amount | Interest Rate | Maturity Date | Amortized Cost | |||||||||
| U.S. Treasury Obligations– (continued) | ||||||||||||
| $ | 2,334,400 | 5.387 | % | 02/20/24 | $ | 2,317,314 | ||||||
| 2,527,700 | 5.506 | 02/27/24 | 2,506,346 | |||||||||
| 869,100 | 5.508 | 02/27/24 | 861,758 | |||||||||
| 4,279,800 | 5.580 | 04/04/24 | 4,220,125 | |||||||||
| 853,500 | 5.421 | 04/09/24 | 841,201 | |||||||||
| 431,800 | 5.558 | 04/11/24 | 425,342 | |||||||||
| 1,279,700 | 5.566 | 04/11/24 | 1,260,560 | |||||||||
| 1,599,600 | 5.571 | 04/11/24 | 1,575,675 | |||||||||
| 2,849,700 | 5.379 | 04/16/24 | 2,805,983 | |||||||||
| 620,400 | 5.384 | 04/16/24 | 610,882 | |||||||||
| 4,317,700 | 5.394 | 04/16/24 | 4,251,462 | |||||||||
| 1,118,100 | 5.399 | 04/16/24 | 1,100,947 | |||||||||
| 810,500 | 5.389 | 04/23/24 | 797,221 | |||||||||
| 731,700 | 5.395 | 04/23/24 | 719,712 | |||||||||
| 48,670,600 | 5.400 | 04/23/24 | 47,873,168 | |||||||||
| 24,320,600 | 5.564 | 04/25/24 | 23,906,897 | |||||||||
| 2,803,600 | 5.379 | (b) | 04/30/24 | 2,755,320 | ||||||||
| 70,991,600 | 5.390 | (b) | 04/30/24 | 69,769,076 | ||||||||
| 7,024,400 | 5.558 | 05/02/24 | 6,897,344 | |||||||||
| 232,700 | 5.480 | 05/09/24 | 228,319 | |||||||||
| 4,807,200 | 5.483 | 05/09/24 | 4,716,694 | |||||||||
| 360,900 | 5.490 | 05/09/24 | 354,105 | |||||||||
| 3,163,200 | 5.494 | 05/09/24 | 3,103,646 | |||||||||
| 50,012,600 | 5.354 | 06/20/24 | 48,793,918 | |||||||||
| 80,000,000 | 5.301 | 06/27/24 | 77,990,578 | |||||||||
| 4,200,400 | 5.421 | 10/31/24 | 4,019,071 | |||||||||
| 1,280,600 | 5.432 | 10/31/24 | 1,225,317 | |||||||||
| 2,019,500 | 5.452 | 10/31/24 | 1,932,319 | |||||||||
| 12,000,000 | 5.506 | 10/31/24 | 11,481,967 | |||||||||
| 5,142,000 | 4.890 | 11/29/24 | 4,908,970 | |||||||||
| 1,163,500 | 5.195 | 11/29/24 | 1,110,771 | |||||||||
| 45,000,000 | 5.282 | 11/29/24 | 42,960,651 | |||||||||
| 44,990,000 | 4.899 | 12/26/24 | 42,922,709 | |||||||||
| United States Treasury Floating Rate Note | ||||||||||||
| 3,750,400 | 5.174 | 11/15/24 | 3,658,235 | |||||||||
| 419,500 | 5.182 | 11/15/24 | 403,763 | |||||||||
| 1,240,500 | 5.184 | 11/15/24 | 1,210,015 | |||||||||
| 890,400 | 5.225 | 11/15/24 | 856,999 | |||||||||
| 445,000 | 5.243 | 11/15/24 | 428,307 | |||||||||
| 1,636,400 | 4.994 | 11/30/24 | 1,595,072 | |||||||||
| 1,408,200 | 5.135 | 12/15/24 | 1,354,776 | |||||||||
| 5,142,100 | 4.805 | 12/31/24 | 5,103,882 | |||||||||
| 939,500 | 5.064 | 12/31/24 | 932,517 | |||||||||
| 1,644,100 | 5.066 | 12/31/24 | 1,631,880 | |||||||||
| 1,168,900 | 5.069 | 12/31/24 | 1,160,212 | |||||||||
| 1,644,100 | 5.070 | 12/31/24 | 1,631,880 | |||||||||
| 1,168,900 | 5.072 | 12/31/24 | 1,131,416 | |||||||||
| 1,873,000 | 5.073 | 12/31/24 | 1,841,733 | |||||||||
| 704,100 | 5.074 | 12/31/24 | 698,867 | |||||||||
| 701,300 | 5.076 | 12/31/24 | 678,811 | |||||||||
| 938,800 | 5.083 | 12/31/24 | 911,000 | |||||||||
| 352,100 | 5.084 | 12/31/24 | 349,483 | |||||||||
| 2,348,800 | 5.089 | 12/31/24 | 2,331,343 | |||||||||
| 1,174,400 | 5.109 | 12/31/24 | 1,165,671 | |||||||||
| 4,675,400 | 5.113 | 12/31/24 | 4,640,650 | |||||||||
| 3,039,200 | 5.115 | 12/31/24 | 2,976,296 | |||||||||
| 935,200 | 5.121 | 12/31/24 | 905,210 | |||||||||
| The accompanying notes are an integral part of these financial statements. | 7 |
GOLDMAN SACHS VARIABLE INSURANCE TRUST GOVERNMENT MONEY MARKET FUND
Schedule of Investments (continued)
December 31, 2023
| Principal Amount | Interest Rate | Maturity Date | Amortized Cost | |||||||||
| U.S. Treasury Obligations– (continued) | ||||||||||||
| United States Treasury Floating Rate Note (3 Mo. U.S. T-Bill MMY + 0.037%) | ||||||||||||
| $ | 4,639,400 | 5.367 | %(a) | 07/31/24 | $ | 4,639,751 | ||||||
| United States Treasury Floating Rate Note (3 Mo. U.S. T-Bill MMY + 0.125%) | ||||||||||||
| 29,438,000 | 5.461 | (a) | 07/31/25 | 29,412,366 | ||||||||
| United States Treasury Floating Rate Note (3 Mo. U.S. T-Bill MMY + 0.169%) | ||||||||||||
| 14,809,000 | 5.500 | (a) | 04/30/25 | 14,808,419 | ||||||||
| United States Treasury Floating Rate Note (3 Mo. U.S. T-Bill MMY + 0.170%) | ||||||||||||
| 849,100 | 5.499 | (a) | 10/31/25 | 847,927 | ||||||||
| 20,970,700 | 5.509 | (a) | 10/31/25 | 20,941,714 | ||||||||
| TOTAL U.S. TREASURY OBLIGATIONS | $ | 569,858,612 | ||||||||||
| TOTAL INVESTMENTS BEFORE REPURCHASE AGREEMENTS | $ | 1,038,046,577 | ||||||||||
| Repurchase Agreements(c)- 60.4% | ||||||||||||
| Bank of America, NA | ||||||||||||
| 19,000,000 | v5.690 | 04/17/24 | $ | 19,000,000 | ||||||||
| Maturity Value: $19,549,559 | ||||||||||||
| Settlement Date: 10/17/23 | ||||||||||||
| Collateralized by Federal National Mortgage Association, 3.500%, due 03/01/45. The market value of the collateral, including accrued interest, was $19,570,000. | ||||||||||||
| 8,000,000 | 5.660 | 04/19/24 | $ | 8,000,000 | ||||||||
| Maturity Value: $8,228,916 | ||||||||||||
| Settlement Date: 10/20/23 | ||||||||||||
| Collateralized by Federal National Mortgage Association, 3.000% to 3.500%, due 03/01/45 to 08/01/46. The aggregate market value of the collateral, including accrued interest, was $8,240,000. | ||||||||||||
| BNP Paribas | ||||||||||||
| 7,000,000 | 5.250 | (d) | 01/07/24 | $ | 7,000,000 | |||||||
| Maturity Value: $7,185,792 | ||||||||||||
| Settlement Date: 12/15/23 | ||||||||||||
| Collateralized by a U.S. Treasury Inflation-Indexed Bond, 1.000%, due 02/15/48, a U.S. Treasury Inflation-Indexed Note, 0.500%, due 04/15/24, U.S. Treasury Interest-Only Stripped Securities, 0.000%, due 11/15/42 to 08/15/46 and a U.S. Treasury Note, 3.625%, due 03/31/30. The aggregate market value of the collateral, including accrued interest, was $7,140,050. | ||||||||||||
| 10,000,000 | 5.260 | (d) | 01/07/24 | $ | 10,000,000 | |||||||
| Maturity Value: $10,265,922 | ||||||||||||
| Settlement Date: 12/15/23 | ||||||||||||
| Collateralized by Federal National Mortgage Association, 3.000%, due 09/01/51, Government National Mortgage Association, 4.000%, due 04/20/52 and U.S. Treasury Notes, 4.125% to 4.375%, due 08/15/26 to 08/31/30. The aggregate market value of the collateral, including accrued interest, was $10,299,818. | ||||||||||||
| 8,600,000 | 5.490 | (d) | 01/07/24 | $ | 8,600,000 | |||||||
| Maturity Value: $8,840,004 | ||||||||||||
| Settlement Date: 08/30/23 | ||||||||||||
| Collateralized by Government National Mortgage Association, 4.000%, due 04/20/52 and a U.S. Treasury Note, 4.125%, due 08/31/30. The aggregate market value of the collateral, including accrued interest, was $8,857,832. | ||||||||||||
| Principal Amount | Interest Rate | Maturity Date | Amortized Cost | |||||||||
| Repurchase Agreements(c)– (continued) | ||||||||||||
| Fixed Income Clearing Corp. | ||||||||||||
| $ | 9,000,000 | 5.310 | % | 01/02/24 | $ | 9,000,000 | ||||||
| Maturity Value: $9,005,310 | ||||||||||||
| Settlement Date: 12/29/23 | ||||||||||||
| Collateralized by a U.S. Treasury Note, 0.250%, due 07/31/25. The market value of the collateral, including accrued interest, was $9,180,000. | ||||||||||||
| 35,000,000 | 5.330 | 01/02/24 | $ | 35,000,000 | ||||||||
| Maturity Value: $35,020,728 | ||||||||||||
| Settlement Date: 12/29/23 | ||||||||||||
| Collateralized by a U.S. Treasury Bill, 4.500%, due 07/15/26. The market value of the collateral, including accrued interest, was $35,700,000. | ||||||||||||
| Joint Account III | ||||||||||||
| 1,328,400,000 | 5.350 | 01/02/24 | $ | 1,328,400,000 | ||||||||
| Maturity Value: $1,329,189,686 | ||||||||||||
| Settlement Date: 12/29/23 | ||||||||||||
| Royal Bank of Canada | ||||||||||||
| 10,000,000 | 5.240 | (d) | 01/07/24 | $ | 10,000,000 | |||||||
| Maturity Value: $10,263,456 | ||||||||||||
| Settlement Date: 12/15/23 | ||||||||||||
| Collateralized by Federal Home Loan Mortgage Corp., 4.000%, due 04/01/52 and Federal National Mortgage Association, 4.000% to 6.000%, due 09/01/52 to 09/01/53. The aggregate market value of the collateral, including accrued interest, was $10,199,999. | ||||||||||||
| 10,000,000 | 5.270 | (d) | 01/07/24 | $ | 10,000,000 | |||||||
| Maturity Value: $10,260,572 | ||||||||||||
| Settlement Date: 12/19/23 | ||||||||||||
| Collateralized by Federal Home Loan Mortgage Corp., 4.000%, due 04/01/52 and Federal National Mortgage Association, 4.500% to 6.000%, due 09/01/48 to 09/01/53. The aggregate market value of the collateral, including accrued interest, was $10,200,000. | ||||||||||||
| 17,000,000 | 5.500 | (d) | 01/07/24 | $ | 17,000,000 | |||||||
| Maturity Value: $17,472,695 | ||||||||||||
| Settlement Date: 09/07/23 | ||||||||||||
| Collateralized by Federal Home Loan Mortgage Corp., 4.000%, due 04/01/52 and Federal National Mortgage Association, 3.500% to 4.000%, due 09/01/45 to 08/01/59. The aggregate market value of the collateral, including accrued interest, was $17,340,002. | ||||||||||||
| 17,000,000 | 5.500 | (d) | 01/07/24 | $ | 17,000,000 | |||||||
| Maturity Value: $17,470,097 | ||||||||||||
| Settlement Date: 09/08/23 | ||||||||||||
| Collateralized by Federal Home Loan Mortgage Corp., 4.000%, due 04/01/52 and Federal National Mortgage Association, 2.500% to 5.500%, due 10/01/45 to 03/01/53. The aggregate market value of the collateral, including accrued interest, was $17,340,001. | ||||||||||||
| 17,200,000 | 5.500 | (d) | 01/07/24 | $ | 17,200,000 | |||||||
| Maturity Value: $17,680,883 | ||||||||||||
| Settlement Date: 08/30/23 | ||||||||||||
| Collateralized by Federal Home Loan Mortgage Corp., 3.000% to 6.500%, due 04/01/33 to 08/01/53 and Federal National Mortgage Association, 2.000% to 6.000%, due 10/01/45 to 09/01/62. The aggregate market value of the collateral, including accrued interest, was $17,543,998. | ||||||||||||
| 8 | The accompanying notes are an integral part of these financial statements. |
GOLDMAN SACHS VARIABLE INSURANCE TRUST GOVERNMENT MONEY MARKET FUND
| Principal Amount | Interest Rate | Maturity Date | Amortized Cost | |||||||||
| Repurchase Agreements(c)– (continued) | ||||||||||||
| Royal Bank of Canada – (continued) | ||||||||||||
| $ | 17,200,000 | 5.500 | %(d) | 01/07/24 | $ | 17,200,000 | ||||||
| Maturity Value: $17,678,256 | ||||||||||||
| Settlement Date: 08/31/23 | ||||||||||||
| Collateralized by Federal Home Loan Mortgage Corp., 4.000%, due 04/01/52 and Federal National Mortgage Association, 2.500% to 6.000%, due 10/01/45 to 09/01/62. The aggregate market value of the collateral, including accrued interest, was $17,544,001. | ||||||||||||
| Wells Fargo Securities, LLC | ||||||||||||
| 15,000,000 | 5.360 | 01/04/24 | $ | 15,000,000 | ||||||||
| Maturity Value: $15,015,633 | ||||||||||||
| Settlement Date: 12/28/23 | ||||||||||||
| Collateralized by Federal National Mortgage Association, 6.000%, due 10/01/53. The market value of the collateral, including accrued interest, was $15,450,000. | ||||||||||||
| 5,000,000 | 5.430 | 03/22/24 | $ | 5,000,000 | ||||||||
| Maturity Value: $5,070,138 | ||||||||||||
| Settlement Date: 12/20/23 | ||||||||||||
| Collateralized by Federal National Mortgage Association, 6.000%, due 10/01/53. The market value of the collateral, including accrued interest, was $5,150,001. | ||||||||||||
| TOTAL REPURCHASE AGREEMENTS | $ | 1,533,400,000 | ||||||||||
| TOTAL INVESTMENTS - 101.3% | $ | 2,571,446,577 | ||||||||||
| LIABILITIES IN EXCESS OF OTHER ASSETS - (1.3)% | (33,356,666 | ) | ||||||||||
| NET ASSETS - 100.0% | $ | 2,538,089,911 | ||||||||||
| The percentage shown for each investment category reflects the value of investments in that category as a percentage of net assets. | ||||||||||||
| (a) | Variable or floating rate security. Except for floating rate notes (for which final maturity is disclosed), maturity date disclosed is the next interest reset date. Interest rate disclosed is that which is in effect on December 31, 2023. |
| (b) | All or a portion represents a forward commitment. |
| (c) | Unless noted, all repurchase agreements were entered into on December 31, 2023. Additional information on Joint Repurchase Agreement Account III appears in the Additional Investment Information section. |
| (d) | The instrument is subject to a demand feature. Interest rates represent either the stated coupon rate, annualized yield on date of purchase for discounted securities, or, for floating rate securities, the current reset rate, which is based upon current interest rate indices. |
Maturity dates represent either the final legal maturity date on the security, the demand date for puttable securities, the date of the next interest rate reset for variable rate securities, or the prerefunded date for those types of securities.
| Investment Abbreviations: | ||
| FEDL01 | — | US Federal Funds Effective Rate |
| Investment Abbreviations: (continued) | ||
| MMY | — | Money Market Yield |
| Mo. | — | Month |
| Prime | — | Federal Reserve Bank Prime Loan Rate US |
| SOFR | — | Secured Overnight Financing Rate |
| T-Bill | — | Treasury Bill |
| The accompanying notes are an integral part of these financial statements. | 9 |
GOLDMAN SACHS VARIABLE INSURANCE TRUST GOVERNMENT MONEY MARKET FUND
Schedule of Investments (continued)
December 31, 2023
| ADDITIONAL INVESTMENT INFORMATION |
JOINT REPURCHASE AGREEMENT ACCOUNT III— At December 31, 2023, the Fund had undivided interests in the Joint Repurchase Agreement Account III with a maturity date of January 2, 2024, as follows:
| Fund | Principal Amount | Maturity Value | Collateral Value Allocation |
| Government Money Market Fund | $1,328,400,000 | $1,329,189,686 | $1,365,566,224 |
REPURCHASE AGREEMENTS— At December 31, 2023, the Principal Amounts of the Fund's interest in the Joint Repurchase Agreement Account III were as follows:
| Counterparty | Interest Rate | Principal Amount | |
| ABN Amro Bank N.V. | 5.360% | $241,527,273 | |
| Bank of America, N.A. | 5.350 | 241,527,273 | |
| Bank of Montreal | 5.340 | 120,763,636 | |
| BofA Securities, Inc. | 5.350 | 241,527,273 | |
| Credit Agricole Corporate and Investment Bank | 5.340 | 96,610,909 | |
| Wells Fargo Securities, LLC | 5.350 | 386,443,636 | |
| Total | $1,328,400,000 | ||
At December 31, 2023, the Joint Repurchase Agreement Account III was fully collateralized by:
| Issuer | Interest Rate | Maturity Dates |
| Federal Home Loan Bank | 4.250% | 10/19/2038 |
| Federal Home Loan Mortgage Corp. | 3.000% to 6.500 | 08/01/46 to 02/01/53 |
| Federal National Mortgage Association | 2.000 to 7.000 | 08/01/33 to 12/01/53 |
| Government National Mortgage Association | 2.000 to 7.500 | 12/20/26 to 12/20/53 |
| U.S. Treasury Bills | – | 3/12/24 to 3/21/2024 |
| U.S. Treasury Bonds | 1.375 | 8/15/2050 |
| U.S. Treasury Notes | 0.375 to 4.875 | 05/15/26 to 05/15/32 |
| 10 | The accompanying notes are an integral part of these financial statements. |
GOLDMAN SACHS VARIABLE INSURANCE TRUST GOVERNMENT MONEY MARKET FUND
Statement of Assets and Liabilities
December 31, 2023
| Goldman Sachs Government Money Market Fund | ||
| Assets: | ||
| Investments based on amortized cost | $ | 1,038,046,577 |
| Repurchase agreements based on amortized cost | 1,533,400,000 | |
| Cash | 20,093,583 | |
| Receivables: | ||
| Fund shares sold | 11,417,197 | |
| Interest | 7,728,545 | |
| Investments sold | 2,754,976 | |
| Reimbursement from investment adviser | 128,333 | |
| Other assets | 43,821 | |
| Total assets | 2,613,613,032 | |
| Liabilities: | ||
| Payables: | ||
| Investments purchased | 72,524,396 | |
| Fund shares redeemed | 2,185,340 | |
| Management fees | 343,439 | |
| Distribution and Service fees and Transfer Agency fees | 208,000 | |
| Accrued expenses | 261,946 | |
| Total liabilities | 75,523,121 | |
| Net Assets: | ||
| Paid-in Capital | 2,538,020,167 | |
| Total distributable earnings (loss) | 69,744 | |
| NET ASSETS | $ | 2,538,089,911 |
| Net asset value, offering and redemption price per share | $ | 1.00 |
| Net Assets: | ||
| Institutional Shares | $ | 1,756,706,849 |
| Service Shares | 781,383,062 | |
| Total Net Assets | $ | 2,538,089,911 |
| Shares Outstanding $0.001 par value (unlimited number of shares authorized): | ||
| Institutional Shares | 1,756,658,468 | |
| Service Shares | 781,361,680 |
| The accompanying notes are an integral part of these financial statements. | 11 |
GOLDMAN SACHS VARIABLE INSURANCE TRUST GOVERNMENT MONEY MARKET FUND
Statement of Operations
For the Fiscal Year Ended December 31, 2023
| Goldman Sachs Government Money Market Fund | ||||
| Investment income: | ||||
| Interest income | $ | 118,175,520 | ||
| Expenses: | ||||
| Management fees | 3,676,946 | |||
| Distribution and Service fees—Service Shares | 1,889,792 | |||
| Transfer Agency fees(a) | 459,577 | |||
| Printing and mailing costs | 345,411 | |||
| Shareholder meeting expense | 96,216 | |||
| Professional fees | 95,446 | |||
| Custody, accounting and administrative services | 87,756 | |||
| Trustee fees | 24,523 | |||
| Other | 39,513 | |||
| Total expenses | 6,715,180 | |||
| Less — expense reductions | (500,726 | ) | ||
| Net expenses | 6,214,454 | |||
| NET INVESTMENT INCOME | 111,961,066 | |||
| Net realized gain from investment transactions | 316,911 | |||
| NET INCREASE IN NET ASSETS RESULTING FROM OPERATIONS | $ | 112,277,977 | ||
| (a) | Institutional and Service Shares incurred Transfer Agency fees of $308,405 and $151,172, respectively. |
| 12 | The accompanying notes are an integral part of these financial statements. |
GOLDMAN SACHS VARIABLE INSURANCE TRUST GOVERNMENT MONEY MARKET FUND
Statements of Changes in Net Assets
.
| Goldman Sachs Government Money Market Fund | ||||||||
| For the Fiscal Year Ended December 31, 2023 | For the Fiscal Year Ended December 31, 2022 | |||||||
| From operations: | ||||||||
| Net investment income | $ | 111,961,066 | $ | 27,763,477 | ||||
| Net realized gain (loss) from investment transactions | 316,911 | (219,781 | ) | |||||
| Net increase in net assets resulting from operations | 112,277,977 | 27,543,696 | ||||||
| Distributions to shareholders: | ||||||||
| From distributable earnings: | ||||||||
| Institutional Shares | (76,620,390 | ) | (18,642,223 | ) | ||||
| Service Shares | (35,577,989 | ) | (8,911,722 | ) | ||||
| Total distributions to shareholders | (112,198,379 | ) | (27,553,945 | ) | ||||
| From share transactions (at $1.00 per share): | ||||||||
| Proceeds from sales of shares | 2,274,304,705 | 2,307,084,458 | ||||||
| Reinvestment of distributions | 111,955,715 | 27,550,932 | ||||||
| Cost of shares redeemed | (2,361,010,400 | ) | (846,623,441 | ) | ||||
| Net increase in net assets resulting from share transactions | 25,250,020 | 1,488,011,949 | ||||||
| TOTAL INCREASE | 25,329,618 | 1,488,001,700 | ||||||
| Net Assets: | ||||||||
| Beginning of year | 2,512,760,293 | 1,024,758,593 | ||||||
| End of year | $ | 2,538,089,911 | $ | 2,512,760,293 | ||||
| The accompanying notes are an integral part of these financial statements. | 13 |
GOLDMAN SACHS VARIABLE INSURANCE TRUST GOVERNMENT MONEY MARKET FUND
Selected Data for a Share Outstanding Throughout Each Year
| Goldman Sachs Government Money Market Fund | ||||||||||||||||||||
| Institutional Shares | ||||||||||||||||||||
| Year Ended December 31, | ||||||||||||||||||||
| 2023 | 2022 | 2021 | 2020 | 2019 | ||||||||||||||||
| Per Share Data | ||||||||||||||||||||
| Net asset value, beginning of year | $ | 1.00 | $ | 1.00 | $ | 1.00 | $ | 1.00 | $ | 1.00 | ||||||||||
| Net investment income(a) | 0.050 | 0.016 | – | (b) | 0.004 | 0.021 | ||||||||||||||
| Distributions to shareholders from net investment income(c) | $ | (0.050 | ) | (0.016 | ) | – | (b) | (0.004 | ) | (0.021 | ) | |||||||||
| Net asset value, end of year | 1.00 | $ | 1.00 | $ | 1.00 | $ | 1.00 | $ | 1.00 | |||||||||||
| Total Return(d) | 5.05 | % | 1.58% | 0.01 | % | 0.43% | 2.11% | |||||||||||||
| Net assets, end of year (in 000's) | $ | 1,756,707 | $ | 1,834,293 | $ | 523,751 | $ | 582,216 | $ | 363,783 | ||||||||||
| Ratio of net expenses to average net assets | 0.19 | % | 0.17% | 0.09 | % | 0.18% | 0.18% | |||||||||||||
| Ratio of total expenses to average net assets | 0.21 | % | 0.20% | 0.21 | % | 0.20% | 0.21% | |||||||||||||
| Ratio of net investment income to average net assets | 4.96 | % | 1.92% | – | %(e) | 0.35% | 2.06% | |||||||||||||
| (a) | Calculated based on the average shares outstanding methodology. |
| (b) | Amount is less than $0.0005 per share. |
| (c) | Distributions may not coincide with the current year net investment income or net realized gains as distributions may be paid from current or prior year earnings. |
| (d) | Assumes reinvestment of all distributions. Returns do not reflect the deduction of taxes that a shareholder would pay on Fund distributions. |
| (e) | Amount is less than 0.005%. |
| Goldman Sachs Government Money Market Fund | ||||||||||||||||||||
| Service Shares | ||||||||||||||||||||
| Year Ended December 31, | ||||||||||||||||||||
| 2023 | 2022 | 2021 | 2020 | 2019 | ||||||||||||||||
| Per Share Data | ||||||||||||||||||||
| Net asset value, beginning of year | $ | 1.00 | $ | 1.00 | $ | 1.00 | $ | 1.00 | $ | 1.00 | ||||||||||
| Net investment income(a) | 0.047 | 0.014 | – | (b) | 0.003 | 0.018 | ||||||||||||||
| Distributions to shareholders from net investment income(c) | (0.047 | ) | (0.014 | ) | – | (b) | (0.003 | ) | (0.018 | ) | ||||||||||
| Net asset value, end of year | $ | 1.00 | $ | 1.00 | $ | 1.00 | $ | 1.00 | $ | 1.00 | ||||||||||
| Total Return(d) | 4.79 | % | 1.37 | % | 0.01 | % | 0.27 | % | 1.86 | % | ||||||||||
| Net assets, end of year (in 000's) | $ | 781,383 | $ | 678,468 | $ | 501,008 | $ | 579,416 | $ | 350,112 | ||||||||||
| Ratio of net expenses to average net assets | 0.44 | % | 0.38 | % | 0.09 | % | 0.33 | % | 0.43 | % | ||||||||||
| Ratio of total expenses to average net assets | 0.46 | % | 0.45 | % | 0.46 | % | 0.45 | % | 0.46 | % | ||||||||||
| Ratio of net investment income to average net assets | 4.70 | % | 1.48 | % | – | %(e) | 0.19 | % | 1.81 | % | ||||||||||
| (a) | Calculated based on the average shares outstanding methodology. |
| (b) | Amount is less than $0.0005 per share. |
| (c) | Distributions may not coincide with the current year net investment income or net realized gains as distributions may be paid from current or prior year earnings. |
| (d) | Assumes reinvestment of all distributions. Returns do not reflect the deduction of taxes that a shareholder would pay on Fund distributions. |
| (e) | Amount is less than 0.005%. |
| 14 | The accompanying notes are an integral part of these financial statements. |
GOLDMAN SACHS VARIABLE INSURANCE TRUST GOVERNMENT MONEY MARKET FUND
December 31, 2023
| 1. ORGANIZATION |
Goldman Sachs Variable Insurance Trust (the “Trust” or “VIT”) is a Delaware statutory trust registered under the Investment Company Act of 1940, as amended (the “Act”), as an open-end management investment company. The Trust includes the Goldman Sachs Government Money Market Fund (the “Fund”). The Fund is a diversified portfolio under the Act offering two classes of shares — Institutional and Service Shares. Shares of the Trust are offered to separate accounts of participating life insurance companies for the purpose of funding variable annuity contracts and variable life insurance policies.
Goldman Sachs Asset Management, L.P. (“GSAM”), an affiliate of Goldman Sachs & Co. LLC (“Goldman Sachs”), serves as investment adviser to the Fund pursuant to a management agreement (the “Agreement”) with the Trust.
| 2. SIGNIFICANT ACCOUNTING POLICIES |
The financial statements have been prepared in accordance with accounting principles generally accepted in the United States of America (“GAAP”) and require management to make estimates and assumptions that may affect the reported amounts and disclosures. Actual results may differ from those estimates and assumptions. The Fund is an investment company under GAAP and follows the accounting and reporting guidance applicable to investment companies.
A. Investment Valuation — The investment valuation policy of the Fund is to use the amortized-cost method permitted by Rule 2a-7 under the Act for valuing portfolio securities. The amortized-cost method of valuation involves valuing a security at its cost and thereafter applying a constant accretion or amortization to maturity of any discount or premium. Normally, a security’s amortized cost will approximate its market value. Under procedures and tolerances approved by the Board of Trustees (“Trustees”), GSAM evaluates daily the difference between the Fund’s net asset value (“NAV”) per share using the amortized costs of its portfolio securities and the Fund’s NAV per share using market-based values of its portfolio securities. The market-based value of a portfolio security is determined, where readily available, on the basis of market quotations provided by pricing services or securities dealers, or, where accurate market quotations are not readily available, on the basis of the security’s fair value as determined in accordance with the Valuation Procedures. The pricing services may use valuation models or matrix pricing, which may consider (among other things): (i) yield or price with respect to debt securities that are considered comparable in characteristics such as rating, interest rate and maturity date or (ii) quotations from securities dealers to determine current value.
B. Investment Income and Investments — Interest income is accrued daily and adjusted for amortization of premiums and accretion of discounts. Investment transactions are reflected on trade date. Realized gains and losses are calculated using identified cost.
C. Class Allocations and Expenses — Investment income, realized and unrealized gain (loss), if any, and non-class specific expenses of the Fund are allocated daily based upon the proportion of net assets of each class. Class specific expenses, where applicable, are borne by the respective share classes and include Distribution and Service and Transfer Agency fees. Non-class specific expenses directly incurred by the Fund are charged to the Fund, while such expenses incurred by the Trust are allocated across the Fund on a straight-line and/or pro-rata basis depending upon the nature of the expenses.
D. Federal Taxes and Distributions to Shareholders — It is the Fund’s policy to comply with the requirements of the Internal Revenue Code of 1986, as amended (the “Code”), applicable to regulated investment companies (mutual funds) and to distribute each year substantially all of its investment company taxable and tax-exempt income and capital gains to its shareholders. Accordingly, the Fund is not required to make any provisions for the payment of federal income tax. Distributions to shareholders are declared and recorded daily and paid monthly by the Fund and may include short-term capital gains. Long-term capital gain distributions, if any, are declared and paid annually. The Fund may defer or accelerate the timing of the distribution of short-term capital gains (or any portion thereof).
The characterization of distributions to shareholders for financial reporting purposes is determined in accordance with federal income tax rules, which may differ from GAAP. The source of the Fund’s distributions may be shown in the accompanying financial statements as either from distributable earnings or capital. Certain components of the Fund’s net assets on the Statement of Assets and Liabilities reflect permanent GAAP/tax differences based on the appropriate tax character.
15
GOLDMAN SACHS VARIABLE INSURANCE TRUST GOVERNMENT MONEY MARKET FUND
Notes to Financial Statements (continued)
December 31, 2023
| 2. SIGNIFICANT ACCOUNTING POLICIES (continued) |
The tax character of distributions paid during the fiscal year ended December 31, 2023 was as follows:
| Goldman Sachs | ||||
| Government Money | ||||
| Market Fund | ||||
| Distributions paid from: | ||||
| Ordinary Income | $ | 112,198,379 | ||
| The tax character of distributions paid during the fiscal year ended December 31, 2022 was as follows: | ||||
| Goldman Sachs | ||||
| Government Money | ||||
| Market Fund | ||||
| Distributions paid from: | ||||
| Ordinary Income | $ | 27,553,945 | ||
As of December 31, 2023, the components of accumulated earnings (losses) on a tax basis were as follows:
| Goldman Sachs | ||||
| Government | ||||
| Money Market | ||||
| Fund | ||||
| Undistributed ordinary income — net | $ | 59,089 | ||
| Undistributed long-term capital gains | 10,732 | |||
| Total undistributed earnings | $ | 69,821 | ||
| Unrealized gains (losses) — net | (77 | ) | ||
| Total accumulated earnings (losses) — net | $ | 69,744 | ||
For the period ended December 31, 2023, the Goldman Sachs Government Money Market Fund utilized $210,225 in Capital Loss Carryforwards.
The amortized cost for the Fund stated in the accompanying Statement of Assets and Liabilities also represents aggregate cost for U.S. federal income tax purposes.
GSAM has reviewed the Fund’s tax positions for all open tax years (the current and prior three years, as applicable) and has concluded that no provision for income tax is required in the Fund’s financial statements. Such open tax years remain subject to examination and adjustment by tax authorities.
E. Forward Commitments — A forward commitment involves entering into a contract to purchase or sell securities, typically on an extended settlement basis, for a fixed price at a future date. The purchase of securities on a forward commitment basis involves a risk of loss if the value of the security to be purchased declines before the settlement date. Conversely, the sale of securities on a forward commitment basis involves the risk that the value of the securities sold may increase before the settlement date. Although the Fund will generally purchase securities on a forward commitment basis with the intention of acquiring the securities for its portfolio, the Fund may dispose of forward commitments prior to settlement which may result in a realized gain or loss.
F. Repurchase Agreements — Repurchase agreements involve the purchase of securities subject to the seller’s agreement to repurchase the securities at a mutually agreed upon date and price, under the terms of a Master Repurchase Agreement (“MRA”). During the term of a repurchase agreement, the value of the underlying securities held as collateral on behalf of the Fund, including accrued interest, is required to exceed the value of the repurchase agreement, including accrued interest. The gross value of repurchase agreements is included in the Statement of Assets and Liabilities for financial reporting purposes. The underlying securities for all repurchase agreements are held at the Fund’s custodian or designated sub-custodians under tri-party repurchase agreements.
16
GOLDMAN SACHS VARIABLE INSURANCE TRUST GOVERNMENT MONEY MARKET FUND
| 2. SIGNIFICANT ACCOUNTING POLICIES (continued) |
An MRA governs transactions between the Fund and select counterparties. An MRA contains provisions for, among other things, initiation of the transaction, income payments, events of default, and maintenance of securities for repurchase agreements. An MRA also permits offsetting with collateral to create one single net payment in the event of default or similar events, including the bankruptcy or insolvency of a counterparty.
If the seller defaults, the Fund could suffer a loss to the extent that the proceeds from the sale of the underlying securities and other collateral held by the Fund are less than the repurchase price and the Fund’s costs associated with delay and enforcement of the repurchase agreement. In addition, in the event of default or insolvency of the seller, a court could determine that the Fund’s interest in the collateral is not enforceable, resulting in additional losses to the Fund.
Pursuant to exemptive relief granted by the Securities and Exchange Commission (“SEC”) and terms and conditions contained therein, the Fund, together with other funds of the Trust and registered investment companies having management agreements with GSAM or its affiliates, may transfer uninvested cash into joint accounts, the daily aggregate balance of which is invested in one or more repurchase agreements. Under these joint accounts, the Fund maintains pro-rata credit exposure to the underlying repurchase agreements’ counterparties. With the exception of certain transaction fees, the Fund is not subject to any expenses in relation to these investments.
| 3. INVESTMENTS AND FAIR VALUE MEASUREMENTS |
U.S. GAAP defines the fair value of a financial instrument as the amount that would be received to sell an asset or paid to transfer a liability in an orderly transaction between market participants at the measurement date (i.e., the exit price); the Fund’s policy is to use the market approach. GAAP establishes a fair value hierarchy that prioritizes the inputs to valuation techniques used to measure fair value. The hierarchy gives the highest priority to unadjusted quoted prices in active markets for identical assets or liabilities (Level 1 measurements) and the lowest priority to unobservable inputs (Level 3 measurements). The level in the fair value hierarchy within which the fair value measurement in its entirety falls shall be determined based on the lowest level input that is significant to the fair value measurement in its entirety. The levels used for classifying investments are not necessarily an indication of the risk associated with investing in these investments. The three levels of the fair value hierarchy are described below:
Level 1 — Unadjusted quoted prices in active markets that are accessible at the measurement date for identical, unrestricted assets or liabilities;
Level 2 — Quoted prices in markets that are not active or financial instruments for which significant inputs are observable
(including, but not limited to, quoted prices for similar investments, interest rates, foreign exchange rates, volatility and credit spreads), either directly or indirectly;
Level 3 — Prices or valuations that require significant unobservable inputs (including GSAM’s assumptions in determining fair value measurement).
The Trustees have approved Valuation Procedures that govern the valuation of the portfolio investments held by the Fund, including investments for which market quotations are not readily available. With respect to the Fund’s investments that do not have readily available market quotations, the Trustees have designated the Adviser as the valuation designee to perform fair valuations pursuant to Rule 2a-5 under the Investment Company Act of 1940 (the “Valuation Designee”). GSAM has day-to-day responsibility for implementing and maintaining internal controls and procedures related to the valuation (including both the amortized cost and market-based methods of valuation) of the Fund’s investments. To assess the continuing appropriateness of pricing sources and methodologies related to the market-based method of valuation, GSAM regularly performs price verification procedures and issues challenges as necessary to third party pricing vendors or brokers, and any differences are reviewed in accordance with the Valuation Procedures.
As of December 31, 2023, all investments, including repurchase agreements, are classified as Level 2 of the fair value hierarchy. Please refer to the Schedule of Investments for further detail.
17
GOLDMAN SACHS VARIABLE INSURANCE TRUST GOVERNMENT MONEY MARKET FUND
Notes to Financial Statements (continued)
December 31, 2023
| 4. AGREEMENTS AND AFFILIATED TRANSACTIONS |
A. Management Agreement — Under the Agreement, GSAM manages the Fund, subject to the general supervision of the Trustees. As compensation for the services rendered pursuant to the Agreement, the assumption of the expenses related thereto and administration of the Fund’s business affairs, including providing facilities, GSAM is entitled to a management fee, accrued daily and paid monthly, equal to an annual percentage rate of the Fund’s average daily net assets.
B. Distribution and/or Service (12b-1) Plans — The Trust, on behalf of the Service Shares of the Fund, has adopted a Distribution and Service Plan subject to Rule 12b-1 under the Act. Under the Distribution and Service Plan, Goldman Sachs, which serves as distributor (the “Distributor”), is entitled to a fee accrued daily and paid monthly, for distribution services and personal and account maintenance services, which may then be paid by Goldman Sachs to authorized dealers, equal to, on an annual basis, 0.25% of the Fund’s average daily net assets attributable to Service Shares.
C. Transfer Agency Agreement — Goldman Sachs also serves as the transfer agent of the Fund for a fee pursuant to a Transfer Agency Agreement. The fee charged for such transfer agency services is accrued daily and paid monthly at an annual rate of 0.02%of the Fund’s average daily net assets of Institutional Shares and Service Shares.
D. Other Expense Agreements — GSAM has agreed to limit certain “Other Expenses” of the Fund (excluding acquired fund fees and expenses, transfer agency fees and expenses, taxes, interest, brokerage fees, expenses of shareholder meetings, litigation and indemnification, and extraordinary expenses) to the extent that such expenses exceed, on an annual basis, 0.004% of the average daily net assets of the Fund. Such Other Expense reimbursements, if any, are accrued daily and paid monthly. In addition, the Fund is not obligated to reimburse GSAM for prior fiscal year expense reimbursements, if any. This Other Expense limitation will remain in place through at least April 28, 2024, and prior to such date GSAM may not terminate the arrangement without the approval of the Trustees. In addition, the Fund has entered into certain offset arrangements with the custodian and the transfer agent, which may result in a reduction of the Fund’s expenses and are received irrespective of the application of the “Other Expense” limitation described above. For the year ended December 31, 2023, these expense reductions, including any fee waiver and Other Expense reimbursements, were as follows:
| Other Expense | Total Expense | |||
| Fund | Reimbursements | Reductions | ||
| Goldman Sachs Government Money Market Fund | $ 500,726 | $ 500,726 |
E. Contractual and Net Fund Expenses — The investment adviser may contractually agree to waive or reimburse certain fees and expenses until a specified date. The investment adviser or transfer agent may also voluntarily waive certain fees and expenses, and such voluntary waivers may be discontinued or modified at any time without notice. The following table outlines such fees (net of waivers) and Other Expenses (net of reimbursements and custodian and transfer agency fee credit reductions) in order to determine the Fund’s net annualized expenses for the fiscal year. The Fund is not obligated to reimburse GSAM or Goldman Sachs for prior fiscal year fee waivers and/or expense reimbursements, if any.
| Institutional Shares | Service Shares | |||||||||||||||
| Ratio of net expenses to | Ratio of net expenses to | |||||||||||||||
| Contractual | average net assets for | Contractual | average net assets for | |||||||||||||
| rate, if any | the fiscal year ended | rate, if any | the fiscal year ended | |||||||||||||
| Fee/Expense Type | December 31, 2023 | December 31, 2023 | ||||||||||||||
| Management Fee | 0.16 | % | 0.16 | % | 0.16 | % | 0.16 | % | ||||||||
| Distribution and Service Fees | N/A | N/A | 0.25 | 0.25 | ||||||||||||
| Transfer Agency Fees | 0.02 | 0.02 | 0.02 | 0.02 | ||||||||||||
| Other Expenses | — | 0.03 | — | 0.03 | ||||||||||||
| Total Annual Fund Operating Expenses | 0.21 | 0.46 | ||||||||||||||
| Other Reimbursements | (0.02 | ) | (0.02 | ) | ||||||||||||
| Net Expenses | 0.19 | % | 0.44 | % | ||||||||||||
N/A — Fees not applicable to respective share class.
F. Other Transactions with Affiliates — The Fund may purchase securities from, or sell securities to, an affiliated fund provided the affiliation is solely due to having a common investment adviser, common officers, or common Trustees.
18
GOLDMAN SACHS VARIABLE INSURANCE TRUST GOVERNMENT MONEY MARKET FUND
| 4. AGREEMENTS AND AFFILIATED TRANSACTIONS (continued) |
For the fiscal year ended December 31, 2023, the purchase and sale transactions and related net realized gain (loss) for the Fund with affiliated funds in compliance with Rule 17a-7 under the Act were as follows:
| Fund | Purchases | Sales | Net Realized Gain/(Loss) | |||||||||
| Goldman Sachs Government Money Market Fund | $ | — | $ | 699,821 | $ | (179 | ) | |||||
G. Line of Credit Facility — As of December 31, 2023, the Fund participated in a $1,110,000,000 committed, unsecured revolving line of credit facility (the “facility”) together with other funds of the Trust and certain registered investment companies having management agreements with GSAM or its affiliates. This facility is to be used for temporary emergency purposes, or to allow for an orderly liquidation of securities to meet redemption requests. The interest rate on borrowings is based on the federal funds rate. The facility also requires a fee to be paid by the Fund based on the amount of the commitment that has not been utilized. For the fiscal year ended December 31, 2023, the Fund did not have any borrowings under the facility. Prior to April 19, 2023, the facility was $1,250,000,000.
| 5. OTHER RISKS |
The Fund’s risks include, but are not limited to, the following:
Interest Rate Risk — When interest rates increase, a Fund's yield will tend to be lower than prevailing market rates, and the market value of its investments will generally decline. A wide variety of market factors can cause interest rates to rise, including central bank monetary policy, rising inflation and changes in general economic conditions. Changing interest rates may have unpredictable effects on the markets, may result in heightened market volatility and may detract from Fund performance. In addition, changes in monetary policy may exacerbate the risks associated with changing interest rates. A low interest rate environment poses additional risks to a Fund, because low yields on the Fund's portfolio holdings may have an adverse impact on the Fund's ability to provide a positive yield to its shareholders, pay expenses out current income, or minimize the volatility of the Fund's NAV per share and/or achieve its investment objective. Fluctuations in interest rates may also affect the liquidity of the Fund investments.
Large Shareholder Transactions Risk — The Fund may experience adverse effects when certain large shareholders, such as other funds, participating insurance companies, accounts and Goldman Sachs affiliates, purchase or redeem large amounts of shares of the Fund. Such large shareholder redemptions, which may occur rapidly or unexpectedly, may cause the Fund to sell portfolio securities at times when it would not otherwise do so, which may negatively impact the Fund’s NAV and liquidity. Similarly, large Fund share purchases may adversely affect the Fund’s performance to the extent that the Fund is delayed in investing new cash or otherwise maintains a larger cash position than it ordinarily would. These transactions may also increase transaction costs. In addition, a large redemption could result in the Fund’s current expenses being allocated over a smaller asset base, leading to an increase in the Fund’s expense ratio.
Market and Credit Risks — In the normal course of business, the Fund trades financial instruments and enters into financial transactions where risk of potential loss exists due to changes in the market (market risk). The value of the securities in which the Fund invests may go up or down in response to the prospects of individual companies, particular sectors or governments and/ or general economic conditions throughout the world due to increasingly interconnected global economies and financial markets. Events such as war, military conflict, acts of terrorism, social unrest, natural disasters, recessions, inflation, rapid interest rate changes, supply chain disruptions, sanctions, the spread of infectious illness or other public health threats could also significantly impact the Fund and its investments. Additionally, the Fund may also be exposed to credit risk in the event that an issuer or guarantor fails to perform or that an institution or entity with which the Fund has unsettled or open transactions defaults.
| 6. IDEMNIFICATION |
Under the Trust’s organizational documents, its Trustees, officers, employees and agents are indemnified, to the extent permitted by the Act and state law, against certain liabilities that may arise out of performance of their duties to the Fund. Additionally, in the course of business, the Fund enters into contracts that contain a variety of indemnification clauses. The Fund’s maximum exposure under these arrangements is unknown, as this would involve future claims that may be made against the Fund that have not yet occurred. However, GSAM believes the risk of loss under these arrangements to be remote.
19
GOLDMAN SACHS VARIABLE INSURANCE TRUST GOVERNMENT MONEY MARKET FUND
Notes to Financial Statements (continued)
December 31, 2023
| 7. OTHER MATTERS |
Exemptive Orders — Pursuant to SEC exemptive orders, the Funds may enter into certain principal transactions, including repurchase agreements, with Goldman Sachs.
Pursuant to an effort to consolidate the membership of the Board of Trustees of the Trust (the “Board”) with the Board of Trustees of each of Goldman Sachs ETF Trust, Goldman Sachs ETF Trust II, Goldman Sachs Real Estate Diversified Income Fund, Goldman Sachs Trust II and Goldman Sachs Trust, in July 2023, the Board voted to nominate Cheryl K. Beebe, John G. Chou, Eileen H. Dowling, Lawrence Hughes, John F. Killian, Steven D. Krichmar, Michael Latham, Lawrence W. Stranghoener and Paul C. Wirth (the “Nominees”) for election as Trustees of the Trust. Messrs. Chou and Wirth and Ms. Dowling were serving as Trustees of the Trust at the time of their nominations. At a virtual special joint meeting of shareholders held on November 16, 2023, each of the Nominees (except Messrs. Chou and Wirth and Ms. Dowling) was elected to serve as Trustees alongside the then current Trustees of the Trust, effective January 1, 2024. Each of Messrs. Chou and Wirth and Ms. Dowling was also elected at the meeting and continue to serve as Trustees of the Trust.
| 8. SUBSEQUENT EVENTS |
Subsequent events after the Statement of Assets and Liabilities date have been evaluated and GSAM has concluded that there is no impact requiring adjustment or disclosure in the financial statements.
| 9. SUMMARY OF SHARE TRANSACTIONS |
Share activity is as follows:
| Goldman Sachs Government Money Market Fund | ||||||||
| For the Fiscal Year Ended | For the Fiscal Year Ended | |||||||
| December 31, 2023 | December 31, 2022 | |||||||
| Shares | Shares | |||||||
| Institutional Shares* | ||||||||
| Shares sold | 1,959,289,446 | 1,919,889,511 | ||||||
| Reinvestment of distributions | 76,375,080 | 18,639,420 | ||||||
| Shares redeemed | (2,113,305,922 | ) | (627,979,771 | ) | ||||
| (77,641,396 | ) | 1,310,549,160 | ||||||
| Service Shares* | ||||||||
| Shares sold | 315,015,259 | 387,194,947 | ||||||
| Reinvestment of distributions | 35,580,635 | 8,911,512 | ||||||
| Shares redeemed | (247,704,478 | ) | (218,643,670 | ) | ||||
| 102,891,416 | 177,462,789 | |||||||
| NET INCREASE IN SHARES | 25,250,020 | 1,488,011,949 | ||||||
* Valued at $1.00 per share.
20
Report of Independent Registered Public Accounting Firm
To the Board of Trustees of Goldman Sachs Variable Insurance Trust and Shareholders of Goldman Sachs Government Money Market Fund
Opinion on the Financial Statements
We have audited the accompanying statement of assets and liabilities, including the schedule of investments, of Goldman Sachs Government Money Market Fund (one of the funds constituting Goldman Sachs Variable Insurance Trust, referred to hereafter as the "Fund") as of December 31, 2023, the related statement of operations for the year ended December 31, 2023, the statements of changes in net assets for each of the two years in the period ended December 31, 2023, including the related notes, and the financial highlights for each of the five years in the period ended December 31, 2023 (collectively referred to as the “financial statements”). In our opinion, the financial statements present fairly, in all material respects, the financial position of the Fund as of December 31, 2023, the results of its operations for the year then ended, the changes in its net assets for each of the two years in the period ended December 31, 2023 and the financial highlights for each of the five years in the period ended December 31, 2023 in conformity with accounting principles generally accepted in the United States of America.
Basis for Opinion
These financial statements are the responsibility of the Fund’s management. Our responsibility is to express an opinion on the Fund’s financial statements based on our audits. We are a public accounting firm registered with the Public Company Accounting Oversight Board (United States) (PCAOB) and are required to be independent with respect to the Fund in accordance with the U.S. federal securities laws and the applicable rules and regulations of the Securities and Exchange Commission and the PCAOB.
We conducted our audits of these financial statements in accordance with the standards of the PCAOB. Those standards require that we plan and perform the audit to obtain reasonable assurance about whether the financial statements are free of material misstatement, whether due to error or fraud.
Our audits included performing procedures to assess the risks of material misstatement of the financial statements, whether due to error or fraud, and performing procedures that respond to those risks. Such procedures included examining, on a test basis, evidence regarding the amounts and disclosures in the financial statements. Our audits also included evaluating the accounting principles used and significant estimates made by management, as well as evaluating the overall presentation of the financial statements. Our procedures included confirmation of securities owned as of December 31, 2023 by correspondence with the custodian and brokers; when replies were not received from brokers, we performed other auditing procedures. We believe that our audits provide a reasonable basis for our opinion.
/s/ PricewaterhouseCoopers LLP
Boston, Massachusetts
February 15, 2024
We have served as the auditor of one or more investment companies in the Goldman Sachs fund complex since 2000.
21
GOLDMAN SACHS VARIABLE INSURANCE TRUST GOVERNMENT MONEY MARKET FUND
Fund Expenses — Six Month Period Ended December 31, 2023 (Unaudited)
As a shareholder of Institutional Shares and Service Shares of the Fund, you incur ongoing costs, including management fees; distribution and service (12b-1) fees (with respect to Service Shares); and other Fund expenses. This example is intended to help you understand your ongoing costs (in dollars) of investing in the Fund and to compare these costs with the ongoing costs of investing in other mutual funds.
The example is based on an investment of $1,000 invested at the beginning of the period and held for the entire period from July 1, 2023, through December 31, 2023, which represents a period of 184 days of a 365 day year.
Actual Expenses — The first line in the table below provides information about actual account values and actual expenses. You may use the information in this line, together with the amount you invested, to estimate the expenses that you paid over the period. Simply divide your account value by $1,000 (for example, an $8,600 account value divided by $1,000=8.6), then multiply the result by the number in the first line under the heading entitled “Expenses Paid” to estimate the expenses you paid on your account during this period.
Hypothetical Example for Comparison Purposes — The second line in the table below provides information about hypothetical account values and hypothetical expenses based on the Fund’s actual net expense ratio and an assumed rate of return of 5% per year before expenses, which is not the Fund’s actual return. The hypothetical account values and expenses may not be used to estimate the actual ending account balance or expenses you paid for the period. You may use this information to compare the ongoing costs of investing in the Fund and other funds. To do so, compare this 5% hypothetical example with the 5% hypothetical examples that appear in the shareholder reports of the other funds.
Please note that the expenses shown in the table are meant to highlight your ongoing costs only and do not reflect any transactional costs, such as sales charges, redemption fees, or exchange fees. Therefore, the second line of the table is useful in comparing ongoing costs only and will not help you determine the relative total costs of owning different funds. In addition, if these transactional costs were included, your costs would have been higher.
| Goldman Sachs Variable Insurance Trust Government Money | |||||||||||||
| Market Fund | |||||||||||||
| Beginning | Ending | Expenses | |||||||||||
| Account Value | Account Value | Paid for the 6 months | |||||||||||
| Share Class | 7/1/23 | 12/31/23 | ended 12/31/23* | ||||||||||
| Institutional Shares | |||||||||||||
| Actual | $ | 1,000.00 | $ | 1,026.50 | $ | 0.97 | |||||||
| Hypothetical 5% return | 1,000.00 | 1,024.25+ | 0.97 | ||||||||||
| Service Shares | |||||||||||||
| Actual | 1,000.00 | 1,025.30 | 2.25 | ||||||||||
| Hypothetical 5% return | 1,000.00 | 1,022.99+ | 2.24 | ||||||||||
| * | Expenses are calculated using each Fund’s annualized net expense ratio for each class, which represents the ongoing expenses as a percentage of net assets for the six months ended December 31, 2023. Expenses are calculated by multiplying the annualized net expense ratio by the average account value for the period; then multiplying the result by the number of days in the most recent fiscal half year; and then dividing that result by the number of days in the fiscal year. |
| + | Hypothetical expenses are based on each Fund’s actual annualized net expense ratios and an assumed rate of return of 5% per year before expenses.
The annualized net expense ratios for the period were as follows: |
| Fund | Institutional Shares | Service Shares | ||
| Goldman Sachs Variable Insurance Trust Government Money Market Fund | 0.19% | 0.44% | ||
22
GOLDMAN SACHS VARIABLE INSURANCE TRUST FUNDS
Voting Results of Special Meeting of Shareholders (Unaudited)
A Special Meeting of Shareholders (the “Meeting”) of the Goldman Sachs Variable Insurance Trust (the “Trust”) was held on November 16, 2023 to consider and elect nominees to the Trust’s Board of Trustees. At the Meeting, Cheryl K. Beebe, Lawrence Hughes, John F. Killian, Steven D. Krichmar, Michael Latham and Lawrence W. Stranghoener were elected to the Trust’s Board of Trustees. In addition, at the Meeting, John G. Chou, Eileen H. Dowling and Paul C. Wirth, each of whom was previously appointed to the Trust’s Board of Trustees rather than elected by shareholders, were elected. In electing the nominees, the Trust’s shareholders voted as follows:
| Proposal | ||||
| Election of Trustees | For | Withheld | ||
| Cheryl K. Beebe | 932,148,752 | 26,776,872 | ||
| John G. Chou | 930,378,362 | 28,547,262 | ||
| Eileen H. Dowling | 932,188,448 | 26,737,175 | ||
| Lawrence Hughes | 932,346,926 | 26,578,698 | ||
| John F. Killian | 931,754,574 | 27,171,049 | ||
| Steven D. Krichmar | 932,002,203 | 26,923,420 | ||
| Michael Latham | 931,832,553 | 27,093,071 | ||
| Lawrence W. Stranghoener | 931,376,144 | 27,549,480 | ||
| Paul C. Wirth | 932,041,013 | 26,884,610 | ||
23
GOLDMAN SACHS VARIABLE INSURANCE TRUST GOVERNMENT MONEY MARKET FUND
Trustees and Officers (Unaudited)
Independent Trustees
| Name, Address and Age1 | Position(s) Held with the Trust | Term of Office and Length of Time Served2 | Principal Occupations During Past 5 Years | Number of Portfolios in Fund Complex Overseen by Trustee3 | Other Directorships Held by Trustee4 |
| Gregory G. Weaver Age: 72 | Chair of the Board of Trustees | Since 2023 (Trustee since 2015) | Mr. Weaver is retired. He is Director, Verizon Communications Inc. (2015-Present); and was formerly Chairman and Chief Executive Officer, Deloitte & Touche LLP (a professional services firm) (2001-2005 and 2012-2014); and Member of the Board of Directors, Deloitte & Touche LLP (2006-2012). Chair of the Board of Trustees — Goldman Sachs Variable Insurance Trust and Goldman Sachs Trust. | 102 | Verizon Communications Inc. |
| Dwight L. Bush Age: 66 | Trustee | Since 2020 | The Honorable Dwight Bush is President and CEO of D.L. Bush & Associates (a financial advisory and private investment firm) (2002-2014 and 2017-Present); Director of MoneyLion, Inc. (an operator of a data-driven, digital financial platform) (2021-Present); and was formerly U.S. Ambassador to the Kingdom of Morocco (2014- 2017) and a Member of the Board of Directors of Santander Bank, N.A. (2018-2019). Previously, he served as an Advisory Board Member of Goldman Sachs Trust and Goldman Sachs Variable Insurance Trust (October 2019-January 2020). Trustee — Goldman Sachs Variable Insurance Trust and Goldman Sachs Trust. | 102 | MoneyLion, Inc. (an operator of a datadriven, digital financial platform) |
| Kathryn A. Cassidy Age: 69 | Trustee | Since 2015 | Ms. Cassidy is retired. She is Director, Vertical Aerospace Ltd. (an aerospace and technology company) (2021-Present). Formerly, Ms. Cassidy was Advisor to the Chairman (May 2014- December 2014); and Senior Vice President and Treasurer (2008-2014), General Electric Company & General Electric Capital Corporation (technology and financial services companies). Trustee — Goldman Sachs Variable Insurance Trust and Goldman Sachs Trust. | 102 | Vertical Aerospace Ltd. (an aerospace and technology company) |
| John G. Chou Age: 67 | Trustee | Since 2022 | Mr. Chou is retired. Formerly, he was Executive Vice President and Special Advisor to the Chairman and CEO (2021-2022); Executive Vice President and Chief Legal Officer (2019-2021); Executive Vice President and Chief Legal & Business Officer (2017-2019); and Executive Vice President and General Counsel (2011-2017) of Cencora, Inc. (a pharmaceutical and healthcare company. Trustee — Goldman Sachs Variable Insurance Trust and Goldman Sachs Trust. | 102 | None |
| Joaquin Delgado Age: 63 | Trustee | Since 2020 | Dr. Delgado is retired. He is Director, Stepan Company (a specialty chemical manufacturer) (2011-Present); and was formerly Director, Hexion Inc. (a specialty chemical manufacturer) (2019-2022); Executive Vice President, Consumer Business Group of 3M Company (July 2016-July 2019); and Executive Vice President, Health Care Business Group of 3M Company (October 2012-July 2016). Previously, Dr. Delgado served as an Advisory Board Member of Goldman Sachs Trust and Goldman Sachs Variable Insurance Trust (October 2019-January 2020). Trustee — Goldman Sachs Variable Insurance Trust and Goldman Sachs Trust. | 102 | Stepan Company (a specialty chemical manufacturer) |
24
GOLDMAN SACHS VARIABLE INSURANCE TRUST GOVERNMENT MONEY MARKET FUND
Trustees and Officers (Unaudited) (continued)
Independent Trustees
| Name, Address and Age1 | Position(s) Held with the Trust | Term of Office and Length of Time Served2 | Principal Occupations During Past 5 Years | Number of Portfolios in Fund Complex Overseen by Trustee3 | Other Directorships Held by Trustee4 |
| Eileen H. Dowling Age: 61 | Trustee | Since 2021 | Ms. Dowling is retired. Formerly, she was Senior Advisor (April 2021-September 2021); and Managing Director (2013-2021), BlackRock, Inc. (a financial services firm). As Managing Director, she held senior management positions, including Global Head of Global Consultant Relations (2017-2021), Multinational Corporations (2019-2021), the Institutional Product Group (2015-2019) and Institutional Marketing (2013- 2016). Ms. Dowling was a member of the Global Operating Committee and Product Executive Committee of BlackRock. Trustee — Goldman Sachs Variable Insurance Trust and Goldman Sachs Trust. | 102 | None |
| Paul C. Wirth Age: 66 | Trustee | Since 2022 | Mr. Wirth is retired. He is Executive Advisor, My Next Season LLC (a career transition advisory firm) (2023 – Present) Formerly, he was Deputy Chief Financial Officer and Principal Accounting Officer (2011-2020); Finance Director and Principal Accounting Officer (2010-2011); and Managing Director, Global Controller, and Chief Accounting Officer (2005-2010) of Morgan Stanley. Trustee — Goldman Sachs Variable Insurance Trust and Goldman Sachs Trust. | 102 | None |
25
GOLDMAN SACHS VARIABLE INSURANCE TRUST GOVERNMENT MONEY MARKET FUND
Trustees and Officers (Unaudited) (continued)
Interested Trustee*
| Name, Address and Age1 | Position(s) Held with the Trust | Term of Office and Length of Time Served2 | Principal Occupations During Past 5 Years | Number of Portfolios in Fund Complex Overseen by Trustee3 | Other Directorships Held by Trustee4 |
| James A. McNamara Age: 61 | President and Trustee | Since 2007 | Advisory Director, Goldman Sachs (January 2018-Present); Managing Director, Goldman Sachs (January 2000-December 2017); Director of Institutional Fund Sales, GSAM (April 1998- December 2000); and Senior Vice President and Manager, Dreyfus Institutional Service Corporation (January 1993-April 1998). President and Trustee — Goldman Sachs Variable Insurance Trust; Goldman Sachs Trust; Goldman Sachs Trust II; Goldman Sachs ETF Trust; Goldman Sachs ETF Trust II; Goldman Sachs Credit Income Fund; and Goldman Sachs Real Estate Diversified Income Fund. | 192 | None |
| * | Mr. McNamara is considered to be an “Interested Trustee” because he holds positions with Goldman Sachs and owns securities issued by The Goldman Sachs Group, Inc. Mr. McNamara holds comparable positions with certain other companies of which Goldman Sachs, GSAM or an affiliate thereof is the investment adviser, administrator and/or distributor. |
| 1 | Each Trustee may be contacted by writing to the Trustee, c/o Goldman Sachs, 200 West Street, New York, New York, 10282, Attn: Robert Griffith. Information is provided as of December 31, 2023. |
| 2 | Subject to such policies as may be adopted by the Board from time-to-time, each Trustee holds office for an indefinite term, until the earliest of: (a) the election of his or her successor; (b) the date the Trustee resigns or is removed by the Board or shareholders, in accordance with the Trust’s Declaration of Trust; or (c) the termination of the Trust. The Board has adopted policies which provide that each Independent Trustee shall retire as of December 31st of the calendar year in which he or she reaches (a) his or her 75th birthday or (b) the 15th anniversary of the date he or she became a Trustee, whichever is earlier, unless a waiver of such requirements shall have been adopted by a majority of the other Trustees. These policies may be changed by the Trustees without shareholder vote. |
| 3 | The Goldman Sachs Fund Complex includes certain other companies listed above for each respective Trustee. As of December 31, 2023, Goldman Sachs Trust consisted of 87 portfolios; Goldman Sachs Variable Insurance Trust consisted of 15 portfolios (11 of which offered shares to the public); Goldman Sachs Trust II consisted of 18 portfolios (7 of which offered shares to the public); Goldman Sachs ETF Trust consisted of 68 portfolios (37 of which offered shares to the public); Goldman Sachs ETF Trust II consisted of 2 portfolios; and Goldman Sachs Credit Income Fund and Goldman Sachs Real Estate Diversified Income Fund each consisted of one portfolio. Goldman Sachs Credit Income Fund did not offer shares to the public. |
| 4 | This column includes only directorships of companies required to report to the Securities and Exchange Commission under the Securities Exchange Act of 1934 (i.e., “public companies”) or other investment companies registered under the Act. |
Additional information about the Trustees is available in the Funds’ Statement of Additional Information, which can be obtained from Goldman Sachs free of charge by calling this toll-free number (in the United States of America): 1-800-621-2550.
26
GOLDMAN SACHS VARIABLE INSURANCE TRUST GOVERNMENT MONEY MARKET FUND
Trustees and Officers (Unaudited) (continued)
Officers of the Trust*
| Name, Address and Age1 | Position(s) Held with the Trust | Term of Office and Length of Time Served2 | Principal Occupations During Past 5 Years |
| James A. McNamara 200 West Street New York, NY 10282 Age: 61 | Trustee and President | Since 2007 | Advisory Director, Goldman Sachs (January 2018-Present); Managing Director, Goldman Sachs (January 2000-December 2017); Director of Institutional Fund Sales, GSAM (April 1998-December 2000); and Senior Vice President and Manager, Dreyfus Institutional Service Corporation (January 1993-April 1998). President and Trustee — Goldman Sachs Variable Insurance Trust; Goldman Sachs Trust; Goldman Sachs Trust II; Goldman Sachs ETF Trust; Goldman Sachs ETF Trust II; Goldman Sachs Credit Income Fund; and Goldman Sachs Real Estate Diversified Income Fund. |
| Robert Griffith 200 West Street New York, NY 10282 Age: 49 | Secretary | Since 2023 | Managing Director, Goldman Sachs (September 2022 – Present); General Counsel, Exchange Traded Concepts, LLC (October 2021 – September 2022); Vice President, Goldman Sachs (August 2011 – October 2021); Associate General Counsel, Goldman Sachs (December 2014 – Present); Assistant General Counsel, Goldman Sachs (August 2011 – December 2014); Vice President and Counsel, Nomura Holding America, Inc. (2010 – 2011); and Associate, Simpson Thacher & Bartlett LLP (2005 – 2010). Secretary—Goldman Sachs Variable Insurance Trust (previously Assistant Secretary (2022)); Goldman Sachs Trust (previously Assistant Secretary (2022)); Goldman Sachs Trust II (previously Assistant Secretary (2022)); Goldman Sachs ETF Trust (previously Assistant Secretary (2022)); Goldman Sachs ETF Trust II (previously Assistant Secretary (2022)); and Goldman Sachs Real Estate Diversified Income Fund (previously Assistant Secretary (2022)). |
| Joseph F. DiMaria 30 Hudson Street Jersey City, NJ 07302 Age: 55 | Treasurer, Principal Financial Officer and Principal Accounting Officer | Since 2017 (Treasurer and Principal Financial Officer since 2019) | Managing Director, Goldman Sachs (November 2015-Present) and Vice President — Mutual Fund Administration, Columbia Management Investment Advisers, LLC (May 2010- October 2015). Treasurer, Principal Financial Officer and Principal Accounting Officer — Goldman Sachs Variable Insurance Trust (previously Assistant Treasurer (2016)); Goldman Sachs Trust (previously Assistant Treasurer (2016)); Goldman Sachs Trust II (previously Assistant Treasurer (2017)); Goldman Sachs ETF Trust (previously Assistant Treasurer (2017)); Goldman Sachs ETF Trust II; Goldman Sachs Credit Income Fund; and Goldman Sachs Real Estate Diversified Income Fund. |
| * | Represents a partial list of officers of the Trust. Additional information about all the officers is available in the Funds’ Statement of Additional Information, which can be obtained from Goldman Sachs free of charge by calling this toll-free number (in the United States): 1-800-621-2550. |
| 1 | Information is provided as of December 31, 2023. |
| 2 | Officers hold office at the pleasure of the Board of Trustees or until their successors are duly elected and qualified. Each officer holds comparable positions with certain other companies of which Goldman Sachs, GSAM or an affiliate thereof is the investment adviser, administrator and/or distributor. |
Goldman Sachs Variable Insurance Trust — Tax Information (Unaudited)
For the year ended December 31, 2023, the Government Money Market Fund designated 99.78% of the dividends paid from net investment company taxable income as section 163(j) Interest Dividends. |
27
(This page intentionally left blank)
(This page intentionally left blank)
| TRUSTEES | TRUSTEES (continued) | ||||
| Gregory G. Weaver, Chair | Michael Latham* | ||||
| Cheryl K. Beebe* | James A. McNamara | ||||
| Dwight L. Bush | Lawrence W. Stranghoener* | ||||
| Kathryn A. Cassidy | Paul C. Wirth | ||||
| John G. Chou | *Effective January 1, 2024 | ||||
| Joaquin Delgado | |||||
| Eileen H. Dowling | OFFICERS | ||||
| Lawrence Hughes* | James A. McNamara, President | ||||
| John F. Killian* | Joseph F. DiMaria, Principal Financial Officer, | ||||
| Steven D. Krichmar* | Principal Accounting Officer and Treasurer | ||||
| Robert Griffith, Secretary | |||||
| GOLDMAN SACHS & CO. LLC | GOLDMAN SACHS ASSET MANAGEMENT, L.P. | ||||
| Distributor and Transfer Agent | Investment Adviser | ||||
| 200 West Street, New York | |||||
| New York 10282 | |||||
| Visit our website at www.GSAMFUNDS.com to obtain the most recent month-end returns. | |||||
The reports concerning the Fund included in this shareholder report may contain certain forward-looking statements about the factors that may affect the performance of the Fund in the future. These statements are based on Fund management’s predictions and expectations concerning certain future events and their expected impact on the Fund, such as performance of the economy as a whole and of specific industry sectors, changes in the levels of interest rates, the impact of developing world events, and other factors that may influence the future performance of the Fund. Management believes these forward-looking statements to be reasonable, although they are inherently uncertain and difficult to predict. Actual events may cause adjustments in portfolio management strategies from those currently expected to be employed.
A description of the policies and procedures that the Fund uses to determine how to vote proxies relating to portfolio securities and information regarding how the Fund voted proxies relating to portfolio securities during the most recent 12-month period ended June 30 is available (i) without charge, upon request by calling 1-800-621-2550; and (ii) on the Securities and Exchange Commission (“SEC”) web site at http://www.sec.gov.
Views and opinions expressed are for informational purposes only and do not constitute a recommendation by Goldman Sachs Asset Management to buy, sell, or hold any security. Views and opinions are current as of the date of this presentation and may be subject to change, they should not be construed as investment advice.
Goldman Sachs & Co. LLC (“Goldman Sachs”) does not provide legal, tax or accounting advice. Any statement contained in this communication (including any attachments) concerning U.S. tax matters was not intended or written to be used, and cannot be used, for the purpose of avoiding penalties under the Internal Revenue Code, and was written to support the promotion or marketing of transaction or matter addressed. Clients of Goldman Sachs should obtain their own independent tax advice based on their particular circumstances.
The website links provided are for your convenience only and are not an endorsement or recommendation by Goldman Sachs Asset Management of any of these websites or the products or services offered. Goldman Sachs Asset Management is not responsible for the accuracy and validity of the content of these websites.
Fund holdings and allocations shown are as of December 31, 2023 and may not be representative of future investments. Fund holdings should not be relied on in making investment decisions and should not be construed as research or investment advice regarding particular securities. Current and future holdings are subject to risk.
The portfolio risk management process includes an effort to monitor and manage risk, but does not imply low risk.
Shares of the Goldman Sachs VIT Funds are offered to separate accounts of participating life insurance companies for the purpose of funding variable annuity contracts and variable life insurance policies. Shares of the Fund are not offered directly to the general public. The variable annuity contracts and variable life insurance policies are described in the separate prospectuses issued by participating insurance companies. You should refer to those prospectuses for information about surrender charges, mortality and expense risk fees and other charges that may be assessed by participating insurance companies under the variable annuity contracts or variable life insurance policies. Such fees or charges, if any, may affect the return you may realize with respect to your investments. Ask your representative for more complete information. Please consider a fund’s objectives, risks and charges and expenses, and read the prospectus carefully before investing. The prospectus contains this and other information about the Fund.
This material is not authorized for distribution to prospective investors unless preceded or accompanied by a current prospectus or summary prospectus, if applicable. Investors should consider the Fund’s objective, risks, and charges and expenses, and read the summary prospectus, if available, and/or the prospectus carefully before investing or sending money. The summary prospectus, if available, and the prospectus contain this and other information about the Fund and may be obtained from your authorized dealer or from Goldman Sachs & Co. LLC by calling1-800-621-2550.
This report is prepared for the general information of contract owners and is not an offer of shares of the Goldman Sachs Variable Insurance Trust — Goldman Sachs Government Money Market Fund.
© 2024 Goldman Sachs. All rights reserved.
VITMMAR-24/356078-OTU-1966940 | |||||
(b) Not applicable
Item 2. Code of Ethics.
The Registrant has adopted a code of ethics that applies to the Registrant’s principal executive officer and principal financial officer. The Registrant has not made any amendments to its code of ethics during the period covered by this report. The Registrant has not granted any waivers from any provisions of the code of ethics during the period covered by this report.
A copy of the Registrant’s Code of Ethics is filed herewith
Item 3. Audit Committee Financial Expert.
The Registrant’s board of trustees has determined that there is at least one audit committee financial expert serving on its audit committee. Eric Berg is the “audit committee financial expert” and is considered to be “independent” as each term is defined in Item 3 of Form N‑CSR.
Item 4. Principal Accountant Fees and Services.
The registrant has engaged its principal accountant to perform audit services, audit-related services, tax services and other services during the past two fiscal years. “Audit services” refer to performing an audit of the registrant's annual financial statements or services that are normally provided by the accountant in connection with statutory and regulatory filings or engagements for those fiscal years. “Tax services” refer to professional services rendered by the principal accountant for tax compliance, tax advice, and tax planning. The following table details the aggregate fees billed or expected to be billed for each of the last two fiscal years for audit fees, audit-related fees, tax fees and other fees by the principal accountant.
| FYE 12/31/2023 | FYE 12/31/2022 | |
| (a) Audit Fees | $49,102 | $504,000 |
| (b) Audit-Related Fees | - | - |
| (c) Tax Fees | 7,500 | 211,000 |
| (d) All Other Fees | - | - |
| (e)(1) | The Registrant’s audit committee is responsible for the approval, prior to appointment, of the selection, retention or termination of the independent registered public accounting firm to provide audit, review or attest services to the Registrant. The audit committee is also responsible for the approval, prior to appointment, of the proposed scope of audit services and related fees and for the approval, prior to appointment, of all non-audit services to be provided by the independent registered public accounting firm to the Registrant (subject to certain exceptions), its investment adviser or any entity that controls, is controlled by, or is under common control with the investment adviser that provides ongoing services to the Registrant, when such non-audit services relates directly to the operations and financial reporting of the Registrant. |
| (e)(2) | There were no services in paragraphs (b) through (d) above (including services required to be approved by the audit committee pursuant to paragraph (c)(7)(ii) of Rule 2-01 of Regulation S-X) that were approved pursuant to the waiver provision of paragraph (c)(7)(i)(C) of Rule 2-01 of Regulation S-X. |
| (f) | None of the hours expended on the principal accountant’s engagement to audit the Registrant’s financial statements for the fiscal year ended December 31, 2023 were attributable to work performed by persons other than the principal accountant’s full-time, permanent employees. |
| (g) | The aggregate non-audit fees billed by the registrant’s accountant for services rendered to the registrant, and rendered to the registrant’s investment adviser (not including any sub-adviser whose role is primarily portfolio management and is subcontracted with or overseen by another investment adviser), and any entity controlling, controlled by, or under common control with the adviser that provides ongoing services to the registrant were $7,500 and $211,000 for the fiscal years ended December 31, 2023 and 2022, respectively. |
(h) Not applicable.
(i) Not applicable.
(j) Not applicable.
Item 5. Audit Committee of Listed Registrants.
Not applicable to registrants who are not listed issuers (as defined in Rule 10A-3 under the Securities Exchange Act of 1934).
Item 6. Investments.
(a) Schedule of Investments is included as part of the report to shareholders filed under Item 1 of this Form.
(b) Not applicable.
Item 7. Disclosure of Proxy Voting Policies and Procedures for Closed-End Management Investment Companies.
Not applicable to open-end investment companies.
Item 8. Portfolio Managers of Closed-End Management Investment Companies.
Not applicable to open-end investment companies.
Item 9. Purchases of Equity Securities by Closed‑End Management Investment Company and Affiliated Purchasers.
Not applicable to open-end investment companies.
Item 10. Submission of Matters to a Vote of Security Holders.
There were no material changes to the procedures by which shareholders may recommend nominees to the registrant’s board of trustees.
Item 11. Controls and Procedures.
| (a) | The Registrant’s President/Principal Executive Officer and Treasurer/Principal Financial Officer have reviewed the Registrant's disclosure controls and procedures (as defined in Rule 30a-3(c) under the Investment Company Act of 1940 (the “Act”)(17 CFR 270.30a-3(c)) as of a date within 90 days of the filing of this report. Based on their evaluation of these controls and procedures as required by Rule 30a-3(b) under the Act (17 CFR 270.30a-3(b)) and Rules 13a-15(b) or 15d‑15(b) under the Securities Exchange Act of 1934, such officers have concluded that the disclosure controls and procedures are effective in ensuring that information required to be disclosed in this report is appropriately recorded, processed, summarized and reported within the time periods specified in the Commission's rules and forms and that the controls are designed to ensure that information required to be disclosed by an investment company in the reports that it files on Form N-CSR is accumulated and communicated to them to allow timely decisions regarding required disclosure. |
| (b) | There were no changes in the Registrant's internal control over financial reporting (as defined in Rule 30a-3(d) under the Act (17 CFR 270.30a-3(d)) that occurred during the period covered by this report that has materially affected, or is reasonably likely to materially affect, the Registrant's internal control over financial reporting. |
Item 12. Disclosure of Securities Lending Activities for Closed-End Management Investment Companies
Not applicable to open-end investment companies.
Item 13. Exhibits.
(3) Any written solicitation to purchase securities under Rule 23c-1 under the Investment Company Act of 1940 sent or given during the period covered by the report by or on behalf of the Registrant to 10 or more persons. Not applicable to open-end investment companies.
(4) Change in the Registrant’s independent public accountant. There was no change in the Registrant’s independent public accountant for the period covered by this report.
SIGNATURES
Pursuant to the requirements of the Securities Exchange Act of 1934 and the Investment Company Act of 1940, the Registrant has duly caused this report to be signed on its behalf by the undersigned, thereunto duly authorized.
(Registrant) Milliman Variable Insurance Trust
By (Signature and Title) /s/ Adam Schenck
Adam Schenck, President
Date February 28, 2024
Pursuant to the requirements of the Securities Exchange Act of 1934 and the Investment Company Act of 1940, this report has been signed below by the following persons on behalf of the Registrant and in the capacities and on the dates indicated.
By (Signature and Title) /s/ Adam Schenck
Adam Schenck, President
Date February 28, 2024
By (Signature and Title) /s/ Arthur W. Jasion
Arthur W. Jasion, Treasurer and Principal Financial Officer
Date February 28, 2024