| FREE WRITING PROSPECTUS | ||
| FILED PURSUANT TO RULE 433 | ||
| REGISTRATION FILE NO.: 333-226123-11 | ||
| March 1, 2021 | BMARK 2021-B24 |
Free Writing Prospectus Structural and Collateral Term Sheet | |||
BENCHMARK 2021-B24
| |||
$1,159,329,914 (Approximate Mortgage Pool Balance) | |||
$956,809,000 (Approximate Offered Certificates) | |||
J.P. Morgan Chase Commercial Mortgage Securities Corp. Depositor | |||
| |||
BENCHMARK 2021-B24 mORTGAGE TRUST, Commercial Mortgage Pass-Through Certificates Series 2021-B24 | |||
|
| |||
JPMorgan Chase Bank, National Association Sponsors and Mortgage Loan Sellers | |||
| J.P. Morgan | Goldman Sachs & Co. LLC | Deutsche Bank Securities | Citigroup |
| Co-Lead Managers and Joint Bookrunners | |||
| Drexel Hamilton | Academy Securities | ||
| Co-Managers | |||
| February [ ], 2021 | BMARK 2021-B24 |
This material is for your information, and none of J.P. Morgan Securities LLC (“JPMS”), Citigroup Global Markets Inc. (“CGMI”), Goldman Sachs & Co. LLC (“GS’), Deutsche Bank Securities Inc. (“DBSI”), Drexel Hamilton, LLC (“Drexel”) or Academy Securities, Inc. (“Academy Securities”) (each individually, an “Underwriter”, and together, the ‘‘Underwriters’’) are soliciting any action based upon it. This material is not to be construed as an offer to sell or the solicitation of any offer to buy any security in any jurisdiction where such an offer or solicitation would be illegal.
The Depositor has filed a registration statement (including a prospectus) with the SEC (SEC File no. 333-226123) for the offering to which this free writing prospectus relates. Before you invest, you should read the prospectus in the registration statement and other documents the Depositor has filed with the SEC for more complete information about the Depositor, the issuing entity and this offering. You may get these documents for free by visiting EDGAR on the SEC Website at www.sec.gov. Alternatively, the Depositor or any Underwriter or any dealer participating in the offering will arrange to send you the prospectus if you request it by calling (800) 408-1016 or by emailing the ABS Syndicate Desk at abs_synd@jpmorgan.com.
Neither this document nor anything contained in this document shall form the basis for any contract or commitment whatsoever. The information contained in this document is preliminary as of the date of this document, supersedes any previous such information delivered to you and will be superseded by any such information subsequently delivered prior to the time of sale. These materials are subject to change, completion or amendment from time to time.
This document has been prepared by the Underwriters for information purposes only and does not constitute, in whole or in part, a prospectus for the purposes of Regulation (EU) 2017/1129 (as amended), such Regulation as it forms part of the domestic law of the United Kingdom and/or Part VI of the Financial Services and Markets Act 2000 (as amended); and does not constitute an offering document for any other purpose.
The attached information contains certain tables and other statistical analyses (the “Computational Materials”) that have been prepared in reliance upon information furnished by the Mortgage Loan Sellers. Numerous assumptions were used in preparing the Computational Materials, which may or may not be reflected in this document. The Computational Materials should not be construed as either projections or predictions or as legal, tax, financial or accounting advice. You should consult your own counsel, accountant and other advisors as to the legal, tax, business, financial and related aspects of a purchase of these certificates. Any weighted average lives, yields and principal payment periods shown in the Computational Materials are based on prepayment and/or loss assumptions, and changes in such prepayment and/or loss assumptions may dramatically affect such weighted average lives, yields and principal payment periods. In addition, it is possible that prepayments or losses on the underlying assets will occur at rates higher or lower than the rates shown in the Computational Materials. The specific characteristics of the certificates may differ from those shown in the Computational Materials due to differences between the final underlying assets and the preliminary underlying assets used in preparing the Computational Materials. The principal amount and designation of any certificate described in the Computational Materials are subject to change prior to issuance. None of the Underwriters nor any of their respective affiliates make any representation or warranty as to the actual rate or timing of payments or losses on any of the underlying assets or the payments or yield on the certificates.
This information is based upon management forecasts and reflects prevailing conditions and management’s views as of this date, all of which are subject to change.
This document contains forward-looking statements. Those statements are subject to certain risks and uncertainties that could cause the success of collections and the actual cash flow generated to differ materially from the information set forth in this document. While such information reflects projections prepared in good faith based upon methods and data that are believed to be reasonable and accurate as of their dates, the Depositor undertakes no obligation to revise these forward-looking statements to reflect subsequent events or circumstances. Investors should not place undue reliance on forward-looking statements and are advised to make their own independent analysis and determination with respect to the forecasted periods, which reflect the Depositor’s view only as of the date of this document.
J.P. Morgan is the marketing name for the investment banking businesses of JPMorgan Chase & Co. and its subsidiaries worldwide. Securities, syndicated loan arranging, financial advisory and other investment banking activities are performed by JPMS and its securities affiliates, and lending, derivatives and other commercial banking activities are performed by JPMorgan Chase Bank, National Association and its banking affiliates. JPMS is a member of SIPC and the NYSE. Securities and investment banking activities in the United States are performed by Deutsche Bank Securities Inc., a member of NYSE, FINRA and SIPC, and its broker-dealer affiliates. Lending and other commercial banking activities in the United States are performed by Deutsche Bank AG, acting through its New York Branch.
Capitalized terms used in this material but not defined herein shall have the meanings ascribed to them in the Preliminary Prospectus (as defined below).
THE CERTIFICATES REFERRED TO IN THESE MATERIALS ARE SUBJECT TO MODIFICATION OR REVISION (INCLUDING THE POSSIBILITY THAT ONE OR MORE CLASSES OF CERTIFICATES MAY BE SPLIT, COMBINED OR ELIMINATED AT ANY TIME PRIOR TO ISSUANCE OR AVAILABILITY OF A FINAL PROSPECTUS) AND ARE OFFERED ON A “WHEN, AS AND IF ISSUED” BASIS.
THE UNDERWRITERS MAY FROM TIME TO TIME PERFORM INVESTMENT BANKING SERVICES FOR, OR SOLICIT INVESTMENT BANKING BUSINESS FROM, ANY COMPANY NAMED IN THESE MATERIALS. THE UNDERWRITERS AND/OR THEIR AFFILIATES OR RESPECTIVE EMPLOYEES MAY FROM TIME TO TIME HAVE A LONG OR SHORT POSITION IN ANY CERTIFICATE OR CONTRACT DISCUSSED IN THESE MATERIALS.
THE INFORMATION IN THIS STRUCTURAL AND COLLATERAL TERM SHEET IS NOT COMPLETE AND MAY BE AMENDED PRIOR TO THE TIME OF SALE. THIS TERM SHEET IS NOT AN OFFER TO SELL THESE SECURITIES AND IT IS NOT A SOLICITATION OF AN OFFER TO BUY THESE SECURITIES IN ANY JURISDICTION WHERE THE OFFER OR SALE IS NOT PERMITTED.
2 of 166
| Structural and Collateral Term Sheet | Benchmark 2021-B24 | |
| Indicative Capital Structure | ||
Publicly Offered Certificates
| Class | Expected Ratings (S&P / Fitch / KBRA) | Approximate Initial Certificate Balance or Notional Amount(1) | Approximate Initial Credit Support(2) | Expected Weighted Avg. Life (years)(3) | Expected Principal Window(3) | Certificate Principal to Value Ratio(4) | Underwritten NOI Debt Yield(5) |
| A-1 | AAA(sf) / AAAsf / AAA(sf) | $11,152,000 | 30.000% | 3.08 | 4/2021 – 1/2026 | 39.1% | 15.6% |
| A-2 | AAA(sf) / AAAsf / AAA(sf) | $73,848,000 | 30.000% | 4.92 | 1/2026 – 3/2026 | 39.1% | 15.6% |
| A-3 | AAA(sf) / AAAsf / AAA(sf) | $81,111,000 | 30.000% | 6.86 | 1/2028 – 11/2028 | 39.1% | 15.6% |
| A-4 | AAA(sf) / AAAsf / AAA(sf) | (6) | 30.000% | (6) | (6) | 39.1% | 15.6% |
| A-5 | AAA(sf) / AAAsf / AAA(sf) | (6) | 30.000% | (6) | (6) | 39.1% | 15.6% |
| A-SB | AAA(sf) / AAAsf / AAA(sf) | $25,562,000 | 30.000% | 7.47 | 3/2026 – 1/2031 | 39.1% | 15.6% |
| X-A | AA+(sf) / AAAsf / AAA(sf) | $857,686,000(7) | N/A | N/A | N/A | N/A | N/A |
| X-B | NR / A-sf / AAA(sf) | $99,123,000(7) | N/A | N/A | N/A | N/A | N/A |
| A-S | AA+(sf) / AAAsf / AAA(sf) | $86,732,000 | 22.125% | 9.98 | 3/2031 – 3/2031 | 43.5% | 14.0% |
| B | NR / AA-sf / AA(sf) | $49,562,000 | 17.625% | 9.98 | 3/2031 – 3/2031 | 46.0% | 13.2% |
| C | NR / A-sf / A-(sf) | $49,561,000 | 13.125% | 9.98 | 3/2031 – 3/2031 | 48.6% | 12.5% |
Privately Offered Certificates(8)
| Class | Expected Ratings (S&P / Fitch / KBRA) | Approximate Initial Certificate Balance or Notional Amount(1) | Approximate Initial Credit Support(2) | Expected Weighted Avg. Life (years)(3) | Expected Principal Window(3) | Certificate Principal to Value Ratio(4) | Underwritten NOI Debt Yield(5) |
| X-D | NR / BBB-sf / BBB-(sf) | $57,822,000(7) | N/A | N/A | N/A | N/A | N/A |
| X-F | NR / BB-sf / BB-(sf) | $28,910,000(7) | N/A | N/A | N/A | N/A | N/A |
| X-G | NR / B-sf / B(sf) | $12,391,000(7) | N/A | N/A | N/A | N/A | N/A |
| X-NR | NR / NR / NR | $45,431,418(7) | N/A | N/A | N/A | N/A | N/A |
| D | NR / BBBsf / BBB+(sf) | $31,664,000 | 10.250% | 9.98 | 3/2031 – 3/2031 | 50.2% | 12.1% |
| E | NR / BBB-sf / BBB-(sf) | $26,158,000 | 7.875% | 9.98 | 3/2031 – 3/2031 | 51.5% | 11.8% |
| F | NR / BB-sf / BB-(sf) | $28,910,000 | 5.250% | 9.98 | 3/2031 – 3/2031 | 53.0% | 11.5% |
| G | NR / B-sf / B(sf) | $12,391,000 | 4.125% | 9.98 | 3/2031 – 3/2031 | 53.6% | 11.4% |
| NR | NR / NR / NR | $45,431,418 | 0.000% | 9.98 | 3/2031 – 3/2031 | 55.9% | 10.9% |
Non-Offered Vertical Risk Retention Interest(8)
| Non-Offered Vertical Risk Retention Interest | Expected Ratings (S&P / Fitch / KBRA) | Approximate Initial VRR Interest Balance(1) | Approximate Initial Credit Support(2) | Expected Weighted Avg. Life (years)(3)(9) | Expected Principal Window(3)(9) | Certificate Principal to Value Ratio(4) | Underwritten NOI Debt Yield(5) |
| Class RR Certificates(10)(11) | NR / NR / NR | $20,859,855 | N/A | 9.08 | 4/2021 – 3/2031 | N/A | N/A |
| RR Interest(10)(11) | NR / NR / NR | $37,106,641 | N/A | 9.08 | 4/2021 – 3/2031 | N/A | N/A |
| (1) | In the case of each such Class or RR Interest, subject to a permitted variance of plus or minus 5%. The VRR interest balance of the VRR Interest is not included in the certificate balance or notional amount of any class of certificates set forth under “Publicly Offered Certificates” or “Privately Offered Certificates” in the table above, and the VRR Interest is not offered by this Term Sheet. In addition, the notional amounts of the Class X-A, Class X-B, Class X-D, Class X-F, Class X-G and Class X-NR Certificates may vary depending upon the final pricing of the Classes of Principal Balance Certificates whose Certificate Balances comprise such notional amounts, and, if as a result of such pricing the pass-through rate of any Class of the Class X-A, Class X-B, Class X-D, Class X-F, Class X-G and Class X-NR Certificates, as applicable, would be equal to zero at all times, such Class of Certificates will not be issued on the closing date of this securitization. |
| (2) | The approximate initial credit support percentages set forth for the certificates are approximate and for the Class A-1, Class A-2, Class A-3, Class A-4, Class A-5 and Class A-SB Certificates are represented in the aggregate. The VRR interest provides credit support only to the limited extent that it is allocated a portion of any losses incurred on the mortgage loans which such losses are allocated between it on the one hand, and the non-VRR certificates (other than the Class X-A, Class X-B, Class X-D, Class X-F, Class X-G and Class X-NR Certificates) on the other hand, pro rata in accordance with their respective percentage allocation entitlement. See “Description of the Certificates” in the Preliminary Prospectus. |
| (3) | Assumes 0% CPR / 0% CDR and March 24, 2021 closing date. Based on modeling assumptions as described in the Preliminary Prospectus dated February 28, 2021 (the “Preliminary Prospectus”). |
| (4) | The “Certificate Principal to Value Ratio” for any Class of Principal Balance Certificates (other than the Class A-1, Class A-2, Class A-3, Class A-4, Class A-5 and Class A-SB Certificates) is calculated as the product of (a) the weighted average Cut-off Date LTV for the mortgage loans, and (b) a fraction, the numerator of which is the total initial Certificate Balance of such Class of Certificates and all Classes of Principal Balance Certificates senior to such Class of Certificates and the denominator of which is the total initial Certificate Balance of all of the Classes of Principal Balance Certificates. The Class A-1, Class A-2, Class A-3, Class A-4, Class A-5 and Class A-SB Certificate Principal to Value Ratios are calculated in the aggregate for those Classes as if they were a single class. Investors should note, however, that excess mortgaged property value associated with a mortgage loan will not be available to offset losses on any other mortgage loan. |
| (5) | The “Underwritten NOI Debt Yield” for any Class of Principal Balance Certificates (other than the Class A-1, Class A-2, Class A-3, Class A-4, Class A-5 and Class A-SB Certificates) is calculated as the product of (a) the weighted average UW NOI DY for the mortgage loans and (b) a fraction, the numerator of which is the total initial Certificate Balance of all of the Classes of Principal Balance Certificates and the denominator of which is the total initial Certificate Balance for such Class and all Classes of Principal Balance Certificates senior to such Class of Certificates. The Underwritten NOI Debt Yield for each of the Class A-1, Class A-2, Class A-3, Class A-4, Class A-5 and Class A-SB Certificates is calculated in the aggregate for those Classes as if they were a single Class. Investors should note, however, that net operating income from any mortgaged property supports only the related mortgage loan and will not be available to support any other mortgage loan. |
| (6) | The exact initial certificate balances of the Class A-4 and Class A-5 certificates are unknown and will be determined based on the final pricing of those classes of certificates. However, the respective initial certificate balances, weighted average lives and principal windows of the Class A-4 and Class A-5 certificates are expected to be within the |
THE INFORMATION IN THIS STRUCTURAL AND COLLATERAL TERM SHEET IS NOT COMPLETE AND MAY BE AMENDED PRIOR TO THE TIME OF SALE. THIS TERM SHEET IS NOT AN OFFER TO SELL THESE SECURITIES AND IT IS NOT A SOLICITATION OF AN OFFER TO BUY THESE SECURITIES IN ANY JURISDICTION WHERE THE OFFER OR SALE IS NOT PERMITTED.
3 of 166
| Structural and Collateral Term Sheet | Benchmark 2021-B24 | |
| Indicative Capital Structure | ||
applicable ranges reflected in the following chart. The aggregate initial certificate balance of the Class A-4 and Class A-5 certificates is expected to be approximately $579,281,000, subject to a variance of plus or minus 5%. In the event that the Class A-5 certificates are issued with an initial certificate balance of $579,281,000, the Class A-4 certificates will not be issued and the Class A-5 certificates will be renamed Class A-4.
| Class of Certificates | Expected Range of Initial Certificate Balance | Expected Range of Weighted Avg. Life (years) | Expected Range of Principal Window |
| A-4 | $0 – $270,000,000 | N/A – 9.20 | N/A / 1/2030–2/2031 |
| A-5 | $309,281,000 – $579,281,000 | 9.95 – 9.60 | 2/2031–3/2031 / 1/2030–3/2031 |
| (7) | The Class X-A, Class X-B, Class X-D, Class X-F, Class X-G and Class X-NR Notional Amounts are defined in the Preliminary Prospectus. |
| (8) | The Classes of Certificates set forth under “Privately Offered Certificates” and “Non-Offered Vertical Risk Retention Interest” in the tables above are not being offered by the Preliminary Prospectus or this Term Sheet. The Class S and Class R Certificates are not shown above. |
| (9) | The expected weighted average life and expected principal window during which distributions of principal would be received as set forth in the foregoing table with respect to the VRR interest are based on the assumptions set forth under “Yield and Maturity Considerations—Weighted Average Life” in the Preliminary Prospectus and on the assumptions that there are no prepayments, modifications or losses in respect of the mortgage loans and that there are no extensions or forbearances of maturity dates or anticipated repayment dates of the mortgage loans. |
| (10) | JPMorgan Chase Bank, National Association, as the retaining sponsor for this securitization, is expected to acquire from the depositor, on the Closing Date, an “eligible vertical interest” (as defined in Regulation RR) comprised of the Class RR Certificates and the RR Interest (collectively, the “VRR Interest”), which is expected to represent approximately 5.00% of all Principal Balance Certificates and the VRR Interest. A portion of the VRR Interest will be acquired by each of Goldman Sachs Bank USA and Citi Real Estate Funding Inc. in accordance with the U.S. credit risk retention rules applicable to this securitization transaction. See “Credit Risk Retention” in the Preliminary Prospectus. |
| (11) | Although it does not have a specified pass-through rate (other than for tax reporting purposes), the effective interest rate for the VRR Interest will be the WAC rate. |
THE INFORMATION IN THIS STRUCTURAL AND COLLATERAL TERM SHEET IS NOT COMPLETE AND MAY BE AMENDED PRIOR TO THE TIME OF SALE. THIS TERM SHEET IS NOT AN OFFER TO SELL THESE SECURITIES AND IT IS NOT A SOLICITATION OF AN OFFER TO BUY THESE SECURITIES IN ANY JURISDICTION WHERE THE OFFER OR SALE IS NOT PERMITTED.
4 of 166
| Structural and Collateral Term Sheet | Benchmark 2021-B24 | |
| Summary of Transaction Terms | ||
| Securities Offered: | $956,809,000 monthly pay, multi-class, commercial mortgage REMIC Pass-Through Certificates. |
| Co-Lead Managers and Joint Bookrunners: | J.P. Morgan Securities LLC, Citigroup Global Markets Inc., Goldman Sachs & Co. LLC and Deutsche Bank Securities Inc. |
| Co-Managers: | Drexel Hamilton, LLC and Academy Securities, Inc. |
| Mortgage Loan Sellers: | Citi Real Estate Funding Inc. (“CREFI”) (36.0%), JPMorgan Chase Bank, National Association (“JPMCB”) (26.1%), Goldman Sachs Mortgage Company (“GSMC”) (25.1%) and German American Capital Corporation (“GACC”) (12.8%). |
| Master Servicer: | Midland Loan Services, a Division of PNC Bank, National Association. |
| Special Servicer: | Greystone Servicing Company LLC. |
| Directing Certificateholder: | Eightfold Real Estate Capital Fund V, L.P. |
| Trustee: | Wells Fargo Bank, National Association. |
| Certificate Administrator: | Wells Fargo Bank, National Association. |
| Operating Advisor: | Park Bridge Lender Services LLC. |
| Asset Representations Reviewer: | Park Bridge Lender Services LLC. |
| Rating Agencies: | S&P Global Ratings, acting through Standard and Poor’s Financial Services LLC (“S&P”), Fitch Ratings, Inc. (“Fitch”) and Kroll Bond Rating Agency, LLC (“KBRA”). |
| U.S. Credit Risk Retention: | JPMCB is expected to act as the “retaining sponsor” for this securitization, and intends to satisfy the U.S. credit risk retention requirement by acquiring (either through itself or through one or more of its “majority owned affiliates” (as defined in Regulation RR)) from the depositor, on the Closing Date, an “eligible vertical interest” which will be comprised of the VRR Interest and a portion of which will be transferred by JPMCB to each of CREFI and GSMC.
The restrictions on hedging and transfer under the U.S. credit risk retention rules as in effect on the closing date of this transaction will expire on and after the date that is the latest of (i) the date on which the aggregate principal balance of the mortgage loans has been reduced to 33% of the aggregate principal balance of the mortgage loans as of the Cut-off Date; (ii) the date on which the total unpaid principal obligations under the Certificates has been reduced to 33% of the aggregate total unpaid principal obligations under the Certificates as of the Closing Date; or (iii) two years after the Closing Date.
Notwithstanding any references in this term sheet to the credit risk retention rules, Regulation RR, the retaining sponsor and other risk retention related matters, in the event the credit risk retention rules and/or Regulation RR (or any relevant portion thereof) are repealed or determined by applicable regulatory agencies to be no longer applicable to this securitization transaction, none of the retaining sponsor or any other party will be required to comply with or act in accordance with the U.S. credit risk retention rules and/or Regulation RR (or such relevant portion thereof).
For additional information, see “Credit Risk Retention” in the Preliminary Prospectus.
|
| EU/UK Credit Risk Retention: | The transaction is not structured to satisfy any requirements in effect in the European Union or the United Kingdom as regards risk retention, transparency/reporting and due diligence. |
| Pricing Date: | On or about March 4, 2021. |
| Closing Date: | On or about March 24, 2021. |
| Cut-off Date: | With respect to each mortgage loan, the related due date in March 2021 or with respect to any mortgage loan that has its first due date after March 2021, the date that would otherwise have been the related due date in March 2021. |
| Distribution Date: | The 4th business day after the Determination Date in each month, commencing in April 2021. |
| Determination Date: | 11th day of each month, or if the 11th day is not a business day, the next succeeding business day, commencing in April 2021. |
| Assumed Final Distribution Date: | The Distribution Date in March 2031, which is the latest anticipated repayment date of the Certificates. |
| Rated Final Distribution Date: | The Distribution Date in March 2054. |
| Tax Treatment: | The Publicly Offered Certificates are expected to be treated as REMIC “regular interests” for U.S. federal income tax purposes. |
THE INFORMATION IN THIS STRUCTURAL AND COLLATERAL TERM SHEET IS NOT COMPLETE AND MAY BE AMENDED PRIOR TO THE TIME OF SALE. THIS TERM SHEET IS NOT AN OFFER TO SELL THESE SECURITIES AND IT IS NOT A SOLICITATION OF AN OFFER TO BUY THESE SECURITIES IN ANY JURISDICTION WHERE THE OFFER OR SALE IS NOT PERMITTED.
5 of 166
| Structural and Collateral Term Sheet | Benchmark 2021-B24 | |
| Summary of Transaction Terms | ||
| Form of Offering: | The Class A-1, Class A-2, Class A-3, Class A-4, Class A-5, Class A-SB, Class X-A, Class X-B, Class A-S, Class B and Class C Certificates (the “Publicly Offered Certificates”) will be offered publicly. The Class X-D, Class X-F, Class X-G, Class X-NR, Class D, Class E, Class F, Class G, Class NR, Class S and Class R Certificates (the “Privately Offered Certificates”) will be offered domestically to Qualified Institutional Buyers and to Institutional Accredited Investors (other than the Class R Certificates) and to institutions that are not U.S. Persons pursuant to Regulation S. |
| SMMEA Status: | The Publicly Offered Certificates will not constitute “mortgage related securities” for purposes of SMMEA. |
| ERISA: | The Publicly Offered Certificates are expected to be ERISA eligible. |
| Optional Termination: | On any Distribution Date on which the aggregate principal balance of the pool of mortgage loans is less than 1% of the aggregate principal balance of the mortgage loans as of the Cut-off Date solely for the purposes of this calculation, if such right is being exercised after the distribution date in March 2031 and the 410 Tenth Avenue mortgage loan or the MGM Grand & Mandalay Bay mortgage loan is still an asset of the issuing entity, then such mortgage loan will be excluded from the then-aggregate principal balance of the pool of mortgage loans and from the aggregate principal balance of the mortgage loans as of the Cut-off Date), certain entities specified in the Preliminary Prospectus will have the option to purchase all of the remaining mortgage loans (and all property acquired through exercise of remedies in respect of any mortgage loan) at the price specified in the Preliminary Prospectus. Refer to “Pooling and Servicing Agreement—Termination; Retirement of Certificates” in the Preliminary Prospectus. |
| Minimum Denominations: | The Publicly Offered Certificates (other than the Class X-A and Class X-B Certificates) will be issued in minimum denominations of $10,000 and integral multiples of $1 in excess of $10,000. The Class X-A and Class X-B Certificates will be issued in minimum denominations of $1,000,000 and in integral multiples of $1 in excess of $1,000,000. |
| Settlement Terms: | DTC, Euroclear and Clearstream Banking. |
| Analytics: | The transaction is expected to be modeled by Intex Solutions, Inc. and Trepp, LLC and is expected to be available on Bloomberg L.P., Blackrock Financial Management, Inc., Interactive Data Corporation, CMBS.com, Inc., Markit Group Limited, Moody’s Analytics, MBS Data, LLC, RealINSIGHT, KBRA Analytics, Inc., Thomson Reuters Corporation and DealView Technologies Ltd. |
| Risk Factors: | THE CERTIFICATES INVOLVE CERTAIN RISKS AND MAY NOT BE SUITABLE FOR ALL INVESTORS. REFER TO “RISK FACTORS” IN THE PRELIMINARY PROSPECTUS. |
THE INFORMATION IN THIS STRUCTURAL AND COLLATERAL TERM SHEET IS NOT COMPLETE AND MAY BE AMENDED PRIOR TO THE TIME OF SALE. THIS TERM SHEET IS NOT AN OFFER TO SELL THESE SECURITIES AND IT IS NOT A SOLICITATION OF AN OFFER TO BUY THESE SECURITIES IN ANY JURISDICTION WHERE THE OFFER OR SALE IS NOT PERMITTED.
6 of 166
| Structural and Collateral Term Sheet | Benchmark 2021-B24 | |
| Collateral Characteristics | ||
| Loan Pool | ||
| Initial Pool Balance (“IPB”): | $1,159,329,914 | |
| Number of Mortgage Loans: | 40 | |
| Number of Mortgaged Properties: | 71 | |
| Average Cut-off Date Balance per Mortgage Loan: | $28,983,248 | |
| Weighted Average Current Mortgage Rate: | 3.55190% | |
| 10 Largest Mortgage Loans as % of IPB: | 55.7% | |
| Weighted Average Remaining Term to Maturity(1): | 111 months | |
| Weighted Average Seasoning: | 3 months | |
| Credit Statistics | ||
| Weighted Average UW NCF DSCR(2)(3): | 2.75x | |
| Weighted Average UW NOI DY(2)(3)(4): | 10.9% | |
| Weighted Average Cut-off Date Loan-to-Value Ratio (“LTV”)(2)(4)(5): | 55.9% | |
| Weighted Average Maturity Date LTV(1)(2)(5): | 54.2% | |
| Other Statistics | ||
| % of Mortgage Loans with Additional Debt: | 27.7% | |
| % of Mortgaged Properties with Single Tenants: | 17.3% | |
| Amortization | ||
| Weighted Average Original Amortization Term(6): | 360 months | |
| Weighted Average Remaining Amortization Term(6): | 359 months | |
| % of Mortgage Loans with Interest-Only: | 62.4% | |
| % of Mortgage Loans with Partial Interest-Only followed by Amortizing Balloon: | 16.8% | |
| % of Mortgage Loans with ARD-Interest Only: | 13.8% | |
| % of Mortgage Loans with Amortizing Balloon: | 7.0% | |
| Lockbox / Cash Management(7) | ||
| % of Mortgage Loans with In-Place, Hard Lockboxes: | 76.1% | |
| % of Mortgage Loans with Springing Lockboxes: | 20.6% | |
| % of Mortgage Loans with In-Place, Soft Lockboxes: | 2.7% | |
| % of Mortgage Loans with Hard (Commercial) / Soft (Residential) Lockboxes: | 0.6% | |
| % of Mortgage Loans with Springing Cash Management: | 91.3% | |
| % of Mortgage Loans with In-Place Cash Management: | 8.7% | |
| Reserves | ||
| % of Mortgage Loans Requiring Monthly Tax Reserves: | 60.6% | |
| % of Mortgage Loans Requiring Monthly Insurance Reserves: | 33.6% | |
| % of Mortgage Loans Requiring Monthly CapEx Reserves(8): | 47.5% | |
| % of Mortgage Loans Requiring Monthly TI/LC Reserves(9): | 30.1% | |
| (1) | In the case of Loan Nos. 1 and 2, each with an anticipated repayment date, Remaining Term to Maturity and Maturity Date LTV are calculated as of the related anticipated repayment date. |
| (2) | In the case of Loan Nos. 1, 2, 3, 4, 5, 6, 7, 8, 10, 13, 15, 16, 17 and 23, UW NCF DSCR, UW NOI DY, Cut-off Date LTV and Maturity Date LTV calculations include the related Pari Passu Companion Loan(s). In the case of Loan Nos. 1, 2, 3, 5, and 20, UW NCF DSCR, UW NOI DY, Cut-off Date LTV and Maturity Date LTV calculations exclude the related Subordinate Companion Loan(s), related mezzanine loan(s) and/or related additional secured subordinate debt. |
| (3) | In the case of Loan No. 2, UW NCF DSCR and UW NOI DY are calculated based on the master lease annual rent of $292,000,000. |
| (4) | In the case of Loan No. 11, Cut-off Date LTV is calculated net of a holdback reserve of $6,095,133. In the case of Loan No. 31, UW NOI DY and Cut-off Date LTV are calculated net of a holdback reserve of $750,000. |
| (5) | In the case of Loan Nos. 1, 2, 3, 8, 10, 18, and 25, Cut-off Date LTV and the Maturity Date LTV are calculated by using an appraised value based on certain hypothetical assumptions. Refer to “Description of the Mortgage Pool—Assessments of Property Value and Condition” and “—Appraised Value” in the Preliminary Prospectus for additional details. |
| (6) | Excludes 25 mortgage loans that are interest-only for the entire term. |
| (7) | For a more detailed description of Lockbox / Cash Management, refer to “Description of the Mortgage Pool—Certain Terms of the Mortgage Loans—Mortgaged Property Accounts” in the Preliminary Prospectus. |
| (8) | CapEx Reserves include FF&E reserves for hotel properties. |
| (9) | Calculated only with respect to the Cut-off Date Balance of mortgage loans secured or partially secured by retail, office, industrial and mixed use properties. |
THE INFORMATION IN THIS STRUCTURAL AND COLLATERAL TERM SHEET IS NOT COMPLETE AND MAY BE AMENDED PRIOR TO THE TIME OF SALE. THIS TERM SHEET IS NOT AN OFFER TO SELL THESE SECURITIES AND IT IS NOT A SOLICITATION OF AN OFFER TO BUY THESE SECURITIES IN ANY JURISDICTION WHERE THE OFFER OR SALE IS NOT PERMITTED.
7 of 166
| Structural and Collateral Term Sheet | Benchmark 2021-B24 | |
| Collateral Characteristics | ||
Mortgage Loan Seller | Number of | Number of | Aggregate | % of IPB |
| CREFI(1) | 17 | 22 | $338,211,450 | 29.2% |
| GSMC(1)(2) | 8 | 17 | 290,850,000 | 25.1 |
| JPMCB | 8 | 8 | 276,752,797 | 23.9 |
| GACC(3) | 5 | 19 | 108,530,000 | 9.4 |
| CREFI/GACC(4) | 1 | 2 | 79,985,667 | 6.9 |
| CREFI/JPMCB(5) | 1 | 3 | 65,000,000 | 5.6 |
| Total | 40 | 71 | $1,159,329,914 | 100.0% |
| (1) | In the case of Loan No. 8, the whole loan was co-originated by Citi Real Estate Funding Inc. (“CREFI”) and Bank of America, N.A. (“BANA”). In the case of Loan No. 17, the whole loan was co-originated by GSBI and BANA. |
| (2) | Each mortgage loan being sold by Goldman Sachs Mortgage Company (“GSMC”) was originated or co-originated by an affiliate thereof, Goldman Sachs Bank USA (“GSBI”), and will be transferred to GSMC on or prior to the Closing Date. |
| (3) | Each mortgage loan being sold by German American Capital Corporation (“GACC”) (with the exception of Loan No. 2) was originated or co-originated by either DBR Investments Co. Limited or Deutsche Bank AG, New York Branch, each an affiliate of GACC, and will be transferred to GACC on or prior to the Closing Date. |
| (4) | In the case of Loan No. 2, the whole loan was co-originated by CREFI, Barclays Capital Real Estate Inc., Deutsche Bank AG, acting through its New York Branch (“DBNY”) and Société Générale Financial Corporation. Loan No. 2 is evidenced by two promissory notes: (i) Note A-15-9, with a principal balance of $40,000,000 as of the Cut-off Date, as to which GACC is acting as mortgage loan seller, and (ii) Note A-13-9, with a principal balance of $39,985,667 as of the Cut-off Date, as to which CREFI is acting as mortgage loan seller. |
| (5) | In the case of Loan No. 6, the whole loan was co-originated by CREFI and JPMCB. Loan No. 6 is evidenced by two promissory notes: (i) Note A-1, with a principal balance of $39,000,000 as of the Cut-off Date, as to which CREFI is acting as mortgage loan seller, and (ii) Note A-3, with a principal balance of $26,000,000 as of the Cut-off Date, as to which JPMCB is acting as mortgage loan seller. |
| Ten Largest Mortgage Loans | |||||||||||
| No. | Loan Name | Mortgage Loan Seller | No. of Prop. | Cut-off Date Balance | % of IPB | SF / Units | Property Type | UW NCF DSCR(1)(2) | UW NOI DY(1)(2) | Cut-off Date LTV(1)(3) | Maturity Date LTV(1)(3)(4) |
| 1 | 410 Tenth Avenue | JPMCB | 1 | $80,000,000 | 6.9% | 631,944 | Office | 4.91x | 13.0% | 39.8% | 39.8% |
| 2 | MGM Grand & Mandalay Bay | CREFI/GACC | 2 | $79,985,667 | 6.9% | 9,748 | Hotel | 4.95x | 17.9% | 35.5% | 35.5% |
| 3 | Phillips Point | GSMC | 1 | $75,000,000 | 6.5% | 448,885 | Office | 2.78x | 9.7% | 68.7% | 68.7% |
| 4 | 141 Livingston | CREFI | 1 | $75,000,000 | 6.5% | 213,745 | Office | 2.52x | 8.9% | 54.9% | 54.9% |
| 5 | Pittock Block | JPMCB | 1 | $66,000,000 | 5.7% | 297,698 | Mixed Use | 2.50x | 8.9% | 42.9% | 42.9% |
| 6 | The Galleria Office Towers | CREFI/JPMCB | 3 | $65,000,000 | 5.6% | 1,067,672 | Office | 1.71x | 12.6% | 48.6% | 39.3% |
| 7 | U.S. Industrial Portfolio VI | GSMC | 10 | $60,000,000 | 5.2% | 2,981,955 | Industrial | 2.56x | 10.7% | 59.3% | 59.3% |
| 8 | Boca Office Portfolio | CREFI | 4 | $50,000,000 | 4.3% | 514,527 | Mixed Use | 2.46x | 10.6% | 63.5% | 63.5% |
| 9 | Gestamp Automocion SLB | CREFI | 1 | $49,500,000 | 4.3% | 637,750 | Industrial | 1.52x | 8.8% | 62.7% | 56.6% |
| 10 | 30 Hudson Yards 67 | JPMCB | 1 | $45,000,000 | 3.9% | 44,954 | Office | 1.92x | 6.6% | 64.5% | 64.5% |
| Top 3 Total/Weighted Average | 4 | $234,985,667 | 20.3% | 4.24x | 13.6% | 47.6% | 47.6% | ||||
| Top 5 Total/Weighted Average | 6 | $375,985,667 | 32.4% | 3.59x | 11.8% | 48.2% | 48.2% | ||||
| Top 10 Total/Weighted Average | 25 | $645,485,667 | 55.7% | 2.94x | 11.1% | 52.7% | 51.3% | ||||
| (1) | In the case of Loan Nos. 1, 2, 3, 4, 5, 6, 7, 8 and 10, UW NCF DSCR, UW NOI DY, Cut-off Date LTV and Maturity Date LTV calculations include the related Pari Passu Companion Loan(s). In the case of Loan Nos. 1, 2, 3 and 5, UW NCF DSCR, UW NOI DY, Cut-off Date LTV and Maturity Date LTV calculations exclude the related Subordinate Companion Loan(s), related mezzanine loan(s) and/or related additional secured subordinate debt. |
| (2) | In the case of Loan No. 2, UW NCF DSCR and UW NOI DY are calculated based on the master lease annual rent of $292,000,000. |
| (3) | In the case of Loan Nos. 1, 2, 3, 8 and 10, Cut-off Date LTV and the Maturity Date LTV are calculated by using an appraised value based on certain hypothetical assumptions. Refer to “Description of the Mortgage Pool—Assessments of Property Value and Condition” and “—Appraised Value” in the Preliminary Prospectus for additional details. |
| (4) | In the case of Loan No. 1 and 2, each with an anticipated repayment date, Maturity Date LTV is calculated as of the related anticipated repayment date. |
THE INFORMATION IN THIS STRUCTURAL AND COLLATERAL TERM SHEET IS NOT COMPLETE AND MAY BE AMENDED PRIOR TO THE TIME OF SALE. THIS TERM SHEET IS NOT AN OFFER TO SELL THESE SECURITIES AND IT IS NOT A SOLICITATION OF AN OFFER TO BUY THESE SECURITIES IN ANY JURISDICTION WHERE THE OFFER OR SALE IS NOT PERMITTED.
8 of 166
| Structural and Collateral Term Sheet | Benchmark 2021-B24 | |
| Collateral Characteristics | ||
| Companion Loan Summary | ||||||||
| Loan No. | Mortgage Loan | Note(s) | Original Balance ($) | Cut-off Date Balance ($) | Holder of Note | Lead Servicer for Whole Loan (Y/N) | Master Servicer Under Lead Securitization | Special Servicer Under Lead Securitization |
| 1 | 410 Tenth Avenue | A-1 | $300,000,000 | $300,000,000 | JPMCC 2021-410T | No | ||
| A-2 | $80,000,000 | $80,000,000 | BMARK 2021-B24 | No | ||||
| B-1(1) | $185,000,000 | $185,000,000 | JPMCC 2021-410T | Yes | KeyBank | Situs | ||
| Total | $565,000,000 | $565,000,000 | ||||||
| 2 | MGM Grand & Mandalay Bay | A-13-9, A-15-9 | $79,985,667 | $79,985,667 | Benchmark 2021-B24 | No | ||
| A-13-8, A-15-8 | $75,000,000 | $75,000,000 | Benchmark 2021-B23 | No | ||||
| A-13-7 | $65,000,000 | $65,000,000 | GSMC 2020-GSA2 | No | ||||
| A-13-16, A-15-7 | $75,000,000 | $75,000,000 | Benchmark 2020-B22 | No | ||||
| A-13-5, A-15-6 | $75,000,000 | $75,000,000 | Benchmark 2020-B21 | No | ||||
| A-1, A-2, A-3, A-4 | $670,139 | $670,139 | BX 2020-VIVA | No | ||||
| A-5, A-6, A-7, A-8 | $794,861 | $794,861 | BX 2020-VIV2 | No | ||||
| A-9, A-10, A-11, A-12 | $1,000,000 | $1,000,000 | BX 2020-VIV3 | No | ||||
| A-13-1, A-15-1 | $65,000,000 | $65,000,000 | BMARK 2020-B18 | No | ||||
| A-14-1, A-16-1 | $69,500,000 | $69,500,000 | BBCMS 2020-C8 | No | ||||
| A-13-2, A-15-3 | $80,000,000 | $80,000,000 | BMARK 2020-B19 | No | ||||
| A-15-2 | $50,000,000 | $50,000,000 | DBJPM 2020-C9 | No | ||||
| A-13-3, A-14-4, A-15-5, A-16-2 | $550,000,000 | $550,000,000 | BX 2020-VIV4 | No | ||||
| A-13-4, A-15-4 | $70,000,000 | $70,000,000 | BMARK 2020-B20 | No | ||||
| A-14-2, A-14-3 | $45,000,000 | $45,000,000 | WFCM 2020-C58 | No | ||||
| A-14-5, A-16-3 | $58,000,000 | $58,000,000 | BBCMS 2021-C9 | No | ||||
| A-14-6 | $72,847,000 | $72,847,000 | Barclays | No | ||||
| A-15-10 | $39,055,333 | $39,055,333 | DBRI | No | ||||
| A-16-4, A-16-5, A-16-6, A-16-7, A-16-8, A-16-9, A-16-10, A-16-11, A-16-12 | $162,347,000 | 162,347,000 | SGFC | |||||
| B-1-A, B-2-A, B-3-A, B-4-A, B-1-B, B-2-B, B-3-B, B-4-B(1) | $329,861 | $329,861 | BX 2020-VIVA | No | ||||
| B-5-A, B-6-A, B-7-A, B-8-A, B-5-B, B-6-B, B-7-B, B-8-B(1) | $374,355,139 | $374,355,139 | BX 2020-VIV2 | No | ||||
| B-9-A, B-10-A, B-11-A, B-12-A(1) | $429,715,000 | $429,715,000 | BX 2020-VIV3 | No | ||||
| C-1, C-2, C-3, C-4(1) | $561,400,000 | $561,400,000 | BX 2020-VIVA | Yes | KeyBank | Situs | ||
| Total | $3,000,000,000 | $3,000,000,000 | ||||||
| 3 | Phillips Point | A-1 | $75,000,000 | $75,000,000 | BMARK 2021-B23 | Yes | Midland | CWCapital |
| A-2, A-4 | $75,000,000 | $75,000,000 | BMARK 2021-B24 | No | ||||
| A-3 | $48,520,000 | $48,520,000 | GSBI | No | ||||
| Total | $198,520,000 | $198,520,000 | ||||||
| 4 | 141 Livingston | A-1 | $75,000,000 | $75,000,000 | BMARK 2021-B24 | Yes | Midland | Greystone |
| A-2 | $25,000,000 | $25,000,000 | CREFI | No | ||||
| Total | $100,000,000 | $100,000,000 | ||||||
| 5 | Pittock Block
| A-1 | $75,000,000 | $75,000,000 | BMARK 2021-B23 | No | Midland | Situs |
| A-2, A-3 | $66,000,000 | $66,000,000 | BMARK 2021-B24 | No | ||||
| B-1(1) | $22,470,000 | $22,470,000 | Third Party | Yes | ||||
| Total | $163,470,000 | $163,470,000 | ||||||
| 6 | The Galleria Office | A-1, A-3 | $65,000,000 | $65,000,000 | BMARK 2021-B24 | Yes | Midland | Greystone |
| Towers | A-2 | $15,000,000 | $15,000,000 | CREFI | ||||
| A-4 | $10,000,000 | $10,000,000 | JPMCB | |||||
| Total | $90,000,000 | $90,000,000 | ||||||
| 7 | U.S. Industrial | A-1 | $60,000,000 | $60,000,000 | BMARK 2021-B24 | Yes | Midland | Greystone |
| Portfolio VI | A-2 | $21,000,000 | $21,000,000 | GSBI | ||||
| Total | $81,000,000 | $81,000,000 | ||||||
| 8 | Boca Office Portfolio | A-1 | $50,000,000 | $50,000,000 | BMARK 2021-B24 | Yes | Midland | Greystone |
| A-2 | $19,300,000 | $19,300,000 | CREFI | |||||
| A-3 | $29,700,000 | $29,700,000 | BANA | |||||
| Total | $99,000,000 | $99,000,000 | ||||||
| (1) | Each note represents a subordinate companion loan. |
THE INFORMATION IN THIS STRUCTURAL AND COLLATERAL TERM SHEET IS NOT COMPLETE AND MAY BE AMENDED PRIOR TO THE TIME OF SALE. THIS TERM SHEET IS NOT AN OFFER TO SELL THESE SECURITIES AND IT IS NOT A SOLICITATION OF AN OFFER TO BUY THESE SECURITIES IN ANY JURISDICTION WHERE THE OFFER OR SALE IS NOT PERMITTED.
9 of 166
| Structural and Collateral Term Sheet | Benchmark 2021-B24 | |
| Collateral Characteristics | ||
| Loan No. | Mortgage Loan | Note(s) | Original Balance ($) | Cut-off Date Balance ($) | Holder of Note | Lead Servicer for Whole Loan (Y/N) | Master Servicer Under Lead Securitization | Special Servicer Under Lead Securitization |
| 10 | 30 Hudson Yards 67 | A-1 | $45,000,000 | $45,000,000 | BMARK 2021-B24 | Yes | Midland | Greystone |
| A-2 | $26,000,000 | $26,000,000 | JPMCB | No | ||||
| Total | $71,000,000 | $71,000,000 | ||||||
| 13 | JW Marriott Nashville | A-1 | $35,000,000 | $35,000,000 | BMARK 2021-B23 | Yes | Midland | CWCapital |
| A-2 | $35,000,000 | $35,000,000 | BMARK 2021-B24 | No | ||||
| A-3 | $25,000,000 | $25,000,000 | GSMS 2020-GSA2 | No | ||||
| A-4 | $20,000,000 | $20,000,000 | BMARK 2020-B21 | No | ||||
| A-5 | $20,000,000 | $20,000,000 | BMARK 2020-B22 | No | ||||
| A-6 | $10,000,000 | $10,000,000 | GSMS 2020-GSA2 | No | ||||
| A-7 | $25,000,000 | $25,000,000 | GSBI | No | ||||
| A-8 | $10,000,000 | $10,000,000 | GSBI | No | ||||
| A-9 | $5,000,000 | $5,000,000 | GSBI | No | ||||
| Total | $185,000,000 | $185,000,000 | ||||||
| 15 | The Village at Meridian | A-1 | $35,000,000 | $35,000,000 | BMARK 2021-B23 | Yes | Midland | CWCapital |
| A-2 | $30,995,000 | $30,995,000 | BMARK 2021-B24 | No | ||||
| Total | $65,995,000 | $65,995,000 | ||||||
| 16 | Millennium Corporate Park | A-1 | $105,000,000 | $105,000,000 | BMARK 2021-B23 | Yes | Midland | CWCapital |
| A-2 | $27,000,000 | $27,000,000 | BMARK 2021-B24 | No | ||||
| Total | $132,000,000 | $132,000,000 | ||||||
| 17 | 711 Fifth Avenue | A-1-1, A-1-10 | $62,500,000 | $62,500,000 | GSMS 2020-GC47 | Yes | Wells Fargo | KeyBank |
| A-1-2 | $60,000,000 | $60,000,000 | BMARK 2020-B21 | No | ||||
| A-1-3 | $27,500,000 | $27,500,000 | BMARK 2021-B23 | No | ||||
| A-1-4 | $40,000,000 | $40,000,000 | GSMS 2020-GSA2 | No | ||||
| A-1-5-A, A-1-5-C | $30,000,000 | $30,000,000 | BMARK 2020-B22 | No | ||||
| A-1-5-B | $15,000,000 | $15,000,000 | BMARK 2020-B20 | No | ||||
| A-1-6, A-1-7 | $40,000,000 | $40,000,000 | JPMDB 2020-COR7 | No | ||||
| A-1-8, A-1-9, A-1-13 | $45,000,000 | $45,000,000 | BMARK 2020-B18 | No | ||||
| A-1-11, A-1-12, A-1-14 | $25,000,000 | $25,000,000 | DBJPM 2020-C9 | No | ||||
| A-1-15 | $10,000,000 | $10,000,000 | BMARK 2020-B19 | No | ||||
| A-1-16, A-1-17 | $26,500,000 | $26,500,000 | BMARK 2021-B24 | No | ||||
| A-2-1 | $60,000,000 | $60,000,000 | BANK 2020-BNK28 | No | ||||
| A-2-2 | $43,000,000 | $43,000,000 | BANK 2020-BNK27 | No | ||||
| A-2-3-A | $25,500,000 | $25,500,000 | BANK 2020-BNK29 | No | ||||
| A-2-3-B | $15,000,000 | $15,000,000 | BANK 2020-BNK30 | No | ||||
| A-2-4 | $20,000,000 | $20,000,000 | BBCMS 2020-C8 | No | ||||
| Total | $545,000,000 | $545,000,000 | ||||||
| 23 | Willoughby Commons | A-1 | $20,000,000 | $20,000,000 | BMARK 2020-B21 | Yes | Midland | Midland |
| A-2, A-3 | $16,950,000 | $16,950,000 | BMARK 2021-B24 | No | ||||
| Total | $36,950,000 | $36,950,000 |
|
THE INFORMATION IN THIS STRUCTURAL AND COLLATERAL TERM SHEET IS NOT COMPLETE AND MAY BE AMENDED PRIOR TO THE TIME OF SALE. THIS TERM SHEET IS NOT AN OFFER TO SELL THESE SECURITIES AND IT IS NOT A SOLICITATION OF AN OFFER TO BUY THESE SECURITIES IN ANY JURISDICTION WHERE THE OFFER OR SALE IS NOT PERMITTED.
10 of 166
| Structural and Collateral Term Sheet | Benchmark 2021-B24 | |
| Collateral Characteristics | ||
| Additional Debt Summary |
No. | Loan Name | Trust | Subordinate | Total Debt | Mortgage | Total | Mortgage | Total | Mortgage | Total |
| 1 | 410 Tenth Avenue | $80,000,000 | $325,000,000 | $705,000,000 | 4.91x | 2.25x | 39.8% | 73.8% | 13.0% | 7.0% |
| 2 | MGM Grand & Mandalay Bay | $79,985,667 | $1,365,800,000 | $3,000,000,000 | 4.95x | 2.70x | 35.5% | 65.2% | 17.9% | 9.7% |
| 3 | Phillips Point | $75,000,000 | $30,540,000 | $229,060,000 | 2.78x | 2.10x | 68.7% | 79.3% | 9.7% | 8.4% |
| 5 | Pittock Block | $66,000,000 | $22,470,000 | $163,470,000 | 2.50x | 1.95x | 42.9% | 49.7% | 8.9% | 7.7% |
| 20 | Woodbury Crossing Phase II | $20,380,000 | $3,120,000 | $23,500,000 | 1.96x | 1.37x | 62.1% | 71.6% | 8.6% | 7.5% |
| (1) | In the case of Loan Nos. 2 and 5, Subordinate Debt Cut-off Date Balance represents one or more Subordinate Companion Loans. In the case of Loan No. 1, Subordinate Debt Cut-off Date Balance represents one or more Subordinate Companion Loans and one or more mezzanine loans. In the case of Loan Nos. 3 and 20, Subordinate Debt Cut-off Date Balance represents one or more mezzanine loans. |
| (2) | In the case of Loan Nos. 1, 2, 3 and 5, Mortgage Loan UW NCF DSCR, Mortgage Loan UW NOI DY and Mortgage Loan Cut-off Date LTV calculations include the related Pari Passu Companion Loan(s). In the case of Loan Nos. 1, 2, 3, 5 and 20, Mortgage Loan UW NCF DSCR, Mortgage Loan UW NOI DY and Mortgage Loan Cut-off Date LTV calculations exclude the related Subordinate Companion Loan(s), related mezzanine loan(s) and/or related additional secured subordinate loan. |
| (3) | In the case of Loan No. 2, Mortgage Loan UW NCF DSCR, Total Debt UW NCF DSCR, Mortgage Loan UW NOI DY and Total Debt UW NOI DY are calculated based on the master lease annual rent of $292,000,000. |
| (4) | In the case of Loan Nos. 1, 2 and 3, Mortgage Loan Cut-off Date LTV and Total Debt Cut-Off Date LTV are calculated by using an appraised value based on certain hypothetical assumptions. Refer to “Description of the Mortgage Pool—Assessments of Property Value and Condition” and “—Appraised Value” in the Preliminary Prospectus for additional details. |
THE INFORMATION IN THIS STRUCTURAL AND COLLATERAL TERM SHEET IS NOT COMPLETE AND MAY BE AMENDED PRIOR TO THE TIME OF SALE. THIS TERM SHEET IS NOT AN OFFER TO SELL THESE SECURITIES AND IT IS NOT A SOLICITATION OF AN OFFER TO BUY THESE SECURITIES IN ANY JURISDICTION WHERE THE OFFER OR SALE IS NOT PERMITTED.
11 of 166
| Structural and Collateral Term Sheet | Benchmark 2021-B24 | |
| Collateral Characteristics | ||
| Mortgaged Properties by Type(1) |
| Weighted Average | |||||||||
| Property Type | ��Property Subtype | Number of Properties | Cut-off Date Principal Balance | % of IPB | Occupancy | UW NCF DSCR(2)(3) | UW NOI DY(2)(3)(4) | Cut-off Date LTV(2)(4)(5) | Maturity Date LTV (2)(5)(6) |
| Office | CBD | 9 | $383,500,000 | 33.1% | 92.1% | 2.79x | 10.4% | 55.3% | 52.9% |
| Suburban | 2 | 51,300,000 | 4.4 | 89.4% | 2.42x | 10.0% | 65.0% | 60.0% | |
| Medical | 1 | 42,500,000 | 3.7 | 100.0% | 1.99x | 7.8% | 60.4% | 60.4% | |
| Flex | 1 | 24,150,000 | 2.1 | 86.9% | 2.03x | 11.6% | 69.0% | 58.9% | |
| Subtotal: | 13 | $501,450,000 | 43.3% | 92.2% | 2.65x | 10.2% | 57.4% | 54.5% | |
| Mixed Use | Office/Retail | 6 | $86,000,000 | 7.4% | 87.6% | 2.57x | 10.0% | 59.5% | 59.5% |
| Office/Retail/Data Center | 1 | 66,000,000 | 5.7 | 71.4% | 2.50x | 8.9% | 42.9% | 42.9% | |
| Self Storage/Retail | 2 | 23,181,250 | 2.0 | 98.1% | 1.88x | 9.3% | 60.3% | 57.0% | |
| Multifamily/Office/Retail | 1 | 7,000,000 | 0.6 | 100.0% | 1.90x | 7.8% | 56.5% | 56.5% | |
| Retail/Multifamily | 1 | 6,600,000 | 0.6 | 100.0% | 2.51x | 9.9% | 50.0% | 50.0% | |
| Subtotal: | 11 | $188,781,250 | 16.3% | 84.1% | 2.43x | 9.5% | 53.4% | 53.0% | |
| Industrial | Manufacturing | 7 | $74,287,407 | 6.4% | 100.0% | 1.87x | 9.4% | 61.6% | 57.5% |
| Warehouse/Distribution | 4 | 48,238,889 | 4.2 | 100.0% | 2.36x | 11.5% | 61.8% | 58.6% | |
| R&D/Flex | 1 | 18,390,000 | 1.6 | 100.0% | 1.58x | 9.2% | 60.0% | 51.7% | |
| Warehouse | 2 | 6,323,704 | 0.5 | 75.1% | 2.56x | 10.7% | 59.3% | 59.3% | |
| Flex | 1 | 5,500,000 | 0.5 | 88.7% | 2.45x | 10.1% | 57.9% | 57.9% | |
| Subtotal: | 15 | $152,740,000 | 13.2% | 98.6% | 2.04x | 10.1% | 61.2% | 57.3% | |
| Retail | Anchored | 3 | $88,380,000 | 7.6% | 91.4% | 3.40x | 13.0% | 49.2% | 53.7% |
| Power Center | 1 | 16,950,000 | 1.5 | 98.9% | 1.55x | 9.4% | 71.5% | 63.4% | |
| Freestanding | 15 | 13,850,000 | 1.2 | 100.0% | 2.81x | 9.1% | 65.0% | 65.0% | |
| Single Tenant | 1 | 6,180,000 | 0.5 | 100.0% | 1.96x | 8.1% | 60.6% | 60.6% | |
| Subtotal: | 20 | $125,360,000 | 10.8% | 93.8% | 3.01x | 11.8% | 54.5% | 56.6% | |
| Hotel | Full Service | 4 | $121,273,464 | 10.5% | 62.1% | 4.56x | 16.9% | 44.4% | 44.0% |
| Subtotal: | 4 | $121,273,464 | 10.5% | 62.1% | 4.56x | 16.9% | 44.4% | 44.0% | |
| Multifamily | Garden | 3 | $44,550,000 | 3.8% | 96.6% | 2.30x | 9.1% | 63.2% | 63.2% |
| Subtotal: | 3 | $44,550,000 | 3.8% | 96.6% | 2.30x | 9.1% | 63.2% | 63.2% | |
| Self Storage | Self Storage | 5 | $25,175,200 | 2.2% | 93.8% | 2.06x | 8.7% | 64.0% | 60.9% |
| Subtotal: | 5 | $25,175,200 | 2.2% | 93.8% | 2.06x | 8.7% | 64.0% | 60.9% | |
| Total / Weighted Average: | 71 | $1,159,329,914 | 100.0% | 89.0% | 2.75x | 10.9% | 55.9% | 54.2% | |
| (1) | Because this table presents information relating to the mortgaged properties and not mortgage loans, the information for mortgage loans secured by more than one mortgaged property is based on allocated loan amounts. |
| (2) | In the case of Loan Nos. 1, 2, 3, 4, 5, 6, 7, 8, 10, 13, 15, 16, 17 and 23, UW NOI DY, Cut-off Date LTV and Maturity Date LTV calculations include the related Pari Passu Companion Loan(s). In the case of Loan Nos. 1, 2, 3, 5, and 20, UW NCF DSCR, UW NOI DY, Cut-off Date LTV and Maturity Date LTV calculations exclude the related Subordinate Companion Loan(s), related mezzanine loan(s) and/or related additional secured subordinate debt. |
| (3) | In the case of Loan No. 2, UW NCF DSCR and UW NOI DY are calculated based on the master lease annual rent of $292,000,000. |
| (4) | In the case of Loan No. 11, Cut-off Date LTV is calculated net of a holdback reserve of $6,095,133. In the case of Loan No. 31, UW NCF DSCR, UW NOI DY and Cut-off Date LTV are calculated net of a holdback reserve of $750,000. |
| (5) | In the case of Loan Nos. 1, 2, 3, 8, 10, 18, and 25, Cut-off Date LTV and the Maturity Date LTV are calculated by using an appraised value based on certain hypothetical assumptions. Refer to “Description of the Mortgage Pool—Assessments of Property Value and Condition” and “—Appraised Value” in the Preliminary Prospectus for additional details. |
| (6) | In the case of Loan Nos. 1 and 2, each with an anticipated repayment date, Maturity Date LTV is calculated as of the related anticipated repayment date. |
THE INFORMATION IN THIS STRUCTURAL AND COLLATERAL TERM SHEET IS NOT COMPLETE AND MAY BE AMENDED PRIOR TO THE TIME OF SALE. THIS TERM SHEET IS NOT AN OFFER TO SELL THESE SECURITIES AND IT IS NOT A SOLICITATION OF AN OFFER TO BUY THESE SECURITIES IN ANY JURISDICTION WHERE THE OFFER OR SALE IS NOT PERMITTED.
12 of 166
| Structural and Collateral Term Sheet | Benchmark 2021-B24 | |
| Collateral Characteristics | ||

| Mortgaged Properties by Location(1) | ||||||||
Weighted Average | ||||||||
State | Number of | Cut-off Date | % of | Occupancy | UW NCF DSCR(2)(3) | UW NOI DY(2)(3)(4) | Cut-off Date LTV(2)(4)(5) | Maturity Date LTV (2)(5)(6) |
| New York | 9 | $263,668,474 | 22.7% | 97.4% | 3.11x | 9.7% | 52.7% | 52.7% |
| Florida | 8 | 200,150,000 | 17.3 | 91.2% | 2.41x | 10.2% | 65.9% | 63.1% |
| Tennessee | 3 | 100,155,000 | 8.6 | 80.3% | 2.61x | 11.2% | 62.4% | 59.4% |
| Texas | 5 | 81,766,450 | 7.1 | 74.3% | 1.77x | 11.8% | 51.7% | 44.0% |
| Nevada | 2 | 79,985,667 | 6.9 | 71.4% | 4.95x | 17.9% | 35.5% | 35.5% |
| Oregon | 2 | 71,500,000 | 6.2 | 72.7% | 2.50x | 9.0% | 44.1% | 44.1% |
| California | 3 | 58,600,000 | 5.1 | 100.0% | 2.09x | 8.2% | 58.0% | 58.0% |
| Georgia | 2 | 56,644,444 | 4.9 | 97.9% | 2.58x | 10.2% | 56.3% | 63.2% |
| Washington | 2 | 47,380,000 | 4.1 | 98.1% | 2.63x | 9.4% | 61.4% | 61.4% |
| Michigan | 4 | 37,852,777 | 3.3 | 85.7% | 1.80x | 10.8% | 69.4% | 59.6% |
| Idaho | 1 | 30,995,000 | 2.7 | 79.3% | 5.14x | 19.1% | 33.5% | 33.5% |
| Colorado | 1 | 18,390,000 | 1.6 | 100.0% | 1.58x | 9.2% | 60.0% | 51.7% |
| Ohio | 1 | 16,950,000 | 1.5 | 98.9% | 1.55x | 9.4% | 71.5% | 63.4% |
| Illinois | 1 | 16,044,444 | 1.4 | 100.0% | 2.56x | 10.7% | 59.3% | 59.3% |
| Wisconsin | 4 | 15,001,481 | 1.3 | 100.0% | 2.56x | 10.7% | 59.3% | 59.3% |
| North Carolina | 2 | 10,091,296 | 0.9 | 79.8% | 2.58x | 9.7% | 64.5% | 64.5% |
| Connecticut | 1 | 9,500,000 | 0.8 | 95.3% | 1.54x | 9.9% | 57.2% | 49.1% |
| Virginia | 1 | 7,650,000 | 0.7 | 100.0% | 2.19x | 13.4% | 59.5% | 54.1% |
| Minnesota | 4 | 7,569,128 | 0.7 | 100.0% | 2.65x | 10.1% | 61.4% | 61.4% |
| New Jersey | 1 | 6,287,797 | 0.5 | 44.8% | 1.82x | 12.4% | 62.9% | 53.8% |
| Pennsylvania | 1 | 5,742,222 | 0.5 | 100.0% | 2.56x | 10.7% | 59.3% | 59.3% |
| Alabama | 3 | 5,090,000 | 0.4 | 98.2% | 1.54x | 8.9% | 65.3% | 56.2% |
| Kentucky | 2 | 4,888,256 | 0.4 | 100.0% | 2.60x | 10.4% | 60.3% | 60.3% |
| Arkansas | 2 | 1,806,949 | 0.2 | 100.0% | 2.81x | 9.1% | 65.0% | 65.0% |
| Mississippi | 1 | 1,126,069 | 0.1 | 100.0% | 2.81x | 9.1% | 65.0% | 65.0% |
| West Virginia | 1 | 1,008,225 | 0.1 | 100.0% | 2.81x | 9.1% | 65.0% | 65.0% |
| Louisiana | 1 | 942,756 | 0.1 | 100.0% | 2.81x | 9.1% | 65.0% | 65.0% |
| North Dakota | 1 | 896,927 | 0.1 | 100.0% | 2.81x | 9.1% | 65.0% | 65.0% |
| South Dakota | 1 | 867,466 | 0.1 | 100.0% | 2.81x | 9.1% | 65.0% | 65.0% |
| Oklahoma | 1 | 779,083 | 0.1 | 100.0% | 2.81x | 9.1% | 65.0% | 65.0% |
| Total / Weighted Average: | 71 | $1,159,329,914 | 100.0% | 89.0% | 2.75x | 10.9% | 55.9% | 54.2% |
| (1) | Because this table presents information relating to the mortgaged properties and not mortgage loans, the information for mortgage loans secured by more than one mortgaged property is based on allocated loan amounts. |
| (2) | In the case of Loan Nos. 1, 2, 3, 4, 5, 6, 7, 8, 10, 13, 15, 16, 17 and 23, UW NCF DSCR, UW NOI DY, Cut-off Date LTV and Maturity Date LTV calculations include the related Pari Passu Companion Loan(s). In the case of Loan Nos. 1, 2, 3, 5, and 20, UW NCF DSCR, UW NOI DY, Cut-off Date LTV and Maturity Date LTV calculations exclude the related Subordinate Companion Loan(s), related mezzanine loan(s) and/or related additional secured subordinate debt. |
| (3) | In the case of Loan No. 2, UW NCF DSCR and UW NOI DY are calculated based on the master lease annual rent of $292,000,000. |
| (4) | In the case of Loan No. 11, Cut-off Date LTV is calculated net of a holdback reserve of $6,095,133. In the case of Loan No. 31, UW NOI DY and Cut-off Date LTV are calculated net of a holdback reserve of $750,000. |
| (5) | In the case of Loan Nos. 1, 2, 3, 8, 10, 18, and 25, Cut-off Date LTV and the Maturity Date LTV are calculated by using an appraised value based on certain hypothetical assumptions. Refer to “Description of the Mortgage Pool—Assessments of Property Value and Condition” and “—Appraised Value” in the Preliminary Prospectus for additional details. |
| (6) | In the case of Loan Nos. 1 and 2, each with an anticipated repayment date, Maturity Date LTV is calculated as of the related anticipated repayment date. |
THE INFORMATION IN THIS STRUCTURAL AND COLLATERAL TERM SHEET IS NOT COMPLETE AND MAY BE AMENDED PRIOR TO THE TIME OF SALE. THIS TERM SHEET IS NOT AN OFFER TO SELL THESE SECURITIES AND IT IS NOT A SOLICITATION OF AN OFFER TO BUY THESE SECURITIES IN ANY JURISDICTION WHERE THE OFFER OR SALE IS NOT PERMITTED.
13 of 166
| Structural and Collateral Term Sheet | Benchmark 2021-B24 | |
| Collateral Characteristics | ||
| Cut-off Date Principal Balance |
Weighted Average | |||||||||||
| Range of Cut-off Date Principal Balances | Number of Loans | Cut-off Date Principal Balance | % of IPB | Mortgage Rate | Remaining Loan Term(1) | UW NCF DSCR(2)(3) | UW NOI DY(2)(3)(4) | Cut-off Date LTV(2)(4)(5) | Maturity Date LTV(1)(2)(5) | ||
| $3,085,200 | - | $9,999,999 | 12 | $84,407,997 | 7.3% | 3.91719% | 118 | 2.06x | 9.7% | 58.8% | 55.8% |
| $10,000,000 | - | $19,999,999 | 8 | 120,811,250 | 10.4 | 3.71509% | 118 | 2.10x | 9.3% | 64.8% | 61.4% |
| $20,000,000 | - | $29,999,999 | 5 | 122,330,000 | 10.6 | 3.59312% | 104 | 2.37x | 10.0% | 63.0% | 58.9% |
| $30,000,000 | - | $39,999,999 | 3 | 99,995,000 | 8.6 | 3.37333% | 115 | 3.68x | 14.9% | 53.3% | 50.2% |
| $40,000,000 | - | $49,999,999 | 4 | 180,800,000 | 15.6 | 3.57688% | 117 | 1.99x | 8.3% | 60.8% | 61.3% |
| $50,000,000 | - | $80,000,000 | 8 | 550,985,667 | 47.5 | 3.47521% | 107 | 3.16x | 11.7% | 50.8% | 49.8% |
Total / Wtd. Avg: | 40 | $1,159,329,914 | 100.0% | 3.55190% | 111 | 2.75x | 10.9% | 55.9% | 54.2% | ||
| Mortgage Interest Rates |
Weighted Average | |||||||||||
| Range of Mortgage Interest Rates | Number of Loans | Cut-off Date Principal Balance | % of IPB | Mortgage Rate | Remaining Loan Term(1) | UW NCF DSCR(2)(3) | UW NOI DY(2)(3)(4) | Cut-off Date LTV(2)(4)(5) | Maturity Date LTV(1)(2)(5) | ||
| 2.59159% | - | 2.99999% | 1 | $80,000,000 | 6.9% | 2.59159% | 82 | 4.91x | 13.0% | 39.8% | 39.8% |
| 3.00000% | - | 3.49999% | 10 | 410,000,000 | 35.4 | 3.27412% | 114 | 2.91x | 10.2% | 56.5% | 56.5% |
| 3.50000% | - | 3.99999% | 21 | 472,582,117 | 40.8 | 3.66191% | 117 | 2.57x | 11.0% | 56.6% | 54.7% |
| 4.00000% | - | 4.49999% | 7 | 190,460,000 | 16.4 | 4.22544% | 103 | 1.94x | 10.9% | 59.5% | 54.0% |
| 4.50000% | - | 5.21200% | 1 | 6,287,797 | 0.5 | 5.21200% | 92 | 1.82x | 12.4% | 62.9% | 53.8% |
| Total / Wtd. Avg: | 40 | $1,159,329,914 | 100.0% | 3.55190% | 111 | 2.75x | 10.9% | 55.9% | 54.2% | ||
| Original Term to Maturity in Months |
Weighted Average | |||||||||
| Original Term to Maturity in Months | Number of Loans | Cut-off Date Principal Balance | % of IPB | Mortgage Rate | Remaining Loan Term(1) | UW NCF DSCR(2)(3) | UW NOI DY(2)(3)(4) | Cut-off Date LTV(2)(4)(5) | Maturity Date LTV(1)(2)(5) |
| 60 | 2 | $77,000,000 | 6.6% | 3.67356% | 59 | 2.69x | 10.4% | 62.6% | 62.6% |
| 84 | 1 | 80,000,000 | 6.9 | 2.59159% | 82 | 4.91x | 13.0% | 39.8% | 39.8% |
| 120 | 37 | 1,002,329,914 | 86.5 | 3.61919% | 117 | 2.58x | 10.7% | 56.7% | 54.7% |
Total / Wtd. Avg: | 40 | $1,159,329,914 | 100.0% | 3.55190% | 111 | 2.75x | 10.9% | 55.9% | 54.2% |
| Remaining Term to Maturity in Months(1) |
| Weighted Average | |||||||||||
| Range of Remaining Term to Maturity in Months | Number of Loans | Cut-off Date Principal Balance | % of IPB | Mortgage Rate | Remaining Loan Term(1) | UW NCF DSCR(2)(3) | UW NOI DY(2)(3)(4) | Cut-off Date LTV(2)(4)(5) | Maturity Date LTV(1)(2)(5) | ||
| 58 | - | 60 | 2 | $77,000,000 | 6.6% | 3.67356% | 59 | 2.69x | 10.4% | 62.6% | 62.6% |
| 61 | - | 84 | 1 | 80,000,000 | 6.9 | 2.59159% | 82 | 4.91x | 13.0% | 39.8% | 39.8% |
| 85 | - | 119 | 12 | 406,953,664 | 35.1 | 3.44639% | 113 | 3.36x | 12.4% | 52.0% | 52.4% |
| 120 | - | 120 | 25 | 595,376,250 | 51.4 | 3.73731% | 120 | 2.04x | 9.6% | 59.9% | 56.3% |
| Total / Wtd. Avg: | 40 | $1,159,329,914 | 100.0% | 3.55190% | 111 | 2.75x | 10.9% | 55.9% | 54.2% | ||
| (1) | In the case of Loan Nos. 1 and 2, each with an anticipated repayment date, Remaining Loan Term and Maturity Date LTV are calculated as of the related anticipated repayment date. |
| (2) | In the case of Loan Nos. 1, 2, 3, 4, 5, 6, 7, 8, 10, 13, 15, 16, 17 and 23, UW NCF DSCR, UW NOI DY, Cut-off Date LTV and Maturity Date LTV calculations include the related Pari Passu Companion Loan(s). In the case of Loan Nos. 1, 2, 3, 5, and 20, UW NCF DSCR, UW NOI DY, Cut-off Date LTV and Maturity Date LTV calculations exclude the related Subordinate Companion Loan(s), related mezzanine loan(s) and/or related additional secured subordinate debt. |
| (3) | In the case of Loan No. 2, UW NCF DSCR and UW NOI DY are calculated based on the master lease annual rent of $292,000,000. |
| (4) | In the case of Loan No. 11, Cut-off Date LTV is calculated net of a holdback reserve of $6,095,133. In the case of Loan No. 31, UW NOI DY and Cut-off Date LTV are calculated net of a holdback reserve of $750,000. |
| (5) | In the case of Loan Nos. 1, 2, 3, 8, 10, 18, and 25, Cut-off Date LTV and the Maturity Date LTV are calculated by using an appraised value based on certain hypothetical assumptions. Refer to “Description of the Mortgage Pool—Assessments of Property Value and Condition” and “—Appraised Value” in the Preliminary Prospectus for additional details. |
THE INFORMATION IN THIS STRUCTURAL AND COLLATERAL TERM SHEET IS NOT COMPLETE AND MAY BE AMENDED PRIOR TO THE TIME OF SALE. THIS TERM SHEET IS NOT AN OFFER TO SELL THESE SECURITIES AND IT IS NOT A SOLICITATION OF AN OFFER TO BUY THESE SECURITIES IN ANY JURISDICTION WHERE THE OFFER OR SALE IS NOT PERMITTED.
14 of 166
| Structural and Collateral Term Sheet | Benchmark 2021-B24 | |
| Collateral Characteristics | ||
| Original Amortization Term in Months |
| Weighted Average | |||||||||||
| Original Amortization Term in Months | Number of Loans | Cut-off Date Principal Balance | % of IPB | Mortgage Rate | Remaining Loan Term(1) | UW NCF DSCR(2)(3) | UW NOI DY(2)(3)(4) | Cut-off Date LTV(2)(4)(5) | Maturity Date LTV(1)(2)(5) | ||
Interest Only | 27 | $883,726,917 | 76.2% | 3.42554% | 108 | 3.07x | 10.9% | 54.3% | 54.8% | ||
| 360 | - | 360 | 13 | 275,602,997 | 23.8 | 3.95707% | 118 | 1.71x | 10.8% | 61.1% | 52.5% |
| Total / Wtd. Avg: | 40 | $1,159,329,914 | 100.0% | 3.55190% | 111 | 2.75x | 10.9% | 55.9% | 54.2% | ||
| Remaining Amortization Term in Months |
| Weighted Average | |||||||||||
| Range of Remaining Amortization Term in Months | Number of Loans | Cut-off Date Principal Balance | % of IPB | Mortgage Rate | Remaining Loan Term(1) | UW NCF DSCR(2)(3) | UW NOI DY(2)(3)(4) | Cut-off Date LTV(2)(4)(5) | Maturity Date LTV(1)(2)(5) | ||
Interest Only | 27 | $883,726,917 | 76.2% | 3.42554% | 108 | 3.07x | 10.9% | 54.3% | 54.8% | ||
| 332 | - | 332 | 1 | 6,287,797 | 0.5 | 5.21200% | 92 | 1.82x | 12.4% | 62.9% | 53.8% |
| 360 | - | 360 | 12 | 269,315,200 | 23.2 | 3.92777% | 119 | 1.71x | 10.7% | 61.0% | 52.4% |
| Total / Wtd. Avg: | 40 | $1,159,329,914 | 100.0% | 3.55190% | 111 | 2.75x | 10.9% | 55.9% | 54.2% | ||
| Amortization Types |
Weighted Average | |||||||||
| Amortization Types | Number of Loans | Cut-off Date Principal Balance | % of IPB | Mortgage Rate | Remaining Loan Term(1) | UW NCF DSCR(2)(3) | UW NOI DY(2)(3)(4) | Cut-off Date LTV(2)(4)(5) | Maturity Date LTV(1)(2)(5) |
| Interest Only | 25 | $723,741,250 | 62.4% | 3.50308% | 111 | 2.66x | 9.9% | 58.0% | 58.6% |
| IO-Balloon | 10 | 194,815,200 | 16.8 | 3.75301% | 119 | 1.72x | 10.1% | 65.3% | 57.0% |
| ARD-Interest Only | 2 | 159,985,667 | 13.8 | 3.07475% | 95 | 4.93x | 15.4% | 37.7% | 37.7% |
| Balloon | 3 | 80,787,797 | 7.0 | 4.44915% | 118 | 1.70x | 12.3% | 50.7% | 41.6% |
| Total / Wtd. Avg: | 40 | $1,159,329,914 | 100.0% | 3.55190% | 111 | 2.75x | 10.9% | 55.9% | 54.2% |
| Underwritten Net Cash Flow Debt Service Coverage Ratios(2)(3) |
| Weighted Average | |||||||||||
| Range of Underwritten Net Cash Flow Debt Service Coverage Ratios | Number of Loans | Cut-off Date Principal Balance | % of IPB | Mortgage Rate | Remaining Loan Term(1) | UW NCF DSCR(2)(3) | UW NOI DY(2)(3)(4) | Cut-off Date LTV(2)(4)(5) | Maturity Date LTV(1)(2)(5) | ||
| 1.52x | - | 1.99x | 16 | $364,862,997 | 31.5% | 3.90929% | 119 | 1.76x | 9.6% | 60.9% | 55.2% |
| 2.00x | - | 2.49x | 9 | 150,566,250 | 13.0 | 3.82018% | 100 | 2.25x | 10.0% | 62.8% | 60.9% |
| 2.50x | - | 2.99x | 10 | 390,920,000 | 33.7 | 3.38733% | 117 | 2.62x | 9.6% | 57.1% | 58.1% |
| 3.00x | - | 3.49x | 1 | 27,000,000 | 2.3 | 3.03200% | 58 | 3.13x | 10.0% | 60.9% | 60.9% |
| 3.50x | 5.14x | 4 | 225,980,667 | 19.5 | 3.14289% | 100 | 4.84x | 15.9% | 40.8% | 40.8% | |
| Total / Wtd. Avg: | 40 | $1,159,329,914 | 100.0% | 3.55190% | 111 | 2.75x | 10.9% | 55.9% | 54.2% | ||
| (1) | In the case of Loan Nos. 1 and 2, each with an anticipated repayment date, Remaining Loan Term and Maturity Date LTV are calculated as of the related anticipated repayment date. |
| (2) | In the case of Loan Nos. 1, 2, 3, 4, 5, 6, 7, 8, 10, 13, 15, 16, 17 and 23, UW NCF DSCR, UW NOI DY, Cut-off Date LTV and Maturity Date LTV calculations include the related Pari Passu Companion Loan(s). In the case of Loan Nos. 1, 2, 3, 5, and 20, UW NCF DSCR, UW NOI DY, Cut-off Date LTV and Maturity Date LTV calculations exclude the related Subordinate Companion Loan(s), related mezzanine loan(s) and/or related additional secured subordinate debt. |
| (3) | In the case of Loan No. 2, UW NCF DSCR and UW NOI DY are calculated based on the master lease annual rent of $292,000,000. |
| (4) | In the case of Loan No. 11, Cut-off Date LTV is calculated net of a holdback reserve of $6,095,133. In the case of Loan No. 31, UW NOI DY and Cut-off Date LTV are calculated net of a holdback reserve of $750,000. |
| (5) | In the case of Loan Nos. 1, 2, 3, 8, 10, 18, and 25, Cut-off Date LTV and the Maturity Date LTV are calculated by using an appraised value based on certain hypothetical assumptions. Refer to “Description of the Mortgage Pool—Assessments of Property Value and Condition” and “—Appraised Value” in the Preliminary Prospectus for additional details. |
THE INFORMATION IN THIS STRUCTURAL AND COLLATERAL TERM SHEET IS NOT COMPLETE AND MAY BE AMENDED PRIOR TO THE TIME OF SALE. THIS TERM SHEET IS NOT AN OFFER TO SELL THESE SECURITIES AND IT IS NOT A SOLICITATION OF AN OFFER TO BUY THESE SECURITIES IN ANY JURISDICTION WHERE THE OFFER OR SALE IS NOT PERMITTED.
15 of 166
| Structural and Collateral Term Sheet | Benchmark 2021-B24 | |
| Collateral Characteristics | ||
| LTV Ratios as of the Cut-off Date(2)(4)(5) |
| Weighted Average | |||||||||||
| Range of Cut-off Date LTVs | Number of Loans | Cut-off Date Principal Balance | % of IPB | Mortgage Rate | Remaining Loan Term(1) | UW NCF DSCR(2)(3) | UW NOI DY(2)(3)(4) | Cut-off Date LTV(2)(4)(5) | Maturity Date LTV(1)(2)(5) | ||
| 33.5% | - | 39.9% | 3 | $190,980,667 | 16.5% | 3.14360% | 99 | 4.96x | 16.0% | 37.0% | 37.0% |
| 40.0% | - | 49.9% | 2 | 131,000,000 | 11.3 | 3.87527% | 119 | 2.11x | 10.7% | 45.7% | 41.1% |
| 50.0% | - | 59.9% | 11 | 260,550,000 | 22.5 | 3.51326% | 117 | 2.49x | 9.7% | 56.2% | 57.2% |
| 60.0% | - | 69.9% | 22 | 556,764,047 | 48.0 | 3.61843% | 110 | 2.30x | 9.7% | 64.2% | 61.5% |
| 70.0% | - | 71.5% | 2 | 20,035,200 | 1.7 | 3.98287% | 108 | 1.56x | 9.4% | 71.3% | 62.9% |
Total / Wtd. Avg: | 40 | $1,159,329,914 | 100.0% | 3.55190% | 111 | 2.75x | 10.9% | 55.9% | 54.2% | ||
| LTV Ratios as of the Maturity Date(1)(2)(5) |
Weighted Average | |||||||||||
| Range of Maturity Date LTVs | Number of Loans | Cut-off Date Principal Balance | % of IPB | Mortgage Rate | Remaining Loan Term(1) | UW NCF DSCR(2)(3) | UW NOI DY(2)(3)(4) | Cut-off Date LTV(2)(4)(5) | Maturity Date LTV(1)(2)(5) | ||
| 33.5% | - | 39.9% | 4 | $255,980,667 | 22.1% | 3.47787% | 104 | 4.14x | 15.2% | 39.9% | 37.6% |
| 40.0% | - | 44.9% | 1 | 66,000,000 | 5.7 | 3.29940% | 118 | 2.50x | 8.9% | 42.9% | 42.9% |
| 45.0% | - | 49.9% | 1 | 9,500,000 | 0.8 | 3.87000% | 120 | 1.54x | 9.9% | 57.2% | 49.1% |
| 50.0% | - | 54.9% | 8 | 183,927,797 | 15.9 | 3.47400% | 117 | 2.30x | 9.7% | 57.0% | 53.9% |
| 55.0% | - | 68.7% | 26 | 643,921,450 | 55.5 | 3.62476% | 111 | 2.36x | 9.7% | 63.3% | 62.2% |
Total / Wtd. Avg: | 40 | $1,159,329,914 | 100.0% | 3.55190% | 111 | 2.75x | 10.9% | 55.9% | 54.2% | ||
| Prepayment Protection |
Weighted Average | |||||||||
| Prepayment Protection | Number of Loans | Cut-off Date Principal Balance | % of IPB | Mortgage Rate | Remaining Loan Term(1) | UW NCF DSCR(2)(3) | UW NOI DY(2)(3)(4) | Cut-off Date LTV(2)(4)(5) | Maturity Date LTV(1)(2)(5) |
| Defeasance | 32 | $888,806,450 | 76.7% | 3.55466% | 109 | 2.57x | 10.3% | 58.7% | 56.9% |
| Defeasance or Yield Maintenance | 3 | 160,480,667 | 13.8 | 3.56264% | 114 | 3.93x | 15.3% | 43.5% | 41.6% |
| Yield Maintenance | 5 | 110,042,797 | 9.5 | 3.51391% | 117 | 2.43x | 9.1% | 51.4% | 50.9% |
Total / Wtd. Avg: | 40 | $1,159,329,914 | 100.0% | 3.55190% | 111 | 2.75x | 10.9% | 55.9% | 54.2% |
| Loan Purpose |
Weighted Average | |||||||||
| Loan Purpose | Number of Loans | Cut-off Date Principal Balance | % of IPB | Mortgage Rate | Remaining Loan Term(1) | UW NCF DSCR(2)(3) | UW NOI DY(2)(3)(4) | Cut-off Date LTV(2)(4)(5) | Maturity Date LTV(1)(2)(5) |
| Refinance | 22 | $560,354,047 | 48.3% | 3.70453% | 118 | 2.26x | 9.9% | 59.3% | 56.8% |
| Acquisition | 14 | 468,000,867 | 40.4 | 3.31689% | 107 | 3.22x | 11.7% | 52.5% | 50.5% |
| Recapitalization | 3 | 80,975,000 | 7.0 | 3.56482% | 113 | 3.51x | 13.4% | 47.4% | 52.3% |
| Recapitalization; Acquisition | 1 | 50,000,000 | 4.3 | 4.02000% | 60 | 2.46x | 10.6% | 63.5% | 63.5% |
| Total / Wtd. Avg: | 40 | $1,159,329,914 | 100.0% | 3.55190% | 111 | 2.75x | 10.9% | 55.9% | 54.2% |
| (1) | In the case of Loan Nos. 1 and 2, each with an anticipated repayment date, Remaining Loan Term and Maturity Date LTV are calculated as of the related anticipated repayment date. |
| (2) | In the case of Loan Nos. 1, 2, 3, 4, 5, 6, 7, 8, 10, 13, 15, 16, 17 and 23, UW NCF DSCR, UW NOI DY, Cut-off Date LTV and Maturity Date LTV calculations include the related Pari Passu Companion Loan(s). In the case of Loan Nos. 1, 2, 3, 5, and 20, UW NCF DSCR, UW NOI DY, Cut-off Date LTV and Maturity Date LTV calculations exclude the related Subordinate Companion Loan(s), related mezzanine loan(s) and/or related additional secured subordinate debt. |
| (3) | In the case of Loan No. 2, UW NCF DSCR and UW NOI DY are calculated based on the master lease annual rent of $292,000,000. |
| (4) | In the case of Loan No. 11, Cut-off Date LTV is calculated net of a holdback reserve of $6,095,133. In the case of Loan No. 31, UW NOI DY and Cut-off Date LTV are calculated net of a holdback reserve of $750,000. |
| (5) | In the case of Loan Nos. 1, 2, 3, 8, 10, 18, and 25, Cut-off Date LTV and the Maturity Date LTV are calculated by using an appraised value based on certain hypothetical assumptions. Refer to “Description of the Mortgage Pool—Assessments of Property Value and Condition” and “—Appraised Value” in the Preliminary Prospectus for additional details. |
THE INFORMATION IN THIS STRUCTURAL AND COLLATERAL TERM SHEET IS NOT COMPLETE AND MAY BE AMENDED PRIOR TO THE TIME OF SALE. THIS TERM SHEET IS NOT AN OFFER TO SELL THESE SECURITIES AND IT IS NOT A SOLICITATION OF AN OFFER TO BUY THESE SECURITIES IN ANY JURISDICTION WHERE THE OFFER OR SALE IS NOT PERMITTED.
16 of 166
| Structural and Collateral Term Sheet | Benchmark 2021-B24 | |
| Collateral Characteristics | ||
| Previous Securitization History(1) |
| No. | Mortgaged Property | Cut-off Date Principal Balance(2) | % of IPB | Location | Property Type | Previous Securitization |
| 6 | The Galleria Office Towers | $65,000,000 | 5.6% | Houston, TX | Office | JPMCC 2011-C3 |
| 12 | 8670 Wilshire | $42,500,000 | 3.7% | Beverly Hills, CA | Office | GSMS 2013-GC16 |
| 18 | Oakland Commons I&II | $24,300,000 | 2.1% | Southfield, MI | Office | AREIT 2019-CRE3 |
| 24 | Camellia Trace | $15,655,000 | 1.4% | Jackson, TN | Multifamily | WFRBS 2011-C3 |
| 8.02 | Fountains Center | $14,393,939 | 1.2% | Boca Raton, FL | Mixed Use | GSMS 2014-GC26 |
| (1) | The table above represents the properties for which the previously existing debt was securitized, based on information provided by the related borrower or obtained through searches of a third-party database. |
| (2) | Cut-off Date Principal Balance represents the allocated loan amount for each respective mortgaged property. |
THE INFORMATION IN THIS STRUCTURAL AND COLLATERAL TERM SHEET IS NOT COMPLETE AND MAY BE AMENDED PRIOR TO THE TIME OF SALE. THIS TERM SHEET IS NOT AN OFFER TO SELL THESE SECURITIES AND IT IS NOT A SOLICITATION OF AN OFFER TO BUY THESE SECURITIES IN ANY JURISDICTION WHERE THE OFFER OR SALE IS NOT PERMITTED.
17 of 166
| Structural and Collateral Term Sheet | Benchmark 2021-B24 | |
| Collateral Characteristics | ||
| COVID Update* | |||||||||||||
| No. | Property Name | Mortgage Loan Seller | Information as of Date | Property Type | January Debt Service Payment Received (Yes/No) | February Debt Service Payment Received (Yes/No) | Forbearance or Other Debt Service Relief Requested (Yes/No) | Other Loan Modification Requested (Yes/No) | Lease Modification or Rent Relief Requested (Yes/No) | Occupied SF or Unit Count Making Full December Rent Payment (%) | UW December Base Rent Paid (%) | Occupied SF or Unit Count Making Full January Rent Payment (%) | UW January Base Rent Paid (%) |
| 1 | 410 Tenth Avenue(1) | JPMCB | 3/1/2021 | Office | NAP | Yes | No | No | No | NAP | NAP | NAP | NAP |
| 2 | MGM Grand & Mandalay Bay(2) | CREFI/GACC | 2/25/2021 | Hotel | Yes | Yes | No | No | No | 100.0% | 100.0% | 100.0% | 100.0% |
| 3 | Phillips Point | GSMC | 2/22/2021 | Office | NAP | NAP | No | No | No | 100% | 100% | 100% | 100% |
| 4 | 141 Livingston | CREFI | 2/25/2021 | Office | NAP | NAP | No | No | No | 100.0% | 100.0% | 100.0% | 100.0% |
| 5 | Pittock Block | JPMCB | 3/1/2021 | Mixed Use | NAP | Yes | No | No | Yes(3) | 68.2% | 82.0% | NAV | NAV |
| 6 | The Galleria Office Towers | CREFI/JPMCB | 2/25/2021 | Office | NAP | NAP | No | No | Yes | 99.3% | 98.3% | 97.2% | 97.2% |
| 7 | U.S. Industrial Portfolio VI | GSMC | 2/19/2021 | Industrial | NAP | NAP | No | No | No | 100% | 100% | 100% | 100% |
| 8 | Boca Office Portfolio | CREFI | 2/25/2021 | Mixed Use | NAP | NAP | No | No | Yes | 96.0% | 96.0% | 94.0% | 95.0% |
| 9 | Gestamp Automocion SLB | CREFI | 2/25/2021 | Industrial | NAP | NAP | No | No | No | 100.0% | 100.0% | 100.0% | 100.0% |
| 10 | 30 Hudson Yards 67(4) | JPMCB | 3/1/2021 | Office | NAP | NAP | No | No | No | NAP | NAP | 100.0% | 100.0% |
| 11 | Dawson Marketplace | GSMC | 1/13/2021 | Retail | Yes | Yes | No | Yes(5) | No | 96.0% | 96.2% | 99.2% | 96.7% |
| 12 | 8670 Wilshire(6) | GACC | 2/17/2021 | Office | NAP | NAP | NAP | NAP | Yes | 90.5% | 95.9% | 90.5% | 95.7% |
| 13 | JW Marriott Nashville | GSMC | 2/19/2021 | Hotel | Yes(7) | Yes(7) | Yes(7) | Yes(7) | Yes(7) | NAP | NAP | NAP | NAP |
| 14 | Morgan Stanley Tower | CREFI | 2/25/2021 | Office | NAP | NAP | No | No | Yes | 95.3% | 97.0% | 92.3% | 95.0% |
| 15 | The Village at Meridian | JPMCB | 3/1/2021 | Retail | NAP | NAP | No | No | Yes(8) | NAV | 79.2% | NAV | 82.9% |
| 16 | Millennium Corporate Park | GSMC | 2/19/2021 | Office | NAP | Yes | No | No | No | 100% | 100% | 100% | 100% |
| 17 | 711 Fifth Avenue | GSMC | 1/20/2021 | Mixed Use | NAP | NAP | No | No | Yes(9) | 100% | 100% | 100% | 100% |
| 18 | Oakland Commons I&II | JPMCB | 3/1/2021 | Office | NAP | NAP | No | No | No | 100.0% | 100.0% | 100.0% | 100.0% |
| 19 | Orlando Technology Park | GACC | 2/17/2021 | Office | NAP | NAP | NAP | NAP | No | 100% | 100% | 100% | 100% |
| 20 | Woodbury Crossing Phase II | GACC | 2/17/2021 | Multifamily | NAP | Yes | No | No | No | 96% | 100% | 96% | 100% |
| 21 | Advanced Energy | CREFI | 2/25/2021 | Industrial | NAP | NAP | No | No | No | 100.0% | 100.0% | 100.0% | 100.0% |
| 22 | Value Store It Miami | CREFI | 2/25/2021 | Self Storage | NAP | NAP | No | No | No | 100.0% | 100.0% | 100.0% | 100.0% |
| 23 | Willoughby Commons | GSMC | 1/31/2021 | Retail | Yes | Yes | No | Yes(10) | Yes(11) | 85.2% | 83.5% | 85.8% | 83.8% |
| 24 | Camellia Trace | JPMCB | 3/1/2021 | Multifamily | NAP | NAP | NAP | NAP | No | NAV | 96.6% | NAV | 97.9% |
| 25 | Dollar General Portfolio | GACC | 2/17/2021 | Retail | NAP | NAP | NAP | NAP | No | 100% | 100% | 100% | 100% |
| 26 | 9633 Westheimer Road | CREFI | 2/25/2021 | Mixed Use | NAP | NAP | No | No | No | 100.0% | 100.0% | 100.0% | 100.0% |
| 27 | 46-50 East 167th Street | CREFI | 2/25/2021 | Retail | NAP | NAP | No | No | No | 100.0% | 100.0% | 100.0% | 100.0% |
| 28 | Bridgeport Distribution Center | CREFI | 2/25/2021 | Industrial | NAP | NAP | No | No | No | 100.0% | 100.0% | 100.0% | 100.0% |
| 29 | 303 3rd Street(12) | CREFI | 2/25/2021 | Mixed Use | NAP | NAP | No | No | Yes | 100.0% | 67.2% | 100.0% | 67.2% |
| 30 | 5501 New Utrecht Avenue | CREFI | 2/25/2021 | Office | NAP | NAP | No | No | No | 100.0% | 100.0% | 100.0% | 100.0% |
| 31 | Hamden Self Storage | CREFI | 2/25/2021 | Mixed Use | NAP | NAP | No | No | No | 100.0% | 100.0% | 100.0% | 100.0% |
| 32 | Bristol Park | JPMCB | 3/1/2021 | Multifamily | NAP | NAP | No | No | No | NAV | 93.0% | NAV | 93.5% |
| 33 | 6450 Industrial | GACC | 2/17/2021 | Industrial | NAP | Yes | No | No | No | 100% | 100% | 100% | 100% |
| 34 | 651 Bushwick Avenue | CREFI | 2/25/2021 | Mixed Use | NAP | Yes | No | No | No | 100% | 90.8% | 100% | 90.8% |
| 35 | Grocery Outlet Truckee | GSMC | 2/18/2021 | Mixed Use | NAP | NAP | No | No | No | 100% | 100% | 100% | 100% |
| 36 | Holiday Inn Philadelphia South | JPMCB | 2/25/2021 | Hotel | Yes | Yes | No | Yes(13) | No | NAP | NAP | NAP | NAP |
| 37 | CVS Valley Stream | CREFI | 2/25/2021 | Retail | NAP | Yes | No | No | No | 100% | 100% | 100% | 100% |
| 38 | Deschutes Business Center | CREFI | 2/25/2021 | Industrial | NAP | Yes | No | No | No | 96.6% | 98.4% | 96.6% | 98.4% |
| 39 | The Cove Storage Portfolio | CREFI | 2/25/2021 | Self Storage | NAP | Yes | No | No | No | 100% | 100% | 100% | 100% |
| 40 | Scotsman Self Storage | CREFI | 2/25/2021 | Self Storage | NAP | Yes | No | No | No | 100% | 100% | 100% | 100% |
* The information in this chart is as of the date indicated and is based on information provided by the related borrowers. The information was based on reports and data aggregated from the related borrower’s existing financial and operational reporting systems and in certain circumstances was produced on an interim or ad hoc basis or was provided by the related borrower verbally. While we have no reason to believe the information presented is not accurate, we cannot assure you that it will not change or be updated in the future.
THE INFORMATION IN THIS STRUCTURAL AND COLLATERAL TERM SHEET IS NOT COMPLETE AND MAY BE AMENDED PRIOR TO THE TIME OF SALE. THIS TERM SHEET IS NOT AN OFFER TO SELL THESE SECURITIES AND IT IS NOT A SOLICITATION OF AN OFFER TO BUY THESE SECURITIES IN ANY JURISDICTION WHERE THE OFFER OR SALE IS NOT PERMITTED.
18 of 166
| Structural and Collateral Term Sheet | Benchmark 2021-B24 | |
| Collateral Characteristics | ||
| (1) | With respect to 410 Tenth Avenue, as of January 2021, comprehensive redevelopment of the mortgaged property is approximately 96% complete. Upon completion of pre-commencement work, Amazon (approximately 53.1% of underwritten base rent) is expected to take possession of (i) floors 9-14 and 16-20 (the “First Tranche Floors”) in March 2021 and (ii) floor 15 in May 2021. Amazon is expected to commence paying rent in (a) June 2022 with respect to the First Tranche Floors and (b) August 2022 with respect to floor 15. On January 22, 2021, the Borrowers provided Amazon with 60 days’ prior notice of completion for the First Tranche Floors, as required under the related lease for commencement to occur. First Republic (36.1% of underwritten base rent) has executed a lease with respect to (i) floors 2-6, (ii) the ground floor retail space and (iii) the below grade space. Upon completion of pre-commencement and turnkey work, First Republic is expected to take possession of all its space by April 2021. First Republic is expected to commence paying rent in (a) August 2021 with respect to floors 4-6, (ii) October 2021 with respect to floors 2 and 3, (iii) August 2022 with respect to the ground floor retail space and (iv) May 2022 with respect to the below grade space. At origination, approximately $57.7 million was reserved for outstanding gap rent and free rent obligations, $5.0 million in excess of projected obligations based on expected lease commencement dates. |
| (2) | With respect to MGM Grand & Mandalay Bay, the Borrowers sent a notice to the mortgage lender on February 8, 2021, which provides that the Borrowers expect that, when the mortgage lender determines the DSCR as of December 31, 2020, a MGM Grand & Mandalay Bay Trigger Period will occur under the terms of the MGM Grand & Mandalay Bay Whole Loan documents. Accordingly, the Borrowers have provided notice to the mortgage lender of their desire to elect to deliver an excess cash flow guaranty for the benefit of the mortgage lender in lieu of depositing all excess cash flow into a reserve account in accordance with the terms and conditions of the MGM Grand & Mandalay Bay Whole Loan documents. The Borrowers proposed (i) BREIT Prime Lease Holdings LLC and (ii) MGM Growth Properties Operating Partnership LP to be the guarantors under the excess cash flow guaranty. |
| (3) | With respect to Pittock Block, as of January 18, 2021, the Pittock Block Property was open for business; however, a majority of the office tenants are working remotely. 11 tenants, representing approximately 8.9% of net rentable area, have requested rent relief. |
| (4) | With respect to 30 Hudson Yards 67, the property is open and operational; however, Facebook (the subtenant) is currently completing build-out of its space. Related (the prime tenant) commenced paying rent in January 2021. |
| (5) | With respect to Dawson Marketplace, a loan modification was completed in conjunction with the One Life lease. |
| (6) | With respect to 8670 Wilshire, two tenants, representing 9.2% of the underwritten base rent, have requested and were granted rent relief. At loan closing, approximately $373,771 was deposited into a rent reserve, which is the equivalent to one year of base rent for the two tenants. |
| (7) | With respect to JW Marriott Nashville, in April 2020, the mortgage loan was modified to permit the use of FF&E reserve funds to pay debt service, and the borrower sponsor provided a 6-month guaranty for debt service, taxes and insurance payments that expired in October 2020. In October 2020, the mortgage loan was further modified to waive the requirement to fund the FF&E reserve until April 2021, waive the cash management debt yield trigger through the second quarter of 2022, and otherwise permanently decrease the debt yield trigger level from 10% to 7.5%, in exchange for the borrower funding an 18-month debt service reserve to be applied to monthly payments from October 2020 through March 2022. |
| (8) | With respect to The Village at Meridian, as a result of COVID-19, the borrower sponsor negotiated rent deferrals on a tenant-by-tenant basis and ultimately provided between one to five months of deferred rent spanning April 2020 to December 2020 to 30 tenants totaling 186,026 square feet, amounting to $909,200 of rent deferment. Leases for these tenants were amended such that the deferred rent will be recouped by the borrower sponsor via 12 equal installments in 2021. In addition, as a result of COVID-19, the borrower sponsor provided partial or full rent abatements to eight tenants spanning May 2020 to December 2020. At origination, a $3,742,823 gap rent reserve was established, representing the aggregate amount of base rent for the succeeding 12-months for tenants who had not paid in-full base rent due pursuant to each such tenant’s underlying lease as of the origination date. Such amounts will not be released to the borrower until, among other conditions, (i) collections exceed 95% of the full rent payable from all tenants in place as of the origination date for a period of 12 consecutive months and (ii) The Village at Meridian property is at least 80% occupied based on total square footage, provided no event of default or cash sweep event then exists. |
| (9) | With respect to 711 Fifth Avenue, this includes one tenant, representing 4.2% of the square feet and 37.3% of UW Base Rent of the 711 Fifth Avenue property who paid their rent in accordance with an agreement to pay 50% abated rent for the months of April, May and June. 50% of the abated rent will be paid back by the end of 2020 and the remainder by the end of the first quarter of 2021. |
| (10) | With respect to Willoughby Commons, five tenants, representing approximately 31.4% of the UW Base Rent have requested rent relief. |
| (11) | With respect to Willoughby Commons, a loan modification has been granted to the borrower to permit it to post $496k in lieu of a cash flow sweep through March 31, 2021 as a result of Regal Cinemas being dark. Regal temporarily closed all theaters in the US and UK in October 2020. |
| (12) | With respect to 303 3rd Street, collections at the mortgaged property reflect that three tenants are in the process of building out their space and have not yet taken occupancy. All three tenants are expected to take possession of their space within the next six months. |
| (13) | With respect to Holiday Inn Philadelphia South, in April 2020, the mortgage loan was modified to, among other things, (a) waive the requirement to fund the FF&E reserve from April 2020 to and including July 2020 and (b) permit the borrower to incur one or more unsecured and unguaranteed Paycheck Protection Program loans made by a participating lender of the United States Small Business Administration pursuant to the Coronavirus Aid, Relief and Economic Security Act. The mortgage loan is expected to be further modified to, among other things, temporarily waive the commencement of a cash sweep period triggered by the debt service coverage ratio being below the applicable threshold set forth in the mortgage loan documents, and delay the requirements during a cash sweep period for the borrower to establish the lockbox account and the cash management account until March 31, 2021, and January 1, 2022, respectively. |
THE INFORMATION IN THIS STRUCTURAL AND COLLATERAL TERM SHEET IS NOT COMPLETE AND MAY BE AMENDED PRIOR TO THE TIME OF SALE. THIS TERM SHEET IS NOT AN OFFER TO SELL THESE SECURITIES AND IT IS NOT A SOLICITATION OF AN OFFER TO BUY THESE SECURITIES IN ANY JURISDICTION WHERE THE OFFER OR SALE IS NOT PERMITTED.
19 of 166
| Structural and Collateral Term Sheet | Benchmark 2021-B24 | |
| Class A-2(1) | ||
Loan Name | Location | Cut-off Date | % of IPB | Maturity Date | % of | Original | Remaining | UW | UW NOI | Cut-off | Maturity | |
| 8 | Boca Office Portfolio | Boca Raton, FL | $50,000,000 | 4.3% | $50,000,000 | 67.7% | 60 | 60 | 2.46x | 10.6% | 63.5% | 63.5% |
| 16 | Millennium Corporate Park | Redmond, WA | $27,000,000 | 2.3% | $27,000,000 | 36.6% | 60 | 58 | 3.13x | 10.0% | 60.9% | 60.9% |
| Total / Weighted Average: | $77,000,000 | 6.6% | $77,000,000 | 104.3% | 60 | 59 | 2.69x | 10.4% | 62.6% | 62.6% | ||
| (1) | The table above presents the mortgage loans whose balloon payments would be applied to pay down the certificate balance of the Class A-2 Certificates, assuming a 0% CPR and applying the “Modeling Assumptions” described in the Preliminary Prospectus, including the assumptions that (i) none of the mortgage loans in the pool experience prepayments, defaults or losses; (ii) there are no extensions or forbearances of maturity dates or anticipated repayment dates of any mortgage loans in the pool; and (iii) each mortgage loan in the pool is paid in full on its stated maturity date or anticipated repayment date, as applicable. Each Class of Certificates, including the Class A-2 Certificates, evidences undivided ownership interests in the entire pool of mortgage loans. Debt service coverage ratio, debt yield and loan-to-value ratio information does not take into account subordinate debt (whether or not secured by the mortgaged property), if any, that exists or is allowed under the terms of any mortgage loan. See Annex A-1 to the Preliminary Prospectus. |
| (2) | Reflects the percentage equal to the Maturity Date Balance divided by the initial Class A-2 Certificate Balance. |
| (3) | In the case of Loan No. 8, the UW NCF DSCR, UW NOI Debt Yield, Cut-off Date LTV and Maturity Date LTV calculations include the related Pari Passu Companion Loans. |
THE INFORMATION IN THIS STRUCTURAL AND COLLATERAL TERM SHEET IS NOT COMPLETE AND MAY BE AMENDED PRIOR TO THE TIME OF SALE. THIS TERM SHEET IS NOT AN OFFER TO SELL THESE SECURITIES AND IT IS NOT A SOLICITATION OF AN OFFER TO BUY THESE SECURITIES IN ANY JURISDICTION WHERE THE OFFER OR SALE IS NOT PERMITTED.
20 of 166
| Structural and Collateral Term Sheet | Benchmark 2021-B24 | |
| Class A-3(1) | ||
Loan Name | Location | Cut-off Date | % of IPB | Maturity Date | % of | Original | Remaining | UW NCF | UW NOI | Cut-off | Maturity | |
| 1 | 410 Tenth Avenue | New York, NY | $80,000,000 | 6.9% | $80,000,000 | 98.6% | 84 | 82 | 4.91x | 13.0% | 39.8% | 39.8% |
| 36 | Holiday Inn Philadelphia South | Swedesboro, NJ | $6,287,797 | 0.5% | $5,380,813 | 6.6% | 120 | 92 | 1.82x | 12.4% | 62.9% | 53.8% |
| Total / Weighted Average: | $86,287,797 | 7.4% | $85,380,813 | 105.3% | 87 | 83 | 4.68x | 13.0% | 41.5% | 40.8% | ||
| (1) | The table above presents the mortgage loans whose balloon payments would be applied to pay down the certificate balance of the Class A-3 Certificates, assuming a 0% CPR and applying the “Modeling Assumptions” described in the Preliminary Prospectus, including the assumptions that (i) none of the mortgage loans in the pool experience prepayments, defaults or losses; (ii) there are no extensions or forbearances of maturity dates or anticipated repayment dates of any mortgage loans in the pool; and (iii) each mortgage loan in the pool is paid in full on its stated maturity date or anticipated repayment date, as applicable. Each Class of Certificates, including the Class A-3 Certificates, evidences undivided ownership interests in the entire pool of mortgage loans. Debt service coverage ratio, debt yield and loan-to-value ratio information does not take into account subordinate debt (whether or not secured by the mortgaged property), if any, that exists or is allowed under the terms of any mortgage loan. See Annex A-1 to the Preliminary Prospectus. |
| (2) | Reflects the percentage equal to the Maturity Date Balance divided by the initial Class A-3 Certificate Balance. |
| (3) | In the case of Loan No. 1, the UW NCF DSCR, UW NOI Debt Yield, Cut-off Date LTV and Maturity Date LTV calculations include the related Pari Passu Companion Loan. |
THE INFORMATION IN THIS STRUCTURAL AND COLLATERAL TERM SHEET IS NOT COMPLETE AND MAY BE AMENDED PRIOR TO THE TIME OF SALE. THIS TERM SHEET IS NOT AN OFFER TO SELL THESE SECURITIES AND IT IS NOT A SOLICITATION OF AN OFFER TO BUY THESE SECURITIES IN ANY JURISDICTION WHERE THE OFFER OR SALE IS NOT PERMITTED.
21 of 166
| Structural and Collateral Term Sheet | Benchmark 2021-B24 | |
| Structural Overview | ||
| ■ Accrual: | Each Class of Certificates (other than the Class S and Class R Certificates) will accrue interest on a 30/360 basis. The Class S and Class R Certificates will not accrue interest. | |
| ■ Allocation between VRR Interest and the Non-VRR Certificates: | The aggregate amount available for distribution to holders of the Certificates (including the VRR Interest) on each Distribution Date will be: (i) the gross amount of interest, principal, yield maintenance charges and prepayment premiums collected with respect to the Mortgage Loans in the applicable one-month collection period, net of specified expenses of the issuing entity, including fees payable therefrom to, and losses, liabilities, costs and expenses reimbursable or indemnifiable therefrom to, the Master Servicer, the Special Servicer, the Certificate Administrator, the Trustee, the Operating Advisor, the Asset Representations Reviewer and CREFC®; and (ii) allocated to amounts available for distribution to the holders of the VRR Interest, on the one hand, and amounts available for distribution to the holders of the remaining Certificates other than the Class S and Class R certificates (the “Non-VRR Certificates”), on the other hand. On each Distribution Date, the portion of such aggregate available funds allocable to: (a) the VRR Interest will be the product of such aggregate available funds multiplied by a fraction, expressed as a percentage, the numerator of which is the initial VRR interest balance of the VRR Interest, and the denominator of which is the aggregate initial Certificate Balances of the Principal Balance Certificates and the initial VRR Interest Balance of the VRR Interest (the “VRR Percentage”); and (b) the Non-VRR Certificates (the “Non-VRR Available Funds”) will at all times be the product of such aggregate available funds multiplied by the difference between 100% and the VRR Percentage (such difference, the “Non-VRR Percentage”). See “Credit Risk Retention” and “Description of the Certificates” in the Preliminary Prospectus. | |
| ■ Distribution of Interest: | On each Distribution Date, accrued interest for each Class of Non-VRR Certificates at the applicable pass-through rate will be distributed in the following order of priority to the extent of the Non-VRR Available Funds: first, to the Class A-1, Class A-2, Class A-3, Class A-4, Class A-5, Class A-SB, Class X-A, Class X-B, Class X-D, Class X-F, Class X-G and Class X-NR Certificates (the “Senior Certificates”), on a pro rata basis, based on the interest entitlement for each such Class on such date, and then to the Class A-S, Class B, Class C, Class D, Class E, Class F, Class G and Class NR Certificates, in that order, in each case until the interest entitlement for such date payable to each such Class is paid in full.
The pass-through rate applicable to the Class A-1, Class A-2, Class A-3, Class A-4, Class A-5, Class A-SB, Class A-S, Class B, Class C, Class D, Class E, Class F, Class G and Class NR Certificates on each Distribution Date, will be a per annum rate equal to one of (i) a fixed rate, (ii) the weighted average of the net mortgage rates on the mortgage loans (in each case adjusted, if necessary, to accrue on the basis of a 360-day year consisting of twelve 30-day months), (iii) a variable rate equal to the lesser of a specified fixed pass-through rate and the rate described in clause (ii) above or (iv) the rate described in clause (ii) above less a specified percentage.
The pass-through rate for the Class X-A Certificates for any Distribution Date will be a per annum rate equal to the excess, if any, of (a) the weighted average of the net mortgage rates on the mortgage loans (in each case adjusted, if necessary, to accrue on the basis of a 360-day year consisting of twelve 30-day months), over (b) the weighted average of the pass-through rates on the Class A-1, Class A-2, Class A-3, Class A-4, Class A-5, Class A-SB and Class A-S Certificates for the related Distribution Date, weighted on the basis of their respective Certificate Balances outstanding immediately prior to that Distribution Date.
The pass-through rate for the Class X-B Certificates for any Distribution Date will be a per annum rate equal to the excess, if any, of (a) the weighted average of the net mortgage rates on the mortgage loans (in each case adjusted, if necessary, to accrue on the basis of a 360-day year consisting of twelve 30-day months), over (b) the weighted average of the pass-through rates on the Class B and Class C Certificates for the related Distribution Date weighted on the basis of their respective Certificate Balances outstanding immediately prior to that Distribution Date.
The pass-through rate for the Class X-D Certificates for any Distribution Date will be a per annum rate equal to the excess, if any, of (a) the weighted average of the net mortgage rates on the mortgage loans (in each case adjusted, if necessary, to accrue on the basis of a 360-day year consisting of twelve 30-day months), over (b) the weighted average of the pass-through rates on the Class D and Class E Certificates for the related Distribution Date weighted on the basis of their respective Certificate Balances outstanding immediately prior to that Distribution Date.
The pass-through rate for the Class X-F Certificates for any Distribution Date will be a per annum rate equal to the excess, if any, of (a) the weighted average of the net mortgage rates on the mortgage loans (in each case adjusted, if necessary, to accrue on the basis of a 360-day year |
THE INFORMATION IN THIS STRUCTURAL AND COLLATERAL TERM SHEET IS NOT COMPLETE AND MAY BE AMENDED PRIOR TO THE TIME OF SALE. THIS TERM SHEET IS NOT AN OFFER TO SELL THESE SECURITIES AND IT IS NOT A SOLICITATION OF AN OFFER TO BUY THESE SECURITIES IN ANY JURISDICTION WHERE THE OFFER OR SALE IS NOT PERMITTED.
22 of 166
| Structural and Collateral Term Sheet | Benchmark 2021-B24 | |
| Structural Overview | ||
consisting of twelve 30-day months), over (b) the pass-through rate on the Class F Certificates for the related Distribution Date.
The pass-through rate for the Class X-G Certificates for any Distribution Date will be a per annum rate equal to the excess, if any, of (a) the weighted average of the net mortgage rates on the mortgage loans (in each case adjusted, if necessary, to accrue on the basis of a 360-day year consisting of twelve 30-day months), over (b) the pass-through rate on the Class G Certificates for the related Distribution Date.
The pass-through rate for the Class X-NR Certificates for any Distribution Date will be a per annum rate equal to the excess, if any, of (a) the weighted average of the net mortgage rates on the mortgage loans (in each case adjusted, if necessary, to accrue on the basis of a 360-day year consisting of twelve 30-day months), over (b) the pass-through rate on the Class NR Certificates for the related Distribution Date.
See “Description of the Certificates—Distributions” in the Preliminary Prospectus.
| ||
| ■ Distribution of Principal: | On any Distribution Date prior to the Cross-Over Date, payments in respect of the Non-VRR Percentage of principal on the Non-VRR Certificates will be distributed, up to the Non-VRR Available Funds:
first, to the Class A-SB Certificates until the Certificate Balance of the Class A-SB Certificates is reduced to the Class A-SB planned principal balance for the related Distribution Date set forth in Annex H to the Preliminary Prospectus, second, to the Class A-1 Certificates, until the Certificate Balance of such Class is reduced to zero, third, to the Class A-2 Certificates, until the Certificate Balance of such Class is reduced to zero, fourth, to the Class A-3 Certificates, until the Certificate Balance of such Class is reduced to zero fifth, to the Class A-4 Certificates, until the Certificate Balance of such Class is reduced to zero, sixth, to the Class A-5 Certificates until the Certificate Balance of such Class is reduced to zero, and seventh, to the Class A-SB Certificates, until the Certificate Balance of such Class is reduced to zero and then to the Class A-S, Class B, Class C, Class D, Class E, Class F, Class G and Class NR Certificates, in that order, until the Certificate Balance of each such Class is reduced to zero.
On any Distribution Date on or after the Cross-Over Date, payments in respect of the Non-VRR Percentage of principal on the Non-VRR Certificates will be distributed, up to the Non-VRR Available Funds, to the Class A-1, Class A-2, Class A-3, Class A-4, Class A-5 and Class A-SB Certificates, pro rata based on the Certificate Balance of each such Class until the Certificate Balance of each such Class is reduced to zero.
The “Cross-Over Date” means the Distribution Date on which the Certificate Balances of the Class A-S, Class B, Class C, Class D, Class E, Class F, Class G and Class NR Certificates have been reduced to zero as a result of the allocation of realized losses to such Classes.
The Class X-A, Class X-B, Class X-D, Class X-F, Class X-G and Class X-NR Certificates (the “Class X Certificates”) will not be entitled to receive distributions of principal; however, the notional amount of the Class X-A Certificates will be reduced by the aggregate amount of principal distributions, realized losses and trust fund expenses, if any, allocated to the Class A-1, Class A-2, Class A-3, Class A-4, Class A-5, Class A-SB and Class A-S Certificates, the notional amount of the Class X-B Certificates will be reduced by the aggregate amount of principal distributions, realized losses and trust fund expenses, if any, allocated to the Class B and Class C Certificates, the notional amount of the Class X-D Certificates will be reduced by the aggregate amount of principal distributions, realized losses and trust fund expenses, if any, allocated to the Class D and Class E Certificates, the notional amount of the Class X-F Certificates will be reduced by the aggregate amount of principal distributions, realized losses and trust fund expenses, if any, allocated to the Class F Certificates, the notional amount of the Class X-G Certificates will be reduced by the aggregate amount of principal distributions, realized losses and trust fund expenses, if any, allocated to the Class G Certificates, and the notional amount of the Class X-NR Certificates will be reduced by the aggregate amount of principal distributions, realized losses and trust fund expenses, if any, allocated to the Class NR Certificates.
See “Description of the Certificates—Distributions” in the Preliminary Prospectus.
| |
| ■ Yield Maintenance / Fixed Penalty Allocation: | For purposes of the distribution of Yield Maintenance Charges on any Distribution Date, the Non-VRR Percentage of any Yield Maintenance Charges collected in respect of the mortgage loans will be allocated pro rata among certain groups (based on the aggregate amount of |
THE INFORMATION IN THIS STRUCTURAL AND COLLATERAL TERM SHEET IS NOT COMPLETE AND MAY BE AMENDED PRIOR TO THE TIME OF SALE. THIS TERM SHEET IS NOT AN OFFER TO SELL THESE SECURITIES AND IT IS NOT A SOLICITATION OF AN OFFER TO BUY THESE SECURITIES IN ANY JURISDICTION WHERE THE OFFER OR SALE IS NOT PERMITTED.
23 of 166
| Structural and Collateral Term Sheet | Benchmark 2021-B24 | |
| Structural Overview | ||
principal distributed to the Principal Balance Certificates in each group), consisting of (a) the Class A-1, Class A-2, Class A-3, Class A-4, Class A-5, Class A-SB, Class A-S and Class X-A Certificates (“YM Group A”), (b) the Class X-B, Class B and Class C Certificates (“YM Group B”) and (c) the Class X-D, Class D and Class E Certificates (“YM Group D”), As among the Classes of Certificates in each YM Group, each Class of Certificates entitled to distributions of principal will receive an amount calculated generally in accordance with the following formula and as more specifically described in the Preliminary Prospectus, with any remaining Yield Maintenance Charges on such Distribution Date being distributed to the class of Class X Certificates in such YM Group. |
| YM Charge | X | Principal Paid to Class | X | (Pass-Through Rate on Class – Discount Rate) |
| Total Principal Paid to the related YM Group | (Mortgage Rate on Loan – Discount Rate) |
| No Yield Maintenance Charges will be distributed to the Class X-F, Class X-G, Class X-NR, Class F, Class G, Class NR, Class R or Class S Certificates. | ||
| ■ Realized Losses: | On each Distribution Date, the Non-VRR Percentage of losses on the mortgage loans will be allocated first to the Class NR, Class G, Class F, Class E, Class D, Class C, Class B and Class A-S Certificates, in that order, in each case until the Certificate Balance of all such Classes have been reduced to zero, and then, to the Class A-1, Class A-2, Class A-3, Class A-4, Class A-5 and Class A-SB Certificates, pro rata, based on the Certificate Balance of each such Class, until the Certificate Balance of each such Class has been reduced to zero. The notional amounts of the Class X-A, Class X-B, Class X-D, Class X-F, Class X-G and Class X-NR Certificates will be reduced by the aggregate amount of realized losses allocated to Certificates that are components of the notional amounts of the Class X-A, Class X-B, Class X-D, Class X-F, Class X-G and Class X-NR Certificates, respectively.
Losses on each Whole Loan will be allocated first, to any related subordinate companion loan(s) until reduced to zero and then to the related mortgage loan and any related pari passu companion loans, pro rata, based on their respective principal balances.
See “Description of the Certificates—Priority of Distributions” in the Preliminary Prospectus.
| |
| ■ Interest Shortfalls: | A shortfall with respect to the amount of available funds distributable in respect of interest can result from, among other sources: (a) delinquencies and defaults by borrowers; (b) shortfalls resulting from the application of appraisal reductions to reduce P&I Advances; (c) shortfalls resulting from interest on Advances made by the Master Servicer, the Special Servicer or the Trustee; (d) shortfalls resulting from the payment of Special Servicing Fees and other additional compensation that the Special Servicer is entitled to receive; (e) shortfalls resulting from extraordinary expenses of the trust, including indemnification payments payable to the Depositor, the Master Servicer, the Special Servicer, the Certificate Administrator, the Trustee, the Operating Advisor and the Asset Representations Reviewer; (f) shortfalls resulting from a modification of a mortgage loan’s interest rate or principal balance; and (g) shortfalls resulting from other unanticipated or default-related expenses of the trust. Any such shortfalls that decrease the amount of available funds distributable in respect of interest to the Certificateholders will reduce distributions to the classes of Certificates (other than the Class R Certificates) beginning with those with the lowest payment priorities, in reverse sequential order. See “Description of the Certificates—Distributions—Priority of Distributions” in the Preliminary Prospectus. | |
| ■ Appraisal Reduction Amounts: | With respect to mortgage loans serviced under the Pooling and Servicing Agreement, upon the occurrence of certain trigger events with respect to a mortgage loan, which are generally tied to certain events of default under the related mortgage loan documents, the Special Servicer will be obligated to obtain an appraisal of the related mortgaged property and the Master Servicer will calculate the Appraisal Reduction Amount. The “Appraisal Reduction Amount” is generally the amount by which the current principal balance of the related mortgage loan or serviced whole loan, plus outstanding advances, real estate taxes, unpaid servicing fees and certain similar amounts exceeds the sum of (a) 90% of the appraised value of the related mortgaged property, (b) the amount of any escrows, letters of credit and reserves and (c) all insurance and casualty proceeds and condemnation awards that are collateral for the related mortgage loan.
With respect to the Non-Serviced Whole Loans, any Appraisal Reduction Amount will be similarly determined pursuant to the related trust and servicing agreement or pooling and servicing agreement, as applicable, under which it is serviced. |
THE INFORMATION IN THIS STRUCTURAL AND COLLATERAL TERM SHEET IS NOT COMPLETE AND MAY BE AMENDED PRIOR TO THE TIME OF SALE. THIS TERM SHEET IS NOT AN OFFER TO SELL THESE SECURITIES AND IT IS NOT A SOLICITATION OF AN OFFER TO BUY THESE SECURITIES IN ANY JURISDICTION WHERE THE OFFER OR SALE IS NOT PERMITTED.
24 of 166
| Structural and Collateral Term Sheet | Benchmark 2021-B24 | |
| Structural Overview | ||
In general, the Non-VRR Percentage of any Appraisal Reduction Amount that is allocated to a mortgage loan is notionally allocated to reduce, in reverse sequential order, the Certificate Balance of each Class of Certificates (other than the Class A-1, Class A-2, Class A-3, Class A-4, Class A-5 and Class A-SB Certificates) beginning with the Class NR Certificates for certain purposes, including certain voting rights and the determination of the controlling class. As a result of calculating one or more Appraisal Reduction Amounts (and, in the case of any Whole Loan, to the extent allocated to the related mortgage loan), the amount of any required P&I Advance will be reduced, which will have the effect of reducing the amount of interest available to the most subordinate class of certificates then-outstanding (i.e., first, to Class NR Certificates; second, to the Class G Certificates; third, to the Class F Certificates; fourth, to the Class E Certificates; fifth, to the Class D Certificates; sixth, to the Class C Certificates; seventh, to the Class B Certificates; eighth, to the Class A-S Certificates; and finally, pro rata based on their respective interest entitlements, to the Senior Certificates).
With respect to each Serviced Whole Loan, the Appraisal Reduction Amount is notionally allocated, first, to any related serviced subordinate companion loan(s), then pro rata, between the related mortgage loan and any related serviced pari passu companion loan(s), based upon their respective principal balances.
Except as described in the Preliminary Prospectus, no event, circumstance or action that has occurred or will occur with respect to a COVID modified loan or the entry into of a COVID modification agreement will constitute an appraisal reduction event, but only if, and for so long as, the related borrower and each related obligor is in compliance with the terms of the related COVID modification agreement. See “Pooling and Servicing Agreement—Appraisal Reduction Amounts” in the Preliminary Prospectus. | ||
| ■ Master Servicer Advances: | The Master Servicer will be required to advance certain delinquent scheduled mortgage loan payments of principal and interest and certain property protection advances, in each case, to the extent the Master Servicer deems such advances to be recoverable. At any time that an Appraisal Reduction Amount exists, the amount that would otherwise be required to be advanced by the Master Servicer in respect of delinquent payments of interest on any mortgage loan will be reduced to equal the product of (x) the interest portion of the amount that would be advanced without regard to any Appraisal Reduction Amount and (y) a fraction, the numerator of which is the then-outstanding principal balance of the mortgage loan, as applicable, minus the Appraisal Reduction Amount and the denominator of which is the then-outstanding principal balance of the mortgage loan. The Master Servicer will not make any principal or interest advances with respect to any companion loan. | |
| ■ Whole Loans: | Fourteen mortgage loans are each evidenced by one mortgage loan and one or more companion loans (each a “Companion Loan” and collectively with the related mortgage loan, a “Whole Loan”), secured by the same mortgage(s) on the related mortgaged property(ies). Each such mortgage loan and its related Companion Loan(s) are subject to an intercreditor agreement. None of these Companion Loans will be part of the trust.
In the case of all of the Whole Loans, referred to as the “410 Tenth Avenue Whole Loan”, the “MGM Grand & Mandalay Bay Whole Loan”, the “Philips Point Whole Loan”, the “141 Livingston Whole Loan”, the “Pittock Block Whole Loan”, the “The Galleria Office Towers Whole Loan”, the “U.S. Industrial Portfolio VI Whole Loan”, the “Boca Office Portfolio Whole Loan”, “30 Hudson Yards 67 Whole Loan”, the “JW Marriott Nashville Whole Loan”, the “The Village at Meridian Whole Loan”, the “The Millennium Corporate Park Whole Loan”, the “The 711 Fifth Avenue Whole Loan” and the “Willoughby Commons Whole Loan”, one or more related Companion Loans are pari passu with the related mortgage loan (these Companion Loans are also referred to as the “Pari Passu Companion Loans”). In the case of each of the 410 Tenth Avenue Whole Loan, the MGM Grand & Mandalay Bay Whole Loan and the Pittock Block Whole Loan, one or more related Companion Loans are subordinate in right of payment to the related mortgage loan and any related Pari Passu Companion Loans (these Companion Loans are also referred to as the “Subordinate Companion Loans”).
The 410 Tenth Avenue Whole Loan, the MGM Grand & Mandalay Bay Whole Loan, the Philips Point Whole Loan, the Pittock Block Whole Loan, the JW Marriott Nashville Whole Loan, The Village at Meridian Whole Loan, the Millennium Corporate Park Whole Loan, the 711 Fifth Avenue Whole Loan and the Willoughby Commons Whole Loan (each, a “Non-Serviced Whole Loan”) are being serviced and administered pursuant to the applicable trust and servicing agreement or pooling and servicing agreement as described under “Description of the Mortgage Pool—The Whole Loans—The Non-Serviced Pari Passu Whole Loans”, “—The Non-Serviced |
THE INFORMATION IN THIS STRUCTURAL AND COLLATERAL TERM SHEET IS NOT COMPLETE AND MAY BE AMENDED PRIOR TO THE TIME OF SALE. THIS TERM SHEET IS NOT AN OFFER TO SELL THESE SECURITIES AND IT IS NOT A SOLICITATION OF AN OFFER TO BUY THESE SECURITIES IN ANY JURISDICTION WHERE THE OFFER OR SALE IS NOT PERMITTED.
25 of 166
| Structural and Collateral Term Sheet | Benchmark 2021-B24 | |
| Structural Overview | ||
AB Whole Loans” and “Pooling and Servicing Agreement—Servicing of the Non-Serviced Mortgage Loans” in the Preliminary Prospectus. | ||
| ■ Highlighted Servicing Provisions: | The following are certain servicing provisions of note:
A mortgage loan may become a specially serviced loan as a result of an imminent or reasonably foreseeable default only if the Master Servicer or, if Midland is not both the Special Servicer and the Master Servicer, the Special Servicer determines such default is not likely to be cured by the related borrower within 60 days.
A mortgage loan will not become a specially serviced loan for up to 120 days in circumstances where the related borrower does not make its balloon payment at maturity upon satisfaction of certain conditions, including that the borrower has, prior to such maturity date, provided documentation from an acceptable lender, including, without limitation, an executed term sheet or refinancing commitment or an executed purchase and sale agreement, in each case, that is consistent with CMBS market practices and is reasonably satisfactory in form and substance to the Master Servicer or the Special Servicer evidencing an expected refinancing of the mortgage loan or sale of the related mortgaged property.
The Special Servicer will not be entitled to any fees from the securitization trust or the related borrower during a fee restricted period, other than a special servicing fee, and, in certain circumstances described in the succeeding paragraph, a liquidation fee, if the Special Servicer elects to cause a mortgage loan to be transferred to special servicing as a result of an imminent or reasonably foreseeable default when the Master Servicer has not independently transferred the mortgage loan to special servicing for that reason.
Notwithstanding the foregoing, the special servicer may be entitled to a liquidation fee if it transfers a mortgage loan into special servicing as described above and a default occurs that leads to a liquidation of the applicable mortgage loan.
In order to streamline the servicing and administration of the mortgage loans with the goal of reducing the amount of time a CMBS borrower has to wait for certain approvals from the lender, “major decisions” will be administered solely by the Special Servicer, thereby reducing the number of parties involved in the approval process. Under these updated terms, the Special Servicer will be directly responsible for obtaining the consent of the Directing Certificateholder for “major decisions” involving all mortgage loans, rather than requiring the Master Servicer’s involvement in the approval process for Non-Specially Serviced Loans. In prior CMBS transactions, the master servicer would commonly prepare a recommendation related to a particular approval and be required to obtain the consent of the special servicer (who, in turn, would commonly be required to obtain the consent of the Directing Certificateholder before providing its consent to the master servicer) prior to taking any action with respect to that “major decision”.
In addition, certain revisions have been incorporated in the scope of the “major decisions” in the Preliminary Prospectus, that limit the involvement of the Directing Certificateholder in (1) the replacement of the related property management company, (2) the approval of releases of certain performance escrows and earnouts, and (3) the consent to modifications of any mezzanine intercreditor agreement in circumstances when the Directing Certificateholder is affiliated with the mezzanine lender.
The Certificate Administrator will be required to identify the then-current Directing Certificateholder as part of its monthly distribution date statement.
See “Description of the Certificates” and “Pooling and Servicing Agreement” in the Preliminary Prospectus.
| |
| ■ Liquidated Loan Waterfall: | On liquidation of any mortgage loan, all net liquidation proceeds related to the mortgage loan (but not any related Companion Loan) will be applied so that amounts allocated as a recovery of accrued and unpaid interest will not, in the first instance, include any delinquent interest that was not advanced as a result of Appraisal Reduction Amounts or interest that accrued on any junior note(s) if such mortgage loan is an AB Modified Loan. After the adjusted interest amount is so allocated, any remaining liquidation proceeds will be allocated to offset certain advances and to pay principal on the mortgage loan until the unpaid principal amount of the mortgage loan has been reduced to zero. Any remaining liquidation proceeds will then be allocated to pay delinquent interest that was not advanced as a result of Appraisal Reduction Amounts and any interest that accrued on any junior note(s) if such mortgage loan is an AB Modified Loan. Any |
THE INFORMATION IN THIS STRUCTURAL AND COLLATERAL TERM SHEET IS NOT COMPLETE AND MAY BE AMENDED PRIOR TO THE TIME OF SALE. THIS TERM SHEET IS NOT AN OFFER TO SELL THESE SECURITIES AND IT IS NOT A SOLICITATION OF AN OFFER TO BUY THESE SECURITIES IN ANY JURISDICTION WHERE THE OFFER OR SALE IS NOT PERMITTED.
26 of 166
| Structural and Collateral Term Sheet | Benchmark 2021-B24 | |
| Structural Overview | ||
liquidation proceeds in respect of each such mortgage loan in excess of the related outstanding balance will first be applied to offset any interest shortfalls allocated to the Certificates (other than the Class R Certificates), in sequential order, and then to offset any realized losses allocated to the Certificates (other than the Class R Certificates), in sequential order. Any liquidation proceeds remaining after such applications will be distributed to the Class R Certificates. | ||
| ■ Sale of Defaulted Loans and REO Properties: | The Special Servicer is required to solicit offers for any defaulted loan (other than a non-serviced mortgage loan) in such a manner as will be reasonably likely to maximize the value of the defaulted loan on a net present value basis, if the Special Servicer determines that no satisfactory arrangements can be made for collection of delinquent payments and the sale would be in the best economic interests of the Certificateholders and the RR Interest Owners (or, in the case of any Serviced Whole Loan, the Certificateholders, the RR Interest Owners and any holders of the related serviced Companion Loans, as a collective whole, taking into account the pari passu or subordinate nature of such serviced Companion Loans), on a net present value basis. Additionally, the Special Servicer may offer to sell any REO property if, and when, the Special Servicer determines that such a sale would be in the best economic interest of the issuing entity and the holders of any related Companion Loans, on a net present value basis.
In the case of each non-serviced mortgage loan, under certain circumstances permitted under the related intercreditor agreement, to the extent that such non-serviced mortgage loan is not sold together with the related non-serviced companion loan by the special servicer for the related Non-Serviced Whole Loans, the Special Servicer will be entitled to sell (with respect to any mortgage loan other than an Excluded Loan, with the consent of the Directing Certificateholder if no Control Termination Event has occurred and is continuing) such non-serviced mortgage loan if it determines in accordance with the servicing standard that such action would be in the best interests of the Certificateholders and the RR Interest Owners.
The Special Servicer is required to accept a cash offer received from any person for any defaulted loan or REO property in an amount at least equal to par plus accrued interest plus all other outstanding amounts due under such mortgage loan and any outstanding expenses of the trust relating to such mortgage loan (the “Purchase Price”) except as described in the Preliminary Prospectus.
With respect to the Serviced Whole Loans, any such sale of the related defaulted loan is required to also include any related Companion Loans, if any, and the prices will be adjusted accordingly.
Within 30 days of a defaulted loan becoming a specially serviced loan, the Special Servicer is required to order an appraisal and, within 30 days of receipt of such appraisal, is required to determine the fair value of such defaulted loan in accordance with the applicable servicing standard. If, however, the Special Servicer is already in the process of obtaining an appraisal with respect to the related mortgaged property, the Special Servicer is required to make its fair value determination as soon as reasonably practicable (but in any event within 30 days) after its receipt of such appraisal. Additionally, with respect to the mortgage loans that have mezzanine debt or permit mezzanine debt in the future, the mezzanine lenders may have the option to purchase the related mortgage loan after certain events of default under such mortgage loan.
The Directing Certificateholder will not have a right of first refusal to purchase a defaulted loan.
If the Special Servicer does not receive a cash offer at least equal to the Purchase Price, the Special Servicer may purchase the defaulted loan or REO property at the Purchase Price. If the Special Servicer does not purchase the defaulted loan or REO property at the Purchase Price, the Special Servicer is required to accept the highest offer received from any person that is determined to be a fair price (supported by an appraisal required to be obtained by the Special Servicer within 30 days of a mortgage loan becoming a specially serviced loan) for such defaulted loan or REO property, if the highest offeror is a person other than an Interested Person. If the highest offer is made by an Interested Person, the Trustee will determine (based upon the most recent appraisal or updated appraisal conducted in accordance with the terms of the Pooling and Servicing Agreement) whether the offer constitutes a fair price for the defaulted loan or REO property provided that no offer from an Interested Person will constitute a fair price unless (A) it is the highest offer received and (B) if the offer is less than the applicable Purchase Price, at least two other offers are received from independent third parties and the Trustee may conclusively rely on the opinion of an independent appraiser or other independent expert retained by the Trustee in connection with making such determination. Neither the Trustee nor any of its affiliates may make an offer for or purchase any specially serviced loan or REO |
THE INFORMATION IN THIS STRUCTURAL AND COLLATERAL TERM SHEET IS NOT COMPLETE AND MAY BE AMENDED PRIOR TO THE TIME OF SALE. THIS TERM SHEET IS NOT AN OFFER TO SELL THESE SECURITIES AND IT IS NOT A SOLICITATION OF AN OFFER TO BUY THESE SECURITIES IN ANY JURISDICTION WHERE THE OFFER OR SALE IS NOT PERMITTED.
27 of 166
| Structural and Collateral Term Sheet | Benchmark 2021-B24 | |
| Structural Overview | ||
property. An “Interested Person” is any person that is (i) a party to the Pooling and Servicing Agreement, the Directing Certificateholder, any sponsor, any Borrower Party, any independent contractor engaged by the Special Servicer, any holder of a mezzanine loan (but only with respect to the related mortgage loan) or any known affiliate of any such person or, (ii) with respect to a defaulted whole loan, the depositor, the master servicer, the special servicer (or independent contractor engaged by such special servicer) or the trustee for any securitization that includes a related Companion Loan and each holder of any related Companion Loan, or any known affiliate of any such person.
The Special Servicer is not required to accept the highest offer for a defaulted loan or REO property if the Special Servicer determines, in accordance with the servicing standard (and subject to the requirements of any related intercreditor agreement), that a rejection of such offer would be in the best interests of the Certificateholders, the RR Interest Owners and, with respect to any Serviced Whole Loan, the holder of the related Companion Loans, as a collective whole, as if such Certificateholders, the RR Interest Owners and, if applicable, the related Companion Loan Holder(s) constituted a single lender), and may accept a lower offer (so long as such lower offer was not made by the Special Servicer or any of its affiliates) if it determines that acceptance of such lower offer would be in the best interests of the Certificateholders, the RR Interest Owners and, with respect to any Serviced Whole Loan, the holder of the related Companion Loans, as a collective whole, as if such Certificateholders and, if applicable, the related Companion Loan Holder(s) constituted a single lender).
If title to any mortgaged property is acquired by the trust fund, the Special Servicer will be required to sell such mortgaged property prior to the close of the third calendar year beginning after the year of acquisition, unless (a) the IRS grants (or has not denied) a qualifying extension of time to sell such mortgaged property or (b) the Special Servicer obtains for the Trustee, the Certificate Administrator and the Master Servicer an opinion of independent counsel to the effect that the holding of the property by the trust longer than the above-referenced three-year period will not result in the imposition of a tax on any REMIC of the trust fund or cause any REMIC of the trust fund to fail to qualify as a REMIC.
The foregoing applies to mortgage loans serviced under the Pooling and Servicing Agreement. With respect to each Non-Serviced Whole Loan, if the special servicer under the applicable trust and servicing agreement or pooling and servicing agreement determines to sell the related Companion Loan(s) as described above, then the applicable special servicer will be required to sell the related non-serviced mortgage loan, included in the Benchmark 2021-B24 trust, and the related Companion Loan(s), as a single loan. In connection with any such sale, the then-applicable special servicer will be required to follow procedures substantially similar to those set forth above. | ||
| ■ Control Eligible Certificates: | Classes G and NR. | |
| ■ Control Rights: | The Control Eligible Certificates will have certain control rights attached to them. The “Directing Certificateholder” will be, with respect to each serviced mortgage loan, the Controlling Class Certificateholder (or its representative) selected by more than 50% of the Controlling Class Certificateholders; provided, however, that (1) absent that selection, (2) until a Directing Certificateholder is so selected or (3) upon receipt of a notice from a majority of the Controlling Class Certificateholders that a Directing Certificateholder is no longer designated, the Controlling Class Certificateholder that owns the largest aggregate Certificate Balance of the Controlling Class (or its representative) will be the Directing Certificateholder; provided, however, that in the case of this clause (3), in the event no one holder owns the largest aggregate Certificate Balance of the Controlling Class, then there will be no Directing Certificateholder until appointed in accordance with the terms of the Pooling and Servicing Agreement. With respect to any mortgage loan (other than any Excluded Loan), unless a Control Termination Event has occurred and is continuing, the Directing Certificateholder will be entitled to direct the Special Servicer to take, or refrain from taking, certain actions with respect to such mortgage loan. Furthermore, the Directing Certificateholder will also have the right to receive notice and provide consent with respect to certain material actions that the Master Servicer and the Special Servicer plan on taking with respect to a mortgage loan (other than any non-serviced mortgage loan or any Excluded Loan). With respect to any mortgage loan that has or may in the future have mezzanine debt, pursuant to the related intercreditor agreement, the related mezzanine lender may have certain consent rights with respect to certain modifications related to such mortgage loan.
A “Borrower Party” means a borrower, a mortgagor, a manager of a mortgaged property, an Accelerated Mezzanine Loan Lender, any other person controlling or controlled by or under |
THE INFORMATION IN THIS STRUCTURAL AND COLLATERAL TERM SHEET IS NOT COMPLETE AND MAY BE AMENDED PRIOR TO THE TIME OF SALE. THIS TERM SHEET IS NOT AN OFFER TO SELL THESE SECURITIES AND IT IS NOT A SOLICITATION OF AN OFFER TO BUY THESE SECURITIES IN ANY JURISDICTION WHERE THE OFFER OR SALE IS NOT PERMITTED.
28 of 166
| Structural and Collateral Term Sheet | Benchmark 2021-B24 | |
| Structural Overview | ||
common control with such borrower, mortgagor, manager or Accelerated Mezzanine Loan Lender, as applicable, or any other person owning, directly or indirectly, 25% or more of the beneficial interests in such borrower, mortgagor, manager or Accelerated Mezzanine Loan Lender, as applicable. For purposes of this definition, “control” when used with respect to any specified person means the power to direct the management and policies of such person, directly or indirectly, whether through the ownership of voting securities, by contract or otherwise and the terms “controlling” and “controlled” have meanings correlative to the foregoing.
An “Accelerated Mezzanine Loan Lender” means a mezzanine lender under a mezzanine loan that has been accelerated or as to which foreclosure or enforcement proceedings have been commenced against the equity collateral pledged to secure such mezzanine loan.
An “Excluded Loan” is a mortgage loan or Whole Loan with respect to which the Directing Certificateholder or the holder of the majority of the controlling class is a Borrower Party. As of the Closing Date, it is expected that there will be no Excluded Loans in this securitization.
With respect to the Serviced Whole Loans, direction, consent and consultation rights with respect to the related Whole Loan are subject to certain consultation rights of the holders of the related Pari Passu Companion Loans pursuant to the related intercreditor agreement.
With respect to any Non-Serviced Whole Loan, direction, consent and consultation rights with respect to the related Whole Loan will be exercised by the directing certificateholder or controlling class representative under the applicable trust and servicing agreement or pooling and servicing agreement or the holder of the related controlling Companion Loan, as applicable. | ||
| ■ Directing Certificateholder: | Eightfold Real Estate Capital Fund V, L.P. is expected to be appointed as the initial directing certificateholder with respect to all serviced mortgage loans (other than the Non-Serviced Mortgage Loans and Excluded Loans). | |
| ■ Controlling Class: | The “Controlling Class” will at any date of determination be the most subordinate Class of Control Eligible Certificates then outstanding that has an aggregate Certificate Balance, as notionally reduced by any Cumulative Appraisal Reduction Amounts allocable to such Class, equal to no less than 25% of the initial Certificate Balance for such Class; provided that if at any time the Certificate Balances of the certificates (other than the Control Eligible Certificates and the Class RR Certificates) have been reduced to zero as a result of the allocation of principal payments on the mortgage loans, then the Controlling Class will be the most subordinate Class among the Control Eligible Certificates that has an aggregate Certificate Balance greater than zero without regard to any Cumulative Appraisal Reduction Amounts. The Controlling Class as of the Closing Date will be the Class NR Certificates.
Each holder of a certificate of the Controlling Class is referred to herein as a “Controlling Class Certificateholder”.
| |
| ■ Control Termination Event: | A “Control Termination Event” will occur with respect to any serviced Mortgage Loan, when the Class G Certificates have a Certificate Balance (taking into account the application of any Cumulative Appraisal Reduction Amounts to notionally reduce the Certificate Balance of such class) of less than 25% of the initial Certificate Balance of that class; provided that a Control Termination Event will not be deemed to be continuing in the event the Certificate Balances of the certificates (other than the Control Eligible Certificates and the Class RR Certificates) have been reduced to zero.
The “Cumulative Appraisal Reduction Amount” as of any date of determination, is equal to the sum of (i) with respect to any mortgage loan, all Appraisal Reduction Amounts then in effect, and (ii) with respect to any AB Modified Loan, any Collateral Deficiency Amount then in effect.
An “AB Modified Loan” means any corrected loan (1) that became a corrected loan (which includes for purposes of this definition any non-serviced mortgage loan that became a “corrected loan” (or any term substantially similar thereto) pursuant to the trust and servicing agreement or pooling and servicing agreement, as applicable, governing such non-serviced mortgage loan) due to a modification thereto that resulted in the creation of an A/B note structure (or similar structure) and as to which the new junior note(s) did not previously exist or the principal amount of the new junior note(s) was previously part of either an A note held by the issuing entity or the original unmodified mortgage loan and (2) as to which an Appraisal Reduction Amount is not in effect.
The “Collateral Deficiency Amount” means, with respect to any AB Modified Loan as of any date of determination, the excess of (i) the principal balance of such AB Modified Loan (taking into account the related junior note(s) and any pari passu notes included therein), over (ii) the sum |
THE INFORMATION IN THIS STRUCTURAL AND COLLATERAL TERM SHEET IS NOT COMPLETE AND MAY BE AMENDED PRIOR TO THE TIME OF SALE. THIS TERM SHEET IS NOT AN OFFER TO SELL THESE SECURITIES AND IT IS NOT A SOLICITATION OF AN OFFER TO BUY THESE SECURITIES IN ANY JURISDICTION WHERE THE OFFER OR SALE IS NOT PERMITTED.
29 of 166
| Structural and Collateral Term Sheet | Benchmark 2021-B24 | |
| Structural Overview | ||
of (in the case of a Whole Loan, solely to the extent allocable to the subject mortgage loan) (x) the most recent Appraised Value for the related mortgaged property or mortgaged properties, plus (y) solely to the extent not reflected or taken into account in such Appraised Value and to the extent on deposit with, or otherwise under the control of, the lender as of the date of such determination, any capital or additional collateral contributed by the related borrower at the time the mortgage loan became (and as part of the modification related to) such AB Modified Loan for the benefit of the related mortgaged property or mortgaged properties (provided that in the case of a non-serviced mortgage loan, the amounts set forth in this clause (y) will be taken into account solely to the extent relevant information is received by the Special Servicer), plus (z) any other escrows or reserves (in addition to any amounts set forth in the immediately preceding clause (y)) held by the lender in respect of such AB Modified Loan as of the date of such determination.
Upon the occurrence and during the continuance of a Control Termination Event, the Controlling Class will no longer have any control rights and the Directing Certificateholder will relinquish its right to direct certain actions of the Special Servicer and will no longer have consent rights with respect to certain actions that the Master Servicer or the Special Servicer plan on taking with respect to a mortgage loan. Following the occurrence and during the continuance of a Control Termination Event, the Directing Certificateholder will retain consultation rights with the Special Servicer with respect to certain material actions that the Special Servicer plans on taking with respect to any mortgage loan other than an Excluded Loan. Such consultation rights will continue until the occurrence of a Consultation Termination Event. | ||
| ■ Consultation Termination Event: | A “Consultation Termination Event” will occur with respect to any serviced Mortgage Loan, when there is no class of Control Eligible Certificates that has a then-outstanding Certificate Balance at least equal to 25% of the initial Certificate Balance of that class, in each case, without regard to the application of any Cumulative Appraisal Reduction Amounts; provided that a Consultation Termination Event will not be deemed to be continuing in the event the Certificate Balances of the certificates (other than the Control Eligible Certificates and the Class RR Certificates) have been reduced to zero.
Upon the occurrence of a Consultation Termination Event, there will be no Class of Certificates that will act as the Controlling Class and the Directing Certificateholder will have no rights under the Pooling and Servicing Agreement, other than those rights generally available to all Certificateholders.
| |
| ■ Risk Retention Consultation Parties: | The risk retention consultation parties will have certain non-binding consultation rights with respect to certain material servicing actions. The owners of the VRR Interest, which is expected to be transferred by the depositor on the Closing Date to JPMCB, CREFI and Goldman Sachs Bank USA, an originator and an affiliate of GSMC, will each be entitled to appoint a risk retention consultation party. JPMCB, CREFI and GSMC are expected to be appointed as the initial risk retention consultation parties. | |
| ■ Appraised-Out Class: | A Class of Control Eligible Certificates that has been determined, as a result of Appraisal Reduction Amounts or Collateral Deficiency Amounts allocable to such Class, to no longer be the Controlling Class. | |
| ■ Remedies Available to Holders of an Appraised-Out Class: | Holders of the majority of any Appraised-Out Class will have the right, at their sole expense, to require the Special Servicer to order a supplemental appraisal report from an MAI appraiser (selected by the Special Servicer) for any mortgage loan (or Serviced Whole Loan) that results in the Class becoming an Appraised-Out Class.
Upon receipt of that supplemental appraisal, the Special Servicer will be required to determine, in accordance with the Servicing Standard, whether, based on its assessment of the supplemental appraisal, any recalculation of the Appraisal Reduction Amount or Collateral Deficiency Amount is warranted, and if so warranted, the Master Servicer will be required to recalculate the Appraisal Reduction Amount or Collateral Deficiency Amount, as applicable, based on the supplemental appraisal and if required by such recalculation, the Appraised-Out Class will be reinstated as the Controlling Class. The holders of an Appraised-Out Class requesting a supplemental appraisal are not permitted to exercise any control or consent rights of the Controlling Class until such time, if any, as the Class is reinstated as the Controlling Class.
| |
| ■ Operating Advisor: | The Operating Advisor will initially be Park Bridge Lender Services. The Operating Advisor will have access to any final asset status report and information available with respect to the transaction on the certificate administrator’s website and will have certain monitoring responsibilities on behalf of the entire issuing entity. During the continuance of a Control Termination Event, the Operating Advisor will be entitled to consult with the Special Servicer |
THE INFORMATION IN THIS STRUCTURAL AND COLLATERAL TERM SHEET IS NOT COMPLETE AND MAY BE AMENDED PRIOR TO THE TIME OF SALE. THIS TERM SHEET IS NOT AN OFFER TO SELL THESE SECURITIES AND IT IS NOT A SOLICITATION OF AN OFFER TO BUY THESE SECURITIES IN ANY JURISDICTION WHERE THE OFFER OR SALE IS NOT PERMITTED.
30 of 166
| Structural and Collateral Term Sheet | Benchmark 2021-B24 | |
| Structural Overview | ||
with respect to certain major decisions on behalf of the issuing entity and in the best interest of, and for the benefit of, the certificateholders, the RR Interest Owners and, in the case of a serviced whole loan, the related companion loan holder(s), as a collective whole, as if those certificateholders, RR Interest Owners and, if applicable, such companion loan holder(s) constituted a single lender (taking into account the pari passu or subordinate nature of any related companion loan(s)).
In addition, if during the continuance of a Control Termination Event, the Operating Advisor determines, in its sole discretion exercised in good faith, that (1) the Special Servicer is not performing its duties as required under the Pooling and Servicing Agreement or is otherwise not acting in accordance with the Servicing Standard and (2) the replacement of the Special Servicer would be in the best interest of the certificateholders and the RR Interest Owners as a collective whole, then, the Operating Advisor will have the right to recommend the replacement of the Special Servicer and will submit its formal recommendation to the Trustee and the Certificate Administrator (along with its rationale, its proposed replacement special servicer and other relevant information justifying its recommendation).
The Operating Advisor’s recommendation to replace the Special Servicer must be confirmed by an affirmative vote of holders of Principal Balance Certificates and Class RR Certificates evidencing at least a majority of a quorum of certificateholders (which, for this purpose, is the holders of Certificates that (i) evidence at least 20% of the Voting Rights (taking into account the application of any Appraisal Reduction Amounts to notionally reduce the respective Certificate Balances) of all Principal Balance Certificates and the Class RR Certificates on an aggregate basis, and (ii) consist of at least three Certificateholders or certificate owners that are not risk retention affiliated with each other). In the event the holders of Principal Balance Certificates and Class RR Certificates evidencing at least a majority of a quorum of certificateholders elect to remove and replace the Special Servicer (which requisite affirmative votes must be received within 180 days of the posting of the notice of the Operating Advisor’s recommendation to replace the Special Servicer to the Certificate Administrator’s website), the Certificate Administrator will be required to receive a Rating Agency Confirmation from each of the Rating Agencies at that time. | ||
| ■ Replacement of Operating Advisor: | The Operating Advisor may be terminated or removed under certain circumstances and a replacement operating advisor appointed as described in the Preliminary Prospectus.
Any replacement operating advisor (or the personnel responsible for supervising the obligations of the replacement operating advisor) must be an institution (A) that is a special servicer or operating advisor on a commercial mortgage-backed securities transaction rated by the Rating Agencies (including, in the case of the Operating Advisor, this transaction) but has not been special servicer or operating advisor on a transaction for which any of the Rating Agencies has qualified, downgraded or withdrawn its rating or ratings of, one or more classes of certificates for such transaction publicly citing servicing concerns with the operating advisor in its capacity as special servicer or operating advisor on such commercial mortgage-backed securities transaction as the sole or a material factor in such rating action; (B) that can and will make the representations and warranties of the operating advisor set forth in the Pooling and Servicing Agreement; (C) that is not (and is not affiliated with) the Depositor, the Trustee, the Certificate Administrator, the Master Servicer, the Special Servicer, a Mortgage Loan Seller, the Directing Certificateholder, a Risk Retention Consultation Party, a depositor, a trustee, a certificate administrator, a master servicer or special servicer with respect to any securitization that includes a Companion Loan, or any of their respective affiliates; (D) that has not been paid by any Special Servicer or successor special servicer any fees, compensation or other remuneration (x) in respect of its obligations hereunder or (y) for the appointment or recommendation for replacement of a successor special servicer to become the Special Servicer; (E) that (x) has been regularly engaged in the business of analyzing and advising clients in commercial mortgage-backed securities matters and that has at least five years of experience in collateral analysis and loss projections and (y) has at least five years of experience in commercial real estate asset management and experience in the workout and management of distressed commercial real estate assets; and (F) that does not directly or indirectly, through one or more affiliates or otherwise, own or have derivative exposure in any interest in any certificates, any mortgage loans, any Companion Loan or any securities backed by a Companion Loan or otherwise have any financial interest in the securitization transaction to which the Pooling and Servicing Agreement relates, other than in fees from its role as operating advisor and asset representations reviewer (to the extent it also acts as the asset representations reviewer). |
THE INFORMATION IN THIS STRUCTURAL AND COLLATERAL TERM SHEET IS NOT COMPLETE AND MAY BE AMENDED PRIOR TO THE TIME OF SALE. THIS TERM SHEET IS NOT AN OFFER TO SELL THESE SECURITIES AND IT IS NOT A SOLICITATION OF AN OFFER TO BUY THESE SECURITIES IN ANY JURISDICTION WHERE THE OFFER OR SALE IS NOT PERMITTED.
31 of 166
| Structural and Collateral Term Sheet | Benchmark 2021-B24 | |
| Structural Overview | ||
| ■ Asset Representations Reviewer: | The Asset Representations Reviewer will be required to review certain delinquent mortgage loans after a specified delinquency threshold has been exceeded and notification from the Certificate Administrator that the required percentage of Certificateholders have voted to direct a review of such delinquent mortgage loans. An “Asset Review Trigger” will occur when either (1) mortgage loans with an aggregate outstanding principal balance of 25.0% or more of the aggregate outstanding principal balance of all of the mortgage loans (including any REO Loans (or a portion of any REO Loan in the case of a Whole Loan) held by the issuing entity as of the end of the applicable Collection Period are Delinquent Loans, (2)(A) prior to and including the second anniversary of the Closing Date, at least 10 mortgage loans are Delinquent Loans and the outstanding principal balance of such Delinquent Loans in the aggregate constitutes at least 15.0% of the aggregate outstanding principal balance of all of the mortgage loans (including any REO Loans (or a portion of any REO Loan in the case of a Whole Loan)) held by the issuing entity as of the end of the applicable Collection Period or (B) after the second anniversary of the Closing Date, at least 15 mortgage loans are Delinquent Loans and the outstanding principal balance of such Delinquent Loans in the aggregate constitutes at least 20.0% of the aggregate outstanding principal balance of all of the mortgage loans (including any REO Loans (or a portion of any REO Loan in the case of a Whole Loan)) held by the issuing entity as of the end of the applicable Collection Period.
Following the determination that an Asset Review Trigger has occurred, the Certificate Administrator will include in the Form 10-D relating to the distribution period in which the Asset Review Trigger occurred a description of the events that caused the Asset Review Trigger to occur. Once an Asset Review Trigger has occurred, Certificateholders evidencing not less than 5% of the voting rights may deliver to the Certificate Administrator a written direction requesting a vote on whether to commence an Asset Review within 90 days after the filing of the Form 10-D reporting the occurrence of the Asset Review Trigger (an “Asset Review Vote Election”). If directed by such Certificateholders, a vote of all Certificateholders will commence and an Asset Review will occur if a majority of Certificateholders voting (assuming Certificateholders representing a minimum of 5% of the voting rights respond) vote affirmatively within 150 days of the Asset Review Vote Election. If the vote does not pass, then no Certificateholder may request a vote or cast a vote for an Asset Review and the Asset Representations Reviewer will not be required to review any delinquent mortgage loan until an additional mortgage loan becomes a Delinquent Loan, an Asset Review Trigger occurs as a result or is otherwise in effect, another Asset Review Vote Election is made and a majority of Certificateholders voting (assuming Certificateholders representing a minimum of 5% of the voting rights respond) vote affirmatively within 150 days of such Asset Review Vote Election.
Delinquent Loan means a mortgage loan that is delinquent at least 60 days in respect of its periodic payments or balloon payment, if any, in either case such delinquency to be determined without giving effect to any grace period. For the avoidance of doubt, a delinquency that would have existed but for a COVID modification will not constitute a delinquency for so long as the related borrower is complying with the terms of such COVID modification. | |
| ■ Replacement of the Asset Representations Reviewer: | The Asset Representations Reviewer may be terminated and replaced without cause. Upon (i) the written direction of Certificateholders evidencing not less than 25% of the voting rights (without regard to the application of any Cumulative Appraisal Reduction Amounts) requesting a vote to terminate and replace the Asset Representations Reviewer with a proposed successor asset representations reviewer that is an Eligible Asset Representations Reviewer, and (ii) payment by such holders to the Certificate Administrator of the reasonable fees and expenses to be incurred by the Certificate Administrator in connection with administering such vote, the Certificate Administrator will promptly provide notice to all Certificateholders and the Asset Representations Reviewer of such request by posting such notice on its website, and by mailing to all Certificateholders, the RR Interest Owners and the Asset Representations Reviewer. Upon the written direction of holders of Principal Balance Certificates and Class RR Certificates evidencing at least 75% of a Certificateholder Quorum (without regard to the application of any Cumulative Appraisal Reduction Amounts), the Trustee will terminate all of the rights and obligations of the Asset Representations Reviewer under the Pooling and Servicing Agreement by written notice to the Asset Representations Reviewer, and the proposed successor asset representations reviewer will be appointed. |
THE INFORMATION IN THIS STRUCTURAL AND COLLATERAL TERM SHEET IS NOT COMPLETE AND MAY BE AMENDED PRIOR TO THE TIME OF SALE. THIS TERM SHEET IS NOT AN OFFER TO SELL THESE SECURITIES AND IT IS NOT A SOLICITATION OF AN OFFER TO BUY THESE SECURITIES IN ANY JURISDICTION WHERE THE OFFER OR SALE IS NOT PERMITTED.
32 of 166
| Structural and Collateral Term Sheet | Benchmark 2021-B24 | |
| Structural Overview | ||
| ■ Appointment and Replacement of Special Servicer: | The Directing Certificateholder will appoint the initial Special Servicer as of the Closing Date. Prior to the occurrence and continuance of a Control Termination Event, the Special Servicer may generally be replaced at any time, with or without cause by the Directing Certificateholder.
If the Special Servicer obtains knowledge that it is a Borrower Party with respect to any mortgage loan or Serviced Whole Loan (any such mortgage loan or Serviced Whole Loan, an “Excluded Special Servicer Loan”), the Special Servicer will be required to resign as Special Servicer of that Excluded Special Servicer Loan. Prior to the occurrence and continuance of a Control Termination Event, if the applicable Excluded Special Servicer Loan is not also an Excluded Loan, the controlling class certificateholders or the Directing Certificateholder on their behalf will be required to select a successor special servicer that is not a Borrower Party in accordance with the terms of the Pooling and Servicing Agreement (an “Excluded Special Servicer”) for the related Excluded Special Servicer Loan. After the occurrence and during the continuance of a Control Termination Event or if at any time the applicable Excluded Special Servicer Loan is also an Excluded Loan, the resigning Special Servicer will be required to use reasonable efforts to select the related Excluded Special Servicer.
Upon the occurrence and during the continuance of a Control Termination Event, the Directing Certificateholder will no longer have the right to replace the Special Servicer and such replacement will occur based on a vote of holders of all voting eligible Classes of Certificates as described below.
The Operating Advisor may also recommend the replacement of the Special Servicer at any time as described in “—Operating Advisor” above.
| |
| ■ Replacement of Special Servicer by Vote of Certificateholders: | After the occurrence and during the continuance of a Control Termination Event and upon (a) the written direction of holders of Principal Balance Certificates and/or Class RR Certificates evidencing not less than 25% of the Voting Rights (taking into account the application of Cumulative Appraisal Reduction Amounts to notionally reduce the Certificate Balances of the Principal Balance Certificates and/or Class RR Certificates) requesting a vote to replace the Special Servicer with a replacement special servicer, (b) payment by such requesting holders to the Certificate Administrator of all reasonable fees and expenses to be incurred by the Certificate Administrator in connection with administering such vote and (c) delivery by such holders to the Certificate Administrator and the Trustee of written confirmations from each Rating Agency that the appointment of such replacement special servicer will not result in a downgrade, withdrawal or qualification of the Certificates (which confirmations will be obtained at the expense of such holders), the Certificate Administrator will be required to post notice of such direction on its website and by mail, and conduct the solicitation of votes of all Certificates in such regard, which such vote must occur within 180 days of the posting of such notice. Upon the written direction of holders of Principal Balance Certificates and/or Class RR Certificates evidencing at least 50% of a Certificateholder Quorum, the Trustee will immediately replace the Special Servicer with a qualified replacement special servicer designated by such holders of Certificates.
A “Certificateholder Quorum” means, in connection with any solicitation of votes in connection with the replacement of the Special Servicer or the Asset Representations Reviewer described above, the holders of Certificates evidencing at least 50% of the aggregate Voting Rights (taking into account the application of realized losses and, other than with respect to the termination of the Asset Representations Reviewer, the application of any Cumulative Appraisal Reduction Amounts to notionally reduce the Certificate Balance of the Certificates) of all Principal Balance Certificates and the Class RR Certificates on an aggregate basis.
With respect to each of the Serviced Whole Loan, subject to the related intercreditor agreement, the holders of the related Pari Passu Companion Loans, under certain circumstances following a servicer termination event with respect to the Special Servicer, will be entitled to direct the Trustee (and the Trustee will be required) to terminate the Special Servicer solely with respect to such Serviced Whole Loan. A replacement special servicer will be selected by the Trustee or, prior to a Control Termination Event, by the Directing Certificateholder; provided, however, that any successor special servicer appointed to replace the Special Servicer with respect to such Whole Loan can generally not be the person (or its affiliate) that was terminated at the direction of the holder of the related Pari Passu Companion Loan.
With respect to any Non-Serviced Whole Loan, subject to the related intercreditor agreement, the Benchmark 2021-B24 trust as holder of the related mortgage loan has similar termination rights in the event of a servicer termination event with respect to the special servicer under the |
THE INFORMATION IN THIS STRUCTURAL AND COLLATERAL TERM SHEET IS NOT COMPLETE AND MAY BE AMENDED PRIOR TO THE TIME OF SALE. THIS TERM SHEET IS NOT AN OFFER TO SELL THESE SECURITIES AND IT IS NOT A SOLICITATION OF AN OFFER TO BUY THESE SECURITIES IN ANY JURISDICTION WHERE THE OFFER OR SALE IS NOT PERMITTED.
33 of 166
| Structural and Collateral Term Sheet | Benchmark 2021-B24 | |
| Structural Overview | ||
applicable trust and servicing agreement or pooling and servicing agreement, as applicable, as described above, which may be exercised by the Directing Certificateholder prior to the Control Termination Event. However, the successor special servicer will be selected pursuant to the applicable trust and servicing agreement or pooling and servicing agreement, as applicable, by the related directing holder prior to a control event under such trust and servicing agreement or pooling and servicing agreement, as applicable. The Master Servicer and Special Servicer are entitled to certain fees in connection with the servicing and administration of the mortgage loans as more fully described in “Pooling and Servicing Agreement—Servicing and Other Compensation and Payment of Expenses” in the Preliminary Prospectus. | ||
| ■ Dispute Resolution Provisions: | Each Mortgage Loan Seller will be subject to the dispute resolution provisions set forth in the Pooling and Servicing Agreement to the extent those provisions are triggered with respect to any mortgage loan sold to the Depositor by a Mortgage Loan Seller and such Mortgage Loan Seller will be obligated under the related mortgage loan purchase agreement to comply with all applicable provisions and to take part in any mediation or arbitration proceedings that may result.
Generally, in the event that a request to repurchase a mortgage loan (a “Repurchase Request”) is not “Resolved” (as defined below) within 180 days after the related Mortgage Loan Seller receives such Repurchase Request (a “Resolution Failure”), then the Enforcing Servicer (as defined below) will be required to send a notice to the “Initial Requesting Certificateholder” (if any) indicating the Enforcing Servicer’s intended course of action with respect to the Repurchase Request. If (a) the Enforcing Servicer’s intended course of action with respect to the Repurchase Request does not involve pursuing further action to exercise rights against the related Mortgage Loan Seller with respect to the Repurchase Request and the Initial Requesting Certificateholder, if any, or any other Certificateholder or Certificate Owner wishes to exercise its right to refer the matter to mediation (including nonbinding arbitration) or arbitration, or (b) the Enforcing Servicer’s intended course of action is to pursue further action to exercise rights against the related Mortgage Loan Seller with respect to the Repurchase Request but the Initial Requesting Certificateholder, if any, or any other Certificateholder or Certificate Owner does not agree with the dispute resolution method selected by the Enforcing Servicer, then the Initial Requesting Certificateholder, if any, or such other Certificateholder or Certificate Owner may deliver a written notice to the Enforcing Servicer indicating its intent to exercise its right to refer the matter to either mediation or arbitration.
The Enforcing Servicer will be required to consult with any Certificateholder or Certificate Owner that delivers a notice of its intent to exercise its dispute resolution rights (a “Requesting Certificateholder”) so that a Requesting Certificateholder may consider the views of the Enforcing Servicer as to the claims underlying the Repurchase Request and possible dispute resolution methods. If a Requesting Certificateholder elects to exercise its right to refer the matter to either mediation or arbitration, then it will become the party responsible for enforcing the Repurchase Request and must promptly submit the matter to mediation (including nonbinding arbitration) or arbitration. Failure to make an election to exercise that right or failure to begin the elected form of proceedings within the certain timeframe set forth in the Pooling and Servicing Agreement will generally waive the Certificateholders’ or Certificate Owners’ rights with respect to the related Repurchase Request.
The “Enforcing Servicer” will be (a) with respect to a specially serviced loan, the Special Servicer, and (b) with respect to a non-specially serviced loan, (i) in the case of a Repurchase Request made by the Special Servicer, the Directing Certificateholder or a Controlling Class Certificateholder, the Master Servicer, and (ii) in the case of a Repurchase Request made by any person other than the Special Servicer, the Directing Certificateholder or a Controlling Class Certificateholder, (A) prior to a Resolution Failure relating to such non-specially serviced loan, the Master Servicer, and (B) from and after a Resolution Failure relating to such non-specially serviced Loan, the Special Servicer.
“Resolved” means, with respect to a Repurchase Request, (i) that the related Material Defect has been cured, (ii) the related mortgage loan has been repurchased in accordance with the related mortgage loan purchase agreement, (iii) a mortgage loan has been substituted for the related mortgage loan in accordance with the related mortgage loan purchase agreement, (iv) the applicable Mortgage Loan Seller has made a Loss of Value Payment, (v) a contractually binding agreement is entered into between the Enforcing Servicer, on behalf of the issuing entity, and the related Mortgage Loan Seller that settles the related Mortgage Loan Seller’s obligations under the related mortgage loan purchase agreement, or (vi) the related mortgage |
THE INFORMATION IN THIS STRUCTURAL AND COLLATERAL TERM SHEET IS NOT COMPLETE AND MAY BE AMENDED PRIOR TO THE TIME OF SALE. THIS TERM SHEET IS NOT AN OFFER TO SELL THESE SECURITIES AND IT IS NOT A SOLICITATION OF AN OFFER TO BUY THESE SECURITIES IN ANY JURISDICTION WHERE THE OFFER OR SALE IS NOT PERMITTED.
34 of 166
| Structural and Collateral Term Sheet | Benchmark 2021-B24 | |
| Structural Overview | ||
loan is no longer property of the issuing entity as a result of a sale or other disposition in accordance with the Pooling and Servicing Agreement. | ||
| ■ Investor Communications | The Certificate Administrator is required to include on any Form 10–D any request received from a Certificateholder to communicate with other Certificateholders related to Certificateholders exercising their rights under the terms of the Pooling and Servicing Agreement. Any Certificateholder wishing to communicate with other Certificateholders regarding the exercise of its rights under the terms of the Pooling and Servicing Agreement should deliver a written request signed by an authorized representative of the requesting investor to the Certificate Administrator at the address below:
9062 Old Annapolis Road
Columbia, Maryland 21045
Attention: Corporate Trust Administration Group – Benchmark 2021-B24
With a copy to: trustadministrationgroup@wellsfargo.com | |
| ■ Master Servicer and Special Servicer Compensation: | The Master Servicer is entitled to a fee (the “Servicing Fee”) payable monthly from interest received in respect of each mortgage loan, any related REO loan and any related serviced Companion Loan that will accrue at the related servicing fee rate described in the Preliminary Prospectus. The Special Servicer is also entitled to a fee (the “Special Servicing Fee”) with respect to each specially serviced loan and REO loan (other than a non-serviced mortgage loan) at the special servicing fee rate described in the Preliminary Prospectus.
In addition to the Servicing Fee, Special Servicing Fee and certain other fees described below, the Master Servicer and Special Servicer are entitled to retain and share certain additional servicing compensation, including assumption application fees, assumption fees, defeasance fees, processing fees and certain Excess Modification Fees and consent fees with respect to the mortgage loans. The Special Servicer may also be entitled to either a Workout Fee or Liquidation Fee, but not both, from recoveries in respect of any particular mortgage loan.
An “Excess Modification Fee” with respect to any mortgage loan (other than the non-serviced mortgage loans) or Serviced Whole Loan is the sum of (A) the excess, if any, of (i) any and all Modification Fees with respect to a mortgage loan or Serviced Whole Loan, as applicable, over (ii) all unpaid or unreimbursed additional expenses described in the Preliminary Prospectus (excluding Special Servicing Fees, Workout Fees and Liquidation Fees) outstanding or previously incurred on behalf of the issuing entity with respect to the related mortgage loan or Serviced Whole Loan, as applicable, and reimbursed from such Modification Fees and (B) expenses previously paid or reimbursed from Modification Fees as described in clause (A), which expenses have been recovered from the related borrower or otherwise.
With respect to the Master Servicer and Special Servicer, the Excess Modification Fees collected and earned by such servicer from the related borrower (taken in the aggregate with any other Excess Modification Fees collected and earned by such servicer from the related borrower within the prior 18 months of the collection of the current Excess Modification Fees) will be subject to a cap of 1.00% of the outstanding principal balance of the related mortgage loan or Serviced Whole Loan, as applicable, on the closing date of the related modification, extension, waiver or amendment. A “Modification Fee” with respect to any mortgage loan (other than the non-serviced mortgage loans) or serviced Companion Loan is generally any fee with respect to a modification, extension, waiver or amendment of any mortgage loan and/or related serviced Companion Loan (other than all assumption fees, assumption application fees, consent fees, defeasance fees, Special Servicing Fees, Liquidation Fees or Workout Fees).
A “Workout Fee” will generally be payable with respect to each corrected loan (except with respect to a corrected loan that was a fee restricted specially serviced loan and became a corrected loan while it was a fee restricted specially serviced loan) (as more specifically described in the Preliminary Prospectus) and will be calculated at a rate of 1.00% of payments of principal and interest on the respective mortgage loan for so long as it remains a corrected loan, subject to a maximum of $1,000,000 in the aggregate with respect to any particular corrected loan. After receipt by the Special Servicer of Workout Fees with respect to a corrected loan in an amount equal to $25,000, any Workout Fees in excess of such amount will be reduced by the Excess Modification Fee Amount; provided that in the event the Workout Fee, collected over the course of such workout calculated at the Workout Fee Rate is less than $25,000, then the Special Servicer will be entitled to an amount from the final payment on the related corrected loan (including any related serviced Companion Loan) that would result in the total Workout |
THE INFORMATION IN THIS STRUCTURAL AND COLLATERAL TERM SHEET IS NOT COMPLETE AND MAY BE AMENDED PRIOR TO THE TIME OF SALE. THIS TERM SHEET IS NOT AN OFFER TO SELL THESE SECURITIES AND IT IS NOT A SOLICITATION OF AN OFFER TO BUY THESE SECURITIES IN ANY JURISDICTION WHERE THE OFFER OR SALE IS NOT PERMITTED.
35 of 166
| Structural and Collateral Term Sheet | Benchmark 2021-B24 | |
| Structural Overview | ||
Fees payable to the Special Servicer in respect of that corrected loan (including any related serviced Companion Loan) to be $25,000.
The “Excess Modification Fee Amount” for any corrected loan is an amount equal to any Excess Modification Fees paid by or on behalf of the related borrower with respect to the related mortgage loan (including the related serviced Companion Loan, unless prohibited under the related intercreditor agreement) and received and retained by the Master Servicer or the Special Servicer, as applicable, as compensation within the prior 18 months of the related modification, waiver, extension or amendment resulting in the mortgage loan or REO loan being a corrected loan, but only to the extent those fees have not previously been deducted from a Workout Fee or Liquidation Fee.
A “Liquidation Fee” will generally be payable with respect to (i) each specially serviced loan (except, under certain circumstances, with respect to any fee restricted specially serviced loan) or REO property (except with respect to any non-serviced mortgage loan), (ii) each Mortgage Loan repurchased by a Mortgage Loan Seller or (iii) each defaulted Mortgage Loan that is a Non-Serviced Mortgage Loan sold by the Special Servicer in accordance with the Pooling and Servicing Agreement, in each case, as to which the Special Servicer obtains a full or partial recovery of the related asset. The Liquidation Fee for each specially serviced loan will be payable at a rate of 1.00% of the liquidation proceeds (exclusive of default interest) subject to a maximum of $1,000,000; provided, however, that no Liquidation Fee will be less than $25,000.
The Liquidation Fees will be reduced by the amount of any Excess Modification Fees received by the Special Servicer with respect to the related mortgage loan (including a serviced Companion Loan) or REO property as additional compensation within the prior 18 months, but only to the extent those fees have not previously been deducted from a Workout Fee or Liquidation Fee.
Similar fees to those described above will be payable to the applicable special servicer for the Non-Serviced Whole Loans under the related trust and servicing agreement or pooling and servicing agreement, as applicable.
Subject to certain limited exceptions, in connection with its duties under the Pooling and Servicing Agreement, the Special Servicer and its affiliates are prohibited from receiving or retaining any compensation (other than compensation specifically provided for under the Pooling and Servicing Agreement) from anyone in connection with the disposition, workout or foreclosure of any mortgage loan, the management or disposition of any REO property, or the performance of any other special servicing duties under the Pooling and Servicing Agreement. In the event the Special Servicer does receive any such compensation, it will be required to disclose those fees to the Certificate Administrator who will include it as part of the statement to Certificateholders.
In addition, no liquidation fee will be payable to the Special Servicer if a mortgage loan or Serviced Whole Loan becomes a specially serviced loan only because of a maturity default and the related liquidation proceeds are received within 90 days following the related maturity date as a result of the related mortgage loan or Serviced Whole Loan being refinanced or otherwise repaid in full.
See “Pooling and Servicing Agreement—Servicing and Other Compensation and Payment of Expenses” in the Preliminary Prospectus. | ||
| ■ Deal Website: | The Certificate Administrator will maintain a deal website to which certain persons will have access to certain information including, but not limited to the following, which will be posted: ■ special notices; ■ summaries of any final asset status reports; ■ appraisals in connection with Appraisal Reductions plus any second appraisals ordered; ■ an “Investor Q&A Forum”; ■ a voluntary investor registry; ■ SEC EDGAR filings; and ■ risk retention. |
THE INFORMATION IN THIS STRUCTURAL AND COLLATERAL TERM SHEET IS NOT COMPLETE AND MAY BE AMENDED PRIOR TO THE TIME OF SALE. THIS TERM SHEET IS NOT AN OFFER TO SELL THESE SECURITIES AND IT IS NOT A SOLICITATION OF AN OFFER TO BUY THESE SECURITIES IN ANY JURISDICTION WHERE THE OFFER OR SALE IS NOT PERMITTED.
36 of 166
(THIS PAGE INTENTIONALLY LEFT BLANK)
THE INFORMATION IN THIS STRUCTURAL AND COLLATERAL TERM SHEET IS NOT COMPLETE AND MAY BE AMENDED PRIOR TO THE TIME OF SALE. THIS TERM SHEET IS NOT AN OFFER TO SELL THESE SECURITIES AND IT IS NOT A SOLICITATION OF AN OFFER TO BUY THESE SECURITIES IN ANY JURISDICTION WHERE THE OFFER OR SALE IS NOT PERMITTED.
37 of 166
| Structural and Collateral Term Sheet | Benchmark 2021-B24 | |
| 410 Tenth Avenue | ||
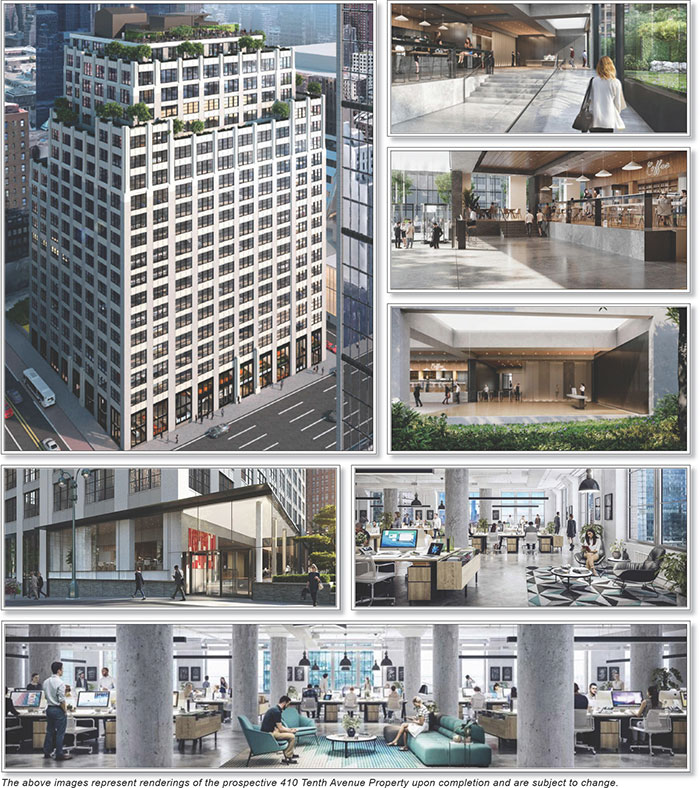
THE INFORMATION IN THIS STRUCTURAL AND COLLATERAL TERM SHEET IS NOT COMPLETE AND MAY BE AMENDED PRIOR TO THE TIME OF SALE. THIS TERM SHEET IS NOT AN OFFER TO SELL THESE SECURITIES AND IT IS NOT A SOLICITATION OF AN OFFER TO BUY THESE SECURITIES IN ANY JURISDICTION WHERE THE OFFER OR SALE IS NOT PERMITTED.
38 of 166
| Structural and Collateral Term Sheet | Benchmark 2021-B24 | |
| 410 Tenth Avenue | ||
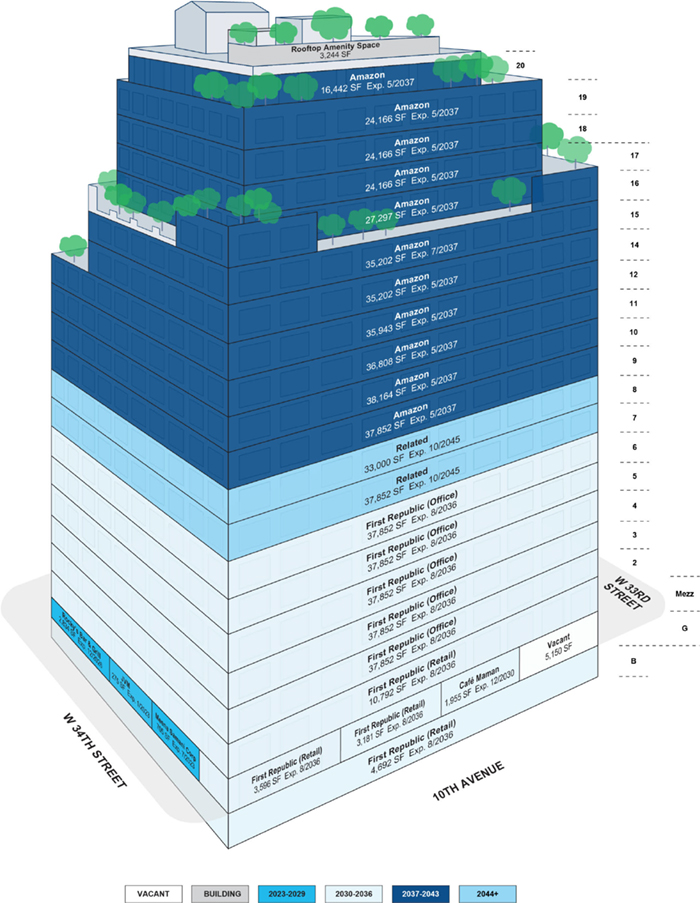
THE INFORMATION IN THIS STRUCTURAL AND COLLATERAL TERM SHEET IS NOT COMPLETE AND MAY BE AMENDED PRIOR TO THE TIME OF SALE. THIS TERM SHEET IS NOT AN OFFER TO SELL THESE SECURITIES AND IT IS NOT A SOLICITATION OF AN OFFER TO BUY THESE SECURITIES IN ANY JURISDICTION WHERE THE OFFER OR SALE IS NOT PERMITTED.
39 of 166
| Structural and Collateral Term Sheet | Benchmark 2021-B24 | |
| 410 Tenth Avenue | ||

THE INFORMATION IN THIS STRUCTURAL AND COLLATERAL TERM SHEET IS NOT COMPLETE AND MAY BE AMENDED PRIOR TO THE TIME OF SALE. THIS TERM SHEET IS NOT AN OFFER TO SELL THESE SECURITIES AND IT IS NOT A SOLICITATION OF AN OFFER TO BUY THESE SECURITIES IN ANY JURISDICTION WHERE THE OFFER OR SALE IS NOT PERMITTED.
40 of 166
| Structural and Collateral Term Sheet | Benchmark 2021-B24 | |
| 410 Tenth Avenue | ||
| Mortgage Loan Information | Property Information | |||
| Mortgage Loan Seller: | JPMCB | Single Asset / Portfolio: | Single Asset | |
| Credit Assessments | Title: | Fee | ||
| (Fitch/KBRA/S&P)(1): | A(sf) / A+ / N/A | Property Type – Subtype: | Office – CBD | |
| Original Principal Balance(2): | $80,000,000 | Net Rentable Area (SF)(6): | 631,944 | |
| Cut-off Date Principal Balance(2): | $80,000,000 | Location: | New York, NY | |
| % of Pool by IPB: | 6.9% | Year Built / Renovated: | 1927 / 2020 | |
| Loan Purpose: | Acquisition | Occupancy: | 99.2% | |
| Borrowers(3): | Various | Occupancy Date: | 12/16/2020 | |
| Loan Sponsors: | Mark Karasick, Michael Silberberg | Number of Tenants: | 7 | |
| Interest Rate(4): | 2.59159% | 2017 NOI(7): | N/A | |
| Note Date: | 12/18/2020 | 2018 NOI(7): | N/A | |
| ARD Date(4): | 1/1/2028 | 2019 NOI(7): | N/A | |
| Maturity Date(4) | 3/1/2032 | TTM NOI(7): | N/A | |
| Interest-only Period: | 84 months | UW Economic Occupancy(8): | 98.0% | |
| Original Term: | 84 months | UW Revenues: | $63,431,013 | |
| Original Amortization: | None | UW Expenses: | $14,141,037 | |
| Amortization Type: | ARD-Interest Only | UW NOI(8): | $49,289,976 | |
| Call Protection: | L(26),Def(54),O(4) | UW NCF(8): | $49,005,601 | |
| Lockbox / Cash Management: | Hard / In Place | Appraised Value / Per SF(8)(9): | $955,000,000 / $1,511 | |
| Additional Debt(2): | Yes | Appraisal Date(9): | 12/1/2020 | |
| Additional Debt Balance(2)(10): | $300,000,000 / $185,000,000 / | |||
| $140,000,000 | ||||
| Additional Debt Type(2): | Pari Passu / Subordinate Debt/ | |||
| Mezzanine | ||||
| Escrows and Reserves(5) | Financial Information(2)(8)(9)(10) | |||||||
| Initial | Monthly | Initial Cap | Senior Notes | Whole Loan | Total Debt | |||
| Taxes: | $379,548 | $378,496 | N/A | Cut-off Date Loan / SF: | $601 | $894 | $1,116 | |
| Insurance: | $78,467 | $78,467 | N/A | Maturity Date Loan / SF: | $601 | $894 | $1,116 | |
| Replacement Reserves: | $10,647 | $10,647 | N/A | Cut-off Date LTV: | 39.8% | 59.2% | 73.8% | |
| TI/LC: | $53,233 | Springing | N/A | Maturity Date LTV: | 39.8% | 59.2% | 73.8% | |
| Other(8): | $92,879,875 | Springing | N/A | UW NCF DSCR: | 4.91x | 3.30x | 2.25x | |
| UW NOI Debt Yield: | 13.0% | 8.7% | 7.0% | |||||
| Sources and Uses | ||||||
| Sources | Proceeds | % of Total | Uses | Proceeds | % of Total | |
| Whole Loan | $565,000,000 | 58.2% | Net Purchase Price(11) | $859,998,032 | 88.6% | |
| Mezzanine A Loan | 20,000,000 | 2.1 | Upfront Reserves | 93,401,769 | 9.6_ | |
| Mezzanine B Loan | 120,000,000 | 12.4 | Closing Costs | 17,402,002 | 1.8_ | |
| Sponsor Equity | 265,801,803 | 27.4 | ||||
| Total Sources | $970,801,803 | 100.0% | Total Uses | $970,801,803 | 100.0% | |
| (1) | Fitch, KBRA and S&P have confirmed that the 410 Tenth Avenue Loan, in the context of the inclusion in the mortgage pool, has credit characteristics consistent with an investment grade obligation. |
| (2) | The 410 Tenth Avenue Loan (as defined below) is part of a whole loan comprised of (i) the mortgage loan (comprised of the non-controlling Note A-2) with an outstanding principal balance as of the Cut-off Date of $80.0 million, (ii) one companion loan, which is pari passu with the 410 Tenth Avenue Loan, with an aggregate outstanding principal balance as of the Cut-off Date of $300.0 million and (iii) one subordinate companion loan with an outstanding balance as of the Cut-off Date of $185.0 million. The Senior Notes Financial Information presented in the chart above reflects the Cut-off Date balance of the $380.0 million 410 Tenth Avenue Senior Notes (as defined below). The Whole Loan Financial Information presented in the chart above reflects the $565.0 million 410 Tenth Avenue Whole Loan (as defined below). The Total Debt Financial Information presented in the chart above reflects the $565.0 million 410 Tenth Avenue Whole Loan and the aggregate $140.0 million in associated mezzanine debt. For additional information, see “The Loan” and “Current Mezzanine and Subordinate Indebtedness” herein. |
| (3) | The borrowers of the 410 Tenth Avenue Loan are 601W Tenth Owner LLC, Tenth Owner 2 LLC, Tenth Owner 3 LLC, Tenth Owner 4 LLC, Tenth Owner 5 LLC, Tenth Owner 6 LLC and Tenth Ave 4 Lessee LLC. |
| (4) | The 410 Tenth Avenue Whole Loan is structured with an anticipated repayment date (“ARD”) of January 1, 2028 and a final maturity date of March 1, 2032. After the ARD, the interest rate will be revised to the greater of (i) 4.59159%, (ii) the 7-year swap yield as of the ARD plus 3.94159%, subject to a cap of 7.59159% and (iii) the default rate, when applicable pursuant to the 410 Tenth Avenue Whole Loan documents. The Mortgage Loan Information and Financial Information presented in the tables above are calculated based on the ARD. |
| (5) | For a full description of Escrows and Reserves, please refer to “Escrows and Reserves” below. |
| (6) | Net Rentable Area represents the “as leased” square footage at the 410 Tenth Avenue Property. Total measured square footage amounts to 638,797 square feet. |
THE INFORMATION IN THIS STRUCTURAL AND COLLATERAL TERM SHEET IS NOT COMPLETE AND MAY BE AMENDED PRIOR TO THE TIME OF SALE. THIS TERM SHEET IS NOT AN OFFER TO SELL THESE SECURITIES AND IT IS NOT A SOLICITATION OF AN OFFER TO BUY THESE SECURITIES IN ANY JURISDICTION WHERE THE OFFER OR SALE IS NOT PERMITTED.
41 of 166
| Structural and Collateral Term Sheet | Benchmark 2021-B24 | |
| 410 Tenth Avenue | ||
| (7) | Historical financials are not available as the property is newly redeveloped with approximately 96% of the work complete as of January 2021. |
| (8) | While the 410 Tenth Avenue Whole Loan was originated after the emergence of the novel coronavirus pandemic and the economic disruption resulting from measures to combat the pandemic, the pandemic is an evolving situation and could impact the 410 Tenth Avenue Whole Loan more severely than assumed in the underwriting of the 410 Tenth Avenue Whole Loan and could adversely affect the NOI, NCF and occupancy, as well as the appraised value and the DSCR, LTV and Debt Yield metrics presented above. See “Special Risks—The Coronavirus Pandemic Has Adversely Affected the Global Economy and Will Likely Adversely Affect the Performance of the Mortgage Loans” in the Preliminary Prospectus. |
| (9) | Based on the “Hypothetical Market Value Assuming Reserves” appraised value, which assumes that escrow accounts were established to cover gap rent, free rent and outstanding tenant improvements and leasing commissions. At origination, the borrowers reserved $57,700,000 for outstanding gap rent and free rent and approximately $35,179,875 for all outstanding tenant improvements and leasing commissions. Based on the “As-Is” appraised value as of December 1, 2020 equal to $825.0 million, the Cut-off Date LTV and Maturity Date LTV are 46.1%. |
| (10) | See “Current Mezzanine or Secured Subordinate Indebtedness” below. |
| (11) | Based on a gross purchase price/valuation of $952.5 million, less approximately $57.3 million in outstanding gap rent and free rent and approximately $35.2 million of outstanding tenant improvement and leasing obligations credited by the Seller (as defined below) on the origination date. |
The Loan. The 410 Tenth Avenue mortgage loan (the “410 Tenth Avenue Loan”) is part of a whole loan secured by a first mortgage lien on the borrowers’ fee interest in a 20-story, 631,944 square foot, newly renovated, Class A multi-tenant office tower located in Midtown Manhattan in New York, New York (the “410 Tenth Avenue Property”). The whole loan (the “410 Tenth Avenue Whole Loan”) has an aggregate outstanding principal balance as of the Cut-off Date of $565.0 million and is comprised of (i) a senior component, comprised of two pari passu notes (one of which evidences the 410 Tenth Avenue Loan) with an aggregate Cut-off Date principal balance of $380.0 million (the “410 Tenth Avenue Senior Notes”) and (ii) a controlling subordinate companion note with a Cutoff Date principal balance of $185.0 million (the “410 Tenth Avenue Subordinate Note”). The 410 Tenth Avenue Loan is evidenced by the non-controlling Note A-2 with an aggregate original principal balance and outstanding principal balance as of the Cut-off Date of $80.0 million. The 410 Tenth Avenue Senior Notes are senior to the 410 Tenth Avenue Subordinate Note. The relationship between the holders of the 410 Tenth Avenue Whole Loan is governed by a co-lender agreement as described under “Description of the Mortgage Pool—The Whole Loans—The Non-Serviced AB Whole Loans—The 410 Tenth Avenue Whole Loan” in the Preliminary Prospectus. The 410 Tenth Avenue Whole Loan is serviced pursuant to the trust and servicing agreement for the JPMCC 2021-410T transaction.
The 410 Tenth Avenue Whole Loan has a seven-year interest-only term through the ARD of January 1, 2028. After the ARD, through and including March 1, 2032 (the “Maturity Date”), the interest rate will be revised to the greater of (i) 4.59159%, (ii) the 7-year swap yield as of the ARD plus 3.94159%, subject to a cap equal to 7.59159% and (iii) the default rate, when applicable pursuant to the 410 Tenth Avenue Whole Loan documents. For the period from the origination date through the ARD, the 410 Tenth Avenue Senior Notes and 410 Tenth Avenue Subordinate Note accrue at the rate of 2.59159%.
| Whole Loan Summary(1) |
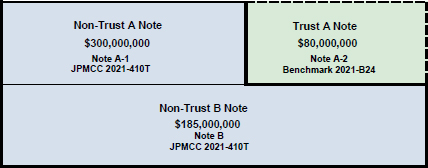 |
| (1) | The 410 Tenth Avenue Subordinate Note will be subordinate in right of payment to the 410 Tenth Avenue Senior Notes. |
The Borrowers. The borrowers of the 410 Tenth Avenue Whole Loan are 601W Tenth Owner LLC, Tenth Owner 2 LLC, Tenth Owner 3 LLC, Tenth Owner 4 LLC (“Tenth Owner 4”), Tenth Owner 5 LLC, Tenth Owner 6 LLC and Tenth Ave 4 Lessee LLC (all of the foregoing, collectively, the “Borrowers”), each a Delaware limited liability company and single purpose entity with two independent directors in its organizational structure. 601W Tenth Owner LLC, Tenth Owner 2 LLC, Tenth Owner 3 LLC, Tenth Owner 4, Tenth Owner 5 LLC, and Tenth Owner 6 LLC own the 410 Tenth Avenue Property as tenants-in-common (“TIC”). Legal counsel to the Borrowers delivered a non-consolidation opinion in connection with the origination of the 410 Tenth Avenue Whole Loan.
Tenth Owner 4 and Tenth Ave 4 Lessee LLC (“Master Tenant”) are subject to a “reverse exchange” under Section 1031 of the Internal Revenue Code (the “Exchange”), pursuant to a master lease between Tenth Owner 4, as the master landlord and Master Tenant as the master tenant, for the TIC interest owned by Tenth Owner 4. Within 180 days following the origination date of the 410 Tenth Avenue Whole Loan, the Tenth Owner 4 and Master Tenant are required under the 410 Tenth Avenue Whole Loan documents to complete the Exchange, at which point the master lease will terminate and Master Tenant will no longer be a borrower under the Whole Loan. The 410 Tenth Avenue Whole Loan documents provide a non-recourse carveout for any losses associated with the breach of the Borrowers’ obligations under the 410 Tenth Avenue Whole Loan documents with respect to the Exchange.
THE INFORMATION IN THIS STRUCTURAL AND COLLATERAL TERM SHEET IS NOT COMPLETE AND MAY BE AMENDED PRIOR TO THE TIME OF SALE. THIS TERM SHEET IS NOT AN OFFER TO SELL THESE SECURITIES AND IT IS NOT A SOLICITATION OF AN OFFER TO BUY THESE SECURITIES IN ANY JURISDICTION WHERE THE OFFER OR SALE IS NOT PERMITTED.
42 of 166
| Structural and Collateral Term Sheet | Benchmark 2021-B24 | |
| 410 Tenth Avenue | ||
The Loan Sponsors. The loan sponsors and non-recourse carveout guarantors are Mark Karasick and Michael Silberberg (collectively, the “Loan Sponsor”). Mark Karasick and Michael Silberberg are senior members of 601W Companies, a New York City based private real estate acquisition, ownership, development and management company with experience in major markets throughout the United States. Over the past 25 years, 601W Companies has acquired a number of substantial and well-known commercial properties throughout the country, aggregating approximately 45 million square feet with a collective value in excess of $12.0 billion. 601W Companies’ investment profile focuses on core plus assets with an opportunity to significantly appreciate, thus yielding income growth and enhanced returns. Notable investments have included: Starrett-Lehigh Building (New York, NY), Aon Center (Chicago, IL), the Old Chicago Post Office, the Wells Fargo Center (Winston-Salem, NC), One South Broad Street (Philadelphia, PA), 111 West Jackson (Chicago, IL) and Civic Opera Building (Chicago, IL).
The Property. The 410 Tenth Avenue Property is a Class A, 20-story, 631,944 square foot, office tower located in Hudson Yards on 10th Avenue between 33rd and 34th Street. The 410 Tenth Avenue Property was constructed in 1927 and is newly redeveloped with approximately 96% of the work complete as of January 2021. Formerly known as the Master Printers Building, the 410 Tenth Avenue Property was acquired by SL Green Realty Corp. (the “Seller”) in 2018, who then hired the architectural firm MdeAS to complete a comprehensive, building-wide redevelopment. The redevelopment includes approximately $145.5 million of estimated capital investment, which does not include tenant improvement allowances, leasing commissions and amounts further invested by the underlying tenants. The additional cost attributable to the build-out of tenant spaces includes $57.6 million in tenant improvement allowances, plus additional tenant funded investment. The Seller reported a total cost basis of approximately $791.1 million. On October 26, 2020, the Seller entered into a sale-purchase agreement with the Borrowers; however, the Seller is responsible for the remainder of the redevelopment work which has an estimated net cost to complete of approximately $12.4 million. Since acquiring the 410 Tenth Avenue Property and launching a comprehensive redevelopment, the Seller executed long-term leases with First Republic and Amazon. The redevelopment also created new retail storefronts on 10th Avenue and 33rd Street, added modernized 10 foot tall windows, moved the lobby to 33rd Street across from the Manhattan West amenities and created a studio and multiple rooftop terraces, some of which provide uninterrupted views south of Downtown Manhattan and the New York Harbor. Tenant spaces have an industrial aesthetic with exposed columns, 13.5 foot ceiling heights, polished cement floors, restored brick and high-performance loft windows.
As of December 16, 2020, the 410 Tenth Avenue Property was 99.2% occupied by seven tenants comprised largely of institutional and investment grade tenancy. The 410 Tenth Avenue Property benefits from long term tenancy, with a weighted average remaining lease term as of the Cut-Off Date of approximately 16.8 years, well beyond the final maturity date of the 410 Tenth Avenue Whole Loan.
The seller of the 410 Tenth Avenue Property has submitted an application to the New York City Department of Finance for the Industrial & Commercial Abatement Program (the “ICAP”). The ICAP abatement for the 410 Tenth Avenue Property is expected to commence in the tax year of 2024/25 and expire in 2033/34. However, the taxes for the 410 Tenth Avenue Property were not underwritten based on the abated tax amounts.
The largest tenant, Amazon (NYSE: AMZN) (335,408 square feet; 53.1% of net rentable area; 53.1% of underwritten base rent), is an American multinational technology company based in Seattle that focuses on e-commerce, cloud computing, digital streaming and artificial intelligence. Amazon is known for its disruption of well-established industries through technological innovation and mass scale. Amazon is the world’s largest online marketplace, AI assistant provider and cloud computing platform as measured by revenue and market capitalization, as well as Amazon is the largest internet company by revenue in the world. Amazon is the second largest private employer in the United States. Amazon has lease expiration dates in May 2037 (300,206 square feet on floors 9 through 14 and 16 through 20) and July 2037 (35,202 square feet on floor 15). On January 22, 2021, the Borrowers provided Amazon with 60 days’ prior notice of completion for the First Tranche Floors (as defined below), as required under the related lease for commencement to occur. The Loan Sponsor anticipates that the landlord’s pre-commencement work will be substantially complete on all floors excluding the 15th floor (the “First Tranche Floors”) by March 25, 2021. If the commencement date for the First Tranche Floors has not occurred on or prior to October 1, 2021 (subject to extension by up to 60 days for casualty, condemnation and tenant delays, (the “First Tranche Outside Termination Date”)), then within 365 days following the First Tranche Outside Termination Date, Amazon may give the Borrower notice of its intention to terminate the lease. Amazon is expected to take possession of its space for floors 9 through 14 and 16 through 20 by March 25, 2021, well in advance of the First Tranche Outside Termination Date. Upon completion of pre-commencement work with respect to the related space, Amazon is expected to take possession of 15th floor by May 1, 2021. Amazon is expected to commence paying rent in June 2022 for the First Tranche Floors and in August 2022 for floor 15. At origination, approximately $57.7 million was reserved for outstanding gap rent and free rent, in excess of projected amounts based on the estimated lease commencement dates. Amazon has two, five-year renewal options upon providing 540 days written notice. Amazon does not have to renew its entire premises if the extension premises consists of directly contiguous floors commencing either at the lower or highest full floor and the expansion premises consist of at least four full floors. Amazon has a one-time termination option effective May 29, 2032 (assuming a first tranche commencement date of March 25, 2021 and a first tranche rent commencement date of May 29, 2022), subject to 600 days prior written notice and payment of a termination fee. Amazon may terminate all or a portion of its space provided a partial termination includes fully contiguous parcels commencing at the lowest or highest full floor.
THE INFORMATION IN THIS STRUCTURAL AND COLLATERAL TERM SHEET IS NOT COMPLETE AND MAY BE AMENDED PRIOR TO THE TIME OF SALE. THIS TERM SHEET IS NOT AN OFFER TO SELL THESE SECURITIES AND IT IS NOT A SOLICITATION OF AN OFFER TO BUY THESE SECURITIES IN ANY JURISDICTION WHERE THE OFFER OR SALE IS NOT PERMITTED.
43 of 166
| Structural and Collateral Term Sheet | Benchmark 2021-B24 | |
| 410 Tenth Avenue | ||
The second largest tenant, First Republic (NYSE: FRC) (211,521 square feet; 33.5% of net rentable area; 36.1% of underwritten base rent), was founded in 1985. First Republic and its subsidiaries offer private banking, private business banking and private wealth management, including investment, trust and brokerage services. First Republic specializes in delivering relationship-based service, and offers a range of products, including residential, commercial and personal loans, deposit services, and wealth management. First Republic is a constituent of the S&P 500 Index and KBW Nasdaq Bank Index. First Republic is expected to take possession of the entirety of its space by April 2021, at which point all pre-commencement and turnkey work is projected to have been completed. First Republic is expected to commence paying rent in (i) August 2021 with respect to floors 4 through 6, (ii) October 2021 with respect to floors 2 and 3, (iii) September 2021 with respect to the ground floor retail space and (iv) May 2022 with respect to the below grade space. At origination, approximately $57.7 million was reserved for outstanding gap rent and free rent, in excess of projected amounts based on the estimated lease commencement dates. First Republic has a lease expiration date in August 2036 with two, five-year renewal options upon providing 570 days’ notice. First Republic can renew (i) the entire premises, (ii) the entire premises excluding the entire retail space, the retail space on 33rd Street or 34th Street or (iii) the entire premises excluding (a) the sixth floor office space, (b) the sixth floor office space and the entire retail premises, (c) the sixth floor office space and the retail space on 33rd Street or (d) the sixth floor office space and the retail space on 34th Street. First Republic has no termination options.
The third largest tenant, Hudson Yards Construction LLC (70,852 square feet; 11.2% of net rentable area; 10.3% of underwritten base rent), is a subsidiary of Related Companies (“Related”), a global real estate and lifestyle company. Formed over 40 years ago, Related is a fully-integrated, diversified industry leader with experience in many aspects of development, acquisitions, management, financing, marketing and sales. Headquartered in New York City, Related has offices and major developments in Boston, Chicago, Los Angeles, San Francisco, South Florida, Washington, DC, Abu Dhabi and London, and boasts a team of approximately 4,000 professionals. With over $60 billion in assets owned or under development including the 28-acre Hudson Yards neighborhood on Manhattan’s West Side, The Grand and Related Santa Clara in California and The 78 in Chicago, Related was recently named to Fast Company Magazine’s list of the 50 Most Innovative Companies in the World. Related first leased 33,000 square feet at the 410 Tenth Avenue Property beginning in March 1987 and subsequently expanded their space by 20,917 square feet in March 2018 and 16,935 square feet in February 2020. In-place rent attributable to Related’s 8th floor leased space (33,000 square feet) is currently $41.00 per square foot, significantly below the appraisal’s concluded market rent. In this instance, contractual rent steps were underwritten through November 2025, at which point rent steps up to an amount in-line with the appraisal’s concluded market rent. Related has a lease expiration date of October 2045 with no renewal options. Related has the right to terminate its lease effective October 31, 2030, October 31, 2035 or October 31, 2040, in each case with 18 months’ prior notice.
COVID-19 Update. As of January 2021, the redevelopment is approximately 96% complete. In spite of the ongoing COVID-19 pandemic, all tenants, both office and retail, have reaffirmed their commitment to the space. As of February 1, 2021, the 410 Tenth Avenue Whole Loan is not subject to any modification or forbearance requests. The 410 Tenth Avenue Whole Loan is current as of the February 2021 payment date. See “Risk Factors—Special Risks—The Coronavirus Pandemic Has Adversely Affected the Global Economy and Will Likely Adversely Affect the Performance of the Mortgage Loans” in the Preliminary Prospectus.
The Market. The 410 Tenth Avenue Property is located on the entire east block frontage of Tenth Avenue between West 33rd Street and West 34th Streets in the Penn Station office submarket of Midtown. Midtown constitutes the largest office market in Manhattan and New York City, with a total of 764 buildings, containing more than 248.4 million square feet within its nine submarkets as of the third quarter of 2020. Midtown is known for its towering office buildings, having dozens of signature buildings in the Manhattan skyline. Trophy office properties and historical landmarks can be found in nearly all nine office submarkets that comprise the Midtown office market, attracting some of the largest companies from around the globe. While the Midtown office market, along with the rest of New York City, has historically been driven by the finance, insurance and real estate sectors, the technology, advertising, media and information (“TAMI”) sectors were the biggest growth drivers of leasing activity at the end of 2019 and through the first half of 2020. Since 2010, TAMI industries have played an increasingly important role in New York City office leasing, particularly in the Midtown office market. Midtown remains the Manhattan office market with the highest concentration of financial and technology firms.
The 410 Tenth Avenue Property’s location provides convenient access to all three of Midtown Manhattan’s transit hubs: Penn Station (providing access to LIRR, NJ Transit and Amtrak), Grand Central Terminal (providing access to Metro-North) and Port Authority (providing access to NJ Transit bus lines). In addition, the 410 Tenth Avenue Property is near multiple New York City bus lines and subway lines. The 410 Tenth Avenue Property is also steps away from attractions such as Madison Square Garden, the Javits Convention Center, The High Line and Manhattan West. Manhattan West is Brookfield’s mega-development that stretches from 9th Avenue to 10th Avenue and 31st Street to 33rd Street, which once completed is expected to include more than 6 million square feet of custom designed class-A office space, a 164-key Pendry Hotel, 240,000 square feet of curated retail space (Whole Foods, Peloton), chef-inspired culinary options (Union Square Hospitality Group and Elemental, with more to be announced) and 844 luxury apartments. The district’s new cultural offerings include the Baryshnikov Arts Center (450 West 37th Street) and the Frank Gehry-designed Signature Theatre (MiMA, 450-460 West 42nd Street) which opened in January 2012. The Vessel is a public landmark that functions as the centerpiece of Hudson Yards’ public square. The 150-foot structure features 154 interconnecting flights of stairs and over 80 landings. The public landmark was designed to encourage socialization amongst the site’s many anticipated visitors and officially opened to the public in March of 2019.
THE INFORMATION IN THIS STRUCTURAL AND COLLATERAL TERM SHEET IS NOT COMPLETE AND MAY BE AMENDED PRIOR TO THE TIME OF SALE. THIS TERM SHEET IS NOT AN OFFER TO SELL THESE SECURITIES AND IT IS NOT A SOLICITATION OF AN OFFER TO BUY THESE SECURITIES IN ANY JURISDICTION WHERE THE OFFER OR SALE IS NOT PERMITTED.
44 of 166
| Structural and Collateral Term Sheet | Benchmark 2021-B24 | |
| 410 Tenth Avenue | ||
According to the appraisal, the Midtown West office market has 248.4 million square feet in inventory as of the third quarter of 2020 with a vacancy rate of 14.3%. The average direct asking rate for Class A office space is $91.28 per square foot. The Penn Station Class A office submarket had approximately 15.6 million square feet of inventory as of the third quarter of 2020. According to the appraisal, the Penn Station office submarket had a vacancy rate as of third quarter 2020 of 4.7% and an average asking rent of $117.17 per square foot. According to a third party report, the estimated 2020 population within a 1-, 3-, and 5-mile radius of the 410 Tenth Avenue Property is 122,787, 1,245,817, and 2,516,577, respectively. In addition, the appraisal states that the estimated 2020 average household income within a 1-, 3-, and 5-mile radius is $141,202, $140,110 and $125,824, respectively.
The appraisal identified 10 comparable office modified leases with rents ranging from $74.00 to $122.00 per square foot with a weighted average rent of approximately $102.53 per square foot. The following table presents certain information relating to the appraisal’s market rent conclusion for the 410 Tenth Avenue Property.
| Summary of Appraisal’s Concluded Office and Retail Market Rent(1)(2) | ||||||||
| Office | ||||||||
| Retail | Floors 2-6 | Floors 7-10 | Floors 11-12 Terrace | Floors 14-15 | Floors 16-17 Terrace | Floors 18-19 Terrace | Floor 20 Terrace | |
| Market Rent | $25.00-$300.00 | $89.00 | $95.00 | $101.00 | $97.00 | $107.00 | $102.00 | $112.00 |
| (1) | Source: Appraisal. |
| (2) | All Market Rent figures concluded by the Appraiser are based on a lease term of 120 months on a Modified Gross basis. |
| Historical Occupancy(1) | |||
| 2017 | 2018 | 2019 | Current(2) |
| N/A | N/A | N/A | 99.2% |
| (1) | Historical occupancies are not available as the property is newly redeveloped with approximately 96% of the work complete as of January 2021. |
| (2) | Current Occupancy is based on the December 16, 2020 rent roll. |
| Tenant Summary(1) | |||||||
| Tenant | Tenant Type | Ratings Moody’s/Fitch/S&P(2) | Net Rentable Area (SF)(3) | % of Total NRA | Base Rent PSF(4) | % of Total Base Rent(4) | Lease Expiration Date(5) |
| Amazon(6) | Office | A2 / AA- / A+ | 335,408 | 53.1% | $93.06 | 53.1% | 5/31/2037 |
| First Republic(7) | Office / Retail | Baa1 / A- / A- | 211,521 | 33.5 | $100.38 | 36.1% | 8/31/2036 |
| Related(8) | Office | NR / NR / NR | 70,852 | 11.2 | $85.85 | 10.3% | 10/31/2045 |
| Rocky’s Bar & Grill | Retail | NR / NR / NR | 2,834 | 0.4 | $35.99 | 0.2 % | 12/31/2026 |
| Café Maman | Retail | NR / NR / NR | 1,955 | 0.3 | $50.64 | 0.2% | 12/31/2030 |
| Meena Samani Corp | Retail | NR / NR / NR | 705 | 0.1 | $68.09 | 0.1% | 7/31/2023 |
| JVM | Retail | NR / NR / NR | 275 | 0.0 | $23.01 | 0.0% | 1/31/2023 |
| Total Occupied | 623,550 | 98.7% | $94.27 | 100.0% | |||
| Rooftop Amenity Space(9) | 3,244 | 0.5 | |||||
| Vacant | 5,150 | 0.8 | |||||
| Total / Wtd. Avg. | 631,944 | 100.0% | |||||
| (1) | Based on the underwritten rent roll dated December 16, 2020. |
| (2) | In certain instances, ratings provided are those of the parent company of the entity shown, whether or not the parent company guarantees the lease. |
| (3) | Total Net Rentable Area represents the “as-leased” square footage at the 410 Tenth Avenue Property. Total measured square footage amounts to 638,797 square feet. |
| (4) | Base Rent PSF and % of Total Base rent are inclusive of (i) contractual rent steps through August 2021 and (ii) straight-line credit for investment grade tenants taken through the ARD. With respect to the 8th floor space (33,000 square feet) leased to Related, rent steps were underwritten through November 2025, as current in-place rent of $41.00 per square feet is materially below the appraisal’s market rent conclusion of $95.00 per square foot. |
| (5) | Lease Expiration date may vary for Amazon and First Republic based on tenant’s acceptance of space. |
| (6) | Amazon leases (i) floors 9-14 and 16-20 (300,206 square feet) with an expected lease expiration in May 2037 (based on assumed March 2021 lease start date) and (ii) floor 15 (35,202 square feet) with an expected lease expiration in July 2037 (based on assumed May 2021 lease start date). Amazon’s lease is fully guaranteed by its parent company Amazon.com, Inc. Amazon has a one-time termination option effective May 29, 2032 (assuming a first tranche commencement date of March 25, 2021 and a first tranche rent commencement date of May 29, 2022), subject to 600 days’ prior written notice and payment of a termination fee. Amazon may terminate all or a portion of its space provided a partial termination includes fully contiguous parcels commencing at the lowest or highest full floor. On January 22, 2021, the Borrowers provided Amazon with 60 days’ prior notice of completion for the First Tranche Floors (as defined below), as required under the related lease for commencement to occur. The Loan Sponsor anticipates pre-commencement work will be substantially complete with respect to the First Tranche Floors by March 25, 2021. Amazon is expected to take possession of its space for floors 9 through 14 and 16 through 20 by March 25, 2021. Amazon is expected to take possession of the 15th floor space by May 1, 2021. |
| (7) | First Republic leases floors 2 through 6 (189,260 square feet of office space) and the ground floor and below grade retail space (22,261 square feet). The rated First Republic parent entity is the named entity on the underlying lease. |
| (8) | Related has the right to terminate its lease effective October 2030, October 2035 or October 2040, in each case with 18 months’ prior written notice. |
| (9) | Roof Amenity Space has no attributable base rent. |
THE INFORMATION IN THIS STRUCTURAL AND COLLATERAL TERM SHEET IS NOT COMPLETE AND MAY BE AMENDED PRIOR TO THE TIME OF SALE. THIS TERM SHEET IS NOT AN OFFER TO SELL THESE SECURITIES AND IT IS NOT A SOLICITATION OF AN OFFER TO BUY THESE SECURITIES IN ANY JURISDICTION WHERE THE OFFER OR SALE IS NOT PERMITTED.
45 of 166
| Structural and Collateral Term Sheet | Benchmark 2021-B24 | |
| 410 Tenth Avenue | ||
| Lease Rollover Schedule(1)(2)(3) | |||||||||
| Year | Number of Leases Expiring | Net Rentable Area Expiring | % of NRA Expiring | Base Rent Expiring(4) | % of Base Rent Expiring(4) | Cumulative Net Rentable Area Expiring | Cumulative % of NRA Expiring | Cumulative Base Rent Expiring | Cumulative % of Base Rent Expiring |
| Vacant | NAP | 5,150 | 0.8% | NAP | NAP | 5,150 | 0.8% | NAP | NAP |
| MTM & 2021 | 0 | 0 | 0.0 | $0 | 0.0% | 5,150 | 0.8% | $0 | 0.0% |
| 2021 | 0 | 0 | 0.0 | 0 | 0.0% | 5,150 | 0.8% | $0 | 0.0% |
| 2022 | 2 | 980 | 0.2 | 54,327 | 0.1% | 6,130 | 1.0% | $54,327 | 0.1% |
| 2023 | 0 | 0 | 0.0 | 0 | 0.0% | 6,130 | 1.0% | $54,327 | 0.1% |
| 2024 | 0 | 0 | 0.0 | 0 | 0.0% | 6,130 | 1.0% | $54,327 | 0.1% |
| 2025 | 1 | 2,834 | 0.4 | 102,000 | 0.2% | 8,964 | 1.4% | $156,327 | 0.3% |
| 2026 | 0 | 0 | 0.0 | 0 | 0.0% | 8,964 | 1.4% | $156,327 | 0.3% |
| 2027 | 0 | 0 | 0.0 | 0 | 0.0% | 8,964 | 1.4% | $156,327 | 0.3% |
| 2028 | 0 | 0 | 0.0 | 0 | 0.0% | 8,964 | 1.4% | $156,327 | 0.3% |
| 2029 | 1 | 1,955 | 0.3 | 99,000 | 0.2% | 10,919 | 1.7% | $255,327 | 0.4% |
| 2030 | 0 | 0 | 0.0 | 0 | 0.0% | 10,919 | 1.7% | $255,327 | 0.4% |
| 2032 | 0 | 0 | 0.0 | 0 | 0.0% | 10,919 | 1.7% | $255,327 | 0.4% |
| 2033 and Thereafter(5) | 3 | 621,025 | 98.3 | 58,528,122 | 99.6% | 631,944 | 100.0% | $58,783,449 | 100.0% |
| Total | 7 | 631,944 | 100.0% | $58,783,449 | 100.0% | ||||
| (1) | Based on the underwritten rent roll dated December 16, 2020. |
| (2) | Certain tenants may have termination or contraction options (which may become exercisable prior to the originally stated expiration date of the tenant lease) that are not considered in the above Lease Rollover Schedule. See “Tenant Summary” above. |
| (3) | Lease expiration dates are subject to change based on actual lease commencement dates for Amazon and First Republic. |
| (4) | Base Rent Expiring and % of Base Rent Expiring is inclusive of (i) contractual rent steps through August 2021 and (ii) straight-line credit for investment grade tenants taken through the ARD. With respect to the 8th floor space (33,000 square feet) leased to Related, rent steps were underwritten through November 2025, as current in-place rents are materially below the appraisal’s market rent conclusion. |
| (5) | 2033 and Thereafter includes 3,244 square feet of rooftop amenity space with no attributable underwritten base rent. |
| Underwritten Net Cash Flow(1)(2) | |||
| Underwritten | Per Square Foot | %(3) | |
| Base Rent(4) | $58,783,449 | $93.02 | 91.0% |
| Vacant Income | 1,287,500 | 2.04 | 2.0 |
| Gross Potential Rent | $60,070,949 | $95.06 | 93.0% |
| Total Reimbursements | 4,492,709 | 7.11 | 7.0 |
| Gross Rental Income | $64,563,658 | $102.17 | 100.0% |
| (Vacancy/Credit Loss) | (1,292,539) | (2.05) | (2.0) |
| Total Other Income(4) | 159,894 | 0.25 | 0.2 |
| Effective Gross Income | $63,431,013 | $100.37 | 98.2% |
| Total Expenses | 14,141,037 | 22.38 | 22.3 |
| Net Operating Income | $49,289,976 | $78.00 | 77.7% |
| Tenant Improvements | 94,792 | 0.15 | 0.1 |
| Leasing Commissions | 63,194 | 0.10 | 0.1 |
| Capital Expenditures | 126,389 | 0.20 | 0.2 |
| Net Cash Flow | $49,005,601 | $77.55 | 77.3% |
| (1) | Based on the underwritten rent roll dated December 16, 2020. |
| (2) | Historical financials are not available as the property is newly redeveloped with approximately 96% of the work complete as of January 2021. |
| (3) | % column represents percent of Gross Rental Income for all revenue lines and represents percent of Effective Gross Income for the remainder of the fields. |
| (4) | Underwritten Base Rent is inclusive of (i) contractual rent steps through August 2021 and (ii) straight-line credit for investment grade tenants taken through the ARD. With respect to the 8th floor space (33,000 square feet) leased to Related, rent steps were underwritten through November 2025, as current in-place rent of $41.00 per square feet is materially below the appraisal’s market rent conclusion of $95.00 per square foot. |
THE INFORMATION IN THIS STRUCTURAL AND COLLATERAL TERM SHEET IS NOT COMPLETE AND MAY BE AMENDED PRIOR TO THE TIME OF SALE. THIS TERM SHEET IS NOT AN OFFER TO SELL THESE SECURITIES AND IT IS NOT A SOLICITATION OF AN OFFER TO BUY THESE SECURITIES IN ANY JURISDICTION WHERE THE OFFER OR SALE IS NOT PERMITTED.
46 of 166
| Structural and Collateral Term Sheet | Benchmark 2021-B24 | |
| 410 Tenth Avenue | ||
Property Management. The 410 Tenth Avenue property is managed by Jones Lang LaSalle Americas, Inc., a Maryland corporation and sub-managed by an affiliate of the Borrowers.
Escrows and Reserves. At loan origination, the Borrowers deposited (i) approximately $379,548 into a real estate tax reserve, (ii) $78,467 into an insurance reserve, (iii) approximately $10,647 into a replacement reserve, (iv) approximately $53,233 into a rollover reserve, (v) $57,700,000 for a gap rent and free rent reserve and (vi) approximately $35,179,875 into an outstanding TI/LC reserve primarily attributable to Amazon (approximately $33.5 million).
At loan origination, $57.7 million was reserved in connection with gap rent and free rent, including an approximately $5.0 million cushion to account for any increase in gap rent potentially caused by any further delay in build-out of tenant space due to the ongoing COVID-19 pandemic. Through February 2021, approximately $4.0 million has been drawn from the free rent reserve, resulting in a current reserve balance of approximately $53.7 million. Any excess amount remaining in the free rent reserve after Amazon and First Republic are in occupancy and paying rent, will be released to the Borrowers.
Tax Reserve – On each monthly due date, the Borrowers are required to deposit an amount equal to 1/12 of the estimated annual real estate taxes into the tax reserve account (initially estimated at $378,496 per month).
Insurance Reserve – On each monthly due date, the Borrowers are required to deposit into an insurance reserve an amount equal to 1/12 of estimated insurance premiums (initially estimated at $78,467 per month), unless the Borrowers maintain a blanket policy in accordance with the 410 Tenth Avenue Whole Loan documents.
Replacement Reserve – On each monthly due date, the Borrowers are required to deposit approximately $10,647 into a replacement reserve.
TI/LC Reserve – On each monthly due date, during the continuance of a Cash Sweep Event, the Borrowers are required to deposit 1/12 of $1.00 times the aggregate amount of rentable square feet at the 410 Tenth Avenue Property for base building work in connection with any lease approved by the lender, and tenant improvement and leasing commission costs, including build out costs and reasonable attorneys’ fees incurred in negotiating leases that are executed in connection with the 410 Tenth Avenue Property.
Lockbox / Cash Management. The 410 Tenth Avenue Whole Loan is structured with a hard lockbox and in place cash management. The Borrowers are required to direct tenants to pay rent directly into the lender-controlled lockbox account and all rents received directly by the Borrowers or the property manager are required to be deposited into the lockbox account within two business days of receipt. All funds in the lockbox account are required to be swept once every other business day to a lender-controlled cash management account to be applied in accordance with the 410 Tenth Avenue Whole Loan documents with remaining funds to be disbursed to the Borrowers. During the continuance of a Cash Sweep Event, any excess cash flow remaining after satisfaction of the waterfall items outlined in the 410 Tenth Avenue Whole Loan documents is required to be swept to a lender-controlled account to be held as additional collateral for the 410 Tenth Avenue Whole Loan, provided, that, in the event of a Major Tenant Trigger, the lender will continue to sweep excess cash into the lender-controlled account only until such time as the amounts in the excess cash reserve equals $100.00 times the aggregate number of rentable square feet demised by the applicable lease. Provided no event of default is continuing, following a Cash Sweep Event Cure, remaining funds in the excess cash flow account will be disbursed to the Borrowers.
A “Cash Sweep Event” means the occurrence of: (a) an event of default under the 410 Tenth Avenue Whole Loan (a “Mortgage Loan Default Trigger”), (b) any bankruptcy action of the Borrowers, (c) any bankruptcy of the property manager (a “Property Manager Trigger”), (d) the debt service coverage ratio being less than 1.65x based on a trailing three month basis (a “DSCR Trigger Event”), (e) (i) the bankruptcy or insolvency of any Major Tenant (a “Major Tenant Bankruptcy Trigger”), (ii) the failure of a Major Tenant to renew its lease prior to the date that is 12 months prior to the expiration of its lease (a “Major Tenant Renewal Trigger”) or (iii) a Major Tenant “going dark”, vacating or abandoning its premises, ceasing operations, giving notice of termination (full or partial) of its lease (except a de minimis portion of its space) or otherwise abandoning its premises or terminating its lease (a “Major Tenant Operations Trigger”, and together with a Major Tenant Bankruptcy Trigger and Major Tenant Renewal Trigger, collectively, a “Major Tenant Trigger”); provided that such Major Tenant Operations Trigger will be waived at any time prior to the date that is 24 months prior to the ARD if (x) the applicable Major Tenant is a Credit Tenant (as defined below) as of the date of determination, there is no event of default under the applicable lease and the applicable Major Tenant has not given notice of termination of its lease or otherwise terminated its lease, or (y) the applicable Major Tenant has (I) subleased the applicable portion of its space to a Credit Tenant for a term equal to the remaining lease term (or one day less than the remaining term of such lease) or (II) assigned such lease to a Credit Tenant and, in each case, (A) there is no event of default under such lease and (B) the Borrowers have provided the lender with a copy of such sublease or assignment, as applicable, (f) a mezzanine loan event of default has occurred (a “Mezzanine Loan Default Trigger”), or (g) the date that is one month prior to the ARD (the “ARD Trigger”).
A “Credit Tenant” means a tenant that has a long term issuer credit rating of at least “BBB-” by S&P, “Baa3” by Moody’s, “BBB-” by Fitch and its equivalent from any of the other rating agencies.
A “Major Tenant” means each of (a) Amazon and (b) First Republic, together with their permitted successors and/or assigns.
THE INFORMATION IN THIS STRUCTURAL AND COLLATERAL TERM SHEET IS NOT COMPLETE AND MAY BE AMENDED PRIOR TO THE TIME OF SALE. THIS TERM SHEET IS NOT AN OFFER TO SELL THESE SECURITIES AND IT IS NOT A SOLICITATION OF AN OFFER TO BUY THESE SECURITIES IN ANY JURISDICTION WHERE THE OFFER OR SALE IS NOT PERMITTED.
47 of 166
| Structural and Collateral Term Sheet | Benchmark 2021-B24 | |
| 410 Tenth Avenue | ||
A “Cash Sweep Event Cure” means if the Cash Sweep Event is caused solely by (a) the occurrence of a DSCR Trigger Event, the achievement of a debt service coverage ratio of 1.65x or greater for two consecutive quarters based upon the trailing three month period immediately preceding the date of determination, (b) the occurrence of a Mortgage Loan Default Trigger, the acceptance by the lender of a cure of such event of default (which cure the lender is not obligated to accept and may reject or accept in its sole and absolute discretion unless otherwise required to accept by law), (c) the occurrence of a Property Manager Trigger, the Borrowers replacing the property manager with a qualified manager under a replacement management agreement within 60 days after such bankruptcy action, (d) the occurrence of a Major Tenant Trigger, (i) the Borrowers leasing all or substantially all of the space previously leased to the respective Major Tenant that is the cause of such Major Tenant Trigger to one or more replacement tenant(s) reasonably acceptable to the lender pursuant to a lease(s) reasonably acceptable to the lender, (ii) the Major Tenant that is the subject of a Major Tenant Operations Trigger, (x) has delivered notice of its intent to vacate or terminate its lease rescinds such notice in writing or (y) was dark resumes operations and, in each case, such Major Tenant is paying full unabated rent, (iii) the Major Tenant that was the subject of a Major Tenant Renewal Trigger extends its lease or (iv) the Major Tenant that was the subject of a Major Tenant Bankruptcy Trigger assumes its lease in a bankruptcy action, or (f) if the Cash Sweep Event is caused solely by a Mezzanine Loan Default Trigger, the acceptance by the mezzanine lender of a cure of such event of default under the mezzanine loan (as defined below). In no event will the Borrowers have the right to cure a Cash Sweep Event occurring by reason of a Borrower bankruptcy (other than an involuntary bankruptcy) or the ARD Trigger. A Cash Sweep Event Cure may occur no more than total of four times in the aggregate during the term of the 410 Tenth Avenue Whole Loan.
Current Mezzanine or Subordinate Indebtedness. Concurrently with the funding of the 410 Tenth Avenue Whole Loan, the direct and certain indirect equity owners of the Borrowers have pledged their respective direct or indirect ownership interests to secure (i) a senior mezzanine loan in the original principal amount of $20,000,000 (the “Mezzanine A Loan”) and (ii) a junior mezzanine loan in the original principal amount of $120,000,000 (the “Mezzanine B Loan” and, together with the Mezzanine A Loan, collectively, the “410 Tenth Avenue Mezzanine Loans” and, the 410 Tenth Avenue Mezzanine Loans together with the 410 Tenth Avenue Whole Loan, the “410 Tenth Avenue Total Debt”). The 410 Tenth Avenue Mezzanine Loans are coterminous with the 410 Tenth Avenue Whole Loan. Interest is payable on the Mezzanine A Loan at a fixed per annum rate equal to 4.15000%. Interest is payable on the Mezzanine B Loan at a fixed per annum rate equal to 5.02500%. The rights of the mezzanine lenders under the 410 Tenth Avenue Mezzanine Loans are further described under “Description of the Mortgage Pool—Additional Indebtedness—Mezzanine Indebtedness” in the Preliminary Prospectus.
Future Mezzanine or Subordinate Indebtedness Permitted. None.
Partial Release. None.
THE INFORMATION IN THIS STRUCTURAL AND COLLATERAL TERM SHEET IS NOT COMPLETE AND MAY BE AMENDED PRIOR TO THE TIME OF SALE. THIS TERM SHEET IS NOT AN OFFER TO SELL THESE SECURITIES AND IT IS NOT A SOLICITATION OF AN OFFER TO BUY THESE SECURITIES IN ANY JURISDICTION WHERE THE OFFER OR SALE IS NOT PERMITTED.
48 of 166
(THIS PAGE INTENTIONALLY LEFT BLANK)
THE INFORMATION IN THIS STRUCTURAL AND COLLATERAL TERM SHEET IS NOT COMPLETE AND MAY BE AMENDED PRIOR TO THE TIME OF SALE. THIS TERM SHEET IS NOT AN OFFER TO SELL THESE SECURITIES AND IT IS NOT A SOLICITATION OF AN OFFER TO BUY THESE SECURITIES IN ANY JURISDICTION WHERE THE OFFER OR SALE IS NOT PERMITTED.
49 of 166
| Structural and Collateral Term Sheet | Benchmark 2021-B24 | |
| MGM Grand & Mandalay Bay | ||

THE INFORMATION IN THIS STRUCTURAL AND COLLATERAL TERM SHEET IS NOT COMPLETE AND MAY BE AMENDED PRIOR TO THE TIME OF SALE. THIS TERM SHEET IS NOT AN OFFER TO SELL THESE SECURITIES AND IT IS NOT A SOLICITATION OF AN OFFER TO BUY THESE SECURITIES IN ANY JURISDICTION WHERE THE OFFER OR SALE IS NOT PERMITTED.
50 of 166
| Structural and Collateral Term Sheet | Benchmark 2021-B24 | |
| MGM Grand & Mandalay Bay | ||

THE INFORMATION IN THIS STRUCTURAL AND COLLATERAL TERM SHEET IS NOT COMPLETE AND MAY BE AMENDED PRIOR TO THE TIME OF SALE. THIS TERM SHEET IS NOT AN OFFER TO SELL THESE SECURITIES AND IT IS NOT A SOLICITATION OF AN OFFER TO BUY THESE SECURITIES IN ANY JURISDICTION WHERE THE OFFER OR SALE IS NOT PERMITTED.
51 of 166
| Structural and Collateral Term Sheet | Benchmark 2021-B24 | |
| MGM Grand & Mandalay Bay | ||
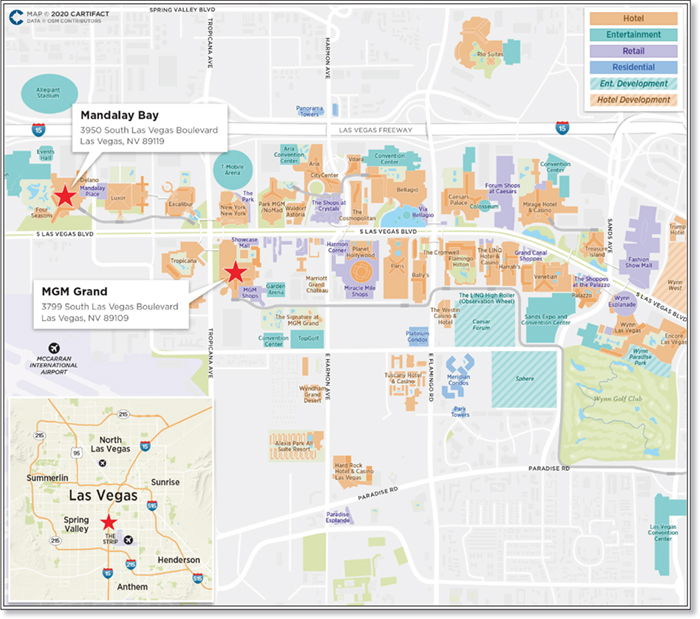
THE INFORMATION IN THIS STRUCTURAL AND COLLATERAL TERM SHEET IS NOT COMPLETE AND MAY BE AMENDED PRIOR TO THE TIME OF SALE. THIS TERM SHEET IS NOT AN OFFER TO SELL THESE SECURITIES AND IT IS NOT A SOLICITATION OF AN OFFER TO BUY THESE SECURITIES IN ANY JURISDICTION WHERE THE OFFER OR SALE IS NOT PERMITTED.
52 of 166
| Structural and Collateral Term Sheet | Benchmark 2021-B24 | |
| MGM Grand & Mandalay Bay | ||
| Mortgage Loan Information | Property Information | |||
| Mortgage Loan Sellers(1): | CREFI/GACC | Single Asset / Portfolio: | Portfolio | |
| Credit Assessments | Title: | Fee | ||
| (Fitch/KBRA/S&P)(2): | BBB+(sf) / AA-(sf) / NA | Property Type - Subtype: | Hotel – Full Service | |
| Original Principal Balance(3): | $79,985,667 | Net Rentable Area (Rooms)(7): | 9,748 | |
| Cut-off Date Principal Balance(3): | $79,985,667 | Location: | Las Vegas, NV | |
| % of Pool by IPB: | 6.9% | Year Built / Renovated(8): | Various / N/A | |
| Loan Purpose: | Acquisition | Occupancy/ADR/RevPAR(7): | 71.4% / $187.46 / $133.76 | |
| Borrowers(4): | MGM Grand PropCo, LLC, Mandalay | Occupancy/ADR/RevPAR Date: | 9/30/2020 | |
| PropCo, LLC | Number of Tenants: | N/A | ||
| Loan Sponsors(4): | BREIT Operating Partnership L.P., | 2017 NOI: | $605,037,208 | |
| MGM Growth Properties Operating | 2018 NOI: | $617,369,266 | ||
| Partnership LP | 2019 NOI: | $520,080,353 | ||
| Interest Rate: | 3.55800% | TTM NOI (as of 9/2020)(4): | $222,041,347 | |
| Note Date: | 2/14/2020 | UW Occupancy/ADR/RevPAR(12): | 92.1% / $196.52 / $180.94 | |
| Anticipated Repayment Date(5): | 3/5/2030 | UW Revenues: | $2,106,295,488 | |
| Final Maturity Date(5): | 3/5/2032 | UW Expenses: | $1,586,215,135 | |
| Interest-only Period(5): | 120 months | UW NOI(12): | $520,080,353 | |
| Original Term(5): | 120 months | UW NCF(12): | $487,305,761 | |
| Original Amortization: | None | Appraised Value / Per Room(9)(12): | $4,600,000,000 / $471,892 | |
| Amortization Type(5): | ARD-Interest Only | Appraisal Date: | 1/10/2020 | |
| Call Protection(6): | Grtr0.5%orYM(35),DeforGrtr0.5%or | |||
| YM(78),O(7) | ||||
| Lockbox / Cash Management: | Hard / Springing | |||
| Additional Debt(3): | Yes | |||
| Additional Debt Balance(3): | $1,554,214,333 / $804,400,000 / | |||
| $561,400,000 | ||||
| Additional Debt Type(3): | Pari Passu / B Notes / C Notes | |||
| Escrows and Reserves(10) | Financial Information(12) | |||||||
| Initial | Monthly | Initial Cap | Senior Notes | Whole Loan | ||||
| Taxes: | $0 | Springing | N/A | Cut-off Date Loan / Room(3): | $167,645 | $307,755 | ||
| Insurance: | $0 | Springing | N/A | Maturity Date Loan / Room(3): | $167,645 | $307,755 | ||
| FF&E Reserves: | $0 | Springing | N/A | Cut-off Date LTV(3)(9): | 35.5% | 65.2% | ||
| Other: | $0 | $0 | N/A | Maturity Date LTV(3)(9): | 35.5% | 65.2% | ||
| UW DSCR Master Lease Rent(4): | 4.95x | 2.70x | ||||||
| UW Debt Yield Master Lease Rent(4): | 17.9% | 9.7% | ||||||
| Sources and Uses | ||||||||
| Sources | Proceeds | % of Total | Uses | Proceeds | % of Total | |
| Senior Notes | $1,634,200,000 | 35.4% | Purchase Price | $4,600,000,000 | 99.6% | |
| Junior Notes | 1,365,800,000 | 29.6 | Closing Costs | 17,792,163 | 0.4% | |
| Sponsor Equity(11) | 1,617,792,163 | 35.0 | % | |||
| Total Sources | $4,617,792,163 | 100.0% | Total Uses | $4,617,792,163 | 100.0% |
| (1) | The MGM Grand & Mandalay Bay Whole Loan (as defined below) was co-originated by Citi Real Estate Funding Inc. (“CREFI”), Barclays Capital Real Estate Inc. (“BCREI”), Deutsche Bank AG, acting through its New York Branch (“DBNY”) and Société Générale Financial Corporation (“SGFC”). CREFI will be contributing Note A-13-9 with an outstanding principal balance of approximately $39,985,667 and GACC will be contributing Note A-15-9 with an outstanding principal balance of approximately $40,000,000 to the Benchmark 2021-B24 mortgage trust. |
| (2) | Fitch, KBRA and S&P have confirmed that the MGM Grand & Mandalay Bay Loan, in the context of the inclusion in the mortgage pool, has credit characteristics consistent with an investment grade obligation. |
| (3) | The MGM Grand & Mandalay Bay Loan (as defined below) is part of the MGM Grand & Mandalay Bay Whole Loan, which is comprised of (i) 49 pari passu senior promissory notes with an aggregate Cut-off Date balance of $1,634,200,000 (the “MGM Grand & Mandalay Bay Senior Notes,” and collectively, the “MGM Grand & Mandalay Bay Senior Loan”) and (ii) 24 promissory notes with an aggregate Cut-off Date balance of $1,365,800,000 consisting of multiple subordination levels, which are subordinate to the MGM Grand & Mandalay Bay Senior Notes (the “MGM Grand & Mandalay Bay Junior Notes”). The MGM Grand Property has an allocated mortgage loan amount (“ALA”) of $1,635,000,000 and the Mandalay Bay Property has an ALA equal to $1,365,000,000. |
| (4) | On January 14, 2020, MGM Growth Properties Operating Partnership LP (“MGP OP”), an affiliate of BREIT Operating Partnership L.P. (“BREIT OP”) and certain other parties entered into an agreement to, among other things, form a joint venture (50.1% indirectly owned by MGP OP and 49.9% indirectly owned by BREIT OP) (the “Joint Venture”) to acquire the MGM Grand & Mandalay Bay Properties (as defined below) for a purchase price of $4.60 billion ($471,892 per room). Contemporaneously with the acquisition, the MGM Grand & Mandalay Bay Borrowers (as defined below), as landlord entered into a 30-year triple-net master/operating lease (the “MGM/Mandalay Lease” or “Master Lease”) with two, 10-year renewal options with MGM Lessee II, LLC (“MGM Tenant”), a wholly owned subsidiary of MGM Resorts International (“MGM”). |
THE INFORMATION IN THIS STRUCTURAL AND COLLATERAL TERM SHEET IS NOT COMPLETE AND MAY BE AMENDED PRIOR TO THE TIME OF SALE. THIS TERM SHEET IS NOT AN OFFER TO SELL THESE SECURITIES AND IT IS NOT A SOLICITATION OF AN OFFER TO BUY THESE SECURITIES IN ANY JURISDICTION WHERE THE OFFER OR SALE IS NOT PERMITTED.
53 of 166
| Structural and Collateral Term Sheet | Benchmark 2021-B24 | |
| MGM Grand & Mandalay Bay | ||
For so long as the MGM/Mandalay Lease is in effect, the MGM Grand & Mandalay Bay Borrowers will be entitled only to the rent due under the MGM/Mandalay Lease and not to the underlying rent and other income from the MGM Grand & Mandalay Bay Properties. The UW DSCR Master Lease Rent and UW Debt Yield Master Lease Rent presented in the chart above are based on the initial MGM/Mandalay Lease annual rent of $292,000,000. The UW EBITDAR Debt Yield and the UW NCF DSCR for the MGM Grand & Mandalay Bay A Notes (based on the UW EBITDAR of $520.1 million and UW NCF of $487.3 million) are 31.8% and 8.27x, respectively. On May 1, 2020, MGM Resorts International reported that, as a result of the temporary closure of its domestic properties (which include the MGM Grand & Mandalay Bay Properties) following the outbreak of COVID-19, its domestic properties (which include the MGM Grand & Mandalay Bay Properties) were effectively generating no revenue, there were high levels of room and convention cancellation through the third quarter of 2020, and that, following the re-opening of its domestic properties (which include the MGM Grand & Mandalay Bay Properties), it expected weakened demand in light of consumer fears and general economic uncertainty, among other things. The September 2020 TTM financials reflect the suspension of operations at the MGM Grand & Mandalay Bay Properties from March 17, 2020 through the end of the first calendar quarter of 2020 (although operations at the MGM Grand Property remained suspended until June 4, 2020 and operations at The Shoppes at Mandalay Bay Place and the Mandalay Bay resort remained suspended through June 24, 2020 and June 30, 2020, respectively). The adjusted September 2020 TTM EBITDAR of $222.0 million takes into account an adjustment for a combined net extraordinary loss add-back of approximately $82.4 million during the September 2020 TTM period (primarily comprised of employee payroll expenses and corporate allocations and net of a combined extraordinary gain of approximately $0.7 million related to a reversal of certain accrued benefit expenses) related to the temporary closure of the MGM Grand & Mandalay Bay Properties following the outbreak of COVID-19. The lender underwriting presented above is based on 2019 financials, which reflect a full year of uninterrupted operations at the MGM Grand & Mandalay Bay Properties. Please see the “Operating History and Net Cash Flow” and “Historical Performance” tables herein, and the footnotes thereto, for more detailed underwritten cash flow information.
| (5) | The MGM Grand & Mandalay Bay Whole Loan is structured with an Anticipated Repayment Date (“ARD”) of March 5, 2030 and a final maturity date of March 5, 2032. After the ARD, the following structure will apply: (i) the interest rate will increase by 200 basis points over the greater of (x) 3.55800%, and (y) (1) the ARD Treasury Note Rate (as defined below) in effect on the ARD plus (2) 1.77000%, (ii) amounts in the Excess Cash Flow Reserve (as defined below) will be applied first to pay monthly additional interest amounts which, to the extent not paid (such amount not paid, together with accrued interest thereon at the Adjusted Interest Rate (as defined below), the “Accrued Interest”), will be deferred and added to the principal balance of the MGM Grand & Mandalay Bay Whole Loan, and (iii) a full cash flow sweep to the extent of remaining amounts in the Excess Cash Flow Reserve will be applied to the principal of the MGM Grand & Mandalay Bay Whole Loan. The metrics presented above are calculated based on the ARD. |
| (6) | The defeasance lockout period will be 35 payment dates beginning with and including the first payment date of April 5, 2020. The MGM Grand & Mandalay Bay Borrowers have the option to defease the MGM Grand & Mandalay Bay Whole Loan, in whole or in part commencing on February 15, 2023. The MGM Grand & Mandalay Bay Whole Loan may be prepaid in whole or in part at any time, subject to payment of the applicable yield maintenance premium if such prepayment occurs prior to September 5, 2029 (provided no yield maintenance will be due in connection with mandatory prepayments arising out of any casualty, condemnation or in connection with a special release or a Default Release (as defined in the Preliminary Prospectus)). |
| (7) | Net Rentable Area (Rooms) and Occupancy/ADR/RevPAR are based solely on the hotel at the MGM Grand & Mandalay Bay Properties. As of the trailing 12 months ending September 30, 2020, approximately 30.0% of revenues were generated by rooms, 22.9% of revenues were from gaming, 24.5% from food & beverage and 22.6% from other sources. |
| (8) | The MGM Grand Property (as defined below) was built in 1993 and the Mandalay Bay Property (as defined below) was built in 1999. The MGM Grand Property has benefited from capital investment of approximately $480.0 million (approximately $96,000 per room) since 2010, $144.0 million of which was spent on a full rooms’ renovation from 2010 to 2013. Additionally, approximately $118.9 million was recently spent on an expansion and renovation of the convention center completed in December 2018, which is expected to expand the group business at the MGM Grand Property. The Mandalay Bay Property (including the Delano) underwent a substantial rooms’ renovation for approximately $159.7 million from 2012 to 2016 and, inclusive of the Four Seasons, has received a total of approximately $510.6 million (approximately $107,500 per room) of capital investment since 2010. |
| (9) | The Appraised Value of $4,600,000,000 as of January 10, 2020, set forth above is the appraised value solely with respect to real property at the MGM Grand & Mandalay Bay Properties, excluding personal property and intangible property attributable to the MGM Grand & Mandalay Bay Properties (the “Aggregate Real Property Appraised Value”). The appraisal also includes an “As Leased-Sale-Leaseback Appraised Value,” which is equal to the Aggregate Real Property Appraised Value. The appraised value of $7,352,600,000 (“Aggregate As-Is Appraised Value”) as of January 10, 2020, includes personal property and intangible property attributable to the MGM Grand & Mandalay Bay Properties. The personal property and intangible property relating to the MGM Grand & Mandalay Bay Properties is owned by the MGM Tenant or certain sublessees at the MGM Grand & Mandalay Bay Properties that are wholly owned subsidiaries of MGM (the “MGM/Mandalay Operating Subtenants”) (as more particularly provided in the Master Lease), which granted a security interest in certain property of the MGM Tenant and the MGM/Mandalay Operating Subtenants (with certain exclusions, including an exclusion for the intellectual property of MGM Tenant as more particularly described in the Master Lease); and provided that the FF&E is only transferred to the MGM Grand & Mandalay Bay Borrowers at no cost in the event of a termination of the Master Lease due to an event of default by the MGM Tenant thereunder) in favor of the MGM Grand & Mandalay Bay Borrowers, and such security interest was collaterally assigned by the MGM Grand & Mandalay Bay Borrowers to the mortgage lender. The Cut-off Date LTV and Maturity Date LTV based on the Aggregate As-Is Appraised Value are 22.2% and 22.2%, respectively, based on the MGM Grand & Mandalay Bay Senior Loan. The Cut-off Date LTV and Maturity Date LTV based on the Aggregate As-Is Appraised Value are 40.8% and 40.8%, respectively, based on the MGM Grand & Mandalay Bay Whole Loan. |
| (10) | For a full description of Escrows and Reserves, please refer to “Escrows and Reserves” below. |
| (11) | Includes MGM’s approximately $80.0 million of retained equity interest in the MGM Grand & Mandalay Bay Properties after the sale-leaseback, by virtue of operating partnership units in MGP OP issued to MGM on the origination date of the MGM Grand & Mandalay Bay Whole Loan. |
| (12) | All NOI, NCF and occupancy information, as well as the appraised value, were determined prior to the emergence of the novel coronavirus pandemic, and the economic disruption resulting from measures to combat the pandemic, and all DSCR, LTV and Debt Yield metrics were calculated, and the MGM Grand & Mandalay Bay Whole loan was underwritten, based on such prior information See “Risk Factors—Special Risks—Coronavirus Pandemic Has Adversely Affected the Global Economy and Will Likely Adversely Affect the Performance of the Mortgage Loans” in the Preliminary Prospectus. |
The Loan. The MGM Grand & Mandalay Bay mortgage loan (the “MGM Grand & Mandalay Bay Loan”) is part of a fixed rate whole loan secured by the borrowers’ fee interest in two full service luxury resort and casinos located in Las Vegas, Nevada (the “MGM Grand Property,” and the “Mandalay Bay Property,” and collectively “The MGM Grand & Mandalay Bay Properties”). The MGM Grand & Mandalay Bay Loan is evidenced by the non-controlling Notes A-13-9 and A-15-9 with an outstanding principal balance as of the Cut-off Date of $79,985,667. The MGM Grand & Mandalay Bay Loan is part of a $3.00 billion whole loan (the MGM Grand & Mandalay Bay Whole Loan”) that is evidenced by (i) 49 MGM Grand & Mandalay Bay Senior Notes with an aggregate principal balance of $1,634,200,000 and (ii) the MGM Grand & Mandalay Bay Junior Notes comprised of 24 notes of multiple subordination levels, which are subordinate to the MGM Grand & Mandalay Bay Senior Loan with an aggregate principal balance of $1,365,800,000. Only the MGM Grand & Mandalay Bay Loan will be included in the mortgage pool for the Benchmark 2021-B24 mortgage trust. The relationship between the holders of the MGM Grand & Mandalay Bay Whole Loan is governed by a co-lender agreement as described under “Description of the Mortgage Pool—The Whole Loans—The Non-Serviced AB Whole Loans—The MGM Grand & Mandalay Bay Pari Passu-AB Whole Loan” in the Preliminary Prospectus. The MGM Grand & Mandalay Bay Whole Loan has a 10-year interest-only term. The MGM Grand & Mandalay Bay Whole Loan will be serviced pursuant to the trust and servicing agreement for the BX 2020-VIVA transaction.
The MGM Grand & Mandalay Bay Whole Loan has a 10-year interest-only term through the ARD of March 5, 2030. After the ARD, through and including March 5, 2032 (the “Maturity Date”), the following structure would apply: (i) the interest rate will increase by 200 basis points over the greater of (x) 3.55800%, and (y)(1) the ARD Treasury Note Rate in effect on the ARD (such new rate, the “Adjusted Interest
THE INFORMATION IN THIS STRUCTURAL AND COLLATERAL TERM SHEET IS NOT COMPLETE AND MAY BE AMENDED PRIOR TO THE TIME OF SALE. THIS TERM SHEET IS NOT AN OFFER TO SELL THESE SECURITIES AND IT IS NOT A SOLICITATION OF AN OFFER TO BUY THESE SECURITIES IN ANY JURISDICTION WHERE THE OFFER OR SALE IS NOT PERMITTED.
54 of 166
| Structural and Collateral Term Sheet | Benchmark 2021-B24 | |
| MGM Grand & Mandalay Bay | ||
Rate”) plus (2) 1.77000%, (ii) amounts in the Excess Cash Flow Reserve (as defined below) will be applied first to pay monthly additional interest amounts which, to the extent not paid, will be deferred (together with interest accrued thereon at the Adjusted Interest Rate) and added to the principal balance of the MGM Grand & Mandalay Bay Whole Loan, and (iii) a full cash flow sweep to the extent of remaining amounts in the Excess Cash Flow Reserve will be applied to principal of the MGM Grand & Mandalay Bay Whole Loan. For the period from the origination date through the ARD, the MGM Grand & Mandalay Bay Senior Notes and Junior Notes accrue at the rate of 3.55800% per annum. The MGM Grand & Mandalay Bay Whole Loan proceeds along with loan sponsor equity were used to purchase the MGM Grand & Mandalay Bay Properties for $4.6 billion.
“ARD Treasury Note Rate” means the rate of interest per annum calculated by the linear interpolation of the yields, as reported in Federal Reserve Statistical Release H.15 Selected Interest Rates under the heading “U.S. Government Securities/Treasury Constant Maturities” for the business day ending immediately prior to the ARD, of “U.S. Government Securities/Treasury Constant Maturities” with maturity dates (one longer and one shorter) most nearly approximating the Maturity Date. In the event Federal Reserve Statistical Release H.15 Selected Interest Rates is no longer published or in the event Federal Reserve Statistical Release H.15 Selected Interest Rates no longer publishes “U.S. Government Securities/Treasury Constant Maturities”, the mortgage lender will select a comparable publication to determine such “U.S. Government Securities/Treasury Constant Maturities” and the applicable ARD Treasury Note Rate. The mortgage lender’s determination of the ARD Treasury Note Rate will be final absent manifest error.
| Whole Loan Summary | |||||
| Note | Original Balance | Cut-off Date Balance | Note Holder | Controlling Piece | |
| A-13-9, A-15-9 | $79,985,667 | $79,985,667 | Benchmark 2021-B24(1) | No | |
| A-13-8, A-15-8 | $75,000,000 | $75,000,000 | Benchmark 2021-B23 | No | |
| A-13-7 | $65,000,000 | $65,000,000 | GSMS 2020-GSA2 | No | |
| A-13-6, A-15-7 | $75,000,000 | $75,000,000 | Benchmark 2020-B22 | No | |
| A-13-5, A-15-6 | $75,000,000 | $75,000,000 | Benchmark 2020-B21 | No | |
| A-13-4, A-15-4 | $70,000,000 | $70,000,000 | Benchmark 2020-B20 | No | |
| A-13-2, A-15-3 | $80,000,000 | $80,000,000 | Benchmark 2020-B19 | No | |
| A-13-1, A-15-1 | $65,000,000 | $65,000,000 | Benchmark 2020-B18 | No | |
| A-15-2 | $50,000,000 | $50,000,000 | DBJPM 2020-C9 | No | |
| A-1, A-2, A-3, A-4 | $670,139 | $670,139 | BX 2020-VIVA | No | |
| A-5, A-6, A-7, A-8 | $794,861 | $794,861 | BX 2020-VIV2 | No | |
| A-9, A-10, A-11, A-12 | $1,000,000 | $1,000,000 | BX 2020-VIV3 | No | |
| A-13-3, A-14-4, A-15-5, A-16-2 | $550,000,000 | $550,000,000 | BX 2020-VIV4 | No | |
| A-14-1, A-16-1 | $69,500,000 | $69,500,000 | BBCMS 2020-C8 | No | |
| A-14-2, A-14-3 | $45,000,000 | $45,000,000 | WFCM 2020-C58 | No | |
| A-14-5, A-16-3 | $58,000,000 | $58,000,000 | BBCMS 2021-C9 | No | |
| A-14-6 | $72,847,000 | $72,847,000 | Barclays Bank PLC(2) | No | |
| A-15-10 | $39,055,333 | $39,055,333 | DBRI(2) | No | |
| A-16-4, A-16-5, A-16-6, A-16-7, A-16-8, A-16-9, A-16-10, A-16-11, A-16-12 | $162,347,000 | $162,347,000 | SGFC(2) | No | |
| Total Senior Notes | $1,634,200,000 | $1,634,200,000 | |||
| B-1-A, B-2-A, B-3-A, B-4-A, B-1-B, B-2-B, B-3-B, B-4-B(4) | $329,861 | $329,861 | BX 2020-VIVA | No | |
| B-5-A, B-6-A, B-7-A, B-8-A, B-5-B, B-6-B, B-7-B, B-8-B(4) | $374,355,139 | $374,355,139 | BX 2020-VIV2 | No | |
| B-9-A, B-10-A, B-11-A, B-12-A(4) | $429,715,000 | $429,715,000 | BX 2020-VIV3 | No | |
| C-1, C-2, C-3, C-4(4) | $561,400,000 | $561,400,000 | BX 2020-VIVA | Yes(3) | |
| Whole Loan | $3,000,000,000 | $3,000,000,000 | |||
| (1) | CREFI will be contributing Note A-13-9, which has an outstanding principal balance of approximately $39,985,667 to the Benchmark 2021-B24 mortgage trust. GACC will be contributing Note A-15-9, which has an outstanding principal balance of approximately $40,000,000 to the Benchmark 2021-B24 mortgage trust. |
| (2) | Expected to be contributed to one or more future securitization transactions. |
| (3) | The initial controlling note is Note C-1, so long as no related control appraisal period with respect to Note C-1 and the related pari passu C notes has occurred and is continuing. If and for so long as a control appraisal period has occurred and is continuing, then the controlling note will be as described under “Description of the Mortgage Pool—The Whole Loans—The Non-Serviced AB Whole Loans—The MGM Grand & Mandalay Bay Pari Passu-AB Whole Loan” in the Preliminary Prospectus. |
| (4) | The MGM Grand & Mandalay Bay Junior Notes are subordinate to the MGM Grand & Mandalay Bay Senior Notes. |
The Borrowers. On January 14, 2020, MGM Growth Properties Operating Partnership LP, an affiliate of BREIT Operating Partnership L.P. (the “Sponsors”, more particularly referred to as the “Loan Sponsors”), and certain other parties entered into an agreement to, among other things, form a joint venture (50.1% indirectly owned by MGP OP and 49.9% indirectly owned by BREIT OP) to acquire the MGM Grand & Mandalay Bay Properties in Las Vegas for a purchase price of $4.60 billion ($471,892 per room). The borrowers under the MGM Grand & Mandalay Bay Whole Loan are MGM Grand PropCo, LLC and Mandalay PropCo, LLC (individually, a “MGM Grand & Mandalay Bay Borrower” and, collectively, the “MGM Grand & Mandalay Bay Borrowers” or the “Borrowers”), which are subsidiaries of the Joint Venture. The MGM Grand & Mandalay Bay Borrowers are Delaware limited liability companies and single purpose entities with two independent directors. Blackstone Real Estate Income Trust, Inc. (“BREIT”) is a non-traded real estate investment trust focused on investing in commercial real estate properties diversified by sector with an emphasis on providing investors with access to Blackstone’s institutional real estate investment platform. BREIT seeks to directly own stabilized income-generating United States commercial real estate across the key property types, including multifamily, industrial, retail, hotel, healthcare and office. BREIT is managed by an external advisor, BX REIT Advisors L.L.C., which is an affiliate of The Blackstone Group Inc. (“Blackstone”). Blackstone’s real estate investor capital under management totals approximately $174.0 billion as of September 30, 2020 and includes prime assets such as the Bellagio, Cosmopolitan Las Vegas, Hotel Del Coronado, Grand Wailea, Arizona Biltmore, Ritz Carlton Kapalua, and Turtle Bay Resort.
THE INFORMATION IN THIS STRUCTURAL AND COLLATERAL TERM SHEET IS NOT COMPLETE AND MAY BE AMENDED PRIOR TO THE TIME OF SALE. THIS TERM SHEET IS NOT AN OFFER TO SELL THESE SECURITIES AND IT IS NOT A SOLICITATION OF AN OFFER TO BUY THESE SECURITIES IN ANY JURISDICTION WHERE THE OFFER OR SALE IS NOT PERMITTED.
55 of 166
| Structural and Collateral Term Sheet | Benchmark 2021-B24 | |
| MGM Grand & Mandalay Bay | ||
MGM Growth Properties LLC (“MGP”) is one of the leading publicly traded real estate investment trusts engaged in the acquisition, ownership and leasing of large-scale destination entertainment and leisure resorts. MGP currently owns a portfolio of properties, consisting of 12 premier destination resorts in Las Vegas and elsewhere across the United States, with over 27,400 rooms, as well as MGM Northfield Park in Northfield, OH, Empire Resort Casino in Yonkers, NY, and a retail and entertainment district, The Park, in Las Vegas.
MGP OP and BREIT OP (together, individually or collectively as the context may require, the “Guarantor”), are the non-recourse carveout guarantors on a several basis in proportion to each Guarantor’s Liability Percentage (as defined below). The Liability Percentage of each Guarantor will be automatically increased or decreased from time to time, as applicable, to the extent any direct and/or indirect equity interest in the Borrowers is transferred by one Guarantor (or its affiliates) to the other Guarantor (or its affiliates) with the transferring Guarantor’s Liability Percentage increasing by the amount of such transferred interests and the transferee Guarantor’s Liability Percentage decreasing by such amount. In no event will the Liability Percentage of the Guarantors in the aggregate be less than or greater than one hundred percent (100%). For the avoidance of doubt, transfers by a Guarantor (or its affiliates) to a third party that is not an affiliate of the other Guarantor will not result in an adjustment to the Liability Percentage of either Guarantor. For illustrative purposes, if BREIT OP transfers a twenty-five percent (25%) indirect equity interest in the Borrowers to a third party that is not an Affiliate of MGP OP and subsequently transfers a ten percent (10%) indirect equity interest in the Borrowers to MGP OP, the adjustments required to be made as a result of such transfers will be: (i) a decrease of ten percentage points to BREIT OP’s Liability Percentage and (ii) an increase of 10 percentage points to MGP OP’s Liability Percentage.
The Guarantor’s liability for full recourse events is capped at an amount equal to 10% of the aggregate outstanding principal balance of the MGM Grand & Mandalay Bay Whole Loan as of the date of the event. In addition, only the Borrowers are liable for breaches of environmental covenants; provided, however, that if the Borrowers fail to maintain an environmental insurance policy required under the MGM Grand & Mandalay Bay Whole Loan documents, the Guarantor is liable for losses other than (x) for any amounts in excess of the applicable coverage amounts under the environmental policy had the same been renewed, replaced or extended as required under the loan agreement and (y) for any amounts recovered under the environmental policy. In addition, recourse for transfers of the MGM Grand & Mandalay Bay Properties or controlling equity interests in the MGM Grand & Mandalay Bay Borrowers is loss recourse, rather than full recourse.
“Liability Percentage” means, initially, (x) with respect to BREIT OP, 49.9% and (y) with respect to MGP OP, 50.1%.
The Properties.
MGM Grand (54.5% of Mortgage ALA and Master Lease Rent)
Built in 1993, the MGM Grand Property is a full-service luxury resort and casino property located on the Las Vegas Strip, situated between Tropicana Boulevard and Harmon Avenue. According to World Atlas, the MGM Grand Property is the third largest hotel in the world by room count. The MGM Grand Property is also a recipient of the AAA Four Diamond award. The MGM Grand Property covers approximately 101.9 acres and consists of 4,998 hotel rooms: 4,270 standard rooms, 554 suites, 88 luxury suites, 51 SKYLOFTS suites (excluding one additional office unit), 30 mansion villas (Mediterranean-themed villas targeted for high-end gamblers, celebrities and casino-invited guests on the strip) (the “Mansion Villas”) and four entourage rooms associated with the Mansion Villas. The MGM Grand Property contains approximately 177,268 square feet of casino space, featuring 1,553 slot machines and 128 gaming tables, over 748,000 square feet of meeting space, 18 restaurants, an approximately 22,858 square foot spa, four swimming pools and approximately 41,800 square feet of rentable retail space (featuring 31 retailers). The MGM Grand Property is home to Cirque du Soleil’s “Kà”, an acrobatic theater production that has been in residence at the MGM Grand Property since October 2004. The MGM Grand Property also includes the David Copperfield Theatre, Hakkasan Nightclub and the MGM Grand Garden Arena, which has a seating capacity of over 16,000 and hosts premier concerts, award shows, sporting events including championship boxing, and other special events.
Room sizes range from 346 square feet to 11,517 square feet and the MGM Grand Property offers one to four bedrooms. Standard room amenities include air conditioning, in-room dining service, minibar, telephone, hair dryer, in-room safe, and high-speed internet. SKYLOFTS at MGM Grand, a AAA Four-Diamond, Forbes Five Star hotel, occupies the top two floors of the main building. The hotel has 51 lofts ranging from 1,401 to 6,040 square feet per loft. SKYLOFTS is also a member of The Leading Hotels of the World. The Mansion at the MGM Grand Property contains 30 Mansion Villas ranging from 2,358 to 11,517 square feet per villa and $5,000 to $35,000 per night.
Since 2010, the MGM Grand Property has benefited from total capital investment of approximately $480.0 million (approximately $96,036 per room). Notable capital expenditures from this time period include an approximately $144.0 million full rooms renovation from 2010 to 2013 and a recent $118.9 million expansion and renovation of the conference center, which was completed in December 2018.
Mandalay Bay (45.5% of Mortgage ALA and Master Lease Rent)
Built in 1999, the Mandalay Bay Property is a full-service luxury resort and casino property located as the first major resort on the strip to greet visitors arriving by automobile from Southern California. The AAA Four Diamond award winning resort is a premier conference hotel in Las Vegas with approximately 2.2 million square feet of convention, ballroom and meeting space, making it the fifth single largest
THE INFORMATION IN THIS STRUCTURAL AND COLLATERAL TERM SHEET IS NOT COMPLETE AND MAY BE AMENDED PRIOR TO THE TIME OF SALE. THIS TERM SHEET IS NOT AN OFFER TO SELL THESE SECURITIES AND IT IS NOT A SOLICITATION OF AN OFFER TO BUY THESE SECURITIES IN ANY JURISDICTION WHERE THE OFFER OR SALE IS NOT PERMITTED.
56 of 166
| Structural and Collateral Term Sheet | Benchmark 2021-B24 | |
| MGM Grand & Mandalay Bay | ||
event space in the United States. The Mandalay Bay Property is immediately across Interstate 15 from Allegiant Stadium, the new home stadium of the National Football League’s (“NFL”) Raiders, which was substantially completed on July 31, 2020 and began being utilized in September 2020. The Mandalay Bay Property covers approximately 124.1 acres and consists of 4,750 hotel rooms. Also included within the Mandalay Bay Property are: (i) the Delano, which is an all-suite hotel tower within the complex and (ii) a Four Seasons hotel, each of which has its own lobby, restaurants and pool and spa. In addition to the significant meeting space, the Mandalay Bay Property contains approximately 152,159 square feet of casino space, featuring approximately 1,232 slot machines and 71 gaming tables, 27 total restaurants, an approximately 30,000 square foot spa, ten swimming pools and approximately 54,000 square feet of rentable retail space featuring 41 retailers. The Mandalay Bay Property is also the home to Cirque du Soleil’s Michael Jackson “ONE”, which has been in residence at the Mandalay Bay Property in an approximately 1,805-seat showroom since 2013, an approximately 12,000-seat special events arena, the House of Blues (which features an arena seating up to 2,500 people) and the Shark Reef Aquarium. Additionally, the Mandalay Bay Property’s expansive pool and beach area plays host to an array of evening open air concerts during the pool season, a large wave pool, and Moorea, a European-style “ultra” beach and Daylight Beach Club.
Room sizes range from 400 to 5,605 square feet and the Mandalay Bay Property offers one- to four-bedroom rooms. Standard room amenities include air conditioning, in-room dining service, minibar, telephone, hair dryer, in-room safe, and high-speed internet. Floors 60–62 are designed as penthouse suites, with a penthouse lounge on level 62 for guests staying in the penthouses. Floors numbered 35–39 of the main hotel building are occupied by the five-star and AAA Four-Diamond Four Seasons Hotel Las Vegas. Located at the resort’s 43-story second tower, the Delano Las Vegas is comprised of 45 rooms and 1,072 suites. Each suite at the Delano is at least 725 square feet.
The Mandalay Bay Property (including the Delano) underwent a substantial rooms’ renovation of approximately $159.7 million (approximately $35,150 per room) from 2012 to 2016 and has received a total of approximately $510.6 million (approximately $107,485 per room) of capital investment since 2010.
Cirque du Soleil performances at the MGM Grand & Mandalay Bay Properties scheduled through December 31, 2020 were cancelled. On June 29, 2020, Cirque du Soleil Entertainment Group (“Cirque”) announced that it and certain of its affiliated companies filed for protection from creditors under the Companies’ Creditors Arrangement Act (“CCAA”) in order to restructure its capital structure, which application was granted by the court. On July 16, 2020, Cirque announced that it entered into a new “stalking horse” purchase agreement with a group of existing first lien and second lien secured lenders pursuant to which such lenders would acquire substantially all of Cirque’s assets in settlement of Cirque’s first and second lien debt. Such purchase agreement was approved by the court on July 17, 2020, and served as the new “stalking horse” bid in a SISP supervised by the court and the court-appointed monitor. As of August 18, 2020, it was reported that the lenders’ bid was the highest bid, which requires court approval to take effect. On October 20, 2020, it was further reported that the plan giving the lenders control and virtually all of the equity of Cirque was approved, and on November 24, 2020, Cirque announced the closing of the sale transaction with its secured lenders and its emergence from creditor protection under the CCAA in Canada and Chapter 15 in the United States.
Revenue Streams. The MGM Grand & Mandalay Bay Properties benefit from a diverse set of revenue streams with a substantial contribution from non-gaming sources (only 18.0% of combined year-end (“YE”) December 2019 revenues were derived from casinos) and offer nearly 2.8 million square feet of combined meeting and convention space.
As of YE December 2019, the MGM Grand Property generated 77.8% of net revenues from rooms, food and beverage, retail, entertainment and other operations. The gaming segment contributed 22.2% of net revenue (approximately $257.9 million), representing a decline from the 2018 level of 29.8% of net revenue (of approximately $365.7 million). A portion of the decline can be attributed to a renovation of the Mansion Villas in 2019, which serve as the MGM Grand Property’s main attractant to high-end gamblers. Nearly all departments at the MGM Grand Property (including rooms, F&B, retail and entertainment) experienced continued growth in the YE December 2019 period despite the decline in casino revenue.
The Mandalay Bay Property has a much smaller casino department as a percentage of total net revenue (12.9% as of YE December 2019) than most casinos on the Las Vegas strip. The Mandalay Bay Property revenues are primarily driven by (i) the focus on group and convention business (according to the appraisal, the Mandalay Bay Property had a 2019 penetration factor of 134.8% for group business) and (ii) the fact that two of the three room types are operated as non-casino focused third party franchises (the Delano and Four Seasons). As of YE December 2019, 64.1% of total revenues at the Mandalay Bay Property were derived from rooms’ revenue (34.1%) and food & beverage revenue (30.0%).
As of YE December 2019, the MGM Grand Property achieved occupancy, ADR and RevPAR of 91.4%, $190.29 and $173.85, respectively. As of YE December 2019, the Mandalay Bay Property achieved occupancy, ADR and RevPAR of 92.8%, $202.98 and $188.40, respectively.
THE INFORMATION IN THIS STRUCTURAL AND COLLATERAL TERM SHEET IS NOT COMPLETE AND MAY BE AMENDED PRIOR TO THE TIME OF SALE. THIS TERM SHEET IS NOT AN OFFER TO SELL THESE SECURITIES AND IT IS NOT A SOLICITATION OF AN OFFER TO BUY THESE SECURITIES IN ANY JURISDICTION WHERE THE OFFER OR SALE IS NOT PERMITTED.
57 of 166
| Structural and Collateral Term Sheet | Benchmark 2021-B24 | |
| MGM Grand & Mandalay Bay | ||
| Historical Performance | |||||||||||||||||||
| EBITDAR ($ Millions)(1) | 2006 | 2007 | 2008 | 2009 | 2010 | 2011 | 2012 | 2013 | 2014 | 2015 | 2016 | 2017 | 2018 | 2019 | March 2020 TTM(1) | June 2020 TTM(1) | Sept. 2020 TTM(1) | UW | |
| MGM Grand | $329 | $396 | $271 | $214 | $163 | $149 | $181 | $236 | $255 | $281 | $332 | $345 | $372 | $283 | $263 | $220 | $129 | $283 | |
| Mandalay Bay | $282 | $291 | $251 | $160 | $125 | $169 | $147 | $167 | $176 | $204 | $237 | $260 | $246 | $237 | $224 | $161 | $93 | $237 | |
| Total Collateral | $611 | $688 | $522 | $374 | $288 | $318 | $327 | $403 | $431 | $485 | $569 | $605 | $617 | $520 | $487 | $381 | $222 | $520 | |
| Debt Yield(2) | 20.4% | 22.9% | 17.4% | 12.5% | 9.6% | 10.6% | 10.9% | 13.4% | 14.4% | 16.2% | 19.0% | 20.2% | 20.6% | 17.3% | 16.2% | 12.7% | 7.4% | 17.3% | |
| Rent Coverage(3) | 2.1x | 2.4x | 1.8x | 1.3x | 1.0x | 1.1x | 1.1x | 1.4x | 1.5x | 1.7x | 1.9x | 2.1x | 2.1x | 1.8x | 1.7x | 1.3x | 0.8x | 1.8x | |
| (1) | On May 1, 2020, MGM Resorts International reported in its first quarter Form 10-Q filing that, as a result of the temporary closure of its domestic properties (which include the MGM Grand & Mandalay Bay Properties) following the outbreak of COVID-19, its domestic properties (which include the MGM Grand & Mandalay Bay Properties) were effectively generating no revenue, and there were high levels of room and convention cancellation through the third quarter of 2020. The March 2020 TTM financials presented above reflect the suspension of operations at the MGM Grand & Mandalay Bay Properties from March 17, 2020 through the end of the first calendar quarter of 2020. On August 3, 2020, MGM reported in its second quarter Form 10-Q filing that, while throughout May, June and July 2020, it re-opened most of its properties with limited amenities and certain measures to mitigate the spread of COVID-19, such properties (which include the MGM Grand & Mandalay Bay Properties) may be subject to temporary, complete or partial shutdowns in the future. On November 3, 2020, MGM reported in its most recent third quarter Form 10-Q filing that throughout the second and third quarters of 2020, all of its properties reopened but are operating without certain amenities and subject to certain occupancy limitations and therefore are generating revenues that are significantly lower than historical results, and that it has seen and expects to continue to see weakened demand in light of consumer fears and general economic uncertainty, among other things. The June 2020 TTM and September 2020 TTM financials presented above reflect the operations at the MGM Grand Property, which remained suspended until June 4, 2020, operations at The Shoppes at Mandalay Bay Place and the Mandalay Bay resort, which remained suspended through June 24, 2020 and June 30, 2020, respectively, and the occupancy limitations imposed on the MGM Grand & Mandalay Bay Properties by the state of Nevada during the third quarter of 2020. The $487 million presented above represents the adjusted March 2020 TTM EBITDAR, which takes into account an adjustment for a combined net extraordinary loss of approximately $20.6 million during the March 2020 TTM period (reflecting primarily operating losses during closure comprised mainly of employee payroll expenses and corporate allocations and net of a combined extraordinary gain of approximately $0.7 million related to a reversal of certain accrued benefit expenses) related to the temporary closure of the MGM Grand & Mandalay Bay Properties following the outbreak of COVID-19. The $381 million presented above represents the adjusted June 2020 TTM EBITDAR and the $222 million presented above represents the adjusted September 2020 TTM EBITDAR, each of which takes into account an adjustment for a combined net extraordinary loss of approximately $82.4 million during each of the respective TTM periods (reflecting primarily operating losses during closure comprised mainly of employee payroll expenses and corporate allocations and net of a combined extraordinary gain of approximately $0.7 million related to a reversal of certain accrued benefit expenses) related to the temporary closure of the MGM Grand & Mandalay Bay Properties following the outbreak of COVID-19. The Lender UW presented above is based on 2019 financials, which reflect a full year of uninterrupted operations at the MGM Grand & Mandalay Bay Properties. Please see “Cash Flow Analysis” herein, and the footnotes thereto, for more detailed underwritten cash flow information. |
| (2) | Debt Yield metrics presented above are based on the MGM Grand & Mandalay Bay Whole Loan Cut-off Date balance of $3.0 billion and the EBITDAR of each respective time period. |
| (3) | Rent Coverage ratios presented above are based on the initial Master Lease Rent of $292.0 million and the EBITDAR of each respective time period. |
| Historical Performance – MGM Grand(1) | |||||||||||||||||
| 2006 | 2007 | 2008 | 2009 | 2010 | 2011 | 2012 | 2013 | 2014 | 2015 | 2016 | 2017 | 2018 | 2019 | March 2020 TTM(2) | June 2020 TTM(2) | September 2020 TTM(2) | |
| RevPAR | $154 | $162 | $145 | $112 | $112 | $128 | $136 | $138 | $151 | $155 | $162 | $167 | $169 | $174 | $172 | $161 | $126 |
| Net Revenue ($ bns) | $1.19 | $1.32 | $1.22 | $1.09 | $1.03 | $1.05 | $1.07 | $1.15 | $1.21 | $1.16 | $1.15 | $1.18 | $1.23 | $1.16 | $1.10 | $0.87 | $0.66 |
| EBITDAR Margin | 28% | 30% | 22% | 20% | 16% | 14% | 17% | 21% | 21% | 24% | 29% | 29% | 30% | 24% | 24% | 25% | 20% |
| (1) | Any financial information contained in this Term Sheet for the MGM Grand Property which relates to any period prior to 2015 has not been recast to reflect the adoption of ASC 606 revenue recognition under GAAP and thus, any financial information provided for periods prior to 2015 may not be comparable to periods on or after 2015 with respect to which recasting has been applied. |
| (2) | The March 2020 TTM financials presented above reflect the suspension of operations at the MGM Grand & Mandalay Bay Properties from March 17, 2020 through the end of the first calendar quarter of 2020. On August 3, 2020, MGM reported in its second quarter Form 10-Q filing that, while throughout May, June and July 2020, it re-opened most of its properties with limited amenities and certain measures to mitigate the spread of COVID-19, such properties (which include the MGM Grand & Mandalay Bay Properties) may be subject to temporary, complete or partial shutdowns in the future, and that it has seen and expects to continue to see weakened demand in light of consumer fears and general economic uncertainty, among other things. The June 2020 TTM financials presented above reflect the operations at the MGM Grand Property, which remained suspended until June 4, 2020 and operations at The Shoppes at Mandalay Bay Place and the Mandalay Bay resort, which remained suspended through June 24, 2020 and June 30, 2020, respectively. The September 2020 TTM financials presented above reflect the suspension of operations at (i) the MGM Grand Property from March 17, 2020 through June 3, 2020 and (ii) The Shoppes at Mandalay Bay Place and the Mandalay Bay resort from March 17, 2020 through June 24, 2020 and June 30, 2020, respectively, and the occupancy limitations imposed on the MGM Grand & Mandalay Bay Properties by the state of Nevada during the third quarter of 2020. Upon reopening, both MGM Grand & Mandalay Bay Properties were operating with limited amenities and certain COVID-19 mitigation procedures. The lender UW presented above is based on 2019 financials, which reflect a full-year of uninterrupted operations at the MGM Grand & Mandalay Bay Properties. |
THE INFORMATION IN THIS STRUCTURAL AND COLLATERAL TERM SHEET IS NOT COMPLETE AND MAY BE AMENDED PRIOR TO THE TIME OF SALE. THIS TERM SHEET IS NOT AN OFFER TO SELL THESE SECURITIES AND IT IS NOT A SOLICITATION OF AN OFFER TO BUY THESE SECURITIES IN ANY JURISDICTION WHERE THE OFFER OR SALE IS NOT PERMITTED.
58 of 166
| Structural and Collateral Term Sheet | Benchmark 2021-B24 | |
| MGM Grand & Mandalay Bay | ||
| Historical Performance – Mandalay Bay(1) | |||||||||||||||||
| 2006 | 2007 | 2008 | 2009 | 2010 | 2011 | 2012 | 2013 | 2014 | 2015 | 2016 | 2017 | 2018 | 2019 | March 2020 TTM(2) | June 2020 TTM(2) | September 2020 TTM(2) | |
| RevPAR | $199 | $213 | $193 | $142 | $142 | $160 | $162 | $164 | $176 | $177 | $185 | $186 | $184 | $188 | $188 | $186 | $143 |
| Net Revenue ($ bns) | $0.99 | $1.02 | $0.95 | $0.79 | $0.78 | $0.84 | $0.78 | $0.86 | $0.95 | $0.94 | $0.97 | $0.98 | $0.97 | $0.94 | $0.90 | $0.67 | $0.49 |
| EBITDAR Margin | 29% | 28% | 26% | 20% | 16% | 20% | 19% | 19% | 19% | 22% | 24% | 27% | 25% | 25% | 25% | 24% | 19% |
| (1) | Any financial information contained in this Term Sheet for the Mandalay Bay Property which relates to any period prior to 2015 has not been recast to reflect the adoption of ASC 606 revenue recognition under GAAP and thus, any financial information provided for periods prior to 2015 may not be comparable to periods on or after 2015 with respect to which recasting has been applied. |
| (2) | The March 2020 TTM financials presented above reflect the suspension of operations at the MGM Grand & Mandalay Bay Properties from March 17, 2020 through the end of the first calendar quarter of 2020. On August 3, 2020, MGM reported in its second quarter Form 10-Q filing that, while throughout May, June and July 2020, it re-opened most of its properties with limited amenities and certain measures to mitigate the spread of COVID-19, such properties (which include the MGM Grand & Mandalay Bay Properties) may be subject to temporary, complete or partial shutdowns in the future, and that it has seen and expects to continue to see weakened demand in light of consumer fears and general economic uncertainty, among other things. The June 2020 TTM financials presented above reflect the operations at the MGM Grand Property, which remained suspended until June 4, 2020 and operations at The Shoppes at Mandalay Bay Place and the Mandalay Bay resort, which remained suspended through June 24, 2020 and June 30, 2020, respectively. The September 2020 TTM financials presented above reflect the suspension of operations at (i) the MGM Grand Property from March 17, 2020 through June 3, 2020 and (ii) The Shoppes at Mandalay Bay Place and the Mandalay Bay resort from March 17, 2020 through June 24, 2020 and June 30, 2020, respectively, and the occupancy limitations imposed on the MGM Grand & Mandalay Bay Properties by the state of Nevada during the third quarter of 2020. Upon reopening, both MGM Grand & Mandalay Bay Properties were operating with limited amenities and certain COVID-19 mitigation procedures. The Lender UW presented above is based on 2019 financials, which reflect a full-year of uninterrupted operations at the MGM Grand & Mandalay Bay Properties. |
Master Lease. The MGM Grand & Mandalay Bay Properties are master leased to MGM Lessee II, LLC (“MGM Tenant”), a wholly-owned subsidiary of MGM under a 30-year, triple-net master and operating lease with two, 10-year renewal options. In turn, the MGM Tenant has subleased a portion of the MGM Grand & Mandalay Bay Properties to each of MGM Grand Hotel, LLC, a Nevada limited liability company (“Grand Operating Subtenant”), Mandalay Bay, LLC, a Nevada limited liability company (“Mandalay Bay Subtenant”) and Mandalay Place, LLC, a Nevada limited liability company (“Mandalay Place Subtenant”; and, together with Grand Operating Subtenant and Mandalay Bay Subtenant, individually or collectively as the context may require, together with any person to whom all or any portion of a Property is sublet by MGM Tenant pursuant to a MGM/Mandalay Operating sublease pursuant to the express terms and conditions of the MGM/Mandalay Lease, each a “MGM/Mandalay Operating Subtenant”). Each MGM/Mandalay Operating Subtenant executed a joinder to the MGM/Mandalay Lease for the purpose of (x) agreeing to be bound by the terms and provisions of the MGM/Mandalay Lease regarding the disposition of any portion of the MGM Tenant’s Property owned by such MGM/Mandalay Operating Subtenant and (y) granting a security interest to the Borrowers in the portion of the MGM Tenant’s pledged property owned by such MGM/Mandalay Operating Subtenant and certain reserve funds under the MGM/Mandalay Lease. The MGM Tenant and each MGM/Mandalay Operating Subtenant is not a borrower or an obligor under the MGM Grand & Mandalay Bay Loan documents.
Under the Master Lease, the MGM Tenant is required to pay to the Borrowers an initial lease rent of $292.0 million per annum ($159.0 million allocated to the MGM Grand Property and $133.0 million allocated to the Mandalay Bay Property, the “Master Lease Rent”), subject to annual increases of (i) 2.0% in years 2 through 15 of the initial lease term, and (ii) thereafter, the greater of 2.0% or CPI (CPI capped at 3.0%) for the remainder of the initial lease term. Additionally, MGM will be required to continue to invest in the MGM Grand & Mandalay Bay Properties, with (x) a minimum aggregate capital investment requirement of 3.5% of actual net revenues every five years (the first such period beginning January 1, 2020 and expiring December 31, 2024, and the second such period beginning January 1, 2021 and expiring December 31, 2025, and each five-year period thereafter on a rolling basis) in the aggregate for the MGM Grand & Mandalay Bay Properties (such amount not to be less than 2.5% of the actual net revenue of any individual Property) (collectively, the “Required CapEx”) and (y) a monthly reserve equal to 1.5% of actual net revenues which may be used for FF&E and on qualifying capital expenditures in satisfaction of the Required CapEx spend. Upon early termination of the Master Lease due to an event of default by MGM Tenant thereunder, the FF&E will be transferred to the Borrowers at no cost.
Beginning with the first full calendar quarter after the origination date for the MGM Grand & Mandalay Bay Whole Loan and continuing thereafter, if either (a) (x) EBITDAR to Rent Ratio (as defined in the Master Lease) for the prior four fiscal quarters is less than 1.60x and (y) MGM’s market cap is less than $6.0 billion or (b) (x) MGM is no longer publicly traded and listed on NYSE, AMEX or NASDAQ and (y) the EBITDAR to Rent Ratio for the prior four fiscal quarters is less than 2.0x, then MGM Tenant will be required to provide one or more letters of credit or fund a cash escrow in an aggregate amount equal to the following year’s rent (taking into account the applicable escalations). Based on the adjusted September 2020 TTM EBITDAR of approximately $222.0 million and the initial Master Lease Rent of $292.0 million, the MGM Grand & Mandalay Bay Whole Loan results in a September 2020 TTM EBITDAR-to-rent coverage ratio of 0.76x.
No intellectual property is licensed to the Borrowers and the Borrowers have no option to purchase upon expiration of the Master Lease. Upon the expiration of the Master Lease term or earlier termination of Master Lease, MGM Tenant will be obligated to provide up to 18 months of transition services to permit the continuous and uninterrupted operation of the Property.
MGM (NYSE: MGM, rated Ba3/BB-/BB- by Moody’s, Fitch and S&P) guarantees to the Borrowers the payment and performance of all monetary obligations and certain other obligations of the MGM Tenant under the Master Lease. In addition to the lease guaranty, MGM (in such capacity, “Shortfall Collection Guarantor”) has executed a shortfall guaranty for the benefit of the mortgage lenders for the MGM Grand & Mandalay Bay Loan, pursuant to which MGM has guaranteed to the mortgage lenders the unpaid portion of the initial principal amount of the MGM Grand & Mandalay Bay Loan (without giving effect to any future amendments that may increase the principal balance)
THE INFORMATION IN THIS STRUCTURAL AND COLLATERAL TERM SHEET IS NOT COMPLETE AND MAY BE AMENDED PRIOR TO THE TIME OF SALE. THIS TERM SHEET IS NOT AN OFFER TO SELL THESE SECURITIES AND IT IS NOT A SOLICITATION OF AN OFFER TO BUY THESE SECURITIES IN ANY JURISDICTION WHERE THE OFFER OR SALE IS NOT PERMITTED.
59 of 166
| Structural and Collateral Term Sheet | Benchmark 2021-B24 | |
| MGM Grand & Mandalay Bay | ||
and all interest accrued and unpaid thereon. For the avoidance of doubt, the Shortfall Collection Guarantor does not guarantee any Accrued Interest or any additional principal as a result of any unpaid Accrued Interest after the ARD. Transfers of interests in MGM are not restricted under the MGM Grand & Mandalay Bay Loan documents and any bankruptcy or other adverse event with respect to the Shortfall Collection Guarantor does not constitute a default under the MGM Grand & Mandalay Bay Loan documents. Neither MGM nor its affiliates (including, without limitation, MGM Tenant) are considered an affiliate of the Borrowers for any purpose under the MGM Grand & Mandalay Bay Loan documents so long as such person does not control the Borrowers. There is no continuing net worth requirement with respect to MGM in connection with the shortfall guaranty. As of the origination of the MGM Grand & Mandalay Bay Loan, neither MGM nor MGM Tenant controlled the Borrowers.
As of December 31, 2019, MGM had a market capitalization of approximately $16.7 billion, full-year 2019 revenue of approximately $12.9 billion and consolidated, adjusted earnings before interest, taxes, depreciation and amortization (“EBITDA”) of approximately $3.0 billion. As of March 31, 2020, MGM reported revenue of approximately $2.3 billion for the first quarter of 2020. This represents a 29% decrease to the first quarter of 2019 which was primarily driven by MGM’s temporary suspension of its domestic and Macau casino operations related to the COVID-19 pandemic.
MGM had $6.0 billion of cash and cash equivalents as of March 31, 2020, which included $1.8 billion at MGP and $381 million at MGM China. In addition, on April 23, 2020, MGM commenced a private offering of $750 million in aggregate principal amount of 6.75% coupon senior notes due in 2025, which further added to MGM’s cash position.
As of June 30, 2020, MGM reported (i) revenue of approximately $290.0 million for the second quarter of 2020 (of which approximately $151.0 million was derived from MGM’s Las Vegas Strip resorts(1)), (ii) a total consolidated liquidity position of $8.1 billion (which includes MGM Resorts (as defined below), MGM China and MGP and is comprised of cash and cash equivalents of approximately $4.8 billion and approximately $3.3 billion available under certain revolving credit facilities) and (iii) a market capitalization of approximately $8.3 billion. According to MGM’s second quarter 2020 earnings presentation, the Adjusted Property EBITDAR margin across all reopened MGM properties on the Las Vegas Strip (during the period the properties were operating through June 30, 2020) increased by approximately 450 basis points compared to the second quarter of 2019 (calculation methodology presented below)(2).
“MGM Resorts” means MGM Resorts unconsolidated, which is exclusive of MGM China and MGP.
As of September 30, 2020, MGM reported (i) revenue of approximately $1.1 billion for the third quarter of 2020 (of which approximately $481.4 million was derived from MGM’s Las Vegas Strip resorts), (ii) a total consolidated liquidity position of $7.8 billion (which includes MGM Resorts, MGM China and MGP and is comprised of cash and cash equivalents of approximately $4.6 billion and approximately $3.2 billion available under certain revolving credit facilities), (iii) an MGM Resorts liquidity position of approximately $4.5 billion (which excludes MGP OP and MGM China) and is comprised of cash and cash equivalents of approximately $3.5 billion and approximately $922 million available under its $1.5 billion revolving facility and (iv) a market capitalization of approximately $10.7 billion. Also as of September 30, 2020, MGM reported that it had $700.0 million remaining under its previously announced agreement with MGP OP to redeem for cash up to $1.4 billion of its MGP OP units and it does not have any debt maturing prior to 2022. Based on the September 2020 TTM adjusted EBITDAR of approximately $222.0 million, the MGM Grand & Mandalay Bay Whole Loan results in an adjusted EBITDAR to Debt Service Ratio of 2.05x (which is below the DSCR Threshold (as defined below) of 2.50x). It is expected that the adjusted EBITDAR to Debt Service Coverage Ratio based on the December 2020 TTM financials (which, as of the date of this term sheet, have not been delivered to the lender) will remain below the DSCR Threshold of 2.50x and cause the commencement of a MGM Grand & Mandalay Bay Trigger Period. See “Lockbox / Cash Management” herein for more detail.
As of December 31, 2020, MGM reported (i) revenue of approximately $1.5 billion for the fourth quarter of 2020 (of which approximately $480 million was derived from MGM’s Las Vegas Strip resorts), (ii) a total consolidated liquidity position of approximately $8.8 billion (which includes MGM Resorts, MGM China and MGP and is comprised of cash and cash equivalents of approximately $5.1 billion and approximately $3.7 billion available under certain revolving credit facilities), (iii) an MGM Resorts liquidity position of approximately $5.6 billion (which excludes MGP and MGM China) and is comprised of cash and cash equivalents of approximately $4.1 billion and approximately $1.472 billion available under its $1.5 billion revolving facility and (iv) a market capitalization of approximately $15.6 billion. In December 2020, MGP redeemed approximately 23.5 million MGP OP units from MGM Resorts for $700.0 million which represented the remaining amount under the agreement with MGP to purchase up to $1.4 billion of the MGP OP units owned by MGM Resorts for cash. MGM’s Las Vegas Strip resorts reported adjusted property EBITDAR of approximately $54.0 million for the fourth quarter of 2020 (compared to $15.0 million in the third quarter of 2020).
THE INFORMATION IN THIS STRUCTURAL AND COLLATERAL TERM SHEET IS NOT COMPLETE AND MAY BE AMENDED PRIOR TO THE TIME OF SALE. THIS TERM SHEET IS NOT AN OFFER TO SELL THESE SECURITIES AND IT IS NOT A SOLICITATION OF AN OFFER TO BUY THESE SECURITIES IN ANY JURISDICTION WHERE THE OFFER OR SALE IS NOT PERMITTED.
60 of 166
| Structural and Collateral Term Sheet | Benchmark 2021-B24 | |
| MGM Grand & Mandalay Bay | ||
MGM Tenant is a casino owner-operator for 29 unique hotel offerings totaling over 44,000 rooms across Las Vegas, United States regional markets and Macau. MGM Tenant has managed the MGM Grand & Mandalay Bay Properties for more than 27 and 18 years, respectively.
| (1) | Second quarter 2020 revenue of approximately $151.0 million for MGM’s Las Vegas Strip resorts reflects revenue from certain resorts which reopened during the second quarter of 2020 with limited amenities and certain COVID-19 mitigation procedures: the Bellagio (reopened on June 4, 2020), the MGM Grand (reopened on June 4, 2020), New York New York (reopened on June 4, 2020), Excalibur (reopened on June 11, 2020) and Luxor (reopened on June 25, 2020). The Mandalay Bay, ARIA, Vdara, Mirage and Park MGM resorts were not open during the second quarter of 2020. |
| (2) | Second quarter 2020 Adjusted Property EBITDAR calculation methodology: Reflects MGM management’s estimates of operating trends for the periods in which the properties were operating (commencing on each respective properties reopening date and calculated through June 30, 2020), compared to the same periods in 2019 using monthly property level financials and internally generated daily operating reports to calculate activity for partial monthly periods, based on the days in the second quarter of 2020 that such properties were opened prior to June 30, 2020, including activity for invitation only customer events prior to reopening to the general public. |
COVID-19 Update. According to a press release issued on March 15, 2020, MGM announced that it would suspend operations at all of its Las Vegas properties, including the MGM Grand & Mandalay Bay Properties, until further notice, effective as of March 17, 2020, and that casino operations would close on March 16, 2020, followed by hotel operations on March 17, 2020. MGM cited COVID-19 as a pandemic that had intensified in the United States, requiring major collective action to slow its progression. MGM stated that it cancelled all reservations at its Las Vegas properties prior to May 21, 2020. MGM further reported that it incurred substantial operating losses in March 2020 and did not expect to see a material improvement until more is known regarding the duration and severity of the pandemic, including when MGM’s properties can reopen to the public. On May 1, 2020, MGM reported in its first quarter Form 10-Q filing that as a result of the government-mandated closure, its domestic properties (which include the MGM Grand & Mandalay Bay Properties and several properties which are not part of the collateral for the MGM Grand & Mandalay Bay Whole Loan) were effectively generating no revenue. In addition, in its Form 10-Q filing, MGM Resorts International reported high levels of room and convention cancellation across its domestic properties through the third quarter of 2020 with some tentative re-bookings in the fourth quarter and into 2021. As of June 4, 2020, the MGM Grand was reopened, with limited amenities and certain COVID-19 mitigation procedures. MGM Resorts International reopened The Shoppes at Mandalay Bay Place on June 25, 2020 and the Mandalay Bay resort on July 1, 2020, both with limited amenities and certain COVID-19 mitigation procedures. On August 3, 2020, MGM reported in its second quarter Form 10-Q filing that, while throughout May, June and July 2020, it re-opened most of its properties with limited amenities and certain measures to mitigate the spread of COVID-19, such properties (which include the MGM Grand & Mandalay Bay Properties) may be subject to temporary, complete or partial shutdowns in the future. On August 28, 2020, several news outlets reported that MGM is expected to lay off approximately 18,000 furloughed workers in the United States, more than one-quarter of its pre-COVID-19 pandemic U.S. workforce, due to the continued impact of the COVID-19 pandemic on MGM’s business. However, MGM permitted certain stage shows and performances to resume at select properties (including the MGM Grand) on or about November 6, 2020. On November 3, 2020, MGM reported in its most recent third quarter Form 10-Q filing that (i) throughout the second and third quarters of 2020, all of its properties reopened but are operating without certain amenities and subject to certain occupancy limitations and therefore are generating revenues that are significantly lower than historical results and (ii) although MGM has engaged in aggressive cost reduction efforts, it still has significant fixed and variable costs, which will adversely affect its profitability, and has seen and expects to continue to see weakened demand in light of continued domestic and international travel restrictions or warnings, restrictions on amenity use (such as gaming, restaurant and pool capacity limitations), consumer fears and reduced consumer discretionary spending, general economic uncertainty and increased rates of unemployment. In MGM’s third quarter 2020 earnings call, MGM disclosed that it is evaluating plans to minimize mid-week Adjusted Property EBITDAR losses at its properties in light of its seasonal low period during the winter months, which could include reducing amenities at some of its properties and the closure of certain hotel towers. MGM Recently announced that the Mandalay Bay Property is currently accepting reservations for stays from Thursday through Sunday. After March 3, 2021, the Mandalay Bay Property will resume 24/7 hotel operations and reservations will be accepted for stays throughout the week. As of February 25, 2021, the MGM Grand & Mandalay Bay Properties continue to operate subject to the restrictions described above. The MGM Grand & Mandalay Bay Whole Loan is current through the February 2021 payment date and as of February 25, 2021, no loan modification or forbearance requests have been made. Additionally, January 2021 and February 2021 master lease payments have been made and there have been no lease modification requests. See “Risk Factors—Special Risks—Current Coronavirus Pandemic May Adversely Affect the Global Economy and the Performance of the Mortgage Loans” in the Preliminary Prospectus.
The Market. The MGM Grand & Mandalay Bay Properties are located on the Las Vegas Strip in the heart of Las Vegas, Nevada. Visitor volume and airport passenger traffic into the Las Vegas region have more than doubled from 1990 to 2019. In connection with the financial downturn in 2008 and 2009, the Las Vegas market generally experienced a contraction. During 2010, the market began to rebound and visitation returned to near peak levels. McCarran International Airport welcomed 51.5 million passengers in 2019 (surpassing the 2018 passenger count of approximately 49.6 million).
Since 2010, annual convention attendance in Las Vegas has grown by over 2 million people (4.0% CAGR). With an estimated local population of 2.3 million people as of 2019, an additional approximately 42.5 million tourists visiting the metropolitan Las Vegas area annually and recent investment in Las Vegas by major sports leagues, the amount of existing gaming activity has increased steadily since the 2009 trough. In Clark County, gaming revenue has increased approximately 17.2% through 2019 since the gaming revenue trough in 2009.
THE INFORMATION IN THIS STRUCTURAL AND COLLATERAL TERM SHEET IS NOT COMPLETE AND MAY BE AMENDED PRIOR TO THE TIME OF SALE. THIS TERM SHEET IS NOT AN OFFER TO SELL THESE SECURITIES AND IT IS NOT A SOLICITATION OF AN OFFER TO BUY THESE SECURITIES IN ANY JURISDICTION WHERE THE OFFER OR SALE IS NOT PERMITTED.
61 of 166
| Structural and Collateral Term Sheet | Benchmark 2021-B24 | |
| MGM Grand & Mandalay Bay | ||
| Market Overview(1) | ||||||||||||
| Category | 1990 | 2009 | 2010 | 2011 | 2012 | 2013 | 2014 | 2015 | 2016 | 2017 | 2018 | 2019 |
| Visitor Volume (thousands) | 20,954 | 36,351 | 37,335 | 38,929 | 39,727 | 39,668 | 41,127 | 42,312 | 42,936 | 42,214 | 42,117 | 42,524 |
| YoY % Change | NAP | -3.0% | 2.7% | 4.3% | 2.1% | -0.1% | 3.7% | 2.9% | 1.5% | -1.7% | -0.2% | 1.0% |
| Clark County Gaming Revenues ($mm) | $4,104 | $8,838 | $8,909 | $9,223 | $9,400 | $9,674 | $9,554 | $9,618 | $9,714 | $9,979 | $10,250 | $10,355 |
| YoY % Change | NAP | -9.8% | 0.8% | 3.5% | 1.9% | 2.9% | -1.2% | 0.7% | 1.0% | 2.7% | 2.7% | 1.0% |
| Hotel / Motel Rooms Inventory | 73,730 | 148,941 | 148,935 | 150,161 | 150,481 | 150,593 | 150,544 | 149,213 | 149,339 | 148,896 | 149,158 | 149,422 |
| YoY % Change | NAP | 6.0% | 0.0% | 0.8% | 0.2% | 0.1% | 0.0% | -0.9% | 0.1% | -0.3% | 0.2% | 0.2% |
| Airport Passenger Traffic (thousands) | 19,090 | 40,469 | 39,757 | 41,481 | 41,668 | 41,857 | 42,885 | 45,319 | 47,368 | 48,430 | 49,645 | 51,538 |
| YoY % Change | NAP | -8.2% | -1.8% | 4.3% | 0.4% | 0.5% | 2.5% | 5.7% | 4.5% | 2.2% | 2.5% | 3.8% |
| Convention Attendance (thousands) | 1,742 | 4,492 | 4,473 | 4,865 | 4,944 | 5,107 | 5,195 | 5,891 | 6,311 | 6,646 | 6,502 | 6,649 |
| YoY % Change | NAP | -23.9% | -0.4% | 8.8% | 1.6% | 3.3% | 1.7% | 13.4% | 7.1% | 5.3% | -2.2% | 2.3% |
| (1) | Source: Las Vegas Convention and Visitors Authority. |
The Las Vegas Strip hotel average occupancy has been approximately 90% over the last three years. The Las Vegas Strip average 2019 occupancy was 90.4% and average 2018 occupancy was 89.5%. The Las Vegas Strip average 2019 ADR of $143.31 increased 3.3% relative to the average 2018 ADR of $138.71.
| Historical Occupancy, ADR, RevPAR – Competitive Set | |||||||||
| MGM Grand Resort(1) | Competitive Set(2)(3) | MGM Grand Penetration Factor(2) | |||||||
| Year | Occupancy | ADR | RevPAR | Occupancy | ADR | RevPAR | Occupancy | ADR | RevPAR |
| December 31, 2017 | 92.1% | $181.76 | $167.36 | 92.0% | $181.95 | $167.10 | 100.2% | 100.0% | 100.3% |
| December 31, 2018 | 92.7% | $182.10 | $168.76 | 93.0% | $187.63 | $173.66 | 100.1% | 97.4% | 97.6% |
| December 31, 2019 | 91.4% | $190.29 | $173.85 | 94.0% | $193.23 | $181.41 | 98.7% | 98.6% | 97.3% |
| (1) | Source: Historical operating statements. |
| (2) | Source: Appraisal. |
| (3) | Includes: The Mirage, New York New York, Luxor, Caesars, Planet Hollywood, and Venetian/Palazzo. |
| Historical Occupancy, ADR, RevPAR – Competitive Set | |||||||||
| Mandalay Bay Resort(1) | Competitive Set(2)(3) | Mandalay Bay Penetration Factor(2) | |||||||
| Year | Occupancy | ADR | RevPAR | Occupancy | ADR | RevPAR | Occupancy | ADR | RevPAR |
| December 31, 2017 | 90.0% | $206.28 | $185.57 | 92.0% | $177.98 | $164.06 | 98.0% | 113.2% | 110.9% |
| December 31, 2018 | 90.2% | $203.96 | $183.96 | 93.0% | $183.94 | $171.13 | 97.4% | 109.2% | 106.4% |
| December 31, 2019 | 92.8% | $202.98 | $188.40 | 94.0% | $190.09 | $178.15 | 96.6% | 108.8% | 105.1% |
| (1) | Source: Historical operating statements. |
| (2) | Source: Appraisal. |
| (3) | Includes: The Mirage, New York New York, Luxor, Caesars, Planet Hollywood, and Venetian/Palazzo. |
Additional group business is expected to enter the market as a result of the delivery of Allegiant Stadium in August 2020 (across the street from the Mandalay Bay Property) which will serve as the home stadium for the Raiders NFL team. Non-gaming revenue in the Las Vegas market was approximately 65% of total revenue in 2019 compared to pre-recession levels of approximately 59% in 2007.
Each of the MGM Grand & Mandalay Bay Properties share the same competitive set. The primary competitive set for the MGM Grand & Mandalay Bay Properties consists of six hotels, which range in size from 2,024 to 7,117 rooms and collectively contain an aggregate 23,058 rooms. According to the appraisal, there are two mega resorts in the construction phase with planned delivery between 2021 and 2022. Resorts World Las Vegas is a 59-story Chinese-themed mega resort under construction at the former Stardust Resort and Casino site on the northern Las Vegas Strip with scheduled delivery by summer of 2021 according to the appraisal. The Drew is a 735-foot tall, 75% completed mega casino resort scheduled to be delivered by 2022.
| Comparable Properties(1) | |||||||
| Property Name | No. of Rooms | Year Opened | Meeting Space (sq. ft.) | Casino Space (sq. ft.) | Estimated 2019 Occ. | Estimated 2019 ADR | Estimated 2019 RevPAR |
| MGM Grand(2) | 4,998 | 1993 | 748,325 | 177,268 | 91.4% | $190.29 | $173.85 |
| Mandalay Bay(2) | 4,750 | 1999 | 2,100,000 | 152,159 | 92.8% | $202.98 | $188.40 |
| The Mirage | 3,044 | 1989 | 170,000 | 94,000 | 94.6% | $178.00 | $168.39 |
| New York New York | 2,024 | 1997 | 30,500 | 81,000 | 95.5% | $151.00 | $144.21 |
| Luxor | 4,397 | 1993 | 20,000 | 120,000 | 95.0% | $119.00 | $113.05 |
| Caesar’s Palace | 3,976 | 1966 | 300,000 | 124,200 | 93.0% | $221.00 | $205.53 |
| Planet Hollywood | 2,500 | 2000 | 20,000 | 64,500 | 90.0% | $185.00 | $166.50 |
| Venetian/Palazzo | 7,117 | 1999 | 450,000 | 335,878 | 94.6% | $237.00 | $224.20 |
| (1) | Source: Appraisal, unless otherwise indicated. |
| (2) | Source: Underwriting and Loan Sponsor provided information. |
THE INFORMATION IN THIS STRUCTURAL AND COLLATERAL TERM SHEET IS NOT COMPLETE AND MAY BE AMENDED PRIOR TO THE TIME OF SALE. THIS TERM SHEET IS NOT AN OFFER TO SELL THESE SECURITIES AND IT IS NOT A SOLICITATION OF AN OFFER TO BUY THESE SECURITIES IN ANY JURISDICTION WHERE THE OFFER OR SALE IS NOT PERMITTED.
62 of 166
| Structural and Collateral Term Sheet | Benchmark 2021-B24 | |
| MGM Grand & Mandalay Bay | ||
| Operating History and Underwritten Net Cash Flow(1) | ||||||||||
| 2015 | 2016 | 2017 | 2018 | 2019 | TTM(2) | Underwritten | Per Room | % of Total Revenue(3) | ||
| Occupancy | 92.5% | 92.4% | 91.0% | 91.5% | 92.1% | 71.4% | 92.1% | |||
| ADR | $179.08 | $187.27 | $193.58 | $192.62 | $196.52 | $187.46 | $196.52 | |||
| RevPAR | $165.56 | $172.97 | $176.24 | $176.18 | $180.94 | $133.76 | $180.94 | |||
| Hotel Revenue | $576,193,751 | $611,611,719 | $621,671,255 | $619,356,266 | $635,408,160 | $347,024,422 | $635,408,160 | $65,183 | 30.2% | |
| Casino Revenue | 461,726,103 | 438,253,825 | 459,676,698 | 492,001,712 | 379,532,959 | 264,556,936 | 379,532,959 | $38,934 | 18.0% | |
| F&B Revenue | 578,021,518 | 598,992,505 | 608,876,978 | 604,859,218 | 629,566,379 | 283,966,048 | 629,566,379 | $64,584 | 29.9% | |
| Other Revenue | 480,778,051 | 465,818,022 | 471,735,234 | 475,323,334 | 461,787,990 | 261,969,455 | 461,787,990(4) | $47,373 | 21.9% | |
| Total Revenue | $2,096,719,423 | $2,114,676,071 | $2,161,960,165 | $2,191,540,530 | $2,106,295,488 | $1,157,516,861 | $2,106,295,488 | $216,075 | 100.0% | |
| Hotel Expense | 230,915,708 | 235,477,994 | 249,304,637 | 255,303,612 | 265,201,312 | $176,427,144 | 265,201,312 | $27,206 | 41.7% | |
| Casino Expense | 253,918,628 | 213,245,938 | 229,109,011 | 226,996,812 | 223,320,361 | 168,325,682 | 223,320,361 | $22,909 | 58.8% | |
| F&B Expense | 428,952,166 | 429,128,035 | 433,970,578 | 437,033,184 | 449,487,794 | 231,438,278 | 449,487,794 | $46,111 | 71.4% | |
| Other Expense | 349,547,741 | 323,328,025 | 322,504,168 | 316,078,620 | 304,747,043 | 174,051,892 | 304,747,043 | $31,263 | 66.0% | |
| Total Departmental Expenses | $1,263,334,243 | $1,201,179,992 | $1,234,888,394 | $1,235,412,228 | $1,242,756,510 | $750,242,996 | $1,242,756,510 | $127,488 | 59.0% | |
| Gross Operating Income | $833,385,180 | $913,496,079 | $927,071,771 | $956,128,302 | $863,538,978 | $407,273,865 | $863,538,978 | $88,586 | 41.0% | |
| Total Undistributed Expenses(5) | 324,769,878 | 321,683,055 | 300,490,103 | 314,251,565 | 315,817,430 | 236,317,563 | 315,817,430 | $32,398 | 15.0% | |
| Gross Operating Profit | $508,615,302 | $591,813,024 | $626,581,668 | $641,876,737 | $547,721,548 | $170,956,302 | $547,721,548 | $56,188 | 26.0% | |
| Taxes | 16,605,853 | 16,929,584 | 15,852,622 | 17,309,478 | 18,451,931 | 19,252,702 | 18,451,931 | $1,893 | 0.9% | |
| Insurance | 6,711,471 | 6,110,026 | 5,691,838 | 7,197,993 | 9,189,264 | 12,039,683 | 9,189,264 | $943 | 0.4% | |
| Net Extraordinary Loss Add-back | 0 | 0 | 0 | 0 | 0 | 82,377,430 | 0 | $0 | 0.0% | |
| Total Operating Expenses | $1,611,421,445 | $1,545,902,657 | $1,556,922,957 | $1,574,171,264 | $1,586,215,135 | $935,475,514 | $1,586,215,135 | $162,722 | 75.3% | |
| EBITDAR | $485,297,978 | $568,773,414 | $605,037,208 | $617,369,266 | $520,080,353 | $222,041,347(7) | $520,080,353 | $53,353 | 24.7% | |
| Capital Expenditures(6) | 0 | 0 | 0 | 0 | 0 | 0 | 32,774,592 | $3,362 | 1.6% | |
| Net Cash Flow | $485,297,978 | $568,773,414 | $605,037,208 | $617,369,266 | $520,080,353 | $222,041,347 (7) | $487,305,761 | $49,990 | 23.1% | |
| (1) | Certain items such as interest expense, interest income, depreciation, amortization, debt service payments and any other non-recurring or non-operating items were excluded from the historical presentation and are not considered for the underwritten cash flow. |
| (2) | TTM column represents the trailing 12-month period ending September 30, 2020. |
| (3) | % of Total Revenue for Hotel Expense, Casino Expense, F&B Expense and Other Expenses are based on their corresponding aggregate revenue line item. |
| (4) | The most recent available breakout of the Signature Condo-Hotel revenue as a component of Other Revenue was from the November 2019 trailing 12-month period. |
| (5) | 2018 property administration expense was adjusted for the Mandalay Bay Property to exclude $21.8 million of one-time business interruption proceeds related to the October 1, 2017 shooting at a country concert in Las Vegas. |
| (6) | Underwritten Capital Expenditures is based on the 1.5% contractual FF&E reserve based on total net revenues (excluding net revenues associated with the Signature Condo-Hotel development at the MGM Grand Property for which FF&E is not reserved under the Master Lease). With respect to the Mandalay Bay Property, 5.0% FF&E Reserve was underwritten for the revenues associated with the closing date Four Seasons Management Agreement. |
| (7) | The TTM financials presented above reflect the suspension of operations at the Properties from March 17, 2020 through the end of the third calendar quarter of 2020. On May 1, 2020, MGM Resorts International reported in its first quarter Form 10-Q filing that, as a result of the temporary closure of its domestic properties (which include the MGM Grand & Mandalay Bay Properties) following the outbreak of COVID-19, its domestic properties (which include the MGM Grand & Mandalay Bay Properties) were effectively generating no revenue, and there were high levels of room and convention cancellation through the third quarter of 2020. On August 3, 2020, MGM reported in its second quarter Form 10-Q filing that, while throughout May, June and July 2020, it re-opened most of its properties with limited amenities and certain measures to mitigate the spread of COVID-19, such properties (which include the MGM Grand & Mandalay Bay Properties) may be subject to temporary, complete or partial shutdowns in the future. On November 3, 2020, MGM reported in its most recent third quarter Form 10-Q filing that throughout the second and third quarters of 2020, all of its properties reopened but are operating without certain amenities and subject to certain occupancy limitations and therefore are generating revenues that are significantly lower than historical results, and that it has seen and expects to continue to see weakened demand in light of consumer fears and general economic uncertainty, among other things. The September 2020 TTM financials presented above reflect the suspension of operations at (i) the MGM Grand Property from March 17, 2020 through June 3, 2020 and (ii) The Shoppes at Mandalay Bay Place and the Mandalay Bay resort from March 17, 2020 through June 24, 2020 and June 30, 2020, respectively, and the occupancy limitations imposed on the MGM Grand & Mandalay Bay Properties by the state of Nevada during the third quarter of 2020. Upon reopening, both MGM Grand & Mandalay Bay Properties were operating with limited amenities and certain COVID-19 mitigation procedures. The Lender UW presented above is based on 2019 financials, which reflect a full-year of uninterrupted operations at the MGM Grand & Mandalay Bay Properties. |
THE INFORMATION IN THIS STRUCTURAL AND COLLATERAL TERM SHEET IS NOT COMPLETE AND MAY BE AMENDED PRIOR TO THE TIME OF SALE. THIS TERM SHEET IS NOT AN OFFER TO SELL THESE SECURITIES AND IT IS NOT A SOLICITATION OF AN OFFER TO BUY THESE SECURITIES IN ANY JURISDICTION WHERE THE OFFER OR SALE IS NOT PERMITTED.
63 of 166
| Structural and Collateral Term Sheet | Benchmark 2021-B24 | |
| MGM Grand & Mandalay Bay | ||
Property Management. The MGM Grand & Mandalay Bay Properties are currently managed by the MGM Tenant and/or the applicable MGM/Mandalay Operating Subtenant, and there are no management agreements currently in effect with the Borrowers and, other than the management agreement with respect to the Four Seasons hotel and the management agreement with respect to certain signature hotel units (which, for the avoidance of doubt, are not part of the MGM Grand & Mandalay Bay Properties), for which management fees related thereto are included as part of the collateral, there are no management agreements currently in effect with respect to the MGM Grand & Mandalay Bay Properties.
Escrows and Reserves. At loan origination, the Borrowers were not required to deposit any upfront reserves. For so long as the MGM Grand & Mandalay Bay Properties are subject to the Master Lease, there are no ongoing reserves required under the MGM Grand & Mandalay Bay Whole Loan documents.
Under the Master Lease, the MGM Tenant is obligated to make monthly deposits of 1.50% of net revenues at an eligible institution to be used for FF&E and qualifying capital expenditures (the “OpCo FF&E Reserve Account”). MGM Tenant granted the Borrowers a security interest in the OpCo FF&E Reserve Account, and the Borrowers collaterally assigned the Borrowers’ security interest in the OpCo FF&E Reserve Account to the mortgage lender.
Tax Reserve – For so long as the MGM Grand & Mandalay Bay Properties are subject to the Master Lease, no reserves for real estate taxes are required under the MGM Grand & Mandalay Bay Whole Loan documents. If the MGM Grand & Mandalay Bay Properties are not subject to the Master Lease, solely if a MGM Grand & Mandalay Bay Trigger Period is in effect, the MGM Grand & Mandalay Bay Whole Loan documents provide for ongoing monthly reserves for real estate taxes in an amount equal to 1/12 of the real estate taxes that the lender estimates will be payable during the next 12 months at least 30 days prior to their respective due dates. Notwithstanding the foregoing, the requirement for such monthly reserves will be reduced dollar for dollar by any taxes paid or reserved for by a brand manager or casino operator pursuant to a brand management or casino management agreement relating to the MGM Grand & Mandalay Bay Properties.
Insurance Reserve – For so long as the MGM Grand & Mandalay Bay Properties are subject to the Master Lease, no reserves for insurance premiums are required under the MGM Grand & Mandalay Bay Whole Loan documents. If the MGM Grand & Mandalay Bay Properties are not subject to the Master Lease, solely if a MGM Grand & Mandalay Bay Trigger Period is in effect, the MGM Grand & Mandalay Bay Whole Loan documents provide for ongoing monthly reserves for insurance premiums in an amount equal to 1/12 of the insurance premiums that the lender estimates will be payable for the renewal of the insurance policies at least 30 days prior to the expiration thereof. Notwithstanding the foregoing, the requirement for such monthly reserves will be reduced dollar for dollar by any insurance premiums paid or reserved for by a brand manager or casino operator pursuant to a brand management or casino management agreement relating to the MGM Grand & Mandalay Bay Properties. In addition, such monthly reserves will not be required so long as (i) no event of default is continuing, and (ii) the insurance coverage for the MGM Grand & Mandalay Bay Properties are included in a blanket policy reasonably acceptable to the lender.
FF&E Reserve – For so long as the MGM Grand & Mandalay Bay Properties are not subject to the Master Lease, (i) on each payment date during a MGM Grand & Mandalay Bay Trigger Period, the Borrowers will be required to make a deposit equal to (a) 4.0% of net revenue from guest rooms and Borrower-managed food and beverage operations and (b) 0.5% of all other net revenue (other than non-recurring items), in each case for the calendar month that is two months prior to the calendar month in which the applicable deposit to the replacement reserve fund is to be made (the sum of (a) and (b), the “Replacement Reserve Monthly Deposit”), and (ii) if a MGM Grand & Mandalay Bay Trigger Period does not exist, on the first payment date of each calendar quarter, an amount equal to the lesser of (x) the Replacement Reserve Current Year Lookback Deficiency (as defined below) and (y) the Replacement Reserve Five Year Lookback Deficiency (as defined below) (the lesser of (x) and (y), the “Replacement Reserve Quarterly Deposit”), provided that for so long as any individual MGM Grand & Mandalay Bay Property is managed by (x) a brand manager pursuant to a brand management agreement and/or (y) a casino operator pursuant to a casino management agreement, the amounts required to be funded as a Replacement Reserve Monthly Deposit or a Replacement Reserve Quarterly Deposit will be reduced on a dollar-for-dollar basis by any amounts deposited into a manager account for replacements, PIP work or brand mandated work for the applicable calendar months as set forth in the annual budget and required pursuant to the terms of the brand management agreement and/or casino management agreement if the Borrowers deliver evidence reasonably satisfactory to the mortgage lender that such deposit has been made.
A “Replacement Reserve Current Year Lookback Deficiency” means an amount equal to (x) the aggregate amount of Replacement Reserve Monthly Deposits which would have been funded from the beginning of the then calendar year to the date of determination had a MGM Grand & Mandalay Bay Trigger Period been in effect for the entirety of such period less (y) the sum of (1) the aggregate amount expended on replacements, PIP work and brand mandated work during such calendar year to date and (2) the aggregate amount funded into the Replacement Reserve during such calendar year to date; provided that, if the foregoing calculation results in a negative number, the Replacement Reserve Current Year Lookback Deficiency will be deemed to be zero.
A “Replacement Reserve Five Year Lookback Deficiency” means (i) zero, with respect to any period before December 31, 2024, and (ii) from and after January 1, 2025, an amount equal to (x) 4.0% of net revenue from guest rooms and Borrower-managed food and beverage operations and 0.5% of all other net revenues (other than non-recurring items) during the Replacement Reserve Five Year Lookback Period (as defined below) less (y) the sum of (1) the aggregate amount expended on replacements, PIP Work and brand mandated work during the Replacement Reserve Five Year Lookback Period (including amounts expended by MGM Tenant pursuant to the express
THE INFORMATION IN THIS STRUCTURAL AND COLLATERAL TERM SHEET IS NOT COMPLETE AND MAY BE AMENDED PRIOR TO THE TIME OF SALE. THIS TERM SHEET IS NOT AN OFFER TO SELL THESE SECURITIES AND IT IS NOT A SOLICITATION OF AN OFFER TO BUY THESE SECURITIES IN ANY JURISDICTION WHERE THE OFFER OR SALE IS NOT PERMITTED.
64 of 166
| Structural and Collateral Term Sheet | Benchmark 2021-B24 | |
| MGM Grand & Mandalay Bay | ||
terms and conditions of the Master Lease) and (2) the aggregate amounts funded into the Replacement Reserve during such Replacement Reserve Five Year Lookback Period; provided, if the foregoing calculation results in a negative number, the Replacement Reserve Five Year Lookback Deficiency will be deemed to be zero.
A “Replacement Reserve Five Year Lookback Period” means each five year period (on a rolling basis) with the first period commencing on January 1, 2020 and expiring on December 31, 2024 and the second period commencing on January 1, 2021 and expiring on December 31, 2025.
Lockbox / Cash Management. The MGM Grand & Mandalay Bay Whole Loan is subject to a hard lockbox with springing cash management. Amounts on deposit in the lockbox account will be disbursed to the Borrower’s operating account in accordance with the clearing account agreement. After the occurrence and during the continuation of a MGM Grand & Mandalay Bay Trigger Period (as defined below), the Borrowers will establish a cash management account and, at least two times per week, the clearing account bank will sweep funds from the lockbox accounts into the cash management account in accordance with the clearing account agreement and the cash management bank will apply funds on deposit in the order of priority described in the MGM Grand & Mandalay Bay Whole Loan documents, with the remaining excess cash flow (“Excess Cash Flow Reserve”) to be held as additional collateral for the MGM Grand & Mandalay Bay Whole Loan (and, after the ARD, all amounts in the Excess Cash Flow Reserve account will be used to pay the monthly additional interest amount and applied to the principal of the MGM Grand & Mandalay Bay Whole Loan).
A “MGM Grand & Mandalay Bay Trigger Period” means a period (A) commencing upon the occurrence of any of the following: (i) the Debt Service Coverage Ratio (“DSCR”) falling below 2.50x (“DSCR Threshold”) for two consecutive quarters (“DSCR Trigger”), (ii) the MGM Tenant is subject to a bankruptcy action (“OpCo Bankruptcy”), (iii) an event of default under the MGM Grand & Mandalay Bay Whole Loan has occurred and is continuing (“EOD Trigger”), (iv) an OpCo Trigger Event (as defined below) or (v) the Borrowers fail to repay the MGM Grand & Mandalay Bay Whole Loan in full on or before the ARD and (B) terminating upon (i) in the event of a DSCR Trigger, either such time that the DSCR exceeds the DSCR Threshold for two consecutive quarters or the Borrowers make voluntary prepayments of the MGM Grand & Mandalay Bay Whole Loan in accordance with the terms of the MGM Grand & Mandalay Bay Whole Loan documents in amounts necessary to achieve a DSCR greater than or equal to the DSCR Threshold (without any obligation to wait two consecutive quarters), (ii) in the event of an OpCo Bankruptcy, the assumption of the Master Lease in such bankruptcy proceeding or the replacement of the MGM Tenant as provided in the MGM Grand & Mandalay Bay Whole Loan documents (or in the event the Master Lease is terminated and not replaced, the DSCR is equal to or greater than the DSCR Threshold or the Borrowers make voluntary prepayments of the MGM Grand & Mandalay Bay Whole Loan in accordance with the terms of the MGM Grand & Mandalay Bay Whole Loan documents in amounts necessary to achieve a DSCR greater than or equal to the DSCR Threshold (without any obligation to wait two consecutive quarters)), (iii) in the event of an OpCo Trigger Period, any OpCo Trigger Event Cure (as defined below) and (iv) in the event of an EOD Trigger, no other events of default exist and are continuing and the mortgage lender will have accepted a cure by the Borrowers of such event of default. For the avoidance of doubt, in no instance will a MGM Grand & Mandalay Bay Trigger Period caused by the failure of the Borrowers to repay the MGM Grand & Mandalay Bay Whole Loan in full on or before the ARD be capable of being cured or deemed to expire. The Borrowers sent a notice to the mortgage lender on February 8, 2021, which provides that the Borrowers expect that, when the mortgage lender determines the DSCR as of December 31, 2020, a MGM Grand & Mandalay Bay Trigger Period will occur under the terms of the MGM Grand & Mandalay Bay Whole Loan documents. Accordingly, the Borrowers have provided notice to the mortgage lender of their desire to elect to deliver an excess cash flow guaranty for the benefit of the mortgage lender in lieu of depositing all excess cash flow into a reserve account in accordance with the terms and conditions of the MGM Grand & Mandalay Bay Whole Loan documents. The Borrowers proposed (i) BREIT Prime Lease Holdings LLC and (ii) MGM Growth Properties Operating Partnership LP to be the guarantors under the excess cash flow guaranty.
An “OpCo Trigger Event” means the occurrence and continuance of all of the following conditions simultaneously: (i) an event of default under the Master Lease has occurred and is continuing; (ii) (x) the managing member of the Joint Venture is an affiliate of the Borrowers other than MGP or MGP OP that is controlled by MGP or MGP OP and (y) MGP OP is controlled by MGM and (iii) such managing member is permitted under the terms of the Joint Venture agreement to take any of the following actions without the consent of (x) BCORE Windmill Parent LLC (the member of the Joint Venture that is affiliated with BREIT OP) (a) granting any consent, approval or wavier or making any election under the Master Lease, Lease Guaranty or other related lease documents, (b) entering into any amendment, supplement or modification to the Master Lease, Lease Guaranty or other related lease documents, or (c) declaring an event of default under the Master Lease, Lease Guaranty or other related lease documents or (y) if applicable, a Qualified Transferee (as defined in the MGM Grand & Mandalay Bay Whole Loan documents) that is not an affiliate of MGM Tenant which owns a 15% or greater direct and/or indirect interest in the Borrowers.
A “Lease Guaranty” means that certain Guaranty of Lease Documents dated as of February 14, 2020, made by MGM in favor of the Borrowers.
An “OpCo Trigger Event Cure” means, as applicable, (i) the Borrowers have provided evidence to the mortgage lender of the cure of the event of default under the Master Lease, (ii) the Borrowers have waived the event of default under the Master Lease, provided that such waiver was approved by the mortgage lender, or (iii) in the event that the event of default results in the termination of the Master Lease, either (a) (I) the Borrowers and MGM Tenant have entered into a new lease on terms and conditions substantially similar to those contained in the Master Lease as of the origination of the MGM Grand & Mandalay Bay Whole Loan and (II) the Master Lease opinion delivery requirements have been satisfied, or (b) after giving effect to the termination of the Master Lease the DSCR is equal to or greater
THE INFORMATION IN THIS STRUCTURAL AND COLLATERAL TERM SHEET IS NOT COMPLETE AND MAY BE AMENDED PRIOR TO THE TIME OF SALE. THIS TERM SHEET IS NOT AN OFFER TO SELL THESE SECURITIES AND IT IS NOT A SOLICITATION OF AN OFFER TO BUY THESE SECURITIES IN ANY JURISDICTION WHERE THE OFFER OR SALE IS NOT PERMITTED.
65 of 166
| Structural and Collateral Term Sheet | Benchmark 2021-B24 | |
| MGM Grand & Mandalay Bay | ||
than 2.50x for two consecutive quarters or the Borrowers make voluntary prepayments in accordance with the terms of the MGM Grand & Mandalay Bay Whole Loan documents in an amount necessary to achieve a DSCR equal to or greater than 2.50x.
Current Mezzanine or Subordinate Indebtedness. In addition to the MGM Grand & Mandalay Bay Loan, the MGM Grand & Mandalay Bay Properties also secure the MGM Grand & Mandalay Bay Senior Notes not included in the Benchmark 2021-B24 mortgage trust, which have an aggregate Cut-off Date principal balance of $1,554,214,333, and the MGM Grand & Mandalay Bay Junior Notes (which have an aggregate Cut-off Date principal balance of $1,365,800,000). The MGM Grand & Mandalay Bay Senior Notes not included in the Benchmark 2021-B24 trust and the MGM Grand & Mandalay Bay Junior Notes accrue interest at the same rate as the MGM Grand & Mandalay Bay Loan. The MGM Grand & Mandalay Bay Loan is entitled to payments of interest and principal on a pro rata and pari passu basis with the MGM Grand & Mandalay Bay Senior Notes not included in the Benchmark 2021-B24 mortgage trust. The MGM Grand & Mandalay Bay Loan and the MGM Grand & Mandalay Bay Senior Notes not included in the Benchmark 2021-B24 mortgage trust are generally senior to the MGM Grand & Mandalay Bay Junior Notes.
Future Mezzanine or Subordinate Indebtedness Permitted. The MGM Grand & Mandalay Bay Borrowers have a one-time right to borrow a mezzanine loan subordinate to the MGM Grand & Mandalay Bay Whole Loan (“Mezzanine Loan”), subject to credit and legal criteria specified in the MGM Grand & Mandalay Bay Whole Loan documents, including, without limitation: (i) a combined maximum loan to value ratio (based on appraisals ordered by the lender in connection with the closing of the Mezzanine Loan and calculated based on the outstanding principal balance of the MGM Grand & Mandalay Bay Whole Loan and the initial principal amount of the Mezzanine Loan) of 67.0%, (ii) a debt service coverage ratio at the closing of the Mezzanine Loan at least equal to 4.81x, in each case, inclusive of the additional mezzanine debt and (iii) an intercreditor agreement reasonably satisfactory to the lender. The lender’s receipt of a rating agency confirmation will not be required in connection with the Mezzanine Loan.
Notwithstanding the foregoing, (1) during a MGM Grand & Mandalay Bay Trigger Period (and for so long as no event of default has occurred and is continuing), in the event that the Mezzanine Loan (or any portion thereof) is directly or indirectly or beneficially owned by the MGM Grand & Mandalay Bay Borrowers, mezzanine borrower or a “broad affiliate” (as defined in the MGM Grand & Mandalay Whole Loan documents) of the Borrowers or mezzanine borrower (“Affiliated Mezzanine Lender”), in no instance will the Affiliated Mezzanine Lender be permitted to receive late charges, principal (other than the pro rata prepayment of the Mezzanine Loan upon the release of an individual Property or prepayment of the MGM Grand & Mandalay Bay Whole Loan in accordance with the terms and conditions of the MGM Grand & Mandalay Bay Whole Loan documents and the Mezzanine Loan documents) or interest at the default rate, even if an event of default has occurred and is continuing under the Mezzanine Loan and such Affiliated Mezzanine Lender will only be permitted to receive interest at the non-default rate on a monthly basis, (2) during a MGM Grand & Mandalay Bay Trigger Period (and for so long as no event of default has occurred and is continuing under the MGM Grand & Mandalay Bay Whole Loan documents), for so long as the whole Mezzanine Loan is not directly or indirectly or beneficially owned by an Affiliated Mezzanine Lender, the mezzanine lender will receive on a monthly basis interest at the non-default rate and, if an event of default has occurred and is continuing under the Mezzanine Loan, funds sufficient to pay any other amounts then due under the Mezzanine Loan and the Mezzanine Loan documents (other than the payment of the outstanding principal amount of the Mezzanine Loan on the maturity date of the Mezzanine Loan whether on the scheduled date for such payment or earlier due to an acceleration of the Mezzanine Loan) and (3) after the ARD, in no instance will any mezzanine lender be permitted to receive any payments whatsoever.
Partial Release. So long as no event of default has occurred and is continuing (other than as set forth below), the Borrowers may at any time release an individual MGM Grand & Mandalay Bay Property from the MGM Grand & Mandalay Bay Whole Loan by prepaying the applicable Release Percentage (as defined below) of the ALA of the subject individual property (including any yield maintenance premium, if required), and subject to the terms and conditions in the MGM Grand & Mandalay Bay Whole Loan documents, including, without limitation: (i) the DSCR after giving effect to such release is at least equal to 4.81x; (ii) continued compliance with the single purpose entity requirements contained in the MGM Grand & Mandalay Bay Whole Loan documents; (iii) payment to an agent or servicer of the then current and customary fee by such persons for such releases in an amount not to exceed $2,000.00 and any reasonable legal fees or other out-of-pocket costs incurred by the lender to effect the release and any applicable prepayment premiums (provided the legal fees may not exceed $10,000.00); (iv) payment of all recording charges, filing fees, taxes or other similar expenses payable in connection therewith; (v) compliance with applicable REMIC requirements relating to the REMIC 125% LTV test for release which may be satisfied by delivery of any of the following if permitted by REMIC requirements: an existing or updated appraisal, a broker’s price opinion or other written determination of value using a commercially reasonable valuation method, in each case satisfactory to the lender, but will be based solely on the value of real property and will exclude personal property and going-concern value; and (vi) if the property is subject to the Master Lease, the Borrowers removing the released individual property from the Master Lease and entering into a new triple-net lease with respect to the remaining individual property on substantially the same terms as the Master Lease (collectively, the “Release Conditions”).
A “Release Percentage” means, with respect to any individual MGM Grand & Mandalay Bay Property, 105.0% until such time as the outstanding principal balance of the MGM Grand & Mandalay Bay Whole Loan is reduced to $2,250,000,000 (the “Release Percentage Threshold”), and 110.0% thereafter. In calculating the Release Amount for an individual Property, the Release Percentage may initially be one hundred and five percent (105%) until the application of a portion of such prepayment would reach the Release Percentage Threshold and with respect to any remaining prepayment for such individual Property, the Release Percentage would be one hundred and ten percent (110%).
THE INFORMATION IN THIS STRUCTURAL AND COLLATERAL TERM SHEET IS NOT COMPLETE AND MAY BE AMENDED PRIOR TO THE TIME OF SALE. THIS TERM SHEET IS NOT AN OFFER TO SELL THESE SECURITIES AND IT IS NOT A SOLICITATION OF AN OFFER TO BUY THESE SECURITIES IN ANY JURISDICTION WHERE THE OFFER OR SALE IS NOT PERMITTED.
66 of 166
| Structural and Collateral Term Sheet | Benchmark 2021-B24 | |
| MGM Grand & Mandalay Bay | ||
Notwithstanding the foregoing, in the event that the DSCR following the release would not satisfy the DSCR requirement in clause (i) of the Release Conditions, and such release is in connection with an arms’ length transaction with an unrelated third party, the Borrowers will be permitted to release the subject property and the amount that will be required to be prepaid (or defeased) in connection with such Release will equal the greater of (I) the Release Percentage of the ALA for such individual property, together with, to the extent the release does not occur in connection with a partial defeasance, any yield maintenance premium required (if any) and (II) the lesser of (x) one hundred percent (100.0%) of the net sales proceeds for the sale of such individual property (net of reasonable and customary closing costs associated with the sale of such individual property) and (y) an amount necessary to, after giving effect to such release of the individual property, achieve the DSCR requirement in the preceding paragraph.
The Borrowers may release any defaulting individual property, without the payment of any yield maintenance premium, in order to cure a default or an event of default related to such individual property, subject to the satisfaction of other terms and conditions in the MGM Grand & Mandalay Bay Whole Loan documents (including, without limitation, Release Conditions (other than clause (i)) (“Default Release”). In addition, the Borrowers may release an individual property (including to an affiliate) if the estimated net proceeds following any casualty or condemnation at such individual Property will be equal to or greater than (x) 25.0% of its ALA, or (y) 5.0% of its ALA (subject to the satisfaction of other terms and conditions in the MGM Grand & Mandalay Bay Whole Loan documents) upon satisfaction of clauses (iii), (iv) and (v) of the Release Conditions above and prepayment of the MGM Grand & Mandalay Bay Whole Loan in an amount equal to the net proceeds (up to an amount equal to the Release Percentage) for such individual property (“Special Release”).
THE INFORMATION IN THIS STRUCTURAL AND COLLATERAL TERM SHEET IS NOT COMPLETE AND MAY BE AMENDED PRIOR TO THE TIME OF SALE. THIS TERM SHEET IS NOT AN OFFER TO SELL THESE SECURITIES AND IT IS NOT A SOLICITATION OF AN OFFER TO BUY THESE SECURITIES IN ANY JURISDICTION WHERE THE OFFER OR SALE IS NOT PERMITTED.
67 of 166
| Structural and Collateral Term Sheet | Benchmark 2021-B24 | |
| Phillips Point | ||
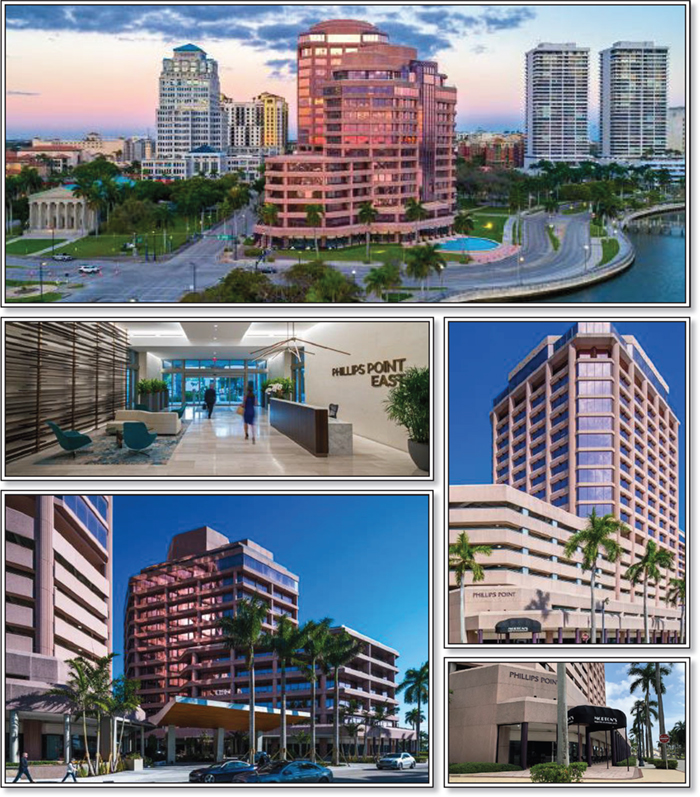
THE INFORMATION IN THIS STRUCTURAL AND COLLATERAL TERM SHEET IS NOT COMPLETE AND MAY BE AMENDED PRIOR TO THE TIME OF SALE. THIS TERM SHEET IS NOT AN OFFER TO SELL THESE SECURITIES AND IT IS NOT A SOLICITATION OF AN OFFER TO BUY THESE SECURITIES IN ANY JURISDICTION WHERE THE OFFER OR SALE IS NOT PERMITTED.
68 of 166
| Structural and Collateral Term Sheet | Benchmark 2021-B24 | |
| Phillips Point | ||

THE INFORMATION IN THIS STRUCTURAL AND COLLATERAL TERM SHEET IS NOT COMPLETE AND MAY BE AMENDED PRIOR TO THE TIME OF SALE. THIS TERM SHEET IS NOT AN OFFER TO SELL THESE SECURITIES AND IT IS NOT A SOLICITATION OF AN OFFER TO BUY THESE SECURITIES IN ANY JURISDICTION WHERE THE OFFER OR SALE IS NOT PERMITTED.
69 of 166
| Structural and Collateral Term Sheet | Benchmark 2021-B24 | |
| Phillips Point | ||
THE INFORMATION IN THIS STRUCTURAL AND COLLATERAL TERM SHEET IS NOT COMPLETE AND MAY BE AMENDED PRIOR TO THE TIME OF SALE. THIS TERM SHEET IS NOT AN OFFER TO SELL THESE SECURITIES AND IT IS NOT A SOLICITATION OF AN OFFER TO BUY THESE SECURITIES IN ANY JURISDICTION WHERE THE OFFER OR SALE IS NOT PERMITTED.
70 of 166
| Structural and Collateral Term Sheet | Benchmark 2021-B24 | |
| Phillips Point | ||
| Mortgage Loan Information | Property Information | |||
| Mortgage Loan Seller: | GSMC | Single Asset / Portfolio: | Single Asset | |
| Original Principal Balance(1): | $75,000,000 | Title: | Fee | |
| Cut-off Date Principal Balance(1): | $75,000,000 | Property Type - Subtype: | Office – CBD | |
| % of Pool by IPB: | 6.5% | Net Rentable Area (SF): | 448,885 | |
| Loan Purpose: | Acquisition | Location: | West Palm Beach, FL | |
| Borrower: | 777 South Flagler Associates | Year Built / Renovated: | 1985, 1988 / 2018-2020 | |
| LLC | Occupancy: | 90.5% | ||
| Loan Sponsor: | The Related Companies, Inc. | Occupancy Date: | 12/1/2020 | |
| Interest Rate: | 3.340025% | Number of Tenants: | 31 | |
| Note Date: | 1/15/2021 | 2017 NOI: | $14,626,020 | |
| Maturity Date: | 2/6/2031 | 2018 NOI: | $16,173,983 | |
| Interest-only Period: | 120 months | 2019 NOI: | $15,603,469 | |
| Original Term: | 120 months | TTM NOI (as of 11/2020): | $17,417,607 | |
| Original Amortization: | None | UW Economic Occupancy(6): | 92.5% | |
| Amortization Type: | Interest Only | UW Revenues: | $28,497,504 | |
| Call Protection(2): | L(25),Def(90),O(5) | UW Expenses: | $9,339,815 | |
| Lockbox / Cash Management: | Hard / Springing | UW NOI(6): | $19,157,689 | |
| Additional Debt(1)(3): | Yes | UW NCF(6): | $18,665,904 | |
| Additional Debt Balance(1)(3): | $123,520,000 / $30,540,000 | Appraised Value / Per SF(6)(7): | $289,000,000 / $644 | |
| Additional Debt Type(1)(3): | Pari Passu / Mezzanine Loan | Appraisal Date: | 12/15/2020 | |
| Escrows and Reserves(4) | Financial Information(1)(6) | ||||||
| Initial | Monthly | Initial Cap | Whole Loan | Total Debt | |||
| Taxes: | $0 | Springing | N/A | Cut-off Date Loan / SF: | $442 | $510 | |
| Insurance: | $0 | Springing | N/A | Maturity Date Loan / SF: | $442 | $510 | |
| Replacement Reserves: | $0 | $0 | N/A | Cut-off Date LTV(7): | 68.7% | 79.3% | |
| TI/LC: | $6,650,000 | Springing | $6,650,000 | Maturity Date LTV(7): | 68.7% | 79.3% | |
| Other(5): | $2,325,042 | $0 | N/A | UW NCF DSCR: | 2.78x | 2.10x | |
| UW NOI Debt Yield: | 9.7% | 8.4% | |||||
| Sources and Uses | ||||||
| Sources | Proceeds | % of Total | Uses | Proceeds | % of Total | |
| Whole Loan | $198,520,000 | 68.1% | Purchase Price | $281,850,000 | 96.6% | |
| Mezzanine Loan | 30,540,000 | 10.5% | Upfront Reserves | 8,975,042 | 3.1% | |
| Principal’s New Cash Contribution | 62,659,814 | 21.5% | Closing Costs | 894,772 | 0.3% | |
| Total Sources | $291,719,814 | 100.0% | Total Uses | $291,719,814 | 100.0% | |
| (1) | The Phillips Point Loan (as defined below) is part of a whole loan evidenced by four pari passu notes, with an aggregate outstanding principal balance as of the Cut-off Date of $198.52 million. The Financial Information presented in the chart above reflects the Cut-off Date Balance of the $198.52 million Phillips Point Whole Loan (as defined below). For additional information, see “The Loan” herein. |
| (2) | The defeasance lockout period will be at least 25 payment dates beginning from the origination date. Defeasance of the Phillips Point Whole Loan is permitted at any time on or after the first payment date following the earlier to occur of (i) January 15, 2024 and (ii) two years from the closing date of the securitization that includes the last note to be securitized. The assumed defeasance lockout period of 25 months is based on the expected closing date of the Benchmark 2021-B24 securitization in March 2021. The actual defeasance lockout period may be longer. |
| (3) | See “Current Mezzanine or Subordinate Indebtedness” below. |
| (4) | For a full description of Escrows and Reserves, please refer to “Escrows and Reserves” below. |
| (5) | Other Initial reserve consists of immediate repair escrows of $768,881.30 and unfunded obligations of $1,556,161.06. |
| (6) | While the Phillips Point Whole Loan was originated after the emergence of the novel coronavirus pandemic and the economic disruption resulting from measures to combat the pandemic, the pandemic is an evolving situation and could impact the Phillips Point Whole Loan more severely than assumed in the underwriting of the Phillips Point Whole Loan and could adversely affect the NOI, NCF and occupancy information, as well as the appraised value and the DSCR, LTV and Debt Yield metrics presented above. See “Risk Factors—Special Risks—Coronavirus Pandemic Has Adversely Affected the Global Economy and Will Likely Adversely Affect the Performance of the Mortgage Loans” in the Preliminary Prospectus. |
| (7) | According to the appraisal, the Phillips Point Property (as defined below) had a “Hypothetical As-Is” appraised value of $289,000,000 as of December 15, 2020, which included the hypothetical that an additional $6.65 million would be reserved by the borrower for future tenant improvement allowances and leasing commissions which amount was held back at origination. Based on the “as-is” appraised value of $282,000,000 as of December 15, 2020, the Cut-off Date LTV and Maturity Date LTV are both 70.4%. |
THE INFORMATION IN THIS STRUCTURAL AND COLLATERAL TERM SHEET IS NOT COMPLETE AND MAY BE AMENDED PRIOR TO THE TIME OF SALE. THIS TERM SHEET IS NOT AN OFFER TO SELL THESE SECURITIES AND IT IS NOT A SOLICITATION OF AN OFFER TO BUY THESE SECURITIES IN ANY JURISDICTION WHERE THE OFFER OR SALE IS NOT PERMITTED.
71 of 166
| Structural and Collateral Term Sheet | Benchmark 2021-B24 | |
| Phillips Point | ||
The Loan. The Phillips Point mortgage loan (the “Phillips Point Loan”) is part of a whole loan consisting of four pari passu notes with an aggregate outstanding principal balance as of the Cut-off Date of $198.52 million (the “Phillips Point Whole Loan”), which is secured by the borrower’s fee simple interest in an office property located in West Palm Beach, Florida (the “Phillips Point Property”). The non-controlling notes A-2 and A-4, with an aggregate outstanding principal balance as of the Cut-off Date of $75.0 million, will be included in the Benchmark 2021-B24 trust; the Phillips Point Whole Loan is serviced under the pooling and servicing agreement for the Benchmark 2021-B23 securitization. The remaining notes have been, or are expected to be, contributed to one or more future securitization trusts. The Phillips Point Whole Loan, which accrues interest at an interest rate of 3.340025% per annum, was originated by Goldman Sachs Bank USA on January 15, 2021, had an aggregate original principal balance of $198.52 million and has an aggregate outstanding principal balance as of the Cut-off Date of $198.52 million. The proceeds of the Phillips Point Whole Loan were primarily used to purchase the Phillips Point Property, pay origination costs, and fund upfront reserves. The relationship between the holders of the Phillips Point Whole Loan is governed by a co-lender agreement as described under “Description of the Mortgage Pool—The Whole Loans—The Non-Serviced Pari Passu Whole Loans” in the Preliminary Prospectus. The Phillips Point Whole Loan had an initial term of 120 months and has a remaining term of 119 months as of the Cut-off Date. The Phillips Point Whole Loan requires monthly payments of interest only for the entire duration of the loan. The scheduled maturity date of the Phillips Point Whole Loan is the payment date in February 2031.
| Whole Loan Summary | |||||
| Note | Original Balance | Cut-off Date Balance | Note Holder | Controlling Piece | |
| A-1 | $75,000,000 | $75,000,000 | Benchmark 2021-B23 | Yes | |
| A-2 | $50,000,000 | $50,000,000 | Benchmark 2021-B24 | No | |
| A-3 | $48,520,000 | $48,520,000 | GSBI(1) | No | |
| A-4 | $25,000,000 | $25,000,000 | Benchmark 2021-B24 | No | |
| Whole Loan | $198,520,000 | $198,520,000 | |||
| (1) | Expected to be contributed to one or more future securitizations. |
The Borrower. The borrower is 777 South Flagler Associates LLC, a Delaware limited liability company. The borrower is structured to be a single purpose bankruptcy-remote entity, having an independent director in its organizational structure. Legal counsel delivered to the borrower a non-consolidation opinion in connection with the origination of the Phillips Point Whole Loan.
The Loan Sponsor. The loan sponsor is a principal of The Related Companies, Inc. (“Related”) and the non-recourse carveout guarantor is The Related Companies, Inc., (“Guarantor”) which is wholly owned, directly and indirectly, by a principal of the borrower. Related is an American privately owned real estate firm based in New York City with offices and major developments in Boston, Chicago, Los Angeles, Las Vegas, Miami / West Palm Beach, San Francisco, Abu Dhabi and London. Related manages a $60 billion real estate portfolio of assets owned or under development across 78,500 residential units and 30 million square feet of commercial space. Related is currently developing 360 Rosemary (approximately two miles from the Phillips Point Property) and is planning to develop One Flagler (less than one mile from the Phillips Point Property) office complexes, further highlighting the principal’s commitment to the area.
The Property. The Phillips Point Property is a 448,885 square foot office property located in West Palm Beach, Florida. The Phillips Point Property consists of an east and west tower that are 13 and 19 stories tall, respectively. The east tower includes ground floor retail tenants as well as parking garages. The Phillips Point Property was built on a 4.28-acre site in phases in 1985 and 1988 and was renovated throughout 2018 to 2020 with $15.2 million of the seller’s capital. These renovations include $4.7 million of lobby renovations in 2020, $1.7 million of elevator modernization in 2018, a $1.5 million plaza renovation in 2020, and a $1.4 million west garage façade renovation in 2018. Based on the underwritten rent roll dated December 1, 2020, the Phillips Point Property is currently 90.5% leased.
The largest tenant, Gunster, Yoakley, Valdes-Fauli (“Gunster”) (50,800 square feet; 11.3% of net rentable area; 10.7% of underwritten base rent) is a corporate law firm that was founded in West Palm Beach in 1925. Today, Gunster employs over 400 lawyers across 11 cities in Florida. Gunster’s services encompass real estate, government affairs, healthcare, international affairs, and technology law. Gunster’s lease began in October 1983 and expires in August 2024. The lease includes one, five-year extension option and two termination options effective December 31, 2021 and December 31, 2022.
The second largest tenant, Akerman, Senterfitt & Eidson (“Akerman”) (48,678 square feet; 10.8% of net rentable area; 11.1% of underwritten base rent) is a global law firm comprised of more than 700 lawyers and staff across 25 offices that focuses on middle market M&A and complex disputes in the financial services, real estate, energy and international sectors. Akerman’s lease began in September 2014 and expires in September 2028. The lease includes two, five-year extension options and two, one-time rights to reduce its premises and/or terminate its lease with respect to its entire premises effective October 31, 2023 or April 30, 2026, with nine months’ prior notice and payment of a reduction or termination fee.
The third largest tenant, Affiliated Managers Group (“AMG”) (38,499 square feet; 8.6% of net rentable area; 10.4% of underwritten base rent) is a global asset management company with $638 billion assets under management. AMG is a top 10 publicly traded manager who partners with global investment firms in order to offer over 500 financial products. AMG is a global firm with 41% of its clients residing outside of the United States and offices in London, Dubai, Hong Kong, Tokyo, and Sydney. AMG’s lease began in June 2007 and expires in March 2026. The lease includes two, five-year extension options and no termination options.
THE INFORMATION IN THIS STRUCTURAL AND COLLATERAL TERM SHEET IS NOT COMPLETE AND MAY BE AMENDED PRIOR TO THE TIME OF SALE. THIS TERM SHEET IS NOT AN OFFER TO SELL THESE SECURITIES AND IT IS NOT A SOLICITATION OF AN OFFER TO BUY THESE SECURITIES IN ANY JURISDICTION WHERE THE OFFER OR SALE IS NOT PERMITTED.
72 of 166
| Structural and Collateral Term Sheet | Benchmark 2021-B24 | |
| Phillips Point | ||
COVID-19 Update. As of February 22, 2021 the Phillips Point Property is open with tenants working remotely. Approximately 100% of tenants by square feet and underwritten base rent made their December 2020 rent payments and approximately 100% of tenants by square feet and underwritten base rent made their January 2021 rent payments. As of February 22, 2021, the Phillips Point Whole Loan is not subject to any modification or forbearance requests.
The Market. The Phillips Point Property is located in West Palm Beach, Florida. According to the appraisal, the Phillips Point Property is located within the West Palm Beach CBD submarket. The Phillips Point Property is considered a Class A office building.
The West Palm Beach CBD submarket contains 3,500,299 square feet of office inventory. In the third quarter of 2020, the overall Palm Beach County market had asking rents of $37.99, which remained in-line with the prior year’s asking rents. According to the appraisal, occupancy rates in the Palm Beach County market have remained relatively stable over the past year. In the third quarter of 2020, approximately 84% of all office space was occupied, which is the same occupancy rate as 2019.
| Competitive Set(1) | |||||
Property Name | City / State | Building SF | NOI/SF | Year Built / Renovated | Occupancy |
| Phillips Point | West Palm Beach, FL | 448,885(2) | $42.68(2) | 1985, 1988 / 2018-2020 | 90.5%(2) |
| Brickell City Centre Two & Three | Miami, FL | 263,384 | $29.09 | 2016 / NAP | 99.0% |
| 800 Brickell | Miami, FL | 209,122 | $22.02 | 1981 / 2012 | 74.0% |
| Brickell Citi Tower | Miami, FL | 290,840 | $19.12 | 1985 / 2015 | 81.0% |
| Sabadell Financial Center | Miami, FL | 522,892 | $24.82 | 2000 / NAP | 85.0% |
| 555 Washington Avenue | Miami Beach, FL | 63,166 | $29.36 | 2001 / NAP | 72.0% |
| (1) | Source: Appraisal. |
| (2) | Based on the underwritten rent roll dated as of December 1, 2020. |
| Historical and Current Occupancy | |||
| 2017(1) | 2018(1) | 2019(1) | Current(2) |
| 86.2% | 92.1% | 91.6% | 90.5% |
| (1) | Historical Occupancies are as of December 31 of each respective year. |
| (2) | Current Occupancy is based on the underwritten rent roll dated December 1, 2020. |
| Tenant Summary(1) | |||||||
| Tenant | Ratings Moody’s/Fitch/S&P(2) | Net Rentable Area (SF) | % of Total NRA | Base Rent PSF | % of Total Base Rent | Lease Expiration Date | |
| Gunster, Yoakley, Valdes-Fauli | NR / NR / NR | 50,800 | 11.3% | $36.37 | 10.7%% | 8/31/2024 | |
| Akerman, Senterfitt & Eidson(3) | NR / NR / NR | 48,678 | 10.8 | $39.42 | 11.1 | 9/30/2028 | |
| Affiliated Managers Group(4) | A3 / NR / BBB+ | 38,499 | 8.6% | $46.74 | 10.4% | 3/31/2026 | |
| Greenberg Traurig(5) | NR / NR / NR | 30,254 | 6.7% | $46.51 | 8.2% | 11/30/2027 | |
| Morgan Stanley | A2 / A / BBB+ | 26,463 | 5.9% | $35.67 | 5.5% | 10/31/2024 | |
| Holland & Knight | NR / NR / NR | 17,467 | 3.9% | $51.50 | 5.2% | 6/30/2025 | |
| Fox Rothschild | NR / NR / NR | 16,679 | 3.7% | $47.83 | 4.6% | 11/30/2027 | |
| Regus (RGN-WPB)(6) | NR / NR / NR | 16,154 | 3.6% | $45.90 | 4.3% | 4/30/2023 | |
| Reyes Holdings | NR / NR / NR | 16,103 | 3.6% | $40.60 | 3.8% | 6/30/2025 | |
| Goodrich Corporation (UTC) | NR / NR / NR | 14,516 | 3.2% | $53.04 | 4.5% | 1/31/2022 | |
| Total | 275,613 | 61.4% | $42.74 | 68.4% | |||
| Other Occupied | 130,824 | 29.1% | $41.69 | 31.6% | |||
| Total Occupied | 406,437 | 90.5% | $42.40 | 100.0% | |||
| Vacant | 42,448 | 9.5% | |||||
| Total | 448,885 | 100.0% | |||||
| (1) | Based on the underwritten rent roll dated December 1, 2020 and adjusted for the Regus (RGN-WPB) tenant’s bankruptcy. |
| (2) | In certain instances, ratings provided are those of the parent company of the entity shown, whether or not the parent company guarantees the lease. |
| (3) | Akerman has two, one-time rights to reduce its premises and/or terminate its lease with respect to its entire premises effective October 31, 2023 or April 30, 2026, with nine months’ prior notice and payment of a reduction or termination fee. |
| (4) | AMG has executed a lease and is currently paying rent on 15,176 square feet of space, but does not occupy the space. We cannot assure you that AMG will take occupancy as expected or at all. |
| (5) | Greenberg Traurig subleases 2,796 square feet to Frankel Loughran Starr & Vallone on a 24-month term through May 2021 at $34.00 per square foot. Greenberg Traurig has an option to extend the term for one period of 10 years. |
| (6) | Regus (RGN-WPB)’s parent company and certain affiliates have filed for bankruptcy, but Regus (RGN-WPB) is currently in-place and paying rent. We cannot assure you that Regus (RGN-WPB) will remain open or continue paying rent. |
THE INFORMATION IN THIS STRUCTURAL AND COLLATERAL TERM SHEET IS NOT COMPLETE AND MAY BE AMENDED PRIOR TO THE TIME OF SALE. THIS TERM SHEET IS NOT AN OFFER TO SELL THESE SECURITIES AND IT IS NOT A SOLICITATION OF AN OFFER TO BUY THESE SECURITIES IN ANY JURISDICTION WHERE THE OFFER OR SALE IS NOT PERMITTED.
73 of 166
| Structural and Collateral Term Sheet | Benchmark 2021-B24 | |
| Phillips Point | ||
| Lease Rollover Schedule(1)(2) | |||||||||||
| Year | Number of Leases Expiring | Net Rentable Area Expiring | % of NRA Expiring | Base Rent Expiring | % of Base Rent Expiring | Cumulative Net Rentable Area Expiring | Cumulative % of NRA Expiring | Cumulative Base Rent Expiring | Cumulative % of Base Rent Expiring | ||
| Vacant | NAP | 42,448 | 9.5% | NAP | NAP | 42,448 | 9.5% | NAP | NAP | ||
| MTM & 2021 | 2 | 5,866 | 1.3 | $189,872 | 1.1% | 48,314 | 10.8% | $189,872 | 1.1% | ||
| 2022 | 3 | 23,103 | 5.1 | 1,048,195 | 6.1 | 71,417 | 15.9% | $1,238,067 | 7.2% | ||
| 2023(3) | 1 | 16,154 | 3.6 | 741,469 | 4.3 | 87,571 | 19.5% | $1,979,536 | 11.5% | ||
| 2024 | 5 | 88,503 | 19.7 | 3,282,037 | 19.0 | 176,074 | 39.2% | $5,261,573 | 30.5% | ||
| 2025 | 9 | 72,110 | 16.1 | 3,193,971 | 18.5 | 248,184 | 55.3% | $8,455,544 | 49.1% | ||
| 2026 | 9 | 66,665 | 14.9 | 2,968,080 | 17.2 | 314,849 | 70.1% | $11,423,624 | 66.3% | ||
| 2027 | 5 | 58,895 | 13.1 | 2,688,269 | 15.6 | 373,744 | 83.3% | $14,111,892 | 81.9% | ||
| 2028 | 4 | 61,437 | 13.7 | 2,518,440 | 14.6 | 435,181 | 96.9% | $16,630,332 | 96.5% | ||
| 2029 | 0 | 0 | 0.0 | 0 | 0.0 | 435,181 | 96.9% | $16,630,332 | 96.5% | ||
| 2030 | 0 | 0 | 0.0 | 0 | 0.0 | 435,181 | 96.9% | $16,630,332 | 96.5% | ||
| 2031(4) | 1 | 4,571 | 1.0 | 198,839 | 1.2 | 439,752 | 98.0% | $16,829,170 | 97.6% | ||
| 2032 and Thereafter | 1 | 9,133 | 2.0 | 405,161 | 2.4 | 448,885 | 100.0% | $17,234,331 | 100.0% | ||
| Total | 40 | 448,885 | 100.0% | $17,234,331 | 100.0% | ||||||
| (1) | Certain tenants may have termination or contraction options that may become exercisable prior to the originally stated expiration date of the tenant lease that are not considered in this rollover schedule. |
| (2) | Based on the underwritten rent roll schedule dated December 1, 2020. |
| (3) | Includes one tenant, Regus (RGN-WPB) (16,154 square feet), whose parent company and certain affiliates have filed for bankruptcy, but is currently in-place and paying rent. We cannot assure you that Regus (RGN-WPB) will remain open or continue paying rent. | |
| (4) | Includes one tenant, Citizens Bank (4,571 square feet), who has executed a lease but has not yet taken occupancy or begun paying rent. Citizens Bank is currently building out its space and is in a free rent period. Citizens Bank is expected to take occupancy in March 2021 and begin paying rent in June 2021. We cannot assure you that Citizens Bank will take occupancy or begin paying rent as anticipated or at all. |
| Operating History and Underwritten Net Cash Flow | |||||||
2017 | 2018 | 2019 | TTM 11/30/2020 | Underwritten(1) | Per Square Foot | %(2) | |
| Base Rent(3) | $13,421,420 | $14,486,971 | $15,138,988 | $15,756,027 | $17,234,331 | $38.39 | 55.9% |
| Vacant Income | 0 | 0 | 0 | 0 | 2,309,680 | 5.15 | 7.5% |
| Gross Potential Rent | $13,421,420 | $14,486,971 | $15,138,988 | $15,756,027 | $19,544,011 | $43.54 | 63.4% |
| Total Reimbursements | 8,124,019 | 8,722,697 | 9,177,454 | 9,017,657 | 9,078,869 | 20.23 | 29.5% |
| Total Other Income | 1,864,579 | 1,982,106 | 1,832,332 | 1,672,514 | 2,184,304 | 4.87 | 7.1% |
| Net Rental Income | $23,410,018 | $25,191,774 | $26,148,774 | $26,446,198 | $30,807,184 | $68.63 | 100.0% |
| (Vacancy/Credit Loss) | 0 | 0 | (1,124,288) | (1,850) | (2,309,680) | (5.15) | (7.5)% |
| Effective Gross Income | $23,410,018 | $25,191,774 | $25,024,486 | $26,444,348 | $28,497,504 | $63.49 | 92.5% |
| Total Expenses | $8,783,998 | $9,017,791 | $9,421,017 | $9,026,741 | $9,339,815 | $20.81 | 32.8% |
| Net Operating Income | $14,626,020 | $16,173,983 | $15,603,469 | $17,417,607 | $19,157,689 | $42.68 | 67.2% |
| Total TI/LC, RR | 0 | 0 | 0 | 0 | 491,785 | 1.10 | 1.7% |
| Net Cash Flow | $14,626,020 | $16,173,983 | $15,603,469 | $17,417,607 | $18,665,904 | $41.58 | 65.5% |
| (1) | Underwritten Base Rent is based on the underwritten rent roll dated as of December 1, 2020. |
| (2) | % column represents percent of Net Rental Income for all revenue lines and represents percent of Effective Gross Income for the remainder of the fields. |
| (3) | Underwritten Base Rent includes one tenant, Regus (RGN-WPB) (16,154 square feet), whose parent company and certain affiliates have filed for bankruptcy, but is currently in-place and paying rent. Underwritten Base Rent also includes one tenant, Citizens Bank (4,571 square feet), who has executed a lease but has not yet taken occupancy or begun paying rent. Citizens Bank is currently building out its space and is in a free rent period. Citizens Bank is expected to take occupancy in March 2021 and begin paying rent in June 2021. Underwritten Base Rent also includes one tenant, AMG, who has executed a lease and is currently paying rent on 15,176 square feet of space, but does not occupy the space. We cannot assure you that these tenants will take occupancy, begin paying rent or continue paying rent as anticipated or at all. |
Property Management. The Phillips Point Property is managed by Cushman & Wakefield U.S., Inc.
Escrows and Reserves. At loan origination, the borrower deposited (i) approximately $1,556,161 into a reserve for certain unfunded obligations, such as unpaid tenant allowances, leasing commissions, and free rent and gap rent, (ii) approximately $768,881 into a deferred maintenance reserve relating to, among other things, roof repair, and (iii) $6,650,000 into a tenant improvements and leasing commissions reserve.
Tax Reserve. The borrower is required to deposit into a real estate tax reserve, on a monthly basis during the continuance of a Phillips Point Trigger Period (as defined below) or an event of default, 1/12 of the reasonably estimated annual real estate taxes.
THE INFORMATION IN THIS STRUCTURAL AND COLLATERAL TERM SHEET IS NOT COMPLETE AND MAY BE AMENDED PRIOR TO THE TIME OF SALE. THIS TERM SHEET IS NOT AN OFFER TO SELL THESE SECURITIES AND IT IS NOT A SOLICITATION OF AN OFFER TO BUY THESE SECURITIES IN ANY JURISDICTION WHERE THE OFFER OR SALE IS NOT PERMITTED.
74 of 166
| Structural and Collateral Term Sheet | Benchmark 2021-B24 | |
| Phillips Point | ||
Insurance Reserve. The borrower is required to deposit into an insurance reserve, on a monthly basis during the continuance of a Phillips Point Trigger Period or an event of default, 1/12 of reasonably estimated insurance premiums.
TI/LC Reserve. The borrower is required to deposit into a tenant improvement and leasing commission reserve, on a monthly basis, an amount equal to approximately $18,704 to the extent that the tenant improvement and leasing commission reserve amount is less than $6,650,000.
A “Phillips Point Trigger Period” means each period (i) commencing when the debt yield (as calculated under the related loan documents), as determined as of the first day of any fiscal quarter, is less than 5.75%, and concluding when the debt yield, determined as of the first day of any fiscal quarter thereafter, is equal to or greater than 5.75%, (ii) commencing upon the borrower’s failure to deliver annual, quarterly or monthly financial reports as and when required under the related loan documents and concluding when such reports are delivered and indicate that no other Phillips Point Trigger Period is continuing and (iii) during the continuance of an event of default under the Phillips Point Mezzanine Loan (as defined below). Notwithstanding the foregoing, provided no event of default under the Phillips Point Whole Loan is continuing, the borrower will have the right to avoid the commencement or terminate the continuance of a Phillips Point Trigger Period by delivering (A) to the lender, as additional collateral, a letter of credit reasonably acceptable to the lender in an amount equal to (x) the outstanding principal balance of the Phillips Point Whole Loan divided by (y) the combined principal balance of the Phillips Point Whole Loan and the Phillips Point Mezzanine Loan (the “Phillips Point Aggregate Indebtedness”) times (z) the amount that, when subtracted from the Phillips Point Aggregate Indebtedness would result in a debt yield that equals or exceeds 5.75% (provided that the aggregate notional amount of all outstanding letters of credit delivered under the Phillips Point Whole Loan agreement may not exceed 10% of the outstanding principal balance of the Phillips Point Whole Loan) and (B) to the Mezzanine Lender (as defined below), as additional collateral for the Phillips Point Mezzanine Loan, a letter of credit reasonably acceptable to the Mezzanine Lender in an amount equal to (x) the outstanding principal balance of the Phillips Point Mezzanine Loan divided by (y) the Phillips Point Aggregate Indebtedness times (z) the amount that, when subtracted from the Phillips Point Aggregate Indebtedness would result in a debt yield that equals or exceeds 5.75% (provided that the aggregate notional amount of all outstanding letters of credit delivered to the Mezzanine Lender may not exceed 10% of the outstanding principal balance of the Phillips Point Mezzanine Loan).
Lockbox / Cash Management. The Phillips Point Whole Loan is structured with a hard lockbox and springing cash management. The borrower was required to direct each tenant to remit all rents directly to a lender-controlled lockbox account. In addition, the borrower is required to cause (or with respect to any property manager that is not an affiliate of borrower, use commercially reasonable efforts to cause) all cash revenues relating to the Phillips Point Property and all other money received by the borrower or the property manager with respect to the Phillips Point Property (other than tenant security deposits) to be deposited into the lockbox account or a lender-controlled cash management account within one business day of receipt. On each business day during the continuance of a Phillips Point Trigger Period or event of default under the Phillips Point Whole Loan, all amounts in the lockbox account are required to be remitted to the cash management account. On each business day that no Phillips Point Trigger Period or event of default under the Phillips Point Whole Loan is continuing, all amounts in the lockbox account are required to be remitted to a borrower-controlled operating account.
On each due date during the continuance of a Phillips Point Trigger Period (or, at the lender’s discretion, during an event of default under the Phillips Point Whole Loan), all funds on deposit in the cash management account after payment of debt service on the Phillips Point Whole Loan and the Phillips Point Mezzanine Loan, required reserves and budgeted operating expenses are required to be deposited into an excess cash flow reserve account as additional collateral for the Phillips Point Whole Loan.
Current Mezzanine or Subordinate Indebtedness. Concurrently with the funding of the Phillips Point Whole Loan, the lender (in such capacity, the “Mezzanine Lender”) also funded a mezzanine loan in the amount of $30,540,000 (the “Phillips Point Mezzanine Loan”, and together with the Phillips Point Whole Loan, the “Phillips Point Total Debt”). The Phillips Point Mezzanine Loan is secured by the pledge of the direct or indirect equity interest in the borrower and is coterminous with the Phillips Point Whole Loan. The Phillips Point Mezzanine Loan accrues interest at a rate of 7.00000% per annum. The rights of the Mezzanine Lender under the Phillips Point Mezzanine Loan are further described under “Description of the Mortgage Pool—Additional Indebtedness—Mezzanine Indebtedness” in the Preliminary Prospectus.
Future Mezzanine or Subordinate Indebtedness Permitted. None.
Partial Release. None.
THE INFORMATION IN THIS STRUCTURAL AND COLLATERAL TERM SHEET IS NOT COMPLETE AND MAY BE AMENDED PRIOR TO THE TIME OF SALE. THIS TERM SHEET IS NOT AN OFFER TO SELL THESE SECURITIES AND IT IS NOT A SOLICITATION OF AN OFFER TO BUY THESE SECURITIES IN ANY JURISDICTION WHERE THE OFFER OR SALE IS NOT PERMITTED.
75 of 166
| Structural and Collateral Term Sheet | Benchmark 2021-B24 | |
| 141 Livingston | ||

THE INFORMATION IN THIS STRUCTURAL AND COLLATERAL TERM SHEET IS NOT COMPLETE AND MAY BE AMENDED PRIOR TO THE TIME OF SALE. THIS TERM SHEET IS NOT AN OFFER TO SELL THESE SECURITIES AND IT IS NOT A SOLICITATION OF AN OFFER TO BUY THESE SECURITIES IN ANY JURISDICTION WHERE THE OFFER OR SALE IS NOT PERMITTED.
76 of 166
| Structural and Collateral Term Sheet | Benchmark 2021-B24 | |
| 141 Livingston | ||

THE INFORMATION IN THIS STRUCTURAL AND COLLATERAL TERM SHEET IS NOT COMPLETE AND MAY BE AMENDED PRIOR TO THE TIME OF SALE. THIS TERM SHEET IS NOT AN OFFER TO SELL THESE SECURITIES AND IT IS NOT A SOLICITATION OF AN OFFER TO BUY THESE SECURITIES IN ANY JURISDICTION WHERE THE OFFER OR SALE IS NOT PERMITTED.
77 of 166
| Structural and Collateral Term Sheet | Benchmark 2021-B24 | |
| 141 Livingston | ||
| Mortgage Loan Information | Property Information | |||
| Mortgage Loan Seller: | CREFI | Single Asset / Portfolio: | Single Asset | |
| Original Principal Balance(1): | $75,000,000 | Title: | Fee | |
| Cut-off Date Principal Balance(1): | $75,000,000 | Property Type - Subtype: | Office – CBD | |
| % of Pool by IPB: | 6.5% | Net Rentable Area (SF): | 213,745 | |
| Loan Purpose: | Refinance | Location: | Brooklyn, NY | |
| Borrower: | 141 Livingston Owner LLC | Year Built / Renovated: | 1959 / 2015 | |
| Loan Sponsors: | Clipper Realty Inc., Clipper Realty | Occupancy: | 100.0% | |
| L.P. | Occupancy Date: | 2/1/2021 | ||
| Interest Rate: | 3.21000% | Number of Tenants: | 3 | |
| Note Date: | 2/18/2021 | 2017 NOI: | $8,551,752 | |
| Maturity Date: | 3/6/2031 | 2018 NOI: | $8,067,576 | |
| Interest-only Period: | 120 months | 2019 NOI: | $8,103,986 | |
| Original Term: | 120 months | TTM NOI (as of 9/2020): | $8,214,573 | |
| Original Amortization: | None | UW Economic Occupancy(4): | 95.0% | |
| Amortization Type: | Interest Only | UW Revenues: | $14,702,075 | |
| Call Protection(2): | L(24),Def(92),O(4) | UW Expenses: | $5,797,645 | |
| Lockbox / Cash Management: | Springing / Springing | UW NOI(4): | $8,904,430 | |
| Additional Debt(1): | Yes | UW NCF(4): | $8,202,879 | |
| Additional Debt Balance(1): | $25,000,000 | Appraised Value / Per SF(4): | $182,300,000 / $853 | |
| Additional Debt Type(1): | Pari Passu | Appraisal Date: | 2/1/2021 | |
| Escrows and Reserves(3) | Financial Information(1)(4) | |||||||
| Initial | Monthly | Initial Cap | Cut-off Date Loan / SF: | $468 | ||||
| Taxes: | $70,582 | $17,646 | N/A | Maturity Date Loan / SF: | $468 | |||
| Insurance: | $0 | Springing | N/A | Cut-off Date LTV: | 54.9% | |||
| Replacement Reserves: | $0 | Springing | N/A | Maturity Date LTV: | 54.9% | |||
| TI/LC: | $0 | $0 | N/A | UW NCF DSCR: | 2.52x | |||
| Other: | $0 | Springing | N/A | UW NOI Debt Yield: | 8.9% | |||
| Sources and Uses | ||||||||
| Sources | Proceeds | % of Total | Uses | Proceeds | % of Total | |||
| Whole Loan | $100,000,000 | 100.0% | Payoff Existing Debt | $75,817,200 | 75.8% | |||
| Return of Equity | 23,559,399 | 23.6 | ||||||
| Closing Costs | 552,819 | 0.6 | ||||||
| Upfront Reserves | 70,582 | 0.1 | ||||||
| Total Sources | $100,000,000 | 100.0% | Total Uses | $100,000,000 | 100.0% | |||
| (1) | The 141 Livingston Loan (as defined below) is part of a whole loan evidenced by two pari passu notes, with an aggregate outstanding principal balance as of the Cut-off Date of $100.0 million. The financial information presented in the chart above reflects the Cut-off Date Balance of the $100.0 million 141 Livingston Whole Loan (as defined below). For additional information see “The Loan” herein. |
| (2) | The defeasance lockout period will be at least 24 payment dates beginning with and including the first payment date in April 2021. Defeasance of the 141 Livingston Whole Loan is permitted at any time after the earlier to occur of (a) the end of the two-year period commencing on the closing date of the securitization of the last promissory note representing a portion of the 141 Livingston Whole Loan to be securitized and (b) February 18, 2025. The assumed defeasance lockout period of 24 months is based on the expected Benchmark 2021-B24 securitization closing date in March 2021. The actual defeasance lockout period may be longer. |
| (3) | For a full description of Escrows and Reserves, please refer to “Escrows and Reserves” herein. |
| (4) | While the 141 Livingston Whole Loan was originated after the emergence of the novel coronavirus pandemic and the economic disruption resulting from measures to combat the pandemic, the pandemic is an evolving situation and could impact the 141 Livingston Whole Loan more severely than assumed in the underwriting of the 141 Livingston Whole Loan and could adversely affect the NOI, NCF, and occupancy information, as well as the appraised value and the DSCR, LTV, and Debt Yield metrics presented above. See “Risk Factors—Special Risks—Coronavirus Pandemic Has Adversely Affected the Global Economy and Will Likely Adversely Affect the Performance of the Mortgage Loans” in the Preliminary Prospectus. |
THE INFORMATION IN THIS STRUCTURAL AND COLLATERAL TERM SHEET IS NOT COMPLETE AND MAY BE AMENDED PRIOR TO THE TIME OF SALE. THIS TERM SHEET IS NOT AN OFFER TO SELL THESE SECURITIES AND IT IS NOT A SOLICITATION OF AN OFFER TO BUY THESE SECURITIES IN ANY JURISDICTION WHERE THE OFFER OR SALE IS NOT PERMITTED.
78 of 166
| Structural and Collateral Term Sheet | Benchmark 2021-B24 | |
| 141 Livingston | ||
The Loan. The 141 Livingston mortgage loan (the “141 Livingston Loan”) is part of a whole loan consisting of two pari passu notes with an outstanding aggregate principal balance as of the Cut-off Date of $100.0 million (the “141 Livingston Whole Loan”), which is secured by the borrower’s fee interest in a 15-story, Class B, office building located in Brooklyn, New York (the “141 Livingston Property”). The 141 Livingston Loan, evidenced by the controlling Note A-1, has an outstanding principal balance as of the Cut-off Date of $75.0 million and represents approximately 6.5% of the Initial Pool Balance. The 141 Livingston Whole Loan was originated by Citi Real Estate Funding Inc. (“CREFI”) on February 18, 2021. The 141 Livingston Whole Loan has an interest rate of 3.21000% per annum. The borrower used the proceeds of the 141 Livingston Whole Loan to refinance existing debt on the 141 Livingston Property, return equity to the borrower, fund upfront reserves, and pay origination costs.
The table below summarizes the promissory notes that comprise the 141 Livingston Whole Loan. The 141 Livingston Whole Loan will be serviced through the Benchmark 2021-B24 securitization transaction. The relationship between the holders of the 141 Livingston Whole Loan is governed by a co-lender agreement as described under “Description of the Mortgage Pool—The Whole Loans—The Serviced Pari Passu Whole Loans” in the Preliminary Prospectus.
| Whole Loan Summary | |||||
| Note | Original Balance | Cut-off Date Balance | Note Holder | Controlling Piece | |
| A-1 | $75,000,000 | $75,000,000 | Benchmark 2021-B24 | Yes | |
| A-2 | $25,000,000 | $25,000,000 | CREFI(1) | No | |
| Total | $100,000,000 | $100,000,000 | |||
| (1) | The non-controlling note A-2 is expected to be contributed to one or more future securitization transactions. |
The Borrower. The borrower is 141 Livingston Owner LLC, a Delaware limited liability company with one independent director (the “141 Livingston Borrower”). Legal counsel to the 141 Livingston Borrower delivered a non-consolidation opinion in connection with the origination of the 141 Livingston Whole Loan.
The Loan Sponsors. The loan sponsors are David Bistricer and Sam Levinson, the co-chairmen of Clipper Realty, Inc. (“Clipper Realty”), which is a Brooklyn-based commercial real estate investment trust (NYSE: CLPR). Founded in 2015, Clipper Realty specializes in acquiring, owning, repositioning, operating, and managing a diverse portfolio of commercial real estate investments in the New York metropolitan area. Clipper Realty’s current portfolio includes a collection of diversified properties, such as Tribeca House, a 505-unit complex of luxury lofts in Manhattan’s Tribeca neighborhood, and Flatbush Gardens, a community of apartments across 59 buildings and 21.4 acres in Brooklyn, New York. Other properties within their portfolio in the NY-Metro area include 250 Livingston (233 Schermerhorn) in Downtown Brooklyn. The non-recourse carve-out guarantors are Clipper Realty Inc., a Maryland corporation and Clipper Realty L.P., a Delaware limited partnership.
The Property. The 141 Livingston Property is a 15-story, Class B, office building located at the northeast corner of Livingston Street and Smith Street in Downtown Brooklyn, New York. The property was built in 1959 and renovated in 2015. Most of the building (206,084 square feet) is occupied by one tenant, City of New York Department of Citywide Administrative Services. According to the appraisal, the building has a small lobby concession/vending area on the ground floor which was recently vacated, and an 80-space below grade and outdoor parking facility operated under a lease by Icon Parking. Over the past several years, the building has undergone several major capital improvement items including new boilers, rooftop chillers, sprinkler system, and some façade work.
As of February 1, 2021, the 141 Livingston Property was approximately 100.0% leased to three tenants.
The largest tenant, City of New York Department of Citywide Administrative Services (“DCAS”) (206,084 square feet; 96.4% of net rentable area; 96.4% of underwritten base rent) is a branch of New York City’s government that offers a suite of operational services to New York City. DCAS utilizes their space at the 141 Livingston Property for the civil court system of New York. The 141 Livingston Property is a mission critical location for the court system as the court is within close proximity to the subway for pedestrian accessibility. DCAS’ lease at the 141 Livingston Property expires in December 2025. The DCAS lease has no termination options. Additionally, DCAS’ lease has no extension options.
The second largest tenant, Smith & Livingston Parking (7,568 square feet; 3.5% of net rentable area; 3.2% of underwritten base rent), combined with Quick Park, is the largest parking operator in Manhattan with more than 200 special locations and over 50 years of operating experience. Smith & Livingston Parking has parking facilities in almost all of Manhattan’s most high-profile, prestigious neighborhoods and business districts. Smith & Livingston Parking’s lease, which expires in June 2027, does not include any termination options. Additionally, Smith & Livingston Parking’s lease has no extension options.
COVID-19 Update. As of February 6, 2021, the 141 Livingston Property is open and operating, with most tenants operating in limited capacity. There has been no rent relief requested and all tenants are current on rent. As of February 6, 2021, no loan modification or forbearance requests have been made on the 141 Livingston Whole Loan. The first payment date of the 141 Livingston Whole Loan is April 6, 2021.
The Market. According to the appraisal, the 141 Livingston Property is located in the Downtown Brooklyn office submarket. The Downtown Brooklyn office submarket is the largest office submarket in Brooklyn and has benefitted from the relocation of financial, insurance, and
THE INFORMATION IN THIS STRUCTURAL AND COLLATERAL TERM SHEET IS NOT COMPLETE AND MAY BE AMENDED PRIOR TO THE TIME OF SALE. THIS TERM SHEET IS NOT AN OFFER TO SELL THESE SECURITIES AND IT IS NOT A SOLICITATION OF AN OFFER TO BUY THESE SECURITIES IN ANY JURISDICTION WHERE THE OFFER OR SALE IS NOT PERMITTED.
79 of 166
| Structural and Collateral Term Sheet | Benchmark 2021-B24 | |
| 141 Livingston | ||
real estate firms looking to lease office space for the operational divisions of their New York City locations. Further, the City of New York has played an integral role in incentivizing office tenants to relocate to Brooklyn. Programs such as the Commercial Expansion Program, Energy Cost Savings Program, and Consolidated Funding Application all lower occupancy costs for firms relocating from Manhattan. According to the appraisal, as of September 30, 2020, Downtown Brooklyn had 16,868,876 square feet of office supply, with a vacancy of 13.3%. The average asking rent for a prime asset was $57.92 and the averaging asking rent of a standard asset was $43.27 with 637,075 square feet of space under construction.
Due to the lack of comparable Class B office buildings in Brooklyn, the appraisal identified five sales comparables, in Manhattan, which directly compete with the subject property. The comparable buildings were built between 1911 and 1948 and range in size from 118,766 square feet to 202,000 square feet. The sales price per square foot ranged from $788.32 to $1,017.33, while net operating income per square foot ranged from $33.90 to $42.58. In addition, the appraisal identified four lease comparables. The comparable leases range in size from 450 square feet to 4,000 square feet with rents ranging from $120.00 per square foot to $184.61 per square foot.
| Historical and Current Occupancy | |||
| 2018(1) | 2019(1) | 2020(2) | Current(3) |
| 100.0% | 100.0% | 100.0% | 100.0% |
| (1) | Historical Occupancies are as of December 31 of each respective year unless specified otherwise. |
| (2) | 2020 occupancy is as of September 30, 2020. |
| (3) | Current Occupancy is as of February 1, 2021. |
| Tenant Summary(1) | |||||||
| Tenant | Ratings Moody’s/Fitch/S&P(2) | Net Rentable Area (SF) | % of Total NRA | Base Rent PSF(3) | % of Total Base Rent | Lease Expiration Date | |
| DCAS | NR/NR/NR | 206,084 | 96.4% | $50.00 | 96.4% | 12/26/2025 | |
| Smith & Livingston Parking | NR/NR/NR | 7,568 | 3.5 | 44.66 | 3.2% | 6/30/2027 | |
| AT&T Mobility(4) | NR/A-/NR | 0 | 0.0 | NAP | 0.5% | 12/31/2023 | |
| Total Occupied | 213,652 | 100.0% | $49.81 | 100.0% | |||
| Vacant | 93 | 0.0 | |||||
| Total | 213,745 | 100.0% | |||||
| (1) | Based on the underwritten rent roll dated February 1, 2021. |
| (2) | In certain instances, ratings provided are those of the parent company of the entity shown, whether or not the parent company guarantees the lease. |
| (3) | Base Rent PSF is inclusive of contractual rent steps of $13,521 for Smith & Livingston Parking’s increase effective July 1, 2021. |
| (4) | AT&T Mobility does not have any net rentable area attributed to it because the tenant is a cell tower. |
| Lease Rollover Schedule(1) | |||||||||
| Year | Number of Leases Expiring | Net Rentable Area Expiring | % of NRA Expiring | Base Rent Expiring(2) | % of Base Rent Expiring(2) | Cumulative Net Rentable Area Expiring | Cumulative % of NRA Expiring | Cumulative Base Rent Expiring | Cumulative % of Base Rent Expiring |
| Vacant | NAP | 93 | 0.0% | NAP | NAP | 93 | 0.0% | NAP | NAP |
| MTM & 2021 | 0 | 0 | 0.0 | $0 | 0.0% | 93 | 0.0% | $0 | 0.0% |
| 2022 | 0 | 0 | 0.0 | 0 | 0.0 | 93 | 0.0% | $0 | 0.0% |
| 2023(3) | 1 | 0 | 0.0 | 52,000 | 0.5 | 93 | 0.0% | $52,000 | 0.5% |
| 2024 | 0 | 0 | 0.0 | 0 | 0.0 | 93 | 0.0% | $52,000 | 0.5% |
| 2025 | 1 | 206,084 | 96.4 | 10,304,200 | 96.2 | 206,177 | 96.5% | $10,356,200 | 96.7% |
| 2026 | 0 | 0 | 0.0 | 0 | 0.0 | 206,177 | 96.5% | $10,356,200 | 96.7% |
| 2027 | 1 | 7,568 | 3.5 | 351,521 | 3.3 | 213,745 | 100.0% | $10,707,721 | 100.0% |
| 2028 | 0 | 0 | 0.0 | 0 | 0.0 | 213,745 | 100.0% | $10,707,721 | 100.0% |
| 2029 | 0 | 0 | 0.0 | 0 | 0.0 | 213,745 | 100.0% | $10,707,721 | 100.0% |
| 2030 | 0 | 0 | 0.0 | 0 | 0.0 | 213,745 | 100.0% | $10,707,721 | 100.0% |
| 2031 | 0 | 0 | 0.0 | 0 | 0.0 | 213,745 | 100.0% | $10,707,721 | 100.0% |
| 2032 and Thereafter | 0 | 0 | 0.0 | 0 | 0.0 | 213,745 | 100.0% | $10,707,721 | 100.0% |
| Total | 3 | 213,745 | 100.0% | $10,707,721 | 100.0% | ||||
| (1) | Based on the underwritten rent roll dated February 1, 2021. |
| (2) | Base Rent Expiring and % of Base Rent Expiring are inclusive of contractual rent steps of $13,521 for Smith & Livingston Parking’s increase effective July 1, 2021. |
(3) AT&T Mobility’s lease expires in 2023, however, the tenant does not have any net rentable area attributed to it because it is a cell tower.
THE INFORMATION IN THIS STRUCTURAL AND COLLATERAL TERM SHEET IS NOT COMPLETE AND MAY BE AMENDED PRIOR TO THE TIME OF SALE. THIS TERM SHEET IS NOT AN OFFER TO SELL THESE SECURITIES AND IT IS NOT A SOLICITATION OF AN OFFER TO BUY THESE SECURITIES IN ANY JURISDICTION WHERE THE OFFER OR SALE IS NOT PERMITTED.
80 of 166
| Structural and Collateral Term Sheet | Benchmark 2021-B24 | |
| 141 Livingston | ||
| Operating History and Underwritten Net Cash Flow | ||||||
| 2018 | 2019 | TTM (9/30/2020) | Underwritten | Per Square Foot | %(1) | |
| Base Rent(2) | $8,636,217 | $8,640,281 | $8,534,903 | $10,694,200 | $50.03 | 69.1% |
| Rent Steps(3) | 0 | 0 | 0 | 13,521 | 0.06 | 0.1% |
| Potential Income from Vacant Space | 0 | 0 | 0 | 13,950 | 0.07 | 0.1% |
| Gross Potential Rent | $8,636,217 | $8,640,281 | $8,534,903 | $10,721,671 | $50.16 | 69.3% |
| Total Reimbursements | 2,739,097 | 3,316,124 | 3,963,067 | 4,754,198 | 22.24 | 30.7% |
| Total Other Income | 0 | 0 | 0 | 0 | 0.00 | 0.0% |
| Net Rental Income | $11,375,314 | $11,956,405 | $12,497,970 | $15,475,869 | $72.40 | 100.0% |
| (Vacancy/Credit Loss) | 0 | 0 | 0 | (773,793) | (3.62) | (5.0)% |
| Effective Gross Income | $11,375,314 | $11,956,405 | $12,497,970 | $14,702,075 | $68.78 | 95.0% |
| Total Expenses | 3,307,738 | 3,852,419 | 4,283,397 | 5,797,645 | 27.12 | 39.4% |
| Net Operating Income | $8,067,576 | $8,103,986 | $8,214,573 | $8,904,430 | $41.66 | 60.6% |
| Total TI/LC, RR | 0 | 0 | 0 | 701,551 | 3.28 | 4.8% |
| Net Cash Flow | $8,067,576 | $8,103,986 | $8,214,573 | $8,202,879 | $38.38 | 55.8% |
| (1) | % column represents percent of Net Rental Income for all revenue lines and represents percent of Effective Gross Income for the remainder of the fields. |
| (2) | Underwritten Base Rent is based on the in place rent roll as of February 1, 2021. |
| (3) | Rent Steps is inclusive of contractual rent steps of $13,521 for Smith & Livingston Parking’s increase effective July 1, 2021. |
Property Management. The 141 Livingston Property is self-managed by the 141 Livingston Borrower.
Escrows and Reserves. At loan origination, the 141 Livingston Borrower deposited approximately $70,582 into the real estate taxes reserve.
Tax Reserve – The 141 Livingston Borrower is required to deposit into a real estate tax reserve, on a monthly basis, 1/12 of the estimated annual real estate taxes (initially estimated at approximately $17,646).
Insurance Reserve – On each payment date, the 141 Livingston Borrower is required to deposit an amount equal to 1/12 of estimated insurance premiums unless the 141 Livingston Borrower maintains a blanket policy in accordance with the 141 Livingston Whole Loan documents. As of the origination date, an acceptable blanket policy is in place.
Replacement Reserve – In the event of a Trigger Period (as defined below) or following the occurrence of a Renewal Trigger Period (as defined below), the 141 Livingston Borrower is required to deposit into a replacement reserve, on a monthly basis, an amount equal to approximately $3,562 for replacement reserves.
Renewal Tenant Reserve – On the 18th monthly payment date immediately following the commencement of any Renewal Trigger Period (as defined below), the 141 Livingston Borrower is required to deposit into a renewal tenant reserve, on each payment date, an amount equal to $555,555. Further, upon the occurrence of an event of default, the 141 Livingston Borrower is required to deposit into the renewal tenant reserve account an amount equal to the positive difference (as of the applicable date of determination) of: (i) $10,000,000 and (ii) the sum of all amounts that have been deposited into the renewal tenant reserve account.
Lockbox / Cash Management. The 141 Livingston Whole Loan is structured with a springing lockbox and springing cash management. Upon the first occurrence of a Trigger Period the 141 Livingston Borrower is required to establish a lender-controlled lockbox account for the sole and exclusive benefit of lender. Upon and after the first occurrence of a Trigger Period, the 141 Livingston Borrower is required to cause revenue received by the 141 Livingston Borrower or the property manager from the 141 Livingston Property to be deposited into such lockbox immediately upon receipt. All funds deposited into the lockbox are required to be transferred on each business day to a cash management account under the control of the lender to be applied and disbursed in accordance with the 141 Livingston Whole Loan documents, and all excess cash flow funds remaining in the cash management account after the application of such funds in accordance with the 141 Livingston Whole Loan documents are required to be held by the lender in an excess cash flow reserve account as additional collateral for the 141 Livingston Whole Loan. Provided no event of default has occurred and is continuing, any excess cash flow funds remaining in the excess cash flow account will be disbursed to the 141 Livingston Borrower upon the expiration of any Trigger Period.
A ”Trigger Period” means a period commencing upon the earliest of (i) the occurrence and continuance of an event of default, (ii) the debt yield falling below 7.00% (provided, however, no Trigger Period will be deemed to exist pursuant to this clause (ii) during any period that the Single Tenant Condition (defined below) is satisfied), and (iii) the occurrence of a Specified Tenant Trigger Period (as defined below) (provided, however, no Trigger Period will be deemed to exist pursuant to this clause (iii) during any period that the Collateral Cure Conditions (as defined below) are satisfied); and (B) expiring upon (x) with regard to any Trigger Period commenced in connection with clause (i) above, the cure (if applicable) of such event of default, (y) with regard to any Trigger Period commenced in connection with clause (ii) above, the date that the debt yield is equal to or greater than 7.25% for two consecutive calendar quarters and (z) with regard to any Trigger Period commenced in connection with clause (iii) above, a Specified Tenant Trigger Period ceasing to exist in accordance
THE INFORMATION IN THIS STRUCTURAL AND COLLATERAL TERM SHEET IS NOT COMPLETE AND MAY BE AMENDED PRIOR TO THE TIME OF SALE. THIS TERM SHEET IS NOT AN OFFER TO SELL THESE SECURITIES AND IT IS NOT A SOLICITATION OF AN OFFER TO BUY THESE SECURITIES IN ANY JURISDICTION WHERE THE OFFER OR SALE IS NOT PERMITTED.
81 of 166
| Structural and Collateral Term Sheet | Benchmark 2021-B24 | |
| 141 Livingston | ||
with the terms of the 141 Livingston Whole Loan documents. Notwithstanding the foregoing, a Trigger Period will not be deemed to expire in the event that a Trigger Period then exists for any other reason.
A “Specified Tenant Trigger Period” means a period (A) commencing upon the first to occur of (i) Specified Tenant (as defined below) being in monetary or material non-monetary default under the applicable Specified Tenant lease beyond applicable notice and cure periods, (ii) (x) any Specified Tenant failing to be in actual, physical possession of the Specified Tenant space (or applicable portion thereof) or, (y) except with respect to any investment grade tenant, any Specified Tenant failing to be open to the public for business during customary hours and/or “going dark” in the Specified Tenant space, (iii) any Specified Tenant giving notice that it is terminating its lease for all or any portion of the Specified Tenant space (or applicable portion thereof), (iv) any termination or cancellation of any Specified Tenant lease (including, without limitation, rejection in any bankruptcy or similar insolvency proceeding) and/or any Specified Tenant lease failing to otherwise be in full force and effect, and (v) any bankruptcy or similar insolvency of any Specified Tenant.
A “Specified Tenant” means, as applicable, (i) City of New York Department of Citywide Administrative Services and (ii) any other lessee(s) of the Specified Tenant space (or any portion thereof) and any guarantor(s) of the applicable related Specified Tenant lease(s).
A “Single Tenant Condition” means (i) the Specified Tenant lease in place as of the origination date (or a single replacement lease which is entered into in accordance with the terms of the 141 Livingston Whole Loan documents) is in full force and effect and the entirety of the 141 Livingston Property is demised pursuant to said lease, (ii) the tenant pursuant to said lease is not in material default thereunder (beyond any applicable notice and cure period) and (iii) no Trigger Period has occurred and is continuing.
A “Renewal Trigger Period” means the period commencing upon a Specified Tenant’s failure to provide written notice to the 141 Livingston Borrower to extend or renew the applicable Specified Tenant lease on or prior to the earlier of: (x) the date occurring 18 months prior to the expiration of the then applicable term of the applicable Specified Tenant lease and (y) the date on which the applicable Specified Tenant is required to give notice of its intent to renew the applicable Specified Tenant lease, in accordance with the applicable terms and conditions thereof for a renewal term of no less than five additional years.
A “Collateral Cure Condition” will be deemed to exist if and for so long as the 141 Livingston Borrower deposits cash into an interest bearing account with lender, or delivers to lender a letter of credit which, in either case, serves as additional collateral for the 141 Livingston Whole Loan, in an amount equal to approximately $10,000,000.
Current Mezzanine or Subordinate Indebtedness. None.
Future Mezzanine or Subordinate Indebtedness Permitted. None.
Partial Release. None.
THE INFORMATION IN THIS STRUCTURAL AND COLLATERAL TERM SHEET IS NOT COMPLETE AND MAY BE AMENDED PRIOR TO THE TIME OF SALE. THIS TERM SHEET IS NOT AN OFFER TO SELL THESE SECURITIES AND IT IS NOT A SOLICITATION OF AN OFFER TO BUY THESE SECURITIES IN ANY JURISDICTION WHERE THE OFFER OR SALE IS NOT PERMITTED.
82 of 166
(THIS PAGE INTENTIONALLY LEFT BLANK)
THE INFORMATION IN THIS STRUCTURAL AND COLLATERAL TERM SHEET IS NOT COMPLETE AND MAY BE AMENDED PRIOR TO THE TIME OF SALE. THIS TERM SHEET IS NOT AN OFFER TO SELL THESE SECURITIES AND IT IS NOT A SOLICITATION OF AN OFFER TO BUY THESE SECURITIES IN ANY JURISDICTION WHERE THE OFFER OR SALE IS NOT PERMITTED.
83 of 166
| Structural and Collateral Term Sheet | Benchmark 2021-B24 | |
| Pittock Block | ||

THE INFORMATION IN THIS STRUCTURAL AND COLLATERAL TERM SHEET IS NOT COMPLETE AND MAY BE AMENDED PRIOR TO THE TIME OF SALE. THIS TERM SHEET IS NOT AN OFFER TO SELL THESE SECURITIES AND IT IS NOT A SOLICITATION OF AN OFFER TO BUY THESE SECURITIES IN ANY JURISDICTION WHERE THE OFFER OR SALE IS NOT PERMITTED.
84 of 166
| Structural and Collateral Term Sheet | Benchmark 2021-B24 | |
| Pittock Block | ||

THE INFORMATION IN THIS STRUCTURAL AND COLLATERAL TERM SHEET IS NOT COMPLETE AND MAY BE AMENDED PRIOR TO THE TIME OF SALE. THIS TERM SHEET IS NOT AN OFFER TO SELL THESE SECURITIES AND IT IS NOT A SOLICITATION OF AN OFFER TO BUY THESE SECURITIES IN ANY JURISDICTION WHERE THE OFFER OR SALE IS NOT PERMITTED.
85 of 166
| Structural and Collateral Term Sheet | Benchmark 2021-B24 | |
| Pittock Block | ||
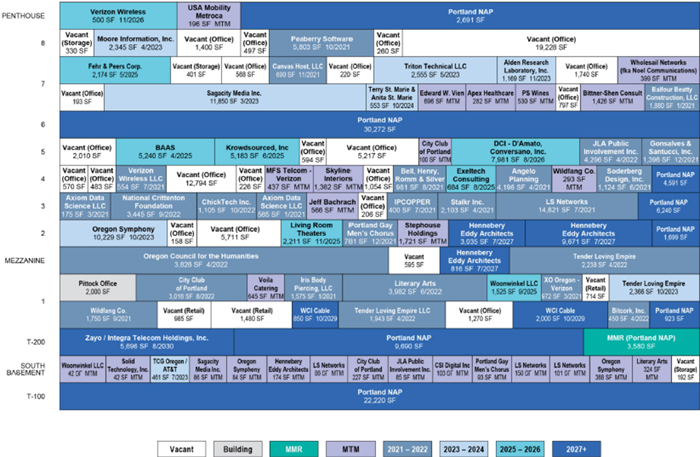
THE INFORMATION IN THIS STRUCTURAL AND COLLATERAL TERM SHEET IS NOT COMPLETE AND MAY BE AMENDED PRIOR TO THE TIME OF SALE. THIS TERM SHEET IS NOT AN OFFER TO SELL THESE SECURITIES AND IT IS NOT A SOLICITATION OF AN OFFER TO BUY THESE SECURITIES IN ANY JURISDICTION WHERE THE OFFER OR SALE IS NOT PERMITTED.
86 of 166
| Structural and Collateral Term Sheet | Benchmark 2021-B24 | |
| Pittock Block | ||
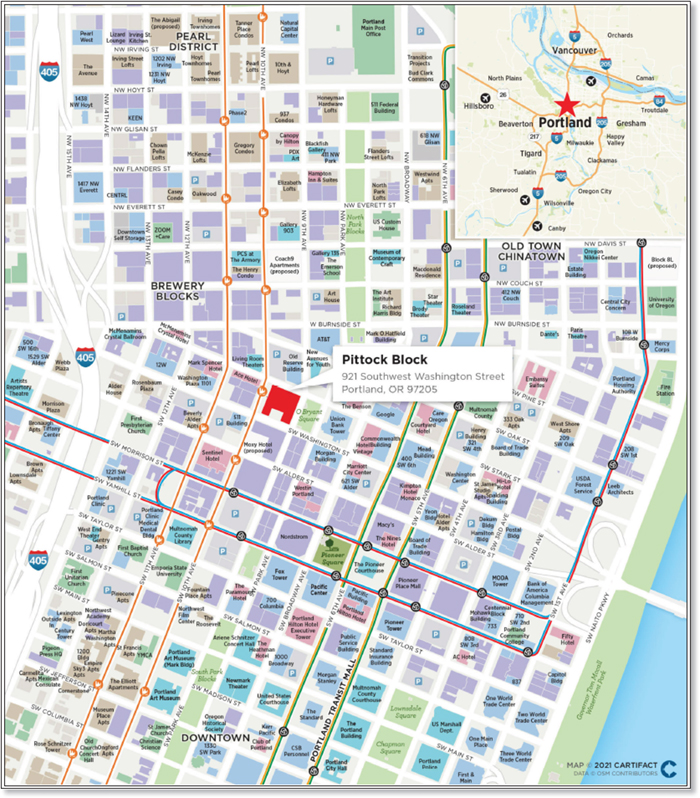
THE INFORMATION IN THIS STRUCTURAL AND COLLATERAL TERM SHEET IS NOT COMPLETE AND MAY BE AMENDED PRIOR TO THE TIME OF SALE. THIS TERM SHEET IS NOT AN OFFER TO SELL THESE SECURITIES AND IT IS NOT A SOLICITATION OF AN OFFER TO BUY THESE SECURITIES IN ANY JURISDICTION WHERE THE OFFER OR SALE IS NOT PERMITTED.
87 of 166
| Structural and Collateral Term Sheet | Benchmark 2021-B24 | |
| Pittock Block | ||
| Mortgage Loan Information | Property Information | |||
| Mortgage Loan Seller: | JPMCB | Single Asset / Portfolio: | Single Asset | |
| Original Principal Balance(1): | $66,000,000 | Title: | Fee | |
| Cut-off Date Principal Balance(1): | $66,000,000 | Property Type - Subtype(3): | Mixed Use | |
| % of Pool by IPB: | 5.7% | Net Rentable Area (SF): | 297,698 | |
| Loan Purpose: | Acquisition | Location: | Portland, OR | |
| Borrower: | 1547 CSR - Pittock Block, LLC | Year Built / Renovated: | 1913 / 2001 | |
| Loan Sponsor(2): | 1547 Data Center Real Estate | Occupancy: | 71.4% | |
| Fund II, L.P. | Occupancy Date: | 12/21/2020 | ||
| Interest Rate: | 3.299404% | Number of Tenants: | 51 | |
| Note Date: | 12/30/2020 | 2017 NOI: | $9,628,702 | |
| Maturity Date: | 1/1/2031 | 2018 NOI: | $9,072,443 | |
| Interest-only Period: | 120 months | 2019 NOI: | $10,019,815 | |
| Original Term: | 120 months | TTM NOI (as of 11/2020): | $11,047,438 | |
| Original Amortization: | None | UW Economic Occupancy(4): | 72.5% | |
| Amortization Type: | Interest Only | UW Revenues: | $18,158,626 | |
| Call Protection: | L(4),Grtr1%orYM(112),O(4) | UW Expenses: | $5,574,346 | |
| Lockbox / Cash Management: | Hard / Springing | UW NOI(4): | $12,584,281 | |
| Additional Debt(1): | Yes | UW NCF(4): | $11,780,493 | |
| Additional Debt Balance(1): | $75,000,000 / $22,470,000 | Appraised Value / Per SF(4): | $329,000,000 / $1,105 | |
| Additional Debt Type(1): | Pari Passu / Subordinate Debt | Appraisal Date: | 12/7/2020 | |
| Escrows and Reserves(5) | Financial Information(1)(4) | |||||||||
| Initial | Monthly | Initial Cap | Senior Notes | Whole Loan | ||||||
| Taxes: | $0 | Springing | N/A | Cut-off Date Loan / SF: | $474 | $549 | ||||
| Insurance: | $0 | Springing | N/A | Maturity Date Loan / SF: | $474 | $549 | ||||
| Replacement Reserves: | $0 | Springing | N/A | Cut-off Date LTV: | 42.9% | 49.7% | ||||
| TI/LC: | $0 | Springing | N/A | Maturity Date LTV: | 42.9% | 49.7% | ||||
| Other(6): | $9,012,030 | $0 | N/A | UW NCF DSCR: | 2.50x | 1.95x | ||||
| UW NOI Debt Yield: | 8.9% | 7.7% | ||||||||
| Sources and Uses | ||||||||||
| Sources | Proceeds | % of Total | Uses | Proceeds | % of Total | |||||
| Senior Notes | $141,000,000 | 41.6% | Purchase Price | $326,000,000 | 96.1% | |||||
| Subordinate Debt Amount | 22,470,000 | 6.6% | Holdback Reserve | 7,500,000 | 2.2% | |||||
| Principal’s New Cash Contribution | 175,849,656 | 51.8% | Closing Costs | 4,307,626 | 1.3% | |||||
| Upfront Reserves | 1,512,030 | 0.4% | ||||||||
| Total Sources | $339,319,656 | 100.0% | Total Uses | $339,319,656 | 100.0% | |||||
| (1) | The Cut-off Date Principal Balance of $66,000,000 represents the non-controlling notes A-2 and A-3, and is part of the Pittock Block Whole Loan (as defined below) which is evidenced by three senior pari passu notes and one junior note and has an aggregate outstanding principal balance as of the Cut-off Date of $163,470,000. Financial Information presented in the chart above reflects the Cut-off Date balance of the $141,000,000 Pittock Block Senior Notes (as defined below) and the $163,470,000 Pittock Block Whole Loan. For additional information, see “The Loan” and “Current Mezzanine or Subordinate Indebtedness” herein. |
| (2) | The nonrecourse carve-out guarantor is 1547 Data Center Real Estate Fund II, L.P. HSRE Social Infrastructure REIT Holding I, LLC has also entered into the Oregon Moratorium Guaranty Agreement. (See “—COVID Update” below). |
| (3) | The Pittock Block Property (as defined below) is comprised of 191,284 square feet of office space, 81,906 square feet of colocation, data center and Meet-Me-Room space, 19,981 square feet of retail space, 3,831 square feet of storage space and 696 square feet of roof space. |
| (4) | While the Pittock Block Whole Loan was originated after the emergence of the novel coronavirus pandemic and the economic disruption resulting from measures to combat the pandemic, the pandemic is an evolving situation and could impact the Pittock Block Whole Loan more severely than assumed in the underwriting of the Pittock Block Whole Loan and could adversely affect the NOI, NCF and occupancy information, as well as the appraised value and the DSCR, LTV and Debt Yield metrics presented above. See “Risk Factors—Special Risks—Coronavirus Pandemic Has Adversely Affected the Global Economy and Will Likely Adversely Affect the Performance of the Mortgage Loans” in the Preliminary Prospectus. |
| (5) | For a full description of Escrows and Reserves, please refer to “Escrows and Reserves” below. |
| (6) | The Other Initial reserve includes a (i) $7,500,000 holdback to be released upon satisfaction of certain conditions (as described in “Escrows and Reserves” below) and (ii) a $1,512,029.60 debt service reserve. According to the loan sponsor, the Holdback Release Conditions (as defined herein) have been satisfied as evidenced by an executed lease with a qualifying Fortune 10 technology company and the associated reserve is expected to be released to the borrower. |
THE INFORMATION IN THIS STRUCTURAL AND COLLATERAL TERM SHEET IS NOT COMPLETE AND MAY BE AMENDED PRIOR TO THE TIME OF SALE. THIS TERM SHEET IS NOT AN OFFER TO SELL THESE SECURITIES AND IT IS NOT A SOLICITATION OF AN OFFER TO BUY THESE SECURITIES IN ANY JURISDICTION WHERE THE OFFER OR SALE IS NOT PERMITTED.
88 of 166
| Structural and Collateral Term Sheet | Benchmark 2021-B24 | |
| Pittock Block | ||
The Loan. The Pittock Block mortgage loan (the “Pittock Block Loan”) is part of a whole loan with an aggregate outstanding principal balance as of the Cut-off Date of $163,470,000 (the “Pittock Block Whole Loan”), evidenced by three pari passu senior notes with an aggregate initial principal balance of $141,000,000 (collectively the “Pittock Block Senior Notes”) and one junior note with an initial principal balance of $22,470,000 (the “Pittock Block Junior Note”). The Pittock Block Whole Loan is secured by a first mortgage encumbering the borrower’s fee interest in a 297,698 square foot mixed-use building located in Portland, Oregon, comprised of office, retail, colocation and data center components. The Pittock Block Loan, which is evidenced by the non-controlling notes A-2 and A-3, has an outstanding principal balance as of the Cut-off Date of $66,000,000 and will be contributed to the Benchmark 2021-B24 Trust. The relationship between the holders of the Pittock Block Whole Loan will be governed by a co-lender agreement as described under “Description of the Mortgage Pool—The Whole Loans—The Serviced Pari Passu Whole Loans” in the Preliminary Prospectus. The Pittock Block Whole Loan has a 10-year term and is interest only for the full term.
| Whole Loan Summary | |||||
| Note | Original Balance | Cut-off Date Balance | Note Holder | Controlling Piece | |
| Note A-1 | $75,000,000 | $75,000,000 | Benchmark 2021-B23 | No | |
| Note A-2, Note A-3 | $66,000,000 | $66,000,000 | Benchmark 2021-B24 | No | |
| Total Senior Notes | $141,000,000 | $141,000,000 | |||
| Note B | $22,470,000 | $22,470,000 | Unaffiliated Third Party Investor(1) | Yes(1) | |
| Whole Loan | $163,470,000 | $163,470,000 | |||
| (1) | The holder of the Pittock Block Junior Note will have the right to appoint the special servicer of the Pittock Block Whole Loan and to direct certain decisions with respect to Pittock Block Whole Loan, unless a control appraisal event exists under the related co-lender agreement; after the occurrence of a control appraisal event with respect to the Pittock Block Junior Note, the holder of the Pittock Block Note A-1 will have such rights. The Pittock Block Whole Loan is serviced pursuant to the pooling and servicing agreement for the Benchmark 2021-B23 securitization. |
The Borrower. The borrower is 1547 CSR - Pittock Block, LLC, a Delaware limited liability company and single purpose entity. Legal counsel to the borrower delivered a non-consolidation opinion in connection with the origination of the Pittock Block Whole Loan.
The Loan Sponsor. The loan sponsor is a joint venture between Harrison Street Real Estate Capital LLC (“Harrison Street”) and 1547 Critical Systems Realty. The nonrecourse carve-out guarantor is 1547 Data Center Real Estate Fund II, L.P. Additionally, HSRE Social Infrastructure REIT Holding I, LLC has entered into the Oregon Moratorium Guaranty Agreement (as defined below). Harrison Street is an investment management firm exclusively focused on alternative real assets. Founded in 2005 with offices in Chicago and London, Harrison Street has invested approximately $36.3 billion across senior housing, student housing, healthcare delivery, life sciences, storage real estate and social and utility infrastructure. Harrison Street has closed on approximately $600.0 million of data center assets with the goal of owning $6.0 billion worth of data centers within five years. 1547 Critical Systems Realty (“1547”) is a leading developer and operator of custom-designed data centers with over 1.3 billion square feet of data center space across eight cities. 1547 was founded in 2011 by a group of experienced executives from the financial and data center industries with a combined 60 years of industry experience.
The Property. The Pittock Block property is an eight-story, 297,698 square foot mixed-use office, retail, colocation and data center building located in the central business district of Portland, Oregon, occupying the entire city block bounded by Southwest Washington Street, Southwest 10th Street, Southwest Harvey Mil Street and Southwest 9th Street. The Pittock Block property is comprised of 191,284 square feet of office space (approximately 64.3% of net rentable area), 81,906 square feet of colocation, data center and Meet-Me-Room (“MMR”) space (27.5% of net rentable area), 19,981 square feet of retail space (6.7% of net rentable area), 3,831 square feet of storage space (1.3% of net rentable area), and 696 square feet of roof space (0.2% of net rentable area). The Pittock Block property was originally constructed in 1913 and was renovated in 2001 into a major telecommunications internet exchange for the west coast region. The Pittock Block property is one of five major internet exchanges on the west coast and one of 11 major internet exchanges in the United States and serves as one of two primary internet exchanges for the Northwest (Westin Building in Seattle is the other major internet exchange). The Pittock Block property’s internet exchange (“Portland Network Access Point” or “Portland NAP”) includes 16 fiber-optic carriers and 179 other service providers, hosting companies such as Facebook and Zayo, and supports a critical IT load reported at 7,000 kilowatts. In addition, the Northwest Access Exchange (“NWAX”) is hosted at the Pittock Block property. NWAX is a carrier neutral internet exchange serving over 80 public and private networks.
Portland Network Access Point
The Portland NAP currently has 335 colocation cabinets and 65 additional cages with 317 cabinets and 50 cages occupied. Colocation cabinets are similar to cabinets in traditional data centers where tenants can house servers, networking equipment and other data center equipment; however, the landlord is responsible for operation of the data center, and the tenant pays for the number of cabinets they are using as well as power usage. The previous owner recently invested over $4.5 million to convert the Pittock Block property’s T-100 level into additional colocation space, spurring Facebook to invest further into the property, expanding into 70 colocation cabinets and retaining the opportunity to expand into an additional 20 cabinets. Additionally, a Fortune 10 technology company recently signed a license agreement for 31 additional cabinets. In connection with the foregoing, the Pittock Block Whole Loan was structured at loan origination with a $7.5 million holdback reserve that is expected to be released to the borrower given the recent execution of the new license agreement and the satisfaction of other Holdback Release Conditions (as defined below). All floors at the Pittock Block property can house a colocation center, with the Pittock Block property having approximately 225,000 square feet of data center potential through the conversion of the traditional office space at the Pittock Block property.
THE INFORMATION IN THIS STRUCTURAL AND COLLATERAL TERM SHEET IS NOT COMPLETE AND MAY BE AMENDED PRIOR TO THE TIME OF SALE. THIS TERM SHEET IS NOT AN OFFER TO SELL THESE SECURITIES AND IT IS NOT A SOLICITATION OF AN OFFER TO BUY THESE SECURITIES IN ANY JURISDICTION WHERE THE OFFER OR SALE IS NOT PERMITTED.
89 of 166
| Structural and Collateral Term Sheet | Benchmark 2021-B24 | |
| Pittock Block | ||
The MMR is a common area in internet exchanges where tenants can connect to one or more carriers. Tenants in the Portland NAP need to be connected to the right carriers in order to ensure that their customers are able to receive the content that they require and the latency needs to be low in order for the customers to receive the content quickly. This peering process is what makes an internet exchange possible, and it is cost-prohibitive for this ecosystem to move, as long-haul connections, subsea connections, and terrestrial points all come together at the Pittock Block property. The MMR currently contains 5,500 cross-connects with the capacity for 12,500 cross-connects with in-place infrastructure. Additionally, the MMR has the ability to expand by two to six times its current capacity, offering significant opportunity for further revenue growth. When using a cross connect at the Pittock Block property, tenants also need to have access to a panel. Currently, there are 1,496 panels built at the Pittock Block property with 846 of these housing a cross connect. The 650 panels that are not in use are not due to tenants having vacated but instead because the tenants are building the panels ahead of time with the understanding that they will use them as their demand grows.
The Pittock Block property also benefits from its proximity to the Hillsboro data center market, which offers direct access to several trans-Pacific submarine cables. Undersea cables connecting Oregon with Asia allow operators in the data center space to provide remote “Infrastructure-as-a-Service” to Asian-based users. As the only major internet exchange in Oregon, the Pittock Block property directly benefits from its role as the access point for Asian-based users to the rest of the United States. The Hillsboro data center market continues to expand the number of Pacific markets it serves, which is anticipated to be a significant revenue driver for the Pittock Block property.
The Portland NAP accounts for approximately 74.1% of underwritten rent at the Pittock Block property or approximately $12.2 million of rent (including rent associated with the new license signed with a Fortune 10 technology company). Revenue from the Portland NAP comes from four main sources: (i) colocation income which comes from license agreements for the colocation cabinets with a set level of power usage, (ii) cross connect income which is additional rent paid for connections to the MMR as well as panels installed in the MMR, (iii) connection income which consists of charges to the tenant for installation of new cabinets, cross connections to the MMR, or installation of new panels in the MMR and (iv) circuit fee income which is overage charges for tenants exceeding their power usage limits on their colocation cabinets.
The largest Portland NAP tenant, a Fortune 10 technology company (18.2% of underwritten colocation and cross connect rent including the additional license agreement it has to signed), is a global cloud platform offering over 175 fully featured services to millions of customers including startups, large enterprises and government agencies. The company has licensed colocation cabinets in the Portland NAP since 2011.
The second largest Portland NAP tenant, Facebook (16.2% of underwritten colocation and cross connect rent including the additional license agreement recently signed by a Fortune 10 technology company). (NASDAQ: FB) is the largest social networking site worldwide, with over 2.7 billion active users and offices in over 80 cities and is considered one of the “Big Four” technology companies along with Amazon, Apple and Google. Headquartered in Menlo Park, California, Facebook has also acquired numerous other companies including Instagram, Oculus and WhatsApp. Facebook has licensed colocation cabinets in the Portland NAP since 2013 and recently expanded into 70 additional cabinets in 2020, retaining the opportunity to expand into 20 more colocation cabinets.
Non-Portland NAP Space
As of December 21, 2020, the Pittock Block property excluding the Portland NAP (the “Non-Portland NAP Space”), which consists primarily of office and retail space, was 71.4% occupied by a diversified roster of 51 tenants, including 34 office tenants, seven retail tenants, six Telco/NNN Powered Shell tenants, three storage tenants and one roof tenant. The Telco/NNN Powered Shell space at the Pittock Block property represents data center space with power and connectivity already in place that tenants can build out to their own specifications. The Pittock Block property’s ten largest tenants occupy approximately 84,324 square feet (39.1% of net rentable area in the Non-Portland NAP Space). For purposes of this section, square feet and base rent figures exclude the Portland NAP.
The largest Non-Portland NAP Space tenant by underwritten base rent, Zayo / Integra Telecom Holdings, Inc. (“Zayo”) (5,696 square feet; 2.6% of NRA; 9.6% of underwritten base rent), is a privately held company headquartered in Boulder, Colorado with more than 3,700 employees. Founded in 2007, Zayo provides mission-critical fiber bandwidth to global companies with a fiber network that spans approximately 133,000 miles across 44 data centers servicing approximately 400 markets. Zayo was formerly traded on the New York Stock Exchange under the ticker ZAYO, but was taken private in 2020 in a $14.3 billion leveraged buyout, which was the second largest leveraged buyout since 2008. Zayo has been in occupancy in the Non-Portland NAP Space since 2011 and has leased colocation cabinets in the Portland NAP since 2000.
The second largest Non-Portland NAP Space tenant by underwritten base rent, Hennebery Eddy Architects (13,696 square feet; 6.3% of NRA; 9.1% of underwritten base rent) is an architecture, planning and interior design firm with a focus on historic resources and net-positive design solutions. Headquartered at the Pittock Block property, Hennebery Eddy Architects serves clients throughout the West and has an additional office in Bozeman, Montana. Hennebery Eddy Architects has been a tenant at the Pittock Block property since 2000, and recently executed a renewal through July 2027.
The third largest Non-Portland NAP Space tenant by underwritten base rent, LS Networks (15,238 square feet; 7.1% of NRA; 8.0% of underwritten base rent), is the largest, locally-owned fiber optic network in the Pacific Northwest. Headquartered at the Pittock Block property, LS Networks serves business, government, healthcare, education and other enterprises with a focus on rural communities in
THE INFORMATION IN THIS STRUCTURAL AND COLLATERAL TERM SHEET IS NOT COMPLETE AND MAY BE AMENDED PRIOR TO THE TIME OF SALE. THIS TERM SHEET IS NOT AN OFFER TO SELL THESE SECURITIES AND IT IS NOT A SOLICITATION OF AN OFFER TO BUY THESE SECURITIES IN ANY JURISDICTION WHERE THE OFFER OR SALE IS NOT PERMITTED.
90 of 166
| Structural and Collateral Term Sheet | Benchmark 2021-B24 | |
| Pittock Block | ||
the Northwest. LS Networks has been in occupancy in the Non-Portland NAP Space since 2004 and has leased colocation cabinets in the Portland NAP since 2003.
COVID-19 Update. As of February 1, 2021 the Pittock Block property is open for business; however, a majority of the tenants are working remotely. 11 tenants, representing approximately 26,625 square feet (8.9% NRA) have requested rent relief. According to the loan sponsor, it collected approximately 82% of rent payments in December 2020. As of February 1, 2021, the Pittock Block Whole Loan is not subject to any modification or forbearance requests.
The Market. The Pittock Block property is located in Downtown Portland occupying an entire city block adjacent to O’Bryant Square. The Pittock Block property is also located approximately 0.2 miles away from Pioneer Courthouse Square, commonly known as “Portland’s Living Room,” which is surrounded by high street retail options, diverse dining options, and immediate access to Portland’s transit system. The Pittock Block property is served by two major thoroughfares: Interstate 5, which is the main north-south interstate on the West Coast connecting Portland to Seattle and San Diego, and Interstate 405, which forms a loop that travels around Downtown Portland west of the Willamette River. The area’s primary public transportation system, TriMet, provides service throughout northwest Oregon and southwest Washington via bus and light rail lines. Additionally, the West End of Portland is served by the Portland Streetcar system, operating from South Waterfront north into the Pearl and Northwest Portland districts, with a stop one block away from the Pittock Block property. The system currently has two routes, measuring approximately 7.2 miles end to end. Portland International Airport is an approximately 20 minute drive from the Pittock Block property.
The Pittock Block property is located in the Greater Portland/Hillsboro data center market. The Hillsboro data center market has seen strong demand recently due to having no city, county or state sales taxes, a property tax abatement program for data centers, and continued reductions in utility costs through new renewable green/energy offerings. Hillsboro is also the location of Wave Business’s fiber-based Ring I, which is a cross-connect facility for several trans-Pacific submarine cables that connect six data centers. Wave Business recently completed Ring II, which is a 3,456 strand fiber optic network that provides access to 13 major data centers in the Hillsboro market and serves nine Pacific markets including China, Taiwan, Japan, Korea and Hawaii. The Pittock Block directly benefits from developments in the Hillsboro data center market as it is the only major internet exchange in the region and in Oregon.
The Pittock Block property is located in the CBD office submarket within the greater Portland office market. The CBD submarket contains approximately 28.5 million square feet of office inventory and is bordered by North Russell Street to the north, Interstate 5 to the south, Southeast Grand Avenue to the east and Interstate 405 to the west. The Pittock Block property’s in-place weighted average office rent is $24.49 per square foot, which compares favorably to the appraisal’s concluded office market rent, ranging between $25.00 and $28.00 per square foot, as demonstrated in the table below. Additionally, the Pittock Block property’s in-place weighted average Telco/NNN Powered Shell rent is $66.52 per square foot, which is below the appraisals concluded Telco/NNN Powered Shell rent of $70.00 per square foot.
The following table presents certain information relating to the appraisal’s market rent conclusion for the Pittock Block property:
| Summary of Appraisal’s Concluded Office Market Rent(1) | ||||||
| Retail | Prime Retail | Office Floors (1-2) | Office Floors (3-4) | Office Floors (5-6) | Office Floors (7-8) | Office (Telco/NNN Powered Shell) |
| $35.00 | $40.00 | $25.00 | $26.00 | $27.00 | $28.00 | $70.00 |
| (1) | Source: Appraisal. |
| Summary of Comparable Office Leases(1) | ||||||||
| Property | Tenant Name | Lease Start Date | Term (mos.) | Lease Type | Tenant Size (SF) | Base Rent PSF | Free Rent (mos.) | TI PSF |
| Pittock Block | ||||||||
| 610 SW Broadway | Oregon CUB | Sep-20 | 60 | Full Service | 2,100 | $23.25 | 0 | $0.00 |
| Power + Light Building | Coinbase, Inc | Jul-20 | 72 | NNN | 16,347 | $29.50 | 0 | $25.00 |
| Wilcox Building | Biztech People | Jul-20 | 72 | Full Service | 2,000 | $20.81 | 6 | $30.00 |
| Broadway Tower | AARP | Jun-20 | 55 | Full Service | 5,509 | $35.00 | 5 | $27.50 |
| Jeffrey Center | Education Tour Center | May-20 | 48 | NNN | 1,348 | $25.00 | 1 | $17.50 |
| Total / Wtd. Avg. | 66 | 27,304 | $29.27 | 1 | $23.58 | |||
| (1) | Source: Appraisal. |
THE INFORMATION IN THIS STRUCTURAL AND COLLATERAL TERM SHEET IS NOT COMPLETE AND MAY BE AMENDED PRIOR TO THE TIME OF SALE. THIS TERM SHEET IS NOT AN OFFER TO SELL THESE SECURITIES AND IT IS NOT A SOLICITATION OF AN OFFER TO BUY THESE SECURITIES IN ANY JURISDICTION WHERE THE OFFER OR SALE IS NOT PERMITTED.
91 of 166
| Structural and Collateral Term Sheet | Benchmark 2021-B24 | |
| Pittock Block | ||
| Summary of Comparable Retail Leases(1) | ||||||||
| Property | Tenant Name | Lease Start Date | Term (mos.) | Lease Type | Tenant Size (SF) | Base Rent PSF | Free Rent (mos.) | TI PSF |
| Pittock Block | ||||||||
| 600 NW 14th Avenue | US Outdoor | Sep-20 | 48 | NNN | 9,076 | $24.00 | 0 | $0.00 |
| Jackson Tower | Crafty Wonderland | Apr-20 | 48 | NNN | 1,447 | $23.99 | 0 | $12.50 |
| Mohawk Gallery Building | Yamhill Pub | Mar-20 | 60 | NNN | 13,968 | $40.00 | 0 | $35.00 |
| Pioneer Square | Yong Kang Noodle House | Mar-20 | 72 | NNN | 3,300 | $38.00 | 2 | $28.00 |
| The Pacific Building | Christian Reading Room | Jan-20 | 60 | NNN | 950 | $28.00 | 0 | $0.00 |
| Total / Wtd. Avg. | 57 | 28,741 | $33.52 | 0 | $20.85 | |||
| (1) | Source: Appraisal. |
| Historical and Current Occupancy(1)(2) | |||
| 2017 | 2018 | 2019(3) | Current(3)(4) |
| 82.8% | 85.7% | 88.7% | 71.4% |
| (1) | Historical occupancies are as of December 31 of each respective year. |
| (2) | Occupancy figures shown exclude the Portland NAP. |
| (3) | The change in occupancy from 2019 to Current Occupancy is primarily attributable to an office tenant occupying approximately 19,228 square feet vacating in November 2020. |
| (4) | Based on the underwritten rent roll dated December 21, 2020. |
| Largest Tenants by Underwritten Base Rent(1) | ||||||||
| Tenant | Property Type | Ratings Moody’s/Fitch/S&P(2) | Net Rentable Area (SF) | % of Total NRA | Base Rent PSF(3) | % of Total Base Rent(3) | Lease Expiration Date | Renewal / Extension Options |
| Zayo / Integra Telecom Holdings, Inc.(4) | Telco/NNN Powered Shell | Caa1/NR/B | 5,696 | 2.6% | $72.10 | 9.6% | 8/31/2030 | None |
| Hennebery Eddy Architects(5) | Office | NR/NR/NR | 13,696 | 6.3% | $28.57 | 9.1% | 7/31/2027 | None |
| LS Networks(6) | Office | NR/NR/NR | 15,238 | 7.1% | $22.34 | 8.0% | 7/31/2021 | 1, 1-year option |
| Sagacity Media Inc.(7) | Office | NR/NR/NR | 11,936 | 5.5% | $24.00 | 6.7% | 3/31/2023 | 1, 5-year option |
| Oregon Symphony(8) | Office | NR/NR/NR | 10,701 | 5.0% | $24.50 | 6.1% | 10/31/2023 | None |
| DCI - D’Amato, Conversano, Inc. | Office | NR/NR/NR | 7,981 | 3.7% | $32.31 | 6.0% | 8/31/2026 | 1, 5-year option |
| Peaberry Software | Office | NR/NR/NR | 5,803 | 2.7% | $25.46 | 3.5% | 10/14/2021 | 1, 3-year option |
| BAAS | Office | NR/NR/NR | 5,240 | 2.4% | $28.14 | 3.4% | 4/30/2025 | 1, 5-year option |
| WCI Cable(9) | Telco/NNN Powered Shell | NR/NR/NR | 2,850 | 1.3% | $45.82 | 3.1% | 10/31/2029 | None |
| Krowdsourced, Inc(10) | Office | NR/NR/NR | 5,183 | 2.4% | $24.72 | 3.0% | 6/30/2025 | None |
| Total | 84,324 | 39.1% | $29.68 | 58.5% | ||||
| Other Occupied(11) | 69,695 | 32.3% | $25.48 | 41.5% | ||||
| Total Occupied | 154,019 | 71.4% | $27.78 | 100.0% | ||||
| Vacant(12) | 61,773 | 28.6% | ||||||
| Total | 215,792 | 100.0% | ||||||
| (1) | Based on the underwritten rent roll dated December 21, 2020. |
| (2) | In certain instances, ratings provided are those of the parent company of the entity shown, whether or not the parent company guarantees the lease. |
| (3) | Base Rent PSF and % of Total Base Rent includes rent steps through December 2021 and 10% haircuts for tenants that are currently experiencing rent relief. |
| (4) | Zayo / Integra Telecom Holdings, Inc. has a Telco lease at the Pittock Block property, which is for suites in the building that have additional power and cooling supply compared to general office/retail suites. |
| (5) | Hennebery Eddy Architects leases 13,696 square feet of which (i) 13,522 square feet is office space leased for $28.84 per square foot and is set to expire in July 2027 and (ii) 174 square feet is storage space leased for approximately $7.59 per square foot on a month to month basis. |
| (6) | LS Networks leases 15,238 square feet of which (i) 14,821 square feet is office space leased for $22.73 per square foot and is set to expire in July 2021 and (ii) 417 square feet is storage space leased for approximately $8.49 per square foot on a month to month basis. |
| (7) | Sagacity Media Inc. leases 11,936 square feet of which (i) 11,850 square feet is office space leased for $24.13 per square foot and is set to expire in March 2023 and (ii) 86 square feet is storage space leased for approximately $6.28 per square foot on a month to month basis. |
| (8) | Oregon Symphony leases 10,701 square feet of which (i) 10,229 square feet is office space leased for $25.34 per square foot and is set to expire in October 2023 and (ii) 472 square feet is storage space leased for approximately $6.23 per square foot on a month to month basis. |
| (9) | WCI Cable leases 2,850 square feet of office space set to expire in October 2029 of which (i) 2,000 square feet is leased for $43.63 per square foot and (ii) 850 square feet is leased for $50.98 per square foot. |
| (10) | Krowdsourced, Inc has the one-time right to terminate its lease effective June 30, 2023 with 12 months prior written notice and payment of an early termination fee of $64,680. |
| (11) | Other Occupied is inclusive of a 2,000 square foot management office with no attributable underwritten base rent. |
| (12) | Vacant space includes 55,791 square feet of office space, 3,179 square feet of retail space and 923 square feet of storage space. |
THE INFORMATION IN THIS STRUCTURAL AND COLLATERAL TERM SHEET IS NOT COMPLETE AND MAY BE AMENDED PRIOR TO THE TIME OF SALE. THIS TERM SHEET IS NOT AN OFFER TO SELL THESE SECURITIES AND IT IS NOT A SOLICITATION OF AN OFFER TO BUY THESE SECURITIES IN ANY JURISDICTION WHERE THE OFFER OR SALE IS NOT PERMITTED.
92 of 166
| Structural and Collateral Term Sheet | Benchmark 2021-B24 | |
| Pittock Block | ||
| Ten Largest Tenants by Underwritten Colocation and Cross Connect Rent(1) | ||||
| Tenant | Ratings Moody’s/Fitch/S&P(2) | Underwritten Colocation and Cross Connect Rent | % of Total Underwritten Colocation and Cross Connect Rent | Lease Expiration Date |
| Fortune 10 Technology Company(3) | A2/A+/AA- | $2,221,140 | 18.2% | MTM |
| Facebook(4) | NR/NR/NR | $1,983,600 | 16.2% | 1/31/2025 |
| Multi-National Corporation | NR/NR/NR | $1,128,060 | 9.2% | MTM |
| Zayo(5) | Caa1/NR/B | $901,488 | 7.4% | 12/31/2022 |
| Charter | Ba2/NR/BB+ | $668,352 | 5.5% | MTM |
| Wave | Caa1/NR/NR | $360,540 | 3.0% | MTM |
| Centurylink | Ba3/BB/BB | $344,340 | 2.8% | MTM |
| Axiom Data Science | NR/NR/NR | $241,380 | 2.0% | MTM |
| CN Servers | NR/NR/NR | $213,840 | 1.7% | MTM |
| AT&T | Baa2/A-/BBB | $207,600 | 1.7% | MTM |
| Total | $8,270,340 | 67.7% | ||
| Remaining Colocation Tenants | $3,950,820 | 32.3% | ||
| Total | $12,221,160 | 32.3% | ||
| (1) | Based on the underwritten rent roll dated December 21, 2020. |
| (2) | In certain instances, ratings provided are those of the parent company of the entity shown, whether or not the parent company guarantees the lease. |
| (3) | The Underwritten Colocation and Cross Connect Rent for the Fortune 10 technology company includes the new license agreement with $837,000 in underwritten rent. |
| (4) | Facebook has three separate license agreements for colocation space of which (i) two license agreements collectively representing $1,458,000 in underwritten rent are set to expire in January 2025 and (ii) one license agreement representing $525,600 in underwritten rent is on a month to month basis. |
| (5) | Zayo has seven separate license agreements for the colocation space of which (i) one license agreement representing $364,152 in underwritten rent is set to expire in December 2022, (ii) two license agreements collectively representing $174,840 in underwritten rent are on a month to month basis, (iii) two license agreements collectively representing $127,296 in underwritten rent are set to expire in March 2021, (iv) one license agreement representing $122,400 in underwritten rent is set to expire in July 2021 and (v) one license agreement representing $112,800 in underwritten rent is set to expire in April 2021. |
| Lease Rollover Schedule(1)(2) | ||||||||
| Year | Number of Leases Expiring | Net Rentable Area Expiring | % of NRA Expiring | Base Rent Expiring | Cumulative Net Rentable Area Expiring | Cumulative % of NRA Expiring | Cumulative Base Rent Expiring | Cumulative % of Base Rent Expiring |
| Vacant | NAP | 61,773 | 28.6% | NAP | 61,773 | 28.6% | NAP | NAP |
| 2021 & MTM | 43 | 48,624 | 22.5% | $1,160,327 | 110,397 | 51.2% | $1,160,327 | 27.1% |
| 2022 | 9 | 24,301 | 11.3% | 555,806 | 134,698 | 62.4% | $1,716,133 | 40.1% |
| 2023 | 7 | 30,975 | 14.4% | 857,559 | 165,673 | 76.8% | $2,573,692 | 60.2% |
| 2024 | 1 | 553 | 0.3% | 14,628 | 166,226 | 77.0% | $2,588,320 | 60.5% |
| 2025 | 6 | 17,017 | 7.9% | 458,391 | 183,243 | 84.9% | $3,046,711 | 71.2% |
| 2026 | 2 | 8,481 | 3.9% | 300,760 | 191,724 | 88.8% | $3,347,471 | 78.2% |
| 2027 | 2 | 13,522 | 6.3% | 389,974 | 205,246 | 95.1% | $3,737,445 | 87.3% |
| 2028 | 0 | 0 | 0.0% | 0 | 205,246 | 95.1% | $3,737,445 | 87.3% |
| 2029 | 2 | 2,850 | 1.3% | 130,601 | 208,096 | 96.4% | $3,868,046 | 90.4% |
| 2030 | 1 | 5,696 | 2.6% | 410,686 | 213,792 | 99.1% | $4,278,732 | 100.0% |
| 2031 | 0 | 0 | 0.0% | 0 | 213,792 | 99.1% | $4,278,732 | 100.0% |
| 2032 and Thereafter(3) | 0 | 2,000 | 0.9% | 0 | 215,792 | 100.0% | $4,278,732 | 100.0% |
| Total | 73 | 215,792 | 100.0% | $4,278,732 | ||||
| (1) | Based on the underwritten rent roll dated December 21, 2020. |
| (2) | Certain tenants may have termination or contraction options (which may become exercisable prior to the originally stated expiration date of the tenant lease) that are not considered in the above Lease Rollover Schedule. |
| (3) | 2032 and Thereafter is inclusive of a 2,000 square foot management office with no underwritten base rent. |
THE INFORMATION IN THIS STRUCTURAL AND COLLATERAL TERM SHEET IS NOT COMPLETE AND MAY BE AMENDED PRIOR TO THE TIME OF SALE. THIS TERM SHEET IS NOT AN OFFER TO SELL THESE SECURITIES AND IT IS NOT A SOLICITATION OF AN OFFER TO BUY THESE SECURITIES IN ANY JURISDICTION WHERE THE OFFER OR SALE IS NOT PERMITTED.
93 of 166
| Structural and Collateral Term Sheet | Benchmark 2021-B24 | |
| Pittock Block | ||
| Underwritten Net Cash Flow(1) | |||||||
| 2017 | 2018 | 2019 | TTM 11/30/2020 | Underwritten | $ Per Square Foot | %(2) | |
| Base Rent(3) | $3,431,224 | $4,027,867 | $4,359,091 | $4,368,598 | $4,278,732 | $14.37 | 23.6% |
| Vacant Income | 0 | 0 | 0 | 0 | 1,622,923 | 5.45 | 8.9% |
| Gross Potential Rent | $3,431,224 | $4,027,867 | $4,359,091 | $4,368,598 | $5,901,655 | $19.82 | 32.5% |
| Total Reimbursements | $1,111,998 | $1,350,416 | $1,697,474 | $999,728 | $1,031,254 | $3.46 | 5.7% |
| Colocation Income | 6,311,688 | 6,396,294 | 6,752,559 | 7,632,953 | 9,673,590 | 32.49 | 53.3% |
| Cross Connect Income | 1,833,633 | 2,004,128 | 2,215,586 | 2,398,766 | 2,547,570 | 8.56 | 14.0% |
| Connection Income | 477,927 | 328,614 | 260,700 | 1,162,438 | 815,849 | 2.74 | 4.5% |
| Circuit Fee Income | 0 | 0 | 91,475 | 581,925 | 95,221 | 0.32 | 0.5% |
| Vacancy & Credit Loss | 0 | 0 | 0 | 0 | (1,906,512) | (6.40) | (10.5)% |
| Concessions | 0 | 0 | (19,740) | (469,809) | 0 | 0.00 | 0.0% |
| Effective Gross Income | $13,166,469 | $14,107,319 | $15,357,144 | $16,674,600 | $18,158,626 | $61.00 | 100.0% |
| Real Estate Taxes | $517,396 | $561,203 | $619,531 | $561,203 | $613,607 | $2.06 | 3.4% |
| Insurance | 194,994 | 254,275 | 292,010 | 489,041 | 80,000 | 0.27 | 0.4% |
| Management Fee | 614,115 | 423,220 | 460,714 | 500,238 | 544,759 | 1.83 | 3.0% |
| Other Operating Expenses | 2,211,262 | 3,796,178 | 3,965,073 | 4,076,679 | 4,335,980 | 14.57 | 23.9% |
| Total Operating Expenses | $3,537,767 | $5,034,876 | $5,337,329 | $5,627,162 | $5,574,346 | $18.72 | 30.7% |
| Net Operating Income(4) | $9,628,702 | $9,072,443 | $10,019,815 | $11,047,438 | $12,584,281 | $42.27 | 69.3% |
| TI/LC | 0 | 0 | 0 | 0 | 702,570 | 2.36 | 3.9% |
| Replacement Reserves | 0 | 0 | 0 | 0 | 101,217 | 0.34 | 0.6% |
| Net Cash Flow | $9,628,702 | $9,072,443 | $10,019,815 | $11,047,438 | $11,780,493 | $39.57 | 64.9% |
| (1) | Certain items such as straight line rent, interest expense, interest income, lease cancellation income, depreciation, amortization, debt service payments and any other non-recurring or non-operating items were excluded from the historical presentation and are not considered for the underwritten cash flow. |
| (2) | % represents percent of Effective Gross Income. |
| (3) | Underwritten Base Rent is inclusive of rent steps through December 2021 and 10% haircuts for tenants that are currently experiencing rent relief. |
| (4) | The increase in TTM 11/30/2020 Net Operating Income from 2019 Net Operating Income is primarily attributable to a new colocation license executed by Facebook for 70 additional cabinets. The increase in Underwritten Net Operating Income from TTM 11/30/2020 Net Operating Income is primarily attributable to the recent license agreement signed by a Fortune 10 technology for 31 cabinets. |
Property Management. The Pittock Block property is managed by 1547 Datacenter Management Services, LLC, a Delaware limited liability company and an affiliate of the borrower.
Escrows and Reserves. At loan origination, the borrower deposited a (i) $7,500,000 holdback to be released upon satisfaction of the Holdback Release Conditions and (ii) an approximately $1,512,030 debt service reserve. According to loan sponsor, the Holdback Release Conditions have been satisfied as evidenced by an executed lease with a qualifying Fortune 10 technology company and the associated reserve is expected to be released to the borrower.
“Holdback Release Conditions” means either (a) the borrower enters into a data license agreement with a Fortune 10 technology company, which demises no fewer than 31 cabinets at the Pittock Block property and provides for annual rent/license fees in an amount not less than $837,000 (the “Data License”), and any payment concessions in favor of the tenant/licensee and/or obligations of the borrower to perform and/or pay for any work in connection with the applicable Data License have either been completed and satisfied in full or the reserve funds have been established with the lender for the purpose of covering the same; or (b) the Pittock Block property achieves a debt service coverage ratio of 1.95x and a loan to value ratio of 51%.
Tax Reserve. On each due date, the borrower is required to deposit into a tax reserve, on a monthly basis, 1/12 of the amount that the lender estimates will be necessary to pay taxes over the then succeeding 12-month period (such reserve has been conditionally waived so long as no Cash Sweep Period (as defined below) is continuing and the borrower has provided satisfactory evidence that taxes have been paid meeting the requirements of the Pittock Block Whole Loan documents).
Insurance Reserve. On each due date, the borrower is required to deposit into an insurance reserve, on a monthly basis, 1/12 of the amount that the lender estimates will be necessary to cover premiums over the then succeeding 12-month period (such reserve has been conditionally waived so long as no event of default is continuing and the borrower maintains a blanket policy meeting the requirements of the Pittock Block Whole Loan documents).
Replacement Reserve. On each due date during the continuance of a Cash Sweep Event (as defined below), the borrower is required to deposit into a replacement reserve an amount equal to approximately $6,202 for replacement reserves (approximately $0.25 per square foot annually).
TI/LC Reserve. On each due date during the continuance of a Cash Sweep Event, the borrower is required to deposit into a TI/LC reserve, on a monthly basis, an amount equal to approximately $62,017 for tenant improvement and leasing commission obligations (approximately $2.50 per square foot annually).
THE INFORMATION IN THIS STRUCTURAL AND COLLATERAL TERM SHEET IS NOT COMPLETE AND MAY BE AMENDED PRIOR TO THE TIME OF SALE. THIS TERM SHEET IS NOT AN OFFER TO SELL THESE SECURITIES AND IT IS NOT A SOLICITATION OF AN OFFER TO BUY THESE SECURITIES IN ANY JURISDICTION WHERE THE OFFER OR SALE IS NOT PERMITTED.
94 of 166
| Structural and Collateral Term Sheet | Benchmark 2021-B24 | |
| Pittock Block | ||
Lockbox / Cash Management. The Pittock Block Whole Loan is structured with a hard lockbox and springing cash management. The borrower was required at loan origination to send tenant direction letters instructing the tenants to deposit all rents and payments into a lender controlled lockbox account. To the extent no Cash Sweep Period is continuing, all funds in the lockbox account are required to be transferred to or at the direction of the borrower. Following the occurrence and during the continuance of a Cash Sweep Period, all funds in the lockbox account are required to be swept each business day to a segregated cash management account under the control of the lender and disbursed in accordance with the Pittock Block Whole Loan documents. To the extent there is a Cash Sweep Period continuing, all excess cash flow after payment of debt service, required reserves and operating expenses are required to be held as additional collateral for the Pittock Block Whole Loan. The lender has been granted a first priority security interest in the cash management account.
A “Cash Sweep Period” means each period commencing on the occurrence of a Cash Sweep Event (as defined below) and continuing until the earlier of the payment date next occurring following the related Cash Sweep Event Cure (as defined below) or payment in full of all principal and interest on the Pittock Block Whole Loan.
A “Cash Sweep Event” means the occurrence of (i) an event of default or (ii) the date on which the debt service coverage ratio (as calculated in the Pittock Block Whole Loan documents and based on the trailing three-month period immediately preceding the date of determination) is less than 1.50x (a “DSCR Trigger Event”).
A “Cash Sweep Event Cure” means (a) with respect to clause (i) above, the acceptance by the lender of a cure of such event of default or (b) with respect to clause (ii) above, achievement of a debt service coverage ratio (as calculated in the Pittock Block Whole Loan documents and based on the trailing three-month period immediately preceding the date of determination) of at least 1.55x for two consecutive quarters immediately preceding the date of determination; provided, (1) a Cash Sweep Event Cure may occur no more than a total of five times in the aggregate during the term of the Pittock Block Whole Loan and (2) the borrower will have paid all of the lender’s reasonable expenses incurred in connection with such Cash Sweep Event Cure.
Current Mezzanine or Subordinate Indebtedness. The Pittock Block Junior Note, with an outstanding principal balance as of the Cut-off Date of $22.47 million, accrues interest at a fixed rate of 5.85000% per annum. The Pittock Block Junior Note has a 120-month term and is interest only for the full term. For additional information, see “Description of the Mortgage Pool—The Whole Loans—The Non-Serviced AB Whole Loans—The Pittock Block Pari Passu-AB Whole Loan” in the Preliminary Prospectus.
Future Mezzanine or Subordinate Indebtedness Permitted. The Pittock Block Whole Loan documents permit the owner of 100% of the direct or indirect interest (the “BMO Mezzanine Equity Collateral”) in the borrower to incur mezzanine financing (the “BMO Mezzanine Loan”) secured by the BMO Mezzanine Equity Collateral (the “Borrower Mezzanine Option”) once during the term of the Pittock Block Whole Loan, upon satisfaction of certain terms and conditions set forth in the Pittock Block Whole Loan documents, including, without limitation, the following: (a) the resulting combined debt service coverage ratio equals or exceeds 1.96x and the resulting combined loan-to-value ratio is equal to or less than 51%; (b) the term of the BMO Mezzanine Loan is coterminous with the Pittock Block Whole Loan; (c) the parties have entered into an intercreditor agreement; and (d) a rating agency confirmation.
Partial Release. None.
THE INFORMATION IN THIS STRUCTURAL AND COLLATERAL TERM SHEET IS NOT COMPLETE AND MAY BE AMENDED PRIOR TO THE TIME OF SALE. THIS TERM SHEET IS NOT AN OFFER TO SELL THESE SECURITIES AND IT IS NOT A SOLICITATION OF AN OFFER TO BUY THESE SECURITIES IN ANY JURISDICTION WHERE THE OFFER OR SALE IS NOT PERMITTED.
95 of 166
| Structural and Collateral Term Sheet | Benchmark 2021-B24 | |
| The Galleria Office Towers | ||

THE INFORMATION IN THIS STRUCTURAL AND COLLATERAL TERM SHEET IS NOT COMPLETE AND MAY BE AMENDED PRIOR TO THE TIME OF SALE. THIS TERM SHEET IS NOT AN OFFER TO SELL THESE SECURITIES AND IT IS NOT A SOLICITATION OF AN OFFER TO BUY THESE SECURITIES IN ANY JURISDICTION WHERE THE OFFER OR SALE IS NOT PERMITTED.
96 of 166
| Structural and Collateral Term Sheet | Benchmark 2021-B24 | |
| The Galleria Office Towers | ||

THE INFORMATION IN THIS STRUCTURAL AND COLLATERAL TERM SHEET IS NOT COMPLETE AND MAY BE AMENDED PRIOR TO THE TIME OF SALE. THIS TERM SHEET IS NOT AN OFFER TO SELL THESE SECURITIES AND IT IS NOT A SOLICITATION OF AN OFFER TO BUY THESE SECURITIES IN ANY JURISDICTION WHERE THE OFFER OR SALE IS NOT PERMITTED.
97 of 166
| Structural and Collateral Term Sheet | Benchmark 2021-B24 | |
| The Galleria Office Towers | ||
| Mortgage Loan Information | Property Information | |||
| Mortgage Loan Seller: | CREFI/JPMCB | Single Asset / Portfolio: | Portfolio | |
| Original Principal Balance(1): | $65,000,000 | Title: | Fee | |
| Cut-off Date Principal Balance(1): | $65,000,000 | Property Type - Subtype: | Office – CBD | |
| % of Pool by IPB: | 5.6% | Net Rentable Area (SF): | 1,067,672 | |
| Loan Purpose: | Refinance | Location: | Houston, TX | |
| Borrower: | Three Galleria Office Buildings, LLC | Year Built / Renovated(5): | Various / Various | |
| Loan Sponsor: | Azrieli Group Ltd. | Occupancy: | 68.1% | |
| Interest Rate: | 4.46000% | Occupancy Date: | 1/20/2021 | |
| Note Date: | 2/17/2021 | Number of Tenants: | 65 | |
| Maturity Date: | 3/6/2031 | 2017 NOI: | $13,471,050 | |
| Interest-only Period: | None | 2018 NOI: | $15,161,719 | |
| Original Term: | 120 months | 2019 NOI: | $12,375,783 | |
| Original Amortization: | 360 months | TTM NOI (as of 12/2020): | $12,459,004 | |
| Amortization Type: | Balloon | UW Economic Occupancy(6): | 68.7% | |
| Call Protection(2): | L(24),Def(91),O(5) | UW Revenues: | $25,273,331 | |
| Lockbox / Cash Management: | Hard / Springing | UW Expenses: | $13,960,632 | |
| Additional Debt(1): | Yes | UW NOI(6): | $11,312,699 | |
| Additional Debt Balance(1): | $25,000,000 | UW NCF(6): | $9,333,289 | |
| Additional Debt Type(1): | Pari Passu | Appraised Value / Per SF(6): | $185,000,000 / $173 | |
| Appraisal Date: | 1/6/2021 | |||
| Escrows and Reserves(3) | Financial Information(1)(6) | |||||
| Initial | Monthly | Initial Cap | Cut-off Date Loan / SF: | $84 | ||
| Taxes: | $1,133,321 | $283,330 | N/A | Maturity Date Loan / SF: | $68 | |
| Insurance: | $0 | Springing | N/A | Cut-off Date LTV: | 48.6% | |
| Replacement Reserves: | $0 | $21,990 | N/A | Maturity Date LTV: | 39.3% | |
| TI/LC: | $6,000,000 | $88,973 | $8,000,000 | UW NCF DSCR: | 1.71x | |
| Other(4): | $2,290,985 | Springing | N/A | UW NOI Debt Yield: | 12.6% | |
| Sources and Uses | ||||||
| Sources | Proceeds | % of Total | Uses | Proceeds | % of Total | |
| Whole Loan | $90,000,000 | 76.1% | Payoff Existing Debt | $108,176,606 | 91.5% | |
| Sponsor Equity | 28,245,409 | 23.9 | Upfront Reserves | 9,424,306 | 8.0 | |
| Closing Costs | 644,496 | 0.5 | ||||
| Total Sources | $118,245,409 | 100.0% | Total Uses | $118,245,409 | 100.0% | |
| (1) | The Galleria Office Towers Loan (as defined below) consists of controlling Note A-1 and non-controlling Note A-3 and is part of the Galleria Office Portfolio Whole Loan (as defined below) evidenced by four pari passu notes, with an aggregate outstanding principal balance as of the Cut-off Date of $90.0 million. Financial Information presented in the chart above reflects Cut-off Date balance of the $90.0 million The Galleria Office Towers Whole Loan. For additional information, see “The Loan” below. |
| (2) | The defeasance lockout period will be at least 24 payment dates beginning with and including the first payment date in April 2021. The borrower has the right to defease the Galleria Office Towers Whole Loan in whole (and not in part) after the earlier to occur of (i) two years after the closing date of the securitization that includes the last note to be securitized and (ii) February 17, 2025. The assumed defeasance lockout period of 24 months is based on the expected closing date of the Benchmark 2021-B24 securitization in March 2021. The actual lockout period may be longer. |
| (3) | For a full description of Escrows and Reserves, please refer to “Escrows and Reserves” herein. |
| (4) | Other Initial reserve is comprised of an approximately $2,192,842 unfunded obligations reserve and a $98,143 condo reserve allocated for one month of assessments. See the “Escrows and Reserves” section for more details. |
| (5) | For a full description of Year Built / Renovated information, please refer to the “Portfolio Summary” table herein. |
| (6) | While The Galleria Office Towers Whole Loan was originated after the emergence of the novel coronavirus pandemic and the economic disruption resulting from measures to combat the pandemic, the pandemic is an evolving situation and could impact The Galleria Office Towers Whole Loan more severely than assumed in the underwriting of The Galleria Office Towers Whole Loan and could adversely affect the NOI, NCF, and occupancy information, as well as the appraised value and the DSCR, LTV, and Debt Yield metrics presented above. See “Risk Factors—Special Risks—Coronavirus Pandemic Has Adversely Affected the Global Economy and Will Likely Adversely Affect the Performance of the Mortgage Loans” in the Preliminary Prospectus. |
THE INFORMATION IN THIS STRUCTURAL AND COLLATERAL TERM SHEET IS NOT COMPLETE AND MAY BE AMENDED PRIOR TO THE TIME OF SALE. THIS TERM SHEET IS NOT AN OFFER TO SELL THESE SECURITIES AND IT IS NOT A SOLICITATION OF AN OFFER TO BUY THESE SECURITIES IN ANY JURISDICTION WHERE THE OFFER OR SALE IS NOT PERMITTED.
98 of 166
| Structural and Collateral Term Sheet | Benchmark 2021-B24 | |
| The Galleria Office Towers | ||
The Loan. The Galleria Office Towers mortgage loan (“The Galleria Office Towers Loan”) is part of a whole loan with an aggregate outstanding principal balance as of the Cut-off Date of $90.0 million (the “Galleria Office Towers Whole Loan”), secured by the borrower’s fee interest in the condominium units consisting of three Class A, central business district, office properties totaling 1,067,672 square feet in Houston, Texas (the “The Galleria Office Towers Properties”). The Galleria Office Towers Whole Loan has a ten-year term and amortizes on a 30-year schedule. The Galleria Office Towers Whole Loan is comprised of four pari passu notes with an aggregate principal balance as of the Cut-off Date of $90.0 million, two of which (Notes A-1 and A-3) with an aggregate outstanding principal balance as of the Cut-off Date of $65.0 million, are being contributed to the Benchmark 2021-B24 trust and constitute The Galleria Office Towers Loan, and the remainder of which are expected to be contributed to one or more future securitization trusts. The Galleria Office Towers Whole Loan was co-originated by Citi Real Estate Funding Inc. (“CREFI”) and JPMorgan Chase Bank, National Association (“JPMCB”) on February 17, 2021. The Galleria Office Towers Whole Loan was previously securitized in JPMCC 2011-C3.
The table below summarizes the promissory notes that comprise The Galleria Office Towers Whole Loan. The relationship between the holders of The Galleria Office Towers Whole Loan is governed by a co-lender agreement as described under “Description of the Mortgage Pool—The Whole Loans—The Serviced Pari Passu Whole Loans” in the Preliminary Prospectus.
| Whole Loan Summary | |||||
| Note | Original Balance | Cut-off Date Balance | Note Holder | Controlling Piece | |
| A-1, A-3 | $65,000,000 | $65,000,000 | Benchmark 2021-B24 | Yes | |
| A-2 | $15,000,000 | $15,000,000 | CREFI(1) | No | |
| A-4 | $10,000,000 | $10,000,000 | JPMCB(1) | No | |
| Total | $90,000,000 | $90,000,000 | |||
| (1) | The related note is currently held by the Note Holder identified in the table above and is expected to be contributed to one or more future securitization transactions. |
The Borrower. The borrower is Three Galleria Office Buildings, LLC, a Delaware limited liability company with one independent director (“The Galleria Office Towers Borrower”). Legal counsel to The Galleria Office Towers Borrower delivered a non-consolidation opinion in connection with the origination of The Galleria Office Towers Whole Loan.
The Loan Sponsor. The loan sponsor and non-recourse carve-out guarantor is the Azrieli Group Ltd. (“Azrieli Group”). Azrieli Group is Israel’s largest real estate group and was founded by the late Mr. David Azrieli in 1982. Headquartered in Tel Aviv-Yafo, Israel, the Azrieli Group currently owns a total leasable area of approximately 1.2 million square meters (approximately 12.9 million square feet), and has an additional 750,000 square meters (approximately 8 million square feet) under construction. The firm wholly owns the largest and high-standard office complexes in Israel, including the iconic Azrieli Center in Tel Aviv.
The Properties. The Galleria Office Towers Properties consists of three Class A office buildings spanning 1,067,672 square feet that are attached to the 2.4 million square foot Galleria Mall. The Galleria Office Towers Properties are comprised of: Galleria Tower I, a 493,695 square foot 25-story office tower located at 2700 Post Oak Boulevard, Galleria Tower II, a 320,687 square foot 22-story office tower located at 5051 Westheimer Road, and the Galleria Financial Center, a 253,290 square foot seven-story office tower located at 5065-5075 Westheimer Road. The Galleria Office Towers Properties are located within the Houston Galleria condominiums (as described under “Condominum” below). As of January 20, 2021, The Galleria Office Towers Properties are 68.1% occupied to 65 tenants.
The following table presents certain information relating to The Galleria Office Towers Properties:
| Portfolio Summary | ||||||||
| Property Name | Year Built / Renovated | SF | % Allocated Whole Loan Original Balance | Appraisal Date | Appraised Value | % Appraised Value | UW NCF | % of UW NCF |
| Galleria Tower I | 1974 / 2002, 2020 | 493,695 | 46.2% | 1/6/2021 | $85,544,600 | 46.2% | $6,556,331 | 70.2% |
| Galleria Tower II | 1970 / 1992, 2005, 2020 | 320,687 | 30.0% | 1/6/2021 | 55,566,781 | 30.0 | 1,999,236 | 21.4% |
| Galleria Financial Center | 1977 / 2020 | 253,290 | 23.7% | 1/6/2021 | 43,888,619 | 23.7 | 777,722 | 8.3% |
| Total / Wtd. Avg. | 1,067,672 | 100.0% | $185,000,000 | 100.0% | $9,333,289 | 100.0% | ||
The largest tenant, WeWork Companies, Inc. (“WeWork”) (100,141 square feet; 9.4% of net rentable area; 14.6% of underwritten base rent; Moody’s/Fitch/S&P: NR/CC/CCC+), is a workspace design company that provides shared co-working spaces for tenants at lower costs than traditional office spaces. Founded in 2010, WeWork leases office space throughout the United States and then transforms that space into a number of smaller offices and common areas. WeWork offers these smaller office spaces to individuals or groups who seek the perks of a traditional office space without the expenses of a full office. WeWork’s lease includes either two, five-year extension options or one, ten-year extension option, each at fair market value.
The second largest tenant, Quanta Services (“Quanta”) (56,345 square feet; 5.3% of net rentable area; 6.9% of underwritten base rent; Moody’s/Fitch/S&P: Baa3/NR/BBB-) is a specialty contractor that provides fully integrated infrastructure solutions for the utility, pipeline, energy, and communications industries. In 1997, founder John Colston merged PAR, Potelco, Union Power, and Trans Tech under the
THE INFORMATION IN THIS STRUCTURAL AND COLLATERAL TERM SHEET IS NOT COMPLETE AND MAY BE AMENDED PRIOR TO THE TIME OF SALE. THIS TERM SHEET IS NOT AN OFFER TO SELL THESE SECURITIES AND IT IS NOT A SOLICITATION OF AN OFFER TO BUY THESE SECURITIES IN ANY JURISDICTION WHERE THE OFFER OR SALE IS NOT PERMITTED.
99 of 166
| Structural and Collateral Term Sheet | Benchmark 2021-B24 | |
| The Galleria Office Towers | ||
umbrella “Quanta”, and has since acquired over 200 companies in the infrastructure space. As of 2020, Quanta had more than 42,000 employees in all 50 states and across 15 different countries. Quanta’s lease includes one renewal option for a minimum of nine months but no more than 21 months with no termination options. Additionally, Quanta subleases 100.0% of its space at the Galleria Tower II property from Panhandle Eastern Pipe Line Company, L.P., which sublease is coterminous with the Panhandle Eastern Pipe Line Company, L.P. lease.
The third largest tenant, Citigroup Technology (49,740 square feet; 4.7% of net rentable area; 8.2% of underwritten base rent) is a subsidiary of Citigroup (“Citi”) a multinational investment bank and financial services firm headquartered in New York, New York. Citi offers a suite of financial services ranging from consumer business such as credit cards and retail banking to consumer banking, securities trading, capital markets advisory, private banking, and treasury solutions. As of June 2020, Citi had more than 200,000 employees throughout offices around the world. Citi is currently paying a base rent of $22.50 per square foot with roughly $1.75 per square foot annual rent steps through January 2028. Citi’s lease includes an extension option for up to twenty years in any combination of five or ten years, each at fair market value. Provided no default is occurring, Citi has the one-time right to terminate its lease on June 30, 2025 as to all of the premises or up to 50% of the premises with 12 months written notice.
The Market. The Galleria Office Towers Properties are located within the Galleria/Uptown office submarket of Houston, Texas. In recent years, this submarket has seen steady increases in residential development and population growth. Some of Houston’s most prestigious residential developments are located in near proximity to The Galleria Office Towers Properties, providing some demographic advantages as compared to other submarkets in the Houston area. A major contributor to this population growth is the existing residential development in the surrounding areas, the proximity to major employment sectors and its access to major thoroughfares in the Houston area such as IH-10, Sam Houston Parkway, and Loop 610.
The Galleria Office Towers Properties are connected to the 2.4 million square foot mixed-use Galleria development, which includes access to over 30 restaurants, over 300 retail stores, and two hotels. The main promenade, Post Oak Boulevard, is undergoing a $200 million renovation, including a bus rapid transit line.
The appraisal report identified five directly competitive office sale comparables. Comparable buildings were built between 1968 and 1983 and range in size from 110,529 square feet to 544,291 square feet. Sales prices per square foot ranged from $169.95 to $340.69 while net operating income per square foot ranged from $13.05 and $20.78. In addition, the appraisal identified five lease comparables. Comparable leases range in size from 176,776 square feet to 1,255,073 square feet with rents ranging from $18.00 per square foot and $23.50 per square foot.
COVID-19 Update. As of February 1, 2021, The Galleria Office Towers Properties are open for operations, with most tenants operating in their space in limited capacity. Rent collections were 99.7% in November 2020, 98.3% in December 2020 and 97.2% in January. In total, six tenants requested some form of rent relief, with only one tenant granted a rent deferment totaling approximately $14,000. As of February 1, 2021, no loan modification or forbearance requests have been made on The Galleria Office Towers Whole Loan. The first payment date of The Galleria Office Towers Whole Loan is the monthly due date in April 2021.
| Historical and Current Occupancy | |||
| 2018(1) | 2019(1) | 2020(1) | Current(2) |
| 76.8% | 70.3% | 68.3% | 68.1% |
| (1) | Historical Occupancies are as of December 31 of each respective year. |
| (2) | Current Occupancy is as of January 20, 2021. |
THE INFORMATION IN THIS STRUCTURAL AND COLLATERAL TERM SHEET IS NOT COMPLETE AND MAY BE AMENDED PRIOR TO THE TIME OF SALE. THIS TERM SHEET IS NOT AN OFFER TO SELL THESE SECURITIES AND IT IS NOT A SOLICITATION OF AN OFFER TO BUY THESE SECURITIES IN ANY JURISDICTION WHERE THE OFFER OR SALE IS NOT PERMITTED.
100 of 166
| Structural and Collateral Term Sheet | Benchmark 2021-B24 | |
| The Galleria Office Towers | ||
| Tenant Summary(1) | |||||||
| Tenant | Ratings Moody’s/Fitch/S&P(2) | Net Rentable Area (SF) | % of Total NRA | Base Rent PSF(3) | % of Total Base Rent | Lease Expiration Date | |
| WeWork Companies, Inc. | NR/CC/CCC+ | 100,141 | 9.4% | $21.48 | 14.6% | 11/30/2033 | |
| Quanta Services | Baa3/NR/BBB- | 56,345 | 5.3 | $18.00 | 6.9% | 3/31/2022 | |
| Citigroup Technology(4) | NR/NR/NR | 49,740 | 4.7 | $24.25 | 8.2% | 12/31/2028 | |
| Hoover, Slovacek | NR/NR/NR | 49,076 | 4.6 | $16.13 | 5.4% | 3/31/2032 | |
| Westlake Management | NR/NR/NR | 40,588 | 3.8 | $22.00 | 6.1% | 8/31/2025 | |
| BKD, LLP(5) | NR/NR/NR | 29,690 | 2.8 | $20.00 | 4.0% | 6/30/2029 | |
| Ascende, Inc. | NR/NR/NR | 27,511 | 2.6 | $25.00 | 4.7% | 4/30/2022 | |
| KRCL | NR/NR/NR | 25,390 | 2.4 | $17.78 | 3.1% | 3/31/2022 | |
| Capgemini U.S. LLC | NR/NR/BBB | 21,651 | 2.0 | $17.50 | 2.6% | 1/31/2027 | |
| Wells Fargo Advisors(6) | A2/A+/BBB+ | 19,662 | 1.8 | $25.75 | 3.4% | 6/30/2026 | |
| Top 10 Occupied Total | 419,794 | 39.3% | $20.66 | 59.1% | |||
| Other Occupied | 307,202 | 28.8 | |||||
| Vacant | 340,676 | 31.9 | |||||
| Total | 1,067,672 | 100.0% | |||||
| (1) | Based on the underwritten rent roll dated January 20, 2021. |
| (2) | In certain instances, ratings provided are those of the parent company of the entity shown, whether or not the parent company guarantees the lease. |
| (3) | Base Rent PSF is inclusive of contractual rent steps through February 2022 for non-credit tenants and the average rent escalations remaining for the applicable credit tenants. |
| (4) | Provided no event of default, Citigroup Technology has a one-time right to terminate either 100.0% or up to 50.0% of its space on June 30, 2025 upon 12 months’ written notice to the landlord. Citigroup Technology will pay an early termination fee. |
| (5) | BKD, LLP has a one-time right to contract up to the entirety of the 14th floor (9,440 square feet) effective as of April 30, 2024. |
| (6) | Wells Fargo Advisors has the right to terminate its lease effective June 30, 2022 upon 12 months’ notice subject to a termination fee equal to sum of unamortized transaction costs. |
| Lease Rollover Schedule(1)(2) | |||||||||
| Year | Number of Leases Expiring | Net Rentable Area Expiring | % of NRA Expiring | Base Rent Expiring(3) | % of Base Rent Expiring(3) | Cumulative Net Rentable Area Expiring | Cumulative % of NRA Expiring | Cumulative Base Rent Expiring | Cumulative % of Base Rent Expiring |
| Vacant | NAP | 340,676 | 31.9% | NAP | NAP | $340,676 | 31.9% | NAP | NAP |
| MTM & 2021(4) | 12 | 19,915 | 1.9 | $384,628 | 2.6% | 360,591 | 33.8% | $384,628 | 2.6% |
| 2022 | 17 | 189,801 | 17.8 | 3,473,497 | 23.7 | 550,392 | 51.6% | $3,858,124 | 26.3% |
| 2023 | 12 | 39,454 | 3.7 | 848,105 | 5.8 | 589,846 | 55.2% | $4,706,229 | 32.0% |
| 2024 | 8 | 13,698 | 1.3 | 285,258 | 1.9 | 603,544 | 56.5% | $4,991,487 | 34.0% |
| 2025 | 6 | 68,075 | 6.4 | 1,411,209 | 9.6 | 671,619 | 62.9% | $6,402,696 | 43.6% |
| 2026 | 6 | 55,848 | 5.2 | 1,267,976 | 8.6 | 727,467 | 68.1% | $7,670,672 | 52.2% |
| 2027 | 4 | 34,612 | 3.2 | 669,018 | 4.6 | 762,079 | 71.4% | $8,339,690 | 56.8% |
| 2028 | 2 | 59,803 | 5.6 | 1,367,203 | 9.3 | 821,882 | 77.0% | $9,706,893 | 66.1% |
| 2029 | 3 | 52,724 | 4.9 | 1,113,838 | 7.6 | 874,606 | 81.9% | $10,820,731 | 73.7% |
| 2030 | 2 | 14,442 | 1.4 | 321,366 | 2.2 | 889,048 | 83.3% | $11,142,096 | 75.9% |
| 2031 | 1 | 11,544 | 1.1 | 386,494 | 2.6 | 900,592 | 84.4% | $11,528,590 | 78.5% |
| 2032 and Thereafter | 3 | 167,080 | 15.6 | 3,156,923 | 21.5 | 1,067,672 | 100.0% | $14,685,513 | 100.0% |
| Total | 76 | 1,067,672 | 100.0% | $14,685,513 | 100.0% | ||||
| (1) | Based on the underwritten rent roll dated January 20, 2021. |
| (2) | Lease Rollover Schedule is based on the lease expiration dates of all direct leases in place. |
| (3) | Base Rent Expiring and % of Base Rent Expiring is inclusive of contractual rent steps through February 2022 for non-credit tenants and the average rent escalations remaining for the applicable credit tenants. |
| (4) | MTM includes conference and property management space. |
THE INFORMATION IN THIS STRUCTURAL AND COLLATERAL TERM SHEET IS NOT COMPLETE AND MAY BE AMENDED PRIOR TO THE TIME OF SALE. THIS TERM SHEET IS NOT AN OFFER TO SELL THESE SECURITIES AND IT IS NOT A SOLICITATION OF AN OFFER TO BUY THESE SECURITIES IN ANY JURISDICTION WHERE THE OFFER OR SALE IS NOT PERMITTED.
101 of 166
| Structural and Collateral Term Sheet | Benchmark 2021-B24 | |
| The Galleria Office Towers | ||
| Operating History and Underwritten Net Cash Flow | ||||||
| 2018 | 2019 | 2020 | Underwritten | Per Square Foot | %(1) | |
| Base Rent(2) | $16,434,652 | $15,065,000 | $14,830,069 | $14,290,644 | $13.38 | 40.3% |
| Rent Steps(3) | 0 | 0 | 0 | 394,869 | 0.37 | 1.1 |
| Potential Income from Vacant Space | 0 | 0 | 0 | 11,106,854 | 10.40 | 31.3 |
| Gross Potential Rent | $16,434,652 | $15,065,000 | $14,830,069 | $25,792,367 | $24.16 | 72.8% |
| Total Reimbursements | 10,769,099 | 9,943,643 | 9,950,041 | 9,654,087 | 9.04 | 27.2 |
| Net Rental Income | $27,203,751 | $25,008,644 | $24,780,109 | $35,446,454 | $33.20 | 100.0% |
| (Vacancy/Credit Loss) | 0 | 0 | 0 | (11,106,854) | (10.40) | (31.3) |
| Total Other Income | 1,497,593 | 1,277,124 | 930,609 | 933,731 | 0.87 | 2.6 |
| Effective Gross Income | $28,701,343 | $26,285,767 | $25,710,718 | $25,273,331 | $23.67 | 71.3% |
| Total Expenses | 13,539,624 | 13,909,984 | 13,251,714 | 13,960,632 | 13.08 | 55.2 |
| Net Operating Income | $15,161,719 | $12,375,783 | $12,459,004 | $11,312,699 | $10.60 | 44.8% |
| Total TI/LC, RR | 0 | 0 | 0 | 1,979,410 | 1.85 | 7.8 |
| Net Cash Flow | $15,161,719 | $12,375,783 | $12,459,004 | $9,333,289 | $8.74 | 36.9% |
| (1) | % column represents percent of Net Rental Income for all revenue lines and represents percent of Effective Gross Income for the remainder of the fields. |
| (2) | Underwritten Base Rent is based on the underwritten rent roll as of January 20, 2021. |
| (3) | Rent steps taken through February 2022 for non-credit tenants and the average rent escalations remaining for the applicable credit tenants. |
Property Management. The Galleria Office Towers Properties are managed by Unilev Management Corp., a Texas corporation and a borrower affiliate.
Escrows and Reserves. At loan origination, The Galleria Office Towers Borrower deposited (i) approximately $1,133,321 into the real estate taxes reserve, (ii) approximately $6,000,000 for ongoing tenant improvements and leasing commissions, (iii) approximately $2,192,842 for unfunded obligations, and (iv) approximately $98,143 into a condominium reserve.
Tax Reserve – The Galleria Office Towers Borrower is required to deposit into a real estate tax reserve, on a monthly basis, 1/12 of the estimated annual real estate taxes (initially estimated at approximately $283,330).
Insurance Reserve – On each payment date, The Galleria Office Towers Borrower is required to deposit an amount equal to 1/12 of estimated insurance premiums unless The Galleria Office Towers Borrower maintains a blanket policy in accordance with The Galleria Office Towers Whole Loan documents. As of the origination date, an acceptable blanket policy was in place.
Replacement Reserve – The Galleria Office Towers Borrower is required to deposit into a replacement reserve, on a monthly basis, an amount equal to approximately $21,990 for replacement reserves.
TI/LC Reserve – The Galleria Office Towers Borrower is required to deposit into a TI/LC reserve, on a monthly basis, an amount equal to approximately $88,973 for TI/LC reserves. At such time that the leasing reserve funds on deposit in the leasing reserve account equal the Leasing Reserve Cap Amount (as defined below), The Galleria Office Towers Borrower may suspend making monthly deposits until such time as the leasing reserve funds are below the Leasing Reserve Low Threshold Amount, at which time The Galleria Office Towers Borrower must recommence making the leasing reserve monthly deposit on each monthly payment date until the Leasing Reserve Cap Amount has been reached (at which time monthly deposits into the leasing reserve account will be suspended until the leasing reserve funds are below the Leasing Reserve Low Threshold Amount, at which time The Galleria Office Towers Borrower will recommence making the leasing reserve monthly deposit on each monthly payment date until the Leasing Reserve Cap Amount has been reached).
A “Leasing Reserve Cap Amount” means $8,000,000.
A “Leasing Reserve Low Threshold Amount” means as of the applicable date of determination, (x) if the Leasing Reserve Lower Threshold Conditions (as defined below) are satisfied (as determined by the lender), an amount equal to $6,000,000 and (y) if the Leasing Reserve Lower Threshold Conditions are not satisfied (as determined by the lender), an amount equal to $8,000,000.
“Leasing Reserve Lower Threshold Conditions” means, that as of the date of determination, (i) the debt yield is greater than 11% and (ii) The Galleria Office Towers Properties exhibit an occupancy rate of greater 90% of all leasable square footage, and (iii) the balance in the leasing reserve account is equal to or greater than $6,000,000.
Condominium Reserve – During the continuance of a Trigger Period (as defined below), The Galleria Office Towers Borrower is required to deposit the sum of 1/12 of an amount which would be sufficient to pay the monthly assessments payable, or reasonably estimated by the lender to be payable, during the next ensuing 12 months.
THE INFORMATION IN THIS STRUCTURAL AND COLLATERAL TERM SHEET IS NOT COMPLETE AND MAY BE AMENDED PRIOR TO THE TIME OF SALE. THIS TERM SHEET IS NOT AN OFFER TO SELL THESE SECURITIES AND IT IS NOT A SOLICITATION OF AN OFFER TO BUY THESE SECURITIES IN ANY JURISDICTION WHERE THE OFFER OR SALE IS NOT PERMITTED.
102 of 166
| Structural and Collateral Term Sheet | Benchmark 2021-B24 | |
| The Galleria Office Towers | ||
Lockbox / Cash Management. The Galleria Office Towers Whole Loan is structured with a hard lockbox and springing cash management. The Galleria Office Towers Borrower is required to deliver tenant direction letters to the existing tenants at The Galleria Office Towers Properties, directing them to remit their rent checks directly to the lender-controlled lockbox. The Galleria Office Towers Borrower is required to cause all revenue received by The Galleria Office Towers Borrower or the property manager from The Galleria Office Towers Properties to be deposited into such lockbox immediately upon receipt. All funds deposited into the lockbox are required to be transferred on each business day to or at the direction of The Galleria Office Towers Borrower unless a Trigger Period exists. Upon the occurrence and during the continuance of a Trigger Period, all funds in the lockbox account are required to be swept on each business day to a cash management account under the control of the lender to be applied and disbursed in accordance with The Galleria Office Towers Whole Loan documents, and all excess cash flow funds remaining in the cash management account after the application of such funds in accordance with The Galleria Office Towers Whole Loan documents are required to be held by the lender in an excess cash flow reserve account as additional collateral for The Galleria Office Towers Whole Loan. Upon the cure of the applicable Trigger Period, so long as no other Trigger Period exists, the lender is required to return any amounts remaining on deposit in the excess cash flow reserve account to The Galleria Office Towers Borrower. Upon an event of default under The Galleria Office Towers Whole Loan documents, the lender will apply funds to the debt in such priority as it may determine.
A “Trigger Period” means a period (A) commencing upon the earliest to occur of (i) an event of default, (ii) the debt service coverage ratio falling below 1.25x, and (iii) the occurrence of a Specified Tenant Trigger Period (as defined below) and (B) expiring upon (x) with regard to any Trigger Period commenced in connection with clause (i) above, the cure (if applicable) of such event of default, (y) with regard to any Trigger Period commenced in connection with clause (ii) above, the date that the debt service coverage ratio is equal to or greater than 1.25x for one calendar quarter and (z) with regard to any Trigger Period commenced in connection with clause (iii) above, a Specified Tenant Trigger Period ceasing to exist in accordance with the terms The Galleria Office Towers Whole Loan documents.
A “Specified Tenant Trigger Period” means a period (A) commencing upon the first to occur of (i) Specified Tenant (as defined below) being in default under the applicable Specified Tenant lease, (ii) (x) any Specified Tenant failing to be in actual, physical possession of the Specified Tenant space (or applicable portion thereof) or, (y) except with respect to any investment grade tenant, any Specified Tenant failing to be open to the public for business during customary hours and/or “going dark” in the Specified Tenant space (or any applicable portion thereof) (the Specified Tenant Trigger Period contemplated by this clause (ii)(y) will be deemed a “ST Dark Event”), (iii) Specified Tenant giving notice that it is terminating its lease for all or any portion of the Specified Tenant space (or applicable portion thereof), (iv) any termination or cancellation of any Specified Tenant lease (including, without limitation, rejection in any bankruptcy or similar insolvency proceeding) and/or any Specified Tenant lease failing to otherwise be in full force and effect, (v) any bankruptcy or similar insolvency of Specified Tenant and (vi) Specified Tenant failing to extend or renew the applicable Specified Tenant lease on or prior the applicable Specified Tenant extension deadline in accordance with the terms of the applicable Specified Tenant lease and The Galleria Office Towers Whole Loan documents for a term extending at least five years beyond the then-applicable expiration date under the applicable Specified Tenant lease and (B) expiring upon the first to occur of the lender’s receipt of evidence reasonably acceptable to the lender of (1) the satisfaction of the Specified Tenant Cure Conditions (as defined below) or (2) The Galleria Office Towers Borrower leasing the entire Specified Tenant space (or applicable portion thereof) in accordance with the applicable terms and conditions of The Galleria Office Towers Whole Loan documents, the applicable tenant under such lease paying the full amount of the rent due under its lease, and being in actual, physical occupancy of, and open to the public for business in, the space demised under its lease. Notwithstanding the foregoing, in no event will a Specified Tenant Trigger Period be deemed to be continuing solely with respect to any ST Dark Event if and for so long as the Excess Cash Flow Condition (as defined below) is satisfied (satisfaction of the Excess Cash Flow Condition will not be deemed to cure or suspend any Specified Tenant Trigger Period other than a Specified Tenant Trigger Period that is solely ongoing in connection with a ST Dark Event).
The “Excess Cash Flow Condition” will be deemed to be satisfied with respect to a Specified Tenant Trigger Period to the extent: (x) such Specified Tenant Trigger Period relates solely to a ST Dark Event, (y) no other Specified Tenant Trigger Period has occurred and is ongoing, and (z) amounts on deposit in the excess cash flow account equal or exceed $30 per square foot demised pursuant to each Specified Tenant lease which may have caused the applicable ST Dark Event.
“Specified Tenant Cure Conditions” means each of the following, as applicable (i) the applicable Specified Tenant has cured all defaults under the applicable Specified Tenant lease, (ii) the applicable Specified Tenant is in actual, physical possession of the Specified Tenant space (or applicable portion thereof), open to the public for business during customary hours and not “dark” in the Specified Tenant space (or applicable portion thereof), (iii) the applicable Specified Tenant has revoked or rescinded all termination or cancellation notices with respect to the applicable Specified Tenant lease and has re-affirmed the applicable Specified Tenant lease as being in full force and effect, (iv) in the event the Specified Tenant Trigger Period is due to the applicable Specified Tenant’s failure to extend or renew the applicable Specified Tenant lease in accordance with clause (vi) of the definition of “Specified Tenant Trigger Period”, the applicable Specified Tenant has renewed or extended the applicable Specified Tenant lease in accordance with the terms of the Specified Tenant lease and The Galleria Office Towers Whole Loan documents for the applicable Specified Tenant renewal term, (v) with respect to any applicable bankruptcy or insolvency proceedings involving the applicable Specified Tenant and/or the applicable Specified Tenant lease, the applicable Specified Tenant is no longer insolvent or subject to any bankruptcy or insolvency proceedings and has affirmed the applicable Specified Tenant lease pursuant to final, non-appealable order of a court of competent jurisdiction and (vi) the applicable Specified Tenant is paying full, unabated rent under the applicable Specified Tenant lease.
THE INFORMATION IN THIS STRUCTURAL AND COLLATERAL TERM SHEET IS NOT COMPLETE AND MAY BE AMENDED PRIOR TO THE TIME OF SALE. THIS TERM SHEET IS NOT AN OFFER TO SELL THESE SECURITIES AND IT IS NOT A SOLICITATION OF AN OFFER TO BUY THESE SECURITIES IN ANY JURISDICTION WHERE THE OFFER OR SALE IS NOT PERMITTED.
103 of 166
| Structural and Collateral Term Sheet | Benchmark 2021-B24 | |
| The Galleria Office Towers | ||
A “Specified Tenant” means (i) any tenant under a lease which, individually or when aggregated with all other leases at The Galleria Office Towers Properties with the same tenant or its affiliate, either (A) accounts for 20% or more of the total rental income for The Galleria Office Towers Properties, or (B) demises 20% or more of the total square footage of The Galleria Office Towers Properties’ gross leasable area, and (ii) any other lessee(s) of the Specified Tenant space (or any portion thereof that otherwise constitutes the foregoing 20% thresholds) and any guarantor(s) of the applicable related Specified Tenant lease(s).
Current Mezzanine or Subordinate Indebtedness. None.
Partial Release. None.
Future Mezzanine or Subordinate Indebtedness Permitted. None.
Condominium Structure. The Galleria Office Towers Borrower is subject to a condominium regime with six total condominium units (for all purposes under the condominium documents), three of which constitute the entirety of the collateral for the Galleria Office Towers Whole Loan, and three of which are not part of the collateral for the Galleria Office Towers Whole Loan. The condominium units are divided among a retail unit (68.7% interest), hotel unit (17.0% interest) and office unit (14.3% interest). There are six board seats, and The Galleria Office Towers Borrower is allocated three of the board seats. One board seat is allocated to the unrelated owner of the retail units, and two board seats are allocated to the unrelated owner of the hotel units. Each board seat is allocated one vote except for the board seat allocated to the unrelated owner of the retail unit, which is allocated five votes. The related borrower does not have the power to control the related condominium. The Galleria Office Towers Borrower may not be removed from the board by the retail and hotel board members.
THE INFORMATION IN THIS STRUCTURAL AND COLLATERAL TERM SHEET IS NOT COMPLETE AND MAY BE AMENDED PRIOR TO THE TIME OF SALE. THIS TERM SHEET IS NOT AN OFFER TO SELL THESE SECURITIES AND IT IS NOT A SOLICITATION OF AN OFFER TO BUY THESE SECURITIES IN ANY JURISDICTION WHERE THE OFFER OR SALE IS NOT PERMITTED.
104 of 166
(THIS PAGE INTENTIONALLY LEFT BLANK)
THE INFORMATION IN THIS STRUCTURAL AND COLLATERAL TERM SHEET IS NOT COMPLETE AND MAY BE AMENDED PRIOR TO THE TIME OF SALE. THIS TERM SHEET IS NOT AN OFFER TO SELL THESE SECURITIES AND IT IS NOT A SOLICITATION OF AN OFFER TO BUY THESE SECURITIES IN ANY JURISDICTION WHERE THE OFFER OR SALE IS NOT PERMITTED.
105 of 166
| Structural and Collateral Term Sheet | Benchmark 2021-B24 | |
| U.S. Industrial Portfolio VI | ||

THE INFORMATION IN THIS STRUCTURAL AND COLLATERAL TERM SHEET IS NOT COMPLETE AND MAY BE AMENDED PRIOR TO THE TIME OF SALE. THIS TERM SHEET IS NOT AN OFFER TO SELL THESE SECURITIES AND IT IS NOT A SOLICITATION OF AN OFFER TO BUY THESE SECURITIES IN ANY JURISDICTION WHERE THE OFFER OR SALE IS NOT PERMITTED.
106 of 166
| Structural and Collateral Term Sheet | Benchmark 2021-B24 | |
| U.S. Industrial Portfolio VI | ||
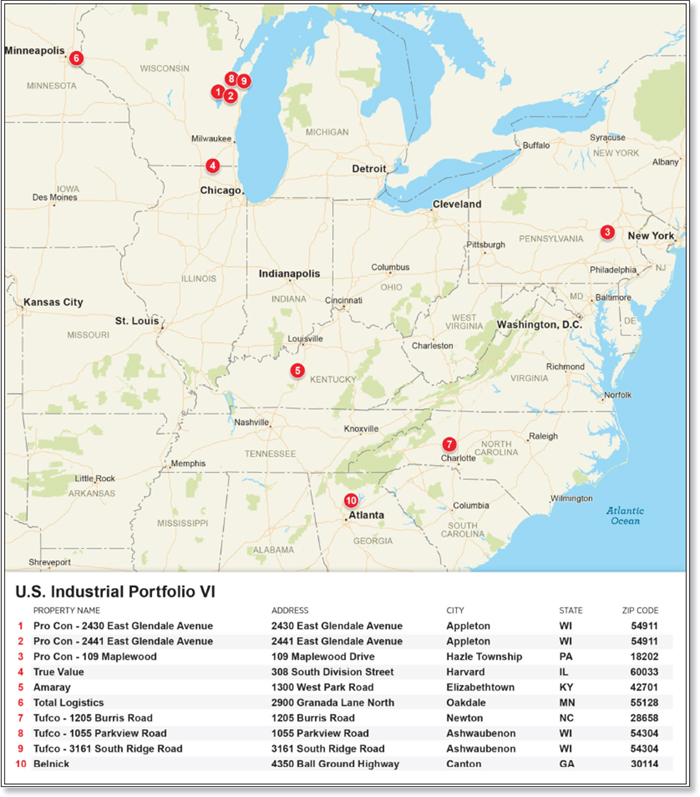
THE INFORMATION IN THIS STRUCTURAL AND COLLATERAL TERM SHEET IS NOT COMPLETE AND MAY BE AMENDED PRIOR TO THE TIME OF SALE. THIS TERM SHEET IS NOT AN OFFER TO SELL THESE SECURITIES AND IT IS NOT A SOLICITATION OF AN OFFER TO BUY THESE SECURITIES IN ANY JURISDICTION WHERE THE OFFER OR SALE IS NOT PERMITTED.
107 of 166
| Structural and Collateral Term Sheet | Benchmark 2021-B24 | |
| U.S. Industrial Portfolio VI | ||
| Mortgage Loan Information | Property Information | |||
| Mortgage Loan Seller: | GSMC | Single Asset / Portfolio: | Portfolio | |
| Original Principal Balance(1): | $60,000,000 | Title: | Fee | |
| Cut-off Date Principal Balance(1): | $60,000,000 | Property Type - Subtype: | Industrial – Various | |
| % of Pool by IPB: | 5.2% | Net Rentable Area (SF): | 2,981,955 | |
| Loan Purpose: | Refinance | Location: | Various, Various | |
| Borrower: | STNL II Property Company, LLC | Year Built / Renovated: | Various / Various | |
| Loan Sponsor: | BIG STNL II LLC | Occupancy: | 95.9% | |
| Interest Rate: | 3.71600% | Occupancy Date: | 2/1/2021 | |
| Note Date: | 2/8/2021 | Number of Tenants: | 6 | |
| Maturity Date: | 3/6/2031 | 2017 NOI(3): | N/A | |
| Interest-only Period: | 120 months | 2018 NOI(3): | N/A | |
| Original Term: | 120 months | 2019 NOI(3): | N/A | |
| Original Amortization: | None | TTM NOI(3): | N/A | |
| Amortization Type: | Interest Only | UW Economic Occupancy(4): | 91.9% | |
| Call Protection(2): | L(24),Def(92),O(4) | UW Revenues: | $8,943,989 | |
| Lockbox / Cash Management: | Hard / Springing | UW Expenses: | $268,320 | |
| Additional Debt(1): | Yes | UW NOI(4): | $8,675,669 | |
| Additional Debt Balance(1): | $21,000,000 | UW NCF(4): | $7,817,775 | |
| Additional Debt Type(1): | Pari Passu | Appraised Value / Per SF(4): | $136,500,000 / $46 | |
| Appraisal Date(5): | Various | |||
| Escrows and Reserves(6) | Financial Information(1)(4) | ||||||
| Initial | Monthly | Initial Cap | Cut-off Date Loan / SF: | $27 | |||
| Taxes: | $0 | Springing | N/A | Maturity Date Loan / SF: | $27 | ||
| Insurance: | $0 | Springing | N/A | Cut-off Date LTV: | 59.3% | ||
| TI/LC: | $0 | Springing | $894,587 | Maturity Date LTV: | 59.3% | ||
| Replacement Reserves: | $0 | Springing | $1,789,173 | UW NCF DSCR: | 2.56x | ||
| Other(7): | $701,088 | $0 | N/A | UW NOI Debt Yield: | 10.7% | ||
| Sources and Uses | |||||||
| Sources | Proceeds | % of Total | Uses | Proceeds | % of Total | ||
| Whole Loan | $81,000,000 | 100.0% | Payoff Existing Debt | $47,259,897 | 58.3% | ||
| Return of Equity | 32,223,585 | 39.8% | |||||
| Closing Costs | 815,430 | 1.0% | |||||
| % | Upfront Reserves | 701,088 | 0.9% | ||||
| Total Sources | $81,000,000 | 100.0% | Total Uses | $81,000,000 | 100.0% | ||
| (1) | The U.S. Industrial Portfolio VI Loan (as defined below) is part of a whole loan evidenced by two pari passu notes, with an aggregate outstanding principal balance as of the Cut-off Date of $81.0 million. The Financial Information presented in the chart above reflects the Cut-off Date Balance of the $81.0 million U.S. Industrial Portfolio VI Whole Loan (as defined below). For additional information, see “The Loan” herein. |
| (2) | The defeasance lockout period will be at least 24 payment dates beginning with and including the first payment date in April 2021. Defeasance of the U.S. Industrial Portfolio VI Whole Loan is permitted at any time on or after the first payment date following the earlier to occur of (a) the end of the two-year period commencing on the closing date of the securitization of the last promissory note representing a portion of the U.S. Industrial Portfolio VI Whole Loan to be securitized and (b) February 8, 2024. The actual defeasance lockout period may be longer. |
| (3) | Historical financial information was not provided as each of the U.S. Industrial Portfolio VI Properties (as defined below) are subject to long term net leases where the related borrower did not provide the related mortgage loan seller with historical financial information. |
| (4) | While the U.S. Industrial Portfolio VI Whole Loan was originated after the emergence of the novel coronavirus pandemic and the economic disruption resulting from measures to combat the pandemic, the pandemic is an evolving situation and could impact the U.S. Industrial Portfolio VI Whole Loan more severely than assumed in the underwriting of the U.S. Industrial Portfolio VI Whole Loan and could adversely affect the NOI, NCF, and occupancy information, as well as the appraised value and the DSCR, LTV, and Debt Yield metrics presented above. See “Risk Factors—Special Risks—Coronavirus Pandemic Has Adversely Affected the Global Economy and Will Likely Adversely Affect the Performance of the Mortgage Loans” in the Preliminary Prospectus. |
| (5) | For a full description of appraisal dates, please refer to the “Portfolio Summary” table herein. |
| (6) | For a full description of Escrows and Reserves, please refer to “Escrows and Reserves” herein. |
| (7) | Other initial reserves consist of an unfunded obligations reserve for True Value. |
THE INFORMATION IN THIS STRUCTURAL AND COLLATERAL TERM SHEET IS NOT COMPLETE AND MAY BE AMENDED PRIOR TO THE TIME OF SALE. THIS TERM SHEET IS NOT AN OFFER TO SELL THESE SECURITIES AND IT IS NOT A SOLICITATION OF AN OFFER TO BUY THESE SECURITIES IN ANY JURISDICTION WHERE THE OFFER OR SALE IS NOT PERMITTED.
108 of 166
| Structural and Collateral Term Sheet | Benchmark 2021-B24 | |
| U.S. Industrial Portfolio VI | ||
The Loan. The mortgage loan (the “U.S. Industrial Portfolio VI Loan”) is part of a whole loan (the “U.S. Industrial Portfolio VI Whole Loan”) consisting of two pari passu notes with an outstanding aggregate principal balance of $81,000,000 and is secured by first mortgages and deeds of trust encumbering the fee interest in a portfolio of ten industrial properties located in seven states (the “U.S. Industrial Portfolio VI Properties”). The U.S. Industrial Portfolio VI Loan, evidenced by the controlling Note A-1, has an outstanding principal balance as of the Cut-off Date of $60,000,000 and represents approximately 5.2% of the Initial Pool Balance. The U.S. Industrial Portfolio VI Whole Loan was originated by Goldman Sachs Bank USA on February 8, 2021. The U.S. Industrial Portfolio VI Whole Loan has an interest rate of 3.71600% per annum. The borrower utilized the proceeds of the U.S. Industrial Portfolio VI Whole Loan to refinance existing debt on the U.S. Industrial Portfolio VI Properties, return equity to the loan sponsor, fund upfront reserves and pay origination costs. The U.S. Industrial Portfolio VI Whole Loan has a ten-year term and will be interest-only for its entire term.
The table below summarizes the promissory notes that comprise the U.S. Industrial Portfolio VI Whole Loan. The relationship between the holders of the U.S. Industrial Portfolio VI Whole Loan is governed by a co-lender agreement as described under “Description of the Mortgage Pool—The Whole Loans—The Serviced Pari Passu Whole Loans” in the Preliminary Prospectus.
| Whole Loan Summary | |||||
| Note | Original Balance | Cut-off Date Balance | Note Holder | Controlling Piece | |
| A-1 | $60,000,000 | $60,000,000 | Benchmark 2021-B24 | Yes | |
| A-2 | $21,000,000 | $21,000,000 | GSBI(1) | No | |
| Whole Loan Total | $81,000,000 | $81,000,000 | |||
| (1) | Expected to be contributed to one or more future securitizations. |
The Borrower. The borrower is STNL II Property Company, LLC, a Delaware limited liability company. The borrower and its sole member, STNL II Property Corp., a Delaware corporation, are each structured to be a single purpose bankruptcy-remote entity, with STNL II Property Corp. having two independent directors in its organizational structure. Legal counsel to the borrower delivered a non-consolidation opinion in connection with the origination of the U.S. Industrial Portfolio VI Whole Loan.
The Loan Sponsors. The loan sponsor is BIG STNL II, LLC, an Illinois limited liability company. The primary non-recourse carve-out guarantor under the U.S. Industrial Portfolio VI Whole Loan is Brennan Management LLC (“Brennan Management”), an Illinois limited liability company; provided, however, that if and for so long as the net worth and/or liquidity of Brennan Management fall below $30.0 million and $5.0 million respectively, the following parties will, on a joint and several basis, become liable as backstop guarantors for any guaranteed obligations that are payable during such period of time: Michael Brennan, Robert G. Vanecko, Scott D. McKibben, Samuel A. Mandarino, Brad S. O’Halloran, Allen H. Crosswell and W. Troy McMane, each a natural person, and Greenwood Holding Company, LLC, a Delaware limited liability company. Each of the individual warm bodied backstop guarantors is a managing principal of Brennan (as defined below).
Brennan Investment Group (“Brennan”) is a Chicago-based private real estate investment firm that focuses on the acquisition and development of industrial real estate in major metropolitan markets throughout the United States. Brennan was formed in 2010 and its managing principals are comprised primarily of former First Industrial Realty Trust (NYSE: FR) founders and executives. The company’s current portfolio is over 99% occupied and has a market value of over $3 billion. Further, its holdings span 29 states and encompass over 44 million square feet. Brennan has also developed over 30 million square feet of built-to-suit industrial space throughout the U.S., targeting markets in the top 15 MSAs. The managing principals of Brennan have invested in over 4,000 properties in more than 60 cities and have an average of 25 years of experience in the commercial real estate industry.
Arch Street Capital / USIPA II: USIPA II Holdings is an investment entity owned by Gatehouse Bank (“Gatehouse”) and is advised by U.S.- based affiliate Arch Street Capital (“Arch Street”), headquartered in Greenwich, CT. Within the joint venture, Brennan sources potential acquisitions and presents opportunities to Arch Street, who underwrites each investment in advance of making recommendations to Gatehouse. Given that most Gatehouse investors are from the Middle East, Gatehouse structures its investments to comply with Shari’ah law. To date, Gatehouse has invested $1.2 billion in real estate assets.
The Properties. The U.S. Industrial Portfolio VI Properties is comprised of ten properties built between 1942 and 2001, spanning Georgia, Illinois, Kentucky, Minnesota, North Carolina, Pennsylvania, and Wisconsin. The U.S. Industrial Portfolio VI Properties consists of 2,981,955 square feet and is 95.9% occupied as of February 1, 2021. The U.S. Industrial Portfolio VI Properties include some of the largest contract manufacturers, supply management and logistics companies, independent paper converting companies, and plastic manufacturers in the United States.
THE INFORMATION IN THIS STRUCTURAL AND COLLATERAL TERM SHEET IS NOT COMPLETE AND MAY BE AMENDED PRIOR TO THE TIME OF SALE. THIS TERM SHEET IS NOT AN OFFER TO SELL THESE SECURITIES AND IT IS NOT A SOLICITATION OF AN OFFER TO BUY THESE SECURITIES IN ANY JURISDICTION WHERE THE OFFER OR SALE IS NOT PERMITTED.
109 of 166
| Structural and Collateral Term Sheet | Benchmark 2021-B24 | |
| U.S. Industrial Portfolio VI | ||
The following table presents certain information relating to the U.S. Industrial Portfolio VI Properties:
| Portfolio Summary | ||||||||
| Property Name | Year Built / Renovated | SF | % Allocated Whole Loan Original Balance | Appraisal Date | Appraised Value | % Appraised Value | UW NCF | % of UW NCF |
| True Value | 1942 / 1982 | 1,331,727 | 26.7% | 1/6/2021 | $36,100,000 | 26.4% | $1,938,218 | 24.8% |
| Belnick | 1999 / 2011 | 477,152 | 21.4 | 1/5/2021 | 28,900,000 | 21.2 | 1,584,381 | 20.3 |
| Pro Con - 109 Maplewood Drive | 1987, 1997, 2001 / NAP | 205,320 | 9.6 | 12/29/2020 | 12,920,000 | 9.5 | 739,029 | 9.5 |
| Total Logistics | 1994 / 2008 | 86,460 | 7.9 | 12/21/2020 | 10,800,000 | 7.9 | 705,985 | 9.0 |
| Pro Con - 2441 East Glendale Avenue | 1978 / 2002 | 172,261 | 6.9 | 12/28/2020 | 9,440,000 | 6.9 | 619,990 | 7.9 |
| Amaray | 1975 / NAP | 194,519 | 6.7 | 12/30/2020 | 9,200,000 | 6.7 | 569,289 | 7.3 |
| Tufco - 3161 South Ridge Road | 1978 / NAP | 226,900 | 11.0 | 12/28/2020 | 14,900,000 | 10.9 | 1,020,249 | 13.1 |
| Tufco - 1055 Parkview Road | 1983 / NAP | 44,020 | 2.1 | 12/28/2020 | 2,870,000 | 2.1 | 200,047 | 2.6 |
| Pro Con - 2430 East Glendale Avenue | 1968, 1974, 1995, 1997 / NAP | 122,500 | 4.9 | 12/28/2020 | 6,720,000 | 4.9 | 440,586 | 5.6 |
| Tufco - 1205 Burris Road | 1971 / NAP | 121,096 | 2.6 | 12/23/2020 | 4,650,000 | 3.4 | 0 | 0 |
| Total / Wtd. Avg. | 2,981,955 | 100.0% | $136,500,000 | 100.0% | $7,817,775 | 100.0% | ||
As of February 1, 2021, the U.S. Industrial Portfolio VI Properties were 95.9% leased to seven tenants.
The largest tenant, True Value (1,331,727 square feet; 44.7% of portfolio net rentable area; 27.6% of underwritten base rent) is a hardware and paint wholesaler that manages a portfolio of hardware brands. It currently supplies over 4,500 stores, with sales totaling more than $8 billion, and focuses on supporting profitability for independent retailers. True Value’s products include hardware, paint-related-products, general merchandise, and services such as advertising, merchandising, and retailer training. It operates 13 regional distribution centers and employs approximately 2,500 True Value associates. True Value occupies the entirety of the space at the 308 South Division Street, Harvard, Illinois property. Its lease began in March 2018 and expires at the end of February 2029. The lease includes no extension options and no termination options.
The second largest tenant, Progressive Converting (“Pro Con”) (500,081 square feet; 16.8% of portfolio net rentable area; 22.3% of underwritten base rent) is the largest independent paper converting company in the United States. Pro Con acts as a liaison between paper mills and end users such as Anheuser-Busch, Snapple, and other Fortune 500 companies relying on custom sized paper and cardboard to package and market their equipment products. The company was founded in 1991 and employs more than 370 individuals. Each of Pro Con’s locations throughout the U.S. Industrial Portfolio VI Properties is equipped with paper converting, warehousing, and distribution capabilities. Pro Con occupies the entirety of the spaces at its 109 Maplewood Drive, Hazle Township, Pennsylvania; 2430 East Glendale Avenue, Appleton, Wisconsin; and 2441 East Glendale Avenue, Appleton, Wisconsin properties. Its lease began in December 2015 and expires in December 2030. The lease includes four, five-year extension options and no termination options.
The third largest tenant, Belnick (477,152 square feet; 16.0% of portfolio net rentable area; 19.5% of underwritten base rent) is an e-commerce retailer of high-quality furniture for personal uses as well as for commercial settings, including medical offices. Belnick’s growth is driven by its two primary brands: Bizchair.com and Flash Furniture. Bizchair.com is a leading internet retailer of office chairs, office furniture, school furniture, home furniture, and medical furniture. Flash Furniture is an importer and wholesaler of mid-market office and restaurant furniture. Belnick has more than 420 employees with multiple distribution centers and showrooms across the country. Belnick occupies the entirety of the space at the 4350 Ball Ground Highway, Canton, Georgia property. Its lease began in January 2017 and expires at the beginning of June 2029. The lease includes no extension options and no termination options.
The Market. The U.S. Industrial Portfolio VI Properties consist of ten properties across seven states. The following highlights the five largest markets by allocated loan amount:
Chicago Industrial Market (26.7% of total loan amount): According to the appraisal, the Chicago Industrial Market has 1.2 billion square feet of space, and a vacancy rate of 6.1%. The Chicago Industrial Market currently has 22.5 million square feet of industrial real estate under construction and absorbed 20.3 million net square feet as of year-end 2020. The appraisal concluded $5.57 per square foot industrial market rents in McHenry County, the location of the True Value property.
Atlanta Industrial Market (21.4% of total loan amount): According to the appraisal, the Atlanta Industrial Market has 683.0 million square feet of space, and a vacancy rate of 6.0%. The Atlanta Industrial Market currently has 18.5 million square feet of industrial real estate under construction and absorbed 16.6 million net square feet as of year-end 2020. The appraisal concluded $6.13 per square foot industrial market rents in the Woodstock/Canton submarket, the location of the Belnick property.
THE INFORMATION IN THIS STRUCTURAL AND COLLATERAL TERM SHEET IS NOT COMPLETE AND MAY BE AMENDED PRIOR TO THE TIME OF SALE. THIS TERM SHEET IS NOT AN OFFER TO SELL THESE SECURITIES AND IT IS NOT A SOLICITATION OF AN OFFER TO BUY THESE SECURITIES IN ANY JURISDICTION WHERE THE OFFER OR SALE IS NOT PERMITTED.
110 of 166
| Structural and Collateral Term Sheet | Benchmark 2021-B24 | |
| U.S. Industrial Portfolio VI | ||
Green Bay Industrial Market (13.2% of total loan amount): According to the appraisal, the Green Bay Industrial Market had 46.4 million square feet of space, and a vacancy rate of 1.8%. The Green Bay Industrial Market had 27,696 square feet of industrial real estate under construction and absorbed (531,856) net square feet as of year-end 2020. The appraisal concluded $4.54 per square foot industrial market rents in the Ashwaubenon submarket, the location of the Tufco – 3161 South Ridge and Tufco – 1055 Parkview Road properties.
Appleton and Oshkosh-Neenah Industrial Market (11.8% of loan amount): According to the appraisal, the Appleton and Oshkosh-Neenah Industrial Market had 54.6 million square feet of space, and a vacancy rate of 2.1%. The Appleton and Oshkosh-Neenah Industrial Market had 228,747 square feet of industrial space under construction and absorbed (151,716) net square feet as of year-end 2019. The appraisal concluded $4.95 per square foot industrial market rents in the Outagamie County industrial submarket, the location of the Pro Con - 2441 East Glendale Avenue and Pro Con - 2430 East Glendale Avenue properties.
Scranton-Wilkes Barre-Hazelton Industrial Market (9.6% of total loan amount): According to the appraisal, the Scranton-Wilkes Barre-Hazelton Industrial Market has 93.8 million square feet of space, and a vacancy rate of 10.7%. The Scranton-Wilkes Barre-Hazelton Industrial Market has 5.1 million square feet of industrial real estate under construction and absorbed 4.2 million net square feet as of year-end 2020. The appraisal concluded $4.12 per square foot industrial market rents in Luzerne county, the location of the Pro Con 109 Maplewood Drive property.
Twin Cities Industrial Market (7.9% of total loan amount): According to the appraisal, the Twin Cities Industrial Market had 314.8 million feet of space, and a vacancy rate of 2.9%. The Twin Cities Industrial Market had 1.8 million square feet of industrial real estate under construction and absorbed (603,843) net square feet as of year-end 2019. The appraisal concluded $5.95 per square foot industrial market rents in the East Ind submarket, the location of the Total Logistics property.
COVID-19 Update. As of February 19, 2021 the U.S. Industrial Portfolio VI Properties are open. Approximately 100% of tenants by square feet and underwritten base rent made their December 2020 rent payments and approximately 100% of tenants by square feet and underwritten base rent made their January 2021 rent payments. As of January 20, 2021, the U.S. Industrial Portfolio VI Whole Loan is not subject to any modification or forbearance requests.
| Historical and Current Occupancy(1)(2) | |||
| 2018 | 2019 | 2020 | Current(3) |
| N/A | N/A | N/A | 95.9% |
| (1) | Historical occupancy information was not provided as each of the U.S. Industrial Portfolio VI Properties are subject to long term net leases where the related borrower did not provide the related mortgage loan seller with historical occupancy information. |
| (2) | Historical Occupancies are as of December 31 of each respective year. |
| (3) | Current Occupancy is as of February 1, 2021. |
| Tenant Summary(1) | |||||||
| Tenant | Ratings Moody’s/Fitch/S&P | Net Rentable Area (SF) | % of Total NRA | Base Rent PSF(2) | % of Total Base Rent | Lease Expiration Date | |
| True Value | NR / NR / NR | 1,331,727 | 44.7% | $1.92 | 27.6% | 2/28/2029 | |
| Pro Con | NR / NR / NR | 500,081 | 16.8 | $4.14 | 22.3 | 12/30/2030 | |
| Belnick | NR / NR / NR | 477,152 | 16.0 | $3.79 | 19.5 | 6/1/2029 | |
| Tufco(3) | NR / NR / NR | 270,920 | 9.1 | $5.20 | 15.2 | 7/21/2037 | |
| Amaray | NR / NR / NR | 194,519 | 6.5 | $3.49 | 7.3 | 10/31/2033 | |
| Total Logistics | NR / NR / NR | 86,460 | 2.9 | $8.84 | 8.2 | 8/31/2032 | |
| Total Occupied | 2,860,859 | 95.9% | $3.25 | 100.0% | |||
| Vacant | 121,096 | 4.1 | |||||
| Total | 2,981,955 | 100.0% | |||||
| (1) | Based on the underwritten rent roll dated February 1, 2021. |
| (2) | Base Rent PSF is inclusive of contractual rent steps through November 30, 2021. |
| (3) | With respect to U.S. Industrial Portfolio VI – Tufco - 1205 Burris Road, the previous sole tenant, Tufco, has vacated its space. Tufco is expected to continue paying full rent until the end of its lease term in July 2037. We cannot assure you that Tufco will continue paying rent as expected or at all. |
THE INFORMATION IN THIS STRUCTURAL AND COLLATERAL TERM SHEET IS NOT COMPLETE AND MAY BE AMENDED PRIOR TO THE TIME OF SALE. THIS TERM SHEET IS NOT AN OFFER TO SELL THESE SECURITIES AND IT IS NOT A SOLICITATION OF AN OFFER TO BUY THESE SECURITIES IN ANY JURISDICTION WHERE THE OFFER OR SALE IS NOT PERMITTED.
111 of 166
| Structural and Collateral Term Sheet | Benchmark 2021-B24 | |
| U.S. Industrial Portfolio VI | ||
| Lease Rollover Schedule(1)(2) | |||||||||
| Year | Number of Leases Expiring | Net Rentable Area Expiring | % of NRA Expiring | Base Rent Expiring(3) | % of Base Rent Expiring | Cumulative Net Rentable Area Expiring | Cumulative % of NRA Expiring | Cumulative Base Rent Expiring | Cumulative % of Base Rent Expiring |
| Vacant | 0 | 121,096 | 4.1% | NAP | NAP | $121,096 | 4.1% | NAP | NAP |
| 2021 & MTM | 0 | 0 | 0.0 | $0 | 0.0% | 121,096 | 4.1% | $0 | 0.0% |
| 2022 | 0 | 0 | 0.0 | 0 | 0.0 | 121,096 | 4.1% | $0 | 0.0% |
| 2023 | 0 | 0 | 0.0 | 0 | 0.0 | 121,096 | 4.1% | $0 | 0.0% |
| 2024 | 0 | 0 | 0.0 | 0 | 0.0 | 121,096 | 4.1% | $0 | 0.0% |
| 2025 | 0 | 0 | 0.0 | 0 | 0.0 | 121,096 | 4.1% | $0 | 0.0% |
| 2026 | 0 | 0 | 0.0 | 0 | 0.0 | 121,096 | 4.1% | $0 | 0.0% |
| 2027 | 0 | 0 | 0.0 | 0 | 0.0 | 121,096 | 4.1% | $0 | 0.0% |
| 2028 | 0 | 0 | 0.0 | 0 | 0.0 | 121,096 | 4.1% | $0 | 0.0% |
| 2029 | 2 | 1,808,879 | 60.7 | 4,368,596 | 47.0 | 1,929,975 | 64.7% | $4,368,596 | 47.0% |
| 2030 | 3 | 500,081 | 16.8 | 2,070,487 | 22.3 | 2,430,056 | 81.5% | $6,439,083 | 69.3% |
| 2031 | 0 | 0 | 0.0 | 0 | 0.0 | 2,430,056 | 81.5% | $6,439,083 | 69.3% |
| 2032 and Thereafter | 4 | 551,899 | 18.5 | 2,851,127 | 30.7 | 2,981,955 | 100.0% | $9,290,210 | 100.0% |
| Total | 9 | 2,981,955 | 100.0% | $9,290,210 | 100.0% | ||||
| (1) | Based on the underwritten rent roll dated February 1, 2021. |
| (2) | Lease rollover schedule is based on the lease expiration dates of all direct leases in place. |
| (3) | Base Rent Expiring is inclusive of contractual rent steps through November 30, 2021. |
| Underwritten Net Cash Flow(1) | |||
| Underwritten | Per Square Foot | %(2) | |
| Base Rent(3)(4) | $9,290,210 | $3.12 | 95.5% |
| Gross Potential Rent | $9,290,210 | $3.12 | 95.5% |
| Total Reimbursements(5) | 115,730 | 0.04 | 1.2 |
| Total Other Income | 326,959 | 0.11 | 3.4 |
| Net Rental Income | $9,732,898 | $3.26 | 100.0% |
| (Vacancy/Credit Loss) | (788,909) | (0.26) | (8.1) |
| Effective Gross Income | $8,943,989 | $3.00 | 91.9% |
| Total Expenses | 268,320 | 0.09 | 3.0 |
| Net Operating Income | $8,675,669 | $2.91 | 97.0% |
| Total TI/LC, RR | 857,895 | 0.29 | 9.6 |
| Net Cash Flow | $7,817,775 | $2.62 | 87.4% |
| (1) | Historical financial information was not provided as each of the U.S. Industrial Portfolio VI Properties are subject to long term net leases where the related borrower did not provide the related mortgage loan seller with historical financial information. |
| (2) | % column represents percent of Net Rental Income for all revenue lines and represents percent of Effective Gross Income for the remainder of the fields. |
| (3) | Underwritten Base Rent is based on the in place rent roll as of February 1, 2021. |
| (4) | Rent steps taken through November 2021. Rent steps excludes rent from the dark tenant at Tufco – 1205 Burris Road in Newton, North Carolina which is current on rent. |
| (5) | Total Reimbursements represent reimbursements of management fee at all properties except Amaray and all Pro Con Properties (none reimbursed). |
Property Management. The U.S. Industrial Portfolio VI Properties are self-managed by Brennan Management, LLC, an Illinois limited liability company.
Escrows and Reserves. On the origination date, the borrower deposited approximately $701,088 into an unfunded obligations reserve for certain unfunded obligations, including an unpaid tenant improvement allowance and certain future office renovations for the tenant True Value.
Tax and Insurance Reserve - On each due date, the borrower is required to fund a tax and insurance reserve in an amount equal to 1/12 of the amount that the lender reasonably estimates will be necessary to pay taxes and insurance premiums during the next ensuing 12 months, unless, for so long as no event of default under the U.S. Industrial Portfolio VI Whole Loan or U.S. Industrial Portfolio VI Trigger Period (as defined below) is continuing, (i) in the case of taxes, one or more tenants are obligated to pay taxes directly, or (ii) in the case of insurance premiums, the borrower is maintaining a blanket policy in accordance with the related loan documents or a tenant is required to maintain insurance for the applicable property that meets the applicable requirements under the loan documents.
THE INFORMATION IN THIS STRUCTURAL AND COLLATERAL TERM SHEET IS NOT COMPLETE AND MAY BE AMENDED PRIOR TO THE TIME OF SALE. THIS TERM SHEET IS NOT AN OFFER TO SELL THESE SECURITIES AND IT IS NOT A SOLICITATION OF AN OFFER TO BUY THESE SECURITIES IN ANY JURISDICTION WHERE THE OFFER OR SALE IS NOT PERMITTED.
112 of 166
| Structural and Collateral Term Sheet | Benchmark 2021-B24 | |
| U.S. Industrial Portfolio VI | ||
TI/LC Reserve - On each due date commencing in April 2027, the borrower is required to deposit into a tenant improvement and leasing commission reserve an amount equal to 1/12 of $0.20 per square foot of the then current square footage capped at $0.60 per square foot of the then current square footage. On each due date during the continuance of a U.S. Industrial Portfolio VI Lease Reserve Period (as defined below), the borrower is required to deposit an amount equal to 1/12 of $2.00 per square foot of the then current square footage of each U.S. Industrial Portfolio VI Property subject to a U.S. Industrial Portfolio VI Lease Reserve Period capped at $6.00 per square foot of the then current square footage of each U.S. Industrial Portfolio VI property subject to a U.S. Industrial Portfolio VI Lease Reserve Period (excluding any amounts deposited in the tenant improvements and leasing commissions reserve attributable to lease termination proceeds).
CapEx Reserve - On each due date commencing in April 2027, the borrower is required to deposit into a capital expenditure reserve an amount equal to 1/12 of $0.10 per square foot of the then current square footage capped at $0.30 per square foot of the then current square footage. On each due date during the continuance of a U.S. Industrial Portfolio VI Lease Reserve Period, the borrower is required to deposit an amount equal to 1/12 of $0.10 per square foot of the then current square footage of each U.S. Industrial Portfolio VI property subject to a U.S. Industrial Portfolio VI Lease Reserve Period capped at $0.30 per square foot of the then current square footage of each U.S. Industrial Portfolio VI property subject to a U.S. Industrial Portfolio VI Lease Reserve Period.
A “U.S. Industrial Portfolio VI Trigger Period” means each period: (i) during the continuance of a U.S. Industrial Portfolio VI Lease Extension Trigger Period, (ii) commencing when the debt yield (as calculated under the related loan documents), determined as of the first day of any fiscal quarter, is less than 9.0%, and concluding when the debt yield, determined as of the first day of each of two consecutive fiscal quarters thereafter, is equal to or greater than 9.0%, and (iii) commencing upon the borrower’s failure to deliver required monthly, quarterly or annual financial reports (subject to any applicable notice and cure periods set forth in the related loan documents) and ending when such reports are delivered and indicate that no other U.S. Industrial Portfolio VI Trigger Period is ongoing. The borrower is permitted to cure or terminate a U.S. Industrial Portfolio VI Trigger Period under clause (ii) above by delivering a letter of credit or a cash deposit in an amount that would result in a debt yield (as calculated under the related loan documents) that exceeds 9.0% (so long as the aggregate notional amount of all outstanding letters of credit do not exceed 10% of the balance of the U.S. Industrial Portfolio VI Whole Loan) or, after the expiration of the U.S. Industrial Portfolio VI Lockout Period, defeasing a portion of the U.S. Industrial Portfolio VI Whole Loan in amount that would cause debt service coverage ratio to equal or exceed 9.0%.
A “U.S. Industrial Portfolio VI Lease Reserve Period” means, with respect to any U.S. Industrial Portfolio VI property, any period during which any tenant at such U.S. Industrial Portfolio VI property (x) is in default under its lease beyond all applicable grace, notice and cure periods, (y) has ceased operations at its leased premises or gone dark or (z) has failed to renew its lease by the earlier of (i) the termination of the renewal option period under its lease and (ii) six months prior to the expiration date of its lease.
A “U.S. Industrial Portfolio VI Lease Extension Trigger Period” means, with respect to any lease at any U.S. Industrial Portfolio VI property which has a scheduled expiration date which is prior to, or within six months following the maturity date of the U.S. Industrial Portfolio VI Whole Loan, each period (i) commencing on the date that is 12 months prior to the expiration of any such lease, unless such lease has been extended in accordance with the terms and conditions set forth in such lease, and (ii) concluding when either (a) the applicable tenant renewing or extending the term of its lease pursuant to the terms set forth in such lease or otherwise on terms and conditions reasonably acceptable to the lender (including, without limitation, a renewal or extension term of not less than the greater of (1) six months following the maturity date of the U.S. Industrial Portfolio VI Whole Loan, or (2) the renewal period set forth in the applicable lease) and, in each case, in accordance with the terms of the related loan documents, or (b) the lender has received reasonably satisfactory evidence that (1) all or substantially all of the space demised under the applicable lease has been leased to one or more replacement tenants in accordance with the requirements of the related loan documents, (2) each such tenant has taken occupancy of its demised space, (3) each such tenant is paying full, unabated rent and (4) all related tenant improvements and leasing commissions have been paid or reserved with the lender.
Lockbox and Cash Management. The U.S. Industrial Portfolio VI Whole Loan is structured with a hard lockbox and springing cash management. The related loan documents require the borrower to direct tenants to pay rent directly to a lender-controlled lockbox account. In addition, the borrower is required to cause all cash revenues relating to the U.S. Industrial Portfolio VI Properties and all other money received by the borrower, guarantors, a master lease party or the property manager with respect to the U.S. Industrial Portfolio VI Properties (other than tenant security deposits) to be deposited into such lockbox account or a lender-controlled cash management account within one business day of receipt. On each business day that no U.S. Industrial Portfolio VI Trigger Period or event of default under the U.S. Industrial Portfolio VI Whole Loan is continuing, all funds in the lockbox account are required to be swept into a borrower-controlled operating account. On each business day during the continuance of a U.S. Industrial Portfolio VI Trigger Period or event of default under the U.S. Industrial Portfolio VI Whole Loan, all funds in the lockbox account are required to be swept into the cash management account.
On each due date during the continuance of a U.S. Industrial Portfolio VI Trigger Period (or, at the lender’s discretion, during the continuance of an event of default under the U.S. Industrial Portfolio VI Whole Loan), all amounts on deposit in the cash management account after payment of debt service, required reserves and budgeted operating expenses are required to be reserved (i) during the continuance of a U.S. Industrial Portfolio VI Lease Extension Trigger Period, in the tenant maturing lease reserve and (ii) otherwise, into an excess cash flow reserve as additional collateral for the U.S. Industrial Portfolio VI Whole Loan.
THE INFORMATION IN THIS STRUCTURAL AND COLLATERAL TERM SHEET IS NOT COMPLETE AND MAY BE AMENDED PRIOR TO THE TIME OF SALE. THIS TERM SHEET IS NOT AN OFFER TO SELL THESE SECURITIES AND IT IS NOT A SOLICITATION OF AN OFFER TO BUY THESE SECURITIES IN ANY JURISDICTION WHERE THE OFFER OR SALE IS NOT PERMITTED.
113 of 166
| Structural and Collateral Term Sheet | Benchmark 2021-B24 | |
| U.S. Industrial Portfolio VI | ||
Master Lease. The mortgage loan was structured with a master lease to be a Shari’ah compliant loan. Title to the related U.S. Industrial Portfolio VI Properties is held by wholly-owned single purpose subsidiaries of the borrower (the “Property Owners”), who master lease each related U.S. Industrial Portfolio VI property to a single-purpose master lessee (the “Master Lessees”), which is indirectly owned by certain investors. The rent payable pursuant to the master lease is intended to cover the debt service payments required under the U.S. Industrial Portfolio VI Whole Loan, as well as reserve payments and any other sums due under the U.S. Industrial Portfolio VI Whole Loan. At origination, the lender received a fee mortgage from each Property Owner on its interest in the applicable U.S. Industrial Portfolio VI Property. The lender also secured a full subordination of the master lease and related operating lease. See “Description of the Mortgage Pool—Certain Terms of the Mortgage Loans— Shari’ah Compliant Loan” in the Preliminary Prospectus.
Operating Lease. An affiliate of one of the guarantors, STNL II Operating Corp. (“Operating Lessee”), a Delaware Corporation, leases the U.S. Industrial Portfolio VI Properties from the Master Lessees pursuant to a sublease agreement (the “Operating Lease”). The Operating Lessee, in turn, sub-leases the U.S. Industrial Portfolio VI Properties to end-user tenants. The Operating Lease is subordinate to the lien of the mortgages and the Operating Lease and the rent due thereunder are pledged to the lender as additional collateral for the U.S. Industrial Portfolio VI Whole Loan. Upon foreclosure, the lender may terminate the Operating Lease and the Master Lease at its sole option without the payment of any termination fee and, pursuant to subordination non-disturbance and attornment agreements with each of the end-user tenants, can enter into a direct lease with such end-user tenants at the U.S. Industrial Portfolio VI Properties.
Current Mezzanine or Subordinate Indebtedness. None.
Future Mezzanine or Subordinate Indebtedness Permitted. Provided no event of default under the U.S. Industrial Portfolio VI Whole Loan, the loan documents permit future mezzanine financing, subject to satisfaction of certain conditions, including, among others (i) execution of an intercreditor agreement reasonably acceptable to the lender, (ii) the mezzanine loan and the U.S. Industrial Portfolio VI Whole Loan have a combined loan-to-value ratio (as calculated under the loan documents) of no greater than 56.37%, (iii) the debt service coverage ratio (as calculated under the loan documents and taking into account the mezzanine loan and the U.S. Industrial Portfolio VI Whole Loan) is at least 3.269x, (iv) the debt yield (as calculated under the loan documents and taking into account the mezzanine loan and the U.S. Industrial Portfolio VI Whole Loan) is at least 12.32%, (v) delivery of a rating agency confirmation and (vi) if the mezzanine debt bears a floating rate of interest, execution of an interest rate cap agreement from a counterparty acceptable to the lender in its reasonable discretion. In addition, Goldman Sachs Bank USA or its designee has a right of first refusal to provide such mezzanine debt. See “Description of the Mortgage Pool—Additional Indebtedness—Mezzanine Indebtedness” in the Preliminary Prospectus.
Partial Release. For so long as no event of default under the U.S. Industrial Portfolio VI Whole Loan is continuing, the borrower has the right at any time from and after the first due date following the expiration of the U.S. Industrial Portfolio VI Lockout Period, to obtain the release of one or more of the U.S. Industrial Portfolio VI Properties subject to the satisfaction of certain conditions, including, among others: (i) defeasance of the U.S. Industrial Portfolio VI Whole Loan in an amount equal to 120% of the allocated loan amount of the individual U.S. Industrial Portfolio VI property to be released, (ii) after giving effect to such release, the debt yield (as calculated in accordance with the related loan documents) for the trailing 12-month period ending on the last day of a fiscal quarter, recalculated to include only income and expense attributable to the portion of the U.S. Industrial Portfolio VI Properties remaining after the contemplated release and to exclude the interest expense on the aggregate amount defeased in connection with such release, is equal to or greater than the greater of (x) 11.73% and (y) the debt yield immediately prior to such release, (iii) delivery of a rating agency confirmation, and (iv) compliance with REMIC requirements.
In addition, for so long as no event of default under the U.S. Industrial Portfolio VI Whole Loan is continuing, on any date following the due date occurring in October 2021, the borrower may obtain the release of the mortgaged property located in Newton, North Carolina (the “Tufco - 1205 Burris Road Mortgaged Property”) subject to the satisfaction of certain conditions, including, among others, (i) prepayment of the U.S. Industrial Portfolio VI Whole Loan in an amount equal to 120% of the applicable allocated loan amount for the Tufco - 1205 Burris Road Mortgaged Property, together with any applicable yield maintenance premium, (ii) after giving effect to such release, the debt yield (as calculated in accordance with the related loan documents) for the trailing 12-month period ending on the last day of a fiscal quarter, recalculated to include only income and expense attributable to the portion of the U.S. Industrial Portfolio VI Properties remaining after the contemplated release and to exclude the interest expense on the aggregate amount defeased in connection with such release, is equal to or greater than the greater of (x) 11.73% and (y) the debt yield immediately prior to such release, (iii) delivery of a rating agency confirmation, and (iv) compliance with REMIC requirements.
THE INFORMATION IN THIS STRUCTURAL AND COLLATERAL TERM SHEET IS NOT COMPLETE AND MAY BE AMENDED PRIOR TO THE TIME OF SALE. THIS TERM SHEET IS NOT AN OFFER TO SELL THESE SECURITIES AND IT IS NOT A SOLICITATION OF AN OFFER TO BUY THESE SECURITIES IN ANY JURISDICTION WHERE THE OFFER OR SALE IS NOT PERMITTED.
114 of 166
(THIS PAGE INTENTIONALLY LEFT BLANK)
THE INFORMATION IN THIS STRUCTURAL AND COLLATERAL TERM SHEET IS NOT COMPLETE AND MAY BE AMENDED PRIOR TO THE TIME OF SALE. THIS TERM SHEET IS NOT AN OFFER TO SELL THESE SECURITIES AND IT IS NOT A SOLICITATION OF AN OFFER TO BUY THESE SECURITIES IN ANY JURISDICTION WHERE THE OFFER OR SALE IS NOT PERMITTED.
115 of 166
| Structural and Collateral Term Sheet | Benchmark 2021-B24 | |
| Boca Office Portfolio | ||
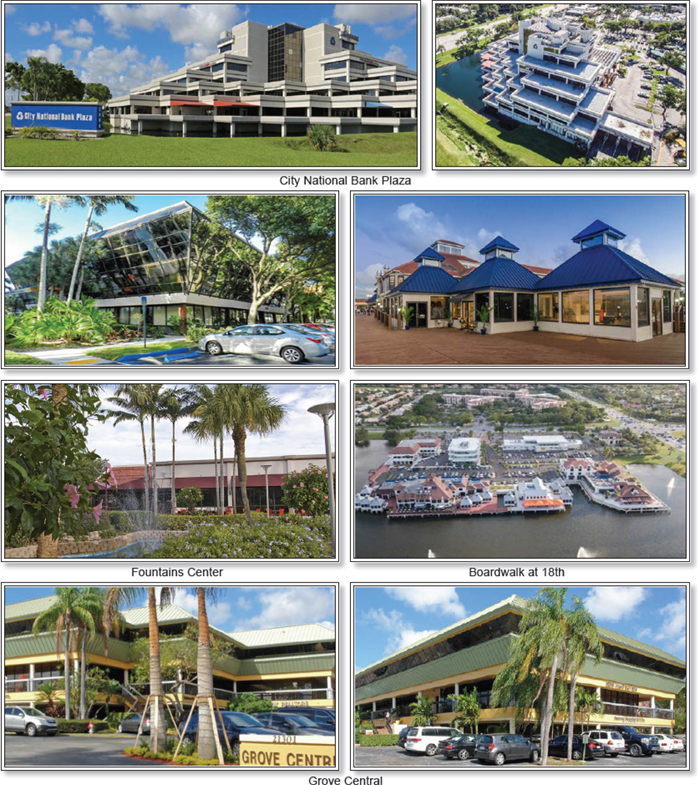
THE INFORMATION IN THIS STRUCTURAL AND COLLATERAL TERM SHEET IS NOT COMPLETE AND MAY BE AMENDED PRIOR TO THE TIME OF SALE. THIS TERM SHEET IS NOT AN OFFER TO SELL THESE SECURITIES AND IT IS NOT A SOLICITATION OF AN OFFER TO BUY THESE SECURITIES IN ANY JURISDICTION WHERE THE OFFER OR SALE IS NOT PERMITTED.
116 of 166
| Structural and Collateral Term Sheet | Benchmark 2021-B24 | |
| Boca Office Portfolio | ||

THE INFORMATION IN THIS STRUCTURAL AND COLLATERAL TERM SHEET IS NOT COMPLETE AND MAY BE AMENDED PRIOR TO THE TIME OF SALE. THIS TERM SHEET IS NOT AN OFFER TO SELL THESE SECURITIES AND IT IS NOT A SOLICITATION OF AN OFFER TO BUY THESE SECURITIES IN ANY JURISDICTION WHERE THE OFFER OR SALE IS NOT PERMITTED.
117 of 166
| Structural and Collateral Term Sheet | Benchmark 2021-B24 | |
| Boca Office Portfolio | ||
| Mortgage Loan Information | Property Information | |||
| Mortgage Loan Seller: | CREFI | Single Asset / Portfolio: | Portfolio | |
| Original Principal Balance(1): | $50,000,000 | Title: | Fee | |
| Cut-off Date Principal Balance(1): | $50,000,000 | Property Type - Subtype: | Mixed Use – Office/Retail | |
| % of Pool by IPB: | 4.3% | Net Rentable Area (SF): | 514,527 | |
| Loan Purpose: | Recapitalization; Acquisition | Location: | Boca Raton, FL | |
| Borrowers: | Boca Wharfside, LLC, Boca Medical | Year Built / Renovated: | Various / Various | |
| Plaza, LLC, TJAC Palmetto Park, | Occupancy: | 90.4% | ||
| LLC, TJAC Boca Grove, LLC | Occupancy Date: | 1/23/2021 | ||
| Loan Sponsors: | Carlos Ulloa, Debra Corchia, Daniel | Number of Tenants: | 153 | |
| Statlander, James Caprio | 2017 NOI(3): | $6,941,106 | ||
| Interest Rate: | 4.02000% | 2018 NOI(3): | $8,512,154 | |
| Note Date: | 2/17/2021 | 2019 NOI: | $8,927,635 | |
| Maturity Date: | 3/6/2026 | TTM NOI (as of 12/2020)(4): | $8,048,222 | |
| Interest-only Period: | 60 months | UW Economic Occupancy(5): | 92.6% | |
| Original Term: | 60 months | UW Revenues: | $16,623,446 | |
| Original Amortization: | None | UW Expenses: | $6,161,981 | |
| Amortization Type: | Interest Only | UW NOI(4)(5): | $10,461,465 | |
| Call Protection(2): | L(24),Def(33),O(3) | UW NCF(5): | $9,922,619 | |
| Lockbox / Cash Management: | Hard / Springing | Appraised Value / Per SF(5)(6): | $155,900,000 / $303 | |
| Additional Debt(1): | Yes | Appraisal Date(6): | 11/13/2020 | |
| Additional Debt Balance(1): | $49,000,000 | |||
| Additional Debt Type(1): | Pari Passu | |||
| Escrows and Reserves(7) | Financial Information(1)(5) | ||||||
| Initial | Monthly | Initial Cap | Cut-off Date Loan / SF: | $192 | |||
| Taxes: | $609,758 | $152,439 | N/A | Maturity Date Loan / SF: | $192 | ||
| Insurance: | $1,008,948 | $84,079 | N/A | Cut-off Date LTV(6): | 63.5% | ||
| Replacement Reserves: | $0 | $10,614 | N/A | Maturity Date LTV(6): | 63.5% | ||
| TI/LC: | $1,500,000 | $42,877 | $3,000,000 | UW NCF DSCR: | 2.46x | ||
| Other(8): | $1,236,505 | $0 | N/A | UW NOI Debt Yield: | 10.6% | ||
| Sources and Uses | |||||||
| Sources | Proceeds | % of Total | Uses | Proceeds | % of Total | ||
| Whole Loan | $99,000,000 | 74.4% | Payoff Existing Debt | $103,381,641 | 77.7% | ||
| Equity Contribution | 34,100,085 | 25.6% | LP Payoff(9) | 19,484,855 | 14.6% | ||
| Upfront Reserves | 4,355,211 | 3.3% | |||||
| Closing Costs | 5,878,378 | 4.4% | |||||
| Total Sources | $133,100,085 | 100.0% | Total Uses | $133,100,085 | 100.0% | ||
| (1) | The Boca Office Portfolio Loan (as defined below) consists of the controlling Note A-1 and is part of the Boca Office Portfolio Whole Loan (as defined below) evidenced by three senior pari passu notes, with an aggregate outstanding principal balance as of the Cut-off Date of $99.0 million. Financial information presented in the chart above reflects the aggregate Cut-off Date Balance of the $99.0 million Boca Office Portfolio Whole Loan. For additional information, see “The Loan” herein. |
| (2) | The defeasance lockout period will be at least 24 payments beginning with and including the first payment date of April 6, 2021. The borrowers have the option to defease the entire $99.0 million Boca Office Portfolio Whole Loan in whole (and not in part) after the earlier to occur of (i) two years after the closing date of the securitization that includes the last note to be securitized and (ii) February 17, 2025. The assumed defeasance lockout period of 24 months is based on the expected closing date of the Benchmark 2021-B24 securitization in March 2021. The actual lockout period may be longer. |
| (3) | The increase from 2017 NOI to 2018 NOI can be attributed to the completion of renovations at the Boardwalk @ 18th and Grove Centre properties in 2017 and subsequent stabilization over the course of the year. |
| (4) | The increase from TTM NOI to UW NOI at the mortgaged property is primarily attributable to unrealized rent accounting for new tenants occupying space, rent abatement expiration, contractual rent steps, and potential income from vacant space. |
| (5) | While the Boca Office Portfolio Whole Loan was originated after the emergence of the novel coronavirus pandemic and the economic disruption resulting from measures to combat the pandemic, the pandemic is an evolving situation and could impact the Boca Office Portfolio Whole Loan more severely than assumed in the underwriting of the Boca Office Portfolio Whole Loan and could adversely affect the NOI, NCF, and occupancy information, as well as the appraised value and the DSCR, LTV, and Debt Yield metrics presented above. See “Risk Factors—Special Risks—Coronavirus Pandemic Has Adversely Affected the Global Economy and Will Likely Adversely Affect the Performance of the Mortgage Loans” in the Preliminary Prospectus |
| (6) | Based on the “As Portfolio” appraised value (inclusive of the portfolio premium), the Cut-off Date LTV Ratio and Maturity Date LTV Ratio are equal to 63.5%, as of November 13, 2020. Based on the sum of the “As Is” appraised values of $150,700,000, the Cut-off Date LTV Ratio and Maturity Date LTV Ratio are equal to 65.7%. |
| (7) | For a full description of Escrows and Reserves, please refer to “Escrows and Reserves” below. |
| (8) | Initial Other Reserves includes debt service reserve ($1,000,000), unfunded obligations reserve ($211,000), immediate repairs reserve ($18,755) and environmental reserve ($6,750). |
| (9) | LP Payoff represents the payoff of the former limited partner as part of the recapitalization of the Boca Office Portfolio Properties. |
THE INFORMATION IN THIS STRUCTURAL AND COLLATERAL TERM SHEET IS NOT COMPLETE AND MAY BE AMENDED PRIOR TO THE TIME OF SALE. THIS TERM SHEET IS NOT AN OFFER TO SELL THESE SECURITIES AND IT IS NOT A SOLICITATION OF AN OFFER TO BUY THESE SECURITIES IN ANY JURISDICTION WHERE THE OFFER OR SALE IS NOT PERMITTED.
118 of 166
| Structural and Collateral Term Sheet | Benchmark 2021-B24 | |
| Boca Office Portfolio | ||
The Loan. The Boca Office Portfolio mortgage loan (the “Boca Office Portfolio Loan”) is part of a whole loan with an aggregate outstanding principal balance as of the Cut-off Date of $99.0 million (the “Boca Office Portfolio Whole Loan”), which is secured by the borrowers’ fee interest in four mixed use properties located in Boca Raton, Florida (collectively, the “Boca Office Portfolio Properties” and individually the “Boca Office Portfolio Property”, as applicable). The Boca Office Portfolio Whole Loan is comprised of three senior pari passu notes with an aggregate principal balance as of the Cut-off Date of $99.0 million, of which note A-1, with an outstanding principal balance as of the Cut-off Date of $50.0 million, is being contributed to the Benchmark 2021-B24 trust and constitutes the Boca Office Portfolio Loan, and the remainder of which is expected to be contributed to one or more future securitization trusts. The Boca Office Portfolio Whole Loan was co-originated by Citi Real Estate Funding Inc. (“CREFI”) and Bank of America, N.A. The Boca Office Portfolio Whole Loan has a five-year term and will be interest-only for its entire term.
The table below summarizes the promissory notes that comprise the Boca Office Portfolio Whole Loan. The Boca Office Portfolio Whole Loan will be serviced through the Benchmark 2021-B24 securitization transaction. The relationship between the holders of the Boca Office Portfolio Whole Loan is governed by a co-lender agreement as described under “Description of the Mortgage Pool—The Whole Loans—The Serviced Pari Passu Whole Loans” in the Preliminary Prospectus.
| Whole Loan Summary | |||||
| Note | Original Balance | Cut-off Date Balance | Note Holder | Controlling Piece | |
| Note A-1 | $50,000,000 | $50,000,000 | Benchmark 2021-B24 | Yes | |
| Note A-2 | $19,300,000 | $19,300,000 | CREFI(1) | No | |
| Note A-3 | $29,700,000 | $29,700,000 | Bank of America, N.A.(1) | No | |
| Whole Loan | $99,000,000 | $99,000,000 | |||
| (1) | The related note is currently held by the Note Holder identified in the table above and is expected to be contributed to one or more future securitization transactions. |
The Borrowers. The borrowers are Boca Wharfside, LLC, Boca Medical Plaza, LLC, TJAC Palmetto Park, LLC and TJAC Boca Grove, LLC (collectively, the “Borrowers”), each a Delaware limited liability company with one independent director. Legal counsel to the Borrowers delivered a non-consolidation opinion in connection with the origination of the Boca Office Portfolio Whole Loan.
The Loan Sponsors. The sponsors of the Boca Office Portfolio Loan are Carlos Ulloa and Debra Corchia, two of the non-recourse carveout guarantors. The Borrowers are collectively owned by a joint venture partnership between entities affiliated with Zvi Schwartzman of TJAC Development, Kireland Equity Investments, the Holdun Family Office and Omicrom Development. Headquartered in Boston, TJAC Development is a full-service real estate investment and development company with a focus on the acquisition and development of mixed-use, retail and student housing properties throughout the United States. TJAC Development has more than 20-years of real estate operational experience and currently owns and operates more than 1.1 million square feet of real estate throughout the East Coast of the United States. Kireland Equity Investments is managed by Alex Kurkin for the benefit of the Klein Family. Holdun Family Office is a 5th generation family office controlled and managed by the Dunn family that provides discretionary capital management, tax and estate planning and asset protection for individual families, private companies, foundations and endowments. Omricom Development is a Boca Raton-based commercial real estate management and investment company. Its principals, James Caprio, Carlos Ulloa and Daniel Statlander have a combined 75 years of industry experience. The loan carveout guarantors are James Caprio, Carlos Ulloa, Daniel Statlander and Debra Corchia.
The Properties. The Boca Office Portfolio Properties are comprised of four Class B mixed use properties totaling 514,527 square feet (the “Portfolio NRA”) located throughout Boca Raton, Florida. The Boca Office Portfolio Properties consist of: Fountains Center (36.7% of Portfolio NRA), Boardwalk @ 18th (25.7% of Portfolio NRA), City National Park (25.7% of Portfolio NRA) and Grove Centre (12.0% of Portfolio NRA). As of January 23, 2021, the Boca Office Portfolio Properties were 90.4% occupied by approximately 155 tenants with no individual tenant comprising more than 3.5% of Portfolio NRA and 3.7% of underwritten base rent. The largest tenants include Belux LLC (Aka Opus) (3.5% of Portfolio NRA), Women’s Health Partners, LLC (3.2% of Portfolio NRA), TDL Centers Inc (2.7% of Portfolio NRA), University of Miami (2.5% of Portfolio NRA) and Soberinves Sober Investments, LLC (2.1% of Portfolio NRA).
The Fountains Center property (36.7% of Portfolio NRA) consists of seven office buildings totaling 188,666 square feet which is comprised of 164,437 square feet of office space and 24,229 square feet of retail space. The Fountains Center property was built in 1983 and was 84.5% occupied as of January 23, 2021 and the office component was 82.1% occupied as of January 23, 2021. The retail component was 100% occupied by eight retail tenants as of January 23, 2021. The office component contributes to 87.2% of the Fountains Center property’s net rentable area, while the retail component is 12.8% of the Fountains Center property’s net rentable area.
The City National Park property (25.7% of Portfolio NRA) consists of three office buildings totaling 132,207 square feet which is comprised of 111,699 square feet of office space and 20,508 square feet of retail space and is 97.4% occupied as of January 23, 2021. The office component was built in 1986 and was 96.9% occupied as of January 23, 2021. The retail component was built in 1998 and 1991 and was 100% occupied by six retail tenants as of January 23, 2021. The office component contributes 84.5% of the City National Park property’s net rentable area, while the retail component is 15.5% of the City National Park property’s net rentable area.
The Boardwalk @ 18th property (25.7% of Portfolio NRA) totals 131,132 square feet including 86,480 square feet of office/medical office space and 45,652 square feet of retail space. The property was built in 1986 and renovated in 2017. Overall, the Boardwalk @ 18th
THE INFORMATION IN THIS STRUCTURAL AND COLLATERAL TERM SHEET IS NOT COMPLETE AND MAY BE AMENDED PRIOR TO THE TIME OF SALE. THIS TERM SHEET IS NOT AN OFFER TO SELL THESE SECURITIES AND IT IS NOT A SOLICITATION OF AN OFFER TO BUY THESE SECURITIES IN ANY JURISDICTION WHERE THE OFFER OR SALE IS NOT PERMITTED.
119 of 166
| Structural and Collateral Term Sheet | Benchmark 2021-B24 | |
| Boca Office Portfolio | ||
property was 91.8% leased by 20 office tenants and 21 retail tenants as of January 23, 2021. The office component contributes to 65.4% of the Boardwalk @ 18th property’s net rentable area, while the retail component is 34.6% of the Boardwalk @ 18th property’s net rentable area.
The Grove Centre property (12.0% of Portfolio NRA) totals 61,522 square feet and consists of a three-story 54,022 square foot office building and a 7,500 square foot retail building. The Grove Centre property was built in 1983 and was 90.8% occupied as of January 23, 2021. The office component was built in 1983 and was 89.6% occupied as of January 23, 2021. The retail component was constructed in 2017 and was 100% occupied by two retail tenants as of January 23, 2021. The office component contributes to 87.8% of the Grove Centre property’s net rentable area, while the retail component is 12.2% of the Grove Centre property’s net rentable area.
The Market. The Boca Office Portfolio Properties are located in Boca Raton, Florida, within Palm Beach County in the Miami-Fort Lauderdale-West Palm Beach, Florida metropolitan statistical area (“MSA”). Each of the properties are located within a five-mile radius of each other. The Boca Office Portfolio Properties are in the unincorporated area of Boca Raton which is considered a suburban location. The MSA, which is also known as the South Florida region, is among the most populous areas in the nation with a population of approximately 6.2 million people. Boca Raton is situated in southwest Palm Beach County, approximately 22 miles northwest of the Ft. Lauderdale CBD and approximately 25 miles southwest of the West Palm Beach central business district.
According to the appraisal, the Boca Office Portfolio Properties are located within the Palm Beach County office market and the Boca Raton submarket. The Palm Beach County office market had a second quarter 2020 inventory of approximately 22.94 million square feet, an overall vacancy of 12.0%, and an average annual asking rent of $24.48 per square feet. For the same period, the market reported a positive net absorption of 41,959 square feet and leasing transactions of 100,021 square feet. As of the second quarter 2020, 836,566 square feet was under construction (3.6% of total inventory). The Boca Raton submarket had a second quarter 2020 inventory of approximately 11.40 million square feet, overall vacancy of 11.1%, and an average annual asking rent of $24.07 per square feet.
The appraiser identified six office properties, which are considered to be the competitive set for the Boca Office Portfolio Properties. The six properties range from 64,419 square feet to 237,331 square feet, and were constructed between 1981 and 1989. Excluding an outlier comparable that has a 41.0% occupancy, the comparable properties had physical occupancies ranging from 89.0% to 97.0%, with a weighted average of 92.5%, and rental rates ranging from $18.00 per square feet to $34.40 per square feet. The appraiser also identified three retail comparables. The retail comparable properties have physical occupancies ranging from 97.0% to 100.0%, with a weighted average of 99.4%, and rental rates ranging from $23.00 per square feet to $65.00 per square feet.
COVID-19 Update. The Boca Office Portfolio Properties have remained open and operational during COVID-19. At the beginning of COVID-19, the sponsor entered into deferral agreements with approximately 50+ tenants throughout the Boca Office Portfolio Properties. The vast majority of deferrals included one to three months of deferred rent and which was paid back by December 2020. Rent collections in December 2020 and January 2021 totaled 96.0% and 95.0% of underwritten based rent, respectively. As of February 6, 2021, no loan modification or forbearance requests have been made on the Boca Office Portfolio Whole Loan.
| Historical and Current Occupancy(1) | ||||
| 2017 | 2018 | 2019 | 2020 | Current(2) |
| 89.6% | 82.3% | 85.8% | 91.4% | 90.4% |
| (1) | Historical Occupancies are as of December 31 of each respective year. |
| (2) | Current Occupancy is based on the underwritten rent roll dated January 23, 2021. |
THE INFORMATION IN THIS STRUCTURAL AND COLLATERAL TERM SHEET IS NOT COMPLETE AND MAY BE AMENDED PRIOR TO THE TIME OF SALE. THIS TERM SHEET IS NOT AN OFFER TO SELL THESE SECURITIES AND IT IS NOT A SOLICITATION OF AN OFFER TO BUY THESE SECURITIES IN ANY JURISDICTION WHERE THE OFFER OR SALE IS NOT PERMITTED.
120 of 166
| Structural and Collateral Term Sheet | Benchmark 2021-B24 | |
| Boca Office Portfolio | ||
| Tenant Summary(1) | |||||||
| Tenant | Ratings Moody’s/Fitch/S&P(2) | Net Rentable Area (SF) | % of Total NRA | Base Rent PSF(3) | % of Total Base Rent | Lease Expiration Date | |
| Belux LLC (Aka Opus) | NR / NR / NR | 17,902 | 3.5% | $17.95 | 3.0% | 12/31/2030 | |
| Women’s Health Partners, LLC | NR / NR / NR | 16,662 | 3.2 | $23.87 | 3.7 | 12/31/2027 | |
| TDL Centers Inc | NR / NR / NR | 14,067 | 2.7 | $18.54 | 2.4 | 7/14/2030 | |
| University of Miami | NR / NR / NR | 12,987 | 2.5 | $18.00 | 2.2 | 10/31/2025 | |
| Executive Suites | NR / NR / NR | 11,571 | 2.2 | $0.00 | 0.0 | MTM | |
| Soberinves Sober Investments, LLC | NR / NR / NR | 10,885 | 2.1 | $24.95 | 2.5 | 6/30/2024 | |
| Hellenic Petroleum LLC | NR / NR / NR | 8,381 | 1.6 | $19.00 | 1.5 | 2/28/2025 | |
| Harbinger Capital Group(4) | NR / NR / NR | 8,281 | 1.6 | $13.88 | 1.1 | 6/30/2021 | |
| Revamp Healthcare Partners | NR / NR / NR | 7,622 | 1.5 | $25.79 | 1.8 | 8/31/2027 | |
| TT of NAS LLC(5) | NR / NR / NR | 7,028 | 1.4 | $20.76 | 1.4 | 2/25/2026 | |
| Total | 115,386 | 22.4% | $18.22 | 19.7% | |||
| Other Occupied | 349,901 | 68.0% | $24.56 | 80.3% | |||
| Total Occupied | 465,287 | 90.4% | $22.99 | 100.0% | |||
| Vacant | 49,240 | 9.6% | |||||
| Total | 514,527 | 100.0% | |||||
| (1) | Based on the underwritten rent roll dated January 23, 2021. |
| (2) | In certain instances, ratings provided are those of the parent company of the entity shown, whether or not the parent company guarantees the lease. |
| (3) | Base Rent PSF includes rent steps through January 2022. |
| (4) | Harbinger Capital Group can terminate its lease with 60-days’ advance written notice. |
| (5) | TT of NAS LLC has two terminations options: (i) on December 31, 2022 upon six-months’ advance written notice and (ii) on December 31, 2023 upon six-months’ advance written notice. |
| Lease Rollover Schedule(1)(2) | ||||||||||
| Year | Number of Leases Expiring | Net Rentable Area Expiring | % of NRA Expiring | Base Rent Expiring(3) | % of Base Rent Expiring | Cumulative Net Rentable Area Expiring | Cumulative % of NRA Expiring | Cumulative Base Rent Expiring | Cumulative % of Base Rent Expiring | |
| Vacant | NAP | 49,240 | 9.6% | NAP | NAP | 49,240 | 9.6% | NAP | NAP | |
| MTM & 2021 | 22 | 57,137 | 11.1 | 972,722 | 9.1% | 106,377 | 20.7% | $972,722 | 9.1% | |
| 2022 | 17 | 37,938 | 7.4 | 847,451 | 7.9 | 144,315 | 28.0% | $1,820,173 | 17.0% | |
| 2023 | 23 | 59,358 | 11.5 | 1,429,770 | 13.4 | 203,673 | 39.6% | $3,249,942 | 30.4% | |
| 2024 | 26 | 70,605 | 13.7 | 1,600,428 | 15.0 | 274,278 | 53.3% | $4,850,370 | 45.3% | |
| 2025 | 28 | 75,696 | 14.7 | 1,716,884 | 16.1 | 349,974 | 68.0% | $6,567,254 | 61.4% | |
| 2026 | 14 | 51,670 | 10.0 | 1,190,540 | 11.1 | 401,644 | 78.1% | $7,757,793 | 72.5% | |
| 2027 | 6 | 33,236 | 6.5 | 854,211 | 8.0 | 434,880 | 84.5% | $8,612,004 | 80.5% | |
| 2028 | 8 | 27,556 | 5.4 | 888,612 | 8.3 | 462,436 | 89.9% | $9,500,616 | 88.8% | |
| 2029 | 3 | 8,720 | 1.7 | 205,053 | 1.9 | 471,156 | 91.6% | $9,705,669 | 90.7% | |
| 2030 | 5 | 39,371 | 7.7 | 779,590 | 7.3 | 510,527 | 99.2% | $10,485,258 | 98.0% | |
| 2031 | 1 | 4,000 | 0.8 | 210,440 | 2.0 | 514,527 | 100.0% | $10,695,698 | 100.0% | |
| 2032 and Thereafter | 0 | 0 | 0.0 | 0 | 0.0 | 514,527 | 100.0% | $10,695,698 | 100.0% | |
| Total | 153 | 514,527 | 100.0% | $10,695,698 | 100.0% | |||||
| (1) | Based on the underwritten rent roll dated January 23, 2021. |
| (2) | Certain tenants may have termination or contraction options (which may become exercisable prior to the originally stated expiration date of the tenant lease) that are not considered in the above Lease Rollover Schedule. |
| (3) | Base Rent Expiring includes rent steps through January 2022. |
THE INFORMATION IN THIS STRUCTURAL AND COLLATERAL TERM SHEET IS NOT COMPLETE AND MAY BE AMENDED PRIOR TO THE TIME OF SALE. THIS TERM SHEET IS NOT AN OFFER TO SELL THESE SECURITIES AND IT IS NOT A SOLICITATION OF AN OFFER TO BUY THESE SECURITIES IN ANY JURISDICTION WHERE THE OFFER OR SALE IS NOT PERMITTED.
121 of 166
| Structural and Collateral Term Sheet | Benchmark 2021-B24 | |
| Boca Office Portfolio | ||
| Operating History and Underwritten Net Cash Flow | |||||||
| 2017 | 2018 |
2019 | 2020 | Underwritten(1) | Per Square Foot | %(2) | |
| Base Rent(3) | $6,668,945 | $7,482,834 | $8,233,181 | $7,787,257 | $10,695,698 | $20.79 | 59.8% |
| Vacant Income | 0 | 0 | 0 | 0 | 1,275,835 | 2.48 | 7.1% |
| Gross Potential Rent | $6,668,945 | $7,482,834 | $8,233,181 | $7,787,257 | $11,971,533 | $23.27 | 66.9% |
| Total Reimbursements | 4,937,569 | 5,488,716 | 5,753,904 | 5,532,564 | 5,376,057 | 10.45 | 30.0% |
| Total Other Income | 369,865 | 596,757 | 638,225 | 575,370 | 551,691 | 1.07 | 3.1 |
| Net Rental Income | $11,976,379 | $13,568,307 | $14,625,310 | $13,895,191 | $17,899,281 | $34.79 | 100.0% |
| (Vacancy/Credit Loss) | 0 | 0 | 0 | 0 | (1,275,835) | (2.48) | (7.1) |
| Effective Gross Income | $11,976,379 | $13,568,307 | $14,625,310 | $13,895,191 | $16,623,446 | $32.31 | 92.9% |
| Total Expenses | $5,035,273 | $5,056,153 | $5,697,675 | $5,846,969 | $6,161,981 | $11.98 | 37.1% |
| Net Operating Income(4)(5) | $6,941,106 | $8,512,154 | $8,927,635 | $8,048,222 | $10,461,465 | $20.33 | 62.9% |
| Total TI/LC, Capex/RR | 0 | 0 | 0 | 0 | 538,846 | 1.05 | 3.2% |
| Net Cash Flow | $6,941,106 | $8,512,154 | $8,927,635 | $8,048,222 | $9,922,619 | $19.28 | 59.7% |
| (1) | Underwritten cash flow based on annualized in-place rents as of January 23, 2021. |
| (2) | % column represents percent of Net Rental Income for all revenue lines and represents percent of Effective Gross Income for the remainder of the fields. |
| (3) | Underwritten Base Rent includes $262,648 of contractual rent steps through January 2022. |
| (4) | The increase from 2020 NOI to Underwritten NOI at the mortgaged property is primarily attributable to unrealized rent accounting for new tenants occupying space, rent abatement expiration, contractual rent steps, and potential income from vacant space. |
| (5) | The increase from 2017 NOI to 2018 NOI can be attributed to the completion of renovations at the Boardwalk @ 18th and Grove Centre properties in 2017 and subsequent stabilization over the course of the year. |
Property Management. The Boca Office Portfolio Properties are managed by Omicrom Property Management, LLC, a Delaware limited liability company, an affiliate of the borrowers, and Stateland Brown, LLC, a Florida limited liability company.
Escrows and Reserves. At loan origination, the Borrowers deposited approximately (i) $609,758 into a real estate tax reserve account, (ii) $1,008,948 into an insurance reserve account, (iii) $1,500,000 into a TI/LC reserve account, (iv) $1,000,000 into a debt service reserve account, (v) $211,000 into an unfunded obligations reserve account, (vi) $18,755 into an immediate repairs reserve account, and (vii) $6,750 into an environmental reserve account.
Tax Reserve – The Borrowers are required to deposit into a real estate tax reserve, on a monthly basis, 1/12 of the estimated annual real estate taxes (initially estimated at approximately $152,439).
Insurance Reserve – The Borrowers are required to deposit into an insurance reserve, on a monthly basis, 1/12 of the amount which would be sufficient to pay the insurance premiums due for the renewal of coverage (initially estimated at approximately $84,079).
TI/LC Reserve – The Borrowers are required to deposit into a TI/LC reserve, on a monthly basis, an amount equal to approximately $42,877 for tenant improvements and leasing commissions (subject to a cap of $3,000,000).
Replacement Reserve – The Borrowers are is required to deposit into a replacement reserve, on a monthly basis, an amount equal to approximately $10,614 for replacement reserves.
Lockbox / Cash Management. The Boca Office Portfolio Whole Loan is structured with a hard lockbox and springing cash management. Prior to a Trigger Period (as defined below), the Borrowers are required to cause all rents and other sums generated by the Boca Office Portfolio Properties to be deposited into the lender-controlled lockbox. Within five days after the first occurrence of a Trigger Period, the Borrowers are required to deliver a tenant direction letter to the existing tenants at the Boca Office Portfolio Properties, directing it to remit their rent checks directly to the lender-controlled lockbox. The Borrowers are required to cause revenue received by the Borrowers or the property manager from the Boca Office Portfolio Properties to be deposited into such lockbox within one day of receipt. All funds deposited into the lockbox are required to be transferred on each business day to or at the direction of the Borrowers unless a Trigger Period exists. Upon the occurrence and during the continuance of a Trigger Period, all funds in the lockbox account are required to be swept on each business day to a cash management account under the control of the lender to be applied and disbursed in accordance with the Boca Office Portfolio Whole Loan documents, and all excess cash flow funds remaining in the cash management account after the application of such funds in accordance with the Boca Office Portfolio Whole Loan documents are required to be held by the lender in an excess cash flow reserve account as additional collateral for the Boca Office Portfolio Whole Loan. Upon the cure of the applicable Trigger Period, so long as no other Trigger Period exists, the lender is required to return any amounts remaining on deposit in the excess cash flow reserve account to the Borrowers. Upon the occurrence and continuance of an event of default under the Boca Office Portfolio Whole Loan documents, the lender will apply funds to the debt in such priority as it may determine.
A “Trigger Period” means a period (A) commencing upon the earliest of (i) the occurrence and continuance of an event of default, by the Borrowers or (ii) the debt yield falling below 7.5%; and (B) expiring upon (x) with regard to any Trigger Period commenced in connection
THE INFORMATION IN THIS STRUCTURAL AND COLLATERAL TERM SHEET IS NOT COMPLETE AND MAY BE AMENDED PRIOR TO THE TIME OF SALE. THIS TERM SHEET IS NOT AN OFFER TO SELL THESE SECURITIES AND IT IS NOT A SOLICITATION OF AN OFFER TO BUY THESE SECURITIES IN ANY JURISDICTION WHERE THE OFFER OR SALE IS NOT PERMITTED.
122 of 166
| Structural and Collateral Term Sheet | Benchmark 2021-B24 | |
| Boca Office Portfolio | ||
with clause (i) above, the cure (if applicable) of such event of default and (y) with regard to any Trigger Period commenced in connection with clause (ii) above, the date that the debt yield is equal to or greater than 7.5% for two consecutive calendar quarters.
Current Mezzanine or Subordinate Indebtedness. None.
Future Mezzanine or Subordinate Indebtedness Permitted. None.
Partial Release. (A) After the date that is 60 days following the Closing Date, the borrower may obtain the release of certain unimproved parcels of land located at the Boca Office Portfolio Properties known as the Fountains Center mortgaged property and/or the City National Park mortgaged property (individually and/or collectively, as the context may require, the “Unimproved Parcel”) from the lien of the related mortgage (“Unimproved Parcel Release”), upon the satisfaction of the following conditions, among other conditions more fully set forth in the Boca Office Portfolio Whole Loan documents, (a) (i) the borrower partially prepays the Boca Office Portfolio Whole Loan in an amount equal to $1,000,000 with respect to each Unimproved Parcel released plus an amount equal to the yield maintenance premium as set forth in the Boca Office Portfolio Whole Loan documents (calculated based on a partial prepayment in the amount of $1,000,000), (ii) the Borrowers delivers to the lender evidence from the rating agencies that the Unimproved Parcel release will not cause any of the rating agencies to withdraw, qualify or downgrade the then-applicable rating on any security issued in connection with such securitization, (iii) the Borrowers deliver a REMIC opinion, and (B) in the event that the lender determines that the borrower has not satisfied the conditions to the Unimproved Parcel Release set forth in clause (A) above, the Borrowers may request (which request will not be unreasonably withheld, but which can be subject to delivery of a rating agency confirmation) to demise a leasehold interest in the Unimproved Parcel to an unaffiliated third party pursuant to a ground lease whereby the applicable tenant intends to develop improvements to be used as general office, retail, restaurant, medical office, out-patient facility, school, assisted living facility, multifamily, hotel, and/or uses ancillary to the foregoing (any such lease an “Unimproved Parcel Ground Lease”); provided the lender’s agreement to reasonably consider any Unimproved Parcel Ground Lease is conditioned upon satisfaction of the following, among other conditions more fully set forth in the Boca Office Portfolio Whole Loan documents (in each case as determined in the lender’s sole discretion): (i) the lender’s determination that such Unimproved Parcel Ground Lease shall be permitted under and comply in all respects with REMIC requirements; (ii) the tenant under such Unimproved Parcel Ground Lease being obligated to perform all work thereunder (and in no event will any Borrowers party or affiliate of any the Borrowers party have any obligation to perform work thereunder), (iii) the tenant under such Unimproved Parcel Ground Lease having sufficient financial wherewithal to complete all work contemplated therein, (iv) the tenant under such Unimproved Parcel Ground Lease or an affiliate of such tenant acceptable to providing a completion guaranty with respect to the work contemplated in such Unimproved Parcel Ground Lease, which completion guaranty will be in a form acceptable to the lender, (v) the Borrowers furnish to the lender a REMIC opinion with respect to the Unimproved Parcel Ground Lease, and (vi) satisfaction of such other conditions as the lender may require.
THE INFORMATION IN THIS STRUCTURAL AND COLLATERAL TERM SHEET IS NOT COMPLETE AND MAY BE AMENDED PRIOR TO THE TIME OF SALE. THIS TERM SHEET IS NOT AN OFFER TO SELL THESE SECURITIES AND IT IS NOT A SOLICITATION OF AN OFFER TO BUY THESE SECURITIES IN ANY JURISDICTION WHERE THE OFFER OR SALE IS NOT PERMITTED.
123 of 166
| Structural and Collateral Term Sheet | Benchmark 2021-B24 | |
| Gestamp Automocion SLB | ||

THE INFORMATION IN THIS STRUCTURAL AND COLLATERAL TERM SHEET IS NOT COMPLETE AND MAY BE AMENDED PRIOR TO THE TIME OF SALE. THIS TERM SHEET IS NOT AN OFFER TO SELL THESE SECURITIES AND IT IS NOT A SOLICITATION OF AN OFFER TO BUY THESE SECURITIES IN ANY JURISDICTION WHERE THE OFFER OR SALE IS NOT PERMITTED.
124 of 166
| Structural and Collateral Term Sheet | Benchmark 2021-B24 | |
| Gestamp Automocion SLB | ||
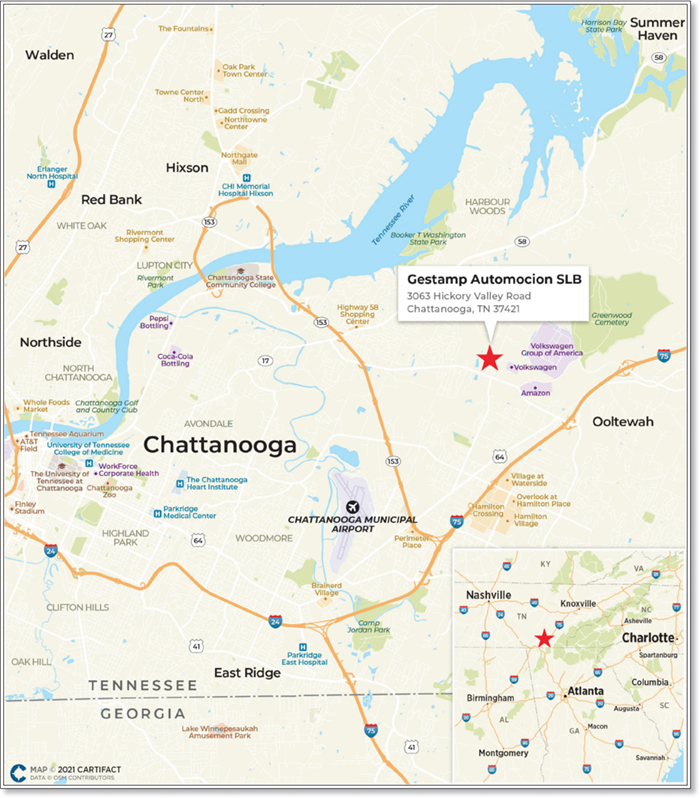
THE INFORMATION IN THIS STRUCTURAL AND COLLATERAL TERM SHEET IS NOT COMPLETE AND MAY BE AMENDED PRIOR TO THE TIME OF SALE. THIS TERM SHEET IS NOT AN OFFER TO SELL THESE SECURITIES AND IT IS NOT A SOLICITATION OF AN OFFER TO BUY THESE SECURITIES IN ANY JURISDICTION WHERE THE OFFER OR SALE IS NOT PERMITTED.
125 of 166
| Structural and Collateral Term Sheet | Benchmark 2021-B24 | |
| Gestamp Automocion SLB | ||
| Mortgage Loan Information | Property Information | |||
| Mortgage Loan Seller: | CREFI | Single Asset / Portfolio: | Single Asset | |
| Original Principal Balance: | $49,500,000 | Title(1): | Fee/Leasehold | |
| Cut-off Date Principal Balance: | $49,500,000 | Property Type - Subtype: | Industrial – Manufacturing | |
| % of Pool by IPB: | 4.3% | Net Rentable Area (SF): | 637,750 | |
| Loan Purpose: | Acquisition | Location: | Chattanooga, TN | |
| Borrower: | AGNL Volks, L.L.C. | Year Built / Renovated: | 2014 / N/A | |
| Loan Sponsors: | AG Net Lease IV Corp., AG Net Lease | Occupancy: | 100.0% | |
| IV (Q) Corp., AG Net Lease Realty | Occupancy Date: | 3/6/2021 | ||
| Fund IV Investments (H-1), L.P. | Number of Tenants: | 1 | ||
| Interest Rate: | 3.61000% | 2017 NOI(3): | N/A | |
| Note Date: | 2/19/2021 | 2018 NOI(3): | N/A | |
| Maturity Date: | 3/6/2031 | 2019 NOI(3): | N/A | |
| Interest-only Period: | 60 months | 2020 NOI(3): | N/A | |
| Original Term: | 120 months | UW Economic Occupancy(5): | 95.0% | |
| Original Amortization: | 360 months | UW Revenues: | $5,177,982 | |
| Amortization Type: | IO-Balloon | UW Expenses: | $823,112 | |
| Call Protection(1): | Grtr4%orYM(24)DeforGrtr1% | UW NOI(5): | $4,354,870 | |
| orYM(89),O(7) | UW NCF(5): | $4,106,687 | ||
| Lockbox / Cash Management: | Hard / Springing | Appraised Value / Per SF(5): | $78,900,000 / $124 | |
| Additional Debt: | N/A | Appraisal Date: | 2/1/2021 | |
| Additional Debt Balance: | N/A | |||
| Additional Debt Type: | N/A | |||
| Escrows and Reserves(4) | Financial Information(5) | |||||
| Initial | Monthly | Initial Cap | Cut-off Date Loan / SF: | $78 | ||
| Taxes: | $0 | Springing | N/A | Maturity Date Loan / SF: | $70 | |
| Insurance: | $0 | Springing | N/A | Cut-off Date LTV: | 62.7% | |
| Replacement Reserves: | $0 | Springing | N/A | Maturity Date LTV: | 56.6% | |
| TI/LC: | $0 | $0 | N/A | UW NCF DSCR: | 1.52x | |
| Other | $0 | $0 | N/A | UW NOI Debt Yield: | 8.8% | |
| Sources and Uses | ||||||
| Sources | Proceeds | % of Total | Uses | Proceeds | % of Total | |
| Loan Amount | $49,500,000 | 64.9% | Purchase Price | $75,500,000 | 99.0% | |
| Equity Contribution | 26,735,487 | 35.1 | Closing Costs | 735,487 | 1.0 | |
| Total Sources | $76,235,487 | 100.0% | Total Uses | $76,235,487 | 100.0% | |
| (1) | The defeasance lockout period will be at least 24 payment dates beginning with and including the first payment date of April 6, 2021. Defeasance of the Gestamp Automocion SLB Loan (as defined below) is permitted at any time after the date that is two years after the Closing Date. |
| (2) | Please see the “PILOT Agreement” section herein for further details on the ground lease entered into in connection with the PILOT program. |
| (3) | Historical financial information is unavailable because this property was recently acquired. |
| (4) | For a full description of Escrows and Reserves, please refer to “Escrows and Reserves” herein. |
| (5) | While the Gestamp Automocion SLB Loan was originated after the emergence of the novel coronavirus pandemic and the economic disruption resulting from measures to combat the pandemic, the pandemic is an evolving situation and could impact the Gestamp Automocion SLB Loan more severely than assumed in the underwriting of the Gestamp Automocion SLB Loan and could adversely affect the NOI, NCF, and occupancy information, as well as the appraised value and the DSCR, LTV, and Debt Yield metrics presented above. See “Risk Factors—Special Risks—Coronavirus Pandemic Has Adversely Affected the Global Economy and Will Likely Adversely Affect the Performance of the Mortgage Loans” in the Preliminary Prospectus. |
The Loan. The Gestamp Automocion SLB Loan (the “Gestamp Automocion SLB Loan”) is secured by a first mortgage lien on the borrower’s leasehold interest and the Industrial Development Board’s (“IDB”) fee interest in a 637,750 square foot industrial building located in Chattanooga, Tennessee (the “Gestamp Automocion SLB Property”). The Gestamp Automocion SLB Loan accrues interest at an interest rate of 3.61000% per annum, had an original term of 120 months, has a remaining term of 120 months as of the Cut-off Date. The Gestamp Automocion SLB Loan has a five-year interest-only period and will amortize on a 30-year schedule. The Gestamp Automocion SLB Loan was originated by Citi Real Estate Funding Inc. (“CREFI”) on February 19, 2021.
The Borrower. The borrower is AGNL Volks, L.L.C., a Delaware limited liability company. The borrower is structured to be a single purpose entity, with at least one independent director in its organizational structure. Legal counsel to the borrower delivered a non-consolidation opinion in connection with the origination of the Gestamp Automocion SLB Loan.
THE INFORMATION IN THIS STRUCTURAL AND COLLATERAL TERM SHEET IS NOT COMPLETE AND MAY BE AMENDED PRIOR TO THE TIME OF SALE. THIS TERM SHEET IS NOT AN OFFER TO SELL THESE SECURITIES AND IT IS NOT A SOLICITATION OF AN OFFER TO BUY THESE SECURITIES IN ANY JURISDICTION WHERE THE OFFER OR SALE IS NOT PERMITTED.
126 of 166
| Structural and Collateral Term Sheet | Benchmark 2021-B24 | |
| Gestamp Automocion SLB | ||
The Loan Sponsors. The loan sponsors and non-recourse carveout guarantors are AG Net Lease IV Corp., a Delaware corporation, AG Net Lease IV (Q) Corp., a Delaware corporation and AG Net Lease Realty Fund IV Investments (H-1), L.P., a Delaware limited partnership, each of which are subsidiaries of Angelo, Gordon & Co., L.P. (“AG”). AG provides real estate sale-leaseback financing to less-than-investment grade owner-occupiers of corporate real estate. AG was founded in 1988, however, the Net Lease Real Estate sector launched in 2005. The Net Lease division of AG draws on the firm’s credit expertise and real estate underwriting skills to focus on below-investment grade tenants.
AG runs a privately-held alternative investment firm, managing approximately $43 billion across a broad range of credit and real estate strategies. For over 30 years, AG has been investing on behalf of pension funds, corporations, endowments, foundations, sovereign wealth funds and individuals. AG now has over 550 employees in offices across the U.S., Europe and Asia.
The Property. The Gestamp Automocion SLB Property, located in Chattanooga, Tennessee, was built in 2014. The Gestamp Automocion SLB Property consists of 637,750 square feet of net rentable area and spans across 40.18-acres. The Gestamp Automocion Property contains 365 parking spaces which equates to a parking ratio of 0.57 spaces per 1,000 square feet. According to the underwritten rent roll dated March 6, 2021, the Gestamp Automocion SLB Property is 100.0% occupied by one industrial tenant, Gestamp Automocion.
The sole tenant, Gestamp Automocion (637,750 square feet; 100.0% of net rentable area; 100.0% of underwritten base rent; Moody’s/Fitch/S&P: B1/NR/BB-) is a leading global automotive supplier and manufacturer of metal automotive parts. Gestamp Automocion has occupied the Property since 2014.
The Market. According to the appraisal, the Outlying Chattanooga Industrial submarket has approximately 63.7 million square feet of space, and vacancy of 4.0%. The Outlying Chattanooga Industrial submarket currently has 25,200 square feet of industrial real estate under construction and absorbed 25,921 square feet as of the current quarter. The appraisal concluded $5.78 per square foot industrial market rents in the Outlying Chattanooga Industrial submarket.
PILOT Agreement. The Gestamp Automocion SLB Property is subject to two separate ground leases entered into in connection with two payment in lieu of taxes (“PILOT”) agreements. Pursuant to the terms of one ground lease, which expires December 31, 2024, the annual payment in lieu of taxes in the amount of approximately $243,113 for the years 2020 through its expiration in the calendar year 2024 represents 64.6% of the unabated tax amount of $376,336. With respect to the remaining portion of the Gestamp Automocion SLB Property, which is subject to the other ground lease that expires December 31, 2029, the annual payment in lieu of taxes for the years 2020 through its expiration in the calendar year 2029 will be an amount equal to 50% of the amount that would have been payable to the city general fund, 50% of the amount that would have been payable to the county general fund, and 100% of the amount that would have been payable to the city school fund. Taxes were underwritten at $495,580.
COVID-19 Update. As of February 6, 2021, the Gestamp Automocion SLB Property is open and operating. There has been no rent relief requested and Gestamp Automocion has paid rent each month. As of February 6, 2021, no loan modification or forbearance requests have been made on the Gestamp Automocion SLB Loan. The first payment date of the Gestamp Automocion SLB Loan is April 2021.
| Historical and Current Leased Occupancy(1) | |||
| 2018 | 2019 | 2020 | Current(2) |
| N/A | N/A | N/A | 100.0% |
| (1) | Historical occupancy of the Gestamp Automocion SLB Property is unavailable because it was recently acquired. |
| (2) | Current Occupancy is as of March 6, 2021. |
| Tenant Summary(1) | |||||||
| Tenant | Ratings Moody’s/Fitch/S&P(2) | Net Rentable Area (SF) | % of Total NRA | Base Rent PSF(3) | % of Total Base Rent | Lease Expiration Date | |
| Gestamp Automocion | B1/NR/BB- | 637,750 | 100.0% | $7.26 | 100.0% | 12/31/2040 | |
| Total Occupied | 637,750 | 100.0% | $7.26 | 100.0% | |||
| Vacant | 0 | 0.0 | |||||
| Total | 637,750 | 100.0% | |||||
| (1) | Based on the underwritten rent roll dated March 6, 2021. |
| (2) | In certain instances, ratings provided are those of the parent company of the entity shown, whether or not the parent company guarantees the lease. |
| (3) | Base Rent PSF is inclusive of contractual rent steps of $97,395 through January 1, 2022. |
THE INFORMATION IN THIS STRUCTURAL AND COLLATERAL TERM SHEET IS NOT COMPLETE AND MAY BE AMENDED PRIOR TO THE TIME OF SALE. THIS TERM SHEET IS NOT AN OFFER TO SELL THESE SECURITIES AND IT IS NOT A SOLICITATION OF AN OFFER TO BUY THESE SECURITIES IN ANY JURISDICTION WHERE THE OFFER OR SALE IS NOT PERMITTED.
127 of 166
| Structural and Collateral Term Sheet | Benchmark 2021-B24 | |
| Gestamp Automocion SLB | ||
| Lease Rollover Schedule(1)(2) | ||||||||||
| Year | Number of Leases Expiring | Net Rentable Area Expiring | % of NRA Expiring | Base Rent Expiring(3) | % of Base Rent Expiring | Cumulative Net Rentable Area Expiring | Cumulative % of NRA Expiring | Cumulative Base Rent Expiring | Cumulative % of Base Rent Expiring | |
| Vacant | NAP | 0 | 0.0% | NAP | NAP | 0 | 0.0% | NAP | NAP | |
| 2021 | 0 | 0 | 0.0 | $0 | 0.0% | 0 | 0.0% | $0 | 0.0% | |
| 2022 | 0 | 0 | 0.0 | 0 | 0.0 | 0 | 0.0% | $0 | 0.0% | |
| 2023 | 0 | 0 | 0.0 | 0 | 0.0 | 0 | 0.0% | $0 | 0.0% | |
| 2024 | 0 | 0 | 0.0 | 0 | 0.0 | 0 | 0.0% | $0 | 0.0% | |
| 2025 | 0 | 0 | 0.0 | 0 | 0.0 | 0 | 0.0% | $0 | 0.0% | |
| 2026 | 0 | 0 | 0.0 | 0 | 0.0 | 0 | 0.0% | $0 | 0.0% | |
| 2027 | 0 | 0 | 0.0 | 0 | 0.0 | 0 | 0.0% | $0 | 0.0% | |
| 2028 | 0 | 0 | 0.0 | 0 | 0.0 | 0 | 0.0% | $0 | 0.0% | |
| 2029 | 0 | 0 | 0.0 | 0 | 0.0 | 0 | 0.0% | $0 | 0.0% | |
| 2030 | 0 | 0 | 0.0 | 0 | 0.0 | 0 | 0.0% | $0 | 0.0% | |
| 2031 | 0 | 0 | 0.0 | 0 | 0.0 | 0 | 0.0% | $0 | 0.0% | |
| 2032 and Thereafter | 1 | 637,750 | 100.0 | 4,627,395 | 100.0 | 637,750 | 100.0% | $4,627,395 | 100.0% | |
| Total | 1 | 637,750 | 100.0% | $4,627,395 | 100.0% | |||||
| (1) | Based on the underwritten rent roll dated March 6, 2021. |
| (2) | Lease rollover schedule is based on the lease expiration dates of all direct leases in place. |
| (3) | Base Rent Expiring is inclusive of contractual rent steps of $97,395 through January 1, 2022. |
| Underwritten Net Cash Flow(1) | |||
| Underwritten | Per Square Foot | %(2) | |
| Base Rent(3) | $4,530,000 | $7.10 | 83.1% |
| Rent Steps(4) | 97,395 | 0.15 | 1.8% |
| Gross Potential Rent | $4,627,395 | $7.26 | 84.9% |
| Total Reimbursements | 823,112 | 1.29 | 15.1% |
| Total Other Income | 0 | 0.00 | 0.0% |
| Net Rental Income | $5,450,507 | $8.55 | 100.0% |
| (Vacancy/Credit Loss) | (272,525) | (0.43) | (5.3)% |
| Effective Gross Income | $5,177,982 | $8.12 | 100.0% |
| Total Expenses | 823,112 | 1.29 | 15.9% |
| Net Operating Income | $4,354,870 | $6.83 | 84.1% |
| Total TI/LC, RR | 248,182 | 0.39 | 4.8% |
| Net Cash Flow | $4,106,687 | $6.44 | 79.3% |
| (1) | Historical financial information is unavailable because the Gestamp Automocion SLB Loan was used to acquire the Gestamp Automocion SLB Property. |
| (2) | % column represents percent of Net Rental Income for all revenue lines and represents percent of Effective Gross Income for the remainder of the fields. |
| (3) | Underwritten Base Rent is based on the in place rent roll as of March 6, 2021. |
| (4) | Rent Steps of $97,395 through January 1, 2022. |
Property Management. The Gestamp Automocion SLB Property is self-managed.
Escrows and Reserves. On the origination date, no upfront reserves were deposited.
Tax and Insurance Reserve - On each due date during the continuance of a Tax Trigger Period (as defined below), the borrower is required to fund a tax reserve in an amount equal to 1/12 of the amount that the lender reasonably estimates will be necessary to pay taxes during the next ensuing 12 months. On each due date during the continuance of an Insurance Trigger Period (as defined below), the borrower is required to fund an insurance reserve in an amount equal to 1/12 of the amount that would be sufficient to pay the insurance premiums due for the renewal of coverage.
A “Tax Trigger Period” means the monthly due date during any period when each of the following conditions is satisfied: (i) a Trigger Period (as defined below) is then continuing and (ii) neither the borrower nor the Specified Tenant (as defined below) has (A) timely paid the taxes directly to the appropriate taxing authority and (B) provided evidence of such payment to the lender.
THE INFORMATION IN THIS STRUCTURAL AND COLLATERAL TERM SHEET IS NOT COMPLETE AND MAY BE AMENDED PRIOR TO THE TIME OF SALE. THIS TERM SHEET IS NOT AN OFFER TO SELL THESE SECURITIES AND IT IS NOT A SOLICITATION OF AN OFFER TO BUY THESE SECURITIES IN ANY JURISDICTION WHERE THE OFFER OR SALE IS NOT PERMITTED.
128 of 166
| Structural and Collateral Term Sheet | Benchmark 2021-B24 | |
| Gestamp Automocion SLB | ||
An “Insurance Trigger Period” means any period when each of the following conditions exist: (i) a Trigger Period is then continuing and (ii) neither the borrower nor the Specified Tenant has (A) timely paid the insurance premiums due on the policies to the issuer of the policies and (B) provided evidence of such payment to the lender.
Replacement Reserve - On each due date during the continuance of a Replacement Reserve Trigger Period (as defined below), the related loan documents require the borrower to deposit an amount equal to approximately $6,909 into a capital expenditure reserve account.
“Replacement Reserve Trigger Period” means the monthly due date during any period when each of the following conditions exists: (i) a Trigger Period is then continuing and (ii) neither the borrower nor the Specified Tenant has diligently made the required replacements.
Lockbox and Cash Management. The Gestamp Automocion SLB Loan is structured with a hard lockbox and springing cash management. The borrower is required to deliver a tenant direction letter to the existing tenant at the Gestamp Automocion SLB Property, directing it to remit its rent checks directly to the lender-controlled lockbox. The borrower is required to cause revenue received by the borrower or the property manager from the Gestamp Automocion SLB Property to be deposited into such lockbox immediately upon receipt. All funds deposited into the lockbox are required to be transferred on each business day to or at the direction of the borrower unless a Trigger Period exists. Upon the occurrence and during the continuance of a Trigger Period, all funds in the lockbox account are required to be swept on each business day to a cash management account under the control of the lender to be applied and disbursed in accordance with the Gestamp Automocion SLB Loan documents, and all excess cash flow funds remaining in the cash management account after the application of such funds in accordance with the Gestamp Automocion SLB Loan documents are required to be held by the lender in an excess cash flow reserve account as additional collateral for the Gestamp Automocion SLB Loan. Upon the cure of the applicable Trigger Period, so long as no other Trigger Period exists, the lender is required to return any amounts remaining on deposit in the excess cash flow reserve account to the borrower. Upon an event of default under the Gestamp Automocion SLB Loan documents, the lender will apply funds to the debt in such priority as it may determine.
A “Trigger Period” means a period (A) commencing upon the earliest to occur of (i) an event of default, (ii) the debt service coverage ratio falling below 1.20x for two consecutive calendar quarters, and (iii) the occurrence of Specified Tenant Trigger Period (as defined below) and (B) expiring upon (x) with regard to any Trigger Period commenced in connection with clause (i) above, the cure (if applicable) of such event of default, (y) with regard to any Trigger Period commenced in connection with clause (ii) above, the date that the debt service coverage ratio is equal to or greater than 1.20x for two consecutive calendar quarters and (z) with regard to any Trigger Period commenced in connection with clause (iii) above, the satisfaction of the Specified Tenant Cure Conditions (as defined below).
A “Specified Tenant Trigger Period” means a period (A) commencing upon the first to occur of (i) an “event of default” by Specified Tenant under the Specified Tenant lease arising directly as result of the Specified Tenant’s failure to be in actual, physical possession (and not merely constructive possession) of, or abandoning, the Specified Tenant Space (or applicable portion thereof), (ii) any termination or cancellation of any Specified Tenant lease (including, without limitation, rejection in any bankruptcy or similar insolvency proceeding) and/or (iii) any bankruptcy or similar insolvency of Specified Tenant and (B) expiring upon the lender’s receipt of evidence reasonably acceptable to the lender (which such evidence will include, without limitation, a duly executed estoppel certificate from the applicable Specified Tenant in form and substance acceptable to the lender) of the satisfaction of the Specified Tenant Cure Conditions.
The ”Specified Tenant Cure Conditions” means each of the following, as applicable: (A) with respect to clause (A)(i) of the definition of Specified Tenant Trigger Period, the lender’s receipt of satisfactory evidence that any “event of default” by Specified Tenant under the Specified Tenant lease arising directly as a result of the Specified Tenant’s failure to be in actual, physical possession of, or abandoning, the Specified Tenant space (or applicable portion thereof) has been cured, (B) with respect to clause (A)(ii) of the definition of Specified Tenant Trigger Period, the Specified Tenant space has been re-leased pursuant to one or more replacement leases approved by the lender in accordance with the Gestamp Automocion SLB Loan Documents and the tenants thereunder are in actual physical occupancy of the Gestamp Automocion SLB Property and paying full unabated rent, and (C) with respect to clause (A)(iii) of the definition of Specified Tenant Trigger Period, (a) the applicable Specified Tenant is no longer insolvent or subject to any bankruptcy or insolvency proceedings and has affirmed the applicable Specified Tenant lease pursuant to final, non-appealable order of a court of competent jurisdiction, (b) if the Specified Tenant lease is assumed or assigned to a new entity in connection with such proceedings, the bankruptcy court has issued a final order approving the Specified Tenant’s reorganization plan or (c) if the Specified Tenant lease is rejected or otherwise terminated due to any bankruptcy or insolvency proceedings, the Gestamp Automocion SLB Property has been re-leased pursuant to one or more replacement leases approved by the lender in accordance with the Gestamp Automocion SLB Loan documents and the tenants thereunder are in actual physical occupancy of the Gestamp Automocion SLB Property and paying full unabated rent.
“Specified Tenant” means, as applicable, (a) Gestamp Chattanooga, LLC, a Delaware limited liability company, together with any parent or affiliate thereof providing credit support or a guaranty under the Specified Tenant lease or (b) any replacement tenant of Gestamp Chattanooga, LLC approved in accordance with the Gestamp Automocion SLB Loan Documents.
Current Mezzanine or Secured Subordinate Indebtedness. None.
Permitted Future Mezzanine or Subordinate Indebtedness. Provided no event of default has occurred and is continuing, at any time after two years from the date that is two years from the startup day of the Benchmark 2021-B24 securitization trust, direct or indirect
THE INFORMATION IN THIS STRUCTURAL AND COLLATERAL TERM SHEET IS NOT COMPLETE AND MAY BE AMENDED PRIOR TO THE TIME OF SALE. THIS TERM SHEET IS NOT AN OFFER TO SELL THESE SECURITIES AND IT IS NOT A SOLICITATION OF AN OFFER TO BUY THESE SECURITIES IN ANY JURISDICTION WHERE THE OFFER OR SALE IS NOT PERMITTED.
129 of 166
| Structural and Collateral Term Sheet | Benchmark 2021-B24 | |
| Gestamp Automocion SLB | ||
owners of the borrower will be permitted to obtain mezzanine financing, which subordinate mezzanine loan will be secured by direct or indirect ownership interests in the borrower and any accounts established under any separate mezzanine cash management arrangement, subject to the certain conditions and requirements set forth in the Gestamp Automocion SLB Loan documents, including, without limitation: (i) the mezzanine loan will be structurally subordinate to the Gestamp Automocion SLB Loan, (ii) the subordinate mezzanine loan, together with the Gestamp Automocion SLB Loan, will have a combined loan-to-value ratio no greater than 62.74%, (iii) the debt service coverage ratio (inclusive of the proposed subordinate mezzanine loan) will be equal to or greater than 1.58x, (iv) the debt yield (inclusive of the proposed subordinate mezzanine loan) will be equal to or greater than 8.63% and (v) the subordinate mezzanine lender enters into an intercreditor agreement with the lender satisfactory to the lender in its reasonable discretion.
Partial Release. None.
THE INFORMATION IN THIS STRUCTURAL AND COLLATERAL TERM SHEET IS NOT COMPLETE AND MAY BE AMENDED PRIOR TO THE TIME OF SALE. THIS TERM SHEET IS NOT AN OFFER TO SELL THESE SECURITIES AND IT IS NOT A SOLICITATION OF AN OFFER TO BUY THESE SECURITIES IN ANY JURISDICTION WHERE THE OFFER OR SALE IS NOT PERMITTED.
130 of 166
(THIS PAGE INTENTIONALLY LEFT BLANK)
THE INFORMATION IN THIS STRUCTURAL AND COLLATERAL TERM SHEET IS NOT COMPLETE AND MAY BE AMENDED PRIOR TO THE TIME OF SALE. THIS TERM SHEET IS NOT AN OFFER TO SELL THESE SECURITIES AND IT IS NOT A SOLICITATION OF AN OFFER TO BUY THESE SECURITIES IN ANY JURISDICTION WHERE THE OFFER OR SALE IS NOT PERMITTED.
131 of 166
| Structural and Collateral Term Sheet | Benchmark 2021-B24 | |
| 30 Hudson Yards 67 | ||

THE INFORMATION IN THIS STRUCTURAL AND COLLATERAL TERM SHEET IS NOT COMPLETE AND MAY BE AMENDED PRIOR TO THE TIME OF SALE. THIS TERM SHEET IS NOT AN OFFER TO SELL THESE SECURITIES AND IT IS NOT A SOLICITATION OF AN OFFER TO BUY THESE SECURITIES IN ANY JURISDICTION WHERE THE OFFER OR SALE IS NOT PERMITTED.
132 of 166
| Structural and Collateral Term Sheet | Benchmark 2021-B24 | |
| 30 Hudson Yards 67 | ||
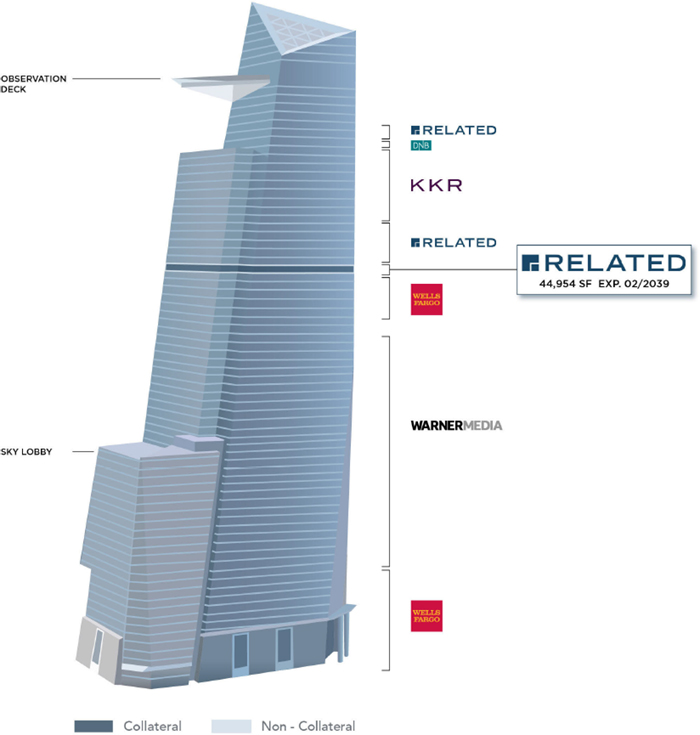
THE INFORMATION IN THIS STRUCTURAL AND COLLATERAL TERM SHEET IS NOT COMPLETE AND MAY BE AMENDED PRIOR TO THE TIME OF SALE. THIS TERM SHEET IS NOT AN OFFER TO SELL THESE SECURITIES AND IT IS NOT A SOLICITATION OF AN OFFER TO BUY THESE SECURITIES IN ANY JURISDICTION WHERE THE OFFER OR SALE IS NOT PERMITTED.
133 of 166
| Structural and Collateral Term Sheet | Benchmark 2021-B24 | |
| 30 Hudson Yards 67 | ||
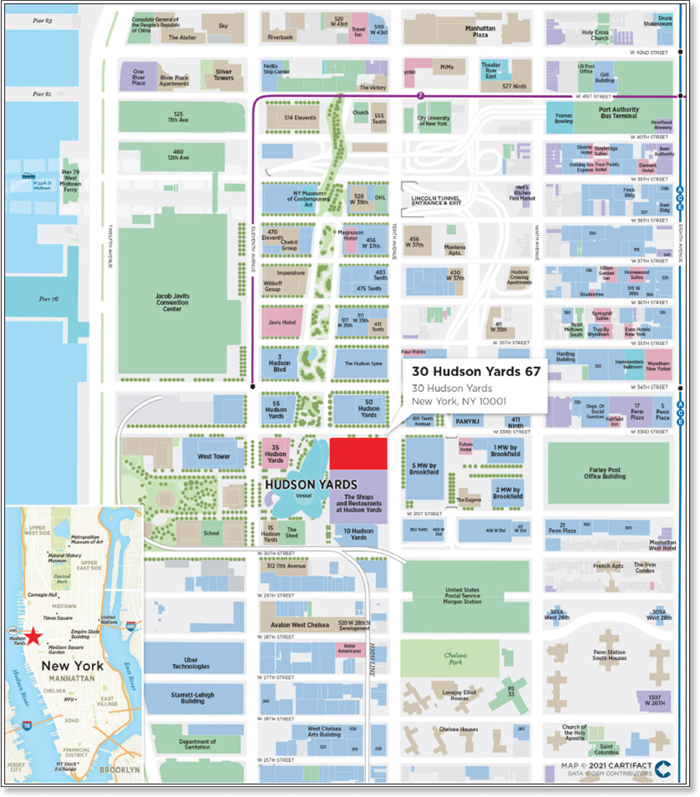
THE INFORMATION IN THIS STRUCTURAL AND COLLATERAL TERM SHEET IS NOT COMPLETE AND MAY BE AMENDED PRIOR TO THE TIME OF SALE. THIS TERM SHEET IS NOT AN OFFER TO SELL THESE SECURITIES AND IT IS NOT A SOLICITATION OF AN OFFER TO BUY THESE SECURITIES IN ANY JURISDICTION WHERE THE OFFER OR SALE IS NOT PERMITTED.
134 of 166
| Structural and Collateral Term Sheet | Benchmark 2021-B24 | |
| 30 Hudson Yards 67 | ||
| Mortgage Loan Information | Property Information | |||
| Mortgage Loan Seller: | JPMCB | Single Asset / Portfolio: | Single Asset | |
| Original Principal Balance(1): | $45,000,000 | Title(3): | Fee | |
| Cut-off Date Principal Balance(1): | $45,000,000 | Property Type - Subtype: | Office – CBD | |
| % of Pool by IPB: | 3.9% | Net Rentable Area (SF): | 44,954 | |
| Loan Purpose: | Refinance | Location: | New York, NY | |
| Borrower: | HY30-67 Owner LP | Year Built / Renovated: | 2019 / N/A | |
| Loan Sponsor: | Massa Nova GmbH | Occupancy: | 100.0% | |
| Interest Rate: | 3.37100% | Occupancy Date: | 3/7/2021 | |
| Note Date: | 2/19/2021 | Number of Tenants: | 1 | |
| Maturity Date: | 3/7/2031 | 2017 NOI(4): | N/A | |
| Interest-only Period: | 120 months | 2018 NOI(4): | N/A | |
| Original Term: | 120 months | 2019 NOI(4): | N/A | |
| Original Amortization: | None | TTM NOI(4): | N/A | |
| Amortization Type: | Interest Only | UW Economic Occupancy(5): | 95.0% | |
| Call Protection(2): | L(24),Def(93),O(3) | UW Revenues: | $6,405,945 | |
| Lockbox / Cash Management: | Hard / Springing | UW Expenses: | $1,700,425 | |
| Additional Debt(1): | Yes | UW NOI(5): | $4,705,520 | |
| Additional Debt Balance(1): | $26,000,000 | UW NCF(5): | $4,651,575 | |
| Additional Debt Type(1): | Pari Passu | Appraised Value / Per SF(5)(6): | $110,000,000 / $2,447 | |
| Appraisal Date: | 2/1/2021 | |||
| Escrows and Reserves(7) | Financial Information(1)(5) | |||||
| Initial | Monthly | Initial Cap | Cut-off Date Loan / SF: | $1,579 | ||
| Taxes: | $143,650 | $47,883 | N/A | Maturity Date Loan / SF: | $1,579 | |
| Insurance: | $97,653 | $7,512 | N/A | Cut-off Date LTV(6): | 64.5% | |
| Replacement Reserves: | $0 | Springing | N/A | Maturity Date LTV(6): | 64.5% | |
| TI/LC: | $0 | $0 | N/A | UW NCF DSCR: | 1.92x | |
| Other: | $4,868,592 | $0 | N/A | UW NOI Debt Yield: | 6.6% | |
| Sources and Uses | ||||||
| Sources | Proceeds | % of Total | Uses | Proceeds | % of Total | |
| Whole Loan | $71,000,000 | 99.8% | Payoff Existing Debt | $64,753,928 | 91.0% | |
| Sponsor Equity | 131,104 | 0.2% | Upfront Reserves | 5,109,895 | 7.2% | |
| Closing Costs | 1,267,282 | 1.8% | ||||
| Total Sources | $71,131,104 | 100.0% | Total Uses | $71,131,104 | 100.0% | |
| (1) | The Cut-off Date Balance of $45,000,000 represents the controlling Note A-1 and is part of the 30 Hudson Yards 67 Whole Loan (as defined below), which is evidenced by two pari passu notes, and has an aggregate outstanding principal balance as of the Cut-off Date of $71,000,000. For additional information, see “The Loan” herein. |
| (2) | The lockout period will be at least 24 payment dates beginning with and including the first payment date of April 7, 2021. The borrower is permitted to (a) defease all, but not part, of the 30 Hudson Yards 67 Whole Loan after two years after the closing date of the securitization that includes the last note to be securitized (the “Permitted Defeasance Date”) or (b) prepay all, but not part, of the Whole Loan on or after April 7, 2025, with the payment of yield maintenance premium if the Permitted Defeasance Date has not yet occurred. The assumed lockout period of 24 payment dates is based on the expected Benchmark 2021-B24 securitization closing date in March 2021. The actual lockout period may be longer. |
| (3) | The 30 Hudson Yards 67 property is comprised of the fee interest in a condominium unit consisting of the 67th floor of the 30 Hudson Yards office tower. To obtain the New York City real estate tax exemption and the payment-in-lieu of taxes (“PILOT”) benefits, the borrower has leased the 30 Hudson Yards 67 property to the NYC Industrial Development Agency, which then subleased the 30 Hudson Yards 67 property back to the borrower pursuant to an agency lease (the “Agency Lease”). The borrower has additionally pledged its leasehold interest under the Agency Lease in connection with the 30 Hudson Yards 67 Whole Loan. See “PILOT/IDA Lease” below for additional information with respect to the PILOT. |
| (4) | The 30 Hudson Yards office tower was recently constructed in 2019 with the sole tenant at the 30 Hudson Yards 67 property, Related (as defined below), having executed its lease in November 2019. As such, no historical operating performance is available for presentation. |
| (5) | While the 30 Hudson Yards 67 Whole Loan was originated after the emergence of the novel coronavirus pandemic and the economic disruption resulting from measures to combat the pandemic, the pandemic is an evolving situation and could impact the 30 Hudson Yards 67 Whole Loan more severely than assumed in the underwriting of the 30 Hudson Yards 67 Whole Loan and could adversely affect the NOI, NCF and occupancy information, as well as the appraised value and the DSCR, LTV and Debt Yield metrics presented above. See “Risk Factors—Special Risks—Coronavirus Pandemic Has Adversely Affected the Global Economy and Will Likely Adversely Affect the Performance of the Mortgage Loans” in the Preliminary Prospectus. |
| (6) | Based on the “Hypothetical Value: Escrow Tenant Improvements” as of February 1, 2021. The appraiser also concluded an “As-Is” appraised value of $105,000,000 as of February 1, 2021, which results in a Cut-off Date LTV and Maturity Date LTV of 67.6%. |
| (7) | For a full description of Escrows and Reserves, please refer to “Escrows and Reserves” below. |
THE INFORMATION IN THIS STRUCTURAL AND COLLATERAL TERM SHEET IS NOT COMPLETE AND MAY BE AMENDED PRIOR TO THE TIME OF SALE. THIS TERM SHEET IS NOT AN OFFER TO SELL THESE SECURITIES AND IT IS NOT A SOLICITATION OF AN OFFER TO BUY THESE SECURITIES IN ANY JURISDICTION WHERE THE OFFER OR SALE IS NOT PERMITTED.
135 of 166
| Structural and Collateral Term Sheet | Benchmark 2021-B24 | |
| 30 Hudson Yards 67 | ||
The Loan. The 30 Hudson Yards 67 mortgage loan (the “30 Hudson Yards 67 Loan”) is part of a whole loan with an aggregate outstanding principal balance as of the Cut-off Date of $71.0 million (the “30 Hudson Yards 67 Whole Loan”), secured by the borrower’s fee interest in a condominium unit consisting of the 44,954 square foot 67th floor of a Class A, newly constructed office building located in New York, New York. The controlling Note A-1, with an outstanding principal balance as of the Cut-off Date of $45.0 million, will be included in the Benchmark 2021-B24 trust. The remaining note will be contributed to one or more securitization trusts. The relationship between the holders of the 30 Hudson Yards 67 Whole Loan is governed by a co-lender agreement as described under “Description of the Mortgage Pool—The Whole Loans—The Serviced Pari Passu Whole Loans” in the Preliminary Prospectus. The 30 Hudson Yards 67 Whole Loan will be serviced under the pooling and servicing agreement for the Benchmark 2021-B24 transaction. The 30 Hudson Yards 67 Whole Loan has a 10-year term and will be interest-only for the term of the loan.
| Whole Loan Summary | ||||
| Note | Original Balance | Cut-off Date Balance | Note Holder | Controlling Piece |
| A-1 | $45,000,000 | $45,000,000 | Benchmark 2021-B24 | Yes |
| A-2 | $26,000,000 | $26,000,000 | JPMCB(1) | No |
| Whole Loan | $71,000,000 | $71,000,000 | ||
| (1) | Expected to be contributed to one or more future securitization transactions. |
The Borrower. The borrower is HY30-67 Owner LP, a Delaware limited partnership. The borrower is structured to be a single purpose entity with two independent directors in its organizational structure. Legal counsel to the Borrowers delivered a non-consolidation opinion in connection with the origination of the 30 Hudson Yards 67 Whole Loan.
The Loan Sponsor. The non-recourse carveout guarantor is Massa Nova GmbH, a Swiss limited liability company. Massa Nova GmbH and the borrower are each owned and controlled by high net worth individuals. The loan sponsor is affiliated with an alternative investment manager focusing on investments in energy and related sectors with over $500.0 million in assets under management as of February 12, 2021.
The Property. The 30 Hudson Yards 67 property is comprised of the 67th floor condominium unit of a newly constructed, 90-story, Class A LEED Gold Certified, trophy office building known as 30 Hudson Yards, located in the Hudson Yards neighborhood of Manhattan, New York. The 30 Hudson Yards 67 property is comprised of 44,954 square feet of office space, which is 100.0% leased to a subsidiary of The Related Companies, L.P. (“Related”), which serves as the guarantor of the lease and also the manager of the building in which the 30 Hudson Yards 67 property is located. Located at the intersection of 33rd Street and 10th Avenue, 30 Hudson Yards is the second-tallest office tower in New York. It features river-to-river panoramic views, outdoor terraces, direct access to premier restaurants and retailers and a direct underground connection to the No. 7 subway station. The 30 Hudson Yards office tower can be accessed along Hudson Boulevard East and 33rd Street, Tenth Avenue and 33rd Street, and through the retail mall at 20 Hudson Yards. The 30 Hudson Yards office tower is anchored by tenants including TimeWarner, KKR, Wells Fargo and Oxford with the broader Hudson Yards development including best in class amenities, including over 18 million square feet of commercial and residential space, more than 100 shops, a collection of restaurants, approximately 4,000 residences, a unique cultural space, 14 acres of public open space, a 750-seat public school and a 212-room Equinox branded luxury hotel.
The 30 Hudson Yards 67 property is 100% leased to a subsidiary of Related through February 2039 with a current in-place rent of $150.00 per square foot and rent escalations in the amount of $10.00 per square foot every five years. The guarantor on the lease is The Related Companies, L.P., which is required to maintain a minimum net worth of $250.0 million during the term of the lease. Related has the option to renew the lease for consecutive periods of five or ten years provided the aggregate of all renewal terms in any combination of such five or ten year renewal terms do not exceed a total of 20 years from the expiration of the initial term. Related develops, acquires, owns, operates, manages, finances, markets, sells and leases real estate properties in the United States and internationally. Founded in 1972 by Stephen M. Ross, Related has grown to amass an over $60 billion real estate portfolio, with 30 million square feet of commercial space and 78,500 residential units. Its portfolio includes luxury residential properties, mixed-use properties, Hudson Yards, retail properties, office properties, hotels and resorts, and trade show and exhibition spaces, as well as housing properties. It is headquartered in New York with additional offices in Boston, Chicago, Las Vegas, Aspen, California, Washington D.C., South Florida, the Middle East and China.
Working with Related (also the developer of the 30 Hudson Yards office tower), the loan sponsor negotiated with Facebook, Inc. (“Facebook”) to sub-lease the entirety of the 67th floor condominium unit through June 2024 as part of a larger multi-floor lease for floors 66 through 71, during which time Facebook’s headquarters at the adjacent 50 Hudson Yards property is to be constructed. To mitigate for the shorter 42-month Facebook lease term, the loan sponsor, at the time of acquisition, entered into the aforementioned lease with Related with Facebook sub-leasing the related space. The Facebook sublease is structured with up to 20 years in renewal options. Facebook’s in-place rent under the sublease agreement mirrors that of the Related prime lease; however, in the event that a sublease renewal should result in a higher rent than that provided for under the Related lease (except with respect to the Facebook sublease), the loan sponsor would share in one-third of the excess rent. Facebook has taken possession of its space at the 30 Hudson Yards 67 property and is currently building out its space. Within the larger 30 Hudson Yards office tower, the Facebook leased space on floors 66 through 71 will be interconnected by an existing internal staircase. Any permitted alterations to the staircase and any required removal of such alterations will be at the sole cost of the tenant.
THE INFORMATION IN THIS STRUCTURAL AND COLLATERAL TERM SHEET IS NOT COMPLETE AND MAY BE AMENDED PRIOR TO THE TIME OF SALE. THIS TERM SHEET IS NOT AN OFFER TO SELL THESE SECURITIES AND IT IS NOT A SOLICITATION OF AN OFFER TO BUY THESE SECURITIES IN ANY JURISDICTION WHERE THE OFFER OR SALE IS NOT PERMITTED.
136 of 166
| Structural and Collateral Term Sheet | Benchmark 2021-B24 | |
| 30 Hudson Yards 67 | ||
COVID-19 Update. As of February 1, 2021, the 30 Hudson Yards 67 property is open and operational. However, Facebook (the subtenant) is currently completing build-out of its space. Related (the prime tenant) commenced paying rent in January 2021 and has not requested any lease modifications. As of February 22, 2021, the 30 Hudson Yards 67 Whole Loan is not subject to any modification or forbearance requests. The first payment date of the 30 Hudson Yards 67 Whole Loan is April 7, 2021. See “Risk Factors—Special Risks—The Coronavirus Pandemic Has Adversely Affected the Global Economy and Will Likely Adversely Affect the Performance of the Mortgage Loans” in the Preliminary Prospectus.
The Market. The 30 Hudson Yards 67 property is located in the Far West Side office submarket of the greater Manhattan office market. The Far West Side office submarket is defined by the appraisal as 30th Street to 41st Street and Hudson River to Ninth Avenue. The Far West Side office submarket has transformed in recent years due to the establishment of Hudson Yards. This development has encompassed a variety of office buildings, residential buildings, retail stores and parks.
Related and Oxford Properties Group, Inc. have driven the development of many of the largest projects in the Hudson Yards neighborhood. Aside from their partnership on the 30 Hudson Yards office tower, the two development firms have partnered in developing at least four other buildings in the neighborhood, in addition to numerous other separate projects in Hudson Yards. In order to sustain these new high-rise office and residential buildings, the Metropolitan Transit Authority undertook a $2.4 billion extension of the MTA’s No. 7 Flushing subway line, which was extended to include an additional subway stop at the corner of 34th Street and Eleventh Avenue, the heart of the Hudson Yards development. The Hudson Yards neighborhood is also accessible via Penn Station, which opened its new Moynihan Train Hall for Penn Station’s Amtrak and Long Island Rail Road (“LIRR”) services on January 1, 2021. The new hall features a 92-foot high glass atrium and aims to relieve commuter congestion and improve train scheduling and capacity. The facility offers direct access to Amtrak, LIRR and six existing subway lines, while also adding eight new train tracks.
Nearby attractions in the area include the Vessel, a 16-story high public display of art comprised of 154 intricately interconnected flights of stairs, with approximately 2,500 individual steps and 80 landings. Additionally, The Shed, which opened in 2019, is New York’s first multi-arts center designed to commission, produce and present all types of performing arts, visual arts and popular culture. The Shed is known for its unique design that features a telescoping outer shell that deploys over the plaza adjoining the building to provide a 120-foot high, temperature-controlled hall. Another attraction is The Shops & Restaurants, a seven-story, 676,229 square foot retail mall that features direct connectivity to the 30 Hudson Yards office tower and is located directly in front of the public space within the Hudson Yards subarea, which includes the Vessel. Other notable attractions include The High Line and the Jacob K Javits Center.
Many office tenants have decided to relocate from Midtown to the Far West Side as a result of the Hudson Yards development, including BlackRock, Wells Fargo Securities, Amazon, Ernst & Young, Time Warner, Pfizer and Facebook. According to the appraisal, increased demand for space has caused asking rents to increase since the beginning of 2017. According to the appraisal, as of the third quarter of 2020, the Manhattan office market consisted of approximately 461.0 million square feet of office space with an overall market availability of 14.1% and average market rents of approximately $78.75 per square foot. According to the appraisal, the Far West Side office submarket has grown to include 12.1 million square feet of commercial real estate as of the third quarter of 2020 with another 9.7 million square feet under construction. The appraisal reported an availability rate of 10.3% and average market rents of $113.14 per square foot as of the third quarter of 2020 for the Far West Side office submarket.
The appraisal identified 14 comparable modified gross office leases ranging in size between 1,638 and 1,463,234 square feet. The comparable leases were executed between June 2019 and December 2021 and located in properties built between 1958 and 2022. Base rents at the comparable properties ranged from $113.00 to $184.35 per square foot with an average rent of approximately $153.61 per square foot. The appraisal’s concluded market rent with respect to the 30 Hudson Yards 67 property is $160.00 per square foot, in-line with underwritten rents.
| Historical and Current Occupancy(1) | |||
| 2018(2) | 2019 | 2020 | Current(3) |
| NAP | 100% | 100% | 100.0% |
| (1) | Historical occupancies are as of December 31 of each respective year. |
| (2) | 2018 Occupancy is not available, as the 30 Hudson Yards development (including the 30 Hudson Yards 67 property) was recently completed in 2019. |
| (3) | Based on the underwritten rent roll dated as of March 7, 2021. |
THE INFORMATION IN THIS STRUCTURAL AND COLLATERAL TERM SHEET IS NOT COMPLETE AND MAY BE AMENDED PRIOR TO THE TIME OF SALE. THIS TERM SHEET IS NOT AN OFFER TO SELL THESE SECURITIES AND IT IS NOT A SOLICITATION OF AN OFFER TO BUY THESE SECURITIES IN ANY JURISDICTION WHERE THE OFFER OR SALE IS NOT PERMITTED.
137 of 166
| Structural and Collateral Term Sheet | Benchmark 2021-B24 | |
| 30 Hudson Yards 67 | ||
| Tenant Summary(1) | ||||||
| Tenant | Ratings Moody’s/Fitch/S&P | Net Rentable Area (SF) | % of NRA | Base Rent PSF | % of Total Base Rent | Lease Expiration Date |
| Related(2) | NR/NR/NR | 44,954 | 100.0% | $150.00 | 100.0% | 2/28/2039 |
| Total Occupied | 44,954 | 100.0% | $150.00 | 100.0% | ||
| Vacant | 0 | 0.0% | ||||
| Total | 44,954 | 100.0% | ||||
| (1) | Based on the underwritten rent roll dated as of March 7, 2021. |
| (2) | Related is the parent entity of the tenant, 50 HY Master Tenant LLC, and also the guarantor under the lease. The tenant subleases the entirety of its space to Facebook through June 2024 at an in-place rent of $150.00 per square foot. |
| Lease Rollover Schedule(1) | |||||||||
| Year | Number of Leases Expiring | Net Rentable Area Expiring | % of NRA Expiring | Base Rent Expiring | % of Base Rent Expiring | Cumulative Net Rentable Area Expiring | Cumulative % of NRA Expiring | Cumulative Base Rent Expiring | Cumulative % of Base Rent Expiring |
| Vacant | NAP | 0 | 0.0% | NAP | NAP | 0 | 0.0% | NAP | NAP |
| 2021 & MTM | 0 | 0 | 0.0% | $0 | 0.0% | 0 | 0.0% | $0 | 0.0% |
| 2022 | 0 | 0 | 0.0% | 0 | 0.0% | 0 | 0.0% | $0 | 0.0% |
| 2023 | 0 | 0 | 0.0% | 0 | 0.0% | 0 | 0.0% | $0 | 0.0% |
| 2024(2) | 0 | 0 | 0.0% | 0 | 0.0% | 0 | 0.0% | $0 | 0.0% |
| 2025 | 0 | 0 | 0.0% | 0 | 0.0% | 0 | 0.0% | $0 | 0.0% |
| 2026 | 0 | 0 | 0.0% | 0 | 0.0% | 0 | 0.0% | $0 | 0.0% |
| 2027 | 0 | 0 | 0.0% | 0 | 0.0% | 0 | 0.0% | $0 | 0.0% |
| 2028 | 0 | 0 | 0.0% | 0 | 0.0% | 0 | 0.0% | $0 | 0.0% |
| 2029 | 0 | 0 | 0.0% | 0 | 0.0% | 0 | 0.0% | $0 | 0.0% |
| 2030 | 0 | 0 | 0.0% | 0 | 0.0% | 0 | 0.0% | $0 | 0.0% |
| 2031 | 0 | 0 | 0.0% | 0 | 0.0% | 0 | 0.0% | $0 | 0.0% |
| 2032 and Thereafter | 1 | 44,954 | 100.0% | 6,743,100 | 100.0% | 44,954 | 100.0% | $6,743,100 | 100.0% |
| Total | 1 | 44,954 | 100.0% | $6,743,100 | 100.0% | ||||
| (1) | Based on the underwritten rent roll dated as of March 7, 2021. |
| (2) | The Facebook sublease expires in June 2024. |
| Underwritten Net Cash Flow(1) | |||
| Underwritten | $ Per Square Foot | %(2) | |
| Base Rent | $6,743,100 | $150.00 | 100.0% |
| Vacant Income | 0 | 0.00 | 0.0% |
| Gross Potential Rent | $6,743,100 | $150.00 | 100.0% |
| Total Reimbursements | 0 | 0.00 | 0.0% |
| Gross Rental Income | $6,743,100 | $150.00 | 100.0% |
| Vacancy / Credit Loss | (337,155) | (7.50) | (5.0)% |
| Effective Gross Income | $6,405,945 | $142.50 | 95.0% |
| Total Expenses | $1,700,425 | $37.83 | 26.5% |
| Net Operating Income | $4,705,520 | $104.67 | 73.5% |
| TI/LC | 44,954 | 1.00 | 0.7% |
| Capital Expenditures | 8,991 | 0.20 | 0.1% |
| Net Cash Flow | $4,651,575 | $103.47 | 72.6% |
| (1) | Historical cash flow information is not available due to the recent construction of the 30 Hudson Yards 67 property. |
| (2) | % column represents percent of Net Rental Income for all revenue lines and represents percent of Effective Gross Income for the remainder of the fields. |
Property Management. The 30 Hudson Yards 67 property is self-managed by the tenant.
Escrows and Reserves. At loan origination, the borrower was required to deposit the following into upfront reserves: (i) $69,299 into a condominium reserve, (ii) $4,799,293 into an outstanding TI/LC reserve, (iii) $143,650 into a tax reserve and (iv) $97,653 into an insurance reserve.
Tax Reserve – On each monthly due date, the borrower is required to deposit into a real estate tax reserve 1/12 of the estimated annual real estate taxes (initially estimated at $47,883 per month).
THE INFORMATION IN THIS STRUCTURAL AND COLLATERAL TERM SHEET IS NOT COMPLETE AND MAY BE AMENDED PRIOR TO THE TIME OF SALE. THIS TERM SHEET IS NOT AN OFFER TO SELL THESE SECURITIES AND IT IS NOT A SOLICITATION OF AN OFFER TO BUY THESE SECURITIES IN ANY JURISDICTION WHERE THE OFFER OR SALE IS NOT PERMITTED.
138 of 166
| Structural and Collateral Term Sheet | Benchmark 2021-B24 | |
| 30 Hudson Yards 67 | ||
Insurance Reserve – On each monthly due date, the borrower is required to deposit into an insurance reserve 1/12 of estimated insurance premiums (initially estimated at $7,512 per month), unless an acceptable blanket policy is in effect. As of origination, no blanket policy was in place.
Replacement Reserve – On each monthly due date during the continuance of a Cash Sweep Period (as defined below), the borrower is required to deposit $750 into a replacement reserve.
Lockbox / Cash Management. The 30 Hudson Yards 67 Whole Loan is structured with a hard lockbox and springing cash management. The borrower was required at loan origination to send tenant direction letters instructing the tenants to deposit all rents and payments into a lender-controlled lockbox account. To the extent no Cash Sweep Period is continuing, all funds in the lockbox account are required to be transferred to or at the direction of the borrower, subject to any minimum balance requirement contained in the related lockbox agreement. Following the occurrence and during the continuance of a Cash Sweep Period, all funds in the lockbox account are required to be swept each business day to a segregated cash management account under the control of the lender and disbursed in accordance with the 30 Hudson Yards 67 Whole Loan documents. To the extent there is a Cash Sweep Period continuing, all excess cash flow after payment of debt service, required reserves and operating expenses are required to be held as additional collateral for the 30 Hudson Yards 67 Whole Loan. The lender has been granted a first priority security interest in the cash management account.
A “Cash Sweep Period” means each period commencing on the occurrence of a Cash Sweep Event (as defined below) and continuing until the earlier of (i) the payment date next occurring following the related Cash Sweep Event Cure (as defined below) or (ii) payment in full of all principal and interest on the 30 Hudson Yards 67 Whole Loan.
A “Cash Sweep Event” means the occurrence of (a) an event of default, (b) any bankruptcy action of the borrower or the property manager, or (c) the date on which the debt service coverage ratio (as calculated in the 30 Hudson Yards 67 Whole Loan documents and based on the trailing three-month basis) is less than 1.60x (a “DSCR Trigger Event”), or (d) a Tenant Trigger Event (as defined below).
A “Cash Sweep Event Cure” means (i) with respect to clause (a) above, the acceptance by the lender of a cure of such event of default; (ii) with respect to clause (b) above solely with respect to the property manager, if the borrower replaces the property manager with a qualified manager under a replacement management agreement within 60 days; (iii) with respect to clause (c) above, the achievement of a DSCR Cure (as defined below); or (iv) with respect to clause (d) above, the achievement of a Tenant Cure Event (as defined below); provided, however, (A) no event of default will have occurred and be continuing under the 30 Hudson Yards 67 Whole Loan documents, (B) a Cash Sweep Event Cure may occur no more than a total of five times in the aggregate during the term of the 30 Hudson Yards 67 Whole Loan (other than a Cash Sweep Event Cure for DSCR Trigger Event or a Tenant Trigger Event, which may be cured an unlimited number of times), (C) the borrower will have paid all of the lender’s reasonable expenses incurred in connection with such Cash Sweep Event Cure including reasonable attorney’s fees and expenses, and (D) the borrower has no right to cure a Cash Sweep Event caused by a bankruptcy action of the borrower.
A “DSCR Cure” means either (a) the debt service coverage ratio based on the trailing three-month period immediately preceding the date of such determination two consecutive quarters is not less than 1.60x, or (b) the borrower posting with the lender cash or an irrevocable letter of credit from an institution reasonably acceptable to the lender in an amount that, if applied to repay the 30 Hudson Yards 67 Whole Loan would cause the outstanding principal amount of the 30 Hudson Yards 67 Whole Loan to satisfy a debt service coverage ratio of 1.60x based upon the trailing three-month period immediately preceding the date of determination for two consecutive quarters (such cash or letter of credit, a “DSCR Trigger Cure Deposit”). Such DSCR Trigger Cure Deposit will be promptly returned to the borrower if the DSCR Cure conditions set forth in (a) above are satisfied without giving any effect to the DSCR Trigger Cure Deposit.
A “Tenant Trigger Event” means (a) if 50 HY Master Tenant LLC, initially, or, subsequently, any other lessees (collectively, “Specified Tenant”) or Related, initially, or, subsequently, guarantors of any other lessees (collectively, “Specified Tenant Guarantor”) commences, or becomes a debtor in, a bankruptcy action, (b) if any Specified Tenant “goes dark”, vacates, or abandons the Property, (c) if any Specified Tenant terminates its lease (the “Specified Tenant Lease”) or gives notice or publicly announces it intends to terminate its Specified Tenant Lease or not to renew its Specified Tenant Lease, or (d) if any Specified Tenant gives notice to the borrower that it intends to “go dark”, vacate, or abandon at the 30 Hudson Yards 67 property or that it intends to terminate its Specified Tenant Lease or not to renew its Specified Tenant Lease; provided, however, 50 HY Master Tenant LLC will not be considered to have “gone dark”, vacated, or abandoned the 30 Hudson Yards 67 property to the extent that (A) the 30 Hudson Yards 67 property has been subleased to and is occupied by Facebook or a replacement subtenant in accordance with the terms of the 30 Hudson Yards 67 Whole Loan documents, or (B)(I) 50 HY Master Tenant LLC continues to pay all rent due under its lease, and (II) 50 HY Master Tenant LLC is actively marketing the 30 Hudson Yards 67 property to prospective subtenants or 50 HY Master Tenant LLC or its affiliate is in actual occupancy of the 30 Hudson Yards 67 property.
A “Tenant Cure Event” means the replacement of the applicable Specified Tenant pursuant to one or more leases for the entire space demised pursuant to the Specified Tenant lease (the “Specified Tenant Space”) entered into in accordance with the 30 Hudson Yards 67 Whole Loan documents, and such replacement tenant(s) being in occupancy of the Specified Tenant Space and paying full contractual rent without right of offset or free rent credit (unless such free rent is deposited with the lender) and without any further landlord obligations for tenant improvement work, tenant allowance or leasing commissions (unless an amount sufficient to cover such obligations is deposited with the lender) and delivery of a tenant estoppel acceptable to the lender.
THE INFORMATION IN THIS STRUCTURAL AND COLLATERAL TERM SHEET IS NOT COMPLETE AND MAY BE AMENDED PRIOR TO THE TIME OF SALE. THIS TERM SHEET IS NOT AN OFFER TO SELL THESE SECURITIES AND IT IS NOT A SOLICITATION OF AN OFFER TO BUY THESE SECURITIES IN ANY JURISDICTION WHERE THE OFFER OR SALE IS NOT PERMITTED.
139 of 166
| Structural and Collateral Term Sheet | Benchmark 2021-B24 | |
| 30 Hudson Yards 67 | ||
Current Mezzanine or Subordinate Indebtedness. None.
Future Mezzanine or Secured Subordinate Indebtedness Permitted. None.
Partial Release. None.
Condominium Structure. The 30 Hudson Yard 67 property is subject to a condominium declaration that governs eight condominium units and is entitled to approximately 1.6% of voting rights. The borrower does not have control of the condominium board or any blocking right with respect to for certain major decisions, such as unit removals and use of proceeds in connection with casualty or condemnation proceedings. However, the condominium policy prohibits implementation of any policies that would have disproportionately negative impacts any unit owners. In addition, the borrower has provided a non-recourse carveout for any losses associated with, among other things, the withdrawal of the unit comprising the 30 Hudson Yard 67 property from the condominium regime or termination of the condominium regime. Please see “Description of the Mortgage Pool—Mortgage Pool Characteristics—Condominium and Other Shared Interests” in the Preliminary Prospectus for additional information.
PILOT/IDA Leases. The borrower owns the fee interest in the 30 Hudson Yard 67 property. However, to obtain the New York City real estate tax exemption and the payment-in-lieu of taxes benefits, the borrower has leased the 30 Hudson Yard 67 property to the New York City Industrial Development Agency, which has subleased the 30 Hudson Yard 67 property back to the borrower under an agency lease, which obligates the borrower to make PILOT payments. In addition to its fee interest in the 30 Hudson Yards 67 property, the borrower has also pledged all of its rights under the Agency Lease to secure the 30 Hudson Yards 67 property. The PILOT commenced in the 2019/20 tax year and is scheduled to expire after the tax year 2038/39. During the term of the 30 Hudson Yard 67 Loan, the amount of annual tax savings from PILOT ranges from $362,437, representing approximately 40% tax savings (2020/21 tax year), to $916,241, representing approximately 54% tax savings (2030/31 tax year). The real estate taxes were underwritten based on the abated tax amount.
THE INFORMATION IN THIS STRUCTURAL AND COLLATERAL TERM SHEET IS NOT COMPLETE AND MAY BE AMENDED PRIOR TO THE TIME OF SALE. THIS TERM SHEET IS NOT AN OFFER TO SELL THESE SECURITIES AND IT IS NOT A SOLICITATION OF AN OFFER TO BUY THESE SECURITIES IN ANY JURISDICTION WHERE THE OFFER OR SALE IS NOT PERMITTED.
140 of 166
(THIS PAGE INTENTIONALLY LEFT BLANK)
THE INFORMATION IN THIS STRUCTURAL AND COLLATERAL TERM SHEET IS NOT COMPLETE AND MAY BE AMENDED PRIOR TO THE TIME OF SALE. THIS TERM SHEET IS NOT AN OFFER TO SELL THESE SECURITIES AND IT IS NOT A SOLICITATION OF AN OFFER TO BUY THESE SECURITIES IN ANY JURISDICTION WHERE THE OFFER OR SALE IS NOT PERMITTED.
141 of 166
| Structural and Collateral Term Sheet | Benchmark 2021-B24 | |
| Dawson Marketplace | ||
| Mortgage Loan Information | Property Information | |||
| Mortgage Loan Seller: | GSMC | Single Asset / Portfolio: | Single Asset | |
| Original Principal Balance: | $43,800,000 | Title: | Fee | |
| Cut-off Date Principal Balance: | $43,800,000 | Property Type - Subtype: | Retail - Anchored | |
| % of Pool by IPB: | 3.8% | Net Rentable Area (SF): | 352,418 | |
| Loan Purpose: | Recapitalization | Location: | Dawsonville, GA | |
| Borrower: | Rainier Hendon Dawson | Year Built / Renovated: | 2017-2020 / N/A | |
| Marketplace Acquisitions I, LLC | Occupancy: | 97.3% | ||
| Loan Sponsor: | J. Kenneth Dunn | Number of Tenants: | 27 | |
| Interest Rate: | 3.55000% | Occupancy Date: | 12/31/2020 | |
| Note Date: | 2/3/2020 | 2017 NOI: | N/A | |
| Maturity Date: | 2/6/2030 | 2018 NOI: | $3,473,525 | |
| Interest-only Period: | 120 months | 2019 NOI: | $3,965,361 | |
| Original Term: | 120 months | TTM NOI (as of 12/2020): | $3,671,012 | |
| Original Amortization: | None | UW Economic Occupancy(2): | 94.5% | |
| Amortization Type: | Interest Only | UW Revenues: | $5,493,094 | |
| Call Protection: | L(37),Def(79),O(4) | UW Expenses: | $1,083,965 | |
| Lockbox / Cash Management: | Springing / Springing | UW NOI(2)(3): | $4,409,129 | |
| Additional Debt: | N/A | UW NCF(2)(3): | $4,061,498 | |
| Additional Debt Balance: | N/A | Appraised Value / Per SF(2): | $68,000,000 / $193 | |
| Additional Debt Type: | N/A | Appraisal Date: | 11/17/2019 | |
| Escrows and Reserves | Financial Information(2) | |||||||
| Initial | Monthly | Initial Cap | Cut-off Date Loan / SF: | $124 | ||||
| Taxes: | $139,820 | $34,955 | N/A | Maturity Date Loan / SF: | $124 | |||
| Insurance: | $0 | Springing | N/A | Cut-off Date LTV(4): | 55.4% | |||
| Replacement Reserves: | $0 | $2,944 | N/A | Maturity Date LTV: | 64.4% | |||
| TI/LC: | $0 | $11,776 | $706,540 | UW NCF DSCR: | 2.58x | |||
| Other(1): | $6,475,815 | $0 | N/A | UW NOI Debt Yield: | 10.1% | |||
| Sources and Uses | ||||||
| Sources | Proceeds | % of Total | Uses | Proceeds | % of Total | |
| Mortgage Loan | $43,800,000 | 59.5% | Payoff Existing Debt | $66,420,218 | 90.2% | |
| Sponsor Equity | 29,828,476 | 40.5 | Upfront Reserves | 6,615,635 | 9.0 | |
| Closing Costs | 592,623 | 0.8 | ||||
| Total Sources | $73,628,476 | 100.0% | Total Uses | $73,628,476 | 100.0% | |
| (1) | Other reserves are comprised of (i) approximately $6,339,944 for tenant improvements, leasing commissions, free rent, gap rent and reimbursements for One Life Fitness (35,000 square feet), (ii) approximately $52,010 for tenant improvements and leasing commissions for Atlanta Bread Company (2,906 square feet), (iii) approximately $36,488 for tenant improvements for Charles Schwab (1,429 square feet), (iv) approximately $26,844 for common area maintenance reconciliations for Marshalls (23,500 square feet), (v) approximately $14,142 for common area maintenance reconciliations for HomeGoods (20,000 square feet), (vi) approximately $5,377 for free rent for Torrid (3,218 square feet), and (vii) approximately $1,010 for property damage repairs for Ross Dress for Less (22,000 square feet). A portion of the One Life Fitness reserve ($5,292,704.73) will be released upon receipt of evidence that One Life Fitness has completed various construction obligations set forth in the One Life Fitness lease inclusive of the issuance of a certificate of occupancy for the related leased premises. The remaining balance in the reserve, approximately $802,428, will be disbursed to the borrower upon the satisfaction of the prior conditions and the tenant (i) has taken occupancy of its leased premises, is open for business and is paying unabated rent in accordance with its lease and (ii) provides an acceptable estoppel. One Life Fitness is anticipated to take occupancy of its space by the first quarter of 2022. We cannot assure you that One Life Fitness will take occupancy as expected or at all. |
| (2) | All NOI, NCF and occupancy information, as well as the appraised value, were determined prior to the emergence of the novel coronavirus pandemic, and the economic disruption resulting from measures to combat the pandemic, and all DSCR, LTV and Debt Yield metrics were calculated, and the Dawson Marketplace Loan (as defined below) was underwritten, based on such prior information. See “Risk Factors—Risks Related to Market Conditions and Other External Factors—The Coronavirus Pandemic Has Adversely Affected the Global Economy and Will Likely Adversely Affect the Performance of the Mortgage Loans” in the Preliminary Prospectus. |
| (3) | The increase in UW NOI is a result of contractual rent steps through March 31, 2022 for investment rated tenants. |
| (4) | Cut-off Date LTV Ratio is calculated based on the Dawson Marketplace Loan Cut-off Date Balance, net of the earn-out reserve of approximately $6,095,133. The Dawson Marketplace Loan Cut-off Date LTV Ratio, without netting the earn-out reserve balance, would be 64.4%. |
The Loan. The Dawson Marketplace loan (the “Dawson Marketplace Loan”) is secured by a first mortgage lien on the borrower’s fee interest in a 352,418 square foot anchored retail center located in Dawsonville, Georgia (the “Dawson Marketplace Property”). The Dawson Marketplace loan accrues interest at an interest rate of 3.55000% per annum, had an original term of 120 months, has a remaining term of 107 months as of the Cut-off Date, and is interest only for its entire term.
THE INFORMATION IN THIS STRUCTURAL AND COLLATERAL TERM SHEET IS NOT COMPLETE AND MAY BE AMENDED PRIOR TO THE TIME OF SALE. THIS TERM SHEET IS NOT AN OFFER TO SELL THESE SECURITIES AND IT IS NOT A SOLICITATION OF AN OFFER TO BUY THESE SECURITIES IN ANY JURISDICTION WHERE THE OFFER OR SALE IS NOT PERMITTED.
142 of 166
| Structural and Collateral Term Sheet | Benchmark 2021-B24 | |
| Dawson Marketplace | ||
The Borrower. The borrowing entity for the Dawson Marketplace Loan is Rainier Hendon Dawson Marketplace Acquisitions I, LLC, a Delaware limited liability company and special purpose entity, with at least two independent directors in its organizational structure.
The Loan Sponsor. The loan sponsor and non-recourse carveout guarantor for the Dawson Marketplace Loan, J. Kenneth Dunn, is a principal and founder of The Rainier Companies. In February 2020, Rainier and Emira (as defined below) acquired a majority interest in the Dawson Marketplace Property, while Hendon Properties (“Hendon”), the developer of the Dawson Marketplace Property, maintained a minority interest as detailed below:
Rainier (25.7% Managing Member) (“Rainier”) is a diversified real estate company based in Dallas, TX. Founded in 2003, the company specializes in value-add equity investing, preferred equity and mezzanine debt investments, and third-party asset management. To date, Rainier has closed over $2.0 billion in transactions and provides asset management services for more than $1.60 billion of commercial real estate.
Emira (49.6% Limited Partner) (“Emira”) is a diversified REIT with a portfolio of predominantly South African assets, and a growing component of properties located in the United States. The company listed on the Johannesburg Stock Exchange in November 2003 in the REIT sector. Emira’s property portfolio spans multiple sectors with a primary focus in office, retail, and industrial investments. As of June 2020, the company owned a total of 79 properties and plans to continue acquiring new assets.
Hendon (24.7% Member) is based in Atlanta and developed the Dawson Marketplace Property beginning in 2016. Hendon is a full-service development, brokerage, and management company specializing in retail investments. The company currently manages 19 properties with a primary focus in the Atlanta market. Projects range from 10,000 square foot build-to-suits to approximately 1.1 million square foot malls. The company has worked with tenants including Target, Walmart, Sam’s Club, Home Depot, Lowe’s, Kohl’s, Marshall’s, Best Buy, Dick’s Sporting Goods, and LA Fitness.
The Property. The Dawson Marketplace Property is a 352,418 square foot retail center located in Dawsonville, Georgia. The Dawson Marketplace Property was built between 2017 and 2020 on a 39.06-acre site and provides 1,778 parking spaces at a ratio of 5.05 spaces per 1,000 square feet of net rentable area. The Dawson Marketplace Property consists of three parcels and is shadow anchored by a Kroger grocery store, which is not included in the Dawson Marketplace Property.
The largest tenant at the Dawson Marketplace Property, Hobby Lobby, occupies 55,000 square feet (15.6% of net rentable area) and has a lease expiration date of February 29, 2032. Hobby Lobby has a base rent of $8.25 per square foot. The second largest tenant at the Dawson Marketplace Property, Burlington, occupies 40,232 square feet (11.4% of net rentable area) and has a lease expiration date of February 29, 2028. Burlington has a base rent of $11.50 per square foot. The third largest tenant, One Life Fitness, is expected to occupy 35,000 square feet (9.9% of net rentable area) and has a lease expiration date of December 31, 2037. One Life Fitness has a base rent of $18.00 per square foot.
COVID-19 Update. As of January 13, 2021 the Dawson Marketplace Property is open. Approximately 96.0% of tenants by square feet and 96.2% by underwritten base rent made their December 2020 rent payments and approximately 99.2% of tenants by square feet and 96.7% by underwritten base rent made their January 2021 rent payments. As of February 6, 2021 there has been an amendment to the loan agreement entered in January 2021 to restructure the reserve amounts held for One Life Fitness, implemented as a direct result of One Life Fitness delaying its occupancy at the property due to COVID-19.
The Market. The Dawson Marketplace Property is located in Dawsonville, Georgia within the Dawson County submarket. According to the appraisal, the Dawson County submarket reported a 5.4% vacancy rate in the third quarter of 2019, 0.5% higher than the overall Atlanta market vacancy rate of 4.9%. However, Dawson County vacancy rates have decreased since reporting a 6.9% vacancy rate in the fourth quarter of 2018. As of the third quarter of 2019, the Dawson County submarket had a total retail inventory of 2,374,126 square feet with 129,209 square feet remaining vacant. Average asking rents in the Dawson County submarket have increased by approximately 7.9% from the fourth quarter of 2018 ($13.37 per square foot) to the third quarter of 2019 ($14.42 per square foot).
| Historical and Current Occupancy(1) | ||
| 2018 | 2019 | Current(2) |
| 85.1% | 95.0% | 97.3% |
| (1) | Historical occupancies are as of December 31 of each respective year. |
| (2) | Current Occupancy is as of December 31, 2020. |
THE INFORMATION IN THIS STRUCTURAL AND COLLATERAL TERM SHEET IS NOT COMPLETE AND MAY BE AMENDED PRIOR TO THE TIME OF SALE. THIS TERM SHEET IS NOT AN OFFER TO SELL THESE SECURITIES AND IT IS NOT A SOLICITATION OF AN OFFER TO BUY THESE SECURITIES IN ANY JURISDICTION WHERE THE OFFER OR SALE IS NOT PERMITTED.
143 of 166
| Structural and Collateral Term Sheet | Benchmark 2021-B24 | |
| Dawson Marketplace | ||
| Tenant Summary(1) | ||||||
| Tenant | Ratings(2) Moody’s/Fitch/S&P | Net Rentable Area (SF) | % of Total NRA | Base Rent PSF | % of Total Base Rent | Lease Expiration Date |
| One Life Fitness(3) | NR / NR / NR | 35,000 | 9.9% | $18.00 | 13.3% | 12/31/2037 |
| Restoration Hardware Outlet | NR / NR / NR | 30,000 | 8.5 | $16.00 | 10.1 | 1/31/2028 |
| Burlington | NR / NR / BB | 40,232 | 11.4 | $11.50 | 9.7 | 2/29/2028 |
| Hobby Lobby | NR / NR / NR | 55,000 | 15.6 | $8.25 | 9.5 | 2/29/2032 |
| Marshalls | A2 / NR / A | 23,500 | 6.7 | $9.50 | 4.7 | 3/31/2027 |
| Ross Dress for Less | A2 / NR / BBB+ | 22,000 | 6.2 | $9.50 | 4.4 | 1/31/2028 |
| Petco | NR / NR / NR | 12,500 | 3.5 | $17.50 | 4.6 | 1/31/2028 |
| Beall’s | NR / NR / NR | 22,000 | 6.2 | $8.50 | 3.9 | 1/31/2028 |
| Ulta | NR / NR / NR | 10,003 | 2.8 | $18.25 | 3.8 | 6/30/2027 |
| HomeGoods | A2 / NR / A | 20,000 | 5.7 | $8.00 | 3.4 | 4/30/2028 |
| Subtotal / Weighted Average | 270,235 | 76.7% | $11.87 | 67.5% | ||
| Remaining Tenants | 72,527 | 20.6 x | $21.34 | 32.5% | ||
| Total Occupied | 342,762 | 97.3% | $13.87 | 100.00% | ||
| Vacant | 9,656 | 2.7 | ||||
| Total / Weighted Average | 352,418 | 100.0% | ||||
| (1) | Based on the underwritten rent roll dated December 31, 2020. |
| (2) | Ratings provided are for the parent company of the entity listed in the “Tenant” field whether or not the parent company guarantees the lease. |
| (3) | One Life Fitness is anticipated to take occupancy of its space by the first quarter of 2022. We cannot assure you that One Life Fitness will take occupancy as expected or at all. |
| Lease Rollover Schedule(1)(2) | |||||||||
| Year | Number of Leases Expiring | Net Rentable Area Expiring | % of NRA Expiring | Base Rent Expiring | % of Base Rent Expiring | Cumulative Net Rentable Area Expiring | Cumulative % of NRA Expiring | Cumulative Base Rent Expiring | Cumulative % of Base Rent Expiring |
| Vacant | NAP | 9,656 | 2.7% | NAP | NAP | $9,656 | 2.7% | NAP | NAP |
| 2021 & MTM | 0 | 0 | 0.0 | $0 | 0.0% | $9,656 | 2.7% | $0 | 0.0% |
| 2022 | 2 | 7,764 | 2.2 | 153,252 | 3.2 | $17,420 | 4.9% | $153,252 | 3.2% |
| 2023 | 0 | 0 | 0.0 | 0 | 0.0 | $17,420 | 4.9% | $153,252 | 3.2% |
| 2024 | 1 | 1,642 | 0.5 | 42,282 | 0.9 | $19,062 | 5.4% | $195,534 | 4.1% |
| 2025 | 1 | 10,918 | 3.1 | 136,475 | 2.9 | $29,980 | 8.5% | $332,009 | 7.0% |
| 2026 | 0 | 0 | 0.0 | 0 | 0.0 | $29,980 | 8.5% | $332,009 | 7.0% |
| 2027 | 8 | 59,049 | 16.8 | 1,008,200 | 21.2 | $89,029 | 25.3% | $1,340,209 | 28.2% |
| 2028 | 9 | 156,614 | 44.4 | 2,030,020 | 42.7 | $245,643 | 69.7% | $3,370,229 | 70.9% |
| 2029 | 3 | 15,335 | 4.4 | 260,196 | 5.5 | $260,978 | 74.1% | $3,630,424 | 76.4% |
| 2030 | 0 | 0 | 0.0 | 0 | 0.0 | $260,978 | 74.1% | $3,630,424 | 76.4% |
| 2031 | 0 | 0 | 0.0 | 0 | 0.0 | $260,978 | 74.1% | $3,630,424 | 76.4% |
| 2032 & Beyond | 3 | 91,440 | 25.9 | 1,124,070 | 23.6 | $352,418 | 100.0% | $4,754,494 | 100.0% |
| Total | 27 | 352,418 | 100.0% | $ 4,754,494 | 100.0 % | ||||
| (1) | Based on the underwritten rent roll dated December 31, 2020. |
| (2) | Certain tenants may hold termination or contraction options (which may become exercisable prior to the originally stated expiration date of the tenant lease) that are not considered in the above Lease Rollover Schedule. |
THE INFORMATION IN THIS STRUCTURAL AND COLLATERAL TERM SHEET IS NOT COMPLETE AND MAY BE AMENDED PRIOR TO THE TIME OF SALE. THIS TERM SHEET IS NOT AN OFFER TO SELL THESE SECURITIES AND IT IS NOT A SOLICITATION OF AN OFFER TO BUY THESE SECURITIES IN ANY JURISDICTION WHERE THE OFFER OR SALE IS NOT PERMITTED.
144 of 166
| Structural and Collateral Term Sheet | Benchmark 2021-B24 | |
| Dawson Marketplace | ||
| Operating History and Underwritten Net Cash Flow | ||||||||||||||||||
| 2018 | 2019 | 2020 | Underwritten | Per Square Foot | %(1) | |||||||||||||
| Base Rent(2) | $3,767,865 | $4,282,011 | $4,009,407 | $4,754,494 | $13.49 | 81.8 | % | |||||||||||
| Vacant Income | 0 | 0 | 0 | 321,407 | 0.91 | 5.5 | ||||||||||||
| Gross Potential Rent | $3,767,865 | $4,282,011 | $4,009,407 | $5,075,901 | $14.40 | 87.3 | % | |||||||||||
| Total Reimbursements | 531,698 | 631,761 | 629,160 | 734,892 | 2.09 | 12.6 | ||||||||||||
| Other Income | 13,497 | 9,226 | 2,918 | 3,708 | 0.01 | 0.1 | ||||||||||||
| Net Rental Income | $4,313,060 | $4,922,998 | $4,641,486 | $5,814,501 | $16.50 | 100.0 | % | |||||||||||
| (Vacancy / Credit Loss) | 0 | 0 | ($53,753 | ) | ($321,407 | ) | ($0.91 | ) | (5.9) | |||||||||
| Effective Gross Income | $4,313,060 | $4,922,998 | $4,587,733 | $5,493,094 | $15.59 | 100.0 | % | |||||||||||
| Total Expenses | $839,535 | $957,637 | $916,721 | $1,083,965 | $3.08 | 19.7 | % | |||||||||||
| Net Operating Income | $3,473,525 | $3,965,361 | $3,671,012 | $4,409,129 | $12.51 | 80.3 | % | |||||||||||
| Total TI/LC, CapEx | 0 | 0 | 0 | 347,632 | 0.99 | 6.3 | ||||||||||||
| Net Cash Flow | $3,473,525 | $3,965,361 | $3,671,012 | $4,061,498 | $11.52 | 73.9 | % | |||||||||||
| (1) | % column represents percent of Net Rental Income for all revenue lines and represents percent of Effective Gross Income for the remainder of the fields. |
| (2) | Underwritten Base Rent is inclusive of contractual rent steps through March 31, 2022. |
Property Management. The Dawson Marketplace Property is managed by Rainer Realty Management, LLC, an affiliate of the borrower.
THE INFORMATION IN THIS STRUCTURAL AND COLLATERAL TERM SHEET IS NOT COMPLETE AND MAY BE AMENDED PRIOR TO THE TIME OF SALE. THIS TERM SHEET IS NOT AN OFFER TO SELL THESE SECURITIES AND IT IS NOT A SOLICITATION OF AN OFFER TO BUY THESE SECURITIES IN ANY JURISDICTION WHERE THE OFFER OR SALE IS NOT PERMITTED.
145 of 166
| Structural and Collateral Term Sheet | Benchmark 2021-B24 | |
| 8670 Wilshire | ||
| Mortgage Loan Information | Property Information | |||
| Mortgage Loan Seller: | GACC | Single Asset / Portfolio: | Single Asset | |
| Original Principal Balance: | $42,500,000 | Title: | Fee | |
| Cut-off Date Principal Balance: | $42,500,000 | Property Type - Subtype: | Office – Medical | |
| % of Pool by IPB: | 3.7% | Net Rentable Area (SF): | 50,520 | |
| Loan Purpose: | Refinance | Location: | Beverly Hills, CA | |
| Borrower: | Specialty Healthcare Properties Subsidiary, LLC | Year Built / Renovated: | 1986 / 2002 | |
| Loan Sponsors: | Andrew Brooks, Randhir Tuli | Occupancy: | 100.0% | |
| Interest Rate: | 3.78400% | Occupancy Date: | 2/21/2021 | |
| Note Date: | 2/19/2021 | Number of Tenants: | 4 | |
| Maturity Date: | 3/6/2031 | 2017 NOI: | $2,644,625 | |
| Interest-only Period: | 120 months | 2018 NOI: | $2,634,001 | |
| Original Term: | 120 months | 2019 NOI: | $2,850,658 | |
| Original Amortization: | None | TTM NOI (as of 12/2020)(1): | $2,825,663 | |
| Amortization Type: | Interest Only | UW Economic Occupancy(4): | 95.0% | |
| Call Protection: | L(24),Def(91),O(5) | UW Revenues: | $4,407,286 | |
| Lockbox / Cash Management: | Hard / Springing | UW Expenses: | $1,104,428 | |
| Additional Debt: | N/A | UW NOI(1)(4): | $3,302,858 | |
| Additional Debt Balance: | N/A | UW NCF(4): | $3,242,234 | |
| Additional Debt Type: | N/A | Appraised Value / Per SF(4): | $70,400,000 / $1,394 | |
| Appraisal Date: | 1/4/2021 | |||
| Escrows and Reserves | Financial Information(4) | ||||||||
| Initial | Monthly | Initial Cap | Cut-off Date Loan / SF: | $841 | |||||
| Taxes: | $0 | $17,561 | N/A | Maturity Date Loan / SF: | $841 | ||||
| Insurance: | $39,366 | $4,374 | N/A | Cut-off Date LTV: | 60.4% | ||||
| Replacement Reserves: | $0 | $842 | $200,000 | Maturity Date LTV: | 60.4% | ||||
| TI/LC: | $0 | Springing | N/A | UW NCF DSCR: | 1.99x | ||||
| Other(2)(3): | $617,517 | $0 | N/A | UW NOI Debt Yield: | 7.8% | ||||
| Sources and Uses | |||||||||
| Sources | Proceeds | % of Total | Uses | Proceeds | % of Total | ||||
| Loan Amount | $42,500,000 | 100.0% | Payoff Existing Debt | $28,333,019 | 66.7% | ||||
| Return of Equity | 12,772,942 | 30.1% | |||||||
| Closing Costs | 737,156 | 1.7% | |||||||
| Upfront Reserves | 656,883 | 1.5% | |||||||
| Total Sources | $42,500,000 | 100.0% | Total Uses | $42,500,000 | 100.0% | ||||
| (1) | The increase in from TTM NOI to UW NOI is attributed to (i) $202,047 of rent steps through January 2022 and straight line rent for investment grade tenants and (ii) the second largest tenant, Specialty Surgical Center of Beverly Hills, L.P., executing a 10-year lease renewal in April 2020 which included two months of free rent in August and September 2020 and increased its rental rate 20.7% from a weighted average $71.78 PSF to $86.64 PSF. |
| (2) | The Other Reserve represents approximately (i) $373,771 deposited into a rent reserve, which is the equivalent to one year of base rent for two tenants (Screening Services Group, LLC and Alexander Café LLC) and (ii) $243,746 deposited into a rent abatement reserve related to Specialty Surgical Center’s free rent according to its lease. |
| (3) | The 8670 Wilshire Loan (as defined below) is structured with a lease sweep for Cedars-Sinai Medical Center Tenant that will trigger upon, among other things set forth in the 8670 Wilshire Loan documents, the date that is 12 months prior to Cedars-Sinai Medical Center Tenant’s lease expiration. |
| (4) | While the 8670 Wilshire Loan was originated after the emergence of the novel coronavirus pandemic and the economic disruption resulting from measures to combat the pandemic, the pandemic is an evolving situation and could impact the 8670 Wilshire Loan more severely than assumed in the underwriting of the 8670 Wilshire Loan and could adversely affect the NOI, NCF and occupancy information, as well as the appraised value and the DSCR, LTV and Debt Yield metrics presented above. See “Risk Factors— Risks Related to Market Conditions and Other External Factors—Coronavirus Pandemic Has Adversely Affected the Global Economy and Will Likely Adversely Affect the Performance of the Mortgage Loans” in the Preliminary Prospectus. |
THE INFORMATION IN THIS STRUCTURAL AND COLLATERAL TERM SHEET IS NOT COMPLETE AND MAY BE AMENDED PRIOR TO THE TIME OF SALE. THIS TERM SHEET IS NOT AN OFFER TO SELL THESE SECURITIES AND IT IS NOT A SOLICITATION OF AN OFFER TO BUY THESE SECURITIES IN ANY JURISDICTION WHERE THE OFFER OR SALE IS NOT PERMITTED.
146 of 166
| Structural and Collateral Term Sheet | Benchmark 2021-B24 | |
| 8670 Wilshire | ||
The Loan. The 8670 Wilshire mortgage loan is a $42.5 million loan (the “8670 Wilshire Loan”) secured by the borrower’s fee interest in a 50,520 square foot mixed use building comprised of medical office and office space in Beverly Hills, California (the “8670 Wilshire Property”). The 8670 Wilshire Loan has a ten-year term and will be interest-only for its entire term. The 8670 Wilshire Loan was originated by DBR Investments Co. Limited. on February 19, 2021.
The Borrower. The borrower is Specialty Healthcare Properties Subsidiary, LLC, a Delaware limited liability company, structured to be a single purpose entity, with the borrower having one independent director in its organizational structure.
The Loan Sponsors. The loan sponsors and non-recourse carveout guarantors, on a joint and several basis, are Andrew Brooks and Randhir Tuli.
Andrew Brooks, M.D. (“Dr. Brooks”) is the Co-founder, and Chief Medical Officer of TigerConnect, a Santa Monica, California based secure messaging platform for business information in the healthcare industry, providing fully encrypted, end-to-end security. Prior to founding TigerConnect, Dr. Brooks founded Cardo Medical, Inc. in May 2007 which was acquired by Arthrex in 2011. Dr. Brooks has been in the private practice of orthopedic surgery since 1994, specializing in sports medicine, arthroscopy, and joint reconstruction. Before founding Cardo Medical, he founded Specialty Surgical Center and sold it to Symbion (NASDAQ: SMBI) in 2005. Dr. Brooks is board-certified by the American Board of Orthopedic Surgery and is a Fellow of the American Academy of Orthopedic Surgeons. Dr. Brooks’ real estate experience primarily includes the owning and developing of medical office buildings in Southern California, with a real estate portfolio of four medical office properties totaling approximately 106,000 square feet.
Randhir Tuli is the Chairman and Chief Executive Officer of MD Synergy Solutions, a Calabasas, California based technology company providing integrated solutions to medical offices by leveraging its cloud based technologies. Mr. Tuli is also Founder and Chief Executive Officer of Althea Care, a technology company offering cloud based electronic health record technology on the IOS platform to medical offices.
The Property. The 8670 Wilshire Property is a three-story, 50,520 square foot, Class B mixed use building comprised of medical office and office space located in Beverly Hills, California. Situated on a 0.56-acre site, the 8670 Wilshire Property was originally constructed in 1986 as a traditional office building and was acquired vacant by the loan sponsors in 2002. Subsequent to their acquisition, the loan sponsors completed an approximately $2.0 million renovation, converting the 8670 Wilshire Property to medical office use. As a result of the 2002 renovation, the 8670 Wilshire Property can accommodate light surgical procedures, an imaging center and patient screening rooms similar to a hospital. In addition, the 8670 Wilshire Property features a ground floor café, two screening rooms located on the first floor, and a three-level subterranean parking garage (200 spaces). Since the initial renovation, the loan sponsor has reportedly invested an additional approximately $3.2 million in tenant improvement and leasing commissions and capital improvement projects.
The 8670 Wilshire Property is located within an immediate area that includes two medical centers within two miles of the 8670 Wilshire Property: the Cedars-Sinai Medical Center (0.8 miles) and Olympia Medical Center (1.4 miles). Cedars-Sinai Medical Center is an 886-bed hospital that was founded in 1902, which focuses on biomedical research and technological advancement. Olympia Medical Center, which came under the ownership of Alexto Healthcare in 2014, has 204 beds and provides 24-hour emergency care, comprehensive inpatient and outpatient services and diagnostic imaging. Additional major hospitals within approximately five miles include Southern California Hospital at Culver City (3.5 miles), Ronald Reagan UCLA Medical Center (4.1 miles), and Southern California Hospital in Hollywood (5.1 miles). Ronald Regan UCLA Medical Center, a 520-bed hospital, is situated within the campus of University of California, Los Angeles. Furthermore, in February 2011, the city of Beverly Hills imposed a permanent moratorium on new medical office development and a cap on any further expansion of medical office space.
As of February 21, 2021, the 8670 Wilshire Property is 100.0% leased to four tenants. Since 2003, the 8670 Wilshire Property has averaged a 95.4% occupancy, with an average occupancy over the last five years of 98.6%.
The largest tenant, “Cedars-Sinai Medical Center Tenant” (28,831 square feet; 57.1% of net rentable area; 54.5% of underwritten base rent; rated Aa3/AA- by Moody’s/Fitch) is affiliated with the Cedars-Sinai Medical Center, which was founded in 1902 in Los Angeles, California and is an 886-bed non-profit academic medical center. The medical center is part of the Cedars-Sinai Health System, which, as of fiscal year 2019, operated over 250 locations across Los Angeles County and employed approximately 14,121 full-time workers. The organization’s research focuses on biomedicine and medical technology, with 2,145 active research projects in 2019. The organization additionally features the Graduate School of Biomedical Sciences at Cedars-Sinai, which offers a PhD program and master’s degree programs. In fiscal year 2019 (ended on June 30, 2019), Cedars-Sinai reported revenues from patient care and other sources of approximately $4.3 billion. Cedars-Sinai Medical Center is ranked nationally and has been named to the “Honor Roll” in U.S. News & World Report’s “Best Hospitals 2020-21”.
Cedars-Sinai Medical Center Tenant signed its lease in June 2016 and in addition to a tenant improvement allowance, invested additional funds to compete the build out of its space and opened the temporary home of the Breast Cancer Center. In March 2020, the Breast Cancer Center was moved to its permanent location and the tenant has been converting the space into the full-time home of the California Heart Center. As of February 17, 2020, Cedars-Sinai Medical Center Tenant finished major construction and has started moving equipment into the patient rooms and getting employees onsite. The property manager indicated the tenant has patients scheduled for appointments on March 1, 2021. Cedars-Sinai Medical Center Tenant has no termination options on any of its suites. Cedars-Sinai
THE INFORMATION IN THIS STRUCTURAL AND COLLATERAL TERM SHEET IS NOT COMPLETE AND MAY BE AMENDED PRIOR TO THE TIME OF SALE. THIS TERM SHEET IS NOT AN OFFER TO SELL THESE SECURITIES AND IT IS NOT A SOLICITATION OF AN OFFER TO BUY THESE SECURITIES IN ANY JURISDICTION WHERE THE OFFER OR SALE IS NOT PERMITTED.
147 of 166
| Structural and Collateral Term Sheet | Benchmark 2021-B24 | |
| 8670 Wilshire | ||
Medical Center Tenant has two, five-year renewal options on its 2nd and 3rd floor suites, totaling 23,329 square feet, at fair market rent and one, five-year renewal option on its 1st floor space totaling 5,502 square feet, at fair market rent.
The 8670 Wilshire loan is structured with a lease sweep for Cedars-Sinai Medical Center Tenant that will trigger upon, among other things set forth in the loan documents, the date that is 12 months prior to Cedars-Sinai Medical Center’s lease expiration.
The second largest tenant, Specialty Surgical Center of Beverly Hills, L.P. (“Specialty Surgical Center”) (16,879 square feet; 33.4% of net rentable area; 36.2% of underwritten base rent) is an outpatient surgical center with two locations along Wilshire Boulevard in Beverly Hills. Specialty Surgical Center is a subsidiary of Symbion, Inc., which itself is a subsidiary of Surgery Partners, Inc. Founded in 2004 and headquartered in Brentwood, Tennessee Surgery Partners, Inc. currently operates over 180 surgical facilities in 32 states. In 2019, Surgery Partners reported revenues of approximately $1.8 billion. Specialty Surgical Center provides outpatient surgical services in the following areas: cataract surgery, hand surgery, plastic and reconstructive surgery, podiatry, pain management and orthopedics, among others. At the 8670 Wilshire Property, Specialty Surgical Center has four operating and two minor procedure rooms.
Specialty Surgical Center has been a tenant at the 8670 Wilshire Property for nearly twenty years and is one of the original tenants the loan sponsor signed following the 8670 Wilshire Property’s repositioning in 2002. Specialty Surgical Center has no termination options and two, five-year renewal options at fair market rent.
The third largest tenant, Screening Services Group, LLC (3,910 square feet; 7.7% of net rentable area; 7.3% of underwritten base rent) is an independent motion picture screening room operator with five locations across Beverly Hills and West Los Angeles. Screening Services Group, LLC works with motion picture studios, PR companies and production companies to present its films for critics, award voters and acquisitions by operating up-scale private screening rooms. The space at the 8670 Wilshire Property features two screening rooms, the Wilshire Screening Room and the QC Room. The Wilshire Screening Room is a 49-56 seat theater that includes an art gallery for receptions, low gain white screen, 4K Christie, Dolby Atmos, and other video formats currently in use. The QC Room includes 20 movable executive office chairs, an art gallery available for receptions, low gain white screen, 3K Barco, Dolby 5.1 & 7.1, and Barco Alchemy formats.
Screening Services Group, LLC has been a tenant at the 8670 Wilshire Property since 2003. As a result of the COVID-19 pandemic county and state wide restrictions on non-essential businesses, the tenant has been operating on a limited capacity basis. In July, the tenant requested and was granted rent relief by the borrower. The borrower and tenant entered into an informal agreement, whereby the tenant received 50.0% rent forbearance for one-year which commenced in July 2020. At this time, the tenant is required to repay the value of the rent deferment over a seven-month period beginning on August 1, 2021. Screening Services Group, LLC has no termination options and no renewal options. As an indoor entertainment venue, the tenant may continue to be affected by government imposed shutdowns and customer reluctance to return for a longer period than other types of businesses. See “Risk Factors—Special Risks—Current Coronavirus Pandemic May Adversely Affect the Global Economy and the Performance of the Mortgage Loans” in the Preliminary Prospectus.
COVID-19 Update. As of February 17, 2021, the 8670 Wilshire Property is open and all tenants are open and operating subject to applicable county and statewide COVID-19 restrictions. As of January 2021, approximately 95.7% of underwritten base rents were collected. Screening Services Group, LLC, representing 7.3% of the underwritten base rent, was granted a 50% rent forbearance for one year which commenced in July 2020 (as described above). Alexander Café, LLC, representing 1.9% of the underwritten base rent, was granted a partial rent forbearance in December 2020 and January 2021. At loan closing, approximately $373,771 was deposited into a rent reserve, which is the equivalent to one year of base rent for Screening Services Group and Alexander Café LLC. As of February 17, 2021, the 8670 Wilshire Loan was not subject to any modification or forbearance requests. The first payment date is scheduled for April 6, 2021. See “Risk Factors—Risks Related to Market Conditions and Other External Factors—Current Coronavirus Pandemic May Adversely Affect the Global Economy and the Performance of the Mortgage Loans” in the Preliminary Prospectus.
The Market. The 8670 Wilshire Property is situated in the northern region of the Pico-Robertson neighborhood of Beverly Hills, California. The area is proximate to transportation linkages with IH-10 to the south, IH-405 to the west, and SR-2 to the north. The Beverly Hills submarket has a strong presence of entertainment and media companies and benefits from the demand of the Beverly Hills address. According to the appraisal, the estimated 2020 population within a 1-, 3- and 5-mile radius was 45,327, 309,805 and 880,704, respectively. The estimated average household income in 2020 within a 1-, 3- and 5-mile radius was $134,616, $131,803 and $110,510, respectively.
According to the appraisal, the 8670 Wilshire Property is located in the Beverly Hills office submarket. The Beverly Hills office submarket contained approximately 11.2 million square feet as of the fourth quarter of 2020, of which 2.2 million square feet was medical office space. An average of 43,803 square feet of net deliveries has been added to the submarket annually over the past decade, of which an average of 2,704 square feet was classified as medical office product. New office development in the Beverly Hills submarket has been more limited historically, with no submarket deliveries occurring between 2014 and 2016 due to the infill nature of the location and high barrier to entry. The Beverly Hills submarket’s medical office space has only witnessed net completions in one year of the past decade, delivering 32,450 square feet in 2017. Through year-end 2020, the submarket has experienced no new additions for both overall and medical office space.
THE INFORMATION IN THIS STRUCTURAL AND COLLATERAL TERM SHEET IS NOT COMPLETE AND MAY BE AMENDED PRIOR TO THE TIME OF SALE. THIS TERM SHEET IS NOT AN OFFER TO SELL THESE SECURITIES AND IT IS NOT A SOLICITATION OF AN OFFER TO BUY THESE SECURITIES IN ANY JURISDICTION WHERE THE OFFER OR SALE IS NOT PERMITTED.
148 of 166
| Structural and Collateral Term Sheet | Benchmark 2021-B24 | |
| 8670 Wilshire | ||
As of the fourth quarter of 2020, the Beverly Hills medical office submarket had a vacancy rate of 14.0%, compared to its 10-year average of 8.1%. Over the same period, the average asking rent was $66.48 per square foot for medical office space, a 6.3% increase year-over-year. The appraisal referenced 10 comparable medical office leases that range in base rent from approximately $36.00 - $90.00 per square foot. The appraiser concluded to a market rent for its medical office space of $93.00 per square foot and $57.00 per square foot for its traditional office space.
| Historical and Current Occupancy | |||
| 2018(1) | 2019(1) | 2020(1) | Current(2) |
| 100.0% | 100.0% | 100.0% | 100.0% |
| (1) | Historical Occupancies are as of December 31 of each respective year. |
| (2) | Current Occupancy is as of February 21, 2021. |
| Tenant Summary(1) | |||||||
| Tenant | Ratings Moody’s/Fitch/S&P(2) | Net Rentable Area (SF) | % of Total Portfolio NRA | Base Rent PSF | % of Total Portfolio Base Rent | Lease Expiration Date | |
| Cedars-Sinai Medical Center | Aa3 / AA- / NR | 28,831 | 57.1% | $76.41 | 54.5% | Various(3) | |
| Specialty Surgical Center | NR / NR / NR | 16,879 | 33.4% | $86.64 | 36.2% | 7/31/2030 | |
| Screening Services Group, LLC | NR / NR / NR | 3,910 | 7.7% | $75.59 | 7.3% | 3/31/2026 | |
| Alexander Café LLC | NR / NR / NR | 900 | 1.8% | $86.91 | 1.9% | 9/30/2023 | |
| Total Occupied | 50,520 | 100.0% | $79.95 | 100.0% | |||
| Vacant | 0 | 0.0 | |||||
| Total | 50,520 | 100.0% | |||||
| (1) | Based on the underwritten rent roll dated February 21, 2021. |
| (2) | Certain ratings are those of the parent or government entity whether or not the parent or government entity guarantees the lease. |
| (3) | Cedars-Sinai Medical Center Tenant leases 23,329 square feet that expires on November 30, 2026 and 5,502 square feet that expires on January 31, 2023. |
| Lease Rollover Schedule(1)(2) | |||||||||
| Year | Number of Leases Expiring | Net Rentable Area Expiring | % of NRA Expiring | Base Rent Expiring | % of Rent | Cumulative Net Rentable Area Expiring | Cumulative % of NRA Expiring | Cumulative Base Rent Expiring | Cumulative % of Base Rent Expiring |
| Vacant | NAP | 0 | 0.0% | NAP | NAP | 0 | 0.0% | NAP | NAP |
| 2021 | 0 | 0 | 0.0% | 0 | 0.0% | 0 | 0.0% | $0 | 0.0% |
| 2022 | 0 | 0 | 0.0% | 0 | 0.0% | 0 | 0.0% | $0 | 0.0% |
| 2023 | 2 | 6,402 | 12.7% | 527,532 | 13.1% | 6,402 | 12.7% | $527,532 | 13.1% |
| 2024 | 0 | 0 | 0.0% | 0 | 0.0% | 6,402 | 12.7% | $527,532 | 13.1% |
| 2025 | 0 | 0 | 0.0% | 0 | 0.0% | 6,402 | 12.7% | $527,532 | 13.1% |
| 2026 | 2 | 27,239 | 53.9% | 2,049,241 | 50.7% | 33,641 | 66.6% | $2,576,773 | 63.8% |
| 2027 | 0 | 0 | 0.0% | 0 | 0.0% | 33,641 | 66.6% | $2,576,773 | 63.8% |
| 2028 | 0 | 0 | 0.0% | 0 | 0.0% | 33,641 | 66.6% | $2,576,773 | 63.8% |
| 2029 | 0 | 0 | 0.0% | 0 | 0.0% | 33,641 | 66.6% | $2,576,773 | 63.8% |
| 2030 | 1 | 16,879 | 33.4% | 1,462,476 | 36.2% | 50,520 | 100.0% | $4,039,249 | 100.0% |
| 2031 | 0 | 0 | 0.0% | 0 | 0.0% | 50,520 | 100.0% | $4,039,249 | 100.0% |
| 2032 and Thereafter | 0 | 0 | 0.0% | 0 | 0.0% | 50,520 | 100.0% | $4,039,249 | 100.0% |
| Total | 5 | 50,520 | 100.0% | $4,039,249 | 100.0% | ||||
| (1) | Based on the underwritten rent roll dated February 21, 2021. |
| (2) | Certain tenants may have termination or contraction options (which may become exercisable prior to the originally stated expiration date of the tenant lease) that are not considered in the above Lease Rollover Schedule. |
THE INFORMATION IN THIS STRUCTURAL AND COLLATERAL TERM SHEET IS NOT COMPLETE AND MAY BE AMENDED PRIOR TO THE TIME OF SALE. THIS TERM SHEET IS NOT AN OFFER TO SELL THESE SECURITIES AND IT IS NOT A SOLICITATION OF AN OFFER TO BUY THESE SECURITIES IN ANY JURISDICTION WHERE THE OFFER OR SALE IS NOT PERMITTED.
149 of 166
| Structural and Collateral Term Sheet | Benchmark 2021-B24 | |
| 8670 Wilshire | ||
| Operating History and Underwritten Net Cash Flow | |||||||
| 2017 | 2018 | 2019 | 2020 | Underwritten | Per Square Foot | %(1) | |
| Base Rent | $3,386,835 | $3,460,197 | $3,540,266 | $3,565,180 | $4,039,249 | $79.95 | 87.1% |
| Rent Steps(2) | 0 | 0 | 0 | 0 | 202,047 | 4.00 | 4.4 |
| Vacant Income | 0 | 0 | 0 | 0 | 0 | 0.00 | 0.0 |
| Gross Potential Rent | $3,386,835 | $3,460,197 | $3,540,266 | $3,565,180 | $4,241,296 | $83.95 | 91.4% |
| Total Reimbursements | 36,716 | 143,351 | 138,697 | 168,210 | 162,552 | 3.22 | 3.5 |
| Total Other Income | 106,981 | 104,751 | 275,500 | 191,854 | 235,400 | 4.66 | 5.1 |
| Net Rental Income | $3,530,532 | $3,708,299 | $3,954,464 | $3,925,244 | $4,639,248 | $91.83 | 100.0% |
| (Vacancy/Credit Loss) | 0 | 0 | 0 | 0 | (231,962) | (4.59) | (5.0) |
| Effective Gross Income | $3,530,532 | $3,708,299 | $3,954,464 | $3,925,244 | $4,407,286 | $87.24 | 95.0% |
| Total Expenses | $885,907 | $1,074,298 | $1,103,805 | $1,099,581 | $1,104,428 | $21.86 | 25.1% |
| Net Operating Income(3) | $2,644,625 | $2,634,001 | $2,850,658 | $2,825,663 | $3,302,858 | $65.38 | 74.9% |
| TI/LC | 0 | 0 | 0 | 0 | 50,520 | 1.00 | 1.1 |
| Capital Expenditures | 0 | 0 | 0 | 0 | 10,104 | 0.20 | 0.2 |
| Net Cash Flow | $2,644,625 | $2,634,001 | $2,850,658 | $2,825,663 | $3,242,234 | $64.18 | 73.6% |
| (1) | % column represents percent of Net Rental Income for all revenue lines and represents percent of Effective Gross Income for the remainder of the fields. |
| (2) | Underwritten Rent Steps include (i) $147,460 of straight line rent steps for Cedars-Sinai Medical Center and (ii) $54,587 in rents steps through January 2022. |
| (3) | The increase in Net Operating Income from 2020 to Underwritten is attributed to (i) $202,047 of rent steps through January 2022 and straight line rent for investment grade tenants and (ii) the second largest tenant, Specialty Surgical Center of Beverly Hills, L.P., executing a 10-year lease renewal in April 2020 which included two months of free rent in August and September 2020 and increased its rental rate 20.7% from a weighted average $71.78 PSF to $86.64 PSF. |
Property Management. The 8670 Wilshire Property is managed by BT Management, LLC, a California limited liability company.
THE INFORMATION IN THIS STRUCTURAL AND COLLATERAL TERM SHEET IS NOT COMPLETE AND MAY BE AMENDED PRIOR TO THE TIME OF SALE. THIS TERM SHEET IS NOT AN OFFER TO SELL THESE SECURITIES AND IT IS NOT A SOLICITATION OF AN OFFER TO BUY THESE SECURITIES IN ANY JURISDICTION WHERE THE OFFER OR SALE IS NOT PERMITTED.
150 of 166
(THIS PAGE INTENTIONALLY LEFT BLANK)
THE INFORMATION IN THIS STRUCTURAL AND COLLATERAL TERM SHEET IS NOT COMPLETE AND MAY BE AMENDED PRIOR TO THE TIME OF SALE. THIS TERM SHEET IS NOT AN OFFER TO SELL THESE SECURITIES AND IT IS NOT A SOLICITATION OF AN OFFER TO BUY THESE SECURITIES IN ANY JURISDICTION WHERE THE OFFER OR SALE IS NOT PERMITTED.
151 of 166
| Structural and Collateral Term Sheet | Benchmark 2021-B24 | |
| JW Marriott Nashville | ||
| Mortgage Loan Information | Property Information | |||
| Mortgage Loan Seller: | GSMC | Single Asset / Portfolio: | Single Asset | |
| Original Principal Balance(1): | $35,000,000 | Title: | Fee / Leasehold | |
| Cut-off Date Principal Balance(1): | $35,000,000 | Property Type - Subtype: | Hotel – Full Service | |
| % of Pool by IPB: | 3.0% | Net Rentable Area (Rooms): | 533 | |
| Loan Purpose: | Refinance | Location: | Nashville, TN | |
| Borrower: | 8th & Demonbreun Hotel LP | Year Built / Renovated: | 2018 / NAP | |
| Loan Sponsor: | Jacquelyn Soffer | Occupancy / ADR / RevPAR: | 44.1% / $277.42 / $122.29 | |
| Interest Rate: | 3.13900% | Occupancy Date: | 9/30/2020 | |
| Note Date: | 3/6/2020 | Number of Tenants: | N/A | |
| Maturity Date: | 3/6/2030 | 2017 NOI(6): | N/A | |
| Interest-only Period: | 120 months | 2018 NOI(6): | N/A | |
| Original Term: | 120 months | 2019 NOI: | $28,553,670 | |
| Original Amortization: | None | TTM NOI (as of 9/2020): | $7,783,401 | |
| Amortization Type: | Interest Only | UW Occupancy/ADR/RevPAR(7): | 85.8% / $295.53 / $253.69 | |
| Call Protection(2): | L(36),Def(77),O(7) | UW Revenues: | $94,449,843 | |
| Lockbox / Cash Management: | Hard / Springing | UW Expenses: | $66,104,698 | |
| Additional Debt(1): | Yes | UW NOI(7): | $28,345,145 | |
| Additional Debt Balance(1): | $150,000,000 | UW NCF(7): | $24,567,151 | |
| Additional Debt Type(1): | Pari Passu | Appraised Value / Per Room(7): | $301,000,000 / $564,728 | |
| Appraisal Date: | 11/10/2020 | |||
| Escrows and Reserves | Financial Information(1)(7) | |||||||
| Initial | Monthly | Initial Cap | Cut-off Date Loan / Room: | $347,092 | ||||
| Taxes: | $0 | Springing(3) | N/A | Maturity Date Loan / Room: Room: Room,: | $347,092 | |||
| Insurance: | $0 | Springing(3) | N/A | Cut-off Date LTV: | 61.5% | |||
| FF&E Reserves: | $1,875,692 | Springing(4) | N/A | Maturity Date LTV: | 61.5% | |||
| Other(5): | $8,831,707 | $0 | N/A | UW NCF DSCR: | 4.17x | |||
| UW NOI Debt Yield: | 15.3% | |||||||
| Sources and Uses | ||||||
| Sources | Proceeds | % of Total | Uses | Proceeds | % of Total | |
| Whole Loan | $185,000,000 | 97.4% | Payoff Existing Debt | $184,529,539 | 97.1% | |
| Principal’s New Cash Contribution | 5,002,002 | 2.6% | Closing Costs | 3,596,771 | 1.9% | |
| % | Reserves | 1,875,692 | 1.0% | |||
| Total Sources | $190,002,002 | 100.0% | Total Uses | $190,002,002 | 100.0% | |
| (1) | The JW Marriott Nashville Loan (as defined below) is part of a whole loan evidenced by nine pari passu notes with an aggregate outstanding original principal balance as of the Cut-off Date of $185.0 million. Financial information presented in the chart above reflects the aggregate Cut-off Date balance of the $185.0 million JW Marriott Nashville Whole Loan (as defined below). |
| (2) | The lockout period will be at least 36 payments beginning with and including the first payment date of April 6, 2020. The borrower has the option to defease the full $185.0 million JW Marriott Nashville Whole Loan on or after the first payment date following the earlier to occur of (i) two years after the closing date of the securitization that includes the last note to be securitized and (ii) March 6, 2023. The lockout period of 36 payments is based on the expected Benchmark 2021-B24 transaction closing date occurring in March 2021. The actual lockout period may be longer. |
| (3) | On each due date during the continuance of a JW Marriott Nashville Trigger Period (as defined below) the borrower is required to fund a property tax and insurance reserve in an amount equal to 1/12 of the amount of property taxes and insurance premiums that the lender reasonably estimates will be payable during the next 12 ensuing months. A “JW Marriott Nashville Trigger Period” means any period (A) from (i) the conclusion of the second of any two consecutive fiscal quarters ending upon or following the conclusion of the second fiscal quarter of 2022, during each of which the debt yield is less than the trigger level as of the end of such fiscal quarter to (ii) the conclusion of the second of any two consecutive fiscal quarters thereafter during each of which the debt yield is equal to or greater than the trigger level as of the end of such fiscal quarter (i.e., the first date that a trigger period could commence under this clause (A) is September 30, 2022); (B) from the date of any debt service withdrawal until the later of (i) the date upon which the FF&E reserve replenishment amount has been deposited into the FF&E reserve account pursuant to the loan documents and (ii) the date upon which debt service withdrawals are no longer permitted pursuant to the loan documents; and/or (C) if the financial reports required under the loan documents are not delivered to the lender as and when required under the loan documents, a JW Marriott Nashville Trigger Period will be deemed to have commenced and be ongoing, unless and until such reports are delivered and they indicate that, in fact, no JW Marriott Nashville Trigger Period is ongoing. |
| (4) | On each due date beginning in April 2021, the borrower is required to fund a FF&E reserve in an amount equal to (i) from the due date in April 2021 up to and including the due date in July 2023, 3.0% of gross revenues and (ii) from and after the due date in August 2023, 4.0% of gross revenues. The borrower may use amounts in the FF&E reserve to make debt service payments on the JW Marriott Nashville Whole Loan, up to an amount of $1,876,087. The borrower will be required to replenish the replacement reserve for any amounts previously withdrawn to pay debt service. |
| (5) | Other initial reserve consists of $8,831,707 for debt service obligations. |
| (6) | The JW Marriott Nashville Property (as defined below) was built in 2018, therefore historical information is unavailable. |
| (7) | All NOI, NCF and occupancy information were determined prior to the emergence of the novel coronavirus pandemic, and the economic disruption resulting from measures to combat the pandemic, and all DSCR and Debt Yield metrics were calculated, and the JW Marriott Nashville Loan was underwritten, based on such prior information. The appraised value was determined after to the emergence of the novel coronavirus pandemic, and the economic disruption resulting from measures to combat the pandemic, and all LTV metrics were calculated based on such information. See “Risk Factors—Risks Related to Market Conditions and Other External Factors—The Coronavirus Pandemic Has Adversely Affected the Global Economy and Will Likely Adversely Affect the Performance of the Mortgage Loans” in the Preliminary Prospectus. |
THE INFORMATION IN THIS STRUCTURAL AND COLLATERAL TERM SHEET IS NOT COMPLETE AND MAY BE AMENDED PRIOR TO THE TIME OF SALE. THIS TERM SHEET IS NOT AN OFFER TO SELL THESE SECURITIES AND IT IS NOT A SOLICITATION OF AN OFFER TO BUY THESE SECURITIES IN ANY JURISDICTION WHERE THE OFFER OR SALE IS NOT PERMITTED.
152 of 166
| Structural and Collateral Term Sheet | Benchmark 2021-B24 | |
| JW Marriott Nashville | ||
The Loan. The JW Marriott Nashville mortgage loan (the “JW Marriott Nashville Loan”) is part of a whole loan with an aggregate outstanding principal balance as of the Cut-off Date of $185.0 million (the “JW Marriott Nashville Whole Loan”), which is secured by the borrower’s fee and leasehold interests in a full service hotel located in Nashville, Tennessee (the “JW Marriott Nashville Property”). The JW Marriott Nashville Loan, which is evidenced by the non-controlling note A-2, has an outstanding principal balance as of the Cut-off Date of $35.0 million. The remaining notes have been, or are expected to be, contributed to one or more future securitization trusts. The JW Marriott Nashville Whole Loan accrues interest at an interest rate of 3.13900% per annum, was originated on March 6, 2020, had an original principal balance of $185.0 million and has an aggregate outstanding principal balance as of the Cut-off Date of $185.0 million. The proceeds of the JW Marriott Nashville Whole Loan were primarily used to refinance a prior debt secured by the JW Marriott Nashville Property, pay origination costs, and fund upfront reserves. The relationship between the holders of the JW Marriott Nashville Whole Loan will be governed by a co-lender agreement as described under “Description of the Mortgage Pool—The Whole Loans—The Non-Serviced Pari Passu Whole Loans” in the Preliminary Prospectus. The JW Marriott Nashville Whole Loan had an initial term of 120 months and has a remaining term of 108 months as of the Cut-off Date. The scheduled maturity date of the JW Marriott Nashville Whole Loan is the due date in March 2030.
| Whole Loan Summary | |||||
| Note | Original Balance | Cut-off Date Balance | Note Holder | Controlling Piece | |
| Note A-1 | $35,000,000 | $35,000,000 | Benchmark 2021-B23 | Yes | |
| Note A-2 | 35,000,000 | 35,000,000 | Benchmark 2021-B24 | No | |
| Note A-3 | 25,000,000 | 25,000,000 | GSMS 2020-GSA2 | No | |
| Note A-4 | 20,000,000 | 20,000,000 | Benchmark 2020-B21 | No | |
| Note A-5 | 20,000,000 | 20,000,000 | Benchmark 2020-B22 | No | |
| Note A-6 | 10,000,000 | 10,000,000 | GSMS 2020-GSA2 | No | |
| Note A-7 | 25,000,000 | 25,000,000 | GSBI(1) | No | |
| Note A-8 | 10,000,000 | 10,000,000 | GSBI(1) | No | |
| Note A-9 | 5,000,000 | 5,000,000 | GSBI(1) | No | |
| Whole Loan | $185,000,000 | $185,000,000 | |||
| (1) | Expected to be contributed to one or more future securitizations. |
The Borrower. The borrower is 8th & Demonbreun Hotel LP, a Delaware limited partnership with two independent managers. Legal counsel to the borrower delivered a non-consolidation opinion in connection with the origination of the JW Marriott Nashville Whole Loan. Jacquelyn Soffer is the non-recourse carveout guarantor under the loan documents.
The Loan Sponsor. The borrower sponsor and non-recourse carveout guarantor under the JW Marriott Nashville Whole Loan is Jacquelyn Soffer.
The Property. The JW Marriott Nashville Property, located in downtown Nashville, is a full-service lodging facility built in 2018. The JW Marriott Nashville Property encompasses approximately 2.72 acres, consisting of the borrower’s fee interest in a 33-story, 533-room hotel (the “Hotel Parcel”) and leasehold interest in a portion of a 300 space parking garage (the “Parking Parcel”). The JW Marriott Nashville Property offers amenities including multiple food/beverage outlets, an outdoor pool and amenities deck, a fitness center, a spa, a business center, a concierge lounge, a retail store, a sundry shop, and approximately 50,000 square feet of meeting space. Guestrooms range from one to two bedrooms. Standard room amenities include a flat-panel television, high-speed internet, and a lounge chair/loveseat. The guest bathrooms are finished with marble tile flooring, granite vanity countertops, and a glass enclosed walk-in shower. Luxury suites are also available with additional amenities. The lobby level includes the Stompin Grounds Restaurant and Market as well as the Cumberland Bar. The Cabana Club is a poolside bar and grill. The JW Marriott Nashville Property carries the JW Marriott flag under a franchise agreement that expires on July 1, 2048.
COVID-19 Update. As of February 19, 2021 the JW Marriott Nashville Property is open. In April 2020, the JW Marriott Nashville Whole Loan was modified to permit the use of FF&E reserve funds to pay debt service, and the loan sponsor provided a six-month guaranty for debt service, taxes and insurance payments that expired in October 2020. In October 2020, the JW Marriott Nashville Whole Loan was further modified to waive the requirement to fund the FF&E reserve until April 2021, waive the cash management debt yield trigger through the second quarter of 2022, and otherwise permanently decrease the debt yield trigger level from 10.0% to 7.5%, in exchange for the borrower funding an 18-month debt service reserve to be applied to monthly payments from October 2020 through March 2022.
The Market. The JW Marriott Nashville Property is located in Nashville, Tennessee, the capital city of the state of Tennessee. According to the appraisal, Nashville is a popular destination for country music fans who travel from all over the world to visit the iconic Country Music Hall of Fame, Printers Alley, Historic Second Avenue, Music Row, as well as numerous country and western bars and music venues in the city. Additionally, football and hockey fans visit Nashville to enjoy NFL and NHL games at Nissan Stadium and the Bridgestone Arena. In addition to the city’s tourism demand, lodging demand from commercial travelers also contributes to the local hotel market. Nashville is a central hub for health care, manufacturing, education, music, publishing, banking, government, and professional services.
THE INFORMATION IN THIS STRUCTURAL AND COLLATERAL TERM SHEET IS NOT COMPLETE AND MAY BE AMENDED PRIOR TO THE TIME OF SALE. THIS TERM SHEET IS NOT AN OFFER TO SELL THESE SECURITIES AND IT IS NOT A SOLICITATION OF AN OFFER TO BUY THESE SECURITIES IN ANY JURISDICTION WHERE THE OFFER OR SALE IS NOT PERMITTED.
153 of 166
| Structural and Collateral Term Sheet | Benchmark 2021-B24 | |
| JW Marriott Nashville | ||
The Nashville, Tennessee lodging market is comprised of approximately 48,300 hotel rooms located primarily in Davidson county. As of the third quarter of 2020, hospitality occupancy in Nashville dropped 48.3% since the third quarter of 2019, largely due to the onset of the COVID-19 pandemic. Prior to COVID-19, the hospitality market occupancy was 74.0% as of year end 2019. Further, from 2015-2019, the compound annual growth rates (“CAGR”) for ADR and RevPAR in the Nashville, Tennessee lodging market were 4.4% and 4.3%, respectively. According to the appraisal, the Nashville, Tennessee lodging market is currently in the “expansion” stage of the recovery cycle, signifying that the overall hotel market may improve in tandem with improvement in the American economy.
| Operating History and Underwritten Net Cash Flow | |||||
| 2019 | TTM(1) | Underwritten | Per Room | % of Total Revenue | |
| Occupancy | 85.5% | 44.1% | 85.8% | ||
| ADR | $294.74 | $277.42 | $295.53 | ||
| RevPAR | $251.86 | $122.29 | $253.69 | ||
| Room Revenue | $48,994,085 | $23,790,872 | $49,350,452 | $92,590 | 52.3%% |
| Food & Beverage Revenue | 38,988,924 | 19,749,159 | 39,009,533 | 73,189 | 41.3%% |
| Other Departmental Revenue(2) | 5,694,188 | 4,705,190 | 6,089,857 | 11,426 | 6.4%% |
| Total Revenue | $93,677,197 | $48,245,221 | $94,449,843 | $177,204 | 100.0%% |
| Room Expense | $9,809,498 | $5,385,294 | $9,923,487 | $18,618 | 10.5%% |
| Food & Beverage Expense | 25,687,127 | 14,055,996 | 25,675,660 | 48,172 | 27.2%% |
| Other Departmental Expense | 1,766,043 | 1,171,880 | 1,758,953 | 3,300 | 1.9%% |
| Departmental Expenses | $37,262,668 | $20,613,170 | $37,358,100 | $70,090 | 39.6%% |
| % | |||||
| Gross Operating Income | $56,414,529 | $27,632,051 | $57,091,742 | $107,114 | 60.4%% |
| Admin & General | $7,718,408 | $5,921,646 | $7,828,348 | $14,687 | 8.3%% |
| Maintenance & Repairs | 1,803,955 | 1,407,861 | 1,845,524 | 3,463 | 2.0%% |
| Utility Costs | 1,725,534 | 1,353,165 | 1,711,506 | 3,211 | 1.8%% |
| Marketing & Franchise Fee | 7,407,655 | 4,167,655 | 7,285,705 | 13,669 | 7.7%% |
| Management Fee | 2,810,313 | 1,447,513 | 2,833,495 | 5,316 | 3.0%% |
| Property Tax | 4,537,519 | 4,178,878 | 5,282,098 | 9,910 | 5.6%% |
| Insurance | 363,063 | 478,132 | 478,132 | 897 | 0.5%% |
| Other Expenses | 1,494,412 | 893,799 | 1,481,788 | 2,780 | 1.6%% |
| Total Expenses | $27,860,859 | $19,848,649 | $28,746,597 | $53,934 | 30.4%% |
| Net Operating Income(3) | $28,553,670 | $7,783,401 | $28,345,145 | $53,180 | 30.0% |
| FF&E | 1,420,973 | 852,165 | 3,777,994 | 7,088 | 4.0%% |
| Net Cash Flow | $27,132,697 | $6,931,237 | $24,567,151 | $46,092 | 26.0%% |
| (1) | TTM column represents the trailing 12-month period ending September 30, 2020. |
| (2) | Other Departmental Revenue includes guaranteed no shows, miscellaneous room revenue, and early/late departure fees. |
| (3) | The increase in Underwritten Net Operating Income is primarily attributable to the JW Marriott Nashville Property’s closure from April 8, 2020 to June 14, 2020. We cannot assure you that the JW Marriott Nashville Property will revert to pre-COVID performance as expected or at all. |
Property Management. The JW Marriott Nashville Property is managed by TB All Fees Operating LP.
THE INFORMATION IN THIS STRUCTURAL AND COLLATERAL TERM SHEET IS NOT COMPLETE AND MAY BE AMENDED PRIOR TO THE TIME OF SALE. THIS TERM SHEET IS NOT AN OFFER TO SELL THESE SECURITIES AND IT IS NOT A SOLICITATION OF AN OFFER TO BUY THESE SECURITIES IN ANY JURISDICTION WHERE THE OFFER OR SALE IS NOT PERMITTED.
154 of 166
(THIS PAGE INTENTIONALLY LEFT BLANK)
THE INFORMATION IN THIS STRUCTURAL AND COLLATERAL TERM SHEET IS NOT COMPLETE AND MAY BE AMENDED PRIOR TO THE TIME OF SALE. THIS TERM SHEET IS NOT AN OFFER TO SELL THESE SECURITIES AND IT IS NOT A SOLICITATION OF AN OFFER TO BUY THESE SECURITIES IN ANY JURISDICTION WHERE THE OFFER OR SALE IS NOT PERMITTED.
155 of 166
| Structural and Collateral Term Sheet | Benchmark 2021-B24 | |
| Morgan Stanley Tower | ||
| Mortgage Loan Information | Property Information | |||
| Mortgage Loan Seller: | CREFI | Single Asset / Portfolio: | Single Asset | |
| Original Principal Balance: | $34,000,000 | Title: | Fee/Leasehold | |
| Cut-off Date Principal Balance: | $34,000,000 | Property Type - Subtype: | Office – CBD | |
| % of Pool by IPB: | 2.9% | Net Rentable Area (SF): | 187,694 | |
| Loan Purpose: | Refinance | Location: | Saint Petersburg, FL | |
| Borrower: | Second Avenue Tower Limited | Year Built / Renovated: | 1985 / 2015 | |
| Partnership | Occupancy: | 94.7% | ||
| Loan Sponsor: | Lawrence Feldman | Occupancy Date: | 12/15/2020 | |
| Interest Rate: | 3.50000% | Number of Tenants: | 40 | |
| Note Date: | 2/12/2021 | 2017 NOI: | $2,865,319 | |
| Maturity Date: | 3/6/2031 | 2018 NOI: | $3,016,334 | |
| Interest-only Period: | 36 months | 2019 NOI: | $3,196,755 | |
| Original Term: | 120 months | 2020 NOI: | $3,373,053 | |
| Original Amortization: | 360 months | UW Economic Occupancy(2): | 93.0% | |
| Amortization Type: | IO-Balloon | UW Revenues: | $5,714,307 | |
| Call Protection: | L(24),Def(90),O(6) | UW Expenses: | $2,078,501 | |
| Lockbox / Cash Management: | Hard / Springing | UW NOI(2): | $3,635,806 | |
| Additional Debt: | N/A | UW NCF(2): | $3,356,993 | |
| Additional Debt Balance: | N/A | Appraised Value / Per SF(2): | $54,100,000 / $288 | |
| Additional Debt Type: | N/A | Appraisal Date: | 12/16/2020 | |
| Escrows and Reserves | Financial Information(2) | |||||||
| Initial | Monthly | Initial Cap | Cut-off Date Loan / SF: | $181 | ||||
| Taxes: | $185,636 | $37,127 | N/A | Maturity Date Loan / SF: | $155 | |||
| Insurance: | $122,133 | $9,395 | N/A | Cut-off Date LTV: | 62.8% | |||
| Replacement Reserves: | $0 | $3,128 | N/A | Maturity Date LTV: | 53.7% | |||
| TI/LC: | $643,632 | $23,462(1) | $2,000,000 | UW NCF DSCR: | 1.83x | |||
| Other(3): | $489,553 | Springing | N/A | UW NOI Debt Yield: | 10.7% | |||
| Sources and Uses | ||||||
| Sources | Proceeds | % of Total | Uses | Proceeds | % of Total | |
| Loan Amount | $34,000,000 | 100.0% | Payoff Existing Debt | $30,810,079 | 90.6% | |
| Upfront Reserves | 1,440,954 | 4.2 | ||||
| Return of Equity | 1,398,971 | 4.1 | ||||
| Closing Costs | 349,996 | 1.0 | ||||
| Total Sources | $34,000,000 | 100.0% | Total Uses | $34,000,000 | 100.0% | |
| (1) | TI/LC Monthly reserve shall decrease to approximately $11,731 beginning on the payment date in April 2023. |
| (2) | While the Morgan Stanley Tower Loan was originated after the emergence of the novel coronavirus pandemic and the economic disruption resulting from measures to combat the pandemic, the pandemic is an evolving situation and could impact the Morgan Stanley Tower Loan more severely than assumed in the underwriting of the Morgan Stanley Tower Loan and could adversely affect the NOI, NCF and occupancy information, as well as the appraised value and the DSCR, LTV and Debt Yield metrics presented above. See “Risk Factors— Special Risks—The Coronavirus Pandemic Has Adversely Affected the Global Economy and Will Likely Adversely Affect the Performance of the Mortgage Loans” in the Prospectus. |
| (3) | The Other Initial reserve consists of a $356,368 unfunded obligations reserve and a $133,185 rent concessions reserve. The Other Monthly reserve consists of a springing parking lease reserve and a springing Morgan Stanley rent concession reserve. |
The Loan. The Morgan Stanley Tower loan (the “Morgan Stanley Tower Loan”) is secured by a first mortgage lien on the borrower’s fee and leasehold interest in a 187,694 square foot office building located in Saint Petersburg, Florida (the “Morgan Stanley Tower Property”). The Morgan Stanley Tower Loan accrues interest at an interest rate of 3.50000% per annum, had an original term of 120 months, has a remaining term of 120 months as of the Cut-off Date, is interest only for 36 months and had an original amortization of 360 months.
The Borrower. The borrowing entity for the Morgan Stanley Tower Loan is Second Avenue Tower Limited Partnership, a Delaware limited partnership. Legal counsel to the borrower delivered a non-consolidation opinion in connection with the origination of the Morgan Stanley Tower Loan.
The Loan Sponsor. Lawrence Feldman is the non-recourse carveout guarantor under the Morgan Stanley Tower Loan documents.
THE INFORMATION IN THIS STRUCTURAL AND COLLATERAL TERM SHEET IS NOT COMPLETE AND MAY BE AMENDED PRIOR TO THE TIME OF SALE. THIS TERM SHEET IS NOT AN OFFER TO SELL THESE SECURITIES AND IT IS NOT A SOLICITATION OF AN OFFER TO BUY THESE SECURITIES IN ANY JURISDICTION WHERE THE OFFER OR SALE IS NOT PERMITTED.
156 of 166
| Structural and Collateral Term Sheet | Benchmark 2021-B24 | |
| Morgan Stanley Tower | ||
The Property. The Morgan Stanley Tower Property consists of a 187,694 square foot, office building which was built in 1985 and renovated in 2015 across approximately 0.92 acres. The Morgan Stanley Tower Property has 192 parking spaces at a ratio of 1.03 spaces per 1,000 square feet. The property is currently 94.7% leased by 40 tenants.
The largest tenant based on net rentable area at the Morgan Stanley Tower Property, Morgan Stanley Smith Barney, occupies 21,854 square feet (11.6% of net rentable area) and has a lease expiration date of April 30, 2029. Morgan Stanley Smith Barney has a base rent of $28.46 per square foot. The second largest tenant based on net rentable area, Enstar (US) Inc, occupies 21,044 square feet (11.2% of net rentable area) and has a lease expiration date of March 31, 2026. Enstar (US) Inc has a base rent of $27.44 per square foot. The third largest tenant at the Morgan Stanley Tower Property is DCR Loan Servicing, LLC, which occupies 13,460 square feet and has a lease expiration date of July 31, 2028. DCR Loan Servicing, LLC has a base rent of $27.46 per square foot.
COVID-19 Update. As of February 6, 2021, the Morgan Stanley Tower Property is open and operating. December 2020 and January 2021 rent collections totaled 97.0% and 95.0% of underwritten base rent, respectively. Two tenants at the Morgan Stanley Tower Property, accounting for 4.3% of NRA and 4.7% of underwritten base rent, have received rent relief/deferrals during the pandemic. As of February 6, 2021, there have been no loan modification or forbearance requests on the Morgan Stanley Tower Loan. The first payment date of the Morgan Stanley Tower Loan is the monthly due date in April 2021. See “Risk Factors—Special Risks—The Coronavirus Pandemic Has Adversely Affected the Global Economy and Will Likely Adversely Affect the Performance of the Mortgage Loans” in the Preliminary Prospectus.
The Market. The Morgan Stanley Tower Property is located at the corner of 2nd Avenue North and 2nd Street North, which is just west of Tampa Bay, in the Downtown Saint Petersburg submarket. Downtown Saint Petersburg offers a pedestrian-friendly atmosphere with numerous condominium and apartment projects, allowing for residents to live, work, and entertain in the same immediate area. Many of the new and existing mixed-used developments in the area offer ground floor retail space with office and/or residential condominiums filling out the remaining upper stories of the mid- and high-rise buildings. The Morgan Stanley Tower Property has direct access to Interstate 175, Interstate 275, and Interstate 375. In the fourth quarter of 2020, the Downtown Saint Petersburg submarket had a vacancy rate of 5.1%, a decrease from the 5.8% vacancy rate recorded in the fourth quarter of 2019. The Downtown Saint Petersburg submarket includes 4,086,779 square feet of office inventory, with 230,593 square feet of vacant office space. Since the second quarter of 2019, the square footage under construction has remained consistent at a total of 11,395 square feet. According to the appraisal, the average household income in the Downtown Saint Petersburg submarket is $78,438.
| Tenant Summary(1) | ||||||
| Tenant | Ratings Moody’s/S&P/Fitch | Net Rentable Area (SF) | % of Total NRA | Base Rent PSF | % of Total Base Rent | Lease Expiration Date |
| Morgan Stanley Smith Barney(2) | A1 / BBB+ / A | 21,854 | 11.6% | $28.46 | 12.1% | 4/30/2029 |
| Enstar (US) Inc | NR / BBB / BBB- | 21,044 | 11.2 | 27.44 | 11.3 | 3/31/2026 |
| DCR Loan Servicing, LLC(3) | NR / NR / NR | 13,460 | 7.2 | 27.46 | 7.2 | 7/31/2028 |
| UBS Financial Services, Inc | NR / NR / NR | 13,310 | 7.1 | 27.50 | 7.1 | 9/30/2023 |
| Manning & Napier Advisors | NR / NR / NR | 10,438 | 5.6 | 29.39 | 6.0 | 12/31/2022 |
| RE/Max Metro | NR / BB / NR | 9,218 | 4.9 | 26.51 | 4.8 | 5/31/2022 |
| Paradise Advertising & Market | NR / NR / NR | 7,014 | 3.7 | 28.26 | 3.9 | 12/31/2021 |
| Adams and Reese LLP | NR / NR / NR | 6,841 | 3.6 | 32.00 | 4.3 | 3/31/2024 |
| Homeowners Financial Group | NR / NR / NR | 6,066 | 3.2 | 30.06 | 3.6 | 5/31/2024 |
| McClanathan, Burg & Assoc | NR / NR / NR | 5,910 | 3.1 | 28.71 | 3.3 | 6/30/2022 |
| Subtotal / Weighted Average | 115,155 | 61.4% | $28.27 | 63.5% | ||
| Remaining Tenants | 62,516 | 33.3 | 29.91 | 36.5% | ||
| Vacant | 10,023 | 5.3 | ||||
| Total / Weighted Average | 187,694 | 100.0% | $28.85 | 100.0% | ||
| (1) | Based on the underwritten rent roll as of December 15, 2020. |
| (2) | Morgan Stanley Smith Barney has the option to terminate its lease on April 31, 2022 upon 12 months’ notice and payment of a termination fee of approximately $1,087,310 or on April 31, 2025 upon 12 months’ notice and payment of a termination fee of approximately $786,024. |
| (3) | DCR Loan Servicing, LLC has the right to terminate its lease on July 31, 2025 on 9 months’ notice and payment of a termination fee of approximately $375,000. |
THE INFORMATION IN THIS STRUCTURAL AND COLLATERAL TERM SHEET IS NOT COMPLETE AND MAY BE AMENDED PRIOR TO THE TIME OF SALE. THIS TERM SHEET IS NOT AN OFFER TO SELL THESE SECURITIES AND IT IS NOT A SOLICITATION OF AN OFFER TO BUY THESE SECURITIES IN ANY JURISDICTION WHERE THE OFFER OR SALE IS NOT PERMITTED.
157 of 166
| Structural and Collateral Term Sheet | Benchmark 2021-B24 | |
| Morgan Stanley Tower | ||
| Lease Rollover Schedule(1) | |||||||||
| Year | Number of Leases Expiring | Net Rentable Area Expiring | % of NRA Expiring | Base Rent Expiring | % of Base Rent Expiring | Cumulative Net Rentable Area Expiring | Cumulative % of NRA Expiring | Cumulative Base Rent Expiring | Cumulative % of Base Rent Expiring |
| Vacant | NAP | 10,023 | 5.3% | NAP | NAP | 10,023 | 5.34% | NAP | NAP |
| MTM & 2021 | 6 | 15,847 | 8.4 | $462,227 | 9.0% | 25,870 | 13.8% | $462,227 | 9.0% |
| 2022 | 6 | 31,258 | 16.7 | $888,458 | 17.3 | 57,128 | 30.4% | $1,350,685 | 26.4% |
| 2023 | 7 | 26,714 | 14.2 | $770,829 | 15.0 | 83,842 | 44.7% | $2,121,515 | 41.4% |
| 2024 | 12 | 30,812 | 16.4 | $975,753 | 19.0 | 114,654 | 61.1% | $3,097,267 | 60.4% |
| 2025 | 3 | 5,131 | 2.7 | $163,797 | 3.2 | 119,785 | 63.8% | $3,261,065 | 63.6% |
| 2026 | 4 | 23,607 | 12.6 | $655,400 | 12.8 | 143,392 | 76.4% | $3,916,465 | 76.4% |
| 2027 | 2 | 6,878 | 3.7 | $217,157 | 4.2 | 150,270 | 80.1% | $4,133,621 | 80.7% |
| 2028 | 1 | 13,460 | 7.2 | $369,612 | 7.2 | 163,730 | 87.2% | $4,503,233 | 87.9% |
| 2029 | 1 | 21,854 | 11.6 | $621,937 | 12.1 | 185,584 | 98.9% | $5,125,170 | 100.0% |
| 2030 | 3 | 2,110 | 1.1 | $0 | 0.0 | 187,694 | 100.0% | $5,125,170 | 100.0% |
| 2031 & Thereafter | 0 | 0 | 0.0 | $0 | 0.0 | 187,694 | 100.0% | $5,125,170 | 100.0% |
| Total | 45 | 187,694 | 100.0% | $5,125,170 | 100.0% | ||||
| (1) | Based on the underwritten rent roll as of December 15, 2020. |
| Underwritten Net Cash Flow(1) | |||||||
| 2017 | 2018 | 2019 | 2020 | Underwritten | Per Square Foot | %(2) | |
| Rents in Place | $4,243,065 | $4,353,013 | $4,483,825 | $4,710,154 | $4,906,331 | $26.14 | 88.3% |
| Rent Steps(3) | 0 | 0 | 0 | 0 | 218,839 | 1.17 | 3.9% |
| Potential Income from Vacant Space | 0 | 0 | 0 | 0 | 306,490 | 1.63 | 5.5% |
| Gross Potential Rent | $4,243,065 | $4,353,013 | $4,483,825 | $4,710,154 | $5,431,660 | $28.94 | 97.7% |
| Total Reimbursements | 126,724 | 219,357 | 252,970 | 329,677 | 126,755 | 0.68 | 2.3% |
| Net Rental Income | $4,369,789 | $4,572,370 | $4,736,795 | $5,039,831 | $5,558,415 | $29.61 | 100.0% |
| (Vacancy/Credit Loss) | 0 | 0 | 0 | 0 | (391,440) | (2.09) | (7.0%) |
| Other Income | 443,008 | 489,697 | 531,158 | 525,327 | 547,331 | 2.92 | 9.8% |
| Effective Gross Income | $4,812,797 | $5,062,067 | $5,267,953 | $5,565,158 | $5,714,307 | $30.44 | 102.8% |
| Real Estate Taxes | 351,078 | 375,613 | 407,152 | 425,163 | 424,311 | 2.26 | 7.4% |
| Insurance | 119,184 | 133,468 | 150,802 | 163,201 | 107,369 | 0.57 | 1.9% |
| Management Fee | 146,209 | 151,772 | 156,750 | 167,488 | 171,429 | 0.91 | 3.0% |
| Other Operating Expenses | 1,331,007 | 1,384,880 | 1,356,494 | 1,436,252 | 1,375,391 | 7.33 | 24.1% |
| Total Expenses | $1,947,477 | $2,045,733 | $2,071,198 | $2,192,104 | $2,078,501 | 11.07 | 36.4% |
| Net Operating Income | $2,865,319 | $3,016,334 | $3,196,755 | $3,373,053 | $3,635,806 | $19.37 | 63.6% |
| TI/LC | 0 | 0 | 0 | 0 | 241,274 | 1.29 | 4.2% |
| Capital Expenditures | 0 | 0 | 0 | 0 | 37,539 | 0.20 | 0.7% |
| Net Cash Flow | $2,865,319 | $3,016,334 | $3,196,755 | $3,373,053 | $3,356,993 | $17.89 | 58.7% |
| (1) | Based on the underwritten rent roll dated December 15, 2020. |
| (2) | % column represents percent of Net Rental Income for all revenue lines and represents percent of Effective Gross Income the remainder of the fields. |
| (3) | Rent Steps totaling $218,839 represent step increases occurring through February 1, 2022 for 26 tenants, plus the average rents over the lease term for Morgan Stanley and UBS using the approach for investment grade tenants. |
Property Management. The Morgan Stanley Tower Property is self-managed by borrower-affiliate, Feldman Equities Management, LLC.
THE INFORMATION IN THIS STRUCTURAL AND COLLATERAL TERM SHEET IS NOT COMPLETE AND MAY BE AMENDED PRIOR TO THE TIME OF SALE. THIS TERM SHEET IS NOT AN OFFER TO SELL THESE SECURITIES AND IT IS NOT A SOLICITATION OF AN OFFER TO BUY THESE SECURITIES IN ANY JURISDICTION WHERE THE OFFER OR SALE IS NOT PERMITTED.
158 of 166
(THIS PAGE INTENTIONALLY LEFT BLANK)
THE INFORMATION IN THIS STRUCTURAL AND COLLATERAL TERM SHEET IS NOT COMPLETE AND MAY BE AMENDED PRIOR TO THE TIME OF SALE. THIS TERM SHEET IS NOT AN OFFER TO SELL THESE SECURITIES AND IT IS NOT A SOLICITATION OF AN OFFER TO BUY THESE SECURITIES IN ANY JURISDICTION WHERE THE OFFER OR SALE IS NOT PERMITTED.
159 of 166
| Structural and Collateral Term Sheet | Benchmark 2021-B24 | |
| The Village at Meridian | ||
| Mortgage Loan Information | Property Information | |||
| Mortgage Loan Seller: | JPMCB | Single Asset / Portfolio: | Single Asset | |
| Original Principal Balance(1): | $30,995,000 | Title: | Fee | |
| Cut-off Date Principal Balance(1): | $30,995,000 | Property Type - Subtype: | Retail – Anchored | |
| % of Pool by IPB: | 2.7% | Net Rentable Area (SF): | 841,927 | |
| Loan Purpose: | Recapitalization | Location: | Meridian, ID | |
| Borrower: | Meridian CenterCal Owner, LLC | Year Built / Renovated: | 2012 / N/A | |
| Loan Sponsor: | None | Occupancy: | 79.3% | |
| Interest Rate: | 3.49900% | Occupancy Date: | 10/1/2020 | |
| Note Date: | 1/14/2021 | Number of Tenants: | 98 | |
| Maturity Date: | 2/5/2031 | 2017 NOI: | $10,854,883 | |
| Interest-only Period: | 120 months | 2018 NOI: | $10,841,859 | |
| Original Term: | 120 months | 2019 NOI: | $12,605,023 | |
| Original Amortization: | None | TTM NOI (as of 10/2020): | $13,816,322 | |
| Amortization Type: | Interest Only | UW Economic Occupancy(3): | 81.4% | |
| Call Protection: | L(24),Grtr1%orYM(1),DeforGrtr1% | UW Revenues: | $20,128,093 | |
| orYM(91),O(4) | UW Expenses: | $7,548,855 | ||
| Lockbox / Cash Management: | Hard / Springing | UW NOI(3): | $12,579,238 | |
| Additional Debt(1): | Yes | UW NCF(3): | $12,031,985 | |
| Additional Debt Balance(1): | $35,000,000 | Appraised Value / Per SF(3): | $197,000,000 / $234 | |
| Additional Debt Type(1): | Pari Passu | Appraisal Date: | 10/6/2020 | |
| Escrows and Reserves | Financial Information(1)(3) | ||||||
| Initial | Monthly | Initial Cap | Cut-off Date Loan / SF: | $78 | |||
| Taxes: | $0 | Springing | N/A | Maturity Date Loan / SF: | $78 | ||
| Insurance: | $0 | Springing | N/A | Cut-off Date LTV: | 33.5% | ||
| Replacement Reserves: | $0 | Springing | $126,288 | Maturity Date LTV: | 33.5% | ||
| TI/LC: | $0 | Springing | $1,683,864 | UW NCF DSCR: | 5.14x | ||
| Other(2): | $3,742,823 | $0 | N/A | UW NOI Debt Yield: | 19.1% | ||
| Sources and Uses | |||||||
| Sources | Proceeds | % of Total | Uses | Proceeds | % of Total | ||
| Whole Loan | $65,995,000 | 100.0% | Return of Equity | $61,735,072 | 93.5% | ||
| Upfront Reserves | 3,742,823 | 5.7% | |||||
| Closing Costs | 517,105 | 0.8% | |||||
| Total Sources | $65,995,000 | 100.0% | Total Uses | $65,995,000 | 100.0% | ||
| (1) | The Village at Meridian Loan (as defined below) is part of a whole loan evidenced by two pari passu notes with an aggregate original principal balance as of the Cut-off Date of $65,995,000. Financial information presented in the chart above reflects the aggregate Cut-off Date balance of the $65,995,000 Village at Meridian Whole Loan (as defined below). |
| (2) | The Initial Other Reserve consists of a $3,742,823 gap rent reserve. Gap rent reserves represent the aggregate amount of base rent for the succeeding 12-months for tenants who have not paid in-full base rent due pursuant to each such tenant’s underlying lease as of the origination date. Such amounts will not be released to the borrower until, among other conditions, (i) collections exceed 95% of the full rent payable from all tenants in place as of the origination date for a period of 12 consecutive months and (ii) The Village at Meridian property is at least 80% occupied based on total square footage, provided no event of default or The Village at Meridian Cash Sweep Event then exists as defined in The Village at Meridian Whole Loan documents. |
| (3) | While The Village at Meridian Whole Loan was originated after the emergence of the novel coronavirus pandemic and the economic disruption resulting from measures to combat the pandemic, the pandemic is an evolving situation and could impact The Village at Meridian Whole Loan more severely than assumed in the underwriting of The Village at Meridian Whole Loan and could adversely affect the NOI, NCF and occupancy information, as well as the appraised value and the DSCR, LTV and Debt Yield metrics presented above. See “Risk Factors— Risks Related to Market Conditions and Other External Factors—The Coronavirus Pandemic Has Adversely Affected the Global Economy and Will Likely Adversely Affect the Performance of the Mortgage Loans” in the Prospectus. |
THE INFORMATION IN THIS STRUCTURAL AND COLLATERAL TERM SHEET IS NOT COMPLETE AND MAY BE AMENDED PRIOR TO THE TIME OF SALE. THIS TERM SHEET IS NOT AN OFFER TO SELL THESE SECURITIES AND IT IS NOT A SOLICITATION OF AN OFFER TO BUY THESE SECURITIES IN ANY JURISDICTION WHERE THE OFFER OR SALE IS NOT PERMITTED.
160 of 166
| Structural and Collateral Term Sheet | Benchmark 2021-B24 | |
| The Village at Meridian | ||
The Loan. The Village at Meridian mortgage loan (the “The Village at Meridian Loan”) is secured by a first mortgage lien on the borrower’s fee interest in an 841,927 square foot retail center located in Meridian, Idaho. The Village at Meridian Loan is part of a whole loan evidenced by two pari passu promissory notes, each as described below, with an aggregate original principal balance as of the Cut-off Date of $65,995,000 (the “The Village at Meridian Whole Loan”). The relationship between the holders of The Village at Meridian Whole Loan will be governed by a co-lender agreement as described under “Description of the Mortgage Pool—The Whole Loans—The Non-Serviced Pari Passu Whole Loans” in the Preliminary Prospectus. The Village at Meridian Loan is serviced pursuant to the pooling and servicing agreement for the Benchmark 2021-B23 transaction. The Village at Meridian Whole Loan has a 10-year term and is interest only for the full term of the loan.
| Whole Loan Summary | |||||
| Note | Original Balance | Cut-off Date Balance | Note Holder | Controlling Piece | |
| Note A-1 | $35,000,000 | $35,000,000 | Benchmark 2021-B23 | Yes | |
| Note A-2 | $30,995,000 | $30,995,000 | Benchmark 2021-B24 | No | |
| Whole Loan | $65,995,000 | $65,995,000 | |||
The Borrower. The borrower is Meridian CenterCal Owner, LLC, a Delaware limited liability company and single purpose entity with two independent directors. Legal counsel to the borrower delivered a non-consolidation opinion in connection with the origination of The Village at Meridian Loan.
The Loan Sponsor. The borrower is indirectly owned or controlled by a joint venture between the California State Teachers Retirement System (“CalSTRS”) and CenterCal, LLC (“CenterCal”). CalSTRS is the largest educator-only pension fund in the world, the second largest pension fund in the United States and as of January 31, 2021, had a market value of approximately $282.5 billion. CenterCal, founded in 2004 by Fred Bruning and Jean Paul Wardy, is a full-service commercial real estate company in the business of investing, developing, leasing and managing its projects. CenterCal has over 120 employees in 12 offices across the Western United States.
There is no separate non-recourse carveout guarantor or environmental indemnitor, and the borrower is the sole party responsible for breaches or violations of the non-recourse carve-out provisions in the related Mortgage Loan documents, including the environmental indemnity. At loan origination, the loan sponsors provided a secured lender environmental policy. See “Environmental Matters” below for additional information related to the environmental insurance.
The Property. The Village at Meridian property is an 841,927 square foot retail center located at 1600-2300 North Eagle Road in Meridian, Idaho. The Village at Meridian property is situated on 59.1 acres in Idaho’s Treasure Valley, at the intersection of Legacy Parkway and Interstate 84. The Village at Meridian property consists of 19, one to three story buildings. Other amenities on The Village at Meridian property include lighted fountains, a synthetic turf play area (which becomes an outdoor skating rink in winter), outdoor seating and a playground. The Village at Meridian property is accessible via Valley Regional Transit’s regional bus system as well as Boise Airport and downtown Boise. The loan sponsor initially acquired The Village at Meridian site in 2008 and developed The Village at Meridian property in 2012 for a total estimated cost of approximately $174.1 million ($206.78 per square foot). The loan sponsor has since invested approximately $73.2 million in leasing costs and $94,111 in capital improvements, resulting in a total cost basis of approximately $247.4 million ($293.87 per square foot).
As of October 1, 2020, The Village at Meridian property was approximately 79.3% occupied by a granular rent roll comprising of 98 tenants. The improvements are comprised of a big box portion on the north end and a mixed-use portion on the south end. The big box portion on the north end is anchored by Petco, Nike, Gap Outlet, and Marshall’s and the south end is anchored by Big Al’s, Village Cinema, and H&M. Despite the ongoing market disruption as a result of the COVID-19 pandemic, there has been continued tenant demand, with the loan sponsor having executed 11 new leases since 2020, including Sierra Trading Post (18,591 square feet).
The largest tenant at The Village at Meridian property is Big Al’s (65,913 square feet; 7.8% of net rentable area; 8.0% of underwritten base rent). Big Al’s is a family friendly entertainment destination with a bowling alley, arcade, and sports book-style restaurant. Opened in 2012, Big Al’s also has locations in Oregon, Washington, California and Canada. Big Al’s lease commenced in March 2013 and expires in August 2027. Big Al’s has five, five-year renewal options remaining and no termination options. Big Al’s is open for business and is currently paying 50% of contractual rent.
The second largest tenant at The Village at Meridian property is Village Cinema (55,309 square feet; 6.6% of net rentable area; 7.1% of underwritten base rent). Village Cinema is owned by Cinema West, which owns 15 theaters, 13 of which are in California and two in Idaho. Village Cinema’s lease commenced in October 2013 and expires in October 2033. Village Cinema has four, five-year renewal options and no termination options. Village Cinema is open for business, but has not yet resumed paying rent.
The third largest tenant at The Village at Meridian property is OpSec Online LLC (“OpSec”) (40,805 square feet; 4.8% of net rentable area; 6.6% of underwritten base rent). OpSec is an office tenant that provides products, services, and solutions to corporate and government clients to protect from internet counterfeiting, fraud, piracy, and cybersquatting. They are present in sixteen locations across nine countries with a network that spans over 40+ countries worldwide. OpSec’s lease commenced in May 2016 and expires in February 2025. OpSec has two, three-year renewal options and no termination options.
THE INFORMATION IN THIS STRUCTURAL AND COLLATERAL TERM SHEET IS NOT COMPLETE AND MAY BE AMENDED PRIOR TO THE TIME OF SALE. THIS TERM SHEET IS NOT AN OFFER TO SELL THESE SECURITIES AND IT IS NOT A SOLICITATION OF AN OFFER TO BUY THESE SECURITIES IN ANY JURISDICTION WHERE THE OFFER OR SALE IS NOT PERMITTED.
161 of 166
| Structural and Collateral Term Sheet | Benchmark 2021-B24 | |
| The Village at Meridian | ||
COVID-19 Update. As of February 5, 2021, The Village at Meridian property is open for operations. As a result of COVID-19, the borrower negotiated rent deferrals on a tenant-by-tenant basis and ultimately provided between one to five months of deferred rent spanning April 2020 to December 2020 to 30 tenants totaling 186,026 square feet, amounting to $909,200 of rent deferment. Leases for these tenants were amended such that the deferred rent will be recouped by the borrower via 12 equal installments in 2021. In addition, as a result of COVID-19, the borrower provided partial or full rent abatements to eight tenants spanning May 2020 to December 2020. At origination, a $3,742,823 gap rent reserve was established, representing the aggregate amount of base rent for the succeeding 12-months for tenants who had not paid in-full base rent due pursuant to each such tenant’s underlying lease as of the origination date. Such amounts will not be released to the borrower until, among other conditions, (i) collections exceed 95% of the full rent payable from all tenants in place as of the origination date for a period of 12 consecutive months and (ii) The Village at Meridian property is at least 80% occupied based on total square footage, provided no event of default or cash sweep event then exists. Rent collections for December 2020 and January 2021 were 79.2% and 82.9%, respectively. As of February 5, 2021, The Village at Meridian Whole Loan is not subject to any modification or forbearance requests. The first payment date is scheduled for March 5, 2021. See “Risk Factors—Risks Related to Market Conditions and Other External Factors—The Coronavirus Pandemic Has Adversely Affected the Global Economy and Will Likely Adversely Affect the Performance of the Mortgage Loans” in the Preliminary Prospectus.
| Historical Occupancy(1) | |||
| 2017 | 2018 | 2019 | Current(2) |
| 85.5% | 81.6% | 85.0% | 79.3% |
| (1) | Historical occupancies are as of December 31 of each respective year. |
| (2) | Current Occupancy is based on the October 1, 2020 rent roll. |
| Tenant Summary(1) | ||||||||
| Tenant | Tenant Type | Ratings Moody’s/Fitch/S&P(2) | Net Rentable Area (SF) | % of Total NRA | Base Rent PSF(3) | % of Total Base Rent | Lease Expiration Date | |
| Big Al’s | Retail | NR / NR / NR | 65,913 | 7.8% | $18.70 | 8.0% | 8/31/2027 | |
| Village Cinema | Retail | NR / NR / NR | 55,309 | 6.6% | 19.69 | 7.1% | 10/31/2033 | |
| OpSec Online LLC(4) | Office | NR / NR / NR | 40,805 | 4.8% | 24.76 | 6.6% | 2/28/2025 | |
| Axiom Fitness | Retail | NR / NR / NR | 37,699 | 4.5% | 19.38 | 4.8% | 3/31/2024 | |
| Boise Co-Op | Retail | NR / NR / NR | 25,036 | 3.0% | 19.80 | 3.2% | 11/30/2035 | |
| Marshalls | Retail | A2 / NR / A | 25,003 | 3.0% | 10.00 | 1.6% | 9/30/2022 | |
| H & M(5) | Retail | NR / NR / NR | 23,000 | 2.7% | 0.00 | 0.0% | 12/31/2025 | |
| Michaels Store | Retail | B2 / NR / NR | 21,958 | 2.6% | 15.08 | 2.2% | 2/28/2025 | |
| Sierra Trading Post | Retail | A2 / NR / A | 18,591 | 2.2% | 13.25 | 1.6% | 4/31/2031 | |
| Regus Corporation | Office | NR / NR / NR | 16,006 | 1.9% | 29.99 | 3.1% | 12/31/2025 | |
| Total | 329,320 | 39.1% | $17.81 | 38.3% | ||||
| Other Occupied Retail | 280,023 | 33.3% | 28.48 | 52.1% | ||||
| Other Occupied Office | 58,587 | 7.0% | 25.17 | 9.6% | ||||
| Total Occupied | 667,930 | 79.3% | $22.93 | 100.0% | ||||
| Vacant | 173,997 | 20.7% | ||||||
| Total / Wtd. Avg. | 841,927 | 100.0% | ||||||
| (1) | Based on the underwritten rent roll dated October 1, 2020. |
| (2) | In certain instances, ratings provided are those of the parent company of the entity shown, whether or not the parent company guarantees the lease. |
| (3) | Base Rent PSF is inclusive of rent steps through January 2022. |
| (4) | OpSec Online LLC has subleased 13,500 square feet of its total lease area of 40,805 square feet to Engage Technologies Group, Inc. for 52 months. The term of the sublease commenced on November 1, 2020, and expires on February 27, 2025, one day before the expiration date of the prime lease. The base rent under the sublease is $24.00 per square foot. |
| (5) | H & M pays percentage rent in lieu on a monthly basis. |
THE INFORMATION IN THIS STRUCTURAL AND COLLATERAL TERM SHEET IS NOT COMPLETE AND MAY BE AMENDED PRIOR TO THE TIME OF SALE. THIS TERM SHEET IS NOT AN OFFER TO SELL THESE SECURITIES AND IT IS NOT A SOLICITATION OF AN OFFER TO BUY THESE SECURITIES IN ANY JURISDICTION WHERE THE OFFER OR SALE IS NOT PERMITTED.
162 of 166
| Structural and Collateral Term Sheet | Benchmark 2021-B24 | |
| The Village at Meridian | ||
| Lease Rollover Schedule(1) | |||||||||
| Year | Number of Leases Expiring | Net Rentable Area Expiring | % of NRA Expiring | Base Rent Expiring(2) | % of Base Rent Expiring(2) | Cumulative NRA Expiring | Cumulative % of NRA Expiring | Cumulative Base Rent Expiring(2) | Cumulative % of Base Rent Expiring(2) |
| Vacant | NAP | 173,997 | 20.7% | NAP | NAP | 173,997 | 20.7% | NAP | NAP |
| 2021 & MTM | 8 | 19,813 | 2.4% | $390,831 | 2.6% | 193,810 | 23.0% | $390,831 | 2.6% |
| 2022 | 12 | 53,081 | 6.3% | 1,003,339 | 6.6% | 246,891 | 29.3% | $1,394,170 | 9.1% |
| 2023 | 9 | 59,421 | 7.1% | 1,817,459 | 11.9% | 306,312 | 36.4% | $3,211,629 | 21.0% |
| 2024 | 23 | 87,497 | 10.4% | 2,534,895 | 16.6% | 393,809 | 46.8% | $5,746,524 | 37.5% |
| 2025 | 16 | 152,326 | 18.1% | 3,400,557 | 22.2% | 546,135 | 64.9% | $9,147,081 | 59.7% |
| 2026 | 8 | 49,070 | 5.8% | 1,094,217 | 7.1% | 595,205 | 70.7% | $10,241,298 | 66.9% |
| 2027 | 5 | 75,613 | 9.0% | 1,540,270 | 10.1% | 670,818 | 79.7% | $11,781,568 | 76.9% |
| 2028 | 3 | 15,338 | 1.8% | 121,271 | 0.8% | 686,156 | 81.5% | $11,902,839 | 77.7% |
| 2029 | 6 | 30,745 | 3.7% | 1,009,909 | 6.6% | 716,901 | 85.2% | $12,912,748 | 84.3% |
| 2030 | 3 | 9,350 | 1.1% | 249,809 | 1.6% | 726,251 | 86.3% | $13,162,557 | 85.9% |
| 2031 | 2 | 23,854 | 2.8% | 431,325 | 2.8% | 750,105 | 89.1% | $13,593,882 | 88.8% |
| 2032 & Thereafter | 3 | 91,822 | 10.9% | 1,722,186 | 11.2% | 841,927 | 100.0% | $15,316,068 | 100.0% |
| Total | 98 | 841,927 | 100.0% | $15,316,068 | 100.0% | ||||
| (1) | Based on the underwritten rent roll dated October 1, 2020. |
| (2) | Base Rent Expiring, % of Base Rent Expiring, Cumulative Base Rent Expiring and Cumulative % of Base Rent Expiring are inclusive of contractual rent steps through January 2022. |
| Operating History and Underwritten Net Cash Flow(1) | |||||||
| 2017 | 2018 | 2019 | TTM(2) | Underwritten | PSF | % | |
| Rents in Place(3) | $14,046,542 | $13,917,169 | $15,070,977 | $16,194,137 | $15,316,068 | $18.19 | 63.1% |
| Vacant Income | 0 | 0 | 0 | 0 | 4,524,908 | 5.37 | 18.6% |
| Gross Potential Rent | $14,046,542 | $13,917,169 | $15,070,977 | $16,194,137 | $19,840,976 | $23.57 | 81.7% |
| Total Reimbursements | 4,709,766 | 4,521,125 | 5,247,505 | 4,838,304 | 4,448,850 | 5.28 | 18.3% |
| Gross Potential Income | $18,756,308 | $18,438,293 | $20,318,482 | $21,032,441 | $24,289,826 | $28.85 | 100.0% |
| (Vacancy/Credit Loss) | (96,546) | 0 | 0 | 0 | (4,524,908) | (5.37) | (18.6)% |
| Other Income | 346,934 | 531,846 | 172,714 | 363,175 | 363,175 | 0.43 | 1.5% |
| Effective Gross Income | $19,006,696 | $18,970,139 | $20,491,196 | $21,395,616 | $20,128,093 | $23.91 | 82.9% |
| Total Expenses | 8,151,813 | 8,128,280 | 7,886,173 | 7,579,294 | 7,548,855 | 8.97 | 37.5% |
| Net Operating Income | $10,854,883 | $10,841,859 | $12,605,023 | $13,816,322 | $12,579,238 | $14.94 | 62.5% |
| TI/LC | 0 | 0 | 0 | 0 | 420,964 | 0.50 | 2.1% |
| Capital Expenditures | 0 | 0 | 0 | 0 | 126,289 | 0.15 | 0.6% |
| Net Cash Flow | $10,854,883 | $10,841,859 | $12,605,023 | $13,816,322 | $12,031,985 | $14.29 | 59.8% |
| (1) | Based on underwritten rent roll dated October 1, 2020. |
| (2) | TTM represents the trailing 12-month period ending October 1, 2020. |
| (3) | Underwritten Rents in Place is inclusive of contractual rent steps through January 2022. |
The Market. The property is located in Meridian, Idaho at the intersection of Legacy Parkway and Interstate 84, which is situated in Ada County, eight miles west of the Boise central business district. Primary access to this area is provided by Interstate 84 and Fairview Avenue which runs into downtown Boise. This area benefits from in-migration from larger metropolitan cities on the west coast as well as increasing construction and growth in consumer industries.
According to the appraisal, The Village at Meridian property is located in the Meridian retail submarket within the greater Boise - Idaho retail market. The Boise - Idaho retail market has a total inventory of approximately 40.7 million square feet as of the fourth quarter of 2020. The Boise - Idaho retail market reported an average asking rent of $14.00 per square foot and a 5.3% vacancy rate as of the fourth quarter of 2020. The Meridian retail submarket had a total inventory of approximately 5.3 million square feet and a 3.8% vacancy rate as of the fourth quarter of 2020. According to the appraisal, the average asking rent in the Meridian retail submarket was $16.86 per square foot as of the fourth quarter of 2020.
According to the appraisal, The Village at Meridian Property is positioned to remain competitive in relation to other retail properties in the Meridian retail submarket and the more immediate primary trade area. It is in good proximity to both employment centers and major roadways, and according to the appraisal, the surrounding retail/office developments are experiencing above average levels of demand.
THE INFORMATION IN THIS STRUCTURAL AND COLLATERAL TERM SHEET IS NOT COMPLETE AND MAY BE AMENDED PRIOR TO THE TIME OF SALE. THIS TERM SHEET IS NOT AN OFFER TO SELL THESE SECURITIES AND IT IS NOT A SOLICITATION OF AN OFFER TO BUY THESE SECURITIES IN ANY JURISDICTION WHERE THE OFFER OR SALE IS NOT PERMITTED.
163 of 166
| Structural and Collateral Term Sheet | Benchmark 2021-B24 | |
| The Village at Meridian | ||
| Competitive/Comparable Properties(1) | |||||||
| Property Name | Distance (Miles) | Size (SF) | Year Built | Occupancy | Anchor / In-line Tenants | Range of Lease Terms (Yrs.) | Range of Base Rents PSF |
| Meridian Crossroads Meridian, ID | 0.29 | 527,926 | 2004 | 98% | Under Armor Petsmart Hook and Reel Bassett Furniture | 5.0 - 10.0 | $15.00 - $25.00 |
| BoDo Urban Lifestyle Center Boise, ID | 7.11 | 116,428 | 2005 | 91% | VR2 Yoi Tomo | 4.0 - 10.0 | $21.00 - $26.78 |
| Eagle Island Marketplace - Pad L Meridian, ID | 4.37 | 10,204 | 2020 | 100% | Profile Sanford Palm Beach Tan Orange Theory Fitness Boise Fry Company | 7.0 - 10.0 | $28.00 - $30.00 |
| Treasure Valley Marketplace Nampa, ID | 12.17 | 294,115 | 2007 | 71% | Dutch Brothers AAA Idaho Oral Surgery America First Credit Union | 5.0 - 10.0 | $24.00 - $28.00 |
| Trader Joe’s on Front Boise, ID | 7.24 | 17,061 | 2014 | 100% | Chipotle Panda Express Trader Joes | 10.0 | $39.25 - $43.00 |
| Smart Foodservice Meridian, ID | 0.68 | 20,000 | 2019 | 100% | Smart Foodservice | 15.0 | $15.50 |
| (1) | Source: Appraisal |
| Summary of Appraisal’s Concluded Market Rents(1) | |
| Category | Market Rent PSF |
| Anchor | $10.00 |
| Jr. Anchors | $15.00 |
| MidBox | $18.00 |
| Theater | $20.00 |
| Inline> 10,000 SF | $18.00 |
| Inline - 1,000-9,999 | $32.00 - $45.00 |
| Inline - Under 1,000 | $50.00 |
| Inline - Food Court | $220.00 |
| Pad Sites | $35.00 |
| Restaurant | $40.00 |
| Office | $25.00 |
| Ground Lease | $12.00 |
| (1) | Source: Appraisal |
Property Management. The Village at Meridian property is currently managed by CenterCal Properties, LLC, a Delaware limited liability company and an affiliate of the borrower.
THE INFORMATION IN THIS STRUCTURAL AND COLLATERAL TERM SHEET IS NOT COMPLETE AND MAY BE AMENDED PRIOR TO THE TIME OF SALE. THIS TERM SHEET IS NOT AN OFFER TO SELL THESE SECURITIES AND IT IS NOT A SOLICITATION OF AN OFFER TO BUY THESE SECURITIES IN ANY JURISDICTION WHERE THE OFFER OR SALE IS NOT PERMITTED.
164 of 166
| Structural and Collateral Term Sheet | Benchmark 2021-B24 | |
| Contacts | ||
| J.P. Morgan CMBS Capital Markets & Banking | ||
| Contact | Phone Number | |
Kunal Singh Managing Director | kunal.k.singh@jpmorgan.com | (212) 834-5467 |
Dwayne McNicholas Executive Director | dwayne.p.mcnicholas@jpmorgan.com | (212) 834-9328 |
| Harris Rendelstein Vice President | harris.rendelstein@jpmorgan.com | (212) 834-6737 |
| J.P. Morgan CMBS Trading | ||
| Contact | Phone Number | |
Avinash Sharma Managing Director | avinash.sharma@jpmorgan.com | (212) 834-3111 |
Derrick Fetzer Vice President | derrick.e.fetzer@jpmchase.com | (212) 834-3111 |
| J.P. Morgan Securitized Products Syndicate | ||
| Contact | Phone Number | |
Jennifer Kornblau Executive Director | jennifer.l.kornblau@jpmorgan.com | (212) 834-4154 |
Kailin Twomey Associate | kailin.e.twomey@jpmchase.com | (212) 834-4154 |
| Deutsche Bank CMBS Capital Markets & Banking | ||
| Contact | Phone Number | |
Lainie Kaye Managing Director | lainie.kaye@db.com | (212) 250-5270 |
Natalie Grainger Director | natalie.grainger@db.com | (212) 250-1254 |
| Deutsche Bank CMBS Trading | ||
| Contact | Phone Number | |
Ryan Horvath Director | ryan.horvath@db.com | (212) 250-5149 |
| Deutsche Bank CMBS Structuring | ||
| Contact | Phone Number | |
Shaishav Agarwal Managing Director | shaishav.agarwal@db.com | (212) 250-6290 |
Dan Penn Director | daniel.penn@db.com | (212) 250-5149 |
| Citigroup CMBS Capital Markets & Securitization | ||
| Contact | Phone Number | |
Rick Simpson Director | richard.simpson@citi.com | (212) 816-5343 |
Sana Petersen Director | sana.petersen@citi.com | (212) 816-3852 |
| Citigroup Structuring, Trading & Syndicate | ||
| Contact | Phone Number | |
Raul Orozco Director | raul.d.orozco@citi.com | (212) 723-1295 |
Mattison Perry Director | mattison.perry@citi.com | (212) 723-1295 |
THE INFORMATION IN THIS STRUCTURAL AND COLLATERAL TERM SHEET IS NOT COMPLETE AND MAY BE AMENDED PRIOR TO THE TIME OF SALE. THIS TERM SHEET IS NOT AN OFFER TO SELL THESE SECURITIES AND IT IS NOT A SOLICITATION OF AN OFFER TO BUY THESE SECURITIES IN ANY JURISDICTION WHERE THE OFFER OR SALE IS NOT PERMITTED.
165 of 166
| Structural and Collateral Term Sheet | Benchmark 2021-B24 | |
| Contacts | ||
| Goldman Sachs & Co. LLC Banking | ||
| Contact | Phone Number | |
Leah Nivison Managing Director | leah.nivison@gs.com | (212) 357-2702 |
Scott Epperson Managing Director | scott.epperson@gs.com | (212) 934-2882 |
Justin Peterson Vice President | justin.peterson@gs.com | (212) 902-4283 |
| Goldman Sachs & Co. LLC Capital Markets | ||
| Contact | Phone Number | |
Mark Romanczuk Managing Director | mark.romanczuk@gs.com | (212) 902-0290 |
Nitin Jagga Vice President | nitin.jagga@gs.com | (212) 855-9035 |
| Goldman Sachs & Co. LLC Syndicate | ||
| Contact | Phone Number | |
Scott Walter Managing Director | scott.walter@gs.com | (212) 357-8910 |
THE INFORMATION IN THIS STRUCTURAL AND COLLATERAL TERM SHEET IS NOT COMPLETE AND MAY BE AMENDED PRIOR TO THE TIME OF SALE. THIS TERM SHEET IS NOT AN OFFER TO SELL THESE SECURITIES AND IT IS NOT A SOLICITATION OF AN OFFER TO BUY THESE SECURITIES IN ANY JURISDICTION WHERE THE OFFER OR SALE IS NOT PERMITTED.
166 of 166