SECURITIES AND EXCHANGE COMMISSION
WASHINGTON, D.C. 20549
| ☐ | REGISTRATION STATEMENT PURSUANT TO SECTION 12(b) OR (g) OF THE SECURITIES EXCHANGE ACT OF 1934 |
| ☒ | ANNUAL REPORT PURSUANT TO SECTION 13 OR 15(d) OF THE SECURITIES EXCHANGE ACT OF 1934 |
| ☐ | TRANSITION REPORT PURSUANT TO SECTION 13 OR 15(d) OF THE SECURITIES EXCHANGE ACT OF 1934 |
| ☐ | SHELL COMPANY REPORT PURSUANT TO SECTION 13 OR 15(d) OF THE SECURITIES EXCHANGE ACT OF 1934 |

monday.com Ltd.
(Exact name of Registrant as specified in its charter)
General Counsel
Telephone: +972(55) 939-7720
monday.com Ltd.
6 Yitzhak Sadeh Street
Title of each class | Trading Symbol | Name of each exchange on which registered |
Ordinary shares, no par value per share | MNDY | The Nasdaq Stock Market LLC |
Large accelerated filer ☐ | Accelerated filer ☐ | Non-accelerated filer ☒ |
Emerging growth company ☒ |
U.S. GAAP ☒ | International Financial Reporting Standards as issued by the International Accounting Standards Board ☐ | Other ☐ |


Annual Report on Form 20-F for the Fiscal Year Ended December 31, 2021
| 1 | ||
| 1 | ||
| PART I | ||
| 3 | ||
| 3 | ||
| 3 | ||
| 46 | ||
| 69 | ||
| 69 | ||
| 90 | ||
| 107 | ||
| 110 | ||
| 110 | ||
| 111 | ||
| 122 | ||
| 123 | ||
| PART II | ||
| 124 | ||
| 124 | ||
| 124 | ||
| 125 | ||
| 125 | ||
| 125 | ||
| 126 | ||
| 126 | ||
| 126 | ||
| 126 | ||
| 127 | ||
| PART III | ||
| 127 | ||
| 127 | ||
| 128 | ||
| • | our ability to predict our revenue and evaluate our business and future prospects; |
| • | our ability to manage our growth effectively; |
| • | our ability to achieve and maintain profitability; |
| • | interruptions or performance problems associated with the technology or infrastructure underlying our platform; |
| • | our ability to attract customers, grow our retention rates, expand usage within organizations and sell subscription plans; |
| • | our ability to offer high-quality customer support; |
| • | our ability to effectively develop and expand our direct sales capabilities; |
| • | our ability to enhance our reputation and market awareness of our Work OS and products; |
| • | actions by governments to restrict access to our platform in their countries; |
| • | our ability to identify and integrate future acquisitions, strategic investments, partnerships or alliances; |
| • | our ability to attract and retain highly skilled employees; |
| • | our ability to raise additional capital or generate cash flows necessary to expand our operations and invest in new technologies; |
| • | the market and software categories in which we participate; |
| • | our ability to ensure that our Work OS and products interoperates with a variety of software applications that are developed by third parties; |
| • | the success of our strategic relationships with third parties; |
| • | privacy, data and cybersecurity; and |
| • | other statements described in this annual report under Item 3.D. “Risk Factors,” Item 4. “Information on the Company” and Item 5. “Operating and Financial Review and Prospects.” |
| A. | Selected Financial Data Reserved. |
| B. | Capitalization and Indebtedness Not applicable. |
| C. | Reasons for the Offer and Use of Proceeds Not applicable. |
| D. | Risk Factors Risk Factors Summary The following summarizes the principal risks that could materially and adversely affect our business, financial condition, operating results and growth prospects. Risks Related to our Business, Industry and Competition: |
Risks Related to our Business, Industry and Competition: |
| ● | We have a limited operating history, experience fluctuations in operating results, and we derive and continue to derive a majority of revenues from a single product. |
| ● | We have a history of net losses, we may not be able to achieve or maintain profitability, and may not manage our growth or business plan effectively. |
| ● | Real or perceived errors, failures, vulnerabilities or bugs on our platform, products and other third-party apps offered on our App Marketplace, and interruptions or performance problems in the technology or infrastructure underlying our platform could harm our business and financial condition. |
| ● | We may be unable to raise capital, generate cash flow, attract customers, grow our retention rates, expand usage within organizations and sell subscription plans. |
| ● | We may fail to offer high quality customer support, timely sales efforts, consistent sales strategies, or expand direct sales capabilities. |
| ● | If we fail to enhance our reputation, brand market awareness, and maintain our corporate culture, the success of our business and financial condition may suffer. |
| ● | The COVID-19 pandemic affects our operations and to business uncertainty. |
| ● | We are susceptible to risks from international operations, including fluctuations in foreign exchange rates, regulation for platform access and information disclosure. |
| ● | Difficulties in integration of partnerships, acquisitions and alliances may divert the attention of key management personnel. |
| ● | An inability to attract and retain highly skilled employees or the loss of key employees, including our founders, could harm our business. |
| ● | We operate in a competitive market that is new and rapidly changing, and we require adequate research and development to generate new capabilities. |
| ● | Our platform may be less competitive if our Work OS fails to interoperate with a variety of software applications developed by third parties, including our partners. |
| ● | We depend on third parties for web engine searches, service interruptions management, infrastructure capacity, and mobile application distribution. |
| ● | We are subject to security disruptions, unauthorized system access, contractual requirements, evolving privacy laws and regulations, cross-border data transfer restrictions, data localization requirements and other domestic or foreign laws. |
| ● | We are subject to changes in tax law and regulations in various jurisdictions. |
| ● | Sales tax requirements, changes to taxation of international business activities, corporate tax reform and new tax legislation may harm our operating results. |
| ● | If we are classified as a passive foreign investment company, U.S. holders of our ordinary shares will be subject to adverse U.S. federal income tax consequences. |
| ● | If a U.S. person is treated as owning 10% or more of our ordinary shares, such holder may be subject to adverse U.S. federal income tax consequences. |
| ● | We may fail to adequately maintain, protect or enforce our intellectual property rights, leading to loss of value, revenue, and costly litigation. |
| ● | We may be subject to a protracted infringement claim that results in a significant damage award or a claim that results in an injunction. |
| ● | Our platform utilizes open-source software, and any defects or security vulnerabilities in the open-source software could negatively affect our business. |
| ● | We have founder shares with certain veto rights, thereby limiting your ability to influence certain key matters affecting our business and affairs. |
| ● | Our reduced disclosure requirements as an emerging growth company may make our ordinary shares less attractive to investors. |
| ● | We are a foreign private issuer not subject to U.S. proxy rules and subject to less stringent Exchange Act reporting obligations compared to a domestic company. |
| ● | Our shareholders may not have the same protections afforded as shareholders of companies subject to Nasdaq governance requirements. |
| ● | We may lose our foreign private issuer status in the future, which could result in significant additional costs and expenses. |
| ● | Israeli law and our amended and restated articles of association may delay or prevent an acquisition of all or a significant portion of our shares or assets. |
| ● | We do not expect to pay any dividends in the foreseeable future. |
| ● | We have not yet determined whether our existing internal controls over financial reporting are in compliance with Section 404 of the Sarbanes-Oxley Act. |
| ● | Conditions in Israel could materially and adversely affect our business. |
| ● | It may be difficult to enforce a U.S. judgment against us or assert U.S. securities laws claims in Israel or serve process on our non-U.S. officers and directors. |
| ● | Your rights and responsibilities as our shareholder are governed by Israeli law, which may differ in some respects from shareholders of U.S. corporations. |
| ● | We may become subject to claims for remuneration or royalties for assigned service invention rights by our employees, resulting in litigation. |
| ● | Tax benefits available to us require meeting various conditions and may be terminated or reduced in the future, which could increase our costs and taxes. |
| ● | Our amended and restated articles of association provide that unless the Company consents otherwise, the competent courts of Tel Aviv, Israel shall be the sole and exclusive forum for substantially all disputes between the Company and its shareholders under the Companies Law and the Israeli Securities Law. |
| ● | Our business and finances may be subject to litigation and regulatory processes. |
| ● | We are subject to anti-corruption, anti-bribery, anti-money laundering and similar laws, where violations may subject us to criminal penalties or significant fines. |
| ● | We are subject to international export control and economic sanctions laws where non-compliance may impair our ability to compete and subject us to liability. |
Risks Related to our Business and Industry |
| ● | achieve widespread adoption of our Work OS by organizations globally in lieu of, or in addition to, legacy systems; |
| ● | continue to acquire new customers; |
| ● | reach teams and organizations through our marketing and sales efforts; |
| ● | sustain innovation and deliver a superior product and customer experience, allowing us to maintain a competitive advantage; |
| ● | grow or maintain our retention rates and expand the usage of our platform within the organizations already using our platform; |
| ● | continue successfully investing in our go-to-market approach with our sales, customer success and partners teams; |
| ● | introduce and grow the adoption of our platform in new markets outside of the markets in which we currently operate; |
| ● | expand the usage of our platform within certain industries; |
| ● | maintain a high level of security and reliability in our platform; |
| ● | maintain compliance with applicable existing laws and regulations and comply with new applicable laws and regulations; |
| ● | effectively price our platform to attract and retain customers while achieving and maintaining profitability; successfully compete against new and existing market players and competing products; |
| ● | increase the global awareness of our brand; and |
| ● | expand the features and capabilities of our platform. |
| ● | the level of demand for our Work OS and other products we offer; |
| ● | our ability to grow or maintain our retention rates, expand usage within our customer base, and sell our Work OS subscription plans to existing and future customers; |
| ● | our ability to convert users of our trial or free versions into paying customers; |
| ● | costs and timing of expenses related to the acquisition of businesses, talent, technologies or intellectual property, including potentially significant amortization costs and possible write-downs; |
| ● | the impact of market volatility and economic downturns caused by macro-economic forces out of our control, such as the COVID-19 pandemic or other highly communicable diseases or viruses; |
| ● | the timing and success of new features, integrations, capabilities and enhancements by us to our platform or by our competitors to their products or any other change in the competitive landscape of our market; |
| ● | errors in our forecasting of the demand for our Work OS, which could lead to lower revenue, increased costs or both; |
| ● | the amount and timing of operating expenses and capital expenditures, as well as entry into operating leases, that we may incur to maintain and expand our business and operations and to remain competitive; |
| ● | the timing of expenses and recognition of revenue; |
| ● | security breaches, technical difficulties, disruptions or outages on our platform resulting in service level agreement credits; |
| ● | adverse litigation judgments, other dispute-related settlement payments or other litigation-related costs; |
| ● | regulatory fines; |
| ● | changes in the legislative or regulatory environment or in legal and regulatory compliance costs in new and existing markets; |
| ● | number of new employees; |
| ● | amount of share-based compensation and timing of the grant or vesting of equity awards to employees, directors or consultants; |
| ● | pricing pressure as a result of competition or otherwise; |
| ● | fluctuations in foreign currency exchange rates; |
| ● | general economic conditions in either domestic or international markets, including geopolitical uncertainty and instability as well as economic conditions specifically affecting industries in which our customers participate; and |
| ● | expenses incurred in connection with our Digital Lift Initiative. |
| ● | unexpected costs in the localization of our Work OS and products, including translation into foreign languages and adaptation for local culture, practices and regulatory requirements; |
| ● | lack of familiarity and burdens of complying with foreign laws, legal standards, privacy standards, regulatory requirements, tariffs and other barriers; |
| ● | the risk of penalties to our users and individual members of management or employees if our practices are deemed to not comply with applicable laws and regulations; |
| ● | practical difficulties of enforcing intellectual property rights in countries with varying laws and standards and reduced or varied protection for intellectual property rights in some countries; |
| ● | an evolving legal framework and additional legal or regulatory requirements for data privacy, which may necessitate the establishment of systems to maintain data in local markets, requiring us to invest in additional data centers and network infrastructure, and the implementation of additional employee data privacy documentation (including locally-compliant data privacy notice and policies); |
| ● | as an Israeli company, we are subject to Israeli laws concerning governmental access to data and the risk, or perception of risk, of such access may make our Work OS and products less attractive to organizations outside Israel, and compliance with such Israeli laws may conflict with legal obligations that we, or our customers, may be subject to in other countries; |
| ● | unexpected changes in regulatory requirements, taxes, trade laws, tariffs, export quotas, custom duties or other trade restrictions; |
| ● | difficulties in managing systems integrators and technology partners; |
| ● | differing technology standards; |
| ● | different pricing environments, longer sales cycles, longer accounts receivable payment cycles and difficulties in collecting accounts receivable; |
| ● | increased financial accounting and reporting burdens and complexities; |
| ● | difficulties in managing and staffing international operations including the proper classification of independent contractors and other contingent workers, differing employer/employee relationships, and local employment laws; |
| ● | increased costs involved with recruiting and retaining an expanded workforce through cash and equity-based incentive programs and unexpected legal costs and regulatory restrictions in issuing our ordinary shares to employees; |
| ● | global political and regulatory changes that may lead to restrictions on immigration and travel for our employees; |
| ● | regional and local economic and political conditions, and personnel culture differences; |
| ● | fluctuations in exchange rates that may decrease the value of our foreign-based revenue; |
| ● | potentially adverse tax consequences, including the complexities of foreign value added tax (or other tax) systems, and restrictions on the repatriation of earnings; and |
| ● | permanent establishment risks and complexities in connection with international payroll, tax and social security requirements for international employees. |
| ● | develop new features, integrations, capabilities and enhancements; |
| ● | continue to expand our product development, sales and marketing organizations; |
| ● | hire, train and retain employees; |
| ● | respond to competitive pressures or unanticipated working capital requirements; or |
| ● | pursue acquisition or strategic investment opportunities. |
| ● | companies that primarily offer project and work management solutions, including the application of processes, methods, skills, and knowledge to achieve specific objectives. This includes companies such as Asana, Inc., SmartSheet Inc., Notion, Inc., Atlassian Corporation PLC (Trello), Citrix Systems, Inc. (Wrike), Zendesk, Inc., ClickUp, Airtable and Freshworks Inc.; and |
| ● | companies that offer products across other use cases we serve or other product offerings, such as customer relationship management solutions, software development tools and marketing campaign management. This includes companies such as SugarCRM, Pipedrive, Zoho, Inc., Atlassian Corporation PLC (Jira), Procore Technologies, Workday, Inc., BombooHR, LLC, Hootsuite Media Inc. and Adobe Experience Cloud. |
| ● | our ability to introduce new, and improve on existing, features, products and services in response to competition, user sentiment, online, market and industry trends and the ever-evolving technological landscape; |
| ● | our ability to continue to increase social and technological acceptance of our Work OS; |
| ● | continued growth in digitalization of the workplace; |
| ● | our ability to maintain the value and reputation of monday.com as a solution; and |
| ● | the scale, growth and engagement of our community relative to those of our competitors. |
| ● | discontinues or limits our access to its software or APIs; |
| ● | modifies its terms of service or other policies, including fees charged to, or other restrictions on, us or other application developers; |
| ● | changes how information is accessed by us or our users; |
| ● | establishes more favorable relationships with one or more of our competitors; or |
| ● | develops or otherwise favors its own competitive offerings over ours. |
| ● | require costly litigation to resolve and the payment of substantial damages; |
| ● | require and divert significant management time; |
| ● | cause us to enter into unfavorable royalty or license agreements; |
| ● | require us to discontinue some or all of the features, integrations, capabilities and enhancements available on our Work OS or products; |
| ● | require us to indemnify organizations on our platform or third-party service providers; and/or |
| ● | require us to expend additional development resources to redesign our Work OS or products. |
| ● | the Companies Law regulates mergers and requires that a tender offer be effected when more than a specified percentage of shares in a company are purchased; |
| ● | the Companies Law requires special approvals for certain transactions involving directors, officers or significant shareholders and regulates other matters that may be relevant to these types of transactions; |
| ● | the Companies Law does not provide for shareholder action by written consent for public companies, thereby requiring all shareholder actions to be taken at a general meeting of shareholders; |
| ● | our amended and restated articles of association divide our directors into three classes, each of which is elected once every three years; |
| ● | an amendment to our amended and restated articles of association generally, in addition to the approval of our board of directors, requires a vote of the holders of a majority of our outstanding ordinary shares entitled to vote present and voting on the matter at a general meeting of shareholders (referred to as simple majority), and the amendment of a limited number of provisions, such as the provision dividing our directors into three classes, the provision that sets forth the procedures and the requirements that must be met in order for a shareholder to require the Company to include a matter on the agenda for a general meeting of the shareholders, the provisions relating to the election and removal of members of our board of directors and empowering our board of directors to fill vacancies on our board of directors requires, in addition to the approval of our board of directors, a vote of the holders of 65% of our outstanding ordinary shares entitled to vote at a general meeting; |
| ● | our amended and restated articles of association restrict us, subject to certain exceptions, from engaging in certain business combination transactions with any shareholder who holds 20% or more of our voting power. The transactions subject to such restrictions include mergers, consolidations, and dispositions of our assets with a market value of 10% or more of our assets or outstanding shares. Subject to certain exceptions, such restrictions will apply for a period of three years following (i) the closing of the offering for any of our shareholders holding 20% or more of our voting power immediately prior to the offering and (ii) each time a shareholder became the holder of 20% or more of our voting power; |
| ● | our amended and restated articles of association do not permit a director to be removed except by a vote of the holders of at least 65% of our outstanding shares entitled to vote at a general meeting of shareholders; |
| ● | our amended and restated articles of association provide that director vacancies may be filled by our board of directors; and |
| ● | Roy Mann, one of our Co-Founders and Co-Executive Officers and a member of our board of directors, holds one founder share, which provides Mr. Mann with certain veto rights over the approval of certain corporate transactions. See “— One of our Co-Founders and Co-Chief Executive Officers holds one founder share with certain veto rights, thereby limiting your ability to influence certain key matters affecting our business and affairs.” |
| ● | Our commitment to charitable donations through the Digital Lift Foundation may not align our interests with those of our customers and shareholders. Moreover, our commitment to charitable donations may not resonate with new or existing customers and shareholders and may fail to attract new customers and shareholders to the Company. |
| ● | The amount of equity contributed to the Digital Lift Foundation over time may be viewed as excessively dilutive to new and existing shareholders. |
| ● | We have no control over how the Digital Lift Foundation will deploy the capital that we donate to it over time. As such, the Digital Lift Foundation may deploy funds in a way that fails to align with our corporate values and culture. |
| ● | If the majority of the members of the Digital Lift Foundation’s board of directors do not remain independent from the Company or if in the future, we try to exert control over the Digital Lift Foundation, tax authorities may view the Digital Lift Foundation as an extension of the Company and require us to treat the Digital Lift Foundation as a consolidated subsidiary of the Company for financial and tax reporting purposes. |
| A. | History and Development of the Company |
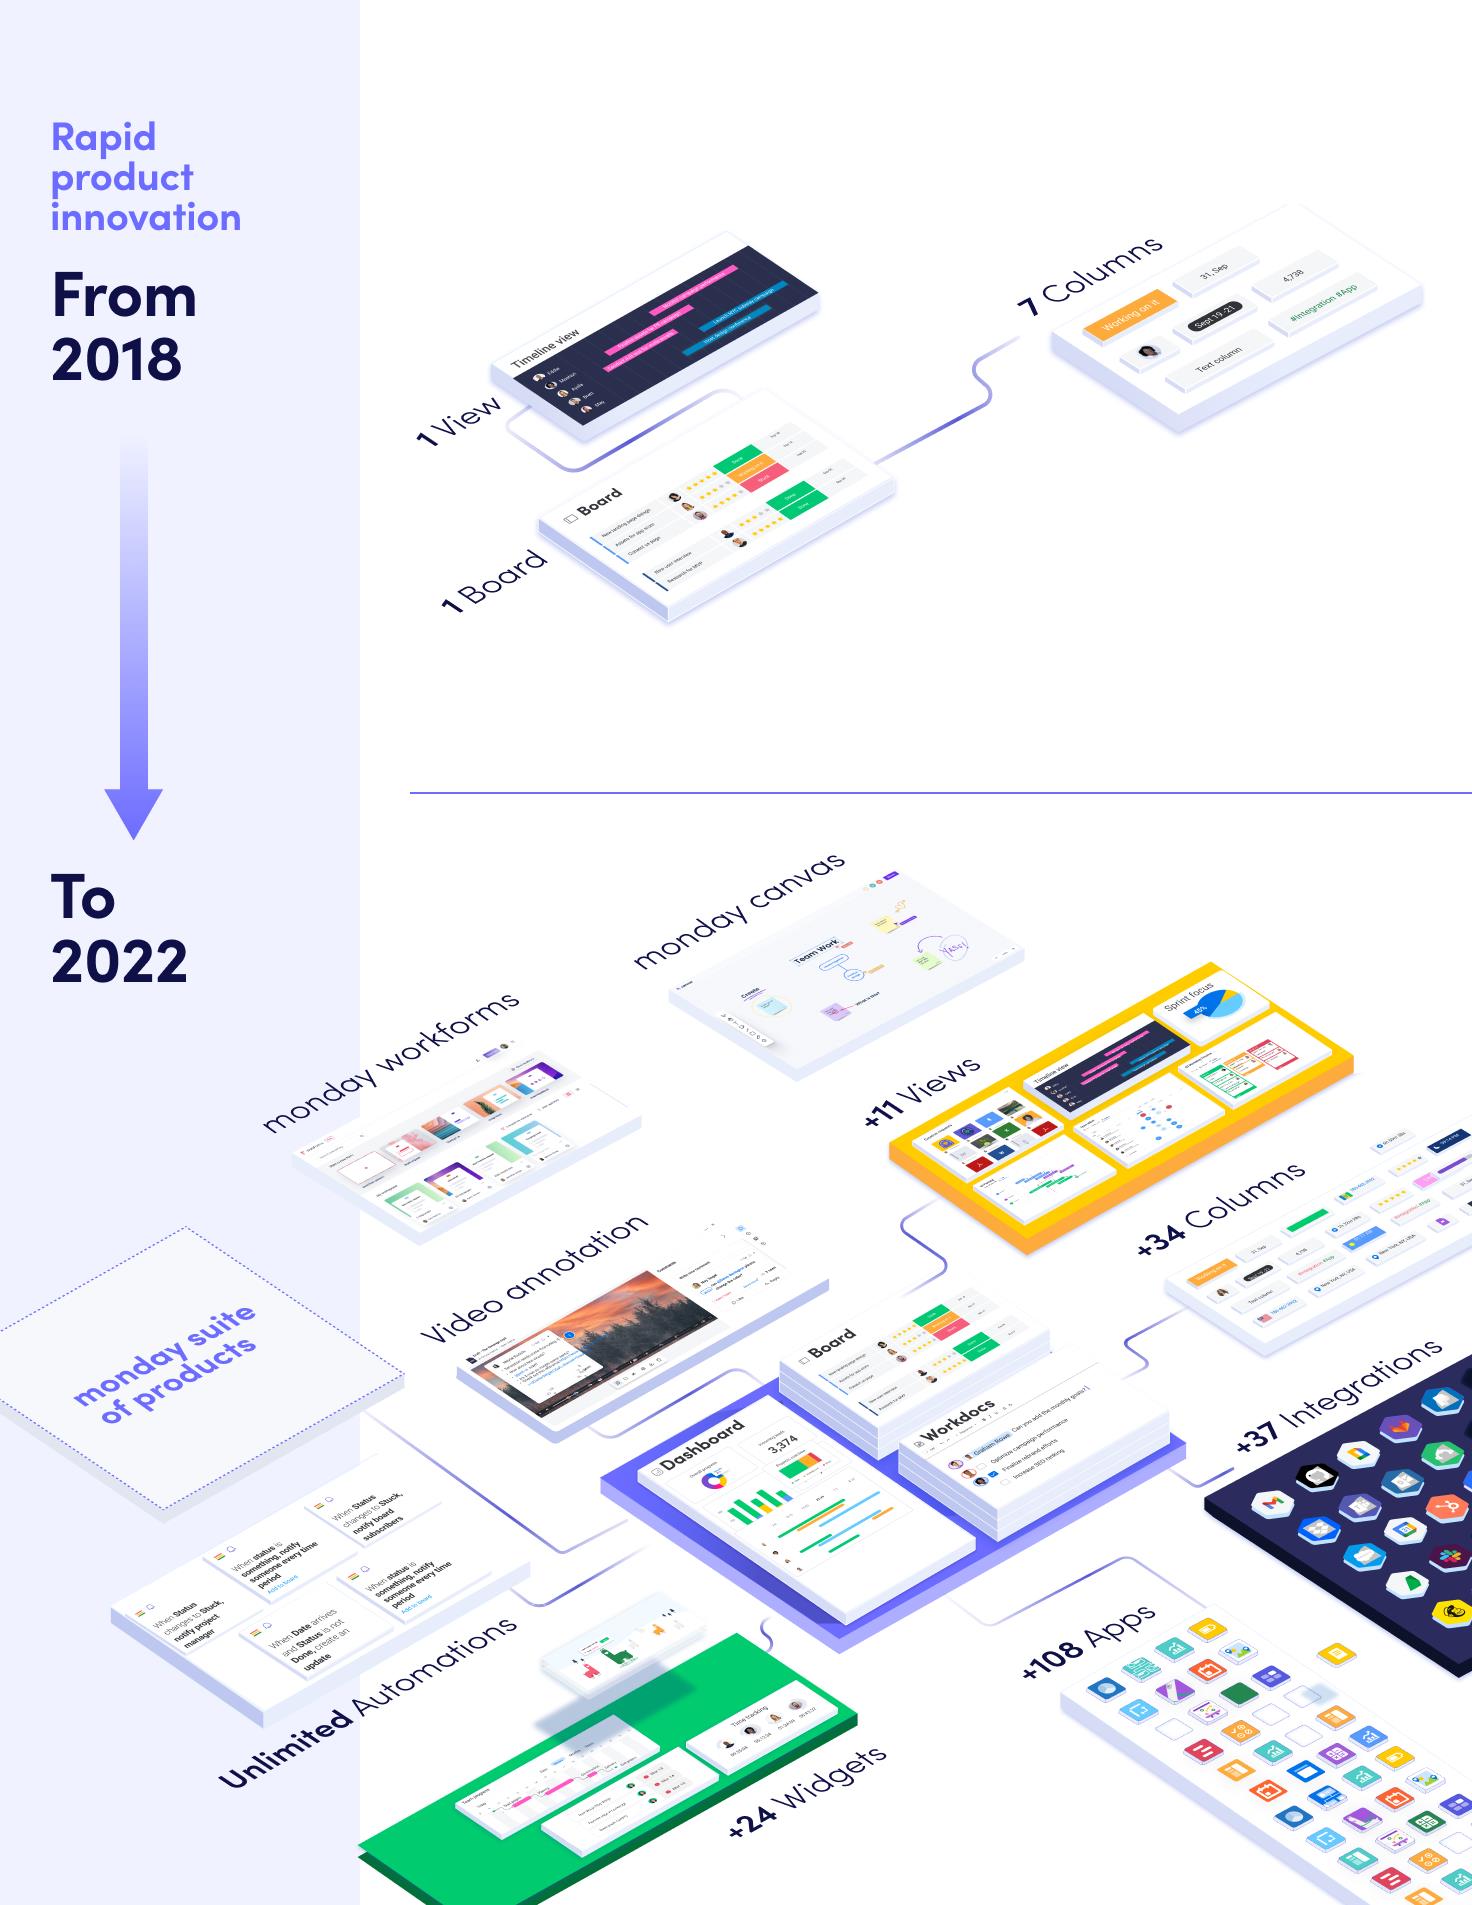

| • | Work OS platform evolution. We have a strong history of technological innovation, releasing new building blocks and features on a regular basis and making frequent updates to our platform. We intend to continue making significant investments in research and development and hiring top technical talent to enable new use cases, serve more verticals and increase enterprise-grade features on our platform. Our ability to innovate is amplified by our apps marketplace, with external developers also expanding our building blocks and creating software applications and work management tools that fit a variety of use cases. We believe these investments will expand our addressable market by enabling us to serve more customers in new verticals and customers in regulated industries with greater security requirements. |
| • | Grow and invest in our ecosystem strategy. We opened our platform to developers, channel partners, global system integrators, and customers to create their own building blocks. While marketplace vendors have already monetized their apps through third-party payment systems, we recently launched a payment processing system directly from within the platform. |
| • | Providing more value to and increasing the number of large accounts: We are constantly adding tools and services to drive adoption and expansion to customers of all sizes while continuing to expand our focus on the needs of larger enterprise accounts. We will also continue to reach out to and expand our partner ecosystem, to deepen and broaden product adoption and scale. |
| • | Augment our vision with a versatile suite of Work OS-based and independent products. We have built five products on top of our platform, which connects with our vision to provide a Work OS that works across organizations. We customize the user experience across the customer lifecycle, from initial discovery through marketing campaigns to onboarding with pre-designed workflows, templates, automations, and integrations. We prioritize the creation of new products by focusing on customer demand and go-to-market. Our products include: monday work management to build workflows that suit their needs using no-code building blocks to manage any kind of work; monday marketer, a product for running marketing campaigns; monday dev, a product that enables software development teams to build agile product workflows; monday projects, a project management product; and monday sales CRM, a sales CRM. We also have two additional, independent products based on specific customer needs: WorkForms, which allows users to create personalized forms or surveys and gain organizational insights. |
| • | Scaling our go-to-market. We continue to scale our go-to-market through the following: |
| — | Continuing to scale our self-serve funnel complimented by expanding sales-led motion. Our focus on seamless adoption of our platform starts with ensuring that customers can easily and independently get up and running on one of our products built on the Work OS. This is accomplished through a self-serve funnel where virtually any user can sign up and immediately gain value, regardless of their technical skills. |
| — | Drive growth by acquiring new customers. To drive new customer growth, we intend to continue investing in sales, marketing, and our partner ecosystem, with a focus on delivering complete products and tailored features for specific use cases, both top-down and bottom-up selling to engage both business users and decision-makers, paid and organic customer outreach and more account-based marketing outreach efforts. |
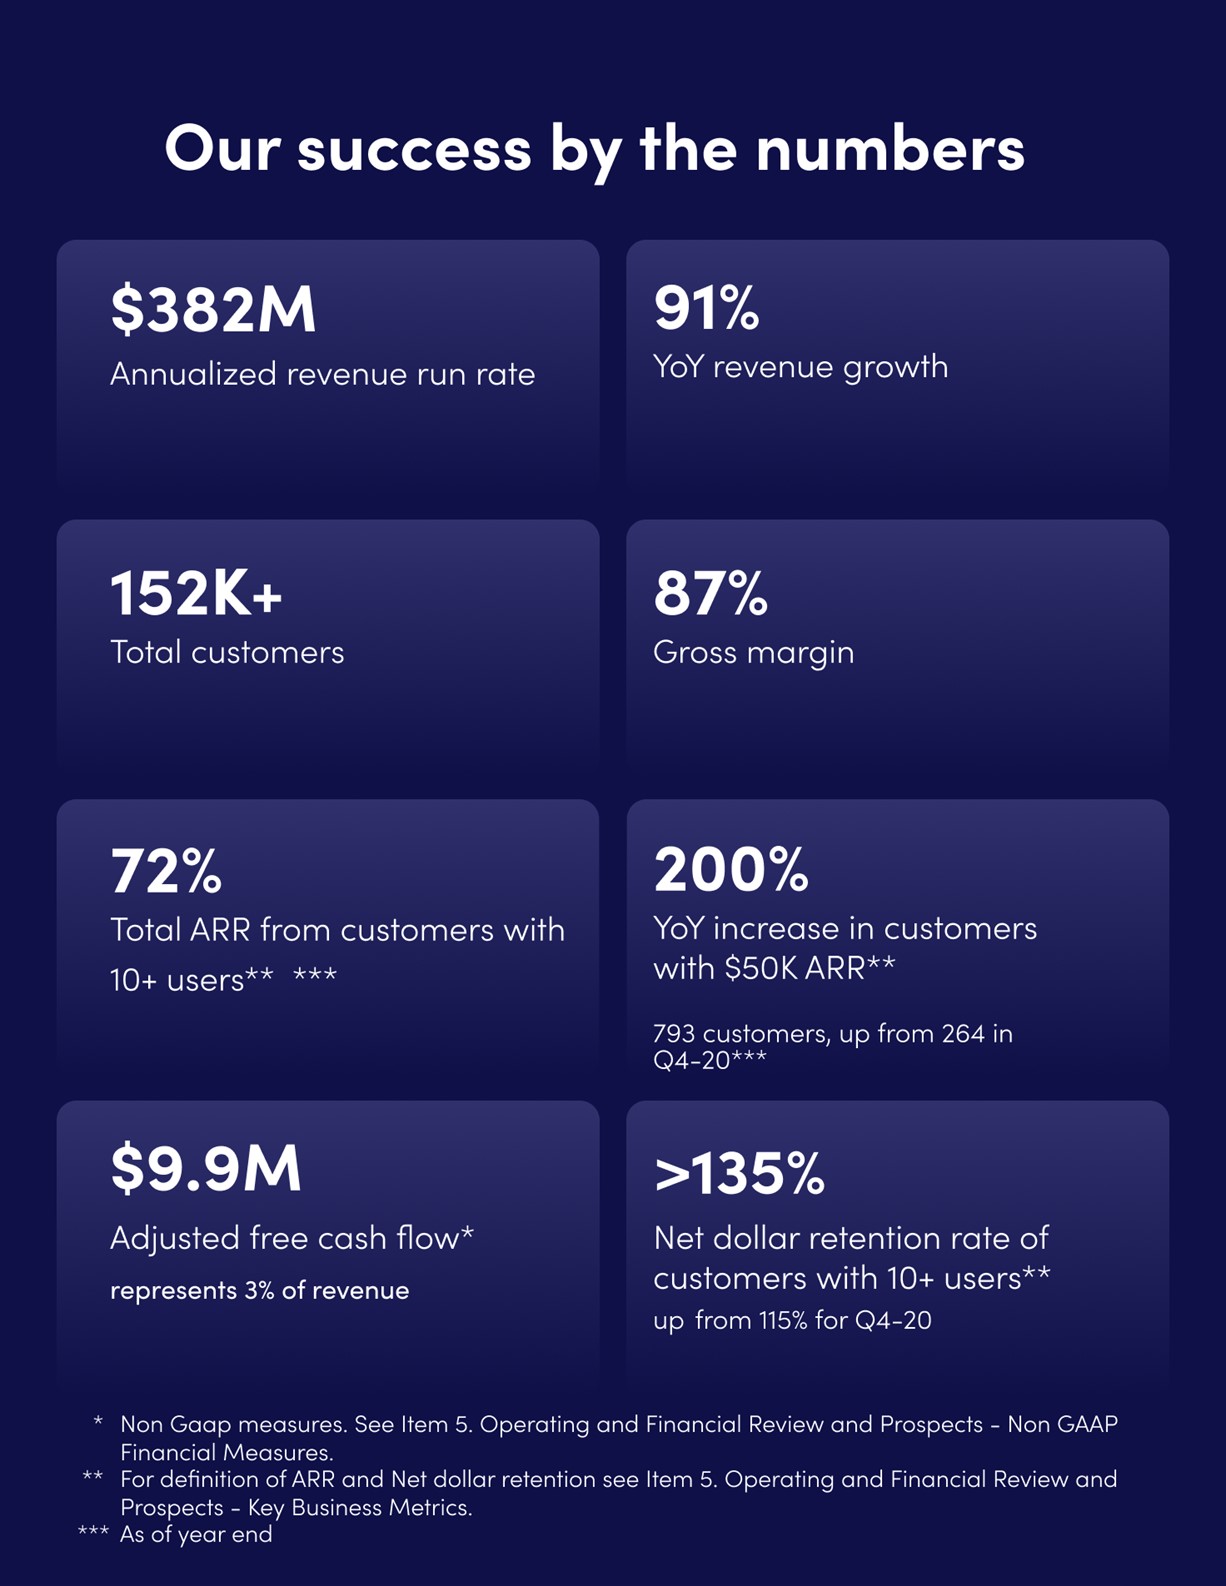
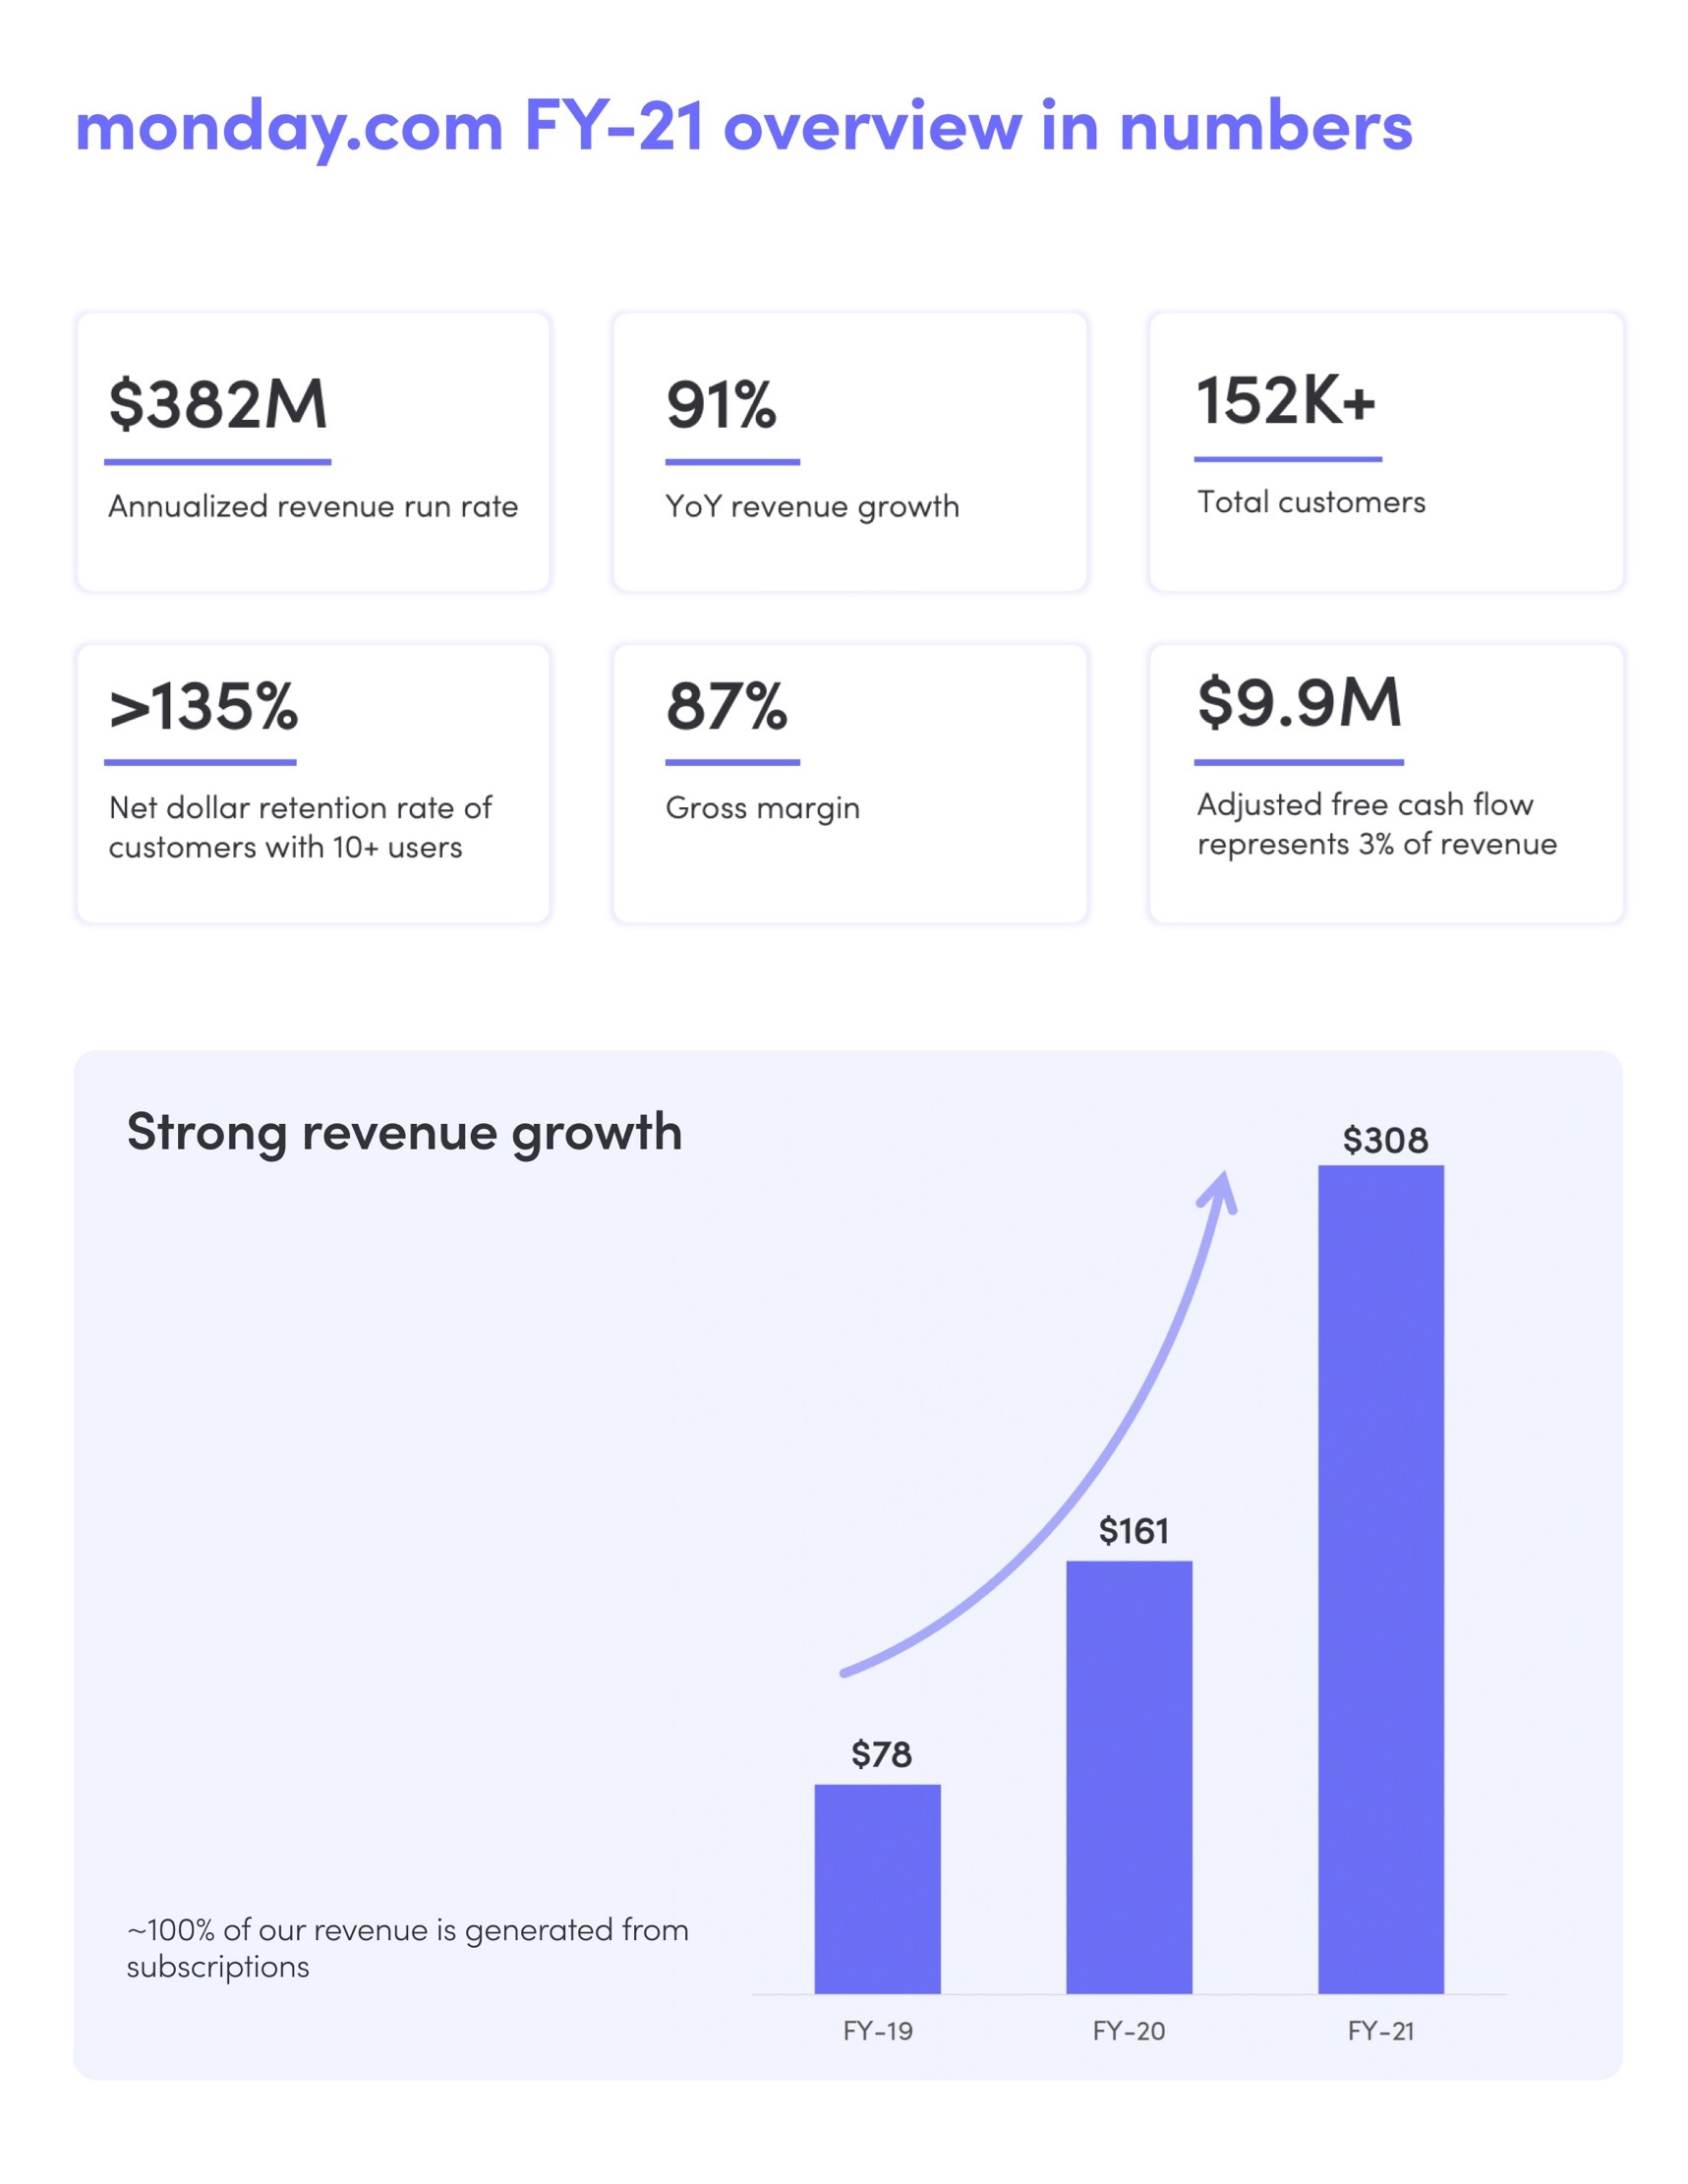
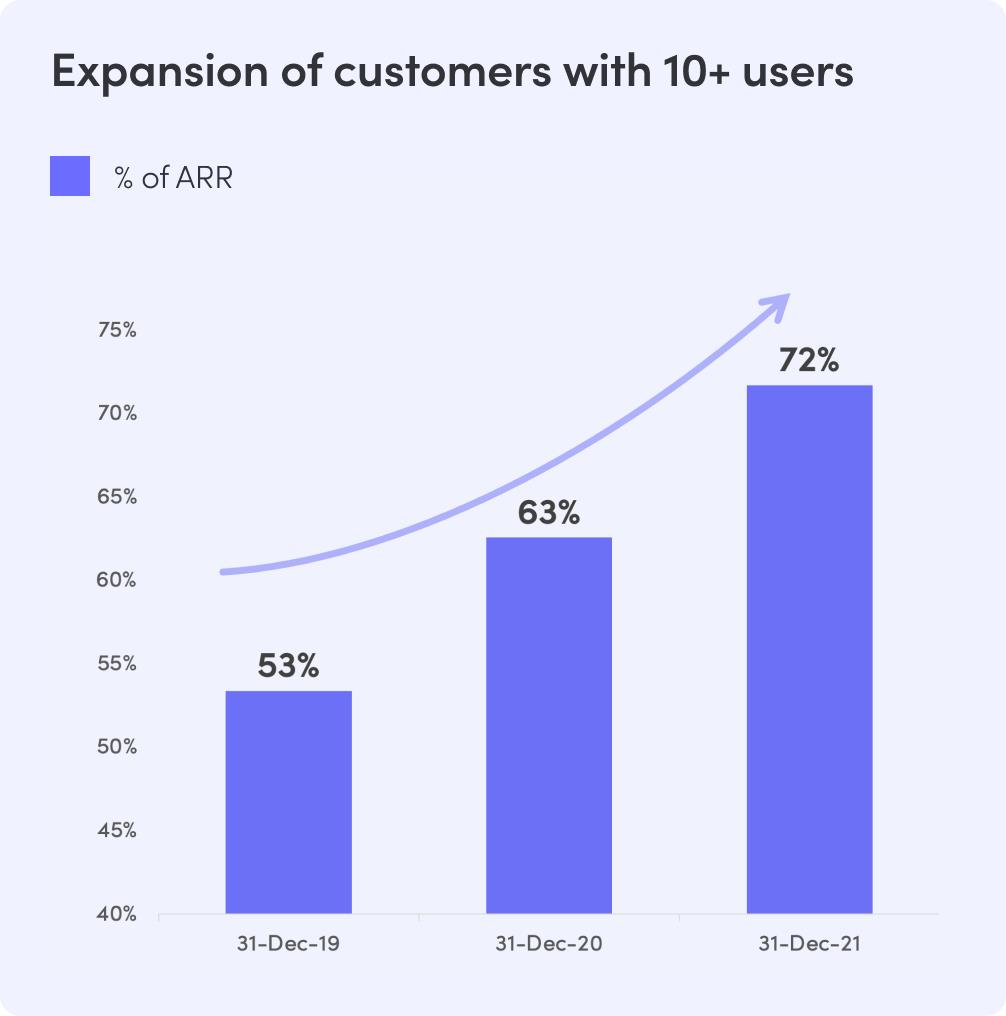
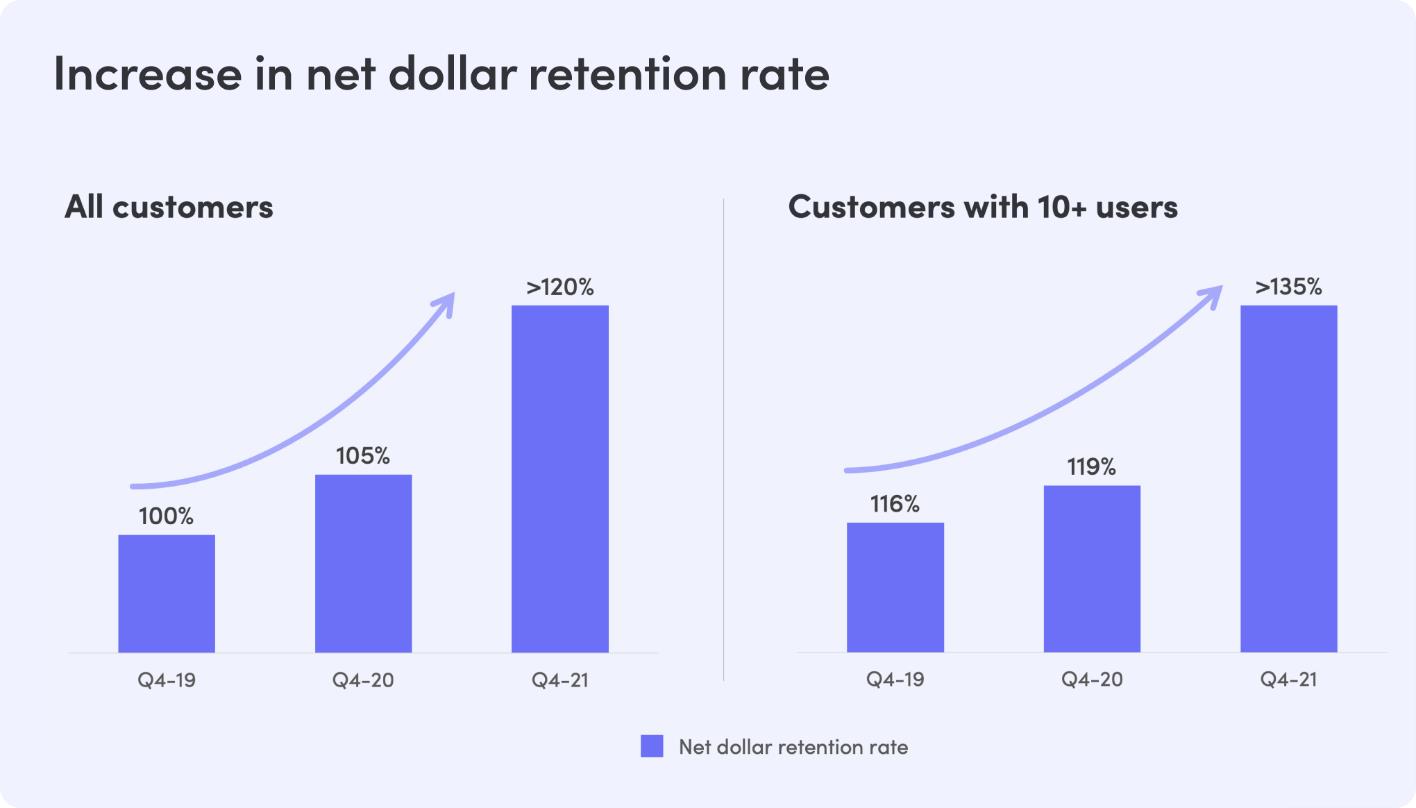
| — | Drive increased adoption and expansion within our existing customer base. As our customers realize the benefits of our platform and products, they typically add more users and expand to other products and use cases within the Work OS, while expanding across different departments. As a result, our Net Dollar Retention Rate for customers with more than 10 users was over 135% for the three months ended December 31, 2021, and over 115% for the three months ended each of December 31, 2020, and 2019. We plan to continue investing in ways to expand within our existing customer base. For definition of Net Dollar Retention Rate see Item 5 – Operating and Financial Review and Prospects – Key Business Metrics. |
| — | Expand our global footprint. We will continue investing in local advertising channels, partnerships, and localizing our platform to address existing and new regions. We believe there is an opportunity to increase our global presence even further over time. |
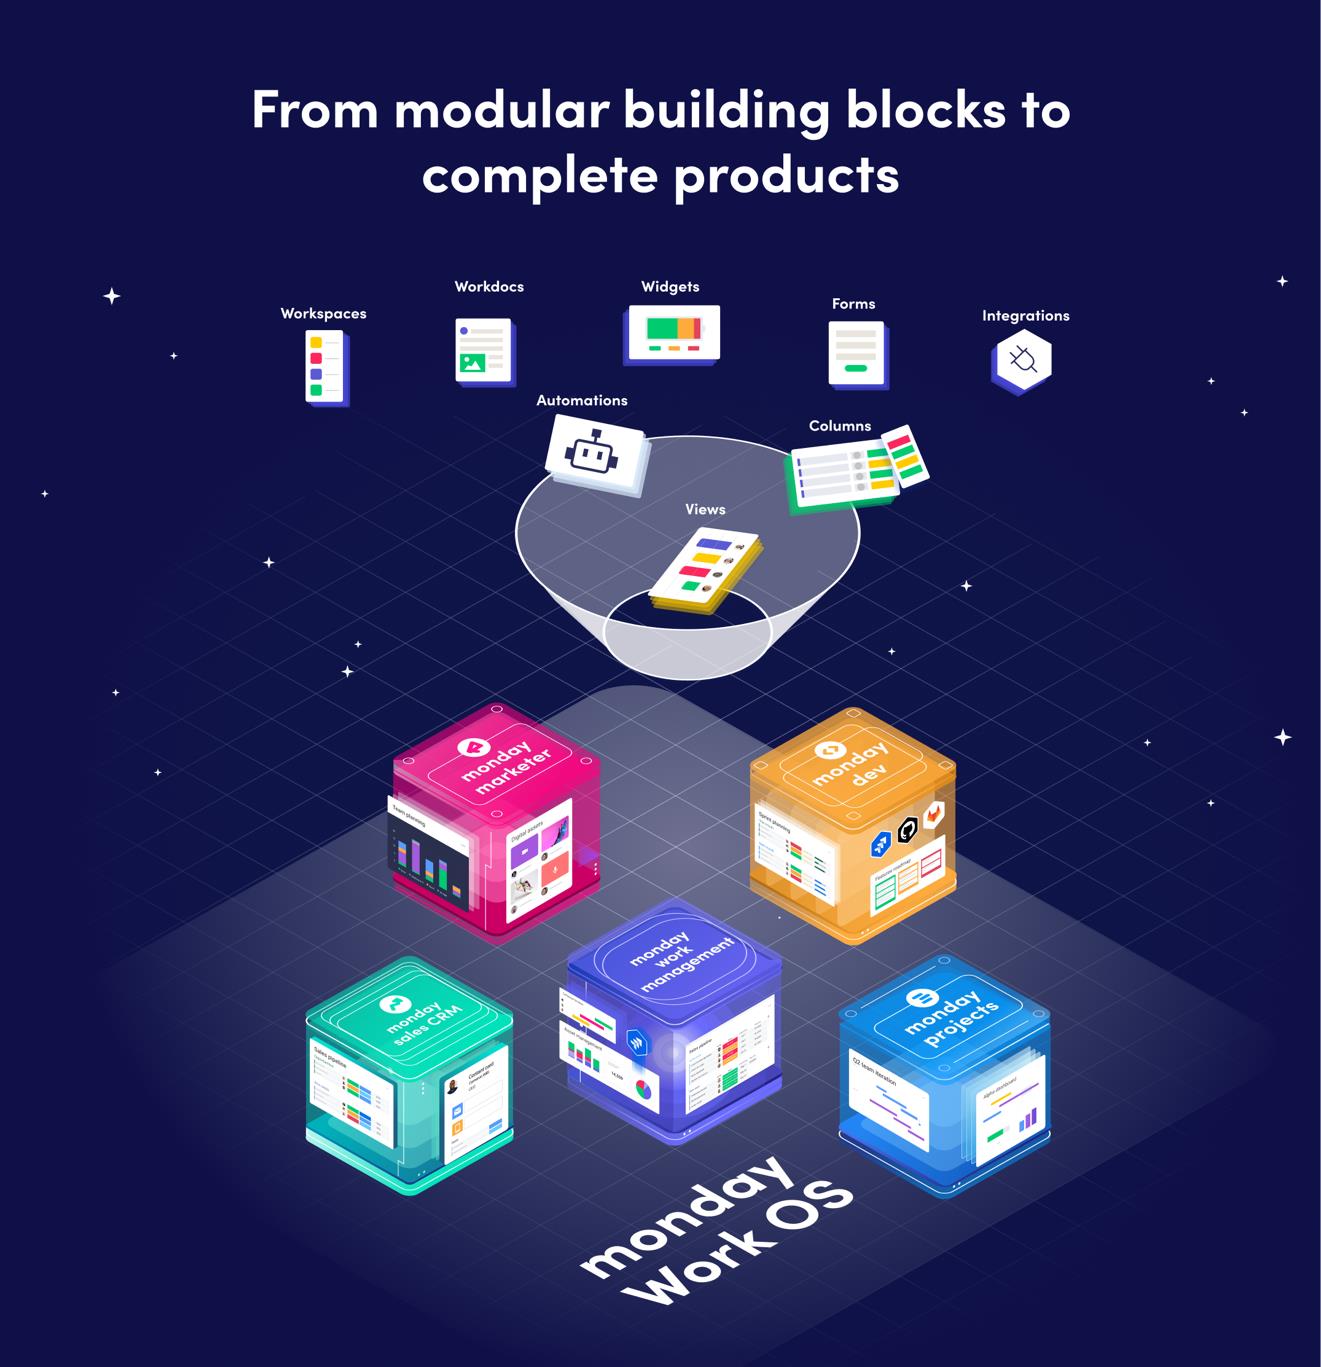

| • | monday work management, where customers can build workflows that suit their needs using no-code building blocks to manage any kind of work. |
| • | monday marketer, which allows customers to plan and track all aspects of marketing and creative campaigns. |
| • | monday dev, where product development teams, including R&D, design, and product management, can plan, build and launch new products. |
| • | monday projects, which allows customers to plan, manage and execute more complex projects or portfolios. |
| • | monday sales CRM, a CRM for tracking and managing all aspects of a sales cycle and sales operations from leads to customer projects. |
| • | monday Canvas, a digital whiteboard for real-time, unstructured collaboration. |
| • | monday WorkForms, which allows users to create personalized forms or surveys and gain organizational insights. |

| • | Democratize the Power of Software to All Users. The possibilities of our platform are virtually endless, as it enables each user to manipulate and access software in ways that fit their needs. |
| • | Accelerate Digitization. Our platform helps our customers digitize their business operations and re-engineer existing digital processes to make them more efficient. This enables our customers to increase their organizational agility, speed, and efficiency. |
| • | Create a Unified Workspace. By serving as a connective layer, our platform brings organizations’ departments, applications, and data into a unified workspace. This enables organizations to make complete, data-driven decisions, eliminate silos across the organization and centralize all tools in one place. |
| • | Make Data-Driven Decisions. Everything in our platform is data, which can be tracked, measured, and analyzed. Our customers are able to capture new insights that were previously unavailable to them. This allows them to implement more data-driven decision-making. |
| • | Increase Productivity and Deep Working. We believe our platform greatly reduces the reliance upon meetings, communications, and emails. This gives employees significant time back to their days to perform more work and unlocks greater potential. Additionally, our platform automates repetitive, manual, and error-prone work, which frees up our users’ time and energy to focus on more impactful work, such as creative thinking, problem-solving, and innovative ideas. |
| • | Enhanced Company Culture. Our platform helps to foster a culture of inclusion, ownership, and clarity. By empowering everyone to think more holistically and have access to greater information, our platform helps promote better idea-sharing and brainstorming within an organization. |

| • | Boards: capturing data and managing processes. Boards work to capture data and manage processes. Our boards are at the core of our platform, as they are the starting point upon which all functionality on our platform is built. Each board has the infrastructure of a schemeless database with an easy-to-use interface, which users can easily customize, populate, and build applications upon. |
| • | Items: customized to fit any use case. An item is a row within a board that can represent virtually anything a user chooses, including an entity, workstream, or campaign. Users populate items with actions, steps, leads, contacts, or other elements of a workstream. |
| • | Columns: represent data in a tailored way. Each item has a number of columns associated with it. Users add columns to identify owners of an item or workstream, track the status of an item, rate specific items, add files related to the item, along with many more options. Users can also customize columns to fit virtually any use case. |
| • | Views: visualize and manipulate a board’s contents for any need. We offer a variety of views, allowing a board’s contents to be visualized and interacted with in a way that suits a user’s needs. Users can update their data within any view they choose, with these changes reflected on the board in real-time. |
| • | Workdocs: collaborate on a powerful doc that empowers users to turn words into actions. We recently launched, monday workdocs, a powerful building block that enables users to work together simultaneously on the same shareable documents. Users can tag each other and embed boards and dashboards so that they can stay within the context of their workflows and processes. They can co-edit in real-time, instantly share comments, and drag and drop text without disrupting other users working on the doc. |
| • | Forms: capture data from others, including non-monday.com users. Users can capture additional data through intuitive, web-based forms that are easily populated by their recipients, including from non-monday.com users. Each submission generates a new item within the board, with all of the data supplied by the recipient automatically populated in the relevant columns. |
| • | Automations: create complex workflows that automate repetitive processes. Automations are triggered based on actions that occur or thresholds that are reached and can include notifications, item creation, assignment of ownership and due date, and moving an item to another board. Users can automate work using our predefined automations or create their own. |
| • | Integrations: connect with external tools to share data and automate actions across tools. Integrations allow our users to connect with external tools to share data and automate actions across tools. Currently, our integration center includes 50 integrations to other tools and growing, such as Gmail, Outlook, Jira, Salesforce, Google Drive, Dropbox, Stripe, Slack, and Zendesk. Users can find additional integrations in our apps marketplace or build their own using the monday.com API. |
| • | Dashboards: a high-level view of everything happening across an organization. Users can create dashboards with summaries and reports from data across multiple boards to track progress across all of their monday.com workstreams. These dashboards can provide visualizations of everything that is happening across their organization. |
| • | Dashboard widgets: track all data on a single pane of glass. Users can select any dashboard widget according to the data they want to display to build a dashboard, with different visualizations of the data they want to track, all on a single pane of glass. Dashboard widgets allow users to immediately gain high-level insights and analysis visually. |
| • | Workspaces: keep work organized as work increases. Users can organize and centralize boards and dashboards using workspaces, which are defined by any category the user chooses. In large organizations, workspaces can represent a department or a team working on a project, for example. |
| • | My Work: centralize all assigned items in a single place. We recently launched My Work, a place for customers to centralize all items — whether it’s deals, campaigns, tasks, or anything else — associated with their account. This mega-table gives individuals within teams the ability to gather customized data across all business units and see the items to which they are assigned chronologically organized by due date. |

| • | companies that primarily offer project and work management solutions, including the application of processes, methods, skills, and knowledge to achieve specific objectives. This includes companies such as Asana, Inc., SmartSheet Inc., Notion, Inc., Atlassian Corporation PLC (Trello), Citrix Systems Inc. (Wrike), Zendesk, Inc., ClickUp, Airtable, and Freshworks Inc.; and |
| • | companies that offer products across other use cases we serve, such as customer relationship management solutions, software development tools, and marketing campaign management. This includes companies such as SugarCRM, Pipedrive, Zoho, Inc., Atlassian Corporation PLC (Jira), Procore Technologies, Workday, Inc., BambooHR, LLC, Hootsuite Media Inc., and Adobe Experience Cloud. |
| • | our ability to introduce new and improve on existing, features, products, and services in response to competition, user sentiment, online, market and industry trends, and the ever-evolving technological landscape; |
| • | our ability to continue to increase social and technological acceptance of our Work OS; |
| • | continued growth in the digitalization of the workplace; |
| • | our ability to maintain the value and reputation of monday.com as a solution; and |
| • | the scale, growth, and engagement of our community relative to those of our competitors. |
| • | Transparency and Trust. Radical transparency, data accessibility, and trust allow us to reduce complexity, ensure that we are all working towards the same goal, and increase accountability and ownership. Transparency is a tool that helps us harness our collective intelligence and eliminates politics and bureaucracy. |
| • | Customer-Centricity. We have achieved leading benchmarks for customer service, answering tickets above-average industry response time. We prioritize customer satisfaction over our potential short-term gains, and we believe that when our customers win, we win. |
| • | Product-first. We believe that a product should work for the customer and not the other way around. Every feature is designed to be intuitive and accessible, as evidenced by the fact that more than 70% of our customers work in traditionally non-tech industries. |
| • | Ownership and Impact. We empower our employees to make their own decisions so that they can maximize their impact. We believe autonomy allows our employees to move faster, be more efficient and learn from their own mistakes. |
| • | Speed and Execution. Speed is the key to success in everything we do. We constantly push the tempo to learn fast, gain first-mover advantage and deliver quickly. As we continue to scale, our ability to execute and adapt quickly will continue to give us a competitive edge. |
| • | Inclusivity. Diversity, belonging, and inclusion are rooted in the core of our company. We celebrate individuality together as a team. We’ve embedded inclusivity within the company’s values, but also within the platform, providing a user experience open to everyone. |
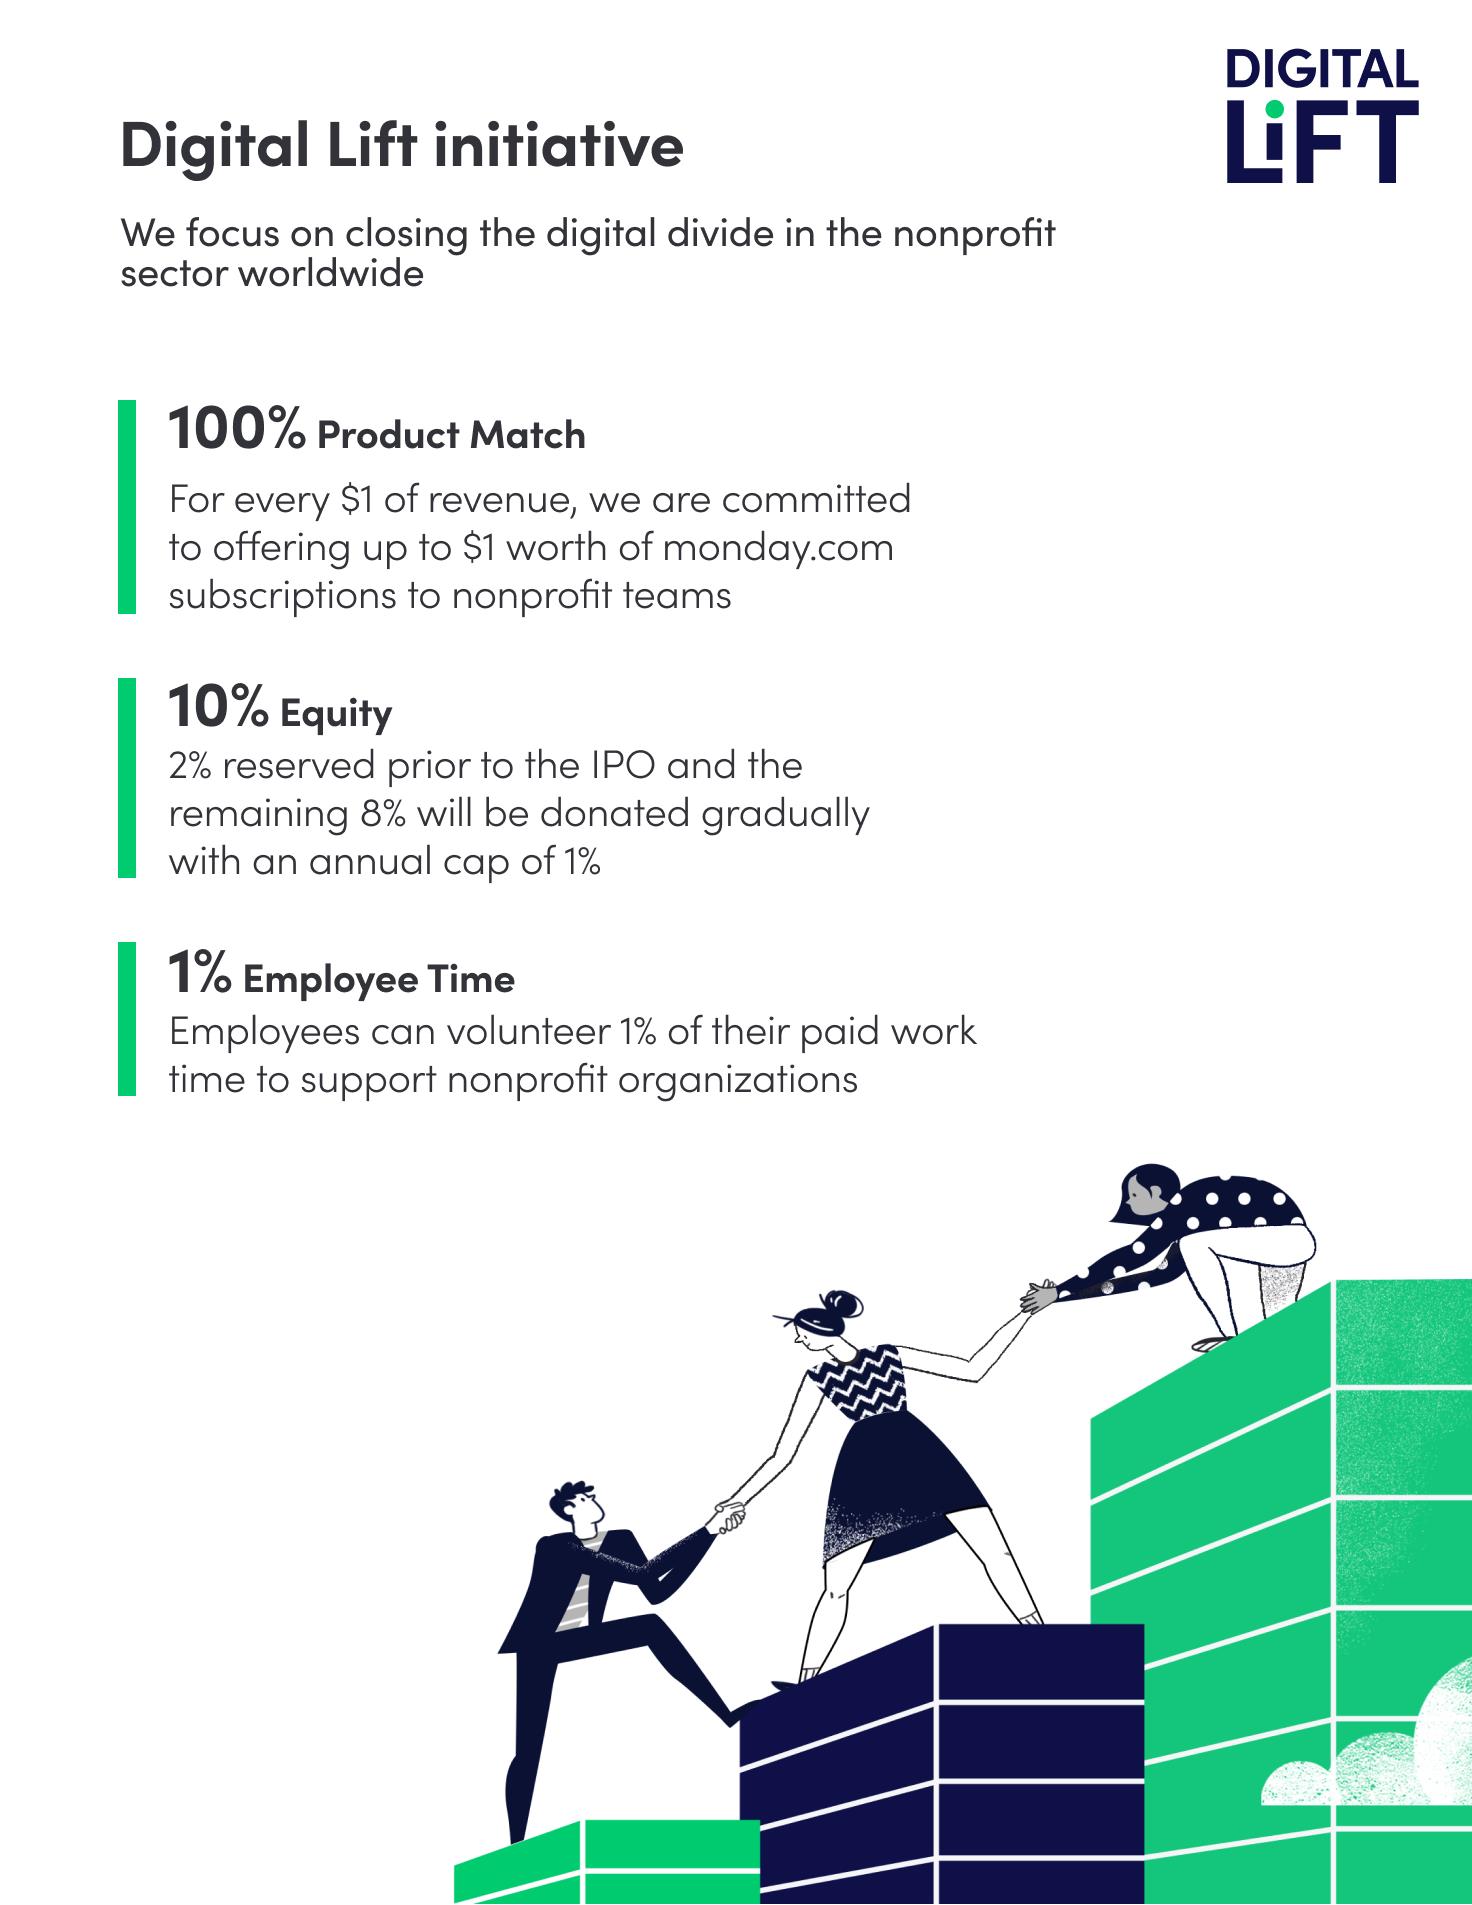
| • | 100% Product match. We offer up to $1 worth of free or substantially discounted monday.com subscriptions to nonprofit organizations, including product support, for every $1 of revenue we generate. Since establishing the initiative, we have provided discounts to over 8,500 nonprofits amounting to a total of $7.2 million in annual recurring revenue (as of December 31, 2021). |
| • | 10% Equity pledge. Following our pledge to contribute 10% of our equity to the Digital Lift Foundation, we reserved 2% prior to the IPO and intend to donate the remaining 8% gradually with a cap of 1% per year. We are currently working with a research firm to further explore the depth of the digital divide and identify areas where the foundation can make a strong impact. |
| • | 1% Employee time. We provide every employee with the opportunity to volunteer 1% of their paid work time to any approved charitable or community initiative. Since announcing the initiative, our employees have already volunteered over 550 hours to support nonprofit organizations. |
 | To help fight the spread of the COVID-19 pandemic in Eswatini, we sent a monday.com delegation to implement monday.com in the local COVID-19 control room and streamline the distribution of vaccines in the area. After initial implementation and consultation, the local leaders continued to operate the vaccine rollout independently through the platform. As of December 31, 2021, over 300,000 vaccines were distributed in Eswatini with the help of monday.com. The optimized system helps avoid vaccine waste and empowers government officials to make data-driven decisions. |
| Region | Employee count | |
| Americas | 291 | |
| EMEA | 727 | |
| APAC | 46 |
| • | Ensuring equitable practices with a DEIB specialist. We are currently recruiting a DEIB (Diversity, Equity, Inclusion, and Belonging) Specialist to build and implement programs and policies to maintain equitable internal practices and support diversity across all of our sites. |
| • | Encouraging employee forums. Alongside our anticipated DEIB goals, we have established multiple internal employee forum groups, including Black, Parents, International, Asian, Latin, Pride, and Mental Health, aimed at creating a sense of community and free speech for employees to voice their opinions to each other and the Company. |

| Name of Subsidiary | Place of Incorporation |
| monday.com Inc. | Delaware, United States |
| monday.com Pty Ltd. | Australia |
| monday.com UK 2020 Ltd. | United Kingdom |
| monday.com Ltda. | Brazil |
| monday.com K.K. | Japan |
| Year ended December 31, | ||||||||||||
| | 2021 | 2020 | 2019 | |||||||||
| (in thousands) | ||||||||||||
| Revenue | $ | 308,150 | $ | 161,123 | $ | 78,089 | ||||||
Cost of revenue (1) | 39,013 | 22,488 | 11,978 | |||||||||
| Gross profit | 269,137 | 138,635 | 66,111 | |||||||||
| Operating Expenses: | ||||||||||||
Research and development (1) | 73,686 | 43,480 | 24,637 | |||||||||
Sales and marketing (1) | 268,083 | 191,353 | 118,534 | |||||||||
General and administrative (1) | 53,493 | 54,339 | 15,458 | |||||||||
| Total operating expenses | 395,292 | 289,172 | 158,629 | |||||||||
| Operating loss | (126,125 | ) | (150,537 | ) | (92,518 | ) | ||||||
| Financial income (expense), net | (838 | ) | 526 | 1,590 | ||||||||
| Loss before income taxes | (126,963 | ) | (150,011 | ) | (90,928 | ) | ||||||
| Income tax expenses | (2,331 | ) | (2,192 | ) | (683 | ) | ||||||
| Net loss | $ | (129,294 | ) | $ | (152,203 | ) | $ | (91,611 | ) | |||
| (1) | Includes share-based compensation expense as follows: |
| Year ended December 31, | ||||||||||||
| | 2021 | 2020 | 2019 | |||||||||
| (in thousands) | ||||||||||||
| Cost of revenue | $ | 7,681 | $ | 2,720 | $ | 970 | ||||||
| Research and development | 21,779 | 12,142 | 9,396 | |||||||||
| Sales and marketing | 23,135 | 10,068 | 3,283 | |||||||||
| General and administrative | 20,934 | 39,415 | 8,190 | |||||||||
Total share-based compensation expense (2) | $ | 73,529 | $ | 64,345 | $ | 21,839 | ||||||
| Year ended December 31, | ||||||||||||
| | 2021 | 2020 | 2019 | |||||||||
| Revenue | 100 | % | 100 | % | 100 | % | ||||||
| Cost of revenue | 13 | 14 | 15 | |||||||||
| Gross profit | 87 | 86 | 85 | |||||||||
| Operating Expenses: | ||||||||||||
| Research and development | 24 | 27 | 31 | |||||||||
| Sales and marketing | 87 | 119 | 152 | |||||||||
| General and administrative | 17 | 33 | 20 | |||||||||
| Total operating expenses | 128 | 179 | 203 | |||||||||
| Operating loss | (41 | ) | (93 | ) | (118 | ) | ||||||
| Financial income (expense), net | — | — | 2 | |||||||||
| Loss before income taxes | (41 | ) | (93 | ) | (116 | ) | ||||||
| Income tax expenses | (1 | ) | (1 | ) | (1 | ) | ||||||
| Net loss | (42 | )% | (94 | )% | (117 | )% | ||||||
| | Year ended December 31, | |||||||||||||||
2021 | 2020 | $ Change | % Change | |||||||||||||
| (in thousands) | ||||||||||||||||
| Revenues | $ | 308,150 | $ | 161,123 | $ | 147,027 | 91 | % | ||||||||
| | Year ended December 31, | |||||||||||||||
2021 | 2020 | $ Change | % Change | |||||||||||||
| (in thousands) | ||||||||||||||||
| Cost of revenue | $ | 39,013 | $ | 22,488 | $ | 16,525 | 73 | % | ||||||||
| Gross profit | 87 | % | 86 | % | ||||||||||||
| | Year ended December 31, | |||||||||||||||
2021 | 2020 | $ Change | % Change | |||||||||||||
| (in thousands) | ||||||||||||||||
| Research and development | $ | 73,686 | $ | 43,480 | $ | 30,206 | 69 | % | ||||||||
| Sales and marketing | 268,083 | 191,353 | 76,730 | 40 | % | |||||||||||
| General and administrative | 53,493 | 54,339 | (846 | ) | (2 | )% | ||||||||||
| Total operating expenses | $ | 395,262 | $ | 289,172 | $ | 106,090 | 37 | % | ||||||||
| | Year ended December 31, | |||||||||||||||
2021 | 2020 | $ Change | % Change | |||||||||||||
| (in thousands) | ||||||||||||||||
| Financial income (expense), net | $ | (838 | ) | $ | 526 | $ | (1,364 | ) | 259 | % | ||||||
| | Year ended December 31, | |||||||||||||||
2021 | 2020 | $ Change | % Change | |||||||||||||
| (in thousands) | ||||||||||||||||
| Income tax expense | $ | 2,331 | $ | 2,192 | $ | 139 | 6 | % | ||||||||
| | Year ended December 31, | |||||||||||||||
2020 | 2019 | $ Change | % Change | |||||||||||||
| (in thousands) | ||||||||||||||||
| Revenues | $ | 161,123 | $ | 78,089 | $ | 83,034 | 106 | % | ||||||||
| | Year ended December 31, | |||||||||||||||
2020 | 2019 | $ Change | % Change | |||||||||||||
(in thousands) | ||||||||||||||||
| Cost of revenue | $ | 22,488 | 11,978 | $ | 10,510 | 88 | % | |||||||||
| Gross profit | 86 | % | 85 | % | ||||||||||||
| | Year ended December 31, | |||||||||||||||
2020 | 2019 | $ Change | % Change | |||||||||||||
| (in thousands) | ||||||||||||||||
| Research and development | $ | 43,480 | $ | 24,637 | $ | 18,843 | 76 | % | ||||||||
| Sales and marketing | 191,353 | 118,534 | 72,819 | 61 | % | |||||||||||
| General and administrative | 54,339 | 15,458 | 38,881 | 252 | % | |||||||||||
| Total operating expenses | $ | 289,172 | $ | 158,629 | $ | 130,543 | 82 | % | ||||||||
| | Year ended December 31, | |||||||||||||||
2020 | 2019 | $ Change | % Change | |||||||||||||
| (in thousands) | ||||||||||||||||
| Financial income (expense), net | $ | 526 | 1,590 | (1,064 | ) | 67 | % | |||||||||
| | Year ended December 31, | |||||||||||||||
2020 | 2019 | $ Change | % Change | |||||||||||||
| (in thousands) | ||||||||||||||||
| Income tax expense | $ | 2,192 | 683 | 1,509 | 221 | % | ||||||||||
| Year ended December 31, | ||||||||||||
| 2021 | 2020 | 2019 | ||||||||||
| (in thousands) | ||||||||||||
| Non-GAAP operating loss | $ | (52,596 | ) | $ | (86,192 | ) | $ | (70,679 | ) | |||
| Adjusted free cash flow | $ | 9,900 | $ | (40,692 | ) | $ | (38,417 | ) | ||||
| Year ended December 31, | ||||||||||||
2021 | 2020 | 2019 | ||||||||||
| (in thousands) | ||||||||||||
| Operating loss | $ | (126,125 | ) | $ | (150,537 | ) | $ | (92,518 | ) | |||
| Share-based compensation expenses | 73,529 | 64,345 | 21,839 | |||||||||
| Non-GAAP operating loss | $ | (52,596 | ) | $ | (86,192 | ) | $ | (70,679 | ) | |||
| Year ended December 31, | ||||||||||||
2021 | 2020 | 2019 | ||||||||||
| (in thousands) | ||||||||||||
| Net cash provided by (used in) operating activities | $ | 16,355 | $ | (37,175 | ) | $ | (36,650 | ) | ||||
| Purchase of property and equipment | (11,578 | ) | (4,362 | ) | (1,402 | ) | ||||||
| Capitalized software development costs | $ | (2,180 | ) | $ | (1,119 | ) | $ | (365 | ) | |||
| Purchase of property and equipment related to build-out of our new corporate headquarters | 7,303 | 1,964 | — | |||||||||
| Adjusted free cash flow | 9,900 | (40,692 | ) | (38,417 | ) | |||||||
| Year ended December 31, | ||||||||||||
| | 2021 | 2020 | 2019 | |||||||||
| (in thousands) | ||||||||||||
| Net cash provided by (used in) operating activities | $ | 16,355 | $ | (37,175 | ) | $ | (36,650 | ) | ||||
| Net cash provided by (used in) investing activities | (3,629 | ) | (11,481 | ) | 13,233 | |||||||
| Net cash provided by financing activities | $ | 742,272 | $ | 8,470 | $ | 158,446 | ||||||
| Year ended December 31, | ||||||
2021 | 2020 | 2019 | ||||
| Risk-free interest rate | 0.68%-1.15% | 0.3%-0.58% | 2.12%-2.75% | |||
| Expected dividend yield | 0% | 0% | 0% | |||
| Expected term (in years) | 5-8 | 5-8 | 5-8 | |||
| Expected volatility | 49%-50% | 47%-48% | 43%-45% | |||
| • | retrospective third-party valuations of our ordinary shares; |
| • | the rights, preferences and privileges of our convertible preferred shares relative to those of our ordinary shares; |
| • | the prices of shares sold to third-party investors in secondary transactions; |
| • | lack of marketability of our ordinary shares; |
| • | current business conditions and projections; |
| • | our actual operating and financial performance; |
| • | the hiring of key personnel; |
| • | the public trading prices of comparable companies; and |
| • | the likelihood of initial public offering, sale, or private company scenarios. |
| A. | Directors and Senior Management |
| Name | Age | Position |
| Executive Officers and Employee Directors: | ||
Roy Mann (1) | 43 | Co-Founder, Co-Chief Executive Officer, Director |
Eran Zinman (1) | 38 | Co-Founder, Co-Chief Executive Officer, Director |
| Eliran Glazer | 50 | Chief Financial Officer |
| Daniel Lereya | 37 | Vice President of Research & Development and Product |
| Yoni Osherov | 44 | Vice President of Global Sales and Marketing |
| Shiran Nawi | 38 | General Counsel |
| Non-Employee Directors | ||
Aviad Eyal (1)(2) | 51 | Director |
| Jeff Horing | 57 | Director |
| Avishai Abrahami | 50 | Director |
Gili Iohan(2)(3) | 46 | External Director |
Ronen Faier(2)(3) | 51 | External Director |
 | Roy Mann is our Co-Founder and has served as our Co-Chief Executive Officer since June 1, 2012. Mr. Mann has also served as a member of our board of directors since February 2012. Mr. Mann previously served as a senior technology leader at Wix.com Ltd. (Nasdaq: WIX), from 2010 to 2012. Mr. Mann is also the Co-Founder of and led the technology vision and operation at SaveAnAlien.com, from 2006 to 2010. Mr. Mann holds a B.A. in Computer Science from the Interdisciplinary Center Herzliya, Israel | |
 | Eran Zinman is our Co-Founder and has served as our Co-Chief Executive Officer since November 2020 after having served as our Chief Technology Officer between 2012 and 2020. Mr. Zinman has also served as a member of our board of directors since March 2018. Mr. Zinman previously served as the Research and Development Manager at the founding team of Conduit Mobile (now Como) at Conduit Ltd. from 2010 to 2012. Mr. Zinman is the Co-Founder of Othersay and served as its Chief Executive Officer from 2009 to 2010. Mr. Zinman holds a B.Sc. in Computer Science and Electrical Engineering from Tel Aviv University, Israel. |
 | Eliran Glazer has served as our Chief Financial Officer since March 2021. Mr. Glazer previously served as the Chief Financial Officer of Lightricks Ltd. from December 2019 to February 2021 and the Chief Financial Officer of Nex Markets from April 2012 to November 2018 and, following the acquisition of Nex Markets by the CME Group, Mr. Glazer served as the Chief Financial Officer of Nex Markets, a CME Group Company from November 2018 to November 2019. Mr. Glazer holds a B.A. in Business and Accounting from The College of Management Academic Studies as well as an L.L.M. from Bar Ilan University and is a licensed certified public accountant. | |
 | Daniel Lereya has served as our Vice President of Research and Development since October 2016 and as our acting Vice President of Product since December 2020. Mr. Lereya previously served in numerous positions including as a software team leader at International Business Machines Corp. (NYSE: IBM) from November 2012 to October 2016. and as a software engineer at SAP SE from February 2011 to October 2012. Mr. Lereya holds a B.Sc. in Computer Science and Economics from Tel Aviv University, Israel. | |
 | Yoni Osherov has served as our Vice President of Global Sales and Marketing since August 2017. Mr. Osherov previously served as a member of the board of directors of Biz-Effective Ltd. (DBA as Centrical) from 2016 to 2017. Mr. Osherov has served in numerous positions at Verint Systems Ltd., including as the Vice President of Product Strategy from 2014 to 2017 and as the Vice President of Customer Analytics from 2013 to 2014. Mr. Osherov was the owner of Tavo.co.il which was acquired by Zap Group Ltd. in 2012. Mr. Osherov holds a B.A. in Business Administration from the College of Management Academic Studies, Israel. | |
 | Shiran Nawi has served as our General Counsel since June 2018. Previously Ms. Nawi served as a senior legal counsel at Wix.com Ltd. (Nasdaq: WIX) from June 2014 to June 2018 and as an associate at Israeli, Ben-Zvi, Attorneys at Law, from July 2009 to April 2014. Ms. Nawi holds an L.L.B. and a Master of Business Taxation from The College of Management Academic Studies, Israel, and is a member of the Israel Bar Association. |
 | Aviad Eyal has served as a member of our board of directors since June 2014. Mr. Eyal is the Co-Founder of Entrée Capital and has served as its Managing Partner since 2009. Prior to that, Mr. Eyal co-founded and built a number of successful startups over a span of 18 years. Mr. Eyal currently serves on the board of directors of several privately held companies, including Broadlume Inc. since 2019; Obligo Inc. since 2019 and as chairman of the board of directors of BreezoMeter Ltd. since 2014. He has also served on the board of directors of Prospa Group Ltd. (ASX:PGL) since 2012. Mr. Eyal holds a B.Sc. Engineering degree from the University of Natal, South Africa. Mr. Eyal was selected to the Forbes Europe Midas list of top 25 VCs for the past three years. |
 | Jeff Horing has served as a member of our board of directors since May 20, 2017. Mr. Horing has been a Managing Director of Insight Partners, a private equity investment firm he co-founded, since 1995. Since September 2014, Mr. Horing has served on the board of directors of Alteryx, Inc. (NYSE: AYX.), a software company. Mr. Horing has served on the board of directors of nCino, Inc. (Nasdaq: NCNO), a financial technology company, since February 2015, and on the board of directors of JFrog Ltd. (Nasdaq: FROG) since September 2018. In addition, Mr. Horing currently serves on the board of directors of several privately held companies. Mr. Horing holds a B.S. and B.A. from the University of Pennsylvania’s Moore School of Engineering and the Wharton School, respectively, and an M.B.A. from the M.I.T. Sloan School of Management. |
 | Avishai Abrahami has served as a member of our board of directors since October 24, 2012. Mr. Abrahami is the Co-Founder of Wix.com Ltd. (Nasdaq: WIX) and has served as its Chief Executive Officer since September 2010, prior to which he served as its Co-Chief Executive Officer, and as a member of its board of directors since October 2006. From May 2016 to November 2017, Mr. Abrahami served as a member of the board of directors of SodaStream International Ltd. (acquired by PepsiCo Inc.). From 2004 to 2006, Mr. Abrahami was the Vice President of Strategic Alliances at Arel Communications & Software Ltd., a private Israeli company specializing in communication technology. In 1998, he co-founded Sphera Corporation, a private company which develops software for managing data centers, and he served as its Chief Technology Officer from 1998 until 2000 and its Vice President of Product Marketing from 2000 until 2003. In 1993, he co-founded AIT Ltd., a private Israeli software company, and served as its Chief Technology Officer until it was acquired in 1997. Mr. Abrahami served in the Israeli Defense Forces’ elite computer intelligence unit from 1990 until 1992. |
 | Gili Iohan has served as a member of our board of directors as an external director under the Companies Law since June 9, 2021. Since 2018, Ms. Iohan has been a partner at ION Crossover Partners, an Israeli based cross- over fund. Ms. Iohan currently serves on the board of directors of Varonis Systems, Inc. (Nasdaq: VRNS), Fiverr International Ltd. (Nasdaq: FVRR) and SimilarWeb Ltd. (NYSE: SMWB), as well as Aqua Security Ltd. Ms. Iohan holds a B.A. in Accounting and Economics and an M.B.A. from Tel Aviv University and is a licensed certified public accountant. |
 | Ronen Faier has served as a member of our board of directors as an external director under the Companies Law since June 9, 2021. Mr. Faier has served the Chief Financial Officer of SolarEdge Technologies Inc. (Nasdaq: SEDG) since January 2011. Previously, Mr. Faier has served as the Chief Financial Officer of Modu Ltd. from March 2007 through December 2010 and as the Chief Financial Officer of msystems Ltd., which was acquired by SanDisk Corp. (a Western Digital Corp. (Nasdaq: WDC) company). Mr. Faier has served on the board of directors of Kaltura Inc. since March 2021. Mr. Faier holds a B.A. in accounting and economics from the Hebrew University in Jerusalem and an M.B.A. from Tel Aviv University and is a licensed certified public accountant. |
| B. | Compensation |
| • | at least a majority of the shares held by all shareholders who are not controlling shareholders and do not have a personal interest in such matter, present and voting at such meeting, are voted in favor of the compensation package, excluding abstentions; or |
| • | the total number of shares of non-controlling shareholders and shareholders who do not have a personal interest in such matter voting against the compensation package does not exceed 2% of the aggregate voting rights in the Company. |
| • | Mr. Eliran Glazer, our CFO. Compensation costs recorded in 2021 of $227 in salary expenses and $73 in social benefits costs. |
| • | Ms. Oshrat Binyamin, our VP of Human Resources. Compensation costs recorded in 2021 of $193 in salary expenses and $53 in social benefits costs. |
| • | Mr. Ouriel Weisz, our VP of Operations. Compensation costs recorded in 2021 of $196 in salary expenses and $64 in social benefits costs. |
| • | Mr. Yoni Osherov, our VP of Global Sales and Marketing. Compensation expenses recorded in 2021 of $235 in salary expenses and $71 in social benefits costs. |
| • | Mr. Daniel Lereya, our VP of Research & Development and Product. Compensation costs recorded in 2021 of $232 in salary expenses and $73 in social benefits costs. |
| • | the Class I director is Roy Mann, and his term will expire at our annual general meeting of shareholders to be held in 2022; |
| • | the Class II directors are Eran Zinman and Aviad Eyal, and their terms will expire at our annual meeting of shareholders to be held in 2023; and |
| • | the Class III directors are Avishai Abrahami and Jeff Horing, and their term will expire at our annual meeting of shareholders to be held in 2024. |
| Board Diversity Matrix (As of December 31, 2021) | |||||||
| Country of Principal Executive Offices: | Israel | ||||||
| Foreign Private Issuer | Yes | ||||||
| Disclosure Prohibited under Home Country Law | No | ||||||
| Total Number of Directors | 7 | ||||||
| Female | Male | Non-Binary | Did Not Disclose Gender | ||||
| Part I: Gender Identity | |||||||
| Directors | 1 | 6 | 0 | 0 | |||
| Part II: Demographic Background | |||||||
| Underrepresented Individual in Home Country Jurisdiction | 0 | ||||||
| LGBTQ+ | 0 | ||||||
| Did Not Disclose Demographic Background | 1 | ||||||
| ● | such majority includes at least a majority of the shares held by all shareholders who are not controlling shareholders and do not have a personal interest in the election of the external director (other than a personal interest not deriving from a relationship with a controlling shareholder) that are voted at the meeting, excluding abstentions, to which we refer as a disinterested majority; or |
| ● | the total number of shares voted by non-controlling shareholders and by shareholders who do not have a personal interest in the election of the external director against the election of the external director does not exceed 2% of the aggregate voting rights in the company. |
| ● | his or her service for each such additional term is recommended by one or more shareholders holding at least 1% of the company’s voting rights and is approved at a shareholders meeting by a disinterested majority, where the total number of shares held by non-controlling, disinterested shareholders voting for such re-election exceeds 2% of the aggregate voting rights in the company, subject to additional restrictions set forth in the Companies Law with respect to affiliations of external director nominees; |
| ● | the external director proposed his or her own nomination, and such nomination was approved in accordance with the requirements described in the paragraph above; or |
| ● | his or her service for each such additional term is recommended by the board of directors and is approved at a meeting of shareholders by the same majority required for the initial election of an external director (as described above). |
| ● | an employment relationship; |
| ● | a business or professional relationship even if not maintained on a regular basis (excluding insignificant relationships); |
| ● | control; and |
| ● | service as an office holder, excluding service as a director in a private company prior to the initial public offering of its shares if such director was appointed as a director of the private company in order to serve as an external director following the initial public offering. |
| ● | he or she meets the qualifications for being appointed as an external director, except for the requirement (i) that the director be an Israeli resident (which does not apply to companies such as ours whose securities have been offered outside of Israel or are listed for trading outside of Israel) and (ii) for accounting and financial expertise or professional qualifications; and |
| ● | he or she has not served as a director of the company for a period exceeding nine consecutive years. For this purpose, a break of less than two years in his or her service as a director shall not be deemed to interrupt the continuity of the service. |
| • | retaining and terminating our independent auditors, subject to ratification by the board of directors, and in the case of retention, subject to ratification by the shareholders; |
| • | pre-approving audit and non-audit services to be provided by the independent auditors and related fees and terms; |
| • | overseeing the accounting and financial reporting processes of the Company and audits of our financial statements, the effectiveness of our internal control over financial reporting and making such reports as may be required of an audit committee under the rules and regulations promulgated under the Exchange Act; |
| • | reviewing with management and our independent auditor our annual and quarterly financial statements prior to publication or filing (or submission, as the case may be) to the SEC; |
| • | recommending to the board of directors the retention and termination of the internal auditor, and the internal auditor’s engagement fees and terms, in accordance with the Companies Law as well as approving the yearly or periodic work plan proposed by the internal auditor; |
| • | reviewing with our general counsel and/or external counsel, as deemed necessary, legal and regulatory matters that could have a material impact on the financial statements; |
| • | identifying irregularities in our business administration by, among other things, consulting with the internal auditor or with the independent auditor, and suggesting corrective measures to the board of directors; |
| • | reviewing policies and procedures with respect to transactions between the Company and officers and directors (other than transactions related to the compensation or terms of service of the officers and directors), or affiliates of officers or directors, or transactions that are not in the ordinary course of the Company’s business and deciding whether to approve such acts and transactions if so required under the Companies Law; and |
| • | establishing procedures for the handling of employees’ complaints as to the management of our business and the protection to be provided to such employees. |
| ● | making recommendations to the board of directors with respect to the approval of the compensation policy for Covered Officers and, once every three years, regarding any extensions to a compensation policy that was adopted for a period of more than three years; |
| ● | reviewing the implementation of the compensation policy and periodically making recommendations to the board of directors with respect to any amendments or updates of the compensation policy; |
| ● | resolving whether or not to approve arrangements with respect to the terms of office and employment of Covered Officers; and |
| ● | exempting, under certain circumstances, transactions with our Co-Chief Executive Officers from the approval of our shareholders. |
| ● | recommending to our board of directors for its approval a compensation policy in accordance with the requirements of the Companies Law as well as other compensation policies, incentive-based compensation plans and equity-based compensation plans, and overseeing the development and implementation of such policies and recommending to our board of directors any amendments or modifications the committee deems appropriate, including as required under the Companies Law; |
| ● | reviewing and approving the granting of options and other incentive awards to our Co-Chief Executive Officers and other executive officers, including reviewing and approving corporate goals and objectives relevant to the compensation of our Co-Chief Executive Officers and other executive officers, including evaluating their performance in light of such goals and objectives; |
| ● | approving and exempting certain transactions regarding Covered Officers’ compensation pursuant to the Companies Law; and |
| ● | administering our equity-based compensation plans, including without limitation, approving the adoption of such plans, amending and interpreting such plans and the awards and agreements issued pursuant thereto, and making awards to eligible persons under the plans and determining the terms of such awards. |
| ● | such majority includes at least a majority of the shares held by shareholders who are not controlling shareholders and shareholders who do not have a personal interest in such compensation policy; or |
| ● | the total number of shares of non-controlling shareholders and shareholders who do not have a personal interest in the compensation policy and who vote against the policy, does not exceed 2% of the aggregate voting rights in the Company. |
| ● | the education, skills, experience, expertise and accomplishments of the relevant office holder; |
| ● | the office holder’s position and responsibilities |
| ● | prior compensation agreements with the office holder; |
| ● | the ratio between the cost of the terms of employment of an office holder and the cost of the employment of other employees of the company, including employees employed through contractors who provide services to the company, in particular the ratio between such cost to the average and median salary of such employees of the company, as well as the impact of disparities between them on the work relationships in the company; |
| ● | if the terms of employment include variable components — the possibility of reducing variable components at the discretion of the board of directors and the possibility of setting a limit on the value of non-cash variable equity-based components; and |
| ● | if the terms of employment include severance compensation — the term of employment or office of the office holder, the terms of the office holder’s compensation during such period, the company’s performance during such period, the office holder’s individual contribution to the achievement of the company goals and the maximization of its profits and the circumstances under which he or she is leaving the company. |
| ● | with the exception of Covered Officers who report to the chief executive officer, a means of determining the variable components on the basis of long-term performance and measurable criteria; provided that the company may determine that an immaterial part of the variable components of the compensation package of an office holder shall be awarded based on non-measurable criteria, or if such amount is not higher than three months’ salary per annum, taking into account such office holder’s contribution to the company; |
| ● | the ratio between variable and fixed components, as well as the limit of the values of variable components at the time of their payment, or in the case of equity-based compensation, at the time of grant. |
| ● | a condition under which the office holder will return to the company, according to conditions to be set forth in the compensation policy, any amounts paid as part of the office holder’s terms of employment, if such amounts were paid based on information later to be discovered to be wrong, and such information was restated in the company’s financial statements; |
| ● | the minimum holding or vesting period of variable equity-based components to be set in the terms of office or employment, as applicable, while taking into consideration long-term incentives; and |
| ● | a limit to retirement grants. |
| ● | recommending to our board of directors the Company’s overall environmental, social and governance strategies, including, but not limited to environmental, health and safety, corporate social responsibility, sustainability, philanthropy, corporate governance, reputation, diversity, equity and inclusion, community issues, political contributions and lobbying and other public policy matters relevant to the Company (collectively, “ESG Matters”); |
| ● | overseeing the Company’s policies, practices and performance with respect to ESG Matters; |
| ● | overseeing the Company’s reporting standards in relation to ESG Matters; |
| ● | reporting to the board of directors of the Company about current and emerging topics relating to ESG Matters that may affect the business, operations, performance, or public image of the Company or are otherwise pertinent to the Company and its stakeholders and, if appropriate, detailing actions taken in relation to the same; |
| ● | assessing the performance of the members of our board; |
| ● | establishing and maintaining effective corporate governance policies and practices, including, but not limited to, developing and recommending to our board a set of corporate governance guidelines applicable to our business; and |
| ● | advising the board of directors of the Company on shareholder proposals and other significant stakeholder concerns relating to ESG Matters. |
| • | each person or entity known by us to own beneficially more than 5% of our outstanding shares; |
| • | each of our directors and executive officers individually; and |
| • | all of our executive officers and directors as a group. |
| Shares Beneficially Owned | ||||||||
| Name of Beneficial Owner | Number | % | ||||||
| Principal Shareholders | ||||||||
Insight Partners(1) | 13,907,278 | 31.0 | ||||||
Sonnipe Limited(2) | 4,511,068 | 10.0 | ||||||
Stripes (3) | 2,587,943 | 5.8 | ||||||
T. Rowe Price Associates Inc. (4) | 2,622,976 | 5.8 | ||||||
| Directors and Executive Officers | ||||||||
| Roy Mann | 5,867,191 | 13.1 | ||||||
Eran Zinman(5) | 2,267,317 | 4.8 | ||||||
Eliran Glazer(6) | 19,182 | * | ||||||
Daniel Lereya(7) | 64,658 | * | ||||||
Yoni Osherov(8) | 55,392 | * | ||||||
Shiran Nawi(9) | 33,313 | * | ||||||
Avishai Abrahami(10) | 1,473,202 | 3.3 | ||||||
Aviad Eyal(11) | 368,748 | * | ||||||
Jeff Horing(12) | 340 | * | ||||||
Ronen Faier(13) | 227 | * | ||||||
Gili Iohan(14) | 227 | * | ||||||
All executive officers and directors as a group (11 persons) | 10,149,797 | 22.3 | % | |||||
| (1) | Based on the Schedule 13G filed by Insight Venture Partners IX, L.P. with the SEC on February 11, 2022, includes: (i) 5,949,910 ordinary shares held of record by Insight Venture Partners IX, L.P. (“Insight IX LP”), (ii) 118,897 ordinary shares held of record by Insight Venture Partners IX (Co-Investors), L.P. (“Insight Co-Investors”), (iii) 2,956,526 ordinary shares held of record by Insight Venture Partners (Cayman) IX, L.P. (“Insight Cayman”), (iv) 630,319 ordinary shares held of record by Insight Venture Partners (Delaware) IX, L.P. (“Insight Delaware”), (v) 407,799 ordinary shares held of record by Grace Software Cross Fund Holdings, L.P. (“Grace”) and (vi) 3,843,827 ordinary shares held of record by IG Aggregator, L.P. (“IGA”). Insight Holdings Group, LLC (“Holdings”) is the sole shareholder of each of Insight Venture Associates IX, Ltd. (“IVA IX Ltd.”), Insight Venture Associates X, Ltd. (“IVA X Ltd.”) and Insight Associates XI, Ltd. (“IA XI Ltd.”). IVA IX Ltd. is the general partner of Insight Venture Associates IX, L.P. (“IVA IX LP”), which is the general partner of Insight IX, LP, Insight Cayman, Insight Delaware and Insight Co-Investors (collectively “Fund IX”). IVA X Ltd. is the general partner of Insight Venture Associates X, L.P. (“IVA X LP”), which is the general partner of IGA. IA XI Ltd. is the general partner of Insight Associates XI, L.P. (“IA XI LP”), which is the manager of Grace Software Holdings II GP, LLC (“Grace LLC”). Grace LLC is the general partner of Grace Software Cross Fund Holdings, L.P. (“Grace LP”). The address of Insight Venture Partners IX, L.P. is 1114 Avenue of the Americas, 36th Floor, New York, New York 10036. |
| (2) | Pursuant to information provided to the us by Sonnipe Limited, represents 4,511,068 ordinary shares held by Sonnipe Limited. The address for this entity is Clinch's House, Lord St, Douglas, Isle of Man, IM99 1RZ. |
| (3) | Based on the Schedule 13G filed by Stripes Holdings LLC with the SEC on February 14, 2022, includes (i) 862,648 ordinary shares held of record by Stripes III Offshore AIV, LP (formerly SG Growth Partners III Offshore AIV, LP) (“Stripes III”) and (ii) 1,725,295 ordinary shares held of record by Stripes IV Offshore AIV, LP (formerly SG Growth Partners IV Offshore AIV, LP) (“Stripes IV”, and together with Stripes III, the “Stripes”). Stripes III is controlled by its general partner, Stripes GP III, LLC, which is controlled by its managing member, Stripes Holdings, LLC (“Stripes Holdings”). Stripes IV is controlled by its general partner, Stripes GP IV, LLC, which is controlled by its managing member, Stripes Holdings. The address of Stripes Holdings LLC is 402 West 13th St. New York, NY 10014. |
| (4) | Based on the Schedule 13G filed by T. Rowe Price Associates Inc. with the SEC on February 14, 2022, T. Rowe Price Associates Inc. may be deemed to have sole voting power with respect to 743,180 ordinary shares and sole dispositive power with respect to 2,622,976 ordinary shares. The address of T. Rowe Price Associates, Inc is 100 E. Pratt Street, Baltimore, MD 21202. |
| (5) | Consists of 2,267,317 ordinary shares subject to options held by Eran Zinman that are exercisable within 60 days of December 31, 2021. |
| (6) | Consists of 19,182 ordinary shares subject to options held by Eliran Glazer that are exercisable within 60 days of December 31, 2021. |
| (7) | Consists of 64,658 ordinary shares subject to options held by Daniel Lereya that are exercisable within 60 days of December 31, 2021. |
| (8) | Consists of 55,392 ordinary shares subject to options held by Yoni Osherov that are exercisable within 60 days of December 31, 2021. |
| (9) | Consists of 33,313 ordinary shares subject to options held by Shiran Nawi that are exercisable within 60 days of December 31, 2021. |
| (10) | Consists of (i) 359,825 ordinary shares held of record by Avishai Abrahami,(ii) 99,500 ordinary shares subject to options held by Avishai Abrahami that are exercisable within 60 days of December 31, 2021, (iii) 227 RSUs held by Avishai Abrahami that vest within 60 days of December 31, 2021, and (iv) 1,013,650 ordinary shares held of record by Wix.com Ltd. Mr. Abrahami is the Chief Executive Officer and Co-Founder of Wix.com Ltd. and may therefore be deemed to be the indirect beneficial owner of the ordinary shares owned directly by Wix.com Ltd. |
| (11) | Consists of (i) 368,521 ordinary shares held of record by Aviad Eyal and (ii) 227 RSUs held by Aviad Eyal that vest within 60 days of December 31, 2021. |
| (12) | Consists of 340 RSUs held by Jeff Horing that vest within 60 days of December 31, 2021. |
| (13) | Consists of 227 RSUs held by Ronen Faier that vest within 60 days of December 31, 2021. |
| (14) | Consists of 227 RSUs held by Gili Iohan that vest within 60 days of December 31, 2021. |
| A. | Consolidated Statements and Other Financial Information |
| • | amendments to our articles of association; |
| • | appointment, terms of service or and termination of service of our auditors; |
| • | appointment of directors, including external directors (if applicable); |
| • | approval of certain related party transactions; |
| • | increases or reductions of our authorized share capital; |
| • | a merger; and |
| ● | amortization of the cost of purchased patent, rights to use a patent, and know-how, which are used for the development or advancement of the Industrial Enterprise, over an eight-year period, commencing on the year in which such rights were first exercised; |
| ● | expenses related to a public offering are deductible in equal amounts over three years commencing on the year of the offering. |
| Maturity in 2022 | ||||
Derivatives designated as hedging instruments: | ||||
| Foreign exchange contracts: | ||||
| NIS | $ | 36,013 | ||
| Derivatives not designated as hedging instruments: | ||||
| Foreign exchange contracts: | ||||
| GBP | 4,054 | |||
| Euro | 2,830 | |||
| AUD | 581 | |||
| 7,465 | ||||
| Total | $ | 43,478 | ||
| | 2021 | 2020 | ||||||
| (In thousands) | ||||||||
| Audit fees (1) | $ | 450 | 650 | |||||
| Audit related fees (2) | 800 | 40 | ||||||
| Tax Fees (3) | 124 | 248 | ||||||
| All other fees (4) | — | — | ||||||
| Total fees | $ | 1,374 | 938 | |||||
| (1) | Audit fees consist of professional services provided in connection with the audit of our annual consolidated financial statements and the review of our unaudited quarterly consolidated financial statements. |
| (2) | Audit-related fees” consist of services in connection with our Initial Public Offering. |
| (3) | Tax fees” consist of fees for professional services for tax compliance, tax advice, and tax audits. These services include consultation on tax matters and assistance regarding federal, state, and international tax compliance. |
| (4) | All other fees” consist of all other fees in the years ended December 31, 2021 and 2020 related to services in connection with non-audit compliance and review work. |
| Exhibit No. | Description |
| 101. INS | Inline XBRL Instance Document. The instance document does not appear in the interactive data file because its XBRL tags are embedded within the inline XBRL document |
| 101. SCH | Inline XBRL Taxonomy Extension Schema Document |
| 101. CAL | Inline XBRL Taxonomy Extension Calculation Linkbase Document |
| 101. DEF | Inline XBRL Taxonomy Extension Definition Linkbase Document |
| 101. LAB | XBRL Taxonomy Extension Label Linkbase Document |
| 101. PRE | XBRL Taxonomy Extension Presentation Linkbase Document |
| 104 | Cover Page Interactive Data File (formatted as inline XBRL and contained in Exhibit 101) |
| monday.com Ltd. | |||
Date: March 16, 2022 | By: | /s/ Eliran Glazer | |
| Eliran Glazer | |||
| Chief Financial Officer | |||
MONDAY.COM LTD. AND SUBSIDARIES
Page | ||
Report of Independent Registered Public Accounting Firm (PCAOB ID No. 1197) | F - 2 | |
| F - 3 | ||
| F - 4 | ||
| F - 5 | ||
| F - 6 | ||
| F - 7 | ||
F - 8 – F - 32 |
| December 31, | ||||||||
2021 | 2020 | |||||||
ASSETS | ||||||||
| CURRENT ASSETS: | ||||||||
| Cash and cash equivalents | $ | 886,812 | $ | 129,814 | ||||
| Short term deposits | 0 | 10,000 | ||||||
Accounts receivable - net of allowance for doubtful accounts of $249, and $264 as of December 31, 2021 and 2020, respectively | 8,509 | 3,911 | ||||||
| Prepaid expenses and other current assets | 18,172 | 3,898 | ||||||
| Total current assets | 913,493 | 147,623 | ||||||
| Property and equipment, net | 19,599 | 7,178 | ||||||
| Other long-term assets | 100 | 2,619 | ||||||
| Total assets | $ | 933,192 | $ | 157,420 | ||||
LIABILITIES, CONVERTIBLE PREFERRED SHARES AND SHAREHOLDERS' (DEFICIT) EQUITY | ||||||||
| CURRENT LIABILITIES: | ||||||||
| Accounts payable | $ | 23,612 | $ | 25,734 | ||||
| Accrued expenses and other current liabilities | 70,135 | 22,967 | ||||||
| Deferred revenue | 134,438 | 70,719 | ||||||
| Revolving credit facility | 0 | 21,016 | ||||||
| Total current liabilities | 228,185 | 140,436 | ||||||
| Other long-term liabilities | 1,612 | 1,045 | ||||||
| Total liabilities | 229,797 | 141,481 | ||||||
| COMMITMENTS AND CONTINGENCIES (NOTE 8) | 0 | 0 | ||||||
| CONVERTIBLE PREFERRED SHARES: | ||||||||
Preferred shares, 0 par value – Authorized: 0 shares as of December 31, 2021 and 27,056,939 shares as of December 31, 2020; Issued and outstanding: 0 shares as of December 31, 2021 and 26,440,239 as of December 31, 2020; | 0 | 233,496 | ||||||
SHAREHOLDERS' EQUITY (DEFICIT): | ||||||||
Ordinary shares, 0 par value – Authorized: 99,999,999 and 52,943,061 shares as of December 31, 2021 and 2020, respectively; Issued and Outstanding: 44,924,038 and 12,354,471 as of December 31, 2021 and 2020 respectively | 0 | 0 | ||||||
Founders shares, 0 par value: Authorized: 1 share as of December 31, 2021, and 0 shares as of December 31, 2020. Issued and outstanding: 1 share as of December 31, 2021 and 0 shares as of December 31, 2020. | 0 | 0 | ||||||
| Accumulated other comprehensive income | 594 | 0 | ||||||
| Additional paid-in capital | 1,148,461 | 98,809 | ||||||
| Accumulated deficit | (445,660 | ) | (316,366 | ) | ||||
Total shareholders’ equity (deficit) | 703,395 | (217,557 | ) | |||||
Total liabilities, convertible preferred shares, and shareholders’ equity (deficit) | $ | 933,192 | $ | 157,420 | ||||
| Year ended December 31, | ||||||||||||
2021 | 2020 | 2019 | ||||||||||
| Revenue | $ | 308,150 | $ | 161,123 | $ | 78,089 | ||||||
| Cost of revenue | 39,013 | 22,488 | 11,978 | |||||||||
| Gross profit | 269,137 | 138,635 | 66,111 | |||||||||
| OPERATING EXPENSES | ||||||||||||
| Research and development | 73,686 | 43,480 | 24,637 | |||||||||
| Sales and marketing | 268,083 | 191,353 | 118,534 | |||||||||
| General and administrative | 53,493 | 54,339 | 15,458 | |||||||||
| Total operating expenses | 395,262 | 289,172 | 158,629 | |||||||||
| Operating loss | (126,125 | ) | (150,537 | ) | (92,518 | ) | ||||||
| Financial income | 875 | 1,537 | 2,359 | |||||||||
| Financial expenses | (1,713 | ) | (1,011 | ) | (769 | ) | ||||||
| Loss before income taxes | (126,963 | ) | (150,011 | ) | (90,928 | ) | ||||||
Taxes on income | (2,331 | ) | (2,192 | ) | (683 | ) | ||||||
| Net loss | $ | (129,294 | ) | $ | (152,203 | ) | $ | (91,611 | ) | |||
| Net loss per share attributable to ordinary shareholders’, basic and diluted | $ | (4.53 | ) | $ | (14.19 | ) | $ | (9.22 | ) | |||
| Weighted-average ordinary shares used in calculating net loss per ordinary share, basic and diluted | 30,332,006 | 12,048,909 | 11,348,428 | |||||||||
U.S. dollars in thousands
| Year ended December 31, | ||||||||||||
2021 | 2020 | 2019 | ||||||||||
| Net loss | $ | 129,294 | $ | 152,203 | $ | 91,611 | ||||||
| Other comprehensive income: | ||||||||||||
| Unrealized gains on derivative instruments | 953 | 0 | 0 | |||||||||
| Realized gains on derivative instruments | (359 | ) | 0 | 0 | ||||||||
| - | ||||||||||||
| Net current-period other comprehensive income | 594 | 0 | 0 | |||||||||
| Comprehensive loss | 128,700 | 152,203 | 91,611 | |||||||||
| Convertible Preferred Shares | Number of Ordinary | Number of Founders’ | Additional Paid-in | Accumulated Other Comprehensive | Accumulated | Shareholders' | ||||||||||||||||||||||||||
Shares | Amount | Shares | Shares | Capital | Income (***) | Deficit | Equity (Deficit) | |||||||||||||||||||||||||
| Balance as of January 1, 2019 | 22,805,727 | $ | 83,646 | 11,017,137 | 0 | $ | 11,500 | $ | 0 | $ | (72,552 | ) | $ | (61,052 | ) | |||||||||||||||||
| - | ||||||||||||||||||||||||||||||||
| Exercise of options | 0 | 0 | 754,901 | 0 | 103 | 0 | 0 | 103 | ||||||||||||||||||||||||
| Share-based compensation | - | 0 | - | - | 21,939 | 0 | 0 | 21,939 | ||||||||||||||||||||||||
| Issuance of Series E preferred shares, net (*) | 3,634,512 | 149,850 | 0 | 0 | 0 | 0 | 0 | 0 | ||||||||||||||||||||||||
| Net loss | - | 0 | - | - | 0 | 0 | (91,611 | ) | (91,611 | ) | ||||||||||||||||||||||
| Balance as of December 31, 2019 | 26,440,239 | $ | 233,496 | 11,772,038 | 0 | $ | 33,542 | 0 | $ | (164,163 | ) | $ | (130,621 | ) | ||||||||||||||||||
| Exercise of options | 0 | 0 | 582,433 | 0 | 542 | 0 | 0 | 542 | ||||||||||||||||||||||||
Share based compensation | - | 0 | - | - | 64,725 | 0 | 0 | 64,725 | ||||||||||||||||||||||||
| Net loss | - | 0 | - | - | 0 | 0 | (152,203 | ) | (152,203 | ) | ||||||||||||||||||||||
| Balance as of December 31, 2020 | 26,440,239 | $ | 233,496 | 12,354,471 | 0 | $ | 98,809 | 0 | $ | (316,366 | ) | $ | (217,557 | ) | ||||||||||||||||||
| Exercise of options | 0 | 0 | 1,090,670 | 0 | 5,249 | 0 | 0 | 5,249 | ||||||||||||||||||||||||
| Issuance of ordinary shares upon the vesting and settlement of restricted stock units | 0 | 0 | 917 | 0 | 0 | 0 | 0 | 0 | ||||||||||||||||||||||||
| Other comprehensive income | - | 0 | - | - | 0 | 594 | 0 | 594 | ||||||||||||||||||||||||
Conversion of convertible preferred shares to ordinary shares in connection with Initial Public Offerring | (26,440,239 | ) | (233,496 | ) | 26,440,239 | 0 | 233,496 | 0 | 0 | 233,496 | ||||||||||||||||||||||
Issuance of Ordinary and Founders’ shares in connection with concurrent initial public offering and private placement,net of underwriting discounts and issuance costs (**) | 0 | 0 | 5,037,741 | 1 | 735,856 | 0 | 0 | 735,856 | ||||||||||||||||||||||||
Share based compensation | - | - | - | - | 75,051 | 0 | 0 | 75,051 | ||||||||||||||||||||||||
| Net loss | - | - | - | - | 0 | 0 | (129,294 | ) | (129,294 | ) | ||||||||||||||||||||||
| Balance as of December 31, 2021 | 0 | 0 | 44,924,038 | 1 | $ | 1,148,461 | 594 | $ | (445,660 | ) | $ | 703,395 | ||||||||||||||||||||
The accompanying notes are an integral part of the consolidated financial statements.
| Year ended December 31, | ||||||||||||
2021 | 2020 | 2019 | ||||||||||
| CASH FLOWS FROM OPERATING ACTIVITIES: | ||||||||||||
| Net loss | $ | (129,294 | ) | $ | (152,203 | ) | $ | (91,611 | ) | |||
Adjustments to reconcile net loss to cash provided by (used in) operating activities: | ||||||||||||
| Depreciation and amortization | 2,746 | 1,888 | 579 | |||||||||
| Capital loss from sale of property and equipment | 76 | 0 | 0 | |||||||||
| Share-based compensation | 73,529 | 64,345 | 21,839 | |||||||||
| Change in accrued interest on revolving credit facility | (16 | ) | (14 | ) | 21 | |||||||
Changes in operating assets and liabilities: | ||||||||||||
| Accounts receivable, net | (4,598 | ) | (472 | ) | (3,101 | ) | ||||||
| Prepaid expenses and other assets | (13,335 | ) | (1,828 | ) | (1,313 | ) | ||||||
| Accounts payable | (2,040 | ) | 6,773 | 8,886 | ||||||||
| Accrued expenses and other liabilities | 25,568 | 14,598 | 5,555 | |||||||||
| Deferred revenue | 63,719 | 29,738 | 22,495 | |||||||||
| Net cash provided by (used in) operating activities | 16,355 | (37,175 | ) | (36,650 | ) | |||||||
| CASH FLOWS FROM INVESTING ACTIVITIES: | ||||||||||||
| Purchase of property and equipment | (11,578 | ) | (4,362 | ) | (1,402 | ) | ||||||
| Capitalized software development costs | (2,180 | ) | (1,119 | ) | (365 | ) | ||||||
| Proceeds from sale of property and equipment | 129 | 0 | 0 | |||||||||
| Changes in short-term deposits | 10,000 | (6,000 | ) | 15,000 | ||||||||
| Net cash provided by (used in) investing activities | (3,629 | ) | (11,481 | ) | 13,233 | |||||||
| CASH FLOWS FROM FINANCING ACTIVITIES: | ||||||||||||
| Proceeds from issuance of preferred shares | 0 | 0 | 149,850 | |||||||||
| Proceeds from exercise of share options | 5,249 | 542 | 103 | |||||||||
| Proceeds from initial public offering and concurrent private placement, net of underwriting discounts and other issuance costs | 735,856 | 0 | 0 | |||||||||
Receipt of tax advance relating to exercises of share options, net | 22,258 | 0 | 0 | |||||||||
| Receipt (repayment) of revolving credit facility, net of payments | (21,000 | ) | 8,000 | 8,500 | ||||||||
| Capital lease payments | (91 | ) | (72 | ) | (7 | ) | ||||||
| Net cash provided by financing activities | 742,272 | 8,470 | 158,446 | |||||||||
| INCREASE (DECREASE) IN CASH, CASH EQUIVALENTS AND RESTRICTED CASH | 754,998 | (40,186 | ) | 135,029 | ||||||||
| CASH, CASH EQUIVALENTS AND RESTRICTED CASH - Beginning of period | 131,814 | 172,000 | 36,971 | |||||||||
| CASH, CASH EQUIVALENTS AND RESTRICTED CASH - End of period | $ | 886,812 | $ | 131,814 | $ | 172,000 | ||||||
| SUPPLEMENTAL DISCLOSURE: | ||||||||||||
| Cash paid for taxes | $ | 3,298 | $ | 2,487 | $ | 250 | ||||||
| Cash paid for interest | $ | 421 | $ | 685 | $ | 522 | ||||||
| NON-CASH INVESTING AND FINANCING ACTIVITIES: | ||||||||||||
| Additions to capital leases | $ | 0 | $ | 0 | $ | 254 | ||||||
| Non-cash purchases of property and equipment | $ | 92 | $ | 232 | $ | 221 | ||||||
| Unpaid deferred offering costs | $ | 0 | $ | 174 | $ | 0 | ||||||
| Share-based compensation included in capitalized software development costs | $ | 1,522 | $ | 380 | $ | 100 | ||||||
| RECONCILIATION OF CASH, CASH EQUIVALENTS AND RESTRICTED CASH TO THE CONSOLIDATED BALANCE SHEET: | ||||||||||||
| Cash and cash equivalents | $ | 886,812 | $ | 129,814 | $ | 171,601 | ||||||
| Restricted cash – Included in prepaid expense and other current assets | 0 | 0 | 20 | |||||||||
| Restricted cash – Included in other long-term assets | 0 | 2,000 | 379 | |||||||||
| Total cash, cash equivalents, and restricted cash | $ | 886,812 | $ | 131,814 | $ | 172,000 | ||||||
| NOTE 1:- | ORGANIZATION AND DESCRIPTION OF BUSINESS |
monday.com Ltd (“monday.com” and together with its subsidiaries collectively, “the Company”) was incorporated under the laws of Israel and commenced operations in 2012. The Company operates a cloud-based visual Work Operating System (‘Work OS’) that consists of modular building blocks that can be easily used and assembled to create software applications and work management tools and serves as a connective layer to integrate with various digital tools across an organization. By using the Company’s Work OS platform, customers can simplify and accelerate their digital transformation, enhance organizational agility, become more productive and increase operational efficiency.
monday.com has five wholly owned subsidiaries: monday.com Inc. (the “U.S Subsidiary”) incorporated in the United States in 2016, monday.com UK incorporated under the laws of England in 2020, monday.com PTY, incorporated in Australia in 2020, monday.com LTDA. incorporated in Brazil in 2021 and monday.com K.K. incorporated in Japan in 2021. The subsidiaries primarily engage in providing business development, presale, and customer success services to the Company’s existing and potential customers.
The accompanying consolidated financial statements, which are prepared in accordance with accounting principles generally accepted in the United States of America ("US GAAP"), reflect the application of the significant accounting policies described below and elsewhere in the notes to the consolidated financial statements.
a. Principles of Consolidation
b. Use of estimates
MONDAY.COM AND SUBSIDIARIES
NOTES TO CONSOLIDATED FINANCIAL STATEMENTS
U.S. dollars in thousands (except share and per share data)
c. Foreign Currency Translation and Transactions
d. Cash and Cash Equivalents
e. Short-term deposits
f. Accounts Receivable
g. Property and Equipment, Net
h. Internal Use Software Development Costs
MONDAY.COM AND SUBSIDIARIES
NOTES TO CONSOLIDATED FINANCIAL STATEMENTS
U.S. dollars in thousands (except share and per share data)
Capitalization ceases when the software is substantially complete and ready for its intended use, including the completion of all significant testing. Costs related to preliminary project activities and post implementation operating activities are expensed as incurred.
i. Amortization and Impairment of Long-Lived Assets:
Years | ||
Computers, software and electronic equipment | 3-5 | |
Office furniture and equipment | 10-14 | |
Capitalized internal software development costs | 3 | |
Leasehold improvements | Shorter of the remaining term of the underlying lease, or estimated useful life of the asset |
j. Leases
MONDAY.COM AND SUBSIDIARIES
NOTES TO CONSOLIDATED FINANCIAL STATEMENTS
U.S. dollars in thousands (except share and per share data)
k. Employee Related Obligations
l. Contingent Liabilities
MONDAY.COM AND SUBSIDIARIES
NOTES TO CONSOLIDATED FINANCIAL STATEMENTS
U.S. dollars in thousands (except share and per share data)
1. Identification of the contract, or contracts, with the customer
2. Identification of the performance obligations in the contract
MONDAY.COM AND SUBSIDIARIES
NOTES TO CONSOLIDATED FINANCIAL STATEMENTS
U.S. dollars in thousands (except share and per share data)
3. Determination of the transaction price
4. Allocation of the transaction price to the performance obligations in the contract
5. Recognition of the revenue when, or as, a performance obligation is satisfied
n. Cost of Revenue
o. Research and Development Costs
MONDAY.COM AND SUBSIDIARIES
NOTES TO CONSOLIDATED FINANCIAL STATEMENTS
U.S. dollars in thousands (except share and per share data)
p. Sales and Marketing
q. General and Administrative
r. Accounting for Share-Based Compensation:
MONDAY.COM AND SUBSIDIARIES
NOTES TO CONSOLIDATED FINANCIAL STATEMENTS
U.S. dollars in thousands (except share and per share data)
| Year ended December 31, | ||||||||||||
2021 | 2020 | 2019 | ||||||||||
Risk-free interest rate | 0.68%-1.15 | % | 0.3%-0.58 | % | 2.12%-2.75 | % | ||||||
Expected dividend yield | 0 | % | 0 | % | 0 | % | ||||||
Expected term (in years) | 5-8 | 5-8 | 5-8 | |||||||||
Expected volatility | 49%-50 | % | 47%-48 | % | 43%-45 | % | ||||||
We also award restricted share units, or RSUs, to certain of our employees, officers and directors. These awards are settled in shares and are accounted for based on the fair market value of the shares at the time of grant.
s. Income Taxes:
t. Net Loss Per Share Attributable to Ordinary Shareholders
The Company’s basic net loss per share is calculated by dividing net loss attributable to ordinary shareholders by the weighted-average number of shares of ordinary shares outstanding for the period, without consideration of potentially dilutive securities. The diluted net loss per share is calculated by giving effect to all potentially dilutive securities outstanding for the period using the treasury shares method or the if-converted method based on the nature of such securities. Diluted net loss per share is the same as basic net loss per share since the effects of potentially dilutive shares of ordinary shares are anti-dilutive in all periods presented. The potentially dilutive options to purchase ordinary shares and RSUs that were excluded from the computation amounted to 6,302,344, 5,909,263, and 4,684,239, for the years ended December 31, 2021, 2020 and 2019, respectively, because including them would have been anti-dilutive. The Company’s Convertible preferred shares were also excluded from the computation and amounted to 26,440,239 shares for each of the years ended December 31, 2020 and 2019.
MONDAY.COM AND SUBSIDIARIES
NOTES TO CONSOLIDATED FINANCIAL STATEMENTS
U.S. dollars in thousands (except share and per share data)
NOTE 2:- SIGNIFICANT ACCOUNTING POLICIES (cont.)
Basic and diluted net loss per share was presented in conformity with the two-class method for participating securities prior to the Company’s IPO for the years ended December 31, 2020 and 2019. The Founder’s share is not a participating security and therefore excluded from the net loss per share. See Note 12c.
The two-class method requires income available to ordinary shareholders for the period to be allocated between ordinary shares and participating securities based upon their respective rights to receive dividends as if all income for the period had been distributed.
The Company considered its convertible preferred shares to be participating securities as the holders of the convertible preferred shares would be entitled to dividends that would be distributed to the holders of ordinary shares, on a pro-rata basis assuming conversion of all convertible preferred shares into ordinary shares. These participating securities do not contractually require the holders of such shares to participate in the Company’s losses. As such, net loss for the periods presented was not allocated to the Company’s participating securities.
u. Concentration of Credit Risks
v. Segment Information
MONDAY.COM AND SUBSIDIARIES
NOTES TO CONSOLIDATED FINANCIAL STATEMENTS
U.S. dollars in thousands (except share and per share data)
NOTE 2:- SIGNIFICANT ACCOUNTING POLICIES (cont.)
w. Fair Value measurements
Level 1 – | Quoted prices in active markets for identical assets or liabilities. |
Level 2 – | Inputs other than Level 1 that are observable, either directly or indirectly, such as quoted prices for similar assets or liabilities; quoted prices in markets that are not active; or other inputs that are observable or can be corroborated by observable market data for substantially the full term of the assets or liabilities. |
Level 3 – | Unobservable inputs that are supported by little or no market activity and that are significant to the fair value of the assets or liabilities. |
x. Derivative Financial Instruments
MONDAY.COM AND SUBSIDIARIES
NOTES TO CONSOLIDATED FINANCIAL STATEMENTS
U.S. dollars in thousands (except share and per share data)
y. Accounting Pronouncements Not Yet Effective:
In February 2016, the FASB issued ASU No. 2016-02, Leases (Topic 842), which would require lessees to include all leases on their balance sheets, whether operating or financing, while continuing to recognize the expenses on their statements of operations in a manner similar to current practice. The guidance states that a lessee would recognize a lease liability for the obligation to make lease payments and a right-to-use asset for the right to use the underlying asset for the lease term. In June 2020, the FASB issued ASU No. 2020-05, Revenue from Contracts with Customers (ASC 606) and Leases (Topic 842): Effective Dates for Certain Entities, which defers the effective date of ASU 2016-02 for non-public entities to fiscal years beginning after December 15, 2021, and interim periods within fiscal years beginning after December 15, 2022. The guidance is effective for the Company beginning January 1, 2022, and interim periods in fiscal years beginning January 1, 2023. A modified retrospective transition approach is required, applying the new standard to all leases existing at the date of initial application. The standard provides a number of optional practical expedients in transition. The Company is electing the ‘package of practical expedients’, which permits it not to reassess under the new standard its prior conclusions about lease identification, lease classification and initial direct costs.
The Company expects the adoption of the standard to have a material impact on its consolidated balance sheets which will result in the recognition of ROU assets and lease liabilities of approximately $58,000 to $68,000 at January 1, 2022. The most significant impact from recognition of ROU assets and lease liabilities relates to its office space. However, the Company does not anticipate that the adoption of this standard will have a material impact on the operating expenses in its consolidated statements of operations since the expense recognition under this new standard will be similar to current practice.
MONDAY.COM AND SUBSIDIARIES
NOTES TO CONSOLIDATED FINANCIAL STATEMENTS
U.S. dollars in thousands (except share and per share data)
| NOTE 3:- | PREPAID EXPENSES AND OTHER CURRENT ASSETS |
Prepaid expenses and other current assets consisted of the following:
| December 31, | |||||||
| 2021 | 2020 | ||||||
| ||||||||
Prepaid expenses | $ | 12,733 | $ | 2,508 | ||||
| Government institutions | 3,520 | 767 | ||||||
| Derivative instruments | 656 | 0 | ||||||
Other current assets | 1,263 | 623 | ||||||
| ||||||||
Total prepaid expenses and other current assets | $ | 18,172 | $ | 3,898 | ||||
| NOTE 4:- | PROPERTY AND EQUIPMENT, NET |
| December 31, | |||||||
| 2021 | 2020 | ||||||
| ||||||||
Computer, software, and electronic equipment | $ | 8,095 | $ | 3,693 | ||||
Office furniture and equipment | 4,458 | 1,178 | ||||||
Leasehold improvements | 6,700 | 2,995 | ||||||
Capitalized internal software development costs | 5,666 | 1,964 | ||||||
Capital leases | 254 | 254 | ||||||
Property and equipment, gross | 25,173 | 10,084 | ||||||
Less accumulated depreciation and amortization | $ | (5,574 | ) | $ | (2,906 | ) | ||
| ||||||||
Property and equipment, net | 19,599 | 7,178 | ||||||
Depreciation and amortization expense was $2,746, $1,888 and $579, for the years ended December 31, 2021, 2020 and 2019, respectively.
During the year ended December 31, 2021, the Company recorded a capital loss of $76 with respect to sell of assets attributed to leasehold improvements.
The Company capitalized costs related to the development of internal-use software of $3,702, $1,499 and $465, for the years ended December 31, 2021, 2020 and 2019, respectively. Amortization of capitalized software development costs was $547, $232 and $94 for the years ended December 31, 2021, 2020 and 2019, respectively. The net carrying value of capitalized internal-use software was $4,793, $1,638 and $371 as of December 31, 2021, 2020 and 2019, respectively.
MONDAY.COM AND SUBSIDIARIES
NOTES TO CONSOLIDATED FINANCIAL STATEMENTS
U.S. dollars in thousands (except share and per share data)
| NOTE 5:- | ACCRUED EXPENSES AND OTHER CURRENT LIABILITIES |
| December 31, | |||||||
| 2021 | 2020 | ||||||
| ||||||||
Accrued employee compensation and benefits | $ | 51,953 | $ | 14,210 | ||||
Accrued expenses | 13,149 | 4,825 | ||||||
Capital lease – short-term | 84 | 88 | ||||||
Advances from customers | 2,134 | 1,556 | ||||||
Income and indirect taxes payable | 2,815 | 2,288 | ||||||
| ||||||||
Total | $ | 70,135 | $ | 22,967 | ||||
NOTE 6:- DERIVATIVES AND HEDGING
The Company uses derivative instruments primarily to manage exposures to foreign currency exchange rate and to reduce the volatility of earnings and cash flows associated with changes in foreign currency exchange rates.
The fair values of derivative instruments and the line items to which they were recorded are summarized as follows:
| Balance sheet line item | December 31, | |||||||
|
| 2021 |
| 2020 | |||||
Derivatives designated as hedging instruments: |
|
|
|
|
| ||||
|
|
|
|
|
| ||||
Foreign exchange contracts | Prepaid expenses and other current assets | $ | 705 |
| $ | 0 | |||
|
|
| 705 |
| 0 | ||||
Derivatives not designated as hedging instruments: |
|
|
|
|
| ||||
|
|
|
|
|
| ||||
Foreign exchange contracts | Prepaid expenses and other current assets |
| (49 | ) | 0 | ||||
|
|
| (49 | ) | 0 | ||||
|
|
|
|
|
| ||||
Total |
| $ | 656 |
| $ | 0 | |||
MONDAY.COM AND SUBSIDIARIES
NOTES TO CONSOLIDATED FINANCIAL STATEMENTS
U.S. dollars in thousands (except share and per share data)
NOTE 6:- DERIVATIVES AND HEDGING (cont.)
The effect of derivative instruments on cash flow hedging, as well as the effect of instruments not designated as hedge and the relationship between income and other comprehensive income for the years ended December 31, 2021 and December 31, 2020, are summarized below:
| Gain (Loss) Recognized in Other Comprehensive Income on Effective- Portion of Derivative, net | Realized Gain on Derivative Reclassified from Accumulated Other Comprehensive Income (*) | Amount Excluded from Effectiveness Testing Recognized in Income(**) | |||||||||||||||||||||
| Year ended December 31 | Year ended December 31 | Year ended December 31 | |||||||||||||||||||||
| 2021 | 2020 | 2021 | 2020 | 2021 | 2020 | ||||||||||||||||||
Derivatives designated as hedging instruments: | ||||||||||||||||||||||||
| ||||||||||||||||||||||||
Foreign exchange contracts | $ | 953 | $ | 0 | $ | (359 | ) | $ | 0 | $ | 0 | $ | 0 | |||||||||||
| 953 | 0 | (359 | ) | 0 | 0 | 0 | |||||||||||||||||
Derivatives not designated as hedging instruments: | ||||||||||||||||||||||||
| ||||||||||||||||||||||||
Foreign exchange contracts | 0 | 0 | 0 | 0 | (49 | ) | 0 | |||||||||||||||||
| 0 | 0 | 0 | 0 | (49 | ) | 0 | |||||||||||||||||
| ||||||||||||||||||||||||
Total | $ | 953 | $ | 0 | $ | (359 | ) | $ | 0 | $ | (49 | ) | $ | 0 | ||||||||||
(*) Classified in operating expenses in the Consolidated Statement of Operations.
(**) Includes derivatives not designated as accounting hedge. Classified in financial expense (income), net in the Consolidated Statement of Operations.
The notional amounts of the outstanding derivatives are summarized as follows:
| As of December 31, | |||||||
| 2021 | 2020 | ||||||
Derivatives designated as hedging instruments: | ||||||||
Foreign exchange contracts: | ||||||||
NIS | $ | 36,013 | $ | 0 | ||||
| ||||||||
Derivatives not designated as hedging instruments: | ||||||||
Foreign exchange contracts: | ||||||||
GBP | 4,054 | 0 | ||||||
Euro | 2,830 | 0 | ||||||
AUD | 581 | 0 | ||||||
| 7,465 | 0 | ||||||
| ||||||||
Total | $ | 43,478 | $ | 0 | ||||
MONDAY.COM AND SUBSIDIARIES
NOTES TO CONSOLIDATED FINANCIAL STATEMENTS
U.S. dollars in thousands (except share and per share data)
NOTE 7:- REVOLVING CREDIT FACILITY
| NOTE 8:- | COMMITMENTS AND CONTINGENCIES |
a. Lease Commitments – Operating Leases:
The Company leases office space for its corporate headquarters in Israel under a non-cancelable operating lease expiring in 2031 with an early termination option. Additionally, the Company entered into certain cancelable monthly lease agreements for short term periods. Total rent expense under all operating leases was $4,326, $3,287, and $1,943, for the years ended December 31, 2021, 2020 and 2019, respectively.
MONDAY.COM AND SUBSIDIARIES
NOTES TO CONSOLIDATED FINANCIAL STATEMENTS
U.S. dollars in thousands (except share and per share data)
| NOTE 8:- | COMMITMENTS AND CONTINGENCIES (cont.) |
The future minimum lease payments, under all non-cancelable lease agreements as of December 31, 2021, are as follows:
Years Ending December 31, | Amount | |||
| ||||
2022 | $ | 8,718 | ||
2023 | 10,531 | |||
2024 | 10,964 | |||
2025 | 11,217 | |||
2026 | 11,242 | |||
Thereafter | 19,093 | |||
Total minimum lease payments | $ | 71,765 | ||
b. Capital Lease
On November 13, 2019, the Company entered into a capital lease agreement with a supplier, according to which, the Company leased software equipment in the total amount of $254 for the period from December 7, 2019 through December 7, 2022 in monthly installments. The Company has the option to purchase the software equipment at the end of the lease period for a payment of 1% of the initial price. The lease liability was $84 and $175 as of December 31, 2021 and 2020, respectively.
c. Guarantees:
As of December 31, 2021 and 2020, the Company has provided a bank guarantee in the amount of $2,186 and $2,115, respectively, to secure its lease agreement.
d. Indemnifications
The Company enters into standard indemnification provisions in the ordinary course of business, including certain customers, business partners, the Company’s officers, and directors. Pursuant to these provisions, the Company has agreed to indemnify and defend the indemnified party claims and related losses suffered or incurred by the indemnified party from actual or threatened third-party claims because of the Company’s activities or non-compliance with certain representations and warranties made by the Company.
It is not possible to determine the maximum potential loss under these indemnification provisions due to the Company’s limited history of prior indemnification claims and the unique facts and circumstances involved in each particular provision. To date, losses recorded in the Company’s consolidated statements of operations in connection with the indemnification provisions have not been material. There are no claims pending as of December 31, 2021 and 2020, related to indemnification agreements.
MONDAY.COM AND SUBSIDIARIES
NOTES TO CONSOLIDATED FINANCIAL STATEMENTS
U.S. dollars in thousands (except share and per share data)
| NOTE 8:- | COMMITMENTS AND CONTINGENCIES (cont.) |
The Company has entered into service-level agreements with some of its enterprise customers defining levels of uptime reliability and performance and permitting those customers to receive credits for prepaid amounts related to unused subscription services if the Company fails to meet the defined levels of uptime in a certain calendar month. To date, the Company has not experienced any significant failures to meet defined levels of uptime reliability and performance. In addition, since the calculation is monthly for each calendar month there is no uncertainty at the end of the reporting period. Therefore, the Company has not accrued any liabilities related to these agreements in the consolidated financial statements.
e. Legal Contingencies:
The Company is currently not involved in any material claims or legal proceedings. The Company reviews the status of each legal matter it is involved in, from time to time, in the ordinary course of business and assesses its potential financial exposure.
f. Other Commitments:
Other commitments include payments to third-party vendors for services related mainly to hosting-related services, as well as future payments associated with the Company’s new corporate offices in Israel and with certain software licenses and services. Future minimum payments under the Company's other commitments, including finance lease liability (see note 8b) as of December 31, 2021, are as follows:
Years Ending December 31, | Amount | |||
2022 | $ | 16,611 | ||
2023 | 12,121 | |||
| 2024 | 6,224 | |||
Total contractual obligations | $ | 34,956 | ||
| NOTE 9:- | FINANCIAL INCOME (EXPENSES) , NET |
| Year ended December 31, | |||||||||||
| 2021 | 2020 | 2019 | |||||||||
| ||||||||||||
Financial expenses: | ||||||||||||
Bank charges and other | $ | 566 | $ | 340 | $ | 226 | ||||||
Interest on credit facility and amortization of debt issuance fees | 405 | 671 | 543 | |||||||||
Exchange rate expense, net | 742 | 0 | 0 | |||||||||
Total financial expenses | 1,713 | 1,011 | 769 | |||||||||
| ||||||||||||
Financial income: | ||||||||||||
Exchange rate income, net | 0 | 492 | 115 | |||||||||
Interest income on deposits | 875 | 1,045 | 2,244 | |||||||||
Total financial income | 875 | 1,537 | 2,359 | |||||||||
| ||||||||||||
Financial income (expenses), net | $ | (838 | ) | $ | 526 | $ | 1,590 | |||||
MONDAY.COM AND SUBSIDIARIES
NOTES TO CONSOLIDATED FINANCIAL STATEMENTS
U.S. dollars in thousands (except share and per share data)
| NOTE 10:- | RELATED PARTIES |
There were no material related party transactions in each of the years ended December 31, 2021, 2020 and 2019 other than the secondary transactions (refer to Note 12f).
| NOTE 11:- | CONVERTIBLE PREFERRED SHARES |
Composition of Convertible Preferred Shares:
Convertible Preferred Shares are carried at the issuance price, net of issuance costs.
Immediately prior to the completion of the IPO in June 2021, all the Convertible Preferred Shares (“the Preferred Shares”) then outstanding were converted into 26,440,239 ordinary shares. As of December 31, 2020, the Preferred Shares consisted of the following:
| Authorized | Issued and Outstanding | Issuance Price Per Share | Carrying Value, Net | ||||||||||||
| ||||||||||||||||
Series A | 5,000,000 | 4,383,300 | $ | 0.30 | $ | 1,280 | ||||||||||
Series B | 4,619,000 | 4,619,000 | 1.08 | 4,970 | ||||||||||||
Series B-1 | 1,563,400 | 1,563,400 | 0.70 | 1,100 | ||||||||||||
Series B-2 | 1,938,100 | 1,938,100 | 0.77 | 1,496 | ||||||||||||
Series C | 6,641,900 | 6,641,900 | 3.76 | 24,925 | ||||||||||||
Series D | 3,660,027 | 3,660,027 | 13.66 | 49,875 | ||||||||||||
Series E | 3,634,512 | 3,634,512 | 41.27 | 149,850 | ||||||||||||
Total | 27,056,939 | 26,440,239 | $ | 233,496 | ||||||||||||
Balance Sheet Classification of Convertible Preferred Shares—The convertible preferred shares are not mandatorily redeemable, nor redeemable at the option of the holder after a specified date, but a deemed liquidation event would constitute a redemption event outside of the ordinary shareholders’ control. Therefore, all convertible preferred shares have been presented outside of permanent equity in accordance with ASC 48-10-S99-3A, Distinguishing Liabilities from Equity. Further, the Company did not adjust the carrying value of the convertible preferred shares to their redemption value, since it is uncertain whether or when a redemption event will occur.
| NOTE 12:- | SHAREHOLDERS’ EQUITY |
| a. | Cancelation of par value: |
| b. | Initial Public Oferring and concurrent Private Placement: |
MONDAY.COM AND SUBSIDIARIES
NOTES TO CONSOLIDATED FINANCIAL STATEMENTS
U.S. dollars in thousands (except share and per share data)
| NOTE 12:- | SHAREHOLDERS’ EQUITY (cont.) |
| c. | Founder’s share: |
| d. | The number of authorized ordinary shares was 99,999,999 and 52,943,061 as of December 31, 2021 and 2020, respectively. |
MONDAY.COM AND SUBSIDIARIES
NOTES TO CONSOLIDATED FINANCIAL STATEMENTS
U.S. dollars in thousands (except share and per share data)
| NOTE 12:- | SHAREHOLDERS’ EQUITY (cont.) |
| e. | Ordinary shares: |
As of December 31, | ||||||||
| 2021 | 2020 | ||||||
Conversion of Preferred shares: | ||||||||
Series A | 0 | 4,383,300 | ||||||
Series B | 0 | 4,619,000 | ||||||
Series B-1 | 0 | 1,563,400 | ||||||
Series B-2 | 0 | 1,938,100 | ||||||
Series C | 0 | 6,641,900 | ||||||
Series D | 0 | 3,660,027 | ||||||
Series E | 0 | 3,634,512 | ||||||
Ordinary shares | 44,924,038 | 12,354,471 | ||||||
Outstanding share options and RSUs | 6,302,344 | 5,909,263 | ||||||
Shares available for future grants under the 2017 and 2021 plans | 5,281,960 | 1,332,909 | ||||||
Total | 56,508,342 | 46,036,882 | ||||||
| f. | Secondary transactions: |
MONDAY.COM AND SUBSIDIARIES
NOTES TO CONSOLIDATED FINANCIAL STATEMENTS
U.S. dollars in thousands (except share and per share data)
| NOTE 12:- | SHAREHOLDERS’ EQUITY (cont.) |
| g. | Share based compensation: |
Number of | Weighted- | Weighted | Aggregate | |||||||||||||
| ||||||||||||||||
Outstanding — January 1, 2021 | 5,909,263 | $ | 4.79 | 7.5 | $ | 341,152 | ||||||||||
Granted | 1,706,770 | $ | 39.02 | |||||||||||||
Exercised | (1,090,670 | ) | $ | 4.83 | ||||||||||||
Expired and forfeited | (320,758 | ) | $ | 22.8 | ||||||||||||
Outstanding — December 31, 2021 | 6,204,605 | $ | 13.53 | 7.21 | $ | 1,831,568 | ||||||||||
Exercisable — December 31, 2021 | 3,832,645 | $ | 3.14 | 6.21 | $ | 1,171,168 | ||||||||||
The following table summarizes the activity for the Company's RSUs for the year ended December 31, 2021:
| Number of Units | Weighted-Average Fair Value | ||||||
Balance at January 1, 2021 | 0 | $ | 0 | |||||
Granted | 100,678 | $ | 277.7 | |||||
Vested | (917 | ) | $ | 245.07 | ||||
Canceled | (2,022 | ) | $ | 255.06 | ||||
Balance at December 31, 2021 | 97,739 | $ | 278.46 | |||||
As of December 31, 2021 there was $22,821 of total unrecognized compensation cost related to unvested restricted share units which is expected to be recognized over a weighted-average period of 1.98 years.As of December 31, 2020 there was no unrecognized compensation costs related to unvested restricted share units.
MONDAY.COM AND SUBSIDIARIES
NOTES TO CONSOLIDATED FINANCIAL STATEMENTS
U.S. dollars in thousands (except share and per share data)
| NOTE 12:- | SHAREHOLDERS’ EQUITY (cont.) |
Share-based compensation expense, including secondary transactions related expenses, for the years ended December 31, 2021, 2020 and 2019, is as follows:
| Year ended December 31, | ||||||||||||
| 2021 | 2020 | 2019 | |||||||||
| ||||||||||||
Cost of revenues | $ | 7,681 | $ | 2,720 | $ | 970 | ||||||
Research and development | 21,779 | 12,142 | 9,396 | |||||||||
Sales and marketing | 23,135 | 10,068 | 3,283 | |||||||||
General and administrative *) | 20,934 | 39,415 | 8,190 | |||||||||
Share-based compensation, net of amounts capitalized | $ | 73,529 | $ | 64,345 | $ | 21,839 | ||||||
Capitalized share-based compensation expense | 1,522 | 380 | 100 | |||||||||
Total share-based compensation | $ | 75,051 | $ | 64,725 | $ | 21,939 | ||||||
*) Share-based compensation expenses in 2020 includes costs related to the fair value of fully vested options granted to the Company’s Co-CEO in December 2020 in the amount of $30,424.
| NOTE 13:- | INCOME TAXES |
| a. | Loss before income taxes: |
Year ended December 31, | ||||||||||||
2021 | 2020 | 2019 | ||||||||||
Domestic (Israel) | $ | (132,203 | ) | $ | (152,335 | ) | $ | (91,788 | ) | |||
Foreign | 5,240 | 2,324 | 860 | |||||||||
Total | $ | (126,963 | ) | $ | (150,011 | ) | $ | (90,928 | ) | |||
| b. | Income taxes: |
Year ended December 31, | ||||||||||||
2021 | 2020 | 2019 | ||||||||||
Domestic (Israel) | $ | 180 | $ | 243 | $ | 249 | ||||||
Foreign | 2,151 | 1,949 | 434 | |||||||||
Total | $ | 2,331 | $ | 2,192 | $ | 683 | ||||||
MONDAY.COM AND SUBSIDIARIES
NOTES TO CONSOLIDATED FINANCIAL STATEMENTS
U.S. dollars in thousands (except share and per share data)
| NOTE 13:- | INCOME TAXES (cont.) |
| c. | Tax rate reconciliation: |
| Year ended December 31, | |||||||||||||||||||||||
| 2021 | 2020 | 2019 | |||||||||||||||||||||
| Tax | Rate | Tax | Rate | Tax | Rate | ||||||||||||||||||
| ||||||||||||||||||||||||
Theoretical tax benefit | $ | (29,201 | ) | 23 | % | $ | (34,503 | ) | 23 | % | (20,914 | ) | 23 | % | ||||||||||
Increase (decrease) in tax rate due to: | ||||||||||||||||||||||||
Change in valuation allowance | 15,039 | (12 | )% | 14,622 | (10 | )% | 10,562 | (12 | )% | |||||||||||||||
Share-based compensation | 10,184 | (8 | )% | 8,324 | (5 | )% | 2,742 | (3 | )% | |||||||||||||||
Tax benefit relating to exercise of disqualified ISO | (3,069 | ) | 2 | % | 0 | 0 | % | 0 | 0 | |||||||||||||||
Initial public offering costs | (5,399 | ) | 4 | % | 0 | 0 | % | 0 | 0 | |||||||||||||||
Preferred technological enterprise | 14,460 | (11 | )% | 16,757 | (11 | )% | 10,097 | (11 | )% | |||||||||||||||
Currency differences | 18 | 0 | % | (2,998 | ) | 2 | % | (1,796 | ) | 2 | % | |||||||||||||
Other | 299 | 0 | % | (10 | ) | 0 | % | (8 | ) | 0 | % | |||||||||||||
Effective tax | $ | 2,331 | (2 | )% | $ | 2,192 | (1 | )% | 683 | |||||||||||||||
| d. | Deferred taxes: |
As of December 31, | ||||||||
2021 | 2020 | |||||||
Net operating loss carry forwards | $ | 35,122 | $ | 27,148 | ||||
Research and development | 5,580 | 3,296 | ||||||
Initial public offering costs | 3,600 | 0 | ||||||
Other temporary differences | 2,577 | 1,414 | ||||||
Carryforward tax credits | 867 | 601 | ||||||
Gross deferred tax assets | 47,746 | 32,459 | ||||||
Valuation allowance | (47,143 | ) | (32,104 | ) | ||||
Total deferred tax assets | 603 | 355 | ||||||
Deferred tax liabilities: | ||||||||
Depreciation and amortization | (603 | ) | (355 | ) | ||||
Deferred tax liabilities | $ | (603 | ) | $ | (355 | ) | ||
Net deferred taxes | $ | 0 | $ | 0 | ||||
MONDAY.COM AND SUBSIDIARIES
NOTES TO CONSOLIDATED FINANCIAL STATEMENTS
U.S. dollars in thousands (except share and per share data)
| NOTE 13:- | INCOME TAXES (cont.) |
| e. | Tax assessments: |
| f. | Basis of taxation: |
| g. | The New Technological Enterprise Incentives Regime (Amendment 73 to the Investment Law) |
MONDAY.COM AND SUBSIDIARIES
NOTES TO CONSOLIDATED FINANCIAL STATEMENTS
U.S. dollars in thousands (except share and per share data)
| NOTE 14:- | LOSS PER SHARE |
The following table presents the calculation of basic and diluted net loss per share:
| Year ended December 31, | |||||||||||
| 2021 | 2020 | 2019 | |||||||||
Numerator: | ||||||||||||
Net loss | $ | 129,294 | $ | 152,203 | $ | 91,611 | ||||||
Undistributed earnings attributable to preferred shareholders | 8,203 | 18,713 | 13,058 | |||||||||
Net loss attributable to ordinary shareholders, basic and diluted | $ | 137,497 | $ | 170,916 | $ | 104,669 | ||||||
| ||||||||||||
Denominator: | ||||||||||||
Weighted-average ordinary shares outstanding | 30,332,006 | 12,048,909 | 11,348,428 | |||||||||
Basic and diluted net loss per share | $ | (4.53 | ) | $ | (14.19 | ) | $ | (9.22 | ) | |||
| NOTE 15:- | GEOGRAPHICAL INFORMATION |
Revenues are attributed to geographic areas based on location of the end customers as follows:
| Year ended December 31, | |||||||||||
| 2021 | 2020 | 2019 | |||||||||
| ||||||||||||
United States | $ | 148,291 | $ | 77,933 | $ | 36,439 | ||||||
EMEA | 97,292 | 49,747 | 24,809 | |||||||||
Rest of the world | 62,567 | 33,443 | 16,841 | |||||||||
| $ | 308,150 | $ | 161,123 | $ | 78,089 | ||||||
Property and equipment, net by geographical areas were as follows:
| As of December 31, | |||||||
| 2021 | 2020 | ||||||
| ||||||||
Israel | $ | 18,583 | $ | 6,361 | ||||
United States | 748 | 756 | ||||||
Rest of the world | 268 | 61 | ||||||
| $ | 19,599 | $ | 7,178 | ||||
- - - - - - - - - - - - - - - - - - -
F-32
