Exhibit 99.1
Investor Presentation November 2023

Disclosures 2 Note: unless otherwise stated, all values included are in Canadian dollars. This Presentation provided to you on the condition that you agree that you will not reproduce, forward or distribute it in whole or in part to any third party without the prior written consent of Telesat Corporation (together, with its direct and indirect subsidiaries, “Telesat” or the “Company”). To the maximum extent permitted by law, none of Telesat, its affiliates, directors, officers, employees, agents, advisors or representatives, nor any other person, accepts any liability, including, without limitation, any liability arising out of fault or negligence for any loss arising from the use of the information contained in this Presentation. This Presentation has been prepared solely for informational purposes, and this Presentation is not, and should not be assumed to be, complete. This presentation is a summary only of certain information in respect of the Company and any recipient hereof should conduct its own independent investigation and analysis of the Company, including legal, accounting and other relevant professional advice. Acceptance of this presentation further constitutes your acknowledgment and agreement that none of Telesat or its affiliates, directors, officers, employees, agents, advisors or representatives (i) makes any representation or warranty, express or implied, as to the accuracy or completeness of the information contained herein or any other information (whether communicated in written or oral form) transmitted or made available to recipients of this Presentation or (ii) shall have any liability to the recipient or its representatives relating to or arising from the information contained herein or any omissions from such information, or any other written or oral communication transmitted to any interested party in the course of its evaluation of Telesat. This Presentation does not constitute an offer to sell, or a solicitation of an offer to purchase, any securities from any of the entities discussed herein. Third Party Information Although all information and opinions expressed in this Presentation, including market data and other statistical information (including estimates and projections relating to the addressable market), were obtained from sources believed to be reliable and are included in good faith, Telesat has not independently verified the information and makes no representation or warranty, express or implied, as to its accuracy or completeness. Some data is also based on the good faith estimates of Telesat, which are derived from its review of internal sources as well as the independent sources described above. This Presentation contains preliminary information only, is subject to change at any time and, is not, and should not be assumed to be, complete. While Telesat is not aware of any misstatements regarding the industry and market data presented in this Presentation, such data involves risks and uncertainties and are subject to change based on various factors, including those factors discussed under “Forward - Looking Information”. Non - GAAP Financial Measures Unless otherwise indicated, financial information in this presentation has been prepared in accordance with International Financial Reporting Standards (“IFRS”) as issued by the International Accounting Standards Board . IFRS differs in some respects from United States generally accepted accounting principles (“U . S . GAAP”), and thus our financial statements may not be comparable to the financial statements of United States companies prepared in accordance with U . S . GAAP . This Presentation includes certain financial measures not presented in accordance with IFRS or U . S . GAAP, including but not limited to, Adjusted EBITDA, Adjusted EBITDA margin, and Free Cash Flow . Adjusted EBITDA, Adjusted EBITDA margin and Free Cash Flow are non - GAAP financial measures as defined in National Instrument 52 - 112 Non - GAAP and Other Financial Measures Disclosure (“NI 52 - 112 ”) . Adjusted EBITDA margin is a non - GAAP ratio as defined in NI 52 - 112 and is the ratio of Adjusted EBITDA to revenue . These measures are not recognized measures under IFRS, do not have standardized meanings prescribed by IFRS and are therefore unlikely to be comparable to similar measures presented by other companies . Rather, these measures are provided as additional information to complement those IFRS measures by providing further understanding of our results of operations from management’s perspective . These measures may exclude items that are significant in understanding and assessing Telesat’s financial results, and therefore should not be considered as alternatives to net income or any other measures derived in accordance with IFRS or U . S . GAAP . Additionally, these measures should not be considered in insolation or as a substitute for analysis of our financial information reported under IFRS . Reconciliations of these non - GAAP financial measures to IFRS are included in the Appendix hereto . Additional information and further reconciliations with respect to the non - IFRS measures included in this Presentation, including among other things, disclosure of their composition, how each non - IFRS measure provides useful information to investors and the additional purposes, if any, for which management uses each non - IFRS measure and reconciliations of non - IFRS measures to the closest IFRS measure can be found in the section entitled “Non - IFRS Measures” beginning on page 42 of our Management’s Discussion and Analysis (the “MD&A”) dated November 6 , 2023 as at and for the nine - month period ended September 30 , 2023 , which information is incorporated by reference in this Presentation . The MD&A is available under our corporate profile on SEDAR+ at www . sedarplus . ca and EDGAR at www . sec . gov .

Disclosures 3 Forward - looking Statements This Presentation includes "forward - looking statements" within the meaning of the Private Securities Litigation Reform Act of 1995, Section 27A of the Securities Act of 1933, as amended and Section 21E of the Securities Exchange Act of 1934, as amended, and “forward - looking information” within the meaning of applicable Canadian securities laws (collectively, “forward - looking statements”) regarding Telesat, its financial condition and its results of operations. Forward - looking statements may be identified by the use of forward - looking words such as “believes”, “expects”, “plans”, “may”, “will”, “would”, “could”, “should”, “anticipates”, “estimates”, “aims”, “targets”, “continues”, “objective”, “projects”, “intend” or “outlook” or other variations of these words or other similar expressions, and include statements regarding Telesat’s plans, strategies, objectives and targets. This information (including information on Telesat’s industry and end markets) is, where applicable, based on forecasts, estimates, assumptions, sources and analysis, that Telesat believes, as of the date hereof, provide a reasonable basis for the information contained herein, including assumptions about future economic conditions and courses of action. There can be no assertion that the information contained in this Presentation will be reflective of future performance to any degree. Readers are cautioned not to place undue reliance on forward - looking statements as a predictor of future performance. These forward - looking statements involve known and unknown risks, uncertainties and other factors, many of which are outside the control of Telesat and its directors, officers, employees, agents, associates or representatives. If one or more of these risks or uncertainties occur, or if our underlying assumptions prove to be incorrect, actual results may vary significantly from those expressed, implied or projected by the forward - looking statements in this Presentation. Known risks and uncertainties include but are not limited to: risks associated with operating satellites and providing satellite services, including satellite construction or launch delays, launch failures, in - orbit failures, impaired satellite performance or inability to restore capacity; volatility in exchange rates and risks associated with domestic and foreign government regulation, inflation and rising interest rates; our ability to enter into definitive funding agreements with our Canadian federal and provincial government partners, and to meet the funding conditions of those agreements and of our vendor financing; technological hurdles, including our and our contractors’ development and deployment of the new technologies required to complete the Lightspeed constellation in time to meet our scheduled timeline, or at all; the availability of services and components from our and our contractors’ supply chains; competition with other LEO systems, deployed, and to be deployed; risks associated with domestic and foreign government regulation, including access to sufficient orbital spectrum to be able to deliver services effectively and access to sufficient geographic markets in which to sell those services; and our ability to develop significant commercial and operational capabilities. The foregoing list of important risk factors is not exhaustive. Readers should review the other risk factors discussed in Telesat’s annual report on Form 20 - F for the year ended December 31, 2022, that was filed on March 29, 2023, as well as in its Quarterly Report on Form 6 - K for the three - and six - month periods ended June 30, 2023, that was filed on August 11, 2023, with the SEC and on SEDAR+, and may be accessed on the SEC’s website at www.sec.gov and SEDAR+’s website at www.sedarplus.ca . Nothing in this Presentation should be regarded as a representation by any person that our future expectations will be achieved and neither Telesat nor any of its directors, officers, affiliates, employees or advisors accepts any responsibility to inform the recipients of this Presentation of any matter arising or coming to any of their notice which may affect any matter referred to in this Presentation (including but not limited to any error or omission which may become apparent after this Presentation has been issued) or to update or revise any forward - looking statements, whether as a result of new information, future events, or otherwise, except as may be required by applicable law. The forward - looking statements also contain future - oriented financial information and information which could be considered to be in the nature of a financial outlook (together with the future - oriented financial information, “FOFI”), which involves statements about Telesat’s prospective financial performance, financial position or cash flows, including, but not limited to, market growth, revenue projections, and capital expenditures. All FOFI contained in this Presentation is subject to the same assumptions, risks, limitations and qualifications as set forth above. All FOFI included in this Presentation is provided for the purpose of helping readers understand Telesat’s current expectations and plans for the future. Readers are cautioned that reliance on FOFI may not be appropriate for other purposes or in other circumstances. The actual results of Telesat’s operations will likely vary from the amounts set forth in any financial outlook and such variances may be material. Historical statements contained in this Presentation regarding past trends or activities should not be taken as a representation that such trends or activities will continue in the future. No statement in this document is intended to be nor may be construed as a profit forecast. Trademarks The use or display of third parties’ trademarks, service marks, trade names or products in this presentation is not intended to, and does not imply, a relationship with Telesat, or an endorsement or sponsorship by or of Telesat.

Telesat (NASDAQ & TSX: TSAT) is a leading global satellite operator with an established, high cash flow generative business and compelling growth opportunities backed by deep commercial, technical and regulatory expertise 4 Leading global satellite operator with diversified revenue and long - term visibility across blue chip customer base Developing highly advanced low earth orbit (LEO) satellite network to capture fast growing enterprise broadband market LTM Revenue LTM Adjusted EBITDA 3 Adjusted EBITDA margin 3 C$ 7 45M 1 C $ 5 4 9 M 1 74% In contracted GEO backlog as of Sept. 30, 2023 Utilization rate as of Sept. 30, 2023 Average remaining commercial life of geostationary satellite fleet C$1.5B 86% ~6 years ~US$320B Addressable Enterprise market Next - generation satellites with enterprise - class service 156+ 2 T e l esat L i ghtsp eed i s fu l l y funded for global service U S $3 .9B In contracted LEO backlog as of Sept. 30, 2023 U S $0 .6B 1 LTM as of September 30, 2023 2 Government financing commitments are subject to a number of conditions, including the conclusion of definitive agreements. 3 Adjusted EBITDA and Adjusted EBITDA margin are non - IFRS measures. See Appendix for reconciliation of Adjusted EBITDA and Adjusted EBITDA margin to Net Income Investment highlights

Revenue supported by blue chip customers and diversified by application and region 5 Percentages are based on LTM as of September 30, 2023 By Service Type By Region Consulting & Other 2% Asia & Australia 7% EM E A 5% LatAm & C ar i b b e an 7% North America 81% Broadcast 46% Enterprise 52% Consulting 2% Ÿ Establishing, operating and upgrading 3rd party satellite systems worldwide (40+ countries) Ÿ Assisted in over 100 satellite systems Broadcast 46% Ÿ Leading North American Direct - to - Home TV providers Ÿ ~8M subscribers across Dish, Bell and Rogers/Shaw 15 in orbit GEO satellites today Enterprise 52% Ÿ Satellite - delivered broadband and communications services for telcos, MNOs, ISPs, aviation, maritime, oil & gas, and government users Ÿ Support networks for telecom operators, resellers and integrators

Demand for broadband continues to increase dramatically with users requiring low latency connectivity 6 Cloud and 5G application performance degrades with higher latency VPN and secure encrypted links can time out over high latency links Interactive webpages and social media apps demand low latency Internet, 5G and Cloud applications need low latency Global data consumption over telecom networks is expected to nearly triple between 2022 - 2027 9,693,738 Petabytes 6,589,868 4,301,647 2,603,144 1,473,769 2027 2025 2023 2019 2021 Note: 2019 - 2022 are actual numbers. Source: PwC’s Global Telecom Outlook 2023 – 2027, Omdia

Telesat Lightspeed will initially focus on the ~US$320B Enterprise market covering terrestrial enterprise, aviation, maritime and government verticals Telesat estimates Total Addressable Market (TAM) for LEO services in 2032 to be ~US$650B 7 | Source: ITU, International Civil Aviation Organization, UNCTAD, NSR, International Defense Budgets, US Department of Defense Budgets, Management’s Analysis and Estimates ~US$330B Direct to Consumer ~US$650B ~US$320B Enterprise Telesat Lightspeed focus ~US$320B ~US$292B Terrestrial/Enterprise ~US$17B Aviation ~US$5B Ma ri time ~US$6B Governm ent ~US$650B Total LEO TAM ~US$320B Enterprise
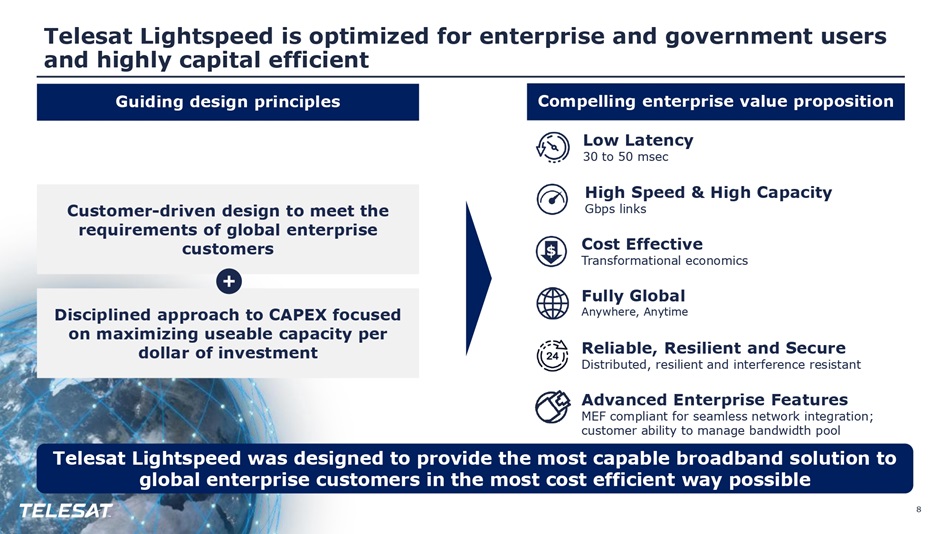
Guiding design principles Telesat Lightspeed is optimized for enterprise and government users and highly capital efficient 8 High Speed & High Capacity Gbps links Low Latency 30 to 50 msec Fully Global Anywhere, Anytime Reliable, Resilient and Secure Distributed, resilient and interference resistant Advanced Enterprise Features MEF compliant for seamless network integration; customer ability to manage bandwidth pool Telesat Lightspeed was designed to provide the most capable broadband solution to global enterprise customers in the most cost efficient way possible Cost Effective Transformational economics Customer - driven design to meet the requirements of global enterprise customers Disciplined approach to CAPEX focused on maximizing useable capacity per dollar of investment Compelling enterprise value proposition

Telesat Lightspeed’s enterprise class service empowered by highly advanced, state - of - the - art digital technologies 9 Digital Processor on - board each satellite supports high efficiency satellite links with full routing capability to deliver secure and dynamic global connectivity Optical Inter - Satellite Links creating a space - based global mesh network for low latency interconnectivity, high resilience and security, and reduced investment in ground infrastructure Global network of landing stations that scales with commercial demand and seamlessly integrates with customer networks End to End Software Defined Network offering the level of flexibility and configurability needed to meet the demands of enterprise customers Highly flexible Digital Beamforming Antenna each satellite generates +1,500 beams (~300,000 in total) to dynamically and efficiently deliver service to users

Telesat Lightspeed timeline 10 Te chno l ogy demo on LEO 3 Network Emula t o r 2023 Launches begin Field Trials Q2 2026 Global service begins Q4 2027 156 satellites in orbit Q1 2028 198 satellites in orbit Q4 2030

Enterprise/Terrestrial US$292B TAM 2032 Maritime US$5B TAM 2032 Aviation US$17B TAM 2032 Government US$6B TAM 2032 Telesat Lightspeed delivers enterprise - class service to key market verticals that lack high - performing broadband 11 2032 Telesat rev. estimate: ~US$1.4B (~.5% of TAM) 2032 Telesat rev. estimate: ~US$0.5B (~10% of TAM) 2032 Telesat rev. estimate: ~US$0.8B (~5% of TAM) 2032 Telesat rev. estimate: ~US$0.5B (~8% of TAM) 2032 TAM; Source: ITU, International Civil Aviation Organization, UNCTAD, NSR, International Defense Budgets, US Department of Defense Budgets, Management’s analysis and estimates Ÿ Cruise & Yacht: High quality broadband for passengers, crew Ÿ Concentrated capacity at ports Ÿ Energy and Merchant Ships: ship - to - shore operations; crew welfare Ÿ Global coverage Ÿ Ships, aircraft (manned and unmanned), military vehicles, and bases Ÿ Low latency, global coverage and true end - to - end encryption Ÿ Distributed, redundant and self - healing mesh network able to bypass terrestrial networks Ÿ Commercial aircraft and business jets: high quality broadband at every seat; flight operations Ÿ Concentrated capacity at large airport hubs Ÿ Global coverage Ÿ Providing high throughput backhaul for fixed and mobile (3G/4G/5G) networks serving rural and remote communities, enterprises and public safety users Ÿ Backhaul to wireless towers where fiber does not exist
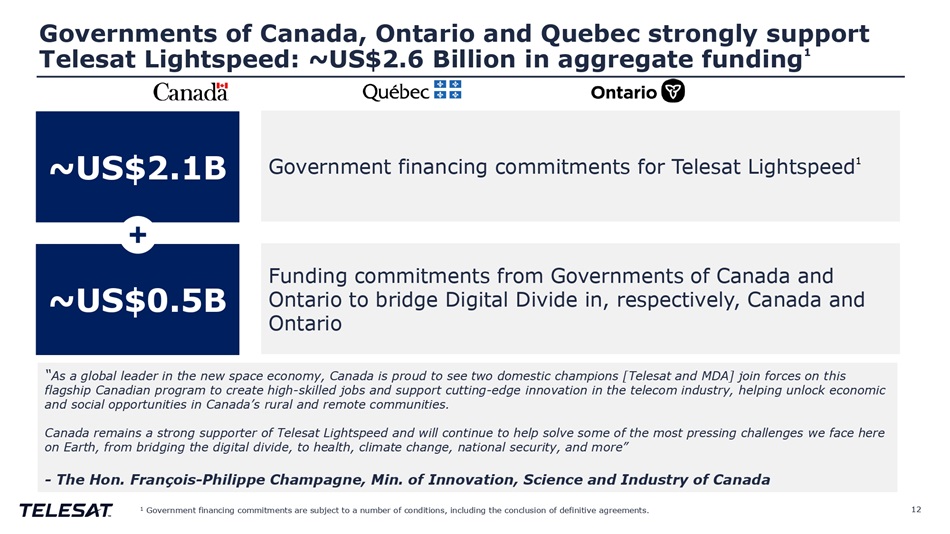
Governments of Canada, Ontario and Quebec strongly support Telesat L i ghtspe e d : ~ U S$2 . 6 B i l l i o n in ag greg ate f u nd i n g 1 12 1 Government financing commitments are subject to a number of conditions, including the conclusion of definitive agreements. “ As a global leader in the new space economy, Canada is proud to see two domestic champions [Telesat and MDA] join forces on this flagship Canadian program to create high - skilled jobs and support cutting - edge innovation in the telecom industry, helping unlock economic and social opportunities in Canada’s rural and remote communities. Canada remains a strong supporter of Telesat Lightspeed and will continue to help solve some of the most pressing challenges we face here on Earth, from bridging the digital divide, to health, climate change, national security, and more” - The Hon. François - Philippe Champagne, Min. of Innovation, Science and Industry of Canada G o v e rn me nt fin a ncing c ommit m e nts for T e l e s a t Li g htsp ee d 1 ~U S $2.1B Funding commitments from Governments of Canada and Ontario to bridge Digital Divide in, respectively, Canada and Ontario ~US$0.5B

Telesat anticipates strong revenue growth driven by fast - growing demand and compelling enterprise - grade service value proposition 13 US$M $3,200 Telesat expects to capture ~1% of 20 3 2 US $ 320 bi l l i on E nterp rise T A M with EBITDA margin in line $600 with its historic GEO performance 2032 2031 2030 2029 2028

Financial Overview 14

Financial Highlights 15 1 Revenue backlog as at 9/30/2023. 2 Adjusted EBITDA margin and Free Cash Flow as of FY 2022 (excluding Lightspeed CAPEX) are non - IFRS measures. Please refer to the Appendix for a reconciliation of Free Cash Flow and Adjusted EBITDA margin to Net Income. 3 Government financing commitments are subject to a number of conditions, including the conclusion of definitive agreements. Significant opportunity for growth at scale and value creation with Telesat Lightspeed ~US$320B Enterprise TAM Significant contractual backlog provides high revenue visibility C$1.5B Revenue Backlog 1 Strategically investing for long - term growth Telesat Lightspeed Program Fully Funded 3 for Global Service Capital efficient business model with high asset utilization C$563M Free Cash Flow 2 Demonstrated disciplined execution enables High Adjusted EBITDA margin ~75%+ Margin (2020 – 2022)
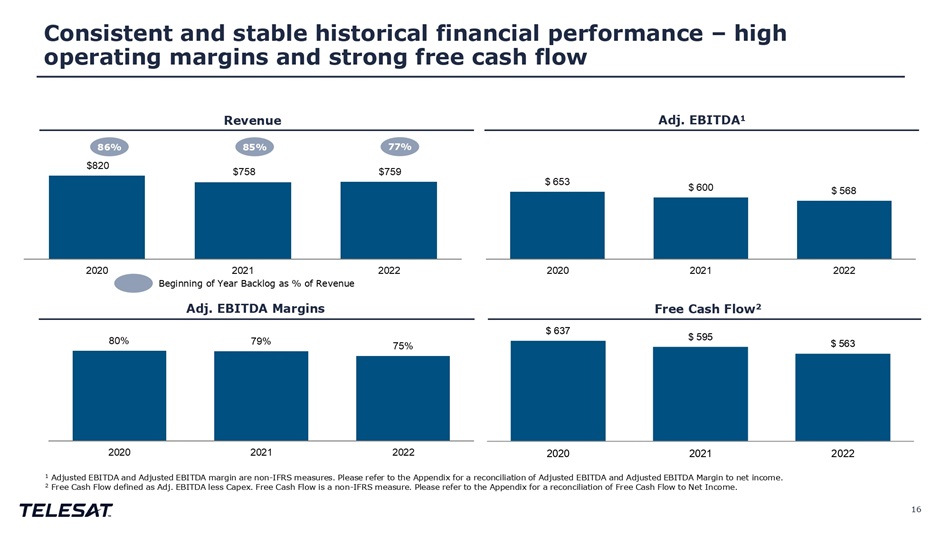
Consistent and stable historical financial performance – high operating margins and strong free cash flow 16 R e v en u e Adj. EBITDA 1 Adj. EBITDA Margins Free Cash Flow 2 86% 85% 77% Beginning of Year Backlog as % of Revenue $ 637 $ 595 $ 563 2020 2021 1 Adjusted EBITDA and Adjusted EBITDA margin are non - IFRS measures. Please refer to the Appendix for a reconciliation of Adjusted EBITDA and Adjusted EBITDA Margin to net income. 2 Free Cash Flow defined as Adj. EBITDA less Capex. Free Cash Flow is a non - IFRS measure. Please refer to the Appendix for a reconciliation of Free Cash Flow to Net Income. 2 0 22
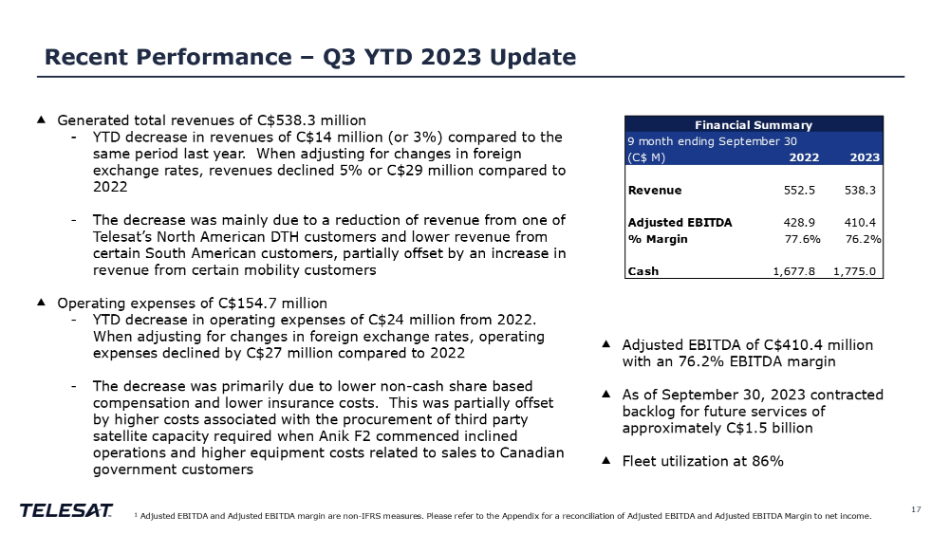
Recent Performance – Q3 YTD 2023 Update 17 1 Adjusted EBITDA and Adjusted EBITDA margin are non - IFRS measures. Please refer to the Appendix for a reconciliation of Adjusted EBITDA and Adjusted EBITDA Margin to net income. ⯅ Generated total revenues of C$538.3 million - YTD decrease in revenues of C$14 million (or 3%) compared to the same period last year. When adjusting for changes in foreign exchange rates, revenues declined 5% or C$29 million compared to 2022 - The decrease was mainly due to a reduction of revenue from one of Telesat’s North American DTH customers and lower revenue from certain South American customers, partially offset by an increase in revenue from certain mobility customers ⯅ Operating expenses of C$154.7 million - YTD decrease in operating expenses of C$24 million from 2022. When adjusting for changes in foreign exchange rates, operating expenses declined by C$27 million compared to 2022 - The decrease was primarily due to lower non - cash share based compensation and lower insurance costs. This was partially offset by higher costs associated with the procurement of third party satellite capacity required when Anik F2 commenced inclined operations and higher equipment costs related to sales to Canadian government customers ⯅ Adjusted EBITDA of C$410.4 million with an 76.2% EBITDA margin ⯅ As of September 30, 2023 contracted backlog for future services of approximately C$1.5 billion ⯅ Fleet utilization at 86% Financial Summary 2023 9 month ending September 30 (C$ M) 2022 538.3 552.5 Revenue 410.4 428.9 Adjusted EBITDA 76.2% 77.6% % Margin 1,775.0 1,677.8 Cash

8.3 2.8 2007 2023 Q3 LTM LTM as of September 30, 2023 2007 to 2009 figures are based upon Canadian Generally Accepted Accounting Principles while 2010 onwards is IFRS Net debt is defined as gross short and long - term indebtedness less cash and short - term investments; 2007 excludes Senior Preferred Shares and swap liability from debt 1 Adjusted EBITDA and Adjusted EBITDA margin are non - IFRS measures. Refer to Appendix for reconciliation of Adjusted EBITDA and Adjusted EBITDA margin to Net Income Strong financial performance and value creation 18 Adjusted EBITDA (C$M) 1 1 Adjusted EBITDA Margin Adjusted EBITDA 74% $549 $331 58% 2023 Q3 LTM 2007 Between 2007 and Q3 2023, Telesat: • C$6.3B in operating cash flow • C$3.1B invested in new satellites and other assets • C$1.2B returned to shareholders • C$0.8B outstanding notes and term loan repurchased • C$0.4B pre - paid in Term Loan • Notes and Term Loan reductions represent approx. 28% of overall debt Cash Generation and Uses Net Debt/Adjusted EBITDA 1 Ratio

$2.7B Uses Constellation Investment (US$) Launch and Development of Initial 156 Satellites $1.6B Sources of Funding (US$) Telesat Equity $0.8B $0.4B ~$3.9B Operational expenditures Contingency Total Investment for 156 Satellite Constellation $2.1B $0.3B ~$3.9B Government Funding 1 Vendor Financing Lightspeed Operational with 156 Satellites $0.8B ~$4.7B Remaining 42 Satellites and Infrastructure Total 198 Satellite Constellation Investment $0.8B ~$4.7B Lightspeed Cash Flows Once Operational Fund Additional 42 Satellites Total Sources of Funding for 198 Satellite Constellation Sources and Uses Lightspeed Program | 198 Satellites 1 Government financing commitments are subject to a number of conditions, including the conclusion of definitive agreements. 19

Telesat Lightspeed Outlook Revenue and EBITDA Telesat Lightspeed Revenue 1 Telesat Lightspeed EBITDA Margin expected to be approximately in line with historical levels by 2029 1 As discussed on slide 13 $600 $3,200 2028 2029 2030 2031 2032 US$M $400 20 $2,700 2028 2029 2030 2031 2032 US$M

Telesat Lightspeed CAPEX 1 US$M Total Capex for 198 satellites US$3.5B Total Capex Program (2023 - 2030) 1 Note 156 satellites in service scheduled early 2028 42 satellites in service scheduled end of 2030 See slide 10 156 Satellites 21 Add’l 42 Sats 198 Satellites US$1,987M 425M 1,562M Satellite Costs (incl. Sys Eng) US$ 840M 184M 656M Launch Vehicle Costs US$ 89M 12M 77M Launch Insurance Costs US$ 596M 184M 412M Ground Network and Other US$3,512M US$ 805M US$ 2,707M Total Capex Costs

Conclusion 22
Telesat is strongly positioned to execute its growth plan and create significant shareholder value 23 50+ years of innovation, industry firsts, engineering excellence and world class customer service Longstanding and trusted provider of mission - critical, enterprise - grade communications services to enterprise and government users Telesat Lightspeed is optimized to meet fast - growing requirements of enterprise and governments users in the most cost efficient manner Telesat Lightspeed is fully funded 1 with ~US$0.6B of contractual backlog Telesat has the strong support of Canada’s Federal and Provincial governments 1 Government financing commitments are subject to a number of conditions, including the conclusion of definitive agreements.
Appendix 24

Environmental 1. Responsible use of space • 50+ years of experience • Advanced features to mitigate space traffic and limit debris • Minimized carbon footprint through low number of satellites and launches 2. Enabling net zero emissions • High - speed, ubiquitous broadband key for clean tech and reducing energy and fuel consumption 3. Global environmental monitoring and climate change / emissions tracking 4. Protecting sensitive and biodiverse environments • Delivering high - quality Internet from space without disrupting local ecosystems Governance 1. Equal votes across shareholders 2. Independent directors 3 . Strong track record of compliance with public company standards prior to public listing 4. 50+ years of service and partnership with blue - chip customers globally Social 1. Committed to STEM community • Major employer of co - op students • Women in STEM Annual Scholarship 2. Committed to Indigenous communities • Critical connectivity provider, closely engaged with Indigenous ISPs and community leaders • Indigenous Youth Fellowship 3. Connecting scientific research outposts globally 4. ESG strategy aligned with several UN SDGs* • Universal access to broadband as a UN - defined human right • Supporting other essential rights (education, healthcare, remote work) and reducing inequalities Telesat’s commitment to ESG 25 *The United Nations identifies 17 Sustainable Development Goals Telesat’s ESG priorities are central to the Telesat Lightspeed network and in line with global best practices and highest business standards
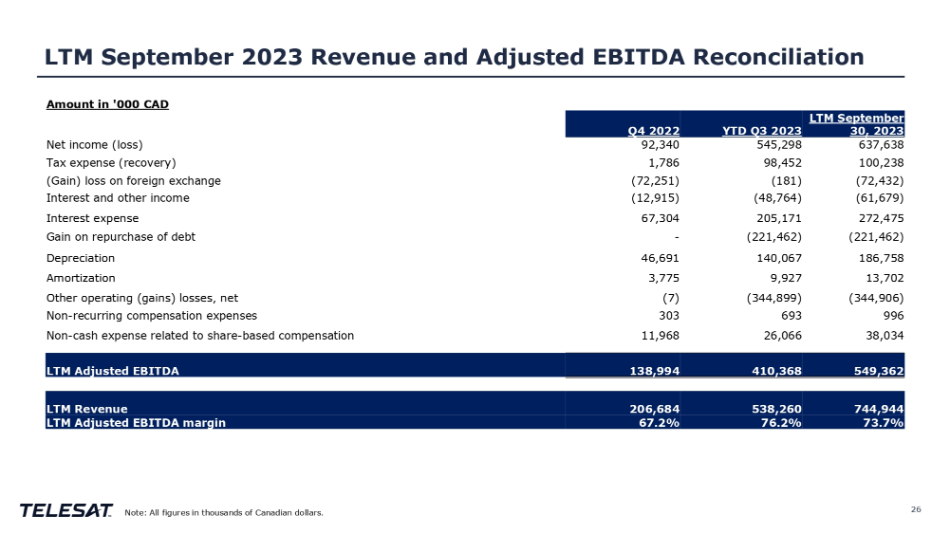
LTM September 2023 Revenue and Adjusted EBITDA Reconciliation 26 Note: All figures in thousands of Canadian dollars. Amount in '000 CAD LTM September 30, 2023 YTD Q3 2023 Q4 2022 637,638 545,298 92,340 Net income (loss) 100,238 98,452 1,786 Tax expense (recovery) (72,432) (181) (72,251) (Gain) loss on foreign exchange (61,679) (48,764) (12,915) Interest and other income 272,475 205,171 67,304 Interest expense (221,462) (221,462) - Gain on repurchase of debt 186,758 140,067 46,691 Depreciation 13,702 9,927 3,775 Amortization (344,906) (344,899) (7) Other operating (gains) losses, net 996 693 303 Non - recurring compensation expenses 38,034 26,066 11,968 Non - cash expense related to share - based compensation 549,362 410,368 138,994 LTM Adjusted EBITDA 744,944 538,260 206,684 LTM Revenue 73.7% 76.2% 67.2% LTM Adjusted EBITDA margin

Adjusted EBITDA YTD Q3 2023 reconciliation 27 Note: All figures in thousands of Canadian dollars. YTD Q3 YTD Q3 2023 2022 $ 545,298 $ (172,457) Net income (loss) 98,452 48,143 Tax expense (recovery) - (4,314) (Gain) loss on changes in fair value of financial instruments (181) (48,764) 311,842 (10,561) (Gain) loss on foreign exchange 205,171 154,452 Interest and other income (221,462) (106,916) Interest expense 140,067 142,064 Gain on repurchase of debt 9,927 11,204 (344,899) - 693 2 26,066 55,460 Other operating (gains) losses, net $ 410,368 $ 428,919 Y N T o D n - Q r e 3 c A u d r r j i u n s g t e c d o m E B p I e T n D s A a t i on expenses Depreciation Amortization
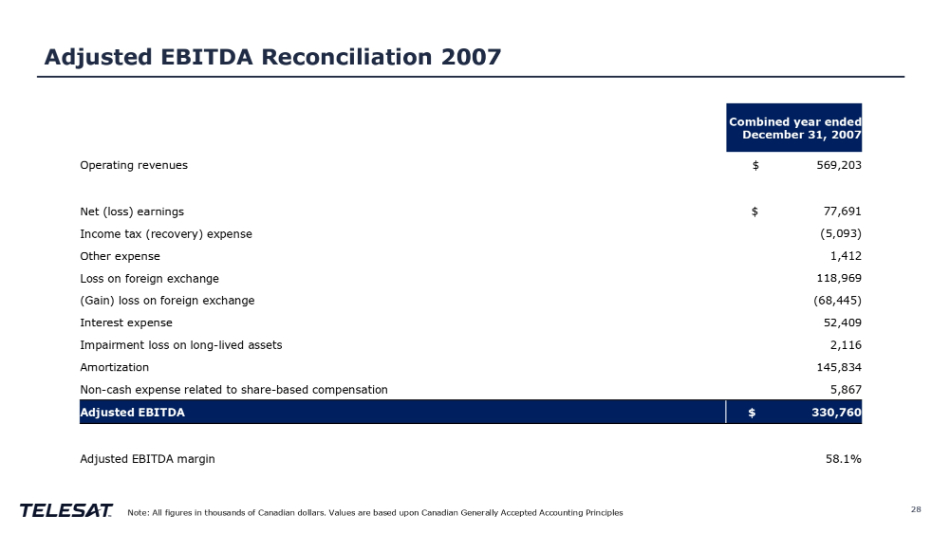
Adjusted EBITDA Reconciliation 2007 28 Note: All figures in thousands of Canadian dollars. Values are based upon Canadian Generally Accepted Accounting Principles Combined year ended December 31, 2007 $ 569,203 Operating revenues $ 77,691 Net (loss) earnings (5,093) Income tax (recovery) expense 1,412 Other expense 118,969 Loss on foreign exchange (68,445) (Gain) loss on foreign exchange 52,409 Interest expense 2,116 Impairment loss on long - lived assets 145,834 Amortization 5,867 Non - cash expense related to share - based compensation $ 330,760 Adjusted EBITDA 58.1% Adjusted EBITDA margin
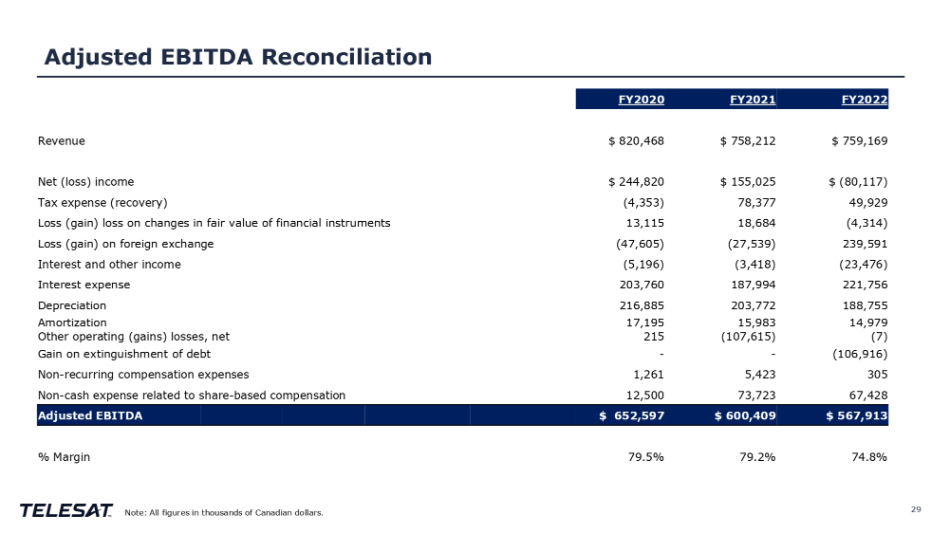
Adjusted EBITDA Reconciliation 29 Note: All figures in thousands of Canadian dollars. FY2022 FY2021 FY2020 $ 759,169 $ 758,212 $ 820,468 Revenue $ (80,117) $ 155,025 $ 244,820 Net (loss) income 49,929 78,377 (4,353) Tax expense (recovery) (4,314) 18,684 13,115 Loss (gain) loss on changes in fair value of financial instruments 239,591 (27,539) (47,605) Loss (gain) on foreign exchange (23,476) (3,418) (5,196) Interest and other income 221,756 187,994 203,760 Interest expense 188,755 203,772 216,885 Depreciation 14,979 15,983 17,195 Amortization (7) (107,615) 215 Other operating (gains) losses, net (106,916) - - Gain on extinguishment of debt 305 5,423 1,261 Non - recurring compensation expenses 67,428 73,723 12,500 Non - cash expense related to share - based compensation $ 567,913 $ 600,409 $ 652,597 Adjusted EBITDA 74.8% 79.2% 79.5% % Margin
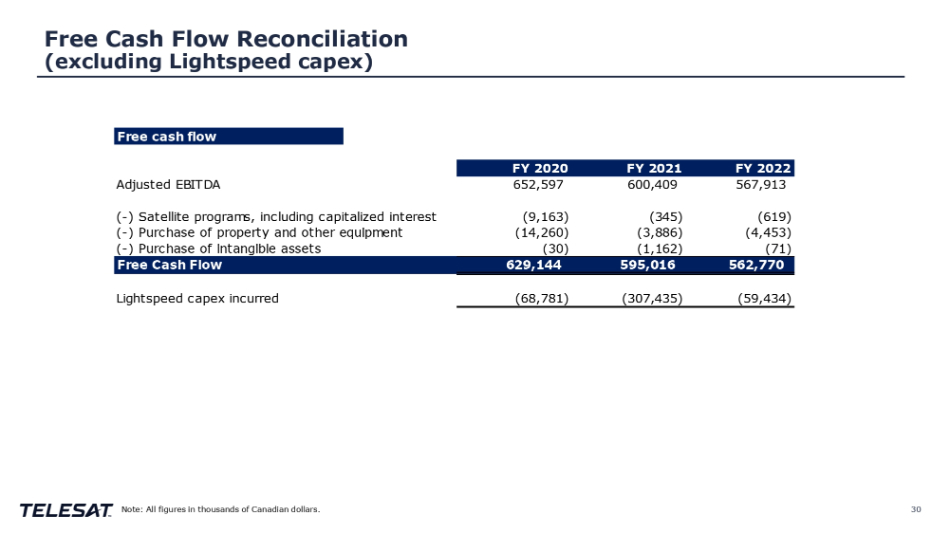
Free Cash Flow Reconciliation (excluding Lightspeed capex) 30 Note: All figures in thousands of Canadian dollars.

www.Telesat.com vimeo.com/telesat Investor contacts: Hugh Harley +1 613 748 8424 Michael Bolitho +1 613 748 8828 IR@Telesat.com