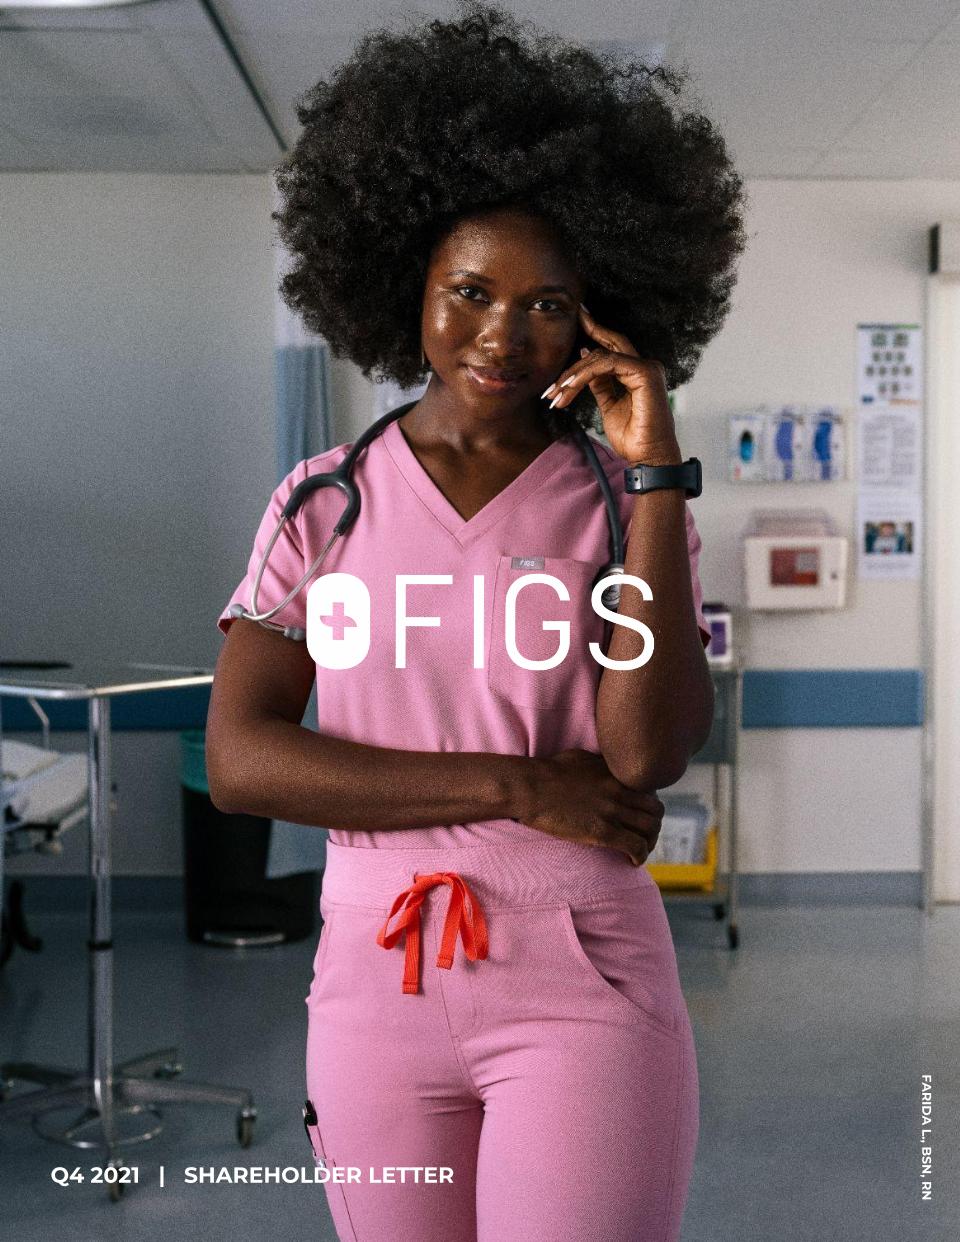
Q4 2021 | SHAREHOLDER LETTER FARIDA L., BSN, RN
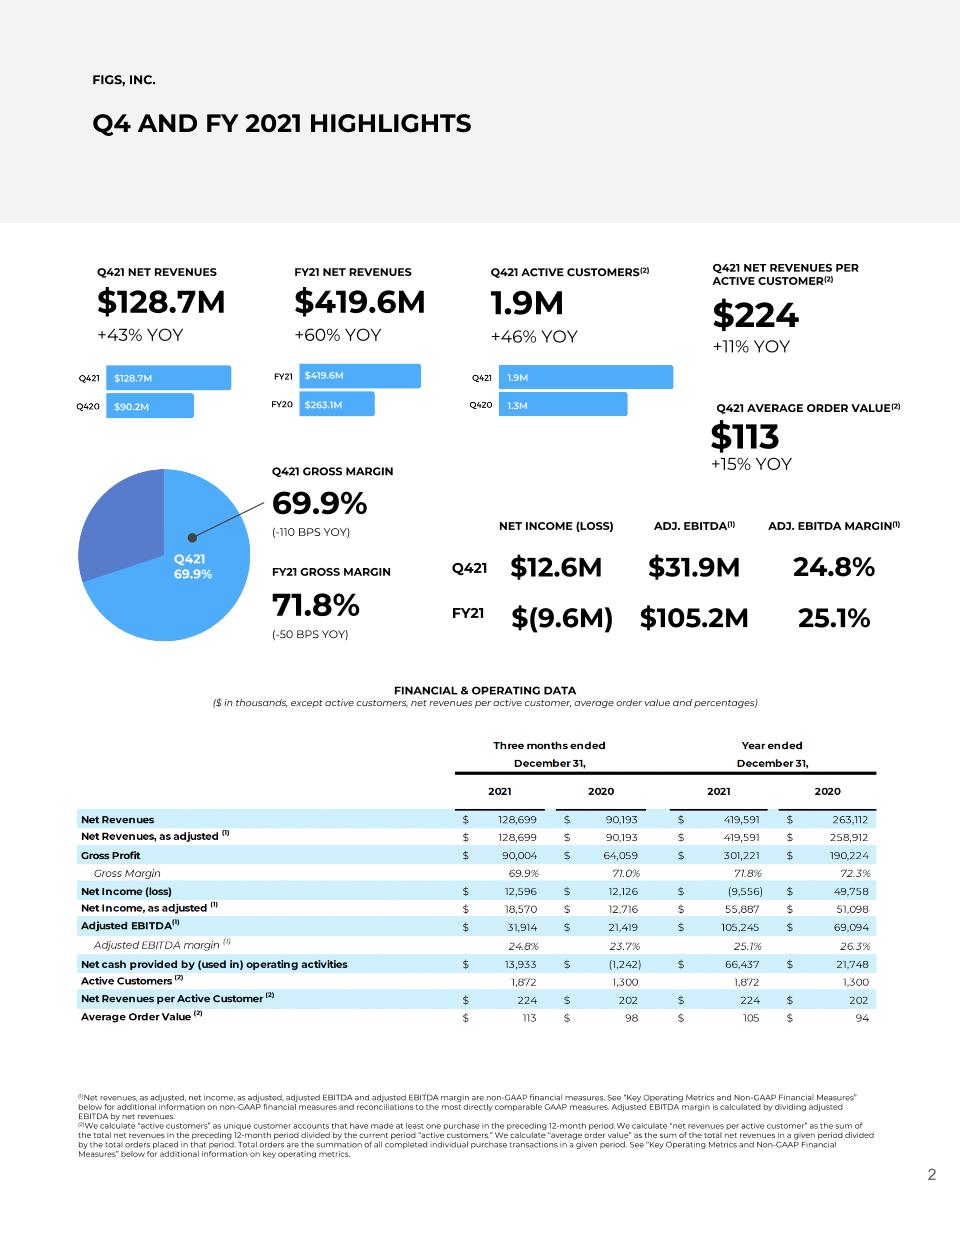
FIGS, INC. Q4 AND FY 2021 HIGHLIGHTS (1)Net revenues, as adjusted, net income, as adjusted, adjusted EBITDA and adjusted EBITDA margin are non-GAAP financial measures. See “Key Operating Metrics and Non-GAAP Financial Measures” below for additional information on non-GAAP financial measures and reconciliations to the most directly comparable GAAP measures. Adjusted EBITDA margin is calculated by dividing adjusted EBITDA by net revenues. (2)We calculate “active customers” as unique customer accounts that have made at least one purchase in the preceding 12-month period. We calculate “net revenues per active customer” as the sum of the total net revenues in the preceding 12-month period divided by the current period “active customers.” We calculate “average order value” as the sum of the total net revenues in a given period divided by the total orders placed in that period. Total orders are the summation of all completed individual purchase transactions in a given period. See “Key Operating Metrics and Non-GAAP Financial Measures” below for additional information on key operating metrics. Q421 NET REVENUES NET INCOME (LOSS) $12.6M ADJ. EBITDA(1) $128.7M +43% YOY $31.9M Q421 GROSS MARGIN 69.9% Q421 ACTIVE CUSTOMERS(2) 1.9M Q421 69.9% FY21 GROSS MARGIN 71.8% (-110 BPS YOY) (-50 BPS YOY) $(9.6M) +46% YOY Q421 AVERAGE ORDER VALUE(2) $113 Q421 NET REVENUES PER ACTIVE CUSTOMER(2) $224 $419.6M FY21 NET REVENUES +60% YOY $105.2M ADJ. EBITDA MARGIN(1) 25.1% 24.8% Q421 FY21 1.9M 1.3M +15% YOY +11% YOY FINANCIAL & OPERATING DATA ($ in thousands, except active customers, net revenues per active customer, average order value and percentages) $419.6M $263.1M $128.7M $90.2M
FIGS SHAREHOLDERS, 2021 was a defining year for our community and our company. For our community, we witnessed incredible sacrifice, strength, and positivity in the face of challenges from the COVID-19 pandemic. For our company, we stayed true to our mission – celebrating, empowering, and serving the healthcare community – in greater ways than ever before. From our IPO in May, to the doubling of our Future Icons Grant, to launching over 100 new products and styles, we continued to show up for our Awesome Humans every single day. We are so proud of our team’s strong operational discipline and the world-class execution required to support our 1.9 million active customers. This dedication and love for our healthcare community is why we exist, and we are truly grateful for every opportunity to create innovative products that help them perform at their best. We continue to deliver an impressive combination of rapid revenue growth and strong adjusted EBITDA margin.(1) For the year, our net revenues were $419.6 million, which was an increase of 59.5% compared to 2020, or an increase of 62.1% adjusting for the $4.2 million non-recurring related party sale in Q3 2020.(1) In the fourth quarter, our net revenues were up 42.7% to $128.7 million, which was larger than our entire business in 2019. This amazing achievement underscores the tremendous growth and scale that we have accomplished in just the past two years. It also demonstrates the power of our unique business model and the continued demand for premium scrubwear and lifestyle products(2) within the highly fragmented healthcare apparel industry. Yet, even as we grew our net revenues to such a high level, we also delivered an adjusted EBITDA margin of 25.1% for the year. To put our results in context, based on our research only 15 companies within the Russell 3000 were able to achieve 60%+ net revenue growth and a 25%+ adjusted EBITDA margin in 2021.(3) So, our 2021 results are an incredible accomplishment. Growth Drivers Drive customer loyalty. As the largest digitally native brand in the healthcare apparel industry, our direct connection to our customers is unique. It enables us to connect and engage with our Awesome Humans in authentic and meaningful ways that drive immense loyalty and brand affinity. (1) Adjusted EBITDA margin and net revenues, as adjusted are non-GAAP financial measures. See “Key Operating Metrics and Non-GAAP Financial Measures” below for additional information on non-GAAP financial measures and reconciliations to the most directly comparable GAAP measures. Adjusted EBITDA margin is calculated by dividing adjusted EBITDA by net revenues. (2) “Lifestyle products” refers to non-scrubs offerings, such as lab coats, underscrubs, outerwear, activewear, loungewear, compression socks, footwear, and masks. (3) Source: CapIQ as of February 24, 2022.
One of the ways we build this connection is through launches of innovative technical products. These products expand and deepen our Layering System – meeting a healthcare professional’s needs to work, at work, and from work, on-shift and off-shift, head-to-toe. As a result of this strategy, our repeat purchases increased to 68% in 2021, up from 62% in 2020, with customers coming back to replenish their favorite scrubwear styles, like the Catarina top and Zamora pant and adding lifestyle products, like our Salta underscrub top and On-shift sweater-knit vest, to complete the look. We also drove a $22 increase in our net revenues per active customer(4) to $224, a clear indicator that our many growth strategies are creating greater customer loyalty. Attract New Customers & Grow Brand Awareness. At the end of Q4 2021, we had 1.9 million active customers, up 46% from the end of 2020. With over 60% of our traffic happening organically through word-of-mouth, we are continuing to attract new customers to the FIGS brand each and every day in a cost-effective manner. Our efficient use of marketing spend enabled us to deliver a return-on-advertising-spend(5) of 7.2x for full year 2021, which increased from 6.8x in 2020. Broaden and deepen lifestyle offerings. We have massive growth potential in our lifestyle business, not only in the categories we offer today but also all the white space we have yet to explore. For the quarter, lifestyle represented 16.9% of our business, up from 14.7% in 2020, with strong growth across our full portfolio of products. Outerwear stole the show in the quarter due to continued strength from our existing scrub jackets and also from new product offerings like our sweater-knit and puffer jackets. With less than 10 product offerings in outerwear today, we have just begun to scratch the surface. International Expansion. In 2021, our international business tripled, growing from just under $10 million in 2020 to almost $30 million in 2021, even though we currently ship to only three countries outside the U.S. – Canada, Australia, and the United Kingdom. With a $67 billion healthcare apparel market outside the U.S, the opportunity is enormous, and our results give us even more confidence that our brand resonates internationally. We are incredibly excited to build on this momentum in 2022 as we look to improve the existing international experience and launch in new markets, giving us the opportunity to provide even more healthcare professionals with the FIGS products they want and deserve. (4) We calculate “net revenues per active customer” as the sum of the total net revenues in the preceding 12-month period divided by the current period “active customers.” See “Key Operating Metrics and Non-GAAP Financial Measures” below for additional information on key operating metrics. (5) Calculated as net revenues divided by marketing spend.
We continue to transform and expand the healthcare apparel industry and have a tremendous runway of growth ahead of us. We are more confident than ever in our ability to harness our unique strengths to drive towards $1 billion-plus in net revenues by 2025. As we continue to scale at a rapid rate, our focus remains on executing against our strategic initiatives to drive long-term sustainable growth and profitability. Most importantly, we will stay focused on what matters most – our community of Awesome Humans – and the meaningful relationships we are building with them every day.
Q4 2021 Business Highlights

Product Innovation Product innovation is the lifeblood of FIGS. That will never change. We’ve transformed the healthcare apparel industry by redefining what a uniform is, what it means, and why fit, function, and style should be the standard not the exception. Our strategy is rooted in understanding the unique preferences of healthcare professionals and making innovative products that fit seamlessly into their lives and help them perform at their best. THE 21-POCKET SCRUB PANT HIJAB
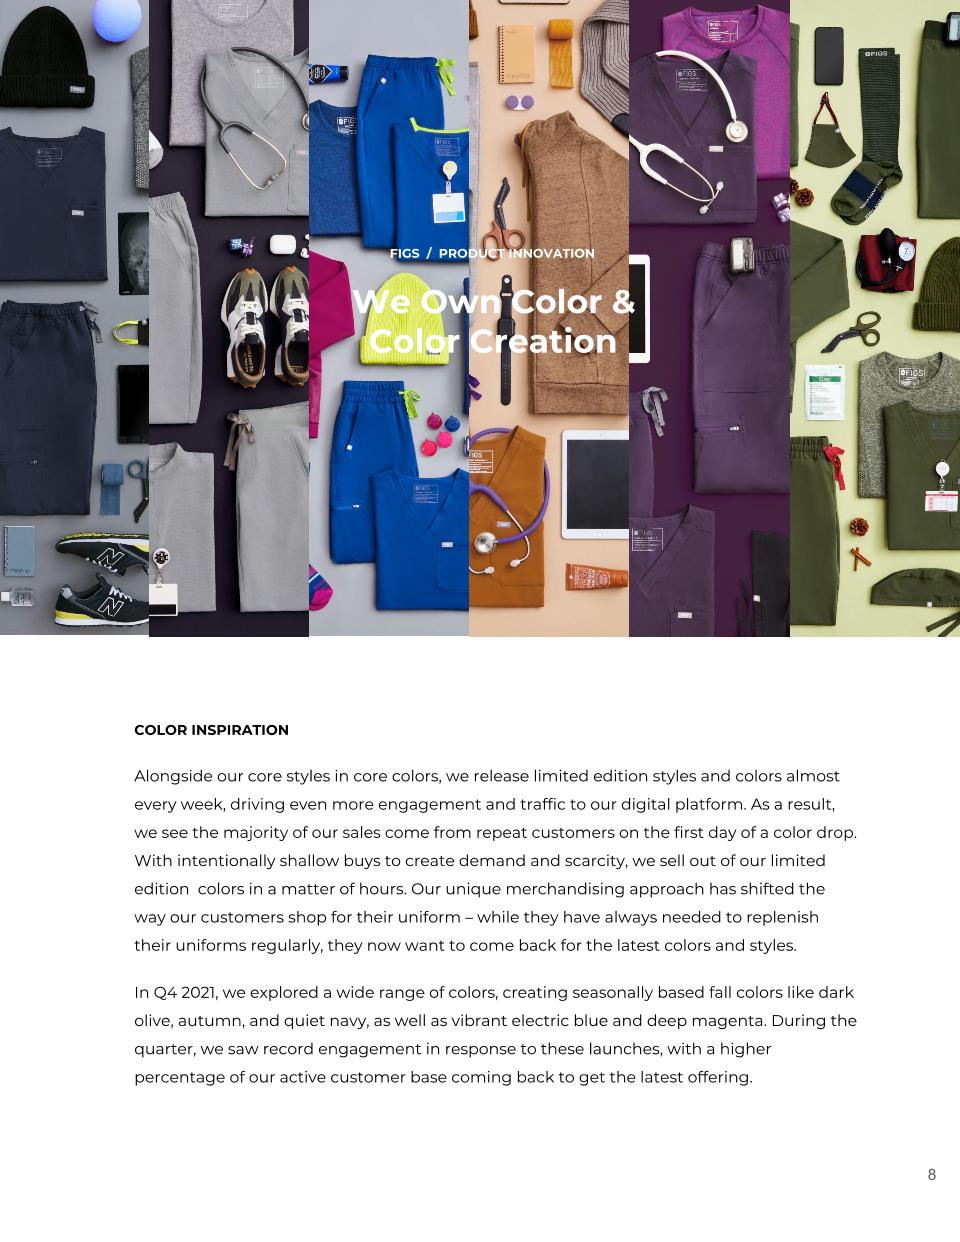
FIGS / PRODUCT INNOVATION We Own Color & Color Creation COLOR INSPIRATION Alongside our core styles in core colors, we release limited edition styles and colors almost every week, driving even more engagement and traffic to our digital platform. As a result, we see the majority of our sales come from repeat customers on the first day of a color drop. With intentionally shallow buys to create demand and scarcity, we sell out of our limited edition colors in a matter of hours. Our unique merchandising approach has shifted the way our customers shop for their uniform – while they have always needed to replenish their uniforms regularly, they now want to come back for the latest colors and styles. In Q4 2021, we explored a wide range of colors, creating seasonally based fall colors like dark olive, autumn, and quiet navy, as well as vibrant electric blue and deep magenta. During the quarter, we saw record engagement in response to these launches, with a higher percentage of our active customer base coming back to get the latest offering.

THE LAYERING SYSTEM We reinvented scrubs, but scrubs serve only one aspect of a healthcare professional’s needs. That’s why we’re so focused on outfitting the medical professional to work, at work, and from work, on-shift and off-shift, head-to-toe. We create, design, and innovate across the entire layering system – from base layer to outer layer – to bring our customers everything they need throughout the day. Our lifestyle business was up 63.4% in Q4 2021 compared to Q4 2020, representing 16.9% of our sales, demonstrating our ability to continue to create an ecosystem of products specifically focused on the needs of medical professionals. As we continue to broaden our product offerings, we have seen an increase in both average order value (“AOV”), up 15% in Q4 2021 compared to Q4 2020, and net revenues per active customer, up $22 compared to Q4 2020, as customers want to come back and shop the full look. We believe no one is better positioned than FIGS to fully outfit the healthcare professional. Providing a complete layering system not only expands our total addressable market beyond the approximately $79 billion global healthcare apparel market that exists today, it enables us to build even greater customer loyalty and even deeper connections with our Awesome Humans. FIGS / PRODUCT INNOVATION Product Expansion
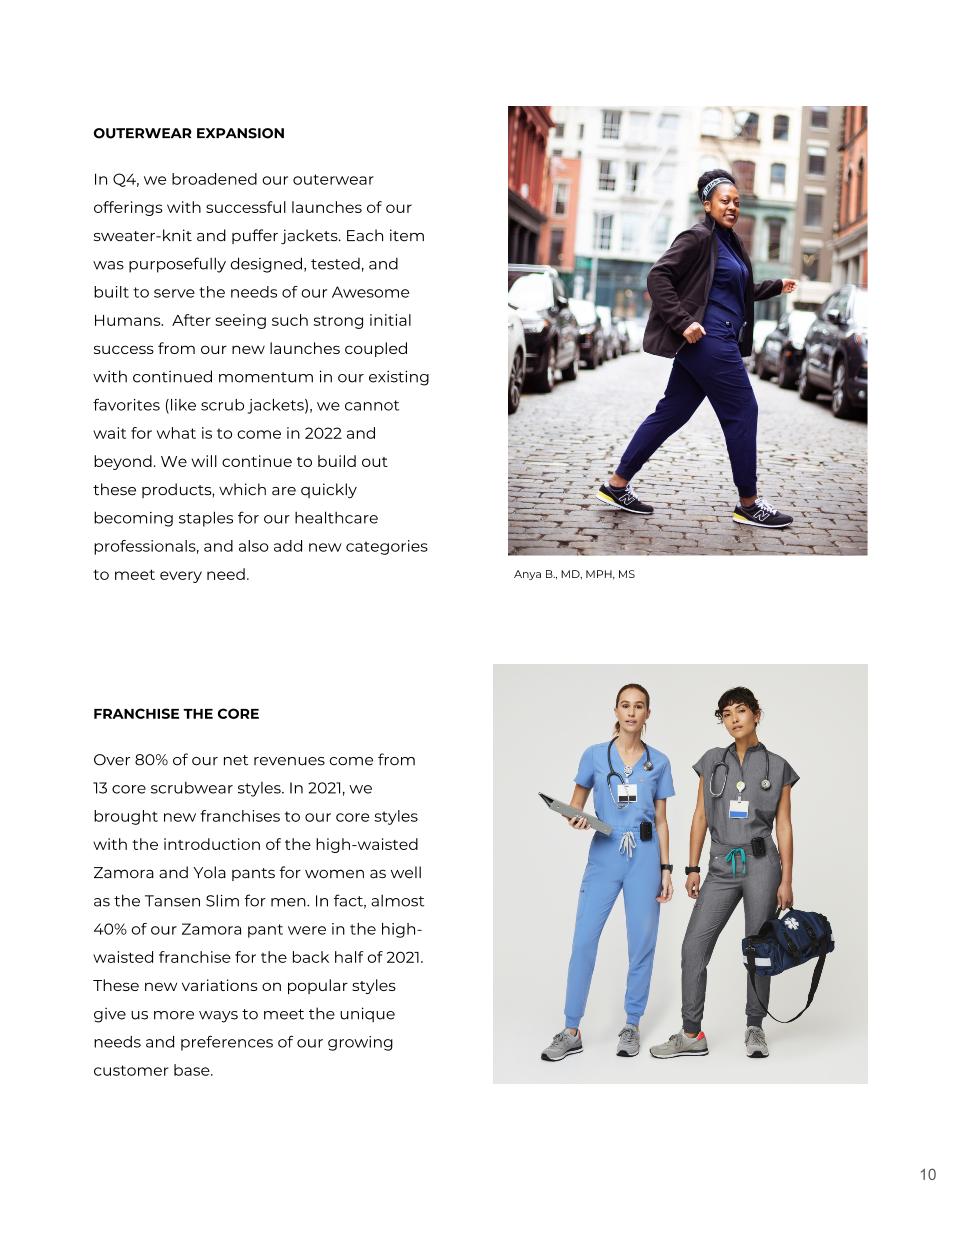
OUTERWEAR EXPANSION In Q4, we broadened our outerwear offerings with successful launches of our sweater-knit and puffer jackets. Each item was purposefully designed, tested, and built to serve the needs of our Awesome Humans. After seeing such strong initial success from our new launches coupled with continued momentum in our existing favorites (like scrub jackets), we cannot wait for what is to come in 2022 and beyond. We will continue to build out these products, which are quickly becoming staples for our healthcare professionals, and also add new categories to meet every need. FRANCHISE THE CORE Over 80% of our net revenues come from 13 core scrubwear styles. In 2021, we brought new franchises to our core styles with the introduction of the high-waisted Zamora and Yola pants for women as well as the Tansen Slim for men. In fact, almost 40% of our Zamora pant were in the high-waisted franchise for the back half of 2021. These new variations on popular styles give us more ways to meet the unique needs and preferences of our growing customer base. Anya B., MD, MPH, MS
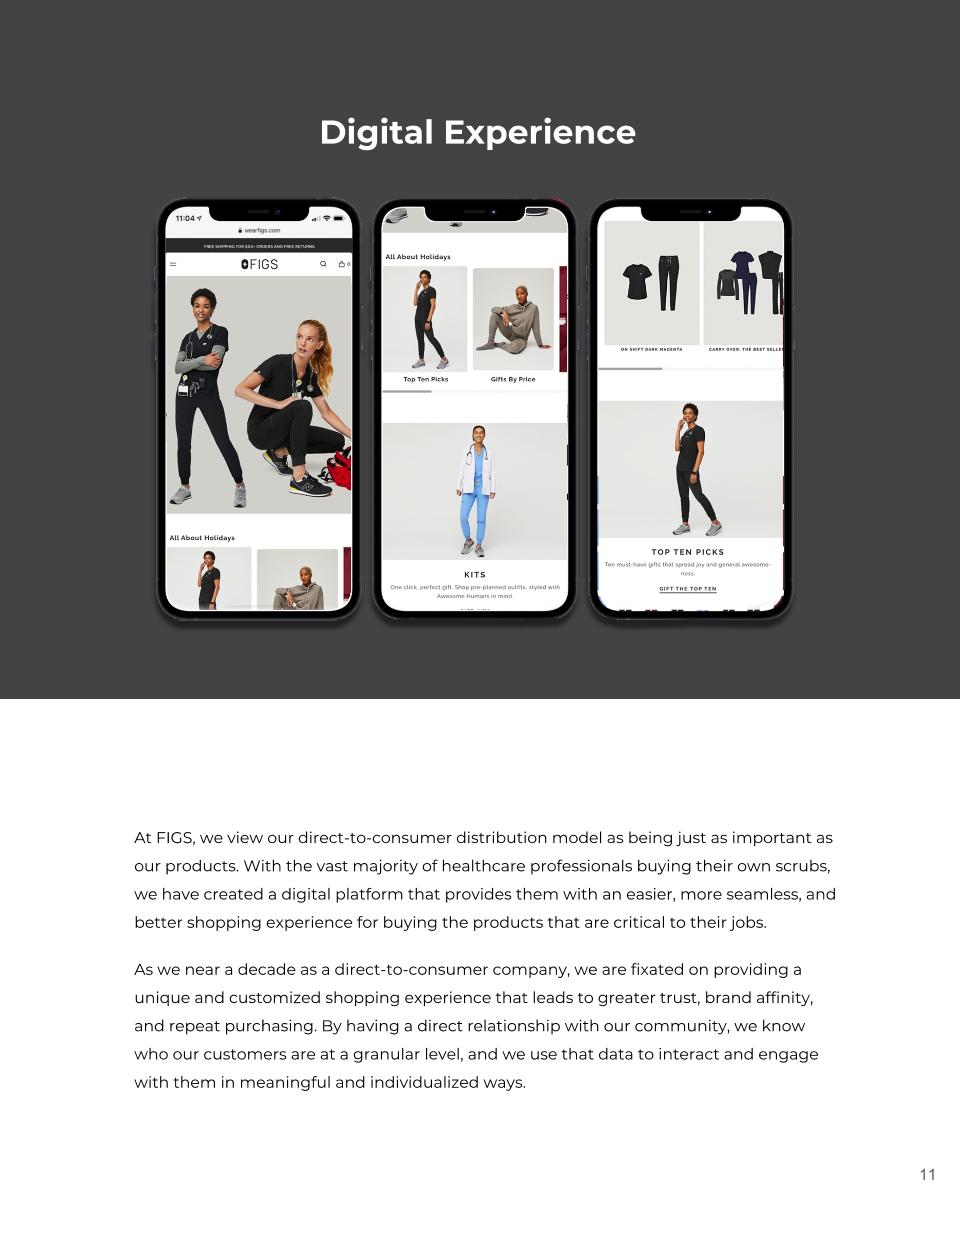
At FIGS, we view our direct-to-consumer distribution model as being just as important as our products. With the vast majority of healthcare professionals buying their own scrubs, we have created a digital platform that provides them with an easier, more seamless, and better shopping experience for buying the products that are critical to their jobs. As we near a decade as a direct-to-consumer company, we are fixated on providing a unique and customized shopping experience that leads to greater trust, brand affinity, and repeat purchasing. By having a direct relationship with our community, we know who our customers are at a granular level, and we use that data to interact and engage with them in meaningful and individualized ways. Digital Experience
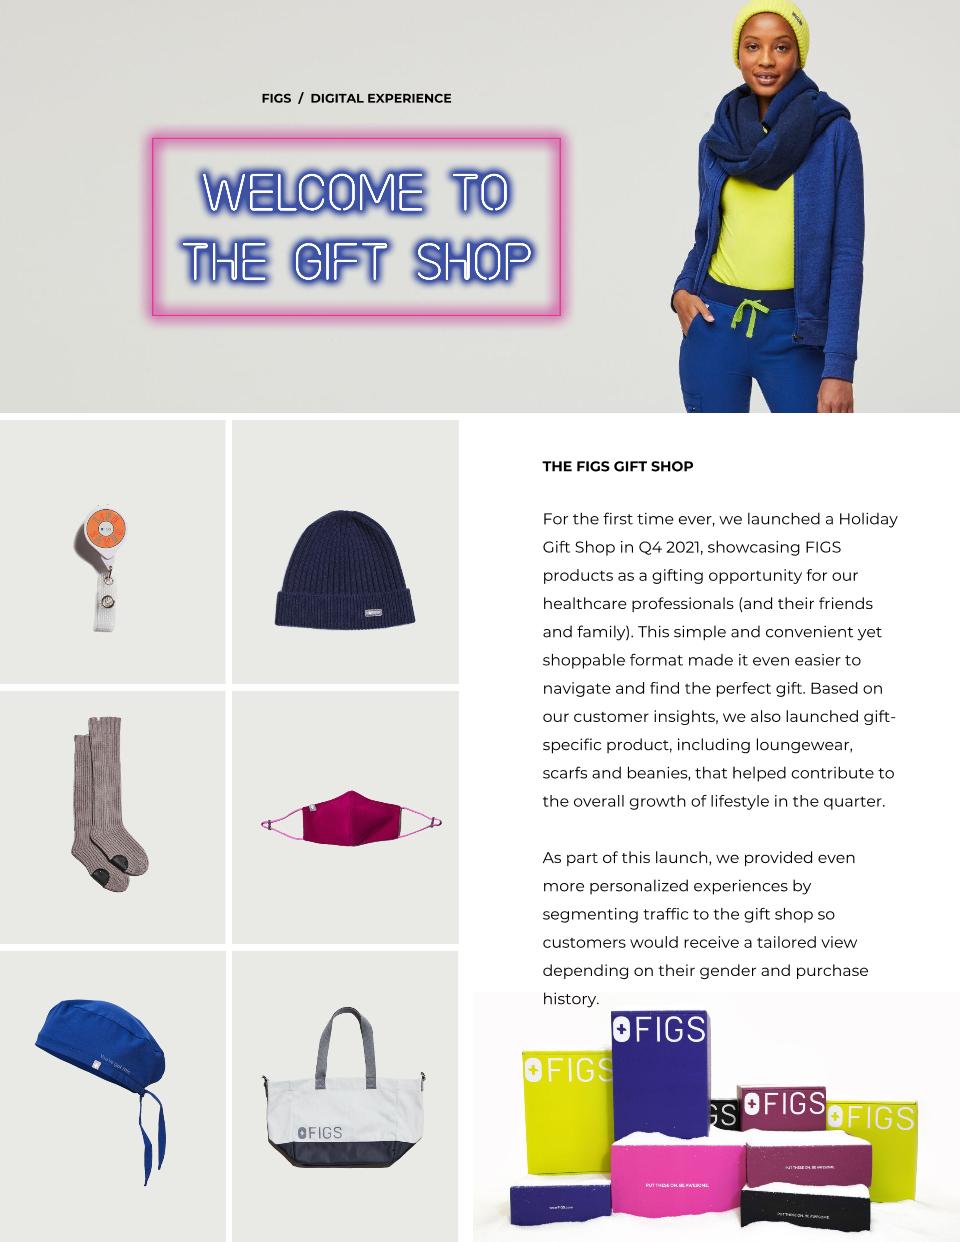
THE FIGS GIFT SHOP For the first time ever, we launched a Holiday Gift Shop in Q4 2021, showcasing FIGS products as a gifting opportunity for our healthcare professionals (and their friends and family). This simple and convenient yet shoppable format made it even easier to navigate and find the perfect gift. Based on our customer insights, we also launched gift-specific product, including loungewear, scarfs and beanies, that helped contribute to the overall growth of lifestyle in the quarter. As part of this launch, we provided even more personalized experiences by segmenting traffic to the gift shop so customers would receive a tailored view depending on their gender and purchase history. FIGS / DIGITAL EXPERIENCE
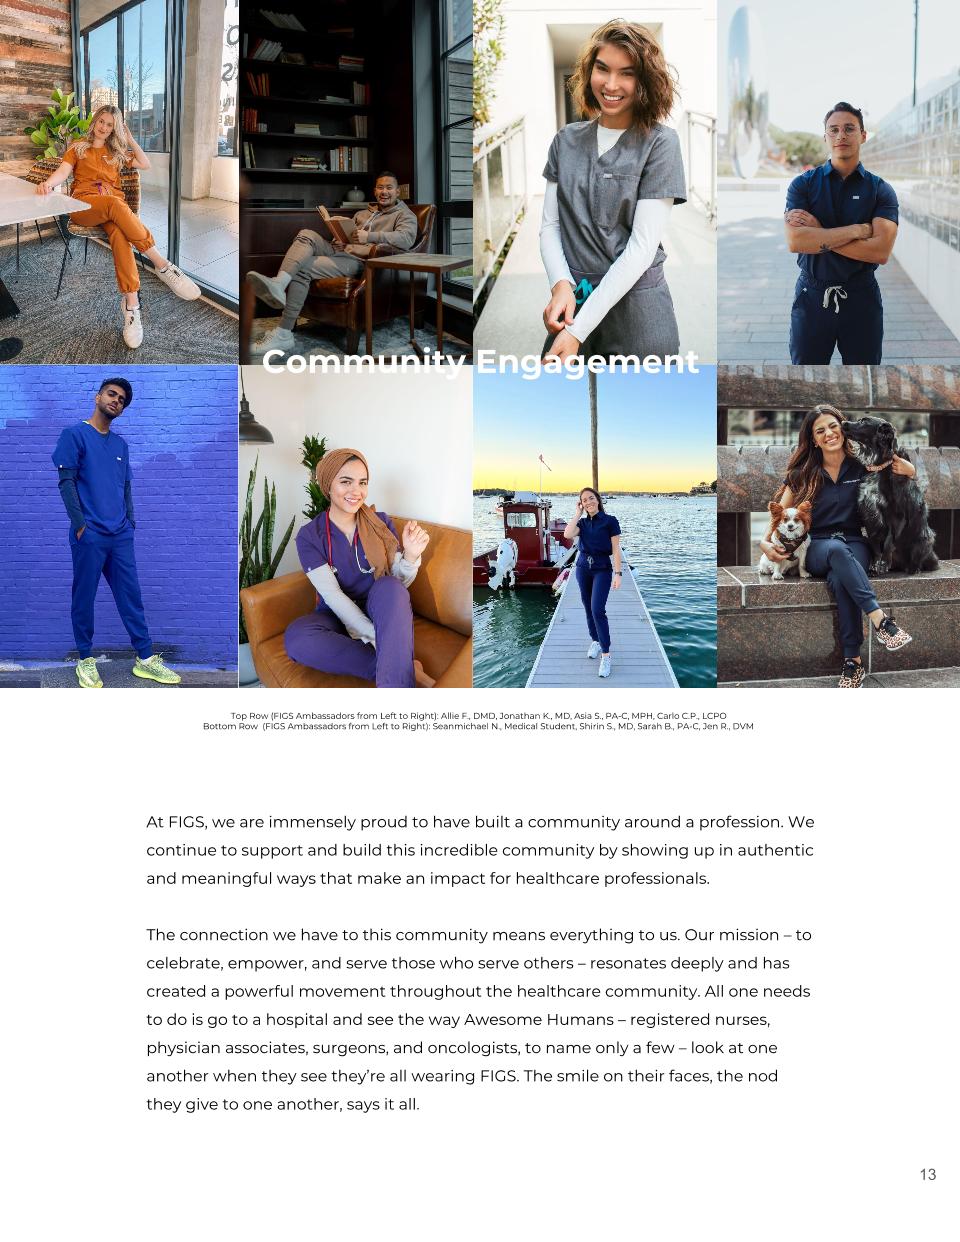
Community Engagement At FIGS, we are immensely proud to have built a community around a profession. We continue to support and build this incredible community by showing up in authentic and meaningful ways that make an impact for healthcare professionals. The connection we have to this community means everything to us. Our mission – to celebrate, empower, and serve those who serve others – resonates deeply and has created a powerful movement throughout the healthcare community. All one needs to do is go to a hospital and see the way Awesome Humans – registered nurses, physician associates, surgeons, and oncologists, to name only a few – look at one another when they see they’re all wearing FIGS. The smile on their faces, the nod they give to one another, says it all. Top Row (FIGS Ambassadors from Left to Right): Allie F., DMD, Jonathan K., MD, Asia S., PA-C, MPH, Carlo C.P., LCPO Bottom Row (FIGS Ambassadors from Left to Right): Seanmichael N., Medical Student, Shirin S., MD, Sarah B., PA-C, Jen R., DVM
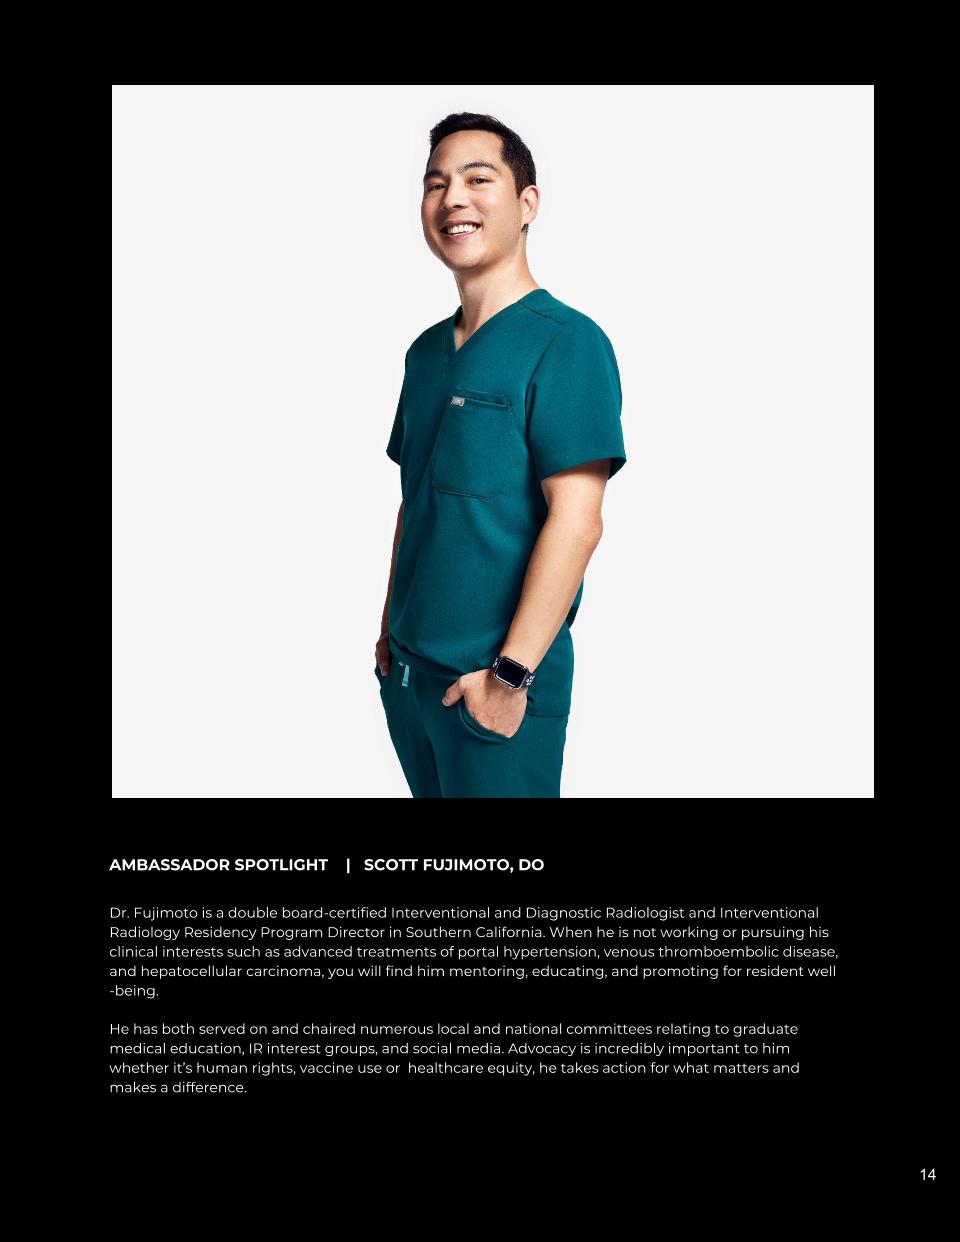
Dr. Fujimoto is a double board-certified Interventional and Diagnostic Radiologist and Interventional Radiology Residency Program Director in Southern California. When he is not working or pursuing his clinical interests such as advanced treatments of portal hypertension, venous thromboembolic disease, and hepatocellular carcinoma, you will find him mentoring, educating, and promoting for resident well-being. He has both served on and chaired numerous local and national committees relating to graduate medical education, IR interest groups, and social media. Advocacy is incredibly important to him whether it’s human rights, vaccine use or healthcare equity, he takes action for what matters and makes a difference. AMBASSADOR SPOTLIGHT | SCOTT FUJIMOTO, DO
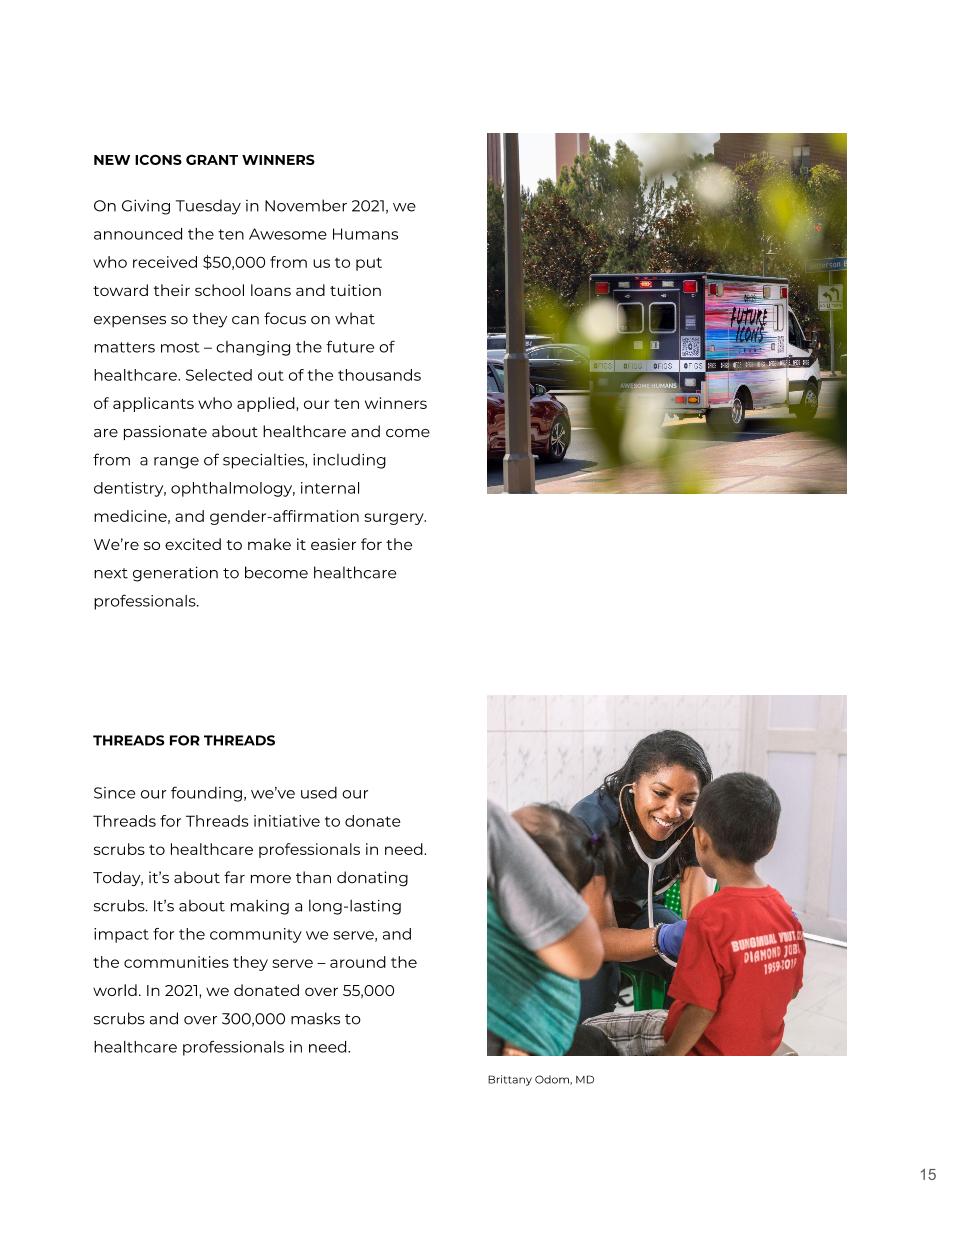
NEW ICONS GRANT WINNERS On Giving Tuesday in November 2021, we announced the ten Awesome Humans who received $50,000 from us to put toward their school loans and tuition expenses so they can focus on what matters most – changing the future of healthcare. Selected out of the thousands of applicants who applied, our ten winners are passionate about healthcare and come from a range of specialties, including dentistry, ophthalmology, internal medicine, and gender-affirmation surgery. We’re so excited to make it easier for the next generation to become healthcare professionals. THREADS FOR THREADS Since our founding, we’ve used our Threads for Threads initiative to donate scrubs to healthcare professionals in need. Today, it’s about far more than donating scrubs. It’s about making a long-lasting impact for the community we serve, and the communities they serve – around the world. In 2021, we donated over 55,000 scrubs and over 300,000 masks to healthcare professionals in need. Brittany Odom, MD
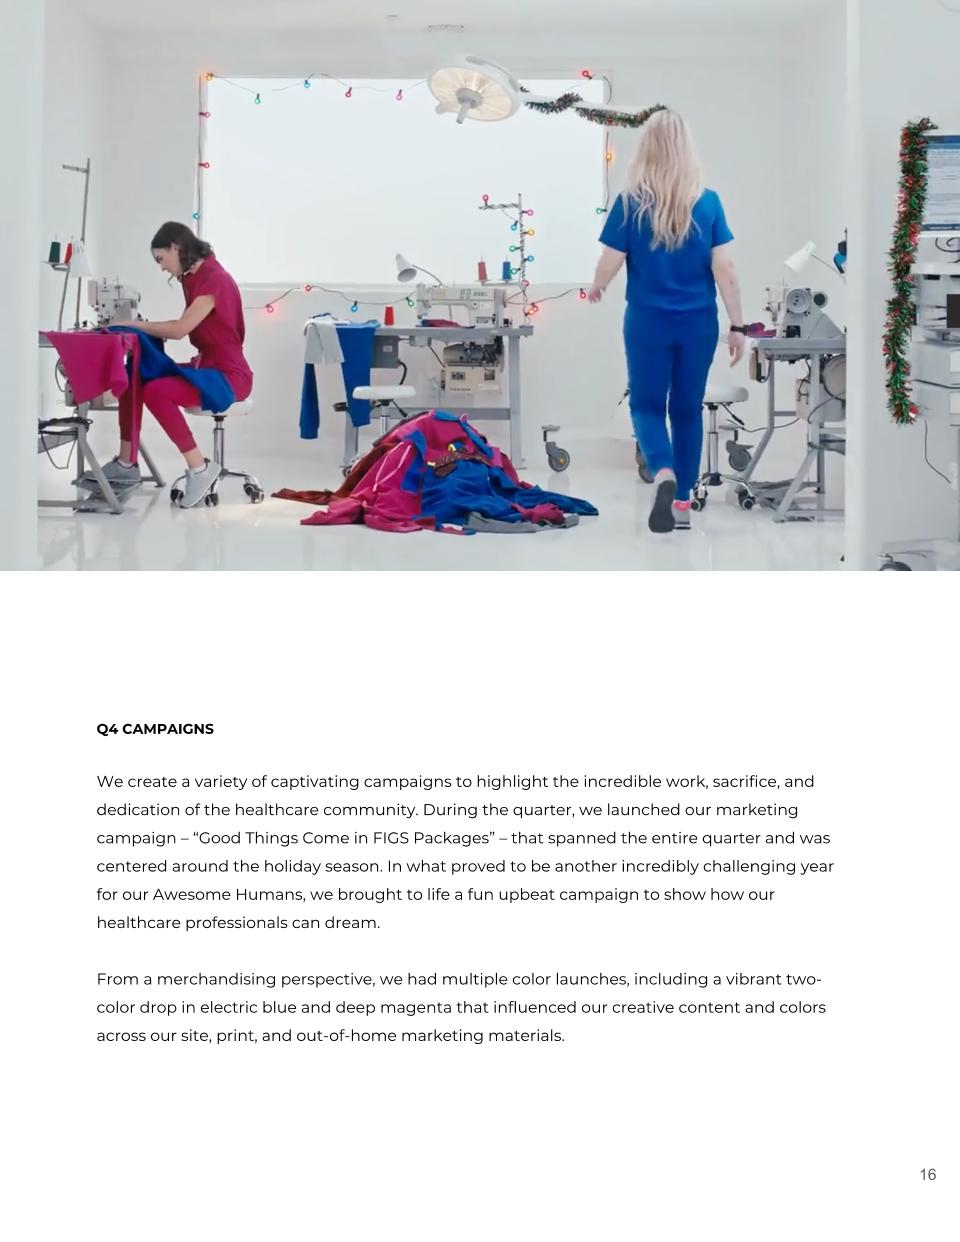
Q4 CAMPAIGNS We create a variety of captivating campaigns to highlight the incredible work, sacrifice, and dedication of the healthcare community. During the quarter, we launched our marketing campaign – “Good Things Come in FIGS Packages” – that spanned the entire quarter and was centered around the holiday season. In what proved to be another incredibly challenging year for our Awesome Humans, we brought to life a fun upbeat campaign to show how our healthcare professionals can dream. From a merchandising perspective, we had multiple color launches, including a vibrant two-color drop in electric blue and deep magenta that influenced our creative content and colors across our site, print, and out-of-home marketing materials.
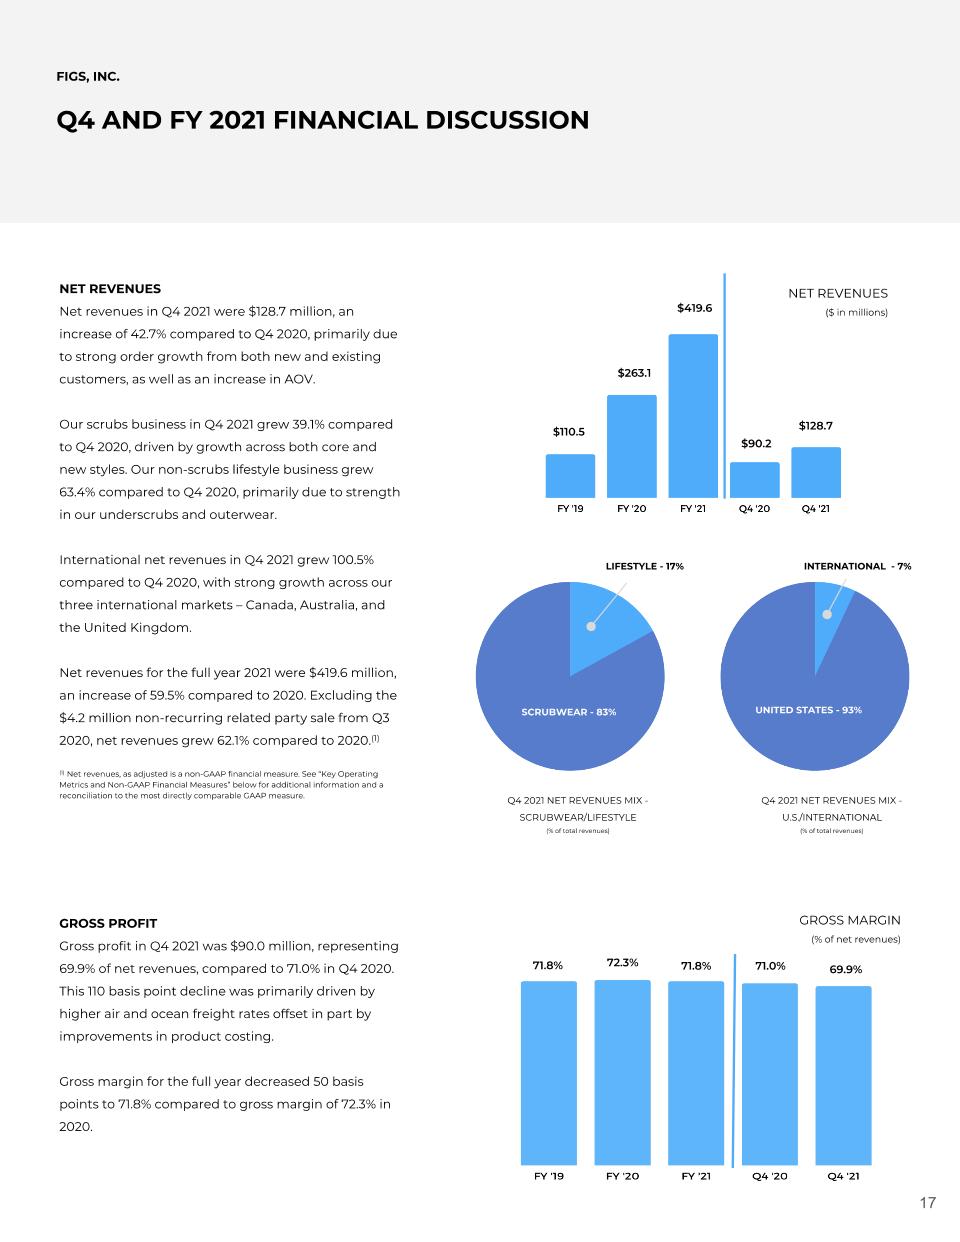
FIGS, INC. Q4 AND FY 2021 FINANCIAL DISCUSSION NET REVENUES Net revenues in Q4 2021 were $128.7 million, an increase of 42.7% compared to Q4 2020, primarily due to strong order growth from both new and existing customers, as well as an increase in AOV. Our scrubs business in Q4 2021 grew 39.1% compared to Q4 2020, driven by growth across both core and new styles. Our non-scrubs lifestyle business grew 63.4% compared to Q4 2020, primarily due to strength in our underscrubs and outerwear. International net revenues in Q4 2021 grew 100.5% compared to Q4 2020, with strong growth across our three international markets – Canada, Australia, and the United Kingdom. Net revenues for the full year 2021 were $419.6 million, an increase of 59.5% compared to 2020. Excluding the $4.2 million non-recurring related party sale from Q3 2020, net revenues grew 62.1% compared to 2020.(1) (1) Net revenues, as adjusted is a non-GAAP financial measure. See “Key Operating Metrics and Non-GAAP Financial Measures” below for additional information and a reconciliation to the most directly comparable GAAP measure. GROSS PROFIT Gross profit in Q4 2021 was $90.0 million, representing 69.9% of net revenues, compared to 71.0% in Q4 2020. This 110 basis point decline was primarily driven by higher air and ocean freight rates offset in part by improvements in product costing. Gross margin for the full year decreased 50 basis points to 71.8% compared to gross margin of 72.3% in 2020. $110.5 $263.1 $419.6 $90.2 $128.7 LIFESTYLE - 17% SCRUBWEAR - 83% INTERNATIONAL - 7% UNITED STATES - 93% 71.8% 72.3% 71.8% 71.0% 69.9% NET REVENUES ($ in millions) GROSS MARGIN (% of net revenues) Q4 2021 NET REVENUES MIX - SCRUBWEAR/LIFESTYLE (% of total revenues) Q4 2021 NET REVENUES MIX - U.S./INTERNATIONAL (% of total revenues)
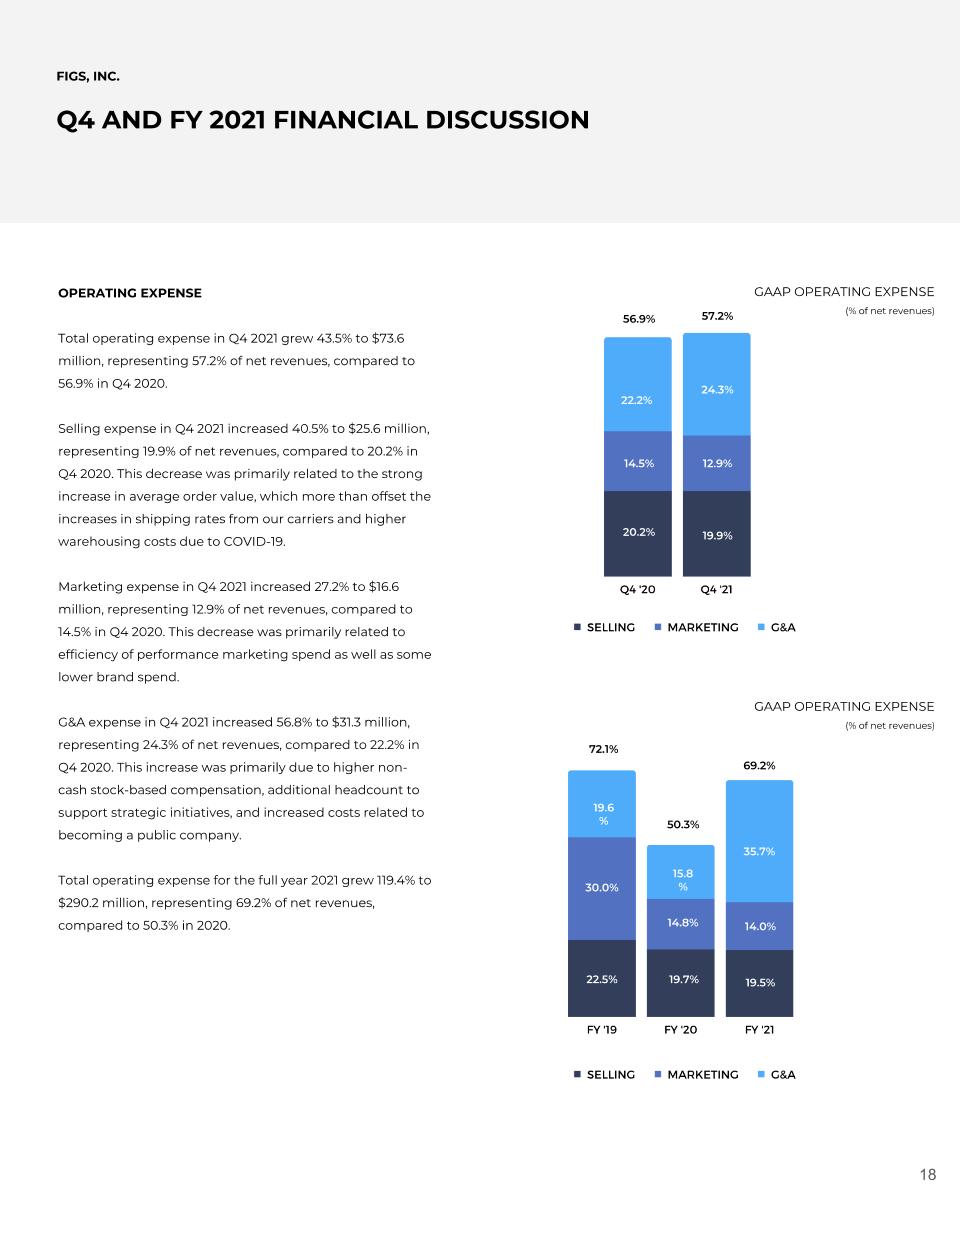
OPERATING EXPENSE Total operating expense in Q4 2021 grew 43.5% to $73.6 million, representing 57.2% of net revenues, compared to 56.9% in Q4 2020. Selling expense in Q4 2021 increased 40.5% to $25.6 million, representing 19.9% of net revenues, compared to 20.2% in Q4 2020. This decrease was primarily related to the strong increase in average order value, which more than offset the increases in shipping rates from our carriers and higher warehousing costs due to COVID-19. Marketing expense in Q4 2021 increased 27.2% to $16.6 million, representing 12.9% of net revenues, compared to 14.5% in Q4 2020. This decrease was primarily related to efficiency of performance marketing spend as well as some lower brand spend. G&A expense in Q4 2021 increased 56.8% to $31.3 million, representing 24.3% of net revenues, compared to 22.2% in Q4 2020. This increase was primarily due to higher non-cash stock-based compensation, additional headcount to support strategic initiatives, and increased costs related to becoming a public company. Total operating expense for the full year 2021 grew 119.4% to $290.2 million, representing 69.2% of net revenues, compared to 50.3% in 2020. FIGS, INC. Q4 AND FY 2021 FINANCIAL DISCUSSION 20.2% 14.5% 22.2% 19.9% 12.9% 24.3% 22.5% 30.0% 19.6% 19.7% 14.8% 15.8% 19.5% 14.0% 35.7% 69.2% 72.1% 50.3% GAAP OPERATING EXPENSE (% of net revenues) GAAP OPERATING EXPENSE (% of net revenues) 57.2% 56.9%
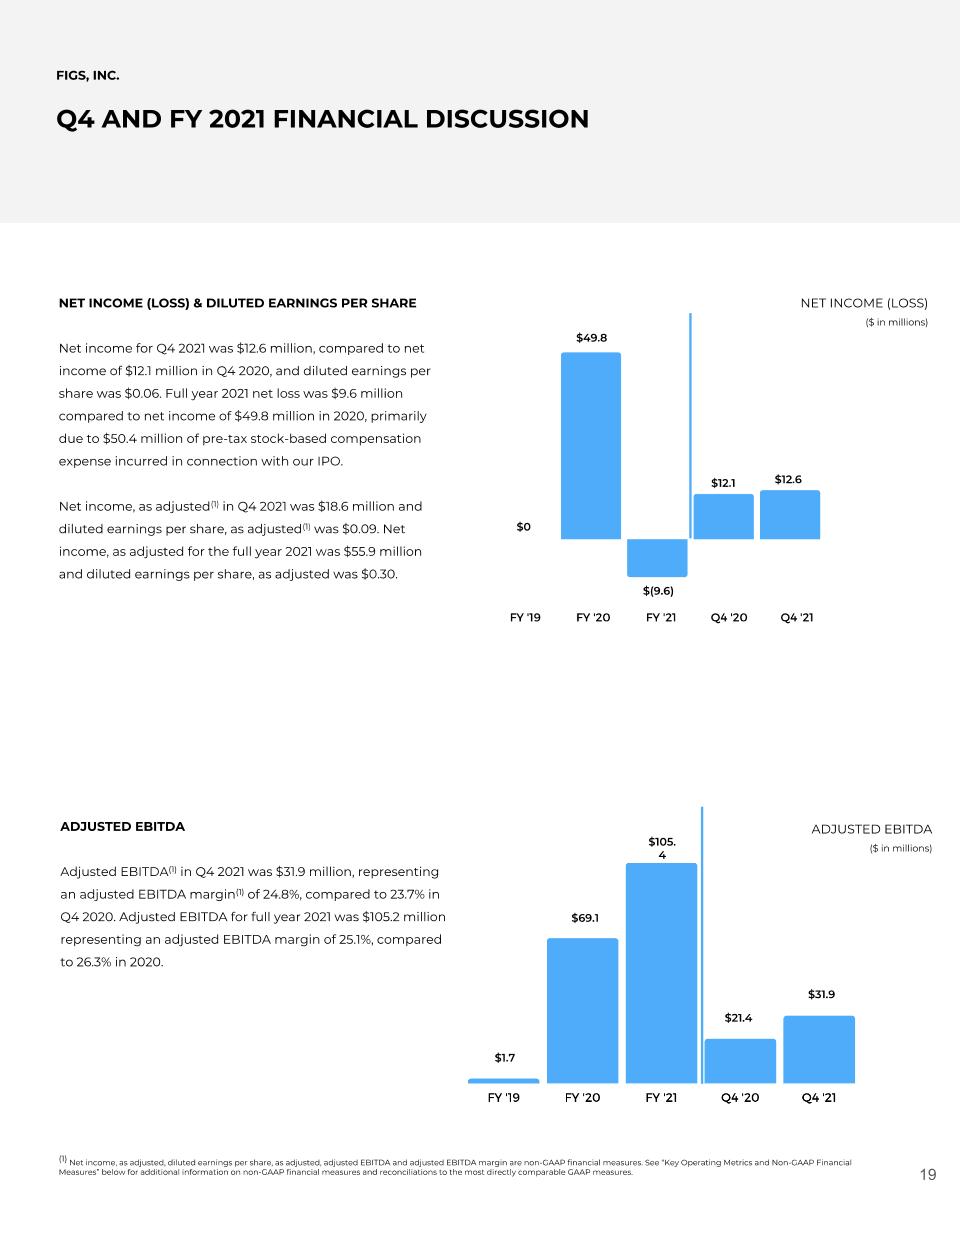
NET INCOME (LOSS) & DILUTED EARNINGS PER SHARE Net income for Q4 2021 was $12.6 million, compared to net income of $12.1 million in Q4 2020, and diluted earnings per share was $0.06. Full year 2021 net loss was $9.6 million compared to net income of $49.8 million in 2020, primarily due to $50.4 million of pre-tax stock-based compensation expense incurred in connection with our IPO. Net income, as adjusted(1) in Q4 2021 was $18.6 million and diluted earnings per share, as adjusted(1) was $0.09. Net income, as adjusted for the full year 2021 was $55.9 million and diluted earnings per share, as adjusted was $0.30. FIGS, INC. Q4 AND FY 2021 FINANCIAL DISCUSSION (1) Net income, as adjusted, diluted earnings per share, as adjusted, adjusted EBITDA and adjusted EBITDA margin are non-GAAP financial measures. See “Key Operating Metrics and Non-GAAP Financial Measures” below for additional information on non-GAAP financial measures and reconciliations to the most directly comparable GAAP measures. ADJUSTED EBITDA Adjusted EBITDA(1) in Q4 2021 was $31.9 million, representing an adjusted EBITDA margin(1) of 24.8%, compared to 23.7% in Q4 2020. Adjusted EBITDA for full year 2021 was $105.2 million representing an adjusted EBITDA margin of 25.1%, compared to 26.3% in 2020. $1.7 $31.9 $0 $49.8 $(9.6) $12.1 $12.6 $69.1 $105.4 $21.4 NET INCOME (LOSS) ($ in millions) ADJUSTED EBITDA ($ in millions)
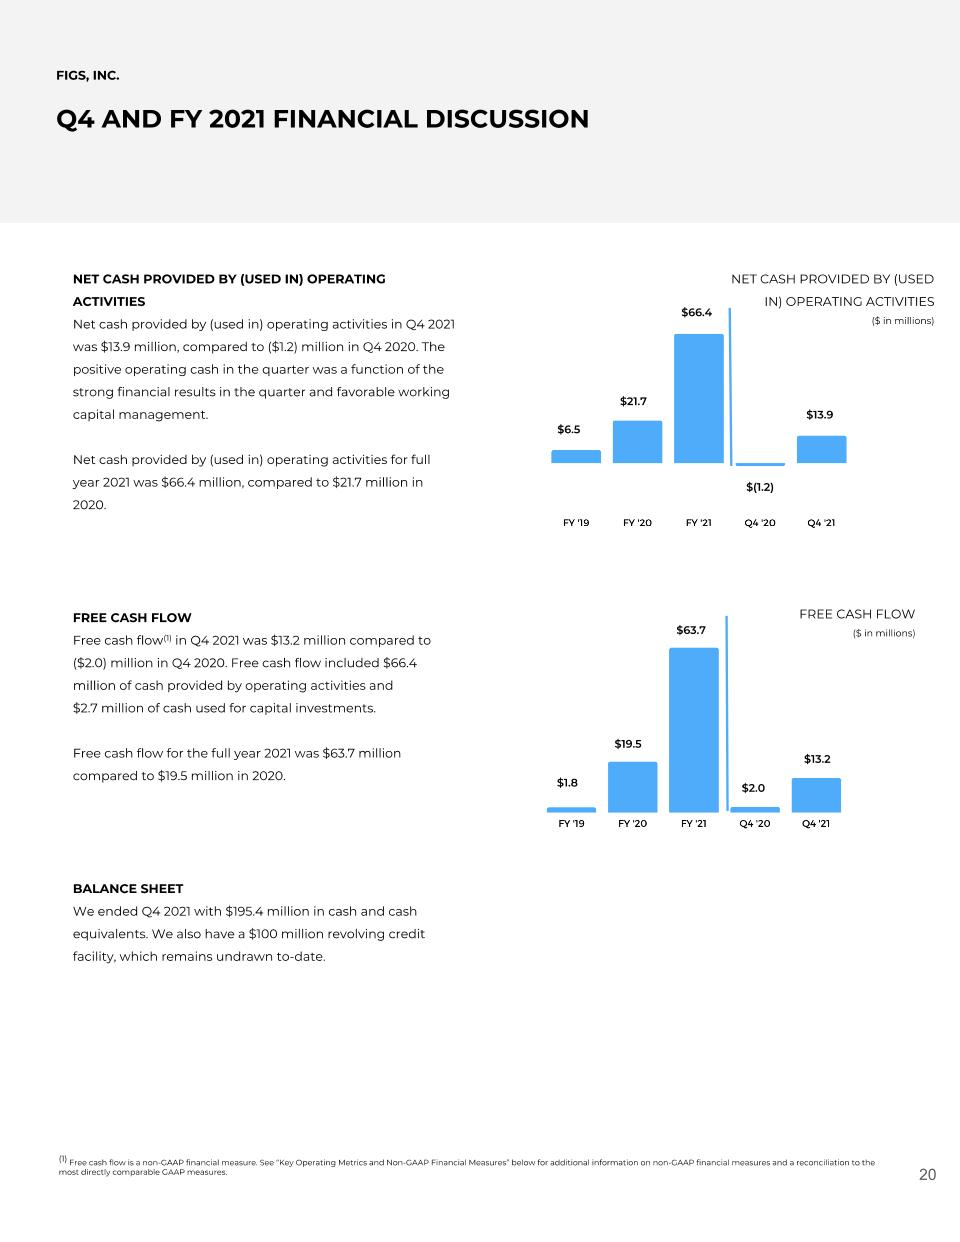
NET CASH PROVIDED BY (USED IN) OPERATING ACTIVITIES Net cash provided by (used in) operating activities in Q4 2021 was $13.9 million, compared to ($1.2) million in Q4 2020. The positive operating cash in the quarter was a function of the strong financial results in the quarter and favorable working capital management. Net cash provided by (used in) operating activities for full year 2021 was $66.4 million, compared to $21.7 million in 2020. FREE CASH FLOW Free cash flow(1) in Q4 2021 was $13.2 million compared to ($2.0) million in Q4 2020. Free cash flow included $66.4 million of cash provided by operating activities and $2.7 million of cash used for capital investments. Free cash flow for the full year 2021 was $63.7 million compared to $19.5 million in 2020. BALANCE SHEET We ended Q4 2021 with $195.4 million in cash and cash equivalents. We also have a $100 million revolving credit facility, which remains undrawn to-date. FIGS, INC. Q4 AND FY 2021 FINANCIAL DISCUSSION (1) Free cash flow is a non-GAAP financial measure. See “Key Operating Metrics and Non-GAAP Financial Measures” below for additional information on non-GAAP financial measures and a reconciliation to the most directly comparable GAAP measures. $1.8 $19.5 $63.7 $2.0 $13.2 FREE CASH FLOW ($ in millions) $6.5 $21.7 $66.4 $(1.2) $13.9 NET CASH PROVIDED BY (USED IN) OPERATING ACTIVITIES ($ in millions)
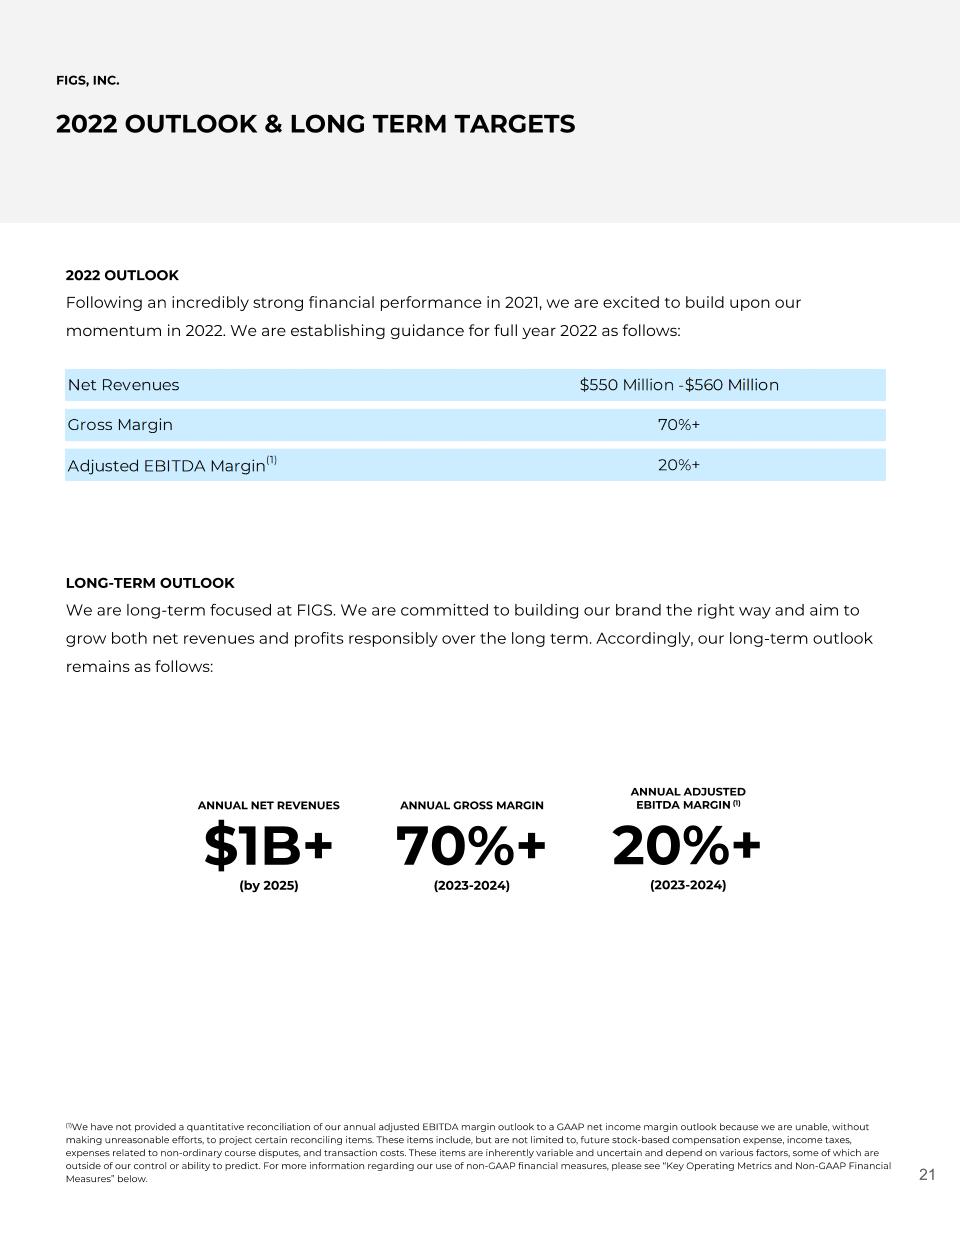
FIGS, INC. 2022 OUTLOOK & LONG TERM TARGETS 2022 OUTLOOK Following an incredibly strong financial performance in 2021, we are excited to build upon our momentum in 2022. We are establishing guidance for full year 2022 as follows: LONG-TERM OUTLOOK We are long-term focused at FIGS. We are committed to building our brand the right way and aim to grow both net revenues and profits responsibly over the long term. Accordingly, our long-term outlook remains as follows: (1)We have not provided a quantitative reconciliation of our annual adjusted EBITDA margin outlook to a GAAP net income margin outlook because we are unable, without making unreasonable efforts, to project certain reconciling items. These items include, but are not limited to, future stock-based compensation expense, income taxes, expenses related to non-ordinary course disputes, and transaction costs. These items are inherently variable and uncertain and depend on various factors, some of which are outside of our control or ability to predict. For more information regarding our use of non-GAAP financial measures, please see “Key Operating Metrics and Non-GAAP Financial Measures” below. ANNUAL NET REVENUES $1B+ (by 2025) ANNUAL GROSS MARGIN 70%+ (2023-2024) ANNUAL ADJUSTED EBITDA MARGIN (1) 20%+ (2023-2024)
FIGS, INC. Q4 2021 CONFERENCE CALL AND WEBCAST DETAILS A conference call to discuss the Company’s Q4 and full year 2021 financial and business results and outlook is scheduled for March 8, 2022, at 2:00 p.m. PT / 5:00 p.m. ET. To participate, please dial 1-844-200-6205 (US) or 1-929-526-1599 (International) and the conference ID 927529. The call is also accessible via webcast on FIGS’ investor relations site at ir.wearfigs.com. A recording will be available shortly after the conclusion of the call until 11:59 p.m. ET on March 15, 2022. To access the replay, please dial 1-866-813-9403 (US) or +44-204-525-0658 (International). An archive of the webcast will be available on FIGS’ investor relations website at ir.wearfigs.com.
FIGS, INC. FORWARD LOOKING STATEMENTS This shareholder letter contains various forward-looking statements about FIGS, Inc. (the “Company”) within the meaning of the Private Securities Litigation Reform Act of 1995, as amended, that are based on current management expectations, and which involve substantial risks and uncertainties that could cause actual results to differ materially from the results expressed in, or implied by, such forward-looking statements. All statements contained in this shareholder letter that do not relate to matters of historical fact should be considered forward-looking. These forward-looking statements generally are identified by the words “anticipate”, “believe”, “contemplate”, “continue”, “could”, “estimate”, “expect”, “forecast”, “future”, “intend”, “may”, “might”, “opportunity”, “outlook”, “plan”, “possible”, “potential”, “predict”, “project,” “should”, “strategy”, “strive”, “target”, “will”, or “would”, the negative of these words or other similar terms or expressions. The absence of these words does not mean that a statement is not forward-looking. These forward-looking statements address various matters including the Company’s business plan, beliefs, and objectives for future operations; the Company’s ability and plans to continue to generate growth and profitability; the Company’s market opportunity; the Company’s international expansion plans; the Company’s ability to promote the FIGS brand; the Company’s ability to attract new customers and to retain and drive repeat purchases from its existing customers; the Company’s ability and plans for developing new products and bringing them to market; the Company’s ability to increase AOV and drive customer loyalty; economic and industry trends, statistics, projected growth, or trend analysis; the Company’s ability to expand its brand reach with the healthcare community beyond scrubs; the Company’s growth potential in its lifestyle business; the COVID-19 pandemic; the Company’s intention to use data to interact and engage with its customers; the Company’s outlook and expectations as to net revenues, gross margin and adjusted EBITDA margin for the full year ending December 31, 2022; and the Company’s long-term outlook as to net revenues, gross margin, and adjusted EBITDA margin, all of which reflect the Company’s expectations based upon currently available information and data. Because such statements are based on expectations as to future financial and operating results and are not statements of fact, actual results may differ materially from those projected and you are cautioned not to place undue reliance on these forward-looking statements. The following important factors and uncertainties, among others, could cause actual results to differ materially from those described in these forward-looking statements: the impact of COVID-19 on the Company’s operations; the Company’s ability to maintain its recent rapid growth; the Company’s ability to maintain profitability; the Company’s ability to maintain the value and reputation of its brand; the Company’s ability to attract new customers, retain existing customers, and to maintain or increase sales to those customers; the success of the Company’s marketing efforts; the Company’s ability to maintain a strong community of engaged customers and Ambassadors; negative publicity related to the Company’s marketing efforts or use of social media; the Company’s ability to successfully develop and introduce new, innovative, and updated products; the competitiveness of the market for healthcare apparel; the Company’s ability to maintain its key employees; the Company’s ability to attract and retain highly skilled personnel and senior management; risks associated with expansion into, and conducting business in, international markets; changes in, or disruptions to, the Company’s shipping arrangements; the Company’s ability to accurately forecast customer demand, manage its inventory, and plan for future expenses; the Company’s reliance on a limited number of third-party suppliers; the fluctuating costs of raw materials; the Company’s failure to protect its intellectual property rights; the fact that the operations of many of the Company’s suppliers and vendors are subject to additional risks that are beyond its control; and other risks, uncertainties, and factors discussed in the “Risk Factors” section of the Company’s Quarterly Report on Form 10-Q filed with the Securities and Exchange Commission (“SEC”) on November 10, 2021, our Annual Report on Form 10-K for the year ended December 31, 2021 to be filed with the SEC, and our other periodic filings with the SEC. The forward-looking statements in this shareholder letter speak only as of the time made and the Company does not undertake to update or revise them to reflect future events or circumstances.
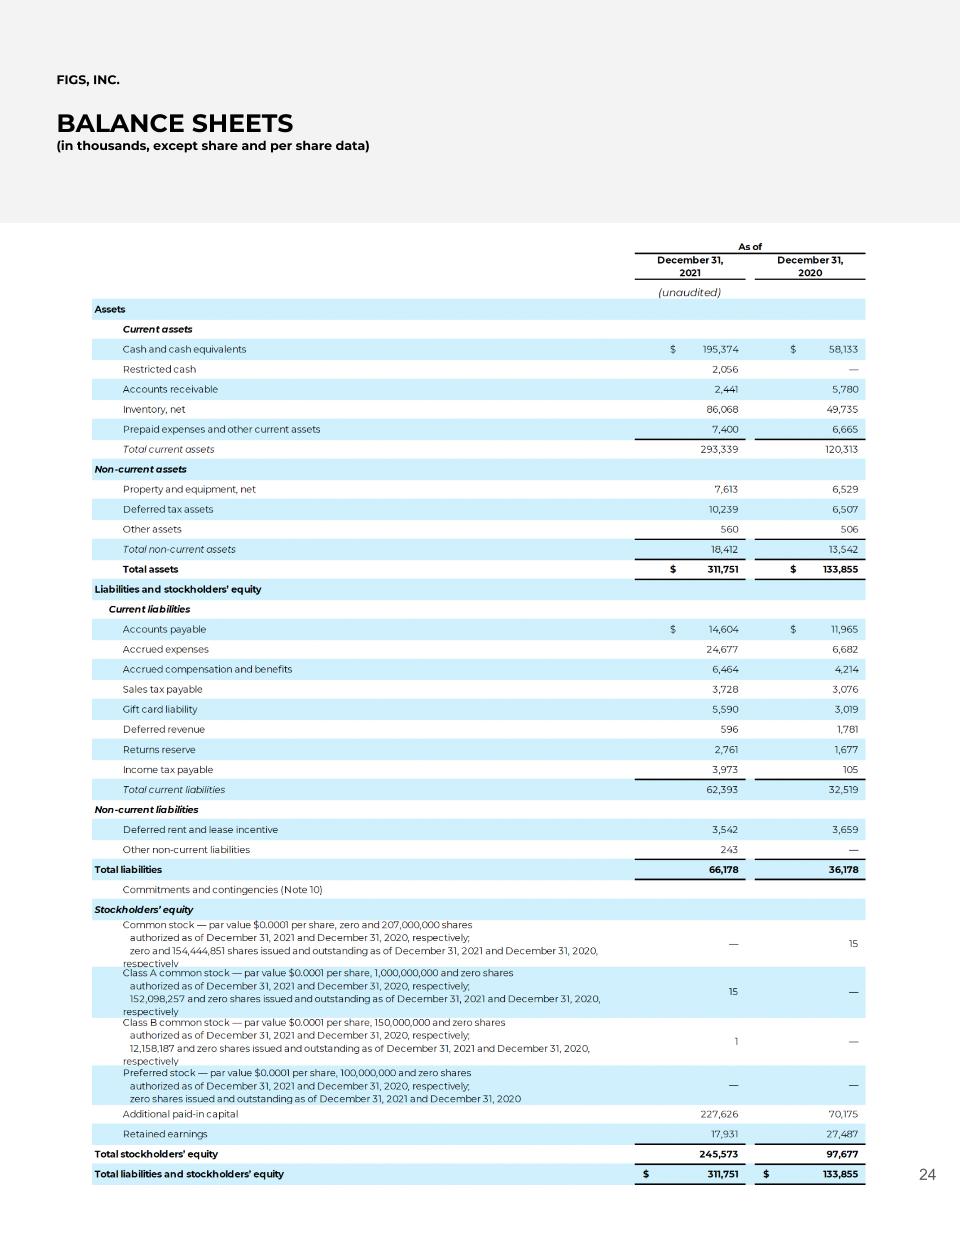
FIGS, INC. BALANCE SHEETS (in thousands, except share and per share data)
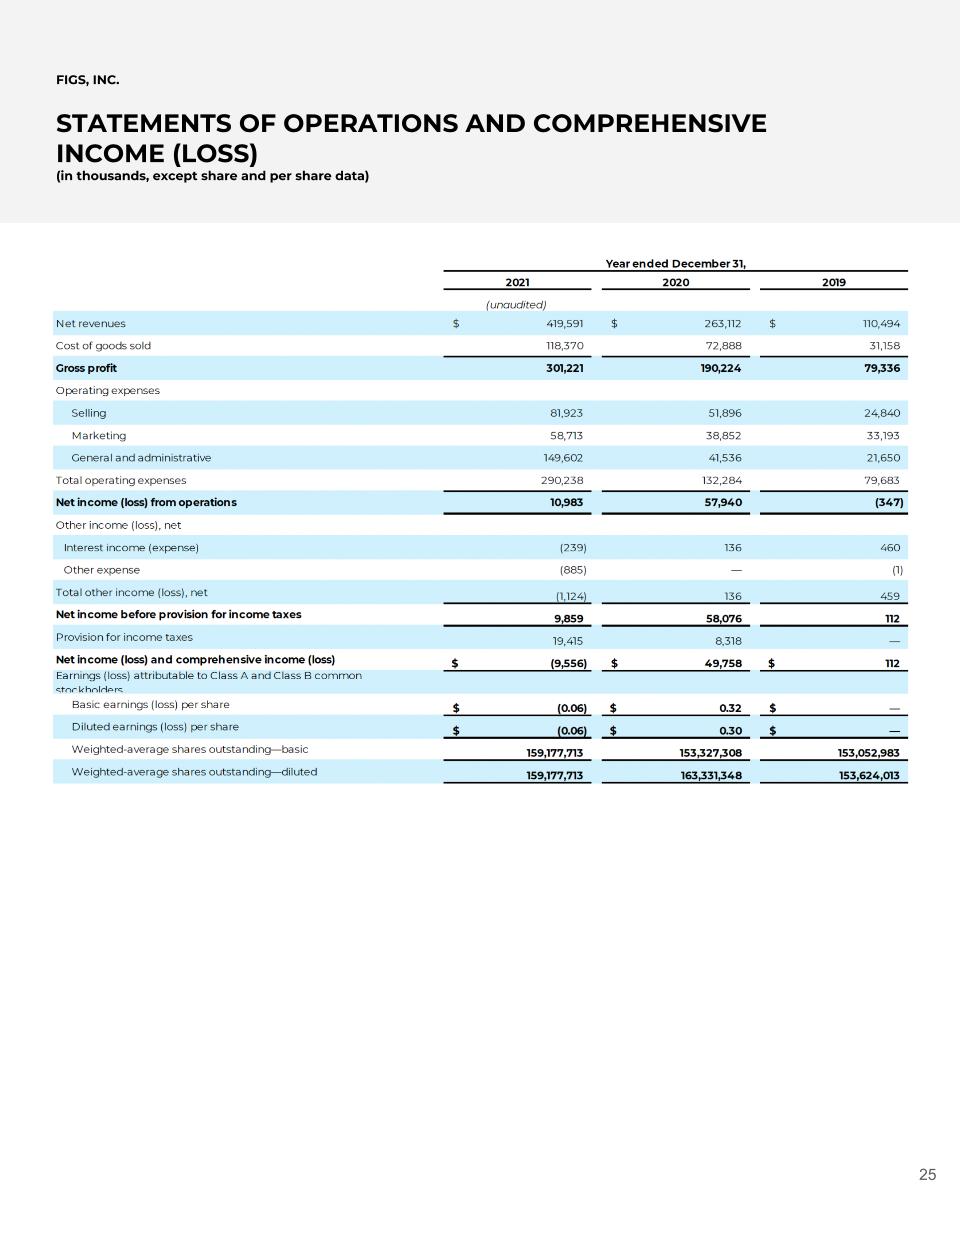
FIGS, INC. STATEMENTS OF OPERATIONS AND COMPREHENSIVE INCOME (LOSS) (in thousands, except share and per share data)
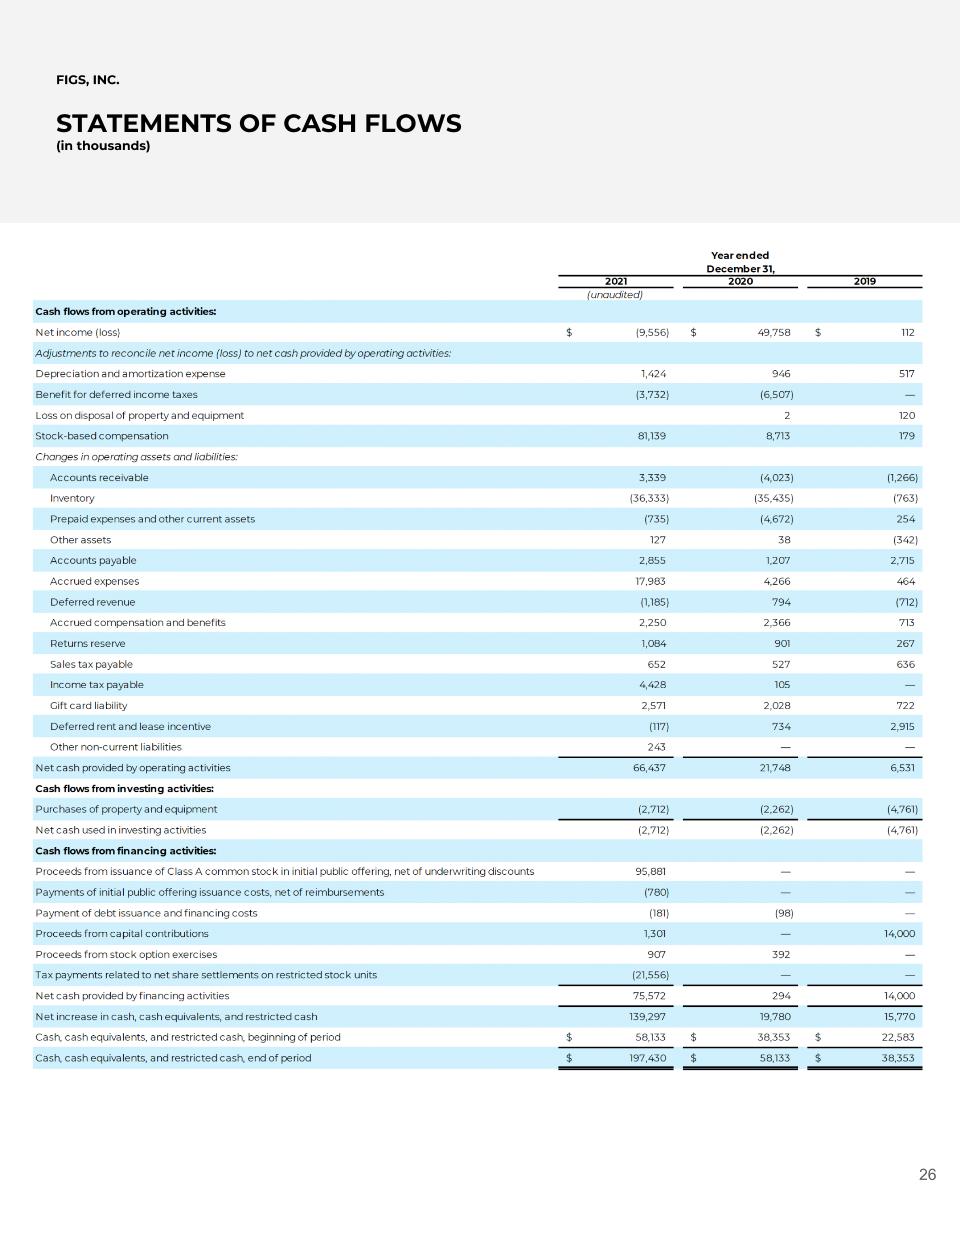
FIGS, INC. STATEMENTS OF CASH FLOWS (in thousands)
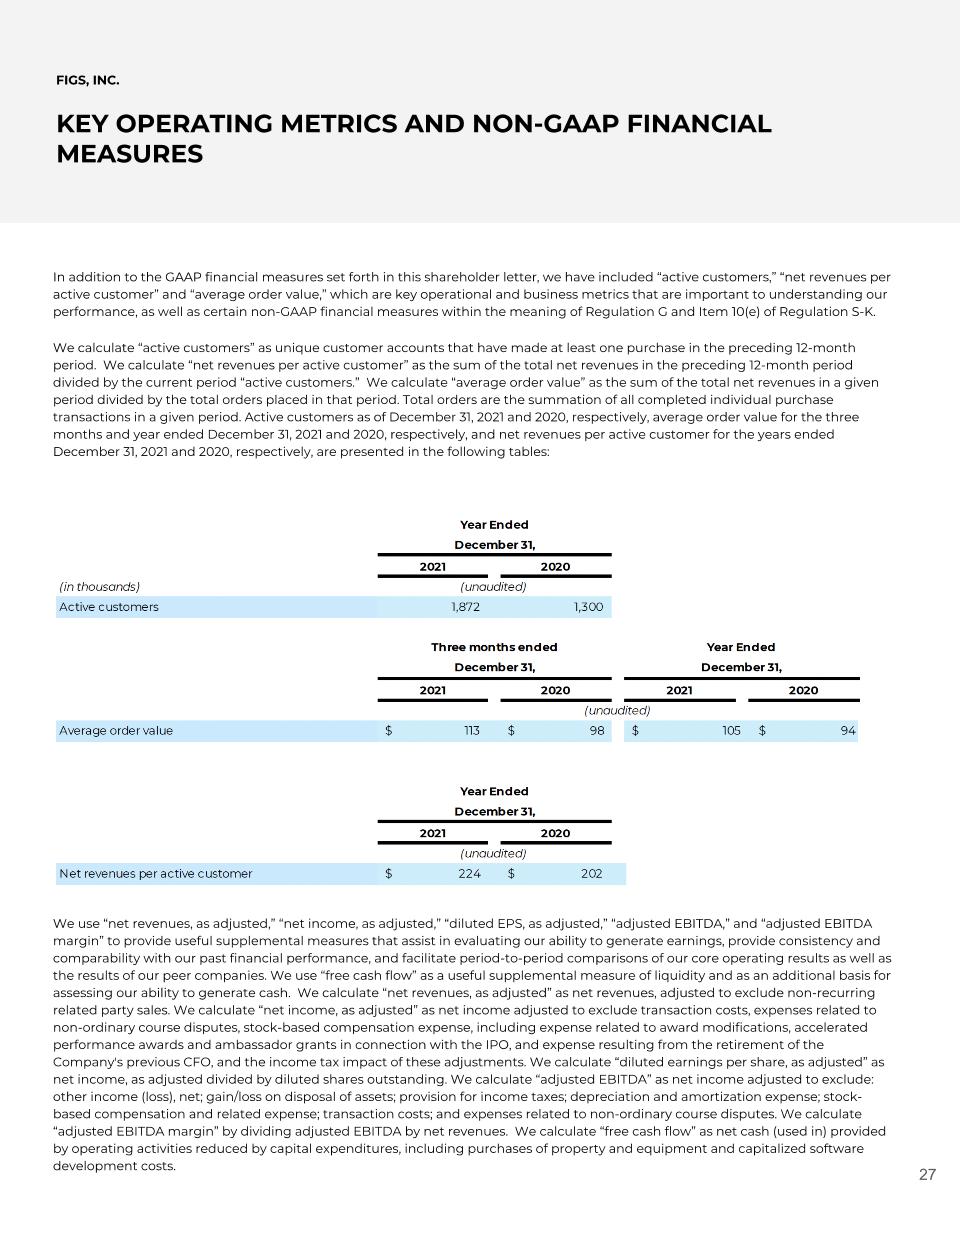
In addition to the GAAP financial measures set forth in this shareholder letter, we have included “active customers,” “net revenues per active customer” and “average order value,” which are key operational and business metrics that are important to understanding our performance, as well as certain non-GAAP financial measures within the meaning of Regulation G and Item 10(e) of Regulation S-K. We calculate “active customers” as unique customer accounts that have made at least one purchase in the preceding 12-month period. We calculate “net revenues per active customer” as the sum of the total net revenues in the preceding 12-month period divided by the current period “active customers.” We calculate “average order value” as the sum of the total net revenues in a given period divided by the total orders placed in that period. Total orders are the summation of all completed individual purchase transactions in a given period. Active customers as of December 31, 2021 and 2020, respectively, average order value for the three months and year ended December 31, 2021 and 2020, respectively, and net revenues per active customer for the years ended December 31, 2021 and 2020, respectively, are presented in the following tables: FIGS, INC. KEY OPERATING METRICS AND NON-GAAP FINANCIAL MEASURES We use “net revenues, as adjusted,” “net income, as adjusted,” “diluted EPS, as adjusted,” “adjusted EBITDA,” and “adjusted EBITDA margin” to provide useful supplemental measures that assist in evaluating our ability to generate earnings, provide consistency and comparability with our past financial performance, and facilitate period-to-period comparisons of our core operating results as well as the results of our peer companies. We use “free cash flow” as a useful supplemental measure of liquidity and as an additional basis for assessing our ability to generate cash. We calculate “net revenues, as adjusted” as net revenues, adjusted to exclude non-recurring related party sales. We calculate “net income, as adjusted” as net income adjusted to exclude transaction costs, expenses related to non-ordinary course disputes, stock-based compensation expense, including expense related to award modifications, accelerated performance awards and ambassador grants in connection with the IPO, and expense resulting from the retirement of the Company's previous CFO, and the income tax impact of these adjustments. We calculate “diluted earnings per share, as adjusted” as net income, as adjusted divided by diluted shares outstanding. We calculate “adjusted EBITDA” as net income adjusted to exclude: other income (loss), net; gain/loss on disposal of assets; provision for income taxes; depreciation and amortization expense; stock-based compensation and related expense; transaction costs; and expenses related to non-ordinary course disputes. We calculate “adjusted EBITDA margin” by dividing adjusted EBITDA by net revenues. We calculate “free cash flow” as net cash (used in) provided by operating activities reduced by capital expenditures, including purchases of property and equipment and capitalized software development costs.
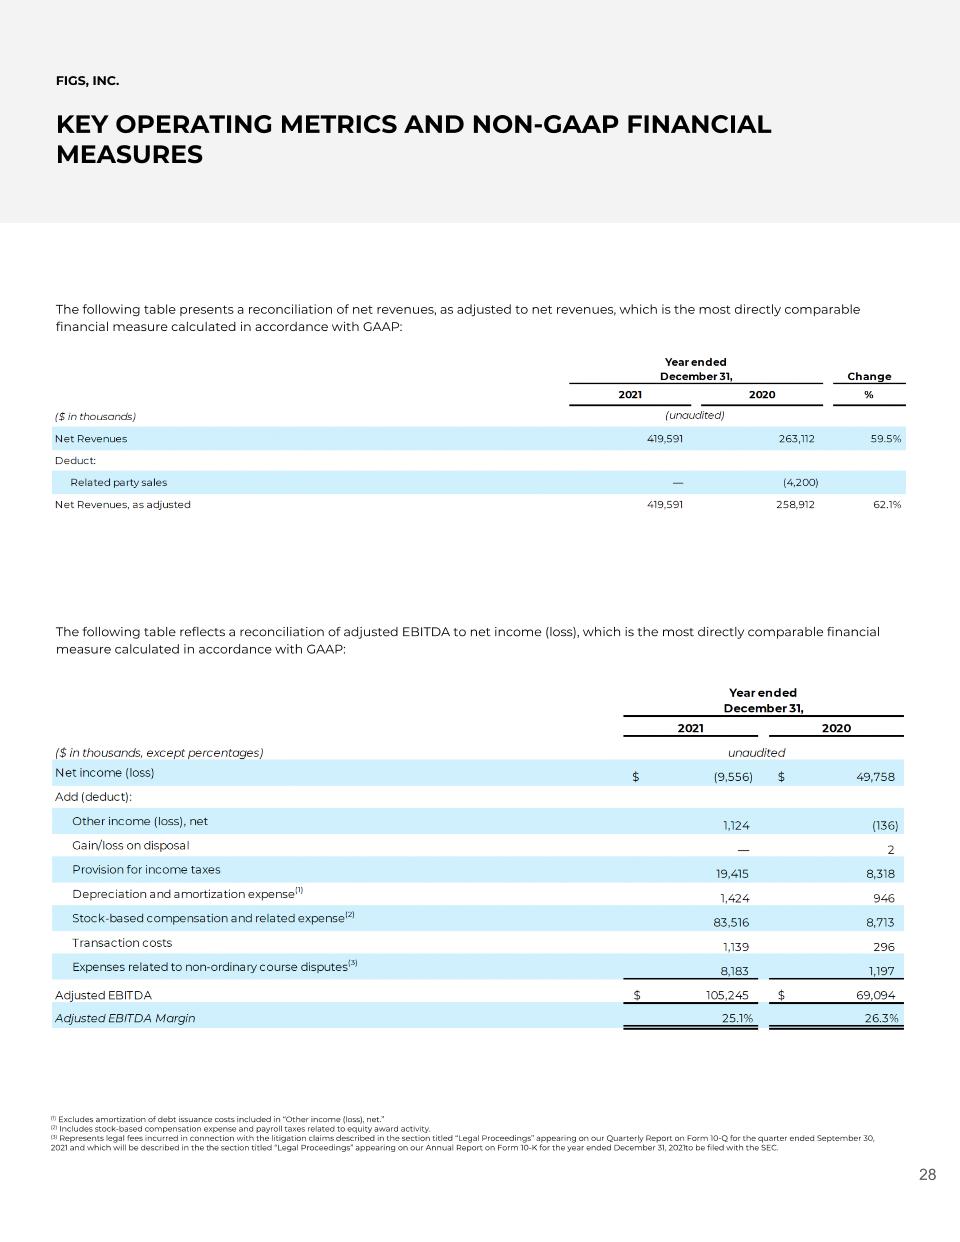
FIGS, INC. KEY OPERATING METRICS AND NON-GAAP FINANCIAL MEASURES (1) Excludes amortization of debt issuance costs included in “Other income (loss), net.” (2) Includes stock-based compensation expense and payroll taxes related to equity award activity. (3) Represents legal fees incurred in connection with the litigation claims described in the section titled “Legal Proceedings” appearing on our Quarterly Report on Form 10-Q for the quarter ended September 30, 2021 and which will be described in the the section titled “Legal Proceedings” appearing on our Annual Report on Form 10-K for the year ended December 31, 2021 to be filed with the SEC. The following table presents a reconciliation of net revenues, as adjusted to net revenues, which is the most directly comparable financial measure calculated in accordance with GAAP: The following table reflects a reconciliation of adjusted EBITDA to net income (loss), which is the most directly comparable financial measure calculated in accordance with GAAP:
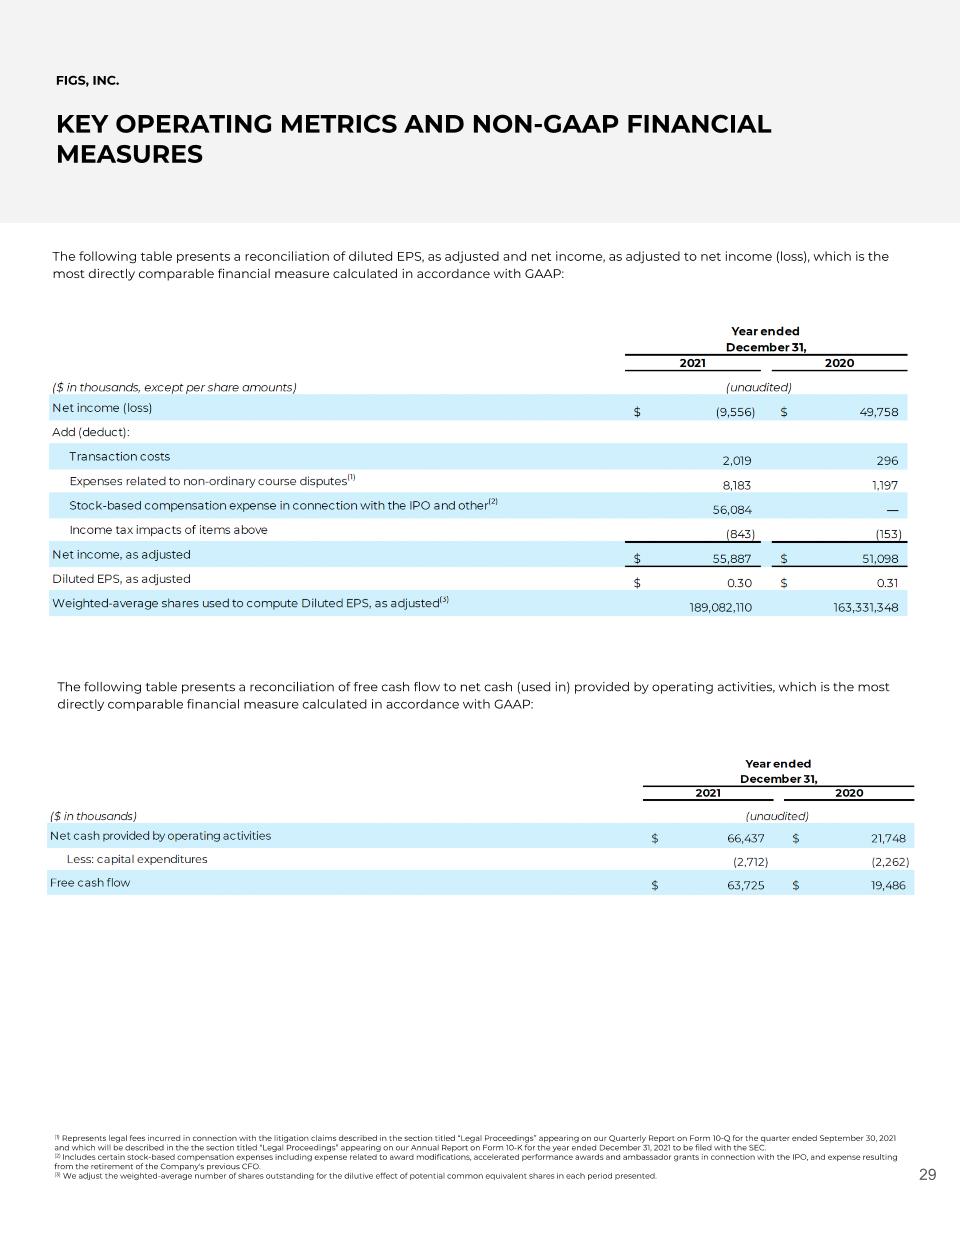
FIGS, INC. KEY OPERATING METRICS AND NON-GAAP FINANCIAL MEASURES (1) Represents legal fees incurred in connection with the litigation claims described in the section titled “Legal Proceedings” appearing on our Quarterly Report on Form 10-Q for the quarter ended September 30, 2021 and which will be described in the the section titled “Legal Proceedings” appearing on our Annual Report on Form 10-K for the year ended December 31, 2021 to be filed with the SEC. (2) Includes certain stock-based compensation expenses including expense related to award modifications, accelerated performance awards and ambassador grants in connection with the IPO, and expense resulting from the retirement of the Company's previous CFO. (3) We adjust the weighted-average number of shares outstanding for the dilutive effect of potential common equivalent shares in each period presented. The following table presents a reconciliation of diluted EPS, as adjusted and net income, as adjusted to net income (loss), which is the most directly comparable financial measure calculated in accordance with GAAP: The following table presents a reconciliation of free cash flow to net cash (used in) provided by operating activities, which is the most directly comparable financial measure calculated in accordance with GAAP:
