Exhibit 99.3

1895 Bancorp of Wisconsin, Inc.,
Greenfield, Wisconsin
PROPOSED HOLDING COMPANY FOR:
PyraMax Bank, FSB
Greenfield, Wisconsin
As of: February 8, 2020
Prepared By:

Faust Financial, LLC
2009 NE 22nd Street
Fort Lauderdale, FL 33305
216.374.6001
faust-financial.com
TABLE OF CONTENTS
1895 Bancorp of Wisconsin, Inc.
PyraMax Bank, FSB
| PAGE | ||||||||||
| I. | OVERVIEW AND CONVERTING COMPANY ANALYSIS | 1 | ||||||||
| A. | Company History and Current Ownership | 1 | ||||||||
| B. | Plan of Conversion | 2 | ||||||||
| C. | Primary Strategies | 2 | ||||||||
| D. | Historical Balance Sheets and Trends | 5 | ||||||||
| E. | Historical Income Statements and Trends | 8 | ||||||||
| F. | Asset / Liability and Interest Rate Risk Management | 11 | ||||||||
| G. | Lending Activities and Strategies | 13 | ||||||||
| H. | Asset Quality | 16 | ||||||||
| I. | Investment Strategies | 17 | ||||||||
| J. | Funding and Strategies | 18 | ||||||||
| K. | Subsidiaries | 19 | ||||||||
| L. | Legal Proceedings | 19 | ||||||||
| M. | Management | 19 | ||||||||
| II. | ANALYSIS OF OPERATING ENVIRONMENT AND PRIMARY MARKET AREA | 21 | ||||||||
| A. | Physical Office Locations | 21 | ||||||||
| B. | Demographics | 21 | ||||||||
| C. | Economic Indicators | 24 | ||||||||
| D. | Deposit Market and Competition | 29 | ||||||||
| III. | COMPARABLE GROUP SELECTION AND ANALYSIS | 32 | ||||||||
| A. | Introduction | 32 | ||||||||
| B. | Comparable Group Selection Criteria | 32 | ||||||||
| C. | Selection of Comparable Group | 33 | ||||||||
| D. | Comparison of Company to Comparable Group | 36 | ||||||||
| 1. | Financial Condition and Efficiency of Asset Utilization | 36 | ||||||||
| 2. | Profitability and Earnings Capacity | 41 | ||||||||
| 3. | Asset / Liability and Interest Rate Risk Management | 44 | ||||||||
| 4. | Primary Market Economic and Demographic Considerations | 46 | ||||||||
| 5. | Projected Dividend Capacity and Intended Dividend Policy | 47 | ||||||||
| 6. | Marketability of the Issued Stock | 47 | ||||||||
| 7. | Management | 54 | ||||||||
| 8. | Effect of Government Regulations and Regulatory Reform | 54 | ||||||||
| E. | Comparability to Comparable Group | 54 | ||||||||
| IV. | VALUATION ANALYSIS | 55 | ||||||||
| A. | Introduction | 55 | ||||||||
| B. | Valuation Methods | 55 | ||||||||
| C. | Valuation Analysis | 56 | ||||||||
| D. | Summary of Valuation Adjustments | 61 | ||||||||
| E. | Application of Valuation Methods | 62 | ||||||||
| F. | Valuation Range | 67 | ||||||||
| G. | Exchange Ratio | 68 | ||||||||
| H. | Valuation Updates | 68 | ||||||||
LIST OF TABLES
NUMERICAL | DESCRIPTION | PAGE | ||||
I.D.1 | Historical Balance Sheet Trends | 6 | ||||
I.E.1 | Historical Income Statements | 9 | ||||
II.B.1 | Demographic Data | 22 | ||||
II.C.1 | Employment by Sector | 27 | ||||
II.C.2 | Market Area Largest Employers | 28 | ||||
II.C.3 | Unemployment Trends | 29 | ||||
II.D.1 | Trends in Total Deposits | 30 | ||||
II.D.2 | Deposit Competitors | 31 | ||||
III.C.1 | Comparable Group of Publicly-Traded Savings institutions | 34 | ||||
III.C.2 | Summary of Comparable Group Market, Pricing and Financial | 35 | ||||
III.D.1 | Balance Sheet Composition, Capital Ratios and Growth Rates | 37 | ||||
III.D.2 | Loan Portfolio Composition | 38 | ||||
III.D.3 | Credit Risk Measures | 39 | ||||
III.D.4 | Income as Percentage of Average Assets and Yields, Costs and Spreads | 42 | ||||
III.D.5 | Net Interest Margin Volatility | 45 | ||||
III.D.6 | Comparable Group Market Area Comparative Analysis | 46 | ||||
III.D.7 | Recently Converted Savings institution Institutions | 51 | ||||
IV.E.1 | Adjusted Core Earnings | 64 | ||||
IV.E.2 | Market Pricing versus Comparable Group | 66 | ||||
IV.F.1 | Pro Forma Valuation Range | 67 | ||||
| Pro Forma Valuation Report for Second Step Conversion
|

I. OVERVIEW AND CONVERTING COMPANY ANALYSIS
| A. | Company History and Current Ownership |
PyraMax Bank, FSB (the “Bank”) was founded in 1895, as a state chartered mutual savings and loan association by the name of South Milwaukee Savings and Loan Association. The Bank later converted its charter to a federal savings bank and changed its name to PyraMax Bank, FSB in 2020 when Mitchell Savings Bank was merged into the Bank. The name emerged from the combination of wanting to retain the pyramid shaped logo of South Milwaukee Savings Bank, hence Pyra, while ensuring clients that they would still receive the same maximized service. The Bank currently conducts operations from the main office / branch in Greenfield, which is in Milwaukee County, Wisconsin and five additional branch offices in Southeast Wisconsin (two in Milwaukee County, one in Ozaukee County and two in Waukesha County). A map of the Bank’s main office and branch office locations is included as Exhibit I-1.
The Bank is subject to regulation and oversight by the Office of the Comptroller of the Currency (“OCC”) and is also subject to certain reserve requirements of the Board of Governors of the Federal Reserve System (the “Federal Reserve Board”). The Bank is a member of the Federal Home Loan Bank (“FHLB”) system, and its deposits are insured up to the regulatory maximums by the Federal Deposit Insurance Corporation (the “FDIC”).
1895 Bancorp of Wisconsin, Inc. (“1895”) is a federally chartered mid-tier holding company for the Bank and owns 100% of the outstanding common stock of the Bank. 1895 was incorporated under federal law on January 8, 2019 and has since been engaged primarily in the business of holding the common stock of the Bank. 1895 completed its initial public offering in January 2019, pursuant to which it sold 2,145,738 shares or approximately 44% of its common stock in its subscription offering for gross proceeds of approximately $21.5 million, including 175,528 shares purchased by the Bank’s employee stock ownership plan. In connection with the reorganization, the Company also issued 48,767 shares or 1% of common stock to 1895 Bancorp of Wisconsin Community Foundation, Inc. and 2,682,172 shares or 55% of common stock to 1895 Bancorp of Wisconsin, MHC (the “MHC”). The MHC and 1895 are subject to supervision and regulation by the Federal Reserve Federal Reserve Board. In January 2020, 1895 adopted a stock repurchase program under which 1895 repurchased 109,725 shares of its common stock, which are included in treasury stock on 1895’s balance sheet as of December 31, 2020. In addition, 1895 has 17,500 treasury shares related to a deferred compensation plan, which are held in a Rabbi Trust. In accordance with Generally Accepted Accounting Principles (“GAAP”) the shares in the Rabbi Trust were reclassified as treasury shares, at cost, in 1895’s consolidated balance sheet as of December 31, 2020.
1
| Pro Forma Valuation Report for Second Step Conversion
|
As of December 31, 2020, 1895 had 4,851,901 shares outstanding net of 109,725 treasury shares of which 2,169,729 or 44.72% were owned by public shareholders (including the 48,767 shares held by the 1895 Bancorp of Wisconsin Community Foundation, Inc. and 17,500 shares held in the Rabbi Trust) and 2,682,172 or 55.28% owned by the MHC (the “MHC Shares”). As of December 31, 2020, 1895 had total consolidated assets of $516.8 million, deposits of $379.8 million and equity of $60.0 million or 11.61% of total assets. As of December 31, 2020, the Company did not report goodwill and core deposit intangibles. 1895’s audited financial statements for the most recent period are included by reference as Exhibit I-2.
| B. | Plan of Conversion |
On March 2, 2021, the respective Board of Directors of the MHC and 1895 adopted a Plan of Conversion, whereby the MHC will convert to stock form. As a result of the conversion, 1895, which currently owns all of the issued and outstanding common stock of the Bank, will be succeeded by 1895 Bancorp of Wisconsin, Inc., a Maryland corporation (“1895 Bancorp” or the “Company”), a newly formed Maryland corporation. Following the conversion, the MHC will no longer exist. For purposes of this document, the existing consolidated entity will also hereinafter be also referred to as the Company or 1895 Bancorp, unless otherwise identified as 1895.
It is our understanding that 1895 Bancorp will offer its stock, representing the majority ownership interest held by the MHC, in a subscription offering to Eligible Account Holders, Tax-Qualified Plans including the Bank’s employee stock ownership plan (the “ESOP”), Supplemental Eligible Account Holders and Other Members. To the extent that shares remain available for purchase after satisfaction of all subscriptions received in the subscription offering, the shares may be offered for sale to the public at large in a community offering and a syndicated community offering. Upon completing of the mutual-to-stock conversion and stock offering (the “second step conversion”), the Company will be 100% owned by public shareholders, the publicly-held shares of 1895 will be exchanged for shares in 1895 Bancorp at an exchange ratio intended to preserve approximately the same aggregate ownership interest in 1895 Bancorp as public stockholders had in 1895, adjusted downward to reflect certain assets held by the MHC, without giving effect to new shares purchased in the offering or cash paid in lieu of any fractional shares.
| C. | Primary Strategies |
The Company’s primary strategy is to operate as a local community bank pursuing a strategy of strengthening its community bank franchise dedicated to meeting the banking needs of small businesses
2
| Pro Forma Valuation Report for Second Step Conversion
|
and retail customers in the communities that are served by the Bank. The Company’s business consists primarily of taking deposits from the general public and investing those deposits, together with funds generated from operations, into commercial real estate (“CRE”) loans (which includes non-owner occupied CRE, multi-family, owner occupied CRE and one- to four-family non-owner occupied loans), commercial business loans, which are also referred to as commercial and industrial (“C&I) loans, one- to four-family residential real estate loans, and consumer loans. Commercial business loans have been the primary source of recent loan growth, and CRE loan originations have also been emphasized. In connection with its origination and sale in the secondary market of one- to four-family residential real estate loans, the Company is also active in mortgage loan servicing, both of its own loans and loans serviced for others.
The Coronavirus Aid, Relief and Economic Security (“CARES”) Act was signed into law at the end of March 2020. The CARES Act authorized the Small Business Administration (“SBA”) to temporarily guarantee loans under a new loan program called the Paycheck Protection Program (“PPP”). As a qualified SBA lender, the Company was automatically authorized to originate PPP loans. On December 27, 2020, the Consolidated Appropriations Act 2021 (the “Relief Act”) became law and provides an additional $284 billion for the PPP and extends the PPP through March 31, 2021. The Company actively participated and is continuing to participate in PPP lending, which has contributed to the Company’s growth in commercial business loans between December 31, 2019 and December 31, 2020. (See Section I.D)
Subject to market conditions and with the benefit of the larger post conversion lending limit, the Company will continue to focus on originating primarily CRE and commercial business loans to increase the overall yield earned on its loans and assist in managing interest rate risk.
The Company also invest in securities, which have historically consisted of mortgage-backed securities issued by U.S. government sponsored enterprises, state and municipal securities, asset-backed securities and to a much lesser extent certificates of deposit and corporate collateralized mortgage-backed obligations.
The Bank offers a variety of deposit accounts, including checking accounts, savings accounts and certificate of deposit accounts as well as treasury management services geared toward small businesses. Through its relationship with LPL Financial, one of the nation’s leading financial services companies and a publicly traded company traded under ticker symbol LPLA, PyraMax Insurance Services LLC, a subsidiary of the Bank, offers insurance and risk management products for personal and business needs on a referral basis and with limited activity. LPL Financial is a third-party provider and neither the Company nor the Bank are affiliated with LPL Financial.
3
| Pro Forma Valuation Report for Second Step Conversion
|
The Bank has also used borrowings consisting primarily of advances from the Federal Home Loan Bank of Chicago (“FHLB”) and brokered deposits, to fund its operations. In 2020, the proportion of FHLB borrowings increased to repay relatively higher costing certificates of deposits, including brokered deposits, and to provide additional on balance sheet liquidity as a precaution to the uncertainty related to the onset of the COVID-19 pandemic. Deposits have consistently served as the primary funding source for the Company, while the Company’s utilization of borrowings was relatively more limited.
The long-term objective of 1895 Bancorp is to grow its balance sheet, control expenses and improve profitability. The Company plans to fund asset growth primarily through deposit growth, emphasizing growth of lower cost core deposits, including non-interest and interest-bearing checking accounts, savings and money market accounts. Core deposit growth is expected to continue to be facilitated by growth of commercial lending relationships, pursuant to which the Bank continuously seeks to establish full-service banking relationship, especially with its commercial loan customers as well as by offering treasury management services to small businesses.
The Company’ earnings are largely dependent upon net interest income to support operating expense levels. The Company has maintained a relatively stable net interest margin, which has declined slightly in 2020. Operating expense to average assets had also been maintained at relatively high and steady levels but decreased measurably for 2020 compared to recent years. Asset growth generated from the origination and funding of PPP loans and related deposit growth provided for some leveraging of operating expenses for the twelve months ended December 31, 2020, the benefits of which the Company does not expect to persist given anticipated repayment/forgiveness of PPP loans and eventual withdrawal of related deposits.
Non-interest operating income mostly increased in recent years, especially for 2020 primarily due to the gain on sale of loans. The Company also recorded a large gain on the sale of investment securities during 2020, while such gains in prior recent years were small or zero. Loan loss provisions were not a factor in the Company’s earnings through 2018. In 2019, the Company recorded a large credit and in 2020 the Company recorded its first provision for loan losses of recent years, to reflect the unknown risk within the Company’s loan portfolio due to the ongoing COVID-19 pandemic.
While the Bank exceeds all minimum regulatory capital ratios to be considered “well capitalized”, and the Company has the ability to infuse additional capital into the Bank, the Company’s planned second step conversion stock offering will further strengthen the Company’s and the Bank’s capital position, enhance its operating flexibility and provide the additional capital to support planned growth strategies. The second step conversion stock offering will significantly increase regulatory capital and if necessary, to provide additional loan loss reserves, greater flexibility to work with borrowers impacted by the COVID-
4
| Pro Forma Valuation Report for Second Step Conversion
|
19-induced economic malaise. The Company’s strengthened capital position will also provide more of a cushion against potential credit quality related losses in future periods. The Company’s higher capital position resulting from the infusion of stock offering proceeds will also serve to increase liquidity and reduce interest rate risk, particularly through enhancing the Company’s interest-earning assets/interest bearing liabilities (“IEA/IBL”) ratio. The additional funds realized from the stock offering will raise the level of interest-earning assets funded with equity and, thereby, reduce the ratio of interest-earning assets funded with interest-bearing liabilities as the balance of interest-bearing liabilities will initially remain relatively unchanged following the second step conversion, which may facilitate a reduction in the Company’s funding costs. Notably, as a fully-converted institution, the Company’s stronger capital position and greater capacity to offer stock as consideration for an acquisition may facilitate increased opportunities to grow through acquisitions, including of whole banking institutions or branches. Currently, the Company has no specific plans for expanding through acquisitions.
The Company is expected to retain up to 50% of the net stock offering proceeds. At present, funds at the Company level, net of the loan to the ESOP, in the short term are expected to be invested into a liquid deposit account at the Bank. Over time, the funds may be utilized for various corporate purposes, possibly including acquisitions, de novo branches, infusing additional equity into the Bank, repurchases of common stock and the payment of cash dividends. The remaining approximate 50% of the net stock offering proceeds will be infused into the Bank and will become part of general operating funds partially offset by deposits withdrawn to fund investor stock purchases. Over time, such funds will be deployed to fund loan growth and to a lesser degree investment portfolio growth, with these efforts anticipated to increase earnings performance.
| D. | Historical Balance Sheet Trends |
The Company’s historical balance sheet data for the past five year-ends are reflected in Table I.D.1.
5
| Pro Forma Valuation Report for Second Step Conversion
|
Table I.D.1
1895 Bancorp of Wisconsin, Inc.
Historical Balance Sheet Trends
| 2016-2020 | ||||||||||||||||||||||||||||||||||||||||||||
| As of December 31, | Annualized | |||||||||||||||||||||||||||||||||||||||||||
| 2016 | 2017 | 2018 | 2019 | 2020 | Growth | |||||||||||||||||||||||||||||||||||||||
| Amount ($000) | Pct (1) (%) | Amount ($000) | Pct (1) (%) | Amount ($000) | Pct (1) (%) | Amount ($000) | Pct (1) (%) | Amount ($000) | Pct (1) (%) | Pct (%) | ||||||||||||||||||||||||||||||||||
Assets | $ | 450,173 | 100.00 | % | $ | 468,361 | 100.00 | % | $ | 481,099 | 100.00 | % | $ | 428,009 | 100.00 | % | $ | 516,757 | 100.00 | % | 3.51 | % | ||||||||||||||||||||||
Cash and Cash Equivalents | 7,779 | 1.73 | % | 12,497 | 2.67 | % | $ | 7,923 | 1.65 | % | $ | 11,707 | 2.74 | % | $ | 92,526 | 17.91 | % | 85.71 | % | ||||||||||||||||||||||||
Investment Securities | 96,458 | 21.43 | % | 88,955 | 18.99 | % | 65,731 | 13.66 | % | 73,928 | 17.27 | % | 61,695 | 11.94 | % | -10.57 | % | |||||||||||||||||||||||||||
Loans Held for Sale | 479 | 0.11 | % | 217 | 0.05 | % | 771 | 0.16 | % | 685 | 0.16 | % | 2,484 | 0.48 | % | 50.91 | % | |||||||||||||||||||||||||||
Loans Receivable, Net | 312,523 | 69.42 | % | 331,206 | 70.72 | % | 369,830 | 76.87 | % | 310,674 | 72.59 | % | 329,073 | 63.68 | % | 1.30 | % | |||||||||||||||||||||||||||
FHLB Stock | 2,170 | 0.48 | % | 1,436 | 0.31 | % | 1,261 | 0.26 | % | 913 | 0.21 | % | 3,032 | 0.59 | % | 8.72 | % | |||||||||||||||||||||||||||
Bank-Owned Life Insurance | 13,321 | 2.96 | % | 13,732 | 2.93 | % | 13,400 | 2.79 | % | 13,085 | 3.06 | % | 13,485 | 2.61 | % | 0.31 | % | |||||||||||||||||||||||||||
Mortgage Servicing Rights, Net | 2,421 | 0.54 | % | 2,270 | 0.48 | % | 2,103 | 0.44 | % | 2,172 | 0.51 | % | 1,806 | 0.35 | % | -7.06 | % | |||||||||||||||||||||||||||
Goodwill and Other Intangibles | 0 | 0.00 | % | 0 | 0.00 | % | 0 | 0.00 | % | 0 | 0.00 | % | 0 | 0.00 | % | 0.00 | % | |||||||||||||||||||||||||||
Deposits | 358,882 | 79.72 | % | 389,291 | 83.12 | % | 406,137 | 84.42 | % | 344,596 | 80.51 | % | 379,848 | 73.51 | % | 1.43 | % | |||||||||||||||||||||||||||
Borrowings | 48,224 | 10.71 | % | 34,693 | 7.41 | % | 30,010 | 6.24 | % | 17,623 | 4.12 | % | 68,398 | 13.24 | % | 9.13 | % | |||||||||||||||||||||||||||
Equity | 37,340 | 8.29 | % | 38,994 | 8.33 | % | 38,181 | 7.94 | % | 58,665 | 13.71 | % | 60,008 | 11.61 | % | 12.59 | % | |||||||||||||||||||||||||||
Tangible Equity | 37,340 | 8.29 | % | 38,994 | 8.33 | % | 38,181 | 7.94 | % | 58,665 | 13.71 | % | 60,008 | 11.61 | % | 12.59 | % | |||||||||||||||||||||||||||
Loans/Deposits | 87.08 | % | 85.08 | % | 91.06 | % | 90.16 | % | 86.63 | % | ||||||||||||||||||||||||||||||||||
| (1) | Ratios are as a percent of ending assets. |
Source: 1895 Bancorp’s Preliminary Offering Prospectus, Draft Audited Financial Statements and Faust Financial, LLC calculations.
Over the five past year-ends depicted in Table I.D.1, the Company’s total assets have fluctuated between a low of $428.0 million for year-end 2019 and a high of $516.8 million for year-end 2020. Overall, assets increased at an average annual rate of 3.51% from year-end 2016 through 2020. Net loans balances fluctuated between a low of $310.7 million for year-end 2019 and a high of $369.8 million for year-end 2018. As of December 31, 2020, loans held for investment, net of reserves for loan losses, were $329.1 million. The Company also had $2.5 million of loans held for sale. Overall, net loans increased at an average annual rate of 1.30% from year-end 2016 through 2020.
The fluctuations in total assets were paralleled by similar fluctuations in total deposits and in some cases also borrowings with assets primarily funded by deposits. The reduction of size in the Company’s balance sheet between year-end 2018 and 2019, including in total assets, net loans and total deposits, were primarily driven by the sale of approximately $30 million of portfolio one-to-four family residential mortgage loans, and payoffs of commercial real estate loans refinanced by other banks, a reduction in brokered deposits of $38.4 million, and the closure of two branches and sale of another branch. The two closed branches were located in Milwaukee and West Allis, Wisconsin; and the other branch, located in Milwaukee, was sold to another financial institution, including approximately $5.0 million of deposits.
The Company also utilizes borrowings as a funding source. Borrowings as of year-ends 2016 through 2020 ranged from a low of $17.6 million as of December 31, 2019 to a high of $68.4 million as of as of December 31, 2020. Between year-end 2019 and 2020, borrowings became a more significant funding source for the Company and consisted entirely of FHLB advances. The increase in borrowings
6
| Pro Forma Valuation Report for Second Step Conversion
|
was used to replace $24.1 million in maturing brokered deposits and to provide the Company with greater on balance sheet liquidity considering the uncertainty surrounding the COVID-19 pandemic’s potential impact on funding sources. A summary of 1895’s key operating ratios for the past five years ended December 31, 2020 is presented in Exhibit I-3.
The Company’s comparatively stronger asset growth relative to loan growth resulted in a decrease in the loans-to-assets ratio from 69.42% at year-end 2016 to 63.68% at year-end 2020. As indicated in Exhibit I-5, loan growth from 2019 to 2020 was primarily driven by the origination of CRE and commercial business loans, primarily PPP and to a lesser degree in one-to-four family mortgage loans, while consumer loans, consisting almost entirely of home equity loans and lines of credit, decreased.
Overall, trends in the Company’s loan portfolio composition since year-end 2016 as set forth in Exhibit I-5, show that the concentration of commercial business loans increased from 4.6% of total loans to 13.9% as of year-end 2020. As of December 31, 2020, PPP loans accounted for 5.2% of total loans outstanding. Between year-end 2016 and year-end 2020, CRE loans (which includes non-owner occupied CRE, multi-family, owner occupied CRE and one- to four-family non-owner-occupied loans) increased from 45.7% of total loans to 57.1% of total loans and one-to-four family mortgage loans decreased from 33.0% to 20.8% of total loans. Construction and land loans remained relatively unchanged at 2.0% at year-end 2016 and 1.40% at year-end 2020. Consumer loans decreased from 14.7% of total loans to 6.8% over the same period.
Between year-ends 2016 and 2020, the Company’s level of cash and investment securities (inclusive of FHLB stock) combined ranged from a low of 15.31% of assets at year-end 2018 to a high of 29.84% of assets at year-end 2020. The increased level of cash held as of December 31, 2020 resulted primarily from additional borrowings to increase on balance sheet liquidity taken as a precaution in light of the ongoing COVID-19 pandemic. As of December 31, 2020, all securities in the Company’s investment portfolio were available for sale and had a net unrealized gain of $1.59 million. Exhibit I-7 provides detail of the Company’s investment portfolio. The Company also held cash and cash equivalents and FHLB stock at year-end 2020, equal to 17.91% and 0.59% of assets, respectively, and maintains an investment in bank-owned life insurance (“BOLI”) policies, which covers the lives of certain officers and former officers of the Company.
Funding needs have been addressed through a combination of deposits, borrowings and internal cash flows. From year-end 2016 through year-end 2020, the Company’s deposits increased at an average annual rate of 1.43%. The average annual rate of growth was negatively impacted in 2019, which is the only year over the past five years during which total deposits decreased (by $61.5 million or 15.15%), primarily because of a decrease in brokered deposits and the closing of two branches and sale of one branch to another financial institution. Deposit growth was 10.23% for 2020 alone and was positively impacted by funds deposited by customers who received PPP loans. As of year-end 2020, core deposits accounted for 76.93% of total deposits compared to 58.68% as of year-end 2019.
7
| Pro Forma Valuation Report for Second Step Conversion
|
Between year-end 2016 through year-end 2020, total equity increased at an average annual rate of 12.59%, with most of the growth occurring in 2019 in connection with the capital raised in the Company’s first-step conversion stock offering and to a lesser degree because of cumulative net income over the past four years. The Company’s equity-to-assets ratio increased from 8.29% at year-end 2016 to 11.61% at year-end 2020. The Company has not reported any intangible assets as of the last five year-ends. The Bank’s regulatory capital levels exceed all regulatory well-capitalized minimum requirements for each of the past five fiscal year-ends. Proceeds from the second step conversion stock offering will further strengthen the Company’s and the Bank’s capital position and provide additional growth capital but are expected to reduce earnings performance measures in the near term.
| E. | Income Statements and Trends |
Table I.E.1 shows the Company’s historical income statements for the years ended December 31, 2016 through December 31, 2020.
8
| Pro Forma Valuation Report for Second Step Conversion
|
Table I.E.1
1895 Bancorp of Wisconsin, Inc.
Historical Income Statements and Trends
| As of December 31, | ||||||||||||||||||||||||||||||||||||||||
| 2016 | 2017 | 2018 | 2019 | 2020 | ||||||||||||||||||||||||||||||||||||
| Amount ($000) | Pct (1) (%) | Amount ($000) | Pct (1) (%) | Amount ($000) | Pct (1) (%) | Amount ($000) | Pct (1) (%) | Amount ($000) | Pct (1) (%) | |||||||||||||||||||||||||||||||
Interest Income | $ | 13,797 | 3.15 | % | $ | 15,256 | 3.32 | % | $ | 16,753 | 3.53 | % | $ | 17,235 | 3.79 | % | $ | 15,393 | 3.26 | % | ||||||||||||||||||||
Interest Expense | (2,685 | ) | -0.61 | % | (3,361 | ) | -0.73 | % | (4,233 | ) | -0.89 | % | (4,933 | ) | -1.09 | % | (3,041 | ) | -0.64 | % | ||||||||||||||||||||
|
|
|
|
|
|
|
|
|
|
|
|
|
|
|
|
|
|
|
| |||||||||||||||||||||
Net Interest Income | 11,112 | 2.54 | % | 11,895 | 2.59 | % | 12,520 | 2.64 | % | 12,302 | 2.71 | % | 12,352 | 2.61 | % | |||||||||||||||||||||||||
Provision for Loan Losses | 0 | 0.00 | % | 0 | 0.00 | % | 0 | 0.00 | % | 1,032 | 0.23 | % | (500 | ) | -0.11 | % | ||||||||||||||||||||||||
|
|
|
|
|
|
|
|
|
|
|
|
|
|
|
|
|
|
|
| |||||||||||||||||||||
Net Interest Income after Provisions | 11,112 | 2.54 | % | 11,895 | 2.59 | % | 12,520 | 2.64 | % | 13,334 | 2.93 | % | 11,852 | 2.51 | % | |||||||||||||||||||||||||
Non-Interest Operating Income | 3,996 | 0.91 | % | 2,892 | 0.63 | % | 2,882 | 0.61 | % | 2,964 | 0.65 | % | 5,943 | 1.26 | % | |||||||||||||||||||||||||
Operating Expense | (14,109 | ) | -3.22 | % | (14,615 | ) | -3.18 | % | (15,655 | ) | -3.30 | % | (16,038 | ) | -3.53 | % | (15,685 | ) | -3.32 | % | ||||||||||||||||||||
|
|
|
|
|
|
|
|
|
|
|
|
|
|
|
|
|
|
|
| |||||||||||||||||||||
Net Operating Income | 999 | 0.23 | % | 172 | 0.04 | % | (253 | ) | -0.05 | % | 260 | 0.06 | % | 2,110 | 0.45 | % | ||||||||||||||||||||||||
Gain on Sale of OREO | 96 | 0.02 | % | 0 | 0.00 | % | 0 | 0.00 | % | 84 | 0.02 | % | 6 | 0.00 | % | |||||||||||||||||||||||||
Gain on Sale of Securities | 159 | 0.04 | % | 0 | 0.00 | % | 67 | 0.01 | % | 0 | 0.00 | % | 1,023 | 0.22 | % | |||||||||||||||||||||||||
Gain (Loss) on Other Assets | 0 | 0.00 | % | (1,095 | ) | -0.24 | % | (10 | ) | 0.00 | % | 96 | 0.02 | % | (86 | ) | -0.02 | % | ||||||||||||||||||||||
Core Data Processing Conversion Expense | 0 | 0.00 | % | (880 | ) | -0.19 | % | 0 | 0.00 | % | 0 | 0.00 | % | 0 | 0.00 | % | ||||||||||||||||||||||||
|
|
|
|
|
|
|
|
|
|
|
|
|
|
|
|
|
|
|
| |||||||||||||||||||||
Total Non-Operating Income (Exp.) | 255 | 0.06 | % | (1,975 | ) | -0.43 | % | 57 | 0.01 | % | 180 | 0.04 | % | 943 | 0.20 | % | ||||||||||||||||||||||||
Net Income (Loss) Before Tax | 1,254 | 0.29 | % | (1,803 | ) | -0.39 | % | (196 | ) | -0.04 | % | 440 | 0.10 | % | 3,053 | 0.65 | % | |||||||||||||||||||||||
Income Tax (Benefit) | 0 | 0.00 | % | (3,462 | ) | -0.75 | % | (177 | ) | -0.04 | % | (9 | ) | 0.00 | % | 1,736 | 0.37 | % | ||||||||||||||||||||||
|
|
|
|
|
|
|
|
|
|
|
|
|
|
|
|
|
|
|
| |||||||||||||||||||||
Net Income (Loss) | 1,254 | 0.29 | % | 1,659 | 0.36 | % | (19 | ) | 0.00 | % | 449 | 0.10 | % | 1,317 | 0.28 | % | ||||||||||||||||||||||||
Adjusted Earnings: | ||||||||||||||||||||||||||||||||||||||||
Net Income | 1,254 | 0.29 | % | 1,659 | 0.36 | % | (19 | ) | 0.00 | % | 449 | 0.10 | % | 1,317 | 0.28 | % | ||||||||||||||||||||||||
Add (Deduct): Non-Operating Inc/Exp | (255 | ) | -0.06 | % | 1,975 | 0.43 | % | (57 | ) | -0.01 | % | (180 | ) | -0.04 | % | (943 | ) | -0.20 | % | |||||||||||||||||||||
Tax Effect (2) | 97 | 0.02 | % | (751 | ) | -0.16 | % | 15 | 0.00 | % | 49 | 0.01 | % | 255 | 0.05 | % | ||||||||||||||||||||||||
Change in DTA Valuation Allowance | 0 | 0.00 | % | 0 | 0.00 | % | 0 | 0.00 | % | 0 | 0.00 | % | 934 | 0.20 | % | |||||||||||||||||||||||||
|
|
|
|
|
|
|
|
|
|
|
|
|
|
|
|
|
| |||||||||||||||||||||||
Adjusted Earnings | 1,096 | 0.25 | % | 2,884 | 0.63 | % | (61 | ) | -0.01 | % | 318 | 0.07 | % | 1,563 | 0.33 | % | ||||||||||||||||||||||||
Expense Coverage Ratio (3) | 0.79x | 0.81x | 0.80x | 0.77x | 0.79x | |||||||||||||||||||||||||||||||||||
Efficiency Ratio (4) | 93.39 | % | 98.84 | % | 101.64 | % | 105.06 | % | 85.73 | % | ||||||||||||||||||||||||||||||
| (1) | Ratios are as a percent of average assets. |
| (2) | Assumes a 38% effective tax rate for 2016-2017 and a 27% effective tax rate for 2018-2020. |
| (3) | Expense coverage ratio calculated as net interest income before provisions for loan losses divided by operating expenses. |
| (4) | Efficiency ratio calculated as operating expenses divided by the sum of net interest income before provisions for loan losses plus non-interest operating income. |
Source: 1895 Bancorp’s Preliminary Offering Prospectus, Draft Audited Financial Statements and Faust Financial, LLC calculations.
During the period covered in Table I.E.1, the Company’s reported earnings ranged from a net loss of $19,000 for 2018 to net income of $1.7 million or 0.36% of average assets for year 2017. Net earnings adjusted for non-operating income and expense (“core earnings”) ranged from a net loss of $61,000 for 2018 to net income of $2.9 million or 0.63% of average assets for 2017. Adjusted net income for 2020 was $1.6 million or 0.33% of average assets. As further discussed below, non-operating income / (expense) and also tax expense had a meaningful impact on the Company’s reported earnings for 2017 and 2020.
Net interest income and operating expenses represent the primary components of the Company’s earnings, while non-interest operating income has been a meaningful contributor to the Company’s income.
9
| Pro Forma Valuation Report for Second Step Conversion
|
For the period covered in Table I.E.1, the Company’s net interest income to average assets ratio remained in a relatively narrow range between a low of 2.54% for 2016 to a high of 2.71% for 2019 as fluctuations in interest income to average assets and interest expense to average assets were directionally consistent with one another over the past five years. Net interest income to average assets for 2020 was 2.61%. Overall, the general trends in the Company’s net interest income as a percent of average assets remained rather stable over the past five-years. During 2020, the Company recognized approximately $590,205 of PPP loan fees and as of December 31, 2020, had an additional $403,000 of deferred PPP loan fees remaining as of that date.
Loan loss provisions established by the Company were zero for 2016 through 2018, and a loan loss provision credit of $1.0 million was recorded in 2019 based on the Company’s continued improvement in the overall risk profile of its loan portfolio. Provision expense of $500,000 was recorded for 2020 to reflect the unknown risk within the Company’s loan portfolio due to the ongoing COVID-19 pandemic. As of December 31, 2020, the Company maintained an allowance for loan and lease losses equal to 0.82% of total loans, 210.03% of non-performing loans. Exhibit I-8 sets forth the Company’s loan loss allowance activity for 2019 and 2020.
As reflected in Exhibit I-3, the Company’s interest rate spread and net interest rate margin were relatively stable between 2.58% and 2.57% (spread), and 2.85% to 2.79% (margin), respectively, from 2019 to 2020. The Company’s net interest rate spreads, margin, and yields and costs for 2019 to 2020 are reflected in Exhibit I-4.
Non-interest operating income as a percent of average assets has fluctuated as a contributor to the Company’s earnings, ranging from a low of 0.61% of average assets for 2018 to a high 1.26% of average assets for 2020, with gains on the sale of loans as the largest single component of non-interest operating income during most years and especially for 2020. Mortgage loan servicing and deposit related fees were also contributors.
Operating expenses represent the largest component of the Company’s earnings and have been relatively stable in a range of 3.18% and 3.53% between 2016 and 2019. Operating expense was 3.32% for 2020, in part because of the reduction in Bank branch offices and related reduction in salary and benefits as well as occupancy expense between 2019 and 2020.
The Company’s expense coverage ratio (net interest income divided by operating expenses) has been in a relatively narrow range over the past five years from a low of 0.77x to a high of 0.81x. For 2020, the expense coverage ratio was 0.79x. These measures being below 1x indicate the Company’s reliance on non-interest operating income to cover operating expenses, which is not unusual for institutions such as the Company, that are active in the mortgage banking business and derive a significant portion of their non-interest operating income from the gain on sale of loans and to a lesser degree mortgage loan servicing.
10
| Pro Forma Valuation Report for Second Step Conversion
|
Based on adjusted earnings, the efficiency ratio (operating expenses as a percent of the sum of net interest income and other operating income) has generally trended unfavorably, having increased steadily from 93.39% for 2016 to 105.06% for 2019, before improving to 85.73% for 2020, aided by the reduction in branches and associated reduction in operating expenses, higher non-interest income for 2020 stemming primarily from higher gains on the sale of loans, and PPP loan fees recorded as interest income.
Over the past five years, non-operating income / (expense) impacted the Company’s reported net income to varying degrees as shown in Table I.E.1. Non-operating income ranged from a $2.0 million loss (-0.43% of average assets) for 2017, consisting of a $1.1 million loss on sale of a branch office and $880,000 of costs incurred as part of a core data processing conversion to $943,000 income for 2020 (0.20% of average assets), consisting of $1.0 million in gains on the sale of securities and an $86,000 loss on the sale of other assets.
The Company’s net income for years 2017 and 2020 was impacted by the Company’s effective tax rates for those periods. The Company’s effective tax rate was 56.86% for 2020 and an effective tax benefit of 192.01% for 2017. For 2017, the Company reported a $1.8 million pre-tax loss and $3.5 million tax benefit which was related to the reversal of the valuation allowance against the Company’s Federal and State deferred tax asset. At the time of reversal in 2017, management projected taxable income for the years ending 2018, 2019, 2020 and 2021. The Company determined that it was necessary to reestablish a valuation allowance against the deferred tax asset and recorded a $934,000 charge to income tax expense in 2020, reducing the Company’s net deferred tax asset to $3.4 million. As such, there may be additional deferred tax asset impairment in subsequent periods. This charge contributed to the high tax expense for the year ended December 31, 2020.
As set forth in the prospectus, the Company’s marginal tax rate is 27.0%.
| F. | Asset/Liability and Interest Rate Risk Management |
The Company’s asset/liability management strategy endeavors to manage the impact of changes in interest rates on net interest income. As such, in recent years, the Company has emphasized originating commercial business and CRE loans, which tend to have shorter terms and/or adjustable interest rates and higher interest rates than owner occupied one- to four-family residential real estate loans and can result in deposit relationships with larger non-interest-bearing checking accounts. The Company sells substantially all conforming and eligible jumbo, longer-term, fixed-rate one- to four-family residential real estate loans while it retains the nonconforming fixed-rate and adjustable-rate one- to four-family residential real estate loans that the Bank originates, subject to market conditions and a periodic review of the Company’s asset/liability management needs. As of December 31, 2020, of the Company’s total loans due after December 31, 2021, floating and adjustable rate loans accounted for 18.9% (see Exhibit I-10).
11
| Pro Forma Valuation Report for Second Step Conversion
|
In recent years, the Company has also reduced its dependence on jumbo and brokered certificates of deposit to support lending and investment activities and increased reliance on core deposits, including checking, savings and money market accounts, which tend to be less interest rate sensitive than certificates of deposit. Further, as of December 31, 2020 the Company maintained 17.9% of its assets in cash and cash equivalents, which provides for immediate term asset repricing.
Overall, the Company’s balance sheet over the short-term (less than one year) is asset-sensitive with an interest earning assets to interest bearing liabilities ratio of 136% as of December 31, 2020. Consequently, the net interest margin is favorably impacted by higher interest rates in the near term. Based on the Company’s interest rate risk analysis as of December 31, 2020, in the event of a 200-basis point instantaneous parallel increase in the U.S. Treasury yield curve, net interest income would increase by 14.0% in year 1 and net economic value would increase by 17.3% (see Exhibit I-13).
In connection with the second step conversion, the stock offering proceeds will further improve the Company’s interest rate risk exposure, as the net proceeds will primarily be invested into interest-earning assets and the increase in the Company’s capital will further reduce the proportion of interest rate sensitive liabilities as a funding source.
As set forth in Exhibit I-4, the yield on interest-earning assets and the cost of interest-bearing liabilities decreased from 4.00% and 1.42%, respectively, to 3.48% and 0.91%, respectively, from 2019 to 2020. The yield on loans decreased over this same period from 4.40% to 4.30%, in part because of lower yielding PPP loans originated putting downward pressure on the average yield on loans, while the cost of interest-bearing deposits and borrowings also decreased from 1.44% and 1.68%, respectively, to 0.87% to 1.22%, respectively. As a result, the net interest spread for 2019 and 2020 was maintained at 2.58% and 2.57%, respectively.
As of December 31, 2020, transaction, savings and money market deposits combined comprised 76.93% of the Company’s total deposits vs. 58.66% at year-end 2019. See Exhibit I-15. The shift in funding mix toward these account types has been aided by the Company’s treasury management services, which provide additional convenience to small businesses in managing their deposit accounts with the Bank.
12
| Pro Forma Valuation Report for Second Step Conversion
|
| G. | Lending Activities and Strategies |
Over the past five years, the Company’s lending activities have emphasized CRE loans (which includes non-owner occupied CRE, multi-family, owner occupied CRE and one- to four-family non-owner occupied loans) and commercial business loans, as well as SBA loans (including PPP loans), while one- to four-family residential real estate loans, which historically were the largest component of the Company’s loan portfolio, and consumer loans have been steadily decreasing as a proportion of the loan portfolio between 2016 and 2020. Going forward, the Company plans to continue to maintain loan portfolio diversification, primarily emphasizing CRE secured loans. The Company’s loan portfolio compositions for the years ended December 31, 2016 through December 31, 2020 is set forth in Exhibit I-5 with the contractual maturity of the Company’s loan portfolio by loan type as of December 31, 2020 set forth in Exhibit I-11. The majority of the Company’s loans have contractual maturities of five years or less.
Commercial Real Estate Loans
CRE loans (includes non-owner occupied CRE, multi-family, owner occupied CRE and one- to four-family non-owner-occupied loans) are typically collateralized by office and industrial buildings, warehouses, properties with five or more rental units, small retail facilities and restaurants and other special purpose commercial properties, primarily in Milwaukee, Waukesha and Ozaukee Counties, in Southeastern Wisconsin, which the Company considers its primary market area. CRE loans generally have initial terms of five to ten years and amortization terms of 15 to 30 years, with a balloon payment at the end of the initial term and may be fixed-rate or adjustable-rate loans. Adjustable-rate CRE loans are generally tied to a margin above the prime rate or the applicable treasury rate. The maximum loan-to-value ratio of the Company’s loans is generally 80% of the lower of cost or appraised value of the property securing the loan. A debt service-coverage ratio of at least 1.20x is generally required.
From time to time, the Company also purchases CRE loan participations secured by properties within and outside the Company’s primary market area in which the Bank is not the lead lender, but for which the Bank follows its customary loan underwriting and approval policies. As of December 31, 2020, the Company’s outstanding balance of CRE loans totaled $189.3 million equal to 57.1% of total loans outstanding. Of this aggregate amount, the Company had $71.2 million in non-owner occupied non-residential real estate, $65.8 million in multi-family residential real estate, $37.6 million in owner occupied non-residential real estate, $10.2 million in non-owner occupied residential real estate loans, $4.5 million in commercial real estate construction loans.
13
| Pro Forma Valuation Report for Second Step Conversion
|
Commercial Business Loans
Commercial business loans are generally to small businesses in the Company’s primary market area. Such loans are generally used by the borrowers for working capital purposes or for acquiring equipment, inventory or furniture, and are primarily secured by business assets other than real estate, such as business equipment, inventory and accounts receivable. Commercial business loans are generally structured as term loans with terms of three to seven years and lines of credit with terms of one to two years, with a target loan size of $250,000 to $5.0 million. Term loans are generally priced at a spread over the applicable treasury rate. Interest rates are on commercial lines of credit are generally on an adjustable-rate basis tied to the prime rate. The Company generally obtains personal guarantees with commercial business loans.
As of December 31, 2020, the Company’s outstanding balance of commercial business loans totaled $46.2 million equal to 13.9% of total loans outstanding.
Payroll Protection Program Loans
PPP loans originated by the Company have: (a) an interest rate of 1.0%, (b) two-year and five-year loan terms to maturity; and (c) principal and interest payments deferred for ten months after the end date of the borrowers’ forgiveness period. The SBA will guarantee 100% of the PPP loans made to eligible borrowers. The entire principal amount of the borrower’s PPP loan, including any accrued interest, is eligible to be reduced by the loan forgiveness amount under the PPP. As of December 31, 2020, the Company had funded 246 PPP loans with outstanding balances totaling $17.2 million, included within the commercial loan balances above. On December 27, 2020, the Consolidated Appropriations Act, 2021 (the “Relief Act”) became law and provides an additional $284 billion for the PPP and extends the PPP through March 31, 2021.
One- to Four- Family Residential Real Estate Loans
The Company offers both fixed rate and adjustable rate loans secured by one- to four-family residential real estate, which are substantially secured by properties located in the Company’s primary market area. Fixed rate loans are generally underwritten to Freddie Mac and Fannie Mae guidelines when the loan balance meets such guidelines, so as to provide the Company with the flexibility to sell the loans into the secondary market for purposes of managing interest rate risk. Loans originated to sell are closed in the Bank’s name and are subsequently sold to investors who provide Fannie Mae and Freddie Mac conventional products as well as FHA and VA government loans. The maximum conforming loan limits as established by Fannie Mae increased to $510,400 for the year ended December 31, 2020. The Company generally sells such fixed rate loans on both a servicing-released and servicing-retained basis.
14
| Pro Forma Valuation Report for Second Step Conversion
|
Loans above the lending limit for conforming loans (i.e. “jumbo loans”) may be retained in the loan portfolio and typically have 15 to 30 year terms and maximum loan-to-value ratios of 80%. Adjustable-rate one- to four-family residential real estate loans originated by the Company are typically held in the loan portfolio and have terms ranging from 10 to 30 years. They generally have fixed rates for initial terms of five years, although the Company also offers initial terms of three or seven years. Thereafter these loans adjust annually at a margin, which in recent years has been tied to the applicable treasury rate. The maximum amount by which the interest rate may be increased or decreased is generally 2% per adjustment period, with a lifetime interest rate cap of generally 6% over the initial interest rate of the loan and a rate floor.
For the year ended December 31, 2020, the Company sold $193.6 million of one- to four-family residential real estate loans, of which $192.1 million were originated in 2020 and $1.5 million were originated prior to 2020. As of December 31, 2020, the Company had $69.0 million of loans secured by permanent mortgages on one- to four-family residential real estate, representing 20.8% of the total loan portfolio. The Company originates both fixed-rate and adjustable-rate one- to four-family residential real estate loans and as of December 31, 2020, 83.5% of such loans were fixed-rate, and 16.5% were adjustable-rate loans.
Construction and Land Loans
Loans to finance the construction of owner occupied one- to four-family residential properties to the prospective homeowners are typically secured by properties located in the Company’s primary market area. Such loans are generally structured as interest-only for 12 months. Loan value ratios generally do not exceed 80% during the construction phase (up to 95% if private mortgage insurance is obtained). Once the construction project is satisfactorily completed, generally within 12 months, the loan converts to an amortizing loan which is evaluated for sale on the secondary market. At December 31, 2020, residential construction loan balances were $3.0 million, or 0.9% of total loans, with an additional $5.5 million available to borrowers.
The Company also originates loans to finance the construction of commercial properties, multi-family residential projects (including non-owner occupied one- to four family residences) and professional complexes in its primary market area. Such loans are generally structured as interest-only during the anticipated construction period. The interest rate is generally fixed for five years at the five-year Treasury rate plus a margin. Loan to value ratios generally do not exceed 80% of the appraised value on a completed basis or the cost of completion, whichever is less. At the end of the construction phase, the loan may convert to a permanent mortgage loan or the loan may be paid in full. Most of these loans are generally secured by properties located in the Company’s primary market area.
15
| Pro Forma Valuation Report for Second Step Conversion
|
Land Development Loans
The Company also originates loans to finance the development of land for agricultural purposes and for the development of commercial and residential properties. Land development loans are generally secured by vacant land and/or property that is in the process of improvement. Most of these loans are secured by properties located in the Company’s primary market area and are structured as interest-only or amortizing. The interest rate generally floats, at the prime rate or prime rate plus a margin and the maximum loan to value ratio is 65%. When providing financing to improve the land, the maximum loan to value ratio is generally 80% of the appraised value on a completed basis or the cost of completion, whichever is less. At December 31, 2020, land development loans were $1.5 million, or 0.5% of the Company’s total loan portfolio, with no additional funds available to borrowers.
Consumer Loans.
The Company offers a variety of consumer loans to individuals who reside or work in its market area, including home equity lines of credit, new and used automobile loans, boat loans, recreational vehicle loans and loans secured by certificates of deposit. Generally, home equity lines of credit are underwritten with a maximum loan to value of 85% and a maximum debt to income ratio of 43%. At December 31, 2020, the Company’s consumer loan portfolio totaled $22.7 million, or 6.8% of its total loan portfolio. Of that amount, 6.7% of the total loan portfolio, consisted of outstanding balances on home equity loans and home equity lines of credit, which lines of credit had $25.7 million available to draw.
| H. | Asset Quality |
As reflected in Exhibit I-9, between year-ends 2019 and 2020, the Company’ non-performing assets decreased from $2.0 million or 0.47% of assets at year-end 2019 to $1.3 million or 0.25% of assets at year-end 2020. Including restructured loans, the Company’s non-performing assets were $2.5 million or 0.57% of assets at year-end 2019 and $1.7 million or 0.33% of assets at year-end 2020. The Company held no foreclosed or repossessed assets as of any year-end between 2016 and 2020. As of December 31, 2020, the Company had $56,000 of residential real estate loans in process of foreclosure. Non-performing assets at year-end 2020 consisted of $1.29 million of non-accruing loans and $432,000 of accruing restructured loans. The Bank had $219,000 in non-accruing troubled debt restructured loans at year-end 2020. Non-accrual loans decreased $726,000, to $1.3 million at December 31, 2020, compared to $1.8 million at December 31, 2019. Non-accruing loans at year-end 2020 included $1.15 million of one- to four-family residential real estate loans and $136,000 of home equity loans.
16
| Pro Forma Valuation Report for Second Step Conversion
|
The provisions of the March 2020 Coronavirus Aid, Relief and Economic Security (“CARES”) Act included an election to not apply the guidance on accounting for troubled debt restructurings to loan modifications, such as extensions or deferrals, related to COVID-19 made between March 1, 2020 and the earlier of (i) December 31, 2020 or (ii) 60 days after the end of the COVID-19 national emergency. The relief can only be applied to modifications for loans that were not more than 30 days past due as of December 31, 2019. As of December 31, 2020, the Company had deferrals of approximately $308,000 in interest, escrow and principal payments on $14.1 million in outstanding loans.
The Company’s ratios of classified assets to assets increased from $6.7 million or 1.56% of assets at year-end 2019 to $10.4 million or 2.0% of assets at at year-end 2020 (See Exhibit I-6). All classified assets for 2019 and 2020 year-ends consisted entirely of loans classified as substandard no assets classified as doubtful or loss.
The Company’s loan loss allowances as of December 31, 2020 totaled $2.7 million or 0.81% of total loans outstanding. Comparatively, as of December 31, 2019, the allowance for loan losses equaled 0.64% of total loans. The allowance for loan losses to non-accrual loans ratio increased to 210.02% as of December 31, 2020, compared to 99.35% at December 31, 2019 due to a reduction in non-accrual loans and an increase in the allowance for loan losses. The Company recorded provision expense of $500,000 during the year ended December 31, 2020 to reflect the unknown risk within the Company’s loan portfolio due to the ongoing COVID-19 pandemic.
| I. | Investment Strategies |
The Company’s investment strategy is to provide and maintain liquidity to meet deposit withdrawal and loan funding needs, to help mitigate interest rate and market risk, to diversify the Company’s assets, and to generate a reasonable rate of return on funds within the context of the Company’s interest rate and credit risk objectives. The Company plans for net conversion offering proceeds retained at the holding company level to initially be primarily invested into liquid funds held as a deposit at the Bank.
Between year-ends 2016 and 2020, the Company’s level of cash and investment securities (inclusive of FHLB stock) ranged from a low of 15.31% of assets at year-end 2018 to a high of 29.85% of assets at year-end 2020. The higher proportion of cash and investments maintained at year-end 2020 was primarily due to an increase in cash and cash equivalents, as a large portion of the PPP loan funds remained in customers’ deposit accounts. As of year-end 2020, the Company held investment securities totaling $61.7 million or 11.94% of assets, consisting primarily of $38.0 million in U.S. Government sponsored mortgage-backed securities, $11.8 million in municipal securities and $1.6 million in U.S. Government agency securities. The Company also has $7.3 million in asset-backed securities comprised of pools of student loans. As of December 31, 2020, $58.7 million or 95.15% in the Company’s investment portfolio were available for sale and had a net unrealized gain of $1.6 million. See Exhibit I-7. The Company also had $3.0 million in marketable equity securities consisting of mutual fund investments and common stock, which are held in a Rabbi Trust and are related to the Company’s obligations to certain retired and active employees and directors under deferred compensation plans.
17
| Pro Forma Valuation Report for Second Step Conversion
|
The Company also held $3.0 million of FHLB stock and cash and cash equivalents of $92.5 million at year-end 2020, equal to 0.59% of assets and 17.91% of assets, respectively. The Company also maintains an investment BOLI policies, which covers the lives of certain officers and former officers of the Company. The life insurance policies earn tax-exempt income through cash value accumulation and death proceeds. As of year-end 2020, the cash surrender value of the Company’s BOLI equaled $13.5 million or 2.61% of total assets.
As of December 31, 2020, the weighted average yield on investment securities and interest-earning deposits was 1.95% (see Exhibit I-12). Exhibit I-7 provides detail of the Company’s investment portfolio.
| J. | Funding and Strategies |
Over the most recent five year-ends through December 31, 2020, deposits were the Company’s primary funding source, with deposits representing approximately 73% to 85% of total assets over that period. The Bank offers a variety of deposit accounts, including checking accounts, savings accounts and certificate of deposit accounts. Deposits gathered in the Company’s primary market area have consistently served as the primary funding source for the Company. At year-end 2020, the Company had $379.8 million of deposits, or 73.51% of total assets and $68.4 million of borrowings, or 13.24% of total assets, consisting of FHLB advances (See Table I.D.1). In 2020, the proportion of FHLB borrowings increased to repay relatively higher costing brokered certificates of deposits and to provide additional on balance sheet liquidity as a precaution to the uncertainty related to the onset of the COVID-19 pandemic.
As of December 31, 2020, transaction, savings and money market deposits combined comprised 76.93% of the Company’s total deposits vs. 58.67% at year-end 2019. The shift in funding mix toward these account types has been aided by the Company’s treasury management services, which provide additional convenience to small businesses in managing their deposit accounts, including customers who received PPP loans. Between December 31, 2019 and 2020, brokered deposits have decreased from 8.59% of total deposits at year-end 2019 to 1.45% at year-end 2020.
Exhibit I-15 sets forth the Company’s deposit composition from year-end 2019 to 2020. During this period, time deposits have decreased from 41.34% to 23.07%. Exhibit I-16 sets forth the maturity schedule of the time deposits, which shows that, as of December 31, 2020, 93.03% of such deposits were scheduled to mature in one year or less.
18
| Pro Forma Valuation Report for Second Step Conversion
|
For 2020, the weighted average interest rate on the FHLB advances was 1.18%, down from 1.46% for 2019. Exhibit I-14 provides further detail of the Company’s borrowings. The Bank has also used borrowings from the FHLB and brokered deposits, to fund its operations.
| K. | Subsidiaries |
The Company has no subsidiaries other than the Bank.
| L. | Legal Proceedings |
The Company is not involved in any pending legal proceedings as a plaintiff or defendant other than routine legal proceedings occurring in the ordinary course of business, and at December 31, 2020, the Company was not involved in any legal proceedings, the outcome of which would be material to the Company’s financial condition or results of operations.
| M. | Management |
The Company’s senior management consists of the following:
Richard Hurd was appointed Chief Executive Officer of the Bank in 2007. Prior to that, Mr. Hurd was the Chief Operating Officer from 2004 to 2007. Mr. Hurd has been a board member since 2004. He joined the Bank in 2001. Prior to joining the Bank, Mr. Hurd had 30 years of banking experience at First Wisconsin National Bank, Marine Bank and Bank One Corporation. Age 68.
David Ball joined the Company and the Bank at the end of February 2021 as a Director, President and Chief Operating Officer. In this role he will oversee the daily operations of the Bank, design and implement business strategies and set comprehensive goals for profitability and growth. Prior to being employed by the Bank, Mr. Ball was most recently the Managing Director of Correspondent Banking at BMO Harris from 2004 until February 2021. Mr. Ball has over 30 years of banking experience prior to joining the Bank, with a depth of experience in finance, commercial lending and management. Age 52.
Monica Baker was appointed Senior Vice President-Chief Brand Officer in January 2014. Ms. Baker joined the Bank in 1993 as the Vice President of Marketing/Human Resources/Savings. In 2000, she was promoted to Senior Vice President of Marketing/Human Resources and in 2010 she was promoted to Senior Vice President of Marketing/Human Resources/Retail Lending. Ms. Baker has been on the Board of Directors since 2006. Prior to being employed with the Bank, Ms. Baker was the Human Resources Officer at Maritime Savings Bank. She brings with her over 34 years of banking experience, focused on retail banking, retail lending, human resources and marketing. Ms. Baker holds her Master of Business Administration Degree from the University of Wisconsin-Milwaukee and undergraduate with a double major in Human Resources and Marketing from the University of Wisconsin-Milwaukee. Age 51.
19
| Pro Forma Valuation Report for Second Step Conversion
|
Richard J. Krier joined the Bank in April 2011 as Senior Vice President Chief Financial Officer. In this role he oversees the Bank’s financial reporting and finance functions. Prior to being employed by the Bank, Mr. Krier served as the Chief Financial Officer of Partnership Community Bancshares from 2008 until 2011 and was employed at Ozaukee Bank from 1990 to 2008 in a variety of administrative and financial roles including Chief Financial Officer from 2004 to 2008. Mr. Krier has over 30 years of broad-based banking experience in the areas of financial management, operations, performance measurement and decision support. Mr. Krier is also a certified public accountant. Age 60.
Charles Mauer joined the Bank in June 2010 as the Bank’s Chief Credit Officer. He is responsible for the overall management of the Bank’s Credit Administration Department, including loan underwriting, loan review, lending support, loan policies, procedures and processes to ensure the overall quality of the Bank’s loan portfolio. Mr. Mauer has over 30 years of commercial, consumer and mortgage lending as well as credit administration experience. Prior to working at the Bank, he was a First Vice President of Credit Administration at Ozaukee Bank where he also managed client relationships for over 20 years. In 2007, Ozaukee Bank was acquired by BMO Harris. Mr. Mauer remained with BMO Harris for three years serving as Senior Vice President—Concurrence Officer. Age 61.
Over the past five years, the Company’s management has maintained the net interest margin and yield-cost spread relatively stable and subsequent to the Bank branch restructure in 2019, achieved a relatively more favorable efficiency ratio in 2020. As indicated in Exhibit I-5 and I-15, the Company’s increasingly diversified loan portfolio from year-ends 2016 to 2020 and favorable trends in deposit composition from year-ends 2019 to 2020, respectively, as well as improving non-performing assets and minimal net loan chargeoffs (see Exhibit I-9), coupled with mostly improving performance metrics (see Exhibit I-3) over the past three years, all are positive indicators of management’s performance in operating the Company.
20
| Pro Forma Valuation Report for Second Step Conversion
|
II. ANALYSIS OF OPERATING ENVIRONMENT AND PRIMARY MARKET AREA
| A. | Physical Office Locations |
As a locally based community-oriented banking company, the Company’s current value and future prospects are directly or indirectly impacted by economic and demographic characteristics and trends in its primary market area, which consists of Milwaukee, Waukesha and Ozaukee Counties, in Southeastern Wisconsin and by regional and national economic factors impacting its primary market area.
1895 Bancorp has a physical “bricks and mortar” presence through its main office/branch and five additional branch locations. The Company conducts operations from three full-service banking offices in Milwaukee County, two full-service banking offices in Waukesha County and one full-service banking office in Ozaukee County, Wisconsin. The Company considers its primary lending and deposit gathering market area to be Milwaukee, Waukesha and Ozaukee Counties, in Southeastern Wisconsin, and only occasionally makes loans secured by properties located outside of its primary lending market, usually to borrowers with whom the Company has an existing relationship and who have a presence within its primary market. Exhibit II-1 provides information on the Company’s office properties.
| B. | Demographic Trends |
Future growth opportunities for 1895 Bancorp depend in part on the future growth and stability of economies, demographic growth trends, and the nature and intensity of the competitive environment.
Demographic and economic growth trends, measured by changes in population, number of households, age distribution and median household income, provide key insight into the health of the market area served by 1895 Bancorp. Demographic data for Milwaukee, Waukesha, and Ozaukee Counties, as well as for Wisconsin and the U.S., is provided in Table II.B.1 from 2016 to 2021 and projected through 2026.
21
| Pro Forma Valuation Report for Second Step Conversion
|
Table II.B.1
1895 Bancorp of Wisconsin, Inc.
Summary Demographic/Economic Data
| Year | Growth Rate | |||||||||||||||||||
| 2016 | 2021 | 2026 | 2016-2021 | 2021-2026 | ||||||||||||||||
| (%) | (%) | |||||||||||||||||||
Population (000) | ||||||||||||||||||||
USA | 322,431 | 330,946 | 340,574 | 0.5 | % | 0.6 | % | |||||||||||||
Wisconsin | 5,782 | 5,842 | 5,911 | 0.2 | % | 0.2 | % | |||||||||||||
Milwaukee, WI | 958 | 943 | 941 | -0.3 | % | 0.0 | % | |||||||||||||
Waukesha, WI | 397 | 407 | 414 | 0.5 | % | 0.4 | % | |||||||||||||
Ozaukee, WI | 88 | 90 | 91 | 0.4 | % | 0.3 | % | |||||||||||||
Households (000) | ||||||||||||||||||||
USA | 122,265 | 125,733 | 129,596 | 0.6 | % | 0.6 | % | |||||||||||||
Wisconsin | 2,346 | 2,384 | 2,423 | 0.3 | % | 0.3 | % | |||||||||||||
Milwaukee, WI | 389 | 384 | 384 | -0.3 | % | 0.0 | % | |||||||||||||
Waukesha, WI | 158 | 163 | 167 | 0.6 | % | 0.5 | % | |||||||||||||
Ozaukee, WI | 36 | 36 | 37 | 0.4 | % | 0.4 | % | |||||||||||||
Median Household Income ($) | ||||||||||||||||||||
USA | 55,551 | 67,761 | 73,868 | 4.1 | % | 1.7 | % | |||||||||||||
Wisconsin | 54,626 | 66,361 | 72,446 | 4.0 | % | 1.8 | % | |||||||||||||
Milwaukee, WI | 44,142 | 54,231 | 59,873 | 4.2 | % | 2.0 | % | |||||||||||||
Waukesha, WI | 78,303 | 93,695 | 103,084 | 3.7 | % | 1.9 | % | |||||||||||||
Ozaukee, WI | 73,176 | 88,966 | 96,492 | 4.0 | % | 1.6 | % | |||||||||||||
Per Capita Income ($) | ||||||||||||||||||||
USA | 30,002 | 37,689 | 41,788 | 4.7 | % | 2.1 | % | |||||||||||||
Wisconsin | 29,183 | 36,330 | 40,537 | 4.5 | % | 2.2 | % | |||||||||||||
Milwaukee, WI | 24,943 | 30,901 | 34,383 | 4.4 | % | 2.2 | % | |||||||||||||
Waukesha, WI | 39,762 | 50,395 | 56,212 | 4.9 | % | 2.2 | % | |||||||||||||
Ozaukee, WI | 40,968 | 50,915 | 55,889 | 4.4 | % | 1.9 | % | |||||||||||||
Owner Occupied Housing Units (000) |
| |||||||||||||||||||
USA | 79,440 | 81,944 | 84,477 | 0.6 | % | 0.6 | % | |||||||||||||
Wisconsin | 1,596 | 1,624 | 1,651 | 0.3 | % | 0.3 | % | |||||||||||||
Milwaukee, WI | 199 | 196 | 196 | -0.3 | % | 0.0 | % | |||||||||||||
Waukesha, WI | 122 | 125 | 129 | 0.6 | % | 0.5 | % | |||||||||||||
Ozaukee, WI | 27 | 28 | 28 | 0.4 | % | 0.4 | % | |||||||||||||
2021 Age Distribution (%) | 0-14 Yrs. | 15-34 Yrs. | 35-54 Yrs. | 55-69 Yrs. | 70+ Yrs. | |||||||||||||||
USA | 18.3 | 26.8 | 25.1 | 18.4 | 11.4 | |||||||||||||||
Wisconsin | 17.8 | 25.9 | 24.3 | 20.1 | 11.9 | |||||||||||||||
Milwaukee, WI | 20.1 | 28.8 | 24.9 | 16.7 | 9.6 | |||||||||||||||
Waukesha, WI | 16.7 | 22.8 | 25.0 | 22.4 | 13.1 | |||||||||||||||
Ozaukee, WI | 16.7 | 23.0 | 23.8 | 22.4 | 14.0 | |||||||||||||||
2021 HH Income Dist. (%) | Less Than 25,000 | $25,000 to 50,000 | $50,000 to 100,000 | $100,000+ | ||||||||||||||||
USA | 18.0 | 20.3 | 29.0 | 32.7 | ||||||||||||||||
Wisconsin | 16.5 | 21.6 | 32.0 | 29.9 | ||||||||||||||||
Milwaukee, WI | 23.5 | 23.5 | 29.6 | 23.4 | ||||||||||||||||
Waukesha, WI | 10.2 | 15.3 | 27.8 | 46.7 | ||||||||||||||||
Ozaukee, WI | 12.3 | 16.2 | 27.4 | 44.1 | ||||||||||||||||
Source: S&P Global Market Intelligence.
22
| Pro Forma Valuation Report for Second Step Conversion
|
The data highlights that the Company’s market area demographics are reflective of a relatively small local market area. Milwaukee County is primarily an urban community. The Company’s Milwaukee County branches are in more suburban areas but are still in relatively close proximity to downtown Milwaukee. The population in Milwaukee County decreased at an annualized rate of 0.3% over the past five years, from 958,000 in 2016 to 943,000 in 2021 while Waukesha County and Ozaukee County grew at annual population growth rates of 0.5% and 0.4%, respectively. Comparatively, Wisconsin and the U.S. recorded annual population growth rates of 0.2% and 0.5%, respectively, over the past five years. Looking ahead to 2026, Milwaukee County is projected to remain flat at annualized population growth rate of 0.0% while Waukesha County and Ozaukee County are projected to grow at annualized rates of 0.4% and 0.3%, respectively, which are higher than the 0.2% projected for the state of Wisconsin but lower than the 0.6% projected for the U.S.
Household growth rates paralleled population growth trends in both market area counties, as Waukesha County recorded a stronger rate of household growth compared to Milwaukee County and Ozaukee County.
Median household income in Waukesha County and Ozaukee County was well above national and state averages in 2021, with Waukesha County and Ozaukee County recording $93,695 and $88,966 per household, respectively, versus $67,761 and $66,361 for the nation and state of Wisconsin, respectively. Comparatively, Milwaukee County’s median household income was lower than the U.S. and Wisconsin measures. Waukesha County is primarily a suburban community and is the wealthiest county in Wisconsin, with a median household income of $93,695. Projected median household income growth rates for the Company’s market area counties were approximately 2.0% as well as the U.S. and state of Wisconsin.
Household income distribution measures provide another indication of the relative affluence of Waukesha County and Ozaukee County, as these two counties maintained a relatively high percentage of households with incomes above $100,000 and a relatively low percentage of households with incomes below $25,000. Household income distribution measures for Milwaukee County were relatively more like the comparable U.S. and Wisconsin measures. The Company’s market area counties’ demographic and economic growth trends, including projected population, number of households, age distribution and median household income could all be impacted by the ongoing COVID-19 pandemic, but such potential longer-term impact are difficult to predict.
23
| Pro Forma Valuation Report for Second Step Conversion
|
| C. | Economic Indicators |
Economic conditions, the interest rate environment, gross domestic product (“GDP”), housing market, comparative employment data, large employers operating in the Company’s market area, are some of the key economic factors that impact the Company’s future prospects.
U.S. Economic Overview:
The March 2020 recession ended 128 months of expansion, the longest in U.S. history. Many U.S. economic indicators hit their lowest point in April 2020 due to the COVID-19 pandemic. In the second quarter of 2020, the economy contracted by a record 31.4%. Quarterly GDP had never experienced a drop greater than 10% since record-keeping began in 1947. The travel, leisure and hospitality sectors have been hit particularly hard. Hotel occupancy was down 30%, and airline travel, as measured by travelers through TSA checkpoints, was down about 70% since early March 2020. Conditions slowly improved in May and June as coronavirus cases started moderating, unemployment claims began falling and some states started lifting operating restrictions on businesses. However, as the pandemic hit the second wave in the fall, sales started falling again, and states backtracked on reopening. Unemployment claims remained higher than during any pre-pandemic period based on records going back to 1967. During the fourth quarter of 2020, the nation has recovered 12.3 million, or 56%, of the 22.2 million jobs lost in March and April as many furloughed workers were called back. During the third quarter of 2020, many economic indicators showed the economy had largely gone sideways. Six months into the crisis, weekly claims for unemployment benefits were about four times higher than they were before the COVID-19 pandemic. The developments eclipsed Joe Biden’s win in the U.S. presidential election, as well as a stimulus package announced in late December 2020.
While the economy has partially rebounded from a deep contraction in the first half of 2020, there are fresh concerns in early 2021 as COVID-19 cases increased on the heels of the prior year-end holidays, the rollout of vaccines has not met expectations, and further Federal pandemic relief was uncertain.
A variety of factors will determine how the recovery unfolds in 2021. Key variables include: a) the scale of the ongoing COVID-19 resurgence and any resulting lockdowns, b) the deployment and effectiveness of COVID-19 vaccines, c) the status of labor markets and household consumption, e) the degree to which volatility related to the U.S. political transition affects consumer and business confidence; and f) whether or not additional stimulus payments occur and how effective they are.
24
| Pro Forma Valuation Report for Second Step Conversion
|
Interest Rates:
Prior to the onset of the COVID-19 pandemic in the first quarter of 2020, the Federal Reserve had maintained that it would hold interest rates steady. As risks to the World and U.S. economies, stemming from the COVID -19 pandemic, came more into focus, the Federal Reserve reduced the Federal Funds target interest rate twice during March 2020 for a total of 150 basis points setting the target Fed Funds rate at 0% to 0.25%. The prime rate ended at 3.25% in March 2020. Exhibit II-2 provides additional information regarding historical interest rates. The aforementioned interest rate reductions reduced the US Treasury yields and yield curve to historic low levels, resulting in short term interest rates near zero, and intermediate and longer-term Treasury rates also at low levels. From March 2020 through early August 2020, the 10-year Treasury Bond rate ranged between 0.50% and 0.75%, while the 30-year Treasury Bond rate ranged from 1.25% to 1.50% over the same period. After reaching a low of 0.52% on August 4, 2020, the 10-year Treasury Bond rate has trended upward and was 1.19% on February 8, 2021. Similarly, after reaching a low of 1.19% on August 4; 2020, the 30-year Treasury Bond rate has trended upward to 1.96% as of February 8, 2021. The latest Wall Street Journal (“WSJ”) survey of leading economists indicates a modestly rising rate scenario through mid-2023 with longer term rates rising more than short term rates.
Gross Domestic Product:
After the economy contracted by a record 31.4% in the second quarter of 2020, quarterly GDP increased 33.4% in the third quarter. The increase in GDP reflected increases in exports, fixed investment and personal consumption expenditures that were partly offset by decreases in state and local government spending and federal government spending. The U.S. economy has rebounded over the fourth quarter of 2020, with November 2020 especially strong due to the vaccine news. GDP increased at an annual rate of 4.0% in the fourth quarter of 2020, according to the Bureau of Economic Analysis. In connection with the COVID-19 pandemic, GDP contracted by 3.5% for 2020 compared to 2019 according to WSJ in February 2021.
As of February 2, 2021, the WSJ projected more rapid economic expansion in 2021 than previously projected in July 2020, with the Congressional Budget Office anticipating GDP to return to pre-pandemic level by mid-2021 and GDP growth of 3.7% projected for the fourth quarter of 2021 compared with a year earlier. For 2022, GDP growth is projected at 2.4% with average growth through 2025 projected at 2.6%. The Congressional Budget Office projected the jobless rate to fall to 6.8% by the end of 2020 and 5.3% by the end of 2021, with the number of unemployed not returning to pre-pandemic levels until 2024.
25
| Pro Forma Valuation Report for Second Step Conversion
|
Housing Market:
Coupled with extremely low interest rates that are driving refinance volumes, the COVID-19 pandemic driven demand for larger homes that provide workspace and the overall shortage of new homes has fueled one-to-four family residential mortgage lending and secondary marketing volumes and related profits. These factors have fueled home prices nationwide. Median home prices for sales of existing homes increased 12.9% from $274,500 in December 2019 to $309,800 in December 2020. As shown in Table II.B.1, growth in the number of owner-occupied housing units in the Bank’s three market area counties between 2016 and 2021 and projected through 2026 ranged from lows of (0.3%) and 0.0%, respectively, for Milwaukee County and highs of 0.6% and 0.5% for Waukesha County, compared to Wisconsin of 0.3% and 0.3%, respectively and the U.S. of 0.6% and 0.6%, respectively.
Trends in the Equities Markets:
Prior to declining precipitously in connection with the onset of the COVID-19 pandemic late in the first quarter of 2020, major stock market indices had reached all-time highs, which they subsequently exceeded in January 2021, reaching yet new record highs. The Dow Jones Industrial Average (“DJIA”) reached its pre-pandemic all-time high of 29,551.42 on February 12, 2020, then declined by 37.1% to 18,591.93 as of March 23, 2020. As of February 8, 2021, the DJIA had recovered all of its 2020 losses reaching a new record high on February 8, 2021. As of February 8, 2021, the DJIA closed at 31,385.76.
Similar trends were observed in other major market indexes such as the S&P 500, National Association of Securities Dealers Automated Quotation System (“NASDAQ”) and SNL US Thrift index.
Employment:
Comparative employment data shown in Table II.C.1 shows that employment in education/healthcare/social services ranked as the largest among employment sectors in primary market area counties, as well as Wisconsin. Services and wholesale/retail trade jobs took the second or third largest employment sectors rankings for primary market area counties and for Wisconsin while finance/insurance/real estate jobs constituted the fourth largest employment sector. Overall, the distribution of employment exhibited in the primary market area is indicative of a fairly diversified economy, that within the market area counties is generally consistent with Wisconsin overall but has a greater proportion of wholesale/retail trade jobs compared to the U.S.
26
| Pro Forma Valuation Report for Second Step Conversion
|
Table II.C.1
1895 Bancorp of Wisconsin, Inc.
Employment by Sectors
(Percent of Labor Force)
| Milwaukee | Waukesha | Ozaukee | ||||||||||||||||||
Employment Sector | USA | Wisconsin | County | County | County | |||||||||||||||
| (%) | (%) | (%) | ||||||||||||||||||
Services | 25.9 | % | 20.2 | % | 23.5 | % | 20.8 | % | 20.7 | % | ||||||||||
Education,Healthcare, Soc. Serv. | 23.1 | % | 23.6 | % | 26.4 | % | 23.5 | % | 25.3 | % | ||||||||||
Government | 1.9 | % | 1.2 | % | 1.3 | % | 1.5 | % | 1.1 | % | ||||||||||
Wholesale/Retail Trade | 12.6 | % | 20.9 | % | 17.3 | % | 21.7 | % | 22.8 | % | ||||||||||
Finance/Insurance/Real Estate | 15.8 | % | 15.7 | % | 15.7 | % | 17.0 | % | 16.7 | % | ||||||||||
Manufacturing | 5.4 | % | 4.3 | % | 4.5 | % | 4.1 | % | 3.6 | % | ||||||||||
Construction | 6.6 | % | 5.8 | % | 3.7 | % | 5.9 | % | 4.2 | % | ||||||||||
Information | 2.0 | % | 1.6 | % | 1.9 | % | 1.7 | % | 1.7 | % | ||||||||||
Transportation/Utility | 5.4 | % | 4.6 | % | 5.5 | % | 3.6 | % | 2.9 | % | ||||||||||
Agriculture | 1.3 | % | 2.1 | % | 0.3 | % | 0.3 | % | 1.0 | % | ||||||||||
|
|
|
|
|
|
|
|
|
| |||||||||||
| 100.0 | % | 100.0 | % | 100.0 | % | 100.0 | % | 100.0 | % | |||||||||||
Source: S&P Global Market Intelligence.
Table II.C.2 lists some of the largest employers in the counties of Milwaukee, Waukesha and Ozaukee.
27
| Pro Forma Valuation Report for Second Step Conversion
|
Table II.C.2
1895 Bancorp of Wisconsin, Inc.
Market Area Largest Employers
Employers | Product/Service | |
Milwaukee County | ||
Auroa Health Care | Health Care System | |
Northwestern Mutual | Insurance and Financial Services | |
Froedtert & Medical College of Wisc. | Health Care Services | |
Children’s Health System Group | Health Care Services | |
Columbia-St. Mary’s | Health Care Services | |
Waukesha County | ||
Kohl’s Corp. | Department Store Chain | |
Quad/Graphics Inc. | Commercial Printing | |
ProHealth Care | Health Care System | |
GE Healthcare | Medical Imaging Devices | |
Target Corporation | Department Store Chain | |
Ozaukee County | ||
Aurora Healthcare | Health Care System | |
Ascension Wisconsin | Health Care System | |
Kroger & Company | Food Retailer | |
Concordia University | Education | |
Columbia-St. Mary’s | Health Care Services | |
Sources: choosemilwaukee.com | ||
Unemployment:
Table II.C.3 below reflects the comparative unemployment rates for primary market area counties, as well as for Wisconsin and the U.S. The December 2020 unemployment rates for Milwaukee, Waukesha and Ozaukee Counties equaled 7.1%, 4.5% and 4.2% respectively, which were well above (Milwaukee County) and slightly below (Waukesha and Ozaukee) the comparable unemployment rate of 5.3% for Wisconsin. Comparatively, the December 2020 unemployment rate for the U.S. equaled 6.5%. The unemployment rates in the market area counties, Wisconsin and the U.S. have all been negatively impacted by the economic and other effects of the COVID-19 pandemic; all were higher compared to a year ago. Future unemployment trends will be impacted by the pandemic, government stimulus payments, consumer demand and other economic factors. At least in the short term, the impact on future unemployment is uncertain.
28
| Pro Forma Valuation Report for Second Step Conversion
|
Table II.C.3
1895 Bancorp of Wisconsin, Inc.
Unemployment Trends
| Unemployment Rate | ||||||||||||
Region | December 2019 | December 2020 | Change | |||||||||
USA | 3.4 | % | 6.5 | % | 3.1 | % | ||||||
Wisconsin | 3.2 | % | 5.3 | % | 2.1 | % | ||||||
Milwaukee, WI | 3.6 | % | 7.1 | % | 3.5 | % | ||||||
Waukesha, WI | 2.6 | % | 4.5 | % | 1.9 | % | ||||||
Ozaukee, WI | 2.5 | % | 4.2 | % | 1.7 | % | ||||||
Source: S&P Global Market Intelligence.
| D. | Deposit Market and Competition |
The Company operates six branch office locations (including its main office location), as indicated in Table II.D.2, in Milwaukee County (3), Waukesha County (2) and Ozaukee County (1). Table II.D.1 displays deposit market trends from June 30, 2016 through June 30, 2020 (the most recent date for which such information is available) for the primary market area counties. Commercial banks maintained a dominant market share of deposits relative to savings institutions in the market are counties.
29
| Pro Forma Valuation Report for Second Step Conversion
|
Table II.D.1
1895 Bancorp of Wisconsin, Inc.
Trends in Total Deposits – Total County (Milwaukee, Waukesha and Ozaukee)
| Total Deposits at June 30, | Growth Rate | |||||||||||||||||||||||
| 2016 | 2017 | 2018 | 2019 | 2020 | 2016 - 2020 | |||||||||||||||||||
Deposits ($000) | ||||||||||||||||||||||||
Bank | 57,459,725 | 63,603,200 | 55,955,030 | 56,688,988 | 69,348,329 | 4.8 | % | |||||||||||||||||
Thrift | 3,867,570 | 3,536,435 | 2,711,066 | 2,837,203 | 3,053,258 | -5.7 | % | |||||||||||||||||
Savings Bank | 614,269 | 685,115 | 689,531 | 495,879 | 526,907 | -3.8 | % | |||||||||||||||||
|
|
|
|
|
|
|
|
|
|
|
| |||||||||||||
Total Bank & Thrift Deposits | 61,941,564 | 67,824,750 | 59,355,627 | 60,022,070 | 72,928,494 | 4.2 | % | |||||||||||||||||
Credit Union | 4,669,882 | 3,779,714 | 5,783,981 | 6,404,416 | 9,300,141 | 18.8 | % | |||||||||||||||||
1895 Bancorp of Wisconsin, Inc. | 351,203 | 383,453 | 412,251 | 414,606 | 366,198 | 1.1 | % | |||||||||||||||||
Branches (actual) | ||||||||||||||||||||||||
Bank | 390 | 380 | 386 | 391 | 350 | -2.7 | % | |||||||||||||||||
Thrift | 105 | 79 | 53 | 51 | 57 | -14.2 | % | |||||||||||||||||
Savings Bank | 12 | 12 | 13 | 6 | 6 | -15.9 | % | |||||||||||||||||
|
|
|
|
|
|
|
|
|
|
|
| |||||||||||||
Total Bank & Thrift Branches | 507 | 471 | 452 | 448 | 413 | -5.0 | % | |||||||||||||||||
Credit Union | 17 | 17 | 17 | 16 | 96 | 54.2 | % | |||||||||||||||||
Avg. Bank Branch Size | 147,333 | 167,377 | 144,961 | 144,985 | 198,138 | 7.7 | % | |||||||||||||||||
Avg. Thrift Branch Size | 38,306 | 46,391 | 51,524 | 58,475 | 56,828 | 10.4 | % | |||||||||||||||||
|
|
|
|
|
|
|
|
|
|
|
| |||||||||||||
Avg. Bank and Thrift Branch Size | 122,173 | 144,002 | 131,318 | 133,978 | 176,582 | 9.6 | % | |||||||||||||||||
Avg. Credit Union Branch Size | 274,699 | 222,336 | 340,234 | 400,276 | 96,876 | -22.9 | % | |||||||||||||||||
Source: S&P Global Market Intelligence.
The Company faces significant competition within its markets both in making loans and attracting deposits. There is a high concentration of financial institutions in the Company’s market area, including national, regional and other locally operated commercial banks, savings banks and credit unions. Many of the national or super-regional institutions, such as for example U.S. Bancorp, Bank of Montreal and JP Morgan Chase have access to greater financial and human resources and compete directly for loan and deposit customers, as do some of the larger institutions based in the region, such as for example Associated Banc-Corp. and Wintrust Financial Corp. A number of the national and regional competitors offer products and services that the Company does not offer, such as trust services, private banking, certain insurance services and asset management. Additionally, the Company faces an increasing level of competition from online financial service providers that do not necessarily maintain a physical presence in the Company’s market area, such as Quicken Loans or Lending Club in the lending areas and Ally Financial in deposit services. The list of competitors facing the Company is extensive.
30
| Pro Forma Valuation Report for Second Step Conversion
|
Table II.D.2 lists the Company’s largest competitors in the counties, based on deposit market share. As of June 30, 2020, the Company’s deposit market share in Milwaukee County was approximately 0.48% of $54.7 billion of total deposits, ranking 16th in market share. There were four Wisconsin based banks in top 10 banks of Milwaukee County. As of June 30, 2020, the Company’s deposit market shares in Waukesha and Ozaukee counties were approximately 0.47% and 1.16% of $15.3 billion and $3.0 billion of total deposits, respectively, ranking 29th and 13th in the counties. As indicated in Table II.D.2, the Company had total deposit of $259.9 million, $71.2 million and $35.1 million in Milwaukee, Waukesha and Ozaukee counties, with respectively, at June 30, 2020.
Table II.D.2
1895 Bancorp of Wisconsin, Inc.
Deposit Competitors
Institution (ST) | 2020 Rank | 2019 Rank | 2020 | 2019 | ||||||||||||||||||||||||
| Number of Branches | Total Deposits In Market ($000) | Total Market Share (%) | Total Deposits In Market ($000) | Total Market Share (%) | ||||||||||||||||||||||||
Milwaukee, WI | ||||||||||||||||||||||||||||
U.S. Bancorp (MN) | 1 | 1 | 23 | 25,071,792 | 45.88 | 19,897,928 | 44.99 | |||||||||||||||||||||
Bank of Montreal | 2 | 2 | 30 | 8,024,760 | 14.68 | 7,048,599 | 15.94 | |||||||||||||||||||||
JPMorgan Chase & Co. (NY) | 3 | 3 | 12 | 6,957,730 | 12.73 | 4,457,517 | 10.08 | |||||||||||||||||||||
Associated Banc-Corp (WI) | 4 | 4 | 22 | 4,468,941 | 8.18 | 4,372,682 | 9.89 | |||||||||||||||||||||
PNC Financial Services Group (PA) | 5 | 5 | 16 | 1,856,168 | 3.40 | 1,465,255 | 3.31 | |||||||||||||||||||||
Wells Fargo & Co. (CA) | 6 | 6 | 8 | 1,478,495 | 2.71 | 1,405,437 | 3.18 | |||||||||||||||||||||
Tri City Bankshares Corp. (WI) | 7 | 7 | 21 | 990,857 | 1.81 | 833,462 | 1.88 | |||||||||||||||||||||
Johnson Financial Group Inc. (WI) | 8 | 10 | 3 | 840,426 | 1.54 | 562,247 | 1.27 | |||||||||||||||||||||
Waterstone Financial Inc. (WI) | 9 | 8 | 11 | 777,634 | 1.42 | 759,449 | 1.72 | |||||||||||||||||||||
First Midwest Bancorp Inc. (IL) | 10 | 11 | 3 | 736,909 | 1.35 | 542,415 | 1.23 | |||||||||||||||||||||
1895 Bancorp Wisconsin (MHC) (WI) | 16 | 13 | 3 | 259,943 | 0.48 | 302,875 | 0.68 | |||||||||||||||||||||
|
|
|
| |||||||||||||||||||||||||
Total For Institutions In Market | 216 | 54,651,726 | 44,229,111 | |||||||||||||||||||||||||
Waukesha, WI | ||||||||||||||||||||||||||||
Bank of Montreal | 1 | 1 | 15 | 2,476,315 | 16.23 | 2,089,511 | 16.01 | |||||||||||||||||||||
JPMorgan Chase & Co. (NY) | 2 | 2 | 11 | 1,556,343 | 10.20 | 1,313,979 | 10.07 | |||||||||||||||||||||
Wintrust Financial Corp. (IL) | 3 | 5 | 6 | 1,474,385 | 9.66 | 1,030,297 | 7.89 | |||||||||||||||||||||
Associated Banc-Corp (WI) | 4 | 3 | 14 | 1,261,300 | 8.27 | 1,152,793 | 8.83 | |||||||||||||||||||||
U.S. Bancorp (MN) | 5 | 4 | 15 | 1,250,546 | 8.20 | 1,062,970 | 8.14 | |||||||||||||||||||||
Bank Street Capital (WI) | 6 | 6 | 16 | 998,968 | 6.55 | 783,362 | 6.00 | |||||||||||||||||||||
Oconomowoc Bancshares Inc. (WI) | 7 | 7 | 7 | 700,909 | 4.59 | 644,768 | 4.94 | |||||||||||||||||||||
Citizens Bank Holding Inc. (WI) | 8 | 8 | 13 | 698,846 | 4.58 | 618,936 | 4.74 | |||||||||||||||||||||
North Shore Bank FSB (WI) | 9 | 9 | 7 | 500,105 | 3.28 | 445,920 | 3.42 | |||||||||||||||||||||
Wells Fargo & Co. (CA) | 10 | 11 | 3 | 400,641 | 2.63 | 367,562 | 2.82 | |||||||||||||||||||||
1895 Bancorp Wisconsin (MHC) (WI) | 29 | 29 | 2 | 71,176 | 0.47 | 73,273 | 0.56 | |||||||||||||||||||||
|
|
|
| |||||||||||||||||||||||||
Total For Institutions In Market | 160 | 15,255,203 | 13,051,765 | |||||||||||||||||||||||||
Ozaukee, WI | ||||||||||||||||||||||||||||
Bank of Montreal | 1 | 1 | 8 | 730,075 | 24.16 | 669,165 | 24.41 | |||||||||||||||||||||
Port Bancshares Inc. (WI) | 2 | 2 | 8 | 637,744 | 21.11 | 529,649 | 19.32 | |||||||||||||||||||||
U.S. Bancorp (MN) | 3 | 3 | 3 | 369,691 | 12.24 | 374,980 | 13.68 | |||||||||||||||||||||
Associated Banc-Corp (WI) | 4 | 4 | 3 | 301,703 | 9.98 | 280,777 | 10.24 | |||||||||||||||||||||
Wells Fargo & Co. (CA) | 5 | 6 | 1 | 190,578 | 6.31 | 142,406 | 5.20 | |||||||||||||||||||||
JPMorgan Chase & Co. (NY) | 6 | 7 | 1 | 168,681 | 5.58 | 131,531 | 4.80 | |||||||||||||||||||||
Bank First Corporation (WI) | 7 | 5 | 2 | 130,605 | 4.32 | 148,911 | 5.43 | |||||||||||||||||||||
Community Bancshares of WI Inc (WI) | 8 | 8 | 1 | 102,194 | 3.38 | 107,434 | 3.92 | |||||||||||||||||||||
Commerce Financial Hldgs Inc. (WI) | 9 | 9 | 1 | 99,060 | 3.28 | 95,122 | 3.47 | |||||||||||||||||||||
North Shore Bank FSB (WI) | 10 | 10 | 2 | 88,297 | 2.92 | 78,045 | 2.85 | |||||||||||||||||||||
1895 Bancorp Wisconsin (MHC) (WI) | 13 | 13 | 1 | 35,080 | 1.16 | 38,458 | 1.40 | |||||||||||||||||||||
|
|
|
| |||||||||||||||||||||||||
Total For Institutions In Market | 37 | 3,021,565 | 2,741,194 | |||||||||||||||||||||||||
Source: S&P Global Market Intelligence.
31
| Pro Forma Valuation Report for Second Step Conversion
|
III. COMPARABLE GROUP SELECTION AND ANALYSIS
| A. | Introduction |
Pursuant to regulatory appraisal guidelines for mutual-to-stock conversions, a group of relatively comparable savings institutions (the “Comparable Group”) is selected from the universe of all publicly-traded savings institutions, depicted in Exhibit III-1. The Comparable Group Selection Criteria is established based on specifically identified parameters, which are considered an appropriate basis for comparison to the Company. Consistent with the regulatory appraisal guidelines, the pro forma market valuation of the Company is developed from the pricing ratios of the Comparable Group and incorporates valuation adjustments for key differences between the Company and the Comparable Group. Characteristics of the Company and how these compare to the Comparable Group provide the primary basis for the valuation adjustments to the Company’s pro forma valuation relative to the Comparable Group’s. Factors we examined to identify key differences include financial condition and efficiency of asset utilization, profitability and earnings capacity, interest rate risk, primary market economic and demographic considerations, projected dividend capacity and intended dividend policy, marketability of the issued stock, management, and effect of government regulations and regulatory reform. Section III.B describes the Comparable Group selection criteria. In Section III.C., the Comparable Group is selected. Section III.D. includes a detailed comparison of the Company to the Comparable Group, which is then used as the basis for the pro forma market valuation of the Company in Section IV.
| B. | Comparable Group Selection Criteria |
The selection of a Comparable Group to the Company is based on the general and specific parameters set forth in the regulatory appraisal guidelines. These guidelines stipulate that only publicly traded savings institutions listed on either the New York Stock Exchange (“NYSE”) or the NASDAQ can be included in the Comparable Group as their stock trading activity is regularly reported and generally more frequent than stock of non-publicly traded and closely-held savings institutions. Such an exchange listing indicates that a savings institution’s stock has trading activity that is reflective of equity market conditions. Institutions that are not listed on the NYSE or NASDAQ are inappropriate, since the trading activity for thinly-traded or closely-held stocks are typically highly irregular in terms of frequency and price and thus may not be a reliable indicator of market value.
32
| Pro Forma Valuation Report for Second Step Conversion
|
Another general parameter for the selection of the Comparable Group is that publicly traded institutions that have completed a conversion offering less than one year ago be excluded as such companies have not had sufficient time to leverage the new capital; and may therefore have distorted trading price multiples and only limited stock trading history. Mutual holding companies are also excluded from the Comparable Group because their pricing ratios are also subject to unusual distortion. Savings institutions that are subject to an announced or rumored merger or acquisition by another company are excluded as the trading price multiples of such savings institutions would not be reflective of normal trading prices in the absence of such acquisition or merger.
Of the 107 publicly traded, including Over-The-Counter (“OTC”) markets, FDIC-insured savings institutions, two are subject to an announced merger. Of the remaining 105, 48 are OTC, 4 are traded on the NYSE and 53 are traded on NASDAQ. The 57, publicly traded on NASDAQ and NYSE, savings institutions include approximately 44 fully-converted publicly traded savings institutions, and 13 publicly traded mutual holding companies, nationally.
The Comparable Group should consist of at least ten savings institutions, preferably based in the same or a comparable market as the Company and with similar asset size. However, given the relatively small universe of potentially comparable savings institutions, it is often necessary to expand the asset size range and/or geography.
| C. | Selection of Comparable Group |
From the universe of fully-converted savings institutions traded on the NYSE and NASDAQ, we selected ten, which we considered reasonably comparable to the Company. In our selection process, we considered all public savings institutions and deselected those not eligible for consideration because of the general selection criteria in the regulatory guidelines described above. We focused first on savings institutions meeting said criteria which were in the same region as the Company and which were in a comparable asset size range and expanded the search to other regions and/or broadened the asset size range as necessary to arrive at no less than ten comparable savings institutions in total as follows:
Midwest and Mid-Atlantic institutions with assets between $200 million and $950 million, tangible equity-to-tangible assets ratios of greater than 7.0%, reported return on equity of less than 12% and positive earnings.
Nine companies met the criteria and all nine were included in the Comparable Group: CBM Bancorp, Inc. of Maryland, Cincinnati Bancorp, Inc. of Ohio, Elmira Savings Bank of New York, FFBW, Inc. of Wisconsin, HMN Financial, Inc. of Minnesota, HV Bancorp, Inc. of Pennsylvania, IF Bancorp, Inc. of Illinois, Mid-Southern Bancorp, Inc. of Indiana, and WVS Financial Corp. of Pennsylvania. We considered companies in the Mid-Atlantic region in our selection as it is adjacent to the Midwest and there were not ten companies in the Midwest, which met the selection criteria. Moreover, there were more companies in the Mid-Atlantic that also met the selection criteria vs. in other regions. Exhibit III-2 provides financial and public market pricing characteristics of all publicly-traded Midwest and Mid-Atlantic savings institutions.
33
| Pro Forma Valuation Report for Second Step Conversion
|
Southwest institutions with assets between $200 million and $950 million, tangible equity-to-tangible assets ratios of greater than 7.0%, reported return on equity of less than 12% and positive earnings.
One company met the criteria and was included in the Comparable Group: Home Federal Bancorp, Inc. of Louisiana. The Southwest region was considered vs. other regions because it is also adjacent to the Midwest region. Exhibit III-3 provides financial and public market pricing characteristics of all publicly-traded Southwest savings institutions.
We did not consider the number of offices or branches in selecting or eliminating candidates, since the number of offices generally impacts the level of operating expenses, which impact return on equity. The established general and specifically defined parameters used in the selection of the Comparable Group are considered to be both reasonable and reflective of the Company for operational and financial comparison.
Table III.C.1 provides general information for each of the Comparable Group companies and Table III.D.6 provides summary demographic and deposit market share data for the primary market areas served by each of the Comparable Group companies.
Table III.C.1
Publicly Traded Savings Institutions Comparable Group
As of December 31, 2020 or the Most Recent Data Available
| As of | ||||||||||||||||||||||||||||||
| February 8, 2021 | ||||||||||||||||||||||||||||||
Ticker | Company Name | Region | State | Exchange | Offices | Month of Fiscal Year End | Total Assets ($000) | Conversion Date | Stock Price ($) | Market Value ($000) | ||||||||||||||||||||
CBMB | CBM Bancorp, Inc. | MA | MD | NASDAQCM | 4 | Dec | 232,186 | 9/27/2018 | 14.00 | 48,191 | ||||||||||||||||||||
CNNB | Cincinnati Bancorp, Inc. | MW | OH | NASDAQCM | 6 | Dec | 231,943 | 10/14/2015 | 11.96 | 35,589 | ||||||||||||||||||||
ESBK | Elmira Savings Bank | MA | NY | NASDAQCM | 12 | Dec | 644,587 | 3/1/1985 | 12.40 | 43,684 | ||||||||||||||||||||
FFBW | FFBW, Inc. | MW | WI | NASDAQCM | 4 | Dec | 285,787 | 10/10/2017 | 10.44 | 74,231 | ||||||||||||||||||||
HMNF | HMN Financial, Inc. | MW | MN | NASDAQGM | 14 | Dec | 909,580 | 6/30/1994 | 19.00 | 90,613 | ||||||||||||||||||||
HFBL | Home Federal Bancorp, Inc. of Louisiana | SW | LA | NASDAQCM | 7 | Jun | 535,394 | 1/18/2005 | 30.00 | 46,416 | ||||||||||||||||||||
HVBC | HV Bancorp, Inc. | MA | PA | NASDAQCM | 4 | Dec | 507,739 | 1/11/2017 | 16.82 | 33,834 | ||||||||||||||||||||
IROQ | IF Bancorp, Inc. | MW | IL | NASDAQCM | 7 | Jun | 713,399 | 7/7/2011 | 20.12 | 65,196 | ||||||||||||||||||||
MSVB | Mid-Southern Bancorp, Inc. | MW | IN | NASDAQCM | 3 | Dec | 218,281 | 4/8/1998 | 15.45 | 46,139 | ||||||||||||||||||||
WVFC | WVS Financial Corp. | MA | PA | NASDAQGM | 6 | Jun | 317,444 | 11/29/1993 | 15.15 | 26,388 | ||||||||||||||||||||
Source: S&P Global Market Intelligence
While no individual savings institution, let alone a group of at least ten, can be perfectly comparable to the Company, the Comparable Group is relatively comparable and provides a sound basis for valuation of the Company subject to valuation adjustments. Accordingly, we have compared the Company’s financial and other characteristics to those of the Comparable Group as of the most recent available date from public sources. The Section III tables also include comparative financial and other data for all national publicly traded savings institutions other than mutual holding companies.
34
| Pro Forma Valuation Report for Second Step Conversion
|
Table III.C.2 compares the Comparable Group to all publicly traded savings institutions (excluding mutual holding companies) traded on the NYSE or on NASDAQ.
Table III.C.2
Comparable Group Market, Pricing and Financials
Comparable Group Analysis
Stock Prices as of February 8, 2021
| All Public Non-MHC | ||||||||||||||||
| Thrifts | Comparable Group | |||||||||||||||
| Average | Median | Average | Median | |||||||||||||
Financial Characteristics | ||||||||||||||||
Assets ($000) | $ | 5,175,845 | $ | 1,722,094 | $ | 459,634 | $ | 412,592 | ||||||||
Tangible Equity/Assets (%) | 11.59 | 10.25 | 15.82 | 12.00 | ||||||||||||
Core ROAA (%) | 1.00 | 0.78 | 0.72 | 0.67 | ||||||||||||
Core ROAE (%) | 7.70 | 6.48 | 6.11 | 6.11 | ||||||||||||
Market Capitalization ($000) | $ | 609,965 | $ | 197,340 | $ | 51,069 | $ | 46,511 | ||||||||
Pricing Ratios | ||||||||||||||||
Price/Tangible Book (%) | 116.46 | 101.04 | 89.71 | 90.12 | ||||||||||||
Price/Core Earnings (x) | 17.17 | 13.64 | 25.54 | 13.72 | ||||||||||||
Price/Assets (%) | 13.07 | 11.85 | 14.04 | 9.71 | ||||||||||||
Source: S&P Global Market Intelligence
Our discussions of the Comparable Group compared to all fully-converted public savings institutions utilizes averages unless otherwise indicated. On average, the Comparable Group companies were significantly smaller in asset size than all fully-converted public savings institutions. The Comparable Group maintained higher tangible equity compared to the industry average (15.82% of assets versus 11.59% for all public companies), generated lower earnings as a percent of average assets (0.62% core ROAA versus 1.00% for all public companies) and earned a lower ROAE (5.47% core ROAE versus 7.70% for all public companies). The Comparable Group’s average P/TB ratio of 89.71% was below that of all fully-converted public savings institutions of 116.46%, while the core P/E multiple of 30.55x was above the average of all fully-converted public savings institutions of 17.17x. However, the median core P/E of 17.40x for the Comparable Group, while also above the median for all public savings institutions of 13.64x, exceeded the public savings institution level by a narrower margin.
35
| Pro Forma Valuation Report for Second Step Conversion
|
| D. | Comparison of the Company to the Comparable Group |
Since no Comparable Group can be exactly comparable to the Company, primary consideration was given to differences in financial condition and performance that we observed in comparing the Company to the Comparable Group. Our discussions of the comparable analysis for differences in the following key factors utilizes averages for the Comparable Group unless otherwise indicated:
| 1. | Financial Condition and Efficiency of Asset Utilization |
| 2. | Profitability and Earnings Capacity |
| 3. | Asset / Liability and Interest Rate Risk Management |
In addition to the foregoing, Faust Financial also takes into consideration how the following factors impact the Company vs. how they may impact the Comparable Group:
| 4. | Primary Market Economic and Demographic Considerations |
| 5. | Projected Dividend Capacity and Intended Dividend Policy |
| 6. | Marketability of the Issued Stock |
| 7. | Management |
| 8. | Effect of Government Regulations and Regulatory Reform |
The conclusions drawn from the comparative analysis as it relates to the eight aforementioned factors are considered as part of our valuation analysis and the valuation adjustments discussed in Section IV.
| 1. | Financial Condition and Efficiency of Asset Utilization |
Table III.D.1 shows comparative balance sheet measures for the Company and the Comparable Group which are utilized in our analysis of the Company’s financial condition and efficiency of asset utilization vs. that of the Comparable Group, which includes an analysis of interest earning assets composition, non interest-earning assets, loan portfolio composition, credit risk measures, funding composition and liquidity, capital, interest-earning assets/interest-bearing liabilities; and balance sheet growth.
From an overall asset size perspective, the Company’s total assets of $516.8 million as of December 31, 2020, rendered the Company approximately 12% larger than the Comparable Group, which had average total assets of $459.6 million. Based on relatively comparable asset size, the Company benefited from similar economies of scale. The Company’s and the Comparable Group’s ratios reflect balances as of or for the last twelve months through December 31, 2020 or the most recent data available:
36
| Pro Forma Valuation Report for Second Step Conversion
|
Table III.D.1
Balance Sheet Composition, Capital Ratios and Growth Rates
Comparable Group Analysis
As of December 31, 2020 or the Most Recent Date Available
| Balance Sheet as a Percent of Assets | Regulatory Capital (1) | Balance Sheet Annual Growth Rates | ||||||||||||||||||||||||||||||||||||||||||||||||||||||||||||||||||||||||||||||||||||||||||
| Cash & Equivalents (%) | MBS & Invest (%) | BOLI (%) | Net Loans (%) | Srv. Assets (%) | Time Deposits (%) | Total Deposits (%) | Borrowed Funds & Sub. Debt (%) | Total Equity (%) | Goodwill & Intang. (%) | Tangible Equity (%) | Avg. IEA/ Avg. IBL (2) (%) | Leverage (%) | Tier 1 Risk- Based (%) | Total Risk-Based Capital (%) | Assets (%) | Cash, MBS & Invest. (%) | Net Loans (%) | Deposits (%) | Borrowed Funds & Sub. Debt (%) | Total Equity (%) | Tangible Equity (%) | |||||||||||||||||||||||||||||||||||||||||||||||||||||||||||||||||||||||
1895 Bancorp of Wisconsin, Inc. | ||||||||||||||||||||||||||||||||||||||||||||||||||||||||||||||||||||||||||||||||||||||||||||
| BCOW | December 31, 2020 | 17.91 | 11.94 | 2.61 | 63.68 | 0.35 | 16.96 | 73.51 | 13.24 | 11.61 | 0.00 | 11.61 | 132.80 | 9.81 | 15.14 | 15.96 | 20.74 | 80.09 | 5.92 | 10.23 | 288.12 | 2.29 | 2.29 | |||||||||||||||||||||||||||||||||||||||||||||||||||||||||||||||||||||
Comparable Group | ||||||||||||||||||||||||||||||||||||||||||||||||||||||||||||||||||||||||||||||||||||||||||||
| CBMB | CBM Bancorp, Inc. | MD | 17.27 | 8.47 | 2.07 | 70.30 | 0.00 | 33.99 | 74.24 | 2.15 | 22.94 | 0.00 | 22.94 | 150.33 | 18.66 | 28.38 | 29.53 | 6.63 | (1.88 | ) | 10.68 | 11.04 | NM | (12.36 | ) | (12.36 | ) | |||||||||||||||||||||||||||||||||||||||||||||||||||||||||||||||||
| CNNB | Cincinnati Bancorp, Inc. | OH | 9.86 | 3.60 | 1.79 | 81.04 | 0.70 | 28.95 | 63.61 | 17.55 | 17.13 | 0.15 | 17.06 | 117.22 | 14.78 | 20.97 | 21.98 | 4.73 | 56.12 | (0.96 | ) | 6.71 | (26.99 | ) | 69.22 | 69.93 | ||||||||||||||||||||||||||||||||||||||||||||||||||||||||||||||||||
| ESBK | Elmira Savings Bank | NY | 13.84 | 3.38 | 2.39 | 75.00 | 0.23 | 33.96 | 84.86 | 4.76 | 9.43 | 3.82 | 7.52 | 109.62 | 7.87 | 12.80 | 14.05 | 6.22 | 172.06 | (6.25 | ) | 6.80 | (0.82 | ) | 3.67 | 4.64 | ||||||||||||||||||||||||||||||||||||||||||||||||||||||||||||||||||
| FFBW | FFBW, Inc. | WI | 2.60 | 21.47 | 2.53 | 71.18 | NA | 17.13 | 58.13 | 5.07 | 35.92 | 0.04 | 35.90 | 171.45 | 25.19 | 33.09 | 34.34 | 10.73 | 38.91 | 4.63 | (7.04 | ) | (2.36 | ) | 67.43 | 67.53 | ||||||||||||||||||||||||||||||||||||||||||||||||||||||||||||||||||
| HMNF | HMN Financial, Inc. | MN | 9.48 | 16.30 | 0.00 | 71.33 | 0.33 | 11.26 | 87.43 | NA | 11.35 | 0.19 | 11.26 | 155.74 | 9.85 | 13.62 | 14.87 | 16.97 | 31.86 | 8.14 | 18.01 | NA | 11.45 | 11.67 | ||||||||||||||||||||||||||||||||||||||||||||||||||||||||||||||||||||
| HFBL | Home Federal Bancorp, Inc. of Louisiana | LA | 14.90 | 11.92 | 1.34 | 68.04 | 0.00 | 26.13 | 89.25 | 0.64 | 9.61 | 0.00 | 9.61 | 137.61 | 9.83 | 16.23 | 17.40 | 17.59 | 31.48 | 7.98 | 19.06 | 41.43 | 2.98 | 2.98 | ||||||||||||||||||||||||||||||||||||||||||||||||||||||||||||||||||||
| HVBC | HV Bancorp, Inc. | PA | 9.28 | 3.97 | 1.25 | 81.92 | 0.22 | 12.37 | 73.09 | 18.13 | 7.33 | 0.00 | 7.33 | 118.72 | 7.37 | 12.70 | 13.41 | 42.40 | 44.60 | 44.62 | 30.41 | 164.08 | 3.31 | 3.31 | ||||||||||||||||||||||||||||||||||||||||||||||||||||||||||||||||||||
| IROQ | IF Bancorp, Inc. | IL | 1.49 | 23.49 | 1.33 | 71.04 | 0.11 | 38.83 | 82.33 | 4.43 | 11.90 | 0.00 | 11.90 | 117.42 | 11.08 | NA | NA | 5.19 | 14.00 | 3.32 | 6.92 | (24.54 | ) | 9.25 | 9.25 | |||||||||||||||||||||||||||||||||||||||||||||||||||||||||||||||||||
| MSVB | Mid-Southern Bancorp, Inc. | IN | 7.08 | 36.89 | 1.76 | 52.81 | 0.00 | 24.10 | 72.62 | 4.58 | 22.38 | 0.00 | 22.38 | 143.53 | 17.38 | NA | NA | 4.38 | 22.85 | (7.20 | ) | 7.35 | 0.00 | (4.01 | ) | (4.01 | ) | |||||||||||||||||||||||||||||||||||||||||||||||||||||||||||||||||
| WVFC | WVS Financial Corp. | PA | 1.30 | 65.62 | 1.56 | 28.45 | 0.00 | 9.98 | 46.69 | 40.54 | 12.11 | 0.00 | 12.11 | 120.69 | 10.21 | 16.93 | 17.26 | (10.64 | ) | (10.55 | ) | (1.11 | ) | 0.74 | (23.42 | ) | 2.44 | 2.44 | ||||||||||||||||||||||||||||||||||||||||||||||||||||||||||||||||
|
|
|
|
|
|
|
|
|
|
|
|
|
|
|
|
|
|
|
|
|
|
|
|
|
|
|
|
|
|
|
|
|
|
|
|
|
|
|
|
|
|
|
| |||||||||||||||||||||||||||||||||||||||||||||||||
Average | 8.71 | 19.51 | 1.60 | 67.11 | 0.18 | 23.67 | 73.23 | 10.87 | 16.01 | 0.42 | 15.80 | 134.23 | 13.22 | 19.34 | 20.36 | 10.42 | 39.95 | 6.38 | 10.00 | 15.92 | 15.34 | 15.54 | ||||||||||||||||||||||||||||||||||||||||||||||||||||||||||||||||||||||
Median | 9.38 | 14.11 | 1.66 | 71.11 | 0.11 | 25.11 | 73.67 | 4.76 | 12.00 | 0.00 | 12.00 | 129.15 | 10.65 | 16.58 | 17.33 | 6.43 | 31.67 | 3.97 | 7.14 | (1.59 | ) | 3.49 | 3.98 | |||||||||||||||||||||||||||||||||||||||||||||||||||||||||||||||||||||
High | 17.27 | 65.62 | 2.53 | 81.92 | 0.70 | 38.83 | 89.25 | 40.54 | 35.92 | 3.82 | 35.90 | 171.45 | 25.19 | 33.09 | 34.34 | 42.40 | 172.06 | 44.62 | 30.41 | 164.08 | 69.22 | 69.93 | ||||||||||||||||||||||||||||||||||||||||||||||||||||||||||||||||||||||
Low | 1.30 | 3.38 | 0.00 | 28.45 | 0.00 | 9.98 | 46.69 | 0.64 | 7.33 | 0.00 | 7.33 | 109.62 | 7.37 | 12.70 | 13.41 | (10.64 | ) | (10.55 | ) | (7.20 | ) | (7.04 | ) | (26.99 | ) | (12.36 | ) | (12.36 | ) | |||||||||||||||||||||||||||||||||||||||||||||||||||||||||||||||
All Public Non-MHC Thrifts | ||||||||||||||||||||||||||||||||||||||||||||||||||||||||||||||||||||||||||||||||||||||||||||
Average | 9.49 | 10.72 | 1.55 | 72.30 | 0.19 | 20.88 | 75.85 | 10.33 | 12.53 | 1.04 | 11.50 | 137.02 | 11.28 | 16.16 | 17.23 | 18.11 | 56.80 | 12.75 | 20.82 | 1.83 | 7.58 | 7.25 | ||||||||||||||||||||||||||||||||||||||||||||||||||||||||||||||||||||||
Median | 8.36 | 8.58 | 1.71 | 72.97 | 0.00 | 19.68 | 78.42 | 8.17 | 11.56 | 0.04 | 10.25 | 134.44 | 10.28 | 14.04 | 15.29 | 12.87 | 31.48 | 7.56 | 18.53 | (2.36 | ) | 4.16 | 3.55 | |||||||||||||||||||||||||||||||||||||||||||||||||||||||||||||||||||||
| (1) | Bank level data |
| (2) | Most recent quarter average |
| Source: | S&P Global Market Intelligence and Faust Financial, LLC calculations. This table contains information from sources Faust Financial, LLC believes are reliable, however we do not control or guarantee the accuracy or completeness of such information. |
37
| Pro Forma Valuation Report for Second Step Conversion
|
Interest-earning assets for the Company amounted to 93.53% of assets, which was similar to the Comparable Group’s average of 95.33%. Net loans were 63.68% of assets, which was lower than 67.11% for the Comparable Group, while cash and equivalents were higher at 17.91% vs. 8.71%, and investments including mortgage-backed securities of 11.94% were lower than the 19.51% for the Comparable Group. Overall, in comparison to the Comparable Group, the Company had similar interest earning assets to total assets somewhat lower net loans and investments, with much higher cash, suggesting that the Company’s interest earning asset composition, including in asset utilization vs. the Comparable Group as it relates to interest earning assets is less favorable than the Comparable Group average.
Non interest-earning assets for the Company included bank-owned life insurance (“BOLI”) equal to 2.61% of assets and loan servicing asset equal to 0.35% compared to the Comparable Group at 1.60% and 0.18%, respectively. No goodwill/intangibles were reported by the Company and the Comparable Group reported 0.42%. Overall, the proportion and composition of non-interest earning assets for the Company and the Comparable Group were relatively similar as a percent of assets.
Loan portfolio composition along with total risk weighted assets (“RWA”) are reflected in Table III.D.2 below:
Table III.D.2
Loan Portfolio Composition (1)
Comparable Group Analysis
As of December 31, 2020 or Most Recent Date Available
| Loan Portfolio Composition as a Percent of Assets | Servicing Assets/ Assets (%) | |||||||||||||||||||||||||||||||||||||
| 1-4 Family (%) | Multifamily (%) | CRE (%) | Construction & Land (%) | C&I (%) | Consumer (%) | RWA/ Assets (%) | ||||||||||||||||||||||||||||||||
1895 Bancorp of Wisconsin, Inc. | ||||||||||||||||||||||||||||||||||||||
BCOW | December 31, 2020 | 20.02 | 12.76 | 21.11 | 1.60 | 8.92 | 0.10 | 0.35 | 63.44 | |||||||||||||||||||||||||||||
Comparable Group | ||||||||||||||||||||||||||||||||||||||
CBMB | CBM Bancorp, Inc. | MD | 30.20 | 3.37 | 21.80 | 6.88 | 4.35 | 0.14 | 0.00 | 65.75 | ||||||||||||||||||||||||||||
CNNB | Cincinnati Bancorp, Inc. | OH | 45.94 | 16.88 | 12.03 | 1.17 | 0.30 | 0.13 | 0.85 | 69.95 | ||||||||||||||||||||||||||||
ESBK | Elmira Savings Bank | NY | 46.92 | 5.98 | 9.38 | 1.83 | 6.67 | 5.08 | 0.23 | 61.85 | ||||||||||||||||||||||||||||
FFBW | FFBW, Inc. | WI | 19.68 | 10.46 | 25.42 | 2.49 | 6.64 | 0.20 | 0.00 | 65.76 | ||||||||||||||||||||||||||||
HMNF | HMN Financial, Inc. | MN | 19.11 | 4.55 | 31.92 | 5.12 | 8.10 | 2.17 | 0.33 | 72.25 | ||||||||||||||||||||||||||||
HFBL | Home Federal Bancorp, Inc. of Louisiana | LA | 26.80 | 7.89 | 16.10 | 4.86 | 12.11 | 0.16 | 0.00 | 60.80 | ||||||||||||||||||||||||||||
HVBC | HV Bancorp, Inc. | PA | 29.89 | 1.22 | 3.16 | 0.98 | 10.69 | 0.61 | 0.24 | 32.77 | ||||||||||||||||||||||||||||
IROQ | IF Bancorp, Inc. | IL | 18.45 | 14.83 | 19.85 | 2.63 | 10.58 | 1.16 | 0.11 | NA | ||||||||||||||||||||||||||||
MSVB | Mid-Southern Bancorp, Inc. | IN | 28.22 | 3.72 | 8.45 | 2.78 | 1.92 | 0.60 | 0.00 | NA | ||||||||||||||||||||||||||||
WVFC | WVS Financial Corp. | PA | 25.86 | 1.15 | 1.31 | 0.63 | 0.01 | 0.02 | 0.00 | 61.40 | ||||||||||||||||||||||||||||
|
|
|
|
|
|
|
|
|
|
|
|
|
|
|
| |||||||||||||||||||||||
| Average | 29.11 | 7.00 | 14.94 | 2.94 | 6.14 | 1.03 | 0.18 | 61.32 | ||||||||||||||||||||||||||||||
| Median | 27.51 | 5.26 | 14.06 | 2.56 | 6.66 | 0.40 | 0.05 | 63.80 | ||||||||||||||||||||||||||||||
| High | 46.92 | 16.88 | 31.92 | 6.88 | 12.11 | 5.08 | 0.85 | 72.25 | ||||||||||||||||||||||||||||||
| Low | 18.45 | 1.15 | 1.31 | 0.63 | 0.01 | 0.02 | 0.00 | 32.77 | ||||||||||||||||||||||||||||||
All Public Non-MHC Thrifts | ||||||||||||||||||||||||||||||||||||||
| Average | 27.32 | 11.18 | 16.89 | 3.93 | 7.74 | 2.30 | 0.16 | 66.88 | ||||||||||||||||||||||||||||||
| Median | 25.86 | 5.62 | 15.58 | 2.76 | 6.13 | 0.20 | 0.01 | 70.05 | ||||||||||||||||||||||||||||||
| (1) | Bank level data |
| Source: | S&P Global Market Intelligence and Faust Financial, LLC calculations. This table contains information from sources Faust Financial, LLC believes are reliable, however we do not control or guarantee the accuracy or completeness of such information. |
38
| Pro Forma Valuation Report for Second Step Conversion
|
The Company’s loan portfolio in comparison to the Comparable Group, had a lower concentration of one-to-four family mortgage loans of 20.02% vs. 29.11%. Conversely, the Company has a greater proportion of higher risk and higher yielding CRE loans (21.11% of assets vs. 14.94% of assets for the Comparable Group), multifamily loans (12.76% vs. 7.00%) and commercial & industrial loans (8.92% vs. 6.14%). However, the Company has a lower proportion of construction & land loans than the Comparable Group has (1.60% vs. 2.94%). In total, construction/land, CRE, multi-family, commercial & industrial loans were 44.39% for the Company vs. 31.02% for the Comparable Group.
As of December 31, 2020, the Company had $1.8 million or 0.35% of assets of capitalized loan servicing intangibles in the form of mortgage servicing rights compared to 0.18% of assets for the Comparable Group.
Despite the Company’s greater diversification into CRE, multifamily and C&I loans, overall, the Company’s and the Comparable Group’s RWA composition were comparable with the Company’s risk weighted assets-to-assets ratio at 63.44% compared to 61.32% for the Comparable Group. The Company’s higher cash and investments to assets compared to the Comparable Group balances out the overall RWA.
Credit Risk Measures compared to the Comparable Group are reflected in Table III.D.3:
Table III.D.3
Credit Risk Measures (1)
Comparable Group Analysis
For Last 12 Months Ended December 31, 2020 or The Most Recent 12 Months Available
| Reserves/ Loans HFI (%) | NPL/ Loans HFI (2) (%) | Reserves/ NPL (2) (%) | Net Loan Chargeoffs/ Avg. Loans HFI (3) (%) | Provision Expense/ Net Loan Chargeoffs (3) (%) | OREO/ Assets (%) | NPA + 90 Days PD/ Assets (4) (%) | ||||||||||||||||||||||||||
1895 Bancorp of Wisconsin, Inc. | ||||||||||||||||||||||||||||||||
BCOW | December 31, 2020 | 0.81 | 0.52 | 157 | (0.06 | ) | (246 | ) | 0.00 | 0.33 | ||||||||||||||||||||||
Comparable Group | ||||||||||||||||||||||||||||||||
CBMB | CBM Bancorp, Inc. | MD | 1.15 | 0.15 | 771 | 0.00 | NM | 0.33 | 0.43 | |||||||||||||||||||||||
CNNB | Cincinnati Bancorp, Inc. | OH | 0.99 | 0.78 | 127 | 0.00 | NA | 0.00 | 0.56 | |||||||||||||||||||||||
ESBK | Elmira Savings Bank | NY | 1.19 | 1.15 | 104 | 0.05 | 535 | 0.03 | 0.89 | |||||||||||||||||||||||
FFBW | FFBW, Inc. | WI | 1.29 | 0.69 | 188 | (0.01 | ) | NM | 0.04 | 0.48 | ||||||||||||||||||||||
HMNF | HMN Financial, Inc. | MN | 1.64 | 0.40 | 405 | 0.09 | 479 | 0.07 | 0.36 | |||||||||||||||||||||||
HFBL | Home Federal Bancorp, Inc. of Louisiana | LA | 1.11 | 1.14 | 97 | 0.53 | 117 | 0.14 | 0.90 | |||||||||||||||||||||||
HVBC | HV Bancorp, Inc. | PA | 0.64 | 0.71 | 89 | 0.18 | 210 | 0.00 | 0.26 | |||||||||||||||||||||||
IROQ | IF Bancorp, Inc. | IL | 1.26 | 0.25 | 509 | 0.05 | 191 | 0.05 | 0.25 | |||||||||||||||||||||||
MSVB | Mid-Southern Bancorp, Inc. | IN | 1.38 | 1.87 | 74 | 0.03 | 322 | 0.04 | 0.96 | |||||||||||||||||||||||
WVFC | WVS Financial Corp. | PA | 0.67 | 0.00 | NA | 0.00 | NA | 0.00 | 0.00 | |||||||||||||||||||||||
|
|
|
|
|
|
|
|
|
|
|
|
|
| |||||||||||||||||||
Average | 1.13 | 0.71 | 263 | 0.09 | 309 | 0.07 | 0.51 | |||||||||||||||||||||||||
Median | 1.17 | 0.70 | 127 | 0.04 | 266 | 0.04 | 0.46 | |||||||||||||||||||||||||
High | 1.64 | 1.87 | 771 | 0.53 | 535 | 0.33 | 0.96 | |||||||||||||||||||||||||
Low | 0.64 | 0.00 | 74 | (0.01 | ) | 117 | 0.00 | 0.00 | ||||||||||||||||||||||||
All Public Non-MHC Thrifts | ||||||||||||||||||||||||||||||||
Average | 1.22 | 1.13 | 182 | 0.05 | 337 | 0.03 | 0.86 | |||||||||||||||||||||||||
Median | 1.19 | 0.87 | 109 | 0.02 | 327 | 0.01 | 0.78 | |||||||||||||||||||||||||
| (1) | Bank level data as related to comparable group |
| (2) | NPLs are defined as total nonaccrual loans plus total restructured loans. |
| (3) | Net loan chargeoffs are shown on a last twelve month basis. |
| (4) | NPAs are defined as total nonaccrual loans, accruing loans 90 days or more past due, OREO and total restructured loans. |
| Source: | S&P Global Market Intelligence and Faust Financial, LLC calculations. This table contains information from sources Faust Financial, LLC believes are reliable, however we do not control or guarantee the accuracy or completeness of such information. |
39
| Pro Forma Valuation Report for Second Step Conversion
|
The Company’s vs. the Comparable Group’s loan loss reserve was lower as a percent of loans held for investment (0.81% vs. 1.13%) and as a percent of non-performing loans (157% vs 263%). Non-performing loans and non-performing assets were both lower at 0.52% of loans held for investment and 0.33% of total assets, respectively vs. comparable measures of 0.71% and 0.51%, respectively, for the Comparable Group. Net loan recoveries or charge-offs were minimal for both the Company and Comparable Group, based on ratios of net recovery of 0.06% for the Company and net charge-offs of 0.09% of net loans receivable for the Comparable Group. The Company’s provision expense of -246% of its net recovery is not a meaningful metric. The Comparable Group recorded provision expense of 309% of its net loan charge-offs. On balance, credit risk measures between the Company and the Comparable group averages were similar.
Funding composition and liquidity for the Company as reflected in Table III.D.1 was comparable to that of the Comparable Group’s with the Company having similar total deposits to average assets, but lower time deposits and higher borrowings. The Company’s deposits equaled 73.51% of assets, which was similar to the Comparable Group’s ratio of 73.23%, but time deposits at 16.96% of assets were lower vs. the Comparable Group’s ratio of 23.67%. The Company’s borrowings were higher than the Comparable Group’s, as indicated by borrowings-to-assets ratios of 13.24% and 10.87%, respectively. Total interest earning assets as a percent of interest-bearing liabilities for the Company and the Comparable Group equaled 129.90% and 134.23%, respectively, indicating that both the Company and the Comparable Group are asset sensitive with a similar amount of assets repricing relative to repricing liabilities. The Company had a higher level of cash and equivalents indicating the Company has more on balance sheet liquidity.
Capital levels, including equity-to-assets and tangible equity-to-assets of 11.61% for the Company were both lower than the Comparable Group’s of 16.01% and 15.80%, respectively. Regulatory capital ratios for the Bank were also lower than the Comparable Group’s subsidiary institution average, with a tier 1 leverage ratio of 9.81% for the Bank compared to 13.22% for the Comparable Group’s subsidiary institution, and total risk-based capital of 15.96% and 20.36%, respectively.
The Company’s pro forma equity-to-assets will be higher as a result of the stock offering proceeds. The increase in 1895 Bancorp’s pro forma capital position will increase the Company’s equity-to-assets ratios and lower its funding cost and risk profile, while increasing its leverage capacity and consequently future earnings potential. However, in the short term, the Company’s higher pro forma equity will negatively impact its return on equity.
40
| Pro Forma Valuation Report for Second Step Conversion
|
As a result of the conversion stock offering, the Company will have additional capital resources to strengthen the Bank’s regulatory capital levels and given its plans to infuse additional capital into the Bank in connection with the offering, the Bank’s regulatory capital levels will also increase.
Interest-earning assets/interest-bearing liabilities (“IEA/IBL”) is a key ratio in measuring balance sheet strength for a savings institution. The Company’s IEA/IBL ratio of 129.90% was comparable albeit slightly lower than the Comparable Group’s ratio of 134.23%. The additional capital realized from stock proceeds should serve to provide the Company with an IEA/IBL ratio that exceeds the Comparable Group’s, as the increase in capital provided by the infusion of conversion stock offering proceeds will reduce the need for interest-bearing liabilities that are funding assets and will be primarily deployed into interest-earning assets.
Balance sheet growth reflected in Table III.D.1 represents annual growth rates for the twelve months ended December 31, 2020, or most recent available, for key balance sheet items. Asset growth of 20.74% for the Company is higher than the Comparable Group’s asset growth of 10.42%. The Company’s cash and investments increased by an annualized 80.09% compared to 39.95% for the Comparable Group. Net loans increased 5.92% compared to 6.38%, while deposits increased 10.23% compared to 10.00% and borrowings increased 288.12% compared to an increase of 15.92% for the Comparable Group. The Company’s equity increased at a 2.29% annual rate, vs. 15.34% based on averages (3.49% based at the median) for the Comparable Group. Overall, the Company’s higher asset growth vs. the Comparable Group was driven primarily by higher growth in borrowings, cash and investments combined (although investments and MBS declined), and not higher growth in loans or deposits, both of which were similar to the Comparable Group’s growth rates.
| 2. | Profitability and Earnings Capacity |
Profitability and Earnings Capacity as measured based on the Company’s vs. the Comparable Group’s interest and expense components, yield/cost and overall efficiency is reflected in Table III.D.4, with the ratios based on earnings for the 12 months ended December 31, 2020 for the Company and for the Comparable Group, the latest 12-month period available.
41
| Pro Forma Valuation Report for Second Step Conversion
|
Table III.D.4
Income as Percent of Average Assets and Yields, Costs and Spreads
Comparable Group Analysis
For Last 12 Months Ended December 31, 2020 or the Most Recent 12 Months Available
| Net Interest Income | Non-Interest Income | Non-Op. Items | Tax Info. | Yield, Cost and Spread (1) | ||||||||||||||||||||||||||||||||||||||||||||||||||||||||||||||||||||||||||
| Net Income (%) | Interest Income (%) | Interest Expense (%) | Net Interest Income (%) | Loan Loss Provision on IEA (%) | NII After Provision (%) | Gain on Sale of Loans (%) | Other Non- Int. Income (%) | Total Non- Int. Expense (%) | Net Gains/ Losses (%) | Non- Recurring Exp & Rev (%) | Extrao. Items (%) | Provision for Taxes (%) | Effective Tax Rate (%) | Yield on IEA (%) | Cost of IBL (%) | Yield- Cost Spread (%) | Efficiency Ratio (%) | |||||||||||||||||||||||||||||||||||||||||||||||||||||||||||||
1895 Bancorp of Wisconsin, Inc. | ||||||||||||||||||||||||||||||||||||||||||||||||||||||||||||||||||||||||||||||
| BCOW | December 31, 2020 | 0.28 | 3.26 | 0.64 | 2.61 | 0.11 | 2.51 | 0.74 | 0.52 | 3.32 | 0.20 | 0.00 | 0.00 | 0.37 | 56.86 | 3.45 | 0.81 | 2.64 | 85.73 | |||||||||||||||||||||||||||||||||||||||||||||||||||||||||||
Comparable Group | ||||||||||||||||||||||||||||||||||||||||||||||||||||||||||||||||||||||||||||||
| CBMB | CBM Bancorp, Inc. | MD | 0.32 | 3.90 | 0.66 | 3.24 | 0.19 | 3.05 | 0.34 | 0.16 | 3.14 | 0.06 | 0.00 | 0.00 | 0.16 | 33.24 | 4.15 | 1.14 | 3.01 | 82.94 | ||||||||||||||||||||||||||||||||||||||||||||||||||||||||||
| CNNB | Cincinnati Bancorp, Inc. | OH | 0.77 | 3.59 | 1.23 | 2.36 | 0.03 | 2.33 | 2.93 | 0.17 | 4.49 | 0.00 | 0.00 | 0.00 | 0.17 | 18.00 | 3.90 | 1.40 | 2.50 | 82.25 | ||||||||||||||||||||||||||||||||||||||||||||||||||||||||||
| ESBK | Elmira Savings Bank | NY | 0.64 | 3.47 | 0.91 | 2.56 | 0.22 | 2.34 | 0.71 | 0.41 | 2.64 | 0.00 | NA | 0.00 | 0.17 | 20.79 | 4.12 | 1.23 | 2.89 | 71.82 | ||||||||||||||||||||||||||||||||||||||||||||||||||||||||||
| FFBW | FFBW, Inc. | WI | 0.63 | 3.89 | 0.69 | 3.20 | 0.11 | 3.09 | 0.15 | 0.25 | 2.68 | 0.00 | 0.00 | 0.00 | 0.19 | 23.29 | 4.29 | 1.02 | 3.27 | 74.14 | ||||||||||||||||||||||||||||||||||||||||||||||||||||||||||
| HMNF | HMN Financial, Inc. | MN | 1.21 | 3.74 | 0.33 | 3.41 | 0.32 | 3.09 | 1.12 | 0.63 | 3.16 | (0.00 | ) | 0.00 | 0.00 | 0.48 | 28.31 | 3.83 | 0.53 | 3.30 | 61.04 | |||||||||||||||||||||||||||||||||||||||||||||||||||||||||
| HFBL | Home Federal Bancorp, Inc. of Louisiana | LA | 0.93 | 4.04 | 0.86 | 3.19 | 0.41 | 2.78 | 0.78 | 0.23 | 2.66 | 0.04 | 0.00 | 0.00 | 0.25 | 21.05 | 4.24 | 1.20 | 3.04 | 62.00 | ||||||||||||||||||||||||||||||||||||||||||||||||||||||||||
| HVBC | HV Bancorp, Inc. | PA | 1.02 | 3.38 | 0.90 | 2.48 | 0.27 | 2.22 | 2.32 | 1.24 | 4.40 | 0.04 | 0.00 | 0.00 | 0.39 | 27.77 | 3.28 | 0.94 | 2.34 | 72.93 | ||||||||||||||||||||||||||||||||||||||||||||||||||||||||||
| IROQ | IF Bancorp, Inc. | IL | 0.70 | 3.61 | 0.90 | 2.71 | 0.07 | 2.64 | 0.22 | 0.52 | 2.48 | 0.07 | 0.00 | 0.00 | 0.27 | 28.00 | 3.74 | 1.12 | 2.62 | 71.72 | ||||||||||||||||||||||||||||||||||||||||||||||||||||||||||
| MSVB | Mid-Southern Bancorp, Inc. | IN | 0.56 | 3.58 | 0.47 | 3.11 | 0.05 | 3.06 | 0.00 | 0.34 | 2.86 | 0.05 | 0.00 | 0.00 | 0.04 | 5.94 | 3.74 | 0.72 | 3.02 | 82.70 | ||||||||||||||||||||||||||||||||||||||||||||||||||||||||||
| WVFC | WVS Financial Corp. | PA | 0.50 | 2.24 | 0.60 | 1.64 | 0.02 | 1.62 | 0.00 | 0.11 | 1.03 | (0.01 | ) | NA | 0.00 | 0.19 | 27.59 | 2.32 | 0.73 | 1.59 | 58.83 | |||||||||||||||||||||||||||||||||||||||||||||||||||||||||
|
|
|
|
|
|
|
|
|
|
|
|
|
|
|
|
|
|
|
|
|
|
|
|
|
|
|
|
|
|
|
|
|
|
|
| |||||||||||||||||||||||||||||||||||||||||||
| Average | 0.73 | 3.55 | 0.76 | 2.79 | 0.17 | 2.62 | 0.86 | 0.41 | 2.95 | 0.03 | 0.00 | 0.00 | 0.23 | 23.40 | 3.76 | 1.00 | 2.76 | 72.04 | ||||||||||||||||||||||||||||||||||||||||||||||||||||||||||||
| Median | 0.67 | 3.60 | 0.78 | 2.91 | 0.15 | 2.71 | 0.52 | 0.30 | 2.77 | 0.02 | 0.00 | 0.00 | 0.19 | 25.44 | 3.87 | 1.07 | 2.95 | 72.38 | ||||||||||||||||||||||||||||||||||||||||||||||||||||||||||||
| High | 1.21 | 4.04 | 1.23 | 3.41 | 0.41 | 3.09 | 2.93 | 1.24 | 4.49 | 0.07 | 0.00 | 0.00 | 0.48 | 33.24 | 4.29 | 1.40 | 3.30 | 82.94 | ||||||||||||||||||||||||||||||||||||||||||||||||||||||||||||
| Low | 0.32 | 2.24 | 0.33 | 1.64 | 0.02 | 1.62 | 0.00 | 0.11 | 1.03 | (0.01 | ) | 0.00 | 0.00 | 0.04 | 5.94 | 2.32 | 0.53 | 1.59 | 58.83 | |||||||||||||||||||||||||||||||||||||||||||||||||||||||||||
All Public Non-MHC Thrifts | ||||||||||||||||||||||||||||||||||||||||||||||||||||||||||||||||||||||||||||||
| Average | 0.91 | 3.68 | 0.75 | 2.93 | 0.28 | 2.60 | 0.69 | 0.44 | 2.74 | 0.04 | (0.03 | ) | 0.00 | 0.28 | 22.71 | 3.90 | 2.93 | 0.96 | 64.52 | |||||||||||||||||||||||||||||||||||||||||||||||||||||||||||
| Median | 0.77 | 3.59 | 0.73 | 2.82 | 0.23 | 2.61 | 0.08 | 0.29 | 2.60 | 0.00 | 0.00 | 0.00 | 0.24 | 22.88 | 3.82 | 2.86 | 0.96 | 63.10 | ||||||||||||||||||||||||||||||||||||||||||||||||||||||||||||
| (1) | Bank level data |
| Source: | S&P Global Market Intelligence and Faust Financial, LLC calculations. This table contains information from sources Faust Financial, LLC believes are reliable, however we do not control or guarantee the accuracy or completeness of such information. |
42
| Pro Forma Valuation Report for Second Step Conversion
|
The Company reported net income equal to 0.28% of average assets, vs. the 0.73% average for the Comparable Group. The Company’s lower interest income to average assets ratio (3.26% versus 3.55% for the Comparable Group) paralleled its lower yield on interest earning assets (3.45% vs. 3.76%); both were indicative of its lower level of net loans and higher level of cash. Likewise, the Company’s lower interest expense ratio (0.64% vs 0.76%) was facilitated by a lower cost of interest-bearing liabilities (0.81% versus 1.00% for the Comparable Group). Overall, the Company and the Comparable Group reported net interest income to average assets ratios of 2.61% and 2.79%, respectively; and a yield-cost spread of 2.64% and 2.76% respectively.
Loan loss provision expense for the Company was 0.11% of average assets while the Comparable Group reported 0.17%. The Company’s net interest income after provision expense of 2.51% vs. 2.62% for the Comparable Group was favorably impacted by the Company’s lower provision expense, but still compared unfavorably to the Comparable Group owing to the Company’s lower net interest income to average assets and lower yield-cost spread.
Non-interest income for the Company of 1.26% of average assets and 1.27% for the Comparable Group consisted of 0.74% and 0.86%, respectively, of gain on sale of loans and 0.52% and 0.41%, respectively, of other non-interest income. Total non-interest expense of 3.32% of average assets for the Company was higher than the 2.95% for the Comparable Group.
Non-operating items of 0.20% were higher than the 0.03% for the Comparable Group and for the Company consisted of 0.22% of securities gains and a 0.02% loss on other assets. Extraordinary items did not impact either the Company’s or the Comparable Group’s earnings.
The Company’s provision for taxes of 0.37% was significantly higher than the Comparable Group’s of 0.23%. Similarly, the Company’s tax expense of 56.86% of pre-tax income, which includes a charge to income tax expense related to an increase in the Company’s deferred tax asset valuation allowance stemming from a reduction in the value of the Company’s deferred tax assets, was significantly higher than the Comparable Group’s of 23.40%. As indicated in the prospectus, the Company’s marginal tax rate is 27%.
The Company’s lower net interest income and especially its higher non-interest expense, are reflected in the Company’s less favorable efficiency ratio of 85.73% compared to the Comparable Group’s 72.04%. The Company’s less favorable efficiency ratio (i.e. operating expenses divided by net interest income plus non-interest income) is indicative of its lower earnings capacity vs. the Comparable Group’s. As the Company’s net interest income of 2.61% of average assets was insufficient to cover its total non-interest expense of 3.32%, the Company’s ability to operate profitably on a pre-tax basis was dependent
43
| Pro Forma Valuation Report for Second Step Conversion
|
on non-interest income sources. This was also the case for the Comparable Group, which recorded net interest income of 2.79% and non-interest expense of 2.95%, albeit its coverage shortfall was 0.16% while the Company’s was significantly higher at 0.71% indicating the Company’s greater reliance on non-interest income to cover non-interest expense.
On an adjusted earnings basis as set forth in Table I.E.1 and as detailed in Table IV.E.1, with the adjustments relating to the Company’s gain on sale of securities and other assets as well as the adjustment to income tax expense to reverse the charge for establishing a valuation allowance against the Company’s deferred tax asset, adjusted net income was 0.33% of average assets vs. reported net income of 0.28% for the Company and 0.73% for the Comparable Group’s net income to average assets.
As the Company’s operating expenses will increase further with the addition of the certain stock based compensation expenses, the Company’s expenses will be even higher on a pro forma basis. Over the longer term, the Company’s greater capacity to leverage its balance sheet and thereby improve its net interest income to average assets should position the Company to reduce operating expenses as a percent of average assets and have a favorable impact on its efficiency ratio and earnings capacity.
| 3. | Asset / Liability and Interest Rate Risk Management |
As previously discussed and reflected in Table III.D.1, the Company has a relatively higher proportion of cash & equivalents vs. the Comparable Group average (17.91% vs. 8.71%), and as reflected in Table III.D.2, a higher proportion of its loan portfolio is in one-to-four family residential mortgage loans, including CRE, multi-family, commercial business, construction and land, and consumer loans, combined, all of which tend to have shorter terms and/or adjustable interest rates than owner occupied one- to four-family residential real estate loans. The Company sells substantially all conforming and eligible jumbo, longer-term, fixed-rate one- to four-family residential real estate loans while it retains the nonconforming and shorter-term, fixed-rate and adjustable-rate one- to four-family residential real estate loans that the Bank originates, subject to market conditions and a periodic review of the Company’s asset/liability management needs. As such, the Company had 20.02% of one-to-four family mortgage loans as of December 31, 2020 vs. 29.11% for the Comparable Group, while it had 44.49% in all other loan types combined vs. 32.22% for the Comparable Group. On the funding side, the Company had 16.96% in time deposits as a percent of assets vs. the Comparable Group’s ratio of 23.67%, which indicates that the Company has not only a greater proportion of loans that reprice relatively faster but also a smaller proportion of rate sensitive deposits. However, the Company has a higher level of borrowed funds to assets than the Comparable Group average (13.24% vs 10.87%).
44
| Pro Forma Valuation Report for Second Step Conversion
|
As noted in Table III.D.5, the Company’s balance sheet, over the short-term (less than one year) is asset-sensitive with an IBA to IBL ratio of 136%. All of the companies in the Comparable Group are also asset sensitive with the average IBA to IBL ratio of 140%. Consequently, the net interest margins for the Company and the Comparable Group are expected to be favorably impacted by increasing interest rates. In connection with the second step conversion, the net stock offering proceeds will further improve the Company’s interest rate risk exposure, as the net proceeds will primarily be invested into interest-earning assets and the increase in the Company’s capital will reduce the proportion of interest rate sensitive liabilities as a funding source.
Table III.D.5 also displays the Company and the Comparable Group’s quarterly basis point changes in net interest margin over the past six quarters through December 31, 2020. Overall, the Company’s net interest margin has been more positively impacted over the period with only three quarters of margin decline and an overall increase in net interest margin for the period while on average the Comparable Group’s margin declined for five consecutive quarters through September 30, 2020, increasing only in the December 31, 2020 quarter, resulting in an overall decline in net interest margin for the period.
Table III.D.5
Net Interest Margin Volatility
Comparable Group Analysis
For Last 12 Months Ended December 31, 2020 or the Most Recent 12 Months Available
| Non-Earn. | ||||||||||||||||||||||||||||||||||||||
IEA/ | Assets/ | Quarterly Change in Net Interest Margin | ||||||||||||||||||||||||||||||||||||
| IBL | Assets | 12/31/2020 | 9/30/2020 | 6/30/2020 | 3/31/2020 | 12/31/2019 | 9/30/2019 | |||||||||||||||||||||||||||||||
| (%) | (%) | (BPS) | (BPS) | (BPS) | (BPS) | (BPS) | (BPS) | |||||||||||||||||||||||||||||||
1895 Bancorp of Wisconsin, Inc. | ||||||||||||||||||||||||||||||||||||||
BCOW | December 31, 2020 | 136.13 | 6.47 | 1 | 33 | (43 | ) | (4 | ) | 7 | 18 | |||||||||||||||||||||||||||
Comparable Group | ||||||||||||||||||||||||||||||||||||||
CBMB | CBM Bancorp, Inc. | MD | 153.18 | 3.95 | NA | (26 | ) | (23 | ) | 3 | (18 | ) | 3 | |||||||||||||||||||||||||
CNNB | Cincinnati Bancorp, Inc. | OH | 144.20 | 5.50 | (6 | ) | (31 | ) | 23 | 8 | (36 | ) | (20 | ) | ||||||||||||||||||||||||
ESBK | Elmira Savings Bank | NY | 126.91 | 7.79 | 44 | (16 | ) | (19 | ) | 14 | 3 | (8 | ) | |||||||||||||||||||||||||
FFBW | FFBW, Inc. | WI | 177.38 | 4.75 | NA | 15 | (11 | ) | (4 | ) | 11 | 5 | ||||||||||||||||||||||||||
HMNF | HMN Financial, Inc. | MN | 155.98 | 2.89 | 11 | (13 | ) | (18 | ) | (5 | ) | (21 | ) | (33 | ) | |||||||||||||||||||||||
HFBL | Home Federal Bancorp, Inc. of Louisiana | LA | 135.67 | 5.13 | 29 | (15 | ) | 10 | (26 | ) | (11 | ) | 12 | |||||||||||||||||||||||||
HVBC | HV Bancorp, Inc. | PA | 118.96 | 4.83 | NA | (12 | ) | 23 | 4 | NA | NA | |||||||||||||||||||||||||||
IROQ | IF Bancorp, Inc. | IL | 118.14 | 3.98 | 12 | 4 | (3 | ) | 12 | (13 | ) | 13 | ||||||||||||||||||||||||||
MSVB | Mid-Southern Bancorp, Inc. | IN | 144.48 | 3.22 | NA | (3 | ) | (22 | ) | (15 | ) | (5 | ) | (19 | ) | |||||||||||||||||||||||
WVFC | WVS Financial Corp. | PA | 120.62 | 4.62 | NA | (11 | ) | (15 | ) | (5 | ) | (16 | ) | (2 | ) | |||||||||||||||||||||||
|
|
|
|
|
|
|
|
|
|
|
|
|
|
|
| |||||||||||||||||||||||
| Average | 139.55 | 4.67 | 18 | (11 | ) | (6 | ) | (1 | ) | (12 | ) | (6 | ) | |||||||||||||||||||||||||
| Median | 139.94 | 4.69 | 12 | (12 | ) | (13 | ) | (0 | ) | (13 | ) | (2 | ) | |||||||||||||||||||||||||
| High | 177.38 | 7.79 | 44 | 15 | 23 | 14 | 11 | 13 | ||||||||||||||||||||||||||||||
| Low | 118.14 | 2.89 | (6 | ) | (31 | ) | (23 | ) | (26 | ) | (36 | ) | (33 | ) | ||||||||||||||||||||||||
All Public Non-MHC Thrifts | ||||||||||||||||||||||||||||||||||||||
| Average | 136.04 | 5.22 | 12 | 0 | (16 | ) | (3 | ) | (7 | ) | (4 | ) | ||||||||||||||||||||||||||
| Median | 132.97 | 4.94 | 10 | (2 | ) | (15 | ) | (4 | ) | (5 | ) | (2 | ) | |||||||||||||||||||||||||
| Source: | S&P Global Market Intelligence and Faust Financial, LLC calculations. This table contains information from sources Faust Financial, LLC believes are reliable, however we do not control or guarantee the accuracy or completeness of such information. |
45
| Pro Forma Valuation Report for Second Step Conversion
|
| 4. | Primary Market Economic and Demographic Considerations |
Table III.D.6 below displays economic and demographic data for the market area county in which the Company is headquartered compared to those market area counties in which members of the Comparable Group are headquartered.
Table III.D.6
Comparable Group Market Area Comparative Analysis
| Per Capita Income | Dec. 2020 | Deposit | ||||||||||||||||||||||||||||||||||||
| Population | 2016-2021 | 2021-2026 | 2021 | % State | Unemployment | Market | ||||||||||||||||||||||||||||||||
Institution | County | 2016 | 2021 | 2026 (1) | % Change | % Change | Amount | Average | Rate | Share (2) | ||||||||||||||||||||||||||||
1895 Bancorp of Wisconsin, Inc. | Milwaukee, WI | 958,242 | 942,546 | 941,193 | -0.27 | % | -0.03 | % | 30,901 | 85.1 | % | 7.1 | % | 0.48 | % | |||||||||||||||||||||||
Comparable Group | ||||||||||||||||||||||||||||||||||||||
CBM Bancorp, Inc. | Baltimore, MD | 833,355 | 827,833 | 838,202 | -0.11 | % | 0.25 | % | 44,121 | 93.6 | % | 5.9 | % | 0.65 | % | |||||||||||||||||||||||
Cincinnati Bancorp, Inc. | Hamilton, OH | 809,436 | 820,001 | 828,307 | 0.22 | % | 0.20 | % | 39,101 | 113.3 | % | 5.0 | % | 0.10 | % | |||||||||||||||||||||||
Elmira Savings Bank | Chemung, NY | 86,984 | 82,370 | 80,032 | -0.90 | % | -0.57 | % | 31,386 | 71.7 | % | 6.7 | % | 24.23 | % | |||||||||||||||||||||||
FFBW, Inc. | Waukesha, WI | 397,051 | 406,583 | 413,751 | 0.40 | % | 0.35 | % | 50,395 | 138.7 | % | 4.5 | % | 1.07 | % | |||||||||||||||||||||||
HMN Financial, Inc. | Olmsted, MN | 152,655 | 160,589 | 167,296 | 0.85 | % | 0.82 | % | 43,936 | 104.6 | % | 3.8 | % | 6.05 | % | |||||||||||||||||||||||
Home Federal Bancorp, Inc. of Louisiana | Caddo, LA | 250,014 | 236,376 | 230,003 | -0.93 | % | -0.55 | % | 26,312 | 89.1 | % | 7.7 | % | 5.90 | % | |||||||||||||||||||||||
HV Bancorp, Inc. | Bucks, PA | 627,070 | 628,796 | 630,606 | 0.05 | % | 0.06 | % | 51,097 | 135.6 | % | 5.3 | % | 0.40 | % | |||||||||||||||||||||||
IF Bancorp, Inc. | Iroquois, IL | 28,599 | 26,613 | 25,608 | -1.19 | % | -0.77 | % | 28,928 | 74.2 | % | 4.7 | % | 22.22 | % | |||||||||||||||||||||||
Mid-Southern Bancorp, Inc. | Washington, IN | 27,824 | 28,097 | 28,348 | 0.16 | % | 0.18 | % | 27,232 | 69.8 | % | 3.6 | % | 27.66 | % | |||||||||||||||||||||||
WVS Financial Corp. | Allegheny, PA | 1,231,991 | 1,212,006 | 1,206,155 | -0.27 | % | -0.10 | % | 43,296 | 134.9 | % | 6.3 | % | 0.08 | % | |||||||||||||||||||||||
| Averages: | 444,498 | 442,926 | 444,831 | -0.17 | % | -0.01 | % | 38,580 | 102.5 | % | 5.4 | % | 8.84 | % | ||||||||||||||||||||||||
| Medians: | 323,533 | 321,480 | 321,877 | -0.03 | % | 0.12 | % | 41,199 | 99.1 | % | 5.2 | % | 3.49 | % | ||||||||||||||||||||||||
| (1) | Projected population. |
| (2) | Total institution deposits in headquarters county as percent of total county deposits as of June 30, 2020. |
| Sources: | S&P Global Market Intelligence and the FDIC. |
Economic and demographic conditions of an institution’s market area have an impact on an institution’s franchise value, as future success is in part dependent upon opportunities for profitable activities in the local market served and the county in which an institution is headquartered more often than not represents its single largest lending and deposit market. The Company serves Southeastern Wisconsin through six full-service branch offices. The markets served by the Company are largely suburban and rural in nature. The Comparable Group companies mostly operate in markets with smaller 2021 populations compared to Milwaukee County. On average, the 2021 population for the Comparable Group’s primary market area counties is 442,926 vs. 942,546 for the Company.
Milwaukee County, where the Company maintains its main office, experienced a decline in population between 2016 to 2021 period of 0.27% similar to the Comparable Group’s markets that experienced a decline of 0.17%. Milwaukee County’s population and the Comparable Group’s on average are forecasted to remain relatively stable over the next five years.
Milwaukee County has a lower per capita income compared to most of the primary market area counties where the Comparable Group companies are headquartered. On average, the Comparable Group’s primary market area counties were more affluent markets within their respective states compared to Milwaukee County’s per capita income as a percent of Wisconsin’s per capita income (102.5% for the Comparable Group versus 85.1% for Milwaukee County).
46
| Pro Forma Valuation Report for Second Step Conversion
|
Milwaukee County’s December 2020 unemployment rate of 7.1% was higher than the comparable unemployment rate of 5.4% for the Comparable Group’s market area counties at the median.
The Company’s competitive position, as indicated by the 0.48% deposit market share in its primary market area, compares unfavorably to that of the Comparable Group companies, many of which have significantly higher market share. The average deposit market shares maintained by the Comparable Group companies was 8.84%.
| 5. | Projected Dividend Capacity and Intended Dividend Policy |
Prior to its second step conversion, the Company has not established a dividend policy and future dividends will depend upon a number of factors including, capital requirements, the Company’s financial condition and results of operations, tax considerations, statutory and regulatory limitations, and general economic conditions.
As set forth in Table IV.E.2 in Section IV, five out of the ten Comparable Group companies pay regular cash dividends, with implied dividend yields ranging from 0.78% to 4.84%. The average dividend yield on the stocks of the Comparable Group institutions was 1.99% as of February 8, 2021, similar to the the average dividend yield of 2.32% for all fully-converted publicly-traded savings institutions.
While the Company has not established a definitive dividend policy, the Company will have the capacity to pay a dividend comparable to the Comparable Group’s median dividend yield based on pro forma earnings and capitalization.
| 6. | Marketability of the Issued Stock |
Trends in the pricing of all publicly traded savings institutions like those in the various broader stock market indices are impacted by broader economic, demographic and other factors as well as the financial condition, earnings and earnings prospects, dividends paid by the companies that comprise an index or stock market segment. As such pricing metrics for the Comparable Group and therefore the Company are also impacted by these factors. Similarly impacted are the pricing for acquisitions of savings institution institutions, and pricing for recently converted companies, all of which we evaluated and, as appropriate, considered in our valuation of the common stock to be issued by the Company in connection with its proposed second step conversion.
47
| Pro Forma Valuation Report for Second Step Conversion
|
Specifically, we considered 1) stock market trends including broad market indices (S&P 500 and NASDAQ composite) and the market for savings institution stocks (SNL U.S. Thrift Index); 2) recent converting savings institutions stock issuances; 3) acquisition market for savings institutions, specifically those institutions headquartered in Wisconsin; 4) market for the currently outstanding public stock of 1895 Bancorp of Wisconsin, Inc; and 5) the size of the prospective stock issuance and market.
Stock Market Trends during 2020 and into early 2021, including various broad market indices and the market for savings institution stocks all experienced periods of significant volatility, declining precipitously and then rebounding strongly with cyclical savings institution stocks lagging in the recovery. The market volatility was driven in large part by the COVID-19 pandemic and related economic factors, the uncertainty around the length of the resulting recession and likely pace of recovery, as well as geo-political and domestic political factors, principally those surrounding the elections in 2020 and early 2021. See Exhibit III-4.
U.S. stock market declined significantly over the first quarter of 2020 as the coronavirus outbreak spread and jobless claims rocketed by over three million in the last week of March. The Federal Reserve cut interest rates twice in March 2020 for the first time since the global financial crisis. All sectors saw significant declines. Financials and industrials fell sharply while the information technology and healthcare sectors held up better. The stock market rebounded in the second quarter of 2020. At the beginning of the second quarter, data confirmed the severe economic impact of lockdown measures. However, the subsequent easing of lockdown restrictions, ongoing loose monetary policy from the Federal Reserve and early indications of a recovery led to widespread and sustained stock market gains. Weekly claims for unemployment insurance slowed substantially and retail sales rebounded strongly from April to May 2020. The U.S. economy’s recuperation continued at the beginning of the third quarter of 2020, and the Federal Reserve’s messaging remained highly accommodative. However, U.S. markets wobbled late in the quarter amid a resurgence in the COVID-19 cases, as well as questions over refreshed fiscal stimulus measures. The labor force participation rate improved, but it was still below its February pre-pandemic level. The stock market continued to improve over the fourth quarter of 2020, with November especially strong due to the vaccine news. The developments eclipsed Joe Biden’s win in the U.S. presidential election, as well as $900 billion stimulus package announced in late December. Overall, on December 31, 2020, the S&P 500 and NASDAQ closed at 3,756.1 and 12,888.3, respectively, an increase of 45.3% and 67.4% from March 31, 2020, which were the lowest point due to the coronavirus outbreak.
On February 8, 2021, the S&P 500 and NASDAQ closed at 3,915.6 and 13,987.6, respectively, an increase of 4.2% and 8.5% from December 31, 2020. The stock market rallied to record levels in early February 2021, as investors anticipated that additional fiscal relief measures would support equities further. The federal budget deficit is projected to total $2.3 trillion in the 2021 fiscal year, a decline from last year but still well above anything the U.S. had seen prior to the COVID-19 crisis, the Congressional Budget Office reported. The total also does not include the $1.9 trillion in relief spending that President Joe Biden has proposed.
48
| Pro Forma Valuation Report for Second Step Conversion
|
Savings institutions Stock Trends reflected relatively similar volatility; the COVID-19 related decline followed by a lagged recovery while the broader stock market rebounded faster than the Savings institution stock market. By the end of first quarter of 2020, the SNL U.S. Thrift index declined by 31.3% from December 31, 2019 which the S&P 500 and NASDAQ lost 20.0% and 14.2%, respectively, during the same timeframe, because fears increased as the COVID-19 pandemic grew into a global pandemic. Related fears regarding economic growth resulting from the outbreak of the COVID-19 pandemic prompted two emergency rate cuts by the Federal Reserve and pushed long-term rates to new historical lows. Within the S&P 500 and NASDAQ, financials trailed only energy as the worst-performing sector with the market capitalization-weighted SNL U.S. Thrift index having plunged far more so than the S&P 500 and NASDAQ as described above.
The U.S. government launched the Paycheck Protection Program (“PPP”), which provides guarantees for about $660 billion in loans to small businesses, and many smaller banks were taking a leading role in the PPP lending, benefiting from additional lending volume and related deposits and fee income during 2020. Excluding the 25 biggest banks, commercial and industrial lending rose approximately 10.5% in the month of April 2020. Among the 25 banks with the most assets, the same type of lending rose by only 1.1%.
While savings institution stocks declined dramatically in early to mid-2020, many savings institution stocks recovered from their lows in late March 2020. The broader U.S. market has since recovered its COVID-19 losses from early 2020. During 2020, the SNL U.S. Thrift index fell 11.3%, while the S&P 500 and NASDAQ rose 16.3% and 43.6%, respectively, even though for the month of December 2020, the SNL U.S. Thrift Index had a total return of 7.9%, outpacing the S&P 500’s total return of 3.8%.
On February 8, 2021, the SNL U.S. Thrift index closed at 862.8, an increase of 5.6% from December 31, 2020, which was around the time of the two most recent second step conversions (See Table III.D.7) while S&P 500 and NASDAQ increased by 4.2% and 8.5%, respectively, from December 31, 2020. See Exhibit IV-1 for average and median pricing ratios for all publicly-traded savings institutions as of February 8, 2021.
49
| Pro Forma Valuation Report for Second Step Conversion
|
Converting savings institutions stock issuances are evaluated on the basis of the same factors and pricing metrics as fully converted savings institutions, but on a pro forma basis without the benefit of prior operations as a fully-converted savings institution. The pro forma pricing ratios for converting savings institutions incorporate certain assumptions, including the use of proceeds, reinvestment of offering proceeds, offering expenses, stock benefit plans, and the marginal tax rate. Such assumptions are not necessary in pricing existing stock issues as they are typically priced based on reported financials. In valuing the Company, we considered as relevant, data from recent second step-conversions.
50
| Pro Forma Valuation Report for Second Step Conversion
|
Two second step conversion offerings were completed during the last six months for which pricing ratios, financial characteristics and after-market trends are reflected in Table III.D.7 below:
Table III.D.7
Pricing Ratios, Financial Characteristics and After-Market Trends
Comparable Group Analysis
Second Step Conversions Completed Last Six Months
| Char. Fdn. | % Off Incl. Fdn.+Merger Shares | Pro Forma Data | ||||||||||||||||||||||||||||||||||||||||||||||||||||||||||||||||||||||||||||||||||||||||||||||||||||||||
Institutional Information | Pre-Conversion Financial Data | Offering Information | % of | Benefit Plans | Initial Div. Yield (%) | Pricing Ratios (2) | Financial Characteristics | Percentage Price Change From IPO Price | ||||||||||||||||||||||||||||||||||||||||||||||||||||||||||||||||||||||||||||||||||||||||||||||||||
Institution | Conversion Date | Ticker | Exchange | State | Assets ($Mil) | T. Equity/ Assets (%) | NPAs/ Assets (%) | Gross Proceeds ($Mil) | % of Mid. (%) | Form | Public Off. Inc. Fdn. (%) | ESOP (%) | Recog. Plans (%) | Stock Option (%) | Mgmt. & Dirs. (1) (%) | P/TB (%) | Core P/E (x) | P/A (%) | T. Equity/ Assets (%) | Core ROA (%) | Core ROE (%) | IPO Price ($) | One Day (%) | One Week (%) | One Month (%) | Through 2/8/2021 (%) | ||||||||||||||||||||||||||||||||||||||||||||||||||||||||||||||||||||||||||||||||
Second Step Conversions |
| |||||||||||||||||||||||||||||||||||||||||||||||||||||||||||||||||||||||||||||||||||||||||||||||||||||||||
Affinity Bancshares, Inc. | 1/21/2021 | AFBI | NASDAQ | GA | 888 | 6.93 | 0.59 | 37.0 | 132.2 | NA | NA | 8.0 | 4.0 | 10.0 | 3.5 | 0.0 | 75.31 | 18.15 | 7.48 | 10.14 | 0.41 | 3.44 | 10.00 | 8.1 | 7.5 | NA | 7.5 | |||||||||||||||||||||||||||||||||||||||||||||||||||||||||||||||||||||||||||||||
Generations Bancorp NY, Inc. | 1/13/2021 | GBNY | NASDAQ | NY | 368 | 7.68 | 1.08 | 14.8 | 98.3 | NA | NA | 8.0 | 4.0 | 10.0 | 3.1 | 0.0 | 61.71 | 18.78 | 6.48 | 10.55 | 0.34 | 3.15 | 10.00 | 0.5 | (5.0 | ) | NA | (2.6 | ) | |||||||||||||||||||||||||||||||||||||||||||||||||||||||||||||||||||||||||||||
|
|
|
|
|
|
|
|
|
|
|
|
|
|
|
|
|
|
|
|
|
|
|
|
|
|
|
|
|
|
|
|
|
|
|
|
|
|
|
| |||||||||||||||||||||||||||||||||||||||||||||||||||||||||||||||||||
| Average | 628 | 7.31 | 0.84 | 25.9 | 115.3 | NA | NA | 8.0 | 4.0 | 10.0 | 3.3 | 0.0 | 68.51 | 18.47 | 6.98 | 10.35 | 0.34 | 3.15 | 10.00 | 4.30 | 1.27 | NA | 2.45 | |||||||||||||||||||||||||||||||||||||||||||||||||||||||||||||||||||||||||||||||||||
| Median | 628 | 7.31 | 0.84 | 25.9 | 115.3 | NA | NA | 8.0 | 4.0 | 10.0 | 3.3 | 0.0 | 68.51 | 18.47 | 6.98 | 10.35 | 0.38 | 3.30 | 10.00 | 4.30 | 1.27 | NA | 2.45 | |||||||||||||||||||||||||||||||||||||||||||||||||||||||||||||||||||||||||||||||||||
| (1) | As a percent of offering. |
| (2) | Does not take into account the adoption of SOP 93-6. |
| Source: | S&P Global Market Intelligence and Faust Financial, LLC calculations. This table contains information from sources Faust Financial, LLC believes are reliable, however we do not control or guarantee the accuracy or completeness of such information. |
51
| Pro Forma Valuation Report for Second Step Conversion
|
The aforementioned two second step conversions closed very recently, in January 2021, when stock market conditions and the economic and operating environments were relatively similar to the present. The most recent second step conversion offering was completed by Affinity Bancshares, Inc. of Georgia, which was a somewhat larger offering compared to 1895 Bancorp’s proposed second step offering. Affinity Bancshares completed its second step conversion offering in January 2021 and raised gross proceeds of $37.0 million, which was the adjusted maximum offering range. Affinity Bancshares’ closing pro forma P/TB ratio was 75.31% and the stock closed 7.5% higher after the first week of trading. The pro forma price to core earnings (“P/CE”) ratio for Affinity Bancshares was 18.15x.
Comparatively, a smaller second step conversion offering was completed by Generations Bancorp NY, Inc. of New York in January 2021. Generations Bancorp NY raised gross proceeds of $14.8 million, which was between the minimum and midpoint of its offering range. Generations Bancorp’s closing pro-forma P/TB equaled 61.71% and the pro forma P/CE ratio was 18.78x. The stock closed 5.0% lower after the first week of trading.
The average closing pro-forma P/TB of these two second step conversions equaled 68.51% and the average pro forma P/CE equaled 18.47x. Average price appreciation for the first day and week of trading of these two second step conversions was 4.3% and 1.27%, respectively, and through February 8, 2021 was 2.45%.
During this six-month period, two standard conversion offerings (Systematic Savings Bank in Missouri and Eastern Bankshares in Massachusetts both started trading in October 2020) were completed and no first-step offerings have been completed. We considered these conversions relatively less relevant because they were not second step conversions.
Acquisitions of Wisconsin Savings institutions and more specifically the pricing metrics of these recently completed and pending acquisitions of target institutions headquartered in Wisconsin could potentially also impact the demand and stock price of the Company’s stock. As indicated in Exhibit III-5, there were three acquisitions of Wisconsin based savings institutions completed from the beginning of 2015 through February 8, 2021, with the most recent acquisition completed three years ago; and there are currently no publicly announced pending acquisitions for Wisconsin savings institutions. As the Company, like all converted and converting savings institutions, will be subject to a three-year regulatory prohibition from being acquired and because there has only been limited recent acquisition activity in Wisconsin, there is less likelihood for investors to make investment decisions based on speculating about the future acquisition of the Company. To the extent there is any such speculation, it would be relatively less vs. the Comparable Group, since the Comparable Group includes only institutions that converted prior to February 8, 2020. Since the two second step conversions closed in January 2021, the economic environment and the market for new stock issuances is relatively unchanged from when these offerings closed.
52
| Pro Forma Valuation Report for Second Step Conversion
|
The market for the currently issued and outstanding public stock of 1895 Bancorp of Wisconsin, Inc. The publicly held 1895’s minority stock trades on NASDAQ under the symbol “BCOW”. As of December 31, 2020, BCOW had a total of 4,749,452 shares issued and outstanding, of which 2,067,280 shares were eligible for trading as public securities. BCOW’s closing price on February 8, 2021 was $9.85 per share and its price trading range over the past 52 weeks was $7.46 to $11.92 per share. While trading in BCOW’s currently outstanding minority public stock also impacts the marketing of the Company’s common stock to be issued in the second step conversion, the trading price of BCOW will become more meaningful only when the pro forma impact of the second step conversion is made public and can be considered by market participants in their trading in anticipation of owning common stock of a fully converted public company. Until that time, differences in the Company’s number of publicly owned shares outstanding and market capitalization; and differences in financial characteristics, including equity, liquidity, balance sheet size and composition, make the trading price relatively less meaningful.
While Faust Financial considered recent BCOW trading activity in this valuation, the trading price of BCOW will become more meaningful only when the pro forma impact of the second step conversion is made public and can be considered by market participants in their trading of BCOW.
Liquidity of the stock to be issued, driven by the size of the prospective stock issuance, if a public offering of the stock is contemplated and whether a formal trading market for the Company’s stock already exists or will exist, also impacts both the marketability and liquidity of the stock. Because investors generally prefer liquidity in the secondary market for their shares, illiquid stock generally has a discounted value as compared to more liquid stock. As the companies that comprise the Comparable Group are required to trade in the public markets on the NASDAQ or the NYSE, all of the Comparable Group companies trade on NASDAQ. Factors such as the market capitalization and the number of shares outstanding are indicators of liquidity of a company’s stock.
As set for in Table IV.E.2 in Section IV, based on market values as of February 8, 2021, the market capitalization of the Comparable Group companies ranged from a low of $26.3 million to a high of $90.6 million, with average and median market values of $51.1 million and $46.5 million, respectively. Shares outstanding for the Comparable Group as set forth in Exhibit IV-1, ranged from a low of 1.6 million to a high of 7.1 million, with the average and median of 3.3 million and 3.1 million, respectively. The Company’s second step conversion stock offering is expected to provide for a pro forma market value and shares outstanding that will be in the upper half of the Comparable Group’s range of market values and shares outstanding. After the second step conversion, the Company’s stock will continue to be traded on the NASDAQ. Accordingly, the liquidity of the Company’s shares should compare favorably to the Comparable Group average and median.
53
| Pro Forma Valuation Report for Second Step Conversion
|
| 7. | Management |
As discussed in Section I.E and reflected in Tables I.E.1, over the past five years, the Company’s management has maintained the net interest margin and yield-cost spread relatively stable and subsequent to the Bank branch restructure in 2019, achieved a relatively more favorable operating expense level for 2020 vs. 2019. The Company’s increasingly diversified loan portfolio and favorable trends in deposit composition over the past five years, as well as improving non-performing assets and minimal net loan chargeoffs, coupled with mostly improving performance metrics over the past three years, are all positive indicators of management’s performance in operating the Company. As is the case with the Company, the balance sheet components, including the tangible equity and bank level regulatory capital measures, asset quality and performance metrics reflect positively on the Comparable Group’s management teams and boards of directors.
| 8. | Effect of Government Regulations and Regulatory Reform |
As a result of the second step conversion, the Company, like the members of the Comparable Group, will operate as a fully converted institution operating under the same or comparable regulatory environment. As our selection criteria for the Comparable Group included a requirement that each member have positive earnings for the last twelve months and all met regulatory minimum well capitalized levels, it can be assumed that none of the Comparable Group members, like the Company, are subject to any material operating restrictions that would impact their financial performance or growth prospects.
| E. | Comparability to Comparable Group |
Our analysis supports that the Comparable Group is appropriate for comparison with the Company in our determination of the pro forma market value of the Company. Consistent with regulatory guidelines, differences between the Company and the Comparable Group’s financial condition and efficiency of asset utilization, profitability and earnings capacity, asset / liability and interest rate risk management, primary market economic and demographic characteristics, dividend capacity and policy, marketability of the issued stock, management and the effect of government regulations and regulatory reform will be addressed via appropriate valuation adjustments.
54
| Pro Forma Valuation Report for Second Step Conversion
|
IV. VALUATION ANALYSIS
| A. | Introduction |
As previously discussed in Section III, the pro forma market valuation of the Company is developed from the pricing ratios of the Comparable Group and incorporates valuation adjustments for key differences between the Company and the Comparable Group. In Section III, we selected the Comparable Group and compared the Company to the Comparable Group in Section III.D, describing both similarities and differences. Based on our analysis, we concluded in Section III.E, that the Company is comparable to the Comparable Group we selected.
We also considered the current market and operating environment, including economic and demographic factors, interest rates; pricing characteristics of recent second step conversions (both at conversion and in the after-market), and the performance of broader stock and savings institution stock indices, all of which impact both the pricing metrics of the Company and of the Comparable Group. Faust Financial also evaluated the marketability of the issued stock based on the market capitalization and number of shares outstanding of the companies in the Comparable Group vs. the Company on a pro forma basis.
Our valuation adjustments for key differences between the Company and the Comparable Group as well as the other considerations described above are described in this Section IV, with such adjustments incorporated into our valuation of the pro forma market value of the Company based on market pricing of the Comparable Group as of the valuation date. The market value adjustments relative to the Comparable Group are based on our detailed analysis in Section III. The basis for these valuation adjustments is summarized and the adjustments are made in this Section IV, which also describes the pro forma market value of the Company on a fully converted basis. In addition to the pro forma market value, which is also referred to as the “midpoint value”, we have defined a valuation range with the minimum of 85% of the pro forma market value, the “maximum” of 115% of the pro forma market value.
| B. | Valuation Methods |
The method most relevant to the pro forma valuation of common stock for savings institutions is the price-to-book value (“P/B”) ratio method as earnings of savings institutions are often volatile, especially when the nature of their operations can include a significant proportion of non-interest income derived from volatile sources, such as for example mortgage banking or when their earnings are low. Moreover, unlike the price to earnings (“P/E”) method, the P/B value method does not entail assumptions as to the use of proceeds, which by the pro forma nature are necessarily more academic than they are
55
| Pro Forma Valuation Report for Second Step Conversion
|
representative of actual future earnings. Therefore, in comparing the Company on a pro forma basis (i.e. fully converted) to the Comparable Group, the P/B value method, particularly the ratio of price to tangible book value (“P/TB”), the latter of which excludes intangible assets from book value to arrive at tangible book value, was given the primary emphasis.
Consistent with regulatory guidelines, we also considered the P/E method including the P/CE and the price to assets (“P/A”) method. The P/E method including the P/CE is considered on a pro forma earnings basis for the Company and therefore assumes interim reinvestment of conversion stock offering proceeds into short-term investment securities. It is important to note that the companies comprising the Comparable Group, which include no companies that converted in the past twelve months, have already had time to leverage their newly raised capital into longer term investments and loans and therefore have a relative earnings advantage over the Company. Combined with the historical volatility of savings institutions’ earnings previously discussed, this supports our view that while also considered by investors, the P/E method including the P/CE is not the primary investment/valuation consideration of investors in converting savings institutions, particularly when the converting savings institutions’ earnings are low. Therefore, we gave the P/E method less weight than the P/B value method.
While we do not believe that investors place much emphasis on the P/A ratio in their investment decisions, consistent with the regulatory guidelines, we nonetheless considered the P/A method, albeit by giving it even less weight than the P/E method. The P/A method is less meaningful, particularly for converting companies with equity in excess of regulatory capital requirements and positive core earnings, and in general because the P/A method does not consider the impact on the converting company’s asset size from deposit withdrawals to fund investors’ stock purchases in the converting company.
As previously discussed in Section III.D.6, while Faust Financial also considered recent BCOW trading activity in this valuation, the trading price of BCOW will become more meaningful only when the pro forma impact of the second step conversion is made public and can be considered by market participants in their trading of BCOW.
To facilitate application of the three valuation methods in Section IV.E below, we apply the valuation adjustments determined in Section IV.C and summarized in Section IV.D below.
| C. | Valuation Analysis |
The valuation analysis based on the comparison of the Company to the Comparable Group as to the following factors was previously discussed in detail in Section III:
| 1. | Financial Condition and Efficiency of Asset Utilization |
| 2. | Profitability and Earnings Capacity |
56
| Pro Forma Valuation Report for Second Step Conversion
|
| 3. | Asset / Liability and Interest Rate Risk Management |
| 4. | Primary Market Economic and Demographic Considerations |
| 5. | Projected Dividend Capacity and Intended Dividend Policy |
| 6. | Marketability of the Issued Stock |
| 7. | Management |
| 8. | Effect of Government Regulations and Regulatory Reform |
In applying each of the valuation methods (P/B, P/E and P/A), valuation adjustments are made to the Company’s pro forma market value based on differences between the Company’s and the Comparable Group’s characteristics discussed in Section III.
| 1. | Financial Condition and Efficiency of Asset Utilization |
Comparison between the Company and the Comparable Group utilize the Comparable Group averages as of or for the last twelve months ended December 31, 2020 or most recent data available, unless otherwise indicated. The following areas of analysis were factored into our aggregate valuation adjustment for financial condition and efficiency of asset utilization.
Interest-earning asset composition as reflected in Table III.D.1 in Section III for the Company and the Comparable Group reflect key differences in interest-earning asset composition, including lower investments and net loans, but higher cash and equivalents. Faust Financial concluded that interest earning asset composition was a negative factor in our adjustment financial condition and efficiency of asset utilization.
Non interest-earning assets for the Company’s and the Comparable Group’s included BOLI and loan servicing, and as to the Comparable Group also goodwill/intangibles as reflected in Table III.D.1. The overall level of non-interest earning assets is relatively similar; accordingly, Faust Financial concluded that based on only small differences in the overall level and composition of non interest-earning assets, this was a neutral factor in our analysis.
Loan Portfolio Composition along with RWA are reflected in Table III.D.2 in Section III. The Company’s loan portfolio in comparison to the Comparable Group, had a lower concentration of one-to-four family mortgage loans and greater proportion of higher risk and higher yielding loans combined (construction/land, CRE, multi-family, commercial & industrial loans). RWA-to-assets were nonetheless similar. Faust Financial concluded that the greater diversification into higher yielding types of loans, which also provides more opportunities for core deposit generation (i.e. cross selling customers) both of which are viewed favorably by investors and were thus a positive factor in our analysis.
57
| Pro Forma Valuation Report for Second Step Conversion
|
Credit Risk Measures for the Company compared to the Comparable Group in Table III.D.3 in Section III reflect similar risk weighted assets to assets, lower reserve coverage levels but also lower non-performing loans and non-performing assets and a net recovery vs. charge-off. On balance, credit risk measures were deemed to be a neutral factor by Faust Financial in our analysis.
Funding composition and liquidity for the Company was comparable to that of the Comparable Group’s with the Company having similar total deposits to average assets, but lower time deposits and higher borrowings. Faust Financial concluded that on balance, funding composition and liquidity was a neutral factor as the lower level of overall deposits and higher level of borrowings are compensated for by the lower proportion of time deposits.
Capital levels including equity-to-assets and tangible equity-to-assets ratios for the Company and regulatory capital levels for the Bank all were lower than the Comparable Group’s as reflected in Table III.D.1. The Company’s pro forma equity-to-assets will be higher as a result of the stock offering proceeds, which will positively impact the Company’s equity-to-assets ratios and lower its funding cost and risk profile, while increasing its leverage capacity and consequently future earnings potential. However, in the short term, the Company’s higher pro forma equity will negatively impact its return on equity. Therefore, Faust Financial concluded that capital was a neutral factor.
Interest-earning assets/interest-bearing liabilities for the Company was slightly lower than for the Comparable Group as reflected in Table III.D.1, however the additional capital realized from stock proceeds should serve to provide the Company with an IEA/IBL ratio that exceeds the Comparable Group’s. Therefore, Faust Financial concluded that the IEA/IBL ratio was a neutral factor.
Balance sheet growth reflected in Table III.D.1 represents annual growth rates for the twelve months ended December 31, 2020 for key balance sheet items. The Company’s higher asset growth vs. the Comparable Group was driven primarily by higher growth in borrowings, cash and investments combined (although investments and MBS declined as reflected in Table I.D.1), and not higher growth in loans, deposits, both of which were similar to the Comparable Group’s growth rates. Therefore, Faust Financial concluded that balance sheet growth was a neutral factor.
58
| Pro Forma Valuation Report for Second Step Conversion
|
In summary, we identified no significant differences between the Company vs. the Comparable Group in terms of interest-earning asset and non interest-earning assets, credit risk measures, funding composition and liquidity, capital, the IEA to IBL ratio, and balance sheet growth having found all of those to be neutral factors. We did identify loan portfolio composition, which reflected greater diversification into higher yielding types of loans, as a positive factor. Overall, we considered the Company’s financial condition and efficiency of asset utilization to be similar to the Comparable Group’s and therefore applied no adjustment.
| 2. | Profitability and Earnings Capacity |
Profitability and Earnings Capacity as measured based on the Company’s vs. the Comparable Group’s interest and expense components, yield/cost and overall efficiency is reflected in Table III.D.4. The Company’s vs. the Comparable Group’s reported lower net interest income to average assets, both before and after provision expense, a lower yield-cost spread, similar non-interest income but higher non-interest expense. Consequently, the Company compared unfavorably in its expense coverage and efficiency ratio and reported lower earnings vs. the Comparable Group, with an ROAA of 0.28% (0.33% on an adjusted basis) vs. 0.73% for the Comparable Group. The aforementioned factors negatively impact the Company’s earnings capacity vs. the Comparable Group.
The Company’s higher balance sheet growth vs. the Comparable Group’s over the last twelve months discussed in Section III.D.1 would generally suggest favorably on the Company’s earnings capacity vs. the Comparable Group. However, such higher growth was not driven by higher loan or deposit growth and the Company’s core earnings to average assets of 0.33%, although higher than reported earnings of 0.28% for 2020, still lagged the Comparable Group’s 0.73% by a wide margin. Going forward, the Company’s earnings should be favorably impacted by a lower effective tax rate compared to 2020 and greater leverage capacity from reinvestment of the conversion stock offering proceeds, but such earnings will also be negatively impacted by higher post-conversion operating expenses.
Faust Financial, based on these factors, made a downward adjustment for profitability and earnings capacity.
| 3. | Asset / Liability and Interest Rate Risk Management |
The Company vs. the Comparable Group had a higher proportion of cash & equivalents and loan portfolio diversification into loans with shorter terms and/or adjustable interest rates. Moreover, the Company sells most of its fixed-rate one- to four-family residential real estate loans, has a lower proportion of time deposits and higher proportion of transaction, savings and money market deposits combined compared to the Comparable Group. Like all of the companies in the Comparable Group, the Company’s balance sheet, over the short-term (less than one year) is asset-sensitive with an IBA to IBL ratio of 136% vs the Comparable Group’s average ratio of 140% (see Table III.D.5). These factors together with the positive impact the stock offering proceeds will have on the Company’s interest rate risk exposure, lead Faust Financial to conclude with no valuation adjustment.
59
| Pro Forma Valuation Report for Second Step Conversion
|
| 4. | Primary Market Economic and Demographic Considerations |
Economic and demographic data for Milwaukee County, where the Company is headquartered, were compared to those market area counties in which members of the Comparable Group are headquartered in Section III.D.4. The Company’s headquarter market area county, Milwaukee County, had a larger population (more than twice the population size of the Comparable Group average), with similar historical and projected growth rates, lower per capita income and higher unemployment. (See Table III.D.6). While the Company’s headquarters county population was larger, as discussed in Section II.D and reflected in Table II.D.1, competition in the Company’s market area counties overall is strong and even though the Company had the majority of its total deposits in Milwaukee County, the Company had lower market share in Milwaukee County compared to the Comparable Group average market share in their headquarter counties. While the larger market population provides more opportunity, the Company operates in a less affluent market and has to contend with the higher unemployment and strong competition. On balance, Faust Financial concluded that no valuation adjustment was appropriate as it relates to primary market demographic and economic considerations.
| 5. | Projected Dividend Capacity and Intended Dividend Policy |
As discussed in Section III.D.5, the Company has not established a dividend policy prior to its second step conversion and future dividends will depend upon a number of factors described in that section. Furthermore, and as also discussed in Section III.D.5 and set forth in Table IV.E.2 in Section IV, five out of the ten Comparable Group companies pay regular cash dividends. While the Company has not established a definitive dividend policy, the Company will have the capacity to pay a dividend comparable to the Comparable Group’s average dividend yield based on pro forma earnings and capitalization. Accordingly, Faust Financial concluded that no valuation adjustment was warranted as it relates to the Company’s projected dividend capacity and intended dividend policy.
| 6. | Marketability of the Issued Stock |
In Section III.D.6, we discussed trends in the pricing of various broader stock market indices and all publicly traded savings institutions, all of which are impacted by broader economic, demographic and other factors as well as the financial condition, earnings and earnings prospects, dividends paid by the companies that comprise an index or stock market segment. (See Exhibits III-4 and IV-1) Naturally, the pricing for acquisitions of savings institution institutions and the pricing for recently converted savings institutions are impacted by these factors. As such, the pricing metrics for the Comparable Group and
60
| Pro Forma Valuation Report for Second Step Conversion
|
therefore the Company are impacted by trends in these indices, as well as by company specific factors such as their relative market capitalization and shares outstanding. The pricing of recent second step conversions are an additional factor, including that such conversion offerings closed in January 2021, when stock market conditions the economic and operating environment were relatively similar to the present. Therefore, we evaluated all of the aforementioned factors in Section III.D.6 and as appropriate considered them in our valuation of the common stock to be issued by the Company in connection with its proposed second step conversion (See Table III.D.7). We concluded that on balance no valuation adjustment is warranted as it relates to marketability of the issued stock.
| 7. | Management |
As discussed in Section III.D.7, management’s performance as measured by the Company’s balance sheet and performance metrics, loan portfolio diversification and asset quality compared to those of the Comparable Group, suggest that management of the Company like management of the Comparable Group have performed satisfactorily. Accordingly, Faust Financial made no valuation adjustment as it relates to the Company’s management.
| 8. | Effect of Government Regulations and Regulatory Reform |
As discussed in Section III.D.8, the Company, like the Comparable Group, will be under the same or comparable regulatory environment. We have assumed that having been profitable for the last twelve months and having met regulatory minimum well capitalized levels, none of the Comparable Group members are subject to material operating restrictions. Accordingly, Faust Financial concluded that no valuation adjustment was warranted as it relates to management of the Company.
| D. | Summary of Valuation Adjustments |
Below is a summary of the valuation adjustments:
| Valuation Adjustment Factors | Adjustment | |||
| 1. | Financial Condition and Efficiency of Asset Utilization | No Adjustment | ||
| 2. | Profitability and Earnings Capacity | Downward Adjustment | ||
| 3. | Asset / Liability and Interest Rate Risk Management | No Adjustment | ||
| 4. | Primary Market Economic and Demographic Considerations | No Adjustment | ||
| 5. | Projected Dividend Capacity and Intended Dividend Policy | No Adjustment | ||
| 6. | Marketability of the Issued Stock | No Adjustment | ||
| 7. | Management | No Adjustment | ||
| 8. | Effect of Government Regulations and Regulatory Reform | No Adjustment | ||
61
| Pro Forma Valuation Report for Second Step Conversion
|
| E. | Application of Valuation Methods |
In applying each of the three valuation methods (P/B, P/E and P/A) described in Section IV.B, we considered the market value adjustments summarized in in Section IV.D relative to the Comparable Group to the Company’s pro forma market value. Therefore, the pro forma market value of the Company on a fully converted basis incorporates these valuation adjustments.
It is noted that the Company has adopted “Employers’ Accounting for Employee Stock Ownership Plans” (“ASC 718-40”), which causes earnings per share computations to be based on shares issued and outstanding excluding unallocated ESOP shares. For purposes of preparing the pro forma pricing analyses, we have reflected all shares issued in the offering, including all ESOP shares, to capture the full dilutive impact, particularly since the ESOP shares are economically dilutive, receive dividends and can be voted. However, we did consider the impact of ASC 718-40 in the valuation.
In preparing the pro forma pricing analysis we have considered certain information disclosed in the Company’s prospectus, including the marginal tax rate, reinvestment rate of return, stock benefit plan assumptions, offering expenses and the pro forma impact of the MHC’s net assets, which will be consolidated with the Company and result in an increase to the Company’s assets and equity. At December 31, 2020, the MHC had pro forma net assets of $100,000, which has been added to the Company’s December 31, 2020 pro forma equity and assets to reflect the consolidation of the MHC into the Company’s operations. Exhibit IV-8 reflects that after accounting for the impact of the MHC’s net assets, the public shareholders’ ownership interest was reduced by approximately 0.08%. Accordingly, for purposes of the Company’s pro forma valuation, the public shareholders’ ownership interest was reduced from 44.72% to 44.64% and the MHC’s ownership interest was increased from 55.28% to 55.36%.
Taking into consideration the valuation adjustments discussed above, Faust Financial concluded that based on the application of the three valuation approaches, as of February 8, 2021, the aggregate pro forma market value of 1895 Bancorp’s conversion stock to be issued and outstanding at the end of the conversion offering was $55,634,630 at the midpoint, equal to 5,563,463 shares at $10.00 per share, including: 1) 3,080,000 newly issued shares representing the MHC’s current ownership interest in the Company; and 2) 2,483,463 shares of the Company issued in exchange for shares in 1895. The $10.00 per share price was determined by the Company’s Board of Directors. The midpoint and resulting valuation range is based on the sale of a 55.36% ownership interest to the public, which provides for a $30,800,000 public offering at the midpoint value.
62
| Pro Forma Valuation Report for Second Step Conversion
|
Price-to-Book
In the P/B valuation method, we calculate the Company’s pro forma market value by applying a P/B ratio and P/TB ratio, derived in our valuation from the Comparable Group’s P/B ratio and P/TB, to the Company’s pro forma book value and tangible book value. Based on the $55,634,630 midpoint valuation, the Company’s pro forma P/B and P/TB ratios each equaled 65.07% vs. the Comparable Group’s averages of 87.76% and 89.71%. The Company’s ratios reflected discounts of 25.85% on a P/B basis and 27.47% on a P/TB basis. Compared to the Comparable Group’s median P/B and P/TB ratios of 88.66% and 90.12%, respectively, the Company’s pro forma P/B and P/TB ratios at the midpoint value reflected discounts of 26.61% on a P/B basis and 27.80% on a P/TB basis. At the maximum of the range, the Company’s P/B and P/TB ratios each equaled 71.47%, respectively. Compared to the Comparable Group’s average P/B and P/TB ratios, the Company’s P/B and P/TB ratios at the maximum of the range reflected discounts of 18.56% and 20.33%, respectively. In comparison to the Comparable Group’s median P/B and P/TB ratios, the Company’s P/B and P/TB ratio at the maximum of the range reflected discounts of 19.39% and 20.69%, respectively.
Price-to-Earnings
In the P/E valuation method, we calculate the Company’s pro forma market value by applying a P/E ratio and a P/CE ratio, derived in our valuation from the Comparable Group’s P/E ratio and P/CE, to the Company’s pro forma reported earnings and core earnings (i.e. earnings adjusted for non-operating items).
For the twelve months ended December 31, 2020, the Company’s reported net income is $1.317 million. We made adjustments to reported earnings by deducting $1.023 million of gains on the sale of investment securities and a $6,000 gain on the sale of OREO, and by adding back to income an $86,000 loss on the sale of other assets. On a tax effected basis, assuming a marginal tax rate of 27.0% for the earnings adjustment, the Company’s core earnings for the twelve months ended December 31, 2020 were determined to equal $1.563 million.
63
| Pro Forma Valuation Report for Second Step Conversion
|
Table IV.E.1
1895 Bancorp of Wisconsin, Inc.
Core Earnings
| Amount | ||||||||
| ($000) | ||||||||
Net Income | $ | 1,317 | ||||||
Deduct: Gain on Sale of OREO | (6 | ) | ||||||
Deduct: Gain on Sale of Securities | (1,023 | ) | ||||||
Add: Loss on Sale of Other Assets | 86 | |||||||
|
| |||||||
| (943 | ) | |||||||
Tax Effect | 255 | |||||||
Change in DTA Valuation Allowance | 934 | |||||||
|
| |||||||
| 1,189 | ||||||||
|
| |||||||
Core Earnings Estimate | $ | 1,563 | ||||||
|
| |||||||
Source: 1895 Bancorp’s Preliminary Offering Prospectus, audited financial statements and Faust Financial, LLC calculations. |
| |||||||
The P/E method including the P/CE is considered on a pro forma earnings basis for the Company and therefore assumes interim reinvestment of conversion stock offering proceeds into short-term investment securities on a tax effected basis. It is important to note that the companies comprising the Comparable Group, which include no companies that converted in the past twelve months, have already had time to leverage their newly raised capital into longer term investments and loans and therefore have a relative earnings advantage over the Company.
Based on the Company’s reported earnings and incorporating the impact of the pro forma assumptions discussed previously, the Company’s pro forma reported P/E multiple at the $55,634,630 midpoint value was 58.29x. On an adjusted earnings basis, the Company’s P/CE multiple equaled 46.34x. Comparatively, the Comparable Group’s average P/E and P/CE multiples equaled 23.83x and 25.54x, respectively (see Table IV.E.2). In comparison to the Comparable Group’s average P/E and P/CE multiples, the Company’s pro forma P/E and P/CE multiples at the midpoint value indicated a premium of 144.61% and 81.44%, respectively. The Comparable Group’s median reported and core earnings multiples equaled 13.82x and 13.72x, respectively. In comparison to the Comparable Group’s median earnings multiples, the Company’s pro forma P/E and P/CE multiples at the midpoint value indicated premiums of 321.78% and 237.76%, respectively. The Company’s pro forma P/CE ratios at the minimum and the maximum equaled 33.49x and 55.80x, respectively, and 40.55x and 71.04x, respectively, for pro forma P/E ratios.
64
| Pro Forma Valuation Report for Second Step Conversion
|
Price-to-Assets
In the P/A valuation method, we calculate the Company’s pro forma market value by applying a P/A ratio, derived in our valuation from the Comparable Group’s P/A ratio, to the Company’s pro forma asset base, conservatively assuming no deposit withdrawals are made to fund stock purchases, even though it is likely that there will be deposit withdrawals, which results in our calculation understating the pro forma P/A ratio. At the $55,634,630 midpoint of the valuation range, the Company’s value equaled 10.26% of pro forma assets. Comparatively, the Comparable Group companies exhibited an average P/A ratio of 14.04%, which indicates that a discount of 26.92% has been applied to the Company’s pro forma P/A ratio. In comparison to the Comparable Group’s median P/A ratio of 9.71%, the Company’s pro forma P/A ratio at the midpoint value reflects a premium of 5.66%.
65
| Pro Forma Valuation Report for Second Step Conversion
|
Table IV.E.2
Market Pricing Versus Comparable Group
1895 Bancorp of Wisconsin, Inc.
As of February 8, 2021
| Financial Characteristics (1) | Market Value ($000) | 12 Mo. Core EPS ($) | Book Value/ Share ($) | Price/ Book Value (%) | Price/ Tang. Bk. Val. (%) | Price/ Earnings (x) | Price/ Core Earnings (4) (x) | Price/ Assets (%) | 12 Mo. Div./ Share ($) | |||||||||||||||||||||||||||||||||||||||||||||||||||||||||||||||||||||||||||||||||||||
| Total Assets ($000) | Equity/ Assets (%) | Tang. Eq./ T. Assets (%) | NPA/ Assets (2) (%) | Reported | Core (3) | Price/ Share ($) | Dividend Yield (%) | Payout Ratio (%) | Exchange Ratio | Offering Size ($000) | ||||||||||||||||||||||||||||||||||||||||||||||||||||||||||||||||||||||||||||||||||||
| ROAA (%) | ROAE (%) | ROAA (%) | ROAE (%) | |||||||||||||||||||||||||||||||||||||||||||||||||||||||||||||||||||||||||||||||||||||||||||
1895 Bancorp of Wisconsin, Inc. |
| |||||||||||||||||||||||||||||||||||||||||||||||||||||||||||||||||||||||||||||||||||||||||||||
Maximum | 546,271 | 16.38 | 16.38 | 0.31 | 0.16 | 1.01 | 0.21 | 1.28 | 63,980 | 10.00 | 0.18 | 13.99 | 71.47 | 71.47 | 71.04 | 55.80 | 11.71 | 0.00 | 0.00 | 0.00 | 1.3163 | 35,420 | ||||||||||||||||||||||||||||||||||||||||||||||||||||||||||||||||||||||||
Midpoint | 542,248 | 15.76 | 15.76 | 0.32 | 0.18 | 1.12 | 0.22 | 1.40 | 55,635 | 10.00 | 0.22 | 15.37 | 65.07 | 65.07 | 58.29 | 46.34 | 10.26 | 0.00 | 0.00 | 0.00 | 1.1446 | 30,800 | ||||||||||||||||||||||||||||||||||||||||||||||||||||||||||||||||||||||||
Minimum | 538,225 | 15.14 | 15.14 | 0.32 | 0.22 | 1.43 | 0.26 | 1.73 | 47,289 | 10.00 | 0.30 | 17.23 | 58.04 | 58.04 | 40.55 | 33.49 | 8.79 | 0.00 | 0.00 | 0.00 | 0.9729 | 26,180 | ||||||||||||||||||||||||||||||||||||||||||||||||||||||||||||||||||||||||
Comparable Group | ||||||||||||||||||||||||||||||||||||||||||||||||||||||||||||||||||||||||||||||||||||||||||||||
CBMB | CBM Bancorp, Inc. | MD | 232,186 | 22.94 | 22.94 | 0.55 | 0.32 | 1.27 | 0.27 | 1.07 | 48,191 | 14.00 | 0.17 | 14.34 | 97.64 | 97.64 | 70.00 | 84.41 | 22.39 | NA | NA | 250.00 | ||||||||||||||||||||||||||||||||||||||||||||||||||||||||||||||||||||||||
CNNB | Cincinnati Bancorp, Inc. | OH | 231,943 | 17.13 | 17.07 | 0.54 | 0.77 | 6.10 | 0.78 | 6.17 | 35,589 | 11.96 | 0.61 | 13.35 | 89.56 | 89.97 | 19.93 | 19.71 | 15.34 | NA | NA | NM | ||||||||||||||||||||||||||||||||||||||||||||||||||||||||||||||||||||||||
ESBK | Elmira Savings Bank | NY | 644,587 | 9.43 | 7.66 | 0.89 | 0.64 | 6.95 | 0.64 | 6.97 | 43,684 | 12.40 | 1.19 | 17.23 | 71.95 | 90.27 | 10.42 | 10.43 | 6.78 | 0.60 | 4.84 | 57.14 | ||||||||||||||||||||||||||||||||||||||||||||||||||||||||||||||||||||||||
FFBW | FFBW, Inc. | WI | 285,787 | 35.92 | 35.90 | 0.63 | 0.63 | 2.41 | 0.63 | 2.41 | 74,231 | 10.44 | NA | 13.32 | 78.37 | 78.41 | 40.14 | 40.14 | 28.15 | NA | NA | NM | ||||||||||||||||||||||||||||||||||||||||||||||||||||||||||||||||||||||||
HMNF | HMN Financial, Inc. | MN | 909,580 | 11.35 | 11.27 | 0.36 | 1.21 | 10.56 | 1.21 | 10.56 | 90,613 | 19.00 | NA | 21.65 | 87.76 | 88.50 | 8.56 | 8.56 | 9.96 | 0.00 | 0.00 | NM | ||||||||||||||||||||||||||||||||||||||||||||||||||||||||||||||||||||||||
HFBL | Home Federal Bancorp, Inc. of Louisiana | LA | 535,394 | 9.61 | 9.61 | 0.87 | 0.93 | 9.31 | 0.93 | 9.31 | 46,883 | 30.00 | NA | 30.46 | 98.49 | 98.49 | 11.07 | 11.07 | 9.47 | 0.66 | 2.20 | 24.17 | ||||||||||||||||||||||||||||||||||||||||||||||||||||||||||||||||||||||||
HVBC | HV Bancorp, Inc. | PA | 507,739 | 7.33 | 7.33 | 0.49 | 1.02 | 11.87 | 0.99 | 11.54 | 33,834 | 16.82 | 1.87 | 16.75 | 100.41 | 100.41 | 8.76 | 9.01 | 7.36 | NA | NA | NM | ||||||||||||||||||||||||||||||||||||||||||||||||||||||||||||||||||||||||
IROQ | IF Bancorp, Inc. | IL | 713,399 | 11.90 | 11.90 | 0.23 | 0.70 | 6.06 | 0.70 | 6.06 | 65,196 | 20.12 | NA | 26.21 | 76.78 | 76.78 | 12.34 | 12.34 | 9.14 | 0.30 | 1.49 | 18.40 | ||||||||||||||||||||||||||||||||||||||||||||||||||||||||||||||||||||||||
MSVB | Mid-Southern Bancorp, Inc. | IN | 218,281 | 22.38 | 22.38 | 1.19 | 0.56 | 2.36 | 0.52 | 2.20 | 46,139 | 15.45 | 0.35 | 15.20 | 101.66 | 101.66 | 41.76 | 44.65 | 22.75 | 0.12 | 0.78 | 24.32 | ||||||||||||||||||||||||||||||||||||||||||||||||||||||||||||||||||||||||
WVFC | WVS Financial Corp. | PA | 317,444 | 12.11 | 12.11 | 0.00 | 0.50 | 4.81 | 0.51 | 4.87 | 26,327 | 15.15 | 1.00 | 20.20 | 75.00 | 75.00 | 15.30 | 15.10 | 9.08 | 0.40 | 2.64 | 40.40 | ||||||||||||||||||||||||||||||||||||||||||||||||||||||||||||||||||||||||
|
|
|
|
|
|
|
|
|
|
|
|
|
|
|
|
|
|
|
|
|
|
|
|
|
|
|
|
|
|
|
|
|
|
|
|
|
|
|
| |||||||||||||||||||||||||||||||||||||||||||||||||||||||
| Average | 459,634 | 16.01 | 15.82 | 0.58 | 0.73 | 6.17 | 0.72 | 6.11 | 51,069 | 16.53 | 0.86 | 18.87 | 87.76 | 89.71 | 23.83 | 25.54 | 14.04 | 0.35 | 1.99 | 69.07 | ||||||||||||||||||||||||||||||||||||||||||||||||||||||||||||||||||||||||||
| Median | 412,592 | 12.00 | 12.00 | 0.55 | 0.67 | 6.08 | 0.67 | 6.11 | 46,511 | 15.30 | 0.81 | 16.99 | 88.66 | 90.12 | 13.82 | 13.72 | 9.71 | 0.35 | 1.85 | 32.36 | ||||||||||||||||||||||||||||||||||||||||||||||||||||||||||||||||||||||||||
| High | 909,580 | 35.92 | 35.90 | 1.19 | 1.21 | 11.87 | 1.21 | 11.54 | 90,613 | 30.00 | 1.87 | 30.46 | 101.66 | 101.66 | 70.00 | 84.41 | 28.15 | 0.66 | 4.84 | 250.00 | ||||||||||||||||||||||||||||||||||||||||||||||||||||||||||||||||||||||||||
| Low | 218,281 | 7.33 | 7.33 | 0.00 | 0.32 | 1.27 | 0.27 | 1.07 | 26,327 | 10.44 | 0.17 | 13.32 | 71.95 | 75.00 | 8.56 | 8.56 | 6.78 | 0.00 | 0.00 | 18.40 | ||||||||||||||||||||||||||||||||||||||||||||||||||||||||||||||||||||||||||
All Public Non-MHC Thrifts |
| |||||||||||||||||||||||||||||||||||||||||||||||||||||||||||||||||||||||||||||||||||||||||||||
| Average | 5,175,845 | 12.53 | 11.59 | 0.84 | 0.91 | 7.56 | 1.00 | 7.70 | 609,965 | 23.71 | 2.17 | 19.95 | 105.06 | 116.46 | 17.61 | 17.17 | 13.07 | 0.43 | 2.32 | 47.00 | ||||||||||||||||||||||||||||||||||||||||||||||||||||||||||||||||||||||||||
| Median | 1,722,094 | 11.56 | 10.25 | 0.82 | 0.77 | 6.49 | 0.78 | 6.48 | 197,340 | 15.30 | 0.86 | 16.44 | 96.71 | 101.04 | 13.44 | 13.64 | 11.85 | 0.32 | 2.14 | 35.59 | ||||||||||||||||||||||||||||||||||||||||||||||||||||||||||||||||||||||||||
| (1) | For last 12 months ended December 31, 2020 or the most recent 12 months available. |
| (2) | Assumes Bank level NPAs for the Comparable Group if NPAs were not reported at the Company level as of February 8, 2021. |
| (3) | Assumes core ROAA and ROAE were the same as the reported ROAA and ROAE for companies in the Comparable Group if core earnings were not reported as of February 8, 2021. |
| (4) | Assumes Price/Core Earnings was the same Price/Earnings as related to Comparable Group if core earnings were not reported as of February 8, 2021. |
| Source: | S&P Global Market Intelligence and Faust Financial, LLC calculations. This table contains information from sources Faust Financial, LLC believes are reliable, however we do not control or guarantee the accuracy or completeness of such information. |
66
| Pro Forma Valuation Report for Second Step Conversion
|
Comparison to Recent Offerings
Unlike our comprehensive analysis of the Comparable Group, our analysis of recent second step conversion offerings of companies that were not eligible under the conversion guidelines to be considered as Comparable Group members, was limited to pricing ratios, financial characteristics and after-market trends. Our analysis was centered around the P/TB approach, since the P/E multiples do not reflect the actual impact of reinvestment and the source of the stock proceeds (i.e., external funds vs. deposit withdrawals). As discussed in Section III.D.6, two second step offerings were completed during the past six months, which had a 68.51% average closing pro forma P/TB ratio and an average pro forma P/CE of 18.47x compared to the Company’s pro forma P/TB ratio of 65.07% at the midpoint value reflects an implied discount of 5.02%. At the maximum, the Company’s P/TB ratio of 71.47% reflects an implied premium of 4.32% relative to the two second step offerings’ average P/TB ratio at closing.
Valuation Conclusion
It is our opinion that as of February 8, 2021, the pro forma market value of the Company’s 5,563,463 shares to be issued at a per share value of $10.00 and outstanding at the end of the conversion offering, including the new shares to be issued that represent the MHC’s ownership in the Company and the shares to be issued in exchange for existing public shares in the Company was $55,634,630 at the midpoint.
| F. | Valuation Range |
In addition to the pro forma market value, which is also referred to as the “midpoint value”, we have defined a valuation range with the minimum of 85% of the pro forma market value and the maximum of 115% of the pro forma market value. The resulting range of value and pro forma shares, all based on $10.00 per share, are shown in Table IV.F.1 below.
Table IV.F.1
1895 Bancorp of Wisconsin, Inc.
Pro Forma Valuation Range
| Exchange Shares Issued | 2nd Step Offering Shares | Full Conversion Shares | Total Market Capitalization Shares | Exchange Ratio | ||||||||||||||||
Shares | ||||||||||||||||||||
Minimum | 2,110,944 | 2,618,000 | 4,728,944 | 4,728,944 | 0.9729 | |||||||||||||||
Midpoint | 2,483,463 | 3,080,000 | 5,563,463 | 5,563,463 | 1.1446 | |||||||||||||||
Maximum | 2,855,982 | 3,542,000 | 6,397,982 | 6,397,982 | 1.3163 | |||||||||||||||
Aggregate Market Value at $10.00 per share | ||||||||||||||||||||
Minimum | $ | 21,109,436 | $ | 26,180,000 | $ | 47,289,436 | $ | 47,289,436 | ||||||||||||
Midpoint | $ | 24,834,630 | $ | 30,800,000 | $ | 55,634,630 | $ | 55,634,630 | ||||||||||||
Maximum | $ | 28,559,825 | $ | 35,420,000 | $ | 63,979,825 | $ | 63,979,825 | ||||||||||||
67
| Pro Forma Valuation Report for Second Step Conversion
|
| G. | Exchange Ratio |
Conversion regulations provide that in a conversion of a mutual holding company, the minority shareholders are entitled to exchange the public shares for newly issued shares in the fully converted company. The Company has established the exchange ratio, which has been designed to preserve the current aggregate percentage ownership in the Company (adjusted for the dilution resulting from the consolidation of the MHC’s unconsolidated equity into the Company).
The exchange ratio to be received by the existing minority shareholders of the Company will be determined at the end of the offering, based on the total number of shares sold in the second step conversion offering and the final appraisal. Based on the valuation conclusion herein, the resulting offering value and the $10.00 per share offering price, the indicated exchange ratio at the midpoint is 1.1446 shares of the Company for every one share held by public shareholders. The exchange ratios established by the Company as applied to the valuation range are 0.9729 shares and 1.3163 shares for each share of the Company’s common stock at the minimum and maximum, respectively. We express no opinion on the proposed exchange of newly issued Company shares for the shares held by the public shareholders or on the proposed exchange ratio.
| H. | Valuation Updates |
Faust Financial’s valuation will be updated as required by the regulatory appraisal guidelines for mutual-to-stock conversions, giving consideration to changes in the Company’s operations and financial condition relative to the Comparable Group. Further, we will give consideration to any changes in general market conditions and to specific changes in the market for publicly-traded savings institutions and the Company’s stock in specific. We will also monitor pending second-step conversion offerings that are in the offering phase. Our appraisal update(s) will include necessary valuation adjustments to the to the pro forma market value of the Company’s to-be-issued stock. In connection with the closing of the offering, Faust Financial will prepare a closing valuation analysis update to assess whether the range of value remains appropriate.
68
LIST OF EXHIBITS
NUMERICAL | DESCRIPTION | |
| I-1 | Map of Branch Locations | |
| I-2 | Consolidated Balance Sheet and Income Statements | |
| I-3 | Key Operating Ratios | |
| I-4 | Yields and Costs | |
| I-5 | Loan Portfolio Composition | |
| I-6 | Classified Assets | |
| I-7 | Investment Portfolio Composition | |
| I-8 | Loan Loss Allowance Activity | |
| I-9 | Non-Performing Loans | |
| I-10 | Fixed and Adjustable Rate Loans | |
| I-11 | Contractual Maturity by Loan Type | |
| I-12 | Contractual Maturity by Investment Type | |
| I-13 | Interest Rate Risk Analysis | |
| I-14 | Borrowing Activity | |
| I-15 | Deposit Composition | |
| I-16 | Maturity of Time Deposits | |
| I-17 | Director and Senior Management Summary Bios | |
| II-1 | Description of Office Properties | |
| II-2 | Historical Interest Rates | |
| III-1 | Characteristics of Publicly-Traded Savings institutions | |
| III-2 | Public Market Pricing of Mid-Atlantic and Midwest Savings institutions | |
| III-3 | Public Market Pricing of Southwest Savings institutions | |
| III-4 | Historical Stock Prices | |
| III-5 | Wisconsin Savings Institution Acquisitions 2015 – Present | |
| IV-1 | Share Data & Pricing Ratios of Publicly-Traded Savings institutions | |
| IV-2 | Key Financial Data and Ratios of Publicly-Traded Savings institutions | |
| IV-3 | Pro Forma Regulatory Capital Ratios | |
| IV-4 | Pro Forma Analysis Sheet | |
| IV-5 | Pro Forma Effects of Conversion Proceeds – Minimum | |
| IV-6 | Pro Forma Effects of Conversion Proceeds – Midpoint | |
| IV-7 | Pro Forma Effects of Conversion Proceeds – Maximum | |
| IV-8 | Impact of MHC Assets & Waived Dividends on Minority Ownership in Second Step Conversion | |
| V-1 | Firm Qualification Statement | |
| V-2 | Affidavit of Independence | |
Exhibit I-1
1895 Bancorp of Wisconsin, Inc.
Map of Branch Locations
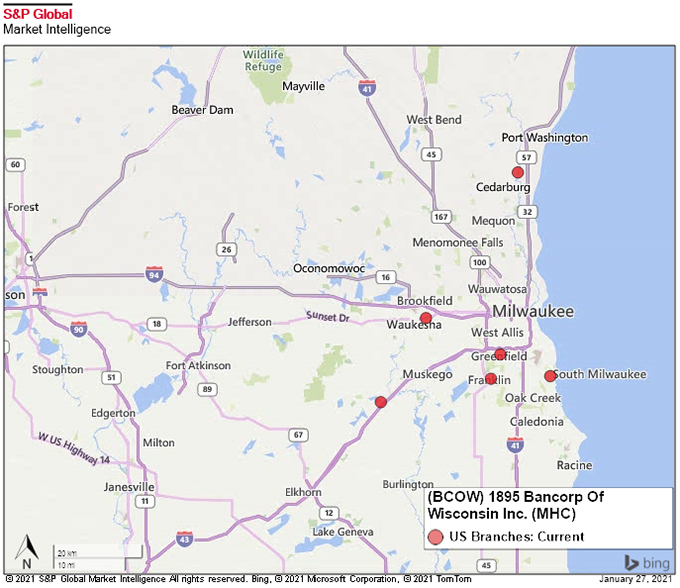
Exhibit I-2
1895 Bancorp of Wisconsin, Inc.
Consolidated Balance Sheet and Income Statements
| For the Year Ended December 31, | ||||||||||||||||||||
| 2020 | 2019 | 2018 | 2017 | 2016 | ||||||||||||||||
Selected Financial Condition Data: | ||||||||||||||||||||
Total assets | $ | 516,757 | $ | 428,009 | $ | 481,099 | $ | 468,361 | $ | 450,173 | ||||||||||
Cash and cash equivalents | 92,526 | 11,707 | 7,923 | 12,497 | 7,779 | |||||||||||||||
Marketable equity securities, stated at fair value (1) | 2,992 | 2,553 | — | — | — | |||||||||||||||
Securities available-for-sale (1) | 58,703 | 71,375 | 65,731 | 88,956 | 96,458 | |||||||||||||||
Loans held for sale | 2,484 | 685 | 771 | 217 | 479 | |||||||||||||||
Loans receivable, net | 329,073 | 310,674 | 369,830 | 331,206 | 312,523 | |||||||||||||||
Premises and equipment, net | 6,275 | 6,681 | 8,163 | 7,661 | 8,925 | |||||||||||||||
Mortgage servicing rights, net | 1,806 | 2,172 | 2,103 | 2,270 | 2,421 | |||||||||||||||
Federal Home Loan Bank stock | 3,032 | 913 | 1,261 | 1,436 | 2,170 | |||||||||||||||
Accrued interest receivable | 912 | 963 | 1,106 | 1,214 | 1,163 | |||||||||||||||
Bank owned life insurance | 13,485 | 13,085 | 13,400 | 13,732 | 13,321 | |||||||||||||||
Other assets | 5,469 | 7,201 | 10,811 | 9,172 | 4,934 | |||||||||||||||
Total liabilities | 456,749 | 369,344 | 442,918 | 429,367 | 412,833 | |||||||||||||||
Deposits | 382,585 | 346,277 | 407,377 | 389,676 | 360,179 | |||||||||||||||
Federal Home Loan Bank advances | 68,398 | 17,623 | 30,010 | 34,693 | 48,224 | |||||||||||||||
Accrued interest payable | 183 | 385 | 372 | 340 | 276 | |||||||||||||||
Other liabilities | 5,583 | 5,059 | 5,159 | 4,658 | 4,154 | |||||||||||||||
Total equity | 60,008 | 58,665 | 38,181 | 38,994 | 37,340 | |||||||||||||||
| (1) | We hold marketable equity securities consisting of mutual fund investments under deferred compensation plans which are held by a Rabbi trust. Prior to 2019, these balances were included in other asset and other liabilities within the consolidated balance sheets. |
| For the Year Ended December 31, | ||||||||||||||||||||
| 2020 | 2019 | 2018 | 2017 | 2016 | ||||||||||||||||
Selected Operating Data: | ||||||||||||||||||||
Interest and dividend income | $ | 15,393 | $ | 17,235 | $ | 16,753 | $ | 15,256 | $ | 13,797 | ||||||||||
Interest expense | 3,041 | 4,933 | 4,233 | 3,361 | 2,685 | |||||||||||||||
|
|
|
|
|
|
|
|
|
| |||||||||||
Net interest income | 12,352 | 12,302 | 12,520 | 11,895 | 11,112 | |||||||||||||||
Provision for loan losses | 500 | (1,032 | ) | — | — | — | ||||||||||||||
|
|
|
|
|
|
|
|
|
| |||||||||||
Net interest income after provision for loan losses | 11,852 | 13,334 | 12,520 | 11,895 | 11,112 | |||||||||||||||
Non-interest income | 6,880 | 3,144 | 2,939 | 2,892 | 4,155 | |||||||||||||||
Non-interest expense (1) | 15,679 | 16,038 | 15,655 | 16,590 | 14,013 | |||||||||||||||
|
|
|
|
|
|
|
|
|
| |||||||||||
Income (loss) before income tax expense (benefit) | 3,053 | 440 | (196 | ) | (1,803 | ) | 1,254 | |||||||||||||
Income tax expense (benefit) (2) | 1,736 | (9 | ) | (177 | ) | (3,462 | ) | — | ||||||||||||
|
|
|
|
|
|
|
|
|
| |||||||||||
Net income (loss) | $ | 1,317 | $ | 449 | $ | (19 | ) | $ | 1,659 | $ | 1,254 | |||||||||
|
|
|
|
|
|
|
|
|
| |||||||||||
| (1) | For the year ended December 31, 2019, non-interest expense included $588,000 of fees incurred in connection with the establishment and funding of our charitable foundation. |
| (2) | Income tax expense was $1.7 million for the year ended December 31, 2020 and included $934,000 increase in our deferred tax valuation allowance. As of December 31, 2020, the deferred tax valuation allowance was $934,000, reducing our net deferred tax asset to $3.4 million at that date. We did not have a deferred tax asset valuation allowance at December 31, 2019. |
Source: 1895 Bancorp’s Preliminary Offering Prospectus
Exhibit I-3
1895 Bancorp of Wisconsin, Inc.
Key Operating Ratios
| At or For the Year Ended December 31, | ||||||||||||||||||||
| 2020 | 2019 | 2018 | 2017 | 2016 | ||||||||||||||||
Performance Ratios: | ||||||||||||||||||||
Return on average assets (1) | 0.28 | % | 0.10 | % | 0.00 | % | 0.36 | % | 0.29 | % | ||||||||||
Return on average equity (2) | 2.42 | % | 0.90 | % | (0.05 | )% | 4.02 | % | 3.26 | % | ||||||||||
Interest rate spread (3) | 2.57 | % | 2.58 | % | 2.70 | % | 2.67 | % | 2.70 | % | ||||||||||
Net interest margin (4) | 2.79 | % | 2.85 | % | 2.86 | % | 2.80 | % | 2.81 | % | ||||||||||
Efficiency ratio (5) | 83.70 | % | 97.30 | % | 101.70 | % | 112.19 | % | 91.79 | % | ||||||||||
Average interest-earning assets to average interest-bearing liabilities | 132.80 | % | 124.00 | % | 116.54 | % | 116.31 | % | 116.80 | % | ||||||||||
Average loans to average deposits | 89.95 | % | 87.73 | % | 91.50 | % | 85.85 | % | 87.74 | % | ||||||||||
Equity to assets (6) | 0.28 | % | 0.10 | % | 0.00 | % | 8.95 | % | 9.02 | % | ||||||||||
Capital Ratios: | ||||||||||||||||||||
Tier 1 capital (to adjusted total assets) | 9.80 | % | 10.70 | % | 7.50 | % | 7.35 | % | 8.41 | % | ||||||||||
Tier I capital (to risk-weighted assets) | 15.10 | % | 13.50 | % | 10.00 | % | 11.07 | % | 11.31 | % | ||||||||||
Total capital (to risk-weighted assets) | 16.00 | % | 14.10 | % | 10.90 | % | 12.05 | % | 12.22 | % | ||||||||||
Common equity Tier 1 capital (to risk-weighted assets) | 15.10 | % | 13.50 | % | 10.00 | % | 11.07 | % | 11.31 | % | ||||||||||
Asset Quality Ratios: | ||||||||||||||||||||
Allowance for loan losses as a percent of total loans | 0.82 | % | 0.64 | % | 0.88 | % | 0.93 | % | 0.95 | % | ||||||||||
Allowance for loan losses as a percent of non-performing loans | 210.02 | % | 99.35 | % | 209.77 | % | 163.90 | % | 100.39 | % | ||||||||||
Allowance for loan losses as a percent of total loans (excluding PPP loans) | 0.86 | % | N/A | N/A | N/A | N/A | ||||||||||||||
Net charge-offs (recoveries) to average outstanding loans during the period | (0.06 | )% | 0.07 | % | (0.05 | )% | (0.03 | )% | 0.03 | % | ||||||||||
Non-performing loans as a percent of total loans | 0.39 | % | 0.64 | % | 0.42 | % | 0.57 | % | 0.95 | % | ||||||||||
Non-performing loans as a percent of total loans (excluding PPP loans) | 0.41 | % | N/A | N/A | N/A | N/A | ||||||||||||||
Non-performing assets as a percent of total assets | 0.25 | % | 0.47 | % | 0.32 | % | 0.40 | % | 0.67 | % | ||||||||||
Other Data: | ||||||||||||||||||||
Number of offices | 6 | 6 | 9 | 9 | 8 | |||||||||||||||
Number of full-time equivalent employees | 100 | 108 | 124 | 111 | 113 | |||||||||||||||
| (1) | Represents net income divided by average total assets. For the year ended December 31, 2017, reflects the reversal of our deferred tax asset valuation in the amount of $4.8 million. |
| (2) | Represents net income divided by average equity. For the year ended December 31, 2017, reflects the reversal of our deferred tax asset valuation in the amount of $4.8 million. |
| (3) | Represents the difference between the weighted average yield on average interest-earning assets and the weighted average cost on average interest-bearing liabilities. |
| (4) | Represents net interest income as a percent of average interest-earning assets. |
| (5) | Represents non-interest expense divided by the sum of net interest income and non-interest income. |
| (6) | Represents average equity divided by average total assets. |
Source: 1895 Bancorp’s Preliminary Offering Prospectus
Exhibit I-4
1895 Bancorp of Wisconsin, Inc.
Yields and Costs
| 2020 | 2019 | |||||||||||||||||||||||
| Outstanding Average Balance | Interest and Dividends | Average Yield/Cost | Outstanding Average Balance | Interest and Dividends | Average Yield/Cost | |||||||||||||||||||
| (Dollars in thousands) | ||||||||||||||||||||||||
Interest-earning assets: | ||||||||||||||||||||||||
Loans | $ | 324,858 | $ | 13,959 | 4.30 | % | $ | 347,736 | $ | 15,305 | 4.40 | % | ||||||||||||
Securities available-for-sale | 63,885 | 1,349 | 2.11 | % | 67,069 | 1,588 | 2.37 | % | ||||||||||||||||
Other interest-earning assets | 53,787 | 85 | 0.16 | % | 16,523 | 342 | 2.07 | % | ||||||||||||||||
|
|
|
|
|
|
|
| |||||||||||||||||
Total interest-earning assets | 442,530 | 15,393 | 3.48 | % | 431,328 | 17,235 | 4.00 | % | ||||||||||||||||
|
|
|
| |||||||||||||||||||||
Non-interest-earning assets | 36,368 | 34,777 | ||||||||||||||||||||||
|
|
|
| |||||||||||||||||||||
Total assets | $ | 478,898 | $ | 466,105 | ||||||||||||||||||||
|
|
|
| |||||||||||||||||||||
Interest-earning liabilities: | ||||||||||||||||||||||||
NOW accounts | $ | 27,702 | $ | 46 | 0.17 | % | $ | 25,606 | $ | 59 | 0.23 | % | ||||||||||||
Money market accounts | 77,313 | 448 | 0.58 | % | 64,095 | 715 | 1.12 | % | ||||||||||||||||
Savings accounts | 53,658 | 58 | 0.11 | % | 50,452 | 66 | 0.13 | % | ||||||||||||||||
Certificates of deposit | 107,250 | 1,768 | 1.65 | % | 182,636 | 3,802 | 2.08 | % | ||||||||||||||||
|
|
|
|
|
|
|
| |||||||||||||||||
Total interest-bearing deposits | 265,923 | 2,320 | 0.87 | % | 322,789 | 4,642 | 1.44 | % | ||||||||||||||||
Federal Home Loan Bank advances | 58,920 | 721 | 1.22 | % | 17,376 | 291 | 1.68 | % | ||||||||||||||||
Other interest-bearing liabilities | 8,396 | — | — | % | 7,687 | — | — | % | ||||||||||||||||
|
|
|
|
|
|
|
| |||||||||||||||||
Total interest-bearing liabilities | 333,239 | 3,041 | 0.91 | % | 347,852 | 4,933 | 1.42 | % | ||||||||||||||||
|
|
|
|
|
|
|
| |||||||||||||||||
Non-interest-bearing deposits | 86,849 | 65,915 | ||||||||||||||||||||||
Other non-interest-bearing liabilities | 4,300 | 2,663 | ||||||||||||||||||||||
|
|
|
| |||||||||||||||||||||
Total liabilities | 424,388 | 416,430 | ||||||||||||||||||||||
Total stockholders’ equity | 54,510 | 49,675 | ||||||||||||||||||||||
|
|
|
| |||||||||||||||||||||
Total liabilities and stockholders’ equity | $ | 478,898 | $ | 466,105 | ||||||||||||||||||||
|
|
|
| |||||||||||||||||||||
Net interest income | $ | 12,352 | $ | 12,302 | ||||||||||||||||||||
|
|
|
| |||||||||||||||||||||
Net interest-earning assets | $ | 109,291 | $ | 83,476 | ||||||||||||||||||||
|
|
|
| |||||||||||||||||||||
Interest rate spread (1) | 2.57 | % | 2.58 | % | ||||||||||||||||||||
Net interest margin (2) | 2.79 | % | 2.85 | % | ||||||||||||||||||||
Average interest-earning assets to average interest-bearing liabilities | 132.80 | % | 124.00 | % | ||||||||||||||||||||
| (1) | Interest rate spread represents the difference between the weighted average yield on interest-earning assets and the weighted average rate of interest-bearing liabilities. |
| (2) | Net interest margin represents net interest income divided by average total interest-earning assets. |
Source: 1895 Bancorp’s Preliminary Offering Prospectus
Exhibit I-5
1895 Bancorp of Wisconsin, Inc.
Loan Portfolio Composition
| At December 31, | ||||||||||||||||||||||||||||||||||||||||
| 2020 | 2019 | 2018 | 2017 | 2016 | ||||||||||||||||||||||||||||||||||||
| Amount | Percent | Amount | Percent | Amount | Percent | Amount | Percent | Amount | Percent | |||||||||||||||||||||||||||||||
| (Dollars in thousands) | ||||||||||||||||||||||||||||||||||||||||
Residential Real Estate Loans: | ||||||||||||||||||||||||||||||||||||||||
First mortgage | $ | 68,968 | 20.8 | % | $ | 65,450 | 21.0 | % | $ | 108,084 | 29.0 | % | $ | 106,120 | 31.8 | % | $ | 103,900 | 33.0 | % | ||||||||||||||||||||
Construction | 2,954 | 0.9 | % | 2,041 | 0.6 | % | 2,097 | 0.6 | % | 3,358 | 1.0 | % | 4,619 | 1.5 | % | |||||||||||||||||||||||||
Commercial Loans: | ||||||||||||||||||||||||||||||||||||||||
Real estate | 189,291 | 57.1 | % | 178,882 | 57.3 | % | 191,645 | 51.4 | % | 156,991 | 47.1 | % | 144,093 | 45.7 | % | |||||||||||||||||||||||||
Land development | 1,492 | 0.5 | % | 1,623 | 0.5 | % | 2,187 | 0.6 | % | 2,687 | 0.8 | % | 1,508 | 0.5 | % | |||||||||||||||||||||||||
Other | 46,184 | 13.9 | % | 34,072 | 10.9 | % | 30,508 | 8.2 | % | 19,715 | 5.9 | % | 14,505 | 4.6 | % | |||||||||||||||||||||||||
Consumer Loans: | ||||||||||||||||||||||||||||||||||||||||
Home equity and lines of credit | 22,348 | 6.7 | % | 29,691 | 9.5 | % | 36,154 | 9.7 | % | 42,344 | 12.7 | % | 45,162 | 14.3 | % | |||||||||||||||||||||||||
Other | 361 | 0.1 | % | 611 | 0.2 | % | 1,914 | 0.5 | % | 2,495 | 0.7 | % | 1,225 | 0.4 | % | |||||||||||||||||||||||||
|
|
|
|
|
|
|
|
|
|
|
|
|
|
|
|
|
|
|
| |||||||||||||||||||||
Total loans receivable | $ | 331,598 | 100.0 | % | $ | 312,370 | 100.0 | % | $ | 372,589 | 100.0 | % | $ | 333,710 | 100.0 | % | $ | 315,012 | 100.0 | % | ||||||||||||||||||||
|
|
|
|
|
|
|
|
|
|
|
|
|
|
|
|
|
|
|
| |||||||||||||||||||||
Net deferred loan fees | $ | 178 | $ | 304 | $ | 503 | $ | 589 | $ | 519 | ||||||||||||||||||||||||||||||
Less: allowance for loan losses | (2,703 | ) | (2,000 | ) | (3,262 | ) | (3,093 | ) | (3,008 | ) | ||||||||||||||||||||||||||||||
|
|
|
|
|
|
|
|
|
| |||||||||||||||||||||||||||||||
Loans receivable, net | $ | 329,073 | $ | 310,674 | $ | 369,830 | $ | 331,206 | $ | 312,523 | ||||||||||||||||||||||||||||||
Source: 1895 Bancorp’s Preliminary Offering Prospectus
Exhibit I-6
1895 Bancorp of Wisconsin, Inc
Classified Assets
| December 31, 2020 | Pass | Watch and Special Mention | Substandard | Total | ||||||||||||
Real estate | $ | 163,961 | $ | 19,272 | $ | 6,058 | $ | 189,291 | ||||||||
Land development | — | — | 1,492 | 1,492 | ||||||||||||
Other | 37,675 | 5,705 | 2,804 | 46,184 | ||||||||||||
|
|
|
|
|
|
|
| |||||||||
Total | $ | 201,636 | $ | 24,977 | $ | 10,354 | $ | 236,967 | ||||||||
|
|
|
|
|
|
|
| |||||||||
| December 31, 2019 | Pass | Watch and Special Mention | Substandard | Total | ||||||||||||
Real estate | $ | 168,834 | $ | 4,418 | $ | 5,630 | $ | 178,882 | ||||||||
Land development | — | 1,623 | — | 1,623 | ||||||||||||
Other | 27,522 | 5,517 | 1,033 | 34,072 | ||||||||||||
|
|
|
|
|
|
|
| |||||||||
Total | $ | 196,356 | $ | 11,558 | $ | 6,663 | $ | 214,577 | ||||||||
|
|
|
|
|
|
|
| |||||||||
Source: 1895 Bancorp’s 12/31/2020 Draft Audited Financial Statements
Exhibit I-7
1895 Bancorp of Wisconsin, Inc
Investment Portfolio Composition
| December 31, 2020 | Amortized Cost | Gross Unrealized Gains | Gross Unrealized Losses | Estimated Fair Value | ||||||||||||
Obligations of states and political subdivisions | $ | 11,570 | $ | 244 | $ | (11 | ) | $ | 11,803 | |||||||
Government-sponsored mortgage-backed securities | 36,886 | 1,165 | (12 | ) | 38,039 | |||||||||||
Asset-backed securities | 7,231 | 57 | (7 | ) | 7,281 | |||||||||||
Certificates of deposit | 1,458 | 122 | — | 1,580 | ||||||||||||
|
|
|
|
|
|
|
| |||||||||
Total available for sale securities | $ | 57,145 | $ | 1,588 | $ | (30 | ) | $ | 58,703 | |||||||
|
|
|
|
|
|
|
| |||||||||
| December 31, 2019 | Amortized Cost | Gross Unrealized Gains | Gross Unrealized Losses | Estimated Fair Value | ||||||||||||
Obligations of states and political subdivisions | $ | 9,779 | $ | 67 | $ | (20 | ) | $ | 9,826 | |||||||
Government-sponsored mortgage-backed securities | 56,975 | 416 | (357 | ) | 57,034 | |||||||||||
Corporate collateralized mortgage obligations | 284 | 5 | — | 289 | ||||||||||||
Asset-backed securities | 2,484 | — | (19 | ) | 2,465 | |||||||||||
Certificates of deposit | 1,707 | 54 | — | 1,761 | ||||||||||||
|
|
|
|
|
|
|
| |||||||||
Total available for sale securities | $ | 71,229 | $ | 542 | $ | (396 | ) | $ | 71,375 | |||||||
|
|
|
|
|
|
|
| |||||||||
Source: 1895 Bancorp’s 12/31/2020 Draft Audited Financial Statements
Exhibit I-8
1895 Bancorp of Wisconsin, Inc.
Loan Loss Allowance Activity
| Year Ended December 31, | ||||||||
| 2020 | 2019 | |||||||
| (Dollars in thousands) | ||||||||
Allowance for loan losses at end of period | $ | 2,703 | $ | 2,000 | ||||
Non-accrual loans at end of period | $ | 1,287 | $ | 2,013 | ||||
Total loans at end of period | $ | 331,598 | $ | 312,370 | ||||
Allowance for loan losses to total loans outstanding at end of period | 0.82 | % | 0.64 | % | ||||
Non-accrual loans to total loans outstanding at end of period | 0.39 | % | 0.64 | % | ||||
Non-accrual loans to total loans (excluding PPP loans) | 0.86 | % | N/A | |||||
Allowance for loan losses to non-accrual loans at end of period | 210.03 | % | 99.35 | % | ||||
Net charge-offs (recoveries) to average loans outstanding during period – Commercial loans | (0.01 | )% | — | |||||
Net charge-offs (recoveries) to average loans outstanding during period – Residential real estate loans | (0.12 | )% | 0.09 | % | ||||
Net charge-offs (recoveries) to average loans outstanding during period – Consumer loans | (0.43 | )% | 0.46 | % | ||||
Net charge-offs (recoveries) to average loans outstanding during period – Total | (0.06 | )% | 0.07 | % | ||||
Source: 1895 Bancorp’s Preliminary Offering Prospectus
Exhibit I-9
1895 Bancorp of Wisconsin, Inc.
Non-Performing Loans
| December 31, 2020 | Current Loans | Loans Past Due 30-89 Days | Loans Past Due 90+ Days | Total Loans | Non-accrual Loans | |||||||||||||||
Commercial: | ||||||||||||||||||||
Real estate | $ | 189,050 | $ | 241 | $ | — | $ | 189,291 | $ | — | ||||||||||
Land development | 1,492 | — | — | 1,492 | — | |||||||||||||||
Other | 46,151 | 33 | — | 46,184 | — | |||||||||||||||
Residential real estate: | ||||||||||||||||||||
First mortgage | 68,147 | 684 | 137 | 68,968 | 1,151 | |||||||||||||||
Construction | 2,954 | — | — | 2,954 | — | |||||||||||||||
Consumer: | ||||||||||||||||||||
Home equity and lines of credit | 22,204 | 121 | 23 | 22,348 | 136 | |||||||||||||||
Other | 361 | — | — | 361 | — | |||||||||||||||
|
|
|
|
|
|
|
|
|
| |||||||||||
Total | $ | 330,359 | $ | 1,079 | $ | 160 | $ | 331,598 | $ | 1,287 | ||||||||||
|
|
|
|
|
|
|
|
|
| |||||||||||
| Total non-accrual loans to total loans | 0.39 | % | ||||||||||||
| Total non-accrual loans to total assets | 0.25 | % | ||||||||||||
| December 31, 2019 | Current Loans | Loans Past Due 30-89 Days | Loans Past Due 90+ Days | Total Loans | Non-accrual Loans | |||||||||||||||
Commercial: | ||||||||||||||||||||
Real estate | $ | 178,702 | $ | — | $ | 180 | $ | 178,882 | $ | 180 | ||||||||||
Land development | 1,623 | — | — | 1,623 | — | |||||||||||||||
Other | 33,924 | 148 | — | 34,072 | — | |||||||||||||||
Residential real estate: | ||||||||||||||||||||
First mortgage | 63,854 | 1,059 | 537 | 65,450 | 1,690 | |||||||||||||||
Construction | 2,041 | — | — | 2,041 | — | |||||||||||||||
Consumer: | ||||||||||||||||||||
Home equity and lines of credit | 29,678 | 13 | — | 29,691 | 143 | |||||||||||||||
Other | 611 | — | — | 611 | — | |||||||||||||||
|
|
|
|
|
|
|
|
|
| |||||||||||
Total | $ | 310,433 | $ | 1,220 | $ | 717 | $ | 312,370 | $ | 2,013 | ||||||||||
|
|
|
|
|
|
|
|
|
| |||||||||||
| Total non-accrual loans to total loans | 0.64 | % | ||||||||||||
| Total non-accrual loans to total assets | 0.47 | % | ||||||||||||
Source: 1895 Bancorp’s 12/31/2020 Draft Audited Financial Statements
Exhibit I-10
1895 Bancorp of Wisconsin, Inc.
Fixed and Adjustable Rate Loans
The following table sets forth the dollar amount of all loans at December 31, 2020 that are due after December 31, 2021 and have either fixed interest rates or floating or adjustable interest rates. The amounts shown below exclude unearned loan origination fees.
| Fixed Rates | Floating or Adjustable Rates | Total | ||||||||||
| (Dollars in thousands) | ||||||||||||
Residential real estate loans | $ | 56,442 | $ | 12,655 | $ | 69,097 | ||||||
Commercial loans | 172,920 | 30,152 | 203,072 | |||||||||
Consumer loans | 3,029 | 11,481 | 14,510 | |||||||||
|
|
|
|
|
| |||||||
Total | $ | 232,391 | $ | 54,288 | $ | 286,679 | ||||||
|
|
|
|
|
| |||||||
Source: 1895 Bancorp’s Preliminary Offering Prospectus
Exhibit I-11
1895 Bancorp of Wisconsin, Inc.
Contractual Maturity by Loan Type
| At December 31, 2020 | ||||||||||||||||
| Residential Real Estate Loans | Commercial Loans | Consumer Loans | Total Loans | |||||||||||||
| (Dollars in thousands) | ||||||||||||||||
Amounts due in: | ||||||||||||||||
One year or less | $ | 2,825 | $ | 33,895 | $ | 8,199 | $ | 44,919 | ||||||||
More than one year through five years | 11,324 | 137,732 | 12,094 | 161,150 | ||||||||||||
More than five through fifteen years | 29,263 | 62,093 | 1,668 | 93,024 | ||||||||||||
More than fifteen years | 28,510 | 3,247 | 748 | 32,505 | ||||||||||||
|
|
|
|
|
|
|
| |||||||||
Total | $ | 71,922 | $ | 236,967 | $ | 22,709 | $ | 331,598 | ||||||||
|
|
|
|
|
|
|
| |||||||||
Source: 1895 Bancorp’s Preliminary Offering Prospectus
Exhibit I-12
1895 Bancorp of Wisconsin, Inc
Contractual Maturity by Investment Type
| One Year or Less | More than One Year to Five Years | More than Five Years to Ten Years | More than Ten Years | Total | ||||||||||||||||||||||||||||||||||||||||
| Amortized Cost | Weighted Average Yield | Amortized Cost | Weighted Average Yield | Amortized Cost | Weighted Average Yield | Amortized Cost | Weighted Average Yield | Amortized Cost | Fair Value | Weighted Average Yield | ||||||||||||||||||||||||||||||||||
| (Dollars in thousands) | ||||||||||||||||||||||||||||||||||||||||||||
Securities available-for-sale: |
| |||||||||||||||||||||||||||||||||||||||||||
Obligations of states and political subdivisions | $ | 1,239 | 2.06 | % | $ | 4,008 | 2.23 | % | $ | 1,077 | 2.89 | % | $ | 5,246 | 1.74 | % | $ | 11,570 | $ | 11,803 | 2.05 | % | ||||||||||||||||||||||
Government-sponsored mortgage-backed securities | — | — | % | 4,542 | 2.41 | % | 8,355 | 2.46 | % | 23,989 | 1.80 | % | 36,886 | 38,039 | 2.02 | % | ||||||||||||||||||||||||||||
Asset-backed securities | — | — | % | 770 | 1.16 | % | — | — | % | 6,461 | 1.24 | % | 7,231 | 7,281 | 1.23 | % | ||||||||||||||||||||||||||||
Certificates of deposit | — | — | % | 1,208 | 2.73 | % | 250 | 2.92 | % | — | — | % | 1,458 | 1,580 | 2.77 | % | ||||||||||||||||||||||||||||
|
|
|
|
|
|
|
|
|
|
|
| |||||||||||||||||||||||||||||||||
Total | $ | 1,239 | 2.06 | % | $ | 10,528 | 2.29 | % | $ | 9,682 | 2.52 | % | $ | 35,696 | 1.69 | % | $ | 57,145 | $ | 58,703 | 1.95 | % | ||||||||||||||||||||||
|
|
|
|
|
|
|
|
|
|
|
| |||||||||||||||||||||||||||||||||
Source: 1895 Bancorp’s Preliminary Offering Prospectus
Exhibit I-13
1895 Bancorp of Wisconsin, Inc
Interest Rate Risk Analysis
Change in Interest Rates (basis points) (1) | Net Interest Income Year 1 Forecast | Year 1 Change from Level | ||||||
| (Dollars in thousands) | ||||||||
+400 | $ | 13,965 | 24.3 | % | ||||
+300 | 13,467 | 19.9 | % | |||||
+200 | 12,800 | 14.0 | % | |||||
+100 | 12,064 | 7.4 | % | |||||
Level | 11,233 | 0 | % | |||||
-100 | 10,857 | (3.3 | )% | |||||
| (1) | Assumes an immediate uniform change in interest rates at all maturities. |
| Estimated Increase (Decrease) in EVE | ||||||||||||
Basis Point (“bp”) Change in | Estimated EVE (2) | Amount | Percent | |||||||||
| (Dollars in thousands) | ||||||||||||
400 | $ | 74,740 | $ | 16,270 | 27.8 | % | ||||||
300 | 71,539 | 13,069 | 22.4 | % | ||||||||
200 | 68,600 | 10,130 | 17.3 | % | ||||||||
100 | 64,830 | 6,360 | 10.9 | % | ||||||||
— | 58,470 | — | — | |||||||||
(100) | 57,828 | (642 | ) | (1.1 | )% | |||||||
| (1) | Assumes an instantaneous uniform change in interest rates at all maturities. |
| (2) | EVE is the discounted present value of expected cash flows from assets, liabilities and off-balance sheet contracts. |
Source: 1895 Bancorp’s Preliminary Offering Prospectus
Exhibit I-14
1895 Bancorp of Wisconsin, Inc
Borrowing Activity
| Year Ended December 31, | ||||||||
| 2020 | 2019 | |||||||
| (Dollars in thousands) | ||||||||
Maximum balance outstanding at any month-end during period | $ | 69,528 | $ | 42,657 | ||||
Average balance outstanding during period | $ | 58,920 | $ | 17,376 | ||||
Weighted average interest rate during period | 1.22 | % | 1.68 | % | ||||
Balance outstanding at end of period | $ | 68,398 | $ | 17,623 | ||||
Weighted average interest rate at end of period | 1.18 | % | 1.46 | % | ||||
Source: 1895 Bancorp’s Preliminary Offering Prospectus
Exhibit I-15
1895 Bancorp of Wisconsin, Inc.
Deposit Composition
| 2020 | 2019 | |||||||||||||||||||||||
| Amount | Percent | Rate | Amount | Percent | Rate | |||||||||||||||||||
| (Dollars in thousands) | ||||||||||||||||||||||||
Noninterest-bearing checking accounts | $ | 98,970 | 26.1 | % | 0.00 | % | $ | 62,768 | 18.21 | % | — | |||||||||||||
NOW accounts | 30,630 | 8.1 | % | 0.17 | % | 25,432 | 7.38 | % | 0.23 | % | ||||||||||||||
Money market accounts | 103,724 | 27.2 | % | 0.58 | % | 65,999 | 19.15 | % | 1.12 | % | ||||||||||||||
Savings accounts | 58,895 | 15.5 | % | 0.11 | % | 47,981 | 13.92 | % | 0.13 | % | ||||||||||||||
Certificates of deposit (1) | 87,629 | 23.1 | % | 1.65 | % | 142,416 | 41.34 | % | 2.08 | % | ||||||||||||||
|
|
|
|
|
|
|
|
|
|
|
| |||||||||||||
Total | $ | 379,848 | 100 | % | 0.67 | % | $ | 344,596 | 100 | % | 1.11 | % | ||||||||||||
|
|
|
|
|
|
|
|
|
|
|
| |||||||||||||
(1) Included in these amounts are brokered deposits of $5.5 million and $29.6 million as of December 31, 2020 and December 31, 2019, respectively. |
| |||||||||||||||||||||||
Source: 1895 Bancorp’s Preliminary Offering Prospectus
Exhibit I-16
1895 Bancorp of Wisconsin, Inc.
Maturity of Time Deposits
2021 | 81,521 | |||
2022 | 3,938 | |||
2023 | 630 | |||
2024 | 860 | |||
2025 | 680 | |||
|
| |||
Total | $ | 87,629 | ||
|
|
Source: 1895 Bancorp’s 12/31/2020 Draft Audited Financial Statements
Exhibit I-17
1895 Bancorp of Wisconsin, Inc.
Director and Senior Management Summary Bios
Directors with terms ending following the fiscal year ending December 31, 2021
David Ball joined 1895 Bancorp of Wisconsin, Inc. and PyraMax Bank, FSB in February 2021 as a Director, President and Chief Operating Officer. In this role he will oversee the daily operations of PyraMax Bank, FSB, design and implement business strategies and set comprehensive goals for profitability and growth. Prior to being employed by PyraMax Bank, Mr. Ball was most recently the Managing Director of Correspondent Banking at BMO Harris from 2004 until February 2021. Mr. Ball has over 30 years of banking experience prior to joining PyraMax Bank, with a depth of experience in finance, commercial lending and management. Age 52.
Joseph Murphy has served on the board of directors of PyraMax Bank, FSB since December 2005. He was City Attorney for the City of South Milwaukee from 1982 to 2016. Mr. Murphy was a principal shareholder in Murphy & Leonard, LLP (formerly Murphy & Brennan), a Milwaukee law firm concentrating in commercial litigation, municipal law, real estate, estate planning and family law from 1981 to 2016. Mr. Murphy was an Assistant District Attorney in Milwaukee County from 1977 to 1981. Mr. Murphy retired in 2017. Mr. Murphy’s extensive and varied background as an attorney and in real estate are valuable to our Board of Directors. Age 73.
Gary Zenobi was appointed to the board of directors in 1992. Mr. Zenobi is a retired certified public accountant who owned his own certified public accounting firm, GAZ LLC, from 2010 to 2015. He was a partner in the accounting firm of Bartlett & Zenobi, SC. from 1994 to 2010. Prior to that, Mr. Zenobi owned his own firm Gary A. Zenobi, S.C. from 1988 to 1994. Mr. Zenobi also worked at the CPA firms Jannsen & Co. SC from 1977 to 1987 and Bersch and Co. SC from 1973 to 1976. He was the Comptroller of American Medical Services, Inc. from 1970 to 1973 and began his career working for Touche Ross from 1967 to 1970. Mr. Zenobi is a certified public accountant and his diverse background and broad experience in public accounting enhances our Board of Director’s oversight of financial reporting. His work experience qualifies him to be a member of the Audit Committee as an “audit committee financial expert” under the rules and regulations of the Securities and Exchange Commission. Age 75.
Directors with terms ending following the fiscal year ending December 31, 2022
Monica Baker was appointed Senior Vice President-Chief Brand Officer in January 2014. Ms. Baker joined PyraMax Bank, FSB in 1993 as the Vice President of Marketing/Human Resources/Savings. In 2000, she was promoted to Senior Vice President of Marketing/Human Resources and in 2010 she was promoted to Senior Vice President of Marketing/Human Resources/Retail Lending. Ms. Baker has been on the board of directors since 2006. Prior to being employed with PyraMax Bank, FSB Ms. Baker was the Human Resources Officer at Maritime Savings Bank. She brings with her over 34 years of banking experience, focused on retail banking, retail lending, human resources and marketing. Ms. Baker holds her Master of Business Administration Degree from the University of Wisconsin-Milwaukee and undergraduate with a double major in Human Resources and Marketing from the University of Wisconsin-Milwaukee. Ms. Baker’s extensive experience in retail banking, retail lending, human resources and marketing are valuable to our board of directors in assessing the performance of PyraMax Bank, FSB. Age 52.
James Spiegelberg was appointed to PyraMax Bank, FSB’s board of directors in 2006. He owns Spiegelberg Financial Services, a full-service tax, accounting and financial services firm. Mr. Spiegelberg has over 27 years of accounting experience. Mr. Spiegelberg was Vice President of Finance, TransWorld Express Airlines from 1987 to 1989 and Vice President of Finance & Administration, JBL Professional from 1989 to 1993. Prior to that, he was Director of Accounting, Jet America Airlines from 1985 to 1987. Mr. Spiegelberg began his professional experience with Touche Ross as an auditor from 1981 to 1983. After successfully passing the CPA exam, he accepted a position in Internal Audit with Rexnord Corporation from 1983 to 1985. In 2001, Mr. Spiegelberg became an Investment Advisor Representative and also holds health and life insurance licenses, which adds valuable knowledge and experience to our board of directors. His work experience qualifies him to be a member of the Audit Committee as an “audit committee financial expert” under the rules and regulations of the Securities and Exchange Commission. Age 62.
Directors with terms ending following the fiscal year ending December 31, 2023
Darrell Francis has served on the board of directors of PyraMax Bank, FSB since June 1986. He was appointed Chairman of the Board in July 2007. He owns and operates a private dental practice in Wisconsin and has performed general dentistry since 1976. Dr. Frances has been a member of the South Milwaukee Police and Fire Commission for over 25 years. He is the former President of the South Milwaukee Lion’s Club and was previously on the Board of Directors of Southshore-YMCA. Mr. Francis has extensive knowledge of local markets and the communities served by PyraMax Bank, FSB. Age 68.
Richard Hurd was appointed Chief Executive Officer of PyraMax Bank, FSB in 2007. Prior to that, Mr. Hurd was the Chief Operating Officer from 2004 to 2007. Mr. Hurd has been a board member since 2004. He joined PyraMax Bank, FSB in 2001. Prior to joining PyraMax Bank, FSB Mr. Hurd had 30 years of banking experience at First Wisconsin National Bank, Marine Bank and Bank One Corporation. Mr. Hurd’s banking experience and knowledge of financial markets enhance the breadth of experience of our board of directors. Age 68.
John Talsky was appointed to the board of directors in 2001. Mr. Talsky is an attorney who has owned a law firm specializing in estate planning and related services since 1973. Mr. Talsky is the Village of Greendale Board of Zoning Appeals Member, Chairman (1990 to Present). Mr. Talsky’s broad legal experience enables him to bring a unique perspective to the board of directors. Age 71.
Executive Officers Who are Not Directors
Richard J. Krier joined PyraMax Bank, FSB in April 2011 as Senior Vice President Chief Financial Officer. In this role he oversees the Bank’s financial reporting and finance functions. Prior to being employed by PyraMax Bank, Mr. Krier served as the Chief Financial Officer of Partnership Community Bancshares from 2008 until 2011, and was employed at Ozaukee Bank from 1990 to 2008 in a variety of administrative and financial roles including Chief Financial Officer from 2004 to 2008. Mr. Krier has over 30 years of broad-based banking experience in the areas of financial management, operations, performance measurement and decision support. Mr. Krier is also a certified public accountant. Age 61.
Charles Mauer joined PyraMax Bank, FSB in June 2010 as PyraMax Bank, FSB’s Chief Credit Officer. He is responsible for the overall management of PyraMax Bank, FSB’s Credit Administration Department, including loan underwriting, loan review, lending support, loan policies, procedures and processes to ensure the overall quality of PyraMax Bank, FSB’s loan portfolio. Mr. Mauer has over 30 years of commercial, consumer and mortgage lending as well as credit administration experience. Prior to working at PyraMax Bank, FSB, he was a First Vice President of Credit Administration at Ozaukee Bank where he also managed client relationships for over 20 years. In 2007, Ozaukee Bank was acquired by BMO Harris. Mr. Mauer remained with BMO Harris for three years serving as Senior Vice President—Concurrence Officer. Age 61.
Thomas K. Peterson jointed PyraMax Bank, FSB as Senior Vice President, Chief Lending Officer in January 2017. Prior to being employed by PyraMax Bank, FSB, Mr. Peterson was the Commercial Business Segment Leader for the Milwaukee-Madison Markets for Associated Bank from 2014 to 2017, and was the Commercial Business Team Leader for the Milwaukee Unit from 2010 to 2014. Mr. Peterson has over 36 years of banking experience, including various commercial banking roles at Ozaukee Bank, Harris-BMO and Associated Bank. Age 64.
Source: 1895 Bancorp’s Preliminary Offering Prospectus
Exhibit II-1
1895 Bancorp of Wisconsin, Inc.
Description of Office Properties
We conduct our operations from our three full-service banking offices in Milwaukee County, our two full-service banking offices in Waukesha County and our full-service banking office in Ozaukee County, Wisconsin. We consider our primary lending market area to be southeastern Wisconsin, however, we occasionally make loans secured by properties located outside of our primary lending market, usually to borrowers with whom we have an existing relationship and who have a presence within our primary market.
Source: 1895 Bancorp’s Preliminary Offering Prospectus
Exhibit II-2
Historical Interest Rates (1)
| March 2016 | June 2016 | September 2016 | December 2016 | |||||||||||||
Prime | 3.50 | % | 3.50 | % | 3.50 | % | 3.50 | % | ||||||||
3-Month Treasury | 0.21 | % | 0.26 | % | 0.29 | % | 0.51 | % | ||||||||
1-Year Treasury | 0.59 | % | 0.45 | % | 0.59 | % | 0.85 | % | ||||||||
30-Year Treasury | 2.66 | % | 2.27 | % | 2.28 | % | 3.14 | % | ||||||||
| March 2017 | June 2017 | September 2017 | December 2017 | |||||||||||||
Prime | 4.00 | % | 4.25 | % | 4.25 | % | 4.50 | % | ||||||||
3-Month Treasury | 0.76 | % | 1.03 | % | 1.06 | % | 1.39 | % | ||||||||
1-Year Treasury | 1.03 | % | 1.24 | % | 1.31 | % | 1.76 | % | ||||||||
30-Year Treasury | 3.02 | % | 2.75 | % | 2.86 | % | 2.75 | % | ||||||||
| March 2018 | June 2018 | September 2018 | December 2018 | |||||||||||||
Prime | 4.75 | % | 5.00 | % | 5.25 | % | 5.50 | % | ||||||||
3-Month Treasury | 1.73 | % | 1.93 | % | 2.19 | % | 2.45 | % | ||||||||
1-Year Treasury | 2.09 | % | 2.33 | % | 2.59 | % | 2.63 | % | ||||||||
30-Year Treasury | 3.01 | % | 2.97 | % | 3.19 | % | 3.04 | % | ||||||||
| March 2019 | June 2019 | September 2019 | December 2019 | |||||||||||||
Prime | 5.50 | % | 5.00 | % | 4.75 | % | 4.75 | % | ||||||||
3-Month Treasury | 2.40 | % | 2.12 | % | 1.88 | % | 1.55 | % | ||||||||
1-Year Treasury | 2.40 | % | 1.92 | % | 1.75 | % | 1.59 | % | ||||||||
30-Year Treasury | 2.81 | % | 2.53 | % | 2.09 | % | 2.39 | % | ||||||||
| March 2020 | June 2020 | September 2020 | December 2020 | |||||||||||||
Prime | 3.25 | % | 3.25 | % | 3.25 | % | 3.25 | % | ||||||||
3-Month Treasury | 0.11 | % | 0.16 | % | 0.10 | % | 0.09 | % | ||||||||
1-Year Treasury | 0.17 | % | 0.16 | % | 0.12 | % | 0.10 | % | ||||||||
30-Year Treasury | 1.31 | % | 1.41 | % | 1.41 | % | 1.65 | % | ||||||||
| January 2020 | ||||||||||||||||
Prime | 3.25 | % | ||||||||||||||
3-Month Treasury | 0.09 | % | ||||||||||||||
1-Year Treasury | 0.10 | % | ||||||||||||||
30-Year Treasury | 1.85 | % | ||||||||||||||
| (1) | End of period data |
| Source: | Department of the Treasury and Federal Reserve |
Exhibit III-1
Characteristics of Publicly-Traded Thrifts
February 8, 2021
| As of February 8, 2021 | ||||||||||||||||||||||||||||||
Ticker | Company Name | Region | State | Exchange | Offices | Fiscal | Total Assets ($000) | Conversion Date | Stock Price ($) | Market Value ($000) | ||||||||||||||||||||
AFBI | Affinity Bancshares, Inc. | SE | GA | NASDAQCM | 3 | Dec | 888,170 | 4/27/2017 | 10.75 | 73,913 | ||||||||||||||||||||
AX | Axos Financial, Inc. | WE | NV | NYSE | NA | Jun | 14,393,267 | 3/14/2005 | 44.42 | 2,624,207 | ||||||||||||||||||||
BYFC | Broadway Financial Corporation | WE | CA | NASDAQCM | 3 | Dec | 499,217 | 1/8/1996 | 2.28 | 62,621 | ||||||||||||||||||||
CFFN | Capitol Federal Financial, Inc. | MW | KS | NASDAQGS | 54 | Sep | 9,606,964 | 3/31/1999 | 12.79 | 1,728,693 | ||||||||||||||||||||
CARV | Carver Bancorp, Inc. | MA | NY | NASDAQCM | 7 | Mar | 672,653 | 10/24/1994 | 9.13 | 27,964 | ||||||||||||||||||||
CBMB | CBM Bancorp, Inc. | MA | MD | NASDAQCM | 4 | Dec | 232,186 | 9/27/2018 | 14.00 | 48,191 | ||||||||||||||||||||
CNNB | Cincinnati Bancorp, Inc. | MW | OH | NASDAQCM | 6 | Dec | 231,943 | 10/14/2015 | 11.96 | 35,589 | ||||||||||||||||||||
ESBK | Elmira Savings Bank | MA | NY | NASDAQCM | 12 | Dec | 644,587 | 3/1/1985 | 12.40 | 43,684 | ||||||||||||||||||||
ESSA | ESSA Bancorp, Inc. | MA | PA | NASDAQGS | 22 | Sep | 1,868,818 | 4/3/2007 | 15.62 | 157,527 | ||||||||||||||||||||
FFBW | FFBW, Inc. | MW | WI | NASDAQCM | 4 | Dec | 285,787 | 10/10/2017 | 10.44 | 74,231 | ||||||||||||||||||||
FNWB | First Northwest Bancorp | WE | WA | NASDAQGM | 10 | Dec | 1,654,349 | 1/29/2015 | 15.99 | 151,584 | ||||||||||||||||||||
FBC | Flagstar Bancorp, Inc. | MW | MI | NYSE | 158 | Dec | 31,038,000 | 4/30/1997 | 45.36 | 2,388,479 | ||||||||||||||||||||
FSBW | FS Bancorp, Inc. | WE | WA | NASDAQCM | 21 | Dec | 2,113,241 | 7/9/2012 | 59.24 | 246,257 | ||||||||||||||||||||
GBNY | Generations Bancorp NY, Inc. | MA | NY | NASDAQCM | 10 | Dec | 371,789 | 7/10/2006 | 9.74 | 23,945 | ||||||||||||||||||||
HONE | HarborOne Bancorp, Inc. | NE | MA | NASDAQGS | 30 | Dec | 4,483,615 | 6/29/2016 | 11.44 | 622,925 | ||||||||||||||||||||
HIFS | Hingham Institution for Savings | NE | MA | NASDAQGM | 10 | Dec | 2,857,093 | 12/13/1988 | 242.50 | 518,430 | ||||||||||||||||||||
HMNF | HMN Financial, Inc. | MW | MN | NASDAQGM | 14 | Dec | 909,580 | 6/30/1994 | 19.00 | 90,613 | ||||||||||||||||||||
HFBL | Home Federal Bancorp, Inc. of Louisiana | SW | LA | NASDAQCM | 7 | Jun | 535,394 | 1/18/2005 | 30.00 | 46,416 | ||||||||||||||||||||
HVBC | HV Bancorp, Inc. | MA | PA | NASDAQCM | 4 | Dec | 507,739 | 1/11/2017 | 16.82 | 33,834 | ||||||||||||||||||||
IROQ | IF Bancorp, Inc. | MW | IL | NASDAQCM | 7 | Jun | 713,399 | 7/7/2011 | 20.12 | 61,131 | ||||||||||||||||||||
KRNY | Kearny Financial Corp. | MA | NJ | NASDAQGS | 49 | Jun | 7,335,153 | 2/23/2005 | 10.92 | 888,236 | ||||||||||||||||||||
EBSB | Meridian Bancorp, Inc. | NE | MA | NASDAQGS | 42 | Dec | 6,619,848 | 1/22/2008 | 16.36 | 821,653 | ||||||||||||||||||||
MSVB | Mid-Southern Bancorp, Inc. | MW | IN | NASDAQCM | 3 | Dec | 218,281 | 4/8/1998 | 15.45 | 46,139 | ||||||||||||||||||||
NYCB | New York Community Bancorp, Inc. | MA | NY | NYSE | 236 | Dec | 56,306,120 | 11/23/1993 | 10.48 | 4,861,691 | ||||||||||||||||||||
NFBK | Northfield Bancorp, Inc. | MA | NJ | NASDAQGS | 38 | Dec | 5,514,544 | 11/7/2007 | 13.65 | 712,665 | ||||||||||||||||||||
NWBI | Northwest Bancshares, Inc. | MA | PA | NASDAQGS | 170 | Dec | 13,806,268 | 11/4/1994 | 13.40 | 1,701,426 | ||||||||||||||||||||
PCSB | PCSB Financial Corporation | MA | NY | NASDAQCM | 15 | Jun | 1,789,839 | 4/20/2017 | 16.18 | 242,238 | ||||||||||||||||||||
PVBC | Provident Bancorp, Inc. | NE | MA | NASDAQCM | 7 | Dec | 1,505,781 | 7/15/2015 | 12.34 | 223,345 | ||||||||||||||||||||
PROV | Provident Financial Holdings, Inc. | WE | CA | NASDAQGS | 13 | Jun | 1,170,727 | 6/27/1996 | 15.73 | 117,067 | ||||||||||||||||||||
PFS | Provident Financial Services, Inc. | MA | NJ | NYSE | NA | Dec | 12,919,741 | 1/15/2003 | 19.68 | 1,498,724 | ||||||||||||||||||||
PBIP | Prudential Bancorp, Inc. | MA | PA | NASDAQGM | 10 | Sep | 1,193,267 | 3/29/2005 | 13.09 | 104,679 | ||||||||||||||||||||
RNDB | Randolph Bancorp, Inc. | NE | MA | NASDAQGM | 5 | Dec | 722,968 | 7/1/2016 | 19.70 | 101,321 | ||||||||||||||||||||
RVSB | Riverview Bancorp, Inc. | WE | WA | NASDAQGS | 19 | Mar | 1,436,184 | 10/26/1993 | 5.69 | 127,144 | ||||||||||||||||||||
SVBI | Severn Bancorp, Inc. | MA | MD | NASDAQCM | 7 | Dec | 952,553 | 1/0/1900 | 7.78 | 99,719 | ||||||||||||||||||||
STXB | Spirit of Texas Bancshares, Inc. | SW | TX | NASDAQGS | 38 | Dec | 3,085,464 | 5/3/2018 | 20.00 | 341,637 | ||||||||||||||||||||
SBT | Sterling Bancorp, Inc. | MW | MI | NASDAQCM | 30 | Dec | 3,914,045 | 11/16/2017 | 5.10 | 254,907 | ||||||||||||||||||||
TBNK | Territorial Bancorp Inc. | WE | HI | NASDAQGS | 29 | Dec | 2,110,799 | 7/13/2009 | 25.57 | 232,947 | ||||||||||||||||||||
TSBK | Timberland Bancorp, Inc. | WE | WA | NASDAQGM | 24 | Sep | 1,588,405 | 1/12/1998 | 27.67 | 230,198 | ||||||||||||||||||||
TBK | Triumph Bancorp, Inc. | SW | TX | NASDAQGS | 63 | Dec | 5,935,791 | 11/6/2014 | 65.87 | 1,624,531 | ||||||||||||||||||||
TRST | TrustCo Bank Corp NY | MA | NY | NASDAQGS | 148 | Dec | 5,901,796 | 1/0/1900 | 6.63 | 639,349 | ||||||||||||||||||||
WSBF | Waterstone Financial, Inc. | MW | WI | NASDAQGS | 13 | Dec | 2,184,587 | 10/4/2005 | 19.30 | 457,148 | ||||||||||||||||||||
WNEB | Western New England Bancorp, Inc. | NE | MA | NASDAQGS | 25 | Dec | 2,365,886 | 12/27/2001 | 7.49 | 186,647 | ||||||||||||||||||||
WSFS | WSFS Financial Corporation | MA | DE | NASDAQGS | 89 | Dec | 14,333,914 | 11/26/1986 | 46.17 | 2,204,895 | ||||||||||||||||||||
WVFC | WVS Financial Corp. | MA | PA | NASDAQGM | 6 | Jun | 317,444 | 11/29/1993 | 15.15 | 26,388 | ||||||||||||||||||||
Source: S&P Global Market Intelligence
Exhibit III-2
Public Thrifts Market Pricing of Mid-Atlantic and Midwest Thrifts
As of February 8, 2021
| Financial Characteristics (1) | ||||||||||||||||||||||||||||||||||||||||||||||||||||||||||||||||||||||||||||||||||||||
Total | Equity/ | Tang. Eq./ | NPA/ | Reported | Core | Market | Price/ | 12 Mo. | Bk. Value | Price/ | Price/ | Price/ | Price/ | Price/ | 12 Mo. | Dividend | Payout | |||||||||||||||||||||||||||||||||||||||||||||||||||||||||||||||||||||
| Assets ($000) | Assets (%) | T. Assets (%) | Assets (%) | ROAA (%) | ROAE (%) | ROAA (%) | ROAE (%) | Value ($000) | Share ($) | EPS ($) | /Share ($) | Book Value (%) | Tang. Bk. Val. (%) | Earnings (x) | Core Earnings (x) | Assets (%) | Div./ Share ($) | Yield (%) | Ratio (%) | |||||||||||||||||||||||||||||||||||||||||||||||||||||||||||||||||||
Publicly Traded Mid-Atlantic and Midwest Thrifts |
| |||||||||||||||||||||||||||||||||||||||||||||||||||||||||||||||||||||||||||||||||||||
CFFN | Capitol Federal Financial, Inc. | KS | 9,606,964 | 13.29 | NA | NA | 0.64 | 4.69 | 0.64 | 4.69 | 1,729,455 | 12.79 | 0.45 | 9.20 | 139.06 | 139.94 | 29.07 | 28.53 | 18.48 | 0.34 | 2.66 | 106.82 | ||||||||||||||||||||||||||||||||||||||||||||||||||||||||||||||||
CARV | Carver Bancorp, Inc. | NY | 672,653 | 6.90 | 6.90 | 1.25 | (0.79 | ) | (9.90 | ) | (0.90 | ) | (11.29 | ) | 27,964 | 9.13 | (1.44 | ) | 9.91 | 92.12 | 92.12 | NM | NM | 3.99 | 0.00 | 0.00 | NM | |||||||||||||||||||||||||||||||||||||||||||||||||||||||||||
CBMB | CBM Bancorp, Inc. | MD | 232,186 | 22.94 | 22.94 | 0.55 | 0.32 | 1.27 | 0.27 | 1.07 | 48,191 | 14.00 | 0.17 | 14.34 | 97.64 | 97.64 | 70.00 | 84.41 | 22.39 | NA | NA | 250.00 | ||||||||||||||||||||||||||||||||||||||||||||||||||||||||||||||||
CNNB | Cincinnati Bancorp, Inc. | OH | 231,943 | 17.13 | 17.07 | 0.54 | 0.77 | 6.10 | 0.78 | 6.17 | 35,589 | 11.96 | 0.61 | 13.35 | 89.56 | 89.97 | 19.93 | 19.71 | 15.34 | NA | NA | NM | ||||||||||||||||||||||||||||||||||||||||||||||||||||||||||||||||
ESBK | Elmira Savings Bank | NY | 644,587 | 9.43 | 7.66 | NA | 0.64 | 6.95 | 0.64 | 6.97 | 43,684 | 12.40 | 1.19 | 17.23 | 71.95 | 90.27 | 10.42 | 10.43 | 6.78 | 0.60 | 4.84 | 57.14 | ||||||||||||||||||||||||||||||||||||||||||||||||||||||||||||||||
ESSA | ESSA Bancorp, Inc. | PA | 1,868,818 | 10.39 | 9.69 | NA | 0.79 | 7.77 | 0.78 | 7.75 | 157,527 | 15.62 | 1.46 | 17.94 | 87.06 | 94.09 | 10.70 | 10.73 | 9.04 | 0.44 | 2.82 | 30.14 | ||||||||||||||||||||||||||||||||||||||||||||||||||||||||||||||||
FFBW | FFBW, Inc. | WI | 285,787 | 35.92 | 35.90 | 0.63 | 0.63 | 2.41 | NA | NA | 74,231 | 10.44 | NA | 13.32 | 78.37 | 78.41 | 40.14 | NA | 28.15 | NA | NA | NM | ||||||||||||||||||||||||||||||||||||||||||||||||||||||||||||||||
FBC | Flagstar Bancorp, Inc. | MI | 31,038,000 | 7.09 | 6.62 | 0.35 | 2.00 | 26.22 | 2.04 | NA | 2,388,479 | 45.36 | 9.70 | NA | 118.11 | 127.40 | 4.76 | 4.68 | NA | 0.20 | 0.44 | 1.58 | ||||||||||||||||||||||||||||||||||||||||||||||||||||||||||||||||
HMNF | HMN Financial, Inc. | MN | 909,580 | 11.35 | 11.27 | NA | 1.21 | 10.56 | NA | NA | 90,613 | 19.00 | NA | 21.65 | 87.76 | 88.50 | 8.56 | NA | 9.96 | 0.00 | 0.00 | NM | ||||||||||||||||||||||||||||||||||||||||||||||||||||||||||||||||
HVBC | HV Bancorp, Inc. | PA | 507,739 | 7.33 | 7.33 | 0.49 | 1.02 | 11.87 | 0.99 | 11.54 | 33,834 | 16.82 | 1.87 | 16.75 | 100.41 | 100.41 | 8.76 | 9.01 | 7.36 | NA | NA | NM | ||||||||||||||||||||||||||||||||||||||||||||||||||||||||||||||||
IROQ | IF Bancorp, Inc. | IL | 713,399 | 11.90 | 11.90 | NA | 0.70 | 6.06 | NA | NA | 65,196 | 20.12 | NA | 26.21 | 76.78 | 76.78 | 12.34 | NA | 9.14 | 0.30 | 1.49 | 18.40 | ||||||||||||||||||||||||||||||||||||||||||||||||||||||||||||||||
KRNY | Kearny Financial Corp. | NJ | 7,335,153 | 14.89 | NA | 1.09 | 0.73 | 4.66 | 0.77 | 4.93 | 945,676 | 10.92 | 0.64 | 12.86 | 84.91 | 107.59 | 17.90 | 16.94 | 12.64 | 0.32 | 2.93 | 52.46 | ||||||||||||||||||||||||||||||||||||||||||||||||||||||||||||||||
MSVB | Mid-Southern Bancorp, Inc. | IN | 218,281 | 22.38 | 22.38 | 1.19 | 0.56 | 2.36 | 0.52 | 2.20 | 46,139 | 15.45 | 0.35 | 15.20 | 101.66 | 101.66 | 41.76 | 44.65 | 22.75 | 0.12 | 0.78 | 24.32 | ||||||||||||||||||||||||||||||||||||||||||||||||||||||||||||||||
NYCB | New York Community Bancorp, Inc. | NY | 56,306,120 | 12.15 | 8.19 | NA | 0.94 | 7.62 | 0.94 | 7.55 | 4,861,691 | 10.48 | 1.01 | 13.66 | 76.70 | 124.26 | 10.27 | 10.37 | 8.71 | 0.68 | 6.49 | 66.67 | ||||||||||||||||||||||||||||||||||||||||||||||||||||||||||||||||
NFBK | Northfield Bancorp, Inc. | NJ | 5,514,544 | 13.67 | 13.01 | NA | 0.70 | 5.07 | 0.80 | 5.76 | 712,665 | 13.65 | 0.86 | 14.44 | 94.52 | 100.09 | 17.96 | 15.80 | 12.92 | 0.44 | 3.22 | 57.89 | ||||||||||||||||||||||||||||||||||||||||||||||||||||||||||||||||
NWBI | Northwest Bancshares, Inc. | PA | 13,806,268 | 11.14 | 8.48 | 0.92 | 0.58 | 4.72 | 0.75 | 6.09 | 1,701,426 | 13.40 | 0.80 | 12.11 | 110.58 | 149.71 | 21.60 | 16.76 | 12.32 | 0.76 | 5.67 | 122.58 | ||||||||||||||||||||||||||||||||||||||||||||||||||||||||||||||||
PCSB | PCSB Financial Corporation | NY | 1,789,839 | 15.05 | 14.75 | NA | 0.55 | 3.50 | 0.55 | 3.51 | 242,238 | 16.18 | 0.63 | 16.73 | 96.71 | 99.02 | 25.68 | 25.58 | 14.55 | 0.16 | 0.99 | 25.40 | ||||||||||||||||||||||||||||||||||||||||||||||||||||||||||||||||
PFS | Provident Financial Services, Inc. | NJ | 12,919,741 | 12.54 | 9.26 | NA | 0.86 | 6.49 | 0.88 | 6.70 | 1,498,724 | 19.68 | 1.44 | 20.87 | 94.29 | 132.40 | 14.16 | 13.70 | 11.82 | 0.92 | 4.67 | 66.19 | ||||||||||||||||||||||||||||||||||||||||||||||||||||||||||||||||
PBIP | Prudential Bancorp, Inc. | PA | 1,193,267 | 11.00 | 10.52 | NA | 0.73 | 6.77 | NA | NA | 104,679 | 13.09 | NA | 16.41 | 79.76 | 83.86 | 12.35 | NA | 8.77 | 0.28 | 2.14 | 66.98 | ||||||||||||||||||||||||||||||||||||||||||||||||||||||||||||||||
SVBI | Severn Bancorp, Inc. | MD | 952,553 | 11.51 | 11.41 | 1.26 | 0.76 | 6.21 | 0.76 | 6.27 | 99,719 | 7.78 | 0.52 | 8.56 | 90.91 | 91.84 | 14.96 | 14.83 | 10.47 | 0.16 | 2.06 | 30.77 | ||||||||||||||||||||||||||||||||||||||||||||||||||||||||||||||||
SBT | Sterling Bancorp, Inc. | MI | 3,914,045 | 8.17 | 8.17 | NA | (0.35 | ) | (3.85 | ) | NA | NA | 254,907 | 5.10 | NA | 6.39 | 79.76 | 79.76 | NM | NA | 6.51 | 0.00 | 0.00 | NM | ||||||||||||||||||||||||||||||||||||||||||||||||||||||||||||||
TRST | TrustCo Bank Corp NY | NY | 5,901,796 | 9.63 | 9.62 | NA | 0.94 | 9.47 | 0.93 | 9.31 | 639,351 | 6.63 | 0.53 | 5.89 | 112.53 | 112.64 | 12.21 | 12.43 | 10.83 | 0.27 | 4.11 | 50.19 | ||||||||||||||||||||||||||||||||||||||||||||||||||||||||||||||||
WSBF | Waterstone Financial, Inc. | WI | 2,184,587 | 18.91 | NA | NA | 3.77 | 20.62 | 3.87 | 21.19 | 457,148 | 19.30 | 3.39 | 16.47 | 117.21 | 122.06 | 5.85 | 5.69 | 22.16 | 0.80 | 4.15 | 41.21 | ||||||||||||||||||||||||||||||||||||||||||||||||||||||||||||||||
WSFS | WSFS Financial Corporation | DE | 14,333,914 | 12.48 | 8.94 | 0.42 | 0.86 | 6.18 | 0.76 | 5.46 | 2,204,895 | 46.17 | 2.01 | 37.52 | 123.06 | 178.63 | 20.34 | 22.93 | 15.38 | 0.48 | 1.04 | 21.15 | ||||||||||||||||||||||||||||||||||||||||||||||||||||||||||||||||
WVFC | WVS Financial Corp. | PA | 317,444 | 12.11 | 12.11 | NA | 0.50 | 4.81 | 0.51 | 4.87 | 26,327 | 15.15 | 1.00 | 20.20 | 75.00 | 75.00 | 15.30 | 15.10 | 9.08 | 0.40 | 2.64 | 40.40 | ||||||||||||||||||||||||||||||||||||||||||||||||||||||||||||||||
|
|
|
|
|
|
|
|
|
|
|
|
|
|
|
|
|
|
|
|
|
|
|
|
|
|
|
|
|
|
|
|
|
|
|
|
|
|
|
| |||||||||||||||||||||||||||||||||||||||||||||||
| Average | 6,935,968 | 13.57 | 12.46 | 0.79 | 0.80 | 6.35 | 0.86 | 5.83 | 739,614 | 16.02 | 1.36 | 15.72 | 95.06 | 105.36 | 19.35 | 20.12 | 12.90 | 0.37 | 2.53 | 59.49 | ||||||||||||||||||||||||||||||||||||||||||||||||||||||||||||||||||
| Median | 1,789,839 | 12.11 | 10.10 | 0.63 | 0.73 | 6.10 | 0.77 | 6.09 | 157,527 | 13.65 | 0.83 | 14.82 | 92.12 | 99.02 | 14.96 | 15.10 | 11.33 | 0.32 | 2.64 | 50.19 | ||||||||||||||||||||||||||||||||||||||||||||||||||||||||||||||||||
| High | 56,306,120 | 35.92 | 35.90 | 1.26 | 3.77 | 26.22 | 3.87 | 21.19 | 4,861,691 | 46.17 | 9.70 | 37.52 | 139.06 | 178.63 | 70.00 | 84.41 | 28.15 | 0.92 | 6.49 | 250.00 | ||||||||||||||||||||||||||||||||||||||||||||||||||||||||||||||||||
| Low | 218,281 | 6.90 | 6.62 | 0.35 | (0.79 | ) | (9.90 | ) | (0.90 | ) | (11.29 | ) | 26,327 | 5.10 | (1.44 | ) | 5.89 | 71.95 | 75.00 | 4.76 | 4.68 | 3.99 | 0.00 | 0.00 | 1.58 | |||||||||||||||||||||||||||||||||||||||||||||||||||||||||||||
All Public Non-MHC Thrifts |
| |||||||||||||||||||||||||||||||||||||||||||||||||||||||||||||||||||||||||||||||||||||
| Average | 5,175,845 | 12.53 | 11.59 | 0.85 | 0.91 | 7.56 | 1.00 | 7.70 | 609,965 | 23.71 | 2.17 | 19.95 | 105.06 | 116.46 | 17.61 | 17.17 | 13.07 | 0.43 | 2.32 | 47.00 | ||||||||||||||||||||||||||||||||||||||||||||||||||||||||||||||||||
| Median | 1,722,094 | 11.56 | 10.25 | 0.88 | 0.77 | 6.49 | 0.78 | 6.48 | 197,340 | 15.30 | 0.86 | 16.44 | 96.71 | 101.04 | 13.44 | 13.64 | 11.85 | 0.32 | 2.14 | 35.59 | ||||||||||||||||||||||||||||||||||||||||||||||||||||||||||||||||||
| (1) | For last 12 months ended December 31, 2020 or the most recent 12 months available. |
| Source: | S&P Global Market Intelligence and Faust Financial, LLC calculations. This table contains information from sources Faust Financial, LLC believes are reliable, however we do not control or guarantee the accuracy or completeness of such information. |
Exhibit III-3
Public Thrifts Market Pricing of Southwest Thrifts
As of February 8, 2021
| Financial Characteristics (1) | Price/ Book Value (%) | Price/ Tang. Bk. Val. (%) | Price/ Core Earnings (x) | 12 Mo. Div./ Share ($) | ||||||||||||||||||||||||||||||||||||||||||||||||||||||||||||||||||||||||||||||||||
| Total Assets ($000) | Equity/ Assets (%) | Tang. Eq./ T. Assets (%) | NPA/ Assets (%) | Reported | Core | Market Value ($000) | Price/ Share ($) | 12 Mo. EPS ($) | Bk. Value /Share ($) | Price/ Earnings (x) | Price/ Assets (%) | Dividend Yield (%) | Payout Ratio (%) | |||||||||||||||||||||||||||||||||||||||||||||||||||||||||||||||||||||||||
| ROAA (%) | ROAE (%) | ROAA (%) | ROAE (%) | |||||||||||||||||||||||||||||||||||||||||||||||||||||||||||||||||||||||||||||||||||
Publicly Traded Southwest Thrifts |
| |||||||||||||||||||||||||||||||||||||||||||||||||||||||||||||||||||||||||||||||||||||
HFBL | Home Federal Bancorp, Inc. of Louisiana | LA | 535,394 | 9.61 | 9.61 | NA | 0.93 | 9.31 | NA | NA | 46,883 | 30.00 | NA | 30.46 | 98.49 | 98.49 | 11.07 | NA | 9.47 | 0.66 | 2.20 | 24.17 | ||||||||||||||||||||||||||||||||||||||||||||||||||||||||||||||||
STXB | Spirit of Texas Bancshares, Inc. | TX | 3,085,464 | 11.69 | 9.09 | NA | 1.12 | 8.97 | 1.25 | 10.03 | 341,637 | 20.00 | 1.99 | 21.12 | 94.69 | 125.45 | 11.24 | 10.05 | 11.07 | 0.36 | 1.80 | 8.99 | ||||||||||||||||||||||||||||||||||||||||||||||||||||||||||||||||
TBK | Triumph Bancorp, Inc. | TX | 5,935,791 | 12.24 | 9.34 | NA | 1.18 | 9.67 | NA | NA | 1,624,367 | 65.87 | NA | 27.42 | 240.26 | 333.04 | 26.04 | NA | 27.81 | NA | NA | NM | ||||||||||||||||||||||||||||||||||||||||||||||||||||||||||||||||
|
|
|
|
|
|
|
|
|
|
|
|
|
|
|
|
|
|
|
|
|
|
|
|
|
|
|
|
|
|
|
|
|
|
|
|
|
|
|
| |||||||||||||||||||||||||||||||||||||||||||||||
| Average | 3,185,550 | 11.18 | 9.35 | NA | 1.08 | 9.32 | 1.25 | 10.03 | 670,962 | 38.62 | 1.99 | 26.33 | 144.48 | 185.66 | 16.11 | 10.05 | 16.12 | 0.51 | 2.00 | 16.58 | ||||||||||||||||||||||||||||||||||||||||||||||||||||||||||||||||||
| Median | 3,085,464 | 11.69 | 9.34 | NA | 1.12 | 9.31 | 1.25 | 10.03 | 341,637 | 30.00 | 1.99 | 27.42 | 98.49 | 125.45 | 11.24 | 10.05 | 11.07 | 0.51 | 2.00 | 16.58 | ||||||||||||||||||||||||||||||||||||||||||||||||||||||||||||||||||
| High | 5,935,791 | 12.24 | 9.61 | 0.00 | 1.18 | 9.67 | 1.25 | 10.03 | 1,624,367 | 65.87 | 1.99 | 30.46 | 240.26 | 333.04 | 26.04 | 10.05 | 27.81 | 0.66 | 2.20 | 24.17 | ||||||||||||||||||||||||||||||||||||||||||||||||||||||||||||||||||
| Low | 535,394 | 9.61 | 9.09 | 0.00 | 0.93 | 8.97 | 1.25 | 10.03 | 46,883 | 20.00 | 1.99 | 21.12 | 94.69 | 98.49 | 11.07 | 10.05 | 9.47 | 0.36 | 1.80 | 8.99 | ||||||||||||||||||||||||||||||||||||||||||||||||||||||||||||||||||
All Public Non-MHC (Region) Thrifts |
| |||||||||||||||||||||||||||||||||||||||||||||||||||||||||||||||||||||||||||||||||||||
| Average | 5,175,845 | 12.53 | 11.59 | 0.85 | 0.91 | 7.56 | 1.00 | 7.70 | 609,965 | 23.71 | 2.17 | 19.95 | 105.06 | 116.46 | 17.61 | 17.17 | 13.07 | 0.43 | 2.32 | 47.00 | ||||||||||||||||||||||||||||||||||||||||||||||||||||||||||||||||||
| Median | 1,722,094 | 11.56 | 10.25 | 0.88 | 0.77 | 6.49 | 0.78 | 6.48 | 197,340 | 15.30 | 0.86 | 16.44 | 96.71 | 101.04 | 13.44 | 13.64 | 11.85 | 0.32 | 2.14 | 35.59 | ||||||||||||||||||||||||||||||||||||||||||||||||||||||||||||||||||
| (1) | For last 12 months ended December 31, 2020 or the most recent 12 months available. |
| Source: | S&P Global Market Intelligence and Faust Financial, LLC calculations. This table contains information from sources Faust Financial, LLC believes are reliable, however we do not control or guarantee the accuracy or completeness of such information. |
Exhibit III-4
Historical Stock Price Trends (1)
| March 2016 | June 2016 | September 2016 | December 2016 | |||||||||||||
SNL U.S. THRIFT | 788.1 | 780.9 | 827.2 | 966.7 | ||||||||||||
S&P 500 | 2,059.7 | 2,098.9 | 2,168.3 | 2,238.8 | ||||||||||||
NASDAQ | 4,869.9 | 4,842.7 | 5,312.0 | 5,383.1 | ||||||||||||
| March 2017 | June 2017 | September 2017 | December 2017 | |||||||||||||
SNL U.S. THRIFT | 918.9 | 897.1 | 939.3 | 937.5 | ||||||||||||
S&P 500 | 2,362.7 | 2,423.4 | 2,519.4 | 2,673.6 | ||||||||||||
NASDAQ | 5,911.7 | 6,140.4 | 6,496.0 | 6,903.4 | ||||||||||||
| March 2018 | June 2018 | September 2018 | December 2018 | |||||||||||||
SNL U.S. THRIFT | 941.4 | 961.3 | 905.5 | 772.0 | ||||||||||||
S&P 500 | 2,640.9 | 2,718.4 | 2,914.0 | 2,506.8 | ||||||||||||
NASDAQ | 7,063.5 | 7,510.3 | 8,046.4 | 6,635.3 | ||||||||||||
| March 2019 | June 2019 | September 2019 | December 2019 | |||||||||||||
SNL U.S. THRIFT | 837.3 | 845.3 | 880.5 | 920.7 | ||||||||||||
S&P 500 | 2,834.4 | 2,941.8 | 2,976.7 | 3,230.8 | ||||||||||||
NASDAQ | 7,729.3 | 8,006.2 | 7,999.3 | 8,972.6 | ||||||||||||
| March 2020 | June 2020 | September 2020 | December 2020 | |||||||||||||
SNL U.S. THRIFT | 632.8 | 658.5 | 605.8 | 816.7 | ||||||||||||
S&P 500 | 2,584.6 | 3,100.3 | 3,363.0 | 3,756.1 | ||||||||||||
NASDAQ | 7,700.1 | 10,058.8 | 11,167.5 | 12,888.3 | ||||||||||||
| January 2021 | ||||||||||||||||
SNL U.S. THRIFT | 821.3 | |||||||||||||||
S&P 500 | 3,714.2 | |||||||||||||||
NASDAQ | 13,070.7 | |||||||||||||||
| (1) | End of period data |
| Source: | S&P Global Market Intelligence |
Exhibit III-5
Wisconsin Thrift Acquisition 2015 - Present
Buyer Information | Seller Information | Deal Characteristics | ||||||||||||||||||||||||||||||||
Date Announce | Date Close | Name | ST | Assets ($000) | Name | ST | Assets ($000) | Deal Value ($M) | P/A (%) | P/TB (%) | P/E (x) | |||||||||||||||||||||||
| 7/20/2017 | 2/1/2018 | Associated Banc-Corp | WI | 29,769,025 | Bank Mutual Corporation | WI | 2,710,618 | 482.28 | 17.79 | 164.07 | 28.84 | |||||||||||||||||||||||
| 5/17/2016 | 11/5/2016 | TCB Mutual Holding Company | WI | 89,198 | Merrill Federal Savings & Loan Association | WI | 47,010 | NA | NA | NA | NA | |||||||||||||||||||||||
| 1/12/2016 | 5/1/2016 | Old National Bancorp | IN | 11,991,527 | Anchor BanCorp Wisconsin Inc. | WI | 2,248,498 | 445.11 | 19.80 | 120.60 | 3.16 | |||||||||||||||||||||||
|
|
|
|
|
|
|
|
|
| |||||||||||||||||||||||||
| Average: | 1,668,709 | 463.7 | 18.80 | 142.34 | 16.00 | |||||||||||||||||||||||||||||
| Median: | 2,248,498 | 463.7 | 18.80 | 142.34 | 16.00 | |||||||||||||||||||||||||||||
| Source: | S&P Global Market Intelligence |
Exhibit IV-1
Share Data and Pricing Ratios
Publicly-Traded Thrifts
Prices as of February 8, 2021
| Pricing Ratios | ||||||||||||||||||||||||||||||||||||||||||||||||||||
| Current Per Share | ||||||||||||||||||||||||||||||||||||||||||||||||||||
Ticker | Company Name | State | Exchange | Price ($) | 52 Week Change (%) | Earnings EPS ($) | Assets/ Shares ($) | Shares Outstanding (000) | 12 Month Dividends ($) | Price/ Earnings (x) | Price/ Core Earnings (1) (x) | Price/ Book Value (%) | Price/ Tang. Bk. Val. (%) | Price/ Assets (%) | ||||||||||||||||||||||||||||||||||||||
Comparable Group | ||||||||||||||||||||||||||||||||||||||||||||||||||||
| CBMB | CBM Bancorp, Inc. | MD | NASDAQCM | 14.00 | (1.75 | ) | 0.17 | 0.07 | 3,442 | 0.50 | 70.00 | 84.41 | 97.64 | 97.64 | 22.39 | |||||||||||||||||||||||||||||||||||||
| CNNB | Cincinnati Bancorp, Inc. | OH | NASDAQCM | 11.96 | 12.20 | 0.61 | 0.08 | 2,976 | 0.00 | 19.93 | 19.71 | 89.56 | 89.97 | 15.34 | ||||||||||||||||||||||||||||||||||||||
| ESBK | Elmira Savings Bank | NY | NASDAQCM | 12.40 | (24.62 | ) | 1.19 | 0.18 | 3,523 | 0.68 | 10.42 | 10.43 | 71.95 | 90.27 | 6.78 | |||||||||||||||||||||||||||||||||||||
| FFBW | FFBW, Inc. | WI | NASDAQCM | 10.44 | (2.50 | ) | NA | 0.04 | 7,112 | 0.00 | 40.14 | 40.14 | 78.37 | 78.41 | 28.15 | |||||||||||||||||||||||||||||||||||||
| HMNF | HMN Financial, Inc. | MN | NASDAQGM | 19.00 | (9.95 | ) | NA | 0.19 | 4,769 | 0.00 | 8.56 | 8.56 | 87.76 | 88.50 | 9.96 | |||||||||||||||||||||||||||||||||||||
| HFBL | Home Federal Bancorp, Inc. of Louisiana | LA | NASDAQCM | 30.00 | (16.50 | ) | NA | 0.34 | 1,563 | 0.66 | 11.07 | 11.07 | 98.49 | 98.49 | 9.47 | |||||||||||||||||||||||||||||||||||||
| HVBC | HV Bancorp, Inc. | PA | NASDAQCM | 16.82 | 5.13 | 1.87 | 0.25 | 2,012 | 0.00 | 8.76 | 9.01 | 100.41 | 100.41 | 7.36 | ||||||||||||||||||||||||||||||||||||||
| IROQ | IF Bancorp, Inc. | IL | NASDAQCM | 20.12 | (12.52 | ) | NA | 0.22 | 3,240 | 0.30 | 12.34 | 12.34 | 76.78 | 76.78 | 9.14 | |||||||||||||||||||||||||||||||||||||
| MSVB | Mid-Southern Bancorp, Inc. | IN | NASDAQCM | 15.45 | 12.44 | 0.35 | 0.07 | 2,986 | 0.09 | 41.76 | 44.65 | 101.66 | 101.66 | 22.75 | ||||||||||||||||||||||||||||||||||||||
| WVFC | WVS Financial Corp. | PA | NASDAQGM | 15.15 | (9.52 | ) | 1.00 | 0.18 | 1,738 | 0.40 | 15.30 | 15.10 | 75.00 | 75.00 | 9.08 | |||||||||||||||||||||||||||||||||||||
|
|
|
|
|
|
|
|
|
|
|
|
|
|
|
|
|
|
|
|
|
| |||||||||||||||||||||||||||||||
| Average | 16.53 | (4.76 | ) | 0.86 | 0.16 | 3,336 | 0.26 | 23.83 | 25.54 | 87.76 | 89.71 | 14.04 | ||||||||||||||||||||||||||||||||||||||||
| Median | 15.30 | (6.01 | ) | 0.81 | 0.18 | 3,113 | 0.20 | 13.82 | 13.72 | 88.66 | 90.12 | 9.71 | ||||||||||||||||||||||||||||||||||||||||
| High | 30.00 | 12.44 | 1.87 | 0.34 | 7,112 | 0.68 | 70.00 | 84.41 | 101.66 | 101.66 | 28.15 | |||||||||||||||||||||||||||||||||||||||||
| Low | 10.44 | (24.62 | ) | 0.17 | 0.04 | 1,563 | 0.00 | 8.56 | 8.56 | 71.95 | 75.00 | 6.78 | ||||||||||||||||||||||||||||||||||||||||
All Public Non-MHC Thrifts (2) | ||||||||||||||||||||||||||||||||||||||||||||||||||||
| AFBI | Affinity Bancshares, Inc. | GA | NASDAQCM | 10.75 | (8.90 | ) | 0.56 | 0.13 | 6,876 | 0.00 | 41.35 | 19.09 | 102.74 | 135.14 | 9.16 | |||||||||||||||||||||||||||||||||||||
| AX | Axos Financial, Inc. | NV | NYSE | 44.42 | 55.64 | 3.71 | 0.24 | 59,045 | 0.00 | 12.88 | 11.97 | 203.81 | 224.88 | 18.23 | ||||||||||||||||||||||||||||||||||||||
| BYFC | Broadway Financial Corporation | CA | NASDAQCM | 2.28 | 52.00 | NA | 0.02 | 27,466 | 0.00 | NM | NA | 129.50 | 129.50 | 12.81 | ||||||||||||||||||||||||||||||||||||||
| CFFN | Capitol Federal Financial, Inc. | KS | NASDAQGS | 12.79 | (3.25 | ) | 0.45 | 0.07 | 135,219 | 0.47 | 29.07 | 28.53 | 139.06 | 139.94 | 18.48 | |||||||||||||||||||||||||||||||||||||
| CARV | Carver Bancorp, Inc. | NY | NASDAQCM | 9.13 | 269.29 | (1.44 | ) | 0.22 | 3,063 | 0.00 | NM | NM | 92.12 | 92.12 | 3.99 | |||||||||||||||||||||||||||||||||||||
| CBMB | CBM Bancorp, Inc. | MD | NASDAQCM | 14.00 | (1.75 | ) | 0.17 | 0.07 | 3,442 | 0.50 | 70.00 | 84.41 | 97.64 | 97.64 | 22.39 | |||||||||||||||||||||||||||||||||||||
| CNNB | Cincinnati Bancorp, Inc. | OH | NASDAQCM | 11.96 | 12.20 | 0.61 | 0.08 | 2,976 | 0.00 | 19.93 | 19.71 | 89.56 | 89.97 | 15.34 | ||||||||||||||||||||||||||||||||||||||
| ESBK | Elmira Savings Bank | NY | NASDAQCM | 12.40 | (24.62 | ) | 1.19 | 0.18 | 3,523 | 0.68 | 10.42 | 10.43 | 71.95 | 90.27 | 6.78 | |||||||||||||||||||||||||||||||||||||
| ESSA | ESSA Bancorp, Inc. | PA | NASDAQGS | 15.62 | (10.18 | ) | 1.46 | 0.19 | 10,085 | 0.44 | 10.70 | 10.73 | 87.06 | 94.09 | 9.04 | |||||||||||||||||||||||||||||||||||||
| FFBW | FFBW, Inc. | WI | NASDAQCM | 10.44 | (2.50 | ) | NA | 0.04 | 7,112 | 0.00 | 40.14 | NA | 78.37 | 78.41 | 28.15 | |||||||||||||||||||||||||||||||||||||
| FNWB | First Northwest Bancorp | WA | NASDAQGM | 15.99 | (4.59 | ) | 0.84 | 0.17 | 9,480 | 0.22 | 14.54 | 19.14 | 87.91 | 87.91 | 9.90 | |||||||||||||||||||||||||||||||||||||
| FBC | Flagstar Bancorp, Inc. | MI | NYSE | 45.36 | 26.35 | 9.70 | 0.59 | 52,656 | 0.15 | 4.76 | 4.68 | 118.11 | 127.40 | NA | ||||||||||||||||||||||||||||||||||||||
| FSBW | FS Bancorp, Inc. | WA | NASDAQCM | 59.24 | 13.66 | 8.77 | 0.49 | 4,292 | 0.63 | 6.60 | 6.75 | 109.15 | 112.61 | 11.88 | ||||||||||||||||||||||||||||||||||||||
| GBNY | Generations Bancorp NY, Inc. | NY | NASDAQCM | 9.74 | (5.07 | ) | NA | 0.15 | 2,458 | 0.00 | NA | NA | NA | NA | NA | |||||||||||||||||||||||||||||||||||||
| HONE | HarborOne Bancorp, Inc. | MA | NASDAQGS | 11.44 | 3.34 | 0.84 | 0.08 | 54,451 | 0.09 | 13.95 | 13.57 | 93.98 | 105.19 | 14.60 | ||||||||||||||||||||||||||||||||||||||
| HIFS | Hingham Institution for Savings | MA | NASDAQGM | 242.50 | 21.40 | 20.31 | 1.34 | 2,137 | 2.47 | 10.43 | 11.94 | 176.97 | 176.97 | 18.15 | ||||||||||||||||||||||||||||||||||||||
| HMNF | HMN Financial, Inc. | MN | NASDAQGM | 19.00 | (9.95 | ) | NA | 0.19 | 4,769 | 0.00 | 8.56 | NA | 87.76 | 88.50 | 9.96 | |||||||||||||||||||||||||||||||||||||
| HFBL | Home Federal Bancorp, Inc. of Louisiana | LA | NASDAQCM | 30.00 | (16.50 | ) | NA | 0.34 | 1,563 | 0.66 | 11.07 | NA | 98.49 | 98.49 | 9.47 | |||||||||||||||||||||||||||||||||||||
| HVBC | HV Bancorp, Inc. | PA | NASDAQCM | 16.82 | 5.13 | 1.87 | 0.25 | 2,012 | 0.00 | 8.76 | 9.01 | 100.41 | 100.41 | 7.36 | ||||||||||||||||||||||||||||||||||||||
| IROQ | IF Bancorp, Inc. | IL | NASDAQCM | 20.12 | (12.52 | ) | NA | 0.22 | 3,240 | 0.30 | 12.34 | NA | 76.78 | 76.78 | 9.14 | |||||||||||||||||||||||||||||||||||||
| KRNY | Kearny Financial Corp. | NJ | NASDAQGS | 10.92 | (9.98 | ) | 0.64 | 0.08 | 81,340 | 0.32 | 17.90 | 16.94 | 84.91 | 107.59 | 12.64 | |||||||||||||||||||||||||||||||||||||
| EBSB | Meridian Bancorp, Inc. | MA | NASDAQGS | 16.36 | (8.32 | ) | 1.22 | 0.13 | 50,223 | 0.32 | 12.68 | 13.42 | 111.53 | 114.82 | 12.95 | |||||||||||||||||||||||||||||||||||||
| MSVB | Mid-Southern Bancorp, Inc. | IN | NASDAQCM | 15.45 | 12.44 | 0.35 | 0.07 | 2,986 | 0.09 | 41.76 | 44.65 | 101.66 | 101.66 | 22.75 | ||||||||||||||||||||||||||||||||||||||
| NYCB | New York Community Bancorp, Inc. | NY | NYSE | 10.48 | (7.83 | ) | 1.01 | 0.12 | 463,902 | 0.68 | 10.27 | 10.37 | 76.70 | 124.26 | 8.71 | |||||||||||||||||||||||||||||||||||||
| NFBK | Northfield Bancorp, Inc. | NJ | NASDAQGS | 13.65 | (15.11 | ) | 0.86 | 0.11 | 52,210 | 0.44 | 17.96 | 15.80 | 94.52 | 100.09 | 12.92 | |||||||||||||||||||||||||||||||||||||
| NWBI | Northwest Bancshares, Inc. | PA | NASDAQGS | 13.40 | (14.63 | ) | 0.80 | 0.11 | 127,019 | 0.76 | 21.60 | 16.76 | 110.58 | 149.71 | 12.32 | |||||||||||||||||||||||||||||||||||||
| PCSB | PCSB Financial Corporation | NY | NASDAQCM | 16.18 | (19.22 | ) | 0.63 | 0.12 | 14,971 | 0.16 | 25.68 | 25.58 | 96.71 | 99.02 | 14.55 | |||||||||||||||||||||||||||||||||||||
| PVBC | Provident Bancorp, Inc. | MA | NASDAQCM | 12.34 | 2.75 | 0.76 | 0.08 | 18,099 | 0.12 | 18.70 | 16.32 | 99.66 | 99.66 | 15.61 | ||||||||||||||||||||||||||||||||||||||
| PROV | Provident Financial Holdings, Inc. | CA | NASDAQGS | 15.73 | (29.46 | ) | 0.72 | 0.16 | 7,442 | 0.56 | 21.85 | 21.85 | 93.67 | 93.67 | 10.00 | |||||||||||||||||||||||||||||||||||||
| PFS | Provident Financial Services, Inc. | NJ | NYSE | 19.68 | (14.25 | ) | 1.44 | 0.17 | 76,155 | 0.92 | 14.16 | 13.70 | 94.29 | 132.40 | 11.82 | |||||||||||||||||||||||||||||||||||||
| PBIP | Prudential Bancorp, Inc. | PA | NASDAQGM | 13.09 | (26.46 | ) | NA | 0.15 | 7,997 | 0.71 | 12.35 | NA | 79.76 | 83.86 | 8.77 | |||||||||||||||||||||||||||||||||||||
| RNDB | Randolph Bancorp, Inc. | MA | NASDAQGM | 19.70 | 23.59 | 3.28 | 0.14 | 5,143 | 0.00 | 6.50 | 6.01 | 114.63 | NA | 15.05 | ||||||||||||||||||||||||||||||||||||||
| RVSB | Riverview Bancorp, Inc. | WA | NASDAQGS | 5.69 | (20.53 | ) | 0.45 | 0.06 | 22,345 | 0.20 | 12.93 | 12.78 | 83.72 | 102.42 | 8.85 | |||||||||||||||||||||||||||||||||||||
| SVBI | Severn Bancorp, Inc. | MD | NASDAQCM | 7.78 | (6.71 | ) | 0.52 | 0.07 | 12,817 | 0.16 | 14.96 | 14.83 | 90.91 | 91.84 | 10.47 | |||||||||||||||||||||||||||||||||||||
| STXB | Spirit of Texas Bancshares, Inc. | TX | NASDAQGS | 20.00 | (2.06 | ) | 1.99 | 0.18 | 17,082 | 0.16 | 11.24 | 10.05 | 94.69 | 125.45 | 11.07 | |||||||||||||||||||||||||||||||||||||
| SBT | Sterling Bancorp, Inc. | MI | NASDAQCM | 5.10 | (29.75 | ) | NA | 0.08 | 49,982 | 0.01 | NM | NA | 79.76 | 79.76 | 6.51 | |||||||||||||||||||||||||||||||||||||
| TBNK | Territorial Bancorp Inc. | HI | NASDAQGS | 25.57 | (15.05 | ) | 1.90 | 0.23 | 9,110 | 1.02 | 12.72 | 13.48 | 97.81 | 97.81 | 11.52 | |||||||||||||||||||||||||||||||||||||
| TSBK | Timberland Bancorp, Inc. | WA | NASDAQGM | 27.67 | (0.79 | ) | 3.01 | 0.19 | 8,318 | 0.91 | 9.32 | 9.21 | 119.05 | 130.28 | 14.49 | |||||||||||||||||||||||||||||||||||||
| TBK | Triumph Bancorp, Inc. | TX | NASDAQGS | 65.87 | 58.61 | NA | 0.24 | 24,660 | 0.00 | 26.04 | NA | 240.26 | 333.04 | 27.81 | ||||||||||||||||||||||||||||||||||||||
| TRST | TrustCo Bank Corp NY | NY | NASDAQGS | 6.63 | (16.34 | ) | 0.53 | 0.06 | 96,433 | 0.27 | 12.21 | 12.43 | 112.53 | 112.64 | 10.83 | |||||||||||||||||||||||||||||||||||||
| WSBF | Waterstone Financial, Inc. | WI | NASDAQGS | 19.30 | 7.82 | 3.39 | 0.09 | 23,686 | 1.36 | 5.85 | 5.69 | 117.21 | 122.06 | 22.16 | ||||||||||||||||||||||||||||||||||||||
| WNEB | Western New England Bancorp, Inc. | MA | NASDAQGS | 7.49 | (19.38 | ) | 0.47 | 0.10 | 22,875 | 0.20 | 16.64 | 15.77 | 83.53 | 89.63 | 8.00 | |||||||||||||||||||||||||||||||||||||
| WSFS | WSFS Financial Corporation | DE | NASDAQGS | 46.17 | 10.96 | 2.01 | 0.30 | 47,756 | 0.48 | 20.34 | 22.93 | 123.06 | 178.63 | 15.38 | ||||||||||||||||||||||||||||||||||||||
| WVFC | WVS Financial Corp. | PA | NASDAQGM | 15.15 | (9.52 | ) | 1.00 | 0.18 | 1,738 | 0.40 | 15.30 | 15.10 | 75.00 | 75.00 | 9.08 | |||||||||||||||||||||||||||||||||||||
|
|
|
|
|
|
|
|
|
|
|
|
|
|
|
|
|
|
|
|
|
| |||||||||||||||||||||||||||||||
| Average | 23.71 | 4.77 | 2.17 | 0.19 | 37,276 | 0.38 | 17.61 | 17.17 | 105.06 | 116.46 | 13.07 | |||||||||||||||||||||||||||||||||||||||||
| Median | 15.30 | (5.89 | ) | 0.86 | 0.14 | 11,451 | 0.25 | 13.44 | 13.64 | 96.71 | 101.04 | 11.85 | ||||||||||||||||||||||||||||||||||||||||
Merger Target | ||||||||||||||||||||||||||||||||||||||||||||||||||||
| STND | Standard AVB Financial Corp. | PA | NASDAQCM | 32.76 | 8.55 | NA | 0.23 | 4,629 | 0.88 | 23.23 | NA | 107.46 | 132.21 | 14.88 | ||||||||||||||||||||||||||||||||||||||
| (1) | Assumes core ROAA and ROAE were the same as the reported ROAA and ROAE for companies in the Comparable Group if core earnings were not reported as of February 8, 2021. |
| (2) | All public Non-MHC thrifts’ financial data and pricing ratios as reported per S&P global market intelligence. |
| Source: | S&P Global Market Intelligence |
Exhibit IV-2
Key Financial Data and Ratios
Publicly-Traded Thrifts
Financial Data as of December 31, 2020 or the Most Recent Date Available
| Total | Equity/ | Tang. Eq./ | NPA/ | Reported | Core | |||||||||||||||||||||||||||||||
| Assets | Assets | T. Assets | Assets | ROAA | ROAE | ROAA | ROAE | |||||||||||||||||||||||||||||
Ticker | Company Name | State | ($000) | (%) | (%) | (%) | (%) | (%) | (%) | (%) | ||||||||||||||||||||||||||
AFBI | Affinity Bancshares, Inc. | GA | 888,170 | 8.92 | 6.93 | 0.76 | 0.32 | 2.55 | 0.69 | 5.55 | ||||||||||||||||||||||||||
AX | Axos Financial, Inc. | NV | 14,393,267 | 8.95 | 8.18 | 1.22 | 1.59 | 16.93 | 1.71 | 18.20 | ||||||||||||||||||||||||||
BYFC | Broadway Financial Corporation | CA | 499,217 | 9.89 | 9.89 | 0.96 | (0.03 | ) | (0.26 | ) | NA | NA | ||||||||||||||||||||||||
CFFN | Capitol Federal Financial, Inc. | KS | 9,606,964 | 13.29 | NA | NA | 0.64 | 4.69 | 0.64 | 4.69 | ||||||||||||||||||||||||||
CARV | Carver Bancorp, Inc. | NY | 672,653 | 6.90 | 6.90 | 1.25 | (0.79 | ) | (9.90 | ) | (0.90 | ) | (11.29 | ) | ||||||||||||||||||||||
CBMB | CBM Bancorp, Inc. | MD | 232,186 | 22.94 | 22.94 | 0.55 | 0.32 | 1.27 | 0.27 | 1.07 | ||||||||||||||||||||||||||
CNNB | Cincinnati Bancorp, Inc. | OH | 231,943 | 17.13 | 17.07 | 0.54 | 0.77 | 6.10 | 0.78 | 6.17 | ||||||||||||||||||||||||||
ESBK | Elmira Savings Bank | NY | 644,587 | 9.43 | 7.66 | NA | 0.64 | 6.95 | 0.64 | 6.97 | ||||||||||||||||||||||||||
ESSA | ESSA Bancorp, Inc. | PA | 1,868,818 | 10.39 | 9.69 | NA | 0.79 | 7.77 | 0.78 | 7.75 | ||||||||||||||||||||||||||
FFBW | FFBW, Inc. | WI | 285,787 | 35.92 | 35.90 | 0.63 | 0.63 | 2.41 | NA | NA | ||||||||||||||||||||||||||
FNWB | First Northwest Bancorp | WA | 1,654,349 | 11.27 | 11.27 | NA | 0.72 | 5.79 | 0.55 | 4.40 | ||||||||||||||||||||||||||
FBC | Flagstar Bancorp, Inc. | MI | 31,038,000 | 7.09 | 6.62 | 0.35 | 2.00 | 26.22 | 2.04 | NA | ||||||||||||||||||||||||||
FSBW | FS Bancorp, Inc. | WA | 2,113,241 | 10.88 | 10.59 | NA | 2.02 | 18.74 | 1.98 | 18.32 | ||||||||||||||||||||||||||
GBNY | Generations Bancorp NY, Inc. | NY | 371,789 | 7.75 | NA | NA | NA | NA | NA | NA | ||||||||||||||||||||||||||
HONE | HarborOne Bancorp, Inc. | MA | 4,483,615 | 15.53 | 14.11 | NA | 1.05 | 6.55 | 1.08 | 6.73 | ||||||||||||||||||||||||||
HIFS | Hingham Institution for Savings | MA | 2,857,093 | 10.25 | 10.25 | NA | 1.88 | 18.96 | 1.65 | 16.56 | ||||||||||||||||||||||||||
HMNF | HMN Financial, Inc. | MN | 909,580 | 11.35 | 11.27 | NA | 1.21 | 10.56 | NA | NA | ||||||||||||||||||||||||||
HFBL | Home Federal Bancorp, Inc. of Louisiana | LA | 535,394 | 9.61 | 9.61 | NA | 0.93 | 9.31 | NA | NA | ||||||||||||||||||||||||||
HVBC | HV Bancorp, Inc. | PA | 507,739 | 7.33 | 7.33 | 0.49 | 1.02 | 11.87 | 0.99 | 11.54 | ||||||||||||||||||||||||||
IROQ | IF Bancorp, Inc. | IL | 713,399 | 11.90 | 11.90 | NA | 0.70 | 6.06 | NA | NA | ||||||||||||||||||||||||||
KRNY | Kearny Financial Corp. | NJ | 7,335,153 | 14.89 | NA | 1.09 | 0.73 | 4.66 | 0.77 | 4.93 | ||||||||||||||||||||||||||
EBSB | Meridian Bancorp, Inc. | MA | 6,619,848 | 11.61 | 11.32 | NA | 1.01 | 8.76 | 0.95 | 8.28 | ||||||||||||||||||||||||||
MSVB | Mid-Southern Bancorp, Inc. | IN | 218,281 | 22.38 | 22.38 | 1.19 | 0.56 | 2.36 | 0.52 | 2.20 | ||||||||||||||||||||||||||
NYCB | New York Community Bancorp, Inc. | NY | 56,306,120 | 12.15 | 8.19 | NA | 0.94 | 7.62 | 0.94 | 7.55 | ||||||||||||||||||||||||||
NFBK | Northfield Bancorp, Inc. | NJ | 5,514,544 | 13.67 | 13.01 | NA | 0.70 | 5.07 | 0.80 | 5.76 | ||||||||||||||||||||||||||
NWBI | Northwest Bancshares, Inc. | PA | 13,806,268 | 11.14 | 8.48 | 0.92 | 0.58 | 4.72 | 0.75 | 6.09 | ||||||||||||||||||||||||||
PCSB | PCSB Financial Corporation | NY | 1,789,839 | 15.05 | 14.75 | NA | 0.55 | 3.50 | 0.55 | 3.51 | ||||||||||||||||||||||||||
PVBC | Provident Bancorp, Inc. | MA | 1,505,781 | 15.66 | 15.66 | NA | 0.89 | 5.05 | 1.02 | 5.79 | ||||||||||||||||||||||||||
PROV | Provident Financial Holdings, Inc. | CA | 1,170,727 | 10.68 | 10.68 | 0.88 | 0.47 | 4.34 | 0.47 | 4.34 | ||||||||||||||||||||||||||
PFS | Provident Financial Services, Inc. | NJ | 12,919,741 | 12.54 | 9.26 | NA | 0.86 | 6.49 | 0.88 | 6.70 | ||||||||||||||||||||||||||
PBIP | Prudential Bancorp, Inc. | PA | 1,193,267 | 11.00 | 10.52 | NA | 0.73 | 6.77 | NA | NA | ||||||||||||||||||||||||||
RNDB | Randolph Bancorp, Inc. | MA | 722,968 | 13.13 | NA | 1.57 | 2.30 | 18.55 | 2.49 | 20.05 | ||||||||||||||||||||||||||
RVSB | Riverview Bancorp, Inc. | WA | 1,436,184 | 10.57 | 8.81 | NA | 0.74 | 6.61 | 0.75 | 6.68 | ||||||||||||||||||||||||||
SVBI | Severn Bancorp, Inc. | MD | 952,553 | 11.51 | 11.41 | 1.26 | 0.76 | 6.21 | 0.76 | 6.27 | ||||||||||||||||||||||||||
STXB | Spirit of Texas Bancshares, Inc. | TX | 3,085,464 | 11.69 | 9.09 | NA | 1.12 | 8.97 | 1.25 | 10.03 | ||||||||||||||||||||||||||
SBT | Sterling Bancorp, Inc. | MI | 3,914,045 | 8.17 | 8.17 | NA | (0.35 | ) | (3.85 | ) | NA | NA | ||||||||||||||||||||||||
TBNK | Territorial Bancorp Inc. | HI | 2,110,799 | 11.78 | 11.78 | NA | 0.89 | 7.55 | 0.84 | 7.12 | ||||||||||||||||||||||||||
TSBK | Timberland Bancorp, Inc. | WA | 1,588,405 | 12.17 | 11.24 | 0.37 | 1.69 | 13.63 | 1.71 | 13.79 | ||||||||||||||||||||||||||
TBK | Triumph Bancorp, Inc. | TX | 5,935,791 | 12.24 | 9.34 | NA | 1.18 | 9.67 | NA | NA | ||||||||||||||||||||||||||
TRST | TrustCo Bank Corp NY | NY | 5,901,796 | 9.63 | 9.62 | NA | 0.94 | 9.47 | 0.93 | 9.31 | ||||||||||||||||||||||||||
WSBF | Waterstone Financial, Inc. | WI | 2,184,587 | 18.91 | NA | NA | 3.77 | 20.62 | 3.87 | 21.19 | ||||||||||||||||||||||||||
WNEB | Western New England Bancorp, Inc. | MA | 2,365,886 | 9.58 | 8.99 | NA | 0.48 | 4.86 | 0.51 | 5.13 | ||||||||||||||||||||||||||
WSFS | WSFS Financial Corporation | DE | 14,333,914 | 12.48 | 8.94 | 0.42 | 0.86 | 6.18 | 0.76 | 5.46 | ||||||||||||||||||||||||||
WVFC | WVS Financial Corp. | PA | 317,444 | 12.11 | 12.11 | NA | 0.50 | 4.81 | 0.51 | 4.87 | ||||||||||||||||||||||||||
|
|
|
|
|
|
|
|
|
|
|
|
|
|
|
| |||||||||||||||||||||
| Average | 5,175,845 | 12.53 | 11.59 | 0.85 | 0.91 | 7.56 | 1.00 | 7.70 | ||||||||||||||||||||||||||||
| Median | 1,722,094 | 11.56 | 10.25 | 0.88 | 0.77 | 6.49 | 0.78 | 6.48 | ||||||||||||||||||||||||||||
| High | 56,306,120 | 35.92 | 35.90 | 1.57 | 3.77 | 26.22 | 3.87 | 21.19 | ||||||||||||||||||||||||||||
| Low | 218,281 | 6.90 | 6.62 | 0.35 | (0.79 | ) | (9.90 | ) | (0.90 | ) | (11.29 | ) | ||||||||||||||||||||||||
Merger Target | ||||||||||||||||||||||||||||||||||||
STND | Standard AVB Financial Corp. | PA | 1,051,174 | 13.85 | 11.55 | NA | 0.63 | 4.56 | NA | NA | ||||||||||||||||||||||||||
Source: S&P Global Market Intelligence
Exhibit IV-3
1895 Bancorp of Wisconsin, Inc.
Pro Forma Regulatory Capital Ratios
| PyraMax Bank, FSB Historical at December 31, 2020 | PyraMax Bank, FSB Pro Forma at December 31, 2020 Based Upon the Sale in the Offering of: | |||||||||||||||||||||||||||||||
| 2,618,000 Shares | 3,080,000 Shares | 3,542,000 Shares | ||||||||||||||||||||||||||||||
| Amount | Percent of Assets | Amount | Percent of Assets | Amount | Percent of Assets | Amount | Percent of Assets | |||||||||||||||||||||||||
| (Dollars in thousands) | ||||||||||||||||||||||||||||||||
Equity | $ | 53,510 | 10.38 | % | $ | 62,624 | 11.93 | % | $ | 64,358 | 12.22 | % | $ | 66,092 | 12.51 | % | ||||||||||||||||
|
|
|
|
|
|
|
|
|
|
|
|
|
|
|
| |||||||||||||||||
Tier 1 leverage capital (1)(2) | $ | 49,534 | 9.81 | % | $ | 58,648 | 11.41 | % | $ | 60,382 | 11.71 | % | $ | 62,116 | 12.00 | % | ||||||||||||||||
Tier 1 leverage requirement | 25,243 | 5.00 | 25,699 | 5.00 | 25,786 | 5.00 | 25,872 | 5.00 | ||||||||||||||||||||||||
|
|
|
|
|
|
|
|
|
|
|
|
|
|
|
| |||||||||||||||||
Excess | $ | 24,291 | 4.81 | % | $ | 32,949 | 6.41 | % | $ | 34,596 | 6.71 | % | $ | 36,244 | 7.00 | % | ||||||||||||||||
|
|
|
|
|
|
|
|
|
|
|
|
|
|
|
| |||||||||||||||||
Tier 1 risk-based capital (1)(2) | $ | 49,534 | 15.14 | % | $ | 58,648 | 17.82 | % | $ | 60,382 | 18.33 | % | $ | 62,116 | 18.84 | % | ||||||||||||||||
Tier 1 risk-based requirement | 26,177 | 8.00 | 26,323 | 8.00 | 26,351 | 8.00 | 26,379 | 8.00 | ||||||||||||||||||||||||
|
|
|
|
|
|
|
|
|
|
|
|
|
|
|
| |||||||||||||||||
Excess | $ | 23,357 | 7.14 | % | $ | 32,325 | 9.82 | % | $ | 34,031 | 10.33 | % | $ | 35,737 | 10.84 | % | ||||||||||||||||
|
|
|
|
|
|
|
|
|
|
|
|
|
|
|
| |||||||||||||||||
Total risk-based capital (1)(2) | $ | 52,237 | 15.96 | % | $ | 61,351 | 18.65 | % | $ | 63,085 | 19.15 | % | $ | 64,819 | 19.66 | % | ||||||||||||||||
Total risk-based requirement | 32,722 | 10.00 | 32,904 | 10.00 | 32,939 | 10.00 | 32,973 | 10.00 | ||||||||||||||||||||||||
|
|
|
|
|
|
|
|
|
|
|
|
|
|
|
| |||||||||||||||||
Excess | $ | 19,515 | 5.96 | % | $ | 28,447 | 8.65 | % | $ | 30,146 | 9.15 | % | $ | 31,846 | 9.66 | % | ||||||||||||||||
|
|
|
|
|
|
|
|
|
|
|
|
|
|
|
| |||||||||||||||||
Common equity tier 1 risk-based capital (1)(2) | $ | 49,534 | 15.14 | % | $ | 58,648 | 17.82 | % | $ | 60,382 | 18.33 | % | $ | 62,116 | 18.84 | % | ||||||||||||||||
Common equity tier 1 risk-based requirement | 21,269 | 6.50 | 21,388 | 6.50 | 21,410 | 6.50 | 21,433 | 6.50 | ||||||||||||||||||||||||
|
|
|
|
|
|
|
|
|
|
|
|
|
|
|
| |||||||||||||||||
Excess | $ | 28,265 | 8.64 | % | $ | 37,260 | 11.32 | % | $ | 38,972 | 11.83 | % | $ | 40,683 | 12.34 | % | ||||||||||||||||
|
|
|
|
|
|
|
|
|
|
|
|
|
|
|
| |||||||||||||||||
Reconciliation of capital infused into PyraMax Bank, FSB: |
| |||||||||||||||||||||||||||||||
Net proceeds |
| $ | 12,255 | $ | 14,544 | $ | 16,832 | |||||||||||||||||||||||||
Less: Common stock acquired by stock-based benefit plans |
| (1,047 | ) | (1,232 | ) | (1,417 | ) | |||||||||||||||||||||||||
Less: Common stock acquired by employee stock ownership plan |
| (2,094 | ) | (2,464 | ) | (2,834 | ) | |||||||||||||||||||||||||
|
|
|
|
|
| |||||||||||||||||||||||||||
Pro forma increase |
| $ | 9,114 | $ | 10,848 | $ | 12,581 | |||||||||||||||||||||||||
|
|
|
|
|
| |||||||||||||||||||||||||||
| (1) | Tier 1 leverage capital levels are shown as a percentage of total average assets. Risk-based capital levels are shown as a percentage of risk-weighted assets. |
| (2) | Pro forma amounts and percentages assume net proceeds are invested in assets that carry a 20% risk weighting. |
Exhibit IV-4
1895 Bancorp of Wisconsin, Inc.
Pro Forma Valuation Analysis—Second Step Offering
Pricing ratios and parameters: | ||||||||||||||||||||||||||||
| Midpoint Ratios | Comparable Group | All Public Thrifts | ||||||||||||||||||||||||||
Valuation Pricing Ratios | Symbol | Average | Median | Average | Median | |||||||||||||||||||||||
Price to earnings | P/E | 58.29 | x | 23.83 | x | 13.82 | x | 17.61 | x | 13.44 | x | |||||||||||||||||
Price to core earnings | P/CE | 46.34 | x | 25.54 | x | 13.72 | x | 17.17 | x | 13.64 | x | |||||||||||||||||
Price to book value | P/B | 65.07 | % | 87.76 | % | 88.66 | % | 105.06 | % | 96.71 | % | |||||||||||||||||
Price to tangible book value | P/TB | 65.07 | % | 89.71 | % | 90.12 | % | 116.46 | % | 101.04 | % | |||||||||||||||||
Price to assets | P/A | 10.26 | % | 14.04 | % | 9.71 | % | 13.07 | % | 11.85 | % | |||||||||||||||||
Valuation Parameters | ||||||||||||||||||||||||||||
Pre conversion earnings | (Y) | $ | 1,317,000 | | For twelve months ended December 31, 2020 | | ||||||||||||||||||||||
Pre conversion core earnings | (CY) | $ | 1,563,000 | | For twelve months ended December 31, 2020 | | ||||||||||||||||||||||
Pre conversion book value | (B) | $ | 60,108,000 | (1 | ) | At December 31, 2020 | ||||||||||||||||||||||
Pre conversion tang. book value | (TB) | $ | 60,108,000 | (1 | ) | At December 31, 2020 | ||||||||||||||||||||||
Pre conversion assets | (A) | $ | 516,857,000 | (1 | ) | At December 31, 2020 | ||||||||||||||||||||||
| Symbol | ||||||||||||||||||||||||||||
Conversion expense | (X) | 5.56 | % | (2 | ) | Percent sold | (PCT) | 55.3612 | % | |||||||||||||||||||
ESOP stock purchase (% of Offering + Foundation) | (E) | 8.00 | % | | Option % granted | | (OP) | 10.00 | % | |||||||||||||||||||
ESOP cost of borrowings, net | (S) | 0.00 | % | | Est. option value | | (OV) | 30.90 | % | |||||||||||||||||||
ESOP loan term (years) | (T) | 25 | | Option vesting (years) | | (OM) | 5 | |||||||||||||||||||||
RRP amount | (M) | 4.00 | % | | Option % taxable | | (OT) | 25.00 | % | |||||||||||||||||||
RRP vesting (years) | (N) | 5 | Price per share | (P) | $ | 10.00 | ||||||||||||||||||||||
Tax rate | (TAX) | 27.00 | % | | Foundation Cash Contribution | | (FC) | $ | — | |||||||||||||||||||
Reinvestment Rate | 0.36 | % | | Foundation Stock Contribution | | (FS) | $ | — | ||||||||||||||||||||
After Tax Reinvetsment Rate | (RR) | 0.26 | % | | Foundation Tax Benefit | | (FT) | |||||||||||||||||||||
Calculation of Pro Forma Value after Conversion: |
| |||||||||||||||||
1. P/E method | P/E*(Y-FC*RR) 1-P/E*PCT*((1-X-E-M)*RR-((1-TAX)*E/T)-((1-TAX)*M/N)-(1-(TAX*OT))*(OP*OV/OM)) | Value = | $ | 55,634,630 | ||||||||||||||
2. P/CE method | P/CE*CY 1-P/CE*PCT*((1-X-E-M)*RR-((1-TAX)*E/T)-((1-TAX)*M/N)-(1-(TAX*OT))*(OP*OV)/OM)) | Value = | $ | 55,634,630 | ||||||||||||||
3. P/B method | P/B*B 1-P/B*PCT*(1-X-E-M) | Value = | $ | 55,634,630 | ||||||||||||||
4. P/TB method | P/TB*TB 1-P/TB*PCT*(1-X-E-M) | Value = | $ | 55,634,630 | ||||||||||||||
5. P/A method | P/A*A 1-P/A*PCT*(1-X-E-M) | Value = | $ | 55,634,630 | ||||||||||||||
Valuation Correlation and Conclusions: | ||||||||||||||||||||||||||
Shares | 2nd Step Exchange | 2nd Step Offering | Full Conversion | Total Market Capitalization | ||||||||||||||||||||||
Shares Issued | Shares | Shares | Foundation Shares | Shares | Exchange Ratio | |||||||||||||||||||||
Midpoint | 2,483,463 | 3,080,000 | 5,563,463 | 5,563,463 | 1.1446 | |||||||||||||||||||||
Minimum | 2,110,944 | 2,618,000 | 4,728,944 | 4,728,944 | 0.9729 | |||||||||||||||||||||
Maximum | 2,855,982 | 3,542,000 | 6,397,982 | 6,397,982 | 1.3163 | |||||||||||||||||||||
Values | 2nd Step Exchange | 2nd Step Offering | Full Conversion | Foundation Shares | Total Market | |||||||||||||||||||||
Shares Value | Value | Value | Value | Capitalization | ||||||||||||||||||||||
Midpoint | $ 24,834,630 | $ | 30,800,000 | $ | 55,634,630 | $ | 55,634,630 | |||||||||||||||||||
Minimum | $ 21,109,436 | $ | 26,180,000 | $ | 47,289,436 | $ | 47,289,436 | |||||||||||||||||||
Maximum | $ 28,559,825 | $ | 35,420,000 | $ | 63,979,825 | $ | 63,979,825 | |||||||||||||||||||
| (1) | Adjusted to reflect consolidation and reinvestment of $100,000 of MHC net assets. |
| (2) | Estimated offering expenses at midpoint of the offering. |
Exhibit IV-5
1895 Bancorp of Wisconsin, Inc.
Pro Forma Effects of Conversion Proceeds
At the Minimun of the Range
| 1. | Fully Converted Value and Exchange Ratio | |||||||||||||
Fully Converted Value | $ | 47,289,436 | ||||||||||||
Exchange Ratio | 0.9729 | |||||||||||||
2nd Step Offering Proceeds | $ | 26,180,000 | ||||||||||||
Less: Estimated Offering Expenses | 1,670,426 | |||||||||||||
|
| |||||||||||||
2nd Step Net Conversion Proceeds (Including Foundation) | $ | 24,509,574 | ||||||||||||
| 2. | Estimated Additional Income from Conversion Proceeds | |||||||||||||
| Net Conversion Proceeds | $ | 24,509,574 | ||||||||||||
Less: Cash Contribution to Foundation | 0 | |||||||||||||
Less: ESOP Stock Purchases (1) | (2,094,400 | ) | ||||||||||||
Less: RRP Stock Purchases (2) | (1,047,200 | ) | ||||||||||||
|
| |||||||||||||
| Net Cash Proceeds | $ | 21,367,974 | ||||||||||||
| Estimated after-tax net incremental rate of return | 0.26 | % | ||||||||||||
|
| |||||||||||||
| Earnings Increase | $ | 56,198 | ||||||||||||
Less: Consolidated interest cost of ESOP borrowings | 0 | |||||||||||||
Less: Amortization of ESOP borrowings (3) | (61,156 | ) | ||||||||||||
Less: RRP Vesting (3) | (152,891 | ) | ||||||||||||
Less: Option Plan Vesting (4) | (150,871 | ) | ||||||||||||
|
| |||||||||||||
| Net Earnings Increase | $ | (308,721) | ||||||||||||
| 3. | Pro Forma Earnings | Before Conversion | Net Earnings Increase | After Conversion | ||||||||||
12 Months ended December 31, 2020 (Reported) | $ | 1,317,000 | $ | (150,871 | ) | $ | 1,166,129 | |||||||
12 Months ended December 31, 2020 (Core) | $ | 1,563,000 | $ | (150,871 | ) | $ | 1,412,129 | |||||||
| 4. | Pro Forma Net Worth | Before Conversion | Net Cash Proceeds | After Conversion | ||||||||||
December 31, 2020 | $ | 60,108,000 | $ | 21,367,974 | $ | 81,475,974 | ||||||||
December 31, 2020 (Tangible) | $ | 60,108,000 | $ | 21,367,974 | $ | 81,475,974 | ||||||||
| 5. | Pro Forma Assets | Before Conversion | Net Cash Proceeds | After Conversion | ||||||||||
December 31, 2020 | $ | 516,857,000 | $ | 21,367,974 | $ | 538,224,974 | ||||||||
| (1) | Includes ESOP purchases of 8% of the second step offering and stock contribution to the Foundation |
| (2) | Includes RRP purchases of 4% of the second step offering and stock contribution to the Foundation |
| (3) | ESOP amortized over 25 years, RRP amortized over 5 years, tax effected at 27.00% |
| (4) | Option valuation based on Black-Scholes model, 5 year vesting and assuming 25% taxable |
Exhibit IV-6
1895 Bancorp of Wisconsin, Inc.
Pro Forma Effects of Conversion Proceeds
At the Midpoint of the Range
| 1. | Fully Converted Value and Exchange Ratio | |||||||||||||
Fully Converted Value | $ | 55,634,630 | ||||||||||||
Exchange Ratio | 1.14460 | |||||||||||||
2nd Step Offering Proceeds | $ | 30,800,000 | ||||||||||||
Less: Estimated Offering Expenses | 1,713,096 | |||||||||||||
|
| |||||||||||||
2nd Step Net Conversion Proceeds (Including Foundation) | $ | 29,086,904 | ||||||||||||
| 2. | Estimated Additional Income from Conversion Proceeds | |||||||||||||
| Net Conversion Proceeds | $ | 29,086,904 | ||||||||||||
Less: Cash Contribution to Foundation | 0 | |||||||||||||
Less: ESOP Stock Purchases (1) | (2,464,000 | ) | ||||||||||||
Less: RRP Stock Purchases (2) | (1,232,000 | ) | ||||||||||||
|
| |||||||||||||
| Net Cash Proceeds | $ | 25,390,904 | ||||||||||||
| Estimated after-tax net incremental rate of return | 0.26 | % | ||||||||||||
|
| |||||||||||||
| Earnings Increase | $ | 66,778 | ||||||||||||
Less: Consolidated interest cost of ESOP borrowings | 0 | |||||||||||||
Less: Amortization of ESOP borrowings (3) | (71,949 | ) | ||||||||||||
Less: RRP Vesting (3) | (179,872 | ) | ||||||||||||
Less: Option Plan Vesting (4) | (177,496 | ) | ||||||||||||
|
| |||||||||||||
| Net Earnings Increase | $ | (362,539 | ) | |||||||||||
| 3. | Pro Forma Earnings | Before Conversion | Net Earnings Increase | After Conversion | ||||||||||
| 12 Months ended December 31, 2020 (Reported) | $ | 1,317,000 | $ | (362,539) | $ | 954,461 | ||||||||
| 12 Months ended December 31, 2020 (Core) | $ | 1,563,000 | $ | (362,539) | $ | 1,200,461 | ||||||||
| 4. | Pro Forma Net Worth | Before Conversion | Net Cash Proceeds | After Conversion | ||||||||||
December 31, 2020 | $ | 60,108,000 | $ | 25,390,904 | $ | 85,498,904 | ||||||||
December 31, 2020 (Tangible) | $ | 60,108,000 | $ | 25,390,904 | $ | 85,498,904 | ||||||||
| 5. | Pro Forma Assets | Before Conversion | Net Cash Proceeds | After Conversion | ||||||||||
December 31, 2020 | $ | 516,857,000 | $ | 25,390,904 | $ | 542,247,904 | ||||||||
| (1) | Includes ESOP purchases of 8% of the second step offering and stock contribution to the Foundation |
| (2) | Includes RRP purchases of 4% of the second step offering and stock contribution to the Foundation |
| (3) | ESOP amortized over 25 years, RRP amortized over 5 years, tax effected at 27.00% |
| (4) | Option valuation based on Black-Scholes model, 5 year vesting and assuming 25% taxable |
Exhibit IV-7
1895 Bancorp of Wisconsin, Inc.
Pro Forma Effects of Conversion Proceeds
At the Maximum of the Range
| 1. | Fully Converted Value and Exchange Ratio | |||||||||||||
Fully Converted Value | $ | 63,979,825 | ||||||||||||
Exchange Ratio | 1.3163 | |||||||||||||
2nd Step Offering Proceeds | $ | 35,420,000 | ||||||||||||
Less: Estimated Offering Expenses | 1,755,434 | |||||||||||||
|
| |||||||||||||
2nd Step Net Conversion Proceeds (Including Foundation) | $ | 33,664,566 | ||||||||||||
| 2. | Estimated Additional Income from Conversion Proceeds | |||||||||||||
| Net Conversion Proceeds | $ | 33,664,566 | ||||||||||||
Less: Cash Contribution to Foundation | 0 | |||||||||||||
Less: ESOP Stock Purchases (1) | (2,833,600 | ) | ||||||||||||
Less: RRP Stock Purchases (2) | (1,416,800 | ) | ||||||||||||
|
| |||||||||||||
| Net Cash Proceeds | $ | 29,414,166 | ||||||||||||
| Estimated after-tax net incremental rate of return | 0.26 | % | ||||||||||||
|
| |||||||||||||
| Earnings Increase | $ | 77,359 | ||||||||||||
Less: Consolidated interest cost of ESOP borrowings | 0 | |||||||||||||
Less: Amortization of ESOP borrowings (3) | (82,741 | ) | ||||||||||||
Less: RRP Vesting (3) | (206,853 | ) | ||||||||||||
Less: Option Plan Vesting (4) | (204,120 | ) | ||||||||||||
|
| |||||||||||||
| Net Earnings Increase | $ | (416,355) | ||||||||||||
|
| |||||||||||||
| 3. | Pro Forma Earnings | Before Conversion | Net Earnings Increase | After Conversion | ||||||||||
| 12 Months ended December 31, 2020 (Reported) | $ | 1,317,000 | $ | (416,355) | $ | 900,645 | ||||||||
| 12 Months ended December 31, 2020 (Core) | $ | 1,563,000 | $ | (416,355) | $ | 1,146,645 | ||||||||
| 4. | Pro Forma Net Worth | Before Conversion | Net Cash Proceeds | After Conversion | ||||||||||
December 31, 2020 | $ | 60,108,000 | $ | 29,414,166 | $ | 89,522,166 | ||||||||
December 31, 2020 (Tangible) | $ | 60,108,000 | $ | 29,414,166 | $ | 89,522,166 | ||||||||
| 5. | Pro Forma Assets | Before Conversion | Net Cash Proceeds | After Conversion | ||||||||||
December 31, 2020 | $ | 516,857,000 | $ | 29,414,166 | $ | 546,271,166 | ||||||||
| (1) | Includes ESOP purchases of 8% of the second step offering and stock contribution to the Foundation |
| (2) | Includes RRP purchases of 4% of the second step offering and stock contribution to the Foundation |
| (3) | ESOP amortized over 25 years, RRP amortized over 5 years, tax effected at 27.00% |
| (4) | Option valuation based on Black-Scholes model, 5 year vesting and assuming 25% taxable |
Exhibit IV-8
1895 Bancorp of Wisconsin, Inc.
Impact of MHC Assets & Waived Dividends on Minority Ownership in 2nd Step Conversion
Financial and Stock Ownership Data as of December 31, 2020
Reflects Appraised Pro Forma Market Value as of February 8, 2021
Key Assumptions
Mid-Tier Stockholders’ Equity | $ | 60,008,000 | BOOK | |||
Aggregate Dividends Waived by MHC | $ | — | WAIVED DIVIDENDS | |||
Minority Ownership Interest | 44.7192 | % | PCT | |||
Pro Forma Market Value | $ | 55,634,630 | VALUE | |||
Market Value of MHC Assets (Other than Stock in Mid-Tier) | $ | 100,000 | MHC ASSETS |
Adjustment for MHC Assets and Waived Dividends - 2 Step Calculation (as required by FDIC and FRB)
Step 1: To Account for Waiver of Dividends | = | (BOOK - WAIVED DIVIDENDS) X PCT | ||||
| BOOK | ||||||
| = | 44.7192% | |||||
| (VALUE - MHC ASSETS) X Step 1 | ||||||
| ||||||
Step 2: To Account for MHC Assets | = | VALUE | ||||
| = | 44.6388% |
Current Ownership | ||||||||
MHC Shares | 2,682,172 | 55.28 | % | |||||
Public Shares | 2,169,729 | 44.72 | % | |||||
|
|
|
| |||||
Total Shares | 4,851,901 | 100.00 | % |
Exhibit V-1
Faust Financial, LLC
Firm Qualifications Statement
Faust Financial, LLC through its principal Marcus Faust (“Faust”), President and Managing Director and its associates, is a nationally recognized specialist in planning, advisory and valuation services to insured financial institutions nationwide. Faust has over 33 years of banking industry experience and is routinely engaged in the valuation of businesses and their securities in connection with mergers and acquisitions, negotiated underwritings, competitive bidding, mutual-to-stock conversions, initial and secondary offerings of listed and unlisted securities, private placements, and valuations for corporate and other purposes.
Faust has worked extensively with bank management, Boards, regulators, auditors, investors and investment bankers. He has developed and implemented formal Enterprise Risk Management programs, business, strategic and capital plans to pursue business opportunities and mitigate risk identified through examination, due diligence and Enterprise Risk Assessment processes; developed and implemented restructuring plans; and negotiated, executed and integrated bank mergers. He contributes to industry publications and frequently speaks on governance, strategic, risk management and regulatory matters.
With experience both as an adviser and in the roles of senior executive officer, Board member and as principal at private and public banks, he has held positions as Chairman of the Board, Chief Executive Officer, Chief Operating Officer, Chief Financial Officer and banking regulator. He has served on the board of six banks and as a principal organizer of three de novo banks, raised capital, developed strategic plans, setup operations and recruited management and directors.
Mr. Faust earned his undergraduate degree from Rollins College and a Masters of Business Administration from Vanderbilt University.
For more information on Faust Financial, LLC, please visit our website: faust-financial.com
For more information on Marcus Faust, please visit https://www.linkedin.com/in/marcusfaust/
| Faust Financial, LLC | ||
| 2009 NE 22nd Street, | Direct: 216.374.6001 | |
| Fort Lauderdale, FL 33305 | mfaust@faust‐financial.com | |
Exhibit V-2
Faust Financial, LLC
Affidavit of Independence
I hereby certify that I have not been the subject of any criminal, civil or administrative judgments, consents, undertakings or orders, or any past administrative proceedings (excluding routine or customary audits, inspections and investigation) issued by any federal or state court, any department, agency, or commission of the U.S. Government, any state or municipality, any self-regulatory trade or professional organization, or any foreign government or governmental entity, which involve:
| (i) | commission of a felony, fraud, moral turpitude, dishonesty or breach of trust; |
| (ii) | violation of securities or commodities laws or regulations; |
| (iii) | violation of depository institution laws or regulations; |
| (iv) | violation of housing authority laws or regulations; |
| (v) | violation of the rules, regulations, codes or conduct or ethics of a self-regulatory trade or professional organization; |
| (vi) | adjudication of bankruptcy or insolvency or appointment of a receiver, conservator, trustee, referee, or guardian. |
I hereby certify that the statements I have made herein are true, complete and correct to the best of my knowledge and belief.
Date: February 8, 2021
 |
| Marcus Faust |
| President and Managing Director |
| Faust Financial, LLC |
| Faust Financial, LLC | ||
| 2009 NE 22nd Street, | Direct: 216.374.6001 | |
| Fort Lauderdale, FL 33305 | mfaust@faust-financial.com | |