Exhibit 96.1
 | ||
| TECHNICAL REPORT SUMMARY | ||
| BRU PROPERTY | ||
| MANITOBA, CANADA | ||
| Submitted to: | ||
| Sio Silica Corporation | ||
| Report Date: | Effective Date: | |
| October 6, 2023 | October 5, 2023 | |
| Stantec Consulting Ltd. | ||
| 200, 325 – 25 Street SE | ||
| Calgary, Alberta T2P 7H8 | ||
| Tel: (403) 716-8000 | ||
| Author(s): | ||
| Ivan Minev, P. Geol. | ||
| Keith Wilson, P. Eng. | ||
| Derek Loveday, P. Geol. | ||
| Project No. 129500488 | ||
TECHNICAL REPORT SUMMARY, BRU PROPERTY, MANITOBA, CANADA
Important Notice
This notice is an integral component of the Sio Silica Corporation BRU Property Technical Report Summary (“Technical Report Summary” or “Report”) and should be read in its entirety and must accompany every copy made of the Technical Report Summary. The Technical Report Summary has been prepared in accordance with the requirements of the U.S. Securities and Exchange Commission (SEC) S-K 1300 Regulations.
The Technical Report Summary has been prepared for Sio Silica Corporation (Sio Silica) by Stantec Consulting Ltd. (Stantec). The Technical Report Summary is based on information and data supplied to Stantec by Sio Silica. The quality of information, conclusions, and estimates contained herein are consistent with the level of effort involved in the services of Stantec, based on: i) information available at the time of preparation of the Report, and ii) the assumptions, conditions, and qualifications set forth in this Report.
Each portion of the Technical Report Summary is intended for use by Sio Silica subject to the terms and conditions of its contract (December 5, 2022) with Stantec. Except for the purposes legislated under United States securities law, any other uses of the Technical Report Summary, by any third party, is at that party’s sole risk.
The results of the Technical Report Summary represent forward-looking information. The forward-looking information includes pricing assumptions, sales forecasts, projected capital and operating costs, mine life and production rates, and other assumptions. Readers are cautioned that actual results may vary from those presented. The factors and assumptions used to develop the forward-looking information, and the risks that could cause the actual results to differ materially are presented in the body of this Report.
Stantec has used their experience and industry expertise to produce the estimates in the Technical Report Summary. Where Stantec has made these estimates, they are subject to qualifications and assumptions, and it should also be noted that all estimates contained in the Technical Report Summary may be prone to fluctuations with time and changing industry circumstances.
This report was prepared by Stantec Consulting Ltd. (Stantec), a third-party firm comprising mining experts in accordance with § 229.1302(b)(1). Sio Silica has determined that Stantec meets the qualifications specified under the definition of qualified person in § 229.1300. References to the Qualified Person or QP in this report are references to Stantec and not to any individual employed at Stantec.
|
TECHNICAL REPORT SUMMARY, BRU PROPERTY, MANITOBA, CANADA
Table of Contents
| 1 | EXECUTIVE SUMMARY | 1-1 | ||
| 2 | INTRODUCTION | 2-1 | ||
| 3 | PROPERTY DESCRIPTION | 3-1 | ||
| 3.1 | Description and Location | 3-1 | ||
| 3.2 | Mining Claims | 3-1 | ||
| 3.3 | Private Property | 3-7 | ||
| 3.4 | Underlying Agreements, Royalties and Encumbrances | 3-8 | ||
| 3.5 | Environmental Liabilities | 3-9 | ||
| 3.6 | Required Permits | 3-9 | ||
| 3.7 | Other Significant Factors and Risks | 3-9 | ||
| 4 | ACCESSIBILITY, CLIMATE, LOCAL RESOURCES, INFRASTRUCTURE AND PHYSIOGRAPHY | 4-1 | ||
| 4.1 | Topography, Elevation and Vegetation | 4-1 | ||
| 4.2 | Property Access and Proximity to Population Centers | 4-1 | ||
| 4.3 | Climate | 4-1 | ||
| 4.4 | Infrastructure | 4-2 | ||
| 5 | HISTORY | 5-1 | ||
| 5.1 | Historical Technical Reports and Preliminary Economic Assessments | 5-1 | ||
| 5.2 | Geotechnical Analysis | 5-2 | ||
| 6 | GEOLOGIC SETTING, MINERALIZATION AND DEPOSIT | 6-1 | ||
| 6.1 | Regional Stratigraphy | 6-1 | ||
| 6.2 | Structural Geology | 6-2 | ||
| 6.3 | Property Geology | 6-2 | ||
| 6.3.1 | Quaternary Sediments | 6-13 | ||
| 6.3.2 | Red River Formation | 6-13 | ||
| 6.3.3 | Winnipeg Formation | 6-14 | ||
| 6.3.4 | Granitoid | 6-14 | ||
| 6.4 | Deposit Types | 6-14 | ||
| 6.5 | Mineralization | 6-1 | ||
| 7 | EXPLORATION | 7-1 | ||
| 7.1 | Historical Hydrocarbon Drill Hole Results | 7-1 | ||
| 7.2 | Groundwater Information Network and Friesen Drilling Historical Data | 7-3 | ||
| 7.3 | Sio Silica 2017 Drilling Campaign summary | 7-3 | ||
| 7.4 | Sio Silica 2018 - 2019 Drilling Campaign Summary | 7-5 | ||
| 7.5 | Sio Silica 2019 Drilling Campaign summary | 7-6 | ||
| 7.6 | Sio Silica 2020 - 2021 Drill Campaign summary | 7-6 | ||
| 7.7 | Sio Silica 2022 Drill Campaign summary | 7-8 | ||
| 8 | SAMPLE PREPARATION, ANALYSES AND SECURITY | 8-1 | ||
| 8.1 | Sampling Method and approach | 8-1 | ||
 | TOC 1 |
TECHNICAL REPORT SUMMARY, BRU PROPERTY, MANITOBA, CANADA
| 8.2 | 2017 and 2018 / 2019 Field Programs Sample Integrity | 8-1 | ||
| 8.3 | Laboratory Credentials, Testing Methodology, and Results | 8-2 | ||
| 8.3.1 | Loring Credentials, Testing Methodology, and 2017 Results | 8-2 | ||
| 8.3.2 | AGAT Credentials, Testing Methodology, and 2018 Results | 8-5 | ||
| 8.3.3 | 2020 AGAT XRF Analytical Methodology and Results | 8-7 | ||
| 8.3.4 | Sio Silica Internal Facility Credentials and Processing Methodology | 8-9 | ||
| 8.3.5 | 2022 Liquids Matter Whole Rock Analysis | 8-10 | ||
| 9 | DATA VERIFICATION | 9-1 | ||
| 9.1 | Site Visit and alignment on Field Procedures and Sampling Protocol | 9-1 | ||
| 9.2 | Sample Chain-of-Custody and Laboratory Results | 9-1 | ||
| 9.2.1 | Chain-of-Custody | 9-1 | ||
| 9.2.2 | Laboratory Results | 9-3 | ||
| 10 | MINERAL PROCESSING AND METALLURGICAL TESTING | 10-1 | ||
| 11 | MINERAL RESOURCE ESTIMATES | 11-1 | ||
| 11.1 | Computer Model Construction | 11-1 | ||
| 11.1.1 | Topographic and Lithological Horizons | 11-1 | ||
| 11.1.2 | Assay Data Compositing and Interpolation | 11-2 | ||
| 11.2 | Resource Estimation Approach | 11-2 | ||
| 11.3 | Mineral Resource Classification | 11-5 | ||
| 11.4 | Assessment of Reasonable Prospect for Eventual Economic Extraction | 11-5 | ||
| 11.5 | Estimation of Sand Volume | 11-8 | ||
| 11.6 | Mineral Resource Estimation | 11-8 | ||
| 12 | MINERAL RESERVE ESTIMATES | 12.1 | ||
| 12.1 | Development Plan | 12.1 | ||
| 13 | MINING METHODS | 13.1 | ||
| 13.1 | Overview | 13.1 | ||
| 13.2 | Geotechnical Analysis | 13.1 | ||
| 13.3 | Extraction Concept | 13.2 | ||
| 13.4 | Surface Development and Reclamation | 13.4 | ||
| 13.5 | Slurry Transportation | 13.4 | ||
| 14 | PROCESS AND RECOVERY METHODS | 14.1 | ||
| 14.1 | Well pad screening circuit | 14.1 | ||
| 14.2 | Wet Plant | 14.2 | ||
| 14.3 | Dry Screening plant | 14.10 | ||
| 14.4 | Storage and loadout | 14.10 | ||
| 14.5 | Plant Design and Construction | 14.10 | ||
| 14.6 | Rail design and construction | 14.10 | ||
| 15 | INFRASTRUCTURE | 15.1 | ||
| 15.1 | Rail | 15.1 | ||
| 15.2 | Power | 15.1 | ||
| 15.3 | Access | 15.1 | ||
| TOC 2 |
TECHNICAL REPORT SUMMARY, BRU PROPERTY, MANITOBA, CANADA
| 15.4 | Gas Line | 15.1 | ||
| 15.5 | Maintenance facility | 15.1 | ||
| 15.6 | Offices | 15.2 | ||
| 15.7 | Operations trailer | 15.2 | ||
| 15.8 | Process water Well | 15.2 | ||
| 16 | MARKET STUDIES | 16.1 | ||
| 16.1 | Introduction | 16.1 | ||
| 16.2 | Markets/ Demand | 16.1 | ||
| 16.3 | Competition | 16.1 | ||
| 16.4 | Contracts And Potential Offtakers | 16.2 | ||
| 17 | ENVIRONMENTAL STUDIES, PERMITTING AND PLANS, NEGOTIATIONS OR AGREEMENTS WITH LOCAL INDIVIDUALS OR GROUPS | 17-1 | ||
| 17.1 | Environmental Baseline Investigations | 17-1 | ||
| 17.2 | Permitting Requirements | 17-2 | ||
| 17.2.1 | Provincial | 17-2 | ||
| 17.2.2 | Federal | 17-3 | ||
| 17.2.3 | Municipal | 17-3 | ||
| 17.3 | Permitting Timelines | 17-4 | ||
| 17.4 | Social and Community Impacts | 17-4 | ||
| 18 | CAPITAL AND OPERATING COSTS | 18-1 | ||
| 18.1 | Cost Summary | 18-1 | ||
| 18.2 | Project Capital Costs | 18-1 | ||
| 18.2.1 | Capital Cost Summary – Phase 1 | 18-1 | ||
| 18.2.2 | Capital Cost Summary – Phase 2 | 18-2 | ||
| 18.2.3 | Contingency | 18-2 | ||
| 18.2.4 | Sustaining Costs | 18-3 | ||
| 18.3 | Project Operating Costs | 18-3 | ||
| 18.3.1 | Land Leasing | 18-3 | ||
| 18.3.2 | Land Preparation and Reclamation | 18-3 | ||
| 18.3.3 | Well Production | 18-3 | ||
| 18.3.4 | Wet process, Dry Process, and Loadout | 18-4 | ||
| 18.3.5 | Support Equipment | 18-4 | ||
| 18.3.6 | Rail & Port | 18-4 | ||
| 18.3.7 | Manpower | 18-5 | ||
| 18.3.8 | General and Administrative Costs | 18-5 | ||
| 18.3.9 | Operating cost Summary | 18-6 | ||
| 19 | ECONOMIC ANALYSIS | 19-1 | ||
| 19.1 | Assumptions | 19-1 | ||
| 19.2 | BRU Property Life | 19-2 | ||
| 19.3 | Royalties and Income Tax | 19-2 | ||
| TOC 3 |
TECHNICAL REPORT SUMMARY, BRU PROPERTY, MANITOBA, CANADA
| 19.4 | Economic Performance | 19-3 | |
| 19.5 | Sensitivity Analysis | 19-7 | |
| 20 | ADJACENT PROPERTIES | 20-1 | |
| 21 | OTHER RELEVANT DATA AND INFORMATION | 21-1 | |
| 22 | INTERPRETATION AND CONCLUSIONS | 22-1 | |
| 22.1 | PRODUCT PRICING AND COST ESCALATION | 22-1 | |
| 22.2 | TIMING OF REGULATORY APPROVALS | 22-1 | |
| 22.3 | Timing Of Project Development | 22-1 | |
| 22.4 | Development Of Extraction Process | 22-1 | |
| 22.5 | Confirmation Of Geotechnical Testing And Analysis | 22-2 | |
| 23 | RECOMMENDATIONS | 23-1 | |
| 23.1 | Phase 1: Geotechnical Testing And Analysis | 23-1 | |
| 23.2 | Phase 2: Engineering Bridging Studies | 23-2 | |
| 24 | REFERENCES | 24-1 | |
| 25 | RELIANCE ON INFORMATION PROVIDED BY THE REGISTRANT | 25-1 | |
| 25.1 | Regulatory Approval Process | 25-1 | |
LIST OF TABLES
| Table 1.1 | Summary of Analyses Completed by Year and Laboratory | 1-6 |
| Table 1.2 | Summary of In-Place Carman Sand as of September 30, 2022 | 1-10 |
| Table 1.3 | Sand Extraction Recommendations | 1-11 |
| Table 1.4 | In-Place Mineral Resource Summary, as of September 30, 2022 | 1-11 |
| Table 1.5 | Summary of Project Permitting Process Key Milestones | 1-16 |
| Table 1.6 | Capital Cost Summary – Phase 1 (C$), no Contingency | 1-16 |
| Table 1.7 | Capital Cost Summary – Phase 2 (C$), no Contingency | 1-17 |
| Table 1.8 | Life of mine Operating Cost Summary, C$ | 1-18 |
| Table 1.9 | Project Economics (C$) | 1-18 |
| Table 1.10 | Key Project Metrics | 1-19 |
| Table 1.11 | Cash Flow Summary | 1-20 |
| Table 1.12 | Cost Estimate – Geotechnical Analysis | 1-24 |
| Table 1.13 | Engineering Bridging Studies | 1-24 |
| Table 3.1 | Active BRU Property Claims | 3-4 |
| Table 4.1 | Mean Climate Data for Nearby Weather Stations | 4-2 |
| Table 5.1 | Previous In-Place Mineral Resource Summary (May 8, 2019 and July 27, 2021) | 5-2 |
| Table 6.1 | Property Lithology | 6-13 |
| Table 7.1 | Sun Core Hole 4 Drilling Summary | 7-2 |
| Table 7.2 | 2017 Drilling Program Summary | 7-4 |
| Table 7.3 | September 2018 to January 2019 Drilling Campaign Summary | 7-5 |
| Table 7.4 | 2019 Drilling Summary | 7-6 |
| Table 7.5 | 2020 / 2021 Drill Holes | 7-8 |
| Table 7.6 | 2022 Drill Holes | 7-8 |
| Table 8.1 | Summary of Analyses Completed by Year and Laboratory | 8-2 |
| Table 8.2 | 2017 Concentration of Major Oxides and LOI (wt %) by Fraction | 8-4 |
| TOC 4 |
TECHNICAL REPORT SUMMARY, BRU PROPERTY, MANITOBA, CANADA
| Table 8.3 | 2018 Mineralogical Assessment Results | 8-5 |
| Table 8.4 | 2018 AGAT XRF Results – Concentration of Major Oxides and LOI (wt %) | 8-6 |
| Table 8.5 | 2020 AGAT XRF Results – Concentration of Major Oxides and LOI (wt %) | 8-8 |
| Table 8.6 | Samples Processed at Sio Silica Facilities | 8-9 |
| Table 8.7 | Liquids Matter ICP-OES Summary Test Results | 8-11 |
| Table 8.8 | Liquids Matter ICP-OES Point A 40/70 Test Results | 8-12 |
| Table 8.9 | Liquids Matter ICP-OES Point B 40/70 Test Results | 8-13 |
| Table 8.10 | Liquids Matter ICP-OES Point A-1 70/140 Test Results | 8-14 |
| Table 8.11 | Liquids Matter ICP-OES Point B-1 70/140 Test Results | 8-15 |
| Table 9.1 | 2017 Stim-Lab Sample Chain-of-Custody | 9-2 |
| Table 9.2 | 2017 Loring Sample Chain-of-Custody | 9-2 |
| Table 9.3 | Stim-Lab Sample Chain-of-Custody | 9-2 |
| Table 9.4 | AGAT Sample Chain-of-Custody | 9-3 |
| Table 11.1 | Summary of In-Place Carman Sand as of September 30, 2022 | 11-8 |
| Table 11.2 | Sand Extraction Recommendations | 11-9 |
| Table 11.3 | In-Place Mineral Resource Summary, as of September 30, 2022 | 11-10 |
| Table 18.1 | Capital Cost Summary – Phase 1 (C$), no Contingency | 18-2 |
| Table 18.2 | Capital Cost Summary – Phase 2 (C$), no Contingency | 18-2 |
| Table 18.4 | Life of mine Operating Cost Summary, C$ | 18-6 |
| Table 19.1 | Project Economics (C$) | 19-3 |
| Table 19.2 | Key Project Metrics | 19-4 |
| Table 19.3 | Cash Flow Summary | 19-5 |
| Table 19.4 | After Tax NPV Sensitivity to Sale Price | 19-8 |
| Table 23.1 | Cost Estimate – Geotechnical Analysis | 23-2 |
| Table 23.2 | Engineering Bridging Studies | 23-2 |
LIST OF FIGURES
| Figure 1-1 | Property Location Map | 1-2 |
| Figure 1-2 | Mining Claims Map | 1-3 |
| Figure 1-3 | Resource Distribution Map | 1-7 |
| Figure 1-4 | Resource Classification Map | 1-8 |
| Figure 3-1 | Property Location Map | 3-2 |
| Figure 3-2 | Mining Claims Map | 3-3 |
| Figure 4-1 | Infrastructure Map | 4-3 |
| Figure 6-1 | Regional Geology Map | 6-3 |
| Figure 6-2 | Carbonate Thickness Map | 6-4 |
| Figure 6-3 | Sand Thickness Map | 6-5 |
| Figure 6-4 | Overburden Thickness Map | 6-6 |
| Figure 6-5 | Structure Map Top of Carbonate | 6-7 |
| Figure 6-6 | Structure Map Top of Carman Sand | 6-8 |
| Figure 6-7 | Cross Section A-A’ | 6-9 |
| Figure 6-8 | Cross Section B-B’ | 6-10 |
| Figure 6-9 | Cross Section C-C’ | 6-11 |
| Figure 6-10 | Cross Section D-D’ | 6-12 |
| Figure 7-1 | Drill Hole Location Map | 7-7 |
| TOC 5 |
TECHNICAL REPORT SUMMARY, BRU PROPERTY, MANITOBA, CANADA
| Figure 8-1 | SiO2 Content for 40/70 Fraction Distribution Map | 8-16 |
| Figure 8-2 | SiO2 Content for 70/140 Fraction Distribution Map | 8-17 |
| Figure 8-3 | Iron Content for 40/70 Fraction Distribution Map | 8-18 |
| Figure 8-4 | Iron Content for 70/140 Fraction Distribution Map | 8-19 |
| Figure 9-1 | 2017 Duplicate Sample Comparison Loring vs. Stim-Lab | 9-4 |
| Figure 9-2 | 2018-2019 Duplicate Sample Comparison AGAT vs. Loring Lab | 9-5 |
| Figure 9-3 | Sample Comparison Sio Silica vs. AGAT | 9-6 |
| Figure 11-1 | 40/70 Fraction Distribution Map | 11-3 |
| Figure 11-2 | 70/140 Fraction Distribution Map | 11-4 |
| Figure 11-3 | Resource Distribution Map | 11-6 |
| Figure 11-4 | Resource Classification Map | 11-7 |
| Figure 13-1 | 25 Year Extraction Plan | 13-5 |
| Figure 14.1 | Wellpad Extraction Flowsheet | 14-4 |
| Figure 14.2 | Extraction Dewatering Flowsheet | 14-5 |
| Figure 14.3 | Overland Transport Dewatering Flowsheet | 14-6 |
| Figure 14.4 | Wet Plant Flowsheet | 14-7 |
| Figure 14-5 | Dry Plant Flowsheet | 14-8 |
| Figure 14-6 | Product Handling | 14-9 |
| TOC 6 |
TECHNICAL REPORT SUMMARY, BRU PROPERTY, MANITOBA, CANADA
SIGNATURE PAGE
This report titled “Technical Report Summary, BRU Property, Manitoba, Canada” with an effective date of October 5, 2023 was prepared by:
| Stantec Consulting Ltd. | (signed) Stantec Consulting Ltd. |
| Dated at Calgary, Alberta | |
| October 6, 2023 |
| i |
TECHNICAL REPORT SUMMARY, BRU PROPERTY, MANITOBA, CANADA
| 1 | EXECUTIVE SUMMARY |
Introduction
On Dec 5, 2022, Sio Silica Corporation (Sio Silica) contracted Stantec Consulting Ltd (Stantec) to prepare a Technical Report Summary regarding the Initial Assessment (IA) of the BRU Property. The Technical Report Summary was prepared in accordance with the requirements of the U.S. Securities and Exchange Commission (SEC) reporting of material mining assets under regulation S-K 1300.
This Technical Report Summary focuses on the quantification of the resource as a source of high purity silica sand. High purity silica sand may be used in a wide range of industrial applications, including electronics, medical research, metals and alloys, specialty glass, and renewable energy.
Description and Location
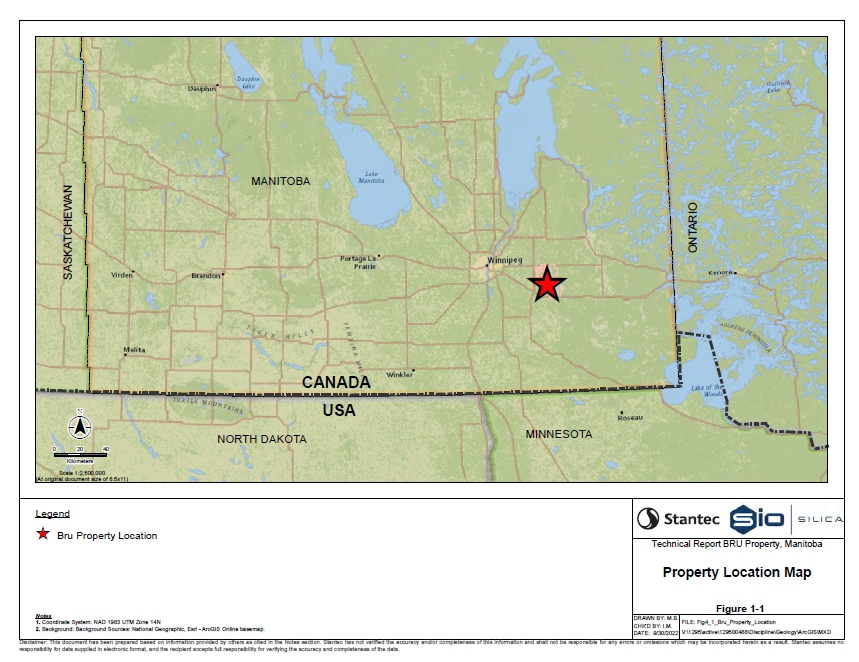
The centre of the Property is located approximately 52 km east of the city of Winnipeg, Manitoba and is within the Rural Municipality of Springfield, as shown on Figure 1.1. The southern end of the Property is accessed from Winnipeg via the TransCanada Highway.
The Property encompasses 27,528 ha and is shown on National Topographic System Map Sheet 62H. The Property spans from 670606E to 690090E, and 5502592N to 5529032N, and the centre of the Property is approximately at 49.75917°N and 96.46818°E (UTM 14 U 682343E and 5514931N, NAD83).
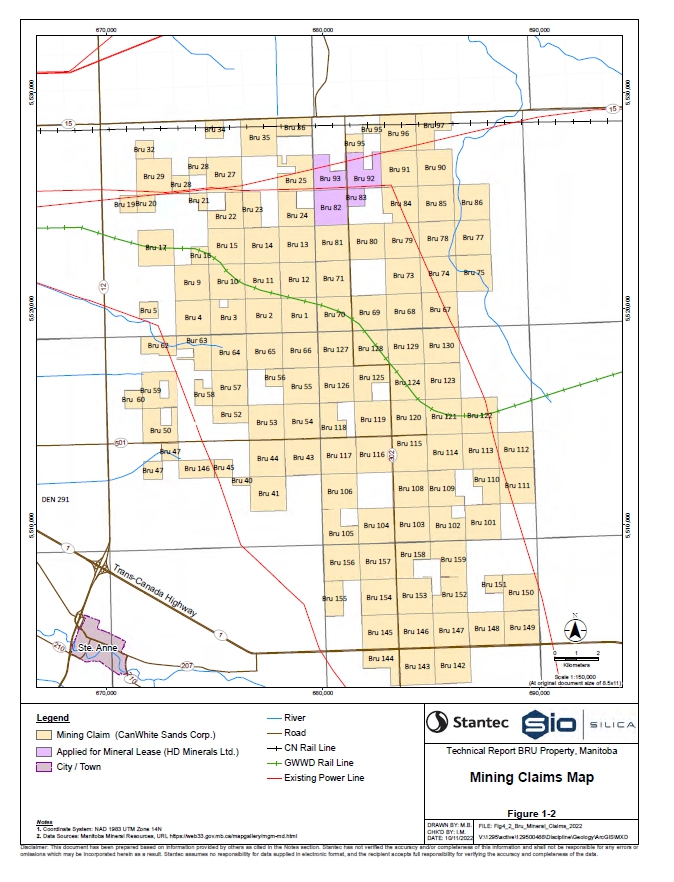
Mineral Claims
The Property consists of 122 claims and are all within surveyed territory. Originally some claims were held under HD Minerals Ltd.; however, following the amalgamation of HD Minerals with Sio Silica Corporation, 100% of the claims that compose the Property are now retained under CanWhite Sands Corp., which is now Sio Silica Corporation. The location of the claims is shown on Figure 1.2
Topography, Elevation and Vegetation
The Property is located in the Boreal Plain Ecozone with the western edge of the Property in the Prairie Ecozone and the eastern edge in the Boreal Shield Ecozone. The Boreal Plain Ecozone is characterized by relatively flat lying to gently rolling plains and terraces formed by morainal diamicton deposits with lower areas composed of glaciolacustrine deposits (Smith et al., 1998).
Infrastructure
Winnipeg is the largest major city near the Property. Winnipeg, as of 2021, has a population of 749,607 residents in the metropolitan area, and provides all required major services to advance the project. The city of Winnipeg, located on the TransCanada Highway, is the home of the James Armstrong Richardson International Airport that has numerous domestic and international flights, and is a major North American rail transportation hub with a 20,000-acre facility that services Canadian National Railway, Canadian Pacific Railway, BNSF Railway and the locally maintained and operated Greater Winnipeg Water District Railway (Railway Association of Canada, 2017; Winnipeg, 2017).
| 1-1 |
TECHNICAL REPORT SUMMARY, BRU PROPERTY, MANITOBA, CANADA
| 1-2 |
TECHNICAL REPORT SUMMARY, BRU PROPERTY, MANITOBA, CANADA
| 1-3 |
TECHNICAL REPORT SUMMARY, BRU PROPERTY, MANITOBA, CANADA
History
Prior to Sio Silica securing the Property, the area within the BRU claims had not been subject to subsurface exploration for silica sands. There is however documentation that exploration for silica sand did occur directly to the south of the Property in the 1960’s (Underwood McLellan & Associates Limited, 1967).
Stantec has prepared the following reports for Sio Silica’s BRU Property. In chronological order these reports are:
| ● | Technical Report BRU Property Manitoba, Effective Date October 4, 2017 | |
| ● | Technical Report BRU Property Manitoba, Effective Date May 8, 2019 | |
| ● | Preliminary Economic Assessment BRU Property, Effective Date February 27, 2020 | |
| ● | Preliminary Economic Assessment BRU Property, Effective Date July 27, 2021 | |
| ● | Technical Report Initial Assessment BRU Property Manitoba, Effective Date August 27, 2021 | |
| ● | Technical Report BRU Property Manitoba, Effective Date September 30, 2022 | |
| ● | Technical Report Summary BRU Property, Effective Date September 30, 2022 |
These reports were prepared in accordance with the requirements of National Instrument 43-101 Standards of Disclosure for Mineral Projects (NI 43-101).
Property Geology
Prior to 2017, the area had undergone little drilling, most of which was limited to water wells that were drilled on behalf of third parties. The lithological descriptions are primarily based on reliable holes that were drilled in the Project area by Sio Silica. In general, the stratigraphy of the Property is consistent; the major units are Quaternary sediments, carbonate and shale intervals of the Red River Formation, unconsolidated sand, sandstone, and shale of the Winnipeg Formation, and Archean-age granitoid basement. The upper unconsolidated sand interval of the Winnipeg Formation, which is known as the Carman Sand Member, is the subject of this report. The maximum Carman Sand Member depth within the property limit is 65-70 m and the average thickness is 22.3 m.
Mineralization
The stratigraphic target is the unconsolidated silica sand from the Carman Sand Member. The high purity of the sand makes it suitable for variety of usages and markets. The primary objective of the program was to delineate the quality of the sand and assess the extractable sand volumes.
Deposit Types
The Carman Sand Member is dominantly an unconsolidated laterally extensive unit across the Property, as validated through numerous drilling campaigns conducted by Sio Silica. Unconsolidated sand type deposits typically require no processing beyond cleaning and size sorting. The deposit appears to have limited geological variability and limited structural complexity.
| 1-4 |
TECHNICAL REPORT SUMMARY, BRU PROPERTY, MANITOBA, CANADA
Sio Silica Drilling Campaigns
Sio Silica conducted the first exploration drilling program during July and August 2017, which resulted in the completion of six vertical holes on the Property. Five of the boreholes were drilled using a dual rotary (DR) drill rig and a reverse circulation (RC) drill rig. A dual rotary drill rig was utilized to drill through the diamicton and the carbonate cap rock. The holes were cased to the top of the carbonate unit. Once the upper contact with the sand was intercepted, a RC rig with a cyclone was used to recover and collect samples of the sand. The remaining borehole,
DDH-10-17, was drilled to obtain geotechnical information about the carbonate unit above the Carman Sand Member.
A drilling campaign was completed between September 2018 and January 2019, in which 10 vertical holes were drilled on the BRU Property. Of these 10 holes, eight were DR / RC holes that were drilled to identify formation tops and to constrain sand samples, and two diamond drill holes were completed to document the geotechnical properties of the carbonate interval.
Nine holes were drilled between April 2019 and August 2019. The purpose of these drill holes was for extraction tests and aquifer monitoring. These drill holes were drilled in close proximity to other wells and provided similar lithological information, as a result some drill holes are excluded from the geological modelling.
Fifteen drill holes were completed between July 2020 and August 2021. Drill hole depths varied from 42 m to 76 m; all holes were drilled vertically. In addition to further constraining lithological depths, the main purpose of the drilling campaign was to further develop production and supply wells, as well as to complete sand, limestone, and shale monitoring wells.
Six vertical drill holes were completed during the last drill hole campaign in August 2022. Drill hole depths varied from 66 m to 83 m. The main purpose of the drilling campaigns was to increase the drill hole density and providing additional information on the depth and the thickness of the lithological units, as well as to collect samples for sand quality assessment.
Sample Preparation, Analyses and Security
Table 1.1 shows a summary of the number and type of analyses by year and laboratory. Loring, AGAT and Liquids Matter are independent laboratories.
Table 1.1
Summary of Analyses Completed by Year and Laboratory
| Laboratory | Year | No. Samples | Analyses Type | |||
| Loring | 2017 | 75 | PSD Sieve | |||
| 2017 | 15 | Inductively Coupled Plasma (ICP) Whole Rock | ||||
| 2019 | 10 | PSD Sieve | ||||
| AGAT | 2019 | 6 | Bulk X-Ray Diffraction and X-Ray Fluorescence | |||
| 2018-2019 | 79 | PSD Sieve | ||||
| 2020 | 13 | X-Ray Fluorescence | ||||
| Sio Silica | 2022 | 20 | PSD Sieve | |||
| 2020-2022 | 14 | 40/70 and 70/140 size fraction clean and magnetic separator | ||||
| Liquids Matter | 2021-2022 | 56 | ICP Whole Rock on 40/70 and 70/140 size fraction |
| 1-5 |
TECHNICAL REPORT SUMMARY, BRU PROPERTY, MANITOBA, CANADA
The Liquids Matter ICP-OES test results show that the magnetic separator used by Sio Silica was successful in increasing sand purity from a mean of 99.87% SiO2 to 99.91% SiO2 for the 40/70 size fraction, and 99.86% SiO2 to 99.91% SiO2 for the 70/140 size fraction.
Data Verification
Multiple site visits were conducted on the property by the QP. The exploration programs (involving collection of the field data, sample collection, and the implementation of chain-of- custody documentation during sample shipment), were observed during the site visits.
Provided analytical data were compared against the laboratory reports. The results from the different laboratories are compared to ensure consistency and accuracy of the analytical data.
Mineral Resource Estimates
The estimates presented below have been prepared in accordance with the requirements of the SEC S-K 1300 Regulations. For the purposes of estimating mineral resource within the Property, Stantec constructed a geological model utilizing all available drill hole data included in Section 5 and Section 7 of this report. The geologic model construction, resource estimation approach, criteria and assumptions taken into consideration during this resource estimation are outlined in the following sub-sections.
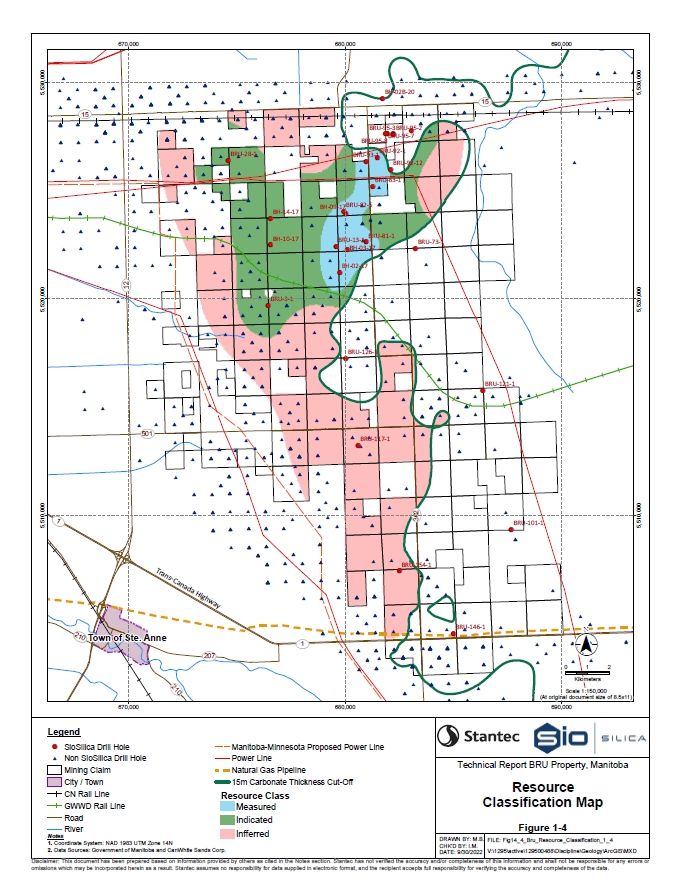
Mineral Resource Classification
Estimated resources are classified according to the confidence level that can be placed in each estimate. The classification template used in this study is based on the three-dimensional distance to the nearest drill hole that penetrates the top and the bottom of the Carman Sand, as well as the distance to the nearest sample that contains sand quality analytical data. The Carman Sand interval in the Property was classed as Measured using an 800 m radial distance from the nearest drill hole intersection with available sand quality data, classed as Indicated using a 1,600 m radial distance from the nearest drill hole intersection with available sand quality data and classed as Inferred using a 3,200 m radial distance from the nearest drill hole intersection with or without available sand quality data. Only drill holes listed in Section 7.1 and Section 7.3- 7.7 were used for resource classification. Due to the reduced reliability of the water-wells described in Section 7.2, this data was only used to define the contacts of the lithological units. Figure 1-3 shows the resource distribution map and Figure 1-4 shows the resource classification map. The resource estimate covers an area of approximately 13,000 ha.
| 1-6 |
TECHNICAL REPORT SUMMARY, BRU PROPERTY, MANITOBA, CANADA

| 1-7 |
TECHNICAL REPORT SUMMARY, BRU PROPERTY, MANITOBA, CANADA
| 1-8 |
TECHNICAL REPORT SUMMARY, BRU PROPERTY, MANITOBA, CANADA
Estimation of Sand Volume
The modeled volumes and weight of the Carman Sand within the resource area are shown in Table 1.2.
Table 1.2
Summary of In-Place Carman Sand as of September 30, 2022
| In-Place Carman Sand Member in Mineable Lease Area | ||||||||
| BRU Property | 40/70 mesh fraction | 70/140 mesh fraction | ||||||
| Estimated Sand Volume (Mm3) | 1,628 | 1,098 | ||||||
| Total Estimated Sand Volume (Mm3) | 2,726 | |||||||
| Estimated Sand Weight (Mt) | 2,442 | 1,647 | ||||||
| Total Estimated Sand Weight (Mt) | 4,089 | |||||||
Mineral Resource Estimation
The Mineral Resource estimate for the Project has been prepared in accordance with the SEC S- K 1300 regulations.
The results of the Preliminary Economic Assessment dated July 27,2021 indicate a positive economic outcome related to the potential development of a silica sand extraction and processing operation for the BRU Property. The QP believes the BRU Property continues to demonstrate a reasonable prospect for eventual economic extraction.
Geotechnical testing and analysis have resulted in the extraction recommendations as summarized in Table 11.2. The extraction holes are planned to be drilled in a pod or cluster of up to seven holes in one extraction pad area. The current planning basis is to extract between 3 K and 23 K tonnes of sand from an extraction cluster, depending on the thickness and structural integrity of the overlying limestone and diamicton material, before relocating to the next extraction pad.
| 1-9 |
TECHNICAL REPORT SUMMARY, BRU PROPERTY, MANITOBA, CANADA
Table 1.3
Sand Extraction Recommendations
| Competent Limestone Thickness (m) | Quaternary Material Thickness (m) | Extractable Sand Volume (m3) | Extractable Sand Mass (t) | Distance Between Well Clusters (m) (Center to Center) | ||||||||||
| >25 | 0-25 | 15,235 | 22,853 | 110 | ||||||||||
| >25 | 25-35 | 12,485 | 18,728 | 107 | ||||||||||
| >25 | >35 | 10,018 | 15,027 | 104 | ||||||||||
| 20-25 | 0-25 | 9,259 | 13,889 | 103 | ||||||||||
| 20-25 | 25-35 | 7,169 | 10,754 | 100 | ||||||||||
| 20-25 | >35 | 5,362 | 8,043 | 97 | ||||||||||
| 15-20 | 0-25 | 4,314 | 6,471 | 95 | ||||||||||
| 15-20 | 25-35 | 2,979 | 4,469 | 92 | ||||||||||
| 15-20 | >35 | 2,245 | 3,368 | 90 | ||||||||||
The mineral resource shown in Table 1.4, utilizing the extraction recommendations from Table 1.2, is reported as in-place tonnages. The calculated volumes were converted to tonnage by the application of a representative average in-place bulk density value of 1.5 g/cm3.
Table 1.4
In-Place Mineral Resource Summary, as of September 30, 2022
| Mineral Resources (Mt) | ||||||||||||
| BRU Property | 40/70 mesh fraction | 70/140 mesh fraction | Total | |||||||||
| Measured | 6.5 | 4.7 | 11.2 | |||||||||
| Indicated | 27.2 | 19.2 | 46.4 | |||||||||
| Total Measured and Indicated | 57.6 | |||||||||||
| Inferred | 55.1 | 36.8 | 91.9 | |||||||||
| Total Inferred | 91.9 | |||||||||||
It should be noted that the drill hole information shows very consistent Carman Sand thickness, averaging 22.3 m. The laboratory results show low variability on the sand quality. The SiO2 content ranges between 99.75% to 99.93%, averaging 99.87% after washing and drying (Point A). The average SiO2 content after magnetic separation (Point B) is 99.91%. Analogical results are observed on the Fe analysis. The Fe content ranges between 52 ppm and 325 ppm with 197 ppm average after washing and drying. The average Fe content after magnetic separation is 55.1 ppm, ranging between 28.9 ppm and 99.5 ppm.
The accuracy of resource estimates is, in part, a function of the quality and quantity of available data and of engineering and geological interpretation and judgment. Given the data available at the time that this Technical Report Summary was prepared, the estimates presented herein are considered reasonable. However, this estimate should be accepted with the understanding that additional data and analysis available after the date of the estimates, may necessitate revision. These revisions may be material. There is no guarantee that all or any part of the estimated resources will be recoverable.
| 1-10 |
TECHNICAL REPORT SUMMARY, BRU PROPERTY, MANITOBA, CANADA
Mineral Reserve Estimation
This Technical Report does not include an estimate of reserves. The level of engineering does not support the preparation of a Pre-Feasibility Study; therefore, in accordance with the requirements of S-K 1300, the reported resources cannot be classified as reserves.
This section of the report includes estimates of recoverable sand tonnage for the BRU Property based on preliminary extraction plans, production schedules and processing plant and materials handling plans. These estimates are only intended for the purpose of completion of the cash flow forecasts presented in Section 19. These recoverable estimates are not, and should not be construed to be, estimates of reserves for the BRU Property. They do not comply with the Classification of Reserves as required under S-K 1300. It should be noted that there is no certainty that the estimated resources will be realized.
Development Plan
The 25-year development plan, that is discussed in more detail in Section 13, results in 66.4 Mt of clean (saleable) sand from the resource estimate. Stantec notes that the 25-year development plan only addresses a portion of the BRU Property resource. The remaining resource is available for development in further planning efforts.
This estimate of clean (saleable) silica sand is considered to be inclusive of the in-place mineral resource estimate detailed in Section 11. These production estimates are contained within the in- place mineral resource summary and cannot be added to the totals to result in additional resources tonnes.
The BRU Property will be developed using an underground extraction technique that involves drilling through the quaternary sediments, carbonate unit and shale, into the underlying sand. The extraction holes will be cased to the top of the sand and an extraction casing is then lowered into the sand. Air is injected into the extraction casing, approximately 10 m - 15 m above the bottom of the casing. Field tests have shown that the air injection process results in a slurry of sand, water, and air that rises to the surface. The solids content of the slurry ranges from 90% to 20% during the extraction trials. The average solids content is approximately 50%.
Sio Silica plans to commence extraction and processing operations in the 3rd Quarter of Year 0 with the first product sales planned for the 1st Quarter of 2025. The extraction and processing operations are planned to take place for eight months a year, April to November, while sales will take place year-round. The sales will be phased with 1.25 Mt of saleable product planned in Year 1, 2.50 Mt in Year 2, and 2.72 Mt in Year 3 and extending out the remainder of the 25-year plan. For the purposes of this Technical Report Summary, Year 0 is defined as 2024.
| 1-11 |
TECHNICAL REPORT SUMMARY, BRU PROPERTY, MANITOBA, CANADA
Geotechnical Analysis
The preliminary analysis indicates that:
| ● | Subsurface sand extraction should be limited to areas where the carbonate unit is more than 15 m in thickness. |
| ● | The analysis here assumes an overburden thickness of up to 25 m. Overburden thicker than this range should be reviewed case by case to assess potential for subsidence to occur following extraction. |
| ● | The diameter of the extraction voids should not extend beyond 60 m in any circumstance. This diameter should be reduced to 50 m as the carbonate unit thins to 15 m. |
| ● | The distance from the edge of one extraction void to the edge of the next extraction void should not be less than 60 m. |
| ● | An extraction void developed as per the above noted maximum diameter assumptions contains approximately 25,000 tonnes. |
The extraction layout was developed with these geotechnical criteria in mind. The author(s) would like to note that these geotechnical parameters and the resulting geotechnical analysis are based on geotechnical work completed for the Limestone caprock and assuming that the controlling failure mode is shear failure. Additional testing is recommended to support further analysis on the sandstone void space evolution, and the joint system in the limestone (to investigate for the possible presence of vertical jointing and if found, to assess its impact on stability). As stated above, evidence from testing in 2018/2019 suggests that the sandstone angle of repose is steeper than previously assumed, and related adjustments of the extraction plan which would lead to a more refined extraction layout might be required. In addition, more complex void shapes in the sandstone may be occurring with both steep and shallow side slopes.
Recovery Methods
The processing component of the BRU silica operation is guided by a modular and multi-stage recovery process. The four general areas are:
| ● | A modular well pad screening and dewatering plant for slurry preparation; |
| ● | A dewatering circuit or ‘wet plant’ for raw sand separation; |
| ● | A dry screening plant for final sizing and beneficiation; and |
| ● | The storage and loadout system. |
Based on preliminary analyses and modeling, extraction, handling and drying losses are estimated at seven (7) percent.
Markets and Contracts
Sio Silica is intending on producing high-quality premium silica sand for end use in the technology markets. The 99.99% SiO2 and low iron content (<100ppm Fe) are typically marketed to manufacturers of solar glass, smart glass for computing and mobile device applications, and semiconductors, among other uses, and receive a premium compared to 95% SiO2 purity. A confidential marketing study was completed by a third party, on behalf of Sio Silica, focused on the premium silica market
The global market for silica sand is approximately 350 million tonnes per annum, with approximately three quarters of that total in North America (112 million tonnes) and Asia Pacific (154 million tonnes), as of 2021. Of this global market, the high purity market consists of approximately 13 million tonnes per annum.
| 1-12 |
TECHNICAL REPORT SUMMARY, BRU PROPERTY, MANITOBA, CANADA
The North American market for high purity, low iron silica has been in the 1 million tonne per annum range historically through 2021 and is anticipated to grow to 2 to 3 million tonnes per annum by 2025, principally driven by the photovoltaic market and technology applications.
Supply of high purity quartz to the Asian market has traditionally been supplied via Vietnam and Cambodia. Both countries have scaled back exports to China to strengthen their local manufacturing, resulting in a supply shortage in the rest of Asia and therefore higher delivered prices.
The anticipated growth in the high purity silica market has provided motivation to other potential sources of supply in Australia, according to the marketing report. It is anticipated that the supply from these to-be-developed proposed mines will require additional beneficiation, adding costs to the mine gate pricing. The timing and tonnage of this new supply and the level of the beneficiation, and associated costs, is uncertain. Australian mining companies are expected to be the primary exporter to China; however, it is unclear how much will materialize, according to the marketing study. In the future scenario, Australian mining companies may potentially have lower delivered costs compared to other international peers for solar glass applications, but will require beneficiation for smart glass applications, resulting in a higher delivered price.
There are only two mines in the US today capable of providing low iron silica sand (99.9% SiO2, <100 ppm) totaling approximately 1 million tonnes per annum of supply.
According to the marketing study, typical contracts are two-to-three-year renewable contracts indexed to inflation, and identified with a specific purity, quality, and quantity. In a similar fashion, there are typically penalties for not meeting these criteria. Sio Silica has provided Stantec with three documents related to their negotiations with potential customers for the silica sand produced from the Bru Property.
Agreement #1
The first document is a proposed sales and purchase agreement contract between Sio Silica and Company 1, that Sio Silica has indicated should be finalized in the fourth quarter of 2023. The document states a sales price of US$180 per MT FOB loading port for 500,000 MT per annum. When exchange rates and port and rail costs are considered, it equates to a mine gate price of CDN$149 per MT.
The initial term of this proposed agreement is from January 1, 2024 to December 21, 2026. Thereafter term of the agreement will be automatically renewed for an unlimited number of one (1) year terms unless terminated by either the buyer or the seller.
Agreement #2
The second document is a Memorandum of Understanding between Sio Silica and Company 2 and dated September 15, 2022. The document states a sales price of US$250 per MT FOB loading port for 800,000 MT per annum. When exchange rates and port and rail costs are considered, it equates to a mine gate price of CDN$240 per MT.
| 1-13 |
TECHNICAL REPORT SUMMARY, BRU PROPERTY, MANITOBA, CANADA
Both the buyer and the seller agree to use their best efforts to enter into a binding Sales Agreement in the first quarter of 2024.
Agreement #3
The third document is an engagement agreement between Sio Silica and Company 3 and dated November 1, 2022. The document states a sales price of US$200 per short ton FOB Mine Gate for 1,200,000 short tons per annum. The agreement also stipulates a service fee equal to 15% of the gross amount of the purchase price paid. When conversion to metric tonnes and the 15% fee are considered, it equates to a mine gate price of CDN$243.60 per MT.
The term of this agreement is unlimited unless terminated by either the buyer or the seller.
Product Pricing
Stantec used a weighted tonnage per annum price from all three agreements for the initial years of the analysis. A weighted tonnage per annum price for the last two agreements was used from 2030 until the end of the project life.
Product Quality
The first two agreements specify that the quality parameters for the delivered sand shall be a silicon dioxide (SiO2) percentage greater than or equal to 99.9% and Fe2O3 content less than or equal to 100 ppm.
It is the opinion of Stantec that given the results of the sand analysis discussed in Section 8, the sand pricing discussed above is applicable to the BRU Property resource and as such has been used in this Study.
Stantec does note, however, that confirmed sales agreements or contracts for the full levels of silica sand production that form the basis of this IA have yet to be finalized.
Environmental Studies, Permitting and Social or Community Impact
Sio Silica has engaged AECOM to provide consulting support through the regulatory approval process. This information is discussed further in Section 17. Refer to Table 1. 5 below for key project permitting milestones and projected dates.
Potential socioeconomic effects of the Project are assessed in the EAPs for the respective facility and extraction Project components that will be reviewed and considered by MBCC in the provincial review and licensing process. Sio Silica has a public ‘Vivian Sand Project’ website that provides updated information on the Project and a summary of the public outreach conducted by Sio Silica to date. Sio Silica has been and will continue to engage with local communities, associations, local businesses, and other interested parties, to share information about the Project and solicit input on improving Project design and/or address any concerns.
| 1-14 |
TECHNICAL REPORT SUMMARY, BRU PROPERTY, MANITOBA, CANADA
Table 1.5
Summary of Project Permitting Process Key Milestones
| Component | Date | |
| Provincial | ||
| Submission of final Sand Extraction EAP to MBCC | July 2021 | |
| Sio Silica Public Engagement Virtual Meeting – Sand Extraction Project | August 2021 | |
| Technical Advisory Committee (TAC) and Public Review and Response to Sand Extraction EAP | September 2021 | |
| Facilitated Public Meeting (potential requirement of MBCC) | September 2021 | |
| Sio Silica Public Engagement In-Person Meeting – Sand Extraction Project | November 2021 | |
| CEC Hearing Announcement for Sand Extraction | November 2021 | |
| Issuance of Environment Act Licence for Facility Project | December 2021 | |
| Sio Public Engagement – Close Neighbor Individual Meetings | Fall 2022 | |
| Sio Silica Public Engagement Virtual Meeting – Q&A Webinar | February 2023 | |
| Completed drafts for the following: Groundwater Monitoring and Impact Mitigation Plan, Progressive Well Abandonment Plan, Waste Characterization and Management Plan | February 2023 | |
| Submitted Draft Closure Plan - Extraction | February 2023 | |
| Clean Environment Commission (CEC) Hearings | February 2023 to March 2023 | |
| CEC Recommendations | June 2023 | |
| Submitted Draft Closure Plan - Facility | June 2023 | |
| Municipal | ||
| Municipal Board Zoning Appeal Hearing for Facility Project | October 2022 | |
| Successful Zoning Result for Facility Property | March 2023 | |
Capital and Operating Costs
The BRU project is developed in two phases to capture the initial production and a future expansion. Phase 1 capital encompasses equipment beginning at extraction well pad, including well rigs, the overland slurry line initial pump stations, booster pump and through to the wet and dry plant, as well as the silos, rail, and supporting infrastructure. Table 1.6, below, outlines the Phase 1 capital estimate by area. It should be noted that no contingency is applied in the table.
Table 1.6
Capital Cost Summary – Phase 1 (C$), no Contingency
| Area | Summary Cost, (C$) | |||
| Extraction | $ | 21.8 | M | |
| Wet Plant | $ | 39.4 | M | |
| Dry Plant | $ | 47.4 | M | |
| Rail and TLO | $ | 25.3 | M | |
| Overland Slurry Pipeline Controls | $ | 6.2 | M | |
| Infrastructure | $ | 15.9 | M | |
| Engineering, Project Management & Permitting | $ | 2.0 | M | |
| Subtotal | $ | 158.0 | M | |
| 1-15 |
TECHNICAL REPORT SUMMARY, BRU PROPERTY, MANITOBA, CANADA
The capital costs for the second phase of development, Phase 2, are shown in Table 1.7 The same battery limits apply as in Phase 1, recognizing that portions of the rail and infrastructure is pre-invested in within the original phase.
Table 1.7
Capital Cost Summary – Phase 2 (C$), no Contingency
| Area | Summary Cost, (C$) | |||
| Extraction | $ | 21.8 | M | |
| Wet Plant | $ | 34.4 | M | |
| Dry Plant | $ | 38.0 | M | |
| Rail and TLO | $ | 11.0 | M | |
| Overland Slurry Pipeline Controls | $ | 0.0 | M | |
| Infrastructure | $ | 0.0 | M | |
| Engineering, Project Management & Permitting | $ | 0.5 | M | |
| Subtotal | $ | 105.7 | M | |
Engineering studies allowance of $0.5M is shown in Phase 2, although in the cashflow outlay, these studies are anticipated to occur as bridging studies ahead of Phase 2. As with the preceding Phase, the Phase 2 tally above does not include contingency.
A 7% contingency has been applied to most capital cost items to account for any unforeseen or otherwise unanticipated cost elements that could be associated with development and operation of the project. Contingency for Phase 1 totals $10.0M. A contingency was not applied to rail costs as these costs were supplied including a contingency.
The project team also developed the operating costs using construction lengths, land requirements, operating units, and process or dryer unit preliminary power and gas consumption. Areas of operating costs breakouts include:
| ● | Land leasing | |
| ● | Land prep and reclaim | |
| ● | Well Production | |
| ● | Slurry Transport | |
| ● | Wet Process | |
| ● | Support Equipment | |
| ● | Dry Process | |
| ● | Loadout | |
| ● | Rail Costs | |
| ● | Manpower | |
| ● | General and Administration |
| 1-16 |
TECHNICAL REPORT SUMMARY, BRU PROPERTY, MANITOBA, CANADA
The total operating cost summary is shown in Table 1.8. In year 1, each extraction site utilizes dedicated supervision leading to higher initial costs. Extraction operation costs are reduced in later years as operations supervision is planned to be centralized. Slurry transport costs are lower in early years due to shorter slurry pumping distances. Dry processing costs are calculated based on the change from trucked propane in Year 1 while the gas line is developed. From Year 2 production onward, operating costs reflect that the installation of a natural gas pipeline and the use of natural gas as opposed to propane.
Table 1.8
Life of mine Operating Cost Summary, C$
| Year 1 C$/tonne | Year 2 onward C$/tonne | |||||||
| Extraction | $ | 12.53 | $ | 8.62 | ||||
| Slurry Transport | $ | 1.74 | $ | 2.90 | ||||
| Wet Processing | $ | 5.07 | $ | 5.07 | ||||
| Dry Processing | $ | 11.99 | $ | 8.63 | ||||
| Site Labor | $ | 1.28 | $ | 1.28 | ||||
| Insurance | $ | 0.38 | $ | 0.38 | ||||
| Total OPEX | $ | 32.99 | $ | 26.88 | ||||
Economic Analyses
Sio Silica prepared the economic analyses for the BRU operation and provided the model to Stantec. Stantec reviewed the model to assess and determined it to be appropriate for the purposes of the IA. Section 19 outlines the specific inputs and assumptions for the analyses. The results of the Study base case economic analysis are shown in Table 1.9 Project Economics.
The economic performance of the project is positive up to the highest analyzed discount rate of 16%.
Table 1.9
Project Economics (C$)
| Discount Rate | After Tax | |||||||
| (%) | IRR | NPV | ||||||
| 6 | 96 | % | $ | 3,774,089,000 | ||||
| 8 | 96 | % | $ | 3,043,276,000 | ||||
| 10 | 96 | % | $ | 2,494,719,000 | ||||
| 12 | 96 | % | $ | 2,075,195,000 | ||||
| 14 | 96 | % | $ | 1,748,649,000 | ||||
| 16 | 96 | % | $ | 1,490,259,000 | ||||
Stantec has not completed a rigorous analysis in order to select the project discount rate. However, Stantec notes that current normalized risk-free rate and equity risk premium, composed of 3.5% and 5.7% respectively which shows that the approximate cost of equity capital to be 9.2%. This rate does not account for project risks, industry risk, size and maturity of the operation to name a few. As such the appropriate discount rate for this study is likely in the range of 10-13%. Ultimately investors in the BRU Property will need to conduct their own discount rate analysis.
| 1-17 |
TECHNICAL REPORT SUMMARY, BRU PROPERTY, MANITOBA, CANADA
The key project metrics and cash flow summary are summarized in Tables 1.10 and 1.11.
Table 1.10
Key Project Metrics
| Economic Analysis | BRU | |||
| Net Present Value (NPV), After-Tax | $ | 2,494,719,000 | ||
| Internal Rate of Return (IRR), After-Tax | 96 | % | ||
| Pay-Back Period (Years based on After-Tax) | 1.58 | |||
| Capital Costs | ||||
| Initial Capital (M) | 168.00 | |||
| Expansion Capital (M) | 112.75 | |||
| Operating Costs at Full Production | ||||
| Extraction ($/MT ) | 8.62 | |||
| Slurry Transport ($/MT) | 2.90 | |||
| Wet Processing ($/MT) | 5.07 | |||
| Dry Processing and Loadout ($/MT) | 8.63 | |||
| Site Labor and Insurance ($/MT) | 1.66 | |||
| Total Operating Cost ($/MT) | 26.88 | |||
| Production Data | ||||
| Life of Mine (Years) | 25 | |||
| Annual Clean Saleable Tonnes Produced (MT) | 2,724,000 | |||
| Total Clean Saleable Tonnes Produced (MT) | 66,398,000 | |||
| 1-18 |
TECHNICAL REPORT SUMMARY, BRU PROPERTY, MANITOBA, CANADA
Table 1.11
Cash Flow Summary
| Year 0 | Year 1 | Year 2 | Year 3 | Year 4 | Year 5 | Year 6 | Year 7 | Year 8 | Year 9 | Year 10 | Year 11 | Year 12 | ||||||||||||||||||||||||||||||||||||||||
| Period | 2024 | 2025 | 2026 | 2027 | 2028 | 2029 | 2030 | 2031 | 2032 | 2033 | 2034 | 2035 | 2036 | |||||||||||||||||||||||||||||||||||||||
| Raw Sand Production (Tonnes) | 549,000 | 1,465,000 | 2,929,000 | 2,929,000 | 2,929,000 | 2,929,000 | 2,929,000 | 2,929,000 | 2,929,000 | 2,929,000 | 2,929,000 | 2,929,000 | 2,929,000 | |||||||||||||||||||||||||||||||||||||||
| Sales Volumes (Tonnes) | - | 1,249,000 | 2,497,000 | 2,724,000 | 2,724,000 | 2,724,000 | 2,724,000 | 2,724,000 | 2,724,000 | 2,724,000 | 2,724,000 | 2,724,000 | 2,724,000 | |||||||||||||||||||||||||||||||||||||||
| Minegate Pricing ($/Tonne) | 223.53 | 223.53 | 223.53 | 223.53 | 223.53 | 223.53 | 242.55 | 242.55 | 242.55 | 242.55 | 242.55 | 242.55 | 242.55 | |||||||||||||||||||||||||||||||||||||||
| Minegate Revenue (M$) | - | 279 | 558 | 609 | 609 | 609 | 661 | 661 | 661 | 661 | 661 | 661 | 661 | |||||||||||||||||||||||||||||||||||||||
| Royalties (M$) | - | 12 | 16 | 10 | 10 | 10 | 11 | 11 | 11 | 11 | 11 | 11 | 11 | |||||||||||||||||||||||||||||||||||||||
| Mining Tax (M$) | - | - | 80 | 89 | 89 | 89 | 98 | 98 | 98 | 98 | 98 | 98 | 98 | |||||||||||||||||||||||||||||||||||||||
| Net Revenue (M$) | - | 267 | 462 | 510 | 510 | 510 | 553 | 553 | 553 | 553 | 553 | 553 | 553 | |||||||||||||||||||||||||||||||||||||||
| Extraction Operating Costs (M$) | 8 | 22 | 37 | 37 | 37 | 37 | 37 | 37 | 37 | 37 | 37 | 37 | 37 | |||||||||||||||||||||||||||||||||||||||
| Wet Processing Operating Costs (M$) | 2 | 7 | 14 | 14 | 14 | 14 | 14 | 14 | 14 | 14 | 14 | 14 | 14 | |||||||||||||||||||||||||||||||||||||||
| Dry Processing and Loadout Operating Costs (M$) | - | 15 | 22 | 24 | 24 | 24 | 24 | 24 | 24 | 24 | 24 | 24 | 24 | |||||||||||||||||||||||||||||||||||||||
| Total Operating Costs (M$) | 10 | 44 | 72 | 74 | 74 | 74 | 74 | 74 | 74 | 74 | 74 | 74 | 74 | |||||||||||||||||||||||||||||||||||||||
| Manitoba Operations G&A (M$) | - | - | - | - | - | - | - | - | - | - | - | - | - | |||||||||||||||||||||||||||||||||||||||
| Head office G&A (M$) | 4 | 4 | 3 | 2 | 2 | 2 | 2 | 2 | 2 | 2 | 2 | 2 | 2 | |||||||||||||||||||||||||||||||||||||||
| Total G&A (M$) | 4 | 4 | 3 | 2 | 2 | 2 | 2 | 2 | 2 | 2 | 2 | 2 | 2 | |||||||||||||||||||||||||||||||||||||||
| Cash Interest Expense (M$) | 12 | 12 | 6 | - | - | - | - | - | - | - | - | - | - | |||||||||||||||||||||||||||||||||||||||
| Cash Income Tax (M$) | - | 33 | 88 | 106 | 109 | 111 | 124 | 125 | 126 | 127 | 127 | 128 | 128 | |||||||||||||||||||||||||||||||||||||||
| Total Cash-flow (M$) | (26 | ) | 175 | 293 | 329 | 326 | 324 | 353 | 352 | 351 | 350 | 350 | 349 | 349 | ||||||||||||||||||||||||||||||||||||||
| Cumulative Cash-Flow (M$) | (28 | ) | 147 | 440 | 768 | 1,094 | 1,418 | 1,770 | 2,122 | 2,473 | 2,823 | 3,173 | 3,522 | 3,871 | ||||||||||||||||||||||||||||||||||||||
| Phase 1 Capital Expenditures (M$) | 166 | - | - | - | - | - | - | - | - | - | - | - | - | |||||||||||||||||||||||||||||||||||||||
| Expansion Capital Expenditures (M$) | - | 86 | 27 | - | - | - | - | - | - | - | - | - | - | |||||||||||||||||||||||||||||||||||||||
| Total Capital Expenditures (M$) | 166 | 86 | 27 | - | - | - | - | - | - | - | - | - | - | |||||||||||||||||||||||||||||||||||||||
| 1-19 |
TECHNICAL REPORT SUMMARY, BRU PROPERTY, MANITOBA, CANADA
| Year 13 | Year 14 | Year 15 | Year 16 | Year 17 | Year 18 | Year 19 | Year 20 | Year 21 | Year 22 | Year 23 | Year 24 | Year 25 | ||||||||||||||||||||||||||||||||||||||||||||
| Period | 2037 | 2038 | 2039 | 2040 | 2041 | 2042 | 2043 | 2044 | 2045 | 2046 | 2047 | 2048 | 2049 | Total | ||||||||||||||||||||||||||||||||||||||||||
| Raw Sand Production (Tonnes) | 2,929,000 | 2,929,000 | 2,929,000 | 2,929,000 | 2,929,000 | 2,929,000 | 2,929,000 | 2,929,000 | 2,929,000 | 2,929,000 | 2,929,000 | 2,929,000 | 2,929,000 | 72,310,000 | ||||||||||||||||||||||||||||||||||||||||||
| Sales Volumes (Tonnes) | 2,724,000 | 2,724,000 | 2,724,000 | 2,724,000 | 2,724,000 | 2,724,000 | 2,724,000 | 2,724,000 | 2,724,000 | 2,724,000 | 2,724,000 | 2,724,000 | 2,724,000 | 66,398,000 | ||||||||||||||||||||||||||||||||||||||||||
| - | ||||||||||||||||||||||||||||||||||||||||||||||||||||||||
| Minegate Pricing ($/Tonne) | 242.55 | 242.55 | 242.55 | 242.55 | 242.55 | 242.55 | 242.55 | 242.55 | 242.55 | 242.55 | 242.55 | 242.55 | 242.55 | |||||||||||||||||||||||||||||||||||||||||||
| Minegate Revenue (M$) | 661 | 661 | 661 | �� | 661 | 661 | 661 | 661 | 661 | 661 | 661 | 661 | 661 | 661 | 15,878 | |||||||||||||||||||||||||||||||||||||||||
| Royalties (M$) | 11 | 11 | 11 | 11 | 11 | 11 | 11 | 11 | 11 | 11 | 11 | 11 | 11 | 268 | ||||||||||||||||||||||||||||||||||||||||||
| Mining Tax (M$) | 98 | 98 | 98 | 98 | 98 | 98 | 98 | 98 | 98 | 98 | 98 | 98 | 98 | 2,303 | ||||||||||||||||||||||||||||||||||||||||||
| Net Revenue (M$) | 553 | 553 | 553 | 552 | 552 | 552 | 552 | 552 | 552 | 552 | 552 | 552 | 552 | 13,307 | ||||||||||||||||||||||||||||||||||||||||||
| Extraction Operating Costs (M$) | 37 | 37 | 37 | 37 | 37 | 37 | 37 | 37 | 37 | 37 | 37 | 37 | 37 | 907 | ||||||||||||||||||||||||||||||||||||||||||
| Wet Processing Operating Costs (M$) | 14 | 14 | 14 | 14 | 14 | 14 | 14 | 14 | 14 | 14 | 14 | 14 | 14 | 341 | ||||||||||||||||||||||||||||||||||||||||||
| Dry Processing and Loadout Operating Costs (M$) | 24 | 24 | 24 | 24 | 24 | 24 | 24 | 24 | 24 | 24 | 24 | 24 | 24 | 577 | ||||||||||||||||||||||||||||||||||||||||||
| Total Operating Costs (M$) | 74 | 74 | 74 | 74 | 74 | 74 | 74 | 74 | 74 | 74 | 74 | 74 | 74 | 1,825 | ||||||||||||||||||||||||||||||||||||||||||
| Manitoba Operations G&A (M$) | - | - | - | - | - | - | - | - | - | - | - | - | - | - | ||||||||||||||||||||||||||||||||||||||||||
| Head office G&A (M$) | 2 | 2 | 2 | 2 | 2 | 2 | 2 | 2 | 2 | 2 | 2 | 2 | 2 | 52 | ||||||||||||||||||||||||||||||||||||||||||
| Total G&A (M$) | 2 | 2 | 2 | 2 | 2 | 2 | 2 | 2 | 2 | 2 | 2 | 2 | 2 | 52 | ||||||||||||||||||||||||||||||||||||||||||
| Cash Interest Expense (M$) | - | - | - | - | - | - | - | - | - | - | - | - | - | 30 | ||||||||||||||||||||||||||||||||||||||||||
| Cash Income Tax (M$) | 128 | 128 | 128 | 128 | 128 | 128 | 129 | 129 | 129 | 129 | 129 | 129 | 129 | 3,002 | ||||||||||||||||||||||||||||||||||||||||||
| Total Cash-flow (M$) | 349 | 349 | 349 | 348 | 348 | 348 | 348 | 348 | 348 | 348 | 348 | 348 | 348 | 8,398 | ||||||||||||||||||||||||||||||||||||||||||
| Cumulative Cash-Flow (M$) | 4,220 | 4,569 | 4,917 | 5,265 | 5,613 | 5,961 | 6,309 | 6,657 | 7,005 | 7,352 | 7,700 | 8,048 | 8,396 | - | ||||||||||||||||||||||||||||||||||||||||||
| Phase 1 Capital Expenditures (M$) | - | - | - | - | - | - | - | - | - | - | - | - | - | 166 | ||||||||||||||||||||||||||||||||||||||||||
| Expansion Capital Expenditures (M$) | - | - | - | - | - | - | - | - | - | - | - | - | - | 113 | ||||||||||||||||||||||||||||||||||||||||||
| Total Capital Expenditures (M$) | - | - | - | - | - | - | - | - | - | - | - | - | - | 279 | ||||||||||||||||||||||||||||||||||||||||||
| 1-20 |
TECHNICAL REPORT SUMMARY, BRU PROPERTY, MANITOBA, CANADA
Interpretation and Conclusions
This Study indicates a positive economic outcome related to the potential development of a silica sand extraction and processing operation for the BRU Property. The extraction plan addressed only a portion of the In-Situ Mineral Resource previously classified, as the entire BRU resource was not required for the 25-year development plan.
Stantec has identified the following risks that could potentially affect the projected economic viability of the BRU Property development.
Product Pricing and Cost Escalation
As indicated in Section 19 of this Study, the project economics are sensitive to the assumed pricing for silica sand and estimated project costs. A 30% reduction in product pricing combined with a 30% increase in project costs, after a 7% contingency (initial project capital) has been applied, results in positive economics.
Stantec has reviewed Sio Silica’s cost estimate and believes it captures reasonable Capex and Opex costs for the project as it is currently planned. However, the cost estimate is based on budgetary quotes provides by third party vendors and Sio Silica’s partners and assumes the project advances as per the current schedule.
Stantec understands that Sio Silica intends to proceed with the project development in 2024, partially based on the results of this Study. As such, the risks associated with cost escalation are not insignificant.
Timing Of Regulatory Approvals
Sio Silica and AECOM are pursuing a regulatory approval process that assumes project approval in late 2023 or early 2024.
If the regulatory process is extended beyond this timeframe, then it is likely that project development and resulting product sales would be delayed beyond the base case project schedule.
Timing of Project Development
Certain process and infrastructure components may be subject to longer lead times. These include rotary dryers, gas pipeline installation, and high voltage substations. The full capacity of the BRU operation and the resultant project economics are dependent on these components.
Development of Extraction Process
The current extraction process is based on the results from 14 drill holes completed from 2017 to 2021. Stantec has no reason to believe that the planned extraction process will not be successful. However, Stantec does note the risks to the project should the planned extraction rates be unachievable or unsustainable over the life and geographic extent of the Project.
| 1-21 |
TECHNICAL REPORT SUMMARY, BRU PROPERTY, MANITOBA, CANADA
Confirmation of Geotechnical Testing and Analysis
As discussed in Section 5.2, Stantec geotechnical engineers have completed a preliminary geotechnical analysis related to extraction of the sand resource on the BRU Property. The conclusions of this analysis are summarized below:
| ● | Based upon current information and assessments, Shear and Bending are the most probable failure modes with the potential to affect long-term stability. Unravelling, Caving, and Chimneying are not controlling failure modes for the BRU property due to the nature of the limestone caprock. |
| ● | The Bending failure mode is controlling the long-term stability of the post extraction cavity for the expected range of caprock and overburden thickness and material properties and the extraction depth in the sand. The stability analysis and extraction borehole spacing design were completed to achieve a factor of safety of 2.0, which is considered to be an acceptably conservative FOS for the project. |
| ● | The cavity after extraction is expected to further expand with time resulting in loose sand infilling the extracted void leaving a larger unsupported caprock span. Based on the assumption that the areas with factor of safety larger than 2 are stable in the long-term, approximately 5 m of additional raveling of the post extraction cavity walls is expected (by end of the design life of 100 years). Therefore, the unsupported caprock span will increase by 10 m with time after extraction. |
| ● | Based upon the results of geotechnical assessment and with the understanding that Sio Silica will follow guidance provided by Stantec including continuing to assess the geotechnical characteristics and performance of the sand deposit and overlying materials during the project life and to adjust design accordingly, no large-scale surface subsidence is expected to occur as a result of sand extraction. |
There is a potential that further geotechnical assessments may impact the current resource estimate, either positively or negatively. In particular, there remains uncertainty regarding the possible presence of vertical fractures in Limestone caprock, which to date has not been investigated or assessed. The presence of continuous vertical fractures in Limestone caprock above extraction voids has the potential to lead to caprock collapse which may propagate to the surface and produce settlement. In addition, there remains uncertainty regarding the long term performance of the extraction voids which may have complex void shapes and have the potential to propagate over larger than currently estimated distances.
Recommendations
Phase 1: Geotechnical Testing and Analysisand Resource Investigation and Analysis
Based on Sio Silica’s current development and production plans, all resources identified in the areas where the first 5 years of production will occur should be classified as Measured. Additional drill holes may be required to increase confidence in the resource estimates within these areas.
| 1-22 |
TECHNICAL REPORT SUMMARY, BRU PROPERTY, MANITOBA, CANADA
As discussed in Section 5.2, Stantec geotechnical engineers completed a preliminary geotechnical analysis of the impact of extraction of the sand on the BRU Property. The recommendations from this analysis are summarized below:
| ● | Design and execute a site investigation and assess the results to confirm expected geotechnical performance. This investigation may include the following components: |
| o | Data Collection: |
| § | Geotechnical borehole drilling, logging, photography, and sampling with vertical and inclined boreholes and SPT or CPT if needed – to characterize extents and properties of sandstone, caprock and overburden. |
| § | Acoustic and Optical Televiewer Survey of Geotechnical Boreholes – to characterize caprock structure. |
| § | Side Scan Sonar Survey – to monitor sand cavity shape and behavior. |
| § | Laboratory testing of selected samples of sandstone, caprock and overburden as required – to characterize properties of sandstone, caprock and overburden. |
| § | Installation and monitoring of Vibrating Wire Piezometers, Vertical Extensometers and Surface Monuments and Total Station or GPS Survey – to monitor changes in caprock and surface subsidence. |
| o | Data Analysis: |
| § | Stability and settlement analysis to identify and assess for changes in assumptions related to vertical jointing (if found) in Limestone caprock, extraction void shape or other design assumptions. |
| ● | Develop and implement a Trigger Action Response Plan as follows: |
| § | Collected data review - to establish baseline values. |
| § | Trigger value range identification - low/moderate/high – green/yellow/red |
| § | Monitoring results verification and comparison against trigger values. |
| ● | Review the impact of potential vibration sources, such as rail traffic, to determine potential offsets from extraction areas. |
| 1-23 |
TECHNICAL REPORT SUMMARY, BRU PROPERTY, MANITOBA, CANADA
Table 1.12 shows the anticipated cost to complete the geotechnical analysis.
Table 1.12
Cost Estimate – Geotechnical Analysis
| Task | Estimated Cost (C$) | |||
| Geotechnical Analysis | $ | 500,000 | ||
Phase 2: Engineering Bridging Studies
Given that this economic assessment and analysis has been developed to an IA level, Stantec recommends that Sio Silica continues to more accurately define the CAPEX and OPEX estimate for the BRU Property and to secure relationships with contractors, vendors, and suppliers.
Table 1.13 provides cost estimates for these studies.
Table 1.13
Engineering Bridging Studies
Task | Estimated Cost (C$) | |||
| Engineering Bridging Studies | 550,000 | |||
| 1-24 |
TECHNICAL REPORT SUMMARY, BRU PROPERTY, MANITOBA, CANADA
| 2 | INTRODUCTION |
On Dec 5, 2022, Sio Silica Corporation (Sio Silica) contracted Stantec Consulting Ltd (Stantec) to prepare a Technical Report Summary regarding the Initial Assessment (IA) of the BRU Property. The Technical Report Summary was prepared in accordance with the requirements of the U.S. Securities and Exchange Commission (SEC) reporting of material mining assets under regulation S-K 1300.
Stantec previously prepared a Preliminary Economic Assessment (PEA) for the BRU Property in August 2021. This report was prepared for CanWhite Sands Corp. On January 1, 2022, the company name was changed from CanWhite Sands Corp. to Sio Silica Corporation.
The author(s) note that this Study is preliminary in nature, that it includes inferred mineral resources that are considered too speculative geologically to have the economic considerations applied to them that would enable them to be categorized as mineral reserves, and there is no certainty that the estimated resources will be realized.
The accuracy of resource estimates is, in part, a function of the quality and quantity of available data and of engineering and geological interpretation and judgment. Given the data available at the time this report was prepared, the estimates presented herein are considered reasonable.
However, they should be accepted with the understanding that additional data and analysis available subsequent to the date of the estimates may necessitate revision. These revisions may be material. There is no guarantee that all or any part of the estimated resources will be recoverable.
| 2-1 |
TECHNICAL REPORT SUMMARY, BRU PROPERTY, MANITOBA, CANADA
| 3 | PROPERTY DESCRIPTION |
| 3.1 | DESCRIPTION AND LOCATION |
The centre of the Property is located approximately 52 km east of the city of Winnipeg, Manitoba and is within the Rural Municipality of Springfield as shown on Figure 3.1. The southern end of the Property is accessed from Winnipeg via the TransCanada Highway.
The Property encompasses 27,528 ha and is shown on National Topographic System Map Sheet 62H. The Property spans from 670606E to 690090E, and 5502592N to 5529032N, and the centre of the Property is approximately at 49.75917°N and 96.46818°E (UTM 14 U 682343E and 5514931N, NAD83).
| 3.2 | MINING CLAIMS |
The Property consists of 122 claims and are all within surveyed territory. Originally some claims were held under HD Minerals Ltd.; however, following the amalgamation of HD Minerals with Sio Silica Corporation, 100% of the claims that comprise the Property are now retained by CanWhite Sands Corp., which is now Sio Silica Corporation.
Table 3.1 provides a summary of the active claims. The location of the claims are shown on Figure 3.2.
To maintain the claims in good standing, Sio Silica must fulfill the requirements of Manitoba Regulation 64/92, which includes the following obligations (Manitoba, 1992b):
| ● | The claim holder must spend $12.50 per hectare/year from year two to year 10, and then $25/year from year 11 and for each year thereafter. |
| ● | An annual assessment report detailing exploration activities and expenditures must be filed within the reporting period. The first assessment report must be filed within 60 days of the second anniversary of claim approval, with subsequent reports submitted annually. |
| 3-1 |
TECHNICAL REPORT SUMMARY, BRU PROPERTY, MANITOBA, CANADA

| 3-2 |
TECHNICAL REPORT SUMMARY, BRU PROPERTY, MANITOBA, CANADA

| 3-3 |
TECHNICAL REPORT SUMMARY, BRU PROPERTY, MANITOBA, CANADA
Table 3.1
Active BRU Property Claims
| Claim Name | Disposition Number | Claim Type | Expiry Date | Area (ha) | ||||||
| BRU 1 | SV12553 | Mining | 2024-12-03 | 271 | ||||||
| BRU 2 | SV12554 | Mining | 2023-12-03 | 270 | ||||||
| BRU 3 | SV12555 | Mining | 2023-12-03 | 253 | ||||||
| BRU 4 | SV12556 | Mining | 2024-12-03 | 268 | ||||||
| BRU 5 | SV14112 | Mining | 2024-01-31 | 69 | ||||||
| BRU 9 | SV12561 | Mining | 2024-12-03 | 269 | ||||||
| BRU 10 | SV12562 | Mining | 2024-12-03 | 269 | ||||||
| BRU 11 | SV12563 | Mining | 2024-12-03 | 268 | ||||||
| BRU 12 | SV12564 | Mining | 2024-12-03 | 269 | ||||||
| BRU 13 | SV12565 | Mining | 2024-12-03 | 270 | ||||||
| BRU 14 | SV12566 | Mining | 2024-12-03 | 266 | ||||||
| BRU 15 | SV12567 | Mining | 2024-12-03 | 271 | ||||||
| BRU 16 | SV12568 | Mining | 2024-12-03 | 68 | ||||||
| BRU 17 | SV12569 | Mining | 2024-12-03 | 271 | ||||||
| BRU 19 | SV12571 | Mining | 2024-12-03 | 64 | ||||||
| BRU 20 | SV12572 | Mining | 2024-12-03 | 67 | ||||||
| BRU 21 | SV12573 | Mining | 2024-12-03 | 49 | ||||||
| BRU 22 | SV12574 | Mining | 2024-12-03 | 202 | ||||||
| BRU 23 | SV12575 | Mining | 2024-12-03 | 138 | ||||||
| BRU 24 | SV12576 | Mining | 2024-12-03 | 205 | ||||||
| BRU 25 | SV12577 | Mining | 2024-12-03 | 238 | ||||||
| BRU 27 | SV12579 | Mining | 2024-12-03 | 269 | ||||||
| BRU 28 | SV12580 | Mining | 2024-12-03 | 134 | ||||||
| BRU 29 | SV12581 | Mining | 2024-12-03 | 269 | ||||||
| BRU 32 | SV12584 | Mining | 2024-12-03 | 72 | ||||||
| BRU 34 | SV14113 | Mining | 2024-01-31 | 75 | ||||||
| BRU 35 | SV12587 | Mining | 2024-12-03 | 281 | ||||||
| BRU 36 | SV12588 | Mining | 2024-12-03 | 139 | ||||||
| BRU 40 | SV12592 | Mining | 2024-12-03 | 33 | ||||||
| BRU 41 | SV12593 | Mining | 2024-12-03 | 269 | ||||||
| BRU 43 | SV12595 | Mining | 2024-12-03 | 270 | ||||||
| BRU 44 | SV12596 | Mining | 2024-12-03 | 268 | ||||||
| BRU 45 | SV12597 | Mining | 2024-12-03 | 70 | ||||||
| BRU 46* | SV12598 | Mining | 2024-12-03 | 137 | ||||||
| BRU 47 | SV12599 | Mining | 2024-12-03 | 136 | ||||||
| 3-4 |
TECHNICAL REPORT SUMMARY, BRU PROPERTY, MANITOBA, CANADA
Table 3.1 (Cont’d)
| Claim Name | Disposition Number | Claim Type | Expiry Date | Area (ha) | ||||||
| BRU 50 | SV12602 | Mining | 2024-12-03 | 230 | ||||||
| BRU 52 | SV12604 | Mining | 2024-12-03 | 132 | ||||||
| BRU 53 | SV12605 | Mining | 2024-12-03 | 271 | ||||||
| BRU 54 | SV12606 | Mining | 2024-12-03 | 271 | ||||||
| BRU 55 | SV12607 | Mining | 2024-12-03 | 267 | ||||||
| BRU 56 | SV12608 | Mining | 2024-12-03 | 65 | ||||||
| BRU 57 | SV12609 | Mining | 2024-12-03 | 269 | ||||||
| BRU 58 | SV12610 | Mining | 2024-12-03 | 81 | ||||||
| BRU 59 | SV12611 | Mining | 2024-12-03 | 236 | ||||||
| BRU 60 | SV12612 | Mining | 2024-12-03 | 68 | ||||||
| BRU 62 | SV12614 | Mining | 2024-12-03 | 140 | ||||||
| BRU 63 | SV12615 | Mining | 2024-12-03 | 189 | ||||||
| BRU 64 | SV12616 | Mining | 2024-12-03 | 269 | ||||||
| BRU 65 | SV12617 | Mining | 2024-12-03 | 269 | ||||||
| BRU 66 | SV12618 | Mining | 2024-12-03 | 269 | ||||||
| BRU 67 | SV12619 | Mining | 2024-12-03 | 274 | ||||||
| BRU 68 | SV12620 | Mining | 2024-12-03 | 268 | ||||||
| BRU 69 | SV12621 | Mining | 2024-12-03 | 268 | ||||||
| BRU 70 | SV12622 | Mining | 2024-12-03 | 259 | ||||||
| BRU 71 | SV12623 | Mining | 2024-12-03 | 256 | ||||||
| BRU 73 | SV12625 | Mining | 2024-12-03 | 267 | ||||||
| BRU 74 | SV12626 | Mining | 2024-12-03 | 273 | ||||||
| BRU 75 | SV12627 | Mining | 2024-12-03 | 271 | ||||||
| BRU 77 | SV12629 | Mining | 2024-12-03 | 260 | ||||||
| BRU 78 | SV12630 | Mining | 2024-12-03 | 265 | ||||||
| BRU 79 | SV12631 | Mining | 2024-12-03 | 263 | ||||||
| BRU 80 | SV12632 | Mining | 2024-12-03 | 272 | ||||||
| BRU 81 | SV12664 | Mining | 2024-12-03 | 252 | ||||||
| BRU 82 | SV12665 | Mining | 2021-12-03** | 247 | ||||||
| BRU 83 | SV12666 | Mining | 2021-12-03** | 67 | ||||||
| BRU 84 | SV12667 | Mining | 2024-12-03 | 251 | ||||||
| BRU 85 | SV12668 | Mining | 2024-12-03 | 272 | ||||||
| BRU 86 | SV12669 | Mining | 2024-12-03 | 274 | ||||||
| BRU 90 | SV12673 | Mining | 2024-12-03 | 271 | ||||||
| BRU 91 | SV12674 | Mining | 2024-12-03 | 271 | ||||||
| 3-5 |
TECHNICAL REPORT SUMMARY, BRU PROPERTY, MANITOBA, CANADA
Table 3.1 (Cont’d)
| Claim Name | Disposition Number | Claim Type | Expiry Date | Area (ha) | ||||||
| BRU 92 | SV12675 | Mining | 2021-12-03** | 236 | ||||||
| BRU 93 | SV12676 | Mining | 2021-12-03** | 188 | ||||||
| BRU 95 | SV12678 | Mining | 2024-12-03 | 103 | ||||||
| BRU 96 | SV12679 | Mining | 2024-12-03 | 275 | ||||||
| BRU 97 | SV12680 | Mining | 2024-12-03 | 206 | ||||||
| BRU 101 | SV12684 | Mining | 2024-12-03 | 274 | ||||||
| BRU 102 | SV12685 | Mining | 2024-12-03 | 233 | ||||||
| BRU 103 | SV12686 | Mining | 2024-12-03 | 270 | ||||||
| BRU 104 | SV12687 | Mining | 2024-12-03 | 272 | ||||||
| BRU 105 | SV12688 | Mining | 2024-12-03 | 206 | ||||||
| BRU 106 | SV12689 | Mining | 2024-12-03 | 268 | ||||||
| BRU 108 | SV12691 | Mining | 2024-12-03 | 271 | ||||||
| BRU 109 | SV12692 | Mining | 2024-12-03 | 223 | ||||||
| BRU 110 | SV12693 | Mining | 2024-12-03 | 165 | ||||||
| BRU 111 | SV12694 | Mining | 2024-12-03 | 266 | ||||||
| BRU 112 | SV12695 | Mining | 2024-12-03 | 271 | ||||||
| BRU 113 | SV12697 | Mining | 2024-12-03 | 267 | ||||||
| BRU 114 | SV12696 | Mining | 2024-12-03 | 269 | ||||||
| BRU 115 | SV12698 | Mining | 2024-12-03 | 266 | ||||||
| BRU 116 | SV12699 | Mining | 2024-12-03 | 269 | ||||||
| BRU 117 | SV12700 | Mining | 2024-12-03 | 266 | ||||||
| BRU 118 | SV12701 | Mining | 2024-12-03 | 169 | ||||||
| BRU 119 | SV12702 | Mining | 2024-12-03 | 272 | ||||||
| BRU 120 | SV12633 | Mining | 2024-12-03 | 269 | ||||||
| BRU 121 | SV12634 | Mining | 2024-12-03 | 271 | ||||||
| BRU 122 | SV12635 | Mining | 2024-12-03 | 271 | ||||||
| BRU 123 | SV12636 | Mining | 2024-12-03 | 269 | ||||||
| BRU 124 | SV12637 | Mining | 2024-12-03 | 269 | ||||||
| BRU 125 | SV12638 | Mining | 2024-12-03 | 203 | ||||||
| BRU 126 | SV12639 | Mining | 2024-12-03 | 264 | ||||||
| BRU 127 | SV12640 | Mining | 2024-12-03 | 261 | ||||||
| BRU 128 | SV12641 | Mining | 2024-12-03 | 269 | ||||||
| BRU 129 | SV12642 | Mining | 2024-12-03 | 268 | ||||||
| BRU 130 | SV12643 | Mining | 2024-12-03 | 269 | ||||||
| BRU 142 | SV12644 | Mining | 2024-12-03 | 270 | ||||||
| 3-6 |
TECHNICAL REPORT SUMMARY, BRU PROPERTY, MANITOBA, CANADA
Table 3.1 (Cont’d)
| Claim Name | Disposition Number | Claim Type | Expiry Date | Area (ha) | ||||||
| BRU 143 | SV12645 | Mining | 2024-12-03 | 272 | ||||||
| BRU 144 | SV12646 | Mining | 2024-12-03 | 172 | ||||||
| BRU 145 | SV12647 | Mining | 2024-12-03 | 268 | ||||||
| BRU 146 | SV12648 | Mining | 2024-12-03 | 269 | ||||||
| BRU 147 | SV12649 | Mining | 2024-12-03 | 265 | ||||||
| BRU 148 | SV12650 | Mining | 2024-12-03 | 265 | ||||||
| BRU 149 | SV12651 | Mining | 2024-12-03 | 267 | ||||||
| BRU 150 | SV12652 | Mining | 2024-12-03 | 270 | ||||||
| BRU 151 | SV12653 | Mining | 2024-12-03 | 66 | ||||||
| BRU 152 | SV12654 | Mining | 2024-12-03 | 232 | ||||||
| BRU 153 | SV12655 | Mining | 2024-12-03 | 269 | ||||||
| BRU 154 | SV12656 | Mining | 2024-12-03 | 265 | ||||||
| BRU 155 | SV12657 | Mining | 2024-12-03 | 139 | ||||||
| BRU 156 | SV12658 | Mining | 2024-12-03 | 277 | ||||||
| BRU 157 | SV12659 | Mining | 2024-12-03 | 269 | ||||||
| BRU 158 | SV12660 | Mining | 2024-12-03 | 205 | ||||||
| BRU 159 | SV12661 | Mining | 2024-12-03 | 236 | ||||||
| Total Area: | 27,528 | |||||||||
| Note: | * Mislabeled on Gov’t Website as Bru 146 |
| ** Applied for Lease |
| 3.3 | PRIVATE PROPERTY |
Sio Silica also plans to develop silica from three privately owned parcels of land, the NE SEC 20 TWP 10 RGE 8 E1M, the SE SEC 20 TWP 10 RGE 8 E1M, and the NE SEC 30 TWP 10 RGE 8 E1M. Sio Silica has entered into a Minerals Rights Agreement for one of these parcels and is actively engaged in negotiations with the owners of the others parcels and expects to enter into definitive agreements before the end of 2024.
The silica sand resources associated with these parcels are included in the resource estimate and development plans in this IA. The resources associated with these parcels, are estimated at 1.2Mt or 0.8% of the total resource estimate.
| 3-7 |
TECHNICAL REPORT SUMMARY, BRU PROPERTY, MANITOBA, CANADA
| 3.4 | UNDERLYING AGREEMENTS, ROYALTIES AND ENCUMBRANCES |
The information presented in this section was provided by Sio Silica personnel and has not been externally validated by independent legal counsel.
November 1, 2016 Production Royalty Agreement
On November 1, 2016, a production royalty agreement was signed between 1993505 Alberta Ltd. (Owner) and 1993502 Alberta Ltd. (Holder). The terms of this royalty agreement were that the Owner (now Sio Silica) is to grant, convey, and agree to pay the Holder a production royalty in respect of the Property equal to the greater of:
| a) | two (2%) percent of the Actual Proceeds commencing on the date on which Commercial Production is achieved; or |
| b) | $1.00 per ton of Product extracted from the Property. |
The BRU Production Royalty Agreement provides for an Advance Minimum Royalty payment as follows: 1) $50,000 on November 1, 2016, for the first year; 2) $75,000 on November 1, 2017 for the second year; and 3) $100,000 on November 1st of each subsequent year for the duration of the agreement.
Actual Proceeds is defined in the agreement as: i) in the case of Product sold or otherwise disposed of by Owner FOB Owner’s mine gate, the actual proceeds received by the Owner from such sale or other disposition of Product; or ii) in the case of Product sold or otherwise disposed of by Owner FOB a location other than Owner’s mine gate, the actual proceeds received by the Owner from such sale or other disposition of Product less reasonable operating costs incurred by Owner to transport the Product to such other sale location.
Commercial Production, as defined in the agreement, means and is deemed to be achieved, for the Property, on the first day of the month in which production of Product exceeds 10,000 tons.
April 6, 2018 Assignment, Novation, and Amending Agreements
The November 1, 2016, Production Agreement was replaced by four amended agreements. The 2% Actual Proceeds based on Commercial Production and the $1.00 per ton of Product extracted from the Property were divided into varying proportions in these agreements. In these agreements, the definition of Commercial Production was changed to mean “the first day of the month in which the Owner sells an amount of Product equal to, or greater than, 15,000 tons, subject to the Owner also selling an amount of Product in each of the three immediately following months equal to, or greater than, 15,000 tons, and the mine mill and processing facility is in the condition necessary for it to be capable of operating in a matter intended by management with the ability to sustain ongoing production.”
Royalty Rights buyback from the Founders
In July 2020, there was a transfer of certain founder’s royalty rights amongst the four founders that hold the royalty. On April 5, 2021, Sio Silica used its right of first refusal to purchase a portion of the founders’ royalties from the original holders. Sio Silica paid a total of $775,000 that included buyback of royalties for both the BRU and DEN properties. The remaining royalties equate to 1.34% of the Actual Proceeds commencing on the date on which Commercial Production is achieved or 67.19 cents per ton of Product extracted from the Property. The remaining Advance Minimum Royalty payment is $25,000 per year.
| 3-8 |
TECHNICAL REPORT SUMMARY, BRU PROPERTY, MANITOBA, CANADA
Third Party Confidential Royalty
In January 2021, Sio Silica entered into an overriding royalty agreement on the BRU Property with a confidential third party. Sio Silica received $5 million in exchange for an overriding royalty granted to third party that is a 3% interest in the BRU Properties, with payments of 3% of mine gate revenue until a payout of $15 million is achieved, at which time the royalty payment is reduced to 0.25% for the duration of the BRU Property life.
| 3.5 | ENVIRONMENTAL LIABILITIES |
Stantec is not aware of any known environmental liabilities that will affect access, title or the right or ability to perform work on the Property.
| 3.6 | REQUIRED PERMITS |
On June 19, 2018, Sio Silica received direction from the Resource Development Division, Mines and Geological Survey of Manitoba that the Carman Sand Member is a Crown mineral and is under the purview of The Mines and Minerals Act.
The following is a summary level list of the BRU Property permitting requirements:
| ● | Provincial |
| o | Environment Act Proposal Vivian Sand Extraction Project (EAP) to Environment, Climate and Parks |
| o | Public Engagement Meetings – Vivian Sand Extraction Project and Vivian Sand Facility Project |
| o | Facilitated Public Meeting required by Environment Climate and Parks for Facility Project |
| o | Draft Sand Extraction Closure Plan to Mining, Oil and Gas as a condition of issuance of Environment Act Licence (Filed February 2023) |
| o | Technical Advisory Committee (TAC) and Public Review and Response to both Facility and Extraction Projects |
| o | Issuance of Environment Act Licence for Vivian Sand Facility Project granted December 16, 2021. |
| o | Clean Environment Commission process as requested by the Minster November 15, 2021, and Commission recommendation to grant Extraction Project Environment Act Licence expected early 2023. |
| ● | Municipal |
| o | Conditional Use approval or other equivalent such as a bylaw amendment to provide for Permitted Use. Issuance of Development Permit |
| o | Issuance of Building Permit(s) |
| 3.7 | OTHER SIGNIFICANT FACTORS AND RISKS |
Stantec is not aware of any other significant factors and risks that may affect access, title or the right or ability to perform work on the Property.
| 3-9 |
TECHNICAL REPORT SUMMARY, BRU PROPERTY, MANITOBA, CANADA
| 4 | ACCESSIBILITY, CLIMATE, LOCAL RESOURCES, INFRASTRUCTURE AND PHYSIOGRAPHY |
| 4.1 | TOPOGRAPHY, ELEVATION AND VEGETATION |
The Property is located in the Boreal Plain Ecozone with the western edge of the Property in the Prairie Ecozone and the eastern edge in the Boreal Shield Ecozone. The Boreal Plain Ecozone is characterized by relatively flat lying to gently rolling plains and terraces formed by morainal diamicton deposits with lower areas composed of glaciolacustrine deposits (Smith et al., 1998).
The Property is within the Interlake Plain Ecoregion and the Steinbach Ecodistrict. The mean elevation of the Ecodistrict is 297 masl. The landforms in the Ecodistrict range from smooth, flat lying glaciolacustrine plain to gently undulating, water-worked glacial diamicton and glaciofluvial diamictons. Much of the diamicton in the Ecodistrict consists of extremely calcareous, cobbly and gravelly loamy diamicton underlain by sandy glaciolacustrine veneers. The western edge of the Property is in the Lake Manitoba Ecoregion. The Lake Manitoba Ecoregion is a flat lying to gently sloping, clayey glaciolacustine plain with a mean elevation of 236 masl. The Lake of the Woods Boreal Shield Ecoregion has a variable topography ranging from a flat lying to depressional glaciolacustrine plain with peatlands to a gently undulating water-worked glacial diamicton and fluvioglacial outwash plain (Smith et al., 1998).
The land use in the area is mixed rural and residential. Settlements include Steinbach and St. Anne. In lowland areas with good drainage, crops such as wheat, oil seeds and hay are grown. In areas where the soil is too stony to cultivate, the land is used for pasture and hay (Smith et al., 1998).
| 4.2 | PROPERTY ACCESS AND PROXIMITY TO POPULATION CENTERS |
The centre of the Property is located approximately 52 km east of the city of Winnipeg and is within the Rural Municipality of Springfield. The southern end of the Property is accessed from Winnipeg via the TransCanada Highway.
| 4.3 | CLIMATE |
There are four weather stations near the Property, which include Ostenfeld, Winnipeg International Airport, Steinbach and Beausejour. The weather station at Ostenfeld, Manitoba is the closest in proximity to the Property and is located at 49°49’ N and 96°29’ W.
The region typically has long cold winters and short, warm summers. The coldest months are December and January. The Environment Canada climate data from Ostenfeld records the average daily temperatures in December and January as -13.4oC and -16.7oC, respectively. The warmest months are July and August with daily average temperatures of 18.9oC and 18.0oC, respectively. The average precipitation varies from 104 mm in July and August to 17.3 mm in February (Environment Canada, 2017).
| 4-1 |
TECHNICAL REPORT SUMMARY, BRU PROPERTY, MANITOBA, CANADA
Table 4.1 summarizes the Mean Climate data for the nearby weather stations (Environment Canada, 2017).
Table 4.1
Mean Climate Data for Nearby Weather Stations
| Weather Station | ||||||||||||||||
| Parameter | Ostenfeld | Winnipeg International Airport | Steinbach | Beausejour | ||||||||||||
| Location (Longitude, Latitude) | 49°49’ N | 49°55’ N | 49°32’ N | 50°02’ N | ||||||||||||
| 96°29’ W | 97°14’ W | 96°46’ W | 96°28’ W | |||||||||||||
| Annual Mean Daily Temperature (oC) | 2.7 | 3.0 | 2.8 | 2.8 | ||||||||||||
| Annual Mean Daily Maximum Temperature (oC) | 8.5 | 8.7 | 8.7 | 8.6 | ||||||||||||
| Annual Mean Daily Minimum Temperature (oC) | -3.1 | -2.7 | -3.1 | -3.1 | ||||||||||||
| Annual Total Rainfall (mm) | 512.2 | 418.9 | 473.4 | 452.4 | ||||||||||||
| Annual Total Snowfall (mm) | 122.7 | 113.7 | 107.1 | 117.8 | ||||||||||||
| Total Precipitation (mm) | 634.9 | 521.1 | 580.5 | 570.3 | ||||||||||||
| 4.4 | INFRASTRUCTURE |
Winnipeg is the largest major city near the Property. Winnipeg, as of 2021, has a population of 749,607 residents in the metropolitan area, and provides all required major services to advance the project. The city of Winnipeg, located on the TransCanada Highway, is the home of the James Armstrong Richardson International Airport that has numerous domestic and international flights, and is a major North American rail transportation hub with a 20,000-acre facility that services Canadian National Railway, Canadian Pacific Railway, BNSF Railway and the locally maintained and operated Greater Winnipeg Water District Railway (Railway Association of Canada, 2017; Winnipeg, 2017).
The city of Steinbach, which is located 58 km south-east of Winnipeg, has a population of approximately 17,806, as of 2021. Steinbach is primarily an agricultural community and has many services and commercial businesses, which includes Friesen Drillers Ltd. (Friesen) that has over 125 years of drilling, hydrogeological, and geological knowledge of the area.
Surface and subsurface infrastructure is well developed near the Property. Manitoba Hydro has proposed the final preferred route of the Manitoba-Minnesota Transmission Project through portions of the Property. High voltage transmission lines transect the Property. An operating Canadian National Railway line intersects the Property as shown on Figure 4.1. Rail lines provide access to western and southern markets.
| 4-2 |
TECHNICAL REPORT SUMMARY, BRU PROPERTY, MANITOBA, CANADA
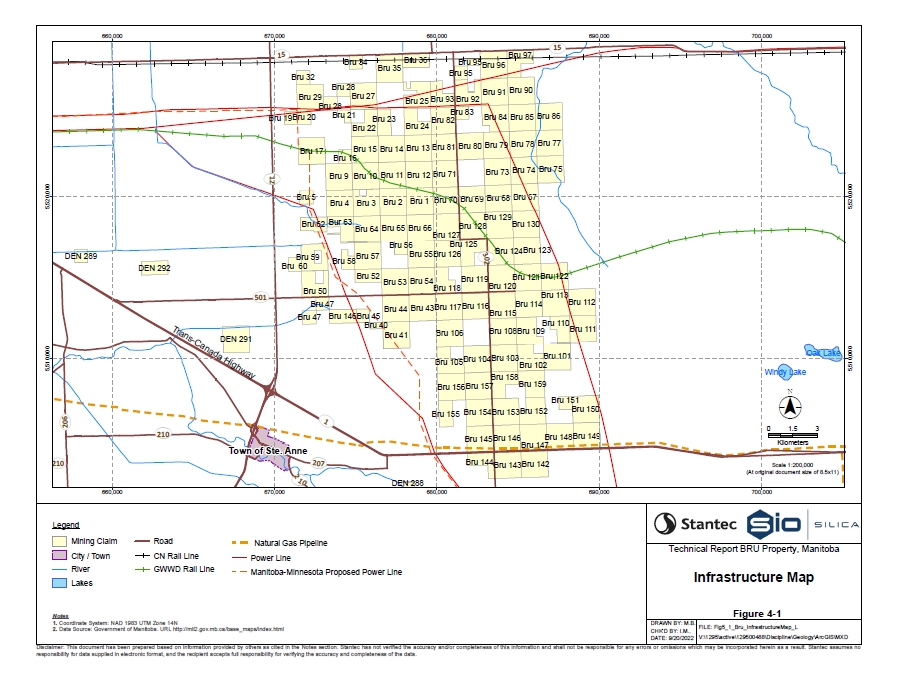
| 4-3 |
TECHNICAL REPORT SUMMARY, BRU PROPERTY, MANITOBA, CANADA
| 5 | HISTORY |
Prior to Sio Silica securing the Property, the area within the BRU claims had not been subject to subsurface exploration for silica sands. There is however documentation that exploration for silica sand did occur directly to the south of the Property in the 1960s (Underwood McLellan & Associates Limited, 1967).
| 5.1 | HISTORICAL TECHNICAL REPORTS AND PRELIMINARY ECONOMIC ASSESSMENTS |
Stantec has prepared the following reports for Sio Silica’s BRU Property. In chronological order these reports are:
| ● | Technical Report BRU Property Manitoba, Effective Date October 4, 2017 |
| ● | Technical Report BRU Property Manitoba, Effective Date May 8, 2019 |
| ● | Preliminary Economic Assessment BRU Property, Effective Date February 27, 2020 |
| ● | Preliminary Economic Assessment BRU Property, Effective Date July 27, 2021 |
| ● | Technical Report Initial Assessment BRU Property Manitoba, Effective Date August 27, 2021 |
| ● | Technical Report BRU Property Manitoba, Effective Date September 30, 2022 |
| ● | Technical Report Summary BRU Property, Effective Date September 30, 2022 |
These reports were prepared in accordance with the requirements of National Instrument 43-101 Standards of Disclosure for Mineral Projects (NI 43-101) and the requirements of Securities and Exchange Commission (SEC) reporting of material mining assets under Regulation S-K 1300.
During the period from 2019 to 2021, Sio Silica transitioned to positioning the BRU Property as a potential source of high purity silica sand for industrial purposes as opposed to a natural sand proppant. As previously mentioned, the high purity silica sand may be used in a wide range of industrial applications including electronics, medical research, metals and alloys, specialty glass, and renewable energy.
The 2019 Technical Report and the 2021 Preliminary Economic Assessment both disclosed identical mineral resource estimates as shown in Table 5.1.
| 5-1 |
TECHNICAL REPORT SUMMARY, BRU PROPERTY, MANITOBA, CANADA
Table 5.1
Previous In-Place Mineral Resource Summary
(May 8, 2019 and July 27, 2021)
| Mineral Resources (Mt) | ||||||||
| BRU Property | 40/70 mesh fraction | 70/140 mesh fraction | ||||||
| Indicated | 37 | 29 | ||||||
| Total Indicated | 66 | |||||||
| Inferred | 65 | 49 | ||||||
| Total Inferred | 114 | |||||||
A comparison between the 2019/2021 resource estimates indicates an overall resource reduction of 18%. The primary reason for the resource reduction is the application of new geotechnical information and analyses used when estimating the extractable sand volumes. The QP believes this information and analysis, and the resultant extractable sand volumes are more representative of actual conditions. This analyses and the resulting resource estimate are discussed further in Section 11.
| 5.2 | GEOTECHNICAL ANALYSIS |
In January 2022, Stantec geotechnical engineers completed a geotechnical analysis related to the development of voids resulting from the sand extraction process. This analysis was presented to Sio Silica in a report entitled “Geotechnical Analysis for Sio Silica Extraction Project”. The conclusions of this analysis are summarized below:
| ● | Shear and Bending are the most probable failure modes with the potential to affect long- term stability. Unravelling, Caving, and Chimneying are not controlling failure modes for the BRU property based on the current understanding of the nature of the limestone caprock. |
| ● | The Bending failure mode is controlling the long-term stability of the post extraction cavity for the expected range of caprock and overburden thickness and material properties and the extraction depth in the sand. The stability analysis and extraction borehole spacing design were completed to achieve a factor of safety of 2.0, which is considered to be an acceptably conservative FOS for the project. |
| ● | The cavity after extraction is expected to further expand with time resulting in loose sand infilling the extracted void leaving a larger unsupported caprock span. Based on the assumption that the areas with factor of safety larger than 2 are stable in the long-term, approximately 5 m of additional raveling of the post extraction cavity walls is expected (by end of the design life of 100 years). Therefore, the unsupported caprock span will increase by 10 m with time after extraction. |
| ● | Based upon the results of geotechnical assessment and with the understanding that Sio Silica will follow guidance provided by Stantec including continuing to assess the geotechnical characteristics and performance of the sand deposit and overlying materials during the project life and to adjust design accordingly, no large-scale surface subsidence is expected to occur as a result of sand extraction. |
The results of this geotechnical analysis were utilized in the resource estimate presented in Section 11.
| 5-2 |
TECHNICAL REPORT SUMMARY, BRU PROPERTY, MANITOBA, CANADA
| 6 | GEOLOGIC SETTING, MINERALIZATION AND DEPOSIT |
| 6.1 | REGIONAL STRATIGRAPHY |
The Winnipeg Formation was deposited in the Ordovician and is interpreted to be an erosionally isolated element of the North American cratonic platform succession that was deposited across the Transcontinental Arch (Bezys and Conley, 1998; Ozadetz and Haidl, 1989). The lowermost part of the Winnipeg Formation was deposited in a deltaic environment during a major transgression event (Bezys and Conley, 1998; Le Fever et al, 1987). With continued sea level rise, the deltaic deposits were overlain by marine shales and dolomitic limestone (Bezys and Conley, 1998).
The Winnipeg Formation, which is in southwestern Manitoba is at the base of the Williston Basin strata, is composed of interbedded sands and shales (Lapenskie, 2016). These sediments were deposited during the Middle Ordovician, in shallow marine seas. The shales are generally light olive-grey in colour, kaolinitic, with variable sand and silt content (Bezys and Conley, 1998). The sand units, the thickest of which is the Carman Sand Member, are typically mature, well rounded, quartz dominant, and poorly-to-nonconsolidated. The Carman Sand Member is a discrete, east- west trending bar-like sand body within the upper half of the Winnipeg Formation in southern Manitoba. The Carman Sand Member is continuous and relatively uniform throughout the region, extending approximately 240 km from west of the Sandilands Provincial Forest located at Range 8 East, to Pelican Lake that is located at Range 16 West. The corridor of the Carman Sand Member varies in width from less than 25 km to greater than 95 km (Bezys and Conley, 1998). The maximum reported thickness is 31 m (Natural Resources Canada, 2009). The Carman Sand Member occurs at depths less than 100 m along the subcrop belt, and dips towards to the west where it can be found at depths of greater than 800 m (Natural Resources Canada, 2004). The maximum Carman Sand Member depth within the property limit is 65-70m. The Carman Sand Member is truncated to the east by the basin edge as shown on Figure 6-1.
In the southwest corner of Manitoba, a thin wedge of the Deadwood Formation, which was deposited in the Cambrian Period, underlies the Winnipeg Formation (Bezys and Conley, 1998). According to Butler et al. (1955) the Deadwood Formation, in South Dakota, “consists of a basal conglomerate and buff sandstone 9 m thick, overlain by grey-green, thin bedded shale with limestone interbeds 79 m thick and topped with red-brown, very glauconitic quartz sandstone, usually thin-bedded, with random partings of green shale and Scolithos borings 40 m thick, for a total thickness of 128 m”. The Deadwood Formation that occurs in Manitoba is measured to be up to 30 m in thickness (Natural Resources Canada, 2004). Where the Deadwood Formation is not present, the Winnipeg Formation overlays the Precambrian basement.
Conformably overlying the Winnipeg Formation is the Ordovician aged Red River Formation, which is composed of limestones and dolomites (Bezys and Conley, 1998). The thickness of the Red River Formation is up to 215 m; however, along the northeastern erosional edge the formation thickness decreases to 50 m (Natural Resources Canada, 2015). The Red River Formation outcrops in central Manitoba, where it has been subdivided into the Dog Head Member, Cat Head Member, Selkirk Member and the Fort Garry Member. The Dog Head Member is primarily a basal fossiliferous, mottled limestone that is overlain by the cherty dolomite of the Cat Head Member. Overlying the Cat Head Member is the Selkirk Member, which is composed of a second sequence of fossiliferous, mottled, dolomitic limestones. The Cat Head Member becomes more calcareous in the south end of the outcrop belt where it becomes indistinguishable from the Dog Head and Selkirk Members. The Fort Garry Member, which directly overlies the Selkirk Member, consists of finely crystalline and micritic, variable argillaceous dolomites, with a medial zone of shaly dolomite breccias (Natural Resources Canada, 2015).
| 6-1 |
TECHNICAL REPORT SUMMARY, BRU PROPERTY, MANITOBA, CANADA
Above the Red River Formation is the Quaternary diamicton, which ranges in composition from silty to rocky, and is calcareous (Matile and Keller, 2004).
| 6.2 | STRUCTURAL GEOLOGY |
The Ordovician strata in southwestern Manitoba generally trends east-west to slightly north-east. The Winnipeg Formation thins irregularly from approximately 68 m in thickness in southwestern Manitoba to zero at the formation’s northern limit. The thinning of the Winnipeg Formation coincides with irregular lithofacies changes, as lithologies change from being shale dominant in the southern area to sand dominant in the northern area. The lithofacies changes may result in differential compaction (Bezys and Conley, 1998).
| 6.3 | PROPERTY GEOLOGY |
Prior to 2017, the area had undergone little drilling, most of which was limited to water wells that were drilled on behalf of third parties. The units described below are primarily based on reliable holes that were drilled in the Project area by Sio Silica. In general, the stratigraphy of the Property is consistent; the major units are Quaternary sediments, carbonate and shale intervals of the Red River Formation, unconsolidated sand, sandstone, and shale of the Winnipeg Formation, and Archean-age granitoid basement. The upper unconsolidated sand interval of the Winnipeg Formation, which is known as the Carman Sand Member, is the target interval to be exploited.
Unit thickness maps are shown on Figure 6-2 and Figure 6-3 for the Red River carbonate unit and the Carman Sand Member, respectively. The diamicton (also referred as overburden) thickness map, which includes all materials above the limestone unit, is shown on Fig 6-4. Structure contour maps of the basal layers of the carbonate and Carman Sand Member are shown on Figure 6-5 and 6-6, respectively. North-south and east-west cross-sections are shown on Figures 6-7 to 6-10. Table 6.1 shows the units encountered on the Property.
| 6-2 |
TECHNICAL REPORT SUMMARY, BRU PROPERTY, MANITOBA, CANADA
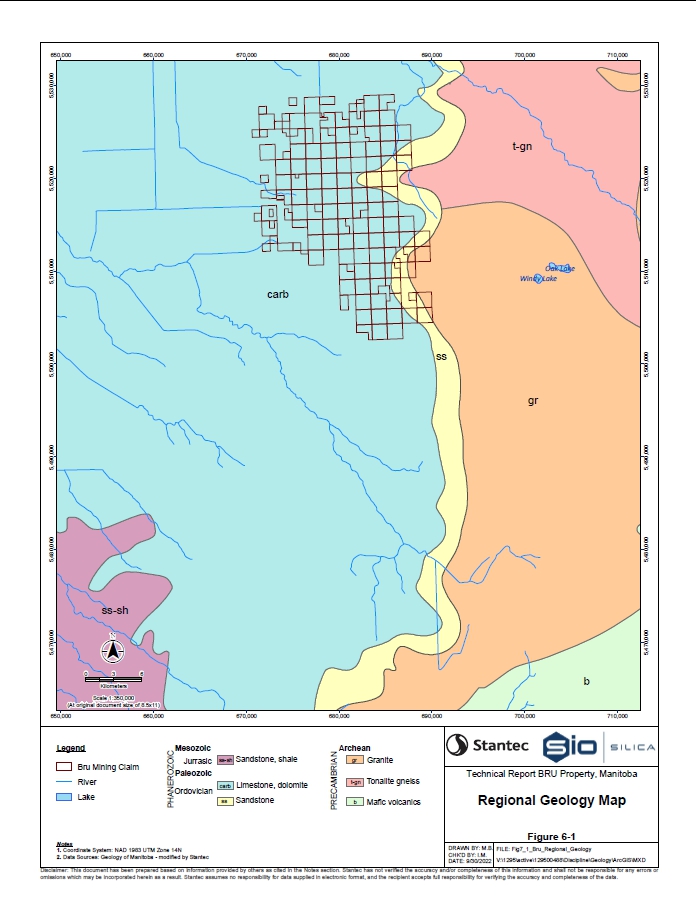
| 6-3 |
TECHNICAL REPORT SUMMARY, BRU PROPERTY, MANITOBA, CANADA
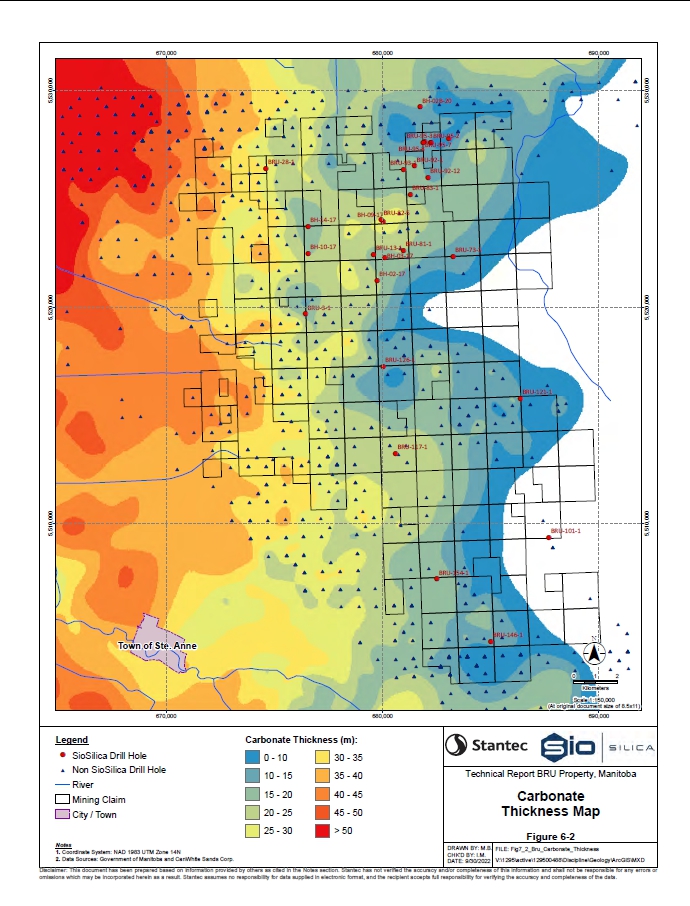
| 6-4 |
TECHNICAL REPORT SUMMARY, BRU PROPERTY, MANITOBA, CANADA
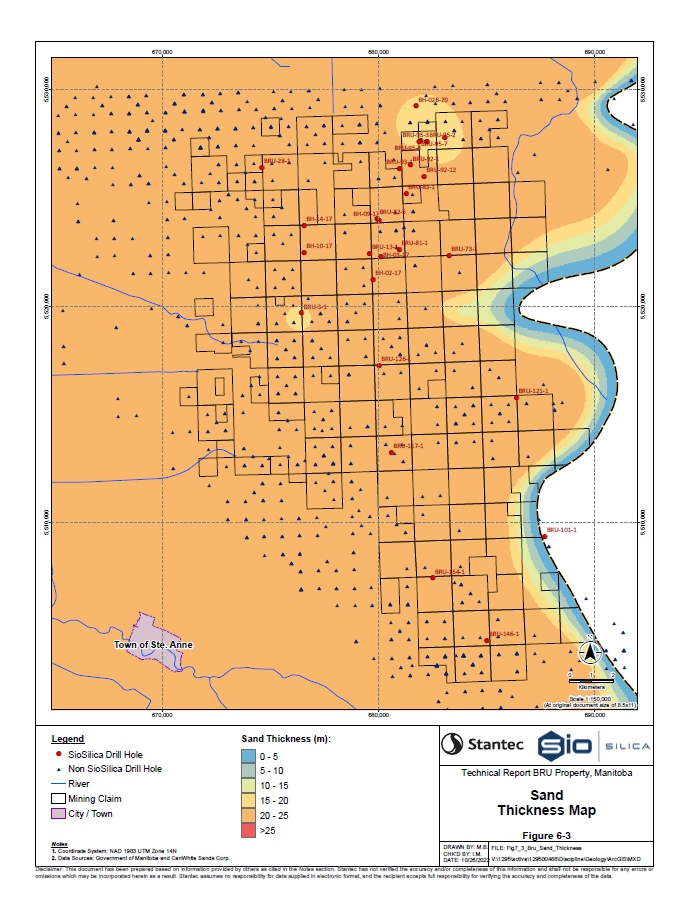
| 6-5 |
TECHNICAL REPORT SUMMARY, BRU PROPERTY, MANITOBA, CANADA

| 6-6 |
TECHNICAL REPORT SUMMARY, BRU PROPERTY, MANITOBA, CANADA
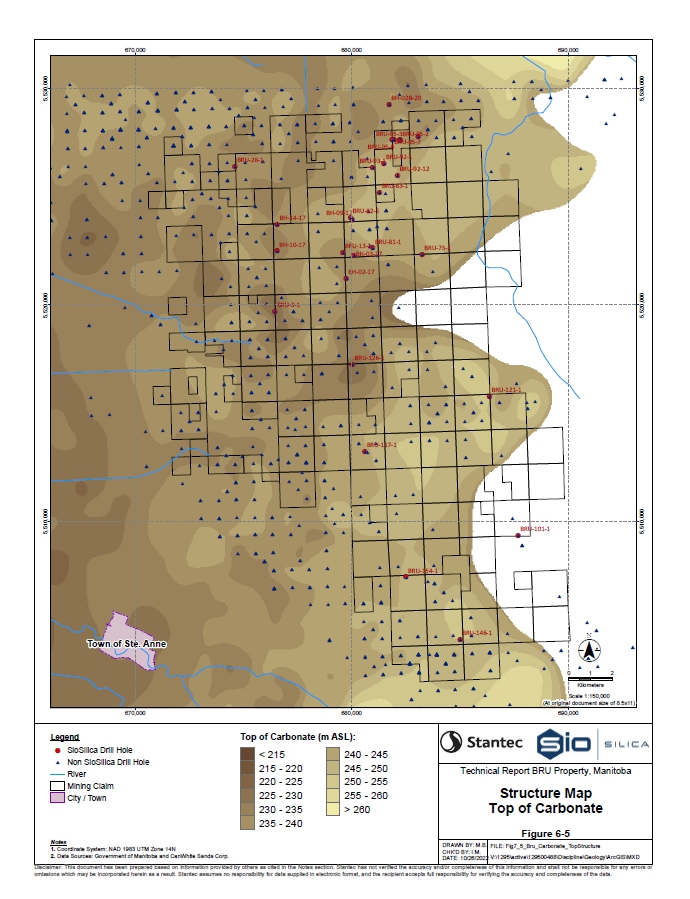
| 6-7 |
TECHNICAL REPORT SUMMARY, BRU PROPERTY, MANITOBA, CANADA

| 6-8 |
TECHNICAL REPORT SUMMARY, BRU PROPERTY, MANITOBA, CANADA
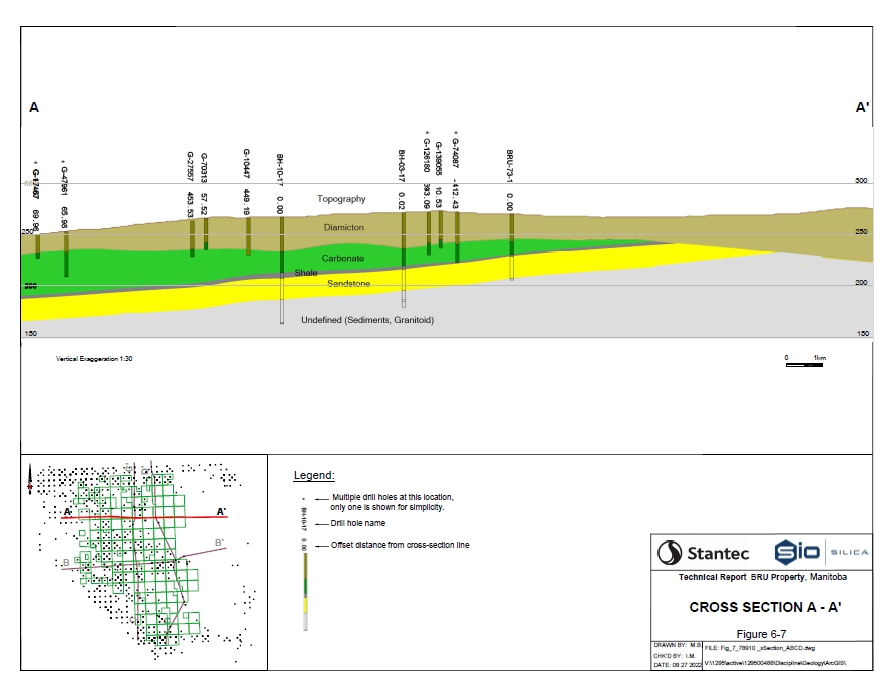
| 6-9 |
TECHNICAL REPORT SUMMARY, BRU PROPERTY, MANITOBA, CANADA
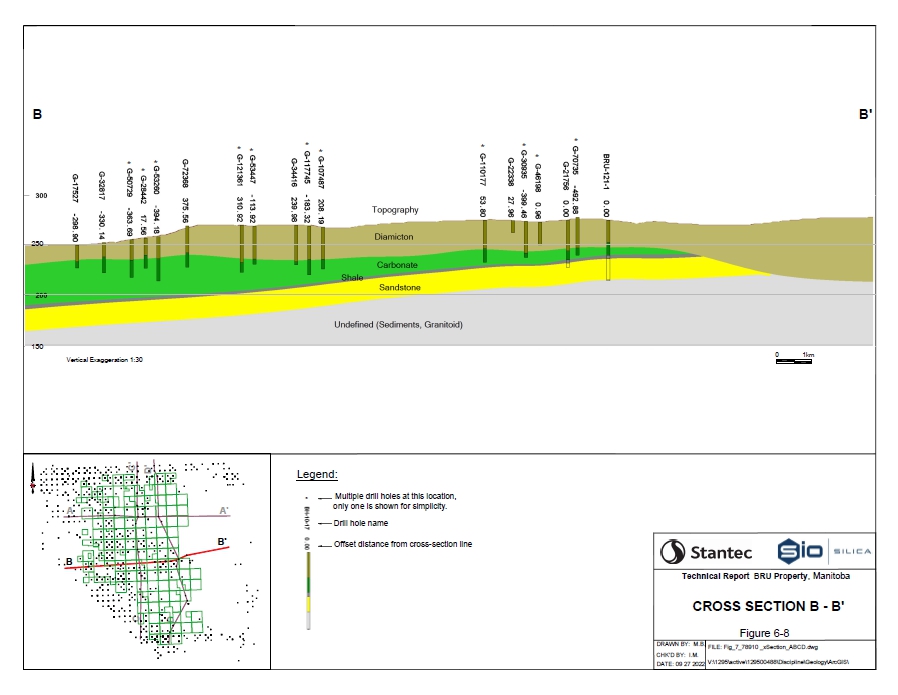
| 6-10 |
TECHNICAL REPORT SUMMARY, BRU PROPERTY, MANITOBA, CANADA
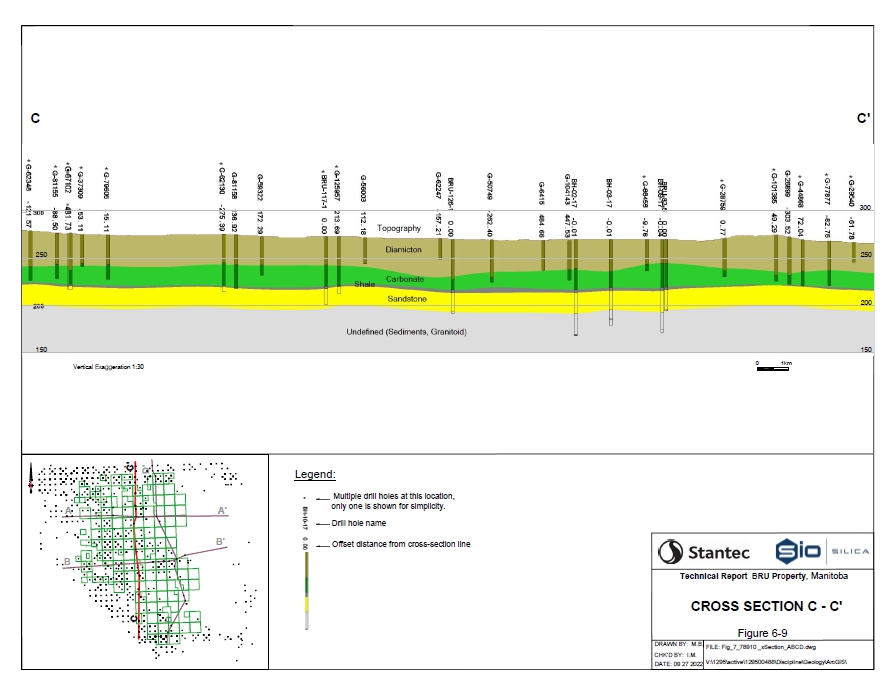
| 6-11 |
TECHNICAL REPORT SUMMARY, BRU PROPERTY, MANITOBA, CANADA

| 6-12 |
TECHNICAL REPORT SUMMARY, BRU PROPERTY, MANITOBA, CANADA
Table 6.1
Property Lithology
| Eon | Era | Period | Geologic Unit | Member | Lithology | |||||
| Phanerozoic | Cenozoic | Quaternary | Diamicton | |||||||
| Paleozoic | Ordovician | Red River | Selkirk, Cat Head, | Carbonate | ||||||
| Formation | Dog Head members | Shale | ||||||||
| Carman Sand Member | Sand | |||||||||
| Winnipeg Formation | Equiv. Ice Box Member | Shale | ||||||||
| Black Island Member | Sand | |||||||||
| Archean | Granitoid |
| 6.3.1 | Quaternary Sediments |
The Pleistocene-aged diamicton is heterolithic, varies in material size distribution from silty to rocky, and typically has a calcareous component. In the Project area, the diamicton ranges from 5 m to 43 m in thickness.
| 6.3.2 | Red River Formation |
Carbonate (Selkirk, Cat Head, Dog Head members)
The carbonate unit, which is upper Ordovician in age, is in the lower Red River Formation. In Southern Manitoba, this unit is comprised of the Dog Head, Cat Head, and Selkirk members (Natural Resources Canada, 2015). The unit varies in composition from limestone to dolostone, contains bedding-parallel fractures, may contain some bedding-perpendicular (vertical) fractures and is vuggy in areas. Commonly, the bottom 1 m to 5 m interval contains shale interbeds within the carbonate unit. of an argillaceous carbonate unit occurs directly above the shale interval. Based on reliable drill holes, the carbonate unit total thickness ranges from 0 m to 48 m in the Project area.
Shale (Selkirk, Cat Head, Dog Head members)
A shale unit occurs directly beneath the carbonate unit. This shale unit forms the base of the Red River Formation and is proposed to be part of the Dog Head Member. This shale unit is highly fractured and friable. The colour of the shale varies through the interval, including brick red, greyish green, and bluish grey colourations. This shale interval, based on reliable historic drill holes as well as the 2017 and 2018 drill campaigns, varies in thickness from 0 m to 11 m.
| 6-13 |
TECHNICAL REPORT SUMMARY, BRU PROPERTY, MANITOBA, CANADA
| 6.3.3 | Winnipeg Formation |
Sand (Carman Sand Member)
The unit encountered directly beneath the base of the Red River Formation is the Carman Sand Member (Natural Resources Canada, 2009a,b). The Carman Sand Member is in the upper section of the Winnipeg Formation. The Carman Sand Member is typically uncemented, well sorted, well-rounded, and typically has a fine to medium grain size. The Carman Sand Member in the Property was measured to have thicknesses between 20 m and 23 m. A basal cemented sandstone unit that typically ranges in thickness from 0.3 m to 0.5 m, was encountered in some of the drill holes.
Shale (Ice Box Member Equivalent)
A shale unit occurs directly beneath the Carman Sand Member. This unit is proposed to be equivalent to the Ice Box Member, which occurs as the middle unit in the Winnipeg Formation in North Dakota and Saskatchewan (Natural Resources Canada, 2004). The colouration of this shale unit varies significantly, including emerald green and dark brown colouration. The drilling of this unit was slow, supporting that this shale unit is more competent than previously encountered units. The thickness of this shale interval in the Project area, based on reliable drill holes that penetrated the entire unit, varies from 1 m to 24 m in thickness.
Sand (Black Island Member Equivalent)
An unconsolidated sand unit below the shale interval is proposed to be equivalent to the Black Island Member (Natural Resources Canada, 2009c). On the Property, is approximately 1 m thick, and is fine-grained, well sorted, and well-rounded. Commonly a cemented sandstone unit occurs either above or below this unconsolidated sand unit. This sandstone interval, where encountered, typically ranges in thickness from 0.3 m to 0.6 m.
| 6.3.4 | Granitoid |
Granitoid basement, which is Archean in age, is altered and in areas contains disseminated pyrite.
| 6.4 | DEPOSIT TYPES |
The Carman Sand Member is dominantly an unconsolidated laterally extensive unit across the Property, as validated through numerous drilling campaigns. Unconsolidated sand type deposits usually require no processing beyond cleaning and size sorting. The deposit appears to have limited geological variability and limited structural complexity.
The geological model that is being applied is similar to other aggregate materials that are laterally extensive and discussed in detail in Section 11.1
| 6.5 | MINERALIZATION |
The target interval is the unconsolidated silica sand from the Carman Sand Member. The high purity of the sand makes it suitable for variety of usages and markets. The primary objective of the program was to delineate the quality of the sand and assess the extractable sand volumes.
| 6-14 |
TECHNICAL REPORT SUMMARY, BRU PROPERTY, MANITOBA, CANADA
| 7 | EXPLORATION |
As mentioned earlier, prior to Sio Silica securing the Property, the area within the BRU claims had not been drilled for silica sands. Publicly available drill hole information for the area, is associated with hydrocarbon exploration, as well as water-well drilling. The publicly available information for drill holes is summarized in Sections 7.1 and 7.2.
Sio Silica collected lithological information from 46 holes on the BRU property. The information for these drill holes is summarized in Sections 7.3 to 7.7.
| 7.1 | HISTORICAL HYDROCARBON DRILL HOLE RESULTS |
Within the Property limits, minor hydrocarbon exploration drilling has occurred that includes the Manitoba Sun Core Hole No. 4 (UWI: 100/16-03-010-07E1/00). Table 7.1 summarizes the information collected from the Manitoba Sun Core Hole No. 4.
| 7-1 |
TECHNICAL REPORT SUMMARY, BRU PROPERTY, MANITOBA, CANADA
Table 7.1
Sun Core Hole 4 Drilling Summary
| Hole Name | Type | Core Size | Inclination at Collar | Date Started | Date Finished | Datum | Zone | Northing | Easting | Elevation (MASL) | Hole Depth (m) | Primary Sampled Interval (m) | |||||||||||||||||||||||||
| Manitoba Sun Core Hole No. 4 | TC | N/A | -90° (Strat) | 1992-08 | 1992-08 | NAD 83 | 14 | 5,52,0342 | 676,748 | 269 | 108.81 | 56.39-79.83 | |||||||||||||||||||||||||
| 7-2 |
TECHNICAL REPORT SUMMARY, BRU PROPERTY, MANITOBA, CANADA
| 7.2 | GROUNDWATER INFORMATION NETWORK AND FRIESEN DRILLING HISTORICAL DATA |
Several water wells were drilled in and around the Property. Information for 1,697 water-wells within the proximity of the property was extracted from the Groundwater Information Network (GIN) database (GIN, 2019). The extracted well data includes lithology and collar information. The lithology information was reviewed, and 285 wells were identified as wells with unreliable data and were excluded from the modelling database.
In addition to the GIN data, information for 34 water-wells from Friesen was provided to Stantec by Sio Silica on March 13, 2019. Nineteen of these wells are away from the property and have been removed from the modeling database. In addition, two wells have been identified as wells with unreliable data.
The total number of wells from GIN and Friesen used in the modelling database is 1,425 and their location is shown on Figure 7-1.
| 7.3 | SIO SILICA 2017 DRILLING CAMPAIGN SUMMARY |
Sio Silica conducted an exploration drilling program during July and August 2017, which resulted in the completion of six vertical holes on the Property. Five of the boreholes were drilled using a dual rotary (DR) drill rig and a reverse circulation (RC) drill rig. A dual rotary drill rig was utilized to drill through the diamicton and the carbonate cap rock. The holes were cased to the top of the carbonate unit. Once the upper contact with the sand was intercepted, a RC rig with a cyclone was used to recover and collect samples of the sand.
The remaining borehole, DDH-10-17, was collared approximately 15 m away from BH-10-17, was drilled to obtain geotechnical information about the carbonate unit above the Carman Sand Member. A tricone (TC) bit was used to drill through the diamicton into the top of the carbonate unit. Following casing of the open hole, a diamond drill rig was used to core the carbonate unit and underlying shale unit. The hole was terminated when contact with the Carman Sand Member was reached.
Table 7.2 is a summary of information associated with the 2017 holes. Figure 7-1 shows the location of these drill holes.
| 7-3 |
TECHNICAL REPORT SUMMARY, BRU PROPERTY, MANITOBA, CANADA
Table 7.2
2017 Drilling Program Summary
Hole ID | Type | Core | Inclination | Completion | Datum | Zone | Northing | Easting | Elevation | Borehole Depth | Primary Sampled Interval (m) | |||||||||||||||||||||||
| BH-02-17 | DR/RC | N/A | -90° | 2017-07-10 | NAD 83 | 14 | 5,521,220 | 679,749 | 271 | 103.17 | 56.69 – 79.55 | |||||||||||||||||||||||
| BH-03-17 | DR/RC | N/A | -90° | 2017-07-6 | NAD 83 | 14 | 5,522,289 | 680,104 | 271 | 91.44 | 54.86 – 85.65 | |||||||||||||||||||||||
| BH-09-17 | DR/RC | N/A | -90° | 2017-07-12 | NAD 83 | 14 | 5,523,942 | 680,026 | 271 | 99.36 | 56.39 – 77.72 | |||||||||||||||||||||||
| BH-10-17 | DR/RC | N/A | -90° | 2017-08-11 | NAD 83 | 14 | 5,522,493 | 676,561 | 267 | 103.63 | 59.44 – 79.25 | |||||||||||||||||||||||
| BH-14-17 | DR/RC | N/A | -90° | 2017-08-9 | NAD 83 | 14 | 5,523,718 | 676,561 | 266 | 78.33 | 52.73 – 57.91 | |||||||||||||||||||||||
DDH-10-17 | TC/DDH | HQ |
-90° | 2017-08-9 |
NAD 83 | 14 | 5,522,500 | 676,539 | 267 | 58.09 | Cored through the carbonate interval | |||||||||||||||||||||||
Figure 7-1
Drill Hole Location Map
| 7-4 |
TECHNICAL REPORT SUMMARY, BRU PROPERTY, MANITOBA, CANADA
| 7.4 | SIO SILICA 2018 - 2019 DRILLING CAMPAIGN SUMMARY |
A drilling campaign was completed between September 2018 and January 2019, in which 10 vertical holes were drilled on the BRU Property. Of these 10 holes, eight were DR / RC holes that were drilled to identify formation tops and to constrain sand samples, and two were diamond drill holes that were completed to document the geotechnical properties of the carbonate interval. The DR/RC wells were entered in the modeling database and the location of these drill holes are shown on Figure 7-1. Table 7.3 shows a summary of the holes.
Table 7.3
September 2018 to January 2019 Drilling Campaign Summary
| Hole Name | Type | Core Size | Inclination at Collar | Completion Date | Datum | Zone | Easting | Northing | Elevation (MASL) | Hole Depth (m) | Primary Sampled Interval (m) | |||||||||||||||||||||||
| BRU 28-1 | DR/RC | N/A | -90 | 2019-01-08 | NAD83 | 14 | 674603 | 5526383 | 264 | 58.22 | 59.13 - 80.47 | |||||||||||||||||||||||
| BRU 73-1 | DR/RC | N/A | -90 | 2018-10-10 | NAD83 | 14 | 683251 | 5522332 | 270 | 64.01 | 41.15 - 62.18 | |||||||||||||||||||||||
| BRU 82-5 | DR/RC | N/A | -90 | 2018-09-28 | NAD83 | 14 | 679941 | 5524035 | 271 | 76.20 | not sampled | |||||||||||||||||||||||
| BRU 101-1 | DR/RC | N/A | -90 | 2018-10-05 | NAD83 | 14 | 687675 | 5509374 | 284 | 60.96 | not sampled | |||||||||||||||||||||||
| BRU 117-1 | DR/RC | N/A | -90 | 2018-10-15 | NAD83 | 14 | 680596 | 5513229 | 274 | 72.85 | 56.39 - 72.85 | |||||||||||||||||||||||
| BRU 121-1 | DR/RC | N/A | -90 | 2018-12-10 | NAD83 | 14 | 686361 | 5515787 | 275 | 60.66 | 39.62 - 59.13 | |||||||||||||||||||||||
| DR/DDH | HQ | -90 | 2018-11-21 | NAD83 | 14 | 686371 | 5515784 | 275 | 38.10 | Geotechnical core logged | ||||||||||||||||||||||||
| BRU 126-1 | DR/RC | N/A | -90 | 2018-09-29 | NAD83 | 14 | 680029 | 5517260 | 271 | 78.94 | 57.91 - 77.42 | |||||||||||||||||||||||
| BRU 146-1 | DR/RC | N/A | -90 | 2018-12-06 | NAD83 | 14 | 685004 | 5504541 | 286 | 75.29 | 51.82 - 72.85 | |||||||||||||||||||||||
| DR/DDH | HQ | -90 | 2018-11-23 | NAD83 | 14 | 684974 | 5504985 | 286 | 50.29 | Geotechnical core logged | ||||||||||||||||||||||||
Note: DR = Dual Rotary; RC = Reverse Circulation; DDH = Diamond Drill Hole
| 7-5 |
TECHNICAL REPORT SUMMARY, BRU PROPERTY, MANITOBA, CANADA
| 7.5 | SIO SILICA 2019 DRILLING CAMPAIGN SUMMARY |
Nine holes were drilled between April 2019 and August 2019. The purpose of these drill holes was for extraction tests and aquifer monitoring. Table 7.4 lists the drill hole attributes. The drill holes were drilled in close proximity to other wells and provide similar lithological information. Two of the drill holes (BRU 95-2 and BRU 95-3) are used in the geological modelling and their location is shown on Figure 7-1.
Table 7.4
2019 Drilling Summary
| Hole Name | Type | Inclination at Collar | Completion Date | Datum | Zone | Easting | Northing | Hole Depth (m) | Drill Hole Purpose | |||||||||||||||||||
| BRU 95-1 | DR/RC | -90 | 2019-06-07 | NAD83 | 14 | 682230 | 5527617 | 69.49 | Extraction Test | |||||||||||||||||||
| BRU 95-2 | DR/RC | -90 | 2019-05-15 | NAD83 | 14 | 682237 | 5527618 | 70.10 | Extraction Test | |||||||||||||||||||
| BRU 95-3 | DR/RC | -90 | 2019-05-23 | NAD83 | 14 | 682230 | 5527606 | 70.10 | Extraction Test | |||||||||||||||||||
| BRU 95-4 | DR/RC | -90 | 2019-07-02 | NAD83 | 14 | 682231 | 5527623 | 54.25 | Aquifer Monitoring | |||||||||||||||||||
| BRU 95-5 | DR/RC | -90 | 2019-06-26 | NAD83 | 14 | 682211 | 5527628 | 42.06 | Aquifer Monitoring | |||||||||||||||||||
| BRU 82-9 | DR/RC | -90 | 2019-05-01 | NAD83 | 14 | 679908 | 5524067 | 59.44 | Aquifer Monitoring | |||||||||||||||||||
| BRU 82-10 | DR/RC | -90 | 2019-08-09 | NAD83 | 14 | 679818 | 5524008 | 71.93 | Extraction Test | |||||||||||||||||||
| BRU 82-11 | DR/RC | -90 | 2019-08-15 | NAD83 | 14 | 679803 | 5524041 | 67.97 | Extraction Test | |||||||||||||||||||
| BRU 82-14 | DR/RC | -90 | 2019-08-22 | NAD83 | 14 | 679831 | 5524053 | 66.45 | Extraction Test | |||||||||||||||||||
| 7.6 | SIO SILICA 2020 - 2021 DRILL CAMPAIGN SUMMARY |
Fifteen drill holes were completed between July 2020 and August 2021. Drill hole depths varied from 42 m to 76 m; all holes were drilled vertically. In addition to further constraining lithological depths, the main purpose of the drilling campaigns was to further develop production and supply wells, as well as to complete sand, limestone, and shale monitoring wells. Table 7.5 shows the associated drill hole information from this campaign. Due to drill hole proximity to each other, the drill holes provide similar geological information and only drill holes BH 02B-20, BRU 154-1, BRU 92-1, BRU 95-7, BRU 95-8 and BRU 96-1 were selected to be used for the geological modeling and their location is shown on Figure 7-1.
| 7-6 |
TECHNICAL REPORT SUMMARY, BRU PROPERTY, MANITOBA, CANADA
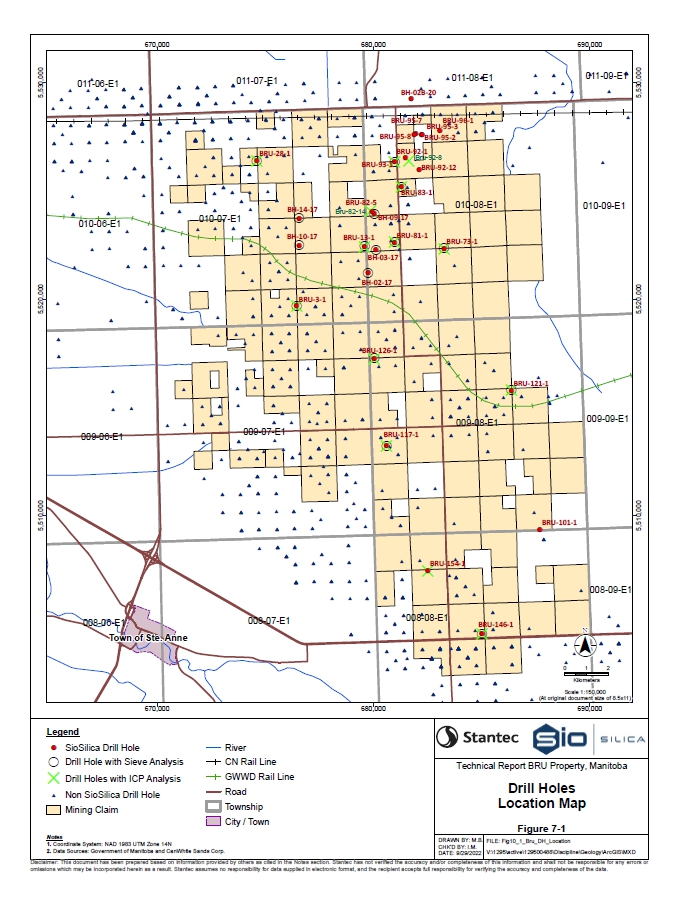
| 7-7 |
TECHNICAL REPORT SUMMARY, BRU PROPERTY, MANITOBA, CANADA
Table 7.5
2020 / 2021 Drill Holes
| Hole Name | Completion Date | Datum | Zone | Easting | Northing | Hole Depth (m) | Limestone Top (m) | Shale Top (m) | Sand Top (m) | |||||||||||||||||||||||
| BRU 154-1 | 2020-07-29 | NAD83 | 14 | 682501 | 5507439 | 72.50 | 38.10 | 54.56 | 57.00 | |||||||||||||||||||||||
| BRU 154-2 | 2020-07-20 | NAD83 | 14 | 682472 | 5507474 | 66.14 | 37.80 | 54.86 | 57.30 | |||||||||||||||||||||||
| BH 02B-20 | 2020-10-05 | NAD83 | 14 | 681658 | 5529326 | 71.17 | 34.14 | 48.16 | 53.34 | |||||||||||||||||||||||
| BH 02C-20 | 2021-02-04 | NAD83 | 14 | 681653 | 5529326 | 55.78 | 35.66 | 51.20 | 53.00 | |||||||||||||||||||||||
| BH 02D-20 | 2021-02-09 | NAD83 | 14 | 681664 | 5529324 | 59.74 | 35.36 | 50.29 | 54.56 | |||||||||||||||||||||||
| BRU 96-1 | 2020-11-09 | NAD83 | 14 | 683058 | 5527790 | 53.34 | 35.05 | 43.28 | 46.02 | |||||||||||||||||||||||
| BRU 92-2 | 2021-05-06 | NAD83 | 14 | 681567 | 5526457 | 57.61 | 33.22 | 47.85 | 51.51 | |||||||||||||||||||||||
| BRU 92-3 | 2021-05-05 | NAD83 | 14 | 681584 | 5526475 | 57.61 | 33.22 | 47.85 | 51.51 | |||||||||||||||||||||||
| BRU 92-8 | 2021-08-25 | NAD83 | 14 | 681632 | 5526383 | 56.69 | 32.92 | 47.55 | 50.60 | |||||||||||||||||||||||
| BRU 96-2 | 2020-11-10 | NAD83 | 14 | �� | 683065 | 5527790 | 41.76 | 35.05 | Not encountered | Not encountered | ||||||||||||||||||||||
| BRU 95-6 | 2020-11-12 | NAD83 | 14 | 682193 | 5527627 | 57.00 | 36.88 | 46.33 | 49.07 | |||||||||||||||||||||||
| BRU 95-7 | 2020-11-19 | NAD83 | 14 | 681863 | 5527616 | 75.00 | 36.00 | 49.07 | 52.12 | |||||||||||||||||||||||
| BRU 95-8 | 2020-11-19 | NAD83 | 14 | 681949 | 5527630 | 55.09 | 35.40 | 49.07 | 52.12 | |||||||||||||||||||||||
| BRU 95-9 | 2020-11-20 | NAD83 | 14 | 682208 | 5527622 | 47.24 | 36.88 | 45.72 | Not encountered | |||||||||||||||||||||||
| BRU 92-1 | 2021-10-03 | NAD83 | 14 | 681479 | 5526513 | 75.60 | 31.70 | 48.46 | 51.50 | |||||||||||||||||||||||
| 7.7 | SIO SILICA 2022 DRILL CAMPAIGN SUMMARY |
Six vertical drill holes were completed between February 2022 and August 2022. Drill hole depths varied from 66 m to 83 m. The main purpose of the drilling campaign was to increase the drill hole density and provide additional information of the depth and the thickness of the lithological units, as well as to collect samples for the analytical data discussed in Section 8. The location of this infill drilling was selected to increase the confidence in the assurance of existence of the resources and improve the resource classification. Table 7.6 shows the associated drill hole information from this drilling campaign. The location of wells is shown on Figure 7-1.
Table 7.6
2022 Drill Holes
| Hole Name | Completion Date | Datum | Zone | Easting | Northing | Hole Depth (m) | Limestone Top (m) | Shale Top (m) | Sand Top (m) | |||||||||||||||||||||||
| BRU 13-1 | 2022-07-13 | NAD83 | 14 | 679585 | 5522428 | 79.55 | 35.97 | 53.95 | 56.69 | |||||||||||||||||||||||
| BRU 3-1 | 2022-08-04 | NAD83 | 14 | 676446 | 5519679 | 82.60 | 43.89 | 60.96 | 63.70 | |||||||||||||||||||||||
| BRU 81-1 | 2022-08-05 | NAD83 | 14 | 680962 | 5522630 | 67.06 | 29.87 | 49.38 | 51.51 | |||||||||||||||||||||||
| BRU 83-1 | 2022-07-15 | NAD83 | 14 | 681277 | 5525191 | 70.41 | 27.43 | 45.11 | 48.16 | |||||||||||||||||||||||
| BRU 92-12 | 2022-02-15 | NAD83 | 14 | 682109 | 5525978 | 67.06 | 35.05 | 49.68 | 52.73 | |||||||||||||||||||||||
| BRU 93-1 | 2022-07-14 | NAD83 | 14 | 680969 | 5526355 | 66.45 | 30.48 | 49.68 | 50.04 | |||||||||||||||||||||||
| 7-8 |
TECHNICAL REPORT SUMMARY, BRU PROPERTY, MANITOBA, CANADA
| 8 | SAMPLE PREPARATION, ANALYSES AND SECURITY |
| 8.1 | SAMPLING METHOD AND APPROACH |
Most drill hole samples collected by Sio Silica have been subject to sieve analysis for particle size distribution (PSD) analysis. In 2017, there were 75 samples that were sent from five of the drill holes to Loring Labs in Calgary, Alberta for sieve analyses. The 2018 / 2019 drill hole samples were sent to laboratories; 79 samples from six drill holes were tested by sieve analyses by AGAT in Calgary, Alberta, 10 duplicate samples were tested by sieve analyses by Loring, Alberta. Twenty (20) samples collected from the 2022 campaign drill holes were subject to PSD sieve analysis at Sio Silica’s internal facilities.
To complete PSD sieve analyses, a selected sieve stack is to be made up of no less than seven sieves of decreasing mesh size and is to include a pan and cover. This sieve stack is to be checked against a master sieve stack. A representative split sample of 100 g ± 20 g is to be selected; the material weight is to be recorded to within 0.1 g. The sample is to be placed at the top of the sieve stack with the lid and pan and is to be placed in the test sieve shaker for 10 minutes ± 5 seconds. Following this procedure, the material is to be weighed on each sieve and the resulting mass of each sieve is to be deducted from the weight for each fraction. The final cumulative mass is to be within 0.5% of the initial sample mass.
| 8.2 | 2017 AND 2018 / 2019 FIELD PROGRAMS SAMPLE INTEGRITY |
2017 to 2019 Programs
Sample collection was completed from the Carman Sand Member, typically at five-foot intervals, with the possible exception of the top and bottom interval at the contacts with the upper and lower shale units. Sample collection involved: 1) Collection of the sand from the RC cyclone; amalgamation of the sand a five-gallon pail; 2) Use of a soil auger to core through the sand in the five-gallon pail and collection of 1 and 2 kg samples; and 3) Completion of chain-of-custody documentation and transportation of the 1 kg sand sample to Calgary-based independent laboratories for sieve analyses.
2020 to 2021 Program
Twelve drill holes were completed between July 2020 and April 2021. Hole depths varied from 42 m to 76 m; all holes were drilled vertically. In addition to further constraining lithological depths, the main purpose of the drilling campaigns was to further develop production and supply wells, as well as to complete sand, limestone, and shale monitoring wells. Table 10.5 shows the associated drill hole information from this campaign. Only one representative Carman Sand Member sample (57.3 m to 66.1 m) from hole BRU 154-1 was subject to select sieve analysis (40/70 and 70/140 fractions) for cleaning and magnetic separation at Sio Silica’s internal facilities as described in Section 8.3.5.
| 8-1 |
TECHNICAL REPORT SUMMARY, BRU PROPERTY, MANITOBA, CANADA
2022 Program
In 2022 twenty composited samples of the Carman Sand Member were collected from five holes (4 samples per hole). Sample depths ranged from 48.2 m to 63.7 m and sample intervals ranged from 13.4 m to 22.6 m. The sample collection method was the same as that for the prior 2017 to 2019 programs. These samples were subject to the same PSD sieve analysis at Sio Silica’s internal facilities. The PSD sieve analysis followed the same methodology as the prior 2019 to 2020 sampling programs.
| 8.3 | LABORATORY CREDENTIALS, TESTING METHODOLOGY, AND RESULTS |
Table 8.1 shows a summary of the number and type of analyses by year and laboratory. The following sections summarize the work completed by each laboratory.
Table 8.1
Summary of Analyses Completed by Year and Laboratory
| Laboratory | Year | No. Samples | Analyses Type | |||
| 2017 | 75 | PSD Sieve | ||||
| Loring | 2017 | 15 | Inductively Coupled Plasma (ICP) Whole Rock | |||
| 2019 | 10 | PSD Sieve | ||||
| 2019 | 6 | Bulk X-Ray Diffraction and X-Ray Fluorescence | ||||
| AGAT | 2018-2019 | 79 | PSD Sieve | |||
| 2020 | 13 | X-Ray Fluorescence | ||||
| Sio Silica | 2022 | 20 | PSD Sieve | |||
| 2020-2022 | 14 | 40/70 and 70/140 size fraction clean and magnetic separator | ||||
| Liquids Matter | 2021-2022 | 56 | ICP Whole Rock on 40/70 and 70/140 size fraction |
| 8.3.1 | Loring Credentials, Testing Methodology, and 2017 Results |
Loring is an independent laboratory with ISO 9001:2008 accreditation (Certificate No. CERT- 0088592).
2017 Sieve Analyses
Loring completed 75 sieve samples in the 2017 program. Loring provided Stantec with calibration certificates and sieve calibration results for their working sieves as well as the working sieve certificate for the working sieves used to analyse the samples. Loring adhered to API recommended Practice 56-5.1 that is titled “Sieve Analysis, recommended Practices for Testing High-Strength Proppants used in Hydraulic Fracturing Operations”. Once received, Loring inventoried, dried, and weighed the material. The samples were then homogenized and screened (deslimed) through a 200-mesh sieve to separate the fines prior to splitting and completing sieve analyses.
| 8-2 |
TECHNICAL REPORT SUMMARY, BRU PROPERTY, MANITOBA, CANADA
Following desliming, samples were then split and reduced to approximately 100 g sample size; sieve analysis was then completed on this sample. The sample retained on the 200-mesh sieve was then dried and reweighed. The percent loss was calculated from the material washed through the sieve. The “pre” and “post” weights were recorded. With the exception of sample 42752, which had a loss of 5.9%, all samples had fine percentages less than 5%. Stantec normalized the sieve sample data to account for the material losses, then recalculated the bins.
2017 Whole Rock Analyses
Following completion of the sieve analyses, 15 samples were selected for Inductively Coupled Plasma (ICP) whole rock analysis, and following processing, were analysed by specific fraction sizes, which included 50/60, 60/70 and 70/80. The sample suite was selected from different depths of the Carman Sand Member, and from the different holes to ensure a spatial representation from across the tested portion of the Property.
To prepare the whole rock analysis sample, 200 g was extracted from the selected sample, was riffled, and pulverized to -140 U.S. standard mesh size sieve through use of a stainless-steel ring and puck pulveriser. Loring used an internal standard called WR-Internal Standard that was analysed to verify the analytical procedure accuracy prior to commencement of the testing, as well as after every 10 samples. In addition, Loring completed a rerun of sample 42830 to verify consistency in the analytical results.
The whole rock analyses, which were completed on the 15 samples, are shown in Table 8.2. The process involved in XRF sample preparation includes heating the sample in a crucible to 1050°C in the oven (Muffelofen) for at least an hour and then the desiccator to restrict the sample collection of atmospheric moisture. During the heating process, volatiles are driven from the sample during this ignition process. The volatiles that are burned off of the samples are termed Loss On Ignition (LOI), which include the compounds H2O, CO2, and the elements F, Cl, S as well as K and Na in the event that the sample is heated for too long. In Table 8.2, the source of the LOI wt. % is unknown, and may potentially be caused by trapped moisture that did not dehydrate during the drying process, trace organics and shale fragments that were not excluded from the sand during washing. The results from this study showed that SiO2 averaged 97.26% to 99.23%; the SiO2 content does not directly correlate to quartz abundance, as silica is present in other minerals such as feldspars.
| 8-3 |
TECHNICAL REPORT SUMMARY, BRU PROPERTY, MANITOBA, CANADA
Table 8.2
2017 Concentration of Major Oxides and LOI (wt %) by Fraction
| Hole Name | Sample Number | Depth From (m) | Depth To (m) | Fraction | Al2O3 | CaO wt % | Fe2O3 | K2O | MgO wt % | MnO wt % | Na2O | P2O5 | SO3 | SiO2 | TiO2 | LOI @ 1000°C | SUM | |||||||||||||||||||||||||||||||||||||||||||||||||
| BH-03-17 | 42753 | 61.72 | 62.48 | 60/70 | 0.26 | 0.24 | 0.51 | 0.07 | 0.03 | 0.01 | 0.01 | 0.01 | 0.02 | 97.26 | 0.02 | 0.40 | 98.82 | |||||||||||||||||||||||||||||||||||||||||||||||||
| BH-03-17 | 42758 | 68.58 | 70.10 | 70/80 | 0.17 | 0.07 | 0.27 | 0.07 | 0.02 | <0.01 | 0.01 | 0.01 | 0.02 | 98.94 | 0.02 | 0.17 | 99.77 | |||||||||||||||||||||||||||||||||||||||||||||||||
| BH-03-17 | 42761 | 73.15 | 74.68 | 60/70 | 0.24 | 0.04 | 0.30 | 0.04 | 0.01 | <0.01 | 0.01 | <0.01 | 0.01 | 97.98 | 0.01 | 0.23 | 98.87 | |||||||||||||||||||||||||||||||||||||||||||||||||
| BH-02-17 | 42765 | 57.91 | 59.44 | 60/70 | 0.21 | 0.04 | 0.28 | 0.05 | 0.01 | <0.01 | 0.03 | <0.01 | 0.01 | 98.77 | 0.02 | 0.20 | 99.62 | |||||||||||||||||||||||||||||||||||||||||||||||||
| BH-02-17 | 42770 | 65.53 | 67.06 | 50/60 | 0.21 | 0.04 | 0.25 | 0.05 | 0.01 | <0.01 | 0.01 | 0.01 | 0.01 | 98.56 | 0.01 | 0.07 | 99.22 | |||||||||||||||||||||||||||||||||||||||||||||||||
| BH-02-17 | 42775 | 73.15 | 74.68 | 50/60 | 0.24 | 0.04 | 0.22 | 0.06 | 0.01 | <0.01 | 0.02 | 0.01 | 0.02 | 98.06 | 0.01 | 0.20 | 98.89 | |||||||||||||||||||||||||||||||||||||||||||||||||
| BH-09-17 | 42783 | 54.86 | 56.39 | 60/70 | 0.08 | 0.05 | 0.44 | 0.05 | 0.01 | <0.01 | 0.01 | 0.01 | 0.02 | 98.58 | 0.01 | 0.17 | 99.43 | |||||||||||||||||||||||||||||||||||||||||||||||||
| BH-09-17 | 42790 | 65.53 | 67.06 | 70/80 | 0.27 | 0.05 | 0.38 | 0.05 | 0.01 | <0.01 | <0.01 | <0.01 | 0.02 | 98.31 | 0.02 | 0.20 | 99.31 | |||||||||||||||||||||||||||||||||||||||||||||||||
| BH-09-17 | 42796 | 74.68 | 76.20 | 70/80 | 0.17 | 0.03 | 0.30 | 0.05 | 0.01 | <0.01 | 0.01 | <0.01 | 0.01 | 98.32 | 0.01 | 0.17 | 99.08 | |||||||||||||||||||||||||||||||||||||||||||||||||
| BH-14-17 | 42805 | 56.39 | 57.91 | 60/70 | 0.22 | 0.04 | 0.26 | 0.05 | 0.01 | <0.01 | 0.01 | 0.01 | 0.02 | 99.23 | 0.02 | 0.10 | 99.96 | |||||||||||||||||||||||||||||||||||||||||||||||||
| BH-14-17 | 42809 | 62.48 | 64.01 | 60/70 | 0.21 | 0.06 | 0.26 | 0.05 | 0.01 | <0.01 | 0.01 | 0.01 | 0.01 | 99.08 | 0.02 | 0.17 | 99.88 | |||||||||||||||||||||||||||||||||||||||||||||||||
| BH-14-17 | 42814 | 70.10 | 71.63 | 70/80 | 0.22 | 0.03 | 0.27 | 0.06 | 0.01 | <0.01 | 0.01 | <0.01 | 0.01 | 99.16 | 0.02 | 0.24 | 100.03 | |||||||||||||||||||||||||||||||||||||||||||||||||
| BH-10-17 | 42820 | 60.96 | 62.48 | 60/70 | 0.19 | 0.04 | 0.31 | 0.05 | 0.01 | <0.01 | 0.01 | 0.01 | 0.02 | 98.88 | 0.01 | 0.08 | 99.60 | |||||||||||||||||||||||||||||||||||||||||||||||||
| BH-10-17 | 42824 | 68.58 | 70.10 | 70/80 | 0.25 | 0.04 | 0.24 | 0.06 | 0.01 | <0.01 | 0.01 | 0.01 | 0.01 | 99.03 | 0.02 | 0.20 | 99.88 | |||||||||||||||||||||||||||||||||||||||||||||||||
| BH-10-17 | 42830 | 77.72 | 79.25 | 70/80 | 0.26 | 0.04 | 0.24 | 0.06 | 0.01 | <0.01 | 0.01 | <0.01 | 0.01 | 99.14 | 0.02 | 0.16 | 99.95 | |||||||||||||||||||||||||||||||||||||||||||||||||
| BH-10-17 | 42830 | 77.72 | 79.25 | 70/80 | 0.28 | 0.05 | 0.25 | 0.06 | 0.01 | <0.01 | 0.01 | 0.0 | 0.01 | 98.73 | 0.02 | 0.21 | 99.62 | |||||||||||||||||||||||||||||||||||||||||||||||||
| 8-4 |
TECHNICAL REPORT SUMMARY, BRU PROPERTY, MANITOBA, CANADA
| 8.3.2 | AGAT Credentials, Testing Methodology, and 2018 Results |
AGAT completed sample preparation and sieve analysis. AGAT is an independent laboratory with ISO 9001:2015 (Certificate No. 0100019). The analyses by year and type are summarized in the following subsections.
2018 Sieve Analyses
In 2018, AGAT completed sieve analyses on 79 samples. AGAT inventoried, dried and processed the samples through a riffle splitter to obtain a representative sample size of approximately 100 g, as required for the sieve analyses. AGAT determined that the material contained clay-size material, but typically very low clay material based on mineralogical assessment. As such, AGAT determined that the material could be dry sieved using a sonic shaker, as outlined in API Recommended Practice 40, Section 7.3.1.
2018 Mineralogical Assessment
BRU-82-8 was drilled as an extraction well. Six samples were taken at three depths. The samples underwent sieve analysis followed by bulk X-ray diffraction (XRD) analysis to determine crystalline phases. XRD analyses is only able to identify crystalline material. The XRD samples were ran at high resolution and step time. This resulted in diffractograms with distinct peaks and low background noise. Table 8.3 summarizes the intervals from which the XRD was completed.
Table 8.3
2018 Mineralogical Assessment Results
| Hole ID | AGAT ID | Depth From (m) | Depth To (m) | Date Sampled | SiO2 (%) | |||||||||||
| BRU 82-8 | 19A19401-01 | 60.96 | 62.48 | 2018-12-16 | 100 | |||||||||||
| BRU 82-8 | 19A19401-02 | 60.96 | 62.48 | 2018-12-16 | 100 | |||||||||||
| BRU 82-8 | 19A19401-03 | 60.96 | 62.48 | 2018-12-16 | 100 | |||||||||||
| BRU 82-8 | 19A19401-04 | 64.01 | 65.53 | 2018-12-17 | 100 | |||||||||||
| BRU 82-8 | 19A19401-05 | 67.06 | 68.58 | 2018-12-17 | 100 | |||||||||||
| BRU 82-8 | 19A19401-06 | 64.01 | 65.53 | 2018-12-18 | 100 | |||||||||||
The only mineral determined during the XRD analyses was quartz, which ranged in size from sand to silt. AGAT proposed that, due to the precision of the XRD equipment, the quartz component of the sample was most likely at ~99.5 ± 0.5%. There is no full Rietveld Refinement process for these results, as monomineralic samples cannot be refined.
2018 AGAT X-Ray Fluorescence Results
X-Ray Fluorescence (XRF) analyse was completed on the same six samples as those analysed by XRD. The process completed by AGAT during the XRF sample preparation includes heating the sample in a crucible to 1050°C in the oven (Muffelofen) for at least an hour and then the desiccator to restrict the sample collection of atmospheric moisture. During the heating process, volatiles are driven from the sample. The volatiles that are burned off of the samples are termed Loss On Ignition (LOI), which include the compounds H2O, CO2, and the elements F, Cl, S as well as K and Na in the event that the sample is heated for too long.
In Table 8.4, the source of the LOI wt. % is unknown, and may potentially be caused by trapped moisture that did not dehydrate during the drying process, trace organics and shale fragments that were not excluded from the sand during washing. Due to this uncertainty of the origin of the LOI concentration, the volatiles need to be included in the normalized major oxide weight percentage. The results from this study showed that the unnormalized SiO2 ranged from 99.47% to 99.82%; the SiO2 content does not directly correlate to quartz abundance, as silica is present in other minerals such as feldspars.
| 8-5 |
TECHNICAL REPORT SUMMARY, BRU PROPERTY, MANITOBA, CANADA
Table 8.4
2018 AGAT XRF Results – Concentration of Major Oxides and LOI (wt %)
| Hole Name | AGAT Sample Number | Na2O (wt %) | MgO (wt %) | Al2O3 (wt %) | SiO2 (wt %) | P2O5 (wt %) | SO3 (wt %) | K2O (wt %) | CaO (wt %) | TiO2 (wt %) | Mn2O3 (wt%) | Fe2O3 (wt %) | LOI (wt %) | Sum (wt %) | ||||||||||||||||||||||||||||||||||||||||
| BRU 82-8 | 19A19401-01 | 0.01 | 0.00 | 0.33 | 99.48 | 0.01 | 0.00 | 0.02 | 0.03 | 0.02 | 0.00 | 0.11 | 0.60 | 100.61 | ||||||||||||||||||||||||||||||||||||||||
| BRU 82-8 | 19A19401-02 | 0.00 | 0.00 | 0.33 | 99.67 | 0.00 | 0.00 | 0.02 | 0.00 | 0.03 | 0.00 | 0.11 | 0.22 | 100.38 | ||||||||||||||||||||||||||||||||||||||||
| BRU 82-8 | 19A19401-03 | 0.00 | 0.00 | 0.36 | 99.82 | 0.01 | 0.00 | 0.02 | 0.00 | 0.02 | 0.00 | 0.09 | 0.17 | 100.49 | ||||||||||||||||||||||||||||||||||||||||
| BRU 82-8 | 19A19401-04 | 0.00 | 0.00 | 0.33 | 99.78 | 0.01 | 0.00 | 0.02 | 0.00 | 0.03 | 0.00 | 0.11 | 0.18 | 100.46 | ||||||||||||||||||||||||||||||||||||||||
| BRU 82-8 | 19A19401-05 | 0.00 | 0.01 | 0.39 | 99.49 | 0.01 | 0.00 | 0.05 | 0.00 | 0.02 | 0.00 | 0.19 | 0.28 | 100.44 | ||||||||||||||||||||||||||||||||||||||||
| BRU 82-8 | 19A19401-06 | 0.00 | 0.00 | 0.34 | 99.47 | 0.01 | 0.00 | 0.03 | 0.00 | 0.03 | 0.00 | 0.17 | 0.37 | 100.42 | ||||||||||||||||||||||||||||||||||||||||
Note: LOI = Loss On Ignition
| 8-6 |
TECHNICAL REPORT SUMMARY, BRU PROPERTY, MANITOBA, CANADA
| 8.3.3 | 2020 AGAT XRF Analytical Methodology and Results |
Thirteen samples that were processed by Sio Silica were sent to AGAT laboratories for whole rock XRF analyses. The process completed by AGAT during the XRF sample preparation includes heating the sample in a crucible to 1050°C in the oven (Muffelofen) for at least an hour and then the desiccator to restrict the sample collection of atmospheric moisture. During the heating process, volatiles are driven from the sample during this ignition process. The volatiles that are burned off of the samples are termed Loss On Ignition (LOI), which include the compounds H2O, CO2, and the elements F, Cl, S as well as K and Na in the event that the sample is heated for too long.
Table 8.5 summarize the results of AGAT XRF results. The source of the LOI wt. % is unknown and may potentially be caused by trapped moisture that did not dehydrate during the drying process, trace organics and shale fragments that were not excluded from the sand during washing. Due to this uncertainty of the origin of the LOI concentration, the volatiles need to be included in the normalized major oxide weight percentage. The results from this study showed that unnormalized SiO2 ranged from 99.41% to 99.99% however, the SiO2content does not directly correlate to quartz abundance, as silica is present in other minerals such as feldspars.
| 8-7 |
TECHNICAL REPORT SUMMARY, BRU PROPERTY, MANITOBA, CANADA
Table 8.5
2020 AGAT XRF Results – Concentration of Major Oxides and LOI (wt %)
| Sample Identification | Na2O (wt %) | MgO (wt %) | Al2O3 (wt %) | SiO2 (wt %) | P2O5 (wt %) | SO3 (wt %) | K2O (wt %) | CaO (wt %) | TiO2 (wt %) | Mn2O3 (wt%) | Fe2O3 (wt %) | LOI (wt %) | Sum (wt %) | |||||||||||||||||||||||||||||||||||||||
| 4Arr | 0.00 | 0.00 | 0.13 | 99.83 | 0.01 | 0.00 | 0.01 | 0.00 | 0.03 | 0.00 | 0.00 | 0.12 | 100.13 | |||||||||||||||||||||||||||||||||||||||
| April20_1A | 0.00 | 0.00 | 0.11 | 99.76 | 0.01 | 0.00 | 0.01 | 0.00 | 0.02 | 0.00 | 0.00 | 0.13 | 100.04 | |||||||||||||||||||||||||||||||||||||||
| April20_1B | 0.00 | 0.00 | 0.11 | 99.59 | 0.01 | 0.00 | 0.01 | 0.00 | 0.02 | 0.00 | 0.00 | 0.31 | 100.05 | |||||||||||||||||||||||||||||||||||||||
| April20_2A | 0.00 | 0.00 | 0.11 | 99.70 | 0.01 | 0.00 | 0.01 | 0.00 | 0.02 | 0.00 | 0.00 | 0.10 | 99.95 | |||||||||||||||||||||||||||||||||||||||
| April20_2B | 0.00 | 0.00 | 0.11 | 99.41 | 0.01 | 0.00 | 0.01 | 0.00 | 0.02 | 0.00 | 0.00 | 0.37 | 99.93 | |||||||||||||||||||||||||||||||||||||||
| April20_2C | 0.00 | 0.00 | 0.12 | 99.64 | 0.01 | 0.00 | 0.01 | 0.00 | 0.01 | 0.00 | 0.00 | 0.10 | 99.89 | |||||||||||||||||||||||||||||||||||||||
| April20_2D | 0.00 | 0.00 | 0.09 | 99.99 | 0.01 | 0.00 | 0.01 | 0.00 | 0.02 | 0.00 | 0.00 | 0.05 | 100.17 | |||||||||||||||||||||||||||||||||||||||
| April29_1A | 0.00 | 0.00 | 0.12 | 99.82 | 0.01 | 0.00 | 0.01 | 0.01 | 0.03 | 0.00 | 0.00 | 0.14 | 100.14 | |||||||||||||||||||||||||||||||||||||||
| April29_1B | 0.00 | 0.00 | 0.11 | 99.86 | 0.01 | 0.00 | 0.01 | 0.00 | 0.02 | 0.00 | 0.00 | 0.11 | 100.12 | |||||||||||||||||||||||||||||||||||||||
| April29_1C | 0.00 | 0.00 | 0.12 | 99.71 | 0.01 | 0.00 | 0.01 | 0.00 | 0.02 | 0.00 | 0.00 | 0.14 | 100.01 | |||||||||||||||||||||||||||||||||||||||
| Sio SilicaMay6 | 0.00 | 0.00 | 0.05 | 99.86 | 0.01 | 0.00 | 0.01 | 0.01 | 0.02 | 0.00 | 0.00 | 0.12 | 100.08 | |||||||||||||||||||||||||||||||||||||||
| Sio SilicaJune16 | 0.00 | 0.00 | 0.06 | 99.73 | 0.01 | 0.00 | 0.01 | 0.00 | 0.04 | 0.00 | 0.00 | 0.22 | 100.07 | |||||||||||||||||||||||||||||||||||||||
| Sio SilicaJune17 | 0.00 | 0.00 | 0.06 | 99.73 | 0.01 | 0.00 | 0.01 | 0.00 | 0.06 | 0.00 | 0.00 | 0.10 | 99.97 | |||||||||||||||||||||||||||||||||||||||
Note: LOI = Loss On Ignition
| 8-8 |
TECHNICAL REPORT SUMMARY, BRU PROPERTY, MANITOBA, CANADA
| 8.3.4 | Sio Silica Internal Facility Credentials and Processing Methodology |
Starting in 2020, personnel from Sio Silica developed an internal methodology to do bench scale test procedures for further purification of raw sand samples from the BRU Property at select sand size ranges, notably 40/70 and 70/140. The purpose of the sample processing was to generate a bench scale market ready sand product. In total 14 representative composite samples from within the Carman Sand Member were processed as shown in Table 8.6. The Sio Silica internal laboratory where these procedures were implemented is not an accredited facility and is not independent.
Table 8.6
Samples Processed at Sio Silica Facilities
| Field | Carman Sand Member Interval (m) | |||||||||
| Program Year | Hole ID | From | To | |||||||
| 2018-2019 | Bru-82-14 | 51.5 | 66.4 | |||||||
| 2018-2019 | Bru-73-1 | 41.1 | 62.2 | |||||||
| 2018-2019 | Bru-117-1 | 56.4 | 72.8 | |||||||
| 2018-2019 | Bru-126-1 | 57.9 | 77.4 | |||||||
| 2018-2019 | Bru-28-1 | 59.1 | 80.5 | |||||||
| 2018-2019 | Bru-146-1 | 51.8 | 72.8 | |||||||
| 2018-2019 | Bru-121-1 | 39.6 | 59.1 | |||||||
| 2020-2021 | Bru-154-1 | 57.3 | 66.1 | |||||||
| 2022 | Bru-3-1 | 63.7 | 82.3 | |||||||
| 2022 | Bru-81-1 | 51.5 | 67.1 | |||||||
| 2022 | Bru-92-8 | 50.6 | 56.7 | |||||||
| 2022 | Bru-13-1 | 56.7 | 79.2 | |||||||
| 2022 | Bru-83-1 | 48.2 | 70.1 | |||||||
| 2022 | Bru-93-1 | 53.0 | 66.4 | |||||||
| Count | 14 | 14 | ||||||||
| Minimum | 39.6 | 56.7 | ||||||||
| Maximum | 63.7 | 82.3 | ||||||||
| Mean | 52.8 | 70.0 | ||||||||
The sample processing procedure as summarised from Sio Silica’s laboratory procedures internal document is described as follows:
| 1. | Ensure sample is completely dry, use oven if necessary. |
| 2. | Composite samples from individual well (~50-100g per sample totaling ~1.2kg. Sample number assigned and recorded in database. |
| 3. | Sieve samples at fractions 40/70 and 70/140 at an amplitude of 1.30mm for 15 minutes |
| a. | Sieve #’s: 30, 40, 50, 60, 70, 80, 100, 140, Pan |
| 4. | Re-sieve the 40/70 and 70/140 sample separately at an amplitude of 1.30mm for 5 minutes |
| a. | 40/70 sample Sieve #’s: 40, 70, Pan |
| b. | 70/140 sample Sieve #’s: 70, 140, Pan |
| 5. | Water wash 40/70 sample using No. 70 and No. 325 wet sieve |
| 8-9 |
TECHNICAL REPORT SUMMARY, BRU PROPERTY, MANITOBA, CANADA
| 6. | Water wash 70/140 sample using the No. 325 wet sieve until water (tap water) runs clear and there are no visible fines suspended in solution. |
| 7. | Transfer samples from steps 4 and 5 to anchor glass baking dishes to dry in oven at 375°F for ~1 hour. Lab Testing Point A (40/70 fraction) and A-1 (70/140 fraction) are taken. |
| 8. | Run each sample through the Eriez Dry High Intensity Rare Earth Roll Magnetic Separator three times. Lab Testing point B (40/70 fraction) and B-1 (70/140 fraction) are taken. Available equipment for drying includes a Quincy Lab 30GC 2.0 ft3 gravity convection oven capable of 450 F. Sieves are ASTM E11 standard and a Retsch AS 300 control sieve shaker is used that complies with ISO 9001 requirements. |
From the original 14 composite sand samples 56 test point samples were produced as outlined:
| ● | Point A: 14 samples at 40/70 fraction – sieved, water washed, and dried. |
| ● | Point A-1: 14 samples at 70/140 fraction – sieved, water washed, and dried. |
| ● | Point B: 14 samples at 40/70 fraction – Sieved, water washed, dried, and ran through dry magnetic separator. |
| ● | Point B-1: 14 samples at 70/140 fraction – Sieved, water washed, dried, and ran through dry magnetic separator. |
These 56 samples were then sent to Liquids Matter laboratory for whole rock analysis
| 8.3.5 | 2022 Liquids Matter Whole Rock Analysis |
Liquids Matter is an independent accredited laboratory located in Calgary, Alberta that was used by Sio Silica to complete whole rock analysis on 56 sized and cleaned samples. The whole rock analysis was completed using Inductively coupled plasma - optical emission spectrometry (ICP- OES). A summary of the ICP-OES test results comparing 40/70 and 70/140 size fractions before (Point A, A-1) and after magnetic separation (Point B, B-1) are shown in Table 11.7. All ICP-OES ion test results for all four sample types (Point A, B, A-1 and A-2) are presented in oxide form and are shown in Tables 11.8 through 11.11. The ICP-OES test results show that the magnetic separator by Sio Silica was successful in increasing sand purity from a mean of 99.87% SiO2 to 99.91% SiO2 for the 40/70 size fraction, and 99.86% SiO2 to 99.91% SiO2 for the 70/140 size fraction.
The spatial distribution SiO2 and iron content measurements received from Liquids Matter after magnetic separation (Step/Point B), are shown in Figures 8-1 through 8-4 for the 40/70 and 70/140 size fractions. The percentage of each size fraction in each sample site, listed in Table 8.6, is shown in the contour overlay at 3% intervals. Also posted at each sample site (drill hole) is the aluminum oxide content for those maps showing iron distribution (Figure 8-3 and Figure 8-4). The spatial trends in SiO2, iron oxide and size fraction percentages were derived from the grid model.
| 8-10 |
TECHNICAL REPORT SUMMARY, BRU PROPERTY, MANITOBA, CANADA
Table 8.7
Liquids Matter ICP-OES Summary Test Results
| Point A 40/70 Fraction | Point B 40/70 Fraction | Point A-1 70/140 Fraction | Point B-1 70/140 Fraction | |||||||||||||||||||||||||||||||||||||||||||||
| Parameter | wash and dry | wash, dry and magnetic separation | wash and dry | wash, dry and magnetic separation | ||||||||||||||||||||||||||||||||||||||||||||
| SiO2 | Total Oxides | FeO2 | SiO2 | Total Oxides | FeO2 | SiO2 | Total Oxides | FeO2 | SiO2 | Total Oxides | FeO2 | |||||||||||||||||||||||||||||||||||||
| (%) | (%) | (ppm) | (%) | (%) | (ppm) | (%) | (%) | (ppm) | (%) | (%) | (ppm) | |||||||||||||||||||||||||||||||||||||
| Count | 14 | 14 | 14 | 14 | 14 | 14 | 14 | 14 | 14 | 14 | 14 | 14 | ||||||||||||||||||||||||||||||||||||
| Minimum | 99.80 | 0.050 | 52.1 | 99.86 | 0.042 | 28.9 | 99.75 | 0.041 | 100.3 | 99.87 | 0.043 | 29.4 | ||||||||||||||||||||||||||||||||||||
| Maximum | 99.93 | 0.263 | 323.0 | 99.95 | 0.167 | 99.5 | 99.92 | 0.319 | 325.3 | 99.95 | 0.149 | 76.4 | ||||||||||||||||||||||||||||||||||||
| Mean | 99.87 | 0.136 | 194.1 | 99.91 | 0.085 | 55.1 | 99.86 | 0.139 | 201.4 | 99.91 | 0.094 | 55.2 | ||||||||||||||||||||||||||||||||||||
| Std. Deviation | 0.04 | 0.066 | 80.2 | 0.03 | 0.035 | 19.1 | 0.04 | 0.070 | 71.4 | 0.03 | 0.034 | 15.1 | ||||||||||||||||||||||||||||||||||||
| 8-11 |
TECHNICAL REPORT SUMMARY, BRU PROPERTY, MANITOBA, CANADA
Table 8.8
Liquids Matter ICP-OES Point A 40/70 Test Results
| Sample Number | Hole ID | SiO2 (%) | S (ppm) | Mg (ppm) | B (ppm) | Ni (ppm) | Ba (ppm) | Mn (ppm) | Fe (ppm) | Cr (ppm) | Mo (ppm) | Al (ppm) | Ca (ppm) | Cu (ppm) | Ti (ppm) | Sr (ppm) | Zr (ppm) | Y (ppm) | Ce (ppm) | Li (ppm) | K (ppm) | Na (ppm) | ||||||||||||||||||||||||||||||||||||||||||||||||||||||||||||||||
| 22101 | Bru-82-14 | 99.81 | 76.7 | 85.1 | - | 0.81 | 0.38 | 0.83 | 137.4 | 2.13 | - | 1305 | 224 | 1.31 | 10.81 | 2.93 | 1.22 | 0.090 | 5.65 | 4.27 | 58.48 | 12.02 | ||||||||||||||||||||||||||||||||||||||||||||||||||||||||||||||||
| 2235 | Bru-73-1 | 99.90 | 86.3 | 38.2 | - | 0.43 | 3.81 | 1.20 | 241.8 | 1.50 | - | 467 | 96 | 2.31 | 4.89 | 2.29 | 3.36 | - | 2.04 | 1.01 | 17.58 | 11.29 | ||||||||||||||||||||||||||||||||||||||||||||||||||||||||||||||||
| 2241 | Bru-117-1 | 99.92 | 114.9 | 29.0 | 39.4 | 0.09 | - | 0.46 | 108.8 | 0.92 | - | 287 | 106 | 1.09 | 3.90 | 2.14 | 4.44 | - | 1.38 | 0.55 | 16.37 | 38.02 | ||||||||||||||||||||||||||||||||||||||||||||||||||||||||||||||||
| 2247 | Bru-126-1 | 99.85 | 104.7 | 95.1 | - | 0.16 | 0.01 | 1.63 | 217.8 | 1.02 | - | 489 | 522 | 1.99 | 7.45 | 2.71 | 0.96 | 0.005 | 2.15 | 1.37 | 14.45 | 22.11 | ||||||||||||||||||||||||||||||||||||||||||||||||||||||||||||||||
| 2253 | Bru-28-1 | 99.87 | 82.6 | 37.3 | 9.5 | 0.48 | 0.62 | 0.96 | 174.1 | 1.63 | - | 835 | 124 | 1.72 | 7.83 | 3.10 | 0.78 | 0.031 | 4.42 | 3.04 | 24.48 | 27.48 | ||||||||||||||||||||||||||||||||||||||||||||||||||||||||||||||||
| 2259 | Bru-146-1 | 99.85 | 116.1 | 46.3 | - | 0.38 | 0.02 | 2.87 | 305.4 | 1.60 | - | 757 | 222 | 4.61 | 19.65 | 2.63 | 1.14 | 0.081 | 3.97 | 2.25 | 14.45 | 17.84 | ||||||||||||||||||||||||||||||||||||||||||||||||||||||||||||||||
| 2265 | Bru-121-1 | 99.89 | 103.0 | 42.8 | 8.5 | 0.14 | - | 2.70 | 323.0 | 1.14 | - | 338 | 224 | 3.43 | 5.16 | 2.01 | 0.84 | 0.076 | 2.63 | 0.71 | 14.99 | 31.69 | ||||||||||||||||||||||||||||||||||||||||||||||||||||||||||||||||
| 2271 | Bru-154-1 | 99.86 | 65.5 | 50.2 | 11.4 | 0.26 | - | 0.71 | 109.3 | 1.67 | - | 985 | 130 | 0.99 | 4.68 | 2.26 | 3.53 | 0.086 | 3.50 | 3.22 | 50.71 | 17.96 | ||||||||||||||||||||||||||||||||||||||||||||||||||||||||||||||||
| 22105 | Bru-3-1 | 99.86 | 56.1 | 61.0 | - | 0.27 | 0.19 | 2.30 | 222.6 | 1.53 | - | 719 | 324 | 0.65 | 16.71 | 3.55 | 1.28 | 0.134 | 5.63 | 2.34 | 17.74 | 1.59 | ||||||||||||||||||||||||||||||||||||||||||||||||||||||||||||||||
| 22109 | Bru-81-1 | 99.87 | 69.9 | 65.5 | - | 0.16 | 0.21 | 1.63 | 139.0 | 1.13 | - | 487 | 475 | 1.13 | 5.81 | 3.46 | 0.98 | 0.167 | 5.64 | 1.33 | 24.23 | 7.84 | ||||||||||||||||||||||||||||||||||||||||||||||||||||||||||||||||
| 2283 | Bru-92-8 | 99.93 | 39.4 | 27.2 | - | 0.13 | - | 0.23 | 52.1 | 0.88 | - | 455 | 60 | 2.36 | 4.16 | 1.94 | 1.35 | 0.013 | 2.76 | 1.57 | 12.31 | - | ||||||||||||||||||||||||||||||||||||||||||||||||||||||||||||||||
| 2289 | Bru-13-1 | 99.80 | 80.1 | 68.6 | - | 0.54 | 0.25 | 1.98 | 298.0 | 2.12 | - | 1175 | 308 | 1.30 | 11.58 | 3.07 | 8.35 | 0.064 | 5.43 | 4.70 | 16.58 | 8.64 | ||||||||||||||||||||||||||||||||||||||||||||||||||||||||||||||||
| 2293 | Bru-83-1 | 99.86 | 170.4 | 56.4 | - | 0.45 | 0.43 | 1.65 | 244.9 | 1.18 | - | 327 | 531 | 1.31 | 5.20 | 4.32 | 0.96 | 0.059 | 3.19 | 0.20 | 25.45 | 18.60 | ||||||||||||||||||||||||||||||||||||||||||||||||||||||||||||||||
| 2297 | Bru-93-1 | 99.85 | 57.7 | 97.2 | - | 0.27 | 0.55 | 1.44 | 142.7 | 1.35 | 0.153 | 657 | 467 | 1.09 | 5.61 | 4.59 | 0.99 | 0.040 | 3.72 | 2.26 | 16.51 | 45.70 | ||||||||||||||||||||||||||||||||||||||||||||||||||||||||||||||||
| Count | n/a | 14 | 14 | 14 | 4 | 14 | 10 | 14 | 14 | 14 | 1 | 14 | 14 | 14 | 14 | 14 | 14 | 12 | 14 | 14 | 14 | 13 | ||||||||||||||||||||||||||||||||||||||||||||||||||||||||||||||||
| Minimum | n/a | 99.80 | 39.4 | 27.2 | 8.5 | 0.09 | 0.01 | 0.23 | 52.1 | 0.88 | 0.153 | 287 | 60 | 0.65 | 3.90 | 1.94 | 0.78 | 0.005 | 1.38 | 0.20 | 12.31 | 1.59 | ||||||||||||||||||||||||||||||||||||||||||||||||||||||||||||||||
| Maximum | n/a | 99.93 | 170.4 | 97.2 | 39.4 | 0.81 | 3.81 | 2.87 | 323.0 | 2.13 | 0.153 | 1305 | 531 | 4.61 | 19.65 | 4.59 | 8.35 | 0.167 | 5.65 | 4.70 | 58.48 | 45.70 | ||||||||||||||||||||||||||||||||||||||||||||||||||||||||||||||||
| Mean | n/a | 99.87 | 87.4 | 57.1 | 17.2 | 0.33 | 0.65 | 1.47 | 194.1 | 1.42 | 0.153 | 663 | 272 | 1.81 | 8.10 | 2.93 | 2.16 | 0.070 | 3.72 | 2.06 | 23.17 | 20.06 | ||||||||||||||||||||||||||||||||||||||||||||||||||||||||||||||||
| Std. Deviation | n/a | 0.04 | 31.8 | 22.1 | 12.9 | 0.19 | 1.07 | 0.77 | 80.2 | 0.39 | - | 307 | 162 | 1.05 | 4.71 | 0.80 | 2.06 | 0.045 | 1.41 | 1.31 | 13.48 | 12.24 | ||||||||||||||||||||||||||||||||||||||||||||||||||||||||||||||||
Note: The reported impurities contents are in an oxide form.
| 8-12 |
TECHNICAL REPORT SUMMARY, BRU PROPERTY, MANITOBA, CANADA
Table 8.9
Liquids Matter ICP-OES Point B 40/70 Test Results
| Sample | Hole | SiO2 | S | Mg | B | Ni | Ba | Mn | Fe | Cr | Mo | Al | Ca | Cu | Ti | Sr | Zr | Y | Ce | Li | K | Na | ||||||||||||||||||||||||||||||||||||||||||||||||||||||||||||||||||
| Number | ID | (%) | (ppm) | (ppm) | (ppm) | (ppm) | (ppm) | (ppm) | (ppm) | (ppm) | (ppm) | (ppm) | (ppm) | (ppm) | (ppm) | (ppm) | (ppm) | (ppm) | (ppm) | (ppm) | (ppm) | (ppm) | ||||||||||||||||||||||||||||||||||||||||||||||||||||||||||||||||||
| 22103 | Bru-82-14 | 99.86 | 77.6 | 65.7 | - | 0.57 | 0.20 | 0.47 | 82.6 | 1.54 | - | 924 | 193 | 1.56 | 4.74 | 2.56 | 1.03 | 0.082 | 4.74 | 3.34 | 42.84 | 5.58 | ||||||||||||||||||||||||||||||||||||||||||||||||||||||||||||||||||
| 2237 | Bru-73-1 | 99.94 | 79.4 | 27.6 | - | 0.16 | - | 0.32 | 39.3 | 0.85 | - | 308 | 90 | 1.02 | 2.78 | 2.09 | 2.52 | 0.009 | 2.57 | 1.51 | 13.64 | 14.17 | ||||||||||||||||||||||||||||||||||||||||||||||||||||||||||||||||||
| 2243 | Bru-117-1 | 99.94 | 110.6 | 20.2 | - | 0.13 | - | 0.18 | 55.8 | 0.83 | - | 299 | 55 | 0.87 | 2.83 | 1.84 | 0.30 | 0.001 | 2.84 | 1.01 | 10.65 | 8.76 | ||||||||||||||||||||||||||||||||||||||||||||||||||||||||||||||||||
| 2249 | Bru-126-1 | 99.94 | 72.6 | 31.1 | - | 0.06 | - | 0.31 | 39.6 | 0.53 | - | 271 | 186 | 1.14 | 2.52 | 1.59 | 0.54 | 0.002 | 1.71 | 1.25 | 9.97 | 9.00 | ||||||||||||||||||||||||||||||||||||||||||||||||||||||||||||||||||
| 2255 | Bru-28-1 | 99.95 | 82.2 | 27.5 | - | 0.24 | - | 0.35 | 63.2 | 0.72 | - | 258 | 75 | 1.07 | 2.12 | 2.50 | 0.40 | 0.020 | 2.46 | 0.81 | 13.90 | 10.59 | ||||||||||||||||||||||||||||||||||||||||||||||||||||||||||||||||||
| 2261 | Bru-146-1 | 99.93 | 96.8 | 22.0 | - | 0.28 | - | 0.32 | 47.7 | 0.95 | - | 383 | 124 | 4.56 | 3.10 | 2.03 | 1.08 | 0.064 | 2.82 | 1.65 | 13.63 | 18.30 | ||||||||||||||||||||||||||||||||||||||||||||||||||||||||||||||||||
| 2267 | Bru-121-1 | 99.91 | 88.1 | 28.1 | - | 0.45 | - | 0.49 | 46.5 | 1.07 | - | 548 | 164 | 3.89 | 3.34 | 2.36 | 1.20 | 0.095 | 3.65 | 2.21 | 16.67 | 34.42 | ||||||||||||||||||||||||||||||||||||||||||||||||||||||||||||||||||
| 2273 | Bru-154-1 | 99.90 | 59.9 | 54.9 | - | 0.14 | - | 0.46 | 73.2 | 1.32 | - | 692 | 108 | 0.91 | 2.91 | 2.10 | 0.44 | 0.064 | 3.04 | 2.23 | 29.09 | 1.84 | ||||||||||||||||||||||||||||||||||||||||||||||||||||||||||||||||||
| 22107 | Bru-3-1 | 99.89 | 56.7 | 42.1 | - | 0.25 | 0.18 | 0.93 | 52.6 | 1.23 | - | 667 | 275 | 1.14 | 6.35 | 3.43 | 1.33 | 0.119 | 5.93 | 2.45 | 16.15 | 2.27 | ||||||||||||||||||||||||||||||||||||||||||||||||||||||||||||||||||
| 22111 | Bru-81-1 | 99.90 | 64.4 | 50.9 | - | 0.15 | 0.17 | 1.10 | 65.9 | 1.05 | - | 412 | 366 | 1.42 | 4.65 | 3.38 | 1.80 | 0.178 | 5.57 | 1.17 | 21.41 | 1.29 | ||||||||||||||||||||||||||||||||||||||||||||||||||||||||||||||||||
| 2285 | Bru-92-8 | 99.94 | 37.0 | 24.4 | - | 0.10 | - | 0.13 | 28.9 | 0.81 | - | 406 | 54 | 1.91 | 4.49 | 1.68 | 1.29 | 0.017 | 2.78 | 1.39 | 12.21 | 4.38 | ||||||||||||||||||||||||||||||||||||||||||||||||||||||||||||||||||
| 2291 | Bru-13-1 | 99.93 | 35.8 | 36.1 | - | 0.14 | 0.24 | 0.27 | 38.2 | 0.69 | - | 358 | 173 | 1.36 | 2.79 | 3.14 | 1.19 | - | 1.48 | 0.61 | 13.06 | 21.18 | ||||||||||||||||||||||||||||||||||||||||||||||||||||||||||||||||||
| 2295 | Bru-83-1 | 99.90 | 88.0 | 43.2 | - | 0.28 | 0.54 | 0.67 | 99.5 | 1.20 | - | 517 | 228 | 1.45 | 4.64 | 4.41 | 0.94 | - | 4.18 | 1.04 | 26.33 | 21.62 | ||||||||||||||||||||||||||||||||||||||||||||||||||||||||||||||||||
| 2299 | Bru-93-1 | 99.90 | 62.3 | 54.9 | - | 0.27 | 0.06 | 0.30 | 39.0 | 1.18 | - | 649 | 187 | 1.34 | 3.78 | 2.61 | 1.25 | 0.052 | 3.81 | 2.67 | 12.64 | 1.57 | ||||||||||||||||||||||||||||||||||||||||||||||||||||||||||||||||||
| Count | n/a | 14 | 14 | 14 | 0 | 14 | 6 | 14 | 14 | 14 | 0 | 14 | 14 | 14 | 14 | 14 | 14 | 12 | 14 | 14 | 14 | 14 | ||||||||||||||||||||||||||||||||||||||||||||||||||||||||||||||||||
| Minimum | n/a | 99.86 | 35.8 | 20.2 | - | 0.06 | 0.06 | 0.13 | 28.9 | 0.53 | - | 258 | 54 | 0.87 | 2.12 | 1.59 | 0.30 | 0.001 | 1.48 | 0.61 | 9.97 | 1.29 | ||||||||||||||||||||||||||||||||||||||||||||||||||||||||||||||||||
| Maximum | n/a | 99.95 | 110.6 | 65.7 | - | 0.57 | 0.54 | 1.10 | 99.5 | 1.54 | - | 924 | 366 | 4.56 | 6.35 | 4.41 | 2.52 | 0.178 | 5.93 | 3.34 | 42.84 | 34.42 | ||||||||||||||||||||||||||||||||||||||||||||||||||||||||||||||||||
| Mean | n/a | 99.91 | 72.2 | 37.8 | - | 0.23 | 0.23 | 0.45 | 55.1 | 1.00 | - | 478 | 163 | 1.69 | 3.65 | 2.55 | 1.09 | 0.058 | 3.40 | 1.67 | 18.01 | 11.07 | ||||||||||||||||||||||||||||||||||||||||||||||||||||||||||||||||||
| Std. Deviation | n/a | 0.03 | 20.5 | 13.8 | - | 0.14 | 0.15 | 0.27 | 19.1 | 0.27 | - | 189 | 85 | 1.07 | 1.13 | 0.76 | 0.57 | 0.052 | 1.28 | 0.77 | 8.81 | 9.46 | ||||||||||||||||||||||||||||||||||||||||||||||||||||||||||||||||||
Note: The reported impurities contents are in an oxide form.
| 8-13 |
TECHNICAL REPORT SUMMARY, BRU PROPERTY, MANITOBA, CANADA
Table 8.10
Liquids Matter ICP-OES Point A-1 70/140 Test Results
| Sample | Hole | SiO2 | S | Mg | B | Ni | Ba | Mn | Fe | Cr | Mo | Al | Ca | Cu | Ti | Sr | Zr | Y | Ce | Li | K | Na | ||||||||||||||||||||||||||||||||||||||||||||||||||||||||||||||||
| Number | ID | (%) | (ppm) | (ppm) | (ppm) | (ppm) | (ppm) | (ppm) | (ppm) | (ppm) | (ppm) | (ppm) | (ppm) | (ppm) | (ppm) | (ppm) | (ppm) | (ppm) | (ppm) | (ppm) | (ppm) | (ppm) | ||||||||||||||||||||||||||||||||||||||||||||||||||||||||||||||||
| 22102 | Bru-82-14 | 99.75 | 72.9 | 83.6 | - | 0.95 | 0.38 | 9.82 | 323.6 | 3.12 | - | 1374 | 242 | 0.71 | 275.59 | 2.42 | 2.31 | 0.155 | 4.60 | 4.65 | 58.27 | 5.71 | ||||||||||||||||||||||||||||||||||||||||||||||||||||||||||||||||
| 2236 | Bru-73-1 | 99.92 | 83.6 | 39.1 | - | 0.35 | 1.35 | 1.74 | 139.7 | 1.41 | - | 305 | 130 | 1.92 | 34.57 | 1.86 | 2.27 | 0.029 | 1.24 | 1.33 | 18.22 | 9.54 | ||||||||||||||||||||||||||||||||||||||||||||||||||||||||||||||||
| 2242 | Bru-117-1 | 99.89 | 88.3 | 26.6 | - | 0.36 | 3.76 | 1.47 | 100.3 | 1.63 | - | 747 | 73 | 2.36 | 44.13 | 1.74 | 0.80 | 0.019 | 2.48 | 2.97 | 15.44 | 14.43 | ||||||||||||||||||||||||||||||||||||||||||||||||||||||||||||||||
| 2248 | Bru-126-1 | 99.86 | 102.5 | 57.6 | - | 0.32 | 1.41 | 3.11 | 155.9 | 1.49 | - | 663 | 259 | 2.58 | 75.21 | 2.50 | 1.05 | 0.041 | 1.79 | 2.19 | 18.23 | 13.89 | ||||||||||||||||||||||||||||||||||||||||||||||||||||||||||||||||
| 2254 | Bru-28-1 | 99.87 | 84.8 | 38.7 | - | 0.31 | 2.49 | 2.75 | 220.7 | 1.75 | - | 633 | 162 | 3.86 | 56.39 | 3.32 | 0.77 | 0.036 | 2.92 | 2.51 | 22.06 | 17.10 | ||||||||||||||||||||||||||||||||||||||||||||||||||||||||||||||||
| 2260 | Bru-146-1 | 99.91 | 164.7 | 36.6 | - | 0.57 | 0.58 | 2.14 | 262.1 | 1.29 | - | 123 | 216 | 12.12 | 8.69 | 1.10 | 0.68 | 0.078 | 1.30 | 0.03 | 9.18 | 10.98 | ||||||||||||||||||||||||||||||||||||||||||||||||||||||||||||||||
| 2266 | Bru-121-1 | 99.88 | 112.1 | 37.1 | - | 0.44 | 0.27 | 2.34 | 247.1 | 1.69 | - | 586 | 188 | 8.48 | 25.74 | 2.11 | 0.88 | 0.093 | 3.39 | 2.36 | 14.91 | 15.38 | ||||||||||||||||||||||||||||||||||||||||||||||||||||||||||||||||
| 2272 | Bru-154-1 | 99.85 | 70.8 | 49.0 | - | 0.60 | - | 2.73 | 170.3 | 2.40 | - | 971 | 122 | 2.37 | 70.16 | 2.41 | 1.59 | 0.158 | 3.80 | 3.40 | 44.30 | 0.58 | ||||||||||||||||||||||||||||||||||||||||||||||||||||||||||||||||
| 22106 | Bru-3-1 | 99.81 | 60.9 | 63.1 | - | 0.52 | 0.26 | 8.07 | 325.3 | 2.30 | - | 950 | 250 | 0.99 | 227.59 | 2.40 | 2.33 | 0.139 | 4.78 | 3.27 | 19.91 | 1.33 | ||||||||||||||||||||||||||||||||||||||||||||||||||||||||||||||||
| 22110 | Bru-81-1 | 99.88 | 62.3 | 58.0 | �� | - | 0.23 | 0.12 | 4.53 | 193.8 | 1.63 | 0.388 | 425 | 315 | 1.48 | 110.39 | 1.90 | 4.85 | 0.136 | 3.45 | 1.31 | 20.29 | 0.59 | |||||||||||||||||||||||||||||||||||||||||||||||||||||||||||||||
| 2284 | Bru-92-8 | 99.90 | 44.2 | 29.0 | - | 0.28 | - | 4.36 | 134.0 | 1.82 | - | 542 | 70 | 1.14 | 120.50 | 1.87 | 1.47 | 0.063 | 2.49 | 1.85 | 14.69 | 5.90 | ||||||||||||||||||||||||||||||||||||||||||||||||||||||||||||||||
| 2290 | Bru-13-1 | 99.84 | 39.5 | 78.2 | 26.1 | 0.29 | 0.52 | 5.89 | 261.5 | 1.82 | - | 666 | 312 | 1.54 | 160.93 | 3.25 | 3.63 | 0.063 | 1.89 | 1.81 | 20.20 | 37.16 | ||||||||||||||||||||||||||||||||||||||||||||||||||||||||||||||||
| 2294 | Bru-83-1 | 99.83 | 82.6 | 53.5 | - | 0.45 | 0.42 | 4.06 | 179.8 | 1.76 | 0.354 | 453 | 802 | 1.46 | 54.61 | 3.66 | 4.22 | 0.082 | 2.81 | 0.75 | 30.74 | 21.46 | ||||||||||||||||||||||||||||||||||||||||||||||||||||||||||||||||
| 2298 | Bru-93-1 | 99.90 | 43.0 | 64.8 | - | 0.32 | 0.50 | 1.76 | 105.8 | 1.51 | - | 511 | 224 | 1.64 | 42.59 | 3.24 | 1.24 | 0.028 | 2.03 | 1.67 | 14.94 | 27.03 | ||||||||||||||||||||||||||||||||||||||||||||||||||||||||||||||||
| Count | n/a | 14 | 14 | 14 | 1 | 14 | 12 | 14 | 14 | 14 | 2 | 14 | 14 | 14 | 14 | 14 | 14 | 14 | 14 | 14 | 14 | 14 | ||||||||||||||||||||||||||||||||||||||||||||||||||||||||||||||||
| Minimum | n/a | 99.75 | 39.5 | 26.6 | 26.1 | 0.23 | 0.12 | 1.47 | 100.3 | 1.29 | 0.354 | 123 | 70 | 0.71 | 8.69 | 1.10 | 0.68 | 0.019 | 1.24 | 0.03 | 9.18 | 0.58 | ||||||||||||||||||||||||||||||||||||||||||||||||||||||||||||||||
| Maximum | n/a | 99.92 | 164.7 | 83.6 | 26.1 | 0.95 | 3.76 | 9.82 | 325.3 | 3.12 | 0.388 | 1374 | 802 | 12.12 | 275.59 | 3.66 | 4.85 | 0.158 | 4.78 | 4.65 | 58.27 | 37.16 | ||||||||||||||||||||||||||||||||||||||||||||||||||||||||||||||||
| Mean | n/a | 99.86 | 79.4 | 51.1 | 26.1 | 0.43 | 1.00 | 3.91 | 201.4 | 1.83 | 0.371 | 639 | 240 | 3.05 | 93.36 | 2.41 | 2.01 | 0.080 | 2.78 | 2.15 | 22.96 | 12.93 | ||||||||||||||||||||||||||||||||||||||||||||||||||||||||||||||||
| Std. Deviation | n/a | 0.04 | 31.5 | 16.9 | 0.0 | 0.18 | 1.05 | 2.41 | 71.4 | 0.46 | 0.017 | 298 | 173 | 3.13 | 75.95 | 0.70 | 1.31 | 0.048 | 1.08 | 1.14 | 12.75 | 10.15 | ||||||||||||||||||||||||||||||||||||||||||||||||||||||||||||||||
Note: The reported impurities contents are in an oxide form.
| 8-14 |
TECHNICAL REPORT SUMMARY, BRU PROPERTY, MANITOBA, CANADA
Table 8.11
Liquids Matter ICP-OES Point B-1 70/140 Test Results
| Sample Number | Hole ID | SiO2 (%) | S (ppm) | Mg (ppm) | B (ppm) | Ni (ppm) | Ba (ppm) | Mn (ppm) | Fe (ppm) | Cr (ppm) | Mo (ppm) | Al (ppm) | Ca (ppm) | Cu (ppm) | Ti (ppm) | Sr (ppm) | Zr (ppm) | Y (ppm) | Ce (ppm) | Li (ppm) | K (ppm) | Na (ppm) | ||||||||||||||||||||||||||||||||||||||||||||||||||||||||||||||||
| 22104 | Bru-82-14 | 99.89 | 50.1 | 50.1 | - | 0.56 | 0.00 | 0.40 | 76.4 | 1.48 | - | 789 | 125 | 0.62 | 4.76 | 1.78 | 2.53 | 0.047 | 3.33 | 2.55 | 40.25 | 0.41 | ||||||||||||||||||||||||||||||||||||||||||||||||||||||||||||||||
| 2238 | Bru-73-1 | 99.93 | 58.3 | 26.2 | - | 0.37 | 1.86 | 0.37 | 57.0 | 1.38 | - | 405 | 78 | 1.11 | 3.51 | 1.37 | 2.02 | 0.038 | 1.65 | 1.23 | 13.73 | 7.43 | ||||||||||||||||||||||||||||||||||||||||||||||||||||||||||||||||
| 2244 | Bru-117-1 | 99.95 | 75.5 | 24.6 | - | 0.10 | - | 0.20 | 29.4 | 0.73 | - | 263 | 65 | 2.02 | 2.63 | 1.06 | 1.71 | - | 1.25 | 1.66 | 8.14 | 11.04 | ||||||||||||||||||||||||||||||||||||||||||||||||||||||||||||||||
| 2250 | Bru-126-1 | 99.87 | 49.8 | 30.8 | - | 0.45 | 1.43 | 0.41 | 74.2 | 1.61 | - | 972 | 119 | 1.48 | 6.00 | 2.07 | 1.73 | 0.046 | 2.97 | 3.78 | 16.94 | 14.74 | ||||||||||||||||||||||||||||||||||||||||||||||||||||||||||||||||
| 2256 | Bru-28-1 | 99.94 | 74.1 | 28.0 | - | 0.12 | 0.04 | 0.33 | 64.7 | 0.89 | - | 369 | 71 | 4.16 | 2.73 | 1.26 | 0.52 | - | 1.88 | 1.58 | 16.28 | 7.45 | ||||||||||||||||||||||||||||||||||||||||||||||||||||||||||||||||
| 2262 | Bru-146-1 | 99.93 | 83.0 | 24.7 | - | 0.31 | - | 0.33 | 38.9 | 1.05 | - | 369 | 112 | 10.66 | 4.42 | 1.56 | 0.80 | 0.046 | 2.33 | 1.80 | 11.65 | 13.79 | ||||||||||||||||||||||||||||||||||||||||||||||||||||||||||||||||
| 2268 | Bru-121-1 | 99.91 | 81.8 | 26.8 | - | 0.28 | - | 0.41 | 37.6 | 1.25 | - | 569 | 138 | 7.91 | 4.09 | 1.88 | 0.90 | 0.070 | 3.37 | 2.67 | 14.47 | 20.18 | ||||||||||||||||||||||||||||||||||||||||||||||||||||||||||||||||
| 2274 | Bru-154-1 | 99.91 | 37.3 | 35.5 | - | 0.21 | - | 0.22 | 55.9 | 1.29 | - | 652 | 76 | 2.40 | 3.76 | 1.68 | 0.45 | 0.019 | 2.68 | 2.23 | 26.39 | 7.62 | ||||||||||||||||||||||||||||||||||||||||||||||||||||||||||||||||
| 22108 | Bru-3-1 | 99.89 | 46.8 | 40.6 | - | 0.26 | - | 0.49 | 49.2 | 1.33 | - | 767 | 154 | 1.00 | 6.64 | 1.89 | 1.26 | 0.079 | 4.01 | 2.69 | 18.58 | 1.57 | ||||||||||||||||||||||||||||||||||||||||||||||||||||||||||||||||
| 22112 | Bru-81-1 | 99.88 | 51.0 | 53.7 | - | 0.32 | 0.18 | 0.68 | 72.6 | 1.73 | - | 751 | 194 | 1.72 | 7.80 | 2.21 | 1.58 | 0.111 | 4.49 | 2.42 | 25.62 | 14.08 | ||||||||||||||||||||||||||||||||||||||||||||||||||||||||||||||||
| 2286 | Bru-92-8 | 99.87 | 60.4 | 32.5 | 1.3 | 0.47 | 2.89 | 0.29 | 56.7 | 1.76 | - | 978 | 80 | 1.18 | 6.80 | 2.23 | 2.02 | 0.058 | 3.19 | 3.86 | 19.15 | 18.31 | ||||||||||||||||||||||||||||||||||||||||||||||||||||||||||||||||
| 2292 | Bru-13-1 | 99.92 | 35.8 | 45.3 | - | 0.14 | 0.22 | 0.28 | 40.5 | 0.89 | - | 462 | 157 | 1.57 | 3.30 | 2.76 | 1.81 | - | 1.32 | 1.10 | 14.18 | 19.09 | ||||||||||||||||||||||||||||||||||||||||||||||||||||||||||||||||
| 2296 | Bru-83-1 | 99.92 | 67.2 | 41.1 | - | 0.31 | 0.33 | 0.51 | 74.5 | 1.28 | - | 408 | 150 | 1.51 | 4.49 | 3.26 | 0.99 | - | 2.58 | 0.76 | 26.81 | 19.48 | ||||||||||||||||||||||||||||||||||||||||||||||||||||||||||||||||
| 22100 | Bru-93-1 | 99.88 | 64.5 | 46.2 | - | 0.33 | 0.02 | 0.24 | 44.8 | 1.51 | - | 900 | 116 | 1.54 | 5.24 | 1.87 | 0.96 | 0.056 | 3.30 | 3.90 | 14.88 | 7.36 | ||||||||||||||||||||||||||||||||||||||||||||||||||||||||||||||||
| Count | n/a | 14 | 14 | 14 | 1 | 14 | 9 | 14 | 14 | 14 | 0 | 14 | 14 | 14 | 14 | 14 | 14 | 10 | 14 | 14 | 14 | 14 | ||||||||||||||||||||||||||||||||||||||||||||||||||||||||||||||||
| Minimum | n/a | 99.87 | 35.8 | 24.6 | 1.3 | 0.10 | 0.00 | 0.20 | 29.4 | 0.73 | - | 263 | 65 | 0.62 | 2.63 | 1.06 | 0.45 | 0.019 | 1.25 | 0.76 | 8.14 | 0.41 | ||||||||||||||||||||||||||||||||||||||||||||||||||||||||||||||||
| Maximum | n/a | 99.95 | 83.0 | 53.7 | 1.3 | 0.56 | 2.89 | 0.68 | 76.4 | 1.76 | - | 978 | 194 | 10.66 | 7.80 | 3.26 | 2.53 | 0.111 | 4.49 | 3.90 | 40.25 | 20.18 | ||||||||||||||||||||||||||||||||||||||||||||||||||||||||||||||||
| Mean | n/a | 99.91 | 59.7 | 36.2 | 1.3 | 0.30 | 0.77 | 0.37 | 55.2 | 1.30 | - | 618 | 117 | 2.78 | 4.73 | 1.92 | 1.38 | 0.057 | 2.74 | 2.30 | 19.08 | 11.61 | ||||||||||||||||||||||||||||||||||||||||||||||||||||||||||||||||
| Std. Deviation | n/a | 0.03 | 14.8 | 9.6 | 0.0 | 0.13 | 0.98 | 0.12 | 15.1 | 0.31 | - | 235 | 38 | 2.82 | 1.53 | 0.56 | 0.60 | 0.024 | 0.94 | 0.99 | 7.94 | 6.28 | ||||||||||||||||||||||||||||||||||||||||||||||||||||||||||||||||
Note: The reported impurities contents are in an oxide form.
| 8-15 |
TECHNICAL REPORT SUMMARY, BRU PROPERTY, MANITOBA, CANADA
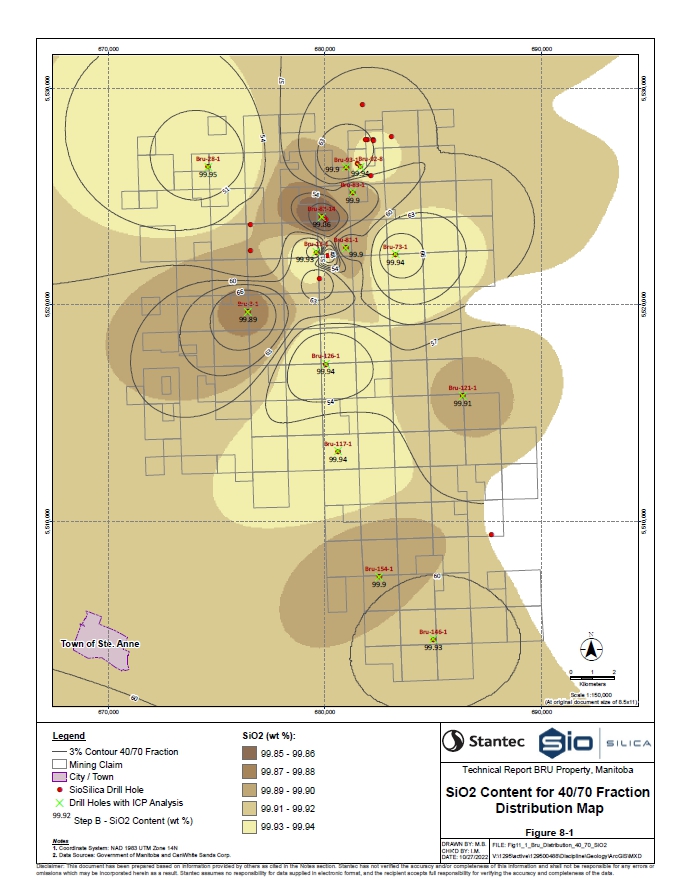
| 8-16 |
TECHNICAL REPORT SUMMARY, BRU PROPERTY, MANITOBA, CANADA
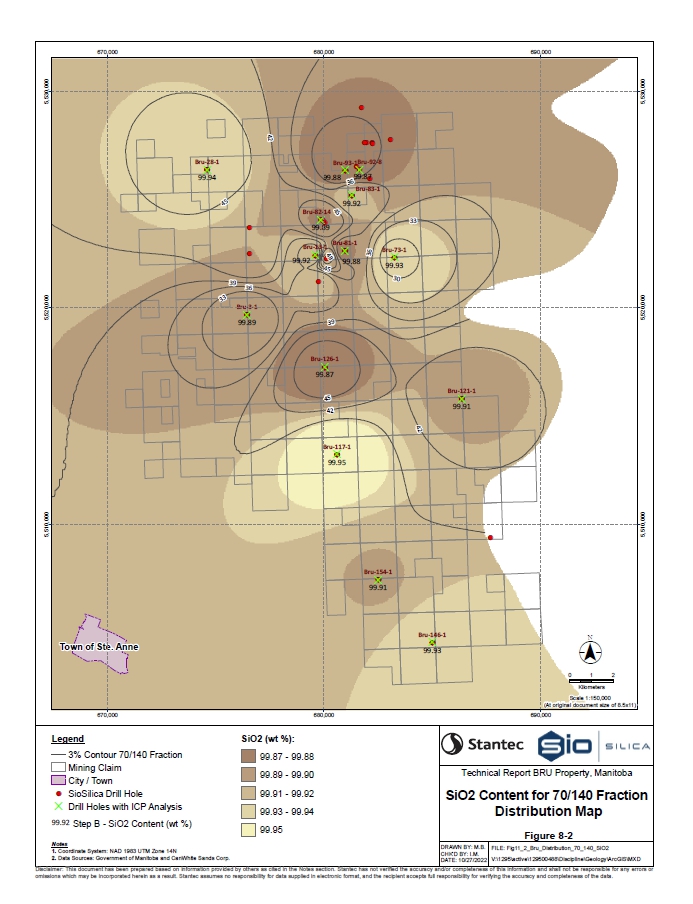
| 8-17 |
TECHNICAL REPORT SUMMARY, BRU PROPERTY, MANITOBA, CANADA
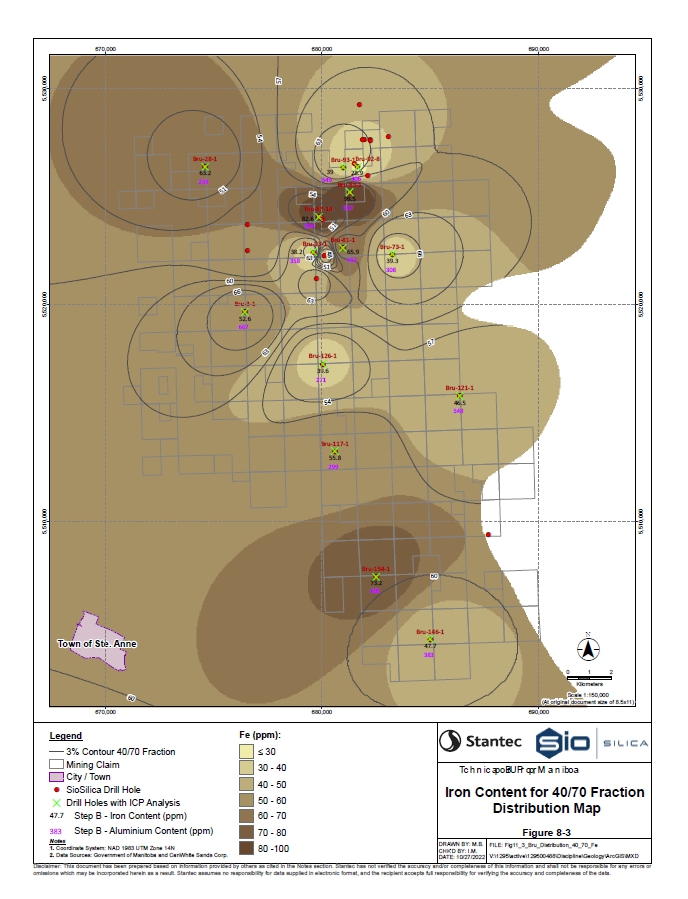
| 8-18 |
TECHNICAL REPORT SUMMARY, BRU PROPERTY, MANITOBA, CANADA
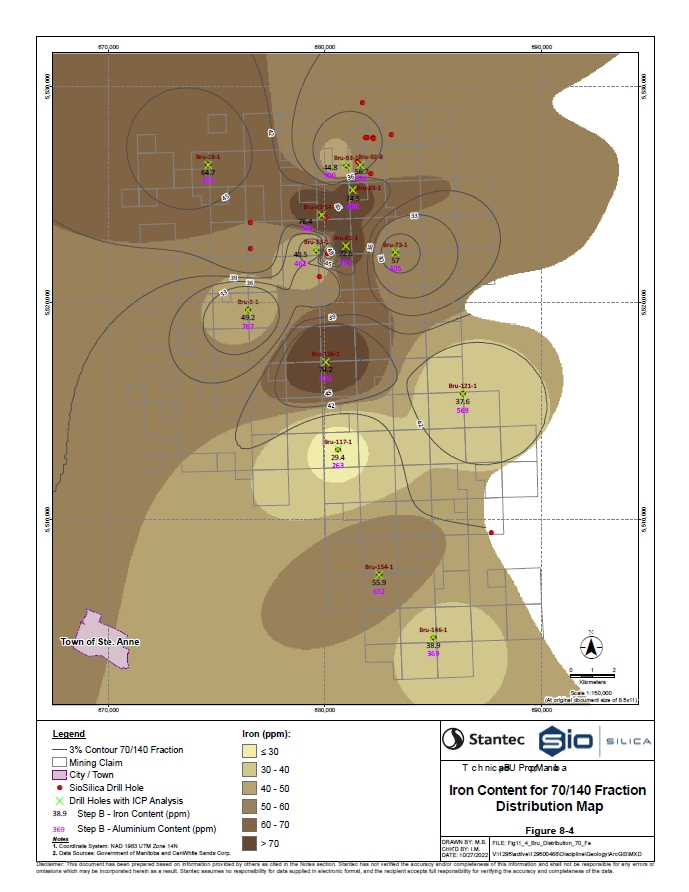
| 8-19 |
TECHNICAL REPORT SUMMARY, BRU PROPERTY, MANITOBA, CANADA
| 9 | DATA VERIFICATION |
| 9.1 | SITE VISIT AND ALIGNMENT ON FIELD PROCEDURES AND SAMPLING PROTOCOL |
A Stantec professional geologist assisted with and oversaw the portion of the program involving collection of the field data, sample collection, and the implementation of chain-of-custody documentation during sample shipment. To streamline the program, the Stantec professional geologist conducted a site visit to the Property on July 5 and 6, 2017, which was at the time that the Sio Silica field personnel were drilling BH-03-17; the first 2017 hole. The timing of this site visit provided the professional geologist the opportunity to align with the Sio Silica field crew on program procedures, as well as to instruct the drilling crew on the required rate of drilling to facilitate sample collection.
On June 10, 2022, the QP visited the Sio Silica’s laboratory in Calgary, Alberta, to review the laboratory equipment, and protocols with Sio Silica personnel. The Sio Silica laboratory is used to process the sand to a product that represents “market ready” sand. The process flow includes sample compositing, drying and sieve analysis. The Sio Silica lab is equipped with a magnetic separator to remove iron contaminant particles. It is the QP’s opinion that Sio Silica’s laboratory equipment, procedures, processes and personal are adequate for the performed analytical work. The QP requested that sieve tests on the retained samples that have been analyzed in AGAT laboratory be analyzed in Sio Silica’s lab to ensure consistency and accuracy of the results.
In 2022 Sio Silica used Liquids Matter laboratory to perform multiple ICP analysis. On June 10, 2022, the QP conducted a laboratory visit at Liquids Matter facility in Calgary, Alberta. Liquid Matter is an independent testing facility, member of the Professional Chemists of Alberta. It is the QP’s opinion that Liquids Matter’s laboratory equipment, procedures, processes and personal are adequate for the performed analytical work.
On August 3 and 4, 2022, the QP conducted a site visit on the property. The location of multiple exploration and production test drill holes were validated. Drilling and sampling procedure on two of the drill holes from 2022 drilling campaign were observed. Multiple locations with stockpiles of sand from the preliminary production wells were visited.
| 9.2 | SAMPLE CHAIN-OF-CUSTODY AND LABORATORY RESULTS |
| 9.2.1 | Chain-of-Custody |
In 2017, samples shipped to Stim-Lab were sent from Steinbach, Manitoba to Duncan, Oklahoma by Purolator Courier. The courier receipts were reviewed by Stantec to verify the shipment dates. Table 9.1 summarizes the date the samples were sent and received by Stim-Lab.
| 9-1 |
TECHNICAL REPORT SUMMARY, BRU PROPERTY, MANITOBA, CANADA
Table 9.1
2017 Stim-Lab Sample Chain-of-Custody
| Hole ID | Sample | Dates Drilled | Date Shipped | Date Received | ||||
| BH-03-17 | 42758 | July 4-6, 2017 | July 11, 2017 | July 12, 2017 | ||||
| BH-02-17 | 42770 | July 7-10, 2017 | July 11, 2017 | July 12, 2017 | ||||
| BH-09-17 | 42800/42801* | July 9-12, 2017 | July 13, 2017 | July 14, 2017 | ||||
| BH-14-17 | 42817/42818* | August 8-9, 2017 | August 10, 2017 | August 11, 2017 | ||||
| BH-10-17 | 42832 | August 10-11, 2017 | August 14, 2017 | August 15, 2017 | ||||
| BH-03-17 | 42758 | July 4-6, 2017 | July 11, 2017 | July 12, 2017 | ||||
| BH-02-17 | 42770 | July 7-10, 2017 | July 11, 2017 | July 12, 2017 | ||||
| BH-09-17 | 42800/42801* | July 9-12, 2017 | July 13, 2017 | July 14, 2017 | ||||
| BH-14-17 | 42817/42818* | August 8-9, 2017 | August 10, 2017 | August 11, 2017 | ||||
| BH-10-17 | 42832 | August 10-11, 2017 | August 14, 2017 | August 15, 2017 |
Note: * Samples 42801 and 42818 were sent to Stim-Lab but not analyzed
Table 9.2 summarizes the date the samples were sent, and the date entered into Loring’s sample tracking system.
Table 9.2
2017 Loring Sample Chain-of-Custody
Hole ID | Batch Number |
Samples |
Date Shipped | Date Entered into Loring’s Sample Tracking System | ||||
| BH-03-17/ BH-02-17 | A17-0717 | 42751-42778; 42833 | July 11, 2017 | July 13, 2017 | ||||
| BH-03-17/ BH-02-17 | A17-0887 | 42751-42778; 42834 | July 11, 2017 | September 12, 2017 | ||||
| BH-09-17 | A17-0722 | 42783-42799 | July 13, 2017 | July 17, 2017 | ||||
| BH-09-17 | A17-0858 | 42783-42797 | July 13, 2017 | September 5, 2017 | ||||
| BH-14-17/ BH-10-17 | A17-0859 | 42802-42831 | August 10, 2017 | September 5, 2017 | ||||
| BH-10-17 | A17-0831 | 42833-42834 | August 14, 2017 | August 28, 2017 |
In 2018, samples that were slated for delivery to Stim-Lab were shipped from Steinbach, Manitoba to Duncan, Oklahoma by Purolator. The courier receipts were reviewed by Stantec to verify the shipment dates. Table 9.3 summarizes the date the samples were sent, and the date was received by Stim-Lab.
Table 9.3
Stim-Lab Sample Chain-of-Custody
| Hole ID | Samples | Dates Drilled | Date Shipped | Date Received | ||||
| BRU 117-1 | 14665-14675 | October 12-15, 2018 | November 19, 2018 | November 21, 2018 | ||||
| BRU 146-1 | 14801-14814 | December 5-6, 2018 | January 21, 2019 | January 22, 2019 |
Shipment of samples was also reviewed for those sent to AGAT in 2018 and 2019. Samples that were slated for delivery to AGAT were shipped from Steinbach, Manitoba to Calgary, Alberta by Purolator. The courier receipts were reviewed by Stantec to verify the shipment dates. Table 9.4 summarizes the date the samples were shipped, received as confirmed by Purolator and the date entered AGAT’s sample tracking system.
| 9-2 |
TECHNICAL REPORT SUMMARY, BRU PROPERTY, MANITOBA, CANADA
Table 9.4
AGAT Sample Chain-of-Custody
Hole Name |
Sample Lists |
Drill Dates |
Date Shipped |
Date Received | Date Entered into AGAT’s Sample Tracking System | |||||
| BRU 28-1 | 14830-14843 | November 20, 2018 - January 8, 2019 | January 11, 2019 | January 14, 2019 | January 14, 2019 | |||||
| BRU 73-1 | 14651-14664 | October 9-10, 2018 | October 15, 2018 | October 17, 2018/ October 18, 2018 | November 3, 2018 | |||||
| BRU 117-1 | 14665-14675 | October 12-15, 2018 | October 17, 2018 | October 18, 2018 | November 3, 2018 | |||||
| BRU 121-1 | 14815-14827 | December 4-10, 2018 | December 17, 2018 | December 19, 2018 | January 9, 2019 | |||||
| BRU 126-1 | 14618-14630 | September 27-29, 2018 | September 29, 2018 | October 3, 2018 | October 3, 2018 | |||||
| BRU 146-1 | 14801-14814 | December 5-6, 2018 | December 7, 2018 | December 10, 2018 | January 9, 2019 |
The duplicate samples sent to Loring were hand delivered by a Sio Silica employee. A chain of custody was obtained with the signature of the receiver at Loring on March 1, 2019.
The 2020 and 2021 drilling campaign follows the established sample shipment procedure. The QP did not review the shipment receipt but has no reason to believe that the established sample shipment procedures from previous years were not followed.
In 2022, UPS services were used to ship the sand samples from Winnipeg to Sio Silica’s laboratory in Calgary. The sand samples from Sio Silicas’ laboratory to Liquid Matter laboratory are hand delivered by a Sio Silica employee. The email tracking system between Sio Silica and Liquid Matter, as well as the UPS tracking sheets have been reviewed by the QP.
The QP’s opinion is that the sample handling and sample security approach is adequate for this type of commodity.
| 9.2.2 | Laboratory Results |
The results from the different laboratories were compared to ensure consistency of the analytical data. The sieve results by fraction between Stim-Lab and Loring on the analyses of the 2017 twinned samples are compared and shown in Figure 9-1. Comparison of the duplicate samples between AGAT and Loring was also complete, and it is shown on Figure 9-2.
In 2022 Sio Silica conducted sieve analysis in the Sio Silica laboratory. To ensure consistency of the analytical data from samples tested in AGAT laboratory are tested in Sio Silica’s laboratory as well. The result of the comparison is shown on Figure 9-3.
Based on this comparison presented in Figures 9-1, 9-2 and 9-3 the QP has concluded that the sieve results for the sand analysed by Loring, Stim-Lab and Sio Silica laboratories have an acceptable level of accuracy and consistency.
| 9-3 |
TECHNICAL REPORT SUMMARY, BRU PROPERTY, MANITOBA, CANADA

| 9-4 |
TECHNICAL REPORT SUMMARY, BRU PROPERTY, MANITOBA, CANADA

| 9-5 |
TECHNICAL REPORT SUMMARY, BRU PROPERTY, MANITOBA, CANADA
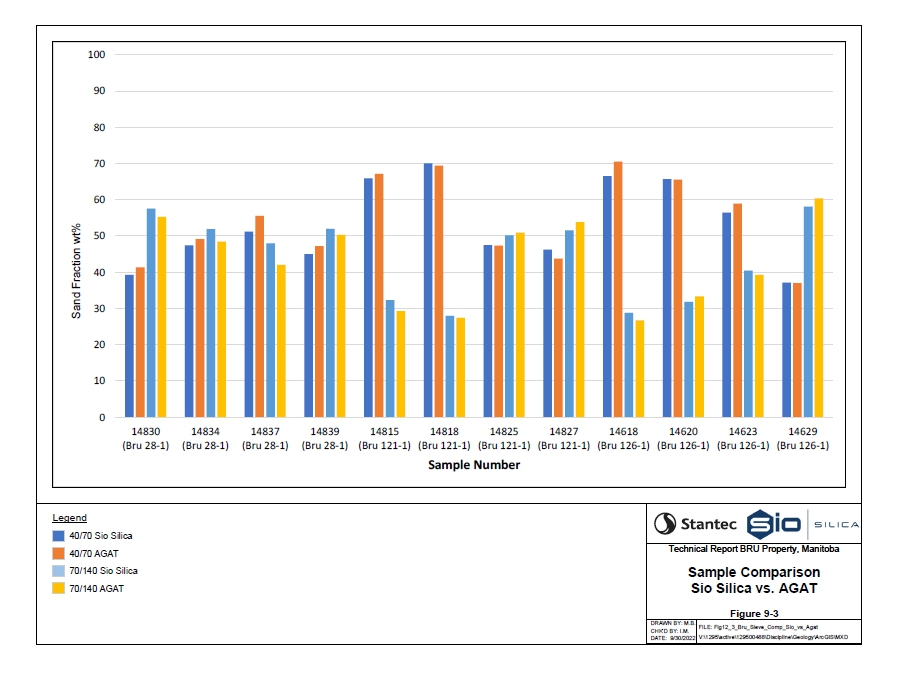
| 9-6 |
TECHNICAL REPORT SUMMARY, BRU PROPERTY, MANITOBA, CANADA
| 10 | MINERAL PROCESSING AND METALLURGICAL TESTING |
Refer to information provided in Section 8.3.4.
| 10-1 |
TECHNICAL REPORT SUMMARY, BRU PROPERTY, MANITOBA, CANADA
| 11 | MINERAL RESOURCE ESTIMATES |
The estimates presented below have been prepared in accordance with the requirements of the SEC S-K 1300 Regulations.
The geologic model construction, resource estimation approach, criteria and assumptions taken into consideration during this resource estimation are outlined in the following sub-sections.
| 11.1 | COMPUTER MODEL CONSTRUCTION |
The geologic resource model was developed using Hexagon Mining’s geological modeling and mine planning software, MinePlan® version 15.80-7. MinePlan® (also known as MineSight) is widely used throughout the mining industry for digital resource model development. Hexagon Mining’s suite of interpretive and modeling tools is well-suited to meet the modeling requirements for the Property.
A gridded-surface modeling approach was used to evaluate and calculate resource estimates for the Carman Sand Member located within the Property. The 3D gridded-surface model consists of laterally contiguous cells (commonly called grids). The selected grid size is determined by the density of the drill hole data and extent of the property. The grid size for this assessment was 50 m x 50 m (x, y). Each grid has a fixed position of easting and northing within the model limits and contains a list of variables or numeric identifiers, such as the lithology thickness, percent of each sand fraction (product), and other pertinent information.
| 11.1.1 | Topographic and Lithological Horizons |
Topography data was downloaded from the Natural Resources Canada website in Canadian Digital Elevation Model (CDEM) format, spatial resolution is 0.75 arc seconds. These datasets were converted into a gridded-surface file within MinePlan®.
Based on the drill hole information, the surfaces representing the bottom of the first four lithological units in stratigraphic order were created: bottom of the Diamicton, bottom of the Carbonate (Red River Formation), the bottom of the Upper Shale (Red River Formation) and the bottom of the Carman Sand Member.
Elevation values were calculated at each drill hole location representing the bottom of the Diamicton, as well as the bottom of the Upper Shale (or the top of the Carman Sand Member). These elevation data were then used to create triangulated surface utilizing the “Implicit Modeler” tool in MinePlan®. The MinePlan’s “Implicit Modeler” tool uses a radial basis function interpolation algorithm. The triangulated surfaces were then converted into gridded surfaces.
The thickness of the Upper Shale was calculated based on the drill hole data. These calculated vertical thicknesses were used to create an isopach gridded surface of the Upper Shale using Inverse Distance Weighted algorithm with power of 2 (IDW2). The isopach gridded values of the Upper Shale were added to the elevation values of the bottom of the Upper Shale gridded surface to construct the elevation of the bottom of the Carbonate.
An isopach gridded surface of the Carman Sand Member was created using the vertical thickness value from the drill holes. The bottom of the Carman Sand Member was constructed by subtracting the interpolated isopach values of the Carman Sand Member from the elevation values of the bottom of the Upper Shale gridded surface.
| 11-1 |
TECHNICAL REPORT SUMMARY, BRU PROPERTY, MANITOBA, CANADA
| 11.1.2 | Assay Data Compositing and Interpolation |
Sieve-derived laboratory data from the Carman Sand samples was used to create two sand size fraction (product) weight percent values: 40/70 and 70/140. For each sand product, a length weighted composited percent value was calculated for each drill hole.
An IDW4 interpolation was used to calculate each weight percent product for each grid. Figure 11-1 shows the 40/70 fraction distribution map and Figure 11-2 shows the 70/140 fraction distribution map.
| 11.2 | RESOURCE ESTIMATION APPROACH |
Stantec used the following approach to facilitate the estimation of resources:
| ● | Carman Sand unit thickness was estimated using all drill holes as discussed in Section 7 |
| ● | During the modeling process, the variations in the elevation of the top of the carbonate surface, caused by geological undulations and data collection inconsistencies in drill holes from GIN, were accounted for through application of a modeling methodology that averaged the elevation values over an area slightly larger than one quarter section (500m) |
| ● | Percentages of the different sand fractions were used in the constructed geological model as provided from the laboratory |
| ● | MinePlan® Software was used to construct a 3D geological computer model of the property to estimate in-place resources. The modeled gridded surfaces for top and bottom of the Carman Sand unit were used for volume estimation |
| ● | Volumes were converted to tonnage by the application of a representative average bulk density value of 1.5 g/cm3 |
| ● | The geological interpretations and the modeled volumes as well as the relationship between the model and the raw data were confirmed through cross-sectional review and statistical model validation |
| ● | This resource estimation only includes extractable sand volumes calculated using the criteria shown in Table 11.2 |
| ● | This resource estimation only includes those in-situ sand volumes found within the mining claims boundaries as shown on Figure 3-2 |
| ● | The drill hole spacing, the available assay data, and resource spatial distribution were considered in the resource classification |
| 11-2 |
TECHNICAL REPORT SUMMARY, BRU PROPERTY, MANITOBA, CANADA
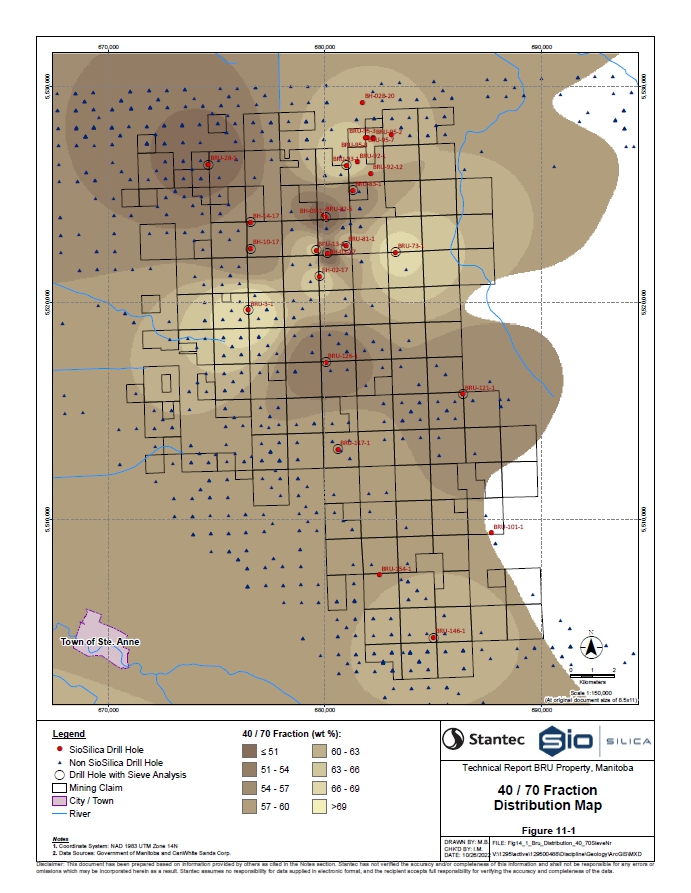
| 11-3 |
TECHNICAL REPORT SUMMARY, BRU PROPERTY, MANITOBA, CANADA
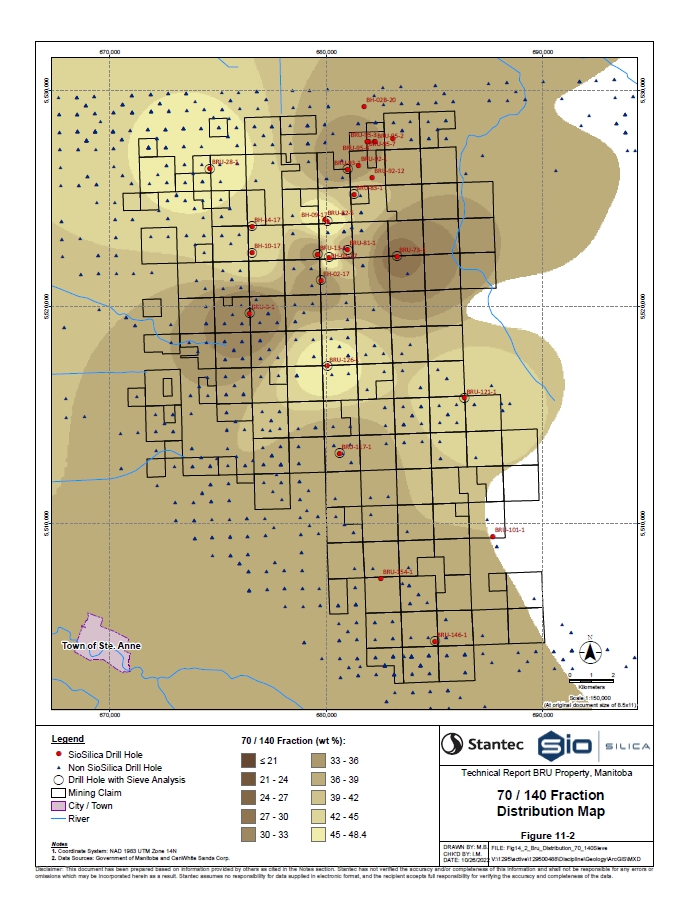
| 11-4 |
TECHNICAL REPORT SUMMARY, BRU PROPERTY, MANITOBA, CANADA
| 11.3 | MINERAL RESOURCE CLASSIFICATION |
SEC S-K 1300 Regulations are aligned with the Committee for Mineral Reserves International Reporting Standards (CRISCO, 2019) that defines a Mineral Resource as: “A Mineral Resource is a concentration or occurrence of solid material of economic interest in or on the Earth’s crust in such form, grade or quality and quantity that there are reasonable prospects for eventual economic extraction. The location, quantity, grade or quality, continuity and other geological characteristics of a Mineral Resource are known, estimated or interpreted from specific geological evidence and knowledge, including sampling. Mineral Resources are subdivided, in order of increasing geological confidence into Inferred, Indicated and Measured categories.”
The CRISCO definition for a Mineral Resources clearly outline that a solid material is considered a resource if there is clear identification of the economic interest in the deposit. For sand deposits this means that the nature of the database, technology for mining and mine planning, some degree of practical recovery constraints and the economic potential in current markets must be considered in order to identify a sand resource.
Resources are classified according to the confidence level that can be placed in each estimate. The classification template used in this study is based on the three-dimensional distance to the nearest drill hole that penetrates the top and the bottom of the Carman Sand, as well as the distance to the nearest sample that contains sieve-derived laboratory data.
The Carman Sand interval in the Property was classed as Measured using a 800 m radial distance from the nearest drill hole intersection with available sand quality data, classed as Indicated using a 1,600 m radial distance from the nearest drill hole intersection with available sand quality data and classed as Inferred using a 3,200 m radial distance from the nearest drill hole intersection with or without available sand quality data. Only drill holes listed in Section 7.1 and Section 7.3-7.7 were used for resource classification. Due to the reduced reliability of the water-wells described in Section 7.2, this data was only used to define the contacts of the lithological units.
Figure 11-3 shows the resource distribution map and Figure 11-4 shows the resource classification map. The resource estimate covers an area of approximately 13,000 ha.
| 11.4 | ASSESSMENT OF REASONABLE PROSPECT FOR EVENTUAL ECONOMIC EXTRACTION |
The results of this Technical Report Summary indicate a positive economic outcome related to the potential development of a silica sand extraction and processing operation for the BRU Property.
As such the QP believes the BRU Property continues to demonstrate a reasonable prospect for eventual economic extraction.
| 11-5 |
TECHNICAL REPORT SUMMARY, BRU PROPERTY, MANITOBA, CANADA
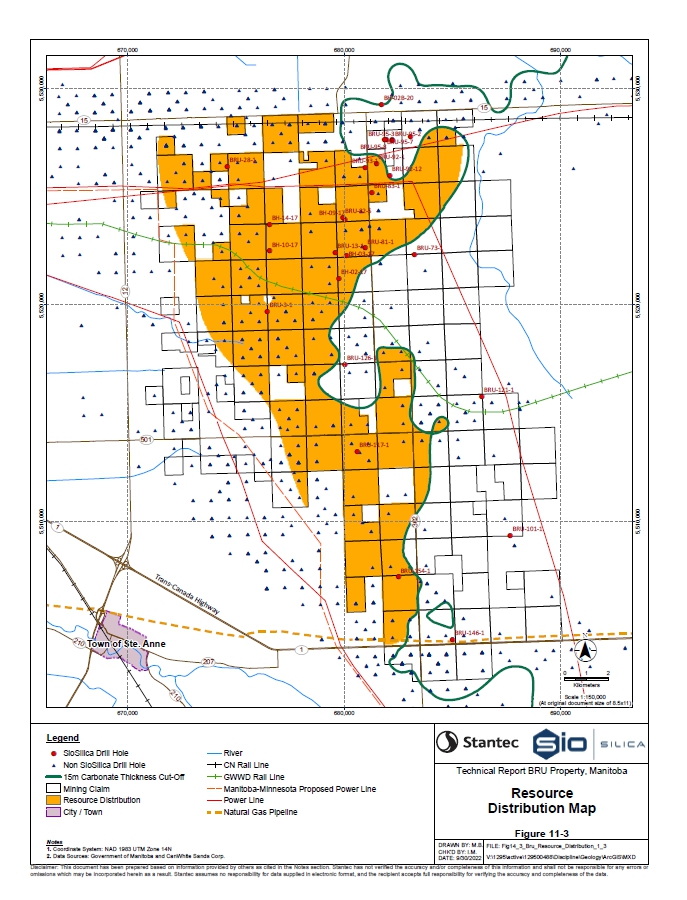
| 11-6 |
TECHNICAL REPORT SUMMARY, BRU PROPERTY, MANITOBA, CANADA

| 11-7 |
TECHNICAL REPORT SUMMARY, BRU PROPERTY, MANITOBA, CANADA
| 11.5 | ESTIMATION OF SAND VOLUME |
The modeled volumes and weight of the Carman Sand within the resource area are shown in Table 11.1.
Table 11.1
Summary of In-Place Carman Sand as of September 30, 2022
| In-Place Carman Sand Member in Mineable Lease Area | ||||||||
| BRU Property | 40/70 mesh fraction | 70/140 mesh fraction | ||||||
| Estimated Sand Volume (Mm3) | 1,628 | 1,098 | ||||||
| Total Estimated Sand Volume (Mm3) | 2,726 | |||||||
| Estimated Sand Weight (Mt) | 2,442 | 1,647 | ||||||
| Total Estimated Sand Weight (Mt) | 4,089 | |||||||
The sand weights by fraction that are shown in Table 11.1 are not resources, as it is not technically feasible to produce the entire sand volume using the proposed extraction methods. The extractable sand volume and resource estimates are discussed in Section 11.6.
| 11.6 | MINERAL RESOURCE ESTIMATION |
Sio Silica plans to develop the BRU Property using an underground extraction technique that involves drilling through the quaternary sediments, a carbonate unit and shale, into the underlying sand. The extraction holes will be cased 5 m into the sand and an extraction casing is then lowered into the sand. Air is injected into the extraction casing through the drill string, approximately 3 m - 5 m above the bottom of the extraction casing. Field tests have shown that the air injection process results in a slurry of sand, water, and air that rises to the surface.
Geotechnical testing and analysis have resulted in the extraction recommendations as summarized in Table 11.2. The extraction holes are planned to be drilled in a pod or cluster of up to seven holes in one extraction pad area. The current planning basis is to extract between 3 K and 23 K tonnes of sand from an extraction cluster, depending on the thickness and structural integrity of the overlying limestone and diamicton material, before relocating to the next extraction pad.
| 11-8 |
TECHNICAL REPORT SUMMARY, BRU PROPERTY, MANITOBA, CANADA
Table 11.2
Sand Extraction Recommendations
| Competent Limestone Thickness (m) | Quaternary Material Thickness (m) |
Extractable Sand Volume (m3) |
Extractable Sand Mass (t) | Distance Between Well Clusters (m) (Center to Center) | ||||||||||
| >25 | 0-25 | 15,235 | 22,853 | 110 | ||||||||||
| >25 | 25-35 | 12,485 | 18,728 | 107 | ||||||||||
| >25 | >35 | 10,018 | 15,027 | 104 | ||||||||||
| 20-25 | 0-25 | 9,259 | 13,889 | 103 | ||||||||||
| 20-25 | 25-35 | 7,169 | 10,754 | 100 | ||||||||||
| 20-25 | >35 | 5,362 | 8,043 | 97 | ||||||||||
| 15-20 | 0-25 | 4,314 | 6,471 | 95 | ||||||||||
| 15-20 | 25-35 | 2,979 | 4,469 | 92 | ||||||||||
| 15-20 | >35 | 2,245 | 3,368 | 90 | ||||||||||
These extraction recommendations have been utilized to update the mineral resource estimate. Table 11.3 shows the estimate of the mineral resource for the Property as of September 30, 2022.
The mineral resource shown in Table 11.3 is reported as in-place tonnages. The calculated volumes were converted to tonnage by the application of representative average in-place bulk density value of 1.5 g/cm3.
| 11-9 |
TECHNICAL REPORT SUMMARY, BRU PROPERTY, MANITOBA, CANADA
Table 11.3
In-Place Mineral Resource Summary, as of September 30, 2022
| Mineral Resources (Mt) | ||||||||||||
| BRU Property | 40/70 mesh fraction | 70/140 mesh fraction | Total | |||||||||
| Measured | 6.5 | 4.7 | 11.2 | |||||||||
| Indicated | 27.2 | 19.2 | 46.4 | |||||||||
| Total Measured and Indicated | 57.6 | |||||||||||
| Inferred | 55.1 | 36.8 | 91.9 | |||||||||
| Total Inferred | 91.9 | |||||||||||
The 40/70 and 70/140 size fractions were assessed during the preparation of this report, as some silica sand markets have preference on the product grain size.
The accuracy of resource estimates is, in part, a function of the quality and quantity of available data and of engineering and geological interpretation and judgment. Given the data available at the time that this Technical Report Summary was prepared, the estimates presented herein are considered reasonable. However, this estimate should be accepted with the understanding that additional data and analysis available after the date of the estimates, may necessitate revision. These revisions may be material. There is no guarantee that all or any part of the estimated resources will be recoverable.
| 11-10 |
TECHNICAL REPORT SUMMARY, BRU PROPERTY, MANITOBA, CANADA
| 12 | MINERAL RESERVE ESTIMATES |
This Technical Report does not include an estimate of reserves. The level of engineering does not support the preparation of a Pre-Feasibility Study; therefore, in accordance with the requirements of S-K 1300, the reported resources cannot be classified as reserves.
This section of the report includes estimates of recoverable sand tonnage for the BRU Property based on preliminary extraction plans, production schedules and processing plant and materials handling plans. These estimates are only intended for the purpose of completion of the cash flow forecasts presented in Section 19. These recoverable estimates are not, and should not be construed to be, estimates of reserves for the BRU Property. They do not comply with the Classification of Reserves as required under S-K 1300. It should be noted that there is no certainty that the resource estimate will be realized.
| 12.1 | DEVELOPMENT PLAN |
The 25-year development plan, that is discussed in more detail in Section 13, results in 66.4 Mt of clean (saleable) sand from the resource estimate. Stantec notes that the 25-year development plan only addresses a portion of the BRU Property resource. The remaining resource is available for development in further planning efforts.
This estimate of clean (saleable) silica sand is considered to be inclusive of the in-place mineral resource estimate detailed in Section 11. These production estimates are contained within the in- place mineral resource summary and cannot be added to the totals to result in additional resources tonnes.
| 12-1 |
TECHNICAL REPORT SUMMARY, BRU PROPERTY, MANITOBA, CANADA
| 13 | MINING METHODS |
| 13.1 | OVERVIEW |
Sio Silica plans to develop the BRU Property using an underground extraction technique that involves drilling through the quaternary sediments, carbonate unit and shale, into the underlying sand. The extraction holes will be cased to the top of the sand and an extraction casing is then lowered into the sand. Air is injected into the extraction casing, approximately 10 m - 15 m above the bottom of the casing. Field tests have shown that the air injection process results in a slurry of sand, water, and air that rises to the surface. The solids content of the slurry ranges from 90% to 20% during the extraction trials. The average solids content is approximately 50%.
The extraction holes are planned to be drilled in a pod or cluster of up to five holes in one extraction pad area. The current planning basis is to extract approximately 3,000 to 23,000 tonnes of sand from the extraction cluster before relocating to the next extraction pad.
Once the slurry reaches the surface, initial processing will remove any oversize or deleterious material such as sand concretions, shale, or chert before it is transported by an overland slurry pipeline to the wet process facility for further processing.
Following wet processing the sand will be stockpiled and fed into a drying and sizing plant where the sand will be separated into saleable fractions and then stored in loadout silos prior to being loaded onto trains for distribution.
Sio Silica plans to commence extraction and processing operations in the 3rd Quarter of Year 0 with the first product sales planned for the 1st Quarter of 2025. The extraction and processing operations are planned to take place for eight months a year, April to November, while sales will take place year-round. The sales will be phased with 1.25 Mt of saleable product planned in Year 1, 2.50 Mt in Year 2, and 2.72 Mt in Year 3 and extending out the remainder of the 25-year plan. For the purposes of this Technical Report Summary, Year 0 is defined as 2024.
| 13.2 | GEOTECHNICAL ANALYSIS |
Stantec completed a preliminary geotechnical analysis of the sand extraction techniques impact on subsurface conditions. The results of the analysis are used to provide recommendations for borehole spacing which are intended to limit surface subsidence to an acceptable level.
The preliminary analysis assumes that the shear failure of the Limestone caprock which overlies the sand is the most likely controlling failure mechanism. The analysis incorporated results from geotechnical tests conducted on the overlying Limestone (carbonate unit) as the performance of this unit was considered to be the governing factor in the analysis. The tests concluded that the carbonate unit has an average Geological Strength index (GSI) of between 55 and 65. It is important to note that based upon site specific borehole drilling results, the caprock does not appear to contain extensive vertical fracturing, however drilling has been limited to vertical boreholes which may fail to identify the presence of vertical fractures. The diamicton thickness also controls the loading on the extraction cavity and should be considered in determining the extraction cavity hole dimension.
| 13-1 |
TECHNICAL REPORT SUMMARY, BRU PROPERTY, MANITOBA, CANADA
The analysis also assumed that the sandstone unit is unconsolidated and after extraction would form a cone with an angle of repose of 31 degrees from the horizontal. Extraction testing by Sio Silica in 2018 and 2019 indicates that there is likely some amount of consolidation within the sandstone unit, perhaps in discrete layers, or perhaps throughout the unit. The extraction tests also infer that voids formed from the extraction process are more complex than a simple conical void with an angle of repose of 31 degrees. Sio Silica completed a sonar survey of one of the boreholes (BRU 92-2) after sand extraction in May 2021. The testing suggests that the extraction voids may be steeper and could have a cylindrical or spherical shape particularly in the short term after extraction. Inspection of other boreholes sometime after sand extraction shows that the voids backfilled with sand; however, to date the mechanism of change in the shape of the extraction voids and source of backfilled sand in the cavities are not well understood.
Sio Silica completed an acoustic borehole image (ABI) and an optical borehole imaging (OBI) of the Limestone caprock in borehole BRU 92-1 in March 2021. The ABI/OBI survey identified horizontal bedding and joints in the caprock with no continuous orthogonal (vertical) joints. This and other boreholes are drilled vertically so there is potential for missing vertical or near vertical joints. Although some cross-bedding joints were identified in the survey, they are limited to a fractured zone potentially in Shale.
Sio Silica also completed surface surveys in the vicinity of the BRU 92-2 and BRU 92-3 (survey points at 5 m to 13 m distance from the boreholes) before and after sand extraction to measure possible resultant subsidence. Surface surveys showed subsidence close to the precision of the survey (1 mm vertical and 1 cm horizontal) due to sand extraction from BRU 92-2 and BRU 92-3 (with single hole arrangement). No test was completed with multi-hole arrangements.
The preliminary analysis indicates that:
| ● | Subsurface sand extraction should be limited to areas where the carbonate unit is more than 15 m in thickness. |
| ● | The analysis here assumes an overburden thickness of up to 25 m. Overburden thicker than this range should be reviewed case by case to assess potential for subsidence to occur following extraction. |
| ● | The diameter of the extraction voids should not extend beyond 60 m in any circumstance. This diameter should be reduced to 50 m as the carbonate unit thins to 15 m. |
| ● | The distance from the edge of one extraction void to the edge of the next extraction void should not be less than 60 m. |
| ● | An extraction void developed as per the above noted maximum diameter assumptionscontains approximately 25,000 tonnes. |
| 13-2 |
TECHNICAL REPORT SUMMARY, BRU PROPERTY, MANITOBA, CANADA
The extraction layout was developed with these geotechnical criteria in mind. The author(s) would like to note that these geotechnical parameters and the resulting geotechnical analysis are based on geotechnical work completed for the Limestone caprock and assuming that the controlling failure mode is shear failure. Additional testing is recommended to support further analysis on the sandstone void space evolution, and the joint system in the limestone (to investigate for the possible presence of vertical jointing and if found, to assess its impact on stability). As stated above, evidence from testing in 2018/2019 suggests that the sandstone angle of repose is steeper than previously assumed, and related adjustments of the extraction plan which would lead to a more refined extraction layout might be required. In addition, more complex void shapes in the sandstone may be occurring with both steep and shallow side slopes.
As a result of the minimum 15 m cut off for the thickness of the limestone to support overburden loading after sand extraction, and the additional potential for strength analysis on the sandstone layer, recommendations for further geotechnical investigation, testing and analysis will be discussed in the next section. The purpose of this additional assessment is to confirm the Limestone thickness in advance of mining operations, to test the (to date untested) presence of Limestone vertical fractures and the sandstone unit extraction void space and to confirm that other failure modes are not controlling the extraction void maximum size.
| 13.3 | EXTRACTION CONCEPT |
Sio Silica conducted 14 extraction tests in the period from 2017 to 2021. The results of these tests indicate that it is reasonable to expect extraction tonnages of approximately 4,500 tonnes from a single extraction well. The current concept involves drilling a central extraction well, surrounded by up to four additional extraction wells, depending on the exact geotechnical conditions of the specific area. The spacing of these wells would be approximately 15-20 m from the centre of one drill hole to the centre of the next well. These seven wells would form one extraction cluster or extraction pad where approximately 3,000 to 23,000 tonnes of sand will be produced.
The current planning basis utilizes relatively small-scale truck mounted drilling equipment to drill the extraction wells and to set the initial casing. Sio Silica is planning to retrofit a fleet of smaller drill rigs to serve as the primary extraction rigs. These drills will be capable of advancing the extraction casing into the sand unit, applying the necessary air to facilitate the air lifting of the sand slurry, and distributing the sand slurry to surface facilities central to the extraction cluster. These facilities would include the initial processing discussed above as well as mixing with water as required to achieve the appropriate solids content to facilitate overland slurry transport to the final process facilities.
A relocatable shack will be located at the extraction pad and will serve as a central control facility for the operating extraction wells, the initial processing, and sand slurry mixing and pumping.
The extraction process is planned to take place for eight months a year, April to November inclusive. During this time enough sand will be produced to supply the drying and sizing plant with enough product to operate on a year-round basis. This concept was developed to minimize the difficulties with operating a slurry system and wet process facility in the winter months.
| 13-3 |
TECHNICAL REPORT SUMMARY, BRU PROPERTY, MANITOBA, CANADA
| 13.4 | SURFACE DEVELOPMENT AND RECLAMATION |
The planned production discussed above will require the surface development of approximately 230 ha in Year 0, 110 ha in Year 1 and averages 225 ha in Year 2 and until the end of the 25 year plan. Figure 13.1 illustrates the proposed surface development plan for the BRU property development. This development plan includes offsets from existing road infrastructure, high voltage transmission lines, and residential areas. Please note this development plan is subject to change as extraction progresses.
The land area required for development will be leased from the current owners for a total of three years. Land required for any specific production year will be leased the prior year. In this manner any pre-production development such as tree clearing/mulching, access road development, slurry pipeline layout, and extraction well drilling will take place one year in advance. In the year following the extraction season, closure and reclamation activities will take place. These activities will include extraction well abandonment, removal of all remaining infrastructure such as slurry and return water piping, and reclamation that is expected to include minor levelling, discing, and seeding to grass.
| 13.5 | SLURRY TRANSPORTATION |
Once the sand slurry reaches the surface and has undergone the initial treatment for the removal of oversize and deleterious materials, water will either be added to or removed from the slurry until it reaches the appropriate solids content for slurry transportation. Sio Silica will employ a network of high-density polyethylene (HDPE) pipe to transport the slurry overland to the main process facilities. In the early years of production this overland distance is between three and four km however it grows to approximately 15 km in the latter years of the project. The first stage slurry pumps will be located at the extraction pad. As the overland distance increases, booster pumps will be located as required along the route. The slurry transportation system has been designed to operate at approximately 25% solids. This allows the slurry process to be stopped and then restarted without having to empty the pipeline.
Once the slurry reaches the main process facilities it will be piped directly into the wet process facility for further treatment. As discussed, the extraction, slurry transport and wet process facilities will be operational 8 months of the year.
| 13-4 |
TECHNICAL REPORT SUMMARY, BRU PROPERTY, MANITOBA, CANADA

| 13-5 |
TECHNICAL REPORT SUMMARY, BRU PROPERTY, MANITOBA, CANADA
| 14 | PROCESS AND RECOVERY METHODS |
The processing component of the BRU silica operation is guided by a modular and multi-stage recovery process. The four general areas are:
| ● | A modular well pad screening and dewatering plant for slurry preparation; |
| ● | A dewatering circuit or ‘wet plant’ for raw sand separation; |
| ● | A dry screening plant for final sizing and beneficiation; and |
| ● | The storage and loadout system. |
| 14.1 | WELL PAD SCREENING CIRCUIT |
The well pad screening circuit is a modular and relocatable system situated at a well pad. Each screening unit is comprised of a series of sumps, screens, and cyclones to ensure the overland slurry transport pipeline is properly fed in terms of size and slurry concentration. The operation is anticipated to have multiple units and several parallel trains of each unit. The units are identified alphanumerically, with a numeral for each unit, e.g. SUW1 identifies the number one (1) Sump (SU) at the well pad (W). A letter identifies one of the two trains, either A or B train. The well pad process is generally as follows:
Incoming slurry from extraction is delivered to a two deck 6‘x16’ protection screen resting atop at sump; overs from the screen are anticipated to be minimal and will be mainly various cobbles and conglomerates. Screen unders are collected in the sump and pumped to a three-part collection sump in the dewatering plant. The three-part collection sump comprises the initial step of the well pad dewatering plant, allowing the fines and sand to settle and thicken and the water to decant from the initial dilute slurry feed. The settled or thickened solids are pumped to feed a series of 20” cyclones, separating again the ultrafines and gravels. Overflow from the cyclones is recycled to the three-compartment sump for a closed loop circuit; underflow from the cyclones feeds a pair of dewatering screens in series. The sand is then prepared for overland slurry transport in the collection sump. Makeup water is added, diluting the slurry to 28% solids, and pumped to the wet plant.
| 14-1 |
TECHNICAL REPORT SUMMARY, BRU PROPERTY, MANITOBA, CANADA
Table 14.1 summarizes the key process equipment for the well pad and dewatering plant up to the overland slurry transport.
Table 14.1
Key Process Equipment – Well Pad and Dewatering Plant
| Item | Identifier (# and train) | Notes/Capacity | ||
| Sump, Well pad | SUW1/2/3/4/5 A&B | |||
| Sand Screen | SCW1/2/3/4/5 A&B | 6‘x’16’ DD | ||
| Sand transport pump | PW1/2/3/4/5 A&B | 4x6 60 HP | ||
| Three compartment sump | SU02 A&B | |||
| Return water pump to well pad | PW1/2/3/4/5 A&B | 4x6 40 HP | ||
| Transport pump, DW plant | P02 A&B | 12x14 250 HP | ||
| Sand Cyclone | CY2-1/2/3/4 A&B | 20” Krebs GMax | ||
| Dewatering Screen | SC02-1/2 A&B | Tabor 8‘x12’ SD | ||
| Collection sump | SU03 A&B | |||
| Overland transport pump | P03 A&B | 8x10 250 HP |
Generally, the well pad circuit components from the initial sumps SUW 1/2/3/4/5 A&B and the well pad dewatering plant SU02 A&B through P03 A&B are anticipated to be in close vicinity to one another to facilitate inter-operability of allocated infrastructure. The return water pump and sand pumps are designed for approximately 1,500’ radius to allow some flexibility if required.
Overland transport pumps are intended to be staged on 3,000’ intervals. As the extraction process progresses further from the wet plant or additional head is encountered due to changing conditions, another booster pump arrangement is required. Preliminary designs indicate 14DR11 piping for the overland slurry transport.
| 14.2 | WET PLANT |
The wet plant receives the incoming slurry from the overland piping system. Similar to the dewatering plant, a three-part collection sump comprises the initial step of the wet plant, allowing the fines and sand to settle and thicken and the water to decant from the initial dilute slurry feed. The settled or thickened solids are pumped to feed a series of 20” cyclones in this case serving as dewatering and thickening cyclones. Overflow from the cyclones is recycled to the three-compartment sump and then to the clarifier; underflow from the cyclones feeds a pair of dewatering screens in series. Underflow from the screens returns to the three-compartment sump. Screen deck discharge is collected via conveyor to be stockpiled in the WIP pile. Cyclone underflow can also be diverted processing by wet high intensity magnetic separation (WHIMS) units, by Eriez, to reject the weakly magnetic and ferrous metal inclusions. The rejected material is collected and separated in a separate stream, with the remaining siliceous sand continuing forward to the WIP pile.
A fines thickener receives slurried fines from the cyclone overflow via the three-compartment sump. Based on the preliminary sizing, the deep cone thickener will settle the dilute fines entrained in the cyclone overflow, producing a thickened slurry. The slurry will be further dewatered by a pair of 2,000 mm plate presses in batch parallel mode, to provide sufficient capacity for the anticipated full throughput and to dewater to a handleable cake. Fines are handled by front-end loaders (FEL) to remove the produced cakes; clarified overflow will be recycled to the slurry transport system from the wet plant thickener and plate press system.
| 14-2 |
TECHNICAL REPORT SUMMARY, BRU PROPERTY, MANITOBA, CANADA
Wet plant key process equipment is identified in Table 14.2.
Table 14.2
Key Process Equipment – Wet Plant
| Item | Identifier (# and train) | Notes/Capacity | ||
| Three compartment sump | SU04 A&B | |||
| Return water pump to well pad | PO 5 A&B | 10x12 125 HP | ||
| Transport pump, Wet plant | P02 A&B | 10x12 250 HP | ||
| Sand Cyclone | CY4-1/2/3/4 A&B | 20” Krebs GMax | ||
| Dewatering Screen | SC04-1/2 A&B | Tabor 8‘x12’ SD | ||
| Collection Conveyor | C101/102/103 | |||
| Thickener/Clarifier | THK101 | 36’ dia. Deep cone. | ||
| Mud Tank | MT101 | |||
| Filter Press Sump Pump | SP102 | |||
| Plate press | PP101/102 | 2,000 mm plate, 207 plates | ||
| Wet high intensity magnet | WM 101/102 |
Figures 14.1 through 14.6 illustrate the anticipated process flow sheets.
| 14-3 |
TECHNICAL REPORT SUMMARY, BRU PROPERTY, MANITOBA, CANADA
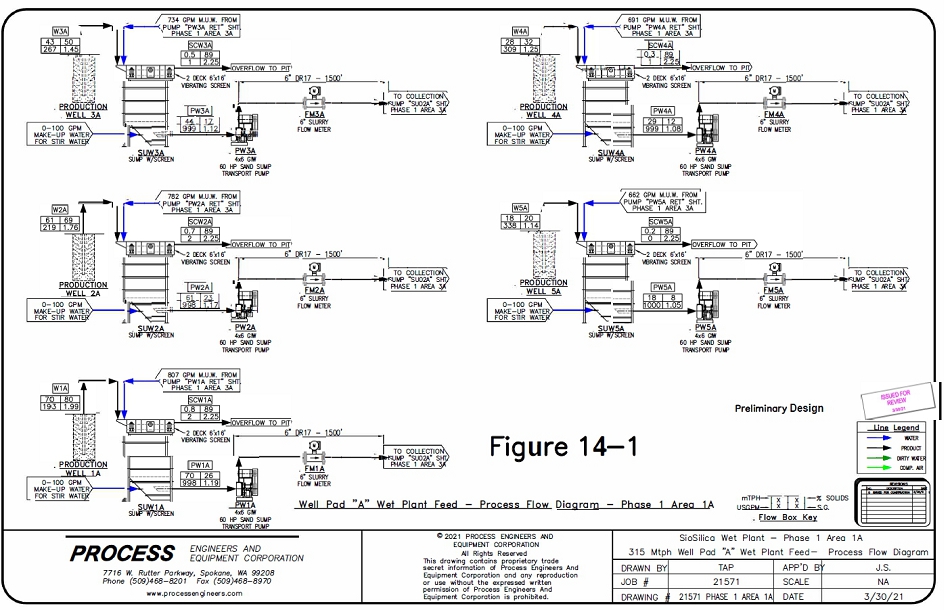
| 14-4 |
TECHNICAL REPORT SUMMARY, BRU PROPERTY, MANITOBA, CANADA
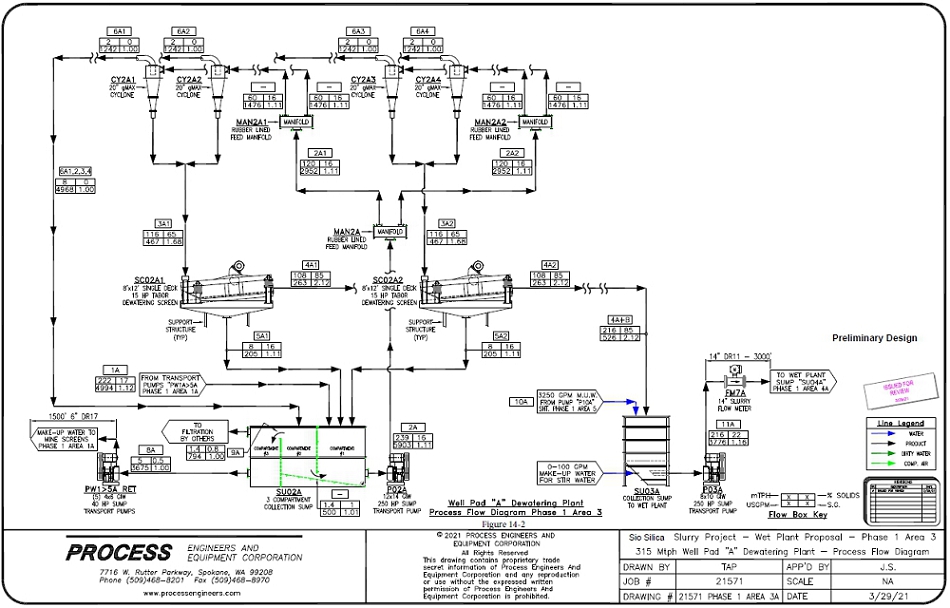
| 14-5 |
TECHNICAL REPORT SUMMARY, BRU PROPERTY, MANITOBA, CANADA
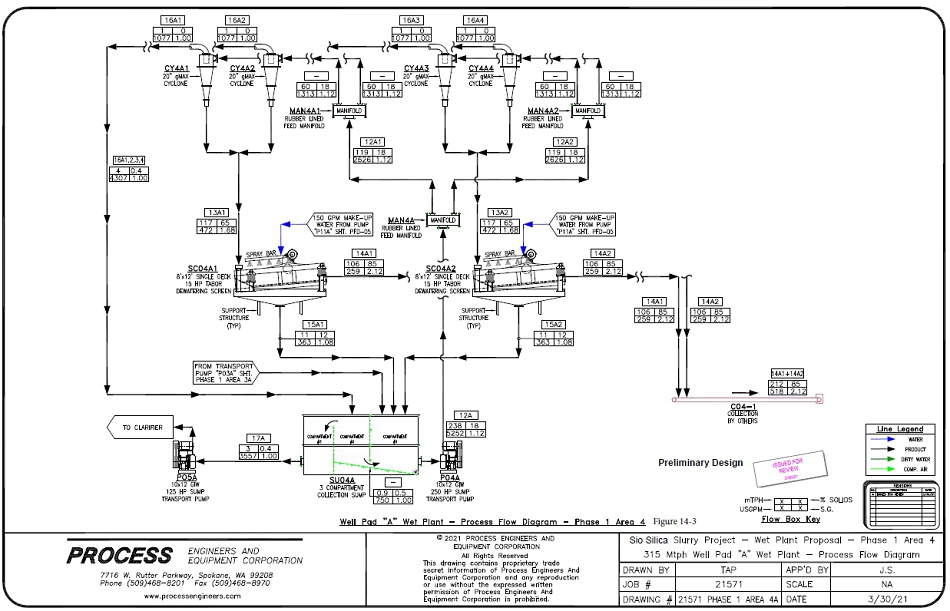
| 14-6 |
TECHNICAL REPORT SUMMARY, BRU PROPERTY, MANITOBA, CANADA

| 14-7 |
TECHNICAL REPORT SUMMARY, BRU PROPERTY, MANITOBA, CANADA
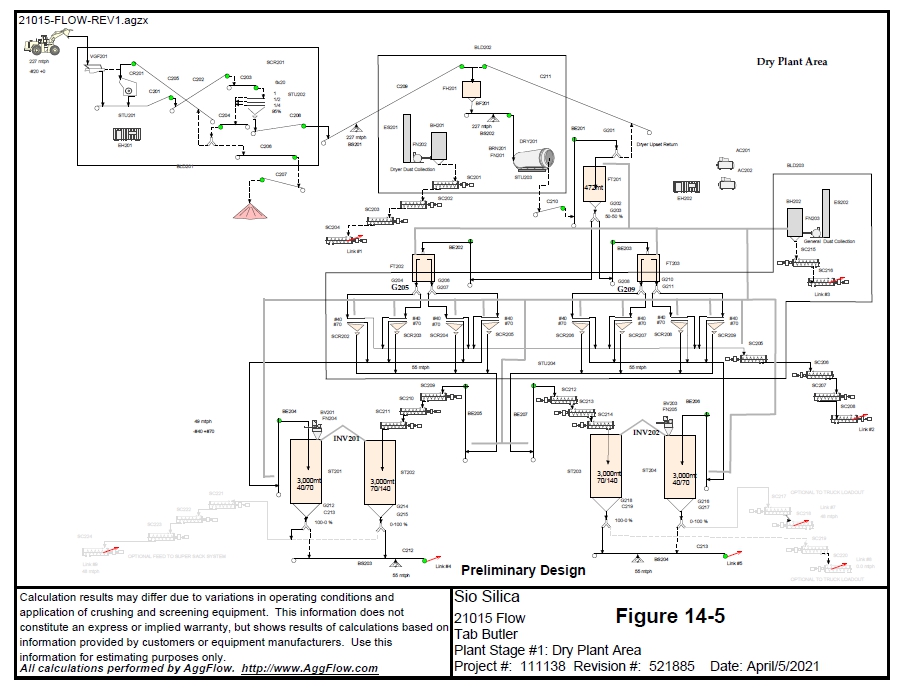
| 14-8 |
TECHNICAL REPORT SUMMARY, BRU PROPERTY, MANITOBA, CANADA
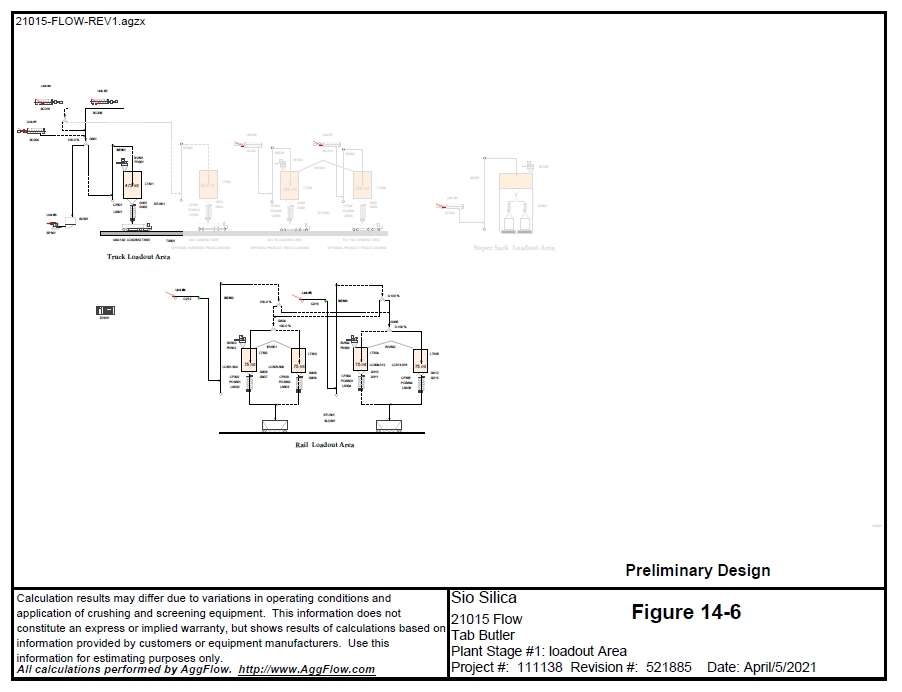
| 14-9 |
TECHNICAL REPORT SUMMARY, BRU PROPERTY, MANITOBA, CANADA
| 14.3 | DRY SCREENING PLANT |
Dry screening plant begins at the reclaim from the WIP pile. Raw sand is reclaimed from the WIP storage area via front end loaders and fed into a feed hopper with a vibrating grizzly feeder feeding an impactor to break any lumps or potentially conglomerated material while in the WIP storage area. A Louisville rotary dryer will drive off excess moisture, designed to take to nominally 2% moisture. The remaining dry plant is continued through bucket elevators to four parallel sets of Rotex sizing screens, for product sizing and separation prior to storage and loading operations. The key dry plant equipment is identified in Table 14.3.
Table 14.3
Key Process Equipment – Dry Plant
| Item | Identifier (# and train) | Notes/Capacity | ||
| Vibrating Grizzly | VGF201 | 62“x24’ grizzly | ||
| Impactor | CR201 | Lippman 5165 Impactor | ||
| Screen | C202 | 6‘x20’ 3 deck screen | ||
| Rotary Dryer | DRY201 | |||
| Screening | SCR202 through 209 | Rotex 5300 2 Deck screen |
The dry plant is partially enclosed, with the dryer and main screens and sizing contained within a building structure.
| 14.4 | STORAGE AND LOADOUT |
Storage and loading battery limits are fed by bucket elevators to four (4) of 3,000 tonne silos (each). These 100’ tall bolted silos are positioned to provide storage for the planned production in two independent trains of equal capacity. Each train of two silos is reclaimed via independent reclaim conveyors to two sets of two (total of four) rail loading batch silos. Each silo has 75 tonnes of capacity, allowing for a total of 150 tonnes of capacity on each loading track.
| 14.5 | PLANT DESIGN AND CONSTRUCTION |
Turnkey Process Solutions (TPS) has provided designs for the wet plant, dry plant, train loadout and the storage silos. TPS is experienced in plant specification, design and construction, and has worked with Sio Silica throughout the design process and engagement on the project.
TPS have developed plant simulations and models to assess the potential plant recovery. These models are based on TPS inspection of and analysis of the BRU project samples and historic test work. Based on this analysis, losses in yield have been accounted for as follows: 4% losses in extraction and wet handling and an additional 3% losses in drying and dry handling.
| 14.6 | RAIL DESIGN AND CONSTRUCTION |
The rail alignment has been developed by another design contractor, integrated with the Sio Silica team. Trans Energy Services has assessed the site to deliver potential rail services and initial track layouts. Initial concepts have been laid out for the dual loading systems and are laid out in the attached preliminary design schematics.
| 14-10 |
TECHNICAL REPORT SUMMARY, BRU PROPERTY, MANITOBA, CANADA
| 15 | INFRASTRUCTURE |
| 15.1 | RAIL |
Rail designs were conceptualized by Trans Energy Services, an outside rail consultant contracted by Sio Silica to design an operating system for the rail operation. Generally, the design will interface with the existing Canadian National (CN) line and is compliant with the current CN design specifications. The design includes approximately 24,000 ft (7.3 km) of track implemented and constructed of two phases to coincide with the development of the project. The multi-loop design includes the capacity to store additional rail cars, or to adapt the operation to container-based loading with future expansion efforts. The current plan is to develop the initial 18,500 ft (5.6 km) in the Phase One construction effort, which will include the sub-grade, sub- ballast, and a perimeter access and inspection road, all compliant to CN design specifications. The additional 5,500 ft (1.8 km) will be built to expand storage and additional loading capacity during Phase Two.
| 15.2 | POWER |
Power to the extraction pad processing and booster pumps will be supplied by relocatable gensets, connected via feeder cables. Incoming power to the wet and dry plant is anticipated to connect to the nearest Manitoba Hydro lines. For the purposes of this report, a high voltage connection line of approximately 1 mile (1.6 km) was allowed for tie-in to the nearest high voltage connection. A substation, with step down transformer and control system, was provided to change to medium distribution voltage. An allowance was made for a power study with the local utility.
| 15.3 | ACCESS |
Site access is via local roads and highways. Considering that no local distribution of the final product is planned, the only access should be for Sio Silica workers, labourer’s, and vendors.
| 15.4 | GAS LINE |
Review of the available gas lines in the area indicate an approximate 22 km overland gas pipeline to provide the gas for the rotary dryer system at the Dry Plant. Stantec has allowed for the tie-in and construction of the line to the dry plant.
| 15.5 | MAINTENANCE FACILITY |
A simple maintenance facility designed from arched fabric structures has been designed to allow all weather access and maintenance on mobile equipment. Commonly, these structures are developed with a concrete slab on grade, with a minor curb wall either of blocking or poured structure, to develop an enclosed working surface. The area is planned for mobile equipment maintenance, as well as maintenance on pumps, skids, or electrical equipment.
| 15-1 |
TECHNICAL REPORT SUMMARY, BRU PROPERTY, MANITOBA, CANADA
| 15.6 | OFFICES |
Office and lavatory space has been accounted for with three 24 ft x 60 ft units to house all site office and logistics, plus a single 12 ft x 32 ft lavatory trailer.
| 15.7 | OPERATIONS TRAILER |
An operations trailer at the at the extraction well pad has been conceptualized to provide an operating center for the drilling, screening, pumping and overland pipeline system.
| 15.8 | PROCESS WATER WELL |
Makeup water will be required at the plant site for initial startup and development. An allowance for one well at the plant site has been estimated.
| 15-2 |
TECHNICAL REPORT SUMMARY, BRU PROPERTY, MANITOBA, CANADA
| 16 | MARKET STUDIES |
| 16.1 | INTRODUCTION |
Sio Silica is intending to produce high-quality premium silica sand for end use in the technology markets. The 99.9% SiO2 and low iron content (<100ppm Fe) are typically marketed to manufacturers of solar glass, smart glass for computing and mobile device applications, and semiconductors, among other uses, and receive a premium compared to 95% SiO2 purity. A confidential marketing study was completed by a third party, on behalf of Sio Silica, focused on the premium silica market and salient points are extracted from the study and discussed in further detail below.
| 16.2 | MARKETS/ DEMAND |
The global market for silica sand is approximately 350 million tonnes per annum, with approximately three quarters of that total in North America (112 million tonnes) and Asia Pacific (154 million tonnes), as of 2021. The growth has historically been at a compound annual growth rate (CAGR) of 3.6% over the past five years. Of this global market, the high purity market consists of approximately 13 million tonnes per annum.
The North American market for high purity, low iron silica has been in the 1 million tonne per annum range historically through 2021 and is anticipated to grow to 2 to 3 million tonnes per annum by 2025, principally driven by the photovoltaic market and technology applications. The growth of PV solar glass is projected at 30% CAGR principally driven by improved economics through manufacturing and new legislation supporting domestic solar PV manufacturing. A 15% compound annual growth rate is projected for smart (technology) glass applications, based on similar regulatory reforms and increased adoption rates.
| 16.3 | COMPETITION |
Supply of high purity quartz to the Asian market has traditionally been supplied via Vietnam and Cambodia. Both countries have scaled back exports to China to strengthen their local manufacturing, resulting in a supply shortage in the rest of Asia and therefore higher delivered prices. These higher prices have incented new mines in Australia, with as much as 10 million tonnes per annum potentially coming online by 2026. The anticipated growth in the high purity silica market has provided motivation to other potential sources of supply in Australia, according to the marketing report. It is anticipated that the supply from these to-be-developed proposed mines will require additional beneficiation, adding costs to the mine gate pricing. The timing and tonnage of this new supply and the level of the beneficiation, and associated costs, is uncertain. Australian mining companies are expected to be the primary exporter to China; however, it is unclear how much will materialize, according to the marketing study. In the future scenario, Australian mining companies may potentially have lower delivered costs compared to other international peers for solar glass applications, but will require beneficiation for smart glass applications, resulting in a higher delivered price.
| 16-1 |
TECHNICAL REPORT SUMMARY, BRU PROPERTY, MANITOBA, CANADA
There are only two mines in the US today capable of providing low iron silica sand (99.9% SiO2, <100 ppm) totaling approximately 1 million tonnes per annum of supply. These two mines are:
| ● | US Silica mine in RockWood, MI. (0.45 Mtpa of production) |
| ● | Covia mine in Junction City, GA. (0.55 Mtpa of production) |
The risk of supply substitution for high purity markets is low. Recycled glass is only used for low purity applications. A very limited potential for quartz production of about 0.5 million tonnes per annum as byproduct of lithium production, although this stream is currently immature and will be subject to further verification and testing.
| 16.4 | CONTRACTS AND POTENTIAL OFFTAKERS |
According to the marketing study, typical contracts are two-to-three-year renewable contracts indexed to inflation, and identified with a specific purity, quality, and quantity. In a similar fashion, there are typically penalties for not meeting these criteria.
Sio Silica has provided Stantec with documents regarding product pricing agreements from three companies.
Agreement #1
The first document is a proposed sales and purchase agreement contract between Sio Silica and Company 1, that Sio Silica has indicated should be finalized in the fourth quarter of 2023. The document states a sales price of US$180 per MT FOB loading port for 500,000 MT per annum. When exchange rates and port and rail costs are considered, it equates to a mine gate price of CDN$149 per MT.
The initial term of this proposed agreement is from January 1, 2024 to December 21, 2026. Thereafter term of the agreement will be automatically renewed for an unlimited number of one (1) year terms unless terminated by either the buyer or the seller.
Agreement #2
The second document is a Memorandum of Understanding between Sio Silica and Company 2 and dated September 15, 2022. The document states a sales price of US$250 per MT FOB loading port for 800,000 MT per annum. When exchange rates and port and rail costs are considered, it equates to a mine gate price of CDN$240 per MT.
Both the buyer and the seller agree to use their best efforts to enter into a binding Sales Agreement in the first quarter of 2024.
| 16-2 |
TECHNICAL REPORT SUMMARY, BRU PROPERTY, MANITOBA, CANADA
Agreement #3
The third document is an engagement agreement between Sio Silica and Company 3 and dated November 1, 2022. The document states a sales price of US$200 per short ton FOB Mine Gate for 1,200,000 short tons per annum. The agreement also stipulates a service fee equal to 15% of the gross amount of the purchase price paid. When conversion to metric tonnes and the 15% fee are considered, it equates to a mine gate price of CDN$243.60 per MT.
The term of this agreement is unlimited unless terminated by either the buyer or the seller.
Product Pricing
Stantec used a weighted tonnage per annum price from all three agreements for the initial years of the analysis. A weighted tonnage per annum price for the last two agreements was used from 2030 until the end of the project life.
Product Quality
The first two agreements specify that the quality parameters for the delivered sand shall be a silicon dioxide (SiO2) percentage greater than or equal to 99.9% and Fe2O3 content less than or equal to 100 ppm.
It is the opinion of Stantec that given the results of the sand analysis discussed in Section 8, the sand pricing discussed above is applicable to the BRU Property resource and as such has been used in this Study.
Stantec does note, however, that confirmed sales agreements or contracts for the full levels of silica sand production that form the basis of this Study have yet to be finalized.
| 16-3 |
TECHNICAL REPORT SUMMARY, BRU PROPERTY, MANITOBA, CANADA
| 17 | ENVIRONMENTAL STUDIES, PERMITTING AND PLANS, NEGOTIATIONS OR AGREEMENTS WITH LOCAL INDIVIDUALS OR GROUPS |
Sio Silica has engaged AECOM to provide consulting support through the regulatory approval process. The following is a summary of information provided by AECOM.
| 17.1 | ENVIRONMENTAL BASELINE INVESTIGATIONS |
Environmental baseline information for the Project area was obtained from the following:
| ● | Available desktop information, such as a previous fish and fish habitat survey (Milani, 2013) |
| ● | Environmental studies that overlapped with Project local and regional areas in 2018 |
| o | Spring auditory amphibian survey (May 2018) focused in wetland areas |
| o | Baseline noise data (May and August 2018) |
| o | Summer vegetation survey (June 2018) in representative vegetation communities |
| o | Fall vegetation survey (September and October 2018) with additional emphasis on wetland areas and the Project Site |
| ● | Heritage Resource Impact Assessment studies conducted by an archaeologist at the processing facility site (May 2020) and at the extraction site for extractions years to 2025 (May 2021) |
| ● | Hydrogeological and geochemical study to document existing groundwater flow and quality at the project site and evaluate the potential to impact groundwater quantity, quality and users of surface water and groundwater in the vicinity of the project (November - December 2020) |
Much of the Project area where the processing facility footprint, and extraction activities up to and including year 2025, will occur has been previously disturbed / cleared due to activities such as tree clearing and aggregate extraction. The remaining naturally vegetated areas are primarily woodlands with some low wet areas occurring that are typically dominated by dense willow and alders. The woodland areas feature trembling aspen and aspen-dominant / bur oak stands. Occasional tamarack, black spruce, balsam poplar and balsam fir / aspen-mixed wood stands also occur with common understory shrub species including American hazel, red-osier dogwood, wild rose and willow.
Considering the largely previously disturbed nature of the Project site and the application of environmental protection measures, such as clearing natural vegetation outside of the breeding season for migratory birds, potential impacts to wildlife and species at risk that may occur in the Project area can be mitigated. Progressive annual closure and rehabilitation of extraction wells and associated disturbed areas will also mitigate environmental effects.
The Heritage Resource Impact Assessments (HRIAs) for the processing facility, and extraction area for years up to and including 2025, recommended that Manitoba Heritage Resources Branch issue a clearance letter for both Project areas due to lack of occurrence of significant heritage resources in areas with highest probability of heritage resources occurrence, and low probability of Project impacts to heritage resources. The HRIA also recommended the development of a Heritage Resources Protection Plan to guide workers on mitigation actions that will need to be implemented should unknown heritage resources be discovered. A clearance letter for the processing facility site was issued by Historic Resources branch on June 28, 2020. A draft HRIA report will be issued to Historic Resources Branch in June 2021 for the extraction site for extractions years up to 2025.
| 17-1 |
TECHNICAL REPORT SUMMARY, BRU PROPERTY, MANITOBA, CANADA
Modeling results from the hydrogeological study using existing data supplemented by on-site pump test data obtained in 2020 and 2021 has determined that effects on groundwater quantity are anticipated to be relatively small, local, temporary and reversible, with groundwater levels simulated to recover shortly (20 to 80 days) with approximately 80% recovery approximately two days after operations end each year. Groundwater model simulations indicate that groundwater users beyond a radial distance of approximately 2.2 km from the active extraction wells are unlikely to experience any effects due to extraction activities, and for those within 2.2 km from the active extraction wells the magnitude of drawdown impacts is anticipated to be between 1 m and 5 m for the majority of the licensed water supply wells. The groundwater removed from the extraction well by air injection is separated from the sand at the dewatering station then passes through a UV treatment system before being immediately returned to the extraction well and to the sandstone aquifer the groundwater was originally extracted from. The groundwater is not exposed to the atmosphere after the UV treatment to prevent any potential for contamination (e.g. bacteria). The UV treatment is a technique commonly used in municipal water treatment facilities, including the city of Winnipeg.
Geochemical modeling indicated that operations would slightly reduce existing high levels of iron and manganese concentrations in the groundwater due to aeration and re-injection of treated water or mixing. Therefore, effects on groundwater quality are anticipated to produce relatively small positive changes in local groundwater chemistry and are temporary and reversible. In summary, potential effects on groundwater quantity and quality will be avoided or minimized with the application of the following mitigation, management and monitoring plans:
| ● | Waste Characterization and Management Plan |
| o | To guide management of natural waste materials from drilling (standard practice for existing mining operations in Manitoba) |
| ● | Water Management Plan |
| o | To balance operational water supply and demands |
| ● | Progressive Well Abandonment Plan |
| o | To ensure groundwater remains protected as per regulatory requirements |
| ● | Groundwater Monitoring and Impact Mitigation Plan |
| o | To confirm modeling predictions and proactively implement mitigation measures before any adverse effects occur to local water well users |
| 17.2 | PERMITTING REQUIREMENTS |
| 17.2.1 | Provincial |
The sand processing facility, and the extraction activities associated with the Project up to and including year 2025, will be reviewed by Manitoba Conservation and Climate (MBCC) and licensed separately under The Environment Act. No other permits / licenses from other provincial agencies can be issued for a project requiring licensing under The Environment Act until the project receives an Environment Act Licence.
| 17-2 |
TECHNICAL REPORT SUMMARY, BRU PROPERTY, MANITOBA, CANADA
The sand processing facility is currently being reviewed under The Environment Act as a “manufacturing and industrial plant” which is a Class 2 development in Section 3 of the Classes of Development Regulation under group 4 “Manufacturing”. An Environment Act Licence application, including the required Environment Act Proposal (EAP), was submitted for MBCC Environmental Assessment Branch review on July 2, 2020. On October 15, 2020, MBCC required that Sio Silica hold a facilitated Public Meeting to present information on the facility Project and address public questions. On November 4, 2020, MBCC confirmed that a more formal Clean Environment Commission Hearing would not be required for the facility Project. Sio Silica held a facilitated virtual Public Meeting on December 15, 2020 and submitted a Public Meeting Report to MBCC on December 23, 2020.
The sand extraction activities associated with the Project, up to and including year 2025, will be reviewed under The Environment Act as a “mine” which is a Class 2 development in Section 3 of the Classes of Development Regulation under group 5 “Mining”. An Environment Act Licence application, including an EAP, for the extraction activities is anticipated to be submitted to MBCC Environmental Assessment Branch in July 2021.
Sand extraction activities are proposed to occur on private land within current mining claim areas issued to Sio Silica under provisions of The Mines and Minerals Act and under borehole licenses issued under Part 3 of the Drilling Regulation. A ‘Closure Plan’, as required in the Mine Closure Regulation under The Mines and Minerals Act, will be prepared and submitted to MBCC and Mines Branch for review and approval before sand extraction operations commence.
In addition to seeking licensing under The Environment Act, Sio Silica will apply to Manitoba for:
| ● | Water rights license(s) for the extraction and reinjection of groundwater; and |
| ● | Burning permits to dispose of woody debris will be sought, as required, in accordance with Section 19(1) of The Wildfires Act. |
| 17.2.2 | Federal |
No federal permits or approvals are expected to be required for the sand extraction activities.
Sio Silica is currently corresponding with the federal Impact Assessment Agency of Canada (IAAC) regarding the proposed area for the rail loop component of the sand processing facility. Under Section 54(b) in the Physical Activities Regulations under the Impact Assessment Act, construction of a new ‘railway yard’ with a total area of 50 ha or more is a ‘designated project’ and subject to review and approval under the Impact Assessment Act. Sio Silica anticipates that the final rail loop design will not trigger federal review under the Impact Assessment Act.
| 17.2.3 | Municipal |
Sio Silica applied to the Rural Municipality (RM) of Springfield in May 2022 to amend the Zoning By-law. A Municipal Board Hearing was held in October 2022 to determine if the Zoning By-law Amendment should be approved. In March 2023, the Municipal Board ruled in favor of the Zoning By-law Amendment. This amendment defines Sio Silica’s proposed Facility and Rail Loop as Permitted Use and will permit Sio Silica to construct and operate it’s proposed Facility and Rail Loop without a Conditional Use Permit from the Municipality.
| 17-3 |
TECHNICAL REPORT SUMMARY, BRU PROPERTY, MANITOBA, CANADA
Sio Silica is currently in negotiations with the RM of Springfield to put in place a Development Agreement for the facility. The RM of Springfield will require the submission, review, and approval of building permit(s) before construction can proceed on the processing facility.
| 17.3 | PERMITTING TIMELINES |
In consideration of the Project permitting requirements and activities completed to date as described above in Section 17.2, the expected permitting timelines are presented in Table 17-1.
Table 17.1
Summary of Project Permitting Process Key Milestones
| Component | Date | |
| Provincial | ||
| Submission of final Sand Extraction EAP to MBCC | July, 2021 | |
| Sio Silica Public Engagement Virtual Meeting – Sand Extraction Project | August, 2021 | |
| Technical Advisory Committee (TAC) and Public Review and Response to Sand Extraction EAP | September, 2021 | |
| Facilitated Public Meeting (potential requirement of MBCC) | September, 2021 | |
| Sio Silica Public Engagement In-Person Meeting – Sand Extraction Project | November, 2021 | |
| CEC Hearing Announcement for Sand Extraction | November, 2021 | |
| Issuance of Environment Act Licence for Facility Project | December, 2021 | |
| Sio Public Engagement – Close Neighbor Individual Meetings | Fall, 2022 | |
| Sio Silica Public Engagement Virtual Meeting – Q&A Webinar | February, 2023 | |
| Completed drafts for the following: Groundwater Monitoring and Impact Mitigation Plan, Progressive Well Abandonment Plan, Waste Characterization and Management Plan | February 2023 | |
| Submitted Draft Closure Plan - Extraction | February, 2023 | |
| Clean Environment Commission (CEC) Hearings | February, 2023 to March, 2023 | |
| CEC Recommendations | June, 2023 | |
| Submitted Draft Closure Plan - Facility | June, 2023 | |
| Municipal | ||
| Municipal Board Zoning Appeal Hearing for Facility Project | October, 2022 | |
| Successful Zoning Result for Facility Property | March, 2023 | |
| 17.4 | SOCIAL AND COMMUNITY IMPACTS |
Potential socioeconomic effects of the Project are assessed in the EAPs for the respective facility and extraction Project components that will be reviewed and considered by MBCC in the provincial review and licencing process. Sio Silica has a public ‘Vivian Sand Project’ website that provides updated information on the Project and a summary of the public outreach conducted by Sio Silica to date. Sio Silica has been and will continue to engage with local communities, associations, local businesses, and other interested parties, to share information about the Project and solicit input on improving Project design and/or address any concerns.
| 17-4 |
TECHNICAL REPORT SUMMARY, BRU PROPERTY, MANITOBA, CANADA
| 18 | CAPITAL AND OPERATING COSTS |
| 18.1 | COST SUMMARY |
Initial Assessment level cost estimates were prepared for the development and operation of the BRU Project. Unit costs are expressed as dollars/clean tonne, unless specified otherwise.
The cost estimates and resulting cash flow analysis were prepared in constant 2023 Canadian dollars (C$). The exchange rate of US$0.77 to C$1.00 was used for the project.
The following sources and approaches were used:
| ● | Extraction and slurry pumping costs were based on estimates prepared by Sio Silica. Wet plant processing, dry plant processing and associated equipment, screening plant, silos, and rail loading systems were developed by Turnkey Process Solutions (TPS). TPS likewise developed budgetary estimates for capital construction and installation costs. |
| ● | Rail transportation costs were provided by CN. |
| ● | Rail siding construction estimates were provided by Trans Energy Services, Sio Silica’s independent consultant and rail specialist. These are based on preliminary designs and development work completed by Trans Energy. |
| ● | Other infrastructure and facilities estimates were compiled by Stantec based on vendor quotes, and discussions with Sio Silica. |
| ● | Operating expenses were estimated by Sio Silica. |
| ● | Labour costs, developed by Sio Silica, were based on knowledge of current labour agreements. |
| ● | Management and staff salaries were estimated by Sio Silica, based on Stantec input on current mining salaries in Western Canada, and in consultation with Sio Silica on their anticipated burden. |
| ● | Electricity rate for process facility operations provided by publicly available sources on Manitoba Hydro and through discussions between Sio Silica and the utility. |
| 18.2 | PROJECT CAPITAL COSTS |
The methods and procedures used to develop the capital cost estimate are described in the following subsections. Project capital costs were sourced from various vendors, and from Stantec’s database of capital costs.
| 18.2.1 | Capital Cost Summary – Phase 1 |
The capital cost summary for the BRU project extraction area is outlined in Table 18.1.
Phase 1 is developed to capture the 1.46 MTPA of insitu production, and requisite capital to extract, process, and load the product. The battery limits begin at extraction well pad, including well rigs, the overland slurry line initial pump stations, booster pump and through to the wet and dry plant, as well as the silos, rail, and supporting infrastructure.
| 18-1 |
TECHNICAL REPORT SUMMARY, BRU PROPERTY, MANITOBA, CANADA
It should be noted that no contingency is applied in the table.
Table 18.1
Capital Cost Summary – Phase 1 (C$), no Contingency
| Area | Summary Cost, (C$) | |||
| Extraction | $ | 21.8 | M | |
| Wet Plant | $ | 39.4 | M | |
| Dry Plant | $ | 47.4 | M | |
| Rail and TLO | $ | 25.3 | M | |
| Overland Slurry Pipeline Controls | $ | 6.2 | M | |
| Infrastructure | $ | 15.9 | M | |
| Engineering, Project Management & Permitting | $ | 2.0 | M | |
| Subtotal | $ | 158.0 | M | |
| 18.2.2 | Capital Cost Summary – Phase 2 |
The capital costs for the second phase of development, Phase 2, are shown in Table 18.2. The same battery limits apply as in Phase 1, recognizing that portions of the rail and infrastructure is pre-invested in within the original phase.
Table 18.2
Capital Cost Summary – Phase 2 (C$), no Contingency
| Area | Summary Cost, (C$) | |||
| Extraction | $ | 21.8 | M | |
| Wet Plant | $ | 34.4 | M | |
| Dry Plant | $ | 38.0 | M | |
| Rail and TLO | $ | 11.0 | M | |
| Overland Slurry Pipeline Controls | $ | 0.0 | M | |
| Infrastructure | $ | 0.0 | M | |
| Engineering, Project Management & Permitting | $ | 0.5 | M | |
| Subtotal | $ | 105.7 | M | |
Engineering studies allowance of $0.5M is shown in Phase 2, although in the cashflow outlay, these studies are anticipated to occur as bridging studies ahead of Phase 2. As with the preceding Phase, the Phase 2 tally above does not include contingency.
| 18.2.3 | Contingency |
A 7% contingency has been applied to most capital cost items to account for any unforeseen or otherwise unanticipated cost elements that could be associated with development and operation of the project. Contingency for Phase 1 totals $10.0M. A contingency was not applied to rail costs as these costs were supplied including a contingency.
| 18-2 |
TECHNICAL REPORT SUMMARY, BRU PROPERTY, MANITOBA, CANADA
| 18.2.4 | Sustaining Costs |
Sustaining costs are captured under the operating cost sections below including additional land, extraction wells, slurry line and booster pumps, and as well the plant repair and maintenance costs.
| 18.3 | PROJECT OPERATING COSTS |
The project team developed the operating costs using construction lengths, land requirements, operating units, and process or dryer unit preliminary power and gas consumption. Areas of operating costs breakouts include:
| ● | Land leasing |
| ● | Land prep and reclaim |
| ● | Well Production |
| ● | Slurry Transport |
| ● | Wet Process |
| ● | Support Equipment |
| ● | Dry Process |
| ● | Loadout |
| ● | Rail Costs |
| ● | Manpower |
| ● | General and Administration |
The diesel fuel cost assumption is $1.59/litre. Propane gas costs are estimated at $0.38/litre propane. Natural gas is estimated at $0.188/m3. As well, the power costs from Manitoba Power are indicative rates based on preliminary verbal discussions. The estimated power rate is $0.045
/ kW-hr.
| 18.3.1 | Land Leasing |
Land Leasing costs are based on the mine development plan, shown earlier in this study. The developed hectares are considered for the projected extraction plan, and a lease cost of $0.22/t is applied based on work by Sio Silica.
| 18.3.2 | Land Preparation and Reclamation |
Land prep and reclaim considers the mulching requirements for the area of the extraction development.
| 18.3.3 | Well Production |
Well production is a function of tonnes produced, and the phase of the project. Typical well costs were provided by the Sio Silica team. Drilling costs per well were estimate by Sio Silica at $14,759 per well; abandonment costs are estimated at $3,352 per well; personnel costs are estimated at $10,430 per well. Extraction area processing is planned to operate approximately 203 days per year to allow for the seasonal operating conditions of the pipeline and extraction pads.
| 18-3 |
TECHNICAL REPORT SUMMARY, BRU PROPERTY, MANITOBA, CANADA
Slurry transport through overland piping is based on an initial pumpstation at or near the wellpad, then booster pumps added or removed to maintain the slurry line velocity and head. A buildup of slurry pipeline costs include an operator at the well pad, an operator at the dewatering plant, and a maintenance operator roving the system. Each position will be repeated on day and night shift over the anticipated March to October timeframe.
| 18.3.4 | Wet process, Dry Process, and Loadout |
Wet process, Dry process and Loadout operating costs are an allowance for maintenance and consumables, as well as gas and power within the plant. Gas consumption is based on the current concept of the dry plant and heating load anticipated to run the dryers. The dryer gas cost is based on the assumption that Year 1 will require trucked propane gas; Year 2 onward will include gas delivered via pipeline at a lower cost rate. It should be noted that the Wet process includes a magnetic separation or beneficiation stage at $0.72 per tonne.
| 18.3.5 | Support Equipment |
Support equipment consists of the mobile equipment that is required to operate the mine, and their upkeep and fuel consumption. The mobile equipment required for the Phase 1 development includes:
| ● | Skidsteer Loader (1) |
| ● | Pickup truck (3) |
| ● | Service Truck (1) |
| ● | Manlift (1) |
| ● | Water Truck (1) |
| ● | Off road forklift (1) |
| ● | Railcar mover (1) |
| ● | 982M (2) |
Additional equipment, such as an additional loader are added as the process expands to Phase 2.
| 18.3.6 | Rail & Port |
Sio Silica has utilized rail costs of $65 per clean tonne and port costs of $20 per clean tonne for sand delivered to ports in Vancouver. Rail costs to other destinations in North America will vary. Sio Silica has adopted a mine gate pricing scenario for this IA.
| 18-4 |
TECHNICAL REPORT SUMMARY, BRU PROPERTY, MANITOBA, CANADA
| 18.3.7 | Manpower |
Manpower estimates are based on staffing at the wet, dry and rail loadout areas, with overall support from salaried management. Wellpad staffing is accounted for in the cost per well estimate noted above. Staffing levels for the Phase 1 and Phase 2 developments are shown in the Table 18.3 outlining anticipated or projected roles and responsibilities. The reader should note that annual salary is provided for professional staff, while and hourly rates are provided for the labour positions.
Table 18.3
Phase 1 Manpower Roster and Costs
| Manpower | ||||
| Role | Number of Employees | Straight-time Compensation, incl. Fringes C$ and C$/hr | ||
| Plant Manager | 1 | $218,400 annual | ||
| Accountant | 1 | $154,700 annual | ||
| Lab Manager | 1 | $147,000 annual | ||
| Foreman | 4 | $145,600 annual | ||
| Field Geologist | 4 | $119,000 annual | ||
| Lab assistant | 1 | $84,000 annual | ||
| Quality Control | 2 | $36 / hr | ||
| Plant Operator | 4 | $46 / hr | ||
| Utility | 8 | $49 / hr | ||
| Loadout / Rail | 4 | $44 / hr | ||
| Laborer / Bagging | 2 | $40 / hr | ||
| Maintenance 2 | 2 | $49 / hr | ||
| Mobile Equipment | 4 | $42 / hr | ||
| Health and Safety Manager | 1 | $140,000 annual | ||
| Environmental Compliance | 1 | $130,000 annual | ||
| Land Management | 1 | $110,000 annual | ||
| Logistics Coordinator | 1 | $90,000 annual | ||
| Warehouse Manager | 1 | $80,000 annual | ||
| Warehouse Assistant | 1 | $65,000 annual | ||
| Asset (Equipment) Manager | 1 | $120,000 annual | ||
| Mechanic | 1 | $110,000 annual | ||
| Jr Mechanic | 1 | $90,000 annual | ||
| Mill Wright | 1 | $140,000 annual | ||
| Welder | 1 | $100,000 annual | ||
| Helper | 1 | $65,000 annual | ||
| Electrician | 1 | $120,000 annual | ||
| Secretary Front Office | 1 | $55,000 annual | ||
| Hydrogeologist | 1 | $140,000 annual | ||
| Field Technology Support | 1 | $90,000 annual | ||
| Heavy Equipment Operator | 1 | $100,000 annual | ||
| Total | 55 | |||
| 18.3.8 | General and Administrative Costs |
General and administrative expenses for the BRU project are developed on an annual allowance of $3,600,000. The G&A costs are intended to cover items such as legal services, financial support, marketing, office supplies, consultants, and other items.
| 18-5 |
TECHNICAL REPORT SUMMARY, BRU PROPERTY, MANITOBA, CANADA
| 18.3.9 | Operating cost Summary |
The total operating cost summary is shown in Table 18.4. In year 1, each extraction site utilizes dedicated supervision leading to higher initial costs. Extraction operation costs are reduced in later years as operations supervision is planned to be centralized. Slurry transport costs are lower in early years due to shorter slurry pumping distances. Dry processing costs are calculated based on the change from trucked propane in Year 1 while the gas line is developed. From Year 2 production onward, operating costs reflect that the installation of a natural gas pipeline and the use of natural gas as opposed to propane.
Table 18.4
Life of mine Operating Cost Summary, C$
| Year 1 C$/tonne | Year 2 onward C$/tonne | |||||||
| Extraction | $ | 12.53 | $ | 8.62 | ||||
| Slurry Transport | $ | 1.74 | $ | 2.90 | ||||
| Wet Processing | $ | 5.07 | $ | 5.07 | ||||
| Dry Processing | $ | 11.99 | $ | 8.63 | ||||
| Site Labor | $ | 1.28 | $ | 1.28 | ||||
| Insurance | $ | 0.38 | $ | 0.38 | ||||
| Total OPEX | $ | 32.99 | $ | 26.88 | ||||
| 18-6 |
TECHNICAL REPORT SUMMARY, BRU PROPERTY, MANITOBA, CANADA
| 19 | ECONOMIC ANALYSIS |
Sio Silica prepared the economic analyses for the BRU operation and provided the model to Stantec. Stantec reviewed the model and determined it to be appropriate for the purposes of this Study.
The economic analyses for this study includes the calculation of Net Present Value (NPV) on a before and after-tax basis. The estimates assume that production, cost targets, pricing and sales goals are achieved. Any deviation from those values affects the determination of NPV.
A cash-flow forecast has been developed for the life of the project. This includes a one-year pre- production phase (prior to sales). The production period is 25 years. The NPV is calculated in Year 0, the first year of pre-production. This is 2024 in the project schedule.
| 19.1 | ASSUMPTIONS |
| 19.1.1 | Exchange Rate |
Stantec has utilized an exchange rate of 1.30 to convert US dollars to CDN dollars.
| 19.1.2 | Rail Transportation Costs |
Sio Silica solicited a quotation from Canadian National Railway (CN) for the transportation of silica sand from the BRU Property to port destinations in Vancouver, British Columbia. This quotation was factored to include both fuel and rail car rentals, resulting in a rail rate of C$ 65/tonne.
| 19.1.3 | Port Costs |
Sio Silica solicited estimates from Vancouver port experts for the unloading of silica sand from bulk railcars and packaging in FIBC super sack bags. As a result, port costs of C$ 20/tonne were used in the IA.
| 19.1.4 | Product Pricing |
Sio Silica has provided Stantec with documents regarding product pricing agreements from three companies.
Agreement #1
The first document is a proposed sales and purchase agreement contract between Sio Silica and Company 1, that Sio Silica has indicated should be finalized in the fourth quarter of 2023. The document states a sales price of US$180 per MT FOB loading port for 500,000 MT per annum. When exchange rates and port and rail costs are considered, it equates to a mine gate price of CDN$149 per MT.
| 19-1 |
TECHNICAL REPORT SUMMARY, BRU PROPERTY, MANITOBA, CANADA
Agreement #2
The second document is a Memorandum of Understanding between Sio Silica and Company 2 and dated September 15, 2022. The document states a sales price of US$250 per MT FOB loading port for 800,000 MT per annum. When exchange rates and port and rail costs are considered, it equates to a mine gate price of CDN$240 per MT.
Both the buyer and the seller agree to use their best efforts to enter into a binding Sales Agreement in the first quarter of 2024.
Agreement #3
The third document is an engagement agreement between Sio Silica and Company 3 and dated November 1, 2022. The document states a sales price of US$200 per short ton FOB Mine Gate for 1,200,000 short tons per annum. The agreement also stipulates a service fee equal to 15% of the gross amount of the purchase price paid. When conversion to metric tonnes and the 15% fee are considered, it equates to a mine gate price of CDN$243.60 per MT.
The term of this agreement is unlimited unless terminated by either the buyer or the seller.
Product Pricing
Stantec used a weighted tonnage per annum price from all three agreements for the initial years of the analysis. A weighted tonnage per annum price for the last two agreements was used from 2030 until the end of the project life.
Product Quality
The first two agreements specify that the quality parameters for the delivered sand shall be a silicon dioxide (SiO2) percentage greater than or equal to 99.9% and Fe2O3 content less than or equal to 100 ppm.
| 19.2 | BRU PROPERTY LIFE |
Sio Silica plans to commence extraction and processing operations in the 3rd Quarter of Year 0 with the first product sales planned for the 1st Quarter of 2025. The extraction and processing operations are planned to take place for eight months a year, April to November, while sales will take place year-round. The sales will be phased with 1.25 Mt of saleable product planned in Year 1, 2.50 Mt in Year 2, and 2.72 Mt in Year 3 and extending out the remainder of the 25-year plan. For the purposes of this Technical Report Summary, Year 0 is defined as 2024.Project Payback
The forecasted project payback occurs in 2026, 1.6 years after facility construction is completed and commercial operations commence.
| 19.3 | ROYALTIES AND INCOME TAX |
| 19.3.1 | Royalties |
Sio Silica has applied the royalties as discussed in Section 3. These royalties equate to 1.34% and 3.0% of pre-tax revenue.
| 19-2 |
TECHNICAL REPORT SUMMARY, BRU PROPERTY, MANITOBA, CANADA
| 19.3.2 | Mineral Tax |
Mineral taxes have been applied as per the requirements of the province of Manitoba.
In summary the tax applies at the following rates, where mining profit is:
| ● | < $50 million; tax = mining profit x 10%. |
| ● | $50 to $55 million; tax = (mining profit - $50,000,000) x 65% + $5,000,000. |
| ● | Between $55 and $100 million; tax = mining profit x 15%. |
| ● | $100 to $105 million; tax = (mining profit - $100,000,000) x 57% + $15,000,000. |
| ● | $105 million; tax = mining profit x 17%. |
A ‘new mine tax holiday’ is in effect which provides that no Mining Tax is payable on new mines until the mining operator has recovered its initial investment.
| 19.3.3 | Taxes |
Federal Canadian and Manitoba income taxes were calculated on a project basis in accordance with the applicable tax laws. The calculation assumes the following:
| ● | A federal income tax rate of 15% |
| ● | A Manitoba income tax rate of 12% |
| 19.4 | ECONOMIC PERFORMANCE |
The results of the Study base case economic analysis are shown in Table 19.1 Project Economics. The economic performance of the project is positive up to the highest analyzed discount rate of 16%.
Table 19.1
Project Economics (C$)
| Discount Rate | After Tax | |||||||
| (%) | IRR | NPV | ||||||
| 6 | 96 | % | $ | 3,774,089,000 | ||||
| 8 | 96 | % | $ | 3,043,276,000 | ||||
| 10 | 96 | % | $ | 2,494,719,000 | ||||
| 12 | 96 | % | $ | 2,075,195,000 | ||||
| 14 | 96 | % | $ | 1,748,649,000 | ||||
| 16 | 96 | % | $ | 1,490,259,000 | ||||
Stantec has not completed a rigorous analysis in order to select the project discount rate. However, Stantec notes that current normalized risk-free rate and equity risk premium, composed of 3.5% and 5.7% respectively which shows that the approximate cost of equity capital to be 9.2%. This rate does not account for project risks, industry risk, size and maturity of the operation to name a few. As such the appropriate discount rate for this study is likely in the range of 10-13%. Ultimately investors in the BRU Property will need to conduct their own discount rate analysis.
| 19-3 |
TECHNICAL REPORT SUMMARY, BRU PROPERTY, MANITOBA, CANADA
The key project metrics and cash flow summary are summarized in Tables 19.2 and 19.3
Table 19.2
Key Project Metrics
| Economic Analysis | BRU | |||
| Net Present Value (NPV), After-Tax | $ | 2,494,719,000 | ||
| Internal Rate of Return (IRR), After-Tax | 96 | % | ||
| Pay-Back Period (Years based on After-Tax) | 1.58 | |||
| Capital Costs | ||||
| Initial Capital (M) | 168.00 | |||
| Expansion Capital (M) | 112.75 | |||
| Operating Costs at Full Production | ||||
| Extraction ($/MT ) | 8.62 | |||
| Slurry Transport ($/MT) | 2.90 | |||
| Wet Processing ($/MT) | 5.07 | |||
| Dry Processing and Loadout ($/MT) | 8.63 | |||
| Site Labor and Insurance ($/MT) | 1.66 | |||
| Total Operating Cost ($/MT) | 26.88 | |||
| Production Data | ||||
| Life of Mine (Years) | 25 | |||
| Annual Clean Saleable Tonnes Produced (MT) | 2,724,000 | |||
| Total Clean Saleable Tonnes Produced (MT) | 66,398,000 | |||
| 19-4 |
TECHNICAL REPORT SUMMARY, BRU PROPERTY, MANITOBA, CANADA
Table 19.3
Cash Flow Summary
| Year 0 | Year 1 | Year 2 | Year 3 | Year 4 | Year 5 | Year 6 | Year 7 | Year 8 | Year 9 | Year 10 | Year 11 | Year 12 | ||||||||||||||||||||||||||||||||||||||||
| Period | 2024 | 2025 | 2026 | 2027 | 2028 | 2029 | 2030 | 2031 | 2032 | 2033 | 2034 | 2035 | 2036 | |||||||||||||||||||||||||||||||||||||||
| Raw Sand Production (Tonnes) | 549,000 | 1,465,000 | 2,929,000 | 2,929,000 | 2,929,000 | 2,929,000 | 2,929,000 | 2,929,000 | 2,929,000 | 2,929,000 | 2,929,000 | 2,929,000 | 2,929,000 | |||||||||||||||||||||||||||||||||||||||
| Sales Volumes (Tonnes) | - | 1,249,000 | 2,497,000 | 2,724,000 | 2,724,000 | 2,724,000 | 2,724,000 | 2,724,000 | 2,724,000 | 2,724,000 | 2,724,000 | 2,724,000 | 2,724,000 | |||||||||||||||||||||||||||||||||||||||
| Minegate Pricing ($/Tonne) | 223.53 | 223.53 | 223.53 | 223.53 | 223.53 | 223.53 | 242.55 | 242.55 | 242.55 | 242.55 | 242.55 | 242.55 | 242.55 | |||||||||||||||||||||||||||||||||||||||
| Minegate Revenue (M$) | - | 279 | 558 | 609 | 609 | 609 | 661 | 661 | 661 | 661 | 661 | 661 | 661 | |||||||||||||||||||||||||||||||||||||||
| Royalties (M$) | - | 12 | 16 | 10 | 10 | 10 | 11 | 11 | 11 | 11 | 11 | 11 | 11 | |||||||||||||||||||||||||||||||||||||||
| Mining Tax (M$) | - | - | 80 | 89 | 89 | 89 | 98 | 98 | 98 | 98 | 98 | 98 | 98 | |||||||||||||||||||||||||||||||||||||||
| Net Revenue (M$) | - | 267 | 462 | 510 | 510 | 510 | 553 | 553 | 553 | 553 | 553 | 553 | 553 | |||||||||||||||||||||||||||||||||||||||
| Extraction Operating Costs (M$) | 8 | 22 | 37 | 37 | 37 | 37 | 37 | 37 | 37 | 37 | 37 | 37 | 37 | |||||||||||||||||||||||||||||||||||||||
| Wet Processing Operating Costs (M$) | 2 | 7 | 14 | 14 | 14 | 14 | 14 | 14 | 14 | 14 | 14 | 14 | 14 | |||||||||||||||||||||||||||||||||||||||
| Dry Processing and Loadout Operating Costs (M$) | - | 15 | 22 | 24 | 24 | 24 | 24 | 24 | 24 | 24 | 24 | 24 | 24 | |||||||||||||||||||||||||||||||||||||||
| Total Operating Costs (M$) | 10 | 44 | 72 | 74 | 74 | 74 | 74 | 74 | 74 | 74 | 74 | 74 | 74 | |||||||||||||||||||||||||||||||||||||||
| Manitoba Operations G&A (M$) | - | - | - | - | - | - | - | - | - | - | - | - | - | |||||||||||||||||||||||||||||||||||||||
| Head office G&A (M$) | 4 | 4 | 3 | 2 | 2 | 2 | 2 | 2 | 2 | 2 | 2 | 2 | 2 | |||||||||||||||||||||||||||||||||||||||
| Total G&A (M$) | 4 | 4 | 3 | 2 | 2 | 2 | 2 | 2 | 2 | 2 | 2 | 2 | 2 | |||||||||||||||||||||||||||||||||||||||
| Cash Interest Expense (M$) | 12 | 12 | 6 | - | - | - | - | - | - | - | - | - | - | |||||||||||||||||||||||||||||||||||||||
| Cash Income Tax (M$) | - | 33 | 88 | 106 | 109 | 111 | 124 | 125 | 126 | 127 | 127 | 128 | 128 | |||||||||||||||||||||||||||||||||||||||
| Total Cash-flow (M$) | (26 | ) | 175 | 293 | 329 | 326 | 324 | 353 | 352 | 351 | 350 | 350 | 349 | 349 | ||||||||||||||||||||||||||||||||||||||
| Cumulative Cash-Flow (M$) | (28 | ) | 147 | 440 | 768 | 1,094 | 1,418 | 1,770 | 2,122 | 2,473 | 2,823 | 3,173 | 3,522 | 3,871 | ||||||||||||||||||||||||||||||||||||||
| Phase 1 Capital Expenditures (M$) | 166 | - | - | - | - | - | - | - | - | - | - | - | - | |||||||||||||||||||||||||||||||||||||||
| Expansion Capital Expenditures (M$) | - | 86 | 27 | - | - | - | - | - | - | - | - | - | - | |||||||||||||||||||||||||||||||||||||||
| Total Capital Expenditures (M$) | 166 | 86 | 27 | - | - | - | - | - | - | - | - | - | - | |||||||||||||||||||||||||||||||||||||||
| 19-5 |
TECHNICAL REPORT SUMMARY, BRU PROPERTY, MANITOBA, CANADA
Table 19.3 (Cont’d)
| Year 13 | Year 14 | Year 15 | Year 16 | Year 17 | Year 18 | Year 19 | Year 20 | Year 21 | Year 22 | Year 23 | Year 24 | Year 25 | ||||||||||||||||||||||||||||||||||||||||||||
| Period | 2037 | 2038 | 2039 | 2040 | 2041 | 2042 | 2043 | 2044 | 2045 | 2046 | 2047 | 2048 | 2049 | Total | ||||||||||||||||||||||||||||||||||||||||||
| Raw Sand Production (Tonnes) | 2,929,000 | 2,929,000 | 2,929,000 | 2,929,000 | 2,929,000 | 2,929,000 | 2,929,000 | 2,929,000 | 2,929,000 | 2,929,000 | 2,929,000 | 2,929,000 | 2,929,000 | 72,310,000 | ||||||||||||||||||||||||||||||||||||||||||
| Sales Volumes (Tonnes) | 2,724,000 | 2,724,000 | 2,724,000 | 2,724,000 | 2,724,000 | 2,724,000 | 2,724,000 | 2,724,000 | 2,724,000 | 2,724,000 | 2,724,000 | 2,724,000 | 2,724,000 | 66,398,000 | ||||||||||||||||||||||||||||||||||||||||||
| Minegate Pricing ($/Tonne) | 242.55 | 242.55 | 242.55 | 242.55 | 242.55 | 242.55 | 242.55 | 242.55 | 242.55 | 242.55 | 242.55 | 242.55 | 242.55 | |||||||||||||||||||||||||||||||||||||||||||
| Minegate Revenue (M$) | 661 | 661 | 661 | 661 | 661 | 661 | 661 | 661 | 661 | 661 | 661 | 661 | 661 | 15,878 | ||||||||||||||||||||||||||||||||||||||||||
| Royalties (M$) | 11 | 11 | 11 | 11 | 11 | 11 | 11 | 11 | 11 | 11 | 11 | 11 | 11 | 268 | ||||||||||||||||||||||||||||||||||||||||||
| Mining Tax (M$) | 98 | 98 | 98 | 98 | 98 | 98 | 98 | 98 | 98 | 98 | 98 | 98 | 98 | 2,303 | ||||||||||||||||||||||||||||||||||||||||||
| Net Revenue (M$) | 553 | 553 | 553 | 552 | 552 | 552 | 552 | 552 | 552 | 552 | 552 | 552 | 552 | 13,307 | ||||||||||||||||||||||||||||||||||||||||||
| Extraction Operating Costs (M$) | 37 | 37 | 37 | 37 | 37 | 37 | 37 | 37 | 37 | 37 | 37 | 37 | 37 | 907 | ||||||||||||||||||||||||||||||||||||||||||
| Wet Processing Operating Costs (M$) | 14 | 14 | 14 | 14 | 14 | 14 | 14 | 14 | 14 | 14 | 14 | 14 | 14 | 341 | ||||||||||||||||||||||||||||||||||||||||||
| Dry Processing and Loadout Operating Costs (M$) | 24 | 24 | 24 | 24 | 24 | 24 | 24 | 24 | 24 | 24 | 24 | 24 | 24 | 577 | ||||||||||||||||||||||||||||||||||||||||||
| Total Operating Costs (M$) | 74 | 74 | 74 | 74 | 74 | 74 | 74 | 74 | 74 | 74 | 74 | 74 | 74 | 1,825 | ||||||||||||||||||||||||||||||||||||||||||
| Manitoba Operations G&A (M$) | - | - | - | - | - | - | - | - | - | - | - | - | - | - | ||||||||||||||||||||||||||||||||||||||||||
| Head office G&A (M$) | 2 | 2 | 2 | 2 | 2 | 2 | 2 | 2 | 2 | 2 | 2 | 2 | 2 | 52 | ||||||||||||||||||||||||||||||||||||||||||
| Total G&A (M$) | 2 | 2 | 2 | 2 | 2 | 2 | 2 | 2 | 2 | 2 | 2 | 2 | 2 | 52 | ||||||||||||||||||||||||||||||||||||||||||
| Cash Interest Expense (M$) | - | - | - | - | - | - | - | - | - | - | - | - | - | 30 | ||||||||||||||||||||||||||||||||||||||||||
| Cash Income Tax (M$) | 128 | 128 | 128 | 128 | 128 | 128 | 129 | 129 | 129 | 129 | 129 | 129 | 129 | 3,002 | ||||||||||||||||||||||||||||||||||||||||||
| Total Cash-flow (M$) | 349 | 349 | 349 | 348 | 348 | 348 | 348 | 348 | 348 | 348 | 348 | 348 | 348 | 8,398 | ||||||||||||||||||||||||||||||||||||||||||
| Cumulative Cash-Flow (M$) | 4,220 | 4,569 | 4,917 | 5,265 | 5,613 | 5,961 | 6,309 | 6,657 | 7,005 | 7,352 | 7,700 | 8,048 | 8,396 | - | ||||||||||||||||||||||||||||||||||||||||||
| Phase 1 Capital Expenditures (M$) | - | - | - | - | - | - | - | - | - | - | - | - | - | 166 | ||||||||||||||||||||||||||||||||||||||||||
| Expansion Capital Expenditures (M$) | - | - | - | - | - | - | - | - | - | - | - | - | - | 113 | ||||||||||||||||||||||||||||||||||||||||||
| Total Capital Expenditures (M$) | - | - | - | - | - | - | - | - | - | - | - | - | - | 279 | ||||||||||||||||||||||||||||||||||||||||||
| 19-6 |
TECHNICAL REPORT SUMMARY, BRU PROPERTY, MANITOBA, CANADA
| 19.5 | SENSITIVITY ANALYSIS |
High-level sensitivity analyses were carried out to determine the impact that changes in product pricing and overall costs (capital and operating) would have on the economic performance of the project. The analyses were carried out to determine the effect on the after-tax IRR and NPV 10 values.
Stantec notes that the project economics remain positive all under circumstances modeled herein.
| 19-7 |
TECHNICAL REPORT SUMMARY, BRU PROPERTY, MANITOBA, CANADA
Table 19.4
After Tax NPV Sensitivity to Sale Price
| Product Pricing | |||||||||||||||||||||||||||||
| Project Costs | -30% | -20% | -10% | 0% | 10% | 20% | 30% | ||||||||||||||||||||||
| -30 | % | 1,589,823,000 | 1,896,351,000 | 2,202,402,000 | 2,508,558,000 | 2,814,831,000 | 3,091,714,000 | 3,394,492,000 | |||||||||||||||||||||
| -20 | % | 1,585,073,000 | 1,891,683,000 | 2,197,799,000 | 2,504,008,000 | 2,810,323,000 | 3,087,387,000 | 3,390,266,000 | |||||||||||||||||||||
| -10 | % | 1,580,251,000 | 1,886,948,000 | 2,193,131,000 | 2,499,395,000 | 2,805,755,000 | 3,083,016,000 | 3,386,007,000 | |||||||||||||||||||||
| -5 | % | 1,577,813,000 | 1,884,555,000 | 2,190,773,000 | 2,497,065,000 | 2,803,448,000 | 3,080,815,000 | 3,383,865,000 | |||||||||||||||||||||
| 0 | % | 1,575,357,000 | 1,882,145,000 | 2,188,398,000 | 2,494,719,000 | 2,801,126,000 | 3,078,603,000 | 3,381,717,000 | |||||||||||||||||||||
| 5 | % | 1,572,882,000 | 1,879,718,000 | 2,186,007,000 | 2,492,358,000 | 2,798,788,000 | 3,076,381,000 | 3,379,562,000 | |||||||||||||||||||||
| 10 | % | 1,570,390,000 | 1,877,274,000 | 2,183,600,000 | 2,489,981,000 | 2,796,436,000 | 3,074,150,000 | 3,377,401,000 | |||||||||||||||||||||
| 20 | % | 1,565,349,000 | 1,872,334,000 | 2,178,737,000 | 2,485,180,000 | 2,791,685,000 | 3,069,662,000 | 3,373,067,000 | |||||||||||||||||||||
| 30 | % | 1,560,235,000 | 1,867,325,000 | 2,173,808,000 | 2,480,316,000 | 2,786,873,000 | 3,065,142,000 | 3,368,721,000 | |||||||||||||||||||||
| 19-8 |
TECHNICAL REPORT SUMMARY, BRU PROPERTY, MANITOBA, CANADA
| 20 | ADJACENT PROPERTIES |
There are no properties exploiting silica sand adjacent to the BRU Property
| 20-1 |
TECHNICAL REPORT SUMMARY, BRU PROPERTY, MANITOBA, CANADA
| 21 | OTHER RELEVANT DATA AND INFORMATION |
All relevant information is included in this Report.
| 21-1 |
TECHNICAL REPORT SUMMARY, BRU PROPERTY, MANITOBA, CANADA
| 22 | INTERPRETATION AND CONCLUSIONS |
This Study indicates a positive economic outcome related to the potential development of a silica sand extraction and processing operation for the BRU Property. The extraction plan addressed only a portion of the In-Situ Mineral Resource previously classified, as the entire BRU resource was not required for the 25-year development plan.
Stantec has identified the following risks that could potentially affect the projected economic viability of the BRU Property development.
| 22.1 | PRODUCT PRICING AND COST ESCALATION |
As indicated in Section 19 of this Study, the project economics are sensitive to the assumed pricing for silica sand and estimated project costs. A 30% reduction in product pricing combined with a 30% increase in project costs, after a 7% contingency (initial project capital) has been applied, results in positive economics.
Stantec has reviewed Sio Silica’s cost estimate and believes it captures reasonable Capex and Opex costs for the project as it is currently planned. However, the cost estimate is based on budgetary quotes provides by third party vendors and Sio Silica’s partners and assumes the project advances as per the current schedule.
Stantec understands that Sio Silica intends to proceed with the project development in 2024, partially based on the results of this Study. As such, the risks associated with cost escalation are not insignificant.
| 22.2 | TIMING OF REGULATORY APPROVALS |
Sio Silica and AECOM are pursuing a regulatory approval process that assumes project approval in late 2023 or early 2024.
If the regulatory process is extended beyond this timeframe, then it is likely that project development and resulting product sales would be delayed beyond the base case project schedule.
| 22.3 | TIMING OF PROJECT DEVELOPMENT |
Certain process and infrastructure components may be subject to longer lead times. These include rotary dryers, gas pipeline installation, and high voltage substations. The full capacity of the BRU operation and the resultant project economics are dependent on these components.
| 22.4 | DEVELOPMENT OF EXTRACTION PROCESS |
The current extraction process is based on the results from 14 drill holes completed from 2017 to 2021. Stantec has no reason to believe that the planned extraction process will not be successful. However, Stantec does note the risks to the project should the planned extraction rates be unachievable or unsustainable over the life and geographic extent of the Project.
| 22-1 |
TECHNICAL REPORT SUMMARY, BRU PROPERTY, MANITOBA, CANADA
| 22.5 | CONFIRMATION OF GEOTECHNICAL TESTING AND ANALYSIS |
As discussed in Section 5.2, Stantec geotechnical engineers have completed a preliminary geotechnical analysis related to extraction of the sand resource on the BRU Property. The conclusions of this analysis are summarized below:
| ● | Based upon current information and assessments, Shear and Bending are the most probable failure modes with the potential to affect long-term stability. Unravelling, Caving, and Chimneying are not controlling failure modes for the BRU property due to the nature of the limestone caprock. |
| ● | The Bending failure mode is controlling the long-term stability of the post extraction cavity for the expected range of caprock and overburden thickness and material properties and the extraction depth in the sand. The stability analysis and extraction borehole spacing design were completed to achieve a factor of safety of 2.0, which is considered to be an acceptably conservative FOS for the project. |
| ● | The cavity after extraction is expected to further expand with time resulting in loose sand infilling the extracted void leaving a larger unsupported caprock span. Based on the assumption that the areas with factor of safety larger than 2 are stable in the long-term, approximately 5 m of additional raveling of the post extraction cavity walls is expected (by end of the design life of 100 years). Therefore, the unsupported caprock span will increase by 10 m with time after extraction. |
| ● | Based upon the results of geotechnical assessment and with the understanding that Sio Silica will follow guidance provided by Stantec including continuing to assess the geotechnical characteristics and performance of the sand deposit and overlying materials during the project life and to adjust design accordingly, no large-scale surface subsidence is expected to occur as a result of sand extraction. |
There is a potential that further geotechnical assessments may impact the current resource estimate, either positively or negatively. In particular, there remains uncertainty regarding the possible presence of vertical fractures in Limestone caprock, which to date has not been investigated or assessed. The presence of continuous vertical fractures in Limestone caprock above extraction voids has the potential to lead to caprock collapse which may propagate to the surface and produce settlement. In addition, there remains uncertainty regarding the long term performance of the extraction voids which may have complex void shapes and have the potential to propagate over larger than currently estimated distances.
| 22-2 |
TECHNICAL REPORT SUMMARY, BRU PROPERTY, MANITOBA, CANADA
| 23 | RECOMMENDATIONS |
| 23.1 | PHASE 1: GEOTECHNICAL AND RESOURCE INVESTIGATION AND ANALYSIS |
Based on Sio Silica’s current development and production plans, all resources identified in the areas where the first 5 years of production will occur should be classified as Measured. Additional drill holes may be required to increase confidence in the resource estimates within these areas.
As discussed in Section 5.2, Stantec geotechnical engineers completed a preliminary geotechnical analysis of the impact of extraction of the sand on the BRU Property. The recommendations from this analysis are summarized below:
| ● | Design and execute a site investigation and assess the results to confirm expected geotechnical performance. This investigation may include the following components: |
| o | Data Collection: |
| § | Geotechnical borehole drilling, logging, photography, and sampling with vertical and inclined boreholes and SPT or CPT if needed – to characterize extents and properties of sandstone, caprock and overburden. |
| § | Acoustic and Optical Televiewer Survey of Geotechnical Boreholes – to characterize caprock structure. |
| § | Side Scan Sonar Survey – to monitor sand cavity shape and behavior. |
| § | Laboratory testing of selected samples of sandstone, caprock and overburden as required – to characterize properties of sandstone, caprock and overburden. |
| § | Installation and monitoring of Vibrating Wire Piezometers, Vertical Extensometers and Surface Monuments and Total Station or GPS Survey – to monitor changes in caprock and surface subsidence. |
| o | Data Analysis: |
| § | Stability and settlement analysis to identify and assess for changes in assumptions related to vertical jointing (if found) in Limestone caprock, extraction void shape or other design assumptions. |
| ● | Develop and implement a Trigger Action Response Plan as follows: |
| § | Collected data review - to establish baseline values. |
| § | Trigger value range identification - low/moderate/high – green/yellow/red |
| § | Monitoring results verification and comparison against trigger values. |
| ● | Review the impact of potential vibration sources, such as rail traffic, to determine potential offsets from extraction areas. |
| 23-1 |
TECHNICAL REPORT SUMMARY, BRU PROPERTY, MANITOBA, CANADA
Table 23.1 shows the anticipated cost to complete the geotechnical analysis.
Table 23.1
Cost Estimate – Geotechnical Analysis
| Task | Estimated Cost (C$) | |||
| Geotechnical Analysis | $ | 500,000 | ||
| 23.2 | PHASE 2: ENGINEERING BRIDGING STUDIES |
Stantec recommends that Sio Silica continues to more accurately define the CAPEX and OPEX estimate for the BRU Property and to secure relationships with contractors, vendors, and suppliers.
Table 23.2 provides cost estimates for these studies.
Table 23.2 Engineering Bridging Studies
| Task | Estimated Cost (C$) | |||
| Engineering Bridging Studies | 550,000 | |||
| 23-2 |
TECHNICAL REPORT SUMMARY, BRU PROPERTY, MANITOBA, CANADA
| 24 | REFERENCES |
Bezys, R.K. and Conley, G.G., 1998. Geology of the Ordovician Winnipeg Formation in Manitoba; Manitoba Energy and Mines, Stratigraphic Map Series, Ow-1, 1:2 000 000.
Butler, J.R., Battin, R.L., Plank, R.F., and Winston, D.B., 1955. Lithologic correlation of Middle and Lower Paleozoic rocks. Swartz, Joe. And others, eds, South Dakota Black Hills: North Dakota Geological Society Annual Field Conference Guidebook 3. Pp. 38-42.
Canadian Securities Administrators, 2011. National Instrument 43-101 Standards of Disclosure for Mineral Projects, Form 43-101F1, Technical Report, and Companion Policy 43-101.
CIM Standing Committee on Reserve Definitions. 2010. CIM Definition Standards - For Mineral Resources and Mineral Reserves.
Environment Canada, 2017. Canadian Climate Normals or Averages 1981-2010. Stations: Ostenfeld, Winnipeg International Airport, Steinbach, Beausejour, CDA. Accessed August 2017. http://www.climate.weatheroffice.ec.gc.ca/climate_normals/index_e.html
Groundwater Information Network (GIN), 2019. Groundwater Information Network. Data obtained on March 13, 2019. http://gin.gw-info.net/service/api_ngwds:gin2/en/gin.html
Krumbein, W.C. and Sloss, L., L., 1963. Stratigraphy and Sedimentation, 2nd ed., W.H. Freeman, San Francisco.
Lapenskie, K. 2016: Preliminary investigations into the high-purity silica sand of the Winnipeg Formation, southern Manitoba; in Report of Activities 2016, Manitoba Growth, Enterprise and Trade, Manitoba Geological Survey, p. 176 - 180.
Le Fever, R.D., Thompson, S.C., and Anderson, D.B., 1978. Earliest Paleozoic history of the Williston Basin in North Dakota; in 5th International Williston Basin Symposium Proceeding, Special Publication No. 9, p. 147-156.
Manitoba, 1992a. M.R. 63/92. Drilling Regulation. Mines and Minerals Act (C.C.S.M. c. M162). Queen’s Printer. Accessed September 20, 2017. https://web2.gov.mb.ca/laws/regs/current/_pdf-regs.php?reg=63/92
Manitoba, 1992b. MR 64/92. Mineral Disposition and Mineral Lease Regulation 1992. Mines and Minerals Act (C.C.S.M. c. M162). Queen’s Printer. Accessed September 18, 2017. http://web2.gov.mb.ca/laws/regs/current/_pdf-regs.php?reg=64/92
Matile G.L.D., and Keller G.R., 2004. Surficial Geology Compilation Map Series. Manitoba Geological Survey, GIS Map Gallery. Geographic Information System. http://www.gov.mb.ca/iem/geo/gis/sgcms/legend.html
Natural Resources Canada, 2004. Ice Box Member. CSPG Lexicon of Canadian Stratigraphy, Volume 4, western Canada, including eastern British Columbia, Alberta, Saskatchewan and southern Manitoba; D.J. Glass (editor). Contributor: D.F. Paterson. http://weblex.nrcan.gc.ca/html/006000/GSCC00053006881.html
| | 24-1 |
TECHNICAL REPORT SUMMARY, BRU PROPERTY, MANITOBA, CANADA
Natural Resources Canada, 2009a. Winnipeg Formation. CSPG Lexicon of Canadian Stratigraphy, Volume 4, western Canada, including eastern British Columbia, Alberta, Saskatchewan and southern Manitoba; D.J. Glass (editor). Contributor: D.F. Paterson. http://weblex.nrcan.gc.ca/html/016000/GSCC00053016596.html
Natural Resources Canada, 2009b. Carman Sand Member. CSPG Lexicon of Canadian Geological Stratigraphy. Volume 4, western Canada, including eastern British Columbia, Alberta, Saskatchewan and southern Manitoba; D.J. Glass (editor). Contributor: H.R. McCabe. http://weblex.rncan.gc.ca/html/002000/GSCC00053002494.html
Natural Resources Canada, 2009c. Black Island Member. CSPG Lexicon of Canadian Stratigraphy, Volume 4, western Canada, including eastern British Columbia, Alberta, Saskatchewan and southern Manitoba; D.J. Glass (editor). Contributor: D.F. Paterson. http://weblex.nrcan.gc.ca/html/001000/GSCC00053001436.html
Natural Resources Canada, 2015. Red River Formation. CSPG Lexicon of Canadian Geological Names. CSPG Lexicon of Canadian Geological Stratigraphy. Volume 4, western Canada, including eastern British Columbia, Alberta, Saskatchewan and southern Manitoba; D.J. Glass (editor). Contributor: H.R. McCabe. http://weblex.nrcan.gc.ca/html/012000/GSCC00053012586.html
Ozadetz, K.G., and Haidl, F.M., 1989. Tippecanoe Sequence: Middle Ordovician to lowest Devonian: vestiges of a great epeiric sea, Chapter 8; in Western Canada Sedimentary Basin: a case study (B.D. Ricketts, ed.); Canadian Society of Petroleum Geologist, Special Bulletin No. 30, p. 121-137.
Railway Association of Canada (RAC), 2017. RAC Canadian Rail Atlas. Accessed October 12, 2017 https://rac.jmaponline.net/canadianrailatlas/
Smith R.E., Veldhuis H., Mills G.F., Eilers R.G., Fraser W.R., Lelyk G.W., 1998. Terrestrial Ecozones, Ecoregions and Ecodistricts of Manitoba. An Ecological Stratification of Manitoba’s Natural Landscapes. Research Branch Technical Bulletin 1998-9E. Land Resource Unit. Brandon Research Centre, Research Branch. Agriculture and Agri-Food Canada. pp. 127, 202-204, 260.
Underwood McLellan & Associates Limited, 1967. A Feasibility Study of Recovery and Utilization of the St. Anne Silica Sand Deposits. Project No. 41 60 0751 01/02. pp. 52.
Winnipeg. 2017. The Greater Winnipeg Water District Railway. Water and Waste Department. Accessed October 12, 2017 http://www.winnipeg.ca/waterandwaste/dept/railway.stm
| | 24-2 |
TECHNICAL REPORT SUMMARY, BRU PROPERTY, MANITOBA, CANADA
| 25 | RELIANCE ON INFORMATION PROVIDED BY THE REGISTRANT |
The qualified persons who prepared this Study relied on input prepared by an expert who is not a qualified person as it relates to this Study. This input relates the regulatory approval process for the BRU Project.
| 25.1 | REGULATORY APPROVAL PROCESS |
Sio Silica has engaged AECOM Canada Ltd. (AECOM) to provide consulting support through the regulatory approval process. Mr. Cliff Samoiloff, Mining Market Lead and Senior Scientist at AECOM leads this support and has provided information related to:
| ● | a summary of environmental studies and a discussion of known environmental issues that could impact development of the BRU Property, |
| ● | a discussion relating to project permitting requirements, |
| ● | an estimate of the permitting process timelines, and |
| ● | a discussion of potential social or community related requirements and plans for the BRU Property development and the status of negotiations or agreements with local communities. |
| 25-1 |