Exhibit 99.3
| PRO FORMA VALUATION REPORT |
| STANDARD CONVERSION |
| PB Bankshares, Inc. │Coatesville, Pennsylvania |
| PROPOSED HOLDING COMPANY FOR: |
| Prosper Bank │Coatesville, Pennsylvania |
Dated as of February 5, 2021

1311-A Dolley Madison Blvd, Suite 2A
McLean, Virginia 22101
703.528.1700
rpfinancial.com
 | RP® FINANCIAL, LC. | |
| Advisory | Planning | Valuation |
February 5, 2021
Board of Directors/Board of Trustees
PB Bankshares, Inc.
Prosper Bank
185 East Lincoln Highway
Coatesville, Pennsylvania 19320
Members of the Boards of Directors/Trustees:
At your request, we have completed and hereby provide an independent appraisal (“Appraisal”) of the estimated pro forma market value of the common stock to be issued in connection with the mutual-to-stock conversion transaction described below.
This Appraisal is furnished pursuant to the requirements stipulated in the Code of Federal Regulations and has been prepared in accordance with the “Guidelines for Appraisal Reports for the Valuation of Savings and Loan Associations Converting from Mutual to Stock Form of Organization” of the Office of Thrift Supervision (“OTS”) and accepted by the Office of the Comptroller of the Currency (“OCC”) and the Federal Reserve Board (“FRB”), and applicable regulatory interpretations thereof.
Description of Plan of Conversion
The Board of Trustees of Prosper Bank, Coatesville, Pennsylvania (“Prosper Bank” or the “Bank”) adopted the plan of conversion on March 8, 2021, incorporated herein by reference. Pursuant to the plan of conversion, the Bank will convert from a Pennsylvania-chartered mutual savings association to a Pennsylvania-chartered stock savings association and become a wholly-owned subsidiary of PB Bankshares, Inc. (the “Company”), a Maryland corporation organized by Prosper Bank. The Company will offer 100% of its common stock to qualifying depositors of the Bank in a subscription offering to Eligible Account Holders, Tax-Qualified Plans including Prosper Bank’s employee stock ownership plan (the “ESOP”), Supplemental Eligible Account Holders and Other Members, as such terms are defined for purposes of applicable federal regulatory guidelines governing mutual-to-stock conversions. To the extent that shares remain available for purchase after satisfaction of all subscriptions received in the subscription offering, the shares may be offered for sale to the public at large in a community offering. Going forward, the Company will own 100% of the Bank’s stock, and the Bank will initially be the Company’s sole subsidiary. A portion of the net proceeds received from the sale of common stock will be used to purchase all of the then to be issued and outstanding capital stock of the Bank and the balance of the net proceeds will be retained by the Company.
At this time, no other activities are contemplated for the Company other than the ownership of the Bank, a loan to the newly formed ESOP and reinvestment of the proceeds that are retained by the Company. In the future, the Company may acquire or organize other operating subsidiaries, diversify into other banking-related activities, pay dividends or repurchase its stock, although there are no specific plans to undertake such activities at the present time.
| Washington Headquarters | |
| 1311-A Dolley Madison Blvd | Telephone: (703) 528-1700 |
| Suite 2A | Fax No.: (703) 528-1788 |
| McLean, VA 22101 | Toll-Free No.: (866) 723-0594 |
| www.rpfinancial.com | E-Mail: mail@rpfinancial.com |
Board of Directors/Trustees
February 5, 2021
Page 2
RP® Financial, LC.
RP® Financial, LC. (“RP Financial”) is a financial consulting firm serving the financial services industry nationwide that, among other things, specializes in financial valuations and analyses of business enterprises and securities, including the pro forma valuation for savings institutions converting from mutual-to-stock form. The background and experience of RP Financial is detailed in Exhibit V-1. For its appraisal services, RP Financial is being compensated on a fixed fee basis for the original appraisal and for any subsequent updates, and such fees are payable regardless of the valuation conclusion or the completion of the conversion offering transaction. We believe that we are independent of the Bank and the other parties engaged by Prosper Bank or the Company to assist in the stock conversion process.
Valuation Methodology
In preparing our Appraisal, we have reviewed the regulatory applications of the Bank and the Company, including the prospectus as filed with the FRB, the FDIC and the Securities and Exchange Commission (“SEC”). We have conducted a financial analysis of the Bank that has included a review of audited financial information for the years ended December 31, 2016 through December 31, 2020 and a review of various unaudited information and internal financial reports through December 31, 2020. We have also conducted due diligence related discussions with Prosper Bank’s management; Yount, Hyde & Barbour, P.C., Prosper Bank’s independent auditor; Luse Gorman, PC, Prosper Bank’s conversion counsel; and Piper Sandler Companies, Prosper Bank’s financial and marketing advisor in connection with the stock offering. All assumptions and conclusions set forth in the Appraisal were reached independently from such discussions. In addition, where appropriate, we have considered information based on other available published sources that we believe are reliable. While we believe the information and data gathered from all these sources are reliable, we cannot guarantee the accuracy and completeness of such information.
We have investigated the competitive environment within which Prosper Bank operates and have assessed the Bank’s relative strengths and weaknesses. We have monitored all material regulatory and legislative actions affecting financial institutions generally and analyzed the potential impact of such developments on Prosper Bank and the industry as a whole to the extent we were aware of such matters. We have analyzed the potential effects of the stock conversion on the Bank’s operating characteristics and financial performance as they relate to the pro forma market value of Prosper Bank. We have reviewed the economy and demographic characteristics of the primary market area in which the Bank currently operates. We have compared Prosper Bank’s financial performance and condition with publicly-traded thrift institutions evaluated and selected in accordance with the Valuation Guidelines, as well as all publicly-traded thrifts and thrift holding companies. We have reviewed conditions in the securities markets in general and the market for thrifts and thrift holding companies, including the market for new issues.
The Appraisal is based on Prosper Bank’s representation that the information contained in the regulatory applications and additional information furnished to us by the Bank and its independent auditors, legal counsel, investment bankers and other authorized agents are truthful, accurate and complete. We did not independently verify the financial statements and other information provided by the Bank, or its independent auditors, legal counsel, investment bankers and other authorized agents nor did we independently value the assets or liabilities of Prosper Bank. The valuation considers Prosper Bank only as a going concern and should not be considered as an indication of the Bank’s liquidation value.
Board of Directors/Trustees
February 5, 2021
Page 3
Our appraised value is predicated on a continuation of the current operating environment for the Bank and for all thrifts and their holding companies. Changes in the local and national economy, the federal and state legislative and regulatory environments for financial institutions, the stock market, interest rates, and other external forces (such as natural disasters or significant world events) may occur from time to time, often with great unpredictability, and may materially impact the value of thrift stocks as a whole or the Bank’s value alone. It is our understanding that Prosper Bank intends to remain an independent institution and there are no current plans for selling control of the Bank as a converted institution. To the extent that such factors can be foreseen, they have been factored into our analysis.
The estimated pro forma market value is defined as the price at which the Company’s stock, immediately upon completion of the offering, would change hands between a willing buyer and a willing seller, neither being under any compulsion to buy or sell and both having reasonable knowledge of relevant facts.
Valuation Conclusion
It is our opinion that, as of February 5, 2020, the estimated aggregate pro forma market value of the shares to be issued immediately following the conversion equaled $21,000,000 at the midpoint, equal to 2,100,000 shares offered at a per share value of $10.00. Pursuant to the conversion guidelines, the 15% offering range indicates a minimum value of $17,850,000 and a maximum value of $24,150,000. Based on the $10.00 per share offering price determined by the Board, this valuation range equates to total shares outstanding of 1,785,000 at the minimum and 2,415,000 at the maximum. In the event the appraised value is subject to an increase, the aggregate pro forma market value may be increased up to a super maximum value of $27,772,500 without a resolicitation. Based on the $10.00 per share offering price, the super maximum value would result in total shares outstanding of 2,777,250.
Limiting Factors and Considerations
The valuation is not intended, and must not be construed, as a recommendation of any kind as to the advisability of purchasing shares of the common stock. Moreover, because such valuation is determined in accordance with applicable regulatory guidelines and is necessarily based upon estimates and projections of a number of matters, all of which are subject to change from time to time, no assurance can be given that persons who purchase shares of common stock in the conversion will thereafter be able to buy or sell such shares at prices related to the foregoing valuation of the estimated pro forma market value thereof. The appraisal reflects only a valuation range as of this date for the pro forma market value of the Company immediately upon issuance of the stock and does not take into account any trading activity with respect to the purchase and sale of common stock in the secondary market on the date of issuance of such securities or at anytime thereafter following the completion of the public stock offering.
Board of Directors/Trustees
February 5, 2021
Page 4
The valuation prepared by RP Financial, in accordance with applicable regulatory guidelines, was based on the financial condition and operations of Prosper Bank as of December 31, 2020, the date of the financial data included in the prospectus.
RP Financial is not a seller of securities within the meaning of any federal and state securities laws and any report prepared by RP Financial shall not be used as an offer or solicitation with respect to the purchase or sale of any securities. RP Financial maintains a policy which prohibits RP Financial, its principals or employees from purchasing stock of its financial institution clients.
The valuation will be updated as provided for in the conversion regulations and guidelines. These updates will consider, among other things, any developments or changes in the financial performance and condition of Prosper Bank, management policies, and current conditions in the equity markets for thrift stocks, both existing issues and new issues. These updates may also consider changes in other external factors which impact value including, but not limited to: various changes in the federal and state legislative and regulatory environments for financial institutions, the stock market in general, the market for thrift stocks and interest rates. Should any such new developments or changes be material, in our opinion, to the valuation of the shares, appropriate adjustments to the estimated pro forma market value will be made. The reasons for any such adjustments will be explained in the update at the date of the release of the update.
| Respectfully submitted, | |
| RP® FINANCIAL, LC. | |
 | |
| William E. Pommerening | |
| Managing Director | |
 | |
| James J. Oren | |
| Director |
| RP® Financial, LC. | TABLE OF CONTENTS | |
| i |
TABLE OF CONTENTS
PB Bankshares, Inc.
Coatesville, Pennsylvania
| DESCRIPTION | PAGE NUMBER | |
| CHAPTER ONE | OVERVIEW AND FINANCIAL ANALYSIS | |
| Introduction | I.1 | |
| Plan of Conversion | I.1 | |
| Strategic Overview | I.2 | |
| Balance Sheet Trends | I.4 | |
| Income and Expense Trends | I.7 | |
| Interest Rate Risk Management | I.10 | |
| Lending Activities and Strategy | I.11 | |
| Asset Quality | I.13 | |
| Funding Composition and Strategy | I.13 | |
| Legal Proceedings | I.14 | |
| CHAPTER TWO | MARKET AREA | |
| Introduction | II.1 | |
| National Economic Factors | II.1 | |
| Interest Rate Environment | II.5 | |
| Primary Market Area | II.6 | |
| Demographic and Economic Trends | II.7 | |
| Economic Sectors | II.10 | |
| Market Area Largest Employers | II.10 | |
| Market Area Unemployment Data | II.10 | |
| Deposit Trends | II.11 | |
| Competition | II.14 | |
| CHAPTER THREE | PEER GROUP ANALYSIS | |
| Peer Group Selection | III.1 | |
| Financial Condition | III.5 | |
| Income and Expense Components | III.7 | |
| Loan Composition | III.10 | |
| Credit Risk | III.10 | |
| Interest Rate Risk | III.13 | |
| Summary | III.13 | |
| RP® Financial, LC. | TABLE OF CONTENTS | |
| ii |
TABLE OF CONTENTS
PB Bankshares, Inc.
Coatesville, Pennsylvania
(continued)
| DESCRIPTION | PAGE NUMBER | |||
| CHAPTER FOUR | VALUATION ANALYSIS | |||
| Introduction | IV.1 | |||
| Appraisal Guidelines | IV.1 | |||
| RP Financial Approach to the Valuation | IV.1 | |||
| Valuation Analysis | IV.2 | |||
| 1. | Financial Condition | IV.3 | ||
| 2. | Profitability, Growth and Viability of Earnings | IV.4 | ||
| 3. | Asset Growth | IV.6 | ||
| 4. | Primary Market Area | IV.6 | ||
| 5. | Dividends | IV.8 | ||
| 6. | Liquidity of the Shares | IV.8 | ||
| 7. | Marketing of the Issue | IV.9 | ||
| A. | The Public Market | IV.9 | ||
| B. | The New Issue Market | IV.14 | ||
| C. | The Acquisition Market | IV.15 | ||
| 8. | Management | IV.17 | ||
| 9. | Effect of Government Regulation and Regulatory Reform | IV.17 | ||
| Summary of Adjustments | IV.17 | |||
| Valuation Approaches: | IV.18 | |||
| 1. | Price-to-Earnings (“P/E”) | IV.19 | ||
| 2. | Price-to-Book (“P/B”) | IV.20 | ||
| 3. | Price-to-Assets (“P/A”) | IV.20 | ||
| Comparison to Recent Offerings | IV.22 | |||
| Valuation Conclusion | IV.22 | |||
| RP® Financial, LC. | LIST OF TABLES | |
| iii |
LIST OF TABLES
PB Bankshares, Inc.
Coatesville, Pennsylvania
| TABLE NUMBER | DESCRIPTION | PAGE | ||
| 1.1 | Historical Balance Sheet Data | I.5 | ||
| 1.2 | Historical Income Statements | I.8 | ||
| 2.1 | Summary Demographic Data | II.8 | ||
| 2.2 | Primary Market Area Employment Sectors | II.11 | ||
| 2.3 | Market Area Largest Employers | II.12 | ||
| 2.4 | Unemployment Trends | II.13 | ||
| 2.5 | Deposit Summary | II.13 | ||
| 2.6 | Market Area Deposit Competitors – As of June 30, 2020 | II.15 | ||
| 3.1 | Peer Group of Publicly-Traded Savings Institutions | III.3 | ||
| 3.2 | Balance Sheet Composition and Growth Rates | III.6 | ||
| 3.3 | Income as a Pct. of Avg. Assets and Yields, Costs, Spreads | III.8 | ||
| 3.4 | Loan Portfolio Composition and Related Information | III.11 | ||
| 3.5 | Credit Risk Measures and Related Information | III.12 | ||
| 3.6 | Interest Rate Risk Measures and Net Interest Income Volatility | III.14 | ||
| 4.1 | Peer Group Market Area Unemployment Rates | IV.7 | ||
| 4.2 | Pricing Characteristics and After-Market Trends | IV.16 | ||
| 4.3 | Public Market Pricing Versus Peer Group | IV.21 |
| RP® Financial, LC. | OVERVIEW AND FINANCIAL ANALYSIS |
| I.1 |
I. Overview and Financial Analysis
Introduction
Prosper Bank (or the “Bank”) is a state-chartered mutual savings bank headquartered in Coatesville, Pennsylvania. The Bank serves the serves the southeastern region of Pennsylvania through the main office and four branches in Chester and Lancaster Counties. A map of the Bank’s office locations is provided in Exhibit I-1. The Bank is a member of the Federal Home Loan Bank (“FHLB”) system, and its deposits are insured up to the regulatory maximums by the Federal Deposit Insurance Corporation (“FDIC”). At December 31, 2020, the Bank had $275.3 million in assets, $231.4 million in deposits and total equity of $22.0 million, equal to 7.98% of total assets. The Bank’s audited financial statements are incorporated by reference as Exhibit I-2.
Plan of Conversion
On March 8, 2021, the Board of Directors of the Bank adopted a plan of conversion, incorporated herein by reference, in which the Bank will convert from a state-chartered mutual savings bank to a state-chartered stock savings bank and become a wholly-owned subsidiary of PB Bankshares, Inc. (“PB Bankshares” or the “Company”), a newly formed Maryland corporation.
PB Bankshares will offer its common stock in a subscription offering to Eligible Account Holders, Tax-Qualified Plans including Prosper Bank’s employee stock ownership plan (the “ESOP”), Supplemental Eligible Account Holders and Other Members, as such terms are defined for purposes of applicable federal regulatory guidelines governing mutual-to-stock conversions. To the extent that shares remain available for purchase after satisfaction of all subscriptions received in the subscription offering, the shares may be offered for sale to members of the general public in a community offering. A portion of the net proceeds received from the sale of the common stock will be used to purchase all of the then to be issued and outstanding capital stock of Prosper Bank and the balance of the net proceeds will be retained by the Company.
At this time, no other activities are contemplated for the Company other than the ownership of the Bank, extending a loan to the newly-formed employee stock ownership plan (the “ESOP”) and reinvestment of the proceeds that are retained by the Company. In the future, Prosper Bank Bancorp may acquire or organize other operating subsidiaries, diversify into other banking-related activities, pay dividends or repurchase its stock, although there are no specific plans to undertake such activities at the present time.
| RP® Financial, LC. | OVERVIEW AND FINANCIAL ANALYSIS |
| I.2 |
Strategic Overview
Prosper Bank maintains a local community banking emphasis, with a primary strategic objective of meeting the borrowing and savings needs of its local customer base. Prosper Bank’s historical operating strategy has been a traditional thrift operating strategy, in which lending has emphasized originating 1-4 family residential mortgage loans and funding has been largely generated through retail deposits. Pursuant to naming a new President and Chief Executive Officer of the Bank with commercial banking experience, growth strategies continue to focus on 1-4 family and, at the same time, pursue increased lending diversification that will emphasize growth of commercial real estate and commercial business loans. The Bank’s objective is to fund asset growth primarily through deposit growth, emphasizing growth of lower cost core deposits.
Investments serve as a supplement to the Bank’s lending activities and the investment portfolio is considered to be indicative of a low risk investment philosophy. As of December 31, 2020, the Bank’s holdings of investment securities consisted of mortgage-backed securities that are guaranteed or insured by government sponsored enterprises (“GSEs”) and U.S. Government agency obligations. The Bank also maintained a large part of its December 31, 2020 balance sheet in cash and equivalents including interest-bearing deposits in other financial institutions.
The Bank’s lending and investment strategies have generally supported management of credit risk exposure and, in recent years, the balance of non-performing assets has trended lower.
Retail deposits have consistently served as the primary interest-bearing funding source for the Bank. Unlike a traditional thrift that relies on certificates of deposit and savings accounts, however, the Bank has successfully diversified its retail deposit into demand deposits, money market accounts and savings accounts. The Bank utilizes borrowings as a supplemental funding source to facilitate management of funding costs and interest rate risk. Borrowing currently consist of FHLB advances.
Prosper Bank’s earnings base is largely dependent upon net interest income and operating expense levels. The Bank has historically been effective in preserving its net interest income to average assets ratio. However, in 2020, the Bank has experienced some net interest margin compression, due to such factors as the relatively flat yield curve and a shift in the Bank’s interest-earning asset mix towards a higher concentration of lower yielding cash and investments. Non-interest operating income has been a small contributor to the Bank’s earnings in recent years. Operating expenses have trended higher in recent years, and 2020 included a significant number of one-time expense items that resulted in an increase in operating expense ratios as a percent of average assets. Loan loss provisions have had a varied but consistent impact on the Bank’s earnings over the past five years, particularly as the Bank increased loan loss provisions during 2020 to address the ongoing economic uncertainty resulting from the Covid-19 pandemic.
| RP® Financial, LC. | OVERVIEW AND FINANCIAL ANALYSIS |
| I.3 |
The post-offering business plan of the Bank is expected to remain consistent with current strategic objectives. Specifically, Prosper Bank will continue to be an independent community-oriented financial institution with a commitment to lending in local markets with operations funded primarily by retail deposits. Growth strategies will continue to be implemented within the context of managing the Bank’s exposure to risk.
A key component of the Bank’s business plan is to complete a mutual-to-stock conversion offering. The Bank’s strengthened capital position will increase operating flexibility and facilitate implementation of planned growth strategies. Additionally, in the near term, the stock conversion offering will serve to substantially increase regulatory capital and liquidity and, thereby, facilitate building and maintaining loss reserves while also providing the Bank with greater flexibility to work with borrowers affected by the Covid-19-induced recession. The Bank’s strengthened capital position will also provide more of a cushion against potential credit quality related losses in future periods. Prosper Bank’s higher capital position resulting from the infusion of stock proceeds will also serve to reduce interest rate risk, particularly through enhancing the Bank’s interest-earning assets/interest-bearing liabilities (“IEA/IBL”) ratio. The additional funds realized from the stock offering will serve to raise the level of interest-earning assets funded with equity and, thereby, reduce the ratio of interest-earning assets funded with interest-bearing liabilities as the balance of interest-bearing liabilities will initially remain relatively unchanged following the conversion, which may facilitate a reduction in Prosper Bank’s funding costs. Prosper Bank’s strengthened capital position will also position the Bank to pursue expansion opportunities. Such expansion could potentially include acquiring another financial institution or acquiring additional branch offices to gain a market presence in nearby markets that are complementary to the Bank’s existing branch network. At this time, the Bank has no specific plans for expansion through acquisitions.
The projected uses of proceeds are highlighted below.
| ○ | PB Bankshares, Inc. The Company is expected to retain 40% of the net offering proceeds. At present, funds at the Company level, net of the loan to the ESOP, are expected to be primarily invested initially into liquid funds held as a deposit at the Bank. Over time, the funds may be utilized for various corporate purposes, possibly including acquisitions, infusing additional equity into the Bank, repurchases of common stock, and the payment of regular and/or special cash dividends. |
| RP® Financial, LC. | OVERVIEW AND FINANCIAL ANALYSIS |
| I.4 |
| ○ | Prosper Bank. Approximately 60% of the net stock proceeds will be infused into the Bank in exchange for all of the Bank’s newly issued stock. Cash proceeds (i.e., net proceeds less deposits withdrawn to fund stock purchases) infused into the Bank are anticipated to become part of general operating funds and are expected to be primarily utilized to fund loan growth over time. |
Overall, it is the Bank’s objective to pursue growth that will serve to increase returns, while, at the same time, growth will not be pursued that could potentially compromise the overall risk associated with Prosper Bank’s operations.
Balance Sheet Trends
Table 1.1 shows the Bank’s historical balance sheet data for the past five years. From year end 2016 through year end 2020, Prosper Bank’s assets increased at a 7.00% annual rate with most of the growth realized in 2019 and 2020. Asset growth was most significant in cash and investments and, to a lesser extent, in loans receivable. Funds received from growth in deposits were largely deployed liquid assets pending future deployment. The growth in assets was funded primarily by a significant increase in deposits. A summary of Prosper Bank’s key operating ratios is presented in Exhibit I-3.
Prosper Bank’s loans receivable portfolio decreased at a 12.43% annual rate from year end 2016 through year end 2020, with the majority of the loan growth occurring in 2020 as new management began implementing a growth strategy. The Bank’s moderate loan growth combined with asset growth provided for a decrease the loans-to-assets ratio from 80.47% at year-end 2016 to 67.57% at year-end 2020. Prosper Bank’s historical emphasis on 1-4 family lending is reflected in its loan portfolio composition, as 56.16% of total loans receivable consisted of 1-4 family loans at year end 2020.
Trends in the Bank’s loan portfolio composition over the past two years show that the concentration of 1-4 family permanent mortgage loans comprising total loans decreased from 63.70% at year-end 2019 to 56.16% at year-end 2020. Commercial real estate/multi-family loans and commercial business loans constitute the primary types of lending diversification for the Bank, with both of those areas of lending diversification showing an increase as a percent of loans outstanding during 2020. From year-end 2019 to year-end 2020, commercial real estate/multi-family loans increased from 29.05% of total loans to 31.41% of total loans and commercial business loans increased from 3.66% of total loans to 6.93% of total loans. Other areas of lending diversification for the Bank have been fairly limited, consisting primarily of construction/land loans and, to a lesser extent, consumer loans. As of December 31, 2020, construction/land loans equaled 3.89% of total loans and consumer loans equaled 1.61% of total loans.
| RP® Financial, LC. | OVERVIEW AND FINANCIAL ANALYSIS |
| I.5 |
Table 1.1
Prosper Bank
Historical Balance Sheet Data
| At December 31, | 12/31/16-12/31/20 Annual. Growth | |||||||||||||||||||||||||||||||||||||||||||
| 2016 | 2017 | 2018 | 2019 | 2020 | Rate | |||||||||||||||||||||||||||||||||||||||
| Amount | Pct(1) | Amount | Pct(1) | Amount | Pct(1) | Amount | Pct(1) | Amount | Pct(1) | Pct | ||||||||||||||||||||||||||||||||||
| ($000) | (%) | ($000) | (%) | ($000) | (%) | ($000) | (%) | ($000) | (%) | (%) | ||||||||||||||||||||||||||||||||||
| Total Amount of: | ||||||||||||||||||||||||||||||||||||||||||||
| Assets | $ | 210,055 | 100.00 | % | $ | 210,199 | 100.00 | % | $ | 210,205 | 100.00 | % | $ | 216,885 | 100.00 | % | $ | 275,324 | 100.00 | % | 7.00 | % | ||||||||||||||||||||||
| Cash and cash equivalents | 8,416 | 4.01 | % | 6,979 | 3.32 | % | 8,412 | 4.00 | % | 12,969 | 5.98 | % | 50,591 | 18.38 | % | 56.58 | % | |||||||||||||||||||||||||||
| Investment securities | 24,134 | 11.49 | % | 22,073 | 10.50 | % | 20,824 | 9.91 | % | 23,691 | 10.92 | % | 26,741 | 9.71 | % | 2.60 | % | |||||||||||||||||||||||||||
| Loans receivable, net | 169,039 | 80.47 | % | 172,695 | 82.16 | % | 171,800 | 81.73 | % | 171,218 | 78.94 | % | 186,045 | 67.57 | % | 2.43 | % | |||||||||||||||||||||||||||
| FHLB stock | 567 | 0.27 | % | 776 | 0.37 | % | 1,263 | 0.60 | % | 1,270 | 0.59 | % | 1,046 | 0.38 | % | 16.54 | % | |||||||||||||||||||||||||||
| Bank-owned life insurance | 3,750 | 1.79 | % | 4,452 | 2.12 | % | 4,684 | 2.23 | % | 4,712 | 2.17 | % | 6,639 | 2.41 | % | 15.35 | % | |||||||||||||||||||||||||||
| Deposits | $ | 179,013 | 85.22 | % | $ | 173,706 | 82.64 | % | $ | 161,195 | 76.68 | % | $ | 168,039 | 77.48 | % | $ | 231,416 | 84.05 | % | 6.63 | % | ||||||||||||||||||||||
| Borrowings | 10,526 | 5.01 | % | 15,689 | 7.46 | % | 27,400 | 13.03 | % | 26,031 | 12.00 | % | 20,553 | 7.47 | % | 18.21 | % | |||||||||||||||||||||||||||
| Equity | $ | 18,688 | 8.90 | % | $ | 19,724 | 9.38 | % | $ | 21,141 | 10.06 | % | $ | 22,203 | 10.24 | % | $ | 21,969 | 7.98 | % | 4.13 | % | ||||||||||||||||||||||
| Loans/Deposits | 94.43 | % | 99.42 | % | 106.58 | % | 101.89 | % | 80.39 | % | ||||||||||||||||||||||||||||||||||
| Number of offices | 5 | 5 | 5 | 5 | 5 | |||||||||||||||||||||||||||||||||||||||
| (1) | Ratios are as a percent of ending assets. |
Sources: Prosper Bank’s prospectus, audited and unaudited financial statements, SNL Financial and RP Financial calculations.
| RP® Financial, LC. | OVERVIEW AND FINANCIAL ANALYSIS |
| I.6 |
The intent of the Bank’s investment policy is to provide adequate liquidity and to generate a favorable return within the context of supporting Prosper Bank’s overall credit and interest rate risk objectives. It is anticipated that proceeds retained at the holding company level will primarily be invested into a deposit at the Bank. Over the past five years, the Bank’s level of cash and investment securities (inclusive of FHLB/ACBB stock) ranged from a low of 13.82% at year-end 2017 to a high of 28.09% at year-end 2020. U.S. Government agency obligations totaling $17.3 million comprised the most significant component of the Bank’s investment portfolio at December 31, 2020. Other investments held by the Bank at December 31, 2020 consisted of $8.4 million of mortgage-backed securities. Exhibit I-4 provides historical detail of the Bank’s investment securities portfolio. As of December 31, 2020, the Bank also held cash and cash equivalents of $50.6 million or 18.38% of assets and FHLB stock of $1.0 million or 0.38% of assets.
The Bank also maintains an investment in bank-owned life insurance (“BOLI”) policies, which cover the lives of certain officers of the Bank. The life insurance policies earn tax-exempt income through cash value accumulation and death proceeds. As of December 31, 2020, the cash surrender value of the Bank’s BOLI equaled $6.6 million or 2.41% of assets.
Over the past five years, Prosper Bank’s funding needs have been addressed through a combination of deposits, borrowings and internal cash flows. From year-end 2016 through year-end 2020, the Bank’s deposits decreased at an annual rate of 6.63%. Total deposits trended lower from year-end 2016 through year-end 2018, which was followed by significant deposit growth recorded in 2019-2020. Deposits as a percent of assets ranged from a low of 76.68% at yearend 2019 to a high of 85.22% at yearend 2016. As of December 31, 2020, deposits equaled 84.05% of assets. Transaction and savings account deposits comprise the largest concentration of the Bank’s deposits and accounted for 63.88% of the Bank’s total deposits at December 31, 2020, with the remaining 37.12% of deposits consisting of certificates of deposit (“CDs”).
Borrowings serve as an alternative funding source for the Bank to address funding needs for growth and to support management of deposit costs and interest rate risk. The Bank’s balance of borrowings ranged from $10.5 million at year-end 2016 to $27.4 million at year-end 2018 and ending at $20.6 million at December 31, 2020. Over the five-year period, borrowings ranged from a low of 5.01% of assets at yearend 2016 to a high of 13.03% of assets at year-end 2018 and equaled 7.47% of asset at yearend 2020. The Bank’s utilization of borrowings over the past five years has been limited to FHLB advances.
| RP® Financial, LC. | OVERVIEW AND FINANCIAL ANALYSIS |
| I.7 |
Since yearend 2016, retention of earnings and the adjustment for accumulated other comprehensive income translated into an annual capital growth rate of 4.13% for the Bank. Although the Bank increased its capital ratios between 2016 and 2019, with the significant balance sheet growth in 2020, the capital ratios declined. Over the five-year period, because of 2020 growth trends, capital growth slightly lagged the Bank’s asset growth rate and Prosper Bank’s equity-to-assets ratio decreased from 8.90% at yearend 2016 to 7.98% at yearend 2020. All of the Bank’s capital is tangible capital, and the Bank maintained capital surpluses relative to all of its regulatory capital requirements at December 31, 2020. The addition of stock proceeds will serve to strengthen the Bank’s capital position, as well as support growth opportunities. At the same time, as the result of the significant increase that will be realized in the Bank’s pro forma capital position, Prosper Bank’s ROE will initially be depressed following its stock conversion.
Income and Expense Trends
Table 1.2 shows the Bank’s historical income statements for the past five years. The Bank’s reported earnings over the past five years ranged from a high of $1.2 million, or 0.58% of average assets during 2017 to a low of a loss of $415,000 or negative 0.17% of average assets during 2020. Net interest income and operating expenses represent the primary components of the Bank’s earnings. Other revenues for the Bank are largely derived from service charges. Loan loss provisions have had a varied impact on the Bank’s earnings over the past five years. The net loss in 2020 resulted from several one-time expenses incurred to terminate vendor contracts and spread compression from the addition of a large amount of low yielding cash and equivalents.
Over the past five years, the Bank’s net interest income to average assets ratio ranged from a higher of low of 3.25% during 2018 to a low of 2.70% during 2020. After peaking during 2018, the Bank’s net interest income ratio has trended lower during the past two years. The recent downward trend in the Bank’s net interest income ratio resulted from spread compression, largely attributable to an increase in cash and equivalents but also the result of loans and securities pricing down in the unusually low interest rate environment in 2020. The Bank’s net interest rate spreads and yields and costs for the past two years are set forth in Exhibits I-3 and I-5.
| RP® Financial, LC. | OVERVIEW AND FINANCIAL ANALYSIS |
| I.8 |
Table 1.2
Prosper Bank
Historical Income Statements
| For the Year Ended December 31, | ||||||||||||||||||||||||||||||||||||||||
| 2016 | 2017 | 2018 | 2019 | 2020 | ||||||||||||||||||||||||||||||||||||
| Amount | Pct(1) | Amount | Pct(1) | Amount | Pct(1) | Amount | Pct(1) | Amount | Pct(1) | |||||||||||||||||||||||||||||||
| ($000) | (%) | ($000) | (%) | ($000) | (%) | ($000) | (%) | ($000) | (%) | |||||||||||||||||||||||||||||||
| Interest income | $ | 8,405 | 3.95 | % | $ | 8,393 | 3.98 | % | $ | 8,807 | 4.17 | % | $ | 9,379 | 4.33 | % | $ | 9,064 | 3.68 | % | ||||||||||||||||||||
| Interest expense | (1,683 | ) | -0.79 | % | (1,591 | ) | -0.75 | % | (1,929 | ) | -0.91 | % | (2,454 | ) | -1.13 | % | (2,431 | ) | -0.99 | % | ||||||||||||||||||||
| Net interest income | $ | 6,722 | 3.16 | % | $ | 6,802 | 3.23 | % | $ | 6,878 | 3.25 | % | $ | 6,925 | 3.20 | % | $ | 6,633 | 2.70 | % | ||||||||||||||||||||
| Provision for loan losses | (367 | ) | -0.17 | % | (53 | ) | -0.03 | % | (510 | ) | -0.24 | % | (697 | ) | -0.32 | % | (760 | ) | -0.31 | % | ||||||||||||||||||||
| Net interest income after provisions | $ | 6,355 | 2.99 | % | $ | 6,749 | 3.20 | % | $ | 6,368 | 3.01 | % | $ | 6,228 | 2.88 | % | $ | 5,873 | 2.39 | % | ||||||||||||||||||||
| Non-interest operating income | $ | 493 | 0.23 | % | $ | 959 | 0.46 | % | $ | 531 | 0.25 | % | $ | 553 | 0.26 | % | $ | 606 | 0.25 | % | ||||||||||||||||||||
| Operating expense | (5,228 | ) | -2.46 | % | (5,598 | ) | -2.66 | % | (5,474 | ) | -2.59 | % | (5,886 | ) | -2.72 | % | (7,064 | ) | -2.87 | % | ||||||||||||||||||||
| Net operating income | $ | 1,620 | 0.76 | % | $ | 2,110 | 1.00 | % | $ | 1,425 | 0.67 | % | $ | 895 | 0.41 | % | $ | (585 | ) | -0.24 | % | |||||||||||||||||||
| Non-Operating Income/(Losses) | ||||||||||||||||||||||||||||||||||||||||
| Gain(loss) on sale of REO | $ | (30 | ) | -0.01 | % | $ | 7 | 0.00 | % | $ | (13 | ) | -0.01 | % | $ | 57 | 0.03 | % | $ | 30 | 0.01 | % | ||||||||||||||||||
| Gain(loss) on sale of securities, net | 0 | 0.00 | % | - | 0.00 | % | 0 | 0.00 | % | - | 0.00 | % | - | 0.00 | % | |||||||||||||||||||||||||
| Net non-operating income(loss) | $ | (30 | ) | -0.01 | % | $ | 7 | 0.00 | % | $ | (13 | ) | -0.01 | % | $ | 57 | 0.03 | % | $ | 30 | 0.01 | % | ||||||||||||||||||
| Net income before tax | $ | 1,590 | 0.75 | % | $ | 2,117 | 1.00 | % | $ | 1,412 | 0.67 | % | $ | 952 | 0.44 | % | $ | (555 | ) | -0.23 | % | |||||||||||||||||||
| Income tax provision | (504 | ) | -0.24 | % | (890 | ) | -0.42 | % | (313 | ) | -0.15 | % | (173 | ) | -0.08 | % | 140 | 0.06 | % | |||||||||||||||||||||
| Net income (loss) | $ | 1,086 | 0.51 | % | $ | 1,227 | 0.58 | % | $ | 1,099 | 0.52 | % | $ | 779 | 0.36 | % | $ | (415 | ) | -0.17 | % | |||||||||||||||||||
| Adjusted Earnings | ||||||||||||||||||||||||||||||||||||||||
| Net income | $ | 1,086 | 0.51 | % | $ | 1,227 | 0.58 | % | $ | 1,099 | 0.52 | % | $ | 779 | 0.36 | % | $ | (415 | ) | -0.17 | % | |||||||||||||||||||
| Add(Deduct): Non-operating income | 30 | 0.01 | % | (7 | ) | 0.00 | % | 13 | 0.01 | % | (57 | ) | -0.03 | % | (30 | ) | -0.01 | % | ||||||||||||||||||||||
| Tax effect (2) | (10 | ) | 0.00 | % | 2 | 0.00 | % | (3 | ) | 0.00 | % | 12 | 0.01 | % | 6 | 0.00 | % | |||||||||||||||||||||||
| Adjusted earnings | $ | 1,106 | 0.52 | % | $ | 1,222 | 0.58 | % | $ | 1,109 | 0.52 | % | $ | 734 | 0.34 | % | $ | (439 | ) | -0.18 | % | |||||||||||||||||||
| Expense Coverage Ratio (3) | 1.28 | x | 1.21 | x | 1.25 | x | 1.18 | x | 0.94 | x | ||||||||||||||||||||||||||||||
| Efficiency Ratio (4) | 72.57 | % | 72.09 | % | 74.00 | % | 78.61 | % | 97.29 | % | ||||||||||||||||||||||||||||||
| (1) | Ratios are as a percent of average assets. |
| (2) | Assumes a 34.0% effective tax rate for 2016-2018 and 21.0% for 2018-2020. |
| (3) | Expense coverage ratio calculated as net interest income before provisions for loan losses divided by operating expenses. |
| (4) | Efficiency ratio calculated as operating expenses divided by the sum of net interest income before provisions for loan losses plus non-interest operating income. |
Sources: Prosper Bank’s prospectus, audited & unaudited financial statements, SNL Financial and RP Financial calculations.
| RP® Financial, LC. | OVERVIEW AND FINANCIAL ANALYSIS |
| I.9 |
Non-interest operating income has generally been somewhat of a limited contributor to the Bank’s earnings over the past five years, although non-interest operating income has shown a growth trend recently due to an increase in service charges. Over the past five years, non-interest operating income ranged from a low of $463,000 or 0.22% of average assets in 2016 to a high of $966,000 or 0.46% of average assets in 2017 and was $606,000 or 0.25% of assets for 2020. Service charges comprise the major source of the Bank’s non-interest operating income, with other sources of non-interest operating income consisting of income earned on BOLI and miscellaneous other sources of non-interest operating income.
Operating expenses represent the other major component of the Bank’s earnings, ranging from a low of $5.2 million or 2.50% of average assets during 2016 to a high of $7.1 million or 2.87% of average assets during 2020. Although the one-time expenses from 2020 are not expected to recur in future years, there will be upward pressure placed on the Bank’s operating expense ratio following the stock offering, due to expenses associated with operating as a publicly-traded company, including expenses related to the stock benefit plans. At the same time, the increase in capital realized from the stock offering will increase the Bank’s capacity to leverage operating expenses through pursuing a more aggressive growth strategy.
Overall, the general trends in the Bank’s net interest income and operating expense ratios over the past five years reflect a decrease in core earnings, as indicated by the Bank’s expense coverage ratio (net interest income divided by operating expenses). Prosper Bank’s expense coverage ratio decreased from 1.29 times during 2016 to 0.94 times during 2020. The decrease in the expense coverage ratio was attributable to a both a decrease in the net interest income ratio and an increase in the operating expense ratio. Similarly, Prosper Bank’s efficiency ratio (operating expenses as a percent of the sum of net interest income plus non-interest operating income) trended less favorably from 72.67% during 2016 to 97.29% during 2020. An increase in the operating expense ratio and a decrease in the net interest income ratio accounted for the increase in the Bank’s efficiency ratio.
During the period covered in Table 1.2, the amount of loan loss provisions recorded by the Bank ranged from $53,000 or 0.03% of average assets during 2017 to $697,000 or 0.32% of average assets during 2019 with the 2020 figure being $760,000 of 0.31% of average assets. The higher loan loss provisions that were established in 2019 and 2020 were largely to resolve non-performing assets and more recently to address the continued economic uncertainty resulting from the Covid-19 pandemic. As of December 31, 2020, the Bank maintained valuation allowances of $2.85 million, equal to 1.51% of total loans and 101.39% of non-performing loans. As of December 31, 2020, non-performing loans totaled $2.8 million or 1.49% of total loans. Exhibit I-6 sets forth the Bank’s loan loss allowance activity during the past two years.
| RP® Financial, LC. | OVERVIEW AND FINANCIAL ANALYSIS |
| I.10 |
Non-operating income and losses over the past five years have been limited. The Bank’s effective tax rate ranged from 18.17% during 2019 to 42.04% during 2017 and equaled 25.23% during 2020. As set forth in the prospectus, the Bank’s marginal effective statutory tax rate is 21.0%.
Interest Rate Risk Management
The Bank’s balance sheet is slightly asset sensitive in the short-term (less than one year), largely the result of the high balance of short-term liquid assets. As interest rates have remained at or near historically low levels for an extended period of time, the Bank experienced interest spread compression during the past two years as the average cost of interest-bearing liabilities generally increased between 2018 and 2019. Comparatively, during 2020 interest rate spread compression resulted from a more significant decrease in yield on earning-assets relative to the decrease in the cost of interest-bearing liabilities. The Bank’s interest rate risk analysis indicated that as of December 31, 2020, in the event of a 200 basis point instantaneous parallel increase in interest rates, the Bank’s net interest margin would increase by 8.1% in year 1 (see Exhibit I-7).
The Bank pursues a number of strategies to manage interest rate risk, particularly with respect to seeking to limit the repricing mismatch between interest rate sensitive assets and liabilities. The Bank manages interest rate risk from the asset side of the balance sheet through maintaining a high level of liquidity in the prevailing low interest rate environment, maintaining most of the investment securities portfolio as available for sale and diversifying into other types of lending beyond 1-4 family permanent mortgage loans which consist primarily of adjustable rate or shorter term fixed rate balloon loans. As of December 31, 2020, of the Bank’s total loans due after December 31, 2021, ARM loans comprised 49.0% of those loans (see Exhibit I-8). On the liability side of the balance sheet, management of interest rate risk has been pursued through emphasizing growth of lower costing and less interest rate sensitive transaction and savings account deposits. Transaction and savings account deposits comprised 62.9% of the Bank’s deposits at December 31, 2020.
| RP® Financial, LC. | OVERVIEW AND FINANCIAL ANALYSIS |
| I.11 |
The infusion of stock proceeds will serve to further limit the Bank’s interest rate risk exposure, as most of the net proceeds will be redeployed into interest-earning assets and the increase in the Bank’s capital position will lessen the proportion of interest rate sensitive liabilities funding assets.
Lending Activities and Strategy
Prosper Bank’s lending activities have emphasized 1-4 family permanent mortgage loans and such loans comprise the major portion of the Bank’s loan portfolio. Beyond 1-4 family loans, lending diversification by the Bank has emphasized commercial real estate/multi-family loans followed by commercial business loans. Other areas of lending diversification for the Bank include construction/land loans and consumer loans. Pursuant to the Bank’s strategic plan, the Bank is pursuing a diversified lending strategy emphasizing commercial real estate and commercial business loans as the primary area of targeted loan growth. Exhibit I-9 provides historical detail of Prosper Bank’s loan portfolio composition over the past two years and Exhibit I-10 provides the contractual maturity of the Bank’s loan portfolio by loan type as of December 31, 2020.
1-4 Family Residential Loans. Prosper Bank offers both fixed rate and adjustable rate 1-4 family permanent mortgage loans with terms of up to 30 years, which are substantially secured by local properties. 1-4 family loans have generally been retained in portfolio but, in the future, the Bank intends to follow secondary market guidelines so as to provide the Bank with the flexibility to sell the loans into the secondary market for purposes of managing interest rate risk. ARM loans offered by the Bank generally have initial fixed rate terms of five to ten years, after which the loans adjusted annually and are indexed to the one-year U.S. Treasury Rate. The Bank has not historically purchased 1-4 family loans but has originated them internally. As of December 31, 2020, the Bank’s outstanding balance of 1-4 residential mortgage loans totaled $106.4 million or 56.16% of total loans outstanding.
Commercial Real Estate and Multi-Family Loans. Commercial real estate and multi-family loans consist largely of loans originated by the Bank, which are generally collateralized by properties in Chester and Lancaster counties. Prosper Bank generally originates commercial real estate and multi-family loans up to a loan-to-value LTV ratio of 80% of the lesser of the purchase price or the appraised value of the property securing the loan and generally requires a minimum debt-coverage ratio of 1.25 times. Commercial real estate and multi-family loans are generally originated as fixed rate loans with balloon terms of three, five or seven years and 20 to 25-year amortization schedules. The commercial real estate portfolio includes loans secured by farmland totaling $7.5 million. At December 31, 2020, the Bank’s largest commercial real estate loan had an outstanding balance of $3.0 million and is secured by a hotel in the Bank’s market area. At December 31, 2020, this loan was performing in accordance with its original terms. As of December 31, 2020, the Bank’s outstanding balance of commercial real estate and multi-family loans totaled $59.5 million or 31.41% of total loans outstanding
| RP® Financial, LC. | OVERVIEW AND FINANCIAL ANALYSIS |
| I.12 |
Commercial & Industrial Loans. The commercial & industrial loan portfolio is generated through extending loans to small-to medium-sized businesses operating in the local market area. Commercial & Industrial lending is a targeted area of loan growth for the Bank, pursuant to which the Bank is seeking to become a full service community bank to its commercial loan customers through offering a full range of commercial loan products that can be packaged with lower cost commercial deposit products. Commercial & Industrial loans offered by the Bank include operating lines of credit secured by general business assets and equipment. Operating lines of credit are generally floating rate loans indexed to The Wall Street Journal prime rate. The Bank did not participate in the Paycheck Protection Program (“PPP”) prior to December 31, 2020 but, beginning in 2021, was qualified to participate in the PPP and plans to originate such loans. As of December 31, 2020, the Bank’s outstanding balance of commercial & industrial loans totaled $13.1 million or 6.93% of total loans outstanding.
Construction and Land Loans. Construction loans originated by the Bank consist of loans to finance the construction of 1-4 family residences and commercial real estate. Construction loans are interest only loans during the construction period, which is usually up to 18 months, and are generally offered up to a LTV ratio of 80% of the lesser of the appraised market value of the completed property or the total cost of the construction project. Land loans consist of properties acquired for development, as well as unimproved land. Land loans are typically extended up to a LTV ratio of 70% of the lesser of the appraised value or the purchase price of the property. Land loans are generally offered as floating rate loans with terms of 12 to 36 months. As of December 31, 2020, Prosper Bank’s outstanding balance of construction and land loans totaled equaled $7.4 million or 3.89% of total loans outstanding.
Consumer Loans. Consumer lending has been a fairly limited area of lending diversification for the Bank, with such loans consisting of loans secured by deposits and other personal assets. As of December 31, 2020, the Bank held $3.1 million of consumer loans equal to 1.61% of total loans outstanding.
| RP® Financial, LC. | OVERVIEW AND FINANCIAL ANALYSIS |
| I.13 |
Asset Quality
The Bank’s credit quality measures have shown improving trends in recent years, which has been facilitated by decreases in the balances of non-accruing loans. Over the past two years, Prosper Bank’s balance of non-performing assets ranged from a high of $3.1 million or 1.43% of assets at year-end 2019 to a low of $2.8 million or 1.02% of assets at year-end 2020. As shown in Exhibit I-11, non-performing assets at December 31, 2020 consisted of $2.8 million of non-accruing loans. There was no OREO or accruing loans 90 days or more past due. Non-accruing loans held by the Bank at December 31, 2020 were concentrated in 1-4 family permanent mortgage loans totaling $1.6 million.
To track the Bank’s asset quality and the adequacy of valuation allowances, the Bank has established detailed asset classification policies and procedures which are consistent with regulatory guidelines. Classified assets are reviewed monthly by senior management and the Board. Pursuant to these procedures, when needed, the Bank establishes additional valuation allowances to cover anticipated losses in classified or non-classified assets. As of December 31, 2020, the Bank maintained loan loss allowances of $2.9 million, equal to 1.51% of total loans receivable and 101.39% of non-performing loans.
Funding Composition and Strategy
Deposits have consistently served as the Bank’s primary funding source and at December 31, 2020 deposits accounted for 91.84% of Prosper Bank’s combined balance of deposits and borrowings. Exhibit I-12 sets forth the Bank’s deposit composition for the past two years. Transaction and savings account deposits constituted 62.88% of total deposits at December 31, 2020, as compared to 62.13% of total deposits at December 31, 2019. The stable nature of the concentration of core deposits comprising total deposits from year-end 2019 to year-end 2020 resulted from across the board growth in total deposits during 2020. Within transaction and savings accounts, the Bank reported the greatest percentage increases in noninterest-bearing demand deposits and money market deposits. As of December 31, 2020, checking accounts and money market accounts comprised the two largest concentrations of the Bank’s core deposits equaling 27.07% and 18.55% of deposits, respectively.
The balance of the Bank’s deposits consists of CDs, which equaled 37.12% of total deposits at December 31, 2020 compared to 37.87% of total deposits at December 31, 2019. Prosper Bank’s current CD composition reflects a higher concentration of short-term CDs (maturities of one year or less). The CD portfolio totaled $85.9 million at December 31, 2020 and $49.1 million or 57.08% of the CDs were scheduled to mature in one year or less. As of December 31, 2020, jumbo CDs (CD accounts with balances of $100,000 or more) amounted to $50.3 million or 58.59% of total CDs. The Bank held $1.2 million of brokered CDs and $14.4 million of municipal deposits at December 31, 2020.
| RP® Financial, LC. | OVERVIEW AND FINANCIAL ANALYSIS |
| I.14 |
Borrowings serve as an alternative funding source for the Bank to facilitate management of funding costs and interest rate risk. FHLB advances have been the only source of borrowings utilized by the Bank over the past five years. The Bank maintained $20.6 million of FHLB advances at December 31, 2020. In addition, the Bank had a $3.0 million borrowing arrangement with the Atlantic Community Bankers Bank and a $2.0 million line of credit with the Federal Reserve Bank of Philadelphia.
Legal Proceedings
Prosper Bank is not currently party to any pending legal proceedings that the Bank’s management believes would have a material adverse effect on the Bank’s financial condition, results of operations or cash flows.
| RP® Financial, LC. | OPERATING ENVIRONMENT AND MARKET AREA |
| Page II.1 |
II. OPERATING ENVIRONMENT AND MARKET AREA
Introduction
Prosper Bank is headquartered in the city of Coatesville, Chester County, Pennsylvania, in southeastern Pennsylvania. The Bank operates a community banking business through its headquarters office, one branch office in Chester County, and three branch offices in Lancaster County, Pennsylvania, located west of Chester County. The Bank also conducts lending operations over a somewhat wider area, with commercial loan personnel located in the Harrisburg, Pennsylvania metropolitan area. A map of the Bank’s office locations is included as Exhibit I-1 and Exhibit II-1 contains details regarding the office properties.
The Bank focuses on providing personal service while meeting the needs of its business and retail customer base, emphasizing personalized banking services to retail customers and full service activities for business customers. Deposit services offered include demand deposits, business accounts, regular savings accounts, money market deposits, certificates of deposit and individual retirement accounts. Recent strategic actions have focused on revamping most functional areas of the Bank’s operations with a goal of increasing efficiencies through technology, developing a new operating culture, improving the capabilities of the employee base, improving the customer experience and planning for the eventual expansion of the Bank primarily through increased commercial lending and depository activities.
Future business and growth opportunities for the Bank depend on the future growth trends of the local and regional economy, demographic growth trends and the nature and intensity of the competitive environment. These factors have been briefly examined to help determine the growth potential that exists for the Bank, the relative economic health of the Bank’s market area, and the resultant impact on value.
National Economic Factors
After expanding for over 10 years, the longest on record, the national economic expansion came to an end in the second quarter of 2020 as a result of the COVID-19 pandemic and related shutdown of businesses and economic activity on both a personal and business basis. Through December 2020, the worldwide impact of COVID-19 has caused a substantial change in current and go-forward expectations in many economic performance factors, including the United States GDP growth. Following annual GDP growth in the range of 1.0% to 3.0% during the most recent economic expansion, the United States GDP declined by 3.5% for calendar year 2021, with a sharp decline in the second quarter (31.4%) and strong growth in the third quarter (33.4%) as a result of the implementation of federal assistance payments. Based on the most recent Wall Street Journal (“WSJ”) economists’ forecast, GDP is projected to increase by 4.2% for all of 2021, indicating a welcome return to economic growth. This growth, however, would be achieved through substantial public spending and related increase in the federal debt, as the fiscal 2020 budget deficit totaled $3.1 trillion, and expectations are that substantial deficits will continue based on pre-COVID deficit levels and that additional COVID-related spending will be required.
| RP® Financial, LC. | OPERATING ENVIRONMENT AND MARKET AREA |
| Page II.2 |
The economy has recorded job growth in recent years, with an average of 2.4 million jobs added annually over the 2015-2019 time period, indicating a steady and notable growth period. As was the case with GDP performance noted above, United States job growth turned negative in March 2020, with the labor force contracting by 1.4 million in March and 20.8 million in April 2020, reflecting an unprecedented deterioration in the employment sector of the economy. During the May-November 2020 time period, a total of 12.5 million jobs were added to the workforce, reflecting a recovery of a portion of the prior losses. However, the December 2020 jobs report indicated a net loss of 140,000 jobs, indicating a continued weakness to the economy. Near-term expectations for employment gains are for a gradual improvement, particularly as the daily impacts of COVID-19 diminish, with quarterly average job growth of 419,000 as estimated by the WSJ economists forecast.
For 2020, the annualized national inflation rate was 1.33%, compared to 2.11% for CY19 and 2.44% for CY18, indicating inflation has been kept under control, which is a focus of the Federal Reserve policy. The 2020 inflation rate was impacted substantially by the COVID-19 crisis, reflecting the reduced demand for products and services nationwide and therefore lower inflation. The Federal Reserve has recently indicated that it intends to manage inflation and interest rates differently, effectively allowing prices to run higher in order to accelerate growth and bring down unemployment. For example, instead of targeting a two percent inflation level and raising rates to head off price pressure, the Federal Reserve would aim for an average of two percent over time, which would let inflation briefly run higher.
| RP® Financial, LC. | OPERATING ENVIRONMENT AND MARKET AREA |
| Page II.3 |
Economists have been focused in recent periods on the national unemployment rate, which prior to 2020 had been at levels considered to be “full employment” for the last year and a half. From highs reached during the national recession of 2008-2009 in the range of 10%, the unemployment rate steadily declined and equaled 3.5% as of December 2019, the lowest rate in 2019. In calendar year 2020, the unemployment rate remained below 4.0% through February 2020, and then began to increase as a result of the economic disruption caused by the COVID-19 crisis, with such rate reaching 14.7% for April 2020, a level not seen since the Great Depression. The national unemployment rate trended downward to reach 6.7% as of December 2020, indicating some improvement and reflecting the job increases noted earlier. It is expected that the unemployment rate will likely take a number of years to fully recover. Such unemployment rates will be contingent upon the impact of COVID-19, with certain industries, such as restaurants and in-person entertainment, expected to be impacted over an extended time period. Further, the labor force may permanently lose certain jobs, such as certain office service industries as “working remotely” becomes a permanent situation for a portion of the national employee base. Other longer term impacts on job growth are expected to include the aging of the employment base, further loss of the working age population base as baby boomers retire, increased use of technology to reduce or replace workers in the workplace, and the overall slower rate of population growth compared to prior generations.
After recording a strong performance in calendar year 2019, the major stock market indices reached all-time highs in early 2020, and then fell quickly and dramatically through March 2020 as a result of worldwide fears of economic slowdowns or recession, based on the emergence of the COVID-19 pandemic. Subsequent to March 2020, these indices have recovered substantially all of the losses incurred or reached new highs as government spending actions to support the economy have provided some positive sentiment and the successful development of COVID-19 vaccines has also supported the economic outlook. From an all-time high of 29,551.42 on February 12, 2020, the DJIA fell by 37.1% to 18,591.93 as of March 23, 2020. Since that date, the DJIA has recorded a recovery to 31,148.24 as of February 5, 2021, reaching an all-time high. Similarly, these trends have also occurred in the other major market indexes such as the S&P 500, which settled at 3,886.83 on February 5, 2021, well above the February 2020 all-time high of 3,386.15, while the NASDAQ has exceeded the February 2020 high of 9,817.18 to reach 13,856.30 as of February 5, 2021.
Similar to the major market indices noted above, the major banking market indexes also increased substantially in calendar year 2019 and then fell quickly and dramatically as a result of worldwide fears of economic slowdowns or recession in early 2020. From an all-time high of 668.69 on January 2, 2020, the SNL Bank Index fell by 49.4% through March 23, 2020 to 338.10 based primarily in expected lower income and eventual loan losses due to the economic decline. Since that low, the SNL Bank index has recovered somewhat to 604.77, representing an increase of 78.9%. This index remains below the January 2020 all-time high, reflecting the continued uncertainty of the eventual impact of COVID-19 and the economic fallout to financial institutions. Similarly, from an all-time high of 928.86 on December 17, 2019, the SNL Thrift Index fell by 38.8% to 568.84 through March 23, 2020 based primarily on expected lower income and eventual loan losses due to the economic decline. Since that low, the SNL Thrift index has recovered somewhat to 851.79, representing an increase of 49.7%. However, this index remains below the December 2019 all-time high, reflecting the continued uncertainty of the eventual impact of COVID-19 and the economic fallout to financial institutions. The greater decline in the banking industry indexes in comparison to the broader market indexes indicated that market expectations for the financial institution sector include a notable reduction in income and losses related to loans held by such institutions.
| RP® Financial, LC. | OPERATING ENVIRONMENT AND MARKET AREA |
| Page II.4 |
Regarding factors that most directly impact the banking and financial services industries, through early 2020, the residential real estate industry was relatively healthy, as new and previously-owned home sales have increased, and residential housing prices have continued to trend upward in most metropolitan areas of the country. Homebuilders were expecting a more stable trend in new home construction with residential housing starts projected to increase somewhat from 2020 to 2021 and total 1.49 million for 2021. As a result of COVID-19 and the corresponding lower interest rates, residential loan volumes dramatically increased for all of 2020, with many mortgage banking operations recording substantial increases in volumes and profits. There are indications that demand for single family residential housing will be enhanced due to the implied benefits of such properties in relation to isolation from COVID-19 and that additional “working remotely” will increase demand for larger homes. As a result of the above, national home price indices have recorded notable increases in 2020. The national median home price for sales of existing homes reached $309,800 in December 2020 versus $266,200 in January 2020, representing an increase of 16.4%. These figures compare favorably to the generational low of $169,000 recorded in March 2009.
Based on the consensus outlook of economists surveyed by The Wall Street Journal in January 2021, GDP was projected to increase by 4.2% overall for 2021 and equal annualized growth of 3.2% in the first half of 2022. The unemployment rate was estimated to decline to 5.3% by the end of 2021 and 4.3% by the end of 2023. On average, the economists forecasted a rising federal funds rate from 0.13% in June 2021, increasing to 0.25% in December 2022 and a subsequent increase to 0.52% in December 2023. On average, the economists forecasted that the 10-year Treasury yield would equal 1.24% in June 2021 and increase to 1.77% in December 2022 and 2.10% in December 2023.
| RP® Financial, LC. | OPERATING ENVIRONMENT AND MARKET AREA |
| Page II.5 |
The January 2021 mortgage finance forecast from the Mortgage Bankers Association (the “MBA”) reflected notable trends in units and dollars of residential housing. The forecast indicated that 2020 existing home sales are expected to increase by 6.0% from 2019 sales and new home sales were forecasted to increase by 19.4% in 2020 compared to 2019 sales. For 2021, existing home sales are projected to increase by 10.2%, while new home sales are to increase by 18.1%. The 2020 median sale price for existing homes was forecasted to increase by 12.1% while the new homes price was forecasted to increase by 3.7%. For 2021, the median sale price of existing homes is projected to increase by 3.2%, while the median price of new homes is to increase by 0.4%. Total mortgage production was forecasted to increase in 2020 to $3.573 trillion, compared to $2.253 trillion in 2019 and equal $2.719 trillion in 2021. The forecasted increase in 2020 originations was based on a 16.2% increase in purchase volume and a 109.0 increase in refinancing volume. Purchase mortgage originations were forecasted to total $1.424 trillion in 2020, versus refinancing volume totaling $2.149 billion. Housing starts for 2020 were projected to increase by 6.7% to total 1.382 million.
Interest Rate Environment
Following a series of three interest rate cuts totaling 0.75% in the last half of CY19 (ending on October 30, 2019), the Federal Reserve elected to hold interest rates steady and stated that the national economic outlook would continue to be monitored and that the Federal Reserve would act as appropriate to sustain the then economic expansion. At that time, the prime rate of interest was 4.75% and the fed funds target was 1.50% to 1.75%. This interest rate position and overall outlook was held by the Federal Reserve through the end of CY2019 and into February 2020.
The COVID-19 outbreak and implied impact to the national economy, which became more and more evident throughout February 2020, led the Federal Reserve to reduce interest rates on March 3, 2020 by 0.50%, and by an additional 1.00% on March 13, 2020 (a rare Sunday action). That latest action resulted in a prime rate target of 3.25%, and a targeted fed funds rate of 0.00% to 0.25%, indicating that the Federal Reserve’s direct interest rate levers had been implemented to support the national economy.
| RP® Financial, LC. | OPERATING ENVIRONMENT AND MARKET AREA |
| Page II.6 |
The above noted rate reductions by the Federal Reserve brought the US Treasury yields and yield curve down to extremely low levels. Short term interest rates approached zero, and intermediate and longer-term Treasury rates also fell to low levels. From March 2020 through early August 2020, the 10-year Treasury Bond rate ranged between 0.50% and 0.75%, while the 30-year Treasury Bond rate ranged from 1.25% to 1.50% over the same time period. After reaching a low of 0.52% on August 4, 2020, the 10-year Treasury Bond rate has trended upward and was 1.19% on February 5, 2021. Similarly, after reaching a low of 1.19% on August 4; 2020, the 30-year Treasury Bond rate has trended upward to 1.97% as of February 5, 2021. The latest Wall Street Journal survey of leading economists indicates a modestly rising rate scenario through mid-2023 with longer term rates rising more than short term rates. The Federal Reserve has indicated in certain information releases that it expects to keep interest rates at historical low levels for approximately the next five years. Historical interest rate trends are presented in Exhibit II-2.
While the low interest rate environment has stimulated loan demand, particularly in the residential sector, such rates have also adversely impacted yields earned on loans by financial institutions. Institutions also are benefiting from the corresponding reduction in rates paid on deposit and borrowed funds.
Given the unprecedented nature and scope of COVID-19, the ultimate and cumulative impact of the pandemic on interest rates remains uncertain, with asset quality issues being another potential financial impact.
Primary Market Area
Chester County was originally established and settled during the earliest years of the state, given its proximity to Philadelphia to the east, and the county has benefited since then from the effects of growth in the southeastern Pennsylvania region. Having a population of 530,000, the county is part of the Philadelphia metropolitan statistical area, with the eastern section of the county comprising the western part of the “Main Line” suburban communities along US Route 30, while the southern section of the county is considered suburban to Wilmington, Delaware. Agriculture remains a notable part of the economic base as the western portion of the county shares characteristics with Lancaster County. The ties to Philadelphia to the east and Wilmington to the south provide for additional commuting capabilities for employment and make Chester County more attractive as a residential community. Because of its proximity to Philadelphia and Wilmington, Chester County has seen large waves of development over the past half-century due to suburbanization. Although development in Chester County has increased, agriculture is still a major part of the county’s economy, and mushroom growing is a specialty in the southern portion of the county.
| RP® Financial, LC. | OPERATING ENVIRONMENT AND MARKET AREA |
| Page II.7 |
With a population of 550,000, Lancaster County has developed into its own metropolitan area, sufficiently separate from Philadelphia to the east and Harrisburg to the west. The county was first settled as part of the western expansion from the east and was attractive as it contains some of the most fertile land in the country and a temperate climate. Agriculture remains the mainstay of the county in terms of economic output and land usage, but the county has developed a diverse economic base that includes manufacturing, services, education and health care and trade. The county is an attractive area to live given the open space, lower cost of living, and the size of the economic base that provides sufficient levels of quality goods and services and quality of life in comparison to a more rural area. The county’s location and available transportation provides easy access to the east coast region, including Interstate 95 and points north and south. These characteristics have made the county a destination for retirees, as there are many retirement communities in the county. Tourism represents a major industry and economic benefit given the agricultural base and the presence of religious sects such as the Amish and Mennonites.
Demographic and Economic Trends
Table 2.1 presents information regarding the demographic and economic trends for the Bank’s market area from 2010 to 2021 and projected through 2026. Data for the nation and the State of Pennsylvania is included for comparative purposes. The size and scope of the market area is evidenced by the demographic data, which shows as of 2021 the Chester and Lancaster Counties combined population was 1.078 million, reflecting a notable population base, with Chester County containing slightly less than 50% of the total population. Coatesville is situated near the center of Chester County with a population of approximately 13,000. Estimated as of 2021, Lancaster County recorded a slightly larger population base of approximately 550,000. Chester County is part of the Philadelphia metropolitan area, while Lancaster County comprises its own metropolitan statistical area.
The data in Table 2.1 also indicates the favorable growth characteristics of the two-county market area, as both counties recorded annual population growth of 0.5% over the last 11 years, higher than the state growth rate of 0.1% and slightly lower than the national growth rate of 0.6%. The size and population growth rate in the two county market area serves to provide support for growth potential for financial institutions, given the implied growth of the potential customer base and resulting higher demand for housing and other related products and services. Over the next projected five years, the state and the market area counties are expected to continue these trends, indicating a favorable operating environment for financial institutions.
| RP® Financial, LC. | OPERATING ENVIRONMENT AND MARKET AREA |
| Page II.8 |
Table 2.1
Prosper Bank
Summary Demographic/Economic Data
| Year | Growth Rate (Annualized) | |||||||||||||||||||
| 2010 | 2021 | 2026 | 2010-2021 | 2021-2026 | ||||||||||||||||
| (%) | (%) | |||||||||||||||||||
| Population (000) | ||||||||||||||||||||
| USA | 308,746 | 330,946 | 340,574 | 0.6 | % | 0.6 | % | |||||||||||||
| Pennsylvania | 12,702 | 12,804 | 12,835 | 0.1 | % | 0.0 | % | |||||||||||||
| Chester, PA | 499 | 529 | 539 | 0.5 | % | 0.4 | % | |||||||||||||
| Lancaster, PA | 519 | 549 | 559 | 0.5 | % | 0.3 | % | |||||||||||||
| Households (000) | ||||||||||||||||||||
| USA | 116,716 | 125,733 | 129,596 | 0.7 | % | 0.6 | % | |||||||||||||
| Pennsylvania | 5,019 | 5,105 | 5,130 | 0.2 | % | 0.1 | % | |||||||||||||
| Chester, PA | 183 | 194 | 198 | 0.5 | % | 0.4 | % | |||||||||||||
| Lancaster, PA | 194 | 206 | 210 | 0.6 | % | 0.4 | % | |||||||||||||
| Median Household Income ($) | ||||||||||||||||||||
| USA | NA | 67,761 | 73,868 | NA | 1.7 | % | ||||||||||||||
| Pennsylvania | NA | 65,958 | 71,502 | NA | 1.6 | % | ||||||||||||||
| Chester, PA | NA | 106,431 | 116,235 | NA | 1.8 | % | ||||||||||||||
| Lancaster, PA | NA | 72,498 | 81,785 | NA | 2.4 | % | ||||||||||||||
| Per Capita Income ($) | ||||||||||||||||||||
| USA | NA | 37,689 | 41,788 | NA | 2.1 | % | ||||||||||||||
| Pennsylvania | NA | 37,695 | 41,557 | NA | 2.0 | % | ||||||||||||||
| Chester, PA | NA | 55,143 | 60,212 | NA | 1.8 | % | ||||||||||||||
| Lancaster, PA | NA | 35,820 | 40,760 | NA | 2.6 | % | ||||||||||||||
| 2021 Age Distribution (%) | 0-14 Yrs. | 15-34 Yrs. | 35-54 Yrs. | 55-69 Yrs. | 70+ Yrs. | |||||||||||||||
| USA | 18.3 | 26.8 | 25.1 | 18.4 | 11.4 | |||||||||||||||
| Pennsylvania | 16.8 | 25.7 | 24.2 | 20.3 | 13.0 | |||||||||||||||
| Chester, PA | 17.8 | 25.1 | 25.4 | 20.1 | 11.6 | |||||||||||||||
| Lancaster, PA | 19.4 | 25.9 | 23.1 | 18.5 | 13.0 | |||||||||||||||
| Less Than | $25,000 to | $50,000 to | ||||||||||||||||||
| 2021 HH Income Dist. (%) | 25,000 | 50,000 | 100,000 | $100,000+ | ||||||||||||||||
| USA | 18.0 | 20.3 | 29.0 | 32.7 | ||||||||||||||||
| Pennsylvania | 18.6 | 20.5 | 29.8 | 31.0 | ||||||||||||||||
| Chester, PA | 9.4 | 12.4 | 25.4 | 52.8 | ||||||||||||||||
| Lancaster, PA | 13.3 | 19.9 | 33.5 | 33.4 | ||||||||||||||||
Source: S&P Global Market Intelligence.
| RP® Financial, LC. | OPERATING ENVIRONMENT AND MARKET AREA |
| Page II.9 |
Changes in the number of households in the market area have generally paralleled trends with respect to population, although at slightly more favorable rates of change. This reflects a national trend towards smaller average household sizes. These growth trends in households also increases business opportunities for community financial institutions such as Prosper Bank.
Table 2.1 provides certain median age distribution figures for the market area and other comparative areas. The data reveals that Chester County’s age distribution generally mirrors the statewide averages, while Lancaster County reported greater proportions of both younger (less than 14 years of age) and older (greater than 70 years of age) residents. Table 2.1 also contains data concerning household and per capita income levels, which are important indicators of a market area’s health and attractiveness in terms of housing and economic activity. Chester County reported by far the highest income levels of all comparative areas, with median household income in excess of $106,000 as of 2021. The 2021 median household income for Lancaster County was much lower at $72,500, which remained above the state and national averages. Chester County’s higher income levels reflected the location as an outer suburban county to the City of Philadelphia whereby residents have moved for additional living space and new infrastructure. The county’s population and related economic is large enough to support the operations of a number of larger companies in various economic sectors. Lancaster Country remains an overall more rural county without a specific connection to a major city or metropolitan area. Projected annual income growth over the next five years is highest for Lancaster County relative to the comparative areas shown in Table 2.1. Per capita incomes generally tracked the household income data, with Chester County recording the highest per capita income of all comparative areas. Household income distribution patterns shown in Table 2.1 also provide support for earlier statements regarding the nature of Prosper Bank’s market as approximately 53% of Chester County households had income levels in excess of $100,000 annually in 2020 while the ratio was 31% for Pennsylvania and 33% for the national average.
| RP® Financial, LC. | OPERATING ENVIRONMENT AND MARKET AREA |
| Page II.10 |
Economic Sectors
As shown in Table 2.2, the Bank’s primary market area has an employment base concentrated in education/healthcare/social services, services, manufacturing and wholesale/retail trade. The distribution of employment exhibited in the primary market area is indicative of a relatively diverse economic environment with a level of dependence on manufacturing, which typically has higher overall wages compared to other economic sectors. Chester County retains an agricultural base as the southern portion of the county is the largest mushroom producer in the country. Employment includes industries such as finance and insurance, professional and technical services, software publishing, scientific research and development and life sciences. These economic sectors result in a highly-paid and highly educated workforce. Lancaster County also maintains a diverse economy, including agriculture, tourism, manufacturing and services.
Market Area Largest Employers
As indicated above, the economic and employment base of the market area is diverse and not dependent on any one industry. Table 2.3 presents a listing of the largest employers in the market area, detailing these characteristics. Chester County’s largest employers reflect a cross-section of most economic sectors, while Lancaster County revealed some concentration in retirement homes along with a variety of other economic sectors.
Market Area Unemployment Data
Comparative unemployment rates for the primary market area counties, as well as for the U.S. and Pennsylvania, are shown in Table 2.4, with the December 2020 unemployment rates for the two-county market area both less than 5%. Over the past 12 months, unemployment rates have increased substantially and then deceased in the market area and the state and nation as a result of the COVID-19 pandemic, causing a notable amount of disruption to the economic and the employee base. At present, the Bank’s market area counties have fared better than most areas, as the unemployment rates are well below the state and national averages. The lower unemployment rates are more significant given the higher population growth rates, which would be expected to place more pressure on the unemployment rates.
| RP® Financial, LC. | OPERATING ENVIRONMENT AND MARKET AREA |
| Page II.11 |
Table 2.2
Prosper Bank
Primary Market Area Employment Sectors
(Percent of Labor Force)
| Employment Sector | Pennsylvania | Chester County | Lancaster County | |||||||||
| (%) | (%) | (%) | ||||||||||
| Services | 23.6 | % | 27.9 | % | 21.6 | % | ||||||
| Education,Healthcare, Soc. Serv. | 25.8 | % | 22.5 | % | 22.5 | % | ||||||
| Government | 4.0 | % | 2.3 | % | 2.2 | % | ||||||
| Wholesale/Retail Trade | 14.0 | % | 12.6 | % | 16.7 | % | ||||||
| Finance/Insurance/Real Estate | 6.5 | % | 9.9 | % | 4.7 | % | ||||||
| Manufacturing | 12.1 | % | 10.9 | % | 15.9 | % | ||||||
| Construction | 5.8 | % | 5.5 | % | 8.3 | % | ||||||
| Information | 1.6 | % | 2.1 | % | 1.1 | % | ||||||
| Transportation/Utility | 5.7 | % | 3.7 | % | 4.6 | % | ||||||
| Agriculture | 0.8 | % | 2.5 | % | 2.4 | % | ||||||
| 100.0 | % | 100.0 | % | 100.0 | % | |||||||
| Source: S&P Global Market Intelligence. | ||||||||||||
Deposit Trends
The competitive environment for financial institution products and services on a national, regional and local level can be expected to become even more competitive going into the future. Consolidation among the bank and thrift industries provides economies of scale to larger institutions, while the heightened availability of investment options provides consumers with attractive alternatives to the deposit products offered by financial institutions. The Bank’s market area for deposits includes primarily other local and regional commercial banks and credit unions.
Table 2.5 displays deposit market trends and deposit market share, respectively, for commercial banks and savings institutions for the state of Pennsylvania and for Chester and Lancaster Counties from June 30, 2016 to June 30, 2020. Deposit growth trends serve as indicators of a market area’s current and future prospects for growth and attractiveness for financial institutions. Pennsylvania state deposits grew at an annual rate of 8.2% over the four-year time period shown in Table 2.5. Commercial banks increased deposits at an annual rate of 10.9% in Pennsylvania, while savings institutions saw their deposits decline at a rate of 11.6%, due in part to acquisitions of savings institutions by commercial banks or charter conversions to commercial banks. Commercial banks continue to dominate the deposit market in Pennsylvania, with an aggregate market share equal to 92.9% of total bank and thrift deposits in market.
| RP® Financial, LC. | OPERATING ENVIRONMENT AND MARKET AREA |
| Page II.12 |
Table 2.3
Prosper Bank
Market Area Largest Employers
| Company/Institution | Industry | |
| Chester County | ||
| Chester County Hospital | Healthcare Services | |
| Cheyney University | Higher Education | |
| County of Chester | Local Government | |
| Downingtown Area School District | Education | |
| Federal Government | Federal Government | |
| Giant Food Stores, LLC | Groceries | |
| Main Line Hospitals, Inc. | Healthcare Services | |
| QVC, Inc. | Retail Store via Shopping Channel | |
| The Deveroux Foundation | Behavioral Health Organization | |
| United Parcel Service, Inc. | Shipping | |
| Vanguard Group, Inc. | Investment Counseling | |
| West Chester University | Higher Education | |
| Lancaster County | ||
| Brethern Village Retirement Community | Retirement Home | |
| Case New Holland | Agriculture Equipment | |
| Dart Container Corp | Plastic Foodservice Products | |
| Eurofins Lancaster Laboratories | Department Stores | |
| Fulton Financial Corp. | Banking | |
| High Companies | Commercial Construction | |
| Johnson and Johnson | Commercial Printing | |
| Lancaster General Health/Penn Medicine | Health Care | |
| Landis Homes Retirement Community | Retirement Home | |
| LSC Communications | Printing/Publishing | |
| Masonic Village Retirement Community | Retirement Home | |
| Turkey Hill Dairy | Consumer Foods | |
| Willow Valley Retirement Community | Retirement Home |
www.edlancaster.com (economic development)
Chester County Economic Development Council
| RP® Financial, LC. | OPERATING ENVIRONMENT AND MARKET AREA |
| Page II.13 |
Table 2.4
Prosper Bank
Unemployment Trends
| Unemployment Rate(1) | ||||||||||||
| Region | Dec. 2019 | Dec. 2020 | Net Change | |||||||||
| USA | 3.4 | % | 6.5 | % | 3.1 | % | ||||||
| Pennsylvania | 4.5 | % | 6.4 | % | 1.9 | % | ||||||
| Counties | ||||||||||||
| Chester, PA | 3.0 | % | 4.2 | % | 1.2 | % | ||||||
| Lancaster, PA | 3.3 | % | 4.7 | % | 1.4 | % | ||||||
| (1) Not seasonally adjusted. | ||||||||||||
| Source: S&P Global Market Intelligence. | ||||||||||||
Table 2.5
Prosper Bank
Deposit Summary
| As of June 30, | ||||||||||||||||||||||||||||
| 2016 | 2020 | |||||||||||||||||||||||||||
| Deposits | Market Share | No. of Branches | Deposits | Market Share | No. of Branches | Deposit Growth Rate 2016-2020 | ||||||||||||||||||||||
| (Dollars in Thousands) | (%) | |||||||||||||||||||||||||||
| Pennsylvania | $ | 365,848,000 | 100.0 | % | 4,300 | $ | 501,241,000 | 100.0 | % | 3,914 | 8.2 | % | ||||||||||||||||
| Commercial Banks | 307,614,000 | 84.1 | % | 3,423 | 465,667,000 | 92.9 | % | 3,417 | 10.9 | % | ||||||||||||||||||
| Savings Institutions | 58,234,000 | 15.9 | % | 877 | 35,574,000 | 7.1 | % | 497 | -11.6 | % | ||||||||||||||||||
| Chester County | $ | 13,595,750 | 100.0 | % | 183 | $ | 17,048,510 | 100.0 | % | 152 | 5.8 | % | ||||||||||||||||
| Commercial Banks | 11,374,696 | 83.7 | % | 143 | 15,785,535 | 92.6 | % | 137 | 8.5 | % | ||||||||||||||||||
| Savings Institutions | 2,221,054 | 16.3 | % | 40 | 1,262,975 | 7.4 | % | 15 | -13.2 | % | ||||||||||||||||||
| Prosper Bank | 111,876 | 0.8 | % | 2 | 115,149 | 0.7 | % | 2 | 0.7 | % | ||||||||||||||||||
| Lancaster County | $ | 10,553,591 | 100.0 | % | 188 | $ | 14,102,995 | 100.0 | % | 174 | 7.5 | % | ||||||||||||||||
| Commercial Banks | 9,631,655 | 91.3 | % | 158 | 13,412,358 | 95.1 | % | 156 | 8.6 | % | ||||||||||||||||||
| Savings Institutions | 921,936 | 8.7 | % | 30 | 690,637 | 4.9 | % | 18 | -7.0 | % | ||||||||||||||||||
| Prosper Bank | 65,040 | 0.6 | % | 2 | 95,212 | 0.7 | % | 3 | 10.0 | % | ||||||||||||||||||
Source: FDIC.
Deposits within Chester County grew over the four-year period at an annual rate of 5.8%, somewhat less than the statewide rate. Consistent with statewide trends, savings institutions experienced declining deposits in Chester County. Savings institutions held a similar market share position in Chester County of 7.4% as of June 30, 2020. In Lancaster County, deposits grew by a higher 7.5%, with commercial banks expanding the deposit base and savings institutions losing deposits. The total deposit base in Lancaster County is somewhat smaller than in Chester County.
| RP® Financial, LC. | OPERATING ENVIRONMENT AND MARKET AREA |
| Page II.14 |
As of June 30, 2020, the Bank maintained a deposit market share of 0.7% in Chester County, indicative of the large deposit base within the county. The Bank also reported a similar market share in Lancaster County. Future deposit gains and market share gains may be likely given the Bank’s low market penetration. In Chester County, since June 30, 2016, the Bank has experienced a slight annualized decrease in deposits, while such deposits increased at a much higher rate in Lancaster County.
Competition
Competition among financial institutions in the market area is significant. Among the Bank’s competitors are much larger and more diversified institutions, which have greater resources and offer more products and services than maintained by the Bank. Financial institution competitors in the Bank’s market area include primarily commercial banks, including banks with a national and regional presence. There are also a number of smaller community-based banks and credit unions that pursue similar operating strategies as the Bank. From a competitive standpoint, the Bank benefits from its status of a locally-owned financial institution, longstanding customer relationships, and continued efforts to offer competitive products and services. However, competitive pressures will also likely continue to build as the financial services industry continues to consolidate and as additional non-bank investment options for consumers become available. A total of 22 banking institutions operate in Chester County and 30 operate in Lancaster County.
Table 2.6 lists the Bank’s largest competitors in the market area counties, based on deposit market share as noted. Going forward, the Bank intends to continue to expand its’ total deposits and market share through continuing the strong ties to the community and operational planning to continue deposit and loan growth. Additionally, there is room to expand regionally in the market area based on the relatively positive economic and demographic environment and the current deposit market share maintained.
| RP® Financial, LC. | OPERATING ENVIRONMENT AND MARKET AREA |
| Page II.15 |
Table 2.6
Prosper Bank
Market Area Deposit Competitors - As of June 30, 2020
| Location Name | Market Share | Rank | |||||
| (%) | |||||||
| Chester, PA | Wells Fargo Bank, NA | 15.61 | |||||
| PNC Bank, NA | 9.86 | ||||||
| Truist Bank | 9.51 | ||||||
| TD Bank, NA | 8.47 | ||||||
| Citizens Bank, NA | 8.44 | ||||||
| Customers Bank | 5.82 | ||||||
| Meridian Bank | 5.64 | ||||||
| Wilmington Savings Fund Society, FSB | 4.90 | 8 out of 20 | |||||
| Bank of America, NA | 4.68 | ||||||
| S&T Bank | 4.61 | ||||||
| Fulton Bank, NA | 4.28 | ||||||
| Malvern Bank, NA | 3.04 | ||||||
| Prosper Bank | 0.68 | 16 out of 22 | |||||
| Lancaster, PA | Fulton Bank, NA | 28.52 | |||||
| Truist Bank | 15.64 | ||||||
| PNC Bank, NA | 12.58 | ||||||
| The Ephrata National Bank | 7.35 | ||||||
| Wells Fargo Bank, NA | 7.25 | ||||||
| Northwest Bank | 4.22 | ||||||
| Manufacturers and Traders Trust Co. | 3.97 | ||||||
| Bank of Bird-In-Hand | 3.21 | ||||||
| S&T Bank | 2.75 | ||||||
| First National Bank of Pennsylvania | 2.66 | ||||||
| Univest Bank and Trust Co. | 2.53 | ||||||
| Prosper Bank | 0.68 | 21 out of 30 | |||||
| Source: S&P Global Market Intelligence. | |||||||
| RP® Financial, LC. | PEER GROUP ANALYSIS |
| III.1 |
III. PEER GROUP ANALYSIS
This chapter presents an analysis of Prosper Bank’s operations versus a group of comparable savings and loan institutions (the “Peer Group”) selected from the universe of all publicly-traded savings institutions in a manner consistent with the regulatory valuation guidelines and other regulatory guidance. The basis of the pro forma market valuation of Prosper Bank is derived from the pricing ratios of the Peer Group institutions, incorporating valuation adjustments for key differences in relation to the Peer Group. Since no Peer Group can be exactly comparable to Prosper Bank, key areas examined for differences are: financial condition; profitability, growth and viability of earnings; asset growth; primary market area; dividends; liquidity of the shares; marketing of the issue; management; and effect of government regulations and regulatory reform.
Peer Group Selection
The Peer Group selection process follows the general parameters set forth in the regulatory valuation guidelines and other regulatory guidance. Specifically, we have limited the Peer Group composition to publicly-traded thrifts whose common stock is either listed on the NYSE or NASDAQ, since their stock trading activity is regularly reported and generally more frequent than non-publicly traded and closely-held institutions. Institutions that are not listed on the NYSE or NASDAQ are inappropriate, since the trading activity for thinly traded or closely-held stocks are typically highly irregular in terms of frequency and price and thus may not be a reliable indicator of market value. We have also excluded from the Peer Group those companies under acquisition or subject to rumored acquisition and recent conversions, since their pricing ratios are subject to unusual distortion and/or have limited trading history. Further, we have excluded from the Peer Group publicly traded thrifts in partial stock mutual holding company form and thus have considered only fully-converted institutions. A recent listing of the universe of all publicly-traded savings institutions is included as Exhibit III-1.
| RP® Financial, LC. | PEER GROUP ANALYSIS |
| III.2 |
From the universe of publicly-traded savings institutions, we selected 10 institutions with characteristics similar to those of Prosper Bank. In the selection process, we applied the following “screen” to the universe of all public companies that were eligible for consideration, after excluding those subject to the above listed selection criteria:
| ○ | Savings institutions with assets less than $1.0 billion that have recorded profitable earnings on a reported basis over the last 12 months and a return on equity of less than 12%. Ten companies met this criteria and all were included in the Peer Group: CBM Bancorp, Inc. of Maryland, Cincinnati Bancorp, Inc. of Ohio, Elmira Savings Bank of New York, FFBW, Inc. of Wisconsin, HMN Financial, Inc. of Minnesota, Home Federal Bancorp, Inc. of Louisiana, HV Bancorp, Inc. of Pennsylvania, IF Bancorp, Inc. of Illinois, Mid-Southern Bancorp, Inc. of Indiana and WVS Bancorp, Inc. of Pennsylvania. |
Table 3.1 shows the general characteristics of the 10 Peer Group companies and Exhibits III-2 and III-3 provide information on MidAtlantic, Midwest and Southwest thrifts. Exhibit III-4 provides summary demographic and deposit market share data for the primary market areas they serve. While there are expectedly some differences between the Peer Group companies and Prosper Bank, we believe that the Peer Group companies, on average, provide a good basis for valuation subject to valuation adjustments. The following sections present a comparison of Prosper Bank’s financial condition and growth, income and expense trends, loan composition, credit risk and interest rate risk versus the Peer Group as of the most recent publicly available date. Comparative data for all public savings institutions have been included in the Chapter III tables as well.
In addition to the selection criteria used to identify the Peer Group companies, a summary description of the key comparable characteristics of each of the Peer Group companies relative to Prosper Bank’s characteristics is detailed below.
| ○ | CBM Bancorp, Inc. of Maryland. Comparable due to similar asset size, comparable regional market area in the Mid-Atlantic U.S., relatively recent mutual-to-stock conversion and current focus on real estate secured loans. |
| ○ | Cincinnati Bancorp of Ohio. Comparable due to similar asset size, relatively recent mutual-to-stock conversion and current concentration of real estate secured loans. |
| ○ | Elmira Savings Bank of New York. Although larger than Prosper Bank, Elmira Savings was considered comparable due to similar balance sheet compositions including a high balance of cash and investments and primary reliance on deposits for funding, similar leveraged equity position, comparable credit quality as measured by NPA/assets ratios, and a similar operating expense ratio. |
| ○ | FFBW, Inc. of Wisconsin. Comparable due to similar asset size, similar composition of interest earning assets, and similar operating expense ratio. |
| ○ | HMN Financial, Inc. of Minnesota. Although larger in total assets than Prosper Bank, HMN Financial was comparable because of similar loan portfolio composition, and similar leveraged equity position. |
| ○ | Home Federal Bancorp, Inc. of Louisiana. Comparable due to similar asset size, similar leveraged capital position and comparable asset quality based on NPA/assets ratios. |
| RP® Financial, LC. | PEER GROUP ANALYSIS |
| III.3 |
Table 3.1
Peer Group of Publicly-Traded Savings Institutions
As of December 31, 2020 or the Most Recent Date Available.
| As of | ||||||||||||||||||||||||
| February 5, 2021 | ||||||||||||||||||||||||
| Financial | Total | Fiscal | Stock | Market | ||||||||||||||||||||
| Ticker | Institution | Exchange | Region | City | State | Assets | Offices | Mth End | Price | Value | ||||||||||||||
| ($Mil) | ($) | ($Mil) | ||||||||||||||||||||||
| CBMB | CBM Bancorp, Inc. | NASDAQ | MA | Baltimore | MD | 232 | (1 | ) | 4 | Dec | 13.95 | 48 | ||||||||||||
| CNNB | Cincinnati Bancorp, Inc. | NASDAQ | MW | Cincinnati | OH | 232 | (1 | ) | 6 | Dec | 11.96 | 36 | ||||||||||||
| ESBK | Elmira Savings Bank | NASDAQ | MA | Elmira | NY | 645 | 12 | Dec | 12.24 | 43 | ||||||||||||||
| FFBW | FFBW, Inc. | NASDAQ | MW | Brookfield | WI | 286 | (1 | ) | 7 | Dec | 10.42 | 74 | ||||||||||||
| HMNF | HMN Financial, Inc. | NASDAQ | MW | Rochester | MN | 910 | 14 | Dec | 19.00 | 91 | ||||||||||||||
| HFBL | Home Federal Bancorp, Inc. of Louis | NASDAQ | SW | Shreveport | LA | 535 | 8 | Jun | 29.09 | 45 | ||||||||||||||
| HVBC | HV Bancorp, Inc. | NASDAQ | MA | Doylestown | PA | 508 | (1 | ) | 5 | Dec | 16.81 | 34 | ||||||||||||
| IROQ | IF Bancorp, Inc. | NASDAQ | MW | Watseka | IL | 713 | 8 | Jun | 20.50 | 66 | ||||||||||||||
| MSVB | Mid-Southern Bancorp, Inc. | NASDAQ | MW | Salem | IN | 218 | (1 | ) | 3 | Dec | 16.24 | 48 | ||||||||||||
| WVFC | WVS Financial Corp. | NASDAQ | MA | Pittsburgh | PA | 317 | 6 | Jun | 15.15 | 26 | ||||||||||||||
Source: S&P Global Market Intelligence
(1) As of September 30, 2020 or the most recent date available.
| RP® Financial, LC. | PEER GROUP ANALYSIS |
| III.4 |
| ○ | HV Bancorp, Inc. of Pennsylvania. Comparable due to similar asset size, shared regional market in Pennsylvania and leveraged capital position. |
| ○ | IF Bancorp, Inc. of Illinois. Comparable due to similar composition of funding liabilities, leveraged capital position and similar operating expense ratios. |
| ○ | Mid-Southern Bancorp, Inc. of Indiana. Comparable due to similar asset size, similar funding liability composition, comparable credit quality as measured by NPA/assets ratios, and similar operating expense ratio. |
| ○ | WVS Financial Corp. of Pennsylvania. Comparable due to similar asset size, shared regional market in Pennsylvania, and similar leveraged capital position. |
In aggregate, the Peer Group companies maintained a higher level of tangible equity as the fully-converted industry average (15.82% of tangible assets versus 11.59% for all public companies), generated a lower ROAA (0.62% core ROAA versus 1.00% for all public companies), and earned a lower ROE (5.47% core ROE versus 7.70% for all public companies). The Peer Group’s average P/TB ratio was lower than the all industry average, while the average core P/E multiple was also lower.
| All Public | ||||||||
| Thrifts | Peer Group | |||||||
| Financial Characteristics (Averages) | ||||||||
| Assets ($Mil) | $ | 5,176 | $ | 460 | ||||
| Market capitalization ($Mil) | $ | 601 | $ | 51 | ||||
| Tangible equity/tangible assets (%) | 11.59 | % | 15.82 | % | ||||
| Core return on average assets (%) | 1.00 | 0.62 | ||||||
| Core return on average equity (%) | 7.70 | 5.47 | ||||||
| Pricing Ratios (Averages)(1) | ||||||||
| Core price/earnings (x) | 13.98 | x | 13.53 | x | ||||
| Price/tangible book (%) | 114.74 | % | 89.91 | % | ||||
| Price/assets (%) | 12.92 | 14.13 | ||||||
| (1) | Based on market prices as of February 5, 2021. |
Since the Peer Group companies have some key differences to the Bank, as will be evaluated in the following pages, it is necessary to determine such differences for the purpose of determining valuation adjustments in the next chapter. However, in general, those selected for the Peer Group are relatively comparable to Prosper Bank and provide a good basis for the valuation analysis incorporated herein. Comparative data for all public savings institutions are included in the Chapter III tables as well.
| RP® Financial, LC. | PEER GROUP ANALYSIS |
| III.5 |
Financial Condition
Table 3.2 shows comparative balance sheet measures for the Company and the Peer Group, reflecting the expected similarities and some differences given the selection procedures outlined above. The Bank’s ratios are as of December 31, 2020, while the Peer Group’s ratios reflect balances as of December 31, 2020 or the latest date available. Prosper Bank’s equity/assets ratio of 7.98% was lower than the Peer Group’s average equity/assets ratio of 16.01%. With the infusion of the net proceeds, the Company’s pro forma equity/assets ratio would be expected to be closer to the Peer Group’s equity/assets ratio. Tangible equity/assets ratios for the Bank and the Peer Group average equaled 7.98% and 15.80%, respectively. The increase in the Bank’s pro forma capital will be favorable from a risk perspective and in terms of future earnings potential through leveraging and lower funding costs. At the same time, the Bank’s lower pro forma capitalization will provide a lower hurdle to achieving a market rate ROE. Both Prosper Bank and the Peer Group’s capital ratios reflect capital surpluses over the regulatory capital requirements.
The interest-earning assets (“IEA”) compositions for the Bank and the Peer Group were somewhat similar, with loans constituting the greatest percentage for both. The Bank’s loans/assets ratio of 67.57% tracked closely to the comparable Peer Group average of 67.11%. Comparatively, the Bank’s cash and investments ratio of 28.09% of assets was higher than the Peer Group average of 22.47%. Overall, Prosper Bank’s IEA amounted to 95.66% of assets, which exceeded the comparable Peer Group ratio of 89.58%. The Peer Group’s non-interest earning assets included BOLI of 1.69% of assets and goodwill/intangibles of 0.21% of assets, on average, while the Bank reported BOLI of 2.41% and did not report any goodwill/intangible assets.
Prosper Bank’s funding strategy reflected more reliance on deposits and lower borrowings utilization. Specifically, the Bank’s deposits equaled 84.05% of assets, higher than the Peer Group average of 73.23%. Comparatively, the Bank’s lower borrowings represented 7.47% of assets, as compared to a 10.87% average for the Peer Group. Total interest-bearing liabilities (“IBL”) for the Bank and the Peer Group equaled 91.52% and 84.10% of assets, respectively.
A key measure of balance sheet strength is the IEA/IBL ratio, and the Bank’s ratio was slightly lower than the Peer Group average at 104.53% and 106.52%, respectively. The additional capital realized from net offering proceeds would act to enhance the Bank’s current IEA/IBL ratio, as the increase in new capital will lower the IBL ratio while increasing the IEA ratio through reinvestment of proceeds.
| RP® Financial, LC. | PEER GROUP ANALYSIS |
| III.6 |
Table 3.2
Balance Sheet Composition and Growth Rates
Comparable Institution Analysis
As of December 31, 2020 or the Most Recent Date Available.
| Balance Sheet as a Percent of Assets | Balance Sheet Annual Growth Rates | Regulatory Capital | ||||||||||||||||||||||||||||||||||||||||||||||||||||||||||||||||||
| Cash & | MBS & | Net | Borrowed | Sub. | Total | Goodwill | Tangible | MBS, Cash & | Borrows. | Total | Tangible | Tier 1 | Tier 1 | Risk-Based | ||||||||||||||||||||||||||||||||||||||||||||||||||||||
| Equivalents | Invest | BOLI | Loans (1) | Deposits | Funds | Debt | Equity | & Intang | Equity | Assets | Investments | Loans | Deposits | &Sub debt | Equity | Equity | Leverage | Risk-Based | Capital | |||||||||||||||||||||||||||||||||||||||||||||||||
| Prosper Bank | ||||||||||||||||||||||||||||||||||||||||||||||||||||||||||||||||||||
| December 31, 2020 | 18.38 | % | 9.71 | % | 2.41 | % | 67.57 | % | 84.05 | % | 7.47 | % | 0.00 | % | 7.98 | % | 0.00 | % | 7.98 | % | 26.94 | % | 110.94 | % | 8.66 | % | 37.72 | % | -21.04 | % | -1.05 | % | -1.05 | % | 8.15 | % | 12.42 | % | 13.67 | % | ||||||||||||||||||||||||||||
| All Fully-Converted Public Thrifts | ||||||||||||||||||||||||||||||||||||||||||||||||||||||||||||||||||||
| Averages | 9.49 | % | 10.72 | % | 1.55 | % | 72.30 | % | 75.87 | % | 9.88 | % | 0.38 | % | 12.56 | % | 0.94 | % | 11.50 | % | 17.86 | % | 63.35 | % | 12.75 | % | 20.58 | % | 1.24 | % | 7.44 | % | 7.63 | % | 10.00 | % | 13.51 | % | 15.40 | % | ||||||||||||||||||||||||||||
| Medians | 8.36 | % | 8.58 | % | 1.71 | % | 72.97 | % | 78.20 | % | 7.78 | % | 0.00 | % | 11.61 | % | 0.33 | % | 10.36 | % | 12.71 | % | 33.59 | % | 7.56 | % | 18.01 | % | -4.01 | % | 4.16 | % | 4.64 | % | 9.90 | % | 12.98 | % | 14.05 | % | ||||||||||||||||||||||||||||
| Comparable Group | ||||||||||||||||||||||||||||||||||||||||||||||||||||||||||||||||||||
| Averages | 9.51 | % | 12.96 | % | 1.69 | % | 67.11 | % | 73.23 | % | 10.87 | % | 0.00 | % | 16.01 | % | 0.21 | % | 15.80 | % | 10.42 | % | 57.61 | % | 6.38 | % | 10.00 | % | 15.92 | % | 16.67 | % | 16.90 | % | 8.51 | % | 12.15 | % | 13.22 | % | ||||||||||||||||||||||||||||
| Medians | 9.48 | % | 6.22 | % | 1.79 | % | 71.11 | % | 73.67 | % | 4.76 | % | 0.00 | % | 12.00 | % | 0.00 | % | 12.00 | % | 6.43 | % | 38.91 | % | 3.97 | % | 7.14 | % | -1.59 | % | 3.67 | % | 4.64 | % | 8.48 | % | 11.59 | % | 12.66 | % | ||||||||||||||||||||||||||||
| Comparable Group | ||||||||||||||||||||||||||||||||||||||||||||||||||||||||||||||||||||
| CBMB | CBM Bancorp, Inc. | (2 | ) | MD | 17.27 | % | 8.47 | % | 2.07 | % | 70.30 | % | 74.24 | % | 2.15 | % | 0.00 | % | 22.94 | % | 0.00 | % | 22.94 | % | 6.63 | % | -1.88 | % | 10.68 | % | 11.04 | % | NA | -12.36 | % | -12.36 | % | 9.05 | % | 10.73 | % | 11.80 | % | |||||||||||||||||||||||||
| CNNB | Cincinnati Bancorp, Inc. | (2 | ) | OH | 9.86 | % | 3.60 | % | 1.79 | % | 81.04 | % | 63.61 | % | 17.55 | % | 0.00 | % | 17.13 | % | 0.08 | % | 17.06 | % | 4.73 | % | 56.12 | % | -0.96 | % | 6.71 | % | -26.99 | % | 69.22 | % | 69.93 | % | 7.63 | % | 11.62 | % | 12.88 | % | ||||||||||||||||||||||||
| ESBK | Elmira Savings Bank | NY | 13.84 | % | 3.38 | % | 2.39 | % | 75.00 | % | 84.86 | % | 4.76 | % | 0.00 | % | 9.43 | % | 1.91 | % | 7.52 | % | 6.22 | % | 172.06 | % | -6.25 | % | 6.80 | % | -0.82 | % | 3.67 | % | 4.64 | % | 8.12 | % | 12.26 | % | 13.52 | % | ||||||||||||||||||||||||||
| FFBW | FFBW, Inc. | (2 | ) | WI | 2.60 | % | 21.47 | % | 2.53 | % | 71.18 | % | 58.13 | % | 5.07 | % | 0.00 | % | 35.92 | % | 0.02 | % | 35.90 | % | 10.73 | % | 38.91 | % | 4.63 | % | -7.04 | % | -2.36 | % | 67.43 | % | 67.53 | % | 9.74 | % | 14.90 | % | 15.65 | % | ||||||||||||||||||||||||
| HMNF | HMN Financial, Inc. | MN | 9.48 | % | NA | 0.00 | % | 71.33 | % | 87.43 | % | NA | 0.00 | % | 11.35 | % | 0.09 | % | 11.26 | % | 16.97 | % | NA | 8.14 | % | 18.01 | % | NA | 11.45 | % | 11.67 | % | NA | NA | NA | |||||||||||||||||||||||||||||||||
| HFBL | Home Federal Bancorp, Inc. of Louisian | LA | 14.90 | % | NA | NA | 68.04 | % | 89.25 | % | 0.64 | % | 0.00 | % | 9.61 | % | 0.00 | % | 9.61 | % | 17.59 | % | NA | 7.98 | % | 19.06 | % | 41.43 | % | 2.98 | % | 2.98 | % | 8.61 | % | 13.99 | % | 15.25 | % | |||||||||||||||||||||||||||||
| HVBC | HV Bancorp, Inc. | (2 | ) | PA | 9.28 | % | 3.97 | % | 1.25 | % | 81.92 | % | 73.09 | % | 18.13 | % | 0.00 | % | 7.33 | % | 0.00 | % | 7.33 | % | 42.40 | % | NA | 44.62 | % | 30.41 | % | 164.08 | % | NA | NA | 8.85 | % | 11.56 | % | 12.43 | % | |||||||||||||||||||||||||||
| IROQ | IF Bancorp, Inc. | IL | NA | NA | NA | 71.04 | % | 82.33 | % | 4.43 | % | 0.00 | % | 11.90 | % | 0.00 | % | 11.90 | % | 5.19 | % | NA | 3.32 | % | 6.92 | % | -24.54 | % | 9.25 | % | 9.25 | % | 8.35 | % | 11.15 | % | 12.40 | % | ||||||||||||||||||||||||||||||
| MSVB | Mid-Southern Bancorp, Inc. | (2 | ) | IN | 7.08 | % | 36.89 | % | 1.76 | % | 52.81 | % | 72.62 | % | 4.58 | % | 0.00 | % | 22.38 | % | 0.00 | % | 22.38 | % | 4.38 | % | 22.85 | % | -7.20 | % | 7.35 | % | 0.00 | % | -4.01 | % | -4.01 | % | 7.72 | % | 10.96 | % | 11.84 | % | ||||||||||||||||||||||||
| WVFC | WVS Financial Corp. | PA | 1.30 | % | NA | NA | 28.45 | % | 46.69 | % | 40.54 | % | 0.00 | % | 12.11 | % | 0.00 | % | 12.11 | % | -10.64 | % | NA | -1.11 | % | 0.74 | % | -23.42 | % | 2.44 | % | 2.44 | % | NA | NA | NA | ||||||||||||||||||||||||||||||||
| (1) | Includes loans held for sale. |
| (2) | As of September 30, 2020 or the latest date available. |
Source: S&P Global Market Intelligence, LC. and RP® Financial, LC. calculations. The information provided in this table has been obtained from sources we believe are reliable, but we cannot guarantee the accuracy or completeness of such information.
Copyright (c) 2021 by RP® Financial, LC.
| RP® Financial, LC. | PEER GROUP ANALYSIS |
| III.7 |
The growth rate section of Table 3.2 shows annual growth rates for key balance sheet items. Prosper Bank’s growth rates are based on annualized growth rates for the 12 months ended December 31, 2020 and the Peer Group’s growth rates are based on growth for the 12 months ended December 31, 2020 or September 30, 2020. Prosper Bank recorded a 26.94% increase in assets, versus asset growth of 10.42% recorded by the Peer Group. The Peer Group recorded a wide range in asset growth rates, from a negative 10.64% to a positive 42.40%, reflecting specific strategies in place for the Peer Group. Both Prosper Bank’s and the Peer Group’s asset growth was supported by higher growth in cash and investments, followed by lower growth in loans.
Asset growth for Prosper Bank was funded by a notable increase in deposits, while borrowings declined. The Peer Group’s growth was funded relatively equally with deposits and borrowings. The Bank’s tangible equity decreased at a modest rate of 1.05%, the result of several one-time expenses from terminating various contract and obligations of the bank, while the Peer Group’s tangible equity increased by a much higher rate. The Bank’s post-conversion tangible equity growth rate would likely be positive as one-time expenses will not be recurring events, but the percentage increase may be constrained for the foreseeable future by a below market earnings and the costs of stock-based benefit plans. Stock repurchases and dividend payments could also slow the Bank’s tangible equity growth rate in the longer term following the stock offering.
Income and Expense Components
Table 3.3 summarizes key components of the income statement for the Bank and the Peer Group, based on earnings for the 12 months ended December 31, 2020 for Prosper Bank and December 31, 2020 or the most recent quarter for the Peer Group. Prosper Bank and the Peer Group reported net income to average assets ratios of negative 0.17% and positive 0.73%, respectively. The Peer Group’s higher return on average assets was realized through a lower provisions for loan losses, a higher ratio of non-interest income and a materially higher level of gains on the sale of loans, while the Bank recorded a slightly lower level of non-interest expenses.
| RP® Financial, LC. | PEER GROUP ANALYSIS |
| III.8 |
Table 3.3
Income as Percent of Average Assets and Yields, Costs, Spreads
Comparable Institution Analysis
For the 12 Months Ended December 31, 2020 or the Most Recent 12 Months Available
| Net Interest Income | Non-Interest Income | Non-Op. Items | Yields, Costs, and Spreads | |||||||||||||||||||||||||||||||||||||||||||||||||||||
| Loss | NII | Gain | Other | Total | Provision | MEMO: | MEMO: | |||||||||||||||||||||||||||||||||||||||||||||||||
| Net | Provis. | After | on Sale of | Non-Int | Non-Int | Net Gains/ | Extrao. | for | Yield | Cost | Yld-Cost | Assets/ | Effective | |||||||||||||||||||||||||||||||||||||||||||
| Income (2) | Income | Expense | NII | on IEA | Provis. | Loans | Income | Expense | Losses (1) | Items | Taxes | On IEA | Of IBL | Spread | FTE Emp. | Tax Rate (2) | ||||||||||||||||||||||||||||||||||||||||
| (%) | (%) | (%) | (%) | (%) | (%) | (%) | (%) | (%) | (%) | (%) | (%) | (%) | (%) | (%) | ($000) | (%) | ||||||||||||||||||||||||||||||||||||||||
| Prosper Bank | ||||||||||||||||||||||||||||||||||||||||||||||||||||||||
| December 31, 2020 | -0.17 | % | 3.68 | % | 0.99 | % | 2.70 | % | 0.31 | % | 2.39 | % | 0.00 | % | 0.25 | % | 2.87 | % | 0.01 | % | 0.00 | % | -0.06 | % | 3.74 | % | 1.15 | % | 2.59 | % | $ | 12,005 | 25.23 | % | ||||||||||||||||||||||
| All Fully-Converted Public Thrifts | ||||||||||||||||||||||||||||||||||||||||||||||||||||||||
| Averages | 0.91 | % | 3.68 | % | 0.75 | % | 2.93 | % | 0.28 | % | 2.59 | % | 0.69 | % | 0.44 | % | 2.73 | % | -0.01 | % | 0.00 | % | 0.28 | % | 3.94 | % | 1.10 | % | 2.84 | % | $ | 8,660 | 22.58 | % | ||||||||||||||||||||||
| Medians | 0.76 | % | 3.59 | % | 0.72 | % | 2.79 | % | 0.23 | % | 2.58 | % | 0.08 | % | 0.29 | % | 2.57 | % | 0.00 | % | 0.00 | % | 0.23 | % | 3.81 | % | 1.13 | % | 2.76 | % | $ | 7,287 | 22.78 | % | ||||||||||||||||||||||
| Comparable Group | ||||||||||||||||||||||||||||||||||||||||||||||||||||||||
| Averages | �� | 0.73 | % | 3.55 | % | 0.76 | % | 2.79 | % | 0.17 | % | 2.62 | % | 0.93 | % | 0.39 | % | 2.95 | % | 0.02 | % | 0.00 | % | 0.23 | % | 3.96 | % | 1.13 | % | 2.82 | % | $ | 6,140 | 23.40 | % | |||||||||||||||||||||
| Medians | 0.67 | % | 3.60 | % | 0.78 | % | 2.91 | % | 0.15 | % | 2.71 | % | 0.71 | % | 0.25 | % | 2.77 | % | 0.02 | % | 0.00 | % | 0.19 | % | 3.96 | % | 1.16 | % | 2.90 | % | $ | 5,655 | 25.44 | % | ||||||||||||||||||||||
| Comparable Group | ||||||||||||||||||||||||||||||||||||||||||||||||||||||||
| CBMB | CBM Bancorp, Inc. | MD | 0.32 | % | 3.90 | % | 0.66 | % | 3.24 | % | 0.19 | % | 3.05 | % | 0.34 | % | 0.16 | % | 3.14 | % | 0.06 | % | 0.00 | % | 0.16 | % | 4.05 | % | 1.18 | % | 2.87 | % | $ | 5,654 | 33.24 | % | ||||||||||||||||||||
| CNNB | Cincinnati Bancorp, Inc. | OH | 0.77 | % | 3.59 | % | 1.23 | % | 2.36 | % | 0.03 | % | 2.33 | % | 2.93 | % | 0.17 | % | 4.49 | % | 0.00 | % | 0.00 | % | 0.17 | % | 3.81 | % | 1.53 | % | 2.28 | % | $ | 3,364 | 18.00 | % | ||||||||||||||||||||
| ESBK | Elmira Savings Bank | NY | 0.64 | % | 3.47 | % | 0.91 | % | 2.56 | % | 0.22 | % | 2.34 | % | 0.71 | % | 0.41 | % | 2.64 | % | 0.00 | % | 0.00 | % | 0.17 | % | 4.13 | % | 1.23 | % | 2.90 | % | $ | 5,656 | 20.79 | % | ||||||||||||||||||||
| FFBW | FFBW, Inc. | WI | 0.63 | % | 3.89 | % | 0.69 | % | 3.20 | % | 0.11 | % | 3.09 | % | 0.15 | % | 0.25 | % | 2.68 | % | NA | 0.00 | % | 0.19 | % | 4.25 | % | 1.26 | % | 2.99 | % | $ | 6,967 | 23.29 | % | |||||||||||||||||||||
| HMNF | HMN Financial, Inc. | MN | 1.21 | % | 3.74 | % | 0.33 | % | 3.41 | % | 0.32 | % | 3.09 | % | 1.12 | % | 0.63 | % | 3.16 | % | NA | 0.00 | % | 0.48 | % | 3.86 | % | 0.62 | % | 3.24 | % | $ | 5,249 | 28.31 | % | |||||||||||||||||||||
| HFBL | Home Federal Bancorp, Inc. of Louisiana | LA | 0.93 | % | 4.04 | % | 0.86 | % | 3.19 | % | 0.41 | % | 2.78 | % | 0.78 | % | 0.23 | % | 2.66 | % | NA | 0.00 | % | 0.25 | % | 4.27 | % | 1.36 | % | 2.91 | % | $ | 9,190 | 21.05 | % | |||||||||||||||||||||
| HVBC | HV Bancorp, Inc. | PA | 1.02 | % | 3.38 | % | 0.90 | % | 2.48 | % | 0.27 | % | 2.22 | % | 2.32 | % | 1.24 | % | 4.40 | % | 0.04 | % | 0.00 | % | 0.39 | % | 3.55 | % | 1.14 | % | 2.41 | % | $ | 4,287 | 27.77 | % | ||||||||||||||||||||
| IROQ | IF Bancorp, Inc. | IL | 0.70 | % | 3.61 | % | 0.90 | % | 2.71 | % | 0.07 | % | 2.64 | % | NA | NA | 2.48 | % | NA | 0.00 | % | 0.27 | % | NA | 1.12 | % | NA | $ | 6,545 | 28.00 | % | |||||||||||||||||||||||||
| MSVB | Mid-Southern Bancorp, Inc. | IN | 0.56 | % | 3.58 | % | 0.47 | % | 3.11 | % | 0.05 | % | 3.06 | % | 0.00 | % | 0.34 | % | 2.86 | % | 0.05 | % | 0.00 | % | 0.04 | % | 3.75 | % | 0.80 | % | 2.95 | % | $ | 4,544 | 5.94 | % | ||||||||||||||||||||
| WVFC | WVS Financial Corp. | PA | 0.50 | % | 2.24 | % | 0.60 | % | 1.64 | % | 0.02 | % | 1.62 | % | 0.00 | % | 0.11 | % | 1.03 | % | -0.01 | % | 0.00 | % | 0.19 | % | NA | 1.01 | % | NA | $ | 9,945 | 27.59 | % | ||||||||||||||||||||||
(1) Net gains/losses includes gain/loss on sale of securities and nonrecurring income and expense.
Source: S&P Global Market Intelligence and RP® Financial, LC. calculations. The information provided in this table has been obtained from sources we believe are reliable, but we cannot guarantee the accuracy or completeness of such information.
Copyright (c) 2021 by RP® Financial, LC.
| RP® Financial, LC. | PEER GROUP ANALYSIS |
| III.9 |
The Bank’s lower net interest income ratio resulted from a higher interest expense ratio that offset the Bank’s slightly higher interest income ratio. The Bank’s higher interest expense ratio resulted from a higher cost of funds (1.15% versus 1.13% for the Peer Group) and a higher concentration of interest-bearing liabilities to total assets. Prosper Bank reported a lower yield on interest earning assets (3.74% versus 3.96% for the Peer Group) but this disadvantage was offset by the higher proportion of assets held in earning status. Prosper Bank and the Peer Group reported net interest income to average assets ratios of 2.70% and 2.79%, respectively.
Notwithstanding the one-time expense items recorded in 2020, operating expense ratios for both the Bank and the Peer Group were similar. The Bank maintains a comparatively lower number of employees relative to its asset size, as assets per full-time equivalent employee equaled $12.005 million for the Bank versus $6.140 million for the Peer Group.
When viewed together net interest income and operating expenses provide considerable insight into a financial institution’s earnings strength, since those sources of income and expenses are typically the most prominent components of earnings and are generally more predictable than losses and gains realized from the sale of assets or other non-recurring activities. In this regard, as measured by their expense coverage ratios (net interest income divided by operating expenses), the Bank’s earnings are comparable to the Peer Group’s, at 0.94x and 0.95x, respectively.
Sources of non-interest operating income provided a larger contribution to the Peer Group’s earnings, at 0.25% and 1.32% of Prosper Bank’s and the Peer Group’s average assets, respectively. Taking non-interest operating income into account, Prosper Bank’s efficiency ratio (operating expenses, as a percent of the sum of non-interest operating income and net interest income) of 97.58% was less favorable than the Peer Group’s efficiency ratio of 71.78%.
Loan loss provisions had a larger impact on Prosper Bank’s earnings at 0.31% of average assets as compared to 0.17% for the Peer Group, reflecting a higher level of NPAs/assets for Prosper Bank and additional provisioning by new management.
Net non-operating gains were 0.01% for the Bank, while the Peer Group recorded net non-operating income of 0.02% of average assets. Typically, gains and losses from the sale of assets and other non-operating activities are relatively volatile, and thus are excluded from a valuation earnings base. Extraordinary items were not a factor for either the Bank or the Peer Group.
Income taxes had a similar impact on the Bank’s and the Peer Group’s earnings, with effective tax rates of 25.23% and 23.40%, respectively. For the valuation calculations, including reinvestment rates from a conversion, the Bank’s effective marginal federal and state income tax rate was assumed to equal to 21%.
| RP® Financial, LC. | PEER GROUP ANALYSIS |
| III.10 |
Loan Composition
Table 3.4 presents a comparison of loan portfolio compositions including the investment in mortgage-backed securities. The Bank’s loan portfolio composition reflected a similar combined concentration of 1-4 family permanent mortgage loans and mortgage-backed securities in comparison to the Peer Group average (41.77% of assets versus 39.14% for the Peer Group), indicative of the both the Bank’s and the Peer Group’s successful diversification away from a strict residential lending strategy. The Peer Group on average maintains a notable level of loans serviced for others (“LSFOs”) while the Bank does not maintain any servicing operations and does not sell loans.
Both the Bank and the Peer Group have diversified into higher risk and higher yielding lending, with a similar level of construction and land loans (2.68% versus 2.94% average for the Peer Group), commercial business loans (4.84% versus 6.14% average for the Peer Group) and consumer loans (1.11% versus 1.03% average for the Peer Group. The greatest area of loan diversification for the Bank is commercial real estate loans at 19.04% of assets. The greatest areas of loan diversification for the Peer Group are commercial real estate and multi-family loans, at 14.94% and 7.00% respectively. Prosper Bank has a slightly higher but generally comparable level of risk-weighted assets at 64.01%, while the Peer Group reported risk weighted assets of 61.32%.
Credit Risk
As indicated by risk-weighted assets ratios, the Bank and the Peer Group have generally comparable credit risk profiles. However, as shown in Table 3.5, the Bank has a higher level of NPAs as a percent of total assets equal to 1.02% versus 0.51% average for the Peer Group. These ratios include accruing loans that are classified as troubled debt restructurings. Prosper Bank’s and the Peer Group’s loss reserves as a percent of non-performing loans equaled 101.39% and 262.72%, respectively. Loss reserves maintained as percent of loans receivable equaled 1.51% for the Bank versus 1.13% for the Peer Group. Net loan charge-offs were a larger factor for the Peer Group, as the Bank actually realized recoveries during the last year versus 0.09% of net loan charge-offs to total loans for the Peer Group.
| RP® Financial, LC. | PEER GROUP ANALYSIS |
| III.11 |
Table 3.4
Loan Portfolio Composition and Related Information
Comparable Institution Analysis
As of December 31, 2020 or the Most Recent Date Available.
| Portfolio Composition as a Percent of Assets | ||||||||||||||||||||||||||||||||||||||||
| 1-4 | Constr. | Multi- | Commerc. | RWA/ | Servicing | |||||||||||||||||||||||||||||||||||
| MBS | Family | & Land | Family | Comm RE | Business | Consumer | Assets | Assets | ||||||||||||||||||||||||||||||||
| (%) | (%) | (%) | (%) | (%) | (%) | (%) | (%) | ($000) | ||||||||||||||||||||||||||||||||
| Prosper Bank | ||||||||||||||||||||||||||||||||||||||||
| December 31, 2020 | 3.12 | % | 38.65 | % | 2.68 | % | 2.48 | % | 19.04 | % | 4.84 | % | 1.11 | % | 64.01 | % | $ | 0 | ||||||||||||||||||||||
| Comparable Group | ||||||||||||||||||||||||||||||||||||||||
| Averages | 10.03 | % | 29.11 | % | 2.94 | % | 7.00 | % | 14.94 | % | 6.14 | % | 1.03 | % | 61.32 | % | $ | 932 | ||||||||||||||||||||||
| Medians | 11.04 | % | 27.51 | % | 2.56 | % | 5.26 | % | 14.06 | % | 6.67 | % | 0.40 | % | 63.80 | % | $ | 378 | ||||||||||||||||||||||
| Comparable Group | ||||||||||||||||||||||||||||||||||||||||
| Chesapeake Bank of Maryland | MD | 5.96 | % | 30.20 | % | 6.88 | % | 3.37 | % | 21.80 | % | 0.00 | % | 0.14 | % | 65.75 | % | $ | 0 | |||||||||||||||||||||
| Cincinnati Federal | OH | 2.20 | % | 45.94 | % | 1.17 | % | 16.88 | % | 12.03 | % | 0.32 | % | 0.13 | % | 69.95 | % | $ | 2,025 | |||||||||||||||||||||
| Elmira Savings Bank | NY | 0.89 | % | 46.92 | % | 1.83 | % | 5.98 | % | 9.38 | % | 6.70 | % | 5.08 | % | 61.85 | % | $ | 1,455 | |||||||||||||||||||||
| First Federal Bank of Wisconsin | WI | 10.92 | % | 19.68 | % | 2.49 | % | 10.46 | % | 25.42 | % | 6.64 | % | 0.20 | % | 65.76 | % | $ | 0 | |||||||||||||||||||||
| Home Federal Savings Bank | MN | 11.16 | % | 19.11 | % | 5.12 | % | 4.55 | % | 31.92 | % | 9.04 | % | 2.17 | % | 72.25 | % | $ | 3,043 | |||||||||||||||||||||
| Home Federal Bank | LA | 11.66 | % | 26.80 | % | 4.86 | % | 7.89 | % | 16.10 | % | 12.12 | % | 0.16 | % | 60.80 | % | $ | 0 | |||||||||||||||||||||
| Huntingdon Valley Bank | PA | 1.08 | % | 29.89 | % | 0.98 | % | 1.22 | % | 3.16 | % | 10.69 | % | 0.61 | % | 32.77 | % | $ | 2,041 | |||||||||||||||||||||
| Iroquois Federal Savings and Loan Association | IL | 21.66 | % | 18.45 | % | 2.63 | % | 14.83 | % | 19.85 | % | 13.87 | % | 1.16 | % | NA | $ | 756 | ||||||||||||||||||||||
| Mid-Southern Savings Bank, FSB | IN | 16.17 | % | 28.22 | % | 2.78 | % | 3.72 | % | 8.45 | % | 2.03 | % | 0.60 | % | NA | $ | 0 | ||||||||||||||||||||||
| West View Savings Bank | PA | 18.63 | % | 25.86 | % | 0.63 | % | 1.15 | % | 1.31 | % | 0.01 | % | 0.02 | % | 61.40 | % | $ | 0 | |||||||||||||||||||||
Note: Bank level data.
Source: S&P Global Market Intelligence and RP® Financial, LC. calculations. The information provided in this table has been obtained from sources we believe are reliable, but we cannot guarantee the accuracy or completeness of such information.
Copyright (c) 2021 by RP® Financial, LC.
| RP® Financial, LC. | PEER GROUP ANALYSIS |
| III.12 |
Table 3.5
Credit Risk Measures and Related Information
Comparable Institution Analysis
As of December 31, 2020 or the Most Recent Date Available.
| NPAs & | Adj NPAs & | Rsrves/ | ||||||||||||||||||||||||||||||||||||||
| REO/ | 90+Del/ | 90+Del/ | NPLs/ | Rsrves/ | Rsrves/ | NPAs & | Net Loan | NLCs/ | ||||||||||||||||||||||||||||||||
| Assets | Assets (1) | Assets (2) | Loans (3) | Loans HFI | NPLs (3) | 90+Del (1) | Chargeoffs (4) | Loans | ||||||||||||||||||||||||||||||||
| (%) | (%) | (%) | (%) | (%) | (%) | (%) | ($000) | (%) | ||||||||||||||||||||||||||||||||
| Prosper Bank | ||||||||||||||||||||||||||||||||||||||||
| December 31, 2020 | 0.00 | % | 1.02 | % | 1.02 | % | 1.49 | % | 1.51 | % | 101.39 | % | 101.39 | % | $ | -254 | -0.13 | % | ||||||||||||||||||||||
| Comparable Group | ||||||||||||||||||||||||||||||||||||||||
| Averages | 0.07 | % | 0.51 | % | 0.38 | % | 0.68 | % | 1.13 | % | 262.72 | % | 166.77 | % | $ | 345 | 0.09 | % | ||||||||||||||||||||||
| Medians | 0.04 | % | 0.46 | % | 0.36 | % | 0.62 | % | 1.17 | % | 127.03 | % | 127.03 | % | $ | 147 | 0.04 | % | ||||||||||||||||||||||
| Comparable Group | ||||||||||||||||||||||||||||||||||||||||
| Chesapeake Bank of Maryland | MD | 0.33 | % | 0.43 | % | 0.41 | % | 0.14 | % | 1.15 | % | 770.98 | % | 172.87 | % | $ | 0 | 0.00 | % | |||||||||||||||||||||
| Cincinnati Federal | OH | 0.00 | % | 0.56 | % | 0.07 | % | 0.72 | % | 0.99 | % | 127.03 | % | 127.03 | % | $ | 0 | 0.00 | % | |||||||||||||||||||||
| Elmira Savings Bank | NY | 0.03 | % | 0.89 | % | 0.82 | % | 1.13 | % | 1.19 | % | 103.71 | % | 100.72 | % | $ | 260 | 0.05 | % | |||||||||||||||||||||
| First Federal Bank of Wisconsin | WI | 0.04 | % | 0.48 | % | 0.35 | % | 0.68 | % | 1.29 | % | 188.40 | % | 173.84 | % | $ | -19 | -0.01 | % | |||||||||||||||||||||
| Home Federal Savings Bank | MN | 0.07 | % | 0.36 | % | 0.36 | % | 0.40 | % | 1.64 | % | 404.65 | % | 326.19 | % | $ | 595 | 0.09 | % | |||||||||||||||||||||
| Home Federal Bank | LA | 0.14 | % | 0.90 | % | 0.87 | % | 1.06 | % | 1.11 | % | 97.30 | % | 78.65 | % | $ | 1,787 | 0.49 | % | |||||||||||||||||||||
| Huntingdon Valley Bank | PA | 0.00 | % | 0.26 | % | 0.26 | % | 0.56 | % | 0.64 | % | 89.49 | % | 89.49 | % | $ | 533 | 0.15 | % | |||||||||||||||||||||
| Iroquois Federal Savings and Loan Association | IL | 0.05 | % | 0.25 | % | 0.07 | % | 0.25 | % | 1.26 | % | 509.00 | % | 361.49 | % | $ | 257 | 0.05 | % | |||||||||||||||||||||
| Mid-Southern Savings Bank, FSB | IN | 0.04 | % | 0.96 | % | 0.58 | % | 1.87 | % | 1.38 | % | 73.91 | % | 70.65 | % | $ | 36 | 0.03 | % | |||||||||||||||||||||
| West View Savings Bank | PA | 0.00 | % | 0.00 | % | 0.00 | % | 0.00 | % | 0.67 | % | NA | NA | $ | 0 | 0.00 | % | |||||||||||||||||||||||
| (1) | NPAs are defined as nonaccrual loans, performing TDRs, and OREO. |
| (2) | Adjusted NPAs are defined as nonaccrual loans and OREO (performing TDRs are excluded). |
| (3) | NPLs are defined as nonaccrual loans and performing TDRs. |
| (4) | Net loan chargeoffs are shown on a last twelve month basis. |
Source: S&P Global Market Intelligence and RP® Financial, LC. calculations. The information provided in this table has been obrained from sources we believe are reliable, but we cannot guarantee the accuracy or completeness of such information.
Copyright (c) 2021 by RP® Financial, LC.
| RP® Financial, LC. | PEER GROUP ANALYSIS |
| III.13 |
Interest Rate Risk
Table 3.6 highlights key measures reflecting interest rate risk. In terms of balance sheet composition, the Bank’s ratio for tangible equity-to-assets was less favorable than the comparable Peer Group ratio, with the IEA/IBL ratio was less favorable as well. Comparatively, the Bank maintained a lower ratio of non-interest assets as a percent of assets. On a pro forma basis, the infusion of net offering proceeds should improve the Bank’s position relative to the Peer Group with higher pro forma equity-to-assets and IEA/IBL ratios. In addition, the net proceeds from the offering will increase the Bank’s liquidity with initial investment in short- to intermediate-term securities.
To analyze interest rate risk on earnings, we reviewed quarterly changes in net interest income as a percent of average assets for the Bank in comparison to the Peer Group average. In general, the quarterly fluctuations in their respective net interest income ratios in recent periods have been higher for Prosper Bank. As noted above, on a pro forma basis it is reasonable to expect the Bank’s quarterly fluctuations in the net income ratio will be less given the higher capitalization and initial investment of the net offering proceeds in short- and intermediate-term securities.
Summary
Based on the above analysis, RP Financial concluded that the Peer Group forms a reasonable basis for determining the pro forma market value of the Bank. Such general characteristics as asset size, capital position, interest-earning asset composition, funding composition, core earnings measures, loan composition, credit quality and exposure to interest rate risk all tend to support the reasonability of the Peer Group from a financial standpoint. Those areas where differences exist will be addressed in the form of valuation adjustments to the extent appropriate.
| RP® Financial, LC. | PEER GROUP ANALYSIS |
| III.14 |
Table 3.6
Interest Rate Risk Measures and Net Interest Income Volatility
Comparable Institution Analysis
As of December 31, 2020 or the Most Recent Date Available.
| Balance Sheet Measures | ||||||||||||||||||||||||||||||||||||||||||||||
| Tangible | Avg | Non-Earn. | Quarterly Change in Net Interest Income | |||||||||||||||||||||||||||||||||||||||||||
| Equity/ | IEA/ | Assets/ | ||||||||||||||||||||||||||||||||||||||||||||
| Assets | Avg IBL | Assets | 12/31/2020 | 9/30/2020 | 6/30/2020 | 3/31/2020 | 12/31/2019 | 9/30/2019 | ||||||||||||||||||||||||||||||||||||||
| (%) | (%) | (%) | (change in net interest income is annualized in basis points) | |||||||||||||||||||||||||||||||||||||||||||
| Prosper Bank | ||||||||||||||||||||||||||||||||||||||||||||||
| December 31, 2020 | 8.0 | % | 104.5 | % | 4.3 | % | -24 | -6 | -31 | -19 | 6 | -6 | ||||||||||||||||||||||||||||||||||
| Comparable Group | ||||||||||||||||||||||||||||||||||||||||||||||
| Average | 15.8 | % | 135.8 | % | 7.6 | % | 18 | -13 | -4 | -3 | -11 | -5 | ||||||||||||||||||||||||||||||||||
| Median | 12.0 | % | 137.6 | % | 5.2 | % | 14 | -11 | -7 | -3 | -14 | -2 | ||||||||||||||||||||||||||||||||||
| Comparable Group | ||||||||||||||||||||||||||||||||||||||||||||||
| CBMB | CBM Bancorp, Inc. | (1 | ) | MD | 22.9 | % | 150.3 | % | 3.7 | % | NA | -24 | -23 | -2 | -14 | 2 | ||||||||||||||||||||||||||||||
| CNNB | Cincinnati Bancorp, Inc. | (1 | ) | OH | 17.1 | % | 117.2 | % | 6.7 | % | NA | -10 | 1 | 3 | -29 | -18 | ||||||||||||||||||||||||||||||
| ESBK | Elmira Savings Bank | NY | 7.7 | % | 109.6 | % | 18.1 | % | 36 | -30 | -30 | 15 | 8 | -7 | ||||||||||||||||||||||||||||||||
| FFBW | FFBW, Inc. | (1 | ) | WI | 35.9 | % | 171.4 | % | 7.7 | % | NA | -2 | 26 | -18 | -5 | 5 | ||||||||||||||||||||||||||||||
| HMNF | HMN Financial, Inc. | MN | 11.3 | % | 155.7 | % | 2.6 | % | 11 | -11 | -18 | -4 | -20 | -35 | ||||||||||||||||||||||||||||||||
| HFBL | Home Federal Bancorp, Inc. of Louisiana | LA | 9.6 | % | 137.6 | % | 5.2 | % | 30 | -29 | 22 | -21 | -14 | 9 | ||||||||||||||||||||||||||||||||
| HVBC | HV Bancorp, Inc. | (1 | ) | PA | 7.3 | % | 118.7 | % | 15.7 | % | NA | -11 | 23 | 5 | NA | NA | ||||||||||||||||||||||||||||||
| IROQ | IF Bancorp, Inc. | IL | 11.9 | % | 118.4 | % | 3.8 | % | 14 | -2 | 1 | 11 | -12 | 10 | ||||||||||||||||||||||||||||||||
| MSVB | Mid-Southern Bancorp, Inc. | (1 | ) | IN | 22.4 | % | 143.5 | % | 4.5 | % | NA | 2 | -27 | -16 | -2 | -9 | ||||||||||||||||||||||||||||||
| WVFC | WVS Financial Corp. | PA | 12.1 | % | NA | NA | -2 | -10 | -15 | -5 | -16 | -2 | ||||||||||||||||||||||||||||||||||
NA=Change is greater than 100 basis points during the quarter.
(1) As of September 30, 2020 or the latest date available.
Source: S&P Global Market Intelligence and RP® Financial, LC. calculations. The information provided in this table has been obtained from sources we believe are reliable, but we cannot guarantee the accuracy or completeness of such information.
Copyright (c) 2021 by RP® Financial, LC.
| RP® Financial, LC. | VALUATION ANALYSIS |
| IV.1 |
IV. VALUATION ANALYSIS
Introduction
This chapter presents the valuation analysis and methodology prepared pursuant to the regulatory valuation guidelines, and valuation adjustments and assumptions used to determine the estimated pro forma market value of the common stock to be issued in conjunction with the Bank’s conversion transaction.
Appraisal Guidelines
The federal regulatory appraisal guidelines required by the FRB, the FDIC and the Department specify the pro forma market value methodology for estimating the pro forma market value of a converting thrift. Pursuant to this methodology: (1) a peer group of comparable publicly-traded institutions is selected; (2) a financial and operational comparison of the subject company to the peer group is conducted to discern key differences; and (3) a valuation analysis in which the pro forma market value of the subject company is determined based on the market pricing of the peer group as of the date of valuation, incorporating valuation adjustments for key differences. In addition, the pricing characteristics of recent conversions, both at conversion and in the aftermarket, must be considered.
RP Financial Approach to the Valuation
The valuation analysis herein complies with such regulatory approval guidelines. Accordingly, the valuation incorporates a detailed analysis based on the Peer Group, discussed in Chapter III, which constitutes “fundamental analysis” techniques. Additionally, the valuation incorporates a “technical analysis” of recently completed stock conversions, including closing pricing and aftermarket trading of such offerings. It should be noted that these valuation analyses cannot possibly fully account for all the market forces which impact trading activity and pricing characteristics of a particular stock on a given day.
The pro forma market value determined herein is a preliminary value for the Bank’s to-be-issued stock. Throughout the conversion process, RP Financial will: (1) review changes in Prosper Bank’s operations and financial condition; (2) monitor Prosper Bank’s operations and financial condition relative to the Peer Group to identify any fundamental changes; (3) monitor the external factors affecting value including, but not limited to, local and national economic conditions, interest rates, and the stock market environment, including the market for thrift stocks; and (4) monitor pending conversion offerings (including those in the offering phase), both regionally and nationally. If material changes should occur during the conversion process, RP Financial will evaluate if updated valuation reports should be prepared reflecting such changes and their related impact on value, if any. RP Financial will also prepare a final valuation update at the closing of the offering to determine if the prepared valuation analysis and resulting range of value continues to be appropriate.
| RP® Financial, LC. | VALUATION ANALYSIS |
| IV.2 |
The appraised value determined herein is based on the current market and operating environment for the Bank and for all thrifts. Subsequent changes in the local and national economy, the legislative and regulatory environment, the stock market, interest rates, and other external forces (such as natural disasters or major world events), which may occur from time to time (often with great unpredictability) may materially impact the market value of all thrift stocks, including Prosper Bank’s value, or Prosper Bank’s value alone. To the extent a change in factors impacting the Bank’s value can be reasonably anticipated and/or quantified, RP Financial has incorporated the estimated impact into the analysis.
Valuation Analysis
A fundamental analysis discussing similarities and differences relative to the Peer Group was presented in Chapter III. The following sections summarize the key differences between the Bank and the Peer Group and how those differences affect the pro forma valuation. Emphasis is placed on the specific strengths and weaknesses of the Bank relative to the Peer Group in such key areas as financial condition, profitability, growth and viability of earnings, asset growth, primary market area, dividends, liquidity of the shares, marketing of the issue, management, and the effect of government regulations and/or regulatory reform. We have also considered the market for thrift stocks, in particular new issues, to assess the impact on value of the Bank coming to market at this time.
| RP® Financial, LC. | VALUATION ANALYSIS |
| IV.3 |
| 1. | Financial Condition |
The financial condition of an institution is an important determinant in pro forma market value because investors typically look to such factors as liquidity, capital, asset composition and quality, and funding sources in assessing investment attractiveness. The similarities and differences in the Bank’s and the Peer Group’s financial strengths are noted as follows:
| ■ | Overall A/L Composition. In comparison to the Peer Group, the Bank’s interest-earning asset composition showed a comparable concentration of loans and a higher concentration of investments. The Bank’s loan portfolio composition as a percent of assets reflected a similar degree of diversification into higher risk and higher yielding types of loans. Overall, in comparison to the Peer Group, the Bank’s interest-earning asset composition provided for a lower yield earned on interest-earning assets and a similar risk weighted assets-to-assets ratio. Prosper Bank’s funding composition reflected a higher level of deposits and a lower level of borrowings relative to the comparable Peer Group ratios. Overall, as a percent of assets, the Bank maintained a slightly higher level of interest-earning assets and a higher level of interest-bearing liabilities compared to the Peer Group’s ratios, which resulted in a higher IEA/IBL ratio for the Peer Group. After factoring in the impact of the net stock proceeds, the Bank’s IEA/IBL ratio should be more comparable to the Peer Group’s ratio. On balance, RP Financial concluded that asset/liability composition was a neutral factor in our adjustment for financial condition. |
| ■ | Credit Quality. The Bank’s ratios for non-performing assets and non-performing loans were less favorable than the comparable Peer Group ratios. Loss reserves as a percent of non-performing loans was lower than the Peer Group ratios, but loss reserves as a percent of loans was higher. Net loan charge-offs were less of a factor for the Bank. As noted above, the Bank’s risk weighted assets-to-assets ratio was similar to the Peer Group’s ratio. Overall, RP Financial concluded that credit quality was a negative factor in our adjustment for financial condition. |
| ■ | Balance Sheet Liquidity. The Bank operates with a higher level of cash and investment securities relative to the Peer Group (28.09% of assets versus 22.47% for the Peer Group). Following the infusion of stock proceeds, the Bank’s cash and investments ratio is expected to increase as the proceeds retained at the holding company level will be initially deployed into investments. The Bank’s future borrowing capacity was considered to be slightly greater than the Peer Group’s borrowing capacity. Overall, RP Financial concluded that balance sheet liquidity was a slightly positive factor in our adjustment for financial condition. |
| ■ | Funding Liabilities. The Bank’s interest-bearing funding composition reflected a higher concentration of deposits and a lower level of borrowings relative to the comparable Peer Group ratios. However, the Bank’s higher cost deposit base offset this generally favorable funding concentration and the overall cost of interest bearing liabilities was comparable to the Peer Group cost of funds Total interest-bearing liabilities as a percent of assets were higher for the Bank compared to the Peer Group’s ratio, which was attributable to Prosper Bank’s lower capital position. Following the stock offering, the increase in the Bank’s capital position will reduce the level of interest-bearing liabilities funding the Bank’s assets. Overall, RP Financial concluded that funding liabilities were a neutral factor in our adjustment for financial condition. |
| ■ | Capital. The Bank currently operates with a lower equity-to-assets ratio than the Peer Group. After the stock offering, however, Prosper Bank’s pro forma capital position will likely be more comparable to the Peer Group’s equity-to-assets ratio. The increase in the Bank’s pro forma capital position will result in enhanced leverage potential and reduce the level of interest-bearing liabilities utilized to fund assets. On balance, RP Financial concluded that capital strength was a neutral factor in our adjustment for financial condition. |
| RP® Financial, LC. | VALUATION ANALYSIS |
| IV.4 |
On balance, Prosper Bank’s balance sheet strength was considered to be less favorable than the Peer Group’s and, thus, a slight downward adjustment was applied for the Bank’s financial condition.
| 2. | Profitability, Growth and Viability of Earnings |
Earnings are a key factor in determining pro forma market value, as the level and risk characteristics of an institution’s earnings stream and the prospects and ability to generate future earnings heavily influence the multiple that the investment community will pay for earnings. The major factors considered in the valuation are described below.
| ■ | Reported Earnings. The Bank’s reported earnings were lower than the Peer Group’s on a ROAA basis (negative 0.17% of average assets versus 0.73% for the Peer Group). The Bank maintained a more favorable ratio for operating expenses, which was more than offset by the Peer Group’s more favorable ratios for loan loss provisions, non-interest operating income and net interest income. Reinvestment of stock proceeds into interest-earning assets will serve to increase the Bank’s earnings, with the benefit of reinvesting proceeds expected to be somewhat offset by higher operating expenses associated with operating as a publicly-traded company and the implementation of stock benefit plans. Overall, given the Bank’s lower reported earnings was largely due to the Bank’s lower core earnings, the Bank’s pro forma reported earnings were viewed as not as strong as the Peer Group’s earnings and, thus, RP Financial concluded that reported earnings were a moderately negative factor in our adjustment for profitability, growth and viability of earnings. |
| ■ | Core Earnings. Net interest income, operating expenses, non-interest operating income and loan loss provisions were reviewed in assessing the relative strengths and weaknesses of the Bank’s and the Peer Group’s core earnings. In these measures, the Bank operated with a similar net interest income ratio, a lower operating expense ratio, a lower level of non-interest operating income and a higher level of loan loss provisions. The Bank’s ratios for net interest income and operating expenses translated into comparable coverage ratio in comparison to the Peer Group’s ratio (equal to 0.94x versus 0.94x for the Peer Group). Comparatively, the Bank’s efficiency ratio of 97.29% was less favorable than the Peer Group’s efficiency ratio of 71.78%, largely the result of the Peer Group’s advantage in noninterest income. Loan loss provisions had a larger impact on the Bank’s earnings. Overall, these measures, as well as the expected earnings benefits the Bank should realize from the redeployment of stock proceeds into interest-earning assets and leveraging of post-conversion capital, which will be somewhat negated by expenses associated with the stock benefit plans and operating as a publicly-traded company, indicate that the Bank’s pro forma core earnings will be less favorable than the Peer Group’s core earnings. Therefore, RP Financial concluded that this was a moderately negative factor in our adjustment for profitability, growth and viability of earnings. |
| RP® Financial, LC. | VALUATION ANALYSIS |
| IV.5 |
| ■ | Interest Rate Risk. Quarterly changes in the Bank’s and the Peer Group’s net interest income to average assets ratios indicated a slightly greater degree of volatility was associated with the Bank’s net interest margin. Other measures of interest rate risk, such as tangible equity/assets and IEA/IBL ratios were more favorable for the Peer Group, while the ratio of non-interest earning assets/assets was slightly more favorable for the Bank. On a pro forma basis, the infusion of stock proceeds can be expected to provide the Bank with tangible equity-to-assets and IEA/ILB ratios that will be more comparable to but still not exceed the Peer Group’s ratios, as well as enhance the stability of the Bank’s net interest margin through the reinvestment of stock proceeds into interest-earning assets. On balance, RP Financial concluded that interest rate risk was a neutral factor in our adjustment for profitability, growth and viability of earnings. |
| ■ | Credit Risk. Loan loss provisions were a larger factor in the Bank’s earnings (0.31% of average assets versus 0.17% of average assets for the Peer Group). In terms of future exposure to credit quality related losses, the Peer Group maintained a comparable concentration of assets in loans and comparable diversification into higher risk types of loans. Credit quality measures for non-performing assets and loss reserves as a percent of non-performing loans were more favorable for the Peer Group. Overall, RP Financial concluded that credit risk was a slightly negative factor in our adjustment for profitability, growth and viability of earnings. |
| ■ | Earnings Growth Potential. Several factors were considered in assessing earnings growth potential. First, the infusion of stock proceeds will provide the Bank with enhanced growth potential through leverage but will still be only comparable to the leverage potential of the Peer Group. Second, the Peer Group’s higher ratio of non-interest operating income and the Bank’s lower operating expense ratio were viewed as respective advantages for the Bank and Peer Group to sustain earnings growth during periods when net interest margins come under pressure as the result of adverse changes in interest rates. Overall, earnings growth potential was considered to be a neutral factor in our adjustment for profitability, growth and viability of earnings. |
| ■ | Return on Equity. Currently, the Bank’s core ROE is lower than the Peer Group’s core ROE. Accordingly, as the result of the increase in capital that will be realized from the infusion of net stock proceeds into the Bank’s equity, the Bank’s pro forma return on equity on a core earnings basis will continue to be less than the Peer Group’s return on equity ratio. Accordingly, this was a moderately negative factor in the adjustment for profitability, growth and viability of earnings. |
On balance, Prosper Bank’s pro forma earnings strength was considered to be less favorable than the Peer Group’s and, thus, a moderate downward adjustment was applied for profitability, growth and viability of earnings.
| RP® Financial, LC. | VALUATION ANALYSIS |
| IV.6 |
| 3. | Asset Growth |
The Bank recorded a 26.94% increase in assets, versus a 10.42% increase in assets recorded by the Peer Group. Asset growth for the Bank was primarily driven by an increase in deposits of 37.72%, considerably more favorable than the 10.00% growth realized by the Peer Group. Both loans and investments realized superior growth trends versus the Peer Group. On a pro forma basis, the Bank’s tangible equity-to-assets ratio will be closer to the Peer Group’s tangible equity-to-assets ratio, indicating more comparable leverage. In considering the recent growth, it was noted that the Bank has benefited from new members of the management team attracting previous customers from other institutions, a dynamic that may not be sustainable over the long-term. On balance, no adjustment was applied for asset growth.
| 4. | Primary Market Area |
The economic and demographic health, population base and type of the primary market area served can impact an institution’s market value, as well as the competitive environment and market share in the local market served. The Bank operates from a headquarters office in Coatesville, Chester County Pennsylvania on the western edge of the Philadelphia metropolitan area, and branch offices in Chester and Lancaster Counties. The general market area focuses on the region from Chester County in the east to Harrisburg, Pennsylvania to the west. The Bank benefits from a market area with a large growing population base and a diversified economy. Summary demographic, economic and deposit market share data for the Bank and the Peer Group companies is provided in Exhibit III-2.
Given the general attractiveness of the market area, there are a large number of financial institutions operating within Chester and Lancaster Counties, including several credit unions along with other financial services providers. The median deposit market share maintained by the Peer Group companies was similar to the Bank’s market share of deposits in Chester County, reflecting relatively minor market shares given the large overall market base.
The Peer Group companies generally operate in markets with somewhat smaller populations as Chester County. Population trends for the primary market area counties served by the Peer Group companies reflected a range of limited growth rates, and overall, such population trends were less favorable compared to Chester County’s historical and projected population growth rates. Chester County has a notably higher per capita income compared to the average and median per capita incomes for the markets served by the Peer Group and, on average, the Bank’s primary market area county was much more affluent within the state of Pennsylvania compared to the Peer Group’s per capita income as a percent of their respective counties’ per capita income (149.5% for Chester County versus 102.0% for the Peer Group median).
| RP® Financial, LC. | VALUATION ANALYSIS |
| IV.7 |
On balance, the degree of competition faced by the Peer Group companies was viewed as similar to the Bank’s competitive environment in Chester County in view of the respective population bases of the Peer Group counties, while the growth potential in the markets served by the Peer Group companies was for the most part viewed to be less favorable to that provided by the Bank’s primary market area. The economic base from the view of the market area’s income levels was deemed more attractive for Chester County given the much higher indicated per capita income levels.
Table 4.1
Market Area Unemployment Rates
Prosper Bank and the Peer Group Companies (1)
| December 2020 | |||||||
| County | Unemployment | ||||||
| Prosper Bank - PA | Chester | 4.2 | % | ||||
| Peer Group Average | 5.4 | ||||||
| Peer Group Median | 5.2 | ||||||
| The Peer Group | |||||||
| CBM Bancorp, Inc. – MD | Baltimore | 5.9 | |||||
| Cincinnati Bancorp - OH | Hamilton | 5.0 | |||||
| Elmira Savings Bank – NY | Chemung | 6.7 | |||||
| FFBW, Inc.– WI | Waukesha | 4.5 | |||||
| HMN Financial, Inc. - MN | Olmsted | 3.8 | |||||
| Home Federal Bancorp, Inc. - LA | Caddo | 7.7 | |||||
| HV Bancorp, Inc. – PA | Bucks | 5.3 | |||||
| IF Bancorp, Inc. - IL | Iroquois | 4.7 | |||||
| Mid-Southern Bancorp, Inc. – IN | Washington | 3.6 | |||||
| WVS Financial Corp. – PA | Allegheny | 6.3 | |||||
| (1) | Unemployment rates are not seasonally adjusted. |
| Source: S&P Global Market Intelligence. | |
| RP® Financial, LC. | VALUATION ANALYSIS |
| IV.8 |
As shown in Table 4.1, the December 2020 average unemployment rate for the primary market area counties served by the Peer Group companies was 5.4% versus a notably lower 4.2% for Chester County. This lower unemployment rate for Chester County is notable given the higher population growth being experienced in Chester County versus the Peer Group counties, on average. On balance, we concluded that a slight upward adjustment was appropriate for the Bank’s market area.
| 5. | Dividends |
At this time the Bank has not established a dividend policy. Future declarations of dividends by the Board of Directors will depend upon a number of factors, including investment opportunities, growth objectives, financial condition, profitability, tax considerations, minimum capital requirements, regulatory limitations, stock market characteristics and general economic conditions. Five of the ten Peer Group companies pay regular cash dividends, with implied dividend yields ranging from 0.74% to 4.90%. The average dividend yield on the stocks of the Peer Group institutions equaled 2.00% as of February 5, 2021. Comparatively, as of February 5, 2021, the average dividend yield on the stocks of all fully-converted publicly-traded thrifts equaled 2.36%. While the Bank has not established a definitive dividend policy prior to converting, the Bank will have the capacity to pay a dividend comparable to the Peer Group’s average dividend yield based on its pro forma capitalization. On balance, we concluded that no adjustment was warranted for this factor.
| 6. | Liquidity of the Shares |
The Peer Group is by definition composed of companies that are traded in the public markets. All ten of the Peer Group members trade on the NASDAQ. Typically, the number of shares outstanding and market capitalization provides an indication of how much liquidity there will be in a particular stock. The market capitalization of the Peer Group companies ranged from $26.3 million to $90.6 million as of February 5, 2021, with average and median market values of $51.2 million and $46.7 million, respectively. The shares issued and outstanding of the Peer Group companies ranged from 1.7 million to 7.7 million, with average and median shares outstanding of 3.5 million and 3.2 million, respectively. The Bank’s stock offering is expected to result in a pro forma market value and pro forma shares outstanding that will be lower than the Peer Group averages. Like all of the Peer Group companies, the Bank’s stock will be quoted on the NASDAQ following the stock offering. Overall, we anticipate that the Bank’s stock will have a less active trading market as the Peer Group companies on average and, therefore, concluded a slight downward adjustment was necessary for this factor.
| RP® Financial, LC. | VALUATION ANALYSIS |
| IV.9 |
| 7. | Marketing of the Issue |
We believe that three separate markets exist for thrift stocks, including those coming to market such as Prosper Bank: (1) the after-market for public companies, in which trading activity is regular and investment decisions are made based upon financial condition, earnings, capital, ROE, dividends and future prospects; (2) the new issue market in which converting thrifts are evaluated on the basis of the same factors, but on a pro forma basis without the benefit of prior operations as a fully-converted publicly-held company and stock trading history; and (3) the acquisition market for thrift franchises in Pennsylvania. All three of these markets were considered in the valuation of the Bank’s to-be-issued stock.
| A. | The Public Market |
The value of publicly-traded bank and thrift stocks is easily measurable and is tracked by most investment houses and related organizations. Exhibit IV-1 provides pricing and financial data on all publicly-traded thrifts. In general, thrift stock values react to market stimuli such as interest rates, inflation, perceived industry health, projected rates of economic growth, regulatory issues and stock market conditions in general. Exhibit IV-2 displays historical stock market trends for various indices and includes historical stock price index values for thrifts. Exhibit IV-3 displays various stock price indices as of February 5, 2021.
| RP® Financial, LC. | VALUATION ANALYSIS |
| IV.10 |
In terms of assessing general stock market conditions, the performance of the overall stock market has been mixed in recent quarters. Stocks opened the second quarter of 2020 with a bruising sell-off after President Trump issued a warning on the coronavirus pandemic, which was followed by major U.S. stock indexes surging higher. News that New York recorded its first daily decline in COVID-19 deaths and the Federal Reserve’s commitment to provide an unprecedent level of support for the economy were noted factors that powered the stock market rally. The second week of April concluded with stocks posting their biggest week of gains since 1974. Stocks advanced a second consecutive week going into mid-April, as investors reacted to reports that an antiviral medicine was showing promise and the growing potential for the gradual reopening of the U.S. economy. Energy shares led stocks lower heading into the second half of April, as oil prices plunged below $0 a barrel. Promising news for a coronavirus drug and the Federal Reserve’s statement that it was in no hurry to end stimulus measures contributed to broader stock market gains through the end of April. Overall, April was the best month for stocks in decades, as the Dow Jones Industrial Average (“DJIA”) and S&P 500 posted respective gains of 11% and 13%. Comparatively, the NASDAQ was down 0.3% in April. Following a sell-off at the start of May, the broader stock market trended higher ahead of the April employment report and then rallied sharply higher with the release of the April employment report on May 8th. Stocks fell broadly the first few trading days the following week, as investors reacted to a sharp decline in the April consumer price index and the Federal Reserve’s grim assessment on how long it would take the U.S. economy to recover. Going into the second half of May, stocks surged higher on positive results reported by a drugmaker’s early study of a potential coronavirus vaccine and optimism that the U.S. economy would start to recover as all 50 states relaxed some of their coronavirus restrictions. Optimism about economies reopening and the potential development of a coronavirus vaccine continued to propel stock market gains in late-May and early-June. Stocks continued to surge higher to close out the first week of trading in June, as investors reacted to a surprisingly strong May employment report. The rebound in the broader stock market continued into the beginning of the second week of June, with the NASDAQ closing at a record high and the S&P 500 moving into positive territory for the year. Stocks closed out the second week of trading in June posting their worst weekly loss since March, as growing fears of a surge in coronavirus infections fueled a stock market route on June 11th. After Federal Reserve officials highlighted the pandemic’s potential to weaken the U.S. economy over the long-term, shares of banks and manufacturers were among the hardest hit stocks in the sell-off. A rebound in May retail sales and the Federal Reserve’s announcement that it would broaden its program to purchase bonds of U.S. companies translated into stocks rallying going into the second half of June, which was followed by a wavering stock market environment through multiple trading sessions as investors weighed a rise in coronavirus infections against signs of the U.S. economy recovering. A record number of new coronavirus cases in some large states fueled a late-June sell-off in the broader stock market, as investors reacted to reinstatement of lockdown measures by some of those states. Growing expectations for additional stimulus from the Federal Reserve contributed to stocks rallying to close out the second quarter, as U.S. stocks wrapped up their best quarter in more than 20 years. For the second quarter of 2020, the DJIA was up 18%, the S&P 500 was up 20% and the NASDAQ was up 31%.
| RP® Financial, LC. | VALUATION ANALYSIS |
| IV.11 |
Stocks started out the third quarter of 2020 trading mixed ahead of the release of the June employment report and then rallied higher with the release of the June employment report, which showed the U.S. economy added more jobs than expected. Volatility prevailed in the broader stock market through mid-July, as investors weighed hopes of a Covid-19 vaccine after two companies received “fast track” designations for the development of their coronavirus vaccine candidates against a resurgence in Covid-19 positive cases that was providing for an uneven reopening of the U.S. economy. Stocks retreated heading into the last week of July, as the first weekly increase in new unemployment claims since March raised concerns that mounting coronavirus infections and a renewed wave of mandated lockdowns could slow an economic recovery. The broader stock market continued to trade unevenly in the final week of July, as investors reacted to mixed second quarter earnings reports by some large companies, a record decline in second quarter GDP and the Federal Reserve’s reiteration that it would continue to support the U.S. economy. Overall, technology stocks were the strongest performing stocks during July, as the NASDAQ closed out July at a new record high. Progress in Congressional negotiations for a new coronavirus relief package and initial weekly unemployment claims falling to their lowest level since the coronavirus hit the U.S. in March fueled stock market gains during the first week of August. The DJIA extended its winning streak to seven sessions on August 10th, as investors assessed the likelihood of another round of stimulus spending and the slowing pace of new coronavirus infections. Led by advances in technology shares, the broader stock market continued to surge higher through the second half of August with the NASDAQ and S&P 500 posting a number of new record highs. Overall, the month of August was the best month for U.S. stocks since April, with stimulus from the U.S. Government, signs of economic revival and progress toward a coronavirus vaccine fueling the gains in the broader stock market. An upbeat report on August manufacturing activity helped to extend the stock market rally into early-September, as the DJIA closed above 29000 for the first time since February. A sell-off in technology stocks led the stock market lower going into the second week of September, as NASDAQ fell into correction territory amid concerns that technology shares had become overvalued. Stocks rebounded heading into mid-September, as technology stocks led the broader stock market higher on large acquisitions announced by Oracle and Nvidia. A decline in oil and gold prices pressured economically sensitive shares lower going in the second half of September, which was followed by a one-day sell-off in technology shares as hopes for additional fiscal stimulus dimmed and investors continued to question the valuation of tech stocks. Stocks regained some lost ground in the final week of the third quarter, which was led by a rebound in economically sensitive shares.
| RP® Financial, LC. | VALUATION ANALYSIS |
| IV.12 |
Stocks traded lower at the start of the fourth quarter of 2020, as investors reacted to the September employment report that showed job growth was less than expected. News of President Trump’s improving health propelled stocks higher at the beginning of the second week of October, which was followed by a one-day sell-off caused by a halt in negotiations for a new economic relief package. Stocks rallied higher following the one-day sell-off on revived hopes for a new stimulus deal, as Democratic and White House negotiators resumed negotiations for a coronavirus relief bill. Mixed earnings reports at the start of the third quarter earnings season pressured stocks lower going into mid-October. The sell-off in the broader stock market sharpened during the second half of October, as a surge in coronavirus cases added to worries about the economic outlook in the absence of a stimulus deal. Better-than-expected economic data for third quarter GDP growth and October manufacturing activity contributed to stocks rallying ahead of the election in early-November. The stock market rallied continued on Election Day and the following day, as Wall Street reacted to election results that indicated a Biden presidency gridlocked by a Republican-controlled Senate. News of promising results for two Covid-19 vaccines bolstered stock markets gains through the end of November, which included the DJIA closing above 30000 for the first time. Overall, for the month of November, the DJIA increased 12%, marking its best month since January 1987, while the NASDAQ and S&P 500 posted respective gains of 12% and 11%. Signs of progress on a stimulus relief package and the effectiveness rates for the forthcoming Covid-19 vaccines helped to sustain the broader stock market rally through the first week of December, with the NASDAQ and S&P 500 closing at new record highs. Stocks retreated going into mid-December, as negotiations over a coronavirus relief package stalled. As Congress neared a deal on a new coronavirus relief package, all three major U.S. stock indexes closed at record highs going into the second half of December. Stocks paused after closing at new record highs, as Covid-19 concerns overshadowed Congress’s approval of a coronavirus relief package. All three major U.S. stock indexes closed at record highs in the final week of 2020, as the rollout of the coronavirus vaccine and passage of a new stimulus package buoyed investors’ sentiment.
A wave of new Covid-19 infections prompted a sell-off in the broader stock at the at the start of 2021, which was followed by stocks rallying higher on expectations that there would be a big boost in government spending under a Democrat-controlled Senate. Stocks fell in mid-January, as initial jobless claims posted their biggest weekly increase since the Covid-19 pandemic hit in March. After all three major U.S. stock indexes closed at record highs going into the second half of January, all three major U.S. stock indexes suffered their sharpest losses in late-January amid concerns about how effectively the Covid-19 vaccine was being distributed. Robust fourth quarter earnings posted by some large-cap stocks and a decline in initial jobless claims for a third straight week contributed to stocks rallying higher in the first week of February. On February 5, 2021, the DJIA closed at 31148.24, an increase of 7.0% from one year ago and an increase of 1.8% year-to-date, and the NASDAQ closed at 13856.30, an increase of 45.5% from one year ago and an increase of 7.5% year-to-date. The S&P 500 Index closed at 3886.83 on February 5, 2021, an increase of 16.8% from one year ago and an increase of 3.5% year-to-date.
| RP® Financial, LC. | VALUATION ANALYSIS |
| IV.13 |
The market for thrift stocks has also experienced varied trends in recent quarters. Financial shares pulled back in early-July 2020 amid a dramatic surge in confirmed coronavirus infections in the south and west regions of the U.S., which forced several states to pause or reverse plans to reopen businesses. Growing optimism of a Covid-19 vaccine being developed in the near term contributed to financial shares trading higher along with the broader stock market heading into mid-July, which was followed by a slight pullback in financial shares as big bank second quarter earnings reports warned of a protracted downturn for the U.S. economy. Financial shares traded unevenly throughout the second half of July, in light of uncertainty over the outlook for the U.S. economy and related impact on credit quality. After trading lower the first few trading days of August, financial shares participated in the broader stock market rally going into mid-August. Financial shares diverged from the broader stock market rally in the second half of August and into early-September, as economic uncertainty revolving around the Covid-19 pandemic weighed on the shares of economically sensitive stocks. After trading higher with the release of the better-than-expected employment report for August 2020, thrift stocks retreated in the second week of September. Financial shares edged higher at the conclusion of the Federal Reserve’s mid-September policy meeting, whereby the Federal Reserve pledged to support the economic recovery by setting a higher bar to raise interest rates and by signaling it expected to hold rates near zero for at least three more years. The sell-off in economically sensitive shares going into the second half of September translated into market losses for bank and thrift stocks, which was followed by an uptick in financial shares at the close of the third quarter.
| RP® Financial, LC. | VALUATION ANALYSIS |
| IV.14 |
The positive trend in thrift stocks continued through the first two weeks of October 2020, as economically sensitive stocks climbed on hopes for passage of a new coronavirus stimulus bill. Despite better-than-expected third quarter earnings results posted by some big banks at the start of the third quarter earnings season, financial shares traded lower in mid-October. Financial shares rallied going into late-October, as news that weekly initial jobless claims fell by 55,000 pushed the 10-year Treasury yield up to 0.85%. Financial shares sold-off along with the broader stock market during the last week of October, as rising coronavirus cases shook investors’ confidence in the economic recovery. Financial shares also participated in the broader stock market rally during the first two trading days of November and on Election Day, but then diverged from the broader stock market rally the day following the election as investors bet that the election results and a potentially long period of vote counting would delay and potentially reduce another round of stimulus. Amid building hopes that drug-makers were on the brink of pushing out vaccines effective enough to fight the coronavirus, economically sensitive stocks, such as bank stocks, were among the strongest performing sectors for the balance of November. After trading lower on last day of November, the positive trend in thrift stocks resumed through the first half of December on signs of a progress in negotiations over a coronavirus relief package. Amid a surge in coronavirus infections and the Federal Reserve leaving its benchmark interest rate near zero, thrift shares edged lower going into final week of 2020 and then rebounded in the last week of 2020 after President Trump signed a Covid-19 relief bill.
Thrift shares traded flat at the start of 2021 and then rallied higher in the second week of January on expectations of additional stimulus after Democrats took control of the Senate. Thrift shares reversed course and trended lower in the second half of January on concerns over the lingering economic impact of the coronavirus and related impact on loan demand and credit quality. A decline in coronavirus cases across the U.S. helped thrift shares to rebound in the first week of February. On February 5, 2021, the SNL Thrift Index for all publicly-traded thrifts closed at 851.8, a decrease of 5.2% from one year ago and an increase of 4.3% year-to-date.
| B. | The New Issue Market |
In addition to thrift stock market conditions in general, the new issue market for converting thrifts is also an important consideration in determining the Association’s pro forma market value. The new issue market is separate and distinct from the market for seasoned thrift stocks in that the pricing ratios for converting issues are computed on a pro forma basis, specifically: (1) the numerator and denominator are both impacted by the conversion offering amount, unlike existing stock issues in which price change affects only the numerator; and (2) the pro forma pricing ratio incorporates assumptions regarding source and use of proceeds, effective tax rates, stock plan purchases, etc. which impact pro forma financials, whereas pricing for existing issues are based on reported financials. The distinction between pricing of converting and existing issues is perhaps no clearer than in the case of the price/book (“P/B”) ratio in that the P/B ratio of a converting thrift will typically result in a discount to book value whereas in the current market for existing thrift stocks the P/B ratio may reflect a premium to book value. Therefore, it is appropriate to also consider the market for new issues, both at the time of the conversion and in the aftermarket.
| RP® Financial, LC. | VALUATION ANALYSIS |
| IV.15 |
As shown in Table 4.2, two standard conversion and two second step offerings have been completed during the past four months. Both of the standard conversion offerings were completed in October 2020, with one offering, Systematic Savings Bank, involving a small, $40 million asset institution. The other offering, Eastern Bankshares, Inc. involved a much larger multi-billion asset institution. The average closing pro forma price/tangible book ratio of the two standard conversion offerings equaled 61.8%, with the Systematic Savings Bank offering closing at 58.6% of pro forma tangible book value. On average, the two standard conversion offerings reflected price appreciation of 12.4% after the first week of trading. As of February 5, 2021, the two recent standard conversion offerings reflected a 30.9% increase in price on average from their IPO prices, although Systematic Savings Bank’s stock has not traded since the initial trading date and thus its stock price remains at $10.00 per share.
| C. | The Acquisition Market |
Also considered in the valuation was the potential impact on Prosper Bank’s stock price of recently completed and pending acquisitions of other thrift institutions operating in Pennsylvania. As shown in Exhibit IV-4, there were 21 Pennsylvania thrift acquisitions completed from the beginning of 2014 through February 5, 2021 and there was one pending transaction for Pennsylvania thrift institutions. The acquisition activity involving Pennsylvania savings institutions may imply a certain degree of acquisition speculation for the Bank’s stock. To the extent that acquisition speculation may impact the Bank’s offering, we have largely taken this into account in selecting companies for the Peer Group which operate in markets that have experienced a comparable level of acquisition activity as the Bank’s market and, thus, are subject to the same type of acquisition speculation that may influence Prosper Bank’s stock. However, since converting thrifts are subject to a three-year regulatory moratorium from being acquired, acquisition speculation in Prosper Bank’s stock would tend to be less compared to the stocks of the Peer Group companies.
| RP® Financial, LC. | VALUATION ANALYSIS |
| IV.16 |
Table 4.2
Pricing Characteristics and After-Market Trends
Conversions Completed in Trailing 12 Months
| Institutional Information | Pre-Conversion Data | Offering Information | Contribution to | Insider Purchases | Pro Forma Data | Post-IPO Pricing Trends | ||||||||||||||||||||||||||
| Financial Info. | Asset Quality | Char. Found. | % Off Incl. Fdn.+Merger Shares | Pricing Ratios(2)(5) | Financial Charac. | Closing Price: | ||||||||||||||||||||||||||
| Excluding Foundation | % of | Benefit Plans | Initial | First | After | After | ||||||||||||||||||||||||||
| Conversion | Equity/ | NPAs/ | Res. | Gross | % | % of | Exp./ | Public Off. | Recog | Stk | Mgmt.& | Div. | Core | Core | Core | IPO | Trading | % | First | % | First | % | Thru | % | ||||||||
| Institution | Date | Ticker | Assets | Assets | Assets | Cov. | Proc. | Offer | Mid. | Proc. | Form | Inc. Fdn. | ESOP | Plans | Option | Dirs. | Yield | P/TB | P/E | P/A | ROA | TE/A | ROE | Price | Day | Chg | Week(3) | Chg | Month(4) | Chg | 2/5/2021 | Chg |
| ($Mil) | (%) | (%) | (%) | ($Mil.) | (%) | (%) | (%) | (%) | (%) | (%) | (%) | (%)(1) | (%) | (%) | (x) | (%) | (%) | (%) | (%) | ($) | ($) | (%) | ($) | (%) | ($) | (%) | ($) | (%) | ||||
| Standard Conversions | ||||||||||||||||||||||||||||||||
| Eastern Bankshares, Inc., MA* | 10/15/20 | EBC-NASDAQ | $ 13,997 | 12.10% | 0.04% | 211% | $ 1,797.1 | 100% | 118% | 1.6% | S | 4.0% | 8.0% | 4.0% | 10.0% | 0.1% | 0.00% | 65.0% | 22.8x | 12.0% | 0.5% | 19.0% | 2.5% | $10.00 | $12.15 | 21.5% | $12.48 | 24.8% | $13.62 | 36.2% | $16.18 | 61.8% |
| Systematic Savings Bank, MO | 10/14/20 | SSSB-OTCPink | $ 40 | 12.64% | 8.00% | NM | $ 6.0 | 100% | 132% | 14.3% | N.A. | N.A. | 0.0% | 0.0% | 0.0% | 18.0% | 0.00% | 58.6% | 46.5x | 13.2% | 0.3% | 22.5% | 1.3% | $10.00 | $10.00 | 0.0% | $10.00 | 0.0% | $10.00 | 0.0% | $10.00 | 0.0% |
| Averages - Standard Conversions: | $ 7,018 | 12.37% | 4.02% | 211% | $ 901.5 | 100% | 125% | 7.9% | N.A. | N.A. | 4.0% | 2.0% | 5.0% | 9.1% | 0.00% | 61.8% | 34.7x | 12.6% | 0.4% | 20.8% | 1.9% | $10.00 | $11.08 | 10.8% | $11.24 | 12.4% | $11.81 | 18.1% | $13.09 | 30.9% | ||
| Medians - Standard Conversions: | $ 7,018 | 12.37% | 4.02% | 211% | $ 901.5 | 100% | 125% | 7.9% | N.A. | N.A. | 4.0% | 2.0% | 5.0% | 9.1% | 0.00% | 61.8% | 34.7x | 12.6% | 0.4% | 20.8% | 1.9% | $10.00 | $11.08 | 10.8% | $11.24 | 12.4% | $11.81 | 18.1% | $13.09 | 30.9% | ||
| Second Step Conversions | ||||||||||||||||||||||||||||||||
| Affinity Bancshares, Inc., GA | 1/21/21 | AFBI-NASDAQ | $ 888 | 8.93% | 0.56% | 154% | $ 37.0 | 54% | 132% | 4.1% | N.A. | N.A. | 8.0% | 4.0% | 10.0% | 3.5% | 0.00% | 75.3% | 17.6x | 7.5% | 0.4% | 10.2% | 3.6% | $10.00 | $10.85 | 8.5% | $10.75 | 7.5% | $10.75 | 7.5% | $10.75 | 7.5% |
| Generations Bancorp NY, Inc. | 1/13/21 | GBNY-NASDAQ | $ 368 | 8.10% | 1.08% | 54% | $ 14.8 | 60% | 98% | 8.8% | N.A. | N.A. | 8.0% | 4.0% | 10.0% | 3.1% | 0.00% | 61.7% | 15.0x | 6.5% | 0.4% | 10.5% | 4.0% | $10.00 | $10.05 | 0.5% | $9.56 | -4.4% | $9.74 | -2.6% | $9.74 | -2.6% |
| Averages - Second Step Conversions: | $ 628 | 8.52% | 0.82% | 104% | $ 25.9 | 57% | 115% | 6.5% | N.A. | N.A. | 8.0% | 4.0% | 10.0% | 3.3% | 0.00% | 68.5% | 16.3x | 7.0% | 0.4% | 10.3% | 3.8% | $10.00 | $10.45 | 4.5% | $10.16 | 1.6% | $10.25 | 2.5% | $10.25 | 2.5% | ||
| Medians - Second Step Conversions: | $ 628 | 8.52% | 0.82% | 104% | $ 25.9 | 57% | 115% | 6.5% | N.A. | N.A. | 8.0% | 4.0% | 10.0% | 3.3% | 0.00% | 68.5% | 16.3x | 7.0% | 0.4% | 10.3% | 3.8% | $10.00 | $10.45 | 4.5% | $10.16 | 1.6% | $10.25 | 2.5% | $10.25 | 2.5% | ||
| Mutual Holding Companies | ||||||||||||||||||||||||||||||||
| Averages - All Conversions: | $ 3,823 | 10.44% | 2.42% | 139% | $ 463.7 | 78% | 120% | 7.2% | N.A. | N.A. | 6.0% | 3.0% | 7.5% | 6.2% | 0.00% | 65.1% | 23.6x | 9.8% | 0.4% | 15.5% | 2.8% | $10.00 | $10.76 | 7.6% | $10.70 | 7.0% | $11.03 | 10.3% | $11.67 | 16.7% | ||
| Medians - All Conversions: | $ 628 | 10.52% | 4.02% | 154% | $ 25.9 | 80% | 125% | 6.5% | N.A. | N.A. | 8.0% | 4.0% | 10.0% | 3.3% | 0.00% | 63.4% | 20.2x | 9.8% | 0.4% | 14.8% | 3.0% | $10.00 | $10.45 | 4.5% | $10.38 | 3.8% | $10.38 | 3.8% | $10.38 | 3.8% | ||
| Note: * - Appraisal performed by RP Financial; BOLD = RP Financial assisted in the business plan preparation, “NT” - Not Traded; “NA” - Not Applicable, Not Available; C/S-Cash/Stock. | |||
| (1) As a percent of MHC offering for MHC transactions. | (5) Mutual holding company pro forma data on full conversion basis. | ||
| (2) Does not take into account the adoption of SOP 93-6. | (6) Simultaneously completed acquisition of another financial institution. | ||
| (3) Latest price if offering is less than one week old. | (7) Simultaneously converted to a commercial bank charter. | ||
| (4) Latest price if offering is more than one week but less than one month old. | (8) Former credit union. | 2/5/2021 | |
| RP® Financial, LC. | VALUATION ANALYSIS |
| IV.17 |
* * * * * * * * * * *
In determining the valuation adjustment for marketing of the issue, we considered trends in both the overall market for thrift stocks, the new issue market and the local acquisition market for thrift stocks. Taking these factors and trends into account, RP Financial concluded that no adjustment was warranted for the marketing of the issue.
| 8. | Management |
The Bank’s management team has recently been enhanced with new hires that appear to have experience and expertise in all of the key areas of the Bank’s operations. Exhibit IV-5 provides summary resumes of the Bank’s Board of Directors and senior management. The Bank currently does not have any senior management positions that are vacant. The returns, equity positions and other operating measures of the Peer Group companies are indicative of well-managed financial institutions, which have Boards and management teams that have been effective in implementing competitive operating strategies. We concluded that, as currently structured, the Bank’s management team and Board of Directors are well qualified to execute on the business plan. Therefore, on balance, we concluded no valuation adjustment relative to the Peer Group was appropriate for this factor.
| 9. | Effect of Government Regulation and Regulatory Reform |
In summary, as a fully-converted, FDIC insured institution, Prosper Bank will operate in substantially the same regulatory environment as the Peer Group members -- all of whom are adequately capitalized institutions and are operating with no apparent restrictions. Exhibit IV-6 reflects Prosper Bank’s pro forma regulatory capital ratios. On balance, no adjustment has been applied for the effect of government regulation and regulatory reform.
Summary of Adjustments
Overall, based on the factors discussed above, we concluded that the Bank’s pro forma market value should reflect the following valuation adjustments relative to the Peer Group:
| Key Valuation Parameters: | Valuation Adjustment |
| Financial Condition | Slight Downward |
| Profitability, Growth and Viability of Earnings | Moderate Downward |
| Asset Growth | No Adjustment |
| Primary Market Area | Slight Upward |
| Dividends | No Adjustment |
| Liquidity of the Shares | Slight Downward |
| Marketing of the Issue | No Adjustment |
| Management | No Adjustment |
| Effect of Govt. Regulations and Regulatory Reform | No Adjustment |
| RP® Financial, LC. | VALUATION ANALYSIS |
| IV.18 |
Valuation Approaches
In applying the accepted valuation methodology promulgated by the FDIC and the Department i.e., the pro forma market value approach, we considered the three key pricing ratios in valuing the Bank’s to-be-issued stock – price/earnings (“P/E”), price/book (“P/B”), and price/assets (“P/A”) approaches – all performed on a pro forma basis including the effects of the stock proceeds. In computing the pro forma impact of the conversion and the related pricing ratios, we have incorporated the valuation parameters disclosed in the Bank’s prospectus for reinvestment rate, effective tax rate, stock benefit plan assumptions and expenses (summarized in Exhibits IV-7 and IV-8).
In our estimate of value, we assessed the relationship of the pro forma pricing ratios relative to the Peer Group and recent conversion offerings.
RP Financial’s valuation placed an emphasis on the following:
| ● | P/E Approach. The P/E approach is generally the best indicator of long-term value for a stock. Given the similarities between the Bank’s and the Peer Group’s operating strategies, earnings composition and overall financial condition, the P/E approach was carefully considered in this valuation. At the same time, since reported earnings for both the Bank and the Peer Group included certain non-recurring items, we also made adjustments to earnings to arrive at core earnings estimates for the Bank and the Peer Group and resulting price/core earnings ratios. |
| ● | P/B Approach. P/B ratios have generally served as a useful benchmark in the valuation of thrift stocks, particularly in the context of an initial public offering, as the earnings approach involves assumptions regarding the use of proceeds. RP Financial considered the P/B approach to be a useful indicator of pro forma value, taking into account the pricing ratios under the P/E and P/A approaches. We have also modified the P/B approach to exclude the impact of intangible assets (i.e., price/tangible book value or “P/TB”), in that the investment community frequently makes this adjustment in its evaluation of this pricing approach. |
| ● | P/A Approach. P/A ratios are generally a less reliable indicator of market value, as investors typically assign less weight to assets and attribute greater weight to book value and earnings. Furthermore, this approach as set forth in the regulatory valuation guidelines does not take into account the amount of stock purchases funded by deposit withdrawals, thus understating the pro forma P/A ratio. At the same time, the P/A ratio is an indicator of franchise value, and, in the case of highly capitalized institutions, high P/A ratios may limit the investment community’s willingness to pay market multiples for earnings or book value when ROE is expected to be low. |
| RP® Financial, LC. | VALUATION ANALYSIS |
| IV.19 |
The Bank will adopt “Employers’ Accounting for Employee Stock Ownership Plans” (“ASC 718-40”), which will cause earnings per share computations to be based on shares issued and outstanding excluding unreleased ESOP shares. For purposes of preparing the pro forma pricing analyses, we have reflected all shares issued in the offering, including all ESOP shares, to capture the full dilutive impact, particularly since the ESOP shares are economically dilutive, receive dividends and can be voted. However, we did consider the impact of the adoption of ASC 718-40 in the valuation.
Based on the application of the three valuation approaches, taking into consideration the valuation adjustments discussed above, RP Financial concluded that, as of February 5, 2021, the pro forma market value of Prosper Bank’s conversion stock was $21,000,000 at the midpoint, equal to 2,100,000 shares at $10.00 per share.
1. Price-to-Earnings (“P/E”). The application of the P/E valuation method requires calculating the Bank’s pro forma market value by applying a valuation P/E multiple to the pro forma earnings base. In applying this technique, we considered both reported earnings and a recurring earnings base, that is, earnings adjusted to exclude any one-time non-operating items, plus the estimated after-tax earnings benefit of the reinvestment of the net proceeds. The Bank’s reported loss was $0.415 million for the twelve months ended December 31, 2020. In deriving Prosper Bank’s core earnings, several adjustments were made to reported earnings to eliminate one time operational and contract termination expenses of merger and acquisition related expenses of $1.163 million. As shown below, on a tax effected basis, assuming an effective marginal tax rate of 21.0% for the earnings adjustment, the Bank’s core earnings were determined to equal $3.567 million for the twelve months ended December 31, 2020.
| Amount | |||
| $ | (000 | ) | |
| Net income | $ | (415 | ) |
| Add: One-time operational costs and contract terminations (1) | 919 | ||
| Core earnings estimate | $ | 504 | |
(1) Tax effected at 21.0%.
Earnings multiples based on negative reported earnings are “not meaningful” and are not discussed further in this section. Based on the Bank’s estimated core earnings and incorporating the impact of the pro forma assumptions discussed previously, the Bank’s pro forma core P/E multiple at the $21.0 million midpoint value equaled 92.22 times, which provided for a premium of 581.6% relative to the Peer Group’s average core P/E multiple of 13.53 times (see Table 4.3). In comparison to the Peer Group’s median core earnings multiple which equaled 12.70 times, the Bank’s pro forma core P/E multiple at the midpoint value indicated a premium of 626.14%. The Bank’s pro forma P/E ratios based on core earnings at the minimum and the super maximum equaled 66.43 times and 199.04 times, respectively.
| RP® Financial, LC. | VALUATION ANALYSIS |
| IV.20 |
2. Price-to-Book (“P/B”). The application of the P/B valuation method requires calculating the Bank’s pro forma market value by applying a valuation P/B ratio, as derived from the Peer Group’s P/B ratio, to the Bank’s pro forma book value. Based on the $21.0 million midpoint valuation, the Bank’s pro forma P/B and P/TB ratios equaled 53.60%. In comparison to the average P/B and P/TB ratios for the Peer Group of 87.98% and 89.91%, the Bank’s ratios reflected a discount of 39.1% on a P/B basis and a discount of 40.4% on a P/TB basis. In comparison to the Peer Group’s median P/B and P/TB ratios of 88.66% and 89.54%, respectively, the Bank’s pro forma P/B and P/TB ratios at the midpoint value reflected discounts of 39.5% and 40.1%, respectively. At the top of the super maximum, the Bank’s P/B and P/TB ratios equaled 61.65%. In comparison to the Peer Group’s average P/B and P/TB ratios, the Bank’s P/B and P/TB ratios at the top of the super maximum reflected discounts of 29.9% and 31.4%, respectively. In comparison to the Peer Group’s median P/B and P/TB ratios, the Bank’s P/B and P/TB ratios at the top of the super maximum reflected discounts of 30.5% and 31.1%, respectively. RP Financial considered the discounts under the P/B approach to be reasonable, given the nature of the calculation of the P/B ratio which mathematically results in a ratio discounted to book value. The discounts reflected under the P/B approach were also supported by the significant premiums reflected in the Bank’s core P/E multiples.
3. Price-to-Assets (“P/A”). The P/A valuation methodology determines market value by applying a valuation P/A ratio to the Bank’s pro forma asset base, conservatively assuming no deposit withdrawals are made to fund stock purchases. In all likelihood there will be deposit withdrawals, which results in understating the pro forma P/A ratio which is computed herein. At the $21.0 million midpoint of the valuation range, the Bank’s value equaled 7.18% of pro forma assets. Comparatively, the Peer Group companies exhibited an average P/A ratio of 14.13%, which implies a discount of 49.1% has been applied to the Bank’s pro forma P/A ratio. In comparison to the Peer Group’s median P/A ratio of 9.64%, the Bank’s pro forma P/A ratio at the midpoint value reflects a premium of 25.5%.
| RP® Financial, LC. | VALUATION ANALYSIS |
| IV.21 |
Table 4.3
Public Market Pricing Versus Peer Group
as of February 5, 2021
| Market | Per Share Data | |||||||||||||||||||||||||||||||||||||||||||||||||||||||||||||||||||
| Capitalization | Core | Book | Dividends(4) | Financial Characteristics(6) | ||||||||||||||||||||||||||||||||||||||||||||||||||||||||||||||||
| Price/ | Market | 12 Month | Value/ | Pricing Ratios(3) | Amount/ | Payout | Total | Tang. Eq./ | NPAs/ | Reported (5) | Core (5) | |||||||||||||||||||||||||||||||||||||||||||||||||||||||||
| Share(1) | Value | EPS(2) | Share | P/E | P/B | P/A | P/TB | P/Core | Share | Yield | Ratio | Assets | T. Assets | Assets | ROAA | ROAE | ROAA | ROAE | ||||||||||||||||||||||||||||||||||||||||||||||||||
| ($) | ($Mil) | ($) | ($) | (x) | (%) | (%) | (%) | (x) | ($) | (%) | (%) | ($Mil) | (%) | (%) | (%) | (%) | (%) | (%) | ||||||||||||||||||||||||||||||||||||||||||||||||||
| Prosper Bank | ||||||||||||||||||||||||||||||||||||||||||||||||||||||||||||||||||||
| Maximum, as Adjusted | $ | 10.00 | $ | 27.77 | $ | 0.05 | $ | 16.22 | NM | 61.65 | % | 9.31 | % | 61.65 | % | 199.04 | x | $ | 0.00 | 0.00 | % | 0.00 | % | $ | 298 | 15.10 | % | 0.94 | % | -0.26 | % | -1.73 | % | 0.05 | % | 0.31 | % | |||||||||||||||||||||||||||||||
| Maximum | $ | 10.00 | $ | 24.15 | $ | 0.08 | $ | 17.35 | NM | 57.64 | % | 8.18 | % | 57.62 | % | 129.35 | x | $ | 0.00 | 0.00 | % | 0.00 | % | $ | 295 | 14.19 | % | 0.95 | % | -0.25 | % | -1.75 | % | 0.06 | % | 0.45 | % | |||||||||||||||||||||||||||||||
| Midpoint | $ | 10.00 | $ | 21.00 | $ | 0.11 | $ | 18.66 | NM | 53.60 | % | 7.18 | % | 53.60 | % | 92.22 | x | $ | 0.00 | 0.00 | % | 0.00 | % | $ | 293 | 13.39 | % | 0.96 | % | -0.24 | % | -1.76 | % | 0.08 | % | 0.58 | % | |||||||||||||||||||||||||||||||
| Minimum | $ | 10.00 | $ | 17.85 | $ | 0.15 | $ | 20.41 | NM | 49.00 | % | 6.16 | % | 48.99 | % | 66.43 | x | $ | 0.00 | 0.00 | % | 0.00 | % | $ | 290 | 12.57 | % | 0.97 | % | -0.22 | % | -1.78 | % | 0.09 | % | 0.74 | % | |||||||||||||||||||||||||||||||
| Thrift Industry (No MHC or Under Acquisition) (44 Institutions) | ||||||||||||||||||||||||||||||||||||||||||||||||||||||||||||||||||||
| Averages | $ | 23.33 | $ | 601.07 | $ | 2.17 | $ | 19.95 | 13.96 | x | 103.63 | % | 12.92 | % | 114.74 | % | 13.98 | x | $ | 0.43 | 2.36 | % | 47.00 | % | $ | 5,176 | 11.59 | % | 0.84 | % | 0.91 | % | 7.56 | % | 1.00 | % | 7.70 | % | ||||||||||||||||||||||||||||||
| Medians | $ | 15.28 | $ | 192.19 | $ | 0.86 | $ | 16.44 | 12.66 | x | 94.14 | % | 11.60 | % | 100.75 | % | 13.14 | x | $ | 0.32 | 2.21 | % | 35.59 | % | $ | 1,722 | 10.25 | % | 0.82 | % | 0.77 | % | 6.49 | % | 0.78 | % | 6.48 | % | ||||||||||||||||||||||||||||||
| Pennsylvania (5 institutions) | ||||||||||||||||||||||||||||||||||||||||||||||||||||||||||||||||||||
| Averages | $ | 14.68 | $ | 398.34 | $ | 1.28 | $ | 16.68 | 13.59 | x | 89.66 | % | 9.22 | % | 99.55 | % | 12.82 | x | $ | 0.47 | 3.36 | % | 65.03 | % | $ | 3,539 | 9.62 | % | 0.70 | % | 0.72 | % | 7.19 | % | 0.76 | % | 7.56 | % | ||||||||||||||||||||||||||||||
| Medians | $ | 15.15 | $ | 101.48 | $ | 1.23 | $ | 16.75 | 11.97 | x | 86.89 | % | 9.03 | % | 93.91 | % | 12.90 | x | $ | 0.42 | 2.73 | % | 53.69 | % | $ | 1,193 | 9.69 | % | 0.70 | % | 0.73 | % | 6.77 | % | 0.77 | % | 6.92 | % | ||||||||||||||||||||||||||||||
| Comparable Group | ||||||||||||||||||||||||||||||||||||||||||||||||||||||||||||||||||||
| Averages | $ | 16.54 | $ | 51.20 | $ | 0.86 | $ | 18.87 | 12.31 | x | 87.98 | % | 14.13 | % | 89.91 | % | 13.53 | x | $ | 0.35 | 2.00 | % | 69.07 | % | $ | 460 | 15.82 | % | 0.68 | % | 0.73 | % | 6.17 | % | 0.62 | % | 5.47 | % | ||||||||||||||||||||||||||||||
| Medians | $ | 15.70 | $ | 46.74 | $ | 0.81 | $ | 16.99 | 10.73 | x | 88.66 | % | 9.64 | % | 89.54 | % | 12.70 | x | $ | 0.35 | 1.87 | % | 32.36 | % | $ | 413 | 12.00 | % | 0.55 | % | 0.67 | % | 6.08 | % | 0.58 | % | 5.52 | % | ||||||||||||||||||||||||||||||
| Comparable Group | ||||||||||||||||||||||||||||||||||||||||||||||||||||||||||||||||||||
| CBMB | CBM Bancorp, Inc. | (7) | MD | $ | 13.95 | $ | 48.02 | $ | 0.17 | $ | 14.34 | NM | 97.29 | % | 22.31 | % | 97.29 | % | NM | NA | NA | 250.00 | % | $ | 232 | 22.94 | % | 0.55 | % | 0.32 | % | 1.27 | % | 0.27 | % | 1.07 | % | |||||||||||||||||||||||||||||||
| CNNB | Cincinnati Bancorp, Inc. | (7) | OH | $ | 11.96 | $ | 35.59 | $ | 0.61 | $ | 13.35 | 19.93 | 89.56 | % | 15.34 | % | 89.97 | % | 19.71 | NA | NA | NA | $ | 232 | 17.07 | % | 0.54 | % | 0.77 | % | 6.10 | % | 0.78 | % | 6.17 | % | ||||||||||||||||||||||||||||||||
| ESBK | Elmira Savings Bank | NY | $ | 12.24 | $ | 43.12 | $ | 1.19 | $ | 17.23 | 10.29 | 71.03 | % | 6.69 | % | 89.11 | % | 10.30 | $ | 0.60 | 4.90 | % | 57.14 | % | $ | 645 | 7.66 | % | NA | 0.64 | % | 6.95 | % | 0.64 | % | 6.97 | % | |||||||||||||||||||||||||||||||
| FFBW | FFBW, Inc. | (7) | WI | $ | 10.42 | $ | 74.11 | NA | $ | 13.32 | NM | 78.24 | % | 28.10 | % | 78.28 | % | NM | NA | NA | NA | $ | 286 | 35.90 | % | 0.63 | % | 0.63 | % | 2.41 | % | NA | NA | |||||||||||||||||||||||||||||||||||
| HMNF | HMN Financial, Inc. | MN | $ | 19.00 | $ | 90.61 | NA | $ | 21.65 | 8.56 | 87.76 | % | 9.96 | % | 88.50 | % | NM | $ | 0.00 | 0.00 | % | NA | $ | 910 | 11.27 | % | NA | 1.21 | % | 10.56 | % | NA | NA | |||||||||||||||||||||||||||||||||||
| HFBL | Home Federal Bancorp, Inc. of Louisiana | LA | $ | 29.09 | $ | 45.46 | NA | $ | 30.46 | 10.73 | 95.50 | % | 9.18 | % | 95.50 | % | NM | $ | 0.66 | 2.27 | % | 24.17 | % | $ | 535 | 9.61 | % | NA | 0.93 | % | 9.31 | % | NA | NA | ||||||||||||||||||||||||||||||||||
| HVBC | HV Bancorp, Inc. | (7) | PA | $ | 16.81 | $ | 33.81 | $ | 1.87 | $ | 16.75 | 8.76 | 100.35 | % | 7.36 | % | 100.35 | % | 9.01 | NA | NA | NA | $ | 508 | 7.33 | % | 0.49 | % | 1.02 | % | 11.87 | % | 0.99 | % | 11.54 | % | ||||||||||||||||||||||||||||||||
| IROQ | IF Bancorp, Inc. | IL | $ | 20.50 | $ | 66.43 | NA | $ | 26.21 | 12.58 | 78.23 | % | 9.31 | % | 78.23 | % | NM | $ | 0.30 | 1.46 | % | 18.40 | % | $ | 713 | 11.90 | % | NA | 0.70 | % | 6.06 | % | NA | NA | ||||||||||||||||||||||||||||||||||
| MSVB | Mid-Southern Bancorp, Inc. | (7) | IN | $ | 16.24 | $ | 48.50 | $ | 0.35 | $ | 15.20 | NM | 106.86 | % | 23.91 | % | 106.86 | % | NM | $ | 0.12 | 0.74 | % | 24.32 | % | $ | 218 | 22.38 | % | 1.19 | % | 0.56 | % | 2.36 | % | 0.52 | % | 2.20 | % | |||||||||||||||||||||||||||||
| WVFC | WVS Financial Corp. | PA | $ | 15.15 | $ | 26.33 | $ | 1.00 | $ | 20.20 | 15.30 | 75.00 | % | 9.08 | % | 75.00 | % | 15.10 | $ | 0.40 | 2.64 | % | 40.40 | % | $ | 317 | 12.11 | % | NA | 0.50 | % | 4.81 | % | 0.51 | % | 4.87 | % | |||||||||||||||||||||||||||||||
(1) Closing price at date indicated, market value equal to public (minority shares) times current stock price.
(2) Core earnings reflect net income less non-recurring items
(3) P/E = Price to earnings; P/B = Price to book; P/A = Price to assets; P/TB = Price to tangible book value; and P/Core = Price to core earnings. P/E and P/Core =NM if the ratio is negative or above 35x.
(4) Dividend is as of most recent quarterly dividend. Indicated 12 month dividend as a percent of trailing 12 month earnings.
(5) ROAA (return on average assets) and ROAE (return on average equity) are indicated ratios based on trailing 12 month earnings and average equity and assets balances.
(6) Excludes from averages and medians those companies the subject of actual or rumored acquisition activities or unusual operating characteristics.
(7) Data as of September 30, 2020
Source: S&P Global Market Intelligence and RP Financial, LC. calculations. The information provided in this report has been obtained from sources we believe are reliable, but we cannot guarantee the accuracy or completeness of such information.
| RP® Financial, LC. | VALUATION ANALYSIS |
| IV.22 |
Comparison to Recent Offerings
As indicated at the beginning of this chapter, RP Financial’s analysis of recent conversion offering pricing characteristics at closing and in the aftermarket has been limited to a “technical” analysis and, thus, the pricing characteristics of recent conversion offerings cannot be a primary determinate of value. Particular focus was placed on the P/TB approach in this analysis, since the P/E multiples do not reflect the actual impact of reinvestment and the source of the stock proceeds (i.e., external funds vs. deposit withdrawals). In comparison to the 61.80% average closing forma P/TB ratio of the two most recent standard conversions, the Bank’s P/TB ratio of 53.60% at the midpoint value reflects an implied discount of 13.3%. At the top of the super maximum, the Bank’s P/TB ratio of 61.65% reflects an implied discount of 0.3% relative to the recent standard conversions average P/TB ratio at closing.
Valuation Conclusion
Based on the foregoing, it is our opinion that, as of February 5, 2021, the estimated aggregate pro forma market value of the shares to be issued immediately following the conversion equaled $21,000,000 at the midpoint, equal to 2,100,000 shares offered at a per share value of $10.00. Pursuant to conversion guidelines, the 15% valuation range indicates a minimum value of $17,850,000 and a maximum value of $24,150,000. Based on the $10.00 per share offering price determined by the Board, this valuation range equates to total shares outstanding of 1,785,000 at the minimum and 2,415,000 at the maximum. In the event the appraised value is subject to an increase, the aggregate pro forma market value may be increased up to a super maximum value of $27,772,500 without a resolicitation. Based on the $10.00 per share offering price, the super maximum value would result in total shares outstanding of 2,777,250. The pro forma valuation calculations relative to the Peer Group are shown in Table 4.35 and are detailed in Exhibit IV-7 and Exhibit IV-8.
EXHIBITS
LIST OF EXHIBITS
| Exhibit Number | Description |
| I-1 | Map of Office Locations |
| I-2 | Audited Financial Statements |
| I-3 | Key Operating Ratios |
| I-4 | Investment Portfolio Composition |
| I-5 | Yields and Costs |
| I-6 | Loan Loss Allowance Activity |
| I-7 | Interest Rate Risk Analysis |
| I-8 | Fixed and Adjustable Rate Loans |
| I-9 | Loan Portfolio Composition |
| I-10 | Contractual Maturities |
| I-11 | Non-Performing Assets |
| I-12 | Deposit Composition |
| II-1 | Description of Office Properties |
| II-2 | Historical Interest Rates |
| III-1 | General Characteristics of Publicly-Traded Institutions |
| III-2 | Public Market Pricing of Mid-Atlantic Thrift Institutions |
| III-3 | Public Market Pricing of Mid-West/Southwest Thrift Institutions |
| III-4 | Peer Group Market Area Comparative Analysis |
| LIST OF EXHIBITS (continued) | |
| Exhibit Number | Description |
| IV-1 | Stock Prices: As of February 5, 2021 |
| IV-2 | Historical Stock Price Indices |
| IV-3 | Stock Indices as of February 5, 2021 |
| IV-4 | Market Area Acquisition Activity |
| IV-5 | Director and Senior Management Summary Resumes |
| IV-6 | Pro Forma Regulatory Capital Ratios |
| IV-7 | Pro Forma Analysis Sheet |
| IV-8 | Pro Forma Effect of Conversion Proceeds |
| V-1 | Firm Qualifications Statement |
Exhibit I-1
Prosper Bank
Map of Office Locations
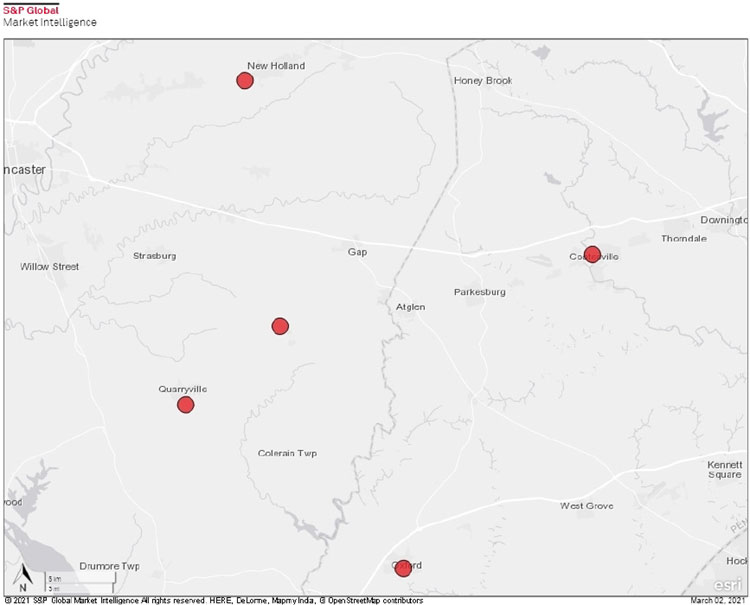
EXHIBIT I-2
Prosper Bank
Audited Financial Statements
[Incorporated by Reference]
Exhibit I-3
Prosper Bank
Key Operating Ratios
At or For the Years Ended December 31, | ||||||||
2020 | 2019 | |||||||
| Performance Ratios: | ||||||||
| Return on average assets | (0.17 | )% | 0.36 | % | ||||
| Return on average equity | (1.84 | )% | 3.56 | % | ||||
| Interest rate spread (1) | 2.59 | % | 3.09 | % | ||||
| Net interest margin (2) | 2.73 | % | 3.25 | % | ||||
| Noninterest expense to average assets | 2.85 | % | 2.71 | % | ||||
| Efficiency ratio (3) | 97.19 | % | 78.28 | % | ||||
| Average interest-earning assets to average interest-bearing liabilities | 114.99 | % | 115.08 | % | ||||
| Average equity to average assets | 9.09 | % | 10.00 | % | ||||
| Capital Ratios(4): | ||||||||
| Total capital to risk-weighted assets | N/A | 16.17 | % | |||||
| Tier 1 capital to risk-weighted assets | N/A | 14.94 | % | |||||
| Common equity tier 1 capital to risk-weighted assets | N/A | 14.94 | % | |||||
| Tier 1 capital to average assets | 8.15 | % | 10.19 | % | ||||
| Asset Quality Ratios: | ||||||||
| Allowance for loan losses as a percentage of total loans | 1.51 | % | 1.06 | % | ||||
| Allowance for loan losses as a percentage of non-performing loans | 101.39 | % | 56.92 | % | ||||
| Net (charge-offs) recoveries to average outstanding loans during the year | 0.14 | % | (0.27 | )% | ||||
| Non-performing loans as a percentage of total loans | 1.49 | % | 1.79 | % | ||||
| Non-performing loans as a percentage of total assets | 1.02 | % | 1.43 | % | ||||
| Total non-performing assets as a percentage of total assets | 1.02 | % | 1.43 | % | ||||
| Other: | ||||||||
| Number of offices | 5 | 5 | ||||||
| Number of full-time equivalent employees | 41 | 40 | ||||||
| (1) | Represents the difference between the weighted-average yield on interest-earning assets and the weighted-average cost of interest-bearing liabilities for the year. |
| (2) | Represents net interest income as a percentage of average interest-earning assets. |
| (3) | Represents noninterest expenses divided by the sum of net interest income and noninterest income. |
| (4) | Capital ratios are for Prosper Bank. On January 1, 2020, Prosper Bank elected to follow the Community Bank Leverage Ratio capital adequacy guidelines. The Community Bank Leverage Ratio is equivalent to the Tier 1 capital to average assets ratio in the table above. |
Source: PB Bankshares’ preliminary prospectus.
Exhibit I-4
Prosper Bank
Investment Portfolio Composition
United States Governmental Securities. At December 31, 2020, we had U.S. Government securities totaling $17.3 million, which constituted 64.6% of our securities portfolio. We maintain these investments, to the extent appropriate, for liquidity purposes, at zero risk weighting for capital purposes and as collateral for borrowings. At December 31, 2020, United States government securities consisted of securities issued by Fannie Mae, Federal Home Loan Bank, Federal Farm Credit Bank, and Freddie Mac.
Mortgage-Backed Securities. At December 31, 2020, we had mortgage-backed securities totaling $184,000, which constituted 0.7% of our securities portfolio. We invest in mortgage-backed securities insured or guaranteed by Ginnie Mae, Freddie Mac or Fannie Mae. We have not purchased privately-issued mortgage-backed securities. We invest in mortgage-backed securities to achieve positive interest rate spreads with minimal administrative expense, and to lower our credit risk as a result of the guarantees provided by Ginnie Mae, Freddie Mac or Fannie Mae.
Collateralized Mortgage Obligations. At December 31, 2020, we had collateralized mortgage obligations (“CMOs”) totaling $8.4 million, which constituted 31.5% of our securities portfolio. We invest in fixed rate CMOs issued by Ginnie Mae, Freddie Mac or Fannie Mae. A CMO is a type of mortgage-backed security that creates separate pools of pass-through rates for different classes of bondholders with varying maturities, called tranches. The repayments from the pool of pass-through securities are used to retire the bonds in the order specified by the bonds’ prospectus.
Mutual Fund. At December 31, 2020, we invested in one mutual fund-based Community Reinvestment Act fund totaling $864,000, which constituted 3.2% of our securities portfolio. The fund allows us the opportunity to invest in a vehicle that targets community development capital to our local market.
Other Securities. We held common stock of the Federal Home Loan Bank of Pittsburgh in connection with our borrowing activities totaling $986,000 at December 31, 2020. The Federal Home Loan Bank of Pittsburgh common stock is carried at cost. We may be required to purchase additional Federal Home Loan Bank of Pittsburgh stock if we increase borrowings in the future. Additionally, we held common stock of Atlantic Community Bankers Bank in connection with membership requirements totaling $60,000 at December 31, 2020.
Source: PB Bankshares’ preliminary prospectus.
Exhibit I-5
Prosper Bank
Yields and Costs
For the Years Ended December 31, | ||||||||||||||||||||||||
2020 | 2019 | |||||||||||||||||||||||
Average | Interest | Average | Average | Interest | Average | |||||||||||||||||||
| (Dollars in thousands) | ||||||||||||||||||||||||
| Interest-earning assets: | ||||||||||||||||||||||||
| Loans | $ | 179,873 | $ | 8,477 | 4.71 | % | $ | 173,877 | $ | 8,456 | 4.86 | % | ||||||||||||
| Debt securities available for sale | 24,714 | 475 | 1.92 | % | 21,800 | 535 | 2.45 | % | ||||||||||||||||
| Restricted stocks | 1,116 | 70 | 6.29 | % | 1,297 | 94 | 7.23 | % | ||||||||||||||||
| Cash and cash equivalents | 36,526 | 42 | 0.11 | % | 15,502 | 294 | 1.90 | % | ||||||||||||||||
| Total interest-earning assets | 242,229 | 9,064 | 3.74 | % | 212,476 | 9,379 | 4.41 | % | ||||||||||||||||
| Noninterest-earning assets | 6,574 | 6,614 | ||||||||||||||||||||||
| Total assets | $ | 248,803 | $ | 219,090 | ||||||||||||||||||||
| Interest-bearing liabilities: | ||||||||||||||||||||||||
| Interest-bearing demand deposits | $ | 61,548 | 230 | 0.37 | % | $ | 52,565 | 283 | 0.54 | % | ||||||||||||||
| Savings deposits | 18,533 | 75 | 0.41 | % | 17,832 | 92 | 0.52 | % | ||||||||||||||||
| Money market deposits | 33,568 | 226 | 0.67 | % | 20,527 | 143 | 0.70 | % | ||||||||||||||||
| Certificates of deposit | 74,843 | 1,364 | 1.82 | % | 66,998 | 1,310 | 1.95 | % | ||||||||||||||||
| Total interest-bearing deposits | 188,492 | 1,895 | 1.01 | % | 157,922 | 1,828 | 1.16 | % | ||||||||||||||||
| FHLB advances | 22,162 | 536 | 2.42 | % | 26,706 | 626 | 2.35 | % | ||||||||||||||||
| Total interest-bearing liabilities | 210,654 | 2,431 | 1.15 | % | 184,628 | 2,454 | 1.33 | % | ||||||||||||||||
| Noninterest-bearing demand deposits | 14,868 | 12,029 | ||||||||||||||||||||||
| Other noninterest-bearing liabilities | 672 | 534 | ||||||||||||||||||||||
| Total liabilities | 226,194 | 197,191 | ||||||||||||||||||||||
| Equity | 22,609 | 21,899 | ||||||||||||||||||||||
| Total liabilities and equity | $ | 248,803 | 219,090 | |||||||||||||||||||||
| Net interest income | $ | 6,633 | $ | 6,925 | ||||||||||||||||||||
| Net interest rate spread (1) | 2.59 | % | 3.08 | % | ||||||||||||||||||||
| Net interest-earning assets (2) | $ | 31,575 | $ | 27,848 | ||||||||||||||||||||
| Net interest margin (3) | 2.74 | % | 3.26 | % | ||||||||||||||||||||
| Average interest-earning assets to interest-bearing liabilities | 114.99 | % | 115.08 | % | ||||||||||||||||||||
| (1) | Net interest rate spread represents the difference between the weighted average yield on interest-earning assets and the weighted average rate of interest-bearing liabilities. |
| (2) | Net interest-earning assets represent total interest-earning assets less total interest-bearing liabilities. |
| (3) | Net interest margin represents net interest income divided by average total interest-earning assets. |
Source: PB Bankshares’ preliminary prospectus.
Exhibit I-6
Prosper Bank
Loan Loss Allowance Activity
At or For the Years Ended December 31, | ||||||||
2020 | 2019 | |||||||
| (Dollars in thousands) | ||||||||
| Allowance for loan losses at beginning of year | $ | 1,839 | $ | 1,616 | ||||
| Provision for loan losses | 760 | 697 | ||||||
| Charge-offs: | ||||||||
| Real estate: | ||||||||
| One- to four-family residential | (14 | ) | — | |||||
| Commercial | — | (481 | ) | |||||
| Construction | — | — | ||||||
| Commercial and industrial | — | — | ||||||
| Consumer | (4 | ) | (4 | ) | ||||
| Total charge-offs | (18 | ) | (485 | ) | ||||
| Recoveries: | ||||||||
| Real estate: | ||||||||
| One- to four-family residential | — | — | ||||||
| Commercial | 264 | — | ||||||
| Construction | — | — | ||||||
| Commercial and industrial | 4 | 8 | ||||||
| Consumer | 5 | 3 | ||||||
| Total recoveries | 273 | 11 | ||||||
| Net (charge-offs) recoveries | 255 | (474 | ) | |||||
| Allowance at end of year | $ | 2,854 | $ | 1,839 | ||||
| Allowance to non-performing loans | 101.39 | % | 56.92 | % | ||||
| Allowance to total loans outstanding at the end of the year | 1.51 | % | 1.06 | % | ||||
| Net (charge-offs) recoveries to average loans outstanding during the year | 0.14 | % | (0.27 | )% | ||||
Source: PB Bankshares’ preliminary prospectus.
Exhibit I-7
Prosper Bank
Interest Rate Risk Analysis
At December 31, 2020 | |||||||||
Change in Interest | Net Interest Income Year 1 Forecast | Year 1 Change from Level | |||||||
| (Dollars in thousands) | |||||||||
| +400 | $ | 7,103 | 14.23 | % | |||||
| +300 | 6,863 | 10.38 | % | ||||||
| +200 | 6,720 | 8.08 | % | ||||||
| +100 | 6,531 | 5.03 | % | ||||||
| Level | 6,218 | — | |||||||
| -100 | 5,953 | (4.27 | )% | ||||||
| (1) | Assumes an immediate uniform change in interest rates at all maturities. |
Source: PB Bankshares’ preliminary prospectus.
Exhibit I-8
Prosper Bank
Fixed and Adjustable Rate Loans
Due After December 31, 2021 | ||||||||||||
Fixed | Adjustable | Total | ||||||||||
| (In thousands) | ||||||||||||
| Real estate: | ||||||||||||
| One- to four-family residential | $ | 78,931 | $ | 24,335 | $ | 103,266 | ||||||
| Commercial | 7,416 | 50,424 | 57,840 | |||||||||
| Construction | 1,720 | 4,401 | 6,121 | |||||||||
| Commercial and industrial | 4,241 | 6,430 | 10,671 | |||||||||
| Consumer | 28 | 3,004 | 3,032 | |||||||||
| Total loans | $ | 92,336 | $ | 88,594 | $ | 180,930 | ||||||
Source: PB Bankshares’ preliminary prospectus.
Exhibit I-9
Prosper Bank
Loan Portfolio Composition
At December 31, | ||||||||||||||||
2020 | 2019 | |||||||||||||||
Amount | Percent | Amount | Percent | |||||||||||||
| (Dollars in thousands) | ||||||||||||||||
| Real estate: | ||||||||||||||||
| One- to four-family residential | $ | 106,413 | 56.16 | % | $ | 110,658 | 63.70 | % | ||||||||
| Commercial | 59,514 | 31.41 | 50,460 | 29.05 | ||||||||||||
| Construction (1) | 8,700 | 4.59 | 6,107 | 3.51 | ||||||||||||
| Commercial and industrial | 11,801 | 6.23 | 6,353 | 3.66 | ||||||||||||
| Consumer | 3,056 | 1.61 | 134 | 0.08 | ||||||||||||
| 189,484 | 100.00 | % | 173,712 | 100.00 | % | |||||||||||
| Less: | ||||||||||||||||
| Net deferred loan fees | (585 | ) | (655 | ) | ||||||||||||
| Allowance for losses | (2,854 | ) | (1,839 | ) | ||||||||||||
| Total loans | $ | 186,045 | $ | 171,218 | ||||||||||||
| (1) | Represents amounts disbursed at December 31, 2020 and 2019. The undrawn amounts of the construction loans totaled $7.6 million and $3.5 million at December 31, 2020 and 2019, respectively. |
Source: PB Bankshares’ preliminary prospectus.
Exhibit I-10
Prosper Bank
Contractual Maturities
One- to Four-Family | Commercial | Construction | ||||||||||
| (In thousands) | ||||||||||||
| Amounts due in: | ||||||||||||
| One year or less | $ | 3,147 | $ | 1,674 | $ | 2,579 | ||||||
| More than one to five years | 4,023 | 1,860 | 2,862 | |||||||||
| More than five to15 years | 34,652 | 18,902 | 2,155 | |||||||||
| More than 15 years | 64,591 | 37,078 | 1,104 | |||||||||
| Total | $ | 106,413 | $ | 59,514 | $ | 8,700 | ||||||
Commercial | Consumer | Total | ||||||||||
| (In thousands) | ||||||||||||
| Amounts due in: | ||||||||||||
| One year or less | $ | 1,130 | $ | 24 | $ | 8,554 | ||||||
| More than one to five years | 2,694 | 28 | 11,467 | |||||||||
| More than five to 15 years | 5,646 | 4 | 61,359 | |||||||||
| More than 15 years | 2,331 | 3,000 | 108,104 | |||||||||
| Total | $ | 11,801 | $ | 3,056 | $ | 189,484 | ||||||
Source: PB Bankshares’ preliminary prospectus.
Exhibit I-11
Prosper Bank
Non-Performing Assets
At December 31, | ||||||||
2020 | 2019 | |||||||
| (Dollars in thousands) | ||||||||
| Non-accrual loans: | ||||||||
| Real estate: | ||||||||
| One- to four-family residential | $ | 1,600 | $ | 1,398 | ||||
| Commercial | 575 | 1,372 | ||||||
| Construction | 640 | 264 | ||||||
| Commercial and industrial | — | — | ||||||
| Consumer | — | — | ||||||
| Total non-accrual loans | 2,815 | 3,034 | ||||||
| Accruing loans past due 90 days or more | ||||||||
| Real estate: | ||||||||
| One- to four-family residential | — | 78 | ||||||
| Commercial | — | — | ||||||
| Construction | — | — | ||||||
| Commercial and industrial | — | — | ||||||
| Consumer | — | — | ||||||
| Total accruing loans past due 90 days or more | — | 78 | ||||||
| Total non-performing loans | $ | 2,815 | $ | 3,112 | ||||
| Foreclosed assets | — | — | ||||||
| Total non-performing assets | $ | 2,815 | $ | 3,112 | ||||
| Non-accruing troubled debt restructurings: | ||||||||
| Real estate: | ||||||||
| One- to four-family residential | — | — | ||||||
| Commercial | 214 | 239 | ||||||
| Construction | 264 | 264 | ||||||
| Commercial and industrial | — | — | ||||||
| Consumer | — | — | ||||||
| Total | $ | 478 | $ | 503 | ||||
| Total accruing troubled debt restructured loans | $ | 594 | $ | 801 | ||||
| Total non-performing loans to total loans | 1.49 | % | 1.79 | % | ||||
| Total non-accrual loans to total loans | 1.49 | % | 1.75 | % | ||||
| Total non-performing assets to total assets | 1.02 | % | 1.43 | % | ||||
Source: PB Bankshares’ preliminary prospectus.
Exhibit I-12
Prosper Bank
Deposit Composition
At December 31, | ||||||||||||||||||||||||
2020 | 2019 | |||||||||||||||||||||||
Amount | Percent | Average | Amount | Percent | Average | |||||||||||||||||||
| (Dollars in thousands) | ||||||||||||||||||||||||
| Noninterest-bearing demand deposits | $ | 21,533 | 9.30 | % | - | % | $ | 12,663 | 7.54 | % | - | % | ||||||||||||
| Interest-bearing demand deposits | 62,639 | 27.07 | 0.37 | 53,267 | 31.70 | 0.54 | ||||||||||||||||||
| Savings deposits | 18,412 | 7.96 | 0.41 | 17,632 | 10.49 | 0.52 | ||||||||||||||||||
| Money market deposits | 42,933 | 18.55 | 0.67 | 20,837 | 12.40 | 0.70 | ||||||||||||||||||
| Certificates of deposit | 85,899 | 37.12 | 1.82 | 63,640 | 37.87 | 1.95 | ||||||||||||||||||
| Total | $ | 231,416 | 100.00 | % | 0.93 | % | $ | 168,039 | 100.00 | % | 1.08 | % | ||||||||||||
Source: PB Bankshares’ preliminary prospectus.
Exhibit II-1
Prosper Bank
Description of Office Properties
Properties
As of December 31, 2020, the net book value of our office properties (including leasehold improvements) was $1.5 million. The following table sets forth information regarding our offices:
Location | Leased or Owner | Year Acquired or Leased | Net Book Value of Real Property | ||||||
| Main Office: | |||||||||
| Coatesville | Owned | 1986 | $ | 239,000 | |||||
| Other Properties: | |||||||||
| New Holland | Owned | 1995 | 536,000 | ||||||
| Oxford | Owned | 1996 | 142,000 | ||||||
| Christiana | Owned | 2005 | 534,000 | ||||||
| Quarryville (1) | Leased | 2016 | — | ||||||
| (1) | This branch will be closed on April 30, 2021. |
Source: PB Bankshares’ preliminary prospectus.
EXHIBIT II-2
Historical Interest Rates
EXHIBIT II-2
Historical Interest Rates(1)
| Prime | 90 Day | One Year | 10 Year | |||||||||||||||
| Year/Qtr. Ended | Rate | T-Note | T-Note | T-Note | ||||||||||||||
| 2007: | Quarter 1 | 8.25 | % | 5.04 | % | 4.90 | % | 4.65 | % | |||||||||
| Quarter 2 | 8.25 | % | 4.82 | % | 4.91 | % | 5.03 | % | ||||||||||
| Quarter 3 | 7.75 | % | 3.82 | % | 4.05 | % | 4.59 | % | ||||||||||
| Quarter 4 | 7.25 | % | 3.36 | % | 3.34 | % | 3.91 | % | ||||||||||
| 2008: | Quarter 1 | 5.25 | % | 1.38 | % | 1.55 | % | 3.45 | % | |||||||||
| Quarter 2 | 5.00 | % | 1.90 | % | 2.36 | % | 3.99 | % | ||||||||||
| Quarter 3 | 5.00 | % | 0.92 | % | 1.78 | % | 3.85 | % | ||||||||||
| Quarter 4 | 3.25 | % | 0.11 | % | 0.37 | % | 2.25 | % | ||||||||||
| 2009: | Quarter 1 | 3.25 | % | 0.21 | % | 0.57 | % | 2.71 | % | |||||||||
| Quarter 2 | 3.25 | % | 0.19 | % | 0.56 | % | 3.53 | % | ||||||||||
| Quarter 3 | 3.25 | % | 0.14 | % | 0.40 | % | 3.31 | % | ||||||||||
| Quarter 4 | 3.25 | % | 0.06 | % | 0.47 | % | 3.85 | % | ||||||||||
| 2010: | Quarter 1 | 3.25 | % | 0.16 | % | 0.41 | % | 3.84 | % | |||||||||
| Quarter 2 | 3.25 | % | 0.18 | % | 0.32 | % | 2.97 | % | ||||||||||
| Quarter 3 | 3.25 | % | 0.18 | % | 0.32 | % | 2.97 | % | ||||||||||
| Quarter 4 | 3.25 | % | 0.12 | % | 0.29 | % | 3.30 | % | ||||||||||
| 2011: | Quarter 1 | 3.25 | % | 0.09 | % | 0.30 | % | 3.47 | % | |||||||||
| Quarter 2 | 3.25 | % | 0.03 | % | 0.19 | % | 3.18 | % | ||||||||||
| Quarter 3 | 3.25 | % | 0.02 | % | 0.13 | % | 1.92 | % | ||||||||||
| Quarter 4 | 3.25 | % | 0.02 | % | 0.12 | % | 1.89 | % | ||||||||||
| 2012: | Quarter 1 | 3.25 | % | 0.07 | % | 0.19 | % | 2.23 | % | |||||||||
| Quarter 2 | 3.25 | % | 0.09 | % | 0.21 | % | 1.67 | % | ||||||||||
| Quarter 3 | 3.25 | % | 0.10 | % | 0.17 | % | 1.65 | % | ||||||||||
| Quarter 4 | 3.25 | % | 0.05 | % | 0.16 | % | 1.78 | % | ||||||||||
| 2013: | Quarter 1 | 3.25 | % | 0.07 | % | 0.14 | % | 1.87 | % | |||||||||
| Quarter 2 | 3.25 | % | 0.04 | % | 0.15 | % | 2.52 | % | ||||||||||
| Quarter 3 | 3.25 | % | 0.02 | % | 0.10 | % | 2.64 | % | ||||||||||
| Quarter 4 | 3.25 | % | 0.07 | % | 0.13 | % | 3.04 | % | ||||||||||
| 2014: | Quarter 1 | 3.25 | % | 0.05 | % | 0.13 | % | 2.73 | % | |||||||||
| Quarter 2 | 3.25 | % | 0.04 | % | 0.11 | % | 2.53 | % | ||||||||||
| Quarter 3 | 3.25 | % | 0.02 | % | 0.13 | % | 2.52 | % | ||||||||||
| Quarter 4 | 3.25 | % | 0.04 | % | 0.25 | % | 2.17 | % | ||||||||||
| 2015: | Quarter 1 | 3.25 | % | 0.03 | % | 0.26 | % | 1.94 | % | |||||||||
| Quarter 2 | 3.25 | % | 0.01 | % | 0.28 | % | 2.35 | % | ||||||||||
| Quarter 3 | 3.25 | % | 0.00 | % | 0.33 | % | 2.06 | % | ||||||||||
| Quarter 4 | 3.50 | % | 0.16 | % | 0.65 | % | 2.27 | % | ||||||||||
| 2016: | Quarter 1 | 3.50 | % | 0.21 | % | 0.59 | % | 1.78 | % | |||||||||
| Quarter 2 | 3.50 | % | 0.26 | % | 0.45 | % | 1.49 | % | ||||||||||
| Quarter 3 | 3.50 | % | 0.29 | % | 0.59 | % | 1.60 | % | ||||||||||
| Quarter 4 | 3.75 | % | 0.51 | % | 0.85 | % | 2.45 | % | ||||||||||
| 2017: | Quarter 1 | 4.00 | % | 0.76 | % | 1.03 | % | 2.40 | % | |||||||||
| Quarter 2 | 4.25 | % | 1.03 | % | 1.24 | % | 2.31 | % | ||||||||||
| Quarter 3 | 4.25 | % | 1.06 | % | 1.31 | % | 2.33 | % | ||||||||||
| Quarter 4 | 4.50 | % | 1.39 | % | 1.76 | % | 2.40 | % | ||||||||||
| 2018: | Quarter 1 | 4.75 | % | 1.73 | % | 2.09 | % | 2.74 | % | |||||||||
| Quarter 2 | 5.00 | % | 1.93 | % | 2.33 | % | 2.85 | % | ||||||||||
| Quarter 3 | 5.25 | % | 2.19 | % | 2.59 | % | 3.05 | % | ||||||||||
| Quarter 4 | 5.50 | % | 2.45 | % | 2.63 | % | 2.69 | % | ||||||||||
| 2019: | Quarter 1 | 5.50 | % | 2.40 | % | 2.40 | % | 2.41 | % | |||||||||
| Quarter 2 | 5.00 | % | 2.12 | % | 1.92 | % | 2.00 | % | ||||||||||
| Quarter 3 | 4.75 | % | 1.88 | % | 1.75 | % | 1.68 | % | ||||||||||
| Quarter 4 | 4.75 | % | 1.55 | % | 1.59 | % | 1.92 | % | ||||||||||
| 2020: | Quarter 1 | 3.25 | % | 0.11 | % | 0.17 | % | 0.70 | % | |||||||||
| Quarter 2 | 3.25 | % | 0.16 | % | 0.16 | % | 0.66 | % | ||||||||||
| Quarter 3 | 3.25 | % | 0.10 | % | 0.12 | % | 0.69 | % | ||||||||||
| Quarter 4 | 3.25 | % | 0.09 | % | 0.10 | % | 0.93 | % | ||||||||||
| As of February 5, 2021 | 3.25 | % | 0.03 | % | 0.06 | % | 1.19 | % | ||||||||||
(1) End of period data.
Sources: Federal Reserve and The Wall Street Journal.
EXHIBIT III-1
General Characteristics of Publicly-Traded Institutions
Exhibit III-1
Characteristics of Publicly-Traded Thrifts
February 5, 2021
| As of | ||||||||||||||||||||||||||||||||||||
| February 5, 2021 | ||||||||||||||||||||||||||||||||||||
| Total | Fiscal | Conv. | Stock | Market | ||||||||||||||||||||||||||||||||
| Ticker | Financial Institution | Exchange | Region | City | State | Assets | Offices | Mth End | Date | Price | Value | |||||||||||||||||||||||||
| ($Mil) | ($) | ($Mil) | ||||||||||||||||||||||||||||||||||
| AFBI | Affinity Bancshares, Inc. | NASDAQCM | SE | Covington | GA | $ | 888 | 3 | Dec | 4/27/17 | $ | 10.75 | $ | 74 | ||||||||||||||||||||||
| AX | Axos Financial, Inc. | NYSE | WE | Las Vegas | NV | $ | 13,382 | 1 | Jun | 3/14/05 | $ | 43.95 | $ | 2,595 | ||||||||||||||||||||||
| BYFC | Broadway Financial Corporation | NASDAQCM | WE | Los Angeles | CA | $ | 499 | 3 | Dec | 1/8/96 | $ | 2.21 | $ | 41 | ||||||||||||||||||||||
| CFFN | Capitol Federal Financial, Inc. | NASDAQGS | MW | Topeka | KS | $ | 9,487 | 54 | Sep | 3/31/99 | $ | 12.65 | $ | 1,711 | ||||||||||||||||||||||
| CARV | Carver Bancorp, Inc. | NASDAQCM | MA | New York | NY | $ | 673 | 7 | Mar | 10/24/94 | $ | 8.90 | $ | 27 | ||||||||||||||||||||||
| CBMB | CBM Bancorp, Inc. | NASDAQCM | MA | Baltimore | MD | $ | 232 | 4 | Dec | 9/27/18 | $ | 13.95 | $ | 48 | ||||||||||||||||||||||
| CNNB | Cincinnati Bancorp, Inc. | NASDAQCM | MW | Cincinnati | OH | $ | 232 | 6 | Dec | 10/14/15 | $ | 11.96 | $ | 36 | ||||||||||||||||||||||
| ESBK | Elmira Savings Bank | NASDAQCM | MA | Elmira | NY | $ | 674 | 12 | Dec | 3/1/85 | $ | 12.24 | $ | 43 | ||||||||||||||||||||||
| ESSA | ESSA Bancorp, Inc. | NASDAQGS | MA | Stroudsburg | PA | $ | 1,894 | 23 | Sep | 4/3/07 | $ | 15.59 | $ | 157 | ||||||||||||||||||||||
| FFBW | FFBW, Inc. | NASDAQCM | MW | Brookfield | WI | $ | 286 | 7 | Dec | 10/10/17 | $ | 10.42 | $ | 74 | ||||||||||||||||||||||
| FNWB | First Northwest Bancorp | NASDAQGM | WE | Port Angeles | WA | $ | 1,565 | 12 | Dec | 1/29/15 | $ | 15.71 | $ | 149 | ||||||||||||||||||||||
| FBC | Flagstar Bancorp, Inc. | NYSE | MW | Troy | MI | $ | 29,476 | 159 | Dec | 4/30/97 | $ | 45.06 | $ | 2,373 | ||||||||||||||||||||||
| FSBW | FS Bancorp, Inc. | NASDAQCM | WE | Mountlake Terrace | WA | $ | 2,055 | 23 | Dec | 7/9/12 | $ | 58.85 | $ | 253 | ||||||||||||||||||||||
| GBNY | Generations Bancorp NY, Inc. | NASDAQCM | MA | Seneca Falls | NY | #VALUE! | 11 | Dec | 7/10/06 | $ | 9.74 | $ | 24 | |||||||||||||||||||||||
| HONE | HarborOne Bancorp, Inc. | NASDAQGS | NE | Brockton | MA | $ | 4,428 | 29 | Dec | 6/29/16 | $ | 11.32 | $ | 616 | ||||||||||||||||||||||
| HIFS | Hingham Institution for Savings | NASDAQGM | NE | Hingham | MA | $ | 2,719 | 10 | Dec | 12/13/88 | $ | 236.30 | $ | 505 | ||||||||||||||||||||||
| HMNF | HMN Financial, Inc. | NASDAQGM | MW | Rochester | MN | $ | 898 | 14 | Dec | 6/30/94 | $ | 19.00 | $ | 91 | ||||||||||||||||||||||
| HFBL | Home Federal Bancorp, Inc. of Louisiana | NASDAQCM | SW | Shreveport | LA | $ | 542 | 8 | Jun | 1/18/05 | $ | 29.09 | $ | 45 | ||||||||||||||||||||||
| HVBC | HV Bancorp, Inc. | NASDAQCM | MA | Doylestown | PA | $ | 508 | 5 | Dec | 1/11/17 | $ | 16.81 | $ | 34 | ||||||||||||||||||||||
| IROQ | IF Bancorp, Inc. | NASDAQCM | MW | Watseka | IL | $ | 726 | 8 | Jun | 7/7/11 | $ | 20.50 | $ | 66 | ||||||||||||||||||||||
| KRNY | Kearny Financial Corp. | NASDAQGS | MA | Fairfield | NJ | $ | 7,310 | 49 | Jun | 2/23/05 | $ | 10.65 | $ | 922 | ||||||||||||||||||||||
| EBSB | Meridian Bancorp, Inc. | NASDAQGS | NE | Peabody | MA | $ | 6,567 | 43 | Dec | 1/22/08 | $ | 15.91 | $ | 799 | ||||||||||||||||||||||
| MSVB | Mid-Southern Bancorp, Inc. | NASDAQCM | MW | Salem | IN | $ | 218 | 3 | Dec | 4/8/98 | $ | 16.24 | $ | 48 | ||||||||||||||||||||||
| NYCB | New York Community Bancorp, Inc. | NYSE | MA | Westbury | NY | $ | 54,932 | 239 | Dec | 11/23/93 | $ | 10.41 | $ | 4,829 | ||||||||||||||||||||||
| NFBK | Northfield Bancorp, Inc. | NASDAQGS | MA | Woodbridge | NJ | $ | 5,589 | 38 | Dec | 11/7/07 | $ | 13.22 | $ | 690 | ||||||||||||||||||||||
| NWBI | Northwest Bancshares, Inc. | NASDAQGS | MA | Warren | PA | $ | 13,789 | 171 | Dec | 11/4/94 | $ | 13.17 | $ | 1,673 | ||||||||||||||||||||||
| PCSB | PCSB Financial Corporation | NASDAQCM | MA | Yorktown Heights | NY | $ | 1,791 | 16 | Jun | 4/20/17 | $ | 15.75 | $ | 241 | ||||||||||||||||||||||
| PVBC | Provident Bancorp, Inc. | NASDAQCM | NE | Amesbury | MA | $ | 1,498 | 7 | Dec | 7/15/15 | $ | 12.10 | $ | 219 | ||||||||||||||||||||||
| PROV | Provident Financial Holdings, Inc. | NASDAQGS | WE | Riverside | CA | $ | 1,184 | 14 | Jun | 6/27/96 | $ | 15.40 | $ | 115 | ||||||||||||||||||||||
| PFS | Provident Financial Services, Inc. | NYSE | MA | Jersey City | NJ | $ | 12,871 | 101 | Dec | 1/15/03 | $ | 18.99 | $ | 1,446 | ||||||||||||||||||||||
| PBIP | Prudential Bancorp, Inc. | NASDAQGM | MA | Philadelphia | PA | $ | 1,223 | 10 | Sep | 3/29/05 | $ | 12.69 | $ | 101 | ||||||||||||||||||||||
| RNDB | Randolph Bancorp, Inc. | NASDAQGM | NE | Stoughton | MA | $ | 723 | 5 | Dec | 7/1/16 | $ | 20.00 | $ | 103 | ||||||||||||||||||||||
| RVSB | Riverview Bancorp, Inc. | NASDAQGS | WE | Vancouver | WA | $ | 1,425 | 17 | Mar | 10/26/93 | $ | 5.62 | $ | 126 | ||||||||||||||||||||||
| SVBI | Severn Bancorp, Inc. | NASDAQCM | MA | Annapolis | MD | $ | 939 | 7 | Dec | $ | 7.80 | $ | 100 | |||||||||||||||||||||||
| STXB | Spirit of Texas Bancshares, Inc. | NASDAQGS | SW | Conroe | TX | $ | 2,925 | 37 | Dec | 5/3/18 | $ | 19.37 | $ | 331 | ||||||||||||||||||||||
| SBT | Sterling Bancorp, Inc. | NASDAQCM | MW | Southfield | MI | $ | 3,937 | 30 | Dec | 11/16/17 | $ | 5.11 | $ | 255 | ||||||||||||||||||||||
| TBNK | Territorial Bancorp Inc. | NASDAQGS | WE | Honolulu | HI | $ | 2,106 | 30 | Dec | 7/13/09 | $ | 24.77 | $ | 226 | ||||||||||||||||||||||
| TSBK | Timberland Bancorp, Inc. | NASDAQGM | WE | Hoquiam | WA | $ | 1,566 | 24 | Sep | 1/12/98 | $ | 27.10 | $ | 225 | ||||||||||||||||||||||
| TBK | Triumph Bancorp, Inc. | NASDAQGS | SW | Dallas | TX | $ | 5,837 | 64 | Dec | 11/6/14 | $ | 64.06 | $ | 1,580 | ||||||||||||||||||||||
| TRST | TrustCo Bank Corp NY | NASDAQGS | MA | Glenville | NY | $ | 5,736 | 148 | Dec | $ | 6.51 | $ | 628 | |||||||||||||||||||||||
| WSBF | Waterstone Financial, Inc. | NASDAQGS | MW | Wauwatosa | WI | $ | 2,221 | 16 | Dec | 10/4/05 | $ | 19.19 | $ | 455 | ||||||||||||||||||||||
| WNEB | Western New England Bancorp, Inc. | NASDAQGS | NE | Westfield | MA | $ | 2,487 | 27 | Dec | 12/27/01 | $ | 7.23 | $ | 165 | ||||||||||||||||||||||
| WSFS | WSFS Financial Corporation | NASDAQGS | MA | Wilmington | DE | $ | 13,830 | 93 | Dec | 11/26/86 | $ | 45.26 | $ | 2,161 | ||||||||||||||||||||||
| WVFC | WVS Financial Corp. | NASDAQGM | MA | Pittsburgh | PA | $ | 332 | 6 | Jun | 11/29/93 | $ | 15.15 | $ | 26 | ||||||||||||||||||||||
| BCOW | 1895 Bancorp Of Wisconsin, Inc. (MHC) | NASDAQCM | MW | Greenfield | WI | $ | 505 | 6 | Dec | 1/8/19 | $ | 9.85 | $ | 45 | ||||||||||||||||||||||
| BSBK | Bogota Financial Corp. (MHC) | NASDAQCM | MA | Teaneck | NJ | $ | 754 | 4 | Dec | 1/15/20 | $ | 9.12 | $ | 120 | ||||||||||||||||||||||
| CLBK | Columbia Financial, Inc. (MHC) | NASDAQGS | MA | Fair Lawn | NJ | $ | 8,865 | 61 | Dec | 4/19/18 | $ | 15.80 | $ | 1,753 | ||||||||||||||||||||||
| FSEA | First Seacoast Bancorp (MHC) | NASDAQCM | NE | Dover | NH | $ | 477 | 5 | Dec | 7/16/19 | $ | 8.73 | $ | 51 | ||||||||||||||||||||||
| GCBC | Greene County Bancorp, Inc. (MHC) | NASDAQCM | MA | Catskill | NY | $ | 1,799 | 19 | Jun | 12/30/98 | $ | 24.70 | $ | 210 | ||||||||||||||||||||||
| KFFB | Kentucky First Federal Bancorp (MHC) | NASDAQGM | MW | Frankfort | KY | $ | 328 | 7 | Jun | 3/2/05 | $ | 6.46 | $ | 53 | ||||||||||||||||||||||
| LSBK | Lake Shore Bancorp, Inc. (MHC) | NASDAQGM | MA | Dunkirk | NY | $ | 683 | 12 | Dec | 4/3/06 | $ | 13.44 | $ | 77 | ||||||||||||||||||||||
| MGYR | Magyar Bancorp, Inc. (MHC) | NASDAQGM | MA | New Brunswick | NJ | $ | 754 | 7 | Sep | 1/23/06 | $ | 10.61 | $ | 62 | ||||||||||||||||||||||
| OFED | Oconee Federal Financial Corp. (MHC) | NASDAQCM | SE | Seneca | SC | $ | 520 | 8 | Jun | 1/13/11 | $ | 24.00 | $ | 135 | ||||||||||||||||||||||
| PDLB | PDL Community Bancorp (MHC) | NASDAQGM | MA | Bronx | NY | $ | 1,277 | 14 | Dec | 9/29/17 | $ | 9.72 | $ | 161 | ||||||||||||||||||||||
| PBFS | Pioneer Bancorp, Inc. (MHC) | NASDAQCM | MA | Albany | NY | $ | 1,629 | 23 | Jun | 7/17/19 | $ | 10.91 | $ | 273 | ||||||||||||||||||||||
| RBKB | Rhinebeck Bancorp, Inc. (MHC) | NASDAQCM | MA | Poughkeepsie | NY | $ | 1,113 | 15 | Dec | 1/16/19 | $ | 9.21 | $ | 99 | ||||||||||||||||||||||
| TFSL | TFS Financial Corporation (MHC) | NASDAQGS | MW | Cleveland | OH | $ | 14,642 | 37 | Sep | 4/20/07 | $ | 17.53 | $ | 4,848 | ||||||||||||||||||||||
Source: S&P Global Market Intelligence.
EXHIBIT III-2
Public Market Pricing of Mid-Atlantic Thrift Institutions
Exhibit III-2
Public Market Pricing of Mid-Atlantic and New England Institutions
As of February 5, 2021
| Market | Per Share Data | |||||||||||||||||||||||||||||||||||||||||||||||||||||||||||||||||||||||||||||||||||
| Capitalization | Core | Book | Dividends(3) | Financial Characteristics(5) | ||||||||||||||||||||||||||||||||||||||||||||||||||||||||||||||||||||||||||||||||
| Price/ | Market | 12 Month | Value/ | Pricing Ratios(2) | Amount/ | Payout | Total | Equity/ | Tang. Eq./ | NPAs/ | Reported | Core | ||||||||||||||||||||||||||||||||||||||||||||||||||||||||||||||||||||||||
| Share | Value | EPS(1) | Share | P/E | P/B | P/A | P/TB | P/Core | Share | Yield | Ratio(4) | Assets | Assets | T. Assets | Assets | ROAA | ROAE | ROAA | ROAE | |||||||||||||||||||||||||||||||||||||||||||||||||||||||||||||||||
| ($) | ($Mil) | ($) | ($) | (x) | (%) | (%) | (%) | (x) | ($) | (%) | (%) | ($Mil) | (%) | (%) | (%) | (%) | (%) | (%) | (%) | |||||||||||||||||||||||||||||||||||||||||||||||||||||||||||||||||
| All Non-MHC Public Companies(6) | ||||||||||||||||||||||||||||||||||||||||||||||||||||||||||||||||||||||||||||||||||||
| Averages | $ | 23.33 | $ | 601.07 | $ | 1.85 | $ | 19.90 | 13.96 | 103.6 | % | 12.9 | % | 114.7 | % | 13.98 | $ | 0.43 | 2.36 | % | 47 | % | $ | 5,167 | 12.62 | % | 11.78 | % | 0.69 | % | 0.84 | % | 6.91 | % | 0.87 | % | 7.23 | % | ||||||||||||||||||||||||||||||||||||||||||||||
| Median | $ | 15.28 | $ | 192.19 | $ | 0.87 | $ | 15.86 | 12.66 | 94.1 | % | 11.6 | % | 100.8 | % | 13.14 | $ | 0.32 | 2.21 | % | 36 | % | $ | 1,791 | 11.51 | % | 10.33 | % | 0.55 | % | 0.76 | % | 5.88 | % | 0.78 | % | 6.15 | % | ||||||||||||||||||||||||||||||||||||||||||||||
| Comparable Group | ||||||||||||||||||||||||||||||||||||||||||||||||||||||||||||||||||||||||||||||||||||
| Averages | $ | 23.90 | $ | 676.53 | $ | 1.69 | $ | 20.30 | 14.31 | x | 96.95 | % | 11.70 | % | 108.27 | % | 14.05 | x | $ | 0.45 | 2.74 | % | 55.10 | % | $ | 6,397 | 12.21 | % | 11.11 | % | 0.72 | % | 0.76 | % | 6.22 | % | 0.75 | % | 6.12 | % | ||||||||||||||||||||||||||||||||||||||||||||
| Medians | $ | 13.17 | $ | 219.00 | $ | 0.74 | $ | 14.31 | 13.73 | x | 92.27 | % | 11.76 | % | 97.72 | % | 13.43 | x | $ | 0.32 | 2.64 | % | 44.44 | % | $ | 2,190 | 11.48 | % | 10.08 | % | 0.65 | % | 0.76 | % | 5.54 | % | 0.74 | % | 5.63 | % | ||||||||||||||||||||||||||||||||||||||||||||
| Comparable Group | ||||||||||||||||||||||||||||||||||||||||||||||||||||||||||||||||||||||||||||||||||||
| CARV | Carver Bancorp, Inc. | NY | $ | 8.90 | $ | 27.26 | ($ | 1.44 | ) | $ | 9.91 | NM | 89.80 | % | 3.89 | % | 89.80 | % | NM | $ | 0.00 | 0.00 | % | NA | $ | 673 | 6.90 | % | 6.90 | % | 1.25 | % | -0.79 | % | -9.90 | % | -0.90 | % | -11.29 | % | ||||||||||||||||||||||||||||||||||||||||||||
| CBMB | CBM Bancorp, Inc. | MD | $ | 13.95 | $ | 48.02 | $ | 0.17 | $ | 14.34 | NM | 97.29 | % | 22.31 | % | 97.29 | % | NM | NA | NA | 250.00 | % | $ | 232 | 22.94 | % | 22.94 | % | 0.55 | % | 0.32 | % | 1.27 | % | 0.27 | % | 1.07 | % | ||||||||||||||||||||||||||||||||||||||||||||||
| ESBK | Elmira Savings Bank | NY | $ | 12.24 | $ | 43.12 | $ | 1.09 | $ | 17.01 | 10.29 | x | 71.03 | % | 6.69 | % | 89.11 | % | 10.30 | x | $ | 0.60 | 4.90 | % | 57.14 | % | $ | 674 | 8.90 | % | 7.20 | % | NA | 0.60 | % | 6.42 | % | 0.60 | % | 6.44 | % | |||||||||||||||||||||||||||||||||||||||||||
| ESSA | ESSA Bancorp, Inc. | PA | $ | 15.59 | $ | 157.22 | $ | 1.38 | $ | 17.60 | 10.68 | x | 86.89 | % | 9.03 | % | 93.91 | % | 10.71 | x | $ | 0.44 | 2.82 | % | 30.14 | % | $ | 1,894 | 10.11 | % | 9.41 | % | 1.09 | % | 0.76 | % | 7.43 | % | 0.75 | % | 7.37 | % | ||||||||||||||||||||||||||||||||||||||||||
| GBNY | Generations Bancorp NY, Inc. | NY | $ | 9.74 | $ | 23.94 | NA | NA | NM | NA | NA | NA | NM | NA | NA | NA | NA | NA | NA | NA | NA | NA | NA | NA | ||||||||||||||||||||||||||||||||||||||||||||||||||||||||||||
| HVBC | HV Bancorp, Inc. | PA | $ | 16.81 | $ | 33.81 | $ | 1.87 | $ | 16.75 | 8.76 | x | 100.35 | % | 7.36 | % | 100.35 | % | 9.01 | x | NA | NA | NA | $ | 508 | 7.33 | % | 7.33 | % | 0.49 | % | 1.02 | % | 11.87 | % | 0.99 | % | 11.54 | % | |||||||||||||||||||||||||||||||||||||||||||||
| KRNY | Kearny Financial Corp. | NJ | $ | 10.65 | $ | 922.29 | $ | 0.58 | $ | 12.56 | 17.46 | x | 82.81 | % | 12.33 | % | 104.93 | % | 16.59 | x | $ | 0.32 | 3.00 | % | 52.46 | % | $ | 7,310 | 15.38 | % | 12.81 | % | 0.72 | % | 0.66 | % | 4.11 | % | 0.70 | % | 4.40 | % | ||||||||||||||||||||||||||||||||||||||||||
| NYCB | New York Community Bancorp, Inc. | NY | $ | 10.41 | $ | 4,829.22 | $ | 0.83 | $ | 13.43 | 10.21 | x | 76.18 | % | 8.65 | % | 123.43 | % | 10.30 | x | $ | 0.68 | 6.53 | % | 66.67 | % | $ | 54,932 | 12.26 | % | 8.21 | % | 0.13 | % | 0.79 | % | 6.32 | % | 0.78 | % | 6.25 | % | ||||||||||||||||||||||||||||||||||||||||||
| NFBK | Northfield Bancorp, Inc. | NJ | $ | 13.22 | $ | 690.21 | $ | 0.78 | $ | 14.26 | 17.39 | x | 91.54 | % | 12.52 | % | 96.94 | % | 15.30 | x | $ | 0.44 | 3.33 | % | 57.89 | % | $ | 5,589 | 13.55 | % | 12.89 | % | 0.39 | % | 0.67 | % | 4.78 | % | 0.73 | % | 5.26 | % | ||||||||||||||||||||||||||||||||||||||||||
| NWBI | Northwest Bancshares, Inc. | PA | $ | 13.17 | $ | 1,672.85 | $ | 0.70 | $ | 12.11 | 21.24 | x | 108.72 | % | 12.12 | % | 147.19 | % | 16.48 | x | $ | 0.76 | 5.77 | % | 122.58 | % | $ | 13,789 | 11.22 | % | 8.52 | % | 0.92 | % | 0.54 | % | 4.53 | % | 0.68 | % | 5.70 | % | ||||||||||||||||||||||||||||||||||||||||||
| PCSB | PCSB Financial Corporation | NY | $ | 15.75 | $ | 241.41 | $ | 0.59 | $ | 16.45 | 25.00 | x | 94.14 | % | 14.17 | % | 96.39 | % | 24.90 | x | $ | 0.16 | 1.02 | % | 25.40 | % | $ | 1,791 | 15.28 | % | 14.98 | % | NA | 0.54 | % | 3.34 | % | 0.54 | % | 3.36 | % | |||||||||||||||||||||||||||||||||||||||||||
| PFS | Provident Financial Services, Inc. | NJ | $ | 18.99 | $ | 1,446.18 | $ | 1.32 | $ | 20.41 | 13.66 | x | 90.99 | % | 11.41 | % | 127.76 | % | 13.22 | x | $ | 0.92 | 4.84 | % | 66.19 | % | $ | 12,871 | 12.44 | % | 9.30 | % | 0.71 | % | 0.78 | % | 5.70 | % | 0.84 | % | 6.15 | % | ||||||||||||||||||||||||||||||||||||||||||
| PBIP | Prudential Bancorp, Inc. | PA | $ | 12.69 | $ | 101.48 | $ | 0.58 | $ | 15.86 | 11.97 | x | 77.32 | % | 8.50 | % | 81.30 | % | NM | $ | 0.28 | 2.21 | % | 66.98 | % | $ | 1,223 | 10.55 | % | 10.08 | % | 1.10 | % | 0.76 | % | 6.88 | % | 0.39 | % | 3.56 | % | |||||||||||||||||||||||||||||||||||||||||||
| SVBI | Severn Bancorp, Inc. | MD | $ | 7.80 | $ | 99.98 | $ | 0.42 | $ | 8.45 | 15.00 | x | 91.15 | % | 10.49 | % | 92.08 | % | 14.87 | x | $ | 0.16 | 2.05 | % | 30.77 | % | $ | 939 | 11.53 | % | 11.43 | % | 1.57 | % | 0.63 | % | 5.06 | % | 0.64 | % | 5.11 | % | ||||||||||||||||||||||||||||||||||||||||||
| TRST | TrustCo Bank Corp NY | NY | $ | 6.51 | $ | 627.78 | $ | 0.53 | $ | 5.81 | 11.99 | x | 110.49 | % | 10.64 | % | 110.60 | % | 12.20 | x | $ | 0.27 | 4.19 | % | 50.19 | % | $ | 5,736 | 9.77 | % | 9.76 | % | 0.59 | % | 0.97 | % | 9.64 | % | 0.95 | % | 9.47 | % | ||||||||||||||||||||||||||||||||||||||||||
| WSFS | WSFS Financial Corporation | DE | $ | 45.26 | $ | 2,161.44 | $ | 2.02 | $ | 36.77 | 19.94 | x | 120.63 | % | 15.08 | % | 175.11 | % | 22.48 | x | $ | 0.48 | 1.06 | % | 21.15 | % | $ | 13,830 | 13.46 | % | 9.83 | % | 0.33 | % | 0.78 | % | 5.38 | % | 0.80 | % | 5.55 | % | ||||||||||||||||||||||||||||||||||||||||||
| WVFC | WVS Financial Corp. | PA | $ | 15.15 | $ | 26.33 | $ | 1.22 | $ | 19.94 | 15.30 | x | 75.00 | % | 9.08 | % | 75.00 | % | 15.10 | x | $ | 0.40 | 2.64 | % | 40.40 | % | $ | 332 | 11.42 | % | 11.42 | % | 0.00 | % | 0.59 | % | 5.88 | % | 0.60 | % | 5.96 | % | ||||||||||||||||||||||||||||||||||||||||||
| MHCs | ||||||||||||||||||||||||||||||||||||||||||||||||||||||||||||||||||||||||||||||||||||
| BSBK | Bogota Financial Corp. (MHC) | NJ | $ | 9.12 | $ | 120.00 | NA | $ | 9.68 | NM | 93.41 | % | 16.20 | % | 93.41 | % | 27.98 | x | NA | NA | NA | $ | 754 | 16.91 | % | 16.91 | % | NA | 0.25 | % | 1.63 | % | 0.50 | % | 3.27 | % | ||||||||||||||||||||||||||||||||||||||||||||||||
| CLBK | Columbia Financial, Inc. (MHC) | NJ | $ | 15.80 | $ | 1,752.85 | $ | 0.51 | $ | 8.89 | 30.38 | x | 173.33 | % | 19.92 | % | 189.54 | % | 27.57 | x | NA | NA | NA | $ | 8,865 | 11.48 | % | 10.55 | % | NA | 0.60 | % | 4.98 | % | 0.66 | % | 5.55 | % | ||||||||||||||||||||||||||||||||||||||||||||||
| GCBC | Greene County Bancorp, Inc. (MHC) | NY | $ | 24.70 | $ | 210.28 | $ | 2.19 | $ | 15.62 | 10.65 | x | 151.57 | % | 11.28 | % | 151.57 | % | NM | $ | 0.48 | 1.94 | % | 20.26 | % | $ | 1,799 | 7.39 | % | 7.39 | % | 0.29 | % | 1.19 | % | 15.05 | % | 1.19 | % | 15.05 | % | |||||||||||||||||||||||||||||||||||||||||||
| LSBK | Lake Shore Bancorp, Inc. (MHC) | NY | $ | 13.44 | $ | 76.62 | $ | 0.76 | $ | 14.55 | 17.45 | x | 91.09 | % | 11.41 | % | 91.09 | % | 17.62 | x | $ | 0.52 | 3.87 | % | 48.05 | % | $ | 683 | 12.43 | % | 12.43 | % | 0.56 | % | 0.70 | % | 5.34 | % | 0.70 | % | 5.31 | % | ||||||||||||||||||||||||||||||||||||||||||
| MGYR | Magyar Bancorp, Inc. (MHC) | NJ | $ | 10.61 | $ | 61.62 | $ | 0.37 | $ | 9.78 | 20.79 | x | 105.88 | % | 8.31 | % | 105.88 | % | 21.16 | x | NA | NA | NA | $ | 754 | 7.54 | % | 7.54 | % | 2.03 | % | 0.32 | % | 3.85 | % | 0.31 | % | 3.75 | % | |||||||||||||||||||||||||||||||||||||||||||||
| PDLB | PDL Community Bancorp (MHC) | NY | $ | 9.72 | $ | 161.09 | ($ | 0.01 | ) | $ | 9.25 | NM | 105.05 | % | 13.02 | % | 105.05 | % | NM | NA | NA | NA | $ | 1,277 | 12.40 | % | 12.40 | % | 1.38 | % | -0.46 | % | -3.28 | % | -0.02 | % | -0.15 | % | ||||||||||||||||||||||||||||||||||||||||||||||
| PBFS | Pioneer Bancorp, Inc. (MHC) | NY | $ | 10.91 | $ | 273.28 | $ | 0.27 | $ | 8.68 | NM | 125.74 | % | 17.40 | % | 131.19 | % | NM | NA | NA | NA | $ | 1,629 | 13.84 | % | 13.34 | % | 1.01 | % | 0.51 | % | 3.35 | % | 0.48 | % | 3.11 | % | |||||||||||||||||||||||||||||||||||||||||||||||
| RBKB | Rhinebeck Bancorp, Inc. (MHC) | NY | $ | 9.21 | $ | 98.87 | $ | 0.50 | $ | 10.35 | 16.75 | x | 88.02 | % | 9.08 | % | 89.25 | % | 16.62 | x | NA | NA | NA | $ | 1,113 | 10.35 | % | 10.22 | % | 0.63 | % | 0.51 | % | 4.72 | % | 0.51 | % | 4.78 | % | |||||||||||||||||||||||||||||||||||||||||||||
(1) Core income, on a diluted per-share basis. Core income is net income after taxes and before extraordinary items, less net income attributable to noncontrolling interest, gain on the sale of securities, amortization of intangibles, goodwill and nonrecurring items. Assumed tax rate is 35%.
(2) P/E = Price to earnings; P/B = Price to book; P/A = Price to assets; P/TB = Price to tangible book value; and P/Core = Price to core earnings. P/E and P/Core =NM if the ratio is negative or above 35x.
(3) Indicated 12 month dividend, based on last quarterly dividend declared.
(4) Indicated 12 month dividend as a percent of trailing 12 month earnings.
(5) Equity and tangible equity equal common equity and tangible common equity, respectively. ROAA (return on average assets) and ROAE (return on average equity) are indicated ratios based on trailing 12 month earnings and average equity and assets balances.
(6) Excludes from averages and medians those companies the subject of actual or rumored acquisition activities or unusual operating characteristics.
Source: SNL Financial, LC. and RP Financial, LC. calculations. The information provided in this report has been obtained from sources we believe are reliable, but we cannot guarantee the accuracy or completeness of such information.
Copyright (c) 2021 by RP® Financial, LC.
EXHIBIT III-3
Public Market Pricing of Midwest/Southwest Thrift Institutions
Exhibit III-3
Public Market Pricing of Midwest, Southwest Institutions
As of February 5, 2021
| Market | Per Share Data | ||||||||||||||||||||||||||||||||||||||||||||||||||||||||||||||||
| Capitalization | Core | Book | Dividends(3) | Financial Characteristics(5) | |||||||||||||||||||||||||||||||||||||||||||||||||||||||||||||
| Price/ | Market | 12 Month | Value/ | Pricing Ratios(2) | Amount/ | Payout | Total | Equity/ | Tang. Eq./ | NPAs/ | Reported | Core | |||||||||||||||||||||||||||||||||||||||||||||||||||||
| Share | Value | EPS(1) | Share | P/E | P/B | P/A | P/TB | P/Core | Share | Yield | Ratio(4) | Assets | Assets | T. Assets | Assets | ROAA | ROAE | ROAA | ROAE | ||||||||||||||||||||||||||||||||||||||||||||||
| ($) | ($Mil) | ($) | ($) | (x) | (%) | (%) | (%) | (x) | ($) | (%) | (%) | ($Mil) | (%) | (%) | (%) | (%) | (%) | (%) | (%) | ||||||||||||||||||||||||||||||||||||||||||||||
| All Non-MHC Public Companies(6) | |||||||||||||||||||||||||||||||||||||||||||||||||||||||||||||||||
| Averages | $ | 23.33 | $ | 601.07 | $ | 1.85 | $ | 19.90 | 13.96 | 103.6 | % | 12.9 | % | 114.7 | % | 13.98 | $ | 0.43 | 2.36 | % | 47 | % | $ | 5,167 | 12.62 | % | 11.78 | % | 0.69 | % | 0.84 | % | 6.91 | % | 0.87 | % | 7.23 | % | |||||||||||||||||||||||||||
| Median | $ | 15.28 | $ | 192.19 | $ | 0.87 | $ | 15.86 | 12.66 | 94.1 | % | 11.6 | % | 100.8 | % | 13.14 | $ | 0.32 | 2.21 | % | 36 | % | $ | 1,791 | 11.51 | % | 10.33 | % | 0.55 | % | 0.76 | % | 5.88 | % | 0.78 | % | 6.15 | % | |||||||||||||||||||||||||||
| Comparable Group | |||||||||||||||||||||||||||||||||||||||||||||||||||||||||||||||||
| Averages | $ | 22.72 | $ | 588.70 | $ | 1.84 | $ | 19.57 | 14.14 | x | 109.40 | % | 16.40 | % | 120.75 | % | 13.59 | x | $ | 0.31 | 1.51 | % | 32.21 | % | $ | 4,732 | 14.91 | % | 14.36 | % | 0.74 | % | 0.94 | % | 7.26 | % | 0.97 | % | 7.80 | % | |||||||||||||||||||||||||
| Medians | $ | 19.10 | $ | 173.01 | $ | 1.56 | $ | 18.07 | 10.88 | x | 93.61 | % | 15.34 | % | 101.18 | % | 9.73 | x | $ | 0.30 | 1.46 | % | 24.17 | % | $ | 1,560 | 11.95 | % | 11.34 | % | 0.58 | % | 0.78 | % | 6.74 | % | 0.78 | % | 6.79 | % | |||||||||||||||||||||||||
| Comparable Group | |||||||||||||||||||||||||||||||||||||||||||||||||||||||||||||||||
| CFFN | Capitol Federal Financial, Inc. | KS | $ | 12.65 | $ | 1,710.52 | $ | 0.48 | $ | 9.25 | 28.75 | x | 137.54 | % | 18.28 | % | 138.41 | % | 28.22 | x | $ | 0.34 | 2.69 | % | 106.82 | % | $ | 9,487 | 13.54 | % | 13.41 | % | 0.27 | % | 0.69 | % | 4.92 | % | 0.70 | % | 5.04 | % | |||||||||||||||||||||||
| CNNB | Cincinnati Bancorp, Inc. | OH | $ | 11.96 | $ | 35.59 | $ | 0.61 | $ | 13.35 | 19.93 | x | 89.56 | % | 15.34 | % | 89.97 | % | 19.71 | x | NA | NA | NA | $ | 232 | 17.13 | % | 17.07 | % | 0.54 | % | 0.77 | % | 6.10 | % | 0.78 | % | 6.17 | % | ||||||||||||||||||||||||||
| FFBW | FFBW, Inc. | WI | $ | 10.42 | $ | 74.11 | NA | $ | 13.32 | NM | 78.24 | % | 28.10 | % | 78.28 | % | NM | NA | NA | NA | $ | 286 | 35.92 | % | 35.90 | % | 0.63 | % | 0.63 | % | 2.41 | % | NA | NA | |||||||||||||||||||||||||||||||
| FBC | Flagstar Bancorp, Inc. | MI | $ | 45.06 | $ | 2,372.68 | $ | 7.90 | $ | 38.41 | 4.73 | x | 117.33 | % | NA | 126.55 | % | 4.64 | x | $ | 0.20 | 0.44 | % | 1.58 | % | $ | 29,476 | 7.45 | % | 6.94 | % | 0.33 | % | 1.75 | % | 22.74 | % | 1.79 | % | 23.96 | % | ||||||||||||||||||||||||
| HMNF | HMN Financial, Inc. | MN | $ | 19.00 | $ | 90.61 | $ | 1.84 | $ | 20.91 | 8.56 | x | 87.76 | % | 9.96 | % | 88.50 | % | NM | $ | 0.00 | 0.00 | % | NA | $ | 898 | 11.26 | % | 11.17 | % | 0.38 | % | 1.03 | % | 8.83 | % | 1.04 | % | 8.95 | % | |||||||||||||||||||||||||
| IROQ | IF Bancorp, Inc. | IL | $ | 20.50 | $ | 66.43 | $ | 1.34 | $ | 25.78 | 12.58 | x | 78.23 | % | 9.31 | % | 78.23 | % | NM | $ | 0.30 | 1.46 | % | 18.40 | % | $ | 726 | 11.51 | % | 11.51 | % | 0.24 | % | 0.64 | % | 5.57 | % | 0.59 | % | 5.10 | % | ||||||||||||||||||||||||
| MSVB | Mid-Southern Bancorp, Inc. | IN | $ | 16.24 | $ | 48.50 | $ | 0.35 | $ | 15.20 | NM | 106.86 | % | 23.91 | % | 106.86 | % | NM | $ | 0.12 | 0.74 | % | 24.32 | % | $ | 218 | 22.38 | % | 22.38 | % | 1.19 | % | 0.56 | % | 2.36 | % | 0.52 | % | 2.20 | % | |||||||||||||||||||||||||
| SBT | Sterling Bancorp, Inc. | MI | $ | 5.11 | $ | 255.41 | ($ | 0.30 | ) | $ | 6.63 | NM | 79.92 | % | 6.53 | % | 79.92 | % | NM | $ | 0.00 | 0.00 | % | NA | $ | 3,937 | 8.41 | % | 8.41 | % | 2.50 | % | -0.43 | % | -4.39 | % | -0.43 | % | -4.43 | % | |||||||||||||||||||||||||
| WSBF | Waterstone Financial, Inc. | WI | $ | 19.19 | $ | 454.54 | $ | 2.60 | $ | 15.84 | 5.82 | x | 116.54 | % | 22.04 | % | 121.36 | % | 5.66 | x | $ | 0.80 | 4.17 | % | 41.21 | % | $ | 2,221 | 17.99 | % | 17.96 | % | 0.70 | % | 2.97 | % | 15.96 | % | 3.07 | % | 16.53 | % | |||||||||||||||||||||||
| HFBL | Home Federal Bancorp, Inc. of Louisiana | LA | $ | 29.09 | $ | 45.46 | $ | 2.10 | $ | 29.74 | 10.73 | x | 95.50 | % | 9.18 | % | 95.50 | % | NM | $ | 0.66 | 2.27 | % | 24.17 | % | $ | 542 | 9.43 | % | 9.43 | % | 1.11 | % | 0.80 | % | 7.72 | % | 0.76 | % | 7.37 | % | ||||||||||||||||||||||||
| STXB | Spirit of Texas Bancshares, Inc. | TX | $ | 19.37 | $ | 330.88 | $ | 1.56 | $ | 20.30 | 10.88 | x | 91.71 | % | 10.72 | % | 121.50 | % | 9.73 | x | $ | 0.36 | 1.86 | % | 8.99 | % | $ | 2,925 | 12.02 | % | 9.24 | % | 0.32 | % | 0.96 | % | 7.37 | % | 1.06 | % | 8.10 | % | |||||||||||||||||||||||
| TBK | Triumph Bancorp, Inc. | TX | $ | 64.06 | $ | 1,579.73 | $ | 1.72 | $ | 26.11 | 25.32 | x | 233.66 | % | 27.04 | % | 323.89 | % | NM | NA | NA | NA | $ | 5,837 | 11.89 | % | 8.89 | % | 0.72 | % | 0.93 | % | 7.55 | % | 0.83 | % | 6.79 | % | |||||||||||||||||||||||||||
| MHCs | |||||||||||||||||||||||||||||||||||||||||||||||||||||||||||||||||
| BCOW | 1895 Bancorp Of Wisconsin, Inc. (MHC) | WI | $ | 9.85 | $ | 45.20 | $ | 0.12 | $ | 12.50 | 32.83 | x | 78.78 | % | 9.31 | % | 78.78 | % | NM | NA | NA | NA | $ | 505 | 11.81 | % | 11.81 | % | 0.37 | % | 0.30 | % | 2.52 | % | 0.13 | % | 1.05 | % | |||||||||||||||||||||||||||
| KFFB | Kentucky First Federal Bancorp (MHC) | KY | $ | 6.46 | $ | 53.05 | ($ | 0.21 | ) | $ | 6.29 | NM | 102.66 | % | 16.09 | % | 104.57 | % | NM | $ | 0.40 | 6.19 | % | NA | $ | 328 | 15.82 | % | 15.57 | % | NA | -3.81 | % | -20.62 | % | -0.54 | % | -2.94 | % | ||||||||||||||||||||||||||
| TFSL | TFS Financial Corporation (MHC) | OH | $ | 17.53 | $ | 4,848.02 | NA | $ | 5.97 | NM | 296.67 | % | 33.75 | % | 298.42 | % | NM | $ | 1.12 | 6.39 | % | 373.33 | % | $ | 14,642 | 11.42 | % | 11.36 | % | 1.04 | % | 0.56 | % | 4.88 | % | NA | NA | ||||||||||||||||||||||||||||
| (1) | Core income, on a diluted per-share basis. Core income is net income after taxes and before extraordinary items, less net income attributable to noncontrolling interest, gain on the sale of securities, amortization of intangibles, goodwill and nonrecurring items. Assumed tax rate is 35%. |
| (2) | P/E = Price to earnings; P/B = Price to book; P/A = Price to assets; P/TB = Price to tangible book value; and P/Core = Price to core earnings. P/E and P/Core =NM if the ratio is negative or above 35x. |
| (3) | Indicated 12 month dividend, based on last quarterly dividend declared. |
| (4) | Indicated 12 month dividend as a percent of trailing 12 month earnings. |
| (5) | Equity and tangible equity equal common equity and tangible common equity, respectively. ROAA (return on average assets) and ROAE (return on average equity) are indicated ratios based on trailing 12 month earnings and average equity and assets balances. |
| (6) | Excludes from averages and medians those companies the subject of actual or rumored acquisition activities or unusual operating characteristics. |
Source: SNL Financial, LC. and RP Financial, LC. calculations. The information provided in this report has been obtained from sources we believe are reliable, but we cannot guarantee the accuracy or completeness of such information.
Copyright (c) 2021 by RP® Financial, LC.
EXHIBIT III-4
Peer Group Market Area Comparative Analysis
Exhibit III-4
Prosper Bank
Peer Group Market Area Comparative Analysis
| Per Capita Income | Deposit | |||||||||||||||||||||||||||||||||
| Population (000s) | 2015-2021 | 2021-2026 | 2021 | % State | Market | |||||||||||||||||||||||||||||
| Institution | County | 2015 | 2021 | 2026 (1) | % Change | % Change | ($) | Average | Share(2) | |||||||||||||||||||||||||
| CBM Bancorp, Inc. | Baltimore, MD | 830,854 | 827,833 | 838,202 | -0.1 | % | 0.2 | % | 44,121 | 96.9 | % | 0.65 | % | |||||||||||||||||||||
| Cincinnati Bancorp | Hamilton, OH | 806,557 | 820,001 | 828,307 | 0.3 | % | 0.2 | % | 39,101 | 116.8 | % | 0.10 | % | |||||||||||||||||||||
| Elmira Savings Bank | Chemung, NY | 88,004 | 82,370 | 80,032 | -1.1 | % | -0.6 | % | 31,386 | 74.5 | % | 24.23 | % | |||||||||||||||||||||
| FFBW, Inc. | Waukesha, WI | 395,838 | 406,583 | 413,751 | 0.4 | % | 0.4 | % | 50,395 | 142.0 | % | 1.07 | % | |||||||||||||||||||||
| HMN Financial, Inc. | Olmsted, MN | 151,624 | 160,589 | 167,296 | 1.0 | % | 0.8 | % | 43,936 | 107.2 | % | 0.41 | % | |||||||||||||||||||||
| Home Federal Bancorp, Inc. of LA | Caddo, LA | 253,214 | 236,376 | 230,003 | -1.1 | % | -0.5 | % | 26,312 | 92.1 | % | 5.92 | % | |||||||||||||||||||||
| HV Bancorp, Inc. | Bucks, PA | 627,549 | 628,796 | 630,606 | 0.0 | % | 0.1 | % | 51,097 | 138.5 | % | 0.41 | % | |||||||||||||||||||||
| IF Bancorp, Inc. | Iroquois, IL | 28,605 | 26,613 | 25,608 | -1.2 | % | -0.8 | % | 28,928 | 76.6 | % | 22.22 | % | |||||||||||||||||||||
| Mid-Southern Bancorp, Inc. | Washington, IN | 27,525 | 28,097 | 28,348 | 0.3 | % | 0.2 | % | 27,232 | 85.6 | % | 27.66 | % | |||||||||||||||||||||
| WVS Financial Corp. | Allegheny, PA | 1,234,342 | 1,212,006 | 1,206,155 | -0.3 | % | -0.1 | % | 43,296 | 117.4 | % | 0.08 | % | |||||||||||||||||||||
| Averages: | 444,411 | 442,926 | 444,831 | -0.2 | % | 0.0 | % | 38,580 | 104.8 | % | 8.28 | % | ||||||||||||||||||||||
| Medians: | 324,526 | 321,480 | 321,877 | 0.0 | % | 0.1 | % | 41,199 | 102.0 | % | 0.86 | % | ||||||||||||||||||||||
| Prosper Bank | Chester, PA | 514,063 | 528,806 | 538,659 | 0.6 | % | 0.4 | % | 55,143 | 149.5 | % | 0.70 | % | |||||||||||||||||||||
| (1) | Projected population. |
| (2) | Total institution deposits in headquarters county as percent of total county deposits as of June 30, 2020. |
Sources: S&P Global Market Intelligence, FDIC.
EXHIBIT IV-1
Stock Prices:
As of February 5, 2021
| RP® Financial, LC. |
Exhibit IV-1A
Weekly Thrift Market Line - Part One
Prices As of February 5, 2021
| Market Capitalization | Price Change Data | Current Per Share Financials | |||||||||||||||||||||||||||||||||||||||||||
| Price/ | Shares | Market | 52 Week (1) | % Change From | LTM | LTM Core | BV/ | TBV/ | Assets/ | ||||||||||||||||||||||||||||||||||||
| Share(1) | Outstanding | Capitalization | High | Low | Last Wk | Last Wk | 52 Wks (2) | MRY (2) | EPS (3) | EPS (3) | Share | Share (4) | Share | ||||||||||||||||||||||||||||||||
| ($) | (000) | ($Mil) | ($) | ($) | ($) | (%) | (%) | (%) | ($) | ($) | ($) | ($) | ($) | ||||||||||||||||||||||||||||||||
| All Fully-Converted Savings Institutions | |||||||||||||||||||||||||||||||||||||||||||||
| Average | 23.33 | 37,445 | 600.6 | 25.99 | 12.55 | 23.33 | 4.99 | 2.60 | 5.63 | 2.06 | 2.17 | 19.95 | 19.07 | 189.07 | |||||||||||||||||||||||||||||||
| Median | 23.63 | 38,156 | 612.9 | 26.32 | 12.72 | 23.63 | 5.09 | 2.86 | 5.56 | 2.10 | 2.22 | 20.19 | 19.37 | 190.46 | |||||||||||||||||||||||||||||||
| Fully Converted Savings Institutions | |||||||||||||||||||||||||||||||||||||||||||||
| AFBI | Affinity Bancshares, Inc. | 10.75 | 6,876 | 73.9 | 11.80 | 5.36 | 10.75 | 0.75 | -8.46 | 8.60 | 0.26 | 0.56 | 10.46 | 7.95 | 129.18 | ||||||||||||||||||||||||||||||
| BYFC | Broadway Financial Corporation | 2.21 | 27,466 | 41.3 | 7.23 | 1.04 | 2.21 | 8.87 | 47.33 | 19.46 | 0.00 | NA | 1.76 | 1.76 | 18.18 | ||||||||||||||||||||||||||||||
| CFFN | Capitol Federal Financial, Inc. | 12.65 | 135,324 | 1,710.5 | 13.50 | 8.75 | 12.65 | 1.85 | -5.10 | 1.20 | 0.44 | 0.45 | 9.20 | NA | 70.99 | ||||||||||||||||||||||||||||||
| CARV | Carver Bancorp, Inc. | 8.90 | 3,063 | 27.3 | 22.97 | 1.25 | 8.90 | 8.67 | 256.00 | 37.13 | -1.31 | -1.44 | 9.91 | 9.91 | 219.62 | ||||||||||||||||||||||||||||||
| CBMB | CBM Bancorp, Inc. | 13.95 | 3,442 | 48.0 | 15.05 | 10.61 | 13.95 | 0.00 | -2.52 | 5.05 | 0.20 | 0.17 | 14.34 | 14.34 | 67.45 | ||||||||||||||||||||||||||||||
| CNNB | Cincinnati Bancorp, Inc. | 11.96 | 2,976 | 35.6 | 12.00 | 6.33 | 11.96 | 1.79 | 11.88 | 0.08 | 0.60 | 0.61 | 13.35 | 13.29 | 77.95 | ||||||||||||||||||||||||||||||
| ESBK | Elmira Savings Bank | 12.24 | 3,523 | 43.1 | 16.57 | 10.30 | 12.24 | 0.25 | -26.27 | 6.43 | 1.19 | 1.19 | 17.23 | 13.74 | 182.97 | ||||||||||||||||||||||||||||||
| ESSA | ESSA Bancorp, Inc. | 15.59 | 10,085 | 157.2 | 17.58 | 9.70 | 15.59 | 9.17 | -10.20 | 3.93 | 1.46 | 1.46 | 17.94 | 16.60 | 185.31 | ||||||||||||||||||||||||||||||
| FFBW | FFBW, Inc. | 10.42 | 7,112 | 74.1 | 10.76 | 6.74 | 10.42 | 1.36 | -3.07 | 3.99 | 0.26 | NA | 13.32 | 13.31 | 40.18 | ||||||||||||||||||||||||||||||
| FNWB | First Northwest Bancorp | 15.71 | 9,480 | 148.9 | 17.85 | 8.77 | 15.71 | 14.67 | -6.77 | 0.71 | 1.10 | 0.84 | 18.19 | 18.19 | 174.51 | ||||||||||||||||||||||||||||||
| FSBW | FS Bancorp, Inc. | 58.85 | 4,157 | 252.6 | 60.65 | 27.50 | 58.85 | 9.75 | 8.56 | 7.39 | 8.97 | 8.77 | 54.27 | 52.61 | 508.36 | ||||||||||||||||||||||||||||||
| GBNY | Generations Bancorp NY, Inc. | 9.74 | 2,458 | 23.9 | 11.75 | 5.85 | 9.74 | -0.91 | -5.98 | -6.53 | NA | NA | NA | NA | 151.23 | ||||||||||||||||||||||||||||||
| HONE | HarborOne Bancorp, Inc. | 11.32 | 54,451 | 616.4 | 11.65 | 6.45 | 11.32 | 4.24 | 2.44 | 4.24 | 0.82 | 0.84 | 12.17 | 10.88 | 82.34 | ||||||||||||||||||||||||||||||
| HIFS | Hingham Institution for Savings | 236.30 | 2,137 | 504.9 | 238.99 | 125.55 | 236.30 | 7.77 | 15.29 | 9.40 | 23.25 | 20.31 | 137.02 | 137.02 | 1337.03 | ||||||||||||||||||||||||||||||
| HMNF | HMN Financial, Inc. | 19.00 | 4,769 | 90.6 | 21.50 | 13.06 | 19.00 | 6.98 | -9.97 | 10.46 | 2.22 | NA | 21.65 | 21.47 | 190.72 | ||||||||||||||||||||||||||||||
| HFBL | Home Federal Bancorp, Inc. of Louisiana | 29.09 | 1,563 | 45.5 | 35.93 | 20.00 | 29.09 | -5.89 | -15.02 | 0.73 | 2.71 | NA | 30.46 | 30.46 | 342.59 | ||||||||||||||||||||||||||||||
| HVBC | HV Bancorp, Inc. | 16.81 | 2,012 | 33.8 | 17.48 | 9.75 | 16.81 | 2.50 | -1.98 | -2.10 | 1.92 | 1.87 | 16.75 | 16.75 | 252.41 | ||||||||||||||||||||||||||||||
| IROQ | IF Bancorp, Inc. | 20.50 | 3,240 | 66.4 | 23.00 | 15.03 | 20.50 | 3.41 | -10.87 | -6.95 | 1.63 | NA | 26.21 | 26.21 | 220.16 | ||||||||||||||||||||||||||||||
| KRNY | Kearny Financial Corp. | 10.65 | 86,600 | 922.3 | 12.26 | 6.91 | 10.65 | 2.90 | -12.27 | 0.85 | 0.61 | 0.64 | 12.86 | NA | 84.70 | ||||||||||||||||||||||||||||||
| EBSB | Meridian Bancorp, Inc. | 15.91 | 50,223 | 799.1 | 18.36 | 8.88 | 15.91 | 5.02 | -11.98 | 6.71 | 1.29 | 1.22 | 14.67 | 14.25 | 131.81 | ||||||||||||||||||||||||||||||
| MSVB | Mid-Southern Bancorp, Inc. | 16.24 | 2,986 | 48.5 | 16.59 | 9.71 | 16.24 | 7.34 | 20.30 | 12.70 | 0.37 | 0.35 | 15.20 | 15.20 | 73.09 | ||||||||||||||||||||||||||||||
| NFBK | Northfield Bancorp, Inc. | 13.22 | 52,210 | 690.2 | 16.33 | 8.72 | 13.22 | 6.96 | -18.55 | 7.22 | 0.76 | 0.86 | 14.44 | 13.64 | 105.62 | ||||||||||||||||||||||||||||||
| NWBI | Northwest Bancshares, Inc. | 13.17 | 127,019 | 1,672.8 | 15.99 | 8.52 | 13.17 | 3.29 | -16.27 | 3.38 | 0.62 | 0.80 | 12.11 | 8.95 | 108.69 | ||||||||||||||||||||||||||||||
| PCSB | PCSB Financial Corporation | 15.75 | 15,328 | 241.4 | 20.35 | 11.01 | 15.75 | 6.89 | -22.38 | -1.19 | 0.63 | 0.63 | 16.73 | 16.34 | 116.77 | ||||||||||||||||||||||||||||||
| PVBC | Provident Bancorp, Inc. | 12.10 | 18,099 | 219.0 | 12.50 | 7.21 | 12.10 | 4.94 | 1.00 | 0.83 | 0.66 | 0.76 | 12.38 | 12.38 | 83.20 | ||||||||||||||||||||||||||||||
| PROV | Provident Financial Holdings, Inc. | 15.40 | 7,442 | 114.6 | 22.46 | 11.40 | 15.40 | -4.05 | -30.88 | -1.97 | 0.72 | 0.72 | 16.79 | 16.79 | 157.31 | ||||||||||||||||||||||||||||||
| PBIP | Prudential Bancorp, Inc. | 12.69 | 7,997 | 101.5 | 18.36 | 9.53 | 12.69 | 7.45 | -28.91 | -8.38 | 1.06 | NA | 16.41 | 15.61 | 149.22 | ||||||||||||||||||||||||||||||
| RNDB | Randolph Bancorp, Inc. | 20.00 | 5,143 | 102.9 | 24.70 | 7.92 | 20.00 | 5.26 | 23.08 | -9.34 | 3.03 | 3.28 | 17.19 | NA | 140.57 | ||||||||||||||||||||||||||||||
| RVSB | Riverview Bancorp, Inc. | 5.62 | 22,345 | 125.6 | 7.35 | 3.77 | 5.62 | 7.87 | -22.38 | 6.84 | 0.44 | 0.45 | 6.80 | 5.56 | 64.27 | ||||||||||||||||||||||||||||||
| SVBI | Severn Bancorp, Inc. | 7.80 | 12,817 | 100.0 | 8.80 | 4.26 | 7.80 | 0.65 | -4.67 | 9.24 | 0.52 | 0.52 | 8.56 | 8.47 | 74.32 | ||||||||||||||||||||||||||||||
| STXB | Spirit of Texas Bancshares, Inc. | 19.37 | 17,082 | 330.9 | 21.59 | 8.96 | 19.37 | 7.97 | -7.05 | 15.30 | 1.78 | 1.99 | 21.12 | 15.94 | 180.63 | ||||||||||||||||||||||||||||||
| SBT | Sterling Bancorp, Inc. | 5.11 | 49,982 | 255.4 | 7.58 | 2.53 | 5.11 | 9.19 | -30.85 | 12.56 | -0.26 | NA | 6.39 | 6.39 | 78.31 | ||||||||||||||||||||||||||||||
| TBNK | Territorial Bancorp Inc. | 24.77 | 9,110 | 225.7 | 30.41 | 19.23 | 24.77 | 3.81 | -16.82 | 3.08 | 2.01 | 1.90 | 26.14 | 26.14 | 231.70 | ||||||||||||||||||||||||||||||
| TSBK | Timberland Bancorp, Inc. | 27.10 | 8,318 | 225.4 | 28.28 | 13.60 | 27.10 | 7.33 | -3.25 | 11.71 | 2.97 | 3.01 | 23.24 | 21.24 | 190.96 | ||||||||||||||||||||||||||||||
| TBK | Triumph Bancorp, Inc. | 64.06 | 24,660 | 1,579.7 | 65.63 | 19.03 | 64.06 | 11.72 | 49.25 | 31.95 | 2.53 | NA | 27.42 | 19.78 | 240.70 | ||||||||||||||||||||||||||||||
| TRST | TrustCo Bank Corp NY | 6.51 | 96,433 | 627.8 | 8.19 | 4.30 | 6.51 | 4.66 | -19.83 | -2.40 | 0.54 | 0.53 | 5.89 | 5.89 | 61.20 | ||||||||||||||||||||||||||||||
| WSBF | Waterstone Financial, Inc. | 19.19 | 23,686 | 454.5 | 19.98 | 12.10 | 19.19 | 3.90 | 7.03 | 1.97 | 3.30 | 3.39 | 16.47 | NA | 92.23 | ||||||||||||||||||||||||||||||
| WNEB | Western New England Bancorp, Inc. | 7.23 | 24,664 | 165.4 | 9.53 | 4.45 | 7.23 | 12.79 | -22.92 | 4.93 | 0.45 | 0.47 | 8.97 | 8.36 | 95.92 | ||||||||||||||||||||||||||||||
| WSFS | WSFS Financial Corporation | 45.26 | 47,756 | 2,161.4 | 47.78 | 17.84 | 45.26 | 5.33 | 8.54 | 0.85 | 2.27 | 2.01 | 37.52 | 25.85 | 300.15 | ||||||||||||||||||||||||||||||
| WVFC | WVS Financial Corp. | 15.15 | 1,742 | 26.3 | 16.89 | 13.00 | 15.15 | 3.06 | -9.85 | 5.75 | 0.99 | 1.00 | 20.20 | 20.20 | 182.25 | ||||||||||||||||||||||||||||||
| AX | Axos Financial, Inc. | 43.95 | 59,077 | 2,595.0 | 44.05 | 13.69 | 43.95 | 12.84 | 53.40 | 17.11 | 3.45 | 3.71 | 21.79 | 19.75 | 243.64 | ||||||||||||||||||||||||||||||
| FBC | Flagstar Bancorp, Inc. | 45.06 | 52,656 | 2,372.7 | 47.92 | 16.76 | 45.06 | 5.16 | 23.28 | 10.55 | 9.52 | 9.70 | NA | NA | 589.45 | ||||||||||||||||||||||||||||||
| NYCB | New York Community Bancorp, Inc. | 10.41 | 463,902 | 4,829.2 | 11.88 | 7.72 | 10.41 | -0.48 | -8.76 | -1.33 | 1.02 | 1.01 | 13.66 | 8.43 | 121.38 | ||||||||||||||||||||||||||||||
| PFS | Provident Financial Services, Inc. | 18.99 | 76,155 | 1,446.2 | 23.56 | 9.05 | 18.99 | 2.54 | -19.09 | 5.73 | 1.39 | 1.44 | 20.87 | 14.86 | 169.65 | ||||||||||||||||||||||||||||||
| Mutual Holding Companies | |||||||||||||||||||||||||||||||||||||||||||||
| BCOW | 1895 Bancorp Of Wisconsin, Inc. (MHC) | 9.85 | 4,589 | 45.2 | 12.01 | 7.43 | 9.85 | 4.12 | -17.02 | -1.10 | 0.30 | 0.12 | 12.50 | 12.50 | 110.01 | ||||||||||||||||||||||||||||||
| BSBK | Bogota Financial Corp. (MHC) | 9.12 | 13,158 | 120.0 | 11.50 | 6.07 | 9.12 | 0.55 | -20.70 | 2.36 | 0.17 | 0.33 | 9.76 | 9.76 | 56.31 | ||||||||||||||||||||||||||||||
| CLBK | Columbia Financial, Inc. (MHC) | 15.80 | 110,940 | 1,752.8 | 17.34 | 10.27 | 15.80 | 2.46 | -8.09 | 1.54 | 0.52 | 0.57 | 9.12 | 8.34 | 79.31 | ||||||||||||||||||||||||||||||
| FSEA | First Seacoast Bancorp (MHC) | 8.73 | 5,866 | 51.2 | 9.80 | 5.07 | 8.73 | 0.69 | -9.06 | -1.68 | 0.22 | 0.18 | 9.66 | 9.66 | 81.37 | ||||||||||||||||||||||||||||||
| GCBC | Greene County Bancorp, Inc. (MHC) | 24.70 | 8,513 | 210.3 | 30.25 | 15.01 | 24.70 | 4.13 | -16.13 | -3.10 | 2.32 | NA | 16.30 | 16.30 | 219.06 | ||||||||||||||||||||||||||||||
| KFFB | Kentucky First Federal Bancorp (MHC) | 6.46 | 8,212 | 53.1 | 8.16 | 4.40 | 6.46 | 2.38 | -17.22 | 2.22 | -1.50 | NA | 6.29 | 6.18 | 40.27 | ||||||||||||||||||||||||||||||
| LSBK | Lake Shore Bancorp, Inc. (MHC) | 13.44 | 5,701 | 76.6 | 15.90 | 8.95 | 13.44 | 3.31 | -13.35 | 3.38 | 0.77 | 0.76 | 14.75 | 14.75 | 120.36 | ||||||||||||||||||||||||||||||
| MGYR | Magyar Bancorp, Inc. (MHC) | 10.61 | 5,811 | 61.6 | 14.30 | 7.50 | 10.61 | -3.59 | -14.20 | 10.01 | 0.51 | 0.50 | 10.02 | 10.02 | 127.66 | ||||||||||||||||||||||||||||||
| OFED | Oconee Federal Financial Corp. (MHC) | 24.00 | 5,604 | 134.5 | 28.00 | 15.25 | 24.00 | -1.60 | -8.01 | -5.14 | 0.73 | 0.73 | 15.87 | 15.37 | 92.74 | ||||||||||||||||||||||||||||||
| PDLB | PDL Community Bancorp (MHC) | 9.72 | 16,574 | 161.1 | 14.64 | 7.31 | 9.72 | 3.18 | -32.97 | -7.52 | -0.29 | -0.01 | 9.25 | 9.25 | 77.07 | ||||||||||||||||||||||||||||||
| PBFS | Pioneer Bancorp, Inc. (MHC) | 10.91 | 25,048 | 273.3 | 15.28 | 8.02 | 10.91 | 4.40 | -28.22 | 3.22 | 0.30 | 0.27 | 8.68 | 8.32 | 65.03 | ||||||||||||||||||||||||||||||
| RBKB | Rhinebeck Bancorp, Inc. (MHC) | 9.21 | 10,735 | 98.9 | 11.25 | 5.90 | 9.21 | 2.05 | -15.74 | 7.72 | 0.55 | 0.55 | 10.46 | 10.32 | 105.15 | ||||||||||||||||||||||||||||||
| TFSL | TFS Financial Corporation (MHC) | 17.53 | 276,556 | 4,848.0 | 22.47 | 12.65 | 17.53 | -0.79 | -18.08 | -0.57 | 0.30 | NA | 5.91 | 5.87 | 52.69 | ||||||||||||||||||||||||||||||
| Merger Target | |||||||||||||||||||||||||||||||||||||||||||||
| STND | Standard AVB Financial Corp. | 32.80 | 4,629 | 151.8 | 33.94 | 17.01 | 32.80 | -0.03 | 7.58 | 0.64 | 1.41 | NA | 30.49 | 24.78 | 227.06 | ||||||||||||||||||||||||||||||
| (1) | Average of High/Low or Bid/Ask price per share. |
| (2) | Or since offering price if converted of first listed in the past 52 weeks. Percent change figures are actual year-to-date and are not annualized |
| (3) | EPS (earnings per share) is based on actual trailing 12 month data and is not shown on a pro forma basis. |
| (4) | Excludes intangibles (such as goodwill, value of core deposits, etc.). |
| (5) | ROA (return on assets) and ROE (return on equity) are indicated ratios based on trailing 12 month common earnings and average common equity and total assets balances. |
| (6) | Annualized based on last regular quarterly cash dividend announcement |
| (7) | Indicated dividend as a percent of trailing 12 month earnings |
| (8) | Excluded from averages due to actual or rumored acquisition activities or unusual operating characteristics. |
| (9) | For MHC institutions, market value reflects share price multiplied by public (non-MHC) shares. |
Source: S&P Market Intelligence, LC. and RP® Financial, LC. calcs. The information provided in this table has been obtained from sources we believe are reliable, but we cannot guarantee the accuracy or completeness of such information.
Copyright (c) 2021 by RP® Financial, LC.
| RP® Financial, LC. |
Exhibit IV-1B
Weekly Thrift Market Line - Part Two
Prices As of February 5, 2021
| Key Financial Ratios | Asset Quality Ratios | Pricing Ratios | Dividend Data (6) | ||||||||||||||||||||||||||||||||||||||||||||||||
| Equity/ | Tang Equity/ | Reported Earnings | Core Earnings | NPAs/ | Rsvs/ | Price/ | Price/ | Price/ | Price/ | Price/ | Div/ | Dividend | Payout | ||||||||||||||||||||||||||||||||||||||
| Assets(1) | Assets(1) | ROA(5) | ROE(5) | ROA(5) | ROE(5) | Assets | NPLs | Earnings | Book | Assets | Tang Book | Core Earnings | Share | Yield | Ratio (7) | ||||||||||||||||||||||||||||||||||||
| (%) | (%) | (%) | (%) | (%) | (%) | (%) | (%) | (x) | (%) | (%) | (%) | (x) | ($) | (%) | (%) | ||||||||||||||||||||||||||||||||||||
| All Fully-Converted Savings Institutions | |||||||||||||||||||||||||||||||||||||||||||||||||||
| Average | 12.53 | 11.59 | 0.91 | 7.56 | 1.00 | 7.70 | 0.84 | 147.38 | 17.44 | 103.63 | 12.92 | 114.74 | 17.01 | 0.43 | 2.36 | 47.00 | |||||||||||||||||||||||||||||||||||
| Median | 12.62 | 11.71 | 0.93 | 7.68 | 1.01 | 7.76 | 0.84 | 149.79 | 16.83 | 103.66 | 13.01 | 114.25 | 16.95 | 0.43 | 2.36 | 47.00 | |||||||||||||||||||||||||||||||||||
| Fully Converted Savings Institutions | |||||||||||||||||||||||||||||||||||||||||||||||||||
| AFBI | Affinity Bancshares, Inc. | 8.92 | 6.93 | 0.32 | 2.55 | 0.69 | 5.55 | 0.76 | 103.99 | 41.35 | 102.74 | 9.16 | 135.14 | 19.09 | NA | NA | NM | ||||||||||||||||||||||||||||||||||
| BYFC | Broadway Financial Corporation | 9.89 | 9.89 | -0.03 | -0.26 | NA | NA | 0.96 | 66.99 | NM | 125.52 | 12.41 | 125.52 | NA | 0.00 | 0.00 | NM | ||||||||||||||||||||||||||||||||||
| CFFN | Capitol Federal Financial, Inc. | 13.29 | NA | 0.64 | 4.69 | 0.64 | 4.69 | NA | NA | 28.75 | 137.54 | 18.28 | 138.41 | 28.22 | 0.34 | 2.69 | 106.82 | ||||||||||||||||||||||||||||||||||
| CARV | Carver Bancorp, Inc. | 6.90 | 6.90 | -0.79 | -9.90 | -0.90 | -11.29 | 1.25 | 58.83 | NM | 89.80 | 3.89 | 89.80 | NM | 0.00 | 0.00 | NM | ||||||||||||||||||||||||||||||||||
| CBMB | CBM Bancorp, Inc. | 22.94 | 22.94 | 0.32 | 1.27 | 0.27 | 1.07 | 0.55 | 337.30 | 69.75 | 97.29 | 22.31 | 97.29 | 84.11 | NA | NA | 250.00 | ||||||||||||||||||||||||||||||||||
| CNNB | Cincinnati Bancorp, Inc. | 17.13 | 17.07 | 0.77 | 6.10 | 0.78 | 6.17 | 0.54 | 118.50 | 19.93 | 89.56 | 15.34 | 89.97 | 19.71 | NA | NA | NM | ||||||||||||||||||||||||||||||||||
| ESBK | Elmira Savings Bank | 9.43 | 7.66 | 0.64 | 6.95 | 0.64 | 6.97 | NA | 103.71 | 10.29 | 71.03 | 6.69 | 89.11 | 10.30 | 0.60 | 4.90 | 57.14 | ||||||||||||||||||||||||||||||||||
| ESSA | ESSA Bancorp, Inc. | 10.39 | 9.69 | 0.79 | 7.77 | 0.78 | 7.75 | NA | NA | 10.68 | 86.89 | 9.03 | 93.91 | 10.71 | 0.44 | 2.82 | 30.14 | ||||||||||||||||||||||||||||||||||
| FFBW | FFBW, Inc. | 35.92 | 35.90 | 0.63 | 2.41 | NA | NA | 0.63 | 143.79 | 40.08 | 78.24 | 28.10 | 78.28 | NA | NA | NA | NM | ||||||||||||||||||||||||||||||||||
| FNWB | First Northwest Bancorp | 11.27 | 11.27 | 0.72 | 5.79 | 0.55 | 4.40 | NA | NA | 14.28 | 86.37 | 9.73 | 86.37 | 18.80 | 0.24 | 1.53 | 20.00 | ||||||||||||||||||||||||||||||||||
| FSBW | FS Bancorp, Inc. | 10.88 | 10.59 | 2.02 | 18.74 | 1.98 | 18.32 | NA | NA | 6.56 | 108.43 | 11.80 | 111.87 | 6.71 | 0.84 | 1.43 | 7.02 | ||||||||||||||||||||||||||||||||||
| GBNY | Generations Bancorp NY, Inc. | 7.75 | NA | NA | NA | NA | NA | NA | NA | NA | NA | NA | NA | NA | NA | NA | NA | ||||||||||||||||||||||||||||||||||
| HONE | HarborOne Bancorp, Inc. | 15.53 | 14.11 | 1.05 | 6.55 | 1.08 | 6.73 | NA | NA | 13.80 | 93.00 | 14.44 | 104.09 | 13.43 | 0.12 | 1.06 | 10.98 | ||||||||||||||||||||||||||||||||||
| HIFS | Hingham Institution for Savings | 10.25 | 10.25 | 1.88 | 18.96 | 1.65 | 16.56 | NA | NA | 10.16 | 172.45 | 17.68 | 172.45 | 11.64 | 1.88 | 0.80 | 10.62 | ||||||||||||||||||||||||||||||||||
| HMNF | HMN Financial, Inc. | 11.35 | 11.27 | 1.21 | 10.56 | NA | NA | NA | NA | 8.56 | 87.76 | 9.96 | 88.50 | NA | 0.00 | 0.00 | NM | ||||||||||||||||||||||||||||||||||
| HFBL | Home Federal Bancorp, Inc. of Louisiana | 9.61 | 9.61 | 0.93 | 9.31 | NA | NA | NA | NA | 10.73 | 95.50 | 9.18 | 95.50 | NA | 0.66 | 2.27 | 24.17 | ||||||||||||||||||||||||||||||||||
| HVBC | HV Bancorp, Inc. | 7.33 | 7.33 | 1.02 | 11.87 | 0.99 | 11.54 | 0.49 | 76.54 | 8.76 | 100.35 | 7.36 | 100.35 | 9.01 | NA | NA | NM | ||||||||||||||||||||||||||||||||||
| IROQ | IF Bancorp, Inc. | 11.90 | 11.90 | 0.70 | 6.06 | NA | NA | NA | NA | 12.58 | 78.23 | 9.31 | 78.23 | NA | 0.30 | 1.46 | 18.40 | ||||||||||||||||||||||||||||||||||
| KRNY | Kearny Financial Corp. | 14.89 | NA | 0.73 | 4.66 | 0.76 | 4.85 | NA | NA | 17.46 | 82.81 | 12.33 | 104.93 | 16.59 | 0.32 | 3.00 | 52.46 | ||||||||||||||||||||||||||||||||||
| EBSB | Meridian Bancorp, Inc. | 11.61 | 11.32 | 1.01 | 8.76 | 0.95 | 8.28 | NA | NA | 12.33 | 108.46 | 12.60 | 111.66 | 13.05 | 0.32 | 2.01 | 24.81 | ||||||||||||||||||||||||||||||||||
| MSVB | Mid-Southern Bancorp, Inc. | 22.38 | 22.38 | 0.56 | 2.36 | 0.52 | 2.20 | 1.19 | 63.20 | 43.89 | 106.86 | 23.91 | 106.86 | 46.93 | 0.12 | 0.74 | 24.32 | ||||||||||||||||||||||||||||||||||
| NFBK | Northfield Bancorp, Inc. | 13.67 | 13.01 | 0.70 | 5.07 | 0.80 | 5.76 | NA | 231.96 | 17.39 | 91.54 | 12.52 | 96.94 | 15.30 | 0.44 | 3.33 | 57.89 | ||||||||||||||||||||||||||||||||||
| NWBI | Northwest Bancshares, Inc. | 11.14 | 8.48 | 0.58 | 4.72 | 0.75 | 6.09 | 0.92 | 108.18 | 21.24 | 108.72 | 12.12 | 147.19 | 16.48 | 0.76 | 5.77 | 122.58 | ||||||||||||||||||||||||||||||||||
| PCSB | PCSB Financial Corporation | 15.05 | 14.75 | 0.55 | 3.50 | 0.55 | 3.51 | NA | 194.03 | 25.00 | 94.14 | 14.17 | 96.39 | 24.90 | 0.16 | 1.02 | 25.40 | ||||||||||||||||||||||||||||||||||
| PVBC | Provident Bancorp, Inc. | 15.66 | 15.66 | 0.89 | 5.05 | 1.02 | 5.79 | NA | NA | 18.33 | 97.72 | 15.31 | 97.72 | 16.00 | 0.12 | 0.99 | 18.18 | ||||||||||||||||||||||||||||||||||
| PROV | Provident Financial Holdings, Inc. | 10.68 | 10.68 | 0.47 | 4.34 | 0.47 | 4.34 | 0.88 | 83.14 | 21.39 | 91.70 | 9.79 | 91.70 | 21.39 | 0.56 | 3.64 | 77.78 | ||||||||||||||||||||||||||||||||||
| PBIP | Prudential Bancorp, Inc. | 11.00 | 10.52 | 0.73 | 6.77 | NA | NA | NA | NA | 11.97 | 77.32 | 8.50 | 81.30 | NA | 0.28 | 2.21 | 66.98 | ||||||||||||||||||||||||||||||||||
| RNDB | Randolph Bancorp, Inc. | 13.13 | NA | 2.30 | 18.55 | 2.49 | 20.05 | 1.57 | 58.62 | 6.60 | 116.38 | 15.28 | NA | 6.11 | NA | NA | NM | ||||||||||||||||||||||||||||||||||
| RVSB | Riverview Bancorp, Inc. | 10.57 | 8.81 | 0.74 | 6.61 | 0.75 | 6.68 | NA | NA | 12.77 | 82.69 | 8.74 | 101.16 | 12.63 | 0.20 | 3.56 | 45.45 | ||||||||||||||||||||||||||||||||||
| SVBI | Severn Bancorp, Inc. | 11.51 | 11.41 | 0.76 | 6.21 | 0.76 | 6.27 | 1.26 | 79.04 | 15.00 | 91.15 | 10.49 | 92.08 | 14.87 | 0.16 | 2.05 | 30.77 | ||||||||||||||||||||||||||||||||||
| STXB | Spirit of Texas Bancshares, Inc. | 11.69 | 9.09 | 1.12 | 8.97 | 1.25 | 10.03 | NA | NA | 10.88 | 91.71 | 10.72 | 121.50 | 9.73 | 0.36 | 1.86 | 8.99 | ||||||||||||||||||||||||||||||||||
| SBT | Sterling Bancorp, Inc. | 8.17 | 8.17 | -0.35 | -3.85 | NA | NA | NA | NA | NM | 79.92 | 6.53 | 79.92 | NA | 0.00 | 0.00 | NM | ||||||||||||||||||||||||||||||||||
| TBNK | Territorial Bancorp Inc. | 11.78 | 11.78 | 0.89 | 7.55 | 0.84 | 7.12 | NA | NA | 12.32 | 94.75 | 11.16 | 94.75 | 13.06 | 0.92 | 3.71 | 50.75 | ||||||||||||||||||||||||||||||||||
| TSBK | Timberland Bancorp, Inc. | 12.17 | 11.24 | 1.69 | 13.63 | 1.71 | 13.79 | 0.37 | 246.50 | 9.12 | 116.60 | 14.19 | 127.60 | 9.02 | 0.84 | 3.10 | 30.64 | ||||||||||||||||||||||||||||||||||
| TBK | Triumph Bancorp, Inc. | 12.24 | 9.34 | 1.18 | 9.67 | NA | NA | NA | NA | 25.32 | 233.66 | 27.04 | 323.89 | NA | NA | NA | NM | ||||||||||||||||||||||||||||||||||
| TRST | TrustCo Bank Corp NY | 9.63 | 9.62 | 0.94 | 9.47 | 0.93 | 9.31 | NA | NA | 11.99 | 110.49 | 10.64 | 110.60 | 12.20 | 0.27 | 4.19 | 50.19 | ||||||||||||||||||||||||||||||||||
| WSBF | Waterstone Financial, Inc. | 18.91 | NA | 3.77 | 20.62 | 3.87 | 21.19 | NA | NA | 5.82 | 116.54 | 22.04 | 121.36 | 5.66 | 0.80 | 4.17 | 41.21 | ||||||||||||||||||||||||||||||||||
| WNEB | Western New England Bancorp, Inc. | 9.58 | 8.99 | 0.48 | 4.86 | 0.51 | 5.13 | NA | NA | 16.07 | 80.63 | 7.72 | 86.52 | 15.23 | 0.20 | 2.77 | 44.44 | ||||||||||||||||||||||||||||||||||
| WSFS | WSFS Financial Corporation | 12.48 | 8.94 | 0.86 | 6.18 | 0.76 | 5.46 | 0.42 | 398.30 | 19.94 | 120.63 | 15.08 | 175.11 | 22.48 | 0.48 | 1.06 | 21.15 | ||||||||||||||||||||||||||||||||||
| WVFC | WVS Financial Corp. | 12.11 | 12.11 | 0.50 | 4.81 | 0.51 | 4.87 | NA | NA | 15.30 | 75.00 | 9.08 | 75.00 | 15.10 | 0.40 | 2.64 | 40.40 | ||||||||||||||||||||||||||||||||||
| AX | Axos Financial, Inc. | 8.95 | 8.18 | 1.59 | 16.93 | 1.71 | 18.20 | 1.22 | 80.58 | 12.74 | 201.65 | 18.04 | 222.50 | 11.85 | NA | NA | NM | ||||||||||||||||||||||||||||||||||
| FBC | Flagstar Bancorp, Inc. | 7.09 | 6.62 | 2.00 | 26.22 | 2.04 | NA | 0.35 | 247.06 | 4.73 | 117.33 | NA | 126.55 | 4.64 | 0.20 | 0.44 | 1.58 | ||||||||||||||||||||||||||||||||||
| NYCB | New York Community Bancorp, Inc. | 12.15 | 8.19 | 0.94 | 7.62 | 0.94 | 7.55 | NA | NA | 10.21 | 76.18 | 8.65 | 123.43 | 10.30 | 0.68 | 6.53 | 66.67 | ||||||||||||||||||||||||||||||||||
| PFS | Provident Financial Services, Inc. | 12.54 | 9.26 | 0.86 | 6.49 | 0.88 | 6.70 | NA | NA | 13.66 | 90.99 | 11.41 | 127.76 | 13.22 | 0.92 | 4.84 | 66.19 | ||||||||||||||||||||||||||||||||||
| Mutual Holding Companies | |||||||||||||||||||||||||||||||||||||||||||||||||||
| BCOW | 1895 Bancorp Of Wisconsin, Inc. (MHC) | 11.81 | 11.81 | 0.30 | 2.52 | 0.13 | 1.05 | 0.37 | 143.09 | 32.83 | 78.78 | 9.31 | 78.78 | 79.58 | NA | NA | NM | ||||||||||||||||||||||||||||||||||
| BSBK | Bogota Financial Corp. (MHC) | 17.34 | 17.34 | 0.28 | 1.66 | 0.54 | 3.19 | NA | NA | 53.65 | 93.41 | 16.20 | 93.41 | 27.98 | NA | NA | NM | ||||||||||||||||||||||||||||||||||
| CLBK | Columbia Financial, Inc. (MHC) | 11.49 | 10.62 | 0.66 | 5.67 | 0.73 | 6.25 | NA | NA | 30.38 | 173.33 | 19.92 | 189.54 | 27.57 | NA | NA | NM | ||||||||||||||||||||||||||||||||||
| FSEA | First Seacoast Bancorp (MHC) | 12.31 | 12.31 | 0.30 | 2.29 | 0.25 | 1.88 | 0.19 | 349.03 | 39.68 | 90.40 | 11.13 | 90.40 | 48.17 | NA | NA | NM | ||||||||||||||||||||||||||||||||||
| GCBC | Greene County Bancorp, Inc. (MHC) | 7.44 | 7.44 | 1.18 | 15.37 | NA | NA | NA | NA | 10.65 | 151.57 | 11.28 | 151.57 | NA | 0.48 | 1.94 | 20.26 | ||||||||||||||||||||||||||||||||||
| KFFB | Kentucky First Federal Bancorp (MHC) | 15.67 | 15.43 | -3.78 | -21.67 | NA | NA | NA | NA | NM | 102.66 | 16.09 | 104.57 | NA | 0.40 | 6.19 | NM | ||||||||||||||||||||||||||||||||||
| LSBK | Lake Shore Bancorp, Inc. (MHC) | 12.52 | 12.52 | 0.69 | 5.38 | 0.68 | 5.33 | NA | NA | 17.45 | 91.09 | 11.41 | 91.09 | 17.62 | 0.52 | 3.87 | 48.05 | ||||||||||||||||||||||||||||||||||
| MGYR | Magyar Bancorp, Inc. (MHC) | 7.85 | 7.85 | 0.41 | 5.31 | 0.40 | 5.21 | NA | NA | 20.79 | 105.88 | 8.31 | 105.88 | 21.16 | NA | NA | NM | ||||||||||||||||||||||||||||||||||
| OFED | Oconee Federal Financial Corp. (MHC) | 17.11 | 16.66 | 0.82 | 4.72 | 0.82 | 4.71 | 0.49 | 57.09 | 32.88 | 151.25 | 25.88 | 156.14 | 32.86 | 0.40 | 1.67 | 54.79 | ||||||||||||||||||||||||||||||||||
| PDLB | PDL Community Bancorp (MHC) | 12.40 | 12.40 | -0.46 | -3.28 | -0.02 | -0.15 | 1.38 | 81.43 | NM | 105.05 | 13.02 | 105.05 | NM | NA | NA | NM | ||||||||||||||||||||||||||||||||||
| PBFS | Pioneer Bancorp, Inc. (MHC) | 13.84 | 13.34 | 0.51 | 3.35 | 0.48 | 3.11 | 1.01 | 145.52 | 36.37 | 125.74 | 17.40 | 131.19 | 39.86 | NA | NA | NM | ||||||||||||||||||||||||||||||||||
| RBKB | Rhinebeck Bancorp, Inc. (MHC) | 10.32 | 10.19 | 0.55 | 5.18 | 0.55 | 5.22 | NA | NA | 16.75 | 88.02 | 9.08 | 89.25 | 16.62 | NA | NA | NM | ||||||||||||||||||||||||||||||||||
| TFSL | TFS Financial Corporation (MHC) | 11.38 | 11.32 | 0.56 | 4.89 | NA | NA | NA | NA | 58.43 | 296.67 | 33.75 | 298.42 | NA | 1.12 | 6.39 | 373.33 | ||||||||||||||||||||||||||||||||||
| Under Acquisition | |||||||||||||||||||||||||||||||||||||||||||||||||||
| STND | Standard AVB Financial Corp. | 13.85 | 11.55 | 0.63 | 4.56 | NA | NA | NA | NA | 23.26 | 107.59 | 14.90 | 132.38 | NA | 0.88 | 2.70 | 62.70 | ||||||||||||||||||||||||||||||||||
| (1) | Average of High/Low or Bid/Ask price per share. |
| (2) | Or since offering price if converted of first listed in the past 52 weeks. Percent change figures are actual year-to-date and are not annualized. |
| (3) | EPS (earnings per share) is based on actual trailing 12 month data and is not shown on a pro forma basis. |
| (4) | Exludes intangibles (such as goodwill, value of core deposits, etc.). |
| (5) | ROA (return on assets) and ROE (return on equity) are indicated ratios based on trailing 12 month common earnings and average common equity and total assets balances. |
| (6) | Annualized based on last regular quarterly cash dividend announcement. |
| (7) | Indicated dividend as a percent of trailing 12 month earnings. |
| (8) | Excluded from averages due to actual or rumored acquisition activities or unusual operating characteristics. |
| (9) | For MHC institutions, market value reflects share price multiplied by public (non-MHC) shares. |
Source: S&P Market Intelligence, LC. and RP® Financial, LC. calculations. The information provided in this table has been obtained from sources we believe are reliable, but we cannot guarantee the accuracy or completeness of such information.
Copyright (c) 2021 by RP® Financial, LC.
EXHIBIT IV-2
Historical Stock Price Indices
Exhibit IV-2
Historical Stock Price Indices(1)
| SNL | SNL | |||||||||||||||||||||||
| NASDAQ | Thrift | Bank | ||||||||||||||||||||||
| Year/Qtr. Ended | DJIA | S&P 500 | Composite | Index | Index | |||||||||||||||||||
| 2007: | Quarter 1 | 12354.4 | 1420.9 | 2421.6 | 1703.6 | 634.40 | ||||||||||||||||||
| Quarter 2 | 13408.6 | 1503.4 | 2603.2 | 1645.9 | 622.63 | |||||||||||||||||||
| Quarter 3 | 13895.6 | 1526.8 | 2701.5 | 1523.3 | 595.80 | |||||||||||||||||||
| Quarter 4 | 13264.8 | 1468.4 | 2652.3 | 1058.0 | 492.85 | |||||||||||||||||||
| 2008: | Quarter 1 | 12262.9 | 1322.7 | 2279.1 | 1001.5 | 442.5 | ||||||||||||||||||
| Quarter 2 | 11350.0 | 1280.0 | 2293.0 | 822.6 | 332.2 | |||||||||||||||||||
| Quarter 3 | 10850.7 | 1166.4 | 2082.3 | 760.1 | 414.8 | |||||||||||||||||||
| Quarter 4 | 8776.4 | 903.3 | 1577.0 | 653.9 | 268.3 | |||||||||||||||||||
| 2009: | Quarter 1 | 7608.9 | 797.9 | 1528.6 | 542.8 | 170.1 | ||||||||||||||||||
| Quarter 2 | 8447.0 | 919.3 | 1835.0 | 538.8 | 227.6 | |||||||||||||||||||
| Quarter 3 | 9712.3 | 1057.1 | 2122.4 | 561.4 | 282.9 | |||||||||||||||||||
| Quarter 4 | 10428.1 | 1115.1 | 2269.2 | 587.0 | 260.8 | |||||||||||||||||||
| 2010: | Quarter 1 | 10856.6 | 1169.4 | 2398.0 | 626.3 | 301.1 | ||||||||||||||||||
| Quarter 2 | 9744.0 | 1030.7 | 2109.2 | 564.5 | 257.2 | |||||||||||||||||||
| Quarter 3 | 9744.0 | 1030.7 | 2109.2 | 564.5 | 257.2 | |||||||||||||||||||
| Quarter 4 | 11577.5 | 1257.6 | 2652.9 | 592.2 | 290.1 | |||||||||||||||||||
| 2011: | Quarter 1 | 12319.7 | 1325.8 | 2781.1 | 578.1 | 293.1 | ||||||||||||||||||
| Quarter 2 | 12414.3 | 1320.6 | 2773.5 | 540.8 | 266.8 | |||||||||||||||||||
| Quarter 3 | 10913.4 | 1131.4 | 2415.4 | 443.2 | 198.9 | |||||||||||||||||||
| Quarter 4 | 12217.6 | 1257.6 | 2605.2 | 481.4 | 221.3 | |||||||||||||||||||
| 2012: | Quarter 1 | 13212.0 | 1408.5 | 3091.6 | 529.3 | 284.9 | ||||||||||||||||||
| Quarter 2 | 12880.1 | 1362.2 | 2935.1 | 511.6 | 257.3 | |||||||||||||||||||
| Quarter 3 | 13437.1 | 1440.7 | 3116.2 | 557.6 | 276.8 | |||||||||||||||||||
| Quarter 4 | 13104.1 | 1426.2 | 3019.5 | 565.8 | 292.7 | |||||||||||||||||||
| 2013: | Quarter 1 | 14578.5 | 1569.2 | 3267.5 | 602.3 | 318.9 | ||||||||||||||||||
| Quarter 2 | 14909.6 | 1606.3 | 3404.3 | 625.3 | 346.7 | |||||||||||||||||||
| Quarter 3 | 15129.7 | 1681.6 | 3771.5 | 650.8 | 354.4 | |||||||||||||||||||
| Quarter 4 | 16576.7 | 1848.4 | 4176.6 | 706.5 | 394.4 | |||||||||||||||||||
| 2014: | Quarter 1 | 16457.7 | 1872.3 | 4199.0 | 718.9 | 410.8 | ||||||||||||||||||
| Quarter 2 | 16826.6 | 1960.2 | 4408.2 | 723.9 | 405.2 | |||||||||||||||||||
| Quarter 3 | 17042.9 | 1972.3 | 4493.4 | 697.7 | 411.0 | |||||||||||||||||||
| Quarter 4 | 17823.1 | 2058.9 | 4736.1 | 738.7 | 432.8 | |||||||||||||||||||
| 2015: | Quarter 1 | 17776.1 | 2067.9 | 4900.9 | 749.3 | 418.8 | ||||||||||||||||||
| Quarter 2 | 17619.5 | 2063.1 | 4986.9 | 795.7 | 448.4 | |||||||||||||||||||
| Quarter 3 | 16284.7 | 1920.0 | 4620.2 | 811.7 | 409.4 | |||||||||||||||||||
| Quarter 4 | 17425.0 | 2043.9 | 5007.4 | 809.1 | 431.5 | |||||||||||||||||||
| 2016: | Quarter 1 | 17685.1 | 2059.7 | 4869.9 | 788.1 | 381.4 | ||||||||||||||||||
| Quarter 2 | 17930.0 | 2098.9 | 4842.7 | 780.9 | 385.6 | |||||||||||||||||||
| Quarter 3 | 18308.2 | 2168.3 | 5312.0 | 827.2 | 413.7 | |||||||||||||||||||
| Quarter 4 | 19762.6 | 2238.8 | 5383.1 | 966.7 | 532.7 | |||||||||||||||||||
| 2017: | Quarter 1 | 20663.2 | 2362.7 | 5911.7 | 918.9 | 535.8 | ||||||||||||||||||
| Quarter 2 | 21349.6 | 2423.4 | 6140.4 | 897.1 | 552.4 | |||||||||||||||||||
| Quarter 3 | 22405.1 | 2519.4 | 6496.0 | 939.3 | 573.2 | |||||||||||||||||||
| Quarter 4 | 24719.2 | 2673..6 | 6903.4 | 937.6 | 617.7 | |||||||||||||||||||
| 2018: | Quarter 1 | 24103.1 | 2640.9 | 7063.5 | 941.5 | 606.8 | ||||||||||||||||||
| Quarter 2 | 24271.4 | 2718.4 | 7510.3 | 961.2 | 597.8 | |||||||||||||||||||
| Quarter 3 | 26458.3 | 2914.0 | 8046.4 | 905.6 | 597.8 | |||||||||||||||||||
| Quarter 4 | 23327.5 | 2506.9 | 6635.3 | 772.0 | 502.9 | |||||||||||||||||||
| 2019: | Quarter 1 | 25928.7 | 2834.4 | 7729.3 | 837.8 | 543.8 | ||||||||||||||||||
| Quarter 2 | 26600.0 | 2941.8 | 8006.2 | 845.3 | 573.0 | |||||||||||||||||||
| Quarter 3 | 26916.8 | 2976.7 | 7999.3 | 890.5 | 584.5 | |||||||||||||||||||
| Quarter 4 | 28538.4 | 3230.8 | 8972.6 | 920.7 | 663.9 | |||||||||||||||||||
| 2020: | Quarter 1 | 21917.2 | 2584.6 | 7700.1 | 632.8 | 392.9 | ||||||||||||||||||
| Quarter 2 | 25812.9 | 3100.3 | 10058.8 | 658.5 | 430.8 | |||||||||||||||||||
| Quarter 3 | 27781.7 | 3363.0 | 11167.5 | 605.8 | 417.8 | |||||||||||||||||||
| Quarter 4 | 30606.5 | 3756.1 | 12888.3 | 816.7 | 558.8 | |||||||||||||||||||
| As of February 5, 2021 | 31148.2 | 3886.8 | 13856.3 | 851.8 | 604.8 | |||||||||||||||||||
(1) End of period data.
Sources: S&P Global Market Intelligence and The Wall Street Journal.
EXHIBIT IV-3
Stock Indices as of February 5, 2021
Index Summary (Current Data)
Industry Banking
Geography All
| Index Name | Current Value | As Of | Day’s Change | Day’s Change (%) | ||||||||||||
| SNL Banking Indexes | ||||||||||||||||
| SNL U.S. Bank and Thrift | 576.20 | 2/5/2021 | (0.66 | ) | (0.11 | ) | ||||||||||
| SNL U.S. Bank | 604.77 | 2/5/2021 | (0.66 | ) | (0.11 | ) | ||||||||||
| SNL U.S. Thrift | 851.79 | 2/5/2021 | (2.74 | ) | (0.32 | ) | ||||||||||
| SNL TARP Participants | 143.21 | 2/5/2021 | 1.23 | 0.87 | ||||||||||||
| KBW Nasdaq Bank Index | 106.28 | 2/5/2021 | (0.08 | ) | (0.07 | ) | ||||||||||
| KBW Nasdaq Regional Bank Index | 106.62 | 2/5/2021 | (0.10 | ) | (0.10 | ) | ||||||||||
| S&P 500 Bank | 339.96 | 2/5/2021 | (0.82 | ) | (0.24 | ) | ||||||||||
| NASDAQ Bank | 3,972.37 | 2/5/2021 | (2.57 | ) | (0.06 | ) | ||||||||||
| S&P 500 Commercial Banks | 485.69 | 2/5/2021 | (1.17 | ) | (0.24 | ) | ||||||||||
| S&P 500 Diversified Banks | 569.50 | 2/5/2021 | (1.04 | ) | (0.18 | ) | ||||||||||
| S&P 500 Regional Banks | 126.76 | 2/5/2021 | (0.54 | ) | (0.42 | ) | ||||||||||
| SNL Asset Size Indexes | ||||||||||||||||
| SNL U.S. Bank < $250M | 34.52 | 2/5/2021 | (1.49 | ) | (4.13 | ) | ||||||||||
| SNL U.S. Bank $250M-$500M | 534.79 | 2/5/2021 | 16.23 | 3.13 | ||||||||||||
| SNL U.S. Thrift < $250M | 1,612.75 | 2/5/2021 | (2.19 | ) | (0.14 | ) | ||||||||||
| SNL U.S. Thrift $250M-$500M | 5,753.50 | 2/5/2021 | 52.37 | 0.92 | ||||||||||||
| SNL U.S. Bank < $500M | 1,054.55 | 2/5/2021 | 13.01 | 1.25 | ||||||||||||
| SNL U.S. Thrift < $500M | 2,025.68 | 2/5/2021 | 11.48 | 0.57 | ||||||||||||
| SNL U.S. Bank $500M-$1B | 1,159.06 | 2/5/2021 | 12.41 | 1.08 | ||||||||||||
| SNL U.S. Thrift $500M-$1B | 3,623.95 | 2/5/2021 | 9.87 | 0.27 | ||||||||||||
| SNL U.S. Bank $1B-$5B | 1,102.99 | 2/5/2021 | 2.55 | 0.23 | ||||||||||||
| SNL U.S. Thrift $1B-$5B | 2,416.16 | 2/5/2021 | 6.03 | 0.25 | ||||||||||||
| SNL U.S. Bank $5B-$10B | 1,473.68 | 2/5/2021 | 2.06 | 0.14 | ||||||||||||
| SNL U.S. Thrift $5B-$10B | 1,029.23 | 2/5/2021 | 0.79 | 0.08 | ||||||||||||
| SNL U.S. Bank > $10B | 487.22 | 2/5/2021 | (0.61 | ) | (0.13 | ) | ||||||||||
| SNL U.S. Thrift > $10B | 149.61 | 2/5/2021 | (1.01 | ) | (0.67 | ) | ||||||||||
| SNL Market Cap Indexes | ||||||||||||||||
| SNL Micro Cap U.S. Bank | 556.34 | 2/5/2021 | 2.27 | 0.41 | ||||||||||||
| SNL Micro Cap U.S. Thrift | 1,078.57 | 2/5/2021 | 4.11 | 0.38 | ||||||||||||
| SNL Micro Cap U.S. Bank & Thrift | 654.43 | 2/5/2021 | 2.64 | 0.41 | ||||||||||||
| SNL Small Cap U.S. Bank | 659.74 | 2/5/2021 | 0.92 | 0.14 | ||||||||||||
| SNL Small Cap U.S. Thrift | 654.55 | 2/5/2021 | 0.08 | 0.01 | ||||||||||||
| SNL Small Cap U.S. Bank & Thrift | 677.04 | 2/5/2021 | 0.86 | 0.13 | ||||||||||||
| SNL Mid Cap U.S. Bank | 401.78 | 2/5/2021 | 0.11 | 0.03 | ||||||||||||
| SNL Mid Cap U.S. Thrift | 286.55 | 2/5/2021 | (1.40 | ) | (0.49 | ) | ||||||||||
| SNL Mid Cap U.S. Bank & Thrift | 395.31 | 2/5/2021 | (0.12 | ) | (0.03 | ) | ||||||||||
| SNL Large Cap U.S. Bank | 384.45 | 2/5/2021 | (0.54 | ) | (0.14 | ) | ||||||||||
| SNL Large Cap U.S. Thrift | 97.84 | 1/29/2021 | (4.65 | ) | ||||||||||||
| SNL Large Cap U.S. Bank & Thrift | 387.76 | 2/5/2021 | (0.54 | ) | (0.14 | ) | ||||||||||
| SNL Geographic Indexes | ||||||||||||||||
| SNL Mid-Atlantic U.S. Bank | 631.73 | 2/5/2021 | (0.44 | ) | (0.07 | ) | ||||||||||
| SNL Mid-Atlantic U.S. Thrift | 2,883.60 | 2/5/2021 | (20.56 | ) | (0.71 | ) | ||||||||||
| SNL Midwest U.S. Bank | 630.72 | 2/5/2021 | (0.26 | ) | (0.04 | ) | ||||||||||
| SNL Midwest U.S. Thrift | 3,188.59 | 2/5/2021 | (23.51 | ) | (0.73 | ) | ||||||||||
| SNL New England U.S. Bank | 558.98 | 2/5/2021 | 2.12 | 0.38 | ||||||||||||
| SNL New England U.S. Thrift | 3,150.15 | 2/5/2021 | (8.49 | ) | (0.27 | ) | ||||||||||
| SNL Southeast U.S. Bank | 420.99 | 2/5/2021 | (1.01 | ) | (0.24 | ) | ||||||||||
| SNL Southeast U.S. Thrift | 447.93 | 2/5/2021 | 3.16 | 0.71 | ||||||||||||
| SNL Southwest U.S. Bank | 1,153.01 | 2/5/2021 | (4.16 | ) | (0.36 | ) | ||||||||||
| SNL Southwest U.S. Thrift | 1,305.60 | 2/5/2021 | 16.43 | 1.27 | ||||||||||||
| SNL Western U.S. Bank | 1,137.71 | 2/5/2021 | (0.97 | ) | (0.09 | ) | ||||||||||
| SNL Western U.S. Thrift | 190.79 | 2/5/2021 | 2.98 | 1.59 | ||||||||||||
| SNL Stock Exchange Indexes | ||||||||||||||||
| SNL U.S. Bank NYSE | 521.89 | 2/5/2021 | (0.71 | ) | (0.14 | ) | ||||||||||
| SNL U.S. Thrift NYSE | 121.84 | 2/5/2021 | (0.51 | ) | (0.42 | ) | ||||||||||
| SNL U.S. Bank NYSE American | 763.00 | 2/5/2021 | 2.35 | 0.31 | ||||||||||||
| SNL U.S. Bank NASDAQ | 903.80 | 2/5/2021 | (0.09 | ) | (0.01 | ) | ||||||||||
| SNL U.S. Thrift NASDAQ | 2,496.30 | 2/5/2021 | (6.89 | ) | (0.28 | ) | ||||||||||
| SNL U.S. Bank Pink | 448.34 | 2/5/2021 | 1.17 | 0.26 | ||||||||||||
| SNL U.S. Thrift Pink | 411.35 | 2/5/2021 | 1.88 | 0.46 | ||||||||||||
| SNL Bank TSX | 1,184.94 | 2/5/2021 | 1.54 | 0.13 | ||||||||||||
| SNL OTHER Indexes | ||||||||||||||||
| SNL U.S. Thrift MHCs | 5,695.92 | 2/5/2021 | (45.06 | ) | (0.78 | ) | ||||||||||
| SNL Pink Asset Size Indexes | ||||||||||||||||
| SNL U.S. Bank Pink < $100M | 213.80 | 2/5/2021 | 0.00 | 0.00 | ||||||||||||
| SNL U.S. Bank Pink $100M-$500M | 511.65 | 2/5/2021 | (1.07 | ) | (0.21 | ) | ||||||||||
| SNL U.S. Bank Pink > $500M | 387.59 | 2/5/2021 | 1.30 | 0.34 | ||||||||||||
| Broad Market Indexes | ||||||||||||||||
| DJIA | 31,148.24 | 2/5/2021 | 92.38 | 0.30 | ||||||||||||
| S&P 500 | 3,886.83 | 2/5/2021 | 15.09 | 0.39 | ||||||||||||
| S&P 400 Mid Cap | 2,476.67 | 2/5/2021 | 24.35 | 0.99 | ||||||||||||
| S&P 600 Small Cap | 1,252.75 | 2/5/2021 | 14.47 | 1.17 | ||||||||||||
| S&P 500 Financials | 512.69 | 2/5/2021 | 0.44 | 0.09 | ||||||||||||
| SNL U.S. Financial Institutions | 1,090.64 | 2/5/2021 | (0.82 | ) | (0.08 | ) | ||||||||||
| MSCI US IMI Financials | 1,857.09 | 2/5/2021 | 3.47 | 0.19 | ||||||||||||
| NASDAQ | 13,856.30 | 2/5/2021 | 78.56 | 0.57 | ||||||||||||
| NASDAQ Finl | 5,553.40 | 2/5/2021 | 15.51 | 0.28 | ||||||||||||
| NYSE | 15,069.60 | 2/5/2021 | 94.17 | 0.63 | ||||||||||||
| Russell 1000 | 2,204.27 | 2/5/2021 | 10.49 | 0.48 | ||||||||||||
| Russell 2000 | 2,233.33 | 2/5/2021 | 30.91 | 1.40 | ||||||||||||
| Russell 3000 | 2,350.17 | 2/5/2021 | 12.68 | 0.54 | ||||||||||||
| S&P TSX Composite | 18,135.90 | 2/5/2021 | 93.92 | 0.52 | ||||||||||||
Intraday data is available for certain exchanges. In all cases, the data is at least 15 minutes delayed.
* - Intraday data is not currently available. Data is as of the previous close.
** - Non-publicly traded institutions and institutions outside of your current subscription are not included in custom indexes. Data is as of the previous close.
All SNL indexes are market-value weighted; i.e., an institution’s effect on an index is proportional to that institution’s market capitalization.
Source: MSCI. MSCI makes no express or implied warranties or representations and shall have no liability whatsoever with respect to any MSCI data contained herein. The MSCI data may not be further redistributed or used as a basis for other
EXHIBIT IV-4
Market Area Acquisition Activity
Exhibit IV-4
State of Pennsylvania Thrift Acquisitions 2014-Present
| Target Financials at Announcement | Deal Terms and Pricing at Announcement | |||||||||||||||||||||||||||||||||||||
| Total | NPAs/ | Rsrvs/ | Deal | Value/ | Prem/ | |||||||||||||||||||||||||||||||||
| Announce | Complete | Assets | E/A | TE/A | ROAA | ROAE | Assets | NPLs | Value | Share | P/B | P/TB | P/E | P/A | Cdeps | |||||||||||||||||||||||
| Date | Date | Buyer Name | Target Name | St. | ($000) | (%) | (%) | (%) | (%) | (%) | (%) | ($M) | ($) | (%) | (%) | (x) | (%) | (%) | ||||||||||||||||||||
| 09/25/2020 | 01/00/1900 | Dollar Mutual Bancorp | PA | Standard AVB Financial Corp. | PA | 1,061,381 | 13.45 | 11.15 | 0.68 | 4.79 | 0.50 | 146.54 | 161.3 | 33.000 | 107.76 | 133.44 | 22.45 | 15.19 | 6.75 | |||||||||||||||||||
| 12/05/2019 | 05/01/2020 | William Penn Bncp Inc. (MHC) | PA | Fidelity Savings and Loan Association of Bucks County | PA | 85,921 | 14.91 | 14.91 | 0.36 | 2.46 | 1.51 | 42.34 | NA | NA | NA | NA | NA | NA | NA | |||||||||||||||||||
| 12/05/2019 | 05/01/2020 | William Penn Bncp Inc. (MHC) | PA | Washington Savings Bank | PA | 159,367 | 8.50 | 8.50 | -0.36 | -4.30 | 0.11 | 430.64 | NA | NA | NA | NA | NA | NA | NA | |||||||||||||||||||
| 02/08/2019 | 10/01/2019 | Somerset Trust Holding Company | PA | First Bank of Lilly | PA | 20,485 | 17.13 | 17.13 | 0.16 | 0.97 | 0.32 | 122.73 | 3.4 | 8222.822 | 96.89 | 96.89 | NM | 16.60 | -0.72 | |||||||||||||||||||
| 08/08/2018 | 03/01/2019 | WSFS Financial Corp. | DE | Beneficial Bancorp, Inc. | PA | 5,770,311 | 17.72 | 15.19 | 0.48 | 2.70 | 0.36 | 206.21 | 1507.4 | 19.607 | 143.73 | 172.91 | 52.99 | 26.12 | 16.64 | |||||||||||||||||||
| 07/19/2018 | 04/01/2019 | MHC of Western Pennsylvania | PA | Union Building and Loan Savings Bank | PA | 32,981 | 24.60 | 24.60 | 0.46 | 1.88 | 1.74 | 29.67 | NA | NA | NA | NA | NA | NA | NA | |||||||||||||||||||
| 06/12/2018 | 03/08/2019 | Northwest Bancshares, Inc. | PA | Donegal Financial Services Corp. | PA | 577,379 | NA | NA | NA | NA | NA | NA | 86.1 | 4817.480 | 170.58 | 174.33 | NA | 15.72 | NA | |||||||||||||||||||
| 06/05/2017 | 10/01/2017 | Penn Community Mutual Holdings | PA | Chelten Hills Savings Bank | PA | 25,666 | 13.87 | 13.87 | -0.19 | -1.50 | 0.14 | NM | NA | NA | NA | NA | NA | NA | NA | |||||||||||||||||||
| 02/17/2017 | 05/31/2017 | Ambler Savings Bank | PA | Bally Savings Bank | PA | 53,023 | 9.28 | 9.28 | 0.72 | 8.01 | 3.11 | 15.29 | NA | NA | NA | NA | NA | NA | NA | |||||||||||||||||||
| 10/05/2016 | 03/25/2017 | Dollar Bank FSB | PA | Progressive-Home Federal Savings and Loan Association | PA | 51,375 | 14.50 | 14.50 | 0.24 | 1.69 | 1.06 | 58.61 | NA | NA | NA | NA | NA | NA | NA | |||||||||||||||||||
| 06/02/2016 | 01/01/2017 | Prudential Bancorp Inc. | PA | Polonia Bancorp, Inc. | PA | 287,731 | 13.02 | 13.02 | -0.19 | -1.40 | NA | NA | 38.1 | 11.299 | 100.99 | 100.99 | NA | 13.25 | NA | |||||||||||||||||||
| 04/04/2016 | 10/01/2016 | DNB Financial Corp. | PA | East River Bank | PA | 311,418 | 9.94 | 9.94 | 0.76 | 7.68 | 0.90 | 148.87 | 49.0 | 19.254 | 158.20 | 158.20 | 21.67 | 15.73 | 11.28 | |||||||||||||||||||
| 12/30/2015 | 04/30/2016 | Emclaire Financial Corp. | PA | United-American Savings Bank | PA | 90,717 | 8.73 | 8.73 | 0.75 | 8.92 | 1.26 | 37.63 | 13.2 | 42.670 | 166.84 | 166.84 | 19.68 | 14.56 | 13.16 | |||||||||||||||||||
| 12/08/2015 | 07/01/2016 | Univest Corp. of Pennsylvania | PA | Fox Chase Bancorp, Inc. | PA | 1,098,797 | 16.02 | 16.02 | 0.91 | 5.62 | 1.11 | 112.81 | 98.9 | 8.400 | 55.32 | 55.32 | 9.55 | 9.00 | -11.85 | |||||||||||||||||||
| 11/04/2015 | 02/29/2016 | C&G Savings Bank | PA | Cresson Community Bank | PA | 58,986 | 12.44 | 12.44 | 0.36 | 3.02 | 0.75 | 22.73 | NA | NA | NA | NA | NA | NA | NA | |||||||||||||||||||
| 10/22/2015 | 04/14/2016 | Beneficial Bancorp Inc | PA | Conestoga Bank | PA | 719,013 | 8.70 | 8.70 | 0.59 | 6.75 | 0.92 | 133.46 | 100.1 | NA | 160.00 | 160.00 | 24.52 | 13.92 | 9.21 | |||||||||||||||||||
| 09/03/2015 | 01/08/2016 | NexTier Inc. | PA | Eureka Financial Corporation | PA | 154,626 | 15.15 | 15.15 | 1.01 | 6.78 | 0.54 | 473.84 | 35.3 | 28.500 | 146.94 | 146.94 | 21.43 | 22.83 | 13.06 | |||||||||||||||||||
| 03/03/2015 | 10/09/2015 | WSFS Financial Corp. | DE | Alliance Bancorp, Inc. of Pennsylvania | PA | 420,829 | 15.79 | 15.79 | 0.60 | 3.82 | 2.24 | 54.85 | 90.7 | 22.526 | 136.50 | 136.50 | 35.76 | 21.55 | 8.32 | |||||||||||||||||||
| 11/19/2014 | 08/01/2015 | FSB Mutual Holdings Inc. | PA | First Federal Savings and Loan Association of Bucks County | PA | 739,405 | 10.87 | 10.87 | 0.72 | 6.70 | 0.36 | 163.82 | NA | NA | NA | NA | NA | NA | NA | |||||||||||||||||||
| 10/29/2014 | 02/10/2015 | WesBanco Inc. | WV | ESB Financial Corporation | PA | 1,945,398 | 10.55 | 8.59 | 0.91 | 8.95 | 1.04 | 37.63 | 357.6 | 19.189 | 165.54 | 207.37 | 19.78 | 18.38 | 18.75 | |||||||||||||||||||
| 06/04/2014 | 10/24/2014 | National Penn Bancshares Inc. | PA | TF Financial Corporation | PA | 846,016 | 11.46 | 10.96 | 0.83 | 7.37 | 1.20 | 99.83 | 141.9 | 43.234 | 140.47 | 147.79 | 19.05 | 16.78 | 7.72 | |||||||||||||||||||
| 04/14/2014 | 10/31/2014 | CB Financial Services Inc. | PA | FedFirst Financial Corporation | PA | 323,283 | 15.78 | 15.48 | 0.64 | 3.81 | 1.47 | 73.07 | 55.1 | 22.929 | 104.21 | 106.56 | 27.96 | 17.03 | 2.62 | |||||||||||||||||||
| Average: | 674,278 | 13.45 | 13.09 | 0.50 | 4.03 | 1.03 | 126.87 | 132.43 | 140.29 | 24.99 | 16.90 | 7.91 | ||||||||||||||||||||||||||
| Median: | 299,575 | 13.45 | 13.02 | 0.60 | 3.82 | 0.98 | 99.83 | 142.10 | 147.37 | 21.67 | 16.17 | 8.77 | ||||||||||||||||||||||||||
Source: S&P Global Market Intelligence.
Exhibit IV-5
Prosper Bank
Director and Senior Management Summary Resumes
Directors
Joseph W. Carroll has served as a Trustee of Prosper Bank since 2013 and as the Chairman of the Board since 2015. Mr. Carroll is a graduate of LaSalle College and Villanova School of Law. He was a member of the Chester County District Attorney’s Office for over 35 years in various capacities, including serving as Chester County District Attorney from 2002 until his retirement in 2012. He has been in private law practice since then. Mr. Carroll also served as Interim President of Prosper Bank from January 2019 to September 2019. A lifelong resident of Chester County, Mr. Carroll has served on the boards of United Way of Chester County, The Crime Victim Center of Chester County and several other charitable organizations. Mr. Carroll’s business, legal and administrative experience and contacts in the local community are among his qualifications to serve as a director.
Janak M. Amin is the President and Chief Executive Officer of Prosper Bank. Mr. Amin leads the team at Prosper Bank with values-driven principles that he has cultivated throughout two decades of executive leadership experience in the banking industry in Pennsylvania and Florida. Prior to joining Prosper Bank, from 2018 to 2019, Mr. Amin served as Chief Executive Officer at LeTort Trust, an Independent Trust Company that provides personalized financial solutions to individuals, businesses and institutions. From 2016 to 2018, Mr. Amin served in various roles at Sunshine Bank, including most recently as Co-President. Mr. Amin served as a consultant to Sunshine Bank in 2015 and previously held the position of Market Chief Executive Officer for the Pennsylvania region for Susquehanna Bank from 2012 to 2014. Mr. Amin has also served in various executive positions at other financial institutions since 1997, including Tower Bancorp, Graystone Tower Bank, Graystone Financial, Sovereign Bank and Waypoint Bank. Mr. Amin is a graduate of Liverpool University (U.K.) and obtained his MBA from Penn State and is a graduate of the Wharton School Advance Management Program. He has held board positions in community organizations such as Holy Spirit Hospital, Leukemia Society and been an active member of YPO. Mr. Amin provides the board with nearly 25 years of banking experience in the Pennsylvania market.
Spencer J. Andress is the founder and President of Comprehensive Planners, LTD, which provides land use planning and project management services to a wide variety of private and municipal clients. Mr. Andress is a U.S. Army veteran who retired with the rank of Chief Warrant Officer Five and earned his Bachelor of Science degree in Physics from Lincoln University. He has been active in the Oxford community, serving as a member of several organizations and in a number of elected and appointed local government positions. Mr. Andress has served as a Trustee of Prosper Bank since 2016 and as the Vice Chairman of the Board since 2018. Mr. Andress’ business and financial experience and contacts in the local community are among his qualifications to serve as a director.
Larry J. Constable is a retired entrepreneur. In 1982, Mr. Constable founded L.C. Auto Body Inc. and sold the company in 2018. Mr. Constable graduated from Octorara High School and attended Delaware Community College. Mr. Constable has participated on advisory boards for the training of youth in the collision industry through CCIU/CAT Brandywine. In 2001, he helped to establish the Parkesburg POINT Youth Center. Mr. Constable has served as board chair and volunteered at the Parkesburg POINT Youth Center for eight years and currently volunteers teaching Sunday School, leading youth retreats, and heading up an after-school Good News Club. Mr. Constable has served as a Trustee of Prosper Bank since 2013. Mr. Constable’s business experience and contacts in the local community are among his qualifications to serve as a director.
Thomas R. Greenfield is a retired businessman. Mr. Greenfield has worked in many industries over the course of his career, including steel, sales, real estate, and food services. Most recently, Mr. Greenfield was self-employed as the owner of an antique lamp refurbishing company. Mr. Greenfield attended the Valley Forge Military Academy and earned his Bachelor of Arts degree in Sociology from Tusculum College. His community involvement includes the Big Brothers Program, and Sadsburyville Township Supervisor and Planning Commission. Mr. Greenfield has served as a Trustee of Prosper Bank since 1997. Mr. Greenfield’s business experience and contacts in the local community are among his qualifications to serve as a director.
John V. Pinno, III is the owner of Pinno Preowned Vehicles, which provides used cars to the Oxford, Pennsylvania community. He has spent his 51 year career in the automobile industry, with 27 years as a Pontiac-Buick dealer. Mr. Pinno sold his business in 2008, but continues to operate Pinno Preowned Vehicles at his former location in Oxford, Pennsylvania. Mr. Pinno has served as a Trustee for Prosper Bank since 1996. Mr. Pinno’s business experience and contacts in the local community are among his qualifications to serve as a director.
Jane B. Tompkins is a retired banking executive, having spent her entire career in the banking industry. She has worked for banks of all sizes, from super-regionals to small community institutions. Generally, she has focused on lending, credit analysis and approval, and overall bank risk. Now retired, her most recent position was Chief Risk Officer at Linkbank. From 2014 to 2018, she was the Chief Risk Officer at Sunshine Bank. She graduated with a Bachelor of Science degree from Elizabethtown College. Ms. Tompkins’ history of community service includes board positions with the Central Pennsylvania Food Bank, Harrisburg YWCA, Theatre Harrisburg, and the Humane Society of Harrisburg Area. Ms. Tompkins has served as a Trustee of Prosper Bank since 2020. Ms. Tompkins’ extensive banking experience enhances our board’s risk management oversight and corporate governance.
M. Joye Wentz is a licensed funeral director and since 1986, has been the third-generation owner of Wentz Funeral Home, started by her grandfather in 1894. Ms. Wentz has a Bachelor’s degree in Psychology from the University of Delaware and a degree in Funeral Service from Northampton County Area Community College. Ms. Wentz is active in the community and is or has been a member and Secretary of the Rotary Club of Coatesville, the Strawberry Festival Steering Committee Advertising and Marketing Chair, and a member of the Coatesville Area Senior Center Board, Coatesville Area Partners for Progress, the Western Chester County Chamber of Commerce, and the Pennsylvania Funeral Directors Association. Ms. Wentz has served as a Trustee of Prosper Bank since 1995. Ms. Wentz’s business experience and contacts in the local community are among her qualifications to serve as a director.
R. Cheston Woolard is the Senior Partner at Woolard, Krajnik, Masciangelo, LLP, a certified public accounting firm. He has spent his entire career in the accounting profession and has guided the firm from inception and six employees to present and 26 employees. He earned his Bachelor of Science degree in Business Administration from Waynesburg University and his Master’s Degree in Accounting and Taxation from LaSalle University. He is a member of the American Institute of CPA’s, the Pennsylvania Institute of CPA’s, and the Affordable Housing Authority of Certified Public Accountants. He previously served the community in positions including Chairman of Municipal Services Commission for West Whiteland Township, Audit Committee Chairman and Director for Alliance Bank, and Professor of Auditing at West Chester University. Mr. Woolard remains active in the community as the elected auditor of West Whiteland Township. Mr. Woolard has served as a Trustee of Prosper Bank since 2016. Mr. Woolard’s diverse background and broad experience in public accounting enhances our board of directors’ oversight of financial reporting and disclosure issues, and he qualifies as an Audit Committee financial expert.
Executive Officers Who Are Not Directors
Douglas L. Byers is the Executive Vice President and Chief Banking Officer of Prosper Bank. Mr. Byers is responsible for overseeing and nurturing customer relationships and helping guide the strategic growth of Prosper Bank and its people. From 2017 to 2019, Mr. Byers was the Southcentral Market Executive and Senior Vice President at First Citizens Community Bank. From 2016 to 2017, Mr. Byers was the President and Chief Executive Officer of Hamilton Bancorp. Prior to that, he was the Commercial Lending Team Leader and Senior Vice President at Northwest Savings Bank. From 2005 to 2015, Mr. Byers was the Cash Management Executive and Senior Vice President at Susquehanna Bank. Mr. Byers earned his Bachelor of Arts degree in Business Administration from Millersville University and MBA from Lebanon Valley College. He also graduated from the American Bankers Association Stonier Graduate School of Banking with a Wharton Leadership Certificate. In addition, he completed the Certified Treasury Professional course at Villanova University. Mr. Byers serves on two non-profit boards in the Lancaster and Chester County areas and will begin a three-year term as a board member of the Pennsylvania Community Bankers Association in 2021.
Larry Witt is the Executive Vice President, Chief Information and Chief Operating Officer of Prosper Bank. Mr. Witt is responsible for developing and maintaining a robust and secure IT environment that ensures Prosper Bank is meeting changing customer needs, from product and service development to process and experience improvements. Prior to joining Prosper Bank in 2019, Mr. Witt was the First Vice President and Director of Technical Services at CenterState Bank, which acquired Sunshine Bank in 2018. Prior to CenterState Bank’s acquisition of Sunshine Bank, Mr. Witt was the Vice President of IT and Operations at Sunshine Bank from 2014 to 2018. Larry is a graduate of the University of South Florida with a degree in Information Technology and is a member of the ISACA Harrisburg chapter for IT professionals.
Angela M. Krezmer is the Chief Financial Officer of Prosper Bank. Ms. Krezmer is responsible for long-term strategic planning, financial analysis, budgeting, and overall accounting oversight. She joined Prosper Bank in June 2020, after serving for more than a decade at Fairport Savings Bank, a publicly traded institution, in the Rochester, New York area. Ms. Krezmer held various positions at Fairport Savings Bank including, most recently, Chief Financial Officer. Ms. Krezmer holds a Bachelor of Science in Accounting from Rochester Institute of Technology and is a graduate of the American Bankers Association Stonier Graduate School of Banking program. Since 2018, Ms. Krezmer has served as a Board member and the Treasurer of the Verona Street Animal Society, the partner and fundraising organization for the City of Rochester’s animal shelter.
Source: PB Bankshares’ preliminary prospectus.
Exhibit IV-6
Prosper Bank
Pro Forma Regulatory Capital Ratios
| Prosper Bank Historical at | Pro Forma at December 31, 2020, Based Upon the Sale in the Offering of (1) | |||||||||||||||||||||||||||||||||||||||
| December 31, 2020 | 1,785,000 Shares | 2,100,000 Shares | 2,415,000 Shares | 2,777,250 Shares (2) | ||||||||||||||||||||||||||||||||||||
| Amount | Percent of Assets | Amount | Percent of Assets | Amount | Percent of Assets | Amount | Percent of Assets | Amount | Percent of Assets | |||||||||||||||||||||||||||||||
| (Dollars in thousands) | ||||||||||||||||||||||||||||||||||||||||
| Equity | $ | 21,969 | 7.98 | % | $ | 29,792 | 10.44 | % | $ | 31,287 | 10.90 | % | $ | 32,774 | 11.34 | % | $ | 34,487 | 11.84 | % | ||||||||||||||||||||
| Tier 1 leverage capital (3)(4) | $ | 21,880 | 8.15 | % | $ | 29,704 | 10.67 | % | $ | 31,199 | 11.13 | $ | 32,686 | 11.59 | % | $ | 34,399 | 12.10 | % | |||||||||||||||||||||
| Tier 1 leverage requirement | 13,420 | 5.00 | 13,918 | 5.00 | 14,011 | 5.00 | 14,105 | 5.00 | 14,212 | 5.00 | ||||||||||||||||||||||||||||||
| Excess | $ | 8,460 | 3.15 | % | $ | 15,787 | 5.67 | % | $ | 17,188 | 6.13 | % | $ | 18,581 | 6.59 | % | $ | 20,187 | 7.10 | % | ||||||||||||||||||||
| Tier 1 risk-based capital (3)(4) | $ | 21,880 | 12.42 | % | $ | 29,704 | 16.67 | % | $ | 31,199 | 17.47 | % | $ | 32,686 | 18.26 | % | $ | 34,399 | 19.17 | % | ||||||||||||||||||||
| Tier 1 risk-based requirement | 14,100 | 8.00 | 14,259 | 8.00 | 14,289 | 8.00 | 14,319 | 8.00 | 14,353 | 8.00 | ||||||||||||||||||||||||||||||
| Excess | $ | 7,780 | 4.42 | % | $ | 15,445 | 8.67 | % | $ | 16,910 | 9.47 | % | $ | 18,368 | 10.26 | % | $ | 20,046 | 11.17 | % | ||||||||||||||||||||
| Total risk-based capital (3)(4) | $ | 24,092 | 13.67 | % | $ | 31,915 | 17.91 | % | $ | 33,410 | 18.71 | % | $ | 34,897 | 19.50 | % | $ | 36,610 | 20.41 | % | ||||||||||||||||||||
| Total risk-based requirement | 17,624 | 10.00 | 17,824 | 10.00 | 17,861 | 10.00 | 17,898 | 10.00 | 17,941 | 10.00 | ||||||||||||||||||||||||||||||
| Excess | $ | 6,468 | 3.67 | % | $ | 14,091 | 7.91 | % | $ | 15,549 | 8.71 | % | $ | 16,999 | 9.50 | % | $ | 18,669 | 10.41 | % | ||||||||||||||||||||
| Common equity tier 1 risk-based capital (3)(4) | $ | 21,880 | 12.42 | % | $ | 29,704 | 16.67 | % | $ | 31,199 | 17.47 | % | $ | 32,686 | 18.26 | % | $ | 34,399 | 19.17 | % | ||||||||||||||||||||
| Common equity tier 1 risk-based requirement | 11,456 | 6.50 | 11,585 | 6.50 | 11,610 | 6.50 | 11,634 | 6.50 | 11,662 | 6.50 | ||||||||||||||||||||||||||||||
| Excess | $ | 10,424 | 5.92 | % | $ | 18,119 | 10.17 | % | $ | 19,589 | 10.97 | % | $ | 21,052 | 11.76 | % | $ | 22,737 | 12.67 | % | ||||||||||||||||||||
| Reconciliation of capital infused into Prosper Bank: | ||||||||||||||||||||||||||||||||||||||||
| Net proceeds | $ | 9,965 | $ | 11,838 | $ | 13,703 | $ | 15,850 | ||||||||||||||||||||||||||||||||
| Less: Common stock acquired by stock-based benefit plan | (714 | ) | (840 | ) | (966 | ) | (1,111 | ) | ||||||||||||||||||||||||||||||||
| Less: Common stock acquired by employee stock ownership plan | (1,428 | ) | (1,680 | ) | (1,932 | ) | (2,222 | ) | ||||||||||||||||||||||||||||||||
| Pro forma increase | $ | 7,823 | $ | 9,318 | $ | 10,805 | $ | 12,517 | ||||||||||||||||||||||||||||||||
| (1) | Pro forma capital levels assume that the employee stock ownership plan purchases 8% of the shares of common stock sold in the stock offering with funds we lend and that our stock-based benefit plan purchases 4% of the shares sold in the offering for restricted stock awards. Pro forma capital calculated under generally accepted accounting principles (“GAAP”) and regulatory capital have been reduced by the amount required to fund these plans. See “Management” for a discussion of the employee stock ownership plan. |
| (2) | As adjusted to give effect to an increase in the number of shares, which could occur due to a 15% increase in the offering range to reflect demand for the shares or changes in market conditions following the commencement of the offering. |
| (3) | Tier 1 leverage capital levels are shown as a percentage of total average assets. Risk-based capital levels are shown as a percentage of risk-weighted assets. |
| (4) | Pro forma amounts and percentages assume net proceeds are invested in assets that carry a 20% risk weighting. |
Source: PB Bankshares’ preliminary prospectus.
EXHIBIT IV-7
Prosper Bank
Pro Forma Analysis Sheet
Exhibit IV-7
PRO FORMA ANALYSIS SHEET
Prosper Bank
Prices as of February 5, 2021
| Peer Group | Pennsylvania | All-Publicly-Traded | ||||||||||||||||||||||||||||||||
| Price Multiple | Symbol | Subject (1) | Mean | Median | Mean | Median | Mean | Median | ||||||||||||||||||||||||||
| Price-earnings ratio (x) | P/E | (30.38 | )x | 12.31 | x | 10.73 | x | 13.59 | x | 11.97 | x | 13.96 | x | 12.66 | x | |||||||||||||||||||
| Price-core earnings ratio (x) | P/Core | 92.22 | x | 13.53 | x | 12.70 | x | 12.82 | x | 12.90 | x | 13.98 | x | 13.14 | x | |||||||||||||||||||
| Price-book ratio (%) | = | P/B | 53.60 | % | 87.98 | % | 88.66 | % | 89.66 | % | 86.89 | % | 103.63 | % | 94.14 | % | ||||||||||||||||||
| Price-tangible book ratio (%) | = | P/TB | 53.60 | % | 89.91 | % | 89.54 | % | 99.55 | % | 93.91 | % | 114.74 | % | 100.75 | % | ||||||||||||||||||
| Price-assets ratio (%) | = | P/A | 7.18 | % | 14.13 | % | 9.64 | % | 9.22 | % | 9.03 | % | 12.92 | % | 11.60 | % | ||||||||||||||||||
Valuation Parameters
| Pre-Conversion Earnings (Y) | $ | (415,000) | ESOP Stock Purchases (E) | 8.00 | %(5) | ||
| Pre-Conversion Earnings (CY) | $ | 504,000 | Cost of ESOP Borrowings (S) | 0.00 | %(4) | ||
| Pre-Conversion Book Value (B) | $ | 21,969,000 | ESOP Amortization (T) | 20.00 years | |||
| Pre-Conv. Tang. Book Val. (TB) | $ | 21,969,000 | RRP Amount (M) | 4.00 | % | ||
| Pre-Conversion Assets (A) | $ | 275,324,000 | RRP Vesting (N) | 5.00 years | (5) | ||
| Reinvestment Rate (2)(R) | 0.36 | % | Foundation (F) | 0.00 | % | ||
| Est. Conversion Expenses (3)(X) | 6.05 | % | Tax Benefit (Z) | 0 | |||
| Tax Rate (TAX) | 21.00 | % | Percentage Sold (PCT) | 100.00 | % | ||
| Option (O1) | 10.00 | %(6) | |||||
| Estimated Option Value (O2) | 31.70 | %(6) | |||||
| Option vesting (O3) | 5.00 | (6) | |||||
| Option pct taxable (O4) | 25.00 | %(6) |
Calculation of Pro Forma Value After Conversion
| 1. V= | P/E * (Y) | V= | $21,000,000 | |||
| 1 - P/E * PCT * ((1-X-E-M-F)*R*(1-TAX) - (1-TAX)*E/T - (1-TAX)*M/N) - (1-(TAX*O4))*(O1*O2)/O3) | ||||||
| 2. V= | P/Core * (Y) | V= | $21,000,000 | |||
| 1 - P/core * PCT * ((1-X-E-M-F)*R*(1-TAX) - (1-TAX)*E/T - (1-TAX)*M/N) - (1-(TAX*O4))*(O1*O2)/O3) | ||||||
| 3. V= | P/B * (B+Z) | V= | $21,000,000 | |||
| 1 - P/B * PCT * (1-X-E-M-F) | ||||||
| 4. V= | P/TB * (TB+Z) | V= | $21,000,000 | |||
| 1 - P/TB * PCT * (1-X-E-M-F) | ||||||
| 5. V= | P/A * (A+Z) | V= | $21,000,000 | |||
| 1 - P/A * PCT * (1-X-E-M-F) | ||||||
| Conclusion | Shares Issued To the Public | Price Per Share | Gross Offering Proceeds | Shares Issued To Foundation | Total Shares Issued | Aggregate Market Value of Shares Issued | |||||||||||||||||||
| Supermaximum | 2,777,250 | 10.00 | $ | 27,772,500 | 0 | 2,777,250 | $ | 27,772,500 | |||||||||||||||||
| Maximum | 2,415,000 | 10.00 | 24,150,000 | 0 | 2,415,000 | 24,150,000 | |||||||||||||||||||
| Midpoint | 2,100,000 | 10.00 | 21,000,000 | 0 | 2,100,000 | 21,000,000 | |||||||||||||||||||
| Minimum | 1,785,000 | 10.00 | 17,850,000 | 0 | 1,785,000 | 17,850,000 | |||||||||||||||||||
| (1) | Pricing ratios shown reflect the midpoint value. |
| (2) | Net return reflects a reinvestment rate of 0.36% and a tax rate of 21.0% percent. |
| (3) | Offering expenses shown at estimated midpoint value. |
| (4) | No cost is applicable since holding company will fund the ESOP loan. |
| (5) | ESOP and MRP amortize over 20 years and 5 years, respectively; amortization expenses tax effected at 21.0%. |
| (6) | 10 percent option plan with an estimated Black-Scholes valuation of 31.70% of the exercise price, including a 5 year vesting with 25 percent of the options (granted to directors) tax effected at 21.0%. |
EXHIBIT IV-8
Prosper Bank
Pro Forma Effect of Conversion Proceeds
Exhibit IV-8
PRO FORMA EFFECT OF CONVERSION PROCEEDS
Prosper Bank
At the Minimum
| 1. | Pro Forma Market Capitalization | $ | 17,850,000 | ||
| Less: Foundation Shares | - | ||||
| 2. | Offering Proceeds | $ | 17,850,000 | ||
| Less: Estimated Offering Expenses | 1,241,000 | ||||
| Net Conversion Proceeds | $ | 16,609,000 | |||
| 3. | Estimated Additional Income from Conversion Proceeds | ||||
| Net Conversion Proceeds | $ | 16,609,000 | |||
| Less: Cash Contribution to Foundation | 0 | ||||
| Less: Non-Cash Stock Purchases (1) | 2,142,000 | ||||
| Net Proceeds Reinvested | $ | 14,467,000 | |||
| Estimated net incremental rate of return | 0.28 | % | |||
| Reinvestment Income | $ | 41,144 | |||
| Less: Estimated cost of ESOP borrowings (2) | 0 | ||||
| Less: Amortization of ESOP borrowings (3) | 56,406 | ||||
| Less: Amortization of Options (4) | 107,228 | ||||
| Less: Recognition Plan Vesting (5) | 112,812 | ||||
| Net Earnings Impact | $ | (235,301 | ) |
| 4. | Pro Forma Earnings | Before Conversion | Net Earnings Increase | After Conversion | |||||||||
| 12 Months ended December 31, 2020 (reported) | $ | (415,000 | ) | $ | (235,301 | ) | $ | (650,301 | ) | ||||
| 12 Months ended December 31, 2020 (core) | $ | 504,000 | $ | (235,301 | ) | $ | 268,699 |
| 5. | Pro Forma Net Worth | Before Conversion | Net Cash Proceeds | Tax Benefit Of Contribution | After Conversion | ||||||||||||
| December 31, 2020 | $ | 21,969,000 | $ | 14,467,000 | $ | 0 | $ | 36,436,000 | |||||||||
| December 31, 2020 (Tangible) | $ | 21,969,000 | $ | 14,467,000 | $ | 0 | $ | 36,436,000 | |||||||||
| 6. | Pro Forma Assets | Before Conversion | Net Cash Proceeds | Tax Benefit Of Contribution | After Conversion | ||||||||||||
| December 31, 2020 | $ | 275,324,000 | $ | 14,467,000 | $ | 0 | $ | 289,791,000 | |||||||||
| (1) | Includes ESOP and RRP stock purchases equal to 8.0 and 4.0 percent of total shares issued, respectively. |
| (2) | ESOP stock purchases are internally financed by a loan from the holding company. |
| (3) | ESOP borrowings are amortized over 20 years, amortization expense is tax-effected at a 21.0 percent rate. |
| (4) | Option valuation based on Black-Scholes model, 5 year vesting, and assumes 25 percent is taxable. |
| (5) | RRP is amortized over 5 years, and amortization expense is tax effected at 21.0 percent. |
Exhibit IV-8
PRO FORMA EFFECT OF CONVERSION PROCEEDS
Prosper Bank
At the Midpoint Value
| 1. | Pro Forma Market Capitalization | $ | 21,000,000 | ||
| Less: Foundation Shares | - | ||||
| 2. | Offering Proceeds | $ | 21,000,000 | ||
| Less: Estimated Offering Expenses | 1,270,000 | ||||
| Net Conversion Proceeds | $ | 19,730,000 | |||
| 3. | Estimated Additional Income from Conversion Proceeds | ||||
| Net Conversion Proceeds | $ | 19,730,000 | |||
| Less: Cash Contribution to Foundation | 0 | ||||
| Less: Non-Cash Stock Purchases (1) | 2,520,000 | ||||
| Net Proceeds Reinvested | $ | 17,210,000 | |||
| Estimated net incremental rate of return | 0.28 | % | |||
| Reinvestment Income | $ | 48,945 | |||
| Less: Estimated cost of ESOP borrowings (2) | 0 | ||||
| Less: Amortization of ESOP borrowings (3) | 66,360 | ||||
| Less: Amortization of Options (4) | 126,150 | ||||
| Less: Recognition Plan Vesting (5) | 132,720 | ||||
| Net Earnings Impact | $ | (276,285 | ) |
| 4. | Pro Forma Earnings | Before Conversion | Net Earnings Increase | After Conversion | |||||||||
| 12 Months ended December 31, 2020 (reported) | $ | (415,000 | ) | $ | (276,285 | ) | $ | (691,285 | ) | ||||
| 12 Months ended December 31, 2020 (core) | $ | 504,000 | $ | (276,285 | ) | $ | 227,715 | ||||||
| 5. | Pro Forma Net Worth | Before Conversion | Net Cash Proceeds | Tax Benefit Of Contribution | After Conversion | ||||||||||||
| December 31, 2020 | $ | 21,969,000 | $ | 17,210,000 | $ | 0 | $ | 39,179,000 | |||||||||
| December 31, 2020 (Tangible) | $ | 21,969,000 | $ | 17,210,000 | $ | 0 | $ | 39,179,000 | |||||||||
| 6. | Pro Forma Assets | Before Conversion | Net Cash Proceeds | Tax Benefit Of Contribution | After Conversion | ||||||||||||
| December 31, 2020 | $ | 275,324,000 | $ | 17,210,000 | $ | 0 | $ | 292,534,000 | |||||||||
| (1) | Includes ESOP and RRP stock purchases equal to 8.0 and 4.0 percent of total shares issued, respectively. |
| (2) | ESOP stock purchases are internally financed by a loan from the holding company. |
| (3) | ESOP borrowings are amortized over 20 years, amortization expense is tax-effected at a 21.0 percent rate. |
| (4) | Option valuation based on Black-Scholes model, 5 year vesting, and assumes 25 percent is taxable. |
| (5) | RRP is amortized over 5 years, and amortization expense is tax effected at 21.0 percent. |
Exhibit IV-8
PRO FORMA EFFECT OF CONVERSION PROCEEDS
Prosper Bank
At the Maximum Value
| 1. | Pro Forma Market Capitalization | $ | 24,150,000 | ||
| Less: Foundation Shares | - | ||||
| 2. | Offering Proceeds | $ | 24,150,000 | ||
| Less: Estimated Offering Expenses | 1,311,000 | ||||
| Net Conversion Proceeds | $ | 22,839,000 | |||
| 3. | Estimated Additional Income from Conversion Proceeds | ||||
| Net Conversion Proceeds | $ | 22,839,000 | |||
| Less: Cash Contribution to Foundation | 0 | ||||
| Less: Non-Cash Stock Purchases (1) | 2,898,000 | ||||
| Net Proceeds Reinvested | $ | 19,941,000 | |||
| Estimated net incremental rate of return | 0.28 | % | |||
| Reinvestment Income | $ | 56,712 | |||
| Less: Estimated cost of ESOP borrowings (2) | 0 | ||||
| Less: Amortization of ESOP borrowings (3) | 76,314 | ||||
| Less: Amortization of Options (4) | 145,073 | ||||
| Less: Recognition Plan Vesting (5) | 152,628 | ||||
| Net Earnings Impact | $ | (317,302 | ) |
| 4. | Pro Forma Earnings | Before Conversion | Net Earnings Increase | After Conversion | ||||||||||
| 12 Months ended December 31, 2020 (reported) | $ | (415,000 | ) | $ | (317,302 | ) | $ | (732,302 | ) | |||||
| 12 Months ended December 31, 2020 (core) | $ | 504,000 | $ | (317,302 | ) | $ | 186,698 | |||||||
| 5. | Pro Forma Net Worth | Before Conversion | Net Cash Proceeds | Tax Benefit Of Contribution | After Conversion | ||||||||||||
| December 31, 2020 | $ | 21,969,000 | $ | 19,941,000 | $ | 0 | $ | 41,910,000 | |||||||||
| December 31, 2020 (Tangible) | $ | 21,969,000 | $ | 19,941,000 | $ | 0 | $ | 41,910,000 | |||||||||
| 6. | Pro Forma Assets | Before Conversion | Net Cash Proceeds | Tax Benefit Of Contribution | After Conversion | ||||||||||||
| December 31, 2020 | $ | 275,324,000 | $ | 19,941,000 | $ | 0 | $ | 295,265,000 | |||||||||
| (1) | Includes ESOP and RRP stock purchases equal to 8.0 and 4.0 percent of total shares issued, respectively. |
| (2) | ESOP stock purchases are internally financed by a loan from the holding company. |
| (3) | ESOP borrowings are amortized over 20 years, amortization expense is tax-effected at a 21.0 percent rate. |
| (4) | Option valuation based on Black-Scholes model, 5 year vesting, and assumes 25 percent is taxable. |
| (5) | RRP is amortized over 5 years, and amortization expense is tax effected at 21.0 percent. |
Exhibit IV-8
PRO FORMA EFFECT OF CONVERSION PROCEEDS
Prosper Bank
At the Supermaximum Value
| 1. | Pro Forma Market Capitalization | $ | 27,772,500 | ||
| Less: Foundation Shares | - | ||||
| 2. | Offering Proceeds | $ | 27,772,500 | ||
| Less: Estimated Offering Expenses | 1,357,000 | ||||
| Net Conversion Proceeds | $ | 26,415,500 | |||
| 3. | Estimated Additional Income from Conversion Proceeds | ||||
| Net Conversion Proceeds | $ | 26,415,500 | |||
| Less: Cash Contribution to Foundation | 0 | ||||
| Less: Non-Cash Stock Purchases (1) | 3,332,700 | ||||
| Net Proceeds Reinvested | $ | 23,082,800 | |||
| Estimated net incremental rate of return | 0.28 | % | |||
| Reinvestment Income | $ | 65,647 | |||
| Less: Estimated cost of ESOP borrowings (2) | 0 | ||||
| Less: Amortization of ESOP borrowings (3) | 87,761 | ||||
| Less: Amortization of Options (4) | 166,834 | ||||
| Less: Recognition Plan Vesting (5) | 175,522 | ||||
| Net Earnings Impact | $ | (364,469 | ) |
| 4. | Pro Forma Earnings | Before Conversion | Net Earnings Increase | After Conversion | |||||||||
| 12 Months ended December 31, 2020 (reported) | $ | (415,000 | ) | $ | (364,469 | ) | $ | (779,469 | ) | ||||
| 12 Months ended December 31, 2020 (core) | $ | 504,000 | $ | (364,469 | ) | $ | 139,531 | ||||||
| 5. | Pro Forma Net Worth | Before Conversion | Net Cash Proceeds | Tax Benefit Of Contribution | After Conversion | ||||||||||||
| December 31, 2020 | $ | 21,969,000 | $ | 23,082,800 | $ | 0 | $ | 45,051,800 | |||||||||
| December 31, 2020 (Tangible) | $ | 21,969,000 | $ | 23,082,800 | $ | 0 | $ | 45,051,800 |
| 6. | Pro Forma Assets | Before Conversion | Net Cash Proceeds | Tax Benefit Of Contribution | After Conversion | ||||||||||||
| December 31, 2020 | $ | 275,324,000 | $ | 23,082,800 | $ | 0 | $ | 298,406,800 |
| (1) | Includes ESOP and RRP stock purchases equal to 8.0 and 4.0 percent of total shares issued, respectively. |
| (2) | ESOP stock purchases are internally financed by a loan from the holding company. |
| (3) | ESOP borrowings are amortized over 20 years, amortization expense is tax-effected at a 21.0 percent rate. |
| (4) | Option valuation based on Black-Scholes model, 5 year vesting, and assumes 25 percent is taxable. |
| (5) | RRP is amortized over 5 years, and amortization expense is tax effected at 21.0 percent. |
EXHIBIT V-1
RP® Financial, LC.
Firm Qualifications Statement
| RP® FINANCIAL, LC. | |
| Advisory | Planning | Valuation |
FIRM QUALIFICATION STATEMENT
RP® Financial (“RP®) provides financial and management consulting, merger advisory and valuation services to the financial services industry nationwide. We offer a broad array of services, high quality and prompt service, hands-on involvement by principals and senior staff, careful structuring of strategic initiatives and sophisticated valuation and other analyses consistent with industry practices and regulatory requirements. Our staff maintains extensive background in financial and management consulting, valuation and investment banking. Our clients include commercial banks, thrifts, credit unions, mortgage companies, insurance companies and other financial services companies.
STRATEGIC PLANNING SERVICES
RP®’s strategic planning services are designed to provide effective feasible plans with quantifiable results. We analyze strategic options to enhance shareholder value, achieve regulatory approval or realize other objectives. Such services involve conducting situation analyses; establishing mission/vision statements, developing strategic goals and objectives; and identifying strategies to enhance franchise and/or market value, capital management, earnings enhancement, operational matters and organizational issues. Strategic recommendations typically focus on: capital formation and management, asset/liability targets, profitability, return on equity and stock pricing. Our proprietary financial simulation models provide the basis for evaluating the impact of various strategies and assessing their feasibility and compatibility with regulations.
MERGER ADVISORY SERVICES
RP®’s merger advisory services include targeting potential buyers and sellers, assessing acquisition merit, conducting due diligence, negotiating and structuring merger transactions, preparing merger business plans and financial simulations, rendering fairness opinions, preparing mark-to-market analyses, valuing intangible assets and supporting the implementation of post-acquisition strategies. Our merger advisory services involve transactions of financially healthy companies and failed bank deals. RP® is also expert in de novo charters and shelf charters. Through financial simulations, comprehensive data bases, valuation proficiency and regulatory familiarity, RP®’s merger advisory services center on enhancing shareholder returns.
VALUATION SERVICES
RP®’s extensive valuation practice includes bank and thrift mergers, thrift mutual-to-stock conversions, goodwill impairment, insurance company demutualizations, ESOPs, subsidiary companies, merger accounting and other purposes. We are highly experienced in performing appraisals which conform to regulatory guidelines and appraisal standards. RP® is the nation’s leading valuation firm for thrift mutual-to-stock conversions, with appraised values ranging up to $4 billion.
OTHER CONSULTING SERVICES
RP® offers other consulting services including evaluating the impact of regulatory changes, branching and diversification strategies, feasibility studies and special research. We assist banks/thrifts in preparing CRA plans and evaluating wealth management activities on a de novo or merger basis. Our other consulting services are facilitated by proprietary valuation and financial simulation models.
KEY PERSONNEL (Years of Relevant Experience & Contact Information)
| Ronald S. Riggins, Managing Director (41) | (703) 647-6543 | rriggins@rpfinancial.com |
| William E. Pommerening, Managing Director (37) | (703) 647-6546 | wpommerening@rpfinancial.com |
| James J. Oren, Director (34) | (703) 647-6549 | joren@rpfinancial.com |
| James P. Hennessey, Director (35) | (703) 647-6544 | jhennessey@rpfinancial.com |
| Gregory E. Dunn, Director (38) | (703) 647-6548 | gdunn@rpfinancial.com |
| 1311-A Dolley Madison Boulevard | Telephone: (703) 528-1700 | |
| Suite 2A | Fax No.: (703) 528-1788 | |
| McLean, VA 22101 | Toll-Free No.: (866) 723-0594 | |
| www.rpfinancial.com | E-Mail: mail@rpfinancial.com |