As filed with the Securities and Exchange Commission on August 23, 2022
Registration No. 333-
UNITED STATES
SECURITIES AND EXCHANGE COMMISSION
Washington, D.C. 20549
FORM S-1
REGISTRATION STATEMENT
UNDER
THE SECURITIES ACT OF 1933
Akili, Inc.
(Exact Name of Registrant as Specified in Its Charter)
Delaware | 3841 | 98-1586159 | ||
(State or other jurisdiction of incorporation or organization) | (Primary Standard Industrial Classification Code Number) | (I.R.S. Employer Identification Number) |
125 Broad Street, Fifth Floor
Boston, Massachusetts 02110
(617)
313-8853
(Address, including zip code, and telephone number, including area code, of Registrant’s principal executive offices)
W. Edward Martucci, Ph.D.
Chief Executive Officer
Akili, Inc.
125 Broad Street, Fifth Floor
Boston, Massachusetts 02110
(617)
456-0597
(Name, address, including zip code, and telephone number, including area code, of agent for service)
Copies to:
Daniel J. Espinoza, Esq. Arthur R. McGivern, Esq. Sarah Ashfaq, Esq. Goodwin Procter LLP 100 Northern Avenue Boston, Massachusetts (617) 570-1000 | Jacqueline Studer, Esq. Chief Legal Officer Akili, Inc. 125 Broad Street, Fifth Floor Boston, Massachusetts 02110 (617) 313-8853 |
Approximate date of commencement of proposed sale of the securities to the public:
If any of the securities being registered on this Form are to be offered on a delayed or continuous basis pursuant to Rule 415 under the Securities Act of 1933 (the “Securities Act”) check the following box: ☒
If this Form is filed to register additional securities for an offering pursuant to Rule 462(b) under the Securities Act, please check the following box and list the Securities Act registration statement number of the earlier effective registration statement for the same offering. ☐
If this Form is a post-effective amendment filed pursuant to Rule 462(c) under the Securities Act, check the following box and list the Securities Act registration statement number of the earlier effective registration statement for the same offering. ☐
If this Form is a post-effective amendment filed pursuant to Rule 462(d) under the Securities Act, check the following box and list the Securities Act registration statement number of the earlier effective registration statement for the same offering.
Indicate by check mark whether the registrant is a large accelerated filer, an accelerated filer, a
non-accelerated
filer, smaller reporting company, or an emerging growth company. See the definitions of “large accelerated filer,” “accelerated filer,” “smaller reporting company,” and “emerging growth company” in Rule12b-2
of the Exchange Act.| Large accelerated filer | ☐ | Accelerated filer | ☐ | |||
Non-accelerated filer | ☒ | Smaller reporting company | ☒ | |||
| Emerging growth company | ☒ | |||||
If an emerging growth company, indicate by check mark if the registrant has elected not to use the extended transition period for complying with any new or revised financial accounting standards provided pursuant to Section 7(a)(2)(B) of the Securities Act. ☐
The registrant hereby amends this registration statement on such date or dates as may be necessary to delay its effective date until the registrant shall file a further amendment which specifically states that this registration statement shall thereafter become effective in accordance with Section 8(a) of the Securities Act or until this registration statement shall become effective on such date as the SEC, acting pursuant to said Section 8(a), may determine.
The information in this preliminary prospectus is not complete and may be changed. We may not sell these securities until the registration statement filed with the Securities and Exchange Commission is effective. This preliminary prospectus is not an offer to sell these securities and it is not soliciting an offer to buy these securities in any jurisdiction where the offer or sale is not permitted.
SUBJECT TO COMPLETION, DATED AUGUST 23, 2022
PROSPECTUS FOR
43,414,721 SHARES OF COMMON STOCK
OF
AKILI, INC.
This prospectus relates to (i) the resale of 16,200,000 shares of common stock issued in the PIPE Investment (as defined below) by certain of the selling securityholders, (ii) the resale of 6,250,000 shares of common stock issued upon consummation of the Business Combination (as defined below), in exchange for Class B ordinary shares of SCS (as defined below) originally issued to the Sponsor (as defined below); (iii) the resale of 640,000 shares of common stock issued upon consummation of the Business Combination (as defined below), in exchange for Class A ordinary shares of SCS (as defined below) originally issued to the Sponsor (as defined below); (iv) the resale of 2,494,549 shares of common stock held by certain of our current and former directors; (v) the resale of 15,684,066 shares of common stock issued to certain former equity holders of Akili (as defined below) pursuant to the Business Combination; (vi) the issuance by us and resale of 2,096,106 shares of common stock reserved for issuance upon the exercise of options to purchase common stock held by persons who previously ended their relationship with Akili prior to or concurrently with the Closing to the Business Combination; and (vii) the issuance by us and resale of 50,000 shares of common stock reserved for issuance upon the settlement of restricted stock units. We collectively refer to the selling securityholders covered by this prospectus as the “Selling Securityholders”.
On August 19, 2022, we consummated the transactions contemplated by that certain Agreement and Plan of Merger, dated as of January 26, 2022 (the “Merger Agreement”), by and among Social Capital Suvretta Holdings Corp. I, a Cayman Islands exempted company (“SCS”), Karibu Merger Sub Inc., a Delaware corporation and a direct wholly owned subsidiary of SCS (“Merger Sub”), and Akili Interactive Labs, Inc., a Delaware corporation (“Akili”). As contemplated by the Merger Agreement, SCS was domesticated as a Delaware corporation and changed its name to “Akili, Inc.” (the “Domestication”). Following the Domestication, Merger Sub merged with and into Akili, the separate corporate existence of Merger Sub ceased and Akili survived as a wholly owned subsidiary of Akili, Inc. (the “Merger” and, together with the Domestication, the “Business Combination”).
We are registering the resale of shares of common stock as required by (i) the amended and restated registration rights agreement, dated as of August 19, 2022 (the “Registration Rights Agreement”), entered into by and among Akili, Inc., SCS Sponsor I LLC, certain affiliates of SCS Sponsor I LLC, certain directors and advisors of SCS and certain former stockholders of Akili, and (ii) the subscription agreements, entered into by and among SCS and certain qualified institutional buyers and accredited investors relating to the purchase of shares of common stock in private placements consummated in connection with the Business Combination.
We will receive the proceeds from any exercise of outstanding stock options, but not from the resale of any of the securities registered hereby by the Selling Securityholders. The amount of aggregate proceeds from exercise of outstanding stock options to which this registration statement relates could be up to approximately $6,440,833. There is no assurance that stock options will be in the money prior to their expiration or that the holders of such securities will elect to exercise any or all of such securities for cash. We believe the likelihood that these holders will exercise such securities, and therefore any cash proceeds that we may receive in relation to the exercise of such securities will be dependent on the trading price of our common stock. If the market price for our common stock is less than the exercise price of stock options, we believe the holders of such stock options will be unlikely to exercise such securities. See “.”
Use of Proceeds
We will bear all costs, expenses and fees in connection with the registration of the securities. The Selling Securityholders will bear all commissions and discounts, if any, attributable to their respective sales of the securities.
Prior to the extraordinary general meeting of SCS in connection with the Business Combination held on August 18, 2022, holders of 24,772,478 SCS class A ordinary shares exercised their right to redeem those shares for cash at a price of $10.03 per share for an aggregate redemption amount of approximately $248.5 million. The shares of common stock being offered for resale in this prospectus, excluding those issuable upon the exercise of stock options, represent approximately 48.4% of our total outstanding shares of common stock as of the date of this prospectus. Additionally, if all the stock options are exercised, the holders of such stock options would own an additional 2,096,106 shares of common stock, representing approximately 2.5% of our total shares of common stock outstanding following such exercise. The sale of all the securities being offered in this prospectus, following any applicable,” and “.”
lock-up
periods, could result in a significant decline in the public trading price of our shares of common stock. Despite such a decline in the public trading price, the Selling Securityholders may still experience a positive rate of return on the securities they purchased due to the difference in the purchase prices of which they purchased the securities described above. See “Risk Factors – Certain existing shareholders purchased securities in the Company at a price below the current trading price of such securities, and may experience a positive rate of return based on the current trading price. Future investors in our Company may not experience a similar rate of return
Risk Factors – Substantial future sales of shares of our shares of common stock could cause the market price of our shares of common stock to decline
Trading of our common stock began on the Nasdaq Capital Market (“Nasdaq”) on August 22, 2022, under the ticker symbol “AKLI”. Prior to the Domestication, SCS’ Class A ordinary shares, par value $0.0001 per share (the “SCS Class A ordinary shares”) traded on Nasdaq under the ticker symbol “DNAA”. On August 22, 2022, the closing sale price of our common stock as reported by Nasdaq was $7.15.
Investing in our securities involves risks that are described in the “Risk Factors” section beginning on page 15 of this prospectus.
Neither the Securities and Exchange Commission (the “SEC”) nor any state securities commission has approved or disapproved of the securities to be issued under this prospectus or determined if this prospectus is truthful or complete. Any representation to the contrary is a criminal offense.
The date of this prospectus is , 2022.
TABLE OF CONTENTS
Page | ||||
| 1 | ||||
| 2 | ||||
| 3 | ||||
| 5 | ||||
| 7 | ||||
| 13 | ||||
| 15 | ||||
| 64 | ||||
| 65 | ||||
| 66 | ||||
| 74 | ||||
| 80 | ||||
| 135 | ||||
| 137 | ||||
| 155 | ||||
| 162 | ||||
| 173 | ||||
| 176 | ||||
| 180 | ||||
| 186 | ||||
| 190 | ||||
| 191 | ||||
| 195 | ||||
| 195 | ||||
| 195 | ||||
F-1 | ||||
II-1 | ||||
You should rely only on the information contained in this prospectus. No one has been authorized to provide you with information that is different from that contained in this prospectus. This prospectus is dated as of the date set forth on the cover hereof. You should not assume that the information contained in this prospectus is accurate as of any date other than that date.
ABOUT THIS PROSPECTUS
This prospectus is part of a registration statement on Form
S-1
that we filed with the SEC using the “shelf” registration process. Under the shelf registration process, the Selling Securityholders may, from time to time, sell the securities offered by them described in this prospectus. We will not receive any proceeds from the sale by such Selling Securityholders of the securities offered by them described in this prospectus. This prospectus also relates to the issuance by us of shares of common stock issuable upon the exercise of stock options. We will receive proceeds from any exercise of stock options for cash.Neither we nor the Selling Securityholders have authorized anyone to provide you with any information or to make any representations other than those contained in this prospectus or any applicable prospectus supplement or any free writing prospectuses prepared by or on behalf of us or to which we have referred you. Neither we nor the Selling Securityholders take responsibility for, and can provide no assurance as to the reliability of, any other information that others may give you. Neither we nor the Selling Securityholders will make an offer to sell these securities in any jurisdiction where such offer or sale are not permitted. No dealer, salesperson or other person is authorized to give any information or to represent anything not contained in this prospectus, any applicable prospectus supplement or any related free writing prospectus. You should assume that the information appearing in this prospectus or any prospectus supplement is accurate as of the date on the front of those documents only, regardless of the time of delivery of this prospectus or any applicable prospectus supplement, or any sale of a security. Our business, financial condition, results of operations and prospects may have changed since those dates.
The Selling Securityholders and their permitted transferees may use this shelf registration statement to sell securities from time to time through any means described in the section titled “”. More specific terms of any securities that the Selling Securityholders and their permitted transferees offer and sell may be provided in a prospectus supplement that describes, among other things, the specific amounts and prices of the securities being offered and the terms of the offering.
Plan of Distribution
We may also provide a prospectus supplement or post-effective amendment to the registration statement to add information to, or update or change information contained in, this prospectus. Any statement contained in this prospectus will be deemed to be modified or superseded for purposes of this prospectus to the extent that a statement contained in such prospectus supplement or post-effective amendment modifies or supersedes such statement. Any statement so modified will be deemed to constitute a part of this prospectus only as so modified, and any statement so superseded will be deemed not to constitute a part of this prospectus. You should read both this prospectus and any applicable prospectus supplement or post-effective amendment to the registration statement together with the additional information to which we refer you in the sections of this prospectus titled.
“Where You Can Find More Information”
Unless the context indicates otherwise, references in this prospectus to the “company”, “we”, “us”, “our” and similar terms refer to Akili, Inc. (f/k/a Social Capital Suvretta Holdings Corp. I) and its consolidated subsidiaries. References to “SCS” refer to our predecessor company prior to the consummation of the Business Combination (the “Closing”, and the date of the consummation of the Business Combination, the “Closing Date”). References to “Akili” refer to Akili Interactive Labs, Inc. prior to the Closing.
This prospectus contains summaries of certain provisions contained in some of the documents described herein, but reference is made to the actual documents for complete information. All of the summaries are qualified in their entirety by the actual documents. Copies of some of the documents referred to herein have been filed, will be filed or will be incorporated by reference as exhibits to the registration statement of which this prospectus is a part, and you may obtain copies of those documents as described below under “”.
Where You Can Find More Information
1
TRADEMARKS
This document contains references to trademarks and service marks belonging to other entities. Solely for convenience, trademarks and trade names referred to in this prospectus may appear without the ® or
™
symbols, but such references are not intended to indicate, in any way, that the applicable licensor will not assert, to the fullest extent under applicable law, its rights to these trademarks and trade names. Akili, Inc. does not intend its use or display of other companies’ trade names, trademarks or service marks to imply a relationship with, or endorsement or sponsorship of it by, any other companies.2
SELECTED DEFINITIONS
Unless otherwise stated in this prospectus or the context otherwise requires, references to:
| • | “2011 Plan” are to Akili Interactive Labs, Inc. Amended and Restated 2011 Stock Incentive Plan, as amended from time to time; |
| • | “2022 Incentive Plan” or “2022 Plan” are to the 2022 Stock Option and Incentive Plan for Akili, Inc.; |
| • | “2022 ESPP” are to the 2022 Employee Stock Purchase Plan for Akili Interactive Labs, Inc.; |
| • | “Akili common stock” are to common stock, par value $0.0001 per share, of Akili; |
| • | “Akili Options” are to options to purchase shares of Akili common stock; |
| • | “Akili, Inc.” are to SCS after the Domestication and its name change from Social Capital Suvretta Corp. I; |
| • | “Akili, Inc. common stock” are to common stock, par value $0.0001 per share, of Akili, Inc.; |
| • | “Akili Stockholders” are to the stockholders of Akili, holders of Akili Options and holders of warrants to acquire Akili common stock, in each case prior to the Business Combination; |
| • | “ASC” are to Accounting Standards Codification; |
| • | “Business Combination” are to the Domestication together with the Merger; |
| • | “Bylaws” are to the bylaws of Akili, Inc. |
| • | “Cayman Constitutional Documents” are to SCS’ amended and restated memorandum and articles of association, as amended from time to time prior to the Domestication; |
| • | “Certificate of Incorporation” are to the certificate of incorporation of Akili, Inc.; |
| • | “Closing” are to the closing of the Business Combination; |
| • | “Company,” “we,” “us” and “our” are to SCS prior to its domestication as a corporation in the State of Delaware and to Akili, Inc. after its domestication as a corporation incorporated in the State of Delaware, including after its change of name to Akili, Inc.; |
| • | “Continental” are to Continental Stock Transfer & Trust Company |
| • | “COVID-19” are to the novel coronavirus pandemic; |
| • | “DGCL” are to the General Corporation Law of the State of Delaware; |
| • | “Domestication” are to the domestication of Social Capital Suvretta Holdings Corp. I as a corporation incorporated in the State of Delaware; |
| • | “Exchange Act” are to the Securities Exchange Act of 1934, as amended; |
| • | “founder shares” are to the SCS Class B ordinary shares purchased by the Sponsor in a private placement prior to the initial public offering, and the SCS Class A ordinary shares that will be issued upon the conversion thereof; |
| • | “initial public offering” are to SCS’ initial public offering that was consummated on July 2, 2021; |
| • | “IPO registration statement” are to the Registration Statements on Form S-1 (333-256723 and333-257543) filed by SCS in connection with its initial public offering, which became effective on June 29, 2021 and June 30, 2021, respectively; |
| • | “IRS” are to the U.S. Internal Revenue Service; |
| • | “Merger” are to the merger of Merger Sub with and into Akili, with Akili surviving the merger as a wholly owned subsidiary of Akili, Inc.; |
| • | “Merger Sub” are to a Delaware corporation and subsidiary of SCS; |
| • | “Nasdaq” are to the Nasdaq Capital Market; |
3
| • | “ordinary shares” are to the SCS Class A ordinary shares and the SCS Class B ordinary shares, collectively; |
| • | “Person” are to any individual, firm, corporation, partnership, limited liability company, incorporated or unincorporated association, joint venture, joint stock company, governmental authority or instrumentality or other entity of any kind; |
| • | “PIPE Investment” are to the purchase of shares of Akili, Inc. common stock pursuant to the Subscription Agreements; |
| • | “PIPE Investors” are to those certain investors participating in the PIPE Investment pursuant to the Subscription Agreements; |
| • | “private placement shares” are to the Class A ordinary shares issued to Sponsor in a private placement that was consummated concurrently with the closing of the initial public offering and the shares of common stock of Akili, Inc. issued as a matter of law upon the conversion thereof at the time of the Domestication; |
| • | “pro forma” are to giving pro forma effect to the Business Combination; |
| • | “public shareholders” are to holders of public shares, whether acquired in SCS’ initial public offering or acquired in the secondary market; |
| • | “public shares” are to the SCS Class A ordinary shares that were offered and sold by SCS in its initial public offering and registered pursuant to the IPO registration statement or the shares of Akili, Inc. common stock issued as a matter of law upon the conversion thereof at the time of the Domestication, as the context requires; |
| • | “redemption” are to each redemption of public shares for cash pursuant to the Cayman Constitutional Documents; |
| • | “Registration Rights Agreement” are to the Amended and Restated Registration Rights Agreement dated as of August 19, 2022, by and among Akili, Inc. (following the Domestication), the Sponsor, certain affiliates of the Sponsor, certain directors and advisors of SCS and certain former stockholders of Akili; |
| • | “Sarbanes-Oxley Act” are to the Sarbanes-Oxley Act of 2002; |
| • | “SCS” are to Social Capital Suvretta Holdings Corp. I, prior to its domestication as a corporation in the State of Delaware; |
| • | “SCS Class A ordinary shares” are to SCS’ Class A ordinary shares, par value $0.0001 per share; |
| • | “SCS Class B ordinary shares” are to SCS’ Class B ordinary shares, par value $0.0001 per share; |
| • | “SEC” are to the U.S. Securities and Exchange Commission; |
| • | “Securities Act” are to the Securities Act of 1933, as amended; |
| • | “SPE” are to special-purpose entity; |
| • | “Sponsor” are to SCS Sponsor I LLC, a Cayman Islands limited liability company, the sponsor of SCS; |
| • | “Sponsor Related PIPE Investor” are to a PIPE Investor that is an affiliate of the Sponsor (together with its permitted transferees); |
| • | “Subscription Agreements” are to the subscription agreements pursuant to which the PIPE Investment was consummated; |
| • | “Third-Party PIPE Investor” are to any PIPE Investor who is not a Sponsor Related PIPE Investor; and |
| • | “trust account” are to the trust account established at the consummation of SCS’ initial public offering and maintained by Continental, acting as trustee. |
4
CAUTIONARY STATEMENT REGARDING FORWARD-LOOKING STATEMENTS
This prospectus contains statements that are forward-looking and as such are not historical facts. This includes, without limitation, statements regarding the financial position, business strategy and the plans and objectives of management for our future operations. These statements constitute projections, forecasts and forward-looking statements, and are not guarantees of performance. Such statements can be identified by the fact that they do not relate strictly to historical or current facts. When used in this prospectus, words such as “anticipate,” “believe,” “continue,” “could,” “estimate,” “expect,” “intend,” “may,” “might,” “plan,” “possible,” “potential,” “predict,” “project,” “should,” “strive,” “would” and similar expressions may identify forward-looking statements, but the absence of these words does not mean that a statement is not forward-looking.
Forward-looking statements in this prospectus and in any document incorporated by reference in this prospectus may include, for example, statements about:
| • | the effect of uncertainties related to the ongoing COVID-19 pandemic; |
| • | our ability to achieve and maintain profitability in the future; |
| • | our financial performance and ability to respond to general economic conditions; |
| • | our ability to manage our growth effectively and our expectations regarding the development and expansion of our business; |
| • | our ability to access sources of capital, including debt financing and other sources of capital to finance operations and growth; |
| • | our ability to achieve and maintain market acceptance and adoption of EndeavorRx and other prescription digital therapeutics by patients and physicians; |
| • | our ability to obtain or maintain adequate insurance coverage and reimbursement for EndeavorRx and its other products; |
| • | our ability to accurately forecast demand for EndeavorRx and its other products; |
| • | our ability to maintain access for EndeavorRx and our other products via the Apple Store and the Google Play Store; |
| • | our ability to achieve or maintain profitability; |
| • | our ability to maintain or obtain patent protection and/or the patent rights relating to EndeavorRx and its other product candidates and our ability to prevent third parties from competing against us; |
| • | our ability to successfully commercialize EndeavorRx and its other products; |
| • | our ability to obtain and maintain regulatory approval for EndeavorRx and our other product candidates, in the U.S. and in foreign markets, and any related restrictions or limitations of an approved product candidate; |
| • | our ability to obtain funding for our operations, including funding necessary to complete further development of EndeavorRx and further development, approval and, if approved, commercialization of our other product candidates; |
| • | our ability to identify, in-license or acquire additional technology or product candidates; |
5
| • | our ability to successfully protect against security breaches and other disruptions to our information technology structure; |
| • | the impact of applicable laws and regulations, whether in the U.S. or foreign jurisdictions, and any changes thereof; |
| • | our ability to successfully compete against other companies developing similar products to our current and future product offerings; |
| • | our estimates regarding expenses, future revenue, capital requirements and needs for additional financing; |
| • | our ability to establish and maintain an effective system of internal controls over financial reporting; |
| • | our ability to maintain the listing of our securities on Nasdaq; |
| • | the risk that the Business Combination disrupts our plans and operations; |
| • | our inability to realize the anticipated benefits of the Business Combination; |
| • | the outcome of any legal or governmental proceedings that may be instituted against us; and |
| • | other factors detailed under the section titled “ Risk Factors |
These forward-looking statements are based on information available as of the date of this prospectus and current expectations, forecasts and assumptions, and involve a number of judgments, risks and uncertainties. Accordingly, forward-looking statements should not be relied upon as representing our views as of any subsequent date, and we do not undertake any obligation to update forward-looking statements to reflect events or circumstances after the date they were made, whether as a result of new information, future events or otherwise, except as may be required under applicable securities laws.
As a result of a number of known and unknown risks and uncertainties, our actual results or performance may be materially different from those expressed or implied by these forward-looking statements. You should not place undue reliance on these forward-looking statements.
6
PROSPECTUS SUMMARY
This summary highlights selected information from this prospectus and may not contain all of the information that is important to you in making an investment decision. Before investing in our securities, you should carefully read this entire prospectus, including our financial statements and the related notes included in this prospectus and the information set forth under the headings “Risk Factors” and “Management’s Discussion and Analysis of Financial Condition and Results of Operations.” See also the section titled “Where You Can Find Additional Information”.
Unless context otherwise requires, references in this prospectus to the “company”, “we”, “us” or “our” refer to the business of Akili, which became the business of Akili, Inc. following the Closing.
Company Overview
We are a leading digital medicine company pioneering the development of cognitive treatments through game- changing technologies. Our approach of leveraging technologies designed to directly target the brain establishes a new category of medicine – medicine that is validated through clinical trials like a drug or medical device, but experienced like entertainment.
Impairments in cognition are associated with many different chronic diseases and acute illnesses, impacting approximately 85 million people in the U.S. These impairments include, but are not limited to attention-deficit/ hyperactivity disorder (“ADHD”), autism spectrum disorder (“ASD”), multiple sclerosis (“MS”), major depressive disorder (“MDD”), post-traumatic stress disorder (“PTSD”), cognitive impairments in
COVID-19
survivors (“COVID fog”), traumatic brain injury (“TBI”), cancer-related cognitive impairment (“CRCI”) and Alzheimer’s Disease, among others. Global recognition of cognitive function by physicians and patients is at anall-time
high, yet many current treatment approaches are inadequate, as they are either unable to effectively target the brain to address underlying impairments or lack clinical validation.With this approach, we introduced EndeavorRx, the first prescription video game treatment (and first digital treatment for a cognitive impairment) reviewed and granted marketing authorization by the U.S. Food and Drug Administration (the “FDA”) in June 2020, as a Class II medical device through the FDA’s de novo process. EndeavorRx is indicated for use to improve attention function for children ages
8-12
years old with primarily inattentive or combined-type ADHD, who have a demonstrated attention issue. In June 2020, EndeavorRx also received Conformité Européenne (“CE”) Mark certification as a prescription-only digital therapeutic software intended for the treatment of attention and inhibitory control deficits in pediatric patients with ADHD, enabling EndeavorRx to be marketed in European Economic Area (“EEA”) member countries. EndeavorRx should be considered for use as part of a therapeutic program that may include clinician-directed therapy, medication and/or educational programs, which further address symptoms of the disorder. It is not intended to be used as a stand- alone therapeutic and is not a substitution for a child’s medication.Within ADHD, there is a large and growing opportunity for innovative
non-drug
treatments. Current ADHD treatment options represent a $10 billion market with over 70 million prescriptions written every year for drugs in the U.S. According to the U.S. Centers for Disease Control and Prevention, nearly half the pediatric ADHD population uses behavioral therapy as well. The total ADHD population in the U.S. is 10.8 million and our initial target population includes those with inattentive or combined type ADHD, or 8.1 million of the total U.S. ADHD population. EndeavorRx is currently cleared in the U.S. to treat patients in the8-12
age group, which represent approximately 22% (1.8 million) of our target 8.1 million ADHD population.Within this market we face competition from a range of companies. Our competitors include both enterprise companies who are focused on or may enter the healthcare industry, including initiatives and partnerships
7
launched by these large companies, and from private companies that offer solutions for specific chronic conditions. We compete with companies that are developing treatments for cognitive impairment associated with ADHD and other diseases and disorders resulting in cognitive impairment. In the digital health space, we compete with companies that have created
non-regulated
products to treat cognitive impairment in ADHD and other diseases and disorders resulting in cognitive impairment.Our Proprietary Approach
Our platform is powered by proprietary therapeutic engines, which are software and associated algorithms that form the core of our products and product candidates, designed to target cognitive impairment at its source in the brain, informed by decades of research (including research conducted prior to the founding of Akili) and validated through rigorous clinical programs. Our most advanced therapeutic engine, SSME, presents specific
sensory stimuli and simultaneous motor challenges designed to target the fronto-parietal cortex which plays a key role in attention function, while our earlier stage therapeutic engines focus on cognitive functions, including spatial navigation, memory, and planning and organization. Each product and product candidate embodies a specific proprietary therapeutic engine with a variation of the video game-like user interface in an effort to optimize user engagement applicable to a particular disease or medical condition indication. Product candidates are clinically tested in development programs for particular disease or medical condition indications. These products and product candidates are delivered in a platform characterized by the following key attributes:
| • | Targeted treatments that are personalized to patients’ needs |
| • | Clinically validated therapeutics like drugs and medical devices. |
| • | Therapeutics that are experienced as entertainment |
| • | Patient focused and adaptive |
EndeavorRx
®
: The first prescription video game treatmentIn June 2020, EndeavorRx, the first product built on our platform was granted marketing authorization and classified as a Class II medical device by the FDA through FDA’s de novo process. The EndeavorRx product is indicated for use to improve attention function for children ages
8-12
with primarily inattentive or combined-type ADHD, who have a demonstrated attention issue. EndeavorRx represents a fundamental paradigm shift in the treatment of cognitive disorders, where technology is not just delivering a therapy but is itself the medicine.EndeavorRx is the only therapeutic that is an
FDA-authorized
and physician-prescribed video game-based treatment designed to directly target cognitive functioning. For the first time, doctors have a treatment option that is purpose-built to target cognitive function and that is not taken as a pill, but delivered through a video game. EndeavorRx also obtained Conformité Européenne (CE) Mark certification in pediatric patients with ADHD, enabling EndeavorRx to be marketed in European Economic Area (EEA) member countries.Our Development Pipeline
Our therapeutic engines are designed to target cognitive functions with the potential to address multiple medical conditions presenting the same functional cognitive impairments. Based on unmet need and market opportunities, our initial advanced-stage pipeline is focused on nine patient populations in pediatric and adult conditions, addressing both chronic and acute cognitive impairments. Additionally, we are pursuing treatments for cognitive impairments associated with MS MDD, and ASD, all of which have achieved proof of concept, as well as for acute cognitive dysfunction brought on by
COVID-19,
surgery and chemotherapy. Lastly, we are advancing research on monitors that can screen and assess cognitive impairments across populations.8
Each of our development programs is oriented toward a single indication and specific patient population. We refer to variations of our treatment software as our products or product candidates, each of which incorporates the core algorithms of one of our proprietary therapeutic engines (for example, our SSME therapeutic engine, which is incorporated into the majority of our existing product candidates). Within a single development program, we may explore multiple product candidates in early research and studies to optimize user engagement applicable to a particular patient population and indication and to determine which product candidate(s) will be evaluated in later clinical studies within that development program. Based on results of our studies and regulatory feedback from our clinical studies, we may also introduce other product candidates into our ongoing development programs. Furthermore, a specific product candidate may be used for one specific development program or across different development programs. Multiple product candidates may embody a single proprietary therapeutic engine but are differentiated based on one or more characteristics, including the videogame-like user interface and gameplay difficulty and progression, and each product candidate includes unique characteristics optimized for a particular indication and population.
Our current development programs are summarized in the chart below:
Current Akili, Inc. pipeline: initial populations demonstrating potential breadth of technology

| (1) | Timeframes are estimates and are subject to change—see Disclaimer and Risk Factors. |
| (2) | AKL-T01 is marketed as EndeavorRx in the U.S. for children ages8-12 old with primarily inattentive or combined-type ADHD, who have a demonstrated attention issue. |
| (3) | Shionogi is responsible for the clinical development and commercialization of SDT-001 (a version ofAKL-T01 localized for Japanese language and culture), as well as any future development and commercialization ofAKL-T02, another version of our SSME engine that has been used for our ASD program, each in Japan and Taiwan. |
| (4) | AKL-M01 is designed to use SSME algorithms to monitor and assess certain aspects of cognition, as opposed to providing cognitive therapy. |
| (5) | To the extent we are unable to access additional sources of funding following the completion of the Business Combination, our current estimated timeframe for initiating a pivotal study in this development program could be delayed. |
| * | Estimated timeframes in figure above correspond to applicable milestone start times, and are subject to change. Please refer to the section entitled “ Risk Factors Risks Related to Our Business and Industry—Enrollment and retention of patients in clinical trials is an expensive and time-consuming process and could be made more difficult or rendered impossible by multiple factors outside of our control. If we experience delays or difficulties in the enrollment or retention of patients in clinical trials, our ability to obtain necessary marketing authorizations for our product candidates could be delayed or preventedRisks Related to Our Products—Our current product candidates are in various stages of development. Our product candidates may fail in development or suffer delays that adversely affect their commercial viability. If we fail to maintain clearance, de novo classification or approval to market our product candidates, including AKL-T01 for expanded indications, or if we are delayed in obtaining such marketing authorizations, our business, prospects, results of operations and financial condition could be materially and adversely affected |
9
Our Strategy
We believe we are uniquely positioned to capitalize on this opportunity, with our technologies designed to directly target the brain and delivered through
high-end
video game interfaces. Our current business strategies include:| • | Establishing a commercial foothold in pediatric ADHD. |
| • | Leveraging our initial success to expand into other ADHD populations. |
| • | Applying our clinically-validated technology to other mental health and neurology conditions. |
| • | Simultaneously pursuing new technologies designed to address other cognitive impairments. |
| • | Further evolving the treatment paradigm by creating new methods of cognitive assessment. |
Risk Factors
Our business is subject to numerous risks and uncertainties, including those highlighted in the section titled “” immediately following this prospectus summary, which illuminate challenges that we face in connection with the successful implementation of our strategy and the growth of our business. The following considerations, among others, may offset our competitive strengths or have a negative effect on our business strategy, which could cause a decline in the price of shares of our securities and result in a loss of all or a portion of your investment:
Risk Factors
Risks relating to our business and industry, including that:
| • | We have a history of significant losses, anticipate losses increasing expenses in the future, and may not be able to achieve or maintain profitability. |
| • | The failure of our prescription digital therapeutics to achieve and maintain market acceptance and adoption by patients and physicians could have a material adverse effect on our business, prospects, results of operation and financial condition. |
| • | The market for prescription digital therapeutics is new, rapidly evolving, and increasingly competitive, as the healthcare industry in the U.S. is undergoing significant structural change, which makes it difficult to forecast demand for our products. As a result, all prospective financial information included herein are subject to change. |
| • | Our development programs represent novel and innovative potential therapeutic areas, and negative perception of any product or product candidate that we develop could adversely affect our ability to conduct our business, obtain marketing authorizations or identify alternate regulatory pathways to market for such product candidate. |
| • | We face competition, and new products may emerge that provide different or better alternatives for treatment of the conditions that EndeavorRx or our future products, if granted marketing authorization, are authorized to treat. |
Risks relating to our products, including that:
| • | If we fail to achieve and maintain clearance, de novo classification or approval to market our product candidates, including AKL-T01 for expanded indications, or if we are delayed in obtaining such marketing authorizations, our business, prospects, results of operations and financial condition could be materially and adversely affected. |
| • | Clinical trials of any of our products or product candidates may fail to produce results necessary to support marketing authorization. |
10
| • | EndeavorRx is made available via the Apple App Store® and on Google PlayTM, and supported by third-party infrastructure. If our ability to access these markets or access necessary third-party infrastructure was stopped or otherwise restricted or limited, it could have a material adverse effect on our business, prospects, results of operations and financial condition. |
| • | If we are not able to develop and release new products, or successful enhancements, new features and modifications to EndeavorRx or any future products, our business, prospects, results of operations and financial condition could be materially and adversely affected. |
| • | We rely on a single third party digital pharmacy for the fulfillment of prescriptions. This reliance on a single third party increases the risk that we could have disruption in the fulfillment of prescriptions, which could have a material and adverse effect on our reputation, business, results of operations and financial condition. |
Risks relating to our intellectual property and technology, including that:
| • | If we are unable to adequately protect and enforce our intellectual property and proprietary technology, obtain and maintain patent protection for our technology and products where appropriate or if the scope of the patent protection obtained is not sufficiently broad, or if we are unable to protect the confidentiality of our trade secrets and know-how, our competitors could develop and commercialize technology and products similar or identical to our products, and our ability to successfully commercialize our technology and products may be impaired. |
| • | If we fail to comply with obligations in the agreements under which we collaborate with or license intellectual property rights from third parties, or otherwise experience disruptions to our business relationships with collaborators or licensors, we could lose rights that are important to its business. |
Risks relating to our financial reporting and position, including that:
| • | We will need substantial additional funding, and if it is unable to raise capital when needed or on terms favorable to us, our business, financial condition and results of operation could be materially and adversely affected. |
| • | The amount of our future losses is uncertain and our quarterly and annual operating results may fluctuate significantly or fall below the expectations of investors or securities analysists, each of which may cause our stock price to fluctuate or decline. |
Implications of Being an Emerging Growth Company
We are an “emerging growth company” as defined in the JOBS Act. As such, we may take advantage of reduced disclosure and other requirements otherwise generally applicable to public companies, including:
| • | exemption from the requirement to have our registered independent public accounting firm attest to management’s assessment of our internal control over financial reporting; |
| • | exemption from compliance with the requirement of the Public Company Accounting Oversight Board, or PCAOB, regarding the communication of critical audit matters in the auditor’s report on the financial statements; |
| • | reduced disclosure about our executive compensation arrangements; and |
| • | exemption from the requirement to hold non-binding advisory votes on executive compensation or golden parachute arrangements. |
We will remain an emerging growth company until the earliest to occur of: (1) the last day of the fiscal year in which we have at least $1.07 billion in annual revenue; (2) the date we qualify as a “large accelerated filer,” with
11
at least $700.0 million of equity securities held by
non-affiliates;
(3) the date on which we have issued more than $1.0 billion innon-convertible
debt securities during the prior three-year period; and (4) the last day of the fiscal year ending after the fifth anniversary of SCS’s initial public offering. As a result of this status, we have taken advantage of reduced reporting requirements in this prospectus and may elect to take advantage of other reduced reporting requirements in our future filings with the SEC. In particular, in this prospectus, we have not included all of the executive compensation-related information that would be required if we were not an emerging growth company.Corporate Information
We were incorporated under the name “Social Capital Suvretta Holdings Corp. I” on February 25, 2021 as a Cayman Islands exempted company for purposes of effecting a merger, share exchange, asset acquisition, share purchase, reorganization or similar business combination with one or more businesses. On August 19, 2022, we domesticated into a Delaware corporation and changed our name to “Akili, Inc.” in connection with the Domestication.
Our principal executive office is located at 125 Broad Street, Fifth Floor, Boston, Massachusetts 02110. Our telephone number is (617). Information contained on, or otherwise accessible through, our website is not a part of this prospectus.
456-0597.
Our website address iswww.akiliinteractive.com
12
The Offering
Issuer | Akili, Inc. |
Issuance of common stock
Shares of common stock to be issued by us | 2,096,106 shares of common stock reserved for issuance upon the exercise of stock options to purchase common stock. |
50,000 shares of common stock reserved for issuance upon the settlement of restricted stock units.
Shares of common stock outstanding prior to the exercise of stock options and settlement of restricted stock units | 85,395,207 shares |
Use of proceeds | We will receive up to an aggregate of approximately $6,440,833 from the exercise of stock options to which this registration statement relates (assuming the exercise in full of all of the outstanding stock options for cash). There is no assurance that stock options will be in the money prior to their expiration or that the holders of such stock options will elect to exercise any or all of such stock options. We believe the likelihood that these holders will exercise such stock options, and therefore any cash proceeds that we may receive in relation to the exercise of such stock options being offered for sale in this prospectus, will be dependent on the trading price of our common stock. If the market price for our common stock is less than the exercise price of stock options, we believe the holders of such stock options will be unlikely to exercise such securities. We expect to use any net proceeds from the exercise of stock options for general corporate purposes. See “ Use of Proceeds |
Resale of common stock
Shares of common stock offered by the Selling Securityholders | 43,414,721 shares consisting of: |
| • | 16,200,000 shares of common stock issued in the PIPE Investment by certain of the selling securityholders; |
| • | 6,250,000 shares of common stock issued upon consummation of the Business Combination, in exchange for Class B ordinary shares of SCS originally issued to the Sponsor; |
| • | 640,000 shares of common stock issued upon consummation of the Business Combination, in exchange for Class A ordinary shares of SCS originally issued to the Sponsor; |
| • | 2,494,549 shares of common stock held by certain of our current and former directors; |
13
| • | 15,684,066 shares of common stock issued to certain former equity holders of Akili pursuant to the Business Combination; |
| • | 2,096,106 shares of common stock reserved for issuance upon the exercise of options to purchase common stock held by persons who previously ended their relationship with Akili prior to or concurrently with the Closing to the Business Combination; and |
| • | 50,000 shares of common stock reserved for issuance upon the settlement of restricted stock units. |
Terms of the offering | The Selling Securityholders will determine when and how they will dispose of the securities registered under this prospectus for resale. See “Plan of Distribution”. |
Use of proceeds | We will not receive any proceeds from the sale of the securities registered under this prospectus by the Selling Securityholders. |
Risk factors | See “Risk Factors” and the other information included in this prospectus for a discussion of factors you should consider before investing in our securities. |
Nasdaq symbols | Our common stock is listed on Nasdaq under the symbol “AKLI”. |
14
RISK FACTORS
An investment in our securities involves a high degree of risk. You should carefully consider the risks described below before making an investment decision. Our business, prospects, financial condition or operating results could be harmed by any of these risks, as well as other risks not currently known to us or that we currently consider immaterial. The trading price of our securities could decline due to any of these risks, and, as a result, you may lose all or part of your investment. Certain statements in “Risk Factors” are forward-looking statements. See “Cautionary Statement Regarding Forward-Looking Statements”.
Risks Related to our Business and Industry
We are a technology company with marketing authorizations to commercialize our first digital therapeutic, EndeavorRx, in the U.S. and the European Economic Area as well as a pipeline of developmental assets and a limited operating history. We have a history of significant losses, anticipate increasing expenses in the future, and may not be able to achieve or maintain profitability.
We are a technology company with developmental stage assets, with a limited operating history. Like biopharmaceutical product development, digital therapeutic product development is a highly speculative undertaking and involves a substantial degree of risk. Since Akili’s inception in December 2011, we have focused substantially all of our efforts and financial resources on developing our computational platform, building our research and development capabilities, and sourcing, researching, licensing in key assets and developing our product candidates. We have generated limited revenue from product sales, and we do not expect to generate significant revenue from product sales in the foreseeable future. We have only obtained marketing authorizations to commercialize EndeavorRx in the U.S. and the European Economic Area, but have not received regulatory approval to market it anywhere else in the world or to market any of our other product candidates and there is no assurance that we will obtain regulatory marketing authorizations to market and sell products in the future.
We have incurred net losses and negative operating cash flows in each year since our inception. Our net losses were $22.5 million and $14.8 million for the three months ended June 30, 2022 and 2021, respectively, and $61.3 million and $25.6 million for the years ended December 31, 2021 and December 31, 2020, respectively, and we had an accumulated deficit of $275.0 million as of June 30, 2022. Our net cash used in operating activities was $41.4 million and $21.2 million for the six months ended June 30, 2022 and 2021, respectively, and $54.0 million and $24.6 million for the years ended December 31, 2021 and December 31, 2020, respectively. Substantially all of our operating losses and negative operating cash flows have resulted from costs incurred in connection with developing our technology, research and development efforts, advancing our research stage and clinical programs, building our clinical operations group, facilities costs, depreciation and amortization and general and administrative expenses. We expect our operating expenses to significantly increase as we continue to invest in our platform and research and development efforts and as we commence and continue clinical trials in our existing and future development programs. In addition, we also expect to incur significant sales and marketing expenses as we launch and commercialize EndeavorRx and any other product candidates for which we may obtain marketing authorization. We will also incur additional costs associated with operating as a public company. As a result, we expect to continue to incur significant and increasing operating and negative operating cash flows losses for the foreseeable future. Our prior losses, combined with expected future losses, have had and will continue to have an adverse effect on our stockholders’ deficit and working capital. Because of the numerous risks and uncertainties associated with developing new technologies, such as our prescription digital therapeutics, or PDTs, we are unable to predict the extent of any future losses or when we will become profitable, if at all. Even if we do become profitable, we may not be able to sustain or increase our profitability on a quarterly or annual basis.
15
The failure of our prescription digital therapeutics to achieve and maintain market acceptance and adoption by patients and physicians could have a material adverse effect on our business, prospects, results of operations and financial condition.
Our current business strategy is highly dependent on our PDTs, following marketing authorization, achieving and maintaining broad market acceptance by patients and physicians. Market acceptance and adoption of our PDTs depends on educating people with cognitive impairments, as well as self-insured employers, commercial and government payers, health plans and physicians and other government entities, as to the distinct features, therapeutic benefits, cost savings, and other advantages of our PDTs as compared to competitive products or other currently available methodologies. If we are not successful in demonstrating to existing or potential patients and prescribers the benefits of our products, or if we are not able to achieve the support of patients, healthcare providers and payers for our products, we may not achieve sales in line with our forecasts.
Achieving and maintaining market acceptance of our products could be negatively impacted by many factors, including:
| • | the failure of EndeavorRx to achieve wide acceptance among patients, self-insured employers, commercial and government payers, health plans, physicians and other government entities, and key opinion leaders in the treatment community; |
| • | lack of additional evidence of peer-reviewed publication of clinical or real world evidence supporting the effectiveness, safety, cost-savings or other advantages of our products over competitive products or other currently available methodologies; |
| • | perceived risks associated with the use of our product or similar products or technologies generally; |
| • | our ability to maintain U.S. Food and Drug Administration, or FDA, marketing authorization and other marketing authorizations for EndeavorRx; |
| • | our ability to secure and maintain other regulatory clearance, authorization or approval for AKL-T01 for expanded indications and our other product candidates; |
| • | the introduction of competitive products and the rate of acceptance of those products as compared to our products; and |
| • | results of clinical, real world and health economics and outcomes research studies relating to chronic condition products or similar competitive products. |
In addition, our products may be perceived by patients and healthcare providers to be more complicated or less effective than traditional approaches, and people may be unwilling to change their current health regimens. Moreover, we believe that healthcare providers tend to be slow to change their medical treatment practices because of perceived liability risks arising from the use of new products and the uncertainty of third-party reimbursement. Accordingly, healthcare providers may not recommend our products until there is sufficient evidence to convince them to alter their current approach.
There is no assurance that we will obtain or maintain adequate coverage and reimbursement for EndeavorRx or any other of our other product candidates, if granted marketing authorization, or that healthcare insurers will agree to reimburse purchases of our products in the future.
We depend upon revenue from sales of EndeavorRx, and in turn on reimbursement from third-party payers for such product. The reimbursement by third-party payers for our product and the amount that we may receive in payment for our products may be materially and adversely affected by factors we do not control, including federal or state regulatory or legislative changes, and cost-containment decisions and changes in reimbursement schedules of third-party payers. Lack of reimbursement or any reduction or elimination of these payments could have a material adverse effect on our business, prospects, results of operations and financial condition.
16
Additionally, the reimbursement process is complex and can involve lengthy delays. Also, third-party payers may reject, in whole or in part, requests for reimbursement based on determinations that certain amounts are not reimbursable under plan coverage, that services provided were not medically necessary, that additional supporting documentation is necessary, or for other reasons. Retroactive adjustments by third-party payers may be difficult or cost-prohibitive to appeal, and such changes could materially reduce the actual amount we receive. Delays and uncertainties in the reimbursement process may be out of our control and could have a material adverse effect on our business, prospects, results of operations and financial condition.
The market for prescription digital therapeutics is new, rapidly evolving, and increasingly competitive, the healthcare industry in the U.S. is undergoing significant structural change, and the demand for prescription digital therapeutics in markets outside of the U.S. is uncertain, which makes it difficult to forecast demand for our products. As a result, all prospective financial information included herein are subject to change.
The market for our PDTs is new and rapidly evolving, and it is uncertain whether it will achieve and sustain high levels of demand and market adoption. Our future financial performance will depend on growth in this market and on our ability to adapt to emerging demands of our customers. It is difficult to predict the future growth rate and size of our target market.
The healthcare industry in the U.S. is undergoing significant structural change and is rapidly evolving. We believe demand for our products has been driven in large part by rapidly growing costs in the traditional healthcare system, the movement toward patient-centricity and personalized healthcare, and advances in technology. Widespread acceptance of personalized healthcare is critical to our future growth and success. A reduction in the growth of personalized healthcare could reduce the demand for our PDTs and result in a lower revenue growth rate or decreased revenue.
If our assumptions regarding these uncertainties are incorrect or change in reaction to changes in our markets, or if we do not manage or address these risks successfully, our results of operations could differ materially from our expectations, and our business could suffer.
Our development programs represent novel and innovative potential therapeutic areas, and negative perception of any product or product candidate that we develop could adversely affect our ability to conduct our business, obtain marketing authorizations or identify alternate regulatory pathways to market for such product candidate.
Our product and product candidates are considered relatively new and novel therapeutic approaches. Our success will depend upon physicians who specialize in the treatment of diseases targeted by our product candidates prescribing potential treatments that involve the use of our product candidates in lieu of, or in addition to, existing treatments with which they are more familiar and for which greater clinical data may be available. Access will also depend on consumer acceptance and adoption of products that are commercialized. In addition, responses by the U.S., state or foreign governments to negative public perception or ethical concerns may result in new legislation or regulations that could limit our ability to develop or commercialize any product candidates, obtain or maintain marketing authorization, identify alternate regulatory pathways to market or otherwise achieve profitability.
For example, in the U.S., EndeavorRx is the first and only video game based prescription digital therapeutic that has been granted marketing authorization by the FDA for children ages
8-12
years old with primarily inattentive or combined-type ADHD, who have a demonstrated attention issue. We have developed a therapeutic technology for the treatment of attention related cognitive impairments associated with ADHD and the potential treatment of cognitive impairments associated with ASD, MS, MDD and acute cognitive dysfunction. The FDA may lack experience in evaluating the safety and efficacy of product candidates based on such technology, which could result in a longer than expected regulatory review process, increase expected development costs and delay or prevent potential commercialization of product candidates.17
Negative publicity concerning our products or the PDT market as a whole could limit market acceptance of our products. If patients and healthcare providers have a negative perception of PDTs, then a market for our products may not develop at all, or it may develop more slowly than we expect. Our success will depend to a substantial extent on the willingness of healthcare providers to prescribe our products, the extent to which coverage and adequate reimbursement for these products and related treatments will be available from government health administration authorities, private health insurers and other organizations and our ability to demonstrate the value of our products to existing and potential patients and prescribers. Similarly, negative publicity regarding patient confidentiality and privacy in the context of technology-enabled healthcare or concerns experienced by our competitors could limit market acceptance of PDTs.
Clinical trials of any of our products or product candidates may fail to produce results necessary to support marketing authorization.
We incur substantial expense for, and devote significant time to, clinical trials but cannot be certain that the trials will ever result in commercial gains. We may experience significant setbacks in clinical trials, even after earlier clinical trials showed promising results, and failure can occur at any time during the clinical development process. Any of our products may malfunction or may produce undesirable adverse effects that could cause us, institutional review boards, or IRBs, or regulatory authorities to interrupt, delay or halt clinical trials. We, IRBs, the FDA, or another regulatory authority may suspend or terminate clinical trials at any time to avoid exposing trial participants to unacceptable health risks. Our clinical trials may produce negative or inconclusive results or may demonstrate a lack of effect of our product candidates. Additionally, the FDA may disagree with our interpretation of the data from our pilot studies and clinical trials, or may find the clinical trial design, conduct or results inadequate to demonstrate safety or effectiveness, and may require us to pursue additional clinical trials, which could further delay the clearance, authorization or approval of our product candidates. If we are unable to demonstrate the safety and effectiveness of product candidates in our clinical trials, we will be unable to obtain the marketing authorizations we need to commercialize new products.
In addition to the extent that additional information regarding products being studied in clinical trials could translate to currently authorized products, such as information on new side effects, those results may impact existing authorizations, and required contraindications, warnings or precautions in product labeling.
Enrollment and retention of patients in clinical trials is an expensive and time-consuming process and could be made more difficult or rendered impossible by multiple factors outside of our control. If we experience delays or difficulties in the enrollment or retention of patients in clinical trials, our ability to obtain necessary marketing authorizations for our product candidates could be delayed or prevented.
We may encounter delays or difficulties in enrolling, or be unable to enroll, a sufficient number of patients to complete any of our clinical trials on our current timelines, or at all, and even once enrolled, we may be unable to retain a sufficient number of patients to complete any of our trials. Slow enrollment in our clinical trials may lead to delays in our development timelines and milestones.
Patient enrollment in clinical trials and completion of patient
follow-up
depend on many factors, including the size of the patient population, the nature of the trial protocol, the ability of patients to continue to receive medical care, the eligibility criteria for the clinical trial, patient compliance, competing clinical trials and clinicians’ and patients’ perceptions as to the potential advantages of the product being studied in relation to other available therapies, including any new treatments that may obtain marketing authorization for the indications we are investigating. For example, patients may be discouraged from enrolling in our clinical trials if the trial protocol requires them to undergo extensive post-treatment procedures orfollow-up
to assess the safety and efficacy of a product candidate, or they may be persuaded to participate in contemporaneous clinical trials of a competitor’s product candidate. In addition, patients participating in our clinical trials may drop out before completion of the trial or experience adverse medical events unrelated to our products. Disruptions caused by the ongoingCOVID-19
pandemic may also increase the likelihood that we encounter such difficulties or delays in initiating,18
enrolling, conducting or completing our planned and ongoing clinical trials. Delays in patient enrollment or failure of patients to continue to participate in a clinical trial may delay commencement or completion of the clinical trial, cause an increase in the costs of the clinical trial and delays, make our data more difficult to interpret, affect the powering of our trial, or result in the failure of the clinical trial.
Delays or failures in planned patient enrollment or retention may result in increased costs, program delays or both, which could have a harmful effect on our ability to develop our product candidates, or could render further development impossible. In addition, we rely on clinical trial sites to ensure timely conduct of our clinical trials and, while we have entered into agreements governing their services, we are limited in our ability to compel their actual performance.
Interim, “topline” and preliminary data from clinical trials of our products or product candidates may change as more patient data becomes available and are subject to confirmation, audit, and verification procedures that could result in material changes in the final data.
From time to time, we may publicly disclose preliminary or topline data from our pilot studies and clinical trials, which is based on a preliminary analysis of then-available data, and the results and related findings and conclusions are subject to change following a more comprehensive review of the data related to the particular study or trial. We also make assumptions, estimations, calculations, and conclusions as part of our analyses of data, and we may not have received or had the opportunity to fully and carefully evaluate all data. As a result, the topline or preliminary results that we report may differ from future results of the same studies, or different conclusions or considerations may qualify such results, once additional data have been received and fully evaluated. Topline data also remain subject to audit and verification procedures that may result in the final data being materially different from the preliminary data we previously published. As a result, topline data should be viewed with caution until the final data are available. Interim or preliminary data from clinical trials are subject to the risk that one or more of the clinical outcomes may materially change as patient enrollment and treatment continues and more patient data become available or as patients from our clinical trials continue other treatments for their disease. Adverse differences between preliminary or interim data and final data could significantly harm our business prospects. Further, disclosure of interim data by us or by our competitors could result in volatility in the price of our common stock.
Further, third parties, including regulatory agencies, may not accept or agree with our assumptions, estimates, calculations, conclusions or analyses or may interpret or weigh the importance of data differently, which could impact the potential of the particular program, the likelihood of marketing authorization or commercialization of the particular product candidate, the commercial success of any product for which we may have already obtained authorization or clearance, and our company in general. In addition, the information we choose to publicly disclose regarding a particular study or clinical trial is derived from information that is typically extensive, and you or others may not agree with what we determine is material or otherwise appropriate information to include in our disclosure.
If the interim, topline, or preliminary data that we report differ from actual results, or if others, including regulatory authorities, disagree with the conclusions reached, our ability to obtain marketing, authorization, and commercialize, our product candidates may be harmed, which could harm our business, operating results, prospects or financial condition.
Due to the significant resources required for the development of our pipeline, and depending on our ability to access capital, we must prioritize certain development programs over others. We may fail to expend our limited resources on certain development programs that may have been more profitable or for which there is a greater likelihood of success.
We currently have one product, EndeavorRx, that has been granted marketing authorization in the U.S. and the European Economic Area and several other product candidates that are at various stages of development. We
19
seek to maintain a process of prioritization and resource allocation to maintain an optimal balance between aggressively commercializing EndeavorRx, pursuing our other development programs and ensuring the development of additional potential product candidates.
Due to the significant resources required for the advancement of our development programs, we must decide which product candidates and indications to pursue and advance and the amount of resources to allocate to each. Our decisions concerning the allocation of research, development, collaboration, management and financial resources toward particular product candidates or therapeutic areas may not lead to the development of any viable commercial products and may divert resources away from better opportunities. If we make incorrect determinations regarding the viability or market potential of any of our product candidates or misread trends in the healthcare and biotechnology industry, in particular for ADHD and other diseases or disorders resulting in cognitive impairment, our business, financial condition, and results of operations could be materially adversely affected. As a result, we may fail to capitalize on viable commercial products or profitable market opportunities, be required to forego or delay pursuit of opportunities with other development programs that may later prove to have greater commercial potential than those we choose to pursue, or relinquish valuable rights to our product candidates through collaboration, licensing, or other royalty arrangements in cases in which it would have been advantageous for us to invest additional resources to retain sole development and commercialization rights.
We are party to and may, in the future, enter collaborations,
in-licensing
arrangements, joint ventures, or strategic alliances with third parties that may not result in the development of commercially viable products or the generation of significant or any future revenues.In the ordinary course of our business, we have and may continue to enter into collaborations,
in-licensing
arrangements, joint ventures, or strategic alliances to develop and/or commercialize new PDTs and/or to pursue new markets. Proposing, negotiating, and implementing collaborations,in-licensing
arrangements, joint ventures, and strategic alliances may be a lengthy and complex process. These transactions may entail numerous operational and financial risks, including exposure to unknown liabilities, disruption of our business and diversion of our management’s time and attention in order to manage any such transaction or develop acquired products, product candidates or technologies, incurrence of substantial debt or dilutive issuances of equity securities to pay transaction consideration or costs, higher than expected transaction, acquisition or integration costs, write-downs of assets or goodwill or impairment charges, increased amortization expenses, and difficulty and cost in facilitating the transaction or combining the operations and personnel of any acquired business, impairment of relationships with key suppliers or customers. Other companies, including those with substantially greater financial, marketing, sales, technology or other business resources, may compete with us for these opportunities or arrangements. We may not identify, secure or complete any such transactions or arrangements in a timely manner, on a cost-effective basis, on acceptable terms, or at all. We have limited institutional knowledge and experience with respect to these business development activities, and we may also not realize the anticipated benefits of any such transaction or arrangement. In particular, these collaborations may not result in the development of products that achieve commercial success or result in significant revenues and could be terminated prior to developing any products.Additionally, we may not be in a position to exercise sole decision-making authority regarding the transaction or arrangement, which could create the potential risk of creating impasses on decisions, and our collaborators may have economic or business interests or goals that are, or that may become, inconsistent with our business interests or goals. It is possible that conflicts may arise with our collaborators, such as conflicts concerning the achievement of performance milestones, or the interpretation of significant terms under any agreement, such as those related to financial obligations or the ownership or control of intellectual property developed during the collaboration. If any conflicts arise with our current or future collaborators, they may act in their self-interest, which may be adverse to our best interest, and they may breach their obligations to us. In addition, we have limited control over the amount and timing of resources that our current collaborators or any future collaborators devote to our collaborators’ or our future products. Disputes between us and our collaborators may result in litigation or arbitration which would increase our expenses and divert the attention of our management. Further,
20
these transactions and arrangements are contractual in nature and may be terminated or dissolved under the terms of the applicable agreements and, in such event, we may not continue to have rights to the products relating to such transaction or arrangement or may need to purchase such rights at a premium.
We depend on our senior management team, and the loss of one or more of our executive officers or key employees or an inability to attract and retain highly skilled employees could adversely affect our business.
Our success depends largely upon the continued services of our key executive officers. These executive officers are
at-will
employees and therefore they may terminate employment with us at any time with no advance notice. We rely on our leadership team in the areas of operations, clinical and software development, information security, marketing, compliance and general and administrative functions. From time to time, there may be changes in our executive management team resulting from the hiring or departure of executives, which could disrupt our business. The loss of one or more of the members of our senior management team, or other key employees, could harm our business. The replacement of one or more of our executive officers or other key employees would likely involve significant time and costs and may significantly delay or prevent the achievement of our business objectives.To continue to execute our growth strategy, we also must attract and retain highly skilled personnel. Competition is intense for qualified professionals. We may not be successful in continuing to attract and retain qualified personnel. We have from time to time in the past experienced, and we expect to continue to experience in the future, difficulty in hiring and retaining highly skilled personnel with appropriate qualifications. The pool of qualified personnel with experience working in the healthcare market is limited overall. In addition, many of the companies with which we compete for experienced personnel have greater resources than we have.
Additionally, our success is dependent on our ability to evolve our culture, align our talent with our business needs, engage our employees and inspire our employees to be open to change and innovate. Our business would be adversely affected if we fail to adequately plan for succession of our executives and senior management, or if we fail to effectively recruit, integrate, retain and develop key talent and/or align our talent with our business needs, in light of the current rapidly changing environment.
The continuing impact of the ongoing
COVID-19
pandemic could have a material adverse effect on our business, prospects, results of operations and financial condition and could cause a disruption to the development of our product candidates.In March 2020, the World Health Organization declaredtravel restrictions, and mandated business closures, have adversely affected workforces, organizations, governments, customers, economies, and financial markets globally, leading to an economic downturn and increased market volatility. It has also disrupted the normal operations of many businesses, including ours. This outbreak, as well as intensified measures undertaken to contain the spread of
COVID-19
a global pandemic. This pandemic, which has continued to spread, and the related adverse public health developments, including orders toshelter-in-place,
COVID-19,
including emerging variants of the virus, could decrease healthcare industry spending for our products, adversely affect demand for our products, affect the ability of our sales team to travel to potential customers and the ability of our professional services teams to conductin-person
services and trainings, impact expected spending from new customers, negatively impact collections of accounts receivable, and harm our business, results of operations, and financial condition.Further, the sales cycle for a new customer of our products could lengthen, resulting in a potentially longer delay between increasing operating expenses and the generation of corresponding revenue, if any. In addition, our clinical trials may be affected by the
COVID-19
pandemic. Clinical site initiation and patient enrollment may be delayed due to prioritization of healthcare system resources toward theCOVID-19
pandemic. Some patients may not be able to comply with clinical trial protocols if quarantines impede patient movement or interrupt healthcare services. Similarly, the ability to recruit and retain patients and principal investigators and site staff who, as21
healthcare providers, may have heightened exposure to
COVID-19
and adversely impact our clinical trial operations.We cannot predict with any certainty whether and to what degree the disruption caused by the
COVID-19
pandemic and reactions thereto will continue and expect to face difficulty accurately predicting our internal financial forecasts. The pandemic also presents challenges as the majority of our workforce is currently working remotely and shifting to assisting new and existing customers who are also generally working remotely. It is not possible for us to predict the duration or magnitude of the adverse results of the outbreak or its continuing impact which may materially and adversely affect our business and financial results and could cause a disruption in the development of our product candidates.If patients or physicians are not willing to change current practices to adopt EndeavorRx, or if EndeavorRx fails to gain increased market acceptance, our ability to execute our growth strategy will be impaired, and our business, prospects, results of operations and financial condition could be materially adversely affected.
Our primary strategy to grow our revenue is to drive the adoption of EndeavorRx by physicians. Physicians may choose not to adopt our digital therapeutic products for a number of reasons, including:
| • | lack of availability of adequate third-party payer coverage or reimbursement; |
| • | lack of experience with our products; |
| • | our inability to convince key opinion leaders to recommend our products; |
| • | perceived inadequacy of evidence supporting clinical benefits, safety or cost-effectiveness of our products; |
| • | liability risks generally associated with the use of new products; and |
| • | the training required to use new products. |
We focus our sales, marketing and training efforts primarily on primary care physicians. However, physicians from other disciplines, as well as other medical professionals, such as psychiatrists and therapists, are often the initial point of contact for patients with ADHD. We believe that educating physicians in these disciplines and other medical professionals about the clinical merits, patient benefits and safety profile of our digital therapeutic products is an element of increasing product adoption.
In addition, patients may not be able to adopt or may choose not to adopt our digital therapeutic if, among other potential reasons, they are worried about potential adverse effects of use of our digital therapeutic or they are unable to obtain adequate third-party coverage or reimbursement. If additional primary care physicians or other medical professionals do not appreciate and recommend the benefits of our digital therapeutic for any reason, or patients choose not to adopt EndeavorRx, our ability to execute our growth strategy will be impaired, and our business, prospects, results of operations and financial condition could be materially adversely affected.
We face competition, and new products may emerge that provide different or better alternatives for treatment of the conditions that EndeavorRx or our future products, if granted marketing authorization, are authorized to treat. Many of our current and future competitors have or will have significantly more resources than us.
Our ability to achieve our strategic objectives will depend, among other things, on our ability to develop and commercialize products for the treatment of chronic conditions that are effective and safe, offer distinct features, areprovide measurable and meaningful cost savings to payers, and are more appealing than available alternatives. Our competitors, as well as a number of other companies, within and outside the healthcare industry, are pursuing new delivery devices, delivery technologies, sensing technologies, procedures, drugs, and other therapies for the monitoring and treatment of chronic conditions. Any technological breakthroughs in monitoring, treatment or prevention could reduce the potential market for our products, which would significantly reduce our sales.
easy-to-use,
22
The introduction by competitors of products that are or claim to be superior to our products may create market confusion, which may make it difficult for potential customers to differentiate the benefits of our products over competitive products. In addition, the entry of new PDTs to the market which treat the same or similar chronic conditions as our products may lead some of our competitors to employ pricing strategies that could materially and adversely affect the pricing of our products. If a competitor develops a product that competes with or is perceived to be superior to our products, or if a competitor employs strategies that place downward pressure on pricing within our industry, our sales may decline significantly or may not increase in line with our forecasts, either of which would materially and adversely affect our business, financial condition and results of operations.
While our market is in an early stage of development, it is evolving rapidly and becoming increasingly competitive, and we expect it to attract increased competition. We currently face competition from a range of companies. Our competitors include both enterprise companies who are focused on or may enter the healthcare industry, including initiatives and partnerships launched by these large companies, and from private companies that offer solutions for specific chronic conditions. We compete with companies that are developing treatments for cognitive impairment associated with ADHD and other diseases and disorders resulting in cognitive impairment, including Shire (Takeda), Eli Lilly & Company, Novartis, Pfizer and Highland/Ironshore Therapeutics. While pharmaceutical and biotechnology companies have increased their focus on digital treatment in general, we are unaware of any pharmaceutical or biotechnology companies currently pursuing digital treatments for ADHD.
In the digital health space, we compete with companies that have created
non-regulated
products to treat cognitive impairment in ADHD and other diseases and disorders resulting in cognitive impairment such as Cogstate, C8 Sciences, Cogmed, MindMaze, and Posit Science. These include educational products that are aimed at improving attention, which are not regulated by authorities like the FDA for children with ADHD, such as ACTIVATE by C8 Sciences and BrainHQ by Posit Science, the latter of which is available via the Apple App Store and on Google PlayTM. These companies, which may offer their solutions at lower prices, are continuing to develop additional products and becoming more sophisticated and effective. Competition from wellness apps, which are not authorized by the FDA but may attract consumers for other reasons, and from other parties will result in continued pricing pressures, which are likely to lead to price declines in certain product segments, which could negatively impact our sales, profitability and market share. Additionally, if such uncleared or unapproved products are allowed to compete with our products, we will face increased competition from parties who have fewer barriers to enter our industry. This increased competition could have a material adverse effect on our business, prospects, results of operations and financial condition.Our ability to compete effectively depends on our ability to distinguish our company and our solution from our competitors and their products.
Some of our competitors may have, or new competitors or alliances may emerge that have, greater name and brand recognition, greater market share, a larger customer base, more widely adopted proprietary technologies, greater marketing expertise, larger sales forces, or significantly greater resources than we do and may be able to offer solutions competitive with ours at a more attractive price than we can. Further, our current or potential competitors may be acquired by third parties with greater available resources. As a result, our competitors may be able to respond more quickly and effectively than we can to new or changing opportunities, technologies, standards or customer requirements and may have the ability to initiate or withstand substantial price competition. In addition, our competitors may in the future establish cooperative relationships with vendors of complementary products, technologies or services to increase the availability of their solutions in the marketplace. Our competitors could also be better positioned to serve certain segments of our market, which could create additional price pressure. In light of these factors, even if our products are more effective than those of our competitors, current or potential customers may accept competitive products in lieu of purchasing our products. If we are unable to successfully compete, our business, financial condition, and results of operations could be materially and adversely affected.
23
If we cannot maintain our corporate culture, we could lose the innovation, collaboration and focus on the mission that contributes to our business.
We believe that our culture has been and will continue to be a critical contributor to our success. We expect to continue to hire aggressively as we expand, and we believe our corporate culture has been crucial in our success and our ability to attract highly skilled personnel. If we do not continue to develop our corporate culture or maintain and preserve our core values as we grow and evolve both in the U.S. and internationally, we may be unable to foster the innovation, curiosity, creativity, focus on execution, teamwork and the facilitation of critical knowledge transfer and knowledge sharing we believe we need to support our growth. Moreover, liquidity available to our employee equity holders, could lead to disparities of wealth among our employees, which could adversely impact relations among employees and our culture in general. Our anticipated headcount growth and our status as a public company may result in a change to our corporate culture, which could harm our business.
We have experienced rapid growth since inception which may not be indicative of our future growth and, if we continue to grow rapidly, we may not be able to manage our growth effectively.
Since EndeavorRx was granted marketing authorization and classified as a Class II medical device by the FDA in June 2020, we have experienced operational growth and we continue to rapidly and significantly expand our operations. For example, our full-time employee headcount has grown from 64 employees as of December 31, 2020 to 127 employees as of July 31, 2022. We expect to experience significant growth in the number of our employees and the scope of our operations, particularly as we function as a public company and in the areas of sales, marketing, distribution, product development, clinical development and regulatory affairs. To manage our anticipated future growth, we must continue to implement and improve our managerial, operational and financial systems, expand our facilities and continue to recruit and train additional qualified personnel. Due to our limited financial resources and the limited experience of our management team in managing a company with such anticipated growth, we may not be able to effectively manage the expansion of our operations or recruit and train additional qualified personnel. This expansion increases the complexity of our business and places significant strain on our management, personnel, operations, systems, technical performance, financial resources, and internal financial control and reporting functions. We may not be able to manage growth effectively, which could damage our reputation, limit our growth, and negatively affect our operating results.
The growth and expansion of our business creates significant challenges for our management, operational and financial resources. In the event of continued growth of our operations or in the number of our third-party relationships, our information technology systems and our internal controls and procedures may not be adequate to support our operations. To effectively manage our growth, we must continue to improve our operational, financial and management processes and systems and to effectively expand, train and manage our employee base. As our organization continues to grow and we are required to implement more complex organizational management structures, we may find it increasingly difficult to maintain the benefits of our corporate culture, including our ability to quickly develop and launch new and innovative products. This could negatively affect our business performance.
We continue to experience growth in our headcount and operations, which will continue to place significant demands on our management and our operational and financial infrastructure. As we continue to grow, we must effectively integrate, develop and motivate a large number of new employees, and we must maintain the beneficial aspects of our corporate culture. To attract top talent, we have had to offer, and believe we will need to continue to offer, highly competitive compensation packages before we can validate the productivity of those employees. In addition, fluctuations in the price of our common stock may make it more difficult or costly to use equity compensation to motivate, incentivize and retain our employees. We face significant competition for talent from other healthcare, technology and high-growth companies, which include both large enterprises and privately-held companies. We may not be able to hire new employees quickly enough to meet our needs. If we fail to effectively manage our hiring needs and successfully integrate our new hires, our efficiency and ability to meet our forecasts and our employee morale, productivity and retention could suffer, and our business, results of operations and financial condition could be materially and adversely affected.
24
Changes in funding or disruption at the FDA, the SEC and other government agencies caused by funding shortages or global health concerns could hinder their ability to hire and retain key leadership and other personnel, or otherwise prevent new or modified products from being developed, reviewed or commercialized in a timely manner or at all, or otherwise prevent those agencies from performing normal business functions on which the operation of our business may rely, which could negatively impact our business.
The ability of the FDA to review and grant marketing authorization for new products can be affected by a variety of factors, including government budget and funding levels, ability to hire and retain key personnel and accept the payment of user fees, and statutory, regulatory and policy changes and other events that may otherwise affect the FDA’s ability to perform routine functions. Average review times at FDA have fluctuated in recent years as a result. In addition, government funding of the SEC and other government agencies on which our operations may rely, including those that fund research and development activities is subject to the political process, which is inherently fluid and unpredictable.
Disruptions at the FDA and other agencies, may also slow the time necessary for new digital therapeutics to be reviewed and/or granted marketing authorization by necessary government agencies, which would adversely affect our business. For example, in recent years, including for 35 days beginning on December 22, 2018, the U.S. government shut down several times and certain regulatory agencies, such as the FDA and the SEC, had to furlough critical employees and stop critical activities.
If a prolonged government shutdown occurs, or if global health concerns continue to prevent the FDA or other regulatory authorities from conducting their regular inspections, reviews or other regulatory activities, it could significantly impact the ability of the FDA to timely review and process our regulatory submissions, which could have a material adverse effect on our business. Further, in our operations as a public company, future government shutdowns or delays could impact our ability to access the public markets and obtain necessary capital in order to properly capitalize and continue our operations.
We will incur increased costs and demands upon management as a result of complying with the laws and regulations affecting public companies, which could adversely affect our business, results of operations, and financial condition.
As of the consummation of the Business Combination, we are a public company, and are subject to the reporting requirements of the Exchange Act, the listing standards of Nasdaq and other applicable securities rules and regulations. We expect that the requirements of these rules and regulations will continue to increase our legal, accounting and financial compliance costs, make some activities more difficult, time-consuming and costly, and place significant strain on our personnel, systems and resources. For example, the Exchange Act requires, among other things, that we file annual, quarterly and current reports with respect to our business and results of operations. As a result of the complexity involved in complying with the rules and regulations applicable to public companies, our management’s attention may be diverted from other business concerns, which could harm our business, results of operations and financial condition.
In addition, changing laws, regulations and standards relating to corporate governance and public disclosure are creating uncertainty for public companies, increasing legal and financial compliance costs, and making some activities more time-consuming. These laws, regulations and standards are subject to varying interpretations, in many cases due to their lack of specificity, and, as a result, their application in practice may evolve over time as new guidance is provided by regulatory and governing bodies. This could result in continuing uncertainty regarding compliance matters and higher costs necessitated by ongoing revisions to disclosure and governance practices. We intend to invest substantial resources to comply with evolving laws, regulations and standards, and this investment may result in increased general and administrative expenses and a diversion of management’s time and attention from business operations to compliance activities. If our efforts to comply with new laws, regulations and standards differ from the activities intended by regulatory or governing bodies due to ambiguities related to their application and practice, regulatory authorities may initiate legal proceedings against us and our business may be harmed.
25
We also expect that being a public company and these new rules and regulations will make it more expensive for us to obtain director and officer liability insurance, and we may be required to accept reduced coverage or incur substantially higher costs to obtain coverage. These factors could also make it more difficult for us to attract and retain qualified members of the Board, particularly to serve on our audit committee and compensation committee, and qualified executive officers.
As a result of disclosure of information in this prospectus and in filings required of a public company, our business and financial condition will become more visible, which may result in an increased risk of threatened or actual litigation, including by competitors and other third parties. If such claims are successful, our business and results of operations could be harmed, and even if the claims do not result in litigation or are resolved in our favor, these claims, and the time and resources necessary to resolve them, could divert the resources of our management and harm our business, results of operations, and financial condition.
Any failure to offer high-quality patient support may adversely affect our relationships with our existing and prospective patients, and in turn our business, results of operations and financial condition.
In implementing and using our products, our patients will depend on our patient support to resolve issues in a timely manner. We may be unable to respond quickly enough to accommodate short-term increases in demand for patient support. Increased patient demand for support could increase costs and adversely affect our results of operations and financial condition. Any failure to maintain high-quality patient support, or a market perception that we do not maintain high-quality patient support, could adversely affect patient satisfaction or the willingness of physicians to prescribe our products, and in turn our business, results of operations, and financial condition.
Acquisitions and strategic alliances could distract management and expose us to financial, execution and operational risks that could have a detrimental effect on our business.
We intend to continue to pursue acquisitions or licenses of technology to, among other things, expand the number of products we provide as well as the features within those products. We cannot guarantee that we will identify suitable candidates for acquisition or licensing, that the transactions will be completed on acceptable terms, or that we will be able to integrate newly acquired or licensed technology into our existing business. The acquisition and integration of another technology would divert management attention from other business activities, including our core business. This diversion, together with other difficulties we may incur in integrating newly acquired or licensed technology, could have a material adverse effect on our business, financial condition and results of operations. In addition, we may borrow money or issue capital stock to finance such transactions. Such borrowings might not be available on terms as favorable to us as our current borrowing terms and may increase our leverage, and the issuance of capital stock (or securities exchangeable therefore) could dilute the interests of our stockholders.
Risks Relating to our Products
Even though we have received marketing authorizations in the U.S. and European Economic Area for EndeavorRx and may receive U.S. and foreign marketing authorizations for other product candidates in the future, we will be subject to ongoing regulatory obligations and continued regulatory review, which may result in significant additional expenses.
While we have received U.S. and European Economic Area marketing authorization for EndeavorRx for an initial indication, FDA or comparable foreign regulatory authorities may grant marketing authorization for any of our other indications or product candidates, including those derived from our SSME technology. In addition, the manufacturing processes, labeling, packaging, distribution, adverse event reporting, storage, advertising, promotion and recordkeeping for the FDA or comparable foreign regulatory authority approved products and product candidates will be subject to extensive and ongoing regulatory requirements. These requirements include submissions of safety and other post-marketing information and reports, establishment registration and listing, compliance with FDA labeling requirements, including unique device identification requirements, as well as
26
continued compliance with cGMPs or similar foreign requirements and GCPs for any post-marketing clinical trials that we conduct post-approval. Any marketing authorizations that we receive for our product candidates may also be subject to limitations on the indicated uses for which the product may be marketed or to the conditions of approval, or contain requirements for potentially costly post-marketing studies, and surveillance to monitor the safety and efficacy of the product. Later discovery of previously unknown problems with a product, including adverse events of unanticipated severity or frequency, or with our third-party manufacturers or manufacturing processes, or failure to comply with regulatory requirements, may result in, among other things:
| • | restrictions on the marketing or manufacturing of the product, withdrawal of the product from the market, or voluntary or mandatory product recalls; |
| • | clinical trial holds; |
| • | fines, warning letters or other regulatory enforcement action; |
| • | refusal by the FDA or comparable foreign regulatory authorities to clear or approve pending submissions filed by us; |
| • | product seizure or detention, or refusal to permit the import or export of products; and |
| • | injunctions or the imposition of civil or criminal penalties. |
FDA’s and comparable foreign regulatory authorities’ policies may change and additional government regulations may be enacted that could prevent, limit or delay marketing authorization of our product candidates. If we are slow or unable to adapt to changes in existing requirements or the adoption of new requirements or policies, or if we are not able to maintain regulatory compliance, we may lose any marketing authorization that we may have obtained, which could have a material adverse effect on our business, prospects, results of operations, financial condition and our ability to achieve or sustain profitability.
Our current product candidates are in various stages of development. Our product candidates may fail in development or suffer delays that adversely affect their commercial viability. If we fail to maintain clearance, de novo classification or approval to market our product candidates, including
AKL-T01
for expanded indications, or if we are delayed in obtaining such marketing authorizations, our business, prospects, results of operations and financial condition could be materially and adversely affected.The process of seeking FDA marketing authorization is expensive and time consuming. There can be no assurance that marketing authorization will be granted. If we are not successful in obtaining timely clearance, de novo classification or approval of our product candidates, we may never be able to generate significant revenue and may be forced to cease operations. Specifically, we plan to pursue additional regulatory marketing clearances for
AKL-T01
in different indications and we have additional product candidates at various stages of development for which we plan to pursue clearance or de novo classification. The FDA can delay, limit or deny marketing authorizations for many reasons, including:| • | We may not be able to demonstrate to the FDA’s satisfaction that our product candidates meet the applicable regulatory standards for clearance, de novo classification, or approval, as applicable; |
| • | The FDA may disagree that our clinical data supports the label and use that we are seeking; and |
| • | The FDA may disagree that the data from our preclinical or pilot studies and clinical trials is sufficient to support marketing authorization. |
Obtaining marketing authorization from the FDA or any foreign regulatory authority could result in unexpected and significant costs for us and consume management’s time and other resources. The FDA could ask us to supplement our submissions, collect additional nonclinical data, conduct additional clinical trials, prepare additional manufacturing data or information or engage in other time-consuming actions, or it could simply deny our requests. In addition, if granted marketing authorization, we will be required to obtain additional FDA
27
approvals or clearances prior to making certain modifications to our devices. Further, FDA may impose other restrictions on our marketing authorizations, or we may lose marketing authorization, if post-market data demonstrates safety issues or lack of efficacy. If we are unable to obtain and maintain the necessary marketing authorizations to market our products, our financial condition may be adversely affected, and our ability to grow domestically and internationally would likely be limited. Additionally, even if granted marketing authorization, our products, including EndeavorRx, may not receive marketing authorization for the indications that are necessary or desirable for successful commercialization or profitability. This could have a material adverse effect on our business, prospects, results of operations and financial condition.
EndeavorRx is made available via the Apple App Store® and on Google PlayTM, and supported by third-party infrastructure. If our ability to access these markets or access necessary third-party infrastructure was stopped or otherwise restricted or limited, it could have a material adverse effect on our business, prospects, results of operations and financial condition.
Our PDTs are exclusively accessed through and depend on the Apple App Store and the Google Play Store. Both Apple and Google have broad discretion to make changes to their operating systems or payment services or change the manner in which their mobile operating systems function and their respective terms and conditions applicable to the distribution of our PDTs and to interpret their respective terms and conditions in ways that may limit, eliminate or otherwise interfere with our products, our ability to distribute our products through their stores, our ability to update our products, including to make bug fixes or other feature updates or upgrades, the features we provide, the manner in which we market our products and our ability to access native functionality or other aspects of mobile devices. To the extent either or both of them do so, our business, prospects, results of operations and financial condition could be materially and adversely affected.
There is no guarantee that the third-party infrastructure that currently supports our PDTs will continue to support them or, if it does not, that other alternatives will be available or that they will be available on terms that are commercially acceptable to us. We will continue to be dependent on third-party mobile operating systems, technologies, networks and standards that we do not control, such as the Android and iOS operating systems, and any changes, bugs, technical or regulatory issues in such systems, our current relationships with carriers or future relationships with mobile manufacturers, or in their terms of service or policies that degrade our PDTs’ functionality, reduce or eliminate our ability to distribute our PDTs, limit our ability to deliver high quality PDTs, or impose fees or other charges related to delivering our offerings, could adversely affect our product usage and revenue.
We rely upon third party providers of cloud-based infrastructure to host our platform. Any disruption in the operations of these third-party providers, limitations on capacity or interference with our use could have a material adverse effect on our business, prospects, results of operations and financial condition.
Our platform’s technological infrastructure is implemented using third-party hosting services, such as Amazon Web Services. We have no control over any of these third parties, and we cannot guarantee that such third-party providers will not experience system interruptions, outages or delays, or deterioration in their performance. We need to be able to access our computational platform at any time, without interruption or degradation of performance. Our hosted platform depends on protecting the virtual cloud infrastructure hosted by third-party hosting services by maintaining our configuration, architecture, features, and interconnection specifications, as well as protecting the information stored in these virtual data centers, which is transmitted by third-party Internet service providers. We have experienced, and expect that in the future we may again experience interruptions, delays and outages in service and availability from time to time due to a variety of factors, including infrastructure changes, human or software errors, hosting disruptions and capacity constraints. Any limitation on the capacity of our third-party hosting services could adversely affect our business, financial condition, and results of operations. In addition, any incident affecting our third-party hosting services’ infrastructure, which may be caused by cyber-attacks, natural disasters, fire, flood, severe storm, earthquake, power loss, telecommunications failures, terrorist or other attacks, and other disruptive events beyond our control, could
28
negatively affect our cloud-based solutions. A prolonged service disruption affecting our cloud-based solutions could damage our reputation or otherwise harm our business. We may also incur significant costs for using alternative equipment or taking other actions in preparation for, or in reaction to, events that damage the third- party hosting services we use.
In the event that our service agreements with our third-party hosting services are terminated, or there is a lapse of service, elimination of services or features that we utilize, interruption of Internet service provider connectivity, or damage to such facilities, we could experience interruptions in access to our platform as well as significant delays and additional expense in arranging or creating new facilities and services and/or
re-architecting
our hosted software solutions for deployment on a different cloud infrastructure service provider, which could have a material adverse effect on our business, prospects, results of operations and financial condition.If we are not able to develop and release new products, or successful enhancements, new features, and modifications to EndeavorRx or any future products, our business, prospects, results of operations and financial condition could be materially and adversely affected.
We expect that the PDT market, as with many technology markets, will be characterized by rapid technological change, frequent new product and service introductions and enhancements, changing customer demands, and evolving industry standards. As an initial matter, a significant portion of our market may not have access to smartphones or other technology necessary to utilize our PDTs. In addition, the introduction of products and services embodying new technologies could quickly make existing products and services obsolete and unmarketable. Additionally, changes in laws and regulations could impact the usefulness of our products and could necessitate changes or modifications to our products to accommodate such changes. We invest substantial resources in researching and developing new products and enhancing our existing products by incorporating additional features, improving functionality, and adding other improvements to meet our patients’ evolving needs. The success of any enhancements or improvements to our products or any new products depends on several factors, including regulatory review timelines, timely completion, competitive pricing, adequate quality testing, integration with new and existing technologies in our products and third-party collaborators’ technologies and overall market acceptance. We may not succeed in developing, marketing and delivering on a timely and cost-effective basis enhancements or improvements to our products or any new products that respond to continued changes in market demands or new customer requirements, and any enhancements or improvements to our products or any new products may not achieve market acceptance. Since developing our products is complex, the timetable for the release of new products and enhancements to existing products is difficult to predict, and we may not offer new products and updates as rapidly as our users require or expect. Any new products that we develop or acquire may not be introduced in a timely or cost-effective manner, may contain errors or defects, or may not achieve the broad market acceptance necessary to generate significant or any revenue.
The introduction of new products and products by competitors, the development of entirely new technologies to replace existing offerings or shifts in healthcare benefits trends could make our products obsolete or materially and adversely affect our business, financial condition and results of operations. We may experience difficulties with software development, industry standards, design or marketing that could delay or prevent our development, introduction or implementation of new products, enhancements, additional features or capabilities. If patients and healthcare providers do not widely adopt our products, we may not be able to realize a return on our investment. If we do not accurately anticipate patient demand or we are unable to develop, license or acquire new features and capabilities on a timely and cost-effective basis, or if such enhancements do not achieve market acceptance, it could result in adverse publicity, loss of revenue or market acceptance or claims by patients or healthcare providers brought against us, each of which could have a material adverse effect on our reputation, business, prospects, results of operations and financial condition.
29
Security breaches, loss of data and other disruptions could compromise sensitive information related to our patients or business or prevent us from accessing critical information and expose us to liability, which could have a material adverse effect on our reputation, business, prospects, results of operations and financial condition.
In the ordinary course of our business, we access, generate, process, and store sensitive data, including research data, clinical trial data, real-world data, patient data, intellectual property and proprietary business information owned or controlled by ourselves or our employees, partners and other parties. We manage and maintain our applications and data utilizing a combination of
on-site
systems and cloud-based data centers and third party services. We utilize third party vendors to manage parts of our code, infrastructure, application and services. These applications and data encompass a wide variety of business-critical information, including confidential, sensitive or personal information regarding our patients, clinical trial subjects, vendors, customers, employees and others, as well as research and development information, commercial information, and business and financial information. We face a number of risks relative to protecting this critical information, including loss of access risk, inappropriate use or disclosure, accidental exposure, unauthorized access, inappropriate modification, and the risk of our being unable to adequately monitor, audit and modify our controls over our critical information. This risk extends to the third party vendors and subcontractors we use to manage this sensitive data or otherwise process on our behalf. Further, to the extent our employees are working at home during the ongoingCOVID-19
pandemic or otherwise, additional risks may arise. The secure processing, storage, maintenance and transmission of this critical information are vital to our operations and business strategy, and we devote significant resources to protecting such information. Although we take reasonable measures to protect sensitive data from unauthorized access, use or disclosure, no security measures can be perfect and our third-party vendors’ and subcontractors’ information technology and infrastructure may be vulnerable to attacks by hackers or infections by viruses or other malware or breached due to employee erroneous actions or inactions by our employees or contractors, malfeasance or other malicious or inadvertent disruptions. Any such breach or interruption could compromise our systems and the information stored there could be accessed by unauthorized parties, publicly disclosed, lost or stolen. Any such access, breach, or other loss of information could result in legal claims or proceedings. Unauthorized access, loss or dissemination could also disrupt our operations, result in a material disruption of our development programs and damage our reputation, any of which could adversely affect our business. For example, the loss, corruption, unavailability of, or damage to our computational models would interfere with and undermine the insights we draw from our platform, which could result in the waste of resources on insights based on flawed premises. In addition, the loss or corruption of, or other damage to, clinical trial data from ongoing or future clinical trials could result in delays in our efforts to obtain marketing authorizations and significantly increase our costs to recover or reproduce the data.Additionally, although we maintain cybersecurity insurance coverage, we cannot be certain that such coverage will be adequate for data security liabilities actually incurred, will cover any indemnification claims against us relating to any incident, will continue to be available to us on economically reasonable terms, or at all, or that any insurer will not deny coverage as to any future claim. The successful assertion of one or more large claims against us that exceed available insurance coverage, or the occurrence of changes in our insurance policies, including premium increases or the imposition of large deductible or
co-insurance
requirements, could have a material adverse effect on our reputation, business, prospects, results of operations and financial condition.We currently rely on a single third party digital pharmacy for the fulfillment of prescriptions. This reliance on a single third party increases the risk that we could have a disruption in the fulfillment of prescriptions, which could have a material and adverse effect on our reputation, business, results of operations and financial condition.
We do not currently own or operate any pharmacy, nor are we licensed to perform pharmacy fulfillment services. We rely, and may continue to rely, on a single third party, Phil, for the fulfillment of prescriptions for EndeavorRx through a pharmacy services agreement. This reliance on a single third party increases the risk that we could have a disruption in the fulfillment of prescriptions for EndeavorRx which could delay, prevent or impair the distribution and sale of EndeavorRx.
30
Pharmacies are subject to state and federal laws and regulations. We do not control the standards and processes of, and will be completely dependent on, our digital pharmacy for compliance with federal and state law and regulations. If our digital pharmacy fails to maintain regulatory compliance, we may need to find alternative pharmacies with the capability to fulfill prescriptions for PDTs. In addition, we have no control over the ability of our digital pharmacy to maintain adequate quality control, quality assurance and qualified personnel. If a regulatory authority finds deficiencies with or withdraws required pharmacy licenses in the future, we may need to find alternative pharmacies with the capability to fulfill prescriptions for PDTs, which would significantly impact our ability to fulfill, distribute and sell EndeavorRx. We may be unable to establish any agreements with other digital pharmacies or to do so on acceptable terms. Even if we are able to establish agreements with digital pharmacies, reliance on a single digital pharmacy entails additional risks, including:
| • | the possible breach of the manufacturing agreement by the third party; and |
| • | the possible termination or nonrenewal of the agreement by the third party at a time that is costly or inconvenient for us. |
Our product candidates and any products that we may develop may compete with other product candidates and products for access to manufacturing facilities or capacity. There are a limited number of digital pharmacies that have the capability to distribute PDTs and that might be capable of fulfilling prescriptions for EndeavorRx for us.
Any performance failure on the part of our existing or future manufacturers could disrupt the distribution and sale of EndeavorRx. If our current digital pharmacy cannot perform as agreed, we may be required to replace such digital pharmacy. We may incur added costs and delays in identifying and qualifying any such replacement. If the agreement with this third party pharmacy is terminated, if the third party pharmacy is unable to perform in accordance with the terms of the agreement, or if the services of the third party pharmacy is terminated for any reason, it could have a material adverse effect on our business, prospects, results of operations and financial condition.
Our current and anticipated future dependence upon others for the fulfillment of prescriptions for our product candidates or products may adversely affect our future profit margins and our ability to distribute any products that receive marketing authorization on a timely and competitive basis.
Our products may cause undesirable side effects or have other properties that could limit their commercial potential.
If we or others identify undesirable side effects directly or indirectly caused by our products, a number of potentially significant negative consequences could result, including:
| • | we may lose marketing authorization of such product; |
| • | regulatory authorities may require additional warnings on the product’s label; |
| • | we may be required to issue safety communications to patients or healthcare providers that outline the risks of such side effects; |
| • | we could be sued and held liable for harm caused to patients; and |
| • | our reputation may suffer. |
Any of these events could prevent us from achieving or maintaining market acceptance of the particular product or product candidate and, as a result of negative impacts to our reputation, our other products or product candidates and could have a material adverse effect on our business, prospects, results of operations and financial condition.
31
The misuse or
off-label
use of our products may harm our reputation in the marketplace, result in injuries that lead to product liability or other suits or result in costly investigations, fines, or sanctions by regulatory bodies.Although our products, if granted marketing authorization, are marketed for the specific therapeutic uses for which the devices were designed and our personnel will be trained to not promote our products for uses outside of the
FDA-authorized
indications for use, known as“off-label
uses,” we cannot, however, prevent a physician from using our products in ways, when in the physician’s independent professional medical judgment, he or she deems it appropriate. There may be increased risk of injury to patients if primary care physicians attempt to use our productsoff-label.
Furthermore, the use of our products foroff-label
uses may not effectively treat such conditions, which could harm our reputation in the marketplace among primary care physicians and patients.If following authorization of any other product candidates we may commercialize, or with respect to EndeavorRx, the FDA or any foreign regulatory body determines that our promotional materials or training constitute promotion of an
off-label
use, it could request that we modify our training or promotional materials or subject us to regulatory or enforcement actions, including the issuance or imposition of an untitled letter or warning letter, injunction, seizure, civil fine or criminal penalties. It is also possible that other federal, state or foreign enforcement authorities might take action under other regulatory authority, such as false claims laws for any products for which we obtain government reimbursement, if they consider our business activities to constitute promotion of anoff-label
use, which could result in significant penalties, including, but not limited to, criminal, civil and administrative penalties, damages, fines, disgorgement, exclusion from participation in government healthcare programs and the curtailment of our operations.In addition, physicians may misuse our products with their patients if they are not adequately trained, potentially leading to injury and an increased risk of product liability. If our products are misused, we may become subject to costly litigation by our patients or their patients. As described below, product liability claims could divert management’s attention from our core business, be expensive to defend and result in sizeable damage awards against us that may not be covered by insurance.
Our products may be subject to product recalls. A recall of our products, either voluntarily or at the direction of the FDA or another governmental authority, or the discovery of serious safety issues with our products, could have a material adverse effect on our business, prospects, results of operations and financial condition.
The FDA and similar foreign governmental authorities have the authority to require the recall of commercialized products, such as in the event of material deficiencies or defects in their design or manufacture or in the event that a product poses an unacceptable risk to health.
The FDA’s authority to require a recall for medical devices must be based on a finding that there is reasonable probability that the device would cause serious injury or death. We may also decide to voluntarily recall our products. A government-mandated or voluntary recall could occur as a result of an unacceptable risk to health, component failures, malfunctions, manufacturing errors, design or labeling defects or other deficiencies and issues. Recalls of any of our products would divert managerial and financial resources and could materially and adversely affect our reputation and business, which could impair our ability to produce our products in a cost- effective and timely manner in order to meet our customers’ demands. We may also be subject to liability claims, be required to bear other costs, or take other actions that could have a material adverse effect on our business, prospects, results of operations and financial condition.
Companies are required to maintain certain records of recalls and corrections, even if they are not reportable to the FDA. We may initiate voluntary recalls or corrections for our products in the future that we determine do not require notification of the FDA. If the FDA disagrees with our determinations, they could require us to report those actions as recalls and we may be subject to enforcement action.
32
We face potential product liability exposure, and, if claims brought against us are successful, we could incur substantial liabilities.
Our business exposes us to potential product liability claims that are inherent in the design, manufacture, testing and sale of medical devices. We could become the subject of product liability lawsuits alleging that component failures, manufacturing flaws, design defects or inadequate disclosure of product-related risks or product-related information resulted in an unsafe condition, injury or death to patients. In addition, the misuse of our products, or the failure of patients to adhere to operating guidelines, could cause significant harm to patients which could result in product liability claims. Product liability lawsuits and claims, safety alerts or product recalls, with or without merit, could cause us to incur substantial costs, and could place a significant strain on our financial resources, divert the attention of management from our core business, harm our reputation and materially and adversely affect our ability to attract and retain patients, any of which could have a material adverse effect on our business, prospects, results of operations and financial condition.
Although we maintain third-party product liability insurance coverage, it is possible that claims against us may exceed the coverage limits of our insurance policies. Even if any product liability loss is covered by an insurance policy, these policies typically have substantial deductibles for which we are responsible. Product liability claims in excess of applicable insurance coverage could have a material adverse effect on our business, prospects, results of operations and financial condition. In addition, any product liability claim brought against us, with or without merit, could result in an increase of our product liability insurance premiums. Insurance coverage varies in cost and can be difficult to obtain, and we cannot guarantee that we will be able to obtain insurance coverage in the future on terms acceptable to us or at all.
Additionally, from time to time we may enter into agreements pursuant to which we indemnify third parties for certain claims relating to our products. These indemnification obligations may require us to pay significant sums of money for claims that are covered by these indemnification obligations. We are not currently subject to any product liability claims; however, any future product liability claims against us, regardless of their merit, may result in negative publicity about us that could ultimately harm our reputation and could have a material adverse effect on our business, prospects, results of operations and financial condition.
We are required to report certain malfunctions, deaths and serious injuries associated with our products, which can result in voluntary corrective action or agency enforcement action.
Under the FDA’s medical device reporting regulations, we are required to report to the FDA when information from any source suggests that our product may have caused or contributed to a death or serious injury or that our product has malfunctioned and, if the malfunction were to recur, would likely cause or contribute to death or serious injury. If we fail to report these events to the FDA within the required timeframes, or at all, the FDA could take enforcement action against us.
Any adverse event involving our products, whether in the U.S. or abroad, could result in future voluntary corrective actions, such as recalls, including corrections or customer notifications, or agency action, such as inspection or enforcement actions. If malfunctions do occur, we may be unable to correct the malfunctions adequately or prevent further malfunctions, in which case we may need to cease manufacture and distribution of the affected products, initiate voluntary recalls, and redesign the products. Regulatory authorities may also take actions against us, such as ordering recalls, imposing fines, or seizing the affected products. Any corrective action, whether voluntary or involuntary, will require the dedication of our time and capital, distract management from operating our business, and may harm our reputation and financial results.
33
Risks Related to our Regulatory Compliance and Legal Matters
We operate in a highly regulated industry and are subject to a wide range of federal, state, and local laws, rules, and regulations, including FDA regulatory requirements and laws pertaining to fraud and abuse in healthcare, that affect nearly all aspects of our operations. Failure to comply with these laws, rules, and regulations, or to obtain and maintain required licenses, could subject us to enforcement actions, including substantial civil and criminal penalties, and might require us to recall or withdraw a product from the market or cease operations. Any of the foregoing could have a material adverse effect on our business, prospects, results of operations and financial condition.
We and our products are subject to extensive regulation in the U.S., including by the FDA. The regulations to which we are subject are complex. The FDA regulates, among other things, with respect to medical devices: design, development and manufacturing; testing, labeling, content and language of instructions for use; clinical trials; product safety; medical device cybersecurity; premarket clearance, de novo classification, and approval; establishment registration and device listing; marketing, sales and distribution; complaint handling; record keeping procedures; advertising and promotion; recalls and field safety corrective actions; post-market surveillance, including reporting of deaths or serious injuries and malfunctions that, if they were to recur, could lead to death or serious injury; post-market studies; and product import and export. The FDA monitors compliance with these applicable regulatory requirements through periodic unannounced inspections as well as various other channels, such as reviewing post-market surveillance and recall reports, monitoring advertising and promotional practices
on-line
and at trade shows, and reviewing trade complaints submitted by competitors or other third parties. We do not know whether we will pass any future inspections for FDA compliance, or whether the FDA might identify compliance concern(s) through other channels of information. Failure to comply with applicable regulations could jeopardize our ability to sell our products and result in enforcement-related actions such as: FDA Form 483s; untitled or warning letters; clinical holds on research; fines; injunctions; civil penalties; termination of distribution; recalls or seizures of products; delays in the introduction of products into the market; total or partial suspension of production; refusal to grant future clearances, de novo classifications, or approvals; withdrawals of current marketing authorizations, resulting in prohibitions on the sale and distribution of our products; and in the most serious cases, criminal penalties. Any of these sanctions could result in higher than anticipated costs or lower than anticipated sales and could have a material adverse effect on our business, prospects, results of operations and financial condition.The FDA and the Federal Trade Commission, or the FTC, also regulate the advertising and promotion of our products to ensure that the claims we make are consistent with our regulatory authorizations, that there is adequate and reasonable data to substantiate the claims and that our promotional labeling and advertising is neither false nor misleading. If the FDA or FTC determines that any of our advertising or promotional claims are false, misleading, not substantiated or not permissible, we may be subject to enforcement actions, including untitled or warning letters, and we may be required to revise our promotional claims and make other corrections or restitutions. We also may be subject to fines, or other regulatory, civil, or criminal sanctions.
We are subject to additional healthcare regulation and enforcement by the federal government and by authorities in the states and foreign jurisdictions in which they conduct their business and may constrain the financial arrangements and relationships through which we research, as well as, sell, market and distribute any products for which we obtain marketing approval. Such laws include, without limitation, federal and state anti-kickback, fraud and abuse, false claims, data privacy and security and physician and other healthcare provider payment transparency laws and regulations. If their operations are found to be in violation of any of such laws or any other governmental regulations that apply, they may be subject to significant penalties, including, without limitation, administrative, civil and criminal penalties, damages, fines, disgorgement, the curtailment or restructuring of operations, integrity oversight and reporting obligations, exclusion from participation in federal and state healthcare programs and imprisonment. See the section entitled “.”
Business—Health Care Laws and Regulations
Ensuring that our internal operations and future business arrangements with third parties comply with applicable healthcare laws and regulations will involve substantial costs. It is possible that governmental authorities will
34
conclude that our business practices, including our relationships with physicians and other healthcare providers, some of whom may be compensated in the form of stock or stock options for services provided to us and may be in the position to influence the ordering of or use of our product candidates, if approved, may not comply with current or future statutes, regulations, agency guidance or case law involving applicable fraud and abuse or other healthcare laws and regulations. If our operations are found to be in violation of any of the laws described above or any other governmental laws and regulations that may apply to us, we may be subject to significant penalties, including civil, criminal and administrative penalties, damages, fines, exclusion from government-funded healthcare programs, such as Medicare and Medicaid or similar programs in other countries or jurisdictions, integrity oversight and reporting obligations to resolve allegations of
non-compliance,
disgorgement, individual imprisonment, contractual damages, reputational harm, diminished profits and the curtailment or restructuring of our operations. If any of the physicians or other providers or entities with whom we expect to do business are found to not be in compliance with applicable laws, they may be subject to significant criminal, civil or administrative sanctions, including exclusions from government funded healthcare programs and imprisonment, which could affect our ability to operate our business. Further, defending against any such actions can be costly, time-consuming and may require significant personnel resources. Therefore, even if we are successful in defending against any such actions that may be brought against us, our business may be impaired.Our employees, consultants and commercial collaborators may engage in misconduct or other improper activities, including
non-compliance
with such regulatory standards and requirements.Because of the breadth of these laws and the narrowness of available statutory and regulatory exemptions, it is possible that some of our activities could be subject to challenge under one or more of such laws. Any action brought against us for violations of these laws or regulations, even if successfully defended, could cause us to incur significant legal expenses and divert our management’s attention from the operation of our business. We may be subject to private “qui tam” actions brought by individual whistleblowers on behalf of the federal or state governments, with potential liability under the federal False Claims Act including mandatory treble damages and significant
per-claim
penalties.Although we have adopted policies and procedures designed to comply with these laws and regulations and conduct internal reviews of our compliance with these laws, our compliance is also subject to governmental review. The growth of our business and sales organization including future expansion outside of the U.S. may increase the potential of violating these laws or our internal policies and procedures. The risk of our being found in violation of these or other laws and regulations is further increased by the fact that many have not been fully interpreted by the regulatory authorities or the courts, and their provisions are open to a variety of interpretations. Any action brought against us for violation of these or other laws or regulations, even if we successfully defend against it, could cause us to incur significant legal expenses and divert our management’s attention from the operation of our business. If our operations are found to be in violation of any of the federal, state and foreign laws described above or any other current or future fraud and abuse or other healthcare laws and regulations that apply to us, we may be subject to penalties, including significant criminal, civil and administrative penalties, damages and fines, disgorgement, additional reporting requirements and oversight if we become subject to a corporate integrity agreement or similar agreement to resolve allegations of noncompliance with these laws, imprisonment for individuals and exclusion from participation in government programs, such as Medicare and Medicaid, as well as contractual damages and reputational harm. We could also be required to curtail or cease our operations. Any of the foregoing consequences could have a material adverse effect on our business, prospects, results of operations and financial condition.
The regulatory framework for digital health products is constantly evolving. Increasingly stringent regulatory requirements could create barriers to our development and introduction of new products. Conversely, in the event regulatory requirements are lowered, competitors could potentially enter the prescription digital therapeutic market and compete against us more easily.
Our PDTs are novel and represent a new category of therapeutics for which the regulatory framework continues to evolve. Our ability to develop and introduce new products will depend, in part, on our ability to comply with
35
these complex requirements, which include regulations related to product design, development and manufacturing; testing, labeling, content and language of instructions for use; clinical trials; product safety; premarket clearance, de novo classification, and approval; establishment registration and device listing; and marketing, sales and distribution. If, however, the regulatory framework for digital health products simplifies and the requirements that we and others are required to comply with are lowered, it could result in the increased competition and the introduction by competitors of products that are or claim to be superior to our products. For example, the FDA issued a guidance entitled: “Enforcement Policy for Digital Health Devices For Treating Psychiatric Disorders During the Coronavirus Disease 2019
(COVID-19)
Public Health Emergency,” which allows for the marketing of certain digital therapeutics without premarket clearance, de novo classification, or approval so long as certain criteria are met for the duration of theCOVID-19
pandemic. Additionally, FDA has issued a proposal for public comment that may provide a limited extension of this enforcement policy after the expiration of theCOVID-19
public health emergency declaration. Additionally, competitors using our products as predicates for 510(k)s may successfully argue that they should be required to submit substantially less data to support clearance of their product than was required for our products based on FDA’s growing familiarity with the technology. As a result, we are subject to risks related to the developing regulatory landscape applicable to our PDTs that could have a material adverse effect on our business, prospects, results of operations and financial condition.Material modifications to our devices may require new 510(k) clearance, de novo classification, premarket approval, or supplement premarket approval, or may require us to cease marketing or recall the modified devices until clearances, authorizations, or approvals are obtained.
Material modifications to the intended use or technological characteristics of our devices may require new 510(k) clearance, de novo classification, Premarket Approval, or PMA, or PMA supplement approval, or may require us to cease marketing or recall the modified devices until clearances, de novo classifications, or approvals are obtained. Any modification to a 510(k)-cleared device that could significantly affect its safety or effectiveness, or that would constitute a major change in its intended use, design, or manufacture, requires a new 510(k) clearance or, possibly, a de novo or a PMA. The FDA requires every manufacturer to make and document this determination in the first instance. A manufacturer may determine that a modification could not significantly affect safety or effectiveness and does not represent a major change in its intended use, so that no new 510(k) clearance is necessary. The FDA may review any manufacturer’s decision and may not agree with our decisions regarding whether new clearances, de novo classifications, or approvals are necessary. The FDA may also on its own initiative determine that a marketing authorization is required.
Obtaining and maintaining marketing authorization of our product candidates in one jurisdiction does not mean that we will be successful in obtaining marketing authorization of our product candidates in other jurisdictions.
We may also submit marketing applications in other countries. Regulatory authorities in jurisdictions outside of the U.S. have requirements for marketing authorization of product candidates with which we must comply prior to marketing in those jurisdictions. Obtaining foreign marketing authorizations and compliance with foreign regulatory requirements could result in significant delays, difficulties and costs for us and could delay or prevent the introduction of our products in certain countries. If we fail to comply with the regulatory requirements in international markets and/or receive applicable marketing authorizations, our target market will be reduced and our ability to realize the full market potential of our product candidates will be harmed.
Obtaining and maintaining marketing authorization of our product candidates in one jurisdiction does not guarantee that we will be able to obtain or maintain marketing authorization in any other jurisdiction, while a failure or delay in obtaining marketing authorization in one jurisdiction may have a negative effect on the marketing authorization process in others. For example, even if the FDA grants marketing authorization of a product candidate, comparable regulatory authorities in foreign jurisdictions must also grant marketing authorization for the manufacturing, marketing and promotion of the product candidate in those countries.
36
Marketing authorization procedures vary among jurisdictions and can involve requirements and administrative review periods different from, and greater than, those in the U.S., including additional nonclinical studies or clinical trials as clinical trials conducted in one jurisdiction may not be accepted by regulatory authorities in other jurisdictions. In short, the foreign marketing authorization process involves all of the risks associated with FDA marketing authorization. In many jurisdictions outside the U.S., a product candidate must be approved for reimbursement before it can be approved for sale in that jurisdiction. In some cases, the price that we may intend to charge for our products will also be subject to approval.
Our commercialization efforts to date have focused almost exclusively on the U.S. Our ability to enter other foreign markets will depend, among other things, on our ability to navigate various regulatory regimes with which we do not have experience, which could delay or prevent the growth of our operations outside of the U.S.
To date, our commercialization efforts have focused almost exclusively on the U.S.. Expanding our business to attract customers in countries other than the U.S. is an element of our long-term business strategy. Our ability to continue to expand our business and to attract talented employees and customers in various international markets will require considerable management attention and resources and is subject to the particular challenges of supporting a rapidly growing business in an environment of multiple languages, cultures, customs, legal systems, alternative dispute resolution systems, regulatory systems and commercial infrastructures. Entering new international markets will be expensive, our ability to successfully gain market acceptance in any particular market is uncertain and the distraction of our senior management team could harm our business, financial condition and results of operation.
Sales of our products outside of the U.S. are subject to foreign regulatory requirements that vary widely from country to country. In addition, the FDA regulates exports of medical devices from the U.S.. While the regulations of some countries may not impose barriers to marketing and selling our products or only require notification, others require that we obtain the marketing authorization of a specified regulatory body. Complying with foreign regulatory requirements, including obtaining registrations or marketing authorizations, can be expensive and time-consuming, and we may not receive marketing authorizations in each country in which we may plan to market our products or we may be unable to do so on a timely basis. The time required to obtain registrations or marketing authorizations, if required by other countries, may be longer than that required for
FDA clearance, de novo classification, or approval, and requirements for such registrations and marketing authorizations may significantly differ from FDA requirements. If we modify our products, we may need to apply for additional regulatory authorizations before we are permitted to sell the modified product. In addition, we may not continue to meet the quality and safety standards required to maintain the authorizations that we have received. If we are unable to maintain our authorizations in a particular country, we will no longer be able to sell the applicable product in that country. Marketing authorization by the FDA does not ensure registration or marketing authorization by regulatory authorities in other countries, and registration or marketing authorization by one or more foreign regulatory authorities does not ensure registration or marketing authorization by regulatory authorities in other foreign countries or by the FDA. A failure or delay in obtaining registration or marketing authorization in one country may have a negative effect on the regulatory process in others.
Doing business internationally involves a number of additional risks, including:
| • | multiple, conflicting and changing laws and regulations such as tax laws, privacy and data protection laws and regulations, export and import restrictions, employment laws, regulatory requirements and other governmental approvals, permits and licenses; |
| • | requirements to maintain data and the processing of that data on servers located within the United States or in such countries; |
| • | protecting and enforcing our intellectual property rights; |
37
| • | converting our products as well as the accompanying instructional and marketing materials to conform to the language and customs of different countries; |
| • | complexities associated with managing multiple payer reimbursement regimes, and government payers; |
| • | competition from companies with significant market share in our market and with a better understanding of user preferences; |
| • | financial risks, such as longer payment cycles, difficulty collecting accounts receivable, the effect of local and regional financial pressures on demand and payment for our products and services and exposure to foreign currency exchange rate fluctuations; |
| • | natural disasters, political and economic instability, including wars, terrorism, political unrest, outbreak of disease (including the recent coronavirus outbreak), boycotts, curtailment of trade, and other market restrictions; and |
| • | regulatory and compliance risks that relate to maintaining accurate information and control over activities subject to regulation under the U.S. Foreign Corrupt Practices Act (the “FCPA”), and comparable laws and regulations in other countries. |
These risks and uncertainties may impact the Company’s ability to enter foreign markets, which could delay or prevent the growth of the Company’s operations outside of the U.S., and have a material adverse effect on our business, prospects, results of operations and financial condition.
The insurance coverage and reimbursement status of products that recently obtained marketing authorization is uncertain. Failure to obtain or maintain adequate coverage and reimbursement for EndeavorRx or any other of our product candidates, if granted marketing authorization, could limit our ability to market those products and materially and adversely affect our ability to generate revenue.
In the U.S., patients generally rely on third-party payers to reimburse all or part of the costs associated with their treatment. Adequate coverage and reimbursement from governmental healthcare programs, such as Medicare and Medicaid, and commercial payers is critical to the ability of patients to afford treatments and new product acceptance. Our ability to successfully commercialize our products will depend in part on the extent to which coverage and adequate reimbursement for these products and related treatments will be available from government health administration authorities, private health insurers and other organizations. Government authorities and third-party payers, such as private health insurers and health maintenance organizations, decide which medications and therapies they will pay for and establish reimbursement levels. The availability of coverage and extent of reimbursement by governmental and private payers is essential for most patients to be able to afford treatments. Sales of products, and of product candidates that we may identify, will depend substantially on the extent to which the costs to users of such products will be paid by health maintenance, managed care, pharmacy benefit and similar healthcare management organizations, or reimbursed by government health administration authorities, private health coverage insurers and other third-party payers. If coverage and adequate reimbursement is not available, or is available only to limited levels, we may not be able to successfully commercialize our products. Even if coverage is provided, the approved reimbursement amount may not be high enough to allow us to establish or maintain pricing sufficient to achieve profitability. See the section entitled “”
Business—Coverage and Reimbursement.
There is also significant uncertainty related to, and there may be significant delays in obtaining, the insurance coverage and reimbursement of newly cleared, de novo classified, or approved products and coverage may be more limited than the purposes for which the device is cleared, de novo classified, or approved by the FDA or comparable foreign regulatory authorities. In the U.S., the principal decisions about reimbursement for new medicines or medical devices are typically made by the Centers for Medicare & Medicaid Services, or CMS, an agency within the U.S. Department of Health and Human Services, or HHS. FDA marketing authorization provides no assurance of coverage or reimbursement by any payer. CMS decides whether and to what extent a
38
new medicine or medical device will be covered and reimbursed under Medicare, and private payers tend to follow CMS to a substantial degree.
Factors payers consider in determining reimbursement are based on whether the product is:
| • | a covered benefit under its health plan; |
| • | safe, effective and medically necessary; |
| • | supported by robust clinical data from well-controlled clinical research; |
| • | appropriate for the specific patient; |
| • | cost-effective; and |
| • | neither experimental nor investigational. |
Each payer determines whether or not it will provide coverage for a treatment, what amount it will pay the manufacturer for the treatment and on what tier of its formulary the treatment will be placed. The position of a treatment on a payer’s list of covered drugs, biological products, and medical devices, or formulary, generally determines the
co-payment
that a patient will need to make to obtain the treatment and can strongly influence the adoption of such treatment by patients and physicians. Patients who are prescribed treatments for their conditions and providers prescribing such services generally rely on third-party payers to reimburse all or part of the associated healthcare costs. Patients are unlikely to use our products unless coverage is provided and reimbursement is adequate to cover a significant portion of the cost of our products.Moreover, eligibility for coverage and reimbursement does not imply that a product will be paid for in all cases or at a rate that covers our costs, including research, development, intellectual property, manufacture, marketing, sale and distribution expenses. Interim reimbursement levels for new products, if applicable, may also not be sufficient to cover our costs and may not be made permanent. Reimbursement rates may vary according to the use of the product and the clinical setting in which it is used, may be based on reimbursement levels already set for lower cost products and may be incorporated into existing payments for other services. Net prices for products may be reduced by mandatory discounts or rebates required by government healthcare programs or private payers, by any future laws limiting prices and by any future relaxation of laws that presently restrict imports of products from countries where they may be sold at lower prices than in the U.S..
Third-party payers have attempted to control costs by limiting coverage and the amount of reimbursement for particular drugs or devices. We cannot be sure that coverage and reimbursement will be available for all products that we commercialize and, if reimbursement is available, what the level of reimbursement will be. Inadequate coverage and reimbursement may impact the demand for, or the price of, any product for which we obtain marketing authorization. If coverage and adequate reimbursement are not available, or are available only at limited levels, we may not be able to successfully commercialize our products.
In addition, in some foreign countries, the proposed pricing for a prescription device must be approved before it may be lawfully marketed. The requirements governing medical product pricing vary widely from country to country. For example, the European Union provides options for its member states to restrict the range of medicinal products for which their national health insurance systems provide reimbursement and to control the prices of medicinal products for human use. To obtain reimbursement or pricing approval, some of these countries may require the completion of clinical trials that compare the cost effectiveness of a particular product candidate to currently available therapies. A member state may approve a specific price for the medicinal products or it may instead adopt a system of direct or indirect controls on the profitability of the company placing the medicinal product on the market. There can be no assurance that any country that has price controls or reimbursement limitations for pharmaceuticals or medical devices will allow favorable reimbursement and pricing arrangements for any of our products. Historically, products launched in the European Union do not follow price structures of the U.S. and generally prices tend to be significantly lower. While the Company is not
39
currently marketing or selling our products in any country other than the U.S., including the European Union or any of its member states, in the event that the Company chooses to do so in the future, it will need to comply with such requirements.
We may be subject to governmental investigation, litigation, and other proceedings, which are costly to defend and could have a material adverse effect on our business, prospects, results of operations and financial condition.
We may be party to government investigations, lawsuits and legal proceedings in the normal course of business. These matters are often expensive and disruptive to normal business operations. We may face allegations, lawsuits and regulatory inquiries, audits and investigations regarding data privacy, security, labor and employment, consumer protection and intellectual property infringement, including claims related to privacy, patents, publicity, trademarks, copyrights and other rights. A portion of the technologies we use incorporates open source software, and we may face claims claiming ownership of open source software or patents related to that software, rights to our intellectual property or breach of open source license terms, including a demand to release material portions of our source code or otherwise seeking to enforce the terms of the applicable open source license. We may also face allegations or litigation related to our acquisitions, securities issuances or business practices, including public disclosures about our business. Litigation and regulatory proceedings, and particularly the patent infringement and class action matters we could face, may be protracted and expensive, and the results are difficult to predict. Certain of these matters may include speculative claims for substantial or indeterminate amounts of damages and include claims for injunctive relief. Additionally, our litigation costs could be significant. Adverse outcomes with respect to litigation or any of these legal proceedings may result in significant settlement costs or judgments, penalties and fines, or require us to modify our solution or require us to stop offering certain features, all of which could have a material adverse effect on our business, prospects, results of operations and financial condition. We may also become subject to periodic audits, which would likely increase our regulatory compliance costs and may require us to change our business practices, which could have a material adverse effect on our business, prospects, results of operations and financial condition. Managing legal proceedings, litigation and audits, even if we achieve favorable outcomes, is time-consuming and diverts management’s attention from our business.
The results of regulatory proceedings, litigation, claims, and audits cannot be predicted with certainty, and determining reserves for pending litigation and other legal, regulatory and audit matters requires significant judgment. There can be no assurance that our expectations will prove correct, and even if these matters are resolved in our favor or without significant cash settlements, these matters, and the time and resources necessary to litigate or resolve them, could have a material adverse effect on our business, prospects, results of operations, financial condition and the market price of our common stock.
Laws and regulations governing any international operations we may have may preclude us from developing, manufacturing and selling certain products outside of the U.S. and require us to develop and implement costly compliance programs.
We currently engage in certain activities supporting our product and platform development activities that occur outside the U.S., and for these activities we must dedicate additional resources to comply with numerous laws and regulations in each such jurisdiction. Additionally, the FCPA prohibits any U.S. individual or business from paying, offering, authorizing payment or offering of anything of value, directly or indirectly, to any foreign official, political party or candidate for the purpose of influencing any act or decision of the foreign entity in order to assist the individual or business in obtaining or retaining business. The FCPA also obligates companies whose securities are listed in the U.S. to comply with certain accounting provisions requiring the company to maintain books and records that accurately and fairly reflect all transactions of the corporation, including international subsidiaries, and to devise and maintain an adequate system of internal accounting controls for international operations.
40
Compliance with the FCPA is expensive and difficult, particularly in countries in which corruption is a recognized problem. In addition, the FCPA presents particular challenges in the pharmaceutical industry, because, in many countries, hospitals are operated by the government, and doctors and other hospital employees are considered foreign officials. Certain payments to hospitals in connection with clinical trials and other work have been deemed to be improper payments to government officials and have led to FCPA enforcement actions.
Various laws, regulations and executive orders also restrict the use and dissemination outside of the U.S., or the sharing with certain
non-U.S.
nationals, of information classified for national security purposes, as well as certain products and technical data relating to those products. If we expand our activities outside of the U.S., it will require us to dedicate additional resources to comply with these laws, and these laws may preclude us from developing, manufacturing, or selling certain products and product candidates outside of the U.S., which could limit our growth potential and increase our development costs.The failure to comply with laws governing international business practices may result in substantial civil and criminal penalties and suspension or debarment from government contracting. The SEC also may suspend or bar issuers from trading securities on U.S. exchanges for violations of the FCPA’s accounting provisions.
Healthcare reform and other governmental and private payer initiatives may have an adverse effect upon, and could prevent, our products’ or product candidates’ commercial success.
In the U.S. and in certain foreign jurisdictions, there have been a number of legislative and regulatory changes to the healthcare system that could impact our ability to sell our products profitably, such as the ACA. See the section entitled “.”
Business—Healthcare Reform
There has been increasing legislative and enforcement interest in the U.S. with respect to prescription- pricing practices. Specifically, there have been several recent U.S. Congressional inquiries and proposed federal and state legislation designed to, among other things, bring more transparency to drug pricing, reduce the cost of prescription drugs under Medicare, review the relationship between pricing and manufacturer patient programs, and reform government program reimbursement methodologies for drugs. The HHS has already started the process of soliciting feedback on some of these measures and, at the same time, is immediately implementing others under its existing authority. It is unclear what effect such legislative and enforcement interest may have on prescription devices. Further, it is unclear whether the Biden administration will challenge, reverse, revoke or otherwise modify the prior administration’s executive and administrative actions.
We expect that these and other healthcare reform measures that may be adopted in the future, may result in more rigorous coverage criteria and in additional downward pressure on the price that we receive for any cleared, de novo classified, or approved device, which could have an adverse effect on patients for our products or product candidates. Any reduction in reimbursement from Medicare or other government programs may result in a similar reduction in payments from private payers.
There have been, and likely will continue to be, legislative and regulatory proposals at the foreign, federal and state levels in the U.S. directed at broadening the availability of healthcare and containing or lowering the cost of healthcare. The implementation of cost containment measures or other healthcare reforms may prevent us from being able to generate revenue, attain profitability or commercialize our products. Such reforms could have an adverse effect on anticipated revenue from product candidates that we may successfully develop and for which we may obtain marketing authorization and that may affect our overall financial condition and ability to develop product candidates. If we or any third parties we may engage are slow or unable to adapt to changes in existing requirements or the adoption of new requirements or policies, or if we or such third parties are not able to maintain regulatory compliance, our current or any future product candidates we may develop may lose any marketing authorization that may have been obtained and we may not achieve or sustain profitability.
41
If we fail to comply with the FDA’s Quality System Regulation, or QSR, or any applicable foreign equivalent, our operations could be interrupted, and our potential product sales and operating results could suffer.
We are required to comply with the FDA’s QSR, which delineates, among other things, the design controls, document controls, purchasing controls, identification and traceability, production and process controls, acceptance activities, nonconforming product requirements, corrective and preventive action requirements, labeling and packaging controls, handling, storage, distribution and installation requirements, complaint handling, records requirements, servicing requirements, and statistical techniques potentially applicable to the production of our medical devices. We are also subject to the regulations of foreign jurisdictions if we market products overseas.
The FDA enforces the QSR through periodic and announced or unannounced inspections of manufacturing facilities. If our facilities or processes are found to be in
non-compliance
or fail to take satisfactory corrective action in response to adverse QSR inspectional findings, the FDA could take legal or regulatory enforcement actions against us and/or our products, including but not limited to the cessation of sales or the initiation of a recall of distributed products, which could impair our ability to produce our products in a cost-effective and timely manner in order to meet our customers’ demands. We may also be required to bear other costs or take other actions that may have a negative impact on our future sales and our ability to generate profits.The FDA’s and other comparable
non-U.S.
regulatory agencies’ statutes, regulations, policies or interpretations may change, and additional government regulation or statutes may be enacted, which could increase regulatory requirements, or delay, suspend, prevent marketing of any cleared, de novo classified, or approved products or necessitate the recall of distributed products. We cannot predict the likelihood, nature or extent of adverse governmental regulation that might arise from future legislative or administrative action, either in the U.S. or abroad.The medical device industry has been under heightened FDA scrutiny as the subject of government investigations and enforcement actions. If our operations and activities are found to be in violation of any FDA laws or any other governmental regulations that apply to us, we may be subject to penalties, including civil and criminal penalties, damages, fines and other legal and/or agency enforcement actions. Any penalties, damages, fines, or curtailment or restructuring of our operations or activities could materially and adversely affect our ability to operate our business and our financial results. The risk of us being found in violation of FDA laws is increased by the fact that many of these laws are broad and their provisions are open to a variety of interpretations. Any action against us for violation of these laws, even if we successfully defend ourselves against that action and its underlying allegations, could cause us to incur significant legal expenses and divert management’s attention from the operation of our business. Where there is a dispute with a federal or state governmental agency that cannot be resolved to the mutual satisfaction of all relevant parties, we may determine that the costs, both real and contingent, are not justified by the commercial returns to us from maintaining the dispute or the product.
Various claims, design features, or performance characteristics of our medical devices that we regarded as permitted by the FDA without new marketing authorization may be challenged by the FDA or state or foreign regulators. The FDA or state or foreign regulatory authorities may find that certain claims, design features, or performance characteristics, in order to be made or included in the products, may have to be supported by further clinical studies and authorizations, which could be lengthy, costly, and possibly unobtainable.
We are subject to data privacy and security laws and regulations governing our collection, use, disclosure or storage of personally identifiable information, including protected health information and payment card data, which may impose restrictions on us and our operations. Any actual or perceived noncompliance with such laws and regulations may result in penalties, regulatory action, loss of business or unfavorable publicity.
Numerous federal and state laws and regulations govern the collection, use, disclosure, storage and transmission of personally identifiable information, or PII, including protected health information, or PHI, and information
42
related to treatment for ADHD and other diseases and disorders resulting in cognitive impairment. These laws and regulations, including their interpretation by governmental agencies, are subject to frequent change and could have a negative impact on our business. In addition, in the future, industry requirements or guidance, contractual obligations, and/or legislation at both the federal and the state level may limit, forbid or regulate the use or transmission of health information outside of the U.S.
These varying interpretations can create complex compliance issues for us and our partners and potentially expose us to additional expense, adverse publicity and liability, any of which could have a material adverse effect on our business, prospects, results of operations and financial condition.
Federal and state consumer protection laws are increasingly being applied by the FTC and states’ attorneys general to regulate the collection, use, storage and disclosure of PII, through websites or otherwise, and to regulate the presentation of website content.
The security measures that we and our third-party vendors and subcontractors have in place to ensure compliance with privacy and data protection laws may not protect our facilities and systems from security breaches, acts of vandalism or theft, computer viruses, misplaced or lost data, programming and human errors or other similar events. Even though we provide for appropriate protections through our agreements with our third-party vendors, we still have limited control over their actions and practices. A breach of privacy or security of PII or PHI may result in an enforcement action, including criminal and civil liability, against us. We are not able to predict the extent of the impact such incidents may have on our business. Enforcement actions against us could be costly and could interrupt regular operations, which could have a material adverse effect on our business, prospects, results of operations and financial condition. Even if it is determined that there was no violation of laws, enforcement actions against us could be costly, generate negative publicity and could interrupt regular operations, which could have a material adverse effect on our business, prospects, results of operations and financial condition. While we have not received any notices of violation of the applicable privacy and data protection laws and believe we are in compliance with such laws, there can be no assurance that we will not receive such notices in the future.
There is ongoing concern from privacy advocates, regulators and others regarding data privacy and security issues, and the number of jurisdictions with data privacy and security laws has been increasing. Also, there are ongoing public policy discussions regarding whether the standards for
de-identification,
anonymization or pseudonymization of health information are sufficient, and the risk ofre-identification
sufficiently small, to adequately protect patient privacy. We expect there will continue to be new proposed and amended laws, regulations and industry standards concerning privacy, data protection and information security in the U.S., such as the California Consumer Privacy Act, the CCPA, which went into effect on January 1, 2020 and has been amended several times. Further, a new California privacy law, the California Privacy Rights Act, the CPRA, was passed by California voters on November 3, 2020, and in March 2021, Virginia passed a new privacy law, the Consumer Data Protection Act, the VCDPA, similar to the CPRA. The CPRA will create additional obligations with respect to processing and storing personal information and the VCDPA is scheduled to take effect on January 1, 2023 (with certain provisions of the CPRA having retroactive effect to January 1, 2022). In addition New York’s Stop Hacks and Improve Electronic Data Security Act, the SHIELD Act, requires any person or business owning or licensing computerized data that includes the private information of a resident of New York to implement and maintain reasonable safeguards to protect the security, confidentiality and integrity of the private information. Other U.S. states also are considering omnibus privacy legislation and industry organizations regularly adopt and advocate for new standards in these areas. While the CCPA and CPRA contain exceptions for certain activities involving PHI under Health Insurance Portability Administration and Accountability Act of 1996, as amended, or HIPAA, we cannot yet determine the impact the CCPA, CPRA, VCDPA or other such future laws, regulations and standards may have on our business.Future laws, regulations, standards, obligations, amendments, and changes in the interpretation of existing laws, regulations, standards and obligations could impair our or our customers’ ability to collect, use or disclose information relating to patients or consumers, including information derived therefrom, which could decrease
43
demand for our products, increase our costs and impair our ability to maintain and grow our customer base and increase our revenue. Accordingly, we may find it necessary or desirable to fundamentally change our business activities and practices or to expend significant resources to modify our software or platform and otherwise adapt to these changes.
Further, our patients may expect us to comply with more stringent privacy and data security requirements than those imposed by laws, regulations or self-regulatory requirements, and we may be obligated contractually to comply with additional or different standards relating to our handling or protection of data. If we, or any third parties we or our partners use to process PII on our behalf, are unable to properly protect the privacy and security of personal information, including protected health information, we and they could be found to have breached our and their contracts with certain third parties.
Any failure or perceived failure by us to comply with federal or state laws or regulations, industry standards or other legal obligations, or any actual or suspected privacy or security incident, whether or not resulting in unauthorized access to, or acquisition, release or transfer of PII or other data, may result in governmental enforcement actions and prosecutions, private litigation, fines and penalties or adverse publicity and could cause our customers to lose trust in us, which could have a material adverse effect on our reputation, business, prospects, results of operations and financial condition. We may be unable to make such changes and modifications in a commercially reasonable manner or at all, and our ability to develop new products could be limited. Any of these developments could harm our business, financial condition and results of operations. Privacy and data security concerns, whether valid or not valid, may inhibit retention of our products by existing customer or adoption of our products by new customers.
Around the world, data collection and use are governed by laws and regulations governing the use, processing and cross-border transfer of personal information.
In the event we decide to conduct clinical trials or engage in other human data collection, we may be subject to additional privacy restrictions. Many foreign jurisdictions, including, without limitation, member states of the European Union (the “EU”), and the United Kingdom, Canada, Israel, Australia, New Zealand, Japan and many other countries have adopted legislation that increase or change the requirements governing the collection, distribution, use, storage, disclosure, or other processing, and/or security of personal information and other data in these jurisdictions. If our privacy or data security measures fail to comply with current or future laws and regulations, we may be subject to litigation, regulatory investigations or other liabilities, or our customers may terminate their relationships with us.
Personal privacy and data security have become significant issues in the U.S., Europe, and in many other jurisdictions. The regulatory framework for privacy and security issues worldwide is rapidly evolving and is likely to remain uncertain for the foreseeable future. Many federal, state, and foreign government bodies and agencies have adopted, or are considering adopting, laws and regulations regarding the collection, use, and disclosure of personal information, including protected health information. These laws and regulations, including their interpretation by governmental agencies, are subject to frequent change and could have a negative impact on Akili’s business. In addition, in the future, industry requirements or guidance, contractual obligations, and/or legislation at both the federal and the state level may limit, forbid or regulate the use or transmission of health information outside of the U.S..
These varying interpretations can create complex compliance issues for Akili and Akili’s partners and potentially expose Akili to additional expense, adverse publicity and liability, any of which could adversely affect Akili’s business.
Federal and state consumer protection laws are increasingly being applied by the U.S. Federal Trade Commission (the “FTC”), and states’ attorneys general to regulate the collection, use, storage and disclosure of personal or personally identifiable information, through websites or otherwise, and to regulate the presentation of website content.
44
The security measures that Akili and Akili’s third-party vendors and subcontractors have in place to ensure compliance with privacy and data protection laws may not protect Akili’s facilities and systems from security breaches, acts of vandalism or theft, computer viruses, misplaced or lost data, programming and human errors or other similar events. Even though Akili provides for appropriate protections through Akili’s agreements with Akili’s third-party vendors, Akili still has limited control over their actions and practices. A breach of privacy or security of personally identifiable health information may result in an enforcement action, including criminal and civil liability, against us. Akili is not able to predict the extent of the impact such incidents may have on Akili’s business. Enforcement actions against Akili could be costly and could interrupt regular operations, which may adversely affect Akili’s business. While Akili has not received any notices of violation of the applicable privacy and data protection laws and believe Akili is in compliance with such laws, there can be no assurance that Akili will not receive such notices in the future.
There is ongoing concern from privacy advocates, regulators and others regarding data privacy and security issues, and the number of jurisdictions with data privacy and security laws has been increasing. Also, there are ongoing public policy discussions regarding whether the standards for
de-identification,
anonymization or pseudonymization of health information are sufficient, and the risk ofre-identification
sufficiently small, to adequately protect patient privacy. Akili expects that there will continue to be new proposed and amended laws, regulations and industry standards concerning privacy, data protection and information security in the U.S., such as the California Consumer Privacy Act (the “CCPA”), which went into effect on January 1, 2020 and has been amended several times. Further, a new California privacy law, the California Privacy Rights Act (the “CPRA”), was passed by California voters on November 3, 2020. The CPRA will create additional obligations with respect to processing and storing personal information that are scheduled to take effect on January 1, 2023 (with certain provisions having retroactive effect to January 1, 2022). Additionally, some observers have noted that the CCPA and CPRA could mark the beginning of a trend toward more stringent privacy legislation in the U.S., which could increase our potential liability and adversely affect our business. Already, in the U.S., we have witnessed significant developments at the state level. For example, on March 2, 2021, Virginia enacted the Consumer Data Protection Act (the “CDPA”) and, on July 8, 2021, Colorado’s governor signed the Colorado Privacy Act (“CPA”), into law. The CDPA and the CPA will both become effective January 1, 2023. While the CDPA and CPA incorporate many similar concepts of the CCPA and CPRA, there are also several key differences in the scope, application, and enforcement of the law that will change the operational practices of regulated businesses. The new laws will, among other things, impact how regulated businesses collect and process personal sensitive data, conduct data protection assessments, transfer personal data to affiliates, and respond to consumer rights requests.A number of other states have proposed new privacy laws, some of which are similar to the above discussed recently passed laws. Such proposed legislation, if enacted, may add additional complexity, variation in requirements, restrictions and potential legal risk, require additional investment of resources in compliance programs, impact strategies and the availability of previously useful data and could result in increased compliance costs and/or changes in business practices and policies. The existence of comprehensive privacy laws in different states in the country would make our compliance obligations more complex and costly and may increase the likelihood that we may be subject to enforcement actions or otherwise incur liability for noncompliance.
Akili’s international operations are subject to international laws and regulations, regulatory guidance, and industry standards relating to data protection, privacy, and information security. For Akili’s EU and UK future operations, this includes the EU General Data Protection Regulation, or GDPR, as well as other national data protection legislation in force in relevant EU member states (including the GDPR in such form as incorporated into the law of England and Wales, Scotland and Northern Ireland by virtue of the European Union (Withdrawal) Act 2018 and any regulations thereunder and the UK Data Protection Act 2018, or UK GDPR.
The General Data Protection Regulation (“GDPR”) and UK GDPR are wide-ranging in scope and impose numerous additional requirements on companies that process personal data, including imposing special
45
requirements in respect of the processing of health and other sensitive data, requiring that consent of individuals to whom the personal data relates is obtained in certain circumstances, requiring additional disclosures to individuals regarding data processing activities, requiring that safeguards are implemented to protect the security and confidentiality of personal data, creating mandatory data breach notification requirements in certain circumstances, requiring data protection impact assessments for high risk processing and requiring that certain measures (including contractual requirements) are put in place when engaging third-party processors. The GDPR and the UK GDPR also provide individuals with various rights in respect of their personal data, including rights of access, erasure, portability, rectification, restriction and objection. The GDPR and UK GDPR define personal data to include pseudonymized or coded data and requires different informed consent practices and more detailed notices for clinical trial participants and investigators than applies to clinical trials conducted in the U.S.. We are required to apply GDPR and UK GDPR standards to any clinical trials that our EU and UK established businesses carry out anywhere in the world.
The GDPR and UK GDPR impose strict rules on the transfer of personal data to countries outside the European Economic Area, including the U.S.. The UK and Switzerland have adopted similar restrictions. Although the UK is regarded as a third country under the EU’s GDPR, the European Commission (“EC”) has now issued a decision recognizing the UK as providing adequate protection under the EU GDPR and, therefore, transfers of personal data originating in the EU to the UK remain unrestricted. Like the EU GDPR, the UK GDPR restricts personal data transfers outside the UK to countries not regarded by the UK as providing adequate protection. The UK government has confirmed that personal data transfers from the UK to the EEA remain free flowing.
To enable the transfer of personal data outside of the EEA or the UK, adequate safeguards must be implemented in compliance with European and UK data protection laws. On June 4, 2021, the EC issued new forms of standard contractual clauses for data transfers from controllers or processors in the EU/EEA (or otherwise subject to the GDPR) to controllers or processors established outside the EU/EEA (and not subject to the GDPR). The new standard contractual clauses replace the standard contractual clauses that were adopted previously under the EU Data Protection Directive. The UK is not subject to the EC’s new standard contractual clauses but has published a draft version of a
UK-specific
transfer mechanism, which, once finalized, will enable transfers from the UK. We will be required to implement these new safeguards when conducting restricted data transfers under the EU and UK GDPR and doing so will require significant effort and cost.The GDPR and UK GDPR may increase Akili’s responsibility and liability in relation to personal data that Akili’s process where such processing is subject to the GDPR and UK GDPR. Implementing legislation in applicable EU member states and the UK, including by seeking to establish appropriate lawful bases for the various processing activities Akili carries out as a controller or joint controller, reviewing security procedures and those of Akili’s vendors and collaborators, and entering into data processing agreements with relevant vendors and collaborators, Akili cannot be certain that its efforts to achieve and remain in compliance have been, and/or will continue to be, fully successful. Given the breadth and depth of changes in data protection obligations, preparing for and complying with the GDPR and UK GDPR and similar laws’ requirements are rigorous and time intensive and require significant resources and a review of our technologies, systems and practices, as well as those of any third-party collaborators, service providers, contractors or consultants that process or transfer personal data.
Other countries around the world in which we conduct trials or otherwise do business have also enacted strict privacy and data protection laws. For example, the Act on the Protection of Personal Information (“APPI”) of Japan regulates privacy protection issues in Japan. The APPI shares similarities with the GDPR, including extraterritorial application and obligations to provide certain notices and rights to citizens of Japan. We may be required to modify our policies, procedures, and data processing measures in order to address requirements under these or other privacy, data protection, or cyber security regimes, and may face claims, litigation, investigations, or other proceedings regarding them and may incur related liabilities, expenses, costs, and operational losses.
In addition to general privacy and data protection requirements, many jurisdictions around the world have adopted legislation that regulates how businesses operate online and enforces information security, including
46
measures relating to privacy, data security and data breaches. Many of these laws require businesses to notify data breaches to the regulators and/or to data subjects. These laws are not consistent, and compliance in the event of a widespread data breach is costly and burdensome.
In many jurisdictions, enforcement actions and consequences for
non-compliance
with protection, privacy and information security laws and regulations are rising. In the EU and the UK, data protection authorities may impose large penalties for violations of the data protection laws, including potential fines of up to €20 million (£17.5 million in the UK) or 4% of annual global revenue, whichever is greater. The authorities have shown a willingness to impose significant fines and issue orders preventing the processing of personal data onnon-compliant
businesses. Data subjects also have a private right of action, as do consumer associations, to lodge complaints with supervisory authorities, seek judicial remedies, and obtain compensation for damages resulting from violations of applicable data protection laws. The APPI allows for fines of up to ¥100M for violations of the law. In the U.S., possible consequences fornon-compliance
include enforcement actions in response to rules and regulations promulgated under the authority of federal agencies and state attorneys general and legislatures and consumer protection agencies.In addition, privacy advocates and industry groups have regularly proposed, and may propose in the future, self- regulatory standards that may legally or contractually apply to us. If we fail to follow these security standards, even if no customer information is compromised, we may incur significant fines or experience a significant increase in costs.
The risk of our being found in violation of these laws is increased by the fact that the interpretation and enforcement of such laws is not entirely clear. Efforts to ensure that our business arrangements with third parties will comply with applicable healthcare laws and regulations will involve substantial costs. Any action against us for violation of these laws, even if we successfully defend against it, could cause us to incur significant legal expenses and divert our management’s attention from the operation of our business. The shifting compliance environment and the need to build and maintain robust and expandable systems to comply with multiple jurisdictions with different compliance and/or reporting requirements increases the possibility that a healthcare company may run afoul of one or more of the requirements.
Compliance with data protection laws and regulations could require us to take on more onerous obligations in our contracts, restrict our ability to collect, use and disclose data, or in some cases, impact our ability to operate in certain jurisdictions. It could also require us to change our business practices and put in place additional compliance mechanisms, may interrupt or delay our development, regulatory and commercialization activities and increase our cost of doing business. Failure by us or our collaborators and third-party providers to comply with data protection laws and regulations could result in government enforcement actions (which could include civil or criminal penalties and orders preventing us from processing personal data), private litigation and result in significant fines and penalties against us. Moreover, clinical trial participants about whom we or our potential collaborators obtain information, as well as the providers who share this information with us, may contractually limit our ability to use and disclose the information. Claims that we have violated individuals’ privacy rights, failed to comply with data protection laws or breached our contractual obligations, even if we are not found liable, could be expensive and time-consuming to defend, could result in adverse publicity and could have a material adverse effect on our business, financial condition, results of operations and prospects.
We provide patient services using text and voice calls to communicate with healthcare providers, patients, and prospective patients, and we are subject to various marketing and advertising laws including the Telephone Consumer Protection Act. If we fail to comply with applicable laws, including the TCPA, we may be subject to significant liabilities.
Our patient service center uses short message service, or SMS, text messages and telephone calls to communicate with healthcare providers, patients and prospective patients. We also may use SMS, text messages and telephone calls for marketing purposes with the recipient’s advance consent. The actual or perceived improper sending of
47
text messages or the making of telephone calls may subject us to potential risks, including liabilities or claims relating to consumer protection laws. Numerous class-action suits under federal and state laws have been filed in recent years against companies who conduct SMS texting programs or make unwanted telephone calls, with many resulting in multi-million-dollar settlements to the plaintiffs. Any future such litigation against us could be costly and time-consuming to defend. For example, the Telephone Consumer Protections Act of 1991, the TCPA, is a federal statute that protects consumers from unwanted telephone calls, faxes, and text messages, restricts telemarketing and the use of automated SMS text messages without proper consent. Additionally, state regulators may determine that telephone calls to our patients are subject to state telemarketing regulations. Federal or state regulatory authorities or private litigants may claim that the notices and disclosures we provide, form of consents we obtain, or our SMS texting practices are not adequate or violate applicable law. This may in the future result in civil claims against us. The scope and interpretation of the laws that are or may be applicable to the delivery of text messages are continuously evolving and developing. If we do not comply with these laws or regulations or if we become liable under these laws or regulations, we could face direct liability, could be required to change some portions of our business model, could face negative publicity, and our business, prospects, results of operations and financial condition could be materially and adversely affected. Even an unsuccessful challenge of our SMS texting or telephone calling practices by our customers, regulatory authorities, or other third parties could result in negative publicity and could require a costly response from and defense by us.
We are subject to certain U.S. and foreign anti-corruption, anti-money laundering, export control, sanctions, and other trade laws and regulations. We can face serious consequences for violations. Our relationships with customers and third-party payers will be subject to applicable anti-kickback, fraud and abuse and other healthcare laws and regulations, which could expose us to criminal sanctions, civil penalties, exclusion from government healthcare programs, contractual damages, reputational harm and diminished profits and future earnings.
Among other matters, U.S. and foreign anti-corruption, anti-money laundering, export control, sanctions, and other trade laws and regulations (which are collectively referred to herein as “Trade Laws”), prohibit companies and their employees, agents, clinical research organizations, legal counsel, accountants, consultants, contractors, and other partners from authorizing, promising, offering, providing, soliciting, or receiving directly or indirectly, corrupt or improper payments or anything else of value to or from recipients in the public or private sector. Violations of Trade Laws can result in substantial criminal fines and civil penalties, imprisonment, the loss of trade privileges, debarment, tax reassessments, breach of contract and fraud litigation, reputational harm, and other consequences. We expect our
non-U.S.
activities to increase in time. We plan to engage third parties for clinical trials and/or to obtain necessary permits, licenses, patent registrations, and other regulatory approvals and we can be held liable for the corrupt or other illegal activities of our personnel, agents, or partners, even if we do not explicitly authorize or have prior knowledge of such activities. Any of these consequences could have a material adverse effect on our business, prospects, results of operations and financial condition.Our employees, independent contractors, consultants, commercial collaborators, principal investigators, vendors and other agents may engage in misconduct or other improper activities, including
non-compliance
with regulatory standards and requirements.We are exposed to the risk that our employees, independent contractors, consultants, commercial collaborators, principal investigators, vendors and other agents may engage in fraudulent conduct or other illegal activity. Misconduct by these parties could include intentional, reckless or negligent conduct or disclosure of unauthorized activities to us that violates applicable regulations, including those laws requiring the reporting of true, complete and accurate information to regulatory agencies, manufacturing standards and U.S. federal and state healthcare laws and regulations. In particular, sales, marketing and business arrangements in the healthcare industry are subject to extensive laws and regulations intended to prevent fraud, kickbacks, self-dealing and other abusive practices. We could face liability under the U.S. federal Anti-Kickback Statute and similar U.S. state laws. These laws and regulations may restrict or prohibit a wide range of pricing, discounting, marketing and promotion, sales commission, referrals, customer incentive programs and other business arrangements.
48
Misconduct by these parties could also involve the improper use of individually identifiable information, including, without limitation, information obtained in the course of clinical trials, which could result in significant regulatory sanctions and serious harm to our reputation. Further, should violations include promotion of unapproved
(off-label)
uses one or more of our products, we could face significant regulatory sanctions for unlawful promotion, as well as substantial penalties under applicable federal or state laws. Similar concerns could exist in jurisdictions outside of the U.S. as well. It is not always possible to identify and deter misconduct by employees and other third parties, and the precautions we take to detect and prevent this activity may not be effective in controlling unknown or unmanaged risks or losses or in protecting us from governmental investigations or other actions or lawsuits stemming from a failure to comply with these laws or regulations. The precautions we take to detect and prevent misconduct may not be effective in controlling unknown or unmanaged risks or losses or in protecting us from governmental investigations or other actions or lawsuits stemming from a failure to be in compliance with such laws or regulations. If any such actions are instituted against us, and we are not successful in defending ourselves or asserting our rights, those actions could have a significant impact on our business, including the imposition of civil, criminal and administrative penalties, damages, monetary fines, imprisonment, possible exclusion from participation in Medicare, Medicaid and other federal healthcare programs, additional reporting requirements and oversight if we become subject to a corporate integrity agreement or similar agreement to resolve allegations of noncompliance with these laws, contractual damages, reputational harm, diminished profits and future earnings, and curtailment of our operations, any of which could have a material adverse effect on our business, prospects, results of operations and financial condition.Federal, state and local employment-related laws and regulations could increase our cost of doing business and subject us to fines and lawsuits.
Our operations are subject to a variety of federal, state and local employment-related laws and regulations, including, but not limited to, the U.S. Fair Labor Standards Act, which governs such matters as minimum wages, the Family Medical Leave Act, overtime pay, compensable time, recordkeeping and other working conditions, Title VII of the Civil Rights Act, the Employee Retirement Income Security Act, the Americans with Disabilities Act, the National Labor Relations Act, regulations of the Equal Employment Opportunity Commission, regulations of the Office of Civil Rights, regulations of the Department of Labor (DOL), regulations of state attorneys general, federal and state wage and hour laws, and a variety of similar laws enacted by the federal and state governments that govern these and other employment-related matters. As our employees are located in a number of states, compliance with these evolving federal, state and local laws and regulations could substantially increase our cost of doing business while failure to do so could subject us to fines and lawsuits.
Risks Related to our Intellectual Property and Technology
If we are unable to adequately protect and enforce our intellectual property and proprietary technology, obtain and maintain patent protection for our technology and products where appropriate or if the scope of the patent protection obtained is not sufficiently broad, or if we are unable to protect the confidentiality of our trade secrets and
know-how,
our competitors could develop and commercialize technology and products similar or identical to our products, and our ability to successfully commercialize our technology and products may be impaired.Our commercial success will depend in part on our ability to obtain, maintain, protect and enforce our proprietary and intellectual property rights in the U.S. and other countries for our product candidates, and our core technologies, including EndeavorRx, preclinical and clinical assets, methods of use patents and related
know-how.
We seek to protect our proprietary and intellectual property position by, among other methods, filing patent applications in the U.S. and abroad related to our proprietary technology, inventions and improvements that are important to the development and implementation of our business. However, the patent process is expensive, time consuming and complex, and we may not be able to apply for patents on certain aspects of our technology and products in a timely fashion, at a reasonable cost, in all jurisdictions or at all, and any potential patent coverage we obtain may not be sufficient to prevent substantial competition. In some circumstances, we may not have the right to control the preparation, filing and prosecution of patent applications, or to maintain,49
enforce and defend the patents, covering technology that we may exclusively license from third parties. Further, we can provide no assurance that any of our current or future patent applications will result in issued patents or that any issued patents will provide us with any competitive advantage. In addition, we also rely on trade secrets,
know-how
and continuing technological innovation to develop and maintain our proprietary and intellectual property position that we seek to protect, in part, through confidentiality agreements with employees, consultants and others. We cannot assure you, however, that our proprietary information will not be shared or accessed without authorization, that our confidentiality agreements will not be breached, that we will have adequate remedies for any breach, or that our trade secrets will not otherwise become known to or independently developed by competitors. Further, if any collaboration partner or licensor is unable to obtain or maintain patent or trade secret protection with respect to product candidates that we or they currently are or may in the future develop, or if the scope of the protection secured is not sufficiently broad, third parties could develop and commercialize products similar or identical to ours and our ability to commercialize any product candidates we may develop may be adversely affected. Our inability to maintain and protect our proprietary information and trade secrets could have a material adverse effect on our business, prospects, results of operations and financial conditions.We may become involved in litigation to protect or enforce our patents and other intellectual property rights, which could be expensive, time consuming and unsuccessful. We may not be able to effectively prosecute and enforce our intellectual property rights throughout the world. Failure to protect or enforce intellectual property rights could have a material adverse effect on our business, prospects, results of operations and financial condition.
Competitors and other third parties may infringe, misappropriate or otherwise violate our patents and other intellectual property rights. To counter infringement or unauthorized use, we may be required to file infringement claims. A court may disagree with our allegations, however, and may refuse to stop the other party from using the technology at issue on the grounds that our patents do not cover it. Further, such third parties could counterclaim that we infringe their intellectual property or that a patent we have asserted against them is invalid or unenforceable. In patent litigation in the U.S., defendant counterclaims, post-grant review, andreviews challenging the validity, enforceability or scope of asserted patents are commonplace. In addition, third parties may initiate legal proceedings against us to assert such challenges to our intellectual property rights. The outcome of any such proceeding is generally unpredictable. Grounds for a validity challenge could be an alleged failure to meet any of several statutory requirements, including lack of novelty, obviousness or
inter partes
non-enablement.
Patents may be unenforceable if someone connected with prosecution of the patent withheld relevant information from the U.S. Patent and Trademark Office (the “USPTO”) or made a misleading statement during prosecution. It is possible that prior art of which we and the patent examiner were unaware during prosecution exists, which could render any patents that may issue invalid. Moreover, it is also possible that prior art may exist that we are aware of but do not believe is relevant to our future patents, should they issue, but that could nevertheless be determined to render our patents invalid.An adverse result in any litigation proceeding could put one or more of our patents at risk of being invalidated or interpreted narrowly. If a defendant were to prevail on a legal assertion of invalidity or unenforceability of our patents covering one of our product candidates, we would lose at least part, and perhaps all, of the patent protection covering such product candidate or technology. Competing products may also be sold in other countries in which our patent coverage might not exist or be as strong. Any litigation or other proceedings to enforce our intellectual property rights may fail and, even if successful, may result in substantial costs and distract our management and other personnel. Any of the foregoing could have a material adverse effect on our business, prospects, results of operations and financial condition.
Accusations of infringement of third-party intellectual property rights could have a material adverse effect on our business, prospects, results of operations and financial condition.
There has been substantial litigation in the healthcare industry regarding intellectual property rights, and we may be sued for infringement from time to time in the future. Also, in some instances, we have agreed to indemnify
50
third parties for expenses and liability resulting from claimed intellectual property infringement. From time to time, we may receive requests for indemnification in connection with allegations of intellectual property infringement and we may choose, or be required, to assume the defense and/or reimburse third parties for their expenses, settlement and/or liability. We cannot assure you that we will be able to settle any future claims or, if we are able to settle any such claims, that the settlement will be on terms favorable to us. Our broad range of technology may increase the likelihood that third parties will claim that we infringe their intellectual property rights.
We may in the future receive notices of allegations of infringement, misappropriation or misuse of other parties’ proprietary rights. Furthermore, regardless of their merits, accusations and litigation of this nature may require significant time and expense to defend, may negatively affect customer relationships, may divert management’s attention away from other aspects of our operations and, upon resolution, could have a material adverse effect on our business, prospects, results of operations and financial condition.
Certain technology necessary for us to provide our solutions may, in fact, be patented by other parties either now or in the future. If such technology were validly patented by a third party, we may have to negotiate a license for the use of that technology. We may not be able to negotiate such a license at a price that is acceptable to us or at all. The existence of such a patent, or our inability to negotiate a license for any such technology on acceptable terms, could force us to cease using the technology and cease offering products incorporating the technology, which could have a material adverse effect on our business, prospects, results of operations and financial condition.
If we, or any of our products, were found to be infringing on the intellectual property rights of any third party, we could be subject to liability for such infringement, which could be material. We could also be prohibited from using or selling certain products, prohibited from using certain processes, or required to redesign certain products, each of which could have a material adverse effect on our business, prospects, results of operations and financial condition.
These and other outcomes may result in the loss of a substantial number of existing customers or prohibit the acquisition of new customers; cause us to pay license fees for intellectual property we are deemed to have infringed; cause us to incur costs and devote valuable technical resources to redesigning our products; cause our cost of revenues to increase; cause us to accelerate expenditures to preserve existing revenues; materially and adversely affect our brand in the marketplace and cause a substantial loss of goodwill; cause us to change our business methods or products; and require us to cease certain business operations or offering certain products or features.
If we fail to comply with obligations in the agreements under which we collaborate with or license intellectual property rights from third parties, or otherwise experience disruptions to our business relationships with collaborators or licensors, we could lose rights that are important to our business.
We license certain intellectual property that is important to our business, including from the University of California San Francisco, and in the future we may enter into additional agreements that provide us with licenses to valuable intellectual property or technology. Some of our current license agreements impose various development, diligence, commercialization or sublicensing, and other obligations, including payments in connection with the achievement of specified milestones, on us in order to maintain the licenses. In spite of our efforts, a current or future licensor might conclude that we have materially breached our obligations under such license agreements and seek to terminate the license agreements, thereby removing or limiting our ability to develop and commercialize products and technology covered by these license agreements. If these
in-licenses
are terminated, or if the underlying patent rights licensed thereunder fail to provide the intended exclusivity, competitors or other third parties would have the freedom to seek marketing authorization of, and to market, products identical to ours and we may be required to cease our development and commercialization of certain of our product candidates. Any of the foregoing could have a material adverse effect on our business, prospects, results of operations and financial condition.51
Moreover, disputes may arise regarding intellectual property subject to a licensing agreement, including:
| • | the scope of rights granted under the license agreement and other interpretation-related issues; |
| • | the extent to which our technology and processing infringe on intellectual property of the licensor that is not subject to the licensing agreement; |
| • | the sublicensing of patent and other rights under our collaborative development relationships; |
| • | our diligence obligations under the license agreement and what activities satisfy those diligence obligations; |
| • | the inventorship and ownership of inventions and know-how resulting from the joint creation or use of intellectual property by our licensors and us and our partners; and |
| • | the priority of invention of patented technology. |
The agreements under which we may license intellectual property or technology from third parties may be complex, and certain provisions in such agreements may be susceptible to multiple interpretations. The resolution of any contract interpretation disagreement that may arise could narrow what we believe to be the scope of our rights to the relevant intellectual property or technology, or increase what we believe to be our financial or other obligations under the relevant agreement, either of which could have a material adverse effect on our business, prospects, results of operations and financial condition. Moreover, if disputes over intellectual property that we have licensed prevent or impair our ability to maintain our licensing arrangements on commercially acceptable terms, we may be unable to successfully develop and commercialize the affected product candidates, which could have a material adverse effect on our business, prospects, results of operations and financial condition.
Confidentiality and intellectual property assignment agreements that we have with our employees and other parties may not adequately prevent disclosure of trade secrets and other proprietary information.
We depend heavily upon confidentiality agreements with our officers, employees, consultants and subcontractors to maintain the proprietary nature of our technology. These measures may not afford us complete or even sufficient protection, and may not afford an adequate remedy in the event of an unauthorized disclosure of confidential information. If we fail to protect and/or maintain our intellectual property, third parties may be able to compete more effectively against us, we may lose our technological or competitive advantage, and/or we may incur substantial litigation costs in our attempts to recover or restrict use of our intellectual property. In addition, others may independently develop technology similar to ours, otherwise avoiding the confidentiality agreements, or produce patents that would materially and adversely affect our business, prospects, financial condition and results of operations. A third party may also attempt to reverse engineer or otherwise obtain and use our proprietary technology without our consent which could have a material adverse effect on our business, prospects, results of operations and financial condition.
Some of our solutions utilize third-party open-source data and software, and any failure to comply with the terms of one or more of these open-source software licenses could have a material adverse effect on our business, prospects, results of operations and financial condition, subject us to litigation, or create potential liability.
Our solutions include software and data licensed from third parties under any one or more open source licenses, and we expect to continue to incorporate open source software in our solutions in the future. Moreover, we cannot ensure that we have effectively monitored our use of open source software, or validated the quality or source of such software, or that we are in compliance with the terms of the applicable open source licenses or our current policies and procedures. There have been claims against companies that use open source software in their products and services asserting that the use of such open source software infringes the claimants’ intellectual property rights. As a result, we could be subject to suits by third parties claiming that what we believe to be licensed open source software infringes such third parties’ intellectual property rights. Additionally, if an author or other third party that distributes such open source software were to allege that we had not complied with the
52
conditions of one or more of these licenses, we could be required to incur significant legal expenses defending against such allegations and could be subject to significant damages and required to comply with onerous conditions or restrictions on these solutions, which could disrupt the distribution and sale of these solutions. Litigation could be costly for us to defend, have a material adverse effect on our business, prospects, results of operations and financial condition, or require us to devote additional research and development resources to change our solutions. Furthermore, these third-party open source providers could experience service outages, data loss, privacy breaches, cyber-attacks, and other events relating to the applications and services they provide that could diminish the utility of these services and which could harm our business as a result.
Use of open source software may entail greater risks than use of third-party commercial software, as open source licensors generally do not provide warranties or other contractual protections regarding infringement claims or the quality of the code, including with respect to security vulnerabilities where open source software may be more susceptible. In addition, certain open source licenses require that source code for software programs that interact with such open source software be made available to the public at no cost and that any modifications or derivative works to such open source software continue to be licensed under the same terms as the open source software license. The terms of various open source licenses to which we are subject have not been interpreted by courts in the relevant jurisdictions, and there is a risk that such licenses could be construed in a manner that imposes unanticipated conditions or restrictions on our ability to market or provide our software and data. By the terms of certain open source licenses, we could be required to release the source code of our proprietary software, and to make our proprietary software available under open source licenses, if we combine our proprietary software with open source software in a certain manner. In the event that portions of our proprietary software are determined to be subject to an open source license, we could be required to publicly release the affected portions of our source code,
re-engineer
all or a portion of our solutions, or otherwise be limited in the licensing of our solutions, each of which could reduce or eliminate the value of our solutions. Disclosing our proprietary source code could allow our competitors to create similar products with lower development effort and time and ultimately could result in a loss of sales. Furthermore, any suchre-engineering
or other remedial efforts could require significant additional research and development resources, and we may not be able to successfully complete any suchre-engineering
or other remedial efforts. Any of these events could create liability for us and damage our reputation, which could have a material adverse effect on our business, prospects, results of operations, financial condition and the market price of our shares.Changes to the patent law in the U.S. and other jurisdictions could diminish the value of patents in general and may impact the validity, scope or enforceability of our patent rights, thereby impairing our ability to protect our product candidates.
As is the case with other digital therapeutic companies, our success is dependent on intellectual property, particularly patents and trade secrets. Obtaining and enforcing patents in the digital therapeutic industry involve both technological and legal complexity and are therefore costly, time consuming, and inherently uncertain. Our patent rights, their associated costs, and the enforcement or defense of such patent rights may be affected by developments or uncertainty in the patent statute, patent case law or USPTO rules and regulations. Changes in either the patent laws or interpretation of the patent laws could increase the uncertainties and costs surrounding the prosecution of patent applications and the enforcement or defense of our issued patents.
For example, in March 2013, under the Leahy-Smith America Invents Act (the “America Invents Act”), the U.S. transitioned from a “first to invent” to apatent system. Under asystem, assuming that other requirements for patentability are met, the first inventor to file a patent application generally will be entitled to a patent on an invention regardless of whether another inventor had made the invention earlier. A third party that files a patent application in the USPTO after March 2013, but before us, could therefore be awarded a patent covering an invention of ours even if we had made the invention before it was made by such third party. This will require us to be cognizant going forward of the time from invention to filing of a patent application. Since patent applications in the U.S. and most other countries are confidential for a period of time after filing or until issuance, we cannot be certain that we or our licensors were the first to either file any patent application
“first-to-file”
“first-to-file”
53
related to our technology or product candidates or invent any of the inventions claimed in our or our licensor’s patents or patent applications. The America Invents Act also includes a number of other significant changes to U.S. patent law, including provisions that affect the way patent applications will be prosecuted, allowing third party submission of prior art and establishing a new post-grant review system including post-grant review,review, and derivation proceedings. Because of a lower evidentiary standard in USPTO proceedings compared to the evidentiary standard in U.S. federal courts necessary to invalidate a patent claim, a third party could potentially provide evidence in a USPTO proceeding sufficient for the USPTO to hold a claim invalid even though the same evidence would be insufficient to invalidate the claim if first presented in a district court action. Accordingly, a third party may attempt to use the USPTO procedures to invalidate our patent claims that would not have been invalidated if first challenged by the third party as a defendant in a district court action. The effects of these changes are currently unclear as the USPTO continues to promulgate new regulations and procedures in connection with the America Invents Act and many of the substantive changes to patent law, including theprovisions, only became effective in March 2013. In addition, the courts have yet to address many of these provisions and the applicability of the act and new regulations on the specific patents discussed in this filing have not been determined and would need to be reviewed. However, the America Invents Act and its implementation could increase the uncertainties and costs surrounding the prosecution of our patent applications and the enforcement or defense of our issued patents.
inter partes
“first-to-file��
The U.S. Supreme Court has ruled on several patent cases in recent years, either narrowing the scope of patent protection available in certain circumstances or weakening the rights of patent owners in certain situations. Additionally, there have been recent proposals for additional changes to the patent laws of the U.S. and other countries that, if adopted, could impact our ability to obtain patent protection for our proprietary technology or our ability to enforce rights in our proprietary technology. Depending on future actions by the U.S. Congress, the U.S. courts, the USPTO and the relevant
law-making
bodies in other countries, the laws and regulations governing patents could change in unpredictable ways that would weaken our ability to obtain new patents or to enforce any patents that we may obtain in the future.In addition, it is uncertain whether the World Trade Organization (the “WTO”) will waive certain intellectual property protections now or in the future on certain technologies. It is unknown if such a waiver would be limited to patents, or would include other forms of intellectual property including trade secrets and confidential
know-how.
We cannot be certain that any of our current or future product candidates or technologies would not be subject to an intellectual property waiver by the WTO. We also cannot be certain that any of our current or future intellectual property rights, whether patents, trade secrets, or confidentialknow-how
would be eliminated, narrowed, or weakened by such a waiver. Given the uncertain future actions by the WTO and other countries and jurisdictions around the world, including the U.S., it is unpredictable how our current or future intellectual property rights or how our current or future business would be impacted.If our trademarks and trade names are not adequately protected, then we may not be able to build name recognition in our markets of interest and our business may be adversely affected.
Our registered or unregistered trademarks or trade names may be challenged, infringed, circumvented or declared generic or determined to be infringing on other marks. We may not be able to protect our rights to these trademarks and trade names, which we need to build name recognition among potential collaborators or customers in our markets of interest. At times, competitors may adopt trade names or trademarks similar to ours, thereby impeding our ability to build brand identity and possibly leading to market confusion. In addition, there could be potential trade name or trademark infringement claims brought by owners of other trademarks or trademarks that incorporate variations of our registered or unregistered trademarks or trade names. Over the long term, if we are unable to establish name recognition based on our trademarks and trade names, then we may not be able to compete effectively and our business may be adversely affected. We may license our trademarks and trade names to third parties, such as distributors. Though these license agreements may provide guidelines for how our trademarks and trade names may be used, a breach of these agreements or misuse of our trademarks and trade names by our licensees may jeopardize our rights in or diminish the goodwill associated with our
54
trademarks and trade names. Our efforts to enforce or protect our proprietary rights related to trademarks, trade names, trade secrets,
know-how,
domain names, copyrights or other intellectual property may be ineffective and could result in substantial costs and diversion of resources and could have a material adverse effect on our business, prospects, results of operations and financial condition.We
in-license
patents and content from third parties to develop our products and product candidates. If we fail to obtain or maintain such licenses, or have a dispute with a third-party licensor, it could materially and adversely affect our ability to commercialize the product or product candidates affected by the dispute.Licensing intellectual property involves complex legal, business and scientific issues. Disputes may arise between us and our licensors regarding intellectual property subject to a license agreement, including:
| • | the scope of rights granted under the license agreement and other interpretation-related issues; |
| • | amount of royalty payments under the license agreement; |
| • | whether and to what extent our technology and processes infringe on intellectual property of the licensor that is not subject to the licensing agreement; |
| • | our right to sublicense patent and other rights to collaborators and other third parties; |
| • | our diligence obligations with respect to the use of the licensed technology in relation to our development and commercialization of our products, and what activities satisfy those diligence obligations; and |
| • | the ownership of inventions and know-how resulting from the joint creation or use of intellectual property by our licensors and us and our collaborators. |
We use the patented or proprietary technology of third parties to commercialize our products, If we are not able to maintain such licenses, or fail to obtain any future necessary licenses on commercially reasonable terms or with sufficient breadth to cover the intended use of third-party intellectual property, our business could be materially harmed.
If disputes over licensed intellectual property prevent or impair our ability to maintain the licensing arrangements on acceptable terms, we may be unable to successfully develop and commercialize the affected product, or the dispute may have an adverse effect on our results of operation.
Risks Related to our Financial Reporting and Position
We will need substantial additional funding, and if we are unable to raise capital when needed or on terms favorable to us, our business, financial condition and results of operations could be materially and adversely affected.
We have consumed substantial amounts of capital to date, and we expect to incur net losses over the next several years as we continue to develop our business, direct market our products and make investments in our human capital in order to scale up our business. We expect to continue to spend substantial amounts to continue the development of our pipeline of product candidates, to complete our currently planned clinical trials and future clinical trials, to achieve and maintain market acceptance by physicians and patients, expand our marketing channels and operations, grow and enhance our platform offering of products, and make the necessary investments in human capital to scale our business. Other unanticipated costs may arise in the course of our development efforts. If we are able to gain marketing authorization for additional product candidates, we will require significant additional amounts of funding in order to launch and commercialize such additional product candidates. We cannot reasonably estimate the actual amounts necessary to successfully complete the development and commercialization of any product candidate we develop and may need substantial additional funding after consummation of this transaction to complete the development and commercialization of our
55
existing and any future product candidates. Our future need for additional funding depends on many factors, including:
| • | the scope, progress, results and costs of researching and developing our current product candidates, as well as other additional product candidates we may develop and pursue in the future; |
| • | the timing of, and the costs involved in, obtaining marketing authorization for our product candidates and any other additional product candidates we may develop and pursue in the future; |
| • | the number of future product candidates that we may pursue and their development requirements; |
| • | the costs of commercialization activities for our product candidates, including the costs and timing of establishing product sales, marketing, and distribution capabilities; |
| • | revenue received from commercial sales of our current products and, subject to receipt of authorization, revenue, if any, received from commercial sales of our product candidates; |
| • | the extent to which we in-license or acquires rights to other products, product candidates or technologies; |
| • | our investment in our human capital required to grow the business and the associated costs as we expand our research and development and establishes a commercial infrastructure; |
| • | the costs of preparing, filing and prosecuting patent applications, maintaining and protecting our intellectual property rights, including enforcing and defending intellectual property-related claims; and |
| • | the cost of operating a public company. |
We cannot be certain that additional funding will be available on acceptable terms, or at all. If we are unable to raise additional capital in sufficient amounts or on terms acceptable to us, we may have to significantly delay, reduce or terminate our product development programs or plans for commercialization. Further, if we raise additional capital in the form of capital stock (or securities exchangeable therefore), such issuances could dilute the interests of our stockholders.
We do not currently have any commitments for future funding. We believe that we will be able to fund our operating expenses and capital expenditure requirements into 2024. Our estimates may prove to be wrong, and we could use our available capital resources sooner than expected. Further, changing circumstances, some of which are beyond our control, could cause us to consume capital significantly faster than anticipated, and we may need to seek additional funds sooner than planned. If adequate funds are not available on acceptable terms, we may not be able to successfully execute our business plan or continue our business.
The amount of our future losses is uncertain and our quarterly and annual operating results may fluctuate significantly or fall below the expectations of investors or securities analysts, each of which may cause our stock price to fluctuate or decline.
Our quarterly and annual operating results may fluctuate significantly in the future due to a variety of factors, many of which are outside of our control and may be difficult to predict, including the following:
| • | the timing and success or failure of clinical trials for our product candidates or competing product candidates, or any other change in the competitive landscape of our industry, including consolidation among our competitors or partners or as a result of COVID-19; |
| • | our ability to successfully recruit and retain subjects for clinical trials, and any delays caused by difficulties in such efforts, including as a result of COVID-19; |
| • | our ability to obtain marketing authorization for our product candidates and the timing and scope of any such marketing authorizations we may receive; |
| • | the timing and cost of, and level of investment in, research and development activities relating to our product candidates, which may change from time to time; |
56
| • | our ability to attract, hire and retain qualified personnel; |
| • | expenditures that we will or may incur to develop additional product candidates; |
| • | the level of demand for EndeavorRx and our other product candidates should such product candidates receive marketing authorizations, which may vary significantly; |
| • | the risk/benefit profile, cost and reimbursement policies with respect to EndeavorRx and our other product candidates, if granted marketing authorization, and existing and potential future therapeutics that compete with our product candidates; |
| • | the changing and volatile U.S. and global economic environments including global inflationary pressures; and |
| • | future accounting pronouncements or changes in our accounting policies. |
The cumulative effects of these factors could result in large fluctuations and unpredictability in our quarterly and annual operating results. As a result, comparing our operating results on abasis may not be meaningful. This variability and unpredictability could also result in our failing to meet the expectations of industry or financial analysts or investors for any period. If our operating results or revenue fall below the expectations of analysts or investors or below any forecasts we may provide to the market, or if the forecasts we provide to the market are below the expectations of analysts or investors, the price of our common stock could decline substantially. Such a stock price decline could occur even when we have met any previously publicly stated guidance we may provide.
period-to-period
If we fail to maintain an effective system of internal control over financial reporting, we may not be able to accurately report our financial results or prevent fraud. As a result, investors may lose confidence in the accuracy of our financial reports, which would harm our business and the trading price of our common stock. Our management is required to evaluate the effectiveness of our internal control over financial reporting.
As a public reporting company, we are subject to the reporting requirements of the Exchange Act, the
Sarbanes-Oxley
Act of 2002 (the “Sarbanes-Oxley Act”), the Dodd-Frank Wall Street Reform and Consumer Protection Act and the rules and regulations established by the SEC and Nasdaq. These rules and regulations require, among other things, that we establish and periodically evaluate procedures with respect to our internal control over financial reporting. Reporting obligations as a public company are likely to place a considerable strain on our financial and management systems, processes and controls, as well as on our personnel, including senior management. In addition, as a public company, we are required to document and test our internal control over financial reporting pursuant to Section 404 of the Sarbanes-Oxley Act so that our management can certify as to the effectiveness of our internal control over financial reporting. Management’s initial certification under Section 404 of the Sarbanes-Oxley Act will be required with our annual report on Form10-K
for the year ending December 31, 2022.In support of such certifications, we are required to document and make significant changes and enhancements, including potentially hiring additional personnel, to our internal control over financial reporting. Likewise, our independent registered public accounting firm will not be required to attest to the effectiveness of our internal control over financial reporting until our first annual report is required to be filed with the SEC following the date we are no longer an emerging growth company.
To achieve compliance with Section 404 within the prescribed period, we need to continue to dedicate internal resources, including hiring additional financial and accounting personnel and potentially engaging outside consultants. During our evaluation of our internal control, if we identify one or more material weaknesses in our internal control over financial reporting, we will be unable to assert that our internal control over financial reporting is effective.
57
We rely on assumptions, estimates, internally developed software and data from third parties to deliver timely and accurate information in order to accurately report our financial results in the timeframe and manner required by law.
Certain of our performance indicators and other business metrics are calculated using third-party applications or internal company data that have not been independently verified. While these numbers are based on what we believe to be reasonable calculations for the applicable period of measurement, there are inherent challenges in measuring such information. In addition, our measurement of certain metrics may differ from estimates published by third parties or from similarly-titled metrics of our competitors due to differences in methodology and as a result our results may not be comparable to our competitors.
We could be subject to additional tax liabilities and our ability to use our net operating loss carryforwards and other tax attributes may be limited.
We have incurred net operating losses, or NOLs, since our inception and may never achieve or sustain profitability. Generally, for U.S. federal income tax purposes, NOLs incurred will carry forward. However, NOL carryforwards generated prior to January 1, 2018, are subject to expiration for U.S. federal income tax purposes. As of December 31, 2021, we had federal NOL carryforwards of approximately $161.4 million, of which $31.2 million will begin to expire in 2031. As of December 31, 2021, we had state NOL carryforwards of approximately $66.9 million which will begin to expire in 2031. As of December 31 2021, we also had federal research and development tax credits of $4.4 million, which may be available to offset future income tax liabilities. The federal research and development tax credit carryforwards would begin to expire in 2039. As of December 31, 2021, we also had state research and development tax credits of $1.9 million, which may be available to offset future income tax liabilities. Certain state research and development tax credit carryforwards would begin to expire in 2033.
In general, under Sections 382 and 383 of the Code, a corporation that undergoes an “ownership change,” generally defined as a greater than 50% change by value in our equity ownership by certain stockholders over a three-year period, the corporation’s ability to use its
pre-ownership
change NOLs, carryforwards and otherpre-ownership
change tax attributes, such as research tax credits, to offset its post-ownership change income or taxes may be limited. Similar provisions of state tax law may also apply to limit the use of our state NOL carryforwards and other state tax attributes. We have not performed an analysis to determine whether our past issuances of stock and other changes in our stock ownership may have resulted in one or more ownership changes. In addition, future changes in our stock ownership, which may be outside of our control, may materially limit our ability to utilize our NOL carryforwards and other tax attributes. As a result, even if we earn net taxable income in the future, we may be unable to use a material portion of our NOL carryforwards and other tax attributes, which could materially and adversely affect our future cash flows. There is also a risk that regulatory changes, such as suspensions on the use of NOL or other unforeseen reasons, may result in our existing NOL carryforwards expiring or otherwise becoming unavailable to offset future taxable income. For these reasons, we may not be able to utilize a material portion of our NOL carryforwards and other tax attributes, even if we attain profitability. A temporary suspension of the use of certain net operating losses and tax credits has been enacted in California, and other states may enact suspensions as well. If we are limited in our ability to use our NOLs in future years in which we have taxable income, we will pay more taxes than if we were able to fully utilize our NOLs. This could have a material adverse effect on our business, prospects, results of operations and financial condition.Risks Related to the Business Combination
We incurred significant transaction and transition costs in connection with the Business Combination.
We incurred and expect to incur significant, nonrecurring costs in connection with the consummation of the Business Combination and operating as a public company following the consummation of the Business Combination. We may also incur additional costs to retain key employees. Certain transaction expenses incurred
58
in connection with the Merger Agreement (including the Business Combination), including all legal, accounting, consulting, investment banking and other fees, expenses and costs, were paid out of the proceeds of the Business Combination or will be paid out by us following the Closing of the Business Combination.
The process of taking a company public by means of a business combination with a special purpose acquisition company is different from that of taking a company public through an underwritten offering and may create risks for our unaffiliated investors.
An underwritten offering involves a company engaging underwriters to purchase its shares and resell them to the public. An underwritten offering imposes statutory liability on the underwriters for material misstatements or omissions contained in the registration statement unless they are able to sustain the burden of proving that they did not know and could not reasonably have discovered such material misstatements or omissions. This is referred to as a “due diligence” defense and results in the underwriters undertaking a detailed review of the company’s business, financial condition and results of operations. Going public by means of a business combination with a special purpose acquisition company does not involve any underwriters and as a result does not necessarily involve the level of third-party review attendant to underwriters seeking to establish a “due diligence” defense in an underwritten offering.
In addition, going public by means of a business combination with a special purpose acquisition company does not involve a book-building process as is the case in an underwritten public offering. In an underwritten public offering, the initial value of a company is based on the indicative price at which investors indicate they are prepared to purchase shares from the underwriters. In the case of a special purpose acquisition company transaction, the value of the company is established through negotiations between the target company, the special purpose acquisition company and, in some cases, “PIPE” investors who agree to purchase shares at the time of the business combination. The process of establishing the value of a company in a special purpose acquisition company business combination may be less effective than the book-building process in an underwritten public offering and also does not reflect events that may have occurred between the date of the business combination agreement and the Closing of the Business Combination. In addition, underwritten public offerings are frequently oversubscribed resulting in additional potential demand for shares in the aftermarket following the underwritten public offering. There is often no such book of demand built up in connection with a special purpose acquisition company transaction and no underwriters with the responsibility of stabilizing the share price which may result in the share price being harder to sustain after the consummation of a business combination.
As a result of the consummation of the Business Combination, we may be exposed to unknown or contingent liabilities and may be required to subsequently take write-downs or write-offs, restructuring and impairment or other charges that could have a significant negative effect on our financial condition, results of operations and our share price, which could cause you to lose some or all of your investment.
We cannot assure you that the due diligence conducted in relation to the Business Combination has identified all material issues or risks associated with the Business Combination. Furthermore, we cannot assure you that factors outside of our control will not later arise. As a result of these factors, we may be exposed to liabilities and incur additional costs and expenses and we may be forced to later write-down or
write-off
assets, restructure our operations, or incur impairment or other charges that could result in our reporting losses.Even if our due diligence has identified certain risks, unexpected risks may arise and previously known risks may materialize in a manner not consistent with our preliminary risk analysis. If any of these risks materialize, this could have a material adverse effect on our financial condition and results of operations and could contribute to negative market perceptions about our securities.
Accordingly, any shareholders of SCS who choose to remain our stockholders following the Business Combination could suffer a reduction in the value of their shares. Such shareholders are unlikely to have a remedy for such reduction in value unless they are able to successfully claim that the reduction was due to the
59
breach by our directors or officers of a duty of care or other fiduciary duty owed to them, or if they are able to successfully bring a private claim under securities laws that the registration statement or proxy statement/ prospectus relating to the Business Combination contained an actionable material misstatement or material omission.
Certain members of our board of directors, management team and affiliated companies have been, and may from time to time be, associated with negative media coverage or public actions or become involved in legal proceedings or governmental investigations unrelated to our business.
Members of our board of directors and management team have been involved in a wide variety of businesses. Such involvement has, and may lead to, media coverage and public awareness. As a result of such involvement, certain members of our management team and affiliated companies have also been, and may from time to time be, involved in legal proceedings or governmental investigations unrelated to our business, and may be exposed to reputational risks resulting from other events such as allegations of misconduct or other negative publicity or press speculation. For example, in February 2021, Clover Health, which merged with Social Capital Hedosophia Holdings Corp. III (“IPOC”), received a letter from the SEC indicating that it is conducting an investigation and requesting document and data preservation from January 1, 2020 relating to certain matters that were referenced in an article by Hindenburg Research, and certain shareholders of Clover Health have also brought civil suits against Mr. Palihapitiya in his capacity as Chairman and Chief Executive Officer of IPOC for alleged breaches of fiduciary duty, unjust enrichment, corporate waste and violations of federal securities laws, in connection with IPOC’s business combination with Clover Health. Any such media coverage, public action, legal proceedings or investigations may be detrimental to our reputation, and may have an adverse effect on the price of our securities or on our business, financial condition, results of operations and prospects.
The historical financial results of Akili and unaudited pro forma financial information included elsewhere in this prospectus may not be indicative of what our actual financial position or results of operations would have been or will be in future periods.
The historical financial results included in this prospectus are not indicative of the financial condition, results of operations or cash flows that we may achieve in the future. This is primarily the result of the following factors: (i) we will incur additional ongoing costs as a result of the Business Combination, including costs related to public company reporting, investor relations and compliance with the Sarbanes-Oxley Act; and (ii) our capital structure is different from that reflected in Akili’s historical financial statements. Our financial condition and future results of operations could be materially different from amounts reflected in the historical financial statements included elsewhere in this prospectus, so it may be difficult for investors to compare our future results to historical results or to evaluate its relative performance or trends in its business.
Similarly, the unaudited pro forma financial information in this prospectus is presented for illustrative purposes only and has been prepared based on a number of assumptions including, but not limited to, SCS being treated as the “acquired” company for financial reporting purposes in the Business Combination, the total debt obligations and the cash and cash equivalents of Akili on the Closing Date and the number of SCS Class A ordinary shares that were redeemed in connection with the Business Combination. Accordingly, such pro forma financial information may not be indicative of our future operating or financial performance and our actual financial condition and results of operations may vary materially from our pro forma results of operations and balance sheet contained elsewhere in this prospectus, including as a result of such assumptions not being accurate. See “”
Unaudited Pro Forma Condensed Combined Financial Information.
Changes in laws or regulations or how such laws or regulations are interpreted or applied, or a failure to comply with any laws or regulations, may adversely affect our business and results of operations.
We are subject to laws and regulations enacted by national, regional and local governments. In particular, we are required to comply with certain SEC and other legal requirements. We may be subject to additional laws and
60
regulations. Compliance with, and monitoring of, applicable laws and regulations may be difficult, time consuming and costly. A failure to comply with applicable laws or regulations, as interpreted and applied, could have a material adverse effect on our business and results of operations. In addition, those laws and regulations and their interpretation and application may change from time to time, including as a result of changes in economic, political, social and government policies, and those changes could have a material adverse effect on our business and results of operations.
Risks Related to the Consummation of the Domestication
Delaware law contain certain provisions, including anti-takeover provisions that limit the ability of stockholders to take certain actions and could delay or discourage takeover attempts that stockholders may consider favorable.
The DGCL contain provisions that could have the effect of rendering more difficult, delaying, or preventing an acquisition that stockholders may consider favorable, including transactions in which stockholders might otherwise receive a premium for their shares. These provisions could also limit the price that investors might be willing to pay in the future for shares of our common stock, and therefore depress the trading price of our common stock. These provisions could also make it difficult for stockholders to take certain actions, including electing directors who are not nominated by the current members of our board of directors or taking other corporate actions, including effecting changes in our management. These provisions could delay or prevent hostile takeovers and changes in control or changes in our board of directors or management.
The provisions of the Bylaws requiring exclusive forum in the Court of Chancery of the State of Delaware and the federal district courts of the U.S. of America for certain types of lawsuits may have the effect of discouraging lawsuits against our directors and officers.
The Bylaws provide that, unless we consent in writing to the selection of an alternative forum, the Court of Chancery of the State of Delaware (or, in the event that such court does not have, or declines to accept, jurisdiction, another state court located within the State of Delaware) will be the sole and exclusive forum for (i) any derivative action or proceeding brought on behalf of us, (ii) any action asserting a claim for or based on a breach of a fiduciary duty owed by any current or former director, officer or other employee of us to us or our stockholders including a claim alleging the aiding and abetting of such a breach of fiduciary duty, (iii) any action asserting a claim against us or any current or former director, officer or other employee of us arising pursuant to any provision of the DGCL or our certificate of incorporation or bylaws (as may be amended from time to time) (including the interpretation, validity or enforceability thereof), (iv) any action asserting a claim related to or involving us that is governed by the internal affairs doctrine, or (v) any action asserting an “internal corporate claim” as that term is defined in Section 115 of the DGCL (the “Delaware Forum Provision”). The Delaware Forum Provision, however, does not apply to any causes of actions arising under the Securities Act or the Exchange Act or to any claim for which the federal courts have exclusive jurisdiction. The Bylaws also provide that, unless we consent in writing to the selection of an alternate forum, the sole and exclusive forum for the resolution of any complaint asserting a cause of action arising under the Securities Act, and the rules and regulations promulgated thereunder, will be the federal district courts of the U.S. (the “Federal Forum Provision”). Section 22 of the Securities Act creates concurrent jurisdiction for federal and state courts over all suits brought to enforce any duty or liability created by the Securities Act or the rules and regulations thereunder. Section 27 of the Exchange Act creates exclusive federal jurisdiction over all suits brought to enforce any duty or liability created by the Exchange Act or the rules and regulations thereunder. The Delaware Forum Provision and the Federal Forum Provision will not relieve our duties to comply with the federal securities laws and the rules and regulations thereunder, and our stockholders will not be deemed to have waived our compliance with these laws, rules and regulations.
These provisions may have the effect of discouraging lawsuits against the directors and officers of us. The enforceability of similar choice of forum provisions in other companies’ certificates of incorporation or bylaws
61
has been challenged in legal proceedings, and it is possible that, in connection with any applicable action brought against us, a court could find the choice of forum provisions contained in the Bylaws to be inapplicable or unenforceable in such action.
Risks Related to our Common Stock
Certain existing shareholders purchased securities in the Company at a price below the current trading price of such securities, and may experience a positive rate of return based on the current trading price. Future investors in our Company may not experience a similar rate of return.
Certain shareholders in the Company, including the Selling Securityholders, acquired shares of common stock in the Company at prices below the current trading price of our common stock and may experience a positive rate of return based on the current trading price. On August 22, 2022, the last reported sale price of our shares of common stock as reported on the Nasdaq was $7.15 per share.
Holders of our stock options will be less likely to exercise their stock options if the exercise prices of their stock options exceed the market price of our shares of common stock. There is no guarantee that our stock options will continue to be in the money prior to their expiration, and as such, the stock options may expire worthless. As such, any cash proceeds that we may receive in relation to the exercise of the stock options overlying shares being offered for sale in this prospectus will be dependent on the trading price of our common stock.
Substantial future sales of shares of our common stock could cause the market price of our common stock to decline.
We have agreed, at our expense to prepare and file this registration statement with the SEC. The shares of common stock being offered for resale in this prospectus, excluding those issuable upon the exercise of stock options, represent approximately 48.4% of our total outstanding shares of common stock as of the date of this prospectus. Additionally, if all the stock options are exercised, the holders of such stock options would own an additional 2,096,106 shares of common stock, representing approximately 2.5% of our total shares of common stock outstanding following such exercise.
After it is effective and until such time that it is no longer effective, the registration statement will permit the resale of these shares. The resale, or expected or potential resale, of a substantial number of our shares of common stock in the public market could adversely affect the market price for our shares of common stock and make it more difficult for you to sell your shares of common stock at times and prices that you feel are appropriate. Furthermore, we expect that, because there will be a large number of shares registered pursuant to this registration statement, Selling Securityholders will continue to offer the securities covered by this registration statement for a significant period of time, the precise duration of which cannot be predicted. Accordingly, the adverse market and price pressures resulting from an offering pursuant to a registration statement may continue for an extended period of time.
The market price of our common stock could be volatile, and you could lose all or part of your investment.
The price of our common stock, may fluctuate due to a variety of factors, including:
| • | changes in the industries in which we and our customers operate; |
| • | developments involving our competitors; |
| • | changes in laws and regulations affecting our business; |
| • | variations in our operating performance and the performance of our competitors in general; |
| • | actual or anticipated fluctuations in our quarterly or annual operating results; |
| • | publication of research reports by securities analysts about our or our competitors or our industry; |
62
| • | the public’s reaction to our press releases, our other public announcements and our filings with the SEC; |
| • | actions by stockholders, including the sale by the Third-Party PIPE Investors of any of their shares of our common stock; |
| • | additions and departures of key personnel; |
| • | commencement of, or involvement in, litigation involving us; |
| • | changes in our capital structure, such as future issuances of securities or the incurrence of additional debt; |
| • | the volume of shares of our common stock available for public sale; and |
| • | general economic and political conditions, such as the effects of the ongoing COVID-19 pandemic, recessions, interest rates, local and national elections, fuel prices, international currency fluctuations, corruption, political instability and acts of war or terrorism. |
These market and industry factors may materially reduce the market price of our common stock regardless of our operating performance and you could lose all or part of your investment.
We do not intend to pay dividends on our common stock.
We currently intend to retain our future earnings, if any, to finance the further development and expansion of our business and do not intend to pay cash dividends in the foreseeable future. Any future determination to pay dividends will be at the discretion of our board of directors and will depend on our financial condition, results of operations, capital requirements, restrictions contained in future agreements and financing instruments, business prospects and such other factors as our board of directors deems relevant.
If securities or industry analysts do not publish research or publish inaccurate or unfavorable research about our business, our stock price and trading volume could decline.
The trading market for our common stock depends in part on the research and reports that analysts publish about our business. We do not have any control over these analysts. If one or more of the analysts who cover us downgrade our common stock or publish inaccurate or unfavorable research about our business, the price of our common stock would likely decline. If few analysts cover us, demand for our common stock could decrease and our common stock price and trading volume may decline. Similar results may occur if one or more of these analysts stop covering us in the future or fail to publish reports onus regularly.
In recent months, there has been a drop in the market values of growth-oriented companies. Accordingly, securities of growth companies such as us may be more volatile than other securities and may involve special risks.
In recent months, there has been a drop in the market values of growth-oriented companies like us due to among other factors, inflationary pressures, increases in interest rates and other adverse economic and market events. As a result, our common stock are subject to potential downward pressures.
63
USE OF PROCEEDS
All of the securities offered by the Selling Securityholders pursuant to this prospectus will be sold by the Selling Securityholders for their respective accounts. We will not receive any of the proceeds from these sales.
We expect to use the net proceeds from the exercise of outstanding stock options, if any, for general corporate purposes. We will have broad discretion over the use of any proceeds from the exercise of outstanding stock options. There is no assurance that the holders of the outstanding stock options will be in the money prior to their expiration or that the holders of such stock options will elect to exercise for cash any or all of such stock options. We believe the likelihood that these stock option holders will exercise such stock options, and therefore any cash proceeds that we may receive in relation to the exercise of such stock options being offered for sale in this prospectus, will be dependent on the trading price of our common stock. If the market price for our common stock is less than the exercise price of stock options, we believe the holders of such stock options will be unlikely to exercise such stock options.
The Selling Securityholders will pay any underwriting discounts and commissions and expenses incurred by them for brokerage, accounting, tax or legal services or any other expenses incurred in disposing of the securities. We will bear the costs, fees and expenses incurred in effecting the registration of the securities covered by this prospectus, including all registration and filing fees, Nasdaq listing fees and fees and expenses of our counsel and our independent registered public accounting firm.
64
MARKET PRICE OF OUR COMMON STOCK AND DIVIDEND INFORMATION
Market Price of Our Common Stock
Our common stock is currently listed on Nasdaq under the symbol “AKLI”. Prior to the Domestication, SCS Class A ordinary shares traded under the ticker symbol “DNAA”. On August 22, 2022, the closing sale price of our common stock was $7.15. As of August 22, 2022 there were approximately 77 holders of record of our common stock. Such numbers do not include beneficial owners holding our securities through nominee names.
Dividend Policy
We have not paid any cash dividends on our common stock to date and prior to the Business Combination, SCS had not paid any dividends on its ordinary shares. The payment of cash dividends in the future will be dependent upon our revenues and earnings, if any, capital requirements and general financial condition. The payment of any cash dividends will be within the discretion of our board of directors. Our ability to declare dividends may be limited by the terms of financing or other agreements entered into by us or our subsidiaries from time to time.
65
UNAUDITED PRO FORMA CONDENSED COMBINED FINANCIAL INFORMATION
The following unaudited pro forma condensed combined financial statements are provided to aid you in your analysis of the financial aspects of the Business Combination and the consummation of the PIPE Investment, which are collectively referred to as the “Transactions.”
The unaudited pro forma condensed combined financial statements are based on the historical financial statements of Social Capital Suvretta Holdings Corp. I (“SCS”) and the historical consolidated financial statements of Akili Interactive Labs, Inc. (“Akili”) as adjusted to give effect to the Transactions. The unaudited pro forma condensed combined balance sheet gives pro forma effect to the Transactions as if they had been consummated on June 30, 2022. The unaudited pro forma condensed combined statement of operations for the six months ended June 30, 2022 and the year ended December 31, 2021 give effect to the Transactions as if they had occurred on January 1, 2021.
The unaudited pro forma condensed combined financial statements have been derived from and should be read in conjunction with:
| • | the accompanying notes to the unaudited pro forma condensed combined financial statements; |
| • | the historical unaudited condensed financial statements of SCS as of June 30, 2022 and for the six months ended June 30, 2022 and the related notes included in the prospectus; |
| • | the historical audited financial statements of SCS as of December 31, 2021 and for the period from February 25, 2021 (inception) through December 31, 2021 and the related notes included in this prospectus; |
| • | the historical unaudited condensed consolidated financial statements of Akili as of June 30, 2022 and for the six months ended June 30, 2022 and the related notes included elsewhere in this prospectus; |
| • | the historical audited consolidated financial statements of Akili as of December 31, 2021 and for the year ended December 31, 2021 and the related notes included elsewhere in this prospectus; and |
| • | the section entitled “ SCS’s Management’s Discussion and Analysis of Financial Condition and Results of Operations Akili’s Management’s Discussion and Analysis of Financial Condition and Results of Operations |
The unaudited pro forma condensed combined financial statements are provided for illustrative purposes only and are not necessarily indicative of what the actual results of operations and financial position would have been had the Transactions taken place on the dates indicated, nor are they indicative of the future consolidated results of operations or financial position of the combined company.
Accounting for the Business Combination
The Business Combination represents a reverse merger and will be accounted for as a reverse recapitalization in accordance with accounting principles generally accepted in the United States of America (“US GAAP”). Under this method of accounting, SCS will be treated as the “acquired” company for financial reporting purposes. This determination is primarily based on the fact that subsequent to the Business Combination, Akili stockholders will have a majority of the voting power of Akili, Inc., Akili will comprise all of the ongoing operations of Akili, Inc., Akili stockholders will have a majority of the voting power in the election of the board of directors of Akili, Inc., and Akili’s senior management will comprise all of the senior management of Akili, Inc. Accordingly, for accounting purposes, the Business Combination will be treated as the equivalent of Akili issuing shares for the net assets of SCS, accompanied by a recapitalization. The net assets of Akili will be stated at historical cost. No goodwill or other intangible assets will be recorded.
66
Description of the Transactions
On August 19, 2022, (the “Closing Date”), SCS consummated the previously announced merger pursuant to the Merger Agreement, dated January 26, 2022, by and among SCS, Akili, and Karibu Merger Sub, Inc., pursuant to which Karibu Merger Sub, Inc. merged with and into Akili, with Akili becoming a wholly owned subsidiary of SCS. (the “Business Combination”). Upon the closing of the Business Combination, SCS changed its name to Akili, Inc.
Based on the following events contemplated by the Merger Agreement and based on Akili capitalization as of August 19, 2022:
(i) the conversion of all 45,865,187 Akili Preferred Shares issued and outstanding into 52,799,537 shares of Akili, Inc. common stock as adjusted by the Conversion Ratio of approximately 1.15;
(ii) the conversion of all 1,512,944 shares of Akili common stock issued and outstanding into 1,741,687 shares of Akili, Inc. common stock as adjusted by the Conversion Ratio. This amount includes 7,674 shares representing the automatic cashless exercise of certain outstanding warrants;
(iii) the conversion of all 8,286,133 granted and outstanding Akili options into options to purchase 9,538,712 Akili, Inc. common stock as adjusted by the Conversion Ratio; and
(iv) the conversion of all remaining 211,020 granted and outstanding Akili warrants into warrants to purchase 242,924 Akili, Inc. common stock as adjusted by the Conversion Ratio.
The determination of the 54,541,224 Akili, Inc. common stock issued and outstanding as of the Closing and Akili options and warrants covering 5,458,743 shares reserved for the potential future issuance of Akili, Inc. common stock is summarized below:
Akili Interactive Labs, Inc. Stock Outstanding at June 30, 2022 | Additional Akili Interactive Labs, Inc. Stock Issued and Options Exercised/Expired After June 30, 2022 (1) | Conversion of Akili Interactive Labs, Inc. Preferred Stock and automatically exercised Warrants into Akili Interactive Labs, Inc. Common Stock | Akili Interactive Labs, Inc. Stock Prior to Closing | Akili, Inc. Stock Held by Akili Stockholders Post Closing (2) | ||||||||||||||||
COMMON STOCK | ||||||||||||||||||||
Common Stock (3) | 1,482,520 | 22,750 | 45,872,861 | (5) | 47,378,131 | 54,541,224 | ||||||||||||||
PREFERRED STOCK | ||||||||||||||||||||
Series A-1 Convertible Preferred Stock | 4,000,000 | — | (4,000,000 | ) | — | — | ||||||||||||||
Series A-2 Convertible Preferred Stock | 4,427,072 | — | (4,427,072 | ) | — | — | ||||||||||||||
Series B Convertible Preferred Stock | 7,341,485 | — | (7,341,485 | ) | — | — | ||||||||||||||
Series C Convertible Preferred Stock | 8,016,645 | — | (8,016,645 | ) | — | — | ||||||||||||||
Series D Convertible Preferred Stock | 13,843,858 | 8,236,127 | (22,079,985 | ) | — | — | ||||||||||||||
Total Common and Preferred Stock (3) | 39,111,580 | 8,258,877 | 7,674 | 47,378,131 | 54,541,224 | |||||||||||||||
Akili Interactive Labs, Inc. Warrants (4) | 134,729 | — | (7,674 | ) | 127,055 | 137,628 | ||||||||||||||
Akili Interactive Labs, Inc. Options (4) | 4,124,718 | (56,389 | ) | — | 4,068,330 | 5,321,115 | ||||||||||||||
Total Stock, Warrants and Options | 43,371,027 | 8,202,488 | — | 51,573,516 | 59,999,967 | |||||||||||||||
67
| (1) | Reflects the capitalization activity of Akili subsequent to the latest balance sheet date through August 19, 2022, in connection with the Merger Agreement. The amount includes cumulative dividends that accrue on each share of Series D at an annual rate of 10%, which are issued in additional shares. Upon conversion, Series D shares are multiplied by 150% when calculating the number of shares of common stock. |
| (2) | Per the terms of the Merger Agreement, no fractional Akili, Inc. common stock were issued. Each holder of Akili stock entitled to a fraction of a Akili, Inc. common stock had its fractional share rounded down to the nearest whole share. Each holder of an Akili option and warrant underlying a fraction of a share of Akili, Inc. common stock had its fractional option rounded down to the nearest whole share. |
| (3) | Amount excludes the issuance of 7,536,461 Earnout Shares, to certain eligible Akili equity holders as a result of Akili, Inc. satisfying certain performance conditions described below with the Earnout Period. |
| (4) | Stock options and warrants to purchase common stock were converted using the treasury stock method at each date. |
| (5) | Includes 7,674 shares representing the cashless exercise of certain outstanding Akili Interactive Labs, Inc. warrants prior to Closing. |
Other related events that occurred in connection with the Business Combination are summarized below:
(i) The filing and effectiveness of our amended and restated certificate of incorporation and the effectiveness of our restated bylaws, each of which occurred immediately prior to the Effective Time and the closing of the PIPE Investment;
(ii) The conversion of 227,522 SCS Class A ordinary shares not redeemed from the Trust Account, resulting in gross proceeds to the Company of $2.3 million. The remaining 24,772,478 SCS Class A ordinary shares were redeemed at $10.03 per share, including interest earned on marketable securities held in the Trust Account;
(iii) The conversion of each SCS Class A ordinary share and each SCS Class B ordinary share issued and outstanding immediately prior to the effective time, which were held by the SCS Sponsor and Independent Director, into one share of Akili, Inc. common stock; and
(iv) The sale and issuance of 16,200,000 shares of Akili, Inc. common stock (“PIPE Shares”) to PIPE Investors, at a purchase price of $10.00 per share pursuant to the Subscription Agreements, and an aggregate purchase price of $162.0 million.
Earnout Shares
After the consummation of the Business Combination, holders of Akili common stock, preferred stock or warrants immediately prior to the closing of the merger and employees or individual service providers holding options, in each case as designated by the board of Akili as an earnout service provider prior to the Closing (“Earnout Service Providers”), will receive their pro rata portion of the Earnout Shares, which will be issued and vest in equal thirds (each such vesting event, a “Triggering Event”) if the trading price of Akili, Inc. common stock exceeds $15.00, $20.00 and $30.00, respectively, for any 20 trading days within any 30 consecutive trading day period on or prior to the date that is five years following the Closing (the “Earnout Period”). In order to receive their pro rata portion of the Earnout Shares, the following must occur through the date of the corresponding Triggering Event that causes such Earnout Shares to become issuable: (a) common stockholders and warrantholders must hold shares (including shares underlying warrants, as applicable), and (b) Earnout Service providers must either remain employed and continue to hold their options or have exercised their options and continue to hold common stock. Any Earnout Shares forfeited pursuant to the preceding sentence shall be reallocated among remaining eligible holders of Earnout Shares (including former Akili common stockholders, preferred stockholders and warrantholders and Earnout Service Providers).
The number of Earnout Shares issuable is equal to 7.5% of the fully diluted shares of Akili, Inc. common stock (including shares reserved under the equity incentive plan to be adopted by Akili, Inc. in connection with the
68
Closing but excluding the Earnout Shares and rights to Earnout Shares), determined as of immediately following the Closing. The price targets and the number of Earnout Shares issued shall be equitably adjusted for any share subdivision, share split, share dividend, reorganization, combination, recapitalization, or similar transaction affecting the Akili, Inc. common stock. If such targets are achieved, such holders will receive shares of Akili,Inc. common stock on the achievement of each target based on their proportional holding of such stock or awards on the date of the applicable Triggering Event. Akili has preliminarily concluded that the Earnout Shares issuable to stockholders and warrantholders represent financial instruments that will be classified as liabilities on the balance sheet. Earnout Shares issuable to Earnout Service Providers will be considered equity classified compensatory awards under ASC 718.
Capitalization
The following summarizes the unaudited pro forma common stock shares outstanding immediately after Closing of the Transactions on August 19, 2022:
| Shares | % | |||||||
SCS Public Stockholders (a) | 227,522 | 0.3 | % | |||||
SCS Sponsor and Independent Director | 6,890,000 | 8.8 | % | |||||
Total SCS | 7,117,522 | 9.1 | % | |||||
Akili Stockholders (b) | 54,541,224 | 70.1 | % | |||||
PIPE Investors | 16,200,000 | 20.8 | % | |||||
Total Shares at Closing (excluding certain Akili shares) | 77,858,746 | 100 | % | |||||
Akili—Remaining Consideration Shares (b)(c) | 5,458,743 | |||||||
Total Shares at Closing (including certain Akili shares) | 83,317,489 | |||||||
| (a) | Reflects redemptions of 24,772,478 public shares of SCS Class A common stock in connection with the Transactions at a redemption price of $10.03 per share based on funds held in the trust account as of August 17, 2022, two business days prior to closing. |
| (b) | Total consideration issued to Akili is $600.0 million or 60,000,000 shares ($10 per share price with no fractional shares). The total shares issued includes those in respect of Akili common and preferred stock and stock options and warrants to purchase common stock, converted using the treasury stock method. The Akili—Remaining Consideration Shares reflect a Conversion Ratio of approximately 1.15. |
| (c) | Amount excludes the issuance of 7,536,461 Earnout Shares, to certain eligible Akili equity holders as a result of Akili, Inc. satisfying certain performance conditions described above with the Earnout Period. |
Under the 2022 Plan, the Company intends to grant awards to certain executive officers representing 6% of our outstanding capital stock immediately following the Business Combination on an as converted basis (excluding any shares reserved for issuance under equity-based plans of Akili, Inc., including the 2022 Plan and the 2022 ESPP). The key terms of these anticipated awards have not yet been defined. As such, the fair value cannot be estimated as of the date of this prospectus and therefore the awards are not included as a transaction accounting adjustment within the unaudited pro forma statements.
The following unaudited pro forma condensed combined balance sheet as of June 30, 2022 and unaudited pro forma condensed combined statement of operations and comprehensive loss for the six months ended June 30, 2022 and year ended December 31, 2021 are based on the historical financial statements of SCS and Akili. The unaudited pro forma adjustments are based on information currently available, and assumptions and estimates underlying the unaudited pro forma adjustments and are described in the accompanying notes. Actual results may differ materially from the assumptions used to present the accompanying unaudited pro forma condensed combined financial information.
69
UNAUDITED PRO FORMA CONDENSED COMBINED BALANCE SHEET AS OF JUNE 30, 2022
(in thousands)
Historical | ||||||||||||||||||||
SCS | Akili | Transaction Accounting Adjustments | Pro Forma Balance Sheet | |||||||||||||||||
ASSETS | ||||||||||||||||||||
Current assets: | ||||||||||||||||||||
Cash and cash equivalents | $ | 145 | $ | 40,638 | $ | 250,814 | 3 | (a) | $ | 175,684 | ||||||||||
| (2,226 | ) | 3 | (d) | |||||||||||||||||
| (9,045 | ) | 3 | (f) | |||||||||||||||||
| 162,000 | 3 | (i) | ||||||||||||||||||
| (2,700 | ) | 3 | (k) | |||||||||||||||||
| (7,752 | ) | 3 | (l) | |||||||||||||||||
| (5,520 | ) | 3 | (e) | |||||||||||||||||
| (248,531 | ) | 3 | (j) | |||||||||||||||||
| (2,139 | ) | 3 | (n) | |||||||||||||||||
Restricted cash | — | 305 | — | 305 | ||||||||||||||||
Short-term investments | — | 4,987 | — | 4,987 | ||||||||||||||||
Account receivable, net | — | 17 | — | 17 | ||||||||||||||||
Prepaid expenses and other current assets | 524 | 5,328 | (2,338 | ) | 3 | (f) | 3,514 | |||||||||||||
Total current assets | 669 | 51,275 | 132,563 | 184,507 | ||||||||||||||||
Property and equipment, net | — | 1,054 | — | 1,054 | ||||||||||||||||
Operating lease right-of-use | — | 2,686 | — | 2,686 | ||||||||||||||||
Marketable securities held in Trust Account | 250,371 | — | (250,371 | ) | 3 | (a) | — | |||||||||||||
Total assets | $ | 251,040 | $ | 55,015 | $ | (117,808 | ) | $ | 188,247 | |||||||||||
LIABILITIES, REDEEMABLE CONVERTIBLE PREFERRED STOCK AND STOCKHOLDERS’ DEFICIT | ||||||||||||||||||||
Current liabilities: | ||||||||||||||||||||
Accounts payable | $ | 17 | $ | 4,309 | $ | (17 | ) | 3 | (l) | $ | 4,309 | |||||||||
Accrued expenses and other current liabilities | 7,405 | 5,044 | (7,405 | ) | 3 | (l) | 5,044 | |||||||||||||
Promissory note—related party | 250 | — | (250 | ) | 3 | (l) | — | |||||||||||||
Due to related party | 80 | — | (80 | ) | 3 | (l) | — | |||||||||||||
Deferred revenue | — | 109 | — | 109 | ||||||||||||||||
Deferred rent, short term | — | 9 | — | 9 | ||||||||||||||||
Operating lease liability | — | 625 | — | 625 | ||||||||||||||||
Note payable, short term | — | 625 | — | 625 | ||||||||||||||||
Total current liabilities | 7,752 | 10,721 | (7,752 | ) | 10,721 | |||||||||||||||
Deferred underwriting fee payable | 7,700 | — | (7,700 | ) | 3 | (e) | — | |||||||||||||
Note payable, long term | — | 14,213 | — | 14,213 | ||||||||||||||||
Operating lease liability, net of current portion | — | 2,832 | — | 2,832 | ||||||||||||||||
Corporate bond, net of bond discount | — | 1,735 | — | 1,735 | ||||||||||||||||
Earnout liability | — | — | 57,197 | 3 | (m) | 57,197 | ||||||||||||||
Total liabilities | $ | 15,452 | $ | 29,501 | $ | 41,745 | $ | 86,698 | ||||||||||||
70
UNAUDITED PRO FORMA CONDENSED COMBINED BALANCE SHEET AS OF JUNE 30, 2022
(in thousands)
Historical | ||||||||||||||||||||
SCS | Akili | Transaction Accounting Adjustments | Pro Forma Balance Sheet | |||||||||||||||||
Commitments and contingencies | ||||||||||||||||||||
Class A ordinary shares | 250,371 | — | (250,371 | ) | 3 | (b) | — | |||||||||||||
Class A common stock | — | — | 250,371 | 3 | (b) | — | ||||||||||||||
| (250,371 | ) | 3 | (j) | |||||||||||||||||
REDEEMABLE CONVERTIBLE PREFERRED STOCK: | ||||||||||||||||||||
Akili Series A-1 redeemable convertible preferred stock | — | — | — | — | ||||||||||||||||
Akili Series A-2 redeemable convertible preferred stock | — | 7,128 | (7,128 | ) | 3 | (g) | — | |||||||||||||
Akili Series B redeemable convertible preferred stock | — | 41,854 | (41,854 | ) | 3 | (g) | — | |||||||||||||
Akili Series C redeemable convertible preferred stock | — | 67,904 | (67,904 | ) | 3 | (g) | — | |||||||||||||
Akili Series D redeemable convertible preferred stock | — | 183,668 | (183,668 | ) | 3 | (g) | — | |||||||||||||
Stockholders equity (deficit): | ||||||||||||||||||||
SCS Preference shares | — | — | — | — | ||||||||||||||||
Class A ordinary shares | — | — | — | 3 | (b) | — | ||||||||||||||
Class A common stock | — | — | — | 3 | (b) | 11 | ||||||||||||||
| 1 | 3 | (c) | ||||||||||||||||||
| 3 | 3 | (j) | ||||||||||||||||||
| 5 | 3 | (h) | ||||||||||||||||||
| 2 | 3 | (i) | ||||||||||||||||||
Class B ordinary shares | 1 | — | (1 | ) | 3 | (b) | — | |||||||||||||
Class B common stock | — | — | 1 | 3 | (b) | — | ||||||||||||||
| (1 | ) | 3 | (c) | |||||||||||||||||
Akili Common stock | — | — | 5 | 3 | (g) | — | ||||||||||||||
| (5 | ) | 3 | (h) | |||||||||||||||||
Additional paid-in capital | — | — | 2,280 | 3 | (j) | 383,783 | ||||||||||||||
| 161,998 | 3 | (i) | ||||||||||||||||||
| (2,700 | ) | 3 | (k) | |||||||||||||||||
| (14,784 | ) | 3 | (h) | |||||||||||||||||
| 300,549 | 3 | (g) | ||||||||||||||||||
| (2,226 | ) | 3 | (d) | |||||||||||||||||
| (11,383 | ) | 3 | (f) | |||||||||||||||||
| (57,197 | ) | 3 | (m) | |||||||||||||||||
| 2,180 | 3 | (e) | ||||||||||||||||||
| 5,066 | 3 | (o) | ||||||||||||||||||
Accumulated deficit | (14,784 | ) | (275,033 | ) | 14,784 | 3 | (h) | (282,238 | ) | |||||||||||
| (2,139 | ) | 3 | (n) | |||||||||||||||||
| (5,066 | ) | 3 | (o) | |||||||||||||||||
| 443 | 3 | (a) | ||||||||||||||||||
| (443 | ) | 3 | (j) | |||||||||||||||||
Accumulated other comprehensive loss | — | (7 | ) | — | (7 | ) | ||||||||||||||
Total stockholders’ equity (deficit) | $ | (14,783 | ) | $ | (275,040 | ) | $ | 391,372 | $ | 101,549 | ||||||||||
Total liabilities, redeemable convertible preferred stock and stockholders’ deficit | $ | 251,040 | $ | 55,015 | $ | (117,808 | ) | $ | 188,247 | |||||||||||
See accompanying notes to the unaudited pro forma condensed combined financial statements.
71
UNAUDITED PRO FORMA CONDENSED COMBINED STATEMENT OF OPERATIONS FOR
SIX MONTHS ENDED JUNE 30, 2022
(in thousands, except share and per share amounts)
Historical | ||||||||||||||||||||
SCS | Akili Interactive Labs, Inc. | Transaction Accounting Adjustments | Pro Forma Statement of Operations | |||||||||||||||||
Revenue | $ | — | $ | 130 | $ | — | $ | 130 | ||||||||||||
Operating expenses: | ||||||||||||||||||||
Cost of revenue | — | 193 | — | 193 | ||||||||||||||||
Research and development | — | 13,662 | 49 | 4 | (c) | 13,711 | ||||||||||||||
Selling, general and administrative | — | 30,339 | 59 | 4 | (c) | 36,671 | ||||||||||||||
| 6,273 | 4 | (b) | ||||||||||||||||||
Operating and formation costs | 6,273 | — | (6,273 | ) | 4 | (b) | — | |||||||||||||
Total operating expenses | 6,273 | 44,194 | 108 | 50,575 | ||||||||||||||||
Loss from operations | (6,273 | ) | (44,064 | ) | (108 | ) | (50,445 | ) | ||||||||||||
Interest earned on marketable securities held in Trust Account | 363 | — | (363 | ) | 4 | (a) | — | |||||||||||||
Loss on extinguishment of debt | — | — | — | — | ||||||||||||||||
Interest expense | — | (370 | ) | — | (370 | ) | ||||||||||||||
Other income | — | 49 | — | 49 | ||||||||||||||||
Loss before provision for income taxes | (5,910 | ) | (44,385 | ) | (471 | ) | (50,766 | ) | ||||||||||||
Provision for income taxes | — | — | — | — | ||||||||||||||||
Net loss | $ | (5,910 | ) | $ | (44,385 | ) | $ | (471 | ) | $ | (50,766 | ) | ||||||||
Unrealized loss on short-term investments | $ | — | $ | (7 | ) | $ | — | $ | — | |||||||||||
Comprehensive loss | $ | (5,910 | ) | $ | (44,392 | ) | $ | (471 | ) | $ | (50,766 | ) | ||||||||
Net loss | $ | (5,910 | ) | $ | (44,385 | ) | $ | (471 | ) | $ | (50,766 | ) | ||||||||
Dividends on Series D convertible preferred stock | — | (5,785 | ) | — | (5,785 | ) | ||||||||||||||
Accretion of Series D convertible preferred stock | — | (2,893 | ) | — | (2,893 | ) | ||||||||||||||
Net loss attributable to common stockholders, basic and diluted | $ | (5,910 | ) | $ | (53,063 | ) | $ | (471 | ) | $ | (59,444 | ) | ||||||||
Net loss per share, basic and diluted | $ | (0.19 | ) | $ | (36.18 | ) | $ | (0.76 | ) | |||||||||||
Weighted-average common shares outstanding: Basic and diluted | 31,890,000 | 1,466,462 | 77,858,746 | |||||||||||||||||
See accompanying notes to the unaudited pro forma condensed combined financial statements.
72
UNAUDITED PRO FORMA CONDENSED COMBINED STATEMENT OF OPERATIONS FOR THE YEAR ENDED DECEMBER 31, 2021
(in thousands, except share and per share amounts)
Historical | ||||||||||||||||||||
SCS | Akili Interactive Labs, Inc. | Transaction Accounting Adjustments | Pro Forma Statement of Operations | |||||||||||||||||
Revenue | $ | — | $ | 538 | $ | — | $ | 538 | ||||||||||||
Operating expenses: | ||||||||||||||||||||
Cost of revenue | — | 355 | — | 355 | ||||||||||||||||
Research and development | — | 18,234 | 2,733 | 5 | (c) | 20,967 | ||||||||||||||
Selling, general and administrative | — | 42,668 | 5,879 | 5 | (c) | 53,133 | ||||||||||||||
| 2,447 | 5 | (b) | ||||||||||||||||||
| 2,139 | 5 | (d) | ||||||||||||||||||
Operating and formation costs | 2,447 | — | (2,447 | ) | 5 | (b) | — | |||||||||||||
Total operating expenses | 2,447 | 61,257 | 10,751 | 74,455 | ||||||||||||||||
Loss from operations | (2,447 | ) | (60,719 | ) | (10,751 | ) | (73,917 | ) | ||||||||||||
Interest earned on marketable securities held in Trust Account | 8 | — | (8 | ) | 5 | (a) | — | |||||||||||||
Loss on extinguishment of debt | — | (181 | ) | — | (181 | ) | ||||||||||||||
Interest expense | — | (465 | ) | — | (465 | ) | ||||||||||||||
Other income | — | 17 | — | 17 | ||||||||||||||||
Loss before provision for income taxes | (2,439 | ) | (61,348 | ) | (10,759 | ) | (74,546 | ) | ||||||||||||
Provision for income taxes | — | — | — | — | ||||||||||||||||
Net loss | (2,439 | ) | (61,348 | ) | (10,759 | ) | (74,546 | ) | ||||||||||||
Dividends on Series D convertible preferred stock | — | (6,660 | ) | — | (6,660 | ) | ||||||||||||||
Accretion of Series D convertible preferred stock | — | (58,649 | ) | — | (58,649 | ) | ||||||||||||||
Net loss attributable to common stockholders, basic and diluted | $ | (2,439 | ) | $ | (126,657 | ) | $ | (10,759 | ) | $ | (139,855 | ) | ||||||||
Net loss per share, basic and diluted | $ | (0.12 | ) | $ | (105.77 | ) | $ | (1.80 | ) | |||||||||||
Weighted-average common shares outstanding: Basic and diluted | 20,954,628 | 1,197,489 | 77,858,746 | |||||||||||||||||
| (1) | For the period from February 25, 2021 (date of inception) to December 31, 2021. |
See accompanying notes to the unaudited pro forma condensed combined financial statements.
73
NOTES TO UNAUDITED PRO FORMA CONDENSED COMBINED FINANCIAL INFORMATION
1. Basis of Pro Forma Presentation
The Business Combination was accounted for as a “reverse recapitalization” in accordance with US GAAP. Under this method of accounting, Akili has been treated as the accounting acquirer, while SCS has been treated as the accounting acquiree for financial reporting purposes. Accordingly, for accounting purposes, the Business Combination was treated as the equivalent of Akili issuing shares for the net assets of SCS, accompanied by a recapitalization. The net assets of SCS are stated at historical cost. No goodwill or other intangible assets were recorded in conjunction with the Transactions.
The unaudited pro forma condensed combined financial statements are based on SCS’s historical financial statements, and Akili’s historical consolidated financial statements as adjusted to give effect to the Transactions. The unaudited pro forma condensed combined balance sheet gives pro forma effect to the Transactions as if they had been consummated on June 30, 2022. The unaudited pro forma condensed combined statement of operations for the six months ended June 30, 2022 and the year ended December 31, 2021 give effect to the Transactions as if they had occurred on January 1, 2021.
Management has made significant estimates and assumptions in its determination of the pro forma adjustments. The pro forma adjustments reflecting the Transactions are based on certain currently available information and certain assumptions and methodologies that management believes are reasonable under the circumstances. The pro forma adjustments, which are described in the accompanying notes, may be revised as additional information becomes available and is evaluated. Therefore, it is likely that the actual adjustments will differ from the pro forma adjustments, and it is possible the difference may be material. Management believes that its assumptions and methodologies provide a reasonable basis for presenting all of the significant effects of the Transactions based on information available to management at this time and that the pro forma adjustments give appropriate effect to those assumptions and are properly applied in the unaudited pro forma condensed combined financial statements.
The unaudited pro forma condensed combined financial statements were prepared in accordance with Article 11 of SEC Regulation. Release
S-X,
as amended by the final rule, ReleaseNo. 33-10786,
Amendments to Financial Disclosures about Acquired and Disposed Businesses
No. 33-10786
replaces the existing pro forma adjustment criteria with simplified requirements to depict the accounting for the Transactions (“Transaction Accounting Adjustments”) and present the reasonably estimable synergies and other transaction effects that have occurred or are reasonably expected to occur (“Management’s Adjustments”). Management has elected not to present Management’s Adjustments and will only be presenting Transaction Accounting Adjustments in the unaudited pro forma condensed combined financial statements. As such, the unaudited pro forma condensed combined financial information does not give effect to any anticipated synergies, operating efficiencies, tax savings, or cost savings that may be associated with the Business Combination. SCS and Akili have not had any historical relationship prior to the business combination. Accordingly, no pro forma adjustments were required to eliminate activities between the companies.The unaudited pro forma condensed combined financial statements are provided for illustrative purposes only and are not necessarily indicative of what the actual results of operations and financial position would have been had the Transactions taken place on the dates indicated, nor are they indicative of the future consolidated results of operations or financial position of the combined company.
2. Accounting Policies
In the preparation of this unaudited pro forma condensed combined financial information, no reclassifications were determined to be necessary to align SCS and Akili Interactive Labs, Inc. financial statement presentations, other than the reclassification of Operating and Formation Costs in adjustments 4(b) and 5(b).
74
There were no intercompany transactions between SCS and Akili Interactive Labs, Inc. that require adjustments to the unaudited pro forma condensed combined financial information for any of the periods presented.
3. Adjustments to Unaudited Pro Forma Condensed Combined Balance Sheet
The pro forma notes and adjustments, based on preliminary estimates that could change materially as additional information is obtained, are as follows:
a. Reflects the release of cash from the trust account to cash and cash equivalents, prior to the adjustment for redemptions, which is illustrated in adjustment (3j). The trust account increased to $250.8 million as of the date of Closing due to interest earned during that time.
b. Reflects the conversion of SCS’s Class A ordinary shares and Class B ordinary shares into Akili, Inc. common stock upon the Domestication.
c. Reflects the conversion of SCS’s 6,250,000 Class B ordinary shares into shares of Akili, Inc. common stock concurrent with the Closing.
d. SCS has estimated advisory, legal, accounting and auditing fees and other professional fees of $9.8 million that are deemed to be direct and incremental costs of the Business Combination. This adjustment reflects the remaining estimated transaction costs of $2.2 million that are unpaid and not recorded on SCS’s financial statements as of June 30, 2022. These costs are directly attributable to the Business Combination and have been recorded as a reduction to additional
paid-in
capital.Transaction costs of $6.6 million were included in SCS’s historical accrued expenses and other current liabilities, which are addressed in adjustment (3l). Transaction costs of $0.1 million were already paid by SCS and included in SCS’s historical operating and formation costs. SCS’s transaction costs are recorded through the income statement and are treated as a reduction to accumulated deficit, however, as SCS’s accumulated deficit is reclassified to additional
paid-in
capital in connection with the Merger, this adjustment reflects the recording of the transaction costs directly to additionalpaid-in
capital.The Company allocated $0.9 million of transaction costs to the liability classified Earnout Shares, as disclosed in adjustment (3n).
e. Reflects the settlement of the deferred underwriters’ fees incurred during SCS’s initial public offering that are payable upon completion of the Business Combination. The amount of $7.7 million recorded on SCS’s historical financial statements was based on a no redemption scenario. The deferred underwriters’ fees were adjusted to $5.5 million based on the amount of final redemptions and will be paid in cash. The difference between the original estimate and the actual balance has been recorded as an increase to additional
paid-in-capital.
f. Akili has estimated advisory, legal, accounting and auditing fees and other professional fees of $12.6 million that are deemed to be direct and incremental costs of the Business Combination. The Company allocated $1.2 million of transaction costs to the liability classified Earnout Shares, as disclosed in adjustment (3n). The Company previously paid $2.4 million of transaction costs, which upon Closing will be reclassified from prepaid expenses and other current assets to additional
paid-in
capital. The remaining $9.0 million will be paid as part of the Closing and has been recorded as a reduction of cash and additionalpaid-in
capital of $9.0 million.g. Reflects the conversion of Akili Convertible Preferred Stock of $300.6 million into Akili common stock of $5 thousand and additional paid in capital of $300.5 million.
h. Reflects the recapitalization of Akili through the contribution of all outstanding common stock of Akili to SCS and the issuance of 54,541,224 shares of Akili, Inc. common stock and the elimination of the accumulated deficit of SCS, the accounting acquiree. As a result of the recapitalization, Akili common stock of $5 thousand and
75
SCS’s accumulated deficit of $14.8 million were derecognized. The shares of Akili, Inc. common stock issued in exchange for Akili’s capital were recorded as an increase to common stock of $5 thousand and a decrease to additional
paid-in
capital of $14.8 million.i. Reflects the issuance of an aggregate of 16,200,000 shares of Akili, Inc. common stock in the PIPE Investment at a price of $10.00 per share, for an aggregate purchase price of $162.0 million.
j. Reflects the redemption of 24,772,478 SCS Class A ordinary shares prior to the consummation of the Business Combination at a redemption price of approximately $10.03 per share, or $248.5 million in cash, including interest earned in the Trust Account. Adjustment (3b) reflects the reclassification of the remaining SCS Class A ordinary shares that were not redeemed into Akili, Inc. common stock.
k. Represents payment of the estimated PIPE Financing transactions costs. The unaudited pro forma condensed combined balance sheet reflects these costs as a reduction of cash, with a corresponding decrease in additional
paid-in
capital.l. Represents payment of historical SCS accounts payable and accrued expenses upon Closing.
m. Reflects recognition of the approximately 6,531,314 Earnout Shares issuable to holders of Akili Common Stock and Akili Convertible Preferred Stock and warrantholders which are not indexed to Akili, Inc.’s stock pursuant to ASC Subtopic
815-40
as of Closing. Therefore, such amount is classified as a liability and recognized at its preliminary estimated fair value. The earnout liability will be remeasured to its fair value at the end of each reporting period and subsequent changes in the fair value will be recognized in Akili, Inc.’s statement of operations within other income/expense. Refer to Note 6—Earnout Shares, for additional information.n. The Company has allocated $2.1 million of transaction costs, to the liability classified Earnout Shares based on the relative fair value of these instruments as compared to the total Merger consideration. The portion of transaction costs allocated to these instruments is reflected as a reduction to cash and retained earnings. The costs are determined to relate to future share issuances and not to the initial recapitalization and therefore they are expensed at the Closing.
o. This adjustment reflects recognition of approximately $5.1 million of share-based compensation expense associated with the Earnout Shares issuable to Earnout Service Providers where the requisite service period was complete as of Closing. See adjustment 4(c) for additional information.
4. Adjustments to Unaudited Pro Forma Condensed Combined Statements of Operations for the Six Months Ended June 30, 2022
The pro forma notes and adjustments, based on preliminary estimates that could change materially as additional information is obtained, are as follows:
a. To eliminate interest income earned on the Trust Account which will be released upon closing of the Business Combination.
b. To reclassify the historical formation costs of SCS to conform to Akili’s financial statement presentation.
c. The Company has preliminarily concluded that the contingent issuance of Earnout Shares to Earnout Service Providers represents a grant of a compensatory award under ASC 718,. Under this guidance, the award is measured at fair value at the grant date and expense is recognized over the requisite service period. The preliminary estimated fair value of the Earnout Shares allocated to Earnout Service Providers is approximately $8.8 million based on an estimated issuance of 1,005,147 shares. The preliminary
Compensation—Stock Compensation
76
estimated fair value of the Earnout Shares was determined using a Monte Carlo simulation, which is described in detail in Note 6. The requisite service period was determined for each grant based on the lesser of estimated time to reach a Triggering Event or the vesting date of the underlying options. The time to reach a Triggering Event was estimated using the median vesting dates produced by a simulation model, which was restricted to consider only iterations/outcomes where the market conditions are achieved. The material assumptions and estimates employed in these calculations are consistent with those described in Note 6 below. This adjustment reflects recognition of approximately $108 thousand of share-based compensation expense associated with the Earnout Shares issuable to Earnout Service Providers for the six months ended June 30, 2022, of which $59 thousand and $49 thousand was recognized as selling, general and administrative expense and research and development expense, respectively, based on the holder’s employment classification. On a pro forma basis, as of June 30, 2022, there was approximately $83 thousand of total unrecognized compensation cost related to the Earnout Shares issuable to the Earnout Service Providers. Upon the date of any forfeiture, any Earnout Shares that have been forfeited will be reallocated pro rata to the other holders of Earnout Shares. The forfeiture and subsequent redistribution of the awards are accounted for as (1) the forfeiture of the original award and (2) the grant of a new award. Upon reallocation, the Company will reverse any compensation previously recognized for the forfeited award and recognize compensation for the new award, based on the fair value on the date of redistribution, over the remaining requisite service period.
5. Adjustments to Unaudited Pro Forma Condensed Combined Statements of Operations for the Year Ended December 31, 2021
a. To eliminate interest income earned on the Trust Account which will be released upon closing of the Business Combination.
b. To reclassify the historical formation costs of SCS to conform to Akili’s financial statement presentation.
c. This adjustment reflects recognition of approximately $8.6 million of share-based compensation expense associated with the Earnout Shares issuable to Earnout Service Providers for the year ended December 31, 2021, of which $5.9 million and $2.7 million was recognized as selling, general and administrative expense and research and development expense, respectively, based on the holder’s employment classification. On a pro forma basis, as of December 31, 2021, there was approximately $191 thousand of total unrecognized compensation cost related to the Earnout Shares issuable to the Earnout Service Providers.
d. To reflect $2.1 million of transaction costs related to the liability classified Earnout Shares, based on the relative fair value of these instruments as compared to the total Merger consideration. These costs are determined to relate to future share issuances and not to the initial recapitalization and therefore are expensed at the Closing Date.
6. Earnout Shares
The Earnout Shares issued to stockholders and warrantholders are expected to be accounted for as liability classified financial instruments. These Earnout Shares were first evaluated under ASC Topic 480, Distinguishing Liabilities from Equity, to determine if the Earnout Shares should be classified as a liability. As part of that analysis, it was determined that the Earnout Shares are freestanding and not liability classified and further accounting assessment was required pursuant to ASC Topic 815, Derivatives and Hedging. Paragraph ASCstates that a reporting entity shall not consider contracts to be derivative instruments if the contracts are both (a) indexed to the entity’s own stock and (b) classified in stockholders’ equity in its statement of financial position. The Earnout Shares contain a provision in which forfeited Earnout Shares will be reallocated to the remaining holders of Earnout Shares which could impact the settlement amount thereof. This provision prevents the Earnout Shares issuable to stockholders and warrantholders from being considered indexed to stock, and therefore results in liability classification of the Earnout Shares pursuant to ASC
815-10-15-74(a)
815-40.
77
The preliminary estimated fair value of the Earnout Shares liability is approximately $57.2 million, based on an estimated issuance of 6,531,314 liability classified Earnout Shares. The preliminary estimated fair value of the Earnout Shares was determined using a Monte Carlo simulation valuation model using a distribution of potential outcomes on a daily basis over the five-year Earnout Period. The preliminary estimated fair value of the Earnout Shares was determined using the most reliable information available. Assumptions used in the preliminary valuation were as follows:
Price Target
| • | Triggering Event I is $15.00 |
| • | Triggering Event II is $20.00 |
| • | Triggering Event III is $30.00 |
Current stock price
Expected term:
Expected volatility:
Expected dividend yield:
At the end of each reporting period, Akili, Inc. will
re-measure
the Earnout Shares liability at fair value using a Monte Carlo simulation valuation model with changes in fair value reflected on the statement of operations at each reporting period.7. Net Loss Per Share
As the Transactions have been reflected as if they occurred on January 1, 2021, the calculation of weighted average shares outstanding for pro forma basic and diluted net loss per share assumes the shares issuable in connection with the Transactions had been outstanding as of such date. Pro forma basic and diluted net loss per share for the six months ended June 30, 2022 and the year ended December 31, 2021 is calculated as follows:
Combined Pro Forma | ||||||||
Year Ended December 31, 2021 | Six Months Ended June 30, 2022 | |||||||
Pro forma net loss | $ | (139,855 | ) | $ | (59,444 | ) | ||
Pro forma weighted average shares outstanding—basic and diluted | 77,858,746 | 77,858,746 | ||||||
Pro forma net loss per share-basic and diluted | $ | (1.80 | ) | $ | (0.76 | ) | ||
Pro Forma weighted average shares calculation—basic and diluted | ||||||||
SCS Sponsors | 6,890,000 | 6,890,000 | ||||||
SCS common stock subject to redemption | 227,522 | 227,522 | ||||||
Total SCS | 7,117,522 | 7,117,522 | ||||||
Issuance of SCS common stock in connection with closing of the PIPE Transaction | 16,200,000 | 16,200,000 | ||||||
Issuance of SCS common stock to Akili shareholders in connection with Business Combination (a)(b) | 54,541,224 | 54,541,224 | ||||||
Pro forma weighted average shares outstanding—basic and diluted (c) | 77,858,746 | 77,858,746 | ||||||
78
| a. | Excludes 5,458,743 Akili consideration shares that will be issued upon the occurrence of future events (i.e., exercise of stock options and warrants). Total consideration to be issued to Akili is $600.0 million or 60,000,000 shares ($10 per share price with no fractional shares issued). The total shares to be issued includes those in respect of all issued and outstanding Akili common and preferred stock and shares underlying stock options and warrants. Accordingly, the weighted average pro forma shares outstanding at Closing has been adjusted to exclude the portion of consideration shares that were unissued at Closing. |
| b. | Amount excludes the issuance of approximately 7,536,461 Earnout Shares to certain eligible Akili equity holders as a result of Akili, Inc. satisfying certain conditions described above within the Earnout Period. |
| c. | For the purposes of applying the if converted method for calculating diluted earnings per share, it was assumed that all Akili common stock options are exchanged for common stock. However, since this results in anti-dilution, the effect of such exchange was not included in the calculation of diluted loss per share. Shares underlying these instruments include 5,458,743 Akili consideration shares for unexercised stock options and warrants. |
79
BUSINESS
Unless the context otherwise requires, all references in this section to the “company”, “we”, “us”, or “our” refer to the business of Akili, Inc. and its subsidiaries and, prior to the consummation of the Business Combination, the business of Akili Interactive Labs, Inc. and its subsidiaries.
Overview
We are a leading digital medicine company pioneering the development of cognitive treatments through game- changing technologies. Our approach of leveraging technologies designed to directly target the brain establishes a new category of medicine—medicine that is validated through clinical trials like a drug or medical device, but experienced like entertainment.
Impairments in cognition are associated with many different chronic diseases and acute illnesses, impacting approximately 85 million people in the U.S. These impairments include, but are not limited to attention-deficit/ hyperactivity disorder (“ADHD”), autism spectrum disorder (“ASD”), multiple sclerosis (“MS”), major depressive disorder (“MDD”), post-traumatic stress disorder (“PTSD”), cognitive impairments in
COVID-19
survivors (“COVID fog”), traumatic brain injury (“TBI”), cancer-related cognitive impairment (“CRCI”) and Alzheimer’s Disease, among others. Global recognition of cognitive function by physicians and patients is at anall-time
high, yet many current treatment approaches are inadequate, as they are either unable to effectively target the brain to address underlying impairments or lack clinical validation.Our vision is to change this paradigm with our development of the first digital prescription treatment to improve cognition, developed through a unique collaboration of cognitive neuroscientists and entertainment and technology designers.
Until now, digital therapeutics have consisted of tools and technology used to deliver existing medical processes, such as cognitive behavioral therapy, through accessible andmobile applications. Our platform represents a fundamental paradigm shift where technology is the medicine itself, designed to target neural networks critical to cognitive function. We aim to transform the user-friendly experiences that digital therapeutics can deliver into clinically-validated treatments for cognitive functions that are designed to be indistinguishable from
easy-to-use
high-end
entertainment experiences.With this approach, we introduced EndeavorRx, the first prescription video game treatment (and first digital treatment for a cognitive impairment) reviewed and granted marketing authorization by the U.S. Food and Drug Administration (the “FDA”) in June 2020, as a Class II medical device through the FDA’s de novo process. EndeavorRx is indicated for use to improve attention function for children ages
8-12
years old with primarily inattentive or combined-type ADHD, who have a demonstrated attention issue. In June 2020, EndeavorRx also received Conformité Européenne (“CE”) Mark certification as a prescription-only digital therapeutic software intended for the treatment of attention and inhibitory control deficits in pediatric patients with ADHD, enabling EndeavorRx to be marketed in European Economic Area (“EEA”) member countries. EndeavorRx should be considered for use as part of a therapeutic program that may include clinician-directed therapy, medication and/or educational programs, which further address symptoms of the disorder. It is not intended to be used as a stand-alone therapeutic and is not a substitution for a child’s medication.We built EndeavorRx using our most advanced therapeutic engine, our selective stimulus management engine (“SSME”) mechanism of action. SSME is currently in clinical trials in adolescent and adult ADHD populations as well as in three other disease areas: post-operative
(post-op)
cognitive dysfunction, chemotherapy-induced cognitive impairment and cognitive dysfunction followingCOVID-19
infection. Further, we have developed a pipeline of development programs focused on other indications.Within ADHD, there is a large and growing opportunity for innovative
non-drug
treatments. Current ADHD treatment options represent a $10 billion market with over 70 million prescriptions written every year for drugs80
in the U.S. According to the U.S. Centers for Disease Control and Prevention, nearly half the pediatric ADHD population uses behavioral therapy as well. The total ADHD population in the U.S. is 10.8 million and our initial target population includes those with inattentive or combined type ADHD, or 8.1 million of the total U.S. ADHD population. EndeavorRx is currently cleared in the U.S. to treat patients in the
8-12
age group, which represent approximately 22% (1.8 million) of our target 8.1 million ADHD population.Within this market we face competition from a range of companies. Our competitors include both enterprise companies who are focused on or may enter the healthcare industry, including initiatives and partnerships launched by these large companies, and from private companies that offer solutions for specific chronic conditions. We compete with companies that are developing treatments for cognitive impairment associated with ADHD and other diseases and disorders resulting in cognitive impairment. In the digital health space, we compete with companies that have created
non-regulated
products to treat cognitive impairment in ADHD and other diseases and disorders resulting in cognitive impairment.Our Proprietary Approach
Our platform is powered by proprietary therapeutic engines, which are software and associated algorithms that form the core of our products and product candidates, designed to target cognitive impairment at its source in the brain, informed by decades of research (including research conducted prior to the founding of Akili) and validated through rigorous clinical programs. Our most advanced therapeutic engine, SSME, presents specific sensory stimuli and simultaneous motor challenges designed to target the fronto-parietal cortex which plays a key role in attention function, while our earlier stage therapeutic engines focus on cognitive functions, including spatial navigation, memory and planning and organization. Each product and product candidate embodies a specific proprietary therapeutic engine with a variation of the video game-like user interface in an effort to optimize user engagement applicable to a particular disease or medical condition indication. Product candidates are clinically tested in development programs for particular disease or medical condition indications.
These products and product candidates are delivered in a platform characterized by these key attributes:
| • | Targeted treatments that are personalized to patients’ needs de-identified, aggregate level view of each patient’s activity, informing our product development. The therapeutics’ mechanics, algorithms and designs are protected by patents, trade secrets and copyrights, combining protections typically seen in both the medicine and technology industries to create a robust intellectual property portfolio. |
| • | Clinically validated therapeutics like drugs and medical devices The American Journal of Psychiatry, The Lancet Digital Health and Nature: Digital Medicine |
| • | Therapeutics that are experienced as entertainment |
81
unique user experiences also allows us to adapt the experience to appeal to different patient populations by developing and testing product candidates in clinical trials. We believe we have the potential to offer the first treatments that both rival the experience of consumer entertainment products and can be utilized as part of a treatment plan. |
| • | Patient focused and adaptive |
This same technology platform also has potential applications beyond the treatment of cognitive impairments, with the potential to measure and monitor cognitive functioning. As we work towards improving cognitive impairments in patients at scale, the ability to measure cognitive function is critical. Today, cognition is typically only assessed in response to a specific patient complaint, and there is no consistent approach for this measurement. Clinical studies have shown our platform’s potential to act as a sensitive cognitive measure that correlates with well-known
in-person
or paper-based cognitive measurements.EndeavorRx
®
: The first prescription video game treatmentIn June 2020, EndeavorRx, the first product built on the Akili platform was granted marketing authorization and classified as a Class II medical device by the FDA through FDA’s de novo process. The EndeavorRx product is indicated for use to improve attention function for children ages
8-12
with primarily inattentive or combined-type ADHD, who have a demonstrated attention issue. EndeavorRx represents a fundamental paradigm shift in the treatment of cognitive disorders, where technology is not just delivering a therapy but is itself the medicine.EndeavorRx is the only therapeutic that is an
FDA-authorized
and physician-prescribed video game-based treatment designed to directly target cognitive functioning. For the first time, doctors have a treatment option that is purpose-built to target cognitive function and that is not taken as a pill, but delivered through a video game. EndeavorRx also obtained Conformité Européenne (CE) Mark certification in pediatric patients with ADHD, enabling EndeavorRx to be marketed in European Economic Area (EEA) member countries.EndeavorRx Commercial Launch
In the second half of 2022, we plan to initiate the commercial launch of EndeavorRx using a commercial model we purpose-built for digital therapeutics. We believe that this customized commercialization approach for the digital therapeutics industry will support a successful launch as well as the rapid commercialization of any future products.
Our commercial model has important levers that go beyond the traditional therapeutic model. Because we are building the model from the ground up, we have the ability to use the extensive data collected through our platform, not just to rapidly iterate our products, but to tailor the entire delivery system for the nature of our products. We are leveraging a fully digital process, from prescription to fulfillment to treatment, creating unparalleled optimization of thepatient experience and potentially enabling higher conversion, better compliance and optimal treatment. Our digital process includes features like a personalized customer support program, Akili Assist, which is designed to help our Health Care Providers (“HCPs”) and caregivers learn more about Akili and our products. Akili Assist representatives can be reached via email, phone and chat. With a commitment to experimenting, testing and learning, we have piloted several initiatives to understand promotional levers for our products and to prioritize the successful commercialization of EndeavorRx. Our commercial model is supported by the learnings and experience we gained from our
end-to-end
pre-launch
of EndeavorRx, which demonstrated strong business fundamentals such as conversion rates, refill rates and breadth and depth of prescribing.82
We plan to train and educate Health Care Providers (“HCPs”) how to incorporate EndeavorRx in their treatment regimens while simultaneously supporting a consumer-driven model through our engagement with parents of children with ADHD, including through social media campaigns. Our approach prioritizes expanding access to EndeavorRx for families through our efforts with payers, while ensuring a path is available for
self-pay.
Our Development Pipeline
Our therapeutic engines are designed to target cognitive functions with the potential to address multiple medical conditions presenting the same functional cognitive impairments. Based on unmet need and market opportunities, our initial advanced-stage pipeline is focused on nine patient populations in pediatric and adult conditions, addressing both chronic and acute cognitive impairments.
We are currently conducting the following Akili-sponsored studies:
| • | pivotal study in adolescents with ADHD |
| • | pivotal study in adults with ADHD |
We are currently conducting the following collaborative studies with:
| • | Weill Cornell Medicine/NewYork-Presbyterian Hospital in acute cognitive dysfunction in COVID-19 survivors |
| • | Vanderbilt University Medical Center in acute cognitive dysfunction in COVID-19 survivors |
The following studies being conducted by partners are in progress:
| • | pivotal study in pediatric ADHD in Japan by Shionogi & Co., Ltd (“Shionogi”) |
The following studies being conducted by partners are in planning stages:
| • | proof of concept study in early childhood (3-8 year olds) ADHD by TALi Digital Limited (“TALi”) |
Investigator-initiated studies that are currently being conducted:
| • | post-operative cognitive dysfunction by Vanderbilt University Medical Center |
| • | chemotherapy-related cognitive impairment by the University of California San Francisco (“UCSF”) |
| • | cognitive monitoring in a healthy aging population |
Future studies planned by Akili:
| • | proof of concept and/or pivotal study in inattention in ASD |
| • | pivotal study in cognitive dysfunction in MS |
| • | pivotal study in cognitive dysfunction in MDD |
We expect our model to be scalable and repeatable.
With our platform and business model, we believe we have created a set of capabilities and infrastructure that can be applied, again and again, with increased efficiency over time, creating a competitive advantage for Akili.
From technology sourcing through regulatory authorization and commercial growth, Akili is the first to take these types of innovative technologies that target brain function and bring them through every step of the product development, regulatory approval and commercialization process. We have built the first platform uniquely designed to leverage these physiologically-targeting digital therapeutics, which will support future products and enable us to be a preferred acquiror of these types of technologies as the field of physiologically-targeting digital therapeutics grows.
83
We meet patients on their own terms.
We believe that we are the first to create a prescribed treatment product that is delivered in a way that feels like high-quality entertainment and designed in a way that fits seamlessly into people’s lives.
With the aims of developing relationships with caregivers and patients that rival that of successful consumer companies, we have created a patient-adaptive model. Our products meet patients on their own terms and engage them in their care. Our products are widely accessible, are personalized and automatically adaptable and generate rich data that caregivers and patients can use to foster meaningful conversations with their health care providers. Caregivers and patients are also our collaborators in product design. We collect ongoing data and feedback through gameplay data, playtesting, workshops and research and refine, adapt and optimize both our products and our communications based on our learnings. Their valuable feedback has led us to add more choices during gameplay, including new quests, new creatures and costumes, and the ability for children to build their own universes.
Our hope is that, in the moment, patients forget that they are being treated with a therapeutic. In our work to fully realize the promise of digital therapeutics, we are just beginning to scratch the surface of what is possible as we develop experiences that capture the imagination and are akin to the best entertainment products.
About Akili
We were founded in 2011 with a vision of creating safe and effective cognitive medicine that is enjoyable for patients to use, and we have since been pioneering the development of game-changing technologies with the potential to change the world’s perception of medicine.
We provide robust compensation and benefits programs to help meet the needs of our employees, and to recruit, retain, and reward our existing and new employees. The principal purposes of our equity and cash incentive plans are to attract, retain and reward personnel, whether existing employees or new hires, through the granting of stock-based and cash-based compensation, salary and bonus awards. We believe that this increases value to our stockholders and the success of our company by motivating such individuals to perform to the best of their abilities and achieve our objectives. Our benefits programs also include a 401(k) plan, healthcare and insurance benefits, health savings and flexible spending accounts, paid time off, family leave, donation matching and flexible work schedules and work locations, among others.
Because the success of our business is fundamentally connected to the well-being of our employees, we are committed to their health, safety and wellness. We provide our employees and their families with access to a variety of innovative, flexible and convenient health and wellness programs, including benefits that: provide peace of mind concerning events that may require time away from work or that impact their financial well-being; support their physical and mental health by providing tools and resources to help them improve or maintain their health status and encourage engagement in healthy behaviors; and offer choice where possible so they can customize their benefits to meet their and their families’ needs. In response to the
COVID-19
pandemic, we implemented significant changes that we determined were in the best interests of our employees and our operational communities, and to comply with government regulations. These include permitting employees to work from home, implementing additional safety measures for any employeeson-site
and providing certain work-from-home equipment reimbursement allowances.Our origins
Akili CEO W. Edward (“Eddie”) Martucci, Ph.D.
co-founded
Akili while serving as a Principal at PureTech Health (“PureTech”). After launching PureTech’s digital health initiative, Dr. Martucci discovered the research of Dr. Adam Gazzaley in a search for innovative new technologies with the potential to transform how to treat central nervous system disorders. Dr. Gazzaley’s research showed that specifically tailored sensory stimuli delivered through a game-like interface can have positive effects on cognition.84
Dr. Martucci and Dr. Gazzaley founded Akili, alongside Matt Omernick, the former executive art director at LucasArts (the video game division of LucasFilms), and Adam Piper, former Creative Director and Engineer from LucasArts, who, together, brought vast experience in video game design and the technical foundation to advance this early research and bring Akili’s vision to life.
Our unique culture
We are passionate about bringing together elements of science, technology and entertainment, along with a great user experience, to change how medicine is designed and delivered. We represent a combination of backgrounds and skills that are not typically found together in a single company, bringing talent together from various industries including biotech, medical device, entertainment and engineering. Aligning such a diverse group around this lofty goal requires a unique culture—one that is inclusive, bold and creative.
Our team and facilities
As of July 31, 2022, we had approximately 127 full-time employees. We lease our corporate headquarters in Boston where we occupy approximately 7,800 square feet pursuant to a lease that expires in October 2022. We also lease approximately 14,100 square feet of office space in Larkspur that expires in November 2026. We believe that our facilities are sufficient to meet our current needs and that suitable additional space will be available as and when needed.
Our Strategy
Direct targeting of the brain’s physiology to improve neural functions is nascent but an area poised for growth in medicine as tens of millions of people worldwide live with cognitive and other brain health issues and many are actively searching for solutions. The growing global recognition of this unmet need comes at a time when patients are increasingly taking control of their own health and looking for medical products to fit into their lives and look and feel like consumer products. We believe we are uniquely positioned to capitalize on this opportunity, with our technologies designed to directly target the brain and delivered through
high-end
video game interfaces.Establishing a commercial foothold in pediatric ADHD
Pediatric ADHD is our initial target market, which has a high-unmet need population, as well as families who are unsatisfied with current treatment and are looking for new options. Traditional ADHD drugs have shown side effects including growth suppression, appetite suppression, weight issues, sleep issues and abdominal pain. Many children with ADHD are not currently on or well-controlled by medication, and more than half of them have tried, are trying or plan to try
non-pharmacological
treatments. EndeavorRx’s safety profile provides a significant advantage over traditional therapeutics as no serious side effects have been associated with its use. However, EndeavorRx should be used as part of an overall treatment regimen and is not intended to substitute for a child’s medication. Our initial targeted market of pediatric ADHD with our flagship product will also allow us to introduce this new type of treatment to a large patient population, building awareness and relationships on which we can build for future products.Additionally within ADHD, there is a large and growing opportunity for innovative
non-drug
treatments. This is a $10 billion market with over 70 million prescriptions written every year for drugs. And, according to the U.S. Centers for Disease Control and Prevention, nearly half the ADHD population uses behavioral therapy as well. The total ADHD population in the U.S. is 10.8 million and our initial target population includes those with inattentive or combined type ADHD, or 8.1 million of the total U.S. ADHD population. EndeavorRx is currently cleared in the U.S. to treat patients in the8-12
age group, which represent approximately 22% of our target 8.1 million ADHD population.85
Leveraging our initial success to expand into other ADHD populations
Our first commercial product is indicated in the U.S. for children ages
8-12
old with primary inattentive or combined-type ADHD, who have a demonstrated attention issue, and we are actively seeking to expand across both age and geography with further clinical studies. We are conducting ongoing clinical trials in adolescents and adults with ADHD, which we plan to complete by the end of 2023. There are studies that our partners are conducting or plan to conduct in pediatric ADHD, including an ongoing study in Japan (Shionogi), and a study in a younger pediatric population (ages 3-8) in the U.S. (TALi) expected to commence in 2023.Applying our clinically-validated technology to other mental health and neurology conditions
Building on the clinical validation of the technology underlying EndeavorRx, we are studying the therapeutic engine for its potential to improve the same cognitive impairment, attention function, in patients with impairments associated with ASD, MDD and MS; post-operative cognitive dysfunction; chemotherapy-related cognitive impairment and cognitive dysfunction related to
COVID-19.
Simultaneously pursuing new technologies designed to address other cognitive impairments
With a goal of helping all those living with cognitive disorders, we are evaluating technologies to address additional impairments, including memory, goal management and spatial navigation. We are simultaneously advancing additional
in-house
technologies in early discovery phase: BBT, which is designed to address impairments including attention, impulsivity, working memory and goal management; and SNAV, which is designed to address impairments including spatial navigation, memory and planning and organization, as well as identifying opportunities to potentially pursue exclusive licenses for other innovative new technologies. We have a deep and specialized scientific and technical expertise in developing technologies to specifically target cognitive issues, which enables us to rapidly assess technologies for development and commercialization.Further evolving the treatment paradigm by creating new methods of cognitive assessment
There is currently no consistent clinical protocol for how to use cognitive assessment tools, and most cognitive assessments have not changed in decades, with many still performed on pen and paper. Our technology has the potential to go beyond treatments and deliver a new way to measure and monitor cognitive function at scale. Early clinical data suggest that our technology may serve a cognitive measure that correlates with well-known
in-person
or paper-based cognitive measurements and detect unique neurological events before symptoms even appear. There is an investigator-initiated study ongoing in cognitive monitoring in a healthy aging population, and we plan to initiate a validation study of our cognitive assessment in late 2023.Our Platform
Our approach is designed to strengthen cognitive function while simultaneously delivering experiences that capture the imagination. We have built a proprietary platform engineered to induce clinically meaningful cognitive changes at the functional level. Informed by decades of research (including researched conducted prior to the founding of Akili) and validated through rigorous clinical testing, our platform is powered by therapeutic engines that deploy sensory stimuli and simultaneous motor challenges designed to target and activate the neural networks that are key to certain cognitive functioning.
Our therapeutic engines employ adaptive closed-loop algorithms to personalize the treatment experience for each individual patient. This enables live adaptation to patient progress within gameplay, causing the treatment to continuously adapt and challenge the patient at an optimized level to drive engagement and improve the targeted cognitive function.
We designed our products to deploy our technology to patients in a way that feels exciting, unlike educational software or brain stimulation. We learned over time how to build these engines into products that look and feel
86
like today’s entertainment and high-quality games. And so, our products operate in patients’ hands like any other video game. Our technology changes over time, adds rewards and increases challenges in a way that feels natural to patients.
Components of our prescription digital therapeutics
Each of our product and product candidates has three basic components: (1) core mechanics (our therapeutic engines), (2) a self-adaptive closed-loop system and (3) a population specific UX/UI (the video game component interface).
Core Mechanics (Our Therapeutic Engines)
We currently have three therapeutic engines, each with proprietary mechanics designed to activate specific systems in the brain responsible for different cognitive functions:(“SSME”),(“BBT”) and(“SNAV”).
Selective Stimulus Management Engine
Body Brain Trainer
Spatial Navigation Engine
Selective Stimulus Management Engine (“SSME”)
SSME technology is our most advanced therapeutic engine. SSME is specifically engineered to target and activate the systems in the brain that play a key role in attention function, a critical function that is often impaired in disorders including ADHD, ASD, MDD, MS, brain fog and others.
SSME is designed to activate the fronto-parietal cortex area in the brain.
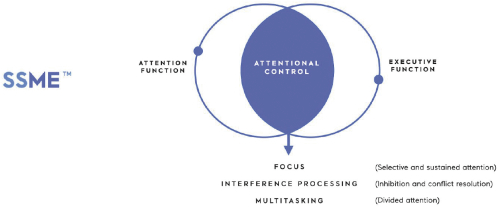
Attentional Control is a set of cognitive processes that allow us to interact with our complex environment in a goal-directed manner. Specifically, it is the capacity to apply the necessary attention at an appropriate time and place, while monitoring the environment for new sources of information, in order to enable the optimal processing of task-relevant information to achieve a particular goal. SSME is designed to target attentional control and to activate the front-parietal cortex area in the brain.
Each of our development programs is oriented toward a single indication and specific patient population. We refer to variations of our treatment software as our products or product candidates, each of which incorporates the core algorithms of one of our proprietary therapeutic engines (for example, our SSME therapeutic engine, which is incorporated into the majority of our existing product candidates). Within a single development program, we may explore multiple product candidates in early research and studies to optimize user engagement applicable to a particular patient population and indication and to determine which product candidate(s) will be evaluated in later clinical studies within that development program. Based on results of our studies and regulatory feedback from our clinical studies, we may also introduce other product candidates into our ongoing development programs. Furthermore, a specific product candidate may be used for one specific development program or
87
across different development programs. Multiple product candidates may embody a single proprietary therapeutic engine but are differentiated based on one or more characteristics, including the videogame-like user interface and gameplay difficulty and progression, and each product candidate includes unique characteristics optimized for a particular indication and population.
AKL-T01
(marketed and branded as EndeavorRx in the U.S. andFDA-cleared
for children ages8-12
old with primary inattentive or combined-type ADHD, who have a demonstrated attention issue), as well as ourAKL-T02
andAKL-T03
product candidates, are each variations of Akili’s treatment software targeting attention aspects of cognition, and each incorporates Akili’s SSME therapeutic engine technology. For example,AKL-T02,
while retaining the same user interface and SSME therapeutic engine asAKL-T01,
has adapted gameplay difficulty intended to increase user engagement in an autism spectrum disorder population. TheSDT-001
product candidate is substantially the same SSME-based software asAKL-T01,
but localized for Japanese language and culture for distribution in Japan. As a commercial product, EndeavorRx maintains the same gameplay functionality and therapeutic engine as theAKL-T01
product candidate used in the clinical studies that were the basis for FDA clearance, while being updated with incremental user interface changes and commercial compatibility modifications, such as compatibility modifications to enable access within applicable app stores. To the extentAKL-T01
is utilized, and cleared for marketing, under another development program (for example, a patient population and/or indication different from that cleared by the FDA for EndeavorRx), the resulting commercial product may be marketed and branded under a different label and reflect different incremental user interface and/ or gameplay changes thanAKL-T01
or EndeavorRx.SSME prototype study
An early prototype utilizing UCSF’s patented technology was studied by UCSF for its potential to improve certain cognitive functioning in older adults. This study served as proof of concept for the patented technology exclusively licensed to us and embedded in the SSME therapeutic engine.
The prototype presented the user with two tasks: a motor function task focused on navigating along a racecourse and a set of
go/no-go
tasks. Presenting users with both tasks simultaneously was used to determine the individual user’s ability to perform under the challenge of a specific interference. An interference (multitasking) cost was calculated based on the reduction in single-task performance when performing multiple tasks simultaneously.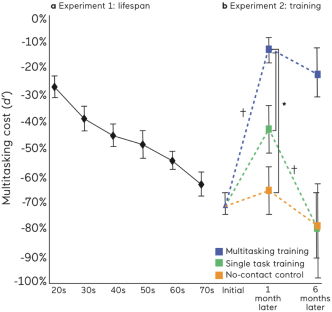
88
The prototype was used to quantify changes in the ability to process information as people age in a study of 174 subjects between the ages of 20 and 79 distributed with 26 to 30 subjects per age decade (experiment 1 above). With each decade of age, the ability to process interference was decreased (reducing multitasking cost in graph a, below). The impact of the prototype on cognitive function was assessed in experiment 2 which involved randomly assigning 46 naive older adults
60-85
years old to one of three groups: Multitasking Training (n=16), Single-task Training (n=15), orNo-Contact
Control (n=15). Training involved playing the prototype on a laptop at home for one hour a day, three times a week for four weeks (12 total hours of training), with all groups returning for aone-month
post-training and asix-month
follow-up
assessment. The multitasking group’s performance significantly improved after four weeks, thus supporting the role of interference during game play as a key mechanistic feature of the prototype. These improvements remained stable six months after training without booster sessions. This group also showed cognitive ‘near transfer’ effects in improvements in measures of sustained attention and working memory after 4 weeks.The neural basis of training effects were assessed by assessing midline frontal theta (MFT), a well-described EEG measure of attentional control, localized to the medial prefrontal cortex. The multitasking group demonstrated a significant increase in MFT between
ore-and
post-training after 4 weeks (p<0.05). Notably, these changes in neural processing reached a level comparable to neural activity patterns observed in younger adults (reference new EEG graphic withpre-
post-and
healthy control).This groundbreaking research demonstrated that neural networks can be specifically and predictably activated and was published on the cover of the peer-reviewed scientific journal.
Nature

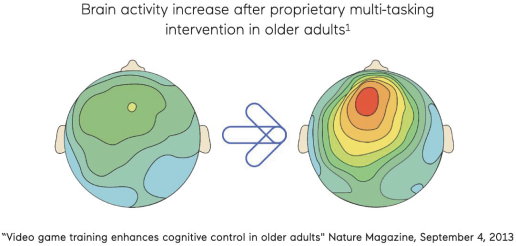
Building on this initial research, we built our SSME therapeutic engine from which we developed EndeavorRx. SSME has been clinically validated across more than 20 research,and pivotal clinical studies.
proof-of-concept
89
Body Brain Trainer (“BBT”)
BBT is designed to target neural systems involved in attention, impulsivity, working memory and goal management (fronto-parieto-cerebellar areas of the brain). BBT integrates cognitive and physical training within a single interactive environment through a motion capture video game and utilizes adaptive closed-loop algorithms that drive individuals to work at their ideal target heart rate and cognitive challenge.
Spatial Navigation Engine (“SNAV”)
SNAV is designed to leverage temporal, object and scene integration to target neural systems involved in spatial navigation, memory and planning and organization (extended hippocampal system in the brain).
Core Mechanic | Description | Targeted Physiology | ||
SSME Stimulus Management Engine | Targets attentional control |  | ||
SNAV Navigation Engine | Targets spatial navigation and episodic memory |  | ||
BBT Trainer | Targets attentional control, goal management and working memory |  |
90
A Self-Adaptive Closed-Loop System
Each user’s experience is algorithmically customized and adapts in real-time based on a closed-loop feedback system. This allows the therapy to optimize and provide the most engaging and effective benefit to each individual. With this ability to adapt real-time based on a patient’s individual performance, the therapeutic is assessed and updated automatically, without the need for ongoing “titration” from prescribers.

A Population Specific UX/UI (Video Game Component Interface)
Our video game mechanics are the means of delivering our digital therapeutics, and we optimize these games to keep patients fully engaged for the duration of the therapy as well as appropriately challenged. Virtually every aspect of gameplay, from audio feedback to
on-screen
rewards, is designed to maximize the user’s engagement.We customize gameplay for each specific patient population that it is intended to address. For example, when adapting a game originally designed for children for adult applications, we built four prototype games using the same clinically-validated technology but reimagined with new themes, art and music, solely for the purpose of testing each treatment product with our target population. Each of our game concepts are focus tested with the target population.
Game mechanics overview of EndeavorRx, our first
FDA-cleared
digital therapeuticThe gameplay experience of EndeavorRx is designed to look and feel like a familiar 3D mobile action video game. Players attempt to successfully navigate their character through courses while collecting targets and avoiding obstacles. Players chase mystic creatures and race through different worlds, using boosts to problem- solve while building their very own universe. Successfully navigating each level requires focus and flexibility to manage multiple tasks at the same time, while filtering out distractions.
The game adapts in real-time as well as between treatment sessions, continuously challenging and encouraging the patient to improve their performance—individualizing each patient’s experience. As is the case with all of our product candidates, EndeavorRx is engineered with adaptive algorithms and designed to automatically adjust the cognitive challenge for each person’s individual treatment needs. Second by second tracking of individual progress allows caregivers to continuously monitor and assess treatment and share progress with their child’s physician.
EndeavorRx involves three key skills: Navigation, Targeting and Multitasking:
| • | Navigation: Steering over gates and/or avoiding obstacles |
| • | Targeting: Tap for targets and ignore non-targets |
| • | Multitasking: Simultaneous navigation and targeting |
91
The multitasking complexity increases through the four worlds of the game, as illustrated below:

Through the development of EndeavorRx and our SSME technology, we developed specialized technologies and practices that allow us to create additional therapeutics with increased efficiency, highlighted in the section below. With the development of EndeavorRx, we have built a platform that enables us to continue developing innovative technologies designed to target brain function and efficiently advance them to commercialization
upon marketing authorization.
Our unique development capabilities
Through our collaboration with world-renowned cognitive neuroscientists and acclaimed entertainment and technology designers, we have development capabilities that allow us to build unique video game interfaces tailored for each target audience. For instance, we have advanced a number of different gameplay experiences through clinical trials, each delivering our SSME technology through completely unique experiences designed for specific audiences. This enables us to efficiently create audience-specific products that, once cleared or approved by the applicable regulatory body, can be prescribed and used at scale.
Market Opportunity
We have the opportunity to develop a new pillar of medicine across dozens of medical conditions. In addition to our initial focus on pediatric ADHD, we are already advancing potential treatments for cognitive impairments across nine patient populations, including expanded ADHD populations, ASD, MS, MDD and acute cognitive dysfunction across multiple conditions
(COVID-19
survivors,post-op
and chemotherapy patients).92
The U.S. market opportunity in our initial areas of focus is as follows:
Disease Area | Total U.S. Population with Disease Diagnosis | Initial Target Population Subset with applicable cognitive impairment, as noted | ||
Attention-deficit/hyperactivity disorder (“ADHD”), all ages | 10.8M (ADHD + inattention) | 8.1M | ||
Autism spectrum disorder (“ASD”) | 1.3M | 410k (ASD + inattention) | ||
Multiple sclerosis (“MS”) | 900K | 180K | ||
| (MS + cognitive dysfunction) | ||||
Major depressive disorder (“MDD”) | 19M | 2.1M | ||
| (MDD + cognitive dysfunction) | ||||
Acute cognitive dysfunction | 81M | 3.3M | ||
(COVID fog, ICU-related, TBI, cancer-related) |
| * | Figures in table above are based on our management’s good faith estimates based on various publications, public health data and national health statistics including from the NIH and CDC. |
In our initial focus area, ADHD, there is a large and growing opportunity for innovative
non-drug
treatments. ADHD currently represents a $10 billion annual market with over 70 million prescriptions written every year for traditional drugs. According to the U.S. Centers for Disease Control and Prevention, nearly half the ADHD population uses behavioral therapy in addition to prescription medicines. Our estimated market for inattentive or combined type ADHD in the U.S. is 8.1 million patients for all age groups, including 1.8 million patients in the8-12
year old age group, which is the population EndeavorRx is currently cleared to treat.Inadequacies of the Current Treatment Paradigm
Widely recognized in aging, cognitive impairments are also associated with dozens of chronic diseases and acute illnesses, including MDD, ASD, ADHD, MS, dementia, anxiety, schizophrenia, PTSD,
“chemo-fog”
and more. This manifests in ways like the inability to concentrate, memory issues, difficulty learning new things or issues making decisions that affect everyday life.The safety profile of ADHD drugs and lack of options to specifically address inattention creates a very high unmet need. Current treatment approaches are limited to traditional medication, which lack precision, largely only treat symptoms, and are often accompanied by side effects. Traditional ADHD drugs have shown side effects that may include growth suppression, appetite suppression, weight issues, sleep issues and abdominal pain. Many children with ADHD are not currently on or well-controlled by medication, and more than half of them have tried, are trying or plan to try
non-pharmacological
treatments. Patients are looking for new options to improve upon the inadequate existing treatment paradigm. Additionally, behavioral therapies teach coping mechanisms rather than addressing the underlying impairment. Furthermore, patients are turning to supplements and brain trainers, which lack clinical evidence of effectiveness.The stress of the global pandemic and the impact of technology in our lives is aggravating these challenges, and recognition of the impact on society is increasing. The World Health Organization estimates that 139 million people will be living with dementia by 2050. Recently, a coalition of the U.S.’s leading experts in pediatric health declared a national emergency in child and adolescent mental health, and the U.S. Surgeon General has issued an advisory to highlight the urgent need to address the mental health crisis among U.S. youth.
Now is the right time to apply technology to treating human diseases, in particular, cognitive conditions for which existing approaches have fallen short of providing clinically meaningful therapeutic options and for which there remains a significant unmet need.
93
Our Advantages
Disease agnostic
Our therapeutic engines are designed to target specific neural networks independent of the cause of the disease, and therefore a single therapeutic engine can potentially power dozens of products that target the same cognitive impairments, serving many different disease populations and creating a highly efficient technology-centric medicine model.
Personalized and adaptable
Our technology continuously learns and adapts based on a patient’s use of and progress in the treatment, resulting in tailored and personalized experiences that automatically adjust to each individual’s therapeutic needs.
Rich data Infrastructure
Our platform gives us real-time direct access to a
de-identified
aggregate level view of each patient’s activity in real-world conditions, enabling continuous innovation and rapid product iteration and allowing us to be truly patient adaptive.Repeatable and Efficient Model
Building on clinically-validated technologies, with the regulated therapeutic engine intact, we can rapidly build different
front-end
experiences for different patient populations, creating completely unique games tailored for each audience.Strong intellectual property protection
We seek to protect our platform, including unique algorithm mechanics, through the use of patents, copyrights, trademarks and trade secrets, providing Akili with a rich intellectual property estate to develop, strengthen and maintain our proprietary position in the digital therapeutics field.
Ability to leverage our platform and infrastructure to achieve scale
We have developed specialized technologies and practices to support our first product, EndeavorRx, that are designed to enable us to repeat that success with increased efficiency over time. Highlighted in the figure below, from technology sourcing all the way up through regulatory clearance, commercial and growth on the market, our platform takes innovative technologies that target brain function and brings them through every step of the process. We are the first company to have built a platform to leverage these types of physiologically-targeting digital therapeutics, and we intend to grow many of our own engines as well as to be an acquirer of choice as this field of digital therapeutics (“DTx”) grows.
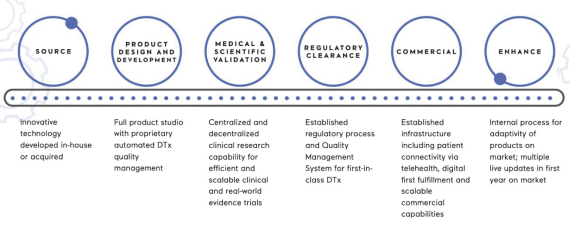
94
Our work to obtain regulatory clearance/marketing authorization, including with regulators to define the product category, clinical endpoints and labeling approach, paves the way not only for our future products but for other novel clinically validated and FDA cleared reviewed digital therapeutics to increasingly come to market.
We are preparing for the commercial launch of our first product and advancing a robust clinical pipeline.
EndeavorRx represents our first commercial offering, demonstrating to the world what is possible using game- changing technology as medicine. But this is just the beginning. Leveraging the clinical success of Endeavor Rx, we intend to advance other product candidates that form our robust clinical pipeline. Our technology platform enables us to potentially improve cognitive impairments across dozens of other diseases and disorders.
Initial Advanced-Stage Pipeline
Issues of cognitive impairment exist across dozens of diseases and disorders, impacting more than one hundred million people worldwide. Each of our therapeutic engines may be applied to multiple different medical conditions. This creates a highly repeatable model as our platform is designed to target the cause of the disease and allows us to create completely unique games tailored for many different conditions and patient populations based on a single therapeutic engine. This ability to pursue different conditions with a single platform is efficient and unlocks the potential to drive value across our pipeline.
Our initial pipeline is focused on nine patient populations in pediatric and adult conditions with both chronic and acute cognitive impairments. Included is one
FDA-authorized
andCE-marked
product, EndeavorRx, with label expansion studies underway and planned to potentially reach all ADHD age groups in the U.S. We also have a product candidate poised for pivotal study in children with ADHD in Japan.Additionally, we are pursuing treatments for cognitive impairments associated with MS MDD and ASD, all of which have achieved proof of concept, as well as for acute cognitive dysfunction brought on by
COVID-19,
surgery and chemotherapy. Lastly, we are advancing research on monitors that can screen and assess cognitive impairments across populations.Our current development programs are summarized in the chart below:
Current Akili, Inc. pipeline: initial populations demonstrating potential breadth of technology
| (1) | Timeframes are estimates and are subject to change—see Disclaimer and Risk Factors. |
95
| (2) | AKL-T01 is marketed as EndeavorRx in the U.S. for children ages8-12 old with primarily inattentive or combined-type ADHD, who have a demonstrated attention issue. |
| (3) | Shionogi is responsible for the clinical development and commercialization of SDT-001 (a version ofAKL-T01 localized for Japanese language and culture), as well as any future development and commercialization ofAKL-T02, another version of our SSME engine that has been used for our ASD program, each in Japan and Taiwan. |
| (4) | AKL-M01 is designed to use SSME algorithms to monitor and assess certain aspects of cognition, as opposed to providing cognitive therapy. |
| (5) | To the extent we are unable to access additional sources of funding, our current estimated timeframe for initiating a pivotal study in this development program could be delayed. |
| * | Estimated timeframes in figure above correspond to applicable milestone start times, and are subject to change. Please refer to the section entitled “ Risk Factors Risks Related to Our Business and Industry—Enrollment and retention of patients in clinical trials is an expensive and time-consuming process and could be made more difficult or rendered impossible by multiple factors outside of our control. If we experience delays or difficulties in the enrollment or retention of patients in clinical trials, our ability to obtain necessary marketing authorizations for our product candidates could be delayed or prevented Risks Related to Our Products—Our current product candidates are in various stages of development. Our product candidates may fail in development or suffer delays that adversely affect their commercial viability. If we fail to maintain clearance, de novo classification or approval to market our product candidates, including AKL-T01 for expanded indications, or if we are delayed in obtaining such marketing authorizations, our business, prospects, results of operations and financial condition could be materially and adversely affected |
The pediatric ADHD market of our flagship product allows us to introduce this new type of treatment to a large patient population, building awareness and relationships on which we can build for future products. While we are working to extend our reach into other ADHD populations and new geographies, we are simultaneously applying that same clinically-validated technology to new conditions and advancing new technologies, through our
organic efforts and
in-licensing
to address a broad range of conditions with cognitive impairments. We are also working to create and validate new methods of cognitive assessments, which could lead to increased diagnosis and awareness of the issue across society.Current Programs and Clinical Validation
We have completed 20 clinical studies of our SSME technology to evaluate its potential to diagnose, treat and monitor certain cognitive functions in patients. Our studies, including large prospective randomized controlled trials, have been conducted in over 2,600 patients across nine disease areas. Our research has been published in leading peer-reviewed scientific journals, including.
The American Journal of Psychiatry, The Lancet Digital Health and Nature: Digital Medicine
SSME is the therapeutic engine underlying our first commercial product in ADHD, EndeavorRx, and we have achieved pilot and/or proof of concept with SSME in MDD, MS and ASD positioning us to begin further proof of concept or pivotal trials in these indications.
Attention-deficit hyperactivity disorder (“ADHD”)
ADHD is a neurobehavioral disorder characterized by a persistent pattern of symptoms such as inattention, hyperactivity and impulsive behavior that interferes with functioning and development. ADHD can have a profound impact on an individual’s life, causing disruption at school, work, home and in relationships. It is one of the most common developmental disorders in children and often persists into adulthood.
ADHD market size
Current ADHD treatment options represent a $10 billion market with over 70 million prescriptions written every year for drugs in the U.S. According to the U.S. Centers for Disease Control and Prevention, nearly half the pediatric ADHD population uses also behavioral therapy. The total ADHD population in the U.S. is 10.8 million and our initial target population includes those with inattentive or combined type ADHD, or 8.1 million of the total U.S. ADHD population. EndeavorRx is currently cleared in the U.S. to treat patients in the
8-12
age group, which represent approximately 22% (1.8 million) of our target 8.1 million ADHD population.96
Current ADHD treatment guidelines recommend a multi-faceted approach that uses medications in conjunction with behavioral interventions. For children with ADHD younger than 6 years of age, the American Academy of Pediatrics recommends parent training in behavior management as the first line of treatment, before medication is tried. For children 6 years of age and older, the recommendations include medication and behavior therapy used
in combination. About 77% of children aged 2 to 17 with ADHD in the U.S. receive treatment, with about 47% receiving behavioral treatment and about 15% receiving only behavioral treatment without any medication. First- line medications used to treat ADHD are stimulants such as methylphenidate, marketed as Ritalin and Methylin, dexmethylphenidate, marketed as Focalin, dextroamphetamine, marketed as Dexedrine and Zenzedi, amphetamine-dextroamphetamine, marketed as Adderall, and lisdexamfetamine, marketed as Vyvanse. Other approved medications include atomoxetine, extended-release guanfacine, and extended-release clonidine. As of
2018, stimulants command 88% of the U.S. ADHD market at a value of $8 billion, with approximately 50% of the total market being amphetamines.
It is estimated that 44% of patients are not currently on or well controlled by ADHD medication, and 64% experience adverse effects from medication. Data show that 55% of patients have tried, are trying or plan to try
non-pharmacological
treatments. However, current validatednon-pharmacological
treatments and approaches—e.g. behavioral therapy—can lead to mixed results and can have accessibility and cost issues.Our initial targeted population in ADHD is U.S. children ages
8-12
with a demonstrated impairment in attention function. This market represents a large and growing opportunity with caregivers actively searching for newnon-drug
solutions and allows us to build relationships with consumers that can be extended to support future market opportunities.Our first commercial product—EndeavorRx for pediatric ADHD patients
Supported by data across five clinical trials, in June 2020, EndeavorRx was granted marketing authorization and was classified as a Class II medical device by the FDA through FDA’s de novo process. EndeavorRx is indicated to improve attention function as measured by computer-based testing in children ages
8-12
years old with primarily inattentive or combined-type ADHD, who have a demonstrated attention issue. Patients who engage with EndeavorRx demonstrate improvements in a digitally assessed measure Test of Variables of Attention (“TOVA®
”) of sustained and selective attention and may not display benefits in typical behavioral symptoms, such as hyperactivity. EndeavorRx should be considered for use as part of a therapeutic program that may include clinician-directed therapy, medication and/or educational programs, which further address symptoms of the disorder. EndeavorRx is available by prescription only. It is not intended to be used as a stand-alone therapeutic and is not a substitution for a child’s medication.According to the FDA, EndeavorRx represents the first game-based digital therapeutic to improve attention function associated with ADHD and the first game-based therapeutic to be granted FDA marketing authorization for any type of condition.
The impact of EndeavorRx as a digital therapeutic treating children with ADHD is
two-fold—it
is transforming how the world experiences medicine and bringing a new clinically-validatednon-drug
solution to patients living with ADHD. It is the first and onlyFDA-authorized
treatment of its kind and is currently being prescribed by physicians and helping patients with ADHD and their families.Created by a team of neuroscientists and game designers, EndeavorRx is built on our SSME therapeutic engine and uses sensory stimuli and simultaneous motor challenges designed to target areas of the brain that play a key role in attention function. Patients who engaged with
AKL-T01
in clinical studies demonstrated improvements in specific ADHD impairments and symptoms in daily life, as detailed in our clinical study data below.97
Clinical evidence supporting EndeavorRx
The EndeavorRx research program includes three studies in ADHD (STARS-ADHD, STARS-Adjunct and
ADHD-POC)
and a pilot studies in ADHD with Sensory Processing Disorder and in ADHD with Autism Spectrum Disorder (see below section for a description of the Autism Spectrum Disorder study).| STARS-ADHD pivotal study | ||
| The pivotal STARS-ADHD study was a 4-week multi-center, randomized, blinded, controlled trial conducted between July 2016 and November 2017 in 348 children aged8-12 years and diagnosed with ADHD. Children enrolled into the study were instructed to useAKL-T01 or an educational-style video game control for approximately 25 minutes a day for 28 days. |  | |
| The predefined primary endpoint of the study was the change from baseline in the TOVA Attention Performance Index (TOVA API), a measure of objective attention for which the study was statistically powered. TOVA is a computerized test cleared by the FDA to assess attention deficits and evaluate the effects of interventions in ADHD; the API is a composite measure of attention functioning. This objective attention endpoint was the primary endpoint for which the study was statistically powered. The control condition used in this study was specifically designed to enable the assessment of changes in the primary endpoint of objective attention. The control was in the form of an educational style word search digital game matched to AKL-T01 for expectation of benefit and time on task.AKL-T01 showed a statistically significant improvement on the TOVA API compared to the control (p=0.006). | ||
The mean (“SD”) change from baseline on the TOVA API was 0.93 in the
AKL-T01
group and 0.03 in the control group. Forty-seven percent of children met the prespecified clinical responder analysis for TOVA API improvement, which was greater than control (47% vs 32%, p=0.0058). In addition to the improvement in the TOVA API, treatment withAKL-T01
resulted in significantly greater improvements across other objective TOVA attention-related measures (sustained attention, attentional consistency, and long attentional lapses). Overall, after treatment withAKL-T01,
36% of children moved into the normative range of objective attention as measured by TOVA and no longer showed an objective attention deficit in at least one aspect of attention functioning, which was statistically greater than control (36% vs 21%, p=0.0027).In addition to these objective measures of attention, the study also looked at secondary outcome measures comparingInattentive, Hyperactive subscales), Clinical Global Impressions of Improvementfor children using
AKL-T01
to control on parent- and clinician-reported ADHD impairment and symptom ratings scales, specifically the Impairment Rating Scale (“IRS”), ADHD Rating Scale(ADHD-RS-IV—Total,
(“CGI-I”)
and the Behavior Rating Inventory of Executive Function (“BRIEF”). Children usingAKL-T01
showed statistically significant change from baseline improvement across all measures. Though there was not a statistically significant separation on the mean magnitude of improvement betweenAKL-T01
and control on these secondary outcome measures, there was a trend towards differential improvement in IRS andADHD-RS-Inattentive
AKL-T01.
98
Predefined responder analyses of these parent- and clinician-reported measures also showed differential improvement, with a significantly greater proportion of children benefiting from
AKL-T01
versus control in the clinician-administered IRS, a parent-reported scale of ADHD-specific impairments (48% vs 37%, p=0·049). Further, 24% of children in theAKL-T01
group were considered responders on theADHD-RS
(≥30% reduction inADHD-RS)
compared to 19% in the control group (p=0.23;post-hoc
analysis). Additionally, 56% of parents said the intervention helped their child’s attention in real life, and 73% of children reported feeling an improvement in their attention when asked via an exit survey. Overall, the effects ofAKL-T01
were strongest for measures of attention function, and weakest for measures of hyperactivity in ADHD. We further investigated these and similar secondary endpoints in other studies described herein.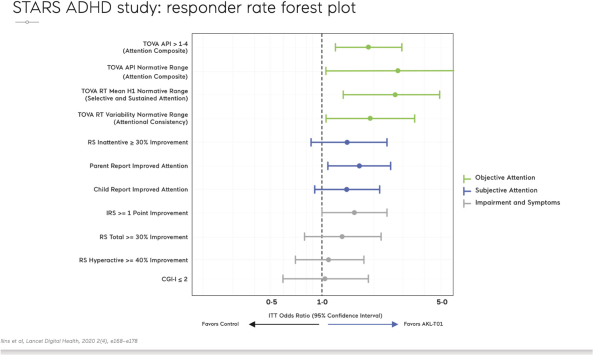
AKL-T01
was shown to be safe in this study, with no serious adverse events observed. All adverse events reported were mild in 7% of patients, and included frustration (3%), headache (2%), emotional reaction (1%), dizziness (1%), nausea (1%) and aggression (1%).STARS-ADHD Adjunctive clinical study
The STARS-ADHD Adjunctive clinical study was a three-month open-label study conducted between December 2018 and September 2019 which enrolled 206 children, aged
8-14
years with a diagnosis of ADHD. The children were separated into two groups: one with children on stimulant medications and one with children not taking ADHD medication. Both groups received a first period ofAKL-T01
treatment in the first month of the study, followed by a pause inAKL-T01
treatment in the second month, and then a second period ofAKL-T01
treatment in the third month. The primary efficacy outcome of the study was change in IRS after one month of treatment.99
| The study demonstrated statistically significant improvement in the IRS from baseline after one month as well as to the end of the three- month trial in both the children on-stimulants andoff-stimulants (both cohorts: p<0.001). The second period ofAKL-T01 treatment resulted in further increases in efficacy on this primary outcome measure, beyond the effects already seen after the first period of treatment. The magnitude of improvement in IRS throughout the study was similar for children independent of their ADHD medication use. Responder rates for IRS (improvement of greater than 1 point or more on the IRS scale) were 41% and 56% at the end of the first period of treatment withAKL-T01 in theoff-stimulant andon-stimulant groups respectively (50% across both groups). This increased to 69% and 68% respectively by the end of the second period of treatment. Further, across both groups, responder rates forADHD-RS Total (% children with ≥30% improvement) after the first period of treatment was 27% and increased to 45% after the second period of treatment. Additionally, after the second period of treatment, 60% of parents said the intervention helped their child’s attention in real life, and 75% of children reported feeling an improvement in their attention when asked via an exit survey. |  |
The treatment was well-tolerated. There were no serious adverse events and the total reported adverse events were in 18% of patients. The most common treatment-related adverse events reported were frustration (13.1%), headache (1.9%), irritability (1.5%), dizziness (1%), agitation (0.5%), anxiety (0.5%), asthenopia (0.5%), nausea (0.5%), feeling abnormal (0.5%) and pruritis (0.5%).
ADHD proof of concept study in pediatric ADHD
Our proof of concept (“POC”) study in ADHD was a
4-week
study with recruitment conducted between January 2014 and August 2014 in children between the ages of8-12
with a primary aim to assess treatment safety and acceptability and explore outcomes forAKL-T01
as a novel digital treatment targeting cognitive processes implicated in pediatric ADHD. Participants included 40 children with ADHD and 40 children without an ADHD diagnosis. Following psychiatric screening, ADHD ratings, and baseline neuropsychological measures (TOVA, CANTAB and BRIEF), participants completed the28-days
ofat-home
treatment and then returned to the clinic forfollow-up
safety, acceptability and neuropsychological measures. A neuropsychological assessment was repeated at the end of the study, and treatment satisfaction measures were assessed.Eighty-four percent of treatment sessions were completed and
AKL-T01
was feasibly deployed in the home setting over the treatment period of four weeks with positive ratings of acceptability by both parents and children.AKL-T01
was well-tolerated by children with ADHD, with no treatment-related adverse events reported. The results of the neurocognitive measures were as follows:Significant improvements compared to baseline were observed in the ADHD group on the TOVA Attention Performance Index (TOVA API) (p = 0.033, Effect Size (d) = 0.35). There was no significant change in TOVA API scores for the
non-ADHD
group (p = 0.30, Effect Size (d) = 0.17).The ADHD group showed significant improvement compared to baseline (p < 0.05) on 8 of 12 variables within the CANTAB Spatial Working Memory (SWM) test, 3 of 10 variables within the CANTAB Rapid Visual Processing (RVP) test, and 0 of 16 within the CANTAB Delayed Match to Sample (DMS) test. The
non-ADHD
group showed significant improvement (p < 0.05) on 5 of 12 variables within the SWM, 6 of 10 variables within the RVP, and 9 of 16 within the DMS.100
The BRIEF summary scores (i.e., Metacognition, Behavioral Regulation, Global Executive Composite) did not change significantly for any of the groups. Findings from the study provided preliminary support that this digital therapy intervention may be effective for improving attention in pediatric ADHD, especially among children with greater symptom severity and impaired attention.
Studies in ADHD with sensory processing disorder
AKL-T01
was evaluated in a pilot study in children between8-12
years old with Sensory Processing Dysfunction (“SPD”) who also met research criteria for ADHD. Recruitment for this study began in February 2014 and ended in January 2015. These children experience attention deficits that often impact their academic and social development. A sample of 38 SPD and 25 typically developing children were tested on behavioral, neural and parental measures of attention before and after a four-week iPad-basedat-home
cognitive remediation program. The primary endpoints were a Test of Variables of Attention (TOVA) reaction time (mean RT first half) and RT variability(RT-var
first half) and ADHD-inattention symptoms (as measured with Vanderbilt inattention subscale, parent report). The secondary endpoints were Neurophysiology EEG Midline Frontal Theta (MFT) during TOVA and perceptual discrimination task. This was a feasibility study and a power analysis was not conducted. At baseline, 54% of children with SPD met or exceeded criteria on a parent report measure for inattention/hyperactivity. Notable deficits involving sustained attention, selective attention and goal management were observed only in the subset of SPD children with parent-reported inattention. This subset of children also showed reduced midline frontal theta activity, a well-established measure of attentional control derived from the electrical activity of the brain. Following the cognitive intervention, only the SPD children with inattention/ hyperactivity showed both improvements in midline frontal theta activity and on a parental report of inattention. Notably, 33% of these individuals no longer met the clinicalcut-off
for inattention, with the parent-reported improvements persisting for nine months. These findings support the benefit of a targeted attention intervention for a subset of children with SPD, while simultaneously highlighting the importance of having a multifaceted assessment for individuals with neurodevelopmental conditions to optimally personalize treatment.
A 9 months follow up study (no intervention with
AKL-T01
and continued treatment as usual) revealed that participants showed a significant decrease in parent-observed inattentive behaviors (p = 0.66, Cohen’s D = 0.14), which remained stable in a nine-monthfollow-up
assessment. A Generalized Estimating Equations analysis was used to assess changes in symptoms over time, specifically to determine whether the initial improvements were retained. The SPD plus inattention cohort continued to show sustained benefits on their parent-reported scores of inattention, with 54% of SPD plus inattention individuals no longer meeting criteria for ADHD three years following intervention.Consistent and Clinically Meaningful Improvements in Objective Attention across Studies in ADHD
We observed consistent improvements in TOVA API and related key measures of objective attention (reaction time (RT Mean H1) and reaction time variability (RT Var)) across all studies of
AKL-T01
in children with attention impairment.We believe the overall efficacy profiles of the ADHD studies described herein reflect the targeted nature of the treatment and underlying technology, i.e., to target attention networks. We believe these efficacy profiles meet an important need for children in ADHD, which is reinforced by the indication of EndeavorRx. Specifically, the
FDA-authorized
indications for use specify that EndeavorRx is intended to improve attention function, and that101
EndeavorRx is for children ages
8-12
years old with primarily inattentive or combined-type ADHD, who have a demonstrated attention issue, and to be used alongside their current treatment program, and that EndeavorRx should be considered for use as part of a therapeutic program that may include clinician-directed therapy, medication, and/or educational programs, which further address symptoms of the disorder.
Electroencephalography (“EEG”) study of
AKL-T01
in ADHDThis
single-arm,
unblinded4-week
study was conducted at UCSF and assessed a sample of 25 children with ADHD (8–12 years old) on neural, behavioral, and clinical metrics of attention before and after a four-weekat-home
intervention withAKL-T01.
The primary endpoints were neural assessment of attentional control, change in midline frontal theta (MFT) power as measured by Perceptual Discrimination Task (PDT)-Locked Electroencephalogram (EEG) from day 0 to day 28. The exploratory endpoints were objective behavioral measures of attention, such as a perceptual discrimination task, reaction time and reaction time variability metrics, and sustained attention task (a continuous performance task similar to TOVA). The parent reported ADHD symptoms were measured on the Vanderbilt inattention subscale. This was a feasibility study and a power analysis was not conducted.The study found that children showed enhancements on MFT, as well as on objective behavioral measures of attention and parent reports of clinical ADHD symptoms. There were also observed relationships between the neural and behavioral cognitive improvements, demonstrating that those children who showed the largest intervention-related neural gains were also those that improved the most on the behavioral tasks indexing attention.
102
Graph (a) shows the time course of MFT EEG changes during treatment with
AKL-T01
and shows there was a general increase in MFT magnitude following four weeks of treatment withAKL-T01
(change frompre-
to post- intervention).Graph (b) illustrates improvements in MFT following four weeks of treatment with
AKL-T01
at the corresponding early, peak and late time windows during treatment, through topographic heat maps with the MFT area of interest highlighted with a dotted bounding box.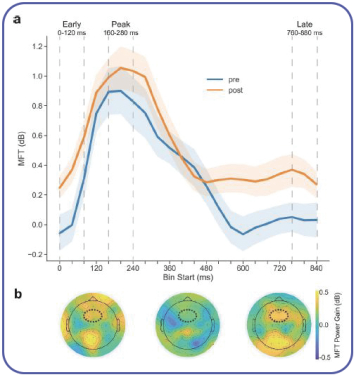
Clinical development program in ADHD
We are conducting several clinical trials to expand our leadership in prescription digital therapeutics in ADHD, building on our flagship product EndeavorRx, which is FDA authorized in
8-12
year old children with primarily inattentive or combined-type ADHD, who have a demonstrated attention issue.U.S. study of TALi technology in early childhood
Planning is underway to conduct a clinical trial of technology exclusively licensed from TALi Digital in children ages
3-8
to support a path to regulatory clearance in the U.S. The technology has demonstrated improved attention in both neurotypical (those with brain functions, behaviors, and processing considered standard or typical) and neurodivergent (those having brain functioning that is not typical) children and is currently available in the following countries:| • | Australia, in which the technology does not require a medical prescription; and |
| • | India, in which the technology does not require a medical prescription. |
103
U.S. study of
AKL-T01
in adolescentsAkili is conducting a multi-center pivotal trial to evaluate objective attention functioning and ADHD symptoms and impairments in adolescents, ages 13 to 17, with a diagnosis of ADHD (combined or Inattentive subtypes), who are stable on or off ADHD medication, after four-weeks of SSME treatment.
U.S. study of
AKL-T01
in adultsCurrently underway, Akili is conducting a multi-center pivotal trial to assess the efficacy of
AKL-T01
in adults 18 years and older diagnosed with ADHD. The study is evaluating objective attention functioning and ADHD symptoms/impairments in adults with a diagnosis of ADHD (combined or inattentive subtype), stably on or off ADHD medication, aftersix-weeks
ofAKL-T01
treatment.Shionogi study of
SDT-001
in JapanThrough our strategic partnership with Shionogi announced in March 2019, Akili conducted a study of
SDT-001,
which is substantially the same SSME-based software as theAKL-T01
product candidate, but localized for Japanese language and culture for distribution in Japan, in children with ADHD in Japan. The study was designed to evaluate the feasibility, safety and efficacy of the investigational digital therapeutic in children with ADHD and to inform the design of a future pivotal study. To enable this clinical trial, Akili localizedAKL-T01
for use in the Japanese market, which included adapting for language and culture and establishing infrastructure in Japan to support the investigational device.The randomized, controlled study of
SDT-001
enrolled children ages6-17
years diagnosed with ADHD whose ADHDRS-IV
Inattention score was 15 or over. A total of 261 patients were enrolled across three study groups: (1) participants who received the AkiliSDT-001
digital treatment, (2) participants who continued treatment as usual (“TAU”), consisting of psychoeducation and environmental support, and (3) participants who received a version of the treatment with reduced cognitive tasks and adaptability (“Sham”). TheSDT-001
treatment group showed larger improvements across the clinical endpoints compared to both the TAU and the Sham groups. In the total population, the improvements seen over Sham did not meet statistical significance, but post hoc analysis applying the propensity score suggested thatSDT-001
improvements over TAU were statistically significant (p < 0.05).SDT-001
was generally well-tolerated and there were no serious adverse events. Adverse events reported were consistent with previous clinical studies ofAKL-T01.
There were 4 adverse device reactions reported in patients treated withSDT-001,
which were mild in severity including irritability, headache, tinnitus and nausea.Upcoming Milestones in ADHD
| • | U.S. commercial launch of EndeavorRx in 8-12 year-old patients with primarily inattentive or combined-type ADHD, who have a demonstrated attention issue: Expected H2 2022 |
| • | Shionogi pivotal trial data in Japan: Expected H2 2023 |
| • | Initiation of TALi technology study in 3-8 year-old children with ADHD: Expected H1 2023 |
| • | Pivotal trial data in adolescent ADHD patients: Expected H2 2023 |
| • | Pivotal trial data in adult ADHD patients: Expected H2 2023 |
Autism spectrum disorder (“ASD”)
ASD is a neurodevelopmental disorder characterized by impairments in social communication and social interaction and restricted repetitive patterns of behavior, interests and activities. Children with ASD are at high risk for impairments in attention function and are often initially diagnosed because of delays in language development or deviant language skills, or because of lack of the intent to communicate. The presence of ADHD symptoms in children with ASD is associated with worse cognitive (attention) control.
104
Individuals with ASD have varying degrees of impairment that require customized management based on the child’s age and needs. Treatment for ASD is focused on behavioral and educational interventions as well as pharmacological interventions to treat targeted symptoms such as hyperactivity, inattention, impulsivity, aggression, anxiety and obsessive-compulsive behaviors. Risperidone and aripiprazole are the only approved treatments for the behavioral disturbances associated with ASD. Common adverse effects from these drugs include weight gain, sedation and
Parkinson’s-like
symptoms such as muscle spasms and stiffness.ASD market size and initial target population
In the U.S., approximately one in 44 children have been identified with ASD according to the Centers for Disease Control and Prevention, representing approximately 1.3 million total patients.
We are initially targeting a population of approximately 410,000 ASD patients in the U.S.
Clinical evidence in ASD
We have conducted a pilot study of an investigational new treatment product built on our SSME technology engine in patients with ADHD with ASD, utilizing the
AKL-T02
variation of our treatment software. While leveraging the same SSME core mechanics and video game interface found in our EndeavorRx product, to address the distinct needs of ASD patients, the rate of change in challenge levels of our investigational treatment product in ASD is decreased. Our pilot study demonstrated high acceptability and engagement of the treatment and an improvement in attention measures compared to a control condition. The study demonstrated an improvement in TOVA scores following use of the Akili investigational treatment compared to a control educational style video game. The primary endpoint was TOVA API. The secondary endpoints were the ADHD Rating Scale IV, parent report and the Behavior Regulation Inventory of ExecutiveFunction-2
(BRIEF-2),
social skills improvement system and the spatial working memory task from the Cambridge Neuropsychological Test Automated Battery (CANTAB). This study was a feasibility study and no power analysis was performed.The study was conducted at the Children’s Hospital of Philadelphia Center for Autism Research, which enrolled 19 children with autism, aged 9-13 years old and with an average age of 10 years old. Patients received either our investigational treatment(AKL-T02) or a control educational style video game based on a word challenge game. Patients were asked to play the game for 30 minutes a day, five days a week, for four weeks.This pilot study found that not only did the child participants like and engage with our investigational treatment, their attention on the TOVA test of attention improved similar to what was seen in our studies of children with only an ADHD diagnosis. The control video game did not demonstrate improvement in the mean TOVA score. There was one adverse event (decreased frustration tolerance) in the AKL-T02 group; no serious adverse events were reported. |  |
105
Clinical development program and upcoming milestones in ASD
With the success of our proof of concept study in ASD, plans are underway to have a meeting with FDA in the second half of 2022 to discuss our anticipated pivotal trial.
Major depressive disorder (“MDD”)
Major depressive disorder is the most prominent subtype of depression, and people suffering from MDD typically have a depressed spirit or mood, known as dysphoria, reduced energy and decreased activity level. They also have a reduced capacity for enjoyment, a lowered self-esteem and reduced self-confidence.
Cognitive impairment is a fundamental diagnostic criterion of depression. Data show that cognitive symptoms are present during up to 94% of depressive episodes and, for many patients, persist even after successful antidepressant treatment (seen in up to 44% of periods of remission). Such cognitive impairments have been shown to be a predictor of daily function.
The most common treatments for a person diagnosed with depression are medication and psychotherapy. There are approximately three dozen medications approved by FDA for managing depression. Commonly prescribed antidepressant medications include fluoxetine, sertraline, paroxetine, escitalopram, venlafaxine, desvenlafaxine and duloxetine. While these drugs are effective for many patients, approximately
two-thirds
of subjects do not achieve remission with a single medication, and approximatelyone-third
of subjects did not achieve remission despite trying four medications. As such, there are large numbers of MDD patients for whom medication therapy is insufficient to alleviate their symptoms.Non-pharmacological
approaches for depression include psychotherapy, physical activity and neurostimulation (interventions that deliver mild electrical or magnetic pulses to the brain) for severe, treatment-resistant depression.MDD market size and initial target population
MDD is the most prominent subtype of depression; it is estimated to affect 19 million adults in the U.S.
We are initially targeting a population of approximately 2.1 million MDD patients in the U.S.
Clinical evidence in MDD
Our development program in MDD utilizes the same SSME core mechanics and video game interface found in our EndeavorRx product, but is customized to appeal to an adult patient population.
| Our proof of concept study in MDD was a multi-center, randomized, controlled trial of our SSME technology engine, utilizing the AKL-T03 variation of our treatment software, in 74 adult patients diagnosed withmild-to-moderate mild-to-moderate AKL-T03 or a control game. Both groups used the treatment/control at home, five days per week for 25 minutes per day, on a tablet device for six weeks. Following the treatment period, anin-clinic assessment was conducted to assess key outcomes. The primary outcome of the study assessed sustained attention as measured by TOVA, anFDA-cleared objective measure of attention. | 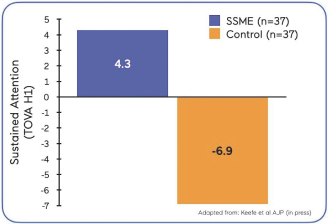 |
106
In the study,.
AKL-T03
showed a statistically significant improvement in sustained attention compared to control (p=0.002) on the predefined primary endpoint, as measured by the TOVA engagement withAKL-T03
also showed a strong correlation with improved processing speed. There were no serious adverse events observed forAKL-T03.
Two (5.5%) of 37 patients usingAKL-T03
reported an intervention-related adverse event (headache) Results of the study have been accepted for publication inThe American Journal of Psychiatry
Clinical development program and upcoming milestones in MDD
With the success of our proof of concept study in MDD, plans are underway to have a meeting with FDA in the second half of 2023 to discuss our anticipated pivotal trial.
Multiple sclerosis (“MS”)
Multiple sclerosis is an inflammatory neurologic disease in which the destruction of myelin inhibits communications between the nerves in the brain. MS frequently causes extreme fatigue, numbness, weakness, difficulty with eyesight, spasticity, speech problems, problems with coordination and problems with memory and concentration.
Cognitive symptoms in patients with MS are predictive of loss of employment, loss of quality of life, and affects all aspects of daily life.
Treatment of MS focuses on symptom management, treatment of attack, and reduction of disease progression. A number of immunosuppressive disease-modifying therapies have been approved that reduce the rate of disease progression, but they do not stop it. Therefore, MS treatment management includes symptomatic treatments as well as rehabilitative and psychological approaches such as physical therapy, speech therapy, occupational therapy and cognitive rehabilitation. There are no current treatments for MS that are specifically designed to address cognitive impairments.
MS market size and initial target population
In the U.S., it is estimated that there are approximately 900,000 people living with MS. The incidence of cognitive dysfunction in MS ranges from
20-60%,
and as MS progresses, symptoms overall tend to increase in frequency and severity.Akili is initially targeting a population of approximately 180,000 MS patients in the U.S.
Clinical evidence in MS
Our development program in MS leverages the SSME therapeutic engine and is focused on treating adult patients. We initially conducted a pilot study in 21 patients with UCSF. Participants completed an
in-clinic
baseline neurological evaluation and then used our investigational digital therapeuticin-home
for 25 minutes daily, five days weekly, for four weeks. This was followed by a repeatin-clinic
evaluation. The study showed significant improvement in processing speed in patients who used our investigational digital therapeutic.We then conducted a proof of concept study designed to assess our investigational digital therapeutic’s ability to improve processing speed in adults with MS as compared to control. Recruitment for this study was between March and September 2018 for adults between the ages of- scores between
18-70
years old. The double-blind randomized controlled clinical trial enrolled 40 adults with MS and baseline Symbol Digit Modalities Test (“SDMT”)z
-2
and 0. After completing a baselinein-clinic
evaluation (Visit 1), subjects were randomized to complete ourin-home
investigational digital therapeutic utilizing theAKL-T03
variation of our treatment software or a control word game for up to 25 minutes/day, five days/week, for six weeks. A repeatin-clinic
evaluation occurred at six weeks (Visit 2), and again eight weeks later to determine persistence of effects (Visit 3). The primary endpoint was SDMT and the secondary endpoint was Paced auditory Serial Addition Test (“PASAT”). No power analysis was reported by the study investigators.107
The
pre-specified
primary outcome was change in SDMT score between Visits 1 and 2. The study demonstrated clinically significant improvement in SDMT (>4) following six weeks ofAKL-T03
use (vs. baseline). This clinically meaningful 4+ point increase in SDMT was maintained after a further eight weeks observation period. No adverse events were reported. The statistical analysis from the study showed:| • | SDMT: No difference between group, p=0.21. Both the AKL-T03 and control groups showed statistically significant improvements, p<0.001 and p=0.024, respectively. |
| • | At 8 weeks follow up, responders analysis (clinically meaningful +4 point increase in SDMT relative to baseline SDMT score) was statistically significant favoring AKL-T03, p=0.038. |
| • | PASAT: No difference between group, p=0.93. Both the AKL-T03 and control groups showed statistically significant improvements, p=0.002 and p=0.07 (marginally significant), respectively. |
Clinical development program and upcoming milestones in MS
With the success of our proof of concept study in MS, plans are underway to conduct a randomized controlled pivotal trial in this indication.
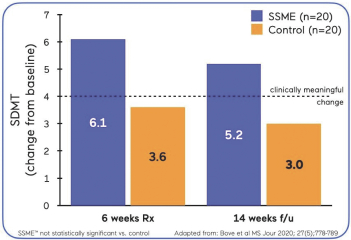
We expect to have a meeting with the FDA in the second half of 2023 to discuss our anticipated pivotal trial.
Acute cognitive dysfunction
Cognitive impairments can occur after acute insults to the brain due to trauma, infection, hypoxia, inflammation, medication, toxins, critical illness, cancer and more. Patients with acute cognitive dysfunction may experience issues related to attention, processing speed, multi-tasking, immediate recall and short- and long-term memory among other impairments.
These impairments can have a significant impact on individuals’ daily functioning and quality of life. Cancer- related cognitive dysfunction (“CRCI”) has a negative impact on survivors’ ability to work, carry out routine activities, and engage in social and family relationships. And, in a recent study of
COVID-19
survivors, for instance, “COVID fog” symptoms including cognitive impairment impacted their ability to work for six months or more.Acute cognitive function market size and initial target population
It is estimated that 81 million people in the U.S. suffer from acute cognitive dysfunction.
We are initially targeting patients with acute cognitive dysfunction associated with COVID fog, chemotherapy and
post-op
patients. We estimate these target populations to be approximately 1.3 million patients with COVID fog, 1 million chemotherapy patients and 300,000 postoperative patients.108
Clinical evidence in acute cognitive function Evaluating the ability of our SSME technology to improve impairments related to acute cognitive dysfunction, we conducted a pilot study between September 2015 and April 2019 of 84 patients with TBI, including 60– 85-year-old HVLT-R learning, delayed recall and recognition. | 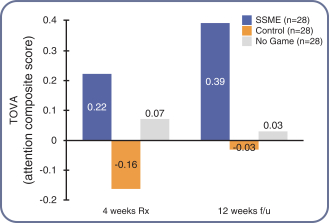 |
The data from the study showed significant improvement in measures of attention (reaction time) and working memory, compared to controls.
This was a feasibility study and no specific power analysis was conducted. There was a statistically significant difference for attention, p=0.045. Only
AKL-T01
showed significant improvement, p=0.006. Neither the control group (p=0.43) nor the no contact group (p=0.79) changed their attention performance. This improvement was maintained for 3 months post-intervention. There were no other changes on the other cognitive domains, all p<0.05. No adverse events were reported.Clinical development program and upcoming milestones in acute cognitive dysfunction
Pilot studies in COVID fog
There are currently no
FDA-approved
treatments for cognitive impairments inCOVID-19
survivors (“COVID fog”) and recent research suggests that it can affect between20-80%
ofCOVID-19
survivors who had been hospitalized. We are working with research teams at Weill Cornell Medicine, NewYork-Presbyterian Hospital and Vanderbilt University Medical Center to conduct randomized, controlled clinical studies evaluating the ability of our investigational digital therapeutic to target and improve cognitive functioning inCOVID-19
survivors who have exhibited a deficit in cognition.The ongoing Akili, Weill Cornell Medicine and NewYork-Presbyterian Hospital randomized, controlled study is evaluating
AKL-T01
in approximately 100COVID-19
survivors ages18-89
who have exhibited a deficit in cognition. The study will take place over 10 weeks, with six weeks of treatment and four weeks offollow-up.
Half of the study participants will receive the investigational digital treatment and half will serve as a control group. The primary endpoint of the study is mean change in cognitive function, as assessed by a measure of attention and processing speed. Secondary endpoints include additional measures of cognitive functioning. The study is being conducted remotely in patients’ homes, and patients in the control arm will have the option to receive theAKL-T01
intervention after the conclusion of their participation in the control group.The ongoing Akili and Vanderbilt randomized, controlled study is evaluatingHousehold Transmission Study. Half of the study participants
AKL-T01
in approximately 100COVID-19
survivors ages 18 and older who have exhibited a deficit in cognition. The study is recruiting from subjects who have completed theSARS-CoV-2
109
will receive the investigational digital treatment for four weeks and half will serve as a control group. The primary endpoint of the study is mean change in cognitive function, as measured by CNS Vital Signs (composite score of cognitive function, especially attention and processing speed). Secondary endpoints include additional measures of cognitive functioning. The study is being conducted remotely in patients’ homes.
We expect data from our pilot studies in COVID fog in the second half of 2022.
Pilot study in postoperative patients
Working with Vanderbilt’s Critical Illness, Brain Dysfunction and Survivorship (CIBS) Center, we are conducting pilot studies of
AKL-T01
in older surgical patients. The ongoingCOPE-iOS
study will assess the efficacy ofAKL-T01
in improving cognitive outcomes inpost-op
patient populations by combining cognitive and physical training as part of interventions that occur before surgery and up to three months after hospital discharge.The
COPE-iOS
controlled study will randomize approximately 250 patients over 60 years old undergoing elective majornon-cardiac
surgery to evaluate the efficacy of a comprehensive cognitive training program (digital cognitive intervention and supervised progressive multimodal physical exercise) in improving long-term cognitive outcomes as compared to an active control (control computer game, health information, stretching exercises) for two to four weeks prior to surgery and for three months after discharge. The primary endpoint of the five year study is the difference in global cognition between intervention and active control three and 12 months after discharge. Neuropsychological professionals blinded to treatment assignment and hospital course will assess global cognition at baseline and after discharge using the CNS Vital Signs neurocognitive battery. In addition, Vanderbilt will obtain blood to evaluate biomarkers of neuronal injury and will be performing brain MRI imaging at baseline and three months after discharge, providing a robust mechanistic aim of the study in addition to evaluation of cognition and physical function outcomes.Pilot study in CRCI
We are working with UCSF to conduct a pilot study in patients with cancer-related cognitive dysfunction. The study will randomize approximately 60 patients to evaluate the feasibility, safety and initial signals of efficacy of
AKL-T01
as compared to control game. Half of the study participants will receive the investigational digital treatment for four weeks and half will serve as a control group. They will use the treatment or control game for25 minutes per day, five days a week for four weeks. Cognitive measures will include TOVA and Adaptive Cognitive Evaluation (“ACE”), a mobile cognitive control assessment battery.
Cognitive Assessment
Cognition is often only assessed when there is a specific, subjective complaint from patients, family members or caregivers. There is no consistent clinical protocol for how to use cognitive assessment tools. Most cognitive assessments have not changed in decades, and many are still performed on pen and paper.
Clinical evidence in cognitive assessment
Our development program in this space leverages our SSME therapeutic engine, but with a focus on assessment as opposed to treatment.
110
A pilot study was conducted in 100 patients with MS, which showed positive correlation between our SSME technology and a recognized cognitive function measure, known as SDMT, in assessing cognition in MS (graph on left below).
 We also conducted a pilot study in 54 healthy older adults in collaboration with Pfizer. The study showed the potential for SSME assessment to detect cognitive differences between amyloid positive and amyloid negative status, where amyloid is a protein biomarker associated with a higher risk of progression to dementia, in otherwise healthy individuals (graph on right). | 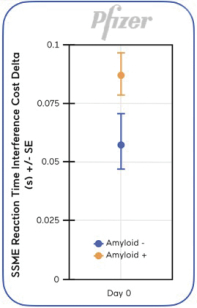 |
Clinical development program and upcoming milestones in acute cognitive dysfunction
There is an ongoing investigator initiated cognitive assessment study in a healthy aging population, and Akili expects to initiate a cognitive assessment validation trial in the second half of 2023.
Additional technology engines
We have two additional technologies beyond SSME – SNAV and BBT. SNAV targets spatial navigation and episodic memory, and BBT targets attention, goal management and working memory. These technologies have potential to improve certain cognitive impairments associated with a number of medical conditions, including Alzheimer’s and Mild Cognitive Impairment (“MCI”). In addition to the technology engines in our current portfolio, we are continuously looking for new innovative technologies through our internal R&D efforts and through potential licensing and acquisition.
EndeavorRx Commercialization Strategy
EndeavorRx is Akili’s first commercial offering and demonstrates our ability to create software with the potential to scale like a drug and be readily available for patients and prescribers.
Akili is commercializing EndeavorRx using a prescription therapeutic business model, where a prescription from a physician is filled by a patient and the cost of the treatment may be shared between the patient and the insurer,
if reimbursed by an insurer. We have carefully developed our commercialization strategy based on our understanding of the key components to successfully target the therapeutics market and the benefits of Akili’s unique technology solution. Our strategy has the potential to address unmet needs among the pediatric ADHD population by:
1) increasing awareness and activation of caregivers, and
111
2) directly educating and activating physicians, using a therapeutic sales model with telemedicine integration. Since obtaining FDA authorization for EndeavorRx, we have built an infrastructure that includes patient connectivity via telehealth, digital first fulfillment and additional scalable commercial capabilities. Our strategy is based on a digital first,
e-commerce
experience and our approach focuses on three main stakeholders: consumers, prescribing physicians and payers.Consumers
Our initial patient population is children with ADHD with inattention who are not well controlled on medication or who are naive to stimulants. This represents about 44% of the pediatric ADHD population in the U.S. We are planning aapproach to increase awareness and activation of the caregivers of this population. These caregivers are constantly looking for
direct-to-consumer
non-drug
and effective options to help their families and already spend on solutions beyond traditional ADHD drugs. On average, caregivers pay five times the amount to raise their child with ADHD as compared to a neurotypical child. We intend to drive consumer demand via a “digital first” approach, including closed-loop marketing usinge-commerce,
a broad influencer program and activations to driveword-of-mouth.
Prescribing physicians
We intend to use a therapeutic sales model with a strong salesforce and integrate telemedicine. The physician targets consist of pediatricians, psychiatrists and health care practices that are considered to be Centers of Excellence that focus on children with ADHD. We have seen that our data, published in leading peer review journals likeand, generates significant credibility with this key stakeholder group, which we will continue to leverage. This approach, combining a proven therapeutic sales model with telemedicine, is designed to enable seamless access to care by physicians.
Lancet
Nature
Payers
Our first market has a unique characteristic where the consumer, caregivers of children with ADHD, have a high willingness to pay cashto help their children. They already spend on approaches beyond drugs, including psychotherapy, dietary supplements, after-school programs, online programs, etc. We expect that our clinically-validated treatments will increasingly be covered by commercial and government payers and, in the interim, we have a cash pay model that allows for expanded access to EndeavorRx. We have a dedicated market access team that is focused on top commercial national and targeted regional plans as well as government payers. Our early conversations with payers indicate that they consider ADHD treatments to be an essential need and we believe that our price point, $450 for a
out-of-pocket
90-day
prescription, is reasonable considering generics in this space. In combination, Akili’s approach with payers prioritizes expanded access to EndeavorRx across more families seeking new therapies while ensuring a path is available for the uniqueself-pay
characteristic of the market as we build expanded coverage over time.In the U.S., we plan to continue to evolve our commercial model through the EndeavorRx commercial launch and beyond, reaching more patients while mitigating risk associated with market conditions or promotional investment. Outside of the U.S., we will consider regional partnerships in relevant markets, leveraging existing and established brands and will franchise on an indication per indication basis. For example, Akili has formed a strategic partnership with Shionogi in Japan and Taiwan, leveraging each party’s distinct expertise to build a novel commercial model and launch a new class of treatment to patients.
Key components of our EndeavorRx commercialization model
| • | Consumer-driven model: |
| • | Active participation by a physician: |
112
| • | Delivered as a comprehensive care program: |
| • | Coverage by formulary decision-makers: self-pay/reimbursement model to enable growth in the short term with potential to track toward expanded access via insurance coverage over time. |
| • | Power of data to inform and adapt: |
Preparations for commercial launch of EndeavorRx
We have been building a patient-adaptive commercial model purpose-built for digital therapeutics.
Building acommercial model from the ground up has allowed us to
first-of-its-kind
re-envision
the entire delivery system. Since obtaining FDA authorization for EndeavorRx, we have created an infrastructure that includes patient connectivity via telehealth, digital first fulfillment and additional scalable commercial capabilities.Our platform and infrastructure allows us to quickly and continuously refine and optimize based on learnings from caregivers, patients and health care providers. We regularly collect insights across multiple forums to inform our commercial activities and communications with caregivers, including workshops,
in-depth
interviews with patients and caregivers and surveys. We are also leveraging the power of the data from our platform, as we gain direct access to an aggregate level view of each patient’s activity and completion of therapy, which we use to inform and adapt our communications with caregivers.Executing
pre-launch
activities—listening, learning and adaptingThere is no established playbook for digital therapeutics, so we have been focused on
pre-launch
activities for EndeavorRx in the U.S. to gather important feedback from families and physicians. We are executing targeted consumer pilots to understand promotional levers and priorities to deliver upon the promise of EndeavorRx commercially.We monitor metrics for three key drivers of our business model: demand, engagement and reimbursement. We measure demand through total prescriptions written by physicians, including for new prescriptions and for refills. We monitor engagement through measuring the total number of prescribing health care providers, the number of new prescribing health care providers and conversion, as measured by patients who paid for a prescription as a percent of those who received a prescription. Our third key driver is reimbursement and the metrics measured for this driver are the percent of prescriptions that are paid in cash and the percent of prescriptions that are reimbursed in whole or in part by a private or public health insurance payer.
EndeavorRx
®
—key drivers of the modelPHASE | PRE-LAUNCH | PRE-LAUNCH | PRE-LAUNCH | |||||||||||
METRIC | FY 2021 | Q 1’22 | GROWTH VS. Q1’21 | |||||||||||
DEMAND | Total Rx Written | 1,713 | 668 | 229 | % | |||||||||
| New Rx | 1,422 | 503 | 166 | % | ||||||||||
| Refill Rx | 291 | 165 | 1079 | % | ||||||||||
ENGAGEMENT | Total Prescribers | 877 | 437 | 191 | % | |||||||||
| New Prescribers | 832 | 239 | 96 | % | ||||||||||
| Conversion (Enrolled To Dispense) | 57 | % | 53 | % | (14 | %) | ||||||||
REIMBURSEMENT | % of TRx Self Paid | 86 | % | 89 | % | N/A | ||||||||
| % of TRx Reimbursed | 10 | % | 4.3 | % | N/A | |||||||||
| Total Covered Lives | 2.8 | M | 2.6 | M | N/A | |||||||||
113
Our
pre-launch
release of EndeavorRx has demonstrated strong business model fundamentals for our ability to scale and execute on significant revenue potential and will inform the commercial launch of the product. With only a handful of health care provider-facing sales representatives and highly targeted consumer pilots, we are seeing strong early indicators.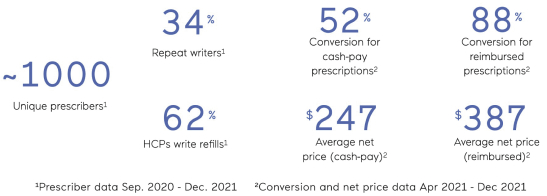
Through key learnings from the
pre-launch
of EndeavorRx, we have developed and refined a robust commercialization model for the commercial launch EndeavorRx that will also support our future products.Potential U.S. Label Expansion in ADHD
In addition to the commercial launch of EndeavorRx for ages
8-12,
we plan to undertake a full label expansion strategy to grow our patient base in ADHD. We hope to leverage this initial patient population to build awareness for our mission and other potential, new treatments in our pipeline.Work is underway to support age and geography expansion with a trusted care program over the ADHD patient’s lifetime. Ourapproach can be extrapolated and optimized beyond our first label and into the other age segments, with a total of approximately 8.1 million people in the U.S. We have ongoing pivotal trials targeting both adolescents and adults, with potential product launches in 2024, and we expect to also have proof of concept in younger children ages
go-to-market
3-8
as early as 2023. From a regulatory perspective, these are all expected to be conducted through the FDA 510(k) process, which is generally a simpler and faster process compared to the FDA de novo process used for our first label.Potential Revenue Opportunity in ADHD
Across ADHD—including our first EndeavorRx label and described label expansions—we anticipate the revenue opportunity to be at least $500 million per year, expected in the next five to seven years assuming clinical and regulatory success of our ADHD label expansion trials to the entire ADHD population and investment in its sales and marketing infrastructure. Additionally, this revenue opportunity assumes an approximately 8% estimated market share, an even split of patients paying in cash as opposed to paying through insurance, an average net price between
$300-350
per prescription and an average of 1.5x refills per patient after their first prescription. This revenue forecast would be negatively impacted to the extent these assumptions, particularly label expansion to the entire ADHD population, prove to be incorrect.Given EndeavorRx’s safety profile, we believe we can offer significant advantages over existing products in market, appealing to a broad spectrum of families, including:
| • | families with children not well-managed on ADHD drugs due to side effects or lack of efficacy, |
| • | families choosing to not put their children on ADHD drugs, and |
| • | families with children actively taking ADHD drugs but looking for additional options to add to their treatment. |
114
The revenue across ADHD described above reflects expectations based on a traditional pharmaceutical revenue model. Yet, we have a unique platform that allows us to grow and evolve our offering through a patient’s lifetime. We have several distinct levers enabling this:
1) We are building meaningful relationships with caregivers and patients, offering products they enjoy that help improve their health.
2) We are developing products that can span a person’s lifetime, from childhood through adulthood—supporting their cognitive health through chronic conditions, acute illness and aging.
3) Our products can be continually iterated for long-term engagement.
4) We have rich data infrastructure that can enable patients to engage with doctors in a new way.
5) We also have the ability to offer premium content and services, like our recently launched EndeavorRx Insight, a companion app for parents to participate in and support their child’s treatment journey. This has the potential to provide additional revenue streams alongside the treatment.
This revenue potential only accounts for treating inattention in ADHD in the U.S. Akili’s platform has the capability of addressing multiple potential markets, and we have prioritized several key programs to enter clinical trials and expand our presence in ADHD outside of the U.S. We are estimating a total addressable market of 15.5 million patients across our initial target patient populations in the U.S. and Japan.
Increasing TAM (Total Addressable Market) through label and indication expansion

| * | Estimated timeframes in figure above correspond to applicable milestone start times, and are subject to change—please refer to the section entitled “ Risk Factors Risks Related to Our Business and Industry—Enrollment and retention of patients in clinical trials is an expensive and time- consuming process and could be made more difficult or rendered impossible by multiple factors outside of our control. If we experience delays or difficulties in the enrollment or retention of patients in clinical trials, our ability to obtain necessary marketing authorizations for our product candidates could be delayed or |
115
prevented Risks Related to Our Products—Our current product candidates are in various stages of development. Our product candidates may fail in development or suffer delays that adversely affect their commercial viability. If we fail to maintain clearance, de novo classification or approval to market our product candidates, including AKL-T01 for expanded indications, or if we are delayed in obtaining such marketing authorizations, our business, prospects, results of operations and financial condition could be materially and adversely affected |
| ** | Population data in table above are estimates based on our management’s good faith estimates based on various publications, public health data, national health statistics including from the NIH and CDC and partner research data. |
Intellectual Property
We actively seek to obtain patent protection in the U.S. and other countries for inventions covering our products and technologies. We also license patents and technologies from third parties. Further, we rely on copyrights (including copyright registrations for software designs), trademarks and trade secrets relating to our proprietary PDT algorithms or processes, in order to develop, strengthen and maintain our proprietary position in the PDT field.
We solely own or exclusively license 21 utility patent families directed to software or methods related to cognition and/or digital therapeutics, including, as of May 31, 2022, seven patents allowed in the U.S., eight patents allowed in Japan, one patent allowed in Canada, two patents allowed in China and three patents allowed in South Korea. Patent expiration dates noted below refer to earliest potential statutory expiration dates and do not take into account any potential patent term adjustments or extensions that may be available.
Exclusively licensed utility patent families include the following:
| • | An exclusive license from UCSF to a patent family directed to software and methods for enhancing cognition via a task performed in the presence of interferences (distractions and/or interrupters) (see “Agreements/Third Parties—UCSF Neuroracer Agreement” below for a description of this exclusive license agreement). Two U.S. patents, five Japanese patents and one Canadian patent have been allowed in this family, the patents expiring as early as 2031 (Japan and Canada) and 2032 (U.S.). Additional applications are pending in this family in Australia, Canada, and Europe. |
| • | An exclusive license from UCSF to a patent family directed to software and methods for enhancing cognition via a task with both a physical and cognitive component. One Japanese patent has been allowed in this family, expiring as early as 2035. Additional applications are pending in this family in the U.S., Australia, Canada, Europe, Hong Kong and Japan. |
Solely owned utility patent families include the following:
| • | A patent family directed to a personalized cognitive training regimen through difficulty progression. One U.S. patent, one Japanese patent and one South Korean patent have been allowed in this family and will expire as early as 2035. Additional applications are pending in this family in Australia, Canada, Europe and Hong Kong. |
| • | A patent family directed to processor-implemented systems and methods for measuring cognitive abilities. One U.S. patent has been allowed in this family and will expire as early as 2036. Additional applications are pending in this family in Australia, Canada, Europe, Japan and South Korea. |
| • | A patent family directed to signal detection metrics in adaptive response-deadline procedures. One Chinese patent has been allowed in this family and will expire as early as 2037. Additional applications are pending in this family in the U.S., Australia, Canada, Europe, Japan and South Korea. |
| • | A patent family directed to audio-only interference training for cognitive disorder screening and treatment. One U.S. patent has been allowed in this family and will expire as early as 2039. Additional applications are pending in this family in China, Hong Kong, South Korea, Canada, Europe, Australia and Japan. |
116
| • | A patent family directed to facial expression detection for screening and treatment of affective disorders. One U.S. patent has been allowed in this family and will expire as early as 2039. Additional applications are pending in this family in China, Hong Kong, South Korea, Canada, Europe, Australia and Japan. |
| • | A patent family directed to a platform configured to render computerized emotional/affective elements for use as stimuli in computerized tasks. One South Korean patent and one Chinese patent have been allowed in this family and will expire as early as 2037. Additional applications are pending in this family in Australia, Canada, Europe, Japan, the U.S, and Hong Kong. |
| • | A patent family directed to a cognitive platform coupled with a physiological component. One U.S. patent, one Japanese patent, and one South Korean patent have been allowed in this family and will expire as early as 2037. Additional applications are pending in this family in Australia, Canada, China, Europe, and Hong Kong. |
| • | A pending patent family directed to a cognitive platform for deriving effort metric for optimizing cognitive treatment, with applications pending in the U.S., Canada, Europe, Australia, Japan, South Korea, China and Hong Kong. If any patents are allowed in this family, they could expire as early as 2039. |
| • | A pending patent family directed to a distributed network for the secured collection, analysis, and sharing of data across platforms, with applications pending in the U.S., Canada, Europe, Australia, Japan and China. If any patents are allowed in this family, they could expire as early as 2038. |
| • | A pending patent family directed to systems and methods for scientific evaluation of program code outputs, with applications pending in the U.S. and pursuant to the international Patent Cooperation Treaty. If any patents are allowed in this family, they could expire as early as 2040. |
| • | A pending patent family directed to systems and methods for software design control and quality assurance, with applications pending in the U.S., Taiwan, and pursuant to the international Patent Cooperation Treaty. If any patents are allowed in this family, they could expire as early as 2040. |
| • | A pending patent family directed to a system and method for adaptive configuration of computerized cognitive training programs, with an application pending in the U.S. If any patents are allowed in this family, they could expire as early as 2041. |
| • | A pending patent family directed to a method for algorithmic rendering of graphical user interface elements, with a provisional application pending in the U.S. If any patents are allowed in this family, they could expire as early as 2041. |
| • | A pending patent family directed to a method and system for determining equitable benefit in digital products and services, with a provisional application pending in the U.S. If any patents are allowed in this family, they could expire as early as 2042. |
| • | A pending patent family directed to a cognitive platform including computerized evocative elements in modes, with applications pending in the U.S., Australia, Canada, China, Europe, Hong Kong, Japan, and South Korea. If any patents are allowed in this family, they could expire as early as 2037. |
| • | A pending patent family directed to a cognitive platform including computerized elements, with applications pending in the U.S., Canada, Europe, Japan, Australia, China, and Hong Kong. If any patents are allowed in this family, they could expire as early as 2038. |
| • | A pending patent family directed to a cognitive platform for identification of biomarkers and other types of markers, with applications pending in the U.S., Europe, Canada, Australia, and Japan. If any patents are allowed in this family, they could expire as early as 2037. |
| • | A pending patent family directed to a platform for identification of biomarkers using navigation tasks and treatments using navigation tasks, with applications pending in the U.S., Australia, Canada, China, Europe, Japan, and South Korea. If any patents are allowed in this family, they could expire as early as 2037. |
117
| • | A pending patent family directed to cognitive screens, monitor and cognitive treatments targeting immune-mediated and neuro-degenerative disorders, with applications pending in the U.S., Taiwan, Canada, Europe, Australia, Japan, China, Hong Kong, and South Korea. If any patents are allowed in this family, they could expire as early as 2039. |
In addition to our utility patents, we own three families of design patents worldwide, relating to various former and/or current Company logos or designs for our software applications, including over 40 granted or allowed design patents as of May 31, 2022. One family of design patents is directed to a graphical user interface with an animated logo for a display screen, with one allowed patent in the U.S., which patents would expire as early as 2034. A second family of design patents is directed to an animated graphical user interface for a display screen, with allowed patents in the U.S., Australia, Canada, Europe, Japan and South Korea, which patents would expire as early as 2030, and a pending application in China. A third family of design patents is directed to a graphical user interface for a display screen, with allowed patents in the U.S., Australia, Canada, China, Europe, Japan and South Korea, which patents would expire as early as 2027. The foregoing design patent expiration dates assume all applicable renewals are paid when due.
Registered Copyrights
In addition to our portfolio of utility and design patents, we hold copyright in our PDTs and companion software apps and pursue federal copyright registration where appropriate. We have registered copyrights with the U.S. Copyright Office in certain core designs and images in our PDTs and companion apps, and can additionally utilize international copyright protection such as the Berne Convention as applicable.
Registered Trademarks
We also protect our trademarks and associated brand recognition by registering trademarks with the United States Patent and Trademark Office and foreign trademark offices.
While we consider these proprietary technology rights to be important to us, a range of factors help to mitigate the future effects of patent and license expiration on our results of operations and financial position. These factors include: publications, including peer-reviewed third-party studies, that demonstrate the efficacy of our products; our brand strength and reputation in the marketplace; our existing distribution platform and our customer support; the applicable regulatory approval status for certain products; our continued investments in innovative product improvements that often result in new technologies and/or additional patents; our investment in innovations that results in new product offerings that often are patentable; and our significant
know-how,
scale and investments related to the clinical development and commercialization of associated product offerings.Our commercial success may depend in part on our ability to: obtain and maintain patent and other proprietary protection for commercially important technology, inventions and
know-how
related to our business; defend and enforce our patents, copyrights, trademarks and other proprietary rights; preserve the confidentiality of our trade secrets; and operate without infringing the valid, enforceable patents and other proprietary rights of third parties. Our ability to limit third parties from making, using, selling, offering to sell or importing our products may depend on the extent to which we have rights under valid and enforceable licenses, patents, copyrights or trade secrets that cover these activities. In some cases, enforcement of these rights may depend on third-party licensors orco-owners.
With respect to both company-owned and licensed intellectual property, we cannot be sure that patents will be granted with respect to any of our pending patent applications or with respect to any patent applications filed by us in the future, nor can we be sure that any of our existing patents or any patents that may be granted to us in the future will be commercially useful in protecting our commercial products.118
Agreements/Third Parties
Shionogi Collaboration Agreement
In March 2019, Shionogi & Co. Ltd. exercised its option to enter into an exclusive collaboration and license agreement (the “Shionogi Agreement”) with us, pursuant to which we and Shionogi agreed to collaborate in the development and commercialization of certain digital therapeutic products, including EndeavorRx and
AKL-T02,
variations of Akili’s SSME technology, in the licensed field in Japan and Taiwan. Under the agreement, Shionogi will be primarily responsible for the development and commercialization of such licensed products at its own cost and expense. Shionogi has agreed to use commercially reasonable efforts to obtain regulatory approval for certain licensed products, including EndeavorRx andAKL-T02,
in each indication in the licensed field throughout Japan and Taiwan. The development and commercialization of the licensed products are overseen by a joint steering committee comprised of an equal number of representatives from each of us and Shionogi. We maintain control over the development and commercialization of the licensed products worldwide for all indications, and in Japan and Taiwan for all indications outside of Shionogi’s licensed field. Additionally, we provide certain technical support services to Shionogi, and we have agreed to certain responsibilities with respect to licensed product development activities under the agreement.Pursuant to the Shionogi Agreement, for a given licensed product, we have granted to Shionogi an exclusive license, with the right to grant sublicenses, under certain patent rights and
know-how
controlled by us (1) to clinically develop such licensed product anywhere in the world for the purposes of obtaining regulatory approval and commercializing such licensed product in the licensed field in Japan and Taiwan and (2) commercialize such licensed product in the licensed field in Japan and Taiwan.To date, we have received an aggregate amount of approximately $25.4 million from Shionogi under the Shionogi Agreement, which includes an initial upfront fee payment of $10.0 million, an additional $10.0 million option exercise payment, proceeds from a $5.0 million corporate bond and $0.4 million to produce a control version of our software for the trials in Japan. We are also entitled receive up to a total of $105.0 million in total development and commercial milestones across all licensed products. Additionally, we are entitled to royalties, in a range between
20-30%,
on annual net sales of licensed products in the territory so long as Shionogi continues to sell the licensed products in such territory, subject to certain specified reductions. Shionogi will also help fund development costs in Japan and Taiwan.In connection with Shionogi exercising its option to enter into the agreement, we issued a $5.0 million corporate bond to Shionogi for cash. The corporate bond is unsecured and is subordinated to our obligations under indebtedness for borrowed money owed by us to any bank or other financial institution.
Unless earlier terminated, the Shionogi Agreement will continue in effect until the expiration of all of Shionogi’s payment obligations thereunder. Either party may terminate the agreement upon an uncured material breach of the agreement by the other party or upon the occurrence of certain events of insolvency of the other party. Additionally, Shionogi may terminate the agreement for any or no reason, in its entirety or on a licensedproduct basis, upon specified written notice to us. Shionogi may also terminate the agreement on a licensedproduct basis for safety reasons, certain clinical failures, or in the event that any third-party
product-by-licensed
product-by-licensed
in-license
entered into by us is terminated and cannot be reestablished within a specified period to allow Shionogi to continue exercising its rights under the agreement.In the event that Shionogi has the right to terminate the Shionogi Agreement, in whole or with respect to a particular target, upon our uncured material breach, then in lieu of so terminating, Shionogi has the right to elect to the have the agreement continue in full force and effect; provided that Shionogi shall pay a reduced royalty. In the event that Shionogi terminates the agreement at will, or if we terminate for a breach or insolvency, we are entitled to certain reversionary rights with respect to the terminated licensed products.
In the event that we want to develop or commercialize certain digital therapeutic products (other than the licensed products) in Japan or Taiwan, we agreed to allow Shionogi a
one-time
first right of negotiation to expand the scope of the agreement to include such products.119
UCSF NeuroRacer Agreement
On October 18, 2013, we entered into an exclusive license agreement with The Regents of the University of California (the “UCSF NeuroRacer Agreement”), which was amended on May 17, 2018, and February 25, 2019. Certain granted patent claims licensed under the agreement cover aspects and/or functionality of EndeavorRx. Under the agreement, UCSF grants us an exclusive, worldwide, sublicensable license under UCSF’s rights in certain patents and copyrights controlled by UCSF, to, in the case of the licensed patents, make, use, sell, offer for sale and import, and to reproduce, prepare derivative works, distribute, perform, and, in the case of the licensed copyrights, display, certain licensed products, services, software, and methods covered by such patents and copyrights. Under the agreement, UCSF retains the right to use the licensed technology for educational and research purposes, including sponsored researching performed for or on behalf of commercial entities. Under this agreement, we have rights to two U.S. patents, five Japanese patents and one Canadian patent. These patents expire as early as 2031 (for the Japanese and Canadian patents) and 2032 (for the U.S. patents).
As consideration for entering into the UCSF NeuroRacer Agreement, we paid UCSF a license issue fee of $10,000. We also paid UCSF an aggregate license maintenance fee of $25,000 ($5,000 annually for five years up to the first sale of a licensed product). Additionally, we are obligated to pay to UCSF up to a total of $1.1 million in total milestone payments for products covered by the license (including EndeavorRx), including for certain patent-related, regulatory and commercial milestones. To date, we have paid UCSF a total of $185,000 in such milestone payments.
In addition, we are obligated to pay to UCSF certainbasis until the later of expiration or abandonment of the licensed patents or on the tenth anniversary of the first commercial sale of each such licensed product or licensed service in such country. As of January 31, 2022, we have paid to UCSF a total of $411,673 in such royalty payments. In total, we have paid UCSF $631,673 million under the UCSF NeuroRacer Agreement.
mid-single
digit percentage royalties on annual net sales of licensed products, methods, or services depending on if such products, methods, or services are clinically tested or not, subject to certain specified reductions. Royalties are payable to UCSF from the date of first commercial sale of a licensed product or licensed service on acountry-by-country
We are also obligated to pay UCSF certain tiered payments upon a change of control transaction (as defined in the agreement), up to a maximum of $2.5 million in such payments, depending on the total amount of payments to shareholders resulting from such transaction.
We must also pay to UCSF a tiered,
low-
tomid-double-digit
percentage of any sublicensee revenue (as defined in the agreement), depending on the regulatory status of the licensed product applicable to such sublicense agreement. To date, we have not made any payments to UCSF in sublicensee revenue.The UCSF NeuroRacer Agreement will remain in effect until the later of (i) expiration or abandonment of the last of the licensed patents or (ii) expiration of the licensed copyrights in all countries. UCSF may terminate the agreement upon an uncured breach of the agreement by us and the agreement will automatically terminate upon our insolvency. Additionally, we may terminate the agreement for any or no reason, in its entirety, or terminate our rights under the licensed patents on abasis, upon specified written notice to UCSF.
country-by-country
TALi Agreement
In August 2021, we entered into a license agreement with TALi Digital Limited (the “TALi Agreement”) pursuant to which we license TALi’s technology designed to address early childhood attention impairments. Under the agreement, TALi grants us an exclusive license to develop, supply and commercialize certain technology controlled by TALi for the treatment of attention or cognitive conditions in children 12 years of age and younger, in the U.S.. TALi agreed to provide us a first right of refusal to any new use or functionality for the licensed technology, including for indications or applications outside of the licensed field or age cohort.
120
The development and commercialization of the licensed technology are overseen by a joint steering committee comprised of an equal number of representatives from each of us and TALi. TALi is responsible for certain initial development activities with respect to certain of the licensed technology, and we must reimburse TALi for such activities up to $2.0 million. We control all other development activities and all commercialization activities with respect to the licensed technology.
Pursuant to the TALi Agreement, we are obligated to pay to TALi up to a total of $2.0 million in regulatory milestone payments and up to a total of $35.5 million in commercial milestone payments. In addition, we are obligated to pay to TALi certain tiered
mid-single
digit percentage royalties on annual net sales of the licensed technology in the U.S. for the term of the agreement, subject to certain specified reductions. To date, we have not made any payments to TALi pursuant to the TALi Agreement.Under the TALi Agreement, the patents in the patent family TALi has licensed to us will expire as early as 2035. The TALi Agreement will continue in effect until otherwise terminated. We may terminate the agreement for any or no reason upon notice after the completion of a clinical study approved by the joint steering committee or within 60 days after FDA marketing authorization of the TALi technology. Either party may terminate the agreement upon an uncured or uncurable material breach of the agreement by the other party, or upon the occurrence of certain events of insolvency of the other party. Additionally, TALi may also terminate the agreement if we have not consummated at least $1.0 million of sales for a product related to the licensed technology by the third anniversary of the first commercial sale of a product related to the licensed technology. However, we have the opportunity to pay TALi an amount equal to the difference between the actual sales and such threshold to avoid termination.
Government Regulation
Coverage and Reimbursement
Sales of any product depend, in part, on the extent to which such product will be covered by third-party payers, such as federal, state and foreign government healthcare programs, commercial insurance and managed healthcare organizations and the level of reimbursement for such product by third-party payers. Decisions regarding the extent of coverage and amount of reimbursement to be provided are made on abasis. These third-party payers are increasingly reducing reimbursements for medical products, drugs and services.
plan-by-plan
In addition, the U.S. government, state legislatures and foreign governments have continued implementing cost- containment programs, including price controls, restrictions on coverage and reimbursement and requirements for substitution of generic products. Adoption of price controls and cost-containment measures, and adoption of more restrictive policies in jurisdictions with existing controls and measures, could further limit sales of any product. Decreases in third-party reimbursement for any product or a decision by a third-party payer not to cover a product could reduce physician usage and patient demand for the product and also have a material adverse effect on sales.
Health Care Laws and Regulations
Our business operations and current and future arrangements with investigators, healthcare professionals, consultants, third-party payers, patient organizations and customers, may be subject to broadly applicable healthcare laws and regulations, including fraud and abuse laws. These laws may constrain the business or financial arrangements and relationships through which we conduct our operations, including how we research, market, sell and distribute our product candidates, if approved. The laws that may affect our ability to operate include, but are not limited to:
| • | the federal Anti-Kickback Statute, which prohibits, among other things, persons from knowingly and willfully soliciting, receiving, offering or paying any remuneration (including any kickback, bribe, or rebate), directly or indirectly, overtly or covertly, in cash or in kind, to induce, or in return for, either the referral of an individual, or the purchase, lease, order or recommendation of any good, facility, item or |
121
service for which payment may be made, in whole or in part, under a federal healthcare program, such as the Medicare and Medicaid programs. A person or entity does not need to have actual knowledge of the statute or specific intent to violate it in order to have committed a violation; |
| • | federal civil and criminal false claims laws, including the False Claims Act (“FCA”), which can be enforced through civil “qui tam” or “whistleblower” actions and civil monetary penalty laws, impose criminal and civil penalties against individuals or entities for, among other things, knowingly presenting, or causing to be presented, claims for payment or approval from Medicare, Medicaid or other federal health care programs that are false or fraudulent; knowingly making or causing a false statement material to a false or fraudulent claim or an obligation to pay money to the federal government; or knowingly concealing or knowingly and improperly avoiding or decreasing such an obligation. Manufacturers can be held liable under the FCA even when they do not submit claims directly to government payers if they are deemed to “cause” the submission of false or fraudulent claims. In addition, the government may assert that a claim including items or services resulting from a violation of the federal Anti-Kickback Statute constitutes a false or fraudulent claim for purposes of the FCA. The FCA also permits a private individual acting as a “whistleblower” to bring actions on behalf of the federal government alleging violations of the FCA and to share in the proceeds of any monetary recovery; |
| • | the federal Health Insurance Portability and Accountability Act of 1996 (“HIPAA”), which created new federal criminal statutes that prohibit knowingly and willfully executing, or attempting to execute, a scheme to defraud any healthcare benefit program or obtain, by means of false or fraudulent pretenses, representations or promises, any of the money or property owned by, or under the custody or control of, any healthcare benefit program, regardless of the payer (e.g., public or private) and knowingly and willfully falsifying, concealing or covering up by any trick or device a material fact or making any materially false statements in connection with the delivery of, or payment for, healthcare benefits, items or services relating to healthcare matters. Similar to the federal Anti-Kickback Statute, a person or entity can be found guilty of violating these statutes without actual knowledge of the statutes or specific intent to violate them in order to have committed a violation; |
| • | the federal Physician Payment Sunshine Act, created under the ACA and its implementing regulations, which require manufacturers of drugs, devices, biologicals and medical supplies for which payment is available under Medicare, Medicaid or the Children’s Health Insurance Program (with certain exceptions) to report annually to the US Department of Health and |
| • | Human Services (“HHS”) information related to payments or other transfers of value made to physicians (defined to include doctors, dentists, optometrists, podiatrists and chiropractors) and teaching hospitals, as well as ownership and investment interests held by physicians and their immediate family members. Effective January 1, 2022, these reporting obligations will extend to include payments and transfers of value made to physician assistants, nurse practitioners, clinical nurse specialists, anesthesiologist assistants, certified registered nurse anesthetists and certified nurse midwives during the previous year; |
| • | federal government price reporting laws, which require us to calculate and report complex pricing metrics in an accurate and timely manner to government programs; |
| • | federal consumer protection and unfair competition laws, which broadly regulate marketplace activities and activities that potentially harm consumers; and |
| • | analogous state and foreign laws and regulations, such as state and foreign anti-kickback, false claims, consumer protection and unfair competition laws which may apply to pharmaceutical business practices, including but not limited to, research, distribution, sales and marketing arrangements as well as submitting claims involving healthcare items or services reimbursed by any third-party payer, including commercial insurers; state laws that require pharmaceutical companies to comply with the pharmaceutical industry’s voluntary compliance guidelines and the relevant compliance guidance promulgated by the federal government that otherwise restricts payments that may be made to healthcare providers and other potential referral sources; state laws that require drug manufacturers to file reports with states regarding pricing and |
122
marketing information, such as the tracking and reporting of gifts, compensations and other remuneration and items of value provided to healthcare professionals and entities; and state and local laws requiring the registration of pharmaceutical sales representatives. |
Healthcare Reform
In March 2010, the ACA was enacted, which substantially changed the way healthcare is financed by both governmental and private insurers, and significantly affected the pharmaceutical industry. The ACA contained a number of provisions, including those governing enrollment in federal healthcare programs, reimbursement adjustments and changes to fraud and abuse laws. For example, the ACA:
| • | increased the minimum level of Medicaid rebates payable by manufacturers of brand name drugs from 15.1% to 23.1% of the average manufacturer price; |
| • | required collection of rebates for drugs paid by Medicaid managed care organizations; |
| • | required manufacturers to participate in a coverage gap discount program, under which they must agree to offer 70 percent point-of-sale |
| • | imposed a non-deductible annual fee on pharmaceutical manufacturers or importers who sell “branded prescription drugs” to specified federal government programs. |
Since its enactment, there have been judicial and Congressional challenges to certain aspects of the ACA. On June 17, 2021, the U.S. Supreme Court dismissed the most recent judicial challenge to the ACA brought by several states without specifically ruling on the constitutionality of the ACA. Prior to the Supreme Court’s decision, President Biden issued an executive order to initiate a special enrollment period from February 15, 2021 through May 15, 2021 for purposes of obtaining health insurance coverage through the ACA marketplace. The executive order also instructs certain governmental agencies to review and reconsider their existing policies and rules that limit access to healthcare, including among others, reexamining Medicaid demonstration projects and waiver programs that include work requirements, and policies that create unnecessary barriers to obtaining access to health insurance coverage through Medicaid or the ACA. Other legislative changes have been proposed and adopted since the ACA was enacted, including aggregate reductions of Medicare payments to providers of2% per fiscal year. These reductions went into effect on April 1, 2013 and, due to subsequent legislative amendments to the statute, will remain in effect through 2030, with the exception of a temporary suspension from May 1, 2020 through March 31, 2022 due to the
COVID-19
pandemic. Following the temporary suspension, a 1% payment reduction will occur beginning April 1, 2022 through June 30, 2022, and the 2% payment reduction will resume on July 1, 2022. It is also possible that additional governmental action is taken in response to theCOVID-19
pandemic.There has been increasing legislative and enforcement interest in the U.S. with respect to specialty drug pricing practices. Specifically, there have been several recent U.S. Congressional inquiries and proposed federal and state legislation designed to, among other things, bring more transparency to drug pricing, reduce the cost of prescription drugs under Medicare, review the relationship between pricing and manufacturer patient programs, and reform government program reimbursement methodologies for drugs. At a federal level, President Bidensigned an Executive Order on July 9, 2021 affirming the administration’s policy to (i) support legislative reforms that would lower the prices of prescription drug and biologics, including by allowing Medicare to negotiate drug prices, by imposing inflation caps, and, by supporting the development and market entry of lower-cost generic drugs and biosimilars; and (ii) support the enactment of a public health insurance option. Among other things, the Executive Order also directs HHS to provide a report on actions to combat excessive pricing of prescriptiondrugs, enhance the domestic drug supply chain, reduce the price that the federal government pays for drugs, and address price gouging in the industry; and directs the FDA to work with states and Indian Tribes that propose to develop section 804 Importation Programs in accordance with the Medicare Prescription Drug,
123
Improvement, and Modernization Act of 2003, and the FDA’s implementing regulations. FDA released such implementing regulations on September 24, 2020, which went into effect on November 30, 2020, providing guidance for states to build and submit importation plans for drugs from Canada. On September 25, 2020, the Centers forMedicare & Medicaid Services (“CMS”) stated drugs imported by states under this rule will not be eligible for federal rebates under Section 1927 of the Social Security Act and manufacturers would not report these drugs for “best price” or Average Manufacturer Price purposes. Since these drugs are not considered covered outpatient drugs, CMS further stated it will not publish a National Average Drug Acquisition Cost for these drugs. If implemented, importation of drugs from Canada may materially and adversely affect the price we receive for any of our product candidates. Further, on November 20, 2020 CMS issued an Interim Final Rule implementing the Most Favored Nation, or MFN, Model under which Medicare Part B reimbursement rates would have been calculated for certain drugs and biologicals based on the lowest price drug manufacturers receive in Organization for Economic Cooperation and Development countries with a similar gross domestic product per capita. However, on December 29, 2021 CMS rescinded the Most Favored Nations rule. Additionally, on November 30, 2020, HHS published a regulation removing safe harbor protection for price reductions from pharmaceutical manufacturers to plan sponsors under Part D, either directly or through pharmacy benefit managers, unless the price reduction is required by law. The rule also creates a new safe harbor for price reductions reflected at theas well as a safe harbor for certain fixed fee arrangements between pharmacy benefit managers and manufacturers. Pursuant to court order, the removal and addition of the aforementioned safe harbors were delayed and recent legislation imposed a moratorium on implementation of the rule until January 1, 2026.
point-of-sale,
Although a number of these and other proposed measures may require authorization through additional legislation to become effective, and the Biden administration may reverse or otherwise change these measures, both the Biden administration and Congress have indicated that they will continue to seek new legislative measures to control drug costs.
In addition, other legislative and regulatory changes have been proposed and adopted in the U.S. since the ACA was enacted:
| • | On January 2, 2013, the U.S. American Taxpayer Relief Act of 2012 was signed into law, which, among other things, further reduced Medicare payments to several types of providers. |
| • | On April 13, 2017, CMS published a final rule that gives states greater flexibility in setting benchmarks for insurers in the individual and small group marketplaces, which may have the effect of relaxing the essential health benefits required under the ACA for plans sold through such marketplaces. |
| • | On May 30, 2018, the Right to Try Act, was signed into law. The law, among other things, provides a federal framework for certain patients to access certain investigational new drug products that have completed a Phase 1 clinical trial and that are undergoing investigation for FDA approval. Under certain circumstances, eligible patients can seek treatment without enrolling in clinical trials and without obtaining FDA permission under the FDA expanded access program. There is no obligation for a pharmaceutical manufacturer to make its drug products available to eligible patients as a result of the Right to Try Act. |
| • | On May 23, 2019, CMS published a final rule to allow Medicare Advantage Plans the option of using step therapy for Part B drugs beginning January 1, 2020. |
| • | On December 20, 2019, former President Trump signed into law the Further Consolidated Appropriations Act (H.R. 1865), which repealed the Cadillac tax, the health insurance provider tax and the medical device excise tax. It is impossible to determine whether similar taxes could be instated in the future. |
Individual states have also been increasingly active in passing legislation and implementing regulations designed to control pharmaceutical and biological product pricing, including price or patient reimbursement constraints, discounts, restrictions on certain product access and marketing cost disclosure and transparency measures, and, in some cases, designed to encourage importation from other countries and bulk purchasing. In addition, regional
124
health care authorities and individual hospitals are increasingly using bidding procedures to determine what pharmaceutical products and which suppliers will be included in their prescription drug and other health care programs. These measures could reduce the ultimate demand for our products, once approved, or put pressure on our product pricing. We expect that additional state and federal healthcare reform measures will be adopted in the future, particularly in light of the new presidential administration, any of which could limit the amounts that federal and state governments will pay for healthcare products and services, which could result in reduced demand for our product candidates or additional pricing pressures.
Data Privacy and Security Laws
Personal privacy and data security have become significant issues in the U.S., Europe, and in many other jurisdictions. The regulatory framework for privacy and security issues worldwide is rapidly evolving and is likely to remain uncertain for the foreseeable future. Many federal, state, and foreign government bodies and agencies have adopted, or are considering adopting, laws and regulations regarding the collection, use, and disclosure of personal information, including protected health information. These laws and regulations, including their interpretation by governmental agencies, are subject to frequent change and could have a negative impact on our business. In addition, in the future, industry requirements or guidance, contractual obligations, and/or legislation at both the federal and the state level may limit, forbid or regulate the use or transmission of health information outside of the U.S..
These varying interpretations can create complex compliance issues for us and our partners and potentially expose us to additional expense, adverse publicity and liability, any of which could adversely affect our business.
Federal and state consumer protection laws are increasingly being applied by the U.S. Federal Trade Commission and states’ attorneys general to regulate the collection, use, storage and disclosure of personal or personally identifiable information, through websites or otherwise, and to regulate the presentation of website content.
The security measures that we and our third-party vendors and subcontractors have in place to ensure compliance with privacy and data protection laws may not protect our facilities and systems from security breaches, acts of vandalism or theft, computer viruses, misplaced or lost data, programming and human errors or other similar events. Even though we provide for appropriate protections through our agreements with our third-party vendors, we still have limited control over their actions and practices. A breach of privacy or security of personally identifiable health information may result in an enforcement action, including criminal and civil liability, against us. We are not able to predict the extent of the impact such incidents may have on our business. Enforcement actions against us could be costly and could interrupt regular operations, which may adversely affect our business. While we have not received any notices of violation of the applicable privacy and data protection laws and believe we are in compliance with such laws, there can be no assurance that we will not receive such notices in the future.
There is ongoing concern from privacy advocates, regulators and others regarding data privacy and security issues, and the number of jurisdictions with data privacy and security laws has been increasing. Also, there are ongoing public policy discussions regarding whether the standards for
de-identification,
anonymization or pseudonymization of health information are sufficient, and the risk ofre-identification
sufficiently small, to adequately protect patient privacy. We expect that there will continue to be new proposed and amended laws, regulations and industry standards concerning privacy, data protection and information security in the U.S., such as the California Consumer Privacy Act (the “CCPA”) which went into effect on January 1, 2020 and has been amended several times. Further, a new California privacy law, the California Privacy Rights Act (the “CPRA”) was passed by California voters on November 3, 2020. The CPRA will create additional obligations with respect to processing and storing personal information that are scheduled to take effect on January 1, 2023 (with certain provisions having retroactive effect to January 1, 2022). Additionally, some observers have noted that the CCPA and CPRA could mark the beginning of a trend toward more stringent privacy legislation in the U.S., which could increase our potential liability and adversely affect our business. Already, in the U.S., we have witnessed125
significant developments at the state level. For example, on March 2, 2021, Virginia enacted the Consumer Data Protection Act (the “CDPA”) and, on July 8, 2021, Colorado’s governor signed the Colorado Privacy Act (the “CPA”), into law. The CDPA and the CPA will both become effective January 1, 2023. While the CDPA and CPA incorporate many similar concepts of the CCPA and CPRA, there are also several key differences in the scope, application, and enforcement of the law that will change the operational practices of regulated businesses. The new laws will, among other things, impact how regulated businesses collect and process personal sensitive data, conduct data protection assessments, transfer personal data to affiliates, and respond to consumer rights requests.
A number of other states have proposed new privacy laws, some of which are similar to the above discussed recently passed laws. Such proposed legislation, if enacted, may add additional complexity, variation in requirements, restrictions and potential legal risk, require additional investment of resources in compliance programs, impact strategies and the availability of previously useful data and could result in increased compliance costs and/or changes in business practices and policies. The existence of comprehensive privacy laws in different states in the country would make our compliance obligations more complex and costly and may increase the likelihood that we may be subject to enforcement actions or otherwise incur liability for noncompliance.
Our international operations are subject to international laws and regulations, regulatory guidance, and industry standards relating to data protection, privacy, and information security. For our EU and UK future operations, this includes the EU General Data Protection Regulation (the “GDPR”) as well as other national data protection legislation in force in relevant EU member states (including the GDPR in such form as incorporated into the law of England and Wales, Scotland and Northern Ireland by virtue of the European Union (Withdrawal) Act 2018 and any regulations thereunder and the UK Data Protection Act 2018 (the “UK GDPR”).
The GDPR and UK GDPR are wide-ranging in scope and impose numerous additional requirements on companies that process personal data, including imposing special requirements in respect of the processing of health and other sensitive data, requiring that consent of individuals to whom the personal data relates is obtained in certain circumstances, requiring additional disclosures to individuals regarding data processing activities, requiring that safeguards are implemented to protect the security and confidentiality of personal data, creating mandatory data breach notification requirements in certain circumstances, requiring data protection impact assessments for high risk processing and requiring that certain measures (including contractual requirements) are put in place when engaging third-party processors. The GDPR and the UK GDPR also provide individuals with various rights in respect of their personal data, including rights of access, erasure, portability, rectification, restriction and objection. The GDPR and UK GDPR define personal data to include pseudonymized or coded data and requires different informed consent practices and more detailed notices for clinical trial participants and investigators than applies to clinical trials conducted in the U.S.. We are required to apply GDPR and UK GDPR standards to any clinical trials that our EU and UK established businesses carry out anywhere in the world.
The GDPR and UK GDPR impose strict rules on the transfer of personal data to countries outside the European Economic Area, including the U.S.. The UK and Switzerland have adopted similar restrictions. Although the UK is regarded as a third country under the EU’s GDPR, the European Commission (“EC”) has now issued a decision recognizing the UK as providing adequate protection under the EU GDPR and, therefore, transfers of personal data originating in the EU to the UK remain unrestricted. Like the EU GDPR, the UK GDPR restricts personal data transfers outside the UK to countries not regarded by the UK as providing adequate protection. The UK government has confirmed that personal data transfers from the UK to the EEA remain free flowing.
To enable the transfer of personal data outside of the EEA or the UK, adequate safeguards must be implemented in compliance with European and UK data protection laws. On June 4, 2021, the EC issued new forms of standard contractual clauses for data transfers from controllers or processors in the EU/EEA (or otherwise subject to the GDPR) to controllers or processors established outside the EU/EEA (and not subject to the GDPR). The new standard contractual clauses replace the standard contractual clauses that were adopted previously under the
126
EU Data Protection Directive. The UK is not subject to the EC’s new standard contractual clauses but has published a draft version of a
UK-specific
transfer mechanism, which, once finalized, will enable transfers from the UK. We will be required to implement these new safeguards when conducting restricted data transfers under the EU and UK GDPR and doing so will require significant effort and cost.The GDPR and UK GDPR may increase our responsibility and liability in relation to personal data that we process where such processing is subject to the GDPR and UK GDPR. Implementing legislation in applicable EU member states and the UK, including by seeking to establish appropriate lawful bases for the various processing activities we carry out as a controller or joint controller, reviewing security procedures and those of our vendors and collaborators, and entering into data processing agreements with relevant vendors and collaborators, we cannot be certain that our efforts to achieve and remain in compliance have been, and/or will continue to be, fully successful. Given the breadth and depth of changes in data protection obligations, preparing for and complying with the GDPR and UK GDPR and similar laws’ requirements are rigorous and time intensive and require significant resources and a review of our technologies, systems and practices, as well as those of any third-party collaborators, service providers, contractors or consultants that process or transfer personal data.
Other countries around the world in which we conduct trials or otherwise do business have also enacted strict privacy and data protection laws. For example, the Act on the Protection of Personal Information (“APPI”) of Japan regulates privacy protection issues in Japan. The APPI shares similarities with the GDPR, including extraterritorial application and obligations to provide certain notices and rights to citizens of Japan. We may be required to modify our policies, procedures, and data processing measures in order to address requirements under these or other privacy, data protection, or cyber security regimes, and may face claims, litigation, investigations, or other proceedings regarding them and may incur related liabilities, expenses, costs, and operational losses.
In addition to general privacy and data protection requirements, many jurisdictions around the world have adopted legislation that regulates how businesses operate online and enforces information security, including measures relating to privacy, data security and data breaches. Many of these laws require businesses to notify data breaches to the regulators and/or to data subjects. These laws are not consistent, and compliance in the event of a widespread data breach is costly and burdensome.
In many jurisdictions, enforcement actions and consequences for
non-compliance
with protection, privacy and information security laws and regulations are rising. In the EU and the UK, data protection authorities may impose large penalties for violations of the data protection laws, including potential fines of up to €20 million (£17.5 million in the UK) or 4% of annual global revenue, whichever is greater. The authorities have shown a willingness to impose significant fines and issue orders preventing the processing of personal data onnon-compliant
businesses. Data subjects also have a private right of action, as do consumer associations, to lodge complaints with supervisory authorities, seek judicial remedies, and obtain compensation for damages resulting from violations of applicable data protection laws. The APPI allows for fines of up up to ¥100M for violations of the law. In the U.S., possible consequences fornon-compliance
include enforcement actions in response to rules and regulations promulgated under the authority of federal agencies and state attorneys general and legislatures and consumer protection agencies.In addition, privacy advocates and industry groups have regularly proposed, and may propose in the future, self- regulatory standards that may legally or contractually apply to us. If we fail to follow these security standards, even if no customer information is compromised, we may incur significant fines or experience a significant increase in costs.
The risk of our being found in violation of these laws is increased by the fact that the in interpretation and enforcement of them is not entirely clear. Efforts to ensure that our business arrangements with third parties will comply with applicable healthcare laws and regulations will involve substantial costs. Any action against us for violation of these laws, even if we successfully defend against it, could cause us to incur significant legal
127
expenses and divert our management’s attention from the operation of our business. The shifting compliance environment and the need to build and maintain robust and expandable systems to comply with multiple jurisdictions with different compliance and/or reporting requirements increases the possibility that a healthcare company may run afoul of one or more of the requirements.
Compliance with data protection laws and regulations could require us to take on more onerous obligations in our contracts, restrict our ability to collect, use and disclose data, or in some cases, impact our ability to operate in certain jurisdictions. It could also require us to change our business practices and put in place additional compliance mechanisms, may interrupt or delay our development, regulatory and commercialization activities and increase our cost of doing business. Failure by us or our collaborators and third-party providers to comply with data protection laws and regulations could result in government enforcement actions (which could include civil or criminal penalties and orders preventing us from processing personal data), private litigation and result in significant fines and penalties against us. Moreover, clinical trial participants about whom we or our potential collaborators obtain information, as well as the providers who share this information with us, may contractually limit our ability to use and disclose the information. Claims that we have violated individuals’ privacy rights, failed to comply with data protection laws or breached our contractual obligations, even if we are not found liable, could be expensive and time-consuming to defend, could result in adverse publicity and could have a material adverse effect on our business, financial condition, results of operations and prospects.
U.S. Medical Device Regulations
General Requirements
Our products and product candidates are medical devices subject to extensive and ongoing regulation by the FDA under the Federal Food, Drug, and Cosmetic Act (the “FDCA”) and its implementing regulations, as well as other federal and state regulatory bodies in the U.S. and comparable authorities in other countries under other statutes and regulations. These laws and regulations govern, among other things, product design and development, preclinical and clinical testing, manufacturing, packaging, labeling, storage, recordkeeping and reporting, clearance or approval, marketing, distribution, promotion, import and export and post-marketing surveillance. Failure to comply with applicable requirements may subject a device and/or its manufacturer to a variety of administrative sanctions, such as issuance of warning letters, import detentions, civil monetary penalties and/or judicial sanctions, such as product seizures, injunctions and criminal prosecution.
In the U.S., medical devices considered to be moderate to high risk by FDA generally require premarket review and marketing authorization from the FDA prior to commercial distribution. The primary types of FDA marketing authorization applicable to a medical device are clearance of a premarket notification, also called 510(k) clearance, premarket approval, or PMA approval, or grant of a de novo request for classification, or de novo grant. Each 510(k), PMA, or de novo request must be accompanied by a user fee, although the fee may be waived under certain circumstances.
Each product candidate we seek to commercially distribute in the U.S. will require either a prior de novo classification grant, 510(k) clearance, unless it is exempt, or a PMA from the FDA under its medical device authorities.
510(k) Clearance Process
Under the FDCA, medical devices are classified into one of three classes – Class I, Class II or Class III – depending on the degree of risk associated with the device and the level of control necessary to provide reasonable assurance of safety and effectiveness.
Class I devices are those for which safety and effectiveness can be reasonably assured by adherence to a set of regulations referred to as General Controls, which require compliance with the applicable portions of FDA’s Quality System Regulation (“QSR”), facility registration and device listing, reporting of adverse events and
128
malfunctions, which is referred to as medical device reporting, and appropriate, truthful and
non-misleading
labeling and promotional materials. Most Class I devices are exempt from the premarket notification requirements.Class II devices are those that are subject to General Controls, as well as Special Controls, which can include performance standards, specialized labeling and post-market surveillance. Most Class II devices are subject to the premarket notification requirements.
To obtain 510(k) clearance, a manufacturer must submit a premarket notification, or 510(k), to the FDA and demonstrate to the FDA’s satisfaction that the proposed device is “substantially equivalent” to a previously 510(k)-cleared device or a device that was in commercial distribution before May 28, 1976 for which the FDA has not yet called for the submission of a PMA application. The previously cleared device is known as a predicate device. A proposed device is substantially equivalent if, with respect to the predicate device, it has the same intended use and has either (i) the same technological characteristics or (ii) different technological characteristics and does not raise different questions of safety and effectiveness, and the information submitted to the FDA that the device is substantially equivalent to the predicate device contains information that demonstrates that the proposed device is as safe and effective as a legally marketed device.
Before the FDA will accept a 510(k) for substantive review, the FDA will first assess whether the submission satisfies a minimum threshold of acceptability to ensure that the 510(k) is administratively complete. The acceptance review, which occurs prior to the substantive review, is generally conducted and completed within 15 calendar days of the FDA receiving the 510(k). If the FDA determines that the 510(k) is incomplete, the FDA will issue a “Refuse to Accept” letter which generally outlines the information the FDA believes is necessary to permit a substantive review and to reach a determination regarding substantial equivalence. The 510(k) submitter must submit the requested information within 180 days before the FDA will proceed with additional review of the submission. Once a 510(k) is accepted for review, the FDA aims to review and issue a determination within 90 FDA Days, although clearance often takes longer in practice. As specified by the Medical Device User Fee Amendments (“MDUFA”) IV commitment letter, which defines performance goals for the FDA for fiscal years 2018 through 2022, “FDA Days” are calculated as the number of calendar days between the date the submission was received by the FDA and the date of the FDA’s decision, excluding the days the submission was on hold pending a response to an FDA additional information request. The FDA may require additional information, including clinical data, to make a determination regarding substantial equivalence.
If the FDA determines that the device is “not substantially equivalent” to a previously cleared device, for example, due to a finding of a lack of a predicate device, or that the proposed device has a new intended use or different technological characteristic that raise different questions of safety or effectiveness when the proposed device is compared to the cited predicate device, the device is automatically designated as a Class III device. The device sponsor must then fulfill more rigorous PMA requirements, or can request a risk-based classification determination for the device in accordance with the de novo process.
Alternatively, if the FDA determines that the information provided in a 510(k) is insufficient to demonstrate substantial equivalence to the predicate device, the FDA generally identifies the specific information that is needed so that the FDA may complete its evaluation of substantial equivalence, and such information may be provided by the 510(k) sponsor within the time allotted by the FDA or in a new 510(k) should the original 510(k) be withdrawn.
If the FDA agrees that the proposed device is substantially equivalent to a predicate device currently on the market, it will grant 510(k) clearance to commercially market the device. After a device receives 510(k) clearance, any modification that could significantly affect its safety or effectiveness, or that would constitute a major change or modification in its intended use, will require a new 510(k) clearance, or depending on the modification, PMA approval. The determination as to whether or not a modification could significantly affect the device’s safety or effectiveness is initially left to the manufacturer. Many minor modifications are accomplished by a “letter to file” in which the manufacturer documents the rationale for the change and why a new 510(k) is
129
not required. However, the FDA may review such letters to file to evaluate the regulatory status of the modified device at any time and may require the manufacturer to cease marketing and recall the modified device until 510(k) clearance or PMA approval is obtained. The manufacturer may also be subject to significant regulatory fines or penalties for marketing a modified device without the requisite 510(k) clearance or PMA approval.
De Novo Classification Process
For novel medical devices that are low to moderate risk and are not substantially equivalent to a predicate device, a manufacturer may request a risk-based classification determination, called a “Request for Evaluation of Automatic Class III Designation,” for the device in accordance with de novo classification process. This procedure allows a de novo requester whose novel device is automatically classified into Class III to request down-classification of its medical device into Class I or Class II on the basis that the device presents low or moderate risk, rather than requiring the submission and approval of a PMA application. A requestor may submit a de novo request for classification after receiving a “not substantially equivalent” determination in response to a 510(k) submission. Alternatively, a requestor may submit a de novo request absent the submission of a 510(k) when the sponsor determines that there is no legally marketed device upon which to base a determination of substantial equivalence. Under the FDCA, FDA must make a classification determination for the device that is the subject of a de novo request within 120 days of receipt of the request. However, under MDUFA IV, the FDA’s goal is to make a decision on most de novo requests within 150 FDA Days, although in practice the FDA’s review may take significantly longer. During the pendency of FDA’s review, the FDA may issue an additional information letter, which places the de novo request on hold and stops the review clock pending receipt of the additional information requested. In the event the de novo requestor does not provide the requested information within 180 calendar days, the FDA will consider the de novo request to be withdrawn.
The FDA may reject the de novo request if it identifies a legally marketed predicate device that would be appropriate for a 510(k) or determines that the device is not low to moderate risk or that General Controls would be inadequate to control the risks and Special Controls cannot be developed. In the event the FDA determines that the data and information submitted demonstrate that General Controls or General and Special Controls are adequate to provide reasonable assurance of safety and effectiveness, the FDA will grant the de novo request and a classification regulation will be established for the device type. When the FDA grants a de novo request for classification, the device is granted marketing authorization and can further serve as a predicate device for a future 510(k) by any person for future devices of that type.
PMA Process
Class III devices include devices deemed by FDA to pose the greatest risk, such as life-supporting or life- sustaining devices, or implantable devices, in addition to those deemed not substantially equivalent following the 510(k) process. The safety and effectiveness of Class III devices cannot be reasonably assured solely by the General Controls and Special Controls described above. With few exceptions for certain types of devices classified into Class III that were in commercial distribution in the U.S. before May 28, 1976, Class III devices are subject to the PMA application process, which is generally more costly and time consuming than the 510(k) process. The PMA application process requires proof of safety and effectiveness of the device to the FDA’s satisfaction.
After a PMA application is submitted, the FDA has 45 days to determine whether the application is sufficiently complete to permit a substantive review and thus whether the FDA will file the application for review. Under the FDCA, the FDA has 180 days to review a filed PMA application, although the review of an application generally occurs over a significantly longer period of time and can take up to several years. During this review period, the FDA may request additional information or clarification of the information already provided. Also, an advisory panel of experts from outside the FDA may be convened to review and evaluate the application and provide recommendations to the FDA as to the approvability of the device. Although the FDA is not bound by the advisory panel decision, the panel’s recommendations are important to the FDA’s overall decision making
130
process. In addition, the FDA may conduct a preapproval inspection of the manufacturing facility to ensure compliance with QSR requirements. The agency also may inspect one or more clinical sites to assure compliance with FDA’s regulations.
Upon completion of the PMA review, the FDA may: (i) approve the PMA which authorizes commercial marketing with specific prescribing information for one or more indications, which can be more limited than those originally sought; (ii) issue an approvable letter which indicates the FDA’s belief that the PMA is approvable and states what additional information the FDA requires, or the post-approval commitments that must be agreed to prior to approval; (iii) issue a not approvable letter which outlines steps required for approval, but which are typically more onerous than those in an approvable letter, and may require additional clinical trials that are often expensive and time consuming and can delay approval for months or even years; or (iv) deny the application. If the FDA issues an approvable or not approvable letter, the applicant has 180 days to respond, after which the FDA’s review clock is reset.
Approval by the FDA of original PMA applications or PMA supplements may be required for modifications to the manufacturing process, labeling, device specifications, materials or design of a device that is approved through the PMA process. PMA supplements often require submission of the same type of information as an original PMA application, except that the supplement is limited to information needed to support any changes from the device covered by the approved PMA application and may or may not require as extensive clinical data or the convening of an advisory panel.
Exempt Devices
If a manufacturer’s device falls into a generic category of Class I or Class II devices that FDA has exempted by regulation, a premarket notification is not required before marketing the device in the U.S. Manufacturers of such devices are required to comply with FDA’s General Controls, including FDA’s establishment registration and device listing requirements. Some 510(k)-exempt devices are also exempt from QSR requirements, except for the QSR’s complaint handling and recordkeeping requirements.
Clinical Trials
Clinical trials are almost always required to support a PMA application or de novo request and are sometimes required for a 510(k). For significant risk devices, the FDA regulations require submission of an application for an investigational device exemption (“IDE”) to the FDA prior to commencement of a human clinical investigation. A nonsignificant risk device does not require the submission of an IDE application; however, the clinical trial must still be conducted in compliance with certain requirements of FDA’s IDE regulations. An IDE application is considered approved 30 calendar days after it has been received by the FDA, unless the FDA informs the sponsor prior to the 30 days that the IDE is approved, approved with conditions, or disapproved.
An IDE application must be supported by appropriate data, such as animal and laboratory testing results, showing that it is safe to test the device in humans and that the testing protocol is scientifically sound. The IDE application must also include a description of product manufacturing and controls, and a proposed clinical trial protocol. The FDA typically grants IDE approval for a specified number of patients to be treated at specific study centers. The FDA’s approval of an IDE allows clinical testing to go forward but does not bind the FDA to accept the results of the trial as sufficient to prove the device’s safety and efficacy, even if the trial meets its intended success criteria.
During the study, the sponsor must comply with the FDA’s IDE requirements for investigator selection, trial monitoring, reporting and recordkeeping. The investigators must rigorously follow the investigational plan and study protocol, control the disposition of investigational devices, and comply with all reporting and recordkeeping requirements. These IDE requirements apply to all investigational devices, whether considered a significant or nonsignificant risk.
131
Clinical trials must further comply with the FDA’s regulations for approval by an institutional review board (IRB) and for informed consent and other human subject protections. The FDA may order the temporary, or permanent, discontinuation of a clinical trial at any time, or impose other sanctions, if it believes that the clinical trial either is not being conducted in accordance with FDA requirements or presents an unacceptable risk to the clinical trial subjects. An IRB may also require the clinical trial at the site to be halted, either temporarily or permanently, for failure to comply with the IRB’s requirements, or may impose other conditions.
Information about certain clinical trials must be submitted within specific timeframes for public dissemination on the ClinicalTrials.gov website. Required records and reports are subject to inspection by the FDA. The results of clinical testing may be unfavorable or, even if the intended safety and efficacy success criteria are achieved, may not be considered sufficient for the FDA to grant clearance or approval of a device.
Post-Market Regulation
After a device is placed on the market, numerous regulatory requirements apply. These include:
| • | establishment registration and device listing; |
| • | compliance with FDA’s QSR requirements; |
| • | labeling regulations; |
| • | medical device reporting regulations, which, for example, require that manufacturers report to the FDA if a device may have caused or contributed to a death or serious injury or malfunctioned in a way that would likely cause or contribute to a death or serious injury if it were to recur; |
| • | voluntary and mandatory device recalls to address problems when a device is defective and/or could be a risk to health; and |
| • | corrections and removal reporting regulations, which require that manufacturers report to the FDA field corrections and product recalls or removals if undertaken to reduce a risk to health posed by the device or to remedy a violation of the FDCA that may present a risk to health. |
Also, the FDA may require manufacturers of certain devices to conduct post-market surveillance studies or order such manufacturers to establish and maintain a system for tracking their devices through the chain of distribution to the patient level. The FDA enforces regulatory requirements, such as those set forth in the QSR, by conducting periodic, unannounced inspections and market surveillance.
Failure to comply with applicable regulatory requirements, including those applicable to the conduct of clinical trials, can result in enforcement action by the FDA, which may lead to any of the following sanctions:
| • | warning letters or untitled letters that require corrective action; |
| • | fines, injunctions and civil penalties; |
| • | recall or seizure of products; |
| • | operating restrictions, partial suspension or total shutdown of production; |
| • | withdrawing PMA approvals already granted; and; |
| • | criminal prosecution. |
Labeling and promotional activities are subject to scrutiny by FDA and, in certain circumstances, by the Federal Trade Commission. Medical devices approved or cleared by FDA may not be promoted for unapproved or uncleared uses, otherwise known as
“off-label”
promotion. FDA and other agencies actively enforce the laws and regulations prohibiting the promotion ofoff-label
uses, and a company that is found to have improperly promotedoff-label
uses may be subject to significant liability, including substantial monetary penalties and criminal prosecution.132
FCPA and Other Anti-Bribery and Anti-Corruption Laws
The U.S. Foreign Corrupt Practices Act (the “FCPA”) prohibits U.S. corporations and their representatives from offering, promising, authorizing or making payments of anything of value to any foreign government official, government staff member, political party or political candidate in an attempt to obtain or retain business abroad or to otherwise influence a person working in an official capacity. The scope of the FCPA would include interactions with certain health care professionals in many countries. We maintain a compliance program designed to comply with the FCPA and anti-bribery laws and regulations applicable to our business. Our present and future business has been and will continue to be subject to various other U.S. and foreign laws, rules and/or regulations.
International Regulation
International sales of medical devices are subject to foreign government regulations, which may vary substantially from country to country. The time required to obtain approval in a foreign country may be longer or shorter than that required for FDA approval, and the requirements may differ. There is a trend towards harmonization of quality system standards among the European Union, U.S., Canada and various other industrialized countries.
The primary regulatory body in Europe is that of the European Union, which includes most of the major countries in Europe. Other countries, such as Switzerland, have voluntarily adopted laws and regulations that mirror those of the European Union with respect to medical devices. The European Union has adopted numerous directives and standards regulating the design, manufacture, clinical trials, labeling and adverse event reporting for medical devices. Devices that comply with the requirements of a relevant directive will be entitled to bear the CE conformity marking, indicating that the device conforms to the essential requirements of the applicable directives and, accordingly, can be commercially distributed throughout Europe. The method of assessing conformity varies depending on the class of the product, but normally involves a combination of self-assessment by the manufacturer and a third-party assessment by a “Notified Body.” This third-party assessment may consist of an audit of the manufacturer’s quality system and specific testing of the manufacturer’s product. An assessment by a Notified Body of one country within the European Union is required in order for a manufacturer to commercially distribute the product throughout the European Union. Outside of the European Union, regulatory approval needs to be sought on abasis in order for us to market our products. The European Union regulatory bodies finalized a new Medical Device Regulation (“MDR”) in 2017, which replaced the existing Directives and provided three years for transition and compliance. The MDR will change several aspects of the existing regulatory framework.
country-by-country
Outside the U.S. a range of anti-bribery and anti-corruption laws, as well and some industry-specific laws and codes of conduct, apply to the medical device industry and interactions with government officials and entities and health care professionals. Further, the EU member countries have emphasized a greater focus on healthcare fraud and abuse and have indicated greater attention to the industry by the European Anti-Fraud Office. MedTech Europe, the medical device industry association, also introduced the Code of Ethical Business Practices, which came into effect on January 1, 2017. Countries in Asia have also become more active in their enforcement of anti-bribery laws and with respect to procurement and supply chain fraud.
Legal Proceedings
Beginning on February 24, 2022, certain purported shareholders of SCS sent demand letters (the “Demands”) alleging deficiencies and/or omissions in the Registration Statement on Form
S-4
filed by SCS with the SEC on February 14, 2022. The Demands seek additional disclosures to remedy these purported deficiencies. On March 11, 2022, a purported shareholder of SCS filed a complaint against SCS, the members of SCS’s board of directors, BofA Securities, Inc. and Morgan Stanley & Co. LLC in the Supreme Court of the State of New York for the County of New York. The complaint is captioned as Elstein v. Palihapitiya et al., Case No. 651138/2022133
(N.Y. Sup. Ct. N.Y. Cty., Mar. 11, 2022) (the “Complaint” and, along with the “Demands,” the “Matters”). The Complaint asserted among other things, claims for breach of fiduciary duty to disclose under Delaware law and Cayman Islands law. The Complaint alleged that SCS and its board of directors caused a materially misleading and incomplete proxy statement to be filed on February 14, 2022 with the SEC. Among other remedies, the plaintiff sought to enjoin SCS’s shareholder meeting in connection with the Business Combination and be awarded attorneys’ fees and costs. On June 29, 2022, the Complaint was voluntarily discontinued with prejudice.
We are not currently a party to any material legal proceedings. From time to time, we may become involved in other litigation or legal proceedings relating to claims arising from the ordinary course of business.
134
SELECTED HISTORICAL FINANCIAL INFORMATION
The following selected historical consolidated financial information for Akili set forth below should be read in conjunction with “” and Akili’s historical consolidated financial statements and the related notes included elsewhere in this prospectus. Akili’s historical results are not necessarily indicative of the results that may be expected in the future.
Akili’s Management’s Discussion and Analysis of Financial Condition and Results of Operations
The selected historical consolidated financial information presented below for the years ended December 31, 2021 and 2020 have been derived from Akili’s audited consolidated financial statements included elsewhere in the proxy statement/prospectus.
The selected financial data as of June 30, 2022, and for the three and six months ended June 30, 2022 and 2021 have been derived from Akili’s unaudited condensed consolidated financial statements included elsewhere in this proxy statement/prospectus. The unaudited financial data presented have been prepared on a basis consistent with Akili’s audited consolidated financial statements. In the opinion of Akili’s management, such unaudited financial data reflect all adjustments, consisting only of normal and recurring adjustments necessary for a fair presentation of the results for those periods. The results of operations for the full year and interim periods are not necessarily indicative of the results to be expected for any future period or, if applicable, the full year.
Three Months Ended June 30, | Six Months Ended June 30, | Years Ended December 31, | ||||||||||||||||||||||
| (dollars in thousands, except per share data) | 2022 | 2021 | 2022 | 2021 | 2021 | 2020 | ||||||||||||||||||
Statement of Operations Data: | ||||||||||||||||||||||||
Total revenue | $ | 64 | $ | 105 | $ | 130 | $ | 222 | $ | 538 | $ | 3,939 | ||||||||||||
Total cost of revenues and operating expenses | 22,403 | 14,663 | 44,194 | 23,526 | 61,257 | 29,375 | ||||||||||||||||||
Loss from operations | (22,339 | ) | (14,558 | ) | (44,064 | ) | (23,304 | ) | (60,719 | ) | (25,436 | ) | ||||||||||||
Other income (expense): | ||||||||||||||||||||||||
Other income | 40 | 4 | 49 | 5 | 17 | 124 | ||||||||||||||||||
Interest expense | (194 | ) | (39 | ) | (370 | ) | (120 | ) | (465 | ) | (333 | ) | ||||||||||||
Loss on extinguishment of debt | — | (181 | ) | — | (181 | ) | (181 | ) | — | |||||||||||||||
Net loss before income taxes | $ | (22,493 | ) | $ | (14,774 | ) | $ | (44,385 | ) | $ | (23,600 | ) | $ | (61,348 | ) | $ | (25,645 | ) | ||||||
Income tax expense | $ | — | $ | — | $ | — | $ | 1 | $ | — | $ | 1 | ||||||||||||
Net loss | $ | (22,493 | ) | $ | (14,774 | ) | $ | (44,385 | ) | $ | (23,601 | ) | $ | (61,348 | ) | $ | (25,646 | ) | ||||||
Unrealized (loss) gain on short-term investments | $ | (1 | ) | $ | — | $ | (7 | ) | $ | — | $ | — | $ | — | ||||||||||
Comprehensive loss | $ | (22,494 | ) | $ | (14,774 | ) | $ | (44,392 | ) | $ | (23,601 | ) | $ | (61,348 | ) | $ | (25,646 | ) | ||||||
Net loss | $ | (22,493 | ) | $ | (14,774 | ) | $ | (44,385 | ) | $ | (23,601 | ) | $ | (61,348 | ) | $ | (25,646 | ) | ||||||
Dividends on Series D convertible preferred stock | (2,908 | ) | (1,115 | ) | (5,785 | ) | (1,115 | ) | (6,660 | ) | — | |||||||||||||
Redemption value of Series D convertible preferred stock | (1,455 | ) | (55,877 | ) | (2,893 | ) | (55,877 | ) | (58,649 | ) | — | |||||||||||||
Net loss attributable to common shareholders | $ | (26,856 | ) | $ | (71,766 | ) | $ | (53,063 | ) | $ | (80,593 | ) | $ | (126,657 | ) | $ | (25,646 | ) | ||||||
Net loss per share - basic and diluted | $ | (18.25 | ) | $ | (61.98 | ) | $ | (36.18 | ) | $ | (69.60 | ) | $ | (105.77 | ) | $ | (22.20 | ) | ||||||
135
June 30, 2022 | December 31, | |||||||||||
| (in thousands) | 2021 | 2020 | ||||||||||
Balance Sheet Data: | ||||||||||||
Cash and cash equivalents | $ | 40,638 | $ | 76,899 | $ | 18,528 | ||||||
Working capital, net (1) | 40,554 | 71,692 | 15,230 | |||||||||
Total assets | 55,015 | 80,937 | 20,181 | |||||||||
Total liabilities | 29,501 | 15,175 | 8,197 | |||||||||
Redeemable convertible preferred stock | 300,554 | 291,876 | 116,886 | |||||||||
Total stockholders' equity (deficit) | (275,040 | ) | (226,114 | ) | (104,902 | ) | ||||||
Statement of Cash Flows Data: | ||||||||||||
Net cash used in operating activities | $ | (41,379 | ) | $ | (53,982 | ) | $ | (24,551 | ) | |||
Net cash used in investing activities | (4,987 | ) | (492 | ) | (116 | ) | ||||||
Net cash provided by financing activities | 10,105 | 112,845 | 1,998 | |||||||||
| (1) | Working capital, net is defined as current assets less current liabilities. |
136
MANAGEMENT’S DISCUSSION AND ANALYSIS OF FINANCIAL CONDITION AND RESULTS OF OPERATIONS
The following discussion and analysis of the financial condition and results of operations of Akili Interactive Labs, Inc. and its consolidated subsidiary should be read together with Akili’s audited consolidated financial statements as of and for the years ended December 31, 2021 and 2020 and unaudited condensed consolidated financial statements as of June 30, 2022 and for the six months ended June 30, 2022 and 2021, together with the related notes thereto, included elsewhere in this prospectus. The discussion and analysis should also be read together with the section titled “Selected Historical Financial Information” and our consolidated financials statements and notes thereto, included elsewhere in this prospectus. This discussion contains forward-looking statements and involves numerous risks and uncertainties, including, but not limited to, those described under the heading “Risk Factors” and “Cautionary Statement Regarding Forward-Looking Statements” included elsewhere in this prospectus. All references to years, unless otherwise noted, refer to our fiscal years, which end on December 31. Akili Interactive Labs, Inc., changed its name to Akili, Inc. on August 19, 2022. For purposes of this section, all references to “we,” “us,” “our,” “Akili” or the “Company” refer to Akili Interactive Labs, Inc. and its consolidated subsidiaries.
Overview
Akili is a leading digital medicine company pioneering the development of cognitive treatments through game- changing technologies. Our approach of leveraging technologies designed to directly target the brain establishes a new category of medicine—medicine that is validated through clinical trials like a drug or medical device, but experienced like entertainment. In June 2020, EndeavorRx, the first product built on our platform was granted marketing authorization and classified as a Class II medical device by the FDA through FDA’s de novo process. EndeavorRx is indicated for use to improve attention function for children ages
8-12
with primarily inattentive or combined-type ADHD, who have a demonstrated attention issue. In the second half of 2022, we plan to initiate the commercial launch of EndeavorRx. In addition to EndeavorRx, we have a robust pipeline of development programs, including twelve that are being evaluated in clinical studies by us or our partners.Through June 30, 2022, we have funded our operations primarily with proceeds from sales of convertible preferred stock, payments received in connection with the Collaboration Agreement (as defined below) and proceeds from borrowings under various credit facilities. Since our inception, we have received gross cash proceeds of $228.3 million from sales of our convertible preferred stock and as of June 30, 2022 have $15.0 million of debt outstanding under a credit facility and $5.0 million outstanding under a corporate bond.
We have incurred losses since our inception. Akili incurred a net loss of $44.4 million and $23.6 million for the six months ended June 30, 2022 and 2021, respectively, and $61.3 million and $25.6 million for the years ended December 31, 2021 and 2020, respectively. As of June 30, 2022 and December 31, 2021, we had an accumulated deficit of $275.0 million and $226.1 million, respectively. We expect to continue to generate operating losses and negative operating cash flows for the foreseeable future as we commercialize EndeavorRx, advance our platform and our pipeline of digital therapeutic candidates into and through clinical development. EndeavorRx, the first product built on the Akili platform was granted FDA marketing authorization in June 2020. We have not yet commercially launched EndeavorRx nor have generated substantial revenue from sales to date. We expect to incur significant expenses related to developing our internal commercialization capability to support product sales, marketing and distribution.
Furthermore, following the closing of the Business Combination (as defined below), we expect to incur additional costs associated with operating as a public company, including significant legal, accounting, investor relations and other expenses that we did not incur as a private company. As a result, we will need substantial additional funding to support our continuing operations and pursue our growth strategy. Until such time as we can generate significant revenue from product sales, if ever, we expect to finance our operations through the sale of equity, debt financings or other capital sources, including potential collaborations with other companies or other strategic transactions.
137
If we are unable to obtain funding, we will be forced to delay, reduce, or eliminate some or all of our research and development programs, product portfolio expansion and commercialization efforts, which would adversely affect our business prospects, or we may be unable to continue operations. Although we continue to pursue these plans, we may not be successful in obtaining sufficient funding on terms acceptable to us to fund continuing operations, if at all.
Because of the numerous risks and uncertainties associated with product and market development, we are unable to predict the timing or amount of increased expenses or when or if we will be able to achieve or maintain profitability. Even if we can generate significant product sales, we may not become profitable. If we fail to become profitable or are unable to sustain profitability on a continuing basis, we may be unable to continue our operations at planned levels and be forced to reduce or terminate our operations.
As of June 30, 2022, we had cash and cash equivalents of $40.6 million and short-term investments of $5.0 million. On August 19, 2022, the Company and SCS completed a merger resulting in the reverse recapitalization of the Company and the Company received aggregate gross proceeds of $2.3 million held in trust by SCS (following satisfaction of redemptions by public stockholders), and $162.0 million in aggregate gross proceeds from PIPE investors. The Company received $133.3 million in net proceeds after the reduction of $31.0 million in transaction related expenses and other costs paid at Closing. Following the consummation of the Business Combination, we will be able to fund our operating expenses and capital expenditure requirements into 2024. We have based this estimate on assumptions that may prove to be wrong, and as a result, we could exhaust our available capital resources sooner than we expect.
Recent Developments
Closing of Business Combination
On January 26, 2022, Akili entered into an Agreement and Plan of Merger Agreement (the “Merger Agreement”) with Social Capital Suvretta Holdings Corp. I (“SCS”) and Karibu Merger Sub, Inc. (“Merger Sub”), pursuant to which Merger Sub will merge with and into Akili, with Akili surviving the merger as a wholly-owned subsidiary of SCS (the “Merger”). In connection with the Merger, SCS will be renamed Akili, Inc. and listed on Nasdaq under the symbol “AKLI”. Akili became a wholly-owned subsidiary of SCS, and SCS was immediately renamed Akili, Inc. upon completion of the Merger on August 19, 2022 (the “Closing”). Each share of Akili common stock that was issued and outstanding immediately prior to Closing, after giving effect to the conversion of all issued and outstanding shares of Akili preferred stock to Akili common stock, was canceled and converted into the right to receive a number of shares of Akili, Inc. Class A common stock equal to the Conversion Ratio multiplied by the number of shares of Akili common stock. As a condition to the consummation of the Merger, SCS deregistered as an exempted company in the Cayman Islands and domesticated as a corporation incorporated under the laws of the State of Delaware (the “Domestication” and, together with the Merger, the “Business Combination”).
Accounting Impact of the Business Combination
The Business Combination was accounted for as a reverse recapitalization, whereby for accounting and financial reporting purposes, Akili is the acquirer. A reverse recapitalization does not result in a new basis of accounting, and the financial statements of the combined entity represent the continuation of the consolidated financial statements of Akili in many respects. The SCS Class A ordinary shares (“Public Shares”) and private placement shares held by the Sponsor and its affiliates remaining after redemptions and the unrestricted net cash and cash equivalents on the date the Business Combination is consummated are accounted for as a capital infusion to Akili.
Cash proceeds of the Business Combination were funded through a combination of $2.3 million in cash held in trust by SCS (following satisfaction of redemptions by public stockholders), and $162.0 million in aggregate gross proceeds from PIPE investors in exchange for 16,200,000 shares of Akili, Inc. common stock that closed
138
substantially contemporaneously with the Closing of the Business Combination. The combined company incurred $31.0 million of expenses related to the transaction and other costs paid at Closing. After giving effect to these transactions, Akili, Inc. received $133.3 million in net proceeds.
The Company will allocate transaction costs between the merger consideration shares and the Earn Out Shares based on the relative fair value of the instruments. The transaction costs allocated to the merger consideration shares will be treated as a reduction of the cash proceeds and will be deducted from Akili’s additional.”
paid-in
capital. The transaction costs allocated to theEarn-Out
Shares will be treated as a reduction of the cash proceeds and will be deducted from Akili’s accumulated deficit and reflected as an expense in the income statement as these expenses do not relate to the initial recapitalization. See the section entitled “Unaudited Pro Forma Condensed Combined Financial Information
Impact of
COVID-19
There continue to be uncertainties regarding the pandemic of the novel coronavirus, or” included elsewhere in this prospectus for more information.
COVID-19,
and Akili is closely monitoring the impact ofCOVID-19
on all aspects of its business, including how it will impact its customers, employees, suppliers, vendors and business partners. Akili is unable to predict the specific impact thatCOVID-19
may have on its financial position and operations moving forward due to the numerous uncertainties. Any estimates made herein may change as new events occur and additional information is obtained, and actual results could differ materially from any estimates made herein under different assumptions or conditions. Akili will continue to assess the evolving impact ofCOVID-19.
Refer to “Risk Factors
Factors Affecting Our Performance and Results of Operations
We believe that our performance and future success depend on many factors that present significant opportunities for us, but also pose risks and challenges, including those discussed below and in the “” section of this prospectus.
Risk Factors
Product Revenue
To date, we have not generated significant product revenue from the sale of EndeavorRx prescriptions. Revenue from sales of our only approved product is difficult to predict and is not expected to reduce Akili’s continued net losses resulting from our increasing commercial efforts and research and development activities for the foreseeable future.
Product revenue from our approved product, as well as potential future product candidates, is and will be impacted by many factors, including the following three variables: patient and clinician adoption, pricing, and reimbursement.
Patient and Clinician Adoption—
Pricing—
139
Reimbursement—
Collaboration Revenue
We currently have a collaboration and licensing agreement with Shionogi & Co., Ltd (the “Collaboration Agreement”) and the Company is eligible to receive development and commercial milestones as well as royalties on the sales of licensed products. If our development efforts for additional programs are successful and result in regulatory marketing authorization or collaboration or license agreements with third parties, we may generate revenue in the future from collaboration or license agreements that we may enter into with third parties. We cannot predict if, when or to what extent we may enter into future licensing or collaboration agreements. Further, we may never succeed in obtaining regulatory approval for any of our product candidates that are currently under development or any other future products.
Cost of Product Revenue
Cost of product revenue consists primarily of costs that are closely correlated or directly related to the delivery of the Company’s product, including pharmacy costs, amortization of capitalized software related to commercialized products and hosting costs. We expect the cost of product revenue to increase as we further commercialize our products and increase the volume of prescriptions filled.
Research and Development Expenses
We currently have one FDA cleared product, EndeavorRx, in pediatric ADHD
(8-12
year olds). We have two ongoing studies to seek expansion of our indication in ADHD in adults and pediatrics age13-17
years. Developing products requires a significant investment of resources over a prolonged period of time, and a core part of our strategy is to continue making sustained investments in this area. We have chosen to leverage our SSME technology to initially focus on advancing our R&D beyond ADHD. We expect our R&D expenses will increase substantially as we continue to invest in clinical development activities, the development of our pipeline of product candidates, and testing of our product candidates.R&D expenses consist of costs incurred in performing R&D activities, which include:
| • | expenses incurred in connection with the development of our pipeline of products; |
| • | personnel-related expenses, including salaries, bonuses, benefits and stock-based compensation for employees engaged in R&D functions; |
| • | cost of clinical trials; |
| • | cost of regulatory submissions, reviews, external consultants; |
| • | expenses incurred in connection with the discovery and development of our products, including under agreements with third parties, such as consultants; |
| • | expenses incurred under agreements with consultants who supplement our internal capabilities, including software development; and |
| • | facilities, depreciation and other expenses, which include direct and allocated expenses, such as rent and maintenance of facilities, insurance and other operating costs. |
140
Our key R&D projects relate to investigating our SSME technology in the following indications: autism spectrum disorder; multiple sclerosis; and major depressive disorder:
| • | attention in ASD: pilot study completed and planning on an FDA Q-submission meeting in the second half of 2022 to discuss our next planned development phase; |
| • | cognitive dysfunction in MS: POC completed and planning on an FDA Q-submission meeting in the first half of 2023 to discuss our next planned development phase; and |
| • | cognitive dysfunction in MDD: POC completed and planning on an FDA Q-submission meeting in the second half of 2023 to discuss our next planned development phase. |
Development activities for our product candidates have a number of risks and uncertainties. All therapeutic development activities have risks and probabilities of success that can vary by disease indication. There are currently no other existing”
FDA-cleared
digital medicine treatments of the above indications on the market. Each of our product candidates have technical, clinical, regulatory and commercial risk. See the section entitled “Risk Factors—Risks Relating to our Products.
We expense R&D costs as incurred and do not track the costs at a project level. Advance payments that we make for goods or services to be received in the future for use in R&D activities are recorded as prepaid expenses. The prepaid amounts are expensed as the benefits are consumed. In the early phases of development, our R&D costs are often devoted to product platform andstudies that are not necessarily allocable to a specific product.
proof-of-concept
Selling, General and Administrative Expenses
Selling, general and administrative (“SG&A”) expenses consist primarily of compensation for personnel, including stock-based compensation, related to commercial, marketing, executive, finance and accounting, legal, information technology, corporate and business development and human resource functions. Other SG&A expenses include marketing initiatives, market research and analysis, software expenses, travel expenses, professional services fees (including legal, patent, accounting, audit, tax and consulting fees), insurance costs, amortization of issuance costs on undrawn debt, general corporate expenses and allocated certain payroll and facilities-related expenses, including payroll taxes, benefits, rent and facility maintenance.
We expect SG&A expenses to continue to increase as we increase potential customers’ awareness and our sales and marketing functions to support our approved products and any potential future product launches. In addition, we expect increased expenditures to expand our infrastructure to both drive and support our anticipated growth as well as additional expenses related to legal, accounting, information technology, investor and public relations, regulatory and
tax-related
services associated with maintaining compliance with Nasdaq and SEC requirements, director and officer insurance costs and other expenses associated with being a public company andimplementing additional controls over financial reporting.
Other income (expense)
Interest expense includes interest due on the notes payable, accretion of the corporate bond discount and note payable debt issuance costs.
Other income consists of interest earned on cash balances held in interest-bearing accounts and interest earned on short-term investments. We expect that our other income will fluctuate based on the timing and ability to raise additional funds as well as the amount of expenditures on our commercial products, R&D and ongoing business operations.
141
Income taxes
Our income tax provision consists of an estimate for U.S. federal and state income taxes based on enacted rates, as adjusted for allowable credits, deductions, uncertain tax positions, changes in deferred tax assets and liabilities and changes in tax law. The provision for income taxes for 2022 and 2021 is immaterial because Akili has historically incurred net operating losses and maintains a full valuation allowance against its deferred tax assets.
Results of Operations
Three and Six Months Ended June 30, 2022 and 2021
The table and discussion below present the results for the periods indicated:
Three Months Ended June 30, | Six Months Ended June 30, | |||||||||||||||||||||||||||||||
| (dollars in thousands, except percentages) | 2022 | 2021 | $ Change | % Change | 2022 | 2021 | $ Change | % Change | ||||||||||||||||||||||||
Revenues | $ | 64 | $ | 105 | $ | (41 | ) | -39 | % | $ | 130 | $ | 222 | $ | (92 | ) | -41 | % | ||||||||||||||
Cost of revenues | 97 | 98 | (1 | ) | -1 | % | 193 | 160 | 33 | 21 | % | |||||||||||||||||||||
Gross profit (loss) | (33 | ) | 7 | (40 | ) | -571 | % | (63 | ) | 62 | (125 | ) | -202 | % | ||||||||||||||||||
Operating expenses: | ||||||||||||||||||||||||||||||||
Research and development | 7,358 | 4,039 | 3,319 | 82 | % | 13,662 | 7,983 | 5,679 | 71 | % | ||||||||||||||||||||||
Selling, general and administrative | 14,948 | 10,526 | 4,422 | 42 | % | 30,339 | 15,383 | 14,956 | 97 | % | ||||||||||||||||||||||
Total operating expenses | 22,306 | 14,565 | 7,741 | 53 | % | 44,001 | 23,366 | 20,635 | 88 | % | ||||||||||||||||||||||
Operating loss | (22,339 | ) | (14,558 | ) | (7,781 | ) | 53 | % | (44,064 | ) | (23,304 | ) | (20,760 | ) | 89 | % | ||||||||||||||||
Other income (expense): | ||||||||||||||||||||||||||||||||
Other income | 40 | 4 | 36 | 900 | % | 49 | 5 | 44 | 880 | % | ||||||||||||||||||||||
Interest expense | (194 | ) | (39 | ) | (155 | ) | 397 | % | (370 | ) | (120 | ) | (250 | ) | 208 | % | ||||||||||||||||
Extinguishment of debt | — | (181 | ) | 181 | * | — | (181 | ) | 181 | -100 | % | |||||||||||||||||||||
Total other income (expense) | (154 | ) | (216 | ) | 62 | -29 | % | (321 | ) | (296 | ) | (25 | ) | 8 | % | |||||||||||||||||
Loss before income taxes | (22,493 | ) | (14,774 | ) | (7,719 | ) | 52 | % | (44,385 | ) | (23,600 | ) | (20,785 | ) | 88 | % | ||||||||||||||||
Expense from income taxes | — | — | — | — | — | 1 | (1 | ) | -100 | % | ||||||||||||||||||||||
Net loss | $ | (22,493 | ) | $ | (14,774 | ) | $ | (7,719 | ) | 52 | % | $ | (44,385 | ) | $ | (23,601 | ) | $ | (20,784 | ) | 88 | % | ||||||||||
Unrealized (loss) gain on short-term investments | $ | (1 | ) | $ | — | $ | (1 | ) | * | $ | (7 | ) | $ | — | $ | (7 | ) | * | ||||||||||||||
Comprehensive loss | $ | (22,494 | ) | $ | (14,774 | ) | $ | (7,720 | ) | 52 | % | $ | (44,392 | ) | $ | (23,601 | ) | $ | (20,791 | ) | 88 | % | ||||||||||
| * | Percentage change not meaningful |
Revenue—
Revenue was $0.1 million and $0.2 million for the six months ended June 30, 2022 and 2021, respectively. All obligations under the Collaboration Agreement were fulfilled by the end of 2021 and there were no revenues related to the Collaboration Agreement in the six months ended June 30, 2022. The decrease in collaboration revenue is partially offset by an increase in product revenue which is recognized as the Company satisfies performance obligations.
142
Cost of revenue—
Cost of revenue was $0.2 million for each of the six months ended June 30, 2022 and 2021. There was an increase in product related costs of revenue in the six months ended June 30, 2022 as the Company continues to build out its pharmacy capabilities in anticipation of the commercial launch. This was offset by a decrease in costs incurred under the Collaboration Agreement as there were no revenues recognized under the arrangement during the six months ended June 30, 2022.
Research and development
| • | an increase of $1.9 million of personnel related expenses due to an increase in R&D personnel headcount, which increased the expense from $2.9 million in the three months ended June 30, 2021 to $4.8 million in the three months ended June 30, 2022; |
| • | an increase of $0.8 million of clinical studies and expenses incurred in discovery and development primarily due to age expansion studies for ADHD patients in the 13-17 year old and adult categories as well as collaborative studies to treat acute cognitive dysfunction inCOVID-19 survivors, which increased from $0.6 million in the three months ended June 30, 2021 to $1.4 million in the three months ended June 30, 2022; |
| • | an increase of $0.2 million of computer and software equipment expenses due to an increase in software subscriptions, which increased the expense from $0.2 million for the three months ended June 30, 2021 to $0.4 million for the three months ended June 30, 2022; and |
| • | an increase of $0.5 million related to various other expenses such as an increase in external consulting fees and travel expenses, which increased the expense from $0.3 million for the three months ended June 30, 2021 to $0.8 million for the three months ended June 30, 2022. |
R&D expenses were $13.7 million and $8.0 million for the six months ended June 30, 2022 and 2021, respectively. Most expenses in each period are related to the development of our SSME platform, which is the therapeutic engine that targets and activates systems in the brain that play a key role in attention function. The increase of $5.7 million was primarily due to the following:
| • | an increase of $3.1 million of personnel related expenses due to an increase in R&D personnel headcount, which increased the expense from $6.1 million in the six months ended June 30, 2021 to $9.2 million in the six months ended June 30, 2022; |
| • | an increase of $1.9 million of clinical studies and expenses incurred in discovery and development primarily due to age expansion studies for ADHD patients in the 13-17 year old and adult categories as well as collaborative studies to treat acute cognitive dysfunction inCOVID-19 survivors, which increased from $0.8 million in the six months ended June 30, 2021 to $2.7 million in the six months ended June 30, 2022; |
| • | an increase of $0.3 million of computer and software equipment expenses due to an increase in software subscriptions, which increased the expense from $0.3 million for the six months ended June 30, 2021 to $0.6 million for the six months ended June 30, 2022; and |
| • | an increase of $0.4 million related to various other expenses such as an increase in external consulting fees and travel expenses, which increased the expense from $0.8 million for the six months ended June 30, 2021 to $1.2 million for the six months ended June 30, 2022. |
143
Selling, general and administrative—
| • | an increase of $2.9 million in personnel-related costs, primarily due to the build-out of our HR, marketing and sales departments; |
| • | an increase of $1.3 million in consulting, legal, accounting and other professional service costs; |
| • | an increase of $0.6 million related to various other expenses such as software subscriptions and travel expenses, and |
| • | a decrease of $0.4 million in marketing and advertising costs. |
SG&A expenses were $30.3 million and $15.4 million for the six months ended June 30, 2022 and 2021, respectively. The increase of $14.9 million was primarily due to the following:
| • | an increase of $4.7 million in marketing and advertising costs; |
| • | an increase of $5.6 million in personnel-related costs, primarily due to the build-out of our HR, marketing and sales departments; |
| • | an increase of $3.7 million in consulting, legal, accounting and other professional service costs; and |
| • | an increase of $0.9 million related to various other expenses such as software subscriptions and travel expenses. |
Other income—
Other income was less than $0.1 million in the six months ended June 30, 2022 and 2021.
Interest expense—
Interest expense was $0.4 million and $0.1 million in the six months ended June 30, 2022 and 2021, respectively. The $0.3 million increase was primarily related to an increase in the outstanding principal of the note payable during the six months ended June 30, 2022.
Loss on the extinguishment of debt—
Income taxes
144
Years Ended December 31, 2021 and 2020
The table and discussion below present the results for the periods indicated:
December 31, | ||||||||||||||||
| (dollars in thousands, except percentages) | 2021 | 2020 | $ Change | % Change | ||||||||||||
Revenues | $ | 538 | $ | 3,939 | $ | (3,401 | ) | -86 | % | |||||||
Cost of revenues | 355 | 416 | (61 | ) | -15 | % | ||||||||||
Net margin | 183 | 3,523 | (3,340 | ) | -95 | % | ||||||||||
Operating expenses: | ||||||||||||||||
Research and development | 18,234 | 15,418 | 2,816 | 18 | % | |||||||||||
Selling, general and administrative | 42,668 | 13,541 | 29,127 | 215 | % | |||||||||||
Total operating expenses | 60,902 | 28,959 | 31,943 | 110 | % | |||||||||||
Operating loss | (60,719 | ) | (25,436 | ) | (35,283 | ) | 139 | % | ||||||||
Other income (expense): | ||||||||||||||||
Other income | 17 | 124 | (107 | ) | -86 | % | ||||||||||
Interest expense | (465 | ) | (333 | ) | (132 | ) | 40 | % | ||||||||
Loss on extinguishment of debt | (181 | ) | — | (181 | ) | * | ||||||||||
Total other income (expense) | (629 | ) | (209 | ) | (420 | ) | 201 | % | ||||||||
Loss before income taxes | (61,348 | ) | (25,645 | ) | (35,703 | ) | 139 | % | ||||||||
Expense from income taxes | — | 1 | (1 | ) | -100 | % | ||||||||||
Net loss | $ | (61,348 | ) | $ | (25,646 | ) | $ | (35,702 | ) | 139 | % | |||||
| * | Percentage change not meaningful. |
Revenue
Cost of revenue
2021.
Research and development
| • | an increase of $1.6 million of personnel related expenses from $11.4 million in 2020 to $13.0 million in 2021 due to an increase in R&D personnel headcount; |
| • | a decrease of $0.9 million of external consulting fees from $1.6 million in 2020 to $0.7 million in 2021 due to an increase in R&D personnel headcount, which allowed more projects to be performed internally; |
| • | a decrease of $0.2 million of facilities and overhead allocation from $1.0 million in 2020 to $0.8 million in 2021 due to a lower allocation to R&D expenses as the SG&A headcount increased at a faster rate; |
145
| • | an increase of $2.3 million of clinical studies and expenses incurred in discovery and development from $0.6 million in 2020 to $2.9 million in 2021 primarily due to age expansion studies for ADHD patients in the 13-17 year old and adult categories as well as collaborative studies to treat acute cognitive dysfunction inCOVID-19 survivors; and |
| • | an increase of $0.2 million of computer and software equipment expense from $0.6 million in 2020 to $0.8 million in 2021. |
Selling, general and administrative—
| • | an increase of $18.9 million in marketing and advertising costs; |
| • | an increase of $4.2 million in consulting, legal, accounting and other professional service costs; |
| • | an increase of $5.0 million in personnel-related costs, primarily due to the build-out of our HR, marketing and sales departments; and |
| • | an increase of $1.1 million related to various other expenses such as software subscriptions and rent expense. |
Other income
Interest expense
Loss on the extinguishment of debt
Income taxes
Liquidity and Capital Resources
Since our inception, our primary sources of capital have been proceeds from sales of convertible preferred stock, payments received in connection with the Collaboration Agreement and proceeds from borrowings under various credit facilities.
For the years ended December 31, 2021 and 2020, we incurred net operating losses of $60.7 million and $25.4 million, respectively. For the six months ended June 30, 2022 and 2021, we incurred net operating losses of $44.1 million and $23.3 million, respectively.
As of December 31, 2021, we had an accumulated deficit of $226.1 million. As of December 31, 2021, we had outstanding debt of $6.4 million, net of debt issuance costs and debt discount. As of December 31, 2021, we had cash and cash equivalents of $76.9 million.
As of June 30, 2022, we had an accumulated deficit of $275.0 million. As of June 30, 2022, we had outstanding debt of $16.6 million, net of debt issuance costs and debt discount. As of June 30, 2022, we had cash and cash equivalents of $40.6 million and short-term investments of $5.0 million.
146
Our cash flows may fluctuate and are difficult to forecast and will depend on many factors. The revenue from the sale of EndeavorRx at the present time is not sufficient to cover operating costs incurred. Our ability to achieve sufficient revenue to cover our costs is highly dependent on achieving and maintaining broad market acceptance by patients and physicians and our patients having the ability to obtain reimbursement from third-party payers. We expect to continue to generate operating losses and negative operating cash flows for the foreseeable future.
Through December 31, 2021, we have received $228.3 million in gross cash proceeds from sales of preferred stock and gross proceeds of $10.0 million from corporate bonds and notes payable.
In May 2021, we entered into an Amended and Restated Loan and Security Agreement, by and between Silicon Valley Bank (“SVB”), SVB Innovation Credit Fund VIII, L.P., (together, with SCB, the “Lenders”) and Akili (such agreement, the “SVB Term Loan”), which consists of a secured term loan facility in an aggregate amount of up to $50.0 million, of which, $35.0 million became available at closing. As of June 30, 2022, there was $15.0 million outstanding under the term loan facility. Additionally, the corporate bond issued with Shionogi in March 2019 continues to have $5.0 million outstanding as of June 30, 2022.
Our primary uses of capital are, and we expect will continue to be for the near future, personnel costs, costs of development, clinical trial costs and commercialization of product candidates, legal, patent and other regulatory expenses and general overhead costs. We may also pursue acquisitions, investments, joint ventures and other strategic transactions.
We will need substantial additional funding to pursue our growth strategy and support continuing operations. Until such time as we can generate significant revenue to fund operations, we expect to use proceeds from the Business Combination and issuance of equity, debt financings or other capital transactions. We may be unable to increase our revenue, raise additional funds or enter into such other agreements or arrangements when needed on favorable terms, or at all. If we fail to raise capital or enter into such agreements as and when needed, we may have to significantly delay, scale back or discontinue the development and commercialization of one or more of our product candidates and other strategic initiatives.
Cash and cash equivalents
Our cash and cash equivalents balance as of June 30, 2022 was $40.6 million. As a result of the Business Combination on August 19, 2022, the Company received $133.3 million in net proceeds after the reduction of transaction related expenses and other costs paid at Closing. Akili’s future capital requirements may vary from those currently planned and will depend on various factors, including the timing and extent of R&D spending and spending on other strategic business initiatives.
Short-term investments
Our short-term investments balance as of June 30, 2022 was $5.0 million and consists of United States Treasuries with original maturity dates of more than three months but less than one year.
Liquidity Risks
We expect to incur substantial additional expenditures in the near term to support our ongoing activities, including operating as a public company. We expect to continue to incur net losses for the foreseeable future. Our ability to fund our product development and clinical operations as well as commercialization of our product candidates will depend on the amount and timing of cash available to fund operations. Our future liquidity and capital funding requirements will depend on numerous factors, including:
| • | our revenue growth; |
| • | the ability of our patients to obtain third-party payer reimbursement for our current product; |
147
| • | the amount and timing of sales and other revenues from our product candidates, if approved, including the sales price and the availability of coverage and adequate third-party payer reimbursement; |
| • | our sales and marketing activities; |
| • | our R&D efforts; |
| • | the emergence and effect of competing or complementary products; |
| • | the outcome, timing and cost of meeting regulatory requirements established by the FDA, or comparable foreign regulatory authorities; |
| • | the progress, timing, scope and costs of our preclinical studies, clinical trials, potential future clinical trials and other related activities; |
| • | the costs of commercialization activities for any of our product candidates that receive marketing authorization, including the costs and timing of establishing product sales, marketing and hosting capabilities, or entering into strategic collaborations with third parties to leverage or access these capabilities; |
| • | the cash requirements of any future discovery of product candidates; |
| • | our ability to retain our current employees and the need to hire additional management and sales, technical and medical personnel; |
| • | the extent to which we acquire or invest in business, products or technology; and |
| • | the impact of the COVID-19 pandemic. |
A change in the outcome of any of these or other variables with respect to the development of any of our product candidates could significantly change the costs and timing associated with the sale of our products or the development of product candidates. Further, our operating plans may change in the future, and we may need additional funds to meet operational needs and capital requirements associated with such operating plans. See “—
Risk Factors
Risks Related to our Financial Reporting and Position.”
Because of the numerous risks and uncertainties associated with the development and commercialization of our product candidates, we are unable to estimate the amounts of increased capital outlays and operating expenditures associated with our current and anticipated product development programs.
Cash Flows
The following table provides a summary of cash flow data for each applicable period:
Six Months Ended June 30, | Year Ended December 31, | |||||||||||||||
2022 | 2021 | 2021 | 2020 | |||||||||||||
(in thousands) | (in thousands) | |||||||||||||||
Net cash used in operating activities | $ | (41,379 | ) | $ | (21,229 | ) | $ | (53,982 | ) | $ | (24,551 | ) | ||||
Net cash used in investing activities | (4,987 | ) | (103 | ) | (492 | ) | (116 | ) | ||||||||
Net cash provided by financing activities | 10,105 | 112,581 | 112,845 | 1,998 | ||||||||||||
Net increase (decrease) in cash | $ | (36,261 | ) | $ | 91,249 | $ | 58,371 | $ | (22,669 | ) | ||||||
Net Cash Used in Operating Activities
Six Months Ended June 30, 2022 and 2021
We continue to ramp up hiring to accelerate commercial activities and our product pipeline and increase staff in anticipation of becoming a public company. We expect our cash used in operating activities to increase significantly before we start to generate any material cash inflows from operating activities.
148
Net cash used in operating activities was $41.4 million for the six months ended June 30, 2022. Net cash used in operating activities consists of a net loss of $44.4 million, adjusted forassets of $0.2 and
non-cash
items and the effect of changes in working capital.Non-cash
adjustments primarily include depreciation expense of $0.2 million, stock-based compensation expense of $4.0 million, reduction in the carrying amount ofright-of-use
non-cash
interest expense of $0.1 million. There was an additional $1.5 million change in operating assets and liabilities primarily due to deferred offering costs for work performed related to the Merger that were incurred in the six months ended June 30, 2022.Net cash used in operating activities was $21.2 million for the six months ended June 30, 2021. Net cash used in operating activities consists of a net loss of $23.6 million, adjusted for
non-cash
items and the effect of changes in working capital.Non-cash
adjustments primarily include depreciation expense of $0.1 million, stock- based compensation expense of $1.8 million,non-cash
interest expense of $0.1 million, loss on extinguishment of debt of $0.2 million and a $0.2 million change in operating assets and liabilities.Years Ended December 31, 2021 and 2020
Net cash used in operating activities was $54.0 million for the year ended December 31, 2021. Net cash used in operating activities consists of net loss of $61.3 million, adjusted for
non-cash
items and the effect of changes in working capital.Non-cash
adjustments primarily include depreciation expense of $0.3 million, stock-based compensation expense of $4.9 million, loss on the extinguishment of debt of $0.2 million, andnon-cash
interest expense of $0.2 million. There was an additional $1.8 million change in operating assets and liabilities.Net cash used in operating activities was $24.6 million for the year ended December 31, 2020. Net cash used in operating activities consists of a net loss of $25.6 million, adjusted for
non-cash
items and the effect of changes in working capital.Non-cash
adjustments primarily include depreciation expense of $0.3 million, stock-based compensation expense of $2.9 million, andnon-cash
interest expense of $0.3 million, offset by a $2.4 million change in operating assets and liabilities. The change in operating assets and liabilities was primarily due to a decrease in deferred revenue related to the Collaboration Agreement with Shionogi.Net Cash Used in Investing Activities
Six Months Ended June 30, 2022 and 2021
Net cash used in investing activities was $5.0 million and $0.1 million for the six months ended June 30, 2022 and 2021, respectively. The cash was primarily used to purchase short-term investments in the six months ended June 30, 2022.
Years Ended December 31, 2021 and 2020
Net cash used in investing activities was $0.5 million and $0.1 million for the years ended December 31, 2021 and 2020, respectively. The cash was used for investments in property and equipment and capitalized
internal-use
software. We expect to continue to invest further ininternal-use
software and incur costs as we expand our operations.Net Cash Provided by Financing Activities
Six Months Ended June 30, 2022 and 2021
Net cash provided by financing activities was $10.1 million for the six months ended June 30, 2022 and consisted primarily of $10.0 million of proceeds from the issuance of a note payable.
Net cash provided by financing activities was $112.6 million for the six months ended June 30, 2021 and consisted primarily of $109.7 million of proceeds associated with the issuance of Series D convertible preferred stock (net of issuance costs) and $5.0 million of proceeds from a note payable, partially offset by $2.0 million for repayment of principal on a note payable and $0.1 million of premiums and issuance costs on notes payable.
149
Years Ended December 31, 2021 and 2020
Net cash provided by financing activities was $112.8 million for the year ended December 31, 2021 and consisted primarily of $109.7 million of proceeds associated with the issuance of Series D convertible preferred stock (net of issuance costs), $5.0 million of proceeds from a note payable, and $0.3 million of proceeds from the exercise of stock options, partially offset by $2.0 million for repayment of principal on a note payable and
$0.1 million of premiums and issuance costs on notes payable.
Net cash provided by financing activities was $2.0 million for the year ended December 31, 2020 and consisted primarily of $2.0 million of proceeds from the issuance of a note payable.
Funding Requirements
Please see the section of this prospectus titled “” for additional risks associated with our substantial capital requirements.
Risk Factors—Risks Related to our Financial Reporting and Position—We will need substantial additional funding, and if we are unable to raise capital when needed or on terms favorable to us, our business, financial condition and results of operations could be materially and adversely affected
Corporate Bond
In March 2019, in connection with Shionogi exercising its option to enter into the Collaboration Agreement, the Company issued a $5.0 million corporate bond to Shionogi for cash. The corporate bond is unsecured and is subordinated to the obligations of the Company under indebtedness for borrowed money owed by the Company to any bank or other financial institution. The maturity date of the corporate bond is November 10, 2031 and does not bear interest during its term. The corporate bond is prepayable by the Company at any time without penalty. The repayment of the corporate bond can be accelerated upon the termination of the Collaboration Agreement or upon the occurrence of certain events of default (as set forth in the corporate bond), in both cases without penalty.
Debt Financing and Covenants
The SVB Term Loan allows us to draw up to $50.0 million over three tranches. The remaining $20.0 million of the first tranche is available at any time through September 30, 2022. As of June 30, 2022, $15.0 million had been drawn from the first tranche, which is used for general business purposes and to extinguish the Company’s then existing term loan with SVB. The remaining two tranches are available through the earlier of December 31, 2022 or certain specified events, subject to certain terms and conditions. The SVB Term Loan bears interest through maturity at a per annum rate of the greater of (a) the Wall Street Journal Prime Rate plus 3.75% and (b) 7.0%. As of June 30, 2022, the interest rate was 8.5%. We are required to make interest-only payments through May 2023, after which point we will be required to repay the outstanding principal in 24 equal monthly payments.
The SVB Term Loan is secured by substantially all of our personal property assets, including accounts receivable, equipment, license agreement, general intangibles, inventory and investment property, and all of the proceeds and products of the foregoing. The Lenders require us to (i) maintain unrestricted cash at SVB equal to the lesser of (a) 100% of cash at all financial institutions and (b) 105% of our obligations to the Lenders. If we draw from the second tranche and fail to meet the cash requirements noted above, there are additional trailing
3-month
revenue milestones that must be met. The SVB Term Loan contains various affirmative and negative covenants that limit our ability to engage in specified types of transactions. We were in compliance with the covenants under the SVB Term Loan as of June 30, 2022.See Note 7,of the notes to Akili’s consolidated financial statements for the years ended December 31, 2021 and 2020, and Akili’s unaudited condensed consolidated financial statements for the six months ended
Note Payable
150
June 30, 2022, included elsewhere in this prospectus, for further information. In the future, we may seek to obtain other additional sources of financing, including incurring term debt or issuing equity or issuing debt securities.
Contractual Obligations
Akili currently leases office space in Boston, Massachusetts, under a
non-cancelable
operating lease that expires in October 2022. Akili also leases office space in Larkspur, California, under anon-cancelable
operating lease that expires in November 2026. We enter into agreements in the normal course of business with various vendors, which are generally cancelable upon notice. Payments due upon cancellation consist only of payments for services provided or expenses incurred, includingnon-cancellable
obligations of service providers, up to the date of cancellation.See Note 11,, of the notes to Akili’s consolidated financial statements for the years ended December 31, 2021 and 2020, and Note 5,, of the notes to Akili’s unaudited condensed consolidated financial statements for the six months ended June 30, 2022, included elsewhere in this prospectus, for further information.
Commitments and Contingencies
Leases
Off-Balance
Sheet ArrangementsDuring the periods presented, Akili did not have any relationships with unconsolidated organizations or financial partnerships, such as structured finance or special purpose entities, which were established for the purpose of facilitating
off-balance
sheet arrangements.Emerging Growth Company Status (JOBS Act)
Following the Business Combination, we expect to qualify as an “emerging growth company,” or EGC as defined in the Jumpstart Our Business Startups (“JOBS”) Act. Pursuant to the JOBS Act, an EGC is provided the option to adopt new or revised accounting standards that may be issued by Financial Accounting Standards Board, or FASB, or the SEC either (i) within the same periods as those otherwise applicable to
non-emerging
growth companies or (ii) within the same time periods as private companies. Akili intends to take advantage of the exemption for complying with new or revised accounting standards within the same time periods as private companies. Accordingly, the information contained in future SEC filings may be different than the information you receive from other public companies.Akili also intends to take advantage of some of the reduced regulatory and reporting requirements applicable to EGCs pursuant to the JOBS Act so long as it qualifies as an EGC, including, but not limited to, not being required to comply with the auditor attestation requirements of Section 404(b) of the Sarbanes-Oxley Act, reduced disclosure obligations regarding executive compensation and exemptions from the requirements of holding
non-binding
advisory votes on executive compensation and golden parachute payments.Recent Accounting Pronouncements
See Note 2,, of the notes to Akili’s consolidated financial statements for the years ended December 31, 2021 and 2020, and Akili’s unaudited condensed consolidated financial statements for the six months ended June 30, 2022, included elsewhere in this prospectus, for more information about recent accounting pronouncements, the timing of their adoption, and our assessment, to the extent we have made one, of the potential impact on our financial condition and results of operations.
Summary of Significant Accounting Policies
Summary of Critical Accounting Policies and Significant Judgements and Estimates
The preparation of our consolidated financial statements in conformity with United States generally accepted accounting principles, or U.S. GAAP, requires us to make estimates and assumptions that affect the reported amounts of assets and liabilities in the consolidated financial statements and accompanying notes. We base these
151
estimates on historical experience and on various other assumptions that we believe are reasonable under the circumstances, the results of which form the basis for making judgments about the carrying amounts of assets and liabilities that are not readily apparent from other sources. Actual results may differ materially from these estimates. The preparation of these consolidated financial statements requires us to make estimates and judgments that affect the reported amounts of assets, liabilities, revenues and expenses, and the related disclosure of contingent assets and liabilities. We monitor our estimates on an ongoing basis for changes in facts and circumstances, and material changes in these estimates could occur in the future. Changes in estimates are recorded in the period in which they become known. We base our estimates on historical experience and other assumptions that we believe to be reasonable under the circumstances. Actual results may differ from our estimates if past experience or other assumptions do not turn out to be substantially accurate.
We have identified the policies below as critical to our business operations and the understanding of our results of operations. The impact and any associated risks related to these policies on our business operations are discussed throughout this section captioned “” where such policies affect our reported and expected financial results. For a detailed discussion on the application of these and other accounting policies, see Note 2 to Akili’s consolidated financial statements for the years ended December 31, 2021 and 2020, and Akili’s unaudited condensed consolidated financial statements for the six months ended June 30, 2022, included elsewhere in this prospectus.
Akili’s Management’s Discussion and Analysis of Financial
Condition and Results of Operations
Revenue Recognition
We account for revenue recognition in accordance with ASC Topic 606,(“ASC 606”). Under ASC 606, an entity recognizes revenue when its customer obtains control of promised goods or services in an amount that reflects the consideration which the entity expects to receive in exchange for those goods or services. To determine revenue recognition for arrangements that an entity determines are within the scope of ASC 606, the entity performs the following five steps: (i) identify the contract(s) with a customer; (ii) identify the performance obligations in the contract; (iii) determine the transaction price; (iv) allocate the transaction price to the performance obligations in the contract; and (v) recognize revenue when (or as) the entity satisfies a performance obligation.
Revenue from Contracts with Customers
We only apply the five-step analysis to contracts when it is probable that we will collect the consideration to which we are entitled in exchange for the goods or services we transfer to the customer. At contract inception, once the contract is determined to be within the scope of ASC 606, we assess the goods or services promised within each contract, determine those that are performance obligations, and assess whether each promised good or service is distinct. We then recognize as revenue the amount of the transaction price that is allocated to the respective performance obligation when (or as) the performance obligation is satisfied.
We generate product revenue from contracts with caregivers and patients (“Clients”) who purchase three-month subscriptions to access our FDA cleared video game. Clients are billed in advance for the entire subscription term. Along with the subscription to the video game product, the Clients also receive reporting metrics and technical support services. The subscription to the video game product, reporting metrics and technical support services are combined as a single stand-ready performance obligation because while the components are separate performance obligations, they have the same method and pattern of recognition. Accordingly, the purchase consideration is recognized ratably on an over time basis over the subscription period which begins once the access code is inputted into the game by the Client and game play has started.
Under the Collaboration Agreement, we recognize revenue over time on an inputs-based method that uses a cost to cost measure of progress.
Stock-Based Compensation
We measure all stock options granted to employees and directors based on the fair value on the date of the grant and recognize compensation expense of those awards over the requisite service period, which is generally the
152
vesting period of the respective award. Generally, we issue stock options with only service-based vesting conditions and record the expense for these awards using the straight-line method.
We classify stock-based compensation expense in our consolidated statement of operations in the same manner in which the award recipient’s payroll costs are classified or in which the award recipients’ service payments are classified.
We recognize adjustments to stock compensation expense for forfeitures as they occur. The fair value of each stock option grant is estimated on the date of grant using the Black-Scholes option-pricing model.
Common Stock Valuations
The fair value of Akili’s common stock underlying stock awards was determined by the board of directors. Given the absence of a public trading market, the board of directors considered numerous objective and subjective factors to determine the fair value of Akili’s common stock at each board of directors meeting in which stock awards were approved. These factors included, but were not limited to:
| • | the prices at which we sold our preferred stock to outside investors in arm’s-length transactions; |
| • | our results of operations, financial position, and capital resources; |
| • | contemporaneous third-party valuations common stock; |
| • | rights, preferences, and privileges of convertible preferred stock relative to common stock; |
| • | the lack of marketability of common stock; |
| • | stage and development of Akili’s business; |
| • | the history and nature of our business, industry trends and competitive environment; |
| • | general economic conditions; and |
| • | the likelihood of achieving a liquidity event, such as an initial public offering or sale of Akili, given prevailing market conditions. |
We determined the fair value per share of the underlying common stock by taking into consideration results obtained from third-party valuations and additional factors that were deemed relevant. These third-party valuations were performed in accordance with the guidance outlined in the American Institute of Certified Public Accountants’ Accounting and Valuation Guide, Valuation of Privately-Held-Company Equity Securities Issued as Compensation (“Practice Aid”). The Practice Aid identifies various available methods for allocating the enterprise value across classes of capital stock in determining the fair value of our common stock at each valuation date. Based on our stage of development and other relevant factors, historically, we have considered both the Probability Weighted Expected Return Method (“PWERM”) and the option pricing method (“OPM”) as appropriate methods for estimating our enterprise value to determine the fair value of our common stock. The PWERM is a scenario-based methodology that estimates the fair value of common stock based upon an analysis of future values for the company, assuming various outcomes. The common stock value is based on the probability-weighted present value of expected future investment returns considering each of the possible outcomes available as well as the rights of each class of stock. The future value of the common stock under each outcome is discounted back to the valuation date at an appropriate risk-adjusted discount rate and probability weighted to arrive at an indication of value for the common stock. The OPM treats the share classes of an enterprise as a series of call options with a claim on the equity value of the company. Exercise prices are determined based on the equity value breakpoints in which the various share classes either receive a liquidation preference or convert, in the case of preferred stock, or exercise, in the case of options and warrants. An option pricing model, such as Black-Scholes, is then utilized to value the call options for the purpose of allocating value to the various share classes of an enterprise. The OPM is a forward-looking analysis in that it considers the liquidation rights and preferences of the share classes as of a future liquidity date.
153
The assumptions underlying these valuations represented management’s best estimates, which involved inherent uncertainties and the application of management’s judgment. As a result, if we had used significantly different assumptions or estimates, the fair value of our preferred and common stock and our stock-based compensation expense could be materially different. The fair value of the underlying common stock will be determined by the board of directors until such time as our common shares are listed on an established stock exchange.
Quantitative and Qualitative Disclosures About Market Risk
We are exposed to market risks from fluctuations in interest rates, which may adversely affect our results of operations and financial condition. We seek to minimize these risks through regular operating and financing activities. For additional information on our variable rate debt, refer to the notes to our consolidated financial statements found elsewhere in this prospectus.
154
MANAGEMENT
Executive Officers and Directors
The following table sets forth certain information concerning our executive officers and directors as of the date of this prospectus:
Name | Age | Title | ||
Executive Officers: | ||||
W. Edward Martucci, Ph.D. | 40 | Chief Executive Officer and Director | ||
Santosh Shanbhag | 45 | Chief Financial Officer | ||
Matthew Franklin | 49 | President and Chief Operating Officer | ||
Anil Jina, MB, BCh, BAO | 51 | Chief Medical Officer | ||
Jacqueline Studer, J.D. | 63 | Chief Legal Officer | ||
Jonathan David . | 44 | Chief Product Officer | ||
Non-Executive Directors: | ||||
Chamath Palihapitiya | 45 | Chairman and Director | ||
Bharatt Chowrira, J.D., Ph.D. | 57 | Director | ||
Kenneth Ehlert | 53 | Director | ||
Adam Gazzaley, M.D., Ph.D. | 53 | Director | ||
William “BJ” Jones, Jr. | 59 | Director | ||
Christine Lemke | 45 | Director |
Executive officers
W. Edward (“Eddie”) Martucci, Ph.D.
co-founders,
has served as our Chief Executive Officer, and as a member of our board of directors since August 2022. Dr. Martucci served in the same capacity at Akili from August 2015 until August 2022, including as Akili’s employee beginning in September 2017. From June 2009 to September 2017, Dr. Martucci was employed by PureTech Health PLC, a publicly traded biotherapeutics company, where heco-founded
Akili in 2011 and served as Akili’s Chief Operating Officer from 2011 until August 2015. Since February 2017, he has served on the board of the Digital Therapeutics Alliance, a digital therapeutics industry advocacy organization. Dr. Martucci holds a B.S. in biochemistry from Providence College and a M.Phil. and Ph.D. in molecular biophysics and biochemistry from Yale University.We believe Dr. Martucci is qualified to serve on our board of directors due to his knowledge of Akili as
co-founder,
his scientific background and knowledge of the broader industry.Santosh Shanbhag
build-out
the international business and secure reimbursement for novel medicines in key international markets. Prior to Vertex, Mr. Shanbhag served in positions of increasing responsibility at Capgemini Consulting, a global leader in consulting, digital transformation, technology and engineering services, and at Texas Instruments Incorporated, a publicly traded technology company.Mr. Shanbhag holds a B.E. in engineering from MSRIT, Bangalore, India, an M.S. in mechanical engineering from the University of Massachusetts, Amherst and an M.S. in management and engineering from the Massachusetts Institute of Technology and the Sloan School of Management.
Matthew Franklin
155
Corp., a publicly traded molecular diagnostics company. From March 2020 to January 2021, Mr. Franklin served as Chief Commercial Officer of Thrive Earlier Detection Corp., a healthcare company, where he led thestrategy development for their multi-cancer early detection assay. From August 2018 to January 2020, Mr. Franklin served as Chief Business Officer of ArcherDX Inc., a growth-stage molecular diagnostics company, where he was responsible for establishing and scaling the global sales, customer support, marketing, market access, business development and corporate development teams. From March 2015 to July 2018, Mr. Franklin served as Senior Vice President of Global Marketing and Clinical Product Strategy of Foundation Medicine Inc., a molecular insights company which was acquired by Roche Holdings, Inc. in 2018. Mr. Franklin holds a B.A. in English literature from Northwestern University and an MBA from the University of Michigan, Ann Arbor.
go-to-market
Anil S. Jina, MB, BCh, BAO
Jacqueline Studer, J.D.
Jonathan David
free-to-play
Non-executive
directorsChamath Palihapitiya
156
Holdings Corp. IV. In addition, Mr. Palihapitiya currently serves as the Chief Executive Officer and the Chairman of the board of directors of each of Social Capital Hedosophia Holdings Corp. IV and Social Capital Hedosophia Holdings Corp. VI. Mr. Palihapitiya previously served as the Chief Executive Officer and the Chairman of the board of directors of Social Capital Hedosophia Holdings Corp. from May 2017 until the consummation of its business combination with Virgin Galactic in October 2019, and served as the Chairman of the board of directors of Virgin Galactic until February 2022. Mr. Palihapitiya also previously served as the Chief Executive Officer and the Chairman of the board of directors of Social Capital Hedosophia Holdings Corp. II until the consummation of its business combination with Opendoor Labs Inc. in December 2020 and as the Chief Executive Officer and the Chairman of the board of directors of Social Capital Hedosophia Holdings Corp. III until the consummation of its business combination with Clover Health Investments, Corp. in January 2021 and as the Chief Executive Officer and Chairman of the board of directors of Social Capital Hedosophia Holdings Corp. V until the consummation of its business combination with Social Finance, Inc. in May 2021 and the Chief Executive Officer and the Chairman of the board of directors of Social Capital Suvretta Holdings Corp. III until the consummation of its business combination with ProKidney in July 2022. Mr. Palihapitiya also served as a director of Slack Technologies Inc. from April 2014 until October 2019. Prior to founding Social Capital in 2011, Mr. Palihapitiya served as Vice President of User Growth at Facebook, and is recognized as having been a major force in its launch and growth. Mr. Palihapitiya was responsible for overseeing Monetization Products and Facebook Platform. Prior to working for Facebook, Mr. Palihapitiya was a principal at the Mayfield Fund, one of the U.S.’ oldest venture firms, before which he headed the instant messaging division at AOL. Mr. Palihapitiya graduated from the University of Waterloo, Canada with a degree in electrical engineering.
We believe that Mr. Palihapitiya’s extensive management history and experience in identifying, investing in and building next-generation technologies and companies provide him with the qualifications to serve as a director of the Company.
Bharatt Chowrira, J.D., Ph.D.,
We believe that Dr. Chowrira’s extensive experience in the pharmaceutical and healthcare industries, including roles in executive management and oversight of financial matters, qualifies him to serve on our board of directors.
Kenneth Ehlert
157
We believe that Mr. Ehlert is qualified to serve as a director due to his extensive experiences in management positions.
Adam Gazzaley, M.D., Ph.D.
co-founders,
has served as a member of our board of directors and Chief Science Advisor since August 2022, as a member of Akili’s board of directors since November 2014 and as Akili’s Chief Science Advisor from January 2011 to August 2022. Dr. Gazzaley is the David Dolby Distinguished Professor of Neurology, Physiology and Psychiatry at the University of California, San Francisco (“UCSF”), and the Founder & Executive Director of Neuroscape at UCSF, where he has been employed since July 2005. Additionally, Dr. Gazzaley isco-founder
and Chief Scientific Advisor of JAZZ Venture Partners LLC, a venture capital firm focused on technologies that improve human performance. Dr. Gazzaley has also been on the Board of Trustees of the California Academy of Sciences since May 2019, a Science Council Member there since August 2019, and a Science Fellow there since May 2020. From January 2015 to January 2018, he served as a Science Board member of the President’s Council on Fitness, Sports & Nutrition. Dr. Gazzaley holds a B.S. in biochemistry from Binghamton University, and a Ph.D. in neuroscience and an M.D. from Mount Sinai School of Medicine. He completed his postdoctoral fellowship in neuroscience at Mount Sinai School of Medicine and his residency in neurology at the hospital of the University of Pennsylvania.We believe that Dr. Gazzaley is qualified to serve as a member of our board of directors because of his scientific background, research in neuroscience and experience in the life sciences industry.
William (“BJ”) Jones, Jr.,
FDA-approved
product (Nurtec ODT), since April 2019. Prior to Biohaven, from January 2016 to March 2019, Mr. Jones served as Vice President, Head of Sales and Commercial Operations for the general medicine business unit of Takeda Pharmaceutical Company Limited, a publicly traded pharmaceutical company. Mr. Jones holds a B.S. in human factors engineering from the U.S. Air Force Academy, an M.S. in industrial engineering from Texas A&M University and an MBA from the Stanford University Graduate School of Business.We believe that Mr. Jones’ experience in the pharmaceutical industry qualifies him to serve on our board of
directors.
Christine Lemke
Co-Chief
Executive Officer and Director. Since February 2016, she has also served asCo-Founder
and General Partner of Ensemble Labs, GP, an investor in early stage health technology companies. Prior to Evidation Health and Ensemble Labs, Ms. Lemke wasco-founder
and Chief Operating Officer of Sense Networks, Inc., developers of the first machine learning platform for mobile phone activity data. Ms. Lemke holds a B.A. in business from the University of Washington and an MBA from HEC Paris.We believe that Ms. Lemke’s leadership in the digital health and biopharmaceutical commercialization industry provides her with the qualifications and skills necessary to serve as a member of our board of directors.
Independence
Our board of directors has determined that all of our directors are “independent directors” as defined in Nasdaq listing standards and applicable SEC rules, except for W. Edward Martucci and Adam Gazzaley. Our independent directors will have regularly scheduled meetings at which only independent directors are present.
158
Classified Board of Directors
Our board of directors consists of seven members and is divided into three classes. At each annual general meeting of stockholders, the successors to directors whose terms then expire will be elected to serve from the time of election and qualification until the third annual meeting following the election. The directors are divided among the three classes as follows:
| • | the Class I directors are Kenneth Ehlert and Bharatt Chowrira, J.D., Ph.D., and their terms will expire at the annual meeting of stockholders to be held in 2023; |
| • | the Class II directors are Christine Lemke and William “BJ” Jones, Jr., and their terms will expire at the annual meeting of stockholders to be held in 2024; and |
| • | the Class III directors are W. Edward Martucci, Ph.D., Chamath Palihapitiya and Adam Gazzaley, M.D., Ph.D., and their terms will expire at the annual meeting of stockholders to be held in 2025. |
It is expected that any additional directorships resulting from an increase in the number of directors will be distributed among the three classes so that, as nearly as possible, each class will consist of
one-third
of the directors. The division of the board into three classes with staggered three-year terms may delay or prevent a change of our management or a change in control.Committees of the Board
Our board of directors has the authority to appoint committees to perform certain management and administration functions. The composition and responsibilities of each committee are described below. Members serve on these committees until their resignation or until otherwise determined by the board of directors. The charters for each of these committees are available on the website of the company at. Information contained on or accessible through the website is not a part of this prospectus, and the inclusion of such website address in this prospectus is an inactive textual reference only.
www.akiliinteractive.com
Audit Committee
The audit committee consists of Kenneth Ehlert, William “BJ” Jones, Jr., and Bharatt Chowrira, J.D., Ph.D. Our board of directors has determined each proposed member of its audit committee is independent under the applicable Nasdaq listing rules and Rule
10A-3(b)(1)
of the Exchange Act. Bharatt Chowrira, J.D., Ph.D. is the chair of the audit committee. Our board of directors has determined that Bharatt Chowrira, J.D., Ph.D. is an “audit committee financial expert” within the meaning of SEC regulations. Our board of directors has also determined that each member of the proposed audit committee has the requisite financial expertise required under the applicable requirements of Nasdaq. In arriving at this determination, our board of directors has examined each audit committee member’s scope of experience and the nature of their employment in the corporate finance sector.The primary purpose of the audit committee is to discharge the responsibilities of the board of directors with respect to accounting, financial, and other reporting and internal control practices and to oversee the independent registered accounting firm.
Specific responsibilities of the audit committee include:
| • | selecting a qualified firm to serve as the independent registered public accounting firm to audit the financial statements of the company; |
| • | helping to ensure the independence and performance of the independent registered public accounting firm; |
| • | discussing the scope and results of the audit with the independent registered public accounting firm, and reviewing, with management and the independent accountants, the annual audited financial statements and quarterly financial statements of the company; |
159
| • | developing procedures for employees to submit concerns anonymously about questionable accounting or audit matters; |
| • | reviewing policies on risk assessment and risk management; |
| • | reviewing related party transactions; |
| • | obtaining and reviewing a report by the independent registered public accounting firm at least annually that describes the internal quality-control procedures, any material issues with such procedures, and any steps taken to deal with such issues when required by applicable law; and |
| • | approving (or, as permitted, pre-approving) all audit and all permissiblenon-audit service to be performed by the independent registered public accounting firm. |
Compensation Committee
Our compensation committee consists of Christine Lemke and William “BJ” Jones, Jr.. Christine Lemke serves as the chair of the compensation committee. Our board of directors has determined each proposed member is a
“non-employee
director” as defined in Rule16b-3
promulgated under the Exchange Act and an “outside director” as that term is defined in Section 162(m) of the Internal Revenue Code of 1986, as amended. Our board of directors has determined that each proposed member of the compensation committee is independent under the applicable Nasdaq listing rules. The primary purpose of the compensation committee is to discharge the responsibilities of the board of directors to oversee its compensation structure, policies and programs and to review the processes and procedures for the consideration and determination of director and executive compensation.Specific responsibilities of the compensation committee will include:
| • | recommending to the company board goals and objectives, non-equity compensation, and equity grants of all senior officers; |
| • | recommending to the company board goals and objectives, non-equity compensation, and equity grants for the Chief Executive Officer; |
| • | recommending to the board non-equity compensation and equity grants for the directors and the Chair; |
| • | selecting independent compensation consultants and assessing whether there are any conflicts of interest with any of the committee’s compensation advisors; |
| • | reviewing and approving employment agreements, severance arrangements and change-of-control |
| • | reviewing the policies relating to compensation and benefits of employees. |
Nominating and Corporate Governance Committee
Our nominating and corporate governance committee consists of Kenneth Ehlert and William “BJ” Jones, Jr.. William “BJ” Jones, Jr. serves as the chair of the nominating and corporate governance committee. Our board of directors has determined that each proposed member of the nominating and corporate governance committee is independent under applicable Nasdaq listing rules.
Specific responsibilities of our nominating and corporate governance committee include:
| • | identify individuals qualified to become board members, consistent with criteria approved by the board of directors; |
| • | recommend that the board of directors select the nominees for election as directors at each annual meeting of stockholders; |
160
| • | develop and recommend to the board of directors corporate governance guidelines and periodically review those guidelines and recommend any changes; and |
| • | oversee an annual evaluation of the board of directors, its committees and management. |
Code of Ethics
We have adopted a Code of Ethics that applies to all of its employees, officers and directors, including those officers responsible for financial reporting. The Code of Ethics is available on the website of the company at. Information contained on or accessible through such website is not a part of this prospectus, and the inclusion of the website address in this prospectus is an inactive textual reference only. We intend to disclose any amendments to the Code of Ethics, or any waivers of its requirements, on its website to the extent required by the applicable rules and exchange requirements.
www.akiliinteractive.com
Compensation Committee Interlocks and Insider Participation
No member of the Compensation Committee has ever been an officer or employee of either SCS or Akili. None of our executive officers serve, or have served during the last year, as a member of the board of directors, compensation committee, or other board committee performing equivalent functions of any other entity that has one or more executive officers serving as one of the directors on either Akili’s or SCS’ compensation committee.
Limitation on Liability and Indemnification of Officer and Directors
Our Certificate of Incorporation and Bylaws provide indemnification and advancement of expenses for our directors and officers to the fullest extent permitted by the DGCL, subject to certain limited exceptions. We have entered into indemnification agreements with each of our directors and officers. In some cases, the provisions of those indemnification agreements may be broader than the specific indemnification provisions contained under Delaware law. In addition, as permitted by Delaware law, our Certificate of Incorporation and Bylaws include provisions that eliminate the personal liability of directors for monetary damages resulting from breaches of certain fiduciary duties as a director. The effect of this provision is to restrict our rights and the rights of the our stockholders in derivative suits to recover monetary damages against a director for breach of fiduciary duties as a director.
We have also obtained a policy of directors’ and officers’ liability insurance that insures our officers and directors against the cost of defense, settlement or payment of a judgment in some circumstances and insures us against our obligations to indemnify our officers and directors.
These provisions may discourage stockholders from bringing a lawsuit against our directors for breach of their fiduciary duty. These provisions also may have the effect of reducing the likelihood of derivative litigation against officers and directors, even though such an action, if successful, might otherwise benefit us and our stockholders. Furthermore, a stockholder’s investment may be adversely affected to the extent we pay the costs of settlement and damage awards against officers and directors pursuant to these indemnification provisions.
We believe that these provisions, the directors’ and officers’ liability insurance and the indemnity agreements are necessary to attract and retain talented and experienced officers and directors.
161
EXECUTIVE COMPENSATION
2021 Summary Compensation Table
The following table shows the total compensation earned by, or paid to, our named executive officers for services rendered to us in all capacities during the fiscal year ended December 31, 2021. Amounts of common stock or options in this section reflect the number of Akili shares of common stock or options issued, respectively, prior to conversion in the Business Combination.
Non-Equity | ||||||||||||||||||||||||||||
Option | Incentive Plan | All Other | ||||||||||||||||||||||||||
Salary | Bonus | Awards | Compensation | Compensation | Total | |||||||||||||||||||||||
Name and Principal Position | Year | ($) | ($) (1) | ($) (2) | ($) (3) | ($) (4) | ($) | |||||||||||||||||||||
W. Edward Martucci | 2021 | 400,000 | — | 2,221,997 | 162,000 | 9,800 | 2,793,797 | |||||||||||||||||||||
Chief Executive Officer | — | |||||||||||||||||||||||||||
Jacqueline Studer | 2021 | 367,800 | 25,000 | 394,380 | 99,306 | 9,800 | 896,286 | |||||||||||||||||||||
Chief Legal Officer | ||||||||||||||||||||||||||||
Santosh Shanbhag | 2021 | 343,419 | 25,000 | 379,024 | 92,723 | 9,800 | 849,966 | |||||||||||||||||||||
Chief Financial Officer | ||||||||||||||||||||||||||||
| (1) | The amounts reported represent discretionary bonuses earned by Ms. Studer and Mr. Shanbhag for performance during December 31, 2021. |
| (2) | The amounts reported represent the aggregate grant date fair value of stock option awards granted to our named executive officers during the fiscal year ended December 31, 2021, computed in accordance with FASB ASC Topic 718. Such grant date fair values do not take into account any estimated forfeitures related to service-based vesting. A discussion of the assumptions used in determining grant date fair value may be found in Note 9 to Akili’s financial statements for the year ended December 31, 2021, included elsewhere in this prospectus. These amounts also include the incremental fair value of certain modified stock options associated with a stock option repricing in 2021 (determined as of such repricing date in accordance with FASB ASC Topic 718). These amounts do not correspond to the actual value that may be recognized by the named executive officers upon exercise of the applicable award or sale of the underlying shares of stock. |
| (3) | The amounts in the “Non-Equity Incentive Plan Compensation” column reflects the actual payout of the 2021 cash bonus, as describe in more details below. |
| (4) | The amounts reported represent matching contributions contributed by Akili to each named executive’s account in Akili’s 401(k) plan. |
Narrative Disclosure to Summary Compensation Table
2021 Base Salaries
Our named executive officers each receive a base salary to compensate them for services rendered to Akili. The base salary payable to each named executive officer is intended to provide a fixed component of compensation reflecting the executive’s skill set, experience, role and responsibilities. Base salaries may be adjusted from time to time to realign salaries with market levels after taking into account individual responsibilities, performance and experience. The annual base salary for each of our named executive officers for the fiscal year ended December 31, 2021 is specified below:
Name | Base Salary | |||
W. Edward Martucci | $ | 400,000 | ||
Jacqueline Studer (1) | $ | 380,000 | ||
Santosh Shanbhag (2) | $ | 350,000 | ||
| (1) | Ms. Studer’s base salary was increased from $328,000 to $380,000 effective as of March 26, 2021. |
| (2) | Mr. Shanbhag’s base salary was increased from $317,200 to $350,000 effective March 12, 2021. |
162
2021 Cash Bonuses
For the fiscal year ended December 31, 2021, each of the named executive officers was eligible to earn a discretionary annual cash bonus determined by Akili’s board of directors in its sole discretion, based on corporate performance. The target annual bonus for each of our named executive officers for the fiscal year ended December 31, 2021 was equal to the percentage of the executive’s respective annual base salary specified below:
Name | Target Bonus Percentage | Actual Payout | ||||||
W. Edward Martucci | 45 | % | 162,000 | |||||
Jacqueline Studer | 30 | % | 99,306 | |||||
Santosh Shanbhag | 30 | % | 92,723 | |||||
In addition, Ms. Studer and Mr. Shanbhag each earned an additional $25,000 for performance during fiscal year ended December 31, 2021.
Equity-Based Compensation
Although Akili did not have a formal policy with respect to the grant of equity incentive awards to its executive officers, Akili believed that equity grants provide its executives with a strong link to its long- term performance, create an ownership culture and help to align the interests of its executives and its stockholders. In addition, Akili believed that equity grants promote executive retention because they incentivize executive officers to remain in our employment during the vesting period. Accordingly, Akili’s board of directors or its compensation committee periodically reviewed the equity incentive compensation of its named executive officers and could have granted equity incentive awards to them from time to time. In furtherance of these goals, in 2021, each of our named executive officers was granted stock option awards. In addition, in 2021, Akili implemented an option repricing program to reduce the exercise prices of underwater stock options held by our employees, including our named executive officers. The number of shares, the vesting schedules, and the expiration dates of the original stock options remained unchanged. For additional information regarding outstanding equity awards held by the our named executive officers as of December 31, 2021, see the “” table below.
Outstanding Equity Awards at 2021 Fiscal Year End
401(k) Plan
We maintains a retirement savings plan, or 401(k) plan, that is intended to qualify for favorable tax treatment under Section 401(a) of the Code, and contains a cash or deferred feature that is intended to meet the requirements of Section 401(k) of the Code. U.S. employees are generally eligible to participate in the 401(k) plan, subject to certain criteria. Participants may make
pre-tax
and certainafter-tax
(Roth) salary deferral contributions to the plan from their eligible earnings up to the statutorily prescribed annual limit under the Code. Participants who are 50 years of age or older may contribute additional amounts based on the statutory limits forcatch-up
contributions. Participant contributions are held in trust as required by law. Akili provided matching contributions under the 401(k) Plan, and provided such contributions during the 2021 Fiscal Year.163
Outstanding Equity Awards at 2021 Fiscal Year End
The following table lists all outstanding equity awards held by our named executive officers as of December 31, 2021.
Option Awards (1) | ||||||||||||||||||||
Name | Number of Securities Underlying Unexercised Options (#) Exercisable | Number of Securities Underlying Unexercised Options (#) Unexercisable | Vesting Commencement Date (“VCD”) | Option Exercise Price ($) | Option Expiration Date | |||||||||||||||
W. Edward Martucci | 75,271 | (2) | — | 4/3/2015 | 2.38 | 8/26/2025 | ||||||||||||||
| 276,540 | (3) | — | 5/6/2016 | 2.46 | 5/20/2026 | |||||||||||||||
| 470,112 | (4) | 156,705 | (4) | 4/2/2019 | 4.40 | 10/2/2028 | ||||||||||||||
| 9,375 | (5) | 5,625 | (5) | 3/15/2020 | 4.40 | 5/21/2030 | ||||||||||||||
| 2,500 | (6) | 2,500 | (6) | 11/18/2020 | 4.40 | 5/21/2030 | ||||||||||||||
| 90,416 | (7) | 529,584 | (7) | 6/25/2021 | 4.40 | 9/29/2031 | ||||||||||||||
Jacqueline Studer | 125,000 | (8) | 75,000 | (8) | 3/26/2020 | 4.40 | 6/12/2029 | |||||||||||||
| 9,375 | (5) | 5,625 | (5) | 3/15/2020 | 4.40 | 5/21/2030 | ||||||||||||||
| 2,500 | (6) | 2,500 | (6) | 11/18/2020 | 4.40 | 5/21/2030 | ||||||||||||||
| 15,312 | (7) | 89,688 | (7) | 6/25/2021 | 4.40 | 9/29/2031 | ||||||||||||||
Santosh Shanbhag | 189,687 | (9) | 113,813 | (9) | 3/12/2020 | 4.40 | 6/12/2029 | |||||||||||||
| 9,375 | (5) | 5,625 | (5) | 3/15/2020 | 4.40 | 5/21/2030 | ||||||||||||||
| 2,500 | (6) | 2,500 | (6) | 11/18/2020 | 4.40 | 5/21/2030 | ||||||||||||||
| 13,854 | (7) | 81,146 | (7) | 6/25/2021 | 4.40 | 9/29/2031 | ||||||||||||||
| (1) | Each equity award was granted under Akili’s Amended and Restated 2011 Stock Incentive Plan (the “2011 Plan”). |
| (2) | Represents an option to purchase shares of common stock granted on April 3, 2015. The shares underlying this option vested as follows: 50% of the shares vested on the vesting commencement date (the “VCD”) and 16.67% vested on each 12 month anniversary of the VCD, subject to continued service through the applicable vesting date. |
| (3) | Represents an option to purchase shares of common stock granted on May 6, 2016. The shares underlying this option vest as follows: 28.6% of the shares vested on the VCD and 8.925% vests at the end of each 6 month period, subject to continued service through the applicable vesting date. |
| (4) | Represents an option to purchase shares of common stock granted on April 2, 2019. The shares underlying this option vest as follows: 12.5% of the shares vested on the VCD and 12.5% vested at the end of each 6 month period, subject to continued service through the applicable vesting date. |
| (5) | Represents an option to purchase shares of common stock granted on March 15, 2020. The shares underlying this option vest as follows: 25% of the shares vested on the VCD and 12.5% vests at the end of each 6 month period, subject to continued service through the applicable vesting date. |
| (6) | Represents an option to purchase shares of common stock granted on November 18, 2020. The shares underlying this option vest as follows: 16.67% of the shares vested on the VCD and 16.67% vests at the end of each 6 month period, subject to continued service through the applicable vesting date. |
| (7) | Represents an option to purchase shares of common stock granted on June 25, 2021. The shares underlying this option vest and become exercisable in 48 equal monthly installments over four years, subject to continued service through the applicable vesting date. |
| (8) | Represents an option to purchase shares of common stock granted on March 26, 2020. The shares underlying this option vest as follows: 25% of the shares vested on the VCD and 12.5% vests at the end of each 6 month period, subject to continued service through the applicable vesting date. |
| (9) | Represents an option to purchase shares of common stock granted on March 12, 2020. The shares underlying this option vest as follows: 25% of the shares vested on the VCD and 12.5% vested at the end of each 6 month period, subject to continued service through the applicable vesting date. |
164
Executive Compensation Arrangements
We have entered into offer letters with each of its named executive officers. Each offer letter provides for
“at-will”
employment and eligibility to participate in our benefit plans generally.Potential Payments Upon Termination or Change in Control
Akili’s named executive officers participate in the Akili Interactive Labs, Inc. Executive Severance Plan (the “Severance Plan”). The Severance Plan provides that upon a covered termination (i.e., a termination by Akili without “cause” or by the executive for “good reason”, each as defined in the Severance Plan) outside of the change in control period (i.e., the 12-month period immediately following the occurrence of a change in control event, as defined in the Severance Plan), each named executive officer will be entitled to receive, subject to the execution and delivery of an effective release of claims in favor of the Company (i) an amount equal to the named executive’s monthly base salary multiplied by nine for Dr. Martucci and six for Ms. Studer and Mr. Shanbhag, reduced by any payment due pursuant to a restrictive covenant agreement (as defined in the Severance Plan), and (ii) an amount equal to the monthly employer COBRA premium for the same level group health coverage as in effect for the executive on the date of termination until the earliest of (A) nine months following the date of termination for Dr. Martucci and 6 months following the date of termination for Ms. Studer and Mr. Shanbhag, (B) the named executive officer’s eligibility for group health coverage through other employment and (C) the end of the named executive officer’s eligibility under COBRA for continuation of coverage for health care. These amounts will be paid out in substantially equal installments in accordance with the Company’s payroll practice over the severance period.
The Severance Plan also provides that upon a covered termination within the change in control period, each named executive officer will be entitled to receive, subject to the execution and delivery of an effective release of claims in favor of the Company, (i) a lump sum in cash equal to the sum of (A) the named executive’s monthly base salary multiplied by 12 for Dr. Martucci and 9 for Ms. Studer and Mr. Shanbhag, plus (B) the 1.0 times the target bonus for Dr. Martucci and 0.75 times the target bonus for Ms. Studer and Mr. Shanbhag, reduced by any payment due pursuant to a restrictive covenant agreement, (ii) an amount equal to the monthly employer COBRA premium for the same level group health coverage as in effect for the executive on the date of termination until the earliest of (A) 12 months following the date of termination for Dr. Martucci and 9 months following the date of termination for Ms. Studer and Mr. Shanbhag, (B) the named executive officer’s eligibility for group health coverage through other employment and (C) the end of the named executive officer’s eligibility under COBRA for continuation of coverage for health care, and (iii) for all outstanding and unvested equity awards of the Company that are subject to time-based vesting held by each named executive officer, full accelerated vesting of such awards. These amounts will be paid out within 60 days following the date of termination within the change in control period.
Employee Benefit and Equity Compensation Plans
Amended and Restated 2011 Stock Incentive Plan
Akili’s Amended and Restated 2011 Plan, or the 2011 Plan, was approved by its board of directors and its stockholders on May 21, 2021. Under the 2011 Plan, Akili has reserved for issuance an aggregate of 11,737,602 shares of its common stock. The number of shares of common stock reserved for issuance is subject to adjustment in the event of any merger, consolidation, sale of all or substantially all of Akili’s assets, reorganization, recapitalization, reclassification, stock split, stock dividend, reverse stock split,
spin-off
or other similar transaction.The shares of common stock underlying awards that are forfeited, expired, canceled, reacquired by us prior to vesting, satisfied without the issuance of stock or otherwise terminated (other than by exercise) and shares of common stock that are withheld upon exercise of an option or settlement of an award to cover the exercise price or tax withholding are added back to the shares of common stock available for issuance under the 2011 Plan.
165
Akili’s board of directors has acted as administrator of the 2011 Plan. The administrator has full power to select, from among the individuals eligible for awards, the individuals to whom awards will be granted, and to determine the specific terms and conditions of each award, subject to the provisions of the 2011 Plan. Persons eligible to participate in the 2011 Plan are those employees, officers and directors of, and consultants and advisors to, Akili as selected from time to time by the administrator in its discretion.
The 2011 Plan permits the granting of (1) options to purchase common stock intended to qualify as incentive stock options under Section 422 of the Internal Revenue Code of 1986, as amended, or the Code, and (2) options that do not so qualify. The per share exercise price of each option is determined by the administrator but may not be less than 100% of the fair market value of the common stock on the date of grant. The term of each option is fixed by the administrator but may not exceed 10 years from the date of grant. The administrator determines at what time or times each option may be exercised. In addition, the 2011 Plan permits the granting of restricted shares of common stock, restricted stock units, and other stock-based awards of common stock.
The 2011 Plan provides that upon the occurrence of a “reorganization event,” as defined in the 2011 Plan, the board of directors may take any one or more of the following actions: (i) provide that awards shall be assumed, or substantially equivalent awards shall be substituted with new awards by the acquiring or succeeding corporation, (ii) provide that the participant’s unexercised awards will terminate immediately prior to the consummation of such reorganization event, unless exercised by the participant within a specified period determined by the board of directors , (iii) provide that outstanding awards shall become exercisable, realizable or deliverable or restrictions applicable to an award shall lapse in whole or in part prior to such reorganization event, (iv) in the event of a reorganization event under the terms of which holders of common stock will receive a cash payment for each share, make or provide for a cash payment to a participant equal to the value of the consideration payable per share in the reorganization event and the per share exercise price, in exchange for the termination of such awards, (v) provide that, in connection with a liquidation or dissolution of Akili, awards shall convert into the right to receive liquidation proceeds, or (vi) a combination of the forgoing.
The board of directors may amend or discontinue the 2011 Plan at any time, subject to stockholder approval where such approval is required by applicable law. The administrator of the 2011 Plan may also amend, modify or cancel any outstanding award, provided that no amendment to an award may adversely affect a participant’s rights without his or her consent.
No awards shall be granted under the 2011 Plan after the expiration of 10 years from the earlier of (i) the date on which the 2011 Plan was adopted by the board of directors, or (ii) the date the Plan was approved by Akili’s stockholders. As of May 31, 2022, options to purchase 8,453,300 shares of common stock and 1,056,250 restricted share awards were outstanding under the 2011 Plan. The 2011 Plan terminated upon the Closing of the Business Combination, but will continue to govern the terms of the options assumed in the Business Combination.
2022 Stock Option and Incentive Plan
The Board unanimously approved the 2022 Stock Option and Incentive Plan, or the 2022 Plan, which was approved by the stockholders on August 18, 2022 and became effective on the Closing Date. The 2022 Plan allows us to make equity-based incentive awards to our officers, employees, directors and consultants.
We have initially reserved 12,813,781 shares of our common stock for the issuance of awards under the 2022 Plan (the “Share Reserve”). The 2022 Plan provides that the Share Reserve will automatically increase on January 1, 2022 and each January 1 thereafter, by the lesser of (1) the excess (if any) of (A) 5% of the outstanding shares on the last day of the immediately preceding December 31 (excluding any shares reserved for issuance under equity-based plans of Akili, Inc., including the 2022 Plan and the 2022 Employee Stock Purchase Plan over (B) the number of shares of Akili, Inc. common stock then reserved for issuance under the 2022 Stock Option and Incentive Plan as of such date, or (2) a lesser number of shares determined by the plan administrator
166
prior to the date of the increase. Share limits under the 2022 Plan are subject to adjustment in the event of a stock split, stock dividend or other change in our capitalization.
The shares we issue under the 2022 Plan will be authorized but unissued shares or shares that we reacquire. The shares of common stock underlying any awards that are forfeited, cancelled, or are otherwise terminated (other than by exercise) under the 2022 Plan will be added back to the Share Reserve. Notwithstanding the foregoing, the following shares shall not be added to the shares authorized for grant under the 2022 Plan: (i) shares tendered or held back upon exercise of an option or settlement of an award to cover the exercise price or tax withholding, and (ii) shares subject to a stock appreciation right that are not issued in connection with the stock settlement of the stock appreciation right upon exercise thereof. The maximum aggregate number of shares of common stock that may be issued upon exercise of incentive stock options under the 2022 Plan shall not exceed the number of shares equal to the Share Reserve.
The grant date fair value of all awards made under the 2022 Plan and all other cash compensation paid by us to any
non-employee
director in any calendar year shall not exceed $750,000; provided, however, that such amount shall be $1,000,000 for the calendar year in which the applicablenon-employee
director is initially elected or appointed to the board.The 2022 Plan is administered by our compensation committee. The compensation committee has full power to select, from among the individuals eligible for awards, the individuals to whom awards will be granted, to make any combination of awards to participants, and to determine the specific terms and conditions of each award, subject to the provisions of the 2022 Plan. The administrator may delegate to a committee consisting of one or more officers the authority to grant awards to employees who are not subject to the reporting and other provisions of Section 16 of the Exchange Act and not members of the delegated committee, subject to certain limitations and guidelines.
Persons eligible to participate in the 2022 Plan will be our full or part-time officers, employees,
non-employee
directors, and consultants as selected from time to time by the compensation committee.The 2022 Plan permits the granting of both options to purchase common stock intended to qualify as incentive stock options under Section 422 of the Code and options that do not so qualify. Options granted under the 2022 Plan will be
non-qualified
options if they fail to qualify as incentive stock options or exceed the annual limit on incentive stock options. Incentive stock options may only be granted to employees of us and our subsidiaries.Non-qualified
options may be granted to any persons eligible for awards under the 2022 Plan. The exercise price of each option will be determined by the administrator but may not be less than 100% of the fair market value of the common stock on the date of grant or, in the case of an incentive stock option granted to a ten percent stockholder, 110% of such share’s fair market value. The term of each option will be fixed by our administrator and may not exceed ten years from the date of grant. The administrator will determine at what time or times each option may be exercised, including the ability to accelerate the vesting of such options.Upon exercise of options, the option exercise price must be paid in full either in cash, by certified or bank check or other instrument acceptable to the administrator or by delivery (or attestation to the ownership) of shares of common stock that are beneficially owned by the optionee free of restrictions or were purchased in the open market. Subject to applicable law, the exercise price may also be delivered by a broker pursuant to irrevocable instructions to the broker from the optionee. In addition, the administrator may permit
non-qualified
options to be exercised using a “net exercise” arrangement that reduces the number of shares issued to the optionee by the largest whole number of shares with a fair market value that does not exceed the aggregate exercise price.The compensation committee may award stock appreciation rights subject to such conditions and restrictions as it may determine. Stock appreciation rights entitle the recipient to cash or shares of common stock equal to the value of the appreciation in our stock price over the exercise price. The exercise price may not be less than 100% of the fair market value of our common stock on the date of grant. The term of each stock appreciation right will
167
be fixed by the compensation committee and may not exceed ten years from the date of grant. The compensation committee will determine at what time or times each stock appreciation right may be exercised.
The compensation committee may award restricted shares of common stock and RSUs to participants subject to such conditions and restrictions as it may determine. These conditions and restrictions may include the achievement of certain performance goals and/or continued employment with us through a specified vesting period. The compensation committee may also grant shares of common stock that are free from any restrictions under the 2022 Plan. Unrestricted stock may be granted to participants in recognition of past services or for other valid consideration and may be issued in lieu of cash compensation due to such participant. The compensation committee may grant dividend equivalent rights to participants that entitle the recipient to receive credits for dividends that would be paid if the recipient had held a specified number of shares of common stock.
The compensation committee may grant cash bonuses under the 2022 Plan to participants, subject to the achievement of certain performance goals.
The 2022 Plan provides that upon the effectiveness of a “sale event,” as defined in the 2022 Plan, an acquirer or successor entity may assume, continue or substitute outstanding awards under the 2022 Plan. To the extent that awards granted under the 2022 Plan are not assumed or continued or substituted by the successor entity, upon the effective time of the sale event, such awards shall terminate. In such case, except as may be otherwise provided in the relevant award agreement, all awards with time-based vesting conditions or restrictions shall become fully vested and nonforfeitable as of the effective time of the sale event, and all awards with conditions and restrictions relating to the attainment of performance goals may become vested and nonforfeitable in connection with a sale event to the extent earned as determined in the compensation committee’s discretion or to the extent specified in the relevant award certificate. In the event of such termination, We may make or provide for payment, in cash or in kind, to participants holding options and stock appreciation rights equal to the excess of the per share cash consideration in the sale event over the exercise price of the options or stock appreciation rights (provided that, in the case of an option or stock appreciation right with an exercise price equal to or greater than the per share cash consideration, such option or stock appreciation right shall be cancelled for no consideration). We shall also have the option to make or provide for a payment, in cash or in kind, to grantees holding other awards in an amount equal to the per share cash consideration multiplied by the number of vested shares under such award.
Our board of directors may amend or discontinue the 2022 Plan and the compensation committee may amend or cancel outstanding awards for purposes of satisfying changes in law or any other lawful purpose, but no such action may adversely affect rights under an award without the holder’s consent. Certain amendments to the 2022 Plan require stockholder approval.
No awards may be granted under the 2022 Plan after the date that is ten years from the effective date of the 2022 Plan.
2022 Employee Stock Purchase Plan
The Board unanimously approved the 2022 Employee Stock Purchase Plan, or the 2022 ESPP, which was approved by the stockholders on August 18, 2022 and became effective on the Closing Date.
The 2022 ESPP includes two components: a 423 Component and a
Non-423 Component.
It is intended that the 423 Component qualify as an “employee stock purchase plan” under Section 423 of the Code. Except as otherwise provided in the 2022 ESPP or determined by the compensation committee, theNon-423 Component
will operate and be administered in the same manner as the 423 Component.An aggregate of 1,167,881 shares of common stock are initially reserved for issuance under the ESPP (the “ESPP Share Reserve”). The 2022 ESPP provides that the number of shares of common stock that are reserved and available for issuance under the 2022 ESPP will automatically increase on January 1st of each year, beginning on January 1, 2023 and continuing through and including January 1, 2032, by the least of (i) the excess (if any) of
168
(A) 1% of the outstanding shares issued and outstanding on the immediately preceding December 31st (excluding any shares reserved for issuance under equity-based plans of Akili, Inc. including the 2022 Stock Option and Incentive Plan and the 2022 Employee Stock Purchase Plan) over (B) the number of shares of Stock then reserved for issuance under the 2022 Employee Stock Purchase Plan as of such date, (ii) the ESPP Share Reserve or (iii) such number of shares determined by the compensation committee. If our capital structure changes because of a stock dividend, stock split or similar event, the number of shares that can be issued under the 2022 ESPP will be appropriately adjusted.
The 2022 ESPP will be administered by the person or persons (the “Administrator”) appointed by the board of directors. The Administrator has authority at any time to: (i) adopt, alter and repeal such rules, guidelines and practices for the administration of the 2022 ESPP and for its own acts and proceedings as it shall deem advisable; (ii) interpret the terms and provisions of the Plan; (iii) make all determinations it deems advisable for the administration of the 2022 ESPP; (iv) decide all disputes arising in connection with the 2022 ESPP; and (v) otherwise supervise the administration of the 2022 ESPP. All interpretations and decisions of the Administrator shall be binding on all persons, including Akili and the participants.
Any employee of ours or our designated subsidiaries is eligible to participate in the 2022 ESPP so long as the employee is employed for more than 20 hours a week (or such lesser number of hours per week as the Administrator shall determine in advance of an offering) on the first day of the applicable offering period. Individuals who are not contemporaneously classified as employees of ours or our designated subsidiaries for purposes of our payroll system are not considered to be eligible employees and are not eligible to participate in the 2022 ESPP. The Administrator may exclude from participation in the 2022 ESPP or any offering period employees who are “highly compensated employees” (within the meaning of Section 414(q) of the Code) or
a sub-set of
such highly compensated employees.Participation in 2022 ESPP is limited to eligible employees who authorize payroll deductions equal to a whole percentage or amount of base pay to the 2022 ESPP. Employees may authorize payroll deductions, with a minimum of 1% of base pay and a maximum of 15% of base pay. As of January 31, 2022, there are 106 employees who are eligible to participate in the 2022 ESPP. Once an employee becomes a participant in the 2022 ESPP, that employee will automatically participate in successive offering periods, as described below, until such time as that employee withdraws from the 2022 ESPP, becomes ineligible to participate in 2022 ESPP, or his or her employment ceases.
We may make one or more offerings to eligible employees to purchase shares of Akili, Inc. common stock under the 2022 ESPP. The Administrator shall determine, in its discretion, when the initial offering and any subsequent offering shall occur and the duration of each such offering, provided that no offering period shall exceed 27 months in duration. Shares are purchased on the last day of each offering period, with that day being referred to as an “exercise date”.
On the first day of an offering period, employees participating in that offering period will receive an option to purchase shares of Akili, Inc. common stock. On the exercise date of each offering period, the employee is deemed to have exercised the option, at the exercise price, to the extent of accumulated payroll deductions. The option exercise price is equal to the lesser of (i) 85% the fair market value per share of Akili, Inc. common stock on the first day of the offering period and (ii) 85% of the fair market value per share of Akili, Inc. common stock on the exercise date. The maximum number of shares of Akili, Inc. common stock that may be issued to any employee under the 2022 ESPP in any offering period shall be determined by dividing $25,000 by the fair market value of a share of Akili, Inc. common stock on the first day of the offering period.
In general, if an employee is no longer a participant on an exercise date, the employee’s option will be automatically terminated, and the amount of the employee’s accumulated payroll deductions will be refunded.
169
Except as may be permitted by the Administrator in advance of an offering, a participant may not increase or decrease the amount of his or her payroll deductions during any offering period but may increase or decrease his or her payroll deduction with respect to the next offering period by filing a new enrollment form at least 15 business days before the beginning of such offering period (or by such other deadline as shall be established by the Administrator for such offering). A participant may withdraw from an offering period by delivering a written notice of withdrawal to his or her appropriate payroll location at least 15 days before the exercise date. If a participant withdraws from an offering period, that participant may not again participate in the same offering period, but may enroll in subsequent offering periods. An employee’s withdrawal will be effective as of the business day following the employee’s delivery of written notice of withdrawal under the 2022 ESPP.
The 2022 ESPP will continue until terminated by the board of directors. The board of directors may, in its discretion, at any time, terminate or amend the 2022 ESPP. Upon termination of the 2022 ESPP, all amounts in the accounts of participating employees will be refunded.
170
DIRECTOR COMPENSATION
The following table presents the total compensation for each person who served as aexpenses incurred in attending meetings of its board of directors and committees of its board of directors. Amounts of common stock or options in this section reflect the number of Akili shares of common stock or options issued, respectively, prior to conversion in the Business Combination.
non-employee
member of Akili’s board of directors during the year ended December 31, 2021. Other than as set forth in the table and described more fully below, we did not pay any compensation, make any equity awards ornon-equity
awards to, or pay any other compensation to any of thenon-employee
members of Akili’s board of directors in 2021. We reimbursenon-employee
members of its board of directors for reasonable travel andout-of-pocket
Name | Fees Earned or Paid in Cash ($) | Option Awards ($) (1) | All Other Compensation ($) | Total ($) | ||||||||||||
Robert Perez* (2) | 100,000 | 589,841 | — | 689,841 | ||||||||||||
Adam Gazzaley (3) | — | 89,411 | 100,000 | 189,411 | ||||||||||||
Christine Lemke (4) | 13,125 | 237,623 | — | 250,748 | ||||||||||||
James Gates* (5) | — | — | — | — | ||||||||||||
John Spinale* (6) | — | — | — | — | ||||||||||||
Bharatt Chowrira* (7) | — | — | — | — | ||||||||||||
Ken Ehlert (8) | 3,646 | — | — | 3,646 | ||||||||||||
| * | Not serving as a director of Akili, Inc. |
| (1) | The amounts reported represent the aggregate grant date fair value of the stock option awards granted to Akili’s directors during 2021, calculated in accordance with FASB ASC Topic 718. Such grant date fair values do not take into account any estimated forfeitures related to service-based vesting. A discussion of the assumptions used in determining grant date fair value may be found in Note 9 to Akili’s financial statements for the year ended December 31, 2021, included elsewhere in this prospectus. These amounts also include the incremental fair value of certain modified stock options associated with a stock option repricing in 2021(determined as of such repricing date in accordance with FASB ASC Topic 718). The amounts reported in this column reflect the accounting cost for these stock option awards and do not correspond to the actual economic value that may be received by such directors upon the exercise of the stock option awards or any sale of the underlying shares. |
| (2) | Mr. Perez has entered into an agreement with Akili, pursuant to which he is entitled to receive a fee of $8,333.33 per month for certain services provided to the Company solely with respect to his role as Executive Chairman. For more information, see “Certain Relationships and Related Person Transactions.” As of December 31, 2021, Mr. Perez held options to purchase an aggregate of 974,925 shares of Akili’s common stock. |
| (3) | Dr. Gazzaly has entered into an advisor agreement with Akili, pursuant to which he is entitled to receive a consulting fee of $8,333.33 per month for certain services provided to the Company. For more information, see “Certain Relationships and Related Person Transactions.” As of December 31, 2021, Dr. Gazzaley held options to purchase an aggregate of 75,000 shares of Akili’s common stock. |
| (4) | As of December 31, 2021, Ms. Lemke held options to purchase an aggregate of 70,000 shares of Akili’s common stock. |
| (5) | As of December 31, 2021, Mr. Gates did not hold any outstanding equity awards. |
| (6) | As of December 31, 2021, Mr. Spinale held options to purchase an aggregate of 29,000 shares of Akili’s common stock. |
| (7) | As of December 31, 2021, Dr. Chowrira did not hold any outstanding equity awards. |
| (8) | As of December 31, 2021, Mr. Ehlert did not hold any outstanding equity awards. |
We established compensation practices for the
non-employee
members of our board of directors. Such compensation may be paid in the form of cash, equity or a combination of both. We may also pay additional fees to the chair of the committees of the board of directors. Consistent with past practice, all members of our board of directors will be reimbursed for reasonable costs and expenses incurred in attending board or committee meetings.171
Non-Employee
Director Compensation PolicyWe intend to adopt a new
non-employee
director compensation policy that will become effective as of the Closing and will be designed to enable us to attract and retain, on a long term basis, highly qualifiednon-employee
directors. Under the policy,our non-employee directors
will be eligible to receive cash retainers (which will be payable quarterly in arrears and prorated for partial years of service) and equity awards as set forth below:Annual Retainer for Board Membership |
$40,000 for general availability and participation in meetings and conference calls of our Board of Directors |
Additional Annual Retainer for Non-Executive Chair |
$40,000 |
Additional Annual Retainer for Committee Membership |
Audit Committee Chairperson: $20,000 |
Audit Committee member (other than Chairperson): $10,000 |
Compensation Committee Chairperson: $15,000 |
Compensation Committee member (other than Chairperson): $7,500 |
Nominating and Corporate Governance Committee Chairperson: $10,000 |
Nominating and Corporate Governance Committee member (other than Chairperson): $5,000 |
In addition, our policy will provide that, upon initial election or appointment to our board of directors, each new
non-employee
director will be granted aone-time
grant (the “Initial Award”) of anon-statutory
stock option to purchase shares of our common stock upon his or her election to the board. The amount of the Initial Award will be determined as the lesser of (x) a stock option with a value of $240,000 and (y) a stock option to purchase 44,000 shares. The Initial Award will vest in substantially equal annual installments over three years, subject to thenon-employee
director’s continued services to the Company. On the date of each annual meeting of stockholders of our company following the completion of this offering, each continuingnon-employee
director, other than a director receiving an Initial Award, will receive an annual stock option award (the “Annual Award”). The amount of the Annual Award will be determined as of the lesser of (x) a stock option with a value of $120,000 and (y) a stock option to purchase 22,000 shares. The Annual Award shall vest in full upon the earlier of (i) the first anniversary of the date of grant or (ii) the date of the next annual meeting of stockholders, subject to thenon-employee
director’s continued services to the Company. Such awards are subject to full acceleration vesting upon the sale of our company or upon such director’s death or disability.The aggregate amount of compensation, including both equity compensation and cash compensation, paid to
any non-employee director
for service asa non-employee director
in a calendar year period will not exceed $1,000,000 in the first calendar year such individual becomesa non-employee director
and $750,000 in any other calendar year.We will reimburse allincurred by directors for their attendance at meetings of our board of directors or any committee thereof.
reasonable out-of-pocket expenses
Employee directors will receive no additional compensation for their service as a director.
172
BENEFICIAL OWNERSHIP OF SECURITIES
The following table sets forth information regarding the beneficial ownership of shares of Akili, Inc. common stock by:
| • | each person who is known to be the beneficial owner of more than 5% of shares of Akili, Inc. common stock; |
| • | each of our named executive officers and directors; and |
| • | all executive officers and directors of Akili, Inc. as a group. |
Beneficial ownership is determined according to the rules of the SEC, which generally provide that a person has beneficial ownership of a security if he, she or it possesses sole or shared voting or investment power over that security, including options and warrants that are currently exercisable or exercisable within 60 days.
The beneficial ownership is based on 85,395,207 shares of common stock issued and outstanding as of August 19, 2022.
Unless otherwise indicated, we believes that all persons named in the table below have sole voting and investment power with respect to the voting securities beneficially owned by them.
Name and Address of Beneficial Owner (1) | Number of Shares | % of Ownership | ||||||
5% Holders | ||||||||
Aaron Cowen (2) | 6,627,000 | 7.8 | % | |||||
Chamath Palihapitiya (3) | 13,773,000 | 16.1 | % | |||||
PureTech Health, LLC (4) | 12,527,477 | 14.7 | % | |||||
TLS Beta Pte. Ltd. (5) | 10,336,425 | 12.1 | % | |||||
Entities affiliated with Neuberger Berman (6) | 5,776,884 | 6.8 | % | |||||
Directors and Named Executive Officers | ||||||||
Chamath Palihapitiya (3) | 13,773,000 | 16.1 | % | |||||
W. Edward Martucci, Ph.D. (7) | 1,390,346 | 1.6 | % | |||||
Santosh Shanbhag (8) | 369,551 | * | ||||||
Jacqueline Studer (9) | 269,135 | * | ||||||
Bharatt Chowrira, Ph.D. | — | — | ||||||
Kenneth Ehlert (10) | 16,787 | * | ||||||
Adam Gazzaley, M.D., Ph.D. (11) | 1,156,464 | 1.4 | % | |||||
William Jones, Jr. | — | — | ||||||
Christine Lemke (12) | 23,502 | * | ||||||
All directors and executive officers as a group (12 individuals) | 17,366,634 | 20.3 | % | |||||
| * | Less than one percent |
| (1) | Unless otherwise noted, the business address of each of those listed in the table above is 125 Broad Street, 5th Floor, Boston, MA 02110. |
| (2) | Consists of 6,627,000 shares of Akili, Inc. common stock. Averill Master Fund, Ltd. (“Averill Fund”) is the record holder of 3,540,000 shares of Akili, Inc. common stock reported herein. Mr. Cowen may be deemed to control Suvretta Capital Management, LLC, the investment manager of the Averill Fund, and therefore may be deemed to beneficially own the Akili, Inc. common stock held by the Averill Fund. SVAV Sponsor I, LLC (“SVAV”) is the record holder of 3,087,000 shares of Akili, Inc. common stock reported herein. Mr. Cowen may be deemed to control SVAV and therefore may be deemed to beneficially own the Akili, Inc. common stock held by SVAV. Mr. Cowen disclaims beneficial ownership of the Akili, Inc. common |
173
| stock reported herein except to the extent of any indirect pecuniary interest therein. The address of Mr. Cowen is c/o Suvretta Capital Management, LLC, 540 Madison Avenue, 7th Floor, New York, NY 10022. |
| (3) | Consists of 13,773,000 shares of Akili, Inc. common stock. SC PIPE Holdings LLC (“SC PIPE Holdings”) is the record holder of 8,100,000 of the shares of Akili, Inc. common stock reported herein. The shares held by SC PIPE Holdings may be pledged pursuant to a security and pledge agreement. SC PIPE Holdings is controlled by Mr. Palihapitiya, the current Chairman of the Board and the former Chief Executive Officer and Chairman of SCS’s Board of Directors SC Master Holdings is the sole member of SC PIPE Holdings. Mr. Palihapitiya and SC Master Holdings may be deemed to beneficially own shares of common stock held directly by SC PIPE Holdings by virtue of their indirect or direct interests in SC PIPE Holdings or their control over SC PIPE Holdings, as the case may be. SC Master Holdings, LLC (“SC Master Holdings”) is the record holder of 3,773,000 of the shares of Akili, Inc. common stock reported herein. SC Master Holdings is controlled by Mr. Palihapitiya. Mr. Palihapitiya may be deemed to beneficially own shares of Akili, Inc. common stock held directly by SC Master Holdings by virtue of his indirect interests in SC Master Holdings or his control over SC Master Holdings, as the case may be. A trust for the benefit of members of Mr. Palihapitiya’s immediate family (the “Family Trust”), is the record holder of 1,900,000 of the shares of Akili, Inc. common stock reported herein. Mr. Palihapitiya may be deemed to beneficially own shares of Akili, Inc. common stock held directly by the Family Trust. The address of each of Mr. Palihapitiya, SC Master Holdings and SC PIPE Holdings is c/o SC Master Holdings, LLC, 506 Santa Cruz Avenue, Suite 300, Menlo Park, California 94025. |
| (4) | Represents 12,027,477 shares of Akili and 500,000 PIPE Shares. Voting and investment power over the shares held by PureTech Health LLC is exercised by its parent entity, PureTech Health plc. The board of directors of PureTech Health plc consists of Ms. Sharon Barber-Lui, Dr. Bharatt Chowrira, Dr. Raju Kucherlapati, Dr. John LaMattina, Dr. Robert Langer, Ms. Kiran Mazumdar-Shaw, Dame Marjorie Scardino, Mr. Christopher Viehbacher and Ms. Daphne Zohar. None of the members of the board of directors of PureTech Health plc or PureTech Health LLC has individual voting or investment power with respect to such shares. The address for PureTech Health LLC and the individuals listed above is c/o PureTech Health LLC, 6 Tide Street, Boston, Massachusetts 02210. |
| (5) | Represents 9,836,425 shares of Akili and 500,000 PIPE Shares. TLS Beta Pte. Ltd. is a direct wholly-owned subsidiary of Temasek Life Sciences Private Limited, which in turn is a direct wholly-owned subsidiary of Fullerton Management Pte Ltd, which in turn is a direct wholly-owned subsidiary of Temasek Holdings (Private) Limited. The address of each of the foregoing entities is 60B Orchard Road, #06-18 Tower 2, The Atrium@Orchard, Singapore. |
| (6) | Consists of shares held directly by (i) Neuberger Berman Principal Strategies PRIMA Fund LP (“NB PRIMA Fund”), (ii) PRIMA MLP Fund LP (“PRIMA MLP”) and (iii) Neuberger Berman Principal Strategies PRIMA Co-Invest Fund VI LP (“NB PRIMA Co-Invest VI” and together with NB PRIMA Fund and PRIMA MLP, the “PRIMA Funds”). Neuberger Berman Investment Advisers LLC (“NBIA”) serves as the adviser to the PRIMA Funds. Neuberger Berman Principal Strategies PRIMA Associates LP (“PRIMA Associates”) serves as the general partner of NB PRIMA Fund and NB PRIMA Co-Invest VI (a separate third-party serves as general partner of PRIMA MLP). Neuberger Berman Group LLC and certain of its affiliates may be deemed to be the beneficial owners of the securities held directly by the PRIMA Funds because it or certain affiliated persons, including NBIA and PRIMA Associates, have shared power to retain, dispose of or vote the securities owned by the PRIMA Funds pursuant to the terms of investment advisory agreements with the PRIMA Funds. Neuberger Berman Group LLC or its affiliated persons do not, however, have any economic interest in the securities held by the PRIMA Funds. Investment and voting decisions with respect to the securities held by the PRIMA Funds made by Neuberger Berman are made by an investment committee consisting of Joseph Rotter, Gabriel Cahill and Sean Badcock (the “PRIMA Investment Committee”), each of whom is an employee of Neuberger Berman. All members of the PRIMA Investment Committee disclaim beneficial ownership of the securities held by the PRIMA Funds. The principal address for the above referenced entities is 1290 Avenue of the Americas, New York, New York 10104. |
| (7) | Includes 122,311 shares of Akili, Inc. common stock issuable upon the exercise of options exercisable as of or within 60 days of August 19, 2022. |
174
| (8) | Includes 50,651 shares of Akili, Inc. common stock issuable upon the exercise of options exercisable as of or within 60 days of August 19, 2022. |
| (9) | Includes 36,238 shares of Akili, Inc. common stock issuable upon the exercise of options exercisable as of or within 60 days of August 19, 2022. |
| (10) | Includes 3,358 shares of Akili, Inc. common stock issuable upon the exercise of options exercisable as of or within 60 days of August 19, 2022. |
| (11) | Includes (i) 1,089,314 shares of common stock and (ii) 1,199 shares of Akili, Inc. common stock issuable upon the exercise of options exercisable as of or within 60 days of August 19, 2022. |
| (12) | Includes 3,357 shares of Akili, Inc. common stock issuable upon the exercise of options exercisable as of or within 60 days of August 19, 2022. |
175
SELLING SECURITYHOLDERS
This prospectus relates to:
| • | the resale of 16,200,000 shares of common stock issued in the PIPE Investment by certain of the Selling Securityholders; |
| • | the resale of 6,250,000 shares of common stock issued upon consummation of the Business Combination, in exchange for shares of Class B ordinary shares of SCS originally issued the Sponsor; |
| • | the resale of 640,000 shares of common stock issued upon consummation of the Business Combination, in exchange for Class A ordinary shares of SCS originally issued to the Sponsor; |
| • | the resale of 2,494,549 shares of common stock held by certain of our former and current directors; |
| • | the resale of 15,684,066 shares of common stock issued to former equity holders of Akili pursuant to the Business Combination; |
| • | the issuance by us and resale of 2,096,106 shares of common stock reserved for issuance upon the exercise of options to purchase common stock held by persons who previously ended their relationship with Akili prior to or concurrently with the Closing of the Business Combination; and |
| • | the issuance by us and resale of 50,000 shares of common stock reserved for issuance upon the settlement of restricted stock units. |
The Selling Securityholders may from time to time offer and sell any or all of the shares of common stock set forth below pursuant to this prospectus and any accompanying prospectus supplement. When we refer to the “Selling Securityholders” in this prospectus, we mean the persons listed in the table below, the holders of shares of common stock reserved for issuance upon the exercise of options to purchase common stock and the settlement of restricted stock units covered by this prospectus, and the pledgees, donees, transferees, assignees, successors, designees and others who later come to hold any of the Selling Securityholders’ interest in the common stock, other than through a public sale.
The following table is prepared based on information provided to us by the Selling Securityholders. The following table sets forth, as of the date of this prospectus, the names of the Selling Securityholders, and the aggregate number of shares of common stock that the Selling Securityholders may offer pursuant to this prospectus. The table does not include the issuance by us and resale of (i) 733,193 shares of common stock reserved for issuance upon the exercise of options to purchase common stock by former employees who previously ended their relationship with Akili prior to the Closing of the Business Combination and (ii) 207,207 shares of common stock reserved for issuance upon the exercise of options to purchase common stock by former consultants and advisors who previously ended their relationship with Akili prior to the Closing of the Business Combination, each of which represents less than 1% of our outstanding shares of common stock and each of which is also covered by this prospectus.
Securities Beneficially Owned Prior to this Offering | Securities to be Sold in this Offering | Securities Beneficially Owned After this Offering | ||||||||||||||
Name of Selling Securityholder (1) | Akili, Inc. Common Stock | Akili, Inc. Common Stock | Akili, Inc. Common Stock | Percent | ||||||||||||
Adam Gazzaley (2) | 1,156,464 | 1,089,314 | 67,150 | * | ||||||||||||
Alyeska Master Fund, L.P. (3) | 500,000 | 500,000 | — | — | ||||||||||||
Amgen Ventures LLC (4) | 1,982,322 | 300,000 | 1,682,322 | 2.0 | ||||||||||||
Apeiron Investment Group Ltd. (5) | 100,000 | 100,000 | — | — | ||||||||||||
Averill Master Fund, Ltd. (6) | 3,540,000 | 3,540,000 | — | — | ||||||||||||
176
Securities Beneficially Owned Prior to this Offering | Securities to be Sold in this Offering | Securities Beneficially Owned After this Offering | ||||||||||||||
Name of Selling Securityholder (1) | Akili, Inc. Common Stock | Akili, Inc. Common Stock | Akili, Inc. Common Stock | Percent | ||||||||||||
Chamath Palihapitiya (7) | 11,873,000 | 11,873,000 | — | — | ||||||||||||
CP WY Remainder Interest Trust U/A/D Dated December 22, 2021. (8) | 1,900,000 | 1,900,000 | — | — | ||||||||||||
David Spiegel, M.D., Ph.D. (9) | 10,000 | 10,000 | — | — | ||||||||||||
Frigga, Ltd. (10) | 1,757,256 | 100,000 | 1,657,256 | 1.9 | ||||||||||||
Gates Irrevocable Trust 2004 fbo the children of James R. Gates (11) | 79,806 | 79,806 | — | — | ||||||||||||
James R. Gates Separate Property Revocable Trust (12) | 1,325,429 | 1,325,429 | — | — | ||||||||||||
JAZZ Human Performance Opportunity Fund, L.P. (13) | 693,226 | 693,226 | — | — | ||||||||||||
JAZZ Human Performance Technology Fund, LP (14) | 3,063,364 | 3,063,364 | — | — | ||||||||||||
John Spinale (15) | 33,384 | 33,384 | — | — | ||||||||||||
Omidyar Technology Ventures, LLC (16) | 1,063,422 | 60,000 | 1,003,422 | 1.2 | ||||||||||||
Polaris Healthcare Technology Opportunities Fund, L.P. (17) | 827,685 | 250,000 | 577,685 | * | ||||||||||||
Polaris Partners IX, L.P. (18) | 827,687 | 250,000 | 577,687 | * | ||||||||||||
PureTech Health LLC (19) | 12,527,476 | 12,527,476 | — | — | ||||||||||||
Robert Perez (20) | 1,122,322 | 1,122,322 | — | — | ||||||||||||
Senthil Sundaram (21) | 30,000 | 30,000 | ||||||||||||||
Sukumar Nagendran (22) | 10,000 | 10,000 | ||||||||||||||
SVAV Sponsor I, LLC (24) | 3,087,000 | 3,087,000 | — | — | ||||||||||||
TLS Beta Pte. Ltd. (24) | 10,336,425 | 500,000 | 9,836,425 | 11.5 | ||||||||||||
Vladimir Coric (25) | 30,000 | 30,000 | — | — | ||||||||||||
| * | represents less than one percent of shares outstanding |
| (1) | Unless otherwise noted, the business address of each of those listed in the table above is 125 Broad Street, 5th Floor, Boston, MA 02110. |
| (2) | Consist of 1,089,314 shares of common stock held by Adam Gazzaley and 67,150 shares of common stock reserved for issuance upon the exercise of options held by Adam Gazzaley. Adam Gazzaley is on the board of directors of Akili, Inc. |
| (3) | Consist of 500,000 shares of common stock held by Alyeska Master Fund, L.P. issued in the PIPE Investment. Alyeska Investment Group, L.P., the investment manager of Alyeska Master Fund, L.P., has voting and investment control of the shares held by Alyeska Master Fund, L.P. Anand Parekh is the Chief Executive Officer of Alyeska Investment Group, L.P. and may be deemed to be the beneficial owner of such shares. Mr. Parekh, however, disclaims any beneficial ownership of the shares held by the Selling Securityholder. The registered address of Alyeska Master Fund, L.P. is at c/o Maples Corporate Services Limited, P.O. Box 309, Ugland House, South Church Street George Town, Grand Cayman, KY1-1104, Cayman Islands. Alyeska Investment Group, L.P. is located at 77 W. Wacker, Suite 700, Chicago IL 60601. |
| (4) | Consist of 1,682,322 shares of common stock held of record by Amgen Ventures LLC and 300,000 shares of common stock held by Amgen Ventures LLC issued in the PIPE Investment. Amgen Ventures LLC is a wholly owned subsidiary of Amgen Inc. The address for Amgen Ventures LLC and Amgen Inc. is One Amgen Center Drive, Thousand Oaks, CA 91320. |
| (5) | Consist of 100,000 shares of common stock held by Apeiron Investment Group Ltd. issued in the PIPE Investment. Julien Höfer, Jefim Gewiet are managing directors of Apeiron Investment Group Ltd. and therefore may be deemed to beneficially own the shares of common stock held by Apeiron Investment Group Ltd. The address for Apeiron Investment Group Ltd. is 66 & 67, Beatrice, Amery Street, SLM1707, Sliema, Malta. |
| (6) | Consist of 3,540,000 shares of common stock held by Averill Master Fund, Ltd. issued in the PIPE Investment. Suvretta Capital Management, LLC, the investment manager of Averill Master Fund, Ltd., may be deemed to beneficially own the shares of common stock held by Averill Master Fund, Ltd. Aaron Cowen may be deemed to control Suvretta Capital Management, LLC, and therefore may be deemed to beneficially own the shares held by Averill Master Fund, Ltd. The business address of Averill Master Fund, Ltd. is 540 Madison Avenue, 7th Floor, New York, NY 10022. |
| (7) | Consists of 11,873,000 shares of common stock, including 8,100,000 shares of common stock held of record by SC PIPE Holdings LLC (“SC PIPE Holdings”) and 3,773,000 shares of common stock held of record by SC Master Holdings, LLC (“SC Master Holdings”). SC PIPE Holdings is controlled by Mr. Palihapitiya, the current Chairman of the Board and the former Chief Executive Officer and Chairman of SCS’s Board of Directors. SC Master Holdings is the sole member of SC PIPE Holdings. Mr. Palihapitiya and SC Master Holdings may be deemed to beneficially own shares of common stock held directly by SC PIPE Holdings by virtue of their indirect or direct interests in SC PIPE Holdings or their control over SC PIPE Holdings, as the case may be. SC Master Holdings is controlled by |
177
| Mr. Palihapitiya. Mr. Palihapitiya may be deemed to beneficially own shares of common stock held directly by SC Master Holdings by virtue of his indirect interests in SC Master Holdings or his control over SC Master Holdings, as the case may be. The shares of common stock reported herein do not include 1,900,000 shares of common stock held directly by a trust for the benefit of members of Mr. Palihapitiya’s immediate family (the “Family Trust”), which are otherwise reported in this table. Mr. Palihapitiya may be deemed to beneficially own shares of common stock held directly by the Family Trust. The address of each of Mr. Palihapitiya, SC Master Holdings and SC PIPE Holdings is c/o SC Master Holdings, LLC, 506 Santa Cruz Avenue, Suite 300, Menlo Park, California 94025. |
| (8) | Consist of 1,900,000 shares of common stock held by the CP WY Remainder Interest Trust U/A/D Dated December 22, 2021. Mr. Palihapitiya, the current Chairman of the Board and the former Chief Executive Officer and Chairman of SCS’s Board of Directors, may be deemed to beneficially own shares of common stock held directly by CP WY Remainder Interest Trust U/A/D Dated December 22, 2021. The business address of the CP WY Remainder Interest Trust U/A/D Dated December 22, 2021 is 415 W 17th Street, Ste B2, Cheyenne, WY 82001. |
| (9) | Consists of 10,000 shares of common stock underlying the RSUs held by David Spiegel, M.D., Ph.D. that vested at Closing and are issuable on the date on which this prospectus is declared effective by the SEC. |
| (10) | Consist of 1,657,256 shares of common stock held of record by Frigga Ltd. and 100,000 shares of common stock held by Frigga Ltd. issued in the PIPE Investment. Evidity Capital, LLC is the discretionary investment advisor of Canepa Advanced Healthcare Partners, Ltd., which is the general partner of Canepa Advanced Healthcare Fund, L.P., which is the sole shareholder of Frigga Ltd. Voting and dispositive determinations with respect to the securities held by Frigga Ltd. are made by the investment committee of Evidity Capital, LLC, which is comprised of Paul Enever, Alejandro Sanchez and Adam Lessler. Accordingly, each of the entities and individuals named herein may be deemed to share beneficial ownership of the securities held of record by Frigga Ltd. The address for Frigga Ltd. is Clarendon House, 2 Church Street. Hamilton HM 11. Bermuda. |
| (11) | Consists of 79,806 shares of common stock held by the Gates Irrevocable Trust 2004 fbo the children of James R. Gates. James R. Gates is the trustee and may be deemed to control the Gates Irrevocable Trust 2004 fbo the children of James R. Gates, and therefore may be deemed to beneficially own the shares held by the Gates Irrevocable Trust 2004 fbo the children of James R. Gates. James R. Gates was on the board of directors of Akili. The business address for the Gates Irrevocable Trust 2004 fbo the children of James R. Gates is 433 El Arroyo Road, Hillsborough, CA 94010. |
| (12) | Consist of 1,325,429 shares of common stock held by the James R. Gates Separate Property Revocable Trust. James R. Gates may be deemed to control the James R. Gates Separate Property Revocable Trust, and therefore may be deemed to beneficially own the shares held by the James R. Gates Separate Property Revocable Trust. James R. Gates was on the board of directors of Akili. The business address for the James R. Gates Separate Property Revocable Trust is 433 El Arroyo Road, Hillsborough, CA 94010. |
| (13) | Consist of 693,226 shares of common stock held by JAZZ Human Performance Opportunity Fund, LP. John Harris, John Spinale, Zack Lynch, Andrew Firlik are managing members of JAZZ Human Performance Opportunity GP, LLC, and therefore may be deemed to beneficially own the shares held by JAZZ Human Performance Opportunity Fund, LP. John Spinale was on the board of directors of Akili. The business address for JAZZ Human Performance Opportunity Fund, LP is 548 Market Street #27799, San Francisco, CA 94014. |
| (14) | Consist of 2,963,364 shares of common stock held of record by JAZZ Human Performance Technology Fund, LP and 100,000 shares of common stock held by JAZZ Human Performance Technology Fund, LP issued in the PIPE Investment. John Harris, John Spinale, Zack Lynch, Andrew Firlik are managing members of JAZZ Human Performance Technology GP, LLC, and therefore may be deemed to beneficially own the shares held by JAZZ Human Performance Technology Fund, LP. John Spinale was on the board of directors of Akili. The business address for JAZZ Human Performance Technology Fund, LP is 548 Market Street #27799, San Francisco, CA 94104. |
| (15) | Consist of 33,384 shares of common stock reserved for issuance upon the exercise of options held by John Spinale. John Spinale was on the board of directors of Akili. The address of John Spinale is 261 Jersey St, San Francisco, CA 94114. |
| (16) | Consist of 1,003,422 shares of common stock held of record by Omidyar Technology Ventures, LLC (“Omidyar”) and 60,000 shares of common stock held by Omidyar issued in the PIPE Investment. Jeffery R. Alvord is the director and president of Omidyar and therefore may be deemed to beneficially own the shares of common stock held by Omidyar. Each of Robinson C. Jacobs and Matthew K. Stepan is the director and vice president of Omidyar and therefore may be deemed to beneficially own the shares of common stock held by Omidyar. Matthew J. Deakin is the trustee of the Pierre M. Omidyar Trust, the ultimate beneficial owner of Omidyar, and therefore may be deemed to beneficially own the shares of common stock held by Omidyar. The address for Omidyar is 720 University Avenue, Suite 200, Los Gatos, California, 95032. |
| (17) | Consist of 577,685 shares of common stock held by record by Polaris Healthcare Technology Opportunities Fund, L.P. (“PHCT”) and 250,000 shares of common stock held by PHCT issued in the PIPE Investment. Polaris Healthcare Technology Opportunities Fund GP, L.L.C. (“PHCT GP”) is the general partner of PHCT and may be deemed to have sole voting and dispositive power with respect to the shares held by PHCT. David Barrett, Brian Chee, Amir Nashat and Amy Schulman (collectively, the “PHCT GP Managing Members”) are the managing members of PHCT GP. Each of the PHCT GP Managing Members, in their respective capacities with respect to PHCT GP, may be deemed to have shared voting and dispositive power with respect to the shares held by PHCT. The principal business address for all entities and individuals affiliated with Polaris Partners is c/o Polaris Partners, One Marina Park Drive, 10th Floor, Boston, Massachusetts 02210. |
| (18) | Consist of 577,687 shares of common stock held of record by Polaris Partners IX, L.P. (“PP IX”) and 250,000 shares of common stock held by PP IX issued in the PIPE Investment. Polaris Partners GP IX, L.L.C. (“PP GP IX”) is the general partner of PP IX and may be deemed to have sole voting and dispositive power with respect to the shares held by PP IX. David Barrett, Brian Chee, Amir Nashat and Amy Schulman (collectively, the “PP GP IX Managing Members”) are the managing members of PP GP IX. Each of the PP GP IX Managing Members, in their respective capacities with respect to PP GP IX, may be deemed to have shared voting and dispositive power |
178
| with respect to the shares held by PP IX. The principal business address for all entities and individuals affiliated with Polaris Partners is c/o Polaris Partners, One Marina Park Drive, 10th Floor, Boston, Massachusetts 02210. |
| (19) | Consist of 12,027,476 shares of common stock held of record by PureTech Health LLC and 500,000 shares of common stock held by PureTech Health LLC issued in the PIPE Investment. Voting and investment power over the shares held by PureTech Health LLC is exercised by its parent entity, PureTech Health plc. The board of directors of PureTech Health plc consists of Ms. Sharon Barber-Lui, Dr. Bharatt Chowrira, Dr. Raju Kucherlapati, Dr. John LaMattina, Dr. Robert Langer, Ms. Kiran Mazumdar-Shaw, Dame Marjorie Scardino, Mr. Christopher Viehbacher and Ms. Daphne Zohar. None of the members of the board of directors of PureTech Health plc or PureTech Health LLC has individual voting or investment power with respect to such shares. Dr. Bharatt Chowrira is a member of the board of directors of Akili, Inc. The address for PureTech Health LLC and the individuals listed above is c/o PureTech Health LLC, 6 Tide Street, Suite 400, Boston, Massachusetts 02210. |
| (20) | Consist of 1,122,322 shares of common stock reserved for issuance upon the exercise of options held by Robert Perez. Robert Perez was on the board of directors of Akili. The address of Robert Perez is 290 Beacon St, Apt 5, Boston MA 02116. |
| (21) | Consists of 30,000 shares of common stock underlying the RSUs held by Senthil Sundaram that vested at Closing and are issuable on the date on which this prospectus is declared effective by the SEC. |
| (22) | Consists of 10,000 shares of common stock underlying the RSUs held by Sukumar Nagendran that vested at Closing and are issuable on the date on which this prospectus is declared effective by the SEC. |
| (23) | Consist of 3,087,000 shares of common stock held by SVAV Sponsor I, LLC. Aaron Cowen and Kishan Mehta may be deemed to control SVAV Sponsor I, LLC, and therefore may be deemed to beneficially own the shares held by SVAV Sponsor I, LLC. Kishan Mehta was the president and on the board of directors of SCS. The business address of SVAV Sponsor I, LLC is 540 Madison Avenue, 7th Floor, New York, NY 10022. |
| (24) | Consist of 9,836,425 shares of common stock held of record by TLS Beta Pte. Ltd. and 500,000 shares of common stock held by TLD Beta Pte. Ltd issued in the PIPE Investment. TLS Beta Pte. Ltd., or TLS, is a direct wholly-owned subsidiary of Temasek Life Sciences Private Limited, or TLSPL, which in turn is a direct wholly-owned subsidiary of Fullerton Management Pte Ltd, or Fullerton, which in turn is a direct wholly-owned subsidiary of Temasek Holdings (Private) Limited, or Temasek. In such capacities, each of TLSPL, Fullerton and Temasek may be deemed to have voting and dispositive power over the shares held by TLS. The address for TLS, TLSPL, Fullerton and Temasek is 60B Orchard Road #06-18 Tower 2, The Atrium@Orchard, Singapore 238891. |
| (25) | Consist of 30,000 shares of common stock held by Vladimir Coric. |
A Selling Securityholder may sell or otherwise transfer all, some or none of such shares of common stock in this offering. See “”.
Plan of Distribution
For information regarding transactions between us and the Selling Securityholders, see the section titled “”.
Certain Relationships and Related Person Transactions
179
CERTAIN RELATIONSHIPS AND RELATED PERSON TRANSACTIONS
Certain
Pre-Business
Combination Relationships and Related Person Transactions—Social Capital Suvretta Holdings Corp. IFounder Shares and Private Placement Shares
In March 2021, the Sponsor purchased 5,750,000 SCS Class B ordinary shares for an aggregate purchase price of $25,000, or approximately $0.004 per share (the “founder shares”). In June 2021, the Sponsor transferred 30,000 founder shares to Vladimir Coric (an independent director). On June 29, 2021, SCS effected a share capitalization resulting in Sponsor and Mr. Coric holding an aggregate of 6,325,000 founder shares (up to 825,000 of which were subject to forfeiture depending on the extent to which the underwriter’s over-allotment option in the initial public offering was exercised), resulting in an effective purchase price per founder share of approximately $0.004. These founder shares are identical to the SCS Class A ordinary shares included in the units sold in SCS’ initial public offering, except that (i) prior to the initial business combination (as defined in the Cayman Constitutional Documents), only the holders of the founder shares have the right to vote on the election of directors and holders of a majority of the founder shares may remove a member of the board of directors for any reason, (ii) the founder shares are subject to certain transfer restrictions, (iii) the holders of the founder shares have agreed pursuant to a letter agreement to waive (x) their redemption rights with respect to the founder shares, private placement shares and public shares held by them in connection with the completion of a business combination, (y) their redemption rights with respect to any founder shares, private placement shares and public shares held by them in connection with a shareholder vote to amend the Cayman Constitutional Documents (A) to modify the substance or timing of our obligation to allow redemption in connection with our initial business combination or to redeem 100% of our public shares if we do not complete our initial business combination by July 2, 2023 or (B) with respect to any other material provisions relating to shareholders’ rights or
pre-initial
business combination activity and (z) their rights to liquidating distributions from the trust account with respect to the founder shares and private placement shares if SCS fails to complete a business combination by July 2, 2023, (iv) the founder shares are automatically convertible into SCS Class A ordinary shares at the time of the initial business combination and (v) the founder shares are entitled to registration rights.On July 2, 2021, SCS consummated its initial public offering of its Class A ordinary shares, which included a partial exercise by the underwriters of their over-allotment option. As a result of the underwriters’ election to partially exercise their over-allotment option, a total of 750,000 founder shares are no longer subject to forfeiture and 75,000 founder shares were forfeited, resulting in an aggregate of 6,250,000 founder shares held by Sponsor and one of our independent directors.
In connection with the Business Combination, upon the Domestication, 6,250,000 private placement shares converted automatically, into shares of Akili, Inc. common stock on abasis.
one-for-one
Simultaneously with the closing of the initial public offering, SCS consummated the private sale of 640,000 private placement shares at a purchase price of $10.00 per private placement share, to the Sponsor generating gross proceeds to us of $6.4 million. The private placement shares are identical to the Class A ordinary shares sold in SCS’ initial public offering except that, so long as they are held by the Sponsor or its permitted transferees: (1) they will not have rights to funds held in the trust account; (2) they may not, subject to certain limited exceptions and as modified by the
Lock-Up
Agreement, be transferred, assigned or sold by the Sponsor until 30 days after the completion of SCS’ initial business combination; and (3) they are entitled to registration rights.In connection with the Business Combination, upon the Domestication, 640,000 founder shares converted automatically, into shares of Akili, Inc. common stock on abasis.
one-for-one
Registration Rights
The holders of the founder shares and private placement shares (and any SCS Class A ordinary shares issuable upon the conversion of the founder shares) are entitled to registration rights pursuant to a registration rights
180
agreement signed June 29, 2021 requiring SCS to register such securities for resale (in the case of the founder shares, only after conversion to SCS Class A ordinary shares). The holders of these securities are entitled to make up to three demands, excluding short form demands, that SCS register such securities. In addition, the holders have certain “piggy-back” registration rights with respect to registration statements filed subsequent to the completion of SCS’ initial business combination and rights to require SCS to register for resale such securities pursuant to Rule 415 under the Securities Act. SCS will bear the expenses incurred in connection with the filing of any such registration statements.
In connection with the Business Combination, the registration rights agreement was amended and restated.
Subscription Agreements
Concurrently with the execution of the Merger Agreement, SCS entered into Subscription Agreements with the Sponsor Related PIPE Investors, pursuant to which the Sponsor Related PIPE Investors have subscribed for shares of Akili, Inc. common stock in connection with the PIPE Investment. The Sponsor Related PIPE Investors funded $135,400,000 of the PIPE Investment, for which they will receive 13,540,000 shares of Akili, Inc. common stock. Specifically, (i) entities affiliated with Chamath Palihapitiya, subscribed for an aggregate of 10,000,000 shares of Akili, Inc. common stock, (ii) Averill Master Fund, Ltd., an entity affiliated with Kishan Mehta via his employment with Suvretta Capital Management, LLC, the investment manager of Averill Master Fund, Ltd., subscribed for 3,540,000 shares of Akili, Inc. common stock.
The PIPE Investment was consummated substantially concurrently with the Closing of the Business Combination.
Related Party Notes and Advances
As of July 2, 2021, the Sponsor paid for certain offering costs on behalf of the SCS in connection with the Initial Public Offering. The advances are
non-interest
bearing and due on demand. As of March 31, 2022, advances amounting to $43,686 were outstanding.On March 2, 2021, SCS issued an unsecured promissory note to the Sponsor (the
“Pre-IPO
SCS Promissory Note”), pursuant to which SCS could borrow up to an aggregate principal amount of $300,000. ThePre-IPO
SCS Promissory Note wasnon-interest
bearing and payable on the earlier of December 31, 2021 and the completion of the Initial Public Offering. The outstanding balance under thePre-IPO
SCS Promissory Note of $300,000 was repaid at the closing of the Initial Public Offering on July 2, 2021. Borrowings are no longer available under thePre-IPO
SCS Promissory Note.On April 20, 2022, SCS issued an unsecured promissory note (the “SCS Promissory Note”) to the Sponsor, pursuant to which SCS may borrow up to an aggregate principal amount of $1,500,000. The SCS Promissory Note is
non-interest
bearing, unsecured and payable upon the earlier of July 2, 2023 and the effective date of a business combination. The SCS Promissory Note is subject to customary events of default which could, subject to certain conditions, cause the SCS Promissory Note to become immediately due and payable. As of July 14, 2022, $250,000 was outstanding under the SCS Promissory Note.Prior to SCS’ initial business combination SCS’ audit committee will review on a quarterly basis all payments that were made to the Sponsor, officers, directors or our or their affiliates and will determine which expenses and the amount of expenses that will be reimbursed. There is no cap or ceiling on the reimbursement ofexpenses incurred by such persons in connection with activities on SCS’ behalf, although no such reimbursements will be made from the proceeds of SCS’ initial public offering held in the trust account prior to the completion of SCS’ initial business combination.
out-of-pocket
181
In order to fund working capital deficiencies or finance transaction costs in connection with a business combination, the Sponsor or an affiliate of the Sponsor or certain of SCS’ officers and directors may, but are not obligated to (other than pursuant to the SCS Promissory Note), loan SCS funds as may be required. In the event that SCS’ initial business combination does not close, SCS may use a portion of the working capital held outside the trust account to repay such loaned amounts but no proceeds from the trust account would be used for such repayment. SCS does not expect to seek loans from parties other than the Sponsor or an affiliate of the Sponsor as SCS does not believe third parties will be willing to loan such funds and provide a waiver against any and all rights to seek access to funds in the trust account.
Administrative Services Agreement
SCS entered into an agreement whereby, commencing on July 2, 2021 through the earlier of the consummation of a business combination or SCS’ liquidation, SCS will pay an affiliate of the Sponsor a monthly fee of $10,000 for office space, administrative and support services.
Certain
Pre-Business
Combination Relationships and Related Person Transactions—AkiliSeries D Preferred Stock Financing
On May 25, 2021, Akili sold an aggregate of 13,053,508 shares of Series D Preferred Stock at a purchase price of approximately $8.426854 per share, for an aggregate purchase price of $110,000,006.11 (the “Akili Series D Preferred Stock Financing”). The participants in the Akili Series D Preferred Stock Financing included persons affiliated with members of Akili’s board of directors and persons that currently hold more than 5% of Akili’s outstanding capital stock. The following table summarizes purchases of shares of Series D Preferred Stock from Akili by such related persons:
Name | Akili Series D Preferred Shares | Total Purchase Price | ||||||
TLS Beta Pte. Ltd. (1) | 2,966,706 | $ | 24,999,998.32 | |||||
Neuberger Berman Principal Strategies | ||||||||
PRIMA Fund LP (2) | 1,201,813 | $ | 10,127,502.69 | |||||
PRIMA MLP Fund LP (2) | 1,186,682 | $ | 9,999,995.95 | |||||
Neuberger Berman Principal Strategies | ||||||||
PRIMA Co-Invest Fund VI LP(2) | 578,211 | $ | 4,872,499.68 | |||||
JAZZ Human Performance Technology Fund, L.P. (3) | 534,007 | $ | 4,499,999.02 | |||||
JAZZ Human Performance Opportunity Fund, L.P. (3) | 356,005 | $ | 3,000,002.16 | |||||
| (1) | TLS Beta Pte. Ltd. (“Temasek”) was a holder of more than 5% of Akili’s outstanding capital stock. |
| (2) | Neuberger Berman Principal Strategies PRIMA Fund LP and its affiliated entities, PRIMA MLP Fund LP and Neuberger Berman Principal Strategies PRIMA Co-Invest Fund VI LP (collectively, “Neuberger”), was a holder of more than 5% of Akili’s outstanding capital stock. |
| (3) | John Spinale is a member of the board of directors of Akili and an affiliate of JAZZ Human Performance Technology Fund, L.P. and JAZZ Human Performance Opportunity Fund, L.P. (collectively, “JAZZ”). JAZZ was a holder of more than 5% of Akili’s outstanding capital stock. |
Series C Preferred Stock Financing
From May 8, 2018 through August 8, 2018, Akili sold an aggregate of 8,016,645 shares of Series C Preferred Stock at a purchase price of approximately $8.5073 per share, for an aggregate purchase price of $68,200,004.00 (the “Akili Series C Preferred Stock Financing”). The participants in the Akili Series C Preferred Stock
182
Financing included persons affiliated with members of Akili’s board of directors and persons that currently hold more than 5% of Akili’s outstanding capital stock. The following table summarizes purchases of Akili Series C Preferred Shares from Akili by such related persons:
Name | Akili Series C Preferred Shares | Total Purchase Price | ||||||
TLS Beta Pte. Ltd. (1) | 3,526,383 | $ | 29,999,998.10 | |||||
JAZZ Human Performance Technology Fund, L.P. (2) | 587,731 | $ | 5,000,003.94 | |||||
| (1) | Temasek was a holder of more than 5% of Akili’s outstanding capital stock. |
| (2) | John Spinale is a member of the board of directors of Akili and an affiliate of JAZZ. JAZZ was a holder of more than 5% of Akili’s outstanding capital stock. |
Akili Agreements with Stockholders
Investors’ Rights Agreement
Akili is party to a Third Amended and Restated Investors’ Rights Agreement, dated as of May 25, 2021 (the “IRA”) which granted registration rights and information rights, among other things, to certain holders of Akili’s capital stock, including entities affiliated with PureTech Health LLC (PureTech), Temasek, JAZZ and Neuberger. Certain holders of Akili’s capital stock, including entities affiliated with PureTech, Temasek, JAZZ and Neuberger, agreed to vote their shares of Akili’s capital stock in favor of certain matters in the IRA, including with respect to the election of directors. The IRA terminated upon the Closing of the Business Combination.
Right of First Refusal and
Co-Sale
AgreementPursuant to certain agreements with its stockholders, including the Amended and Restated Right of First Refusal and
Co-Sale
Agreement, dated as of May 25, 2021 (the “ROFR Agreement”), Akili had the right to purchase shares of Akili’s capital stock that certain of its stockholders proposed to sell to other parties. Certain holders of Akili’s capital stock that were party to the ROFR Agreement include PureTech, Temasek, JAZZ and Neuberger. The ROFR Agreement terminated upon the Closing of the Business Combination.PureTech Services Agreement
Akili entered into that certain Business Services, Personnel and Information Management Agreement effective as of December 1, 2011 (the “Services Agreement”) with PureTech Management, Inc. (“PureTech Management”), PureTech and PureTech Health plc (collectively with PureTech Management and PureTech, the “PureTech Entities”) and PureTech currently holds more than 5% of Akili’s outstanding capital stock. Pursuant to the terms of the Services Agreement, the PureTech Entities provide Akili with management expertise, strategic advice, accounting and administrative support, computer and telecommunications services and office infrastructure and personnel services from time to time. In connection with such services provided by the PureTech Entities to Akili under the Services Agreement, Akili paid PureTech an aggregate of $1,000 in 2019 and $19,000 in 2020 and $0 in 2021. The Services Agreement was terminated in connection with the Business Combination.
Executive Officer and Director Compensation Arrangements
See “” for information regarding compensation arrangements with the executive officers and directors of Akili, which include, among other things, employment, termination of employment and change in control arrangements, stock awards and certain other benefits.
Executive Compensation
On May 1, 2016, Akili and Adam Gazzaley, M.D., Ph.D., a member of the our board of directors, entered into a Scientific Advisory Board and Chief Science Advisor Agreement (the “Gazzaley Agreement”), as amended on
183
October 29, 2018. Pursuant to the Gazzaley Agreement, Dr. Gazzaley provides certain consulting, advisory and related services to us. In consideration for Dr. Gazzaley’s services, Akili agreed to pay Dr. Gazzaley a monthly retainer of $8,333.33. In connection with entering into the Gazzaley Agreement, Akili also granted Dr. Gazzaley a stock option to purchase 25,000 shares of the our common stock. Additionally, as compensation and in consideration of a license to Akili for any additional intellectual property developed in Dr. Gazzaley’s lab, if any, Akili agreed to grant a stock option to purchase 25,000 shares of our common stock, which conditional grant has not occurred.
On January 8, 2017, Akili and Robert Perez, a member of Akili’s board of directors, entered into an Executive Advisor Agreement (the “Perez Agreement”), as amended on June 15, 2017, which terminated upon the Closing of the Business Combination. Pursuant to the Perez Agreement, Mr. Perez provided certain consulting, advisory and related services for Akili in connection with his role as Executive Chairman. In consideration for Mr. Perez’s services, Akili agreed to pay Mr. Perez a consulting fee of $4,000 for each week that Mr. Perez spends actively engaged in the consulting, advisory, and related services for Akili. In connection with entering into the Perez Agreement, Akili also granted Mr. Perez a stock option to purchase 195,000 shares of Akili’s common stock. Since entering into the Perez Agreement and from time to time, the Akili’s board of directors had adjusted the consulting fee that Mr. Perez was entitled to in exchange for his services. In connection with such services, Akili paid Mr. Perez an aggregate of $292,501 in 2019, $38,333 in 2020 and $100,000 in 2021.
Director and Officer Indemnification
Akili’s certificate of incorporation and bylaws provided for indemnification and advancement of expenses for its directors and officers to the fullest extent permitted by the DGCL, subject to certain limited exceptions. Akili entered into indemnification agreements with each of its directors. Following the Business Combination, these agreements were replaced with new indemnification agreements for each of the directors and officers of Akili, Inc. For additional information, see “.”
Description of Our Securities—Limitations on Liability and Indemnification of Officers and Directors
Certain Relationships and Related Person Transactions—Akili, Inc.
Amended and Restated Registration Rights Agreement
At the Closing, SCS and certain stockholders of Akili and SCS entered into the Amended and Restated Registration Rights Agreement, pursuant to which SCS agreed to register for resale, pursuant to Rule 415 under the Securities Act, certain shares of Akili, Inc. common stock that are held by the parties thereto from time to time. Pursuant to the Registration Rights Agreement, the stockholder parties have customary registration rights, including shelf, demand and piggy-back rights, subject to cooperation and
cut-back
provisions, with respect to the shares of Akili, Inc. common stock held by such parties.Policies and Procedures for Related Party Transactions
We adopted a formal written policy that was effective upon the completion of the Business Combination, providing that our officers, directors, nominees for election as directors, beneficial owners of more than 5% of any class of our capital stock, any member of the immediate family of any of the foregoing persons and any firm, corporation or other entity in which any of the foregoing persons is employed or is a general partner or principal or in a similar position or in which such person has a 5% or greater beneficial ownership interest, are not permitted to enter into a related party transaction with us without the approval of our Audit Committee, subject to certain exceptions. Such written policy on transactions with related persons is in conformity with the requirements for issuers having publicly held common stock that is listed on Nasdaq.
Following the Business Combination, our audit committee has the primary responsibility for reviewing and approving or disapproving “related party transactions,” which are transactions between us and related persons in which the aggregate amount involved exceeds or may be expected to exceed $120,000 and in which a related
184
person has or will have a direct or indirect material interest. The charter of our Audit Committee provides that the audit committee will review and approve in advance any related party transaction.
Review and Approval of Related Person Transactions
In connection with the Business Combination, we adopted a policy for the review and approval of related party transaction, which will require, among other things, that:
| • | The audit committee will review the material facts of all related person transactions. |
| • | In reviewing any related person transaction, the audit committee will take into account, among other factors that it deems appropriate, whether the related person transaction is on terms no less favorable to us than terms generally available in a transaction with an unaffiliated third-party under the same or similar circumstances and the extent of the related person’s interest in the transaction. |
| • | In connection with its review of any related person transaction, we will provide the audit committee with all material information regarding such related person transaction, the interest of the related person and any potential disclosure obligations of us in connection with such related person transaction. |
| • | If a related person transaction will be ongoing, the audit committee may establish guidelines for our management to follow in its ongoing dealings with the related person. |
185
DESCRIPTION OF OUR SECURITIES
This prospectus contains summaries of certain provisions contained in some of the documents described herein, but reference is made to the actual documents for complete information. All of the summaries are qualified in their entirety by the actual documents. Copies of some of the documents referred to herein have been filed, will be filed or will be incorporated by reference as exhibits to the registration statement of which this prospectus is a part, and you may obtain copies of those documents as described below under “”.
Where You Can Find More Information
Authorized Capitalization
General
The total amount of authorized capital stock of Akili, Inc. consists of 1,000,000,000 shares of common stock, par value $0.0001 per share, and 100,000,000 shares of preferred stock, par value $0.0001 per share. We have approximately 85,395,207 shares of Akili, Inc. common stock held by 77 holders of record and no shares of Akili Inc. preferred stock outstanding as of August 22, 2022.
Preferred Stock
The board of directors of Akili, Inc. (the “Board”) has authority to issue shares of Akili, Inc.’s preferred stock in one or more series, to fix for each such series such voting powers, designations, preferences, qualifications, limitations or restrictions thereof, including dividend rights, conversion rights, redemption privileges and liquidation preferences for the issue of such series all to the fullest extent permitted by the DGCL. The issuance of Akili, Inc. preferred stock could have the effect of decreasing the trading price of Akili, Inc. common stock, restricting dividends on Akili, Inc. capital stock, diluting the voting power of Akili, Inc. common stock, impairing the liquidation rights of Akili, Inc. capital stock, or delaying or preventing a change in control of Akili, Inc.
Common Stock
Akili, Inc. common stock is not entitled to preemptive or other similar subscription rights to purchase any of Akili, Inc. securities. Akili, Inc. common stock is neither convertible nor redeemable.
Warrants
As of August 22, 2022, warrants to purchase up to 242,924 shares of Akili, Inc. common stock were issued and outstanding.
Voting Rights
Each holder of Akili, Inc. common stock is entitled to one vote per share on each matter submitted to a vote of stockholders, as provided by the Certificate of Incorporation. The Bylaws provide that the holders of a majority of the capital stock issued and outstanding and entitled to vote thereat, present in person or represented by proxy, will constitute a quorum at all meetings of the stockholders for the transaction of business. When a quorum is present, the affirmative vote of a majority of the votes cast is required to take action, unless otherwise specified by law, the Bylaws or the Certificate of Incorporation, and except for the election of directors, which is determined by a plurality vote. There are no cumulative voting rights.
Dividend Rights
Akili, Inc. common stock holders are entitled to the payment of dividends and other distributions as may be declared by the Board from time to time out of the assets of Akili, Inc. or funds legally available for dividends or other distributions. These rights are subject to the preferential rights of the holders of Akili, Inc. preferred stock, if any, and any contractual limitations on the ability of Akili, Inc. to declare and pay dividends.
186
Other Rights
Each holder of Akili, Inc. common stock is subject to, and may be adversely affected by, the rights of the holders of Akili, Inc. preferred stock that Akili, Inc. may designate and issue in the future.
Liquidation Rights
If Akili, Inc. is involved in voluntary or involuntary liquidation, dissolution or winding up of the affairs of Akili, Inc., or a similar event, each holder of Akili, Inc. common stock will participate pro rata in all assets remaining after payment of liabilities, subject to prior distribution rights of Akili, Inc. preferred stock, if any, then outstanding.
Registration Rights
Certain PIPE Investors are entitled to registration rights pursuant to the Subscription Agreements which SCS entered into with the
non-Sponsor
related PIPE Investors. In particular, SCS is required to, as soon as practicable but no later than thirty (30) calendar days following the Closing, submit to or file with the SEC a registration statement registering the resale of the shares of SCS Common Stock issued to thenon-Sponsor
related PIPE Investors in the PIPE Investment.At the Closing, Akili, Inc., the Sponsor, certain affiliates of the Sponsor and certain former stockholders of Akili entered into the Amended and Restated Registration Rights Agreement, pursuant to which Akili, Inc. agrees to register for resale, pursuant to Rule 415 under the Securities Act, certain shares of Akili, Inc. common stock that are held by the parties thereto from time to time.
Anti-takeover Effects of the Certificate of Incorporation and the Bylaws
The Certificate of Incorporation and the Bylaws contain provisions that may delay, defer or discourage another party from acquiring control of Akili, Inc. Akili, Inc. expects that these provisions, which are summarized below, will discourage coercive takeover practices or inadequate takeover bids. These provisions are also designed to encourage persons seeking to acquire control of Akili, Inc. to first negotiate with the Board, which Akili, Inc. believes may result in an improvement of the terms of any such acquisition in favor of Akili, Inc. stockholders. However, they also give the Board the power to discourage mergers that some stockholders may favor.
C
lassified Board
The Certificate of Incorporation provides that the Board is divided into three classes (Class I, Class II and Class III), one class of which will be elected each year by our stockholders. The first term of office of the Class I directors will expire at the first annual meeting of stockholders following the effectiveness of the Certificate of Incorporation, the first term of office of the Class II directors will expire at the second annual meeting of stockholders following the effectiveness of the Certificate of Incorporation and the first term of office of the Class III directors will expire at the third annual meeting of stockholders following the effectiveness of the Certificate of Incorporation. Accordingly, a third party may be discouraged from making a tender offer or otherwise attempting to obtain control of Akili, Inc. because it is more difficult and time-consuming for stockholders to replace a majority of the directors on a classified board.
Director Removal and Filling Vacancies
The Certificate of Incorporation provides that directors may be removed only for cause and then only by the affirmative vote of not less than
two-thirds
(2/3) of the holders of the shares then entitled to vote at an election of directors. Furthermore, any vacancy on the Board, however occurring, including a vacancy resulting from an increase in the size of the Board, may only be filled by the affirmative vote of a majority of our directors then in office even if less than a quorum. The limitations on removal of directors and treatment of vacancies, has the effect of making it more difficult for stockholders to change the composition of our board of directors.187
Special Meetings of Stockholders
The Certificate of Incorporation provides that a special meeting of stockholders may be called by the (a) the Chair of the Board, (b) the Board acting pursuant to a resolution approved by the affirmative vote of a majority of the directors then in office or (c) the Chief Executive Officer of Akili, Inc., provided that such special meeting may be postponed, rescheduled or cancelled by the Board. The Bylaws limit the business that may be conducted at an annual or special meeting of stockholders to those matters properly brought before the meeting.
Action by Written Consent
The Certificate of Incorporation provides that any action required or permitted to be taken by the stockholders must be effected at an annual or special meeting of the stockholders, and may not be taken by written consent in lieu of a meeting. This limit may lengthen the amount of time required to take stockholder actions and would prevent the amendment of our bylaws or removal of directors by our stockholders without holding a meeting of stockholders.
Advance Notice Requirements
The Bylaws establish advance notice procedures with regard to stockholder proposals relating to the nomination of candidates for election as directors or new business to be brought before meetings of Akili, Inc.’s stockholders. These procedures provide that notice of stockholder proposals must be timely given in writing to the corporate secretary of Akili, Inc. prior to the meeting at which the action is to be taken. Generally, to be timely, notice must be received at the principal executive offices of Akili, Inc. not less than 90 days nor more than 120 days prior to the first anniversary date of the annual meeting for the preceding year. The Bylaws specify the requirements as to form and content of all stockholders’ notices. These requirements may preclude stockholders from bringing matters before the stockholders at an annual or special meeting.
Amendment to Certificate of Incorporation and Bylaws
Any amendment of the Certificate of Incorporation must first be approved by a majority of the Board, and if required by law or the Certificate of Incorporation, must thereafter be approved by a majority of the outstanding shares entitled to vote on the amendment and a majority of the outstanding shares of each class entitled to vote thereon as a class, except that the amendment of the provisions relating to stockholder action, board composition, limitation of liability and amendment of the certificate of incorporation must be approved by not less than
two-thirds
(2/3) of the outstanding shares entitled to vote on the amendment, and not less thantwo-thirds
(2/3) of the outstanding shares of each class entitled to vote thereon as a class. The Bylaws may be amended or repealed by the affirmative vote of a majority of the directors then in office, subject to any limitations set forth in the Bylaws; and generally may also be amended by the affirmative vote of the holders oftwo-thirds
(2/3) of the outstanding shares entitled to vote on the amendment.Delaware Anti-Takeover Statute
Section 203 of the DGCL provides that if a person acquires 15% or more of the voting stock of a Delaware corporation, such person becomes an “interested stockholder” and may not engage in certain “business combinations” with such corporation for a period of three years from the time such person acquired 15% or more of such corporation’s voting stock, unless: (i) the board of directors of such corporation approves the acquisition of stock or the merger transaction before the time that the person becomes an interested stockholder, (ii) the interested stockholder owns at least 85% of the outstanding voting stock of such corporation at the time the merger transaction commences (excluding voting stock owned by directors who are also officers and certain employee stock plans), or (iii) the merger transaction is approved by the board of directors and at a meeting of stockholders, not by written consent, by the affirmative vote of
two-thirds
(2/3) of the outstanding voting stock which is not owned by the interested stockholder. A Delaware corporation may elect in its certificate of incorporation not to be governed by this particular Delaware law. The Certificate of Incorporation does not opt Akili, Inc. out of Section 203 and, therefore, Section 203 will apply to Akili, Inc.188
Limitations on Liability and Indemnification of Officers and Directors
The Certificate of Incorporation provides that Akili, Inc. will indemnify its directors to the fullest extent authorized or permitted by applicable law. Akili, Inc. expects to enter into agreements to indemnify its directors, executive officers and other employees as determined by the Board. Under the Bylaws, Akili, Inc. is required to indemnify each of Akili, Inc.’s directors and officers if the basis of the indemnitee’s involvement was by reason of the fact that the indemnitee is or was a director or officer of Akili, Inc. or was serving at the request of Akili, Inc. as a director, officer, employee or agent for another entity. Akili, Inc. must indemnify its officers and directors against all expenses (including attorneys’ fees), judgments, fines and amounts paid in settlement actually and reasonably incurred by the indemnitee in connection with such action, suit or proceeding if the indemnitee acted in good faith and in a manner the indemnitee reasonably believed to be in or not opposed to the best interests of Akili, Inc., and, with respect to any criminal action or proceeding, had no reasonable cause to believe the indemnitee’s conduct was unlawful. The Bylaws also require Akili, Inc. to advance expenses (including attorneys’ fees) incurred by a director in defending any civil, criminal, administrative or investigative action, suit or proceeding, provided that such person will repay any such advance if it is ultimately determined that such person is not entitled to indemnification by Akili, Inc. Any claims for indemnification by Akili, Inc.’s directors and officers may reduce Akili, Inc.’s available funds to satisfy successful third-party claims against Akili, Inc. and may reduce the amount of money available to Akili, Inc.
Exclusive Jurisdiction of Certain Actions
The Bylaws provide that, unless Akili, Inc. consents in writing to the selection of an alternative forum, the Court of Chancery of the State of Delaware (or, if the Court of Chancery does not have, or declines to accept, jurisdiction, another state court located within the State of Delaware) will be the sole and exclusive forum for
(a) any derivative action or proceeding brought on behalf of Akili, Inc., (b) any action asserting a claim for or based on a breach of a fiduciary duty owed by any current or former director, officer or other employee of Akili, Inc. to Akili, Inc. or Akili, Inc.’s stockholders including a claim alleging the aiding and abetting of such a breach of fiduciary duty, (c) any action asserting a claim against Akili, Inc. or any current or former director, officer or other employee of Akili, Inc. arising pursuant to any provision of the DGCL or the Certificate of Incorporation or the Bylaws (as may be amended from time to time) (including the interpretation, validity or enforceability thereof), (d) any action asserting a claim related to or involving Akili, Inc. that is governed by the internal affairs doctrine, or (e) any action asserting an “internal corporate claim” as that term is defined in Section 115 of the DGCL (the “Delaware Forum Provision”). The Delaware Forum Provision, however, does not apply to any causes of action arising under the Securities Act or the Exchange Act or to any claim for which the federal courts have exclusive jurisdiction. The Bylaws also provide that, unless Akili, Inc. consents in writing to the selection of an alternate forum, the sole and exclusive forum for the resolution of any complaint asserting a cause of action arising under the Securities Act, and the rules and regulation promulgated thereunder, will be the federal district courts of the U.S. (the “Federal Forum Provision”). Section 22 of the Securities Act creates concurrent jurisdiction for federal and state courts over all suits brought to enforce any duty or liability created by the Securities Act or the rules and regulations thereunder. Section 27 of the Exchange Act creates exclusive federal jurisdiction over all suits brought to enforce any duty or liability created by the Exchange Act or the rules and regulations thereunder. The Delaware Forum Provision and the Federal Forum Provision will not relieve Akili, Inc. of its duties to comply with the federal securities laws and the rules and regulations thereunder, and Akili, Inc. stockholders will not be deemed to have waived Akili, Inc.’s compliance with these laws, rules and regulations.
Transfer Agent
The transfer agent for Akili, Inc. common stock is Continental Stock Transfer & Trust Company.
189
SECURITIES ACT RESTRICTIONS ON RESALE OF OUR SECURITIES
Pursuant to Rule 144 under the Securities Act (“Rule 144”), a person who has beneficially owned restricted Akili, Inc. common stock or Akili, Inc. warrants for at least six months would be entitled to sell their securities provided that (i) such person is not deemed to have been an affiliate of Akili, Inc. at the time of, or at any time during the three months preceding, a sale and (ii) Akili, Inc. is subject to periodic reporting requirements under the Exchange Act for at least three months before the sale and has filed all required reports under Section 13 or 15(d) of the Exchange Act during the 12 months (or such shorter period as Akili, Inc. was required to file reports) preceding the sale.
Persons who have beneficially owned restricted shares of Akili, Inc. common stock or Akili, Inc. warrants for at least six months but who are affiliates of Akili, Inc. at the time of, or at any time during the three months preceding, a sale, would be subject to additional restrictions, by which such person would be entitled to sell within any three-month period only a number of securities that does not exceed the greater of:
| • | 1% of the total number of shares of Akili, Inc. common stock then outstanding; or |
| • | the average weekly reported trading volume of Akili, Inc. common stock during the four calendar weeks preceding the filing of a notice on Form 144 with respect to the sale. |
Sales by affiliates of Akili, Inc. under Rule 144 are also limited by manner of sale provisions and notice requirements and to the availability of current public information about Akili, Inc.
Restrictions on the Use of Rule 144 by Shell Companies or Former Shell Companies
Rule 144 is not available for the resale of securities initially issued by shell companies (other than business combination related shell companies) or issuers that have been at any time previously a shell company. However, Rule 144 also includes an important exception to this prohibition if the following conditions are met:
| • | the issuer of the securities that was formerly a shell company has ceased to be a shell company; |
| • | the issuer of the securities is subject to the reporting requirements of Section 13 or 15(d) of the Exchange Act; |
| • | the issuer of the securities has filed all Exchange Act reports and material required to be filed, as applicable, during the preceding 12 months (or such shorter period that the issuer was required to file such reports and materials), other than Current Reports on Form 8-K; and |
| • | at least one year has elapsed from the time that the issuer filed current Form 10 type information with the SEC reflecting its status as an entity that is not a shell company. |
Following the Business Combination, Akili, Inc. is no longer a shell company, and so, once the conditions set forth in the exceptions listed above are satisfied, Rule 144 will become available for the resale of any of the above noted restricted securities.
190
PLAN OF DISTRIBUTION
The Selling Securityholders, which as used herein includes donees, pledgees, transferees, distributees or otherselling shares of common stock which we refer to as the securities, or interests in the securities received after the date of this prospectus from the Selling Securityholders as a gift, pledge, partnership distribution or other transfer, may, from time to time, sell, transfer, distribute or otherwise dispose of certain of their securities or interests in the securities on any stock exchange, market or trading facility on which the securities are traded, or in private transactions. These dispositions may be at fixed prices, at prevailing market prices at the time of sale, at prices related to the prevailing market price, at varying prices determined at the time of sale, or at negotiated prices.
successors-in-interest
The Selling Securityholders may use any one or more of the following methods when disposing of the securities or their interests therein:
| • | ordinary brokerage transactions and transactions in which the broker-dealer solicits purchasers; |
| • | one or more underwritten offerings on a firm commitment or best efforts basis; |
| • | block trades in which the broker-dealer will attempt to sell the securities as agent, but may position and resell a portion of the block as principal to facilitate the transaction; |
| • | purchases by a broker-dealer as principal and resale by the broker-dealer for its accounts; |
| • | an exchange distribution in accordance with the rules of the applicable exchange; |
| • | privately negotiated transactions; |
| • | distributions or transfers to their members, partners, employees or shareholders; |
| • | short sales effected after the date of the registration statement of which this prospectus is a part is declared effective by the SEC; |
| • | through the writing or settlement of options or other hedging transactions, whether through an options exchange or otherwise; |
| • | in market transactions, including transactions on a national securities exchange or quotations service or over-the-counter |
| • | through trading plans entered into by a Selling Securityholder pursuant to Rule 10b5-1 under the Exchange Act that are in place at the time of an offering pursuant to this prospectus and any applicable prospectus supplement hereto that provide for periodic sales of their securities on the basis of parameters described in such trading plans; |
| • | directly to one or more purchasers, including through a specific bidding, auction or other process or in privately negotiated transactions; |
| • | in “at the market” offerings, as defined in Rule 415 under the Securities Act, at negotiated prices, at prices prevailing at the time of sale or at prices related to such prevailing market prices, including sales made directly on a national securities exchange or sales made through a market maker other than on an exchange or other similar offerings through sales agents; |
| • | through agents; |
| • | through broker-dealers who may agree with the Selling Securityholders to sell a specified number of such securities at a stipulated price per share or warrant; and |
| • | by entering into transactions with third parties who may (or may cause others to) issue securities convertible or exchangeable into, or the return of which is derived in whole or in part from the value of, our ordinary shares and a combination of any such methods of sale or any other method permitted pursuant to applicable law. |
191
The Selling Securityholders may, from time to time, pledge or grant a security interest in some portion or all of the securities owned by them and, if a Selling Securityholder defaults in the performance of its secured obligations, the pledgees or secured parties may offer and sell such securities, as applicable, from time to time, under this prospectus, or under an amendment or supplement to this prospectus amending the list of the Selling Securityholders to include the pledgee, transferee or other successors in interest as the Selling Securityholders under this prospectus. The Selling Securityholders also may transfer the securities in other circumstances, in which case the transferees, pledgees or other successors in interest will be the selling beneficial owners for purposes of this prospectus.
In connection with the sale of the securities or interests in the securities, the Selling Securityholders may enter into hedging transactions with broker-dealers or other financial institutions, which may in turn engage in short sales of the securities in the course of hedging the positions they assume. The Selling Securityholders may also sell the securities short and deliver the securities to close out their short positions, or loan or pledge the securities to broker- dealers that in turn may sell the securities. The Selling Securityholders may also enter into option or other transactions with broker-dealers or other financial institutions or the creation of one or more derivative securities that require the delivery to such broker-dealer or other financial institution of the securities, which securities such broker-dealer or other financial institution may resell pursuant to this prospectus (as supplemented or amended to reflect such transaction).
The aggregate proceeds to the Selling Securityholders from the sale of the securities offered by them will be the purchase price of such securities less discounts or commissions, if any. The Selling Securityholders reserve the right to accept and, together with their agents from time to time, to reject, in whole or in part, any proposed purchase of the securities to be made directly or through agents. We will not receive any of the proceeds from any offering by the Selling Securityholders.
There can be no assurance that the Selling Securityholders will sell all or any of the securities offered by this prospectus. The Selling Securityholders also may in the future resell securities in open market transactions in reliance upon Rule 144 under the Securities Act, provided that they meet the criteria and conform to the requirements of that rule, or pursuant to other available exemptions from the registration requirements of the Securities Act.
The Selling Securityholders and any underwriters, broker-dealers or agents that participate in the sale of the securities or interests in the securities may be “underwriters” within the meaning of Section 2(11) of the Securities Act. Any discounts, commissions, concessions or profit they earn on any resale of the securities may be underwriting discounts and commissions under the Securities Act. If any Selling Securityholders is an “underwriter” within the meaning of Section 2(11) of the Securities Act, then the Selling Securityholders will be subject to the prospectus delivery requirements of the Securities Act. Underwriters and their controlling persons, dealers and agents may be entitled, under agreements entered into with us and the Selling Securityholders, to indemnification against and contribution toward specific civil liabilities, including liabilities under the Securities Act.
To the extent required, the securities to be sold, the respective purchase prices and public offering prices, the names of any agent, dealer or underwriter, and any applicable discounts, commissions, concessions or other compensation with respect to a particular offer will be set forth in an accompanying prospectus supplement or, if appropriate, a post-effective amendment to the registration statement that includes this prospectus.
To facilitate the offering of shares of the securities, certain persons participating in the offering may engage in transactions that stabilize, maintain or otherwise affect the price of the securities. This may include over-allotments or short sales, which involve the sale by persons participating in the offering of more securities than were sold to them. In these circumstances, these persons would cover such over-allotments or short positions by making purchases in the open market or by exercising their over-allotment option, if any. In addition, these persons may stabilize or maintain the price of the securities by bidding for or purchasing securities in the open
192
market or by imposing penalty bids, whereby selling concessions allowed to dealers participating in the offering may be reclaimed if the securities sold by them are repurchased in connection with stabilization transactions. The effect of these transactions may be to stabilize or maintain the market price of our securities at a level above that which might otherwise prevail in the open market. These transactions may be discontinued at any time.
The Selling Securityholders may solicit offers to purchase the securities directly from, and it may sell such securities directly to, institutional investors or others. In this case, no underwriters or agents would be involved. The terms of any of those sales, including the terms of any bidding or auction process, if utilized, will be described in the applicable prospectus supplement.
It is possible that one or more underwriters may make a market in our securities, but such underwriters will not be obligated to do so and may discontinue any market making at any time without notice. We cannot give any assurance as to the liquidity of the trading market for our securities.
Our common stock is listed on Nasdaq under the symbol “AKLI”.
The Selling Securityholders may authorize underwriters, broker-dealers or agents to solicit offers by certain purchasers to purchase the securities at the public offering price set forth in the prospectus supplement pursuant to delayed delivery contracts providing for payment and delivery on a specified date in the future. The contracts will be subject only to those conditions set forth in the prospectus supplement, and the prospectus supplement will set forth any commissions we or the Selling Securityholders pay for solicitation of these contracts. The underwriters, broker- dealers and agents may engage in transactions with us or the Selling Securityholders, or perform services for us or the Selling Securityholders, in the ordinary course of business.
Under the Registration Rights Agreement, we have agreed to indemnify the Selling Securityholders party thereto against certain liabilities that they may incur in connection with the sale of the securities registered hereunder, including liabilities under the Securities Act, and to contribute to payments that the Selling Securityholders may be required to make with respect thereto.
We have agreed to maintain the effectiveness of this registration statement until all such securities have been sold under this registration statement or Rule 144 under the Securities Act or are no longer outstanding. We have agreed to pay all expenses in connection with this offering, other than underwriting fees, discounts, selling commissions, stock transfer taxes and certain legal expenses. The Selling Securityholders will pay, on a pro rata basis, any underwriting fees, discounts, selling commissions, stock transfer taxes and certain legal expenses relating to the offering. We will make copies of this prospectus available to the Selling Securityholders for the purpose of satisfying the prospectus delivery requirements of the Securities Act.
Selling Securityholders may use this prospectus in connection with resales of the securities. This prospectus and any accompanying prospectus supplement will identify the Selling Securityholders, the terms of the securities and any material relationships between us and the Selling Securityholders. Selling Securityholders may be deemed to be underwriters under the Securities Act in connection with the securities they resell and any profits on the sales may be deemed to be underwriting discounts and commissions under the Securities Act. Unless otherwise set forth in a prospectus supplement, the Selling Securityholders will receive all the net proceeds from the resale of the securities.
A Selling Securityholder that is an entity may elect to make an
in-kind
distribution of the securities to its members, partners or shareholders pursuant to the registration statement of which this prospectus is a part by delivering a prospectus. To the extent that such members, partners or shareholders are not affiliates of ours, such members, partners or shareholders would thereby receive freely tradable securities pursuant to the distribution through a registration statement.193
If at the time of any offering made under this prospectus a member of FINRA participating in the offering has a “conflict of interest” as defined in FINRA Rule 5121 (“Rule 5121”), that offering will be conducted in accordance with the relevant provisions of Rule 5121.
To our knowledge, there are currently no plans, arrangements or understandings between the Selling Securityholders and any broker-dealer or agent regarding the sale of the securities by the Selling Securityholders. Upon our notification by a Selling Securityholder that any material arrangement has been entered into with an underwriter or broker-dealer for the sale of securities through a block trade, special offering, exchange distribution, secondary distribution or a purchase by an underwriter or broker-dealer, we will file, if required by applicable law or regulation, a supplement to this prospectus pursuant to Rule 424(b) under the Securities Act disclosing certain material information relating to such underwriter or broker-dealer and such offering.
In order to comply with the securities laws of certain states, if applicable, the securities must be sold in such jurisdictions only through registered or licensed brokers or dealers. In addition, in certain states the securities may not be sold unless they have been registered or qualified for sale in the applicable state or an exemption from the registration or qualification requirement is available and is complied with.
The Selling Securityholders and any other persons participating in the sale or distribution of the securities will be subject to applicable provisions of the Securities Act and the Exchange Act, and the rules and regulations thereunder, including, without limitation, Regulation M. These provisions may restrict certain activities of, and limit the timing of purchases and sales of any of the securities by, the Selling Securityholders or any other person, which limitations may affect the marketability of the shares of the securities.
We are required to pay all fees and expenses incident to the registration of the securities to be offered and sold pursuant to this prospectus, which we expect to be approximately $344,205.
194
LEGAL MATTERS
Goodwin Procter LLP, Boston, Massachusetts has passed upon the validity of the securities of Akili, Inc. offered by this prospectus and certain other legal matters related to this prospectus.
EXPERTS
The financial statements of Social Capital Suvretta Holdings Corp. I as of December 31, 2021, and for the period from February 25, 2021 (inception) through December 31, 2021, included in this prospectus have been audited by Marcum LLP, an independent registered public accounting firm, as stated in their report appearing herein (which contains an explanatory paragraph relating to substantial doubt about the ability of Social Capital Suvretta Holdings Corp. I to continue as a going concern as described in Note 1 to the financial statements). Such financial statements are included in reliance upon the report of such firm given upon their authority as experts in accounting and auditing.
The consolidated financial statements of Akili Interactive Labs, Inc. as of December 31, 2021 and 2020, and for each of the years then ended, have been included in this prospectus in reliance upon the report of KPMG LLP, independent registered public accounting firm, appearing elsewhere herein, and upon the authority of said firm as experts in accounting and auditing.
WHERE YOU CAN FIND MORE INFORMATION
We file annual, quarterly and current reports, proxy statements and other information with the SEC. We have also filed a registration statement on Form
S-1,
including exhibits, under the Securities Act with respect to the securities offered by this prospectus. This prospectus is part of the registration statement, but does not contain all of the information included in the registration statement or the exhibits. Our SEC filings are available to the public on the Internet at a website maintained by the SEC located at http://www.sec.gov. Those filings are also available to the public on, or accessible through, our website under the heading “Investors” at www.akiliinteractive.com. The information contained on, or otherwise accessible through, our website, however, is not, and should not be deemed to be, a part of this prospectus.195
SOCIAL CAPITAL SUVRETTA HOLDINGS CORP. I INDEX TO FINANCIAL STATEMENTS
Page | ||||
Condensed Consolidated Financial Statements for the Quarter Ended June 30, 2022 | ||||
| F-3 | ||||
| F-4 | ||||
| F-5 | ||||
| F-6 | ||||
| F-7 | ||||
Audited Financial Statements as of December 31, 2021 and for the Period from February 25, 2021 (inception) to December 31, 2021 | ||||
| F-24 | ||||
| F-25 | ||||
| F-26 | ||||
| F-27 | ||||
| F-28 | ||||
| F-29 | ||||
F-1
AKILI INTERACTIVE LABS, INC. INDEX TO FINANCIAL STATEMENTS
Unaudited Financial Statements for the periods ended June 30, 2022 and June 30, 2021
PAGE | ||||
| F-42 | ||||
| F-43 | ||||
| F-44 | ||||
| F-46 | ||||
| F-47 | ||||
Financial Statements for the years ended December 31, 2021 and December 31, 2020 | ||||
PAGE | ||||
| F-58 | ||||
| F-59 | ||||
| F-60 | ||||
| F-61 | ||||
| F-62 | ||||
| F-63 | ||||
F-2
SOCIAL CAPITAL SUVRETTA HOLDINGS CORP. I
CONDENSED CONSOLIDATED BALANCE SHEETS
June 30, 2022 | December 31, 2021 | |||||||
| (Unaudited) | ||||||||
ASSETS | ||||||||
Current assets | ||||||||
Cash | $ | 145,044 | $ | 428,189 | ||||
Prepaid expenses | 524,750 | 504,034 | ||||||
Total Current Assets | 669,794 | 932,223 | ||||||
Non-current prepaid insurance | — | 247,500 | ||||||
Marketable securities held in Trust Account | 250,371,095 | 250,008,324 | ||||||
TOTAL ASSETS | $ | 251,040,889 | $ | 251,188,047 | ||||
LIABILITIES, TEMPORARY EQUITY AND PERMANENT DEFICIT | ||||||||
Current liabilities | ||||||||
Accounts payable | $ | 17,465 | $ | 5,000 | ||||
Accrued expenses | 7,405,342 | 1,974,837 | ||||||
Promissory note - related party | 250,000 | — | ||||||
Due to related party | 80,127 | 10,000 | ||||||
Total current liabilities | 7,752,934 | 1,989,837 | ||||||
Deferred underwriting fee payable | 7,700,000 | 7,700,000 | ||||||
Total Liabilities | 15,452,934 | 9,689,837 | ||||||
Commitments and Contingencies (Note 6) | ||||||||
Temporary Equity | ||||||||
Class A ordinary shares subject to possible redemption, 25,000,000 shares at redemption value as of June 30, 2022 and December 31, 2021 | 250,371,095 | 250,008,324 | ||||||
Permanent Deficit | ||||||||
Preference shares, $0.0001 par value; 5,000,000 shares authorized; no shares issued and outstanding as of June 30, 2022 and December 31, 2021 | — | — | ||||||
Class A ordinary shares, $0.0001 par value; 500,000,000 shares authorized; 640,000 shares issued and outstanding (excluding 25,000,000 shares subject to possible redemption) as of June 30, 2022 and December 31, 2021 | 64 | 64 | ||||||
Class B ordinary shares, $0.0001 par value; 50,000,000 shares authorized; 6,250,000 shares issued and outstanding as of June 30, 2022 and December 31, 2021 | 625 | 625 | ||||||
Additional paid-in capital | — | — | ||||||
Accumulated deficit | (14,783,829 | ) | (8,510,803 | ) | ||||
Total Permanent Deficit | (14,783,140 | ) | (8,510,114 | ) | ||||
TOTAL LIABILITIES, TEMPORARY EQUITY AND PERMANENT DEFICIT | $ | 251,040,889 | $ | 251,188,047 | ||||
The accompanying notes are an integral part of the unaudited condensed consolidated financial statements.
F-3
SOCIAL CAPITAL SUVRETTA HOLDINGS CORP. I
CONDENSED CONSOLIDATED STATEMENTS OF OPERATIONS
(UNAUDITED)
For the Three Months Ended June 30, 2022 | For the Three Months Ended June 30, 2021 | For the Six Months Ended June 30, 2022 | For the Period from February 25, 2021 (Inception) Through June 30, 2021 | |||||||||||||
Operating and formation costs | $ | 2,071,642 | $ | 143 | $ | 6,273,026 | $ | 5,325 | ||||||||
Loss from operations | (2,071,642 | ) | (143 | ) | (6,273,026 | ) | (5,325 | ) | ||||||||
Other expense: | ||||||||||||||||
Interest earned on marketable securities held in Trust Account | 337,595 | — | 362,771 | — | ||||||||||||
Net loss | $ | (1,734,047 | ) | $ | (143 | ) | $ | (5,910,255 | ) | $ | (5,325 | ) | ||||
Weighted average shares outstanding, Class A ordinary shares | 25,640,000 | — | 25,640,000 | — | ||||||||||||
Basic and diluted net loss per share, Class A ordinary shares | $ | (0.05 | ) | $ | — | $ | (0.19 | ) | $ | — | ||||||
Weighted average shares outstanding, Class B ordinary shares | 6,250,000 | 5,500,000 | 6,250,000 | 5,500,000 | ||||||||||||
Basic and diluted net loss per share, Class B ordinary shares | $ | (0.05 | ) | $ | (0.00 | ) | $ | (0.19 | ) | $ | (0.00 | ) | ||||
The accompanying notes are an integral part of the unaudited condensed consolidated financial statements.
F-4
SOCIAL CAPITAL SUVRETTA HOLDINGS CORP. I
CONDENSED CONSOLIDATED STATEMENTS OF CHANGES IN TEMPORARY EQUITY
AND PERMANENT (DEFICIT) EQUITY
(UNAUDITED)
FOR THE THREE AND SIX MONTHS ENDED JUNE 30, 2022
Temporary Equity | Class A Ordinary Shares | Class B Ordinary Shares | Additional Paid-in Capital | Accumulated Deficit | Total Permanent Deficit | |||||||||||||||||||||||||||||||
Shares | Amount | Shares | Amount | Shares | Amount | |||||||||||||||||||||||||||||||
Balance – January 1, 2022 | 25,000,000 | $ | 250,008,324 | 640,000 | $ | 64 | 6,250,000 | $ | 625 | $ | — | $ | (8,510,803 | ) | $ | (8,510,114 | ) | |||||||||||||||||||
Remeasurement for Class A ordinary shares to redemption value | — | (8,324 | ) | — | — | — | — | — | 8,324 | 8,324 | ||||||||||||||||||||||||||
Net loss | — | — | — | — | — | — | — | (4,176,208 | ) | (4,176,208 | ) | |||||||||||||||||||||||||
Balance – March 31, 2022 | 25,000,000 | $ | 250,000,000 | 640,000 | $ | 64 | 6,250,000 | $ | 625 | $ | — | $ | (12,678,687 | ) | $ | (12,677,998 | ) | |||||||||||||||||||
Remeasurement for Class A ordinary shares to redemption value | — | 371,095 | — | — | — | — | — | (371,095 | ) | (371,095 | ) | |||||||||||||||||||||||||
Net loss | — | — | — | — | — | — | — | (1,734,047 | ) | (1,734,047 | ) | |||||||||||||||||||||||||
Balance – June 30, 2022 | 25,000,000 | $ | 250,371,095 | 640,000 | $ | 64 | 6,250,000 | $ | 625 | $ | — | $ | (14,783,829 | ) | $ | (14,783,140 | ) | |||||||||||||||||||
FOR THE THREE MONTHS ENDED JUNE 30, 2021 AND
FOR THE PERIOD FROM FEBRUARY 25, 2021 (INCEPTION) THROUGH JUNE 30, 2021
Temporary Equity | Class A Ordinary Shares | Class B Ordinary Shares | Additional Paid-in Capital | Accumulated Deficit | Total Permanent Equity | |||||||||||||||||||||||||||||||
Shares | Amount | Shares | Amount | Shares | Amount | |||||||||||||||||||||||||||||||
Balance – February 25, 2021 (inception) | — | $ | — | — | $ | — | — | $ | — | $ | — | $ | — | $ | — | |||||||||||||||||||||
Issuance of Class B ordinary shares to Sponsor | — | — | — | — | 6,325,000 | 633 | 24,367 | — | 25,000 | |||||||||||||||||||||||||||
Net loss | — | — | — | — | — | — | — | (5,182 | ) | (5,182 | ) | |||||||||||||||||||||||||
Balance – March 31, 2021 | — | $ | — | — | $ | — | 6,325,000 | $ | 633 | $ | 24,367 | $ | (5,182 | ) | $ | 19,818 | ||||||||||||||||||||
Net loss | — | — | — | — | — | — | — | (143 | ) | (143 | ) | |||||||||||||||||||||||||
Balance – June 30, 2021 | — | $ | — | — | $ | — | 6,325,000 | $ | 633 | $ | 24,367 | $ | (5,325 | ) | $ | 19,675 | ||||||||||||||||||||
The accompanying notes are an integral part of the unaudited condensed consolidated financial statements.
F-5
SOCIAL CAPITAL SUVRETTA HOLDINGS CORP. I
CONDENSED CONSOLIDATED STATEMENTS OF CASH FLOWS
(UNAUDITED)
For the Six Months Ended June 30, 2022 | For the Period from February 25, 2021 (Inception) Through June 30, 2021 | |||||||
Cash Flows from Operating Activities: | ||||||||
Net loss | $ | (5,910,255 | ) | $ | (5,325 | ) | ||
Adjustments to reconcile net loss to net cash used in operating activities: | ||||||||
Formation costs paid by Sponsor in exchange for issuance of Founder Shares | — | 5,000 | ||||||
Interest earned on marketable securities held in Trust Account | (362,771 | ) | — | |||||
Changes in operating assets and liabilities: | ||||||||
Prepaid expenses | (20,716 | ) | (19,600 | ) | ||||
Non-current prepaid insurance | 247,500 | — | ||||||
Accounts payable and accrued expenses | 5,442,970 | 88 | ||||||
Advance from related party | 70,127 | — | ||||||
Net cash used in operating activities | (533,145 | ) | (19,837 | ) | ||||
Cash Flows from Financing Activities: | ||||||||
Advance from related party | — | 25,692 | ||||||
Proceeds from promissory note – related party | 250,000 | 300,000 | ||||||
Payment of offering costs | — | (82,317 | ) | |||||
Net cash provided by financing activities | 250,000 | 243,375 | ||||||
Net Change in Cash | (283,145 | ) | 223,538 | |||||
Cash – Beginning of period | 428,189 | — | ||||||
Cash – End of period | $ | 145,044 | $ | 223,538 | ||||
Non-Cash investing and financing Activities: | ||||||||
Offering costs included in accrued offering costs | $ | — | $ | 285,873 | ||||
Offering costs paid by Sponsor in exchange for issuance of Founder Shares | $ | — | $ | 20,000 | ||||
Remeasurement of Class A ordinary shares subject to possible redemption | $ | 362,771 | $ | — | ||||
The accompanying notes are an integral part of the unaudited condensed consolidated financial statements.
F-6
SOCIAL CAPITAL SUVRETTA HOLDINGS CORP. I
NOTES TO CONDENSED CONSOLIDATED FINANCIAL STATEMENTS
JUNE 30, 2022
(Unaudited)
NOTE 1. DESCRIPTION OF ORGANIZATION, BUSINESS OPERATIONS AND GOING CONCERN
Social Capital Suvretta Holdings Corp. I (the “Company”) is a blank check company incorporated as a Cayman Islands exempted company on February 25, 2021. The Company was incorporated for the purpose of effecting a merger, share exchange, asset acquisition, share purchase, reorganization or similar business combination with one or more businesses (a “Business Combination”). The Company is an early stage and emerging growth company and, as such, the Company is subject to all of the risks associated with early stage and emerging growth companies.
The Company has one wholly-owned subsidiary, Karibu Merger Sub, Inc., which was incorporated in the State of Delaware on January 24, 2022 (“Merger Sub”).
As of June 30, 2022, the Company had not commenced any operations. All activity for the period from February 25, 2021 (inception) through June 30, 2022 relates to the Company’s formation, the initial public offering (the “Initial Public Offering”), described below, and, subsequent to the Initial Public Offering, identifying a target company for a Business Combination and activities in connection with the proposed acquisition of Akili Interactive Labs, Inc. (see Note 6). The Company will not generate any operating revenues until after the completion of a Business Combination, at the earliest. The Company generates
non-operating
income in the form of interest income from the marketable securities held in the Trust Account (as defined below).The registration statements for the Company’s Initial Public Offering became effective on June 29, 2021 and June 30, 2021. On July 2, 2021, the Company consummated the Initial Public Offering of 25,000,000 Class A ordinary shares (the “Public Shares”), which includes the partial exercise by the underwriters of their over-allotment option in the amount of 3,000,000 Public Shares, at $10.00 per Public Share, generating gross proceeds of $250,000,000, which is described in Note 3. The fair value attributable to the unexercised portion of the over-allotment option was deemed to be immaterial to the condensed consolidated financial statements.
Substantially concurrently with the closing of the Initial Public Offering, the Company consummated the sale of 640,000 Class A ordinary shares (the “Private Placement Shares”) at a price of $10.00 per Private Placement Share in a private placement to SCS Sponsor I LLC, a Cayman Islands limited liability company (the “Sponsor”), generating gross proceeds of $6,400,000, which is described in Note 4.
Transaction costs amounted to $12,488,190, consisting of $4,400,000 of underwriting fees, $7,700,000 of deferred underwriting fees and $388,190 of other offering costs.
In connection with the closing of the Initial Public Offering on July 2, 2021, an amount of $250,000,000 ($10.00 per Public Share) from the net proceeds of the sale of the Public Shares in the Initial Public Offering and the sale of the Private Placement Shares was placed in a trust account (the “Trust Account”), and invested in U.S. government treasury bills with a maturity of 185 days or less or in money market funds investing solely in U.S. Treasuries and meeting certain conditions of
Rule2a-7
of the Investment Company Act of 1940, as amended (the “Investment Company Act”). Except with respect to interest earned on the funds held in the Trust Account that may be released to the Company to pay its taxes, if any, the funds held in the Trust Account will not be released from the Trust Account until the earliest of: (a) the completion of a Business Combination, and then only in connection with those Public Shares that such shareholder properly elected to redeem, subject to certain limitations; (b) the redemption of any Public Shares properly submitted in connection with a shareholder vote to amend the Company’s Amended and Restated Memorandum and Articles of Association (i) to modify theF-7
SOCIAL CAPITAL SUVRETTA HOLDINGS CORP. I
NOTES TO CONDENSED CONSOLIDATED FINANCIAL STATEMENTS
JUNE 30, 2022
(Unaudited)
substance or timing of the Company’s obligation to allow redemption in connection with the Business Combination or to redeem 100% of the Public Shares if the Company does not complete a Business Combination within the Combination Period (as defined below) or (ii) with respect to any other material provisions relating to shareholders’ rights or
pre-Business
Combination activity; and (c) the redemption of the Public Shares if the Company has not completed a Business Combination within the Combination Period or during any applicable extension period. The proceeds deposited in the Trust Account could become subject to the claims of the Company’s creditors, if any, which could have priority over the claims of the holders of the Public Shares (the “Public Shareholders”).The Company’s management has broad discretion with respect to the specific application of the net proceeds of the Initial Public Offering and the sale of the Private Placement Shares, although substantially all of the net proceeds are intended to be applied generally toward consummating a Business Combination. The Company must complete one or more Business Combinations having an aggregate fair market value of at least 80% of the value of the assets held in the Trust Account (excluding any deferred underwriting commissions and taxes payable on the income earned on the Trust Account) at the time of the Company signing a definitive agreement in connection with the Business Combination. However, the Company will only complete a Business Combination if the post-Business Combination company owns or acquires 50% or more of the issued and outstanding voting securities of the target or otherwise acquires a controlling interest in the target business sufficient for it not to be required to register as an investment company under the Investment Company Act. There is no assurance that the Company will be able to complete a Business Combination successfully.
The Company will provide the Public Shareholders with the opportunity to redeem all or a portion of their Public Shares upon the completion of the Business Combination, either (a) in connection with a general meeting called to approve the Business Combination or (b) by means of a tender offer. The decision as to whether the Company will seek shareholder approval of a Business Combination or conduct a tender offer will be made by the Company. The Public Shareholders will be entitled to redeem all or a portion of their Public Shares at a
per-share
price, payable in cash, equal to the aggregate amount then on deposit in the Trust Account, calculated as of two business days prior to the consummation of the Business Combination, including interest (which interest shall be net of taxes payable), divided by the number of then issued and outstanding Public Shares, subject to the limitations described below.In accordance with the Company’s Amended and Restated Memorandum and Articles of Association, in no event will the Company redeem the Public Shares in an amount that would cause the Company’s net tangible assets to be less than $5,000,001 following such redemptions. Redemptions of the Public Shares may also be subject to a higher net tangible asset test or cash requirement pursuant to an agreement relating to the Business Combination.
If a shareholder vote is not required in connection with a Business Combination and the Company does not decide to hold a shareholder vote for business or other reasons, the Company will, pursuant to its Amended and Restated Memorandum and Articles of Association, conduct the redemptions pursuant to the tender offer rules of the Securities and Exchange Commission (the “SEC”), and file tender offer documents with the SEC prior to completing a Business Combination. If, however, shareholder approval of the transaction is required by applicable law or stock exchange listing requirement, or the Company decides to obtain shareholder approval for business or other reasons, the Company will conduct the redemptions in conjunction with a proxy solicitation pursuant to the proxy rules and not pursuant to the tender offer rules and will file proxy materials with the SEC. If the Company seeks shareholder approval in connection with a Business Combination, the Company will complete such Business Combination only if the Company receives an ordinary resolution under Cayman Islands
F-8
SOCIAL CAPITAL SUVRETTA HOLDINGS CORP. I
NOTES TO CONDENSED CONSOLIDATED FINANCIAL STATEMENTS
JUNE 30, 2022
(Unaudited)
law, which requires the affirmative vote of holders of a majority of ordinary shares who attend and vote at a general meeting of the Company. The Public Shareholders may elect to redeem their Public Shares without voting and, if they do vote, irrespective of whether they vote for or against a Business Combination.
Notwithstanding the foregoing redemption rights, if the Company seeks shareholder approval of the Business Combination and the Company does not conduct redemptions pursuant to the tender offer rules, the Company’s Amended and Restated Memorandum and Articles of Association provide that a Public Shareholder, together with any affiliate of such shareholder or any other person with whom such shareholder is acting in concert or as a “group” (as defined under Section 13 of the Securities Exchange Act of 1934, as amended (the “Exchange Act”)), will be restricted from redeeming its Public Shares with respect to more than an aggregate of 15% of the Public Shares without the Company’s prior written consent.
The Sponsor and the Company’s directors and officers have agreed to waive: (a) their redemption rights with respect to any Founder Shares, Private Placement Shares and Public Shares held by them, as applicable, in connection with the completion of a Business Combination; (b) their redemption rights with respect to any Founder Shares, Private Placement Shares and Public Shares held by them in connection with a shareholder vote to amend the Company’s Amended and Restated Memorandum and Articles of Association (i) to modify the substance or timing of the Company’s obligation to allow redemption in connection with the Business Combination or to redeem 100% of the Public Shares if the Company does not complete a Business Combination within the Combination Period, or (ii) with respect to any other material provisions relating to shareholders’ rights or
pre-Business
Combination activity; and (c) their rights to liquidating distributions from the Trust Account with respect to any Founder Shares and Private Placement Shares they hold if the Company fails to complete a Business Combination within the Combination Period or during any applicable extension period (although such persons will be entitled to liquidating distributions from the Trust Account with respect to any Public Shares they hold if the Company fails to complete a Business Combination within the prescribed time frame). If the Company submits the Business Combination to the Public Shareholders for a vote, the Sponsor and the Company’s directors and officers have also agreed to vote any Founder Shares, Private Placement Shares and Public Shares held by them in favor of the Business Combination.The Company will have until July 2, 2023 to complete a Business Combination (the “Combination Period”), or such longer period as a result of a shareholder vote to amend such time period pursuant to the Company’s Amended and Restated Memorandum and Articles of Association. However, if the Company has not completed a Business Combination within such Combination Period or during any applicable extension period, the Company will: (a) cease all operations except for the purpose of winding up; (b) as promptly as reasonably possible but not more than ten business days thereafter, redeem the Public Shares, at a
per-share
price, payable in cash, equal to the aggregate amount then on deposit in the Trust Account, including interest (less up to $100,000 of interest to pay dissolution expenses and which interest shall be net of taxes payable) divided by the number of then issued and outstanding Public Shares, which redemption will completely extinguish the Public Shareholders’ rights as shareholders (including the right to receive further liquidating distributions, if any); and (c) as promptly as reasonably possible following such redemption, subject to the approval of the Company’s remaining shareholders and its board of directors, liquidate and dissolve, subject in each case to the Company’s obligations under Cayman Islands law to provide for claims of creditors and the requirements of other applicable law.The Sponsor has agreed that it will be liable to the Company if and to the extent any claims by a third party (other than the Company’s independent auditors) for services rendered or products sold to the Company, or a prospective target business with which the Company has discussed entering into a transaction agreement, reduce the amount of funds in the Trust Account to below (1) $10.00 per Public Share or (2) such lesser amount per
F-9
SOCIAL CAPITAL SUVRETTA HOLDINGS CORP. I
NOTES TO CONDENSED CONSOLIDATED FINANCIAL STATEMENTS
JUNE 30, 2022
(Unaudited)
Public Share held in the Trust Account as of the date of the liquidation of the Trust Account, due to reductions in the value of the trust assets, in each case net of the interest which may be withdrawn to pay taxes, except as to any claims by a third party that executed a waiver of any and all rights to seek access to the Trust Account and except as to any claims under the Company’s indemnity of the underwriters of the Initial Public Offering against certain liabilities, including liabilities under the Securities Act of 1933, as amended (the “Securities Act”). In the event that an executed waiver is deemed to be unenforceable against a third party, the Sponsor will not be responsible to the extent of any liability for such third-party claims. The Company has not independently verified whether the Sponsor has sufficient funds to satisfy its indemnity obligations and believes that the Sponsor’s only assets are securities of the Company and, therefore, the Sponsor may not be able to satisfy those obligations. The Company has not asked the Sponsor to reserve for such obligations. None of the Company’s directors or officers will indemnify the Company for claims by third parties, including, without limitation, claims by vendors and prospective target businesses.
Proposed Akili Business Combination
On January 26, 2022, the Company entered into an Agreement and Plan of Merger (the “Akili Merger Agreement”) by and among the Company, Karibu Merger Sub, Inc., a Delaware corporation and its direct wholly owned subsidiary (“Merger Sub”), and Akili Interactive Labs, Inc., a Delaware corporation (“Akili”).
The Akili Merger Agreement provides that, among other things and upon the terms and subject to the conditions thereof, the following transactions will occur (together with the other agreements and transactions contemplated by the Akili Merger Agreement, the “Akili Business Combination”): (1) at the closing of the transactions contemplated by the Akili Merger Agreement (the “Closing”), upon the terms and subject to the conditions thereof, and in accordance with the Delaware General Corporation Law, as amended (the “DGCL”), Merger Sub will merge with and into Akili, with Akili continuing as the surviving corporation and the Company’s wholly owned subsidiary (the “Merger”); (2) at the Closing, all of the outstanding capital stock of Akili and all options and warrants to acquire capital stock of Akili will be converted into the right to receive shares of common stock, par value $0.0001 per share, of the Company (after the Domestication (as defined below)) (“SCS Common Stock”) or comparable equity awards or warrants that are settled or are exercisable for shares of SCS Common Stock, representing an aggregate of 60 million shares of SCS Common Stock; (3) at the Closing, the Company will deposit into an escrow account for the benefit of the
pre-Closing
Akili stockholders, option holders and warrant holders an aggregate number of shares of SCS Common Stock equal to 7.5% of the fully diluted shares of SCS Common Stock (including shares reserved under the equity incentive plan to be adopted by the combined company in connection with the Closing), determined as of immediately following the Closing (collectively, the “Earnout Shares”), which Earnout Shares will be subject to release from escrow to thepre-Closing
Akili stockholders, option holders and warrant holders in three equal tranches upon the daily volume weighted average price of a share of SCS Common Stock reaching $15.00 per share, $20.00 per share and $30.00 per share, respectively, over any 20 trading days within any 30 consecutive trading day period following the Closing and prior to the fifth anniversary of the Closing, in each case, on the terms set forth in the Akili Merger Agreement; and (4) at the Closing, the Company will be renamed “Akili, Inc.” The Closing is subject to the satisfaction or waiver of certain closing conditions contained in the Akili Merger Agreement, including the approval of the Company’s shareholders.Prior to the Closing, subject to the approval of the Company’s shareholders, and in accordance with the DGCL, the Cayman Islands Companies Act (As Revised) (the “CICA”) and the Company’s Amended and Restated Memorandum and Articles of Association, the Company will effect a deregistration under the CICA and a domestication under Section 388 of the DGCL, pursuant to which the Company’s jurisdiction of incorporation
F-10
SOCIAL CAPITAL SUVRETTA HOLDINGS CORP. I
NOTES TO CONDENSED CONSOLIDATED FINANCIAL STATEMENTS
JUNE 30, 2022
(Unaudited)
will be changed from the Cayman Islands to the State of Delaware (the “Domestication”). In connection with the Domestication, (i) each of the Company’s then issued and outstanding Class A ordinary shares will convert automatically, on abasis, into a share of SCS Common Stock, which is entitled to one vote per share, and (ii) each of the Company’s then issued and outstanding Class B ordinary shares will convert automatically, on abasis, into a share of SCS Common Stock.
one-for-one
one-for-one
On January 26, 2022, concurrently with the execution of the Akili Merger Agreement, the Company entered into subscription agreements (the “Subscription Agreements”) with certain investors (collectively, the “PIPE Investors”), pursuant to which the PIPE Investors have subscribed for an aggregate of 16,200,000 shares of SCS Common Stock for an aggregate purchase price of $162,000,000 (the “PIPE Investment”), of which approximately $135,400,000 is committed by certain existing directors, officers and equity holders of, or investment funds managed by, the Company, the Sponsor, Suvretta and/or their respective affiliates (the “Sponsor Related PIPE Investors”). The PIPE Investment will be consummated substantially concurrently with the Closing.
The consummation of the proposed Akili Business Combination is subject to certain conditions as further described in the Akili Merger Agreement.
Risks and Uncertainties
Management continues to evaluate the impact of the
COVID-19
pandemic and has concluded that while it is reasonably possible that the pandemic could have a negative effect on the Company’s business, financial position, results of operations and/or the search for a target company, the specific impact is not readily determinable as of the date of these condensed consolidated financial statements. The condensed consolidated financial statements do not include any adjustments that might result from the outcome of this uncertainty.Liquidity and Going Concern
As of June 30, 2022, the Company had $145,044 in its operating bank account and working capital deficit of $7,083,140.
Until the consummation of a Business Combination, the Company will be using the funds not held in the Trust Account for identifying and evaluating prospective acquisition candidates, performing due diligence on prospective target businesses, paying for travel expenditures, selecting the target business to acquire, and structuring, negotiating and consummating the Business Combination.
The Company may need to raise additional capital through loans or additional investments from its Sponsor, shareholders, officers, directors, or third parties. The Company’s officers, directors and Sponsor may, but are not obligated to (other than pursuant to the Promissory Note (as defined in Note 5)), loan the Company additional funds, from time to time or at any time, in whatever amount they deem reasonable in their sole discretion, to meet the Company’s working capital needs. Accordingly, the Company may not be able to obtain such additional financing. If the Company is unable to raise additional capital, it may be required to take additional measures to conserve liquidity, which could include, but not necessarily be limited to, curtailing operations, suspending the pursuit of a potential transaction, and reducing overhead expenses. The Company cannot provide any assurance that new financing will be available to it on commercially acceptable terms, if at all. These conditions raise substantial doubt about the Company’s ability to continue as a going concern for a reasonable period of time, which is considered to be one year from the issuance date of the condensed consolidated financial statements.
F-11
SOCIAL CAPITAL SUVRETTA HOLDINGS CORP. I
NOTES TO CONDENSED CONSOLIDATED FINANCIAL STATEMENTS
JUNE 30, 2022
(Unaudited)
These condensed consolidated financial statements do not include any adjustments relating to the recovery of the recorded assets or the classification of the liabilities that might be necessary should the Company be unable to continue as a going concern.
The Company has performed an assessment of going concern considerations in accordance with Financial Accounting Standard Board’s Accounting Standards Update (“ASU”)
2014-15,
“Disclosures of Uncertainties about an Entity’s Ability to Continue as a Going Concern”. The Company has until July 2, 2023 to consummate a Business Combination, which date may be extended pursuant to its Amended and Restated Memorandum and Articles of Association. It is uncertain that the Company will be able to consummate a Business Combination by July 2, 2023. If a Business Combination is not consummated by this date and such date is not extended pursuant to the Company’s Amended and Restated Memorandum and Articles of Association, there will be a mandatory liquidation and subsequent dissolution of the Company. Management has determined that the mandatory liquidation, should a Business Combination not occur within the required time period, and potential subsequent dissolution raises substantial doubt about the Company’s ability to continue as a going concern. No adjustments have been made to the carrying amounts of assets or liabilities should the Company be required to liquidate after July 2, 2023.NOTE 2. SUMMARY OF SIGNIFICANT ACCOUNTING POLICIES
Basis of Presentation
The accompanying unaudited condensed consolidated financial statements are prepared in conformity with accounting principles generally accepted in the United States of America (“GAAP”) for interim financial information and in accordance with the instructions to Form
10-Q
and Article 8 of RegulationS-X
of the SEC. Certain information or footnote disclosures normally included in condensed consolidated financial statements prepared in accordance with GAAP have been condensed or omitted, pursuant to the rules and regulations of the SEC for interim financial reporting. Accordingly, they do not include all the information and footnotes necessary for a complete presentation of financial position, results of operations, or cash flows. In the opinion of management, the accompanying unaudited condensed consolidated financial statements include all adjustments, consisting of a normal recurring nature, which are necessary for a fair presentation of the financial position, operating results and cash flows for the periods presented.The accompanying unaudited condensed consolidated financial statements should be read in conjunction with the audited financial statements contained in the Company’s Annual Report on Form
10-K
for the period ended December 31, 2021 filed with the SEC on March 24, 2022. The interim results for the three and six months ended June 30, 2022 are not necessarily indicative of the results to be expected for the year ending December 31, 2022 or for any future periods.Emerging Growth Company
The Company is an “emerging growth company,” as defined in Section 2(a) of the Securities Act, as modified by the Jumpstart Our Business Startups Act of 2012 (the “JOBS Act”), and it may take advantage of certain exemptions from various reporting requirements that are applicable to other public companies that are not emerging growth companies including, but not limited to, not being required to comply with the independent registered public accounting firm attestation requirements of Section 404 of the Sarbanes-Oxley Act of 2002, reduced disclosure obligations regarding executive compensation in its periodic reports and proxy statements, and exemptions from the requirements of holding a nonbinding advisory vote on executive compensation and shareholder approval of any golden parachute payments not previously approved.
F-12
SOCIAL CAPITAL SUVRETTA HOLDINGS CORP. I
NOTES TO CONDENSED CONSOLIDATED FINANCIAL STATEMENTS
JUNE 30, 2022
(Unaudited)
Further, Section 102(b)(1) of the JOBS Act exempts emerging growth companies from being required to comply with new or revised financial accounting standards until private companies (that is, those that have not had a Securities Act registration statement declared effective or do not have a class of securities registered under the Exchange Act) are required to comply with the new or revised financial accounting standards. The JOBS Act provides that a company can elect to opt out of the extended transition period and comply with the requirements that apply to
non-emerging
growth companies but any such election to opt out is irrevocable. The Company has elected not to opt out of such extended transition period, which means that when a standard is issued or revised and it has different application dates for public or private companies, the Company, as an emerging growth company, can adopt the new or revised standard at the time private companies adopt the new or revised standard. This may make comparison of the Company’s condensed consolidated financial statements with another public company which is neither an emerging growth company nor an emerging growth company which has opted out of using the extended transition period difficult or impossible because of the potential differences in accounting standards used.Principles of Consolidation
The accompanying unaudited condensed consolidated financial statements include the accounts of the Company and its wholly-owned subsidiary where the Company has the ability to exercise control.
Use of Estimates
The preparation of the condensed consolidated financial statements in conformity with GAAP requires management to make estimates and assumptions that affect the reported amounts of assets and liabilities and disclosure of contingent assets and liabilities at the date of the condensed consolidated financial statements and the reported amounts of revenues and expenses during the reporting period.
Making estimates requires management to exercise significant judgment. It is at least reasonably possible that the estimate of the effect of a condition, situation or set of circumstances that existed at the date of the condensed consolidated financial statements, which management considered in formulating its estimate, could change in the near term due to one or more future confirming events. Significant accounting estimates include the determination of the fair value of Class A ordinary shares subject to possible redemption and the fair value of Founder Shares transferred to directors. Accordingly, the actual results could differ significantly from those estimates.
Cash and Cash Equivalents
The Company considers all short-term investments with an original maturity of three months or less when purchased to be cash equivalents. The Company did not have any cash equivalents as of June 30, 2022 and December 31, 2021.
Marketable Securities Held in Trust Account
At June 30, 2022 and December 31, 2021, substantially all of the assets held in the Trust Account were held in a money market fund which is invested primarily in U.S. Treasury securities.
F-13
SOCIAL CAPITAL SUVRETTA HOLDINGS CORP. I
NOTES TO CONDENSED CONSOLIDATED FINANCIAL STATEMENTS
JUNE 30, 2022
(Unaudited)
Class A Ordinary Shares Subject to Possible Redemption
The Company accounts for its Class A ordinary shares subject to possible redemption in accordance with the guidance in Financial Accounting Standards Board (“FASB”) Accounting Standards Codification (“ASC”) 480, “Distinguishing Liabilities from Equity.” Class A ordinary shares subject to mandatory redemption are classified as a liability instrument and are measured at redemption value. Conditionally redeemable ordinary shares (including ordinary shares that feature redemption rights that are either within the control of the holder or subject to redemption upon the occurrence of uncertain events not solely within the Company’s control) are classified as temporary equity. At all other times, ordinary shares are classified as permanent deficit. The Company’s Class A ordinary shares feature certain redemption rights that are considered to be outside of the Company’s control and subject to occurrence of uncertain future events. Accordingly, Class A ordinary shares subject to possible redemption are presented at redemption value as temporary equity, outside of the permanent deficit section of the Company’s condensed consolidated balance sheets.
The Company recognizes changes in redemption value immediately as they occur and adjusts the carrying value of redeemable ordinary shares to equal the redemption value at the end of each reporting period. Increases or decreases in the carrying amount of redeemable ordinary shares are affected by charges against additional
paid-in
capital (to the extent available) and accumulated deficit.At June 30, 2022 and December 31, 2021, the Class A ordinary shares subject to possible redemption reflected in the condensed consolidated balance sheets are reconciled in the following table:
Gross proceeds | $ | 250,000,000 | ||
Less: | ||||
Class A ordinary shares issuance costs | (12,488,190 | ) | ||
Plus: | ||||
Remeasurement of carrying value to redemption value | 12,496,514 | |||
Class A ordinary shares subject to possible redemption, December 31, 2021 | $ | 250,008,324 | ||
Plus: | ||||
Remeasurement of carrying value to redemption value | (8,324 | ) | ||
Class A ordinary shares subject to possible redemption, March 31, 2022 | $ | 250,000,000 | ||
Plus: | ||||
Remeasurement of carrying value to redemption value | 371,095 | |||
Class A ordinary shares subject to possible redemption, June 30, 2022 | $ | 250,371,095 | ||
Offering Costs
The Company complies with the requirements of the ASCOffering costs consisted of legal, accounting, underwriting fees and other costs incurred through the Initial Public Offering that were directly related to the Initial Public Offering. The Company incurred offering costs amounting to $12,488,190 as a result of the Initial Public Offering, consisting of $4,400,000 of underwriting commissions, $7,700,000 of deferred underwriting commissions, and $388,190 of other offering costs. The offering costs were charged to temporary
340-10-S99-1.
F-14
SOCIAL CAPITAL SUVRETTA HOLDINGS CORP. I
NOTES TO CONDENSED CONSOLIDATED FINANCIAL STATEMENTS
JUNE 30, 2022
(Unaudited)
equity and additional
paid-in
capital upon the completion of the Initial Public Offering. Immediately thereafter, temporary equity was remeasured and an adjustment was recognized through additional paid in capital and accumulated deficit to adjust temporary equity to the redemption value.Share-Based Payment Arrangements
The Company accounts for stock awards in accordance with ASC 718, “Compensation—Stock Compensation,” which requires that all equity awards be accounted for at their “fair value.” Fair value is measured on the grant date and is equal to the underlying value of the stock.
Costs equal to these fair values are recognized ratably over the requisite service period based on the number of awards that are expected to vest, in the period of grant for awards that vest immediately and have no future service condition, or in the period the awards vest immediately after meeting a performance condition becomes probable (i.e., the occurrence of a Business Combination). For awards that vest over time, cumulative adjustments in later periods are recorded to the extent actual forfeitures differ from the Company’s initial estimates; previously recognized compensation cost is reversed if the service or performance conditions are not satisfied and the award is forfeited.
Income Taxes
The Company accounts for income taxes under ASC 740, “Income Taxes” (“ASC 740”). ASC 740 requires the recognition of deferred tax assets and liabilities for both the expected impact of differences between the condensed consolidated financial statement and tax basis of assets and liabilities and for the expected future tax benefit to be derived from tax loss and tax credit carry forwards. ASC 740 additionally requires a valuation allowance to be established when it is more likely than not that all or a portion of deferred tax assets will not be realized.
ASC 740 also clarifies the accounting for uncertainty in income taxes recognized in an enterprise’s condensed consolidated financial statements and prescribes a recognition threshold and measurement process for condensed consolidated financial statement recognition and measurement of a tax position taken or expected to be taken in a tax return. For those benefits to be recognized, a tax position must be
more-likely-than-not
to be sustained uponexamination by taxing authorities. The Company’s management has determined that the Cayman Islands is the Company’s major tax jurisdiction. The Company recognizes accrued interest and penalties related to unrecognized tax benefits as income tax expense. There were no unrecognized tax benefits and no amounts accrued for interest and penalties as of June 30, 2022 and December 31, 2021. The Company is currently not aware of any issues under review that could result in significant payments, accruals or material deviation from its position. The Company has been subject to income tax examinations by major taxing authorities since inception.
The Company is considered to be an exempted Cayman Islands company and is presently not subject to income taxes or income tax filing requirements in the Cayman Islands or the United States. As such, the Company’s tax provision was zero for the periods presented.
Net Loss per Ordinary Share
Net loss per ordinary share is computed by dividing net loss by the weighted-average number of ordinary shares outstanding during the period. The Company has two classes of ordinary shares, which are referred to as Class A
F-15
SOCIAL CAPITAL SUVRETTA HOLDINGS CORP. I
NOTES TO CONDENSED CONSOLIDATED FINANCIAL STATEMENTS
JUNE 30, 2022
(Unaudited)
ordinary shares and Class B ordinary shares. Losses are shared pro rata between the two classes of shares. Charges associated with the redeemable Class A ordinary shares are excluded from net loss per ordinary share as the redemption value approximates fair value.
As of June 30, 2022 and 2021, the Company did not have any dilutive securities or other contracts that could, potentially, be exercised or converted into ordinary shares and then share in the earnings of the Company. As a result, diluted net loss per ordinary share is the same as basic net loss per ordinary share for the periods presented.
The following table reflects the calculation of basic and diluted net loss per ordinary share (in dollars, except per share amounts):
Three Months Ended June 30, 2022 | Three Months Ended June 30, 2021 | Six Months Ended June 30, 2022 | For the Period from February 25, 2021 (Inception) Through June 30, 2021 | |||||||||||||||||||||||||||||
Class A | Class B | Class A | Class B | Class A | Class B | Class A | Class B | |||||||||||||||||||||||||
Basic and diluted net loss per ordinary share | ||||||||||||||||||||||||||||||||
Numerator: | ||||||||||||||||||||||||||||||||
Allocation of net loss, as adjusted | $ | (1,394,198 | ) | $ | (339,849 | ) | $ | — | (143 | ) | $ | (4,751,927 | ) | $ | (1,158,328 | ) | $ | — | $ | (5,325 | ) | |||||||||||
Denominator: | ||||||||||||||||||||||||||||||||
Basic and diluted weighted average shares outstanding | 25,640,000 | 6,250,000 | — | 5,500,000 | 25,640,000 | 6,250,000 | — | 5,500,000 | ||||||||||||||||||||||||
Basic and diluted net loss per ordinary share | $ | (0.05 | ) | $ | (0.05 | ) | $ | — | (0.00 | ) | $ | (0.19 | ) | $ | (0.19 | ) | $ | — | $ | (0.00 | ) | |||||||||||
Concentration of Credit Risk
Financial instruments that potentially subject the Company to concentrations of credit risk consist of cash accounts in a financial institution, which, at times, may exceed the Federal Depository Insurance Corporation coverage limit of $250,000. The Company has not experienced losses on these accounts.
Fair Value of Financial Instruments
The fair value of the Company’s assets and liabilities, which qualify as financial instruments under ASC Topic 820, “Fair Value Measurement,” (“ASC 820”), approximates the carrying amounts represented in the accompanying condensed consolidated balance sheets, primarily due to their short-term nature.
F-16
SOCIAL CAPITAL SUVRETTA HOLDINGS CORP. I
NOTES TO CONDENSED CONSOLIDATED FINANCIAL STATEMENTS
JUNE 30, 2022
(Unaudited)
Recent Accounting Standards
In August 2020, the FASB issued ASU
No. 2020-06,
“Debt—Debt with Conversion and Other Options (Subtopic470-20)
and Derivatives and Hedging—Contracts in Entity’s Own Equity (Subtopic815-40):
Accounting for Convertible Instruments and Contracts in an Entity’s Own Equity” (“ASU2020-06”),
which simplifies accounting for convertible instruments by removing major separation models required under current GAAP. ASU2020-06
removes certain settlement conditions that are required for equity contracts to qualify for the derivative scope exception and it also simplifies the diluted earnings per share calculation in certain areas.ASU 2020-06
is effective for fiscal years beginning after December 15, 2023, including interim periods within those fiscal years, with early adoption permitted. The Company adopted ASU2020-06
effective as of January 1, 2021. The adoption of ASU2020-06
did not have an impact on the Company’s condensed consolidated financial statements.Management does not believe that any recently issued, but not yet effective, accounting standards, if currently adopted, would have a material effect on the Company’s condensed consolidated financial statements.
Accrued Expenses
At June 30, 2022, accrued expenses included $5,503,563 of legal expenses, $891,169 of printer expense, $754,802 of due diligence expense, $70,000 of regulatory filing fee, and $185,808 of other transactional related expenses incurred in connection with the Business Combination with Akili.
At December 31, 2021, accrued expenses included $1,514,044 of legal expenses, $5,000 of printer expense, $385,000 of due diligence expense, $70,000 of regulatory filing fee and $793 of accounting expense.
NOTE 3. INITIAL PUBLIC OFFERING
Pursuant to the Initial Public Offering, the Company sold 25,000,000 Public Shares, which includes a partial exercise by the underwriters of their over-allotment option in the amount of 3,000,000 Public Shares, at a price of $10.00 per Public Share. Unlike some other initial public offerings of special purpose acquisition companies, investors in the Initial Public Offering did not receive any warrants (which would typically become exercisable following completion of the Business Combination). The fair value attributable to the unexercised portion of the over-allotment option was deemed to be immaterial to the condensed consolidated financial statements.
NOTE 4. PRIVATE PLACEMENT
Substantially concurrently with the closing of the Initial Public Offering, the Sponsor purchased 640,000 Private Placement Shares at a price of $10.00 per Private Placement Share, for an aggregate purchase price of $6,400,000. Each Private Placement Share is identical to the Class A ordinary shares sold in the Initial Public Offering, subject to certain limited exceptions as described in Note 7. A portion of the proceeds from the sale of the Private Placement Shares was added to the net proceeds from the Initial Public Offering held in the Trust Account. If the Company does not complete a Business Combination within the Combination Period or during any applicable extension period, the proceeds from the sale of the Private Placement Shares held in the Trust Account will be used to fund the redemption of the Public Shares (subject to the requirements of applicable law) and the Private Placement Shares will be worthless.
F-17
SOCIAL CAPITAL SUVRETTA HOLDINGS CORP. I
NOTES TO CONDENSED CONSOLIDATED FINANCIAL STATEMENTS
JUNE 30, 2022
(Unaudited)
NOTE 5. RELATED PARTY TRANSACTIONS
Founder Shares
On March 2, 2021, the Sponsor paid $25,000 to cover certain offering and formation costs of the Company in consideration for which the Sponsor received 5,750,000 Class B ordinary shares (the “Founder Shares”). On June 29, 2021, the Company effected a share capitalization with respect to its Class B ordinary shares of 575,000 shares thereof, resulting in the Company’s initial shareholders holding an aggregate of 6,325,000 Founder Shares. All share and
per-share
amounts have been retroactively restated to reflect the share capitalization. The Founder Shares included an aggregate of up to 825,000 shares that were subject to forfeiture depending on the extent to which the underwriters’ over-allotment option was exercised. As a result of the underwriters’ election to partially exercise their over-allotment option, a total of 750,000 Founder Shares are no longer subject to forfeiture and 75,000 Founder Shares were forfeited, resulting in an aggregate of 6,250,000 Founder Shares outstanding.In June 2021, the Sponsor transferred 30,000 Founder Shares to Vladimir Coric, an independent director of the Company. The sale of the Founders Shares to the Company’s director is in the scope of FASB ASC Topic 718, “Compensation-Stock Compensation” (“ASC 718”). Under ASC 718, stock-based compensation associated with equity-classified awards is measured at fair value upon the grant date. The fair value of the 30,000 shares granted to the Company’s director was $214,160 or approximately $7.14 per share. The Founders Shares were effectively sold subject to a performance condition (i.e., the occurrence of a Business Combination). Compensation expense related to the Founders Shares is recognized only when the performance condition is probable of occurrence under the applicable accounting literature in this circumstance. As of June 30, 2022, the Company determined that a Business Combination is not considered probable, and, therefore, no stock-based compensation expense has been recognized. Stock-based compensation would be recognized at the date a Business Combination is considered probable (i.e., upon consummation of a Business Combination) in an amount equal to the number of Founders Shares times the grant date fair value per share (unless subsequently modified) less the amount initially received for the purchase of the Founders Shares.
The Sponsor and the Company’s directors and officers have agreed, subject to limited exceptions, not to transfer, assign or sell any of their Founder Shares until the earlier of: (A) one year after the completion of a Business Combination and (B) subsequent to a Business Combination, (x) if the last reported sale price of the Class A ordinary shares equals or exceeds $12.00 per share (as adjusted for share
sub-divisions,
share dividends, rights issuances, consolidations, reorganizations, recapitalizations and other similar transactions) for any 20 trading days within any30-trading day period commencing at least 150 days after a Business Combination, or (y) the date on which the Company completes a liquidation, merger, amalgamation, share exchange, reorganization or other similar transaction that results in all of the Public Shareholders having the right to exchange their Class A ordinary shares for cash, securities or other property.Administrative Services Agreement
The Company entered into an agreement in which it will pay an affiliate of the Sponsor $10,000 per month, commencing on June 30, 2021, for office space, administrative and support services. Upon completion of a Business Combination or its liquidation, the Company will cease paying these monthly fees. For the three and six months ended June 30, 2022, the Company incurred $30,000 and $60,000, respectively, in fees for these services, of which such amount was accrued in due to related parties. For the period from February 25, 2021 (inception) through June 30, 2021, the Company did not incur any fees for these services.
F-18
SOCIAL CAPITAL SUVRETTA HOLDINGS CORP. I
NOTES TO CONDENSED CONSOLIDATED FINANCIAL STATEMENTS
JUNE 30, 2022
(Unaudited)
Due to Related Party
For the six months ended June 30, 2022, an affiliate of the Sponsor had advanced the Company $70,127 for working capital purposes, inclusive of the administrative services agreement noted above, of which $0 was repaid during the six months ended June 30, 2022. As of June 30, 2022 and December 31, 2021, the outstanding balance was $80,127 and $10,000, respectively.
Promissory Note—Related Party
On March 2, 2021, the Company issued an unsecured promissory note to the Sponsor (the
“Pre-IPO
Sponsor Promissory Note”), pursuant to which the Company could borrow up to an aggregate principal amount of $300,000. ThePre-IPO
Sponsor Promissory Note wasnon-interest
bearing and payable on the earlier of December 31, 2021 and the completion of the Initial Public Offering. The outstanding balance under thePre-IPO
Sponsor Promissory Note of $300,000 was repaid at the closing of the Initial Public Offering on July 2, 2021. Borrowings are no longer available under thePre-IPO
Sponsor Promissory Note.On April 20, 2022, the Company issued an unsecured promissory note (the “Promissory Note”) to the Sponsor pursuant to which the Company may borrow up to an aggregate principal amount of $1,500,000. The Promissory Note is
non-interest
bearing, unsecured and payable upon the earlier of July 2, 2023 and the effective date of the Company’s Business Combination. The Promissory Note is subject to customary events of default which could, subject to certain conditions, cause the Promissory Notes to become immediately due and payable. On April 26, 2022, the Company drew $250,000 under the Promissory Note, which amount remains outstanding as of June 30, 2022.Related Party Loans
In order to fund working capital deficiencies or finance transaction costs in connection with a Business Combination, the Sponsor or an affiliate of the Sponsor or certain of the Company’s officers and directors may, but are not obligated to (other than pursuant to the Promissory Note, loan the Company additional funds as may be required (“Working Capital Loans”). If the Company completes a Business Combination, it may repay such loaned amounts out of the proceeds of the Trust Account. In the event that the Business Combination does not close, the Company may use a portion of the working capital held outside the Trust Account to repay such loaned amounts but no proceeds from the Trust Account would be used to repay such loaned amounts. As of June 30, 2022 and December 31, 2021, other than as described above with respect to the Promissory Note, there were no outstanding amounts under the Working Capital Loans.
Subscription Agreements
Concurrently with the execution of the Akili Merger Agreement, the Company entered into Subscription Agreements with the Sponsor Related PIPE Investors, pursuant to which the Sponsor Related PIPE Investors have subscribed for shares of Akili, Inc. common stock in connection with the PIPE Investment. The Sponsor Related PIPE Investors are expected to fund $135,400,000 of the PIPE Investment, for which they will receive 13,540,000 shares of Akili, Inc. common stock. Specifically, (i) SC Master Holdings, LLC, an entity affiliated with Chamath Palihapitiya, subscribed for 10,000,000 shares of Akili, Inc. common stock, (ii) Averill Master Fund, Ltd., an entity affiliated with Kishen Mehta, subscribed for 3,540,000 shares of Akili, Inc. common stock. The PIPE Investment will be consummated substantially concurrently with the closing of the Akili Business Combination.
F-19
SOCIAL CAPITAL SUVRETTA HOLDINGS CORP. I
NOTES TO CONDENSED CONSOLIDATED FINANCIAL STATEMENTS
JUNE 30, 2022
(Unaudited)
NOTE 6. COMMITMENTS AND CONTINGENCIES
Registration Rights
Pursuant to a registration rights agreement entered into on June 29, 2021, the holders of the Founder Shares, Private Placement Shares and any Private Placement Shares that may be issued on conversion of Working Capital Loans (and any Class A ordinary shares issuable upon the conversion of the Founder Shares) are entitled to registration rights requiring the Company to register such securities for resale (in the case of the Founder Shares, only after conversion to the Class A ordinary shares). The holders of these securities will be entitled to make up to three demands, excluding short form registration demands, that the Company register such securities. In addition, the holders have certain “piggy-back” registration rights with respect to registration statements filed subsequent to the completion of a Business Combination and rights to require the Company to register for resale such securities pursuant to Rule 415 under the Securities Act. The Company will bear the expenses incurred in connection with the filing of any such registration statements. In connection with the Akili Business Combination, the registration rights agreement will be amended and restated.
Beginning on February 24, 2022, certain purported shareholders of the Company sent demand letters (the “Demands”) alleging deficiencies and/or omissions in the Registration Statement on Form
S-4
filed by the Company with the SEC on February 14, 2022. The Demands seek additional disclosures to remedy these purported deficiencies.On March 11, 2022, a purported shareholder of the Company filed a complaint against the Company, the members of the Company’s board of directors, BofA Securities, Inc. and Morgan Stanley & Co. LLC in the Supreme Court of the State of New York for the County of New York. The complaint is captioned as Elstein v. Palihapitiya et al., Case No. 651138/2022 (N.Y. Sup. Ct. N.Y. Cty., Mar. 11, 2022) (the “Complaint” and, along with the Demands, the “Matters”). The Complaint asserted, among other things, claims for breach of fiduciary duty to disclose under Delaware law and Cayman Islands law. The Complaint alleged that the Company and its board of directors caused a materially misleading and incomplete proxy statement to be filed on February 14, 2022 with the SEC. Among other remedies, the plaintiff sought to enjoin the Company’s shareholder meeting in connection with the Akili Business Combination and be awarded attorney fees and costs. On June 29, 2022, the Complaint was voluntarily discontinued with prejudice.
The Company believes that the allegations in the Matters are meritless. If any Matter is not resolved, the Matters could prevent or delay completion of the Akili Business Combination and result in costs to the Company and Akili. If plaintiffs are successful in obtaining an injunction prohibiting the completion of the Akili Business Combination on the agreed-upon terms, then such injunction may prevent the Akili Business Combination from being completed, or from being completed within the expected time frame. Other potential plaintiffs may file additional lawsuits or send additional demand letters in connection with the Akili Business Combination.
Underwriting Agreement
The underwriters are entitled to a deferred underwriting commission of $7,700,000 in the aggregate. The deferred fee will become payable to the underwriters from the amounts held in the Trust Account solely in the event that the Company completes a Business Combination, subject to the terms of the underwriting agreement.
Restricted Stock Unit Award
In September 2021, pursuant to a Director Restricted Stock Unit Award Agreement, dated September 24, 2021, between the Company and Senthil Sundaram, the Company agreed to grant 30,000 restricted stock units
F-20
SOCIAL CAPITAL SUVRETTA HOLDINGS CORP. I
NOTES TO CONDENSED CONSOLIDATED FINANCIAL STATEMENTS
JUNE 30, 2022
(Unaudited)
(“RSUs”) to Mr. Sundaram, which grant is contingent on both the consummation of a Business Combination and a shareholder approved equity plan. The RSUs will vest upon the consummation of such Business Combination and represent 30,000 Class A ordinary shares (or, following a domestication by the Company as a Delaware corporation, shares of common stock) of the Company that will settle on a date determined in the sole discretion of the Company that shall occur between the vesting date and March 15 of the year following the year in which vesting occurs.
The RSUs granted by the Company are in the scope of ASC 718. Under ASC 718, stock-based compensation associated with equity-classified awards is measured at fair value upon the grant date. The RSUs granted are subject to a performance condition (i.e., the occurrence of a Business Combination). Compensation expense related to the RSUs is recognized only when the performance condition is probable of occurrence under the applicable accounting literature in this circumstance. As of June 30, 2022, the Company did not have a shareholder approved equity plan and also determined that a Business Combination is not considered probable, and, therefore, no stock-based compensation expense has been recognized. Stock-based compensation would be recognized at the date a Business Combination is considered probable (i.e., upon consummation of a Business Combination) in an amount equal to the number of RSUs times the grant date fair value per share (unless subsequently modified).
NOTE 7. TEMPORARY EQUITY AND PERMANENT DEFICIT
Preference Shares
Class
A Ordinary Shares
Class
B Ordinary Shares
Holders of record of Class A ordinary shares and Class B ordinary shares are entitled to one vote for each share held on all matters to be voted on by shareholders and vote together as a single class, except as required by law; provided that prior to a Business Combination, holders of Class B ordinary shares will have the right to appoint all of the Company’s directors and remove members of its board of directors for any reason, and holders of Class A ordinary shares will not be entitled to vote on the appointment of directors during such time.
The Class B ordinary shares will automatically convert into Class A ordinary shares at the time of the Business Combination, or earlier at the option of the holder, on abasis, subject to adjustment for share
one-for-one
sub-divisions,
share dividends, rights issuances, consolidations, reorganizations, recapitalizations and the like. Additionally, in the event that additional (in excess of the amounts issued in the Initial Public Offering) Class AF-21
SOCIAL CAPITAL SUVRETTA HOLDINGS CORP. I
NOTES TO CONDENSED CONSOLIDATED FINANCIAL STATEMENTS
JUNE 30, 2022
(Unaudited)
ordinary shares, or equity-linked securities, are issued or deemed issued in connection with the closing of the Business Combination, the ratio at which the Class B ordinary shares will convert into Class A ordinary shares will be adjusted (unless the holders of a majority of the issued and outstanding Class B ordinary shares agree to waive such anti-dilution adjustment with respect to any such issuance or deemed issuance) so that the number of Class A ordinary shares issuable upon conversion of all Class B ordinary shares will equal, in the aggregate, 20% of the sum of the total number of Class A ordinary shares outstanding after such conversion (after giving effect to any redemptions of Class A ordinary shares by Public Shareholders, and excluding the Private Placement Shares), including any Class A ordinary shares issued or deemed issued, or issuable upon the conversion or exercise of any equity-linked securities or rights issued or deemed issued, by the Company in connection with the Business Combination, excluding any Class A ordinary shares or equity-linked securities exercisable for or convertible into Class A ordinary shares issued, or to be issued, to any seller in the Business Combination and any private placement shares issued to the Sponsor or its affiliates upon conversion of Working Capital Loans; provided that such conversion of Class B ordinary shares will never occur on a less than
one-for-one-basis.
Private Placement Shares
NOTE 8. FAIR VALUE MEASUREMENTS
The Company follows the guidance in ASC 820 for its financial assets and liabilities that are
re-measured
and reported at fair value at each reporting period, andnon-financial
assets and liabilities that arere-measured
and reported at fair value at least annually.The fair value of the Company’s financial assets and liabilities reflects management’s estimate of amounts that the Company would have received in connection with the sale of the assets or paid in connection with the transfer of the liabilities in an orderly transaction between market participants at the measurement date. In connection with measuring the fair value of its assets and liabilities, the Company seeks to maximize the use of observable inputs (market data obtained from independent sources) and to minimize the use of unobservable inputs (internal assumptions about how market participants would price assets and liabilities). The following fair value hierarchy is used to classify assets and liabilities based on the observable inputs and unobservable inputs used in order to value the assets and liabilities:
| Level 1: | Quoted prices in active markets for identical assets or liabilities. An active market for an asset or liability is a market in which transactions for the asset or liability occur with sufficient frequency and volume to provide pricing information on an ongoing basis. | |
| Level 2: | Observable inputs other than Level 1 inputs. Examples of Level 2 inputs include quoted prices in active markets for similar assets or liabilities and quoted prices for identical assets or liabilities in markets that are not active. | |
| Level 3: | Unobservable inputs based on the Company’s assessment of the assumptions that market participants would use in pricing the asset or liability. | |
F-22
SOCIAL CAPITAL SUVRETTA HOLDINGS CORP. I
NOTES TO CONDENSED CONSOLIDATED FINANCIAL STATEMENTS
JUNE 30, 2022
(Unaudited)
The following table presents information about the Company’s assets that are measured at fair value on a recurring basis at June 30, 2022 and December 31, 2021, and indicates the fair value hierarchy of the valuation inputs the Company utilized to determine such fair value:
Description | Level | June 30, 2022 | December 31, 2021 | |||||||||||||
Assets: | ||||||||||||||||
Marketable securities held in Trust Account | 1 | $ | 250,371,095 | $ | 250,008,324 | |||||||||||
NOTE 9. SUBSEQUENT EVENTS
The Company evaluated subsequent events and transactions that occurred after the balance sheet date up to the date that the condensed consolidated financial statements were issued. Based upon this review, the Company did not identify any subsequent events that would have required adjustment or disclosure in the condensed consolidated financial statements.
F-23
REPORT OF INDEPENDENT REGISTERED PUBLIC ACCOUNTING FIRM
To the Shareholders and Board of Directors of
Social Capital Suvretta Holdings Corp. I
Opinion on the Financial Statements
We have audited the accompanying balance sheet of Social Capital Suvretta Holdings Corp. I (the “Company”) as of December 31, 2021, the related statements of operations, changes in temporary equity and permanent deficit and cash flows for the period from February 25, 2021 (inception) through December 31, 2021, and the related notes (collectively referred to as the “financial statements”). In our opinion, the financial statements present fairly, in all material respects, the financial position of the Company as of December 31, 2021, and the results of its operations and its cash flows for the period from February 25, 2021 (inception) through December 31, 2021, in conformity with accounting principles generally accepted in the United States of America.
Explanatory Paragraph – Going Concern
The accompanying financial statements have been prepared assuming that the Company will continue as a going concern. As more fully described in Note 1 to the financial statements the Company’s business plan is dependent on the completion of a business combination and the Company’s cash and working capital as of December 31, 2021 are not sufficient to complete its planned activities. These conditions raise substantial doubt about the Company’s ability to continue as a going concern. Management’s plans in regard to these matters are also described in Note 1. The financial statements do not include any adjustments that might result from the outcome of this uncertainty.
Basis for Opinion
These financial statements are the responsibility of the Company’s management. Our responsibility is to express an opinion on the Company’s financial statements based on our audit. We are a public accounting firm registered with the Public Company Accounting Oversight Board (United States) (“PCAOB”) and are required to be independent with respect to the Company in accordance with the U.S. federal securities laws and the applicable rules and regulations of the Securities and Exchange Commission and the PCAOB.
We conducted our audit in accordance with the standards of the PCAOB. Those standards require that we plan and perform the audit to obtain reasonable assurance about whether the financial statements are free of material misstatement, whether due to error or fraud. The Company is not required to have, nor were we engaged to perform, an audit of its internal control over financial reporting. As part of our audit we are required to obtain an understanding of internal control over financial reporting but not for the purpose of expressing an opinion on the effectiveness of the Company’s internal control over financial reporting. Accordingly, we express no such opinion.
Our audit included performing procedures to assess the risks of material misstatement of the financial statements, whether due to error or fraud, and performing procedures that respond to those risks. Such procedures included examining, on a test basis, evidence regarding the amounts and disclosures in the financial statements. Our audit also included evaluating the accounting principles used and significant estimates made by management, as well as evaluating the overall presentation of the financial statements. We believe that our audit provide a reasonable basis for our opinion.
/s/ Marcum LLP
Marcum LLP
We have served as the Company’s auditor since 2021.
New York, NY
March 23, 2022
F-24
SOCIAL CAPITAL SUVRETTA HOLDINGS CORP. I
BALANCE SHEET
DECEMBER 31, 2021
ASSETS | ||||
Current Assets | ||||
Cash | $ | 428,189 | ||
Prepaid expenses | 504,034 | |||
Total Current Assets | 932,223 | |||
Non-current prepaid insurance | 247,500 | |||
Marketable securities held in Trust Account | 250,008,324 | |||
TOTAL ASSETS | $ | 251,188,047 | ||
LIABILITIES, TEMPORARY EQUITY AND PERMANENT DEFICIT | ||||
Current liabilities | ||||
Accounts payable | $ | 5,000 | ||
Accrued expense | 1,974,837 | |||
Advances from related party | 10,000 | |||
Total Current Liabilities | 1,989,837 | |||
Deferred underwriting fee payable | 7,700,000 | |||
TOTAL LIABILITIES | 9,689,837 | |||
Commitments and Contingencies (Note 6) | ||||
Temporary Equity | ||||
Class A ordinary shares subject to possible redemption, 25,000,000 shares at redemption value | 250,008,324 | |||
Permanent Deficit | ||||
Preference shares, $0.0001 par value; 5,000,000 shares authorized; no shares issued and outstanding | — | |||
Class A ordinary shares, $0.0001 par value; 500,000,000 shares authorized; 640,000 shares issued and outstanding (excluding 25,000,000 shares subject to possible redemption) | 64 | |||
Class B ordinary shares, $0.0001 par value; 50,000,000 shares authorized; 6,250,000 shares issued and outstanding | 625 | |||
Additional paid-in capital | — | |||
Accumulated deficit | (8,510,803 | ) | ||
Total Permanent Deficit | (8,510,114 | ) | ||
TOTAL LIABILITIES, TEMPORARY EQUITY AND PERMANENT DEFICIT | $ | 251,188,047 | ||
The accompanying notes are an integral part of the financial statements.
F-25
SOCIAL CAPITAL SUVRETTA HOLDINGS CORP. I
STATEMENT OF OPERATIONS
FOR THE PERIOD FROM FEBRUARY 25, 2021 (INCEPTION) THROUGH DECEMBER 31, 2021
| Operating and formation costs | $ | 2,446,924 | ||
| Loss from operations | (2,446,924 | ) | ||
| Other income: | ||||
| Interest earned on marketable securities held in Trust Account | 8,324 | |||
| Net loss | $ | (2,438,600 | ) | |
| Basic and diluted weighted average shares outstanding, Class A ordinary shares | 15,101,877 | |||
| Basic and diluted net loss per share, Class A ordinary shares | $ | (0.12 | ) | |
| Basic and diluted weighted average shares outstanding, Class B ordinary shares | 5,852,751 | |||
| Basic and diluted net loss per share, Class B ordinary shares | $ | (0.12 | ) | |
The accompanying notes are an integral part of the financial statements.
F-26
SOCIAL CAPITAL SUVRETTA HOLDINGS CORP. I
STATEMENT OF CHANGES IN TEMPORARY EQUITY AND PERMANENT DEFICIT
FOR THE PERIOD FROM FEBRUARY 25, 2021 (INCEPTION) THROUGH DECEMBER 31, 2021
Temporary Equity | Class A Ordinary Shares | Class B Ordinary Shares | Additional Paid-in | Accumulated | Total Permanent | |||||||||||||||||||||||||||||||
Shares | Amount | Shares | Amount | Shares | Amount | Capital | Deficit | Deficit | ||||||||||||||||||||||||||||
Balance – February 25, 2021 (inception) | — | $ | — | — | $ | — | — | $ | — | $ | — | $ | — | $ | — | |||||||||||||||||||||
| Issuance of Class B ordinary shares to Sponsor | — | — | — | — | 6,325,000 | 633 | 24,367 | — | 25,000 | |||||||||||||||||||||||||||
| Sale of 25,000,000 Public Shares, net of underwriting discounts and offering expenses | 25,000,000 | 237,511,810 | — | — | — | — | — | — | — | |||||||||||||||||||||||||||
| Remeasurement of Class A ordinary shares to redemption value | — | 12,496,514 | — | — | — | — | (6,424,311 | ) | (6,072,203 | ) | (12,496,514 | ) | ||||||||||||||||||||||||
| Sale of 640,000 Private Placement Shares | — | — | 640,000 | 64 | — | — | 6,399,936 | — | 6,400,000 | |||||||||||||||||||||||||||
| Forfeiture of Founder Shares | — | — | — | — | (75,000 | ) | (8 | ) | 8 | — | — | |||||||||||||||||||||||||
| Net loss | — | — | — | — | — | — | — | (2,438,600 | ) | (2,438,600 | ) | |||||||||||||||||||||||||
Balance – December 31, 2021 | 25,000,000 | $ | 250,008,324 | 640,000 | $ | 64 | 6,250,000 | $ | 625 | $ | — | $ | (8,510,803 | ) | $ | (8,510,114 | ) | |||||||||||||||||||
The accompanying notes are an integral part of the financial statements.
F-27
SOCIAL CAPITAL SUVRETTA HOLDINGS CORP. I
STATEMENT OF CASH FLOWS
FOR THE PERIOD FROM FEBRUARY 25, 2021 (INCEPTION) THROUGH DECEMBER 31, 2021
Cash Flows from Operating Activities: | ||||
| Net loss | $ | (2,438,600 | ) | |
| Adjustments to reconcile net loss to net cash used in operating activities: | ||||
| Formation costs paid by Sponsor in exchange for issuance of Founder Shares | 5,000 | |||
| Interest earned on marketable securities held in Trust Account | (8,324 | ) | ||
| Changes in operating assets and liabilities: | ||||
| Prepaid expenses | (751,534 | ) | ||
| Accounts payable and accrued expenses | 1,979,837 | |||
Net cash used in operating activities | (1,213,621 | ) | ||
Cash Flows from Investing Activities: | ||||
| Investment of cash into Trust Account | (250,000,000 | ) | ||
Net cash used in investing activities | $ | (250,000,000 | ) | |
Cash Flows from Financing Activities: | ||||
| Proceeds from sale of Public Shares, net of underwriting discounts paid | 245,600,000 | |||
| Proceeds from sale of Private Placement Shares | 6,400,000 | |||
| Advances from related party | 97,640 | |||
| Repayment of advances from related party | (87,640 | ) | ||
| Proceeds from promissory note – related party | 300,000 | |||
| Repayment of promissory note – related party | (300,000 | ) | ||
| Payment of offering costs | (368,190 | ) | ||
Net cash provided by financing activities | $ | 251,641,810 | ||
Net Change in Cash | 428,189 | |||
| Cash – Beginning of period (inception) | — | |||
Cash – End of period | $ | 428,189 | ||
Non-Cash Investing and Financing Activities: | ||||
| Offering costs paid by Sponsor in exchange for issuance of Founder Shares | $ | 20,000 | ||
| Remeasurement of Class A ordinary share subject to possible redemption | $ | 12,496,514 | ||
| Deferred underwriting fee payable | $ | 7,700,000 | ||
| Forfeiture of Founder Shares | $ | (8 | ) | |
The accompanying notes are an integral part of the financial statements.
F-28
NOTE 1. DESCRIPTION OF ORGANIZATION, BUSINESS OPERATIONS AND GOING CONCERN
Social Capital Suvretta Holdings Corp. I (the “Company”) is a blank check company incorporated as a Cayman Islands exempted company on February 25, 2021. The Company was incorporated for the purpose of effecting a merger, share exchange, asset acquisition, share purchase, reorganization or similar business combination with one or more businesses (a “Business Combination”).
As of December 31, 2021, the Company had not commenced any operations. All activity for the period from February 25, 2021 (inception) through December 31, 2021 relates to the Company’s formation, the initial public offering (the “Initial Public Offering”), described below, and, subsequent to the Initial Public Offering, identifying a target company for a Business Combination and activities in connection with the proposed acquisition of Akili Interactive Labs, Inc. (see Note 9). The Company will not generate any operating revenues until after the completion of a Business Combination, at the earliest. The Company generates non-operating income in the form of interest income from the marketable securities held in the Trust Account (as defined below).
The registration statements for the Company’s Initial Public Offering became effective on June 29, 2021 and June 30, 2021. On July 2, 2021, the Company consummated the Initial Public Offering of 25,000,000 Class A ordinary shares (the “Public Shares”), which includes the partial exercise by the underwriters of their over-allotment option in the amount of 3,000,000 Public Shares, at $10.00 per Public Share, generating gross proceeds of $250,000,000, which is described in Note 3. The fair value attributable to the unexercised portion of the over-allotment option was deemed to be immaterial to the financial statements.
Substantially concurrently with the closing of the Initial Public Offering, the Company consummated the sale of 640,000 Class A ordinary shares (the “Private Placement Shares”) at a price of $10.00 per Private Placement Share in a private placement to SCS Sponsor I LLC, a Cayman Islands limited liability company (the “Sponsor”), generating gross proceeds of $6,400,000, which is described in Note 4.
Transaction costs amounted to $12,488,190, consisting of $4,400,000 of underwriting fees, $7,700,000 of deferred underwriting fees and $388,190 of other offering costs.
In connection with the closing of the Initial Public Offering on July 2, 2021, an amount of $250,000,000 ($10.00 per Public Share) from the net proceeds of the sale of the Public Shares in the Initial Public Offering and the sale of the Private Placement Shares was placed in a trust account (the “Trust Account”), and invested in U.S. government treasury bills with a maturity of 185 days or less or in money market funds investing solely in U.S. Treasuries and meeting certain conditions of Rule 2a-7 of the Investment Company Act of 1940, as amended (the “Investment Company Act”). Except with respect to interest earned on the funds held in the Trust Account that may be released to the Company to pay its taxes, if any, the funds held in the Trust Account will not be released from the Trust Account until the earliest of: (a) the completion of a Business Combination, and then only in connection with those Public Shares that such shareholder properly elected to redeem, subject to certain limitations; (b) the redemption of any Public Shares properly submitted in connection with a shareholder vote to amend the Company’s Amended and Restated Memorandum and Articles of Association (i) to modify the substance or timing of the Company’s obligation to allow redemption in connection with the Business Combination or to redeem 100% of the Public Shares if the Company does not complete a Business Combination within the Combination Period (as defined below) or (ii) with respect to any other material provisions relating to shareholders’ rights or pre-Business Combination activity; and (c) the redemption of the Public Shares if the Company has not completed a Business Combination within the Combination Period or during any applicable extension period. The proceeds deposited in the Trust Account could become subject to the claims of the Company’s creditors, if any, which could have priority over the claims of the holders of the Public Shares (the “Public Shareholders”).
The Company’s management has broad discretion with respect to the specific application of the net proceeds of the Initial Public Offering and the sale of the Private Placement Shares, although substantially all of
F-29
the net proceeds are intended to be applied generally toward consummating a Business Combination. The Company must complete one or more Business Combinations having an aggregate fair market value of at least 80% of the value of the assets held in the Trust Account (excluding any deferred underwriting commissions and taxes payable on the income earned on the Trust Account) at the time of the Company signing a definitive agreement in connection with the Business Combination. However, the Company will only complete a Business Combination if the post-Business Combination company owns or acquires 50% or more of the issued and outstanding voting securities of the target or otherwise acquires a controlling interest in the target business sufficient for it not to be required to register as an investment company under the Investment Company Act. There is no assurance that the Company will be able to complete a Business Combination successfully.
The Company will provide the Public Shareholders with the opportunity to redeem all or a portion of their Public Shares upon the completion of the Business Combination, either (a) in connection with a general meeting called to approve the Business Combination or (b) by means of a tender offer. The decision as to whether the Company will seek shareholder approval of a Business Combination or conduct a tender offer will be made by the Company. The Public Shareholders will be entitled to redeem all or a portion of their Public Shares at a per-share price, payable in cash, equal to the aggregate amount then on deposit in the Trust Account, calculated as of two business days prior to the consummation of the Business Combination, including interest (which interest shall be net of taxes payable), divided by the number of then issued and outstanding Public Shares, subject to the limitations described below.
In accordance with the Company’s Amended and Restated Memorandum and Articles of Association, in no event will the Company redeem the Public Shares in an amount that would cause the Company’s net tangible assets to be less than $5,000,001 following such redemptions. Redemptions of the Public Shares may also be subject to a higher net tangible asset test or cash requirement pursuant to an agreement relating to the Business Combination.
If a shareholder vote is not required in connection with a Business Combination and the Company does not decide to hold a shareholder vote for business or other reasons, the Company will, pursuant to its Amended and Restated Memorandum and Articles of Association, conduct the redemptions pursuant to the tender offer rules of the Securities and Exchange Commission (the “SEC”), and file tender offer documents with the SEC prior to completing a Business Combination. If, however, shareholder approval of the transaction is required by applicable law or stock exchange listing requirement, or the Company decides to obtain shareholder approval for business or other reasons, the Company will conduct the redemptions in conjunction with a proxy solicitation pursuant to the proxy rules and not pursuant to the tender offer rules and will file proxy materials with the SEC. If the Company seeks shareholder approval in connection with a Business Combination, the Company will complete such Business Combination only if the Company receives an ordinary resolution under Cayman Islands law, which requires the affirmative vote of holders of a majority of ordinary shares who attend and vote at a general meeting of the Company. The Public Shareholders may elect to redeem their Public Shares without voting and, if they do vote, irrespective of whether they vote for or against a Business Combination.
Notwithstanding the foregoing redemption rights, if the Company seeks shareholder approval of the Business Combination and the Company does not conduct redemptions pursuant to the tender offer rules, the Company’s Amended and Restated Memorandum and Articles of Association provide that a Public Shareholder, together with any affiliate of such shareholder or any other person with whom such shareholder is acting in concert or as a “group” (as defined under Section 13 of the Securities Exchange Act of 1934, as amended (the “Exchange Act”)), will be restricted from redeeming its Public Shares with respect to more than an aggregate of 15% of the Public Shares without the Company’s prior written consent.
The Sponsor and the Company’s directors and officers have agreed to waive: (a) their redemption rights with respect to any Founder Shares, Private Placement Shares and Public Shares held by them, as applicable, in connection with the completion of a Business Combination; (b) their redemption rights with respect to any Founder Shares, Private Placement Shares and Public Shares held by them in connection with a shareholder vote
F-30
to amend the Company’s Amended and Restated Memorandum and Articles of Association (i) to modify the substance or timing of the Company’s obligation to allow redemption in connection with the Business Combination or to redeem 100% of the Public Shares if the Company does not complete a Business Combination within the Combination Period, or (ii) with respect to any other material provisions relating to shareholders’ rights or pre-Business Combination activity; and (c) their rights to liquidating distributions from the Trust Account with respect to any Founder Shares and Private Placement Shares they hold if the Company fails to complete a Business Combination within the Combination Period or during any applicable extension period (although such persons will be entitled to liquidating distributions from the Trust Account with respect to any Public Shares they hold if the Company fails to complete a Business Combination within the prescribed time frame). If the Company submits the Business Combination to the Public Shareholders for a vote, the Sponsor and the Company’s directors and officers have also agreed to vote any Founder Shares, Private Placement Shares and Public Shares held by them in favor of the Business Combination.
The Company will have until July 2, 2023 to complete a Business Combination (the “Combination Period”), or such longer period as a result of a shareholder vote to amend such time period pursuant to the Company’s Amended and Restated Memorandum and Articles of Association. However, if the Company has not completed a Business Combination within such Combination Period or during any applicable extension period, the Company will: (a) cease all operations except for the purpose of winding up; (b) as promptly as reasonably possible but not more than ten business days thereafter, redeem the Public Shares, at a per-share price, payable in cash, equal to the aggregate amount then on deposit in the Trust Account, including interest (less up to $100,000 of interest to pay dissolution expenses and which interest shall be net of taxes payable) divided by the number of then issued and outstanding Public Shares, which redemption will completely extinguish the Public Shareholders’ rights as shareholders (including the right to receive further liquidating distributions, if any); and (c) as promptly as reasonably possible following such redemption, subject to the approval of the Company’s remaining shareholders and its board of directors, liquidate and dissolve, subject in each case to the Company’s obligations under Cayman Islands law to provide for claims of creditors and the requirements of other applicable law.
The Sponsor has agreed that it will be liable to the Company if and to the extent any claims by a third party (other than the Company’s independent auditors) for services rendered or products sold to the Company, or a prospective target business with which the Company has discussed entering into a transaction agreement, reduce the amount of funds in the Trust Account to below (1) $10.00 per Public Share or (2) such lesser amount per Public Share held in the Trust Account as of the date of the liquidation of the Trust Account, due to reductions in the value of the trust assets, in each case net of the interest which may be withdrawn to pay taxes, except as to any claims by a third party that executed a waiver of any and all rights to seek access to the Trust Account and except as to any claims under the Company’s indemnity of the underwriters of the Initial Public Offering against certain liabilities, including liabilities under the Securities Act of 1933, as amended (the “Securities Act”). In the event that an executed waiver is deemed to be unenforceable against a third party, the Sponsor will not be responsible to the extent of any liability for such third-party claims. The Company has not independently verified whether the Sponsor has sufficient funds to satisfy its indemnity obligations and believes that the Sponsor’s only assets are securities of the Company and, therefore, the Sponsor may not be able to satisfy those obligations. The Company has not asked the Sponsor to reserve for such obligations. None of the Company’s directors or officers will indemnify the Company for claims by third parties, including, without limitation, claims by vendors and prospective target businesses.
Risks and Uncertainties
Management continues to evaluate the impact of the COVID-19 pandemic and has concluded that while it is reasonably possible that the pandemic could have a negative effect on the Company’s business, financial position, results of operations and/or the search for a target company, the specific impact is not readily determinable as of the date of these financial statements. The financial statements do not include any adjustments that might result from the outcome of this uncertainty.
F-31
Liquidity and Going Concern
As of December 31, 2021, the Company had $428,189 in its operating bank accounts and working capital deficit of $1,057,614.
Until the consummation of a Business Combination, the Company will be using the funds not held in the Trust Account for identifying and evaluating prospective acquisition candidates, performing due diligence on prospective target businesses, paying for travel expenditures, selecting the target business to acquire, and structuring, negotiating and consummating the Business Combination.
The Company may need to raise additional capital through loans or additional investments from its Sponsor, shareholders, officers, directors, or third parties. The Company’s officers, directors and Sponsor may, but are not obligated to, loan the Company funds, from time to time or at any time, in whatever amount they deem reasonable in their sole discretion, to meet the Company’s working capital needs. Accordingly, the Company may not be able to obtain additional financing. If the Company is unable to raise additional capital, it may be required to take additional measures to conserve liquidity, which could include, but not necessarily be limited to, curtailing operations, suspending the pursuit of a potential transaction, and reducing overhead expenses. The Company cannot provide any assurance that new financing will be available to it on commercially acceptable terms, if at all. These conditions raise substantial doubt about the Company’s ability to continue as a going concern for a reasonable period of time, which is considered to be one year from the issuance date of the financial statements. These financial statements do not include any adjustments relating to the recovery of the recorded assets or the classification of the liabilities that might be necessary should the Company be unable to continue as a going concern.
NOTE 2. SUMMARY OF SIGNIFICANT ACCOUNTING POLICIES
Basis of Presentation
The accompanying financial statements are presented in conformity with accounting principles generally accepted in the United States of America (“GAAP”) and pursuant to the rules and regulations of the SEC.
Emerging Growth Company
The Company is an “emerging growth company,” as defined in Section 2(a) of the Securities Act, as modified by the Jumpstart Our Business Startups Act of 2012 (the “JOBS Act”), and it may take advantage of certain exemptions from various reporting requirements that are applicable to other public companies that are not emerging growth companies including, but not limited to, not being required to comply with the independent registered public accounting firm attestation requirements of Section 404 of the Sarbanes-Oxley Act of 2002, reduced disclosure obligations regarding executive compensation in its periodic reports and proxy statements, and exemptions from the requirements of holding a nonbinding advisory vote on executive compensation and shareholder approval of any golden parachute payments not previously approved.
Further, Section 102(b)(1) of the JOBS Act exempts emerging growth companies from being required to comply with new or revised financial accounting standards until private companies (that is, those that have not had a Securities Act registration statement declared effective or do not have a class of securities registered under the Exchange Act) are required to comply with the new or revised financial accounting standards. The JOBS Act provides that a company can elect to opt out of the extended transition period and comply with the requirements that apply to non-emerging growth companies but any such election to opt out is irrevocable. The Company has elected not to opt out of such extended transition period, which means that when a standard is issued or revised and it has different application dates for public or private companies, the Company, as an emerging growth company, can adopt the new or revised standard at the time private companies adopt the new or revised standard. This may make comparison of the Company’s financial statements with another public company which is neither an emerging growth company nor an emerging growth company which has opted out of using the extended transition period difficult or impossible because of the potential differences in accounting standards used.
F-32
Use of Estimates
The preparation of the financial statements in conformity with GAAP requires management to make estimates and assumptions that affect the reported amounts of assets and liabilities and disclosure of contingent assets and liabilities at the date of the financial statements and the reported amounts of revenues and expenses during the reporting period.
Making estimates requires management to exercise significant judgment. It is at least reasonably possible that the estimate of the effect of a condition, situation or set of circumstances that existed at the date of the financial statements, which management considered in formulating its estimate, could change in the near term due to one or more future confirming events. Significant accounting estimates include the determination of the fair value of Class A ordinary shares subject to possible redemption and the fair value of Founder Shares transferred to directors. Accordingly, the actual results could differ significantly from those estimates.
Cash and Cash Equivalents
The Company considers all short-term investments with an original maturity of three months or less when purchased to be cash equivalents. The Company did not have any cash equivalents as of December 31, 2021.
Marketable Securities Held in Trust Account
At December 31, 2021, substantially all of the assets held in the Trust Account were held in money market funds which are invested primarily in U.S. Treasury securities.
Class A Ordinary Shares Subject to Possible Redemption
The Company accounts for its Class A ordinary shares subject to possible redemption in accordance with the guidance in Financial Accounting Standards Board (“FASB”) ASC 480, “Distinguishing Liabilities from Equity.” Class A ordinary shares subject to mandatory redemption are classified as a liability instrument and are measured at redemption value. Conditionally redeemable ordinary shares (including ordinary shares that feature redemption rights that are either within the control of the holder or subject to redemption upon the occurrence of uncertain events not solely within the Company’s control) are classified as temporary equity. At all other times, ordinary shares are classified as shareholders’ equity. The Company’s Class A ordinary shares feature certain redemption rights that are considered to be outside of the Company’s control and subject to occurrence of uncertain future events. Accordingly, Class A ordinary shares subject to possible redemption are presented at redemption value as temporary equity, outside of the permanent deficit section of the Company’s balance sheet.
The Company recognizes changes in redemption value immediately as they occur and adjusts the carrying value of redeemable ordinary shares to equal the redemption value at the end of each reporting period. Increases or decreases in the carrying value of redeemable ordinary shares are affected by charges against additional paid-in capital (to the extent available) and accumulated deficit.
At December 31, 2021, the Class A ordinary shares subject to possible redemption reflected in the balance sheet are reconciled in the following table:
| Gross proceeds | $ | 250,000,000 | ||
| Less: | ||||
| Class A ordinary shares issuance costs | (12,488,190 | ) | ||
| Plus: | ||||
| Accretion of carrying value to redemption value | 12,496,514 | |||
Class A ordinary shares subject to possible redemption | $ | 250,008,324 | ||
F-33
Offering Costs
The Company complies with the requirements of the ASC 340-10-S99-1. Offering costs consisted of legal, accounting, underwriting fees and other costs incurred through the Initial Public Offering that were directly related to the Initial Public Offering. The Company incurred offering costs amounting to $12,488,190 as a result of the Initial Public Offering, consisting of $4,400,000 of underwriting commissions, $7,700,000 of deferred underwriting commissions, and $388,190 of other offering costs. The offering costs were charged to temporary equity and additional paid-in capital upon the completion of the Initial Public Offering. Immediately thereafter, temporary equity was remeasured and an adjustment was recognized through additional paid in capital and accumulated deficit to adjust temporary equity to the redemption value.
Share-Based Payment Arrangements
The Company accounts for stock awards in accordance with ASC 718, “Compensation—Stock Compensation,” which requires that all equity awards be accounted for at their “fair value.” Fair value is measured on the grant date and is equal to the underlying value of the stock.
Costs equal to these fair values are recognized ratably over the requisite service period based on the number of awards that are expected to vest, in the period of grant for awards that vest immediately and have no future service condition, or in the period the awards vest immediately after meeting a performance condition becomes probable (i.e., the occurrence of a Business Combination). For awards that vest over time, cumulative adjustments in later periods are recorded to the extent actual forfeitures differ from the Company’s initial estimates; previously recognized compensation cost is reversed if the service or performance conditions are not satisfied and the award is forfeited.
Income Taxes
The Company accounts for income taxes under ASC 740, “Income Taxes” (“ASC 740”). ASC 740 requires the recognition of deferred tax assets and liabilities for both the expected impact of differences between the financial statement and tax basis of assets and liabilities and for the expected future tax benefit to be derived from tax loss and tax credit carry forwards. ASC 740 additionally requires a valuation allowance to be established when it is more likely than not that all or a portion of deferred tax assets will not be realized.
ASC 740 also clarifies the accounting for uncertainty in income taxes recognized in an enterprise’s financial statements and prescribes a recognition threshold and measurement process for financial statement recognition and measurement of a tax position taken or expected to be taken in a tax return. For those benefits to be recognized, a tax position must be more-likely-than-not to be sustained upon examination by taxing authorities. The Company’s management has determined that the Cayman Islands is the Company’s major tax jurisdiction. The Company recognizes accrued interest and penalties related to unrecognized tax benefits as income tax expense. There were no unrecognized tax benefits and no amounts accrued for interest and penalties as of December 31, 2021. The Company is currently not aware of any issues under review that could result in significant payments, accruals or material deviation from its position. The Company is subject to income tax examinations by major taxing authorities since inception.
The Company is considered to be an exempted Cayman Islands company and is presently not subject to income taxes or income tax filing requirements in the Cayman Islands or the United States. As such, the Company’s tax provision was zero for the period presented.
Net Loss Per Ordinary Share
Net loss per ordinary share is computed by dividing net loss by the weighted-average number of ordinary shares outstanding during the period. The Company has two classes of shares, which are referred to as Class A
F-34
ordinary shares and Class B ordinary shares. Losses are shared pro rata between the two classes of shares. Charges associated with the redeemable Class A ordinary shares are excluded from net loss per ordinary share as the redemption value approximates fair value.
As of December 31, 2021, the Company did not have any dilutive securities or other contracts that could, potentially, be exercised or converted into ordinary shares and then share in the earnings of the Company. As a result, diluted net loss per ordinary share is the same as basic net loss per ordinary share for the periods presented.
The following table reflects the calculation of basic and diluted net loss per ordinary share (in dollars, except per share amounts):
For the Period from February 25, 2021 (Inception) Through December 31, 2021 | ||||||||
Class A | Class B | |||||||
Basic and diluted net loss per ordinary share | ||||||||
| Numerator: | ||||||||
| Allocation of net loss | $ | (1,757,485 | ) | $ | (681,115 | ) | ||
| Denominator: | ||||||||
| Basic and diluted weighted average shares outstanding | 15,101,877 | 5,852,751 | ||||||
| Basic and diluted net loss per ordinary share | $ | (0.12 | ) | $ | (0.12 | ) | ||
Concentration of Credit Risk
Financial instruments that potentially subject the Company to concentrations of credit risk consist of cash accounts in a financial institution which, at times may exceed the Federal Depository Insurance Corporation coverage limit of $250,000. The Company has not experienced losses on these accounts.
Fair Value of Financial Instruments
The fair value of the Company’s assets and liabilities, which qualify as financial instruments under ASC Topic 820, “Fair Value Measurement,” approximates the carrying amounts represented in the accompanying balance sheet, primarily due to their short-term nature.
Recent Accounting Standards
In August 2020, the FASB issued ASU No. 2020-06, “Debt—Debt with Conversion and Other Options (Subtopic 470-20) and Derivatives and Hedging—Contracts in Entity’s Own Equity (Subtopic 815-40): Accounting for Convertible Instruments and Contracts in an Entity’s Own Equity” (“ASU 2020-06”), which simplifies accounting for convertible instruments by removing major separation models required under current GAAP. ASU 2020-06 removes certain settlement conditions that are required for equity contracts to qualify for the derivative scope exception and it also simplifies the diluted earnings per share calculation in certain areas. ASU 2020-06 is effective for fiscal years beginning after December 15, 2023, including interim periods within those fiscal years, with early adoption permitted. We adopted ASU 2020-06 effective as of January 1, 2021. The adoption of ASU 2020-06 did not have an impact on our financial statements.
Management does not believe that any recently issued, but not yet effective, accounting standards, if currently adopted, would have a material effect on the Company’s financial statements.
F-35
Accrued Expense
Accrued expenses includes $1,514,044 of accrued legal expenses, $5,000 of accrued printer expense, $385,000 of accrued due diligence expense, $70,000 of accrued regulatory filing fee and $793 of accrued accounting expense.
NOTE 3. INITIAL PUBLIC OFFERING
Pursuant to the Initial Public Offering, the Company sold 25,000,000 Public Shares, which includes a partial exercise by the underwriters of their over-allotment option in the amount of 3,000,000 Public Shares, at a price of $10.00 per Public Share. Unlike some other initial public offerings of special purpose acquisition companies, investors in the Initial Public Offering did not receive any warrants (which would typically become exercisable following completion of the Business Combination). The fair value attributable to the unexercised portion of the over-allotment option was deemed to be immaterial to the financial statements.
NOTE 4. PRIVATE PLACEMENT
Substantially concurrently with the closing of the Initial Public Offering, the Sponsor purchased 640,000 Private Placement Shares at a price of $10.00 per Private Placement Share, for an aggregate purchase price of $6,400,000. Each Private Placement Share is identical to the Class A ordinary shares sold in the Initial Public Offering, subject to certain limited exceptions as described in Note 7. A portion of the proceeds from the sale of the Private Placement Shares was added to the net proceeds from the Initial Public Offering held in the Trust Account. If the Company does not complete a Business Combination within the Combination Period or during any applicable extension period, the proceeds from the sale of the Private Placement Shares held in the Trust Account will be used to fund the redemption of the Public Shares (subject to the requirements of applicable law) and the Private Placement Shares will be worthless.
NOTE 5. RELATED PARTY TRANSACTIONS
Founder Shares
On March 2, 2021, the Sponsor paid $25,000 to cover certain offering and formation costs of the Company in consideration for which the Sponsor received 5,750,000 Class B ordinary shares (the “Founder Shares”). On June 29, 2021, the Company effected a share capitalization with respect to its Class B ordinary shares of 575,000 shares thereof, resulting in the Company’s initial shareholders holding an aggregate of 6,325,000 Founder Shares. All share and per-share amounts have been retroactively restated to reflect the share capitalization. The Founder Shares included an aggregate of up to 825,000 shares that were subject to forfeiture depending on the extent to which the underwriters’ over-allotment option was exercised. As a result of the underwriters’ election to partially exercise their over-allotment option, a total of 750,000 Founder Shares are no longer subject to forfeiture and 75,000 Founder Shares were forfeited, resulting in an aggregate of 6,250,000 Founder Shares outstanding.
In June 2021, the Sponsor transferred 30,000 Founder Shares to Vladimir Coric, an independent director of the Company. The sale of the Founders Shares to the Company’s director is in the scope of FASB ASC Topic 718, “Compensation-Stock Compensation” (“ASC 718”). Under ASC 718, stock-based compensation associated with equity-classified awards is measured at fair value upon the grant date. The fair value of the 30,000 shares granted to the Company’s director was $214,160 or approximately $7.14 per share. The Founders Shares were effectively sold subject to a performance condition (i.e., the occurrence of a Business Combination). Compensation expense related to the Founders Shares is recognized only when the performance condition is probable of occurrence under the applicable accounting literature in this circumstance. As of December 31, 2021, the Company determined that a Business Combination is not considered probable, and, therefore, no stock-based compensation expense has been recognized. Stock-based compensation would be recognized at the date a Business Combination is considered probable (i.e., upon consummation of a Business Combination) in an
F-36
amount equal to the number of Founders Shares times the grant date fair value per share (unless subsequently modified) less the amount initially received for the purchase of the Founders Shares.
The Sponsor and the Company’s directors and officers have agreed, subject to limited exceptions, not to transfer, assign or sell any of their Founder Shares until the earlier of: (A) one year after the completion of a Business Combination and (B) subsequent to a Business Combination, (x) if the last reported sale price of the Class A ordinary shares equals or exceeds $12.00 per share (as adjusted for share sub-divisions, share dividends, rights issuances, consolidations, reorganizations, recapitalizations and other similar transactions) for any 20 trading days within any 30-trading day period commencing at least 150 days after a Business Combination, or (y) the date on which the Company completes a liquidation, merger, amalgamation, share exchange, reorganization or other similar transaction that results in all of the Public Shareholders having the right to exchange their Class A ordinary shares for cash, securities or other property.
Administrative Services Agreement
The Company entered into an agreement in which it will pay an affiliate of the Sponsor $10,000 per month, commencing on June 30, 2021, for office space, administrative and support services. Upon completion of a Business Combination or its liquidation, the Company will cease paying these monthly fees. For the period from February 25, 2021 (inception) through December 31, 2021, the Company incurred $60,000 in fees for these services, of which such amount was recognized in Operating and Formation Costs in the accompanying statement of operations.
Advances from Related Party
As of December 31, 2021, the Sponsor had advanced the Company $97,640 for working capital purposes, inclusive of the administrative services agreement noted above, of which $87,640 was repaid during the period ended December 31, 2021. As of December 31, 2021, the outstanding balance was $10,000.
Promissory Note — Related Party
On March 2, 2021, the Sponsor issued an unsecured promissory note to the Company (the “Promissory Note”), pursuant to which the Company could borrow up to an aggregate principal amount of $300,000. The Promissory Note was non-interest bearing and payable on the earlier of December 31, 2021 and the completion of the Initial Public Offering. The outstanding balance under the Promissory Note of $300,000 was repaid at the closing of the Initial Public Offering on July 2, 2021. Borrowings are no longer available under the Promissory Note.
Related Party Loans
In order to fund working capital deficiencies or finance transaction costs in connection with a Business Combination, the Sponsor or an affiliate of the Sponsor or certain of the Company’s officers and directors may, but are not obligated to, loan the Company funds as may be required (“Working Capital Loans”). If the Company completes a Business Combination, it may repay such loaned amounts out of the proceeds of the Trust Account. In the event that the Business Combination does not close, the Company may use a portion of the working capital held outside the Trust Account to repay such loaned amounts but no proceeds from the Trust Account would be used to repay such loaned amounts. As of December 31, 2021, there were no outstanding amounts under the Working Capital Loans.
NOTE 6. COMMITMENTS AND CONTINGENCIES
Registration Rights
Pursuant to a registration rights agreement entered into on June 29, 2021, the holders of the Founder Shares, Private Placement Shares and any Private Placement Shares that may be issued on conversion of Working
F-37
Capital Loans (and any Class A ordinary shares issuable upon the conversion of the Founder Shares) are entitled to registration rights requiring the Company to register such securities for resale (in the case of the Founder Shares, only after conversion to the Class A ordinary shares). The holders of these securities will be entitled to make up to three demands, excluding short form registration demands, that the Company register such securities. In addition, the holders have certain “piggy-back” registration rights with respect to registration statements filed subsequent to the completion of a Business Combination and rights to require the Company to register for resale such securities pursuant to Rule 415 under the Securities Act. The Company will bear the expenses incurred in connection with the filing of any such registration statements.
Underwriting Agreement
The underwriters are entitled to a deferred underwriting commission of $7,700,000 in the aggregate. The deferred fee will become payable to the underwriters from the amounts held in the Trust Account solely in the event that the Company completes a Business Combination, subject to the terms of the underwriting agreement.
Restricted Stock Unit Award
In September 2021, pursuant to a Director Restricted Stock Unit Award Agreement, dated September 24, 2021, between the Company and Senthil Sundaram, the Company agreed to grant 30,000 restricted stock units (“RSUs”) to Mr. Sundaram, which grant is contingent on both the consummation of a Business Combination and a shareholder approved equity plan. The RSUs will vest upon the consummation of such Business Combination and represent 30,000 Class A ordinary shares of the Company that will settle on a date determined in the sole discretion of the Company that shall occur between the vesting date and March 15 of the year following the year in which vesting occurs.
The RSUs granted by the Company are in the scope of ASC 718. Under ASC 718, stock-based compensation associated with equity-classified awards is measured at fair value upon the grant date. The RSUs to be were granted are subject to a performance condition (i.e., the occurrence of a Business Combination). Compensation expense related to the RSUs is recognized only when the performance condition is probable of occurrence under the applicable accounting literature in this circumstance. As of December 31, 2021, the Company did not have a shareholder approved equity plan and also determined that a Business Combination is not considered probable, therefore, no stock-based compensation expense has been recognized. Stock-based compensation would be recognized at the date a Business Combination is considered probable (i.e., upon consummation of a Business Combination) in an amount equal to the number of RSUs times the grant date fair value per share (unless subsequently modified).
NOTE 7. TEMPORARY EQUITY AND PERMANENT DEFICIT
Preference Shares
Class A Ordinary Shares
Class B Ordinary Shares
F-38
Holders of record of Class A ordinary shares and Class B ordinary shares are entitled to one vote for each share held on all matters to be voted on by shareholders and vote together as a single class, except as required by law; provided that prior to a Business Combination, holders of Class B ordinary shares will have the right to appoint all of the Company’s directors and remove members of its board of directors for any reason, and holders of Class A ordinary shares will not be entitled to vote on the appointment of directors during such time.
The Class B ordinary shares will automatically convert into Class A ordinary shares at the time of the Business Combination, or earlier at the option of the holder, on a one-for-one basis, subject to adjustment for share sub-divisions, share dividends, rights issuances, consolidations, reorganizations, recapitalizations and the like. Additionally, in the event that additional (in excess of the amounts issued in the Initial Public Offering) Class A ordinary shares, or equity-linked securities, are issued or deemed issued in connection with the closing of the Business Combination, the ratio at which the Class B ordinary shares will convert into Class A ordinary shares will be adjusted (unless the holders of a majority of the issued and outstanding Class B ordinary shares agree to waive such anti-dilution adjustment with respect to any such issuance or deemed issuance) so that the number of Class A ordinary shares issuable upon conversion of all Class B ordinary shares will equal, in the aggregate, 20% of the sum of the total number of Class A ordinary shares outstanding after such conversion (after giving effect to any redemptions of Class A ordinary shares by Public Shareholders, and excluding the Private Placement Shares), including any Class A ordinary shares issued or deemed issued, or issuable upon the conversion or exercise of any equity-linked securities or rights issued or deemed issued, by the Company in connection with the Business Combination, excluding any Class A ordinary shares or equity-linked securities exercisable for or convertible into Class A ordinary shares issued, or to be issued, to any seller in the Business Combination and any private placement shares issued to the Sponsor or its affiliates upon conversion of Working Capital Loans; provided that such conversion of Class B ordinary shares will never occur on a less than one-for-one-basis.
Private Placement Shares
NOTE 8. FAIR VALUE MEASUREMENTS
The Company follows the guidance in ASC Topic 820 for its financial assets and liabilities that are re-measured and reported at fair value at each reporting period, and non-financial assets and liabilities that are re-measured and reported at fair value at least annually.
The fair value of the Company’s financial assets and liabilities reflects management’s estimate of amounts that the Company would have received in connection with the sale of the assets or paid in connection with the transfer of the liabilities in an orderly transaction between market participants at the measurement date. In connection with measuring the fair value of its assets and liabilities, the Company seeks to maximize the use of observable inputs (market data obtained from independent sources) and to minimize the use of unobservable inputs (internal assumptions about how market participants would price assets and liabilities). The following fair value hierarchy is used to classify assets and liabilities based on the observable inputs and unobservable inputs used in order to value the assets and liabilities:
| Level 1: | Quoted prices in active markets for identical assets or liabilities. An active market for an asset or liability is a market in which transactions for the asset or liability occur with sufficient frequency and volume to provide pricing information on an ongoing basis. |
F-39
| Level 2: | Observable inputs other than Level 1 inputs. Examples of Level 2 inputs include quoted prices in active markets for similar assets or liabilities and quoted prices for identical assets or liabilities in markets that are not active. | |
| Level 3: | Unobservable inputs based on our assessment of the assumptions that market participants would use in pricing the asset or liability. | |
The following table presents information about the Company’s assets that are measured at fair value on a recurring basis at December 31, 2021, and indicates the fair value hierarchy of the valuation inputs the Company utilized to determine such fair value:
Description | Level | December 31, 2021 | ||||||
| Assets: | ||||||||
| Marketable securities held in Trust Account | 1 | $ | 250,008,324 | |||||
NOTE 9. SUBSEQUENT EVENTS
The Company evaluated subsequent events and transactions that occurred after the balance sheet date up to the date that the financial statements were issued. Based upon this review, other than as described below, the Company did not identify any subsequent events that would have required adjustment or disclosure in the financial statements, except as follows:
On January 26, 2022, the Company entered into an Agreement and Plan of Merger (the “Akili Merger Agreement”) by and among the Company, Karibu Merger Sub, Inc., a Delaware corporation and its direct wholly owned subsidiary, and Akili Interactive Labs, Inc., a Delaware corporation (“Akili”).
Proposed Akili Business Combination
The Akili Merger Agreement provides that, among other things and upon the terms and subject to the conditions thereof, the following transactions will occur (together with the other agreements and transactions contemplated by the Akili Merger Agreement, the “Akili Business Combination”): (1) at the closing of the transactions contemplated by the Akili Merger Agreement (the “Closing”), upon the terms and subject to the conditions thereof, and in accordance with the Delaware General Corporation Law, as amended (the “DGCL”), Merger Sub will merge with and into Akili, with Akili continuing as the surviving corporation and the Company’s wholly owned subsidiary (the “Merger”); (2) at the Closing, all of the outstanding capital stock of Akili and all options and warrants to acquire capital stock of Akili will be converted into the right to receive shares of common stock, par value $0.0001 per share, of SCS (after the Domestication (as defined below)) (“SCS Common Stock”) or comparable equity awards or warrants that are settled or are exercisable for shares of SCS Common Stock, representing an aggregate of 60 million shares of SCS Common Stock; (3) at the Closing, the Company will deposit into an escrow account for the benefit of the pre-Closing Akili stockholders, optionholders and warrantholders an aggregate number of shares of SCS Common Stock equal to 7.5% of the fully diluted shares of SCS Common Stock (including shares reserved under the equity incentive plan to be adopted by the combined company in connection with the Closing), determined as of immediately following the Closing (collectively, the “Earnout Shares”), which Earnout Shares will be subject to release from escrow to the pre-Closing Akili stockholders, optionholders and warrantholders in three equal tranches upon the daily volume weighted average price of a share of SCS Common Stock reaching $15.00/share, $20.00/share and $30.00/share, respectively, over any 20 trading days within any 30 consecutive trading day period following the Closing and prior to the fifth anniversary of the Closing, in each case, on the terms set forth in the Akili Merger Agreement; and (4) at the Closing, SCS will be renamed “Akili, Inc.” The Closing is subject to the satisfaction or waiver of certain closing conditions contained in the Akili Merger Agreement, including the approval of the Company’s shareholders.
F-40
Prior to the Closing, subject to the approval of the Company’s shareholders, and in accordance with the DGCL, the Cayman Islands Companies Act (As Revised) (the “CICA”) and the Company’s Amended and Restated Memorandum and Articles of Association, the Company will effect a deregistration under the CICA and a domestication under Section 388 of the DGCL, pursuant to which the Company’s jurisdiction of incorporation will be changed from the Cayman Islands to the State of Delaware (the “Domestication”). In connection with the Domestication, (i) each of the Company’s then issued and outstanding Class A ordinary shares will convert automatically, on a one-for-one basis, into a share of SCS Common Stock, which is entitled to one vote per share, and (ii) each of the Company’s then issued and outstanding Class B ordinary shares will convert automatically, on a one-for-one basis, into a share of SCS Common Stock.
On January 26, 2022, concurrently with the execution of the Akili Merger Agreement, the Company entered into subscription agreements (the “Subscription Agreements”) with certain investors (collectively, the “PIPE Investors”), pursuant to which the PIPE Investors have subscribed for an aggregate of 16,200,000 shares of SCS Common Stock for an aggregate purchase price of $162,000,000 (the “PIPE Investment”), of which approximately $135,400,000 is committed by certain existing directors, officers and equityholders of, or investment funds managed by, the Company, the Sponsor, Suvretta and/or their respective affiliates (the “Sponsor Related PIPE Investors”). The PIPE Investment will be consummated substantially concurrently with the Closing.
The consummation of the proposed Business Combination with Akili is subject to certain conditions as further described in the Akili Merger Agreement.
Legal Proceedings
Certain purported shareholders of the Company sent demand letters (the “Demands”) alleging deficiencies and/or omissions in the Akili Disclosure Statement filed by the Company with the SEC on February 14, 2022. The Demands seek additional disclosures to remedy these purported deficiencies.
Promissory Note: Unaudited
On April 20, 2022, the Company issued an unsecured promissory note (the “SCS Promissory Note”) to the Sponsor pursuant to which the Company may borrow up to an aggregate principal amount of $1,500,000. The SCS Promissory Note is non-interest bearing, unsecured and payable upon the earlier of July 2, 2023 and the effective date of the Company’s Business Combination. The SCS Promissory Note is subject to customary events of default which could, subject to certain conditions, cause the SCS Promissory Note to become immediately due and payable. On April 26, 2022, the Company drew a $250,000 under the SCS Promissory Note.
F-41
AKILI INTERACTIVE LABS, INC. AND SUBSIDIARY
Condensed Consolidated Balance Sheets
(In thousands, except share and per share amounts)
(unaudited)
June 30, | December 31, | |||||||
2022 | 2021 | |||||||
Assets | ||||||||
Current assets: | ||||||||
| Cash and cash equivalents | $ | 40,638 | $ | 76,899 | ||||
| Restricted cash | 305 | 305 | ||||||
| Short-term investments | 4,987 | — | ||||||
| Accounts receivable | 17 | 29 | ||||||
| Prepaid expenses and other current assets | 5,328 | 2,500 | ||||||
Total current assets | 51,275 | 79,733 | ||||||
| Property and equipment, net | 1,054 | 1,193 | ||||||
Operating lease right-of-use | 2,686 | — | ||||||
| Prepaid expenses and other long-term assets | — | 11 | ||||||
Total assets | $ | 55,015 | $ | 80,937 | ||||
Liabilities, redeemable convertible preferred stock and stockholders’ deficit | ||||||||
| Current liabilities: | ||||||||
| Accounts payable | 4,309 | 2,345 | ||||||
| Accrued expenses and other current liabilities | 5,044 | 5,477 | ||||||
| Deferred revenue | 109 | 96 | ||||||
| Deferred rent, short term | 9 | 123 | ||||||
| Operating lease liability | 625 | — | ||||||
| Note payable, short term | 625 | — | ||||||
Total current liabilities | 10,721 | 8,041 | ||||||
| Note payable, long term | 14,213 | 4,784 | ||||||
| Operating lease liability, net of current portion | 2,832 | — | ||||||
| Corporate bond, net of bond discount | 1,735 | 1,638 | ||||||
| Deferred rent, long term | — | 712 | ||||||
Total liabilities | 29,501 | 15,175 | ||||||
| Commitments and contingencies | 0 | 0 | ||||||
Redeemable convertible preferred stock, $0.0001 par value—authorized 41,785,202 shares: | ||||||||
Series A-1: designated, 4,000,000 shares; issued and outstanding shares, 4,000,000 at June 30, 2022 and December 31, 2021 (liquidation value of $4,000 at June 30, 2022 and December 31, 2021) | — | — | ||||||
Series A-2: designated 4,427,072 shares; issued and outstanding shares, 4,427,072 at June 30, 2022 and December 31, 2021 (liquidation value of $8,832 at June 30, 2022 and December 31, 2021) | 7,128 | 7,128 | ||||||
Series B: designated 7,341,485 shares; issued and outstanding shares, 7,341,485 at June 30, 2022 and December 31, 2021 (liquidation value of $42,360 at June 30, 2022 and December 31, 2021) | 41,854 | 41,854 | ||||||
Series C: designated 8,016,645 shares; issued and outstanding shares, 8,016,645 at June 30, 2022 and December 31, 2021 (liquidation value $68,200 at June 30, 2022 and December 31, 2021) | 67,904 | 67,904 | ||||||
Series D: designated 18,000,000 shares; issued and outstanding shares, 13,843,858 at June 30, 2022 and December 31, 2021 (liquidation value | 183,668 | 174,990 | ||||||
| Stockholders’ deficit: | ||||||||
Common stock, $0.0001 par value: 55,000,000 shares authorized at June 30, 2022 and December 31, 2021; 1,482,520 and 1,454,239 shares issued and outstanding at June 30, 2022 and December 31, 2021, respectively | — | — | ||||||
Additional paid-in capital | — | — | ||||||
| Accumulated deficit | (275,033 | ) | (226,114 | ) | ||||
| Accumulated other comprehensive loss | (7 | ) | — | |||||
Total stockholders’ deficit | (275,040 | ) | (226,114 | ) | ||||
Total liabilities, redeemable convertible preferred stock and stockholders’ deficit | $ | 55,015 | $ | 80,937 | ||||
The accompanying notes are an integral part of these unaudited condensed consolidated financial statements.
F-
42
AKILI INTERACTIVE LABS, INC. AND SUBSIDIARY
Condensed Consolidated Statements of Operations and Comprehensive Loss
(In thousands, except share and per share amounts) (unaudited)
Three Months Ended June 30, | Six Months Ended June 30, | |||||||||||||||
2022 | 2021 | 2022 | 2021 | |||||||||||||
| Revenues | $ | 64 | $ | 105 | $ | 130 | $ | 222 | ||||||||
| Cost of revenues | 97 | 98 | 193 | 160 | ||||||||||||
| Gross profit (loss) | (33 | ) | 7 | (63 | ) | 62 | ||||||||||
| Operating expenses: | ||||||||||||||||
| Research and development | 7,358 | 4,039 | 13,662 | 7,983 | ||||||||||||
| Selling, general and administrative | 14,948 | 10,526 | 30,339 | 15,383 | ||||||||||||
| Total operating expenses | 22,306 | 14,565 | 44,001 | 23,366 | ||||||||||||
| Operating loss | (22,339 | ) | (14,558 | ) | (44,064 | ) | (23,304 | ) | ||||||||
| Other income (expense): | ||||||||||||||||
| Other income | 40 | 4 | 49 | 5 | ||||||||||||
| Interest expense | (194 | ) | (39 | ) | (370 | ) | (120 | ) | ||||||||
| Extinguishment of debt | — | (181 | ) | — | (181 | ) | ||||||||||
| Total other income (expense) | (154 | ) | (216 | ) | (321 | ) | (296 | ) | ||||||||
| Loss before income taxes | (22,493 | ) | (14,774 | ) | (44,385 | ) | (23,600 | ) | ||||||||
| Income tax expense | — | — | — | 1 | ||||||||||||
| Net loss | $ | (22,493 | ) | $ | (14,774 | ) | $ | (44,385 | ) | $ | (23,601 | ) | ||||
| Unrealized loss on short-term investments | $ | (1 | ) | $ | — | $ | (7 | ) | $ | — | ||||||
| Comprehensive loss | $ | (22,494 | ) | $ | (14,774 | ) | $ | (44,392 | ) | $ | (23,601 | ) | ||||
| Net loss | $ | (22,493 | ) | $ | (14,774 | ) | $ | (44,385 | ) | $ | (23,601 | ) | ||||
| Dividends on Series D convertible preferred stock | (2,908 | ) | (1,115 | ) | (5,785 | ) | (1,115 | ) | ||||||||
| Redemption value of Series D convertible preferred stock | (1,455 | ) | (55,877 | ) | (2,893 | ) | (55,877 | ) | ||||||||
| Net loss attributable to common stockholders | $ | (26,856 | ) | $ | (71,766 | ) | $ | (53,063 | ) | $ | (80,593 | ) | ||||
| Net loss per share: | ||||||||||||||||
| Basic and diluted | $ | (18.25 | ) | $ | (61.98 | ) | $ | (36.18 | ) | $ | (69.60 | ) | ||||
| Weighted average common shares outstanding: | ||||||||||||||||
| Basic and diluted | 1,471,296 | 1,157,870 | 1,466,462 | 1,157,869 | ||||||||||||
The accompanying notes are an integral part of these unaudited condensed consolidated financial statements.
F-
43
AKILI INTERACTIVE LABS, INC. AND SUBSIDIARY
Condensed Consolidated Statements of Redeemable Convertible Preferred Stock and Stockholders’ Deficit
(In thousands, except unit amounts) (unaudited)
Six Months Ended June 30, 2022 | ||||||||||||||||||||||||||||||||||||||||||||||||||||||||||||||||
| Series A-1 | Series A-2 | Series B | Series C | Series D | ||||||||||||||||||||||||||||||||||||||||||||||||||||||||||||
| Redeemable Convertible Preferred Stock | Redeemable Convertible Preferred Stock | Redeemable Convertible Preferred Stock | Redeemable Convertible Preferred Stock | Redeemable Convertible Preferred Stock | Common Stock | Additional Paid-in | Accumulated | Accumulated other comprehensive | Total Stockholders’ | |||||||||||||||||||||||||||||||||||||||||||||||||||||||
| Shares | Value | Shares | Value | Shares | Value | Shares | Value | Shares | Value | Shares | Value | Capital | Deficit | (loss) income | Deficit | |||||||||||||||||||||||||||||||||||||||||||||||||
Balance at December 31, 2021 | 4,000,000 | $ | — | 4,427,072 | $ | 7,128 | 7,341,485 | $ | 41,854 | 8,016,645 | $ | 67,904 | 13,843,858 | $ | 174,990 | 1,454,239 | $ | — | $ | — | $ | (226,114 | ) | $ | — | $ | (226,114 | ) | ||||||||||||||||||||||||||||||||||||
Stock-based compensation expense | — | — | — | — | — | — | — | — | — | — | — | — | 2,070 | — | — | 2,070 | ||||||||||||||||||||||||||||||||||||||||||||||||
Exercise of stock options | — | — | — | — | — | — | — | — | — | — | 15,000 | — | 64 | — | — | 64 | ||||||||||||||||||||||||||||||||||||||||||||||||
Stock divdend | — | — | — | — | — | — | — | — | — | 2,877 | — | — | (2,134 | ) | (743 | ) | — | (2,877 | ) | |||||||||||||||||||||||||||||||||||||||||||||
Redemption value | — | — | — | — | — | — | — | — | — | 1,438 | — | — | — | (1,438 | ) | — | (1,438 | ) | ||||||||||||||||||||||||||||||||||||||||||||||
Other comprehensive loss | — | — | — | — | — | — | — | — | — | — | — | — | — | — | (6 | ) | (6 | ) | ||||||||||||||||||||||||||||||||||||||||||||||
Net loss | — | — | — | — | — | — | — | — | — | — | — | — | — | (21,892 | ) | — | (21,892 | ) | ||||||||||||||||||||||||||||||||||||||||||||||
Balance at March 31, 2022 | 4,000,000 | $ | — | 4,427,072 | $ | 7,128 | 7,341,485 | $ | 41,854 | 8,016,645 | $ | 67,904 | 13,843,858 | $ | 179,305 | 1,469,239 | $ | — | $ | — | $ | (250,187 | ) | $ | (6 | ) | $ | (250,193 | ) | |||||||||||||||||||||||||||||||||||
Stock-based compensation expense | — | — | — | — | — | — | — | — | — | — | — | — | 1,969 | — | — | 1,969 | ||||||||||||||||||||||||||||||||||||||||||||||||
Exercise of stock options | — | — | — | — | — | — | — | — | — | — | 13,281 | — | 41 | — | — | 41 | ||||||||||||||||||||||||||||||||||||||||||||||||
Stock divdend | — | — | — | — | — | — | — | — | — | 2,908 | — | — | (2,010 | ) | (898 | ) | — | (2,908 | ) | |||||||||||||||||||||||||||||||||||||||||||||
Redemption value | — | — | — | — | — | — | — | — | — | 1,455 | — | — | — | (1,455 | ) | — | (1,455 | ) | ||||||||||||||||||||||||||||||||||||||||||||||
Other comprehensive loss | — | — | — | — | — | — | — | — | — | — | — | — | — | — | (1 | ) | (1 | ) | ||||||||||||||||||||||||||||||||||||||||||||||
Net loss | — | — | — | — | — | — | — | — | — | — | — | — | — | (22,493 | ) | — | (22,493 | ) | ||||||||||||||||||||||||||||||||||||||||||||||
Balance at June 30, 2022 | 4,000,000 | $ | — | 4,427,072 | $ | 7,128 | 7,341,485 | $ | 41,854 | 8,016,645 | $ | 67,904 | 13,843,858 | $ | 183,668 | 1,482,520 | $ | — | $ | — | $ | (275,033 | ) | $ | (7 | ) | $ | (275,040 | ) | |||||||||||||||||||||||||||||||||||
F-44
AKILI INTERACTIVE LABS, INC. AND SUBSIDIARY
Condensed Consolidated Statements of Redeemable Convertible Preferred Stock and Stockholders’ Deficit
(In thousands, except unit amounts) (unaudited)
Six Months Ended June 30, 2021 | ||||||||||||||||||||||||||||||||||||||||||||||||||||||||||||
| Series A-1 | Series A-2 | Series B | Series C | Series D | ||||||||||||||||||||||||||||||||||||||||||||||||||||||||
| Redeemable Convertible Preferred Stock | Redeemable Convertible Preferred Stock | Redeemable Convertible Preferred Stock | Redeemable Convertible Preferred Stock | Redeemable Convertible Preferred Stock | Common Stock | Additional Paid-in | Accumulated | Total Stockholders’ | ||||||||||||||||||||||||||||||||||||||||||||||||||||
| Shares | Value | Shares | Value | Shares | Value | Shares | Value | Shares | Value | Shares | Value | Capital | Deficit | Deficit | ||||||||||||||||||||||||||||||||||||||||||||||
Balance at December 31, 2020 | 4,000,000 | $ | — | 4,427,072 | $ | 7,128 | 7,341,485 | $ | 41,854 | 8,016,645 | $ | 67,904 | — | $ | — | 1,157,868 | $ | — | $ | 9,905 | $ | (114,807 | ) | $ | (104,902 | ) | ||||||||||||||||||||||||||||||||||
Stock-based compensation expense | — | — | — | — | — | — | — | — | — | — | — | — | 842 | — | 842 | |||||||||||||||||||||||||||||||||||||||||||||
Net loss | — | — | — | — | — | — | — | — | — | — | — | — | — | (8,827 | ) | (8,827 | ) | |||||||||||||||||||||||||||||||||||||||||||
Balance at March 31, 2021 | 4,000,000 | $ | — | 4,427,072 | $ | 7,128 | 7,341,485 | $ | 41,854 | 8,016,645 | $ | 67,904 | — | $ | — | 1,157,868 | $ | — | $ | 10,747 | $ | (123,634 | ) | $ | (112,887 | ) | ||||||||||||||||||||||||||||||||||
Stock-based compensation expense | — | — | — | — | — | — | — | — | — | — | — | — | 958 | — | 958 | |||||||||||||||||||||||||||||||||||||||||||||
Exercise of stock options | — | — | — | — | — | — | — | — | — | — | 5 | — | — | — | — | |||||||||||||||||||||||||||||||||||||||||||||
Issuance of common stock warrants | — | — | — | — | — | — | — | — | — | — | — | — | 268 | — | 268 | |||||||||||||||||||||||||||||||||||||||||||||
Issuance of convertible preferred stock, | ||||||||||||||||||||||||||||||||||||||||||||||||||||||||||||
net of issuance costs | — | — | — | — | — | — | — | — | 13,053,508 | 109,681 | — | — | — | — | — | |||||||||||||||||||||||||||||||||||||||||||||
Stock divdend | — | — | — | — | — | — | — | — | — | 1,115 | — | — | (1,115 | ) | — | (1,115 | ) | |||||||||||||||||||||||||||||||||||||||||||
Redemption value | — | — | — | — | — | — | — | — | — | 55,877 | — | — | (10,858 | ) | (45,019 | ) | (55,877 | ) | ||||||||||||||||||||||||||||||||||||||||||
Net loss | — | — | — | — | — | — | — | — | — | — | — | — | — | (14,774 | ) | (14,774 | ) | |||||||||||||||||||||||||||||||||||||||||||
Balance at June 30, 2021 | 4,000,000 | $ | — | 4,427,072 | $ | 7,128 | 7,341,485 | $ | 41,854 | 8,016,645 | $ | 67,904 | 13,053,508 | $ | 166,673 | 1,157,873 | $ | — | $ | — | $ | (183,427 | ) | $ | (183,427 | ) | ||||||||||||||||||||||||||||||||||
The accompanying notes are an integral part of these unaudited condensed consolidated financial statements.
F-45
AKILI INTERACTIVE LABS, INC. AND SUBSIDIARY
Condensed Consolidated Statements of Cash Flows
(In thousands) (unaudited)
Six Months Ended June 30, | ||||||||
2022 | 2021 | |||||||
| Cash flows from operating activities: | ||||||||
| Net loss | $ | (44,385 | ) | $ | (23,601 | ) | ||
| Adjustments to reconcile net loss to net cash used in operating activities: | ||||||||
| Depreciation and amortization | 154 | 138 | ||||||
| Reduction in the carrying amount of right-of-use assets | 239 | — | ||||||
| Stock-based compensation expense | 4,039 | 1,800 | ||||||
| Loss on extinguishment of debt | — | 181 | ||||||
| Amortization of premium on short-term investments | (20 | ) | — | |||||
| Non cash interest expense | 152 | 53 | ||||||
| Changes in operating assets and liabilities: | ||||||||
| Accounts receivable | 12 | (19 | ) | |||||
| Prepaid expenses and other current assets | (2,828 | ) | (1,171 | ) | ||||
| Prepaid expenses and other long-term assets | 11 | (116 | ) | |||||
| Accounts payable | 1,961 | 1,328 | ||||||
| Accrued expenses and other current liabilities | (433 | ) | 343 | |||||
| Deferred rent | (14 | ) | (42 | ) | ||||
| Operating lease liabilities | (280 | ) | — | |||||
| Deferred revenue | 13 | (123 | ) | |||||
Net cash used in operating activities | (41,379 | ) | (21,229 | ) | ||||
Cash flows from investing activities: | ||||||||
| Acquisition of property and equipment | (13 | ) | (46 | ) | ||||
| Capitalized software development costs | — | (57 | ) | |||||
| Purchases of short-term investments | (14,974 | ) | — | |||||
| Proceeds from maturities of short-term investments | 10,000 | — | ||||||
Net cash used in investing activities | (4,987 | ) | (103 | ) | ||||
Cash flows from financing activities: | ||||||||
| Proceeds from exercise of stock options | 105 | — | ||||||
| Proceeds from note payable | 10,000 | 5,000 | ||||||
| Proceeds from issuance of preferred stock, net issuance costs | — | 109,681 | ||||||
| Payment of debt issuance costs | — | (74 | ) | |||||
| Payment of premium on note payable | — | (26 | ) | |||||
| Repayment of principal on note payable | — | (2,000 | ) | |||||
Net cash provided by financing activities | 10,105 | 112,581 | ||||||
Net increase (decrease) in cash, cash equivalents, and restricted cash | (36,261 | ) | 91,249 | |||||
| Cash, cash equivalents, and restricted cash at beginning of period | 77,204 | 18,833 | ||||||
| Cash, cash equivalents, and restricted cash at end of period | $ | 40,943 | $ | 110,082 | ||||
Supplementary Information: | ||||||||
| Cash paid for income taxes | $ | — | $ | — | ||||
| Cash paid for interest | 181 | 39 | ||||||
Noncash investing and financing activities: | ||||||||
| Purchase of property and equipment included in accounts payable and accrued expenses | 10 | 7 | ||||||
| Common stock warrants issued related to note payable | — | 268 | ||||||
| Redemption value of Series D preferred stock | 2,893 | 55,877 | ||||||
| Dividends accrued for Series D preferred stock | 5,785 | 1,115 | ||||||
The accompanying notes are an integral part of these unaudited condensed consolidated financial statements.
F-
46
AKILI INTERACTIVE LABS, INC. AND SUBSIDIARY
NOTES TO THE UNAUDITED CONDENSED CONSOLIDATED FINANCIAL STATEMENTS
(dollars in thousands, except share and per share amounts)
1. Nature of the Business and Basis of Presentation
Organization
Akili Interactive Labs, Inc. (collectively referred to with its wholly-owned, controlled subsidiary, Akili Securities Corporation as “Akili” or the “the Company”) was incorporated under the laws of the State of Delaware on December 1, 2011. The Company operates as one business segment and is developing a digital medicine platform for the treatment and assessment of cognitive dysfunction across several neurology and psychiatry indications, including attention-deficit hyperactivity disorder (“ADHD”), major depressive disorder, autism spectrum disorder, multiple sclerosis, and various neuroinflammatory diseases. In June 2020, the U.S. Food and Drug Administration (“FDA”) granted clearance for EndeavorRx as a prescription treatment for children with ADHD. The Company is headquartered in Boston, Massachusetts.
Business Combination Agreement and Plan of Merger
On January 26, 2022, the Company entered into an Agreement and Plan of Merger (the “Merger Agreement”) with Social Capital Suvretta Holdings
Corp. I, (“SCS”) to affect a business combination between SCS and the Company with the Company surviving the merger as a wholly owned subsidiary of SCS. At the effective time of the Merger, each share of Akili Redeemable Convertible Preferred Stock and each share of Akili Common Stock will be converted into the right to receive such number of shares of SCS Class A Common Stock. The estimated combined enterprise value will be
approximately $777 million. The consummation of the proposed transaction was completed on August 19, 2022, see Note 13 for further details.
Going Concern
The Company is subject to risks common to companies in the biotechnology industry including, but not limited to, new technological innovations, protection of proprietary technology, dependence on key personnel, compliance with government regulations and the need to obtain additional financing. Product candidates currently under development will require significant additional research and development efforts, including extensive
pre-clinical
and clinical testing and regulatory approval, prior to commercialization. These efforts require significant amounts of additional capital, adequate personnel infrastructure and extensive compliance- reporting capabilities.Most of the Company’s product candidates are still in development. There can be no assurance that the Company’s research and development will be successfully completed; that adequate protection for the Company’s intellectual property will be obtained; that any products developed will obtain necessary government regulatory approval; or that any approved products will be commercially viable. Even if the Company’s product development efforts are successful, it is uncertain when, if ever, the Company will generate significant revenue from product sales. The Company operates in an environment of rapid change in technology and substantial competition from pharmaceutical and biotechnology companies. In addition, the Company is dependent upon the services of its employees and consultants.
The Company’s condensed consolidated financial statements have been prepared on the basis of continuity of operations, realization of assets and the satisfaction of liabilities in the ordinary course of business. The Company has experienced negative operating cash flows for the six months ended June 30, 2022 and had an accumulated deficit of $275,033.and $162,000
On August 19, 2022, the Company and SCS completed a merger resulting in the reverse recapitalization of the Company and the Company received aggregate gross proceeds of $2,283 held in trust by SCS (following satisfaction of redemptions by public stockholders),
in aggregate gross proceeds from PIPE investors. The Company received $133,293 in net proceeds after the reduction of $30,990 in
F-
47
AKILI INTERACTIVE LABS, INC. AND SUBSIDIARY
NOTES TO THE UNAUDITED CONDENSED CONSOLIDATED FINANCIAL STATEMENTS
(dollars in thousands, except share and per share amounts)
transaction related expenses and other costs paid at Closing. Management believes the Company’s sources of liquidity will be sufficient to fund the Company’s planned operations and existing obligations within one year after the date that the consolidated financial statements are issued.
The future viability of the Company is dependent on its ability to generate cash from operating activities or to raise additional capital to finance its operations. The Company’s failure to raise capital as and when needed could have a negative impact on its financial condition and ability to pursue its business strategies.
COVID-19
Related Significant Risks and UncertaintiesThere continue to be uncertainties regarding the pandemic of the novel coronavirus, or
COVID-19,
and the Company is closely monitoring the impact ofCOVID-19
on all aspects of its business, including how it will impact its customers, employees, suppliers, vendors, and business partners. The Company is unable to predict the specific impact thatCOVID-19
may have on its financial position and operations moving forward due to the numerous uncertainties. Any estimates made herein may change as new events occur and additional informationis obtained, and actual results could differ materially from any estimates made herein under different assumptions or conditions. The Company will continue to assess the evolving impact of
COVID-19.
In response to the COVID-19 pandemic, Congress passed the Coronavirus Aid, Relief and Economic Security Act of 2020, or the CARES Act, which was signed into law on March 27, 2020. The CARES Act provides for deferred payment of the employer portion of social security taxes through the end of 2020, with a portion of the deferred amount due by December 31, 2022. As of June 30, 2022 and December 31, 2021, the Company has deferred payments of $187 of social security taxes, which is included in accrued expenses and other current liabilities within the condensed consolidated balance sheet.
Basis of Presentation
The accompanying condensed consolidated financial statements have been prepared in conformity with accounting principles generally accepted in the United States of America (“GAAP”) and include the accounts of the Company, after elimination of all intercompany accounts and transactions. As permitted for interim reporting, certain footnotes or other financial information that are normally required by U.S. GAAP may be condensed or omitted, unless otherwise required by U.S. GAAP or Securities and Exchange Commission (“SEC”) rules and regulations. These condensed consolidated financial statements were prepared on the same basis as and should be read in conjunction with the Company’s annual consolidated financial statements included elsewhere in the proxy/registration statement. In the opinion of management, all adjustments of a normal recurring nature, considered necessary for fair presentation, have been included in these condensed consolidated financial statements. The results of operations for the six months ended June 30, 2022 are not necessarily indicative of the results to be expected for the year ending December 31, 2022 or for any other interim period or future year. The condensed consolidated balance sheet as of December 31, 2021 was derived from the audited annual consolidated financial statements but does not include all information required by U.S. GAAP for annual consolidated financial statements.
2. Summary of Significant Accounting Policies
The Company’s significant accounting policies are disclosed in the audited consolidated financial statements for the year ended December 31, 2021, included elsewhere in this prospectus. Since the date of those consolidated financial statements, there have been no changes to the Company’s significant accounting policies except as noted below.
F-
48
AKILI INTERACTIVE LABS, INC. AND SUBSIDIARY
NOTES TO THE UNAUDITED CONDENSED CONSOLIDATED FINANCIAL STATEMENTS
(dollars in thousands, except share and per share amounts)
Investments:
sale.securities are reported at fair value, with temporary unrealized gains and losses excluded from earnings and reported as a separate component of stockholders’ equity, while other-than-temporary gains or losses are included in earnings. The cost of securities sold is determined on a specific identification basis, and realized gains and losses are included in other income (expense) within the condensed consolidated statements of operations and comprehensive loss.
Available-for-sale
Revenue from Contracts with Customers:
Three Months Ended June 30, | Six Months Ended June 30, | |||||||||||||||
2022 | 2021 | 2022 | 2021 | |||||||||||||
| Product revenue | $ | 64 | $ | 37 | $ | 130 | $ | 66 | ||||||||
| Collaboration revenue | $ | — | $ | 68 | — | 156 | ||||||||||
| Total | $ | 64 | $ | 105 | $ | 130 | $ | 222 | ||||||||
As
been
recognized as revenue. All amounts are expected to be recognized as revenue within 12 months of the balance sheet date and are classified as current deferred revenue. The Company recognized $51 of product revenue, in the six months ended June 30, 2022, that was previously included in the December 31, 2021 deferred revenue balance.Contract Liabilities | Product | |||
| Balance at December 31, 2021 | $ | 96 | ||
| Revenue recognized | (130 | ) | ||
| Revenue deferred | 143 | |||
| Balance at June 30, 2022 | $ | 109 | ||
Advertising:
Leases:
one-year
are recognized on the consolidated balance sheets asright-of-use
F-49
AKILI INTERACTIVE LABS, INC. AND SUBSIDIARY
NOTES TO THE UNAUDITED CONDENSED CONSOLIDATED FINANCIAL STATEMENTS
(dollars in thousands, except share and per share amounts)
payments on a straight-line basis over the expected lease term. The Company has elected the practical expedient not to separate lease andcomponents for real estate leases.
non-lease
Recently adopted accounting pronouncements:
In February 2016, the FASB issued ASU(Topic 842) as amended by ASU. The new standard requires lessees to apply a dual approach, classifying leases as either finance or operating leases based on the principle of whether or not the lease is effectively a financed purchase by the lessee. This classification will determine whether lease expense is recognized based on an effective interest method or on a straight-line basis over the term of the lease. A lessee is also required to record aasset and a lease liability for all leases with a term of greater than 12 months regardless of their classification. Leases with a term of 12 months or less are not impacted by the new guidance.
No. 2016-02
(“ASU2016-02”),
Leases
2019-10
and ASU2020-05,
which supersedes the guidance in former ASC Topic 840,Leases
right-of-use
The Company adopted this guidance, effective January 1, 2022, using the modified retrospective method as of the date of adoption such that prior periods will not be restated. The Company elected a package of practical expedients, under which an entity need not reassess whether any expired or existing contracts are or contain leases, the lease classification for any expired or existing leases, or initial direct costs for any existing leases. Additional disclosures related to accounting for leases under this new standard are included in Note 5. The adoption incrementally increased the Company’s assets and liabilities by theasset and lease liabilities. As the leases do not provide an implicit rate, the Company’s incremental borrowing rate was determined based on the information available at the date of adoption to measure its lease liability. The adoption did not have a material impact on the Company’s condensed consolidated statement of operations and comprehensive loss and did not require a cumulative adjustment to accumulated deficit on its condensed consolidated statement of stockholders’ equity as of June 30, 2022.
right-of-use
Recently issued accounting pronouncements:
No. 2016-13,
Measurement of Credit Losses on Financial Instruments
2016-13”),
as amended by ASU2019-10.
ASU2016-13
will change how companies account for credit losses for most financial assets and certain other instruments. For trade receivables, loans andheld-to-maturity
2016-13
is effective for the Company for the annual reporting period beginning January 1, 2023. The Company is currently evaluating the potential impact this standard may have on its consolidated financial statements and results of operations.In December 2019, the FASB issued ASUASU
No. 2019-12,
Income Taxes-Simplifying the Accounting for Income Taxes.
2019-12
eliminates certain exceptions related to the approach for intra-period tax allocation, the methodology for calculating income taxes in an interim period and the recognition of deferred tax liabilities for outside basis differences. It also clarifies and simplifies other aspects of the accounting for income taxes. This standard is effective for annual reporting periods beginning after December 15, 2021, and interim periods within annual periods beginning after December 15, 2022. The Company is currently evaluating the potential impact that ASU2019-12
will have on its consolidated financial statements and related disclosures; however, it does not expect the impact to be material.F-
50
AKILI INTERACTIVE LABS, INC. AND SUBSIDIARY
NOTES TO THE UNAUDITED CONDENSED CONSOLIDATED FINANCIAL STATEMENTS
(dollars in thousands, except share and per share amounts)
3. Prepaid Expenses and Other Current Assets
Prepaid expenses and other current assets consisted of the following:
June 30, 2022 | December 31, 2021 | |||||||
| Deferred issuance costs | $ | 2,999 | $ | 572 | ||||
| Prepaid clinical trials | 879 | 872 | ||||||
| Other current assets | 1,450 | 1,056 | ||||||
| Prepaid expenses and other current assets | $ | 5,328 | $ | 2,500 | ||||
4. Property and Equipment
Property and equipment, net consisted of the following:
June 30, 2022 | December 31, 2021 | |||||||
| Furniture and fixtures | $ | 184 | $ | 184 | ||||
| Computer equipment and software | 459 | 443 | ||||||
| Office equipment | 60 | 60 | ||||||
| Leasehold improvements | 975 | 975 | ||||||
| Capitalized internal-use software costs | 427 | 427 | ||||||
| Total property and equipment | 2,105 | 2,089 | ||||||
| Less: accumulated depreciation and amortization | (1,051 | ) | (896 | ) | ||||
| Property and equipment, net | $ | 1,054 | $ | 1,193 | ||||
Depreciation and amortization expense was $76 and $154 for the three and six months ended June 30, 2022. Depreciation and amortization expense was $68 and $138 for the three and six months ended June 30, 2021.
5. Leases
As of June 30, 2022, the Company leases office space under non-cancelable operating leases in two cities. The office space in Boston, Massachusetts consists of approximately
7,200
square feet that will expire in October 2022 and is classified as a short-term lease. The office space in Larkspur, California consists of approximately43,600
square feet that will expire inNovember 2026
. The Company posted a customary letter of credit in the amount of approximately $250 as a security deposit, which is included in restricted cash within the condensed consolidated balance sheets. This lease does not include any restrictions or covenants that had to be accounted for under the lease guidance.During the three and six months ended June 30, 2022, the Company recognized $262 and $524 of rent expense. During the three and six months ended June 30, 2021, the Company recognized $299 and $585 of rent expense. Of the $524 recognized during the six months ended June 30, 2022, $150 was related to short term leases.
Net cash paid under the Larkspur lease for the amounts included in the measurement of the operating lease liability on the condensed consolidated balance sheet and operating activities in our condensed consolidated statement of cash flow was $415 for the period ending June 30, 2022. The remaining lease term and incremental borrowing rate for the Larkspur lease as of June 30, 2022 was 4.4 years and 7.6%, respectively.
F-
51
AKILI INTERACTIVE LABS, INC. AND SUBSIDIARY
NOTES TO THE UNAUDITED CONDENSED CONSOLIDATED FINANCIAL STATEMENTS
(dollars in thousands, except share and per share amounts)
Future minimum lease payments for the Massachusetts lease are $109 for the year ending December 31, 2022.
Future lease payments for our California noncancelable operating lease as of June 30, 2022 and a reconciliation to the carrying amount of the operating lease liability presented in the condensed consolidated balance sheet as of June 30, 2022 is as follows:
Years Ending December 31, | Amounts | |||
| 2022 (remaining 6 months) | $ | 429 | ||
| 2023 | 878 | |||
| 2024 | 914 | |||
| 2025 | 950 | |||
| 2026 | 905 | |||
| Total undiscounted payments due under operating leases | 4,076 | |||
| Less imputed interest | (619 | ) | ||
| Total | $ | 3,457 | ||
| Current operating lease liability | $ | 625 | ||
| Non-current operating lease liability | 2,832 | |||
| Total | $ | 3,457 | ||
For comparable purposes, aggregate future minimum
non-cancellable
commitments under leases as of December 31, 2021, are as follows:Years Ending December 31, | Amounts | |||
2022 | $ | 538 | ||
| 2023 | 878 | |||
| 2024 | 914 | |||
| 2025 | 950 | |||
| 2026 | 905 | |||
| Total | $ | 4,185 | ||
6. Accrued Expenses and Other Current Liabilities
Accrued expenses and other current liabilities consisted of the following:
June 30, 2022 | December 31, 2021 | |||||||
| Accrued bonus | $ | 1,801 | $ | 2,516 | ||||
| Accrued royalties | 106 | 106 | ||||||
| Accrued wages and benefits | 669 | 421 | ||||||
| Accrued clinical study expenses | 418 | 363 | ||||||
| Accrued consulting service expenses | 1,489 | 766 | ||||||
| Other accrued expenses | 561 | 1,305 | ||||||
| Total | $ | 5,044 | $ | 5,477 | ||||
F-
52
AKILI INTERACTIVE LABS, INC. AND SUBSIDIARY
NOTES TO THE UNAUDITED CONDENSED CONSOLIDATED FINANCIAL STATEMENTS
(dollars in thousands, except share and per share amounts)
7. Corporate Bond
The Company recognized amortization expense of $49 and $97 related to the discount on the corporate bond as a component of interest expense in the condensed consolidated statements of operations and comprehensive loss for the three and six months ended June 30, 2022. The Company recognized amortization expense of $44 and $87 for the three and six months ended June 30, 2021.
The carrying amount of the corporate bond is as follows:
June 30, 2022 | December 31, 2021 | |||||||
| Corporate bond | 5,000 | $ | 5,000 | |||||
| Unamortized discount on corporate bond | (3,265 | ) | (3,362 | ) | ||||
| Corporate bond, net of discount | $ | 1,735 | $ | 1,638 | ||||
8. Note Payable
Amended and restated Loan and Security Agreement
On June 28, 2022, the Company drew an additional $10,000 from Tranche 1 of the Amended and Restated Loan and Security Agreement with Silicon Valley Bank. The Company is required to make interest-only payments through May 2023 before beginning to repay the $15,000 in outstanding principal in 24 equal monthly payments on the first day of each month beginning June 1, 2023, plus interest. In relation to this additional draw of $10,000, the Company incurred $500 of debt issuance costs in the form of a final payment fee.
At June 30, 2022, the Company had outstanding principal of $15,000. The Company recognized interest expense related to debt issuance costs of $81 for the six months ended June 30, 2022. The interest rate in effect as of June 30, 2022 was 8.5%. At June 30, 2022, the carrying amount of the note payable is as follows:
| Note payable, long term | $ | 14,375 | ||
| Final Payment | 750 | |||
| Unamortized debt issuance costs | (912 | ) | ||
| Note payable, long term (net of debt issuance costs) | $ | 14,213 | ||
Future minimum principal payments due under the Amended and Restated Loan and Security Agreement, excluding the Final Payment, are as follows:
Years Ending December 31, | ||||
| Remainder of 2022 | — | |||
| 2023 | 4,375 | |||
| 2024 | 7,500 | |||
| 2025 | 3,125 | |||
| Total | $ | 15,000 | ||
9. Redeemable Convertible Preferred Stock
The Company has 41,785,202 shares of $
.0001
par value redeemable convertible preferred stock authorized, of which 4,000,000 shares are designated as Series A-1 redeemable convertible preferred stock (“Series A-1”),F-
53
AKILI INTERACTIVE LABS, INC. AND SUBSIDIARY
NOTES TO THE UNAUDITED CONDENSED CONSOLIDATED FINANCIAL STATEMENTS
(dollars in thousands, except share and per share amounts)
4,427,072 shares are designated as Series A-2 redeemable convertible preferred stock (“Series A-2”), 7,341,485 shares are designated as Series B redeemable convertible preferred stock (“Series B”), and 8,016,645 shares are designated as Series C redeemable convertible preferred stock (“Series C”), and 18,000,000 shares are designated as Series D redeemable convertible preferred stock (“Series D”).
The amount of accumulated, but undeclared stock dividends on Series D Shares at June 30, 2022 is $5,785 and the cumulative redemption value adjustment recorded since issuance amounted to $61,542.
10. Common Stock
The holders of the common stock are entitled to one vote for each share of common stock. Subject to the payment in full of all preferential dividends to which the holders of the preferred stock are entitled, the holders of common stock shall be entitled to receive dividends out of funds legally available. In the event of any voluntary or involuntary liquidation, dissolution or winding up of the Company, after the payment or provision for payment of all debts and liabilities of the Company and all preferential amounts to which the holders of preferred stock are entitled with respect to the distribution of assets in liquidation, the holders of common stock shall be entitled to share ratably in the remaining assets of the Company available for distribution.
2011 Stock Incentive Plan:
Options generally vest based on the grantee’s continued service with the Company during a specified period following a grant as determined by the Board of Directors and expire ten years from the grant date. In general, awards typically vest in four years, but vesting conditions can vary based on the discretion of the Company’s Board of Directors. Stock-based compensation expense is classified in the condensed consolidated statements of operations and comprehensive loss as
follows:
Three Months Ended June 30, | Six Months Ended June 30, | |||||||||||||||
2022 | 2021 | 2022 | 2021 | |||||||||||||
| Research and development | $ | 841 | $ | 265 | $ | 1,450 | $ | 512 | ||||||||
| Selling, general and administrative | 1,128 | 693 | 2,589 | 1,288 | ||||||||||||
| Total | $ | 1,969 | $ | 958 | $ | 4,039 | $ | 1,800 | ||||||||
A summary of the Company’s stock option activity and related information is as
follows:
| Number of Options | Weighted- Average Exercise Price Per Share | Weighted- Average Remaining Contractual Term (Years) | Aggregate Intrinsic Value | |||||||||||||
| Balance, December 31, 2021 | 7,529,063 | $ | 3.89 | 7.28 | $ | 4,020 | ||||||||||
| Granted | 1,334,379 | $ | 11.58 | |||||||||||||
| Cancelled | (458,986 | ) | $ | 4.55 | ||||||||||||
| Exercised | (28,281 | ) | $ | 3.73 | ||||||||||||
| Balance, June 30, 2022 | 8,376,175 | $ | 5.08 | 7.13 | $ | 54,482 | ||||||||||
| Exercisable, June 30, 2022 | 5,110,692 | $ | 3.77 | 5.99 | $ | 39,901 | ||||||||||
| Options vested and expected to vest, June 30, 2022 | 8,376,175 | $ | 5.08 | 7.13 | $ | 54,482 | ||||||||||
F-54
AKILI INTERACTIVE LABS, INC. AND SUBSIDIARY
NOTES TO THE UNAUDITED CONDENSED CONSOLIDATED FINANCIAL STATEMENTS
(dollars in thousands, except share and per share amounts)
The fair value of all option activity was estimated at the date of grant using Black-Scholes with the following weighted-average assumptions for the six months ended June 30, 2022:
| Fair value of common stock | $ | 11.58 | ||
| Expected volatility | 96.21 | % | ||
| Expected term (in years) | 6.03 | |||
| Risk-free interest rate | 1.73 | % | ||
| Expected dividend yield | 0.00 | % |
There was no option activity for the six months ended June 30, 2021.
The weighted average grant-date fair value of stock options granted to employees during the six months ended June 30, 2022 was $8.97 per share. There were 0 options granted during the six months ended June 30, 2021.
During the six months ended June 30, 2022, the aggregate intrinsic value of stock option awards exercised was $222. There were 0 stock option awards exercised during the six months ended June 30, 2021. Aggregate intrinsic value represents the difference between the exercise price and the fair value of the underlying common stock on the date of exercise.
As of June 30, 2022 there was $17,069 of unrecognized compensation cost related to unvested stock option grants to employees under the Plan, which is expected to be recognized over a weighted-average period of 3.0 years.
11. Fair Value of Financial Assets and Liabilities
The following table presents information about the Company’s assets and liabilities that are measured at fair value on a recurring basis and indicates the level of the fair value hierarchy utilized to determine such fair
values:
| Fair Value Measurements as of June 30, 2022 | ||||||||||||||||
Description | Level 1 | Level 2 | Level 3 | Total | ||||||||||||
Assets | ||||||||||||||||
Cash equivalents: | ||||||||||||||||
| Money market funds | $ | 16,550 | $ | 0— | $ | 0— | $ | 16,550 | ||||||||
| Short-term investments: | ||||||||||||||||
| United States Treasuries | 4,987 | 0— | 0— | 4,987 | ||||||||||||
| Total assets | $ | 21,537 | $ | 0— | $ | 0— | $ | 21,537 | ||||||||
| Fair Value Measurements as of December 31, 2021 | ||||||||||||||||
Description | Level 1 | Level 2 | Level 3 | Total | ||||||||||||
Assets | ||||||||||||||||
Cash equivalents: | ||||||||||||||||
| Money market funds | $ | 61,510 | $ | 0— | $ | 0— | $ | 61,510 | ||||||||
The Company evaluates transfers between levels at the end of each reporting period. There were
no
transfers of financial instruments between levels during the six months ended June 30, 2022 and 2021. The Company recorded unrealized losses on short-term investments of $7 in other comprehensiveloss for the six months ended June 30, 2022.
F-55
AKILI INTERACTIVE LABS, INC. AND SUBSIDIARY
NOTES TO THE UNAUDITED CONDENSED CONSOLIDATED FINANCIAL STATEMENTS
(dollars in thousands, except share and per share amounts)
As of Jun
recurring basis.
12. Net Loss Per Share
The following table summarizes the computation of basic and diluted net loss per share attributable to common stockholders of the Company:
Three Months Ended June 30, | Six Months Ended June 30, | |||||||||||||||
2022 | 2021 | 2022 | 2021 | |||||||||||||
Numerator: | ||||||||||||||||
| Net loss | $ | (22,493 | ) | $ | (14,774 | ) | $ | (44,385 | ) | $ | (23,601 | ) | ||||
| Dividends on Series D convertible preferred stock | (2,908 | ) | (1,115 | ) | (5,785 | ) | (1,115 | ) | ||||||||
| Redemption value of Series D convertible preferred stock | (1,455 | ) | (55,877 | ) | (2,893 | ) | (55,877 | ) | ||||||||
Net loss attributable to common stockholders—basic and diluted | $ | (26,856 | ) | $ | (71,766 | ) | $ | (53,063 | ) | $ | (80,593 | ) | ||||
| Denominator: | ||||||||||||||||
| Weighted-average common stock outstanding | 1,471,296 | 1,157,870 | 1,466,462 | 1,157,869 | ||||||||||||
Net loss per share attributable to common stockholders—basic and diluted | $ | (18.25 | ) | $ | (61.98 | ) | $ | (36.18 | ) | $ | (69.60 | ) | ||||
For periods in which the Company reports a net loss attributable to common stockholders, potentially dilutive securities have been excluded from the computation of diluted net loss per share as their effects would be anti- dilutive. Therefore, the weighted average number of common shares outstanding used to calculate both basic and diluted net loss per share attributable to common stockholders is the same. The Company excluded the following potential common shares, presented based on amounts outstanding at period end, from the computation of diluted net loss per share attributable to common stockholders because including them would have had an anti-dilutive effect:
As of June 30, | ||||||||
2022 | 2021 | |||||||
| Series A-1 convertible preferred stock (as converted to common stock) | 4,000,000 | 4,000,000 | ||||||
| Series A-2 convertible preferred stock (as converted to common stock) | 4,427,072 | 4,427,072 | ||||||
| Series B convertible preferred stock (as converted to common stock) | 7,341,485 | 7,341,485 | ||||||
| Series C convertible preferred stock (as converted to common stock) | 8,016,645 | 8,016,645 | ||||||
| Series D convertible preferred stock (as converted to common stock) | 21,795,525 | 19,778,730 | ||||||
| Warrants to purchase common stock | 226,196 | 226,196 | ||||||
| Stock options to purchase common stock | 8,376,175 | 5,912,116 | ||||||
| Total | 54,183,098 | 49,702,244 | ||||||
F-
56
AKILI INTERACTIVE LABS, INC. AND SUBSIDIARY
NOTES TO THE UNAUDITED CONDENSED CONSOLIDATED FINANCIAL STATEMENTS
(dollars in thousands, except share and per share amounts)
13. Subsequent Events
The Company has evaluated subsequent events through August 23, 2022, which is the date these condensed consolidated financial statements were available to be issued and determined that there have been no events that have occurred that would require adjustments to our disclosures in the consolidated financial statements except for the transaction described below.
On August 19, 2022, (the “Closing Date”), Social Capital Suvretta Holdings Corp. I, (“SCS”) consummated the previously announced merger pursuant to the Merger Agreement, dated January 26, 2022, by and among SCS, Akili Interactive Labs, Inc. (now Akili, Inc.) and Karibu Merger Sub, Inc.,
pursuant to which Karibu Merger Sub, Inc. merged with and into Akili Interactive Labs, Inc., with Akili Interactive Labs, Inc. becoming a wholly
owned subsidiary of Akili, Inc. (the “Business Combination”). Upon the closing of the Business Combination, SCS changed its name to Akili, Inc. In connection with the Business Combination, SCS completed the sale and issuance of 16,200,000 shares of Akili, Inc. common stock in a fully committed common stock private placement at a purchase price of $10.00 per share (“PIPE Shares”) for an aggregate purchase price of $162,000
(“PIPE Investment”). Gross proceeds from the Merger totaled approximately $164,283 which included funds held in SCS’s trust account (after giving effect to redemptions).
Transaction costs and other costs paid at Closing totaled
approximately $30,990.F-
57
Report of Independent Registered Public Accounting Firm
To the Stockholders and Board of Directors
Akili Interactive Labs, Inc.:
Opinion on the Consolidated Financial Statements
We have audited the accompanying consolidated balance sheets of Akili Interactive Labs, Inc. and subsidiary (the Company) as of December 31, 2021 and 2020, the related consolidated statements of operations and comprehensive loss, redeemable convertible preferred stock and stockholders’ deficit, and cash flows for the years then ended, and the related notes (collectively, the consolidated financial statements). In our opinion, the consolidated financial statements present fairly, in all material respects, the financial position of the Company as of December 31, 2021 and 2020, and the results of its operations and its cash flows for the years then ended, in conformity with U.S. generally accepted accounting principles.
Basis for Opinion
These consolidated financial statements are the responsibility of the Company’s management. Our responsibility is to express an opinion on these consolidated financial statements based on our audits. We are a public accounting firm registered with the Public Company Accounting Oversight Board (United States) (PCAOB) and are required to be independent with respect to the Company in accordance with the U.S. federal securities laws and the applicable rules and regulations of the Securities and Exchange Commission and the PCAOB.
We conducted our audits in accordance with the standards of the PCAOB and in accordance with auditing standards generally accepted in the United States of America. Those standards require that we plan and perform the audit to obtain reasonable assurance about whether the consolidated financial statements are free of material misstatement, whether due to error or fraud. Our audits included performing procedures to assess the risks of material misstatement of the consolidated financial statements, whether due to error or fraud, and performing procedures that respond to those risks. Such procedures included examining, on a test basis, evidence regarding the amounts and disclosures in the consolidated financial statements. Our audits also included evaluating the accounting principles used and significant estimates made by management, as well as evaluating the overall presentation of the consolidated financial statements. We believe that our audits provide a reasonable basis for our opinion.
/s/ KPMG LLP
We have served as the Company’s auditor since 2018.
Boston, Massachusetts
April 4, 2022
F-
58
AKILI INTERACTIVE LABS, INC. AND SUBSIDIARY
Consolidated Balance Sheets
(In thousands, except share and per share amounts)
December 31, | ||||||||
Assets | 2021 | 2020 | ||||||
| Current assets: | ||||||||
| Cash and cash equivalents | $ | 76,899 | $ | 18,528 | ||||
| Restricted cash | 305 | 305 | ||||||
| Accounts receivable | 29 | 8 | ||||||
| Prepaid expenses and other current assets | 2,500 | 314 | ||||||
Total current assets | 79,733 | 19,155 | ||||||
| Property and equipment, net | 1,193 | 1,004 | ||||||
| Deposits | — | 22 | ||||||
| Prepaid expenses and other long-term assets | 11 | — | ||||||
Total assets | $ | 80,937 | $ | 20,181 | ||||
Liabilities, redeemable convertible preferred stock and stockholders’ deficit | ||||||||
| Current liabilities: | ||||||||
| Note payable | $ | — | $ | 114 | ||||
| Accounts payable | 2,345 | 876 | ||||||
| Accrued expenses and other current liabilities | 5,477 | 2,445 | ||||||
| Deferred revenue | 96 | 369 | ||||||
| Deferred rent, short term | 123 | 121 | ||||||
Total current liabilities | 8,041 | 3,925 | ||||||
| Note payable, long term | 4,784 | 1,814 | ||||||
| Corporate bond, net of bond discount | 1,638 | 1,462 | ||||||
| Deferred rent, long term | 712 | 774 | ||||||
| Other long-term liabilities | — | 222 | ||||||
Total liabilities | 15,175 | 8,197 | ||||||
| Commitments and contingencies (Note 11) | 0 | 0 | ||||||
| Redeemable convertible preferred stock, $0.0001 par value—authorized 41,785,202 shares: | ||||||||
Series A-1: designated, 4,000,000 shares; issued and outstanding shares, 4,000,000 at December 31, 2021 and 2020 (liquidation value of $4,000 at December 31, 2021 and 2020) | — | — | ||||||
Series A-2: designated 4,427,072 shares; issued and outstanding shares, 4,427,072 at December 31, 2021 and 2020 (liquidation value of $8,832 at December 31, 2021 and 2020) | 7,128 | 7,128 | ||||||
| Series B: designated 7,341,485 shares; issued and outstanding shares, 7,341,485 at December 31, 2021 and 2020 (liquidation value of $42,360 at December 31, 2021 and 2020) | 41,854 | 41,854 | ||||||
| Series C: designated 8,016,645 shares; issued and outstanding shares, 8,016,645 at December 31, 2021 and 2020 (liquidation value of $68,200 at December 31, 2021 and 2020) | 67,904 | 67,904 | ||||||
| Series D: designated 18,000,000 shares; issued and outstanding shares, 13,843,858 at December 31, 2021 (liquidation value of $174,990 at December 31, 2021) | 174,990 | — | ||||||
| Stockholders’ deficit: | ||||||||
| Common shares, $0.0001 par value: 55,000,000 and 32,000,000 shares authorized at December 31, 2021 and 2020, respectively; 1,454,239 and 1,157,868 shares issued and outstanding at December 31, 2021 and 2020, respectively | — | — | ||||||
Additional paid-in capital | — | 9,905 | ||||||
| Accumulated deficit | (226,114 | ) | (114,807 | ) | ||||
Total stockholders’ deficit | (226,114 | ) | (104,902 | ) | ||||
Total liabilities, redeemable convertible preferred stock and stockholders’ deficit | $ | 80,937 | $ | 20,181 | ||||
The accompanying notes are an integral part of these consolidated financial statements.
F-
59
AKILI INTERACTIVE LABS, INC. AND SUBSIDIARY
Consolidated Statements of Operations and Comprehensive Loss
(In thousands, except share and per share amounts)
Years Ended December 31, | ||||||||
2021 | 2020 | |||||||
| Revenues | $ | 538 | $ | 3,939 | ||||
| Cost of revenues | 355 | 416 | ||||||
| Gross profit | 183 | 3,523 | ||||||
| Operating expenses: | ||||||||
| Research and development | 18,234 | 15,418 | ||||||
| Selling, general and administrative | 42,668 | 13,541 | ||||||
| Total operating expenses | 60,902 | 28,959 | ||||||
| Operating loss | (60,719 | ) | (25,436 | ) | ||||
| Other income (expense): | ||||||||
| Other income | 17 | 124 | ||||||
| Interest expense | (465 | ) | (333 | ) | ||||
| Loss on extinguishment of debt | (181 | ) | — | |||||
| Total other income (expense) | (629 | ) | (209 | ) | ||||
| Loss before income taxes | (61,348 | ) | (25,645 | ) | ||||
| Income tax expense | — | 1 | ||||||
| Net loss and comprehensive loss | $ | (61,348 | ) | $ | (25,646 | ) | ||
| Dividends on Series D convertible preferred stock | $ | (6,660 | ) | — | ||||
| Redemption value of Series D convertible preferred stock | (58,649 | ) | — | |||||
| Net loss attributable to common stockholders | $ | (126,657 | ) | $ | (25,646 | ) | ||
| Net loss per share: | ||||||||
| Basic and diluted | $ | (105.77 | ) | $ | (22.20 | ) | ||
| Weighted average common shares outstanding: | ||||||||
| Basic and diluted | 1,197,489 | 1,155,319 | ||||||
The accompanying notes are an integral part of these consolidated financial statements.
F-
60
AKILI INTERACTIVE LABS, INC. AND SUBSIDIARY
Consolidated Statements of Redeemable Convertible Preferred Stock and Stockholders’ Deficit
(In thousands, except unit amounts)
Series A-1 Redeemable Convertible Preferred Stock | Series A-2 Redeemable Convertible Preferred Stock | Series B Redeemable Convertible Preferred Stock | Series C Redeemable Convertible Preferred Stock | Series D Redeemable Convertible Preferred Stock | Common Stock | Additional Paid-in Capital | Accumulated Deficit | Total Stockholders’ Deficit | ||||||||||||||||||||||||||||||||||||||||||||||||||||
| Shares | Value | Shares | Value | Shares | Value | Shares | Value | Shares | Value | Shares | Value | |||||||||||||||||||||||||||||||||||||||||||||||||
Balance at December 31, 2019 | 4,000,000 | $ | — | 4,427,072 | $ | 7,128 | 7,341,485 | $ | 41,854 | 8,016,645 | $ | 67,904 | — | $ | — | 1,153,368 | $ | — | $ | 6,913 | $ | (89,161 | ) | $ | (82,248 | ) | ||||||||||||||||||||||||||||||||||
| Stock-based compensation expense | — | — | — | — | — | — | — | — | — | — | — | — | 2,898 | — | 2,898 | |||||||||||||||||||||||||||||||||||||||||||||
| Exercise of stock options | — | — | — | — | — | — | — | — | — | — | 4,500 | — | 19 | — | 19 | |||||||||||||||||||||||||||||||||||||||||||||
| Issuance of common stock warrants | — | — | — | — | — | — | — | — | — | — | — | — | 75 | — | 75 | |||||||||||||||||||||||||||||||||||||||||||||
| Net loss | — | — | — | — | — | — | — | — | — | — | — | — | — | (25,646 | ) | (25,646 | ) | |||||||||||||||||||||||||||||||||||||||||||
Balance at December 31, 2020 | 4,000,000 | $ | — | 4,427,072 | $ | 7,128 | 7,341,485 | $ | 41,854 | 8,016,645 | $ | 67,904 | — | $ | — | 1,157,868 | $ | — | $ | 9,905 | $ | (114,807 | ) | $ | (104,902 | ) | ||||||||||||||||||||||||||||||||||
| Stock-based compensation expense | — | — | — | — | — | — | — | — | — | — | — | — | 4,913 | — | 4,913 | |||||||||||||||||||||||||||||||||||||||||||||
| Exercise of stock options | — | — | — | — | — | — | — | — | — | — | 296,371 | — | 264 | — | 264 | |||||||||||||||||||||||||||||||||||||||||||||
| Issuance of common stock warrants | — | — | — | — | — | — | — | — | — | — | — | — | 268 | — | 268 | |||||||||||||||||||||||||||||||||||||||||||||
| Issuance of convertible preferred stock, net of issuance costs | — | — | — | — | — | — | — | — | 13,053,508 | 109,681 | — | — | — | — | — | |||||||||||||||||||||||||||||||||||||||||||||
| Stock divdend | — | — | — | — | — | — | — | — | 790,350 | 6,660 | — | — | (4,661 | ) | (1,999 | ) | (6,660 | ) | ||||||||||||||||||||||||||||||||||||||||||
| Redemption value | — | — | — | — | — | — | — | — | — | 58,649 | — | — | (10,689 | ) | (47,960 | ) | (58,649 | ) | ||||||||||||||||||||||||||||||||||||||||||
| Net loss | — | — | — | — | — | — | — | — | — | — | — | — | — | (61,348 | ) | (61,348 | ) | |||||||||||||||||||||||||||||||||||||||||||
Balance at December 31, 2021 | 4,000,000 | $ | — | 4,427,072 | $ | 7,128 | 7,341,485 | $ | 41,854 | 8,016,645 | $ | 67,904 | 13,843,858 | $ | 174,990 | 1,454,239 | $ | — | $ | — | $ | (226,114 | ) | $ | (226,114 | ) | ||||||||||||||||||||||||||||||||||
The accompanying notes are an integral part of these consolidated financial statements.
F-
61
AKILI INTERACTIVE LABS, INC. AND SUBSIDIARY
Consolidated Statements of Cash Flows
(In thousands)
Years Ended December 31, | ||||||||
2021 | 2020 | |||||||
| Cash flows from operating activities: | ||||||||
| Net loss | $ | (61,348 | ) | $ | (25,646 | ) | ||
| Adjustments to reconcile net loss to net cash used in operating activities: | ||||||||
| Depreciation and amortization of property and equipment | 279 | 300 | ||||||
| Stock-based compensation expense | 4,913 | 2,898 | ||||||
| Loss on disposal of fixed assets | 13 | 6 | ||||||
| Loss on extinguishment of debt | 181 | — | ||||||
| Non cash interest expense | 219 | 294 | ||||||
| Premium of end of term payment | — | 12 | ||||||
| Changes in operating assets and liabilities: | ||||||||
| Accounts receivable | (21 | ) | (8 | ) | ||||
| Prepaid expenses and other current assets | (2,186 | ) | 311 | |||||
| Deposits | 22 | — | ||||||
| Prepaid expenses and other long-term assets | (11 | ) | — | |||||
| Accounts payable | 1,480 | (38 | ) | |||||
| Accrued expenses and other current liabilities | 3,032 | 637 | ||||||
| Deferred rent, short term | 2 | — | ||||||
| Deferred rent and other long term liabilities | (284 | ) | 133 | |||||
| Deferred revenue | (273 | ) | (3,450 | ) | ||||
Net cash used in operating activities | (53,982 | ) | (24,551 | ) | ||||
Cash flows from investing activities: | ||||||||
| Acquisition of property and equipment | (65 | ) | (116 | ) | ||||
| Capitalized software development costs | (427 | ) | — | |||||
Net cash used in investing activities | (492 | ) | (116 | ) | ||||
Cash flows from financing activities: | ||||||||
| Proceeds from note payable | 5,000 | 2,000 | ||||||
| Proceeds from issuance of preferred stock, net issuance costs | 109,681 | — | ||||||
| Payment of debt issuance costs | (74 | ) | (21 | ) | ||||
| Payment of premium on note payable | (26 | ) | — | |||||
| Repayment of principal on note payable | (2,000 | ) | — | |||||
| Proceeds from exercise of stock options | 264 | 19 | ||||||
Net cash provided by financing activities | 112,845 | 1,998 | ||||||
Net increase (decrease) in cash, cash equivalents, and restricted cash | 58,371 | (22,669 | ) | |||||
| Cash, cash equivalents, and restricted cash at beginning of period | 18,833 | 41,502 | ||||||
| Cash, cash equivalents, and restricted cash at end of period | $ | 77,204 | $ | 18,833 | ||||
Supplementary Information: | ||||||||
| Cash paid for income taxes | $ | — | $ | 15 | ||||
| Cash paid for interest | 217 | 20 | ||||||
Noncash investing and financing activities: | ||||||||
| Purchase of property and equipment included in accounts payable and accrued expenses | 7 | 18 | ||||||
| Common stock warrants issued related to note payable | 268 | 75 | ||||||
| Redemption value of Series D preferred stock | 58,649 | — | ||||||
| Dividends accrued for Series D preferred stock | 6,660 | — | ||||||
The accompanying notes are an integral part of these consolidated financial statements.
F-
62
AKILI INTERACTIVE LABS, INC. AND SUBSIDIARY
NOTES TO THE CONSOLIDATED FINANCIAL STATEMENTS
(dollars in thousands, except share and per share amounts)
1. | Nature of the Business and Basis of Presentation |
Organization
Akili Interactive Labs, Inc. (collectively referred to with its wholly-owned, controlled subsidiary, Akili Securities Corporation as “Akili” or the “the Company”) was incorporated under the laws of the State of Delaware on December 1, 2011. The Company operates as one business segment and is developing a digital medicine platform for the treatment and assessment of cognitive dysfunction across several neurology and psychiatry indications, including attention-deficit hyperactivity disorder (“ADHD”), major depressive disorder, autism spectrum disorder, multiple sclerosis, and various neuroinflammatory diseases. In June 2020, the U.S. Food and Drug Administration (“FDA”) granted clearance for EndeavorRx as a prescription treatment for children with ADHD. The Company is headquartered in Boston, Massachusetts.
Going Concern
The Company is subject to risks common to companies in the biotechnology industry including, but not limited to, new technological innovations, protection of proprietary technology, dependence on key personnel, compliance with government regulations and the need to obtain additional financing. Product candidates currently under development will require significant additional research and development efforts, including extensive
pre-clinical
and clinical testing and regulatory approval, prior to commercialization. These efforts require significant amounts of additional capital, adequate personnel infrastructure and extensive compliance-reporting capabilities.Most of the Company’s product candidates are still in development. There can be no assurance that the Company’s research and development will be successfully completed; that adequate protection for the Company’s intellectual property will be obtained; that any products developed will obtain necessary government regulatory approval; or that any approved products will be commercially viable. Even if the Company’s product development efforts are successful, it is uncertain when, if ever, the Company will generate significant revenue from product sales. The Company operates in an environment of rapid change in technology and substantial competition from pharmaceutical and biotechnology companies. In addition, the Company is dependent upon the services of its employees and consultants.
The Company’s consolidated financial statements have been prepared on the basis of continuity of operations, realization of assets and the satisfaction of liabilities in the ordinary course of business. The Company has experienced negative operating cash flows for the year ended December 31, 2021 and had an accumulated deficit of $226,114 at December 31, 2021. The Company expects that its cash and cash equivalents at December 31, 2021 of $76,899, along with the $30,000 in available, undrawn debt through the SVB Amended and Restated Loan and Security Agreement, will enable it to fund the Company’s operating expense and capital expenditure requirements through at least April 2023. The future viability of the Company is dependent on its ability to generate cash from operating activities or to raise additional capital to finance its operations. The Company’s failure to raise capital as and when needed could have a negative impact on its financial condition and ability to pursue its business strategies.
COVID-19
Related Significant Risks and UncertaintiesThere continue to be uncertainties regarding the pandemic of the novel coronavirus, or
COVID-19,
and the Company is closely monitoring the impact ofCOVID-19
on all aspects of its business, including how it will impact its customers, employees, suppliers, vendors, and business partners. The Company is unable to predict the specific impact thatCOVID-19
may have on its financial position and operations moving forward due to theF-
63
AKILI INTERACTIVE LABS, INC. AND SUBSIDIARY
NOTES TO THE CONSOLIDATED FINANCIAL STATEMENTS
(dollars in thousands, except share and per share amounts)
numerous uncertainties. Any estimates made herein may change as new events occur and additional information is obtained, and actual results could differ materially from any estimates made herein under different assumptions or conditions. The Company will continue to assess the evolving impact of
COVID-19.
In response to the
COVID-19
pandemic, Congress passed the Coronavirus Aid, Relief and Economic Security Act of 2020, or the CARES Act, which was signed into law on March 27, 2020. The CARES Act provides for deferred payment of the employer portion of social security taxes through the end of 2020, with a portion of the deferred amount due by December 31, 2021, and the remaining amount due by December 31, 2022. During the year ended December 31, 2021, the Company deferred payments of $187 of social security taxes, which is included in accrued expenses and other current liabilities within the consolidated balance sheet as of December 31, 2021.Basis of Presentation
The accompanying consolidated financial statements have been prepared in conformity with accounting principles generally accepted in the United States of America (“GAAP”) and include the accounts of the Company, after elimination of all intercompany accounts and transactions.
2. | Summary of Significant Accounting Policies |
Use of estimates:
Cash and cash equivalents:
Restricted cash:
Concentration of credit risk and significant customers:
For the years ended December 31, 2021 and 2020, a single customer comprised 65.4% and 97.8% of the Company’s revenue, respectively (see Note 3).
Fair value of financial instruments:
instru
ments consist of cash equivalents, accounts payable, accrued expenses, a corporate bond, note payable and preferred shares. The carrying amount of accountsF-
64
AKILI INTERACTIVE LABS, INC. AND SUBSIDIARY
NOTES TO THE CONSOLIDATED FINANCIAL STATEMENTS
(dollars in thousands, except share and per share amounts)
payable and accrued expenses are considered a reasonable estimate of their fair value, due to the short-term maturity of these instruments. The Company’s cash equivalents are carried at fair value, determined according to the fair value hierarchy described below (see Note 10).
The Company follows the guidance in Financial Accounting Standards Board (FASB) Accounting Standards Codification (ASC) 820,or ASC 820, which defines fair value and establishes a fair value hierarchy that prioritizes the inputs to valuation techniques used to measure fair value. The hierarchy gives the highest priority to unadjusted quoted prices in active markets for identical assets or liabilities (Level 1 measurements) and the lowest priority to unobservable inputs (Level 3 measurements). The three levels of the fair value hierarchy are described below:
Fair Value Measurements and Disclosures,
Level 1: | Inputs are quoted prices (unadjusted) in active markets for identical assets or liabilities that the reporting entity has the ability to access at the measurement date. |
Level 2: | Valuations based on quoted prices in markets that are not active or for which all significant inputs are observable, either directly or indirectly. |
Level 3: | Prices or valuations that require inputs that are both significant to the fair value measurement and unobservable. |
To the extent that valuation is based on models or inputs that are less observable or unobservable in the market, the determination of fair value requires more judgment. Accordingly, the degree of judgment exercised by the Company in determining fair value is greatest for instruments categorized in Level 3. A financial instrument’s level within the fair value hierarchy is based on the lowest level of any input that is significant to the fair value measurement.
Fair value is a market-based measure considered from the perspective of a market participant rather than an entity-specific measure. Therefore, even when market assumptions are not readily available, the Company’s own assumptions are set to reflect those that market participants would use in pricing the asset or liability at the measurement date. The Company uses prices and inputs that are current as of the measurement date, including during periods of market dislocation. In periods of market dislocation, the observability of prices and inputs may be reduced for many instruments. This condition could cause an instrument to be reclassified from Level I to Level 2 or Level 2 to Level 3.
Property and equipment:
| Furniture and fixtures | 5-7 years | |
| Computer equipment and software | 3 years | |
| Office equipment | 3 years | |
| Leasehold improvements | 3-7 years (Or remaining term of the lease, if shorter) | |
Internal-use software | 2-5 years |
Depreciation methods, useful lives and residual values are reviewed at least annually and adjusted, if appropriate.
Impairment of long-lived assets:
F-
65
AKILI INTERACTIVE LABS, INC. AND SUBSIDIARY
NOTES TO THE CONSOLIDATED FINANCIAL STATEMENTS
(dollars in thousands, except share and per share amounts)
carrying amounts may not be recoverable. Recoverability of assets held and used is measured by comparison of the carrying amount of an asset or an asset group to estimated undiscounted future net cash flows expected to be generated by the asset or asset group. If the carrying amount of an asset exceeds these estimated future cash flows, an impairment charge is recognized by the amount by which the carrying amount of the assets exceeds the fair value of the asset or asset group, based on discounted cash flows. Management judgment is necessary to estimate the fair value of asset groups. Accordingly, actual results could vary significantly from such estimates. The Company has not identified any circumstances that would warrant an impairment charge for any long-lived assets on the consolidated balance sheet at December 31, 2021 or 2020.
Internal-use
software development costsFASB ASC 350-40, Internal-Use
Deferred revenue:
Deferred rent:
Redeemable convertible preferred stock:
Distinguishing Liabilities from Equity: Classification and Measurement of Redeemable Securities
A-1,
SeriesA-2,
Series B, and Series C and as such the Company does not accrete the redeemable convertible preferred stock to its redemption value. Because of the existence of a stated redemption feature based on the passage of time, the Company has elected an accounting policy to measure the Series D redeemable convertible preferred stock at current redemption value (see Note 8).Revenue from Contracts with Customers:
Revenue from Contracts with Customers
F-
66
AKILI INTERACTIVE LABS, INC. AND SUBSIDIARY
NOTES TO THE CONSOLIDATED FINANCIAL STATEMENTS
(dollars in thousands, except share and per share amounts)
The Company only applies the five-step analysis to contracts when it is probable that the entity will collect the consideration to which it is entitled in exchange for the goods or services it transfers to the customer. At contract inception, once the contract is determined to be within the scope of ASC 606, the Company assesses the goods or services promised within each contract, determines those that are performance obligations, and assesses whether each promised good or service is distinct. The Company then recognizes as revenue the amount of the transaction price that is allocated to the respective performance obligation when (or as) the performance obligation is satisfied.
The Company generates product revenue from contracts with caregivers and patients (“Clients”) who purchase three-month subscriptions to access the Company’s FDA-cleared video game. Clients are billed in advance for the entire subscription term. Along with the subscription to the video game product, the Clients also receive reporting metrics and technical support services. The subscription to the video game product, reporting metrics and technical support services are combined as a single stand-ready performance obligation because while the components are separate performance obligations, they have the same method and pattern of recognition. Accordingly, the purchase consideration is recognized ratably on an over time basis over the subscription period which begins once the access code is inputted into the game by the Client and game play has started.
The Company has generated revenue from a collaboration agreement with Shionogi. The consideration allocated to each performance obligation is recognized as revenue when control is transferred for the related goods or services. For performance obligations that consist of licenses and other promises, the Company applies judgment to assess the nature of the combined performance obligation to determine whether the combined performance obligation is satisfied over time or at a point in time and, if over time, the appropriate method of measuring progress. The Company evaluates the measure of progress each reporting period and, if necessary, adjusts the measure of performance and related revenue recognition. The Company has determined that the licenses and other promises under the Collaboration Agreement are a single combined performance obligation satisfied over time. The Company must select a single measure of progress that best depicts the Company’s measurement of progress.that appropriate methods of measuring progress include output methods and input methods and notes that an entity should consider the nature of the good or service that the entity promised to transfer to the customer in determining the appropriate method for measuring progress. Since activities performed to research and validate one phase may be useful in researching and validating subsequent phases, the Company believes that an input method, which tracks the Company’s efforts required to perform the contracted activities during the contract term, is more representationally faithful than an output method, which might track the agreed upon deliverables that are not similar to one another.
ASC 606-10-26-33 states
The following table presents the Company’s revenue by type:
Years Ended December 31, | ||||||||
2021 | 2020 | |||||||
| Product revenue | $ | 186 | $ | 12 | ||||
| Collaboration revenue | 352 | 3,927 | ||||||
| Total | $ | 538 | $ | 3,939 | ||||
The Company has a contract liability related to product and collaboration revenue, which consists of amounts that have been paid but have not been recognized as revenue. All amounts are expected to be recognized as revenue within 12 months of the balance sheet date and are classified as current deferred revenue. The Company
F-
67
AKILI INTERACTIVE LABS, INC. AND SUBSIDIARY
NOTES TO THE CONSOLIDATED FINANCIAL STATEMENTS
(dollars in thousands, except share and per share amounts)
recognized $17 and $352 of product and collaboration revenue, respectively, in the year ended December 31, 2021, that was previously included in the December 31, 2020 deferred revenue balance.
Contract Liabilities | Product | Collaboration | ||||||
| Balance at December 31, 2019 | $ | — | $ | 3,819 | ||||
| Revenue recognized | (12 | ) | (3,928 | ) | ||||
| Revenue deferred | 29 | 461 | ||||||
| Balance at December 31, 2020 | 17 | 352 | ||||||
| Revenue recognized | (186 | ) | (352 | ) | ||||
| Revenue deferred | 265 | — | ||||||
| Balance at December 31, 2021 | $ | 96 | $ | — | ||||
If an arrangement includes development and regulatory milestone payments or royalties, the Company evaluates whether the milestones or royalties are considered probable of being reached and estimates the amount to be included in the transaction price using the most likely amount method. If it is probable that a significant revenue reversal would not occur, the associated milestone or royalty value is included in the transaction price. Payments that are not within the Company’s control or the licensee’s control, such as regulatory approvals, are generally not considered probable of being achieved until those approvals are received. As the sales based royalties relate to a license of intellectual property, the Company recognizes revenue at the later of (i) when the related sales occur or (ii) when the performance obligation to which some or all of the royalty has been allocated has been satisfied or partially satisfied.
Cost of revenue:
Research and development costs:
non-related
entities to conduct research on behalf of the Company. The expenses incurred associated with these agreements are expensed as incurred within research and development costs.Advertising:
Accounting for stock-based compensation:
The Company classifies stock-based compensation expense in its consolidated statement of operations in the same manner in which the award recipient’s payroll costs are classified or in which the award recipients’ service payments are classified.
The Company recognizes adjustments to stock compensation expense for forfeitures as they occur. The fair value of each stock option grant is estimated on the date of grant using the Black- Scholes option-pricing model.
Income taxes:
F-
68
AKILI INTERACTIVE LABS, INC. AND SUBSIDIARY
NOTES TO THE CONSOLIDATED FINANCIAL STATEMENTS
(dollars in thousands, except share and per share amounts)
temporary differences reverse. A change in tax rates is recognized in income in the period of the enactment date. A valuation allowance against net deferred tax assets is required if, based upon the available evidence, it is more likely than not that some or all of the deferred tax assets will not be realized.
The Company also assesses the probability that the positions taken or expected to be taken in its income tax returns will be sustained by taxing authorities. A “more likely than not” (more than 50%) recognition threshold must be met before a tax benefit can be recognized. Tax positions that are more likely than not to be sustained on examination by the taxing authorities, based on the technical merits of the position, are reflected in the Company’s consolidated financial statements. Tax positions are measured as the largest amount of tax benefit that is greater than 50% likely of being realized upon settlement with a taxing authority that has full knowledge of all relevant information. The difference between the benefit recognized for a position and the tax benefit claimed on a tax return is referred to as an unrecognized tax benefit. Potential interest and penalties associated with such uncertain tax positions are recorded as a component of income tax expense.
Comprehensive Loss:
Net Loss Per Share:
two-class
method when computing net loss per share, or EPS, as the Company has issued shares that meet the definition of participating securities. Thetwo-class
method determines net loss per share for each class of common and participating securities according to dividends declared or accumulated and participation rights in undistributed earnings. Thetwo-class
method requires income available to common stockholders for the period to be allocated between common and participating securities based upon their respective rights to receive dividends as if all income for the period had been distributed.Basic net loss per share attributable to common stockholders is computed by dividing the net loss attributable to common stockholders by the weighted average number of common shares outstanding for the period. Diluted net loss attributable to common stockholders is computed by adjusting net loss attributable to common stockholders to reallocate undistributed earnings based on the potential impact of dilutive securities. Diluted net loss per share attributable to common stockholders is computed by dividing the diluted net loss attributable to common stockholders by the weighted average number of common shares outstanding for the period, including potential dilutive common shares assuming the dilutive effect of common stock equivalents.
The Company’s convertible preferred stock contractually entitles the holders of such shares to participate in dividends but does not contractually require the holders of such shares to participate in losses of the Company. Accordingly, in periods in which the Company reports a net loss, such losses are not allocated to such participating securities. In periods in which the Company reports a net loss attributable to common stockholders, diluted net loss per share attributable to common stockholders is the same as basic net loss per share attributable to common stockholders, since dilutive common shares are not assumed to have been issued if their effect is anti-dilutive. The Company reported a net loss attributable to common stockholders for the years ended December 31, 2021 and 2020.
Segment and Geographic Information:
Emerging Growth Company Status:
F-
69
AKILI INTERACTIVE LABS, INC. AND SUBSIDIARY
NOTES TO THE CONSOLIDATED FINANCIAL STATEMENTS
(dollars in thousands, except share and per share amounts)
new or revised accounting standards applicable to public companies until those standards would otherwise apply to private companies. The Company has elected to use this extended transition period under the JOBS Act until such time the Company is no longer considered to be an EGC, which means that when a standard is issued or revised, it has different applications for public or private companies, the Company will adopt the new or revised standard at the time private companies adopt the new or revised standard and will do so until such time that the Company either (i) irrevocably elect to
“opt-out”
of such extended transition period or (ii) no longer qualify as an EGC.Recently adopted accounting pronouncements:
2018-18,
Collaborative Arrangements (Topic 808): Clarifying the Interaction between Topic 808 and Topic 606
2018-18
provides guidance on how to assess whether certain transactions between collaborative participants should be accounted for in accordance with the guidance in ASC 606, Revenue from Contracts with Customers. The Company adopted this guidance, effective January 1, 2021. Its adoption did not have a material effect on the Company’s consolidated financial statements.In December 2019, the FASB issued ASU(“ASU
2019-12,
Income Taxes
(Topic 740): Simplifying the Accounting for Income Taxes
2019-12”).
ASU2019-12
is intended to simplify various areas related to accounting for income taxes. ASU2019-12
removes certain exceptions to the general principles in ASC 740 and also clarifies and amends existing guidance to improve consistent application. The Company adopted this guidance, effective January 1, 2021. Its adoption did not have a material effect on the Company’s consolidated financial statements.Recently issued accounting pronouncements:
No. 2016-02
(“ASU2016-02”),
Leases
2019-10
and ASU2020-05, which
supersedes the guidance in former ASC Topic 840,Leases
right-of-use
In June 2016, the FASB issued ASU No.(“ASUdebt securities, companies will be required to recognize an allowance for credit losses rather than reducing the carrying value of the asset. ASU
2016-13,
Measurement of Credit Losses on Financial Instruments
2016-13”),
as amended by ASU2019-10.
ASU2016-13
will change how companies account for credit losses for most financial assets and certain other instruments. For trade receivables, loans andheld-to-maturity
2016-13
is effective for the Company for the annual reporting period beginning January 1, 2023. The Company is currently evaluating the potential impact this standard may have on its consolidated financial statements and results of operations.3. | Option and Collaboration Agreements |
On December 19, 2018, the Company entered into an Option and Collaboration Agreement (the “Collaboration Agreement”) with Shionogi & Co., Ltd (“Shionogi”), whereby the Company granted an option to Shionogi to develop and commercialize licensed digital therapeutic software products in specified territories. The option was effective between December 19, 2018 and April 15, 2019 (“Option Period”). It was determined that this period was the initial term of the contract.
F-
70
AKILI INTERACTIVE LABS, INC. AND SUBSIDIARY
NOTES TO THE CONSOLIDATED FINANCIAL STATEMENTS
(dollars in thousands, except share and per share amounts)
As part of the agreement, Shionogi made an upfront payment to the Company of $10,000 at the date of execution that provided Shionogi up to April 15, 2019 to continue to evaluate the technology. In March 2019, Shionogi exercised its option to license the technology in exchange for another $10,000 cash payment. With the execution of the option, the Company is eligible to receive development and commercial milestones of up to $105,000. In addition, the Company will receive royalties on sales of the licensed products in Japan and Taiwan. The Company determined that the upfront, nonrefundable payment of $
10,000
made by Shionogi upon execution of the Collaboration Agreement represented fixed consideration as there were no contingencies which could potentially result in an adjustment to this amount. This amount was the only consideration to be received by the Company during the Option Period. The Company also determined that the license rights granted and any assistance provided by the Company to Shionogi in drafting a protocol of a clinical study during the Option Period represented immaterial performance obligations in relation to the technology transfer within the Collaboration Agreement. As such, the $10,000 payment was added to the $10,000 consideration the Company received from Shionogi upon the exercise of the option and is being recognized based on the delivery of the promised license rights, the language translation of the technology, supporting of Shionogi’s preparation of its clinical trial, and access to Shionogi’s clinical trial patients’ data subsequent to that exercise. The Company determined that the license is not distinct from the associated platform and clinical trial support services to be performed under the agreement. Specifically, the Company believes the license is not capable of being distinct, as Shionogi would not be able to obtain the benefit from the license without the associated support services. Without the support services, Shionogi did not have the know-how to prepare or deliver the licensed technology for use in clinical trials and no other third parties could perform such assistance due to the novel, early stage nature of the licensed product. In October 2019, the Company and Shionogi entered into a modification scope of work agreement. Shionogi paid the Company an additional fee of $387 as a result of the modification. The Company recognized revenue over time from this contract on an inputs-based method that uses a cost to cost measure of progress. For the years ended December 31, 2021 and 2020, the Company recognized approximately 1.5% and 15.9%, respectively, of the $24,192 total transaction price as summarized below. As of December 31, 2021 and 2020, deferred revenue related to the Collaboration Agreement was $0 and $352, respectively.The total transaction price of the Collaboration Agreement consisted of the following at December 31, 2021:
| Payment associated with option period | $ | 10,000 | ||
| Payment to exercise agreement | 10,000 | |||
| Discount on issuance on corporate bond (see Note 6) | 3,805 | |||
| Contract modification | 387 | |||
| Total transaction price | 24,192 | |||
| Less: Revenue recognized | (24,192 | ) | ||
| Deferred revenue at December 31, 2021 | $ | — | ||
In August 2021, the Company entered into an exclusive License, Development and Commercialization Agreement with TALi Digital Limited (“TALi”). Pursuant to the license agreement, TALi granted to the Company an exclusive right to develop, supply and commercialize certain products for use in pediatric ADHD, in the United States and its territories. Under the license agreement, the Company will reimburse TALi for certain direct out of pocket costs incurred conducting specified studies. Additionally, TALi is entitled to receive from the Company up to $2.0 million upon achievement of a specified development milestone and up to $35.5 million upon achievement of specified commercialization milestones, plus tiered royalties on the net sales of the licensed products. As of December 31, 2021, the Company has not made any payments for out of pocket costs, milestones or royalties.
F-
71
AKILI INTERACTIVE LABS, INC. AND SUBSIDIARY
NOTES TO THE CONSOLIDATED FINANCIAL STATEMENTS
(dollars in thousands, except share and per share amounts)
4. | Property and Equipment |
Property and equipment, net consisted of the following:
December 31, | ||||||||
2021 | 2020 | |||||||
| Furniture and fixtures | $ | 184 | $ | 184 | ||||
| Computer equipment and software | 443 | 390 | ||||||
| Office equipment | 60 | 60 | ||||||
| Leasehold improvements | 975 | 1,020 | ||||||
Capitalized internal-use software costs | 427 | — | ||||||
| Total property and equipment | 2,089 | 1,654 | ||||||
| Less: accumulated depreciation and amortization | (896 | ) | (650 | ) | ||||
| Property and equipment, net | $ | 1,193 | $ | 1,004 | ||||
Depreciation and amortization expense was $279 and $300 for the years ended December 31, 2021 and 2020, respectively.
5. | Accrued Expenses and Other Current Liabilities |
Accrued expenses and other current liabilities consisted of the following:
December 31, | ||||||||
2021 | 2020 | |||||||
| Accrued bonus | $ | 2,516 | $ | 1,715 | ||||
| Accrued royalties | 106 | 101 | ||||||
| Accrued wages and benefits | 421 | 287 | ||||||
| Accrued clinical study expenses | 363 | 9 | ||||||
| Accrued consulting service expenses | 766 | 100 | ||||||
| Other accrued expenses | 1,305 | 233 | ||||||
| Total | $ | 5,477 | $ | 2,445 | ||||
6. | Corporate Bond |
In March 2019, in connection with Shionogi exercising its option to enter into the Collaboration Agreement, the Company issued a $5,000 corporate bond to Shionogi for cash. The corporate bond is unsecured and is subordinated to the obligations of the Company under indebtedness for borrowed money owed by the Company to any bank or other financial institution. The maturity date of the corporate bond is November 10, 2031 and does not bear interest during its term (fixed interest rate of 0.0%). The corporate bond is prepayable by the Company at any time without penalty. The repayment of the corporate bond can be accelerated upon the termination of the Collaboration Agreement or upon the occurrence of an event of default (as defined), in both cases without penalty.
The Company determined that the interest rate on the corporate bond did not reflect a market interest rate that the Company would expect to incur on a similar instrument issued apart from the Collaboration Agreement. As such, the Company estimated the market rate of interest for a similar instrument (as 12.0%) and recorded a discount on the corporate bond at issuance in order to impute interest at this rate over the term of the instrument. The initial
F-
72
AKILI INTERACTIVE LABS, INC. AND SUBSIDIARY
NOTES TO THE CONSOLIDATED FINANCIAL STATEMENTS
(dollars in thousands, except share and per share amounts)
discount on the corporate bond was estimated to be $3,805. As the corporate bond was issued in connection with the Collaboration Agreement, the Company also added the estimated initial discount as a component of the transaction price (and an adjustment to revenue recognized) related to the Collaboration Agreement. The Company amortizes the initial discount to interest expense using the effective interest method over the term of the corporate bond.
The Company recognized amortization expense of $175 and $157 related to the discount on the corporate bond as a component of interest expense in the consolidated statements of operations and comprehensive loss for the years ended December 31, 2021 and 2020, respectively. At December 31, 2021 and 2020, the carrying amount of the corporate bond is as follows:
December 31, | ||||||||
2021 | 2020 | |||||||
| Corporate bond | 5,000 | $ | 5,000 | |||||
| Unamortized discount on corporate bond | (3,362 | ) | (3,538 | ) | ||||
| Corporate bond, net of discount | $ | 1,638 | $ | 1,462 | ||||
7. | Note Payable |
Amended and restated Loan and Security Agreement
On May 25, 2021, the Company entered into an Amended and Restated Loan and Security Agreement with Silicon Valley Bank (“SVB”) and SVB Innovation Credit Fund VIII, L.P. (“SVB Innovation Fund”) (collectively, the “Lenders”). On May 25, 2021, using the proceeds from the Amended and Restated Loan and Security Agreement, the Company paid SVB the then outstanding principal of $2,000 under the August 10, 2020 First Loan Modification Agreement with SVB (“First Loan Modification Agreement”). The Company recorded a loss on extinguishment of debt of $181 for the year ended December 31, 2021 related to unamortized debt issuance costs and fees paid on behalf of the Lenders.
The Amended and Restated Loan and Security Agreement allowed the Company to draw up to $50,000 in financing through three tranches. A total of $35,000 is available immediately in Tranche 1 and of that amount, a draw of $5,000 was mandatory upon the closing date. The remaining $30,000 of Tranche 1 is available at any time through June 30, 2022 (extended to September 30, 2022 if the aggregate original principal amount drawn prior to June 30, 2022 is equal to at least $15,000) and must be taken in minimum of $5,000 increments. The remaining two tranches are available subject to certain contingent events:
| • | Tranche 2—$5,000, is available following the achievement of a certain revenue milestone, the occurrence of which must be on or prior to December 31, 2022 or prior to an event of default. |
| • | Tranche 3—$10,000, is available based on the satisfaction of certain conditions, including a certain revenue milestone, and at sole discretion of the Lenders, the occurrence of which must be on or prior to December 31, 2022 or prior to an event of default. |
The Company borrowed $5,000 in May 2021 and will make interest-only payments through May 2023 before beginning to repay the outstanding principal in 24 equal monthly payments on the first day of each month beginning June 1, 2023, plus interest. The maturity date of the Amended and Restated Loan and Security Agreement is May 1, 2025. Upon achieving the Tranche 2 milestone, interest-only payments shall be extended by 12 months followed by 12 equal monthly payments of principal plus interest.
The Amended and Restated Loan and Security Agreement accrues interest on each advance at a per annum rate of the greater of (a) the Wall Street Journal prime rate plus 3.75% or (b) 7.0%. The Company can elect to prepay
F-
73
AKILI INTERACTIVE LABS, INC. AND SUBSIDIARY
NOTES TO THE CONSOLIDATED FINANCIAL STATEMENTS
(dollars in thousands, except share and per share amounts)
all, but not less than all, of the advances drawn prior to the maturity date. The Company will be required to pay a prepayment fee, calculated by multiplying the outstanding principal balance outstanding immediately prior to such prepayment by (a) 3.0%, if repaid on or prior to May 25, 2022, (b) 2.0%, if repaid after May 25, 2022, but on or prior to May 25, 2023, or (c) 1.0%, if repaid after May 25, 2023. The Company will be required to make a final payment equal to 5.0% of the total amounts drawn from each tranche (the “Final Payment”), due upon the earliest of maturity, prepayment or termination of the amounts drawn under the Amended and Restated Loan and Security Agreement.
The Loan and Security Agreement is secured by substantially all of the Company’s personal property assets, including accounts receivable, equipment, license agreements, general intangibles, inventory and investment property, and all of the proceeds and products of the foregoing. The Company is also subject to certain financial and
non-financial
covenants in the Loan and Security Agreement, including requirements to maintain operating and deposit accounts with the lender and restrictions on certain corporate actions.Upon closing of the Amended and Restated Loan and Security Agreement, the Company entered into warrant agreements with the Lenders (“Warrant Agreements”). As part of the Warrant Agreements, the Company issued fully-vested warrants to purchase 73,274 shares of common stock to the Lenders with an exercise price of $4.40 per share with a fair value of $268 on the date of issuance (see Note 9 for details). There are warrants to purchase an additional 122,122 shares that become available under the Warrant Agreements when aggregate term loan advances exceed $5,000. The additional shares to be issued are calculated by multiplying the 122,122 shares by the amount of term loan advances in excess of $5,000 and dividing the total by $45,000.
In relation to the entering into the Amended and Restated Loan and Security Agreement, the Company incurred a total of $559 of debt issuance costs (including the value of the warrants granted to the Lenders, plus the $250 Final Payment). The Company is amortizing the deferred issuance costs to interest expense on the effective interest method through the maturity date of the Amended and Restated Loan and Security Agreement. Interest expense related to debt issuance costs was $306 for the year ended December 31, 2021. The interest rate in effect as of December 31, 2021 was 7.0%. At December 31, 2021, the carrying amount of the note payable is as follows:
| Note payable | $ | 5,000 | ||
| Final Payment | 250 | |||
| Unamortized debt issuance costs | (466 | ) | ||
| Note payable, net of debt issuance costs | $ | 4,784 | ||
As of December 31, 2021, future annual principal payments due under the Amended and Restated Loan and Security Agreement, excluding the Final Payment, are as follows:
Years Ending December 31, | ||||
| 2022 | — | |||
| 2023 | $ | 1,250 | ||
| 2024 | 2,500 | |||
| 2025 | 1,250 | |||
| Total | $ | 5,000 | ||
8. | Redeemable Convertible Preferred Stock |
The Company has 41,785,202 shares of $.0001 par value redeemable convertible preferred stock authorized, of which 4,000,000 shares are designated as Series
A-1
redeemable convertible preferred stock (“SeriesA-1”),
F-
74
AKILI INTERACTIVE LABS, INC. AND SUBSIDIARY
NOTES TO THE CONSOLIDATED FINANCIAL STATEMENTS
(dollars in thousands, except share and per share amounts)
4,427,072 shares are designated as Series
A-2
redeemable convertible preferred stock (“SeriesA-2”),
7,341,485 shares are designated as Series B redeemable convertible preferred stock (“Series B”), 8,016,645 shares are designated as Series C redeemable convertible preferred stock (“Series C”), and 18,000,000 shares are designated as Series D redeemable convertible preferred stock (“Series D”). In May 2021, the Company issued 13,053,508 shares of Series D at a purchase price of $8.426854 per share in the initial closing for net proceeds of $109,681, after deducting issuance costs of $319.Terms of Redeemable Convertible Preferred Stock
A-1,
SeriesA-2,
Series B, Series C, and Series D redeemable convertible preferred stock (collectively the “Series Preferred”) have the following rights and preferences:Voting:
Dividends:
Cumulative dividends accrue on Series D at an annual rate of 10% and are paid annually in additional shares of Series D at the Series D purchase price. If not previously paid for, any partial period will convert or be paid, as applicable, in additional shares of Series D at the Series D purchase price upon a liquidation, dissolution, liquidation event, sale, winding up, redemption, conversion, SPAC merger, or initial public offering of the Common Stock. For any other dividends or distributions, participation with Common Stock on an
as-converted
basis. In accordance with the terms of the Series D issuance, the accrued stock dividends are automatically declared at the end of each fiscal year. Accordingly, a 2021 stock dividend of 790,350 Series D shares in the amount of $6,660 was declared on December 31, 2021.Liquidation preference:
winding-up
of the Company, each holder of a share of the Series D then outstanding is entitled to be paid out of the assets of the Company available for distribution before any payment shall be made to the holders of Series C, Series B, SeriesA-2,
or SeriesA-1
and common stock an amount equal to 150% of the original purchase price per share ($8.426854), plus any dividends declared, but unpaid thereon. From the remaining assets, Series C then outstanding is entitled to be paid out of the assets of the Company available for distribution before any payment shall be made to the holders of Series B, SeriesA-2
and SeriesA-1
and common stock an amount equal to $8.5073 per share, plus any dividends declared, but unpaid thereon. From the remaining assets, Series B, SeriesA-2,
and SeriesA-1
then outstanding is entitled to be paid out of the assets of the Company available for distribution before any payment shall be made to the holders of common stock an amount equal to $5.7699, $1.995 and $1.00 per share, respectively, plus any dividends declared, but unpaid thereon. Any remaining assets are to be distributed among the holders of the shares of Preferred Stock and common stock on apro-rata
basis.Conversion:
non-assessable
shares of common stock as determined by dividing the original issue price of each series of preferred stock by the conversion price of each series in effect at time of the conversion. The initial conversion price is the respective original issue price, subject to adjustment in accordance with the antidilution provisions of each series. The conversion prices of the SeriesA-1,
SeriesA-2,
Series B,F-
75
AKILI INTERACTIVE LABS, INC. AND SUBSIDIARY
NOTES TO THE CONSOLIDATED FINANCIAL STATEMENTS
(dollars in thousands, except share and per share amounts)
Series C and Series D redeemable convertible preferred stock is $1.00, $1.995, $5.7699, $8.5073, and $8.426854 respectively. Each Series Preferred will automatically be converted into one share of common stock at the then effective conversion rate in the event of either (i) a qualified initial public offering that results in minimum gross proceeds to the Company of $75 million and a price of at least $12.64035 per share, (ii) a merger, combination or transaction with a special purpose acquisition company resulting in $75 million of gross proceeds to the Company, or (iii) when voted upon by a majority of the then outstanding shares of the Preferred Stock. Any Series D accrued dividends shall automatically be converted into shares of common stock, at the then effective conversion rate, provided that each share of Series D shall be multiplied by 150% when calculating the number of shares of common stock to be received upon conversion. As of December 31, 2021, none of the outstanding shares of Series Preferred were converted into common stock.
Redemption:
opt-out.
This redemption feature is not solely within the control of the Company. The Series D shares are not currently redeemable, but it is probable that the Series D shares will become redeemable in the future and therefore the Company has elected an accounting policy to subsequently measure the preferred stock at current redemption value. The redemption value adjustment reduces additionalpaid-in
capital until the balance reaches zero, at which point, any remaining adjustment increases the accumulated deficit. All accumulated dividends were issued as of December 31, 2021 and the redemption value adjustment amounted to $58,649.The holders of the other series of preferred shares do not have the option to demand redemption except in the case of a liquidation or deemed liquidation event, nor does the Company have the right to call the shares. Any shares of preferred shares that are redeemed by the Company shall be automatically cancelled and retired and shall not be reissued, sold or transferred.
9. | Common Stock |
The holders of the common stock are entitled to one vote for each share of common stock. Subject to the payment in full of all preferential dividends to which the holders of the preferred stock are entitled, the holders of common stock shall be entitled to receive dividends out of funds legally available. In the event of any voluntary or involuntary liquidation, dissolution or winding up of the Company, after the payment or provision for payment of all debts and liabilities of the Company and all preferential amounts to which the holders of preferred stock are entitled with respect to the distribution of assets in liquidation, the holders of common stock shall be entitled to share ratably in the remaining assets of the Company available for distribution.
Common Stock Warrants:
815-40.
Upon initial issuance, the 15,624 vested warrants to purchase the Company’s common stock were recorded at fair value. The Company utilized the Black-Scholes option valuation approach to value the common warrants that were issued, resulting in anF-
76
AKILI INTERACTIVE LABS, INC. AND SUBSIDIARY
NOTES TO THE CONSOLIDATED FINANCIAL STATEMENTS
(dollars in thousands, except share and per share amounts)
estimated fair value of $75. The Company recorded this amount as an increase to additional paid in capital and an increase to debt issuance costs (see Note 7).
In May 2021, the Company entered into the Amended and Restated Loan and Security Agreement (see note 7). In conjunction with this modification, the Company issued warrants to the Lenders to purchase a total of 195,396 shares of common stock with an exercise price of $4.40 per share, of which, 73,274 were fully vested and immediately exercisable. These warrants were determined to be a separate freestanding instrument from the Amended and Restated Loan and Security Agreement. The Company also concluded that the remaining warrants that could vest in future periods in connection with additional loan advances will be treated as separate issuances if and when they are issued. The Company considered the accounting for the warrants and concluded that they met the requirements for equity classification under ASC
815-40.
Upon initial issuance, the 73,274 vested warrants to purchase the Company’s common stock were recorded at fair value. The Company utilized the Black-Scholes option valuation approach to value the common warrants that were issued, resulting in an estimated fair value of $268. The Company recorded this amount as an increase to additionalpaid-in
capital and an increase to debt issuance costs (see Note 7).The Company determined the fair value of the warrants using the Black-Scholes option model with the following assumptions:
First Loan Modification Agreement Warrants | ||||
| Fair value of common stock | $ | 6.84 | ||
| Expected volatility | 67.70 | % | ||
| Expected term (in years) | 9.95 | |||
| Risk-free interest rate | 0.72 | % | ||
| Expected dividend yield | 0.00 | % | ||
Amended and Restated Loan and Security Agreement Warrants | ||||
| Fair value of common stock | $ | 4.40 | ||
| Expected volatility | 95.00 | % | ||
| Expected term (in years) | 10.00 | |||
| Risk-free interest rate | 1.56 | % | ||
| Expected dividend yield | 0.00 | % |
2011 Stock Incentive Plan:
Options generally vest based on the grantee’s continued service with the Company during a specified period following a grant as determined by the Board of Directors and expire ten years from the grant date. In general, awards typically vest in four years but vesting conditions can vary based on the discretion of the Company’s
F-
77
AKILI INTERACTIVE LABS, INC. AND SUBSIDIARY
NOTES TO THE CONSOLIDATED FINANCIAL STATEMENTS
(dollars in thousands, except share and per share amounts)
Board of Directors. Stock-based compensation expense is classified in the consolidated statements of operations and comprehensive loss as follows:
Years Ended December 31, | ||||||||
2021 | 2020 | |||||||
| Research and development | $ | 1,340 | $ | 988 | ||||
| Selling, general and administrative | 3,573 | 1,910 | ||||||
| Total | $ | 4,913 | $ | 2,898 | ||||
A summary of the Company’s stock option activity and related information is as follows:
| Number of Options | Weighted- Average Exercise Price Per Share | Weighted- Average Remaining Contractual Term (Years) | Aggregate Intrinsic Value | |||||||||||||
| Balance, December 31, 2020 | 6,020,392 | $ | 4.53 | 7.25 | $ | 13,878 | ||||||||||
| Granted | 5,783,942 | $ | 4.40 | |||||||||||||
| Cancelled | (3,978,900 | ) | $ | 5.85 | ||||||||||||
| Exercised | (296,371 | ) | $ | 0.89 | ||||||||||||
| Balance, December 31, 2021 | 7,529,063 | $ | 3.89 | 7.28 | $ | 4,020 | ||||||||||
| Exercisable, December 31, 2021 | | 4,366,874 | | $ | 3.52 | 6.11 | $ | 4,020 | ||||||||
| Options vested and expected to vest, December 31, 2021 | 7,529,063 | $ | 3.89 | 7.28 | $ | 4,020 | ||||||||||
In August 2021, the Board of Directors of the Company approved the reduction in exercise price of certain stock options granted to 60 grantees during the period from April 2018 to December 2020, with original exercise prices ranging from $5.67 to $6.84. The exercise price for these stock options was reduced to $4.40 per share. Incremental compensation expense on the repricing date was $351. There were no changes in the vesting schedule or maturity term of these repriced stock options.
The fair value of all option activity was estimated at the date of grant using Black-Scholes with the following weighted-average assumptions:
Years Ended December 31, | ||||||||
2021 | 2020 | |||||||
| Fair value of common stock | $ | 4.40 | $ | 6.29 | ||||
| Expected volatility | 98.73 | % | 93.50 | % | ||||
| Expected term (in years) | 4.88 | 5.94 | ||||||
| Risk-free interest rate | 0.81 | % | 0.46 | % | ||||
| Expected dividend yield | 0.00 | % | 0.00 | % | ||||
Exercise price:
In determining the exercise prices for options granted, the Board of Directors has considered the fair value of the common stock as of each grant date. The fair value of the common stock underlying the stock options has been determined by the Board of Directors at each award grant date based upon a variety of factors, including the results obtained from independent third-party valuations, the Company’s financial position and historical financial performance, the status of technological developments within the Company’s products, the composition and ability of the current clinical and management team, an evaluation or benchmark of the
F-
78
AKILI INTERACTIVE LABS, INC. AND SUBSIDIARY
NOTES TO THE CONSOLIDATED FINANCIAL STATEMENTS
(dollars in thousands, except share and per share amounts)
Company’s competition, the current business climate in the marketplace, the illiquid nature of the common stock, arm’s length sales of the Company’s capital stock (including preferred stock), the effect of the rights and preferences of the preferred stockholders, and the prospects of a liquidity event, among others.
Expected volatility:
As the Company is a privately-owned company, there is not sufficient historical volatility for the expected term of the options. Therefore, the Company used an average historical share price volatility based on an analysis of reported data for a peer group of comparable companies, which were selected based upon industry similarities.
Expected term (in years):
Expected term represents the period that the Company’s share option grants are expected to be outstanding. There is not sufficient historical share exercise data to calculate the expected term of the options. Therefore, the Company utilizes the “simplified” method for all options granted to value share option grants. Under this approach, the weighted-average expected life is presumed to be the average of the vesting term and the contractual term of the option.
Risk-free interest rate:
The Company determined the risk-free interest rate by using a weighted-average equivalent to the expected term based on the U.S. Treasury yield curve in effect as of the date of grant.
Expected dividend yield:
The Company does not anticipate paying any dividends in the foreseeable future.
The weighted average grant-date fair value of stock options granted to employees during the years ended December 31, 2021 and 2020 was $3.39 and $4.71 per share, respectively.
During the years ended December 31, 2021 and 2020, the aggregate intrinsic value of stock option awards exercised was $1,040 and $12 respectively. Aggregate intrinsic value represents the difference between the exercise price and the fair value of the underlying common stock on the date of exercise.
As of December 31, 2021 there was $10,016 of unrecognized compensation cost related to unvested stock option grants to employees under the Plan, which is expected to be recognized over a weighted-average period of 2.6 years.
10. | Fair Value of Financial Assets and Liabilities |
The following table presents information about the Company’s assets and liabilities as of December 31, 2021 and 2020 that are measured at fair value on a recurring basis and indicates the level of the fair value hierarchy utilized to determine such fair values:
| Fair Value Measurements as of December 31, 2021 | ||||||||||||||||
| Description | Level 1 | Level 2 | Level 3 | Total | ||||||||||||
Assets | ||||||||||||||||
| Cash equivalents: | ||||||||||||||||
| Money market funds | $ | 61,510 | $ | 0— | $ | 0— | $ | 61,510 | ||||||||
| Fair Value Measurements as of December 31, 2020 | ||||||||||||||||
| Description | Level 1 | Level 2 | Level 3 | Total | ||||||||||||
Assets | ||||||||||||||||
| Cash equivalents: | ||||||||||||||||
| Money market funds | $ | 17,508 | $ | 0— | $ | 0— | $ | 17,508 | ||||||||
F-
79
AKILI INTERACTIVE LABS, INC. AND SUBSIDIARY
NOTES TO THE CONSOLIDATED FINANCIAL STATEMENTS
(dollars in thousands, except share and per share amounts)
The Company evaluates transfers between levels at the end of each reporting period. There were no transfers of financial instruments between levels during the years ended December 31, 2021 and 2020.
As of December 31, 2021 and 2020, the Company’s cash equivalents consisted of money market funds with original maturities of less than 90 days from the date of purchase. As of December 31, 2021 and 2020, the Company did 0t have any liabilities that are measured at fair value on a recurring basis.
11. | Commitments and Contingencies |
Litigation:
Leases:
non-cancelable
operating leases in two cities, Boston, Massachusetts, consisting of approximately 7,200 square feet that will expire in October 2022, and Larkspur, California consisting of approximately 43,600 square feet that will expire in November 2026.During the years ended December 31, 2021 and 2020, the Company recognized $1,116 and $915 of rent expense, respectively.
Future minimum annual lease payments for these operating leases as of December 31, 2021 are as follows:
| 2022 | $ | 1,118 | ||
| 2023 | 878 | |||
| 2024 | 914 | |||
| 2025 | 950 | |||
| 2026 | 904 | |||
| Total | $ | 4,764 | ||
12. | Income Taxes |
The provision for income taxes consists of the following components:
Years Ended December 31, | ||||||||
2021 | 2020 | |||||||
| Current | ||||||||
| Federal | $ | — | $ | — | ||||
| State | — | 1 | ||||||
| Total current expense (benefit) | — | 1 | ||||||
| Deferred | ||||||||
| Federal | — | — | ||||||
| State | — | — | ||||||
| Total deferred expense (benefit) | — | — | ||||||
| Total tax recognized | $ | — | $ | 1 | ||||
F-
80
AKILI INTERACTIVE LABS, INC. AND SUBSIDIARY
NOTES TO THE CONSOLIDATED FINANCIAL STATEMENTS
(dollars in thousands, except share and per share amounts)
A reconciliation setting forth the differences between effective tax rate of the Company as well as the U.S. federal statutory tax rate is as follows:
Years Ended December 31, | ||||||||
2021 | 2020 | |||||||
| Benefit at federal statutory rate | 21.00 | % | 21.00 | % | ||||
| State taxes | 3.41 | % | 2.70 | % | ||||
| Credits | 1.20 | % | 2.61 | % | ||||
| Share-based payment measurement | (0.57 | %) | (1.01 | %) | ||||
| Other | (1.90 | %) | 0.18 | % | ||||
| Change in valuation allowance | (23.14 | %) | (25.49 | %) | ||||
| Effective tax rate | 0.00 | % | (0.01 | %) | ||||
Significant components of the Company’s deferred tax assets and liabilities are as follows:
2021 | 2020 | |||||||
| Deferred tax assets: | ||||||||
| Operating tax losses | $ | 38,084 | $ | 26,016 | ||||
| Research credits | 5,920 | 4,810 | ||||||
| Temporary differences | 981 | 773 | ||||||
| Share based payments | 1,902 | 1,099 | ||||||
| Gross deferred tax assets | 46,887 | 32,698 | ||||||
| Valuation Allowance | (46,287 | ) | (32,090 | ) | ||||
| Deferred tax assets, Less: valuation allowance | 600 | 608 | ||||||
| Deferred tax liabilities: | ||||||||
| Other temporary differences | (600 | ) | (608 | ) | ||||
| Deferred tax liabilities | (600 | ) | (608 | ) | ||||
| Total | $ | — | $ | — | ||||
Deferred income taxes reflect the net tax effect of temporary differences between the carrying amount of assets and liabilities for financial reporting purposes and the amount used for income tax purposes. At December 31, 2021, the Company has federal net operating loss carryforwards totaling $161,416 of which $31,208 begin to expire in 2031 and $130,209 can be carried forward indefinitely. At December 31, 2021, the Company had state net operating loss carryforwards totaling $66,921, which begin to expire in 2031, as well as other temporary differences that will be available to offset regular taxable income during the carryforward period.
Additionally, at December 31, 2021, the Company has federal R&D credit carryforwards totaling $4,426 which begin to expire in 2039, state R&D credit carryforwards totaling $1,884 which begin to expire in 2033, and state investment tax credits of $7.
Management of the Company has evaluated the positive and negative evidence bearing upon the realizability of its deferred tax assets, which are comprised principally of net operating loss carryforwards and research and development credits. Under the applicable accounting standards, management has considered the Company’s history of losses and concluded that it is more likely than not that the Company will not recognize the benefits of
F-
81
AKILI INTERACTIVE LABS, INC. AND SUBSIDIARY
NOTES TO THE CONSOLIDATED FINANCIAL STATEMENTS
(dollars in thousands, except share and per share amounts)
domestic deferred tax assets. Accordingly, a full valuation allowance has been established at December 31, 2021 as the Company is in development stage and does not have assurance of future income as the Company expects to generate continued losses while in development.
Under the provisions of the Internal Revenue Code, the net operating loss and tax credit carryforwards are subject to review and possible adjustment by the Internal Revenue Service and state tax authorities. Net operating loss and tax credit carryforwards may become subject to an annual limitation in the event of certain cumulative changes in the ownership interest of significant shareholders over a three-year period in excess of 50%, as defined under Sections 382 and 383 of the Internal Revenue Code, respectively, as well as similar state provisions. This could limit the amount of tax attributes that can be utilized annually to offset future taxable income or tax liabilities. The amount of the annual limitation is determined based on the value of the Company immediately prior to the ownership change. Subsequent ownership changes may further affect the limitation in future years. The Company has completed financings since its inception which may have resulted in a change in control as defined by Section 382 and 383 of the Internal Revenue Code, and it may complete future financings that could result in a change in control in the future. The Company has not, as yet, conducted a study to determine if any such changes have occurred that could limit its ability to use the net operating loss and tax credit carryforward. Also, the Company has undertaken only a preliminary analysis of its research and experimentation credits. In order to substantiate fully such credits it intends to complete a full credit study before such credits are utilized on its tax return.
The Company accounts for uncertain tax positions pursuant to ASC 740 which prescribes a recognition threshold and measurement process for financial statement recognition of uncertain tax positions taken or expected to be taken in a tax return. If the tax position meets this threshold, the benefit to be recognized is measured as the largest amount of tax benefit that is greater than 50% likely of being realized upon settlement with a taxing authority that has full knowledge of all relevant information. As of December 31, 2021 and 2020, the Company has not recorded any unrecognized tax benefits. The Company has not, as yet, conducted a study of research and development tax credit carryforwards. This study may result in an adjustment to the Company’s research and development credit carryforwards; however, until a study is completed, and any adjustment is known, no amounts are being presented as an uncertain tax position. A full valuation allowance has been provided against the Company’s research and development tax credits and, if an adjustment is required, this adjustment would be offset by an adjustment to the valuation allowance. Thus, there would be no impact to the consolidated balance sheets or consolidated statement of operations and comprehensive loss if an adjustment was required. The Company does not expect any material changes in the unrecognized tax benefits within the next twelve months.
F-
82
AKILI INTERACTIVE LABS, INC. AND SUBSIDIARY
NOTES TO THE CONSOLIDATED FINANCIAL STATEMENTS
(dollars in thousands, except share and per share amounts)
13. | Net Loss Per Share |
The following table summarizes the computation of basic and diluted net loss per share attributable to common stockholders of the Company:
Years Ended December 31, | ||||||||
2021 | 2020 | |||||||
| Numerator: | ||||||||
| Net loss | $ | (61,348 | ) | $ | (25,646 | ) | ||
| Dividends on Series D convertible preferred stock | (6,660 | ) | — | |||||
| Redemption value of Series D convertible preferred stock | (58,649 | ) | — | |||||
| Net loss attributable to common stockholders—basic and diluted | $ | (126,657 | ) | $ | (25,646 | ) | ||
| Denominator: | ||||||||
| Weighted-average common stock outstanding | 1,197,489 | 1,155,319 | ||||||
| Net loss per share attributable to common stockholders—basic and diluted | $ | (105.77 | ) | $ | (22.20 | ) | ||
For periods in which the Company reports a net loss attributable to common stockholders, potentially dilutive securities have been excluded from the computation of diluted net loss per share as their effects would be anti-dilutive. Therefore, the weighted average number of common shares outstanding used to calculate both basic and diluted net loss per share attributable to common stockholders is the same. The Company excluded the following potential common shares, presented based on amounts outstanding at period end, from the computation of diluted net loss per share attributable to common stockholders because including them would have had an anti-dilutive effect:
Years Ended December 31, | ||||||||
2021 | 2020 | |||||||
Series A-1 convertible preferred stock (as converted to common stock) | 4,000,000 | 4,000,000 | ||||||
Series A-2 convertible preferred stock (as converted to common stock) | 4,427,072 | 4,427,072 | ||||||
| Series B convertible preferred stock (as converted to common stock) | 7,341,485 | 7,341,485 | ||||||
| Series C convertible preferred stock (as converted to common stock) | 8,016,645 | 8,016,645 | ||||||
| Series D convertible preferred stock (as converted to common stock) | 20,765,787 | — | ||||||
| Warrants to purchase common stock | 226,196 | 77,672 | ||||||
| Stock options to purchase common stock | 7,529,063 | 6,020,392 | ||||||
| Total | 52,306,248 | 29,883,266 | ||||||
F-
83
AKILI INTERACTIVE LABS, INC. AND SUBSIDIARY
NOTES TO THE CONSOLIDATED FINANCIAL STATEMENTS
(dollars in thousands, except share and per share amounts)
14. | Employee Benefit Plan |
The Company has a 401(k) retirement plan in which substantially all U.S. employees are eligible to participate. Eligible employees may elect to contribute up to the maximum limits, as set by the Internal Revenue Service, of their eligible compensation. The total contribution matching expense for the Company was $459 and $381 for the years ended December 31, 2021 and 2020, respectively.
15. | Subsequent Events |
The Company has evaluated subsequent events through April 4, 2022, which is the date these consolidated financial statements were available to be issued and determined that there have been no events that have occurred that would require adjustments to our disclosures in the consolidated financial statements except for the transactions described below.
Options Granted
Subsequent to December 31, 2021, there were a total of 1,334,379 options granted with a grant date fair value of $11.58 per share.
Business Combination Agreement and Plan of Merger
On January 26, 2022, the Company entered into an Agreement and Plan of Merger (the “Merger Agreement”) with Social Capital Suvretta Holdings Corp. I, (“SCS”) to affect a business combination between SCS and the Company with the Company surviving the merger as a wholly owned subsidiary of SCS. At the effective time of the Merger, each share of Akili Redeemable Convertible Preferred Stock and each share of Akili Common Stock will be converted into the right to receive such number of shares of SCS Class A Common Stock. The estimated combined enterprise value will be approximately $1.0 billion. The consummation of the proposed transaction is subject to the receipt of the requisite approval of the stockholders of each SCS and Akili and the fulfillment of certain other closing conditions.
F-
84
PART II: INFORMATION NOT REQUIRED IN PROSPECTUS
Item 13. | Other Expenses of Issuance and Distribution |
The following table sets forth the estimated expenses to be borne by the registrant in connection with the issuance and distribution of the shares of common stock being registered hereby.
SEC registration fee | $ | 38,395 | ||
Accounting fees and expenses | 55,810 | |||
Legal fees and expenses | 125,000 | |||
Financial printing and miscellaneous expenses | 125,000 | |||
Total | $ | 344,205 | ||
Item 14. | Indemnification of directors and officers. |
Subsection (a) of Section 145 of the General Corporation Law of the State of Delaware (the “DGCL”) empowers a corporation to indemnify any person who was or is a party or who is threatened to be made a party to any threatened, pending or completed action, suit or proceeding, whether civil, criminal, administrative or investigative (other than an action by or in the right of the corporation) by reason of the fact that the person is or was a director, officer, employee or agent of the corporation, or is or was serving at the request of the corporation as a director, officer, employee or agent of another corporation, partnership, joint venture, trust or other enterprise, against expenses (including attorneys’ fees), judgments, fines and amounts paid in settlement actually and reasonably incurred by the person in connection with such action, suit or proceeding if the person acted in good faith and in a manner the person reasonably believed to be in or not opposed to the best interests of the corporation, and, with respect to any criminal action or proceeding, had no reasonable cause to believe the person’s conduct was unlawful.
Subsection (b) of Section 145 empowers a corporation to indemnify any person who was or is a party or is threatened to be made a party to any threatened, pending or completed action or suit by or in the right of the corporation to procure a judgment in its favor by reason of the fact that the person acted in any of the capacities set forth above, against expenses (including attorneys’ fees) actually and reasonably incurred by the person in connection with the defense or settlement of such action or suit if the person acted in good faith and in a manner the person reasonably believed to be in or not opposed to the best interests of the corporation, except that no indemnification shall be made in respect of any claim, issue or matter as to which such person shall have been adjudged to be liable to the corporation unless and only to the extent that the Court of Chancery or the court in which such action or suit was brought shall determine upon application that, despite the adjudication of liability but in view of all the circumstances of the case, such person is fairly and reasonably entitled to indemnity for such expenses which the Court of Chancery or such other court shall deem proper.
Section 145 further provides that to the extent a director or officer of a corporation has been successful on the merits or otherwise in the defense of any action, suit or proceeding referred to in subsections (a) and (b) of Section 145, or in defense of any claim, issue or matter therein, such person shall be indemnified against expenses (including attorneys’ fees) actually and reasonably incurred by such person in connection therewith; that indemnification provided for by Section 145 shall not be deemed exclusive of any other rights to which the indemnified party may be entitled; and the indemnification provided for by Section 145 shall, unless otherwise provided when authorized or ratified, continue as to a person who has ceased to be a director, officer, employee or agent and shall inure to the benefit of such person’s heirs, executors and administrators. Section 145 also empowers the corporation to purchase and maintain insurance on behalf of any person who is or was a director, officer, employee or agent of the corporation, or is or was serving at the request of the corporation as a director, officer, employee or agent of another corporation, partnership, joint venture, trust or other enterprise against any
II-1
liability asserted against such person and incurred by such person in any such capacity, or arising out of his status as such, whether or not the corporation would have the power to indemnify such person against such liabilities under Section 145.
Section 102(b)(7) of the DGCL provides that a corporation’s certificate of incorporation may contain a provision eliminating or limiting the personal liability of a director to the corporation or its stockholders for monetary damages for breach of fiduciary duty as a director, provided that such provision shall not eliminate or limit the liability of a director (i) for any breach of the director’s duty of loyalty to the corporation or its stockholders, (ii) for acts or omissions not in good faith or which involve intentional misconduct or a knowing violation of law, (iii) under Section 174 of the DGCL, or (iv) for any transaction from which the director derived an improper personal benefit.
Additionally, our Certificate of Incorporation limits the liability of our directors to the fullest extent permitted by the DGCL, and our Bylaws provide that we will indemnify them to the fullest extent permitted by such law. We have entered into and expect to continue to enter into agreements to indemnify our directors, executive officers and other employees as determined by our board of directors. Under the terms of such indemnification agreements, we are required to indemnify each of our directors and officers, to the fullest extent permitted by the laws of the state of Delaware, if the basis of the indemnitee’s involvement was by reason of the fact that the indemnitee is or was our director or officer or was serving at our request in an official capacity for another entity. We must indemnify our officers and directors against all reasonable fees, expenses, charges and other costs of any type or nature whatsoever, including any and all expenses and obligations paid or incurred in connection with investigating, defending, being a witness in, participating in (including on appeal), or preparing to defend, be a witness or participate in any completed, actual, pending or threatened action, suit, claim or proceeding, whether civil, criminal, administrative or investigative, or establishing or enforcing a right to indemnification under the indemnification agreement. The indemnification agreements also require us, if so requested, to advance all fees, expenses and other costs that such director or officer incurred, provided that such person will return any such advance if it is ultimately determined that such person is not entitled to indemnification by us. Any claims for indemnification by our directors and officers may reduce our available funds to satisfy successful third-party claims against us and may reduce the amount of money available to us.
Item 15. | Recent Sales of Unregistered Securities. |
Since January 1, 2019, we have made sales of the following unregistered securities:
| • | Prior to SCS’s initial public offering, the Sponsor purchased 5,750,000 SCS Class B ordinary shares for an aggregate purchase price of $25,000. In June 2021, the Sponsor transferred 30,000 SCS Class B ordinary shares to Vladimir Coric (an independent director of SCS, and with the Sponsor, “SCS’s initial shareholders”). On June 29, 2021, SCS effected a share capitalization with respect to the SCS Class B ordinary shares of 575,000 shares thereof, resulting in SCS’s initial shareholders holding an aggregate of 6,325,000 founder shares (up to 825,000 of which were subject to forfeiture depending on the extent to which the underwriter’s over-allotment option in the initial public offering was exercised), resulting in an effective purchase price per SCS Class B ordinary share of approximately $0.004. As a result of the underwriters’ election to partially exercise their over-allotment option, a total of 750,000 SCS Class B ordinary shares are no longer subject to forfeiture and 75,000 SCS Class B ordinary shares were forfeited, resulting in an aggregate of 6,250,000 SCS Class B ordinary shares outstanding. |
| • | On July 2, 2021, SCS issued 640,000 SCS Class A ordinary shares, par value $0.0001 per share, to the Sponsor concurrently with the closing of SCS’s IPO for a total purchase price of $6,400,000; and |
| • | On August 19, 2022, we issued 16,200,000 shares of common stock to certain qualified institutional buyers and accredited investors that agreed to purchase such shares in connection with the Business Combination for aggregate consideration of $162,000,000. |
II-2
We issued the foregoing securities in transactions not involving an underwriter and not requiring registration under Section 5 of the Securities Act of 1933, as amended, in reliance on the exemption afforded by Section 4(a)(2) thereof.
Item 16. | Exhibits and Financial Statements Schedules. |
| (a) | Exhibits. |
II-3
II-4
| * | Filed herewith. |
| ** | To be filed, if necessary, subsequent to the effectiveness of this registration statement by an amendment to this registration statement or incorporated by reference pursuant to a Current Report on Form 8-K |
| + | Schedules and exhibits have been omitted pursuant to Item 601(b)(2) of Regulation S-K. |
| † | Portions of this exhibit (indicated by asterisks) have been omitted in accordance with Item 601(b)(10) of Regulation S-K. |
Item 17. | Undertakings. |
The undersigned registrant hereby undertakes:
| (1) | to file, during any period in which offers or sales are being made, a post-effective amendment to this registration statement: (i) to include any prospectus required by Section 10(a)(3) of the Securities Act of 1933, as amended (the “Securities Act”); (ii) to reflect in the prospectus any facts or events arising after the effective date of the registration statement (or the most recent post-effective amendment thereof) which, individually or in the aggregate, represent a fundamental change in the information set forth in the registration statement. Notwithstanding the foregoing, any increase or decrease in volume of securities offered (if the total dollar value of securities offered would not exceed that which was registered) and any |
II-5
| deviation from the low or high end of the estimated maximum offering range may be reflected in the form of prospectus filed with the Commission pursuant to Rule 424(b) if, in the aggregate, the changes in volume and price represent no more than a 20% change in the maximum aggregate offering price set forth in the “Calculation of Registration Fee” table in the effective registration statement; and (iii) to include any material information with respect to the plan of distribution not previously disclosed in the registration statement or any material change to such information in the registration statement; provided, however, that paragraphs (i), (ii) and (iii) do not apply if the registration statement is on Form S-1 and the information required to be included in a post-effective amendment by those paragraphs is contained in reports filed with or furnished to the Commission by the registrant pursuant to Section 13 or Section 15(d) of the Securities Exchange Act of 1934 that are incorporated by reference in the registration statement, or is contained in a form of prospectus filed pursuant to Rule 424(b) that is part of the registration statement; |
| (2) | that, for the purpose of determining any liability under the Securities Act, each such post-effective amendment shall be deemed to be a new registration statement relating to the securities offered therein, and the offering of such securities at that time shall be deemed to be the initial bona fide offering thereof; |
| (3) | to remove from registration by means of a post-effective amendment any of the securities being registered which remain unsold at the termination of the offering; |
| (4) | that, for the purpose of determining liability under the Securities Act to any purchaser: |
Each prospectus filed pursuant to Rule 424(b) as part of a registration statement relating to an offering, other than registration statements relying on Rule 430B or other than prospectuses filed in reliance on Rule 430A, shall be deemed to be part of and included in the registration statement as of the date it is first used after effectiveness.
Provided, however
| (5) | that, for the purpose of determining liability of the registrant under the Securities Act to any purchaser in the initial distribution of the securities, the undersigned registrant undertakes that in a primary offering of securities of the undersigned registrant pursuant to this registration statement, regardless of the underwriting method used to sell the securities to the purchaser, if the securities are offered or sold to such purchaser by means of any of the following communications, the undersigned registrant will be a seller to the purchaser and will be considered to offer or sell such securities to such purchaser: |
(a) any preliminary prospectus or prospectus of the undersigned registrant relating to the offering required to be filed pursuant to Rule 424;
(b) any free writing prospectus relating to the offering prepared by or on behalf of the undersigned registrant or used or referred to by the undersigned registrant;
(c) the portion of any other free writing prospectus relating to the offering containing material information about the undersigned registrant or its securities provided by or on behalf of an undersigned registrant; and
(d) any other communication that is an offer in the offering made by the undersigned registrant to the purchaser.
Insofar as indemnification for liabilities arising under the Securities Act of 1933 may be permitted to directors, officers, and controlling persons of the registrant pursuant to the foregoing provisions, or otherwise, the registrant has been advised that in the opinion of the Securities and Exchange Commission, such indemnification is against public policy as expressed in the Securities Act of 1933 and is, therefore, unenforceable. In the event that a claim
II-6
for indemnification against such liabilities (other than the payment by the registrant of expenses incurred or paid by a director, officer, or controlling person of the registrant in the successful defense of any action, suit, or proceeding) is asserted by such director, officer, or controlling person in connection with the securities being registered, the registrant will, unless in the opinion of its counsel the matter has been settled by controlling precedent, submit to a court of appropriate jurisdiction the question whether such indemnification by it is against public policy as expressed in the Securities Act of 1933 and will be governed by the final adjudication of such issue.
II-7
SIGNATURES
Pursuant to the requirements of the Securities Act, the registrant has duly caused this registration statement to be signed on its behalf by the undersigned, thereunto duly authorized, in Boston, Massachusetts, on the 23
rd
of August, 2022.Akili, Inc. | ||
| By: | /s/ W. Edward Martucci, Ph.D. | |
| Name: | W. Edward Martucci, Ph.D. | |
| Title: | Chief Executive Officer | |
Each person whose signature appears below constitutes and appoints each of W. Edward Martucci and Santosh Shanbhag, acting alone or together with anotheras his or her true and lawfuland agent, with full power of substitution and resubstitution, for such person and in his or her name, place and stead, in any and all capacities, to sign any or all further amendments (including post-effective amendments) to this registration statement (and any additional registration statement related hereto permitted by Rule 462(b) promulgated under the Securities Act (and all further amendments, including post-effective amendments, thereto)), and to file the same, with all exhibits thereto, and other documents in connection therewith, with the SEC, granting unto saidand agents, and each of them, full power and authority to do and perform each and every act and thing requisite and necessary to be done in and about the premises, as fully to all intents and purposes as he might or could do in person, hereby ratifying and confirming all that saidand agent, or his or her substitute or substitutes, may lawfully do or cause to be done by virtue hereof.
attorney-in-fact,
attorney-in-fact
attorneys-in-fact
attorney-in-fact
Pursuant to the requirements of the Securities Act, this registration statement has been signed by the following persons in the capacities and on the dates indicated:
Signature | Title | Date | ||
| /s/ W. Edward Martucci, Ph.D. | Chief Executive Officer and Director | August 23, 2022 | ||
| W. Edward Martucci, Ph.D. | (Principal Executive Officer) | |||
| /s/ Santosh Shanbhag | Chief Financial Officer | August 23, 2022 | ||
| Santosh Shanbhag | (Principal Financial Officer and Principal Accounting Officer) | |||
| /s/ Chamath Palihapitiya | Chairman and Director | August 23, 2022 | ||
| Chamath Palihapitiya | ||||
| /s/ Bharatt Chowrira, Ph.D. | Director | August 23, 2022 | ||
| Bharatt Chowrira, Ph.D. | ||||
| /s/ Kenneth Ehlert | Director | August 23, 2022 | ||
| Kenneth Ehlert | ||||
| /s/ Adam Gazzaley, M.D., Ph.D. | Director | August 23, 2022 | ||
| Adam Gazzaley, M.D., Ph.D. | ||||
| /s/ William Jones, Jr. | Director | August 23, 2022 | ||
| William Jones, Jr. | ||||
| /s/ Christine Lemke | Director | August 23, 2022 | ||
| Christine Lemke | ||||
II-8