Exhibit 99.1 Investor Presentation SEPTEMBER 2021 2021 ZETA GLOBAL – PROPRIETARY & CONFIDENTIAL
Safe Harbor This presentation has been prepared by Zeta Global Holdings Corp. and its subsidiaries (together, the “Company”, “Zeta”, or “we”) and is made for informational purposes only. The information set forth herein does not purport to be complete or to contain all of the information you may desire. You must evaluate, and bear all risks associated with, the use of any information provided hereunder, including any reliance on the accuracy, completeness, safety or usefulness of such information. This information is not intended to be used as the primary basis of investment decisions. It should not be construed as advice designed to meet the particular investment needs of any investor. Statements contained herein are made as of the date of this presentation unless stated otherwise, and this presentation shall not under any circumstances create an implication that the information contained herein is correct as of any time after such date or that information will be updated or revised to reflect information that subsequently becomes available or changes occurring after the date hereof. You should read the prospectus in the Registration Statement (No. 333-255499) and the other documents that the Company has filed with the SEC for more information about the Company. You can obtain these documents for free by visiting EDGAR on the SEC website at www.sec.gov. This presentation shall not constitute an offer to sell or the solicitation of an offer to buy any securities, nor shall there be any sale of securities in any state or jurisdiction in which such offer, solicitation or sale would be unlawful prior to registration or qualification under the securities laws of such state or jurisdiction. This presentation contains forward-looking statements within the meaning of Section 27A of the Securities Act of 1933, as amended, and Section 21E of the Securities Exchange Act of 1934, as amended. The Company intends such forward-looking statements to be covered by the safe harbor provisions for forward-looking statements contained in the Private Securities Litigation Reform Act of 1995 and includes this statement for purposes of complying with these safe harbor provisions. Any statements made in this presentation that are not statements of historical fact, including statements about the Company’s beliefs and expectations, are forward-looking statements and should be evaluated as such. Forward-looking statements include information concerning possible or assumed future results of operations, including descriptions of our business plan and strategies. These statements often include words such as “anticipate,” “expect,” “suggests,” “plan,” “believe,” “intend,” “estimates,” “targets,” “projects,” “should,” “could,” “would,” “may,” “will,” “forecast” and other similar expressions. The Company bases these forward-looking statements on its current expectations, plans and assumptions that the Company has made in light of its experience in the industry, as well as its perceptions of historical trends, current conditions, expected future developments and other factors the Company believes are appropriate under the circumstances at such time. As you read and consider this presentation, you should understand that these statements are not guarantees of future performance or results. The forward-looking statements are subject to and involve risks, uncertainties and assumptions, and you should not place undue reliance on these forward-looking statements. Although the Company believes that these forward-looking statements are based on reasonable assumptions at the time they are made, you should be aware that many factors could affect the Company’s actual results or results of operations and could cause actual results to differ materially from those expressed in the forward- looking statements. The Company undertakes no obligation to update or revise any forward-looking statements, whether as a result of new information, future events or otherwise, except as required by applicable law. All future written and oral forward-looking statements made in connection with this presentation attributable to the Company or persons acting on the Company’s behalf are expressly qualified in their entirety by this paragraph. This presentation contains non-GAAP financial measures such as adjusted EBITDA and adjusted EBITDA margin. These measures are not prepared in accordance with generally accepted accounting principles in the United States of America (“GAAP”) and have important limitations as analytical tools. Non-GAAP financial measures are supplemental, should only be used in conjunction with results presented in accordance with GAAP and should not be considered in isolation or as a substitute for such GAAP results. Refer to the Appendix of this presentation for a reconciliation of the non-GAAP financial measures to the most directly comparable financial measures calculated and presented in accordance with GAAP. Any third-party trademarks, including names, logos and brands, referenced by the Company in this presentation are property of their respective owners. All references to third-party trademarks are for identification purposes only and shall be considered nominative fair use under trademark law. The contents and appearance of this report is copyrighted and the trademarks and service marks are owned by Zeta Global Corp. All rights reserved. 2

Chris Greiner Chief Financial Officer 3

DAVID A. JOHN STEINBERG SCULLEY Co-Founder Co-Founder Chairman CEO 4 2021 ZETA GLOBAL – PROPRIETARY & CONFIDENTIAL 4

What We Do: Zeta’s Marketing Platform Empowers Enterprises to Deliver Better Experiences for Consumers and Higher ROI for Marketers. Patented Software & AI Proprietary Data Cloud Omnichannel Marketing 2021 ZETA – 20 P2 R1 OZET PRIETA A GLO RY BA & L CO –N P F R ID OEN PRTI IETA AL R | ZET Y & A CO GLO NFBA IDEN L.CO TIA M L 5 5

Who Chooses Us 1 34% of the Fortune 100 Leverage Zeta’s Marketing Platform Blue chip customer base With leading technology across multiple industries recognized by the experts 8 out of the 10 7 of the 10 largest 4 of the 6 largest largest credit card issuers auto insurance automotive in the US companies in the manufacturers in US LEADER VISIONARY the world 1 3 Email Service in Magic Quadrant Platforms Digital Marketing Hubs 3 of the 5 largest 4 of the 10 largest 3 of the 6 paid TV companies hospitality largest QSR RECOGNIZED in the US companies in companies the world in the US 2 Enterprise Marketing Software Providers 2 Cross-Channel 2 of the 4 largest 4 of the 5 largest The 3 largest Management meal delivery gig drug store chains banks in the US economy companies in the US 1. Awarded in 2020 2. Awarded in 2019 3. Awarded in 2017 in the US 1. As of 12/31/2020 6
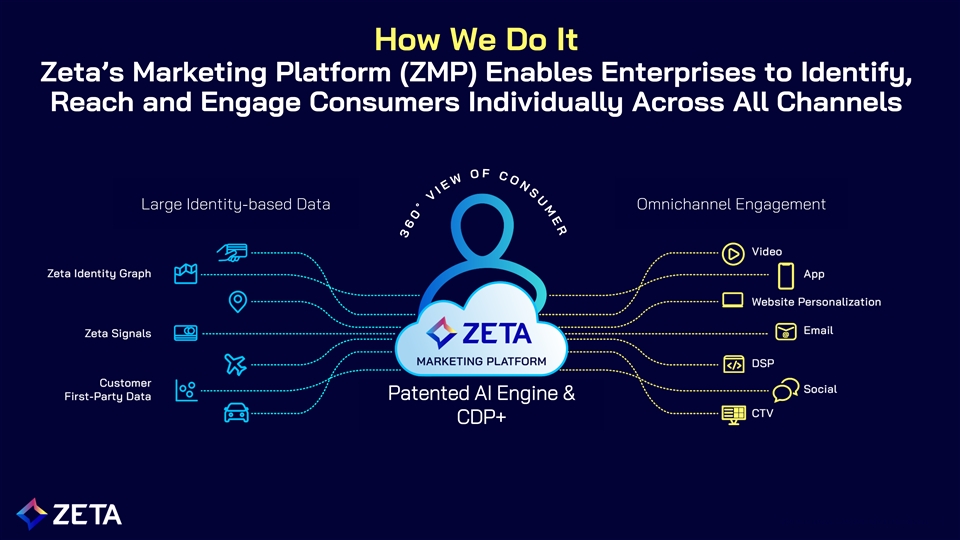
How We Do It Zeta’s Marketing Platform (ZMP) Enables Enterprises to Identify, Reach and Engage Consumers Individually Across All Channels Large Identity-based Data Omnichannel Engagement Patented AI Engine & CDP+ 2021 ZETA GLOBAL – PROPRIETARY & CONFIDENTIAL 7
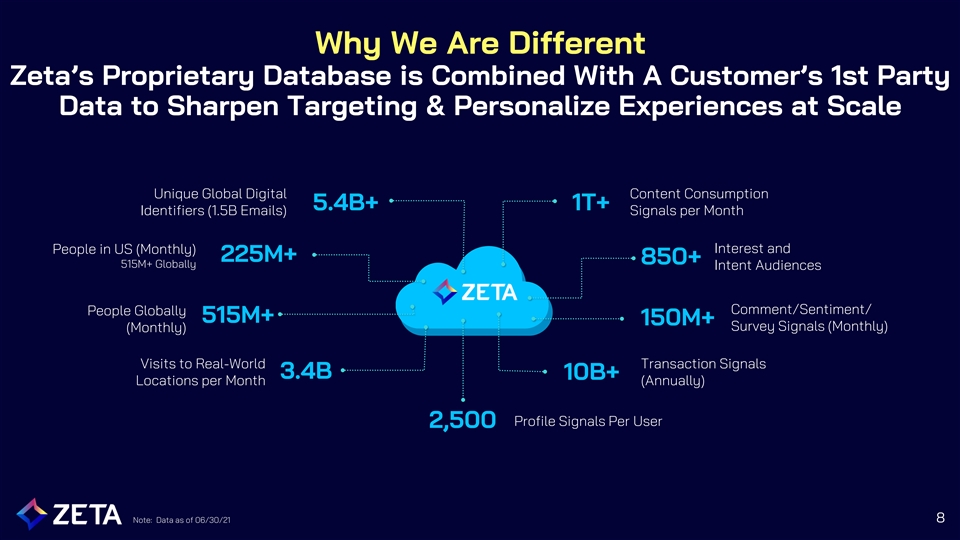
Why We Are Different Zeta’s Proprietary Database is Combined With A Customer’s 1st Party Data to Sharpen Targeting & Personalize Experiences at Scale Unique Global Digital Content Consumption 5.4B+ 1T+ Identifiers (1.5B Emails) Signals per Month Interest and People in US (Monthly) 225M+ 850+ 515M+ Globally Intent Audiences Comment/Sentiment/ People Globally 515M+ 150M+ Survey Signals (Monthly) (Monthly) Visits to Real-World Transaction Signals 3.4B 10B+ Locations per Month (Annually) Profile Signals Per User 2,500 8 Note: Data as of 06/30/21
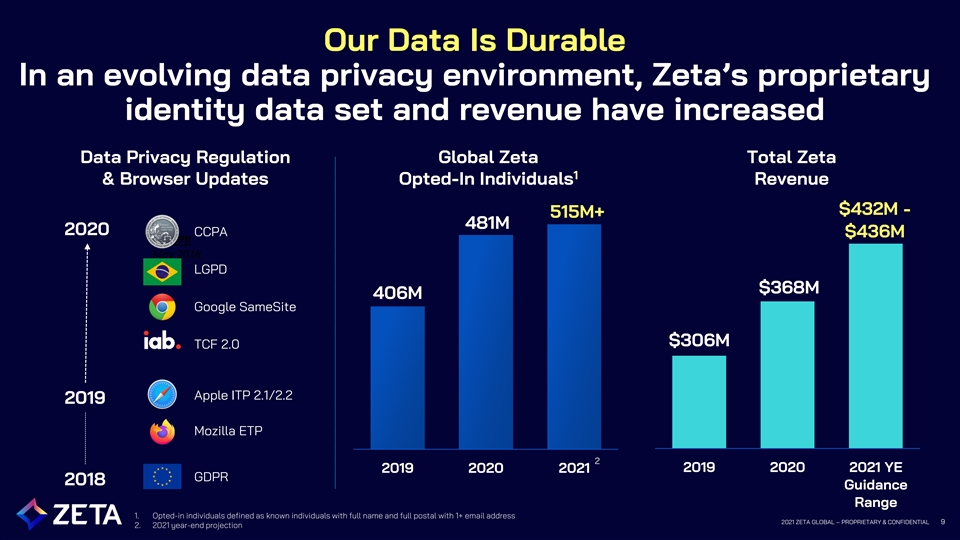
Our Data Is Durable In an evolving data privacy environment, Zeta’s proprietary identity data set and revenue have increased Data Privacy Regulation Global Zeta Total Zeta 1 & Browser Updates Opted-In Individuals Revenue $432M - 515M+ 481M 2020 CCPA $436M GDPR May 2018 LGPD $368M 406M Google SameSite $306M TCF 2.0 Apple ITP 2.1/2.2 2019 Mozilla ETP 2 2019 2020 2021 YE 2019 2020 2021 GDPR 2018 Guidance Range 1. Opted-in individuals defined as known individuals with full name and full postal with 1+ email address 2021 ZETA GLOBAL – PROPRIETARY & CONFIDENTIAL 9 2. 2021 year-end projection
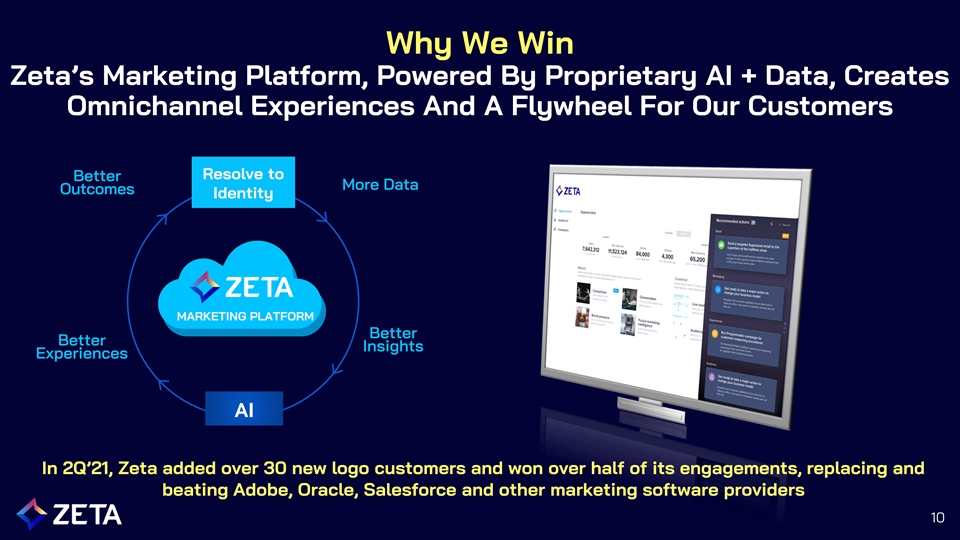
Why We Win Zeta’s Marketing Platform, Powered By Proprietary AI + Data, Creates Omnichannel Experiences And A Flywheel For Our Customers Resolve to Better More Data Outcomes Identity MARKETING PLATFORM Better Better Insights Experiences AI In 2Q’21, Zeta added over 30 new logo customers and won over half of its engagements, replacing and beating Adobe, Oracle, Salesforce and other marketing software providers 10
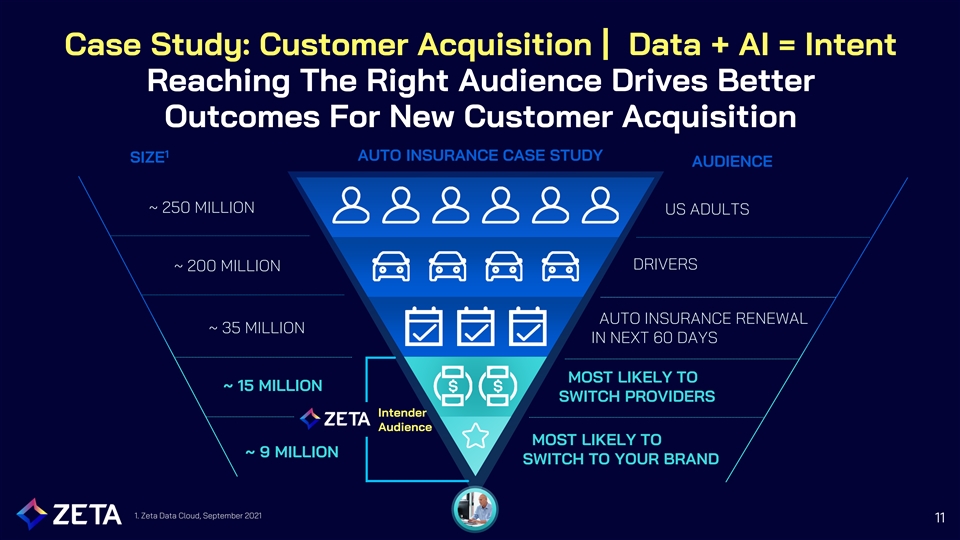
Case Study: Customer Acquisition | Data + AI = Intent Reaching The Right Audience Drives Better Outcomes For New Customer Acquisition 1 AUTO INSURANCE CASE STUDY SIZE AUDIENCE ~ 250 MILLION US ADULTS DRIVERS ~ 200 MILLION AUTO INSURANCE RENEWAL ~ 35 MILLION IN NEXT 60 DAYS MOST LIKELY TO ~ 15 MILLION SWITCH PROVIDERS Intender Audience MOST LIKELY TO ~ 9 MILLION SWITCH TO YOUR BRAND 1. Zeta Data Cloud, September 2021 11

ZMP Helps Customers Realize Strong ROI CASE STUDY: As Their Success On the Platform Takes Hold, ACQUIRE Insurance Customer Zeta's Revenue Scales With Them CAC AI and ML leads to significantly improving efficiency and customer outcomes $7,000,000 1 Minimum commitments steadily increase, incremental platform utilization scales 2 $6,000,000 CROSS-SELL OPPORTUNITY: New use cases (Grow, Retain), new channels (Activation) 3 CAC $5,000,000 CAC = Customer’s target CAC KPI CAC 200% reduction in Year 1 300% CAC reduction Year 1 to Year 3 $4,000,000 $3,000,000 $2,000,000 $1,000,000 $- Q1 '18 Q2 '18 Q3 '18 Q4 '18 Q1 '19 Q2 '19 Q3 '19 Q4 '19 Q1 '20 Q2 '20 Q3 '20 Q4 '20 Minimum Commitment Revenue (Recurring) Incremental Utilization Revenue (Re-occurring) Customer Outcomes New Customer Policies 12
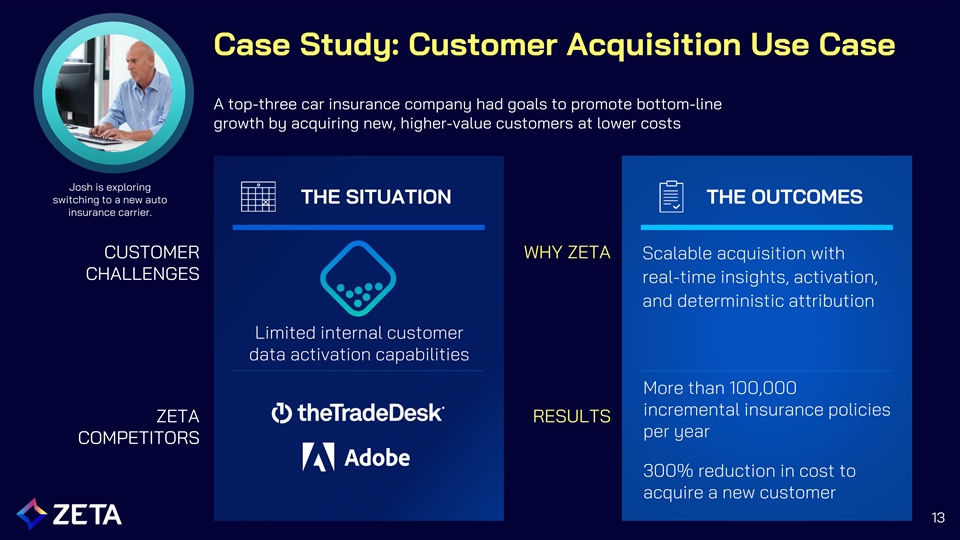
Case Study: Customer Acquisition Use Case A top-three car insurance company had goals to promote bottom-line growth by acquiring new, higher-value customers at lower costs Josh is exploring switching to a new auto THE SITUATION THE OUTCOMES insurance carrier. CUSTOMER WHY ZETA Scalable acquisition with CHALLENGES real-time insights, activation, and deterministic attribution Limited internal customer data activation capabilities More than 100,000 incremental insurance policies ZETA RESULTS per year COMPETITORS 300% reduction in cost to acquire a new customer 13
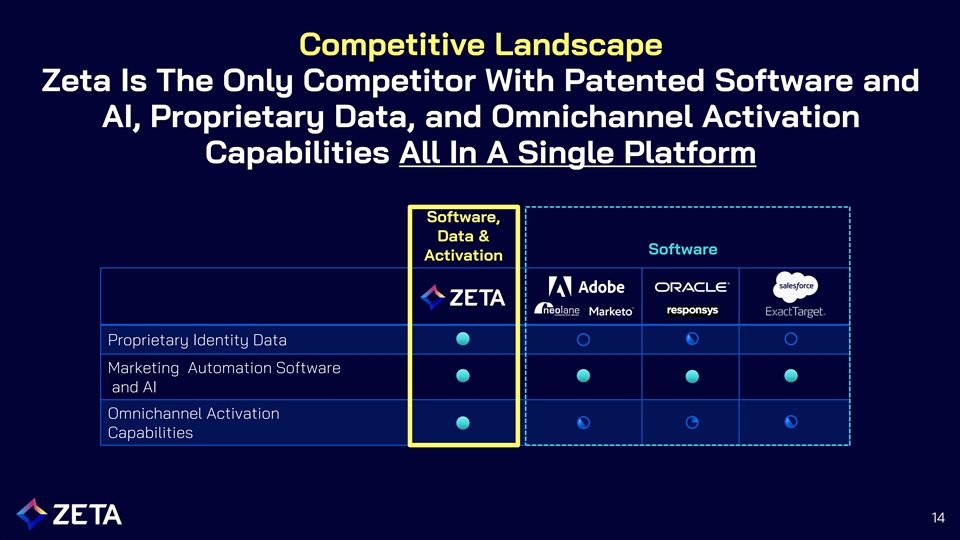
Competitive Landscape Zeta Is The Only Competitor With Patented Software and AI, Proprietary Data, and Omnichannel Activation Capabilities All In A Single Platform Software, Data & Software Activation Proprietary Identity Data Marketing Automation Software and AI Omnichannel Activation Capabilities 14

Business Model and Financial Overview 15
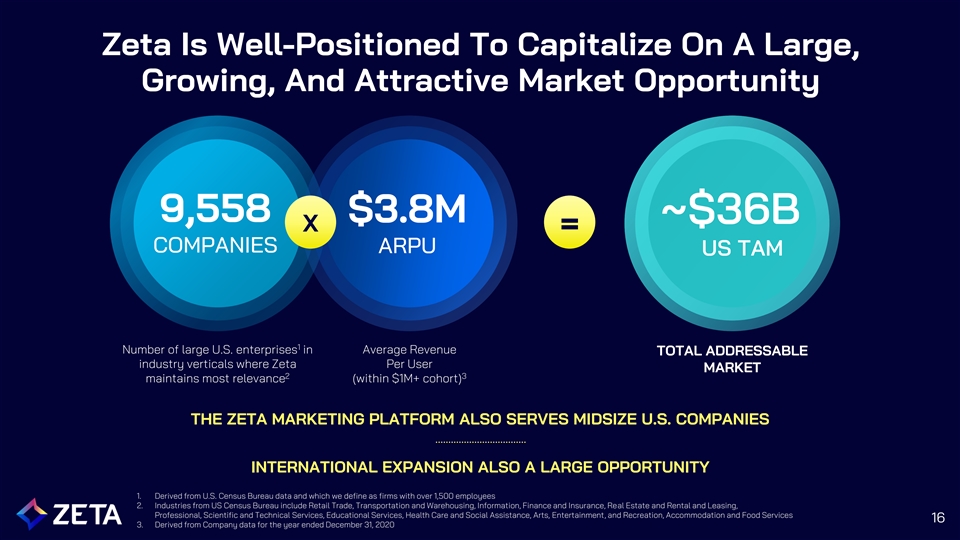
Zeta Is Well-Positioned To Capitalize On A Large, Growing, And Attractive Market Opportunity 9,558 $3.8M ~$36B X = COMPANIES ARPU US TAM 1 Number of large U.S. enterprises in Average Revenue TOTAL ADDRESSABLE industry verticals where Zeta Per User MARKET 2 3 maintains most relevance (within $1M+ cohort) THE ZETA MARKETING PLATFORM ALSO SERVES MIDSIZE U.S. COMPANIES INTERNATIONAL EXPANSION ALSO A LARGE OPPORTUNITY 1. Derived from U.S. Census Bureau data and which we define as firms with over 1,500 employees 2. Industries from US Census Bureau include Retail Trade, Transportation and Warehousing, Information, Finance and Insurance, Real Estate and Rental and Leasing, Professional, Scientific and Technical Services, Educational Services, Health Care and Social Assistance, Arts, Entertainment, and Recreation, Accommodation and Food Services 16 3. Derived from Company data for the year ended December 31, 2020
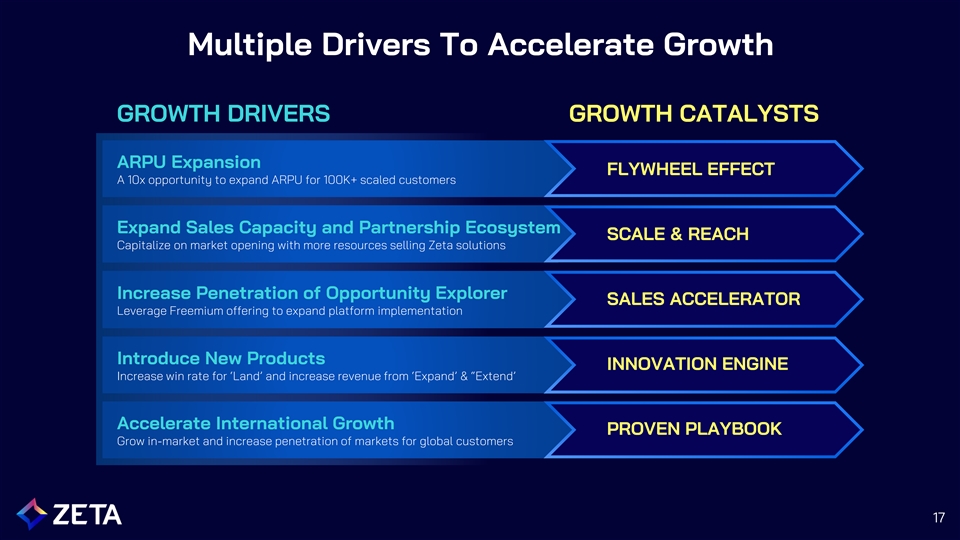
Multiple Drivers To Accelerate Growth GROWTH DRIVERS GROWTH CATALYSTS ARPU Expansion FLYWHEEL EFFECT A 10x opportunity to expand ARPU for 100K+ scaled customers Expand Sales Capacity and Partnership Ecosystem SCALE & REACH Capitalize on market opening with more resources selling Zeta solutions Increase Penetration of Opportunity Explorer SALES ACCELERATOR Leverage Freemium offering to expand platform implementation Introduce New Products INNOVATION ENGINE Increase win rate for ‘Land’ and increase revenue from ‘Expand’ & “Extend’ Accelerate International Growth PROVEN PLAYBOOK Grow in-market and increase penetration of markets for global customers 17
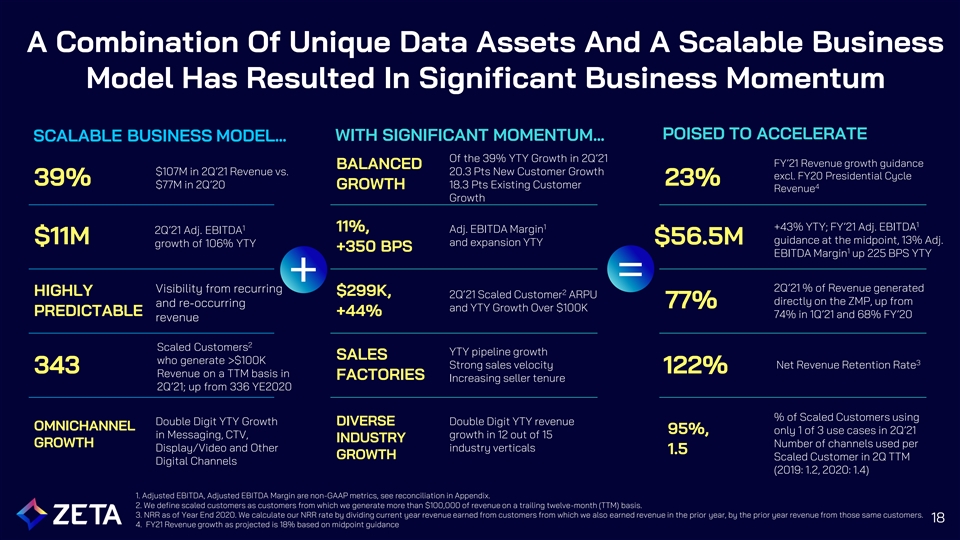
A Combination Of Unique Data Assets And A Scalable Business Model Has Resulted In Significant Business Momentum POISED TO ACCELERATE WITH SIGNIFICANT MOMENTUM… SCALABLE BUSINESS MODEL… Of the 39% YTY Growth in 2Q’21 FY’21 Revenue growth guidance BALANCED $107M in 2Q’21 Revenue vs. 20.3 Pts New Customer Growth excl. FY20 Presidential Cycle 39% 23% $77M in 2Q’20 18.3 Pts Existing Customer GROWTH 4 Revenue Growth 1 1 1 +43% YTY; FY’21 Adj. EBITDA 11%, Adj. EBITDA Margin 2Q’21 Adj. EBITDA $11M guidance at the midpoint, 13% Adj. $56.5M and expansion YTY growth of 106% YTY +350 BPS 1 EBITDA Margin up 225 BPS YTY = + 2Q’21 % of Revenue generated Visibility from recurring 2 HIGHLY $299K, 2Q‘21 Scaled Customer ARPU directly on the ZMP, up from and re-occurring 77% and YTY Growth Over $100K PREDICTABLE +44% 74% in 1Q’21 and 68% FY’20 revenue 2 Scaled Customers YTY pipeline growth SALES who generate >$100K 3 Strong sales velocity Net Revenue Retention Rate 343 122% Revenue on a TTM basis in FACTORIES Increasing seller tenure 2Q’21; up from 336 YE2020 % of Scaled Customers using Double Digit YTY Growth Double Digit YTY revenue DIVERSE OMNICHANNEL 95%, only 1 of 3 use cases in 2Q’21 in Messaging, CTV, growth in 12 out of 15 INDUSTRY GROWTH Number of channels used per Display/Video and Other industry verticals 1.5 GROWTH Scaled Customer in 2Q TTM Digital Channels (2019: 1.2, 2020: 1.4) 1. Adjusted EBITDA, Adjusted EBITDA Margin are non-GAAP metrics, see reconciliation in Appendix. 2. We define scaled customers as customers from which we generate more than $100,000 of revenue on a trailing twelve-month (TTM) basis. 3. NRR as of Year End 2020. We calculate our NRR rate by dividing current year revenue earned from customers from which we also earned revenue in the prior year, by the prior year revenue from those same customers. 18 4. FY21 Revenue growth as projected is 18% based on midpoint guidance

Revenue Mix Split Evenly Between Recurring and Reoccurring Business Pricing Model Revenue Model REOCCURRING Usage revenue generated from pilots and channels linked to shorter term UTILIZATION & ~50% contracts where customers have a OVERAGES multiyear history of replenishing budgets. MINIMUM RECURRING COMMITMENTS Software subscription and usage PLATFORM revenue generated from platform fees, ~50% FEES utilization, audience creation and data management that is governed by long term contracts and minimum commitments. 19
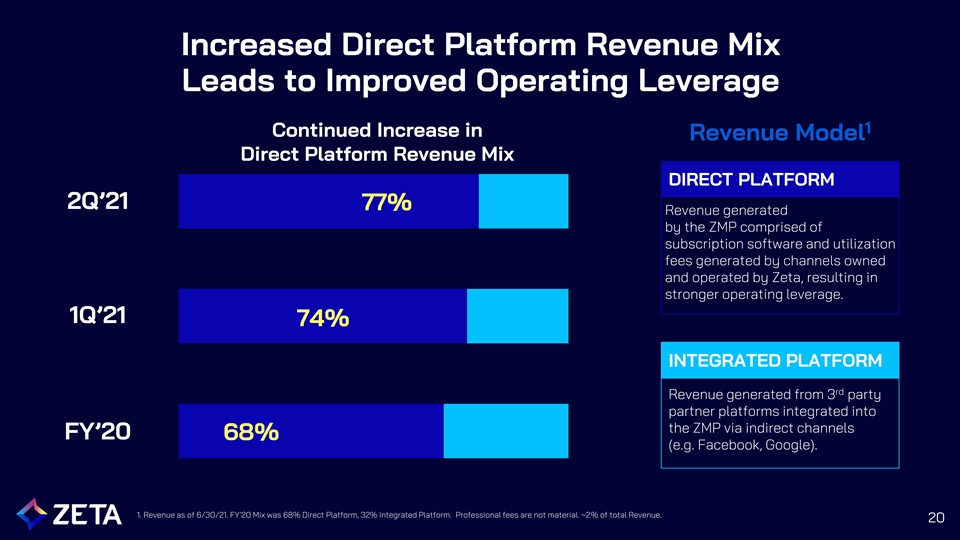
Increased Direct Platform Revenue Mix Leads to Improved Operating Leverage 1 Continued Increase in Revenue Model Direct Platform Revenue Mix DIRECT PLATFORM 2Q’21 77% Revenue generated by the ZMP comprised of subscription software and utilization fees generated by channels owned and operated by Zeta, resulting in stronger operating leverage. 1Q’21 74% INTEGRATED PLATFORM rd Revenue generated from 3 party partner platforms integrated into the ZMP via indirect channels FY’20 68% (e.g. Facebook, Google). 1. Revenue as of 6/30/21. FY’20 Mix was 68% Direct Platform, 32% Integrated Platform. Professional fees are not material. ~2% of total Revenue. 20
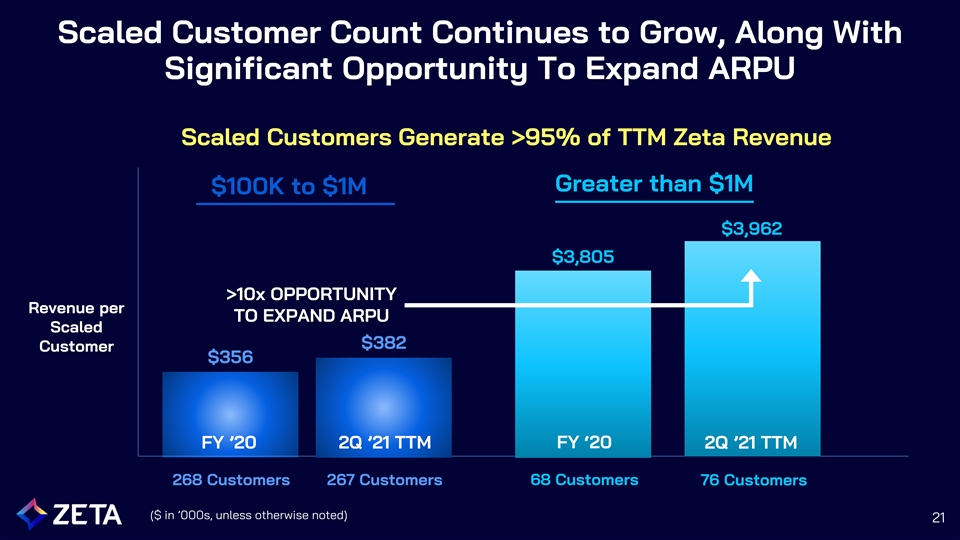
Scaled Customer Count Continues to Grow, Along With Significant Opportunity To Expand ARPU Scaled Customers Generate >95% of TTM Zeta Revenue Greater than $1M $100K to $1M $3,962 $3,805 >10x OPPORTUNITY Revenue per TO EXPAND ARPU Scaled $382 Customer $356 FY ‘20 FY ’20 2Q ’21 TTM 2Q ’21 TTM 268 Customers 267 Customers 68 Customers 76 Customers ($ in ’000s, unless otherwise noted) 21

The Longer Our Customers Stay With Us, The Bigger They Become Scaled Customer Count and ARPU 61 Customers 141 Customers 141 Customers $200M OPPORTUNITY: Graduating the less $1,741K than 3-year customer cohort and growing them at a rate consistent with history $246M $915K $129M $467K C H A N N E L & U S E C A S E E X P A N S I O N $28M I N C R E A S E D U T I L I Z A T I O N <1 Year 1-3 Years 3+ Years ARPU Revenue 23 Note: Cohort as of 6/30/21
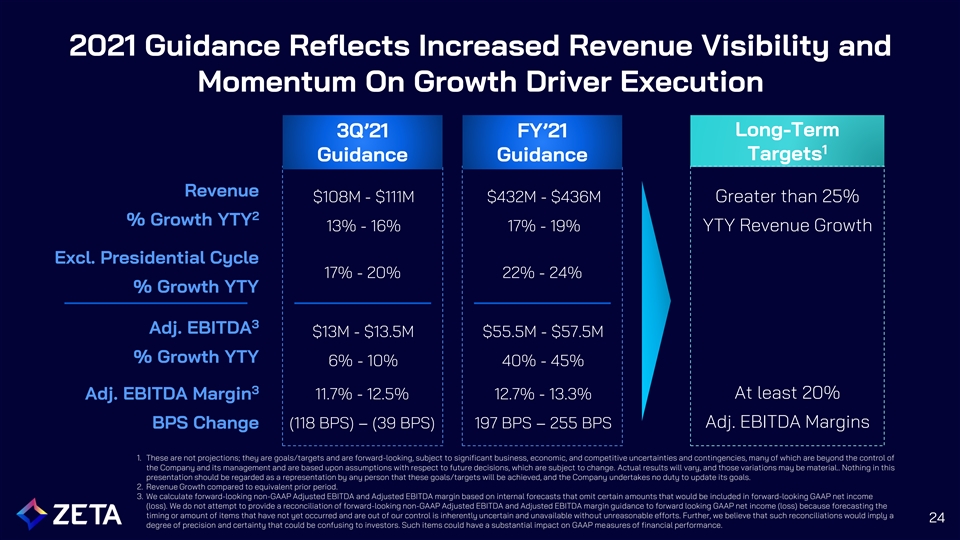
2021 Guidance Reflects Increased Revenue Visibility and Momentum On Growth Driver Execution Long-Term 3Q’21 FY’21 1 Targets Guidance Guidance Revenue $108M - $111M $432M - $436M Greater than 25% 2 % Growth YTY 13% - 16% 17% - 19% YTY Revenue Growth Excl. Presidential Cycle 17% - 20% 22% - 24% % Growth YTY 3 Adj. EBITDA $13M - $13.5M $55.5M - $57.5M % Growth YTY 6% - 10% 40% - 45% 3 11.7% - 12.5% 12.7% - 13.3% At least 20% Adj. EBITDA Margin (118 BPS) – (39 BPS) 197 BPS – 255 BPS Adj. EBITDA Margins BPS Change 1. These are not projections; they are goals/targets and are forward-looking, subject to significant business, economic, and competitive uncertainties and contingencies, many of which are beyond the control of the Company and its management and are based upon assumptions with respect to future decisions, which are subject to change. Actual results will vary, and those variations may be material.. Nothing in this presentation should be regarded as a representation by any person that these goals/targets will be achieved, and the Company undertakes no duty to update its goals. 2. Revenue Growth compared to equivalent prior period. 3. We calculate forward-looking non-GAAP Adjusted EBITDA and Adjusted EBITDA margin based on internal forecasts that omit certain amounts that would be included in forward-looking GAAP net income (loss). We do not attempt to provide a reconciliation of forward-looking non-GAAP Adjusted EBITDA and Adjusted EBITDA margin guidance to forward looking GAAP net income (loss) because forecasting the timing or amount of items that have not yet occurred and are out of our control is inherently uncertain and unavailable without unreasonable efforts. Further, we believe that such reconciliations would imply a 24 degree of precision and certainty that could be confusing to investors. Such items could have a substantial impact on GAAP measures of financial performance.
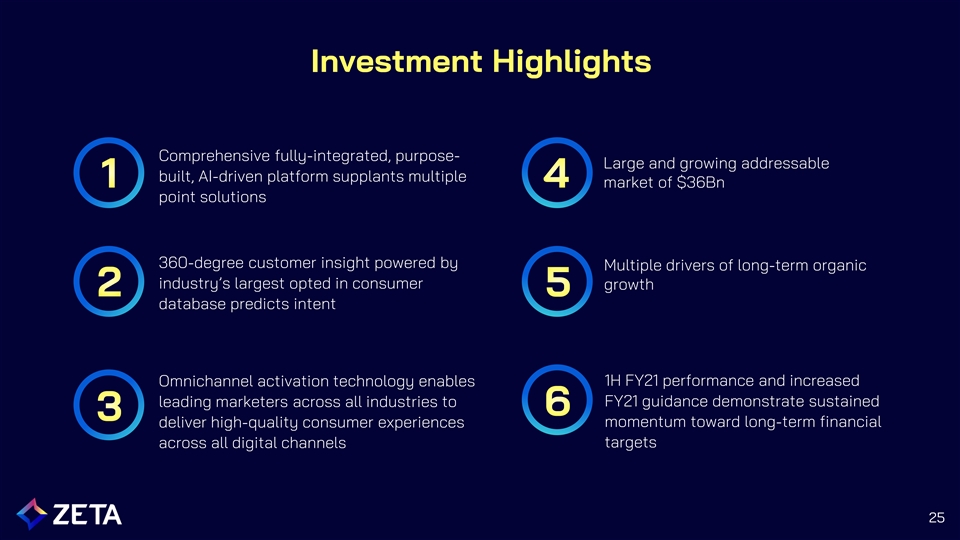
Investment Highlights Comprehensive fully-integrated, purpose- Large and growing addressable built, AI-driven platform supplants multiple market of $36Bn point solutions 360-degree customer insight powered by Multiple drivers of long-term organic industry’s largest opted in consumer growth database predicts intent Omnichannel activation technology enables 1H FY21 performance and increased leading marketers across all industries to FY21 guidance demonstrate sustained momentum toward long-term financial deliver high-quality consumer experiences across all digital channels targets 25

Appendix 26
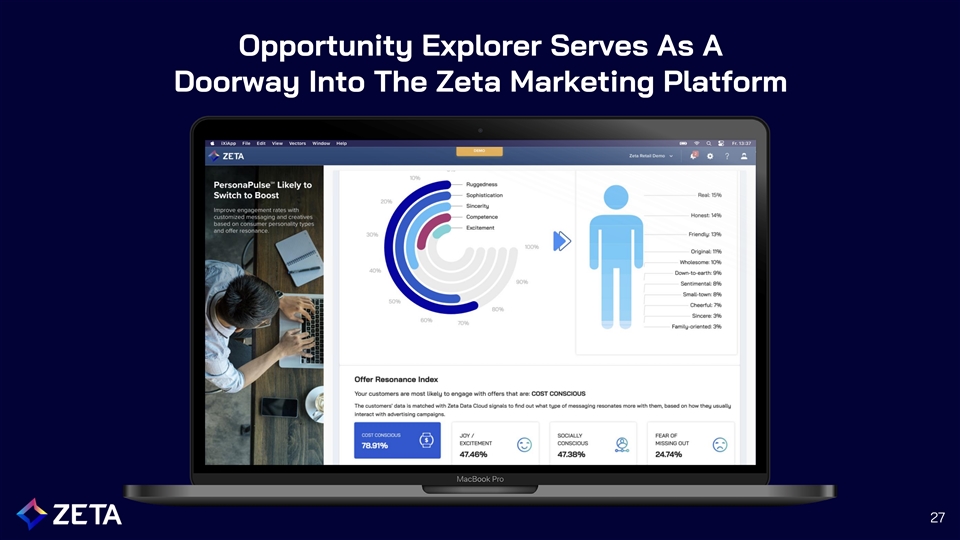
Opportunity Explorer Serves As A Doorway Into The Zeta Marketing Platform 27

Opportunities Proven By Experiences • Personalized experiences across hundreds of channels • Orchestrates interactions for known and unknown users • Allows customers to use Zeta’s channels or plug into existing workflows 28
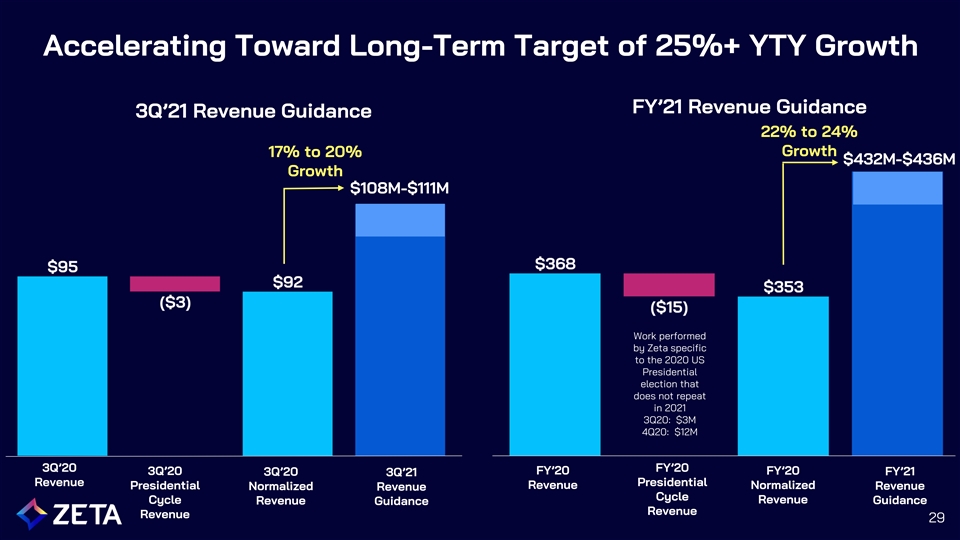
Accelerating Toward Long-Term Target of 25%+ YTY Growth FY’21 Revenue Guidance 3Q’21 Revenue Guidance 22% to 24% Growth 17% to 20% $432M-$436M Growth $108M-$111M Work performed by Zeta specific to the 2020 US Presidential election that does not repeat in 2021 3Q20: $3M 4Q20: $12M 3Q’20 FY’20 3Q’20 FY’20 FY’20 FY’21 3Q’20 3Q’21 Revenue Presidential Presidential Revenue Normalized Normalized Revenue Revenue Cycle Cycle Revenue Guidance Revenue Guidance Revenue Revenue 29

Bridge To Adjusted EBITDA And Adjusted EBITDA Margin 2Q’2021 2Q’2020 Net loss ($94,922) ($15,054) Interest expense 1,402 4,382 Depreciation and amortization 11,235 10,497 Stock based compensation 119,270 27 IPO related expense 2,705 - Gain on extinguishment of debt (10,000) - Income tax provision / (benefit) 584 396 Acquisition related expenses 329 1,156 Restructuring expenses 150 498 Change in fair value of derivatives (18,600) 4,100 Other (income) / expense (749) (471) Adjusted EBITDA $11,404 $5,531 Adjusted EBITDA Margin % 11% 7% 30
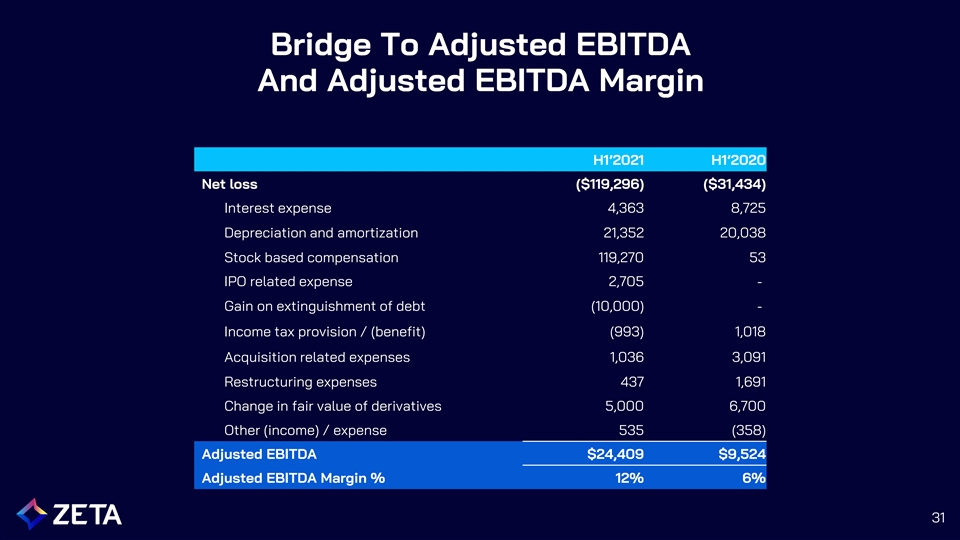
Bridge To Adjusted EBITDA And Adjusted EBITDA Margin H1’2021 H1’2020 Net loss ($119,296) ($31,434) Interest expense 4,363 8,725 Depreciation and amortization 21,352 20,038 Stock based compensation 119,270 53 IPO related expense 2,705 - Gain on extinguishment of debt (10,000) - Income tax provision / (benefit) (993) 1,018 Acquisition related expenses 1,036 3,091 Restructuring expenses 437 1,691 Change in fair value of derivatives 5,000 6,700 Other (income) / expense 535 (358) Adjusted EBITDA $24,409 $9,524 Adjusted EBITDA Margin % 12% 6% 31

2Q 2021 and 2020 P&L Bridge For the three months ended June 30, 2021 For the three months ended June 30, 2020 Stock One-time One-time Stock One-time One-time As Based IPO Other Depr. As As Based IPO Other Depr. As Reported Comp. Expenses Items & Amort. Adjusted Reported Comp. Expenses Items & Amort. Adjusted Revenues $106,896 $- $- $- $- $106,896 $77,130 $- $- $- $- $77,130 Operating expenses: Cost of revenues (excluding depreciation and 42,212 (266) - - - 41,946 29,296 - - - - 29,296 amortization) General and administrative expenses 65,907 (42,625) (1,461) - - 21,820 17,327 (27) - - - 17,300 Selling and marketing expenses 82,845 (59,512) (845) - - 22,488 16,842 - - - - 16,842 Research and development expenses 26,503 (16,867) (399) - - 9,237 8,161 - - - - 8,161 Depreciation and amortization 11,235 - - - (11,235) - 10,497 - - - (10,497) - Acquisition related expenses 329 - - (329) - - 1,156 - - (1,156) - - Restructuring expenses 150 - - (150) - - 498 - - (498) - - Total operating expenses $229,181 ($119,270) ($2,705) ($479) ($11,235) $95,492 $83,777 ($27) $- ($1,654) ($10,497) $71,599 ($122,285) $119,270 $2,705 $479 $11,235 $11,404 ($6,647) $27 $- $1,654 $10,497 $5,531 Operating loss Interest expense 1,402 - - - - 1,402 4,382 - - - - 4,382 Other (incomes) / expenses (749) - - - - (749) (471) - - - - (471) Gain on extinguishment of debt (10,000) - - - - (10,000) - - - - - - Change in fair value of warrants and (18,600) - - - - (18,600) 4,100 - - - - 4,100 derivative liabilities Stock based compensation - 119,270 - - - 119,270 - 27 - - - 27 One-Time IPO Expenses - - 2,705 479 - 3,184 - - - 1,654 - 1,654 Depreciation and amortization - - - - 11,235 11,235 - - - - 10,497 10,497 Total other expenses ($27,947) $119,270 $2,705 $479 $11,235 ($27,947) $8,011 $27 $- $1,654 $10,497 $8,011 (94,338) - - - - (94,338) (14,658) - - - - (14,658) Loss before income taxes Income tax provision 584 - - - - 584 396 - - - - 396 Net loss ($94,922) $- $- $- $- ($94,922) ($15,054) $- $- $- $- ($15,054) 32
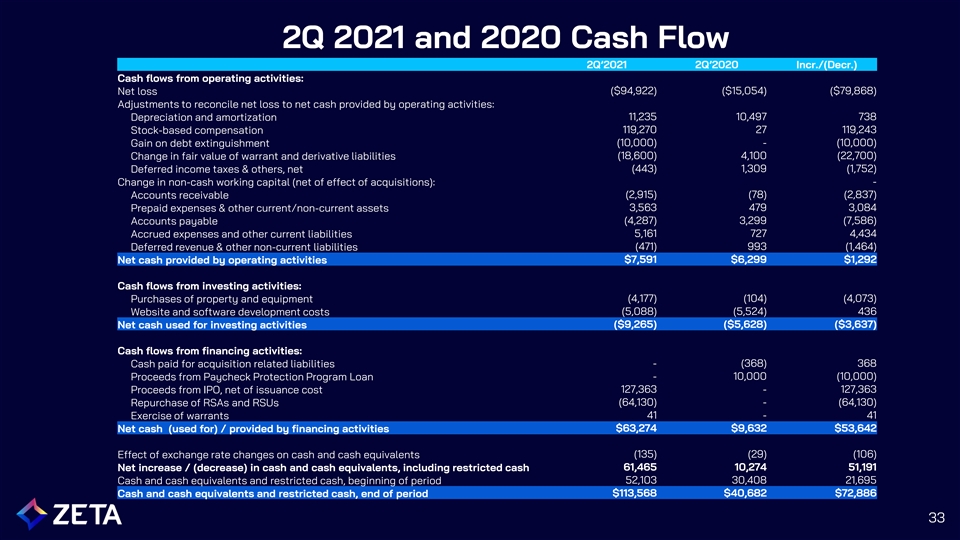
2Q 2021 and 2020 Cash Flow 2Q’2021 2Q’2020 Incr./(Decr.) Cash flows from operating activities: ($94,922) ($15,054) ($79,868) Net loss Adjustments to reconcile net loss to net cash provided by operating activities: 11,235 10,497 738 Depreciation and amortization 119,270 27 119,243 Stock-based compensation (10,000) - (10,000) Gain on debt extinguishment (18,600) 4,100 (22,700) Change in fair value of warrant and derivative liabilities (443) 1,309 (1,752) Deferred income taxes & others, net - Change in non-cash working capital (net of effect of acquisitions): (2,915) (78) (2,837) Accounts receivable 3,563 479 3,084 Prepaid expenses & other current/non-current assets (4,287) 3,299 (7,586) Accounts payable 5,161 727 4,434 Accrued expenses and other current liabilities (471) 993 (1,464) Deferred revenue & other non-current liabilities $7,591 $6,299 $1,292 Net cash provided by operating activities Cash flows from investing activities: (4,177) (104) (4,073) Purchases of property and equipment (5,088) (5,524) 436 Website and software development costs ($9,265) ($5,628) ($3,637) Net cash used for investing activities Cash flows from financing activities: Cash paid for acquisition related liabilities - (368) 368 Proceeds from Paycheck Protection Program Loan - 10,000 (10,000) Proceeds from IPO, net of issuance cost 127,363 - 127,363 Repurchase of RSAs and RSUs (64,130) - (64,130) Exercise of warrants 41 - 41 Net cash (used for) / provided by financing activities $63,274 $9,632 $53,642 Effect of exchange rate changes on cash and cash equivalents (135) (29) (106) Net increase / (decrease) in cash and cash equivalents, including restricted cash 61,465 10,274 51,191 Cash and cash equivalents and restricted cash, beginning of period 52,103 30,408 21,695 Cash and cash equivalents and restricted cash, end of period $113,568 $40,682 $72,886 33