Exhibit 99.2 Supplemental 3Q’21 Earnings Presentation November 9, 2021 2021 ZETA GLOBAL – PROPRIETARY & CONFIDENTIAL
Safe Harbor This presentation has been prepared by Zeta Global Holdings Corp. and its subsidiaries (together, the “Company”, “Zeta”, or “we”) and is made for informational purposes only. The information set forth herein does not purport to be complete or to contain all of the information you may desire. You must evaluate, and bear all risks associated with, the use of any information provided hereunder, including any reliance on the accuracy, completeness, safety or usefulness of such information. This information is not intended to be used as the primary basis of investment decisions. It should not be construed as advice designed to meet the particular investment needs of any investor. Statements contained herein are made as of the date of this presentation unless stated otherwise, and this presentation shall not under any circumstances create an implication that the information contained herein is correct as of any time after such date or that information will be updated or revised to reflect information that subsequently becomes available or changes occurring after the date hereof. You should read the prospectus in the Registration Statement (No. 333-255499) and the other documents that the Company has filed with the SEC for more information about the Company. You can obtain these documents for free by visiting EDGAR on the SEC website at www.sec.gov or on our website at https://investors.zetaglobal.com/financials/sec-filings. This presentation shall not constitute an offer to sell or the solicitation of an offer to buy any securities, nor shall there be any sale of securities in any state or jurisdiction in which such offer, solicitation or sale would be unlawful prior to registration or qualification under the securities laws of such state or jurisdiction. This presentation contains forward-looking statements within the meaning of Section 27A of the Securities Act of 1933, as amended, and Section 21E of the Securities Exchange Act of 1934, as amended. The Company intends such forward-looking statements to be covered by the safe harbor provisions for forward-looking statements contained in the Private Securities Litigation Reform Act of 1995 and includes this statement for purposes of complying with these safe harbor provisions. Any statements made in this presentation that are not statements of historical fact, including statements about the Company’s beliefs and expectations, are forward-looking statements and should be evaluated as such. Forward-looking statements include information concerning possible or assumed future results of operations, including descriptions of our business plan and strategies. These statements often include words such as “anticipate,” “expect,” “suggests,” “plan,” “believe,” “intend,” “estimates,” “targets,” “projects,” “should,” “could,” “would,” “may,” “will,” “forecast,” “outlook,” “guidance” and other similar expressions. The Company bases these forward-looking statements on its current expectations, plans and assumptions that the Company has made in light of its experience in the industry, as well as its perceptions of historical trends, current conditions, expected future developments and other factors the Company believes are appropriate under the circumstances at such time. As you read and consider this presentation, you should understand that these statements are not guarantees of future performance or results. The forward-looking statements are subject to and involve risks, uncertainties and assumptions, and you should not place undue reliance on these forward-looking statements. Although the Company believes that these forward-looking statements are based on reasonable assumptions at the time they are made, you should be aware that many factors could affect the Company’s actual results or results of operations and could cause actual results to differ materially from those expressed in the forward- looking statements. The Company undertakes no obligation to update or revise any forward-looking statements, whether as a result of new information, future events or otherwise, except as required by applicable law. All future written and oral forward-looking statements made in connection with this presentation attributable to the Company or persons acting on the Company’s behalf are expressly qualified in their entirety by this paragraph. This presentation contains non-GAAP financial measures such as adjusted EBITDA and adjusted EBITDA margin. These measures are not prepared in accordance with generally accepted accounting principles in the United States of America (“GAAP”) and have important limitations as analytical tools. Non-GAAP financial measures are supplemental, should only be used in conjunction with results presented in accordance with GAAP and should not be considered in isolation or as a substitute for such GAAP results. Refer to the Appendix of this presentation for a reconciliation of the non-GAAP financial measures to the most directly comparable financial measures calculated and presented in accordance with GAAP. The contents and appearance of this presentation is copyrighted and the trademarks and service marks are owned by Zeta Global Corp. All rights reserved. 2021 ZETA GLOBAL – PROPRIETARY & CONFIDENTIAL 2

3Q’21 Performance Highlights Strong Execution: Beating the Largest Delivering on our Beat & Raise Marketing Clouds Growth Drivers ü Sales transformation ü Executing on our plan to ü Continued positive mix ahead of pace, with add more multi-year, shift towards higher revenue above high-end of software subscription and margin solutions with guidance, up 21% YtY and minimum usage contracts 74% of revenue from 25% ex-Pres. cycle Direct Platform ü Booked 6 multi-year, ü Increasing midpoint of recurring revenue deals ü Two-thirds of YtY FY21 revenue guidance at $16M of TCV growth generated from by $12.5M to $446.5M new customers ü Opportunity Explorer ü Increasing Adj. EBITDA continues to be a sales ü Increased scaled guidance by $4.8M to accelerator customer count QtQ and $61.3M accelerated scaled customer ARPU 2021 ZETA GLOBAL – PROPRIETARY & CONFIDENTIAL 3
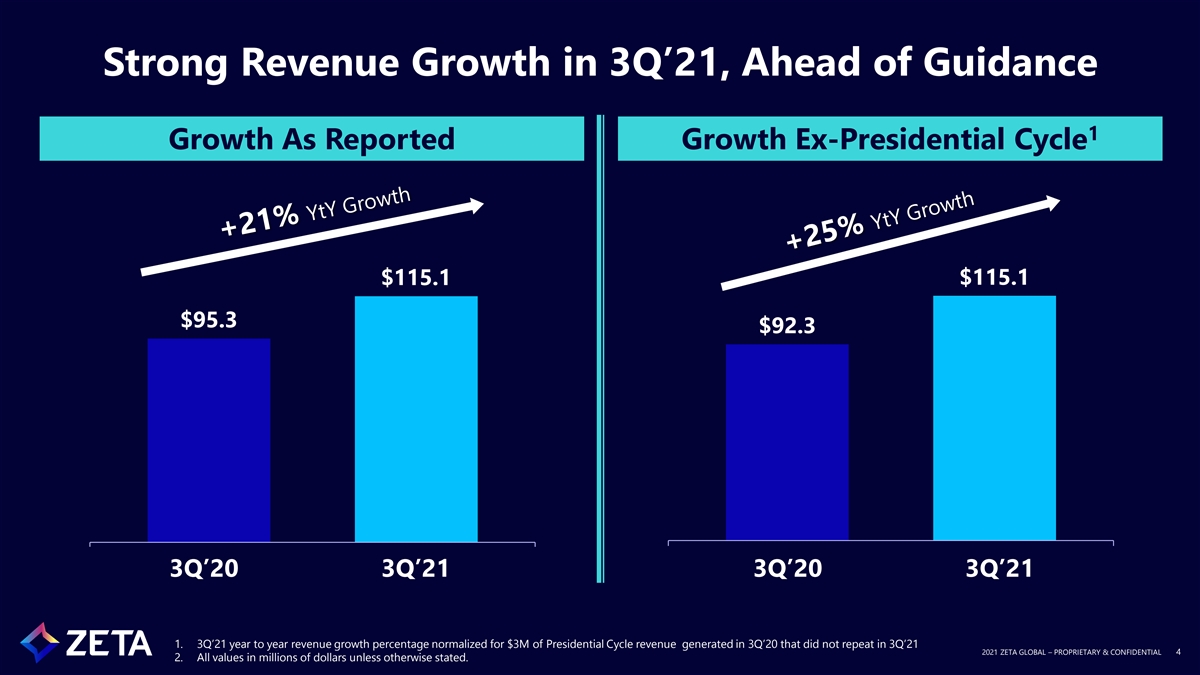
Strong Revenue Growth in 3Q’21, Ahead of Guidance 1 Growth As Reported Growth Ex-Presidential Cycle $115.1 $115.1 $95.3 $92.3 3Q’20 3Q’21 3Q’20 3Q’21 1. 3Q’21 year to year revenue growth percentage normalized for $3M of Presidential Cycle revenue generated in 3Q’20 that did not repeat in 3Q’21 2021 ZETA GLOBAL – PROPRIETARY & CONFIDENTIAL 4 2. All values in millions of dollars unless otherwise stated.
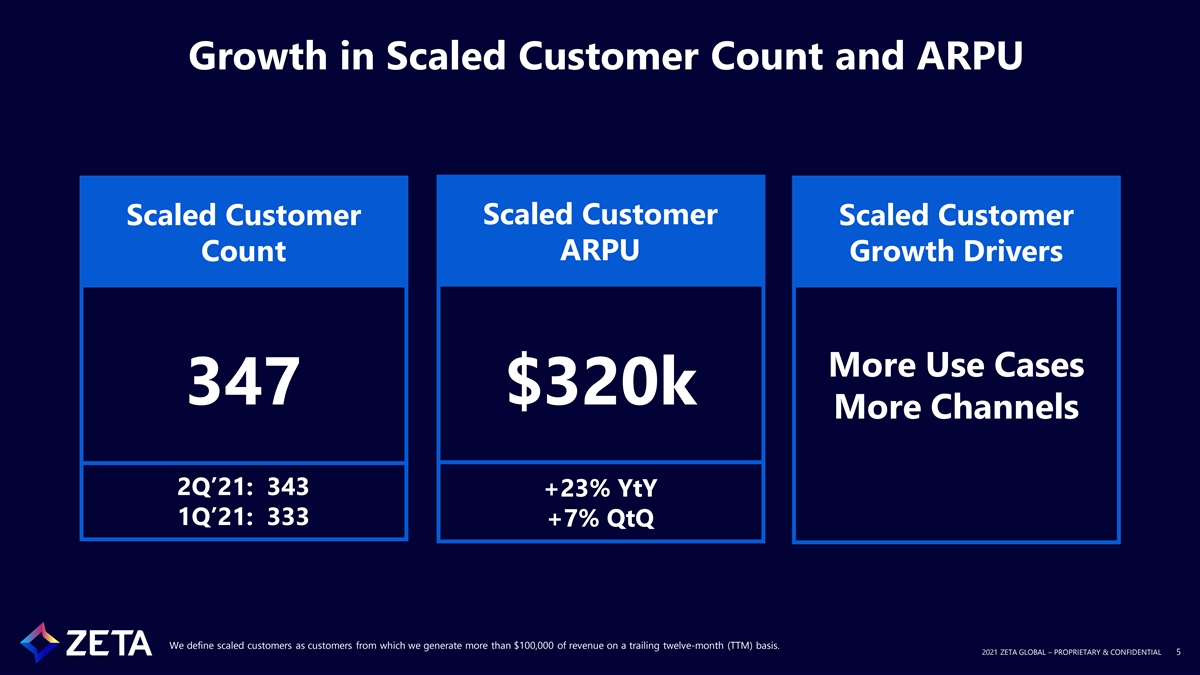
Growth in Scaled Customer Count and ARPU Scaled Customer Scaled Customer Scaled Customer ARPU Count Growth Drivers More Use Cases 347 $320k More Channels 2Q’21: 343 +23% YtY 1Q’21: 333 +7% QtQ We define scaled customers as customers from which we generate more than $100,000 of revenue on a trailing twelve-month (TTM) basis. 2021 ZETA GLOBAL – PROPRIETARY & CONFIDENTIAL 5
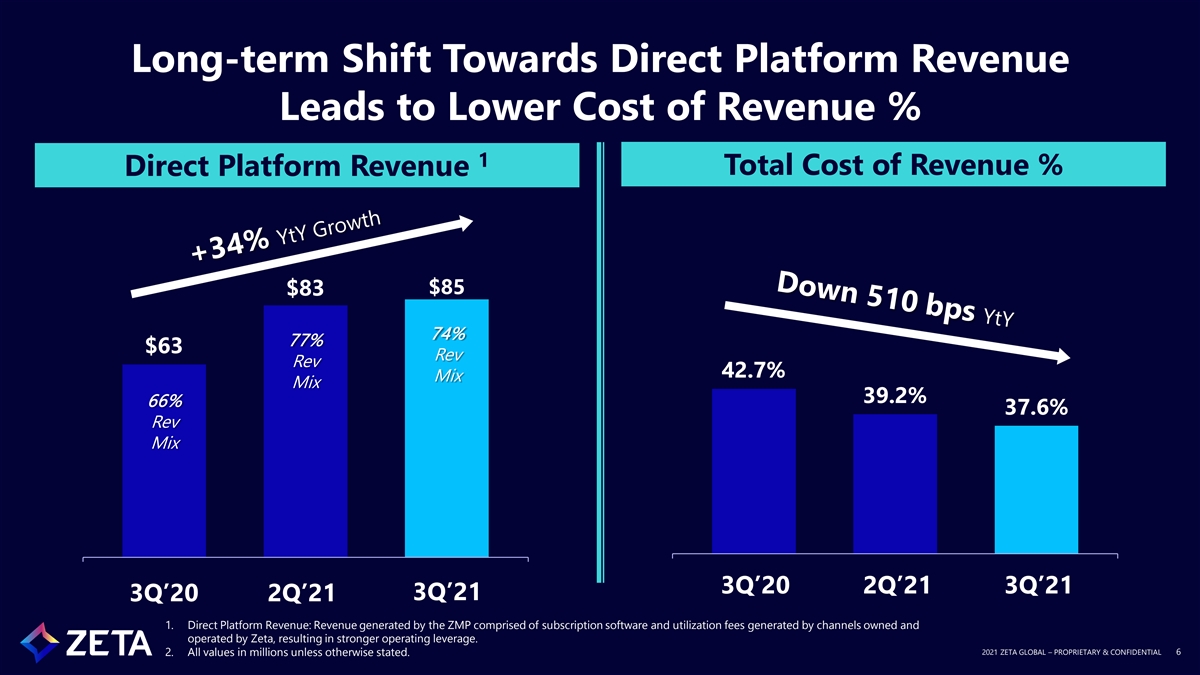
Long-term Shift Towards Direct Platform Revenue Leads to Lower Cost of Revenue % 1 Total Cost of Revenue % Direct Platform Revenue $85 $83 74% 77% $63 Rev Rev 42.7% Mix Mix 39.2% 66% 37.6% Rev Mix 3Q’20 2Q’21 3Q’21 3Q’21 3Q’20 2Q’21 1. Direct Platform Revenue: Revenue generated by the ZMP comprised of subscription software and utilization fees generated by channels owned and operated by Zeta, resulting in stronger operating leverage. 2021 2021 Z ZE ET TA A G GL LO OB BA AL L – – P PR RO OP PR RIET IETA AR RY Y & & C CO ON NF FID IDEN ENT TIA IAL L 6 6 2. All values in millions unless otherwise stated.
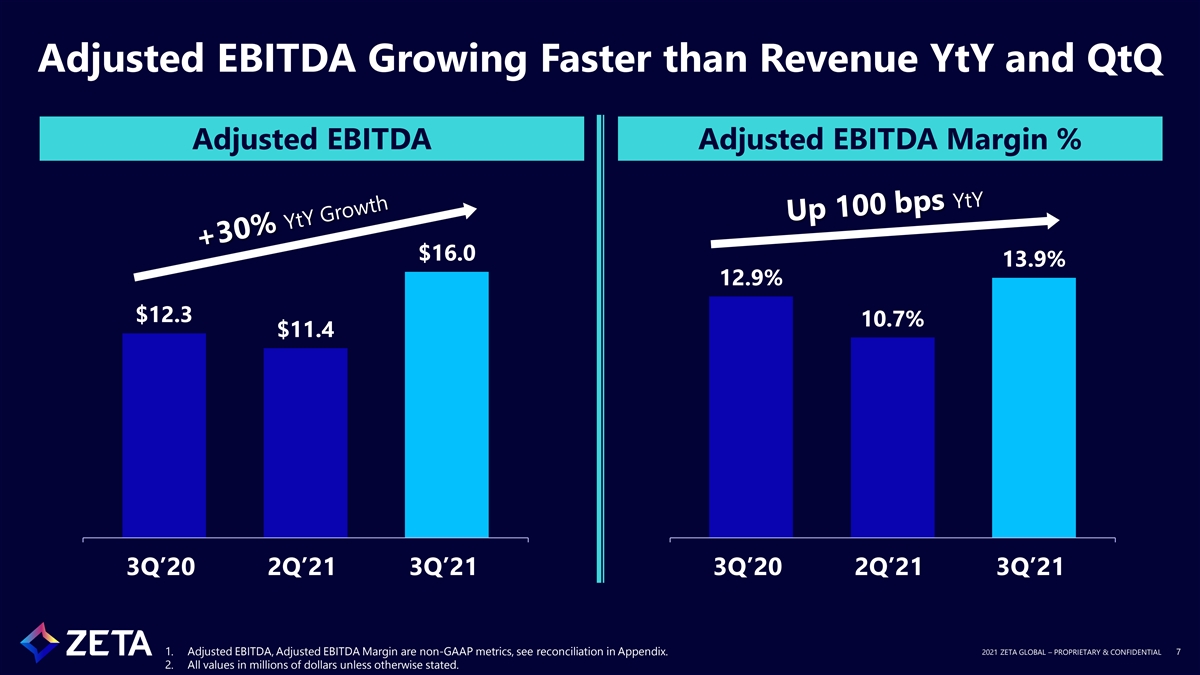
Adjusted EBITDA Growing Faster than Revenue YtY and QtQ Adjusted EBITDA Adjusted EBITDA Margin % $16.0 13.9% 12.9% $12.3 10.7% $11.4 3Q’20 2Q’21 3Q’21 3Q’20 2Q’21 3Q’21 1. Adjusted EBITDA, Adjusted EBITDA Margin are non-GAAP metrics, see reconciliation in Appendix. 2021 ZETA GLOBAL – PROPRIETARY & CONFIDENTIAL 7 2. All values in millions of dollars unless otherwise stated.
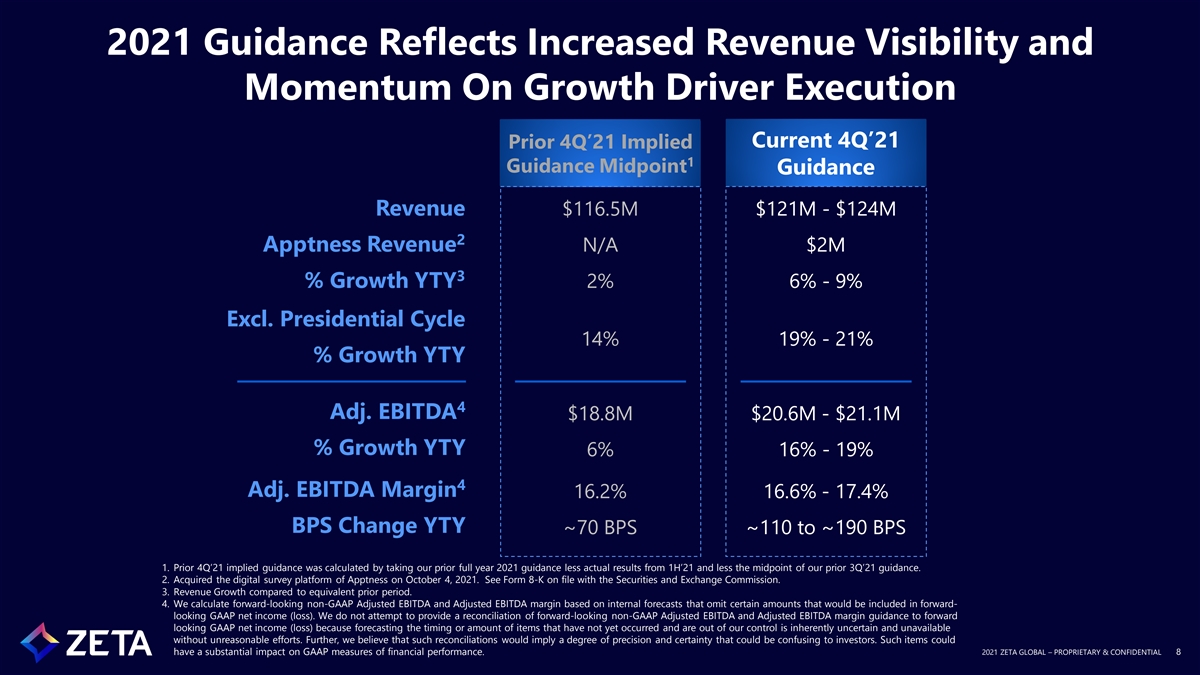
2021 Guidance Reflects Increased Revenue Visibility and Momentum On Growth Driver Execution Current 4Q’21 Prior 4Q’21 Implied 1 Guidance Midpoint Guidance Revenue $116.5M $121M - $124M 2 Apptness Revenue N/A $2M 3 % Growth YTY 2% 6% - 9% Excl. Presidential Cycle 14% 19% - 21% % Growth YTY 4 Adj. EBITDA $18.8M $20.6M - $21.1M % Growth YTY 6% 16% - 19% 4 Adj. EBITDA Margin 16.2% 16.6% - 17.4% BPS Change YTY ~70 BPS ~110 to ~190 BPS 1. Prior 4Q’21 implied guidance was calculated by taking our prior full year 2021 guidance less actual results from 1H’21 and less the midpoint of our prior 3Q’21 guidance. 2. Acquired the digital survey platform of Apptness on October 4, 2021. See Form 8-K on file with the Securities and Exchange Commission. 3. Revenue Growth compared to equivalent prior period. 4. We calculate forward-looking non-GAAP Adjusted EBITDA and Adjusted EBITDA margin based on internal forecasts that omit certain amounts that would be included in forward- looking GAAP net income (loss). We do not attempt to provide a reconciliation of forward-looking non-GAAP Adjusted EBITDA and Adjusted EBITDA margin guidance to forward looking GAAP net income (loss) because forecasting the timing or amount of items that have not yet occurred and are out of our control is inherently uncertain and unavailable without unreasonable efforts. Further, we believe that such reconciliations would imply a degree of precision and certainty that could be confusing to investors. Such items could have a substantial impact on GAAP measures of financial performance. 2021 ZETA GLOBAL – PROPRIETARY & CONFIDENTIAL 8
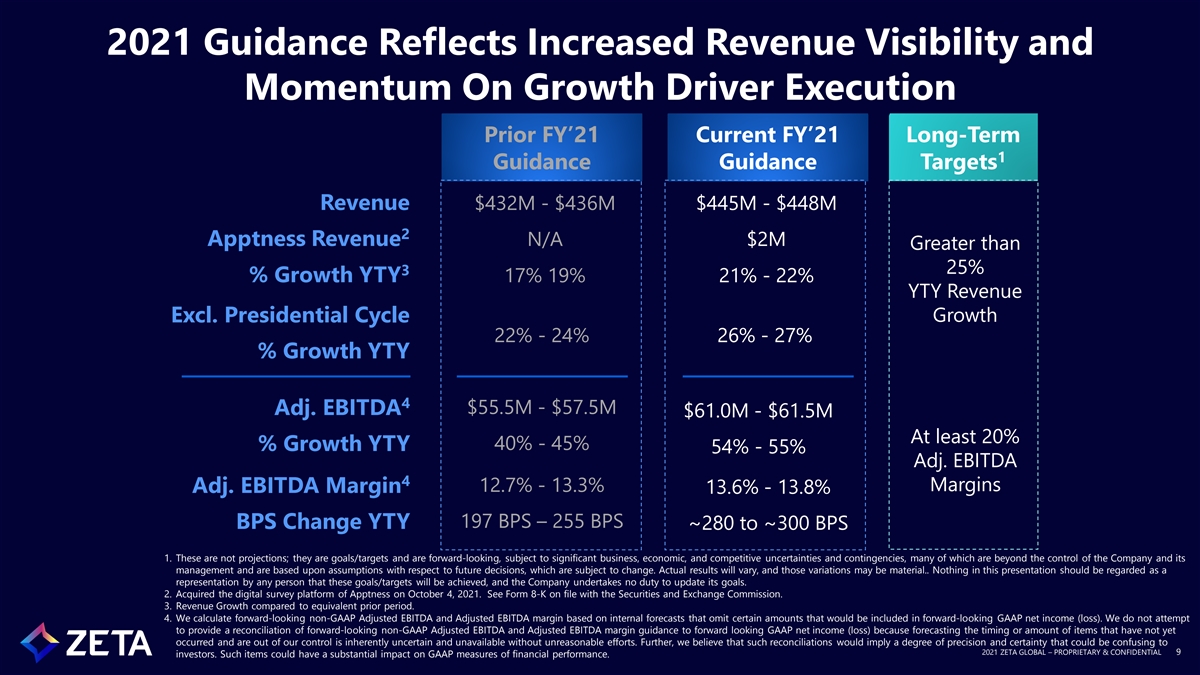
2021 Guidance Reflects Increased Revenue Visibility and Momentum On Growth Driver Execution Prior FY’21 Current FY’21 Long-Term 1 Guidance Guidance Targets Revenue $432M - $436M $445M - $448M 2 Apptness Revenue N/A $2M Greater than 25% 3 % Growth YTY 17% 19% 21% - 22% YTY Revenue Excl. Presidential Cycle Growth 22% - 24% 26% - 27% % Growth YTY 4 $55.5M - $57.5M Adj. EBITDA $61.0M - $61.5M At least 20% 40% - 45% % Growth YTY 54% - 55% Adj. EBITDA 4 Margins 12.7% - 13.3% Adj. EBITDA Margin 13.6% - 13.8% 197 BPS – 255 BPS BPS Change YTY ~280 to ~300 BPS 1. These are not projections; they are goals/targets and are forward-looking, subject to significant business, economic, and competitive uncertainties and contingencies, many of which are beyond the control of the Company and its management and are based upon assumptions with respect to future decisions, which are subject to change. Actual results will vary, and those variations may be material.. Nothing in this presentation should be regarded as a representation by any person that these goals/targets will be achieved, and the Company undertakes no duty to update its goals. 2. Acquired the digital survey platform of Apptness on October 4, 2021. See Form 8-K on file with the Securities and Exchange Commission. 3. Revenue Growth compared to equivalent prior period. 4. We calculate forward-looking non-GAAP Adjusted EBITDA and Adjusted EBITDA margin based on internal forecasts that omit certain amounts that would be included in forward-looking GAAP net income (loss). We do not attempt to provide a reconciliation of forward-looking non-GAAP Adjusted EBITDA and Adjusted EBITDA margin guidance to forward looking GAAP net income (loss) because forecasting the timing or amount of items that have not yet occurred and are out of our control is inherently uncertain and unavailable without unreasonable efforts. Further, we believe that such reconciliations would imply a degree of precision and certainty that could be confusing to 2021 ZETA GLOBAL – PROPRIETARY & CONFIDENTIAL 9 investors. Such items could have a substantial impact on GAAP measures of financial performance.

REGISTER NOW: https://zetalive.splasht hat.com/ W HAT YOU C AN E XPECT Insights from industry luminaries on the future of marketing technology Preview Zeta’s Future Innovations Hear How Zeta’s Customers Leverage the Zeta Marketing Platform 2021 ZETA GLOBAL – PROPRIETARY & CONFIDENTIAL 10

Appendix
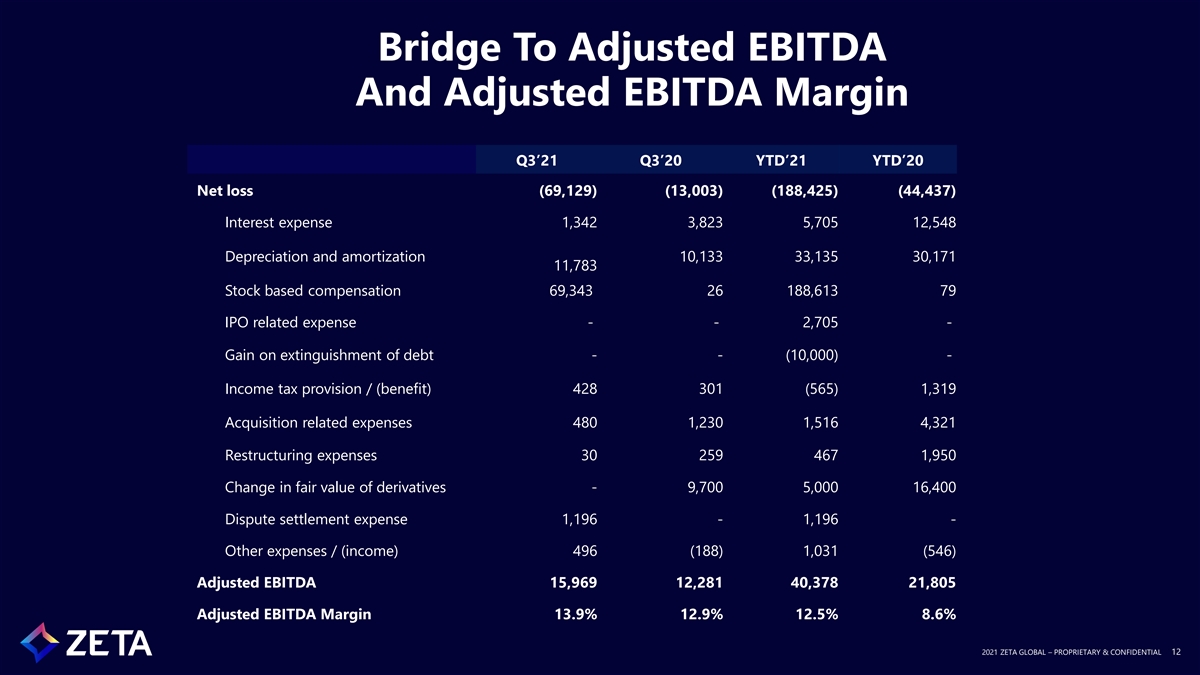
Bridge To Adjusted EBITDA And Adjusted EBITDA Margin Q3’21 Q3’20 YTD’21 YTD’20 Net loss (69,129) (13,003) (188,425) (44,437) Interest expense 1,342 3,823 5,705 12,548 Depreciation and amortization 10,133 33,135 30,171 11,783 Stock based compensation 69,343 26 188,613 79 IPO related expense - - 2,705 - Gain on extinguishment of debt - - (10,000) - Income tax provision / (benefit) 428 301 (565) 1,319 Acquisition related expenses 480 1,230 1,516 4,321 Restructuring expenses 30 259 467 1,950 Change in fair value of derivatives - 9,700 5,000 16,400 Dispute settlement expense 1,196 - 1,196 - Other expenses / (income) 496 (188) 1,031 (546) Adjusted EBITDA 15,969 12,281 40,378 21,805 Adjusted EBITDA Margin 13.9% 12.9% 12.5% 8.6% 2021 ZETA GLOBAL – PROPRIETARY & CONFIDENTIAL 12
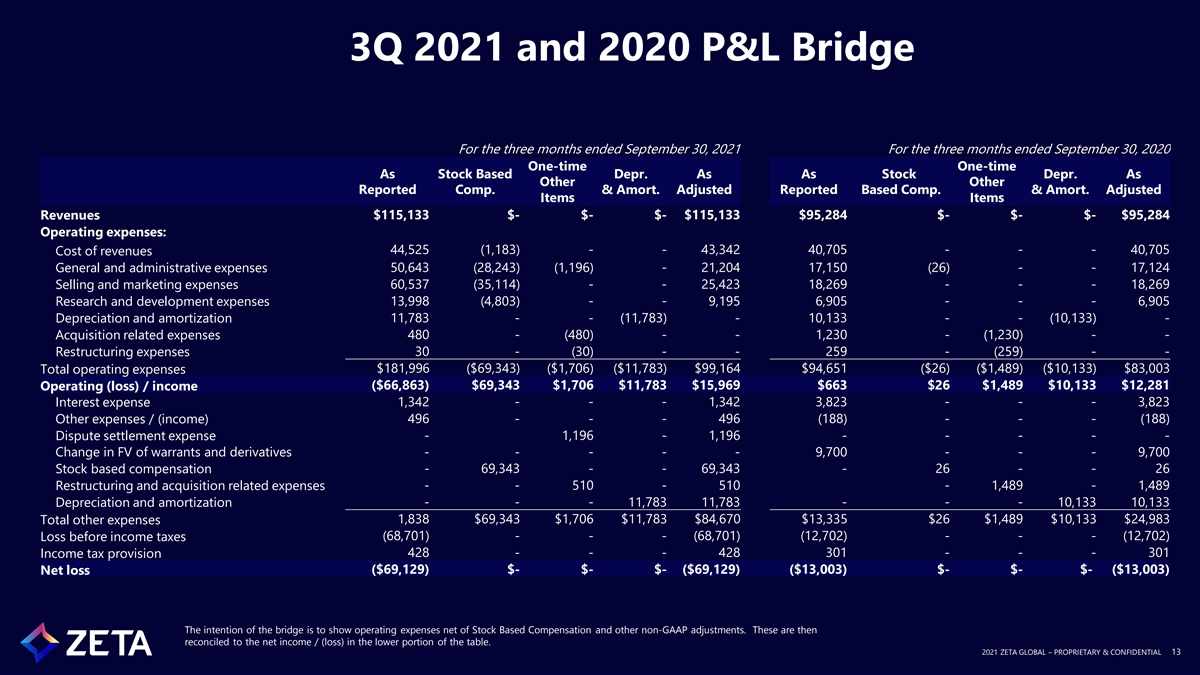
3Q 2021 and 2020 P&L Bridge For the three months ended September 30, 2021 For the three months ended September 30, 2020 One-time One-time As Stock Based Depr. As As Stock Depr. As Other Other Reported Comp. & Amort. Adjusted Reported Based Comp. & Amort. Adjusted Items Items Revenues $115,133 $- $- $- $115,133 $95,284 $- $- $- $95,284 Operating expenses: 44,525 (1,183) - - 43,342 40,705 - - - 40,705 Cost of revenues General and administrative expenses 50,643 (28,243) (1,196) - 21,204 17,150 (26) - - 17,124 Selling and marketing expenses 60,537 (35,114) - - 25,423 18,269 - - - 18,269 Research and development expenses 13,998 (4,803) - - 9,195 6,905 - - - 6,905 Depreciation and amortization 11,783 - - (11,783) - 10,133 - - (10,133) - 480 - (480) - - 1,230 - (1,230) - - Acquisition related expenses Restructuring expenses 30 - (30) - - 259 - (259) - - $181,996 ($69,343) ($1,706) ($11,783) $99,164 $94,651 ($26) ($1,489) ($10,133) $83,003 Total operating expenses ($66,863) $69,343 $1,706 $11,783 $15,969 $663 $26 $1,489 $10,133 $12,281 Operating (loss) / income Interest expense 1,342 - - - 1,342 3,823 - - - 3,823 Other expenses / (income) 496 - - - 496 (188) - - - (188) Dispute settlement expense - 1,196 - 1,196 - - - - - Change in FV of warrants and derivatives - - - - - 9,700 - - - 9,700 Stock based compensation - 69,343 - - 69,343 - 26 - - 26 Restructuring and acquisition related expenses - - 510 - 510 - 1,489 - 1,489 - - - 11,783 11,783 - - - 10,133 10,133 Depreciation and amortization 1,838 $69,343 $1,706 $11,783 $84,670 $13,335 $26 $1,489 $10,133 $24,983 Total other expenses (68,701) - - - (68,701) (12,702) - - - (12,702) Loss before income taxes Income tax provision 428 - - - 428 301 - - - 301 ($69,129) $- $- $- ($69,129) ($13,003) $- $- $- ($13,003) Net loss The intention of the bridge is to show operating expenses net of Stock Based Compensation and other non-GAAP adjustments. These are then reconciled to the net income / (loss) in the lower portion of the table. 2021 ZETA GLOBAL – PROPRIETARY & CONFIDENTIAL 13
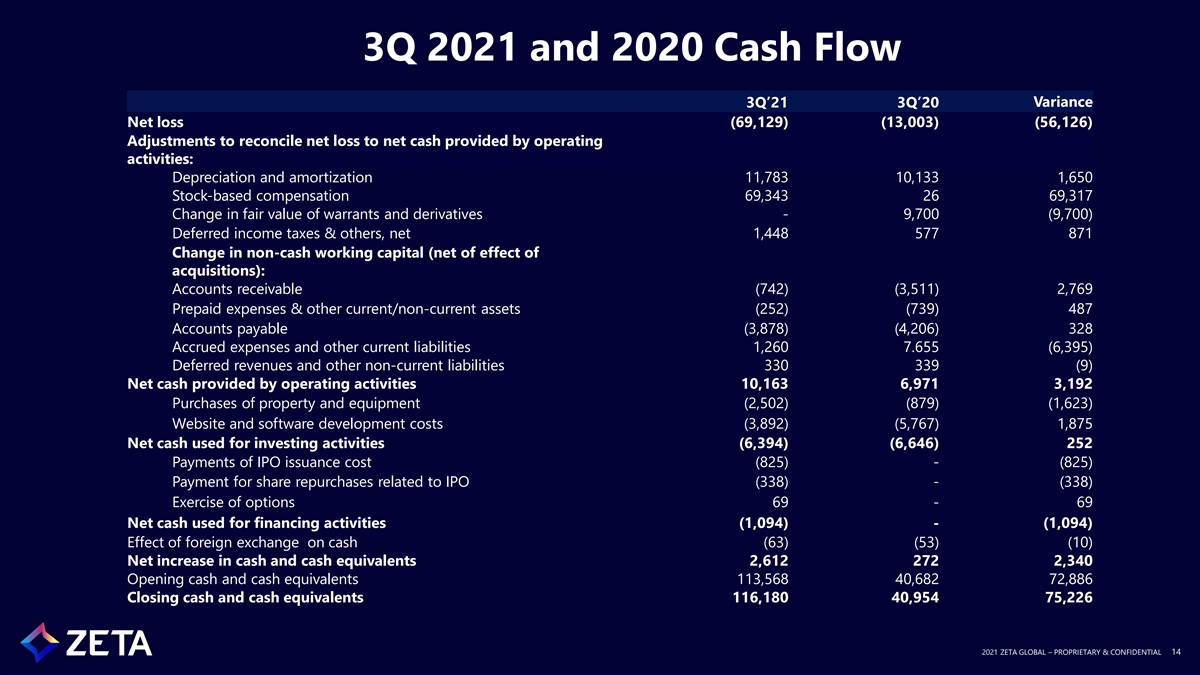
3Q 2021 and 2020 Cash Flow 3Q’21 3Q’20 Variance Net loss (69,129) (13,003) (56,126) Adjustments to reconcile net loss to net cash provided by operating activities: Depreciation and amortization 11,783 10,133 1,650 Stock-based compensation 69,343 26 69,317 Change in fair value of warrants and derivatives - 9,700 (9,700) Deferred income taxes & others, net 1,448 577 871 Change in non-cash working capital (net of effect of acquisitions): Accounts receivable (742) (3,511) 2,769 Prepaid expenses & other current/non-current assets (252) (739) 487 Accounts payable (3,878) (4,206) 328 Accrued expenses and other current liabilities 1,260 7.655 (6,395) Deferred revenues and other non-current liabilities 330 339 (9) Net cash provided by operating activities 10,163 6,971 3,192 Purchases of property and equipment (2,502) (879) (1,623) Website and software development costs (3,892) (5,767) 1,875 Net cash used for investing activities (6,394) (6,646) 252 Payments of IPO issuance cost (825) - (825) Payment for share repurchases related to IPO (338) - (338) Exercise of options 69 - 69 Net cash used for financing activities (1,094) - (1,094) Effect of foreign exchange on cash (63) (53) (10) Net increase in cash and cash equivalents 2,612 272 2,340 Opening cash and cash equivalents 113,568 40,682 72,886 Closing cash and cash equivalents 116,180 40,954 75,226 2021 ZETA GLOBAL – PROPRIETARY & CONFIDENTIAL 14
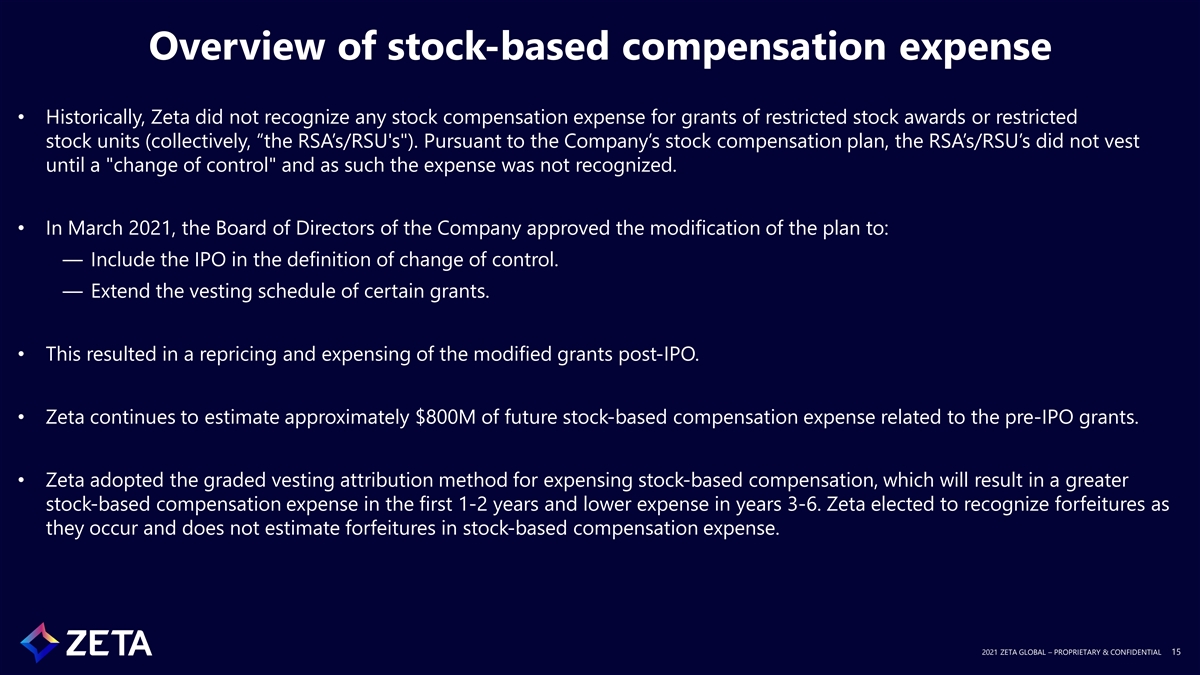
Overview of stock-based compensation expense • Historically, Zeta did not recognize any stock compensation expense for grants of restricted stock awards or restricted stock units (collectively, “the RSA’s/RSU's ). Pursuant to the Company’s stock compensation plan, the RSA’s/RSU’s did not vest until a change of control and as such the expense was not recognized. • In March 2021, the Board of Directors of the Company approved the modification of the plan to: ― Include the IPO in the definition of change of control. ― Extend the vesting schedule of certain grants. • This resulted in a repricing and expensing of the modified grants post-IPO. • Zeta continues to estimate approximately $800M of future stock-based compensation expense related to the pre-IPO grants. • Zeta adopted the graded vesting attribution method for expensing stock-based compensation, which will result in a greater stock-based compensation expense in the first 1-2 years and lower expense in years 3-6. Zeta elected to recognize forfeitures as they occur and does not estimate forfeitures in stock-based compensation expense. 2021 ZETA GLOBAL – PROPRIETARY & CONFIDENTIAL 15
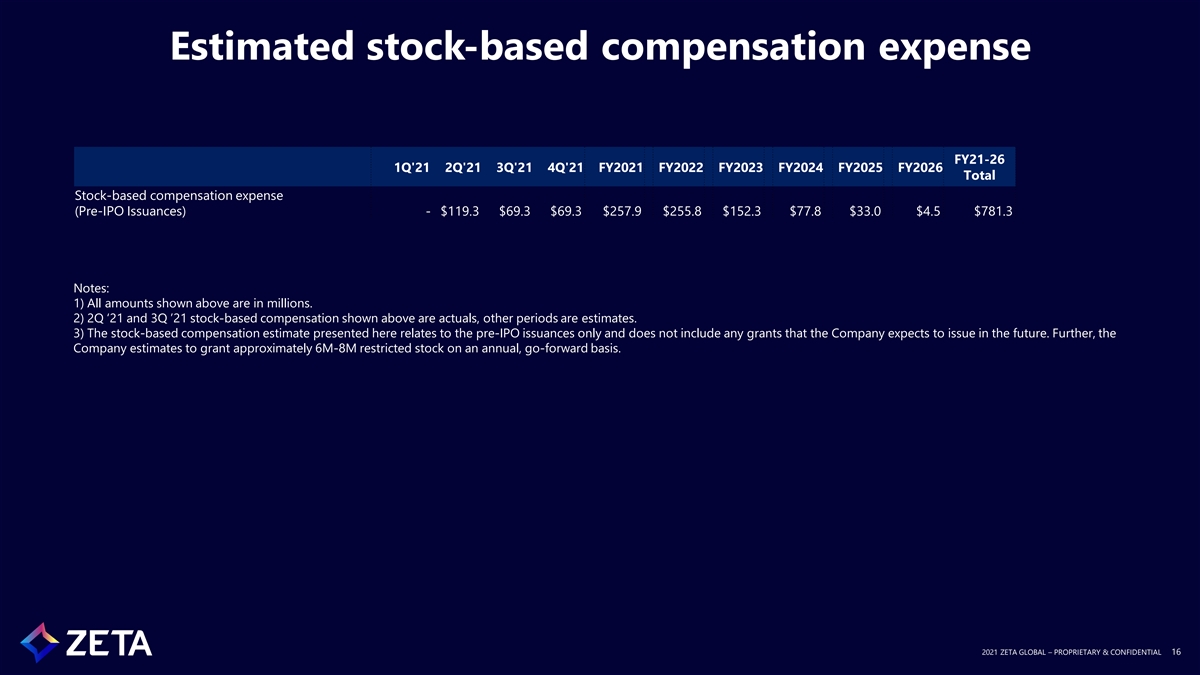
Estimated stock-based compensation expense FY21-26 1Q'21 2Q'21 3Q'21 4Q'21 FY2021 FY2022 FY2023 FY2024 FY2025 FY2026 Total Stock-based compensation expense (Pre-IPO Issuances) - $119.3 $69.3 $69.3 $257.9 $255.8 $152.3 $77.8 $33.0 $4.5 $781.3 Notes: 1) All amounts shown above are in millions. 2) 2Q ‘21 and 3Q ’21 stock-based compensation shown above are actuals, other periods are estimates. 3) The stock-based compensation estimate presented here relates to the pre-IPO issuances only and does not include any grants that the Company expects to issue in the future. Further, the Company estimates to grant approximately 6M-8M restricted stock on an annual, go-forward basis. 2021 ZETA GLOBAL – PROPRIETARY & CONFIDENTIAL 16