EXHIBIT 99.3
WILLIAM M. COBB & ASSOCIATES, INC.
Worldwide Petroleum Consultants
| 12770 Coit Road, Suite 907 | (972) 385-0354 |
| Dallas, Texas 75251 | Fax: (972) 788-5165 |
January 16, 2024
Via email: jcoates@protongreen.com, sel@protongreen.com
Mr. John Coates
Proton Green LLC
2000 Bering Drive, Suite 210
Houston TX 77057
Dear Mr. Coates,
As requested by Proton Green LLC (Proton Green), William M. Cobb & Associates, Inc. (Cobb & Associates) has prepared this resource and cash flow evaluation associated with the planned sales of beverage-grade carbon dioxide (BG CO2) at the St. Johns Field. This is an updated version of the December, 2023 analysis, incorporating revisions to the electrical expansion costs and BG CO2 recovery efficiency, applying an accelerated facility installation schedule, and adding a $200 per ton BG CO2 price sensitivity case.
Based on project timing, rate estimates, capital cost, operating cost, and estimated sales price information supplied by Proton Green, BG CO2 sales can be considered an add-on (incremental) project to the ongoing helium development project currently under way and planned for the St. Johns Field. Therefore, this analysis considers only the incremental costs and revenues associated with BG CO2 production.
The base costs are assumed to be borne by the helium development project (well capital and operating costs, flow lines, gas re-injection costs, any radon separation and treatment costs, and facility operating costs for helium recovery). This base helium development project (the “40/160/310 MMCF/D Case”) is described in the January 16, 2024 report (the Helium Report). The well drilling timing and production rates assumed for the helium development project are shown in Table 1 (note, existing wells are included in this table).
St. Johns Field CO2 Sales Evaluation
January 16, 2024
Page 2 of 7
| Table 1: Potential Helium Project Schedule | |
| | |
| | | 40/160/310 MMCF/D Case | |
| Year | | Tot
MCF/Day | | | Helium MCF/Day | | | Production Wells | | | Injection Wells | | | Total Wells Drilled | |
| 2024 | | | 0 | | | | 0 | | | | 3 | | | | 0 | | | | 3 | |
| 2025 | | | 36,127 | | | | 151 | | | | 14 | | | | 0 | | | | 14 | |
| 2026 | | | 156,127 | | | | 653 | | | | 24 | | | | 10 | | | | 34 | |
| 2027 | | | 307,363 | | | | 1,285 | | | | 18 | | | | 1 | | | | 19 | |
| 2028 | | | 310,000 | | | | 1,296 | | | | 84 | | | | 1 | | | | 85 | |
| 2029 | | | 310,000 | | | | 1,296 | | | | 47 | | | | 1 | | | | 48 | |
| 2030 | | | 310,000 | | | | 1,296 | | | | 27 | | | | 1 | | | | 28 | |
| 2031 | | | 310,000 | | | | 1,296 | | | | 19 | | | | 1 | | | | 20 | |
| 2032 | | | 310,000 | | | | 1,296 | | | | 15 | | | | 1 | | | | 16 | |
| 2033 | | | 310,000 | | | | 1,296 | | | | 13 | | | | | | | | 13 | |
| 2034 | | | 310,000 | | | | 1,296 | | | | 12 | | | | | | | | 12 | |
| 2035 | | | 310,000 | | | | 1,296 | | | | 12 | | | | | | | | 12 | |
| 2036 | | | 310,000 | | | | 1,296 | | | | 12 | | | | | | | | 12 | |
| 2037 | | | 310,000 | | | | 1,296 | | | | 12 | | | | | | | | 12 | |
| 2038 | | | 310,000 | | | | 1,296 | | | | 12 | | | | | | | | 12 | |
| 2039 | | | 310,000 | | | | 1,296 | | | | 12 | | | | | | | | 12 | |
| 2040 | | | 310,000 | | | | 1,296 | | | | 4 | | | | | | | | 4 | |
| 2041 | | | 293,556 | | | | 1,227 | | | | | | | | | | | | 0 | |
| 2042 | | | 270,952 | | | | 1,133 | | | | | | | | | | | | 0 | |
| 2043 | | | 250,089 | | | | 1,045 | | | | | | | | | | | | 0 | |
| 2044 | | | 230,832 | | | | 965 | | | | | | | | | | | | 0 | |
| 2045 | | | 213,058 | | | | 891 | | | | | | | | | | | | 0 | |
| 2046 | | | 196,652 | | | | 822 | | | | | | | | | | | | 0 | |
| 2047 | | | 181,510 | | | | 759 | | | | | | | | | | | | 0 | |
| 2048 | | | 167,534 | | | | 700 | | | | | | | | | | | | 0 | |
| 2049 | | | 154,634 | | | | 646 | | | | | | | | | | | | 0 | |
| 2050 | | | 142,727 | | | | 597 | | | | | | | | | | | | 0 | |
| 2051 | | | 131,737 | | | | 551 | | | | | | | | | | | | 0 | |
Note: Of 3 2024 Production Wells, 1 is new drill
The BG CO2 project consists of 12 separate plant installations, each consisting of a 500 ton per day (T/D) sales volume BG CO2 plant. The project schedule assumes the plants will be installed as six pairs, with the second plant of each pair bearing a “B” designation. Based on information from Proton Green, field CO2 offtake is assumed to undergo zero shrinkage as it is processed to yield BG CO2. Each plant is assumed to have a 20-year productive life. The construction and production timing and rates for the 12 plants is shown in Table 2, based on information provided by Proton Green.
St. Johns Field CO2 Sales Evaluation
January 16, 2024
Page 3 of 7
Table 2: Beverage Grade Carbon Dioxide Plant Timing and Rates
Plant Number | | CO2 Plant
Construction
Start Date | | CO2 Production
Start Date | | Months to
Complete
Plant | | | Field
Offtake
to Plant
(MCF/D) | | | Plant
Beverage
Grade CO2
Sales (MCF/D) | | | Plant
Beverage
Grade CO2
Sales (T/D) | |
| 1 | | 1/2/2024 | | 10/1/2024 | | | 9 | | | | 8,700 | | | | 8,700 | | | | 500 | |
| 1B | | 1/2/2024 | | 10/1/2024 | | | 9 | | | | 8,700 | | | | 8,700 | | | | 500 | |
| 2 | | 3/2/2024 | | 12/1/2024 | | | 9 | | | | 8,700 | | | | 8,700 | | | | 500 | |
| 2B | | 3/2/2024 | | 12/1/2024 | | | 9 | | | | 8,700 | | | | 8,700 | | | | 500 | |
| 3 | | 3/2/2024 | | 3/1/2025 | | | 12 | | | | 8,700 | | | | 8,700 | | | | 500 | |
| 3B | | 3/2/2024 | | 3/1/2025 | | | 12 | | | | 8,700 | | | | 8,700 | | | | 500 | |
| 4 | | 5/2/2024 | | 5/1/2025 | | | 12 | | | | 8,700 | | | | 8,700 | | | | 500 | |
| 4B | | 5/2/2024 | | 5/1/2025 | | | 12 | | | | 8,700 | | | | 8,700 | | | | 500 | |
| 5 | | 11/1/2024 | | 7/1/2025 | | | 8 | | | | 8,700 | | | | 8,700 | | | | 500 | |
| 5B | | 11/1/2024 | | 7/1/2025 | | | 8 | | | | 8,700 | | | | 8,700 | | | | 500 | |
| 6 | | 1/2/2025 | | 9/1/2025 | | | 8 | | | | 8,700 | | | | 8,700 | | | | 500 | |
| 6B | | 1/2/2025 | | 9/1/2025 | | | 8 | | | | 8,700 | | | | 8,700 | | | | 500 | |
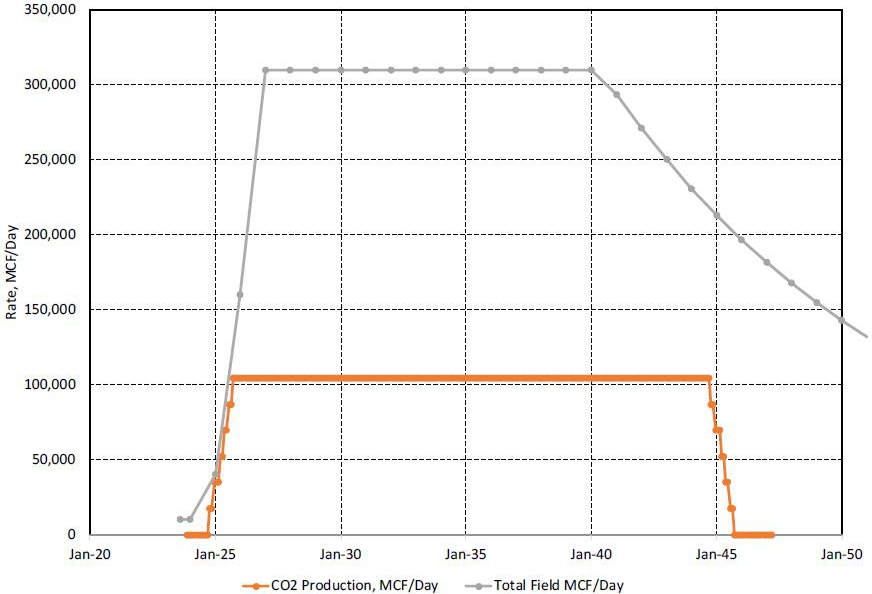
The ability of the helium project to supply the rates needed by this BG CO2 project was confirmed by plotting the total field rate from the helium project and the production rates needed to supply the 12 plants, Figure 1. Note that the helium project development will need to proceed as described in Table 1 to provide the necessary gas production to the BV CO2 plants.
St. Johns Field CO2 Sales Evaluation
January 16, 2024
Page 4 of 7
Figure 1: Total Project Rate and Rate Dedicated to CO2 Extraction Plants
Each plant’s installation and operating costs are shown in Table 3 based on information provided by Proton Green.
Table 3: Beverage Grade Carbon Dioxide Plant Costs
| 500 TPD Beverage Grade CO2 Plant | | Cost | |
| Pre-Processing | | $ | 1,000,000 | |
| Plant Capex | | $ | 8,150,000 | |
| Shipping | | $ | 160,000 | |
| Construction | | $ | 1,630,000 | |
| Loading Bays | | $ | 500,000 | |
| Spare Parts | | $ | 300,000 | |
| Storage (5500 tons) | | $ | 1,000,000 | |
| Total Plant Cost | | $ | 12,740,000 | |
| Electricity Expansion Cost (Plant 1 only) | | $ | 3,000,000 | |
| Plant Operating cost (monthly) | | $ | 16,979 | |
| Electricity (monthly) (based on $0.12 per kwh) | | | 164,376 | |
St. Johns Field CO2 Sales Evaluation
January 16, 2024
Page 5 of 7
Assuming $100/Ton BG CO2 price and the Table 3 cost values, the resulting rates and cash flow for the first plant’s initial 24 months is provided in Table 4:
Table 4: Plant 1 Rates and Cash Flow, First 24 Months
Date | | Prod. Mo. | | | CO2 Production MCF/D | | | CO2 Sales MCF/D | | | CO2 Sales T/D | | | CO2 Sales
T/Mo | | | Plant Capital Cost, $ | | | Plant Operating Cost $/Mo | | | Electrical
Cost, $/Mo | | | Electrical Expansion, $ | | | Revenue, $/Mo | | | Cash Flow | | | Cumulative Cash Flow | |
| Nov-23 | | | | | | | | | | | | | | | | | | | | | | | | | | | | | | | | | | | | | | | | | | $ | 0 | | | $ | 0 | |
| Dec-23 | | | | | | | | | | | | | | | | | | | | | | | | | | | | | | | | | | | | | | | | | | $ | 0 | | | $ | 0 | |
| Jan-24 | | | | | | | | | | | | | | | | | | | | | | $ | 12,740,000 | | | | | | | | | | | $ | 3,000,000 | | | | | | | $ | (15,740,000 | ) | | $ | (15,740,000 | ) |
| Feb-24 | | | | | | | | | | | | | | | | | | | | | | | | | | | | | | | | | | | | | | | | | | $ | 0 | | | $ | 15,740,000 | ) |
| Mar-24 | | | | | | | | | | | | | | | | | | | | | | | | | | | | | | | | | | | | | | | | | | $ | 0 | | | $ | (15,740,000 | ) |
| Apr-24 | | | | | | | | | | | | | | | | | | | | | | | | | | | | | | | | | | | | | | | | | | $ | 0 | | | $ | (15,740,000 | ) |
| May-24 | | | | | | | | | | | | | | | | | | | | | | | | | | | | | | | | | | | | | | | | | | $ | 0 | | | $ | (15,740,000 | ) |
| Jun-24 | | | | | | | | | | | | | | | | | | | | | | | | | | | | | | | | | | | | | | | | | | $ | 0 | | | $ | (15,740,000 | ) |
| Jul-24 | | | | | | | | | | | | | | | | | | | | | | | | | | | | | | | | | | | | | | | | | | $ | 0 | | | $ | (15,740,000 | ) |
| Aug-24 | | | | | | | | | | | | | | | | | | | | | | | | | | | | | | | | | | | | | | | | | | $ | 0 | | | $ | (15,740,000 | ) |
| Sep-24 | | | | | | | | | | | | | | | | | | | | | | | | | | | | | | | | | | | | | | | | | | $ | 0 | | | $ | (15,740,000 | ) |
| Oct-24 | | | 1 | | | | 8,700 | | | | 8,700 | | | | 500 | | | | 15,220 | | | | | | | $ | 16,979 | | | $ | 164,376 | | | | | | | $ | 2,435,200 | | | $ | 2,253,845 | | | $ | (13,486,155 | ) |
| Nov-24 | | | 2 | | | | 8,700 | | | | 8,700 | | | | 500 | | | | 15,220 | | | | | | | $ | 16,979 | | | $ | 164,376 | | | | | | | $ | 2,435,200 | | | $ | 2,253,845 | | | $ | (11,232,310 | ) |
| Dec-24 | | | 3 | | | | 8,700 | | | | 8,700 | | | | 500 | | | | 15,220 | | | | | | | $ | 16,979 | | | $ | 164,376 | | | | | | | $ | 2,435,200 | | | $ | 2,253,845 | | | $ | (8,978,466 | ) |
| Jan-25 | | | 4 | | | | 8,700 | | | | 8,700 | | | | 500 | | | | 15,220 | | | | | | | $ | 16,979 | | | $ | 164,376 | | | | | | | $ | 2,435,200 | | | $ | 2,253,845 | | | $ | (6,724,621 | ) |
| Feb-25 | | | 5 | | | | 8,700 | | | | 8,700 | | | | 500 | | | | 15,220 | | | | | | | $ | 16,979 | | | $ | 164,376 | | | | | | | $ | 2,435,200 | | | $ | 2,253,845 | | | $ | (4,470,776 | ) |
| Mar-25 | | | 6 | | | | 8,700 | | | | 8,700 | | | | 500 | | | | 15,220 | | | | | | | $ | 16,979 | | | $ | 164,376 | | | | | | | $ | 2,435,200 | | | $ | 2,253,845 | | | $ | (2,216,931 | ) |
| Apr-25 | | | 7 | | | | 8,700 | | | | 8,700 | | | | 500 | | | | 15,220 | | | | | | | $ | 16,979 | | | $ | 164,376 | | | | | | | $ | 2,435,200 | | | $ | 2,253,845 | | | $ | 36,914 | |
| May-25 | | | 8 | | | | 8,700 | | | | 8,700 | | | | 500 | | | | 15,220 | | | | | | | $ | 16,979 | | | $ | 164,376 | | | | | | | $ | 2,435,200 | | | $ | 2,253,845 | | | $ | 2,290,759 | |
| Jun-25 | | | 9 | | | | 8,700 | | | | 8,700 | | | | 500 | | | | 15,220 | | | | | | | $ | 16,979 | | | $ | 164,376 | | | | | | | $ | 2,435,200 | | | $ | 2,253,845 | | | $ | 4,544,604 | |
| Jul-25 | | | 10 | | | | 8,700 | | | | 8,700 | | | | 500 | | | | 15,220 | | | | | | | $ | 16,979 | | | $ | 164,376 | | | | | | | $ | 2,435,200 | | | $ | 2,253,845 | | | $ | 6,798,448 | |
| Aug-25 | | | 11 | | | | 8,700 | | | | 8,700 | | | | 500 | | | | 15,220 | | | | | | | $ | 16,979 | | | $ | 164,376 | | | | | | | $ | 2,435,200 | | | $ | 2,253,845 | | | $ | 9,052,293 | |
| Sep-25 | | | 12 | | | | 8,700 | | | | 8,700 | | | | 500 | | | | 15,220 | | | | | | | $ | 16,979 | | | $ | 164,376 | | | | | | | $ | 2,435,200 | | | $ | 2,253,845 | | | $ | 11,306,138 | |
| Oct-25 | | | 13 | | | | 8,700 | | | | 8,700 | | | | 500 | | | | 15,220 | | | | | | | $ | 16,979 | | | $ | 164,376 | | | | | | | $ | 2,435,200 | | | $ | 2,253,845 | | | $ | 13,559,983 | |
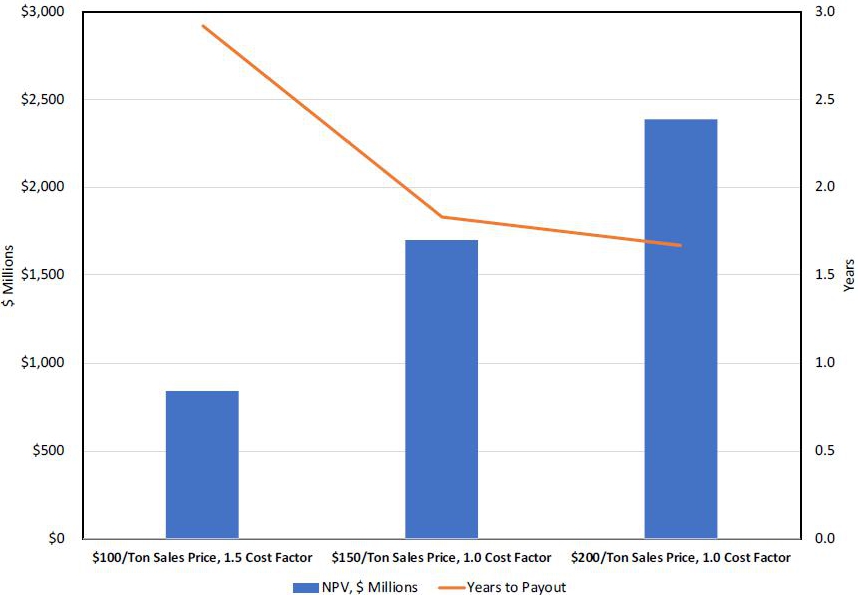
Incremental economics for the BG CO2 project over the helium development were run for three cases. The base case assumes a BG CO2 sales price at the plant gate of $150/ton, with all costs as supplied by Proton Green. The stress case assumes a BG CO2 sales price of $100/ton and all costs equal to 1.5 times the values supplied by Proton Green. A high price case assumes a BG CO2 sales price of $200/ton, with all costs as supplied by Proton Green. Under these three sets of assumptions the by-plant and total project are economic in all three cases. A summary of the by-plant and total economics is provided in Table 5, and a comparison of the results for the three cases is provided in Figure 2.
St. Johns Field CO2 Sales Evaluation
January 16, 2024
Page 6 of 7
Table 5: Estimated By-Plant and Total Project Incremental Economics
| | | $100/Ton Sales Price, 1.5 Cost Factor | | | $150/Ton Sales Price, 1.0 Cost Factor | | | $200/Ton Sales Price, 1.0 Cost Factor | |
Plant Number | | NPV, $ Millions | | | Investors
Rate of Return | | | Years to
Payout | | | NPV, $ Millions | | | Investors
Rate of
Return | | | Years to
Payout | | | NPV, $ Millions | | | Investors
Rate of
Return | | | Years to
Payout | |
| 1 | | $ | 69 | | | | 45 | % | | | 2.8 | | | $ | 146 | | | | 110 | % | | | 1.5 | | | $ | 205 | | | | 147 | % | | | 1.3 | |
| 1B | | $ | 74 | | | | 55 | % | | | 2.4 | | | $ | 148 | | | | 134 | % | | | 1.3 | | | $ | 208 | | | | 179 | % | | | 1.2 | |
| 2 | | $ | 73 | | | | 55 | % | | | 2.4 | | | $ | 146 | | | | 134 | % | | | 1.3 | | | $ | 205 | | | | 179 | % | | | 1.2 | |
| 2B | | $ | 73 | | | | 55 | % | | | 2.4 | | | $ | 146 | | | | 134 | % | | | 1.3 | | | $ | 205 | | | | 179 | % | | | 1.2 | |
| 3 | | $ | 71 | | | | 50 | % | | | 2.7 | | | $ | 142 | | | | 112 | % | | | 1.6 | | | $ | 200 | | | | 145 | % | | | 1.4 | |
| 3B | | $ | 71 | | | | 50 | % | | | 2.7 | | | $ | 142 | | | | 112 | % | | | 1.6 | | | $ | 200 | | | | 145 | % | | | 1.4 | |
| 4 | | $ | 69 | | | | 50 | % | | | 2.7 | | | $ | 140 | | | | 112 | % | | | 1.6 | | | $ | 197 | | | | 145 | % | | | 1.4 | |
| 4B | | $ | 69 | | | | 50 | % | | | 2.7 | | | $ | 140 | | | | 112 | % | | | 1.6 | | | $ | 197 | | | | 145 | % | | | 1.4 | |
| 5 | | $ | 69 | | | | 57 | % | | | 2.3 | | | $ | 138 | | | | 143 | % | | | 1.3 | | | $ | 194 | | | | 195 | % | | | 1.1 | |
| 5B | | $ | 69 | | | | 57 | % | | | 2.3 | | | $ | 138 | | | | 143 | % | | | 1.3 | | | $ | 194 | | | | 195 | % | | | 1.1 | |
| 6 | | $ | 68 | | | | 57 | % | | | 2.3 | | | $ | 136 | | | | 143 | % | | | 1.3 | | | $ | 191 | | | | 195 | % | | | 1.1 | |
| 6B | | $ | 68 | | | | 57 | % | | | 2.3 | | | $ | 136 | | | | 143 | % | | | 1.3 | | | $ | 191 | | | | 195 | % | | | 1.1 | |
| Total | | $ | 842 | | | | NA | | | | 2.9 | | | $ | 1,701 | | | | NA | | | | 1.8 | | | $ | 2,384 | | | | NA | | | | 1.7 | |
Figure 2: Beverage Grade CO2 Project Present Value and Payout Period Results
St. Johns Field CO2 Sales Evaluation
January 16, 2024
Page 7 of 7
Evaluation Stipulations
This potential volumes and values presented in this evaluation is based on the Helium Report’s estimates of in-place and potentially recoverable CO2 gas volumes in the St. Johns Field. Because these gases are not hydrocarbons, they are not subject to the SEC’s or the petroleum industry’s hydrocarbon reserves definitions. However, to put these volumes estimates into a technical context, the corresponding reserves category would be “contingent resources”, as defined by the petroleum industry’s Petroleum Resources Management System, revised in June 2018 (the PRMS).
The PRMS defines “contingent resources” as “Those quantities of petroleum estimated, as of a given date, to be potentially recoverable from known accumulations by application of development projects, but which are not currently considered to be commercially recoverable owing to one or more contingencies.” While not petroleum, the CO2 gas contained in the Field otherwise fits this definition. The “contingent” aspect of this resource relates to the current absence of a fully- budgeted development project. Commitments to the execution of both the helium and BG CO2 development projects would remove this contingency for each area subject to development, with volumes moving to reserves categories as commitments, well data, and production data warrant.
No review has been made of the agreements, if any, under which the Field would be developed and operated, nor of any sales agreements. No on-site Field inspection or review of the title to the properties has been carried out. No review has been made of the permitting requirements of this project, nor of the ability of Proton Green to obtain any such needed permits or approvals.
The results presented in the referenced reports are based on geologic and engineering judgment, and as such are estimates. There are uncertainties in the analysis of the available data. Any estimated future production volumes may or may not, in fact, occur. Volumes may increase or decrease as a result of future operations, or as the result of unforeseen geological conditions. Therefore, those results are not warranted or guaranteed as to their accuracy, but represent opinions based on the interpretation of technical data.
Cobb & Associates appreciates this opportunity to be of service to Proton Green. Please let me know if you have any questions.
| | Sincerely, |
| | |
| | WILLIAM M. COBB & ASSOCIATES, INC. |
| | Texas Registered Engineering Firm F-84 |
| | |
| | /s/ Randal M. Brush |
| | Randal M. Brush, P.E. |
| | President |
RMB |  |