As filed with the Securities and Exchange Commission on November 29, 2021
Registration
No. 333-
UNITED STATES
SECURITIES AND EXCHANGE COMMISSION
Washington, D.C. 20549
FORM
S-1
REGISTRATION STATEMENT
UNDER
THE SECURITIES ACT OF 1933
Rockley Photonics Holdings Limited
(Exact name of registrant as specified in its charter)
Cayman Islands | 3674 | Not Applicable | ||
(State or other jurisdiction of incorporation or organization) | (Primary Standard Industrial Classification Code No.) | (I.R.S. Employer Identification No.) |
3
rd
Floor, 1 Ashley RoadAltrincham, Cheshire, United Kingdom, WA14 2DT
+44 (0) 1865 292017
(Address, including zip code, and telephone number, including area code, of registrant’s principal executive offices)
Tom Adams, Esq.
General Counsel
Rockley Photonics Holdings Limited
3rd Floor, 1 Ashley Road
Altrincham, Cheshire, United Kingdom, WA14 2DT
+44 (0) 1865 292017
(Name, address, including zip code, and telephone number, including area code, of agent for service)
Copies to:
James J. Masetti, Esq.
Davina K. Kaile, Esq.
Pillsbury Winthrop Shaw Pittman LLP
2550 Hanover Street
Palo Alto, CA 94304
Tel: (650)
233-4500
Fax: (650)
233-4545
Approximate date of commencement of proposed sale to the public: From time to time after the effective date of this registration statement.
If any of the securities being registered on this Form are to be offered on a delayed or continuous basis pursuant to Rule 415 under the Securities Act of 1933, please check the following box. ☒
If this Form is filed to register additional securities for an offering pursuant to Rule 462(b) under the Securities Act, please check the following box and list the Securities Act registration statement number of the earlier effective registration statement for the same offering. ☐
If this Form is a post-effective amendment filed pursuant to Rule 462(c) under the Securities Act, check the following box and list the Securities Act registration statement number of the earlier effective registration statement for the same offering. ☐
If this Form is a post-effective amendment filed pursuant to Rule 462(d) under the Securities Act, check the following box and list the Securities Act registration statement number of the earlier effective registration statement for the same offering. ☐
Indicate by check mark whether the registrant is a large accelerated filer, an accelerated filer, a
non-accelerated
filer, a smaller reporting company, or an emerging growth company. See the definitions of “large accelerated filer,” “accelerated filer,” “smaller reporting company” and “emerging growth company” in Rule12b-2
under the Securities Exchange Act of 1934:| Large accelerated filer | ☐ | Accelerated filer | ☐ | |||
Non-accelerated filer | ☒ | Smaller reporting company | ☒ | |||
| Emerging growth company | ☒ | |||||
If an emerging growth company, indicate by check mark if the registrant has elected not to use the extended transition period for complying with any new or revised financial accounting standards provided pursuant to Section 7(a)(2)(B) of the Securities Act. ☐
CALCULATION OF REGISTRATION FEE
Title of Each Class of Securities to be Registered | Amount to be Registered (1) | Proposed Maximum Offering Price Per Share (2) | Proposed Maximum Aggregate Offering Price | Amount of Registration Fee | ||||
Ordinary Shares, nominal value $.000004026575398 per share | 7,785,560 | $6.29 | $48,971,173 | $4,540 | ||||
| (1) | Represents 69,512 ordinary shares previously issued to the selling shareholder named herein and 7,716,048 ordinary shares that are issuable pursuant to a purchase agreement with the selling shareholder named herein. Pursuant to Rule 416(a) under the Securities Act of 1933, as amended (the “Securities Act”), the registrant is also registering hereunder an indeterminate number of shares that may be issued and resold resulting from stock splits, stock dividends or similar transactions. |
| (2) | Estimated pursuant to Rule 457(c) under the Securities Act solely for the purpose of calculating the registration fee, based upon the average of the high and low prices for the registrant’s ordinary shares as reported on the New York Stock Exchange on November 23, 2021. |
The Registrant hereby amends this registration statement on such date or dates as may be necessary to delay its effective date until the Registrant shall file a further amendment which specifically states that this registration statement shall thereafter become effective in accordance with Section 8(a) of the Securities Act of 1933, as amended, or until the registration statement shall become effective on such date as the Securities and Exchange Commission, acting pursuant to said Section 8(a), may determine.
The information in this preliminary prospectus is not complete and may be changed. Neither we nor the selling shareholder may sell these securities until the registration statement filed with the Securities and Exchange Commission is effective. This preliminary prospectus is not an offer to sell these securities and is not soliciting an offer to buy these securities in any jurisdiction where the offer or sale is not permitted.
SUBJECT TO COMPLETION, DATED NOVEMBER 29, 2021
PROSPECTUS

Rockley Photonics Holdings Limited
7,785,560 Ordinary Shares
This prospectus relates to the offer and sale from time to time of up to 7,785,560 ordinary shares, nominal value $0.000004026575398 per share, of Rockley Photonics Holdings Limited, a Cayman Islands exempted company, by Lincoln Park Capital Fund, LLC, or Lincoln Park or the selling shareholder.
The ordinary shares being offered by the selling shareholder may be issued pursuant to the purchase agreement dated November 15, 2021 that we entered into with Lincoln Park. See “The Lincoln Park Transaction” for a description of that agreement and “Selling Shareholder” for additional information regarding Lincoln Park. The prices at which Lincoln Park may sell the shares will be determined by the prevailing market price for the shares or in negotiated transactions.
We are not selling any securities under this prospectus and will not receive any of the proceeds from the sale of shares by the selling shareholder.
The selling shareholder may sell the ordinary shares described in this prospectus in a number of different ways and at varying prices. See “Plan of Distribution” for more information about how the selling shareholder may sell the ordinary shares being registered pursuant to this prospectus. The selling shareholder is an “underwriter” within the meaning of Section 2(a)(11) of the Securities Act of 1933, as amended (the “Securities Act”).
The selling shareholder will pay all brokerage fees and commissions and similar expenses. We will pay the expenses (except brokerage fees and commissions and similar expenses) incurred in registering the shares, including legal and accounting fees. See “Plan of Distribution.”
We are an “emerging growth company” and a “smaller reporting company” as those terms are defined under the federal securities laws and, as such, have elected to comply with certain reduced public company disclosure and reporting requirements.
Our ordinary shares are listed on the New York Stock Exchange under the symbol “RKLY.” On November 26, 2021, the closing price of our ordinary shares was $6.53 per share.
Investing in our securities involves a high degree of risk. See “Risk Factors” beginning on page 10 of this prospectus and under similar headings in any amendments or supplements to this prospectus to read about factors you should consider before buying our securities.
Neither the Securities and Exchange Commission nor any state securities commission has approved or disapproved of these securities or determined if this prospectus is truthful or complete. Any representation to the contrary is a criminal offense.
The date of this prospectus is , 2021.
TABLE OF CONTENTS
| i | ||||
| i | ||||
| iii | ||||
| 1 | ||||
| 3 | ||||
| 6 | ||||
| 10 | ||||
| 50 | ||||
| 56 | ||||
| 57 | ||||
| 58 | ||||
| 60 | ||||
| 60 | ||||
| 61 | ||||
| 67 | ||||
| 71 | ||||
| 93 | ||||
| 114 | ||||
| 124 | ||||
| 133 | ||||
| 138 | ||||
| 140 | ||||
| 148 | ||||
| 150 | ||||
| 154 | ||||
| 154 | ||||
| 154 | ||||
| 154 | ||||
| F-1 |
ABOUT THIS PROSPECTUS
This prospectus is part of a registration statement on Form
S-1
that we filed with the Securities and Exchange Commission (the “SEC”), which includes exhibits and provides more detail of the matters discussed in this prospectus. You should read this prospectus and the related exhibits filed with the SEC, together with the additional information described under the heading “Where You Can Find More Information” before making your investment decision. The selling shareholder may, from time to time, sell the securities offered by them described in this prospectus. We will not receive any proceeds from the sale by such selling shareholder of the securities offered by them described in this prospectus.Neither we nor the selling shareholder have authorized anyone to provide you with any information or to make any representations other than those contained in this prospectus or any applicable prospectus supplement or any free writing prospectuses prepared by or on behalf of us or to which we have referred you. Neither we nor the selling shareholder take responsibility for, and can provide no assurance as to the reliability of, any other information that others may give you. Neither we nor the selling shareholder will make an offer to sell these securities in any jurisdiction where the offer or sale is not permitted.
Except as otherwise set forth in this prospectus, neither we nor the selling shareholder have taken any action to permit a public offering of these securities outside the United States or to permit the possession or distribution of this prospectus outside the United States. Persons outside the United States who come into possession of this prospectus must inform themselves about and observe any restrictions relating to the offering of these securities and the distribution of this prospectus outside the United States.
We may also provide a prospectus supplement or post-effective amendment to the registration statement to add information to, or update or change information contained in, this prospectus. You should read both this prospectus and any applicable prospectus supplement or post-effective amendment to the registration statement together with the additional information to which we refer you in the sections of this prospectus entitled “Where You Can Find More Information.”
On August 11, 2021, Rockley Photonics Holdings Limited, an exempted company incorporated in the Cayman Islands with limited liability, Rockley Photonics Limited, a company organized under the laws of England and Wales (“Rockley UK”), and SC Health Corporation, an exempted company incorporated in the Cayman Islands with limited liability (“SC Health”), consummated the previously announced business combination (the “Business Combination”) contemplated by the Business Combination Agreement and Plan of Merger, dated March 19, 2021 (the “Business Combination Agreement”), by and among HoldCo, Rockley UK, SC Health, and Rockley Mergersub Limited, an exempted company incorporated in the Cayman Islands with limited liability and a direct wholly owned subsidiary of HoldCo (“Merger Sub”). In connection with the closing of the Business Combination (the “Closing”), Rockley UK became a direct wholly owned subsidiary of HoldCo and Merger Sub was merged with and into SC Health, with SC Health surviving the merger and becoming a direct wholly owned subsidiary of HoldCo.
Unless the context indicates otherwise, references in this prospectus to “HoldCo,” the “Company,” “Rockley,” “we,” “us,” “our” and similar terms refer to Rockley Photonics Holdings Limited, and, as the context requires, its consolidated subsidiaries (including Rockley UK and SC Health).
CAUTIONARY STATEMENT REGARDING FORWARD-LOOKING STATEMENTS
All statements in this prospectus that are not historical in nature constitute forward-looking statements within the meaning of the Private Securities Litigation Reform Act of 1995. These forward-looking statements include, without limitation, statements regarding the financial position, business strategy, and the plans and objectives of management, and Rockley’s product development plans and timeline and anticipated customer and strategic relationships, and are not guarantees of performance. When used in this prospectus, The words
i
“anticipate,” “believe,” “can,” “continue,” “could,” “developing,” “enable,” “estimate,” “eventual,” “expand, “expect,” “focus,” “future,” “goal,” “intend,” “may,” “might,” “opportunity,” “outlook,” “plan,” “possible,” “position,” “potential,” “predict,” “project,” “revolutionize,” “seem,” “should,” “trend,” “will,” “would” or other terms that predict or indicate future events, trends, or expectations, and similar expressions or the negative of such expressions may identify forward-looking statements, but the absence of these words or terms does not mean that a statement is not forward-looking. Forward-looking statements in this prospectus include, but are not limited to, statements regarding the following:
| • | Rockley’s ability to recognize the anticipated benefits of the Business Combination, which may be affected by, among other things, competition and the ability of the combined business to grow and manage growth profitably; |
| • | Rockley’s financial and business performance following the Business Combination, including its expectations regarding expenses and other financial measures and business metrics; |
| • | Rockley’s strategy, future operations, financial position, prospects and plans; |
| • | the implementation, market acceptance, and success of Rockley’s business model; |
| • | developments and expectations relating to Rockley’s competitors, target markets, and industry; |
| • | Rockley’s future capital requirements and sources and uses of cash; |
| • | Rockley’s ability to obtain funding for its product development plans, execution of its business strategy, and its operations; |
| • | Rockley’s business, product development plans, and opportunities; |
| • | the outcome of any known and unknown litigation and regulatory proceedings; |
| • | Rockley’s anticipated growth and market opportunities; |
| • | Rockley’s plans to commercialize its products and services, and anticipated timing thereof; |
| • | Rockley’s expectations as to when it may generate sufficient revenue from the sale of its products and services to cover expansion plans, operating expenses, working capital, and capital expenditures; |
| • | the development status and anticipated timeline for commercial production of Rockley’s products; |
| • | Rockley’s plans for products under development and future products and anticipated features and benefits thereof; |
| • | the status and expectations regarding Rockley’s customer and strategic partner, and potential customer and strategic partner relationships; |
| • | the total addressable markets for Rockley’s products and technology; |
| • | the ability of Rockley to increase market share in its existing markets or any new markets it may enter; |
| • | Rockley’s ability to obtain any required regulatory approvals, including any required U.S. Food and Drug Administration (“FDA”) approvals, in connection with its anticipated products and technology; |
| • | Rockley’s ability to maintain an effective system of internal control over financial reporting; |
| • | Rockley’s ability to maintain and protect its intellectual property; |
| • | Rockley’s success in retaining or recruiting, or changes required in, officers, key employees, or directors; the ability of Rockley to manage its growth effectively; |
| • | the ability of Rockley to achieve and maintain profitability in the future; |
| • | Rockley’s sale of ordinary shares to Lincoln Park pursuant to the terms of the Purchase Agreement (as defined below) and its ability to register and maintain the registration of the shares issued and issuable thereunder; |
ii
| • | Rockley’s anticipated use of the net proceeds from the potential sale of ordinary shares to Lincoln Park; and |
| • | the impact of the COVID-19 pandemic. |
The forward-looking statements contained in this prospectus are based on various assumptions, whether or not identified in this prospectus, and on Rockley’s current expectations, beliefs, and assumptions and are not predictions of actual performance. These forward-looking statements involve a number of risks, uncertainties (many of which are beyond Rockley’s control), or other assumptions that may cause actual results or performance to differ materially from those expressed or implied by these forward-looking statements. We discuss many of these risk and uncertainties in greater detail under the section entitled “Risk Factors” contained in this prospectus and in our SEC filings. If any of these risks or uncertainties materialize, or should any of these assumptions prove incorrect, actual results may differ materially from those discussed in or implied by these forward-looking statements. There can be no assurance that future developments affecting Rockley will be those that have been anticipated.
Given these risks and uncertainties, you should not place undue reliance on these forward-looking statements. Additional cautionary statements or discussions of risks and uncertainties that could affect our results or the achievement of the expectations described in forward-looking statements may also be contained in any accompanying prospectus supplement.
These forward-looking statements made by us in this prospectus and any accompanying prospectus supplement speak only as of the date of this prospectus and any accompanying prospectus supplement. Except as required under the federal securities laws and rules and regulations of the SEC, we expressly disclaim any obligation or undertaking to release publicly any updates or revisions to any forward-looking statements contained herein to reflect any change in our expectations with regard thereto or any change in events, conditions or circumstances on which any such statement is based. You should, however, review additional disclosures we make in our Annual Report on Form
10-K,
Quarterly Reports on Form10-Q,
and Current Reports on Form8-K
filed with the SEC.You should read this prospectus and any accompanying prospectus supplement completely and with the understanding that our actual future results, levels of activity and performance as well as other events and circumstances may be materially different from what we expect. We qualify all of our forward-looking statements by these cautionary statements.
INDUSTRY AND MARKET DATA
In this prospectus, we rely on and refer to industry data, information, and statistics regarding the markets in which we compete from research as well as from publicly available information, industry and general publications and research and studies conducted by third parties. We have supplemented this information where necessary with our own internal estimates, considering publicly available information about other industry participants and our management’s best view as to information that is not publicly available. This information appears in “Management’s Discussion and Analysis of Financial Condition and Results of Operations,” “Business” and other sections of this prospectus. We have taken such care as we consider reasonable in the extraction and reproduction of information from such data from third party sources.
Industry publications, research, studies, and forecasts generally state that the information they contain has been obtained from sources believed to be reliable, but that the accuracy and completeness of such information is not guaranteed. Forecasts and other forward-looking information obtained from these sources are subject to the same qualifications and uncertainties as the other forward-looking statements in this prospectus. These forecasts and forward-looking information are subject to uncertainty and risk due to a variety of factors, including those described under “Risk Factors.” These and other factors could cause results to differ materially from those expressed in the forecasts or estimates from independent third parties and us.
iii
SUMMARY
This summary highlights selected information appearing elsewhere in this prospectus. Because it is a summary, it may not contain all of the information that may be important to you. To understand this offering fully, you should read this entire prospectus carefully, including the information set forth under the heading “Risk Factors” and our financial statements.
The Company
Rockley specializes in the research and development of integrated silicon photonics chipsets and have developed a versatile, application specific, third-generation silicon photonics platform specifically designed for the optical integration challenges facing numerous mega-trend markets. Rockley has partnered with multiple
tier-1
customers across the markets to deliver complex optical systems required for transformational sensor, communications, and medical product realization.We have developed a unique sensing platform that we believe can reshape the wellness and healthcare industries through multiple applications in
non-invasive,
multi-modal biomarker monitoring. We believe products based on our technology platform could have the potential to unlock and accelerate advancements in areas such as early disease detection, nutrition management, and preventative healthcare delivery through continuous health and wellness monitoring.To date, we have been engaged in developing customer-specific designs of our silicon photonics chipsets for incorporation into our customers’ end products. Accordingly, all of our products are presently in the development stage and we do not currently have any of our own end products in commercial production and have not yet shipped any products commercially. Our unique sensing platform has been built upon our silicon photonics technology, which enables compelling sensor performance, power, resolution, and density. This technology has the potential to allow monitoring devices, currently the size of clinical machines, to be condensed to the size of a wearable device. We believe this in turn has the potential to unlock additional uses in consumer electronics and medical devices. The resulting combination of technologies and manufacturing
know-how
is the “full-stack Rockley Platform” which is made up of photonic integrated circuits (“PICs”) in silicon with integratedIII-V
devices (devices incorporating certain conductor elements that offer superior electronic properties, such as lasers), application-specific electronic integrated circuits (“ASICs”), photonic and electronicco-packaging,
together with biosensing algorithms and AI cloud analytics, firmware/software, system architecture, and hardware design.To date, we have generated revenue primarily from
non-recurring
engineering (“NRE”) and development services for customer-specific designs of silicon photonics chipsets for incorporation into their customers’ end products and we have financed our operations primarily through the issuance of convertible loan notes, as well as private placements of ordinary shares. From the date of our formation through September 30, 2021, we have raised aggregate gross proceeds of approximately $290.0 million from the issuance of convertible loan notes and ordinary shares. For the nine months ended September 30, 2021, we incurred a net loss of $153.3 million and utilized $91.9 million in cash to fund our operations.On August 11, 2021, Rockley, Rockley UK, and SC Health consummated the Business Combination pursuant to the Business Combination Agreement dated as of March 19, 2021 among HoldCo, SC Health, Rockley UK and Merger Sub. Rockley was deemed to be the accounting acquirer in the Merger based on an analysis of the criteria outlined in Accounting Standards Codification 805. Accordingly, the historical financial statements of Rockley UK became the historical financial statements of the combined company, upon the consummation of the Merger.
1
Pursuant to the Business Combination Agreement, each of the following transactions occurred in the following order: (i) pursuant to a scheme of arrangement approved by the UK courts (the “Scheme”), all of Rockley UK’s ordinary shares, including shares issued immediately prior to the Scheme becoming effective as a result of the conversion of then-outstanding convertible loan notes and the exercise of warrants, were transferred by Rockley UK shareholders in exchange for an equivalent number of shares in HoldCo; (ii) the holders of options to purchase shares in Rockley UK rolled over their options into new options to purchase shares in HoldCo; (iii) warrants to purchase shares in Rockley UK (other than one warrant instrument that by its terms was replicated at HoldCo) not exercised for shares in Rockley UK prior to the effectiveness of the Scheme described above were cancelled, such that immediately following the Scheme, Rockley UK became a direct wholly owned subsidiary of HoldCo; (iv) HoldCo completed a stock split to prepare its share capital for Merger Sub’s merger into SC Health; (v) certain investors (including entities affiliated with the Sponsor) purchased an aggregate of $150,000,000 of ordinary shares in HoldCo pursuant to the PIPE financing in connection with the Business Combination; (vi) on August 11, 2021, Merger Sub was merged with and into SC Health, with SC Health surviving the merger and becoming a direct wholly owned subsidiary of HoldCo; and (vii) the ordinary shares and warrants in SC Health were exchanged for ordinary shares and warrants in HoldCo.
Our ordinary shares and Public Warrants are currently listed on the New York Stock Exchange (“NYSE”) under the symbols “RKLY” and “RKLY.WS,” respectively.
The rights of holders of our ordinary shares are governed by our Second Amended and Restated Memorandum and Articles of Association (the “Articles of Association”), and the laws of the Cayman Islands. See “Description of Our Securities.”
Corporate Information
HoldCo was incorporated in the Cayman Islands in March 2021 to facilitate the Business Combination. Rockley Photonics Limited was founded in 2013 in the United Kingdom. SC Health was incorporated in the Cayman Islands in December 2018 as a special purpose acquisition company, formed for the purpose of effecting a merger, capital stock exchange, asset acquisition, stock purchase, recapitalization, reorganization or similar business combination with one or more businesses. SC Health completed its initial public offering in July 2019. In August 2021, Rockley Mergersub Limited, a wholly owned subsidiary of HoldCo, merged with and into SC Health (which was subsequently renamed Rockley Photonics Cayman Limited) and securityholders of Rockley UK exchanged their securities in Rockley UK for ordinary shares of HoldCo, with each of Rockley UK and SC Health surviving the merger as a wholly owned subsidiary of Rockley. Our principal executive offices are located at 3
rd
Floor, 1 Ashley Road, Altrincham, Cheshire, United Kingdom. Our telephone number is +44 (0) 1865 292017. Our website address is www.rockleyphotonics.com. Information contained on our website or connected thereto does not constitute part of, and is not incorporated by reference into, this prospectus or the registration statement of which it forms a part.Implications of Being an Emerging Growth Company and a Smaller Reporting Company
We qualify as an “emerging growth company” as defined in the Jumpstart Our Business Startups Act of 2012 (the “JOBS Act”). As an emerging growth company, we intend to take advantage of certain exemptions from specified disclosure and other requirements that are otherwise generally applicable to public companies. These exemptions include:
| • | not being required to comply with the auditor attestation requirements for the assessment of our internal control over financial reporting provided by Section 404 of the Sarbanes-Oxley Act of 2002; |
| • | reduced disclosure obligations regarding executive compensation; and |
2
| • | not being required to hold a nonbinding advisory vote on executive compensation or seek shareholder approval of any golden parachute payments not previously approved. |
We intend to take advantage of these provisions for up to five years or such earlier time that we are no longer an emerging growth company. We would cease to be an emerging growth company upon the earliest to occur of (1) the last day of the fiscal year (a) following the fifth anniversary of the date of the first sale of common equity securities pursuant to an effective registration statement, (b) in which we have total annual gross revenue of at least $1.07 billion, or (c) in which we are deemed to be a large accelerated filer, which means the market value of our ordinary shares that is held by
non-affiliates
exceeds $700 million as of the prior June 30th, and (2) the date on which we have issued more than $1.0 billion innon-convertible
debt during the prior three-year period.We are also deemed to be a “smaller reporting company” as defined in Rule
12b-2
under the Securities Exchange Act of 1934, as amended (the “Exchange Act”), and are thus allowed to provide simplified executive compensation disclosures in our filings with the Securities and Exchange Commission (the “SEC”), will be exempt from the provisions of Section 404(b) of Sarbanes-Oxley requiring that an independent registered public accounting firm provide an attestation report on the effectiveness of internal control over financial reporting and will have certain other reduced disclosure obligations with respect to our SEC filings. We may choose to take advantage of some or all of these accommodations. We have taken advantage of reduced reporting requirements in this prospectus. Accordingly, the information contained herein may be different from the information you receive from U.S. public companies that do not qualify as an emerging growth company or a smaller reporting company.For additional details, see “Risk Factors —We qualify as an “emerging growth company” within the meaning of the Securities Act, and if we take advantage of certain exemptions from disclosure requirements available to emerging growth companies, it could make our securities less attractive to investors and may make it more difficult to compare our performance to the performance of other public companies.”
Risks Related to Ownership of Our Ordinary Shares
—
Risk Factor Summary
Rockley’s business and its ability to execute its strategy or realize the anticipated benefits of the Business Combination, and any investment in its securities are subject to risks and uncertainties, many of which are beyond Rockley’s control. You should carefully consider and evaluate all of the risks and uncertainties with respect to any investment in the securities of Rockley, including, but not limited to, the following and those discussed under “Risk Factors.” References below to Rockley shall be deemed to also refer to Rockley and its subsidiaries, as the context requires or as appropriate.
Risks Related to Rockley’s Business and Industry; Customer-Related Risks
| • | If Rockley does not fully develop or commercialize its products and services, or if such products and services experience significant delays, Rockley’s business, financial condition, and results of operation will be materially and adversely affected. |
| • | Rockley has a history of recurring losses and a significant accumulated deficit, which raises substantial doubt about its ability to continue as a “going concern.” Rockley expects to incur significant research and development expenses and devote substantial resources to commercializing new products, which could increase its losses and negatively impact its ability to achieve or maintain profitability. |
| • | If the end products into which Rockley’s products are incorporated are not fully developed and commercialized or do not achieve widespread market acceptance, or if such products experience |
3
delays, cancellations, or reductions, or if Rockley’s products are not selected for inclusion in its customers’ end products, are not adopted in other industry verticals or use cases, or are not adopted by leading consumer and medical device companies, Rockley’s business will be materially and adversely affected. |
| • | Rockley’s estimates and expectations as to its financial performance are based upon assumptions, analyses, and internal estimates developed by Rockley’s management. If these assumptions, analyses, or estimates prove to be incorrect or inaccurate, Rockley’s actual operating results may differ materially from any such estimates and expectations. |
| • | Rockley expects its results of operations to fluctuate on a quarterly and annual basis, which could cause Rockley’s stock price to fluctuate or decline. |
| • | If Rockley is unable to manage its growth or scale its operations, its business and operating results could be materially and adversely affected. |
| • | Market opportunity estimates and growth forecasts are subject to significant uncertainty and are based on assumptions and estimates that may not prove to be accurate. |
| • | Rockley’s international operations expose it to operational, financial, and regulatory risks, which could harm Rockley’s business. |
| • | Rockley is susceptible to supply shortages, long lead times for components, and supply changes, any of which could disrupt its supply chain and could delay deliveries of its products to customers, which in turn could adversely affect Rockley’s business, results of operations, and financial condition. |
| • | If Rockley is unable to sell its products to its target customers, including large corporations with substantial negotiating power, or is unable to enter into agreements with customers and suppliers on satisfactory terms, its prospects and results of operations will be adversely affected. |
| • | Rockley currently depends on a few large customers for a substantial portion of its revenue. The loss of, or a significant reduction in, orders from Rockley’s customers, or Rockley’s failure to diversify its customer base, could significantly reduce its revenue and adversely impact Rockley’s operating results. |
| • | Because Rockley does not anticipate long-term purchase commitments with its customers, orders may be cancelled, reduced, or rescheduled with little or no notice, which in turn exposes Rockley to inventory risk, and may cause its business and results of operations to suffer. |
| • | Rockley’s business depends substantially on the efforts of its executive officers, including its Chief Executive Officer and founder, Dr. Andrew Rickman. |
Regulatory, Intellectual Property, Infrastructure, Cybersecurity and Privacy Risks
| • | Rockley’s failure to comply with applicable governmental export and import control laws and regulations, including those related to the use, distribution, and sale of its products, FDA clearance or approval requirements, or privacy, data protection, and information security requirements in the jurisdictions in which Rockley operates could materially harm its business and operating results. |
| • | Rockley may not be able to adequately protect or enforce its intellectual property rights or prevent unauthorized parties from copying or reverse engineering its products or technology. Further, Rockley’s intellectual property applications, including patent applications, may not be approved or granted. |
| • | A network or data security incident or disruption or performance issues with Rockley’s network infrastructure could harm its brand, reputation, and business, as well as its operating results. |
4
Risks Related to Financial and Accounting Matters
| • | Rockley’s failure to raise additional capital or generate the significant capital necessary to expand its operations could reduce its ability to compete and could harm its business. |
| • | In preparing Rockley’s consolidated financial statements, Rockley makes good faith estimates and judgments that may change or turn out to be erroneous, which could adversely affect Rockley’s operating results. |
Risks Related to Being a Public Company, Rockley’s Ordinary Shares, and General Risks
| • | Rockley’s ordinary shares may not remain eligible for listing on the NYSE. |
| • | If the Business Combination’s benefits do not meet the expectations of investors or securities analysts, the market price of Rockley’s securities, may decline. |
| • | Rockley may be required to take write downs or write offs, or may be subject to restructuring, impairment or other charges that could have a significant negative effect on Rockley’s financial condition, results of operations and the market price of Rockley’s ordinary shares. |
| • | The unaudited pro forma financial information included herein may not be indicative of actual results of Rockley after the Business Combination. |
| • | If analysts do not publish or cease publishing research or reports about Rockley or if they change their recommendations regarding Rockley’s securities, the price and trading volume of Rockley’s securities could decline. |
| • | The requirements of being a public company may strain Rockley’s resources, divert management’s attention, and affect its ability to attract and retain qualified board members. |
| • | The global COVID-19 pandemic could harm Rockley’s business, financial condition, results of operations, and prospects. |
| • | The sale or issuance of our ordinary shares to Lincoln Park may cause dilution, and the sale of the ordinary shares acquired by Lincoln Park, or the perception that such sales may occur, could cause the price of our ordinary shares to fall. |
| • | We may not have access to the full amount available under the Purchase Agreement with Lincoln Park. |
5
THE OFFERING
On November 15, 2021, we entered into a purchase agreement with Lincoln Park, which we refer to in this prospectus as the “Purchase Agreement,” pursuant to which Lincoln Park has agreed to purchase from us up to an aggregate of $50,000,000 of our ordinary shares (subject to certain limitations) from time to time over a
24-month
period. Also on November 15, 2021, we entered into a registration rights agreement with Lincoln Park, which we refer to in this prospectus as the “Registration Rights Agreement,” pursuant to which we have filed with the SEC the registration statement that includes this prospectus to register for resale under the Securities Act of 1933, as amended, or the Securities Act, the ordinary shares that may be issued to Lincoln Park under the Purchase Agreement. Pursuant to the terms of the Purchase Agreement, at the time we signed the Purchase Agreement and the Registration Rights Agreement, we issued 69,512 Commitment Shares (as defined in the Purchase Agreement) to Lincoln Park as consideration for its commitment to purchase our ordinary shares under the Purchase Agreement. The 69,512 Commitment Shares are also covered by this prospectus.We do not have the right to commence any sales of our ordinary shares to Lincoln Park under the Purchase Agreement until certain conditions set forth in the Purchase Agreement have been satisfied, including that the SEC has declared effective the registration statement that includes this prospectus. Thereafter, from time to time, at our sole discretion, we may direct Lincoln Park to purchase our ordinary shares in amounts up to 160,000 shares on any single business day, which amounts may be increased up to 250,000 shares, depending on the market price of our ordinary shares at the time of sale and subject to a maximum commitment by Lincoln Park of $3,500,000 per single purchase, which we refer to in this prospectus as “Regular Purchases.” In addition, at our discretion, Lincoln Park has committed to purchase other “accelerated amounts” and/or “additional accelerated amounts” under certain circumstances. We will control the timing and amount of any sales of our ordinary shares to Lincoln Park. The purchase price of the shares that may be sold to Lincoln Park in Regular Purchases under the Purchase Agreement will be based on the market price of our ordinary shares preceding the time of sale as computed under the Purchase Agreement. The purchase price per share will be equitably adjusted for any reorganization,
recapitalization, non-cash dividend,
stock split, or other similar transaction occurring during the business days used to compute such price. We may at any time, in our sole discretion, terminate the Purchase Agreement without fee, penalty or cost upon one business day notice. There are no restrictions on future financings, rights of first refusal, participation rights, penalties or liquidated damages in the Purchase Agreement or Registration Rights Agreement, other than a prohibition on our entering into certain types of transactions that are defined in the Purchase Agreement as “Variable Rate Transactions.” Lincoln Park may not assign or transfer its rights and obligations under the Purchase Agreement.As of November 12, 2021, there were 127,219,418 of our ordinary shares outstanding, of which 112,744,434 shares were held
by non-affiliates.
The 127,031,025 ordinary shares outstanding as of November 8, 2021 includes 69,512 Commitment Shares previously issued to Lincoln Park under the Purchase Agreement. If all of the 7,785,560 ordinary shares offered by Lincoln Park under this prospectus were issued and outstanding (without taking into account the 19.99% shareholder approval limitation or the $50,000,000 total commitment available), such shares would represent approximately 5.8% of the total number of ordinary shares outstanding and approximately 6.5% of the total number of outstanding ordinary shares held bynon-affiliates,
in each case as of the date hereof. Although the Purchase Agreement provides that we may sell up to $50,000,000 of our ordinary shares to Lincoln Park, 7,785,560 ordinary shares are being offered under this prospectus, which represents shares which have been or may be issued to Lincoln Park in the future under the Purchase Agreement, if and when we sell shares to Lincoln Park under the Purchase Agreement. Depending on the market prices of our ordinary shares at the time we elect to issue and sell shares to Lincoln Park under the Purchase Agreement, we may need to register for resale under the Securities Act additional ordinary shares in order to receive aggregate gross proceeds equal to the $50,000,000 total commitment available to us under the Purchase Agreement. Conversely, depending on the market prices of our ordinary shares at the time of any sales to Lincoln Park under the Purchase Agreement, we may need to sell less than the number of ordinary shares being offered under this6
prospectus, given the $50,000,000 total commitment available to us under the Purchase Agreement. If we elect to issue and sell more than the 7,785,560 shares offered under this prospectus to Lincoln Park, which we have the right, but not the obligation, to do depending on the market prices of our ordinary shares subject to the $50,000,000 total commitment available to us under the Purchase Agreement, we must first register for resale under the Securities Act any such additional shares, which could cause additional substantial dilution to our shareholders. The number of shares ultimately offered for resale by Lincoln Park is dependent upon the number of shares we sell to Lincoln Park under the Purchase Agreement.
Under applicable rules of the NYSE, in no event may we issue or sell to Lincoln Park under the Purchase Agreement more than 19.99% of our ordinary shares outstanding immediately prior to the execution of the Purchase Agreement (which is 25,431,161 ordinary shares based on 127,219,418 shares outstanding immediately prior to the execution of the Purchase Agreement), which limitation we refer to in this prospectus as the “Exchange Cap,” unless (i) we obtain shareholder approval to issue ordinary shares in excess of the Exchange Cap or (ii) the average price of all applicable sales of our ordinary shares to Lincoln Park under the Purchase Agreement equals or exceeds $6.38 per share (which represents the average closing price of our ordinary shares for the five trading days ending on November 12, 2021, the trading day immediately preceding the date the Purchase Agreement was executed) plus an incremental amount, such that issuances and sales of our ordinary shares to Lincoln Park under the Purchase Agreement would be exempt from the Exchange Cap limitation under applicable NYSE rules. In any event, the Purchase Agreement specifically provides that we may not issue or sell any of our ordinary shares under the Purchase Agreement if such issuance or sale would breach any applicable NYSE rules.
The Purchase Agreement also prohibits us from directing Lincoln Park to purchase any ordinary shares if those shares, when aggregated with all other ordinary shares then beneficially owned by Lincoln Park and its affiliates, would result in Lincoln Park and its affiliates having beneficial ownership, at any single point in time, of more than 4.99% of the then issued and outstanding ordinary shares, as calculated pursuant to Section 13(d) of the Securities Exchange Act of 1934, as amended, or the Exchange Act, and
Rule 13d-3 thereunder,
which limitation we refer to in this prospectus as the “Beneficial Ownership Cap.”There are substantial risks to our shareholders as a result of the sale and issuance of ordinary shares to Lincoln Park under the Purchase Agreement. These risks include substantial dilution, significant declines in our stock price, and our inability to draw sufficient funds when needed. See “Risk Factors.” Issuance of our ordinary shares to Lincoln Park under the Purchase Agreement will not affect the rights or privileges of our existing shareholders, except that the economic and voting interests of our existing shareholders will be diluted as a result of any such issuance. Although the number of ordinary shares that our existing shareholders own will not decrease, the shares owned by our existing shareholders will represent a smaller percentage of our total outstanding shares after any such issuance to Lincoln Park.
7
Securities Offered
Ordinary shares to be offered by the selling shareholder | 69,512 Commitment Shares issued to Lincoln Park upon execution of the Purchase Agreement. We will not receive any cash proceeds from the issuance of these Commitment Shares. |
| Up to 7,716,048 shares we may sell to Lincoln Park under the Purchase Agreement from time to time after the date of this prospectus (subject to the limitations under the Purchase Agreement, including the $50,000,000 total commitment available thereunder). |
Ordinary shares outstanding prior to this offering | 126,675,098 ordinary shares |
Ordinary shares to be outstanding after this offering | 134,460,658 shares, assuming the sale of a total of 7,716,048 ordinary shares to Lincoln Park and the 69,512 Commitment Shares issued to Lincoln Park. The actual number of shares issued will vary depending upon the actual sales prices under this offering. |
Use of proceeds | We will receive no proceeds from the sale of ordinary shares by Lincoln Park in this offering. We may receive up to $50,000,000 aggregate gross proceeds under the Purchase Agreement from any sales we make to Lincoln Park pursuant to the Purchase Agreement after the date of this prospectus. |
| Any proceeds that we receive from sales to Lincoln Park under the Purchase Agreement will be used for working capital and general corporate purposes. See “Use of Proceeds.” |
Dividend policy | We have not paid any cash dividends on our ordinary shares to date and have no current plans to pay cash dividends on our ordinary shares. See “Market Information for Ordinary Shares and Dividend Policy — Dividend Policy.” |
Risk factors | This investment involves a high degree of risk. See “Risk Factors” for a discussion of factors you should consider carefully before making an investment decision. |
NYSE Symbol | “RKLY” |
Unless otherwise noted, the number of our ordinary shares outstanding prior to and after this offering is based on 126,675,098 ordinary shares outstanding as of September 30, 2021, and excludes:
| • | 17,520,135 ordinary shares issuable upon exercise of outstanding stock options as of September 30, 2021 at a weighted-average exercise price of $2.72 per share; |
| • | 14,355,705 ordinary shares reserved for future issuance under our 2021 Stock Incentive Plan (the “2021 Plan”) and 1,526,239 ordinary shares reserved for future issuance under our 2021 Employee Stock Purchase Plan (the “ESPP”) as of September 30, 2021, plus any future increases in the number of ordinary shares reserved for issuance pursuant to evergreen provisions; |
8
| • | 14,074,986 shares issuable upon exercise of warrants outstanding as of September 30, 2021 at a weighted-average exercise price of $11.50 per share; and |
| • | any additional shares that we may issue to Lincoln Park pursuant to the Purchase Agreement dated November 15, 2021, should we elect to sell shares to Lincoln Park. |
To the extent that additional shares are issued pursuant to the foregoing, investors purchasing our ordinary shares in this offering will experience further dilution. In addition, we may offer other securities in other offerings due to market conditions or strategic considerations. To the extent we issue such securities, investors may experience further dilution.
9
RISK FACTORS
Investing in our securities involves risks. Before you make a decision to buy our securities, you should carefully consider the specific risks set forth herein. If any of these risks actually occur, it may materially harm our business, financial condition, liquidity, results of operations, and prospects. As a result, the market price of our securities could decline, and you could lose all or part of your investment. Additionally, the risks and uncertainties described in this prospectus or any prospectus supplement are not the only risks and uncertainties that we face. Additional risks and uncertainties not presently known to us or that we currently believe to be immaterial may become material and adversely affect our business. If any of the following risks or other not specified below materialize, our business financial condition and results of operations could be materially and adversely affected. In that case, the trading price of our ordinary shares could decline.
Risks Related to the Offering
The sale or issuance of our ordinary shares to Lincoln Park may cause dilution, and the sale of the ordinary shares acquired by Lincoln Park, or the perception that such sales may occur, could cause the price of our ordinary shares to fall.
On November 15, 2021, we entered into the Purchase Agreement with Lincoln Park, pursuant to which Lincoln Park has committed to purchase up to $50,000,000 of our ordinary shares. Upon the execution of the Purchase Agreement, we issued 69,512 Commitment Shares to Lincoln Park as consideration for its commitment to purchase our ordinary shares under the Purchase Agreement. The remaining shares of our ordinary shares that may be issued under the Purchase Agreement may be sold by us to Lincoln Park at our discretion from time to time over
a 24-month period
commencing after the satisfaction of certain conditions set forth in the Purchase Agreement, including that the SEC has declared effective the registration statement that includes this prospectus. The purchase price for the shares that we may sell to Lincoln Park under the Purchase Agreement will fluctuate based on the price of our ordinary shares. Depending on market liquidity at the time, sales of such shares may cause the trading price of our ordinary shares to fall.We generally have the right to control the timing and amount of any sales of our shares to Lincoln Park under the Purchase Agreement. Sales of our ordinary shares, if any, to Lincoln Park under the Purchase Agreement will depend upon market conditions and other factors to be determined by us. We may ultimately decide to sell to Lincoln Park all, some, or none of the shares of our ordinary shares that may be available for us to sell pursuant to the Purchase Agreement. If and when we do sell shares to Lincoln Park, after Lincoln Park has acquired the shares, Lincoln Park may resell all, some, or none of those shares at any time or from time to time in its discretion. Therefore, sales to Lincoln Park by us could result in substantial dilution to the interests of other holders of our ordinary shares. Additionally, the sale of a substantial number of our ordinary shares to Lincoln Park, or the anticipation of such sales, could make it more difficult for us to sell equity or equity-related securities in the future at a time and at a price that we might otherwise wish to effect sales.
We may not have access to the full amount available under the Purchase Agreement with Lincoln Park.
Pursuant to the Purchase Agreement with Lincoln Park, Lincoln Park has committed to purchase up to $50,000,000 of our ordinary shares from time to time over
a 24-month period.
The number of shares we may sell to Lincoln Park on any single business day in a Regular Purchase is 160,000, but that amount may be increased to up to 250,000 shares of our ordinary shares, depending on the market price of our ordinary shares at the time of sale and subject to a maximum limit of $3,500,000 per Regular Purchase. Depending on the prevailing market price of our ordinary shares, we may not be able to sell shares to Lincoln Park for the maximum $50,000,000 over the term of the Purchase Agreement, or we may need to sell to Lincoln Park under the Purchase Agreement more of our ordinary shares than are offered under this prospectus to receive aggregate gross proceeds equal to the $50,000,000 total commitment of Lincoln Park under the Purchase Agreement. If we choose to do so, we must first register such additional shares for resale under the Securities Act. In addition, under the rules of the10
NYSE, in no event may we issue more than 19.99% of our shares outstanding under the Purchase Agreement unless we obtain shareholder approval or an exception pursuant to the rules of the NYSE is obtained to issue more than 19.99%. This limitation will not apply in certain limited circumstances as set out in the Purchase Agreement. We are not required or permitted to issue any ordinary shares under the Purchase Agreement if such issuance would breach our obligations under the rules or regulations of the NYSE. In addition, Lincoln Park will not be required to purchase any of our ordinary shares if such sale would result in Lincoln Park’s beneficial ownership exceeding 4.99% of the then issued and outstanding ordinary shares. Our inability to access a portion or the full amount available under the Purchase Agreement, in the absence of any other financing sources, could have a material adverse effect on our business.
The extent we rely on Lincoln Park as a source of funding will depend on a number of factors including, the prevailing market price of our ordinary shares and the extent to which we are able to secure working capital from other sources. If obtaining sufficient funding from Lincoln Park were to prove unavailable or prohibitively dilutive, we will need to secure another source of funding in order to satisfy our working capital needs. Even if we were to receive all $50,000,000 in gross proceeds under the Purchase Agreement with Lincoln Park, we may still need additional capital to fully implement our business, operating and development plans. Should the financing we require to sustain our working capital needs be unavailable or prohibitively expensive when we require it, the consequences could be a material adverse effect on our business, operating results, financial condition and prospects.
Our management will have broad discretion over the use of the net proceeds from our sale of ordinary shares to Lincoln Park, you may not agree with how we use the proceeds and the proceeds may not be invested successfully.
Our management will have broad discretion as to the use of the net proceeds from our sale of ordinary shares to Lincoln Park, and we could use them for purposes other than those contemplated at the time of commencement of this offering. Accordingly, you will be relying on the judgment of our management with regard to the use of those net proceeds, and you will not have the opportunity, as part of your investment decision, to assess whether the proceeds are being used appropriately. It is possible that, pending their use, we may invest those net proceeds in a way that does not yield a favorable, or any, return for us. The failure of our management to use such funds effectively could have a material adverse effect on our business, financial condition, operating results and cash flows.
Risks Related to Rockley’s Business and Industry
Rockley has incurred net losses since inception and expects to continue to incur losses for the foreseeable future. If Rockley does not fully develop or commercialize its products and services, including its silicon photonics chipsets, or if such products and services experience significant delays, Rockley’s business, financial condition, and results of operation will be materially and adversely affected and Rockley may never achieve or sustain profitability.
Rockley has to date generated revenue primarily from
non-recurring
engineering (“NRE”) and development services for customer-specific designs of silicon photonics chipsets for incorporation into its customers’ end products. Rockley incurred a net loss of $58.0 million and $153.3 million for the three and nine months ended September 30, 2021, respectively. As of September 30, 2021, Rockley had an accumulated deficit of $386.2 million. Rockley believes that it will continue to incur operating and net losses for the foreseeable future, including for a period of time after commercialization of its silicon photonics chipsets, which is not currently expected to begin until 2022; provided that any such commercialization may occur later than 2022 or not at all. Even if Rockley is able to successfully develop and sell its products, there can be no guarantee that it will do so within its anticipated timeframe or that its products will be commercially successful. Rockley’s potential future profitability is dependent upon the successful development, commercial introduction, and acceptance of its products and services, including its silicon photonics chipsets for the consumer wearables market and its module11
applications with biomarker detection capabilities for advanced health metrics. Because Rockley will incur costs to develop and commercialize its products and services, including its chipsets and module applications, before it receives any significant revenue from any sales of such products or services, Rockley’s losses in future periods may continue. Rockley may never achieve or sustain profitability.
Rockley expects to continue to incur operating losses for the foreseeable future as it:
| • | continues to invest in its technology and its silicon photonics chipsets and modules, as well as its cloud-based analytics subscription service; |
| • | continues to develop innovative solutions and applications for its technology; |
| • | commercializes its silicon photonics solutions; |
| • | continues to invest in its sales and marketing activities and distribution channels; |
| • | invests and improves its operational, financial, and management information systems; |
| • | increases its headcount; |
| • | expands its intellectual property portfolio; and |
| • | enhances internal functions, systems, and infrastructure to support its anticipated transition to a public company. |
Rockley has a history of recurring losses and negative cash flows from operations, and a significant accumulated deficit, which raises substantial doubt about its ability to continue as a “going concern.”
Since inception, Rockley has financed its operations primarily through the issuance and sale of convertible loan notes, ordinary shares and revenue received from agreed-upon projects. As of September 30, 2021, Rockley’s cash and cash equivalents balance was $75.2 million and it had an accumulated deficit of $386.2 million. Due to Rockley’s history of recurring losses from operations, negative cash flows from operations, and a significant accumulated deficit, its management concluded that there is substantial doubt about Rockley’s ability to continue as a going concern. There have been no adjustments to the accompanying financial statements of Rockley to reflect this uncertainty. Rockley’s ability to continue as a going concern is dependent upon it becoming profitable in the future or obtaining the necessary capital to meet its obligations. Rockley’s determination of substantial doubt about its ability to continue as a going concern could materially limit its ability to raise additional funds through the issuance of equity securities, debt financing or otherwise. There can be no assurance that any such issuance of equity securities, debt financing or other means of financing will be available in the future, or the terms of any such financing will be acceptable to Rockley. Further, there can be no assurance that Rockley will ever become profitable or continue as a going concern.
If the end products into which Rockley’s products are incorporated are not fully developed and commercialized or do not achieve widespread market acceptance, or if such products experience delays, cancellations, or reductions, Rockley’s business, financial condition, and results of operations will be materially and adversely affected.
Rockley’s success in developing and commercializing its products depends in large part on its customers’ success in developing, commercializing, and achieving widespread market acceptance of their end products that incorporate Rockley’s products. Rockley’s customers may be unable to fully develop and commercialize, or achieve widespread market acceptance of, their end products that incorporate Rockley’s products. Further, these customers may not continue to incorporate Rockley’s products into their end products either in the short or long term. If such customers’ end products are not fully developed and commercialized, fail to achieve or maintain widespread market acceptance, experience delays, or if Rockley’s customers otherwise choose not incorporate Rockley’s products into their end products, Rockley’s business, financial condition, and results of operations will be materially and adversely affected.
12
If Rockley’s products are not selected for inclusion in its customers’ end products, including products for the consumer health and wellness market, or adopted in other industry verticals or use cases or are not adopted by leading consumer and medical device companies, life sciences companies, or their respective suppliers, Rockley’s business will be materially and adversely affected.
Rockley is currently developing products for use in its customers’ end products, which are in varying stages of development. Many of these products, including products for consumer device, medical device, and life sciences companies, require extensive testing or qualification processes, which involve testing of Rockley’s products in the customers’ end products and systems, as well as testing for reliability. These qualification processes may continue for several months or longer. However, qualification of any of Rockley’s products by a customer does not assure any sales of such product by Rockley to that customer. Even after successful qualification and sales by Rockley of a product to a customer, a subsequent revision in Rockley’s third-party contractors’ manufacturing process or Rockley’s selection of a new supplier may require a new qualification process with Rockley’s customers, which may result in delays in the sale of such product and could also result in Rockley holding excess or obsolete inventory. After Rockley’s products are qualified, it can take several months before the customer commences production of end products that incorporate Rockley’s products. Rockley spends significant time and resources to have its products selected for incorporation into these end products, which is known as a “design win.” If Rockley fails to win a significant number of design wins in its target markets, its business, results of operations, and financial condition will be materially and adversely affected.
Rockley is targeting the deployment of its products in the consumer health and wellness and medical device sectors and any estimates of Rockley’s future results assume that Rockley will successfully commercialize its products and achieve significant market penetration in these sectors. As a result, if Rockley’s products are not selected for inclusion by consumer device and medical device companies or life sciences companies, or their suppliers, Rockley’s actual results may differ materially from its estimates and Rockley’s business would be materially and adversely affected.
Rockley’s limited operating history makes it difficult to evaluate its future prospects and the risks and challenges which may impact its business.
Rockley was founded in 2013, completed development of its advanced sensing platform in 2019, launched its healthcare module offering in 2020, and has not yet fully developed and commercialized any of its products. This relatively limited operating history makes it difficult to evaluate Rockley’s future prospects and the risks and challenges it may encounter. The risks and challenges which may impact Rockley’s future prospects and business include, but are not limited to, its ability to:
| • | successfully commercialize its products and services, including its silicon photonics chipsets, module applications, and analytics subscription service; |
| • | develop innovative applications for its silicon photonics and sensing technology; |
| • | expand its sales and marketing activities and distribution channels; |
| • | improve its operational, financial, and management information systems; |
| • | attract, hire, integrate, and retain qualified talent to support the growth of its business. This includes increasing headcount to appropriately staff to projected growth; |
| • | protect its intellectual property portfolio; |
| • | enhance internal, systems, functions, and infrastructure to support its anticipated transition to a public company; |
| • | comply with existing and new or modified laws and regulations applicable to its business; |
| • | manage capital expenditures for its current and future products, as well as its supply chain and supplier relationships; |
13
| • | anticipate and respond to macroeconomic changes and changes in the markets in which it operates; |
| • | effectively manage its growth and business operations, including the impacts of the COVID-19 pandemic on its business; and |
| • | hire, integrate, and retain qualified talent to support the growth of its business. |
If Rockley fails to successfully manage the risks and difficulties that it faces, including those associated with the challenges listed above and those described elsewhere in this “Risk Factors Related to Rockley’s Business and Industry” section, its business, financial condition, and results of operations could be materially and adversely affected. Further, because Rockley has a limited operating history and has not yet commercialized its products, it is difficult to accurately assess its future prospects or financial performance. Rockley has encountered in the past, and will encounter in the future, risks and uncertainties frequently experienced by growing companies with limited operating histories in rapidly changing industries. If Rockley’s assumptions regarding these risks and uncertainties, which it uses to plan and operate its business, are incorrect or change, or if it does not address these risks successfully, its results of operations could differ materially from its expectations and its business, financial condition, and results of operations could be materially and adversely affected.
Rockley’s estimates and expectations as to its financial performance are based upon assumptions, analyses, and internal estimates developed by Rockley’s management. If these assumptions, analyses, or estimates prove to be incorrect or inaccurate, Rockley’s actual operating results may differ materially from any such estimates and expectations.
Rockley’s estimates and expectations as to its future financial performance are subject to uncertainty and are based on assumptions, analyses, and internal estimates developed by Rockley’s management, all or some of which may not prove to be correct or accurate. If these assumptions, analyses, or estimates prove to be incorrect or inaccurate, Rockley’s actual operating results may differ materially from any such estimates or expectations. We have in the past experienced actual results which varied from our estimates. These assumptions, analyses, or estimates are subject to risks and uncertainties, some of which are outside of Rockley’s control. These risks and uncertainties include, but are not limited to, risks discussed elsewhere in this “Risk Factors Related to Rockley’s Business and Industry” section, as well as those discussed below:
| • | Revenue-related assumptions: |
| • | customer contracts and design wins: Rockley’s existing memoranda of understanding (“MOUs”) and development contracts may not ultimately convert into production contracts. In addition, Rockley may be unable to secure design wins from additional customers in a timely manner; |
| • | form of customer arrangement: It is possible that instead of entering into agreements with customers for the purchase of a significant amount of Rockley’s products, Rockley may be required to enter into license arrangements with certain customers, any of which would have a significant impact on the revenue Rockley has currently forecasted to achieve; |
| • | timing of launch and delivery: Rockley or Rockley’s customers may encounter delays in the launch or delivery of Rockley’s product or the customer’s end product incorporating Rockley’s product, including due to a customer’s decision to delay the launch of a product, Rockley’s ability to deliver its product in a timely manner to a customer, which in turn may result in the customer canceling a contract, technical challenges, or customer-related delays in its development program; |
| • | pricing and volume fluctuation: Rockley may experience pricing and volume fluctuations due to price negotiations, lower than anticipated unit volumes, delays in volume ramp, decreases in average selling prices due to competition or market dynamics, or other factors; |
| • | timing and execution of customer agreements: Rockley may face difficulties in meeting customer milestones in a timely manner or achieving required technical specifications. In addition, Rockley |
14
may experience execution delays under its NRE programs, including with its largest customer, due to resource constraints or customer delay. Further, to the extent Rockley were to enter into licensing arrangements in lieu of a product sale with a customer, including its largest customer, it could have a significant negative impact on Rockley’s anticipated revenue; and |
| • | commercialization of products and services: Rockley must successfully commercialize its products and services, including its silicon photonics chipsets, module applications, and analytics subscription service. |
| • | Production cost-related assumptions: |
| • | production volume and ramp: Rockley has in the past, and may in the future experience delays in contract execution, lower than expected manufacturing yields, manufacturing delays, and technical challenges, including if and when Rockley commences commercial production of its products, any of which could negatively impact forecasted production volume and ramp; |
| • | production cost: Rockley may be unable to secure the volume pricing or yield cost levels underlying its assumptions and indirect materials and production overhead costs may exceed forecasted amounts; and |
| • | inventory and obsolescence: Rockley’s quality, warranty, return merchandise authorization, and inventory obsolescence may exceed forecasted amounts. Rockley may also experience product recalls which are not included in Rockley’s assumptions. Further, Rockley may incur greater than expected costs in connection with its NRE programs. |
| • | Operating expenses and cash utilization-related assumptions: Rockley’s cash utilization may exceed currently anticipated rates due to a variety of factors, including lower than expected revenue, revenue delays, higher than anticipated production and manufacturing costs, operating expenses, and capital expenditures, lower than anticipated average selling prices, greater than anticipated cash needs for internal resources and organic growth, and potential strategic investments and acquisitions not currently anticipated. |
Rockley’s estimates and expectations may also be based in part on the expected size and growth of the markets in which Rockley operates or intends to enter, including the consumer wearables, mobile device, and medical device markets. Such markets may not develop or grow, or may develop and grow at a lower rate than expected, and even if these markets experience the forecasted growth described in this prospectus, Rockley may not grow its business at similar rates, or at all. Accordingly, the forecasts and estimates of market size and growth described in this prospectus should not be taken as a guarantee or other indication of Rockley’s future growth or results of operations. In addition, these forecasts may be materially and adversely affected by a number of factors outside of Rockley’s control, including, but limited to, factors associated with the ongoing
COVID-19 pandemic.
The strategic initiatives Rockley has undertaken or may undertake in the future may be more costly than currently anticipated and Rockley may not generate sufficient revenue to offset the costs of these initiatives, which in turn would negatively impact Rockley’s ability to achieve and maintain profitability.
Rockley continues to invest in initiatives designed to grow its business, including:
| • | partnering with customers and potential customers to develop and commercialize Rockley’s products; |
| • | investing in research and development; |
| • | investing in its workforce, including its engineering talent; |
| • | expanding its sales, marketing, and distribution efforts; |
| • | investing in new applications and markets for its products; |
| • | partnering with third parties to develop manufacturing processes; and |
15
| • | investing in legal, accounting, and other administrative and internal functions necessary to support its operations as a public company. |
These initiatives may be more costly than anticipated and Rockley may not generate sufficient revenue to offset the costs of these initiatives. Certain of Rockley’s market opportunities, such as healthcare monitoring devices incorporating sensing capabilities for disease detection and management, are at an early stage of development, and it may be years before these end markets generate demand for Rockley’s products at scale, if at all. Rockley’s revenue may be adversely affected for a number of reasons, including the rate and degree of development or market acceptance of new technology that competes with its products, failure of Rockley’s customers to develop and commercialize their end products that incorporate Rockley’s products, Rockley’s inability to effectively manage production of its products to scale, Rockley’s inability to enter new markets or help its customers adopt Rockley’s products for new applications, and Rockley’s failure to attract new customers or expand orders from existing customers. Further, it is difficult to predict the size and growth rate of Rockley’s target markets, customer demand for its products, commercialization timelines, developments in silicon photonics technology, the entry of competitive products, or the success of existing competitive products and services. As a result, Rockley does not expect to achieve profitability until 2023 at the earliest. If Rockley’s revenue does not grow over the short or long term, its ability to achieve and maintain profitability will be adversely affected, and the value of its business may significantly decrease.
Rockley expects its results of operations to fluctuate on a quarterly and annual basis, which could cause the Company’s share price to fluctuate or decline.
Rockley’s revenue and operating results have fluctuated in the past and may vary significantly in the future. Historical comparisons of its operating results may not be relevant, or indicative of future results. In particular, because Rockley’s revenue to date has been generated from NRE and development services for customer-specific designs of silicon photonics chipsets for testing in the customers’ end products, revenue in any given quarter or period can fluctuate based on the timing and success of its customers’ development projects. Accordingly, the results of any one quarter should not be relied upon as an indication of future performance. Rockley’s quarterly financial results may fluctuate as a result of a variety of factors, many of which are outside of its control and may not fully reflect the underlying performance of Rockley’s business. These fluctuations could adversely affect Rockley’s ability to meet its expectations or those of securities analysts, ratings agencies, or investors. If Rockley does not meet these expectations for any reporting period, the value of its business and its securities, could decline significantly. Factors that may cause these quarterly fluctuations include, but are not limited to, those listed below:
| • | the timing and magnitude of NRE services revenue in any quarter; |
| • | the timing and magnitude of operating expenses incurred, including research and development expenses; |
| • | Rockley’s ability to meet product development roadmaps and timelines, which in turn may be impacted by resource constraints and must meet certain technical standards; |
| • | the timing and degree of success of commercialization of Rockley’s products; |
| • | Rockley’s ability to attract and retain customers and successfully transition customers with which it is engaged in discussions to contracted customers with whom it has MOUs or development and supply agreements and to attract new customers; |
| • | changes in terms of customer agreements; |
| • | the ability of Rockley’s customers to commercialize and achieve widespread market adoption of products incorporating Rockley’s products; |
| • | the timing and magnitude of orders and shipments of Rockley’s products in any quarter; |
| • | the mix of product sales and licensing arrangements in lieu of product sales; |
16
| • | the actual timing and magnitude of sales returns and warranty claims of Rockley’s products in any quarter may differ from estimate; |
| • | Rockley’s ability to develop, introduce, commercialize, manufacture, and ship in a timely manner products that meet customer requirements; |
| • | disruptions in Rockley’s sales channels or termination of its relationships with key channel partners; |
| • | customer demand and product life cycles; |
| • | the receipt, reduction, or cancellation of, or changes in the forecasts or timing of, orders by customers; |
| • | fluctuations in the levels of inventories held by distributors or end customers; |
| • | the gain or loss of significant customers, including Rockley’s largest customer; |
| • | fluctuations in sales by customers who incorporate Rockley’s products into their products; |
| • | cyclicality, seasonality, and the competitive landscape in Rockley’s target markets; |
| • | fluctuations in manufacturing yields; |
| • | changes in pricing, product cost, product volume, and product mix; |
| • | sales of subscriptions to Rockley’s cloud-based analytics subscription service, if and when commercially launched, and in the future, the rate of renewal of subscriptions by existing customers, the extent the use of subscription offerings and related services is expanded under such subscriptions, and timing and magnitude of any such subscriptions which are not renewed; |
| • | the mix of customers licensing the service on a subscription basis as compared to a perpetual license; |
| • | the size, timing, and terms of its subscription agreements with new customers; |
| • | supply chain disruptions, delays, shortages, and capacity limitations as a result of the COVID-19 pandemic or other reasons; |
| • | the impact and duration of the global COVID-19 pandemic; |
| • | the timing and rate of broader market adoption of consumer and medical devices utilizing Rockley’s products or technology across the consumer wearables, mobile device, and medical device sectors; |
| • | changes in the competitive landscape in Rockley’s target markets, including industry consolidation, regulatory developments, and new market entrants; |
| • | Rockley’s ability to effectively manage its third-party suppliers and manufacturing partners; |
| • | changes in the source, cost, and availability of materials and components incorporated in Rockley’s products; |
| • | adverse litigation, judgments, settlements or other litigation-related costs, or claims that may give rise to such costs; |
| • | general economic, industry, and market conditions, including trade disputes; and |
| • | Rockley’s estimates of potential or future market growth in this prospectus may not be accurate. |
Rockley expects to incur significant research and development expenses and devote substantial resources to commercializing new products, which could increase its losses and negatively impact its ability to achieve or maintain profitability.
Rockley’s future growth depends on developing and commercializing its products, achieving widespread market adoption of its products, adapting existing products to new applications and customer requirements, and introducing new products to address changing customer and market demands. Rockley plans to incur substantial
17
research and development expenses as part of its efforts to design, develop, manufacture, and commercialize new products and enhance existing products. Rockley’s research and development expenditures could increase its losses and adversely affect its results of operations in the future. Further, Rockley’s research and development efforts may not be successful or result in additional revenue. This in turn would negatively impact Rockley’s ability to achieve or maintain profitability.
If Rockley is unable to manage its growth or expansion of operations, including in a cost-efficient manner, its business, operations, and financial condition, as well as its ability to scale its operations, could be materially and adversely affected.
Rockley’s ability to effectively manage its anticipated growth and expansion of operations and manage its transition to operating as a public company will also require it to enhance its operational, financial, and management controls and infrastructure, human resources policies, and reporting systems. These enhancements and improvements will require significant capital expenditures, investments in additional headcount and other operating expenditures, and allocation of valuable management and employee resources. Rockley’s future financial performance and ability to execute on its business plan will depend, in part, on its ability to effectively manage any future growth and expansion. Rockley may be unable to effectively manage any future growth or expansion in an efficient or timely manner. Further, Rockley may not be able to implement improvements in an efficient or timely manner and may discover deficiencies in existing controls, programs, systems, and procedures, which could have an adverse effect on its business, reputation, and financial results.
Market opportunity estimates and growth forecasts included in this prospectus are subject to significant uncertainty and are based on assumptions and estimates that may not prove to be accurate.
The forecasts and estimates in this prospectus relating to the expected size and growth of the markets for consumer wearables, mobile devices, and medical devices may prove to be inaccurate. Even if these markets experience the forecasted growth described in this prospectus, Rockley may not grow its business at similar rates, or at all. Rockley’s future growth is subject to many factors, including market adoption of its products, which is subject to many risks and uncertainties. Accordingly, the forecasts and estimates of market size and growth described in this prospectus, including Rockley’s estimates that the consumer wearables, mobile device, and medical devices markets will represent, in the aggregate, an approximately over $48 billion of total addressable market for healthcare monitoring devices incorporating additional sensing capabilities by 2025, should not be taken as indicative of Rockley’s future growth. In addition, these forecasts may be materially and adversely affected as a result of the
COVID-19 pandemic.
If Rockley is unable to accurately forecast long-term
end-customer
adoption rates and demand for Rockley’s products, it could materially and adversely affect its current and future financial results of operations.Rockley is pursuing opportunities in markets that are undergoing rapid changes, including technological and regulatory changes, and it is difficult to predict the timing and size of the opportunities. For example, consumer health and wellness applications and healthcare monitoring devices require complex technology. Because these products may incorporate technology from other companies, commercialization of these products could be delayed or impaired on account of certain technological components of Rockley or others not being ready to be deployed. Although Rockley currently has MOUs or development and supply agreements with various consumer and medical device companies, these companies may not be able to commercialize products incorporating Rockley’s products immediately, or at all. Regulatory developments, many of which are outside of Rockley’s control, could also cause delays or otherwise impair commercial adoption of these products. Rockley’s future financial performance will depend on its ability to make timely investments in the correct market opportunities. Given the evolving nature of the markets in which Rockley operates in, it is difficult to predict customer demand or adoption rates for its products or the future growth of the markets in which it operates. As a result, the Company’s estimates may not necessarily reflect various estimates and assumptions that may not prove accurate and any such estimates could differ materially from actual results due to the risks included in this “Risk Factors
18
Related to Rockley’s Business and Industry” section, among others. If demand does not develop or if Rockley cannot accurately forecast customer demand, the size of its markets, inventory requirements, or its future financial results, its business, results of operations, and financial condition will be adversely affected.
Rockley’s target customer and product markets may not grow or develop as Rockley currently expects, and if Rockley fails to penetrate new markets and scale successfully within those markets, Rockley’s revenue and financial condition would be harmed.
Rockley’s target markets include the consumer wearables, mobile device, and medical device markets. Any deterioration in Rockley’s target customer or product markets or reduction in capital spending to support these markets could lead to a reduction in demand for Rockley’s products, which would adversely affect its revenue and results of operations. Further, if Rockley’s target customer markets do not grow or develop in ways that Rockley currently expects, demand for Rockley’s products may not materialize as expected, which would also negatively impact its business, financial condition, and results of operations. Rockley may be unable to predict the timing or development of trends in its target markets with any accuracy. If Rockley fails to accurately predict market requirements or market demand for these solutions, Rockley’s business may suffer.
Rockley’s future revenue growth, if any, will depend in part on Rockley’s ability to penetrate Rockley’s current target markets, and to enter emerging markets, such as the market for consumer healthcare monitoring devices and predictive analytics. Meeting the technical requirements and securing design wins in any of these new markets will require a substantial investment of Rockley’s time and resources. Rockley may not secure design wins from these or other new markets, or achieve meaningful revenue from sales in these markets. If any of these markets do not develop as Rockley currently anticipates or if Rockley is unable to penetrate and scale them successfully, it may adversely affect Rockley’s ability to grow its business.
Rockley’s target markets are characterized by rapid technological change, which requires Rockley to continue to develop new products and technology innovations and could adversely affect market adoption of its products.
Rapid technological changes in the markets for sensing technology, including the consumer wearables, mobile device, and medical device markets, could adversely affect adoption of Rockley’s products, either generally or for particular applications. Rockley’s future success will depend upon its ability to develop and introduce a variety of new capabilities and innovations to its products, as well as introduce new products, to address the changing needs of its target markets. Delays in delivering new products that meet customers’ requirements could damage Rockley’s relationships with its customers and lead them to seek alternative sources of supply. Further, the introduction of new products by Rockley’s competitors, the delay or cancellation of any of Rockley’s customers’ end products into which Rockley’s products are designed, the market acceptance of products based on new or alternative technologies, or the emergence of new industry standards could render Rockley’s existing or future products uncompetitive, obsolete, and/or otherwise unmarketable.
In addition, Rockley’s success to date has been based on the delivery of prototypes and services to research and development programs in which customers are investing substantial capital to develop new products. Delays in introducing products and innovations, the failure to choose correctly among technical alternatives, or the failure to offer innovative products at competitive prices may cause existing and potential customers to purchase Rockley’s competitors’ products or turn to alternative sensing technology. If Rockley is unable to successfully develop products that meet changing customer or market requirements on a timely basis or that remain competitive with technological alternatives, its products may fail to achieve commercial adoption, its revenue will decline, it may experience operating losses, and its business and prospects will be adversely affected.
Rockley may be unable to make the substantial investments that are required to remain competitive.
The silicon photonics industry requires substantial and continuous investment in research and development in order to bring to market new and enhanced solutions. Rockley expects its research and development
19
expenditures to increase in the future as part of its strategy to increase demand for Rockley’s solutions in Rockley’s current target markets and to expand into additional markets. Rockley may not have sufficient resources to maintain the level of investment in research and development required to remain competitive. In addition, Rockley cannot assure you that the technologies, that are the focus of its research and development expenditures will become commercially successful or generate any revenue.
If Rockley fails to compete effectively, it may lose or fail to gain market share, which could negatively impact Rockley’s operating results and Rockley’s business.
The global optical components market in general, and the consumer sensor, healthcare, and data communications markets in particular, are highly competitive. Rockley expects competition to increase and intensify as additional companies enter Rockley’s target markets. Increased competition could result in price pressure, reduced gross margins, and difficulty achieving market penetration, any of which could harm Rockley’s business, financial condition, and results of operations. Rockley’s competitors range from large, international companies offering a wide range of services and optical components, such as LEDs, lasers, detectors, or PICs, to smaller companies specializing in narrow market verticals. Some of Rockley’s key competitors across various verticals include: ams AG (“AMS”), Analog Devices, Inc. (“ADI”), Broadcom Inc. (“Broadcom”), Brolis Semiconductors (“Brolis”), Cisco Systems, Inc. (“Cisco”), GlobalFoundries Inc. (“GlobalFoundries”), Intel Corporation (“Intel”), Lumentum Holdings Inc. (“Lumentum”), Maxim Integrated Products Inc. (“Maxim”), Osram Licht AG (“OSRAM”), Taiwan Semiconductor Manufacturing Company, Limited (“TSMC”), and Tower Semiconductor Ltd. (“Tower Jazz”). Rockley expects competition in its target markets to increase in the future as existing competitors improve or expand their product offerings and as new competitors enter these markets.
Rockley’s ability to compete successfully depends, in part, on factors that are outside of its control, including industry and general economic trends. Rockley’s ability to compete successfully will depend on a number of factors, including its ability to:
| • | define, design, and regularly introduce new products that anticipate the functionality and integration needs of Rockley’s customers’ next-generation products and applications; |
| • | build strong and long-lasting relationships with Rockley’s customers and other industry participants; |
| • | cost-effectively develop and commercialize products which compete favorably with competitors’ products; |
| • | achieve design wins; |
| • | accurately estimate the effectiveness and success of Rockley’s customers’ end products incorporating Rockley’s products in their competitive end markets; |
| • | expand its research and development capabilities to provide innovative solutions and maintain Rockley’s product roadmap; |
| • | strengthen its sales and marketing efforts, brand awareness and reputation; |
| • | deliver products in volume on a timely basis at competitive prices; |
| • | withstand or respond to significant price competition; |
| • | build and expand international operations in a cost-effective manner; |
| • | obtain, maintain, protect, and enforce Rockley’s intellectual property rights; |
| • | defend potential patent infringement claims arising from third parties; |
| • | promote and support Rockley’s customers’ incorporation of Rockley’s products into their products; and |
| • | retain high-level talent, including Rockley’s management team and engineers. |
20
Rockley’s competitors may also establish cooperative relationships among themselves or with third parties or may acquire companies that provide similar products to Rockley’s. As a result, new competitors or alliances may emerge that could capture significant market share. Any of these factors, alone or in combination with others, could harm Rockley’s business, financial condition, and results of operations and result in a loss of market share and an increase in pricing pressure.
Rockley may pursue strategic investments or acquisitions in the future. If Rockley fails to successfully select, execute, or integrate its acquisitions, then its business, results of operations, and financial condition could be materially and adversely affected, and the Company’s share price could decline.
From time to time, Rockley may pursue investments or acquisitions to add new products and technologies, acquire talent, gain new sales channels, or enter into new markets or sales territories. In addition to possible shareholder approval, Rockley may need approvals and licenses from relevant government authorities for the acquisitions and to comply with any applicable laws and regulations, which could result in increased delay and costs. Furthermore, acquisitions and the subsequent integration of new assets, businesses, key talent, customers, vendors, and suppliers require significant attention from Rockley’s management and could result in a diversion of resources from Rockley’s existing business, which in turn could have an adverse effect on Rockley’s operations. Acquired assets or businesses may not generate the financial results Rockley expects. Acquisitions could result in the use of substantial amounts of cash, potentially dilutive issuances of equity securities, the occurrence of significant goodwill impairment charges, amortization expenses for other intangible assets, and exposure to potential unknown liabilities of the acquired business. Moreover, the costs of identifying and consummating acquisitions may be significant.
Failure to successfully identify, complete, manage, and integrate acquisitions could materially and adversely affect its business, financial condition, and results of operations and could cause the Company’s share price to decline.
Rockley’s international operations expose it to operational, financial, and regulatory risks, including possible unfavorable regulatory, political, tax, and labor conditions, which could harm Rockley’s business.
Rockley is committed to growing its international sales, and while it has committed resources to expanding its international operations and sales channels, these efforts may not be successful. International operations are subject to a number of other risks, including:
| • | foreign currency fluctuations, which could result in increased operating expenses and reduced revenue; |
| • | political and economic instability, international terrorism, and anti-American or British sentiment, particularly in emerging markets; |
| • | disadvantages of competing against companies from countries that are not subject to U.S. and U.K. laws and regulations, including the Foreign Corrupt Practices Act, Office of Foreign Assets Control regulations, and U.S. anti-money laundering regulations, as well as exposure of Rockley’s foreign operations to liability under these regulatory regimes; |
| • | preference for locally branded products, and laws and business practices favoring local competition; |
| • | potential consequences of, and uncertainty related to, the “Brexit” process in the United Kingdom, which could lead to additional expense and complexity in doing business there; |
| • | less effective protection of intellectual property; |
| • | stringent regulation of the end products incorporating Rockley’s products and stringent consumer protection and product compliance regulations, including but not limited to General Data Protection Regulation in the European Union, European competition law, the Restriction of Hazardous Substances Directive, the Waste Electrical and Electronic Equipment Directive, and the European Ecodesign Directive that are costly to comply with and may vary from country to country; |
21
| • | difficulties and costs of staffing and managing foreign operations; |
| • | foreign taxes, including withholding of payroll taxes; and |
| • | the U.S. government’s and U.K. government’s restrictions on certain technology transfer to certain countries of concern. |
For example, Rockley has significant international operations that are denominated in foreign currencies, primarily the British Pound and Euro, subjecting it to foreign currency exchange risk that may adversely impact its financial results. The occurrence of any of these risks could negatively affect Rockley’s international business and consequently its business, operating results, and financial condition.
The average selling prices of Rockley’s products could decrease rapidly over the life of the product, which may negatively affect Rockley’s revenue and margins. In addition, the selling prices Rockley is able to ultimately charge in the future for the products it is currently developing or commercializing may be less than what Rockley currently anticipates, which may cause Rockley’s actual operating results to differ materially from its expectations.
The prices that Rockley is able to ultimately charge in the future for the products it is currently developing or commercializing may experience declines for a variety of reasons, many of which are outside of Rockley’s control. In order to sell products that have a falling average unit selling price and maintain margins at the same time, Rockley will need to continually reduce product and manufacturing costs. To manage manufacturing costs, Rockley must engineer the most cost-effective design for its products and collaborate with its manufacturing counterparties to reduce manufacturing costs. Rockley also needs to continually introduce new products with higher sales prices and gross margin in order to maintain its overall gross margin. If Rockley is unable to manage the cost of older products or successfully introduce new products with higher gross margin, its revenue and overall gross margin would likely decline. In addition, the selling prices Rockley is able to ultimately charge in the future for the products it is currently developing or commercializing may be less than what Rockley currently projects, which may cause Rockley’s actual operating results to differ materially from its estimates.
Rockley’s gross margins may fluctuate due to a variety of factors, which could negatively impact Rockley’s results of operations and Rockley’s financial condition.
Rockley’s gross margins may fluctuate due to a number of factors, including customer and product mix, market acceptance of Rockley’s new products, yield, wafer pricing, packaging and testing costs, competitive pricing dynamics, the impact of the
COVID-19
pandemic, and geographic and market pricing strategies. To the extent Rockley may offer certain customers favorable prices, it would decrease Rockley’s average selling prices and likely impact gross margins. Further, Rockley may in the future offer pricing incentives to Rockley’s customers on earlier generations of products that inherently have a higher cost structure, which would negatively affect Rockley’s gross margins. In addition, in the event Rockley’s customers, including Rockley’s larger customers, exert more pressure with respect to pricing and other terms, it could put downward pressure on Rockley’s margins.Because Rockley does not operate its own manufacturing, assembly, or testing facilities, it may not be able to reduce its costs as rapidly as companies that operate their own facilities, and Rockley’s costs may even increase, which could further reduce Rockley’s gross margins. Rockley relies primarily on obtaining yield improvements and volume-based cost reductions to drive cost reductions. To the extent that such cost reductions do not occur at a sufficient level and in a timely manner, Rockley’s business, financial condition, and results of operations could be adversely affected and may vary from Rockley’s estimates.
In addition, Rockley may in the future maintain an inventory of Rockley’s products at various stages of production and in finished goods inventory. Rockley will hold these inventories in anticipation of customer orders. If those customer orders do not materialize in a timely manner, Rockley may have excess or obsolete
22
inventory which Rockley would have to reserve or write-down, and Rockley’s gross margins would be adversely affected.
Because some of the raw materials and key components in its products come from limited or single source suppliers, Rockley is susceptible to supply shortages, long lead times for components, and supply changes, including as a result of industry consolidation, any of which could disrupt its supply chain and could delay deliveries of its products to customers, which could adversely affect Rockley’s business, results of operations, and financial condition.
Some of the components used in the manufacturing of Rockley’s products are sourced from third-party suppliers. To date, Rockley has produced its products in relatively limited quantities for use in products. Rockley does not have extensive experience in managing its supply chain to manufacture and deliver its products at scale. Some of the key components used to manufacture Rockley’s products come from limited or single source suppliers. Rockley is therefore subject to the risk of shortages and long lead times in the supply of these components and the risk that its suppliers discontinue or modify components used in its products. Rockley has a global supply chain and the
COVID-19 pandemic
and other health epidemics and outbreaks may adversely affect its ability to source components in a timely or cost effective manner from its third-party suppliers due to, among other things, work stoppages or interruptions. For example, Rockley relies on third-party foundries to manufacture its silicon photonic integrated circuits (“PICs”) and for wafer scale integration. Any disruptions to those foundries could materially and adversely affect Rockley’s ability to manufacture its products. In addition, the lead times associated with certain components are lengthy and preclude rapid changes in quantities and delivery schedules. Rockley has in the past experienced and may in the future experience component shortages and price fluctuations of certain key components and materials, and the predictability of the availability and pricing of these components may be limited. In the event of a component shortage, supply interruption or material pricing change from suppliers of these components, Rockley may not be able to develop alternate sources in a timely manner or at all in the case of sole or limited sources. These risks may be exacerbated if any of Rockley’s suppliers were to cease operations or be acquired by a third party. If this were to occur, Rockley may need tore-qualify
the supplier and/or otherwise confirm that such an event would not cause concerns with Rockley’s end customers or otherwise negatively impact Rockley’s relationships with its end customers. Developing alternate sources of supply for these components may be time-consuming, difficult, and costly and Rockley may not be able to source these components on terms that are acceptable to it, or at all, which may undermine Rockley’s ability to meet its requirements or to fill customer orders in a timely manner. Any interruption or delay in the supply of any of these parts or components, or the inability to obtain these parts or components from alternate sources at acceptable prices and within a reasonable amount of time, would adversely affect Rockley’s ability to meet its scheduled product deliveries to its customers. This could adversely affect Rockley’s relationships with its customers and channel partners and could cause delays in shipment of its products and adversely affect its operating results. In addition, increased component costs could result in lower gross margins. Even where Rockley is able to pass increased component costs along to its customers, there may be a lapse of time before it is able to do so such that Rockley must absorb the increased cost. If Rockley is unable to buy these components in quantities sufficient to meet its requirements on a timely basis, it will not be able to deliver products to its customers. This in turn could materially and adversely affect Rockley’s business, financial condition, and results of operations.If the foundries with which Rockley contracts do not achieve satisfactory yields or quality, Rockley’s reputation and customer relationships could be harmed.
Rockley depends on satisfactory wafer foundry manufacturing capacity, wafer prices, and production yields, as well as timely wafer delivery, to meet customer demand and enable it to maintain gross margins. The fabrication of Rockley’s products is a complex and technically demanding process. Minor deviations in the manufacturing process can cause substantial decreases in yields and, in some cases, cause production to be suspended. Rockley’s foundry vendors may experience manufacturing defects and reduced manufacturing yields from time to time. Further, any new foundry vendors Rockley employs, whether due to industry consolidation,
23
customer requirements, or otherwise, may present additional and unexpected manufacturing challenges that could require significant management time and focus. Changes in manufacturing processes or the inadvertent use of defective or contaminated materials by the foundries that Rockley employs could result in lower than anticipated production yields or unacceptable performance of Rockley’s products. Many of these problems are difficult to detect at an early stage of the manufacturing process and may be time-consuming and expensive to correct. Poor production yields from the foundries that Rockley employs, or defects, integration issues, or other performance problems in Rockley’s products could significantly harm Rockley’s customer relationships and financial results, and give rise to financial or other damages to Rockley’s customers. Any product liability claim brought against Rockley, even if unsuccessful, would likely be time-consuming and costly to defend.
Manufacturing yields for new products initially tend to be lower as Rockley completes product development and commence volume manufacturing, and typically increase as Rockley brings the product to full production. While Rockley’s business model includes this assumption of improving manufacturing yields its assumptions may be incorrect and, as a result, material variances between projected and actual manufacturing yields will have a direct effect on Rockley’s gross margin and profitability. The difficulty of accurately forecasting manufacturing yields and maintaining cost competitiveness through improving manufacturing yields will continue to be magnified by the increasing process complexity of manufacturing silicon photonics products.
Raw material price fluctuations can increase the cost of Rockley’s products, impact Rockley’s ability to meet customer commitments, and may adversely affect its results of operations.
The cost of raw materials is a key element in the cost of Rockley’s products. Rockley’s inability to offset material price inflation through increased prices to customers, suppliers, productivity actions, or through commodity hedges could adversely affect Rockley’s results of operations. Many major components, product equipment items, and raw materials are procured or subcontracted on a single or sole-source basis. Although Rockley maintains a qualification and performance surveillance process and Rockley believes that sources of supply for raw materials and components are generally adequate, it is difficult to predict what effects shortages or price increases may have in the future. Rockley’s inability to fill its supply needs would jeopardize its ability to fulfill its contractual obligations, which could, in turn, result in reduced revenue, contract penalties or terminations, and damage to Rockley’s customer relationships.
Furthermore, increases in the price of wafers, testing costs, and commodities, which may result in increased production costs, mainly assembly and packaging costs, may result in a decrease in Rockley’s gross margins. Moreover, Rockley’s suppliers may pass the increase in raw materials and commodity costs onto it which would further reduce the gross margin of Rockley’s products. In addition, as Rockley is a fabless company, global market trends such as a shortage of capacity to fulfill Rockley’s fabrication needs also may increase Rockley’s raw material costs and thus decrease its gross margin.
Rockley is subject to the cyclical nature of the semiconductor industry.
The semiconductor industry is highly cyclical and is characterized by constant and rapid technological change, rapid product obsolescence, price erosion, evolving standards, short product life cycles, industry consolidation, and wide fluctuations in product supply and demand. The industry experienced significant downturns during past global recessions. These downturns have been characterized by diminished product demand, production overcapacity, high inventory levels, and accelerated erosion of average selling prices. While these downturns have not directly impacted Rockley’s business to date, any prolonged or significant downturn in the semiconductor industry could adversely affect Rockley’s business and reduce demand for Rockley’s products. Any future downturns in the semiconductor industry could also harm Rockley’s business, financial condition, and results of operations. Furthermore, any significant upturn in the semiconductor industry could result in increased competition for access to third-party foundry and assembly capacity. Rockley is dependent on the availability of this capacity to manufacture and assemble Rockley’s products and Rockley can provide no assurance that adequate capacity will be available to it in the future.
24
If Rockley or its suppliers do not maintain sufficient inventory or if they do not adequately manage their respective inventory, Rockley could lose sales or incur higher inventory-related expenses, which could negatively affect Rockley’s operating results.
To ensure adequate inventory supply, Rockley and its suppliers must forecast inventory needs and expenses, place orders sufficiently in advance with their respective suppliers and manufacturing counterparties, and manufacture products based on its estimates of future demand for particular products. Changes in customer purchasing patterns may affect Rockley’s ability to forecast its future operating results, including revenue, gross margins, cash flows, and profitability. Rockley’s ability to accurately forecast demand for its products could be affected by many factors, including the growth rate, if any, in Rockley’s target markets or the market adoption of the end products into which Rockley’s products are incorporated, the emergence of new markets, an increase or decrease in customer demand for Rockley’s products or for products and services of its competitors, product introductions by competitors, the
COVID-19 pandemic,
other health epidemics and outbreaks, and any associated work stoppages or interruptions, unanticipated changes in general market conditions, and the weakening of economic conditions or consumer confidence in future economic conditions. If Rockley’s products are commercialized in markets that are quickly growing, including the consumer wearables, mobile device, and medical device markets, Rockley may face challenges acquiring adequate supplies to manufacture its products and/or Rockley and its manufacturing counterparties may not be able to manufacture its products at a rate necessary to satisfy the levels of demand, which would negatively affect Rockley’s revenue. This risk may be exacerbated by the fact that Rockley may not carry or be able to obtain for its manufacturers a significant amount of inventory to satisfy short-term demand increases. If it fails to accurately forecast customer demand, Rockley may experience excess inventory levels or a shortage of products available for sale.Inventory levels in excess of customer demand may result in inventory write-downs or write-offs and the sale of excess inventory at discounted prices, which would adversely affect Rockley’s financial results, including its gross margin, and have a negative effect on its brand. Conversely, if Rockley underestimates customer demand for its products, Rockley, or its manufacturing counterparties, may not be able to deliver products to meet its requirements, and this could result in damage to Rockley’s brand and customer relationships and adversely affect its revenue and operating results.
If Rockley’s products do not conform to, or are not compatible with, existing or emerging industry standards, demand for Rockley’s products may decrease, which in turn would harm Rockley’s business and operating results.
Rockley’s ability to compete in the future will depend on its ability to identify and ensure compliance with evolving industry standards in its target markets, as well as in the silicon photonics and sensing technology industry generally. The emergence of new industry standards could render Rockley’s products incompatible with products developed by third-party suppliers or make it difficult for Rockley’s products to meet the requirements of certain device manufacturers and their suppliers. If Rockley’s customers or Rockley’s third-party suppliers adopt new or competing industry standards with which Rockley’s solutions are not compatible, or if industry groups fail to adopt standards with which Rockley’s products are compatible, Rockley’s products would become less desirable to its current or prospective customers. As a result, Rockley’s sales would suffer and it could be required to make significant expenditures to develop new products. Although Rockley designs its products to be compliant with applicable industry standards, proprietary enhancements may not in the future result in conformance with existing industry standards under all circumstances. If Rockley’s products do not conform to, or are not compatible with, existing or emerging standards, it would harm its business, financial condition, and results of operations.
Rockley may be subject to warranty or product liability claims, which could result in unexpected expenses and loss of market share.
Rockley may be subject to warranty or product liability claims. These claims may require Rockley to make significant expenditures to defend those claims, replace Rockley’s solutions, refund payments, or pay damage
25
awards. Rockley has not yet commercialized its products. Accordingly, the operation of Rockley’s products and technology has not been validated over longer periods. If a customer’s end product fails in use, the customer may incur significant monetary damages, including a product recall or associated replacement expenses as well as lost revenue. The customer may claim that a defect in Rockley’s product caused the product failure and assert a claim against Rockley to recover monetary damages. The cost of defending these claims and satisfying any arbitration award or judgment with respect to these claims would result in unexpected expenses, which could be substantial, and could harm Rockley’s business, financial condition, and results of operations. Although Rockley carries product liability insurance, this insurance is subject to significant deductibles and may not adequately cover Rockley’s costs arising from defects in its products or otherwise.
The complexity of Rockley’s products and its anticipated future product and service offerings could result in unforeseen delays or expenses from undetected defects, errors, or reliability issues in hardware or software that could reduce the market adoption of its new products, damage its reputation with current or prospective customers, and adversely affect its operating costs.
Rockley’s current and future products and service offerings are or are expected to be highly technical and very complex and require high standards to manufacture or distribute and have in the past and will likely in the future experience defects, errors, or reliability issues at various stages of development. Rockley may be unable to timely release new products, product updates, manufacture existing products, correct problems that have arisen, or correct such problems to its customers’ satisfaction. Additionally, undetected errors, defects, or security vulnerabilities, especially as new products or updates are introduced or as new versions are released, could result in inaccurate data to the end users of products incorporating Rockley’s products. Any of the foregoing could negatively impact Rockley’s ability to commercialize a product or service offering, result in litigation against Rockley, and damage Rockley’s credibility. These risks may be heightened in the medical device industry, one of Rockley’s target markets, where the end user may act in reliance upon inaccurate data as a result of errors or defects, or where there may be a privacy or data breach of an end user’s personal health information. Some errors or defects in Rockley’s products and service offerings may only be discovered after they have been tested, commercialized, and deployed by customers. In these cases, Rockley may incur significant additional development costs and product recall, repair, or replacement costs. These problems may also result in claims, including class actions, against Rockley by its customers or others. Rockley’s reputation or brand may be damaged as a result of these problems and customers may be reluctant to buy its products, which could adversely affect its ability to retain existing customers and attract new customers and could adversely affect its financial results.
In addition to product liability claims, Rockley could face material legal claims for breach of contract, fraud, tort, or breach of warranty as a result of these problems. Defending a lawsuit, regardless of its merit, could be costly and may divert management’s attention and adversely affect the market’s perception of Rockley and its products. In addition, Rockley’s business liability insurance coverage could prove inadequate with respect to a claim and future coverage may be unavailable on acceptable terms or at all. These product-related issues could result in claims against Rockley and its business could be adversely affected.
Rockley currently expects to recognize subscription revenue from its future cloud-based analytics subscription offering ratably over the term of these subscriptions and, to a lesser extent, perpetual licenses ratably over an expected period of benefit and, as a result, downturns in sales may not be immediately reflected in its operating results.
If Rockley is able to commercially launch its cloud-based analytics subscription service, which may occur as early as 2023, it expects to recognize revenue ratably over the terms of its subscriptions with customers. As a result, a substantial portion of the revenue that it will report in each period will be derived from the recognition of deferred revenue relating to agreements entered into during previous periods. Consequently, a decline in new sales or renewals in any one period may not be immediately reflected in its revenue results for that period. This decline, however, will negatively affect its revenue in future periods. Accordingly, the effect of significant
26
downturns in sales and market acceptance of its subscription service and potential changes in the rate of renewals may not be fully reflected in its results of operations until future periods. This will also make it difficult for Rockley to rapidly increase revenue growth through additional sales in any period, as revenue from new customers generally will be recognized over the term of the applicable agreement. Rockley may be unable to commercially launch its subscription service offering in a timely manner or at all and such subscription offering may not achieve widespread customer adoption.
Any decline in customer renewals, terminations, or failure to convince customers to use Rockley’s cloud-based analytics subscription service would harm its business, results of operations, and financial condition.
The rate at which Rockley’s customers purchase subscriptions to its cloud-based analytics service will depend on a number of factors, including the perceived value of the service. Rockley anticipates that its subscription offerings for enterprise customers will range from one to two years subject to renewal terms. Rockley’s ability to grow revenue from its cloud-based analytics subscription offering, if and when commercially launched, will depend on a significant percentage of customer renewals when the then-existing subscription terms expire, as well as renewals on the same or more favorable terms. Customers will have no obligation to renew their subscriptions, and Rockley may not be able to accurately predict customer renewal rates. The growth of Rockley’s business will depend in part on its customers adopting and expanding their use of Rockley’s cloud-based analytics subscription offering and related services. If Rockley’s customers do not maintain or renew their subscriptions or renew on less favorable terms, Rockley’s future business prospects and growth opportunities may suffer.
If Rockley’s future platform offerings do not interoperate with its customers’ network and security infrastructure or with third-party products, websites, or services, it would negatively impact its business and results of operations.
Rockley’s cloud-based analytics subscription offering, which is under development and may be commercially launched as early as 2023, is expected to allow for the deployment of Rockley’s technology through a cloud-basedmodel. As a result, it must interoperate with Rockley’s customers’ existing network and security infrastructure. The components of Rockley’s customers’ infrastructure have different specifications, rapidly evolve, utilize multiple protocol standards, include multiple versions and generations of products, and may be highly customized. Rockley must be able to interoperate and provide its software service to customers with highly complex and customized networks, which requires careful planning and execution between its customers, its customer support teams, and its channel partners. Further, whenever there are new or updated elements of the customers’ infrastructure or new industry standards or protocols, Rockley may have to update or enhance its cloud platform to continue to provide service to customers. Rockley’s competitors or other vendors may refuse to work with Rockley to allow their products to interoperate with Rockley’s, which could make it difficult for Rockley’s cloud-based analytics subscription service to function properly in customer networks that include these third-party products.
software-as-a-service
Rockley may not deliver or maintain interoperability quickly or cost-effectively, or at all. If Rockley fails to maintain compatibility of its cloud-based analytics subscription service with its customers’ network and security infrastructures, its customers may not be able to fully utilize the service, and Rockley may, among other consequences, fail to achieve widespread customer adoption of this subscription service and experience reduced demand for its products and services, which would materially harm its business, operating results, and financial condition.
Rockley licenses technology from third parties, and its inability to maintain those licenses could harm its business.
Rockley incorporates technology that it licenses from third parties, including software, into its software subscriptions. Rockley cannot be certain that its licensors are not infringing the intellectual property rights of
27
third parties or that its licensors have sufficient rights to the licensed intellectual property in all jurisdictions in which Rockley may sell its software subscriptions. In addition, some licenses may be
non-exclusive,
and therefore its competitors may have access to the same technology licensed to Rockley. Some of Rockley’s license agreements may be terminated for convenience by the licensors. Rockley may also be subject to additional fees or be required to obtain new licenses if any of its licensors allege that Rockley has not properly paid for such licenses or that it has improperly used the technologies under such licenses, and such licenses may not be available on terms acceptable to Rockley or at all. If Rockley is unable to continue to license any of this technology because of intellectual property infringement claims brought by third parties against its licensors or against it, or claims against Rockley by its licensors, or if Rockley is unable to continue its license agreements or enter into new licenses on commercially reasonable terms, its ability to develop and sell software subscriptions containing such technology would be severely limited, and its business could be harmed. Additionally, if Rockley is unable to license necessary technology from third parties, it may be forced to acquire or develop alternative technology, which it may be unable to do in a commercially feasible manner or at all, and Rockley may be required to use alternative technology of lower quality or performance standards. This would limit and delay its ability to offer new or competitive software subscriptions and increase its costs of production. As a result, Rockley’s margins, market share, and operating results could be significantly harmed.Portions of Rockley’s cloud-based analytics subscription offering utilize open source software, and any failure to comply with the terms of one or more of these open source licenses could negatively affect its business.
Rockley’s cloud-based analytics subscription offering contains software made available by third parties under
so-called
“open source” licenses. From time to time, there have been claims against companies that distribute or use open source software in their products and services, asserting that such open source software infringes the claimants’ intellectual property rights. Rockley could be subject to suits by parties claiming that what Rockley believes to be licensed open source software infringes their intellectual property rights. Use and distribution of open source software may entail greater risks than use of third-party commercial software, as open source licensors generally do not provide warranties or other contractual protections regarding infringement claims or the quality of the code. In addition, certain open source licenses require that source code for software programs that are subject to the license be made available to the public and that any modifications or derivative works to such open source software continue to be licensed under the same terms. Further, certain open source licenses also include a provision that if Rockley enforces any patents against the software programs that are subject to the license, it will lose the license to such software. If Rockley were to fail to comply with the terms of such open source software licenses, such failures could result in costly litigation, lead to negative public relations, or require that it quickly find replacement software which may be difficult to accomplish in a timely manner.Although Rockley monitors its use of open source software in an effort both to comply with the terms of the applicable open source licenses and to avoid subjecting its software to conditions it does not intend, the terms of many open source licenses have not been interpreted by U.S. or international courts, and there is a risk that these licenses could be construed in a way that could impose unanticipated conditions or restrictions on its ability to commercialize its product or operate its business. By the terms of certain open source licenses, Rockley could be required to release the source code of its software and to make its proprietary software available under open source licenses, if Rockley combines or distributes its software with open source software in a certain manner. In the event that portions of its software are determined to be subject to an open source license, Rockley could be required to publicly release the affected portions of its source code,
re-engineer
all, or a portion of, that software or otherwise be limited in the licensing of its software, each of which could reduce or eliminate the value of its product. Many of the risks associated with usage of open source software cannot be eliminated, and could negatively affect its business, results of operations, and financial condition.28
Customer-Related Risks
Rockley currently has, and intends to target, customers and suppliers that are large corporations with substantial negotiating power, exacting product, quality, and warranty standards, and potentially competitive internal solutions. If Rockley is unable to sell its products to these customers or is unable to enter into agreements with customers and suppliers on satisfactory terms, its prospects and results of operations will be adversely affected.
Many of Rockley’s customers and suppliers, and potential customers, are large corporations with substantial negotiating power relative to it and, in some instances, may have internal solutions that are competitive to Rockley’s products. Many of these large corporations that are customers or potential customers also have significant development resources, which may allow them to acquire or develop independently, or in partnership with others, competitive technologies. Meeting the technical requirements and securing design wins with any of these companies will require a substantial investment of Rockley’s time and resources. Rockley cannot assure you that its products or technology will secure design wins from these or other companies or that it will generate meaningful revenue from the sales of its products to these key customers and potential customers. If Rockley’s products are not selected by these large corporations or if these corporations develop or acquire competitive technology, it will have an adverse effect on Rockley’s business.
Rockley currently depends on a few large customers for a substantial portion of its revenue. The loss of, or a significant reduction in, orders from Rockley’s customers, including its largest customer, could significantly reduce its revenue and adversely impact Rockley’s operating results.
Rockley believes that its operating results for the foreseeable future will continue to depend to a significant extent on revenue attributable to a few large customers, including Apple Inc., Rockley’s largest customer, and Hengtong Rockley Technology Co., Ltd (“HRT”), its second largest customer. Rockley’s two largest customers collectively accounted for 100% and 99.6% of Rockley’s revenue in 2020 and 2019, respectively. Revenue attributable to Rockley’s largest customer accounted for the majority of its revenue in 2020 and 2019, respectively. Rockley anticipates revenue attributable to this customer will fluctuate from period to period, although it expects to remain dependent on this customer for a significant portion of its revenue for the foreseeable future. Rockley has a master supply and development agreement with this customer, which provides a general framework for Rockley’s transactions with it. This agreement continues until either party terminates for material breach. Under this agreement, Rockley has agreed to develop and deliver new products to this customer at its request, provided it also meets Rockley’s business purposes, and has agreed to indemnify it for intellectual property infringement or any injury or damages caused by Rockley’s products. This customer does not have any minimum or binding purchase obligations to Rockley under this agreement and could elect to discontinue or reduce making purchases from Rockley with little or no notice.
HRT is a joint venture formed by Rockley with Hengtong Optic-Electric Co., Ltd., a subsidiary of Hengtong Group, Co., Ltd., in 2017. Under the Sino-Foreign Equity Joint Venture Contract (the “JV Agreement”) and the related technology development agreement and license agreement, HRT must procure chipsets from Rockley for use in finished products and HRT owns the copyright in the final designs. HRT has a license to the underlying intellectual property in the reference designs and Rockley has certain
non-compete
obligations under the JV Agreement. During the years ended December 31, 2020 and 2019, Rockley made sales to HRT of $5.3 million and $6.7 million, respectively. See notes 4 and 13 to the notes to Rockley’s condensed consolidated financial statements included elsewhere in this prospectus.In addition, customers may seek to enter into licensing arrangements in lieu of product purchases, which could negatively impact Rockley’s revenue, and, to a lesser extent, Rockley’s gross margins. If Rockley’s customers were to choose to work with other manufacturers or its relationships with its customers is disrupted for any reason, it could have a significant negative impact on Rockley’s business. Any reduction in sales attributable to Rockley’s larger customers would have a significant and disproportionate impact on Rockley’s business, financial condition, and results of operations.
29
Rockley’s customers, or the distributors through which it sells to these customers, may choose to use products in addition to Rockley’s, use a different product altogether, or develop an
in-house
solution. Any of these events could significantly harm its business, financial condition, and results of operations. In addition, if Rockley’s distributors’ relationships with Rockley’s end customers, including its larger end customers, are disrupted for inability to deliver sufficient products or for any other reason, it could have a significant negative impact on Rockley’s business, financial condition, and results of operations.Rockley is dependent in part upon its relationships and alliances with industry participants to generate revenue, which involves risks and uncertainties.
Rockley has, and in the future may, acquire interests in joint ventures, which may subject Rockley to risk because, among other things, Rockley cannot exercise sole decision-making power and its partners may have different economic interests than Rockley has. For example, Rockley currently holds a 24.9% share in a strategic joint venture with another industry participant and is currently in discussions regarding potential licensing of technology to the joint venture in return for future payments. Rockley is therefore dependent on the successful execution of a licensing agreement with this joint venture partner to generate additional revenue. Rockley may also acquire interests in other joint ventures with third parties. There are additional risks involved in joint venture transactions. For example, as a
co-investor
in a joint venture, Rockley may not be in a position to exercise sole decision-making authority relating to the joint venture or other entity. As a result, the operations of any joint venture are subject to the risk that third parties may make business, financial, or management decisions with which Rockley does not agree, or the management of the joint venture may take risks or otherwise act in a manner that does not serve Rockley’s interests. Further, there may be a potential risk of impasse in some business decisions because Rockley may not be in a position to exercise sole decision-making authority. In such situations, it is possible that Rockley may not be able to exit the relationship because it may not have the funds necessary to complete abuy-out
of the other partner or it may be difficult to locate a third-party purchaser for its interest. Because Rockley may not have the ability to exercise control over such operations, it may not be able to realize some or all of the benefits that it believes will be created from its involvement. In addition, there is the potential that a joint venture partner may become bankrupt or have divergent, conflicting, or inconsistent economic or business interests from Rockley. This could result in, among other things, exposing Rockley to liabilities of the joint venture in excess of its proportionate share of these liabilities. If any of the foregoing were to occur, Rockley’s business, financial condition, and results of operations could suffer.If Rockley is unable to expand or further diversify its customer base, its business, financial condition, and results of operations could suffer.
Rockley currently expects the composition of its largest customers to vary over time, and that revenue attributable to its largest customers in any given period may decline over time. Rockley’s relationships with existing customers may deter potential customers who compete with these customers from buying Rockley’s products. If Rockley is unable to expand or further diversify its customer base, it could harm its business, financial condition, and results of operations.
Rockley does not currently have any products in commercial production. Accordingly, Rockley views its current customer relationships in the following stages: (a) customers with whom it is “engaged,” or in discussions with, regarding potential product features for incorporation into such customer’s end products or (b) customers with whom it is “contracted” where Rockley has
non-binding
MOUs or development and supply agreements. Thesenon-binding
MOUs and development and supply agreements provide a general framework for Rockley’s transactions with the customer and typically provide that Rockley will develop and deliver new products meeting the customer’s specifications. These agreements do not contain any minimum or binding purchase obligations. If Rockley is unable to transition customers with whom it is engaged in discussions to contracted customers or if Rockley fails to otherwise attract new customers, it would negatively impact Rockley’s ability to grow its business and gain market share, which in turn would harm Rockley’s financial condition and results of operations.30
Because Rockley does not anticipate long-term purchase commitments with its customers, orders may be cancelled, reduced, or rescheduled with little or no notice, which in turn exposes Rockley to inventory risk, and may cause its business and results of operations to suffer.
Rockley anticipates that its products will be sold directly to customers as well as through distributors and resellers, with, in certain cases, no long-term or minimum purchase commitments from them or their end customers. Rockley expects that sales of its products will be primarily made pursuant to standard purchase orders, which orders may be cancelled, reduced, changed, or rescheduled with little or no notice or penalty. As a result, Rockley’s revenue and operating results could fluctuate materially and could be materially and disproportionately impacted by purchasing decisions of Rockley’s customers, including Rockley’s larger customers. In the future, Rockley’s customers or its distributors or their end customers may decide to purchase fewer units than expected, may alter their purchasing patterns at any time with limited or no notice, or may decide not to continue to purchase Rockley’s products at all, any of which could cause Rockley’s revenue to decline materially and materially harm Rockley’s business, financial condition, and results of operations.
Cancellations of, reductions in, or rescheduling of customer orders could also result in the loss of anticipated sales without allowing Rockley sufficient time to reduce its inventory and operating expenses, as a substantial portion of Rockley’s expenses are fixed at least in the short term. In addition, changes in forecasts or the timing of orders expose Rockley to the risks of inventory shortages or excess inventory. Any of the foregoing events could materially and adversely affect Rockley’s business, financial condition, and results of operations.
If Rockley is unable to establish and maintain confidence in its long-term business prospects among customers and analysts and within its industry or is subject to negative publicity, then Rockley’s financial condition, operating results, business prospects, and access to capital may suffer materially.
Rockley has not yet fully developed or commercialized its products or services and the successful commercialization of Rockley’s products depends in part on Rockley’s customers and potential customers committing to use Rockley’s products in their own products. Customers may be less likely to purchase Rockley’s products if they are not convinced that Rockley’s business will succeed or that its service and support and other operations will continue in the long term. Similarly, suppliers and other third parties will be less likely to invest time and resources in developing business relationships with Rockley if they are not convinced that Rockley’s business will succeed. If Rockley is unable to establish and maintain confidence in its long-term business prospects among customers, suppliers, analysts, ratings agencies, and within its industry or is subject to negative publicity, then Rockley’s financial condition, operating results, business prospects, and access to capital may suffer materially.
Rockley’s investments in educating its customers and potential customers about the advantages of Rockley’s silicon photonics and sensing technology and its applications will require significant financial and talent resources and may not result in sales of Rockley’s products.
Educating Rockley’s prospective customers, and to a lesser extent, its existing customers, about Rockley’s silicon photonics and sensing technology and its applications in health monitoring devices, its advantages over competitive technologies, and the potential application of Rockley’s products in different industries and use cases is an integral part of Rockley’s strategy to expand into additional markets. Rockley’s efforts to educate potential customers and the market generally will require significant financial and talent resources. These educational efforts may not be successful and Rockley may not offset the costs of such efforts with revenue from the new customers. If Rockley is unable to acquire new customers to offset these expenses, its financial condition will be adversely affected.
31
Rockley’s business depends substantially on the efforts of its executive officers, including its Chief Executive Officer and founder, Dr. Andrew Rickman, OBE, and highly skilled talent, and its operations may be severely disrupted if it lost their services.
Rockley is highly dependent on its founder, Dr. Andrew Rickman, OBE as well its other executive officers, and the loss of his services would adversely affect Rockley’s business because his loss could make it more difficult to, among other things, compete with other market participants, manage Rockley’s research and development activities, and retain existing customers or cultivate new ones. Competition for highly skilled talent is often intense and Rockley may incur significant costs to attract highly skilled talent. Rockley may not be successful in attracting, integrating, or retaining qualified talent to fulfill its current or future needs. Rockley has, from time to time, experienced, and it expects to continue to experience, difficulty in hiring and retaining highly skilled employees with appropriate qualifications.
In addition, job candidates and existing employees often consider the value of the equity awards they receive in connection with their employment. If the perceived value of Rockley’s equity or equity awards declines, it may adversely affect Rockley’s ability to retain highly skilled employees. If Rockley fails to attract new talent or fails to retain and motivate its current talent, its business and future growth prospects could be adversely affected.
Legal and Regulatory Risks Related to Rockley’s Business
Rockley is subject to governmental export and import control laws and regulations. Rockley’s failure to comply with these laws and regulations could have an adverse effect on its business, prospects, financial condition, and results of operations.
Certain of Rockley’s products and services are subject to export control and import laws and regulations, including the U.S. Export Administration Regulations, U.S. Customs regulations, and various economic and trade sanctions regulations administered by the U.S. Treasury Department’s Office of Foreign Assets Controls. U.S. export control laws and regulations and economic sanctions prohibit the shipment of certain products and services to U.S. embargoed or sanctioned countries, governments and persons. In addition, complying with export control and sanctions regulations for a particular sale may be time-consuming and result in the delay or loss of sales opportunities. Exports of Rockley’s products and technology must be made in compliance with these laws and regulations. If Rockley fails to comply with these laws and regulations, Rockley and certain of its employees could be subject to substantial civil or criminal penalties, including the possible loss of export or import privileges, fines, which may be imposed on Rockley and responsible employees or managers, and, in extreme cases, the incarceration of responsible employees or managers.
Changes to trade policy, tariffs, and import/export regulations may have a material adverse effect on Rockley’s business, financial condition, and results of operations.
Changes in global political, regulatory, and economic conditions, or in laws and policies governing foreign trade, manufacturing, development, and investment in the territories or countries where Rockley may purchase its components, sell its products, or conduct its business, could adversely affect Rockley’s business. The United States has in the past instituted or proposed changes in trade policies that included the negotiation or termination of trade agreements, the imposition of higher tariffs on imports into the United States, economic sanctions on individuals, corporations, or countries, and other government regulations affecting trade between the United States and other countries where Rockley conducts its business. A number of other nations have proposed or instituted similar measures directed at trade with the United States in response. As a result of these developments or any future similar developments, there may be greater restrictions and economic disincentives on international trade that could adversely affect Rockley’s business. It may be time-consuming and expensive for Rockley to alter its business operations to adapt to or comply with any such changes, and any failure to do so could have a material adverse effect on its business, financial condition, and results of operations.
32
Rockley may become involved in legal and regulatory proceedings and commercial or contractual disputes, which could have an adverse effect on its profitability and financial position.
Rockley may be, from time to time, involved in litigation, regulatory proceedings, and commercial or contractual disputes that may be significant. These matters may include, without limitation, disputes with Rockley’s suppliers and customers, intellectual property claims, shareholder litigation, government investigations, class action lawsuits, personal injury claims, environmental issues, customs and value-added tax disputes, and employment and tax issues. In addition, Rockley could face in the future a variety of labor and employment claims against it, which could include but is not limited to general discrimination, wage and hour, privacy, ERISA, or disability claims. In such matters, government agencies or private parties may seek to recover from Rockley indeterminate amounts in penalties or monetary damages (including, in some cases, treble or punitive damages) or seek to limit Rockley’s operations in some way. These types of lawsuits could require significant management time and attention or could involve substantial legal liability, adverse regulatory outcomes, and/or substantial expenses to defend. Often these cases raise complex factual and legal issues and create risks and uncertainties. No assurances can be given that any proceedings and claims will not have a material adverse impact on Rockley’s operating results and financial position or that its established reserves or its available insurance will mitigate this impact.
Rockley is subject to, and must remain in compliance with, numerous laws and governmental regulations across various jurisdictions concerning the use, distribution, and sale of its products. Some of Rockley’s customers also require that it comply with their own unique requirements relating to these matters.
Rockley sells products that contain electronic components, and such components may contain materials that are subject to government regulation in locations where Rockley sells its products. For example, certain regulations limit the use of lead in electronic components. Since Rockley operates on a global basis, compliance with regulations is a complex process which requires continual monitoring of regulations and an ongoing compliance process to ensure that Rockley and its suppliers are in compliance with existing regulations in each market where it operates. If there is an unanticipated new regulation that significantly impacts Rockley’s use and sourcing of various components or requires more expensive components, that regulation could materially and adversely affect its business, results of operations, and financial condition. Rockley’s products may also be used in healthcare monitoring and other medical devices, which are subject to additional regulation. If Rockley fails to adhere to these new regulations or fails to continually monitor the updates, it may be subject to litigation, loss of customers, or negative publicity and its business, results of operations, and financial condition will be adversely affected.
Rockley may in the future become subject to additional regulations, including FDA clearance or approval, for health monitoring products in which Rockley’s products are incorporated. Achieving and maintaining compliance and approval under applicable regulations may be difficult to achieve.
Rockley’s products may be incorporated into end products in the health monitoring sector, including products which collect clinical data. Accordingly, it is possible that certain of Rockley’s products, or the end products which incorporate Rockley’s products will be subject to current and future regulation by the FDA, as well as by other federal, state, and local agencies. As Rockley’s target market is consumer wellness rather than medical, Rockley currently anticipates that FDA clearance will be unnecessary for its products targeting the consumer wearables market; however, Rockley intends to monitor and comply with regulations to the extent they become applicable to Rockley.
Manufacturers of medical devices are required to comply with applicable laws and regulations governing development, testing, manufacturing, labeling, marketing, and distribution of medical devices. Devices are generally subject to varying levels of regulatory control, based on the risk level of the device. Governmental regulations specific to medical devices are wide-ranging and govern, among other things:
| • | product design, development, and manufacture; |
33
| • | laboratory, pre-clinical and clinical testing, labeling, packaging, storage, and distribution; |
| • | premarketing clearance or approval; |
| • | record-keeping; |
| • | product marketing, promotion and advertising, sales, and distribution; and |
| • | post-marketing surveillance, including reporting of deaths or serious injuries and recalls and correction and removals. |
Rockley or its customers may not be able to obtain the necessary clearances or approvals for their products or may be unduly delayed in doing so, which could harm Rockley’s business. Furthermore, even if Rockley is granted regulatory clearances or approvals, they may include significant limitations on the permitted uses for the product, which may limit the market potential for the product. Delays in obtaining clearance or approval could increase Rockley’s costs and harm Rockley’s revenue and growth.
Additionally, Rockley’s products may be subject to regulation by similar agencies in other states and foreign countries. While Rockley believes that it has complied with all applicable laws and regulations, continued compliance with such laws or regulations, including any new laws or regulations, might impose additional costs on Rockley which could adversely affect its financial performance and results of operations.
Rockley is subject to various environmental laws and regulations that could impose substantial costs upon Rockley.
Concerns over environmental pollution and climate change have produced significant legislative and regulatory efforts on a global basis, and Rockley believes this will continue both in scope and in the number of countries participating. In addition, as climate change issues become more prevalent, foreign, federal, state, and local governments and Rockley’s customers have been responding to these issues. The increased focus on environmental sustainability may result in new regulations and customer requirements, or changes in current regulations and customer requirements, which could materially and adversely impact Rockley’s business, results of operations, and financial condition. If Rockley is unable to effectively manage real or perceived issues, including concerns about environmental impacts or similar matters, sentiments toward Rockley or its products could be negatively impacted, and its business, results of operations, or financial condition could suffer.
Rockley’s operations are and will be subject to foreign, federal, state, and local environmental laws and regulations, and such laws and regulations could directly increase the cost of energy, which may have an effect on the way Rockley manufactures products or utilizes energy to produce its products. In addition, any new regulations or laws in the environmental area might increase the cost of raw materials or key components Rockley uses in its products. Environmental regulations require Rockley to reduce product energy usage, monitor and exclude an expanding list of restricted substances, and to participate in required recovery and recycling of its products. Environmental and health and safety laws and regulations can be complex, and Rockley has limited experience complying with them. Capital and operating expenses needed to comply with environmental laws and regulations can be significant, and violations may result in substantial fines and penalties, third-party damages, suspension of production, or a cessation of Rockley’s operations.
The costs of complying with environmental laws and regulations and any claims concerning noncompliance, or liability with respect to contamination in the future, could have a material adverse effect on Rockley’s financial condition or operating results. Rockley may face unexpected delays in obtaining the required permits and approvals in connection with its planned production facilities that could require significant time and financial resources and delay its ability to operate these facilities, which would adversely impact Rockley’s business, prospects, financial condition, and operating results.
34
Rockley is subject to U.S. and foreign anti-corruption and anti-money laundering laws and regulations. Rockley can face criminal liability and other serious consequences for violations, which can harm its business.
Rockley is subject to the U.S. Foreign Corrupt Practices Act of 1977, as amended, the U.S. domestic bribery statute contained in 18 U.S.C. § 201, the U.S. Travel Act, the USA PATRIOT Act, the U.K. Bribery Act of 2010, and possibly other anti-bribery and anti-money laundering laws in countries in which Rockley conducts activities. Anti-corruption laws are interpreted broadly and prohibit companies and their employees, agents, contractors, and other collaborators from authorizing, promising, offering, or providing, directly or indirectly, improper payments or anything else of value to recipients in the public or private sector. Rockley can be held liable for the corrupt or other illegal activities of its employees, agents, contractors, and other collaborators, even if Rockley does not explicitly authorize or have actual knowledge of such activities. Any violations of the laws and regulations described above may result in substantial civil and criminal fines and penalties, imprisonment, the loss of export or import privileges, debarment, tax reassessments, breach of contract and fraud litigation, reputational harm, and other consequences.
Failures, or perceived failures, to comply with privacy, data protection, and information security requirements in the variety of jurisdictions in which Rockley operates may adversely impact its business, and such legal requirements are evolving, uncertain, and may require improvements in, or changes to, Rockley’s policies and operations.
Rockley’s current and potential future operations and sales are subject to laws and regulations addressing privacy and the collection, use, storage, disclosure, transfer, and protection of a variety of types of data. For example, the European Commission has adopted the General Data Protection Regulation and California recently enacted the California Consumer Privacy Act of 2018, both of which provide for potentially material penalties for
non-compliance.
These regimes may, among other things, impose data security requirements, disclosure requirements, and restrictions on data collection, uses, and sharing that may impact Rockley’s operations and the development of its business. Rockley has limited access to collect, store, process, or share certain information collected by its products, and Rockley’s products may evolve to collect additional information. Therefore, the full impact of these privacy regimes on Rockley’s business is rapidly evolving across jurisdictions and remains uncertain at this time.Rockley may also be affected by cyber-attacks and other means of gaining unauthorized access to its products, systems, and data. For instance, cyber criminals or insiders may target Rockley or third parties with which it has business relationships to obtain data, or in a manner that disrupts Rockley’s operations or compromises its products or the systems into which its products are integrated.
Rockley is assessing the continually evolving privacy and data security regimes and measures it believes are appropriate in response. Since these data security regimes are evolving, uncertain, and complex, especially for a global business like Rockley, Rockley may need to update or enhance its compliance measures and these updates or enhancements may require implementation costs. In addition, Rockley may not be able to monitor and react to all developments in a timely manner. The compliance measures Rockley does adopt may prove ineffective. Any failure, or perceived failure, by Rockley to comply with current and future regulatory or customer-driven privacy, data protection, and information security requirements, or to prevent or mitigate security breaches, cyber-attacks, or improper access to, use of, or disclosure of data, or any security issues or cyber-attacks affecting Rockley, could result in significant liability, costs (including the costs of mitigation and recovery), and a material loss of revenue resulting from the adverse impact on its reputation and brand, loss of proprietary information and data, disruption to its business and relationships, and diminished ability to retain or attract customers and business partners. Such events may result in governmental enforcement actions and prosecutions, private litigation, fines, and penalties or adverse publicity, and could cause customers and business partners to lose trust in Rockley, which could have an adverse effect on its reputation and business.
35
Further, in the event Rockley’s products, or the end products into which Rockley’s products are incorporated, involve the collection of personal medical or clinical data, Rockley would be subject to additional privacy regulations. For example, the Health Insurance Portability and Accountability Act of 1996 (“HIPAA”) regulations apply U.S. national standards for some types of electronic health information transactions and the data elements used in those transactions to ensure the integrity, security, and confidentiality of health information and standards to protect the privacy of individually identifiable health information businesses receive, maintain or transmit. The Health Information Technology for Economic and Clinical Health Act of 2009 (“HITECH Act”) expanded the scope of the privacy and security requirements under HIPAA and increased penalties for violations. In addition, the HITECH Act enacted federal breach notification rules requiring notification to affected individuals and the Department of Health and Human Services (and in some cases, relevant media outlets) whenever a breach of protected health information occurs. Rockley’s failure to maintain confidentiality of sensitive protected health information or other personal information in accordance with the applicable regulatory requirements could damage its reputation and expose Rockley to claims, fines, and penalties. Rockley’s business, operating results, and financial condition could also be negatively impacted by a violation of the HIPAA privacy or security rules or any other applicable privacy or data security law.
Many U.S. states and international jurisdictions in which Rockley operates also have laws and regulations that protect the privacy and security of confidential, protected health information, or other personal information and have similar or even more protection than U.S. federal regulations. Furthermore, state data breach notification laws continue to expand the type of protected health information and other personal information they encompass, and in many cases are more burdensome than the HIPAA/HITECH breach reporting requirements.
Regulations related to conflict minerals may cause Rockley to incur additional expenses and could limit the supply and increase the costs of certain metals used in the manufacturing of its products.
As a public company, Rockley is subject to the requirements under the Dodd-Frank Wall Street Reform and Consumer Protection Act of 2010, or the Dodd-Frank Act, that will require it to determine, disclose, and report whether its products contain conflict minerals. The implementation of these requirements could adversely affect the sourcing, availability, and pricing of the materials used in the manufacture of components used in Rockley’s products. In addition, Rockley will incur additional costs to comply with the disclosure requirements, including costs related to conducting diligence procedures to determine the sources of conflict minerals that may be used in or necessary to the production of its products and, if applicable, potential changes to products, processes, or sources of supply as a consequence of such verification activities. It is also possible that its reputation may be adversely affected if Rockley determines that certain of its products contain minerals not determined to be conflict-free or if Rockley is unable to alter its products, processes, or sources of supply to avoid use of such materials.
Risks Related to Rockley’s Intellectual Property
Despite the actions Rockley is taking to defend and protect its intellectual property, Rockley may not be able to adequately protect or enforce its intellectual property rights or prevent unauthorized parties from copying or reverse engineering its products or technology. Rockley’s efforts to protect and enforce its intellectual property rights and prevent third parties from violating its rights may be costly.
The success of Rockley’s products and its business depend in part on Rockley’s ability to obtain patents and other intellectual property rights and maintain adequate legal protection for its products in the United States and other international jurisdictions. Rockley relies on a combination of patent, trademark, and trade secret laws, as well as confidentiality procedures and contractual restrictions, to establish and protect its proprietary rights, all of which provide only limited protection.
As of September 30, 2021 Rockley had 96 issued and allowed patents and 83 other patent applications pending in the United States and 68 patents in foreign jurisdictions. The 96 issued and allowed patents in the
36
United States expire in the years beginning in 2021 through 2040. The 68 patents in foreign jurisdictions include 41 in the United Kingdom, 24 in China, and 3 in Japan, and they expire in the years beginning 2027 through 2039. Many of Rockley’s issued patents and pending patent applications relate to sensors and sensor chips.
Rockley cannot assure you that any patents will be issued with respect to its currently pending patent applications or that any trademarks will be registered with respect to its currently pending applications in a manner that gives Rockley adequate defensive protection or competitive advantages, if at all, or that any patents issued to Rockley or any trademarks registered by it will not be challenged, invalidated, or circumvented. Rockley may file for patents and trademarks in the United States and in certain international jurisdictions, but such protections may not be available in all countries in which it operates or in which Rockley seeks to enforce its intellectual property rights, or may be difficult to enforce in practice. For example, the legal environment relating to intellectual property protection in certain emerging market countries where Rockley may operate in the future is relatively weaker, often making it difficult to create and enforce such rights. Rockley’s currently registered trademarks and any patents and trademarks that may be issued or registered, as applicable, in the future with respect to pending or future applications may not provide sufficiently broad protection or may not prove to be enforceable in actions against alleged infringers. Rockley cannot be certain that the steps it has taken will prevent unauthorized use of its technology or the reverse engineering of its technology. Moreover, others may independently develop technologies that are competitive to Rockley or infringe Rockley’s intellectual property.
Protecting against the unauthorized use of Rockley’s intellectual property, products, and other proprietary rights is expensive and difficult, particularly internationally. Unauthorized parties may attempt to copy or reverse engineer Rockley’s sensing technology or certain aspects of Rockley’s products or manufacturing processes that it considers proprietary. Litigation may be necessary in the future to enforce or defend Rockley’s intellectual property rights, to prevent unauthorized parties from copying or reverse engineering its products, or technology to determine the validity and scope of the proprietary rights of others or to block the importation of infringing products into the United States.
Any such litigation, whether initiated by Rockley or a third party, could result in substantial costs and diversion of management resources, either of which could adversely affect Rockley’s business, operating results, and financial condition. Even if it obtains favorable outcomes in litigation, Rockley may not be able to obtain adequate remedies, especially in the context of unauthorized parties copying or reverse engineering its products or technology.
Further, many of Rockley’s current and potential competitors have the ability to dedicate substantially greater resources to defending intellectual property infringement claims and to enforcing their intellectual property rights than Rockley has. Attempts to enforce its rights against third parties could also provoke these third parties to assert their own intellectual property or other rights against Rockley or result in a holding that invalidates or narrows the scope of Rockley’s rights, in whole or in part. Effective patent, trademark, service mark, copyright, and trade secret protection may not be available in every country in which Rockley’s products are available and competitors based in other countries may sell infringing products in one or more markets. Failure to adequately protect Rockley’s intellectual property rights could result in Rockley’s competitors offering similar products, potentially resulting in the loss of some of Rockley’s competitive advantage and a decrease in its revenue, which would adversely affect Rockley’s business, operating results, financial condition, and prospects.
Third-party claims that Rockley is infringing intellectual property, whether successful or not, could subject Rockley to costly and time-consuming litigation or expensive licenses, and its business could be adversely affected.
Although Rockley has applied for patents related to its products and technology, a number of companies hold patents covering aspects of sensing and photonic chip technologies. In addition to these patents, participants
37
in this industry typically also protect their technology, especially embedded software, through copyrights and trade secrets. As a result, there is frequent litigation based on allegations of infringement, misappropriation, or other violations of intellectual property rights. Rockley may in the future receive inquiries from other intellectual property holders and may become subject to claims that it infringes their intellectual property rights, particularly as Rockley expands its presence in the market, expands to new use cases, and faces increasing competition. In addition, parties may claim that the names and branding of Rockley’s products infringe their trademark rights in certain countries or territories. If such a claim were to prevail, Rockley may have to change the names and branding of its products in the affected territories and it could incur other costs.
Rockley currently has a number of agreements in effect pursuant to which it has agreed to defend, indemnify, and hold harmless its customers, suppliers, and channel partners and other counterparties from damages and costs which may arise from the infringement by Rockley’s products of third-party patents or other intellectual property rights. The scope of these indemnity obligations varies, and, in some instances, include indemnification for damages and expenses, including attorneys’ fees. Rockley’s insurance may not cover all intellectual property infringement claims. A claim that its products infringe a third party’s intellectual property rights, even if untrue, could adversely affect Rockley’s relationships with its customers, may deter future customers from purchasing its products, and could expose Rockley to costly litigation and settlement expenses. Even if Rockley is not a party to any litigation between a customer and a third party relating to infringement by its products, an adverse outcome in any such litigation could make it more difficult for Rockley to defend its products against intellectual property infringement claims in any subsequent litigation in which it is a named party. Any of these results could adversely affect Rockley’s brand and operating results.
Rockley may in the future need to initiate infringement claims or litigation to try to protect its intellectual property rights. In addition to litigation where Rockley is a plaintiff, Rockley’s defense of intellectual property rights claims brought against it or its customers, suppliers, and channel partners, with or without merit, could be time-consuming, expensive to litigate or settle, divert management resources and attention, and force Rockley to acquire intellectual property rights and licenses, which may involve substantial royalty or other payments and may not be available on acceptable terms or at all. Further, a party making such a claim, if successful, could secure a judgment that requires Rockley to pay substantial damages or obtain an injunction and also Rockley may lose the opportunity to license its technology to others or to collect royalty payments. An adverse determination also could invalidate or narrow Rockley’s intellectual property rights and adversely affect its ability to offer its products to its customers and may require that Rockley procure or develop substitute products that do not infringe, which could require significant effort and expense. Any of these events could adversely affect Rockley’s business, reputation, operating results, financial condition, and prospects.
Rockley’s intellectual property applications, including patent applications, may not be approved or granted or may take longer than expected to result in approval or grant, which may have a material adverse effect on Rockley’s ability to prevent others from commercially exploiting products similar to Rockley’s.
Rockley cannot be certain that it is the first inventor of the subject matter to which it has filed a particular patent application, or if it is the first party to file such a patent application. If another party has filed a patent application to the same subject matter as Rockley has, Rockley may not be entitled to the protection sought by the patent application. Rockley also cannot be certain whether the claims included in a patent application will ultimately be allowed in the applicable issued patent or the timing of any approval or grant of a patent application. Further, the scope of protection of issued patent claims is often difficult to determine. As a result, Rockley cannot be certain that the patent applications that it files will issue, or that its issued patents will afford protection against competitors with similar technology. In addition, Rockley’s competitors may design around Rockley’s registered or issued intellectual property, which may adversely affect Rockley’s business, prospects, financial condition, and operating results.
38
In addition to patented technology, Rockley relies on its unpatented proprietary technology, trade secrets, designs, experiences, workflows, data, processes, software, and
know-how.
Rockley relies on proprietary information (such as trade secrets, designs, experiences, workflows, data,
know-how, and
confidential information) to protect intellectual property that may not be patentable or subject to copyright, trademark, trade dress, or service mark protection, or that Rockley believes is best protected by means that do not require public disclosure. Rockley generally seeks to protect this proprietary information by entering into confidentiality agreements, or consulting, services, or employment agreements that containnon-disclosure
andnon-use
provisions with its employees, consultants, contractors, and third parties. However, these agreements may be breached or may otherwise fail to prevent disclosure, third-party infringement, or misappropriation of its proprietary information, may be limited as to their term, and may not provide an adequate remedy in the event of unauthorized disclosure or use of proprietary information. Rockley has limited control over the protection of trade secrets used by its current or future manufacturing counterparties and suppliers and could lose future trade secret protection if any unauthorized disclosure of such information occurs. In addition, Rockley’s proprietary information may otherwise become known or be independently developed by its competitors or other third parties. To the extent that its employees, consultants, contractors, advisors, and other third parties use intellectual property owned by others in their work for Rockley, disputes may arise as to the rights in related or resultingknow-how and
inventions. Costly and time-consuming litigation could be necessary to enforce and determine the scope of Rockley’s proprietary rights, and failure to obtain or maintain protection for its proprietary information could adversely affect its competitive business position. Furthermore, laws regarding trade secret rights in certain markets where Rockley operates may afford little or no protection to its trade secrets.Rockley also relies on physical and electronic security measures to protect its proprietary information, but it cannot provide assurance that these security measures will not be breached or provide adequate protection for its property. There is a risk that third parties may obtain and improperly utilize Rockley’s proprietary information to its competitive disadvantage. Rockley may not be able to detect or prevent the unauthorized use of such information or take appropriate and timely steps to enforce its intellectual property rights.
Rockley may be subject to damages resulting from claims that it or its current or former employees have wrongfully used or disclosed alleged trade secrets of its current or former employees’ former employers. Rockley may be subject to damages if its current or former employees wrongfully use or disclose Rockley’s trade secrets.
Rockley may be subject to claims that it or its current or former employees have inadvertently or otherwise used or disclosed trade secrets or other proprietary information of a current or former employee’s former employers. Litigation may be necessary to defend against these claims. If Rockley fails to defend against such claims, in addition to paying monetary damages, it may lose valuable intellectual property rights or talent. A loss of key talent or their work product could hamper or prevent Rockley’s ability to commercialize its products, which could severely harm its business. Even if Rockley is successful in defending against these claims, litigation could result in substantial costs and demand on management resources.
Risks Related to Infrastructure, Cybersecurity and Privacy
A network or data security incident may allow unauthorized access to Rockley’s network or data, harm its reputation, create additional liability, and adversely impact its financial results.
Rockley and its third-party service providers may face security threats and attacks from a variety of sources. In addition to traditional computer “hackers,” malicious code (such as viruses and worms), phishing attempts, employee theft or misuse, and denial of service attacks, sophisticated nation-state and nation-state supported actors engage in attacks (including advanced persistent threat intrusions) and increase the risks to Rockley’s internal networks and customer facing environments and the information they store and process. These risks may increase due to
COVID-19.
A breach in Rockley’s data or an attack against its service availability, or that of its third-party service providers, could impact Rockley’s networks, creating system disruptions or slowdowns and39
exploiting security vulnerabilities of Rockley’s products, and the information stored on Rockley’s networks or those of its third-party service providers could be accessed, publicly disclosed, altered, lost, or stolen, which could subject Rockley to liability and cause it financial harm.
Unauthorized access by a third party to Rockley’s internal network, any actual or perceived breach of network security in its systems or networks, or any other actual or perceived data security incident Rockley or its third-party service providers suffer, could result in damage to its reputation, negative publicity, loss of channel partners,
end-customers
and sales, loss of competitive advantages over its competitors, increased costs to remedy any problems and otherwise respond to any incident, regulatory investigations and enforcement actions, costly litigation, and other liability. In addition, Rockley may incur significant costs to investigate and remediate any security breaches and other security incidents. Rockley’s data, corporate systems, third-party systems, and security measures may be breached due to the actions of outside parties, employee error, malfeasance, a combination of these, or otherwise, and, as a result, an unauthorized party may obtain access to its data. For example, in late 2020, Rockley was subject to phishing attacks, one involving a spoofed email whereby certain vendor account information was charged and payment was made to a fraudulent account and a second closely timed incident where a “forwarding” rule was applied to the spoofed email’s recipient. While no personal data was accessed and the issue was addressed, the incident resulted in a net loss of approximately $66,345, which loss has been accounted for in Rockley’s 2020 financial statements (which amount has been offset by a payout under Rockley’s cybersecurity insurance policy in March 2021). While Rockley maintains cybersecurity insurance, such insurance may be insufficient to cover all liabilities incurred by these incidents, and any incidents may result in loss or increased costs of its cybersecurity insurance. Any of these negative outcomes could adversely impact the market perception of, and investor confidence in, Rockley.Any disruption or performance issues with Rockley’s network infrastructure could harm its brand, reputation, and business.
Rockley has experienced, and may in the future experience, disruptions, outages, and other performance problems due to a variety of factors, including infrastructure changes, human or software errors, capacity constraints, and fraud. Any disruptions or other performance problems with Rockley’s products or reliability or security of Rockley’s systems could harm its reputation, brand, and Rockley’s business and operating results. In addition, Rockley must continually improve its computer network and infrastructure to avoid service interruptions or slower system performance. Rockley will need to devote additional resources to improving its platform architecture and its infrastructure. Any failure or delays in Rockley’s computer systems could cause service interruptions or slower system performance. These performance issues could harm Rockley’s business operations and financial condition.
Rockley relies on third parties to maintain and operate certain elements of its network infrastructure.
Rockley relies on third parties to operate and maintain certain elements of its network infrastructure. Interruptions in Rockley’s systems or the third-party systems on which it relies, whether due to system failures, computer viruses, physical or electronic
break-ins,
or other factors, could affect the security or availability of Rockley’s network infrastructure and website. Rockley’s existing data center facilities and third-party hosting providers have no obligations to renew their agreements with Rockley on commercially reasonable terms or at all, and certain of the agreements governing these relationships may be terminated by either party at any time, with no or limited notice. If any of these arrangements with third parties are terminated, Rockley could experience interruptions, as well as downtime, delays, and additional expenses in arranging alternative cloud infrastructure services. Rockley may incur significant liability from those customers and from third parties with respect to any breach of security affecting third parties’ infrastructure.40
Risks Related to Financial and Accounting Matters
Rockley’s failure to raise additional capital or generate the significant capital necessary to expand its operations could reduce its ability to compete and could harm its business.
Rockley intends to continue to make investments to support its product development efforts and overall business growth and may require additional funds to respond to business challenges, including the need to develop new features to enhance its products or acquire complementary businesses and technologies. Accordingly, Rockley may in the long-term need to engage in equity or debt financings to secure additional funds. If Rockley raises additional equity or equity-linked financing, shareholders may experience dilution of their ownership interests. Current and future indebtedness may also contain terms that, among other things, restrict Rockley’s ability to incur additional indebtedness. Rockley may also be required to take other actions that would otherwise be in the interests of the debt holders and would require it to maintain specified liquidity or other ratios, any of which could harm Rockley’s business, operating results, and financial condition. Rockley may not be able to obtain additional financing on terms favorable to it, if at all. If Rockley is unable to obtain adequate financing or financing on satisfactory terms when required, Rockley’s ability to continue to support its business growth and to respond to business challenges could be significantly impaired, and its business may be adversely affected.
The nature of Rockley’s business requires the application of complex revenue recognition rules. Significant changes in current principles will affect its consolidated financial statements and changes in financial accounting standards or practices may cause adverse, unexpected financial reporting fluctuations and harm its results of operations.
The accounting rules and regulations with which Rockley must comply with are complex and subject to interpretation by the Financial Accounting Standards Board (“FASB”), the SEC, and various bodies formed to promulgate and interpret appropriate accounting principles. In addition, many companies’ accounting disclosures are being subjected to heightened scrutiny by regulators and the public. Further, the accounting rules and regulations are continually changing in ways that could impact Rockley’s financial statements.
In preparing Rockley’s consolidated financial statements, Rockley makes good faith estimates and judgments that may change or turn out to be erroneous, which could adversely affect Rockley’s operating results.
In preparing Rockley’s consolidated financial statements in conformity with generally accepted accounting principles (“GAAP”), Rockley must make estimates and judgments in applying Rockley’s most critical accounting policies. Those estimates and judgments have a significant impact on the results Rockley reports in its consolidated financial statements. The most difficult estimates and subjective judgments that Rockley makes relate to (i) revenue recognition including variable consideration, (ii) useful lives and recoverability of property and equipment and long-lived assets, (iii) incremental borrowing rates on the Company’s finance and operating leases, (iv) valuation of our convertible loan notes, (v) valuation allowances for income taxes, (vi) stock-based compensation including the valuation of ordinary shares, (vii) valuation of warrants and (viii) contingencies. Rockley bases its estimates on historical experience, input from outside experts, and on various other assumptions that Rockley believe to be reasonable under the circumstances, the results of which form the basis for making judgments about the carrying values of assets and liabilities that are not readily apparent from other sources. Rockley also has other key accounting policies that are not as subjective, and therefore, their application would not require Rockley to make estimates or judgments that are as difficult, but which nevertheless could significantly affect its financial reporting. Actual results may differ materially from these estimates. In general, if Rockley’s estimates, judgments, or assumptions relating to its critical accounting policies are inaccurate or change or if actual circumstances differ from its estimates, judgments, or assumptions, including uncertainty in the current economic environment due to
COVID-19,
its operating results may be adversely affected and could fall below Rockley’s publicly announced projections or guidance or the expectations of securities analysts and investors.41
Additionally, Rockley regularly monitors its compliance with applicable financial reporting standards and review new pronouncements and drafts thereof that are relevant to it. As a result of new standards, changes to existing standards, and changes in their interpretation, Rockley might be required to change its accounting policies, alter its operational policies, and implement new or enhance existing systems so that they reflect new or amended financial reporting standards, or Rockley may be required to restate its published financial statements. Such changes to existing standards or changes in their interpretation may have an adverse effect on Rockley’s reputation, business, financial position, and profit, or cause an adverse deviation from Rockley’s revenue and operating profit target, which may negatively impact Rockley’s financial results. For more information, see “Critical Accounting Policies and Estimates” in “Management’s Discussion and Analysis of Financial Condition and Results of Operations” in this prospectus.
Rockley’s ability to use its net operating loss carryforwards and certain other tax attributes may be limited.
As of December 31, 2020, Rockley had $79.3 million of U.K. net operating loss carryforwards available to reduce future taxable income and will be carried forward indefinitely. To the extent Rockley is not able to offset future taxable income with its net operating losses, Rockley’s cash flows may be adversely affected.
Risks Related to Being a Public Company
Rockley’s management team has varying degrees of experience managing and operating a public company.
Members of Rockley’s management team have varying degrees of experience managing and operating a publicly traded company, interacting with public company investors, and complying with the increasingly complex laws pertaining to public companies. Additionally, some members of Rockley’s management team were recently hired, including its Senior Director of Sensing Application Algorithm Development, Controller, Senior Director of Sensing Product Module Development, and VP of Sensing Cloud, and AI Product. Rockley’s management team may not successfully or efficiently manage their new roles and responsibilities. Rockley’s transition to being a public company subjects it to significant regulatory oversight and reporting obligations under the U.S. securities laws and the continuous scrutiny of securities analysts and investors. These new obligations and constituents will require significant attention from Rockley’s senior management and could divert their attention away from theof Rockley’s business. Rockley may not have adequate key talent with the appropriate level of knowledge, experience, and training in the accounting policies, practices, or internal controls over financial reporting required of public companies. The development and implementation of the standards and controls necessary for Rockley to achieve the level of accounting standards required of a public company may require costs greater than expected. It is possible that Rockley will be required to expand its employee base and hire additional employees to support its operations as a public company which will increase its operating costs in future periods. These factors could adversely affect Rockley’s business, financial condition, and operating results.
day-to-day management
If Rockley fails to maintain an effective system of internal controls, its ability to produce timely and accurate financial statements or comply with applicable regulations could be adversely affected.
Upon the closing of the Business Combination, Rockley became subject to the reporting requirements of the Exchange Act, the Sarbanes-Oxley Act, and the rules and regulations of the NYSE. The requirements of these rules and regulations have increased, and Rockley expects ongoing compliance with these rules and regulations will continue to increase its legal, accounting, and financial compliance costs, make some activities more difficult, time-consuming, and costly, and place significant strain on its talent, systems, and resources.
The Sarbanes-Oxley Act requires, among other things, that Rockley maintain effective disclosure controls and procedures and internal control over financial reporting. Rockley is continuing to develop and refine its disclosure controls, internal control over financial reporting, and other procedures that are designed to ensure that information required to be disclosed by it in the reports that it will file with the SEC is recorded, processed,
42
summarized, and reported within the time periods specified in SEC rules and forms, and that information required to be disclosed in reports under the Exchange Act is accumulated and communicated to Rockley’s principal executive and financial officers.
Rockley’s current controls and any new controls that it develops may be inadequate because of changes in conditions in its business. Further, additional weaknesses in Rockley’s internal controls may be discovered in the future. Any failure to develop or maintain effective controls, or any difficulties encountered in their implementation or improvement, could adversely affect Rockley’s operating results or cause it to fail to meet its reporting obligations and may result in a restatement of Rockley’s financial statements for prior periods. Any failure to implement and maintain effective internal controls also could adversely affect the results of periodic management evaluations and annual independent registered public accounting firm attestation reports regarding the effectiveness of Rockley’s internal control over financial reporting that it is required to include in its periodic reports Rockley will file with the SEC under Section 404 of the Sarbanes-Oxley Act. Ineffective disclosure controls and procedures and internal control over financial reporting could also cause investors to lose confidence in Rockley’s reported financial and other information.
In order to maintain and improve the effectiveness of its disclosure controls and procedures and internal control over financial reporting, Rockley has expended and anticipates that it will continue to expend significant resources, including accounting-related costs, and provide significant management oversight. Any failure to maintain the adequacy of its internal controls, or consequent inability to produce accurate financial statements on a timely basis, could increase Rockley’s operating costs and could materially and adversely affect its ability to operate its business. If Rockley’s internal controls are perceived as inadequate or that it is unable to produce timely or accurate financial statements, investors may lose confidence in Rockley’s operating results and Rockley’s share price could decline.
Rockley’s independent registered public accounting firm is not required to formally attest to the effectiveness of its internal control over financial reporting until after Rockley is no longer an emerging growth company. At such time, Rockley’s independent registered public accounting firm may issue a report that is adverse in the event it is not satisfied with the level at which Rockley’s controls are documented, designed, or operating. Any failure to maintain effective disclosure controls and internal control over financial reporting could have a material and adverse effect on Rockley’s business and operating results.
In addition to Rockley’s results determined in accordance with GAAP, Rockley believes certain
non-GAAP measures
may be useful in evaluating its operating performance. Rockley intends to present certainnon-GAAP financial
measures in future filings with the SEC and other public statements. Any failure to accurately report and present itsnon-GAAP financial
measures could cause investors to lose confidence in its reported financial and other information, which would likely have a negative effect on the trading price of its ordinary shares.The requirements of being a public company may strain Rockley’s resources, divert management’s attention, and affect its ability to attract and retain qualified board members.
Upon the closing of the Business Combination, Rockley became subject to the reporting requirements of the Exchange Act, the Sarbanes-Oxley Act, the Dodd-Frank Act, the listing requirements of the NYSE, and other applicable securities rules and regulations. Compliance with these rules and regulations has increased, and will continue to increase, Rockley’s legal and financial compliance costs, make some activities more difficult, time-consuming, or costly, and increase demand on its systems and resources. Among other things, the Exchange Act requires that public companies file annual, quarterly, and current reports with respect to their business and operating results. In addition, the Sarbanes-Oxley Act requires, among other things, that companies maintain effective disclosure controls and procedures and internal control over financial reporting. In order to meet the requirements of this standard, significant resources and management oversight may be required. As a result, management’s attention may be diverted from other business concerns, which could harm Rockley’s business
43
and operating results. As a private company, Rockley was not required to comply with these requirements and as such, had not invested in the resources required for such compliance. Although Rockley has already hired additional employees to comply with these requirements, it may need to hire even more employees in the future and will need to engage its auditors to review its quarterly and annual reports, which will increase its costs and expenses.
In addition, changing laws, regulations, and standards related to corporate governance and public disclosure are creating uncertainty for public companies, increasing legal and financial compliance costs, and making some activities more time-consuming. These laws, regulations, and standards are subject to varying interpretations, in many cases due to their lack of specificity, and, as a result, their application in practice may evolve over time as new guidance is provided by regulatory and governing bodies. This could result in continuing uncertainty regarding compliance matters and higher costs necessitated by ongoing revisions to disclosure and governance practices. Rockley intends to invest resources to comply with evolving laws, regulations, and standards, and this investment may result in increased general and administrative expense and a diversion of management’s time and attention from revenue-generating activities to compliance activities. If Rockley’s efforts to comply with new laws, regulations, and standards differ from the activities intended by regulatory or governing bodies, regulatory authorities may initiate legal proceedings against Rockley and its business may be harmed.
Risks Related to Ownership of Our Ordinary Shares
Concentration of ownership among our existing executive officers, directors and their affiliates may prevent new investors from influencing significant corporate decisions.
As of September 30, 2021, our executive officers and directors collectively beneficially own approximately 16.1% of our outstanding ordinary shares, with Dr. Andrew Rickman, our Chief Executive Officer, beneficially owning approximately 13.8% of our outstanding ordinary shares. As a result, these shareholders will be able to exercise a significant level of control over all matters requiring shareholder approval, including the election of directors, any amendment of the Articles of Association, and approval of significant corporate transactions. This control could have the effect of delaying or preventing a change of control or changes in management and will make the approval of certain transactions difficult or impossible without the support of these shareholders.
Sales of a substantial number of our ordinary shares in the public market or the perception that such sales may occur could cause the price of our ordinary shares to fall.
Sales of a substantial number of our ordinary shares in the public market or the perception that these sales might occur could depress the market price of our ordinary shares and could impair our ability to raise capital through the sale of additional equity securities. We are unable to predict the effect that sales may have on the prevailing market price of our ordinary shares. In addition, the sale of substantial amounts of our ordinary shares could adversely impact its price.
In addition to the shares being registered for resale hereunder, we have registered for resale approximately 61.9 million of our outstanding ordinary shares, not including the ordinary shares underlying any of our outstanding Warrants. Outstanding Warrants to purchase an aggregate of 8,625,000 ordinary shares, which we refer to in this prospectus as the “Public Warrants,” became exercisable on the effectiveness of the registration statement that we filed with the SEC to register the shares underlying the Public Warrants. The exercise price of the Warrants is currently $11.50 per share. To the extent the Public Warrants are exercised, additional ordinary shares will be issued, which will result in dilution to the holders of our ordinary shares and increase the number of shares eligible for resale in the public market. Sales, or the potential sales, of substantial numbers of shares in the public market by selling shareholders upon termination of applicable contractual
lock-up
agreements or by holders of the Public Warrants, could increase the volatility of the market price of our ordinary shares or adversely affect the market price of our ordinary shares.As of September 30, 2021, we had outstanding approximately 126.7 million ordinary shares, and Warrants to purchase approximately 14.1 million ordinary shares. In addition, we intend to register for sale our ordinary
44
shares issuable under our equity compensation plans, including approximately 15.4 million ordinary shares available for future issuance under our 2021 Plan, approximately 1.5 million ordinary shares available for future issuance under our ESPP, and approximately 16.5 million ordinary shares issuable upon the exercise of outstanding options under our 2013 Stock Option Plan. We also intend to register additional shares under our 2021 Plan and ESPP pursuant to the evergreen provisions under such plans. The sale or the availability for sale of a large number of our ordinary shares in the public market could cause the price of our ordinary shares to decline.
We may sell additional ordinary shares, as well as securities convertible into or exercisable for ordinary shares, in subsequent public or private offerings. We may also issue additional ordinary shares, as well as securities convertible into or exercisable for ordinary shares, for strategic or other purposes. We may also need to raise additional capital in order to commercially develop our products, and this may require us to issue additional securities (including ordinary shares as well as securities convertible into or exercisable for ordinary shares). There can be no assurance that our capital raising efforts will be able to attract the capital needed to execute on our business plan and sustain our operations. Moreover, we cannot predict the size of future issuances of our ordinary shares, as well as securities convertible into or exercisable for ordinary shares, or the effect, if any, that future issuances and sales of our securities will have on the market price of our ordinary shares. Sales of substantial amounts of our ordinary shares, as well as securities convertible into or exercisable for ordinary shares, or the perception that such sales could occur, may result in substantial dilution and may adversely affect prevailing market prices for our ordinary shares.
We have never paid dividends on our capital stock, and we do not anticipate paying dividends in the foreseeable future.
We have never paid dividends on any of our capital stock and currently intend to retain any future earnings to fund the growth of our business. Any determination to pay dividends in the future will be at the discretion of our board of directors (the “Board”) and will depend on our financial condition, operating results, capital requirements, general business conditions and other factors that the Board may deem relevant. As a result, capital appreciation, if any, of our ordinary shares will be the sole source of gain for the foreseeable future.
Our stock price is volatile, and you may not be able to sell our ordinary shares at or above the price you paid.
The trading price of our ordinary shares is volatile and could be subject to wide fluctuations in response to various factors, some of which are beyond our control. These factors include:
| • | actual or anticipated fluctuations in operating results; |
| • | failure to meet or exceed financial estimates and projections of the investment community or that we may provide to the public; |
| • | issuance of new or updated research or reports by securities analysts or changed recommendations for our ordinary shares or the semiconductor industry in general; |
| • | announcements by us or our competitors of significant acquisitions, strategic partnerships, joint ventures, collaborations or capital commitments; |
| • | operating and share price performance of other companies that investors deem comparable to us; |
| • | our focus on long-term goals over short-term results; |
| • | the timing and magnitude of our investments in the growth of our business; |
| • | actual or anticipated changes in laws and regulations affecting our business; |
| • | additions or departures of key management or other personnel; |
| • | disputes or other developments related to our intellectual property or other proprietary rights, including litigation; |
45
| • | our ability to market new and enhanced products and technologies on a timely basis; |
| • | sales of substantial amounts of the ordinary shares by the Board, executive officers or significant shareholders or the perception that such sales could occur; |
| • | changes in our capital structure, including future issuances of securities or the incurrence of debt; and |
| • | general economic, political, and market conditions. |
In addition, the stock market in general, and the NYSE in particular, has experienced extreme price and volume fluctuations that have often been unrelated or disproportionate to the operating performance of those companies. Broad market and industry factors may seriously affect the market price of our ordinary shares, regardless of our actual operating performance. In addition, in the past, following periods of volatility in the overall market and the market price of a particular company’s securities, securities class action litigation has often been instituted against these companies. This litigation, if instituted against us, could result in substantial costs and a diversion of our management’s attention and resources.
We qualify as an “emerging growth company” within the meaning of the Securities Act, and if we take advantage of certain exemptions from disclosure requirements available to emerging growth companies, it could make our securities less attractive to investors and may make it more difficult to compare our performance to the performance of other public companies.
We qualify as an “emerging growth company” as defined in Section 2(a)(19) of the Securities Act, as modified by the JOBS Act. As such, we are eligible for and intend to take advantage of certain exemptions from various reporting requirements applicable to other public companies that are not emerging growth companies for as long as we continue to be an emerging growth company, including (a) the exemption from the auditor attestation requirements with respect to internal control over financial reporting under Section 404(b) of the Sarbanes-Oxley Act, (b) the exemptions fromandparachute voting requirements and (c) reduced disclosure obligations regarding executive compensation in our periodic reports and proxy statements. We will remain an emerging growth company until the earliest of (i) the last day of the fiscal year in which the market value of ordinary shares that are held by
say-on-pay,
say-on-frequency
say-on-golden
non-affiliates
exceeds $700.0 million as of June 30 of that fiscal year, (ii) the last day of the fiscal year in which we have total annual gross revenue of $1.07 billion or more during such fiscal year (as indexed for inflation), (iii) the date on which we have issued more than $1 billion innon-convertible
debt in the prior three-year period or (iv) the last day of the fiscal year following the fifth anniversary of the date of the first sale of ordinary shares in SC Health’s initial public offering of units, consummated on July 16, 2019 (the “IPO”). In addition, Section 107 of the JOBS Act also provides that an emerging growth company can take advantage of the exemption from complying with new or revised accounting standards provided in Section 7(a)(2)(B) of the Securities Act as long as we are an emerging growth company. An emerging growth company can therefore delay the adoption of certain accounting standards until those standards would otherwise apply to private companies. We have elected not to opt out of such extended transition period and, therefore, we may not be subject to the same new or revised accounting standards as other public companies that are not emerging growth companies. Investors may find our securities less attractive because we will rely on these exemptions, which may result in a less active trading market for the ordinary shares and Warrants and the price of such securities may be more volatile.The unaudited pro forma financial information included herein is not indicative of what our actual financial position or results of operations would have been.
The unaudited pro forma financial information included herein is presented for illustrative purposes only and is not necessarily indicative of what our actual financial position or results of operations would have been had the Business Combination been completed on the dates indicated.
46
We may amend the terms of the Warrants in a manner that may be adverse to holders with the approval by the holders of at least 50% of the then outstanding Public Warrants.
The Warrants were issued in registered form under the HoldCo Warrant Agreement between ComputerShare Trust Company, as warrant agent, and us. The Warrant Agreement provides that the terms of the Warrants may be amended without the consent of any holder to cure any ambiguity or correct any defective provision, but requires the approval by the holders of at least 50% of the then outstanding Public Warrants to make any change that adversely affects the interests of the registered holders. Accordingly, we may amend the terms of the Warrants in a manner adverse to a holder if holders of at least 50% of the then outstanding Public Warrants approve of such amendment. Although our ability to amend the terms of the Warrants with the consent of at least 50% of the then outstanding Public Warrants is unlimited, examples of such amendments could be amendments to, among other things, increase the exercise price of the Warrants, convert the Warrants into equity or cash, shorten the exercise period or decrease the number of warrant shares issuable upon exercise of a Warrant.
We may redeem unexpired Warrants prior to their exercise at a time that is disadvantageous to you, thereby making those Warrants worthless.
The Private Warrants will be not redeemable by us so long as they are held by their initial purchasers or their permitted transferees. We will have the ability to redeem outstanding Warrants (including Private Warrants if they are sold to a holder who is not a permitted transferee under the terms of the Private Warrants) at any time after they become exercisable and prior to their expiration, at a price of $0.01 per warrant, provided that the last reported sales price of ordinary shares equals or exceeds $18.00 per share for any 20 trading days within a
30-trading
day period ending on the third trading day prior to the date we give notice of redemption. If and when the Warrants become redeemable by us, we may exercise our redemption right even if we are unable to register or qualify the underlying securities for sale under all applicable state securities laws. Redemption of the outstanding Warrants could force you (i) to exercise your Warrants and pay the exercise price therefor at a time when it may be disadvantageous for you to do so, (ii) to sell your Warrants at the then-current market price when you might otherwise wish to hold your Warrants or (iii) to accept the nominal redemption price which, at the time the outstanding Warrants are called for redemption, is likely to be substantially less than the market value of your Warrants.If securities or industry analysts issue an adverse opinion regarding our ordinary shares or do not publish research or reports about our company, our share price and trading volume could decline.
The trading market for our ordinary shares will depend in part on the research and reports that equity research analysts publish about us and our business. We do not control these analysts or the content and opinions included in their reports. Securities analysts may elect not to provide research coverage of our company and such lack of research coverage may adversely affect the market price of our ordinary shares. The price of our ordinary shares could also decline if one or more equity research analysts downgrade our ordinary shares, change their price targets, issue other unfavorable commentary or cease publishing reports about us or our business. If one or more equity research analysts cease coverage of our company, we could lose visibility in the market, which in turn could cause our share price to decline.
General Risk Factors
The global
COVID-19
pandemic could harm Rockley’s business and results of operations.On March 11, 2020, the World Health Organization characterized the outbreak oforders, and similar mandates and guidelines for many individuals to substantially restrict daily activities and for many businesses to curtail or cease normal operations.
COVID-19
as a global pandemic and recommended containment and mitigation measures. Since then, extraordinary actions have been taken by international, federal, state, and local public health and governmental authorities and organizations to contain and combat the outbreak and spread ofCOVID-19
in regions throughout the world. These actions include travel bans, quarantines,“stay-at-home”
47
The
COVID-19
pandemic has negatively impacted, and will likely continue to have a negative impact on, worldwide economic activity and financial markets and has impacted, and will further impact, Rockley’s workforce and operations, the operations of its customers, and those of their respective channel partners, vendors, and suppliers. In light of the uncertain and evolving situation and various international and government restrictions and guidelines, Rockley has taken measures intended to mitigate the spread of the virus and minimize the risk to its employees, channel partners,end-customers,
and the communities in which it operates. Specifically, these measures include transitioning its employee population to work remotely from home, which is planned to continue through September 30, 2021 with the anticipated roll out of a phased return to office plan in through September 30, 2021 in accordance with government guidance and, in accordance with applicable government directives, reducingon-site
operations at its facilities. Certain key laboratory employees and facilities were designated as Essential Critical Infrastructure and Rockley was able to continue internal testing and laboratory work to the extent necessary to service customer commitments. To facilitateon-site
operations, revised operational and manufacturing plans were implemented that conform toCOVID-19
precautionary health guidelines, including universal requirement of facial coverings, rearranging facilities to follow social distancing protocols, conducting active daily temperature checks, regular and thorough disinfecting of surfaces and tools, and regular testing of its employees forCOVID-19.
The remainingnon-essential
workforce was required to perform their duties from home.Rockley intends to continue to monitor the situation and may adjust its current policies as more information and public health guidance become available. Any precautionary measures that Rockley has adopted or may adopt could negatively affect Rockley’s sales and marketing efforts, delay and lengthen its sales cycles, and create operational or other challenges, any of which could harm its business and results of operations. In addition,
COVID-19
may disrupt the operations of Rockley’s customers and channel partners for an indefinite period of time, including as a result of travel restrictions and/or business shutdowns, all of which could negatively impact Rockley’s business and results of operations, including cash flows.The ongoing impact will depend on the duration of the pandemic, which is being mitigated by advances in the treatment of the disease, prevention efforts including vaccines, broad government measures to contain the spread of the virus, and related government stimulus measures. However, should Rockley experience sustained impact from the pandemic, additional actions such as cost reduction measures may need to be implemented. The impact of
COVID-19
is fluid and uncertain, but it has caused and may continue to cause various negative effects, including an inability to meet with actual or potential customers; customers deciding to delay or abandon their planned product development programs and product commercialization timelines; increased requests for delayed payment terms by customers and channel partners; changes in the demand of Rockley’s products, which may cause it to reprioritize its engineering and research and development efforts; and delays or possible disruptions in its supply chain. Until theCOVID-19
pandemic is contained and global economic activity stabilizes, it will continue to be more difficult for Rockley to forecast its operating results.The recurrence or continued effects of a global economic downturn as a result of the
COVID-19
pandemic could have an adverse effect on Rockley’s business and operating results.Rockley operates globally and as a result its business and revenue are impacted by global macroeconomic conditions. The multinational efforts to contain the spread of
COVID-19
had a significant adverse effect on the global macroeconomic environment. In addition, the instability in the global credit markets, uncertainties regarding the effects of Brexit, uncertainties related to the timing of the lifting of governmental restrictions to mitigate the spread ofCOVID-19,
uncertainties related to changes in public policies such as domestic and international regulations, taxes, or international trade agreements, international trade disputes, government shutdowns, geopolitical turmoil, and other disruptions to global and regional economies and markets could continue to add uncertainty to global economic conditions.48
These adverse conditions could result in longer sales, development, and production cycles, slower adoption of new technologies, and increased price competition. As a result, any continued or further uncertainty, weakness, or deterioration in global macroeconomic and market conditions may cause Rockley’s customers to modify spending priorities or delay purchasing decisions, and result in lengthened sales, development, and production cycles, any of which could harm its business and operating results.
49
THE LINCOLN PARK TRANSACTION
General
On November 15, 2021, we entered into the Purchase Agreement and the Registration Rights Agreement with Lincoln Park. Pursuant to the terms of the Purchase Agreement, Lincoln Park has agreed to purchase from us up to $50,000,000 of our ordinary shares (subject to certain limitations) from time to time over
a 24-month period.
Pursuant to the terms of the Registration Rights Agreement, we have filed with the SEC the registration statement that includes this prospectus to register for resale under the Securities Act the shares that may be issued to Lincoln Park under the Purchase Agreement. Pursuant to the terms of the Purchase Agreement, we previously issued 69,512 Commitment Shares to Lincoln Park as consideration for its commitment to purchase our ordinary shares under the Purchase Agreement. The 69,512 Commitment Shares are also covered by this prospectus.We do not have the right to commence any sales to Lincoln Park under the Purchase Agreement until certain conditions set forth in the Purchase Agreement have been satisfied, including the registration statement that includes this prospectus being declared effective by the SEC. Thereafter, from time to time, at our sole discretion, we may direct Lincoln Park to purchase our ordinary shares in amounts up to 160,000 shares on any single business day in a Regular Purchase, which maximum amount may be increased up to 250,000 shares, depending on the market price of our ordinary shares at the time of sale and subject to a maximum commitment by Lincoln Park of $3,500,000 per single Regular Purchase. In addition, at our discretion, Lincoln Park has committed to purchase other “accelerated amounts” and/or “additional accelerated amounts” under certain circumstances. The purchase price per share sold in Regular Purchases will be based on the market price of our ordinary shares immediately preceding the time of sale as computed under the Purchase Agreement. Lincoln Park may not assign or transfer its rights and obligations under the Purchase Agreement.
As of November 12, 2021, there were 127,219,418 ordinary shares outstanding, of which 112,744,434 shares were held
by non-affiliates.
The 127,031,025 ordinary shares outstanding as of November 8, 2021 includes 69,512 Commitment Shares previously issued to Lincoln Park under the Purchase Agreement. If all of the 7,785,560 ordinary shares offered by Lincoln Park under this prospectus were issued and outstanding (without taking into account the 19.99% shareholder approval limitation or the $50,000,000 total commitment available), such shares would represent approximately 5.8% of the total number of ordinary shares outstanding and approximately 6.5% of the total number of outstanding ordinary shares held bynon-affiliates,
in each case as of the date hereof. Depending on the market prices of our ordinary shares at the time we elect to issue and sell shares to Lincoln Park under the Purchase Agreement, we may need to sell more shares to Lincoln Park than are offered under this prospectus to receive aggregate gross proceeds equal to the $50,000,000 total commitment of Lincoln Park under the Purchase Agreement, in which case we must first register for resale under the Securities Act additional ordinary shares, which could cause additional substantial dilution to our shareholders. The number of shares ultimately offered for resale by Lincoln Park is dependent upon the number of shares we sell to Lincoln Park under the Purchase Agreement.Under applicable rules of the NYSE, in no event may we issue or sell to Lincoln Park under the Purchase Agreement our ordinary shares in excess of the Exchange Cap (which is 25,431,161 shares, or 19.99% of the 127,219,418 ordinary shares outstanding immediately prior to the execution of the Purchase Agreement), unless (i) we obtain shareholder approval to issue ordinary shares in excess of the Exchange Cap or (ii) the average price of all applicable sales of our ordinary shares to Lincoln Park under the Purchase Agreement equals or exceeds $6.38 (which represents the average closing price of our ordinary shares for the five trading days ending on November 12, 2021, the trading day immediately preceding the date the Purchase Agreement was executed) plus an incremental amount, such that issuances and sales of our ordinary shares to Lincoln Park under the Purchase Agreement would be exempt from the Exchange Cap limitation under applicable NYSE rules. In any event, the Purchase Agreement specifically provides that we may not issue or sell any of our ordinary shares under the Purchase Agreement if such issuance or sale would breach any applicable NYSE rules.
50
The Purchase Agreement also prohibits us from directing Lincoln Park to purchase any ordinary shares if those shares, when aggregated with all other ordinary shares then beneficially owned by Lincoln Park and its affiliates, would result in Lincoln Park and its affiliates having beneficial ownership, at any single point in time, of more than 4.99% of the then issued and outstanding ordinary shares of Rockley, as calculated pursuant to Section 13(d) of the Exchange Act, and
Rule 13d-3 thereunder,
which limitation we refer to in this prospectus as the “Beneficial Ownership Cap.”Purchase of Shares Under the Purchase Agreement
Under the Purchase Agreement, we may from time to time, at our discretion, direct Lincoln Park to purchase on any single business day up to 160,000 ordinary shares in a Regular Purchase, provided, however, that (i) the Regular Purchase may be increased up to 175,000 shares, provided that the closing sale price of the ordinary shares is not below $8.50 on the purchase date (subject to adjustment for any reorganization, recapitalization,
non-cash
dividend, stock split, reverse stock split or other similar transaction as provided in the Purchase Agreement), (ii) the Regular Purchase may be increased up to 200,000 shares, provided that the closing sale price of the ordinary shares is not below $10.00 on the purchase date (subject to adjustment for any reorganization, recapitalization,non-cash
dividend, stock split, reverse stock split or other similar transaction as provided in the Purchase Agreement), and (iii) the Regular Purchase may be increased up to 250,000 shares, provided that the closing sale price of the ordinary shares is not below $12.00 on the purchase date (subject to adjustment for any reorganization, recapitalization,non-cash
dividend, stock split, reverse stock split or other similar transaction as provided in the Purchase Agreement). In each case, Lincoln Park’s maximum commitment in any single Regular Purchase may not exceed $3,500,000. The purchase price per share for each such Regular Purchase will be based on prevailing market prices of our ordinary shares immediately preceding the time of sale as computed under the Purchase Agreement. In addition to Regular Purchases, we may also direct Lincoln Park to purchase other amounts as accelerated purchases or as additional accelerated purchases if the closing sale price of the ordinary shares exceeds certain threshold prices as set forth in the Purchase AgreementThe purchase price per share for each such Regular Purchase will be equal to the lower of:
| • | the lowest sale price for our ordinary shares on the purchase date of such shares; or |
| • | the arithmetic average of the three lowest closing sale prices for our ordinary shares during the 10 consecutive business days ending on the business day immediately preceding the purchase date of such shares. |
In addition to Regular Purchases described above, we may also direct Lincoln Park, on the business day that we have properly submitted a Regular Purchase notice directing Lincoln Park to purchase the maximum number of our ordinary shares that we are then permitted to include in a single Regular Purchase notice, to purchase an additional amount of our ordinary shares, which we refer to in this prospectus as an “Accelerated Purchase,” not to exceed the lesser of:
| • | 300% of the applicable Regular Purchase Share Limit for the corresponding Regular Purchase; and |
| • | 20% of the total volume of ordinary shares traded on the NYSE during the Accelerated Purchase Period or the Additional Accelerated Purchase Period. |
The purchase price per share for each such Accelerated Purchase will be equal to the lower of 97% of:
| • | the volume weighted average price of our ordinary shares for the period beginning at the Accelerated Purchase Commencement Time and ending at the Accelerated Purchase Termination Time; and |
| • | the closing sale price of our ordinary shares on the applicable Accelerated Purchase date. |
We may also direct Lincoln Park, not later than 1:00 p.m., Eastern time, on a business day on which an Accelerated Purchase has been completed and all of the shares to be purchased thereunder (and under the
51
corresponding Regular Purchase) have been properly delivered to Lincoln Park in accordance with the Purchase Agreement prior to such time on such business day, to purchase an additional amount of our ordinary shares, which we refer to in this prospectus as an “Additional Accelerated Purchase,” not to exceed the lesser of:
| • | 300% of the number of purchase shares directed by us to be purchased by Lincoln Park pursuant to the corresponding Regular Purchase Notice for the corresponding Regular Purchase (subject to the purchase share limitations contained in the Purchase Agreement); and |
| • | an amount equal to (A) the Additional Accelerated Purchase Share Percentage multiplied by (B) the total number (or volume) of ordinary shares traded on the NYSE during the period on the applicable Additional Accelerated Purchase Date beginning at the Additional Accelerated Purchase Commencement Time for such Additional Accelerated Purchase and ending at the Additional Accelerated Purchase Termination Time for such Additional Accelerated Purchase. |
We may, in our sole discretion, submit multiple Additional Accelerated Purchase notices to Lincoln Park prior to 1:00 p.m., Eastern time, on a single Accelerated Purchase date, provided that all prior Accelerated Purchases and Additional Accelerated Purchases (including those that have occurred earlier on the same day) have been completed and all of the shares to be purchased thereunder (and under the corresponding Regular Purchase) have been properly delivered to Lincoln Park in accordance with the Purchase Agreement.
The purchase price per share for each such Additional Accelerated Purchase will be equal to the lower of 97% of:
| • | the volume weighted average price of our ordinary shares for the period beginning at the Additional Accelerated Purchase Commencement Time and ending at the Additional Accelerated Purchase Termination Time; and |
| • | the closing sale price of our ordinary shares on the applicable Additional Accelerated Purchase date. |
In the case of Regular Purchases, Accelerated Purchases and Additional Accelerated Purchases, the purchase price per share will be equitably adjusted for any reorganization,
recapitalization, non-cash dividend,
stock split, reverse stock split, or other similar transaction occurring during the business days used to compute the purchase price.Other than as described above, there are no trading volume requirements or restrictions under the Purchase Agreement, and we will control the timing and amount of any sales of our ordinary shares to Lincoln Park.
Minimum Share Price
Under the Purchase Agreement, we and Lincoln Park may not effect any sales of our ordinary shares under the Purchase Agreement on any purchase date that the closing sale price of our ordinary shares is less than the floor price of $1.00 per share of ordinary shares, subject to adjustment as provided in the Purchase Agreement.
Events of Default
Events of default under the Purchase Agreement include the following:
| • | the effectiveness of the registration statement of which this prospectus forms a part lapses for any reason (including, without limitation, the issuance of a stop order or similar order), or any required prospectus supplement and accompanying prospectus are unavailable for the resale by Lincoln Park of our ordinary shares offered hereby, and such lapse or unavailability continues for a period of 10 consecutive business days or for more than an aggregate of 30 business days in any 365-day period; |
| • | suspension by our principal market of our ordinary shares from trading for a period of one business day; |
52
| • | the de-listing of our ordinary shares from the NYSE, our principal market, provided our ordinary shares are not immediately thereafter trading on The Nasdaq Global Select Market, the Nasdaq Capital Market, the NYSE Arca, the NYSE American, the OTC Bulletin Board, or the OTCQB or the OTCQX operated by the OTC Markets Group, Inc. (or any nationally recognized successor to any of the foregoing); |
| • | if at any time the Exchange Cap is reached unless and until shareholder approval is obtained, to the extent applicable; |
| • | the failure of our transfer agent to issue to Lincoln Park ordinary shares within two business days after the applicable date on which Lincoln Park is entitled to receive such shares; |
| • | any breach of the representations, warranties, or covenants contained in the Purchase Agreement or Registration Rights Agreement that has or would reasonably be expected to have a material adverse effect on us and, in the case of a breach of a covenant that is reasonably curable, that is not cured within five business days; |
| • | any voluntary or involuntary participation or threatened participation in insolvency or bankruptcy proceedings by or against us; or |
| • | if at any time we are not eligible to transfer our ordinary shares electronically as DWAC shares. |
Lincoln Park does not have the right to terminate the Purchase Agreement upon any of the events of default set forth above, although the Purchase Agreement would automatically terminate in the event of any voluntary or involuntary participation or threatened participation in insolvency or bankruptcy proceedings by or against us. During an event of default, all of which are outside of Lincoln Park’s control, we may not direct Lincoln Park to purchase any of our ordinary shares under the Purchase Agreement.
Our Termination Rights
We have the unconditional right, at any time, for any reason (or for no reason) and without any payment or liability to us, to give notice to Lincoln Park to terminate the Purchase Agreement.
No Short-Selling or Hedging by Lincoln Park
Lincoln Park has agreed that neither it nor any of its affiliates shall engage in any direct or indirect short-selling or hedging of our ordinary shares during any time prior to the termination of the Purchase Agreement.
Prohibitions on Variable Rate Transactions
There are no restrictions on future financings, rights of first refusal, participation rights, penalties or liquidated damages in the Purchase Agreement or Registration Rights Agreement other than a prohibition on entering into a “Variable Rate Transaction,” as defined in the Purchase Agreement.
Effect of Performance of the Purchase Agreement on Our Shareholders
All shares registered in this offering that have been or may be issued or sold by us to Lincoln Park under the Purchase Agreement are expected to be freely tradable. It is anticipated that shares registered in this offering will be sold over a period of up
to 24-months commencing
on the date that the conditions set forth in the Purchase Agreement have been satisfied, including that the registration statement, including this prospectus, becomes effective. The sale by Lincoln Park of a significant amount of shares registered in this offering at any given time could cause the market price of our ordinary shares to decline and to be highly volatile. Sales of our ordinary shares to Lincoln Park, if any, will depend upon market conditions and other factors to be determined by us. We may ultimately decide to sell to Lincoln Park all, some, or none of the additional ordinary shares that may be53
available for us to sell pursuant to the Purchase Agreement. If and when we do sell shares to Lincoln Park, after Lincoln Park has acquired the shares, Lincoln Park may resell all, some, or none of those shares at any time or from time to time in its discretion. Therefore, sales to Lincoln Park by us under the Purchase Agreement may result in substantial dilution to the interests of other holders of our ordinary shares. In addition, if we sell a substantial number of shares to Lincoln Park under the Purchase Agreement, or if investors expect that we will do so, the actual sales of shares or the mere existence of our arrangement with Lincoln Park may make it more difficult for us to sell equity or equity-related securities in the future at a time and at a price that we might otherwise wish to effect such sales. However, we have the right to control the timing and amount of any additional sales of our shares to Lincoln Park and the Purchase Agreement may be terminated by us at any time at our discretion without any cost to us.
Pursuant to the terms of the Purchase Agreement, we have the right, but not the obligation, to direct Lincoln Park to purchase up to $50,000,000 of our ordinary shares (exclusive of the 69,512 Commitment Shares issued to Lincoln Park on the date of the Purchase Agreement). Depending on the price per share at which we sell our ordinary shares to Lincoln Park pursuant to the Purchase Agreement, we may need to sell to Lincoln Park under the Purchase Agreement more of our ordinary shares than are offered under this prospectus in order to receive aggregate gross proceeds equal to the $50,000,000 total commitment available to us under the Purchase Agreement. If we choose to do so, we must first register for resale under the Securities Act such additional ordinary shares, which could cause additional substantial dilution to our shareholders. Conversely, depending on the market prices of our ordinary shares at the time of any sales to Lincoln Park under the Purchase Agreement, we may need to sell less than the number of ordinary shares being offered under this prospectus, given the $50,000,000 total commitment available to us under the Purchase Agreement. The number of shares ultimately offered for resale by Lincoln Park under this prospectus is dependent upon the number of shares we direct Lincoln Park to purchase under the Purchase Agreement.
The Purchase Agreement prohibits us from issuing or selling to Lincoln Park under the Purchase Agreement (i) ordinary shares in excess of the Exchange Cap, unless and until we obtain shareholder approval to issue shares in excess of the Exchange Cap or the average price of all applicable sales of our ordinary shares to Lincoln Park under the Purchase Agreement equals or exceeds $6.38 (which represents the average closing price of our ordinary shares for the five trading days ending on November 12, 2021) plus an incremental amount, such that the transactions contemplated by the Purchase Agreement are exempt from the Exchange Cap limitation under applicable NYSE rules, and (ii) any ordinary shares if those shares, when aggregated with all other ordinary shares then beneficially owned by Lincoln Park and its affiliates, would exceed the Beneficial Ownership Cap.
The following table sets forth the amount of gross proceeds we may receive from Lincoln Park from our sale of shares to Lincoln Park under the Purchase Agreement at varying assumed average purchase prices after the date of this prospectus:
Assumed Average Purchase Price Per Share | Maximum Number of Shares Issuable Under the Purchase Agreement (1) | Number of Registered Shares to be Issued if Full Purchase (1) (2 ) | Percentage of Outstanding Shares After Giving Effect to the Issuance to Lincoln Park (3) | Gross Proceeds from the Sale of Shares to Lincoln Park Under the Purchase Agreement | ||||||||||||||||
| $ | 5.00 | 7,716,048 | 7,716,048 | 5.8 | % | $ | 38,580,240 | |||||||||||||
| $ | 6.00 | 7,716,048 | 7,716,048 | 5.8 | % | $ | 46,296,288 | |||||||||||||
| $ | 6.68 | (4) | 7,485,029 | 7,554,541 | 5.6 | % | $ | 49,999,993 | ||||||||||||
| $ | 7.00 | 7,142,857 | 7,212,369 | 5.4 | % | $ | 49,999,999 | |||||||||||||
| $ | 8.00 | 6,250,000 | 6,319,512 | 4.7 | % | $ | 50,000,000 | |||||||||||||
| (1) | Based on the $50,000,000 total commitment available under the Purchase Agreement and the corresponding assumed average purchase price per share in the first column. The registration statement of which this prospectus forms a part registers 7,716,048 ordinary shares for resale, excluding the 69,512 Commitment |
54
| Shares. However, as we may not sell ordinary shares in excess of the $50,000,000 total commitment available to us under the Purchase Agreement, the actual number of shares we may sell may be more or less than the number of shares covered by this prospectus, depending on the price per share at which we sell our ordinary shares to Lincoln Park pursuant to the Purchase Agreement. |
| (2) | Represents: (i) 69,512 Commitment Shares that we already issued to Lincoln Park as commitment fee for making the commitment under the Purchase Agreement; and (ii) the maximum number of shares set forth in the second column which represents the maximum number of shares which may be issued and sold to Lincoln Park in the future under the Purchase Agreement at the corresponding average purchase price per share set forth in the first column, if and when we sell shares to Lincoln Park under the Purchase Agreement, and which may or may not cover all the shares we ultimately sell to Lincoln Park under the Purchase Agreement, depending on the purchase price per share. See footnote 1. If we seek to issue ordinary shares, including shares from other transactions that may be aggregated with the transactions contemplated by the Purchase Agreement under the applicable rules of the NYSE, in excess of 25,431,161 shares, or 19.99% of the total ordinary shares outstanding immediately prior to the execution of the Purchase Agreement, we may be required to seek shareholder approval in order to be in compliance with the rules of the NYSE. |
| (3) | The denominator is based on 127,219,418 shares outstanding as of November 12, 2021, adjusted to include (i) the 69,512 Commitment Shares issued to Lincoln Park upon execution of the Purchase Agreement and (ii) the number of shares set forth in the second column, which represents the maximum number of shares which may be issued and sold to Lincoln Park in the future under the Purchase Agreement at the corresponding average purchase price per share set forth in the first column. The numerator is based on the 69,512 Commitment Shares issued to Lincoln Park upon execution of the Purchase Agreement plus the maximum number of shares set forth in the second column which may be issued to Lincoln Park under the Purchase Agreement at the corresponding assumed purchase price set forth in the first column. See footnote 1. |
| (4) | The closing sale price of our ordinary shares on November 12, 2021, the last trading date immediately preceding the execution of the Purchase Agreement. |
55
USE OF PROCEEDS
This prospectus relates to ordinary shares that may be offered and sold from time to time by Lincoln Park. We will receive no proceeds from the sale of ordinary shares by Lincoln Park in this offering. We may receive up to $50,000,000 aggregate gross proceeds under the Purchase Agreement from any sales we make to Lincoln Park pursuant to the Purchase Agreement. We estimate that the net proceeds to us from the sale of our ordinary shares to Lincoln Park pursuant to the Purchase Agreement will be up to $49,744,500 over an approximately
24-month period,
assuming that we sell the full amount of our ordinary shares that we have the right, but not the obligation, to sell to Lincoln Park under the Purchase Agreement, and after estimated fees and expenses. See “Plan of Distribution” elsewhere in this prospectus for more information.We expect to use any proceeds that we receive under the Purchase Agreement for working capital and general corporate purposes. It is possible that no shares will be issued under the Purchase Agreement. We may also use a portion of the net proceeds to acquire or invest in complementary businesses, technologies, product candidates or other intellectual property, although we have no present commitments or agreements to do so.
The amounts and timing of these expenditures will depend on a number of factors, such as timing and the costs involved in bringing our products to market, ability to secure and execute on customer contracts and design wins and timing thereof, timing and progress of our product development and commercialization efforts, pricing and sales volumes, production costs, and other factors. As of the date of this prospectus, we cannot specify with certainty all of the particular uses for any net proceeds we receive or the adequacy of such proceeds to support our intended activities. Accordingly, we will retain broad discretion over the use of these proceeds. Pending use of the net proceeds as described above, we expect to invest the net proceeds in short- and intermediate-term, interest-bearing obligations, investment-grade instruments, certificates of deposit or direct or guaranteed obligations of the U.S. government.
56
DILUTION
The sale of our ordinary shares to Lincoln Park pursuant to the Purchase Agreement will have a dilutive impact on our shareholders. In addition, the lower our stock price is at the time we exercise our right to sell shares to Lincoln Park, the more ordinary shares we will have to issue to Lincoln Park pursuant to the Purchase Agreement and our existing shareholders would experience greater dilution.
Our net tangible book value as September 30, 2021 was $110.5 million, or $0.87 per share, based on 127,219,418 ordinary shares outstanding as of that date. After giving effect to the assumed sale of 7,716,048 ordinary shares to Lincoln Park pursuant to the Purchase Agreement at an assumed sale price of $6.68 per share of our ordinary shares (which represents the closing price of our ordinary shares on November 12, 2021), and after the issuance of 69,512 ordinary shares to Lincoln Park as Commitment Shares and after deducting estimated offering expenses payable by us,
our as-adjusted net
tangible book value as of September 30, 2021 would have been approximately $160.2 million, or $1.19 per share. This represents an immediate increase in net tangible book value of $0.32 per share to existing shareholders and an immediate dilution of $5.49 per share to investors in this offering.The number of ordinary shares to be outstanding immediately after this offering is based on 126,675,098 shares outstanding as of September 30, 2021 and excludes:
| • | 17,520,135 ordinary shares issuable upon exercise of outstanding stock options as of September 30, 2021 at a weighted-average exercise price of $2.72 per share; |
| • | 14,355,705 ordinary shares reserved for future issuance under the 2021 Plan and 1,526,239 ordinary shares reserved for future issuance under the ESPP as of September 30, 2021, plus any future increases in the number of ordinary shares reserved for issuance pursuant to evergreen provisions; |
| • | 14,074,986 shares issuable upon exercise of warrants outstanding as of September 30, 2021 at a weighted-average exercise price of $11.50 per share; and |
| • | any additional shares that we may issue to Lincoln Park pursuant to the Purchase Agreement dated November 15, 2021, should we elect to sell shares to Lincoln Park. |
To the extent that additional shares are issued pursuant to the foregoing, investors purchasing our ordinary shares in this offering will experience further dilution. In addition, we may offer other securities in other offerings due to market conditions or strategic considerations. To the extent we issue such securities, investors may experience further dilution.
57
SELLING SHAREHOLDER
This prospectus relates to the possible resale by the selling shareholder, Lincoln Park, of ordinary shares that may be issued to Lincoln Park pursuant to the Purchase Agreement. We are filing the registration statement of which this prospectus forms a part pursuant to the provisions of the Registration Rights Agreement, which we entered into with Lincoln Park on November 15, 2021, concurrently with our execution of the Purchase Agreement, in which we agreed to provide certain registration rights with respect to sales by Lincoln Park of the ordinary shares that may be issued to Lincoln Park under the Purchase Agreement.
Lincoln Park, as the selling shareholder, may, from time to time, offer and sell pursuant to this prospectus any or all of the shares that we may sell to Lincoln Park under the Purchase Agreement. The selling shareholder may sell some, all, or none of its shares. We do not know how long the selling shareholder will hold the shares before selling them, and we currently have no agreements, arrangements, or understandings with the selling shareholder regarding the sale of any of the shares.
The following table presents information regarding the selling shareholder and the ordinary shares that it may offer and sell from time to time under this prospectus. The table is prepared based on information supplied to us by the selling shareholder, and reflects its holdings as of November 15, 2021. Neither Lincoln Park nor any of its affiliates has held a position or office, or had any other material relationship, with us or any of our predecessors or affiliates. Beneficial ownership is determined in accordance with Section 13(d) of the Exchange Act and
Rule 13d-3 thereunder.
Selling Shareholder | Shares Beneficially Owned Before this Offering | Percentage of Outstanding Shares Beneficially Owned Before this Offering | Shares to be Sold in this Offering Assuming the Company issues the Maximum Number of Shares Under the Purchase Agreement | Percentage of Outstanding Shares Beneficially Owned After this Offering | ||||||||||||
Lincoln Park Capital Fund, LLC (1) | 69,512 | (2) | * | (3) | 7,785,560 | (4) | * | |||||||||
| * | Represents less than 1% of the outstanding shares and/or assumes all ordinary shares registered hereunder have been resold by Lincoln Park. |
| (1) | Josh Scheinfeld and Jonathan Cope, the Managing Members of Lincoln Park Capital, LLC, are deemed to be beneficial owners of all of the ordinary shares owned by Lincoln Park Capital Fund, LLC. Messrs. Cope and Scheinfeld have shared voting and investment power over the shares being offered under the prospectus in connection with the transactions contemplated under the Purchase Agreement. Lincoln Park Capital, LLC is not a licensed broker dealer or an affiliate of a licensed broker dealer. |
| (2) | Represents 69,512 Commitment Shares issued to Lincoln Park upon our execution of the Purchase Agreement as a fee for its commitment to purchase ordinary shares under the Purchase Agreement, all of which are covered by the registration statement that includes this prospectus. We have excluded from the number of shares beneficially owned by Lincoln Park prior to the offering all of the ordinary shares that Lincoln Park may be required to purchase on or after the date of this prospectus pursuant to the Purchase Agreement, because the issuance of such shares is solely at our discretion and is subject to certain conditions, the satisfaction of all of which are outside of Lincoln Park’s control, including the registration statement of which this prospectus is a part becoming and remaining effective. Furthermore, under the terms of the Purchase Agreement, issuances and sales of ordinary shares to Lincoln Park are subject to certain limitations on the amounts we may sell to Lincoln Park at any time, including the Exchange Cap and the Beneficial Ownership Cap. See the description under the heading “The Lincoln Park Transaction” for more information about the Purchase Agreement. |
| (3) | Based on 127,219,418 outstanding ordinary shares as of November 12, 2021, adjusted to include the 69,512 Commitment Shares we have already issued to Lincoln Park pursuant to the Purchase Agreement. |
| (4) | Represents: (i) 69,512 Commitment Shares issued to Lincoln Park upon our execution of the Purchase Agreement as a fee for its commitment to purchase ordinary shares under the Purchase Agreement; and |
58
| (ii) an aggregate of 7,716,048 shares that may be sold by us to Lincoln Park at our discretion from time to time over a 24-month period commencing after the satisfaction of certain conditions set forth in the Purchase Agreement, including that the SEC has declared effective the registration statement that includes this prospectus. Depending on the price per share at which we sell our ordinary shares to Lincoln Park pursuant to the Purchase Agreement, we may need to sell to Lincoln Park under the Purchase Agreement more or less ordinary shares than are offered under this prospectus in order to receive aggregate gross proceeds equal to the $50,000,000 total commitment available to us under the Purchase Agreement. If we choose to sell more shares than are offered under this prospectus, we must first register for resale under the Securities Act such additional shares. The number of shares ultimately offered for resale by Lincoln Park is dependent upon the number of shares we sell to Lincoln Park under the Purchase Agreement. |
59
DETERMINATION OF OFFERING PRICE
We cannot currently determine the price or prices at which our ordinary shares may be sold by the selling shareholder under this prospectus.
MARKET INFORMATION FOR ORDINARY SHARES AND DIVIDEND POLICY
Market Information
Our ordinary shares and Public Warrants began trading on the NYSE under the symbols “RKLY” and “RKLY.WS,” respectively, on August 12, 2021. As of September 30, 2021, there were approximately 250 registered holders of our ordinary shares, one registered holder of our convertible loan notes, and four registered holders of our Warrants.
Dividend Policy
We have not paid any cash dividends on the ordinary shares to date. We may retain future earnings, if any, for future operations, expansion and debt repayment and has no current plans to pay cash dividends for the foreseeable future. Any decision to declare and pay dividends in the future will be made at the discretion of the Board and will depend on, among other things, our results of operations, financial condition, cash requirements, contractual restrictions and other factors that the Board may deem relevant. In addition, our ability to pay dividends may be limited by covenants of any existing and future outstanding indebtedness we or our subsidiaries incur. We do not anticipate declaring any cash dividends to holders of the ordinary shares in the foreseeable future.
Securities Authorized for Issuance under Equity Compensation Plans
As of September 30, 2021, we had 15,369,185 ordinary shares authorized for issuance under the 2021 Plan and other equity compensation plans.
We have filed and may in the future to file one or more registration statements on Form
S-8
under the Securities Act to register the ordinary shares issued or issuable under the 2021 Plan, the 2021 ESPP and the assumed Rockley UK Options (as defined herein). Any such FormS-8
registration statement will become effective automatically upon filing. Once these shares are registered, they can be sold in the public market upon issuance, subject to applicable restrictions.60
UNAUDITED PRO FORMA CONDENSED COMBINED FINANCIAL INFORMATION
Introduction
As noted in the Condensed Consolidated Financial Statements as of and for the three and nine months ended September 30, 2021 and the related notes that are included elsewhere in this prospectus, we accounted for the Business Combination as a forward recapitalization in accordance with GAAP (the “Forward Recapitalization”). Under this method of accounting, SC Health was treated as the acquired company and Legacy Rockley was deemed to be the accounting acquirer for financial reporting purposes. Accordingly, for accounting purposes, the Forward Recapitalization was treated as the equivalent of Legacy Rockley issuing stock for the net assets of SC Health, accompanied by a recapitalization. SC Health was terminated as a registrant, and HoldCo became the new SEC registrant, as such the pro forma outlined below illustrates the capital infusion (issuing stock for the net assets of SC Health, including the outstanding warrants) but do not reflect the historical financial statements of SC Health as they are not the SEC registrant in this prospectus and it is not considered an acquired business under SEC Rule
3-05.
We are providing the following unaudited pro forma condensed combined financial information to aid you in your analysis of the financial aspects of the recently-completed Business Combination. The unaudited pro forma condensed combined financial information below should be read in conjunction with the accompanying notes.
The unaudited pro forma condensed combined balance sheet as of June 30, 2021 illustrated the historical unaudited consolidated balance sheet of Rockley as of June 30, 2021 with capital infusion and the outstanding private and public warrants from the forward recapitalization, giving effect to the Business Combination as if it had been consummated on that date.
The unaudited pro forma condensed combined statement of operations for the six months ended June 30, 2021 combines the historical unaudited statement of operations of Rockley for the six months ended June 30, 2021 with the additional expense related to the private and public warrants and other additional costs as a result of the Business Combination.
The unaudited pro forma condensed combined statement of operations for the fiscal year ended December 31, 2020 combines the historical audited statement of operations of Rockley for the fiscal year ended December 31, 2020 with the additional expense related to the private and public warrants and other additional costs as a result of the Business Combination, giving effect to the Business Combination as if it had been consummated on January 1, 2020.
The unaudited pro forma condensed combined financial information was derived from and should be read in conjunction with the following historical financial statements and the accompanying notes, which are included elsewhere in this prospectus:
| • | The additional expense related to the private and public warrants and other additional costs as a result of the Business Combination as and for the six months ended June 30, 2021 and as of and for the fiscal year ended December 31, 2020; and |
| • | The historical unaudited consolidated financial statements of Rockley as of and for the six months ended June 30, 2021 and the historical audited consolidated financial statements of Rockley as of and for the fiscal year ended December 31, 2020. |
The foregoing historical financial statements have been prepared in accordance with GAAP.
The unaudited pro forma condensed combined financial information should also be read together with “Rockley’s Management’s Discussion and Analysis of Financial Condition and Results of Operations,” and other financial information included elsewhere in this prospectus.
61
Description of the Business Combination
Pursuant to the Business Combination Agreement, Rockley shareholders, which includes shares issued to convert Rockley’s convertible loan notes and warrants to equity, transferred their shares in Rockley to HoldCo, a newly formed entity. HoldCo further undertook a stock split based upon an exchange ratio to align the valuation of Rockley’s shares with the valuation of the SC Health’s shares. Rockley MergerSub Limited (“MergerSub”), another newly formed entity and a wholly owned subsidiary of HoldCo, merged with SC Health, with SC Health surviving the merger. All SC Health’s ordinary shares outstanding immediately after the merger with Merger Sub were exchanged with HoldCo for the right to receive HoldCo ordinary shares and HoldCo became a public company.
The aggregate merger consideration for Rockley was 114,811,411 HoldCo ordinary shares at a deemed value of $10 per share for an aggregate merger consideration of $1,148.1 million.
Accounting for the Business Combination
The Business Combination is accounted for as a forward recapitalization in accordance with GAAP. Under this method of accounting, SC Health has been treated as the “acquired” company for financial reporting purposes. This determination was primarily based on current shareholders of Rockley having a relative majority of the voting power of the combined entity, and as such, having the power to appoint a majority of the member of HoldCo’s board of directors, the operations of Rockley prior to the acquisition comprising the only ongoing operations of the combined entity and senior management of Rockley comprising the majority of the senior management of the combined entity. Accordingly, for accounting purposes, the financial statements of the combined entity represent a continuation of the financial statements of Rockley with the acquisition being treated as the equivalent of Rockley issuing stock for the net assets of SC Health, accompanied by a recapitalization. The net assets of SC Health are stated at historical cost, with no goodwill or other intangible assets recorded.
Other Events in Connection with the Business Combination
| • | The board of directors of HoldCo approved and implemented a director compensation program for HoldCo’s non-employee directors (the “Director Compensation Program”). Under the Director Compensation Program, and following the filing of a registration statement on FormS-8 with respect to the 2021 Plan, HoldCo expects to grant (i) an “Initial RSU Award” to eachnon-employee director in connection with the closing of the Business Combination and (ii) an “Annual RSU Award” following the conclusion of each regular annual meeting of HoldCo’s shareholders commencing with the 2022 annual meeting, to eachnon-employee director who continues serving as a member of HoldCo’s board of directors. In addition, each eligiblenon-employee director will receive an annual cash retainer in connection with their service on HoldCo’s board of directors and respective committees. For additional information, including size of any cash retainers, and the size and vesting terms of the Initial RSU Award and Annual RSU Award, see “Management —Non-Employee Director Compensation Policy.” |
| • | Following the filing of a registration statement on Form S-8 with respect to the 2021 Plan, the board of directors of HoldCo is also expected to approve grants of stock options and RSU awards to select members of the management team. For additional information, including the size and vesting terms application to these awards, see “Executive Compensation — Equity Compensation.” |
| • | In addition, HoldCo entered into new employment agreements with its executive officers, including its named executive officers. Accordingly, the effect of the new employment arrangements with HoldCo’s executive officers has been included in the unaudited pro forma condensed combined financial information. For additional information, see “Executive Compensation — Employment Agreements.” |
| • | All of the Rockley issued and outstanding convertible loan notes (other than certain convertible notes issued in connection with Rockley’s term facility with Argentum Securities Ireland plc), inclusive of interest accrued thereon, converted into ordinary shares of HoldCo at a conversion price of $10.00 per |
62
share, and outstanding options exercisable for Rockley ordinary shares converted into options exercisable for HoldCo ordinary shares (“Rockley UK Options”). On May 25, 2021, Rockley entered into an agreement in principle to amend the payment and maturity terms of the Argentum term facility such that 30% of the outstanding principal balance was converted to ordinary shares of HoldCo at the time of the Business Combination and 70% which would otherwise be redeemable after the closing of the Business Combination is expected to mature on August 31, 2022. For additional information, see “Management’s Discussion and Analysis of Financial Condition and Results of Operations — Business Combination and Public Company Costs” and Note 16 to the notes to the condensed consolidated financial statements of Rockley Photonics Limited. |
The adjustments in the unaudited pro forma condensed combined financial information have been identified and presented to provide relevant information necessary for an accurate understanding of the combined entity at closing of the Business Combination.
The unaudited pro forma condensed combined financial information is for illustrative purposes only. The financial results may have been different had the companies always been combined. You should not rely on the unaudited pro forma condensed combined financial information as being indicative of the historical results that would have been achieved had the companies always been combined or the future results that the combined entity will experience. SC Health and Rockley have not had any historical relationship prior to the transactions. Accordingly, no pro forma adjustments were required to eliminate activities between the companies.
63
Unaudited Pro Forma Condensed Combined Balance Sheet
As of June 30, 2021
(in thousands, except share and per share amounts)
Capital Infusion | Rockley | Transaction Accounting Adjustments | Ref | Pro Forma Combined | ||||||||||||||||
Assets | ||||||||||||||||||||
Current assets | ||||||||||||||||||||
Cash and cash equivalents | — | $ | 35,395 | $ | 126,565 | A | $ | 161,960 | ||||||||||||
Accounts receivable | — | 2,411 | — | 2,411 | ||||||||||||||||
Other receivable | — | 23,037 | — | 23,037 | ||||||||||||||||
Prepaid expenses | — | 7,724 | — | 7,724 | ||||||||||||||||
Other current assets | — | 258 | — | 258 | ||||||||||||||||
Total current assets | — | 68,825 | 126,565 | 195,390 | ||||||||||||||||
Property, equipment and finance lease right-of-use | — | 8,170 | — | 8,170 | ||||||||||||||||
Equity method investments | — | 4,711 | — | 4,711 | ||||||||||||||||
Intangible assets | — | 3,048 | — | 3,048 | ||||||||||||||||
Cash and marketable securities held in trust account | 93,839 | — | (93,839 | ) | C | — | ||||||||||||||
Other non-current assets | — | 11,715 | (8,427 | ) | D | 3,288 | ||||||||||||||
Total assets | 93,839 | $ | 96,469 | $ | 24,299 | $ | 214,607 | |||||||||||||
Liabilities | ||||||||||||||||||||
Accounts payable and accrued expenses | 922 | $ | 20,796 | $ | (4,875 | ) | E | $ | 16,843 | |||||||||||
Long-term debt, current portion | — | — | 12,500 | I | 12,500 | |||||||||||||||
Other current liabilities | 1,035 | 1,020 | (1,035 | ) | J | 1,020 | ||||||||||||||
Total current liabilities | 1,957 | 21,816 | 6,590 | 30,363 | ||||||||||||||||
Long-term debt, net of current portion | — | 194,328 | (183,064 | ) | K | 11,264 | ||||||||||||||
Deferred underwriting fee payable | 6,038 | — | (6,038 | ) | E | — | ||||||||||||||
Warrant liabilities | 32,502 | — | — | 32,502 | ||||||||||||||||
Other long-term liabilities | — | 2,719 | — | 2,719 | ||||||||||||||||
Total liabilities | 40,497 | 218,863 | (182,512 | ) | 76,848 | |||||||||||||||
Class A Ordinary Shares subject to redemption | 48,342 | — | (48,342 | ) | L | — | ||||||||||||||
Shareholders’ Equity | ||||||||||||||||||||
Ordinary Shares | — | — | — | M | — | |||||||||||||||
Class A Ordinary Shares | — | — | — | M | — | |||||||||||||||
Class B Ordinary Shares | — | — | — | M | — | |||||||||||||||
Additional paid-in capital | 30,382 | 205,823 | 229,771 | M | 465,976 | |||||||||||||||
Accumulated deficit | (25,382 | ) | (328,217 | ) | 25,382 | N | (328,217 | ) | ||||||||||||
Total shareholders’ equity | 5,000 | $ | (122,394 | ) | $ | 255,153 | $ | 137,759 | ||||||||||||
Total liabilities and shareholders’ equity | 93,839 | $ | 96,469 | $ | 24,299 | $ | 214,607 | |||||||||||||
See the accompanying notes to the unaudited pro forma condensed combined financial statements.
64
Unaudited Pro Forma Condensed Combined Statement of Operations
For the Six Months Ended June 30, 2021
(in thousands, except share and per share amounts)
Expenses Related to Capital Infusion | Rockley | Transaction Accounting Adjustments | Ref | Pro Forma Combined | Ref | |||||||||||||||||||
Revenue | $ | — | $ | 3,966 | $ | — | 3,966 | |||||||||||||||||
Cost of revenue | — | 8,283 | — | 8,283 | ||||||||||||||||||||
Gross profit | — | (4,317 | ) | — | (4,317 | ) | ||||||||||||||||||
Selling, general and administrative expenses | — | 14,020 | 198 | a | ||||||||||||||||||||
| 1,256 | b | |||||||||||||||||||||||
| 754 | c | 16,228 | ||||||||||||||||||||||
Research and development | — | 33,531 | 331 | b | 33,862 | |||||||||||||||||||
Operating loss | — | (51,868 | ) | (2,539 | ) | (54,407 | ) | |||||||||||||||||
Interest income (expense), net | — | (326 | ) | — | (326 | ) | ||||||||||||||||||
Other income | — | 2,860 | — | 2,860 | ||||||||||||||||||||
Equity method investment loss | — | (760 | ) | — | (760 | ) | ||||||||||||||||||
Change in fair value of debt instruments | — | (45,661 | ) | 45,661 | f | — | ||||||||||||||||||
Realized and unrealized gain (loss) on foreign currency | — | 631 | — | 631 | ||||||||||||||||||||
Change in fair value of warrant liabilities | (13,447 | ) | — | — | (13,447 | ) | ||||||||||||||||||
Loss before income taxes | (13,447 | ) | (95,124 | ) | 40,162 | (65,449 | ) | |||||||||||||||||
Income tax expense | — | 210 | — | 210 | ||||||||||||||||||||
Net loss | $ | (13,447 | ) | $ | (95,334 | ) | $ | 40,162 | $ | (65,659 | ) | |||||||||||||
Net loss per share | ||||||||||||||||||||||||
Basic and diluted | $ | (0.52 | ) | d | ||||||||||||||||||||
Weighted average shares outstanding | ||||||||||||||||||||||||
Basic and diluted | 126,575,257 | e | ||||||||||||||||||||||
See the accompanying notes to the unaudited pro forma condensed combined financial statements.
65
Unaudited Pro Forma Condensed Combined Statement of Operations
For the Fiscal year Ended December 31, 2020
(in thousands, except share and per share amounts)
Expenses related to Capital Infusion | Rockley | Transaction Accounting Adjustments | Ref | Pro Forma Combined | Ref | |||||||||||||||||||
Revenue | $ | — | $ | 22,343 | $ | — | 22,343 | |||||||||||||||||
Cost of revenue | — | 24,240 | — | 24,240 | ||||||||||||||||||||
Gross profit | — | (1,897 | ) | — | (1,897 | ) | ||||||||||||||||||
Selling, general and administrative expenses | — | 20,260 | 198 | a | ||||||||||||||||||||
| 389 | b | |||||||||||||||||||||||
| 754 | c | 21,601 | ||||||||||||||||||||||
Research and development | — | 35,900 | 542 | b | 36,442 | |||||||||||||||||||
Operating loss | — | (58,057 | ) | (1,883 | ) | (59,940 | ) | |||||||||||||||||
Interest income (expense), net | (189 | ) | (189 | ) | ||||||||||||||||||||
Equity method investment loss | — | (1,274 | ) | — | (1,274 | ) | ||||||||||||||||||
Change in fair value of debt instruments | — | (20,163 | ) | 20,163 | f | — | ||||||||||||||||||
Realized and unrealized gain (loss) on foreign currency | — | (25 | ) | — | (25 | ) | ||||||||||||||||||
Change in fair value of warrant liabilities | (5,489 | ) | — | — | (5,489 | ) | ||||||||||||||||||
Loss before income taxes | (5,489 | ) | (79,708 | ) | 19,277 | (66,917 | ) | |||||||||||||||||
Income tax expense | — | 569 | — | 569 | ||||||||||||||||||||
Net loss | $ | (5,489 | ) | $ | (80,277 | ) | $ | 19,277 | $ | (67,486 | ) | |||||||||||||
Net loss per share | ||||||||||||||||||||||||
Basic and diluted | $ | (0.53 | ) | d | ||||||||||||||||||||
Weighted average shares outstanding | ||||||||||||||||||||||||
Basic and diluted | 126,575,257 | e | ||||||||||||||||||||||
See the accompanying notes to the unaudited pro forma condensed combined financial statements.
66
NOTES TO UNAUDITED PRO FORMA CONDENSED COMBINED FINANCIAL INFORMATION
The pro forma adjustments have been prepared as if the Business Combination had been consummated on June 30, 2021 in the case of the unaudited pro forma condensed combined balance sheet and on January 1, 2020, the beginning of the earliest period presented in the unaudited pro forma condensed combined statement of operations.
The unaudited pro forma condensed combined financial information has been prepared assuming the following methods of accounting in accordance with GAAP.
The Business Combination is accounted for as a forward recapitalization in accordance with GAAP. Accordingly, for accounting purposes, the financial statements of the combined entity represent a continuation of the financial statements of Rockley with the acquisition being treated as the equivalent of Rockley issuing stock for the net assets of SC Health, accompanied by a recapitalization. The net assets of SC Health are stated at historical cost, with no goodwill or other intangible assets recorded.
The pro forma adjustments represent management’s estimates based on information available as of the date of this prospectus and are subject to change as additional information becomes available and additional analyses are performed. Management considers this basis of presentation to be reasonable under the circumstances.
One-time
direct and incremental transaction costs anticipated to be incurred prior to, or concurrent with, the closing of the Business Combination are reflected in the unaudited pro forma condensed combined balance sheet as a direct reduction to the combined entity’s additionalpaid-in
capital (“APIC”) and are assumed to be cash settled.The pro forma combined provision for income taxes does not necessarily reflect the amounts that would have resulted had the post-combination company filed consolidated income tax returns during the periods presented.
1. Adjustments and Assumptions to the Unaudited Pro Forma Condensed Combined Balance Sheet as of June 30, 2021.
The unaudited pro forma condensed combined balance sheet as of June 30, 2021 reflects the following adjustments:
Amount | Ref | |||||
(In thousands) | ||||||
Cash inflow from PIPE financing | $ | 150,000 | B | |||
Cash inflow from trust account | 17,966 | C | ||||
Payment from deferred IPO fees and accrued transaction-related liabilities | (4,392 | ) | E | |||
Payments of estimated financing fees | (25,820 | ) | F | |||
Payments of estimated transaction fees incurred by Rockley | (5,185 | ) | G | |||
Payments of estimated transaction fees incurred by acquiree | (5,569 | ) | H | |||
Settlement of acquiree promissory note | (435 | ) | I | |||
Net Pro Forma adjustment to cash | 126,565 | A | ||||
B
67
C
D
de-recognized
as a reduction to additionalpaid-in
capital at the close of the Business Combination. Refer to balance sheet adjustmentsA
N
paid-in
capital reported for the combined company.E
Deferred IPO underwriting commissions | $ | 6,038 | ||
Less: IPO underwriting discount | (1,510 | ) | ||
Deferred IPO underwriting commission paid | 4,528 | |||
Acquiree’s deferred transaction fees | 1,005 | |||
Rockley’s deferred transaction fees | 5,201 | |||
Total deferred costs and accrued expenses paid at or after Business Combination close | $ | 10,734 | ||
F
G
paid-in
capital. Refer to balance sheet adjustmentsM
paid-in
capital reported for the combined company.H
paid-in
capital. Refer to balance sheet adjustmentsM
paid-in
capital reported for the combined company.I
J
K
68
subsequently converting to HoldCo’s Ordinary Shares for which HoldCo undertook a stock split prior to the Business Combination. Interest continued to accrue on the convertible notes through the date that the Business Combination consummated, increasing the aggregate notes payable obligation for which HoldCo Ordinary Shares were exchanged. $23.8 million of the convertible loan note did not convert into equity upon consummation of the business combination of which $12.5 million has been reclassified to long-term debt, current portion. Refer to balance sheet adjustmentfor the pro forma impact of this exchange on additional
O
paid-in
capital reported for the combined company.L
N
paid-in
capital of the combined company.M
HoldCo Par Value | Acquiree Par Value | Rockley Par Value | ||||||||||||||||||
Ordinary Shares | Class A Ordinary Shares | Class B Ordinary Shares | Ordinary Shares | Additional Paid-in Capital | ||||||||||||||||
Redemption of acquiree shares to Class A Ordinary Shares | — | — | — | — | (27,532 | ) | ||||||||||||||
Conversion of acquiree Class B to Class A Ordinary Shares | — | — | — | — | — | |||||||||||||||
PIPE financing | — | — | — | — | 150,000 | |||||||||||||||
Conversion of Rockley’s convertible loan notes to Ordinary Shares | — | — | — | — | 170,564 | |||||||||||||||
Adjustment for share issuance and conversion transaction | — | — | — | — | 293,032 | |||||||||||||||
Estimated acquiree transaction costs | — | — | — | — | (4,298 | ) | ||||||||||||||
Estimated Rockley’s transaction costs | — | — | — | — | (9,741 | ) | ||||||||||||||
Estimated financing transaction costs | — | — | — | — | (25,820 | ) | ||||||||||||||
Elimination of acquiree’s historical retained Earnings | — | — | — | — | (23,402 | ) | ||||||||||||||
Total adjustments to par value and additional paid-in capital | — | — | — | — | 229,771 | |||||||||||||||
N
paid-in
capital.2. Adjustments to the Unaudited Pro Forma Condensed Combined Statement of Operations for the six months ended June 30, 2021 and for the Fiscal year Ended December 31, 2020
The unaudited pro forma condensed combined statement of operations for the six months ended June 30, 2021 and for the fiscal year ended December 31, 2020 reflects the following adjustments:
a
69
executive officers and employees that were to be paid contingent upon, and no later than shortly following, the closing of the Business Combination because these bonuses did not have a continuing impact on ongoing operations.
b
c
d
e
f
Six Months Ended June 30, 2021 | Year Ended December 31, 2020 | |||||||
Numerator | ||||||||
Pro forma net loss | $ | (65,659 | ) | $ | (67,486 | ) | ||
Denominator | ||||||||
Current Rockley Shareholders | 103,916,607 | 103,916,607 | ||||||
Acquiree Shareholders | 1,777,150 | 1,777,150 | ||||||
Sponsor Shareholders | 10,562,500 | 10,562,500 | ||||||
PIPE Investors | 10,000,000 | 10,000,000 | ||||||
Other Shareholders (1) | 319,000 | 319,000 | ||||||
Total | $ | 126,575,257 | $ | 126,575,257 | ||||
Net loss per share | ||||||||
Basic and diluted | $ | (0.52 | ) | $ | (0.53 | ) | ||
| (1) | On September 27, 2021, the Company entered into an agreement with Cowen and Company LLC (“Cowen”) and BCW Securities LLC (“BCW”) to issue 319,000 ordinary shares at a value of $10.00 per share pursuant to a private placement exemption under Section 4(a)(2) of the Securities Act in lieu of cash payment for a portion ($3.194 million) of the fees payable to Cowen as part of the transaction costs. |
70
MANAGEMENT’S DISCUSSION AND ANALYSIS OF FINANCIAL CONDITION AND RESULTS OF OPERATIONS
The following discussion and analysis provides information which Rockley’s management believes is relevant to an assessment and understanding of Rockley’s consolidated results of operations and financial condition. The discussion should be read together with the consolidated financial statements and related notes that are included elsewhere in this prospectus. The discussion and analysis should also be read together with our pro forma financial information for the six months ended June 30, 2021 and the year ended December 31, 2020. See “Unaudited Pro Forma Condensed Combined Financial Information.” This discussion may contain forward-looking statements based upon current expectations that involve risks and uncertainties. Our actual results may differ materially from those anticipated in these forward-looking statements as a result of various factors, including those set forth under “Risk Factors” or in other parts of this prospectus. This discussion and analysis reflects our historical results of operations and financial position, and, except as otherwise indicated below, does not give effect to the Business Combination. Historic results are not necessarily indicative of future results. As used in discussion, unless the context requires otherwise, references to “the Company,” “Rockley,” “we,” “us,” and “our” are intended to refer to the business and operations of Rockley prior to the Business Combination and the business and operations of HoldCo as directly or indirectly affected by Rockley by virtue of HoldCo’s ownership of Rockley following the Business Combination, unless the context clearly indicates otherwise.
Emerging Growth Company Status
We are an emerging growth company (“EGC”), as defined in the JOBS Act. The JOBS Act permits companies with EGC status to take advantage of an extended transition period to comply with new or revised accounting standards, delaying the adoption of these accounting standards until they would apply to private companies. We have elected to use this extended transition period to enable us to comply with new or revised accounting standards that have different effective dates for public and private companies until the earlier of the date we (i) are no longer an emerging growth company or (ii) affirmatively and irrevocably opt out of the extended transition period provided in the JOBS Act. As a result, our financial statements may not be comparable to companies that comply with the new or revised accounting standards as of public company effective dates.
In addition, we intend to rely on the other exemptions and reduced reporting requirements provided by the JOBS Act. Subject to certain conditions set forth in the JOBS Act, if, as an EGC, we intend to rely on such exemptions, we are not required to, among other things: (i) provide an auditor’s attestation report on our system of internal controls over financial reporting pursuant to Section 404(b) of the Sarbanes-Oxley Act; (ii) provide all of the compensation disclosure that may be required of
non-emerging
growth public companies under the Dodd-Frank Wall Street Reform and Consumer Protection Act; (iii) comply with any requirement that may be adopted by the PCAOB regarding mandatory audit firm rotation or a supplement to the auditor’s report providing additional information about the audit and the financial statements (auditor discussion and analysis); and (iv) disclose certain executive compensation-related items such as the correlation between executive compensation and performance and comparisons of the Chief Executive Officer’s compensation to median employee compensation.We will remain an EGC under the JOBS Act until the earliest of (i) the last day of our first fiscal year following the fifth anniversary of the first sale of our ordinary shares in our initial public offering, (ii) the last date of our fiscal year in which we have total annual gross revenue of at least $1.07 billion, (iii) the date on which we are deemed to be a “large accelerated filer” under the rules of the SEC with at least $700.0 million of outstanding securities held by
non-affiliates,
or (iv) the date on which we have issued more than $1.0 billion innon-convertible
debt securities during the previous three years.Overview
We have developed a unique sensing platform that we believe can reshape the wellness and healthcare industries through multiple applications in
non-invasive,
multi-modal biomarker monitoring. We believe71
products based on our technology platform could have the potential to unlock and accelerate advancements in areas such as early disease detection, nutrition management, and preventative healthcare delivery through continuous health and wellness monitoring.
To date, we have been engaged in developing customer-specific designs of our silicon photonics chipsets for incorporation into our customers’ end products. Accordingly, all of our products are presently in the development stage and we do not currently have any of our own end products in commercial production and have not yet shipped any products commercially. Our unique sensing platform has been built upon our silicon photonics technology, which enables compelling sensor performance, power, resolution, and density. This technology has the potential to allow monitoring devices, currently the size of clinical machines, to be condensed to the size of a wearable device. We believe this in turn has the potential to unlock additional uses in consumer electronics and medical devices. The resulting combination of technologies and manufacturing
know-how
is the “full-stack Rockley Platform” which is made up of PICs in silicon with integratedIII-V
devices (devices incorporating certain conductor elements that offer superior electronic properties, such as lasers), ASICs, photonic and electronicco-packaging,
together with biosensing algorithms and AI cloud analytics, firmware/software, system architecture, and hardware design.As testament to the relevance of our product development, we have captured the attention of several consumer electronics companies and, as of the date of this prospectus, we have established strategic relationships with six of the world’s
top-ten
largest manufacturers of smart watches and wristbands (based on volume as reported by IDC). We plan to leverage this attention to develop new capabilities in consumer wearables in the near term, and to expand over time into medical devices and other industry applications.Our vision is to address many pressing healthcare concerns using our technology and we believe that there exists a large market opportunity for our platform. We estimate that the TAM for the consumer wearables, mobile device, and medical device markets is projected to be over $48 billion by 2025, based on data sourced from the Yole Report, the IDtexEx Report, the TrendForce Report, and our internal volume forecasts for smartphone, smart watch, and smart earbuds through 2025 (based on customer data), as the universe of healthcare and consumer wearable devices incorporating additional sensing capabilities emerges. Our target biomarkers for consumer healthcare include lactate, alcohol, glucose (indicator), carbon monoxide, blood pressure, blood oxygen, and core body temperature, among others. Our high-performance lasers have up to 1,000,000 times higher resolution, 1,000 times higher accuracy and 100 times broader range in wavelengths compared with existing LED offerings in wearable solutions (based on product analysis undertaken by Rockley comparing the Rockley silicon photonics-based spectrometer chip to existing solutions). We believe our platform will also be able to address existing applications in consumer wearable devices with significantly higher resolution, accuracy, and range. Further, we believe there are multiple additional markets and concrete opportunities for our technology platform in areas such as data center connectivity (optical transceivers), machine vision (robotic and automotive LiDAR), and compute connectivity
(co-packaged
optics, or CPO).To date, we have generated revenue primarily from
non-recurring
engineering (“NRE”) and development services for customer-specific designs of silicon photonics chipsets for incorporation into their customers’ end products and we have financed our operations primarily through the issuance of convertible loan notes, as well as private placements of ordinary shares. From the date of our formation through September 30, 2021 we have raised aggregate gross proceeds of approximately $290.0 million from the issuance of convertible loan notes and ordinary shares. For the nine months ended September 30, 2021, we incurred a net loss of $153.3 million and utilized $91.9 million in cash to fund our operations.We expect both our capital and operating expenditures will increase significantly in connection with our ongoing activities, as we:
| • | continue to invest in our technology and our silicon photonics solutions; |
| • | continue to develop innovative solutions and applications for our technology; |
72
| • | commercialize our silicon photonics solutions; |
| • | continue to invest in our sales and marketing activities and distribution channels; |
| • | invest and improve our operational, financial, and management information systems; |
| • | increase our headcount; |
| • | obtain, maintain and expand our intellectual property portfolio; and |
| • | enhance internal functions to support our operations as a public company. |
Impact of
COVID-19
The
COVID-19
global pandemic has prompted extraordinary measures by governments and businesses to control the spread ofCOVID-19
in most or all regions throughout the world. These actions have included travel bans, quarantines, and similar mandates for individuals to substantially restrict normal activities and for businesses to curtail normal operations.The COVID19 pandemic has adversely impacted our operational efficiency and caused delays in operational activities. During the third quarter of 2021, we continue to take cautious steps to protect our workforce, support community efforts, and follow local government guidelines. Certain key laboratory employees and facilities have continued internal testing and laboratory work to the extent necessary to service customer commitments. The remaining
–
non-essential
workforce were recommended to continue performing their duties from home. The ongoing impact will depend on the duration of the pandemic which is being mitigated by the vaccination of the general population and gradual easing of restrictions. For more information on risks associated with theCOVID-19
pandemic and regulatory actions, see “Risk Factors—General Risks.”Comparability of Financial Information
Our results of operations and statements of assets and liabilities may not be comparable between periods as a result of the Business Combination and becoming a public company. As a consequence of the Business Combination, we became a NYSE listed company, which will require us to hire additional personnel and implement procedures and processes to address public company regulatory requirements and customary practices. We expect to incur additional annual expenses as a public company for, among other things, directors’ and officers’ liability insurance, director fees and additional internal and external accounting, legal and administrative resources, including increased audit, compliance, and legal fees.
Business Combination and Public Company Costs
On March 19, 2021, SC Health Corporation (“SC Health”), Rockley Photonics Holdings Limited (“HoldCo”), Merger Sub, and Rockley UK entered into a definitive Business Combination Agreement pursuant to which HoldCo to acquire all of the issued and outstanding equity interest of Rockley UK and SC Health. Merger Sub, a newly formed subsidiary of HoldCo, merged with and into SC Health, with SC Health surviving the merger. Merger Sub ceased to exist and SC Health became a wholly owned subsidiary of HoldCo.
On August 9, 2021, among other things, we proposed to the High Court of the United Kingdom a transfer scheme of arrangement under Part 26 of the Companies Act pursuant to which our shareholders exchanged all of Rockley Photonics Limited shares for Rockley Photonics Holdings Limited ordinary shares, at a conversion price of $10.00 per share. The transfer was conditional upon the approval of the Business Combination Agreement, the Business Combination and the Plan of Merger by SC Health shareholders.
The Business Combination was consummated on August 11, 2021. HoldCo became a publicly traded company listed on the NYSE under the symbol “RKLY” on August 12, 2021.
73
Consideration for the Business Combination consisted of ordinary shares of HoldCo issued in exchange for all outstanding ordinary shares of Rockley UK and SC Health, determined on a fully diluted basis, as if all of Rockley UK issued and outstanding convertible loan notes (other than certain convertible notes issued in connection with Rockley UK term facility with Argentum Securities Ireland plc, of which 30% was converted to ordinary shares of HoldCo prior to the Scheme becoming effective and 70% was converted to convertible notes of HoldCo that will mature on August 31, 2022), inclusive of interest accrued thereon, converted into ordinary shares of HoldCo at a conversion price of $10.00 per share, and options exercisable for HoldCo ordinary shares issued in exchange for all outstanding options exercisable for Rockley ordinary shares.
The following expenses were incurred upon closing of the Business Combination:
| • | Total non-recurring transaction costs estimated at approximately $44.1 million, of which the Company expects approximately $1.0 million to be expensed; and |
| ��� | The payment of deferred legal fees, underwriting commission, and other costs in connection with the initial public offering. |
Pursuant to the Business Combination Agreement, the aggregate consideration, consisting of ordinary shares of HoldCo issuable to Rockley UK security holders following a stock split at HoldCo, was the number of HoldCo ordinary shares that results from dividing $1,148,114,113 by 10.
Concurrently with the execution of the Business Combination Agreement, SC Health and HoldCo entered into subscription agreements with certain investors, including, among others, entities affiliated with the Sponsor (the “Sponsor Related PIPE Investors”). Pursuant to the subscription agreements, each investor agreed to subscribe for and purchase, and HoldCo agreed to issue and sell an aggregate of 14,790,000 HoldCo ordinary shares, at $10.00 per share, for an aggregate commitment amount of $147,900,000.
Also, concurrently with the execution of the Business Combination Agreement, SC Health and HoldCo entered into subscription agreements with three individuals pursuant to which HoldCo agreed to issue and sell an aggregate of 210,000 HoldCo ordinary shares, at $10.00 per share, for an aggregate commitment amount of $2,100,000. These three individuals are existing shareholders of Rockley UK.
Accounting for the Business Combination
The Business Combination was accounted for as a forward recapitalization, with no goodwill or other intangible assets recorded, in accordance with GAAP. Under this method of accounting, SC Health was treated as the acquired company and Rockley was deemed to be the accounting acquirer for financial reporting purposes. This determination was primarily based on the evaluation of the following facts and circumstances:
| • | Rockley’s existing shareholders will hold a majority ownership interest in HoldCo, irrespective of whether or not existing shareholders of SC Health exercise their right to redeem their ordinary shares of SC Health; |
| • | Rockley’s existing senior management team will comprise senior management of HoldCo; |
| • | Rockley’s is the larger of the companies based on historical operating activity and employee base; and |
| • | Rockley’s operations will comprise the ongoing operations of HoldCo. |
As a consequence of the Business Combination, HoldCo became an
SEC-registered
and NYSE-listed company, which will require it to hire additional talent and implement procedures and processes to address public company regulatory requirements and customary practices. HoldCo expects to incur additional annual expenses as a public company for, among other things, directors’ and officers’ liability insurance, director fees, and additional internal and external accounting and legal and administrative resources, including increased audit and legal fees.74
Key Factors Affecting Operating Results
We believe that our performance and future success depend on several factors that present significant opportunities for us but also pose risks and challenges, including, without limitation, the following:
Resource Constraints
Our products are currently under development and we do not have any products in commercial production. Our ability to achieve our product roadmaps and development timelines, including our ability to commence commercial production of our products, may be impacted by resource constraints, including the need for additional capital. We have a history of losses and our determination of substantial doubt as a going concern could materially limit our ability to raise additional funds through the issuance of equity securities or otherwise. Further, our products must also meet certain technical standards and customer requirements, which in turn require additional funds and other resources. Additional financing and resources may not be available to us when needed or on commercially reasonable terms.
Ability to Achieve Design Wins or Long-Term Production Contracts
We may engage in discussions with customers and
co-develop
products but we may not be able to convert the relationship into a design win or a long-term production contract due to resource constraints, delays, or technical challenges. We work closely with our customers and potential customers to understand their product roadmaps and strategies. Our customers also continuously develop new products in existing and new application areas. We believe achieving design wins and the ability to secure long-term production contracts will be critical to our future success. The selection process is typically lengthy and may require us to incur significant design and development expenditures in pursuit of a design win with no assurance that our products will be selected. The failure to secure a design win or long-term production contract could adversely affect our business.Customer Orders and Forecasts
We currently anticipate that sales of our future products will be made pursuant to standard purchase orders, which may be cancelled, reduced, or rescheduled with little or no notice and without penalty. Cancellations of orders could result in the loss of anticipated sales without allowing us sufficient time to reduce our inventory and operating expenses. In addition, changes in forecasts or the timing of orders from customers, including if and when we commence commercial production of our products, could expose us to the risks of inventory shortages or excess inventory.
Pricing and Customer Demand
We expect our operating results, including if and when we commence commercial production of our products, will be impacted by the pricing of our products, our average selling prices, and fluctuations in customer purchasing volumes. If and when we begin commercial production of our products, we may not be able to fulfill customer demand in a timely manner or at all. We monitor and work to reduce our product manufacturing costs and improve the potential value our products can provide to our customers’ end products. The cost of raw materials and components critical for the manufacture of our anticipated products is largely out of our control and may fluctuate significantly. Since we rely on third-party wafer foundries and assembly and test contractors to manufacture, assemble, and test our products, we maintain a close relationship with our suppliers to improve quality, increase yields, and lower manufacturing costs.
New Markets and Applications
As we evaluate potential markets and applications for the products we are developing, we analyze forecasts by industry analysts, the adoption curve of technology, and potential competing forces that could hinder such
75
adoption. If we fail to anticipate or respond to technological shifts or market demands, or to timely develop products or technologies in response to the same, it could result in our inability to achieve revenue growth and could harm our business and operations.
Cyclical Nature of the Semiconductor Industry
The semiconductor industry is highly cyclical and is characterized by constant and rapid technological change, rapid product obsolescence, price erosion, evolving standards, short product life cycles, and wide fluctuations in product supply and demand. Downturns in the semiconductor industry have been characterized by diminished product demand, production overcapacity, high inventory levels, and accelerated erosion of average selling prices. Any prolonged or significant downturn in the semiconductor industry generally could adversely affect our business and reduce demand for our products and otherwise harm our financial condition and results of operations.
See the “Risk Factors” section of this prospectus for additional discussion of the risks and challenges facing our business.
Basis of Presentation
Currently, we conduct business through one operating and reportable segment. All long-lived assets are maintained in, and all losses are attributable to the one segment.
Components of Results of Operations
The following discusses certain line items in Rockley’s condensed consolidated statements of operations.
Revenue
To date, we have primarily generated revenue from development services, which entail developing customer-specific designs of silicon photonics chipsets. Our contracts with customers include specific achievement of agreed-upon projects and a substantive acceptance criteria for each agreed-upon project. In the event an agreed-upon project is successful and the customer provides acceptance, we allocate the contract consideration related to the performance obligations that are satisfied during the period and recognize the revenue at that point in time.
Following the completion of our product development phase and introduction of our spectra-sense chipsets to the wearable devices market, we expect the majority of our revenue to be derived from sales of high-volume consumer wearable products. In addition, we plan to offer advanced module applications with biomarker detection capabilities for advanced health metrics that can detect, classify, and potentially prevent disease. We also expect to offer a cloud analytics platform to provide a full range of subscription services, including the deployment of our technology through a subscription and cloud-based software as a service.
Cost of Revenue
To date, our cost of revenue has included cost related to our development services, which include cost of materials, cost associated with packaging and assembly, testing and shipping, cost of talent, including stock-based compensation, and equipment associated with manufacturing support, logistics, and quality assurance, overhead, and occupancy costs. Once we commence commercial production of our silicon photonics chipsets, cost of revenues will include direct parts, material, and labor costs, manufacturing overhead, including amortized tooling costs, shipping and logistics costs, and reserves for estimated warranty expenses.
76
Gross Profit and Gross Margin
Gross profit is calculated based on the difference between our revenue and cost of revenue. Gross margin is the percentage obtained by dividing gross profit by our revenue. As we approach commercial production of spectra-sense chipsets, advanced module applications, and Rockley Photonics Cloud Analytics technology, we expect our gross profit and gross margin to vary.
Selling, General, and Administrative Expense
Selling, general, and administrative expenses consist of human capital related expenses for employees involved in general corporate functions, including executive management and administration, accounting, finance, tax, legal, information technology, marketing, and human resources; depreciation expense and rent relating to facilities; travel costs; professional fees; and other general corporate costs. Human capital expenses primarily include salaries, benefits, bonuses, and stock-based compensation. We expect our selling, general and administrative expense to increase in absolute dollars for the foreseeable future as we increase our headcount to support the growth of our business, and as a result of operating as a public company, including compliance with the rules and regulations of the SEC, legal, audit, additional general and director and officer insurance expenses, investor relations activities, and other administrative and professional services.
Research and Development Expense
Research and development expense consists primarily of talent costs for engineers and third parties engaged in the design and development of products, software, and technologies, including salary, bonus, and stock-based compensation expense, project material costs, services, and depreciation of our research and development facilities and equipment. We expense research and development costs as they are incurred. Research and development expense also includes the research and development tax credits that we are able to claim in accordance with the relevant U.K. tax legislation. These tax credits are payable to us in cash and are carried on the consolidated balance sheets at the amount claimed and expected to be received from the U.K. government within the next 12 months. We expect research and development expense to increase in absolute dollars as we continue to invest in the development of our products and technology.
Other income (Expense)
Other income consists of miscellaneous
non-operating
items, such as forgiveness of debt and related accrued interest.Interest Income (Expense)
Interest income consists primarily of interest received or earned on our cash, cash equivalents, and investment balances held in interest-bearing deposit accounts. Interest expense consists of interest paid on our convertible loan notes and capital lease obligations.
Equity Method Investment
Equity method investments consist of entities over which we have significant influence but not control or joint control. Under the equity method of accounting, all of our investments are initially recognized at cost and adjusted thereafter to recognize our share of the post-acquisition profits or losses of the investee in our consolidated statements of operations.
Change in Fair Value of Debt Instruments
Gains or losses from the change in fair value of debt instruments are recorded from the remeasurement of the fair value of our convertible loan notes using discounted cash flow and binomial lattice methodologies based upon certain valuation assumptions.
77
Change in Fair Value of Warrant Liabilities
Gains or losses from the change in fair value of warrants are recorded from the remeasurement of the fair value of our private placement and public warrants based upon certain valuation assumptions.
Gain (Loss) on Foreign Currency
We have significant international operations that are denominated in foreign currencies, primarily the British Pound and Euro, subjecting us to foreign currency exchange risk that may adversely impact our financial results. We calculate the year-over-year impact of foreign currency movement on our business using foreign currency exchange rates that are applied to transactional currency amounts.
Provision for Income Tax
We are subject to income taxes in the United Kingdom, the United States, Finland, Ireland, and Switzerland. Our income tax provision consists of an estimate of federal, state, and foreign income taxes based on enacted federal, state, and foreign tax rates, as adjusted for allowable credits, deductions, uncertain tax positions, changes in the valuation of our deferred tax assets and liabilities, and changes in tax laws. Due to cumulative losses, we maintain a valuation allowance against our U.S. federal and foreign deferred tax assets.
Results of Operations for the Three and Nine Months Ended September 30, 2021 Compared to the Three and Nine Months Ended September 30, 2020
The following table sets forth our historical operating results for the periods indicated (in thousands):
Three Months Ended September 30, | Nine Months Ended September 30, | |||||||||||||||
2021 | 2020 | 2021 | 2020 | |||||||||||||
Revenue | $ | 1,839 | $ | 4,517 | $ | 5,805 | $ | 19,061 | ||||||||
Cost of revenue | 3,459 | 5,015 | 11,742 | 18,100 | ||||||||||||
Gross profit | (1,620 | ) | (498 | ) | (5,937 | ) | 961 | |||||||||
Operating expenses: | ||||||||||||||||
Selling, general, and administrative expenses | 13,568 | 5,354 | 27,588 | 12,603 | ||||||||||||
Research and development expenses | 26,418 | 10,790 | 59,949 | 27,007 | ||||||||||||
Total operating expenses | 39,986 | 16,144 | 87,537 | 39,610 | ||||||||||||
Loss from operations | (41,606 | ) | (16,642 | ) | (93,474 | ) | (38,649 | ) | ||||||||
Other income (expense): | ||||||||||||||||
Forgiveness of PPP loan | — | — | 2,860 | — | ||||||||||||
Interest expense, net | (1,587 | ) | 1 | (1,913 | ) | (73 | ) | |||||||||
Equity method investment loss | 40 | (689 | ) | (720 | ) | (941 | ) | |||||||||
Change in fair value of debt instruments | (14,255 | ) | (3,325 | ) | (59,916 | ) | (5,547 | ) | ||||||||
Change in fair value of warrant liabilities | 515 | — | 515 | — | ||||||||||||
Gain (loss) on foreign currency | (481 | ) | 285 | 150 | (1,369 | ) | ||||||||||
Total other income (expense) | (15,768 | ) | (3,728 | ) | (59,024 | ) | (7,930 | ) | ||||||||
Loss before income taxes | (57,374 | ) | (20,370 | ) | (152,498 | ) | (46,579 | ) | ||||||||
Provision for income tax | 598 | 154 | 808 | 374 | ||||||||||||
Net loss and comprehensive loss | $ | (57,972 | ) | $ | (20,524 | ) | $ | (153,306 | ) | $ | (46,953 | ) | ||||
78
Discussion and Analysis of Results of Operations
Revenue (in thousands, except for percentages)
Three Months Ended September 30, | Change | Nine Months Ended September 30, | Change | |||||||||||||||||||||||||||||
2021 | 2020 | $ | % | 2021 | 2020 | $ | % | |||||||||||||||||||||||||
Revenue | $ | 1,839 | $ | 4,517 | $ | (2,678 | ) | (59 | )% | $ | 5,805 | $ | 19,061 | $ | (13,256 | ) | (70 | )% | ||||||||||||||
Revenue decreased by $2.7 million, or 59%, to $1.8 million for the three months ended September 30, 2021 from $4.5 million for the three months ended September 30, 2020. Revenue decreased by $13.3 million, or 70%, to $5.8 million for the nine months ended September 30, 2021 from $19.1 million for the nine months ended September 30, 2020. This decrease is primarily driven by an ongoing backlog of project deliverables in fiscal 2021 when compared to fiscal 2020 where we completed and delivered on project milestones for our significant customers.
Cost of Revenue and Gross Profit (in thousands, except for percentages)
Three Months Ended September 30, | Change | Nine Months Ended September 30, | Change | |||||||||||||||||||||||||||||
2021 | 2020 | $ | % | 2021 | 2020 | $ | % | |||||||||||||||||||||||||
Cost of revenue | $ | 3,459 | $ | 5,015 | $ | (1,556 | ) | (31 | )% | $ | 11,742 | $ | 18,100 | $ | (6,358 | ) | (35 | )% | ||||||||||||||
Gross Profit | (1,620 | ) | (498 | ) | (1,122 | ) | 225 | % | (5,937 | ) | 961 | (6,898 | ) | (718 | )% | |||||||||||||||||
Gross Margin | (88 | )% | (11 | )% | NM | NM | (102 | )% | 5 | % | NM | NM | ||||||||||||||||||||
| NM | – Not meaningful |
Cost of revenue decreased by $1.6 million, or 31%, to $3.5 million for the three months ended September 30, 2021 from $5.0 million for the three months ended September 30, 2020. This decrease in cost of revenue was primarily driven by a decrease of $2.1 million from engineering, fab partner, and stock-based compensation costs. The decrease was partially offset by $0.5 million in research and development tax credits and grants we received in 2021 compared to the prior period due to lower claims for our research and development activities. Gross profit decreased by $1.1 million, or 225% to $(1.6) million for the three months ended September 30, 2021 from $(0.5) million for the three months ended September 30, 2020. The decrease in gross profit was primarily driven by an overall decrease in revenue for the three months ended September 30, 2021.
Cost of revenue decreased by $6.4 million, or 35%, to $11.7 million for the nine months ended September 30, 2021 from $18.1 million for the nine months ended September 30, 2020. This decrease in cost of revenue was primarily driven by a decrease of $8.0 million from engineering, fab, partner and stock-based compensation costs. The decrease was partially offset by $2.3 million in research and development tax credits and grants we received in 2021 compared to the prior period due to lower claims for our research and development activities. Gross profit decreased by $6.9 million, or 718% to $(5.9) million for the nine months ended September 30, 2021 from $1.0 million for the nine months ended September 30, 2020. The decrease in gross profit was primarily driven by a decrease in revenue for the nine months ended September 30, 2021. Our revenue is recognized at the achievement of milestones and is not necessarily aligned with the timing of costs we incur.
Our gross margin has fluctuated and may fluctuate from period to period based on a number of factors, including the timing of completion of project milestones with each project requiring differing levels of time and costs. The projects we undertake are determined by our customer commitments and our long-term strategy goals.
79
Selling, General and Administrative Expenses (in thousands, except for percentages)
Three Months Ended September 30, | Change | Nine Months Ended September 30, | Change | |||||||||||||||||||||||||||||
2021 | 2020 | $ | % | 2021 | 2020 | $ | % | |||||||||||||||||||||||||
Selling, general, and administrative expenses | $ | 13,568 | $ | 5,354 | $ | 8,214 | 153 | % | $ | 27,588 | $ | 12,603 | $ | 14,985 | 119 | % | ||||||||||||||||
Selling, general. and administrative expenses increased by $8.2 million, or 153%, to $13.6 million for the three months ended September 30, 2021 from $5.4 million for the three months ended September 30, 2020. The increase was primarily due to general corporate growth, of which $4.0 million was from additional professional fees related to accounting, legal and audit matters, and $2.6 million and $0.1 million were due to increased human capital and stock-based compensation costs, respectively.
Selling, general, and administrative expenses increased by $15.0 million, or 119%, to $27.6 million for the nine months ended September 30, 2021 from $12.6 million for the nine months ended September 30, 2020. The increase was primarily due to general corporate growth, of which $6.1 million was from additional professional fees related to accounting, legal and audit matters, and $4.8 million and $0.2 million were due to increased human capital and stock-based compensation costs, respectively.
Research and Development Expenses (in thousands, except for percentages)
Three Months Ended September 30, | Change | Nine Months Ended September 30, | Change | |||||||||||||||||||||||||||||
2021 | 2020 | $ | % | 2021 | 2020 | $ | % | |||||||||||||||||||||||||
Research and development expenses | $ | 26,418 | $ | 10,790 | $ | 15,628 | 145 | % | $ | 59,949 | $ | 27,007 | $ | 32,942 | 122 | % | ||||||||||||||||
Research and development expenses increased by $15.6 million, or 145%, to $26.4 million for the three months ended September 30, 2021 from $10.8 million for the three months ended September 30, 2020. The increase was primarily attributable to growth of $2.8 million from engineering, fab partners, and engineering research and development headcount. This also led to an increase in human capital and stock-based compensation expenses of $9.2 million and $0.8 million. The increase was partially offset by a decrease of $0.9 million in research and development tax credits and grants we received in 2021 compared to the prior period due to lower claims for our research and development activities.
Research and development expenses increased by $32.9 million, or 122%, to $59.9 million for the nine months ended September 30, 2021 from $27.0 million for the nine months ended September 30, 2020. The increase was primarily attributable to growth of $11.4 million from engineering, fab partners, and engineering research and development headcount. This also led to an increase in human capital and stock-based compensation expenses of $15.9 million and $1.6 million, respectively. The increase was partially offset by a decrease of $2.4 million in research and development tax credits and grants we received in 2021 compared to the prior period due to lower claims for our research and development activities.
Other income, net (in thousands, except for percentages)
Three Months Ended September 30, | Change | Nine Months Ended September 30, | Change | |||||||||||||||||||||||||||||
2021 | 2020 | $ | % | 2021 | 2020 | $ | % | |||||||||||||||||||||||||
Other income, net | — | — | $ | — | 100 | % | $ | 2,860 | $ | — | $ | 2,860 | 100 | % | ||||||||||||||||||
Other income, net during the three and nine months ended September 30, 2021 consisted of debt forgiveness of the $2.9 million PPP Loan and related accrued interest.
80
Interest Expense, net (in thousands, except for percentages)
Three Months Ended September 30, | Change | Nine Months Ended September 30, | Change | |||||||||||||||||||||||||||||
2021 | 2020 | $ | % | 2021 | 2020 | $ | % | |||||||||||||||||||||||||
Interest expense, net | $ | (1,587 | ) | $ | 1 | $ | (1,588 | ) | (158,800 | )% | $ | (1,913 | ) | $ | (73 | ) | $ | (1,840 | ) | 2,521 | % | |||||||||||
The increase in interest expense, net by $1.6 million and $1.8 million, or (158,800)% and 2,521%, for the three and nine months ended September 30, 2021, respectively was primarily due to the interest expense recorded for the 2020 Term Facility Loan using the effective interest rate method.
Equity Method Investment Loss (in thousands, except for percentages)
Three Months Ended September 30, | Change | Nine Months Ended September 30, | Change | |||||||||||||||||||||||||||||
2021 | 2020 | $ | % | 2021 | 2020 | $ | % | |||||||||||||||||||||||||
Equity method investment loss | $ | 40 | $ | (689 | ) | $ | 729 | (106 | )% | $ | (720 | ) | $ | (941 | ) | $ | 221 | (23 | )% | |||||||||||||
Change in equity method investment captures our share of losses of the investment in Hengtong Rockley Technology Co., Ltd (“HRT”) according to our percentage of ownership.
Change in Fair Value of Debt Instruments (in thousands, except for percentages)
Three Months Ended September 30, | Change | Nine Months Ended September 30, | Change | |||||||||||||||||||||||||||||
2021 | 2020 | $ | % | 2021 | 2020 | $ | % | |||||||||||||||||||||||||
Change in fair value of debt instruments | $ | (14,255 | ) | $ | (3,325 | ) | $ | (10,930 | ) | 329 | % | $ | (59,916 | ) | $ | (5,547 | ) | $ | (54,369 | ) | 980 | % | ||||||||||
Change in fair value of debt instruments captures losses from a change in fair value estimates using discounted cash flow and binomial lattice methodologies that are based upon a set of valuation assumptions. As of September 30, 2021, there was no fair value associated with the convertible debt instruments due to the conversion of the debt securities into the Company’s ordinary shares as a result of the Business Combination.
Change in Fair Value of Warrant Liabilities (in thousands, except for percentages)
Three Months Ended September 30, | Change | Nine Months Ended September 30, | Change | |||||||||||||||||||||||||||||
2021 | 2020 | $ | % | 2021 | 2020 | $ | % | |||||||||||||||||||||||||
Change in fair value of warrants | $ | 515 | $ | — | $ | 515 | 100 | % | $ | 515 | $ | — | $ | 515 | 100 | % | ||||||||||||||||
Change in fair value of warrant liabilities captures activity from a change in fair value estimates based upon a set of valuation assumptions. The Private Placement Warrants were assumed from SC Health and recorded as part of the Business Combination and therefore there was no prior year balance.
Gain (Loss) on Foreign Currency (in thousands, except for percentages)
Three Months Ended September 30, | Change | Nine Months Ended September 30, | Change | |||||||||||||||||||||||||||||
2021 | 2020 | $ | % | 2021 | 2020 | $ | % | |||||||||||||||||||||||||
Gain (loss) on foreign currency | $ | (481 | ) | $ | 285 | $ | (766 | ) | (269 | )% | $ | 150 | $ | (1,369 | ) | $ | 1,519 | (111 | )% | |||||||||||||
81
Change in gain (loss) on foreign currency captures activity from the impact of foreign currency exchange rates as a result of the translation of foreign functional currencies into our reporting currency and the
re-measurement
of foreign currency transactions and balances. During the three and nine months ended September 30, 2021 and 2020, most of our balances are held in the reporting currency, which decrease the impact of foreign currency fluctuations on the results of our operations.Provision for Income Tax (in thousands, except for percentages)
Three Months Ended September 30, | Change | Nine Months Ended September 30, | Change | |||||||||||||||||||||||||||||
2021 | 2020 | $ | % | 2021 | 2020 | $ | % | |||||||||||||||||||||||||
Provision for income tax | $ | 598 | $ | 154 | $ | 444 | 288 | % | $ | 808 | $ | 374 | $ | 434 | 116 | % | ||||||||||||||||
Change in provision for income tax expense for the three and nine months ended September 30, 2021 is due to an overall increase in expenditures. The effective income tax rate was less than 1.0% for the three and nine months ended September 30, 2021 and 2020. Our effective tax rate differs from the U.S. statutory rate primarily due to a substantially full valuation allowance against our net deferred tax assets where it is more likely than not that some or all of the deferred tax assets will not be realized. The income tax expenses shown above are primarily related to corporate income taxes in the United States, which operates on a cost-plus arrangement and minimum filing fees in the foreign jurisdictions where we have operations.
Results of Operations for the Years Ended December 31, 2020 and 2019
The following table sets forth our historical operating results for the periods indicated (in thousands):
Years Ended December 31, | ||||||||
2020 | 2019 | |||||||
Consolidated Statements of Operations and Loss Data: | ||||||||
Revenue | $ | 22,343 | $ | 20,492 | ||||
Cost of revenue | 24,240 | 30,705 | ||||||
Gross Profit | (1,897 | ) | (10,213 | ) | ||||
Operating expenses: | ||||||||
Selling, general and administrative expenses | 20,260 | 13,306 | ||||||
Research and development expenses | 35,900 | 22,303 | ||||||
Operating loss | (58,057 | ) | (45,822 | ) | ||||
Other income (expense): | ||||||||
Interest income (expense), net | (189 | ) | (747 | ) | ||||
Equity method investment loss | (1,274 | ) | (1,281 | ) | ||||
Change in fair value of debt instruments | (20,163 | ) | 2,969 | ) | ||||
Gain (loss) on foreign currency | (25 | ) | 280 | |||||
Loss before provision for income tax | (79,708 | ) | (50,539 | ) | ||||
Provision for income tax | 569 | 311 | ||||||
Net loss and comprehensive loss | $ | (80,277 | ) | $ | (50,850 | ) | ||
Discussion and Analysis of Results of Operations
Revenue (in thousands, except for percentages)
Years Ended December 31, | Change | |||||||||||||||
2020 | 2019 | $ | % | |||||||||||||
Revenue | $ | 22,343 | $ | 20,492 | $ | 1,851 | 9 | % | ||||||||
82
Revenue increased by $1.9 million, or 9%, to $22.3 million for the year ended December 31, 2020 from $20.5 million for the year ended December 31, 2019. This is primarily due to an increase of development activities provided to customers under long-term contracts, as well as related fulfillment costs incurred for material and subcontractor costs to satisfy performance obligations. The increase in revenue was partially offset by a decrease in development activities with smaller scale customers, primarily due to the completion of project milestones with those customers in fiscal 2019.
Cost of Revenue and Gross Profit (in thousands, except for percentages)
Years Ended December 31, | Change | |||||||||||||||
2020 | 2019 | $ | % | |||||||||||||
Cost of Revenue | $ | 24,240 | $ | 30,705 | $ | (6,465 | ) | (21 | )% | |||||||
Gross Profit | $ | (1,897 | ) | $ | (10,213 | ) | $ | 8,316 | 81 | % | ||||||
Gross Margin | (8 | )% | (50 | )% | NM | NM | ||||||||||
| NM | – Not meaningful |
Cost of revenue decreased by $6.5 million, or 21%, to $24.2 million for the year ended December 31, 2020 from $30.7 million for the year ended December 31, 2019. This decrease in cost of revenue was primarily driven by a decrease of $8.3 million from engineering, fab partner, and compensation costs. The decrease was partially offset by $1.7 million in fulfillment costs to satisfy performance obligations with customers. Gross profit increased by $8.3 million, or 81 % to ($1.9) million for the year ended December 31, 2020 from ($10.2) million for the year ended December 31, 2019. The increase in gross profit was primarily driven by increased revenue from development services and a substantial decrease in engineering level of effort, fab partner, and human capital costs related to cost of revenue. Revenue is recognized at the achievement of milestones and is not necessarily aligned with the timing of costs incurred.
In general, our margins and cost of revenue varies from project to project, with each project requiring differing levels of time and costs. The projects we undertake are determined by our customer commitments and our long-term strategy goals.
Selling, General and Administrative Expenses (in thousands, except for percentages)
Years Ended December 31, | Change | |||||||||||||||
2020 | 2019 | $ | % | |||||||||||||
Selling, general and administrative expenses | $ | 20,260 | $ | 13,306 | $ | 6,954 | 52 | % | ||||||||
Selling, general and administrative expenses increased by $7.0 million, or 52%, to $20.3 million for the year ended December 31, 2020 from $13.3 million for the year ended December 31, 2019. The $7.0 million increase was primarily due to general corporate growth, of which $4.8 million was from additional professional fees related to accounting and audit matters, and $1.1 million and $0.3 million were due to increased human capital and stock-based compensation costs, respectively.
Research and Development Expenses (in thousands, except for percentages)
Years Ended December 31, | Change | |||||||||||||||
2020 | 2019 | $ | % | |||||||||||||
Research and development expenses | $ | 35,900 | $ | 22,303 | $ | 13,597 | 61 | % | ||||||||
83
Research and development expenses increased by $13.6 million, or 61 %, to $35.9 million for the year ended December 31, 2020 from $22.3 million for the year ended December 31, 2019. The increase was primarily attributable to growth of $16.5 million from engineering, fab partner, and engineering research and development headcount due to the allocation of resources into products that are considered part of research and development activities. This also led to an increase in stock-based compensation expenses of $1.5 million. The increase was mainly offset by $3.7 million in research and development tax credits and grants we received in 2020 supporting our research and development activities.
Interest Income (Expense) (in thousands, except for percentages)
Years Ended December 31, | Change | |||||||||||||||
2020 | 2019 | $ | % | |||||||||||||
Interest income | $ | 30 | $ | 281 | $ | (251 | ) | (89 | )% | |||||||
Interest expense | $ | (219 | ) | $ | (1,028 | ) | $ | 809 | (79 | )% | ||||||
Interest income decreased by $0.3 million, or 89%, in the year ended December 31, 2020 primarily due to a decrease in interest rates and our investment deposit balances. Interest expense decreased by $0.8 million, or 79%, to $0.2 million for the year ended December 31, 2020 from $1.0 million for year ended December 31, 2019, primarily due to new convertible loan notes issued in fiscal 2020. Interest expense relating to convertible loan notes is recorded as part of the change in fair value of the notes.
Equity Method Investment Loss
Years Ended December 31, | Change | |||||||||||||||
2020 | 2019 | $ | % | |||||||||||||
Change in fair value of debt instruments | $ | 20,163 | $ | 2,969 | $ | 17,194 | 579 | % | ||||||||
Change in fair value of debt instruments captures losses from a change in fair value estimates using discounted cash flow and binominal lattice methodologies that are based upon a set of valuation assumptions. The key assumptions used in valuation include default rates from historical performance, risk-free rates, expected volatility rates, and discount rates that reflect estimates of the rates of return that investors would require when investing in other convertible debt with similar characteristics. The change in fair value of debt instruments is a result of the difference in value between the initial issuance and subsequent fair value measurements.
Gain (Loss) on Foreign Currency (in thousands)
Years Ended December 31, | Change | |||||||||||||||
2020 | 2019 | $ | % | |||||||||||||
Gain (loss) on foreign currency | $ | 25 | $ | (280 | ) | $ | 305 | NM | ||||||||
| NM | – Not meaningful |
During the year ended December 31, 2020, we recorded an overall loss from the impact of foreign currency, primarily due to timing of transactions in the fiscal year, as well as fluctuations in average foreign currency translation rates versus the closing rates year-over-year.
84
Provision for Income Tax (in thousands, except for percentages)
Years Ended December 31, | Change | |||||||||||||||
2020 | 2019 | $ | % | |||||||||||||
Provision for income tax | $ | 569 | $ | 311 | $ | 258 | 83 | % | ||||||||
Provision for income tax expense was immaterial for the years ended December 31, 2020 and 2019. We have accumulated net operating losses as we have not yet started commercial operations. We maintain a substantially full valuation allowance against our net deferred tax assets. The income tax expenses shown above are primarily related to minimum filing fees in the states where we have operations as well as corporate income taxes for the foreign jurisdictions.
Liquidity and Capital Resources
Due to Rockley’s history of recurring losses from operations, negative cash flows from operations, and a significant accumulated deficit, management concluded that there is substantial doubt about Rockley’s ability to continue as a going concern. In addition, our independent registered public accounting firm has included an explanatory paragraph in their opinion for the year ended December 31, 2020 as to the substantial doubt about our ability to continue as a going concern. Since inception, Rockley has financed its operations primarily through the issuance and sale of convertible loan notes, ordinary shares and agreed-upon projects. As of September 30, 2021 and December 31, 2020, the cash and cash equivalents balance was $75.2 million and $19.2 million, respectively.
Short-Term Liquidity Requirements
As of the date of this prospectus, we have yet to generate any material revenue from our business operations. On August 11, 2021, the consummation of the Business Combination resulted in net cash proceeds of $124.1 million of cash, net of transaction costs, which will be used to fund our future capital and liquidity needs in order to support our core business operations and overall growth of our business and to execute our current growth strategies.
As of the date of this prospectus, management believes that the cash generated by the closing of the Business Combination and the PIPE financing is sufficient to fund both our cash needs for the execution of our business strategy at least the next 12 months, including (1) investing in research and developments activities, including completion and commercialization of our wearables, smart phone andtechnologies, (2) investing in backend processing, intellectual property protection, quality control and process, (3) expanding sales and marketing activities, and (4) pursuing strategic partnerships. However, our anticipated cash needs could vary materially and negatively as a result of a number of factors, including:
point-of-care
| • | timing and the costs involved in bringing our products to market; |
| • | anticipated customer contracts and design wins may not materialize; |
| • | delay in launching our products due to technical challenges from our customers or our product development team; |
| • | pricing and the volume of sales of our products may be different from our estimates; |
| • | execution delays due to resources constraints; |
| • | assisting our fab partners with expansion of production capacity; |
| • | the cost of maintaining, expanding and protecting our intellectual property portfolio, including litigation costs and liabilities; |
85
| • | the cost of additional general and administrative talent, including accounting and finance, legal and human resources, as a result of becoming a public company; |
| • | Rockley’s additional investment requirement needed for HRT to be self-sufficient; and |
| • | other risks discussed in the section entitled “Risk Factors.” |
Long-Term Liquidity Requirements
If we do not generate sufficient revenue, we will be required to explore various options to fund future cash needs through sale of additional equity, debt financing, and others. There can be no assurance that any such issuance of equity securities, debt financing or other means of financing will be available in the future, or the terms of any such financing will be acceptable to us. If we raise funds by issuing equity securities, there will be dilution to the existing shareholders. Any equity securities issued may also provide for rights, preferences, or privileges senior to those holders of ordinary shares. If we raise funds by issuing debt securities, these debt securities would have rights, preferences, and privileges senior to the holders of ordinary shares. The term of debt securities or borrowing could impose significant restriction on our operations. The credit market and financial service industry have in the past, and may in the future, experience periods of upheaval that could impact the availability and cost of equity and debt financing.
If adequate funds are not available, we will need to curb our expansion plans or limit our research and development activities, which would have a material adverse impact on our business prospects and results of operations.
Historical Cash Flows
For the Nine Months Ended September 30, 2021 and 2020
Nine Months Ended September 30, | ||||||||
2021 | 2020 | |||||||
(in thousands) | ||||||||
Net cash used in operating activities | $ | (91,902 | ) | $ | (28,738 | ) | ||
Net cash used in investing activities | (55,968 | ) | (3,590 | ) | ||||
Net cash provided by financing activities | 203,833 | 30,352 | ||||||
Net increase (decrease) in cash and cash equivalents | $ | 55,963 | $ | (1,976 | ) | |||
Cash Flows from Operating Activities
During the nine months ended September 30, 2021, net cash used in operating activities was $91.9 million, primarily consisting of net losses of $153.3 million, adjusted by
non-cash
depreciation and amortization of $3.2 million, bad debt expense of $0.4 million, stock-based compensation of $5.9 million, equity-method investment loss of $0.3 million, and losses/(gains) related to the changes in fair value of debt instruments and warrants of $59.9 million and $(0.5) million, respectively. Changes in assets and liabilities for the nine months ended September 30, 2021 included the following: increases in other receivables, prepaid expenses, trade payables and accrued expenses, offset by decreases in accounts receivable and other current assets.During the nine months ended September 30, 2020, net cash used in operating activities was $28.7 million, primarily consisting of net losses of $47.0 million, adjusted by
non-cash
depreciation and amortization of $2.1 million, stock-based compensation of $5.9 million, equity-method investment loss of $0.9 million, and a loss related to the change in fair value of debt instruments of $5.5 million. Changes in assets and liabilities for the nine months ended September 30, 2020 included the following: increases in accounts receivable and accrued expenses, offset by decreases in other receivables, prepaid expenses, other current assets and trade payables.86
Cash Flows from Investing Activities
Net cash used in investing activities was $56.0 million for the nine months ended September 30, 2021, primarily related to the purchase and the sale of marketable securities of $54.8 million and $5.0 million, respectively, and also from the purchases of property and equipment to be used in the ordinary course of business. Net cash used in investing activities was $3.6 million for the nine months ended September 30, 2020, primarily related to the investment in our HRT of $2.5 million and the remaining $1.1 million was related to purchases of property and equipment to be used in the ordinary course of business.
Cash Flows from Financing Activities
Net cash provided by financing activities was $203.8 million for the nine months ended September 30, 2021, primarily related to the proceeds received from the Business Combination and convertible loan notes. Net cash provided by financing activities was $30.4 million for the nine months ended September 30, 2020, primarily consisting of proceeds received for convertible loan notes and Paycheck Protection Program.
Contractual Obligations and Commitments
Purchase obligations include commitments to third-party suppliers for various research and development activities. As of September 30, 2021, we had $8.9 million in contractual obligations for which we have not yet received services.
For the Years Ended December 31, 2020 and 2019
The following table is a summary of our cash flow activities (in thousands):
Years Ended December 31, | ||||||||
2020 | 2019 | |||||||
Consolidated Statements of Cash Flow Data: | ||||||||
Net cash (used in) provided by: | ||||||||
Operating activities | $ | (48,354 | ) | $ | (36,556 | ) | ||
Investing activities | (6,656 | ) | (2,831 | ) | ||||
Financing activities | 53,334 | 48,933 | ||||||
Net (decrease) increase in cash and cash equivalents | $ | (1,676 | ) | $ | 9,546 | |||
Cash Flows from Operating Activities
During the year ended December 31, 2020, net cash used in operating activities was $48.4 million, primarily consisting of net losses of $80.3 million, adjusted by
non-cash
depreciation and amortization of $2.8 million, stock-based compensation of $8.0 million, equity-method investment loss of $1.3 million, increase in fair value of debt instruments of $20.2 million, and gain on disposal of assets of $0.1 million. Changes in assets and liabilities for the year ended December 31, 2020 included the following: decreases in accounts receivable, trade payables, prepaid expenses, other current assets, offset by increases in other receivables, and accrued expenses.During the year ended December 31, 2019, net cash used in operating activities was $36.6 million, primarily consisting of net losses of $50.9 million, adjusted by
non-cash
depreciation and amortization of $1.9 million, stock-based compensation of $6.2 million, equity-method investment loss of $1.3 million,non-cash
interest on convertible loan notes of $0.3 million, and change in fair value of debt instruments of $3.0 million. Changes in assets and liabilities for the year ended December 31, 2019 included the following: increases in accounts receivable, other receivables, prepaid expenses, other current assets, and trade payables offset by a decrease in long term debt, net of current portion.87
Cash Flows from Investing Activities
Net cash used in investing activities was $6.7 million for the year ended December 31, 2020, primarily consisting of $1.4 million purchases of property and equipment to be used in the ordinary course of business, $0.3 million acquisition of TruTouch assets, and $5.0 million additional investments made in
equity method investment. Net cash used in investing activities was $2.9 million for the year ended December 31, 2019, primarily consisting of purchases of property and equipment to be used in the ordinary course of business.
Cash Flows from Financing Activities
Net cash provided by financing activities was $53.3 million for the year ended December 31, 2020, primarily consisting of proceeds received for convertible loan notes and issuance of ordinary shares and warrants. Net cash provided by financing activities was $49.0 million for the year ended December 31, 2019, primarily consisting of proceeds received for convertible loan notes and issuance of ordinary shares and warrants.
Purchase obligations include commitments to third-party suppliers for various research and development activities. As of December 31, 2020, we had $3.0 million in contractual obligations for which we have not yet received services.
We are a party to operating leases, primarily for office space. These leases have remaining lease terms of 1 years to 4 years. Some leases include extension options for up to 5 years.
Off-Balance
Sheet ArrangementsSince the date of our incorporation, we have not engaged in any
off-balance
sheet arrangements, as defined in the rules and regulations of the SEC.Recent Accounting Pronouncements
Please refer to
Note 1
of our condensed consolidated financial statements included elsewhere in this prospectus for more information about recent accounting pronouncements, the timing of their adoption, and our assessment, to the extent we have made one, of their potential impact on our financial condition and our results of operations.Critical Accounting Policies and Estimates
Our financial statements have been prepared in accordance with GAAP as set forth in the Financial Accounting Standards Board’s Accounting Standards Codification, and we consider the various staff accounting bulletins and other applicable guidance issued by the SEC. The preparation of our condensed consolidated financial statements requires us to make estimates and assumptions that affect the reported amounts of assets and liabilities and the disclosure of contingent assets and liabilities as of the date of the financial statements, as well as the reported expenses incurred during the reporting periods. Our estimates are based on our historical experience and on various other factors that we believe are reasonable under the circumstances, the results of which form the basis for making judgments about the carrying value of assets and liabilities that are not readily apparent from other sources. Our actual results may differ from these estimates under different assumptions or conditions.
There have been no substantial changes to these estimates, or the policies related during the nine months ended September 30, 2021. For a full discussion of these estimates and policies is fully described in “” section included in the Rockley Photonics Holdings Limited’s Registration Statement on Form
Management’s Discussion and Analysis of Financial Condition and Results of Operations—Critical Accounting Policies
S-4
(FileNo. 333-255019),
filed with the SEC on April 2, 2021 and declared effective on July 22, 2021.88
We believe that the accounting policies discussed below are critical to understanding our historical and future performance, as these policies relate to the more significant areas involving management’s judgments and estimates.
While our significant accounting policies are described in Note 1 of our condensed consolidated financial statements included in prospectus, we believe that the following accounting policies are most critical to understanding our financial condition and historical and future results of operations:
| • | Revenue recognition; |
| • | equity valuations; |
| • | fair value of financial instruments and fair value measurements; and |
| • | income taxes. |
Revenue Recognition
We generate revenue principally from development services, which entails developing customer-specific designs of photonics chipsets. Our contracts with customers include specific achievement milestones and a substantive acceptance criteria for each milestone. In the event a milestone is achieved and the customer provides acceptance, we allocate the contract consideration related to the performance obligations that are satisfied during the period and recognize the revenue at that point in time.
Equity Valuations
As there is not a market for the Company’s equity, valuations of the Company’s equity instruments require the application of significant estimates, assumptions, and judgment. These valuations impact various amounts reported in the Company’s financial statements, inclusive of the recognition of equity-based compensation and fair value of convertible loan notes. The following discussion provides additional detail regarding the significant estimates, assumptions, and judgment that impact the determination of the fair values of equity-based compensation awards, warrants, and the ordinary shares that comprises the Company’s capital structure. The following discussion also explains why these estimates, assumptions, and judgments could be subject to uncertainties and future variability.
Equity-Based Compensation, Warrants
The Company estimates the grant date fair value of stock options, warrants, and restricted stock awards granted to employees,
non-employees
and directors and uses the estimated fair values to measure and recognize the costs for services received in exchange for the grants.The Company uses the Black-Scholes option-pricing model in order to estimate the fair values of both time-based stock option awards and warrants. Estimating the fair value of stock options and warrants using the Black-Scholes option-pricing model requires the application of significant assumptions, such as the fair value of our underlying ordinary shares, the estimated term of the option, the risk-free interest rates, the expected volatility of the price of our ordinary shares and the expected dividend yield. Each of these assumptions is subjective, require significant judgment, and is based upon management’s best estimates. If any of these assumptions were to change significantly in the future, equity-based compensation for future awards may differ significantly, as compared with awards previously granted.
The assumptions and estimates applied by the Company to derive the inputs for inclusion in the Black-Scholes pricing model are as follows:
| • | Fair value of ordinary shares—see “Ordinary Shares Valuations” discussion below; |
89
| • | Expected Term—This is the period that the options or warrants that have been granted are expected to remain unexercised. The Company employs the average period the stock options and warrants are expected to remain outstanding; |
| • | Volatility—This is a measure of the amount by which a financial variable, such as a share price, has fluctuated (historical volatility) or is expected to fluctuate (expected volatility) during a period. As the Company does not yet have sufficient history of its own volatility, management has identified several guideline comparable companies and estimates volatility based on the volatility of those companies; |
| • | Risk-Free Interest Rate—This is the U.S. Treasury rate, having a term that most closely resembles the expected life of the stock option or warrant; and |
| • | Dividend Yield—The Company has not and does not expect to pay dividends on its ordinary shares in the foreseeable future. |
Convertible Loan Notes
The Company estimates the fair value of convertible loan notes held by its investors at issuance of the note and also at each reporting
period-end
by using the estimated fair values of the ordinary shares and recognizing changes in the fair value of the note in the Company’s statement of operations and comprehensive loss. The Company determines the conversion option component by using the binomial lattice approach which requires the application of significant assumptions, such as the fair value of our underlying ordinary shares, the risk-free interest rates, the expected volatility of the price of our ordinary shares and the implied discount yield. Each of these assumptions is subjective, require significant judgment, and is based upon management’s best estimates, and may impact the change in fair value of the convertible loan note that is recognized in the Company’s statement of operations and comprehensive loss.Ordinary Shares Valuations
The Company uses valuations of its ordinary shares for various purposes, including, but not limited to, the determination of the exercise price of stock options and warrants and inclusion in the Black-Scholes option pricing model. The Company also uses valuations of its ordinary shares for determining the fair value of its convertible loan notes. During the time we were a privately held company, the lack of an active public market for our ordinary shares required our management and board of directors to exercise reasonable judgment and consider a number of factors in order to make the best estimate of fair value of our equity. We engaged the assistance of a third-party valuation specialist to determine the fair value of the ordinary shares by first estimating the fair value of our total enterprise value and total equity value using a combination of the income approach and guideline transaction method. Estimating our total enterprise value and total equity value requires the application of significant judgment and assumptions. Factors considered in connection with estimating these values:
| • | Rockley’s historical financial results and future financial projections; |
| • | the lack of marketability of Rockley’s ordinary shares; |
| • | the likelihood of achieving a liquidity event, such as an initial public offering or business combination, given prevailing market conditions; |
| • | industry outlook; and |
| • | general economic outlook, including economic growth, inflation and unemployment, interest rate environment and global economic trends. |
The fair value ultimately assigned to our ordinary shares may take into account any number or combination of the various factors described above, based upon their applicability at the time of measurement. Determination of the fair value of our ordinary shares may also involve the application of multiple valuation methodologies and
90
approaches, with varying weighting applied to each methodology as of the grant date. Application of these approaches involves the use of estimates, judgment, and assumptions that are highly complex and subjective, such as those regarding our expected future revenue, expenses, and future cash flows; discount rates; market multiples; the selection of comparable companies; and the probability of possible future events. Changes in any or all of these estimates and assumptions or the relationships between those assumptions impact our valuations as of each valuation date and may have a material impact on the valuation of our ordinary shares. During 2020, the estimated fair value of our ordinary shares fluctuated between $10.433 and $20.280 per share, the later fair value primarily reflecting our progress towards a business combination. The necessary steps undertaken to prepare for the Business Combination included meeting with SC Health and investment bankers, discussing timing expectations, and negotiating the preliminary Letter of Intent between SC Health and the Company. A Letter of Intent related to the Business Combination was signed by both parties in January 2021 reflecting an increased likelihood of a near-term exit transaction and/or liquidity event. The valuation of the Company’s equity as of December 31, 2020 took into consideration the indicated equity value implied in the signed Letter of Intent. While the December 31, 2020 valuation incorporated equity values based upon the traditional income approach consisting of the discounted cash flow method, the valuation also incorporated the equity value implied by the planned Business Combination transaction. Accordingly, the valuation applied the probability-weighted expected return method (PWERM) to weigh the indicated equity value determined under the traditional income approach and the equity value implied by our planned Business Combination. Based upon management’s determination that there was a high probability that the Business Combination would occur, a higher weighting was assigned to the implied value of the negotiated Business Combination transaction.
As of June 30, 2021, the Company estimated fair value of ordinary shares to be $24.70 per share, which represents an increase in value when compared to the ordinary shares value of $20.28 per share determined as of December 31, 2020. While the June 30, 2021 valuation incorporated equity values based upon the interpolation and income approach consisting of the discounted cash flow method, the valuation also incorporated the equity value implied by the planned Business Combination, which was consummated on August 11, 2021. Accordingly, the valuation applied a calibration approach to determine the implied internal rate of return of the recent Series E round as of the investment date and discount rate in order to calculate the company-specific risk premium of the Series E round of financing. Based upon management’s assumption that the Business Combination would occur, a higher weighting was assigned to the implied value of the negotiated Business Combination transaction.
Equity-based grants and issuance of convertible loan notes occur throughout the year. However, the valuation of the ordinary shares is performed at specific points in the fiscal year such as the end of the fiscal quarter or fiscal year. Therefore, to determine the fair value of the ordinary shares at points in time in between valuation dates, management interpolated the change in the fair value of our ordinary shares to derive a fair value between valuation dates.
Upon consummation of the Business Combination, we exchanged approximately 0.403 of our ordinary shares for each SC Health common share equivalent, determined based upon the number of our ordinary shares that would be outstanding if each outstanding share of our warrants and all of our convertible loan notes were to convert to our ordinary shares immediately prior to the merger. Accordingly, the indicated fair value of our equity based upon the terms of the Business Combination was $1.2 billion. Following the Business Combination with SC Health, it is no longer necessary for our management and its board of directors to estimate the fair value of our ordinary shares, as our ordinary shares are traded on the NYSE.
Fair Value of Financial Instruments and Fair Value Measurements
We determine fair value based on assumptions that market participants would use in pricing an asset or liability in the principal or most advantageous market. For debt instruments for which we have elected fair value accounting, fair value is based on the exchange price that would be received for an asset or paid to transfer a liability (an exit price) in the principal or most advantageous market for the asset or liability in an orderly transaction between market participants. Where available, fair value is based on or derived from observable
91
market prices or other observable inputs. Where observable prices or inputs are not available, valuation techniques are applied. These valuation techniques involve some level of management estimation and judgment, the degree of which is dependent on the price transparency for the instruments or market and the instruments’ complexity. For debt instruments for which we have not elected fair value accounting, fair value is based on the present value of expected future cash flows and assumptions about the then-current market interest rates as of the reporting period and our creditworthiness. The carrying value of these debt instruments approximates fair value as the stated interest rate approximates market rates currently available to us.
Income Taxes
We record income tax expense for the anticipated tax consequences of the reported results of operations using the asset and liability method. Under this method, we recognize deferred tax assets and liabilities for the expected future tax consequences of temporary differences between the financial reporting and tax basis of asset and liabilities, as well as for operating loss and tax credit carryforwards. Deferred tax assets and liabilities are measured using tax rates that are expected to apply to taxable income for the years in which those tax assets and liabilities are expected to be realized or settled. We record valuation allowances to reduce its deferred tax assets to the net amount that it believes is more likely than not to be realized. Its assessment considers the realization of deferred tax assets on a jurisdictional basis. We recognize the income tax benefit from an uncertain tax position only if it is more likely than not that the tax position will be sustained upon examination by taxing authorities, based on the technical merits of the position. The income tax benefits recognized in the financial statements from such a position are measured based on the largest benefit that has a greater than 50% likelihood of being realized upon ultimate settlement.
Quantitative and Qualitative Disclosures about Market Risk
We are exposed to a variety of market and other risks, including the effects of changes in interest rates, inflation, and foreign currency exchange rates, as well as risks to the availability of funding sources, hazard events, and specific asset risks.
Interest Rate Risk
The market risk inherent in our financial instruments and our financial position represents the potential loss arising from adverse changes in interest rates. As of September 30, 2021, we had cash and cash equivalents of $75.2 million, consisting of interest-bearing money market accounts for which the fair market value would be affected by changes in the general level of U.S. interest rates. However, due to the short-term maturities and the
low-risk
profile of our investments, an immediate 10% change in interest rates would not have a material effect on the fair market value of our cash and cash equivalents.Foreign Currency Risk
The functional currency of our operations is the United States dollar. We conduct operations in the United Kingdom, as well as various parts of Europe, and as such we are exposed to foreign currency risk. Currently, we do not use foreign currency forward contracts to manage exchange rate risk, as the amount subject to foreign currency risk has no material impact to our overall operations and results.
92
BUSINESS
Company Overview
We have developed a unique sensing platform that we believe can reshape the wellness and healthcare industries through multiple applications in
non-invasive,
multi-modal biomarker monitoring. We believe products based on our technology platform could have the potential to unlock and accelerate advancements in areas such as early disease detection, nutrition management, and preventative healthcare delivery through continuous health and wellness monitoring.To date, we have been engaged in developing customer-specific designs of our silicon photonics chipsets for incorporation into our customers’ end products. Accordingly, all of our products are presently in the development stage and we do not currently have any of our own end products in commercial production and have not yet shipped any products commercially. Our unique sensing platform has been built upon our silicon photonics technology, which enables compelling sensor performance, power, resolution, and density. This technology has the potential to allow monitoring devices, currently the size of clinical machines, to be condensed to the size of a wearable device. We believe this in turn has the potential to unlock additional uses in consumer electronics and medical devices. Our technology is built on over 159 patents, over seven years of product development, and $290 million in total funding prior to the consummation of the Business Combination, through the issuance of convertible loan notes and ordinary shares. We have established a manufacturing ecosystem based upon our wholly owned, proprietary processes in several areas for rapid scalability, which we believe provides us with a significant competitive advantage. The resulting combination of technologies and manufacturing
know-how
is the “full-stack Rockley Platform” which is made up of PICs in silicon with integratedIII-V
devices (devices incorporating certain conductor elements that offer superior electronic properties, such as lasers), ASICs, photonic and electronicco-packaging,
together with biosensing algorithms and artificial intelligence (“AI”) cloud analytics, firmware/software, system architecture, and hardware design.As testament to the relevance of our product development, we have captured the attention of several consumer electronics companies and, as of the date of this prospectus, we are engaged in discussions or have
non-binding
MOUs or development and supply agreements with entities which collectively account for over 55% market share of wearable devices (of the 55%,we have an agreement with an entity that represents 42%, an MOU with an entity that represents 5%, and we are in discussions with entities which represent at least 8%) and over 50% market share of smartphone devices, based on a combination of data sourced from the Yole Report, the IDtechEx Report and the TrendForce Report, as well as our internal volume forecasts for smartphone, smart watch, and smart earbuds through 2025 (based on customer data). We plan to leverage this attention to develop new capabilities in consumer wearables in the near term, and to expand over time into medical devices and other industry applications. As we do not currently have any products in commercial production, our current customer relationships are in the following stages: (a) customers with whom we are “engaged,” or in discussions with, regarding potential product features for incorporation into such customer’s end products, or (b) customers with whom we are “contracted,” where we have
non-binding
MOUs or development and supply agreements. These MOUs and development and supply agreements provide a general framework for our transactions with the customer and typically provide that we will develop and deliver new products meeting the customer’s specifications. There are no binding purchase commitments under our MOUs and supply agreements. We currently anticipate that sales of our products will be primarily made pursuant to standard purchase orders, which orders may be cancelled, reduced, changed, or rescheduled with little or no notice or penalty. Our ability to grow our business will depend on our ability to attract and retain customers which whom we are engaged in discussions only and successfully transition such customers to contracted customers with whom we have MOUs or development and supply agreements, and to otherwise attract new customers.Our company was founded in 2013 by Dr. Andrew Rickman, OBE. Dr. Rickman, who has over 30 years of experience in silicon photonics and is a pioneer in the field, led the development of our unique and versatile platform to address a range of emerging and growing markets. In 1988, Dr. Rickman founded Bookham
93
Technology Ltd, the first silicon photonics company and one of the world’s largest photonics and fiber optics telecom component producers, and he served as its chief executive officer and chairman until 2004. The acquisition by Bookham of Avanex, Inc., led to the creation of Oclaro, Inc. (NASDAQ: OCLR), which in turn was acquired by Lumentum, Inc., in 2018 (NASDAQ: LITE). From 2007 to 2013, Dr. Rickman was chairman of Kotura Inc., a leader in the field of silicon photonics for fiber optic communications, where he oversaw its development and eventual sale to Mellanox Technologies, Ltd. From Rockley’s inception in 2013 through December 31, 2020, Dr. Rickman has assembled an industry leading team in silicon photonics with over 82 Ph.Ds. and over 150 engineers to work at Rockley. We believe our extensive industry knowledge and deep talent base is a key differentiator to enable us to build a successful business based on our platform.
Our vision is to address many pressing healthcare concerns using our technology and we believe that there exists a large market opportunity for our platform. We estimate that the total addressable market (“TAM”) for the consumer wearables, mobile device, and medical device markets is projected to be over $48 billion by 2025, based on data sourced from the Yole Report, the IDtechEx Report, the TrendForce Report, and our internal volume forecasts for smartphone, smart watch, and smart earbuds through 2025 (based on customer data), as the universe of healthcare and consumer wearable devices incorporating additional sensing capabilities emerges.
1
Our target biomarkers for consumer healthcare include lactate, alcohol, glucose (indicator), carbon monoxide, blood pressure, blood oxygen, and core body temperature, among others. Due to the high performance of our lasers up to 1,000,000 times higher resolution, 1,000 times higher accuracy and 100 times broader range in wavelengths compared with existing LED offerings in wearable solutions (based on product analysis undertaken by Rockley comparing the Rockley silicon photonics-based spectrometer chip to existing solutions), we believe our platform will also be able to address existing applications in consumer wearable devices with significantly higher resolution, accuracy, and range. Further, we believe there are multiple additional markets and concrete opportunities for our technology platform in areas such as data center connectivity (optical transceivers), machine vision (robotic and automotive LiDAR), and compute connectivity(co-packaged
optics, or CPO).Product Applications and Development Status
We believe our innovative and differentiated silicon photonics platform positions us to make photonics-based solutions increasingly pervasive while unlocking previously unaddressed applications. Consequently, we believe the potential applications for our technology will be wide-ranging. Leveraging the flexibility and power of our innovative silicon photonics platform, we believe we are positioned to become a
| 1 | Specifically, we believe our TAM for the wearables, mobile, and medical device markets will be approximately $48 billion by 2025, taking into account our anticipated timeline for commercial availability of our products and the market for the end products into which our products are designed to be incorporated. Our products are being designed for utilization in: (a) medical devices, including blood pressure, body temperature, blood glucose, and alcohol monitoring devices, pulse oximetry, and near infra-red (“NIR”) spectrometers, with an aggregate forecasted TAM of $15.1 billion by 2025, according to the Yole Report, and mobile cardiac telemetry/general patient monitoring patch devices, with an aggregate forecasted TAM of $2.7 billion by 2025, according to the IDtechEx Report; and (b) consumer wearables and mobile devices, including smartwatches, smart earbuds, fitness bands, and mobile phones, which, based on our internal estimates, are expected to have a TAM of $2.7 billion, $3.0 billion, $1.5 billion, and $23.5 billion, respectively, or an aggregate TAM of $30.7 billion, by 2025. We estimated our TAM in the consumer wearables and mobile device sectors by multiplying third-party forecasted total volumes in 2025 for the devices for which our products are being designed, by our currently anticipated and estimated average selling prices for these products. The volume estimate for smartwatches was based on the benchmarked figure forecasted by annual volume for smartwatches for 2022 according to the TrendForce Report. The volume estimate for smart earbuds was based a 20% volume CAGR between 2020-2025, with 2020 annual shipments estimated at 230 million units, according to the TrendForce Report. According to the Yole Report, fitness bands were forecasted to reach 89 million units by 2025. The volume estimates for smartphones were based on multiple third-party forecasted volumes for mobile phones, multiplied by the average selling price. |
94
leading supplier of integrated optical components for dynamic, high-growth market sectors, including consumer sensors, healthcare, and data communications. To date, we have been engaged in developing customer-specific designs of our silicon photonics chipsets for incorporation into our customers’ end products and currently we do not have any of our own end products in commercial production. We expect that our immediate focus over the next two years will be on developing and commercializing our products for incorporation in consumer wearables and mobile applications, followed by medical devices in the healthcare space, and subsequently on developing our AI analytics cloud platform. In respect of consumer wearables and mobile applications, we plan to start delivering final samples to customers in the first half of 2022 with production ramp of these products commencing in the second half of 2022. For medical devices in the healthcare space, we plan to commence data collection trials in 2022 with production of units commencing in the first half of 2023, initially at a low run rate. During 2022, our aim is to build a collaboration model for our AI analytics cloud platform before progressing to a commercial launch of a subscription platform planned for the first half of 2023.
Healthcare: Consumer Wearables
We are developing an integrated optics module for health-related biomarker sensing and monitoring applications. We believe the high-density optical integration capabilities of our platform can personalize healthcare monitoring of multiple biophysical and biochemical biomarkers and can significantly improve how individuals track and monitor their health and wellbeing. We believe the ability to bring laboratory precision diagnostics to the wrist and other small and convenient form factors can significantly enhance consumer awareness of their health and wellbeing. Further, we plan to develop an AI analytics cloud platform which will offer further insight by leveraging data we collect through our sensing platform and provide meaningful and actionable insight to end users. Although our target market is consumer wellness rather than medical, we intend to monitor and comply with regulations to the extent they become applicable to us, including any requirements for clearance by the FDA. Our plans for the Rockley Platform include a Basic Module and an Advanced Module, which will have a wide array of current and potential applications, as shown in the figure below.
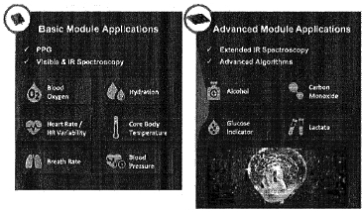
Healthcare: Medical Devices
We plan to incorporate our technology into existing devices such as medical patches, wearable bands, and other monitoring devices to provide additional biomarkers not currently available to consumers. We believe this will enhanceand remote monitoring solutions that have the potential to ultimately transform and disrupt the delivery of patient monitoring and healthcare. In the medical device space, we currently anticipate that we will need to seek FDA clearance for devices that are currently under development based on our technology platform. As these products are still under development and while there can be no assurance that we will be successful in these product development efforts or that even if developed, that such products will achieve widespread market acceptance, we believe these efforts present significant market opportunities in addition to our consumer wearables applications.
point-of-care
95
Datacom: Transceiver Chipsets and
Co-Packaged
OpticsData centers, which are the nerve centers of the digital economy, require interconnected communications for which we believe our optical transceiver products offer several advantages. Business, entertainment, vital medical research, and other aspects of daily life are in many ways connected to hyperscale data centers, which in tum rely on cost-effective, power-efficient optical communication links. Whether incorporated in pluggable optical transceiver modules or inapproach of partnering with a joint venture in China has economic benefits over participating directly as a chipset provider in this margin-sensitive market. By licensing our technology to the joint venture, we offer the joint venture the opportunity to create an economically compelling solution without being required to source elements from multiple suppliers and therefore not incurring higher margin costs, while Rockley benefits from license revenue and our equity stake in the joint venture.
co-packaged
optics, we believe hyperscale data centers will benefit from the unique advantages that our silicon photonics platform has to offer. Furthermore, we believe ourgo-to-market
Other Applications
We believe that our silicon photonic platform is ideally suited for delivering sensing solutions needed for machine perception and interrogation at depth, which is increasingly required in industrial automation, robotic vision, including surgical applications, safety, and autonomous applications. Finely tuned light, delivered through a PIC via a free space aperture or fiber optic interconnect with accompanying detection receiver capabilities, enables substantially better capabilities than previously available technology, such as frequency modulated continuous wave (“FMCW”) LiDAR for automotive safety solutions, as well as future autonomous vehicle offerings. Our team has extensive experience in the design of PICs for use in the LiDAR domain and we have prototyped the key components of the system and demonstrated their superior performance. Although we believe the inflection point for LiDAR and the automotive market may be approaching, we plan to leverage our core technology readiness and economies of scale from our consumer business to position ourselves for this potential market opportunity.
Market Opportunity
Health and Wellness
There is growing demand for miniaturized,
non-invasive
sensing technology devices with real-time diagnostics and analytics that are affordable and accessible outside the clinical environment. We believe this demand is driven by two major market and secular trends:| • | Consumer health and wellbeing awareness. COVID-19 has had a profound impact on the way consumers perceive their need for“at-home” monitoring solutions. |
| • | Chronic conditions and disease care. non-invasive monitoring solutions for chronic conditions have historically been costly and available only in a medical facility. With our potential for individual noninvasive wearable monitoring solutions, we believe we have a great opportunity to impact patients’ compliance with healthcare guidance, that will lead to better quality of life and drastic overall healthcare cost reductions.Non-invasive monitoring could also allow detection and prevention of potential chronic conditions and disease at a much earlier stage, resulting in reduced overall healthcare cost. |
96
We believe existing technologies are not capable of taking full advantage of the above trends, which require solutions that can be miniaturized and operate with low enough power to be integrated into consumer wearables, medical patches, and other compact form factors, that can cover a broad range of conditions and biomarkers, and that can scale cost effectively to high volumes. We believe that our unique silicon photonics-based platform is now poised to serve at the confluence of the above two market and secular trends.
We consider our immediate addressable market to be comprised of consumer wearables and mobile smartphone devices. Based on data sourced from the Yale Report, the IDtechEx Report, and TrendForce Report, as well as our internal forecasts, we estimate that, by 2025, consumer wearables, which includes, smart watches, fitness bands, and smart earbuds, will reach a total of 700 million units per year; smart phones may reach a total of 1.5 billion units per year; and medical devices, which includes blood pressure monitors, pulse oximeters, body temperature monitors, blood glucose monitors, alcohol monitors, and NIR spectrometers, will reach a TAM of $18 billion.
2
Beyond these opportunities, we believe there may be significant potential for us in the field of genomics. As the field of genomics grows, as shown in the development of personalized medicines and treatment, the value and effectiveness are enhanced when genomic information is combined and processed along with continuous biomarker monitoring for the users. We believe this emerging field could play to the strengths of our platform and potentially represents a high value growth opportunity for the future.
Datacom
Datacenter operators continue to build and upgrade their datacenter infrastructure to meet the continuing growth in public, private, and hybrid cloud capacity. As these datacenters rely heavily on fiber optics to interconnect compute, storage, accelerators and other resources, this trend is reflected with substantial growth in demand in the high-speed Ethernet optics. LightCounting forecasts that the market for Ethernet optics will grow from approximately $3.0 billion in 2018 to approximately $6.0 billion in 2025. The market segment that we are primarily targeting comprises 400Gb/s and 800Gb/s modules and their addressable market are expected to grow to approximately $3.0 billion in 2025, according to LightCounting’s forecasts. We believe our silicon photonics platform is well positioned to address this market with highly integrated PICs to implement the optical functionality required for such transceiver modules. We believe that our platform will provide a substantial cost advantage over conventional discrete-optics-based solutions, as well as over competing integrated photonics solutions due to our platform’s volume-scale manufacturing readiness and wafer-level integration and testing capabilities. In addition to the PICs, our silicon photonics-based spectrometer chipset for transceiver modules includes the analog/mixed-signal ICs that implement the interface to the electrical domain.
Competitive Advantages
We believe our silicon photonics solutions and technology offer the following key benefits:
| • | Superior sensing performance. LED-based solutions based on product analysis undertaken by Rockley comparing the Rockley silicon photonics-based spectrometer chip to existingLED-based solutions. We believe our unique silicon photonics technology and the entire product ecosystem we are developing will make ourend-to-end |
| 2 | We believe the TAM for medical devices into which our products may be incorporated will be approximately $18 billion by 2025 based on: (a) an aggregate forecasted addressable market of $15.1 billion for healthcare monitoring devices and NIR spectrometers by 2025, according to the Yole Report; and (b) mobile cardiac telemetry/general patient monitoring patch devices with an aggregate forecasted addressable market of $2.7 billion by 2025, according to the IDtechEx Report. |
97
offerings in the health and wellness domain difficult to replicate. Current optical-based sensing solutions rely on LED-based sensing (PPG signals for SpO2, heart rate, heart rate variability, breath rate, and blood pressure). However, there are many biomarkers present in the body (such as in blood or interstitial fluid) that are not detectable in visible LED range. We believe the wide wavelength span ininfra-red and capability of our silicon photonics solutions to integrate many wavelengths within that range in a compact chip at high volume and low cost opens the door to addressing those biomarkers. |
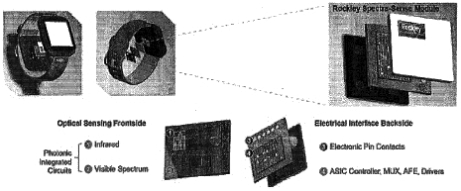
| • | Flexible platform architecture. |
| • | Deep understanding of market opportunity and customer priorities. are developing many applications and systems with our silicon photonics solutions that are driven by industry leaders in the consumer sensors, healthcare, and data communications markets. Through our established relationships with industry leaders, we have consistently demonstrated our ability to address their technological challenges. As a result, we have signed MOUs and have contracted with several industry leaders in wearable consumer technology to establish product specifications and desirable features. We believe we are well-positioned to develop high-volume optical sensing modules and algorithms for their emerging architectures. We have ongoing, collaborative discussions with consumer wearables, healthcare, and communication companies and original equipment manufacturers (“OEM”) and module and component vendors to address their next generation product offering to end users. |
| • | Fabless, scalable business model with manufacturing process expertise and ownership. |
| • | Highly differentiated process. III-V actives, Integration) are unique and well suited to meeting our customers’ economic and performance needs for their applications. In particular, we believe our silicon PIC process on multi-micron thickSilicon-On-Insulator |
98
| • | Strong intellectual property portfolio. know-how is based on over 30 years of leadership in the development and commercialization of silicon photonics and we have established strong and deep technical foundations and expertise for high-volume product delivery that would be difficult for a competitor to replicate. |
| • | Established and committed foundry partner network. |
We believe the combination of all our capabilities makes the Rockley Platform unique. Our high-performance optical sensing module with broad biomarker detection capabilities, combined with the power of our algorithms and AI platform, enable us to target unmet needs and challenges in the health and wellness markets. We have ongoing formal and informal collaborative discussions with the industry and technology leaders in consumer sensor, healthcare, and data communications companies, as well as with OEMs, and module and component vendors concerning the design of architectures and products to address existing and next generation applications. Based on these interactions, we believe we are one of a limited number of suppliers to these OEMs for the type of products we plan to sell, and in some cases, we may be the sole supplier for certain applications.
Our Strategy
Our strategy is to become the leading global provider of sensing products comprised of integrated optical modules with supporting electronics, software, application algorithms, and AI platforms for high-volume applications in dynamic and high-growth market sectors. Key elements of our strategy include:
| • | Extend our silicon photonics leadership. |
| • | Identify and promote new and emerging applications for our technologies. end-product roadmaps and to demonstrate how our technologies can help them to devise and enable innovative solutions. |
| • | Develop our product portfolio. |
| • | Forming strategic partnerships in products and applications: |
| • | Continue to attract and acquire new customers. |
99
| • | Sustain margin through expansion of our products into higher-end markets. |
Our Technology Platform and Product Offerings
Our solutions leverage our deep understanding of silicon photonics, application science, and our innovative platform architecture to address high-volume applications in the consumer sensors, healthcare, and data communications markets. We believe our leadership position in developing silicon photonics-based sensing solutions is a result of the following core strengths:
| • | A unique and proprietary silicon photonics platform technology to address a broad set of requirements in the healthcare and wellness industries. |
| • | Our custom multi-micron-waveguide photonics-optimized process with integrated III-V semiconductor actives brings multiple competitive advantages in terms of performance and manufacturability, offering lower waveguide losses, higher waveguide power handling, polarization independence, ubiquitous integration ofIII-V actives in their nativeknown-good-die form, ultra-broad-band performance, and lower sensitivity to manufacturing variations while enabling compact circuitry with high integration densities. |
The figure below illustrates the key benefits of Rockley’s silicon photonics platform in comparison with mainstream platforms. The horizontal axis represents waveguide thickness—conventional platforms are based on thin waveguides with a thickness in the range of
220-300nm
(on the left side of the scale), whereas Rockley’s platform adopts multi-micron thick waveguides (on the right side of the scale). The diagram shows how several key performance metrics improve with waveguide thickness, highlighting the platform’s superior photonic performance and suitability for high-yield volume manufacturing.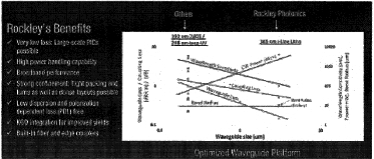
Additional key points concerning the photonics technology include the following:
| • | Optical loss per unit distance is much lower than for others, enabling lower power solutions and/or larger-scale PICs. |
| • | The platform provides broadband performance and is suitable for the visible, short-wave and mid-infrared bands. This is a key enabler for sensing applications that other platforms cannot serve. |
| • | A larger waveguide is much less sensitive to manufacturing variations that can affect its shape and hence its refractive index, thus achieving much better center wavelength registration than small waveguides enabling accurate wavelength filters. |
| • | Strong optical confinement enables tight packing of waveguides and sharp waveguide bends, hence dense layout capability and compact PICs. |
100
| • | Our waveguides exhibit low dispersion (low signal distortion) and low polarization dependent loss (simplifying receiver architectures in particular). |
| • | The platform incorporates features that enable low-loss, passively aligned fiber coupling (integrated mode size converters andv-grooves). |
| • | The platform is well suited to power-efficient integration of III-V waveguide devices such as lasers and modulators that also have a multi-micron mode size. Processed, known good,III-V devices can be flip-chip bonded into recesses etched in the silicon waveguide layer to achieve edge coupling. This has the advantages of compact coupling without tapers orspot-size converters, active device processing in existingIII-V foundries,back-end integration of known good and reliableIII-V devices, and more favorable thermals. |
| • | The large waveguides also offer a much higher optical power handling capability than small waveguides. |
| • | Broadband optical performance enables sensing a large optical spectrum to cover a wide range of measurands. |
| • | Accurate wavelength targeting enables using many finely spaced wavelengths for accurate detection. |
| • | Low optical loss enables a high signal-to-noise |
| • | Low-loss coupling fromIII-V to Si waveguide drives down power consumption for long battery life. |
| • | Compact PIC layouts result in small chip sizes to fit within consumer device form factors and reduce product cost. |
| • | Known-good-die integration of active elements improved yields, which leads to cost-effective solutions. |
The figure below illustrates our full stack platform model.
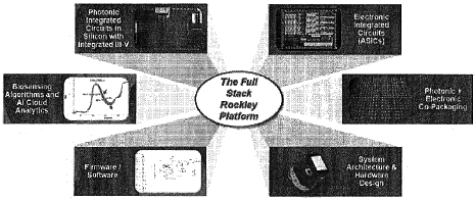
| • | Photonic integrated circuits in silicon with integrated III-V: “III-V” elements onto these PI Cs are the foundational competencies of Rockley. These PICs are manufactured using our proprietary and highly differentiated process flow deployed at our foundry partners. |
| • | Application-specific integrated circuits (“ASICs”): |
| • | Photonic & electronic co-packaging: co-packaging technologies, including 2.5D and |
101
3D integration. Such dense integration is key and enables us to achieve the energy efficiency and physical size requirements for our core use cases. We partner with specialized packaging houses to provide the capacity required for serving consumer markets. |
| • | System architecture & hardware design: value-add photonic subsystems, modules and chipsets that fit seamlessly into our end product partners’ designs. |
| • | Firmware/software: in-house expertise to develop the necessary firmware and software to complement our hardware offerings and facilitate system integration, testing, and monitoring by our customers. |
| • | Sensing algorithms, AI & cloud analytics: |
We believe the key benefits that our solutions can provide to our customers are as follows:
| • | Low Power and Small Footprint. |
| • | Faster Time to Market. time-to-market |
Business Unit | Product | Application | ||
Health Sensing | Basic Module | • PPG sensing: Heart rate, heart rate variability breath rate, blood oxygenation, blood pressure • IR sensing: Temperature, hydration | ||
Health Sensing | Advanced Module | • PPG sensing: Heart rate, heart rate variability, breath rate, blood oxygenation, blood pressure • IR sensing: Temperature, hydration, alcohol lactate, glucose | ||
Datacomms | 400G-DR4 Chipset, 800G-2DR4 Chipset | • Intra datacenter optical communications |
| • | We will target applications in the consumer health and wellness industry and expect strong customer engagement in the consumer electronics and wearables market. The Rockley Platform represents a breakthrough which will confer on consumer electronic devices, primarily including personal wearables, smartphones and homecare devices, the capacity for new powerful healthcare and wellness monitoring. Our first health monitoring product offering is expected to launch in 2022 consists of a basic module targeting fitness tracker bands and an advanced module targeting smartwatches. |
102
| • | The Rockley basic and advanced modules leverages existing LED based optical sensing and augments with Rockley’s proprietary infrared optical sensing to expand biomarkers sensing at the wrist. The advanced module will have the hardware and software capabilities to collect information available relevant to glucose tracking. This feature will then be enabled for our customers after we gather and analyze an appropriate amount of user data and determine the level of information we need to make available. |
| • | The continuing growth in datacenter deployments and upgrades is driving demand for high-speed optical intra-datacenter network links with reaches up to 2km. Our 400G-DR4 chipset provides 400Gb/s of capacity (four lanes of 100Gb/s each) and is targeted at the market for400GBASE-DR4 Ethernet optics (pluggable transceiver modules) inQSFP-DD and OSFP form factors. This is forecast to be the largest segment within the datacenter optics market for the coming years. This chipset enables transceiver module vendors to implement a solution with lower cost and lower power than conventional discrete-optics-based approaches. The four-part chipset comprises a transmit PIC, a receive PIC, a transmit IC, and a receive IC, which have beenco-optimized for highest performance. |
| • | The 800G-2DR4 chipset addresses the emerging market for 800Gb/s transceiver modules. This market is expected to take off when switch AS I Cs with 100Gb/s serdes start being deployed. This chipset essentially doubles the number of channels of the 400G-DR4 chipset from four to eight and enables a doubling of bandwidth density at the transceiver module level that will increase power efficiency, and reduce cost per capacity. |
Rockley’s Silicon Photonics Toolbox Elements
Rockley’s proprietary silicon photonics platform covers a uniquesolution, from generation of the light into, manipulation (modulation, multiplexing), radiation out of the module, and collection and processing of the returned light. The following provides an overview of the key components of our platform:
end-to-end
| • | Lasers: |
| • | Modulators and detectors: |
| • | Combiners and splitters: |
| • | Fiber optic coupling: on-chip embedded interfaces to the optical fibers. These interfaces allow the fiber to be passively attached directly to the photonic IC without external light coupling elements. |
| • | Free-space optics: |
| • | Photonic integrated circuits: |
| • | Wafer-scale processing: multi-die structures forchip-on-wafer |
| • | Interface electronics: in-house design expertise for custom analog circuitry to translate high-speed data streams into signals that actuate the photonics ICs (drivers) and receive signals from them (amplifiers). This is complimented with our digital design capability for device control, signal processing and interfaces to our customers systems. |
103
| • | Packaged assembly: |
Further application-based expertise is focused on:
| • | Tissue optics design: |
| • | Bio marker application: |
| • | Applied data science: |
Future Product Capabilities
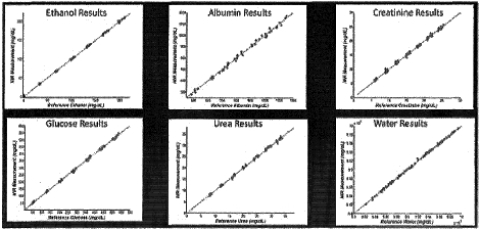
These biomarkers along a few others we are investigating are key in early detection, prevention, and monitoring of major chronic illnesses, as illustrated in the table below:
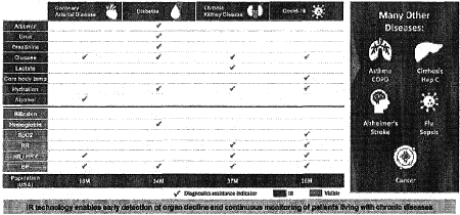
As these products are still under development, there can be no assurance that we will be successful in these product development efforts or that even if developed, that such products will achieve widespread market acceptance.
104
Customers
We believe existing commercial relationships with leading consumer device customers validates our unique technology and the business opportunity at hand. Our near-term commercial focus is on a robust pipeline in consumer devices, medical devices, and life sciences companies. We have a sales funnel of over 100 potential customer targets of which we started discussions with 47, entered into due diligence with 27 of the 47, proceeded to contract negotiations with 18, and engaged (through
non-binding
memorandums of understanding) or entered into contracts with 16 of the 18. The customers with whom we are engaged or contracted with represent more than 60% of wearable global volumes (of the 60%, we have agreements with entities that represent more than 50% and we are in discussions with the remaining entities ) and more than 50% of smartphone global volumes. Although our near-term focus through 2024 is on our consumer health and wellness strategy, we believe other markets also represent upside potential.To date, we have generated revenue primarily from NRE and development services for customer-specific designs of silicon photonics chipsets for incorporation into their customers’ end products. Our two largest customers collectively accounted for 100% and 99.6% of our revenue in 2020 and 2019, respectively. We anticipate revenue attributable to these customers will fluctuate from period to period, although we expect to remain dependent on these customers for a significant portion of our revenue for the foreseeable future. See “Risk Factors—Customer-Related Risks.”
We work closely with our end customers throughout their design cycles and will develop long-term relationships as our differentiated technology becomes embedded into their products. For example, we currently hold a development and supply agreement with one customer since 2017 and have successfully designed and delivered critical sample chips to them. As a result, we believe we are well-positioned to be designed into their current product roadmaps and develop their next generation solutions for their future products. Because many of our target customers or their OEMs are located in North America and Asia Pacific, we anticipate that a majority of our future revenue will come from sales in these regions. Although a large percentage of our sales are made to customers in North America, we believe that a significant number of the systems and devices designed by these customers will incorporate our semiconductor products which are then sold to
end-users
globally. In addition to our current customers, we have entered intonon-binding
memorandums of understanding with Zepp Health Corp., LifeSignals Group, Inc., and Withings France SA with respect to the future supply of our Rockley basic and advanced modules, if and when such products become commercially available. The terms of these agreements arenon-binding
in nature andnon-committal
as to volumes and price. However, we believe these memorandums of understandings indicate a significant interest in Rockley’s products and the potential for the future supply of our products to significant product manufacturers. We expect that once the Rockley modules are commercially available, Rockley will enter into standard supply agreements with each of these parties.Sales and Marketing
Our customers’ design cycle from initial engagement to volume shipment typically ranges from three to five years, with product life cycles of two years or more. For many of our products, which are technically complex, we must engage early with our customers’ technical staff. To ensure an adequate level of early engagement, our sales, marketing, and development engineers must work closely with our customers and channel partners to understand, identify, and propose solutions to meet their systems’ challenges. We work closely with our customers to anticipate end customer market needs. In some cases, we work with ecosystem partners to better understand market trends and new requirements that are being placed on our end customers.
Manufacturing
Our Proprietary Production and Manufacturing Ecosystem
We have built, and plan to continue to develop, a global manufacturing ecosystem designed with the ability to scale in a rapid and efficient manner. Several key areas within this manufacturing ecosystem run on our
105
proprietary process and manufacturing technologies and are protected by our intellectual property portfolio. We possesscontrol over design, manufacturing and packaging process, algorithms, and software. Our disciplined and systematic documentation and protection of critical
end-to-end
know-how,
trade secrets, and proprietary information further underpins our manufacturing ecosystem. To the best of our knowledge, there are no other turnkey options with the components and technologies needed to put together our sensing product. In addition to the intellectual property arrangements, we also have commercial exclusivity agreements with some of the key manufacturing ecosystem partners to prevent replication of this capability.In addition to providing what we believe to be unmatched capabilities at the product level, our platform and the associated technology have been designed from bottom up to take into account the relative ease and cost of manufacturing and scaling. Elements like waveguide dimensions for ease of wafer fabrication and high yields, robust and position tolerant coupling strategies for
III-V
integration, wafer scaleback-end
activities forIII-V
manufacturing, and all known good die integration at the module are integral to the product and the process technology. These elements are covered by the intellectual property which we have licensed to our manufacturing ecosystem.Manufacturing Model Overview
We plan to operate a fabless business model and use third-party foundries and assembly and test contractors to manufacture, assemble and test our products. In several key areas, our third-party partners operate a proprietary process wholly owned by us and protected by our intellectual property portfolio. This outsourced manufacturing approach allows us to focus our resources on the design, sale, and marketing of our products. In addition, we believe that outsourcing many of our manufacturing and assembly activities provides us with the flexibility needed to respond to new market opportunities and scale for customer demand, simplifies our operations, and significantly reduces our capital commitments.
We believe our fabless model will allow us to scale in a capex efficient manner. We have contracted with global
tier-I
foundries, including Newport Wafer Fab (“NWF”) for silicon PICs and wafer-scaleIII-V
device integration and testing. This foundry is qualified for health, consumer and auto applications and has the capacity to manufacture over 400,000 wafers per year. The terms of this agreement provide that Rockley will be a priority customer of NWF with regard to supply of PICs, wafers, and testing facilities. In return, Rockley agrees to give NWF a right of first refusal to supply of such products and services, subject to NWF completing a build out of their capabilities, provided that Rockley is entitled to seek alternative supply where NWF does not satisfy Rockley that NWF is able to meet Rockley’s requirements for price, lead times, or quality of supply. Our agreement with NWF does not include any binding commitments or minimum requirements with respect to order or supply volumes. Our high-volumeIII-V
semiconductor foundry is consumer and telecom qualified, supports very high volumes, and runs fully automated processes at one of the largest wafer scale inIII-V
manufacturing globally. Finally, our global IC foundry supplier handles the manufacturing of the electronic integrated circuits for our sensing modules. The foundry is used by most major consumer OEMs and is qualified for the ultra-high volume process node that we have chosen.| • | Raw Materials and Wafer Supply: III-V components, we have arrangements in place with the world’s leading epitaxial wafer supplier. We also have volume ready suppliers for commercialoff-the shelf-components (“COTS”) that go into the visible sensing and the overall module. |
| • | Wafer Fabrication: Tier-1 global companies. The process used by NWF is wholly owned by Rockley and licensed for use by NWF only in Rockley products. The process design kit (“PDK”) for this process is developed and maintained by us and constitutes our intellectual property. |
106
For thewafer-scale levels of automation. We have adapted the base process technology from this foundry to incorporate the previously discussed elements that allow for ease of integration into our platform and ease of manufacturing. These elements are exclusively for use in Rockley products.
III-V
active components, epitaxial materials are processed into finished wafers at a world leading dedicatedIII-V
foundry making detectors, lasers and LEDs usingstate-of-the-art
Finally, for ASIC manufacturing, we use a standard process node and PDK provided to us by TSMC. While the manufacturing process is widely used in high volume (good for product economics), the design
know-how
belongs to Rockley. The custom ASIC matches our silicon photonics platform optimally for low noise, low power and high level of integration.| • | Chipset and module integration: III-V active components into the silicon PICs is done at wafer scale and using passive alignment techniques that are uniquely enabled in our platform. Furthermore, we have ensured that theIII-V components are in arrays of devices (reduces amount of alignment and integration activities) and on pretested known good die (“KGD”) which ensures very high compounded yields. The process IP is developed and owned by Rockley and the integration will be performed at NWF where the PIC wafers are fabricated. |
The integration of the overall module is
in-line
with assemblies used for wearables and mobile devices and there are many global suppliers with this capability. We have engaged with leading suppliers that serveTier-I
consumers in this space and expect to finalize these arrangements for assembly within 2021.We have development and supply agreements in place with the key suppliers. These agreements cover the development program, economic framework, IP licenses, exclusivity terms and other matters. Although we have commenced long-term supply agreement discussions in parallel with the detailed manufacturing ramp discussions, we do not currently have any long-term supply agreements in place and transact business with our third-party suppliers on a purchase-order basis with no minimum supply obligations on their part. We have designed our manufacturing partner network to be resilient by having multiple sources of supply for several key processes/components and we have plans for the appropriate inventory and stocking strategies to mitigate risks to our ramp plans.
Commitment to Quality
We are committed to excellence by creating class-leading silicon photonics-based products and services. We intend to meet or exceed our global customer expectations by:
| • | creating long-lasting, trusting, and mutually beneficial relationships with customers and partners; |
| • | establishing a full understanding of our customers’ requirements and ensuring our products and services meet their expectations; |
| • | building a team of highly trained, empowered, and accountable employees; |
| • | innovating in the creation of technology driving our products and services; and |
| • | improving the effectiveness and efficiency of our quality management system through review of results, learning, and enhancement on a continual basis. |
We are actively seeking ISO 9001:2015 certification, and expect to complete phase 1 by the end of 2021. We subject our third-party manufacturing contractors to rigorous qualification requirements to meet the high quality and reliability standards required of our products. We carefully qualify each of our partners and their processes. Our engineers work closely with our foundries (we even have teams embedded at partners sites in some critical areas) and other contractors to perfect the
in-house
processes, increase yield, lower manufacturing107
costs, and improve product quality. See “Risk Factors—Risks Related to Rockley’s Business and Industry” for a discussion of risks related to the semiconductor industry and Rockley’s manufacturing processes and foundry relationships.
Research and Development
We believe that our future success depends on our ability to develop new products for both existing and new markets, development enhancements to our products once developed or if and when commercially launched, to stay ahead of our competition by being leaders in extending the boundaries of our technologies. As a result, a significant amount of our operating expenses has been allocated towards next-generation platform development. Our research and development efforts are focused primarily on extending the functionality and addressable markets of our integrated photonics platform, as well as continually increasing its performance, efficiency, and volume manufacturing competitiveness. We have assembled a core team of experienced engineers and systems designers with an extremely broad range of skill sets across different disciplines who conduct research and development activities in the United States and various European locations, and we are supported by partnerships with leading research institutions and consumer electronics and medical devices companies. As of September 30, 2021, we have 275 employees globally with over 75% of our workforce focused on research, product development, and engineering.
Competition
The global optical components market in general, and the consumer sensor, healthcare, and data communications markets in particular, are highly competitive. We expect competition to increase and intensify as additional companies enter our target markets. Our competitors range from large, international companies offering a wide range of services and optical components, such as LEDs, lasers, detectors, or PICs, to smaller companies specializing in narrow market verticals. Some of our key competitors across various verticals include: AMS, ADI, Broadcom, Brolis, Cisco, GlobalFoundries, Intel, Lumentum, Maxim, OSRAM, TSMC, and Tower Jazz. We expect competition in our target markets to increase in the future as existing competitors improve or expand their product offerings and as new competitors enter these markets. However, we believe we are currently the only provider with the capability to integrate the technologies and features and performance required by customers in our target markets. We believe our unique silicon photonic-based platform and the entire product ecosystem which we have developed around it will make ourofferings in the health and wellness domain difficult to replicate and provides us with a significant competitive advantage. We believe this will be particularly true as we incorporate our AI and cloud-based offerings currently under development.
end-to-end
The following summarizes how we believe we are positioned with respect to key competitive factors across our target markets:
• | Product performance and features |
| • | Power consumption meeting wearable product requirements: We believe our proprietary low-loss photonics platform in combination with electronics designed in astate-of-the-art |
| • | Novel features and extended functionality: Compared with existing conventional solutions, we believe our platform supports more wavelengths in both the visible and infrared (“IR”) wavelength ranges. This in turn unlocks multiple biomarkers that can only be targeted in our optimized IR platform. The number of wavelengths, wavelength registration (accuracy), wavelength resolution, tunability, and stability are all key aspects in delivering such broad functionality. |
| • | Application specific algorithms and AI: We plan to monetize the sensor data generated by our unique hardware capabilities by means of a cloud-based data collection and processing |
108
platform based on proprietary algorithms and AI models. We believe this will enable extraction of lower order health information, Moreover, processing the sensor data through our AI platform can extract more in-depth health information such as indications of illness or trending direction of all health-related information. |
| • | Size: Our compact form factor technology enables us to meet the product requirements smart bands and smartwatch end products. |
• | End to end manufacturing ecosystem |
| • | Covers all the elements needed to bring full solution together. |
| • | Optimized to meet the application performance needs. |
| • | Cost effective and designed to scale rapidly. |
| • | Unique and not easy to replicate. |
| • | Reputation and reliability: |
Intellectual Property
We rely on a combination of intellectual property rights, including patents, trade secrets, copyrights and trademarks, and contractual protections, to protect our core technology and intellectual property. As of September 30, 2021, we had 96 issued and allowed patents and 83 other patent applications pending in the United States and 68 patents in foreign jurisdictions. The 96 issued and allowed patents in the United States expire in the years beginning in 2021 through 2040. The 68 patents in foreign jurisdictions include 41 in the United Kingdom, 24 in China, and 3 in Japan, and they expire in the years beginning 2027 through 2039. Many of our issued patents and pending patent applications relate to sensors and sensor chips, and we have extensive geographic coverage over numerous relevant technology domains.
In addition to our own intellectual property, we also use third-party licensors for certain technologies embedded in our silicon photonics solutions. These are typically
non-exclusive
contracts provided underpaid-up
licenses. These licenses are generally perpetual or automatically renewed for as long as we continue to pay any maintenance fees that may be due. To date, maintenance fees have not constituted a significant portion of our annual capital expenditures. We have entered into a number of licensing arrangements pursuant to which we license third-party technologies. We do not believe our business is dependent to any significant degree on any individual third-party license.We generally control access to and use of our confidential information and trade secrets through the use of internal and external controls, including contractual protections with employees, contractors, and customers. We rely in part on the laws of the United States and international laws to protect our work. All employees and consultants are required to execute confidentiality agreements in connection with their employment and consulting relationships with us. We also require them to agree to disclose and assign to us all inventions conceived or made in connection with the employment or consulting relationship. However, we cannot guarantee that we have entered into such agreements with every such party, and we may not have adequate remedies in case of a breach of any such agreements. Our trade secrets could be disclosed to our competitors or others may independently develop substantially equivalent technologies or otherwise gain access to our trade secrets. Trade secrets can be difficult to protect and some courts inside and outside of the United States are less willing or unwilling to protect trade secrets.
Government Regulation
Healthcare-Related Regulation
Our solutions may be incorporated into multi-application, health-related sensing, and monitoring applications, including healthcare consumer wearables. Accordingly, the end products into which our solutions
109
are incorporated may be subject to FDA and similar or related regulations, and demand for these end products or future regulated products could be adversely affected if such end products do not comply with applicable requirements. Although our target market is consumer wellness rather than medical, we intend to monitor and comply with regulations to the extent they become applicable to us, including any requirements for FDA clearance. Certain healthcare-related products may be regulated by the FDA and corresponding state regulatory agencies in the United States and separate governmental authorities outside of the United States. In the United States, the medical device industry is regulated by governmental authorities, principally the FDA and corresponding state regulatory agencies. Before a new regulated product or a significant modification to an existing medical device may be marketed or sold in the United States, it must comply with FDA Quality Management System regulations, and must obtain regulatory clearance or approval from the FDA, unless an exemption from
pre-market
review applies. In addition, certain future software functionality, whether standalone or embedded in existing or future devices, may be regulated as a medical device and requirepre-market
review and clearance or approval by the FDA. The process of obtaining regulatory clearances or approvals to market a medical device can be costly and time consuming, and our end customers may not be able to obtain these clearances or approvals on a timely basis, or at all, for future products. Any delay in, or failure to receive or maintain, clearance or approval for any medical device products under development could prevent us from generating revenue from our solutions incorporated into these products.Medical devices are also subject to numerous ongoing compliance requirements under the regulations of the FDA and corresponding state regulatory agencies, which can be costly and time consuming. For example, under FDA regulations medical device manufacturers are required to, among other things: (i) establish a quality management system to help ensure that their products consistently meet applicable requirements and specifications; (ii) establish and maintain procedures for receiving, reviewing, and evaluating complaints; (iii) establish and maintain a corrective and preventive action procedure; (iv) report certain device-related adverse events and product problems to the FDA; and (v) report to the FDA the removal or correction of a distributed product. If our solutions are incorporated into any medical device products of our end customers and these customers experience any product problems requiring reporting to the FDA or otherwise fail to comply with applicable FDA regulations or the regulations of corresponding state regulatory agencies, it could harm our ability to sell our solutions. In addition, if our end customers in the healthcare market are subject to enforcement actions such as fines, civil penalties, injunctions, recalls of products, delays in the introduction of products into the market, and refusal of the FDA or other regulators to grant future clearances or approvals, it could harm our reputation, business, operating results, and financial condition. In addition, in the United States, the FDA has taken the position that device manufacturers are prohibited from promoting their products other than for the uses and indications set forth in the approved product labeling, and any failure to comply could subject our end customers to significant civil or criminal exposure, administrative obligations and costs, and/or other potential penalties from, and/or agreements with, the federal government.
Government regulations outside the United States have, and may continue to, become increasingly stringent and common. In the European Union, for example, the European Union Medical Device Regulation was published in 2017 and, when it entered into full force in 2020, included significant additional
pre-market
and post-market requirements. Penalties for regulatorynon-compliance
could be severe, including fines and revocation or suspension of a company’s business license, mandatory price reductions, and criminal sanctions. Future laws and regulations may have a material adverse effect on our end customers in the healthcare market, which in turn may negatively impact our ability to sell our solutions and otherwise harm our business and financial results.Export Regulation
Our business activities are also subject to various restrictions under U.S. export and similar laws and regulations, as well as various economic and trade sanctions administered by the U.S. Treasury Department’s Office of Foreign Assets Control. Further, various countries regulate the import of certain technology and have enacted or could enact laws that could limit our ability to provide customers with our products in those countries.
110
We are also subject to various domestic and international anti-competition laws, such as the U.S. Foreign Corrupt Practices Act and the U.K. Bribery Act, as well as other similar anti-bribery and anti-kickback laws and regulations, These laws and regulations generally prohibit companies, their employees, and their intermediaries from authorizing, offering, providing, and/or accepting improper payments or other benefits for improper purposes. Although we take precautions to prevent violations of these laws, our exposure for violating these laws increases as our international presence expands and as we increase sales and operations in foreign jurisdictions.
New legislation or regulation, the application of laws from jurisdictions whose laws do not currently apply to our business, or the application of existing laws and regulations to technology in the wearables industry generally could result in significant additional compliance costs and responsibilities for our business.
Privacy
We are or may become subject to a variety of laws and regulations in the United States and abroad regarding privacy, data protection, and data security. These laws and regulations are continuously evolving and developing. The scope and interpretation of the laws that are or may be applicable to us are often uncertain and may be conflicting, particularly with respect to foreign laws.
In particular, there are numerous U.S. federal, state, and local laws and regulations and foreign laws and regulations regarding privacy and the collection, sharing, use, processing, disclosure, and protection of personal data. Such laws and regulations often have changes in scope, may be subject to differing interpretations, and may be inconsistent among different jurisdictions. For example, the General Data Protection Regulation (the “GDPR”), which became effective in May 2018, includes operational requirements for companies that receive or process personal data of residents of the European Union that are broader and more stringent than those previously in place in the European Union. The GDPR includes significant penalties for
non-compliance,
including fines of up to €20 million or 4% of total worldwide revenue, Additionally, in June 2018, California enacted the California Consumer Privacy Act (the “CCPA”), which became effective in January 2020. The CCPA requires covered companies to provide California consumers with new disclosures and expands the rights afforded consumers regarding their data, Fines for noncompliance may be up to $7,500 per violation. We cannot currently estimate the potential impact of the CCPA on our business or operations.Additionally, we rely on various legal mechanisms for transferring certain personal data outside of the European Economic Area, or EEA, including the
EU-U.S.
Privacy Shield Framework, or Privacy Shield, and EU Standard Contractual Clauses, or SCCs. If we fail or are perceived to fail to meet the Privacy Shield principles or our obligations under the SCCs, or if any of these legal mechanisms for transferring data from the EEA are invalidated by European courts or otherwise become defunct, European Union data protection authorities or the U.S. Federal Trade Commission, or FTC, could bring enforcement actions seeking to prohibit or suspend our data transfers or alleging unfair or deceptive practices, In such cases, we could be required to make potentially expensive changes toour information technology infrastructure and business operations, and we could face legal liability, fines, negative publicity, and resulting loss of business.
Certain health-related laws and regulations such as the Health Insurance Portability and Accountability Act of 1996, or HIPAA, and the Health Information Technology for Economic and Clinical Health Act, or HITECH, may also have an impact on our business. If we are unable to comply with the applicable privacy and security requirements under HIPAA, HITECH, or PCI DSS, or we fail to
comply with BAAs that we enter into with covered entities, we could be subject to claims, legal liabilities, penalties, fines, and negative publicity, which could harm our operating results.
Governments are continuing to focus on privacy and data security, and it is possible that new privacy or data security laws will be passed, or existing laws will be amended in a way that is material to our business. Any significant change to applicable laws, regulations, or industry practices regarding our users’ data could
111
require us to modify our services and features, possibly in a material manner, and may limit our ability to develop new products, services, and features. Although we have made efforts to design our policies, procedures, and systems to comply with the current requirements of applicable state, federal, and foreign laws, changes to applicable laws and regulations in this area could subject us to additional regulation and oversight, any of which could significantly increase our operating costs.
We strive to comply with all applicable laws, policies, legal obligations, and industry codes of conduct relating to privacy, data security, and data protection. The costs of compliance with, and other burdens imposed by, the GDPR, CCPA, HIPAA, and similar laws may limit the use and adoption of our products and services, and/or require us to incur substantial compliance costs, which could have an adverse impact on our business. In addition, given that the scope, interpretation, and application of these laws and regulations are often uncertain and may be conflicting, it is possible that these obligations may be interpreted and applied in a manner that is inconsistent from one jurisdiction to another and may conflict with other rules or our practices. Any failure or perceived failure by us, our end customers, or third-party service-providers to comply with our privacy or security policies or privacy-related legal obligations, the failure or perceived failure by our end customers to comply with their privacy policiesprivacy-related legal obligations, or any compromise of security that results in the unauthorized release or transfer of personal data, may result in governmental enforcement actions, litigation, damages, penalties, and negative publicity, and could also have an adverse effect on our brand and operating results.
or
Cybersecurity
We have designed and implemented and continue to maintain a security program consisting of policies, procedures, and technology intended to maintain the privacy, security and integrity of our information, systems, and networks. Among other things, the program includes controls designed to limit and monitor access to authorized systems, networks, and data, prevent inappropriate access or modification, and monitor for threats or vulnerability.
Employees and Human Capital Resources
Our workforce represents a highly regarded team of silicon photonics and measurement science experts under the same organization. A significant number of our employees have advanced degrees, including a large percentage holding Ph.Ds. As of September 30, 2021, we had 275 full-time employees, a large percentage of those employees are in technical roles, including engineering.
| • | The quality of our employees is well recognized in the industry and has a strong and positive impact on our ability to develop and capitalize on our strategic operating model and business plan. |
| • | Our leadership team is recognized for world-leading expertise in silicon photonics design and process, microelectronics design, packaging and test, software and Algorithms including Cloud and AI, and applications in data communications and medical sensing. |
| • | We have strong relationship with our employees and have never experienced a work stoppage. |
Despite the significant challenges facing the world economy in light of the
COVID-19
pandemic, we have remained focused on our business plan and priorities. We intend to continue to focus on:| • | Protecting the wellbeing of our employees and keeping them healthy and engaged. |
| • | Making our physical workplaces safe and compliant. |
| • | Building out efficient global human resource information systems and processes. |
| • | Recruiting and staff retention for critical skills and competencies. |
| • | Investing in the development of current and future leadership. |
112
| • | Creating sustainable operations, while building resilience, efficiency and flexibility into everything, from strategy to work design. |
Facilities
Our headquarters are currently located in Pasadena, California under a lease for approximately 16,000 square feet, which lease for the majority of the premises leased expires in June 2023. The premises in Pasadena are predominantly used for engineering and finance and general administration services. We also lease a property in San Jose, California to approximately 4,600 square feet under a lease expiring in 2024, which is predominantly used for finance and general administration services. To support headcount growth over the past year, we continue to explore options and timing for improving and expanding our facilities. In the United States, we recently finalized a new office lease in Irvine, California to accommodate our sensor application facility under a lease for approximately 8,000 square feet, which lease expires in July 2026. In the United Kingdom, we have expanded our lab facilities in Wales to approximately 1,733 square feet under a lease due to expire in 2024. We believe our current facilities are sufficient to support our operations and growth plans and that additional space, if needed, will be available on commercially reasonably terms.
Legal Proceedings
From time to time, we may become involved in additional legal proceedings arising in the ordinary course of our business. We are currently not a party to any legal proceedings the outcome of which, if determined adversely to us, would individually or in the aggregate have a material adverse effect on our business, financial condition, and results of operations.
113
MANAGEMENT
Executive Officers and Directors
Rockley’s directors and executive officers and their ages as of September 30, 2021 are as follows:
Name | Age | Position | ||
Executive Officers | ||||
| Andrew Rickman, OBE | 61 | Chairman and Chief Executive Officer | ||
| Mahesh Karanth | 60 | Chief Financial Officer | ||
| Amit Nagra, Ph.D. | 48 | Chief Operating Officer | ||
Non-Employee Director Nominees | ||||
| William Huyett (1)(2) | 65 | Lead Independent Director | ||
| Brian Blaser (1) | 57 | Director | ||
| Caroline Brown, Ph.D. (1)(3) | 59 | Director | ||
| Karim Karti | 52 | Director | ||
| Michele Klein (2)(3) | 72 | Director | ||
| Pamela Puryear (2)(3) | 58 | Director | ||
| (1) | Member of the audit committee. |
| (2) | Member of the compensation committee. |
| (3) | Member of the nominating and corporation governance committee. |
Executive Officers
Andrew Rickman OBE.
Mahesh Karanth.
114
sold to Harris Stratex Networks. From 1995 to 2002, Mr. Karanth held several senior roles at Compaq including M&A, treasury, and corporate development. After Compaq’s acquisition by Hewlett-Packard Company, he led corporate development for the customer services group and several major services acquisitions of publicly listed companies in India and the United Kingdom. Mr. Karanth holds a bachelor’s and master’s degree in commerce and finance from Bangalore University, certifications as a Chartered Accountant from The Institute of Chartered Accountants of India (ICAI), and Chartered Secretary from The Institute of Company Secretaries of India (ICSI), and is a Certified Public Accountant (inactive) in the State of Texas.
Amit Nagra,
Ph.D.
start-up
involved in high-speed optical communications that was acquired by Emcore Corporation (NASDAQ: EMKR), and was previously a member of technical staff at Vitesse Semiconductor Corporation, working on the design of 40Gbps circuits for optical communications. Dr. Nagra holds a Ph.D. and MS in electrical engineering from the University of California at Santa Barbara and an MBA from the Anderson School of Business at University of California at Los Angeles.William Huyett.
30-year
career at McKinsey, he was a leader in the firm’s pharmaceutical and medical products and its strategy and corporate finance practices, and served on McKinsey’s Shareholder’s Council (its board of directors) from 2005 to 2014, serving as chair of its Finance Committee from 2007 to 2010. Mr. Huyett was, until the company’s merger in August 2020,non-executive
board chair of the London Stock Exchange listed, Tbilisi-based Georgia Healthcare Group. He serves on the boards of the Rockefeller University, the Marine Biological Laboratory Woods Hole, the University of Virginia Engineering School Foundation, and the National Parks Conservation Association. Mr. Huyett earned his B.S. in electronics in engineering and his MBA from the University of Virginia, where he now serves as a lecturer on corporate finance, corporate strategy and governance. We believe Mr. Huyett’s top executive experience, and his strong governance background, make him well-qualified to serve on the HoldCo board of directors.Brian Blaser.
15-year
tenure at Abbott Laboratories (NYSE: ABT), a multinational medical devices and healthcare company. Since March 2021, Mr. Blaser has served as an Executive Advisor to Water Street Healthcare Partners, an investment and strategic advisory firm specializing in the healthcare sector. Effective December 1, 2021, Mr. Blaser has been appointed as president, CEO, and director of Talis Biomedical. From 2012 to 2019, Mr. Blaser was executive vice president of the Diagnostics Products division at Abbott, and he served in several roles covering global and strategic operations. Prior to joining Abbott in 2004, Mr. Blaser held positions in operations, finance, and engineering at Johnson & Johnson, Eastman Kodak Company, and General Motors Company. Mr. Blaser holds a B.S. in mechanical engineering technology from the University of Dayton and an MBA from the Rochester Institute of Technology Saunders College of Business. We believe Mr. Blaser’s strategic and operational experience in thein-vitro
diagnostics industry make him well-qualified to serve on the HoldCo board of directors.Caroline Brown,
Ph.D.
non-executive
director for the IP Group plc (LON: IPO), an intellectual property commercialization company, where she currently chairs the audit committee. Dr. Brown is also anon-executive
director of Georgia Capital plc (LON: CGEO) and Luceco plc (LON: LUCE). Since June 2021, Dr. Brown has served as an external member of115
the Partnership Council and the Audit and Risk
sub-Committee
of the Partnership Council of Clifford Chance LLP, a privately held international law firm. Dr. Brown has served on public company boards for 20 years and is experienced in managing early-stage companies and divisions of FTSE 100 groups in the energy and technology sectors. Dr. Brown spent her early career in corporate finance with Merrill Lynch (New York), UBS, and HSBC, advising global corporations and governments. Dr. Brown holds a first-class degree and Ph.D. in Natural Sciences from the University of Cambridge, an MBA from the City Business School, University of London and is a Fellow of the Chartered Institute of Management Accountants. We believe Dr. Brown’s strong corporate governance experience and leadership on public company boards makes her well-qualified to serve on the HoldCo board of directors.Karim Karti.
Michele Klein.
co-founded
to provide science-based tools to improve vision. Ms. Klein currently serves as a board member of Aviat Networks Inc (NASDAQ: AVNW), Intevac (NASDAQ: IVAC), Photon Control (TSX:PHO), and Gridtential Energy Inc. From 2005 to 2010, she was a senior director of Applied Ventures, LLC, the venture capital arm of Applied Materials Inc. (NASDAQ: AMAT) (“Applied”), where she recommended and managed investments in energy storage and solar energy, representing Applied on the boards of seven technology companies. Earlier she founded and led two semiconductor equipment companies. Ms. Klein was chief executive of Boxer Cross Inc. from 1997 to 2003 when it was acquired by Applied, and ran theIn-line
Electrical Metrology team from 2003 to 2005. She led High Yield Technology from 1986 to 1996 when it was acquired by Pacific Scientific (NYSE:DHR). Ms. Klein previously held marketing management positions at Knoll International and Hewlett-Packard Company. Ms. Klein holds a B.S. from the University of Illinois and an MBA from the Stanford Graduate School of Business. We believe Ms. Klein’s founder and leadership experience in the semiconductor industry, coupled with her corporate governance background, makes her well-qualified to serve on the HoldCo board of directors.Pamela Puryear, Ph.D.
116
Corporate Governance
Composition of the HoldCo Board of Directors
The business and affairs of HoldCo are managed under the direction of its board of directors (the “Board” or the “HoldCo Board”). Dr. Andrew Rickman serves as chairman and William Huyett serves as the lead independent director. Subject to the terms of HoldCo’s governing documents, the number of directors is fixed by the Board.
When considering whether directors and director nominees have the experience, qualifications, attributes, and skills, taken as a whole, to enable the Board to satisfy its oversight responsibilities effectively in light of its business and structure, the board of directors expects to focus primarily on each person’s background and experience as reflected in the information discussed in each of the directors’ individual biographies set forth above in order to provide an appropriate mix of experience and skills relevant to the size and nature of its business.
In accordance with the terms of HoldCo’s governing documents, the Board is divided into three classes, Class I, Class II, and Class III, with members of each class serving staggered three-year terms. The Board is currently divided into the following classes:
| • | Class I: Brian Blaser and Pamela Puryear, whose terms will expire at HoldCo’s first annual meeting of shareholders to be held after the Closing; |
| • | Class II: Karim Karti and Michele Klein, whose terms will expire at HoldCo’s second annual meeting of shareholders to be held after the Closing; and |
| • | Class III: Andrew Rickman, William Huyett, and Caroline Brown, whose terms will expire at HoldCo’s third annual meeting of shareholders to be held after the Closing. |
At each annual meeting of shareholders to be held after the initial classification, the successors to directors whose terms then expire will be elected to serve from the time of election and qualification until the third annual meeting following their election and until their successors are duly elected and qualified. This classification of the HoldCo Board may have the effect of delaying or preventing changes in control or management of HoldCo. HoldCo’s directors may be removed from office at any time, but only for cause and only by the affirmative vote of the holders of at least a majority of all HoldCo ordinary shares entitled to vote and who vote at a general meeting of HoldCo.
Director Independence
The HoldCo Board determined that each of the directors on the HoldCo board of directors, other than Dr. Andrew Rickman, OBE, and Karim Karti, qualifies as an independent director, as defined under the rules of the NYSE Listed Company Manual (the “NYSE listing rules”), and the HoldCo Board consists of a majority of “independent directors,” as defined under the rules of the SEC and the NYSE listing rules relating to director independence requirements. In addition, HoldCo is subject to the rules of the SEC and NYSE listing rules relating to the membership, qualifications, and operations of the audit committee, nominating and corporate governance committee, and compensation committee, as discussed below.
Role of the Board in Risk Oversight/Risk Committee
One of the key functions of the Board is informed oversight of Rockley’s risk management process. The Board does not have a standing risk management committee, but rather administers this oversight function directly through the Board as a whole, as well as through various standing committees of the Board that address risks inherent in their respective areas of oversight. In particular, the Board is responsible for monitoring and assessing strategic risk exposure and the audit committee has the responsibility to consider and discuss Rockley’s
117
major financial risk exposures and the steps its management will take to monitor and control such exposures, including guidelines and policies to govern the process by which risk assessment and management is undertaken. The audit committee also monitors compliance with legal and regulatory requirements. Our compensation committee also assess and monitor whether our compensation plans, policies and programs comply with applicable legal and regulatory requirements.
Board Committees
In connection with the Closing, the Board established an audit committee, a compensation committee, and a nominating and corporate governance committee and adopted a charter for each of these committees, which complies with the applicable requirements of the NYSE listing rules. The composition and function of the audit committee, the nominating and corporate governance committee comply with all applicable requirements of the Sarbanes-Oxley Act and all applicable SEC and NYSE rules and regulations. We intend to comply with future requirements to the extent they will be applicable to us. Copies of the charters for each committee are available on the investor relations portion of Rockley’s website.
Audit Committee
HoldCo’s audit committee consists of Dr. Brown, Mr. Blaser, and Mr. Huyett, with Dr. Brown serving as chair. The HoldCo Board affirmatively determined that each director appointed to the audit committee qualifies as independent under the NYSE listing rules applicable to board members generally and under the NYSE listing rules and Exchange Act Rule
10A-3
with respect to audit committee members. All members of HoldCo’s audit committee meet the requirements for financial literacy under the applicable NYSE listing rules. Dr. Brown currently serves on the audit committees of three public companies listed on the London public stock exchange. In accordance with NYSE Rule 303A.07, the Board has determined that such simultaneous service does not impair the ability of Dr. Brown to effectively serve as the chair of the audit committee. In addition, the Board has determined that Dr. Brown qualifies as an “audit committee financial expert,” as such term is defined in Item 407(d)(5) of RegulationS-K.
The audit committee’s responsibilities include, among other things:| • | appointing, compensating, retaining, evaluating, terminating, and overseeing HoldCo’s independent registered public accounting firm; |
| • | discussing with HoldCo’s independent registered public accounting firm their independence from management; |
| • | reviewing with HoldCo’s independent registered public accounting firm the scope and results of their audit; |
| • | approving all audit and permissible non-audit services to be performed by HoldCo’s independent registered public accounting firm; |
| • | overseeing the financial reporting process and discussing with management and HoldCo’s independent registered public accounting firm the interim and annual financial statements that HoldCo will file with the SEC; |
| • | reviewing and monitoring HoldCo’s accounting principles, accounting policies, financial and accounting controls, and compliance with legal and regulatory requirements; and |
| • | establishing procedures for the confidential anonymous submission of concerns regarding questionable accounting, internal controls, or auditing matters. |
Nominating and Corporate Governance Committee
HoldCo’s nominating and corporate governance committee consists of Dr. Brown, Ms. Klein, and Ms. Puryear. Ms. Klein serves as chair of the nominating and corporate governance committee. In accordance
118
with the NYSE listing rules and SEC rules, HoldCo’s nominating and corporate governance committee consists solely of independent directors. The corporate governance committee’s responsibilities include:
| • | identifying, screening, and reviewing individuals qualified to serve as directors and recommending to the board of directors candidates for nomination for election at the annual meeting of shareholders or to fill vacancies on the board of directors; |
| • | developing, recommending to the board of directors, and overseeing implementation of HoldCo’s corporate governance guidelines; |
| • | coordinating and overseeing the annual self-evaluation of the board of directors, its committees, individual directors, and management in the governance of the Company; and |
| • | reviewing on a regular basis our overall corporate governance and recommending improvements as and when necessary. |
HoldCo’s nominating and corporate governance committee will recommend to the Board candidates for nomination for election at the annual meeting of the shareholders. In identifying and evaluating potential candidates, HoldCo’s nominating and corporate governance committee will consider several factors, including, without limitation, high personal and professional integrity, strong ethics and values, the ability to make mature business judgments, experience in corporate management such as serving as an officer or former officer of a publicly held company, experience as a board member of another publicly held company, professional and academic experience relevant to our business, leadership skills, experience in finance and accounting, or executive compensation practices, whether candidate has the time required for preparation, participation and attendance at board of directors meetings and committee meetings, if applicable, independence, and the ability to represent the best interests of HoldCo’s shareholders. See “Director Nominations.”
Compensation Committee
HoldCo’s compensation committee consists of Mr. Huyett, Ms. Klein, and Dr. Puryear. Dr. Puryear serves as chair of the compensation committee. In accordance with the NYSE listing rules and SEC rules, HoldCo’s compensation committee consists solely of independent directors.
The compensation committee’s responsibilities include, without limitation:
| • | reviewing and approving on an annual basis the corporate goals and objectives relevant to HoldCo’s chief executive officer’s compensation, evaluating HoldCo’s chief executive officer’s performance in light of such goals and objectives, and determining and approving the remuneration (if any) of HoldCo’s chief executive officer based on such evaluation; |
| • | reviewing and approving on an annual basis the compensation of all of HoldCo’s other officers; |
| • | reviewing on an annual basis HoldCo’s executive compensation policies and plans; |
| • | implementing and administering HoldCo’s incentive compensation equity-based remuneration plans; |
| • | assisting management in complying with HoldCo’s proxy statement and annual report disclosure requirements; |
| • | approving all special perquisites, special cash payments, and other special compensation and benefit arrangements for HoldCo’s officers and employees; |
| • | if required, producing a report on executive compensation to be included in HoldCo’s annual proxy statement; and |
| • | reviewing, evaluating, and recommending changes, if appropriate, to the remuneration for directors. |
119
The charter also provides that the compensation committee may, in its sole discretion, retain or obtain the advice of a compensation consultant, legal counsel, or other adviser and will be directly responsible for the appointment, compensation, and oversight of the work of any such adviser. However, before engaging or receiving advice from a compensation consultant, external legal counsel, or any other adviser, the compensation committee will consider the independence of each such adviser, including the factors required by the NYSE and the SEC.
Compensation Committee Interlocks and Insider Participation
None of the members of our compensation committee has ever been an executive officer or employee of Rockley. None of our executive officers currently serve, or has served during the last completed fiscal year, on the compensation committee or board of directors of any other entity that has one or more executive officers that serves as a member of the Board or our compensation committee.
Code of Business Conduct and Ethics and Code of Ethics for Senior Financial Officers
The Board adopted a Code of Business Conduct and Ethics (the “Code of Conduct”) applicable to all of our employees, executive officers and directors. The Board also adopted a Code of Ethics for Senior Financial Officers (the “Code of Ethics”) applicable to our principal executive officer, principal financial officer, principal accounting officer or controller or person performing similar functions identified by the Board, and other key management employees. The Code of Conduct is available on Rockley’s website at www.rockleyphotonics.com. Information contained on or accessible through Rockley’s website is not a part of this registration statement, and the inclusion of Rockley’s website address in this registration statement is an inactive textual reference only. The audit committee of the Board is responsible for overseeing the Code of Conduct and the Code of Ethics and must approve any waivers of the Code of Conduct for employees, executive officers and directors and the Code of Ethics for senior financial officers. We expect that any amendments to the Code of Conduct and Code of Ethics, or any waivers of their requirements, will be disclosed on our website.
Director Compensation
2020 Director Compensation
The table below summarizes the compensation of each person serving as a
non-employee
director of Rockley UK in 2020.Name | Fees Earned or Paid in Cash ($) | Option Awards ($) (1) | All other Compensation ($) | Total ($) | ||||||||||||
Caroline Brown (2) | 50,000 | 40,063 | — | 90,063 | ||||||||||||
Markku Hirvonen (4) | 47,500 | 40,063 | (3) | 103,509 | (5) | 191,072 | ||||||||||
Robert Rickman | 40,000 | 40,063 | — | 80,063 | ||||||||||||
Sunit Rikhi | 40,000 | 40,063 | (3) | 20,247 | (6) | 100,310 | ||||||||||
John Burgess | 12,500 | (7) | — | 33,764 | (8) | 46,264 | ||||||||||
Andy Parker | — | — | — | — | ||||||||||||
Jianquiang Ma | — | — | — | — | ||||||||||||
| (1) | The amount in this column represents the aggregate grant date fair value of options granted to each of Rockley’s directors, computed in accordance with the FASB ASC Topic 718. See Note 11 to Rockley’s audited consolidated financial statements included elsewhere in this prospectus for a discussion of the assumptions Rockley made in determining the grant date fair value of Rockley’s equity awards. |
| (2) | Dr. Brown served as the Audit Committee Chair in 2020 and therefore received $10,000 in additional compensation. |
| (3) | Mr. Hirvonen and Mr. Rikhi entered into consulting agreements in connection with their resignation from the board of Rockley pursuant to which, among other terms, their options continue to vest after the consummation of the Business Combination. |
120
| (4) | Mr. Hirvonen served as the Compensation Committee Chair from April 1, 2020 through December 31, 2020 and therefore received $7,500 in additional compensation. |
| (5) | Paid in connection with Mr. Hirvonen’s consultancy services to Rockley. |
| (6) | Paid in connection with Mr. Rikhi’s consultancy services to Rockley. |
| (7) | Mr. Burgess resigned as a director and the Compensation Committee Chair on March 31, 2020 and therefore received only a prorated portion of any associated director fees. |
| (8) | Paid in connection with Mr. Burgess’ consultancy services to Rockley. |
The following table summarizes equity awards outstanding on December 31, 2020 for each
non-employee
director of Rockley UK:Name | Option Awards (#) | |||
Caroline Brown | 25,000 | |||
Markku Hirvonen | 168,490 | (1) | ||
Robert Rickman | 18,750 | |||
Sunit Rikhi | 72,500 | |||
John Burgess | 169,650 | |||
| (1) | Representing options to purchase 93,620 ordinary shares held personally by Mr. Hirvonen and options to purchase 74,870 ordinary shares held by Hirvonenventures OY. |
Rockley UK’s policy was to reimburse directors for reasonable and necessaryexpenses incurred in attending board and committee meetings or performing other services in their capacities as directors. Rockley UK did not provide tax
out-of-pocket
gross-up
payments to members of the Board.Non-Employee
Director Compensation PolicyThe Company’s policy is to reimburse directors for reasonable and necessaryexpenses incurred in connection with attending Board and committee meetings or performing other services in their capacities as directors. The Company does not provide tax
out-of-pocket
gross-up
payments to members of the Board. Effective upon the Closing, the Board approved anon-employee
director compensation policy (the “Director Compensation Program”), consisting of annual retainer fees and long-term equity awards for HoldCo’snon-employee
directors.Under the Director Compensation Program and in connection with the Closing, HoldCo will grant RSUs to each
non-employee
director (each an “Initial RSU Award”) under the 2021 Plan covering HoldCo ordinary shares with an aggregate fair market value of $220,000 determined at the date of grant or, fornon-employee
directors who joined the HoldCo board prior to the date, such RSUs may be issued under applicable U.S. securities laws, the later of the date suchnon-employee
director joined the HoldCo board of directors or the Closing. Each Initial RSU Award vests as to 1/3 of the total number of shares subject to the award on the earlier of the first anniversary of the date of grant or the next annual meeting of HoldCo’s shareholders, and in each of the next two calendar years following the year of the initial vesting date, 1/3 of the total number of shares will vest on the earlier of theone-year
anniversary of the prior annual meeting of shareholders or the current year annual meeting of shareholders. Each Initial RSU Award will become 100% vested if a change in control as defined in the 2021 Plan occurs during such director’s service.In addition, under the Director Compensation Program, following the conclusion of each regular annual meeting of HoldCo’s shareholders, commencing with the 2022 annual meeting, each
non-employee
director who will continue serving as a member of the HoldCo Board thereafter will receive a grant of RSUs (each an “Annual RSU Award”) under the 2021 Plan covering HoldCo ordinary shares with an aggregate grant date fair market value of $162,000. In addition, if anon-employee
director is elected to the HoldCo Board other than at an annual meeting of shareholders after the 2022 annual meeting of shareholders and thenon-employee
director will121
receive an Annual RSU Award upon election to HoldCo’s board of directors that is prorated based upon the number of calendar days remaining before (1) the next annual meeting of shareholders, if scheduled, or (2) the date of the first anniversary of the last annual meeting of shareholders, if the next annual meeting is not yet scheduled.
Each Annual RSU Award will become fully vested, subject to the applicable
non-employee
director’s continued service as a director, on the earliest of theone-year
anniversary of the date of grant, the next annual meeting of shareholders following the date of grant or the consummation of a change in control as defined in the 2021 plan.The Director Compensation Program also consists of the following cash components:
| • | Annual Retainer for all non-employee directors: $45,000 |
| • | Lead Director Retainer: $23,000 |
| • | Annual Committee Chair Retainer: |
| • | Audit: $20,000 |
| • | Nominating and Corporate Governance $10,000 |
| • | Compensation: $15,000 |
| • | Annual Committee Member (Non-Chair) Retainer: |
| • | Audit: $10,000 |
| • | Nominating and Corporate Governance: $5,000 |
| • | Compensation: $7,500 |
The annual cash retainer will be paid in quarterly installments in arrears following the end of each quarter in which the service occurred,
pro-rated
for any partial months of service.Non-Employee
Director Share Ownership PolicyIn connection with the closing of the Business Combination, HoldCo adopted a share ownership policy (the “Share Ownership Policy”) for its
non-employee
directors to further align the personal interests of such directors with the interests of HoldCo.Under the Share Ownership Policy, each
non-employee
director is expected to acquire, and continue to hold during the term or his or her service on HoldCo’s board of directors, ownership of HoldCo ordinary shares having a value equal to four times the annual cash retainer paid by HoldCo to itsnon-employee
directors. For this purpose, shares are considered owned by anon-employee
director which are directly owned by such director or subject to vested RSUs.Non-employee
directors are required to hold 100% of the shares acquired through any of HoldCo’s equity incentive plans (net of the number applied to pay applicable taxes) until the Share Ownership Policy is satisfied.Director Nominations
Our nominating and corporate governance committee recommends to the Board candidates for nomination for election at the annual meeting of the shareholders. We have not formally established any specific, minimum qualifications that must be met or skills that are necessary for directors to possess. In general, in identifying and evaluating nominees for director, the Board of directors considers several factors, including, without limitation, high personal and professional integrity, strong ethics and values, the ability to make mature business judgments, experience in corporate management such as serving as an officer or former officer of a
122
publicly held company, experience as a board member of another publicly held company, professional and academic experience relevant to our business, leadership skills, experience in finance and accounting, or executive compensation practices, whether candidate has the time required for preparation, participation and attendance at board of directors meetings and committee meetings, if applicable, independence, and the ability to represent the best interests of HoldCo’s shareholders. See “Board Committees—Nominating and Corporate Governance Committee.”
123
EXECUTIVE COMPENSATION
Throughout this section, unless otherwise noted, “we,” “us,” “our,” and similar terms refer to Rockley (which includes its subsidiaries) prior to the closing of the Business Combination, and to HoldCo (which includes its subsidiaries) after the closing of the Business Combination.
This section discusses the material components of the executive compensation program for Rockley’s executive officers who are named in the “2020 Summary Compensation Table” below. For 2020, the “named executive officers” and their positions with Rockley were as follows:
| • | Andrew Rickman, OBE, Chief Executive Officer; |
| • | Mahesh Karanth, Chief Financial Officer; and |
| • | Amit Nagra, Ph.D., Chief Operating Officer. |
Following the Closing, Dr. Rickman serves as chief executive officer. Mr. Karanth serves as chief financial officer, and Dr. Nagra serves as chief operating officer, in each case, of HoldCo.
2020 Summary Compensation Table
The following table sets forth information concerning the compensation of the named executive officers of Rockley for the year ended December 31, 2020.
Name and Principal Position | Salary ($) | Option Awards ($) (1) | Nonequity Incentive Plan Compensation ($) (2) | All other Compensation ($) (4) | Total ($) | |||||||||||||||
Andrew Rickman, OBE | 366,200 | 165,275 | 10,679 | 542,154 | ||||||||||||||||
Chief Executive Officer | ||||||||||||||||||||
Mahesh Karanth | 300,012 | 586,814 | 138,006 | 3,072 | 1,027,904 | |||||||||||||||
Chief Financial Officer | ||||||||||||||||||||
Amit Nagra, Ph.D. | 337,851 | 311,494 | (3) | 3,081 | 652,426 | |||||||||||||||
Chief Operating Officer | ||||||||||||||||||||
| (1) | The amount in this column represents the aggregate grant date fair value of awards granted to each named executive officer, computed in accordance with the Financial Accounting Standards Board’s (“FASB”) Accounting Standards Codification (“ASC”) Topic 718. See Note 11 to Rockley’s audited consolidated financial statements included elsewhere in this prospectus for a discussion of the assumptions Rockley made in determining the grant date fair value of Rockley’s equity awards. |
| (2) | The amount in this column represents annual bonuses earned by each named executive officer in 2020 and to be paid in cash in 2021, based on the attainment of individual and company performance metrics as determined by the board of directors of Rockley in its discretion. |
| (3) | The annual target bonus reflected above includes $186,494 earned in 2020 and paid in 2021. There was a one-time cash bonus payment of $125,000, paid in 2020, pursuant to Dr. Nagra’s employment agreement amendment dated November 15, 2019. |
| (4) | Amounts in this column include the amounts set forth in the table below: |
Name Executive Officer | Employer Retirement Contributions ($) | AD&D Premium ($) | ||||||
Andrew Rickman, OBE | 10,679 | — | ||||||
Mahesh Karanth | 3,000 | 72 | ||||||
Amit Nagra, Ph.D. | 3,000 | 81 | ||||||
124
Narrative to the Summary Compensation Table
2020 Salaries
In 2020, each of the named executive officers of Rockley received an annual base salary to compensate them for services rendered to Rockley. The base salary payable to each named executive officer was intended to provide a fixed component of compensation reflecting such executive’s skill set, experience, role, and responsibilities.
2020 Bonus
In 2020, Dr. Rickman, Mr. Karanth, and Dr. Nagra were eligible to earn annual cash bonuses targeted at 50%, 50%, and 60% of their respective base salaries. Each named executive officer was eligible to earn his bonus based on the attainment of company and individual performance metrics, as determined by the board of directors of Rockley, in its discretion. The actual annual cash bonuses awarded to each named executive officer for 2020 performance are set forth above in the 2020 Summary Compensation Table in the column titled “Nonequity Incentive Plan Compensation.”
Equity Compensation
The 2013 Plan was adopted by Rockley’s board of directors, and approved by its shareholders, on November 12, 2013. The 2013 Plan has been amended since that date, with the most recent amendment adopted by Rockley’s board of directors on November 18, 2020 and approved by its shareholders on December 4, 2020. Rockley’s board of directors or the remuneration committee thereof administers the 2013 Plan and any awards granted thereunder.
Options granted pursuant to the 2013 Plan to eligible service providers, including executive officers, have an exercise price that Rockley’s board of directors determined is not less than the fair market value of the underlying shares on the date of grant. Options generally vest and become exercisable over a four-year period, often with a 25% cliff vest at the first anniversary of the vesting commencement date, subject to the option holder’s continued service with Rockley. Options generally expire ten years from the date of grant.
Shareholders approved the 2021 Plan in connection with the approval of the Business Combination. As a result of the 2021 Plan becoming effective, no new awards will be granted under the 2013 Plan.
Other Elements of Compensation
Retirement Plans
In 2020, Dr. Rickman participated in the Rockley U.K. pension (“U.K. Pension”) and Mr. Karanth and Dr. Nagra participated in the ADP TotalSource Retirement Savings Plan, a multiple employer defined contribution plan in which Rockley participates (“401(k) Plan”). The U.K. Pension and the 401(k) Plan are designed to take advantage of certain provisions of Her Majesty’s Revenue and Customs (“HRMC”) and the Internal Revenue Code, respectively, which allow eligible employees to defer a portion of their compensation, within prescribed limits, on a
pre-tax
basis to the U.K. Pension or the 401(k) Plan, as applicable. In 2020, contributions made by participants in the U.K. Pension and the 401(k) Plan were matched up to a specified percentage of the employee contributions on behalf of the named executive officers. These matching contributions are fully vested as of the date on which the contribution is made. Rockley anticipates that, following the closing of the Business Combination, its named executive officers will continue to participate in these retirement plans on the same terms as other full-time employees.Employee Benefits and Perquisites
Health
& Welfare Benefit Plans.
| • | medical, dental, and vision benefits; |
125
| • | medical and dependent care flexible spending accounts; |
| • | short-term and long-term disability insurance; |
| • | life insurance; and |
| • | paid time off and paid holidays. |
No Tax
Gross-Ups
In 2020, Rockley did not make
gross-up
payments to cover the named executive officers’ personal income taxes that may pertain to any of the compensation or perquisites paid or provided by Rockley.Outstanding Equity Awards at 2020 Fiscal
Year-End
Option Awards | ||||||||||||||||||||
Name | Grant Date | Number of Securities Underlying Unexercised Options Exercisable (#) | Number of Securities Underlying Unexercised Options Unexercisable (#) | Options Exercise Price ($) | Options Expiration Date | |||||||||||||||
Andrew Rickman, OBE | — | — | — | — | — | |||||||||||||||
Mahesh Karanth | 12/22/17 | (1) | 303,750 | 101,250 | 5.363 | 12/21/27 | ||||||||||||||
| 10/05/20 | (2) | 4,218 | 97,032 | 7.722 | 06/28/30 | |||||||||||||||
Amit Nagra, Ph.D. | 05/20/15 | (3) | 712,230 | — | 1.331 | 05/19/26 | ||||||||||||||
| (1) | Option vests monthly over a 48-month period, with 25% vesting on December 20, 2018 and the remaining portion vesting in 36 equal monthly installments thereafter. All unvested options will vest in the event of a Change in Control or Sale of Assets, each as defined in the 2013 Plan. |
| (2) | Option vests monthly over a 48-month period following the grant date. All unvested options will vest in the event of a Change in Control or Sale of Assets, each as defined in the 2013 Plan. |
| (3) | Options vest monthly over a 48-month period, with 25% vesting on first anniversary of the grant date and the remaining portion vesting in 36 equal monthly installments thereafter. All unvested options will vest in the event of a Change in Control or Sale of Assets, each as defined in the 2013 Plan. |
Employment Agreements
Effective as of August 11, 2021, HoldCo entered into amended employment agreements with the following executive officers, which agreements superseded and restated each named executive officer’s prior employment and compensation arrangements. In connection with such agreements, each executive officer waived any entitlement to accelerated vesting under the terms of their respective option award agreements with respect to the Business Combination.
Andrew Rickman, OBE
HoldCo entered into an amended employment agreement with Dr. Rickman, pursuant to which Dr. Rickman will serve as the chief executive officer of HoldCo and will report directly to the board of directors of HoldCo. Dr. Rickman’s employment with HoldCo will continue until terminated in accordance with its terms.
Under the amended employment agreement, among other terms, Dr. Rickman is entitled to receive an initial annual base salary of $500,000, which will be subject to increase at the discretion of the board of directors of HoldCo or the Compensation Committee thereof and to be eligible to receive an annual performance bonus targeted at 100% of Dr. Rickman’s then current annual base salary. The actual amount of any such bonus will be determined by reference to the attainment of applicable HoldCo and/or individual performance objectives, as determined by the board of directors of HoldCo or the Compensation Committee.
126
Dr. Rickman will also be eligible to participate in the customary health, welfare, and fringe benefit plans provided by HoldCo to its employees.
In addition, HoldCo entered into a side letter pursuant to which Dr. Rickman will be eligible to receive equity awards with a fair value of $5.0 million, determined at HoldCo’s board of directors’ discretion either on the date of grant or on the Closing, and weighted equally between (i) stock options to purchase HoldCo ordinary shares at a price equal to such stock’s fair market value at grant and (ii) restricted stock units (“RSUs”), in each case under the 2021 Plan. Both Dr. Rickman’s stock options and his RSUs would be subject to ratable vesting over 4 years beginning on the closing of the Business Combination, subject to acceleration upon involuntary termination in connection with a change in control, as defined in the 2021 Plan. Upon the Closing, Dr. Rickman received the above referenced stock options, which stock options will become exercisable (to the extent vested) only after the shares underlying such options are registered on an applicable Form
S-8
registration statement and will not be exercisable before such date.Under his amended employment agreement, HoldCo must provide Dr. Rickman at least 12 months’ notice, or pay in lieu of notice, prior to any termination of his employment unless that termination is for “cause” (as defined under his amended employment agreement). Dr. Rickman must provide HoldCo with at least 12 months’ notice prior to his resignation, unless HoldCo reasonably determines that such resignation is for “good reason” (as defined in his amended employment agreement).
If Dr. Rickman’s employment is terminated by HoldCo without “cause,” or by Dr. Rickman for “good reason,” subject to his execution and
non-revocation
of a release of claims and continued compliance with his confidentiality andnon-solicitation
requirements, then, in addition to any accrued amounts, Dr. Rickman will be entitled to receive the following severance payments and benefits: (i) an amount equal to the sum of (a) his annual base salary then in effect and (b) 100% of his target annual bonus amount, payable in equal instalments over one year and reduced by any basic salary paid in lieu of notice; and (ii) continuation of all benefits for a period of 12 months.The amended employment agreement contains
non-competition
andnon-solicitation
and confidentiality provisions which, among other restrictions, and except in the case of an involuntary termination, restrict Dr. Rickman’s ability to be engaged or employed by, undertake duties for or be otherwise interested in HoldCo’s competitors, customers or suppliers, for a period of 12 months following his termination (reduced by any portion of Dr. Rickman’spre-termination
notice period during which time he is not providing services, or “garden leave”).Mahesh Karanth
HoldCo entered into an amended employment agreement with Mr. Karanth, pursuant to which Mr. Karanth will serve as the chief financial officer of HoldCo and will report directly to HoldCo’s chief executive officer. Mr. Karanth’s service pursuant to the amended employment agreement will continue until terminated in accordance with its terms. Under the amended employment agreement, Mr. Karanth will receive an initial annual base salary of $450,000, which will be subject to increase at the discretion of the board of directors of HoldCo or the Compensation Committee thereof and will be eligible to receive an annual performance bonus targeted at 60% of Mr. Karanth’s then-current annual base salary. The actual amount of any such bonus will be determined by reference to the attainment of applicable company and/or individual performance objectives, as determined by the board of directors of HoldCo or the Compensation Committee thereof.
Pursuant to his amended employment agreement, Mr. Karanth will also be eligible to participate in the customary health, welfare, and fringe benefit plans provided by HoldCo to its employees.
In addition, pursuant his amended employment agreement, Mr. Karanth will be eligible to receive equity awards with a fair value of $2.0 million, determined at HoldCo’s board of director’s discretion either on
127
the date of grant or on the Closing, and weighted equally between (i) stock options to purchase HoldCo ordinary shares at a price equal to such stock’s fair market value at grant and (ii) RSUs, in each case under the 2021 Plan. Both Mr. Karanth’s stock options and his RSUs would be subject to ratable vesting over 4 years beginning on the closing of the Business Combination, subject to acceleration upon involuntary termination in connection with a change in control, as defined in the 2021 Plan. Upon the Closing, Mr. Karanth received the above referenced stock options, which stock options will become exercisable (to the extent vested) only after the shares underlying such options are registered on an applicable Form
S-8
registration statement and will not be exercisable before such date.If Mr. Karanth’s employment is terminated by HoldCo without “cause,” or by Mr. Karanth for “good reason” (each, as defined in his amended employment agreement), subject to his execution and
non-revocation
of a general release of claims in our favor and continued compliance with customary confidentiality andnon-solicitation
requirements, then, in addition to any accrued amounts, Mr. Karanth will be entitled to receive the following severance payments and benefits: (i) an amount equal to the sum of (a) 6 months of his annual base salary then in effect and (b) 50% of his target annual bonus amount, payable in equal installments over six months; and (ii) payment of premiums for continued healthcare coverage under the Consolidated Omnibus Budget Reconciliation Act of 1985 (“COBRA”) for up to 6 months after the termination date.The amended employment agreement contains customary confidentiality and
non-solicitation
provisions, and also includes a “best pay” provision under Section 280G of the Code, pursuant to which any “parachute payments” that become payable to Mr. Karanth will either be paid in full or reduced so that such payments are not subject to the excise tax under Section 4999 of the Code, whichever results in the betterafter-tax
treatment to Mr. Karanth.Amit Nagra, Ph.D.
HoldCo entered into an amended employment agreement with Dr. Nagra, pursuant to which Dr. Nagra will serve as the chief operating officer of HoldCo and will report directly to HoldCo’s chief executive officer. Dr. Nagra’s service pursuant to the amended employment agreement will continue until terminated in accordance with its terms. Under the amended employment agreement, Dr. Nagra will receive an initial annual base salary of $450,000, which will be subject to increase at the discretion of the board of directors or the Compensation Committee thereof and will be eligible to receive an annual performance bonus targeted at 60% of Dr. Nagra’s then-current annual base salary. The actual amount of any such bonus will be determined by reference to the attainment of applicable company and/or individual performance objectives, as determined by the board of directors of HoldCo or the Compensation Committee thereof.
Pursuant to the amended employment agreement, Dr. Nagra will also be eligible to participate in the customary health, welfare, and fringe benefit plans, provided by HoldCo to its employees.
In addition, pursuant to his amended employment agreement, Dr. Nagra will be eligible receive equity awards with a fair value of $1.5 million, determined at the HoldCo’s board of director’s discretion either on the date of grant or on the closing of the business combination, and weighted equally between (i) stock options to purchase HoldCo ordinary shares at a price equal to such stock’s fair market value at grant and (ii) RSUs, in each case under the 2021 Plan. Both Dr. Nagra’s stock options and his RSUs would be subject to ratable vesting over 4 years beginning on the closing of the Business Combination, subject to acceleration upon involuntary termination in connection with a change in control, as defined in the 2021 Plan. Upon the Closing, Dr. Nagra received the above referenced stock options, which stock options will become exercisable (to the extent vested) only after the shares underlying such options are registered on an applicable Form
S-8
registration statement and will not be exercisable before such date.If Dr. Nagra’s employment is terminated by HoldCo without “cause,” or by Dr. Nagra for “good reason” (each, as defined in his amended employment agreement), subject to his execution and
non-revocation
of128
a general release of claims in our favor, then, in addition to any accrued amounts, Dr. Nagra will be entitled to receive the following severance payments and benefits: (i) an amount equal to the sum of (a) six months of his annual base salary then in effect and (b) 50% of his target annual bonus amount, payable in equal installments over six months; and (ii) payments of premiums for continued healthcare coverage under COBRA for up to six months after the termination date.
The amended employment agreement contains customary confidentiality and
non-solicitation
provisions, and also includes a “best pay” provision under Section 280G of the Code, pursuant to which any “parachute payments” that become payable to Dr. Nagra will either be paid in full or reduced so that such payments are not subject to the excise tax under Section 4999 of the Code, whichever results in the betterafter-tax
treatment to Dr. Nagra.2021 Stock Incentive Plan
Prior to the Closing, HoldCo adopted the Rockley Photonics Holdings Limited 2021 Stock Incentive Plan of Rockley (the “2021 Plan”) that was considered and approved by SC Health shareholders at the extraordinary general meeting of the SC Health shareholders held on August 6, 2021, and approved by the shareholders of HoldCo and Rockley UK, to be effective as of and contingent on the Closing. The purpose of the 2021 Plan is to enhance HoldCo’s ability to attract, retain, incentivize, reward, and motivate persons who make (or are expected to make) important contributions by providing these individuals with equity ownership opportunities and/or equity-linked compensatory opportunities.
HoldCo’s employees, consultants and directors, and employees, consultants and directors of its subsidiaries will be eligible to receive awards under the 2021 Plan. The 2021 Plan will be administered by the compensation committee of the HoldCo Board or by the HoldCo Board acting as the compensation committee, each of which may delegate its duties and responsibilities to committees of HoldCo directors and/or officers (referred to collectively as the “plan administrator” below), subject to certain limitations that may be imposed under Section 16 of the Exchange Act, and/or stock exchange rules, as applicable. Subject to the limitations set forth in the 2021 Plan, the compensation committee will have the authority to determine, among other things, to whom awards will be granted, the number of shares subject to awards, the term during which an option or stock appreciation right may be exercised and the rate at which the awards may vest or be earned, including any performance criteria to which they may be subject. The compensation committee also will have the authority to determine the consideration and methodology of payment for awards. To the extent permitted by applicable law, the board of directors or compensation committee may also authorize one or more officers of HoldCo to designate employees, other than officers under Section 16 of the Exchange Act, to receive awards and/or to determine the number of such awards to be received by such persons subject to a maximum total number of awards.
The aggregate number HoldCo ordinary shares on an
as-converted
basis that may be issued pursuant to stock awards after the Closing under the 2021 Plan will not exceed the sum of (x) 7,631,196 shares, plus (y) the sum of the number of shares subject to outstanding awards under the Rockley Photonic Limited 2013 Equity Incentive Plan, as amended (the “2013 Plan”), following the Effective Date that (i) are subsequently forfeited or terminated for any reason before being exercised or settled, (ii) are not issued because such stock award or any portion thereof is settled in cash, (iii) are subject to vesting restrictions and are subsequently forfeited, (iv) are withheld or reacquired to satisfy the exercise, strike or purchase price, or (v) are withheld or reacquired to satisfy a tax withholding obligation, plus (z) the number of shares reserved on anas-converted
basis which, but for their cancellation immediately prior to the Effective Date, were at such time under the 2013 Plan but not issued or subject to outstanding grants under the 2013 Plan. In addition, the share reserve will be subject to an annual increase on the first day of each fiscal year, for a period of not more than 10 years, beginning on January 1, 2022 and ending on (and including) January 1,2031, in an amount equal to the lesser of (i) four percent of the outstanding shares on the last day of the immediately preceding fiscal year or (ii) such lesser amount (including zero) that the compensation committee determines for purposes of the annual increase for that fiscal year.
129
If restricted shares or shares issued upon the exercise of options are forfeited, then such shares will again become available for awards under the 2021 Plan. If stock units, options, or stock appreciation rights are forfeited or terminate for any reason before being exercised or settled, or an award is settled in cash without the delivery of shares to the holder, then the corresponding shares will again become available for awards under the 2021 Plan. Any shares withheld to satisfy the exercise price or tax withholding obligation pursuant to any award of options or stock appreciation rights will again become available for awards under the 2021 Plan. If stock units or stock appreciation rights are settled, then only the number of shares (if any) actually issued in settlement of such stock units or stock appreciation rights will reduce the number of shares available under the 2021 Plan, and the balance (including any shares withheld to cover taxes) will again become available for awards under the 2021 Plan.
Awards granted under the 2021 Plan upon the assumption of, or in substitution for, outstanding equity awards previously granted by an entity in connection with a corporate transaction, such as a merger, combination, consolidation or acquisition of property or shares will not reduce the number of shares authorized for grant under the 2021 Plan. The sum of (i) the grant date fair value for financial reporting purposes of any awards granted during any calendar year under the 2021 Plan to an outside director as compensation for services as an outside director and (ii) any cash fees paid by HoldCo to such outside director during such calendar year for service on HoldCo’s board of directors, may not exceed $750,000 (other than in the calendar year in which the outside director commences service). In addition, initial awards granted under the 2021 Plan to outside directors who are members of the board on the Effective Date or who first join the board in the calendar year of the Effective Date will not be taken into account for purposes of this limitation.
The 2021 Plan provides for the grant of stock options, including incentive stock options (“ISOs”) and
non-qualified
stock options (“NSOs”), restricted share awards, stock unit awards, stock appreciation rights, other stock-based awards, and cash-based awards, and performance-based stock awards, (collectively, “stock awards”). ISOs may be granted only to HoldCo’s employees, including officers, and the employees of HoldCo’s parent or subsidiaries. All other stock awards may be granted to HoldCo’s employees, officers, HoldCo’snon-employee
directors, and consultants and the employees and consultants of HoldCo’s parent, subsidiaries, and affiliates. Certain awards under the 2021 Plan may constitute or provide for a deferral of compensation, subject to Section 409A of the Internal Revenue Code of 1986, as amended (the “Code”), which may impose additional requirements on the terms and conditions of such awards. All awards under the 2021 Plan will be set forth in award agreements, which will detail all terms and conditions of the awards, including any applicable vesting and payment terms and post-termination exercise limitations. Awards, other than cash awards, generally will be settled in HoldCo ordinary shares, but the plan administrator may provide for cash settlement of any award.No award may be granted pursuant to the 2021 Plan after the tenth anniversary of March 31, 2021, the date on which the sole director of HoldCo adopted the 2021 Plan prior to the Closing.
The foregoing description of the 2021 Plan does not purport to be complete and is qualified in its entirety by reference to the text of the 2021 Plan filed as Exhibit 10.5 hereto and incorporated herein by reference.
2021 Employee Stock Purchase Plan
Prior to the Closing, HoldCo adopted the Rockley Photonics Holdings Limited 2021 Employee Stock Purchase Plan (the “ESPP”), effective as of and contingent on the Closing, which plan was approved by the shareholders of HoldCo, Rockley UK, and SC Health. Under the ESPP, HoldCo is authorized to provide eligible employees with an opportunity to request payroll deductions to purchase a number of HoldCo ordinary shares at a discount and in an amount determined in accordance with the ESPP’s terms.
The purpose of the ESPP is to provide a broad-based employee benefit to attract the services of new employees, to retain the services of existing employees, and to provide incentives for such individuals to exert
130
maximum efforts toward our success by purchasing HoldCo ordinary shares from HoldCo on favorable terms and to pay for such purchases through payroll deductions. HoldCo believes by providing eligible employees with an opportunity to increase their proprietary interest in the success of HoldCo, the ESPP will motivate recipients to offer their maximum effort to HoldCo and help focus them on the creation of long-term value consistent with the interests of the HoldCo shareholders.
The ESPP is intended to qualify as an “employee stock purchase plan” under Code Section 423, except as explained below with respect to
non-U.S.
employees. During regularly scheduled “offerings” under the ESPP, participants will be able to request payroll deductions and then expend the accumulated deduction to purchase a number of HoldCo ordinary shares at a discount and in an amount determined in accordance with the ESPP’s terms.The ESPP has 1,526,239 authorized but unissued or reacquired HoldCo ordinary shares reserved for issuance, plus an additional number of shares to be reserved annually on the first day of each fiscal year for a period of not more than ten years, beginning on January 1, 2022, in an amount equal to the least of (i) one percent of the outstanding HoldCo ordinary shares on such date (ii) 7,631,196 shares, or (iii) a lesser amount (including zero) that the compensation committee of the HoldCo board of directors determines for purposes of the annual increase for that fiscal year.
The ESPP is administered by the compensation committee, or by the HoldCo Board acting as the compensation committee. The compensation committee has the authority to construe, interpret and apply the terms of the ESPP, to determine eligibility, to establish such limitations and procedures as it determines are consistent with the ESPP and to adjudicate any disputed claims under the ESPP.
Each employee of HoldCo and any of its participating subsidiaries who is employed by HoldCo (or its participating subsidiaries) on the day preceding the start of any offering period, is eligible to participate in the ESPP. The ESPP requires that any such employee customarily work more than 20 hours per week and more than 5 months per calendar year with HoldCo (or its participating subsidiaries) in order to be eligible to participate in the ESPP. The ESPP will permit an eligible employee to purchase HoldCo ordinary shares through payroll deductions, which may not be less than one percent nor more than fifteen percent of the employee’s compensation, or such lower limit as may be determined by the Compensation Committee from time to time. However, no employee is eligible to participate in the ESPP if, immediately after electing to participate, the employee would own stock (including stock such employee may purchase under this plan or other outstanding options) representing five percent or more of the total combined voting power or value of all classes of HoldCo’s stock. No employee will be able to purchase more than 5,000 shares, or such number of shares as may be determined by the Compensation Committee with respect to a single offering period, or purchase period, if applicable. In addition, no employee is permitted to accrue, under the ESPP and all similar purchase plans of HoldCo or its subsidiaries, a right to purchase stock of the HoldCo having a value in excess of $25,000 of the fair market value of such stock (determined at the time the right is granted) for each calendar year. Employees will be able to withdraw their accumulated payroll deductions prior to the end of the offering period in accordance with the terms of the offering. Participation in the ESPP will end automatically on termination of employment.
The ESPP is implemented through a series of offerings of purchase rights to eligible employees. Under the ESPP, the compensation committee may specify offerings with a duration of not more than 27 months and may specify shorter purchase periods within each offering. During each purchase period, payroll deductions will accumulate, without interest. On the last day of the purchase period, accumulated payroll deductions will be used to purchase HoldCo ordinary shares for employees participating in the offering.
The purchase price will be specified pursuant to the offering, but cannot, under the terms of the ESPP, be less than 85% of the fair market value per HoldCo ordinary share on either the offering date or on the purchase date, whichever is less. The fair market value of HoldCo ordinary shares for this purpose will generally be the closing price on the NYSE (or such other exchange as the HoldCo ordinary shares may be traded at the
131
relevant time) for the date in question, or if such date is not a trading day, for the last trading day before the date in question.
The compensation committee may specify that, if the fair market value of HoldCo ordinary shares on any purchase date within a particular offering period is less than or equal to the fair market value on the start date of that offering period, then the offering period will automatically terminate and the employee in that offering period will automatically be transferred and enrolled in a new offering period which will begin on the next day following such purchase date.
To provide HoldCo with greater flexibility in structuring HoldCo’s equity compensation programs for HoldCo’s
non-U.S.
employees, the ESPP also permits HoldCo to grant employees of HoldCo’snon-U.S.
subsidiary entities rights to purchase HoldCo ordinary shares pursuant to other offering rules orsub-plans
adopted by the compensation committee in order to achieve tax, securities law, or other compliance objectives. The internationalsub-plans
or offerings are subject to the ESPP terms limiting the overall shares available for issuance, the maximum payroll deduction rate, maximum purchase price discount and maximum offering period length.The foregoing description of the ESPP does not purport to be complete and is qualified in its entirety by reference to the text of the ESPP filed as Exhibit 10.7 hereto and incorporated herein by reference.
132
CERTAIN RELATIONSHIPS AND RELATED PARTY TRANSACTIONS
The following includes a summary of transactions since January 1, 2020 to which we have been a party, in which the amount involved in the transaction exceeded $120,000, and in which any of our directors, executive officers or, to our knowledge, beneficial owners of more than 5% of our capital stock or any member of the immediate family of any of the foregoing persons had or will have a direct or indirect material interest, other than equity and other compensation, termination, change of control, and other arrangements, which are described under the section entitled “Executive Compensation.”
SC Health Corporation
Founder Shares
On December 28, 2018, the Sponsor paid $25,000, or approximately $0.006 per share, to cover certain of SC Health’s offering costs relating to the initial public offering in exchange for 3,450,000 Founder Shares. On February 8, 2019, SC Health effected a share capital
sub-division
(in respect of the Founder Shares) so that there were 4,312,500 Founder Shares outstanding. The Sponsor surrendered 562,500 Founder Shares to SC Health for no consideration in connection with the underwriters’ election to not exercise the overallotment option relating to the initial public offering at the end of the45-day
option period.In connection with the Business Combination, each of the 5,562,500 Founder Shares converted into one HoldCo ordinary share.
Private Placement Warrants
The Sponsor purchased an aggregate of 5,000,000 private placement warrants, each exercisable to purchase one SC Health Class A Ordinary Share at $11.50 per share, at a price of $1.00 per SC Health warrant, or $5,000,000 in the aggregate, in connection with the initial public offering. The private placement warrants are identical to the warrants sold in the initial public offering except that the private placement warrants, so long as they are held by the Sponsor or its permitted transferees, (i) are not be redeemable by SC Health, (ii) may not (including the SC Health Class A Ordinary Shares issuable upon exercise of these warrants), subject to certain limited exceptions, be transferred, assigned or sold by the holders until 30 days after the completion of SC Health’s initial business combination, (iii) may be exercised by the holders on a cashless basis and (iv) are entitled to registration rights. On August 2, 2019, SC Health consummated the closing of the sale of 2,250,000 additional SC Health units at the price of $10.00 per unit upon receiving the underwriters’ election to fully exercise their over-allotment option, generating additional gross proceeds of $22,500,000 to SC Health. Simultaneously with the exercise of the over-allotment, SC Health completed the private sale of an additional 450,000 SC Health private placement warrants to the Sponsor, generating gross proceeds to SC Health of $450,000.
In connection with the Business Combination, each of the 5,450,000 SC Health private placement warrants converted automatically into one HoldCo warrant to purchase one HoldCo ordinary share pursuant to the HoldCo Warrant Agreement.
PIPE Subscription Agreements
Concurrently with the execution of the Business Combination Agreement, SC Health and HoldCo entered into subscription agreements with certain investors, including, among others, entities affiliated with the Sponsor (the “Sponsor Related PIPE Investors”). Pursuant to the subscription agreements, each investor agreed to subscribe for and purchase, and HoldCo agreed to issue and sell, an aggregate of 14,790,000 HoldCo ordinary shares, at $10.00 per share, for an aggregate commitment amount of $147,900,000, which financing was completed in connection with the Closing.
133
Previously, SC Health had entered into a forward purchase agreement with one of the Sponsor Related PIPE Investor which provided for the purchase by such Sponsor Related PIPE Investor of an aggregate of 5,000,000 SC Health Class A Ordinary Shares, plus an aggregate of 1,250,000 redeemable warrants to purchase one SC Health Class A Ordinary Share at $11.50 per share, for an aggregate purchase price of $50,000,000, or $10.00 per SC Health Class A Ordinary Share and accompanying fraction of a warrant in a private placement to close concurrently with the closing of its initial business combination. Effective as of May 20, 2021, SC Health Corp and SC Health Group Limited terminated the forward purchase agreement as part of the Business Combination.
The Sponsor Related PIPE Investors instead entered into the subscription agreement referenced above and, pursuant to that agreement, agreed to purchase an aggregate of $50,000,000 shares in HoldCo. Entities affiliated with the Sponsor (the “Sponsor Borrower”) entered into financing arrangements with unrelated third parties to facilitate the financing of the Sponsor Borrower’s purchase in the PIPE financing in exchange for the transfer of, and a security interest in, the HoldCo ordinary shares (including shares to be purchased in the PIPE financing) and HoldCo warrants held by the Sponsor Borrower.
Also concurrently with the execution of the Business Combination Agreement, SC Health and HoldCo entered into subscription agreements with three individuals pursuant to which HoldCo agreed to issue and sell an aggregate of 210,000 HoldCo ordinary shares, at $10.00 per share, for an aggregate commitment amount of $2,100,000, which financing was completed in connection with the Closing. These three individuals are existing shareholders of Rockley UK.
The issuance and sale of HoldCo ordinary shares pursuant to the subscription agreements was consummated substantially concurrently with the Closing.
Registration Rights Agreements
HoldCo, the Sponsor, and the PIPE investors entered into registration rights agreements, pursuant to which HoldCo agreed to register for resale, pursuant to Rule 415 under the Securities Act, certain HoldCo ordinary shares and other equity securities of HoldCo that are held by the parties thereto from time to time.
The registration rights agreements provide that, solely with respect to subscriptions by the shareholders and certain ordinary shares held by the Sponsor-Related Holders and the Rockley
UK-Related
Holders. HoldCo is required to file with the SEC, within 30 days after the closing of the Business Combination (the “Filing Deadline”), a registration statement registering the resale of the HoldCo ordinary shares to be issued to any such investor and to use its commercially reasonable efforts to have such registration statement declared effective as soon as practicable after the filing thereof but no later than the earlier of: (i) the 90th calendar day (or 120th calendar day if the SEC notifies HoldCo that it will “review” such registration statement) following the earlier of (A) the filing of the registration statement and (B) Filing Deadline; and (ii) the 10th business day after the date HoldCo is notified (in writing) by the SEC that such registration statement will not be “reviewed” or will not be subject to further review. However, HoldCo may delay such filing or effectiveness of such registration statement under certain circumstances, including if the Company were required to update the financial statements included in such registration statement in order to comply with RegulationS-X
age of financial statement requirements.The holders affiliated with the Sponsor have agreed, subject to limited exceptions, not to transfer, assign or sell any of their Founder Shares until the earlier of one year after the Closing; provided, however, that if the closing price of HoldCo ordinary shares equals or exceeds $12.00 per share (as adjusted for share splits, share dividends, reorganizations, recapitalizations and the like) for any 20 trading days within any
30-trading
day period commencing at least 150 days after the Closing, the Founder Shares will be released from thelock-up.
Additionally, the Registration Rights and
Lock-Up
Agreement between HoldCo, the Sponsor-Related Holders, and the RockleyUK-Related
Holders generally provides for the Sponsor and other equity investors and134
their Permitted Transferees (as defined in the Registration Rights and
Lock-Up
Agreement), to be subject to transfer restrictions, subject to certain other terms and conditions depending on the price of the HoldCo ordinary shares.Company Holders Support Agreement
Concurrently with the execution of the Business Combination Agreement, SC Health, Rockley, HoldCo, Merger Sub and certain of the shareholders of Rockley entered into the Company Holders Support Agreement, pursuant to which certain shareholders who held a material number of shares in Rockley have agreed to, among other things and subject to certain tax conditions being met: (i) vote in favor of the transactions contemplated by the Business Combination Agreement, any resolutions proposed at the court meeting and general meeting of Rockley shareholders contemplated in the Business Combination Agreement, and take all other necessary and desirable actions reasonably requested by Rockley in connection with the transactions contemplated by the Business Combination Agreement or any ancillary agreement; (ii) vote against certain transactions involving Rockley that would reasonably be expected to, among other things, impede or nullify the transactions contemplated by the Business Combination Agreement, any ancillary agreements or Company Holders Support Agreement, result in a breach of any obligation or agreement of Rockley under the Business Combination Agreement or other related agreement, or result in any of the conditions to obligations of the Business Combination Agreement not being fulfilled; (iii) be bound by certain transfer restrictions with respect to the ordinary shares of Rockley held by the shareholder; and (iv) do all things reasonably necessary, proper or advisable to consummate the transactions contemplated by the Business Combination Agreement and not take any action that would reasonably be expected to prevent or delay the satisfaction of any of the conditions to those transactions.
Dr. Andrew Rickman, OBE (chairman and chief executive officer of Rockley), entered into the AR
Support Agreement which is on the same terms as the Company Holders Support Agreement except that it also includes Dr. Rickman agreeing to vote in favor of the transactions contemplated by the Business Combination Agreement, any resolutions proposed at a general meeting (or by written consent) of the shareholders of HoldCo, and take all other necessary and desirable actions reasonably requested by HoldCo in connection with the transactions contemplated by the Business Combination Agreement or any ancillary agreement.
Rockley
HengtongJV
In 2017, Rockley formed HRT, a joint venture with Hengtong pursuant to the JV Agreement. Under the JV Agreement, HRT must procure chipsets from Rockley for use in finished products and HRT owns the copyright in the final designs. HRT has a license to the underlying intellectual property in the reference designs, including a license to modify and improve. Rockley has certain
non-compete
obligations under the JVAgreement. During the years ended December 31, 2020 and 2019, Rockley made sales to HRT of $5.3 million and $6.7 million, respectively. As of December 31, 2020 and 2019, the balance owed by the joint venture amounted to $3.3 million and $2.9 million, respectively, and is included in accounts receivable in the accompanying balance sheets.
On December 19, 2017, Hengtong participated in Rockley’s Round D financing and entered into a Subscription Agreement whereby Hengtong agreed to purchase, and Rockley agreed to sell, 70,000 ordinary shares for an aggregate purchase price of $6,650,000. On March 22, 2018 Rockley conducted a 10/1 share split resulting in Hengtong owning 700,000 ordinary shares. On March 15, 2019, Hengtong participated in Rockley’s Round E financing, and entered into a further Subscription Agreement whereby Hengtong agreed to purchase, and Rockley agreed to sell, 2,098,195 ordinary shares at a purchase price of $14.298, for an aggregate of $30,000,000.
135
Consultancy Agreements
Rockley engages two affiliate entities of certain of Rockley’s directors for consulting and administrative services, Rockley Ventures Limited and Rockley Management (HK) Limited. For the nine months ended September 30, 2021 and 2020, Rockley incurred $0.4 million and $0.6 million in fees for these services, respectively. For the years ended December 31, 2020 and 2019, Rockley incurred $0.8 million and $1.9 million in fees for these services, respectively. On March 14, 2021, Rockley Photonics, Inc., a subsidiary of Rockley, entered into a consulting agreement with HealthKapital LLC, a California limited liability company wholly owned by Karim Karti, a director of HoldCo. Pursuant to the terms of the consulting agreement, Mr. Karti is entitled to cash compensation at the rate of $600 per hour, estimated at up to 20 hours per week, and fully vested 4,000 RSUs for every 30 days of service during the consultation period, up to a maximum of 24,000 RSUs, subject to the terms and conditions of the consulting agreement. For the nine months ended September 30, 2021, Rockley incurred $0.3 million in fees for these services and to date, we have not paid any compensation to Mr. Karti under this agreement.
Intra Group Loan
On February 24, 2021, Rockley entered into an Intra Group Loan Agreement with Rockley Photonics Oy as borrower, for an amount of €928,794 (the “Finland Loan”). The Finland Loan will be drawn down in full on or before February 28, 2023 and be repayable immediately by the borrower to Rockley following the final claim submission to a grant funded project with Business Finland (the Finnish funding agency for innovation) scheduled for June 30, 2023.
In the ordinary course of its business activities, BofA, Cowen and their respective affiliates, officers, directors and employees may make or hold a broad array of investments and actively trade debt and equity securities (or related derivative securities) and financial instruments (including bank loans) for their own account and for the accounts of their customers. Such investments and securities activities may involve securities and/or instruments of SC Health or Rockley, or their respective affiliates. BofA, Cowen and their respective affiliates, may also make investment recommendations and/or publish or express independent research views in respect of such securities or financial instruments and may hold, or recommend to clients that they acquire, long and/or short positions in such securities and instruments.
Indemnification Agreements
HoldCo has entered into separate indemnification agreements with its directors and executive officers, in addition to the indemnification provided for in HoldCo’s governing documents. These agreements, among other things, require HoldCo to indemnify HoldCo’s directors and executive officers for certain expenses, including attorneys’ fees, judgments, fines and settlement amounts incurred by a director or executive officer in any action or proceeding arising out of their services as one of HoldCo’s directors or executive officers or as a director or executive officer of any other company or enterprise to which the person provides services at HoldCo’s request. HoldCo believes that these charter provisions and indemnification agreements are necessary to attract and retain qualified persons as directors and officers.
The limitation of liability and indemnification provisions in HoldCo’s governing documents may discourage shareholders from bringing a lawsuit against directors for breach of their fiduciary duties. They may also reduce the likelihood of derivative litigation against directors and officers, even though an action, if successful, might benefit HoldCo and its shareholders. A shareholder’s investment may decline in value to the extent HoldCo pays the costs of settlement and damage awards against directors and officers pursuant to these indemnification provisions.
Related Person Transactions Policy
HoldCo has adopted a written Related Person Transactions Policy that sets forth HoldCo’s policies and procedures regarding the identification, review, consideration and oversight of “related person transactions.” For
136
purposes of HoldCo’s policy only, a “related person transaction” is a transaction, arrangement or relationship (or any series of similar transactions, arrangements or relationships) in which HoldCo or any of its subsidiaries are participants in which any “related person” has a material interest.
Transactions involving compensation for services provided to HoldCo as an employee, consultant or director will not be considered related person transactions under this policy. A related person is any executive officer, director, nominee to become a director or a holder of more than 5% of any class of HoldCo’s voting securities (including HoldCo’s ordinary shares), including any of their immediate family members and affiliates, including entities owned or controlled by such persons.
Under the policy, the related person in question or, in the case of transactions with a holder of more than 5% of any class of HoldCo’s voting securities, an officer with knowledge of a proposed transaction, must present information regarding the proposed related person transaction to HoldCo’s audit committee (or, where review by HoldCo’s audit committee would be inappropriate, to another independent body of HoldCo’s Board) for review. To identify related person transactions in advance, HoldCo will rely on information supplied by HoldCo’s executive officers, directors and certain significant shareholders. In considering related person transactions, HoldCo’s audit committee will take into account the relevant available facts and circumstances, which may include, but are not limited to:
| • | the risks, costs, and benefits to HoldCo; |
| • | the impact on a director’s independence in the event the related person is a director, immediate family member of a director or an entity with which a director is affiliated; |
| • | the terms of the transaction; |
| • | the availability of other sources for comparable services or products; and |
| • | the terms available to or from, as the case may be, unrelated third parties. |
HoldCo’s audit committee will approve only those transactions that it determines are fair to HoldCo’s shareholders and in HoldCo’s and the HoldCo shareholders’ best interests. All of the transactions described above were entered into prior to the adoption of such policy.
137
PRINCIPAL SECURITYHOLDERS
The following table sets forth information regarding the beneficial ownership of HoldCo ordinary shares as of November 12, 2021 by:
| • | each person who is known to be the beneficial owner of more than 5% of HoldCo’s ordinary shares; |
| • | each of HoldCo’s current executive officers and directors; and |
| • | all executive officers and directors of HoldCo as a group. |
Beneficial ownership is determined according to the rules of the SEC, which generally provide that a person has beneficial ownership of a security if he, she or it possesses sole or shared voting or investment power over that security, including options, warrants, and other similar instruments that are currently exercisable or exercisable within 60 days, but does not include any other ordinary shares issuable upon the exercise of any other outstanding options, warrants or similar instruments held by other persons. The beneficial ownership percentages below are based on 127,219,418 HoldCo ordinary shares issued and outstanding as of November 12, 2021.
Unless otherwise indicated, and subject to applicable community property laws, HoldCo believes that all persons named in the table have sole voting and investment power with respect to all ordinary shares beneficially owned by them.
Name and Address of Beneficial Owner (1) | Number of Shares Beneficially Owned | Percentage | ||||||
5% Holders: | ||||||||
SC Health Group Limited (2) | 9,237,500 | 7.3 | % | |||||
Hengtong Optic-Electric International Co. Limited (3) | 6,949,317 | 5.5 | % | |||||
Executive Officers and Directors: | ||||||||
Andrew Rickman (4) | 17,559,783 | 13.9 | % | |||||
Mahesh Karanth (5) | 1,081,717 | 1.7 | % | |||||
Amit Nagra (6) | 1,795,658 | 2.8 | % | |||||
William Huyett | — | — | ||||||
Brian Blaser | — | — | ||||||
Caroline Brown (7) | 38,826 | * | ||||||
Karim Karti | — | — | ||||||
Michele Klein | — | — | ||||||
Pamela Puryear | — | — | ||||||
All directors and executive officers as a group (nine individuals) (8) | 20,475,984 | 18.4 | % | |||||
| * | Less than 1% |
| (1) | Unless otherwise noted, the business address of each of those listed in the table above is 3rd Floor 1 Ashley Road, Altrincham, Cheshire, United Kingdom, WA14 2DT. |
| (2) | SC Health Group Limited, the principal address of which is 108 Robinson Road #10-00, Singapore 068900, wholly owns each of the Sponsor and SC Health II Limited. Each of SC Health Group Limited and David Sin may be deemed to beneficially own the shares held by the Sponsor and SC Health II Limited by virtue of their direct and indirect ownership, respectively, of the shares of SC Health Holdings Limited and SC Health II Limited. David Sin holds voting and dispositive power over these shares. Each of SC Health Group Limited and David Sin disclaims beneficial ownership over any securities owned by the Sponsor and SC Health II Limited other than to the extent of any of their respective pecuniary interest therein, directly or indirectly. The beneficial ownership information reflects the transfer by the Sponsor of 1,250,000 Founder Shares to unrelated third parties to facilitate the financing of the Sponsor-affiliated entities’ purchase in the PIPE financing. Such entities entered into financing arrangements with unrelated third parties in exchange |
138
| for the transfer of and a security interest in, the HoldCo ordinary shares (including shares purchased in the PIPE financing) and HoldCo warrants of the Sponsor-affiliated entities. Such third parties may have dispositive power over shares pledged as collateral, but would not have voting power unless and until such shares are sold or forfeited under such financing arrangements. In addition, Sponsor-affiliated entities have agreed to transfer shares held by such entities to Dr. Rickman in exchange for Dr. Rickman’s making available up to 6.0 million of his HoldCo ordinary shares to facilitate the Sponsor’s financing of its PIPE subscription commitment, with the number of shares to be transferred to be based on the price performance of HoldCo ordinary shares. Subject to the terms of the Sponsor PIPE financings, the Sponsor could cease to beneficially own any HoldCo equity. |
| (3) | Lawrence Lau holds voting and dispositive power over these shares and disclaims beneficial ownership of such shares other than to the extent of any pecuniary interest therein. |
| (4) | Includes 59,955 and 22,100 ordinary shares subject to options and restricted stock units held by Dr. Rickman exercisable within 60 days of November 12, 2021, respectively. Dr. Rickman has pledged up to 6.0 million of his HoldCo ordinary shares to facilitate the Sponsor’s financing of its PIPE subscription commitment, which, if forfeited in their entirety, would reduce his estimated beneficial ownership by approximately 4%. The lender may have dispositive power over such pledged shares but would not have voting power unless and until such shares are forfeited to the lender. In addition, Sponsor-affiliated entities have agreed to transfer shares held by such entities to Dr. Rickman in exchange for Dr. Rickman’s making available up to 6.0 million of his HoldCo ordinary shares to facilitate the Sponsor’s financing of its PIPE subscription commitment, with the number of shares to be transferred to be based on the price performance of HoldCo ordinary shares. |
| (5) | Includes 1,108,384 and 8,840 ordinary shares subject to options and restricted stock units held by Mr. Karanth exercisable within 60 days of November 12, 2021, respectively. |
| (6) | Includes 1,755,765 and 6,630 ordinary shares subject to options and restricted stock units held by Mr. Nagra exercisable within 60 days of November 12, 2021, respectively. |
| (7) | Represents 38,826 ordinary shares subject to options held by Dr. Brown exercisable within 60 days of November 12, 2021. |
| (8) | Includes 2,962,930 and 37,570 ordinary shares subject to options and restricted stock units held by our current directors and executive officers exercisable within 60 days of November 12, 2021, respectively. |
139
DESCRIPTION OF OUR SECURITIES
The following summary of the material terms of our securities is not intended to be a complete summary of the rights and preferences of such securities, and is qualified by reference to the Articles of Association and the warrant-related documents described herein, which are exhibits to the registration statement of which this prospectus is a part. We urge to you reach each of the Articles of Association and the warrant-related documents described herein in their entirety for a complete description of the rights and preferences of our securities.
Share Capital
Authorized Capitalization
General
The total amount of HoldCo’s authorized share capital consists of 12,417,500,000 ordinary shares with a par value of $0.000004026575398 per share. As of November 12, 2021, HoldCo had 127,219,418 ordinary shares and warrants to purchase 14,074,986 ordinary shares outstanding.
Ordinary Shares
HoldCo ordinary shares are not entitled to preemptive or other similar subscription rights to purchase any of HoldCo’s securities. HoldCo ordinary shares are neither convertible nor redeemable. Unless HoldCo’s Board determines otherwise, HoldCo will issue all of HoldCo’s share capital in uncertificated form.
Voting Rights
Each holder of HoldCo ordinary shares is entitled to one vote per share on each matter submitted to a vote of shareholders, as provided by the governing documents. The governing documents provide that the holders of
one-third
of the share capital issued and outstanding and entitled to vote thereat, present in person, or by remote communication, if applicable, or represented by proxy, will constitute a quorum at all meetings of the shareholders for the transaction of business. When a quorum is present, the affirmative vote of a majority of the votes cast is required to take action, unless otherwise specified by law, the governing documents. There are no cumulative voting rights.Dividend Rights
Each holder of HoldCo ordinary shares is entitled to the payment of dividends and other distributions as may be declared by the Board from time to time out of HoldCo’s assets or funds legally available for dividends or other distributions. These rights are subject to the preferential rights of the holders of HoldCo’s preferred shares, if any, and any contractual limitations on HoldCo’s ability to declare and pay dividends.
Other Rights
Each holder of HoldCo ordinary shares is subject to, and may be adversely affected by, the rights of the holders of any series of HoldCo preferred shares, if any, that HoldCo may designate and issue in the future.
Liquidation Rights
If HoldCo is involved in voluntary or involuntary liquidation, dissolution or winding up of HoldCo’s affairs, or a similar event, each holder of HoldCo ordinary shares will participate pro rata in all assets remaining after payment of liabilities, subject to prior distribution rights of HoldCo preferred shares, if any, then outstanding.
140
Transfer Restrictions
Certain holders of HoldCo’s ordinary shares entered into a customary
lock-up
agreements for a period not to exceed 180 days from the effective date of the registration statement on FormS-4
relating to the Business Combination (July 22, 2021). As permitted under Cayman Islands law, if any holder of HoldCo’s ordinary shares fails to comply with thelock-up
provisions of the Articles of Association, HoldCo will be constituted the agent of such defaulting holder for taking such actions as are necessary to effect the lockup, and the directors of HoldCo may authorize an officer or member to execute and deliver the necessary documents to effect thelock-up
on behalf of the defaulting holder including, without limitation, alock-up
agreement, in a form approved by the Board.Special Meetings of Shareholders
The governing documents provide that a meeting of shareholders may be called by the Board. At least seven calendar days’ notice will be given for any meeting. Every notice will be exclusive of the day on which it is given or deemed to be given and of the day for which it is given and will specify the place, the day and the hour of the meeting and the general nature of the business.
Action by Written Consent
The governing documents provide that any action required or permitted to be taken by the shareholders may be effected at an annual or extraordinary
general meeting of the shareholders, or taken by unanimous written consent in lieu of a meeting.
Removal of Directors
The Board or any individual director may be removed from office at any time but only for cause and only by the affirmative vote of the holders of at least a majority of the HoldCo ordinary shares entitled to vote and who vote at a general meeting.
Limitations on Liability and Indemnification of Officers and Directors
The governing documents provide that HoldCo will indemnify HoldCo’s directors. In addition, HoldCo expects to enter into agreements to indemnify HoldCo’s directors, executive officers and other employees as determined by the Board.
Transfer Agent
The transfer agent for HoldCo ordinary shares is Computershare Trust Company, N.A.
Warrants
Public Warrants
Each whole HoldCo warrant entitles the registered holder to purchase one HoldCo ordinary share at a price of $11.50 per share, subject to adjustment as discussed below, at any time commencing 30 days after the Closing, provided that there is an effective registration statement under the Securities Act covering the HoldCo ordinary shares issuable upon exercise of the HoldCo warrants and a current prospectus relating to them available (or HoldCo permits holders to exercise their HoldCo warrants on a cashless basis under the circumstances specified in the HoldCo Warrant Agreement) and such shares are registered, qualified or exempt from registration under the securities, or blue sky, laws of the state of residence of the holder. Pursuant to the HoldCo Warrant Agreement, a HoldCo warrant holder may exercise its HoldCo warrants only for a whole number of HoldCo ordinary shares. This means only a whole HoldCo warrant may be exercised at a given time by a HoldCo warrant holder. The HoldCo warrants will expire five years after the Closing, at 5:00 p.m. Eastern Time, or earlier upon redemption or liquidation.
141
HoldCo will not be obligated to deliver any HoldCo ordinary shares pursuant to the exercise of a HoldCo warrant and will have no obligation to settle such HoldCo warrant exercise unless a registration statement under the Securities Act with respect to the HoldCo ordinary shares underlying the HoldCo warrants is then effective and a prospectus relating thereto is current, subject to HoldCo satisfying its obligations described below with respect to registration. No HoldCo warrant will be exercisable and HoldCo will not be obligated to issue a HoldCo ordinary share upon exercise of a HoldCo warrant unless the HoldCo ordinary shares issuable upon such HoldCo warrant exercise has been registered, qualified or deemed to be exempt under the securities laws of the state of residence of the registered holder of the HoldCo warrants. In the event that the conditions in the two immediately preceding sentences are not satisfied with respect to a HoldCo warrant, the holder of such HoldCo warrant will not be entitled to exercise such HoldCo warrant and such HoldCo warrant may have no value and expire worthless. In no event will HoldCo be required to net cash settle any HoldCo warrant.
HoldCo is obligated to use its best efforts to file as soon as practicable, but in no event later than 30 business days after the Closing, with the SEC a registration statement for the registration, under the Securities Act, of the HoldCo ordinary shares issuable upon exercise of the warrants. HoldCo is obligated to use its best efforts to cause the same to become effective and to maintain the effectiveness of such registration statement, and a current prospectus relating thereto, until the expiration of the warrants in accordance with the provisions of the HoldCo Warrant Agreement. If a registration statement covering the HoldCo ordinary shares issuable upon exercise of the warrants is not effective by the 60th business day after the Closing, warrant holders may, until such time as there is an effective registration statement and during any period when HoldCo will have failed to maintain an effective registration statement, exercise such warrants on a “cashless basis” in accordance with Section 3(a) (9) of the Securities Act or another exemption. Notwithstanding the above, if the HoldCo ordinary shares are at the time of any exercise of a warrant not listed on a national securities exchange such that they satisfy the definition of a “covered security” under Section 18(b)(1) of the Securities Act, HoldCo may, at its option, require holders of public warrants who exercise their warrants to do so on a “cashless basis” in accordance with Section 3(a )(9) of the Securities Act and, in the event HoldCo so elects, it will not be required to file or maintain in effect a registration statement, and in the event HoldCo does not so elect, it will use its best efforts to register or qualify the shares under applicable blue sky laws to the extent an exemption is not available.
Once the HoldCo warrants become exercisable, HoldCo may call the warrants for redemption:
| • | in whole and not in part; |
| • | at a price of $0.01 per HoldCo warrant; |
| • | upon not less than 30 days’ prior written notice of redemption (the “30-day redemption period”) to each warrantholder; and |
| • | if: and only if, the reported closing price of the HoldCo ordinary shares equals or exceeds $18.00 per share (as adjusted for stock splits, stock dividends, reorganizations, recapitalizations and the like) for any 20 trading days within a 30 trading-day period ending three business days |
| • | before HoldCo sends the notice of redemption to the warrantholders. |
If and when the HoldCo warrants become redeemable by HoldCo, HoldCo may exercise its redemption right even if it is unable to register or qualify the underlying securities for sale under all applicable state securities laws.
If the foregoing conditions are satisfied and HoldCo issues a notice of redemption of the warrants, each HoldCo warrant holder will be entitled to exercise his, her or its warrant prior to the scheduled redemption date. However, the price of HoldCo ordinary shares may fall below the $18.00 redemption trigger price (as adjusted for stock splits, stock dividends, reorganizations, recapitalizations and the like) as well as the $11.50 warrant exercise price after the redemption notice is issued.
If HoldCo calls the HoldCo warrants for redemption as described above, HoldCo’s Board will have the option to require any holder that wishes to exercise his, her or its warrant to do so on a “cashless basis.” In
142
determining whether to require all holders to exercise their warrants on a “cashless basis,” HoldCo’s management will consider, among other factors, HoldCo’s cash position, the number of warrants that are outstanding and the dilutive effect on its shareholders of issuing the maximum number of HoldCo ordinary shares issuable upon the exercise of HoldCo’s warrants. If HoldCo’s management takes advantage of this option, all holders of warrants would pay the exercise price by surrendering their warrants for that number of HoldCo ordinary shares equal to the quotient obtained by dividing (a) the product of the number of HoldCo ordinary shares underlying the warrants, multiplied by the excess of the “fair market value” (defined below) over the exercise price of the warrants by (b) the fair market value. The “fair market value” will mean the average reported closing price of the HoldCo ordinary shares for the 10 trading days ending on the third trading day prior to the date on which the notice of redemption is sent to the holders of warrants. If HoldCo’s management takes advantage of this option, the notice of redemption will contain the information necessary to calculate the number of HoldCo ordinary shares to be received upon exercise of the warrants, including the “fair market value” in such case. Requiring a cashless exercise in this manner will reduce the number of shares to be issued and thereby lessen the dilutive effect of a warrant redemption. HoldCo believes this feature is an attractive option to it if it does not need the cash from the exercise of the warrants after the Closing. If HoldCo calls its warrants for redemption and HoldCo’s management does not take advantage of this option, the holders of the private placement warrants and their permitted transferees would still be entitled to exercise their private placement warrants for cash or on a cashless basis using the same formula described above that other warrant holders would have been required to use had all warrant holders been required to exercise their warrants on a cashless basis, as described in more detail below. A holder of a warrant may notify HoldCo in writing in the event it elects to be subject to a requirement that such holder will not have the right to exercise such warrant, to the extent that after giving effect to such exercise, such person (together with such person’s affiliates), to the warrant agent’s actual knowledge, would beneficially own in excess of 4.9% or 9.8% (or such other amount as specified by the holder) of the HoldCo ordinary shares outstanding immediately after giving effect to such exercise.
If the number of outstanding HoldCo ordinary shares is increased by a stock dividend payable in HoldCo ordinary shares, or by a
split-up
or other similar event, then, on the effective date of stock dividend,split-up
or similar event, the number of HoldCo ordinary shares issuable on exercise of each warrant will be increased in proportion to such increase in the outstanding HoldCo ordinary shares. A rights offering to holders of HoldCo ordinary shares entitling holders to purchase HoldCo ordinary shares at a price less than the fair market value will be deemed a stock dividend of a number of HoldCo ordinary shares equal to the product of (a) the number of HoldCo ordinary shares actually sold in such rights offering (or issuable under any other equity securities sold in such rights offering that are convertible into or exercisable for HoldCo ordinary shares) and (b) the quotient of (i) the price per HoldCo ordinary share paid in such rights offering and (ii) the fair market value. For these purposes (a) if the rights offering is for securities convertible into or exercisable for HoldCo ordinary shares, in determining the price payable for HoldCo ordinary shares, there will be taken into account any consideration received for such rights, as well as any additional amount payable upon exercise or conversion and (b) fair market value means the volume weighted average price of HoldCo ordinary shares as reported during the 10 trading day period ending on the trading day prior to the first date on which the HoldCo ordinary shares trade on the applicable exchange or in the applicable market, regular way, without the right to receive such rights.In addition, if HoldCo, at any time while the warrants are outstanding and unexpired, pay a dividend or make a distribution in cash, securities or other assets to the holders of HoldCo ordinary shares on account of such HoldCo ordinary shares (or other securities into which the warrants are convertible), other than (a) as described above, (b) certain ordinary cash dividends, (c) to satisfy the redemption rights of the holders of HoldCo ordinary shares in connection with the closing of the Business Combination, or (d) to satisfy the redemption rights of the holders of HoldCo ordinary shares in connection with a shareholder vote to amend the governing documents, then the warrant exercise price will be decreased, effective immediately after the effective date of such event, by the amount of cash and/or the fair market value of any securities or other assets paid on each HoldCo ordinary share in respect of such event.
143
If the number of outstanding HoldCo ordinary shares is decreased by a consolidation, combination, reverse stock split or reclassification of HoldCo ordinary shares or other similar event, then, on the effective date of such consolidation, combination, reverse stock split, reclassification or similar event, the number of HoldCo ordinary shares issuable on exercise of each warrant will be decreased in proportion to such decrease in outstanding HoldCo ordinary shares.
Whenever the number of HoldCo ordinary shares purchasable upon the exercise of the warrants is adjusted, as described above, the warrant exercise price will be adjusted by multiplying the warrant exercise price immediately prior to such adjustment by a fraction (a) the numerator of which will be the number of HoldCo ordinary shares purchasable upon the exercise of the warrants immediately prior to such adjustment, and (b) the denominator of which will be the number of HoldCo ordinary shares so purchasable immediately thereafter.
In case of any reclassification or reorganization of the outstanding HoldCo ordinary shares (other than those described above or that solely affects the par value of such HoldCo ordinary shares), or in the case of any merger or consolidation of HoldCo with or into another corporation (other than a consolidation or merger in which HoldCo is the continuing corporation and that does not result in any reclassification or reorganization of the issued and outstanding HoldCo ordinary shares), or in the case of any sale or conveyance to another corporation or entity of the assets or other property of HoldCo as an entirety or substantially as an entirety in connection with which HoldCo is dissolved, the holders of the warrants will thereafter have the right to purchase and receive, upon the basis and upon the terms and conditions specified in the warrants and in lieu of the HoldCo ordinary shares immediately theretofore purchasable and receivable upon the exercise of the rights represented thereby, the kind and amount of HoldCo ordinary shares or other securities or property (including cash) receivable upon such reclassification, reorganization, merger or consolidation, or upon a dissolution following any such sale or transfer, that the holder of the warrants would have received if such holder had exercised their warrants immediately prior to such event. If less than 70% of the consideration receivable by the holders of HoldCo ordinary shares in such a transaction is payable in the form of HoldCo ordinary shares in the successor entity that is listed for trading on a national securities exchange or is quoted in an establishedmarket, or is to be so listed for trading or quoted immediately following such event, and if the registered holder of the warrant properly exercises the warrant within 30 days following public disclosure of such transaction, the warrant exercise price will be reduced as specified in the HoldCo Warrant Agreement based on the Black-Scholes Warrant Value (as defined in the HoldCo Warrant Agreement) of the warrant. The purpose of such exercise price reduction is to provide additional value to holders of the warrants when an extraordinary transaction occurs during the exercise period of the warrants pursuant to which the holders of the warrants otherwise do not receive the full potential value of the warrants.
over-the-counter
The HoldCo Warrant Agreement provides that the terms of the warrants may be amended without the consent of any holder for the purpose of (a) curing any ambiguity or to correct any defective provision, (b) adjusting the provisions relating to cash dividends on HoldCo ordinary shares as contemplated by and in accordance with the HoldCo Warrant Agreement or (c) adding or changing any other provisions with respect to matters or questions arising under the HoldCo Warrant Agreement as the parties to the HoldCo Warrant Agreement may deem necessary or desirable and that the parties deem to not adversely affect the interests of the registered holders of the warrants. All other modifications or amendments will require the approval by the holders of at least 50% of the then-outstanding public warrants and, solely with respect to any amendment to the terms of the private placement warrants, 50% of the then outstanding private placement warrants. You should review a copy of the HoldCo Warrant Agreement, which is filed as an exhibit to the registration statement of which this prospectus is a part, for a complete description of the terms and conditions applicable to the warrants.
The warrants may be exercised upon surrender of the warrant certificate on or prior to the expiration date at the offices of the warrant agent, with the exercise form on the reverse side of the warrant certificate completed and executed as indicated, accompanied by full payment of the exercise price (or on a cashless basis, if applicable), by certified or official bank check payable to HoldCo, for the number of warrants being exercised. The warrant holders do not have the rights or privileges of holders of HoldCo ordinary shares and any voting
144
rights until they exercise their warrants and receive HoldCo ordinary shares. After the issuance of HoldCo ordinary shares upon exercise of the warrants, each holder will be entitled to one vote for each share held of record on all matters to be voted on by shareholders.
No fractional shares will be issued upon exercise of the warrants. If, upon exercise of the warrants, a holder would be entitled to receive a fractional interest in a share, HoldCo will, upon exercise, round down to the nearest whole number of HoldCo ordinary shares to be issued to the warrantholder.
Private Placement Warrants
In connection with the initial public offering of SC Health, the Sponsor purchased an aggregate of 5,000,000 SC Health private placement warrants, each exercisable to purchase one SC Health Class A Ordinary Share at $11.50 per share, at a price of $1.00 per warrant, or $5,000,000 in the aggregate. On August 2, 2019, SC Health consummated the closing of the sale of 2,250,000 additional units at the price of $10.00 per SC Health unit upon receiving the underwriters’ election to fully exercise their over-allotment option, generating additional gross proceeds of $22,500,000 to SC Health. Simultaneously with the exercise of the over-allotment, SC Health completed the private sale of an additional 450,000 SC Health private placement warrants to the Sponsor, generating gross proceeds to SC Health of $450,000.
The SC Health private placement warrants (including the HoldCo ordinary shares issuable upon exercise of such warrants) will not be transferable, assignable or salable until 30 days after the Closing (except, among other limited exceptions to HoldCo’s officers and directors and other persons or entities affiliated with the Sponsor) and they will not be redeemable by HoldCo so long as they are held by the Sponsor, members of the Sponsor or their permitted transferees. The Sponsor or its permitted transferees, have the option to exercise the private placement warrants on a cashless basis. Except as described below, the private placement warrants have terms and provisions that are identical to those of the public warrants, including as to exercise price, exercisability and exercise period. If the private placement warrants are held by holders other than the Sponsor or its permitted transferees, the private placement warrants will be redeemable by HoldCo and exercisable by the holders on the same basis as the public warrants.
If holders of the private placement warrants elect to exercise them on a cashless basis, they would pay the exercise price by surrendering his, her or its warrants for that number of HoldCo ordinary shares equal to the quotient obtained by dividing (a) the product of the number of HoldCo ordinary shares underlying the warrants, multiplied by the excess of the “fair market value” (defined below) over the exercise price of the warrants by (b) the fair market value. The “fair market value” will mean the average reported closing price of the HoldCo ordinary shares for the 10 trading days ending on the third trading day prior to the date on which the notice of warrant exercise is sent to the warrant agent.
Exclusive Forum Provision in HoldCo Warrant Agreement
The HoldCo Warrant Agreement provides that the courts of the State of New York or the U.S. District Court for the Southern District of New York is the exclusive jurisdiction for any claims relating to such agreement. Further, the exclusive forum provision in the HoldCo Warrant Agreement provides that such exclusive jurisdiction will not apply to claims arising under the Securities Act or the Exchange Act.
Section 27 of the Exchange Act creates exclusive federal jurisdiction over all suits brought to enforce any duty or liability created by the Exchange Act or the rules and regulations thereunder. As a result, the exclusive forum provision in the HoldCo Warrant Agreement will not apply to suits brought to enforce any duty or liability created by the Exchange Act or any other claim for which the federal courts have exclusive jurisdiction. Accordingly, the exclusive forum provision does not designate the courts of the State of New York as the exclusive forum for any derivative action arising under the Exchange Act, as there is exclusive federal jurisdiction in that instance.
145
Section 22 of the Securities Act creates concurrent jurisdiction for federal and state courts over all suits brought to enforce any duty or liability created by the Securities Act or the rules and regulations thereunder. As a result, the enforceability of the exclusive forum provision in the HoldCo Warrant Agreement is uncertain, and a court may determine that such provision will not apply to suits brought to enforce any duty or liability created by the Securities Act or any other claim for which the federal and state courts have concurrent jurisdiction. Further, compliance with the federal securities laws and the rules and regulations thereunder cannot be waived by investors in our ordinary shares.
This exclusive forum provision may limit a shareholder’s ability to bring a claim in a judicial forum that it finds favorable for disputes with us or our directors and officers or other employees arising under the HoldCo Warrant Agreement, which may discourage such lawsuits against us and our directors, officers, or other employees. Alternatively, if a court were to find this exclusive forum provision is inapplicable to, or unenforceable in respect of, one or more of the specified types of actions or proceedings, we may incur additional costs associated with resolving such matters in other jurisdictions, which could adversely affect our business, financial condition, and results of operations and result in a diversion of the time and resources of our management and board of directors.
Lock-Up
RestrictionsCertain of our shareholders are subject to certain restrictions on transfer until the termination of applicable
lock-up
periods.Rule 144
Rule 144 is not available for the resale of securities initially issued by shell companies (other than business combination related shell companies) or issuers that have been at any time previously a shell company, such as the Company. However, Rule 144 also includes an important exception to this prohibition if the following conditions are met:
| • | the issuer of the securities that was formerly a shell company has ceased to be a shell company; |
| • | the issuer of the securities is subject to the reporting requirements of Section 13 or 15(d) of the Exchange Act; |
| • | the issuer of the securities has filed all Exchange Act reports and material required to be filed, as applicable, during the preceding 12 months (or such shorter period that the issuer was required to file such reports and materials), other than Form 8-K reports; and |
| • | at least one year has elapsed from the time that the issuer filed current Form 10 type information with the SEC reflecting its status as an entity that is not a shell company. |
Upon the Closing, the Company ceased to be a shell company.
When and if Rule 144 becomes available for the resale of our securities, a person who has beneficially owned restricted ordinary shares or Warrants for at least six months would be entitled to sell their securities, provided that (i) such person is not deemed to have been one of our affiliates at the time of, or at any time during the three months preceding, a sale and (ii) we are subject to the Exchange Act periodic reporting requirements for at least three months before the sale and have filed all required reports under Section 13 or 15(d) of the Exchange Act during the 12 months (or such shorter period as we were required to file reports) preceding the sale.
Persons who have beneficially owned restricted ordinary shares or Warrants for at least six months but who are our affiliates at the time of, or at any time during the three months preceding, a sale, would be subject to
146
additional restrictions, by which such person would be entitled to sell within any three-month period only a number of securities that does not exceed the greater of:
| • | one percent (1%) of the total number of ordinary shares then outstanding; or |
| • | the average weekly reported trading volume of the ordinary shares during the four calendar weeks preceding the filing of a notice on Form 144 with respect to the sale. |
Sales by our affiliates under Rule 144 will also be limited by manner of sale provisions and notice requirements and to the availability of current public information about us.
Transfer Agent, Warrant Agent and Registrar
The transfer agent, warrant agent and registrar for our ordinary shares and Warrants is ComputerShare Trust Company.
Listing of Securities
Our ordinary shares and Public Warrants are listed on the NYSE under the symbols “RKLY” and “RKLY.WS,” respectively.
147
PLAN OF DISTRIBUTION
The ordinary shares offered by this prospectus are being offered by the selling shareholder, Lincoln Park. The ordinary shares may be sold or distributed from time to time by the selling shareholder directly to one or more purchasers or through brokers, dealers, or underwriters who may act solely as agents at market prices prevailing at the time of sale, at prices related to the prevailing market prices, at negotiated prices, or at fixed prices, which may be changed. The sale of the ordinary shares offered by this prospectus could be effected in one or more of the following methods:
| • | ordinary brokers’ transactions; |
| • | transactions involving cross or block trades; |
| • | through brokers, dealers, or underwriters who may act solely as agents |
| • | “at the market” into an existing market for the ordinary shares; |
| • | in other ways not involving market makers or established business markets, including direct sales to purchasers or sales effected through agents; |
| • | in privately negotiated transactions; or |
| • | any combination of the foregoing. |
In order to comply with the securities laws of certain states, if applicable, the shares may be sold only through registered or licensed brokers or dealers. In addition, in certain states, the shares may not be sold unless they have been registered or qualified for sale in the state or an exemption from the state’s registration or qualification requirement is available and complied with.
Lincoln Park is an “underwriter” within the meaning of Section 2(a)(11) of the Securities Act.
Lincoln Park has informed us that it intends to use an unaffiliated broker-dealer to effectuate all sales, if any, of the ordinary shares that it may purchase from us pursuant to the Purchase Agreement. Such sales will be made at prices and at terms then prevailing or at prices related to the then current market price. Each such unaffiliated broker-dealer will be an underwriter within the meaning of Section 2(a)(11) of the Securities Act. Lincoln Park has informed us that each such broker-dealer will receive commissions from Lincoln Park that will not exceed customary brokerage commissions.
Brokers, dealers, underwriters, or agents participating in the distribution of the shares may receive compensation in the form of commissions, discounts, or concessions from the selling shareholder and/or purchasers for whom the broker-dealers may act as agent. The compensation paid to any such particular broker-dealer may be less than or in excess of customary commissions. Neither we nor Lincoln Park can presently estimate the amount of compensation that any agent will receive.
We know of no existing arrangements between Lincoln Park or any other shareholder, broker, dealer, underwriter or agent relating to the sale or distribution of the shares offered by this prospectus.
We may from time to time file with the SEC one or more supplements to this prospectus or amendments to the registration statement of which this prospectus forms a part to amend, supplement, or update information contained in this prospectus, including, if and when required under the Securities Act, to disclose certain information relating to a particular sale of shares offered by this prospectus by the selling shareholder, including the names of any brokers, dealers, underwriters or agents participating in the distribution of such shares by the selling shareholder, any compensation paid by Lincoln Park to any such brokers, dealers, underwriters or agents, and any other required information.
148
We will pay the expenses incident to the registration, offering, and sale of the shares to Lincoln Park. We have agreed to indemnify Lincoln Park and certain other persons against certain liabilities in connection with the offering of ordinary shares offered hereby, including liabilities arising under the Securities Act or, if such indemnity is unavailable, to contribute amounts required to be paid in respect of such liabilities. Lincoln Park has agreed to indemnify us against liabilities under the Securities Act that may arise from certain written information furnished to us by Lincoln Park specifically for use in this prospectus or, if such indemnity is unavailable, to contribute amounts required to be paid in respect of such liabilities.
Lincoln Park has represented to us that at no time prior to the Purchase Agreement has Lincoln Park or its agents, representatives or affiliates engaged in or effected, in any manner whatsoever, directly or indirectly, any short sale (as such term is defined in Rule 200 of Regulation SHO of the Exchange Act) of our ordinary shares or any hedging transaction, which establishes a net short position with respect to our ordinary shares. Lincoln Park has agreed that during the term of the Purchase Agreement, it and its agents, representatives or affiliates will not enter into or effect, directly or indirectly, any of the foregoing transactions.
We have advised Lincoln Park that it is required to comply with Regulation M promulgated under the Exchange Act. With certain exceptions, Regulation M precludes the selling shareholder, any affiliated purchasers, and any broker-dealer or other person who participates in the distribution from bidding for or purchasing, or attempting to induce any person to bid for or purchase any security which is the subject of the distribution until the entire distribution is complete. Regulation M also prohibits any bids or purchases made in order to stabilize the price of a security in connection with the distribution of that security. All of the foregoing may affect the marketability of the securities offered by this prospectus.
This offering will terminate on the earlier of (i) termination of the Purchase Agreement or (ii) the date that all shares offered by this prospectus have been sold by Lincoln Park. The term “selling shareholder” includes donees, pledgees, transferees, or other successors in interest, including those who receive any of the shares as a gift, pledge, distribution, redemption, repurchase, cancellation, or other
non-sale
related transfer from a selling shareholder (including after the date of this prospectus).149
MATERIAL UNITED STATES FEDERAL INCOME TAX CONSIDERATIONS FOR U.S. HOLDERS
The following discussion is a summary of material U.S. federal income tax considerations applicable to U.S. Holders (as defined below) of our ordinary shares purchased from Lincoln Park in this offering as a consequence of the ownership and disposition of our ordinary shares. This discussion addresses only those holders that hold our ordinary shares as capital assets (generally property held for investment). This summary does not discuss all aspects of U.S. federal income taxation that may be relevant to particular investors in light of their particular circumstances, or to investors subject to special tax rules, such as:
| • | financial institutions or financial services entities, |
| • | insurance companies, |
| • | mutual funds, |
| • | pension plans, |
| • | S corporations, |
| • | broker-dealers, |
| • | traders in securities that elect mark-to-market treatment, |
| • | regulated investment companies, |
| • | real estate investment trusts, |
| • | trusts and estates, |
| • | tax-exempt organizations (including private foundations), |
| • | passive foreign investment companies, |
| • | controlled foreign corporations, |
| • | governments or agencies or instrumentalities thereof, |
| • | investors that hold our ordinary shares or who will hold our ordinary shares as part of a “straddle,” “hedge,” “conversion,” “synthetic security,” “constructive ownership transaction,” “constructive sale” or other integrated transaction for U.S. federal income tax purposes, |
| • | investors subject to the alternative minimum tax provisions of the Internal Revenue Code of 1986, as amended (the “Code”), |
| • | U.S. Holders that have a functional currency other than the U.S. dollar, |
| • | accrual method taxpayers that file applicable financial statements as described in Section 451(b) of the Code, |
| • | U.S. expatriates, |
| • | investors subject to the U.S. “inversion” rules, |
| • | holders owning or considered as owning (directly, indirectly, or through attribution) five percent (measured by vote or value) or more of our ordinary shares, or |
| • | persons who received any of our ordinary shares or warrants issued pursuant to an exercise of employee share options, in connection with employee share incentive plans or otherwise as compensation, fees or other consideration in connection with performance of services or similar arrangements. |
This summary does not discuss any state, local,
or non-U.S.
tax considerations, anynon-income
tax (such as gift or estate tax) considerations, the alternative minimum tax or the Medicare tax on net investment income.150
If a partnership (including an entity or arrangement treated as a partnership for U.S. federal income tax purposes) is the beneficial owner of our ordinary shares, the tax treatment of a partner in such partnership will generally depend upon the status of the partner, the activities of the partnership and the partner and certain determinations made at the partner level. If you are a partner of a partnership holding our ordinary shares, you are urged to consult your tax advisor regarding the tax consequences to you of the ownership and disposition of our ordinary shares by the partnership.
This summary is based upon the Code, the regulations promulgated by the U.S. Treasury Department, current administrative interpretations and practices of the U.S. Internal Revenue Service (“IRS”), and judicial decisions, all as currently in effect and all of which are subject to differing interpretations or to change, possibly with retroactive effect. We have not sought, and do not intend to seek, a ruling from the IRS as to any U.S. federal income tax consideration described herein. No assurance can be given that the IRS would not assert, or that a court would not sustain, a position contrary to any of the tax considerations described below.
THIS DISCUSSION IS FOR INFORMATIONAL PURPOSES ONLY. EACH U.S. HOLDER SHOULD CONSULT ITS TAX ADVISOR WITH RESPECT TO THE PARTICULAR TAX CONSEQUENCES TO SUCH HOLDER OF THE OWNERSHIP AND DISPOSITION OF OUR ORDINARY SHARES.
For purposes of this discussion, a “U.S. Holder” is a beneficial owner of our ordinary shares that is:
| • | an individual who is a U.S. citizen or resident of the United States, |
| • | a corporation (including an entity treated as a corporation for U.S. federal income tax purposes) created or organized (or treated as created or organized) in or under the laws of the United States, any state thereof or the District of Columbia, |
| • | an estate the income of which is includible in gross income for U.S. federal income tax purposes regardless of its source, or |
| • | a trust (i) the administration of which is subject to the primary supervision of a U.S. court and which has one or more U.S. persons (within the meaning of the Code) having the authority to control all substantial decisions of the trust or (ii) that has in effect a valid election under applicable Treasury Regulations to be treated as a U.S. person. |
Treatment of HoldCo as a
Non-U.S.
Corporation for U.S. Federal Income Tax PurposesUnder current U.S. federal income tax law, a corporation generally will be considered to be a U.S. corporation for U.S. federal income tax purposes only if it is created or organized in the United States or under the law of the United States, any state thereof or the District of Columbia. Accordingly, under generally applicable U.S. federal income tax rules, HoldCo, which is not created or organized in the United States or under the law of the United States, any state thereof or the District of Columbia but is instead a Cayman Islands incorporated entity and tax resident of the United Kingdom, would generally be classified as
a non-U.S.
corporation. Section 7874 of the Code and the Treasury Regulations promulgated thereunder, however, contain specific rules that may cause anon-U.S.
corporation to be treated as a U.S. corporation for U.S. federal income tax purposes.The Section 7874 rules are complex and require analysis of all relevant facts, and there is limited guidance as to their application. HoldCo believes, and the remainder of this discussion assumes that, it will not be treated as a U.S. corporation for U.S. federal income tax purposes under Section 7874 of the Code. If it were determined that HoldCo is treated as a U.S. corporation for U.S. federal income tax purposes under Section 7874 of the Code and the Treasury Regulations promulgated thereunder, HoldCo would be liable for U.S. federal income tax on its income just like any other U.S. corporation, and U.S. Holders of our ordinary shares would be treated as holders of stock of a U.S. corporation.
151
Dividends and Other Distributions on our Ordinary Shares
Distributions on our ordinary shares will generally be taxable as a dividend for U.S. federal income tax purposes to the extent paid from HoldCo’s current or accumulated earnings and profits, as determined under U.S. federal income tax principles. Because we do not intend to determine our earnings and profits on the basis of U.S. federal income tax principles, the full amount of any distribution we pay will generally be treated as a dividend for U.S. federal income tax purposes. The amount of any such distribution will include any amounts withheld by us (or another applicable withholding agent). Amounts treated as dividends that HoldCo pays to a U.S. Holder that is a taxable corporation generally will be taxed at regular tax rates and will not qualify for the dividends-received deduction generally allowed to domestic corporations in respect of dividends received from other domestic corporations. With respect
to non-corporate U.S.
Holders, under tax laws currently in effect and subject to certain exceptions (including, but not limited to, dividends treated as investment income for purposes of investment interest deduction limitations), dividends generally will be taxed at the lower applicable long-term capital gains rate only if our ordinary shares are readily tradable on an established securities market in the United States or HoldCo is eligible for benefits under an applicable tax treaty with the United States, and, in each case, HoldCo is not treated as a PFIC (as defined below) with respect to such U.S. Holder at the time the dividend was paid or in the preceding year and provided certain holding period requirements are met. The amount of any dividend distribution paid in foreign currency will be the U.S. dollar amount calculated by reference to the applicable exchange rate in effect on the date of actual or constructive receipt, regardless of whether the payment is in fact converted into U.S. dollars at that time. A U.S. Holder may have foreign currency gain or loss if a foreign-currency dividend is converted into U.S. dollars after the date of receipt.Dividends paid on our ordinary shares will generally be treated as income from foreign sources and will generally constitute passive category income for U.S. foreign tax credit purposes. Depending on the U.S. Holder’s individual facts and circumstances, a U.S. Holder may be eligible, subject to a number of complex limitations, to claim a foreign tax credit in respect of any nonrefundable foreign withholding taxes imposed on dividends received on our ordinary shares. A U.S. Holder that does not elect to claim a foreign tax credit for foreign taxes withheld may instead claim a deduction, for U.S. federal income tax purposes, in respect of such withholding, but only for a year in which the U.S. Holder elects to do so for all creditable foreign income taxes. The rules governing the foreign tax credit are complex and their outcome depends in large part on the U.S. Holder’s individual facts and circumstances. Accordingly, U.S. Holders are urged to consult their tax advisors regarding the availability of the foreign tax credit under their particular circumstances.
Gain or Loss on Sale, Taxable Exchange or Other Taxable Disposition of Ordinary Shares
Upon any sale, exchange or other taxable disposition of our ordinary shares, a U.S. Holder generally will recognize gain or loss in an amount equal to the difference between (i) the sum of (x) the amount of cash and (y) the fair market value of any other property, received in such sale, exchange or other taxable disposition and (ii) the U.S. Holder’s adjusted tax basis in such ordinary shares as calculated in U.S. dollars. Any such gain or loss generally will be capital gain or loss and will be long-term capital gain or loss if the U.S. Holder’s holding period for such ordinary shares exceeds one year. Long-term capital gain realized by
a non-corporate U.S.
Holder generally will be taxable at a reduced rate. The deduction of capital losses is subject to limitations. U.S. Holders are urged to consult their tax advisors regarding the tax consequences if anon-U.S.
tax is imposed on a disposition of our ordinary shares, including the availability of the foreign tax credit under their particular circumstances.Passive Foreign Investment Company Rules
A “foreign” (
i.e.,
non-U.S.)
corporation will be classified as a “passive foreign investment company” or PFIC for any taxable year if either (i) at least 75 percent of its gross income for such year consists of certain types of “passive” income, or (ii) at least 50 percent of the value of its assets (generally determined on the basis of a quarterly average) during such year is attributable to assets that produce passive income or are held for the152
production of passive income. Based on the current and anticipated value of our assets and composition of our income and assets, we do not presently expect to be a PFIC for the current taxable year or the foreseeable future. However, while we do not expect to be or become a PFIC, no assurance can be given in this regard because the determination as to whether we are a PFIC for any taxable year is a fact-intensive determination that depends, in part, upon the composition and classification of our income and assets, which cannot be determined until after the end of a taxable year.
If we are classified as a PFIC in any year during which a U.S. Holder owns our ordinary shares, certain adverse tax consequences could apply to such U.S. Holder. Certain elections may be available (including aelection) to U.S. Holders that may mitigate some of those adverse consequences. U.S. Holders should consult their tax advisors regarding the U.S. federal income tax consequences of owning and disposing of our ordinary shares if we are or become a PFIC.
mark-to-market
Additional Reporting Requirements
Certain U.S. Holders holding specified foreign financial assets with an aggregate value in excess of the applicable dollar thresholds are required to report information to the IRS relating to our ordinary shares, subject to certain exceptions (including an exception for ordinary shares held in accounts maintained by U.S. financial institutions), by attaching a complete IRS Form 8938 (Statement of Specified Foreign Financial Assets) with their tax return for each year in which they hold our ordinary shares. Substantial penalties apply to any failure to file IRS Form 8938 and the period of limitations on assessment and collection of U.S. federal income taxes will be extended in the event of a failure to comply. U.S. Holders are urged to consult their tax advisors regarding the effect, if any, of these rules on the ownership and disposition of our ordinary shares.
Information Reporting and Backup Withholding
Payments of dividends and sales proceeds that are made within the United States or through certain U.S.-related financial intermediaries are subject to information reporting, and may be subject to backup withholding. Backup withholding generally will not apply, however, to a U.S. Holder if (i) the U.S. Holder is a corporation or other exempt recipient or (ii) in the case of backup withholding, the U.S. Holder provides a correct taxpayer identification number and certifies that it is not subject to backup withholding.
Backup withholding is not an additional tax. The amount of any backup withholding from a payment to a holder will be allowed as a credit against such holder’s U.S. federal income tax liability and may entitle it to a refund, provided that the required information is timely furnished to the IRS.
THE U.S. FEDERAL INCOME TAX DISCUSSION SET FORTH ABOVE IS INCLUDED FOR GENERAL INFORMATION ONLY AND MAY NOT BE APPLICABLE TO YOU DEPENDING UPON YOUR PARTICULAR SITUATION. PROSPECTIVE INVESTORS ARE URGED TO CONSULT THEIR OWN TAX ADVISORS WITH RESPECT TO THE TAX CONSEQUENCES TO THEM OF THE OWNERSHIP AND DISPOSITION OF OUR ORDINARY SHARES INCLUDING THE TAX CONSEQUENCES UNDER STATE, LOCAL, ESTATE, FOREIGN AND OTHER TAX LAWS AND TAX TREATIES AND THE POSSIBLE EFFECTS OF CHANGES IN U.S. OR OTHER TAX LAWS.
153
LEGAL MATTERS
The validity of the securities offered by this prospectus will be passed upon for us by Travers Thorp Alberga.
EXPERTS
The consolidated financial statements of Rockley Photonics Limited at December 31, 2020 and 2019, and for each of the two years in the period ended December 31, 2020, included in the prospectus of Rockley Photonics Holdings Limited, which is referred to and made part of this Registration Statement, have been audited by Ernst & Young LLP, independent registered public accounting firm, as set forth in their report thereon (which contains an explanatory paragraph describing conditions that raise substantial doubt about the Company’s ability to continue as a going concern as described in Note 1 to the consolidated financial statements) appearing elsewhere herein, and are included in reliance upon such report given on the authority of such firm as experts in auditing and accounting.
WHERE YOU CAN FIND MORE INFORMATION
We are required to file annual, quarterly and current reports, proxy statements and other information with the SEC as required by the Exchange Act. The SEC maintains an Internet site that contains reports, proxy and information statements, and other information regarding issuers, including Rockley, that file electronically with the SEC. You can read Rockley’s SEC filings, including this prospectus, over the Internet at the SEC’s website at http://www.sec.gov.
Our website address is www.rockleyphotonics.com. Through our website, we make available, free of charge, the following documents as soon as reasonably practicable after they are electronically filed with, or furnished to, the SEC, including our Annual Reports on Form
10-K;
our proxy statements for our annual and special shareholder meetings; our Quarterly Reports on Form10-Q;
our Current Reports on Form8-K;
Forms 3, 4, and 5 and Schedules 13D with respect to our securities filed on behalf of our directors and our executive officers; and amendments to those documents. The information contained on, or that may be accessed through, our website is not a part of, and is not incorporated into, this prospectus.We will provide to each person, including any beneficial owner, to whom a prospectus is delivered, a copy of any or all of the reports or documents that have been incorporated by reference in the prospectus contained in the registration statement but not delivered with the prospectus. We will provide these reports or documents upon written or oral request at no cost to the requester. You may request these reports or documents by contacting us at: Rockley Photonics Holdings Limited, 3rd Floor, 1 Ashley Road, Altrincham, Cheshire, United Kingdom WA14 2DT, Attn: Investor Relations, telephone number +44 (0) 1865 292017 oremail address: investors@rockleyphotonics.comOur website address is
626-995-0001,
.
www.rockleyphotonics.com and such reports and documents may be accessed from
https://investors.rockleyphotonics.com/financials/sec-filings/default.aspxiv.
Information contained on or accessible through Rockley’s website is not a part of the registration statement of which this prospectus forms a part, and the inclusion of Rockley’s website address in this prospectus is an inactive textual reference only.DISCLOSURE OF COMMISSION POSITION ON INDEMNIFICATION FOR SECURITIES ACT LIABILITIES
Insofar as indemnification for liabilities arising under the Securities Act may be permitted to our directors, officers, and controlling persons, we have been informed that in the opinion of the Securities and Exchange Commission this indemnification is against public policy as expressed in the Securities Act and is therefore unenforceable.
154
INDEX TO CONDENSED CONSOLIDATED FINANCIAL STATEMENTS
ROCKLEY PHOTONICS HOLDINGS LIMITED
For the Nine Months Ended September 30, 2021 (Unaudited)
Page | ||||
| F-2 | ||||
| F-3 | ||||
| F-4 | ||||
| F-5 | ||||
| F-6 | ||||
F-1
ROCKLEY PHOTONICS HOLDINGS LIMITED
Condensed Consolidated Balance Sheets
(in thousands, except share amounts and par value)
September 30, 2021 | December 31, 2020 | |||||||
(Unaudited) | ||||||||
Assets | ||||||||
Current assets | ||||||||
Cash and cash equivalents | $ | 75,191 | $ | 19,228 | ||||
Short-term investments, at fair value | 29,317 | 0 | ||||||
Accounts receivable | 1,516 | 4,925 | ||||||
Other receivables | 24,966 | 18,024 | ||||||
Prepaid expenses | 9,815 | 1,605 | ||||||
Other current assets | 4 | 609 | ||||||
Total current assets | 140,809 | 44,391 | ||||||
Long-term investments, at fair value | 20,485 | 0 | ||||||
Property, equipment, net | 9,358 | 6,182 | ||||||
Equity method investment | 4,856 | 5,202 | ||||||
Intangible assets, net | 3,048 | 3,048 | ||||||
Other non-current assets | 3,069 | 1,607 | ||||||
Total assets | $ | 181,625 | $ | 60,430 | ||||
Liabilities and Shareholders’ Equity (Deficit) | ||||||||
Current liabilities | ||||||||
Trade payables | $ | 6,266 | $ | 4,413 | ||||
Accrued expenses | 16,121 | 10,395 | ||||||
Debt, current portion | 28,590 | 0 | ||||||
Other current liabilities | 923 | 998 | ||||||
Total current liabilities | 51,900 | 15,806 | ||||||
Long-term debt, net of current portion | 0 | 74,804 | ||||||
Warrant liabilities | 13,789 | 0 | ||||||
Other long-term liabilities | 2,442 | 1,127 | ||||||
Total liabilities | $ | 68,131 | $ | 91,737 | ||||
Commitments and contingencies (Note 15) | 0 | 0 | ||||||
Shareholders’ equity (deficit) | ||||||||
Ordinary shares, $0.000004 par value; 12,417,500,000 and 139,033,366 authorized as of September 30, 2021 and December 31, 2020, respectively; 126,675,098 and 83,539,382 issued and outstanding as of September 30, 2021 and December 31, 2020, respectively | 0 | 0 | ||||||
Additional paid-in-capital | 499,683 | 201,576 | ||||||
Accumulated deficit | (386,189 | ) | (232,883 | ) | ||||
Total shareholders’ equity (deficit) | 113,494 | (31,307 | ) | |||||
Total liabilities and shareholders’ equity (deficit) | $ | 181,625 | $ | 60,430 | ||||
See accompanying notes to condensed consolidated financial statements.
F-2
ROCKLEY PHOTONICS HOLDINGS LIMITED
Condensed Consolidated Statements of Operations and Comprehensive Loss
(Unaudited and in thousands, except share and per share amounts)
Three Months Ended September 30, | Nine Months Ended September 30, | |||||||||||||||
2021 | 2020 | 2021 | 2020 | |||||||||||||
Revenue | $ | 1,839 | $ | 4,517 | $ | 5,805 | $ | 19,061 | ||||||||
Cost of revenue | 3,459 | 5,015 | 11,742 | 18,100 | ||||||||||||
Gross profit | (1,620 | ) | (498 | ) | (5,937 | ) | 961 | |||||||||
Operating expenses: | ||||||||||||||||
Selling, general, and administrative expenses | 13,568 | 5,354 | 27,588 | 12,603 | ||||||||||||
Research and development expenses | 26,418 | 10,790 | 59,949 | 27,007 | ||||||||||||
Total operating expenses | 39,986 | 16,144 | 87,537 | 39,610 | ||||||||||||
Loss from operations | (41,606 | ) | (16,642 | ) | (93,474 | ) | (38,649 | ) | ||||||||
Other income (expense): | ||||||||||||||||
Forgiveness of PPP loan | — | — | 2,860 | — | ||||||||||||
Interest expense, net | (1,587 | ) | 1 | (1,913 | ) | (73 | ) | |||||||||
Equity method investment loss | 40 | (689 | ) | (720 | ) | (941 | ) | |||||||||
Change in fair value of debt instruments | (14,255 | ) | (3,325 | ) | (59,916 | ) | (5,547 | ) | ||||||||
Change in fair value of warrant liabilities | 515 | — | 515 | — | ||||||||||||
Gain (loss) on foreign currency | (481 | ) | 285 | 150 | (1,369 | ) | ||||||||||
Total other income (expense) | (15,768 | ) | (3,728 | ) | (59,024 | ) | (7,930 | ) | ||||||||
Loss before income taxes | (57,374 | ) | (20,370 | ) | (152,498 | ) | (46,579 | ) | ||||||||
Provision for income tax | 598 | 154 | 808 | 374 | ||||||||||||
Net loss and comprehensive loss | $ | (57,972 | ) | $ | (20,524 | ) | $ | (153,306 | ) | $ | (46,953 | ) | ||||
Net loss per share: | ||||||||||||||||
Basic and diluted | $ | (0.54 | ) | $ | (0.25 | ) | $ | (1.67 | ) | $ | (0.56 | ) | ||||
Weighted-average shares outstanding: | ||||||||||||||||
Basic and diluted | 107,633,037 | 83,509,920 | 92,008,435 | 83,392,042 | ||||||||||||
See accompanying notes to condensed consolidated financial statements.
F-3
ROCKLEY PHOTONICS HOLDINGS LIMITED
Condensed Consolidated Statements of Shareholders’ Equity (Deficit)
(Unaudited and in thousands, except share amounts)
Number of Ordinary Shares | Ordinary Shares and Additional Paid-in Capital | Accumulated Deficit | Total Shareholders’ Equity (Deficit) | |||||||||||||
Balance, December 31, 2020 | 83,539,382 | 201,576 | (232,883 | ) | (31,307 | ) | ||||||||||
Net loss | — | — | (64,777 | ) | (64,777 | ) | ||||||||||
Exercise of stock options | 216,670 | 137 | — | 137 | ||||||||||||
Exercise of warrants | 57,811 | — | — | — | ||||||||||||
Issuance of warrants | — | 263 | — | 263 | ||||||||||||
Stock-based compensation | — | 1,725 | — | 1,725 | ||||||||||||
Balance, March 31, 2021 | 83,813,863 | 203,701 | (297,660 | ) | (93,959 | ) | ||||||||||
Net loss | — | — | (30,557 | ) | (30,557 | ) | ||||||||||
Exercise of stock options | 192,064 | 146 | — | 146 | ||||||||||||
Stock-based compensation | — | 1,976 | — | 1,976 | ||||||||||||
Balance, June 30, 2021 | 84,005,927 | 205,823 | (328,217 | ) | (122,394 | ) | ||||||||||
Net loss | — | — | (57,972 | ) | (57,972 | ) | ||||||||||
Exercise of stock options | 57,123 | 86 | — | 86 | ||||||||||||
Exercise of warrants | 4,057,307 | 379 | — | 379 | ||||||||||||
Conversion of convertible notes to ordinary shares | 15,896,210 | 181,404 | — | 181,404 | ||||||||||||
Equity consideration issued to SC Health | 1,777,031 | 17,966 | — | 17,966 | ||||||||||||
Equity consideration issued to PIPE | 10,000,000 | 100,000 | — | 100,000 | ||||||||||||
Equity consideration issued to SC Health Sponsor | 10,562,500 | 50,000 | — | 50,000 | ||||||||||||
Stock-based compensation | — | 2,155 | — | 2,155 | ||||||||||||
Transaction costs | — | (43,825 | ) | — | (43,825 | ) | ||||||||||
Non-cash fair value of assumed liability-classified ordinary share warrants | — | (14,305 | ) | — | (14,305 | ) | ||||||||||
Ordinary share issuance, net of issuance costs | 319,000 | — | — | — | ||||||||||||
Balance, September 30, 2021 | 126,675,098 | 499,683 | (386,189 | ) | 113,494 | |||||||||||
Number of Ordinary Shares | Ordinary Shares and Additional Paid-in Capital | Accumulated Deficit | Total Shareholders’ Equity (Deficit) | |||||||||||||
Balance, December 31, 2019 | 82,792,725 | $ | 188,865 | $ | (152,606 | ) | $ | 36,259 | ||||||||
Net loss | — | — | (16,426 | ) | (16,426 | ) | ||||||||||
Exercise of stock options | 9,263 | 20 | — | 20 | ||||||||||||
Exercise of warrants | 13,717 | 7 | — | 7 | ||||||||||||
Stock-based compensation | — | 1,644 | — | 1,644 | ||||||||||||
Ordinary share issuance, net of issuance costs | 366,147 | 2,087 | — | 2,087 | ||||||||||||
Balance, March 31, 2020 | 83,181,852 | $ | 192,623 | $ | (169,032 | ) | $ | 23,591 | ||||||||
Net loss | — | — | (10,003 | ) | (10,003 | ) | ||||||||||
Exercise of stock options | — | — | — | — | ||||||||||||
Exercise of warrants | — | — | — | — | ||||||||||||
Stock-based compensation | — | 2,545 | — | 2,545 | ||||||||||||
Ordinary share issuance, net of issuance costs | — | (126 | ) | — | (126 | ) | ||||||||||
Balance, June 30, 2020 | 83,181,852 | $ | 195,042 | $ | (179,035 | ) | $ | 16,007 | ||||||||
Net loss | — | — | (20,524 | ) | (20,524 | ) | ||||||||||
Exercise of stock options | — | — | — | — | ||||||||||||
Exercise of warrants | — | — | — | — | ||||||||||||
Stock-based compensation | — | 1,677 | — | 1,677 | ||||||||||||
Ordinary share issuance, net of issuance costs | — | — | — | — | ||||||||||||
Balance, September 30, 2020 | 83,181,852 | 196,719 | (199,559 | ) | (2,840 | ) | ||||||||||
See accompanying notes to condensed consolidated financial statements.
F-4
ROCKLEY PHOTONICS HOLDINGS LIMITED
Condensed Consolidated Statements of Cash Flows
(Unaudited and in thousands)
Nine Months Ended September 30, | ||||||||
2021 | 2020 | |||||||
Cash flows from operating activities: | ||||||||
Net loss | $ | (153,306 | ) | $ | (46,953 | ) | ||
Adjustments to reconcile net loss to net cash used in operating activities: | ||||||||
Depreciation of property and equipment | 3,228 | 2,095 | ||||||
Amortization of debt issuance costs | 0 | 26 | ||||||
Gain on disposal of property and equipment | 0 | (98 | ) | |||||
Bad debt expense | 377 | 0 | ||||||
Accretion of marketable securities to redemption value | (32 | ) | 0 | |||||
Stock-based compensation | 5,856 | 5,865 | ||||||
Change in equity-method investment | 346 | 941 | ||||||
Change in fair value of debt instrument | 59,916 | 5,547 | ||||||
Change in fair value of warrant liabilities | (515 | ) | 0 | |||||
Forgiveness of Paycheck Protection Program loan | (2,860 | ) | 0 | |||||
Changes in operating assets and liabilities: | ||||||||
Accounts receivable | 3,032 | (1,111 | ) | |||||
Other receivables | (6,942 | ) | 4,036 | |||||
Prepaid expenses and other current assets | (7,859 | ) | 878 | |||||
Other non-current assets | (1,330 | ) | 485 | |||||
Trade payables | 1,147 | (3,915 | ) | |||||
Accrued expenses | 5,800 | 4,306 | ||||||
Other current and long-term liabilities | 1,240 | (840 | ) | |||||
Net cash used in operating activities | (91,902 | ) | (28,738 | ) | ||||
Cash flows from investing activities: | ||||||||
Purchase of property and equipment | (5,698 | ) | (1,090 | ) | ||||
Purchase of marketable securities | (54,800 | ) | 0 | |||||
Proceeds from sale of marketable securities | 5,000 | 0 | ||||||
Proceeds from maturity of marketable securities | 30 | 0 | ||||||
Payment for asset acquisition | (500 | ) | 0 | |||||
Investment in equity method investee | 0 | (2,500 | ) | |||||
Net cash used in investing activities | (55,968 | ) | (3,590 | ) | ||||
Cash flows from financing activities: | ||||||||
Proceeds from convertible loan notes | 76,723 | 28,714 | ||||||
Principal payments on long-term debt | 0 | (1,979 | ) | |||||
Proceeds from issuance of ordinary shares | 167,966 | 1,961 | ||||||
Proceeds from Paycheck Protection Program loan | 0 | 2,860 | ||||||
Proceeds from exercise of options | 369 | 20 | ||||||
Proceeds from the exercise of warrants | 379 | 7 | ||||||
Proceeds from issuance of warrants | 263 | 0 | ||||||
Debt issuance costs incurred | (383 | ) | 0 | |||||
Transaction costs | (41,484 | ) | 0 | |||||
Principal payments on finance lease | 0 | (1,231 | ) | |||||
Net cash provided by financing activities | 203,833 | 30,352 | ||||||
Net increase (decrease) in cash and cash equivalents | 55,963 | (1,976 | ) | |||||
Cash and cash equivalents: | ||||||||
Beginning of period | 19,228 | 20,904 | ||||||
End of period | $ | 75,191 | $ | 18,928 | ||||
See accompanying notes to condensed consolidated financial statements.
F-5
ROCKLEY PHOTONICS HOLDINGS LIMITED
Notes to Condensed Consolidated Financial Statements
(Unaudited)
1. | Description of Business and Significant Accounting Policies |
Description of Business
On August 11, 2021, Rockley Photonics Limited (“Legacy Rockley”) completed a business combination (the “Business Combination”) with SC Health Corporation, a special purpose acquisition company (“SC Health”), with Rockley Photonics Holdings Limited and its subsidiaries surviving the merger. Upon the consummation of the Business Combination, the Company became a publicly traded company listed on the New York Stock Exchange (“NYSE”) under the symbol “RKLY”. For additional information on the Business Combination, please refer to Note 2,, to these condensed consolidated financial statements. Unless the context otherwise requires, references in these notes to “Rockley”, the “Company”, “we”, “us”, or “our” and any related terms are intended to mean the post-Business Combination consolidated company, Rockley Photonics Holdings Limited, while “Legacy Rockley” and “SC Health” refers to the entities prior to the Business Combination.
Business Combination
Rockley specializes in the research and development of integrated silicon photonics chipsets. Rockley has developed a versatile, application specific, third-generation silicon photonics platform specifically designed for the optical integration challenges facing numerous mega-trend markets. Rockley has partnered with multiple
tier-1
customers across the markets to deliver complex optical systems required for transformational sensors, communications, and medical product realization.Basis of Presentation and Preparation
The accompanying unaudited condensed consolidated financial statements have been prepared by the Company, and reflect all adjustments, consisting only of normal recurring adjustments, that are, in the opinion of management, necessary for the fair presentation of our financial position, results of operations, comprehensive income, cash flows and shareholders’ equity for the interim periods presented. The statements have been prepared in accordance with GAAP for interim financial information. Accordingly, these statements do not include all information and footnotes required by GAAP for annual consolidated financial statements, and should be read in conjunction with Legacy Rockley’s audited consolidated financial statements and notes thereto as of and for the year ended December 31, 2020 in Rockley Photonics Holdings Limited’s Form
S-4
Registration Statement (FileNo. 333-255019),
which was declared effective by the SEC on July 22, 2021. The results of operations for the three and nine months ended September 30, 2021 are not necessarily indicative of the operating results to be expected for the full fiscal year or future operating periods.We accounted for the Business Combination as a forward recapitalization in accordance with GAAP (the “Forward Recapitalization”). Under this method of accounting, SC Health was treated as the acquired company and Legacy Rockley was deemed to be the accounting acquirer for financial reporting purposes. Accordingly, for accounting purposes, the Forward Recapitalization was treated as the equivalent of Legacy Rockley issuing stock for the net assets of SC Health, accompanied by a recapitalization. The net assets of SC Health are stated at historical cost, with no goodwill or other intangible assets recorded. The condensed consolidated assets, liabilities and results of operations prior to the Forward Recapitalization are those of Legacy Rockley. The condensed consolidated financial statements of the combined company post-Forward Recapitalization represents the combined results of Rockley and SC Health beginning August 11, 2021, the date the Business Combination was consummated. The shares, corresponding capital amounts and earnings per share available for shareholders of Legacy Rockley, prior to the Business Combination, converted into the right to receive 2.4835 shares (the “Exchange Ratio”) of ordinary shares, par value $0.000004 (the “ordinary shares”). The recapitalization of the number of ordinary shares attributable to Legacy Rockley is reflected retroactively as shares reflecting the Exchange Ratio to the earliest period presented and is utilized for calculating earnings per share in all prior periods presented.
F-6
The preparation of the condensed consolidated financial statements in conformity with GAAP requires management to make estimates and assumptions that affect the reported amounts of assets and liabilities and disclosure of contingent assets and liabilities at the date of the condensed consolidated financial statements and the reported amounts of revenues and expenses during the reporting periods. Such estimates include, but are not limited to, revenue recognition, reserves and allowances; valuation of intangibles; product warranties; employee compensation and benefit accruals; stock-based compensation; loss contingencies; income taxes; fair value measurements; and warrant liabilities. Actual results could differ materially from those estimates. Management’s estimates include, as applicable, the anticipated impacts of the
COVID-19
pandemic.Available-for-Sale
We classify our investments in debt securities asinvestments. Debt securities primarily consist of corporate bonds, commercial paper and U.S. Treasury debt securities. These investments are primarily held in the custody of a major financial institution. A specific identification method is used to determine the cost basis of debt securities sold. These investments are recorded in the consolidated balance sheets at fair value.
available-for-sale
Unrealized gains and temporary losses, net of related taxes, are included in accumulated other comprehensive income (loss) (“AOCI”). Upon realization, those amounts are reclassified from AOCI to earnings. The amortization of premiums and discounts on the investments are included in our results of operations. Realized gains and losses are calculated based on the specific identification method.
We classify our investments as current or
non-current
based on the nature of the investment and their availability for use in current operations.Other-than-Temporary Impairments on Investments
All of ourinvestments are subject to periodic impairment review. When the fair value of a debt security is less than its amortized cost, it is deemed impaired, and we assess whether the impairment is other-than-temporary. An impairment is considered other-than-temporary if (i) we have the intent to sell the security, (ii) it is more likely than not that we will be required to sell the security before recovery of the entire amortized cost basis, or (iii) we do not expect to recover the entire amortized cost basis of the security. If impairment is considered other-than-temporary based on condition (i) or (ii) described above, the entire difference between the amortized cost and the fair value of the debt security is recognized in the results of operations. If an impairment is considered other-than-temporary based on condition (iii) described above, the amount representing credit losses (defined as the difference between the present value of the cash flows expected to be collected and the amortized cost basis of the debt security) is recognized in earnings, and the amount relating to all other factors is recognized in other comprehensive income (OCI).
available-for-sale
Going Concern
The Company has incurred net losses since inception, has an accumulated deficit of $386.2 million as of September 30, 2021 and negative cash flow from operations of $91.9 million for the nine months ended September 30, 2021 and expects to incur losses from operations for the foreseeable future. As of September 30, 2021, the Company had cash and cash equivalents of approximately $75.2 million. The Company’s ability to meet its obligations in the ordinary course of business is dependent on its ability to obtain additional financing. As a result, there is substantial doubt about our ability to continue as a going concern. The condensed consolidated financial statements have been prepared on a going concern basis, which contemplates the realization of assets and satisfaction of liabilities in the normal course of business. The condensed consolidated financial statements do not include any adjustments relating to the recoverability and classification of recorded asset amounts or the amounts and classification of liabilities that might result from the outcome of this uncertainty.
F-7
Our future liquidity needs, and ability to address those needs, will largely be determined by our ability to obtain additional financing on terms acceptable to us. We will continue to seek additional capital through the sale of debt or equity, or other arrangements, however, there can be no assurance that we will be able to raise additional capital when needed or under acceptable terms, if at all. The sale of additional equity may dilute existing shareholders and newly issued shares may contain senior rights and preferences compared to currently outstanding ordinary shares. Issued debt securities may contain covenants and limit our ability to pay dividends or make other distributions to shareholders. If we are unable to obtain additional financing, operations may be scaled back or discontinued.
Global Pandemic
The
COVID-19
global pandemic has prompted extraordinary measures by governments and businesses to control the spread ofCOVID-19
in most or all regions throughout the world. These actions have included travel bans, quarantines, and similar mandates for individuals to substantially restrict normal activities and for businesses to curtail normal operations.The COVID19 pandemic has adversely impacted our operational efficiency and caused delays in operational activities. During the third quarter of 2021, we continue to take cautious steps to protect our workforce, support community efforts, and follow local government guidelines. Certain key laboratory employees and facilities have continued internal testing and laboratory work to the extent necessary to service customer commitments. The remaining
–
non-essential
workforce were recommended to continue performing their duties from home. The ongoing impact will depend on the duration of the pandemic which is being mitigated by the vaccination of the general population and gradual easing of restrictions.Recently Adopted Accounting Pronouncements
In August 2018, the FASB issued ASU, which modifies the disclosure requirements on fair value measurements in Topic 820, based on the concepts in the Concepts Statement, including the consideration of costs and benefits. An entity is permitted to early adopt either the entire standard or only the provisions that eliminate or modify requirements. The Company adopted this guidance on January 1, 2020. The adoption of the guidance did not have a material impact on the condensed consolidated financial statements.
2018-13,
Fair Value Measurement (“Topic 820”):
Disclosure Framework – Changes to the Disclosure Requirements for Fair Value Measurement
On June 16, 2016, the FASB issued ASUrequiring the measurement and recognition of expected credit losses for financial assets held at amortized cost, which include our accounts receivable and contract assets. The standard also requires that the Company recognizes credit impairment losses related to ourdebt securities through an allowance for credit losses instead of a reduction in the cost basis. The Company adopted this guidance on January 1, 2021. The adoption of the guidance did not have a material impact on the condensed consolidated financial statements.
No. 2016-13,
Measurement of Credit Losses on Financial Instruments (“Topic 326”),
available-for-sale
In August 2020, the FASB issued ASU. This ASU simplifies the accounting for certain financial instruments with characteristics of liabilities and equity, including convertible instruments and contracts in an entity’s own equity. The Company adopted this guidance on January 1, 2021. The adoption of the guidance did not have a material impact on the condensed consolidated financial statements.
2020-06,
Debt-Debt with Conversion and Other Options (Subtopic
470-20)
and Derivatives and Hedging – Contracts in Entity’s Own Equity (Subtopic815-40):
Accounting for Convertible Instruments and Contracts in an Entity’s Own EquityAccounting Pronouncements Issued but Not Yet Adopted
In December 2019, the Financial Accounting Standard Board (“FASB”) issued ASUwhich affects general principles within Topic 740,
2019-12,
Income Taxes (Topic 740): Simplifying the Accounting for Income Taxes,
F-8
and are meant to simplify and reduce the cost of accounting for income taxes. It removes certain exceptions to the general principles in Topic 740 and simplifies areas including franchise taxes that are partially based on income, transactions with a government that result in a step up in the tax basis of goodwill, the incremental approach for intraperiod tax allocation, interim period income tax accounting forlosses that exceed anticipated losses and enacted changes in tax laws in interim periods. ASU
year-to-date
2019-12
is effective for fiscal years beginning after December 15, 2020, with early adoption permitted. The Company is currently evaluating the impact this guidance will have on the condensed consolidated financial statements.2. | Business Combination |
On August 11, 2021 (the “Closing Date”), Legacy Rockley, SC Health, and Rockley Mergersub Limited, an exempted company incorporated in the Cayman Islands as a direct wholly owned subsidiary of the Company (“Merger Sub”), consummated the business combination contemplated by the Business Combination Agreement and Plan of Merger, dated as of March 19, 2021 (the “Business Combination Agreement”). Immediately upon the consummation of the Business Combination, Legacy Rockley became a wholly owned subsidiary of the Company and Merger Sub merged with and into SC Health, with SC Health surviving the merger and becoming a direct wholly owned subsidiary of the Company. Subsequently, SC Health’s ordinary shares and warrants ceased trading on the NYSE while the Company’s ordinary shares and warrants began trading on the NYSE under the symbols “RKLY” and “RKLY.WS,” respectively.
Pursuant to the Business Combination Agreement, each of the following transactions occurred in the following order: (i) pursuant to a scheme of arrangement approved by the UK courts (the “Scheme”), on August 9, 2021, all of Legacy Rockley’s ordinary shares, including shares issued immediately prior to the Scheme becoming effective as a result of the conversion of then-outstanding convertible loan notes and the exercise of warrants, were transferred by Rockley shareholders in exchange for an equivalent number of shares in the Company; (ii) the holders of options over shares in Legacy Rockley rolled over their options into new options to purchase shares in the Company; (iii) warrants to purchase shares in Legacy Rockley (other than one warrant instrument that by its terms was replicated at the Company) not exercised for shares in Legacy Rockley prior to the effectiveness of the Scheme described above were cancelled, such that immediately following the Scheme, Legacy Rockley became a direct wholly-owned subsidiary of the Company; (iv) the Company subsequently completed a stock-split to prepare its share capital for Merger Sub’s merger into SC Health; (v) certain accredited investors (including entities affiliated with the SC Health Sponsor) purchased an aggregate of 15.0 million ordinary shares for a purchase price of $10.00 per share, or an aggregate purchase price of $150.0 million; (vi) on August 11, 2021, Merger Sub was merged with and into SC Health, with SC Health surviving the merger and becoming a direct wholly-owned subsidiary of the Company; and (vii) the ordinary shares and warrants in SC Health were exchanged for ordinary shares and warrants in the Company.
The Business Combination was accounted for as a forward recapitalization, with no goodwill or other intangible assets recorded, in accordance with GAAP. Under this method of accounting, SC Health was treated as the acquired company and Legacy Rockley was deemed to be the accounting acquirer for financial reporting purposes. This determination was primarily based on the existing shareholders of Legacy Rockley obtaining a majority voting power in the Company, and as such, having the power to appoint a majority of the members of the Company’s board of directors (the “Board”); the operations of Legacy Rockley prior to the acquisition comprising the only ongoing operations of the combined entity based on the historical operating activity and employee base; and the senior management of Legacy Rockley comprising the majority of the senior management of the Company. Accordingly, for accounting purposes, the financial statements of the Company represent a continuation of the financial statements of Legacy Rockley with the acquisition being treated as the equivalent of Legacy Rockley issuing stock for the net assets of SC Health, accompanied by a recapitalization.
As a result of the Business Combination, the Company incurred equity issuance costs and other costs considered direct and incremental to the transaction, totaling $43.8 million and consisting of legal, accounting,
F-9
financial advisory and other professional fees. These amounts are reflected within additional
paid-in
capital in the condensed consolidated balance sheet as of September 30, 2021.Summary of Net Proceeds
The following table reconciles the elements of the net proceeds from the Business Combination as of September 30, 2021 (in thousands):
Recapitalization | ||||
Cash inflow from SC Health’s trust account, net of redemptions | $ | 17,966 | ||
Cash inflow from PIPE | 100,000 | |||
Cash inflow from SC Health Sponsor | 50,000 | |||
Less: Transaction Costs | (43,825 | ) | ||
Net cash received from the Business Combination | $ | 124,141 | ||
Summary of Shares Issued
The total number of shares of the Company’s ordinary shares issued and outstanding immediately following the consummation of the Business Combination was approximately 126.7 million, comprising (in thousands):
Number of Shares | ||||
Current Rockley’s shareholders prior to the Business Combination | 104,016 | |||
SC Health Shareholders | 1,777 | |||
Sponsor Shareholders | 10,563 | |||
PIPE Investors | 10,000 | |||
Other Shareholders 1 | 319 | |||
Total number of shares | 126,675 | |||
| 1 | The Company issued 319,000 ordinary shares at a value of $10.00 per share to Cowen and Company LLC (“Cowen”) and BCW Securities LLC in lieu of cash payment for a portion of the fees payable $3.2 million to Cowen as part of the transaction costs. |
3. | Segment, Geographic, and Significant Customer Information |
Our operations are organized into a single operating and reportable segment for financial reporting purposes, based on how our Chief Operating Decision Maker (“CODM”) manages the business, makes operating decisions around the allocation of resources, and evaluates operating performance. Our CODM is our Chief Executive Officer, who reviews our operating results on a consolidated basis.
The following table presents our revenue disaggregated by primary geographical market where revenues are attributable to the region in which the billing address of the customer is located (in thousands):
Three Months Ended September 30, | Nine Months Ended September 30, | |||||||||||||||
2021 | 2020 | 2021 | 2020 | |||||||||||||
(Unaudited) | (Unaudited) | |||||||||||||||
United States | $ | 1,537 | $ | 2,265 | $ | 5,503 | $ | 14,351 | ||||||||
Rest of World | $ | 302 | $ | 2,252 | $ | 302 | $ | 4,710 | ||||||||
Total revenue | $ | 1,839 | $ | 4,517 | $ | 5,805 | $ | 19,061 | ||||||||
F-10
The following tables summarize our most significant customers as of September 30, 2021 and December 31, 2020 and for the three and nine months ended September 30, 2021 and 2020:
Revenue | ||||||||||||||||
Three Months Ended September 30, | Nine Months Ended September 30, | |||||||||||||||
2021 | 2020 | 2021 | 2020 | |||||||||||||
(Unaudited) | (Unaudited) | |||||||||||||||
Customer A | 69 | % | 50 | % | 89 | % | 75 | % | ||||||||
Customer B | 16 | % | 50 | % | 5 | % | 25 | % | ||||||||
Accounts Receivable | ||||||||
As of | ||||||||
September 30, 2021 | December 31, 2020 | |||||||
(Unaudited) | ||||||||
Customer A | 63 | % | 33 | % | ||||
Customer B | 20 | % | 67 | % | ||||
4. | Equity Method Investment |
As of September 30, 2021 and December 31, 2020, we held an investment in Hengtong Rockley Technology Co., Ltd (“HRT”) and we appointed two of the HRT’s five board members. HRT manufactures and sells optical fiber transceivers based on silicon photonics chipsets. HRT has share capital consisting solely of ordinary shares. We hold 24.9% of HRT’s ordinary shares, and the same proportion of its voting rights. We consider HRT to be a variable interest entity upon which the Company does exercise significant influence. However, the Company concluded it does not control the investment. Accordingly, the investment in HRT is accounted for under the equity method. We elected to use a three-month lag to record our share of HRT’s results. See Note 13, Related Party Transactions for details on the Company’s transactions with HRT.
The following table summarizes our investment in HRT for the nine months ended September 30, 2021 (in thousands):
Beginning balance, January 1, 2021 | $ | 5,202 | ||
Investment in HRT | 0 | |||
Remeasurement gain on HRT | 374 | |||
Share of loss of HRT | (720 | ) | ||
Ending balance, September 30, 2021 | $ | 4,856 | ||
Our maximum exposure to loss as a result of our involvement with HRT is limited to the balance of our investment.
5. | Financial Instruments and Fair Value Measurements |
The accounting guidance for fair value measurements provides a framework for measuring fair value on either a recurring or nonrecurring basis, whereby the inputs used in valuation techniques are assigned a hierarchical level. The following are the three levels of inputs to measure fair value:
Level
1:
Level
2:
F-11
Level
3:
We consider an active market to be one in which transactions for the asset or liability occur with sufficient frequency and volume to provide pricing information on an ongoing basis, and consider an inactive market to be one in which there are infrequent or few transactions for the asset or liability, the prices are not current, or price quotations vary substantially either over time or among market makers. Where appropriate, our own or the counterparty’s
non-performance
risk is considered in measuring the fair values of liabilities and assets, respectively.Investments
The following is a summary of our investments at their cost or amortized cost for the periods ended September 30, 2021 and December 31, 2020 (in thousands):
As of | ||||||||
September 30, 2021 | December 31, 2020 | |||||||
(Unaudited) | ||||||||
Corporate bonds and commercial paper | $ | 25,082 | $ | 0 | ||||
U.S. Treasury securities | 24,668 | 0 | ||||||
Total investments | $ | 49,750 | $ | 0 | ||||
The fair value of our investments approximates their cost or amortized cost for both periods presented.
The following table presents the contractual maturities of our debt investments as of September 30, 2021 (in thousands):
Amortized Cost | Fair Value | |||||||
Due in one year or less | $ | 29,315 | $ | 29,317 | ||||
Due after one year through five years | 20,435 | 20,485 | ||||||
| $ | 49,750 | $ | 49,802 | |||||
Actual maturities may differ from the contractual maturities because borrowers may have the right to call or prepay certain obligations.
F-12
Fair Value of Financial Instruments
The following table summarizes our financial assets measured at fair value on a recurring basis (in thousands):
September 30, 2021 | ||||||||||||
Fair Value Measurements at Reporting Date Using | ||||||||||||
Total | Level 1 | Level 2 | ||||||||||
Cash and cash equivalents | $ | 75,191 | $ | 75,191 | $ | 0 | ||||||
Corporate bonds and commercial paper | 25,085 | 0 | 25,085 | |||||||||
U.S. Treasury securities | 24,717 | 24,717 | 0 | |||||||||
Total cash, cash equivalents and investments | $ | 124,993 | $ | 99,908 | $ | 25,085 | ||||||
December 31, 2020 | ||||||||||||
Fair Value Measurements at Reporting Date Using | ||||||||||||
Total | Level 1 | Level 2 | ||||||||||
Cash and cash equivalents | $ | 19,228 | $ | 19,228 | $ | 0 | ||||||
Total cash and cash equivalents | $ | 19,228 | $ | 19,228 | $ | 0 | ||||||
The financial liabilities subject to fair value measurement on a recurring basis, were as follows (in thousands):
As of | ||||||||
September 30, 2021 | December 31, 2020 | |||||||
(Unaudited) | ||||||||
Financial Liabilities | ||||||||
3.00% – 2020 Convertible Notes | $ | 0 | $ | 32,106 | ||||
8.00% – 2020 Convertible Notes | 0 | 14,789 | ||||||
2020 Term Facility Loan | 0 | 25,049 | ||||||
Private Placement Warrants | 13,789 | 0 | ||||||
Total financial liabilities | $ | 13,789 | $ | 71,944 | ||||
As of September 30, 2021, there was no fair value associated with the convertible debt instruments due to the conversion of the debt securities into the Company’s ordinary shares in connection with the Business Combination. The estimated fair value of the debt securities prior to their conversion into the Company’s ordinary shares was $208.6 million. The estimated fair value of the convertible securities on the Closing Date was calculated as the product of (i) the number of conversion shares at the Closing Date and (ii) the marketable value per ordinary share at the Closing Date. Changes in the fair value of debt that is accounted for at fair value are presented as gains or losses in the condensed consolidated statements of operations and comprehensive loss under Change in Fair Value of Debt Instruments.
3.00% – 2020 Convertible Notes
On March 9, 2020, Legacy Rockley issued $21.3 million of the 3.00% Convertible Notes and elected the fair value option of accounting for this debt instrument (see Note 7, Debt for details). In connection with the closing of the Business Combination on August 11, 2021, the outstanding principal and interest of the 3.00% Convertible Notes Due 2025 were cancelled and converted into the right to receive ordinary shares of the Company, resulting in $
0.0 million
outstanding balance on the 3.00% Convertible Notes at September 30, 2021.F-13
For the three and nine months ended September 30, 2021, we recorded a loss of $1.9 million and $6.0 million, respectively from a change in fair value of debt in connection with the subsequent fair value remeasurement of the 3.00% Convertible Notes, as follows (in thousands):
Fair value at December 31, 2020 | $ | 32,106 | ||
Plus: Loss from change in fair value | $ | 5,986 | ||
Less: Fair value adjustment extinguished upon conversion of debt | $ | (38,092 | ) | |
Fair value at September 30, 2021 | $ | 0 | ||
A binomial lattice model was used to determine the fair value of the 3.00% Convertible Notes based on assumptions as to when the notes would be converted or redeemed at each decision point. Within the lattice model, the following assumptions were made: (i) upon IPO/Sale/Merger/SPAC or maturity, the convertible notes may be converted to ordinary shares or redeemed at principal and accrued interest; and (ii) upon qualified financing event, the convertible notes will automatically convert to ordinary shares. The lattice model used the share price, conversion price, maturity date, risk-free rate, estimated stock volatility and estimated credit spread. The remeasurement of the fair value of the debt instrument was recorded as a gain or loss in the statements of operations and comprehensive loss for each reporting period.
8.00% – 2020 Convertible Notes
On February 19, 2020, Legacy Rockley issued $8.0 million of 8.00% Convertible Notes and elected the fair value option of accounting for this debt instrument (see, Debt for details). In connection with the closing of the Business Combination on August 11, 2021, the outstanding principal, interest and warrants of the 8.00% Convertible Notes were cancelled and converted into the right to receive ordinary shares of the Company, resulting in $
Note 7
0.0 million
outstanding balance on the 8.00% Convertible Notes at September 30, 2021.For the three and nine months ended September 30, 2021, we recorded a loss of $13.9 million and $16.1 million, respectively from a change in fair value of debt in connection with the subsequent fair value remeasurement of the 8.00% Convertible Notes, as follows (in thousands):
Fair value at December 31, 2020 | $ | 14,789 | ||
Plus: Loss from change in fair value | $ | 16,108 | ||
Less: Fair value adjustment extinguished upon conversion of debt | $ | (30,897 | ) | |
Fair value at September 30, 2021 | $ | 0 | ||
A binomial lattice model was used to determine the fair value of the 8.00% Convertible Notes Due 2025 based on assumptions as to when the notes would be converted or redeemed at each decision point. Within the lattice model, the following assumptions were made: (i) upon IPO/Sale/Merger/SPAC or maturity, the convertible notes may be converted to ordinary shares or put at 125% of principal and accrued interest; and (ii) upon financing event, the convertible notes may be converted to ordinary shares. The remeasurement of the fair value of the debt instrument was recorded as a gain or loss in the statements of operations and comprehensive loss for each reporting period.
2020 Term Facility Loan
On September 29, 2020, Legacy Rockley issued $35.0 million of convertible notes and at inception elected the fair value option of accounting for this debt instrument (see, Debt for details). In connection with the closing of the Business Combination on August 11, 2021, thirty percent (30%) of the outstanding principal and interest balance of the 2020 Term Facility Loan were cancelled and converted into the right to receive ordinary shares of the Company and seventy percent (70%) of the outstanding principal and interest balance is required to be repaid in full on or prior to August 31, 2022. At September 30, 2021, the contractual outstanding principal and interest on the 2020 Term Facility Loan was $37.3 million.
Note 7
F-14
For the three and nine months ended September 30, 2021, we recorded a loss of $0.2 million and $15.1 million, respectively from a change in fair value of debt in connection with the subsequent fair value remeasurement of the 2020 Term Facility Loans, as follows (in thousands):
Fair value at December 31, 2020 | $ | 25,049 | ||
Plus: Loss from change in fair value | $ | 15,134 | ||
Less: Fair value adjustment extinguished upon conversion of the thirty percent (30%) balance | $ | (13,003 | ) | |
Fair value at August 11, 2021 | $ | 27,180 | ||
At August 11, 2021, the fair value of the 2020 Term Facility Loan was $27.2 million. The interest expense is subsequently accreted to statements of operations and comprehensive loss using the effective interest rate method over the term of the loan.
A binomial lattice model was used to determine the fair value of the 2020 Term Facility Loan based on assumptions as to when the loan would be converted upon IPO/Sale/Merger/SPAC. Upon such event, the convertible notes may be paid off as following: (i) if par value exit, repayment of base multiple times principal plus unpaid interest; (ii) if greater value exit, repayment of base multiple plus
add-on
multiple ratio times principal plus unpaid interest.5.00% – $50.0 Million Convertible Notes
On January 11, 2021, Legacy Rockley issued $50.0 million of the 5.00% – $50.0 Million Convertible Notes (the “5.00% – $50.0 Million Convertible Notes”) and at inception elected the fair value option of accounting for this debt instrument (see, Debt for details). In connection with the closing of the Business Combination, the outstanding principal and interest of the 5.00% – $50.0 Million Convertible Notes were cancelled and converted into the right to receive ordinary shares of the Company, resulting in $0.0 million outstanding balance on the 5.00% – $50.0 Million Convertible Notes at September 30, 2021.
Note 7
For the three and nine months ended September 30, 2021, we recorded a loss of $1.4 million and $2.3 million, respectively from a change in fair value of debt in connection with the subsequent fair value remeasurement of the 5.00% – $50.0 Million Convertible Notes, as follows (in thousands):
Fair value at January 11, 2021 | $ | 10,274 | ||
Plus: Loss from change in fair value | $ | 2,310 | ||
Less: Fair value adjustment extinguished upon conversion of debt | $ | (12,584 | ) | |
Fair value at September 30, 2021 | $ | 0 | ||
A binomial lattice model was used to determine the fair value of the 5.00% – $50.0 Million Convertible Notes Due 2026 based on assumptions as to when the notes would be converted or redeemed at each decision point. Within the lattice model, the following assumptions were made: (i) upon IPO/Sale/Merger/SPAC, the convertible notes may be converted to ordinary shares or put at principal and accrued interest; and (ii) upon qualified financing event or maturity, the convertible notes will automatically convert to ordinary shares at base price. The lattice model used the share price, conversion price, maturity date, risk-free rate, estimated stock volatility and estimated credit spread. The remeasurement of the fair value of the debt instrument was recorded as a gain or loss in the statements of operations and comprehensive loss for each reporting period.
5.00% – $25.0 Million Convertible Notes
On December 31, 2020, Legacy Rockley issued $25.0 million of the 5.00% – $25.0 Million Convertible Notes and at inception elected the fair value option of accounting for this debt instrument (see, Debt for
Note 7
F-15
details). In connection with the closing of the Business Combination, the outstanding principal, interest and warrants of the 5.00% – $25.0 Million Convertible Notes were cancelled and converted into the right to receive ordinary shares of the Company, resulting in $0.0 million outstanding balance on the 5.00% – $25.0 Million Convertible Notes at September 30, 2021.
For the three and nine months ended September 30, 2021, we recorded an adjustment of $(0.5) million and $5.0 million, respectively from a change in fair value of debt in connection with the subsequent fair value remeasurement of the 5.00% – $25.0 Million Convertible Notes, as follows (in thousands):
Fair value at December 31, 2020 | $ | 37,592 | ||
Plus: Loss from change in fair value | $ | 4,977 | ||
Less: Fair value adjustment extinguished upon conversion of debt | $ | (42,569 | ) | |
Fair value at September 30, 2021 | $ | 0 | ||
A binomial lattice model was used to determine the fair value of the 5.00% – $25.0 Million Convertible Notes Due 2025 based on assumptions as to when the notes would be converted or redeemed at each decision point. Within the lattice model, the following assumptions were made: (i) upon SPAC, the convertible notes may be converted to ordinary shares or put at principal and accrued interest; (ii) upon qualified financing event, the convertible notes may be converted to ordinary shares with discount any time after financing date; and (iii) upon maturity, the convertible notes may be converted to ordinary shares at $675.0 million divided by the number of fully diluted shares. The remeasurement of the fair value of the debt instrument was recorded as a gain or loss in the statements of operations and comprehensive loss for each reporting period.
5.00% – $30.0 Million Convertible Notes
On January 11, 2021, Legacy Rockley issued $30.0 million of the 5.00% Convertible Notes and at inception elected the fair value option of accounting for this debt instrument (see, Debt for details). In connection with the closing of the Business Combination, the outstanding principal and interest of the 5.00% – $30.0 Million Convertible Notes were cancelled and converted into the right to receive ordinary shares of the Company, resulting in $0.0 million outstanding balance on the 5.00% – $30.0 Million Convertible Notes at September 30, 2021.
Note 7
For the three and nine months ended September 30, 2021, we recorded an adjustment of $(2.6) million and $5.9 million, respectively from a change in fair value of debt in connection with the subsequent fair value remeasurement of the 5.00% – $30.0 Million Convertible Notes, as follows (in thousands):
Fair value at January 11, 2021 | $ | 38,403 | ||
Plus: Loss from change in fair value | $ | 5,855 | ||
Less: Fair value adjustment extinguished upon conversion of debt | $ | (44,258 | ) | |
Fair value at September 30, 2021 | $ | 0 | ||
A binomial lattice model was used to determine the fair value of the 5.00% Convertible Notes Due 2026 based on assumptions as to when the notes would be converted or redeemed at each decision point. Within the lattice model, the following assumptions were made: (i) upon SPAC, the convertible notes may be converted to ordinary shares or put at principal and accrued interest; and (ii) upon qualified financing event or maturity, the convertible notes will automatically convert to ordinary shares at base price. The lattice model used the share price, conversion price, maturity date, risk-free rate, estimated stock volatility and estimated credit spread. The remeasurement of the fair value of the debt instrument was recorded as a gain or loss in the statements of operations and comprehensive loss for each reporting period.
F-16
At September 30, 2021 and December 31, 2020, the carrying value of certain financial instruments, such as cash, accounts receivable, other receivable, prepaid expenses and other current assets, trade payable and other current accrued liabilities, approximate fair value due to their relatively short maturities and low market interest rates, if applicable.
Private Placement Warrants
The Private Placement Warrants are accounted for as liabilities in accordance with the FASB’s Accounting Standards Codification (“ASC”)
815-40
and are presented within the Warrants Liabilities on the condensed consolidated balance sheet. The warrant liabilities were measured at fair value at inception and are measured on a recurring basis, with changes in fair value presented within change in fair value of warrants liabilities in the condensed consolidated statement of operations and comprehensive loss.The Private Placement Warrants are measured at fair value on a recurring basis. The measurement of the warrants as of September 30, 2021 was $13.8 million. The Company has classified the Private Placement Warrants as a liability due to certain settlement terms and provisions related to certain tender offers and indexation characteristics following the Business Combination and has accounted for them as liability instruments in accordance with ASC 815, adjusting the fair value at the end of each reporting period. Additionally, the Company has determined that the Private Placement Warrants are classified within Level 3 of the fair value hierarchy as the fair value is estimated using the Modified Black Scholes Option Pricing Model.
The following table presents the changes in the fair value of the Private Placement Warrants (in thousands):
Initial measurement, August 11, 2021 | $ | 14,304 | ||
Mark-to-market | $ | (515 | ) | |
Private Placement Warrants balance, September 30, 2021 | $ | 13,789 | ||
6. | Balance Sheet Components |
Cash and cash equivalents
Cash and cash equivalents balances were concentrated by location as follows:
As of | ||||||||
September 30, 2021 | December 31, 2020 | |||||||
(Unaudited) | ||||||||
United Kingdom | 89 | % | 96 | % | ||||
United States | 11 | % | 3 | % | ||||
Other | 0 | % | 1 | % | ||||
Other receivables (in thousands):
As of | ||||||||
September 30, 2021 | December 31, 2020 | |||||||
(Unaudited) | ||||||||
R&D tax credit receivable | $ | 23,424 | $ | 17,412 | ||||
Grants receivable | 533 | 0 | ||||||
VAT receivable | 1,005 | 607 | ||||||
Other receivable | 4 | 5 | ||||||
Total other receivables | $ | 24,966 | $ | 18,024 | ||||
F-17
Property and equipment, net (in thousands):
As of | ||||||||
September 30, 2021 | December 31, 2020 | |||||||
(Unaudited) | ||||||||
Computer equipment | $ | 1,957 | $ | 1,218 | ||||
Lab equipment | 12,003 | 7,607 | ||||||
Motor vehicles | 31 | 31 | ||||||
Furniture and fixtures | 303 | 265 | ||||||
Leasehold improvements | 909 | 704 | ||||||
Assets under construction | 359 | 27 | ||||||
Total property and equipment | $ | 15,562 | $ | 9,852 | ||||
Less: accumulated depreciation | (8,057 | ) | (5,802 | ) | ||||
Total property and equipment, net | $ | 7,505 | $ | 4,050 | ||||
Total depreciation expense for the three months ended September 30, 2021 and 2020 was $1.2 million and $0.7 million, respectively. Total depreciation expense for the nine months ended September 30, 2021 and 2020 was $3.0 million and $1.9 million, respectively.
Finance leaseassets, net (in thousands):
right-of-use
As of | ||||||||
September 30, 2021 | December 31, 2020 | |||||||
(Unaudited) | ||||||||
Finance lease right-of-use | $ | 2,966 | $ | 2,966 | ||||
Less: accumulated amortization | (1,113 | ) | (834 | ) | ||||
Total finance lease right-of-use assets, net | $ | 1,853 | $ | 2,132 | ||||
Amortization expense for the three months ended September 30, 2021 and 2020 was $0.1 million and $0.1 million, respectively. Amortization expense for the nine months ended September 30, 2021 and 2020 was $0.3 million and $0.3 million, respectively.
Intangible assets, net (in thousands):
As of | ||||||||
September 30, 2021 | December 31, 2020 | |||||||
(Unaudited) | ||||||||
In-process research and development | $ | 3,048 | $ | 3,048 | ||||
Total intangible assets, net | $ | 3,048 | $ | 3,048 | ||||
The Company reviews its intangible assets for potential impairment whenever events or circumstances indicate that the carrying value of the intangible assets may not be recoverable. No impairment charges were recorded for the three and nine months ended September 30, 2021 and 2020.
F-18
Other
non-current
assets (in thousands):As of | ||||||||
September 30, 2021 | December 31, 2020 | |||||||
(Unaudited) | ||||||||
Capitalized transaction costs | $ | 0 | $ | 121 | ||||
Security deposits | $ | 253 | $ | 0 | ||||
Operating right of use assets | $ | 2,816 | $ | 1,486 | ||||
Total other non-current assets | $ | 3,069 | $ | 1,607 | ||||
Accrued expenses (in thousands):
As of | ||||||||
September 30, 2021 | December 31, 2020 | |||||||
(Unaudited) | ||||||||
Accrued bonus | $ | 6,207 | $ | 3,349 | ||||
Accrued payroll and benefits | 2,908 | 1,524 | ||||||
Accrued taxes | 593 | 332 | ||||||
Accrued fabrication costs | 2,479 | 2,321 | ||||||
Share appreciation rights | 0 | 706 | ||||||
Accrued transaction costs | 2,340 | 335 | ||||||
Other accrued expenses | 1,594 | 1,828 | ||||||
Total accrued expenses | $ | 16,121 | $ | 10,395 | ||||
F-19
7. | Debt |
The following table summarizes information relating to our long-term debt, (in thousands):
September 30, 2021 | ||||||||||||||||||||
(Unaudited) | ||||||||||||||||||||
Principal | Change in Fair Value | Conversion of Debt | Accreted Debt Interest | Net | ||||||||||||||||
3.00% – 2020 Convertible Notes | $ | 21,281 | $ | 16,811 | (38,092 | ) | 0 | $ | 0 | |||||||||||
8.00% – 2020 Convertible Notes | 8,000 | 22,897 | (30,897 | ) | 0 | 0 | ||||||||||||||
2020 Term Facility Loan | 33,949 | 6,234 | (13,003 | ) | 1,410 | 28,590 | ||||||||||||||
5.00% – $50.0 Million Convertible Notes | 10,274 | 2,310 | (12,584 | ) | 0 | 0 | ||||||||||||||
5.00% – $25.0 Million Convertible Notes | 25,000 | 17,569 | (42,569 | ) | 0 | 0 | ||||||||||||||
5.00% – $30.0 Million Convertible Notes | 30,000 | 14,258 | (44,258 | ) | 0 | 0 | ||||||||||||||
Total long-term debt | $ | 128,504 | $ | 80,079 | (181,403 | ) | 1,410 | $ | 28,590 | |||||||||||
Less: current portion of long-term debt | (28,590 | ) | ||||||||||||||||||
Long-term debt, net of current portion | $ | 0 | ||||||||||||||||||
December 31, 2020 | ||||||||||||
Principal | Change in Fair Value | Net | ||||||||||
3.00% – 2020 Convertible Notes | $ | 21,281 | $ | 10,825 | $ | 32,106 | ||||||
8.00% – 2020 Convertible Notes | 8,000 | 6,789 | 14,789 | |||||||||
2020 Term Facility Loan | 22,500 | 2,549 | 25,049 | |||||||||
Paycheck Protection Program | 2,860 | 0 | 2,860 | |||||||||
Total long-term debt | $ | 54,641 | $ | 20,163 | $ | 74,804 | ||||||
Less: current portion of long-term debt | 0 | |||||||||||
Long-term debt, net of current portion | $ | 74,804 | ||||||||||
Future minimum payments under the Company’s debt agreements as of September 30, 2021 are as follows (in thousands):
2020 Term Facility Loan | ||||
2021 (for the remaining period) | $ | 5,000 | ||
2022 | 32,303 | |||
2023 | 0 | |||
2024 | 0 | |||
2025 | 0 | |||
Thereafter | 0 | |||
Total future minimum payments | $ | 37,303 | ||
Less: current portion of debt principal | (37,303 | ) | ||
Non-current portion of debt principal | $ | 0 | ||
3.00% – 2020 Convertible Notes
The discussion on the 3.00% – 2020 Convertible Notes is fully described in Note 7 of the “Notes to Consolidated Financial Statements” included in Rockley Photonics Holdings Limited’s Registration Statement on Form
S-4
(FileNo. 333-255019),
filed with the SEC on April 2, 2021 and declared effective on July 22, 2021.F-20
Upon consummation of the Business Combination discussed in,, the total outstanding principal and accrued unpaid interest of $21.9 million for the 3.00% – 2020 Convertible Notes were cancelled and converted into the right to receive 3.8 million ordinary shares of the Company, with a fair value of $38.1 million, recorded in the condensed consolidated statement of shareholders’ equity (deficit) with a corresponding decrease to the convertible note in the condensed consolidated balance sheet. The Company recorded a $38.1 million adjustment upon extinguishment of the 3.00% – 2020 Convertible Notes.
Note 2
Business Combination
8.00% – 2020 Convertible Notes
The discussion on the 8.00% Convertible Notes is fully described in Note 7 of the “Notes to Consolidated Financial Statements” included in Rockley Photonics Holdings Limited’s Registration Statement on Form
S-4
(FileNo. 333-255019),
filed with the SEC on April 2, 2021 and declared effective on July 22, 2021.Upon consummation of the Business Combination discussed in,, the total outstanding principal and accrued unpaid interest of $8.9 million for the 8.00% Convertible Notes were cancelled and converted into the right to receive 1.5 million ordinary shares of the Company, with a fair value of $15.5 million, recorded in the condensed consolidated statement of shareholders’ equity (deficit) with a corresponding decrease to the convertible note in the condensed consolidated balance sheet. In addition, the warrants issued in conjunction with the 8.00% Convertible Note were also cancelled and converted into the right to receive 1.5 million ordinary shares of the Company, with a fair value of $15.5 million, recorded in the condensed consolidated statement of shareholders’ equity (deficit) with a corresponding decrease to the convertible note in the condensed consolidated balance sheet. The Company recorded a total 30.9 million adjustment upon extinguishment of the 8.00% Convertible Notes and warrants.
Note 2
Business Combination
2020 Term Facility Loan
The discussion on the 2020 Term Facility Loan is fully described in Note 7 of the “Notes to Consolidated Financial Statements” included in Rockley Photonics Holdings Limited’s Registration Statement on Form
S-4
(FileNo. 333-255019),
filed with the SEC on April 2, 2021 and declared effective on July 22, 2021.Upon consummation of the Business Combination discussed in,, thirty percent (30%) of the outstanding principal and interest balance of $10.2 million for the 2020 Term Facility Loan were cancelled and converted into the right to receive 1.3 million ordinary shares of the Company, with a fair value of $13.0 million, recorded in the condensed consolidated statement of shareholders’ equity (deficit) with a corresponding decrease to the convertible note in the condensed consolidated balance sheet. The Company recorded a $13.0 million adjustment upon extinguishment of debt. The seventy percent (70%) of the outstanding principal and interest balance will remain as debt and is required to be repaid in full on or prior to August 31, 2022, in the total amount of $37.3 million. At August 11, 2021, the Company recorded a fair value of $27.1 million for the seventy percent (70%) of the outstanding principal and interest balance. The Company will accrete the adjusted interest expense over the amended term of the loan using the effective interest rate method. The Company accrued unpaid interest expense of $1.4 million for the three months ended September 30, 2021. As of September 30, 2021, the total outstanding debt for the 2020 Term Facility Loan balance was $28.6 million
Note 2
Business Combination
5.00% – $50.0 Million Convertible Notes
On January 11, 2021, Legacy Rockley issued convertible loan notes for an aggregate principal amount of $50.0 million. The 5.00% – $50.0 Million Convertible Notes had an interest rate of 5.00% per annum and contained no financial covenants. The total amount borrowed was $10.3 million.
The 5.00% – $50.0 Million Convertible Notes were subject to conversion as follows:
(a)
F-21
share at a conversion price being lower of 15% discount to the per share subscription price of the equity shares or the price obtained by diving $1,500.0 million by fully diluted share capital of the Company at the date of conversion;
(b)
(c)
Upon consummation of the Business Combination discussed in,, the total outstanding principal and accrued unpaid interest of $10.6 million for the 5.00% – $50.0 Million Convertible Notes were cancelled and converted into the right to receive 1.3 million ordinary shares of the Company, with a fair value of $12.6 million, recorded in the condensed consolidated statement of shareholders’ equity (deficit) with a corresponding decrease to the convertible note in the condensed consolidated balance sheet. The Company recognized a $12.6 million adjustment upon extinguishment of the 5.00% – $50.0 Million Convertible Notes.
Note 2
Business Combination
5.00%
–
$25.0 Million Convertible Notes
On December 31, 2020, Legacy Rockley issued convertible loan notes in an aggregate principal amount of $25.0 million. The 5.00% – $25.0 Million Convertible Notes had an interest rate of 5.0% per annum and contained no financial covenants.
The 5.00% – $25.0 Million Convertible Notes were subject to conversion as follows:
(a)
(b)
(c)
Upon consummation of the Business Combination discussed in,, the total outstanding principal and accrued unpaid interest of $25.7 million for the 5.00% – $25.0 Million Convertible Notes were cancelled and converted into the right to receive 3.6 million ordinary shares of the Company, with a fair value of $35.6 million, recorded in the condensed consolidated statement of shareholders’ equity (deficit) with a corresponding decrease to the convertible note in the condensed consolidated balance sheet. In addition, the warrants issued in conjunction with the 5.00% – $25.0 Million Convertible Notes were also cancelled and converted into the right to receive 0.7 million ordinary shares of the Company, with a fair value of $7.0 million, recorded in the condensed consolidated statement of shareholders’ equity (deficit) with a corresponding decrease to the convertible note in the condensed consolidated balance sheet. The Company recorded a total $42.6 million adjustment upon extinguishment of the 5.00% – $25.0 Million Convertible Notes and warrants.
Note 2
Business Combination
F-22
5.00% – $30.0 Million Convertible Notes
On January 11, 2021, Legacy Rockley issued the 5.00% – $30.0 Million Convertible Notes. The 5.00% – $30.0 Million Convertible Notes had an interest rate of 5.0% per annum and contained no financial covenants.
The 5.00% – $30.0 Million Convertible Notes were subject to conversion as follows:
(a)
(b)
(c)
Upon consummation of the Business Combination discussed in,, the total outstanding principal and accrued unpaid interest of $30.8 million for the 5.00%– $30.0 Million Convertible Notes were cancelled and converted into the right to receive 4.4 million ordinary shares of the Company, with a fair value of $44.3 million, recorded in the condensed consolidated statement of shareholders’ equity (deficit) with a corresponding decrease to the convertible note in the condensed consolidated balance sheet. The Company recorded a $44.3 million adjustment upon extinguishment of the 5.00%– $30.0 Million Convertible Notes.
Note 2
Business Combination
Paycheck Protection Program
The discussion on paycheck protection program is fully described in Note 7 of the “Notes to Consolidated Financial Statements” included in Rockley Photonics Holdings Limited’s Registration Statement on Form
S-4
(FileNo. 333-255019),
filed with the SEC on April 2, 2021 and declared effective on July 22, 2021.During June 2021, the $2.9 million of borrowings outstanding under the Paycheck Protection Program (“PPP”) Loan was forgiven in full. Forgiveness income is recorded as a component of other income, net in the condensed consolidated statements of operations and comprehensive loss.
8. | Warrants |
As of September 30, 2021, the Company had 8,625,000 Public Warrants outstanding with a balance of $28.0 million, and classified as equity, and 5,450,000 Private Placement Warrants outstanding with a balance of $13.8 million, and classified as liability. These warrants are exercisable for the Company’s ordinary shares. Warrants may only be exercised for a whole number of shares at an exercise price of $11.50. These warrants expire five years from the closing of the Forward Recapitalization.
The ordinary shares underlying the warrants were registered on Rockley Photonics Holdings Limited’s Registration Statement on Form
S-4
(FileNo. 333-255019),
filed with the SEC on April 2, 2021 and declared effective on July 22, 2021. The Company is obligated to issue ordinary shares upon exercise of a warrant.Redemption of warrants when the ordinary share price equals or exceeds $18.00. Once the warrants become exercisable, the Company may redeem the warrants in whole and not in part, at a price of $0.01 per warrant,
F-23
upon not less than 30 days’ prior written notice of redemption to each warrant holder and if, and only if, the closing price of the Company’s ordinary shares equals or exceeds $18.00 per share (as adjusted for share
sub-divisions,
share capitalizations, reorganizations, recapitalizations and the like) for any 20 trading days within a30-trading
day period ending on the third trading day prior to the date on which the notice of redemption is given to the warrant holders.The Company may redeem the warrants in whole and not in part no earlier than 90 days after they are first exercisable and prior to their expiration at a price equal to a number of the Company’s ordinary shares based on the redemption date and the “fair market value” of the ordinary shares, upon not less than 30 days’ prior written notice of redemption each warrant holder, and if, and only if, the closing price of the ordinary shares equals or exceeds $10.00 per share (as adjusted for share
sub-divisions,
share dividends, reorganizations, reclassifications, recapitalizations and the like) on the trading day before the Company sends the notice of redemption to the warrant holders.The Private Placement Warrants were accounted for as liabilities in accordance with ASC, and are presented within warrant liabilities on our balance sheet. The warrant liabilities assumed from SC Health, and on a recurring basis, changes in fair value will be presented in the consolidated statement of operations at each reporting period. The Private Placement Warrants are considered to be a Level 3 liability, see Note 5 – Fair Value Measurements for description of the valuation methodology of the Private Placement Warrants.
815-40,
Derivatives and Hedging-Contracts in Entity’s Own Equity
The Public Warrants were accounted for as equity and are presented within Additionalas such an event would be in connection with a change in control and all of the Company’s ordinary shareholders, as well as warrant holders, could participate and receive cash from the settlement.
Paid-In
Capital on our balance sheet. Although an event such as a qualifying cash tender offer could occur outside of the company’s control that would require net cash settlement, equity classification for the public warrants is not precluded per ASC815-40-25
9. | Income Taxes |
Income tax expense was $0.6 million and $0.2 million for the three months ended September 30, 2021 and 2020, respectively. Income tax expense was $0.8 million and $0.4 million for the nine months ended September 30, 2021 and 2020, respectively. The effective income tax rate was less than 1.0% in the three and nine months ended September 30, 2021 and 2020. Our effective tax rate differs from the U.K. statutory rate primarily due to a substantially full valuation allowance against our net deferred tax assets where it is more likely than not that some or all of the deferred tax assets will not be realized. The income tax expense is primarily related to corporate income taxes in the United States, which operates on a cost–plus arrangements and minimum filing fees in the foreign jurisdictions where we have operations.
10. | Shareholders’ Equity (Deficit) |
The Company is authorized to issue 12,417,500,000 ordinary shares with par value of $0.000004 per share. Each holder of the Company’s ordinary shares is entitled to one vote per share. As of September 30, 2021, there were 126,675,098 of the Company’s ordinary shares issued and outstanding. Holders of the Company’s ordinary shares do not have cumulative voting rights. Additionally, the Company has 14,074,986 warrants outstanding as of September 30, 2021. See Note 8,for additional information.
Warrants
Each holder of the Company’s ordinary shares is entitled to the payment of dividends and other distributions as may be declared by the Board from time to time out of the Company’s assets or funds legally available for dividends or other distributions. The Company has not declared or paid any dividends with respect to its ordinary shares for the periods presented.
If the Company is involved in voluntary or involuntary liquidation, dissolution or winding up of the Company’s affairs, or a similar event, each holder of the Company ordinary shares will participate pro rata in all
F-24
assets remaining after payment of liabilities, subject to prior distribution rights of the Company preferred shares, if any, then outstanding.
11. | Net Loss per Share |
The following is a calculation of basic and diluted net loss per share (in thousands, except for share and per share amounts):
Three Months Ended September 30, | Nine Months Ended September 30, | |||||||||||||||
2021 | 2020 | 2021 | 2020 | |||||||||||||
(Unaudited) | (Unaudited) | |||||||||||||||
Basic and diluted: | ||||||||||||||||
Net loss | $ | (57,972 | ) | $ | (20,524 | ) | $ | (153,306 | ) | $ | (46,953 | ) | ||||
Weighted average ordinary shares outstanding | 107,633,037 | 83,509,920 | 92,008,435 | 83,392,042 | ||||||||||||
Basic and diluted net loss per share | $ | (0.54 | ) | $ | (0.25 | ) | $ | (1.67 | ) | $ | (0.56 | ) | ||||
Basic net loss per share is calculated by dividing net loss for the period by the weighted average number of the ordinary shares outstanding plus outstanding warrants with a $0.01 exercise price.
For the three and nine months ended September 30, 2021 and 2020, we excluded the potential effect of outstanding and exercisable options (including performance options) and warrants , in the calculation of the diluted loss per share, as the effect would be anti-dilutive due to losses incurred. As of September 30, 2021 and 2020, there were approximately 12.9 million and 13.1 million potentially issuable shares respectively, with dilutive effect.
12. | Stock-Based Compensation |
The Company has established a number of share-based incentive plans for current employees, directors and others, which include Share Appreciation Rights (“SARs”), 2013 Share Option Plan, 2021 Share Option Plan and Warrants.
Share Appreciation Rights
As of September 30, 2021, there were 0 SARs outstanding. In connection with the Business Combination on August 11, 2021, the liability associated with outstanding SARs was settled with a cash payment of $0.7 million.
2013 Share Option Plan
The holders of Legacy Rockley options under the 2013 Share Option Plan (the “2013 Plan”) continue to hold such options and such options remain subject to the same vesting, exercise and other terms and conditions. In connection with the Business Combination, the holders of Legacy Rockley options may exercise their options to purchase a number of ordinary shares equal to the number of shares of Legacy Rockley ordinary shares subject to such Legacy Rockley options multiplied by the Exchange Ratio of 2.4835 (rounded down to the nearest whole share) at an exercise price per share divided by the Exchange Ratio (rounded to the nearest whole cent). The information presented herein is as if the exchange of stock options occurred as of the earliest period presented.
As of September 30, 2021, there were 0 shares available for grant. Any new grants will become available for issuance under the 2021 Stock Incentive Plan (the “2021 Plan”).
F-25
The following table summarizes the stock option activity related to the 2013 Plan:
Number of Options Outstanding | Average Exercise Price Per Share | Remaining Contractual Life (Years) | Aggregate Intrinsic Value 1 | |||||||||||||
(In thousands) | ||||||||||||||||
Options outstanding at December 31, 2020 | 17,898,619 | $ | 1.99 | 6.75 | 44,515 | |||||||||||
Granted | 0 | $ | 0 | |||||||||||||
Exercised | (465,853 | ) | $ | 0.79 | ||||||||||||
Forfeited | (890,369 | ) | $ | 4.07 | ||||||||||||
Expired | (35,742 | ) | $ | 2.92 | ||||||||||||
Options outstanding at September 30, 2021 | 16,506,655 | $ | 1.91 | 5.80 | $ | 92,787 | ||||||||||
Options exercisable – September 30, 2021 | 12,925,646 | $ | 1.50 | 5.05 | $ | 77,978 | ||||||||||
2021 Stock Incentive Plan
On March 31, 2021, the Board approved the 2021 Plan. The purpose of the 2021 Plan is to attract, retain, incentivize and reward top talent through stock ownership, to improve operating and financial performance and strengthen the mutuality of interest between eligible service providers and shareholders.
As of September 30, 2021, there were 15,369,185 shares authorized for issuance under the Plan, of which 14,355,705 shares were available for grant.
The following table summarizes the stock option activity related to the 2021 Plan:
Number of Options Outstanding | Average Exercise Price Per Share | Remaining Contractual Life (Years) | Intrinsic Value | |||||||||||||
(In thousands) | ||||||||||||||||
Options outstanding at December 31, 2020 | 0 | $ | 0 | 0.00 | 0 | |||||||||||
Options granted | 1,013,480 | $ | 15.84 | |||||||||||||
Options exercised | 0 | $ | 0 | |||||||||||||
Options forfeited | 0 | $ | 0 | |||||||||||||
Options expired | 0 | $ | 0 | |||||||||||||
Options outstanding at September 30, 2021 | 1,013,480 | $ | 15.84 | 9.86 | $ | 0 | ||||||||||
Options exercisable – September 30, 2021 | 20,384 | $ | 15.84 | 9.86 | $ | 0 | ||||||||||
| 1 | The aggregated intrinsic value represents the difference between the exercise price and the closing stock price of $7.19 for the Company’s ordinary shares on September 30, 2021. |
F-26
Stock-based compensation expense
The following table summarizes our stock-based compensation expense for all equity arrangements and is included in the condensed consolidated statements of operations and comprehensive loss as follows (in thousands):
Three Months Ended September 30, | Nine Months Ended September 30, | |||||||||||||||
2021 | 2020 | 2021 | 2020 | |||||||||||||
(Unaudited) | (Unaudited) | |||||||||||||||
Cost of revenue | $ | 346 | $ | 467 | $ | 977 | $ | 1,808 | ||||||||
Research and development | 1,340 | 891 | 3,559 | 2,971 | ||||||||||||
Selling, general and administrative | 469 | 319 | 1,320 | 1,086 | ||||||||||||
Total stock-based compensation expense | $ | 2,155 | $ | 1,677 | $ | 5,856 | $ | 5,865 | ||||||||
As of September 30, 2021, total unrecognized compensation expense related to unvested options granted to employees under the Company’s stock option plans was $17.6 million, which is expected to be recognized over a weighted average period of 1.3 years.
Performance Options
For the three months ended September 30, 2021 and 2020, we recognized a total expense of $0.1 million and $0.02 million in relation to the performance-based options. For the nine months ended September 30, 2021 and 2020, we recognized a total expense of $0.3 million and $0.1 million. As of September 30, 2021 and December 31, 2020, there were approximately $0.9 million and $1.2 million of unrecognized stock-based compensation expense related to the performance-based options. During the nine months ended September 30, 2021, no additional performance-based options were granted.
Warrants
In connection with the Business Combination on August 11, 2021, all outstanding warrants of Legacy Rockley were exercised on a cashless basis and converted into the right to receive 1.8 million ordinary shares of the Company, with a fair value of $18.1 million.
13. | Related Party Transactions |
The Company formed HRT, a joint venture with Hengtong Optic-Electric Co., Ltd. in 2017, which was recognized by the Company as an equity method investment. The total sales made to HRT for the three months ended September 30, 2021 and 2020 were $0.3 million and $2.3 million, respectively. The total sales made to HRT for the nine months ended September 30, 2021 and 2020 were $0.3 million and $4.7 million, respectively. As of September 30, 2021 and December 31, 2020, the balance owed by the joint venture amounted to $0.3 million and $3.3 million, respectively, and is included in accounts receivable in the accompanying balance sheets. As of September 30, 2021 and December 31, 2020, the balance owed to the joint venture was $0 and $0.2 million, respectively, and included in trade payables.
14. | Leases |
The weighted average remaining lease term was 1 year for operating leases as of September 30, 2021. The weighted average discount rate was 6% for operating leases as of September 30, 2021.
F-27
Finance lease costs were immaterial for the three and nine months ended September 30, 2021 and 2020. The components of operating lease cost for the three and nine months ended September 30, 2021 and 2020, were as follows (in thousands):
Three Months Ended September 30, | Nine Months Ended September 30, | |||||||||||||||
2021 | 2020 | 2021 | 2020 | |||||||||||||
(Unaudited) | (Unaudited) | |||||||||||||||
Operating Lease Cost: | ||||||||||||||||
Fixed lease cost | $ | 268 | 213 | $ | 773 | 638 | ||||||||||
Variable lease cost | 81 | (3 | ) | 200 | 118 | |||||||||||
Total operating lease cost | $ | 349 | $ | 210 | $ | 973 | $ | 756 | ||||||||
The supplemental cash flow information related to our operating leases is as follows (in thousands):
Nine Months Ended September 30, | ||||||||
2021 | 2020 | |||||||
Supplemental Cash Flow Information: | ||||||||
Cash paid for amounts included in the measurement of lease liabilities: | ||||||||
Operating cash flows for operating leases | $ | 706 | $ | 685 | ||||
Operating cash flows for finance leases | $ | 0 | $ | 12 | ||||
Financing cash flows for finance leases | $ | 0 | $ | 933 | ||||
Right-of-use | ||||||||
Right-of-use | $ | 1,981 | $ | 0 | ||||
There are no finance lease liabilities as of September 30, 2021. Maturities of operating lease liabilities as of September 30, 2021, are as follows (in thousands):
Operating Leases | ||||
2021 (for the remaining period) | $ | 230 | ||
2022 | 1,165 | |||
2023 | 931 | |||
2024 | 437 | |||
2025 | 327 | |||
Thereafter | 394 | |||
Total lease obligation | $ | 3,484 | ||
Less: Imputed interest | (363 | ) | ||
Total lease liabilities | $ | 3,121 | ||
Less: Current lease liabilities | (923 | ) | ||
Total non-current lease liabilities | $ | 2,198 | ||
15. | Commitments and Contingencies |
Legal Contingencies
From time to time, we are a party to various lawsuits, claims and other legal proceedings that arise in the ordinary course of business. We apply accounting for contingencies to determine when and how much to accrue for and disclose related to legal and other contingencies. Accordingly, we disclose contingencies deemed to be
F-28
reasonably possible and accrue loss contingencies when, in consultation with legal advisors, it is concluded that a loss is probable and reasonably estimable. Although the ultimate aggregate amount of monetary liability or financial impact with respect to these matters is subject to many uncertainties and is therefore not predictable with assurance, management believes that as of September 30, 2021 there is no litigation pending that could have, individually and in the aggregate, a material adverse effect on our financial position, results of operations or cash flows.
Financial Commitments
In the ordinary course of business, we make commitments to third-party suppliers for various research and development activities. As of September 30, 2021 and December 31, 2020, we had $8.9 million and $3.0 million, respectively, in contractual obligations for which we have not yet received the services.
16. | Defined Contribution Plan |
We have defined contribution plans, under which we contribute based on a percentage of the employees’ elected contributions. We will have no legal or constructive obligation to pay further amounts. Obligations for contributions to defined contribution plans are recognized within selling, general and administrative expenses and research and development in the condensed consolidated statements of operations and comprehensive loss. Defined contributions were $0.2 million and $0.1 million for the three months ended September 30, 2021 and 2020, respectively. Defined contributions were $0.6 million and $0.4 million for the nine months ended September 30, 2021 and 2020, respectively.
F-29
17. | Supplemental Cash Flow Information |
Non-cash
operating, investing, and financing activities, and supplemental cash flow information are as follows (in thousands):Nine Months Ended September 30, | ||||||||
2021 | 2020 | |||||||
(Unaudited) | ||||||||
Supplemental Cash Flow Information: | ||||||||
Interest paid | $ | 465 | $ | 49 | ||||
Income tax paid | $ | 300 | $ | 147 | ||||
Non-cash Operating Activities: | ||||||||
Right-of-use | $ | 1,981 | $ | 0 | ||||
| $ | 1,981 | $ | 0 | |||||
Non-cash Investing Activities: | ||||||||
Unpaid property and equipment received | $ | 707 | $ | 222 | ||||
| $ | 707 | $ | 222 | |||||
Non-cash Financing Activities: | ||||||||
Conversion of convertible debt and accrued interest to ordinary shares | $ | 181,404 | $ | 0 | ||||
Conversion of Legacy Rockley ordinary shares to Rockley ordinary shares | 206,888 | 0 | ||||||
Private Placement Warrants | 14,304 | 0 | ||||||
Public Warrants | 28,031 | 0 | ||||||
Issuance of ordinary shares in lieu of cash payment of transaction costs | 3,190 | 0 | ||||||
Unpaid deferred transaction costs | 2,263 | 0 | ||||||
Forgiveness of Paycheck Protection Program loan | 2,860 | 0 | ||||||
| $ | 438,940 | $ | 0 | |||||
18. | Subsequent Events |
Subsequent events have been evaluated through the date that these financial statements were issued.
In October 2021, the Company filed a registration statement on Form
S-8
under the Securities Act of 1933 (the“S-8
Registration Statement”). TheS-8
Registration Statement registered a total of 33,410,136 ordinary shares, which includes all shares issued under the 2021 Plan and the 2021 Employee Stock Purchase Plan (the “ESPP”). Once these shares are registered, they can be sold in the public market upon issuance, subject to applicable restrictions.On October 19, 2021, the Board unanimously approved to enter into and consummate a “Term Sheet” with Lincoln Park Capital Fund, LLC, an Illinois limited liability company (“LPCF”). The Term Sheet is a private placement with registration rights, providing LPCF the ability to purchase up to $50.0 million of the Company’s ordinary shares. The term of the Term Sheet is 24 months. Following the execution of the term sheet, the Company is to pay LPCF $0.04 million to cover associated expenses relating to, amongst other things, preparation of future securities agreements relating to the Term Sheet. Any proceeds from the sale of shares, pursuant to the aforementioned term sheet, are to go towards the Company to be used for working capital.
F-30
ROCKLEY PHOTONICS LIMITED
INDEX TO CONSOLIDATED FINANCIAL STATEMENTS
Years Ended December 31, 2020 and 2019
Page | ||||
| F-32 | ||||
| F-33 | ||||
| F-34 | ||||
| F-35 | ||||
| F-36 | ||||
| F-37 | ||||
F-31
Report of Independent Registered Public Accounting Firm
To the Shareholders and the Board of Directors of Rockley Photonics Limited
Opinion on the Financial Statements
We have audited the accompanying consolidated balance sheets of Rockley Photonics Limited (the Company) as of December 31, 2020 and 2019, the related consolidated statements of operations and comprehensive loss, shareholders’ equity and cash flows for the years then ended, and the related notes (collectively referred to as the “consolidated financial statements”). In our opinion, the consolidated financial statements present fairly, in all material respects, the financial position of the Company at December 31, 2020 and 2019, and the results of its operations and its cash flows for the years then ended, in conformity with U.S. generally accepted accounting principles.
The Company’s Ability to Continue as a Going Concern
The accompanying consolidated financial statements have been prepared assuming that the Company will continue as a going concern. As discussed in Note 1 to the consolidated financial statements, the Company has incurred losses from operations since inception and has stated that substantial doubt exists about the Company’s ability to continue as a going concern. Management’s evaluation of the events and conditions and management’s plans regarding these matters are also described in Note 1. The consolidated financial statements do not include any adjustments that might result from the outcome of this uncertainty. Our opinion is not modified with respect to this matter.
Basis for Opinion
These financial statements are the responsibility of the Company’s management. Our responsibility is to express an opinion on the Company’s financial statements based on our audits. We are a public accounting firm registered with the Public Company Accounting Oversight Board (United States) (PCAOB) and are required to be independent with respect to the Company in accordance with the U.S. federal securities laws and the applicable rules and regulations of the SEC and the PCAOB.
We conducted our audits in accordance with the standards of the PCAOB and in accordance with auditing standards generally accepted in the United States of America. Those standards require that we plan and perform the audit to obtain reasonable assurance about whether the financial statements are free of material misstatement, whether due to error or fraud. The Company is not required to have, nor were we engaged to perform, an audit of its internal control over financial reporting. As part of our audits we are required to obtain an understanding of internal control over financial reporting but not for the purpose of expressing an opinion on the effectiveness of the Company’s internal control over financial reporting. Accordingly, we express no such opinion.
Our audits included performing procedures to assess the risks of material misstatement of the financial statements, whether due to error or fraud, and performing procedures that respond to those risks. Such procedures included examining, on a test basis, evidence regarding the amounts and disclosures in the financial statements. Our audits also included evaluating the accounting principles used and significant estimates made by management, as well as evaluating the overall presentation of the financial statements. We believe that our audits provide a reasonable basis for our opinion.
/s/ Ernst & Young LLP
We have served as the Company’s auditor since 2020.
San Jose, California
April 2, 2021
F-32
ROCKLEY PHOTONICS LIMITED
Consolidated Balance Sheets
(in thousands, except share and per share amounts)
December 31, | ||||||||
2020 | 2019 | |||||||
Assets | ||||||||
Current assets | ||||||||
Cash and cash equivalents | $ | 19,228 | $ | 20,904 | ||||
Accounts receivable | 4,925 | 6,383 | ||||||
Other receivables | 18,024 | 15,949 | ||||||
Prepaid expenses | 1,605 | 1,763 | ||||||
Other current assets | 609 | 1,757 | ||||||
Total current assets | 44,391 | 46,756 | ||||||
Property, equipment, and finance lease right-of-use | 6,182 | 7,280 | ||||||
Equity method investment | 5,202 | 1,486 | ||||||
Intangible asset | 3,048 | 0 | ||||||
Other non-current assets | 1,607 | 2,212 | ||||||
Total assets | $ | 60,430 | $ | 57,734 | ||||
Liabilities and Shareholders’ equity | ||||||||
Current liabilities | ||||||||
Trade payables | $ | 4,413 | $ | 7,373 | ||||
Accrued expenses | 10,395 | 6,852 | ||||||
Long term debt, current portion | 0 | 1,952 | ||||||
Other current liabilities | 998 | 3,569 | ||||||
Total current liabilities | 15,806 | 19,746 | ||||||
Long-term debt | 74,804 | 0 | ||||||
Other long-term liabilities | 1,127 | 1,729 | ||||||
Total liabilities | 91,737 | 21,475 | ||||||
Commitments and contingencies (Note 14) | 0 | 0 | ||||||
| Shareholders’ (deficit) equity | ||||||||
Ordinary Shares, $0.00001 par value; 55,982,833 and 38,312,233 authorized as of December 31, 2020 and 2019, respectively; 33,637,762 and 33,337,115 issued and outstanding as of December 31, 2020 and 2019, respectively | 0 | 0 | ||||||
Additional paid-in-capital | 201,576 | 188,865 | ||||||
Accumulated deficit | (232,883 | ) | (152,606 | ) | ||||
| Total shareholders’ equity (deficit) | (31,307 | ) | 36,259 | |||||
| Total liabilities and shareholders’ equity | $ | 60,430 | $ | 57,734 | ||||
The accompanying notes are an integral part of these consolidated financial statements.
F-
33
ROCKLEY PHOTONICS LIMITED
Consolidated Statements of Operations and Comprehensive Loss
(in thousands, except share and per share amounts)
Years Ended December 31, | ||||||||
2020 | 2019 | |||||||
Revenue | $ | 22,343 | $ | 20,492 | ||||
Cost of revenue | 24,240 | 30,705 | ||||||
Gross profit | (1,897 | ) | (10,213 | ) | ||||
Operating expenses: | ||||||||
Selling, general and administrative expenses | 20,260 | 13,306 | ||||||
Research and development expenses | 35,900 | 22,303 | ||||||
Total operating expenses | 56,160 | 35,609 | ||||||
Loss from operations | (58,057 | ) | (45,822 | ) | ||||
Other income (expense): | ||||||||
Interest expense, net | (189 | ) | (747 | ) | ||||
Equity method investment loss | (1,274 | ) | (1,281 | ) | ||||
Change in fair value of debt instruments | (20,163 | ) | (2,969 | ) | ||||
Gain (loss) on foreign currency | (25 | ) | 280 | |||||
Total other expense | (21,651 | ) | (4,717 | ) | ||||
Loss before income taxes | (79,708 | ) | (50,539 | ) | ||||
Provision for income tax | 569 | 311 | ||||||
Net loss and comprehensive loss | $ | (80,277 | ) | $ | (50,850 | ) | ||
Net loss per share: | ||||||||
Basic and diluted | $ | (2.39 | ) | $ | (1.62 | ) | ||
Weighted-average shares outstanding: | ||||||||
Basic and diluted | 33,604,752 | 31,406,127 | ||||||
The accompanying notes are an integral part of these consolidated financial statements.
F-3
4
ROCKLEY PHOTONICS LIMITED
Consolidated Statements of Shareholders’ Equity
(in thousands, except share amounts)
Number of Ordinary Shares | Ordinary Shares | Additional paid-in capital | Accumulated Deficit | Total Shareholders’ Equity (Deficit) | ||||||||||||||||
Balance, December 31, 2018 | 29,215,692 | $ | — | $ | 125,662 | $ | (101,756 | ) | $ | 23,906 | ||||||||||
Net loss | — | — | — | (50,850 | ) | (50,850 | ) | |||||||||||||
Exercise of stock options | 24,750 | — | 33 | — | 33 | |||||||||||||||
Exercise of warrants | 2,757 | — | 19 | — | 19 | |||||||||||||||
Issuance of warrants | — | — | 2,878 | — | 2,878 | |||||||||||||||
Stock-based compensation | — | — | 6,229 | — | 6,229 | |||||||||||||||
Non-cash warrants issued as dividends | — | — | (1,838 | ) | — | (1,838 | ) | |||||||||||||
Extinguishment of 2019 Convertible Loan Note | — | — | 18,244 | — | 18,244 | |||||||||||||||
Ordinary share issuance, net of issuance costs | 4,093,916 | — | 37,638 | — | 37,638 | |||||||||||||||
Balance, December 31, 2019 | 33,337,115 | $ | — | $ | 188,865 | $ | (152,606 | ) | $ | 36,259 | ||||||||||
Net loss | — | — | — | (80,277 | ) | (80,277 | ) | |||||||||||||
Exercise of stock options | 7,813 | — | 42 | — | 42 | |||||||||||||||
Exercise of warrants | 5,523 | — | 7 | — | 7 | |||||||||||||||
Issuance of warrants | — | — | 360 | — | 360 | |||||||||||||||
Stock-based compensation | — | — | 8,043 | — | 8,043 | |||||||||||||||
Ordinary share issuance for acquisition of in-process research and development | 139,879 | — | 2,298 | — | 2,298 | |||||||||||||||
Ordinary share issuance, net of issuance costs | 147,432 | — | 1,961 | — | 1,961 | |||||||||||||||
Balance, December 31, 2020 | 33,637,762 | $ | — | $ | 201,576 | $ | (232,883 | ) | $ | (31,307 | ) | |||||||||
The accompanying notes are an integral part of these consolidated financial statements.
F-3
5
ROCKLEY PHOTONICS LIMITED
Consolidated Statements of Cash Flows
(in thousands)
| Years Ended December 31 | ||||||||
2020 | 2019 | |||||||
OPERATING ACTIVITIES | ||||||||
Net loss | $ | (80,277 | ) | $ | (50,850 | ) | ||
Adjustments to reconcile net loss to net cash used in operating activities: | ||||||||
Depreciation and amortization of property, equipment and finance lease right-of-use | 2,787 | 1,948 | ||||||
Gain on disposal of property and equipment | (107 | ) | (24 | ) | ||||
Amortization of debt discount and issuance costs | — | 268 | ||||||
Stock-based compensation | 8,043 | 6,229 | ||||||
Equity-method investment loss | 1,274 | 1,281 | ||||||
Change in fair value of debt instrument | 20,163 | 2,958 | ||||||
Non-cash interest on convertible loan notes | 0 | 286 | ||||||
Changes in operating assets and liabilities: | ||||||||
Accounts receivable | 1,458 | (618 | ) | |||||
Other receivables | (2,074 | ) | (3,246 | ) | ||||
Prepaid expenses and other current assets | 1,307 | (1,030 | ) | |||||
Other non-current assets | 604 | (672 | ) | |||||
Trade payables | (3,126 | ) | 2,464 | |||||
Accrued expenses | 3,537 | 2,214 | ||||||
Other current and long-term liabilities | (1,943 | ) | 2,236 | |||||
Net cash used in operating activities | (48,354 | ) | (36,556 | ) | ||||
INVESTING ACTIVITIES | ||||||||
Purchase of property and equipment | (1,416 | ) | (2,973 | ) | ||||
Purchase of asset acquisition | (250 | ) | — | |||||
Proceeds from disposal of property and equipment | 0 | 142 | ||||||
Investment in equity method investee | (4,990 | ) | — | |||||
Net cash used in investing activities | (6,656 | ) | (2,831 | ) | ||||
FINANCING ACTIVITIES | ||||||||
Proceeds from convertible loan notes | 51,781 | 15,000 | ||||||
Principal payments on long-term debt | (1,952 | ) | (3,534 | ) | ||||
Proceeds from Paycheck Protection Program | 2,860 | — | ||||||
Proceeds from issuance of Ordinary Shares, net of issuance costs | 1,961 | 38,639 | ||||||
Proceeds from exercise of options | 42 | 33 | ||||||
Proceeds from issuance of warrants | 360 | — | ||||||
Proceeds from exercise of warrants | 7 | — | ||||||
Debt issuance costs incurred | (494 | ) | — | |||||
Principal payments on finance lease | (1,231 | ) | (1,205 | ) | ||||
Net cash provided by financing activities | 53,334 | 48,933 | ||||||
Net (decrease) increase in cash and cash equivalents | (1,676 | ) | 9,546 | |||||
Cash and cash equivalents beginning of year | 20,904 | 11,358 | ||||||
Cash and cash equivalents at end of year | $ | 19,228 | $ | 20,904 | ||||
The accompanying notes are an integral part of these consolidated financial statements.
F-3
6
ROCKLEY PHOTONICS LIMITED
Notes to Consolidated Financial Statements
1. | Description of Business and Significant Accounting Policies |
Description of Business
Rockley Photonics Limited and its subsidiaries (together, “we”, “us,” “our,” or, “the Company”) was founded in 2013 in the United Kingdom. We specialize in the research and development of integrated silicon photonics chipsets and have developed a versatile, application specific, third-generation silicon photonics platform specifically designed for the optical integration challenges facing numerous mega-trend markets. We have partnered with multiple
tier-1
customers across the markets to deliver complex optical systems required for transformational sensor, communications, and medical product realization.Going Concern
The Company has incurred net losses since inception, has an accumulated deficit of $232.9 million as of December 31, 2020 and negative cash flow from operations of $48.4 million for the year ended December 31, 2020 and expects to incur losses from operations for the foreseeable future. As of December 31, 2020, the Company had cash and cash equivalents of approximately $19.2 million. The Company’s ability to meet its obligations in the ordinary course of business is dependent on its ability to obtain additional financing. As a result, there is substantial doubt about our ability to continue as a going concern. The consolidated financial statements have been prepared on a going concern basis, which contemplates the realization of assets and satisfaction of liabilities in the normal course of business. The consolidated financial statements do not include any adjustments relating to the recoverability and classification of recorded asset amounts or the amounts and classification of liabilities that might result from the outcome of this uncertainty.
Our future liquidity needs, and ability to address those needs, will largely be determined by its ability to obtain additional financing on terms acceptable to us. We will continue to seek additional capital through the sale of debt or equity, or other arrangements, however, there can be no assurance that we will be able to raise additional capital when needed or under acceptable terms, if at all. The sale of additional equity may dilute existing shareholders and newly issued shares may contain senior rights and preferences compared to currently outstanding Ordinary Shares. Issued debt securities may contain covenants and limit our ability to pay dividends or make other distributions to shareholders. If we are unable to obtain additional financing, operations may be scaled back or discontinued.
Global Pandemic
On March 11, 2020, the World Health Organization characterized the outbreak oforders, and similar mandates for many individuals to substantially restrict daily activities and for many businesses to curtail or cease normal operations.
COVID-19
as a global pandemic and recommended containment and mitigation measures. Since then, extraordinary actions have been taken by international, federal, state, and local public health and governmental authorities to contain and combat the outbreak and spread ofCOVID-19
in regions throughout the world. These actions include travel bans, quarantines,“stay-at-home”
Consistent with the actions taken by governmental authorities, we have taken appropriately cautious steps to protect our workforce and support community efforts. As part of these efforts and in accordance with applicable government directives, we reduced
on-site
operations at our facilities. Certain key laboratory employees and facilities were designated as Essential Critical Infrastructure and we were able to continue internal testing and laboratory work to the extent necessary to service customer commitments. To facilitateon-site
operations, revised operational and manufacturing plans were implemented that conform toCOVID-19
precautionary health guidelines, including universal requirement of facial coverings, rearranging facilities to follow social distancing protocols, conducting active daily temperature checks, regular and thorough disinfecting of surfaces and tools,F-3
7
and regular testing of its employees for
COVID-19.
The remainingnon-essential
workforce was required to perform their duties from home.The
COVID-19
pandemic and continuing precautionary measures taken have adversely impacted our operational efficiency and caused delays in operational activities. The ongoing impact will depend on the duration of the pandemic, which is being mitigated by advances in the treatment of the disease, prevention efforts including vaccines, broad government measures to contain the spread of the virus, and related government stimulus measures. However, should we experience sustained impact from the pandemic, additional actions such as cost reduction measures may need to be implemented.Basis of Presentation
The consolidated financial statements and accompanying notes were prepared in accordance with accounting principles generally accepted in the United States (“U.S. GAAP”).
Principles of Consolidation
The consolidated financial statements include Rockley Photonics Limited and its wholly owned subsidiaries. All intercompany balances and transactions have been eliminated in consolidation.
Use of Estimates
The preparation of consolidated financial statements in conformity with U.S. GAAP requires management to make estimates and assumptions that affect the reported amounts of assets and liabilities and the disclosure of contingent assets and liabilities at the date of the financial statements and the reported amounts of revenues and expenses during the reporting period.
On an ongoing basis, we evaluate our estimates and assumptions, including those related to (i) revenue recognition including variable consideration, (ii) useful lives and recoverability of property and equipment and long-lived assets, (iii) incremental borrowing rates on the Company’s finance and operating leases, (iv) valuation of our convertible loan notes, (v) valuation allowances for income taxes, (vi) stock-based compensation including the valuation of Ordinary Shares, (vii) valuation of warrants and (viii) contingencies. We base our estimates on historical experience and on various other assumptions that are believed to be reasonable under the circumstances. Actual results could materially differ from these estimates, including impacts from the
COVID-19
pandemic, the anticipated effects of which have been incorporated, as applicable, into management’s estimates as of and for the year ended December 31, 2020.Cash and Cash Equivalents
Cash and cash equivalents include short-term, highly liquid investments with an original maturity of three months or less.
Property and Equipment, Net
Property and equipment are recorded at cost and presented net of accumulated depreciation and amortization. Significant additions or improvements extending the useful life of an asset are capitalized, while repairs and maintenance costs are expensed as incurred. Leasehold improvements are amortized on a straight-line basis over the shorter of the term of the lease or the useful life of the assets. Depreciation and amortization are computed using the straight-line method over the estimated useful lives of the related assets.
Computer equipment | 3 years | |
Lab equipment | 3 years | |
Furnitures and fixtures | 4 years | |
Leasehold improvements | Shorter of the lease term and the useful life |
F-3
8
Impairment of Long-Lived Assets
We evaluate our long-lived assets, such as property and equipment, andassets for impairment whenever events or changes in circumstances indicate that the carrying value of assets or asset group may not be recoverable. Recoverability of these assets or asset groups is measured by comparing their carrying value to the future net undiscounted cash flows the assets are expected to generate over their remaining economic life. If such assets or asset groups are considered impaired, the impairment to be recognized is measured by the amount by which the carrying value of the assets exceeds their fair value.
right-of-use
The Company tests other intangible assets not subject to amortization for impairment annually and more frequently if events or changes in circumstances between annual tests indicate that it is more likely than not that the asset is impaired.
For the purposes of assessing impairment, assets are grouped at the lowest levels for which there are separately identifiable cash inflows which are largely independent of the cash inflows from other assets or groups of assets. To date, no such impairment losses have been recorded.
Revenue Recognition
We generate our revenue principally from development services, which entails developing the customer-specific designs of photonics chips. Revenue is recognized when control of promised goods and services are transferred to customers in an amount that reflects the expected consideration in exchange for those products and services. This principle is achieved by applying the following five-step approach:
| • | Identification of the contract with a customer – |
| • | Identification of the performance obligations in the contract |
| • | Determination of the transaction price |
F-3
9
| • | Allocation of the transaction price to the performance obligations in the contract |
| • | Recognition of revenue when or as performance obligations are satisfied |
Contract balances
30-45
days, and such amounts are nonrefundable. In situations where revenue recognition occurs before invoicing, an unbilled receivable is recorded, which represents a contract asset. Deferred revenue is recognized if we have an unconditional right to bill or have collected consideration in advance of the right to recognize revenue. There have been no contract balances recorded to date.Costs to obtain and fulfill a contract –
Foreign Currency Transactions
The Company’s reporting currency is the U.S. dollar and the functional currency of the Company’s foreign subsidiaries is the U.S. dollar. Assets and liabilities that are not denominated in the functional currency are remeasured into the functional currency with any related gain or loss recorded in earnings.
Transaction gains and losses that arise from exchange rate fluctuations on transactions denominated in a currency other than the functional currency are included in realized and unrealized losses/(gains) on foreign currency in the accompanying consolidated statements of operations and comprehensive loss.
Segment Information
Operating segments are defined as components of an entity for which discrete financial information is available that is regularly reviewed by the Chief Operating Decision Maker (“CODM”) in deciding how to allocate resources to an individual segment and in assessing performance. The Company’s Chief Executive Officer is the CODM. The CODM reviews financial information presented on a consolidated basis for purposes of making operating decisions, allocating resources, and evaluating financial performance. As such, the Company determined that it has 1operating and reportable segment.
Net Loss Per Share
Basic earnings per share is calculated using our weighted-average outstanding Ordinary Shares. Diluted earnings per share is calculated using our weighted-average outstanding Ordinary Shares including the dilutive
F-
4
0
effect of outstanding equity instruments as determined under the treasury stock method. For periods in which we report net losses, diluted net loss per ordinary share attributable to ordinary shareholders is the same as basic net loss per ordinary share attributable to ordinary shareholders, because all potentially dilutive Ordinary Shares are anti-dilutive.
Concentration of Risk
Financial instruments that potentially subject us to significant concentrations of credit risk consist principally of cash and cash equivalents and accounts receivable. We maintain cash balances at financial institutions that management believes are high-credit, quality financial institutions, where deposits, at times, exceed the Federal Deposit Insurance Corporation limits.
Accounts Receivable
Accounts receivable is recorded at the invoiced amount and do not bear interest. We assess the need for an allowance for doubtful accounts based upon an analysis of past credit history and the current financial condition of its customers, as well as the consideration of expected trends based upon characteristics of the accounts and general economic conditions. Account balances are written off against the allowance after all means of collection have been exhausted and the potential for recovery is considered remote. The allowance for doubtful accounts is insignificant as of December 31, 2020 and 2019.
Equity Method Investments
Equity method investments are all entities over which we have significant influence but not control or joint control. Under the equity method of accounting, the investments are initially recognized at cost and adjusted thereafter to recognize the Company’s share of the post-acquisition profits or losses of the investee in the consolidated statement of operations and comprehensive loss. Earnings and losses of equity method investments are based on the most recently available financial statements of the investee. Basis differences between the cost of an equity method investment and the underlying equity in the long-lived assets are amortized over the estimated economic useful life of the underlying long-lived asset. We periodically review our equity method investments for impairment and record a reduction in the carrying value, if and when necessary. To date, 0such impairment losses have been recorded.
Stock-Based Compensation
We measure compensation expense for all stock-based awards based on the estimated fair value of the awards on the date of grant. Compensation expense is generally recognized as expense on a straight-line basis over the service period based on the vesting requirements. We recognize forfeitures as they occur. We estimate the fair value of stock options granted to employees using the Black-Scholes option pricing model, which requires the input of subjective assumptions, including (i) the fair value of Ordinary Shares, (ii) the expected stock price volatility, (iii) the expected term of the award, (iv) the risk-free interest rate and (v) expected dividends.
We measure nonemployee awards at their fair value on the adoption date of ASU
No. 2018-07.
Following the adoption of ASUNo. 2018-07
on January 1, 2018, the accounting for nonemployee awards is consistent with the accounting for employee stock-based compensation as described above.We granted options and restricted stock units which vest on the satisfaction of both a specific performance condition and a service-based condition.
Warrants
We determine the accounting classification of warrants, as either liability or equity classified, by first assessing whether the warrants meet liability classification in accordance with ASC
480-10,
Accounting forF-
41
Certain Financial Instruments with Characteristics of both Liabilities and Equity, then in accordance with ASC
815-40,
Accounting for Derivative Financial Instruments Indexed to and Potentially Settled in, a Company’s Own Stock. Under ASC 480, warrants are considered liability classified if the warrants are mandatorily redeemable, obligate the Company to settle the warrants or the underlying shares by paying cash or other assets, and warrants that must or may require settlement by issuing variable number of shares. If warrants do not meet the liability classification under ASC480-10,
the Company assesses the requirements under ASC815-40,
which states that contracts that require or may require the issuer to settle the contract for cash are liabilities recorded at fair value, irrespective of the likelihood of the transaction occurring that triggers the net cash settlement feature. If the warrants do not require liability classification under ASC815-40,
in order to conclude equity classification, the company also assesses whether the warrants are indexed to the Company’s ordinary share and whether the warrants are classified as equity under ASC815-40
or other U.S. GAAP. After all such assessments, the Company concludes whether the warrants are classified as liability or equity. Liability classified warrants require fair value accounting at issuance and subsequent to initial issuance with all changes in fair value after the issuance date recorded in the statements of operations and comprehensive loss. Equity classified warrants only require fair value accounting at issuance with no changes recognized subsequent to the issuance date.We issue warrants to purchase Ordinary Shares for goods and services received and these warrants are measured at their fair values upon issuance. Where vendors are issued warrants, the fair value of the services are determined by the fair value of the warrants issued. This fair value is measured at the grant date and excludes the impact of
non-market
vesting conditions (for example profitability and sales growth targets and performance conditions). Warrants issued for goods and services are ultimately recognized as an expense in selling, general and administrative expenses on the consolidated statements of operations and comprehensive loss with a corresponding credit in additionalpaid-in
capital.We may also issue warrants to purchase Ordinary Shares in conjunction with equity financing rounds. Such warrant issuances are recognized as equity issuance costs, with a corresponding credit in additional
paid-in
capital, resulting in a net zero change in additionalpaid-in
capital.We issued the liability classified warrants during the year ended December 31, 2020 that are embedded with the 8.0% Convertible Notes. Refer to Note 7, Long Term Debt for details.
Leases
Our lease portfolio is comprised of two major classes: real estate leases, which are the majority of our leased assets, are accounted for as operating leases and a manufacturing equipment lease accounted for as a finance lease on the consolidated balance sheet.
We classify leases as either operating or financing. We determine if an arrangement is a lease at inception by evaluating whether the arrangement conveys the right to use an identified asset and whether we obtain substantially all the economic benefits from and have the ability to direct the use of the asset. Operating lease assets are included under otherassets, net and finance lease liabilities, current portion under other current liabilities in the consolidated balance sheets. Finance ROU assets are amortized on a straight-line basis over their estimated useful lives.
non-current
assets and operating lease liabilities under other current and long-term liabilities, respectively in the consolidated balance sheets. We recognize lease expense for operating leases on a straight-line basis over the term of the lease. Finance lease asset is included under property, equipment, and finance leaseright-of-use
ROU assets represent the right to use an underlying asset for the lease term and lease liabilities represent the obligation to make lease payments arising from the lease. Operating lease ROU assets and liabilities are recognized at commencement date based on the present value of lease payments over the lease term. As the Company’s leases do not provide an implicit rate, an incremental borrowing rate based on the information available at the commencement date in determining the present value of lease payments is used. The operating
F-
42
lease ROU asset includes any lease payments made and excludes lease incentives. Lease terms may include options to extend or terminate the lease when it is reasonably certain that the option will be exercised. Lease expense for lease payments is recognized on a straight-line basis over the lease term. The Company has lease agreements with lease and
non-lease
components, which are generally combined.We elected, as an accounting policy for leases of real estate, to account for lease and
non-lease
components in a contract as a single lease component. In addition, the recognition requirements are not applied to leases with a term of twelve months or less. Rather, the lease payments for short-term leases are recognized on the consolidated statements of operations and comprehensive loss on a straight-line basis over the lease term.Variable payments, such as common area charges, maintenance, insurance and taxes, are primarily based on the amount of space occupied. These payments in the Company’s leases are not dependent on an index or a rate and are excluded from the measurement of the lease liabilities and recognized in the consolidated statements of operations and comprehensive loss in the period in which the obligation for those payments is incurred. The Company remeasures lease payments when the contingency underlying such variable payments is resolved such that some or all of the remaining payments become fixed.
Cost of Revenue
Our cost of revenue consists of costs related to the Company’s development services which includes cost of materials, cost associated with packaging and assembly, testing and shipping, cost of personnel, including stock-based compensation, and equipment associated with manufacturing support, logistics and quality assurance, overhead and occupancy costs.
Research and Development Expenses
Research and development expense consists primarily of personnel costs for engineers and third parties engaged in the design and development of products, software and technologies, including salary, bonus and share-based compensation expense, project material costs, services and depreciation. The Company expenses research and development costs as they are incurred
.
Selling, General and Administrative Expenses
Selling, general and administrative expenses consist of human capital related expenses for employees involved in general corporate functions, including executive management and administration, accounting, finance, tax, legal, information technology, marketing, and human resources; depreciation expense and rent relating to facilities; travel costs; professional fees; and other general corporate costs. Human capital expenses primarily include salaries, benefits, bonuses and stock-based compensation. As we continue to grow as a company, we expect that our selling, general and administrative costs will increase on an absolute dollar basis.
Fair Value of Financial Instruments and Fair Value Measurements
The Company determines fair value based on assumptions that market participants would use in pricing an asset or liability in the principal or most advantageous market. When considering market participant assumptions in fair value measurements, the following fair value hierarchy distinguishes between observable and unobservable inputs, which are categorized in one of the following levels:
Level 1 Inputs: Unadjusted quoted prices for identical assets or instruments in active markets.
Level 2 Inputs: Quoted prices for similar instruments in active markets and quoted prices for identical or similar instruments in markets that are not active and model derived valuations whose inputs are observable or whose significant value drivers are observable.
F-
43
Level 3 Inputs: Significant inputs into the valuation model are unobservable.
As permitted under the FASB,, we have elected the fair value option to account for the 2019 Convertible Notes, the 3.0% – 2020 Convertible Notes, the 8.00% – 2020 Convertible Notes and the 2020 Term Facility Loan. In accordance with ASC 825, the Company records these debt instruments at fair value with changes in fair value recorded under change in fair value of debt instruments in the consolidated statements of operations and comprehensive loss. As a result of applying the fair value option, direct costs and fees related to the debt instruments were recognized in earnings as incurred and were not deferred.
ASC 825, Financial Instruments (“ASC 825”)
Fair value is based on the exchange price that would be received for an asset or paid to transfer a liability (an exit price) in the principal or most advantageous market for the asset or liability in an orderly transaction between market participants. Where available, fair value is based on or derived from observable market prices or other observable inputs. Where observable prices or inputs are not available, valuation techniques are applied. These valuation techniques involve some level of management estimation and judgment, the degree of which is dependent on the price transparency for the instruments or market and the instruments’ complexity.
For debt instruments for which we have not elected fair value accounting (i.e. paycheck protection program), fair value is based on the present value of expected future cash flows and assumptions about the then-current market interest rates as of the reporting period and the creditworthiness of the Company. The carrying value of these debt instruments approximates fair value as the stated interest rate approximates market rates currently available to us.
For all debt instruments, including any for which we have elected fair value accounting, the Company classifies interest that has been accrued during each period as Interest expense on the consolidated statements of operations and comprehensive loss.
The recorded amounts of cash, accounts receivable, trade payable, and accrued expenses and other liabilities approximate the fair values principally because of their short-term nature.
Income Taxes
Deferred income taxes are provided on a liability method, whereby deferred income tax assets are recognized for deductible temporary differences, operating losses, and tax loss carryforwards, and deferred income tax liabilities are recognized for taxable temporary differences. Deferred income tax balances reflect the effects of temporary differences between the carrying amounts of assets and liabilities and their tax bases and are stated at enacted tax rates expected to be in effect when taxes are actually paid or recovered. Deferred income tax assets are reduced by a valuation allowance when, considering all sources of taxable income, in the opinion of management, it is more likely than not that some portion or all of the deferred income tax assets will not be realized. Deferred income tax assets and liabilities are adjusted for the effects of changes in tax laws and rates on the date of enactment.
The Company recognizes the income tax benefit from an uncertain tax position only if it is more likely than not that the tax position will be sustained upon examination by taxing authorities, based on the technical merits of the position. The income tax benefits recognized in the financial statements from such a position are measured based on the largest benefit that has a greater than 50% likelihood of being realized upon ultimate settlement.
Recently Adopted Accounting Pronouncements
In January 2016, the FASB issued ASU, to address certain aspects of recognition, measurement, presentation, and disclosure of financial assets and financial liabilities. The Company adopted this guidance on January 1, 2019 and it did not have a material impact on the Company’s consolidated financial statements.
2016-01,
Financial Instruments – Overall (Subtopic
825-10):
Recognition and Measurement of Financial Assets and Financial LiabilitiesF-
44
In February 2018, the FASB issued ASU, which allows a reclassification from accumulated other comprehensive income (loss) to retained earnings (accumulated deficit) for stranded income tax effects resulting from the 2017 Tax Cuts and Jobs Act. The amendments in ASU
No. 2018-02,
Reclassification of Certain Tax Effects from Accumulated Other Comprehensive Income (Topic 815)
2018-02
also require certain disclosures about stranded income tax effects. The Company adopted this guidance on January 1, 2019 and it did not have a material impact on the consolidated financial statements.In August 2018, the FASB issued ASU, which modifies the disclosure requirements on fair value measurements in Topic 820, based on the concepts in the Concepts Statement, including the consideration of costs and benefits. An entity is permitted to early adopt either the entire standard or only the provisions that eliminate or modify requirements. The Company adopted this guidance on January 1, 2020. The adoption of the guidance did not have a material impact on the consolidated financial statements. The Company has updated its fair value footnote (see Note 5, Fair Value Measurements for details) with additional and modified disclosures as required by the standard upon adoption.
2018-13,
Fair Value Measurement (“Topic 820”):
Disclosure Framework – Changes to the Disclosure Requirements for Fair Value Measurement
Accounting Pronouncements Issued but Not Yet Adopted
In December 2019, the FASB issued ASUwhich simplifies the accounting for income taxes by eliminating certain exceptions to the guidance in Topic 740 related to the approach for intraperiod tax allocation, the methodology for calculating income taxes in an interim period and the recognition of deferred tax liabilities for outside basis differences. The new guidance also simplifies aspects of the accounting for franchise taxes and enacted changes in tax laws or rates. ASU
2019-12,
Income Taxes (Topic 740): Simplifying the Accounting for Income Taxes,
2019-12
is effective for fiscal years beginning after December 15, 2020, with early adoption permitted. Upon adoption, the Company must apply certain aspects of this standard retrospectively for all periods presented while other aspects are applied on a modified retrospective basis through a cumulative-effect adjustment to retained earnings as of the beginning of the fiscal year of adoption. The Company is currently evaluating the impact this guidance will have on the consolidated financial statements.On June 16, 2016, the FASB issued ASUdebt securities through an allowance for credit losses instead of a reduction in the cost basis. The effective date of the new standard for all
No. 2016-13,
Financial Instruments-Credit Losses, requiring the measurement and recognition of expected credit losses for financial assets held at amortized cost, which include our accounts receivable and contract assets. The standard also requires that the Company recognizes credit impairment losses related to ouravailable-for-sale
non-public
entities is for fiscal years beginning after December 15, 2020 and interim periods within fiscal years beginning after December 2021. Early adoption is permitted. The new standard must be adopted using a modified retrospective transition with a cumulative effect adjustment recorded to opening retained earnings as of the initial adoption date. The Company is currently evaluating the impact this guidance will have on the consolidated financial statements.2. | Fiscal 2020 Asset Acquisition |
On November 25, 2020, we acquired certain technologies from TruTouch Technologies, Inc. (“Trutouch”). The consideration for the purchased technology was $3.1 million and consisted of $0.8 million in cash and $2.3 million in equity. The cash payments consisted of $0.3 million paid prior to the close of the transaction, and an additional $0.5 million to be paid in April 2021. The equity component of the consideration was 139,879 shares of ordinary stock in Rockley Photonics Limited, with a fair value of $16.43 per share or $2.3 million in total.
We accounted for the transaction as an asset acquisition as substantially all of the estimated fair value of the gross assets acquired was concentrated in a single identified asset,
in-process
research & development (“IPR&D”), thus satisfying the requirements of the screen test in ASU2017-1.
We allocated the total purchase price consideration of $3.1 million to IPR&D asset as the asset was purchased solely for the research andF-4
5
development activities and will be incorporated in efforts and milestones to be undertaken by the Company to design and develop a new application in order to expand its presence in the healthcare and well-being markets (which the Company has determined to be the alternative future use of the asset). The IPR&D asset is reported as an indefinite-lived intangible asset and subject to impairment whenever events or changes in circumstances indicate that the carrying amount of the asset might not be recoverable. Upon completion of our new product development cycle that incorporates Trutouch technology, the IPR&D asset will be amortized over the useful life of the developed technology that underpins our product. In the event the Company abandons the project, the entire IPR&D asset will be written off in full.
3. | Revenue Recognition |
We satisfy performance obligations at a point in time for the development services since the customers do not simultaneously receive and consume the benefits, we do not create or enhance an asset that the customer controls, and we do not have an enforceable right to payment for the performance completed to date. The contracts also contain substantive acceptance terms for each milestone due to its complexity. Revenue is recognized at the time the related performance obligation is satisfied with the transfer of a promised good or service to a customer, e.g., upon achievement of the milestone and acceptance by the customer.
Disaggregation of Revenue and Revenue Recognition
The following table depicts the disaggregation of revenue by geography, consistent with how we evaluate its financial performance (in thousands):
December 31, | ||||||||
2020 | 2019 | |||||||
United States | $ | 17,037 | $ | 13,783 | ||||
Rest of World | 5,306 | 6,709 | ||||||
Total revenue | $ | 22,343 | $ | 20,492 | ||||
Significant Customers
The following is our significant customers as of and for the years ended December 31, 2020 and 2019:
Revenue | Accounts receivable | |||||||||||||||
December 31, | December 31, | |||||||||||||||
2020 | 2019 | 2021 | 2020 | |||||||||||||
Customer A | 76 | % | 67 | % | 33 | % | 55 | % | ||||||||
Customer B | 24 | % | 33 | % | 67 | % | 45 | % | ||||||||
4. | Investments |
As of December 31, 2020 and 2019, we held an investment in Hengtong Rockley Technology Co., Ltd (“HRT”) and have appointed two of their five board members. HRT manufactures and sells optical fiber transceivers based on silicon photonics chipsets. HRT has share capital consisting solely of Ordinary Shares. We hold 24.9% of HRT’s Ordinary Shares, which is the same as the proportion of its voting rights. We consider HRT to be a variable interest entity upon which it does exercise significant influence, but the Company concluded it does not control the investment. Accordingly, the investment in HRT is accounted for under the equity method. We have made the election to use a three-month lag to record our share of HRT’s results. See Note 12, Related Party Transactions for details of the Company’s transactions with HRT.
F-4
6
For the years ended December 31, 2020 and 2019, the accompanying consolidated balance sheets and statements of operations and comprehensive loss reflected the following (in thousands):
December 31, | ||||||||
2020 | 2019 | |||||||
As of January 1, | $ | 1,486 | $ | 2,767 | ||||
Investment in HRT | 4,990 | — | ||||||
Share of loss of HRT | (1,274 | ) | (1,281 | ) | ||||
As of December 31, | $ | 5,202 | $ | 1,486 | ||||
5. | Fair Value Measurements |
Our financial assets as of December 31, 2020 and 2019 are considered Level 1 in the fair value hierarchy and measured at fair value as follows:
December 31, | ||||||||
2020 | 2019 | |||||||
Assets | ||||||||
Money market funds | $ | 11,516 | $ | 12,343 | ||||
All of our financial liabilities as of December 31, 2020, and 2019, are considered Level 3 in the fair value hierarchy, where inputs to the valuation techniques used to measure fair value were considered unobservable.
The fair value of our liabilities are as follows (in thousands):
December 31, | ||||||||
2020 | 2019 | |||||||
Liabilities | ||||||||
3.0% – 2020 Convertible Notes | $ | 32,106 | — | |||||
8.00% – 2020 Convertible Notes | 14,789 | — | ||||||
2020 Term Facility Loan | 25,049 | — | ||||||
2017 Term Loan | — | 1,952 | ||||||
Total financial liabilities | $ | 71,944 | $ | 1,952 | ||||
The fair value of the 2017 Term Loan approximates the carrying value, as of December 31, 2019, due to the rate of interest of the Term Loan being variable.
The Company’s assessment of the significance of a particular input to the fair value measurement in its entirety requires management to make judgments and consider factors specific to the asset or liability.
At December 31, 2020 and December 31, 2019, the carrying value of certain financial instruments, such as cash equivalents, accounts receivable, other receivable, prepaid expenses and other current assets, trade payable and other current accrued liabilities, approximate fair value due to their relatively short maturities and low market interest rates, if applicable.
Changes in the fair value of debt that is accounted for at fair value are presented as gains or losses in the consolidated statements of operations and comprehensive loss under Change in Fair Value of Debt Instruments.
3.0% – 2020 Convertible Notes
On March 9, 2020, we issued $21.3 million of 3.0% Convertible Notes and elected the fair value option of accounting for this debt instrument (see Note 7, Long Term Debt for details). At December 31, 2020, the
F-4
7
contractual outstanding principal of the 3.0% Convertible Notes Due 2025 was $21.3 million and the fair value was $32.1 million. As of December 31, 2020, we measured fair value using a binominal lattice model (which is discussed in further detail below) with the following significant inputs:
Fair Value per share of Ordinary Shares | $20.28 | |||
Risk-free interest rate | 0.08% - 0.10 | % | ||
Expected volatility | 55 | % | ||
Expected term, in years | 0.14 - 4.19 | |||
Discount yield | 48.4 | % | ||
Conversion price discount | 25% - 40 | % |
For the year ended December 31, 2020, we recorded a $10.8 million loss from change in fair value of debt in connection with the initial issuance and subsequent fair value remeasurement of the 3.0% Convertible Notes, as follows (in thousands):
Fair value at March 9, 2020 | $ | 21,281 | ||
Plus: Loss from change in fair value | 10,825 | |||
Fair value at December 31, 2020 | $ | 32,106 | ||
A binomial lattice model was used to determine the fair value of the 3.0% Convertible Notes Due 2025 based on assumptions as to when these would be converted or redeemed at each decision point. Within the lattice model, the following assumptions are made: (i) upon IPO/Sale/Merger/SPAC or maturity, the convertible notes may be converted to Ordinary Shares or redeemed at principal and accrued interest; and (ii) upon qualified financing event, the convertible notes will automatically convert to Ordinary Shares. The lattice model uses the stock price, conversion price, maturity date, risk-free rate, estimated stock volatility and estimated credit spread. We remeasure the fair value of the debt instrument and record the change as a gain or loss from change in fair value of debt in the statements of operations and comprehensive loss for each reporting period.
8.00% – 2020 Convertible Notes
On February 19, 2020, we issued $8.0 million of 8.0% Convertible Notes and elected the fair value option of accounting for this debt instrument (see Note 7, Long Term Debt for details). At December 31, 2020, the contractual outstanding principal of the 8.0% Convertible Notes Due 2027 was $8.0 million and the fair value was $14.8 million (including embedded warrants). As of December 31, 2020, we measured fair value using a binominal lattice model (which is discussed in further detail below) with the following significant inputs:
Fair Value per share of Ordinary Shares | $ | 20.28 | ||
Risk-free interest rate | 0.08% - 0.52 | % | ||
Expected volatility | 55 | % | ||
Expected term, in years | 0.14 - 6.14 | |||
Discount yield | 35 | % | ||
Conversion price discount | 25% - 40 | % |
For the year ended December 31, 2020, we recorded a $4.4 million loss from change in fair value of debt in connection with the initial issuance and subsequent fair value remeasurement of the 8.0% Convertible Notes, as follows (in thousands):
Fair value at February 19, 2020 | $ | 10,415 | ||
Plus: Loss from change in fair value | 4,374 | |||
Fair value at December 31, 2020 | $ | 14,789 | ||
F-4
8
A binomial lattice model was used to determine the fair value of the 8.0% Convertible Notes Due 2025 based on assumptions as to when these would be converted or redeemed at each decision point. Within the lattice model, the following assumptions are made: (i) upon IPO/Sale/Merger/SPAC or maturity, the convertible notes may be converted to Ordinary Shares or put at 125% of principal and accrued interest; and (ii) upon financing event, the convertible notes may be converted to Ordinary Shares. We remeasure the fair value of the debt instrument and record the change as a gain or loss from change in fair value of debt in the statements of operations and comprehensive loss for each reporting period.
We issued liability classified warrants in conjunction with the issuance of the 8.0% Convertible Notes. We evaluated the terms of these warrants and noted that under ASC 480, our potential obligation to settle the warrants only when the exercise of contingencies is met. Due to this provision, ASC 480 requires that these warrants be classified as liabilities and combined within the 8.0% Convertible Notes. The fair value of these warrants is embedded within the fair value of the 8.0% Convertible Notes presented in the table above.
2020 Term Facility Loan
On September 29, 2020, we issued $35.0 million of convertible notes and elected the fair value option of accounting for this debt instrument (see Note 7, Long Term Debt for details). At December 31, 2020, the contractual outstanding principal of the 2020 Term Facility Loan was $22.5 million and the fair value was $25.1 million. As of December 31, 2020, we measured fair value using a binominal lattice model and discounted cash flow approach for various exit event scenario, with the following significant inputs:
Fair Value per share of Ordinary Shares | $ | 20.28 | ||
Risk-free interest rate | 0.21 | % | ||
Expected volatility | 55 | % | ||
Expected term, in years | 0.14 - 4.13 | |||
Discount yield | 35 | % |
For the year ended December 31, 2020, we recorded a $1.7 million loss from change in fair value of debt in connection with the initial issuance and subsequent fair value remeasurement of 2020 Term Facility Loan, as follows (in thousands):
Fair value at September 29, 2020 | $ | 23,320 | ||
Plus: Loss from change in fair value | 1,729 | |||
Fair value at December 31, 2020 | $ | 25,049 | ||
A binomial lattice model was used to determine the fair value of the 2020 Term Facility Loan based on assumptions as to when these would be converted upon IPO/Sale/Merger/SPAC. Upon such event, the convertible notes will be paid off as following: (i) if par value exit, repayment of base multiple times principal plus unpaid interest; (ii) if greater value exit, repayment of base multiple plus
add-on
multiple ratio times principal plus accrued interest.We used the probability weighted discounted cash flow approach to determine if the 2020 Term Facility Loan would be converted upon qualified financing or maturity. Upon the qualified financing, the convertible notes will not be converted and will remain outstanding until maturity and put at 280% principal plus unpaid interest. Upon maturity, the convertible notes will be repaid at a full principal balance. We remeasure the fair value of the debt instrument and record the change as a gain or loss from change in fair value of debt in the statements of operations and comprehensive loss for each reporting period.
2019 Convertible Notes
During 2019, we issued convertible loan notes in an aggregate principal amount of $15.0 million (see Note 7, “Long Term Debt” for details). We elected to account for the 2019 Convertible Notes at fair value.
F-4
9
Management believes that the fair value option better reflects the underlying economics of the 2019 Convertible Notes, which contains embedded derivatives. The notes were converted to Ordinary Shares due to a qualified financing event in June 2019. During 2019, the 2019 Convertible Notes were converted into 1,336,344 Ordinary Shares.
6. | Balance Sheet Components |
Cash and cash equivalents
Our cash and cash equivalents balances as of December 31, 2020 and 2019 were concentrated by location as follows:
December 31, | ||||||||
2020 | 2019 | |||||||
United Kingdom | 96 | % | 95 | % | ||||
United States | 3 | % | 4 | % | ||||
Other | 1 | % | 1 | % | ||||
We have not experienced any losses on cash and cash equivalents to date.
Other receivables
Other receivables consist of the following (in thousands):
As of December 31, | ||||||||
2020 | 2019 | |||||||
R&D tax credit receivable | $ | 17,412 | $ | 14,731 | ||||
Grants receivable | 0 | 239 | ||||||
VAT receivable | 607 | 886 | ||||||
Other receivable | 5 | 93 | ||||||
Total other receivables | $ | 18,024 | $ | 15,949 | ||||
The research and development tax credit receivable consists of research and development expenses that have been claimed as research and development tax credits in accordance with the relevant U.K. tax legislation. These refundable tax credits are payable to the Company in cash and are carried on the consolidated balance sheet at the amount claimed and expected to be received from the U.K. government within the next 12 months. The amount of the R&D tax credit has been recorded as a reduction to cost of revenue and operating expenses (based on the nature of the underlying expenditure) on the accompanying consolidated statements of operations and comprehensive loss.
F-
50
Property, equipment and finance leaseassets, net
right-of-use
Property and equipment, net consisted of the following (in thousands):
As of December 31, | ||||||||
2020 | 2019 | |||||||
Computer equipment | $ | 1,218 | $ | 1,020 | ||||
Lab equipment | 7,607 | 5,614 | ||||||
Motor vehicles | 31 | 31 | ||||||
Furnitures and fixtures | 265 | 265 | ||||||
Leasehold improvements | 704 | 704 | ||||||
Assets under construction | 27 | 587 | ||||||
Total property and equipment | $ | 9,852 | $ | 8,221 | ||||
Less: accumulated depreciation | (5,802 | ) | (3,561 | ) | ||||
Total property and equipment, net | $ | 4,050 | $ | 4,660 | ||||
Depreciation expense was $2.4 million and $1.5 million for the years ended December 31, 2020, and 2019, respectively.
Finance leaseassets, net consisted of the following (in thousands):
right-of-use
As of December 31, | ||||||||
2020 | 2019 | |||||||
Finance lease right-of-use | $ | 2,966 | $ | 3,105 | ||||
Less: accumulated amortization | (834 | ) | (485 | ) | ||||
| Total finance lease right-of-use assets, net | $ | 2,132 | $ | 2,620 | ||||
Amortization expense was $0.4 million and $0.4 million for the years ended December 31, 2020, and 2019, respectively.
Intangible asset
Intangible asset consisted of the following (in thousands):
As of December 31, | ||||||||
2020 | 2019 | |||||||
In-process Research and Development | $ | 3,048 | $ | 0 | ||||
Total intangible asset | $ | 3,048 | $ | 0 | ||||
F-
51
Accrued expenses
Accrued expenses consist of the following (in thousands):
As of December 31, | ||||||||
2020 | 2019 | |||||||
Accrued bonus | $ | 3,349 | $ | 2,501 | ||||
Accrued payroll and benefits | 1,524 | 602 | ||||||
Accrued taxes | 332 | 75 | ||||||
Accrued fabrication costs | 2,321 | 1,884 | ||||||
Share appreciation rights | 706 | 435 | ||||||
Other accrued expenses | 2,163 | 1,355 | ||||||
Total accrued expenses | $ | 10,395 | $ | 6,852 | ||||
7. | Long Term Debt |
The following table summarizes information relating to our long-term debt, (in thousands):
December 31, 2020 | ||||||||||||
Principal | Fair Value Adjustment | Net | ||||||||||
3.0% – 2020 Convertible Notes | $ | 21,281 | $ | 10,825 | $ | 32,106 | ||||||
8.00% – 2020 Convertible Notes | 8,000 | 6,789 | 14,789 | |||||||||
2020 Term Facility Loan | 22,500 | 2,549 | 25,049 | |||||||||
Paycheck Protection Program | 2,860 | — | 2,860 | |||||||||
Total long-term debt | $ | 54,641 | $ | 20,163 | $ | 74,804 | ||||||
Less: current portion of long-term debt | 0 | 0 | 0 | |||||||||
Long-term debt, net of current portion | $ | 54,641 | $ | 20,163 | $ | 74,804 | ||||||
Future minimum payments under the debt agreements as of December 31, 2020 are as follows (in thousands):
Convertible Notes | ||||
Year Ending December 31: | ||||
2021 | $ | 0 | ||
2022 | 0 | |||
2023 | 0 | |||
2024 | 0 | |||
2025 | 66,281 | |||
Thereafter | 10,000 | |||
Total future minimum payments | $ | 76,281 | ||
Less: current portion of debt principal | 0 | |||
Non-current portion of debt principal | $ | 76,281 | ||
January 2017 Term Loan and May 2017 Term Loan
On January 27, 2017, we secured a term loan of $5.0 million from Silicon Valley Bank (“January 2017 Term Loan”). The January 2017 Term Loan matured on March 31, 2020, with an interest only period through
F-
52
March 31, 2017 preceding the
24-month
On May 26, 2017, we secured a new term loan for $10.0 million of which $5.0 million was provided by Silicon Valley Bank and €4.5 million was provided by Kreos Capital (“May 2017 Term Loan”). The May 2017 Term Loan had a
thirty-six
month term and matured on June 1, 2020. Interest is accrued on the outstanding balance of the loan at a variable rate based on Wall Street Prime Rate plus 5.50% and has an interest floor of 9.00%. The interest rate was 11.0% as of December 31, 2019. There are no financial covenants included in the May 2017 Term Loan.The $5.0 million received from Silicon Valley Bank under the May 2017 Term Loan was used to repay the January 2017 Term Loan and we received a waiver of the prepayment fee. The repayment of the January 2017 Term Loan was treated as a modification of debt. Therefore, additional fees paid to the creditor was reflected as additional debt discount and amortized over the remaining term using the interest method and has been fully amortized as of December 31, 2020 and was immaterial as of December 31, 2019.
Under the January 2017 Term Loan, Silicon Valley Bank and under the May 2017 Term Loan, Kreos Capital each received 52,050 warrants to purchase Ordinary Shares of the Company at an exercise price of $8.646 per warrant (“Bank Warrants”). The Silicon Valley Bank and Kreos Capital warrants expire on January 27, 2027 and May 26, 2027, respectively. See Note 11 for further discussion regarding warrants.
2019 Convertible Notes
During 2019, we issued convertible loan notes in an aggregate principal amount of $15.0 million (“2019 Convertible Notes”). The 2019 Convertible Notes mature on the second anniversary date of the instrument and bore interest at a rate of 8.0% per annum. The 2019 Convertible Notes were issued in two tranches—$6.7 million on March 5, 2019 and $8.3 million on March 27, 2019. The 2019 Convertible Notes were convertible as follows:
| (a) | if in an equity financing raised total proceeds for the Company of not less than $10.0 million then the outstanding principal amount of all notes and any unpaid accrued interest shall automatically convert into the most senior class of share at a conversion price of $11.4384, equal to a 20% discount to the Series E issuance price of $14.298 per share; or |
| (b) | At an exit event, convert the outstanding principal amount of all notes and any unpaid accrued interest thereon into the most senior class of share of the Company, at a conversion price equal to the Series E issuance price of $14.298 per share. |
| (c) | At the maturity date, convert into the most senior class of share at a conversion price equal to the Series E issuance price of $14.298. |
We elected to account for the 2019 Convertible Notes at fair value as of the issuance date. Management believes that the fair value option better reflects the underlying economics of the 2019 Convertible Notes, which contains embedded derivatives. Under the fair value election, changes in fair value are reported in the consolidated statements of operations and comprehensive loss under Change in Fair Value of Debt Instruments.
On June 12, 2019, we received equity financing of $24.0 million, resulting in the automatic conversion of the 2019 Convertible Notes. Upon settlement, we recorded interest expense in the amount of $0.3 million for the amount that would have been accrued from the issuance date to the settlement date at annual rate of 8%, on the $15.0 million of principal under the terms of the 2019 Convertible Notes. To extinguish the 2019 Convertible Notes, 1,336,344 Ordinary Shares were issued. A loss of $3.0 million was generated on the extinguishment of the liability during the conversion based on the difference between the fair value of the shares at $13.65 and the conversion price of $11.44 and was recorded in statements of operations and comprehensive loss under change in fair value of debt instruments.
F-
53
3.0% – 2020 Convertible Notes
On March 9, 2020, we issued convertible loan notes in an aggregate principal amount of $21.3 million (the “3.0% Convertible Notes”). The 3.0% Convertible Notes mature on the fifth anniversary date of the instrument and bear interest at a rate of 3.0% per annum. The 3.0% Convertible Notes contain no financial covenants. We accrued but unpaid interest of
$
0.3 million for the year ended December 31, 2020. The 3.0% Convertible Notes were issued in two tranches – $
20.0 million on March 9, 2020 and $
1.3 million on October 20, 2020. The 3.0% Convertible Notes were convertible as follows:
| (a) | If in an equity financing raised total proceeds for the Company of not less than $10.0 million then the outstanding principal amount of all notes and any unpaid accrued interest shall automatically convert into the most senior class of equity share at a conversion price of $14.298 per share; or |
| (b) | if an equity financing is not raised for the Company, then the outstanding principal amount of all notes and any unpaid accrued interest may convert into the most senior class of share at a conversion price of $14.298 per share. |
| (c) | At an exit event, redeem the outstanding notes for an amount equal to the outstanding principal plus accrued interests or convert the outstanding principal amount of all notes and any unpaid accrued interest thereon into the most senior class of share of the Company, at a conversion price equal to the issuance price of $14.298 per share. |
| (d) | At the maturity date, convert into the most senior class of shares at a conversion price equal to the issuance price of $14.298 per share. |
We elected to account for the 3.0% Convertible Notes at fair value as of the issuance date. Management believes that the fair value option better reflects the underlying economics of the 3.0% Convertible Notes. Under the fair value election, changes in fair value are reported in the consolidated statements of operations and comprehensive loss under Change in Fair Value of Debt Instruments. For the year ended December 31, 2020, we recorded a loss of $10.8 million which is shown as Fair Value Adjustment in the table at the beginning of this Note 7. See Note 5, Fair Value Measurements for information about the assumptions we used to measure the fair value of the 3.0% Convertible Notes.
8.00% – 2020 Convertible Notes
On February 19, 2020, we issued convertible loan notes to our board member in an aggregate principal amount of $8.0 million (the “8.0% Convertible Notes”). The 8.0% Convertible Notes mature on the seventh anniversary date of the instrument and bear interest at a rate of 8.0% per annum. The 8.0% Convertible Notes contain no financial covenants. We accrued but unpaid interest of $0.6 million for the year ended December 31, 2020. The 8.0% Convertible Notes were convertible as follows:
| (a) | In the event of an equity financing, the outstanding principal amount of all notes and any unpaid accrued interest shall automatically convert into the most senior class of share at a conversion price being the lower of 14.298 per share or a discounted subscription price of the equity shares; or |
| (b) | At an exit event, convert the outstanding principal amount of all notes and any unpaid accrued interest thereon into the most senior class of share of the Company, at a conversion price, equal to a 25% discount to the Series E issuance price of $14.298 per share. |
| (c) | At the maturity date, convert into the most senior class of equity share at a conversion price of $14.298. |
We elected to account for the 8.0% Convertible Notes at fair value as of the issuance date. Management believes that the fair value option better reflects the underlying economics of the 8.0% Convertible Notes. Under the fair value election, changes in fair value are reported in the consolidated statements of operations and comprehensive loss under Change in Fair Value of Debt Instruments. For the year ended December 31, 2020, we recorded a loss of $6.8
million which is shown as Fair Value Adjustment in the table at the beginning of this
F-5
4
Note 7. See Note 5, Fair Value Measurements for information about the assumptions we used to measure the fair value of 8.0% Convertible Notes.
In conjunction with the 8.0% Convertible Notes, we also issued the holder warrants (“Investor Warrants”) which are convertible into Ordinary Shares of the Company. The warrants have an exercise price of $0.00001 per share and will only become exercisable if we fail to achieve certain revenue and contribution margin targets in 2021 and 2022. The number of shares that the warrants will convert into varies according to the proportion of the revenue and contribution targets ultimately achieved. The value of the warrants is embedded within the 8.0% Convertible Notes
.
2020 Term Facility Loan
On September 29, 2020, we secured a term facility loan of $35.0 million from Argentum (“2020 Term Facility Loan”). The 2020 Term Facility Loan matures on March 29, 2025 and bears interest at a rate of 2.0% per annum. The 2020 Term Facility Loan has no financial covenants. We may extend the maturity date through the filing of an extension request up to an additional one year. The 2020 Term Facility Loan may be voluntarily prepaid in full (no partial repayments), plus the applicable repayment premium payable. The Company paid interest of $0.1 million for the year ended December 31, 2020.
The Company shall repay the aggregate amount of the loans utilized in full on the maturity date, subject to no Qualified Exit occurring at the time plus the applicable repayment premium payable. The Qualified Exit means: 1) qualified listing—a flotation or a public offering, the value of which is equal to or exceeds the free float value of $350.0 million; 2)
non-qualified
trade. As of December 31, 2020, the total amount borrowed was $22.5 million.Upon any occurrence of a
non-qualified
trade sale or qualified listing, amounts due to Argentum will be discharged in full by way of conversion into our most senior class of shares.We elected to account for the 2020 Term Facility Loan at fair value as of the issuance date. Management believes that the fair value option better reflects the underlying economics of the 2020 Term Facility Loan. Under the fair value election, changes in fair value are reported in the consolidated statements of operations and comprehensive loss under Change in Fair Value of Debt Instruments. For the year ended December 31, 2020, we recorded a loss of $2.5 million which is shown as Fair Value Adjustment in the table at the beginning of this Note 7. See Note 5, Fair Value Measurements for information about the assumptions we used to measure the fair value of 2020 Term Facility Loan.
Paycheck Protection Program
On April 21, 2020, we received loan proceeds of approximately $2.9 million (“PPP Loan”) under the Paycheck Protection Program (“PPP”). The PPP, established as part of the Coronavirus Aid, Relief and Economic Security Act, provides for loans to qualifying businesses for amounts up to 2.5 times the average monthly payroll expenses of the qualifying business. The PPP Loan and accrued interest are forgivable after twenty-four weeks as long as the borrower uses the loan proceeds for eligible purposes, including payroll, benefits, rent and utilities, and maintains its payroll levels. The amount of loan forgiveness will be reduced if the borrower terminates employees or reduces salaries during the eight-week period.
The PPP Loan is evidenced by a promissory note, dated as of April 21, 2020 (the “Note”), between the Company, as Borrower, and Silicon Valley Bank, as Lender (the “Lender”). The interest rate on the Note is 1.0% per annum, with interest accruing on the unpaid principal balance computed on the basis of the actual number of days elapsed in a year of 360 days. No payments of principal or interest are due during the
six-month
period beginning on the date of the Note (the “Deferral Period”). On December 8, 2020, we filed an application seeking forgiveness of the PPP Loan. On March 2, 2021, we received notification from the Lender that our loan forgiveness application has been submitted to Small Business Administration (“SBA”).F-5
5
Beginning one month following expiration of the Deferral Period and continuing monthly until 24 months from the date of the Note (the “Maturity Date”), we are obligated to make monthly payments of principal and interest to the Lender with respect to any unforgiven portion of the Note, in such equal amounts required to fully amortize the principal amount outstanding on the Note as of the last day of the Deferral Period by the Maturity Date. We are permitted to prepay the Note at any time without payment of any premium. As of December 31, 2020, we had $
8. | Income Taxes |
For the years ended December 31, 2020 and 2019, loss before income taxes were as follows (in thousands):
Years Ended December 31, | ||||||||
2020 | 2019 | |||||||
U.K. Operations | $ | (82,705 | ) | $ | (53,291 | ) | ||
Foreign operations | 2,997 | 2,752 | ||||||
Loss before income taxes | $ | (79,708 | ) | $ | (50,539 | ) | ||
The components of provision for income tax for the years ended December 31, 2020 and 2019 are as follows (in thousands):
Current | Deferred | Total | ||||||||||
Year ended December 31, 2020 | ||||||||||||
U.K. operations | $ | 0 | $ | 0 | $ | 0 | ||||||
Foreign jurisdictions | 569 | 0 | 569 | |||||||||
| $ | 569 | $ | 0 | $ | 569 | |||||||
Current | Deferred | Total | ||||||||||
Year ended December 31, 2019 | ||||||||||||
U.K. operations | $ | 0 | $ | 0 | $ | 0 | ||||||
Foreign jurisdictions | 311 | 0 | 311 | |||||||||
| $ | 311 | $ | 0 | $ | 311 | |||||||
The effective tax rate of the Company’s provision for income taxes differs from the 19% statutory rate of the Company’s U.K. headquarters entity (in thousands, except percentages):
Years Ended December 31, | ||||||||||||||||
2020 | 2019 | |||||||||||||||
U.K. Statutory Rate | $ | (15,145 | ) | 19.0 | % | $ | (9,602 | ) | 19.0 | % | ||||||
Foreign income tax | 308 | (0.4 | )% | 96 | (0.2 | )% | ||||||||||
Research & Development credit | (628 | ) | 0.8 | % | (1,086 | ) | 2.1 | % | ||||||||
Stock-based compensation | 1,293 | (1.6 | )% | 758 | (1.5 | )% | ||||||||||
Permanent differences | 3,325 | (4.2 | )% | (681 | ) | 1.3 | % | |||||||||
Change in valuation allowance | 7,480 | (9.4 | )% | 2,636 | (5.2 | )% | ||||||||||
Losses not benefited | 3,999 | (5.0 | )% | 8,169 | (16.1 | )% | ||||||||||
Others, net | (63 | ) | 0.1 | % | 21 | 0 | % | |||||||||
Total | $ | 569 | (0.7 | )% | $ | 311 | (0.6 | )% | ||||||||
F-5
6
Deferred Tax Assets and Liabilities
Deferred income taxes reflect the net effects of (a) temporary differences between the carrying amounts of assets and liabilities for financial reporting purposes and the amounts used for income tax purposes, and (b) operating losses and tax credit carryforwards.
We record income tax expense for the anticipated tax consequences of the reported results of operations using the asset and liability method. Under this method, the Company recognizes deferred tax assets and liabilities for the expected future tax consequences of temporary differences between the financial reporting and tax basis of assets and liabilities, as well as for operating loss and tax credit carryforwards. Deferred tax assets and liabilities are measured using tax rates that are expected to apply to taxable income for the years in which those tax assets and liabilities are expected to be realized or settled. The Company records valuation allowances to reduce its deferred tax assets to the net amount that it believes is more likely than not to be realized. Its assessment considers the realization of deferred tax assets on a jurisdictional basis.
The significant components of the Company’s deferred taxes are as follows (in thousands):
December 31, | ||||||||
2020 | 2019 | |||||||
Deferred tax assets: | ||||||||
Net operating loss carryforwards | $ | 15,066 | $ | 7,494 | ||||
Research and development credits | 0 | 1,217 | ||||||
Stock-based compensation | 1,476 | 1,057 | ||||||
Lease liabilities | 482 | 916 | ||||||
Accrued liabilities | 788 | 633 | ||||||
Other | 2 | 0 | ||||||
Total gross deferred tax assets | 17,814 | 11,317 | ||||||
Less valuation allowance | (16,377 | ) | (9,520 | ) | ||||
Net deferred tax assets | $ | 1,437 | $ | 1,797 | ||||
Deferred tax liabilities: | ||||||||
Right-of-use | $ | (821 | ) | $ | (1,064 | ) | ||
Property and equipment, principally due to differences in depreciation | (592 | ) | (733 | ) | ||||
Other | (24 | ) | 0 | |||||
Total gross deferred tax liabilities | (1,437 | ) | (1,797 | ) | ||||
Net deferred tax assets | $ | 0 | $ | 0 | ||||
ASC 740 requires that the tax benefit of net operating losses (“NOLs”), temporary differences and credit carryforwards be recorded as an asset to the extent that management assesses that realization is “more likely than not.” Realization of our future tax benefits is dependent on our ability to generate sufficient taxable income within the carryforward period.
The changes in valuation allowance related to operating activity was an increase in the amount of $6.9 million and $2.8 million during the years ended December 31, 2020 and 2019, respectively.
NOLs and tax credit gross carryforwards as of December 31, 2020 are as follows (in thousands):
Amount | Expiration Years | |||||||
NOLs, U.K. (gross) | $ | 79,293 | See notes below | |||||
Tax credits, Federal | $ | 0 | See notes below | |||||
Tax credits, State | $ | 0 | See notes below | |||||
F-5
7
Net Operating Losses
As of December 31, 2020, the Company has U.K. NOL of approximately $79.3 million that can be carried forward indefinitely.
The U.S. R&D tax credit for the year ended December 31, 2020 has been fully utilized.
Uncertain Tax Positions
The Company recognizes tax benefits from uncertain tax positions only if it believes that it is more likely than not that the tax position will be sustained on examination by the taxing authorities based on the technical merits of the position. As the Company expands, it will face increased complexity in determining the appropriate tax jurisdictions for revenue and expense items. The Company’s policy is to adjust these reserves when facts and circumstances change. To the extent that the final tax outcome of these matters is different than the amounts recorded, such differences will affect the income tax expense in the period in which such determination is made and could have a material impact on its financial condition and operating results. The income tax expense includes the effects of any accruals that the Company believes are appropriate, as well as the related net interest and penalties. As of December 31, 2020 and 2019, the Company had total uncertain tax positions of $2.2 million and $0.4 million. No interest or penalties have been recorded related to the uncertain tax positions. None of the unrecognized tax benefits, if recognized, would affect the effective tax rate. A reconciliation of the beginning and ending balances of unrecognized tax benefits is as follows (in thousands):
Years Ended December 31, | ||||||||
2020 | 2019 | |||||||
Balance at beginning of the year | $ | 405 | $ | 271 | ||||
Increases based on tax positions related to current year | 733 | 134 | ||||||
Increases based on tax positions related to prior years | 1,199 | 0 | ||||||
Decreases based on tax positions related to prior years | (101 | ) | 0— | |||||
Balance at end of year | $ | 2,236 | $ | 405 | ||||
It is not expected that there will be a significant change in uncertain tax position in the next 12 months. We are subject to income tax in the U.K., U.S. federal and various states and three other foreign jurisdictions. Our U.S. income tax filings are currently under audit for the tax year ended December 31, 2018. The statute of limitations for U.K. and foreign tax jurisdictions other than the U.S. are no longer subject to audit for tax years before December 31, 2018. We are no longer subject to U.S. federal income tax audit for the tax years before the year ended December 31, 2017 and are no longer subject to state income tax audit for tax years before December 31, 2016.
9. | Ordinary Shares |
Ordinary Shares have no liquidation preferences and entitle holders to one vote per share. Ordinary shareholders are entitled to receive
non-cumulative
dividends, when and if declared by our Board of Directors.F-58
10. | Earnings Per Share |
A reconciliation of net loss available to ordinary shareholders and the number of shares in the calculation of basic and diluted net loss per share follows (in thousands, except for share and per share data):
Years Ended December 31, | ||||||||
2020 | 2019 | |||||||
Basic and diluted: | ||||||||
Net loss | $ | (80,277 | ) | $ | (50,850 | ) | ||
Weighted average Ordinary Shares outstanding | 33,604,752 | 31,406,127 | ||||||
Basic and diluted net loss per share | $ | (2.39 | ) | $ | (1.62 | ) | ||
Basic net loss per share is calculated by dividing net loss for the period by the weighted average number of the Ordinary Shares outstanding plus 132,099 outstanding warrants outstanding with a $0.01 exercise price during the period.
As of December 31, 2020 and 2019, we excluded the potential effect of the following in the calculation of the diluted loss per share, as the effect would be anti-dilutive due to losses incurred.
As of December 31, | ||||||||
2020 | 2019 | |||||||
Outstanding warrants, less 132,099 outstanding warrants with a $0.01 exercise price | 881,004 | 848,240 | ||||||
Outstanding options | 7,207,044 | 5,904,413 | ||||||
Outstanding performance awards | 249,605 | 249,605 | ||||||
| 8,337,653 | 7,002,258 | |||||||
11. | Stock-Based Compensation |
The Company has established a number of share-based incentive plans for current employees, directors and others, which include Share Appreciation Rights, 2013 Share Option Plan and Warrants.
Share Appreciation Rights
On November 12, 2013, the Company issued to certain employees Share Appreciation Rights (“SARs”) that require us to pay the intrinsic value of the SARs to the employee at the date of exercise. These SARs vest over a period of four years, provided the employee remains in the employment of the Company and recorded as liabilities at fair value as of the respective period end. As of December 31, 2020 and 2019, there were 30,000 SARs outstanding at an exercise price per share of $0.00001.
As of December 31, 2020 and 2019, the Company had recorded liabilities of $0.7 million and $0.4 million related to these SARs based on their fair value of $20.28 and $12.98 per share as of December 31, 2020 and 2019, respectively. The Company recognized expense for the SARs in the consolidated statements of operations and comprehensive loss under selling, general and administrative of $0.3 million and $0.02 million during the years ended December 31, 2020 and 2019.
2013 Share Option Plan
In 2013, we adopted the 2013 Equity Incentive Plan (the “Plan”), which provides for grants of stock options to attract and retain employees, directors, officers, and consultants.
As of December 31, 2020, there were 11,458,989 shares authorized for issuance under the Plan, of which 2,746,089 shares were available for grant. Share options can be granted with an exercise price less than, equal to
F-59
or greater than the shares’ fair market value at the date of grant. All options vest over the earlier of 4 years of service from grant or start of service, with typically 25% becoming exercisable on the first anniversary of the grant or start of service and the balance becoming exercisable in equal monthly portions over the following 36 months.
The following table summarizes stock option activity related to the plans during the years ended December 31, 2020 and 2019:
Number of Options Outstanding | Average Exercise Price Per Share | Remaining Contractual Life | Intrinsic Value | |||||||||||||
(Years) | (In thousands) | |||||||||||||||
Balances as of December 31, 2018 | 5,565,292 | $ | 2.88 | 6.68 | $ | 59,146 | ||||||||||
Options granted | 1,135,148 | 9.29 | ||||||||||||||
Options exercised | (24,750 | ) | 1.33 | |||||||||||||
Options forfeited | (120,001 | ) | 6.65 | |||||||||||||
Options expired | (651,276 | ) | 2.78 | |||||||||||||
Balances as of December 31, 2019 | 5,904,413 | $ | 4.05 | 6.94 | $ | 54,100 | ||||||||||
Options granted | 2,328,385 | 8.67 | ||||||||||||||
Options exercised | (7,813 | ) | 5.36 | |||||||||||||
Options forfeited | (826,488 | ) | 8.62 | |||||||||||||
Options expired | (191,453 | ) | 6.92 | |||||||||||||
Balances as of December 31, 2020 | 7,207,044 | $ | 4.94 | 6.75 | $ | 110,552 | ||||||||||
Options exercisable—December 31, 2020 | 4,693,313 | $ | 3.16 | 5.51 | $ | 80,334 | ||||||||||
The aggregated intrinsic value represents the difference between the exercise price and the fair value of Ordinary Shares. The total aggregate intrinsic value of options exercised during the years ended December 31, 2020 and 2019 was $0.1 million and $0.3 million, respectively. The weighted-average grant-date fair value of options granted during the years ended December 31, 2020 and 2019 was $8.32 and $7.92 per share, respectively.
Stock-based compensation expense for all equity arrangements for the years ended December 31, 2020 and 2019 was as follows (in thousands):
Years Ended December 31, | ||||||||
2020 | 2019 | |||||||
Cost of revenue | $ | 2,271 | $ | 2,230 | ||||
Research and development | 4,313 | 2,835 | ||||||
Sales and marketing | 639 | 475 | ||||||
General and administrative | 820 | 689 | ||||||
Total stock-based compensation expense | $ | 8,043 | $ | 6,229 | ||||
As of December 31, 2020 and 2019, there was approximately $19.5 million and $13.8 million of total unrecognized stock based compensation expense, related to unvested options granted to employees under the Company’s stock option plan that is expected to be recognized over a weighted average period of 1.4 years and 1.3 years, respectively.
Performance Awards
During the year ended December 31, 2019, 249,605 performance-based awards at a weighted average grant date fair value of $7.84 were granted to certain individuals with conditions that include specific sales and
F-60
fundrai
sing targets. As of December 31, 2020, it was determined that all of these awards met their performance conditions, and the Company recognized a total ex
pense of $0.8 million in relation to these awards. As of December 31, 2020 and 2019, there were approximately $1.2 million and $2.0 million ofunrecognized stock-based compensation expense related to these performance-based awards. During the year ended December 31, 2020, no additiona
l performance-based awards were granted.Fair Value of Options
The fair values of options granted during the period wer
e determined using a Black-Scholes model. The following principal assumptions were used in the valuation:
Fair Value of Ordinary Shares
erlying the stock option awards was determined by the Board of Directors (“the Board”). Given the absence of a public trading market, the Board considered numerous objective and subjective factors to determine the fair value of the Company’s Ordinary Shares at each meeting at which awards were approved. These factors included, but were not limited to (i) contemporaneous third party valuations of Ordinary Shares; (ii) the lack of marketability of Ordinary Shares; (iii) stage and development of the Company’s business; (iv) general economic conditions; and (vi) the likelihood of achieving a liquidity event, such as an IPO or sale of the Company, given prevailing market conditions. To evaluate the fair value of the underlying shares for grants between two independent valuations and after the last independent valuation, a linear interpolation framework was used to evaluate the
fair value of the underlying shares.Volatility
d on the historical and implied volatilities of comparable publicly traded companies as the Company does not have sufficient history of trading its
Ordinary Shares.Risk-free Interest Rate
e based on US Treasury yields in effect at the grant date for notes with comparable terms as the awards.
Expected Term
nt historical information to develop reasonable expectations about future exercise patterns and post-vesting employment termination behavior, the Company determines the expected term based on the average period the stock options are expected to remain outstanding. For stock options, expected ter
m is calculated as the midpoint of the stock options vesting term and contractual expiration period.Dividend Yield
d dividend rate is zero as the Company has not declared or paid any cash dividends and does not anticipate to do so in the foreseeable future.
Years Ended December 31, | ||||||||
2020 | 2019 | |||||||
Expected term (in years) | 4.86 – 6.25 | 5.61 | ||||||
Expected volatility (%) | 50.29 – 52.45 | 50.40 – 51.37 | ||||||
Risk-free interest rate (%) | 0.30 – 1.75 | 1.42 – 1.88 | ||||||
Fair value of Ordinary Shares | $ | 10.58 – 19.96 | $ | 13.21 – 13.52 | ||||
Dividend yield | 0 | 0 | ||||||
Warrants
We issued warrant certificates to certain counterparties to subscribe in its Ordinary Shares.
During the years ended December 31, 2020 and 2019, 51,859
and 164,485 warrants were issued to intermediaries for introducing new investors related to equity financings. The Company recognized these warrants as equity issuance costs, with a corresponding credit in additional
paid-in
capital. Accordingly, there were no net change in additional paid in capital.F-61
The 2019 Convertible Loan Notes were co
nverted into Ordinary Shares during 2019 at a lower price than was paid by certain shareholders who had invested prior to the issuance of the 2019 Conv
ertible Loan Notes. In order to compensate these investors, the Company issued 135,133 warrants to these investors. The fair value of the warrants issued was $1.8 million and was accounted for as anon-cash
dividend by the Company. NaN additional warrants were issued during the year ended December 31, 2020.During the year ended December 31, 2019, the Company issued 5,246 warran
ts for goods and services, which were recognized as an expense in selling, general and administrative expense on the consolidated statements of oper
ations and comprehensive loss with a corresponding credit in additionalpaid-in
capital.The below warrants are equity classified and exercisable as of December 31, 2020 and 2019. Investor Warrants in connection with the 8.0% Convertible Notes were excluded from the
below table as they were classified as liabilities. A summary of the Company’s outstanding warrants as of December 31, 2020 and 2019 are presented below
:Number of Warrants Outstanding | Weighted- Average Exercise Per Shares | Weighted- Average Contractual Life (Years) | ||||||||||
Balances as of December 31, 2018 | 678,232 | $ | 7.05 | 7.60 | ||||||||
Warrants issued | 304,864 | 7.44 | ||||||||||
Warrants exercised | (2,757 | ) | 0.00 | |||||||||
Warrants cancelled | 0 | 0 | ||||||||||
Balances as of December 31, 2019 | 980,339 | $ | 7.19 | 7.29 | ||||||||
Warrants issued | 51,859 | 10.30 | ||||||||||
Warrants exercised | (5,523 | ) | 1.26 | |||||||||
Warrants cancelled | (13,572 | ) | 11.44 | |||||||||
Balances as of December 31, 2020 | 1,013,103 | $ | 7.33 | 6.45 | ||||||||
12. | Related Party Transactions |
The Company formed HRT, a joint venture with Hengtong Optic-Electric Co., Ltd. in 2017, which was recognized by the Company as an equity method investment. During the years ended December 31, 2020 and 2019, we made sales to HRT of
$5.3 million and $6.7 million, respectively. As of December 31, 2020 and 2019, the balance owed by the joint venture amounted to $3.3 million and $2.9 million, respectively, and is included in accounts receivable in the accompanying balance sheets.
The Company engages two affiliate entities of the Company’s directors for consulting and administrative services. For the years ended December 31, 2020 and 2019, the Company incurred $0.8 million and $1.9 million in fees for these services,
respectively. As of December 31, 2020 and 2019, the amounts included in accounts payable and accrued expenses in the accompanying balance shee
ts were not considered material.13. | Leases |
We have operating leases for office space and finance leases for manufacturing equipment. These leases have remaining lease terms of 1 years to 4 years. Some leases include extension options for up to 5 years. These options are included in the lease term when it is reasonably certain that the option will be exercised.
The weighted average remaining lease term was 3 years for operating leases as of December 31, 2020. The weighted average discount rate was 6% for operating leases as of December 31, 2020.
F-
62
The components of lease cost for the year e
n
ded December 31, 2020, were as follows (in thousands):Years Ended December 31, | ||||||||
2020 | 2019 | |||||||
Operating Lease Cost: | ||||||||
Fixed lease cost | $ | 851 | 777 | |||||
Variable lease cost | 154 | 253 | ||||||
Total operating cost | $ | 1,005 | $ | 1,030 | ||||
Total lease cost | $ | 1,391 | $ | 1,533 | ||||
Other information related to leases was as follows (in thousands):
Years Ended December 31, | ||||||||
2020 | 2019 | |||||||
Supplemental Cash Flow Information: | ||||||||
Cash paid for amounts included in the measurement of lease liabilities: | ||||||||
Operating cash flows for operating leases | $ | 916 | $ | 756 | ||||
Operating cash flows for finance leases | $ | 15 | $ | 115 | ||||
Financing cash flows for finance leases | $ | 1,192 | $ | 1,215 | ||||
Right-of-use | ||||||||
Right-of-use | $ | 0 | $ | 1,158 | ||||
There are no finance lease liabilities as of December 31, 2020. Maturities of operating lease liabilities as of December 31, 2020, were as follows (in thousands):
Operating Leases | ||||
Year Ending December 31: | ||||
2021 | $ | 682 | ||
2022 | 613 | |||
2023 | 456 | |||
2024 | 121 | |||
Total lease obligation | $ | 1,872 | ||
Less: Imputed interest | (149 | ) | ||
Total lease liabilities | �� | $ | 1,723 | |
Less: Current lease liabilities | (596 | ) | ||
Total non-current lease liabilities | $ | 1,127 | ||
14. | Commitments and Contingencies |
Legal Contingencies
From time to time, we are a party to various lawsuits, claims and other legal proceedings that arise in the ordinary course of business. We apply accounting for contingencies to determine when and how much to accrue for and disclose related to legal and other contingencies. Accordingly, we disclose contingencies deemed to be reasonably possible and accrue loss contingencies when, in consultation with legal advisors, it is concluded that a loss is probable and reasonably estimable. Although the ultimate aggregate amount of monetary liability or financial impact with respect to these matters is subject to many uncertainties and is therefore not predictable with assurance, management believes that as of December 31, 2020 there are no litigations pending that could
F-
63
have, individually and in the aggregate, a material adverse effect on our financial position, results of operations or cash flows.
Financial Commitments
In the ordinary course of business, we make commitments to third-party suppliers for various research and development activities. As of December 31, 2020 and 2019, we had $3.0 million and $3.3 million, respectively, in contractual obligations for which we have not yet received the services.
15. | Defined Contribution Plan |
We have defined contribution plans, under which we contribute based on a percentage of the employees’ elected contributions. We will have no legal or constructive obligation to pay further amounts. The contributions made by us for the years ended December 31, 2020 and 2019 was $0.5 million and $0.4 million, respectively.
16. | Supplemental Cash Flow Information |
Non-cash
operating, investing, and financing activities, and supplemental cash flow information are as follows (in thousands):Years Ended December 31, | ||||||||
2020 | 2019 | |||||||
Supplemental disclosure | ||||||||
Cash payments for: | ||||||||
Interest paid | $ | 47 | $ | 506 | ||||
Income tax paid | $ | 313 | $ | 352 | ||||
Schedule for noncash operating activities | ||||||||
Right-of-use | $ | 0 | $ | 1,158 | ||||
| $ | 0 | $ | 1,158 | |||||
Schedule for noncash investing activities | ||||||||
Unpaid property and equipment received | $ | 166 | $ | 397 | ||||
Unpaid balance related to the Trutouch Asset Acquisition | 500 | 0 | ||||||
| $ | 666 | $ | 397 | |||||
Schedule for noncash financing activities | ||||||||
Conversion of note payable to Ordinary Shares | $ | 0 | $ | 18,244 | ||||
Issuance of Ordinary Shares related to the Trutouch Asset Acquisition | 2,298 | 0 | ||||||
Non-cash equity issuance costs | 0 | 995 | ||||||
Non-cash dividend | 0 | 1,838 | ||||||
| $ | 2,298 | $ | 21,077 | |||||
17. | Subsequent Events |
Subsequent events have been evaluated through April 2, 2021, which is the date that the financial statements were issued.
During the year ended December 31, 2020, 250,000 restricted stock units (“RSUs”) were offered to our three executives. Each RSU has a performance-based grant criteria that the Company completes a SPAC transaction. As of December 31, 2020, it was determined that none of these awards meet the performance condition and no expense was recognized in relation to these awards.
F-6
4
In 2021, the Company issued convertible notes bearing interest at a rate of 5.0% per annum. The terms of the notes are similar to the 2020 Convertible Notes. We received $25.0 million on January 5, 2021, $10.0 million on January 13, 2021, and $30.0 million on January 18, 2021. We also received $11.4 million in connection with the 2020 Term Facility Loan on February 19, 2021.
On March 19, 2021, the Company entered into a definitive agreement to combine with SC Health Corporation, a publicly traded special purpose acquisition company. The transaction will result in Rockley becoming a publicly traded company on the NYSE under the symbol “RKLY” and values the Company at a pro forma enterprise value of $1.2 billion.
F-6
5
7,785,560 Ordinary Shares
PART II
Information Not Required in Prospectus
Item 13. Other Expenses of Issuance and Distribution.
The following is an estimate of the expenses (all of which are to be paid by the registrant) that we may incur in connection with the securities being registered hereby.
Amount | ||||
SEC registration fee | $ | 4,540 | ||
Legal fees and expenses* | $ | 100,000 | ||
Accounting fees and expenses* | $ | 50,000 | ||
Miscellaneous* | $ | 100,960 | ||
Total* | $ | 255,500 | ||
* These fees and expenses are calculated based on the securities offered and the number of issuances and accordingly cannot be defined at this time.
Item 14. Indemnification of Directors and Officers.
Limitation on Liability and Indemnification of Directors and Officers
HoldCo’s organizational documents limits HoldCo’s directors’ liability to the fullest extent permitted under the laws of the Cayman Islands. Cayman Islands law does not limit the extent to which a company’s memorandum and articles of association may provide for indemnification of officers and directors, except to the extent any such provision may be held by the Cayman Islands courts to be contrary to public policy, such as to provide indemnification against civil fraud or the consequences of committing a crime.
HoldCo’s Second Amended and Restated Memorandum and Articles of Association provides that HoldCo will, in certain situations, indemnify HoldCo’s directors and officers and may indemnify other employees and other agents, to the fullest extent permitted by law. Any indemnified person is also entitled, subject to certain limitations, to advancement, direct payment, or reimbursement of reasonable expenses (including attorneys’ fees and disbursements) in advance of the final disposition of the proceeding.
In addition, HoldCo enters into separate indemnification agreements with HoldCo’s directors and officers. These agreements, among other things, require HoldCo to indemnify its directors and officers for certain expenses, including attorneys’ fees, judgments, fines, and settlement amounts incurred by a director or officer in any action or proceeding arising out of their services as one of HoldCo’s directors or officers or any other company or enterprise to which the person provides services at HoldCo’s request.
HoldCo maintains a directors’ and officers’ insurance policy pursuant to which HoldCo’s directors and officers are insured against liability for actions taken in their capacities as directors and officers. We believe these provisions in the Second Amended and Restated Memorandum and Articles of Association and these indemnification agreements are necessary to attract and retain qualified persons as directors and officers.
Insofar as indemnification for liabilities arising under the Securities Act may be permitted to directors, officers, or control persons, in the opinion of the SEC, such indemnification is against public policy as expressed in the Securities Act and is therefore unenforceable.
II-1
Item 15.
Recent Sales of Unregistered Securities
Lincoln Park Transaction
On November 15, 2021, we completed a private placement to Lincoln Park Capital Fund, LLC pursuant to which we have the right to sell to Lincoln Park up to $50,000,000 in ordinary shares, subject to certain limitations, from time to time over
the 24-month period
commencing on the date that the conditions set forth in the Purchase Agreement have been satisfied, which includes that a registration statement covering the resale of the shares is declared effective by the SEC. We issued 69,512 Commitment Shares to Lincoln Park as consideration for its commitment to purchase our shares under the Purchase Agreement. In the Purchase Agreement, Lincoln Park represented to the Company, among other things, that it was an “accredited investor” (as such term is defined in Rule 501(a) of Regulation D under the Securities Act of 1933, or the Securities Act). The securities were sold by the Company under the Purchase Agreement in reliance upon an exemption from the registration requirements under the Securities Act afforded by Section 4(a)(2) of the Securities Act.Issuance of Shares for Fee Payment
On September 27, 2021, we issued an aggregate of 319,000 ordinary shares to two accredited investor entities in lieu of cash as payment for $3.194 million of fees payable to such entities for services provided as financial advisor and placement agent in connection with the Business Combination and the PIPE financing pursuant to an exemption under Section 4(a)(2) of the Securities Act.
PIPE Financing
In connection with the Business Combination, on March 19, 2021, HoldCo and SC Health entered into subscription agreements with certain investors (including entities affiliated with the Sponsor)(the “Subscribers”), SC Health and HoldCo, pursuant to which the Subscribers agreed to purchase the PIPE Shares for a purchase price of $10.00 per share in the PIPE or an aggregate purchase price of $150 million.
At the closing of the PIPE immediately prior to the Merger Effective Time, the Subscribers purchased 15,000,000 PIPE Shares for an aggregate purchase price of approximately $150 million, of which subscribers affiliated with the Sponsor purchased an aggregate of 5,000,000 shares for $50 million. At the Closing, the PIPE Shares were issued pursuant to an exemption under Section 4(a)(2) of the Securities Act.
SIG-i
FacilityPrior to the Business Combination, Rockley UK was party to a $35.0 million term loan facility dated September 29, 2020, as amended from time to time, with Rockley UK, as borrower, Rockley Photonics Inc., as guarantor, Credit Suisse International as agent and security agent and
SIG-i
Capital AG as arranger (the“SIG-I
Facility”). In connection with the Business Combination, the Loan Facility was amended on June 28, 2021 to permit a novation of the facility to HoldCo at the effective time of the Scheme and to permit a conversion of 30% of the debt thereunder to ordinary shares of HoldCo at the time the Business Combination, with a90-day
lock-up
applying to such shares. The term of the remaining facility was also extended to August 31, 2022. Rockley UK will remain a guarantor under the amendedSIG-I
Facility going forward.II-2
Item 16. Exhibits.
II-3
II-4
II-5
Exhibit Number | Description | |
| 24.1 | Power of Attorney (see signature page hereto). | |
| 101.INS | Inline XBRL Instance Document (the instance document does not appear in the Interactive Data File because iXBRL tags are embedded within the Inline XBRL document). | |
| 101.SCH | Inline XBRL Taxonomy Extension Schema Document. | |
| 101.CAL | Inline XBRL Taxonomy Extension Calculation Linkbase Document. | |
| 101.DEF | Inline XBRL Taxonomy Extension Definition Linkbase Document. | |
| 101.LAB | Inline XBRL Taxonomy Extension Labels Linkbase Document. | |
| 101.PRE | Inline XBRL Taxonomy Extension Presentation Linkbase Document | |
| 104 | The Cover Page Interactive Data File, formatted in Inline XBRL (included within the Exhibit 101 attachments). | |
| # | The schedules and exhibits to this agreement have been omitted pursuant to Item 601(a)(5) of Regulation S-K. A copy of any omitted schedule and/or exhibit will be furnished to the SEC upon request. |
| + | Indicates management contract or compensatory plan or arrangement. |
Item 17. Undertakings.
(a) The undersigned registrant hereby undertakes:
(1) To file, during any period in which offers or sales are being made, a post-effective amendment to this registration statement:
(i) to include any prospectus required by Section 10(a)(3) of the Securities Act;
(ii) to reflect in the prospectus any facts or events arising after the effective date of the registration statement (or the most recent post-effective amendment thereof) which, individually or in the aggregate, represent a fundamental change in the information set forth in the registration statement. Notwithstanding the foregoing, any increase or decrease in volume of securities offered (if the total dollar value of securities offered would not exceed that which was registered) and any deviation from the low or high end of the estimated maximum offering range may be reflected in the form of prospectus filed with the Securities and Exchange Commission (the “Commission”) pursuant to Rule 424(b) if, in the aggregate, the changes in volume and price represent no more than 20 percent change in the maximum aggregate offering price set forth in the “Calculation of Registration Fee” table in the effective registration statement; and
(iii) to include any material information with respect to the plan of distribution not previously disclosed in the registration statement or any material change to such information in the registration statement;
provided, however
(2) That, for the purpose of determining any liability under the Securities Act, each such post-effective amendment shall be deemed to be a new registration statement relating to the securities offered therein, and the offering of such securities at that time shall be deemed to be the initial bona fide offering thereof.
II-6
(3) To remove from registration by means of a post-effective amendment any of the securities being registered which remain unsold at the termination of the offering.
(4) That, for the purpose of determining liability under the Securities Act to any purchaser:
(i) Each prospectus filed by the registrant pursuant to Rule 424(b)(3) shall be deemed to be part of the registration statement as of the date the filed prospectus was deemed part of and included in the registration statement; and
(ii) Each prospectus required to be filed pursuant to Rule 424(b)(2), (b)(5) or (b)(7) as part of a registration statement in reliance on Rule 430B relating to an offering made pursuant to Rule 415(a)(1)(i), (vii) or (x) for the purpose of providing the information required by Section 10(a) of the Securities Act shall be deemed to be part of and included in the registration statement as of the earlier of the date such form of prospectus is first used after effectiveness or the date of the first contract of sale of securities in the offering described in the prospectus. As provided in Rule 430B, for liability purposes of the issuer and any person that is at that date an underwriter, such date shall be deemed to be a new effective date of the registration statement relating to the securities in the registration statement to which that prospectus relates, and the offering of such securities at that time shall be deemed to be the initialoffering thereof.,, that no statement made in a registration statement or prospectus that is part of the registration statement or made in a document incorporated or deemed incorporated by reference into the registration statement or prospectus that is part of the registration statement will, as to a purchaser with a time of contract of sale prior to such effective date, supersede or modify any statement that was made in the registration statement or prospectus that was part of the registration statement or made in any such document immediately prior to such effective date.
bona fide
Provided
however
(5) That, for the purpose of determining liability of the registrant under the Securities Act to any purchaser in the initial distribution of the securities, the undersigned registrant undertakes that in a primary offering of securities of the undersigned registrant pursuant to this registration statement, regardless of the underwriting method used to sell the securities to the purchaser, if the securities are offered or sold to such purchaser by means of any of the following communications, the undersigned registrant will be a seller to the purchaser and will be considered to offer or sell such securities to such purchaser:
(i) Any preliminary prospectus or prospectus of the undersigned registrant relating to the offering required to be filed pursuant to Rule 424;
(ii) Any free writing prospectus relating to the offering prepared by or on behalf of the undersigned registrant or used or referred to by the undersigned registrant;
(iii) The portion of any other free writing prospectus relating to the offering containing material information about the undersigned registrant or its securities provided by or on behalf of the undersigned registrant; and
(iv) Any other communication that is an offer in the offering made by the undersigned registrant to the purchaser.
(h) Insofar as indemnification for liabilities arising under the Securities Act may be permitted to directors, officers and controlling persons of the Registrant pursuant to the foregoing provisions, or otherwise, the Registrant has been advised that in the opinion of the SEC such indemnification is against public policy as expressed in the Securities Act and is, therefore, unenforceable. In the event that a claim for indemnification against such liabilities (other than the payment by the Registrant of expenses incurred or paid by a director, officer or controlling person of the Registrant in the successful defense of any action, suit or proceeding) is asserted by such director, officer or controlling person in connection with the securities being registered, the Registrant will, unless in the opinion of its counsel the matter has been settled by controlling precedent, submit to a court of appropriate jurisdiction the question whether such indemnification by it is against public policy as expressed in the Securities Act and will be governed by the final adjudication of such issue.
II-7
SIGNATURES
Pursuant to the requirements of the Securities Act of 1933, the registrant has duly caused this registration statement to be signed on its behalf by the undersigned, thereunto duly authorized in London, United Kingdom, on November 29, 2021.
| ROCKLEY PHOTONICS HOLDINGS LIMITED |
/s/ Andrew Rickman |
| Name: Andrew Rickman |
| Title: President and Chief Executive Officer |
POWER OF ATTORNEY
KNOW ALL PERSONS BY THESE PRESENTS, that each person whose signature appears below hereby constitutes and appoints Dr. Andrew Rickman and Mahesh Karanth, and each of them, his or her true and lawfuland agents, each with full power of substitution and resubstitution, for him or her and in his or her name, place and stead, in any and all capacities, to sign any and all amendments, including post-effective amendments, to this Registration Statement, and any registration statement relating to the offering covered by this Registration Statement and filed pursuant to Rule 462(b) under the Securities Act of 1933, and to file the same, with exhibits thereto and other documents in connection therewith, with the Securities and Exchange Commission, granting unto saidand agents, and each of them, full power and authority to do and perform each and every act and thing requisite and necessary to be done, as fully for all intents and purposes as he or she might or could do in person, hereby ratifying and confirming all that each of saidand agents, or his or her substitute or substitutes may lawfully do or cause to be done by virtue hereof.
attorneys-in-fact
attorneys-in-fact
attorneys-in-fact
Pursuant to the requirements of the Securities Act of 1933, this registration statement has been signed below by the following persons in the capacities and on the date indicated.
Signature | Title | Date | ||
/s/ Dr. Andrew Rickman | President, Chief Executive Officer and Director | November 29, 2021 | ||
| Dr. Andrew Rickman | (Principal Executive Officer) | |||
/s/ Mahesh Karanth Mahesh Karanth | Chief Financial Officer (Principal Financial Officer and Principal Accounting Officer) | November 29, 2021 | ||
/s/ William Huyett | Lead Independent Director | November 29, 2021 | ||
| William Huyett | ||||
/s/ Dr. Caroline Brown | Director | November 29, 2021 | ||
| Dr. Caroline Brown | ||||
/s/ Karim Karti | Director | November 29, 2021 | ||
| Karim Karti | ||||
/s/ Michele Klein | Director | November 29, 2021 | ||
| Michele Klein | ||||
II-8
Signature | Title | Date | ||
/s/ Pamela Puryear | Director | November 29, 2021 | ||
| Dr. Pamela Puryear | ||||
/s/ Brian Blaser | Director | November 29, 2021 | ||
| Brian Blaser | ||||
II-9