UNITED STATES
SECURITIES AND EXCHANGE COMMISSION
Washington, D.C. 20549
FORM N-CSR
CERTIFIED SHAREHOLDER REPORT OF REGISTERED
MANAGEMENT INVESTMENT COMPANIES
Investment Company Act file number: 811-23686
MULTI-SELECT SECURITIES FUND FOR PUERTO RICO RESIDENTS
(Exact name of registrant as specified in charter)
American International Plaza Building - Tenth Floor
250 Muñoz Rivera Avenue
San Juan, Puerto Rico 00918
(Address of principal executive offices)(Zip code)
Liana Loyola
Secretary
American International Plaza Building - Tenth Floor
250 Muñoz Rivera Avenue
San Juan, Puerto Rico 00918
(Name and Address of Agent for Service)
Copies to:
Jesse C. Kean Carla G. Teodoro Sidley Austin LLP 787 Seventh Avenue New York, NY 10019 | Owen Meacham UBS Business Solutions US LLC One North Wacker Drive Chicago, IL 60606 |
Registrant’s telephone number, including area code: (787) 250-3600
Date of fiscal year end: March 31
Date of reporting period: March 31, 2023
Item 1. Report to Unitholders.
(a) The following is a copy of the report transmitted to unitholders pursuant to Rule 30e-1 under the Investment Company Act of 1940, as amended (the “1940 Act”).

2023
ANNUAL REPORT
Dear Unitholder:
Multi-Select Securities Fund for Puerto Rico Residents (the “Fund”) is pleased to present this Letter to Unitholders for the fiscal year ended March 31, 2023.
During the fiscal year, the Federal Reserve Board (the “Fed”) raised the Fed Funds rate at every meeting. The initial 0.25% increase in March 2022 was followed by larger increases of 0.50% in May and 0.75% in June, July, September, and November. Inflation reports in December showed a moderation in the pace of price increases. At its December meeting, the Fed reduced the pace of tightening to 0.50%.
Financial conditions changed during March 2023. In the U.S., three regional banks failed and in Europe, the Swiss National Bank oversaw the takeover of Credit Suisse by UBS. In response, the Fed created a Bank Term Funding Program to allow banks to meet their funding needs and strengthen confidence in the banking sector. In a statement following its March meeting, the Fed indicated these developments would likely result in tighter credit conditions. At the March meeting the Fed Funds rate was increased 0.25% to a range of 4.75% to 5.00%.
Interest rates increased across the yield curve and the spread of the two-year year note to the ten-year note inverted. The yield of the two-year note increased to 4.04% and the yield of the ten-year note increased to 3.47% on March 31, 2023, resulting in the yield curve being inverted 0.57%. Market expectations for the Fed Funds rate for the remainder of the year are one additional 0.25% increase. This is lower than expectations at the beginning of the year. Volatility is high and conditions can change rapidly.
Major stock indexes also reacted negatively to events during the first quarter of 2023. The Standard and Poor’s 500 decreased 9.29% during the year. The technology heavy NASDAQ 100 performed even worse, decreasing 13.25% during the year. International developed markets were also affected; the MSCI EAFE Index decreased 0.78%. The Mid Cap and Small Cap markets were impacted more than larger capitalization stocks. The Russell Midcap and Russell 2000 Indexes decreased 11.63% and 8.80%, respectively versus a total return decrease of 5.96% in the Russell 1000 Value Index. Refer to the Management Discussion of Fund Performance section below for specific comments on the Fund’s portfolios.
The combination of continued inflation, an inverted yield curve, increased risks of a possible recession in the U.S., and elevated geopolitical risks present a challenging environment for the management of the Fund. Notwithstanding, the Investment Adviser and Sub-Advisers remain committed to seeking investment opportunities within each portfolio’s investment objective while providing professional management services to the Fund for the benefit of its shareholders.
Sincerely,

Leslie Highley, Jr.
Managing Director
UBS Asset Managers of Puerto Rico,
a division of UBS Trust Company of
Puerto Rico, as Investment Adviser
Multi-Select Securities Fund for Puerto Rico Residents
Management Discussion and Analysis1
I. Recent Developments
The Multi-Select Securities Fund for Puerto Rico Residents (hereinafter referred to as the “Fund”) is pleased to present the Management Discussion and Analysis for the fiscal year ended March 31, 2023.
The Fund is a Puerto Rico investment trust organized under the laws of the Commonwealth of Puerto Rico and is registered as an investment company under the Investment Company Act of 1940, as amended (the “1940 Act”), as of May 19, 2021.
Recent market data suggests growth remains resilient. Near-term recession risk appears off the table. The market is expecting two additional rate hikes by the Fed this year as inflation remains a concern. The collapse of Silicon Valley Bank and the subsequent turmoil in the banking sector have prompted comparisons with the global financial crisis. Yet despite recent market headlines, the S&P 500 is still closer to its six-month high than its six-month low. Financial conditions are likely to tighten, raising the risk of a hard landing for the US economy. Some banks may scale back on lending. Banking sector turmoil appears unlikely to evolve into a full-blown crisis. Central banks and other regulators have acted with speed and conviction to restore confidence in the banking system.
China and Europe are inflecting sooner than expected. The US economy has remained robust, but this may raise the risk of a later, deeper recession as the Fed tries to combat inflation. Diverging inflections back a more regionally selective approach to risk decisions.
| 1 | Unaudited |
MD&A _ 1
II. Market Commentary for the Period April 1, 2022 to March 31, 2023
This Management Discussion and Analysis focuses primarily on market performance and the performance for the portfolios offered by the Fund for the period from April 1, 2022, to March 31, 2023. Under normal conditions, each portfolio will invest up to 80% of its total assets in common stocks and other equity securities of U.S. or foreign companies and intends to invest at least 20% of its total assets in equity or taxable fixed-income securities, including cash equivalents, issued by Puerto Rico entities.
| 1. | Equity Markets |
U.S. equities, represented by the Standard and Poor’s 500 Index® (“S&P 500 Index®”) returned -7.73% for the year ended March 31, 2023. (The indices described herein are defined in the Glossary at the end of this Management Discussion and Analysis). International developed market equities, as represented by the MSCI EAFE Index®, returned -0.86% for the year ended March 31, 2023, outperforming the U.S. equity markets. Following a strong start to the new year, global equities lost traction in February amid a slower-than-expected moderation in inflation and most recently, the increasing uncertainty around US regional banks and the potential impact of tightening credit and liquidity conditions on economic growth. Policy rates are expected to stay higher for longer.
| Index | Investment Style | 2Q22 | 3Q22 | 4Q22 | 1Q23 | 1 Year | ||||||||||||||||
Domestic Equites |
| |||||||||||||||||||||
Dow Jones Industrial Average - Total Return | Blue Chips | (10.78 | ) | (6.17 | ) | 16.01 | 0.93 | -1.98 | ||||||||||||||
S&P 500 - Total Return | Large Cap Core | (16.10 | ) | (4.88 | ) | 7.56 | 7.50 | -7.73 | ||||||||||||||
Rusell 1000 Growth - Total Return | Large Cap Growth | (20.92 | ) | (3.60 | ) | 2.20 | 14.37 | -10.90 | ||||||||||||||
Rusell 1000 Value - Total Return | Large Cap Value | (12.21 | ) | (5.62 | ) | 12.42 | 1.01 | -5.91 | ||||||||||||||
Rusell Midcap - Total Return | Mid Cap Core | (16.85 | ) | (3.44 | ) | 9.18 | 4.06 | -8.78 | ||||||||||||||
Rusell 2000 - Total Return | Small Cap Core | (17.20 | ) | (2.19 | ) | 6.23 | 2.74 | (11.61 | ) | |||||||||||||
International Equites |
| |||||||||||||||||||||
MSCI EAFE - Gross Return | Developed Markets | (14.29 | ) | (9.29 | ) | 17.40 | 8.62 | -0.86 | ||||||||||||||
MSCI EMF - (Emerging Markets) - Gross Return | Emerging Markets | (11.34 | ) | (11.42 | ) | 9.79 | 4.02 | (10.30 | ) | |||||||||||||
| *Indices | are not managed and do not reflect fees and expenses that would reduce returns. |
| Past | performance does not guarantee future results. |
MD&A _ 2
| 2. | Bond Markets |
During the period covered, the U.S. bond market, as measured by the Barclays Capital Aggregate Bond Index®, produced a return of -4.78%. Municipal bonds, as measured by Barclays Municipal Bond Index® outperformed the broader bond market, returning 0.26%. The Barclays Capital U.S. Treasury Index® and the Barclays Capital Intermediate Government Bond Index® returned -4.51% and -1.52%, respectively. Despite recent strong returns, the more defensive, higher quality segments of fixed income remain appealing, given the all-in yields on offer and as inflation risks transition to growth risks. The tightening of lending standards due to financial instability and higher official policy rates are likely to weigh on growth and inflation and apply downward pressure on nominal interest rates.
| Index | Investment Style | 2Q22 | 3Q22 | 4Q22 | 1Q23 | 1 Year | ||||||||||||||||
Domestic Fixed Income - Taxable |
| |||||||||||||||||||||
Bloomberg Barclays US Aggregate Government - Treasury | Treasury Bonds | (3.78 | ) | -4.35 | 0.72 | 3.01 | (4.51 | ) | ||||||||||||||
Bloomberg Barclays US Aggregate | Taxable Bonds (Broad) | (4.69 | ) | -4.75 | 1.87 | 2.96 | (4.78 | ) | ||||||||||||||
Bloomberg Barclays US Aggregate Government - Intermediate Gov’t Bonds | (1.65 | ) | -3.05 | 1.01 | 2.26 | (1.52 | ) | |||||||||||||||
Domestic Fixed Income - Municipal |
| |||||||||||||||||||||
Bloomberg Barclays Municipal Bond | Munis (IG only) | -2.94 | (3.46 | ) | 4.10 | 2.78 | 0.26 | |||||||||||||||
Bloomberg Barclays Municipal Bond High Yield | Munis (HY only) | -5.61 | -4.83 | 3.48 | 2.73 | (4.49 | ) | |||||||||||||||
III. Results of the Various Portfolios of the Fund
The Fund received its first inflows on June 29, 2004, and started investing the monies on or about June 30, 2004. The Fund is currently comprised of seven separate investment portfolios (each, a “Portfolio” and collectively, the “Portfolios”), and each Portfolio offers two classes of units: Class A and Class L. For each class of units, the underlying investments are identical, although each class’ expense structure is different. For each Portfolio, approximately 20% of the Portfolio, the Puerto Rico Securities Portion, is directly managed by the Fund’s adviser, UBS Asset Managers of Puerto Rico (“UBS AMPR”), a division of UBS Trust Company of Puerto Rico. For each Portfolio, approximately 80% of the Portfolio, the Equity Portion, is invested in common stocks and other equity securities of U.S. or foreign companies and is managed by a selection of money managers. For details of each Portfolio’s structure, please refer to the Fund’s prospectus.
The following table reflects total returns for the quarter and year ending March 31, 2023, as well as 3, 5 and 10 years. Returns show the combined results for each Portfolio, net of expenses, and include both the Puerto Rico Securities Portion and the Equity Portion. Returns do not reflect the sales load or dividend paid applicable to Class A units.2
| 2 | Unaudited |
MD&A _ 3
| Returns (1) | ||||||||||||||||||||||||
Multi-Select Portfolio
Share Class Benchmark | Equity Portion Manager | Qtr Ended 3/31/2023 | 1 Year Ended 3/31/2023 | 3 years Ended 3/31/2023 | 5 years Ended 3/31/2023 | 10 years Ended 3/31/2023 | ||||||||||||||||||
Large Cap Value I | ||||||||||||||||||||||||
Class A | 0.90 | % | -9.46 | % | 13.95 | % | 7.53 | % | 7.53 | % | ||||||||||||||
Class L | The London Co. | 1.16 | % | -9.52 | % | 13.63 | % | 7.17 | % | 7.16 | % | |||||||||||||
Large Cap Value Benchmark (2) | 1.01 | % | -5.91 | % | 17.93 | % | 7.50 | % | 9.13 | % | ||||||||||||||
Large Cap Core I | ||||||||||||||||||||||||
Class A* | 7.14 | % | -13.94 | % | 13.38 | % | 6.92 | % | 9.30 | % | ||||||||||||||
Class L (b)* | Atalanta Sosnoff | 7.47 | % | -13.98 | % | 13.05 | % | 6.56 | % | 8.91 | % | |||||||||||||
Large Cap Core Benchmark (2) | 7.50 | % | -7.73 | % | 18.60 | % | 11.19 | % | 12.24 | % | ||||||||||||||
Large Cap Growth I | ||||||||||||||||||||||||
Class A | 11.13 | % | -13.58 | % | 12.18 | % | 8.80 | % | 10.96 | % | ||||||||||||||
Class L | Winslow Capital | 11.39 | % | -13.64 | % | 11.86 | % | 8.43 | % | 10.55 | % | |||||||||||||
Large Cap Growth Benchmark (2) | 14.37 | % | -10.90 | % | 18.58 | % | 13.66 | % | 14.59 | % | ||||||||||||||
International I | ||||||||||||||||||||||||
Class A | Cambiar Investors | 7.67 | % | -5.79 | % | 7.94 | % | -1.79 | % | -0.80 | % | |||||||||||||
International Benchmark (2) | 8.47 | % | -1.38 | % | 12.99 | % | 3.52 | % | 5.00 | % | ||||||||||||||
Mid Cap Core I | ||||||||||||||||||||||||
Class A | 5.29 | % | -4.39 | % | 17.46 | % | 9.08 | % | 10.16 | % | ||||||||||||||
Class L (c) | The London Co. | 5.60 | % | -4.45 | % | 17.12 | % | 8.73 | % | 9.75 | % | |||||||||||||
Mid Cap Core Benchmark (2) | 4.06 | % | -8.78 | % | 19.20 | % | 8.05 | % | 10.05 | % | ||||||||||||||
Small Cap Core I | ||||||||||||||||||||||||
Class A | Cambiar Investors | 5.37 | % | -5.71 | % | 16.79 | % | 6.67 | % | 7.86 | % | |||||||||||||
Small Cap Core Benchmark (2) | 2.74 | % | -11.61 | % | 17.51 | % | 4.71 | % | 8.04 | % | ||||||||||||||
(1) The performance data for each of the Portfolios listed above represents past performance and is not an indicator of future performance. Returns may vary from audited financial statements due to the consideration of income reinvestment. Current results may be lower or higher than those shown. The investment return and principal value of an investment will fluctuate so that an investor’s shares, when redeemed, may be worth more or less than their original cost. All returns are based on the Net Asset Value. Performance is net of fund fees and trading costs and excludes the effects of applicable sales loads. Performance data for Class L units since inception may vary from Class A units. The inception date for each class of each Portfolio is 6/30/2004 except for the following:
(a) U.S. Large Cap ETF Portfolio I, Class A Units: December 2007.
(b) Large Cap Core Portfolio I Class L Units: December 2004 and stopped trading on February 2007 and recommenced trading on September 2008. Benchmark for Class L units may vary due to different inception dates from Class A units.
(c) Mid Cap Core Portfolio Class L Units: Stopped trading on December 2007 and recommenced trading on September 2008. Benchmark for Class L units may vary due to different inception dates from Class A units.
(2) All Benchmark Indices were rebalanced on 12/31/07 due to strategy changes. Please refer to Benchmark Index Section for a description of each index. Returns with periods of more than one year are annualized.
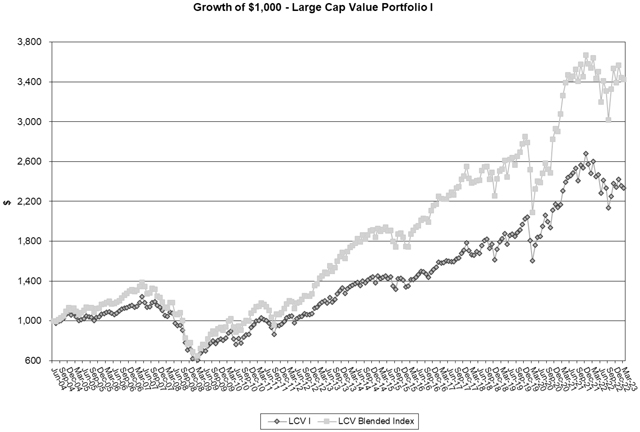
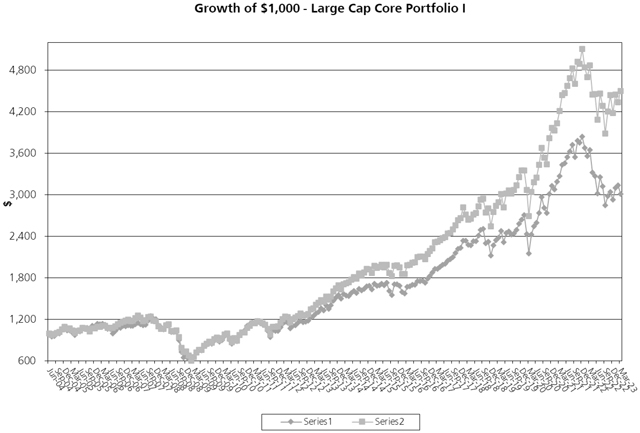
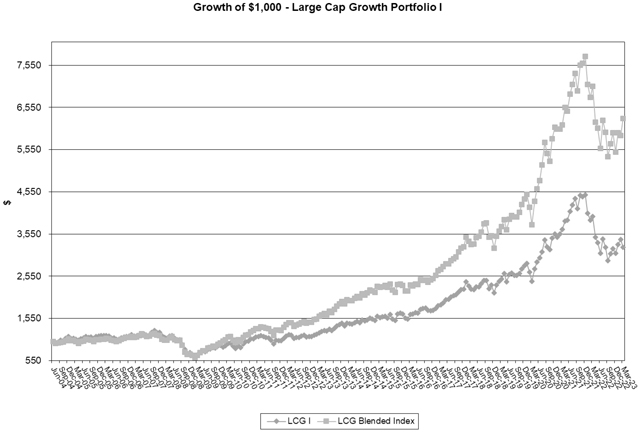
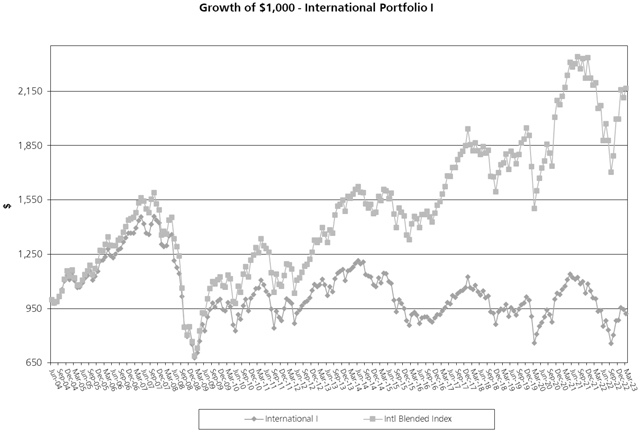
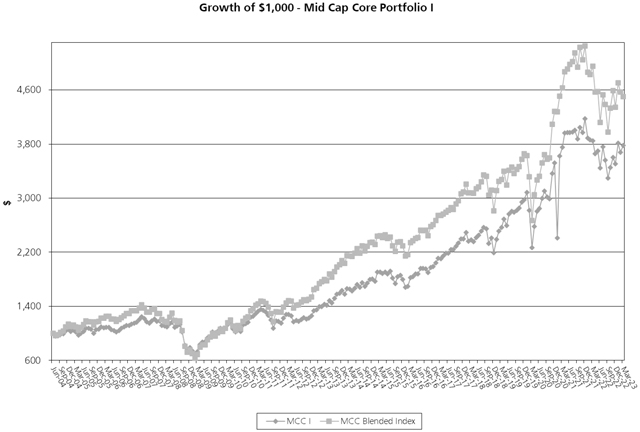
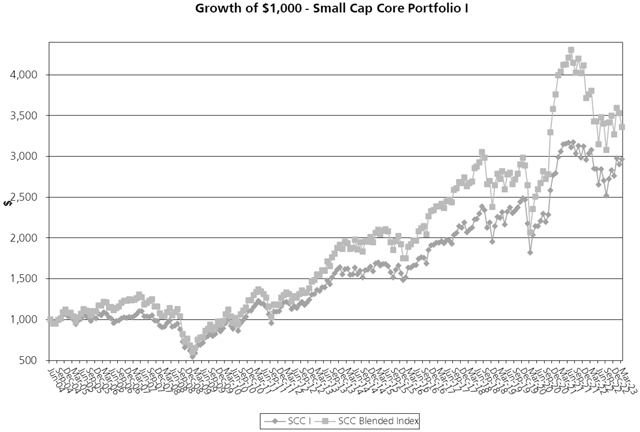
Comments on each Portfolio are included below. Also included are graphs that depict the performance of a $1,000 investment in each of the Portfolios from April 1, 2005, through March 31, 2023, with any income generated being reinvested in the same Portfolio. The graphs include the results of the Class A units only. Sales load applicable to Class A units, which have the effect of reducing the rate of return during the applicable period, are not considered in the graphs. It is important to note that past performance does not guarantee future results.
Comments on Performance of the Portfolios
MD&A _ 4
| 1. | Comments on the Puerto Rico Securities Portion, managed by UBS AMPR |
Starting January 1, 2008, the Puerto Rico Securities Portion allocation was significantly tilted towards cash and cash equivalents in order to implement a futures strategy. By investing a portion of the Equity Portion in stock index futures contracts, the Investment Adviser is attempting to achieve a risk and return profile for each Portfolio that approximates the result that might be achieved by investing the assets of the Puerto Rico Securities Portion in the securities comprising the stock index used as a benchmark for the investment strategy of the relevant Equity Portion.
In order to fulfill its strategy, UBS AMPR purchases and sells stock index futures contracts with the objective of achieving a high correlation to the relevant benchmarks. Due to the minimum denominations required to enter into stock index futures contracts, the Portfolios may have different weightings, thus resulting in different returns than their respective benchmarks. Also, because the Fund constantly issues and redeems shares, and due to market volatility, UBS AMPR has to adjust the number of contracts either by purchasing new stock index futures contracts or selling existing positions of stock index futures contracts. UBS AMPR strives to optimize the proper mix of stock index futures contracts in order to fulfill its investment strategy.
| 2. | Comments on the Equity Portion of the Portfolios managed by sub-advisors |
MD&A _ 5
| A. | Large Cap Value Portfolio I |
Since February 1, 2016, the Equity Portion of the Large Cap Value Portfolio I is managed by The London Company (“London”), which replaced Blackrock. The goal of the strategy is total return, with a primary focus on downside protection, with above average income and capital appreciation as secondary objectives. The investment team believes in investing like private market buyers, focusing on cash return on tangible capital; they believe value is defined by discounting cash inflows and outflows by an optimal cost of capital. Bottom-up stock selection is a critical component of their investment process as the firm’s process begins with a screen to identify companies characterized by high return on operating capital (profitability), consistent and stable free cash flow yield (cash generation), and attractive operating earnings/enterprise value (valuation). Their fundamental research consists of four critical elements: Balance sheet optimization analysis, Private Market Value Analysis, Corporate governance/management incentives audit, and Insider ownership/trading activity. This result in a portfolio of 30 – 40 stocks which the manager believes are trading at a 30% to 40% discount to fair market value. The Large Cap Value Portfolio I lagged the Russell 1000 Value Index® -9.47% versus -5.91% during the last 12 months.
Returns shown are based on the Class A NAVs of each individual Portfolio, net of expenses and are annualized for periods of over one year. Returns may vary from audited financial statements due to the consideration of income reinvestment and the fact that the Fund’s trustee waived a portion of its fee during the periods indicated. If the Fund’s adviser did not waive a portion of its fee during the periods indicated, returns would have been lower. Figures do not incorporate applicable Class A units sales load, which would reduce returns. The investment return and principal value of an investment in this Portfolio will fluctuate so that an investment in the Units issued by such Portfolio may be worth more or less than their original cost. Past performance does not guarantee future results.
MD&A _ 6
| B. | Large Cap Core Portfolio I |
Since January 27, 2011, the Equity Portion of the Large Cap Core Portfolio I is managed by Atalanta Sosnoff Capital, LLC (“Atalanta”), which replaced Alliance Bernstein Strategic Research. Atalanta’s investment philosophy is focused on finding companies entering periods of earnings acceleration, believing that over time earnings drive stock prices, positioning them to capture the compounding effects of earnings acceleration and multiple expansions. The process is predominantly a fundamental bottom-up approach but does take macro factors into consideration when forming the investment opinion. They typically select stocks from the Russell 1000 Index universe. The strategy generally holds 35-65 positions, diversified across 10-15 industries and 5-8 sectors. The Large Cap Core Portfolio I lagged the S&P 500 Index® -13.94% versus -7.73% during the last 12 months.
Returns shown are based on the Class A NAVs of each individual Portfolio, net of expenses and are annualized for periods of over one year. Returns may vary from audited financial statements due to the consideration of income reinvestment and the fact that the Fund’s trustee waived a portion of its fee during the periods indicated. If the Fund’s adviser did not waive a portion of its fee during the periods indicated, returns would have been lower. Figures do not incorporate applicable Class A units sales load, which would reduce returns. The investment return and principal value of an investment in this Portfolio will fluctuate so that an investment in the Units issued by such Portfolio may be worth more or less than their original cost. Past performance does not guarantee future results.
MD&A _ 7
| C. | Large Cap Growth Portfolio I |
Since May 28, 2021, the Equity Portion of the Large Cap Growth Portfolio I is managed by Winslow Capital (“Winslow”), which replaced Loomis Sayles & Company. Winslow Capital, LLC is a registered investment adviser and an affiliate of Nuveen, LLC.
Winslow Capital has specialized in Growth equities for almost 30 years, having followed the same investment philosophy and process. They are one of the industry’s largest active U.S. Large Cap Growth managers and the Winslow brand is synonymous with high quality growth investing. Also, experts in analyzing growth companies, growth industries and pricing growth assets. Their goal is to achieve successful client outcomes over the long-term while carefully managing risk. The Winslow Perspective, which is their differentiated, proprietary research process, along with disciplined portfolio and risk management, is at the heart of achieving successful outcomes for their clients. Their Client-Centric Culture drives all decision making at the firm. The Large Cap Growth Portfolio I lagged the Russell 1000 Growth Index® -13.59% versus -10.90% during the last 12 months.
Returns shown are based on the Class A NAVs of each individual Portfolio, net of expenses and are annualized for periods of over one year. Returns may vary from audited financial statements due to the consideration of income reinvestment and the fact that the Fund’s trustee waived a portion of its fee during the periods indicated. If the Fund’s adviser did not waive a portion of its fee during the periods indicated, returns would have been lower. Figures do not incorporate applicable Class A units sales load, which would reduce returns. The investment return and principal value of an vestment in this Portfolio will fluctuate so that an investment in the Units issued by such Portfolio may be worth more or less than their original cost. Past performance does not guarantee future results.
MD&A _ 8
| D. | International Equity Portfolio I |
Since August 1, 2016 the Equity Portion of the International Portfolio I is managed by Cambiar Investors, LLC (“Cambiar”), which replaced NFJ Investment Group. Cambiar is a Denver-based boutique with a history that goes back to the early 1970’s, with a bottom-up relative value manager that seeks what they believe to be financially strong companies that area trading at significant discounts, and that also possess one or more catalysts that have the potential to unlock a projected upside of 50% in the next 12-24 months. The strategy invests in international companies with a capitalization of $1 billion or greater. Cambiar has run an international strategy since 1997, shortly after CIO Brian Barish, who had international/emerging market responsibilities in previous jobs, joined the firm. Originally independent, then a subsidiary of a couple of companies, employees bought in 2001 and is now 100% employee owned. The International Equity Portfolio I lagged the MSCI EAFE International Equity Index® -5.79% versus -0.86% during the last 12 months.
Returns shown are based on the Class A NAVs of each individual Portfolio, net of expenses and are annualized for periods of over one year. Returns may vary from audited financial statements due to the consideration of income reinvestment and the fact that the Fund’s trustee waived a portion of its fee during the periods indicated. If the Fund’s adviser did not waive a portion of its fee during the periods indicated, returns would have been lower. Figures do not incorporate applicable Class A units sales load, which would reduce returns. The investment return and principal value of an investment in this Portfolio will fluctuate so that an investment in the Units issued by such Portfolio may be worth more or less than their original cost. Past performance does not guarantee future results.
MD&A _ 9
| E. | Mid Cap Core Portfolio I |
Since May 28, 2021 the Equity Portion of the Mid Cap Core Portfolio is being managed by The London Company (“London”), which replaced Principal Global Investors. London believes that the markets are less efficient at predicting risk than they are at predicting reward. Their investment process begins with a quantitative screen that evaluates companies on return on capital, earnings yield, and free cash flow yield. They seek out companies that are delivering high returns on capital. They believe that investing in companies that can earn cash on their cash provides those companies with advantaged financial flexibility which allows them to better weather downturns in their businesses. The manager believes this metric, combined with a durable and sustainable competitive advantage, should lead to more predictable cash flows, lower volatility of returns, and lower downside risk. London uses their unique Balance Sheet Optimization Analysis to uncover companies that may be overcapitalized and under levered with high levels of free cash flow. The optimization assesses management’s ability to create value through the optimization of the capital structure based on the strength of the company’s balance sheet and tangible assets under management’s control. Companies are valued using current free cash flow, the lowered cost of capital and little-to-no growth assumptions. If the cost of capital can be lowered by using the assets on hand, downside risk can be mitigated to create a more concrete margin of safety. London compliments the optimization through a private market value (PMV) analysis that considers recent M&A activity in order to assess what valuation multiples are being paid for like companies or assets. The PMV analysis attempts to corroborate the balance sheet optimization analysis and develops a realistic range of intrinsic value. Purchase candidates will be trading at a 20-40% discount to the manager’s estimate of intrinsic value. The Mid Cap Core Portfolio I outperformed the Russell Mid Cap Index®, -4.38% versus -8.78% during the last 12 months.
MD&A _ 10
Returns shown are based on the Class A NAVs of each individual Portfolio, net of expenses and are annualized for periods of over one year. Returns may vary from audited financial statements due to the consideration of income reinvestment and the fact that the Fund’s trustee waived a portion of its fee during the periods indicated. If the Fund’s adviser did not waive a portion of its fee during the periods indicated, returns would have been lower. Figures do not incorporate applicable Class A units sales load, which would reduce returns. The investment return and principal value of an vestment in this Portfolio will fluctuate so that an investment in the Units issued by such Portfolio may be worth more or less than their original cost. Past performance does not guarantee future results.
MD&A _ 11
| F. | Small Cap Core Portfolio I |
Since May 28, 2021 the Equity Portion of the Small Cap Core Portfolio is being managed by Cambiar Investors, LLC (“Cambiar”), which replaced The Boston Trust & Investment Management Company is a Denver-based boutique with a history that goes back to the early 1970’s, Cambiar is a bottom-up relative value manager that seeks what they believe to be financially strong companies selling at significant undervaluations that also possess one or more catalysts that have the potential to unlock the company’s upside potential in the next 12-18 months. The strategy focuses on companies with a capitalization below $3 billion, targeting a weighted average portfolio market cap of around $1.5 billion. Originally independent, then a subsidiary of a couple of companies, employees bought the firm in 2001 and is now 100% employee-owned. The Small Cap Core Portfolio I outperformed the Russell 2000 Index® -5.71% versus -11.61% during the last 12 months.
Returns shown are based on the Class A NAVs of each individual Portfolio, net of expenses and are annualized for periods of over one year. Returns may vary from audited financial statements due to the consideration of income reinvestment and the fact that the Fund’s trustee waived a portion of its fee during the periods indicated. If the Fund’s adviser did not waive a portion of its fee during the periods indicated, returns would have been lower. Figures do not incorporate applicable Class A units sales load, which would reduce returns. The investment return and principal value of an investment in this Portfolio will fluctuate so that an investment in the Units issued by such Portfolio may be worth more or less than their original cost. Past performance does not guarantee future results.
MD&A _ 12
III. MD&A Glossary
Fixed Income and Equity Indices
Barclays Capital Aggregate Bond Index® - Composed of securities from Barclays Capital government/corporate bond index, mortgage-backed securities index, and the asset-backed securities index. Total return comprises price appreciation/depreciation and income as a percentage of the original investment. Indexes are rebalanced monthly by market capitalization.
Barclays Capital Intermediate Government Bond Index® - (BC Int. Gov) -The BCIG the Government Bond Index which is made up of the Treasury Bond Index (all public obligations of the U.S. Treasury, excluding flower bonds and foreign traded issues) and the Agency Bond Index (all publicly issued debt of the U.S. Government agencies and quasi-federal corporation, and corporate debt guaranteed by the U.S. Government). However, it is different from the Government Bond Index in that it has a duration of little over 3 years and a maturity of close to 4 years.
Barclays Capital Municipal Bond Index® - Computed twice monthly from prices on approximately 1,100 bonds. Prices are supplied by Kenny Information Systems, Inc. The index is composed of approximately 60% revenue bonds and 40% state government obligations.
Morgan Stanley / Capital International EAFE Index® (MSCI EAFE) - The MSCI EAFE Index consists of over 2,600 securities in nearly 62 industry classifications listed on 21 stock exchanges in Europe, Australia, New Zealand, and the Far East. The EAFE aims to cover about 85% of each market’s total capitalization. Included companies represent a sampling of large, medium, and small capitalization companies and replicate the industries from each local market. The index is computed as an arithmetic average of the individual capitalization-weighted indices of the component countries, and returns are calculated in US dollars. Total return includes reinvestment of dividends, net of withholding taxes.
Puerto Rico Stock Index® (PRSI) - is a capitalization weighted index that measures the performance of all publicly traded stocks of corporations headquartered in the Commonwealth of Puerto Rico.
Russell 1000 Growth Index® - Contains those Russell 1000 securities with a greater-than-average growth orientation. Securities in this index tend to exhibit higher price-to-book and price-earnings ratios, lower dividend yields and higher forecasted growth values than the value universe.
Russell 1000 Value Index® - Contains those Russell 1000 securities with a less-than-average growth orientation. It represents the universe of stocks from which value managers typically select. Securities in this index tend to exhibit low price-to-book and price-earnings ratios, higher dividend yields and lower forecasted growth values than the growth universe.
MD&A _ 13
Russell 2000 Index® - Consists of the smallest 2,000 securities in the Russell 3000 index, representing approximately 11% of the Russell 3000 total market capitalization. This index is widely regarded in the industry as the premier measure of small cap stocks.
Russell Mid Cap Index® - Consists of the smallest 800 securities in the Russell 1000 index, as ranked by total market capitalization. This index accurately captures the medium-sized universe of securities and represents approximately 35% of the Russell 1000 total market capitalization.
Standard & Poor’s 500 Index® (S&P 500) - Covers 500 industrial, utility, transportation, and financial companies of the U.S. markets (mostly NYSE issues). The index represents about 75% of NYSE market capitalization and 30% of NYSE issues. It is a capitalization-weighted index calculated on a total return basis with dividends reinvested.
Benchmark Indices
| 1. | The Standard & Poor’s 500® Index covers 500 industrial, utility, transportation, and financial companies of the US markets (mostly NYSE issues). The index represents about 75% of NYSE market capitalization and 30% of NYSE issues. It is a capitalization-weighted index calculated on a total return basis with dividends reinvested. |
| 2. | From the Fund’s inception to 12/31/2007, the Large Cap Value Benchmark Index was composed of 80% in the Russell 1000 Value® Index, 10% in the GDB Puerto Rico Stock® Index, 5% in the Barclays Capital Intermediate Government® Index, and 5% in the 90-Day U.S. Treasury Bills. Effective 1/1/2008, the Large Cap Value Benchmark Index was rebalanced due to portfolio strategy changes (please refer to the prospectus for details) and is now composed of 100% in the Russell 1000 Value® Index. |
| 3. | From the Fund’s inception to 12/31/2007, the Large Cap Core Benchmark Index was composed of 80% in the S&P 500® Index, 10% in the GDB Puerto Rico Stock® Index, 5% in the Barclays Capital Intermediate Government® Index, and 5% in the 90-Day U.S. Treasury Bills. Effective 1/1/2008, the Large Cap Core Benchmark Index was rebalanced due to portfolio strategy changes (please refer to the prospectus for details) and is now composed of 100% in the S&P 500® Index. |
| 4. | From the Fund’s inception to 12/31/2007, the Large Cap Growth Benchmark Index was composed of 80% in the Russell 1000 Growth® Index, 10% in the GDB Puerto Rico Stock® Index, 5% in the Barclays Capital Intermediate Government® Index, and 5% in the 90-Day U.S. Treasury Bills. Effective 1/1/2008, the Large Cap Growth Benchmark Index was rebalanced due to portfolio strategy changes (please refer to the prospectus for details) and is now composed of 100% in the Russell 1000 Growth® Index. |
MD&A _ 14
| 5. | From the Fund’s inception to 12/31/2007, the International Benchmark Index was composed of 80% in the Morgan Stanley/Capital International EAFE® Index, 10% in the GDB Puerto Rico Stock® Index, 5% in the Barclays Capital Intermediate Government® Index, and 5% in the 90-Day U.S. Treasury Bills. Effective 1/1/2008, the International Benchmark Index was rebalanced due to portfolio strategy changes (please refer to the prospectus for details) and is now composed of 100% in the Morgan Stanley/Capital International EAFE® Index. |
| 6. | From the Fund’s inception to 12/31/2007, the Mid Cap Core Benchmark Index was composed of 80% in the Russell Mid Cap® Index, 10% in the GDB Puerto Rico Stock® Index, 5% in the Barclays Capital Intermediate Government® Index, and 5% in the 90-Day U.S. Treasury Bills. Effective 1/1/2008, the Mid Cap Core Benchmark Index was rebalanced due to portfolio strategy changes (please refer to the prospectus for details) and is now composed of 100% in the Russell Mid Cap® Index. |
| 7. | From the Fund’s inception to 12/31/2007, the Small Cap Core Benchmark Index was composed of 80% in the Russell 2000® Index, 10% in the GDB Puerto Rico Stock® Index, 5% in the Barclays Capital Intermediate Government® Index, and 5% in the 90-Day U.S. Treasury Bills. Effective 1/1/2008, the Small Cap Core Benchmark Index was rebalanced due to portfolio strategy changes (please refer to the prospectus for details) and is now composed of 100% in the Russell 2000® Index. |
MD&A _ 15
[This page intentionally left blank]
Multi-Select Securities Fund for Puerto Rico Residents |
The following table includes selected data for a unit outstanding throughout the periods and other performance information derived from the financial
statements. It should be read in conjunction with the financial statements and notes thereto.
International Portfolio I - Financial Highlights |
| Class A Units | ||||||||||||
| For the fiscal year ended March 31, 2023
| For the fiscal year ended March 31, 2022
| |||||||||||
Increase (Decrease) in Net Asset Value: | ||||||||||||
Per Unit | Net asset value, beginning of period | $9.84 | $10.53 | |||||||||
|
|
|
| |||||||||
Operating | Net investment gain (loss) | 0.00 | ** | (0.04) | ||||||||
Performance: (a) | Net realized gain (loss) and unrealized appreciation (depreciation) on investments and future contracts | (0.57) | (0.65) | |||||||||
|
|
|
| |||||||||
Total from investment operations | (0.57) | (0.69) | ||||||||||
|
|
|
| |||||||||
Net asset value, end of period | $9.27 | $9.84 | ||||||||||
|
|
|
| |||||||||
| ||||||||||||
Total Investment | ||||||||||||
Return: (b) | Based on net asset value per unit ^ | (5.79%) | (6.55%) | |||||||||
| ||||||||||||
Ratios: (c)(d) | Net expenses to average net assets - net of waived and/or reimbursed expenses | 1.82% | 1.75% | |||||||||
Gross expenses to average net assets | 3.06% | 2.78% | ||||||||||
Net investment gain (loss) to average net assets - net of waived and/or reimbursed expenses | 0.02% | (0.40%) | ||||||||||
| ||||||||||||
Supplemental | Net assets, end of period (in thousands) | $3,040 | $3,897 | |||||||||
|
|
|
| |||||||||
Data: | Portfolio turnover | 32.83% | 60.95% | |||||||||
|
|
|
| |||||||||
| ||||||||||||
** Net investment gain for the fiscal year ended March 31, 2023, amounted to $0.002. | ||||||||
^ Total investment return excludes the effects of sales charges. | ||||||||
(a) Based on average outstanding units of 355,315 and 414,618 for the fiscal years ended March 31, 2023, and March 31, 2022, respectively. | ||||||||
(b) Calculation is based on beginning and end of period net asset values and assumes reinvestment of dividends. | ||||||||
(c) Based on average net assets of $3,086,355 and $4,428,630 for the fiscal years ended March 31, 2023, and March 31, 2022, respectively. | ||||||||
(d) The effect of the expenses waived for the fiscal years ended March 31, 2023, and March 31, 2022, was to decrease the expense ratios, thus increasing the net investment income ratio to average net assets applicable to common unitholders by 1.24% and 1.03%, respectively. | ||||||||
The accompanying notes are an integral part of these financial statements.
1
Multi-Select Securities Fund for Puerto Rico Residents |
The following table includes selected data for a unit outstanding throughout the periods and other performance information derived from the financial
statements. It should be read in conjunction with the financial statements and notes thereto.
Large Cap Core Portfolio I - Financial Highlights | (continued) |
| Class A Units | ||||||||||||
| For the fiscal year ended March 31, 2023
| For the fiscal year ended March 31, 2022
| |||||||||||
Increase (Decrease) in Net Asset Value: | ||||||||||||
Per Unit | Net asset value, beginning of period | $36.44 | $32.67 | |||||||||
|
|
|
| |||||||||
Operating | Net investment gain (loss) | (0.24) | (0.35) | |||||||||
Performance: (a) | Net realized gain (loss) and unrealized appreciation (depreciation) on investments and future contracts | (4.85) | 4.12 | |||||||||
|
|
|
| |||||||||
Total from investment operations | (5.09) | 3.77 | ||||||||||
|
|
|
| |||||||||
Net asset value, end of period | $31.35 | $36.44 | ||||||||||
|
|
|
| |||||||||
| ||||||||||||
Total Investment | ||||||||||||
Return: (b) | Based on net asset value per unit ^ | (13.94%) | 11.51% | |||||||||
| ||||||||||||
Ratios: (c)(d) | Net expenses to average net assets - net of waived and/or reimbursed expenses | 1.81% | 1.75% | |||||||||
Gross expenses to average net assets | 2.64% | 2.80% | ||||||||||
Net investment gain (loss) to average net assets - net of waived and/or reimbursed expenses | (0.79%) | (0.97%) | ||||||||||
| ||||||||||||
Supplemental | Net assets, end of period (in thousands) | $4,325 | $5,383 | |||||||||
|
|
|
| |||||||||
Data: | Portfolio turnover | 67.09% | 47.04% | |||||||||
|
|
|
| |||||||||
| ||||||||||||
^ Total investment return excludes the effects of sales charges. | ||||||||
(a) Based on average outstanding units of 142,680 and 153,350 for the fiscal years ended March 31, 2023, and March 31, 2022, respectively. | ||||||||
(b) Calculation is based on beginning and end of period net asset values and assumes reinvestment of dividends. | ||||||||
(c) Based on average net assets of $4,440,889 and $5,535,739 for the fiscal years ended March 31, 2023, and March 31, 2022, respectively. | ||||||||
(d) The effect of the expenses waived for the fiscal years ended March 31, 2023, and March 31, 2022, was to decrease the expense ratios, thus decreasing the net investment loss ratio to average net assets applicable to common unitholders by 0.83% and 1.05%, respectively. | ||||||||
The accompanying notes are an integral part of these financial statements.
2
Multi-Select Securities Fund for Puerto Rico Residents |
The following table includes selected data for a unit outstanding throughout the periods and other performance information derived from the financial
statements. It should be read in conjunction with the financial statements and notes thereto.
Large Cap Core Portfolio I - Financial Highlights | (concluded) |
| Class L Units | ||||||||||||||
| For the fiscal year ended March 31, 2023
| For the fiscal year ended March 31, 2022
| |||||||||||||
Increase (Decrease) in Net Asset Value: | ||||||||||||||
Per Unit | Net asset value, beginning of period | $37.99 | $34.20 | |||||||||||
|
|
|
| |||||||||||
Operating | Net investment gain (loss) | (0.27) | (0.52) | |||||||||||
Performance: (a) | Net realized gain (loss) and unrealized appreciation (depreciation) on investments and future contracts | (5.05) | 4.31 | |||||||||||
|
|
|
| |||||||||||
Total from investment operations | (5.32) | 3.79 | ||||||||||||
|
|
|
| |||||||||||
Net asset value, end of period | $32.67 | $37.99 | ||||||||||||
|
|
|
| |||||||||||
| ||||||||||||||
Total Investment | ||||||||||||||
Return: (b) | Based on net asset value per unit ^ | (13.98%) | 11.05% | |||||||||||
| ||||||||||||||
Ratios: (c)(d) | Net expenses to average net assets - net of waived and/or reimbursed expenses | 1.87% | 2.15% | |||||||||||
Gross expenses to average net assets | 2.71% | 3.30% | ||||||||||||
Net investment gain (loss) to average net assets - net of waived and/or reimbursed expenses | (0.85%) | (1.37%) | ||||||||||||
| ||||||||||||||
Supplemental | Net assets, end of period (in thousands) | $1,774 | $2,063 | |||||||||||
|
|
|
| |||||||||||
Data: | Portfolio turnover | 67.09% | 47.04% | |||||||||||
|
|
|
| |||||||||||
| ||||||||||||||
^ Total investment return excludes the effects of sales charges. | ||||||||
(a) Based on average outstanding units of 54,318 for both fiscal years ended March 31, 2023, and March 31, 2022. | ||||||||
(b) Calculation is based on beginning and end of period net asset values and assumes reinvestment of dividends. | ||||||||
(c) Based on average net assets of $1,758,151 and $2,049,032 for the fiscal years ended March 31, 2023, and March 31, 2022, respectively. | ||||||||
(d) The effect of the expenses waived for the fiscal years ended March 31, 2023, and March 31, 2022 was to decrease the expense ratios, thus decreasing the net investment loss ratio to average net assets applicable to common unitholders by 0.84% and 1.15%, respectively. | ||||||||
The accompanying notes are an integral part of these financial statements.
3
Multi-Select Securities Fund for Puerto Rico Residents |
The following table includes selected data for a unit outstanding throughout the periods and other performance information derived from the financial
statements. It should be read in conjunction with the financial statements and notes thereto.
Large Cap Growth Portfolio I - Financial Highlights | (continued) |
| Class A Units | ||||||||||||||
| For the fiscal year ended March 31, 2023
| For the fiscal year ended March 31, 2022
| |||||||||||||
Increase (Decrease) in Net Asset Value: | ||||||||||||||
Per Unit | Net asset value, beginning of period | $39.63 | $36.62 | |||||||||||
|
|
|
| |||||||||||
Operating | Net investment gain (loss) | (0.41) | (0.60) | |||||||||||
Performance: (a) | Net realized gain (loss) and unrealized appreciation (depreciation) on investments and future contracts | (4.97) | 3.61 | |||||||||||
|
|
|
| |||||||||||
Total from investment operations | (5.38) | 3.01 | ||||||||||||
|
|
|
| |||||||||||
Net asset value, end of period | $34.25 | $39.63 | ||||||||||||
|
|
|
| |||||||||||
| ||||||||||||||
Total Investment | ||||||||||||||
Return: (b) | Based on net asset value per unit ^ | (13.58%) | 8.22% | |||||||||||
| ||||||||||||||
Ratios: (c)(d) | Net expenses to average net assets - net of waived and/or reimbursed expenses | 1.81% | 1.75% | |||||||||||
Gross expenses to average net assets | 2.65% | 2.77% | ||||||||||||
Net investment gain (loss) to average net assets - net of waived and/or reimbursed expenses | (1.27%) | (1.44%) | ||||||||||||
| ||||||||||||||
Supplemental | Net assets, end of period (in thousands) | $5,462 | $6,556 | |||||||||||
|
|
|
| |||||||||||
Data: | Portfolio turnover | 76.07% | 124.60% | |||||||||||
|
|
|
| |||||||||||
| ||||||||||||||
^ Total investment return excludes the effects of sales charges. | ||||||||
(a) Based on average outstanding units of 161,956 and 172,95 for the fiscal years ended March 31, 2023, and March 31, 2022, respectively. | ||||||||
(b) Calculation is based on beginning and end of period net asset values and assumes reinvestment of dividends. | ||||||||
(c) Based on average net assets of $5,287,251 and $7,139,920 for the fiscal years ended March 31, 2023, and March 31, 2022, respectively. | ||||||||
(d) The effect of the expenses waived for the fiscal years ended March 31, 2023, and March 31, 2022 was to decrease the expense ratios, thus decreasing the net investment loss ratio to average net assets applicable to common unitholders by 0.84% and 1.02%, respectively. | ||||||||
The accompanying notes are an integral part of these financial statements.
4
Multi-Select Securities Fund for Puerto Rico Residents |
The following table includes selected data for a unit outstanding throughout the periods and other performance information derived from the financial
statements. It should be read in conjunction with the financial statements and notes thereto.
Large Cap Growth Portfolio I - Financial Highlights | (concluded) |
| Class L Units | ||||||||||||||
| For the fiscal year ended March 31, 2023
| For the fiscal year ended March 31, 2022
| |||||||||||||
Increase (Decrease) in Net Asset Value: | ||||||||||||||
Per Unit | Net asset value, beginning of period | $37.03 | $34.35 | |||||||||||
|
|
|
| |||||||||||
Operating | Net investment gain (loss) | (0.40) | (0.71) | |||||||||||
Performance: (a) | Net realized gain (loss) and unrealized appreciation (depreciation) on investments and future contracts | (4.65) | 3.39 | |||||||||||
|
|
|
| |||||||||||
Total from investment operations | (5.05) | 2.68 | ||||||||||||
|
|
|
| |||||||||||
Net asset value, end of period | $31.98 | $37.03 | ||||||||||||
|
|
|
| |||||||||||
| ||||||||||||||
Total Investment | ||||||||||||||
Return: (b) | Based on net asset value per unit ^ | (13.64%) | 7.80% | |||||||||||
| ||||||||||||||
Ratios: (c)(d) | Net expenses to average net assets - net of waived and/or reimbursed expenses | 1.88% | 2.15% | |||||||||||
Gross expenses to average net assets | 2.72% | 3.27% | ||||||||||||
Net investment gain (loss) to average net assets - net of waived and/or reimbursed expenses | (1.33%) | (1.84%) | ||||||||||||
| ||||||||||||||
Supplemental | Net assets, end of period (in thousands) | $1,737 | $2,011 | |||||||||||
|
|
|
| |||||||||||
Data: | Portfolio turnover | 76.07% | 124.60% | |||||||||||
|
|
|
| |||||||||||
| ||||||||||||||
^ Total investment return excludes the effects of sales charges. | ||||||||
(a) Based on average outstanding units of 54,310 for both fiscal years ended March 31, 2023, and March 31, 2022. | ||||||||
(b) Calculation is based on beginning and end of period net asset values and assumes reinvestment of dividends. | ||||||||
(c) Based on average net assets of $1,653,329 and $2,100,811 for the fiscal years ended March 31, 2023, and March 31, 2022, respectively. | ||||||||
(d) The effect of the expenses waived for the fiscal years ended March 31, 2023, and March 31, 2022 was to decrease the expense ratios, thus decreasing the net investment loss ratio to average net assets applicable to common unitholders by 0.84% and 1.12%, respectively. | ||||||||
The accompanying notes are an integral part of these financial statements.
5
Multi-Select Securities Fund for Puerto Rico Residents |
The following table includes selected data for a unit outstanding throughout the periods and other performance information derived from the financial
statements. It should be read in conjunction with the financial statements and notes thereto.
Large Cap Value Portfolio I - Financial Highlights | (continued) |
| Class A Units | ||||||||||||||
| For the fiscal year ended March 31, 2023
| For the fiscal year ended March 31, 2022
| |||||||||||||
Increase (Decrease) in Net Asset Value: | ||||||||||||||
Per Unit | Net asset value, beginning of period | $25.89 | $22.93 | |||||||||||
|
|
|
| |||||||||||
Operating | Net investment gain (loss) | 0.02 | (0.02) | |||||||||||
Performance: (a) | Net realized gain (loss) and unrealized appreciation (depreciation) on investments and future contracts | (2.47) | 3.00 | |||||||||||
|
|
|
| |||||||||||
Total from investment operations | (2.45) | 2.98 | ||||||||||||
Net asset value, end of period | - | (0.02) | ||||||||||||
|
|
|
| |||||||||||
| $23.44 | $25.89 | |||||||||||||
|
|
|
| |||||||||||
| ||||||||||||||
Total Investment | ||||||||||||||
Return: (b) | Based on net asset value per unit ^ | (9.46%) | 12.99% | |||||||||||
| ||||||||||||||
Ratios: (c)(d) | Net expenses to average net assets - net of waived and/or reimbursed expenses | 1.81% | 1.75% | |||||||||||
Gross expenses to average net assets | 2.63% | 2.82% | ||||||||||||
Net investment gain (loss) to average net assets - net of waived and/or reimbursed expenses | (0.07%) | (0.09%) | ||||||||||||
| ||||||||||||||
Supplemental | Net assets, end of period (in thousands) | $5,306 | $6,193 | |||||||||||
|
|
|
| |||||||||||
Data: | Portfolio turnover | 2.81% | 12.17% | |||||||||||
|
|
|
| |||||||||||
| ||||||||||||||
^ Total investment return excludes the effects of sales charges. | ||||||||
(a) Based on average outstanding units of 230,480 and 246,603 for the fiscal years ended March 31, 2023, and March 31, 2022. | ||||||||
(b) Calculation is based on beginning and end of period net asset values and assumes reinvestment of dividends. | ||||||||
(c) Based on average net assets of $5,422,365 and $6,148,778 for the fiscal years ended March 31, 2023, and March 31, 2022, respectively. | ||||||||
(d) The effect of the expenses waived for the fiscal years ended March 31, 2023, and March 31, 2022 was to decrease the expense ratios, thus decreasing the net investment loss ratio to average net assets applicable to common unitholders by 0.82% and 1.07%, respectively. | ||||||||
The accompanying notes are an integral part of these financial statements.
6
Multi-Select Securities Fund for Puerto Rico Residents |
The following table includes selected data for a unit outstanding throughout the periods and other performance information derived from the financial
statements. It should be read in conjunction with the financial statements and notes thereto.
Large Cap Value Portfolio I - Financial Highlights | (concluded) |
| Class L Units | ||||||||||
| For the fiscal year ended March 31, 2023
| For the fiscal year ended March 31, 2022
| |||||||||
Increase (Decrease) in Net Asset Value: | ||||||||||
Per Unit | Net asset value, beginning of period | $25.01 | $22.22 | |||||||
|
| |||||||||
Operating | Net investment gain (loss) | 0.00 | ** | (0.12) | ||||||
Performance: (a) | Net realized gain (loss) and unrealized appreciation (depreciation) on investments and future contracts | (2.38) | 2.91 | |||||||
|
| |||||||||
Total from investment operations | (2.38) | 2.79 | ||||||||
|
| |||||||||
Net asset value, end of period | $22.63 | $25.01 | ||||||||
|
| |||||||||
| ||||||||||
Total Investment | ||||||||||
Return: (b) | Based on net asset value per unit ^ | (9.52%) | 12.56% | |||||||
| ||||||||||
Ratios: (c)(d) | Net expenses to average net assets - net of waived and/or reimbursed expenses | 1.87% | 2.15% | |||||||
Gross expenses to average net assets | 2.69% | 3.32% | ||||||||
Net investment gain (loss) to average net assets - net of waived and/or reimbursed expenses | (0.01%) | (0.49%) | ||||||||
| ||||||||||
Supplemental | Net assets, end of period (in thousands) | $1,619 | $1,790 | |||||||
|
| |||||||||
Data: | Portfolio turnover | 2.81% | 12.17% | |||||||
|
| |||||||||
| ||||||||||
** Net investment gain for the fiscal year ended March 31, 2023 amounted to $0.002. | ||||||||||
^ Total investment return excludes the effects of sales charges. | ||||||||||
(a) Based on average outstanding units of 71,563 for both fiscal years ended March 31, 2023, and March 31, 2022. | ||||||||||
(b) Calculation is based on beginning and end of period net asset values and assumes reinvestment of dividends. | ||||||||||
(c) Based on average net assets of $1,622,972 and $1,727,903 for the fiscal years ended March 31, 2023, and March 31, 2022, respectively. | ||||||||||
(d) The effect of the expenses waived for the fiscal years ended March 31, 2023, and March 31, 2022 was to decrease the expense ratios, thus decreasing the net investment loss ratio to average net assets applicable to common unitholders by 0.82% and 1.17%, respectively. | ||||||||||
The accompanying notes are an integral part of these financial statements.
7
Multi-Select Securities Fund for Puerto Rico Residents |
The following table includes selected data for a unit outstanding throughout the periods and other performance information derived from the financial
statements. It should be read in conjunction with the financial statements and notes thereto.
Mid Cap Core Portfolio I - Financial Highlights | (continued) |
| Class A Units | ||||||||||
| For the fiscal year ended March 31, 2023
| For the fiscal year ended March 31, 2022
| |||||||||
Increase (Decrease) in Net Asset Value: | ||||||||||
Per Unit | Net asset value, beginning of period | $38.48 | $37.50 | |||||||
|
| |||||||||
Operating | Net investment gain (loss) | (0.33) | (0.38) | |||||||
Performance: (a) | Net realized gain (loss) and unrealized appreciation (depreciation) on investments and future contracts | (1.36) | 1.36 | |||||||
|
| |||||||||
Total from investment operations | (1.69) | 0.98 | ||||||||
|
| |||||||||
Net asset value, end of period | $36.79 | $38.48 | ||||||||
|
| |||||||||
| ||||||||||
Total Investment | ||||||||||
Return: (b) | Based on net asset value per unit ^ | (4.39%) | 2.61% | |||||||
| ||||||||||
Ratios: (c)(d) | Net expenses to average net assets - net of waived and/or reimbursed expenses | 1.80% | 1.75% | |||||||
Gross expenses to average net assets | 2.76% | 2.80% | ||||||||
Net investment gain (loss) to average net assets - net of waived and/or reimbursed expenses | (0.92%) | (0.97%) | ||||||||
| ||||||||||
Supplemental | Net assets, end of period (in thousands) | $3,761 | $4,234 | |||||||
|
| |||||||||
Data: | Portfolio turnover | 18.48% | 101.44% | |||||||
|
| |||||||||
| ||||||||||
^ Total investment return excludes the effects of sales charges. | ||||||||||
(a) Based on average outstanding units of 106,117 and 113,446 for the fiscal years ended March 31, 2023, and March 31, 2022, respectively. | ||||||||||
(b) Calculation is based on beginning and end of period net asset values and assumes reinvestment of dividends. | ||||||||||
(c) Based on average net assets of $3,836,236 and $4,496,162 for the fiscal years ended March 31, 2023, and March 31, 2022, respectively. | ||||||||||
(d) The effect of the expenses waived for the fiscal years ended March 31, 2023, and March 31, 2022 was to decrease the expense ratios, thus decreasing the net investment loss ratio to average net assets applicable to common unitholders by 0.96% and 1.05%, respectively. | ||||||||||
The accompanying notes are an integral part of these financial statements.
8
Multi-Select Securities Fund for Puerto Rico Residents |
The following table includes selected data for a unit outstanding throughout the periods and other performance information derived from the financial
statements. It should be read in conjunction with the financial statements and notes thereto.
Mid Cap Core Portfolio I - Financial Highlights | (concluded) |
| Class L Units | ||||||||
| For the fiscal year ended March 31, 2023
| For the fiscal year ended March 31, 2022
| |||||||
Increase (Decrease) in Net Asset Value: | ||||||||
Per Unit | Net asset value, beginning of period | $33.95 | $33.22 | |||||
|
| |||||||
Operating | Net investment gain (loss) | (0.31) | (0.48) | |||||
Performance: (a) | Net realized gain (loss) and unrealized appreciation (depreciation) on investments and future contracts | (1.20) | 1.21 | |||||
|
| |||||||
Total from investment operations | (1.51) | 0.73 | ||||||
|
| |||||||
Net asset value, end of period | $32.44 | $33.95 | ||||||
|
| |||||||
| ||||||||
Total Investment | ||||||||
Return: (b) | Based on net asset value per unit ^ | (4.45%) | 2.20% | |||||
| ||||||||
Ratios: (c)(d) | Net expenses to average net assets - net of waived and/or reimbursed expenses | 1.86% | 2.15% | |||||
Gross expenses to average net assets | 2.83% | 3.30% | ||||||
Net investment gain (loss) to average net assets - net of waived and/or reimbursed expenses | (0.98%) | (1.37%) | ||||||
| ||||||||
Supplemental | Net assets, end of period (in thousands) | $1,364 | $1,428 | |||||
|
| |||||||
Data: | Portfolio turnover | 18.48% | 101.44% | |||||
|
| |||||||
| ||||||||
^ Total investment return excludes the effects of sales charges. | ||||||||
(a) Based on average outstanding units of 42,055 for both fiscal years ended March 31, 2023, and March 31, 2022. | ||||||||
(b) Calculation is based on beginning and end of period net asset values and assumes reinvestment of dividends. | ||||||||
(c) Based on average net assets of $1,339,166 and $1,473,501 for the fiscal years ended March 31, 2023, and March 31, 2022, respectively. | ||||||||
(d) The effect of the expenses waived for the fiscal years ended March 31, 2023, and March 31, 2022 was to decrease the expense ratios, thus decreasing the net investment loss ratio to average net assets applicable to common unitholders by 0.97% and 1.15%, respectively. | ||||||||
The accompanying notes are an integral part of these financial statements.
9
Multi-Select Securities Fund for Puerto Rico Residents |
The following table includes selected data for a unit outstanding throughout the periods and other performance information derived from the financial
statements. It should be read in conjunction with the financial statements and notes thereto.
Small Cap Core Portfolio I - Financial Highlights |
| Class A Units | ||||||||||||||
| For the fiscal year ended March 31, 2023
| For the fiscal year ended March 31, 2022
| |||||||||||||
Increase (Decrease) in Net Asset Value: | ||||||||||||||
Per Unit | Net asset value, beginning of period | $30.79 | $30.63 | |||||||||||
|
|
|
| |||||||||||
Operating | Net investment gain (loss) | (0.21) | (0.30) | |||||||||||
Performance: (a) | Net realized gain (loss) and unrealized appreciation (depreciation) on investments and future contracts | (1.54) | 0.46 | |||||||||||
|
|
|
| |||||||||||
Total from investment operations | (1.75) | 0.16 | ||||||||||||
|
|
|
| |||||||||||
Net asset value, end of period | $29.04 | $30.79 | ||||||||||||
|
|
|
| |||||||||||
| ||||||||||||||
Total Investment | ||||||||||||||
Return: (b) | Based on net asset value per unit ^ | (5.71%) | 0.56% | |||||||||||
| ||||||||||||||
Ratios: (c)(d) | Net expenses to average net assets - net of waived and/or reimbursed expenses | 1.82% | 1.75% | |||||||||||
Gross expenses to average net assets | 3.06% | 2.81% | ||||||||||||
Net investment gain (loss) to average net assets - net of waived and/or reimbursed expenses | (0.74%) | (0.96%) | ||||||||||||
| ||||||||||||||
Supplemental | Net assets, end of period (in thousands) | $3,074 | $3,643 | |||||||||||
|
|
|
| |||||||||||
Data: | Portfolio turnover | 31.79% | 146.86% | |||||||||||
|
|
|
| |||||||||||
| ||||||||||||||
^ Total investment return excludes the effects of sales charges. | ||||||||
(a) Based on average outstanding units of 110,524 and 126,041 for the fiscal years ended March 31, 2023, and March 31, 2022, respectively. | ||||||||
(b) Calculation is based on beginning and end of period net asset values and assumes reinvestment of dividends. | ||||||||
(c) Based on average net assets of $3,100,291 and $3,904,319 for the fiscal years ended March 31, 2023, and March 31, 2022, respectively. | ||||||||
(d) The effect of the expenses waived for the fiscal years ended March 31, 2023, and March 31, 2022 was to decrease the expense ratios, thus decreasing the net investment loss ratio to average net assets applicable to common unitholders by 1.24% and 1.06%, respectively. | ||||||||
The accompanying notes are an integral part of these financial statements.
10
Multi-Select Securities Fund for Puerto Rico Residents |
International Portfolio I |
Schedule of Investments | March 31, 2023 |
COMMON STOCKS - 72.37% of net assets applicable to common unitholders | ||||||||||||||||||||
| Shares | Issuer | Value | ||||||||||||||||||
Australia - 1.51% of net assets applicable to common unitholders | ||||||||||||||||||||
Oil and Gas Extraction - 2.09% of total investments |
| |||||||||||||||||||
| 10,019 | B | Santos Limited - Sponsored ADR |
| $ | 45,887 | |||||||||||||||
|
| |||||||||||||||||||
Total Australia (cost $60,466) | $ | 45,887 | ||||||||||||||||||
|
| |||||||||||||||||||
Belgium - 4.17% of net assets applicable to common unitholders | ||||||||||||||||||||
Chemicals & Allied - 2.59% of total investments |
| |||||||||||||||||||
| 1,275 | B | UCB SA - Sponsored ADR |
| $ | 57,018 | |||||||||||||||
Depository Institutions - 3.16% of total investments |
| |||||||||||||||||||
| 2,031 | B | KBC Group NV - Sponsored ADR |
| 69,582 | ||||||||||||||||
|
| |||||||||||||||||||
Total Belgium (cost $133,484) | $ | 126,600 | ||||||||||||||||||
|
| |||||||||||||||||||
Canada - 4.66% of net assets applicable to common unitholders | ||||||||||||||||||||
Metal Mining - 2.09% of total investments |
| |||||||||||||||||||
| 901 | Agnico Eagle Mines Limited |
| $ | 45,924 | ||||||||||||||||
Railroad Transportation - 2.18% of total investments |
| |||||||||||||||||||
| 406 | Canadian National Railway Company |
| 47,896 | |||||||||||||||||
Oil and Gas Extraction - 2.18% of total investments |
| |||||||||||||||||||
| 1,543 | Suncor Energy, Inc. |
| 47,910 | |||||||||||||||||
|
| |||||||||||||||||||
Total Canada (cost $159,043) | $ | 141,730 | ||||||||||||||||||
|
| |||||||||||||||||||
England - 17.47% of net assets applicable to common unitholders | ||||||||||||||||||||
Food and Kindred Products - 2.64% of total investments |
| |||||||||||||||||||
| 320 | B | Diageo PLC - Sponsored ADR |
| $ | 57,978 | |||||||||||||||
Amusement and Recreation Services - 1.79% of total investments |
| |||||||||||||||||||
| 2,539 | B | A | Entain PLC - Sponsored ADR |
| 39,329 | |||||||||||||||
Depository Institutions - 2.33% of total investments |
| |||||||||||||||||||
| 7,140 | B | Barclays PLC - Sponsored ADR |
| 51,337 | ||||||||||||||||
Oil and Gas Extraction - 3.20% of total investments |
| |||||||||||||||||||
| 1,225 | B | Shell PLC - Sponsored ADR |
| 70,487 | ||||||||||||||||
Engineering, Accounting, Research, Management, and Related Services - 2.04% of total investments |
| |||||||||||||||||||
| 898 | B | Intertek Group PLC - Sponsored ADR |
| 44,963 | ||||||||||||||||
Fabricated Metal Products, except Machinery and Transportation Equipment - 2.15% of total investments |
| |||||||||||||||||||
| 957 | B | BAE Systems PLC - Sponsored ADR |
| 47,247 | ||||||||||||||||
Miscellaneous Services - 4.58% of total investments |
| |||||||||||||||||||
| 1,890 | B | Compass Group PLC - Sponsored ADR |
| 47,685 | ||||||||||||||||
| 2,386 | B | SSE PLC - Sponsored ADR |
| 53,112 | ||||||||||||||||
Security & Commodity Brokers, Dealers, Exchanges and Services - 2.82% of total investments |
| |||||||||||||||||||
| 2,522 | B | London Stock Exchange Group, Inc - Sponsored ADR |
| 62,041 | ||||||||||||||||
Wholesale Trade Non-Durable Goods - 2.59% of total investments |
| |||||||||||||||||||
| 1,508 | B | Bunzl PLC - Sponsored ADR |
| 56,882 | ||||||||||||||||
|
| |||||||||||||||||||
Total England (cost $549,012) | $ | 531,061 | ||||||||||||||||||
|
| |||||||||||||||||||
France - 9.49% of net assets applicable to common unitholders | ||||||||||||||||||||
Food and Kindred Products - 3.01% of total investments |
| |||||||||||||||||||
| 1,463 | B | Pernod Ricard S.A. - Sponsored ADR |
| $ | 66,259 | |||||||||||||||
Transportation Equipment - 3.07% of total investments |
| |||||||||||||||||||
| 2,020 | B | Airbus SE - Sponsored ADR |
| 67,630 | ||||||||||||||||
Fabricated Metal Products, except Machinery and Transportation Equipment - 2.20% of total investments |
| |||||||||||||||||||
| 264 | B | LVMH Moët Hennessy - Louis Vuitton, Société Européenne - Sponsored ADR |
| 48,505 | ||||||||||||||||
Chemicals & Allied - 2.18% of total investments |
| |||||||||||||||||||
| 1,434 | B | L’Air Liquide S.A. - Sponsored ADR |
| 47,924 | ||||||||||||||||
Business Services - 2.64% of total investments |
| |||||||||||||||||||
| 1,567 | B | Capgemini SE - Sponsored ADR |
| 58,010 | ||||||||||||||||
|
| |||||||||||||||||||
Total France (cost $200,101) | $ | 288,328 | ||||||||||||||||||
|
| |||||||||||||||||||
Germany - 7.29% of net assets applicable to common unitholders | ||||||||||||||||||||
Postal Service - 2.50% of total investments |
| |||||||||||||||||||
| 1,178 | B | Deutsche Post AG- Sponsored ADR |
| $ | 55,095 | |||||||||||||||
Business Services - 3.20% of total investments |
| |||||||||||||||||||
| 557 | SAP SE |
| 70,488 | |||||||||||||||||
Chemicals & Allied - 4.36% of total investments |
| |||||||||||||||||||
| 1,212 | B | Merck Kommanditgesellschaft auf Aktien - Sponsored ADR |
| 45,086 | ||||||||||||||||
| 3,192 | B | Bayer Aktiengesellschaft - Sponsored ADR |
| 50,849 | ||||||||||||||||
|
| |||||||||||||||||||
Total Germany (cost $202,989) | $ | 221,518 | ||||||||||||||||||
|
| |||||||||||||||||||
The accompanying notes are an integral part of these financial statements.
11
Multi-Select Securities Fund for Puerto Rico Residents |
International Portfolio I |
Schedule of Investments | (concluded) | March 31, 2023 |
| Shares | Issuer | Value | ||||||||||||||||||
Hong Kong - 1.78% of net assets applicable to common unitholders | ||||||||||||||||||||
Insurance Carriers - 2.46% of total investments |
| |||||||||||||||||||
| 1,287 | B | AIA Group Limited - Sponsored ADR |
| $ | 54,054 | |||||||||||||||
|
| |||||||||||||||||||
Total Hong Kong (cost $47,568) | $ | 54,054 | ||||||||||||||||||
|
| |||||||||||||||||||
Japan - 6.78% of net assets applicable to common unitholders | ||||||||||||||||||||
Industrial & Commercial Machinery & Computer Equipment - 5.43% of total investments |
| |||||||||||||||||||
| 677 | B | Tokyo Electron Limited - Sponsored ADR |
| $ | 60,260 | |||||||||||||||
| 538 | B | Hitachi, Ltd. - Sponsored ADR |
| 59,153 | ||||||||||||||||
Electronic & Equipment - 3.95% of total investments |
| |||||||||||||||||||
| 621 | B | Sony Group Corp - Sponsored ADR |
| 56,294 | ||||||||||||||||
| 2,007 | B | Murata Manufacturing Co. - Sponsored ADR |
| 30,547 | ||||||||||||||||
|
| |||||||||||||||||||
Total Japan (cost $177,452) | $ | 206,254 | ||||||||||||||||||
|
| |||||||||||||||||||
Netherlands - 2.03% of net assets applicable to common unitholders | ||||||||||||||||||||
Insurance Carriers - 2.80% of total investments |
| |||||||||||||||||||
| 5,196 | B | ING Groep N.V. - Sponsored ADR |
| $ | 61,677 | |||||||||||||||
|
| |||||||||||||||||||
Total Netherlands (cost $58,147) | $ | 61,677 | ||||||||||||||||||
|
| |||||||||||||||||||
Singapore - 3.28% of net assets applicable to common unitholders | ||||||||||||||||||||
Depository Institutions - 2.16% of total investments |
| |||||||||||||||||||
| 480 | B | DBS Group Holdings Limited - Sponsored ADR |
| $ | 47,573 | |||||||||||||||
Telecommunications - Other - 2.37% of total investments |
| |||||||||||||||||||
| 2,821 | B | Singapore Telecommunications Limited - Sponsored ADR |
| 52,069 | ||||||||||||||||
|
| |||||||||||||||||||
Total Singapore (cost $80,907) | $ | 99,642 | ||||||||||||||||||
|
| |||||||||||||||||||
Spain - 2.02% of net assets applicable to common unitholders | ||||||||||||||||||||
Electric, Gas, and Sanitary Services - 2.80% of total investments |
| |||||||||||||||||||
| 1,238 | B | Iberdrola, S.A. - Sponsored ADR |
| $ | 61,553 | |||||||||||||||
|
| |||||||||||||||||||
Total Spain (cost $57,126) | $ | 61,553 | ||||||||||||||||||
|
| |||||||||||||||||||
Switzerland - 8.39% of net assets applicable to common unitholders | ||||||||||||||||||||
Chemicals & Allied - 6.40% of total investments |
| |||||||||||||||||||
| 1,861 | B | Roche Holding AG - Sponsored ADR |
| $ | 66,735 | |||||||||||||||
| 806 | Novartis AG - Sponsored ADR |
| 74,152 | |||||||||||||||||
Food and Kindred Products - 2.55% of total investments |
| |||||||||||||||||||
| 461 | B | Nestle SA - Sponsored ADR |
| 56,099 | ||||||||||||||||
Insurance Carriers - 2.64% of total investments |
| |||||||||||||||||||
| 1,215 | B | Zurich Insurance Group AG - Sponsored ADR |
| 58,126 | ||||||||||||||||
|
| |||||||||||||||||||
Total Switzerland (cost $230,935) | $ | 255,112 | ||||||||||||||||||
|
| |||||||||||||||||||
Taiwan - 1.61% of net assets applicable to common unitholders | ||||||||||||||||||||
Depository Institutions - 2.22% of total investments |
| |||||||||||||||||||
| 525 | B | Taiwan Semiconductor Manufacturing Company Limited - Sponsored ADR |
| $ | 48,836 | |||||||||||||||
|
| |||||||||||||||||||
Total Taiwan (cost $37,789) | $ | 48,836 | ||||||||||||||||||
|
| |||||||||||||||||||
United States - 1.89% of net assets applicable to common unitholders | ||||||||||||||||||||
Communications - 2.62% of total investments |
| |||||||||||||||||||
| 770 | A | Liberty Media Corp. |
| $ | 57,616 | |||||||||||||||
|
| |||||||||||||||||||
Total United States (cost $45,695) |
| $ | 57,616 | |||||||||||||||||
|
| |||||||||||||||||||
TOTAL COMMON STOCKS (cost $2,040,714) |
| $ | 2,199,868 | |||||||||||||||||
|
| |||||||||||||||||||
| Total investments (72.37% of net assets) |
| $ | 2,199,868 | |||||||||||||||||
| Other assets less liabilities (27.63% of net assets) |
| 839,774 | ||||||||||||||||||
|
| |||||||||||||||||||
| Net assets applicable to common unitholders - 100% |
| $ | 3,039,642 | |||||||||||||||||
|
| |||||||||||||||||||
| Open Futures | Issuer | Expiration Date | Underlying Notional Amount at Value | Unrealized Appreciation | ||||||||||||||||
Futures Contracts | ||||||||||||||||||||
6 Equity Index Contracts | E-Mini MSCI EAFE Index Contracts | 06/16/23 | $ 629,190 | $ | 21,330 | |||||||||||||||
|
| |||||||||||||||||||
| The underlying notional amount at value of open futures contracts is 20.70% of net assets applicable to common unitholders. |
| |||||||||||||||||||
| A | Non-dividend producing security. |
| ||||||||||||||||||
| B | A Sponsored ADR is an American Depository Receipt (“ADR”) that is issued through the cooperation of the company whose stock will be the underlying asset. |
| ||||||||||||||||||
The accompanying notes are an integral part of these financial statements.
12
Multi-Select Securities Fund for Puerto Rico Residents |
Large Cap Core Portfolio I |
Schedule of Investments | (continued) | March 31, 2023 |
COMMON STOCKS - 77.89% of net assets applicable to common unitholders | ||||||||||||||||||||
| Shares | Issuer | Value | ||||||||||||||||||
Ireland - 1.40% of net assets applicable to common unitholders | ||||||||||||||||||||
Business Services - 1.80% of total investments |
| |||||||||||||||||||
| 1,059 | Medtronic PLC |
| $ | 85,377 | ||||||||||||||||
|
| |||||||||||||||||||
Total Ireland (cost $111,562) | $ | 85,377 | ||||||||||||||||||
|
| |||||||||||||||||||
Cayman Islands - 0.36% of net assets applicable to common unitholders | ||||||||||||||||||||
Holdging & Other Investment Offices - 0.46% of total investments |
| |||||||||||||||||||
| 215 | A | B | Alibaba Group - Sponsored ADR |
| $ | 21,969 | ||||||||||||||
|
| |||||||||||||||||||
Total Cayman Islands (cost $22,623) | $ | 21,969 | ||||||||||||||||||
|
| |||||||||||||||||||
United States - 76.13% of net assets applicable to common unitholders (continued) | ||||||||||||||||||||
Aircraft Engines - 1.34% of total investments |
| |||||||||||||||||||
| 334 | Honeywell International, Inc. |
| $ | 63,834 | ||||||||||||||||
Amusement and Recreation Services - 1.63% of total investments |
| |||||||||||||||||||
| 773 | A | The Walt Disney Company |
| 77,400 | ||||||||||||||||
Apparel and Other Finished Products Made from Fabrics and Similar Materials - 0.93% of total investments |
| |||||||||||||||||||
| 121 | A | Lululemon Athletica, Inc. |
| 44,067 | ||||||||||||||||
Building Materials - 1.15% of total investments |
| |||||||||||||||||||
| 185 | Home Depot, Inc. |
| 54,597 | |||||||||||||||||
Business Services - 12.95% of total investments |
| |||||||||||||||||||
| 1,352 | Microsoft Corp. |
| 389,782 | |||||||||||||||||
| 1,700 | A | Alphabet, Inc. Class A |
| 176,341 | ||||||||||||||||
| 245 | A | Salesforce, Inc. |
| 48,946 | ||||||||||||||||
Chemicals & Allied - 6.45% of total investments |
| |||||||||||||||||||
| 312 | Eli Lilly and Company |
| 107,147 | |||||||||||||||||
| 170 | A | Vertex Pharmaceuticals, Inc. |
| 53,562 | ||||||||||||||||
| 1,370 | Merck & Co. |
| 145,754 | |||||||||||||||||
Communications - 3.38% of total investments |
| |||||||||||||||||||
| 2,250 | AT&T, Inc. |
| 43,313 | |||||||||||||||||
| 475 | Crown Castle, Inc. |
| 63,574 | |||||||||||||||||
| 370 | A | T-Mobile US, Inc. |
| 53,591 | ||||||||||||||||
Depository Institutions - 5.38% of total investments |
| |||||||||||||||||||
| 1,450 | The Bank of New York Mellon Corp. |
| 65,888 | |||||||||||||||||
| 225 | The Goldman Sachs Group, Inc. |
| 73,600 | |||||||||||||||||
| 585 | JPMorgan Chase & Co. |
| 76,231 | |||||||||||||||||
| 1,061 | Wells Fargo and Company |
| 39,660 | |||||||||||||||||
Eating & Drinking Places - 3.89% of total investments |
| |||||||||||||||||||
| 495 | McDonald’s Corp. |
| 138,407 | |||||||||||||||||
| 445 | Starbucks Corp. |
| 46,338 | |||||||||||||||||
Electric, Gas, & Sanitary Services - 1.86% of total investments |
| |||||||||||||||||||
| 1,145 | NextEra Energy, Inc. |
| 88,257 | |||||||||||||||||
Electronic & Equipment - 7.14% of total investments |
| |||||||||||||||||||
| 755 | A | Advanced Micro Devices, Inc |
| 73,998 | ||||||||||||||||
| 153 | Broadcom, Inc. |
| 98,156 | |||||||||||||||||
| 235 | Micron Technology, Inc. |
| 14,180 | |||||||||||||||||
| 550 | NVIDIA Corp. |
| 152,774 | |||||||||||||||||
Engineering, Accounting, Research, Management, and Related Services - 0.53% of total investments |
| |||||||||||||||||||
| 71 | Martin Marietta Materials, Inc. |
| 25,209 | |||||||||||||||||
Food and Kindred Products - 2.01% of total investments |
| |||||||||||||||||||
| 1,540 | The Coca-Cola Company |
| 95,526 | |||||||||||||||||
Furnitures and Fixtures - 0.94% of total investments |
| |||||||||||||||||||
| 745 | Johnson Controls International PLC |
| 44,864 | |||||||||||||||||
General Merchandise Store - 3.95% of total investments |
| |||||||||||||||||||
| 186 | Costco Wholesale Corporation |
| 92,418 | |||||||||||||||||
| 645 | Walmart, Inc. |
| 95,105 | |||||||||||||||||
Health Services - 1.17% of total investments |
| |||||||||||||||||||
| 210 | HCA, Inc. |
| 55,373 | |||||||||||||||||
Industrial & Commercial Machinery & Computer Equipment - 11.32% of total investments |
| |||||||||||||||||||
| 2,470 | Apple Computer, Inc. |
| 407,303 | |||||||||||||||||
| 225 | A | Palo Alto Networks, Inc. |
| 44,942 | ||||||||||||||||
| 103 | Deere & Company |
| 42,527 | |||||||||||||||||
| 81 | Lam Research Corp. |
| 42,940 | |||||||||||||||||
Insurance Carriers - 4.86% of total investments |
| |||||||||||||||||||
| 203 | UnitedHealth Group, Inc. |
| 95,936 | |||||||||||||||||
| 158 | Anthem, Inc. |
| 72,650 | |||||||||||||||||
| 320 | Chubb Limited |
| 62,138 | |||||||||||||||||
Measuring, Analytics, & Control Instruments - 4.11% of total investments |
| |||||||||||||||||||
| 2,060 | A | Boston Scientific Co. |
| 103,062 | ||||||||||||||||
| 160 | Thermo Fisher Scientific, Inc. |
| 92,219 | |||||||||||||||||
Metal Mining - 1.12% of total investments |
| |||||||||||||||||||
| 1,305 | Freeport-McMoRan, Inc. |
| 53,388 | |||||||||||||||||
The accompanying notes are an integral part of these financial statements.
13
Multi-Select Securities Fund for Puerto Rico Residents |
Large Cap Core Portfolio I |
Schedule of Investments | (concluded) | March 31, 2023 |
| Shares | Issuer | Value | ||||||||||||||||||
United States - 76.13% of net assets applicable to common unitholders (concluded) |
| |||||||||||||||||||
Miscellaneous Retail - 3.76% of total investments |
| |||||||||||||||||||
| 1,730 | A | Amazon.com, Inc. |
| $ | 178,692 | |||||||||||||||
Miscellaneous Services - 2.30% of total investments |
| |||||||||||||||||||
| 395 | A | Meta Platforms, Inc. |
| 83,716 | ||||||||||||||||
| 55 | A | ServiceNow, Inc. |
| 25,560 | ||||||||||||||||
Motion Picture - 1.49% of total investments |
| |||||||||||||||||||
| 205 | A | Netflix, Inc. |
| 70,823 | ||||||||||||||||
Non-Depository Institution - 3.01% of total investments |
| |||||||||||||||||||
| 320 | Visa, Inc. |
| 72,147 | |||||||||||||||||
| 430 | American Express Company |
| 70,929 | |||||||||||||||||
Petroleum Refining & Related Industries - 4.45% of total investments |
| |||||||||||||||||||
| 523 | ConocoPhillips |
| 51,887 | |||||||||||||||||
| 1,455 | Exxon Mobil Corp. |
| 159,555 | |||||||||||||||||
Rubber and Miscellaneous Plastic Products - 0.98% of total investments |
| |||||||||||||||||||
| 380 | NIKE, Inc. |
| 46,603 | |||||||||||||||||
Security & Commodity Brokers, Dealers, Exchanges and Services - 2.17% of total investments |
| |||||||||||||||||||
| 805 | Morgan Stanley |
| 70,679 | |||||||||||||||||
| 615 | The Charles Schwab Corp. |
| 32,214 | |||||||||||||||||
Transportation Equipment - 3.48% of total investments |
| |||||||||||||||||||
| 295 | A | Tesla, Inc. |
| 61,201 | ||||||||||||||||
| 490 | The Boeing Company |
| 104,085 | |||||||||||||||||
|
| |||||||||||||||||||
Total United States (cost $3,518,085) |
| $ | 4,643,088 | |||||||||||||||||
|
| |||||||||||||||||||
|
| |||||||||||||||||||
TOTAL COMMON STOCKS (cost $3,652,270) |
| $ | 4,750,434 | |||||||||||||||||
|
| |||||||||||||||||||
| Total investments (77.89% of net assets) |
| $ | 4,750,434 | |||||||||||||||||
| Other assets less liabilities (22.11% of net assets) |
| 1,348,809 | ||||||||||||||||||
|
| |||||||||||||||||||
| Net assets applicable to common unitholders - 100% |
| $ | 6,099,243 | |||||||||||||||||
|
| |||||||||||||||||||
| Open Futures | Issuer | Expiration Date | Underlying Notional Amount at Value | Unrealized Appreciation | ||||||||||||||||
Futures Contracts | ||||||||||||||||||||
5 Equity Index Contracts | E-Mini S&P 500 Index | 06/16/23 | $ 1,035,000 | $ | 62,313 | |||||||||||||||
|
| |||||||||||||||||||
| The underlying notional amount at value of open futures contracts is 16.97% of net assets applicable to common unitholders. |
| |||||||||||||||||||
| A | Non-dividend producing security. |
| ||||||||||||||||||
| B | A Sponsored ADR is an American Depository Receipt (“ADR”) that is issued through the cooperation of the company whose stock will be the underlying asset. |
| ||||||||||||||||||
The accompanying notes are an integral part of these financial statements.
14
Multi-Select Securities Fund for Puerto Rico Residents |
Large Cap Growth Portfolio I |
Schedule of Investments | (continued) | March 31, 2023 |
COMMON STOCKS - 78.99% of net assets applicable to common unitholders | ||||||||||||||||||||
| Shares | Issuer | Value | ||||||||||||||||||
England - 0.82% of net assets applicable to common unitholders | ||||||||||||||||||||
Pharmaceutical Preparations - 1.04% of total investments |
| |||||||||||||||||||
| 853 | B | AstraZeneca PLC - Sponsored ADR |
| $ | 59,207 | |||||||||||||||
|
| |||||||||||||||||||
Total England (cost $52,463) | $ | 59,207 | ||||||||||||||||||
|
| |||||||||||||||||||
Netherlands - 2.13% of net assets applicable to common unitholders | ||||||||||||||||||||
Industrial & Commercial Machinery & Computer Equipment - 2.69% of total investments |
| |||||||||||||||||||
| 225 | B | ASML Holding N.V. - Sponsored ADR |
| $ | 153,160 | |||||||||||||||
|
| |||||||||||||||||||
Total Netherlands (cost $149,987) | $ | 153,160 | ||||||||||||||||||
|
| |||||||||||||||||||
United States - 76.04% of net assets applicable to common unitholders | ||||||||||||||||||||
Apparel and Other Finished Products Made from Fabrics and Similar Materials - 1.84% of total investments |
| |||||||||||||||||||
| 288 | A | Lululemon Athletica, Inc. |
| $ | 104,887 | |||||||||||||||
Auto, Dealers & Gas - 1.55% of total investments |
| |||||||||||||||||||
| 104 | A | O’Reilly Automotive, Inc |
| 88,294 | ||||||||||||||||
Business Services - 29.07% of total investments |
| |||||||||||||||||||
| 190 | A | Synopsys, Inc. |
| 73,388 | ||||||||||||||||
| 510 | A | Workday, Inc. |
| 105,335 | ||||||||||||||||
| 1,360 | A | Alphabet, Inc. Class A |
| 141,073 | ||||||||||||||||
| 1,345 | A | Alphabet, Inc. Class C |
| 139,880 | ||||||||||||||||
| 1,671 | A | Microsoft Corp. |
| 481,749 | ||||||||||||||||
| 361 | A | Atlassian Corporation PLC |
| 61,792 | ||||||||||||||||
| 423 | Intuit, Inc. |
| 188,586 | |||||||||||||||||
| 485 | A | Mastercard Incorporated |
| 176,254 | ||||||||||||||||
| 222 | Moody’s Corp. |
| 67,936 | |||||||||||||||||
| 146 | MSCI, Inc. |
| 81,715 | |||||||||||||||||
| 738 | A | Veeva Systems, Inc. |
| 135,637 | ||||||||||||||||
Chemicals & Allied - 4.18% of total investments |
| |||||||||||||||||||
| 341 | Linde PLC |
| 121,205 | |||||||||||||||||
| 150 | A | Vertex Pharmaceuticals, Inc. |
| 47,261 | ||||||||||||||||
| 139 | A | Idexx Laboratories, Inc. |
| 69,511 | ||||||||||||||||
Eating & Drinking Places - 6.29% of total investments |
| |||||||||||||||||||
| 105 | A | Chipotle Mexican Grill, Inc. |
| 179,370 | ||||||||||||||||
| 394 | A | McDonald’s Corp. |
| 110,166 | ||||||||||||||||
| 655 | A | Starbucks Corp. |
| 68,205 | ||||||||||||||||
Electronic and Equipment - 8.20% of total investments |
| |||||||||||||||||||
| 936 | Analog Devices, Inc. |
| 184,598 | |||||||||||||||||
| 1,015 | A | NVIDIA Corp. |
| 281,937 | ||||||||||||||||
Engineering, Accounting, Research, Management, and Related Services - 2.19% of total investments |
| |||||||||||||||||||
| 296 | A | IQVIA Holdings, Inc. |
| 58,871 | ||||||||||||||||
| 201 | A | Gartner, Inc. |
| 65,480 | ||||||||||||||||
Fabricated Metal Products- 1.27% of total investments |
| |||||||||||||||||||
| 215 | Parker-Hannifin Corp. |
| 72,264 | |||||||||||||||||
General Merchandise Stores - 4.43% of total investments |
| |||||||||||||||||||
| 326 | A | Costco Wholesale Corp. |
| 161,980 | ||||||||||||||||
| 625 | A | Dollar Tree, Inc. |
| 89,719 | ||||||||||||||||
Hotels, Rooming Houses, Camps, and Other Lodging Places - 2.20% of total investments |
| |||||||||||||||||||
| 890 | Hilton Worldwide Holdings, Inc. |
| 125,374 | |||||||||||||||||
Industrial & Commercial Machinery & Computer Equipment - 12.85% of total investments |
| |||||||||||||||||||
| 215 | A | Deere & Company |
| 88,769 | ||||||||||||||||
| 2,290 | A | Apple, Inc. |
| 377,621 | ||||||||||||||||
| 668 | A | Palo Alto Networks, Inc. |
| 133,426 | ||||||||||||||||
| 247 | A | Lam Research Corp. |
| 130,940 | ||||||||||||||||
Insurance Carriers - 4.40% of total investments |
| |||||||||||||||||||
| 529 | A | UnitedHealth Group |
| 250,000 | ||||||||||||||||
Local and Suburban Transit - 1.58% of total investments |
| |||||||||||||||||||
| 2,830 | A | Uber Technologies, Inc. |
| 89,711 | ||||||||||||||||
Measuring, Analytics, & Control Instruments - 6.18% of total investments |
| |||||||||||||||||||
| 635 | �� | Agilent Technologies, Inc. |
| 87,846 | ||||||||||||||||
| 339 | Danaher Corp. |
| 85,442 | |||||||||||||||||
| 697 | A | Intuitive Surgical, Inc. |
| 178,063 | ||||||||||||||||
Miscellaneous Retail - 1.56% of total investments |
| |||||||||||||||||||
| 860 | A | Amazon.com, Inc. |
| 88,829 | ||||||||||||||||
Miscellaneous Services - 4.46% of total investments |
| |||||||||||||||||||
| 436 | A | ServiceNow, Inc. |
| 202,618 | ||||||||||||||||
| 240 | A | Meta Platforms, Inc. |
| 50,866 | ||||||||||||||||
Non-depository Institutions - 2.91% of total investments |
| |||||||||||||||||||
| 733 | A | Visa, Inc. |
| 165,262 | ||||||||||||||||
Transportation Equipment - 1.10% of total investments |
| |||||||||||||||||||
| 302 | A | Tesla, Inc. |
| 62,652 | ||||||||||||||||
|
| |||||||||||||||||||
Total United States (cost $4,876,269) | $ | 5,474,512 | ||||||||||||||||||
|
| |||||||||||||||||||
|
| |||||||||||||||||||
TOTAL COMMON STOCKS (cost $5,078,719) | $ | 5,686,879 | ||||||||||||||||||
|
| |||||||||||||||||||
| Total investments (78.99% of net assets) |
| $ | 5,686,879 | |||||||||||||||||
| Other assets less liabilities (21.01% of net assets) |
| 1,512,317 | ||||||||||||||||||
|
| |||||||||||||||||||
| Net assets applicable to common unitholders - 100% |
| $ | 7,199,196 | |||||||||||||||||
|
| |||||||||||||||||||
The accompanying notes are an integral part of these financial statements.
15
Multi-Select Securities Fund for Puerto Rico Residents |
Large Cap Growth Portfolio I |
Schedule of Investments | (concluded) | March 31, 2023 |
United States - 69.78% of net assets applicable to common unitholders (concluded) | ||||||||||||||||||||
| Open Futures | Issuer | Expiration Date | Underlying Notional Amount at Value | Unrealized Appreciation | ||||||||||||||||
Futures Contracts | ||||||||||||||||||||
11 Equity Index Contracts | Russell 1000 Mini Index | 06/16/23 | $ 1,365,045 | $ | 105,001 | |||||||||||||||
|
| |||||||||||||||||||
| The underlying notional amount at value of open futures contracts is 18.96% of net assets applicable to common unitholders. |
| |||||||||||||||||||
| A | Non-dividend producing security. |
| ||||||||||||||||||
| B | A Sponsored ADR is an American Depository Receipt (“ADR”) that is issued through the cooperation of the company whose stock will be the underlying asset. |
| ||||||||||||||||||
The accompanying notes are an integral part of these financial statements.
16
Multi-Select Securities Fund for Puerto Rico Residents |
Large Cap Value Portfolio I |
Schedule of Investments | March 31, 2023 |
COMMON STOCKS- 78.62% of net assets applicable to common unitholders | ||||||||||||||||||||
| Shares | Issuer | Value | ||||||||||||||||||
England - 2.73% of net assets applicable to common unitholders | ||||||||||||||||||||
Food and Kindred Products - 3.47% of total investments |
| |||||||||||||||||||
| 1,042 | B | Diageo PLC - Sponsored ADR |
| $ | 188,790 | |||||||||||||||
|
| |||||||||||||||||||
Total England (cost $126,914) | $ | 188,790 | ||||||||||||||||||
|
| |||||||||||||||||||
Japan - 1.41% of net assets applicable to common unitholders | ||||||||||||||||||||
Food and Kindred Products - 1.80% of total investments |
| |||||||||||||||||||
| 10,115 | B | Nintendo Co., Ltd. - Sponsored ADR |
| $ | 98,014 | |||||||||||||||
|
| |||||||||||||||||||
Total Japan (cost $137,199) | $ | 98,014 | ||||||||||||||||||
|
| |||||||||||||||||||
Switzerland - 1.89% of net assets applicable to common unitholders | ||||||||||||||||||||
Food and Kindred Products - 2.40% of total investments |
| |||||||||||||||||||
| 1,073 | B | Nestlé, S.A. - Sponsored ADR |
| $ | 130,573 | |||||||||||||||
|
| |||||||||||||||||||
Total Switzerland (cost $95,521) | $ | 130,573 | ||||||||||||||||||
|
| |||||||||||||||||||
United States - 72.59% of net assets applicable to common unitholders | ||||||||||||||||||||
Building Materials - 6.57% of total investments |
| |||||||||||||||||||
| 1,030 | Lowe’s Companies, Inc. |
| $ | 205,969 | ||||||||||||||||
| 2,815 | Fastenal Company |
| 151,841 | |||||||||||||||||
Business Services - 3.59% of total investments |
| |||||||||||||||||||
| 678 | A | Microsoft Corp. |
| 195,467 | ||||||||||||||||
| 2,785 | Fidelity National Information Services, Inc |
| 151,309 | |||||||||||||||||
Chemicals & Allied - 14.34% of total investments |
| |||||||||||||||||||
| 1,908 | A | Merck & Co. |
| 202,992 | ||||||||||||||||
| 3,808 | Pfizer, Inc. |
| 155,366 | |||||||||||||||||
| 725 | Air Products and Chemicals, Inc |
| 208,227 | |||||||||||||||||
| 1,381 | Johnson & Johnson |
| 214,055 | |||||||||||||||||
Communications - 7.62% of total investments |
| |||||||||||||||||||
| 3,542 | Verizon Communications, Inc. |
| 137,748 | |||||||||||||||||
| 1,272 | A | Crown Castle International Corp. |
| 170,244 | ||||||||||||||||
| 2,820 | Comcast Corp. |
| 106,906 | |||||||||||||||||
Electric, Gas, & Sanitary Services - 2.62% of total investments |
| |||||||||||||||||||
| 2,548 | Dominion Resources, Inc. |
| 142,459 | |||||||||||||||||
Eating and Drinking Places- 3.92% of total investments |
| |||||||||||||||||||
| 2,049 | A | Starbucks Corp. |
| 213,362 | ||||||||||||||||
Electronic & Equipment - 4.97% of total investments |
| |||||||||||||||||||
| 1,454 | Texas Instruments, Inc. |
| 270,459 | |||||||||||||||||
Engineering, Accounting, Research, Management, and Related Services - 3.00% of total investments |
| |||||||||||||||||||
| 1,426 | Paychex, Inc. |
| 163,405 | |||||||||||||||||
General Merchandise Stores - 2.94% of total investments |
| |||||||||||||||||||
| 966 | Target Corporation |
| 159,999 | |||||||||||||||||
Industrial & Commercial Machinery & Computer Equipment - 9.47% of total investments |
| |||||||||||||||||||
| 3,224 | Cisco Systems, Inc. |
| 168,535 | |||||||||||||||||
| 2,105 | A | Apple Inc. |
| 347,115 | ||||||||||||||||
Insurance Carriers - 10.86% of total investments |
| |||||||||||||||||||
| 693 | A | Berkshire Hathaway, Inc. |
| 213,978 | ||||||||||||||||
| 1,100 | Cincinnati Financial Corp. |
| 123,288 | |||||||||||||||||
| 1,776 | The Progressive Corporation |
| 254,075 | |||||||||||||||||
Motor Freight Transportation and Warehousing - 3.97% of total investments |
| |||||||||||||||||||
| 1,115 | United Parcel Service, Inc. |
| 216,299 | |||||||||||||||||
Petroleum Refining & Related Industries - 3.49% of total investments |
| |||||||||||||||||||
| 1,163 | Chevron Corp. |
| 189,755 | |||||||||||||||||
Railroad Transportation - 2.41% of total investments |
| |||||||||||||||||||
| 620 | Norfolk Southern Corp. |
| 131,440 | |||||||||||||||||
Security & Commodity Brokers, Dealers, Exchanges and Services - 5.15% of total investments |
| |||||||||||||||||||
| 309 | BlackRock, Inc. |
| 206,758 | |||||||||||||||||
| 1,409 | A | The Charles Schwab Corp. |
| 73,803 | ||||||||||||||||
Tobacco Products - 4.63% of total investments |
| |||||||||||||||||||
| 2,858 | Altria Group, Inc. |
| 127,524 | |||||||||||||||||
| 1,283 | Phillip Morris International, Inc. |
| 124,772 | |||||||||||||||||
|
| |||||||||||||||||||
Total United States (cost $3,518,457) | $ | 5,027,150 | ||||||||||||||||||
|
| |||||||||||||||||||
|
| |||||||||||||||||||
TOTAL COMMON STOCKS (cost $3,878,091) | $ | 5,444,527 | ||||||||||||||||||
|
| |||||||||||||||||||
| Total investments (78.62% of net assets) |
| $ | 5,444,527 | |||||||||||||||||
| Other assets less liabilities (21.38% of net assets) |
| 1,481,019 | ||||||||||||||||||
|
| |||||||||||||||||||
| Net assets applicable to common unitholders - 100% |
| $ | 6,925,546 | |||||||||||||||||
|
| |||||||||||||||||||
| Open Futures | Issuer | Expiration Date | Underlying Notional Amount at Value | Unrealized Appreciation | ||||||||||||||||
Futures Contracts |
| |||||||||||||||||||
18 Equity Index Contracts | Russell 1000 Mini Index | 06/16/23 | $ 1,360,980 | $ | 53,405 | |||||||||||||||
|
| |||||||||||||||||||
| The underlying notional amount at value of open futures contracts is 19.65% of net assets applicable to common unitholders. |
| |||||||||||||||||||
| A | Non-dividend producing security. |
| ||||||||||||||||||
| B | A Sponsored ADR is an American Depository Receipt (“ADR”) that is issued through the cooperation of the company whose stock will be the underlying asset. |
| ||||||||||||||||||
The accompanying notes are an integral part of these financial statements.
17
Multi-Select Securities Fund for Puerto Rico Residents |
Mid Cap Core Portfolio I |
Schedule of Investments | (continued) | March 31, 2023 |
| �� | ||||||||||||||||||||
COMMON STOCKS - 77.90% of net assets applicable to common unitholders | ||||||||||||||||||||
| Shares | Issuer | Value | ||||||||||||||||||
Japan - 1.93% of net assets applicable to common unitholders | ||||||||||||||||||||
Insurance Agents, Brokers and Services - 2.52% of total investments |
| |||||||||||||||||||
| 2,571 | Moelis & Company |
| $ | 98,829 | ||||||||||||||||
|
| |||||||||||||||||||
Total Japan (cost $138,400) | $ | 98,829 | ||||||||||||||||||
|
| |||||||||||||||||||
Netherlands - 3.18% of net assets applicable to common unitholders | ||||||||||||||||||||
Business Services - 4.15% of total investments |
| |||||||||||||||||||
| 2,897 | A | AerCap Holdings N.V. |
| $ | 162,898 | |||||||||||||||
|
| |||||||||||||||||||
Total Netherlands (cost $161,420) | $ | 162,898 | ||||||||||||||||||
|
| |||||||||||||||||||
United States - 71.47% of net assets applicable to common unitholders | ||||||||||||||||||||
Amusement and Recreation Services- 3.52% of total investments |
| |||||||||||||||||||
| 538 | Churchill Downs, Inc. |
| $ | 138,293 | ||||||||||||||||
Auto, Dealers & Gas - 2.20% of total investments |
| |||||||||||||||||||
| 1,342 | A | Carmax, Inc. |
| 86,264 | ||||||||||||||||
Business Services - 9.62% of total investments |
| |||||||||||||||||||
| 2,967 | A | Copart, Inc. |
| 223,148 | ||||||||||||||||
| 2,682 | A | Black Knight, Inc. |
| 154,376 | ||||||||||||||||
Chemicals & Allied - 4.41% of total investments |
| |||||||||||||||||||
| 276 | NewMarket Corp. |
| 100,734 | |||||||||||||||||
| 2,017 | Perrigo Company PLC |
| 72,350 | |||||||||||||||||
Electronic & Equipment - 15.18% of total investments |
| |||||||||||||||||||
| 1,341 | Amphenol Corp. |
| 109,587 | |||||||||||||||||
| 1,892 | Otis Worldwide Corp. |
| 159,685 | |||||||||||||||||
| 1,521 | Skyworks Solutions, Inc. |
| 179,448 | |||||||||||||||||
| 586 | Lennox International, Inc. |
| 147,250 | |||||||||||||||||
Fabricated Metal Products - 2.23% of total investments |
| |||||||||||||||||||
| 1,591 | A | Ball Corp. |
| 87,680 | ||||||||||||||||
Food and Kindred Products - 10.10% of total investments |
| |||||||||||||||||||
| 1,228 | Brown-Forman Corp. |
| 78,924 | |||||||||||||||||
| 1,685 | Lamb Weston Holdings, Inc. |
| 176,116 | |||||||||||||||||
| 1,572 | A | Post Holdings, Inc. |
| 141,276 | ||||||||||||||||
General Merchandise Store - 4.13% of total investments |
| |||||||||||||||||||
| 1,128 | A | Dollar Tree, Inc. |
| 161,924 | ||||||||||||||||
Holdging & Other Investment Offices- 2.77% of total investments |
| |||||||||||||||||||
| 1,492 | A | CBRE Group, Inc. |
| 108,633 | ||||||||||||||||
Industrial & Commercial Machinery & Computer Equipment - 1.73% of total investments |
| |||||||||||||||||||
| 1,992 | A | BellRing Brands, Inc. |
| 67,728 | ||||||||||||||||
Insurance Carriers - 1.98% of total investments |
| |||||||||||||||||||
| 693 | A | Cincinnati Financial Corp. |
| 77,671 | ||||||||||||||||
Measuring, Analytics, & Control Instruments - 3.70% of total investments |
| |||||||||||||||||||
| 760 | Steris PLC |
| 145,373 | |||||||||||||||||
Mining and Quarrying of Nonmetallic Minerals, Except Fuels - 4.17% of total investments |
| |||||||||||||||||||
| 954 | Vulcan Materials Company |
| 163,668 | |||||||||||||||||
Miscellaneous Manufacturing Industries - 5.42% of total investments |
| |||||||||||||||||||
| 1,682 | Armstrong World Industries, Inc. |
| 119,826 | |||||||||||||||||
| 1,729 | Hasbro, Inc. |
| 92,830 | |||||||||||||||||
Motor Freight Transportation and Warehousing - 4.12% of total investments |
| |||||||||||||||||||
| 474 | Old Dominion Freight Line, Inc. |
| 161,558 | |||||||||||||||||
Personal Services - 2.88% of total investments |
| |||||||||||||||||||
| 642 | UniFirst Corp. |
| 113,140 | |||||||||||||||||
Primary Metal Industry - 2.51% of total investments |
| |||||||||||||||||||
| 823 | M&T Bank Corp. |
| 98,406 | |||||||||||||||||
Rubber and Miscellaneous Plastic Products - 7.09% of total investments |
| |||||||||||||||||||
| 934 | AptarGroup, Inc. |
| 110,389 | |||||||||||||||||
| 2,049 | Entegris, Inc. |
| 168,038 | |||||||||||||||||
Wholesale Trade-Durable Goods - 5.57% of total investments |
| |||||||||||||||||||
| 2,155 | Allison Transmission Holdings, Inc. |
| 97,492 | |||||||||||||||||
| 354 | Pool, Corp. |
| 121,224 | |||||||||||||||||
|
| |||||||||||||||||||
Total United States (cost $3,667,402) | $ | 3,663,031 | ||||||||||||||||||
|
| |||||||||||||||||||
TOTAL COMMON STOCK (cost $3,967,222) | $ | 3,924,758 | ||||||||||||||||||
|
| |||||||||||||||||||
The accompanying notes are an integral part of these financial statements.
18
Multi-Select Securities Fund for Puerto Rico Residents |
Mid Cap Core Portfolio I |
Schedule of Investments | (concluded) | March 31, 2023 |
| Total investments (76.58% of net assets) |
| $ | 3,924,758 | |||||||||||||||||||||
| Other assets less liabilities (23.42% of net assets) |
| 1,200,287 | ||||||||||||||||||||||
|
| |||||||||||||||||||||||
| Net assets applicable to common unitholders - 100% |
| $ | 5,125,045 | |||||||||||||||||||||
|
| |||||||||||||||||||||||
| Open Futures | Issuer | Expiration Date | Underlying Notional Amount | Unrealized Appreciation | ||||||||||||||||||||
Futures Contracts | ||||||||||||||||||||||||
4 Equity Index Contracts | E-Mini S&P Midcap 400 Index | 06/16/23 | $ 1,012,680 | $ | 42,100 | |||||||||||||||||||
|
| |||||||||||||||||||||||
| The underlying notional amount at value of open futures contracts is 19.76% of net assets applicable to common unitholders. |
| |||||||||||||||||||||||
| A | Non-dividend producing security. | |||||||||||||||||||||||
The accompanying notes are an integral part of these financial statements.
19
Multi-Select Securities Fund for Puerto Rico Residents |
| |||||||||
Small Cap Core Portfolio I |
| |||||||||
Schedule of Investments | (continued) | March 31, 2023 | ||||||||
COMMON STOCKS - 76.60% of net assets applicable to common unitholders | ||||||||||
| Shares | Issuer | Value | ||||||||
Bermuda - 3.76% of net assets applicable to common unitholders | ||||||||||
Insurance Carriers - 2.36% of total investments |
| |||||||||
1,020 | AXIS Capital Holdings Ltd. | $ | 55,610 | |||||||
300 | RenaissanceRe Holdings Ltd. | 60,102 | ||||||||
| ||||||||||
|
| |||||||||
Total Bermuda (cost $98,458) | $ | 115,712 | ||||||||
|
| |||||||||
|
| |||||||||
United States - 72.84% of net assets applicable to common unitholders (continued) | ||||||||||
Auto, Dealers & Gas - 2.15% of total investments |
| |||||||||
2,310 | Magnolia Oil & Gas Corp. | $ | 50,543 | |||||||
|
| |||||||||
Building Contractors General - 2.33% of total investments |
| |||||||||
1,410 | M.D.C. Holdings, Inc. | 54,807 | ||||||||
|
| |||||||||
Business Services - 11.30% of total investments |
| |||||||||
460 | Insperity, Inc. | 55,913 | ||||||||
1,780 | A | Cerence, Inc. | 50,000 | |||||||
990 | A | Envestnet, Inc | 58,083 | |||||||
600 | ManpowerGroup Inc. | 49,518 | ||||||||
730 | A | Perficient, Inc. | 52,699 | |||||||
|
| |||||||||
Depository Institutions - 7.64% of total investments |
| |||||||||
700 | Prosperity Bancshares, Inc. | 43,064 | ||||||||
900 | A | Texas Capital Bancshares, Inc. | 44,064 | |||||||
1,350 | United Bankshares, Inc. | 47,520 | ||||||||
1,610 | United Community Banks, Inc. | 45,273 | ||||||||
|
| |||||||||
Electronic & Equipment - 12.62% of total investments |
| |||||||||
650 | Advanced Energy Industries, Inc. | 63,700 | ||||||||
680 | A | Diodes, Inc. | 63,077 | |||||||
980 | A | Mercury Systems, Inc. | 50,098 | |||||||
1,200 | A | Rambus, Inc. | 61,512 | |||||||
380 | Universal Display Corp. | 58,949 | ||||||||
|
| |||||||||
Electric, Gas & Sanitary Services - 4.70% of total investments |
| |||||||||
560 | IDACORP, Inc. | 60,665 | ||||||||
1,180 | Avista Corp. | 50,091 | ||||||||
|
| |||||||||
Engineering, Accounting, Research, Management, and Related Services - 6.84% of total investments |
| |||||||||
580 | A | WNS (Holdings) Limited | 54,039 | |||||||
3,110 | A | Exelixis, Inc. | 60,365 | |||||||
1,440 | Forrester Research, Inc. | 46,584 | ||||||||
|
| |||||||||
Fabricated Metal Products - 4.87% of total investments |
| |||||||||
840 | BWX Technologies, Inc. | 52,954 | ||||||||
2,460 | A | PGT Innovations, Inc. | 61,771 | |||||||
|
| |||||||||
Food and Kindred Products - 1.19% of total investments |
| |||||||||
1,640 | A | The Hain Celestial Group, Inc. | 28,126 | |||||||
|
| |||||||||
Health Services - 7.37% of total investments |
| |||||||||
2,220 | HealthStream, Inc. | 60,162 | ||||||||
570 | U.S. Physical Therapy, Inc. | 55,809 | ||||||||
540 | A | Addus HomeCare Corp. | 57,650 | |||||||
|
| |||||||||
Holding & Other Investments Offices - 4.68% of total investments |
| |||||||||
8,000 | A | InnovAge Holding Corp. | 63,840 | |||||||
2,540 | NETSTREIT Corp. | 46,431 | ||||||||
|
| |||||||||
Hotels, Rooming Houses, Camps and Other Lodging Places - 2.36% of total investments |
| |||||||||
750 | Monarch Casino & Resort, Inc. | 55,613 | ||||||||
|
| |||||||||
Industrial & Commercial Machinery & Computer Equipment - 2.19% of total investments |
| |||||||||
280 | Alamo Group, Inc. | 51,565 | ||||||||
|
| |||||||||
Insurance Carriers - 8.25% of total investments |
| |||||||||
850 | First American Financial Corp. | 47,311 | ||||||||
1,940 | James River Group Holdings, Ltd. | 40,061 | ||||||||
400 | Reinsurance Group of America, Inc. | 53,104 | ||||||||
1,931 | A | Frontdoor, Inc. | 53,836 | |||||||
|
| |||||||||
Measuring, Analytics & Controls Instruments - 3.61% of total investments |
| |||||||||
1,010 | A | NuVasive, Inc. | 41,723 | |||||||
262 | A | ICU Medical, Inc. | 43,220 | |||||||
|
| |||||||||
Miscellaneous Manufacturing Industries - 2.43% of total investments |
| |||||||||
910 | Johnson Outdoors, Inc. | 57,339 | ||||||||
|
| |||||||||
Personal Services - 1.97% of total investments |
| |||||||||
3,340 | Healthcare Services Group, Inc. | 46,326 | ||||||||
|
| |||||||||
Real Estate - 2.13% of total investments |
| |||||||||
1,560 | Marcus & Millichap, Inc. | 50,092 | ||||||||
|
| |||||||||
Social Services - 2.02% of total investments |
| |||||||||
810 | A | HealthEquity, Inc. | 47,555 | |||||||
|
| |||||||||
Transportation Air - 2.24% of total investments |
| |||||||||
490 | Forward Air Corp. | 52,801 | ||||||||
|
| |||||||||
Transportation Equipment - 2.19% of total investments |
| |||||||||
1,840 | Gentex Corp. | 51,575 | ||||||||
The accompanying notes are an integral part of these financial statements.
20
Multi-Select Securities Fund for Puerto Rico Residents |
| |||||||||||||||||||||
Small Cap Core Portfolio I |
| |||||||||||||||||||||
|
| |||||||||||||||||||||
Schedule of Investments | (concluded) | March 31, 2023 | ||||||||||||||||||||
| ||||||||||||||||||||||
|
| |||||||||||||||||||||
Total United States (cost $2,414,950) | $ | 2,239,428 | ||||||||||||||||||||
|
| |||||||||||||||||||||
|
| |||||||||||||||||||||
TOTAL COMMON STOCKS (cost $2,513,408) | $ | 2,355,140 | ||||||||||||||||||||
|
| |||||||||||||||||||||
Total investments (76.60% of net assets) | $ | 2,355,140 | ||||||||||||||||||||
Other assets less liabilities (23.40% of net assets) |
| 719,330 | ||||||||||||||||||||
|
| |||||||||||||||||||||
Net assets applicable to common unitholders - 100% |
| $ | 3,074,470 | |||||||||||||||||||
|
| |||||||||||||||||||||
| Open Futures | Issuer | Expiration Date | Underlying Notional Amount at Value | Unrealized Appreciation | ||||||||||||||||||
Futures Contracts | ||||||||||||||||||||||
6 Equity Index Contracts | Russell 2000 Mini Index | 06/16/23 | $ | 544,050 | $ | 16,080 | ||||||||||||||||
|
| |||||||||||||||||||||
| The underlying notional amount at value of open futures contracts is 17.70% of net assets applicable to common unitholders. | ||||||||||||||||||||||
| A | Non-dividend producing security. | |||||||||||||||||||||
The accompanying notes are an integral part of these financial statements.
21
Multi-Select Securities Fund for Puerto Rico Residents | March 31, 2023 |
Statement of Assets and Liabilities (continued) |
| International Portfolio I | Large Cap Core Portfolio I | Large Cap Growth Portfolio I | Large Cap Value Portfolio I | |||||||||||||||
Assets: | ||||||||||||||||||
Investments at market value | $ | 2,199,868 | $ | 4,750,434 | $ | 5,686,879 | $ | 5,444,527 | ||||||||||
Cash and cash equivalents | 180,030 | 70,207 | 25,165 | 52,999 | ||||||||||||||
Cash restricted for futures contracts | 53,275 | 106,417 | 148,771 | 193,647 | ||||||||||||||
Due from administrator | 609,360 | 1,153,603 | 1,311,182 | 1,247,424 | ||||||||||||||
Interest and dividends receivable | 2,820 | 3,894 | 981 | 8,615 | ||||||||||||||
Receivable for investment sold | 3,874 | 19,682 | - | - | ||||||||||||||
Due from broker | 18,600 | 47,813 | 82,506 | 35,855 | ||||||||||||||
Variation margin receivable | 2,730 | 14,500 | 22,495 | 17,550 | ||||||||||||||
Receivable for operating expeses reimbursed | 9,791 | 8,802 | 9,354 | 11,612 | ||||||||||||||
Prepaid and other assets | 4,677 | 5,244 | 6,083 | 4,594 | ||||||||||||||
Total assets | 3,085,025 | 6,180,596 | 7,293,416 | 7,016,823 | ||||||||||||||
Liabilities: | Investment advisory fees payable | 1,001 | 1,991 | 2,320 | 2,302 | |||||||||||||
Professional fees | 34,474 | 63,232 | 73,444 | 71,078 | ||||||||||||||
Sub-transfer agent fees | 2,557 | 2,542 | 2,552 | 2,551 | ||||||||||||||
Reporting fees | 5,398 | 10,617 | 12,471 | 12,042 | ||||||||||||||
Directors fees | 592 | 1,164 | 1,367 | 1,320 | ||||||||||||||
Accrued expenses and other liabilities | 1,361 | 1,807 | 2,066 | 1,984 | ||||||||||||||
Total liabilities | 45,383 | 81,353 | 94,220 | 91,277 | ||||||||||||||
| Net Assets Applicable to Common Unitholders | $ | 3,039,642 | $ | 6,099,243 | $ | 7,199,196 | $ | 6,925,546 | ||||||||||
Net Assets Applicable | ||||||||||||||||||
to Common Unitholders: | ||||||||||||||||||
Paid-in-Capital | $ | 3,032,645 | $ | (1,191,090 | ) | $ | (1,682,932 | ) | $ | 305,619 | ||||||||
Total Distributable Earnings (Accumulated Loss) | 6,997 | 7,290,333 | 8,882,128 | 6,619,927 | ||||||||||||||
Net assets applicable to common unitholders | $ | 3,039,642 | $ | 6,099,243 | $ | 7,199,196 | $ | 6,925,546 | ||||||||||
Net assets per class: | ||||||||||||||||||
Class A units | $ | 3,039,642 | $ | 4,324,839 | $ | 5,462,278 | $ | 5,306,267 | ||||||||||
Class L units | - | 1,774,404 | 1,736,918 | 1,619,279 | ||||||||||||||
Net assets applicable to common unitholders | $ | 3,039,642 | $ | 6,099,243 | $ | 7,199,196 | $ | 6,925,546 | ||||||||||
Units outstanding at end of the year: | ||||||||||||||||||
Class A units | 328,007 | 137,932 | 159,484 | 226,400 | ||||||||||||||
Class L units | - | 54,318 | 54,310 | 71,563 | ||||||||||||||
Net asset value per unit: | ||||||||||||||||||
Class A units | $ | 9.27 | $ | 31.35 | $ | 34.25 | $ | 23.44 | ||||||||||
Class L units | $ | - | $ | 32.67 | $ | 31.98 | $ | 22.63 | ||||||||||
Maximum public offering price per unit: | ||||||||||||||||||
Class A units (net asset value divided by 0.95) | $ | 9.75 | $ | 33.01 | $ | 36.05 | $ | 24.67 | ||||||||||
Investments at cost | $ | 2,040,714 | $ | 3,652,270 | $ | 5,078,719 | $ | 3,878,091 | ||||||||||
The accompanying notes are an integral part of these financial statements.
22
Multi-Select Securities Fund for Puerto Rico Residents | March 31, 2023 |
Statement of Assets and Liabilities (concluded) |
| Mid Cap Core Portfolio I | Small Cap Core Portfolio I | |||||||||
Assets: | ||||||||||
Investments at market value | $ | 3,924,758 | $ | 2,355,140 | ||||||
Cash and cash equivalents | 132,125 | 119,085 | ||||||||
Cash restricted for futures contracts | 150,606 | 91,352 | ||||||||
Due from administrator | 925,738 | 521,955 | ||||||||
Interest and dividends receivable | 2,037 | 2,083 | ||||||||
Due from broker | 24,060 | 6,450 | ||||||||
Variation margin receivable | 18,040 | 9,630 | ||||||||
Receivable for operating expeses reimbursed | 13,561 | 10,898 | ||||||||
Prepaid and other assets | 3,543 | 2,473 | ||||||||
Total assets | 5,194,468 | 3,119,066 | ||||||||
Liabilities: | Investment advisory fees payable | 1,741 | 1,037 | |||||||
Professional fees | 53,663 | 34,070 | ||||||||
Sub-transfer agent fees | 2,552 | 2,539 | ||||||||
Reporting fees | 8,881 | 5,325 | ||||||||
Directors fees | 974 | 584 | ||||||||
Custodian fees | 224 | 134 | ||||||||
Accrued expenses and other liabilities | 1,388 | 907 | ||||||||
Total liabilities | 69,423 | 44,596 | ||||||||
Net Assets Applicable to Common Unitholders | $ | 5,125,045 | $ | 3,074,470 | ||||||
Net Assets Applicable | ||||||||||
to Common Unitholders: | ||||||||||
Paid-in -Capital | $ | (1,437,502 | ) | $ | (1,107,114 | ) | ||||
Total Distributable Earnings (Accumulated Loss) | 6,562,547 | 4,181,584 | ||||||||
Net assets applicable to common unitholders | $ | 5,125,045 | $ | 3,074,470 | ||||||
Net assets per class: | ||||||||||
Class A units | $ | 3,760,869 | $ | 3,074,470 | ||||||
Class L units | 1,364,176 | - | ||||||||
Net assets applicable to common unitholders | $ | 5,125,045 | $ | 3,074,470 | ||||||
Units outstanding at end of the year: | ||||||||||
Class A units | 102,213 | 105,885 | ||||||||
Class L units | 42,055 | - | ||||||||
Net asset value per unit: | ||||||||||
Class A units | $ | 36.79 | $ | 29.04 | ||||||
Class L units | $ | 32.44 | $ | - | ||||||
Maximum public offering price per unit: | ||||||||||
Class A units (net asset value divided by 0.95) | $ | 38.73 | $ | 30.56 | ||||||
Investments at cost | $ | 3,967,222 | $ | 2,513,408 | ||||||
The accompanying notes are an integral part of these financial statements.
23
| Multi-Select Securities Fund for Puerto Rico Residents | March 31, 2023 | |
Statement of Operations (continued) |
| International Portfolio I | Large Cap Core Portfolio I | Large Cap Growth Portfolio I | Large Cap Value Portfolio I | |||||||||||||||
Investment gain: | Interest from unaffiliated issuers | $ | 637 | $ | 1,238 | $ | 1,388 | $ | 1,434 | |||||||||
Dividends ^ | 56,340 | 62,078 | 36,612 | 131,113 | ||||||||||||||
Total gain | $ | 56,977 | $ | 63,316 | $ | 38,000 | $ | 132,547 | ||||||||||
Expenses: | Investment advisory fees | $ | 30,800 | $ | 62,192 | $ | 69,453 | $ | 70,329 | |||||||||
Administration fees | 4,659 | 9,352 | 10,466 | 10,604 | ||||||||||||||
Distribution fees: | ||||||||||||||||||
Class L units | - | 1,106 | 1,058 | 981 | ||||||||||||||
Service fees: | ||||||||||||||||||
Class A units | 1,031 | 1,442 | 1,722 | 1,698 | ||||||||||||||
Class L units | - | 553 | 529 | 490 | ||||||||||||||
Sub-transfer agent fees | 15,176 | 15,091 | 15,029 | 15,260 | ||||||||||||||
Custodian fees | 839 | 1,662 | 1,870 | 1,902 | ||||||||||||||
Professional fees | 23,285 | 41,831 | 48,514 | 48,634 | ||||||||||||||
Directors fees and expenses | 2,841 | 5,820 | 6,544 | 6,672 | ||||||||||||||
Reporting fees | 10,864 | 17,580 | 19,598 | 19,867 | ||||||||||||||
Insurance expenses | 3,663 | 6,314 | 7,709 | 6,461 | ||||||||||||||
Other | 1,320 | 2,164 | 2,796 | 3,287 | ||||||||||||||
Total expenses | 94,478 | 165,107 | 185,288 | 186,185 | ||||||||||||||
Waived fees and reimbursed expenses * | (38,255 | ) | (51,973 | ) | (58,445 | ) | (57,471 | ) | ||||||||||
Net expenses after waived fees and reimbursed expenses | 56,223 | 113,134 | 126,843 | 128,714 | ||||||||||||||
Net Investment Gain (Loss): | 754 | (49,818 | ) | (88,843 | ) | 3,833 | ||||||||||||
Realized Gain (Loss) & | Net realized gain (loss) on investments | (187,536 | ) | (51,542 | ) | 125,476 | 59,917 | |||||||||||
Unrealized Appreciation | Net realized gain (loss) on futures contracts | (17,175 | ) | (113,895 | ) | (406,050 | ) | (210,637 | ) | |||||||||
(Depreciation) on Investments | Change in unrealized net appreciation (depreciation) on investments | (59,295 | ) | (794,380 | ) | (956,199 | ) | (694,791 | ) | |||||||||
and Futures Contracts: | Change in unrealized net appreciation (depreciation) on futures contracts | (16,785 | ) | (39,132 | ) | 144,531 | 77,240 | |||||||||||
Net gain (loss) on investments and futures contracts | (280,791 | ) | (998,949 | ) | (1,092,242 | ) | (768,271 | ) | ||||||||||
| Net increase (decrease) in net assets resulting from operations applicable to common unitholders | $ | (280,037) | $ | (1,048,767 | ) | $ | (1,181,085 | ) | $ | (764,438 | ) | |||||||
^ Net of tax withholding for dividend income in the amount of $14,964; $7,063; $3,938; and $15,232 for the International Portfolio I, Large Cap Core Portfolio I, Large Cap Growth Portfolio I and Large Cap Value Portfolio I, respectively. |
| |||||||||||||||||
* Refer to Note 2 for expenses subject to future reimbursement by the Portfolios. |
| |||||||||||||||||
The accompanying notes are an integral part of these financial statements.
24
| Multi-Select Securities Fund for Puerto Rico Residents | March 31, 2023 | |
Statement of Operations (concluded) |
| Mid Cap Core Portfolio I | Small Cap Core Portfolio I | |||||||||
Investment gain: | Interest from unaffiliated issuers | $ | 1,058 | $ | 598 | |||||
Dividends ^ | 44,415 | 32,769 | ||||||||
Total gain | $ | 45,473 | $ | 33,367 | ||||||
Expenses: | Investment advisory fees | $ | 51,605 | $ | 31,038 | |||||
Administration fees | 7,786 | 4,674 | ||||||||
Distribution fees: | ||||||||||
Class L units | 774 | - | ||||||||
Service fees: | ||||||||||
Class A units | 1,148 | 980 | ||||||||
Class L units | 387 | - | ||||||||
Sub-transfer agent fees | 15,230 | 15,094 | ||||||||
Custodian fees | 1,393 | 835 | ||||||||
Professional fees | 37,743 | 23,659 | ||||||||
Directors fees and expenses | 4,961 | 2,883 | ||||||||
Reporting fees | 16,113 | 11,161 | ||||||||
Insurance expenses | 4,988 | 3,265 | ||||||||
Other | 1,794 | 1,296 | ||||||||
Total expenses | 143,922 | 94,885 | ||||||||
Waived fees and reimbursed expenses * | (49,890 | ) | (38,563 | ) | ||||||
Net expenses after waived fees and reimbursed expenses | 94,032 | 56,322 | ||||||||
Net Investment Gain (Loss): | (48,559 | ) | (22,955 | ) | ||||||
Realized Gain (Loss) & Unrealized | Net realized gain (loss) on investments | (14,158 | ) | (133,545 | ) | |||||
Appreciation (Depreciation) | Net realized gain (loss) on futures contracts | (71,800 | ) | (75,075 | ) | |||||
on Investments and Futures | Change in unrealized net appreciation (depreciation) on investments | (116,155 | ) | 18,268 | ||||||
Contracts: | Change in unrealized net appreciation (depreciation) on futures contracts | (9,480 | ) | (11,565 | ) | |||||
Net gain (loss) on investments and futures contracts | (211,593 | ) | (201,917 | ) | ||||||
| Net increase (decrease) in net assets resulting from operations applicable to common unitholders | $ | (260,152 | ) | $ | (224,872 | ) | ||||
^ Net of tax withholding for dividend income in the amount of $5,562 and $3,315 for the Mid Cap Core Portfolio and Small Cap Core Portfolio, respectively.
* Refer to Note 2 for expenses subject to future reimbursement by the Portfolios. |
| |||||||||
The accompanying notes are an integral part of these financial statements.
25
| Multi-Select Securities Fund for Puerto Rico Residents | ||
| Statement of Changes in Net Assets | International Portfolio I | |
| For the fiscal year ended March 31, 2023 | For the fiscal year ended March 31, 2022 | |||||||||
| Increase (Decrease) in Net Assets: | ||||||||||
Net investment gain (loss) | $ | 754 | $ | (17,640 | ) | |||||
Net realized gain (loss) on investments | (187,536 | ) | 120,646 | |||||||
Net realized gain (loss) on futures contracts | (17,175 | ) | (41,225 | ) | ||||||
Change in unrealized net appreciation (depreciation) on investments | (59,295 | ) | (380,365 | ) | ||||||
Change in unrealized net appreciation (depreciation) on futures contracts | (16,785 | ) | 47,810 | |||||||
|
|
|
|
|
| |||||
Net increase (decrease) in net assets resulting from operations | (280,037 | ) | (270,774 | ) | ||||||
|
|
|
|
|
| |||||
Dividends to Common | ||||||||||
|
|
|
|
|
| |||||
Unitholders From | Class A | - | - | |||||||
|
|
|
|
|
| |||||
| Net Investment Income: | ||||||||||
Units | ||||||||||
|
|
|
|
|
| |||||
transactions-net : | Class A | (578,248 | ) | (401,014 | ) | |||||
|
|
|
|
|
| |||||
Net Assets: | ||||||||||
Net increase (decrease) in net assets applicable to common unitholders | (858,285 | ) | (671,788 | ) | ||||||
Balance at the beginning of the year | 3,897,927 | 4,569,715 | ||||||||
|
|
|
|
|
| |||||
Balance at the end of year | $ | 3,039,642 | $ | 3,897,927 | ||||||
|
|
|
|
|
| |||||
The accompanying notes are an integral part of these financial statements.
26
| Multi-Select Securities Fund for Puerto Rico Residents | ||
| Statement of Changes in Net Assets | Large Cap Core Portfolio I | |
| For the fiscal year ended March 31, 2023 | For the fiscal year ended March 31, 2022 | |||||||||
| Increase (Decrease) in Net Assets: | ||||||||||
Net investment gain (loss) | $ | (49,818 | ) | $ | (81,578 | ) | ||||
Net realized gain (loss) on investments | (51,542 | ) | 777,650 | |||||||
Net realized gain (loss) on futures contracts | (113,895 | ) | 96,380 | |||||||
Change in unrealized net appreciation (depreciation) on investments | (794,380 | ) | (87,734 | ) | ||||||
Change in unrealized net appreciation (depreciation) on futures contracts | (39,132 | ) | 99,397 | |||||||
|
|
|
|
|
| |||||
Net increase (decrease) in net assets resulting from operations | (1,048,767 | ) | 804,115 | |||||||
|
|
|
|
|
| |||||
Units | Class A | (298,634 | ) | (342,995 | ) | |||||
transactions-net : | Class L | - | - | |||||||
|
|
|
|
|
| |||||
| (298,634 | ) | (342,995 | ) | |||||||
|
|
|
|
|
| |||||
Net Assets: | ||||||||||
Net increase (decrease) in net assets applicable to common unitholders | (1,347,401 | ) | 461,120 | |||||||
Balance at the beginning of the year | 7,446,644 | 6,985,524 | ||||||||
|
|
|
|
|
| |||||
Balance at the end of year | $ | 6,099,243 | $ | 7,446,644 | ||||||
|
|
|
|
|
| |||||
The accompanying notes are an integral part of these financial statements.
27
Multi-Select Securities Fund for Puerto Rico Residents |
| Statement of Changes in Net Assets | Large Cap Growth Portfolio I | |
| For the fiscal year ended March 31, 2023 | For the fiscal year ended March 31, 2022 | |||||||||
| Increase (Decrease) in Net Assets: | ||||||||||
Net investment gain (loss) | $ | (88,843 | ) | $ | (141,589 | ) | ||||
Net realized gain (loss) on investments | 125,476 | 2,403,838 | ||||||||
Net realized gain (loss) on futures contracts | (406,050 | ) | 302,972 | |||||||
Change in unrealized net appreciation (depreciation) on investments | (956,199 | ) | (1,794,780 | ) | ||||||
Change in unrealized net appreciation (depreciation) on futures contracts | 144,531 | (41,838 | ) | |||||||
|
|
|
|
|
| |||||
Net increase (decrease) in net assets resulting from operations | (1,181,085 | ) | 728,603 | |||||||
|
|
|
|
|
| |||||
Units | Class A | (186,945 | ) | (665,190 | ) | |||||
transactions-net : | Class L | - | - | |||||||
|
|
|
|
|
| |||||
| (186,945 | ) | (665,190 | ) | |||||||
|
|
|
|
|
| |||||
Net Assets: | ||||||||||
Net increase (decrease) in net assets applicable to common unitholders | (1,368,030 | ) | 63,413 | |||||||
Balance at the beginning of the year | 8,567,226 | 8,503,813 | ||||||||
|
|
|
|
|
| |||||
Balance at the end of year | $ | 7,199,196 | $ | 8,567,226 | ||||||
|
|
|
|
|
| |||||
The accompanying notes are an integral part of these financial statements.
28
Multi-Select Securities Fund for Puerto Rico Residents |
| Statement of Changes in Net Assets | Large Cap Value Portfolio I | |
| For the fiscal year ended March 31, 2023 | For the fiscal year ended March 31, 2022 | |||||||||
| Increase (Decrease) in Net Assets: | ||||||||||
Net investment gain (loss) | $ | 3,833 | $ | (13,782 | ) | |||||
Net realized gain (loss) on investments | 59,917 | 376,041 | ||||||||
Net realized gain (loss) on futures contracts | (210,637 | ) | 254,772 | |||||||
Change in unrealized net appreciation (depreciation) on investments | (694,791 | ) | 353,798 | |||||||
Change in unrealized net appreciation (depreciation) on futures contracts | 77,240 | (26,175 | ) | |||||||
|
|
|
|
|
| |||||
Net increase (decrease) in net assets resulting from operations | (764,438 | ) | 944,654 | |||||||
|
|
|
|
|
| |||||
| Dividends to Common Unitholders From | Class A | - | (4,291 | ) | ||||||
| Net Investment Income: | Class L | - | - | |||||||
|
|
|
|
|
| |||||
| - | (4,291 | ) | ||||||||
|
|
|
|
|
| |||||
Units | Class A | (293,068 | ) | (377,524 | ) | |||||
transactions-net : | Class L | - | - | |||||||
|
|
|
|
|
| |||||
| (293,068 | ) | (377,524 | ) | |||||||
|
|
|
|
|
| |||||
Net Assets: | ||||||||||
Net increase (decrease) in net assets applicable to common unitholders | (1,057,506 | ) | 562,839 | |||||||
Balance at the beginning of the year | 7,983,052 | 7,420,213 | ||||||||
|
|
|
|
|
| |||||
Balance at the end of year | $ | 6,925,546 | $ | 7,983,052 | ||||||
|
|
|
|
|
| |||||
The accompanying notes are an integral part of these financial statements.
29
Multi-Select Securities Fund for Puerto Rico Residents |
| Statement of Changes in Net Assets | Mid Cap Core Portfolio I | |
| For the fiscal year ended March 31, 2023 | For the fiscal year ended March 31, 2022 | |||||||||
| Increase (Decrease) in Net Assets: | ||||||||||
Net investment gain (loss) | $ | (48,559 | ) | $ | (63,793 | ) | ||||
Net realized gain (loss) on investments | (14,158 | ) | 1,869,051 | |||||||
Net realized gain (loss) on futures contracts | (71,800 | ) | (45,740 | ) | ||||||
Change in unrealized net appreciation (depreciation) on investments | (116,155 | ) | (1,698,039 | ) | ||||||
Change in unrealized net appreciation (depreciation) on futures contracts | (9,480 | ) | 87,805 | |||||||
|
|
|
|
|
| |||||
Net increase (decrease) in net assets resulting from operations | (260,152 | ) | 149,284 | |||||||
|
|
|
|
|
| |||||
Units | Class A | (276,622 | ) | (180,807 | ) | |||||
transactions-net : | Class L | - | - | |||||||
|
|
|
|
|
| |||||
| (276,622 | ) | (180,807 | ) | |||||||
|
|
|
|
|
| |||||
Net Assets: | ||||||||||
Net increase (decrease) in net assets applicable to common unitholders | (536,774 | ) | (31,523 | ) | ||||||
Balance at the beginning of the year | 5,661,819 | 5,693,342 | ||||||||
|
|
|
|
|
| |||||
Balance at the end of year | $ | 5,125,045 | $ | 5,661,819 | ||||||
|
|
|
|
|
| |||||
The accompanying notes are an integral part of these financial statements.
30
Multi-Select Securities Fund for Puerto Rico Residents |
| Statement of Changes in Net Assets | Small Cap Core Portfolio I | |
| For the fiscal year ended March 31, 2023 | For the fiscal year ended March 31, 2022 | |||||||||
| Increase (Decrease) in Net Assets: | ||||||||||
Net investment gain (loss) | $ | (22,955 | ) | $ | (37,401 | ) | ||||
Net realized gain (loss) on investments | (133,545 | ) | 1,150,666 | |||||||
Net realized gain (loss) on futures contracts | (75,075 | ) | (133,663 | ) | ||||||
Change in unrealized net appreciation (depreciation) on investments | 18,268 | (1,025,720 | ) | |||||||
Change in unrealized net appreciation (depreciation) on futures contracts | (11,565 | ) | 76,908 | |||||||
|
|
|
|
|
| |||||
Net increase (decrease) in net assets resulting from operations | (224,872 | ) | 30,790 | |||||||
|
|
|
|
|
| |||||
Units | Class A | (343,219 | ) | (427,109 | ) | |||||
transactions-net : | Class L | - | - | |||||||
|
|
|
|
|
| |||||
| (343,219 | ) | (427,109 | ) | |||||||
|
|
|
|
|
| |||||
Net Assets: | ||||||||||
Net increase (decrease) in net assets applicable to common unitholders | (568,091 | ) | (396,319 | ) | ||||||
Balance at the beginning of the year | 3,642,561 | 4,038,880 | ||||||||
|
|
|
|
|
| |||||
Balance at the end of year | $ | 3,074,470 | $ | 3,642,561 | ||||||
|
|
|
|
|
| |||||
The accompanying notes are an integral part of these financial statements.
31
Multi-Select Securities Fund for Puerto Rico Residents
Notes to Financial Statements
For the fiscal year ended March 31, 2023
| 1. | Reporting Entity and Significant Accounting Policies: |
Multi-Select Securities Fund for Puerto Rico Residents (the “Fund”) is a non-diversified open-end investment trust, organized under the laws of the Commonwealth of Puerto Rico (the “Commonwealth” or “Puerto Rico”) and is registered as an investment company under the Investment Company Act of 1940, as amended (the “1940 Act”), as of May 14, 2021. Prior to such date and since inception, the Fund was registered and operated under the Puerto Rico Investment Companies Act of 1954, as amended. The Fund was incorporated on March 22, 2004, and commenced operations on June 22, 2004.
Since May 14, 2021, the Fund consists of six separately managed pools of assets (each a “Portfolio”). Each Portfolio is a management investment company registered under the 1940 Act. An investor may invest in one or more of the following Portfolios:
International Portfolio I
Large Cap Core Portfolio I
Large Cap Growth Portfolio I
Large Cap Value Portfolio I
Mid Cap Core Portfolio I
Small Cap Core Portfolio I
Units in each Portfolio are offered separately. Each Portfolio’s investment objective is long-term growth of capital. There is no assurance that the Portfolios will achieve their investment objective.
Each Portfolio is divided into a Puerto Rico securities portion (the “Puerto Rico Securities Portion”) and an equity portion (consisting of non-Puerto Rico equity securities, the “Equity Portion”). The Fund uses a variation of what has been termed a “multi manager” approach with regard to the Equity Portion of each Portfolio. The Equity Portion of each Portfolio is managed by a different portfolio manager. The Fund has established six accounts (each an “Account”) at JP Morgan Chase Bank, N.A. (each Portfolio’s sub-custodian). Each Portfolio has its own account and portfolio manager. UBS Asset Managers of Puerto Rico (“UBS AMPR” or the “Investment Adviser”) established the specific investment style for each Account and chose the portfolio managers.
On May 24, 2018, the Economic Growth, Regulatory Relief, and Consumer Protection Act (Pub. L. No. 115-174) was signed into law and amended the 1940 Act, to repeal the exemption from its registration of investment companies created under the laws of Puerto Rico, the U.S. Virgin Islands, or any other U.S. possession under Section 6(a)(1) thereof. The repeal of the exemption took effect on May 24, 2021. Upon the Fund’s registration under the 1940 Act, it must now register its future offerings of securities under the Securities Act of 1933, as amended (the “1933 Act”), absent an available exception. In connection with the process required for registration of the Fund’s securities, it was required to change its corporate name and implement certain operational changes including, without limitation, a reduction in the types and/or amount of leverage, as well as a prohibition against engaging in principal transactions with affiliates. The Fund also suspended the trading of its securities pending its registration under the 1933 Act.
The following is a summary of the Fund’s significant accounting policies:
Use of Estimates in Financial Statements Preparation
The Fund is an investment company that applies the accounting and reporting guidance in the Financial Accounting Standards Board (“FASB”) Accounting Standards Codification Topic 946, Financial Services-Investment Companies (“ASC 946”). The financial statements are prepared in accordance with U.S. generally accepted accounting principles (“GAAP”), which requires management to make certain estimates and assumptions that affect the reported amounts of assets and liabilities, the disclosure of contingent assets and liabilities at the date of the financial statements and the reported amounts of income and expenses during the reporting period. Actual results could differ from those estimates.
Net Asset Value per Unit
The net asset value (“NAV”) per unit of each Portfolio is determined daily by UBS Trust Company of Puerto Rico, Inc. (“UBSTC” or the “Administrator” or the “Transfer Agent”) after the close of trading on the New York Stock Exchange (“NYSE”), or if such day is not a business day in New York and Puerto Rico, on the next
32
Multi-Select Securities Fund for Puerto Rico Residents
Notes to Financial Statements
For the fiscal year ended March 31, 2023
succeeding business day. The NAV per unit is computed by dividing the assets of each Portfolio, less its liabilities, by the number of outstanding units of such Portfolio.
Cash and Cash equivalents
The Fund considers highly liquid investments with original maturities at the time of purchase of three months or less to be cash equivalents.
Valuation of Investments
All securities are valued by UBSTC on the basis of valuations provided by pricing services or by dealers which were approved by Fund management and the Board of Directors. Specifically, equity securities are valued based on the last quoted sales prices as of the close of trading on the valuation date. Valuation adjustments are limited to those necessary to ensure that the financial instrument’s fair value is adequately representative of the price that would be received or paid in the marketplace. These adjustments include amounts that reflect counterparty credit quality, constraints on liquidity, and unobservable parameters that are applied consistently.
The Investment Adviser has established a Valuation Committee (the “Committee”) which is responsible for overseeing the pricing and valuation of all securities held in the Fund. The Committee operates under pricing and valuation policies and procedures established by the Investment Adviser and approved by the Board of Directors. The policies and procedures set forth the mechanisms and processes to be employed on a daily basis related to the valuation of portfolio securities for the purpose of determining the NAV of the Fund. The Committee reports to the Board of Directors on a regular basis. At March 31, 2023, no security’s fair value was determined by the Committee.
GAAP provides a framework for measuring fair value and expands disclosures about fair value measurements and requires disclosure surrounding the various inputs that are used in determining the fair value of the Fund’s investments. These inputs are summarized in three broad levels listed below.
| ● | Level 1 - Quoted prices in active markets for identical assets and liabilities at the measurement date. An active market is one in which transactions for the asset occurs with sufficient frequency and volume to provide pricing information on an ongoing basis. |
| ● | Level 2 - Are significant inputs other than quoted prices included in Level 1 that are observable (including quoted prices for similar securities, interest rates, prepayments speeds, credit risk, etc.), either directly or indirectly. |
| ● | Level 3 - Significant unobservable inputs, for example, inputs derived through extrapolation that cannot be corroborated by observable market data. These are developed based on the best information available in the circumstances, which might include UBSTC’s own data. Level 3 inputs will consider the assumptions that market participants would use in pricing the asset, including assumptions about risk (e.g., credit risk, model risk, etc.). |
The Fund maximizes the use of observable inputs and minimizes the use of unobservable inputs by requiring that the observable inputs be used when available. Fair value is based upon quoted market prices when available.
The estimated fair value may be subjective in nature and may involve uncertainties and matters of significant judgment for certain financial instruments. Changes in the underlying assumptions used in calculating fair value could significantly affect the results. Therefore, the estimated fair value may materially differ from the value that could actually be realized on sale.
The inputs or methodology used for valuing securities are not necessarily an indication of the risk associated with investing in those securities.
Following is a description of the Fund’s valuation methodologies used for assets measured at fair value:
Equity securities and exchange traded funds: Equity securities and exchange traded funds with quoted market prices obtained from an active exchange market are classified as Level 1.
Futures contracts: Futures contracts are valued at the quoted daily settlement prices established by the exchange on which they trade and are classified as Level 1.
33
Multi-Select Securities Fund for Puerto Rico Residents
Notes to Financial Statements
For the fiscal year ended March 31, 2023
The following is a summary of the inputs used as of March 31, 2023, in valuing the Fund’s assets carried at fair value:
| Investments in Securities |
| Investments in Futures Contracts |
| ||||||||||||||||
Portfolios | Level 1 | Level 2 | Level 3 | Sub-Total | Level 1 | Total | ||||||||||||||
| Common Stocks | Futures Contracts* | |||||||||||||||||||
International Portfolio I | $ | 2,199,868 | - | - | $ | 2,199,868 | $ | 21,330 | $ | 2,221,198 | ||||||||||
Large Cap Core Portfolio I | 4,750,434 | - | - | 4,750,434 | 62,313 | 4,812,747 | ||||||||||||||
Large Cap Growth Portfolio I | 5,686,879 | - | - | 5,686,879 | 105,001 | 5,791,880 | ||||||||||||||
Large Cap Value Portfolio I | 5,444,527 | - | - | 5,444,527 | 53,405 | 5,497,932 | ||||||||||||||
Mid Cap Core Portfolio I | 3,924,758 | - | - | 3,924,758 | 42,100 | 3,966,858 | ||||||||||||||
Small Cap Core Portfolio I | 2,355,140 | - | - | 2,355,140 | 16,080 | 2,371,220 | ||||||||||||||
| * | Includes cumulative appreciation (depreciation) of futures contracts as reported in the Schedule of Investments. Only the current day’s variation margin is reported within the Statement of Assets and Liabilities in variation margin receivable/payable. |
There were no Level 3 securities for the fiscal year ended March 31, 2023.
There were no transfers between levels for the fiscal year ended March 31, 2023.
Cash equivalents and temporary cash investments are valued at amortized cost, which approximates market value.
Taxation
As a registered investment company under the 1940 Act, each Portfolio will not be subject to Puerto Rico income tax for any taxable year if it distributes at least 90% of its taxable net investment gain for such year, as determined for these purposes pursuant to section 1112.01(a)(2) of the Puerto Rico Internal Revenue Code of 2011, as amended. Accordingly, as each Portfolio intends to meet this distribution requirement, the income earned by each Portfolio is not subject to Puerto Rico income tax at the Fund level.
In addition, in the opinion of the Fund’s legal counsel, the Fund is not required to file a U.S. federal income tax return. Each Portfolio is, however, subject to a 30% U.S. federal income tax on certain types of income from sources within the United States, such as dividends and interest. However, interest that qualifies as “portfolio interest” is not subject to the 30% income tax. In addition, dividends from sources within the United States may qualify for a reduced 10% rate if certain conditions are met. Such income is reflected in the Statement of Operations net of the applicable U.S. federal tax withholding. Individual unitholders may be subject to an alternate basic tax on certain fund distributions. Puerto Rico entities taxed as corporations are entitled to claim a deduction of 85% of the amount received as dividends, but no greater than 85% of the corporation’s net income. Fund unitholders are advised to consult their own tax advisers.
Distributions to Unitholders
Each Portfolio intends to distribute to its unitholders substantially all of such Portfolio’s net investment gain; provided, however, that such Portfolio may elect to distribute less of its net investment gain if, in the judgment of the Investment Adviser, such reduced distribution is in the best economic interests of such Portfolio’s unitholders. Such distributions, if any, shall be paid by the Fund on no less than an annual basis. Distributions on units will be reinvested automatically in full or fractional units of the same Portfolio at the net asset value per unit determined on the ex-dividend date.
Units Subscriptions and Redemptions
The Fund offers two classes of units of Common Stock: Class A units and Class L units. Units are generally sold at their NAV, which is determined daily after the close of trading on the NYSE (or if such day is not a business day in New York and Puerto Rico, on the next succeeding business day). In the event that at any time there are no issued and outstanding units of a particular class of a Portfolio of the Fund, units of such class of such Portfolio will be sold at $10.00 per unit. Once any units of such class of such Portfolio are sold and the proceeds are invested by the Portfolio, and so long as any units of such class of such Portfolio are outstanding, all future sales of units of such class of such Portfolio shall be sold at NAV. Assuming that there are outstanding units of each class for each Portfolio, (i) Class A units are sold at NAV with an initial sales charge of up to 5.00% and are only available to investors investing more than $5,000, with a minimum of $500
34
Multi-Select Securities Fund for Puerto Rico Residents
Notes to Financial Statements
For the fiscal year ended March 31, 2023
in a given Portfolio, and are subject to a minimum balance requirement of $500 in a given Portfolio and (ii) Class L units are sold at NAV with no initial sales charge and are only available to investors investing more than $1,000,000, with a minimum of $500 in a given Portfolio, and are subject to a minimum balance requirement of $500 in a given Portfolio. Subsequent purchases of Class A and Class L units in a given Portfolio must be made in amounts of at least $100.
Class A unitholders are subject to a redemption fee of 1.00% applicable to redemptions and exchanges made between Portfolios within 60 days of purchase based on net asset value at the time of redemption or exchange. No redemption fees were collected for the fiscal year ended March 31, 2023.
Class L unitholders will pay a redemption fee of 1.25% on redemptions made within six months of purchase, 1.00% on redemptions made after six months but within twelve months of purchase, and 0.50% on redemptions made after twelve months but within eighteen months of purchase, in each case based on the lower of the net asset value at the time of the purchase or the net asset value at the time of redemption. In the case of redemptions made as part of an exchange between Portfolios, unitholders will pay a redemption fee of 1.00% on exchanges made within 60 days of purchase based on net asset value at the time of redemption. The redemption fees collected are for the benefit of the respective Portfolio. No redemption fees were collected for the fiscal year ended March 31, 2023.
Futures Contracts
Futures contracts provide for the future exchange of a specified security at a specified future time and at a specified price. Stock index futures contracts are based on indices that reflect the market value of common stock of the firms included in the indices. Upon entering into a financial futures contract, the Fund is required to pledge to the broker an amount of cash, U.S. government securities, or other assets, equal to a certain percentage of the contract amount (initial margin deposit). Subsequent payments, known as “variation margin,” are made or received by the Fund each day, depending on the daily fluctuations in the fair value of the underlying security. The Fund recognizes an unrealized gain or loss which includes the daily variation margin until the contract is closed out, at which time the Fund realizes a gain or loss. There are several risks accompanying the utilization of futures contracts. First, positions in futures contracts may be closed only on an exchange. While the Fund plans to utilize futures contracts only if there exists an active market for such contracts, there is no guarantee that a liquid market will exist for the contracts at a specified time.
Furthermore, because, by definition, futures contracts look to projected price levels in the future and not to current levels or valuation, market circumstances may result in there being a discrepancy between the price of the future and the movement in the underlying instrument or index. The absence of a perfect price correlation between the futures contract and its underlying instrument or index could stem from investors choosing to close futures contracts by offsetting transactions rather than satisfying additional margin requirements. This could result in a distortion of the relationship between the index and the futures market.
Most U.S. futures exchanges limit the amount of fluctuation permitted in futures contract prices during a single trading day. The daily limit establishes the maximum amount that the price of a futures contract may vary either up or down from the previous day’s settlement price at the end of a trading session. Once the daily limit has been reached in a particular type of futures contract, no trades may be made on that day at a price beyond that limit. The daily limit governs only price movement during a particular trading day and therefore does not limit potential losses because the limit may prevent the liquidation of unfavorable positions. Futures contract prices have occasionally moved to the daily limit on several consecutive trading days with little or no trading, thereby preventing prompt liquidation of futures positions and subjecting some futures traders to substantial losses.
The Portfolios enter into stock index futures contracts that are traded on public exchanges. By investing in futures contracts, the Investment Adviser attempts to achieve a risk and return profile for the Portfolios that approximates the result that might be achieved by investing the assets of the Puerto Rico Securities Portion in the securities comprising the stock index used as a benchmark for the relevant investment strategy and investing the assets of the Equity Portion in the assets selected by the Portfolio Manager or the Investment Adviser, as the case may be.
Other
Investment transactions are accounted for on a trade date plus one basis for daily NAV calculations. However, for financial reporting purposes, investment transactions are reported on trade date. Realized gains
35
Multi-Select Securities Fund for Puerto Rico Residents
Notes to Financial Statements
For the fiscal year ended March 31, 2023
and losses on investment transactions are determined on the average cost method for the futures contracts, equity securities, and exchange traded funds. Interest income is accrued on a daily basis, except when collection is not expected. Dividend income is recorded on the ex-dividend date, except for certain dividends on foreign securities, which are recorded as soon as the Fund is informed after the ex-dividend date. Dividends received from entities outside Puerto Rico are presented net of any applicable withholding taxes.
Income and expenses of each Portfolio, other than class-specific expenses, and realized and unrealized gains and losses on investments, are allocated daily to each class of units based upon the NAV of outstanding units of each class at the beginning of the day. Fund expenses are allocated between each Portfolio based upon the total assets of each Portfolio.
| 2. | Investment Advisory, Administrative, Custodian, Distribution, Unit Holder Servicing, Transfer Agency Agreements, and Other Transactions with Affiliates |
Investment Advisory Fees
The Fund has entered into an Investment Advisory Agreement with the Investment Adviser, a division of UBSTC, to provide investment advisory services to the Fund in exchange for a fee not to exceed 1.00% of each Portfolio’s average weekly net assets. UBS AMPR provides day-to-day management of the Puerto Rico Securities Portion of each Portfolio. With respect to the Equity Portion of each Portfolio, which consists entirely of non-Puerto Rico securities, the Fund has entered into investment sub-advisory agreements with various sub-advisers.
The sub-advisers for the Equity Portion of each Portfolio are the following:
Portfolios | Portfolio Manager | |
International Portfolio I | Cambiar Investors, LLC | |
Large Cap Core Portfolio I | Atalanta Sosnoff Capital, LLC | |
Large Cap Growth Portfolio I | Winslow Capital | |
Large Cap Value Portfolio I | The London Company | |
Mid Cap Core Portfolio I | The London Company | |
Small Cap Core Portfolio I | Cambiar Investors, LLC |
These sub-advisers are responsible for the day-to-day investment management of the Equity Portion of each Portfolio. From the total advisory fee, the Investment Adviser pays the sub-advisers a fee in accordance with the terms of the sub-advisory agreements.
For the fiscal year ended March 31, 2023, gross, waived and net investment advisory fees, calculated as a percentage of average weekly net assets, are indicated below:
| International Portfolio I | Large Cap Core Portfolio I | Large Cap Growth Portfolio I | Large Cap Value Portfolio I | |||||||||||||
|
| |||||||||||||||
Annual Gross Fees | $ | 30,800 | $ | 62,192 | $ | 69,453 | $ | 70,329 | ||||||||
Fees waived by Investment Adviser | (18,480) | (37,315) | (41,671) | (42,198) | ||||||||||||
|
| |||||||||||||||
Net fees | $ | 12,320 | $ | 24,877 | $ | 27,782 | $ | 28,131 | ||||||||
|
| |||||||||||||||
Effective annual rate | 0.40% | 0.40% | 0.40% | 0.40% | ||||||||||||
|
| |||||||||||||||
| Mid Cap Core Portfolio I | Small Cap Core Portfolio I | |||||||||||||||
|
| |||||||||||||||
Annual Gross Fees | $ | 51,605 | $ | 31,038 | ||||||||||||
Fees waived by Investment Adviser | (30,962) | (18,623) | ||||||||||||||
|
| |||||||||||||||
Net fees | $ | 20,643 | $ | 12,415 | ||||||||||||
|
| |||||||||||||||
Effective annual rate | 0.40% | 0.40% | ||||||||||||||
|
| |||||||||||||||
36
Multi-Select Securities Fund for Puerto Rico Residents
Notes to Financial Statements
For the fiscal year ended March 31, 2023
Administration Fees
UBSTC also provides administrative, custody, and transfer agency services (collectively “Administration Fees”) pursuant to Administration, Custodian and Transfer Agency, Registrar, and Shareholder Servicing Agreements. The transfer agent has engaged BNY Mellon Investment Servicing US Inc. (“BNYM”) to act as recordkeeping and shareholder servicing agent for the Fund. The compensation paid by the Fund to the transfer agent under the Transfer Agency, Registrar, and Shareholder Servicing Agreement is equal to the compensation that the transfer agent is required to pay to BNYM, from time to time, for services to the Fund. UBSTC provides facilities and personnel to the Fund for the performance of Administrator duties. The administration fees will not exceed 0.15% of the Portfolio’s average weekly net assets. For the fiscal year ended March 31, 2023, gross, waived, and net administration fees, calculated as a percentage of average weekly net assets, are indicated below:
International Portfolio I | Large Cap Portfolio I | Large Cap Growth Portfolio I | Large Cap Value Portfolio I | |||||||||||||
|
| |||||||||||||||
Annual Gross Fees | $ | 4,659 | $ | 9,352 | $ | 10,466 | $ | 10,604 | ||||||||
Fees waived by Administrator | (4,659) | (9,352) | (10,466) | (10,604) | ||||||||||||
|
| |||||||||||||||
Net fees | $ | - | $ | - | $ | - | $ | - | ||||||||
|
| |||||||||||||||
Effective annual rate | 0.00% | 0.00% | 0.00% | 0.00% | ||||||||||||
|
| |||||||||||||||
Mid Cap Core Portfolio I | Small Cap Core | |||||||||||||||
|
| |||||||||||||||
Annual Gross Fees | $ | 7,786 | $ | 4,674 | ||||||||||||
Fees waived by Administrator | (7,786) | (4,674) | ||||||||||||||
|
| |||||||||||||||
Net fees | $ | - | $ | - | ||||||||||||
|
| |||||||||||||||
Effective annual rate |
|
0.00% |
|
|
0.00% |
| ||||||||||
|
| |||||||||||||||
Expense Limitation Agreement
UBSTC and the Fund have entered into an agreement (the “Expense Limitation Agreement”) whereby UBSTC agrees to reduce its compensation as set forth in the Investment Advisory Agreement and to assume all or a portion of the ordinary operating expenses of the Fund (subject to future reimbursement by the Fund), including but not limited to shareholder services, custodial and transfer agency fees, legal, regulatory, and accounting fees, printing costs, and registration fees, but excluding taxes, leverage, interest, brokerage commissions, dividends or interest expenses on short positions acquired fund fees and expenses and extraordinary expenses (“Other Expenses”) to the extent necessary to maintain the Fund’s total annual fund operating expenses less Other Expenses at a level which is no greater than 1.75% of the daily net assets attributable to total annual Fund operating expenses. The Fund will reimburse UBSTC for Other Expenses paid by UBSTC when total annual Fund operating expenses les Other Expenses fall below the expense limitation; provided that such reimbursement is made within three years after UBSTC paid the expense. The excess expenses potentially reimbursable by UBSTC at March 31, 2023 are approximately $190,000 and are distributed as reflected in the table that follows. The Expense Limitation Agreement is effective through June 30, 2024, and may be renewed for successive one year periods.
37
Multi-Select Securities Fund for Puerto Rico Residents
Notes to Financial Statements
For the fiscal year ended March 31, 2023
International Portfolio I | 03/31/24 | 03/31/25 | 03/31/26 | Large Cap Core Portfolio I | 03/31/24 | 03/31/25 | 03/31/26 | |||||||||||||||||||||||||||||||||||
Class A units | $ | - | $ | 12,075 | $ | 15,370 | Class A units | $ | - | $ | 13,071 | $ | 8,737 | |||||||||||||||||||||||||||||
Class L units | - | - | - | Class L units | - | 8,994 | 3,566 | |||||||||||||||||||||||||||||||||||
Total | $ | - | $ | 12,075 | $ | 15,370 | $ | - | $ | 22,065 | $ | 12,303 | ||||||||||||||||||||||||||||||
Large Cap Growth Portfolio I | 03/31/24 | 03/31/25 | 03/31/26 | Large Cap Value Portfolio I | 03/31/24 | 03/31/25 | 03/31/26 | |||||||||||||||||||||||||||||||||||
Class A units | $ | - | $ | 14,030 | $ | 10,543 | Class A units | $ | - | $ | 9,693 | $ | 13,380 | |||||||||||||||||||||||||||||
Class L units | - | 7,833 | 3,344 | Class L units | - | 5,928 | 4,079 | |||||||||||||||||||||||||||||||||||
Total | $ | - | $ | 21,863 | $ | 13,887 | $ | - | $ | 15,621 | $ | 17,459 | ||||||||||||||||||||||||||||||
Mid Cap Core Portfolio I | 03/31/24 | 03/31/25 | 03/31/26 | Small Cap Core Portfolio I | 03/31/24 | 03/31/25 | 03/31/26 | |||||||||||||||||||||||||||||||||||
Class A units | $ | - | $ | 9,035 | $ | 12,758 | Class A units | $ | - | $ | 12,786 | $ | 15,350 | |||||||||||||||||||||||||||||
Class L units | - | 5,143 | 4,612 | Class L units | - | - | - | |||||||||||||||||||||||||||||||||||
Total | $ | - | $ | 14,178 | $ | 17,370 | $ | - | $ | 12,786 | $ | 15,350 | ||||||||||||||||||||||||||||||
The net effect of the Expense Limitation Agreement was to decrease the operating expenses of the Fund and increase net investment gain for the fiscal year ended March 31, 2023.
Distribution Fees
UBS Financial Services Inc. (“UBSFSI”) serves as distributor (“Distributor”) of the units of common stock of the Fund. Pursuant to a Distribution Plan, the Fund makes payments to the Distributor for the distribution of the Fund’s Class L units. The distribution fee will not exceed 0.50% of average weekly net assets attributable to Class L units.
Pursuant to a Unitholder Servicing Plan, the Fund makes payments to the Distributor to compensate the Distributor and selected dealers for account maintenance and other unitholder services. The service fee will not exceed 0.25% for Class A units and Class L units of each Portfolio’s average weekly net assets.
As of May 11, 2022, the distribution and/or service plan, which was previously in effect, was terminated.
Other Transactions
Certain Fund officers and directors are also officers and directors of UBSTC. The six (6) independent directors of the Fund’s Board of Directors are paid based upon an agreed fee of $1,000 per quarterly Board meeting, plus expenses, and $500 per quarterly Audit Committee meeting, plus expenses. For the fiscal year ended March 31, 2023, the independent directors of the Fund were paid an aggregate compensation and expenses of $29,721. The directors fee payable amounted to $6,000 as of March 31, 2023.
During the fiscal year ended March 31, 2023, all purchases and sales of equity securities were investments of unaffiliated parties.
3. Unit Transactions
Unit transactions for the fiscal years ended March 31, 2023 and March 31, 2022 were as follows:
| International Portfolio I: | ||||||||||||||||||||
| For the fiscal year ended March 31, 2023 | For the fiscal year ended March 31, 2022 | |||||||||||||||||||
| Units | Amount | Units | Amount | |||||||||||||||||
Class A: | ||||||||||||||||||||
Units Sold | - | $ | - | 1,847 | $ | 20,174 | ||||||||||||||
Units Redeemed | (68,143 | ) | (578,248 | ) | (39,608 | ) | (421,188 | ) | ||||||||||||
Net decrease from capital share transactions | (68,143 | ) | $ | (578,248 | ) | (37,761 | ) | $ | (401,014 | ) | ||||||||||
| Large Cap Core Portfolio I: | ||||||||||||||||||||
| For the fiscal year ended March 31, 2023 | For the fiscal year ended March 31, 2022 | |||||||||||||||||||
| Units | Amount | Units | Amount | |||||||||||||||||
Class A: | ||||||||||||||||||||
Units Sold | - | $ | - | 1,044 | $ | 35,746 | ||||||||||||||
Units Redeemed | (9,808 | ) | (298,634 | ) | (10,261 | ) | (378,741 | ) | ||||||||||||
Net decrease from capital share transactions | (9,808 | ) | $ | (298,634 | ) | (9,217 | ) | $ | (342,995 | ) | ||||||||||
38
Multi-Select Securities Fund for Puerto Rico Residents
Notes to Financial Statements
For the fiscal year ended March 31, 2023
| Large Cap Growth Portfolio I: | ||||||||||||||||||||
| For the fiscal year ended March 31, 2023 | For the fiscal year ended March 31, 2022 | |||||||||||||||||||
| Units | Amount | Units | Amount | |||||||||||||||||
Class A: | ||||||||||||||||||||
Units Sold | - | $ | - | 1,044 | $ | 39,821 | ||||||||||||||
Units Redeemed | (5,937 | ) | (186,945 | ) | (16,907 | ) | (705,011 | ) | ||||||||||||
Net decrease from capital share transactions | (5,937 | ) | $ | (186,945 | ) | (15,863 | ) | $ | (665,190 | ) | ||||||||||
| Large Cap Value Portfolio I: | ||||||||||||||||||||
| For the fiscal year ended March 31, 2023 | For the fiscal year ended March 31, 2022 | |||||||||||||||||||
| Units | Amount | Units | Amount | |||||||||||||||||
Class A: | ||||||||||||||||||||
Units Sold | - | $ | - | 3,048 | $ | 73,123 | ||||||||||||||
Units Redeemed | (12,832 | ) | (293,068 | ) | (18,240 | ) | (453,738 | ) | ||||||||||||
Units Reinvested | - | - | 129 | 3,091 | ||||||||||||||||
Net decrease from capital share transactions | (12,832 | ) | $ | (293,068 | ) | (15,063 | ) | $ | (377,524 | ) | ||||||||||
| Mid Cap Core Portfolio I: | ||||||||||||||||||||
| For the fiscal year ended March 31, 2023 | For the fiscal year ended March 31, 2022 | |||||||||||||||||||
| Units | Amount | Units | Amount | |||||||||||||||||
Class A: | ||||||||||||||||||||
Units Sold | - | $ | - | 1,830 | $ | 72,083 | ||||||||||||||
Units Redeemed | (7,828 | ) | (276,622 | ) | (6,361 | ) | (252,890 | ) | ||||||||||||
Net decrease from capital share transactions | (7,828 | ) | $ | (276,622 | ) | (4,531 | ) | $ | (180,807 | ) | ||||||||||
| Small Cap Core Portfolio I: | ||||||||||||||||||||
| For the fiscal year ended March 31, 2023 | For the fiscal year ended March 31, 2022 | |||||||||||||||||||
| Units | Amount | Units | Amount | |||||||||||||||||
Class A: | ||||||||||||||||||||
Units Sold | - | $ | - | 2,333 | $ | 73,730 | ||||||||||||||
Units Redeemed | (12,414 | ) | (343,219 | ) | (15,889 | ) | (500,839 | ) | ||||||||||||
Net decrease from capital share transactions | (12,414 | ) | $ | (343,219 | ) | (13,556 | ) | $ | (427,109 | ) | ||||||||||
Since April 2016, there are no Class L units outstanding for the International Portfolio I. However, Class L units are presently offered for purchase at a par value of $10.00 per unit.
Since December 2018, there are no Class L units outstanding for the Small Cap Core Portfolio. However, Class L units are presently offered for purchase at a par value of $10.00 per unit.
4. Securities Transactions
The cost of portfolio securities purchased and proceeds from sales of portfolio securities for the fiscal year ended March 31, 2023, were as follows:
| Portfolios | Purchases | Sales | ||||||
International Portfolio I | $ | 764,608 | $ | 1,312,374 | ||||
Large Cap Core Portfolio I | 3,352,806 | 3,173,090 | ||||||
Large Cap Growth Portfolio I | 4,156,081 | 4,246,777 | ||||||
Large Cap Value Portfolio I | 152,986 | 221,296 | ||||||
Mid Cap Core Portfolio I | 723,388 | 849,067 | ||||||
Small Cap Core Portfolio I | 764,219 | 1,011,542 | ||||||
39
Multi-Select Securities Fund for Puerto Rico Residents
Notes to Financial Statements
For the fiscal year ended March 31, 2023
5. Futures Contracts
The Fund engaged in the following transactions as of March 31, 2023, related to futures contracts:
| International Portfolio I | No. of Contracts | Notional Amount at Cost | Net Unrealized Loss | Variation Margin | ||||||||||||||||
| Asset | Liablility | |||||||||||||||||||
Balance at March 31, 2022 | 7 | $ | 712,845 | $ | 38,115 | $ | - | $ | 12,880 | |||||||||||
Purchases | 25 | 2,421,095 | ||||||||||||||||||
Sales | (26 | ) | (2,526,080 | ) | ||||||||||||||||
|
|
|
| |||||||||||||||||
Balance at end of the year* | 6 | $ | 607,860 | $ | 21,330 | $ | 2,730 | $ | - | |||||||||||
* At March 31, 2023 the Portfolio had 6 Equity Index E-Mini MSCI EAFE futures contracts that expire on June 16, 2023. |
| |||||||||||||||||||
| Large Cap Core Portfolio I | No. of Contracts | Notional Amount at Cost | Net Unrealized Gain (Loss) | Variation Margin | ||||||||||||||||
| Asset | Liablility | |||||||||||||||||||
Balance at March 31, 2022 | 6 | $ | 1,257,780 | $ | 101,445 | $ | - | $ | 20,850 | |||||||||||
Purchases | 23 | 4,545,327 | ||||||||||||||||||
Sales | (24 | ) | (4,830,420 | ) | ||||||||||||||||
|
|
|
| |||||||||||||||||
Balance at end of the year* | 5 | $ | 972,687 | $ | 62,313 | $ | 14,500 | $ | - | |||||||||||
* At March 31, 2023 the Portfolio had 5 Equity Index E-Mini S&P 500 futures contracts that expire on June 16, 2023. |
| |||||||||||||||||||
| Large Cap Growth Portfolio I | No. of Contracts | Notional Amount at Cost | Net Unrealized Gain (Loss) | Variation Margin | ||||||||||||||||
| Asset | Liablility | |||||||||||||||||||
Balance at March 31, 2022 | 13 | $ | 1,855,045 | $ | (39,530 | ) | $ | - | $ | 202,590 | ||||||||||
Purchases | 45 | 5,175,699 | ||||||||||||||||||
Sales | (47 | ) | (5,770,700 | ) | ||||||||||||||||
|
|
|
| |||||||||||||||||
Balance at end of the year* | 11 | $ | 1,260,044 | $ | 105,001 | $ | 22,495 | $ | - | |||||||||||
* At March 31, 2023, the Portfolio had 11 Equity Index Russell 1000 Mini futures contracts that expire on June 16, 2023. |
| |||||||||||||||||||
| Large Cap Value Portfolio I | No. of Contracts | Notional Amount at Cost | Net Unrealized Gain (Loss) | Variation Margin | ||||||||||||||||
| Asset | Liablility | |||||||||||||||||||
Balance at March 31, 2022 | 19 | $ | 1,573,570 | $ | (23,835 | ) | $ | - | $ | 166,513 | ||||||||||
Purchases | 72 | 5,360,553 | ||||||||||||||||||
Sales | (73 | ) | (5,626,548 | ) | ||||||||||||||||
|
|
|
| |||||||||||||||||
Balance at end of the year* | 18 | $ | 1,307,575 | $ | 53,405 | $ | 17,550 | $ | - | |||||||||||
* At March 31, 2023, the Portfolio had 18 Equity Index Russell 1000 Mini futures contracts that expire on June 16, 2023. |
| |||||||||||||||||||
| Mid Cap Core Portfolio I | No. of Contracts | Notional Amount at Cost | Net Unrealized Loss | Variation Margin | ||||||||||||||||
| Asset | Liablility | |||||||||||||||||||
Balance at March 31, 2022 | 4 | $ | 1,024,100 | $ | 51,580 | $ | - | $ | 16,520 | |||||||||||
Purchases | 16 | 3,905,480 | ||||||||||||||||||
Sales | (16 | ) | (3,959,000 | ) | ||||||||||||||||
|
|
|
| |||||||||||||||||
Balance at end of the year* | 4 | $ | 970,580 | $ | 42,100 | $ | 18,040 | $ | - | |||||||||||
* At March 31, 2023 the Portfolio had 4 Equity Index E-Mini S&P Midcap 400 futures contracts that expire on June 16, 2023. |
| |||||||||||||||||||
| Small Cap Core Portfolio I | No. of Contracts | Notional Amount at Cost | Net Unrealized Loss | Variation Margin | ||||||||||||||||
| Asset | Liablility | |||||||||||||||||||
Balance at March 31, 2022 | 6 | $ | 592,275 | $ | 27,645 | $ | - | $ | 7,080 | |||||||||||
Purchases | 24 | 2,166,840 | ||||||||||||||||||
Sales | (24 | ) | (2,231,145 | ) | ||||||||||||||||
|
|
|
| |||||||||||||||||
Balance at end of the year* | 6 | $ | 527,970 | $ | 16,080 | $ | 9,630 | $ | - | |||||||||||
* At March 31, 2023 the Portfolio had 6 Equity Index Russell 2000 Mini futures contracts that expire on June 16, 2023. |
| |||||||||||||||||||
The following table represents the average underlying notional amount of futures contracts during the year:
| Portfolio | Average Notional Amount | |||
International Portfolio I | $ | 626,228 | ||
Large Cap Core Portfolio I | 1,188,261 | |||
Large Cap Growth Portfolio I | 1,363,745 | |||
Large Cap Value Portfolio I | 1,370,003 | |||
Mid Cap Core Portfolio I | 988,876 | |||
Small Cap Core Portfolio I | 551,716 | |||
The futures contracts for each Portfolio are managed by UBS AMPR. These futures contracts are equity contracts. The following tables present the effect of futures contracts on the Statement of Operations for the fiscal year ended March 31, 2023, by underlying risk exposure:
40
Multi-Select Securities Fund for Puerto Rico Residents
Notes to Financial Statements
For the fiscal year ended March 31, 2023
| Amount of net realized gain (loss) and unrealized net appreciation (depreciation) on futures contracts recognized in income: | ||||||||||||||
| Portfolio | Risk Exposure | Derivative Contract | Net Realized Gain (Loss) | Change in Unrealized Net Appreciation (Depreciation) | ||||||||||
International Portfolio I | Equity Index | Futures contract | $ | (17,175 | ) | $ | (16,785 | ) | ||||||
Large Cap Core Portfolio I | Equity Index | Futures contract | (113,895 | ) | (39,132 | ) | ||||||||
Large Cap Growth Portfolio I | Equity Index | Futures contract | (406,050 | ) | 144,531 | |||||||||
Large Cap Value Portfolio I | Equity Index | Futures contract | (210,637 | ) | 77,240 | |||||||||
Mid Cap Core Portfolio I | Equity Index | Futures contract | (71,800 | ) | (9,480 | ) | ||||||||
Small Cap Core Portfolio I | Equity Index | Futures contract | (75,075 | ) | (11,565 | ) | ||||||||
The following table presents the amount of cash pledged as collateral for futures contracts on the Statement of Assets and Liabilities as of March 31, 2023:
| Portfolio |
Cash Restricted | |||
International Portfolio I | $ | 53,275 | ||
Large Cap Core Portfolio I | 106,417 | |||
Large Cap Growth Portfolio I | 148,771 | |||
Large Cap Value Portfolio I | 193,647 | |||
Mid Cap Core Portfolio I | 150,606 | |||
Small Cap Core Portfolio I | 91,352 | |||
6. Concentration of Risk
Concentration of risk that arises from financial instruments exists for groups of investments or counterparties when they have similar economic characteristics that would cause their ability to meet contractual obligations to be similarly affected by changes in economic or other conditions.
The major concentration of risk arises from the Fund’s investment securities in relation to the location of issuers or the industries they are engaged in. The concentration by location of issuers and by industries is shown in the Schedule of Investments. At March 31, 2023, the Fund had cash due from UBSTC, consisting of a Time Deposit Open Account with Citibank Puerto Rico with an aggregate market value as follows:
Portfolios | Puerto Rico Investments | % of Net Assets | ||||||
International Portfolio I | $ | 609,360 | 20.05% | |||||
Large Cap Core Portfolio I | 1,153,603 | 18.91% | ||||||
Large Cap Growth Portfolio I | 1,311,182 | 18.21% | ||||||
Large Cap Value Portfolio I | 1,247,424 | 18.01% | ||||||
Mid Cap Core Portfolio I | 925,738 | 18.06% | ||||||
Small Cap Core Portfolio I | 521,955 | 16.97% | ||||||
These deposits were issued by entities located in the Commonwealth of Puerto Rico and are not guaranteed by the U.S. Government or any of its subdivisions. However, they are insured by the Federal Deposit Insurance Corporation (“FDIC”) up to $250,000.
Each Portfolio intends to invest at least 20% of its total assets in equity or taxable fixed-income securities, including cash equivalents, issued by Puerto Rico entities (i.e.; the “Puerto Rico Securities Portion”), and such investments will normally consist of cash equivalents. Therefore, the Fund is more susceptible to factors affecting issuers of Puerto Rico securities than an investment company that is not concentrated in Puerto Rico securities to such degree. However, if any Portfolio is unable to procure sufficient taxable securities issued by Puerto Rico issuers which meet the Portfolio’s investment criteria, in the opinion of the Investment Adviser, the Portfolio may acquire taxable securities of non-Puerto Rico (i.e., the 50 States comprising the United States) issuers which satisfy the Portfolio’s investment criteria, provided this does not result in a change to the tax considerations to Portfolio unitholders.
Common stocks and other similar equity securities generally are the riskiest investments in a company and
41
Multi-Select Securities Fund for Puerto Rico Residents
Notes to Financial Statements
For the fiscal year ended March 31, 2023
they fluctuate in value more than bonds. A Portfolio could lose all of its investment in a company’s stock.
Certain entities or individuals currently own (beneficially or of record) or control 5% or more of the units of the International Portfolio I, Large Cap Core Portfolio I, Large Cap Growth Portfolio I, Large Cap Value Portfolio I, Mid Cap Core Portfolio I, and Small Cap Core Portfolio I. Redemptions by these entities or individuals of their holdings in one or more of these Portfolios may impact such Portfolio’s liquidity and NAV. These redemptions may also force such Portfolio to sell securities.
7. Investment and Other Requirements and Limitations
The Fund is subject to certain requirements and limitations related to investments. Some of these requirements and limitations are imposed by statute or by regulation while others are imposed by procedures established by the Board of Directors. The most significant requirements and limitations are discussed below. Each Portfolio intends to invest up to 80% of its total assets in common stocks and other equity securities of U.S. or foreign companies and intends to invest at least 20% of its total assets in equity or taxable fixed-income securities issued by Puerto Rico entities. The Fund’s Investment Adviser will manage the Puerto Rico Securities Portion of each Portfolio directly.
Securities held in each Portfolio may be issued by Puerto Rico or U.S. issuers; generally the Portfolios invest primarily in securities of U.S. issuers, with the exception of the International portfolio, which primarily invests in sponsored or unsponsored American Depositary Receipts (“ADRs”) representing interests in securities of foreign issuers and foreign stocks.
Each Portfolio may make certain short-term high quality investments of up to 100% of its assets for temporary or defensive purposes, subject to certain conditions. Temporary investments of each Portfolio will be invested in money market funds or other temporary investments and may lend its securities to qualified buyers. Each Portfolio also may invest in repurchase agreements, derivative instruments, and when issued and delayed delivery securities with respect to its Puerto Rico Securities Portion. In addition, the Fund, on behalf of a Portfolio, may borrow money in an amount up to 5% of such Portfolio’s total assets for temporary purposes and to meet redemptions.
8. Components of Distributable Earnings (Accumulated Losses)
The amount of net unrealized appreciation/(depreciation) and the cost of investment securities was as follows:
| International Portfolio I | Large Cap Core Portfolio I | Large Cap Growth Portfolio I | Large Cap Value Portfolio I | |||||||||||||
Cost of Investments | $ | 2,040,714 | $ | 3,652,270 | $ | 5,078,719 | $ | 3,878,091 | ||||||||
Gross appreciation | $ | 264,238 | $ | 1,227,864 | $ | 681,401 | $ | 1,861,922 | ||||||||
Gross depreciation | (105,084 | ) | (129,699 | ) | (73,241 | ) | (295,485 | ) | ||||||||
Net appreciation (depreciation) | 159,154 | 1,098,165 | 608,160 | 1,566,437 | ||||||||||||
| Mid Cap Core Portfolio I | Small Cap Core Portfolio I | |||||||||||||||
Cost of Investments | $ | 3,967,222 | $ | 2,513,408 | ||||||||||||
Gross appreciation | $ | 410,309 | $ | 212,768 | ||||||||||||
Gross depreciation | (452,793 | ) | (371,036 | ) | ||||||||||||
Net appreciation (depreciation) | (42,484 | ) | (158,268 | ) | ||||||||||||
The Fund’s policy, as stated in the Prospectus, is to distribute substantially all net investment gain. In order to maintain a stable level of dividends, however, the Fund may at times pay more or less the net investment gain earned in a particular year.
The undistributed net investment gain (loss) and components of total distributable (accumulated losses) at fiscal years ended March 31, 2023, and March 31, 2022 were as follows:
42
Multi-Select Securities Fund for Puerto Rico Residents
Notes to Financial Statements
For the fiscal year ended March 31, 2023
March 31, 2023: | ||||||||||||||||
| International Portfolio I | Large Cap Core Portfolio I | Large Cap Growth Portfolio I | Large Cap Value Portfolio I | |||||||||||||
Undistributed net investment gain (loss) at the end of the year | $ | 36,903 | $ | (626,819 | ) | $ | (1,289,647 | ) | $ | (82,312 | ) | |||||
Accumulated net realized gain (loss) from investment and futures | (210,390 | ) | 6,756,675 | 9,458,614 | 5,082,397 | |||||||||||
Unrealized net appreciation (depreciation) from investment and futures | 180,484 | 1,160,477 | 713,161 | 1,619,842 | ||||||||||||
Total Distributable Earnings (Acummulated Loss) | $ | 6,997 | $ | 7,290,333 | $ | 8,882,128 | $ | 6,619,927 | ||||||||
| Mid Cap Core Portfolio I | Small Cap Core Portfolio I | |||||||||||||||
Undistributed net investment gain (loss) at the end of the year | $ | (714,902 | ) | $ | (529,035 | ) | ||||||||||
Accumulated net realized gain (loss) from investment and futures | 7,277,833 | 4,852,807 | ||||||||||||||
Unrealized net appreciation (depreciation) from investment and futures | (384 | ) | (142,188 | ) | ||||||||||||
Total Distributable Earnings (Acummulated Loss) | $ | 6,562,547 | $ | 4,181,584 | ||||||||||||
March 31, 2022: | ||||||||||||||||
| International Portfolio I | Large Cap Core Portfolio I | Large Cap Growth Portfolio I | Large Cap Value Portfolio I | |||||||||||||
Undistributed net investment gain (loss) at the end of the year | $ | 36,150 | $ | (577,007 | ) | $ | (1,200,806 | ) | $ | (86,140 | ) | |||||
Accumulated net realized gain (loss) from investment and futures | (5,680 | ) | 6,922,118 | 9,739,189 | 5,233,112 | |||||||||||
Unrealized net appreciation (depreciation) from investment and futures | 256,564 | 1,993,989 | 1,524,830 | 2,237,393 | ||||||||||||
Total Distributable Earnings (Acummulated Loss) | $ | 287,034 | $ | 8,339,100 | $ | 10,063,213 | $ | 7,384,365 | ||||||||
| Mid Cap Core Portfolio I | Small Cap Core Portfolio I | |||||||||||||||
Undistributed net investment gain (loss) at the end of the year | $ | (666,365 | ) | $ | (506,080 | ) | ||||||||||
Accumulated net realized gain (loss) from investment and futures | $ | 7,363,793 | $ | 5,061,427 | ||||||||||||
Unrealized net appreciation (depreciation) from investment and futures | 125,271 | (148,891 | ) | |||||||||||||
Total Distributable Earnings (Acummulated Loss) | $ | 6,822,699 | $ | 4,406,456 | ||||||||||||
9. Risks and Uncertainties
The Fund and its Portfolios are exposed to various types of risks, such as portfolio manager oversight, conflict of interest, equity, geographic concentration, industry concentration, futures, fixed income securities, non-diversification, fund of funds and bankruptcy risks, among others. This list is qualified by reference to the more detailed information provided in the offering documentation for the securities issued by the Fund.
Investment and Market Risk. Each Portfolio’s investments may be adversely affected by the performance of U.S. and Puerto Rico investment securities markets, which, in turn, may be influenced by a number of factors, including, among other things, (i) the level of interest rates, (ii) the rate of inflation, (iii) political decisions, (iv) fiscal policy, and (v) current events in general.
In addition, turbulence in financial markets and reduced liquidity in equity and/or fixed-income markets may negatively affect the Portfolio. Global economies and financial markets are becoming increasingly interconnected, and conditions and events in one country, region or financial market may adversely impact issuers in a different country, region or financial market. These risks may be magnified if certain events or developments adversely interrupt the global supply chain, and could affect companies worldwide. Recent examples include pandemic risks related to the novel coronavirus (“COVID-19”) and the aggressive measures taken worldwide in response by (i) governments, including closing borders, restricting travel and imposing prolonged quarantines of, or similar restrictions on, large populations, and (ii) businesses, including forced or voluntary closures, changes to operations and reductions of staff. The effects of COVID-19 have contributed to increased volatility in global financial markets and may affect certain countries, regions, companies, industries and market sectors more dramatically than others. The COVID-19 pandemic has had, and any other outbreak of an infectious disease or serious environmental or public health concern could have, a significant negative impact on economic and market conditions, could exacerbate pre-existing political, social and economic risks in certain countries or regions and could trigger a prolonged period of global economic slowdown, which may impact the Portfolio. Although vaccines have been developed and approved for use by various governments, the duration of the pandemic and its effects cannot be predicted with certainty. To the extent the Portfolio is
43
Multi-Select Securities Fund for Puerto Rico Residents
Notes to Financial Statements
For the fiscal year ended March 31, 2023
overweight in certain countries, regions, companies, industries or market sectors, such positions will increase the risk of loss from adverse developments affecting those countries, regions, companies, industries or sectors.
Portfolio Risk. There is no assurance that the investment approaches used by the Investment Adviser or the Equity Portion Portfolio Managers selected by the Investment Adviser will be successful, and certain Portfolios may be more or less successful than others. The overall success of an investment in the Fund also may depend on the investors ability to choose successfully from among the Portfolios.
Conflicts of Interest Risk. The Investment Adviser (and its affiliates) may have interests that compete with those of the Fund and the Portfolio, for example, because they may engage in transactions directly with the Fund, subject to applicable law. Those entities and the Equity Portion Portfolio Managers also may have interests in, or business relationships with, a company in which the Portfolio invests and those interests may conflict with those of the Portfolio.
Equity Risk. Common stocks and other similar equity securities generally are the riskiest investment in a company and they fluctuate in value more than bonds. The Portfolio could lose all of its investment in a company’s stock.
Foreign Securities Risk. The International Portfolio I invests primarily in ADR representing interests in securities of foreign issuers. While ADRs are not necessarily denominated in the currencies of the foreign securities that they represent, they are subject to many of the risks associated with foreign securities. Such risks can increase the chances that the applicable Portfolios will lose money. These risks include difficulties in pricing securities, defaults on foreign government securities, difficulties enforcing favorable legal judgments in foreign courts and political and social instability. The issuers of unsponsored depositary receipts are not obligated to disclose material information in the United States. Therefore, there may be less information available regarding these issuers and there may not be a correlation between such information and the market value of the depositary receipts.
Puerto Rico Concentration Risk. Under normal conditions, the Portfolio will invest the Puerto Rico Securities Portion in cash equivalents. However, to the extent the Portfolio invests in other Puerto Rico securities, it will be more susceptible to economic, political, regulatory or other factors adversely affecting issuers in Puerto Rico than funds that invest to a lesser degree in Puerto Rico issuers. There presently are a limited number of participants in the market for certain securities of Puerto Rico issuers. As a result, changes in the market value of a single investment in the Puerto Rico Securities Portion of the Portfolio could cause significant fluctuations in the Portfolio’s NAV price. In addition, the investments in the Puerto Rico Securities Portion had previously been concentrated in the stocks of Puerto Rico financial services companies. Because market risk may affect a single issuer, industry (such as Puerto Rico financial services companies), or sector of the economy, the Portfolio may experience greater price volatility than if it held more diversified investments.
In addition, certain Puerto Rico Securities may have periods of illiquidity. These factors may affect the Portfolio’s ability to acquire or dispose of such securities, as well as the price paid or received upon such acquisition or disposition. In addition, investment by the Portfolio in such securities is subject to their availability in the open market.
Futures. The Portfolios may invest a portion of their Equity Portion in futures contracts in the relevant stock index for each Portfolio. There are several risks accompanying the utilization of futures contracts. First, positions in futures contracts may be closed only on an exchange or board of trade that furnishes a secondary market for such contracts. While the Portfolios plan to utilize futures contracts only if an active market for such contracts exists, there is no guarantee that a liquid market will exist for the contracts at a specified time. Furthermore, because, by definition, futures contracts look to projected price levels in the future and not to current levels or valuation, market circumstances may result in there being a discrepancy between the price of the future and the movement in the underlying instrument or index. The absence of a perfect price correlation between the futures contract and its underlying instrument or index could stem from investors choosing to close futures contracts by offsetting transactions, rather than satisfying additional margin requirements. This could result in a distortion of the relationship between the index and futures market. In addition, because the futures market imposes less burdensome margin requirements than the securities market, an increased amount of participation by speculators in the futures market could result in price fluctuations.
44
Multi-Select Securities Fund for Puerto Rico Residents
Notes to Financial Statements
For the fiscal year ended March 31, 2023
Derivatives Risk. The Portfolios may use financial instruments referred to as derivatives with respect to their respective Puerto Rico Securities Portion, which derive their value from another security, a commodity (such as gold or oil) or an index (a measure of value or rates). The Portfolios’ investments in derivatives may fall more rapidly than other investments. Derivatives, because of their increased volatility and potential leveraging effect, may adversely affect the Portfolio. For example, investments in derivatives linked to an equities or commodities index may subject a Portfolio to the risks associated with changes in the particular indices, which may include reduced or eliminated interest payments and losses of invested principal.
Such investments, in effect, may also be leveraged, thereby magnifying the risk of loss. If the Portfolio invests in derivative instruments, it could lose more than the principal amount invested. For example, investments in futures involve the risk of imperfect correlation between movements in the price of such futures and movements in the price of the underlying securities or interest rates.
Under Rule 18f-4 under the 1940 Act, among other things, the Fund must either use derivatives in a limited manner or comply with an outer limit on fund leverage risk based on value at-risk. To ensure compliance with this Rule, the Fund has adopted policies and procedures as a limited derivatives user. This Fund limits its derivative exposure to 10% of its net assets, therefore, will not be required to adopt a full derivative risk management program and would not be subject to the Rule 18f-4’s board oversight and reporting requirements. The Fund still must adopt policies and procedures reasonably designed to manage the Fund’s level of derivatives risk. Also, the Fund should be required to manage its derivatives risk, including, but not limited to, leverage risk, market risk liquidity risk, counterparty risk, operational risk, legal risk, and any risks that the Adviser deems material. Such risk management includes daily monitoring of the Fund’s derivatives exposure.
Credit and Interest Rate Risks. Each Portfolio is authorized with respect to its Puerto Rico Securities Portion to invest in bonds and other income-producing securities, such as preferred stock. These securities are subject to credit risk and interest rate risk.
Credit risk is the risk that the issuer of a bond will not make principal or interest payments when they are due. Even if an issuer does not default on a payment, a bond’s value may decline if the market anticipates that the issuer has become less able, or less willing, to make payments on time. Even high-quality bonds are subject to some credit risk. However, credit risk is higher for lower quality bonds. Bonds that are not investment grade involve high credit risk and are considered speculative. The Portfolios may invest in preferred stock and subordinated debt of Puerto Rico issuers that may be unrated or rated below investment grade, provided that either (i) the issuer of such preferred stock or subordinated debt has senior unsecured debt rated investment grade by a nationally recognized statistical rating organization or (ii) if such issuer does not have senior unsecured debt rated investment grade, the Fund’s Investment Adviser determines that such issuer’s senior unsecured debt is of comparable credit quality. The Portfolio also may invest in other debt securities rated below investment grade, or that the Fund’s Investment Adviser determines to be below investment grade quality, provided that the amount invested in such debt securities may not exceed 5% of the Puerto Rico Securities Portion of each Portfolio’s total assets.
The value of bonds generally can be expected to fall when interest rates rise and to rise when interest rates fall. Interest rate risk is the risk that interest rates will rise and that the value of a Portfolio’s investments in bonds will fall as a result.
Non-Diversification Risk. Certain Portfolios may be non-diversified. Non-diversification risk is the risk that large positions in a small number of issuers may cause greater fluctuations in a Portfolio’s net asset value as a result of changes in the market’s assessment of the financial condition of those issuers.
Illiquid Securities Risk. The Portfolios may invest up to an aggregate amount of 15% of its net assets in illiquid investments. An illiquid investment is any investment that the Portfolio reasonably expects cannot be sold or disposed of in current market conditions in seven calendar days or less without the sale or disposition significantly changing the market value of the investment. There presently are a limited number of participants in the market for certain Puerto Rico securities or other securities or assets that the Portfolio may own. That and other factors may cause certain securities to have periods of illiquidity. Illiquid securities include, among other things, securities subject to legal or contractual restrictions on resale that hinder the marketability of the
45
Multi-Select Securities Fund for Puerto Rico Residents
Notes to Financial Statements
For the fiscal year ended March 31, 2023
securities. It is presently anticipated that illiquid investments may be made with respect to the Puerto Rico Securities Portion of the Portfolio.
Segregation of Portfolios. The Fund intends to segregate the assets of each Portfolio so that an investor has the exclusive right to the assets, income, and profits from the Portfolio(s) in which it invests, and only bear the expenses, deductions and costs properly attributable or allocated to those Portfolio(s).
The Fund also intends that creditors of any Portfolio only will have recourse to the assets in that Portfolio. There can be no assurance, however, that efforts to effect this segregation of assets and liabilities will be successful, nor that a court, in the event of the Fund’s or a Portfolio’s bankruptcy, would regard the Portfolios as separate entities for purposes of determining the bankruptcy estate.
Equity Portion Portfolio Manager Oversight Risks. Because the Equity Portion Portfolio Manager, or other sub-adviser engaged directly by the Investment Adviser, makes trading decisions on behalf of the Portfolios independently, the Investment Adviser may not always have access to information concerning the securities positions of the Portfolios at a given point in time. Delays in receipt of such information may hinder the Investment Adviser’s oversight of the Equity Portion Portfolio Manager and/or sub-advisers.
Mid and Small Cap Company Risk. The Mid Cap Core Portfolio I and the Small Cap Core Portfolio I may invest to a significant degree in common stocks of mid and small cap companies, respectively. These companies present greater risks because they generally are more vulnerable to adverse business or economic developments and they may have more limited resources. In general, these risks are greater for small cap companies than for mid cap companies.
Russia-Ukraine Conflict Risk. The Russian Federation invaded Ukraine on February 24, 2022. Geopolitical tensions have risen significantly in response and the United States, the United Kingdom, European Union member states, and other countries have imposed economic sanctions on the Russian Federation, parts of Ukraine, as well as various designated parties. As further military conflicts and economic sanctions continue to evolve, it has become increasingly difficult to predict the impact of these events or how long they will last. Depending on direction and timing, the Russian Federation-Ukraine conflict may significantly exacerbate the normal risks associated with the Fund and its Portfolios, and result in adverse changes to, among other things: (i) general economic and market conditions; (ii) shipping and transportation costs and supply chain constraints; (iii) interest rates, currency exchange rates, and expenses associated with currency management transactions; (iv) demand for investments; (v) available credit in certain markets; (vi) import and export activity from certain markets; and (vii) laws, regulations, treaties, pacts, accords, and governmental policies. Economic and military sanctions related to the Russian Federation-Ukraine conflict, or other conflicts, have the potential to gravely impact markets, global supply and demand, import/export policies, and the availability of labor in certain markets. There is no guarantee that such sanctions and economic actions will abate or that more restrictive measures will not be put in place in the near term. Moreover, it is expected that the Russian Federation-Ukraine military conflict could spark further sanctions and/or military conflicts which will impact other regions. The foregoing could seriously impact the Fund’s operations, its ability to realize its investment objectives in a timely manner, and the performance of the Portfolios.
10. Indemnifications
In the normal course of business, the Fund enters into contracts that contain a variety of indemnification clauses. The Fund’s maximum exposure under these agreements is unknown. However, the Fund has not had prior claims or losses for indemnifications and expects the risk of loss to be remote.
11. Subsequent Events
Events and transactions from April 1, 2023 through May 25, 2023 (the date the financial statements were available to be issued) have been evaluated by management for subsequent events. Management has determined that there were no material events that would require adjustment to or additional disclosure in the Fund’s financial statements through this date, except as disclosed below.
46
Multi-Select Securities Fund for Puerto Rico Residents
Notes to Financial Statements
For the fiscal year ended March 31, 2023
Dividends:
On May 12, 2023, the Board of Directors declared an ordinary net investment gain dividend in the issued and outstanding Class A and Class L units of the Fund. Refer to table below for a detail of dividends declared:
| Class A | Class L | |||||||||||||||||||
| Amount | Per Unit | Amount | Per Unit | |||||||||||||||||
International Portfolio I | $ | 722 | $ | 0.00220 | $ | - | $ | - | ||||||||||||
Large Cap Value Portfolio I | 3,466 | 0.01530 | 172 | 0.00240 | ||||||||||||||||
The dividends declared above were subject to a 15% tax withholding and the net after tax dividend will be paid on May 19, 2023, to the holders of record of the issued and outstanding Class A and Class L units of the respective Portfolios on May 11, 2023.
47
Report of Independent Registered Public Accounting Firm
To the Shareholders and the Board of Directors of Multi-Select Securities Fund for Puerto Rico Residents
Opinion on the Financial Statements
We have audited the accompanying statements of assets and liabilities of the International Portfolio I, the Large Cap Core Portfolio I, the Large Cap Growth Portfolio I, the Large Cap Value Portfolio I, the Mid Cap Core Portfolio I, and the Small Cap Core Portfolio I (the six funds constituting the Multi-Select Securities Fund for Puerto Rico Residents, hereafter referred to as the “Funds”), including the schedules of investments, as of March 31, 2023, and the related statements of operations for the year then ended, the statements of changes in net assets and the financial highlights for each of the two years in the period then ended and the related notes (collectively referred to as the “financial statements”). In our opinion, the financial statements present fairly, in all material respects, the financial position of the Funds at March 31, 2023, the results of its operations for the year then ended, the changes in its net assets and its financial highlights for each of the two years in the period then ended, in conformity with U.S. generally accepted accounting principles.
Basis for Opinion
These financial statements are the responsibility of the Funds’ management. Our responsibility is to express an opinion on the Funds’ financial statements based on our audits. We are a public accounting firm registered with the Public Company Accounting Oversight Board (United States) (“PCAOB”) and are required to be independent with respect to the Funds in accordance with the U.S. federal securities laws and the applicable rules and regulations of the Securities and Exchange Commission and the PCAOB.
We conducted our audits in accordance with the standards of the PCAOB. Those standards require that we plan and perform the audit to obtain reasonable assurance about whether the financial statements are free of material misstatement, whether due to error or fraud. The Funds are not required to have, nor were we engaged to perform, an audit of the Funds’ internal control over financial reporting. As part of our audit, we are required to obtain an understanding of internal control over financial reporting but not for the purpose of expressing an opinion on the effectiveness of the Funds’ internal control over financial reporting. Accordingly, we express no such opinion.
Our audits included performing procedures to assess the risks of material misstatement of the financial statements, whether due to error or fraud, and performing procedures that respond to those risks. Such procedures included examining, on a test basis, evidence regarding the amounts and disclosures in the financial statements. Our procedures included confirmation of securities owned as of March 31, 2023, by correspondence with the custodian, brokers and others.
Our audits also included evaluating the accounting principles used and significant estimates made by management, as well as evaluating the overall presentation of the financial statements. We believe that our audits provide a reasonable basis for our opinion.

We have served as the auditor of one or more UBS investment companies since 1978.
New York, New York
May 25, 2023
OTHER INFORMATION (Unaudited)
Management of the Fund
Management Information. The business affairs of the Fund are overseen by its Board of Directors. Certain biographical and other information relating to the Directors and officers of the Fund are set forth below, including their ages and their principal occupations for at least five years.
The Fund’s Statement of Additional Information includes additional information about the Directors and is available free of charge upon request by calling the Fund at 787-250-3600.
Name, Address*, and Age | Position(s) Held with the Fund | Term of Office and Length of Time Served** | Principal Occupation(s) During Past Five Years | Number of Overseen*** | Public Directorships | |||||
| Independent Directors | ||||||||||
Agustin Cabrer (73) | Director | Director since 2003 | President of Antonio Roig Sucesores (land holding enterprise with commercial properties) since 1995; President of Libra Government Building, Inc. (administration of court house building) since 1997; President of Cabrer Consulting (financial services business); President of CC Development, LLC (construction supervision and management consulting) for the last five years; President of CC Development, LLC (construction supervision and management consulting) since 2021; and Director of V. Suarez & Co. (food and beverage distribution company) since 2002. | 17 funds | None | |||||
Vicente J. León (83) | Director | Director since 2021 | Independent business consultant since 1999; | 17 funds | None | |||||
Carlos Nido (58) | Director | Director since 2007 | President of Green Isle Capital LLC, a Puerto Rico Venture Capital Fund under law 185 investing primarily in feature films and healthcare since 2016. | 24 funds | None | |||||
Luis M. Pellot (74) | Director | Director since 2003 | President of Pellot-González, Tax Attorneys & Counselors at Law, PSC (legal services business), since 1989. | 24 funds | None | |||||
Clotilde Pérez (71) | Director | Director since 2009 | Consultant for Corporate Development of V. Suarez & Co., Inc. since 2022; Vice President Corporate Development Officer of V. Suarez & Co., Inc. (food and beverage wholesale distribution business) from 1999 until 2022. | 24 funds | None | |||||
José J. Villamil (83) | Director | Director since 2021 | Chairman of the Board and Chief Executive Officer of Estudios Técnicos, Inc. (consulting business) since 2005. | 17 funds | None | |||||
| Interested Director | ||||||||||
1
Name, Address*, and Age | Position(s) Held with the Fund | Term of Office and Length of Time Served** | Principal Occupation(s) During Past Five Years | Number of Overseen*** | Public Directorships | |||||
Carlos V. Ubiñas (68)**** | Director, Chairman of the Board of Directors, and President | President since 2015; Chairman of the Board of Directors since 2012; and Director since 2003 | Managing Director, Vice Chairman of Wealth Management and President of UBS Trust Company of Puerto Rico; Chief Executive Officer of UBS Financial Services Inc of Puerto Rico from 2009 to 2021; President of UBS Financial Services Inc. of Puerto Rico since 2005; Managing Director, Head of Asset Management and Investment Banking of UBS Financial Services Inc of Puerto Rico. since 2014. | 17 funds | None | |||||
| Officers | ||||||||||
| Jose Arias (57) | Senior Executive Vice President | Senior Executive Vice President since 2022 | Managing Director of UBS Trust Company of PR since 2020; Managing Director for Public Finance at UBS Financial Services Inc. from 2017 to 2020; Managing Director for Investment Banking at UBS Financial Services Inc. of PR from 2000 to 2017. | Not applicable | None | |||||
Leslie Highley (76) | Senior Vice President | Senior Vice President since 2005 | Managing Director of UBS Trust PR; Senior Vice-President of UBS Financial Services Inc.; Senior Vice President of the Puerto Rico Residents Tax-Free Family of Funds; President of Dean Witter Puerto Rico, Inc. since 1989 and Executive Vice President of the Government Development Bank for Puerto Rico. | Not applicable | None | |||||
William Rivera (64) | First Vice President and Treasurer | First Vice President since 2005 and Treasurer since 2015 | Executive Director of UBS Asset Managers since 2011; Director of UBS Asset Managers from 2006 to 2010; Assistant Portfolio Manager for UBS Asset Managers; First Vice President of Trading of UBS Trust PR since January 2002 and of UBS Financial Services Puerto Rico since 1987. UBS Asset Managers, UBS Trust PR and UBS Financial Services Inc. are affiliates of the Fund. | Not applicable | None | |||||
Javier Rodríguez (49) | Assistant Vice President and Assistant Treasurer | Assistant Vice President and Assistant Treasurer since 2005 | Divisional Assistant Vice President, trader, and portfolio manager of UBS Trust PR since 2003; financial analyst with UBS Trust PR from 2002 to 2003; financial analyst with Popular Asset Management from 1998 to 2002. Management from 1998 to 2002. UBS Trust PR is an affiliate of the Fund. | Not applicable | None | |||||
Liana Loyola (61) | Secretary | Secretary since 2014 | Attorney in private practice since 2009. | Not applicable | None | |||||
| Luz Colon (47) | Chief Compliance Officer | Chief Compliance Officer since 2013 | Executive Director and Chief Compliance Officer of UBS Asset Managers of Puerto Rico and the Funds; CCO for UBS Fund Advisor (RIA for private equity funds) from 2019 to 2022; Co- CCO for the Puerto Rico Investors Family of Funds, which is co-managed by UBS Asset Managers of Puerto Rico and Banco Popular of Puerto Rico, from 2013 to 2021. | Not applicable | None | |||||
2
Name, Address*, and Age | Position(s) Held with the Fund | Term of Office and Length of Time Served** | Principal Occupation(s) During Past Five Years | Number of Overseen*** | Public Directorships | |||||
Heydi Cuadrado (42) | Assistant Vice President | Assistant Vice President since 2019 | Director of UBS Trust Company since March 2012. Trader and Assistant Portfolio Manager for UBS Asset Managers of Puerto Rico since 2008. | Not applicable | None | |||||
Gustavo Romañach (48) | Assistant Vice President | Assistant Vice President since 2019 | Director of UBS Asset Managers of Puerto Rico since 2013; Associate Director Portfolio analyst & trader of UBS Asset Managers of Puerto Rico since 2009; Assistant Vice- President of UBS Asset Managers of PR since 2003. | Not applicable | None | |||||
* The address of each Director and officer is UBS Trust Company of Puerto Rico, American International Plaza – Tenth Floor, 250 Muñoz Rivera Avenue, San Juan, Puerto Rico 00918. ** Each Director holds his or her office from the time of their election and qualification until the election meeting for the year in which his or her term expires and until his or her successor shall have been elected and shall have qualified, or until his or her death, or until December 31 of the year in which he or she shall have reached eighty years of age, or until he or she shall have resigned or been removed. Each Officer is annually elected by and serves at the pleasure of the Board of Directors. *** The Affiliated Funds consist of GNMA & US Government Target Maturity Fund for Puerto Rico Residents, Inc.; Multi-Select Securities Fund for Puerto Rico Residents; Short Term Investment Fund for Puerto Rico Residents, Inc.; Tax Free Fund for Puerto Rico Residents, Inc.; Tax Free Fund II for Puerto Rico Residents, Inc.; Tax Free Target Maturity Fund for Puerto Rico Residents, Inc.; Tax- Free Fixed Income Fund for Puerto Rico Residents, Inc.; Tax-Free Fixed Income Fund II for Puerto Rico Residents,Inc.; Tax-Free Fixed Income Fund III for Puerto Rico Residents,Inc.; Tax-Free Fixed Income Fund IV for Puerto Rico Residents, Inc.; Tax-Free Fixed Income Fund V for Puerto Rico Residents, Inc.; Tax-Free Fixed Income Fund VI for Puerto Rico Residents, Inc.; Tax-Free High Grade Portfolio Bond Fund for Puerto Rico Residents, Inc.; Tax-Free High Grade Portfolio Bond Fund II for Puerto Rico Residents,Inc.; Tax-Free High Grade Portfolio Target Maturity Fund for Puerto Rico Residents, Inc.; U.S. Monthly Income Fund for Puerto Rico Residents, Inc.; and US Mortgage-Backed & Income Fund for Puerto Rico Residents, Inc. (the “UBS Family of Funds”); and Puerto Rico Residents Tax-Free Fund, Inc.; Puerto Rico Residents Tax-Free Fund Inc. II; Puerto Rico Residents Tax-Free Fund III, Inc.; Puerto Rico Residents Tax-Free Fund IV, Inc.; Puerto Rico Residents Tax-Free Fund V, Inc.; Puerto Rico Residents Tax-Free Fund VI, Inc..; and Puerto Rico Residents Bond Fund I (the “Co-Advised Family of Funds,” and together with the UBS Family of Funds, the “Affiliated Funds”). The UBS Family of Funds is managed by UBS Asset Managers of Puerto Rico, a division of UBS Trust Company of Puerto Rico. The Co-Advised Family of Funds is co-advised by UBS Asset Managers of Puerto Rico and Popular Asset Management, a division of Banco Popular de Puerto Rico. Messrs. Nido, Pellot and Ms. Perez serve on the Board of Directors of each of the investment companies comprising the Co- Advised Family of Funds. **** Considered an “Interested Director” of the Fund as that term is defined in Section 2(a)(19) of the 1940 Act as a result of his employment as an officer of the Fund, the Fund’s investment adviser, or an affiliate thereof. | ||||||||||
3
Disclosure of Fund Expenses
We believe it is important for you to understand the impact of fees regarding your investment. All mutual funds have operating expenses. As a shareholder of a mutual fund, you incur ongoing costs, which include costs for fund management, administrative services, and shareholder reports (like this one), among others. Operating expenses, which are deducted from a mutual fund’s gross income, directly reduce the investment return of a mutual fund. A mutual fund’s expenses are expressed as a percentage of its average net assets. This figure is known as the expense ratio. The following examples are intended to help you understand the ongoing fees (in dollars) of investing in your Fund and to compare these costs with those of other mutual funds. The examples are based on an investment of $1,000 made at the one half year period shown and held for the entire period (July 1, 2022 to December 31, 2022).
The table below illustrates your Fund’s costs in two ways.
| ● | Actual fund return. This section helps you to estimate the actual expenses after fee waivers that you paid over the period. The “Ending Account Value” shown is derived from the Fund’s actual return, and the fourth column shows the dollar amount that would have been paid by an investor who started with $1,000 in the Fund. You may use the information here, together with the amount you invested, to estimate the expenses that you paid over the year. To do so, simply divide your account value by $1,000 (for example, an $8,600 account value divided by $1,000 = 8.6), then multiply the result by the number given for your Fund under the heading “Expenses Paid During Period.” |
| ● | Hypothetical 5% return. This section is intended to help you compare your Fund’s costs with those of other mutual funds. It assumes that the Fund had a return of 5% before expenses during the year, but that the expense ratio is unchanged. In this case, because the return used is not the Fund’s actual return, the results do not apply to your investment. The example is useful in making comparisons because the SEC requires all mutual funds to calculate expenses based on a 5% return. You can assess your Fund’s costs by comparing this hypothetical example with the hypothetical examples that appear in shareholder reports of other mutual funds. |
NOTE: Because the return is set at 5% for comparison purposes — NOT your Funds’ actual return — the account values shown do not apply to your specific investment.
| INTERNATIONAL PORTFOLIO I - CLASS A | Beginning Account Value 10/1/2022 | Ending Account Value 3/31/2023 | Expense Ratio Six Month | Expenses Paid During the Period* | ||||
Actual Fund Return | $1,000 | $942 | 0.91% | $4.43 | ||||
Hypothetical 5% Return | 1,000 | 1,021 | 0.91% | $4.56 |
* Expenses are equal to the Fund’s annualized expense ratio multiplied by the average account value over the period, multiplied by 183/365 (to reflect the one-half year period).
| LARGE CAP CORE PORTFOLIO I - CLASS A | Beginning Account Value 10/1/2022 | Ending Account Value 3/31/2023 | Expense Ratio Six Month | Expenses Paid During the Period* | ||||
Actual Fund Return | $1,000 | $861 | 0.91% | $4.24 | ||||
Hypothetical 5% Return | 1,000 | 1,021 | 0.91% | $4.56 |
* Expenses are equal to the Fund’s annualized expense ratio multiplied by the average account value over the period, multiplied by 183/365 (to reflect the one-half year period).
4
| LARGE CAP CORE PORTFOLIO I - CLASS L | Beginning Account Value 10/1/2022 | Ending Account Value 3/31/2023 | Expense Ratio Six Month | Expenses Paid During the Period* | ||||
Actual Fund Return | $1,000 | $860 | 0.94% | $4.38 | ||||
Hypothetical 5% Return | 1,000 | 1,020 | 0.94% | $4.71 |
* Expenses are equal to the Fund’s annualized expense ratio multiplied by the average account value over the period, multiplied by 183/365 (to reflect the one-half year period).
| LARGE CAP GROWTH PORTFOLIO I - CLASS A | Beginning Account Value 10/1/2022 | Ending Account Value 3/31/2023 | Expense Ratio Six Month | Expenses Paid During the Period* | ||||
Actual Fund Return | $1,000 | $864 | 0.91% | $4.25 | ||||
Hypothetical 5% Return | 1,000 | 1,021 | 0.91% | $4.56 |
* Expenses are equal to the Fund’s annualized expense ratio multiplied by the average account value over the period, multiplied by 183/365 (to reflect the one-half year period).
| LARGE CAP GROWTH PORTFOLIO I - CLASS L | Beginning Account Value 10/1/2022 | Ending Account Value 3/31/2023 | Expense Ratio Six Month | Expenses Paid During the Period* | ||||
Actual Fund Return | $1,000 | $864 | 0.94% | $4.39 | ||||
Hypothetical 5% Return | 1,000 | 1,020 | 0.94% | $4.71 |
* Expenses are equal to the Fund’s annualized expense ratio multiplied by the average account value over the period, multiplied by 183/365 (to reflect the one-half year period).
| LARGE CAP VALUE PORTFOLIO I - CLASS A | Beginning Account Value 10/1/2022 | Ending Account Value 3/31/2023 | Expense Ratio Six Month | Expenses Paid During the Period* | ||||
Actual Fund Return | $1,000 | $905 | 0.91% | $4.35 | ||||
Hypothetical 5% Return | 1,000 | 1,021 | 0.91% | $4.56 |
* Expenses are equal to the Fund’s annualized expense ratio multiplied by the average account value over the period, multiplied by 183/365 (to reflect the one-half year period).
| LARGE CAP VALUE PORTFOLIO I - CLASS L | Beginning Account Value 10/1/2022 | Ending Account Value 3/31/2023 | Expense Ratio Six Month | Expenses Paid During the Period* | ||||
Actual Fund Return | $1,000 | $905 | 0.94% | $4.49 | ||||
Hypothetical 5% Return | 1,000 | 1,020 | 0.94% | $4.71 |
* Expenses are equal to the Fund’s annualized expense ratio multiplied by the average account value over the period, multiplied by 183/365 (to reflect the one-half year period).
| MID CAP CORE PORTFOLIO I - CLASS A | Beginning Account Value 10/1/2022 | Ending Account Value 3/31/2023 | Expense Ratio Six Month | Expenses Paid During the Period* | ||||
Actual Fund Return | $1,000 | $956 | 0.90% | $4.41 | ||||
Hypothetical 5% Return | 1,000 | 1,021 | 0.90% | $4.51 |
* Expenses are equal to the Fund’s annualized expense ratio multiplied by the average account value over the period, multiplied by 183/365 (to reflect the one-half year period).
| MID CAP CORE PORTFOLIO I - CLASS L | Beginning Account Value 10/1/2022 | Ending Account Value 3/31/2023 | Expense Ratio Six Month | Expenses Paid During the Period* | ||||
Actual Fund Return | $1,000 | $956 | 0.93% | $4.56 | ||||
Hypothetical 5% Return | 1,000 | 1,020 | 0.93% | $4.66 |
* Expenses are equal to the Fund’s annualized expense ratio multiplied by the average account value over the period, multiplied by 183/365 (to reflect the one-half year period).
| SMALL CAP CORE PORTFOLIO I - CLASS A | Beginning Account Value 10/1/2022 | Ending Account Value 3/31/2023 | Expense Ratio Six Month | Expenses Paid During the Period* | ||||
Actual Fund Return | $1,000 | $943 | 0.91% | $4.43 | ||||
Hypothetical 5% Return | 1,000 | 1,021 | 0.91% | $4.56 |
* Expenses are equal to the Fund’s annualized expense ratio multiplied by the average account value over the period, multiplied by 183/365 (to reflect the one-half year period).
5
Privacy Notice
The Fund is committed to protecting the personal information that it collects about individuals who are prospective, former or current investors.
If you are located in a jurisdiction where specific laws, rules or regulations require the Fund to provide you with additional or different privacy-related rights beyond what is set forth below, then the Fund will comply with those specific laws, rules or regulations.
The Fund collects personal information for business purposes to process requests and transactions and to provide customer service. Personal information is obtained from the following sources:
| ● | Investor applications and other forms, |
| ● | Written and electronic correspondence, |
| ● | Telephone contacts, |
| ● | Account history (including information about Fund transactions and balances in your accounts with the Distributor or our affiliates, other fund holdings in the UBS family of funds, and any affiliation with the Distributor and its affiliates), |
| ● | Website visits, |
| ● | Consumer reporting agencies |
The Fund limits access to personal information to those employees who need to know that information in order to process transactions and service accounts. Employees are required to maintain and protect the confidentiality of personal information. The Fund maintains physical, electronic, and procedural safeguards to protect personal information.
The Fund may share personal information described above with their affiliates for business purposes, such as to facilitate the servicing of accounts. The Fund may share the personal information described above for business purposes with a non-affiliated third party only if the entity is under contract to perform transaction processing, servicing or maintaining investor accounts on behalf of the Fund. The Fund may share personal information with its affiliates or other companies who are not affiliates of the Fund that perform marketing services on the Fund’s behalf or to other financial institutions with whom it has marketing agreements for joint products or services. These companies are not permitted to use personal information for any purposes beyond the intended use (or as permitted by law). The Fund does not sell personal information to third parties for their independent use. The Fund may also disclose personal information to regulatory authorities or otherwise as permitted by law.
6
Statement Regarding Availability of Quarterly Portfolio Schedule.
Until the registration under the Securities Act of 1933 becomes effective, the Fund is not required to submit Form N-PORT with the U.S. Securities and Exchange Commission (the “SEC”). After registration becomes effective, the Fund will file its complete schedule of portfolio holdings with the SEC for the first and third quarters of each fiscal year as an exhibit to its reports on Form N-PORT. The Fund’s Form N-PORT reports will be available on the SEC’s website at http://www.sec.gov. The quarterly schedule of portfolio holdings will be made available upon request by calling 787-250-3600.
7
Statement Regarding Availability of Proxy Voting Policies and Procedures
A description of the policies and procedures that are used by the Fund’s Investment Adviser to vote proxies relating to the Fund’s portfolio securities is available upon request by calling 787-250-3600 and on the SEC’s website at http://www.sec.gov.
8
Statement Regarding Availability of Proxy Voting Record
Information regarding how the Investment Adviser voted proxies relating to the Fund’s portfolio securities during the most recent 12-month period ended March 31 is available upon request by calling 787-250-3600 and on the SEC’s website at http://www.sec.gov.
9
Statement Regarding Basis for Approval of Investment Advisory Contract
The Board of Directors (the “Board”) of the Fund met on May 11, 2023 (the “Meeting”) to consider the approval of the Investment Advisory Agreements and Sub-Investment Advisory Agreements (collectively, the “Advisory Agreements”) by and between the Fund and each of UBS Asset Managers of Puerto Rico, a division of UBS Trust Company of Puerto Rico, as well as Cambiar Investors, LLC; Atalanta Sosnoff Capital, LLC; Winslow Capital; and The London Company (each, an “Investment Adviser,” and collectively, the “Investment Advisers”). At such meeting, the Board participated in comparative performance reviews with the portfolio managers of the Investment Advisers, in conjunction with other Fund service providers, and considered various investment and trading strategies used in pursuing the Fund’s investment objective(s). The Board also evaluated issues pertaining to industry and regulatory developments, compliance procedures, fund governance and other issues with respect to the Fund and received and participated in reports and presentations provided by the Investment Advisers with respect to such matters.
The independent members of the Board (the “Independent Directors”) were assisted throughout the contract review process by Willkie Farr & Gallagher LLP, as their independent legal counsel. The Board relied upon the advice of such counsel and their own business judgment in determining the material factors to be considered in evaluating the Advisory Agreements and the weight to be given to each such factor. The conclusions reached with respect to the Advisory Agreements were based on a comprehensive evaluation of all the information provided and not any single factor. Moreover, each Director may have placed varying emphasis on particular factors in reaching conclusions with respect to the Advisory Agreements. In evaluating the Advisory Agreements, including the specific fee structures and other terms of such agreements, the Board was informed by multiple years of analysis and discussion amongst themselves and the Investment Advisers. The Board, including a majority of Independent Directors, concluded that the terms of the Advisory Agreements for the Fund were fair and reasonable and that the Investment Advisers’ fees were reasonable in light of the services provided to the Fund.
Nature, Extent and Quality of Services. In evaluating the Advisory Agreements, the Board considered, in relevant part, the nature, extent and quality of the Investment Advisers’ services to the Fund.
The Board considered the vast array of management, oversight, and administrative services the Investment Advisers provide to manage and operate the Fund, and the increases of such services over time due to new or revised market, regulatory or other developments, such as liquidity management and cybersecurity programs, and the resources and capabilities necessary to provide these services. The Independent Directors recognized that the Investment Advisers provide portfolio management services for the Fund. In addition to portfolio management, the Board considered the wide range of administrative or non-advisory services the Investment Advisers provide to manage and operate the Fund (in addition to those provided by other third parties). These services include, but are not limited to, administrative services (such as providing the employees and officers necessary for the Fund’s operations); operational expertise (such as providing portfolio accounting and addressing complex pricing issues, corporate actions, foreign registrations and foreign filings, as may be necessary); oversight of third-party service providers (such as coordinating and evaluating the services of the Fund’s custodian, transfer agent and other intermediaries); Board support and administration (such as overseeing the organization of Board and committee meetings and preparing or overseeing the timely preparation of various materials and/or presentations for such meetings); fund share transactions (monitoring daily purchases and redemptions); shareholder communications (such as overseeing the preparation of annual and semi-annual and other periodic shareholder reports); tax administration and compliance services (such as helping to maintain and update the Fund’s compliance program and related policies and procedures as necessary or appropriate to meet new or revised regulatory requirements and reviewing such program annually,
10
overseeing the preparation of the Fund’s registration statements and regulatory filings, overseeing the valuation of portfolio securities and daily pricing, helping to ensure the Fund complies with its portfolio limitations and restrictions, voting proxies on behalf of the Fund, monitoring the liquidity of the portfolios, providing compliance training for personnel and evaluating the compliance programs of the Fund’s service providers). In evaluating such services, the Board considered, among other things, whether the Fund has operated in accordance with its investment objective(s) and the Fund’s record of compliance with its investment restrictions and regulatory requirements.
In addition to the services provided by the Investment Advisers, the Independent Directors also considered the risks borne by the Investment Advisers in managing the Fund in a highly regulated industry, including various material entrepreneurial, reputational, and regulatory risks. Based on their review, the Independent Directors found that, overall, the nature, extent and quality of services provided under the Advisory Agreements were satisfactory on behalf of the Fund.
Investment Performance of the Fund. In evaluating the quality of the services provided by the Investment Advisers, the Board also received and considered the investment performance of the Fund. In this regard, the Board received and reviewed a report prepared by Broadridge which generally provided the Fund’s performance data for the one, three, five, and ten-year periods ended December 31, 2022 (or for the periods available for the Fund that did not exist for part of the foregoing timeframe) on an absolute basis and as compared to the performance of unaffiliated comparable funds (a “Broadridge Peer Group”). The Board was provided with information describing the methodology Broadridge used to create the Broadridge Peer Group. The performance data prepared for the review of the Advisory Agreements supplements the performance data the Board received throughout the year as the Board regularly reviews and meets with portfolio manager(s) during the year to discuss, in relevant part, the performance of the Fund.
Fees and Expenses. As part of its review, the Board also considered, among other things, the contractual management fee rate, and the net management fee rate (i.e., the management fee after taking into account expense reimbursements and/or fee waivers, if any) paid by the Fund to the Investment Advisers in light of the nature, extent and quality of the services provided. The Board also considered the net total expense ratio of the Fund in relation to those of a comparable group of funds (the “Broadridge Expense Group”). The Board considered the net total expense ratio of the Fund (expressed as a percentage of average net assets) as the expense ratio is more reflective of the shareholder’s costs in investing in the Fund.
In evaluating the management fee rate, the Board considered the Investment Advisers’ rationale for proposing the management fee rate of the Fund which included its evaluation of, among other things, the value of the potential service being provided (e.g., the expertise of the Investment Advisers with the proposed strategy), the competitive marketplace (i.e., the uniqueness of the Fund and the fees of competitor funds) and the economics to the Investment Advisers (e.g., the costs of operating the Fund). The Board considered, among other things, the expense limitations and/or fee waivers proposed by the Investment Advisers to keep expenses to certain levels and reviewed the amounts the Investment Advisers had waived or reimbursed over the last fiscal years; and the costs incurred and resources necessary in effectively managing mutual funds, particularly given the costs in attracting and maintaining quality and experienced portfolio managers and research staff. The Board further considered the Fund’s net management fee and net total expense ratio in light of its performance history.
Profitability. In conjunction with their review of fees, the Independent Directors reviewed information reflecting each Investment Adviser’s financial condition. The Independent Directors reviewed the consolidated financial
11
statements of the Investment Advisers for the year ended December 31, 2022. The Independent Directors also considered the overall financial condition of the Investment Advisers and the Investment Advisers’ representations regarding the stability of each firm, its operating margins, and the manner in which it funds its future financial commitments, such as employee deferred compensation programs. The Independent Directors also reviewed the profitability information for the Investment Advisers derived from their relationship with the Fund for the fiscal year ended December 31, 2022 on an actual and adjusted basis, as described below. The Independent Directors evaluated, among other things, the Investment Advisers’ revenues, expenses, and net income (pre-tax and after-tax) and the net profit margins (pre-tax and after-tax). The Independent Directors also reviewed the level of profitability realized by the Investment Advisers including and excluding distribution expenses incurred by the Investment Advisers from their own resources.
Economies of Scale and Whether Fee Levels Reflect These Economies of Scale. In evaluating the reasonableness of the investment advisory fees, the Board considered the existence of any economies of scale in the provision of services by the Investment Advisers and whether those economies are appropriately shared with the Fund. In its review, the Independent Directors recognized that economies of scale are difficult to assess or quantify, particularly on a fund-by-fund basis, and certain expenses may not decline with a rise in assets. The Independent Directors further considered that economies of scale may be shared in various ways including breakpoints in the management fee schedule, fee waivers and/or expense limitations, pricing of the Fund at scale at inception or other means.
The Board considered that not all funds have breakpoints in their fee structures and that breakpoints are not the exclusive means of sharing potential economies of scale. The Board and the Independent Directors considered each of the Investment Advisers’ statement that it believes that breakpoints would not be appropriate for the Fund at this time given uncertainties regarding the direction of the economy, rising inflation, increasing costs for personnel and systems and growth or contraction in the Fund’s assets, all of which could negatively impact the profitability of the Investment Advisers. In addition, the Investment Advisers noted that since the Fund is an open-end fund, and based upon the Fund’s current operating policies, the ability to raise additional assets is limited, and that the Fund’s asset level had decreased from distributions resulting from the transition to the Fund’s new investment program and from share repurchases. Considering the factors above, the Independent Directors concluded the absence of breakpoints in the management fee was acceptable and that any economies of scale that exist are adequately reflected in the Investment Advisers’ fee structures.
Indirect Benefits. The Independent Directors received and considered information regarding indirect benefits the Investment Advisers may receive as a result of their relationship with the Fund. The Independent Directors further considered the reputational and/or marketing benefits the Investment Advisers may receive as a result of their association with the Fund. The Independent Directors took these indirect benefits into account when assessing the level of advisory fees paid to the Investment Advisers and concluded that the indirect benefits received were reasonable.
12
LIQUIDITY RISK MANAGEMENT PROGRAM
The SEC has adopted Rule 22e-4 under the 1940 Act (the “Liquidity Rule”) in order to promote effective liquidity risk management throughout the open-end investment company industry, thereby reducing the risk that the Fund will be unable to meet its redemption obligations and mitigating dilution of the interests of Fund shareholders. The Fund has adopted and implemented a liquidity risk management program in accordance with the Liquidity Rule (the “Program”). The Program is reasonably designed to assess and manage the Fund’s liquidity risk, which is the risk that the Fund could not meet redemption requests without significant dilution of remaining investors’ interest in the Fund.
As required by the Liquidity Rule, the Program includes policies and procedures providing for an assessment, no less frequently than annually, of the Fund’s liquidity risk that takes into account as relevant to the Fund’s liquidity risk: 1) the Fund’s investment strategy and liquidity of portfolio investments during both normal and reasonably foreseeable stressed conditions; and 2) short-term and long-term cash flow projections for the Fund during both normal and reasonably foreseeable stressed conditions. The Liquidity Rule also requires the classification of the Fund’s investments into categories that reflect the assessment of their relative liquidity under current market conditions. The Fund classifies its investments into one of four categories defined in the Liquidity Rule: “Highly Liquid”, “Moderately Liquid”, “Less Liquid”, and “Illiquid.” Funds that are not invested primarily in “Highly Liquid Investments” (cash or investments that are reasonably expected to be convertible into cash within three business days without significantly changing the market value of the investment) are required to establish a “Highly Liquid Investment Minimum” (“HLIM”), which is the minimum percentage of net assets that must be invested in Highly Liquid Investments. Funds with HLIMs have procedures for addressing HLIM shortfalls, including reporting to the Board of Directors (“BOD”) and the SEC (on a non-public basis) as required by the Program and Liquidity Rule. In addition, the Fund may not acquire an investment if, immediately after the acquisition, over 15% of the Fund’s net assets would consist of “Illiquid Investments” (an investment that cannot reasonably be expected to be sold or disposed of in current market conditions in seven calendar days or less without the sale or disposition significantly changing the market value of the investment). The Liquidity Rule and consequently the Program, also require reporting to the BOD and the SEC (on a non-public basis) if a Fund’s holdings of Illiquid Investments exceed 15% of the Fund’s assets.
At a meeting held on May 25, 2023, the Committee presented a report to the BOD that addressed the operation of the Program and assessed the Program’s adequacy and effectiveness of implementation (the “Report”). The Report covered the period from January 1, 2023, through March 31, 2023, and stated the following:
| ● | The Program, as adopted and implemented, remained reasonably designed to assess and manage the Fund’s liquidity risk and was operated effectively to achieve that goal; |
| ● | The Fund’s investment strategy remained appropriate for an open-end Fund; |
| ● | The Fund was able to meet requests for redemption without significant dilution of remaining investor’s interests in the Fund; |
| ● | The Fund did not breach the 15% limit on Illiquid Investments; and |
| ● | The Fund primarily held Highly Liquid Investments and therefore has not adopted an HLIM. |
13
INVESTMENT ADVISER
UBS Asset Managers of Puerto Rico,
a division of UBS Trust Company of Puerto Rico
250 Muñoz Rivera Avenue, 10th Floor
San Juan, Puerto Rico 00918
ADMINISTRATOR, TRANSFER AGENT, AND CUSTODIAN
UBS Trust Company of Puerto Rico
250 Muñoz Rivera Avenue, 10th Floor
San Juan, Puerto Rico 00918
U.S. LEGAL COUNSEL
Sidley, Austin, Brown & Wood, LLP
787 Seventh Avenue
New York, New York 10019
PUERTO RICO LEGAL COUNSEL
DLA Piper, LLC
500 Calle de la Tanca, Ochoa Building Suite 401
San Juan, Puerto Rico 00901-1969
INDEPENDENT AUDITORS
Ernst & Young LLP
One Manhattan West,
New York, NY 10001
DIRECTORS AND OFFICERS
Carlos V. Ubiñas
Director, Chairman of the Board and President
Agustín Cabrer-Roig
Director
Carlos Nido
Director
Vicente J. León
Director
Luis M. Pellot-González
Director
Clotilde Pérez
Director
José J. Villamil
Director
José Arias
Senior Executive Vice President
Leslie Highley, Jr.
Senior Vice President
William Rivera
First Vice President and Treasurer
Javier Rodríguez
Assistant Vice President and Assistant Treasurer
Heydi Cuadrado
Assistant Vice President
Gustavo Romanach
Assistant Vice President
Liana Loyola, Esq.
Secretary
Remember that:
| • | Mutual Fund’s units are not bank deposits or FDIC insured. |
| • | Mutual Fund’s units are not obligations of or guaranteed by UBS Financial Services Incorporated of Puerto Rico or any of its affiliates. |
| • | Mutual Fund’s units are subject to investment risks, including possible loss of the principal amount invested. |
[This page intentionally left blank]
[This page intentionally left blank]
[This page intentionally left blank]
| ||||
(b) Not applicable.
Item 2. Code of Ethics.
(a) Multi-Select Securities Fund for Puerto Rico Residents (the “Fund” or the “registrant”) has adopted a Code of Ethics that applies to the Fund’s principal executive officer and principal financial officer (the “Code”).
(b) No disclosures are required by this Item 2(b).
(c) The Fund has not made any amendment to the Code during the period covered by this Form N-CSR.
(d) There have been no waivers granted by the Fund to individuals covered by the Code during the period covered by this Form N-CSR.
(e) Not applicable.
(f) A copy of the Code is filed herewith as Exhibit 13(a)(1).
Item 3. Audit Committee Financial Expert.
| (a) | (1) The Board of Directors of the Fund has determined that it has an audit committee financial expert serving on the Fund’s Audit Committee that possesses the attributes identified in Item 3(b) to Form N-CSR. |
(2) The name of the audit committee financial expert is Vicente León. Mr. León has been deemed to be “independent” as that term is defined in Item 3(a)(2) of Form N-CSR. |
(3) Not applicable. |
Item 4. Principal Accountant Fees and Services.
Information provided in response to Item 4 includes amounts billed during the applicable time period for services rendered by Ernst & Young LLP (“E&Y”), the registrant’s principal accountant.
(a) Audit Fees – The aggregate fees billed for professional services rendered by E&Y for the audit of the registrant’s annual financial statements and for services that are normally provided by E&Y in connection with statutory and regulatory filings for the fiscal years ended March 31, 2022, and March 31, 2023, were $115,836 and $115,836, respectively.
(b) Audit-Related Fees – The aggregate fees billed for assurance and related services by E&Y that reasonably relate to the performance of the audit of the registrant’s financial statements and are not reported as audit fees for the fiscal years ended March 31, 2022, and March 31, 2023, were $0 and $0, respectively.
There were no audit-related fees required to be approved pursuant to paragraph (c)(7)(ii) of Rule 2-01 of Regulation S-X during the fiscal years indicated above.
(c) Tax Fees – The aggregate fees billed for professional services rendered by E&Y for tax compliance, tax advice and tax planning in the form of preparation of excise filings and income tax returns for the fiscal years ended March 31, 2022, and March 31, 2023, were $19,109 and $33,408, respectively.
There were no tax fees required to be approved pursuant to paragraph (c)(7)(ii) of Rule 2-01 of Regulation S-X during the fiscal years indicated above.
(d) All Other Fees - The aggregate fees billed for any other products or services provided by E&Y for the fiscal years ended March 31, 2022, and March 31, 2023, other than the services reported in paragraphs (a) through (c) above were $0 and $0, respectively.
There were no “all other” fees required to be approved pursuant to paragraph (c)(7)(ii) of Rule 2-01 of Regulation S-X during the fiscal years indicated above.
(e)(1) The Fund’s Audit Committee Charter requires that the Audit Committee pre-approve all audit and non-audit services to be provided to the Fund by the Fund’s independent registered public accounting firm; provided, however, that the pre-approval requirement with respect to non-auditing services to the Fund may be waived consistent with the exceptions provided for in the Securities Exchange Act of 1934, as amended.
All the audit and tax services described above for which E&Y billed the Fund fees for the fiscal years ended March 31, 2022, and March 31, 2023, were pre-approved by the Audit Committee. For the fiscal years ended March 31, 2022, and March 31, 2023, the Fund’s Audit Committee did not waive the pre-approval requirement of any non-audit services to be provided to the Fund by E&Y.
(e)(2) Not applicable.
(f) Not applicable.
(g) The aggregate fees billed by E&Y for non-audit services rendered to the registrant, its investment adviser and any entity controlling, controlled by or under common control with the adviser that provides ongoing services to the registrant for the fiscal years ended March 31, 2022, and March 31, 2023, other than those disclosed in (c) and (d) above, were $0 and $0, respectively.
(h) The Audit Committee of the registrant’s Board of Directors considered the provision of non-audit services that were rendered to the registrant’s investment adviser, and any entity controlling, controlled by or under common control with the investment adviser that provides ongoing services to the registrant that were not pre-approved pursuant to paragraph (c)(7)(ii) of Rule 2-01 of Regulation S-X and concluded that such services are compatible with maintaining the principal accountant’s independence.
(i) Not applicable.
(j) Not applicable.
Item 5. Audit Committee of Listed Registrants.
Not applicable.
Item 6. Investments.
(a) Schedule of Investments is included as a part of the report to unitholders included under Item 1 of this Form N-CSR.
(b) Not applicable.
Item 7. Disclosure of Proxy Voting Policies and Procedures for Closed-End Management Investment Companies.
Not applicable.
Item 8. Portfolio Managers of Closed-End Management Investment Companies.
Not applicable.
Item 9. Purchases of Equity Securities by Closed-End Management Investment Company and Affiliated Purchasers.
Not applicable.
Item 10. Submission of Matters to a Vote of Security Holders.
There have been no material changes to the procedures by which unitholders may recommend nominees to the Fund’s Board of Trustees during the period covered by this Form N-CSR filing.
Item 11. Controls and Procedures.
(a) The Fund’s principal executive and principal financial officers have concluded that the Fund’s disclosure controls and procedures (as defined in Rule 30a-3(c) under the 1940 Act) are effective, as of a date within 90 days of the filing date of this Form N-CSR based on their evaluation of these controls and procedures required by Rule 30a-3(b) under the 1940 Act and Rules 13a-15(b) or 15d-15(b) under the Securities Exchange Act of 1934.
(b) There were no changes in the Fund’s internal control over financial reporting (as defined in Rule 30a-3(d) under the 1940 Act) that occurred during the period covered by this report that has materially affected, or is reasonably likely to materially affect, the Fund’s internal control over financial reporting.
Item 12. Disclosure of Securities Lending Activities for Closed-End Management Investment Companies.
Not applicable.
Item 13. Exhibits.
(a) (1) Code of Ethics is filed herewith.
(a) (2) The certifications required by Rule 30a-2(a) under the 1940 Act are filed herewith.
(a) (3) Not applicable.
(a)(4) Not applicable.
(b) Certification pursuant to Section 906 of the Sarbanes-Oxley Act of 2002 is filed herewith.
SIGNATURES
Pursuant to the requirements of the Securities Exchange Act of 1934 and the Investment Company Act of 1940, the registrant has duly caused this report to be signed on its behalf by the undersigned, thereunto duly authorized.
MULTI-SELECT SECURITIES FUND FOR PUERTO RICO RESIDENTS
By: | /s/ Carlos V. Ubiñas | |
Carlos V. Ubiñas | ||
President | ||
Date: | June 1, 2023 | |
Pursuant to the requirements of the Securities Exchange Act of 1934 and the Investment Company Act of 1940, this report has been signed below by the following persons on behalf of the registrant and in the capacities and on the dates indicated.
By: | /s/ Carlos V. Ubiñas | |
Carlos V. Ubiñas | ||
President | ||
Date: | June 1, 2023 | |
By: | /s/ William Rivera | |
William Rivera | ||
First Vice President and Treasurer | ||
Date: | June 1, 2023 | |