Exhibit 99.1
| | Nova Minerals Ltd | Annual Report  | 2 |
Contents
| | Nova Minerals Ltd | Annual Report | 3 |
Message from the CEO, Christopher Gerteisen |  |
Dear Fellow Shareholders,
It is with great pleasure that I present to you Nova Minerals Ltd’s 2024 Annual Report, which details the exciting progress we have made both corporately and in our development of the Estelle Gold and Critical Minerals District.
We are excited with how the Estelle project is unfolding with optionality available in terms of the initial project size and scale. This allows us development flexibility to align with current market conditions, whereby future growth can be achieved through cash flow and/or strategic partnerships to meet our objective of ultimately growing the Estelle Project into a tier 1 producer. In addition, a near-term cash flow opportunity in advancing the stand-alone antimony project is being pursued with ongoing discussion and support of the DoD that will run in parallel to our gold project within the wider Estelle Gold and Critical Elements District.
With the RPM deposit having some of the best drill intercepts in the last 10 years globally, coupled with the positive technical parameters we have seen in our test work, we are laser focussed on completing the PFS on the lower capex, high margin, RPM start up production scenario. Upon completion of the PFS we are positioned to begin the permitting process to put RPM into production and achieve cash flow, enabling us to organically develop the larger Estelle Gold Project at the RPM and Korbel deposits. We are also maintaining communications with potential strategic partners that would see project expansion on a much faster timeline.
Antimony is currently in the spotlight with global supply shortages and historic high prices. At Estelle we have identified two highly prospective antimony-gold zones at Stibium and Styx with surface samples returning results up to 60.5% Sb. While the potential scale of this discovery continues to be assessed by our technical team, these discoveries represent a significant opportunity for the company, and Nova is in advanced discussions with various agencies within the US Dept. of Defense and has submitted applications for US federal grants to develop these resources with an aim towards fully securing the US domestic supply chain. Given the additional value that antimony production could add to the project, antimony will now also be considered in future project studies. The speed of this work and potential production is subject to DoD grant funding.
Subsequent to the end of year after many countless hours of dedication, the company also completed a major milestone with the dual listing on the NASDAQ, under ticker code NVA.
As of the date of this report we are well-funded with fantastic near-term gold and antimony development opportunities across the Estelle Project that offer us great optionality and flexibility along the way. We have a clear strategy and focus to move towards production for early cash flow and are confident in the value proposition we are creating via our current strategy. There are many catalysts for share price appreciation over the next year to create a high-grade, high margin project at RPM, and grow organically into the much larger Korbel deposit and wider Estelle district, while continuing to expand the RPM resource with the added gratuity of establishing a standalone antimony project with DoD support. Concurrently, we have only scratched the surface and our ongoing exploration programs continue to advance the over 20 other known prospects containing gold, antimony, silver, copper, and other critical elements across the Estelle Project. I encourage you to review our activities in greater detail as described in this annual report and on our website to truly understand the magnitude, opportunity, and value Estelle presents to the investor.
I, together with the rest of the Nova team, thank you for your continued support as we continue to push forward rapidly on our path towards production

Christopher Gerteisen
CEO and Executive Director
| | Nova Minerals Ltd | Annual Report | 4 |
| | Nova Minerals Ltd | Annual Report | 5 |
Review of Operations
Strategic Review
During the year Nova conducted a strategic review on its Estelle Gold Project to investigate opportunities to improve the proposed flowsheet (Figure 2) which could potentially increase gold production, whilst reducing the capital and operating costs of the project, and to look at ways to get Estelle into production sooner (Figure 1). The review identified a number of material opportunities which are now being tested as part of the PFS level studies currently underway, and which have been identified as being important to potential partners and funders in early discussions. Items identified include:
Development Optionality
| 1. | High-Grade RPM Starter Mine |
Establishing an initial lower capex smaller scale operation at the high-grade RPM deposit for potential near term cashflow at high margins to self-fund expansion plans; and/or
| 2. | Expanded Project – Korbel + RPM + Regional |
Scalability – Large project for both gold and critical minerals with a pipeline spanning decades of potential production from over 20 known prospects. Higher capex larger mining operation with increased gold production, cash flow, and mine life, which is of interest to potential future large gold company strategic partners.
| 3. | Stand Alone Antimony-Gold Starter Mine: |
With China announcing export restrictions on antimony, the Company is now also investigating the possibility to fast track the Stibium gold-antimony prospect development option with potential US Dept. of Defense (DoD) support.
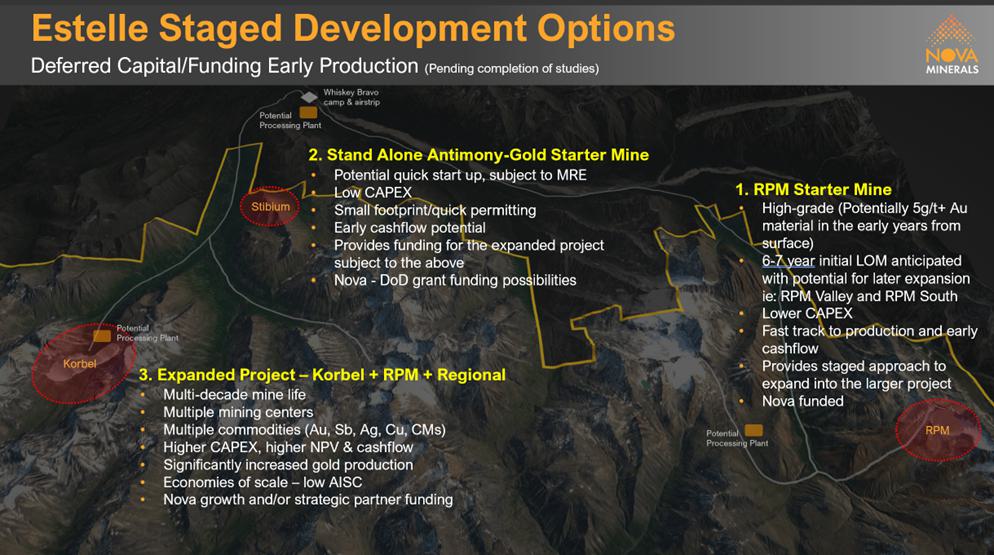
Figure 1. Estelle staged development options
| | Nova Minerals Ltd | Annual Report | 6 |
Heap Leaching Lower Grade Ore
| ● | Evaluating heap leaching, a well-proven low cost gold recovery method which could potentially recover gold from the 100’s of millions of tons of lower grade material and the reject material from the ore sorters, which in the current flowsheet is waste, to provide a lift to the annual gold production profile. METS Engineering (METS) has commenced test work on bulk samples sent to Perth late last year using a finer crush size, with early stage indications looking positive. |
| | |
| ● | Investigating various heap leaching options, including agglomeration, and alternative leach reagents, with results expected in the 2nd half of 2024. |
Critical Minerals Extraction
| ● | Assessing extraction options of the highly elevated concentrations of Silver, Copper, Antimony and other CM identified across the project which could potentially provide valuable bi-product credits and which the US government is currently trying to sure up a domestic supply. |
Ore Sorting Options
| ● | Reviewing various selective ore sorting options on material from both RPM and Korbel with Steinart ore sorting to test a combination of different sensors including, XRT density, colour, laser, and induction, to potentially improve the ore sorting results further. |
| | |
| ● | Early-stage discussions with potential partners and funders has shown the need to demonstrate the capabilities of ore sorting on a larger scale. A bulk, up to 200 kt, pilot scale ore sort test program is currently being planned in consultation with Rough Stock, METS and Steinert. |
Alternative Technologies
| ● | Investigating alternative technology options, such as SAG (Semi Autogenous Grinding) mills, coarse flotation using Hydrofloat technology, and gravity recovery using a Reflux Classifier to further improve and optimize the process flowsheet. |
| | |
| ● | The review also identified numerous power options that would meet the startup requirements (10-20MW) for the Estelle Project with the ability to scale up in the future. |
Resource Drilling
| ● | The review also identified that additional drilling was required at RPM this year, with a focus on increasing the resource to the higher measured and indicted categories to prove up a larger ore reserve for the PFS. |
| | |
| ● | Maiden drill testing at the Stibium, Train, Trumpet, Muddy Creek and Stoney prospects, to follow up on the high-grade surface samples of gold, antimony and other CM discovered in those areas last year, was also identified as being a necessity to increase gold resources and to support the proposed CM bi-product extraction. |
Road Access
| ● | While the review recognised the importance of the West Susitna Access Road (WSAR), which is due to break ground in 2025, it also identified that Nova could potentially utilize the road at an early stage and commence mine construction using the initial frontier trail along the proposed WSAR alignment prior to the road being fully completed, along with the winter snow road to transport equipment to site. |
| | Nova Minerals Ltd | Annual Report | 7 |

Figure 2. Current and proposed conceptual flowsheet, which is being tested as part of the PFS level studies underway
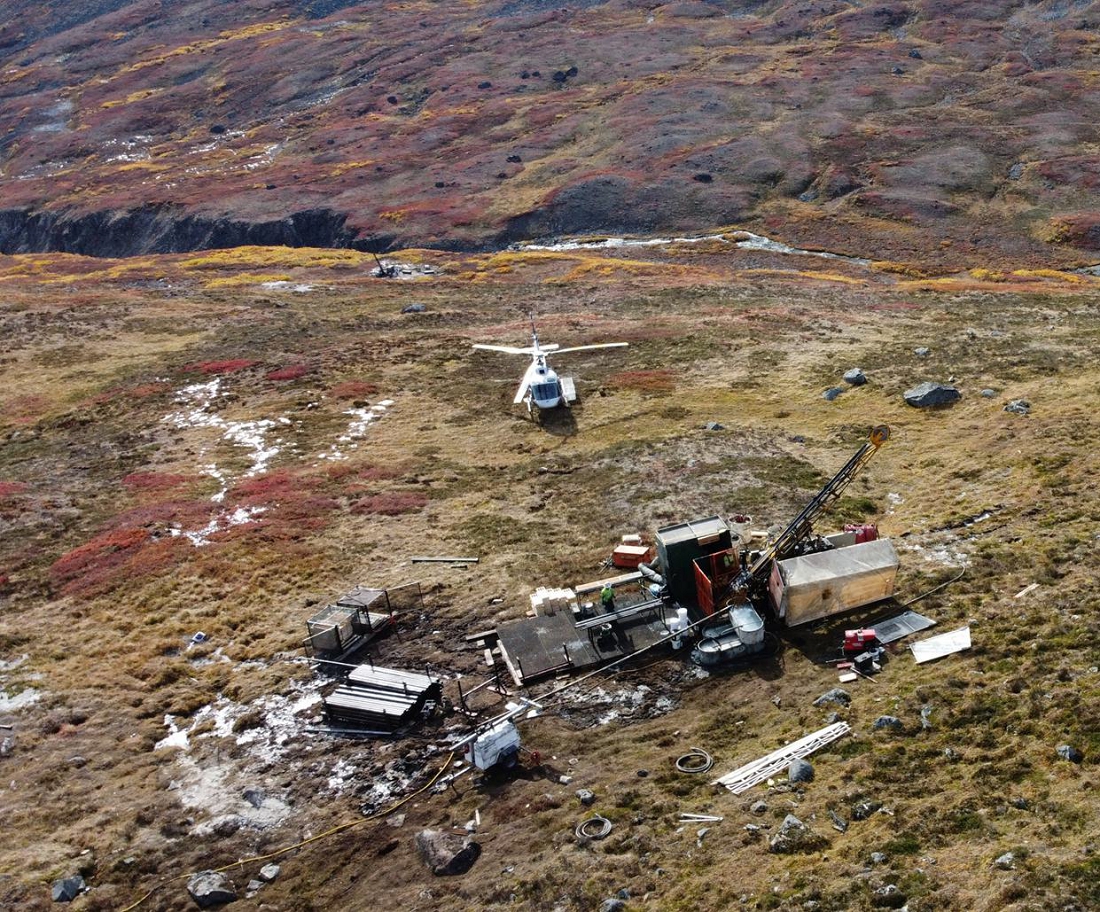
Drill Program Results
During the 1st half of the 2024 financial year, Nova undertook a highly targeted ~6,600m diamond drill program at RPM. The primary aim of this program was to increase both the size and confidence of the resource at RPM.
At RPM North, the high-grade infill and step-out drilling confirmed the consistency of mineralization and resource extension potential at RPM North to the South, East and at depth, with over 10 broad intersections grading > 5 g/t Au. Highlight results included:
| ● | RPM-056: 152m @ 2.3 g/t Au from 3m, including 98m @ 3.4 g/t Au from 48m and 38m @7.5 g/t Au from 99m |
| | |
| ● | RPM-057: 211m @ 3.2 g/t Au from 3m, including 120m @ 5.0 g/t Au from 93m and 79m @ 7.4 g/t Au from 128m |
| | |
| ● | RPM-065: 314m @ 1.9 g/t Au from 2m, including 231m 2.4 g/t Au from 39m and 118m 3.9 g/t Au from 152m |
At RPM Valley, drilling confirmed an additional zone of broad high-grade gold with mineralization remaining wide open and the potential exists for RPM Valley to connect with RPM North. Highlight results included:
| ● | RPM-048: 54m @ 1.2 g/t Au from 244m including 22m @ 1.8 g/t Au from 255m and 16m @ 2.4 g/t Au from 255m |
| | |
| ● | RPM-060: 54m @ 2.1 g/t Au from 260m including 42m @ 2.6 g/t Au from 270m and 17m @ 5.3 g/t Au from 273m |
At RPM South, infill and extensional drilling continued to show large intervals of near surface gold. Importantly, 6 of the 7 holes drilled had average grades above the current MRE grade for RPM South of 0.4 g/t Au and a number of the significantly intercepts were also greater than the 0.73 g/t Au mill feed grade used in the 2023 scoping study. Highlight results included:
| ● | RPM-039: 30m @ 1.2 g/t Au from 30m, 7m @ 2.1 g/t Au from 48m including 1m @ 7.7 g/t Au from 48m |
| | Nova Minerals Ltd | Annual Report | 8 |
The drill results from the overall 2023 drilling program at RPM clearly demonstrate that RPM is a large system that continues to grow with the deposit remaining wide open in several directions where the potential remains for continuity linking the mineralized zones and to discover further very high-grade pods similar to RPM North. The planned 2024 resource drilling program will prioritize RPM to increase and prove up resources for inclusion in the upcoming Pre-Feasibility Study (PFS).
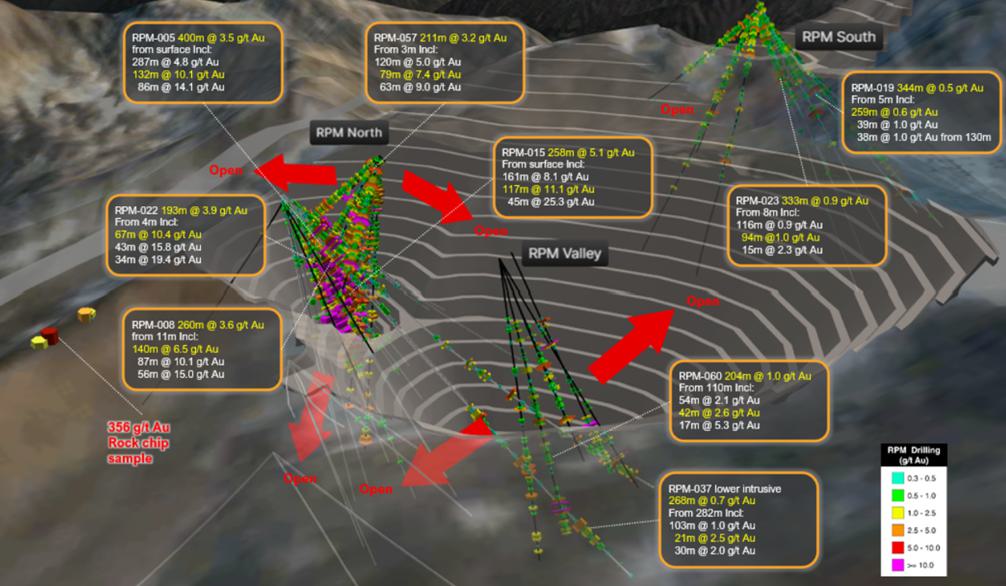
Figure 3. High-light drill results at RPM. Black drill traces show 2023 drilling
New Discoveries from an Extensive Surface Exploration Program
During the 2023 field season Nova’s Head of Exploration, Mr Hans Hoffman, undertook an extensive surface exploration mapping and sampling program across the entire Estelle Gold Project comprising of over 45 traverses covering 100-line kilometers, 674 soil samples, 446 rock samples and 21 stream sediment samples. The program resulted in a number of significant new discoveries including:
| ● | A record 1,290 g/t Au rock chip sample, along with many other samples returning high-grades for gold, antimony, copper and silver at the Shoeshine and Shadow prospects (Figure 4). |
| | |
| ● | The discovery of one of the most continuous high-grade zones of mineralization on the property at the new Discovery and Muddy Creek prospects, with a 1.5km long surface gold anomaly including 18 rock samples grading > 10 g/t Au, with a high of 127.5 g/t Au and 15 multi-gram soil samples > 2/g/t Au, with a high of 6.1 g/t Au (Figure 4). |
| | |
| ● | The identification of two new gold-antimony prospect areas, Stibium and Styx with surface samples returning highs of 12.7g/t Au, 2.1% Sb, 1600g/t Ag and 1.5g/t Au, 60.5% Sb. |
| | |
| ● | Further numerous high-grade gold, silver, copper and antimony at the Train and Trumpet prospects with a high of 132.5 g/t Au, 1.2% Cu and 0.1% Sb and one sample returning a very high 16.8% Sb (Figure 4). |
| | |
| ● | The identification of the thickest gold-bearing veins to date with over a 1km strike length and grades up to 24.2 g/t Au at the new Wombat Prospect. |
| | Nova Minerals Ltd | Annual Report | 9 |
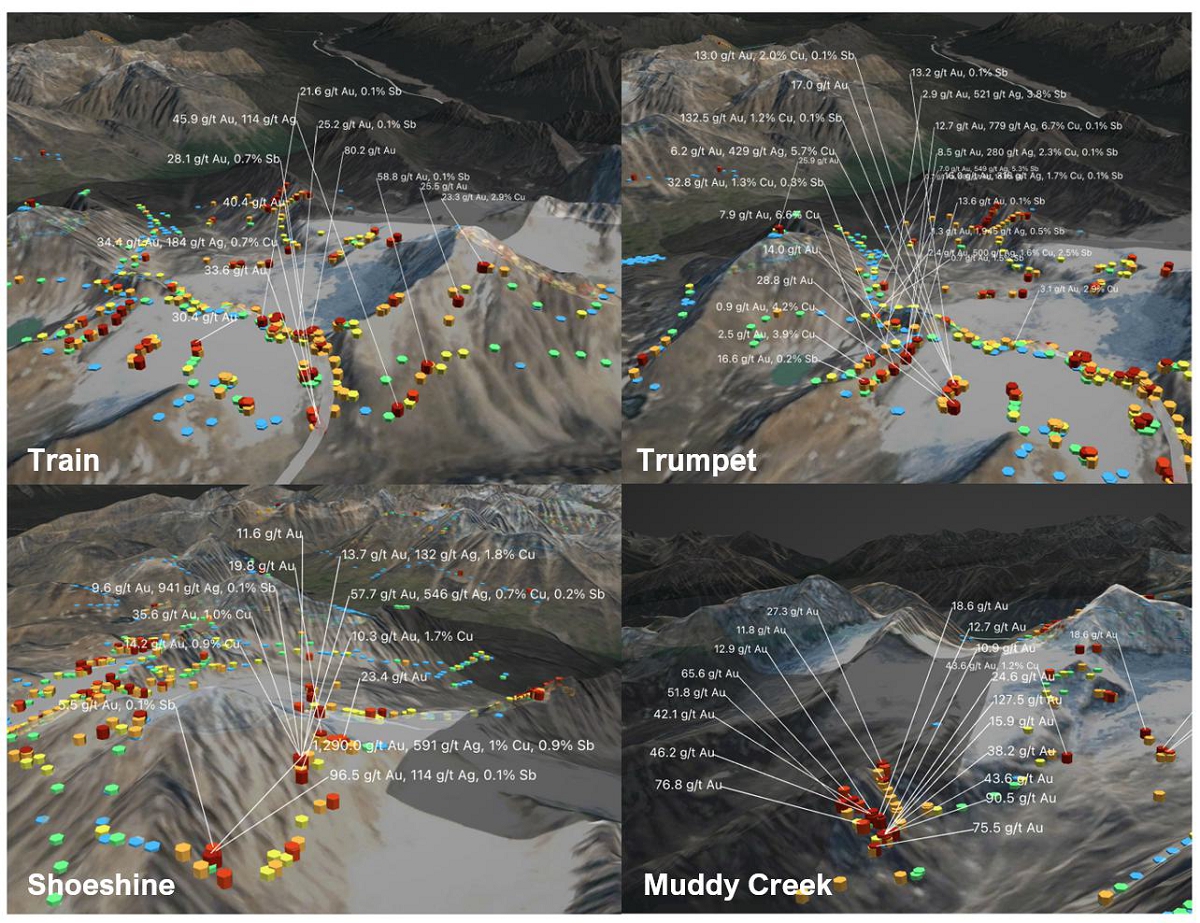
Figure 4. High-grade rock and soil samples discovered in 2023 in the Train, Trumpet, Shoeshine and Muddy Creek prospects
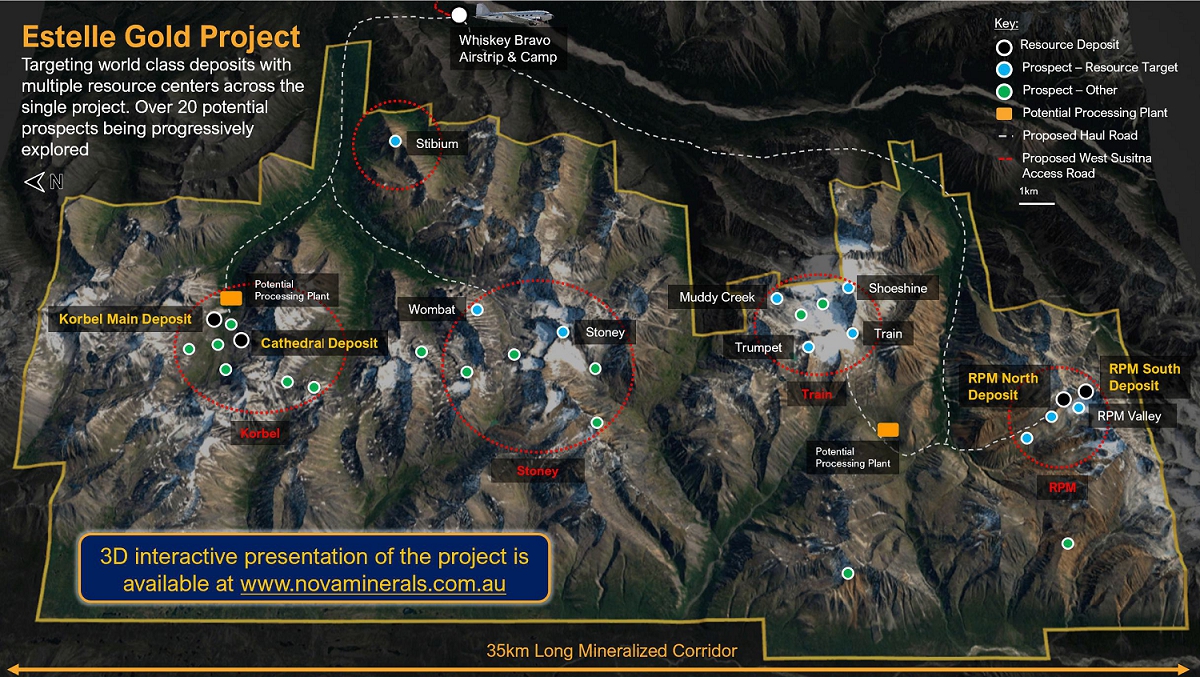
Figure 5. The Estelle Gold Project, a 513km2 district scale project on State Alaska mining claims with over 20 prospects advancing at varying stages. And not just gold, with future targets including antimony, silver, copper and other critical minerals to expand the exploration pipeline for longer term opportunity.
| | Nova Minerals Ltd | Annual Report | 10 |
New Gold-Antimony Targets Discovered
The discovery of high grade stibnite a primary ore source for the critical mineral antimony (Figures 6 and 7), associated with the gold systems at several prospects across the project site, represented a significant development for the Company as antimony is listed as a critical and strategic mineral to US economic and national security interests with no current US domestic supply.
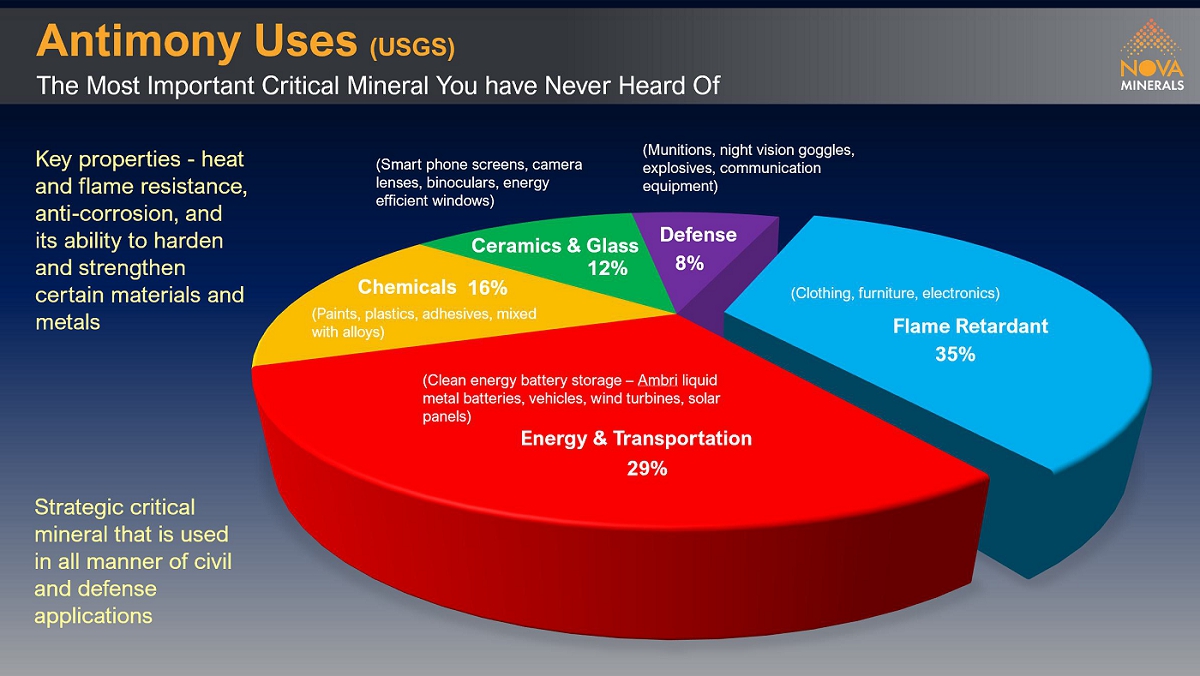
Figure 6. Antimony uses (Source USGS)
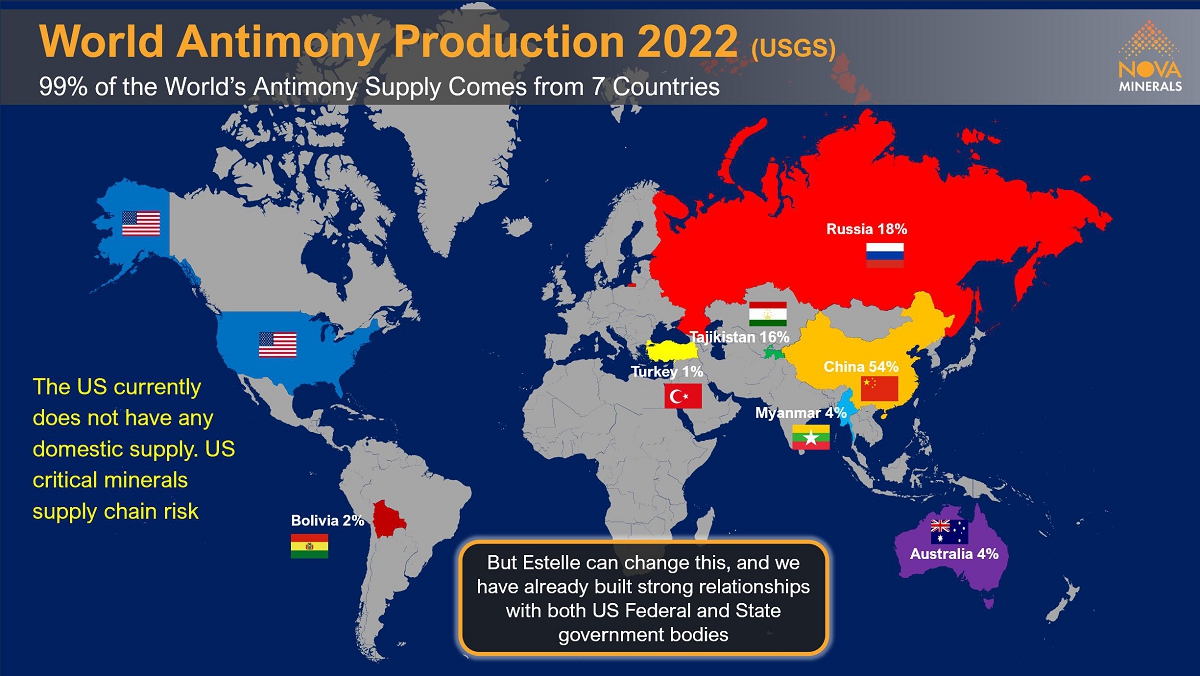
Figure 5. Antimony supply (Source USGS) – No US domestic supply currently While the potential scale of this discovery continues to be assessed by our technical team, Nova has now appointed a highly reputable national consulting group and assembled a highly influential internal team, to assist the company with accessing any potential US federal grants and funding to further investigate and progress the discovery across the entire supply chain. Given the additional value that antimony could add to the project, via the potential to provide substantial bi-product credits amongst other benefits, antimony will now also be included in any future studies.
| | Nova Minerals Ltd | Annual Report | 11 |
Significant Subsequent Events
US NASDAQ Listing
On 24 July 2024 Nova announced that it had successfully completed its US listing on the NASDAQ under the symbol NVA, along with an associated US$3.3m (AUD$4.9m) capital raising, before deducting underwriting discounts and offering expenses. The public offering comprised of 475,000 units, with each unit consisting of one American Depositary Share representing ordinary shares (“ADS”) and one warrant, with an ADS-to-ordinary-share ratio of 1 to 60, at a price to the public of US$6.92 per unit, Each whole warrant is exercisable for one ADS at an exercise price of US$7.266 per ADS, and will be immediately exercisable upon issuance for a period of five years following the date of issuance. In addition, Nova granted the underwriters an option to purchase up to an additional 47,500 ADSs and/or an additional 47,500 warrants to cover over-allotments, if any until August 29, 2024.
2025 Financial Year Next Steps
| ● | RPM resource drilling and results |
| | |
| ● | Updated Mineral Resource Estimate (MRE) for 2023 and 2024 drilling results, and higher gold price |
| | |
| ● | Lidar survey results across the property to enable detailed infrastructure design, mineral reserve classification, exploration, etc. |
| | |
| ● | Material PFS test work results and trade-off studies as they become available |
| | |
| ● | Results and potential new discoveries from the ongoing surface exploration mapping and sampling program |
| | |
| ● | Metallurgical test work ongoing |
| | |
| ● | Environmental test work ongoing |
| | |
| ● | West Susitna access road update |
| | Nova Minerals Ltd | Annual Report | 12 |
| | Nova Minerals Ltd | Annual Report | 13 |
Financial Report
| | Nova Minerals Ltd | Annual Report | 14 |
Directors’ Report
The directors present their report, together with the financial statements, on the consolidated entity (referred to hereafter as the ‘consolidated entity’) consisting of Nova Minerals Limited (referred to hereafter as the ‘company’ or ‘parent entity’) and the entities it controlled at the end of, or during, the year ended 30 June 2024.
Directors
The following persons were directors of Nova Minerals Limited during the whole of the financial year and up to the date of this report, unless otherwise stated:
Richard Beazley (Appointed 24 July 2024)
Christopher Gerteisen
Louie Simens
Craig Bentley
Rodrigo Capel Pasqua
Avi Geller
Principal Activities
During the financial year the principal contributing activities of the consolidated entity consisted of mining exploration.
Dividends
There were no dividends paid, recommended, or declared during the current or previous financial year.
Review of Operations
Statement of Profit or Loss and Other Comprehensive Income
As an exploration company, Nova does not have an ongoing source of revenue. Its revenue stream is normally from interest received on cash at bank. Administration expenses increased from $2,721,273 in 2023 to $3,536,622 in 2024 primarily due to increase legal costs, USA listing fees, and marketing fees. Share-based expense was $780,235 in 2023 compared to $335,669 in 2024. Snow Lake Resources impairment was nil 2023 compared to $8,824,187 in 2024. Share of losses of associate was $6,254,759 in 2023 compared to $839,153 in 2024. As a result the loss for the consolidated entity after providing for income tax amounted to $16,389,292 (2023: $11,571,240).
Statement of Financial Position
At 30 June 2024, the Company had cash at bank of $3,149,909 (2023: $19,240,707). During the year, trade and other receivables decreased from $495,186 to $328,794, and capitalised exploration expenditure increased from $81,070,075 to $92,117,750 as a result of expenditure incurred on the Estelle Gold project. At 30 June 2024, the Company had total liabilities of $8,862,289 (2023: $8,946,817). As a result, the Company had net assets of $98,383,732 as at 30 June 2024 (2023: $113,389,965).
Cashflow
During the year, the Company paid $3,666,768 (2023: $3,083,677) for operating activities; paid $13,321,921 (2023: $24,139,677) for investing activities; and received $986,892 (2023: $25,158,615) from financing activities.
Significant Changes in the State of Affairs
There were no significant changes in the state of affairs of the consolidated entity during the financial year.
| | Nova Minerals Ltd | Annual Report | 15 |
Matters Subsequent to the End of the Financial Year
The following events have occurred subsequent to 30 June 2024:
| ● | The Company announced on 24 July 2024 the NASDAQ IPO and an underwritten public offering of 475,000 units, with each unit consisting of one American Depositary Share representing ordinary shares (“ADS”) and one warrant, with an ADS-to-ordinary-share ratio of 1 to 60, at a price to the public of US$6.92 per unit, for gross proceeds of approximately US$3.3m (AUD$4.9m), before deducting underwriting discounts and offering expenses. Each whole warrant is exercisable for one ADS at an exercise price of US$7.266 per ADS and will be immediately exercisable upon issuance for a period of five years following the date of issuance. In addition, Nova has granted the underwriters an option to purchase up to an additional 47,500 ADSs and/or an additional 47,500 warrants to cover over-allotments, if any until August 29, 2024. |
| | |
| ● | The Company announced on 24 July 2024 the appointment of Mr. Richard Beazley to the Board of Directors as Independent Non-Executive Chairman. Mr. Louie Simens reverted to Executive Director from his Interim Chairman position at that time. |
| | |
| ● | The Company announced on 31 July 2024 the commencement of resource definition drilling at RPM and exploration field programs on its Estelle Gold Project. |
| | |
| ● | The Company announced on 21 August 2024 an update on the progress of its 2024 resource definition drilling and exploration field programs. |
| | |
| ● | The Company announced on 5 September 2024 an update on its Antimony-Gold prospects at Stibium and Styx where bulk samples of stibnite (antimony) have been collected for metallurgical testing. |
| | |
| ● | The Company announced on 20 September 2024 that has filed a registration statement on Form F-1 with the U.S. Securities and Exchange Commission (“SEC”) relating to a secondary public offering of its American Depositary Shares (“ADSs”), each of which will represent 60 of the Company’s ordinary shares of no par value each (“Ordinary Shares”) in the United States (the “Offering”). |
| | |
| ● | The Company announced on 20 September 2024 that it had executed a variation agreement with its largest institutional shareholder and convertible note holder, Nebari Gold Fund 1, LP (“Nebari”), to reduce the month-end cash covenant required under the previously announced loan agreement dated 21 November 2022 from US$2m to A$1m, with the option to extend the convertible facility for a further 12 months to 29 November 2026. In return for Nebari’s support, Nova has agreed to amend the conversion price from A$0.53 to A$0.25, subject to shareholder approval. |
| | |
| ● | Further to the announcement on 20 September 2024, the Company announced the ability to accelerate the RPM early start up option to a Pre-Feasibility Study (PFS) for delivery in 2025 by undertaking internal optimization studies aimed to investigate how it can potentially generate as much early cashflow as possible to organically fund our expansion plans across the Estelle project. It also gives the Company the ability to continue our advanced discussions with the US Dept. of Defense (“DoD”) in relation to potentially establishing a starter antimony operation at Stibium in parallel. |
| | |
| ● | The Company announced on 24 September 2024 a secondary NASDAQ public offering of 430,000 units, with each unit consisting of one American Depositary Share representing ordinary shares (“ADS”), with an ADS-to-ordinary-share ratio of 1 to 60, at a price to the public of US$5.00 per unit, for gross proceeds of approximately US$2.15m (AUD$3.14m), before deducting underwriting discounts and offering expenses. In addition, Nova has granted the underwriters an option to purchase up to an additional 43,000 ADSs to cover over-allotments, if any, for 45 days. |
No other matters or circumstance has arisen since 30 June 2024 that has significantly affected, or may significantly affect the consolidated entity’s operations, the results of those operations, or the consolidated entity’s state of affairs in future financial years.
Likely Developments and Expected Results of Operations
Information on likely developments in the operations of the consolidated entity and the expected results of operations have not been included in this report because the directors believe it would be likely to result in unreasonable prejudice to the consolidated entity.
| | Nova Minerals Ltd | Annual Report | 16 |
Environmental Regulation
The exploration activities of the Company are conducted in accordance with and controlled principally by government legislation in Alaska, United States of America.
The Company has exploration land holdings in Alaska (USA) and Manitoba (Canada). The Company employs a system for reporting environmental incidents, establishing and communicating accountability, and rating environmental performance. During the year, data on environmental performance was reported as part of the monthly exploration reporting regime. In addition, as required under various state and territory legislation, procedures are in place to ensure that the relevant authorities are notified prior to the commencement of ground disturbing exploration activities.
The Company is committed to minimising the impact of its activities on the surrounding environment, while at the same time aiming to maximise the social, environmental and economic returns for the local community. To this end, the environment is a key consideration in our exploration activities and during the rehabilitation of disturbed areas. Generally, rehabilitation occurs immediately following the completion of a particular phase of exploration. In addition, the Company continues to develop and maintain mutually beneficial relationships with the local communities affected by its activities.
Material Business Risks
The key risk factors affecting the Company are set out below. The occurrence of any of the risk below could adversely impact the Company’s operating or financial performance.
There are specific risks which relate directly to the Company’s business. In addition, there are other general risks, many of which are largely beyond the control of the Company and the Directors. The risks identified in this section, or other risk factors, may have a material impact on the financial performance of the Company and the market price of the Shares.
The following is not intended to be an exhaustive list of the risk factors to which the Company is exposed.
| (a) | General risks associated with operating overseas |
The Company conducts and has interests in operations in the USA and Canada. Consequently, the Company will be subject to the risks associated with operating in such countries. Such risks can include economic, social or political instability or change, hyperinflation, currency non-convertibility or instability and changes of law affecting foreign ownership, government participation, taxation, working conditions, rates of exchange, exchange control, exploration licensing, export duties, repatriation of income or return of capital, environmental protection, mine safety, labour relations as well as government control over mineral properties or government regulations.
Changes to mining or investment policies and legislation or a shift in political attitude may adversely affect the Company’s operations and profitability.
| (b) | Future capital requirements |
The Company believes its available cash should be adequate to fund its exploration and corporate activities and other Company objectives in the short-to medium-term.
However, in order to successfully develop its lithium projects and for production to commence, the Company may require additional financing in the future. Any additional equity financing may be dilutive to Shareholders, may be undertaken at lower prices than the then market price or may involve restrictive covenants which limit the Company’s operations and business strategy. Debt financing, if available, may involve restrictions on financing and operating activities.
Although the Directors believe that additional capital can be obtained as and when required, no assurances can be made that appropriate capital or funding, if and when needed, will be available on terms favourable to the Company or at all. If the Company is unable to obtain additional financing as needed, it may be required to reduce the scope of its activities and this could have a material adverse effect on the Company.
| | Nova Minerals Ltd | Annual Report | 17 |
The mineral claims in which the Company will, or may, acquire an interest in the future are subject to the applicable local laws and regulations.
Mineral claims in which the Company has an interest are subject to the relevant conditions applying in each jurisdiction. Failure to comply with these conditions may render the mineral claims liable for forfeiture.
The mineral claims will be subject to application for renewal from time to time. Renewal of the term of each mineral claim is subject to applicable legislation. If the mineral claim is not renewed for any reason, the Company may suffer significant damage through loss of the opportunity to develop and discover any mineral resources on that mineral claim.
Overseas jurisdictions are subject to differing legal and political systems, when compared with the systems in place in Australia.
Possible risks include, without limitation, changes in the terms of mining legislation, changes to royalty arrangements, changes to taxation rates and concessions and changes in the ability to enforce legal rights. Any of these factors may, in the future, adversely affect the financial performance of the Company and the market price of its Shares.
In relation to the Company’s projects in Canada, there may be areas over which First Nations land claims exist at present or in the future. The impact of any such claim on the Company’s Canadian projects cannot be foreseen with any degree of certainty and no assurance can be given that a broad recognition of First Nations rights in the areas in which the Canadian Projects are located would not have an adverse effect on the Company’s activities. Even in the absence of such recognition, the Company may at some point be required to negotiate with and seek the approval of holders of First Nations interests in order to facilitate exploration and development work on the Company’s mineral properties. It cannot be assured that the Company will be able to establish practical working relationships with the First Nations in the area which would allow it to ultimately develop the Company’s Canadian projects.
The Company is required to pay royalties on some or all minerals derived from its projects.
There is a risk that the royalties will have an impact on the economics of progressing any proposed mining operations. However, the Company has no control over the incurrence of these costs and is unable to predict the magnitude of such costs.
| (g) | Exploration and operating costs |
The proposed exploration expenditure of the Company is based on certain assumptions with respect to the method and timing of exploration and feasibility work. By their nature, these estimates and assumptions are subject to significant uncertainties and, accordingly, the actual costs may materially differ from these estimates and assumptions. Accordingly, no assurance can be given that the cost estimates and the underlying assumptions will be realised in practice.
The Company is not aware of any expenses that may need to be incurred that have not been taken into account. However, if such unforeseen expenses were subsequently incurred, the expenditure proposals of the Company may be adversely affected.
The Company may need to seek various Federal, state or local permits and approvals to undertake exploration or mining activities on the Mineral Claims. This could result in unforeseen delay in the undertaking of such activities.
The Company is of the view however that the exploration activities as outlined in this Prospectus can be undertaken in the timeframes contemplated.
| | Nova Minerals Ltd | Annual Report | 18 |
| (j) | Potential acquisitions |
As part of its business strategy, the Company may make acquisitions of, or significant investments in, other resource projects. Any such future transactions would be accompanied by the risks commonly encountered in making acquisitions of resource projects.
The ability of the Company to achieve its objectives will depend on the performance by the counterparties to any agreements that the Company may enter into. If any counterparty defaults in the performance of their obligations, it may be necessary for the Company to approach a court to seek a legal remedy. Legal action can be costly.
Furthermore, certain contracts to which the Company is a party are governed by laws of jurisdictions outside Australia - namely the United States and Canada. There is a risk that the Company may not be able to seek the legal redress that it could expect under Australian law and generally there can be no guarantee that a legal remedy will ultimately be granted on the appropriate terms.
| (l) | Health, safety and the environment |
The conduct of business in the resources sector involves a variety of risks to the health and safety of personnel and to the environment. If it is conceivable that an incident may occur which might negatively impact on the Company’s business.
| (m) | International operations |
International sales and operations are subject to a number of risks, including:
| i. | Potential difficulties in enforcing agreements (including joint venture agreements) and collecting receivables through foreign local systems; |
| ii. | Potential difficulties in protecting intellectual property; |
| iii. | Increases in costs for transportation and shipping; and |
| iv. | Restrictive governmental actions, such as imposition of trade quotas, tariffs and other taxes. |
These factors (or others) could materially and adversely affect the Company’s business, results of operations and financial condition.
Increases in commodity prices may encourage increases in exploration, development and construction activities, which can result in increased demand for, and cost of, exploration, development and construction services and equipment. Increased demand for services and equipment could cause exploration and project costs to increase materially, resulting in delays if services cannot be obtained in a timely manner due to inadequate availability, and could increase potential scheduling difficulties and costs due to the need to co-ordinate the availability of services or equipment, any of which could materially increase project exploration, development or construction costs or result in project delays or both. Any such material increase in costs would adversely affect the Company’s financial condition.
A decrease in commodity prices may render mineral properties uneconomic or may result in material reductions in the value of exploration, development or developed mineral properties.
| (o) | Risk of adverse publicity |
The projects which the Company aims to develop involves exploration and ore processing within the relevant local communities. Any failure to adequately manage community expectations with respect to compensation for land access, artisanal mining activity, employment opportunities, impact on local business and any other expectations may lead to local dissatisfaction. The political and social pressures resulting from local dissatisfaction and adverse publicity could lead to delays in approval of, and increased expenses in the Company’s proposed exploration programme.
| | Nova Minerals Ltd | Annual Report | 19 |
| (a) | Exploration and evaluation risks |
The Company’s mineral claims are at various stages of exploration, and potential investors should understand that mineral exploration and development are high-risk undertakings. There can be no assurance that exploration of these mineral claims, or any other mineral claims that may be acquired in the future, will result in the development of an economic ore deposit. Even if an apparently viable deposit is identified, there is no guarantee that it can be economically exploited.
The future exploration activities of the Company may be affected by a range of factors including geological conditions, limitations on activities due to permitting conditions, seasonal weather patterns, unanticipated operational and technical difficulties, industrial and environmental accidents, changing government regulations and many other factors beyond the control of the Company.
The success of the Company will also depend upon the Company having access to sufficient development capital, being able to maintain title to its mineral claims and obtaining all required approvals for its activities and so doing in a timely manner considering constraints associated with the presence of special management areas, the absence of existing or suitable physical access or seasonal road closures. In the event that exploration programs prove to be unsuccessful this could lead to a diminution in the value of the mineral claims and possible relinquishment or sale of the mineral claims.
The exploration costs of the Company are based on certain assumptions with respect to the method and timing of exploration. By their nature, these estimates and assumptions are subject to significant uncertainties and, accordingly, the actual costs may materially differ from these estimates and assumptions. Accordingly, no assurance can be given that the cost estimates and the underlying assumptions will be realised in practice, which may materially and adversely affect the Company’s viability.
Resource estimates are expressions of judgement based on knowledge, experience and industry practice. Estimates which were valid when originally calculated may alter significantly when new information or techniques become available. In addition, by their very nature, resource estimates are imprecise and depend to some extent on interpretations, which may prove to be inaccurate. As further information becomes available through additional fieldwork and analysis, the estimates are likely to change. This may result in alterations to development and mining plans which may, in turn, adversely affect the Company’s operations.
| (c) | Ability to exploit successful discoveries |
It may not always be possible for the Company to exploit successful discoveries which may be made in areas in which the Company has an interest. Such exploration would involve obtaining the necessary licences or clearances from the relevant authorities that may require conditions to be satisfied and/or the exercise of discretions by such authorities. It may or may not be possible for such conditions to be satisfied. Further, the decision to proceed to further exploration may require participation of other companies whose interests and objectives may not be the same as the Company’s.
| (d) | Development risks and costs |
Possible future development of mining operations at any of the Company’s projects is dependent on a number of factors and avoiding various risks including, but not limited to, failure to acquire and/or delineate economically recoverable ore bodies, unfavourable geological conditions, failing to receive the necessary approvals from all relevant authorities and parties, failure to withstand legal challenges to Federal and state agency permit approvals, unseasonal weather patterns, excessive seasonal weather patterns, fire, flooding, unanticipated challenges related to background conditions or area soil or water quality, access and utilities, unanticipated technical and operational difficulties encountered in extraction and production activities, mechanical failure of operating plant and equipment, unexpected shortages or increases in the price of consumables, spare parts and plant and equipment, cost overruns, risk of access to the required level of funding and contracting risk from third parties providing essential services.
| | Nova Minerals Ltd | Annual Report | 20 |
In addition, the exploration and pre-development Federal and state approvals prior to construction of any proposed development may exceed the expected timeframe or cost for a variety of reasons out of the Company’s control, including but not limited to Federal and state agency approvals being subject to administrative and judicial appeals. Any delays to project development could adversely affect the Company’s operations and financial results and may require the Company to raise further funds to complete resource delineation, project development and commence operations.
There can be no assurance that the Company’s intended goals will lead to successful exploration, mining and/or production operations. Further, no assurance can be given that the Company will be able to initiate or sustain minerals production, or that future operations will achieve commercial viability.
When additional exploration is undertaken and if a JORC compliant resource or reserve is not defined, then it may have a negative impact on the Company.
Future operations of the Company may be affected by various factors including:
| i. | Geological and hydrogeological conditions; |
| ii. | Limitations on activities due to seasonal weather patterns and monsoon activity; |
| iii. | Delays associated with the obtaining of permits and approvals to undertake exploration activity including allowing ground disturbing activity associated with operations in Canada and the United States; |
| iv. | Unanticipated operational and technical difficulties encountered in survey, drilling and production activities; |
| v. | Electrical and/or mechanical failure of operating plant and equipment, industrial and environmental accidents, industrial disputes and other force majeure events; |
| vi. | Equipment failure, fires, spills or industrial and environmental accidents; |
| vii. | Unavailability of aircraft or equipment to undertake airborne surveys and other geological and geophysical investigations; |
| viii. | Risk that exploration, appraisal, development, plant or operating costs prove to be greater than expected or that the proposed timing of exploration, development or production may not be achieved; |
| ix. | Failure to achieve exploration success; |
| x. | The supply and cost of skilled labour; |
| xi. | Unexpected shortages or increases in the costs of consumables, diesel fuel, spare parts, plant and equipment; and |
| xii. | Prevention and restriction of access by reason of political unrest, outbreak of hostilities and inability to obtain consents or approvals. |
No assurances can be given that the Company’s operations will achieve commercial viability through successful exploration and/or mining.
The proposed activities of the Company are subject to the laws and regulations of Australia, USA and Canada concerning the environment. As with most exploration projects, the Company’s activities are expected to have an impact on the environment, particularly during advanced exploration and future mining activities. It is the Company’s intention to conduct its activities to the highest standard of environmental obligation, including compliance with all environmental laws.
Mining operations have inherent risks and liabilities associated with safety and damage to the environment and the disposal of waste products occurring as a result of mineral exploration, development and production. The occurrence of any such safety or environmental incident could delay production or increase costs. Events such as unpredictable rainfall or bushfires may impact on the Company’s ongoing compliance with environmental laws, regulations and licenses. Significant liabilities could be imposed on the Company for damages, clean-up costs or penalties in the event of certain discharges into the environment, environmental damage caused by previous operations or non-compliance with environmental laws or regulations.
| | Nova Minerals Ltd | Annual Report | 21 |
The disposal of mining and process waste and mine water discharge and air emissions discharge are under constant legislative scrutiny and regulation. There is a risk that environmental laws and regulations become more onerous, which could delay the Company’s activities and make its operations more expensive.
| (g) | Occupational Health and Safety |
The exploration and mining industry is subject to increasing occupational health and safety responsibility and liability. The Company may become liable for past and current conduct which violates such laws and regulations, which may be amended by the relevant authorities. Penalties for breaching health and safety laws can be significant and victims of workplace accidents may also commence civil proceedings against the Company. These events may not be insured, or may be uninsurable.
Changes to health and safety laws and regulations may also increase compliance costs for the Company, which would negatively impact the financial results of the Company.
The mining, processing, development and mineral exploration activities of the Company are subject to various Federal and state laws governing prospecting, development, production, taxes, labour standards and occupational health, mine safety, toxic substances, land use authorisations, water use protection of water quality, sensitive, threatened and endangered species and cultural resources and other matters. Although the Company’s activities are and will be currently carried out in accordance with all applicable rules and regulations, no assurance can be given that new statutes, regulations, executive orders, agency directives or policies or judicial decisions will not be adopted or that existing statutes, regulations or policies will not be applied in a manner which could limit exploration efforts or preclude or curtail future development or production. Amendments to current laws and regulations governing exploration and operations or more stringent implementation thereof could have a substantial adverse impact on the Company’s ability to further delineate and develop the resource.
The Company’s business operations are subject to risks and hazards inherent in the mining industry. The exploration for and the development of mineral deposits involves significant risks, including environmental hazards; industrial accidents; metallurgical and other processing problems; unusual or unexpected rock formations; structure cave-in or slides; flooding; fires and interruption due to inclement or hazardous weather conditions. These risks could result in damage to, or destruction of, mineral properties, production facilities or other properties, personal injury or death, environmental damage, delays in mining, increased production costs, monetary losses and possible legal liability.
Whether income will result from projects undergoing exploration and development programs depends on the successful establishment of mining operations. Factors including costs, actual mineralisation, consistency and reliability of ore grades and commodity prices affect successful project development.
The Company operates in multiple currencies and exchanges rates are constantly fluctuating. International prices of various commodities as well as the exploration expenditure of the Company are denominated in United States or Canadian dollars, whereas the Company will rely principally on funds raised and accounted for in Australian currency, exposing the Company to the fluctuations and volatility of the rate of exchange between the United States or Canadian dollar and the Australian dollar as determined in international markets.
There are a number of climate-related factors that may affect the operations and proposed activities of the Company. The climate change risks particularly attributable to the Company include:
| i. | The emergence of new or expanded regulations associated with the transitioning to a lower-carbon economy and market changes related to climate change mitigation. The Company may be impacted by changes to local or international compliance regulations related to air quality emissions and/or climate change mitigation efforts, or by specific taxation or penalties for carbon emissions or environmental damage. These examples sit amongst an array of possible restraints on industry that may further impact the Company and its profitability. While the Company will endeavor to manage these risks and limit any consequential impacts, there can be no guarantee that the Company will not be impacted by these occurrences; and |
| | Nova Minerals Ltd | Annual Report | 22 |
| ii. | Climate change may cause certain physical and environmental risks that cannot be predicted by the Company, including events such as increased severity of weather patterns and incidence of extreme weather events and longer term physical risks such as shifting climate patterns. All these risks associated with climate change may significantly change the industry in which the Company operates. |
| 3. | General Investment Risks |
General economic conditions, introduction of tax reform, new legislation, movements in interest rates, inflation and currency exchange rates may have an adverse effect on the Company’s exploration, development and production activities, as well as on its ability to fund those activities.
| (b) | Reliance on key management personnel |
The responsibility of overseeing the day-to-day operations and the strategic management of the Company and its controlled entities depends substantially on its senior management and its key personnel. There can be no assurance given that there will be no detrimental impact on the Company if one or more of these senior management, key personnel or employees cease their involvement or employment with the Company or its controlled entities.
| (c) | Market risk and interest rate volatility |
From time to time, the Company may borrow money and accordingly will be subject to interest rates which may be fixed or floating. A change in interest rates would be expected to result in a change in the interest rate to the Company and, hence, may affect its profit.
The industry in which the Company will be involved is subject to global competition. While the Company will undertake all reasonable due diligence in its business decisions and operations, the Company will have no influence or control over the activities or actions of its competitors, whose activities or actions may, positively or negatively, affect the operating and financial performance of the Company’s Projects and business. The potential also exists for the nature and extent of the competition to change rapidly, which may cause loss to the Company.
There are general risks associated with an investment and the share market. The price of the Company’s securities on ASX may rise and fall depending on a range of factors beyond the Company’s control and which are unrelated to the Company’s financial performance. These factors may include movements on international stock markets, interest rates and exchange rates, together with domestic and international economic conditions, inflation rates, investor perceptions, changes in government policy, commodity supply and demand, government taxation and royalties, war, global hostilities and acts of terrorism.
Neither the Company nor the Directors warrant the future performance of the Company or any return on an investment in the Company.
There is no guarantee that there will be an ongoing liquid market for the Company’s securities. Accordingly, there is a risk that, should the market for the securities become illiquid, Shareholders will be unable to realise their investment in the Company.
| (g) | Insurance and uninsured risks |
The Company, where economically feasible, may insure its operations in accordance with industry practice. However, even if insurance is taken out, in certain circumstances the Company’s insurance may not be of a nature or level to provide adequate insurance cover. The occurrence of an event that is not covered, or fully covered, by insurance could have a material adverse effect on the business, financial condition and results of the Company. Insurance of all risks associated with mineral exploration and production is not always available and, where available, the costs can be prohibitive.
| | Nova Minerals Ltd | Annual Report | 23 |
| (h) | Infectious disease pandemics |
Infectious disease pandemics such as the coronavirus, whilst opening up various new opportunities for the deployment of the Company’s technology, have the potential to interrupt the Company’s operations, impair deployment of its products to customers and prevent suppliers or distributors from honouring their contractual obligations. Such pandemics could also cause hospitalisation or death of the Company’s existing and potential customers and staff.
The Company’s projects now or in the future may be adversely affected by risks outside the control of the Company including labour unrest, civil disorder, war, subversive activities or sabotage, fires, floods, explosions or other catastrophes, epidemics, pandemics or quarantine restrictions.
| (j) | Investment speculative |
The above list of risk factors ought not to be taken as exhaustive of the risks faced by the Company or by investors in the Company. The above factors, and others not specifically referred to above may, in the future, materially affect the financial performance of the Company and the value of the new Shares offered under this Prospectus.
Therefore, the new Shares to be issued pursuant to this Prospectus carry no guarantee with respect to the payment of dividends, returns of capital or the market value of those new Shares.
Potential investors should consider that an investment in the Company is highly speculative and should consult their professional advisers before deciding whether to apply for new Shares pursuant to this Prospectus.
| (k) | Cyber risks and security breaches |
The Company stores data in its own systems and networks and also with a variety of third-party service providers. A malicious attack on the Company’s systems, processes or people, from external or internal sources, could put the integrity and privacy of customers’ data and business systems at risk. It could prevent customers from using the products for a period of time, put its users’ premises at risk and could also lead to unauthorised disclosure of data.
Other risk factors include those normally found in conducting business, including litigation through breach of agreements or in relation to employees (through personal injuries, industrial matters or otherwise) or any other cause, strikes, lockouts, loss of service of key management or operational personnel and other matters that may interfere with the Company’s business or trade.

| | Nova Minerals Ltd | Annual Report | 24 |
Information on Directors
| Name: | | Richard Beazley (Appointed 24 July 2024) |
| Title: | | Non-Executive Chairman |
| Age: | | 60 |
Experience and expertise: 
| | Mr. Beazley is an internationally experienced mining professional and director with over 35 years of experience in senior corporate, operational and project development roles. He is a qualified Mining Engineer and has worked in a range of projects throughout Australia, Africa, North and South America, in both underground and open cut operations, producing gold, base metals and critical minerals. Mr Beazley holds a Bachelor of Engineering (Honours) (Mining) from the University of New South Wales. He holds a MBA from APESMA (Association of Professional Engineers, Scientists and Managers, Australia) and Deakin University. He is a Member of the Australian Institute of Company Directors (MAICD) and a Member and Competent Person of the Australasian Institute of Mining and Metallurgy (MAusIMM (CP)) |
| Other current directorships: | | MetalsGrove Mining Limited (Non-executive Chair), Catalina Resources Ltd (Non-executive Director) |
| Former directorships (last 3 yr): | | None |
| Special responsibilities | | Audit and Risk Committee and Remuneration and Nomination Committee |
| Interests in shares: | | - |
| Interests in options: | | - |
| Interests in rights: | | - |
| Name: | | Christopher Gerstein |
| Title: | | Executive Director & CEO |
| Age: | | 51 |
Experience and expertise: 
| | Mr. Christopher Gerteisen as CEO controls all aspects of the Estelle Gold project while implementing efficiencies and savings to keep cost per discovery ounce well below industry average. Mr. Gerteisen has over 20 years of experience as a professional geologist with an extensive record of managing and advancing complex and challenging resource projects across North America, Australia, and Asia. His work experience spans greenfields from discovery through to production stage and other projects with a focus on commodities including gold and copper. He worked as a geologist on the Carlin Trend in Nevada and on exploration in Alaska with Newmont. He has held senior positions within several projects throughout the goldfields of Western Australia. As a research geologist with Newmont he worked on the Batu Hijau Porhryry Cu-Au deposit in Indonesia. Most recently, through his technical contributions and management skills, Mr. Gerteisen played a significant role in the successful start-up, operations, and exploration which resulted in further mine-life extending discoveries at several prominent projects in the Australasian region, including Oxiana’s Sepon and PanAust’s Phu Bia in Laos. Mr. Gerteisen holds a Bachelor of Geology from the University of Idaho and a Master’s Degree in Economic Geology from the Western Australia School of Mines. He is a dual USA and Australia Citizen based in Alaska and a member of the Australian Institute of Geoscientists. |
| Other current directorships: | | Viridis Mining and Minerals Limited (ASX: VMM) |
| Former directorships (last 3 yr): None |
| Interests in shares: | | 1,833,614 |
| Interests in options: | | 2,050,000 |
| Interests in rights: | | 800,000 |
| | Nova Minerals Ltd | Annual Report | 25 |
| Name: | | Louie Simens |
| Title: | | Executive Director |
| Age: | | 42 |
Experience and expertise: 
| | Louie Simens served on our Board since December 2017, from Estelle greenfields to its current 10Moz global resources under JORC code and as our interim executive Chairman from April 2023 to July 23, 2024. Mr. Simens is responsible for managing our core business operations, which requires oversight of company-wide operational efficiencies and working with management and the board to review and implement strategic plans to facilitate growth. Mr. Simens has served as manager of our AK Custom Mining LLC subsidiary since 2017, our Alaska Range Resources LLC subsidiary since 2022 and our AK Operations LLC subsidiary since 2018. In addition, Mr. Simens has served as a director of our AKCM (AUST) Pty Ltd subsidiary since 2017. He has extensive experience in capital markets and running businesses, as well as in corporate restructuring, due diligence and mergers & acquisitions, where he utilizes his knowledge of corporate governance and project management. Mr. Simens has a successful track record spanning more than a decade, owning and operating contracting businesses in the fields of both civil and building construction. Mr. Simens has been a director of Benison Contractors Pty Ltd, his family construction group since inception on 5 July 2007. He also undertakes property development and investment. Mr. Simens was a Director of Snow Lake Resources Ltd (Nasdaq: LITM), an entity in which we have a 29.6% interest, since November 2018 to May 2022 and was appointed Snow Lake’s Non-Executive Chairman in December 2020 after the company’s Nasdaq listing. He has also served as Non-Executive Chairman of Torian Resources Ltd. (now Asra Minerals (ASX: ASR)). Since February 2024, Mr. Simens serves as a Director of CryptAi Pty Ltd, an artificial intelligence investment company. |
| Other current directorships: | | None |
| Former directorships (last 3 yr): | | Asra Minerals Limited (ASX: ASR), Snow Lake Resources Ltd (NASDAQ: LITM) |
| Interests in shares: | | 9,033,199 |
| Interests in options: | | 2,214,286 |
| Interests in rights: | | 800,000 |
| Name: | | Craig Bentley |
| Title: | | Director of Finance and Compliance |
| Age: | | 55 |
Experience and expertise: 
| | Mr Craig Bentley holds a Bachelor of Commerce and Administration degree, majoring in accountancy and commercial law. Mr Bentley held positions at Ernst and Young and worked internationally, including on the audit of the Bank of America and a special audit for an insurance company prior to IPO listing in the USA amongst others. In addition, he has over 30 years commercial and finance experience working in senior roles in multinational private enterprises. As part of his role with Nova, Mr Bentley will also be tasked with compliance and risk management, as well as assisting with the company’s strategy during Nova’s forecasted rapid growth period. |
| Other current directorships: | | None |
| Former directorships (last 3 yr): | | None |
| Interests in shares: | | 3,616,669 |
| Interests in options: | | 821,429 |
| Interests in rights: | | - |
| | Nova Minerals Ltd | Annual Report | 26 |
| Name: | | Rodrigo Capel Pasqua |
| Title: | | Non-Executive Director |
| Age: | | 35 |
Experience and expertise: 
| | Mr Rodrigo Capel Pasqua is a Member of the AusIMM, holds a BEng in Mining Engineering from the University of São Paulo, a Western Australia First Class Mine Managers Certificate and specialisations in Corporate Leadership (University of Oxford), Corporate Strategy (London University) and Finance (University of Illinois and Harvard University). Technically, Mr Capel Pasqua skills encompass most aspects of underground and open pit engineering, going from mining studies, financial valuations and project execution to systems and new technology implementation, operations management, and technical teams’ supervision. He has vast experience in unlocking the value of mining projects across the world, including specific expertise in large tonnage bulk mining operations and at his tenure at Evolution Mining Limited, as Group Head of Mining and Transformation, amongst many other projects and sites Mr Capel Pasqua was involved with the Cowal Open Pit project and was also instrumental in the Red Lake mine turnaround At Nova Mr Capel Pasqua will provide technical and corporate advice as the Company progresses the development of its flagship Estelle Gold Project in Alaska |
| Other current directorships: | | None |
| Former directorships (last 3 yr): | | None |
| Special responsibilities: | | Audit and Risk Committee and Remuneration and Nomination Committee |
| Interests in shares: | | 28,500 |
| Interests in options: | | 264,250 |
| Interests in rights: | | - |
| Name: | | Avi Geller |
| Title: | | Non-Executive Director |
| Age: | | 36 |
Experience and expertise: 
| | Mr. Geller has served as a member of our board of directors since November 2018. Mr. Geller has extensive investment experience and a deep knowledge of corporate finance, including capital markets, venture capital, hybrid, debt and private equity. He has been serving as the Chief Investment Officer of Leonite Capital LLC, a family office he co-founded focusing on real estate and capital markets, since January 2017. Mr. Geller has also served as a director at DealFlow Financial Products, Inc. since January 2017. Since May 2018, he has also served as a Director of Parkit Enterprise Inc., a publicly traded real estate company (TSX-V:PKT; OTCQX:PKTEF). In the past he served as an Interim Chief Executive Officer. From November 2020 through June 2022, He served as a Director at Australis Capital Inc., (AUSA.CN; OTCQB:AUSAF) a publicly traded company that is implementing a capital light growth strategy towards establishing a highly competitive and profitable MSO in the U.S. and global cannabis markets. |
| Other current directorships: | | Parkit Enterprise Inc (TSX-V: PKT | OTCQX: PKTEF) |
| Former directorships (last 3 yr): | | None |
| Special responsibilities: | | Audit and Risk Committee and Remuneration and Nomination Committee |
| Interests in shares: | | 2,290,177 |
| Interests in options: | | 550,000 |
| Interests in rights: | | - |
| | Nova Minerals Ltd | Annual Report | 27 |
‘Other current directorships’ quoted above are current directorships for listed entities only and excludes directorships of all other types of entities, unless otherwise stated.
‘Former directorships (last 3 years)’ quoted above are directorships held in the last 3 years for listed entities only and excludes directorships of all other types of entities, unless otherwise stated.
Company Secretary
| Name: | | Ian Pamensky |
| Title: | | Company Secretary |
| Age: | | 56 |
Experience and expertise: 
| | Mr. Ian Pamensky has been our Secretary since September 18, 2019. Mr. Pamensky is a Chartered Accountant, Fellow of Governance Institute of Australia and fellow of FinSIA. He has over 30 years of experience working across a wide range of industries, from audit and funds management to mining and AgTech. Mr. Pamensky has significant experience as Company Secretary of ASX listed companies. |
Meetings of Directors
The number of meetings of the company’s Board of Directors (‘the Board’) held during the year ended 30 June 2024, and the number of meetings attended by each director were:
| | | Full Board | | | Nomination and Remuneration Committee* | | | Audit and Risk Committee* | |
| | | Attended | | | Held | | | Attended | | | Held | | | Attended | | | Held | |
| C Bentley | | | 6 | | | | 6 | | | | - | | | | - | | | | - | | | | - | |
| R Pasqua | | | 6 | | | | 6 | | | | - | | | | - | | | | - | | | | - | |
| A Geller | | | 5 | | | | 6 | | | | - | | | | - | | | | - | | | | - | |
| L Simens | | | 6 | | | | 6 | | | | - | | | | - | | | | - | | | | - | |
| C Gerteisen | | | 6 | | | | 6 | | | | - | | | | - | | | | - | | | | - | |
‘Held’ represents the number of meetings held during the time the director held office.
* Committees were formed on 24 July 2024.
| | Nova Minerals Ltd | Annual Report | 28 |
Remuneration Report (Audited)
The remuneration report details the key management personnel remuneration arrangements for the consolidated entity, in accordance with the requirements of the Corporations Act 2001 and its Regulations.
Key management personnel are those persons having authority and responsibility for planning, directing and controlling the activities of the entity, directly or indirectly, including all directors.
The remuneration report is set out under the following main headings:
| ● | Principles used to determine the nature and amount of remuneration |
| ● | Details of remuneration |
| ● | Service agreements |
| ● | Share-based compensation |
| ● | Additional information |
| ● | Additional disclosures relating to key management personnel |
Principles Used to Determine the Nature and Amount of Remuneration
The objective of the consolidated entity’s executive reward framework is to ensure reward for performance is competitive and appropriate for the results delivered. The framework aligns executive reward with the achievement of strategic objectives and the creation of value for shareholders, and it is considered to conform to the market best practice for the delivery of reward. The Board of Directors (‘the Board’) ensures that executive reward satisfies the following key criteria for good reward governance practices:
| ● | Competitiveness and reasonableness |
| ● | Acceptability to shareholders |
| ● | Performance linkage / alignment of executive compensation |
| ● | Transparency |
At 30 June 2024, the consolidated entity did not have a formal Nomination and Remuneration Committee, having regard to the size of the consolidated entity and its operations. The Board acknowledges that when the size and nature of the Company warrants the necessity of a formal remuneration committee, such a committee will operate under a remuneration committee charter to be approved by the Board. Until 30 June 2024, the Board as a whole, excluding any relevant affected director, serves as a nomination committee to the Company. On 24 July 2024, the Board approved the formation of a formal committee in conjunction with the NASDAQ IPO.
The reward framework is designed to align executive reward to shareholders’ interests. The Board have considered that it should seek to enhance shareholders’ interests by:
| ● | Having economic profit as a core component of plan design |
| ● | Focusing on sustained growth in shareholder wealth, consisting of dividends and growth in share price, and delivering constant or increasing return on assets as well as focusing the executive on key non-financial drivers of value |
| ● | Attracting and retaining high calibre executives |
Additionally, the reward framework should seek to enhance executives’ interests by:
| ● | Rewarding capability and experience |
| ● | Reflecting competitive reward for contribution to growth in shareholder wealth |
| ● | Providing a clear structure for earning rewards |
In accordance with best practice corporate governance, the structure of non-executive director and executive director remuneration is separate.
| | Nova Minerals Ltd | Annual Report | 29 |
Non-Executive Directors Remuneration
Fees and payments to non-executive directors reflect the demands and responsibilities of their role. Non-executive directors’ fees and payments are reviewed annually by the Nomination and Remuneration Committee. The Nomination and Remuneration Committee may, from time to time, receive advice from independent remuneration consultants to ensure non-executive directors’ fees and payments are appropriate and in line with the market. The chairman’s fees are determined independently to the fees of other non-executive directors based on comparative roles in the external market. The chairman is not present at any discussions relating to the determination of his own remuneration. Non-executive directors do receive share options or other incentives
ASX listing rules require the aggregate non-executive directors’ remuneration be determined periodically by a general meeting. The most recent determination was at the Annual General Meeting held on 29 November 2022, where the shareholders approved a maximum annual aggregate remuneration for non-executive directors of $500,000.
Executive Remuneration
The consolidated entity aims to reward executives based on their position and responsibility, with a level and mix of remuneration which has both fixed and variable components.
The executive remuneration and reward framework has four components:
| ● | Base pay and non-monetary benefits |
| ● | Short-term performance incentives |
| ● | Share-based payments |
| ● | Other remuneration such as superannuation and long service leave |
The combination of these comprises the executive’s total remuneration.
Voting and comments made at the company’s 2023 Annual General Meeting (‘AGM’)
At the 29 November 2023 AGM, 96.83% of the votes received supported the adoption of the remuneration report for the year ended 30 June 2023. The company did not receive any specific feedback at the AGM regarding its remuneration practices.
Details of Remuneration
Amounts of remuneration
Details of the remuneration of key management personnel of the consolidated entity are set out in the following tables.
| | | Short-Term Benefits | | | Post-
Employ-
ment | | | Long-
Term Benefits | | | Share-
Based Payments | | | | |
| | | Cash Salary | | | Cash | | | Non- | | | Super- | | | Long Service | | | Equity- | | | | |
| | | and Fees | | | Bonus | | | monetary | | | annuation | | | Leave | | | Settled | | | Total | |
| 30 June 2024 | | $ | | | $ | | | $ | | | $ | | | $ | | | $ | | | $ | |
| | | | | | | | | | | | | | | | | | | | | | | | | | | | | |
| Non-Executive Directors: | | | | | | | | | | | | | | | | | | | | | | | | | | | | |
| | | | | | | | | | | | | | | | | | | | | | | | | | | | | |
| R Capel Pasqua | | | 84,900 | | | | - | | | | - | | | | - | | | | - | | | | 24,962 | | | | 109,862 | |
| A Geller | | | 60,000 | | | | - | | | | - | | | | - | | | | - | | | | 49,925 | | | | 109,925 | |
| | | | | | | | | | | | | | | | | | | | | | | | | | | | | |
| Executive Directors: | | | | | | | | | | | | | | | | | | | | | | | | | | | | |
| L Simens | | | 276,000 | | | | - | | | | - | | | | - | | | | - | | | | 45,323 | | | | 321,323 | |
| C Gerteisen | | | 384,369 | | | | - | | | | - | | | | - | | | | - | | | | 45,323 | | | | 429,692 | |
| C Bentley | | | 120,000 | | | | - | | | | - | | | | - | | | | - | | | | 74,887 | | | | 194,887 | |
| | | | 925,269 | | | | - | | | | - | | | | - | | | | - | | | | 240,420 | | | | 1,165,689 | |
| | Nova Minerals Ltd | Annual Report | 30 |
| | | Short-Term Benefits | | | Post-
Employ-
ment | | | Long-
Term Benefits | | | Share-
Based Payments | | | | |
| | | Cash Salary | | | Cash | | | Non- | | | Super- | | | Long Service | | | Equity- | | | | |
| | | and Fees | | | Bonus | | | monetary | | | annuation | | | Leave | | | Settled | | | Total | |
| 30 June 2023 | | $ | | | $ | | | $ | | | $ | | | $ | | | $ | | | $ | |
| | | | | | | | | | | | | | | | | | | | | | | | | | | | | |
| Non-Executive Directors: | | | | | | | | | | | | | | | | | | | | | | | | | | | | |
| | | | | | | | | | | | | | | | | | | | | | | | | | | | | |
| R Capel Pasqua | | | 59,545 | | | | - | | | | - | | | | - | | | | - | | | | 16,195 | | | | 75,740 | |
| A Geller | | | 60,000 | | | | - | | | | - | | | | - | | | | - | | | | 28,918 | | | | 88,918 | |
| A Ladd-Kruger | | | 50,684 | | | | - | | | | - | | | | - | | | | - | | | | - | | | | 50,684 | |
| | | | | | | | | | | | | | | | | | | | | | | | | | | | | |
| Executive Directors: | | | | | | | | | | | | | | | | | | | | | | | | | | | | |
| L Simens | | | 268,000 | | | | - | | | | - | | | | - | | | | - | | | | 215,698 | | | | 483,698 | |
| C Gerteisen | | | 374,208 | | | | - | | | | - | | | | - | | | | - | | | | 215,698 | | | | 589,906 | |
| C Bentley | | | 112,000 | | | | - | | | | - | | | | - | | | | - | | | | 44,650 | | | | 156,650 | |
| | | | 924,437 | | | | - | | | | - | | | | - | | | | - | | | | 521,159 | | | | 1,445,596 | |
The proportion of remuneration linked to performance and the fixed proportion are as follows:
| | | Percentage Fixed Remuneration | | | Percentage Share-Based Payments | |
| Name | | 30 June 2024 | | | 30 June 2023 | | | 30 June 2024 | | | 30 June 2023 | |
| | | | | | | | | | | | | |
| Non-Executive Directors: | | | | | | | | | | | | | | | | |
| R Capel Pasqua | | | 77 | % | | | 78 | % | | | 23 | % | | | 22 | % |
| A Geller | | | 55 | % | | | 67 | % | | | 45 | % | | | 33 | % |
| A Ladd-Kruger | | | - | | | | 100 | % | | | - | | | | - | |
| | | | | | | | | | | | | | | | | |
| Executive Directors | | | | | | | | | | | | | | | | |
| L Simens | | | 86 | % | | | 55 | % | | | 14 | % | | | 45 | % |
| C Gerteisen | | | 89 | % | | | 63 | % | | | 11 | % | | | 37 | % |
| C Bentley | | | 62 | % | | | 71 | % | | | 38 | % | | | 29 | % |
Service Agreements
Remuneration and other terms of employment for key management personnel are formalised in service agreements. Details of these agreements are as follows:
| Name: | | Richard Beazley |
| Title: | | Non-Executive Chairman |
| Agreement commenced: | | Appointed 24 July 2024 |
| Term of agreement: | | The Company has entered into a Non-Executive Director letter agreement with Mr Beazley on 04 June 2024 (Mr Beazley’s appointment being concurrent with the effectiveness of the Company’s F-1 registration statement located with the American Securities Exchange Commission on 24 July 2024). The Company has agreed to pay Mr Beazley an annual fee of AUD$120,000 (inclusive of superannuation contributions, if applicable) for up to 20 hours per month. Any excess hours will be charged at AUD$300 per hour. |
| | Nova Minerals Ltd | Annual Report | 31 |
| Name: | | Rodrigo Capel Pasqua |
| Title: | | Non-Executive Director |
| Agreement commenced: | | 1 May 2022 |
| Term of agreement: | | The Company has entered into a Non-Executive Director letter agreement with Mr Pasqua on 2 May 2022. The Company has agreed to pay Mr Pasqua an annual fee of A$60,000 (inclusive of superannuation contributions, if applicable) for up to 20 hours per month. Any excess hours will be charged at AUD$300 per hour. |
| Name: | | Craig Bentley |
| Title: | | Director of Finance and Compliance |
| Agreement commenced: | | 19 February 2022 (Updated on 9 September 2022) |
| Term of agreement: | | On 9 September 2022 the Company entered into an updated agreement to pay Mr Bentley $120,000 (inclusive of superannuation contributions, if applicable, effective 1 September 2022. Termination by Company: The Company must either give Mr Bentley twelve months’ written notice and, at the end of that notice period, make a payment to Mr Bentley equal to his salary over a twelve month period; or otherwise may terminate Mr Bentley’s employment with immediate effect by paying him the equivalent of his salary over a twelve month period. Termination by Mr Bentley Mr Bentley may terminate his employment if the Company commits a serious breach of the agreement and does not remedy that breach; or, otherwise, by providing twelve months written notice to the Company. |
| Name: | | Avi Gellar |
| Title: | | Non-Executive Director |
| Agreement commenced: | | 23 July 2020 |
| Term of agreement: | | The Company has entered into a Non-Executive Director letter agreement with Mr Gellar on 23 July 2020. The Company has agreed to pay Mr Gellar an annual fee of A$60,000 (inclusive of superannuation contributions, if applicable). |
| Name: | | Chris Gerteisen |
| Title: | | Executive Director and CEO |
| Agreement commenced: | | 20 April 2022 (Updated on 22 June 2023) |
| Term of agreement: | | On 22 June 2022 the Company entered into an updated agreement to pay Mr Gerteisen USD$252,000 pa (inclusive of superannuation contributions, if applicable), effective 1 July 2022. Termination by Company: The Company must either give Mr Gerteisen twelve months’ written notice and, at the end of that notice period, make a payment to Mr Gerteisen equal to his salary over a twelve month period; or otherwise may terminate Mr Gerteisen’s employment with immediate effect by paying him the equivalent of his salary over a twelve month period. Termination by Mr Gerteisen: Mr Gerteisen may terminate his employment if the Company commits a serious breach of the agreement and does not remedy that breach; or, otherwise, by providing twelve months written notice to the Company. |
| | Nova Minerals Ltd | Annual Report | 32 |
| Name: | | Louie Simens |
| Title: | | Executive Director (Executive Chairman to 24 July 2024) |
| Agreement commenced: | | 20 April 2022 (Updated on 9 September 2022) |
| Term of agreement: | | On 9 September 2022 the Company entered into an updated agreement to pay Mr Simens $276,000 pa (inclusive of superannuation contributions, if applicable), effective 1 September 2022
Termination by Company
The Company must either give Mr Simens twelve months’ written notice and, at the end of that notice period, make a payment to Mr Simens equal to his salary over a twelve month period; or otherwise may terminate Mr Simens employment with immediate effect by paying him the equivalent of his salary over a twelve month period.
Termination by Mr Simens
Mr Simens may terminate his employment if the Company commits a serious breach of the agreement and does not remedy that breach; or, otherwise, by providing twelve months written notice to the Company. |
Key management personnel have no entitlement to termination payments in the event of removal for misconduct.
Share-Based Compensation
Issue of shares
There were no shares issued to directors and other key management personnel as part of compensation during the year ended 30 June 2024.
Options
There were no options over ordinary shares issued to directors and other key management personnel as part of compensation that were outstanding as at 30 June 2024.
There were no options over ordinary shares granted to or vested by directors and other key management personnel as part of compensation during the year ended 30 June 2024.
Performance rights
There were no performance rights over ordinary shares issued to directors and other key management personnel as part of compensation that were outstanding as at 30 June 2024.
There were no performance rights over ordinary shares granted to or vested by directors and other key management personnel as part of compensation during the year ended 30 June 2024.
Additional Information
The earnings of the consolidated entity for the five years to 30 June 2024 are summarised below:
| | | 2024 | | | 2023 | | | 2022 | | | 2021 | | | 2020 | |
| | | $ | | | $ | | | $ | | | $ | | | $ | |
| | | | | | | | | | | | | | | | |
| Revenue | | | 270,626 | | | | 12,027 | | | | 20,000 | | | | 2,145 | | | | 104,662 | |
| Net assets | | | 97,946,745 | | | | 113,389,965 | | | | 104,329,326 | | | | 52,580,191 | | | | 18,036,550 | |
| Net profit/(loss) | | | (16,954,105 | ) | | | (9,629,678 | ) | | | 38,097,293 | | | | (3,343,467 | ) | | | (4,276,995 | ) |
The factors that are considered to affect total shareholders return are summarised below:
| | | 2024 | | | 2023 | | | 2022 | | | 2021 | | | 2020 | |
| | | | | | | | | | | | | | | | |
| Basic earnings per share (cents per share) | | | (7.70 | ) | | | (5.77 | ) | | | 19.61 | | | | (0.20 | ) | | | (0.43 | ) |
| Diluted earnings per share (cents per share) | | | (7.70 | ) | | | (5.77 | ) | | | 19.61 | | | | (0.20 | ) | | | (0.43 | ) |
| | Nova Minerals Ltd | Annual Report | 33 |
Additional Disclosures Relating to Key Management Personnel
Shareholding
The number of shares in the company held during the financial year by each director and other members of key management personnel of the consolidated entity, including their personally related parties, is set out below:
| | | Balance at the Start of the year | | | Received as Part of Remuneration | | | Additions | | | Disposals/
Other | | | Balance at the End of the Year | |
| Ordinary shares | | | | | | | | | | | | | | | | | | | | |
| C Bentley | | | 3,000,002 | | | | - | | | | 616,667 | | | | - | | | | 3,616,669 | |
| R Pasqua | | | 28,500 | | | | - | | | | - | | | | - | | | | 28,500 | |
| A Geller | | | 2,290,177 | | | | - | | | | - | | | | - | | | | 2,290,177 | |
| L Simens | | | 8,199,866 | | | | - | | | | 833,333 | | | | - | | | | 9,033,199 | |
| C Gerteisen | | | 930,281 | | | | - | | | | 903,333 | | | | - | | | | 1,833,614 | |
| | | | 14,448,826 | | | | - | | | | 2,353,333 | | | | - | | | | 16,802,159 | |
Option Holding
The number of options over ordinary shares in the company held during the financial year by each director and other members of key management personnel of the consolidated entity, including their personally related parties, is set out below:
| | | Balance at | | | | | | | | | Expired/ | | | Balance at | |
| | | the Start of | | | | | | | | | Forfeited/ | | | the End of | |
| | | the Year | | | Granted | | | Exercised | | | Other | | | the Year | |
| Options over ordinary shares | | | | | | | | | | | | | | | | | | | | |
| C Bentley | | | 1,094,358 | | | | - | | | | - | | | | (272,929 | ) | | | 821,429 | |
| R Pasqua | | | 265,200 | | | | - | | | | - | | | | (950 | ) | | | 264,250 | |
| A Geller | | | 626,340 | | | | - | | | | - | | | | (76,340 | ) | | | 550,000 | |
| L Simens | | | 2,487,616 | | | | - | | | | - | | | | (273,330 | ) | | | 2,214,286 | |
| C Gerteisen | | | 2,579,178 | | | | - | | | | - | | | | (529,178 | ) | | | 2,050,000 | |
| | | | 7,052,692 | | | | - | | | | - | | | | (1,152,727 | ) | | | 5,899,965 | |
Performance Rights Holding
The number of performance rights over ordinary shares in the company held during the financial year by each director and other members of key management personnel of the consolidated entity, including their personally related parties, is set out below:
| | | Balance at | | | | | | | | | Expired/ | | | Balance at | |
| | | the start of | | | | | | | | | forfeited/ | | | the end of | |
| | | the year | | | Granted | | | Vested | | | other | | | the year | |
| Performance rights over ordinary shares | | | | | | | | | | | | | | | | | | | | |
| L Simens | | | 800,000 | | | | - | | | | - | | | | - | | | | 800,000 | |
| C Gerteisen | | | 800,000 | | | | - | | | | - | | | | - | | | | 800,000 | |
| | | | 1,600,000 | | | | - | | | | - | | | | - | | | | 1,600,000 | |
This concludes the remuneration report, which has been audited.
Shares Under Option
There were no unissued ordinary shares of Nova Minerals Limited under option outstanding at the date of this report.
| | Nova Minerals Ltd | Annual Report | 34 |
Indemnity and Insurance of Officers
The company has indemnified the directors and executives of the company for costs incurred, in their capacity as a director or executive, for which they may be held personally liable, except where there is a lack of good faith.
During the financial year, the company paid a premium in respect of a contract to insure the directors and executives of the company against a liability to the extent permitted by the Corporations Act 2001. The contract of insurance prohibits disclosure of the nature of the liability and the amount of the premium.
Indemnity and Insurance of Auditor
The company has not, during or since the end of the financial year, indemnified or agreed to indemnify the auditor of the company or any related entity against a liability incurred by the auditor.
During the financial year, the company has not paid a premium in respect of a contract to insure the auditor of the company or any related entity.
Proceedings on Behalf of the Company
No person has applied to the Court under section 237 of the Corporations Act 2001 for leave to bring proceedings on behalf of the company, or to intervene in any proceedings to which the company is a party for the purpose of taking responsibility on behalf of the company for all or part of those proceedings.
Non-Audit Services
Details of the amounts paid or payable to the auditor for non-audit services provided during the financial year by the auditor are outlined in note 20 to the financial statements.
The directors are satisfied that the provision of non-audit services during the financial year, by the auditor (or by another person or firm on the auditor’s behalf), is compatible with the general standard of independence for auditors imposed by the Corporations Act 2001.
The directors are of the opinion that the services as disclosed in note 20 to the financial statements do not compromise the external auditor’s independence requirements of the Corporations Act 2001 for the following reasons:
| ● | all non-audit services have been reviewed and approved to ensure that they do not impact the integrity and objectivity of the auditor; and |
| | |
| ● | none of the services undermine the general principles relating to auditor independence as set out in APES 110 Code of Ethics for Professional Accountants issued by the Accounting Professional and Ethical Standards Board, including reviewing or auditing the auditor’s own work, acting in a management or decision-making capacity for the company, acting as advocate for the company or jointly sharing economic risks and rewards. |
Officers of the Company Who are Former Partners of RSM Australia Partners
There are no officers of the company who are former partners of RSM Australia Partners.
Auditor’s Independence Declaration
A copy of the auditor’s independence declaration as required under section 307C of the Corporations Act 2001 is set out immediately after this directors’ report.
| | Nova Minerals Ltd | Annual Report | 35 |
Auditor
RSM Australia Partners continues in office in accordance with section 327 of the Corporations Act 2001.
This report is made in accordance with a resolution of directors, pursuant to section 298(2)(a) of the Corporations Act 2001.
On behalf of the directors

___________________________
Richard Beazley
Chairman
30 September 2024
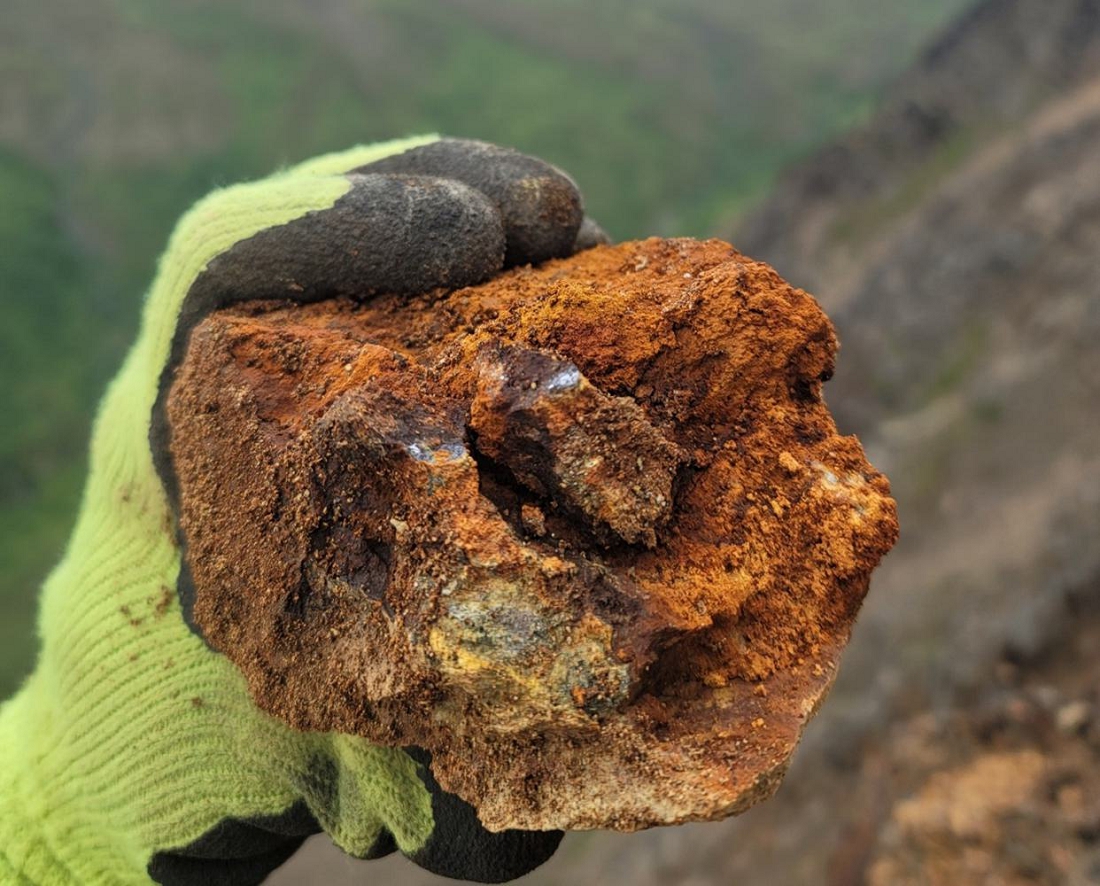
| | Nova Minerals Ltd | Annual Report | 36 |

AUDITOR’S INDEPENDENCE DECLARATION
As lead auditor for the audit of the financial report of Nova Minerals Limited for the year ended 30 June 2024, I declare that, to the best of my knowledge and belief, there have been no contraventions of:
| (i) | the auditor independence requirements of the Corporations Act 2001 in relation to the audit; and |
| | |
| (ii) | any applicable code of professional conduct in relation to the audit. |

RSM AUSTRALIA PARTNERS

A L WHITTINGHAM
Partner
Dated: 30 September 2024
Melbourne, Victoria
| | Nova Minerals Ltd | Annual Report | 37 |
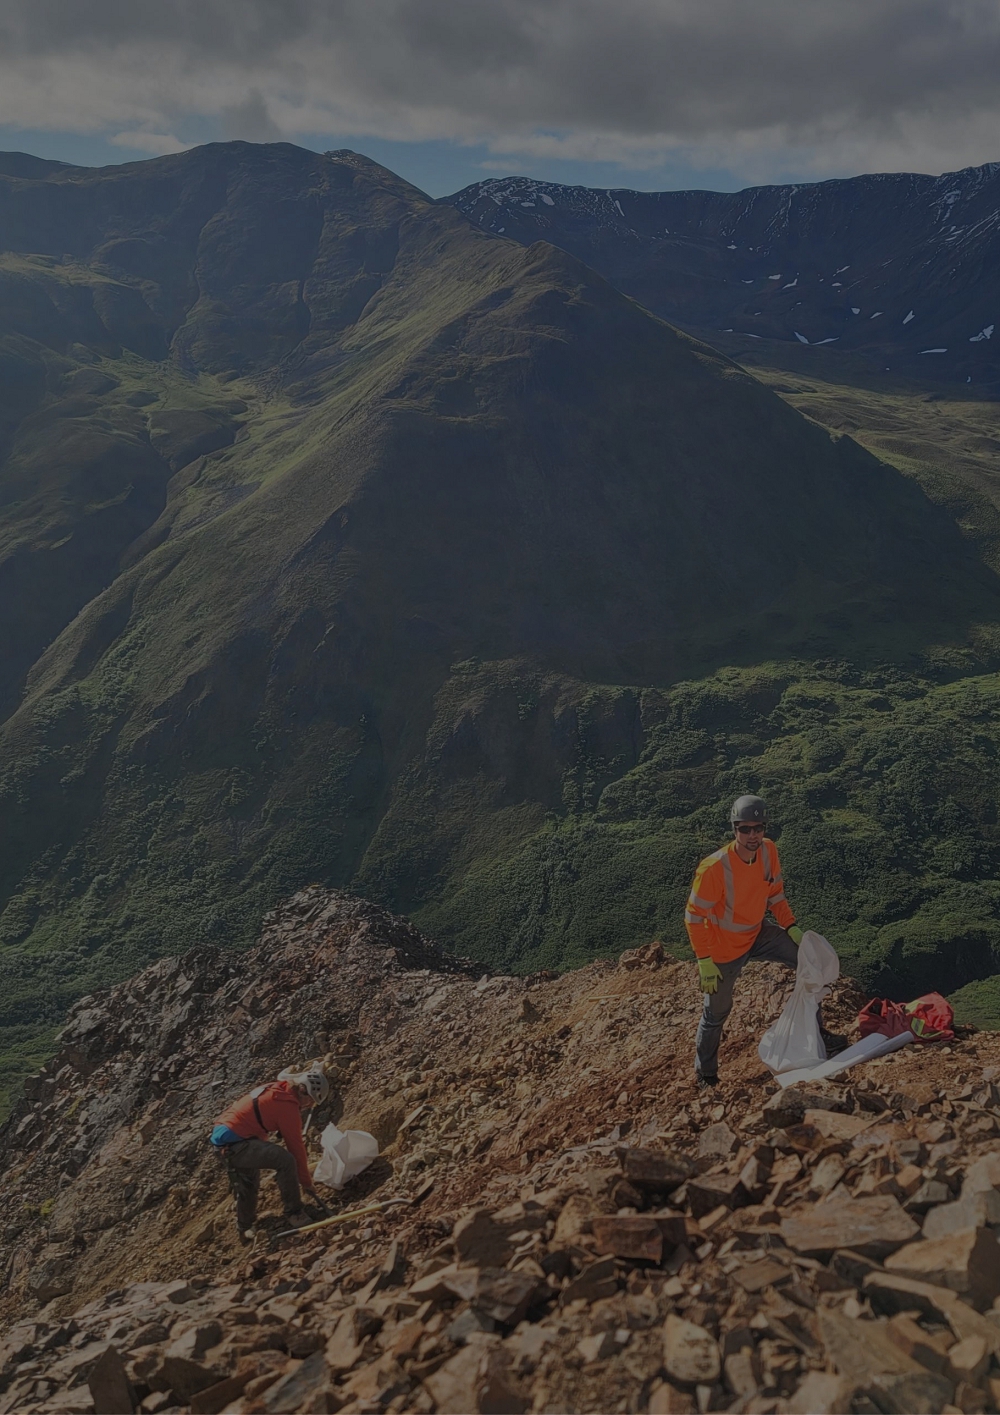
| | Nova Minerals Ltd | Annual Report | 38 |
Financial Statements
| | Nova Minerals Ltd | Annual Report | 39 |
General Information
The financial statements cover Nova Minerals Limited as a consolidated entity consisting of Nova Minerals Limited and the entities it controlled at the end of, or during, the year. The financial statements are presented in Australian dollars, which is Nova Minerals Limited’s functional and presentation currency.
Nova Minerals Limited is a listed public company limited by shares, incorporated and domiciled in Australia. Its registered office and principal place of business is:
Suite 5 242 Hawthorn Road
Caulfield Victoria 3161 Australia
A description of the nature of the consolidated entity’s operations and its principal activities are included in the directors’ report, which is not part of the financial statements.
The financial statements were authorised for issue, in accordance with a resolution of directors on 30 September 2024. The directors have the power to amend and reissue the financial statements.
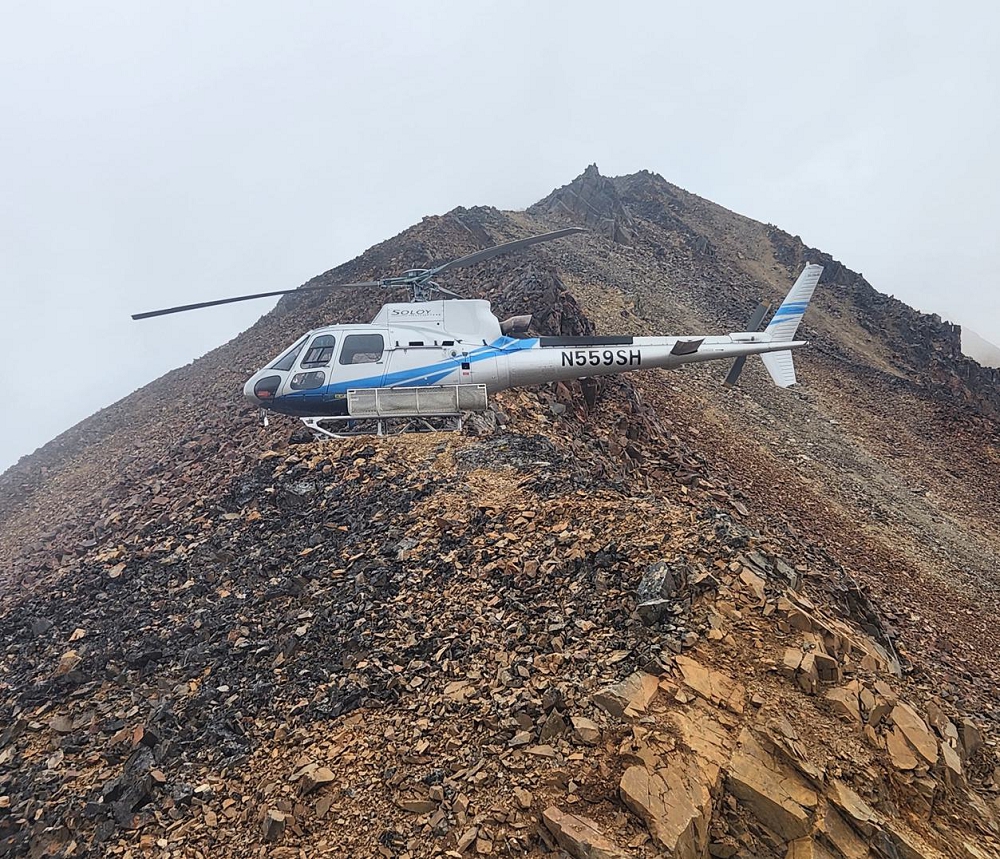
| | Nova Minerals Ltd | Annual Report | 40 |
Consolidated Statement of Profit or Loss
and Other Comprehensive Income
For the Year Ended 30 June 2024
| | | | | Consolidated | |
| | | Note | | 30 June 2024 | | | 30 June 2023 | |
| | | | | $ | | | $ | |
| Revenue | | | | | | | | | | |
| Interest income | | | | | 270,626 | | | | 12,027 | |
| Other income, gains, and losses | | | | | | | | | | |
| Foreign exchange movement on financial liability | | | | | (226,908 | ) | | | (24,883 | ) |
| Gain from sale of property plant and equipment | | | | | - | | | | 16,137 | |
| Management fee | | | | | - | | | | 47,423 | |
| Fair value loss on investments | | 9 | | | (833,951 | ) | | | (2,577,419 | ) |
| Gain from sale of investment | | 9 | | | 51,464 | | | | - | |
| Gain on derivative liabilities | | 13 | | | 624,654 | | | | 1,870,042 | |
| Impairment of Investment in Snow Lake Resources | | 8 | | | (8,824,187 | ) | | | - | |
| Foreign exchange (loss)/gain | | | | | (201,545 | ) | | | 868,392 | |
| Share of losses of associate accounted for using equity method | | 8 | | | (839,153 | ) | | | (6,254,759 | ) |
| Total revenue | | | | | (9,979,000 | ) | | | (6,043,040 | ) |
| | | | | | | | | | | |
| Expenses | | | | | | | | | | |
| Administration expenses | | 4 | | | (3,536,622 | ) | | | (2,721,273 | ) |
| Contractors & consultants | | 4 | | | (1,264,728 | ) | | | (739,380 | ) |
| Share based payments | | 28 | | | (335,669 | ) | | | (780,235 | ) |
| Amortisation of financial liability | | | | | (577,961 | ) | | | (928,281 | ) |
| Finance costs | | 4 | | | (695,312 | ) | | | (359,031 | ) |
| Total expenses | | | | | (6,410,292 | ) | | | (5,528,200 | ) |
| | | | | | | | | | | |
| Loss Before Income Tax Expense | | | | | (16,389,292 | ) | | | (11,571,240 | ) |
| | | | | | | | | | | |
| Income tax expense | | 5 | | | - | | | | - | |
| | | | | | | | | | | |
| Loss After Income Tax Expense for the Year | | | | | (16,389,292 | ) | | | (11,571,240 | ) |
| | | | | | | | | | | |
| Other Comprehensive Income | | | | | | | | | | |
| | | | | | | | | | | |
| Items that may be reclassified subsequently to profit or loss | | | | | | | | | | |
| Foreign currency translation | | | | | 61,491 | | | | 1,941,562 | |
| | | | | | | | | | | |
| Other comprehensive income for the year, net of tax | | | | | 61,491 | | | | 1,941,562 | |
| | | | | | | | | | | |
| Total Comprehensive Loss for the Year | | | | | (16,327,801 | ) | | | (9,629,678 | ) |
| | | | | | | | | | | |
| Loss for the year is attributable to: | | | | | | | | | | |
| Non-controlling interest | | | | | (106,181 | ) | | | (87,149 | ) |
| Owners of Nova Minerals Limited | | | | | (16,283,111 | ) | | | (11,484,091 | ) |
| | | | | | | | | | | |
| | | | | | (16,389,292 | ) | | | (11,571,240 | ) |
| | | | | | | | | | | |
| Total comprehensive income/(loss) for the year is attributable to: | | | | | | | | | | |
| Non-controlling interest | | | | | (98,299 | ) | | | 205,159 | |
| Owners of Nova Minerals Limited | | | | | (16,229,502 | ) | | | (9,834,837 | ) |
| | | | | | | | | | | |
| | | | | | (16,327,801 | ) | | | (9,629,678 | ) |
| | | | | Cents | | | Cents | |
| | | | | | | | | |
| Basic earnings/(loss) per share | | 27 | | | (7.70 | ) | | | (5.77 | ) |
| Diluted earnings/(loss) per share | | 27 | | | (7.70 | ) | | | (5.77 | ) |
The above consolidated statement of comprehensive income should be read in conjunction with the accompanying notes
| | Nova Minerals Ltd | Annual Report | 41 |
Consolidated Statement of Financial Position
For the Year Ended 30 June 2024
| | | | | Consolidated | |
| | | Note | | 30 June 2024 | | | 30 June 2023 | |
| | | | | $ | | | $ | |
| Assets | | | | | | | | | | |
| | | | | | | | | | | |
| Current Assets | | | | | | | | | | |
| Cash and cash equivalents | | 6 | | | 3,149,909 | | | | 19,240,707 | |
| Trade and other receivables | | 7 | | | 328,794 | | | | 495,186 | |
| Total current assets | | | | | 3,478,703 | | | | 19,735,893 | |
| | | | | | | | | | | |
| Non-Current Assets | | | | | | | | | | |
| Investment in associate | | 8 | | | 7,104,167 | | | | 16,767,507 | |
| Other financial assets at fair value through profit or loss | | 9 | | | 1,929,321 | | | | 1,738,137 | |
| Property, plant and equipment | | 10 | | | 2,616,080 | | | | 3,025,170 | |
| Exploration and evaluation | | 11 | | | 92,117,750 | | | | 81,070,075 | |
| Total non-current assets | | | | | 103,767,318 | | | | 102,600,889 | |
| | | | | | | | | | | |
| Total Assets | | | | | 107,246,021 | | | | 122,336,782 | |
| | | | | | | | | | | |
| Liabilities | | | | | | | | | | |
| | | | | | | | | | | |
| Current Liabilities | | | | | | | | | | |
| Trade and other payables | | 12 | | | 1,804,042 | | | | 2,414,485 | |
| Convertible notes | | 13 | | | 1,405,990 | | | | 1,179,788 | |
| Total current liabilities | | | | | 3,210,032 | | | | 3,594,273 | |
| | | | | | | | | | | |
| Non-Current Assets | | | | | | | | | | |
| Convertible notes | | 13 | | | 5,652,257 | | | | 5,352,544 | |
| Total non-current liabilities | | | | | 5,652,257 | | | | 5,352,544 | |
| | | | | | | | | | | |
| Total Liabilities | | | | | 8,862,289 | | | | 8,946,817 | |
| | | | | | | | | | | |
| Net Assets | | | | | 98,383,732 | | | | 113,389,965 | |
| Equity | | | | | | | | | | |
| Issued capital | | 14 | | | 143,972,570 | | | | 142,986,671 | |
| Foreign currency reserves | | | | | 3,928,914 | | | | 3,875,305 | |
| Share based-payment reserves | | 15 | | | 9,061,897 | | | | 8,726,228 | |
| Accumulated losses | | | | | (66,268,134 | ) | | | (49,985,023 | ) |
| Equity attributable to the owners of Nova Minerals Limited | | | | | 90,695,247 | | | | 105,603,181 | |
| Non-controlling interest | | 16 | | | 7,688,485 | | | | 7,786,784 | |
| | | | | | | | | | | |
| Total Equity | | | | | 98,383,732 | | | | 113,389,965 | |
The above consolidated statement of financial position should be read in conjunction with the accompanying notes
| | Nova Minerals Ltd | Annual Report | 42 |
Consolidated Statement of Changes in Equity
For the Year Ended 30 June 2024
| | | Issued | | | Share Based Payments | | | Foreign Currency | | | Accumulated | | | Non-
Controll-
ing | | | Total | |
| | | Capital | | | Reserves | | | Reserves | | | Losses | | | Interest | | | Equity | |
| Consolidated | | $ | | | $ | | | $ | | | $ | | | $ | | | $ | |
| | | | | | | | | | | | | | | | | | | |
| Balance at 1 July 2022 | | | 125,713,259 | | | | 7,309,323 | | | | 2,226,051 | | | | (38,500,932 | ) | | | 7,581,625 | | | | 104,329,326 | |
| | | | | | | | | | | | | | | | | | | | | | | | | |
| Loss after income tax expense for the year | | | - | | | | - | | | | - | | | | (11,484,091 | ) | | | (87,149 | ) | | | (11,571,240 | ) |
| Other comprehensive income for the year, net of tax | | | - | | | | - | | | | 1,649,254 | | | | - | | | | 292,308 | | | | 1,941,562 | |
| | | | | | | | | | | | | | | | | | | | | | | | | |
| Total comprehensive income/(loss) for the year | | | - | | | | - | | | | 1,649,254 | | | | (11,484,091 | ) | | | 205,159 | | | | (9,629,678 | ) |
| | | | | | | | | | | | | | | | | | | | | | | | | |
| Transactions with owners in their capacity as owners: | | | | | | | | | | | | | | | | | | | | | | | | |
| Issue of shares for cash (Note 14) | | | 19,059,988 | | | | - | | | | - | | | | - | | | | - | | | | 19,059,988 | |
| Options converted (Note 14) | | | 40,130 | | | | | | | | | | | | | | | | | | | | 40,130 | |
| Share issue costs (Note 14) | | | (1,826,706 | ) | | | - | | | | - | | | | - | | | | - | | | | (1,826,706 | ) |
| Share options expense for period (Note 28) | | | - | | | | 1,116,829 | | | | - | | | | - | | | | - | | | | 1,116,829 | |
| Performance rights granted (Note 28) | | | - | | | | 300,076 | | | | - | | | | - | | | | - | | | | 300,076 | |
| | | | | | | | | | | | | | | | | | | | | | | | | |
| Balance at 30 June 2023 | | | 142,986,671 | | | | 8,726,228 | | | | 3,875,305 | | | | (49,985,023 | ) | | | 7,786,784 | | | | 113,389,965 | |
The above consolidated statement of financial position should be read in conjunction with the accompanying notes
| | Nova Minerals Ltd | Annual Report | 43 |
Consolidated Statement of Changes in Equity (Continued)
For the Year Ended 30 June 2024
| | | Issued | | | Share Based Payments | | | Foreign Currency | | | Accumulated | | | Non-
Controll-
ing | | | Total | |
| | | Capital | | | Reserves | | | Reserves | | | Losses | | | Interest | | | Equity | |
| Consolidated | | $ | | | $ | | | $ | | | $ | | | $ | | | $ | |
| | | | | | | | | | | | | | | | | | | |
| Balance at 1 July 2023 | | | 142,986,671 | | | | 8,726,228 | | | | 3,875,305 | | | | (49,985,023 | ) | | | 7,786,784 | | | | 113,389,965 | |
| | | | | | | | | | | | | | | | | | | | | | | | | |
| Loss after income tax expense for the year | | | - | | | | - | | | | - | | | | (16,283,111 | ) | | | (106,181 | ) | | | (16,389,292 | ) |
| Other comprehensive income/(loss) for the year, net of tax | | | - | | | | - | | | | 53,609 | | | | - | | | | 7,882 | | | | 61,491 | |
| | | | | | | | | | | | | | | | | | | | | | | | | |
| Total comprehensive income/(loss) for the year | | | - | | | | - | | | | 53,609 | | | | (16,283,111 | ) | | | (98,299 | ) | | | (16,327,801 | ) |
| | | | | | | | | | | | | | | | | | | | | | | | | |
| Transactions with owners in their capacity as owners: | | | | | | | | | | | | | | | | | | | | | | | | |
| Issue of shares for cash (Note 14) | | | 1,000,005 | | | | - | | | | - | | | | - | | | | - | | | | 1,000,005 | |
Options converted
(Note 14) | | | 176 | | | | - | | | | - | | | | - | | | | - | | | | 176 | |
| Share issue costs (Note 14) | | | (14,282 | ) | | | - | | | | - | | | | - | | | | - | | | | (14,282 | ) |
| Share options expense for period (Note 28) | | | - | | | | 798,798 | | | | - | | | | - | | | | - | | | | 798,798 | |
| Performance rights (Note 28) | | | - | | | | (463,129 | ) | | | - | | | | - | | | | - | | | | (463,129 | ) |
| | | | | | | | | | | | | | | | | | | | | | | | | |
| Balance at 30 June 2024 | | | 143,972,570 | | | | 9,061,897 | | | | 3,928,914 | | | | (66,268,134 | ) | | | 7,688,485 | | | | 98,383,732 | |
The above consolidated statement of financial position should be read in conjunction with the accompanying notes
| | Nova Minerals Ltd | Annual Report | 44 |
Consolidated Statement of Cash Flows
For the Year Ended 30 June 2024
| | | | | Consolidated | |
| | | Note | | 30 June 2024 | | | 30 June 2023 | |
| | | | | $ | | | $ | |
| Cash Flows from Operating Activities | | | | | | | | | | |
| Payments to suppliers and employees (inclusive of GST) | | | | | (3,210,966 | ) | | | (3,095,422 | ) |
| Interest received | | | | | 262,818 | | | | 13,530 | |
| Interest and other finance costs paid | | | | | (718,620 | ) | | | (1,785 | ) |
| | | | | | | | | | | |
| Net cash used in operating activities | | 26 | | | (3,666,768 | ) | | | (3,083,677 | ) |
| Cash Flows from Investing Activities | | | | | | | | | | |
| Payments for property, plant and equipment | | | | | (255,553 | ) | | | (213,299 | ) |
| Payments for exploration and evaluation | | | | | (12,398,898 | ) | | | (23,647,509 | ) |
| Loans to Snow Lake Resources | | | | | 144,804 | | | | 100,000 | |
| Loans to other entity | | | | | (996,546 | ) | | | - | |
| Loans to related party | | | | | - | | | | 103,813 | |
| Payments to acquire investments | | | | | (125,000 | ) | | | (271,182 | ) |
| Convertible note Asra Minerals | | | | | 257,808 | | | | (250,000 | ) |
| Proceeds from disposal of property, plant and equipment | | | | | - | | | | 38,500 | |
| Proceeds from disposal of investments | | | | | 51,464 | | | | - | |
| | | | | | | | | | | |
| Net cash used in investing activities | | | | | (13,321,921 | ) | | | (24,139,677 | ) |
| | | | | | | | | | | |
| Cash Flows from Financing Activities | | | | | | | | | | |
| Proceeds from issue of shares | | 14 | | | 996,966 | | | | 19,059,988 | |
| Proceeds from Issue of derivative financial liability | | | | | - | | | | 7,449,210 | |
| Proceeds from exercise of options | | | | | 176 | | | | 39,871 | |
| Share issue transaction costs | | | | | (10,250 | ) | | | (1,390,454 | ) |
| | | | | | | | | | | |
| Net cash from financing activities | | | | | 986,892 | | | | 25,158,615 | |
| | | | | | | | | | | |
| Net decrease in cash and cash equivalents | | | | | (16,001,797 | ) | | | (2,064,739 | ) |
| Cash and cash equivalents at the beginning of the financial year | | | | | 19,240,707 | | | | 21,278,936 | |
| Effects of exchange rate changes on cash and cash equivalents | | | | | (89,001 | ) | | | 26,510 | |
| | | | | | | | | | | |
| Cash and Cash Equivalents at the End of the Financial Year | | 6 | | | 3,149,909 | | | | 19,240,707 | |
The above consolidated statement of cash flows should be read in conjunction with the accompanying notes
| | Nova Minerals Ltd | Annual Report | 45 |
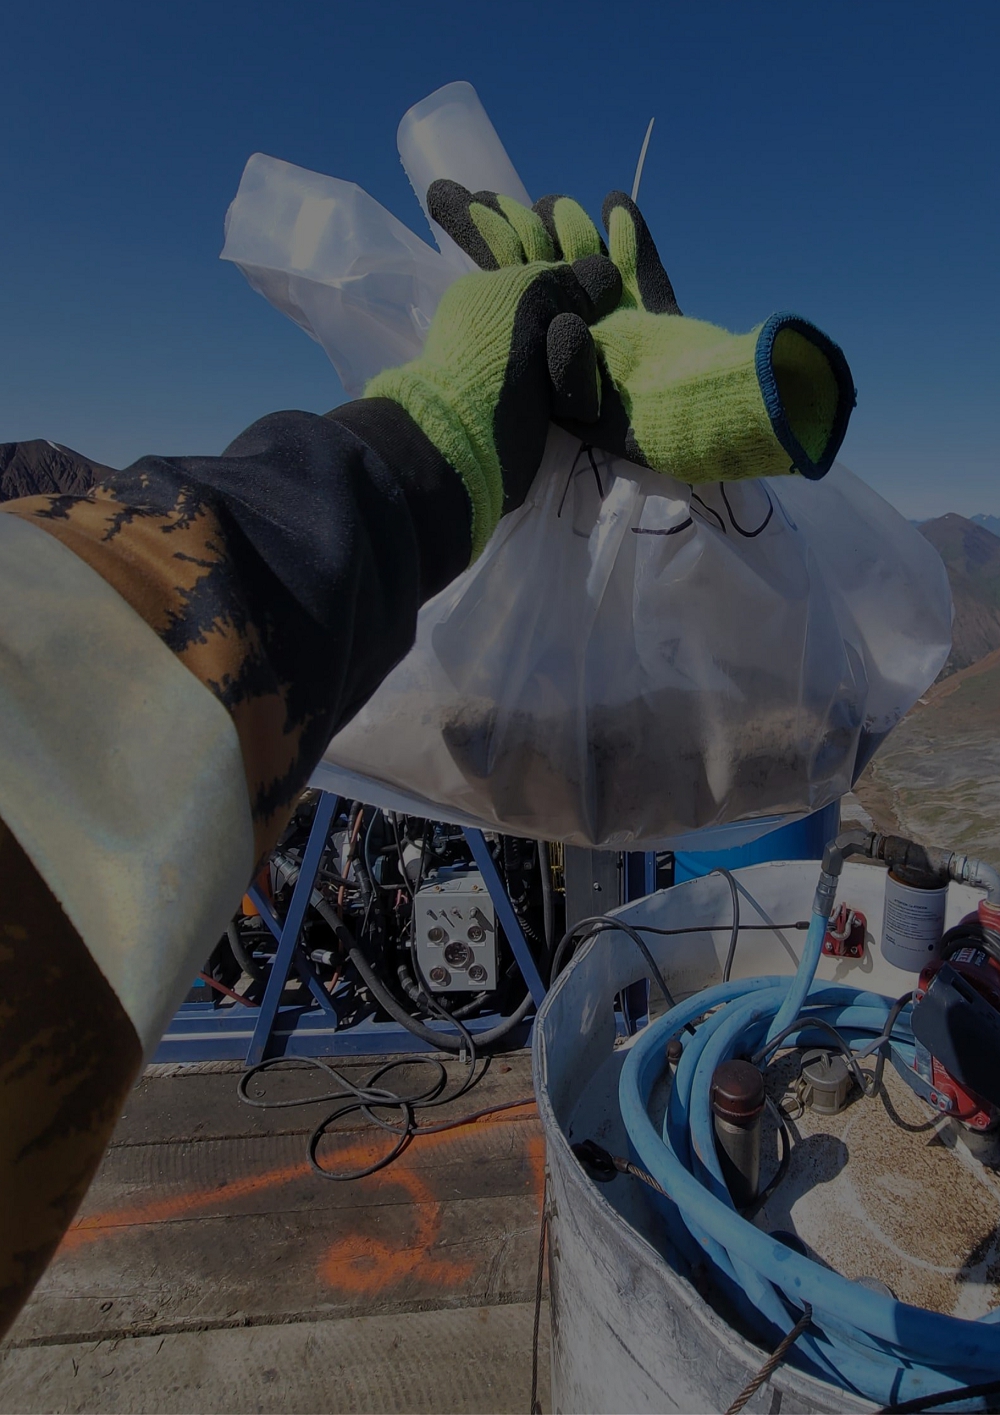
| | Nova Minerals Ltd | Annual Report | 46 |
Notes to the Financial Statements
| | Nova Minerals Ltd | Annual Report | 47 |
Notes to the Consolidated Financial Statements
For the Year Ended 30 June 2024
Note 1 Material Accounting Policy Information
The principal accounting policies adopted in the preparation of the financial statements are set out below. These policies have been consistently applied to all the years presented, unless otherwise stated.
New or Amended Accounting Standards and Interpretations Adopted
The consolidated entity has adopted all of the new or amended Accounting Standards and Interpretations issued by the Australian Accounting Standards Board (‘AASB’) that are mandatory for the current reporting period.
Any new or amended Accounting Standards or Interpretations that are not yet mandatory have not been early adopted.
Basis of Preparation
These general-purpose financial statements have been prepared in accordance with Australian Accounting Standards and Interpretations issued by the Australian Accounting Standards Board (‘AASB’) and the Corporations Act 2001, as appropriate for for-profit oriented entities. These financial statements also comply with International Financial Reporting Standards as issued by the International Accounting Standards Board (‘IASB’).
Historical Cost Convention
The financial statements have been prepared under the historical cost convention, except for, where applicable, the revaluation of financial assets and liabilities at fair value through profit or loss, financial assets at fair value through other comprehensive income, investment properties, certain classes of property, plant and equipment and derivative financial instruments.
Critical Accounting Estimates
The preparation of the financial statements requires the use of certain critical accounting estimates. It also requires management to exercise its judgement in the process of applying the consolidated entity’s accounting policies. The areas involving a higher degree of judgement or complexity, or areas where assumptions and estimates are significant to the financial statements, are disclosed in note 2.
Going Concern
The accompanying consolidated financial statements have been prepared assuming that the Company will continue as a going concern.
For the financial year ended 30 June 2024, the Company incurred a net loss after tax of $16,389,292 and utilized cash in operating and investing activities of $3,666,768 and $13,321,921 respectively. The ability to continue as a going concern and realize its exploration asset is dependent on a number of factors, the most significant of which is obtaining additional funding to complete the exploration activities.
These factors indicate a material uncertainty which may cast significant doubt as to whether the Company will continue as a going concern and therefore whether it will realize its assets and extinguish its liabilities in the normal course of business and at the amounts stated in the financial report.
The directors have reviewed the Company’s overall position and outlook in respect of the matters identified above and are of the opinion that the use of the going concern basis is appropriate in the circumstances for the following reasons:
| ● | The Company has cash resources of $3,149,909 as at 30 June 2024; |
| | |
| ● | The Company announced on 24 July 2024 the NASDAQ IPO for gross proceeds of approximately US$3.3m (AUD$4.9m), before deducting underwriting discounts and offering expenses. |
| | Nova Minerals Ltd | Annual Report | 48 |
| ● | The Company announced on 24 September 2024 a secondary raising on the NASDAQ for gross proceeds of approximately US$2.15m (AUD$3.14m), before deducting underwriting discounts and offering expenses. |
| | |
| ● | The Company has the ability to scale back its exploration activities should funding not be available to continue exploration at its current levels; and |
| | |
| ● | The Company has listed investments that can be realized as needed to support the company’s cash flows |
The financial report does not include any adjustments relating to the amounts or classification of recorded assets or liabilities that might be necessary if the company and Group does not continue as a going concern.
Accordingly, the Company has concluded that substantial doubt of its ability to continue as a going concern has been alleviated
Parent Entity Information
In accordance with the Corporations Act 2001, these financial statements present the results of the consolidated entity only. Supplementary information about the parent entity is disclosed in note 24.
Principles of Consolidation
The consolidated financial statements incorporate the assets and liabilities of all subsidiaries of Nova Minerals Limited (‘company’ or ‘parent entity’) as at 30 June 2024 and the results of all subsidiaries for the year then ended. Nova Minerals Limited and its subsidiaries together are referred to in these financial statements as the ‘consolidated entity’.
Subsidiaries are all those entities over which the consolidated entity has control. The consolidated entity controls an entity when the consolidated entity is exposed to, or has rights to, variable returns from its involvement with the entity and has the ability to affect those returns through its power to direct the activities of the entity. Subsidiaries are fully consolidated from the date on which control is transferred to the consolidated entity. They are de-consolidated from the date that control ceases.
Intercompany transactions, balances, and unrealised gains on transactions between entities in the consolidated entity are eliminated. Unrealised losses are also eliminated unless the transaction provides evidence of the impairment of the asset transferred. Accounting policies of subsidiaries have been changed where necessary to ensure consistency with the policies adopted by the consolidated entity.
The acquisition of subsidiaries is accounted for using the acquisition method of accounting. A change in ownership interest, without the loss of control, is accounted for as an equity transaction, where the difference between the consideration transferred and the book value of the share of the non-controlling interest acquired is recognised directly in equity attributable to the parent.
Non-controlling interest in the results and equity of subsidiaries are shown separately in the statement of profit or loss and other comprehensive income, statement of financial position and statement of changes in equity of the consolidated entity. Losses incurred by the consolidated entity are attributed to the non-controlling interest in full, even if that results in a deficit balance.
Where the consolidated entity loses control over a subsidiary, it derecognises the assets including goodwill, liabilities, and non-controlling interest in the subsidiary together with any cumulative translation differences recognised in equity. The consolidated entity recognises the fair value of the consideration received and the fair value of any investment retained together with any gain or loss in profit or loss.
Operating Segments
Operating segments are presented using the ‘management approach’, where the information presented is on the same basis as the internal reports provided to the Chief Operating Decision Makers (‘CODM’). The CODM is responsible for the allocation of resources to operating segments and assessing their performance.
| | Nova Minerals Ltd | Annual Report | 49 |
Foreign Currency Translation
The financial statements are presented in Australian dollars, which is Nova Minerals Limited’s functional and presentation currency.
Foreign Currency Transactions
Foreign currency transactions are translated into Australian dollars using the exchange rates prevailing at the dates of the transactions. Foreign exchange gains and losses resulting from the settlement of such transactions and from the translation at financial year-end exchange rates of monetary assets and liabilities denominated in foreign currencies are recognised in profit or loss.
Foreign Operations
The assets and liabilities of foreign operations are translated into Australian dollars using the exchange rates at the reporting date. The revenues and expenses of foreign operations are translated into Australian dollars using the average exchange rates, which approximate the rates at the dates of the transactions, for the period. All resulting foreign exchange differences are recognised in other comprehensive income through the foreign currency reserve in equity.
The foreign currency reserve is recognised in profit or loss when the foreign operation or net investment is disposed of.
Revenue Recognition
The consolidated entity recognises revenue as follows:
Interest
Interest revenue is recognised as interest accrues using the effective interest method. This is a method of calculating the amortised cost of a financial asset and allocating the interest income over the relevant period using the effective interest rate, which is the rate that exactly discounts estimated future cash receipts through the expected life of the financial asset to the net carrying amount of the financial asset.
Income Tax
The income tax expense or benefit for the period is the tax payable on that period’s taxable income based on the applicable income tax rate for each jurisdiction, adjusted by the changes in deferred tax assets and liabilities attributable to temporary differences, unused tax losses and the adjustment recognised for prior periods, where applicable.
Deferred tax assets and liabilities are recognised for temporary differences at the tax rates expected to be applied when the assets are recovered or liabilities are settled, based on those tax rates that are enacted or substantively enacted, except for:
| ● | When the deferred income tax asset or liability arises from the initial recognition of goodwill or an asset or liability in a transaction that is not a business combination and that, at the time of the transaction, affects neither the accounting nor taxable profits; or |
| | |
| ● | When the taxable temporary difference is associated with interests in subsidiaries, associates or joint ventures, and the timing of the reversal can be controlled, and it is probable that the temporary difference will not reverse in the foreseeable future. |
Deferred tax assets are recognised for deductible temporary differences and unused tax losses only if it is probable that future taxable amounts will be available to utilise those temporary differences and losses.
The carrying amount of recognised and unrecognised deferred tax assets are reviewed at each reporting date. Deferred tax assets recognised are reduced to the extent that it is no longer probable that future taxable profits will be available for the carrying amount to be recovered. Previously unrecognised deferred tax assets are recognised to the extent that it is probable that there are future taxable profits available to recover the asset.
| | Nova Minerals Ltd | Annual Report | 50 |
Deferred tax assets and liabilities are offset only where there is a legally enforceable right to offset current tax assets against current tax liabilities and deferred tax assets against deferred tax liabilities; and they relate to the same taxable authority on either the same taxable entity or different taxable entities which intend to settle simultaneously.
Nova Minerals Limited (the ‘head entity’) and its wholly owned Australian subsidiaries have formed an income tax consolidated group under the tax consolidation regime. The head entity and each subsidiary in the tax consolidated group continue to account for their own current and deferred tax amounts. The tax consolidated group has applied the ‘separate taxpayer within group’ approach in determining the appropriate amount of taxes to allocate to members of the tax consolidated group.
In addition to its own current and deferred tax amounts, the head entity also recognises the current tax liabilities (or assets) and the deferred tax assets arising from unused tax losses and unused tax credits assumed from each subsidiary in the tax consolidated group.
Assets or liabilities arising under tax funding agreements with the tax consolidated entities are recognised as amounts receivable from or payable to other entities in the tax consolidated group. The tax funding arrangement ensures that the intercompany charge equals the current tax liability or benefit of each tax consolidated group member, resulting in neither a contribution by the head entity to the subsidiaries nor a distribution by the subsidiaries to the head entity.
Current and Non-Current Classification
Assets and liabilities are presented in the statement of financial position based on current and non-current classification.
An asset is classified as current when: it is either expected to be realised or intended to be sold or consumed in the consolidated entity’s normal operating cycle; it is held primarily for the purpose of trading; it is expected to be realised within 12 months after the reporting period; or the asset is cash or cash equivalent unless restricted from being exchanged or used to settle a liability for at least 12 months after the reporting period. All other assets are classified as non-current.
A liability is classified as current when: it is either expected to be settled in the consolidated entity’s normal operating cycle; it is held primarily for the purpose of trading; it is due to be settled within 12 months after the reporting period; or there is no unconditional right to defer the settlement of the liability for at least 12 months after the reporting period. All other liabilities are classified as non-current.
Deferred tax assets and liabilities are always classified as non-current.
Cash and Cash Equivalents
Cash and cash equivalents include cash on hand, deposits held at call with financial institutions, other short-term, highly liquid investments with original maturities of three months or less that are readily convertible to known amounts of cash and which are subject to an insignificant risk of changes in value. For the statement of cash flows presentation purposes, cash and cash equivalents also includes bank overdrafts, which are shown within borrowings in current liabilities on the statement of financial position.
Trade and Other Receivables
Trade receivables are initially recognised at fair value and subsequently measured at amortised cost using the effective interest method, less any allowance for expected credit losses. Trade receivables are generally due for settlement within 30 days.
Other receivables are recognised at amortised cost, less any allowance for expected credit losses.
Derivative Financial Instruments
Derivatives are initially recognised at fair value on the date a derivative contract is entered into and are subsequently remeasured to their fair value at each reporting date. The accounting for subsequent changes in fair value depends on whether the derivative is designated as a hedging instrument, and if so, the nature of the item being hedged.
| | Nova Minerals Ltd | Annual Report | 51 |
Associates
Associates are entities over which the consolidated entity has significant influence but not control or joint control. Investments in associates are accounted for using the equity method. Under the equity method, the share of the profits or losses of the associate is recognised in profit or loss and the share of the movements in equity is recognised in other comprehensive income. Investments in associates are carried in the statement of financial position at cost plus post-acquisition changes in the consolidated entity’s share of net assets of the associate. Goodwill relating to the associate is included in the carrying amount of the investment and is neither amortised nor individually tested for impairment. Dividends received or receivable from associates reduce the carrying amount of the investment.
When the consolidated entity’s share of losses in an associate equal or exceeds its interest in the associate, including any unsecured long-term receivables, the consolidated entity does not recognise further losses, unless it has incurred obligations or made payments on behalf of the associate.
The consolidated entity discontinues the use of the equity method upon the loss of significant influence over the associate and recognises any retained investment at its fair value. Any difference between the associate’s carrying amount, fair value of the retained investment and proceeds from disposal is recognised in profit or loss.
Investments and Other Financial Assets
Investments and other financial assets are initially measured at fair value. Transaction costs are included as part of the initial measurement, except for financial assets at fair value through profit or loss. Such assets are subsequently measured at either amortised cost or fair value depending on their classification. Classification is determined based on both the business model within which such assets are held and the contractual cash flow characteristics of the financial asset unless an accounting mismatch is being avoided.
Financial assets are derecognised when the rights to receive cash flows have expired or have been transferred and the consolidated entity has transferred substantially all the risks and rewards of ownership. When there is no reasonable expectation of recovering part or all of a financial asset, its carrying value is written off.
Financial Assets at Amortised Cost
A financial asset is measured at amortised cost only if both of the following conditions are met: (i) it is held within a business model whose objective is to hold assets in order to collect contractual cash flows; and (ii) the contractual terms of the financial asset represent contractual cash flows that are solely payments of principal and interest.
Financial Assets at Fair Value Through Profit or Loss
Financial assets not measured at amortised cost or at fair value through other comprehensive income are classified as financial assets at fair value through profit or loss. Typically, such financial assets will be either: (i) held for trading, where they are acquired for the purpose of selling in the short-term with an intention of making a profit, or a derivative; or (ii) designated as such upon initial recognition where permitted. Fair value movements are recognised in profit or loss.
Impairment of Financial Assets
The consolidated entity recognises a loss allowance for expected credit losses on financial assets which are either measured at amortised cost or fair value through other comprehensive income. The measurement of the loss allowance depends upon the consolidated entity’s assessment at the end of each reporting period as to whether the financial instrument’s credit risk has increased significantly since initial recognition, based on reasonable and supportable information that is available, without undue cost or effort to obtain.
Where there has not been a significant increase in exposure to credit risk since initial recognition, a 12-month expected credit loss allowance is estimated. This represents a portion of the asset’s lifetime expected credit losses that is attributable to a default event that is possible within the next 12 months. Where a financial asset has become credit impaired or where it is determined that credit risk has increased significantly, the loss allowance is based on the asset’s lifetime expected credit losses. The amount of expected credit loss recognised is measured on the basis of the probability weighted present value of anticipated cash shortfalls over the life of the instrument discounted at the original effective interest rate.
| | Nova Minerals Ltd | Annual Report | 52 |
For financial assets mandatorily measured at fair value through other comprehensive income, the loss allowance is recognised in other comprehensive income with a corresponding expense through profit or loss. In all other cases, the loss allowance reduces the asset’s carrying value with a corresponding expense through profit or loss.
Property, Plant and Equipment
Plant and equipment is stated at historical cost less accumulated depreciation and impairment. Historical cost includes expenditure that is directly attributable to the acquisition of the items.
Depreciation is calculated on a straight-line basis to write off the net cost of each item of property, plant and equipment (excluding land) over their expected useful lives as follows:
| Plant and equipment | 5-10 years |
The residual values, useful lives and depreciation methods are reviewed, and adjusted if appropriate, at each reporting date.
An item of property, plant and equipment is derecognised upon disposal or when there is no future economic benefit to the consolidated entity. Gains and losses between the carrying amount and the disposal proceeds are taken to profit or loss.
Exploration and Evaluation
Exploration and evaluation expenditure in relation to separate areas of interest for which rights of tenure are current is carried forward as an asset in the statement of financial position where it is expected that the expenditure will be recovered through the successful development and exploitation of an area of interest, or by its sale; or exploration activities are continuing in an area and activities have not reached a stage which permits a reasonable estimate of the existence or otherwise of economically recoverable reserves. Where a project or an area of interest has been abandoned, the expenditure incurred thereon is written off in the year in which the decision is made.
When production commences, the accumulated costs for the relevant area of interest are amortised over the life of the area according to the rate of depletion of the economically recoverable reserves.
A regular review is undertaken of each area of interest to determine the appropriateness of continuing to carry forward costs in relation to that area of interest.
Trade and Other Payables
These amounts represent liabilities for goods and services provided to the consolidated entity prior to the end of the financial year and which are unpaid. Due to their short-term nature they are measured at amortised cost and are not discounted.
Borrowings
Loans and borrowings are initially recognised at the fair value of the consideration received, net of transaction costs. They are subsequently measured at amortised cost using the effective interest method.
The component of the convertible notes that exhibits characteristics of a liability is recognised as a liability in the statement of financial position, net of transaction costs.
On the issue of the convertible notes the fair value of the liability component is determined using a market rate for an equivalent non-convertible bond and this amount is carried as a non-current liability on the amortised cost basis until extinguished on conversion or redemption. The increase in the liability due to the passage of time is recognised as a finance cost. The remainder of the proceeds are allocated to the conversion option that is recognised and included in shareholders equity as a convertible note reserve, net of transaction costs. The carrying amount of the conversion option is not remeasured in the subsequent years. The corresponding interest on convertible notes is expensed to profit or loss.
| | Nova Minerals Ltd | Annual Report | 53 |
Finance Costs
Finance costs attributable to qualifying assets are capitalised as part of the asset. All other finance costs are expensed in the period in which they are incurred.
Employee Benefits
Short-Term Employee Benefits
Liabilities for wages and salaries, including non-monetary benefits, annual leave, long service leave and accumulating sick leave expected to be settled wholly within 12 months of the reporting date are measured at the amounts expected to be paid when the liabilities are settled. Non-accumulating sick leave is expensed to profit or loss when incurred.
Other Long-Term Employee Benefits
The liability for annual leave and long service leave not expected to be settled within 12 months of the reporting date are measured at the present value of expected future payments to be made in respect of services provided by employees up to the reporting date using the projected unit credit method. Consideration is given to expected future wage and salary levels, experience of employee departures and periods of service. Expected future payments are discounted using market yields at the reporting date on high quality corporate bonds with terms to maturity and currency that match, as closely as possible, the estimated future cash outflows.
Retirement Benefit Obligations
All employees of the consolidated entity are entitled to benefits from the consolidated entity’s superannuation plan on retirement, disability or death. The consolidated entity has a defined benefit section and a defined contribution section within its plan. The defined benefit section provides defined lump sum benefits based on years of service and final average salary. The defined contribution section receives fixed contributions from entities in the consolidated entity and the consolidated entity’s legal or constructive obligation is limited to these contributions.
A liability or asset in respect of defined benefit superannuation plans is recognised in the statement of financial position, and is measured at the present value of the defined benefit obligation at the reporting date less the fair value of the superannuation fund’s assets at that date and any unrecognised past service cost. The present value of the defined benefit obligation is based on expected future payments which arise from membership of the fund to the reporting date, calculated annually by independent actuaries using the projected unit credit method. Consideration is given to expected future wage and salary levels, experience of employee departures and periods of service.
Expected future payments are discounted using market yields at the reporting date on high quality corporate bonds with terms to maturity and currency that match, as closely as possible, the estimated future cash outflows.
Actuarial gains and losses arising from experience adjustments and changes in actuarial assumptions are recognised, in the period in which they occur, in other comprehensive income.
Past service costs are recognised immediately in profit or loss, unless the changes to the superannuation fund are conditional on the employees remaining in service for a specified period of time (‘the vesting period’). In this case, the past service costs are amortised on a straight-line basis over the vesting period.
Share-Based Payments
Equity-settled and cash-settled share-based compensation benefits are provided to employees and advisors.
Equity-settled transactions are awards of shares, or options over shares, that are provided to employees in exchange for the rendering of services. Cash-settled transactions are awards of cash for the exchange of services, where the amount of cash is determined by reference to the share price.
| | Nova Minerals Ltd | Annual Report | 54 |
The cost of equity-settled transactions are measured at fair value on grant date. Fair value is independently determined using either the Binomial or Black-Scholes option pricing model that takes into account the exercise price, the term of the option, the impact of dilution, the share price at grant date and expected price volatility of the underlying share, the expected dividend yield and the risk free interest rate for the term of the option, together with non-vesting conditions that do not determine whether the consolidated entity receives the services that entitle the employees to receive payment. No account is taken of any other vesting conditions.
The cost of equity-settled transactions are recognised as an expense with a corresponding increase in equity over the vesting period. The cumulative charge to profit or loss is calculated based on the grant date fair value of the award, the best estimate of the number of awards that are likely to vest and the expired portion of the vesting period. The amount recognised in profit or loss for the period is the cumulative amount calculated at each reporting date less amounts already recognised in previous periods.
The cost of cash-settled transactions is initially, and at each reporting date until vested, determined by applying either the Binomial or Black-Scholes option pricing model, taking into consideration the terms and conditions on which the award was granted. The cumulative charge to profit or loss until settlement of the liability is calculated as follows:
| ● | during the vesting period, the liability at each reporting date is the fair value of the award at that date multiplied by the expired portion of the vesting period. |
| | |
| ● | from the end of the vesting period until settlement of the award, the liability is the full fair value of the liability at the reporting date. |
All changes in the liability are recognised in profit or loss. The ultimate cost of cash-settled transactions is the cash paid to settle the liability.
Market conditions are taken into consideration in determining fair value. Therefore any awards subject to market conditions are considered to vest irrespective of whether or not that market condition has been met, provided all other conditions are satisfied.
If equity-settled awards are modified, as a minimum an expense is recognised as if the modification has not been made. An additional expense is recognised, over the remaining vesting period, for any modification that increases the total fair value of the share-based compensation benefit as at the date of modification.
If the non-vesting condition is within the control of the consolidated entity or employee, the failure to satisfy the condition is treated as a cancellation. If the condition is not within the control of the consolidated entity or employee and is not satisfied during the vesting period, any remaining expense for the award is recognised over the remaining vesting period, unless the award is forfeited.
If equity-settled awards are cancelled, it is treated as if it has vested on the date of cancellation, and any remaining expense is recognised immediately. If a new replacement award is substituted for the cancelled award, the cancelled and new award is treated as if they were a modification.
Fair Value Measurement
When an asset or liability, financial or non-financial, is measured at fair value for recognition or disclosure purposes, the fair value is based on the price that would be received to sell an asset or paid to transfer a liability in an orderly transaction between market participants at the measurement date; and assumes that the transaction will take place either: in the principal market; or in the absence of a principal market, in the most advantageous market.
Fair value is measured using the assumptions that market participants would use when pricing the asset or liability, assuming they act in their economic best interests. For non-financial assets, the fair value measurement is based on its highest and best use. Valuation techniques that are appropriate in the circumstances and for which sufficient data are available to measure fair value, are used, maximising the use of relevant observable inputs and minimising the use of unobservable inputs.
| | Nova Minerals Ltd | Annual Report | 55 |
Assets and liabilities measured at fair value are classified into three levels, using a fair value hierarchy that reflects the significance of the inputs used in making the measurements. Classifications are reviewed at each reporting date and transfers between levels are determined based on a reassessment of the lowest level of input that is significant to the fair value measurement.
For recurring and non-recurring fair value measurements, external valuers may be used when internal expertise is either not available or when the valuation is deemed to be significant. External valuers are selected based on market knowledge and reputation. Where there is a significant change in fair value of an asset or liability from one period to another, an analysis is undertaken, which includes a verification of the major inputs applied in the latest valuation and a comparison, where applicable, with external sources of data.
Issued Capital
Ordinary shares are classified as equity.
Incremental costs directly attributable to the issue of new shares or options are shown in equity as a deduction, net of tax, from the proceeds.
Earnings per share
Basic Earnings Per Share
Basic earnings per share is calculated by dividing the profit attributable to the owners of Nova Minerals Limited, excluding any costs of servicing equity other than ordinary shares, by the weighted average number of ordinary shares outstanding during the financial year, adjusted for bonus elements in ordinary shares issued during the financial year.
Diluted Earnings Per Share
Diluted earnings per share adjusts the figures used in the determination of basic earnings per share to take into account the after income tax effect of interest and other financing costs associated with dilutive potential ordinary shares and the weighted average number of shares assumed to have been issued for no consideration in relation to dilutive potential ordinary shares.
Goods and Services Tax (‘GST’) and Other Similar Taxes
Revenues, expenses and assets are recognised net of the amount of associated GST, unless the GST incurred is not recoverable from the tax authority. In this case it is recognised as part of the cost of the acquisition of the asset or as part of the expense.
Receivables and payables are stated inclusive of the amount of GST receivable or payable. The net amount of GST recoverable from, or payable to, the tax authority is included in other receivables or other payables in the statement of financial position.
Cash flows are presented on a gross basis. The GST components of cash flows arising from investing or financing activities which are recoverable from, or payable to the tax authority, are presented as operating cash flows.
Commitments and contingencies are disclosed net of the amount of GST recoverable from, or payable to, the tax authority.
New Accounting Standards and Interpretations Not Yet Mandatory or Early Adopted
Australian Accounting Standards and Interpretations that have recently been issued or amended but are not yet mandatory, have not been early adopted by the consolidated entity for the annual reporting period ended 30 June 2024. The consolidated entity has not yet assessed the impact of these new or amended Accounting Standards and Interpretations.
| | Nova Minerals Ltd | Annual Report | 56 |
Note 2. Critical Accounting Judgements, Estimates and Assumptions
The preparation of the financial statements requires management to make judgements, estimates and assumptions that affect the reported amounts in the financial statements. Management continually evaluates its judgements and estimates in relation to assets, liabilities, contingent liabilities, revenue and expenses.
Management bases its judgements, estimates and assumptions on historical experience and on other various factors, including expectations of future events, management believes to be reasonable under the circumstances. The resulting accounting judgements and estimates will seldom equal the related actual results. The judgements, estimates and assumptions that have a significant risk of causing a material adjustment to the carrying amounts of assets and liabilities (refer to the respective notes) within the next financial year are discussed below.
Share-Based Payment Transactions
The consolidated entity measures the cost of equity-settled transactions with employees by reference to the fair value of the equity instruments at the date at which they are granted. The fair value is determined by using either the Binomial or Black-Scholes model taking into account the terms and conditions upon which the instruments were granted. The accounting estimates and assumptions relating to equity-settled share-based payments would have no impact on the carrying amounts of assets and liabilities within the next annual reporting period but may impact profit or loss and equity.
Allowance for Expected Credit Losses
The allowance for expected credit losses assessment requires a degree of estimation and judgement. It is based on the lifetime expected credit loss, grouped based on days overdue, and makes assumptions to allocate an overall expected credit loss rate for each group. These assumptions include recent sales experience and historical collection rates.
Fair Value Measurement Hierarchy
The consolidated entity is required to classify all assets and liabilities, measured at fair value, using a three level hierarchy, based on the lowest level of input that is significant to the entire fair value measurement, being: Level 1: Quoted prices (unadjusted) in active markets for identical assets or liabilities that the entity can access at the measurement date; Level 2: Inputs other than quoted prices included within Level 1 that are observable for the asset or liability, either directly or indirectly; and Level 3: Unobservable inputs for the asset or liability. Considerable judgement is required to determine what is significant to fair value and therefore which category the asset or liability is placed in can be subjective.
The fair value of assets and liabilities classified as level 3 is determined by the use of valuation models. These include discounted cash flow analysis or the use of observable inputs that require significant adjustments based on unobservable inputs.
Estimation of Useful Lives of Assets
The consolidated entity determines the estimated useful lives and related depreciation and amortisation charges for its property, plant and equipment and finite life intangible assets. The useful lives could change significantly as a result of technical innovations or some other event. The depreciation and amortisation charge will increase where the useful lives are less than previously estimated lives, or technically obsolete or non-strategic assets that have been abandoned or sold will be written off or written down.
Recovery of deferred tax assets
Deferred tax assets are recognised for deductible temporary differences only if the consolidated entity considers it is probable that future taxable amounts will be available to utilise those temporary differences and losses.
Exploration and Evaluation Costs
Exploration and evaluation costs have been capitalised on the basis that the consolidated entity will commence commercial production in the future, from which time the costs will be amortised in proportion to the depletion of the mineral resources. Key judgements are applied in considering costs to be capitalised which includes determining expenditures directly related to these activities and allocating overheads between those that are expensed and capitalised. In addition, costs are only capitalised that are expected to be recovered either through successful development or sale of the relevant mining interest. Factors that could impact the future commercial production at the mine include the level of reserves and resources, future technology changes, which could impact the cost of mining, future legal changes and changes in commodity prices. To the extent that capitalised costs are determined not to be recoverable in the future, they will be written off in the period in which this determination is made.
| | Nova Minerals Ltd | Annual Report | 57 |
Note 3. Operating Segments
Operating segment information is disclosed on the same basis as information used for internal reporting purposes
At regular intervals, the board is provided management information for the Company’s cash position, the carrying values of exploration permits and Company cash forecast for the next twelve months of operation. On this basis, the board considers the consolidated entity operates in one segment being exploration of minerals and two geographical areas, being Australia and United States. For the financial year ended 30 June 2024 the Canadian assets relate to the investment in associate and the exploration asset has been eliminated due to the deconsolidation.
Geographical Information
| | | Interest Income | | | Geographical Non-Current Assets | |
| | | 30 June 2024 | | | 30 June 2023 | | | 30 June 2024 | | | 30 June 2023 | |
| | | $ | | | $ | | | $ | | | $ | |
| | | | | | | | | | | | | |
| Australia | | | 270,381 | | | | 7,397 | | | | 511,073 | | | | 1,470,024 | |
| Canada | | | - | | | | - | | | | 7,104,167 | | | | 16,767,507 | |
| United States | | | 245 | | | | 4,630 | | | | 96,152,078 | | | | 84,363,356 | |
| | | | | | | | | | | | | | | | | |
| | | | 270,626 | | | | 12,027 | | | | 103,767,318 | | | | 102,600,889 | |
Note 4. Expenses
| | | Consolidated | |
| | | 30 June 2024 | | | 30 June 2023 | |
| | | $ | | | $ | |
| | | | | | | |
| Loss before income tax includes the following specific expenses: | | | | | | | | |
| | | | | | | | | |
| Depreciation | | | 592,385 | | | | 456,904 | |
| Superannuation | | | 894 | | | | 1,151 | |
| Corporate and Consultants | | | 1,264,728 | | | | 739,380 | |
| Finance Charges | | | 695,312 | | | | 359,031 | |
| | | | | | | | | |
| | | | 2,553,319 | | | | 1,556,466 | |
| | Nova Minerals Ltd | Annual Report | 58 |
Note 5. Income Tax Expense
| | | Consolidated | |
| | | 30 June 2024 | | | 30 June 2023 | |
| | | $ | | | $ | |
| | | | | | | |
| Numerical reconciliation of income tax expense and tax at the statutory rate | | | | | | | | |
| Loss before income tax expense | | | (16,389,292 | ) | | | (11,571,240 | ) |
| | | | | | | | | |
| Tax at the statutory tax rate of 25% | | | (4,097,323 | ) | | | (2,892,810 | ) |
| | | | | | | | | |
| Tax effect amounts which are not deductible/(taxable) in calculating taxable income: | | | | | | | | |
| Impairment of Investment in Snow Lake Resources | | | 2,206,047 | | | | - | |
| Share-based payments | | | 83,917 | | | | 195,059 | |
| Share of profits(losses) - associates | | | 215,558 | | | | 1,563,690 | |
| | | | | | | | | |
| | | | (1,591,801 | ) | | | (1,134,061 | ) |
| Current year temporary differences not recognised | | | 1,591,801 | | | | 1,134,061 | |
| | | | | | | | | |
| Income tax expense | | | - | | | | - | |
| | | Consolidated | |
| | | 30 June 2024 | | | 30 June 2023 | |
| | | $ | | | $ | |
| | | | | | | |
| Tax losses not recognised | | | | | | | | |
| Unused tax losses for which no deferred tax asset has been recognised | | | 50,533,261 | | | | 37,940,614 | |
| | | | | | | | | |
| Potential tax benefit @ 25%/21% | | | 12,471,642 | | | | 9,359,226 | |
.
Under current legislation the tax losses cannot be carried forward indefinitely if control, ownership, or business nature changes. Deferred tax assets have not been recognised in respect of these items because it is not probable that future taxable profit will be available against which the consolidated entity can utilise the benefits.
These tax losses are also subject to final determination by the taxation authorities when the company derives taxable income.
The tax losses are subject to further review to determine if they satisfy the necessary legislative requirements under Income Tax legislation for carry forward and recoupment of tax losses.
Note 6. Current Assets – Cash and Cash Equivalents
| | | Consolidated | |
| | | 30 June 2024 | | | 30 June 2023 | |
| | | $ | | | $ | |
| Current Assets | | | | | | | | |
| Cash at bank | | | 3,149,909 | | | | 19,240,707 | |
| | Nova Minerals Ltd | Annual Report | 59 |
Note 7. Other Current Assets
| | | Consolidated | |
| | | 30 June 2024 | | | 30 June 2023 | |
| | | $ | | | $ | |
| Current Assets | | | | | | | | |
| Other receivable | | | 104,868 | | | | 264,705 | |
| Rent bond | | | - | | | | 5,830 | |
| Prepayments | | | 288,987 | | | | 217,351 | |
| GST (payable)/receivable | | | (65,061 | ) | | | 7,300 | |
| | | | | | | | | |
| | | | 328,794 | | | | 495,186 | |
The Company’s exposure to credit risk related to other receivables are disclosed in note 17.
Note 8. Investment in Associate
| | | Consolidated | |
| | | 30 June 2024 | | | 30 June 2023 | |
| | | $ | | | $ | |
| Non-Current Assets | | | | | | | | |
| Investment in Snow Lake Resources | | | 7,104,167 | | | | 16,767,507 | |
| | | | | | | | | |
| Reconciliation | | | | | | | | |
| Reconciliation of the carrying amounts at the beginning and end of the current and previous financial year are set out below: | | | | | | | | |
| | | | | | | | | |
| Opening carrying amount | | | 16,767,507 | | | | 23,022,266 | |
| Share of Snow Lake Resources loss for period | | | (839,153 | ) | | | (6,254,759 | ) |
| Impairment of investment in Snow Lake Resources | | | (8,824,187 | ) | | | - | |
| | | | | | | | | |
| Closing carrying amount | | | 7,104,167 | | | | 16,767,507 | |
As of 30 June 2024, Nova Minerals owns 29.6% of Snow Lake Resources due to dilution and has applied the equity method of investment accounting for its interest in Snow Lake Resources (Address of principal executive office: Winnipeg, Manitoba , Canada)
As a result of the shareholding dilution, as well as the company having limited oversight in management of Snow Lake Resources, the directors of Nova Minerals determined the company had lost control of its subsidiary as at 23 November 2021.
In line with AASB 10 (IFRS 10) Consolidated Financial Statements Nova Minerals therefore derecognized the assets and liabilities of the Snow Lake Resources group in its consolidated statement of financial position as at 23 November 2021, generating a gain on deconsolidation recognized in the consolidated profit and loss statement of the group in the period.
As a result of a significant and prolonged decline in the operations of Snow Lake Resources, management have decided to recognize an impairment as at 30 June 2024 of $8,824,187.
As at the 30 June 2024 Nova Mineral’s 6,600,000 shares in Snow Lake Resources, which is listed on the NASDAQ, had a market price of USD$0.713 per share, giving a fair value as of that date of USD$4,705,800, AUD$7,104,167, (30 June 2023, 6,600,000 shares with a market value of USD$2.27 per share giving a fair value of USD$22,597,351, AUD$34,081,977).
| | Nova Minerals Ltd | Annual Report | 60 |
Note 9. Other Financial Assets at Fair Value Through Profit or Loss
| | | Consolidated | |
| | | 30 June 2024 | | | 30 June 2023 | |
| | | | $ | | | | $ | |
| Non-Current Assets | | | | | | | | |
| Investments in Asra Minerals Limited at fair value | | | 511,073 | | | | 1,220,024 | |
| Investment in Alaska Asia Clean Energy Corp at fair value | | | 205,887 | | | | 205,887 | |
| Loans granted to related parties note 23 | | | 62,226 | | | | 62,226 | |
| Loan to Alaska Asia Clean Energy Corp * | | | 1,150,135 | | | | - | |
| Convertible note in ASRA Minerals Limited | | | - | | | | 250,000 | |
| | | | | | | | | |
| | | | 1,929,321 | | | | 1,738,137 | |
*This loan is recorded at amortised cost not fair value
| | | Consolidated | |
| | | 30 June 2024 | | | 30 June 2023 | |
| | | | $ | | | | $ | |
| Reconciliation Investments at Fair Value | | | | | | | | |
| Reconciliation of the carrying amounts at the beginning and end of the current and previous financial year are set out below: | | | | | | | | |
| Opening balance | | | 1,425,911 | | | | 3,797,443 | |
| Addition | | | | | | | | |
| Alaska Asia Clean Energy Corp | | | - | | | | 205,887 | |
| AX8 Shares | | | 51,464 | | | | - | |
| Asra Minerals Shares | | | 125,000 | | | | - | |
| | | | | | | | | |
| Gain on Disposal | | | | | | | | |
| AX8 Shares | | | (51,464 | ) | | | - | |
| | | | | | | | | |
| Movement in Fair Value | | | | | | | | |
| Asra Minerals Shares | | | (787,443 | ) | | | (2,112,330 | ) |
| Asra Minerals ASROB options | | | (46,508 | ) | | | (465,089 | ) |
| | | | | | | | | |
| Closing fair value | | | 716,960 | | | | 1,425,911 | |
The Investment in Asra Minerals Limited comprises shares and options held by the group measured at fair value. The group shareholding in Asra Minerals comprises 6.28% ownership.
Note 10. Property, Plant and Equipment
| | | Consolidated | |
| | | 30 June 2024 | | | 30 June 2023 | |
| | | | $ | | | | $ | |
| Non-Current Assets | | | | | | | | |
| Plant and equipment - at cost | | | 4,385,521 | | | | 4,206,168 | |
| Less: Accumulated depreciation | | | (1,769,441 | ) | | | (1,180,998 | ) |
| | | | | | | | | |
| | | | 2,616,080 | | | | 3,025,170 | |
| | Nova Minerals Ltd | Annual Report | 61 |
Note 10. Property, Plant and Equipment (Continued)
Reconciliations
| | | Consolidated | |
| | | 30 June 2024 | | | 30 June 2023 | |
| | | | $ | | | | $ | |
| Opening balance | | | 3,025,170 | | | | 3,118,808 | |
| Additions | | | 176,113 | | | | 283,655 | |
| Foreign exchange movement | | | 7,182 | | | | 98,474 | |
| Depreciation expense | | | (592,385 | ) | | | (456,904 | ) |
| Disposals | | | - | | | | (18,863 | ) |
| | | | | | | | | |
| Carrying amount at end of period | | | 2,616,080 | | | | 3,025,170 | |
All property plant and equipment stated under the historical cost convention
Note 11. Exploration and Evaluation
| | | Consolidated | |
| | | 30 June 2024 | | | 30 June 2023 | |
| | | | $ | | | | $ | |
| Non-Current Assets | | | | | | | | |
| Exploration and evaluation expenditure – At cost | | | 92,117,750 | | | | 81,070,075 | |
Reconciliations
Reconciliations of the written down values at the beginning and end of the current financial year are set out below:
| | | Consolidated | |
| | | 30 June 2024 | | | 30 June 2023 | |
| | | | $ | | | | $ | |
| Opening balance | | | 81,080,075 | | | | 56,702,626 | |
| Additions | | | 10,974,363 | | | | 22,157,270 | |
| Revaluation due to foreign exchange | | | 63,312 | | | | 2,210,179 | |
| | | | | | | | | |
| Carrying amount at end of year | | | 92,117,750 | | | | 81,070,075 | |
Note 12. Trade and Other Payables
| | | Consolidated | |
| | | 30 June 2024 | | | 30 June 2023 | |
| | | | $ | | | | $ | |
| Current Liabilities | | | | | | | | |
| Trade and Other Payables | | | 1,804,042 | | | | 2,414,485 | |
| | Nova Minerals Ltd | Annual Report | 62 |
Note 13. Convertible Notes
| | | Consolidated | |
| | | 30 June 2024 | | | 30 June 2023 | |
| | | | $ | | | | $ | |
| Current Liabilities | | | | | | | | |
| Financial derivative liability | | | 384,500 | | | | 250,921 | |
| Financial liability | | | 1,021,490 | | | | 928,867 | |
| | | | | | | | | |
| | | | 1,405,990 | | | | 1,179,788 | |
| Non-Current liabilities | | | | | | | | |
| Financial liability | | | 5,652,257 | | | | 5,352,544 | |
| | | | | | | | | |
| | | | 7,058,247 | | | | 6,532,332 | |
Reconciliations
Reconciliation of convertible note since inception to 30 June 2024 is set out below:
| | | Consolidated | |
| | | 30 June 2024 | | | 30 June 2023 | |
| | | $ | | | $ | |
| The initial recognition of the financial liability and derivative was: | | | | | | | | |
| Financial derivative liability | | | 250,921 | | | | 2,120,963 | |
| Financial liability | | | 6,281,411 | | | | 5,328,247 | |
| | | | | | | | | |
| | | | 6,532,332 | | | | 7,449,210 | |
| Movement to 30 June 2024 | | | | | | | | |
| Gain on financial derivative | | | (624,654 | ) | | | (1,870,042 | ) |
| Amortization of financial liability | | | 577,961 | | | | 928,281 | |
| Financial liability movement | | | 428,333 | | | | - | |
| Foreign exchange movement | | | 226,908 | | | | 24,883 | |
| Option fee | | | (82,633 | ) | | | - | |
| | | | 525,915 | | | | (916,878 | ) |
| | | | | | | | | |
| | | | 7,058,247 | | | | 6,532,332 | |
The financial liability and corresponding derivative represent the fair value of the loan facility Nova entered into on 27 October 2022 up to USD$7 million with an interest payable of 6.05% adjusted by the delta over a 3% SOFR floor. This was subsequently drawn down on 21 November 2022 and has a maturity of 24 months from draw down. Subsequently on the 3 June 2024 Nova exercised its right to extend the maturity date of the loan by a period of 12 months to 29 November 2025.
The facility has a conversion option which gives the lender the right to convert the principal plus any accrued interest into a variable number of shares. If Nova’s share price is greater than 150% of the conversion price, then Nova at its option may elect to force Nebari to convert the conversion amount, at the conversion price. Given the lender has the right to a variable number of shares and in accordance with AASB 9 (IFRS 9) this constitutes a compound financial instrument which requires both a financial liability and derivative to be recognised.
The derivative is recognised first at fair value and subsequently remeasured at each reporting period with the corresponding gain or loss recognised through the profit and loss. The remaining value is recognised as a financial liability and amortised over the life of the loan based on a 25.32% effective interest rate in accordance with AASB 9 (IFRS 9).
| | Nova Minerals Ltd | Annual Report | 63 |
Note 13. Convertible Notes (Continued)
Due to the extension of the term on the loan facility by 12 months, to November 2025, this was determined to be a substantial modification, in accordance with AASB 9 (IFRS 9), resulting in the previous financial instruments associated needing to be extinguished and a new financial instrument being recognised at fair value.
Nova may repay up to 50% of the outstanding principal in discounted shares (10% discount to the 15 day VWAP proceeding the prepayment date). In the event of a voluntary prepayment, Nova will also issue Nebari options to subscribe for Nova shares, with a 2 year expiry period from the date of the options issuance, at a strike price equal to a 40% premium to the VWAP of the Company’s shares for the 15 days preceding the earlier of the documentation completion date and the date at which the financing facility is announced to the public, converted at the AUD:USD exchange rate on the day preceding the conversion date (“Strike Price”) and in the amount of 80% of the Prepayment Amount divided by the Strike Price.
Note 14. Issued Capital
| | | Consolidated | |
| | | 30 June 2024 | | | 30 June 2024 | | | 30 June 2023 | | | 30 June 2023 | |
| | | Shares | | | $ | | | Shares | | | $ | |
| | | | | | | | | | | | | |
| Issued capital | | | 215,056,881 | | | | 150,346,596 | | | | 210,889,961 | | | | 149,346,415 | |
| Share issue costs | | | - | | | | (6,374,026 | ) | | | - | | | | (6,359,744 | ) |
| | | | | | | | | | | | | | | | | |
| | | | 215,056,881 | | | | 143,972,570 | | | | 210,889,961 | | | | 142,986,671 | |
| | | June 2024 | | | June 2024 | | | June 2023 | | | June 2023 | |
| Ordinary share - Issued and fully paid | | No | | | $ | | | No | | | $ | |
| | | | | | | | | | | | | |
| At the beginning of the period | | | 210,889,961 | | | | 142,986,671 | | | | 180,202,285 | | | | 125,713,259 | |
| - Contributions of equity | | | 4,166,669 | | | | 1,000,005 | | | | 27,228,501 | | | | 19,059,988 | |
| - Shares issued on conversion of options | | | 251 | | | | 176 | | | | 100,185 | | | | 40,130 | |
| - Shares issued on conversion of conversion of cashless options | | | - | | | | - | | | | 3,358,990 | | | | - | |
| - Share issue costs – share based payments | | | - | | | | - | | | | - | | | | (636,670 | ) |
| - Share issue costs - cash payments | | | - | | | | (14,282 | ) | | | - | | | | (1,190,036 | ) |
| | | | | | | | | | | | | | | | | |
| Closing balance | | | 215,056,881 | | | | 143,972,570 | | | | 210,889,961 | | | | 142,986,671 | |
Ordinary Shares
Ordinary shares entitle the holder to participate in dividends and the proceeds on the winding up of the company in proportion to the number of and amounts paid on the shares held. The fully paid ordinary shares have no par value and the company does not have a limited amount of authorised capital.
On a show of hands every member present at a meeting in person or by proxy shall have one vote and upon a poll each share shall have one vote.
Capital Risk Management
The consolidated entity’s objectives when managing capital is to safeguard its ability to continue as a going concern, so that it can provide returns for shareholders and benefits for other stakeholders and to maintain an optimum capital structure to reduce the cost of capital.
| | Nova Minerals Ltd | Annual Report | 64 |
Note 15. Share Based-Payment Reserves
| | | Consolidated | |
| | | 30 June 2024 | | | 30 June 2023 | |
| | | | $ | | | | $ | |
| | | | | | | | | |
| Share-based payments reserve | | | 9,061,897 | | | | 8,726,228 | |
Share-based payments reserve
The reserve is used to recognise the value of equity benefits provided to employees and directors as part of their remuneration, and other parties as part of their compensation for services.
Movements in reserves
Movements in each class of reserve during the financial years are set out below:
| | | Consolidated | |
| | | 30 June 2024 | | | 30 June 2023 | |
| | | $ | | | $ | |
| | | | | | | |
| Opening balance | | | 8,726,228 | | | | 7,309,323 | |
| Options expense in period (note 28) | | | 798,798 | | | | 1,116,829 | |
| Performance rights granted (note 28) | | | (463,129 | ) | | | 300,076 | |
| | | | | | | | | |
| Closing balance | | | 9,061,897 | | | | 8,726,228 | |
Note 16. Non-Controlling Interest
| | | Consolidated | |
| | | 30 June 2024 | | | 30 June 2023 | |
| | | | $ | | | | $ | |
| | | | | | | | | |
| Issued capital | | | 7,357,911 | | | | 7,357,911 | |
| Reserves | | | 693,023 | | | | 685,141 | |
| Accumulated losses | | | (362,449 | ) | | | (256,268 | ) |
| | | | | | | | | |
| | | | 7,688,485 | | | | 7,786,784 | |
As of the 30 June 2024 the non-controlling interest is 15% equity holding in AKCM Pty Ltd (2023: 15%).
| | Nova Minerals Ltd | Annual Report | 65 |
Note 17. Financial Instruments
The consolidated entity activities expose it to a variety of financial risks, market risk, credit risk and liquidity risk.
The Company’s overall risk management program focuses on the unpredictability of financial markets and seeks to minimize potential adverse effects of the financial performance of the entity.
Market Risk
Market risk is the risk that changes in market prices, such as foreign exchange risk, interest rates and equity prices will affect the Company’s income or the value of its holdings of financial instruments. The objective of market risk management is to manage and control market risk exposures within acceptable parameters, while optimizing the return.
The consolidated entity operates internationally and therefore there is exposure to foreign exchange risk arising from currency exposures. The consolidated entity holds investments in Asra Minerals Ltd (ASX: ASR) and Alaska Asian Clean Energy Corp which are exposed to security price risk. The objective of market risk management associated with equity security price is to manage and control market risk exposures within acceptable parameters. The consolidated entity is not exposed to commodity price risk as the consolidated entity is still carrying out exploration.
Interest Rate Risk
Interest rate risk arises from investment of cash at variable rates. The consolidated entity income and operating cash flows are not materially exposed to changes in market interest rates. At the reporting date, the interest rate profile of the Company’s interest-bearing financial instruments was:
| | | Consolidated | |
| | | 30 June 2024 | | | 30 June 2023 | |
| | | | $ | | | | $ | |
| | | | | | | | | |
Variable Rate Instruments | | | | | | | | |
| | | | | | | | | |
| Cash and cash equivalents | | | 3,149,909 | | | | 19,240,707 | |
Interest rate risk arises from investment of cash at variable rates. The Company’s income and operating cash flows are not materially exposed to changes in market interest rates.
An increase of 100 basis points (decrease of 100 basis points) in interest rates at the reporting date would have increased (decreased) equity and profit or loss by the amounts presented below. This analysis assumes that all other variables remain constant. The analysis was performed on the same basis for June 2023. The following table summarises the sensitivity of the Company’s financial assets (cash) to interest rate risk:
| | | | | | Profit or Loss | | | Profit or Loss | |
| | | Carrying Amount | | | 100 bp
Increase | | | 100 bp
Decrease | |
| | | $ | | | $ | | | $ | |
| 30 June 2024 | | | | | | | | | | | | |
| Variable rate instruments | | | | | | | | | | | | |
| Cash and cash equivalents | | | 3,149,909 | | | | 31,499 | | | | (31,499 | ) |
| | | | | | | | | | | | | |
| 30 June 2023 | | | | | | | | | | | | |
| Variable rate instruments | | | | | | | | | | | | |
| Cash and cash equivalents | | | 19,240,707 | | | | 192,407 | | | | (192,407 | ) |
| | Nova Minerals Ltd | Annual Report | 66 |
Foreign Currency Risk
The consolidated entity undertakes certain transactions denominated in foreign currency and is exposed to foreign currency risk through foreign exchange rate fluctuations. Foreign exchange risk arises from future commercial transactions denominated in a currency that is not the entity’s functional currency.
The average exchange rates and reporting date exchange rates applied were as follows:
| | | Average Exchange Rates | | | Reporting Date Exchange Rates | |
| | | 30 June 2024 | | | 30 June 2023 | | | 30 June 2024 | | | 30 June 2023 | |
| | | | | | | | | | | | | |
| Australian dollars | | | | | | | | | | | | | | | | |
| US Dollars | | | 0.6556 | | | | 0.6734 | | | | 0.6624 | | | | 0.6630 | |
Credit Risk
Credit risk is the risk of financial loss to the Company if a customer or counterparty to a financial instrument fails to meet its contractual obligations.
The Company has no significant concentration of credit risk. Credit risk arises from cash and cash equivalents held with the bank and financial institutions and receivables due from other entities. For banks and financial institutions, only independently rated parties with a minimum rating of ‘A’ are accepted.
The maximum exposure to credit risk is the carrying amount of the financial asset. The maximum exposure to credit risk at the reporting date was:
| | | Consolidated | |
| | | 30 June 2024 | | | 30 June 2023 | |
| | | | $ | | | | $ | |
| | | | | | | | | |
| Cash and cash equivalents | | | 3,149,909 | | | | 19,240,707 | |
| BAS Receivables | | | (65,061 | ) | | | 7,300 | |
| | | | | | | | | |
| | | | 3,084,848 | | | | 19,248,007 | |
Liquidity Risk
Liquidity risk is the risk that the consolidated entity will encounter difficulty in meeting the obligations associated with its financial liabilities that are settled by delivering cash or another financial asset. The Company’s liquidity risk arises from operational commitments. Prudent liquidity risk management implies maintaining sufficient cash and marketable securities. Management aims at maintaining flexibility in funding by regularly reviewing cash requirements and monitoring forecast cash flows.
| | Nova Minerals Ltd | Annual Report | 67 |
The following are the contractual maturities of financial liabilities:
| | | Weighted Average Interest Rate | | | 6 Months
or Less | | | 6 to 12
Months | | | Between 2 and 5 Years | | | Over 5 Years | | | Total
Contractual
Cash Flows | |
| Consolidated - 30 June 2024 | | % | | | $ | | | $ | | | $ | | | $ | | | $ | |
| | | | | | | | | | | | | | | | | | | |
| Non-derivatives | | | | | | | | | | | | | | | | | | | | | | | | |
| Non-interest bearing | | | | | | | | | | | | | | | | | | | | | | | | |
| Trade payables | | | - | | | | 1,804,042 | | | | - | | | | - | | | | - | | | | 1,804,042 | |
| | | | | | | | | | | | | | | | | | | | | | | | | |
| Interest-bearing | | | | | | | | | | | | | | | | | | | | | | | | |
| Financial liability | | | 11.39 | % | | | - | | | | 678,395 | | | | 5,995,352 | | | | - | | | | 6,673,747 | |
| Total non-derivatives | | | | | | | 1,804,042 | | | | 678,395 | | | | 5,995,352 | | | | - | | | | 8,477,789 | |
| | | | | | | | | | | | | | | | | | | | | | | | | |
| Derivatives | | | | | | | | | | | | | | | | | | | | | | | | |
| Financial derivative liability | | | - | | | | - | | | | 384,500 | | | | - | | | | - | | | | 384,500 | |
| Total non-derivatives | | | | | | | - | | | | 384,500 | | | | - | | | | - | | | | 384,500 | |
| | | Weighted Average Interest Rate | | | 6 Months
or Less | | | 6 to 12
Months | | | Between 2 and 5 Years | | | Over 5 Years | | | Total
Contractual
Cash Flows | |
| Consolidated - 30 June 2023 | | % | | | $ | | | $ | | | $ | | | $ | | | $ | |
| | | | | | | | | | | | | | | | | | | |
| Non-derivatives | | | | | | | | | | | | | | | | | | | | | | | | |
| Non-interest bearing | | | | | | | | | | | | | | | | | | | | | | | | |
| Trade payables | | | - | | | | 2,414,485 | | | | - | | | | - | | | | - | | | | 2,414,485 | |
| | | | | | | | | | | | | | | | | | | | | | | | | |
| Interest-bearing | | | | | | | | | | | | | | | | | | | | | | | | |
| Financial liability | | | 10.86 | % | | | - | | | | 690,568 | | | | 5,590,843 | | | | - | | | | 6,281,411 | |
| Total non-derivatives | | | | | | | 2,414,485 | | | | 690,568 | | | | 5,590,843 | | | | - | | | | 8,695,896 | |
| Derivatives | | | | | | | | | | | | | | | | | | |
| Financial derivative liability | | | - | | | | - | | | | 250,921 | | | | - | | | | - | | | | - | |
| Total non-derivatives | | | | | | | - | | | | 250,921 | | | | - | | | | - | | | | - | |
Fair Value
The carrying amount of the financial assets and financial liabilities recorded in the financial statements represent their respective net fair value determined in accordance with the accounting policies.
Capital Management
The Company’s policy in relation to capital management is for management to regularly and consistently monitor future cash flows against expected expenditures for a rolling period of up to 12 months in advance. The Board determines the Company’s need for additional funding by way of either share placements or loan funds depending on market conditions at the time. Management defines working capital in such circumstances as its excess liquid funds over liabilities, and defines capital as being the ordinary share capital of the Company. There were no changes in the Company’s approach to capital management during the year. The Company is not subject to externally imposed capital requirements.
| | Nova Minerals Ltd | Annual Report | 68 |
Note 18. Fair Value Measurement
The following tables detail the consolidated entity’s assets and liabilities, measured or disclosed at fair value, using a three-level hierarchy, based on the lowest level of input that is significant to the entire fair value measurement, being:
Level 1: Quoted prices (unadjusted) in active markets for identical assets or liabilities that the entity can access at the measurement date
Level 2: Inputs other than quoted prices included within Level 1 that are observable for the asset or liability, either directly or indirectly
Level 3: Unobservable inputs for the asset or liability
| | | Level 1 | | | Level 2 | | | Level 3 | | | Total | |
| Consolidated - 30 June 2024 | | $ | | | $ | | | $ | | | $ | |
| | | | | | | | | | | | | |
| Assets | | | | | | | | | | | | | | | | |
| Investments at fair value | | | 511,073 | | | | 205,887 | | | | - | | | | 716,960 | |
| Total assets | | | 511,073 | | | | 205,887 | | | | - | | | | 716,960 | |
| | | | | | | | | | | | | | | | | |
| Liabilities | | | | | | | | | | | | | | | | |
| Financial derivative liability | | | 384,500 | | | | - | | | | - | | | | 384,500 | |
| Total liabilities | | | 384,500 | | | | - | | | | - | | | | 384,500 | |
| | | Level 1 | | | Level 2 | | | Level 3 | | | Total | |
| Consolidated - 30 June 2023 | | $ | | | $ | | | $ | | | $ | |
| | | | | | | | | | | | | |
| Assets | | | | | | | | | | | | | | | | |
| Investments at fair value | | | 1,220,024 | | | | 205,887 | | | | - | | | | 1,425,911 | |
| Convertible note in Asra Minerals | | | - | | | | 250,000 | | | | - | | | | 250,000 | |
| Total assets | | | 1,220,024 | | | | 455,887 | | | | - | | | | 1,675,911 | |
| | | | | | | | | | | | | | | | | |
| Liabilities | | | | | | | | | | | | | | | | |
| Financial derivative liability | | | 250,921 | | | | - | | | | - | | | | 250,921 | |
| Total liabilities | | | 250,921 | | | | - | | | | - | | | | 250,921 | |
Valuation Techniques
The fair value of financial liabilities is estimated by discounting the remaining contractual maturities at the current market interest rate that is available for similar financial liabilities.
Derivative financial instruments have been valued using quoted market rates. This valuation technique maximises the use of observable market data where it is available and relies as little as possible on entity specific estimates.
| | Nova Minerals Ltd | Annual Report | 69 |
Note 19. Key Management Personnel Disclosures
The aggregate compensation made to directors and other members of key management personnel of the consolidated entity is set out below:
| | | Consolidated | |
| | | 30 June 2024 | | | 30 June 2023 | |
| | | | $ | | | | $ | |
| | | | | | | | | |
| Short-term employee benefits | | | 925,269 | | | | 924,437 | |
| Share-based payments | | | 240,420 | | | | 521,159 | |
| | | | | | | | | |
| | | | 1,165,689 | | | | 1,445,596 | |
Note 20. Remuneration of Auditors
During the financial year the following fees were paid or payable for services provided by RSM Australia Partners and Grassi & Co., CPAs, P.C., the auditors of the company:
| | | Consolidated | |
| | | 30 June 2024 | | | 30 June 2023 | |
| | | | $ | | | | $ | |
| Audit Services - RSM Australia Partners | | | | | | | | |
| Audit or review of the financial statements | | | 80,000 | | | | 81,000 | |
| | | | | | | | | |
| Other Services - RSM Australia Partners | | | | | | | | |
| Preparation of the tax return | | | 29,550 | | | | 38,849 | |
| | | | | | | | | |
| Other Services - RSM USA | | | | | | | | |
| Preparation of the tax return | | | 2,950 | | | | 52,730 | |
| | | | | | | | | |
| | | | 112,500 | | | | 172,579 | |
| | | | Consolidated | |
| | | | 30 June 2024 | | | | 30 June 2023 | |
| | | | $ | | | | $ | |
| Audit Services – Grassi & Co | | | | | | | | |
| Audit and review of the financial statements | | | 261,222 | | | | 138,712 | |
RSM Australia Partners is responsible for reporting on the ASX and Grassi & Co., CPAs, P.C. is responsible for the NASDAQ.
Note 21. Capital Commitments – Property. Plant and Equipment
The Consolidated entity had no capital commitments for property, plant and equipment as at 30 June 2024 and 30 June 2023.
| | Nova Minerals Ltd | Annual Report | 70 |
Note 22. Contingent Liabilities
There are no contingent liabilities that the consolidated entity has become aware of at 30 June 2024 and 30 June 2023.
Note 23. Related Party Transactions
Parent entity
Nova Minerals Limited is the parent entity.
Subsidiaries
Interests in subsidiaries are set out in Note 25.
Key management personnel
Disclosures relating to key management personnel are set out in Note 19 and the remuneration report included in the directors’ report.
The following transactions occurred with related parties:
Loans to/from related parties
The following balances are outstanding at the reporting date in relation to loans with related parties:
| | | Consolidated | |
| | | 30 June 2024 | | | 30 June 2023 | |
| | | | $ | | | | $ | |
| | | | | | | | | |
| Current Receivables: | | | | | | | | |
| Snow Lake Resources other receivable | | | 100,000 | | | | 250,207 | |
| | | | | | | | | |
| Non-Current Receivables: | | | | | | | | |
| Loan to Rotor X | | | 62,226 | | | | 62,226 | |
Terms and conditions
All transactions were made on normal commercial terms and conditions and at market rates
Note 24. Parent Entity Information
Set out below is the supplementary information about the parent entity.
Statement of profit or loss and other comprehensive income
| | | Parent | |
| | | 30 June 2024 | | | 30 June 2023 | |
| | | | $ | | | | $ | |
| | | | | | | | | |
| Loss after income tax | | | (15,166,025 | ) | | | (10,534,690 | ) |
| | | | | | | | | |
| Total comprehensive loss | | | (15,166,025 | ) | | | (10,534,690 | ) |
| | Nova Minerals Ltd | Annual Report | 71 |
Statement of financial position
| | | Parent | |
| | | 30 June 2024 | | | 30 June 2023 | |
| | | $ | | | $ | |
| | | | | | | |
| Total current assets | | | 3,170,822 | | | | 17,352,971 | |
| | | | | | | | | |
| Total assets | | | 105,439,276 | | | | 118,145,995 | |
| | | | | | | | | |
| Total current liabilities | | | 2,637,947 | | | | 1,799,920 | |
| | | | | | | | | |
| Total liabilities | | | 8,290,204 | | | | 7,152,464 | |
| | | | | | | | | |
| Equity | | | | | | | | |
| Issued capital | | | 143,972,569 | | | | 142,986,671 | |
| Share-based payments reserve | | | 9,061,897 | | | | 8,726,228 | |
| Accumulated losses | | | (55,885,394 | ) | | | (40,719,368 | ) |
| | | | | | | | | |
| Total equity | | | 97,149,072 | | | | 110,993,531 | |
Contingent liabilities
The parent entity had no contingent liabilities as at 30 June 2024 and 30 June 2023.
Capital commitments - Property, plant and equipment
The parent entity had no capital commitments for property, plant and equipment as at 30 June 2024 and 30 June 2023.
Significant accounting policies
The accounting policies of the parent entity are consistent with those of the consolidated entity, as disclosed in note 1.
Note 25. Interests in Subsidiaries
The consolidated financial statements incorporate the assets, liabilities and results of the following subsidiaries with non-controlling interests in accordance with the accounting policy described in note 1:
| | | | | | | Parent | | | Non-Controlling Interest | |
| | | Principal Place of Business / | | | | Ownership Interest | | | Ownership Interest | | | Ownership Interest | | | Ownership Interest | |
| Name | | Country of Incorporation | | Class of Shares | | 30 June
2024 | | | 30 June
2023 | | | 30 June
2024 | | | 30 June
2023 | |
| | | | | | | % | | | % | | | % | | | % | |
| | | | | | | | | | | | | | | | | |
| AKCM (Aust) Pty Ltd* | | Australia | | Ordinary | | | 85.00 | % | | | 85.00 | % | | | 15.00 | % | | | 15.00 | % |
| AK Operations LLC | | USA | | Ordinary | | | 100.00 | % | | | 100.00 | % | | | - | | | | - | |
| AK Custom Mining LLC | | USA | | Ordinary | | | 100.00 | % | | | 100.00 | % | | | - | | | | - | |
| Alaska Range Resources LLC | | USA | | Ordinary | | | 100.00 | % | | | 100.00 | % | | | - | | | | - | |
*AKCM (Aust) Pty Ltd is the immediate parent of AK Operations LLC and AK Custom Mining LLC.
| | Nova Minerals Ltd | Annual Report | 72 |
Summarised financial information
Summarised financial information of subsidiaries with non-controlling interests that are material to the consolidated entity are set out below:
| | | AKCM (Aust) Pty Ltd | |
| | | 30 June 2024 | | | 30 June 2023 | |
| | | $ | | | $ | |
| | | | | | | |
| Summarised statement of financial position | | | | | | | | |
| Current assets | | | 111,502 | | | | 1,827,323 | |
| Non-current assets | | | 94,603,581 | | | | 83,964,996 | |
| | | | | | | | | |
| Total assets | | | 94,715,083 | | | | 85,792,319 | |
| | | | | | | | | |
| Current liabilities | | | 59,373 | | | | 141,459 | |
| | | | | | | | | |
| Total liabilities | | | 59,373 | | | | 141,459 | |
| | | | | | | | | |
| Net assets/(liabilities) | | | 94,655,710 | | | | 85,650,860 | |
| | | | | | | | | |
| Summarised statement of profit or loss and other comprehensive income | | | | | | | | |
| Revenue | | | 245 | | | | 20,697 | |
| Expenses | | | (707,872 | ) | | | (601,690 | ) |
| | | | | | | | | |
| Loss before income tax expense | | | (707,627 | ) | | | (580,993 | ) |
| Income tax expense | | | - | | | | - | |
| | | | | | | | | |
| Loss after income tax expense | | | (707,627 | ) | | | (580,993 | ) |
| | | | | | | | | |
| Other comprehensive income/(loss) | | | 52,550 | | | | 1,948,722 | |
| | | | | | | | | |
| Total comprehensive income/(loss) | | | (655,077 | ) | | | 1,367,729 | |
| | | | | | | | | |
| Statement of cash flows | | | | | | | | |
| Net cash used in operating activities | | | (38,326 | ) | | | (238,904 | ) |
| Net cash used in investing activities | | | (1,665,045 | ) | | | (13,239,174 | ) |
| | | | | | | | | |
| Net increase/(decrease) in cash and cash equivalents | | | (1,703,371 | ) | | | (13,478,078 | ) |
| | | | | | | | | |
| Other financial information | | | | | | | | |
| Loss attributable to non-controlling interests | | | (106,181 | ) | | | (87,149 | ) |
| Total comprehensive Income/(loss) attributable to non-controlling interests | | | | | | | | |
| | | | (98,299 | ) | | | 205,159 | |
| Accumulated non-controlling interests at the end of reporting period | | | (431,005 | ) | | | (324,861 | ) |
| | Nova Minerals Ltd | Annual Report | 73 |
Note 26. Reconciliation of Loss After Income Tax to Net Cash Used in Operating Activities
| | | Consolidated | |
| | | 30 June
2024 | | | 30 June
2023 | |
| | | $ | | | $ | |
| | | | | | | |
| Loss after income tax expense for the year | | | (16,389,292 | ) | | | (11,571,240 | ) |
| | | | | | | | | |
| Adjustments for: | | | | | | | | |
| Gain from sale of equipment | | | - | | | | (16,137 | ) |
| Fair value gain on investments | | | 833,951 | | | | 2,577,419 | |
| Amortisation of financial liability | | | 577,961 | | | | 928,281 | |
| Depreciation | | | 592,385 | | | | 456,904 | |
| Management fee | | | - | | | | (47,423 | ) |
| Share based payments (Note 28) | | | 335,669 | | | | 780,235 | |
| Non-cash finance costs | | | (624,654 | ) | | | (1,870,042 | ) |
| Foreign exchange movement on financial liability | | | 226,908 | | | | 24,883 | |
| Gain from sale of investment | | | (51,464 | ) | | | - | |
| Impairment of Investment in Snow Lake Resources | | | 8,824,187 | | | | - | |
| Share of loss - associates | | | 839,153 | | | | 6,254,759 | |
| Foreign exchange gain intercompany loans | | | 209,545 | | | | (868,392 | ) |
| | | | | | | | | |
| Change in operating assets and liabilities: | | | | | | | | |
| Increase in trade and other receivables | | | 160,561 | | | | (96,579 | ) |
| Increase in trade and other payables | | | 806,322 | | | | 363,655 | |
| | | | | | | | | |
| Net cash used in operating activities | | | (3,666,768 | ) | | | (3,083,677 | ) |
Note 27. Earnings/(Loss) per share
| | | Consolidated | |
| | | 30 June 2024 | | | 30 June 2023 | |
| | | $ | | | $ | |
| | | | | | | | | |
| Loss after income tax | | | (16,389,292 | ) | | | (11,571,240 | ) |
| Non-controlling interest | | | 106,181 | | | | 87,149 | |
| | | | | | | | | |
| Loss after income tax | | | (16,283,111 | ) | | | (11,484,091 | ) |
| | | Number | | | Number | |
| | | | | | | |
| Weighted average number of ordinary shares used in calculating basic earnings per share | | | 211,477,929 | | | | 198,945,248 | |
| Adjustments for calculation of diluted earnings per share: | | | | | | | | |
| Options over ordinary shares | | | - | | | | - | |
| | | | | | | | | |
| Weighted average number of ordinary shares used in calculating diluted earnings per share | | | 211,477,929 | | | | 198,945,248 | |
| | | Cents | | | Cents | |
| | | | | | | |
| Basic earnings/(loss) per share | | | (7.70 | ) | | | (5.77 | ) |
| Diluted earnings/(loss) per share | | | (7.70 | ) | | | (5.77 | ) |
As of the 30 June 2024 there were 23,578,766 (2023: 33,572,158) outstanding unlisted options that would be included in the diluted calculation.
Note 28. Share-Based Payments
From time to time, the Group provides Incentive Options and Performance Rights to officers, employees, consultants and other key advisors as part of remuneration and incentive arrangements. The number of options or rights granted, and the terms of the options or rights granted are determined by the Board. Shareholder approval is sought where required. During the period the following share-based payments have been recognised:
Share-based payments
During the period, the following share-based payments have been granted:
| | | Consolidated | |
| | | 30 June 2024 | | | 30 June 2023 | |
| | | | $ | | | | $ | |
| | | | | | | | | |
| Recognised in profit & loss : | | | | | | | | |
| Director options 1 & 3 | | | 549,174 | | | | 332,560 | |
| Consultant options 2 & 4 | | | 249,624 | | | | 144,590 | |
| Director options 5 | | | - | | | | 3,009 | |
| Total options granted | | | 798,798 | | | | 480,159 | |
| | | | | | | | | |
| Performance Rights | | | | | | | | |
| Performance rights | | | (463,129 | ) | | | 300,076 | |
| | | | | | | | | |
| Total | | | 335,669 | | | | 780,235 | |
| | | Consolidated | |
| | | 30 June 2024 | | | 30 June 2023 | |
| | | | $ | | | | $ | |
| | | | | | | | | |
| Recognised in equity: | | | | | | | | |
| Options issued to brokers 6 | | | - | | | | 636,670 | |
| | | | | | | | | |
| | | | - | | | | 636,670 | |
| | Nova Minerals Ltd | Annual Report | 74 |
Options Expense
For the options expensed during the current financial year, the valuation model inputs used to determine the fair value at the grant date, are as follows:
| | | 1. Director Options | | | 2. Consultants Options | | | 3. Director Options | | | 4. Consultants Options | |
| | | | | | | | | | | | | |
| Recognised in | | | Profit & Loss | | | | Profit & Loss | | | | Profit & Loss | | | | Profit & Loss | |
| Grant date | | | 29/11/2022 | | | | 29/11/2022 | | | | 29/11/2022 | | | | 29/11/2022 | |
| Number of options issued | | | 5,750,000 | | | | 2,500,000 | | | | 5,750,000 | | | | 2,500,000 | |
| Expiry date | | | 30/11/2025 | | | | 30/11/2025 | | | | 30/11/2025 | | | | 30/11/2025 | |
| Vesting date | | | 31/03/2023 | | | | 31/03/2023 | | | | 30/11/2025 | | | | 30/11/2025 | |
| Share price at grant date | | | 0.66 | | | | 0.66 | | | | 0.66 | | | | 0.66 | |
| Exercise Price | | | 1.20 | | | | 1.20 | | | | 1.20 | | | | 1.20 | |
| Expected Volatility | | | 90 | % | | | 90 | % | | | 90 | % | | | 90 | % |
| Risk-Free Interest Rate | | | 3.24 | % | | | 3.24 | % | | | 3.24 | % | | | 3.24 | % |
| Trinomial step | | | 200 | | | | 200 | | | | 200 | | | | 200 | |
| Early exercise factor | | | 2.50 | | | | 2.50 | | | | 2.50 | | | | 2.50 | |
| Underlying fair value at grant date | | | 0.299 | | | | 0.299 | | | | 0.299 | | | | 0.299 | |
| The total share-based payment expense recognised form the amortisation as of the 30 June 2024 for the issued options | | | 549,174 | | | | 249,624 | | | | 332,560 | | | | 144,590 | |
| Vesting terms | | | Continuous employment and, $1bn project valuation | | | | Continuous employment and, $1bn project valuation | | | | Continuous employment and, A$1bn project valuation | | | | Continuous employment and, A$1bn project valuation | |
| | | 5. Director Options | | | 6. Broker Options | |
| | | | | | | |
| Recognised in | | | Profit & Loss | | | | Equity | |
| Grant date | | | 29/11/2022 | | | | 16/09/2022 | |
| Number of options issued | | | 200,000 | | | | 1,714,286 | |
| Expiry date | | | 07/10/2023 | | | | 16/09/2025 | |
| Vesting date | | | 29/11/2022 | | | | 16/09/2022 | |
| Share price at grant date | | | 0.66 | | | | 0.78 | |
| Exercise Price | | | 2.20 | | | | 0.91 | |
| Expected Volatility | | | 90 | % | | | 90 | % |
| Risk-Free Interest Rate | | | 3.18 | % | | | 3.45 | % |
| Trinomial step | | | 200 | | | | 200 | |
| Early exercise factor | | | 2.5 | | | | 2.5 | |
| Underlying fair value at grant date | | | 0.0329 | | | | 0.3714 | |
| Fair Value | | | 3,009 | | | | 636,670 | |
| | | | | | | | | |
| | Nova Minerals Ltd | Annual Report | 75 |
Option movement June 2024
Set out below are movements in options on issue over ordinary shares of Nova Minerals Limited during the 30 June 2024 financial year:
| Exercise period | | Exercise price | | | Beginning balance | | | Issued | | | Exercised | | | Lapsed | | | Ending balance | |
| | | | | | | | | | | | | | | | | | | |
| On or before 29 December 2023 | | | 0.75 | | | | 1,100,000 | | | | - | | | | - | | | | (1,100,000 | ) | | | - | |
| On or before 7 October 2023 | | | 2.20 | | | | 1,900,000 | | | | - | | | | - | | | | (1,900,000 | ) | | | - | |
| On or before 30 November 2025 | | | 1.20 | | | | 8,250,000 | | | | - | | | | - | | | | - | | | | 8,250,000 | |
| On or before 30 November 2024 | | | 1.10 | | | | 13,614,264 | | | | - | | | | - | | | | - | | | | 13,614,264 | |
| On or before 16 January 2026 | | | 0.91 | | | | 1,714,286 | | | | - | | | | - | | | | - | | | | 1,714,286 | |
| On or before 30 April 2024 (1) | | | 0.70 | | | | 6,993,608 | | | | - | | | | (251 | ) | | | (6,993,357 | ) | | | - | |
| On or before 30 June 2025 | | | 1.00 | | | | - | | | | 216 | | | | - | | | | - | | | | 216 | |
| | | | | | | | 33,572,158 | | | | 216 | | | | (251 | ) | | | (9,993,357 | ) | | | 23,578,766 | |
(1) For every two options exercised at A$0.70, holder will receive an option to purchase one additional ordinary share at an exercise price of A$1.00, with an expiry date of June 30, 2025.
Option movement June 2023
Set out below are movements in options on issue over ordinary shares of Nova Minerals Limited during the 30 June 2023 financial year:
| Exercise period | | Exercise price | | | Beginning balance | | | Issued | | | Exercised | | | Lapsed | | | Ending balance | |
| | | | | | | | | | | | | | | | | | | |
| On or before 19 September 2022 | | | 0.40 | | | | 6,100,000 | | | | - | | | | (6,100,000 | ) | | | - | | | | - | |
| On or before 28 October 2022 | | | 0.56 | | | | 150,000 | | | | - | | | | (150,000 | ) | | | - | | | | - | |
| On or before 28 January 2023 | | | 0.60 | | | | 750,000 | | | | - | | | | - | | | | (750,000 | ) | | | - | |
| On or before 2 December 2022 | | | 3.00 | | | | 1,050,000 | | | | - | | | | - | | | | (1,050,000 | ) | | | - | |
| On or before 29 December 2023 | | | 0.75 | | | | 1,100,000 | | | | - | | | | - | | | | - | | | | 1,100,000 | |
| On or before 20 May 2023 | | | 1.35 | | | | 1,100,000 | | | | 500,000 | | | | - | | | | (1,600,000 | ) | | | - | |
| On or before 23 Sept 2023 | | | 2.20 | | | | 1,700,000 | | | | 200,000 | | | | - | | | | - | | | | 1,900,000 | |
| On or before 30 November 2024 | | | 1.10 | | | | - | | | | 13,614,264 | | | | - | | | | - | | | | 13,614,264 | |
| On or before 30 November 2025 | | | 1.20 | | | | - | | | | 8,250,000 | | | | - | | | | - | | | | 8,250,000 | |
| On or before 16 January 2026 | | | 0.91 | | | | - | | | | 1,714,286 | | | | - | | | | - | | | | 1,714,286 | |
| On or before 30 April 2024 (1) | | | 0.70 | | | | - | | | | 6,993,793 | | | | (185 | ) | | | - | | | | 6,993,608 | |
| Total | | | | | | | 11,950,000 | | | | 31,272,343 | | | | (6,250,185 | ) | | | (3,400,000 | ) | | | 33,572,158 | |
(1) For every two options exercised at A$0.70, holder will receive an option to purchase one additional ordinary share at an exercise price of A$1.00, with an expiry date of June 30, 2025.
The weighted average year remaining contractual life
The weighted average number of years remaining for the contractual life for share-based payment options outstanding as of the 30 June 2024 was 0.85 years (2023: 1.51 years).
The weighted average exercise price
The weighted average exercise price for the share-based payment options outstanding as at 30 June 2024 was $1.12 (2023: $1.08).
The average price for the 30 June 2024 financial year was $0.26 (30 June 2023: 0.61)
Performance rights
During the June 2022 Financial year the Company issued 24 million performance rights (2.4 million post-consolidation) to three directors. The terms of the performance rights issued were disclosed in the annual general meeting notice announced 22 October 2021. The performance rights are long-term incentives to offer conditional rights to fully paid ordinary shares in the Company upon satisfaction of vesting criteria over the vesting periods for no cash consideration. Fair value has been measured using the share price at grant date.
| | Nova Minerals Ltd | Annual Report | 76 |
| Class of Performance | | Applicable | | Lapse | | Rights |
| Rights | | Milestone | | Date | | Issued |
| | | | | | | |
| Class A Performance Rights | | Completion of either a pre-feasibility study or a definitive feasibility study of the Korbel Main deposit that demonstrates at the time of reporting that extraction is reasonably justified and economically mineable indicating an internal rate of return to the Company of greater than 20% and an independently verified JORC classified mineral reserve equal to or greater than 1,500,000 oz Au with an average grade of not less than 0.4g/t for not less than 116Mt. | | 5 years from issue | | 600,000 |
| Class B Performance Rights | | Completion of the first gold pour (defined as a minimum quantity of 500 oz.) from the Korbel Main deposit. | | 5 years from issue | | 600,000 |
| Class C Performance Rights | | Achievement of an EBITDA of more than $20m in the second half-year reporting period following the commencement of commercial operations at the Korbel Main deposit. | | 5 years from issue | | 1,200,000 |
30 June 2024 performance rights
The performance rights were valued as the closing share price $1.30 on the grant date 24 November 2021. During the current period the probabilities of meeting the vesting conditions were altered and the amount was reduced by $463,129 to reflect the change in probability.
30 June 2023 performance rights
The performance rights were valued as the closing share price $1.30 on the grant date 24 November 2021. The total share-based payment expense recognised from the amortisation of the 2022 issued performance rights was $300,076 for the 30 June 2023 financial year
Set out below are the summaries of Performance rights granted during period as share based payments
| | | | | | | | Price at | | | | | | | | | Expired/ | | | Balance at | |
| | | | | | | | grant | | | | | | | | | Lapsed/ | | | the end of | |
| Grant date | | Expiry date | | Class | | | date | | | Granted | | | Exercised | | | other | | | the year | |
| | | | | | | | | | | | | | | | | | | | | |
| 24/11/2021 | | 24/11/2026 | | | A | | | $ | 1.30 | | | | 600,000 | | | | - | | | | - | | | | 600,000 | |
| 24/11/2021 | | 24/11/2026 | | | B | | | $ | 1.30 | | | | 600,000 | | | | - | | | | - | | | | 600,000 | |
| 24/11/2021 | | 24/11/2026 | | | C | | | $ | 1.30 | | | | 1,200,000 | | | | - | | | | - | | | | 1,200,000 | |
Note 29. Events After the Reporting Period
The following events and transactions occurred subsequent to 30 June 2024:
The Company announced on 24 July 2024 the NASDAQ IPO and an underwritten public offering of 475,000 units, with each unit consisting of one American Depositary Share representing ordinary shares (“ADS”) and one warrant, with an ADS-to-ordinary-share ratio of 1 to 60, at a price to the public of US$6.92 per unit, for gross proceeds of approximately US$3.3m (AUD$4.9m), before deducting underwriting discounts and offering expenses. Each whole warrant is exercisable for one ADS at an exercise price of US$7.266 per ADS and will be immediately exercisable upon issuance for a period of five years following the date of issuance. In addition, Nova has granted the underwriters an option to purchase up to an additional 47,500 ADSs and/or an additional 47,500 warrants to cover over-allotments, if any until August 29, 2024
The Company announced on 24 July 2024 the appointment of Mr. Richard Beazley to the Board of Directors as Independent Non-Executive Chairman. Mr. Louie Simens reverted to Executive Director from his Interim Chairman position at that time.
The Company announced on 31July 2024 the commencement of resource definition drilling at RPM and exploration field programs on its Estelle Gold Project
| | Nova Minerals Ltd | Annual Report | 77 |
The Company announced on 21 August 2024 an update on the progress of its 2024 resource definition drilling and exploration field programs.
The Company announced on 5 September 2024 an update on its Antimony-Gold prospects at Stibium and Styx where bulk samples of stibnite (antimony) have been collected for metallurgical testing.
The Company announced on 20 September 2024 that has filed a registration statement on Form F-1 with the U.S. Securities and Exchange Commission (“SEC”) relating to a secondary public offering of its American Depositary Shares (“ADSs”), each of which will represent 60 of the Company’s ordinary shares of no par value each (“Ordinary Shares”) in the United States (the “Offering”).
The Company announced on 20 September 2024 that it had executed a variation agreement with its largest institutional shareholder and convertible note holder, Nebari Gold Fund 1, LP (“Nebari”), to reduce the month-end cash covenant required under the previously announced loan agreement dated 21 November 2022 from US$2m to A$1m, with the option to extend the convertible facility for a further 12 months to 29 November 2026. In return for Nebari’s support, Nova has agreed to amend the conversion price from A$0.53 to A$0.25, subject to shareholder approval.
Further to the announcement on 20 September 2024, the Company announced the ability to accelerate the RPM early start up option to a Pre-Feasibility Study (PFS) for delivery in 2025 by undertaking internal optimization studies aimed to investigate how it can potentially generate as much early cashflow as possible to organically fund our expansion plans across the Estelle project. It also gives the Company the ability to continue our advanced discussions with the US Dept. of Defense (“DoD”) in relation to potentially establishing a starter antimony operation at Stibium in parallel.
The Company announced on 24 September 2024 a secondary NASDAQ public offering of 430,000 units, with each unit consisting of one American Depositary Share representing ordinary shares (“ADS”), with an ADS-to-ordinary-share ratio of 1 to 60, at a price to the public of US$5.00 per unit, for gross proceeds of approximately US$2.15m (AUD$3.14), before deducting underwriting discounts and offering expenses. In addition, Nova has granted the underwriters an option to purchase up to an additional 43,000 ADSs to cover over-allotments, if any, for 45 days.
No other matter or circumstance has arisen since 30 June 2024 that has significantly affected, or may significantly affect the consolidated entity’s operations, the results of those operations, or the consolidated entity’s state of affairs in future financial years.
| | Nova Minerals Ltd | Annual Report | 78 |
Note 30. Consolidated Entity Disclosure Statement
| Entity name | | Entity type | | Place formed / Country of incorporation | | Ownership interest % | | | Tax residency |
| | | | | | | | | | |
| Nova Minerals Limited | | Body corporate | | Australia | | | - | | | Australia |
| AKCM (Aust) Pty Ltd * | | Body corporate | | Australia | | | 85.00 | % | | Australia |
| AK Operations LLC | | Body corporate | | USA | | | 100.00 | % | | USA |
| AK Custom Mining LLC | | Body corporate | | USA | | | 100.00 | % | | USA |
| Alaska Range Resources LLC | | Body corporate | | USA | | | 100.00 | % | | USA |
*ACKM (AUS) Pty Ltd is the immediate parent of AK Operations LLC and AK Custom Mining LLC.
Director’s Declaration
In the Directors’ opinion:
| ● | The attached financial statements and notes comply with the Corporations Act 2001, the Accounting Standards, the Corporations Regulations 2001 and other mandatory professional reporting requirements; |
| ● | The attached financial statements and notes comply with International Financial Reporting Standards as issued by the International Accounting Standards Board as described in note 1 to the financial statements; |
| ● | The attached financial statements and notes give a true and fair view of the consolidated entity’s financial position as at 30 June 2024 and of its performance for the financial year ended on that date; |
| ● | There are reasonable grounds to believe that the company will be able to pay its debts as and when they become due and payable; and |
| ● | The information disclosed in the attached consolidated entity disclosure statement is true and correct. |
The directors have been given the declarations required by section 295A of the Corporations Act 2001.
Signed in accordance with a resolution of directors made pursuant to section 295(5)(a) of the Corporations Act 2001.
On behalf of the directors

________________________
Richard Beazley
Chairman
30 September 2024
| | Nova Minerals Ltd | Annual Report | 79 |

INDEPENDENT AUDITOR’S REPORT
To the Directors of Nova Minerals Limited
Opinion
We have audited the financial report of Nova Minerals Limited. (the Company) and its subsidiaries (the Group), which comprises the consolidated statement of financial position as at 30 June 2024, the consolidated statement of profit or loss and other comprehensive income, the consolidated statement of changes in equity and the consolidated statement of cash flows for the year then ended, and notes to the financial statements, including material accounting policy information, the consolidated entity disclosure statement and the directors’ declaration.
In our opinion the accompanying financial report of the Group is in accordance with the Corporations Act 2001, including:
| (i) | giving a true and fair view of the Group’s financial position as at 30 June 2024 and of its financial performance for the year then ended; and |
| (ii) | complying with Australian Accounting Standards and the Corporations Regulations 2001. |
Basis for Opinion
We conducted our audit in accordance with Australian Auditing Standards. Our responsibilities under those standards are further described in the Auditor’s Responsibilities for the Audit of the Financial Report section of our report. We are independent of the Group in accordance with the auditor independence requirements of the Corporations Act 2001 and the ethical requirements of the Accounting Professional and Ethical Standards Board’s APES 110 Code of Ethics for Professional Accountants (including independence standards) (the Code) that are relevant to our audit of the financial report in Australia. We have also fulfilled our other ethical responsibilities in accordance with the Code.
We confirm that the independence declaration required by the Corporations Act 2001, which has been given to the directors of the Company, would be in the same terms if given to the directors as at the time of this auditor’s report.
We believe that the audit evidence we have obtained is sufficient and appropriate to provide a basis for our opinion.
| | Nova Minerals Ltd | Annual Report | 80 |

Material Uncertainty Related to Going Concern
We draw attention to Note 1 in the financial report, which indicates that the Group incurred a net loss of $16,389,292 and cash from operating and investing activities of $3,666,768 and $13,321,921 respectively during the year ended 30 June 2024. As stated in Note 1, these events or conditions, along with other matters as set forth in Note 1, indicate that a material uncertainty exists that may cast significant doubt on the Group’s ability to continue as a going concern. Our opinion is not modified in respect of this matter.
Key Audit Matters
Key audit matters are those matters that, in our professional judgement, were of most significance in our audit of the financial report of the current period. These matters were addressed in the context of our audit of the financial report as a whole, and in forming our opinion thereon, and we do not provide a separate opinion on these matters report as a whole.
In addition to the matter described in the Material Uncertainty Related to Going Concern section, we have determined the matters described below to be the key audit matters to be communicated in our report.
| Key Audit Matter | | How our audit addressed this matter |
Capitalisation & Impairment of exploration and evaluation assets Refer to Note 11 in the financial statements |
At 30 June 2024 the Group held capitalised exploration and evaluation assets (“E&E Asset”) of $92,117,750. This represents 86% of the total assets of the Group at that date. We consider the carrying amount of these assets to be a key audit matter, under AASB 6 Exploration for and Evaluation of Mineral Resources, due to the significant management judgments involved, including: ● Whether the exploration and evaluation spend can be associated with finding specific mineral resources, and the basis on which that expenditure is allocated to an area of interest in line with AASB 6; ● The Group’s ability and intention to continue to explore the area; ● The existence of any impairment indicators, and if so, those applied to determine and quantify any impairment loss; and ● Whether exploration activities have reached the stage at which the existence of an economically recoverable reserve may be determined. | | Our audit procedures included: ● Obtaining evidence that the Group has valid rights to explore in the specific areas of interest; ● Critically assessing and evaluating management’s assessment that no indicators of impairment existed; ● Agreeing a sample of the additions to capitalised exploration assets to supporting documentation, to confirm they were capitalised in line with the measurement and other criteria of the Group’s policy and AASB 6; ● Holding discussions with, and making enquiries of, the Group’s management team, reviewing of the Group’s ASX announcements, and other relevant documentation; ● Confirming the existence of plans to determine that the Group will incur substantive expenditure on further exploration for and evaluation of mineral resources in the specific areas of interest; ● Confirming the Group’s intention to carry out significant exploration and evaluation activity in the relevant exploration area, through enquiries, and by assessing the Group’s future cashflow forecasts, and reviewing the Group’s business and financial strategy; and ● Confirming that management has not resolved to discontinue activities in the specific area of interest. |
| | Nova Minerals Ltd | Annual Report | 81 |
Key Audit Matters (continued.)
| Key Audit Matter | | How our audit addressed this matter |
Convertible notes |
| |
| Refer to Note 13 in the financial statements |
| |
The Company previously entered into a convertible loan note whereby they have access to draw down up to USD $7,000,000. There was an addendum to the agreement in the 30 June 2024 financial year which resulted in a 12- month extension to the facility taking this to November 2025. This note is considered a hybrid financial instrument due to its USD denomination and other terms, including provisions for compulsory conversion if a specific share price is reached. The addendum in the year resulted in the derecognition of the existing liability and the recognition of a new liability which reflected the new terms of the agreement. The numerous conditions and variable elements of the note, along with the financial model used by management to value the instrument, was considered complex. There is a risk that the note has not been valued correctly and the accounting is not in accordance with AASB 9 Financial Instruments. | | Our audit procedures in relation to the convertible loan note were, reviewing the accuracy and completeness of managements calculations including: ● Ensuring all terms of the agreement have been appropriately included in the valuation model; ● Performing substantive testing to verify the accuracy of the valuation model used by the entity, including the inputs, assumptions, and discount rates applied; and ● Ensuring the accounting treatment of the note including disclosures are compliant with AASB 9. |
Other Information
The directors are responsible for the other information. The other information comprises the information included in the Group’s annual report for the year ended 30 June 2024, but does not include the financial report and the auditor’s report thereon.
Our opinion on the financial report does not cover the other information and accordingly we do not express any form of assurance conclusion thereon.
In connection with our audit of the financial report, our responsibility is to read the other information and, in doing so, consider whether the other information is materially inconsistent with the financial report or our knowledge obtained in the audit or otherwise appears to be materially misstated.
If, based on the work we have performed, we conclude that there is a material misstatement of this other information, we are required to report that fact. We have nothing to report in this regard.
Responsibilities of the Directors for the Financial Report
The directors of the Company are responsible for the preparation of:
| | a. | the financial report (other than the consolidated entity disclosure statement) that gives a true and fair view in accordance with Australian Accounting Standards and the Corporations Act 2001; and |
| | | |
| | b. | the consolidated entity disclosure statement that is true and correct in accordance with the Corporations Act 2001, and |
| | Nova Minerals Ltd | Annual Report | 82 |
for such internal control as the directors determine is necessary to enable the preparation of:
| i. | the financial report (other than the consolidated entity disclosure statement) that gives a true and fair view and is free from material misstatement, whether due to fraud or error; and |
| | | |
| | ii. | the consolidated entity disclosure statement that is true and correct and is free of misstatement, whether due to fraud or error. |
In preparing the financial report, the directors are responsible for assessing the ability of the Group to continue as a going concern, disclosing, as applicable, matters related to going concern and using the going concern basis of accounting unless the directors either intend to liquidate the Group or to cease operations, or have no realistic alternative but to do so.
Auditor’s Responsibilities for the Audit of the Financial Report
Our objectives are to obtain reasonable assurance about whether the financial report as a whole is free from material misstatement, whether due to fraud or error, and to issue an auditor’s report that includes our opinion. Reasonable assurance is a high level of assurance, but is not a guarantee that an audit conducted in accordance with the Australian Auditing Standards will always detect a material misstatement when it exists. Misstatements can arise from fraud or error and are considered material if, individually or in the aggregate, they could reasonably be expected to influence the economic decisions of users taken on the basis of this financial report.
A further description of our responsibilities for the audit of the financial report is located at the Auditing and Assurance Standards Board website at: https://www.auasb.gov.au/admin/file/content102/c3/ar1_2020.pdf This description forms part of our auditor’s report.
Report on the Remuneration Report
Opinion on the Remuneration Report
We have audited the Remuneration Report included in the directors’ report for the year ended 30 June 2024.
In our opinion, the Remuneration Report of Nova Minerals Limited, for the year ended 30 June 2024, complies with section 300A of the Corporations Act 2001.
Responsibilities
The directors of the Company are responsible for the preparation and presentation of the Remuneration Report in accordance with section 300A of the Corporations Act 2001. Our responsibility is to express an opinion on the Remuneration Report, based on our audit conducted in accordance with Australian Auditing Standards.

RSM AUSTRALIA PARTNERS

A L WHITTINGHAM
Partner
Dated: 30 September 2024
Melbourne, Victoria
| | Nova Minerals Ltd | Annual Report | 83 |

| | Nova Minerals Ltd | Annual Report | 84 |
Additional Information for ASX Listed Companies
In accordance with ASX Listing Rule 4.10, the Company provides the following information to shareholders not elsewhere disclosed in this Annual Report. The following additional information is required under the ASX Listing Rules and is current as of 16 September 2024. (Reporting Date)
Corporate Governance Statement
The Company has prepared a Corporate Governance Statement which sets out the corporate governance practices that were in operation throughout the financial year for the Company. In accordance with ASX Listing Rule 4.10.3, the Corporate Governance Statement will be available for review on the Company’s website (www.novaminerals.com.au), and will be lodged with the ASX at the same time that this Annual Report is lodged with ASX.
| Security | | Number | |
| Fully Paid Ordinary Shares | | | 243,556,881 | |
| Unlisted - Unl Bonus Opt @ $1.00 Exp 30/06/2025 | | | 216 | |
| Unlisted - Unl Opt @ $1.10 Exp 30/11/2024 | | | 13,614,264 | |
| Unlisted - Unl Opt @ $0.91 Exp 16/01/2026 | | | 1,714,286 | |
| Unlisted - Unl Opt @ $1.20 Exp 30/11/2025 | | | 8,250,000 | |
| Performance Rights – Various Vesting Conditions | | | 2,400,000 | |
| Unquoted warrants exercisable for NASDAQ | | | 31,250,000 | |
| Unquoted underwriter warrants | | | 1,425,000 | |
Capital Structure
Distribution Schedule
| Holding Ranges | | Securities | | | % of Share Capital | | | No. of holders | | | % Issued of Holders | |
| above 0 up to and including 1,000 | | | 733,168 | | | | 0.30 | % | | | 1,382 | | | | 24.87 | % |
| above 1,000 up to and including 5,000 | | | 5,015,755 | | | | 2.06 | % | | | 1,902 | | | | 34.22 | % |
| above 5,000 up to and including 10,000 | | | 5,840,720 | | | | 2.40 | % | | | 755 | | | | 13.58 | % |
| above 10,000 up to and including 100,000 | | | 41,842,266 | | | | 17.18 | % | | | 1,228 | | | | 22.09 | % |
| above 100,000 | | | 190,124,972 | | | | 78.06 | % | | | 291 | | | | 5.24 | % |
| Totals | | | 243,556,881 | | | | 100.00 | % | | | 5,558 | | | | 100.00 | % |
In accordance with ASX Listing Rule 4.10.7, the security holder distribution schedules for fully paid ordinary shares is detailed below:
Unmarketable Parcels
In accordance with ASX Listing Rule 4.10.8, the unmarketable parcels for fully paid ordinary shares are based on the price per security of $0.16. The number of holders with an unmarketable holding is 2,698, with a total of 3,315,910 fully paid ordinary shares, amounting to 1.36% of Issued Capital.
| | Nova Minerals Ltd | Annual Report | 85 |
Top Holders
The 20 largest registered holders of fully paid ordinary shares were:
| | | Name | | Shares Held at 16 September 2024 | | | % Held | |
| 1 | | HSBC CUSTODY NOMINEES (AUSTRALIA) LIMITED | | | 24,586,107 | | | | 10.09 | % |
| 2 | | BNP PARIBAS NOMS PTY LTD | | | 14,974,543 | | | | 6.15 | % |
| 3 | | BNP PARIBAS NOMINEES PTY LTD <CLEARSTREAM> | | | 7,949,463 | | | | 3.26 | % |
| 4 | | SL INVESTORS PTY LTD <SL SUPERFUND A/C> | | | 6,441,393 | | | | 2.64 | % |
| 5 | | SWIFT GLOBAL LTD | | | 5,669,833 | | | | 2.33 | % |
| 6 | | KUSHKUSH INVESTMENTS PTY LTD <ALEXANDRA DISCRETIONARY A/C> | | | 5,300,000 | | | | 2.18 | % |
| 7 | | BNP PARIBAS NOMINEES PTY LTD <IB AU NOMS RETAILCLIENT> | | | 4,530,611 | | | | 1.86 | % |
| 8 | | CITICORP NOMINEES PTY LIMITED | | | 4,253,968 | | | | 1.75 | % |
| 9 | | MR JAGDISH MANJI VARSANI <PINDORIA FAMILY AC A/C> | | | 4,100,000 | | | | 1.68 | % |
| 10 | | KAOS INVESTMENTS PTY LIMITED | | | 3,287,692 | | | | 1.35 | % |
| 11 | | NEBARI GOLD FUND 1 LP | | | 3,198,294 | | | | 1.31 | % |
| 12 | | MR JUSTIN BRUCE GARE & MRS KRISTIN DENISE PHILLIPS <TINTIN INVESTMENT A/C> | | | 2,508,510 | | | | 1.03 | % |
| 13 | | MR MAHMOUD EL HORR | | | 2,500,000 | | | | 1.03 | % |
| 14 | | MURTAGH BROS VINEYARDS PTY LTD | | | 2,440,000 | | | | 1.00 | % |
| 15 | | MR CRAIG EDWIN BENTLEY | | | 2,259,669 | | | | 0.93 | % |
| 16 | | MURTAGH BROS VINEYARDS PTY LTD <MURTAGH BROS VINEYARDS S/F> | | | 2,167,380 | | | | 0.89 | % |
| 17 | | LETTERED MANAGEMENT PTY LTD <BALMORAL FAMILY A/C> | | | 2,050,000 | | | | 0.84 | % |
| 18 | | KIKCETO PTY LTD <BENJAMIN DISCRETIONARY A/C> | | | 2,028,924 | | | | 0.83 | % |
| 19 | | PATRON PARTNERS PTY LTD <AP & RL MURTAGH FAMILY A/C> | | | 1,983,214 | | | | 0.81 | % |
| 20 | | KUSHKUSH INVESTMENTS PTY LTD <ALEXANDRA DISCRETIONARY A/C> | | | 1,701,124 | | | | 0.70 | % |
| Total of Top 20 | | | 103,930,725 | | | | 42.66 | % |
| Balance of Register | | | 139,626,156 | | | | 57.34 | % |
| Grand Total | | | 243,556,881 | | | | 100.00 | % |
Substantial Shareholders
The names of substantial shareholders and the number of shares to which each substantial shareholder and their associates have a relevant interest, as disclosed in substantial shareholding notices given to the Company, are set out below:
| Holder Name | | Number of Shares | | | % Held | |
| The Bank of New York Mellon Corporation (BNYMC) and each Group Entity* | | | 21,750,373 | | | | 8.93 | % |
* Refer Form 604 lodged with the ASX on 16 September 2024
| | Nova Minerals Ltd | Annual Report | 86 |
Unquoted Securities
In accordance with ASX Listing Rule 4.10.5 and 4.10.16 the details of unquoted securities are detailed below:
Unquoted securities on issue were:
| Class | | | | Expiry Date | | Exercise Price | | | Number of Options | | | Number of holders | |
| Unlisted – Unl Bonus Opt @$1.00 Exp 20/05/2025 | | NVAAT
(NVAAT) | | 30 Jun 2025 | | $ | 1.00 | | | | 216 | | | | 4 | |
| Unlisted - Unl Opt @ $1.10 Exp 30/11/2024 | | NVAOP3
(NVAAN) | | 30 Nov 2024 | | $ | 1.10 | | | | 13,614,264 | | | | 73 | |
| Unlisted - Unl Opt @ $0.91 Exp 16/01/2026 | | NVAOP4
(NVAAO) | | 16 Jan 2026 | | $ | 0.91 | | | | 1,714,286 | | | | 2 | |
| Unlisted - Unl Opt @ $1.20 Exp 30/11/2025 | | NVAOP5
(NVAAP) | | 30 Nov 2025 | | $ | 1.20 | | | | 8,250,000 | | | | 9 | |
| Unquoted warrants exercisable for NASDAQ listed American Depositary Shares (ADSs) | | VSTOCK
(NVAAV) | | 25 July 2029 | | $ | 0.1806 | ** | | | 31,350,000 | | | | 1 | |
| Unquoted underwriter warrants exercisable for NASDAQ listed American Depositary Shares (ADSs) | | NVSTOCKUW (NVAAV) | | 25 July 2028 | | $ | 0.2580 | * | | | 1,425,000 | | | | 1 | |
** Warrants exercisable for US$7.266 (ADS-to-ordinary-share ratio of 1 to 60) - Exercise Price is AUD$0.1806
* Underwriter warrants (Options) - Exercise price per warrant in the USA is US$10.365 (ADS-to-ordinary-share ratio of 1 to 60) AUD$0.2580 in Australia (US$0.1728)
NVAAT [Unlisted Options @ $1.00 Exp 30/6/2025] – 4 Holders (Holders with more than 20% shown)
| | | Name | | Held at 16 Sept 2024 | | | % Held | |
| 1 | | BNP PARIBAS NOMINEES PTY LTD ACF CLEARSTREAM | | | 75 | | | | 34.7 | % |
| 2 | | CITICORP NOMINEES PTY LIMITED | | | 91 | | | | 42.1 | % |
| 3 | | MR WILFRED ANTHONY TAPIOLAS & MRS HELEN MARGARET TAPIOLAS <TAPIOLAS SUPER FUND A/C> | | | 49 | | | | 22.7 | % |
NVAOP3 [Unlisted Options @ $1.10 Exp 30/11/2024] – 73 Holders (Holders with more than 20% shown)
| | | Name | | Held at 16 Sept 2024 | | | % Held | |
| 1 | | CITICORP NOMINEES PTY LIMITED | | | 2,895,234 | | | | 21.3 | % |
NVAOP4 [Unlisted Options @ $0.91 Exp 16/01/2026] – 2 Holders (Holders with more than 20% shown)
| | | Name | | Held at 16 Sept 2024 | | | % Held | |
| 1 | | CIRCUMFERENCE CAPITAL CT PTY LTD | | | 857,143 | | | | 50.0 | % |
| 2 | | JETT CAPITAL ADVISORS HOLDINGS LLC | | | 857,143 | | | | 50.0 | % |
NVAOP5 [Unlisted Options @ $1.20 Exp 30/11/2025] – 9 Holders (Holders with more than 20% shown)
| | | Name | | Held at 16 Sept 2024 | | | % Held | |
| 1 | | CHRISTOPHER GERTEISEN | | | 2,000,000 | | | | 24.2 | % |
| 2 | | KIKCETO PTY LTD <BENJAMIN DISCRETIONARY>A/C> | | | 2,000,000 | | | | 24.2 | % |
| 3 | | KUSHKUSH INVESTMENTS PTY LTD <ALEXANDRA DISCRETIONARY> | | | 2,000,000 | | | | 24.2 | % |
| | Nova Minerals Ltd | Annual Report | 87 |
VSTOCK [Unquoted warrants exercisable for Nasdaq listed American Depositary Shares (ADSs)] – 1 Holder (Holders with more than 20% shown)
| | | Name | | Held at 16 Sept 2024 | | | % Held | |
| 1 | | VSTOCK TRANSFER LLC | | | 31,350,000 | | | | 100.0 | % |
VSTOCKUW [Unquoted Underwriter warrants exercisable for Nasdaq listed American Depositary Shares (ADSs)] – 1 Holder (Holders with more than 20% shown)
| | | Name | | Held at 16 Sept 2024 | | | % Held | |
| 1 | | VSTOCK TRANSFER LLC | | | 1,425,000 | | | | 100.0 | % |
Restricted Securities
Not applicable
Voting Rights
The voting rights attached to each class of equity security are as follows:
| ● | Ordinary shares: each ordinary share is entitled to one vote when a poll is called, otherwise each member present at a meeting or by proxy has one vote on a show of hands. |
| | |
| ● | Options: options do not entitle the holders to vote in respect of that equity instrument, nor participate in dividends, when declared, until such time as the options are exercised and subsequently registered as ordinary shares. |
| | |
| ● | Performance rights: performance rights do not entitle the holders to vote in respect of that equity instrument, nor participate in dividends, when declared, until such time as the performance rights are vested and converted and subsequently registered as ordinary shares. |
ASX Admission Statement
During the financial year, the Company applied its cash in a way that is consistent with its business objectives.
On-Market Buy-Back
There is no current on-market buy-back.
Item 7, Section 611 Issues of Securities
There are no issues of securities approved for the purposes of item 7 of section 611 of the Corporations Act 2001 (Cth) which have not yet been completed
| | Nova Minerals Ltd | Annual Report | 88 |
Competent Person Statement
Mr Vannu Khounphakdee P.Geo., who is an independent consulting geologist of a number of mineral exploration and development companies, reviewed and approves the technical information in this release and is a member of the Australian Institute of Geoscientists (AIG), which is ROPO accepted for the purpose of reporting in accordance with ASX listing rules. Mr Vannu Khounphakdee has sufficient experience relevant to the gold deposits under evaluation to qualify as a Competent Person as defined in the 2012 edition of the ‘Australian Code for Reporting of Exploration Results, Mineral Resources and Ore Reserves’. Mr Vannu Khounphakdee is also a Qualified Person as defined by S-K 1300 rules for mineral deposit disclosure. Mr Vannu Khounphakdee consents to the inclusion in the report of the matters based on information in the form and context in which it appears.
Schedule of Interests in Mining Tenements as at 30 June 2024
| Tenement/Claim/ADL Number | | Location | | Beneficial % Held |
| 725940 - 725966 | | Alaska, USA | | 85% |
| 726071 - 726216 | | Alaska, USA | | 85% |
| 727286 - 727289 | | Alaska, USA | | 85% |
| 728676 - 728684 | | Alaska, USA | | 85% |
| 730362 - 730521 | | Alaska, USA | | 85% |
| 737162 - 737357 | | Alaska, USA | | 85% |
| 733438 - 733598 | | Alaska, USA | | 85% |
| 740524 - 740621 | | Alaska, USA | | 85% |
| 741364 - 741366 | | Alaska, USA | | 85% |
| | Nova Minerals Ltd | Annual Report | 89 |

| | Nova Minerals Ltd | Annual Report | 90 |