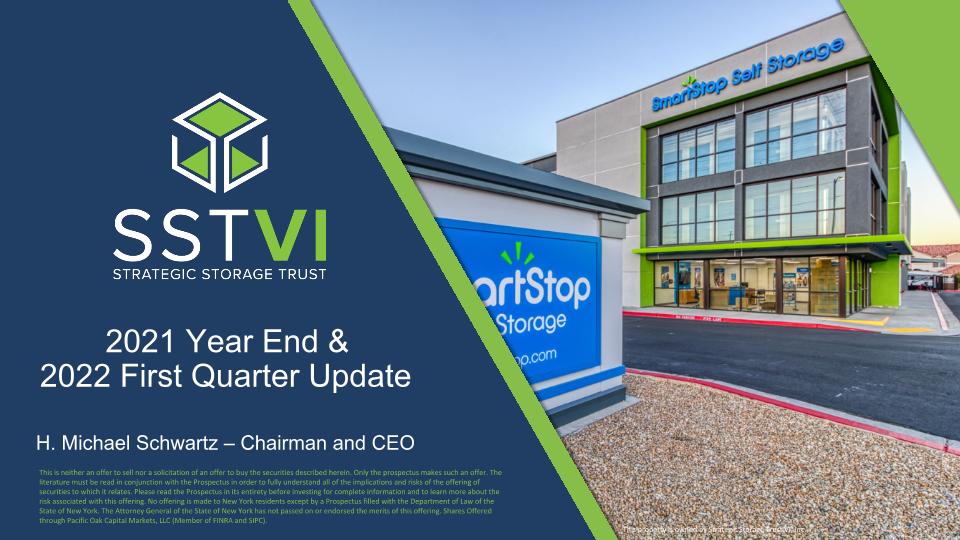
2021 Year End & 2022 First Quarter Update H. Michael Schwartz – Chairman and CEO This property is owned by Strategic Storage Trust VI, Inc. This is neither an offer to sell nor a solicitation of an offer to buy the securities described herein. Only the prospectus makes such an offer. The literature must be read in conjunction with the Prospectus in order to fully understand all of the implications and risks of the offering of securities to which it relates. Please read the Prospectus in its entirety before investing for complete information and to learn more about the risk associated with this offering. No offering is made to New York residents except by a Prospectus filled with the Department of Law of the State of New York. The Attorney General of the State of New York has not passed on or endorsed the merits of this offering. Shares Offered through Pacific Oak Capital Markets, LLC (Member of FINRA and SIPC).
Risk Factors & Other Information OTHER INFORMATION We encourage you to review our SEC filings at www.sec.gov. An investment in our shares is not suitable for all investors. An investment in our shares involves significant risks and is only suitable for persons who have adequate financial means, desire a relatively long-term investment and will not need immediate liquidity from their investment. Investors should only purchase shares if they can afford a complete loss of their investment. Generally, a purchaser of shares must have, excluding the value of a purchaser’s home, furnishings and automobiles, either: a net worth of at least $250,000: or a gross annual income of at least $70,000 and a net worth of at least $70,000. Please see the prospectus for a full description of suitability standards. Residents of Alabama, California, Idaho, Kansas, Kentucky, Maine, Massachusetts, Missouri, Nebraska, New Jersey, New Mexico, North Dakota, Ohio, Oregon, Pennsylvania, Tennessee and Vermont should consult the prospectus for details regarding the more stringent suitability standards that apply to them based on their states of residence. We are an “emerging growth company” under the federal securities laws and will be subject to reduced public company reporting requirements. Investing in our common stock involves a high degree of risk. You should purchase these securities only if you can afford a complete loss of your investment. See “Restrictions on Ownership and Transfer” beginning on page 172 of our prospectus to read about limitations on transferability. See “Risk Factors” beginning on page 24 of our prospectus to read about the risks you should consider before buying shares of our common stock. The most significant risks include the following: An investment in this offering is speculative, illiquid and involves a high degree of risk, including loss of the entire investment. No public market currently exists for shares of our common stock and we may not list our shares on a national securities exchange before three to five years after completion of this offering, if at all; therefore, it may be difficult to sell your shares. If you sell your shares, it will likely be at a substantial discount. Our charter does not require us to pursue a liquidity transaction at any time. Until we generate operating cash flows sufficient to pay distributions to you, we may pay distributions from financing activities, which may include borrowings in anticipation of future cash flows or the net proceeds of this offering (which may constitute a return of capital). Therefore, it is likely that some or all of the distributions that we make will represent a return of capital to you, at least in the first few years of operation. We are not prohibited from undertaking such activities by our charter, bylaws or investment policies, and we may use an unlimited amount from any source to pay our distributions, and it is likely that we will use offering proceeds to fund a majority of our initial distributions. This is an initial public offering; we have little operating history, and the prior performance of real estate programs sponsored by our sponsor or its affiliates may not be indicative of our future results. This is a “best efforts” offering. If we are unable to raise substantial funds in this offering, we may not be able to invest in a diverse portfolio of real estate and real estate-related investments, and the value of your investment may fluctuate more widely with the performance of specific investments. We are a “blind pool” because we have not identified any properties to acquire with the net proceeds from this offering. As a result, you will not be able to evaluate the economic merits of our future investments prior to their purchase. We may be unable to invest the net proceeds from this offering on acceptable terms to investors, or at all. Investors in this offering will experience immediate dilution in their investment primarily because (i) we pay upfront fees in connection with the sale of our shares that reduce the proceeds to us, (ii) pursuant to our private offering, as of March 31, 2022, we have sold approximately 10.5 million shares of our common stock at a weighted average purchase price of approximately $9.53 per share and received weighted average net proceeds of approximately $8.76 per share, and (iii) we paid organization and other offering expenses in connection with our private offering. There are substantial conflicts of interest among us and our sponsor, advisor, property manager, and transfer agent. Our advisor will face conflicts of interest relating to the purchase of properties, including conflicts with SmartStop Self Storage REIT, Inc., the parent company of our sponsor, and Strategic Storage Growth Trust II, Inc., and such conflicts may not be resolved in our favor, which could adversely affect our investment opportunities. We have no employees and must depend on our advisor to select investments and conduct our operations, and there is no guarantee that our advisor will devote adequate time or resources to us. We will pay substantial fees and expenses to our advisor, its affiliates and participating broker-dealers, which will reduce cash available for investment and distribution. We may incur substantial debt, which could hinder our ability to pay distributions to our stockholders or could decrease the value of your investment. We may fail to qualify as a REIT, which could adversely affect our operations and our ability to make distributions. Our board of directors may change any of our investment objectives without your consent.
Agenda SmartStop REIT Advisors, LLC Why Self Storage? Strategic Storage Trust VI, Inc.
SmartStop REIT Advisors, LLC
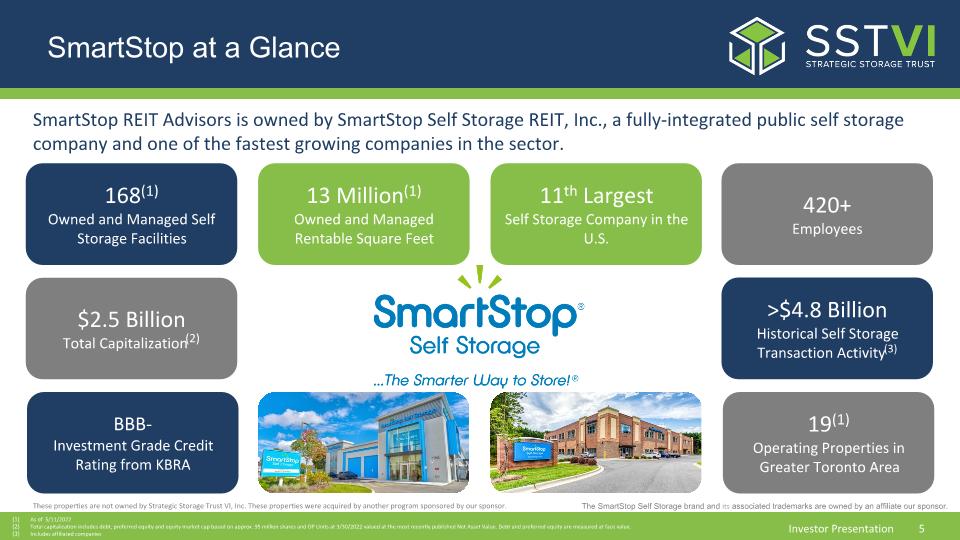
SmartStop at a Glance 168(1) Owned and Managed Self Storage Facilities 13 Million(1) Owned and Managed Rentable Square Feet 11th Largest Self Storage Company in the U.S. $2.5 Billion Total Capitalization(2) >$4.8 Billion Historical Self Storage Transaction Activity(3) 420+ Employees SmartStop REIT Advisors is owned by SmartStop Self Storage REIT, Inc., a fully-integrated public self storage company and one of the fastest growing companies in the sector. Initially started raising equity capital in 2014 through the broker dealer network as a public non-traded REIT These properties are not owned by Strategic Storage Trust VI, Inc. These properties were acquired by another program sponsored by our sponsor. The SmartStop Self Storage brand and its associated trademarks are owned by an affiliate our sponsor. As of 5/11/2022 Total capitalization includes debt, preferred equity and equity market cap based on approx. 95 million shares and OP Units at 3/30/2022 valued at the most recently published Net Asset Value. Debt and preferred equity are measured at face value. Includes affiliated companies BBB- Investment Grade Credit Rating from KBRA 19(1) Operating Properties in Greater Toronto Area
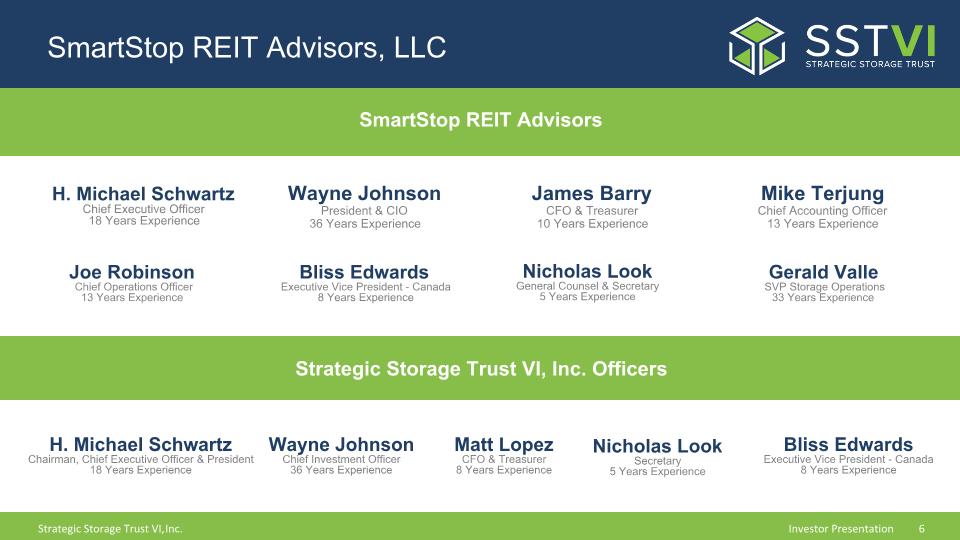
SmartStop REIT Advisors, LLC H. Michael Schwartz�Chief Executive Officer�18 Years Experience Wayne Johnson�President & CIO�36 Years Experience Gerald Valle� SVP Storage Operations�33 Years Experience Mike Terjung�Chief Accounting Officer�13 Years Experience Wayne Johnson�Chief Investment Officer�36 Years Experience H. Michael Schwartz�Chairman, Chief Executive Officer & President�18 Years Experience James Barry�CFO & Treasurer�10 Years Experience Nicholas Look�General Counsel & Secretary�5 Years Experience SmartStop REIT Advisors Matt Lopez�CFO & Treasurer�8 Years Experience Strategic Storage Trust VI, Inc. Officers Bliss Edwards� Executive Vice President - Canada� 8 Years Experience Joe Robinson� Chief Operations Officer�13 Years Experience Bliss Edwards�Executive Vice President - Canada�8 Years Experience Nicholas Look�Secretary�5 Years Experience
Why Self Storage?
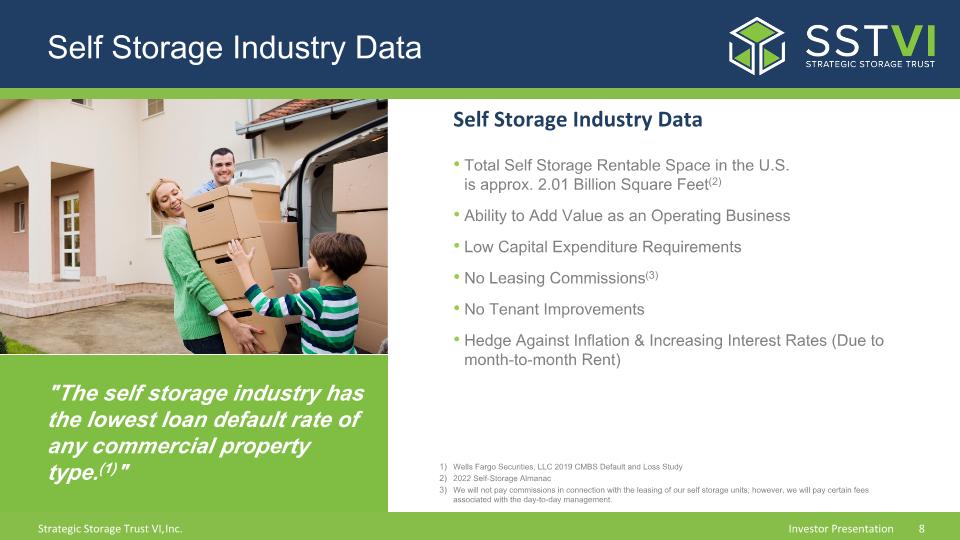
Self Storage Industry Data Self Storage Industry Data Total Self Storage Rentable Space in the U.S.�is approx. 2.01 Billion Square Feet(2) Ability to Add Value as an Operating Business Low Capital Expenditure Requirements No Leasing Commissions(3) No Tenant Improvements Hedge Against Inflation & Increasing Interest Rates (Due to month-to-month Rent) "The self storage industry has the lowest loan default rate of any commercial property type.(1)" Wells Fargo Securities, LLC 2019 CMBS Default and Loss Study 2022 Self-Storage Almanac We will not pay commissions in connection with the leasing of our self storage units; however, we will pay certain fees associated with the day-to-day management.
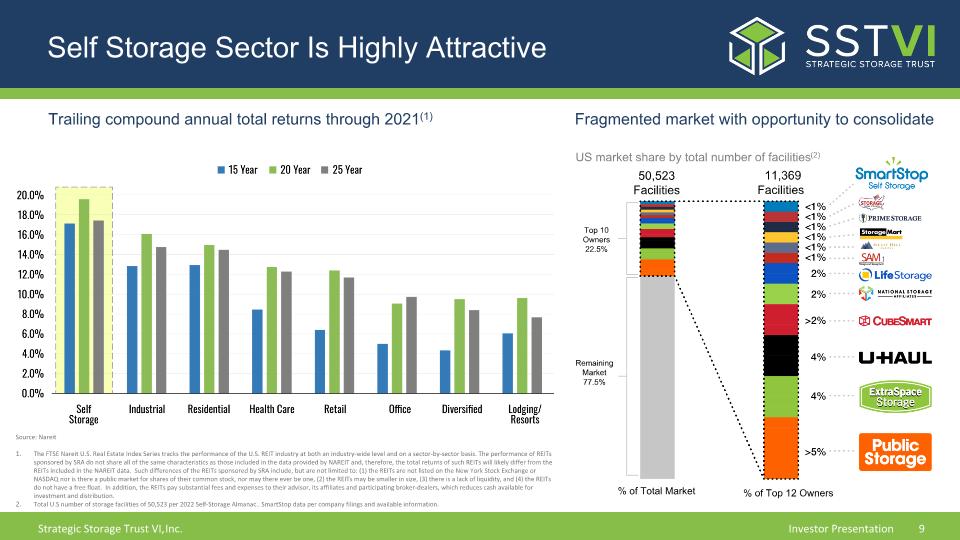
Self Storage Sector Is Highly Attractive Fragmented market with opportunity to consolidate US market share by total number of facilities(2) Source: Nareit The FTSE Nareit U.S. Real Estate Index Series tracks the performance of the U.S. REIT industry at both an industry-wide level and on a sector-by-sector basis. The performance of REITs sponsored by SRA do not share all of the same characteristics as those included in the data provided by NAREIT and, therefore, the total returns of such REITs will likely differ from the REITs included in the NAREIT data. Such differences of the REITs sponsored by SRA include, but are not limited to: (1) the REITs are not listed on the New York Stock Exchange or NASDAQ nor is there a public market for shares of their common stock, nor may there ever be one, (2) the REITs may be smaller in size, (3) there is a lack of liquidity, and (4) the REITs do not have a free float. In addition, the REITs pay substantial fees and expenses to their advisor, its affiliates and participating broker-dealers, which reduces cash available for investment and distribution. Total U.S number of storage facilities of 50,523 per 2022 Self-Storage Almanac.. SmartStop data per company filings and available information. Trailing compound annual total returns through 2021(1) Top 10 Owners 22.5% Remaining Market 77.5% 50,523 Facilities 11,369 Facilities % of Total Market % of Top 12 Owners
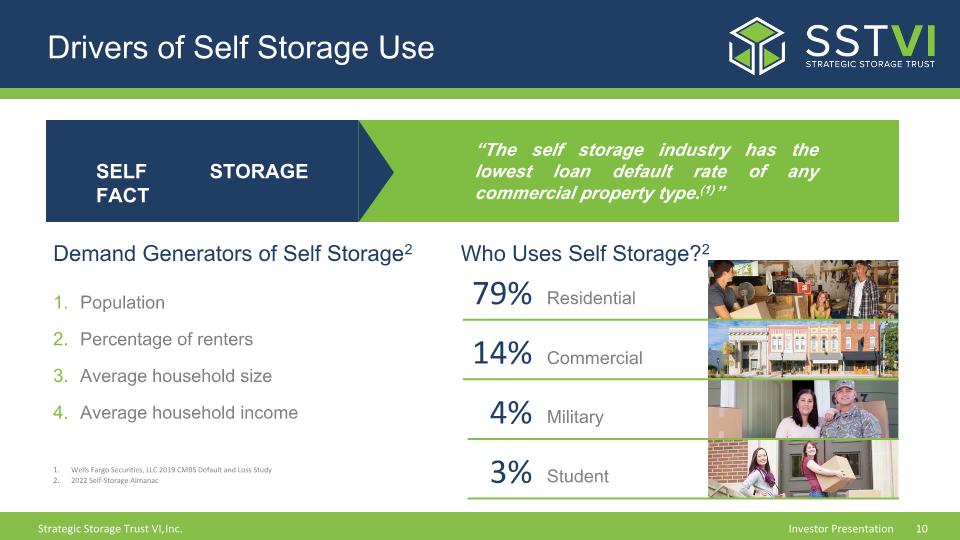
Drivers of Self Storage Use SELF STORAGE FACT “The self storage industry has the lowest loan default rate of any commercial property type.(1)” Demand Generators of Self Storage2 Population Percentage of renters Average household size Average household income Who Uses Self Storage?2 79% 14% 4% 3% Residential Commercial Military Student Wells Fargo Securities, LLC 2019 CMBS Default and Loss Study 2022 Self-Storage Almanac
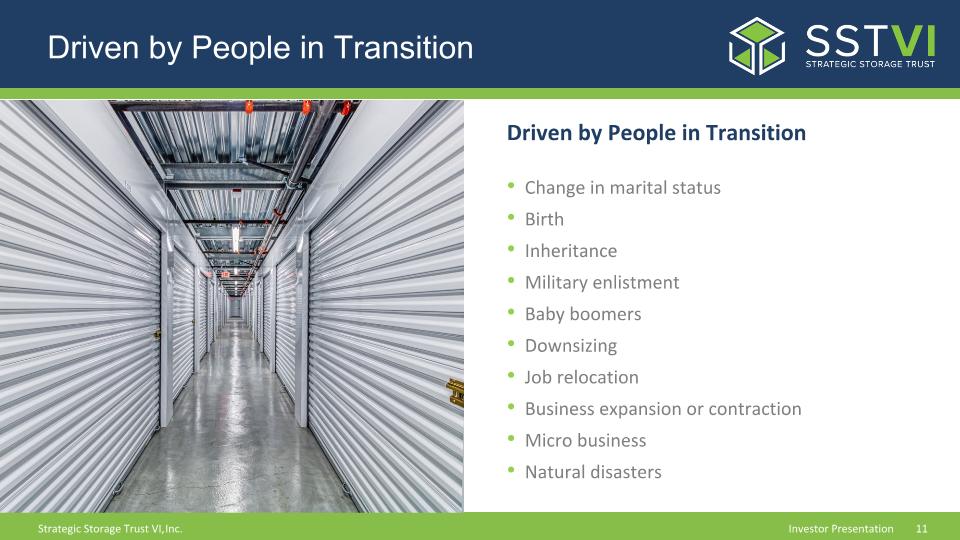
Driven by People in Transition Driven by People in Transition Change in marital status Birth Inheritance Military enlistment Baby boomers Downsizing Job relocation Business expansion or contraction Micro business Natural disasters
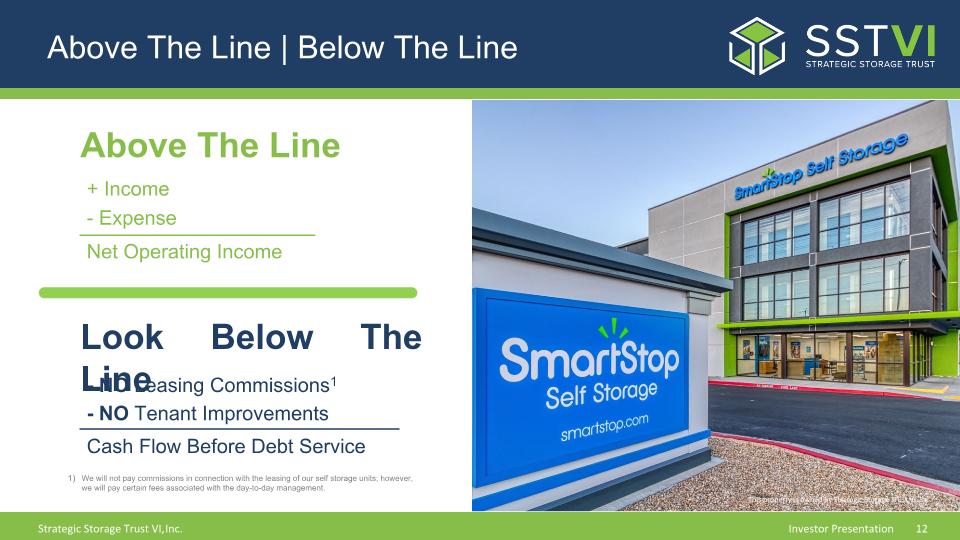
Above The Line | Below The Line We will not pay commissions in connection with the leasing of our self storage units; however, we will pay certain fees associated with the day-to-day management. Above The Line + Income - Expense Net Operating Income Look Below The Line - NO Leasing Commissions1 - NO Tenant Improvements Cash Flow Before Debt Service This property is owned by Strategic Storage Trust VI, Inc.
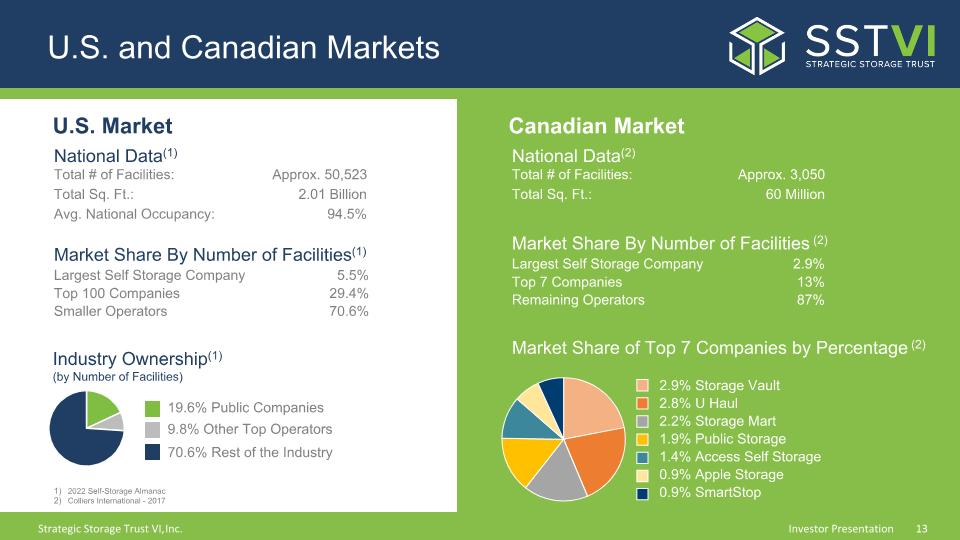
U.S. and Canadian Markets Canadian Market National Data(2) Total # of Facilities: Approx. 3,050 Total Sq. Ft.: 60 Million Market Share By Number of Facilities (2) Largest Self Storage Company 2.9% Top 7 Companies 13% Remaining Operators 87% 2.9% Storage Vault 2.8% U Haul 2.2% Storage Mart 1.9% Public Storage 1.4% Access Self Storage 0.9% Apple Storage 0.9% SmartStop Market Share of Top 7 Companies by Percentage (2) National Data(1) Total # of Facilities: Approx. 50,523 Total Sq. Ft.: 2.01 Billion Avg. National Occupancy: 94.5% Market Share By Number of Facilities(1) Largest Self Storage Company 5.5% Top 100 Companies 29.4% Smaller Operators 70.6% 2022 Self-Storage Almanac Colliers International - 2017 Industry Ownership(1) (by Number of Facilities) 9.8% Other Top Operators 19.6% Public Companies 70.6% Rest of the Industry U.S. Market
Strategic Storage Trust VI, Inc.
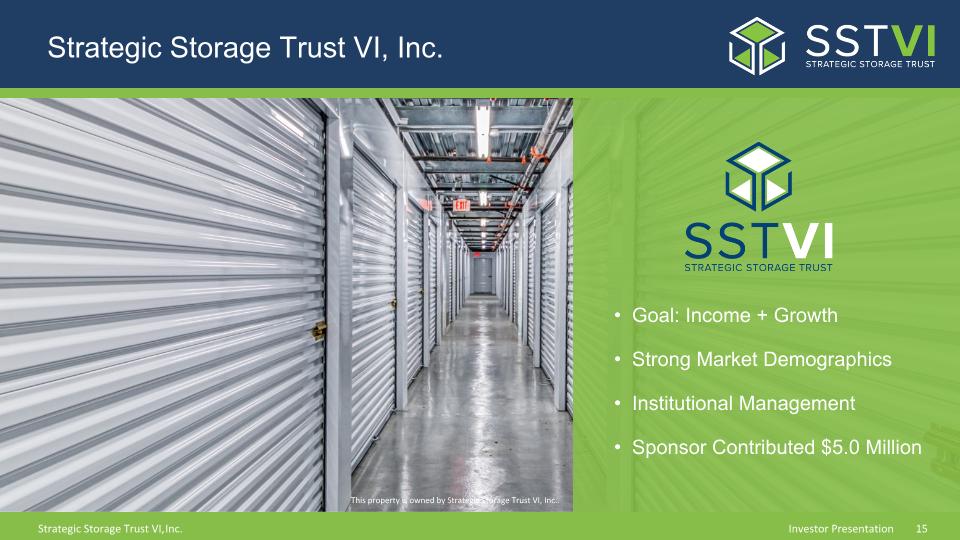
Strategic Storage Trust VI, Inc. Goal: Income + Growth Strong Market Demographics Institutional Management Sponsor Contributed $5.0 Million This property is owned by Strategic Storage Trust VI, Inc..
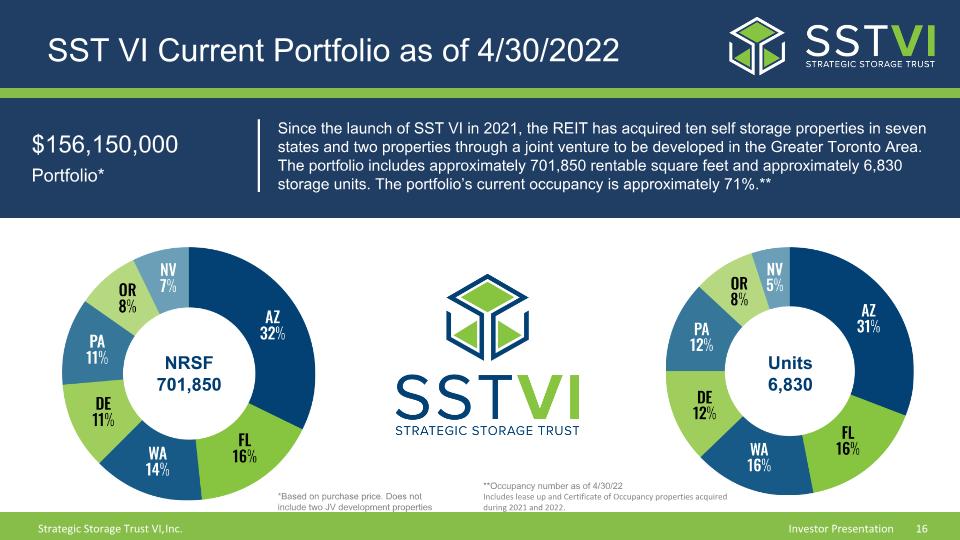
SST VI Current Portfolio as of 4/30/2022 $156,150,000 Portfolio* Since the launch of SST VI in 2021, the REIT has acquired ten self storage properties in seven states and two properties through a joint venture to be developed in the Greater Toronto Area. The portfolio includes approximately 701,850 rentable square feet and approximately 6,830 storage units. The portfolio’s current occupancy is approximately 71%.** NRSF 701,850 Units 6,830 **Occupancy number as of 4/30/22 Includes lease up and Certificate of Occupancy properties acquired during 2021 and 2022. *Based on purchase price. Does not include two JV development properties
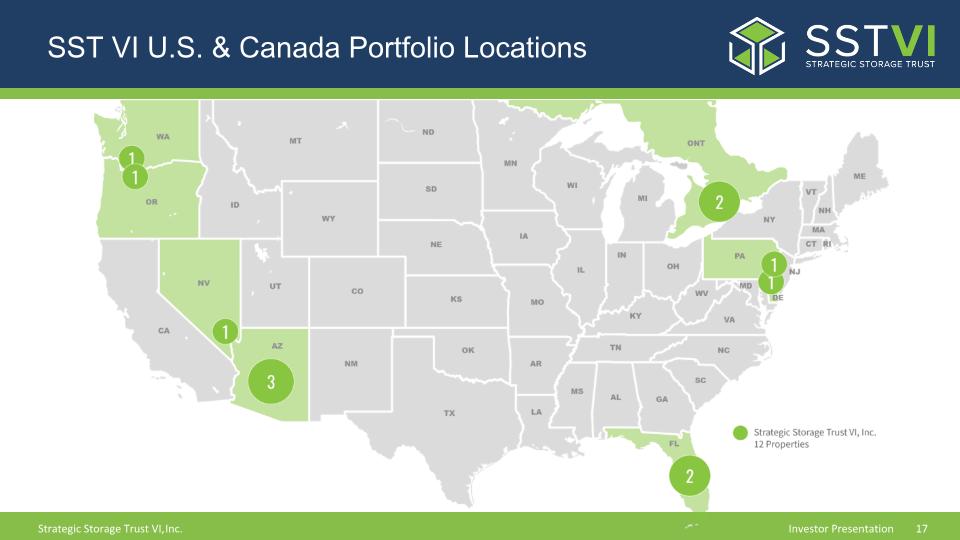
SST VI U.S. & Canada Portfolio Locations
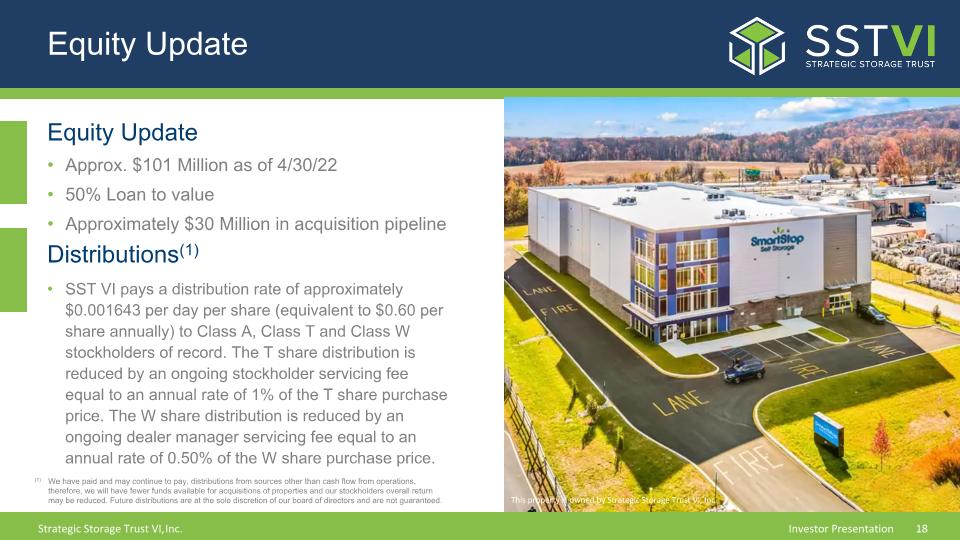
Equity Update Equity Update Approx. $101 Million as of 4/30/22 50% Loan to value Approximately $30 Million in acquisition pipeline Distributions(1) SST VI pays a distribution rate of approximately $0.001643 per day per share (equivalent to $0.60 per share annually) to Class A, Class T and Class W stockholders of record. The T share distribution is reduced by an ongoing stockholder servicing fee equal to an annual rate of 1% of the T share purchase price. The W share distribution is reduced by an ongoing dealer manager servicing fee equal to an annual rate of 0.50% of the W share purchase price. (1) We have paid and may continue to pay, distributions from sources other than cash flow from operations, therefore, we will have fewer funds available for acquisitions of properties and our stockholders overall return may be reduced. Future distributions are at the sole discretion of our board of directors and are not guaranteed. This property is owned by Strategic Storage Trust VI, Inc.
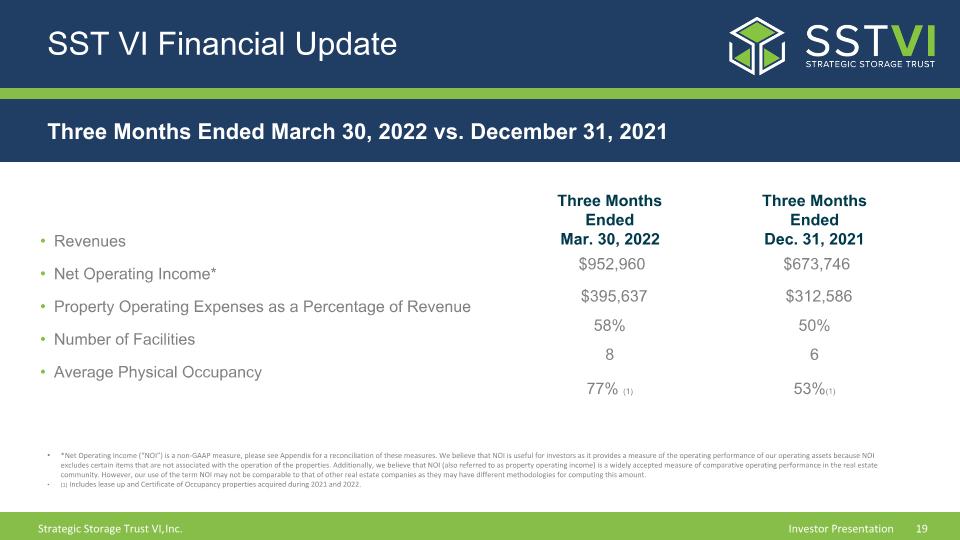
SST VI Financial Update Revenues Net Operating Income* Property Operating Expenses as a Percentage of Revenue Number of Facilities Average Physical Occupancy Three Months Ended Mar. 30, 2022 $952,960 $395,637 58% 8 77% (1) Three Months Ended Dec. 31, 2021 $673,746 $312,586 50% 6 53%(1) *Net Operating Income (“NOI”) is a non-GAAP measure, please see Appendix for a reconciliation of these measures. We believe that NOI is useful for investors as it provides a measure of the operating performance of our operating assets because NOI excludes certain items that are not associated with the operation of the properties. Additionally, we believe that NOI (also referred to as property operating income) is a widely accepted measure of comparative operating performance in the real estate community. However, our use of the term NOI may not be comparable to that of other real estate companies as they may have different methodologies for computing this amount. (1) Includes lease up and Certificate of Occupancy properties acquired during 2021 and 2022. Three Months Ended March 30, 2022 vs. December 31, 2021
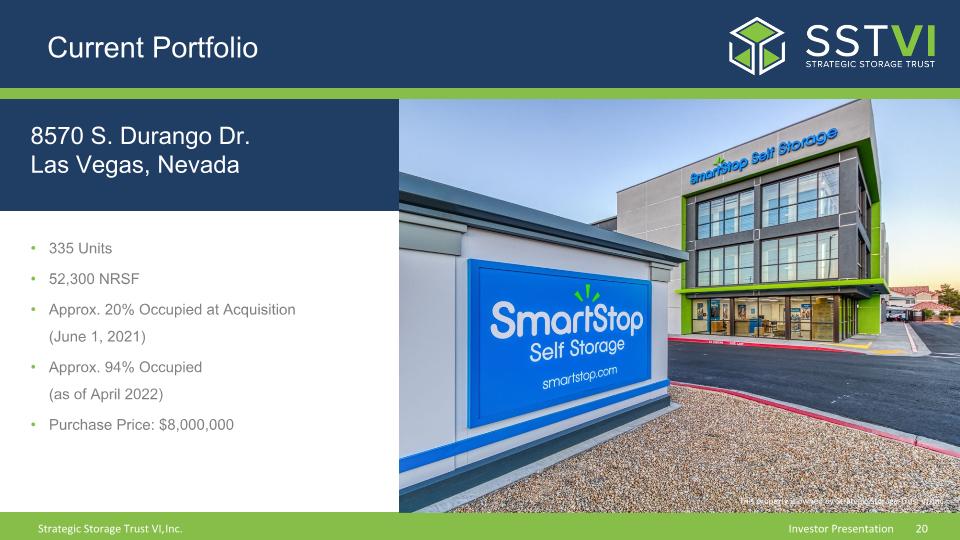
Current Portfolio 8570 S. Durango Dr. Las Vegas, Nevada 335 Units 52,300 NRSF Approx. 20% Occupied at Acquisition (June 1, 2021) Approx. 94% Occupied�(as of April 2022) Purchase Price: $8,000,000 This property is owned by Strategic Storage Trust VI, Inc.
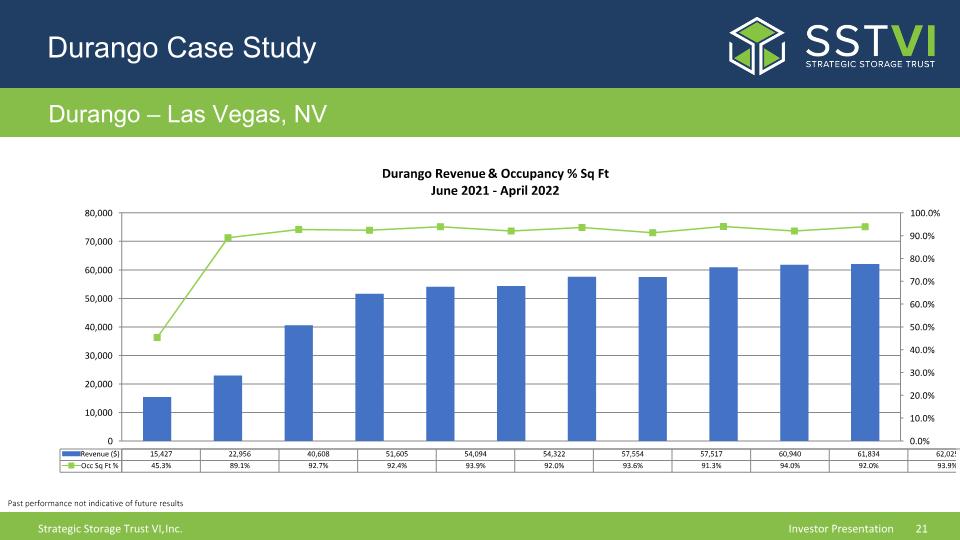
Durango Case Study Durango – Las Vegas, NV Past performance not indicative of future results
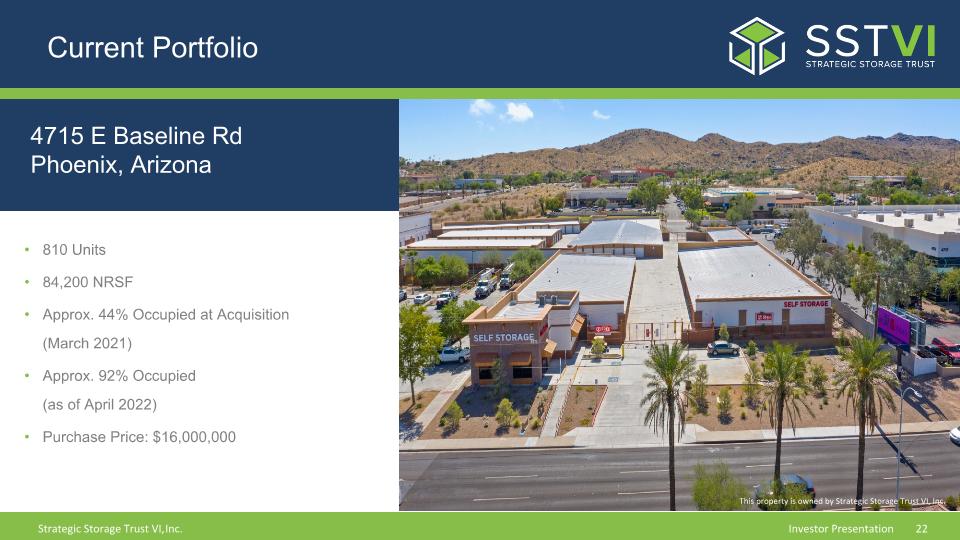
Current Portfolio 4715 E Baseline Rd�Phoenix, Arizona 810 Units 84,200 NRSF Approx. 44% Occupied at Acquisition�(March 2021) Approx. 92% Occupied�(as of April 2022) Purchase Price: $16,000,000 This property is owned by Strategic Storage Trust VI, Inc.
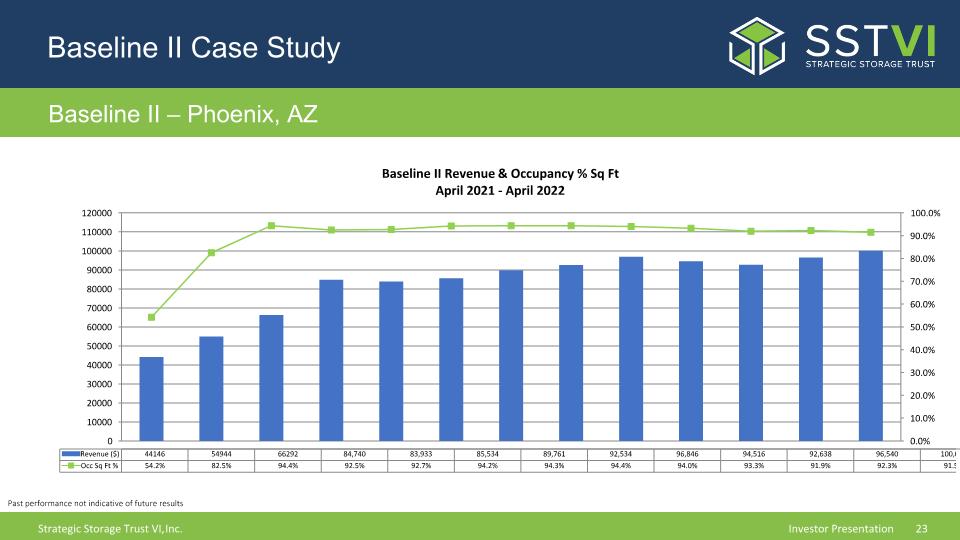
Baseline II Case Study Baseline II – Phoenix, AZ Past performance not indicative of future results
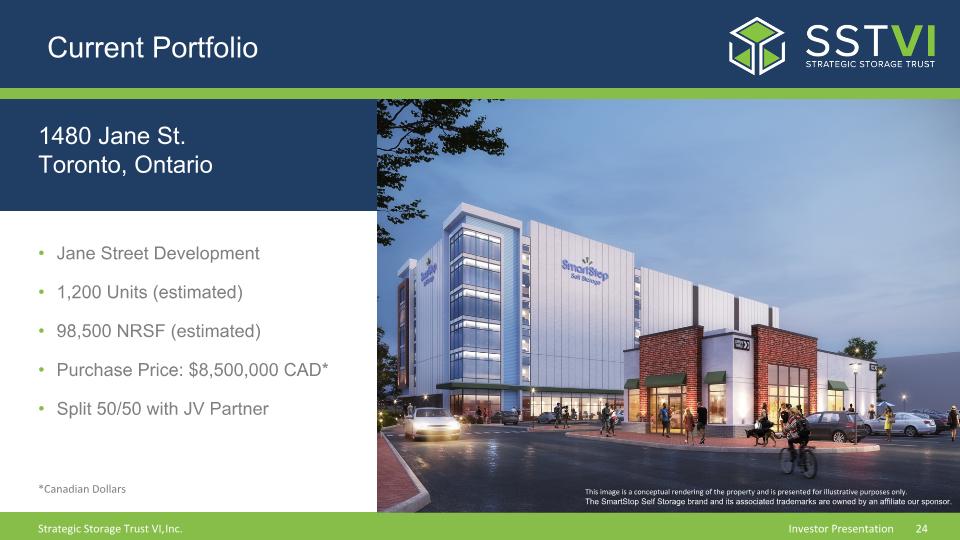
Current Portfolio 1480 Jane St. Toronto, Ontario Jane Street Development 1,200 Units (estimated) 98,500 NRSF (estimated) Purchase Price: $8,500,000 CAD* Split 50/50 with JV Partner This image is a conceptual rendering of the property and is presented for illustrative purposes only. The SmartStop Self Storage brand and its associated trademarks are owned by an affiliate our sponsor. *Canadian Dollars
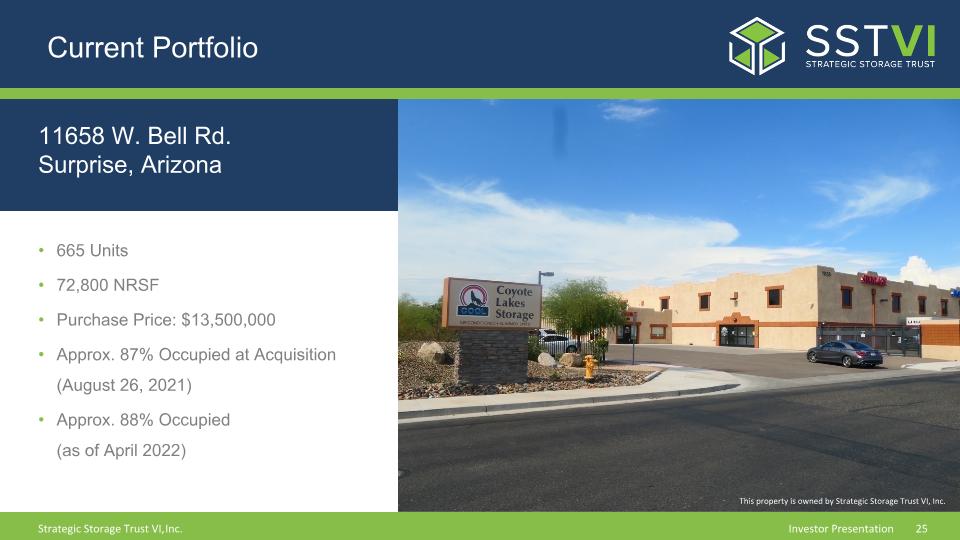
Current Portfolio 11658 W. Bell Rd. Surprise, Arizona 665 Units 72,800 NRSF Purchase Price: $13,500,000 Approx. 87% Occupied at Acquisition (August 26, 2021) Approx. 88% Occupied�(as of April 2022) This property is owned by Strategic Storage Trust VI, Inc.
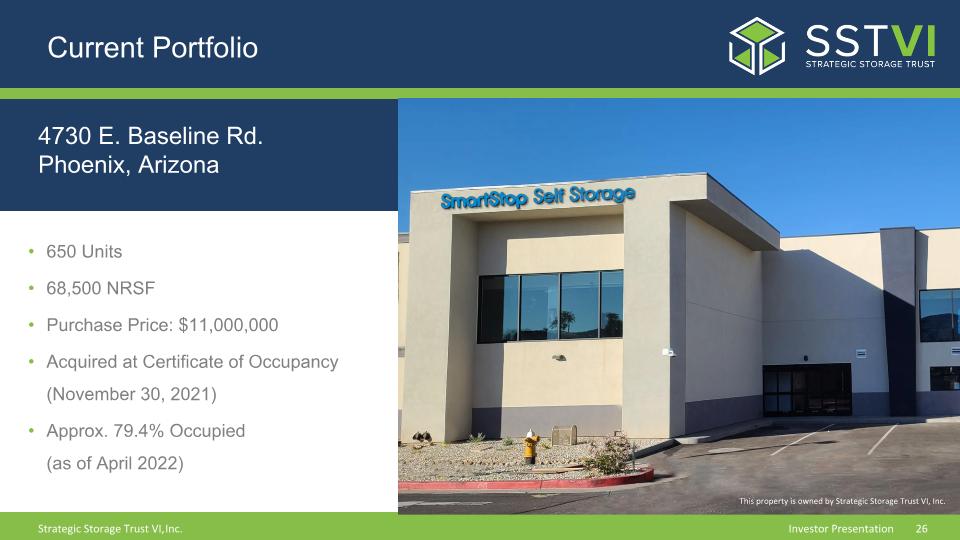
Current Portfolio 4730 E. Baseline Rd. Phoenix, Arizona 650 Units 68,500 NRSF Purchase Price: $11,000,000 Acquired at Certificate of Occupancy�(November 30, 2021) Approx. 79.4% Occupied�(as of April 2022) This property is owned by Strategic Storage Trust VI, Inc.
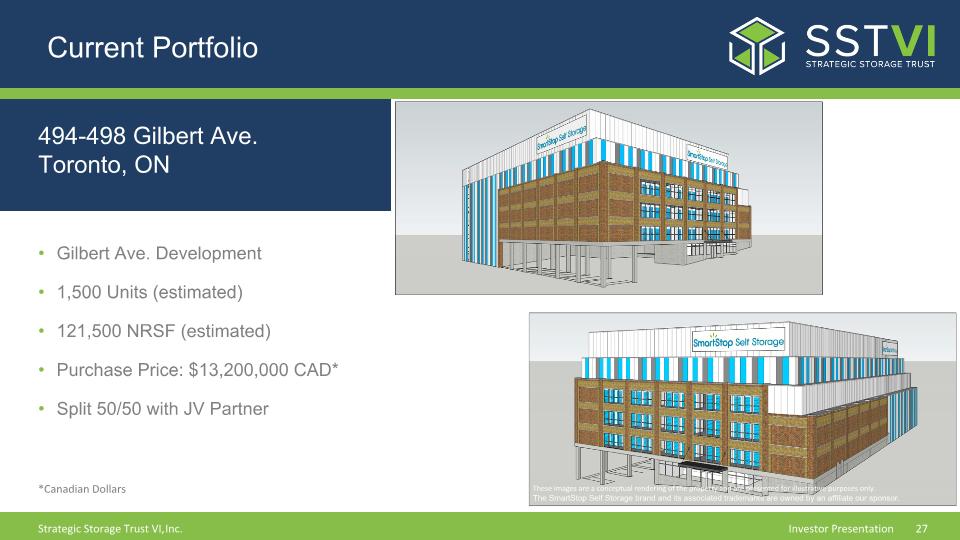
Current Portfolio 494-498 Gilbert Ave. Toronto, ON The image shown is a property acquired by the offering. Gilbert Ave. Development 1,500 Units (estimated) 121,500 NRSF (estimated) Purchase Price: $13,200,000 CAD* Split 50/50 with JV Partner These images are a conceptual rendering of the property and are presented for illustrative purposes only. The SmartStop Self Storage brand and its associated trademarks are owned by an affiliate our sponsor. *Canadian Dollars
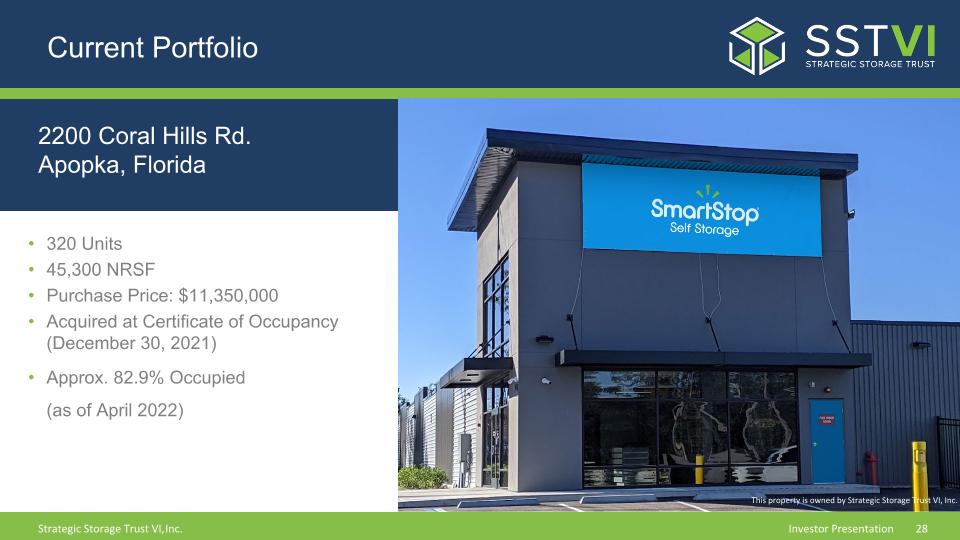
Current Portfolio 2200 Coral Hills Rd. Apopka, Florida 320 Units 45,300 NRSF Purchase Price: $11,350,000 Acquired at Certificate of Occupancy�(December 30, 2021) Approx. 82.9% Occupied �(as of April 2022) The image shown is a property acquired by the offering. This property is owned by Strategic Storage Trust VI, Inc.
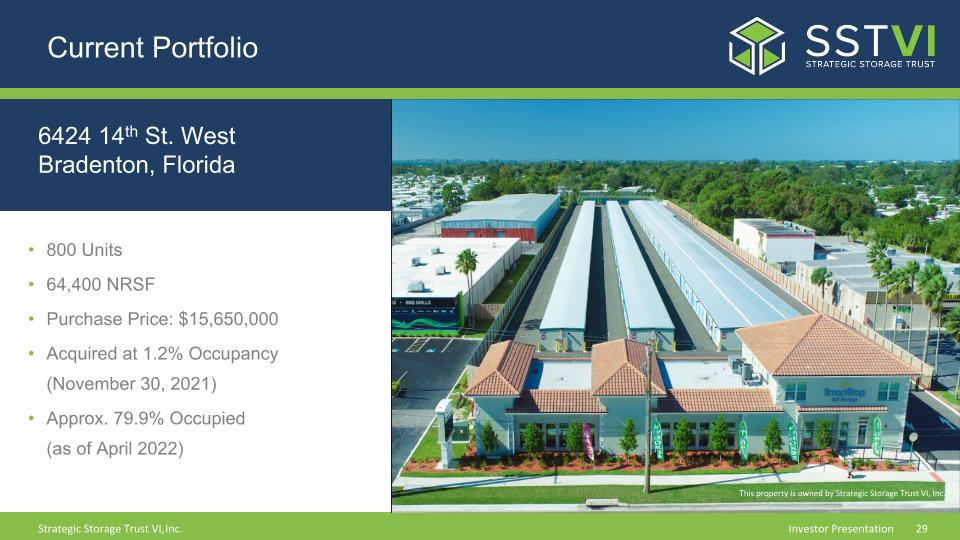
Current Portfolio 6424 14th St. West Bradenton, Florida 800 Units 64,400 NRSF Purchase Price: $15,650,000 Acquired at 1.2% Occupancy�(November 30, 2021) Approx. 79.9% Occupied�(as of April 2022) The image shown is a property acquired by the offering. This property is owned by Strategic Storage Trust VI, Inc.
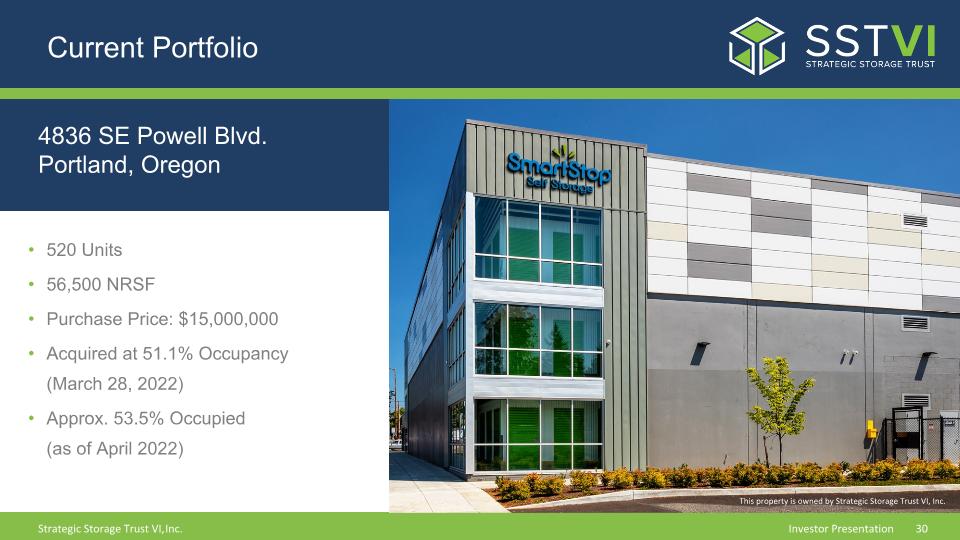
Current Portfolio 4836 SE Powell Blvd. Portland, Oregon 520 Units 56,500 NRSF Purchase Price: $15,000,000 Acquired at 51.1% Occupancy�(March 28, 2022) Approx. 53.5% Occupied�(as of April 2022) The image shown is a property acquired by the offering. This property is owned by Strategic Storage Trust VI, Inc.
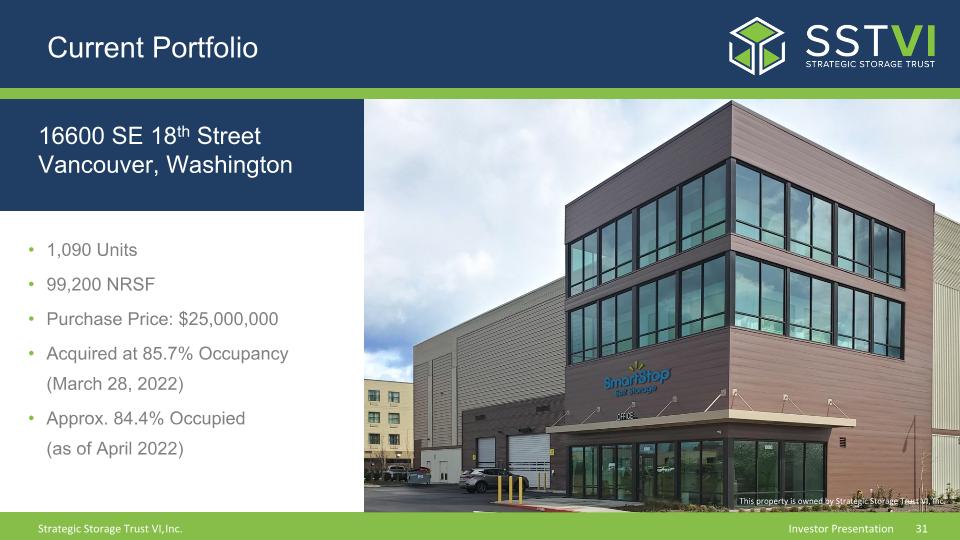
Current Portfolio 16600 SE 18th Street Vancouver, Washington 1,090 Units 99,200 NRSF Purchase Price: $25,000,000 Acquired at 85.7% Occupancy�(March 28, 2022) Approx. 84.4% Occupied�(as of April 2022) The image shown is a property acquired by the offering. This property is owned by Strategic Storage Trust VI, Inc.
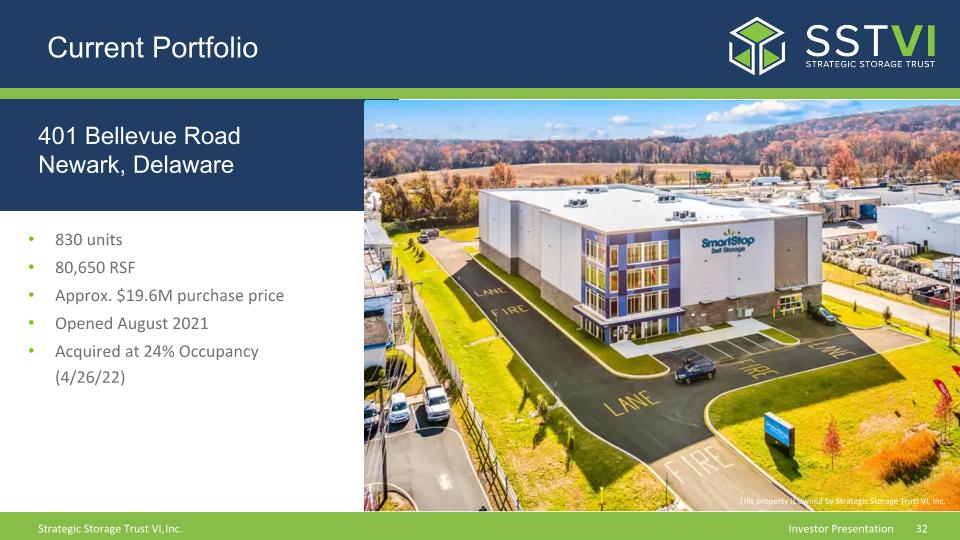
Current Portfolio 401 Bellevue Road Newark, Delaware 830 units 80,650 RSF Approx. $19.6M purchase price Opened August 2021 Acquired at 24% Occupancy (4/26/22) The image shown is a property acquired by the offering. This property is owned by Strategic Storage Trust VI, Inc.
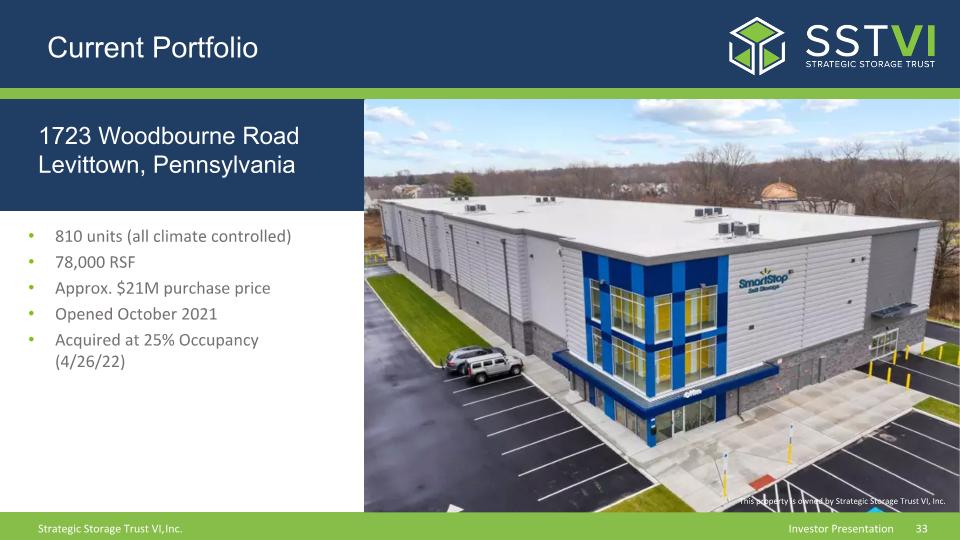
Current Portfolio 1723 Woodbourne Road Levittown, Pennsylvania 810 units (all climate controlled) 78,000 RSF Approx. $21M purchase price Opened October 2021 Acquired at 25% Occupancy (4/26/22) The image shown is a property acquired by the offering. This property is owned by Strategic Storage Trust VI, Inc.
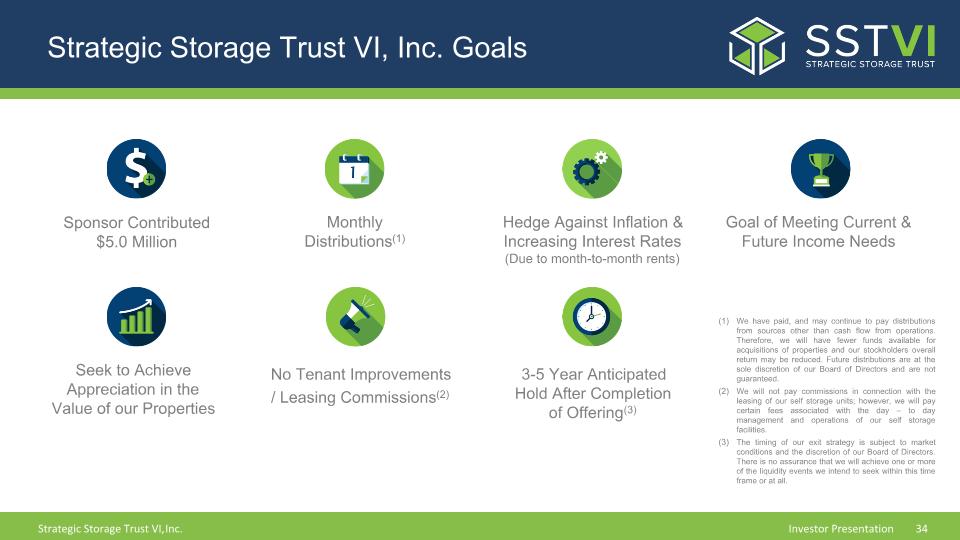
Strategic Storage Trust VI, Inc. Goals Monthly�Distributions(1) Seek to Achieve�Appreciation in the Value of our Properties Hedge Against Inflation & Increasing Interest Rates�(Due to month-to-month rents) No Tenant Improvements / Leasing Commissions(2) Goal of Meeting Current & Future Income Needs 3-5 Year Anticipated�Hold After Completion�of Offering(3) We have paid, and may continue to pay distributions from sources other than cash flow from operations. Therefore, we will have fewer funds available for acquisitions of properties and our stockholders overall return may be reduced. Future distributions are at the sole discretion of our Board of Directors and are not guaranteed. We will not pay commissions in connection with the leasing of our self storage units; however, we will pay certain fees associated with the day – to day management and operations of our self storage facilities. The timing of our exit strategy is subject to market conditions and the discretion of our Board of Directors. There is no assurance that we will achieve one or more of the liquidity events we intend to seek within this time frame or at all. Sponsor Contributed $5.0 Million
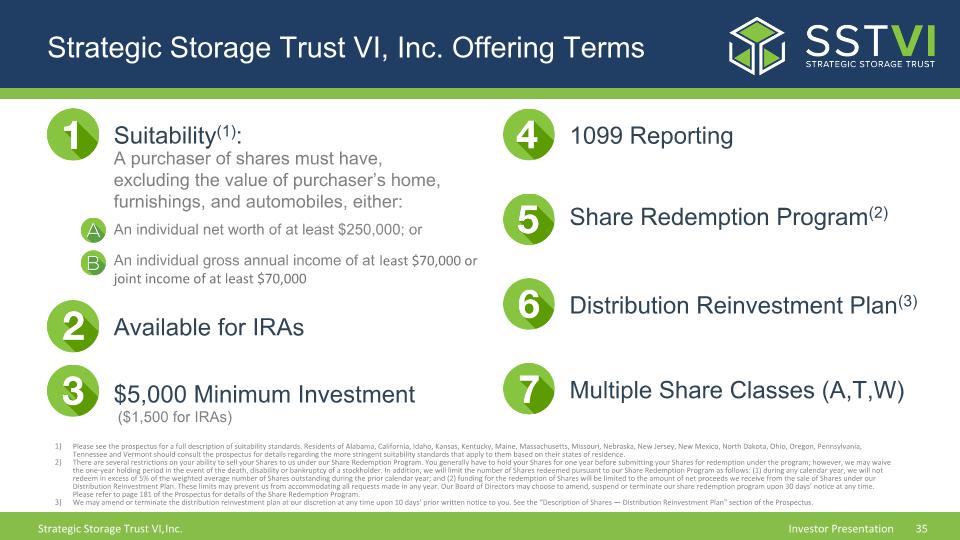
Strategic Storage Trust VI, Inc. Offering Terms Suitability(1): Please see the prospectus for a full description of suitability standards. Residents of Alabama, California, Idaho, Kansas, Kentucky, Maine, Massachusetts, Missouri, Nebraska, New Jersey, New Mexico, North Dakota, Ohio, Oregon, Pennsylvania, Tennessee and Vermont should consult the prospectus for details regarding the more stringent suitability standards that apply to them based on their states of residence. There are several restrictions on your ability to sell your Shares to us under our Share Redemption Program. You generally have to hold your Shares for one year before submitting your Shares for redemption under the program; however, we may waive the one-year holding period in the event of the death, disability or bankruptcy of a stockholder. In addition, we will limit the number of Shares redeemed pursuant to our Share Redemption Program as follows: (1) during any calendar year, we will not redeem in excess of 5% of the weighted average number of Shares outstanding during the prior calendar year; and (2) funding for the redemption of Shares will be limited to the amount of net proceeds we receive from the sale of Shares under our Distribution Reinvestment Plan. These limits may prevent us from accommodating all requests made in any year. Our Board of Directors may choose to amend, suspend or terminate our share redemption program upon 30 days’ notice at any time. Please refer to page 181 of the Prospectus for details of the Share Redemption Program. We may amend or terminate the distribution reinvestment plan at our discretion at any time upon 10 days’ prior written notice to you. See the “Description of Shares — Distribution Reinvestment Plan” section of the Prospectus. An individual net worth of at least $250,000; or An individual gross annual income of at least $70,000 or joint income of at least $70,000 Available for IRAs $5,000 Minimum Investment A purchaser of shares must have, excluding the value of purchaser’s home, furnishings, and automobiles, either: 1099 Reporting Share Redemption Program(2) Distribution Reinvestment Plan(3) Multiple Share Classes (A,T,W) ($1,500 for IRAs)
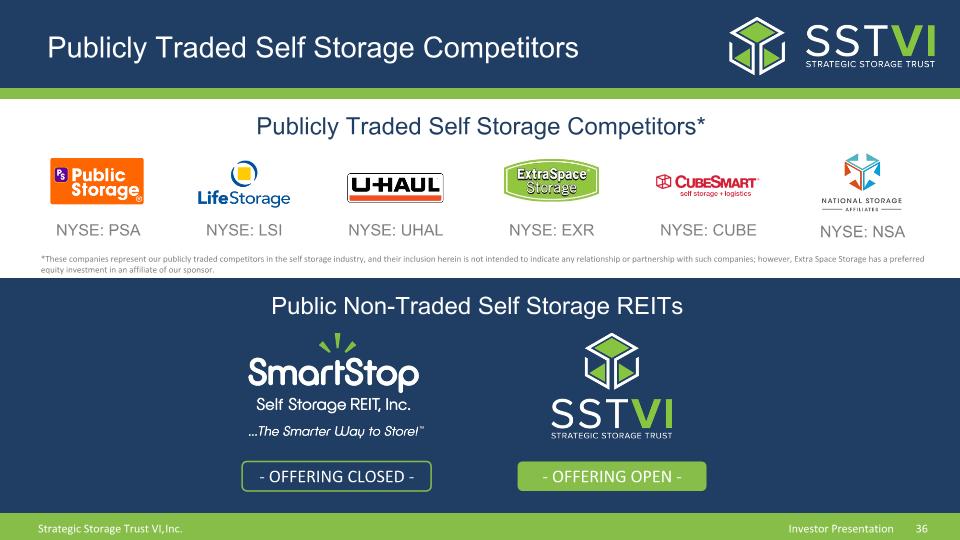
Publicly Traded Self Storage Competitors Publicly Traded Self Storage Competitors* NYSE: EXR NYSE: PSA NYSE: CUBE NYSE: LSI NYSE: UHAL NYSE: NSA Public Non-Traded Self Storage REITs - OFFERING CLOSED - *These companies represent our publicly traded competitors in the self storage industry, and their inclusion herein is not intended to indicate any relationship or partnership with such companies; however, Extra Space Storage has a preferred equity investment in an affiliate of our sponsor. - OFFERING OPEN -
Next Steps Main Office 10 Terrace Road Ladera Ranch, CA 92694 Sales Desk 866.412.5161 info@strategicreit.com Investor Services 866.418.5144 investorrelations@sam.com Shares Offered Through Pacific Oak Capital Markets, LLC Member FINRA | SIPC

QUESTIONS?
Appendix
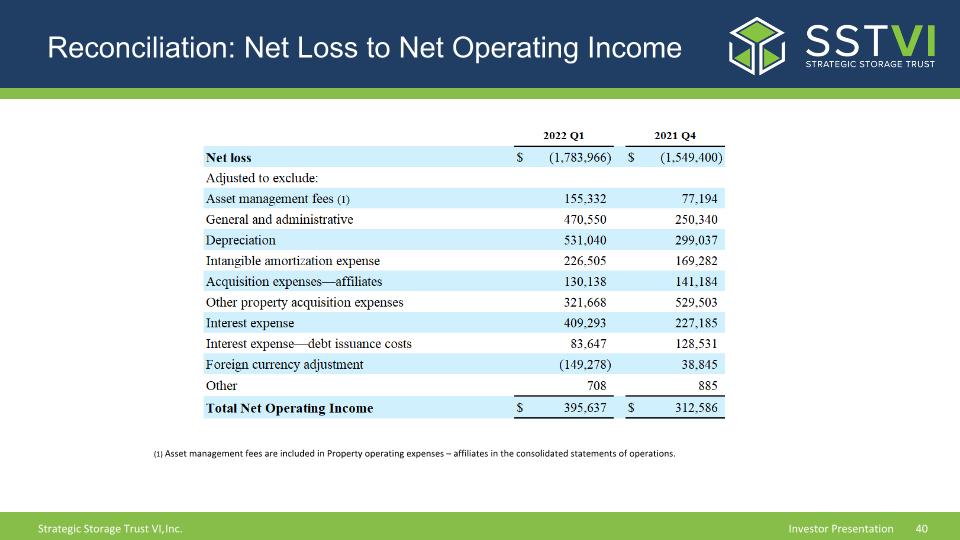
Reconciliation: Net Loss to Net Operating Income (1) Asset management fees are included in Property operating expenses – affiliates in the consolidated statements of operations.


