2023 Fourth Quarter And Full Year Update H. Michael Schwartz – Chairman and CEO This is neither an offer to sell nor a solicitation of an offer to buy the securities described herein. Only the prospectus makes such an offer. The literature must be read in conjunction with the Prospectus in order to fully understand all of the implications and risks of the offering of securities to which it relates. Please read the Prospectus in its entirety before investing for complete information and to learn more about the risk associated with this offering. No offering is made to New York residents except by a Prospectus filled with the Department of Law of the State of New York. The Attorney General of the State of New York has not passed on or endorsed the merits of this offering. Shares Offered through Pacific Oak Capital Markets, LLC (Member of FINRA and SIPC). The SmartStop Self Storage brand and its associated trademarks are owned by an affiliate our sponsor. Exhibit 99.1
Risk Factors & Other Information We are an “emerging growth company” under the federal securities laws and will be subject to reduced public company reporting requirements. Investing in our common stock involves a high degree of risk. You should purchase these securities only if you can afford a complete loss of your investment. See “Restrictions on Ownership and Transfer” in our prospectus to read about limitations on transferability. See “Risk Factors” in our prospectus to read about the risks you should consider before buying shares of our common stock. An investment in our shares is not suitable for all investors. An investment in our shares involves significant risks and is only suitable for persons who have adequate financial means, desire a relatively long-term investment and will not need immediate liquidity from their investment. Investors should only purchase shares if they can afford a complete loss of their investment. We encourage you to review our SEC filings at www.sec.gov. All properties pictured are part of SST VI unless otherwise noted. The most significant risks include the following: An investment in this offering is speculative, illiquid and involves a high degree of risk, including loss of the entire investment. No public market currently exists for shares of our common stock and we may not list our shares on a national securities exchange before three to five years after completion of this offering, if at all; therefore, it may be difficult to sell your shares. If you sell your shares, it will likely be at a substantial discount. Our charter does not require us to pursue a liquidity transaction at any time. As of December 31, 2023, our accumulated deficit was approximately $64.1 million, and we anticipate that our operations will not be profitable in 2024. No public market currently exists for shares of our common stock, and we may not list our shares on a national securities exchange before three to five years after completion of this offering, if at all; therefore, it may be difficult to sell your shares. If you sell your shares, it will likely be at a substantial discount. Our charter does not require us to pursue a liquidity transaction at any time. We have paid 100% of our cash distributions from sources other than our cash flows from operations. We are not prohibited from undertaking such activities by our charter, bylaws, or investment policies, and we may use an unlimited amount from any source to pay our distributions. From commencement of paying cash distributions in March 2021, the payment of all distributions has been funded from our public offering and our private offering. Until we generate cash flows sufficient to pay distributions to you, we may pay distributions from the net proceeds of our public offering or from borrowings in anticipation of future cash flows. Until we generate operating cash flows sufficient to pay distributions to you, we may pay distributions from financing activities, which may include borrowings in anticipation of future cash flows or the net proceeds of this offering (which may constitute a return of capital); in such event, we will have fewer funds available for the acquisition of properties, and our stockholders’ overall return may be reduced. Therefore, it is likely that some or all of the distributions that we make will represent a return of capital to you, at least in the first few years of operation. We are not prohibited from undertaking such activities by our charter, bylaws or investment policies, and we may use an unlimited amount from any source to pay our distributions, and it is likely that we will use offering proceeds to fund a majority of our initial distributions. This is an initial public offering; we have limited operating history, and the prior performance of real estate programs sponsored by our sponsor or its affiliates may not be indicative of our future results. This is a “best efforts” offering. If we are unable to raise substantial funds in this offering, we may not be able to invest in a diverse portfolio of real estate and real estate-related investments, and the value of your investment may fluctuate more widely with the performance of specific investments. We are a “blind pool.” As a result, you will not be able to evaluate the economic merits of our future investments prior to their purchase. We may be unable to invest the net proceeds from this offering on acceptable terms to investors, or at all. Investors in this offering will experience immediate dilution in their investment primarily because (i) pursuant to our private offering, we sold approximately 10.6 million shares of our common stock at a weighted average purchase price of approximately $9.53 per share and received weighted average net proceeds of approximately $8.76 per share, and (ii) we paid organization and other offering expenses in connection with our private offering. There are substantial conflicts of interest among us and our sponsor, advisor, and property manager. Our advisor will face conflicts of interest relating to the purchase of properties, including conflicts with SmartStop Self Storage REIT, Inc., the parent company of our sponsor, and Strategic Storage Growth Trust III, Inc., and such conflicts may not be resolved in our favor, which could adversely affect our investment opportunities. We have no employees and must depend on our advisor to select investments and conduct our operations. However, the personnel at our advisor and its affiliates are also the personnel of other advisory entities of other real estate programs. Accordingly, time spent on these other initiatives diverts attention from our activities, which could negatively impact us. We will pay substantial fees and expenses to our advisor, its affiliates and participating broker-dealers, which will reduce cash available for investment and distribution. We may incur substantial debt, which could hinder our ability to pay distributions to our stockholders or could decrease the value of your investment. We may fail to qualify as a REIT, which could adversely affect our operations and our ability to make distributions. Our board of directors may change any of our investment objectives without your consent.
SmartStop REIT Advisors, LLC
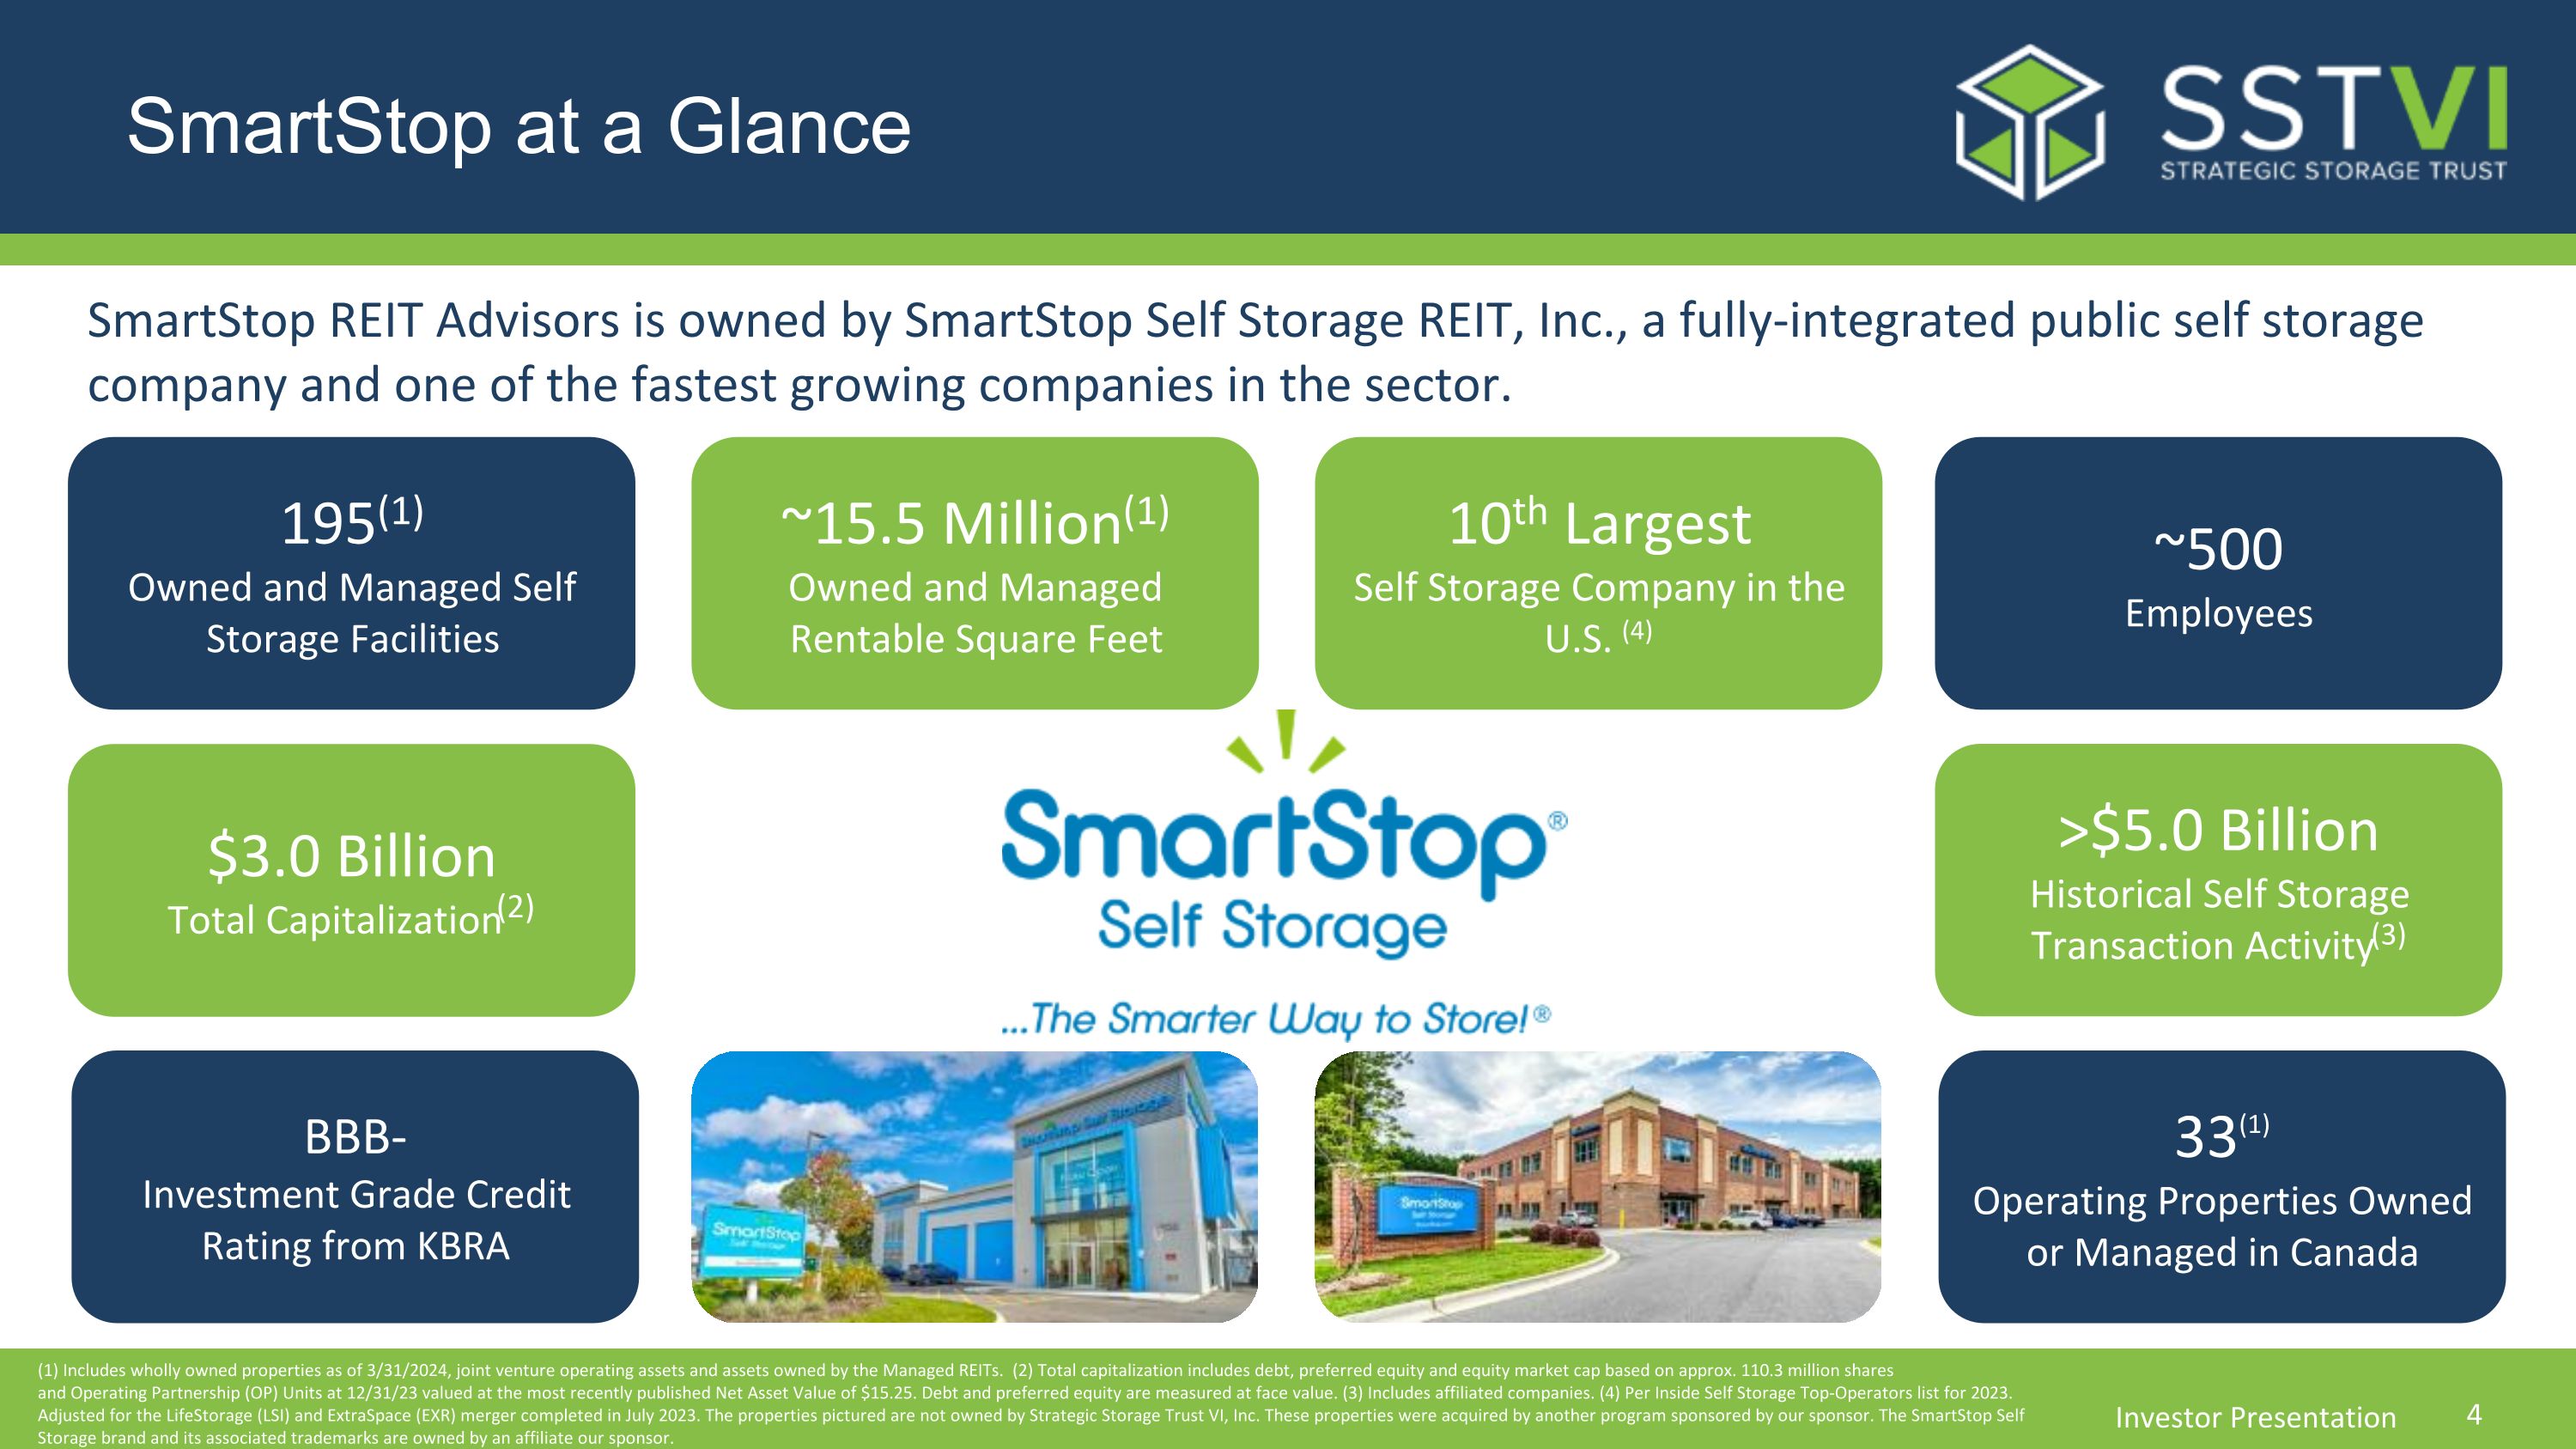
SmartStop at a Glance 195(1) Owned and Managed Self Storage Facilities ~15.5 Million(1) Owned and Managed Rentable Square Feet 10th Largest Self Storage Company in the U.S. (4) $3.0 Billion Total Capitalization(2) >$5.0 Billion Historical Self Storage Transaction Activity(3) ~500 Employees SmartStop REIT Advisors is owned by SmartStop Self Storage REIT, Inc., a fully-integrated public self storage company and one of the fastest growing companies in the sector. Initially started raising equity capital in 2014 through the broker dealer network as a public non-traded REIT BBB- Investment Grade Credit Rating from KBRA 33(1) Operating Properties Owned or Managed in Canada (1) Includes wholly owned properties as of 3/31/2024, joint venture operating assets and assets owned by the Managed REITs. (2) Total capitalization includes debt, preferred equity and equity market cap based on approx. 110.3 million shares and Operating Partnership (OP) Units at 12/31/23 valued at the most recently published Net Asset Value of $15.25. Debt and preferred equity are measured at face value. (3) Includes affiliated companies. (4) Per Inside Self Storage Top-Operators list for 2023. Adjusted for the LifeStorage (LSI) and ExtraSpace (EXR) merger completed in July 2023. The properties pictured are not owned by Strategic Storage Trust VI, Inc. These properties were acquired by another program sponsored by our sponsor. The SmartStop Self Storage brand and its associated trademarks are owned by an affiliate our sponsor. Investor Presentation 4
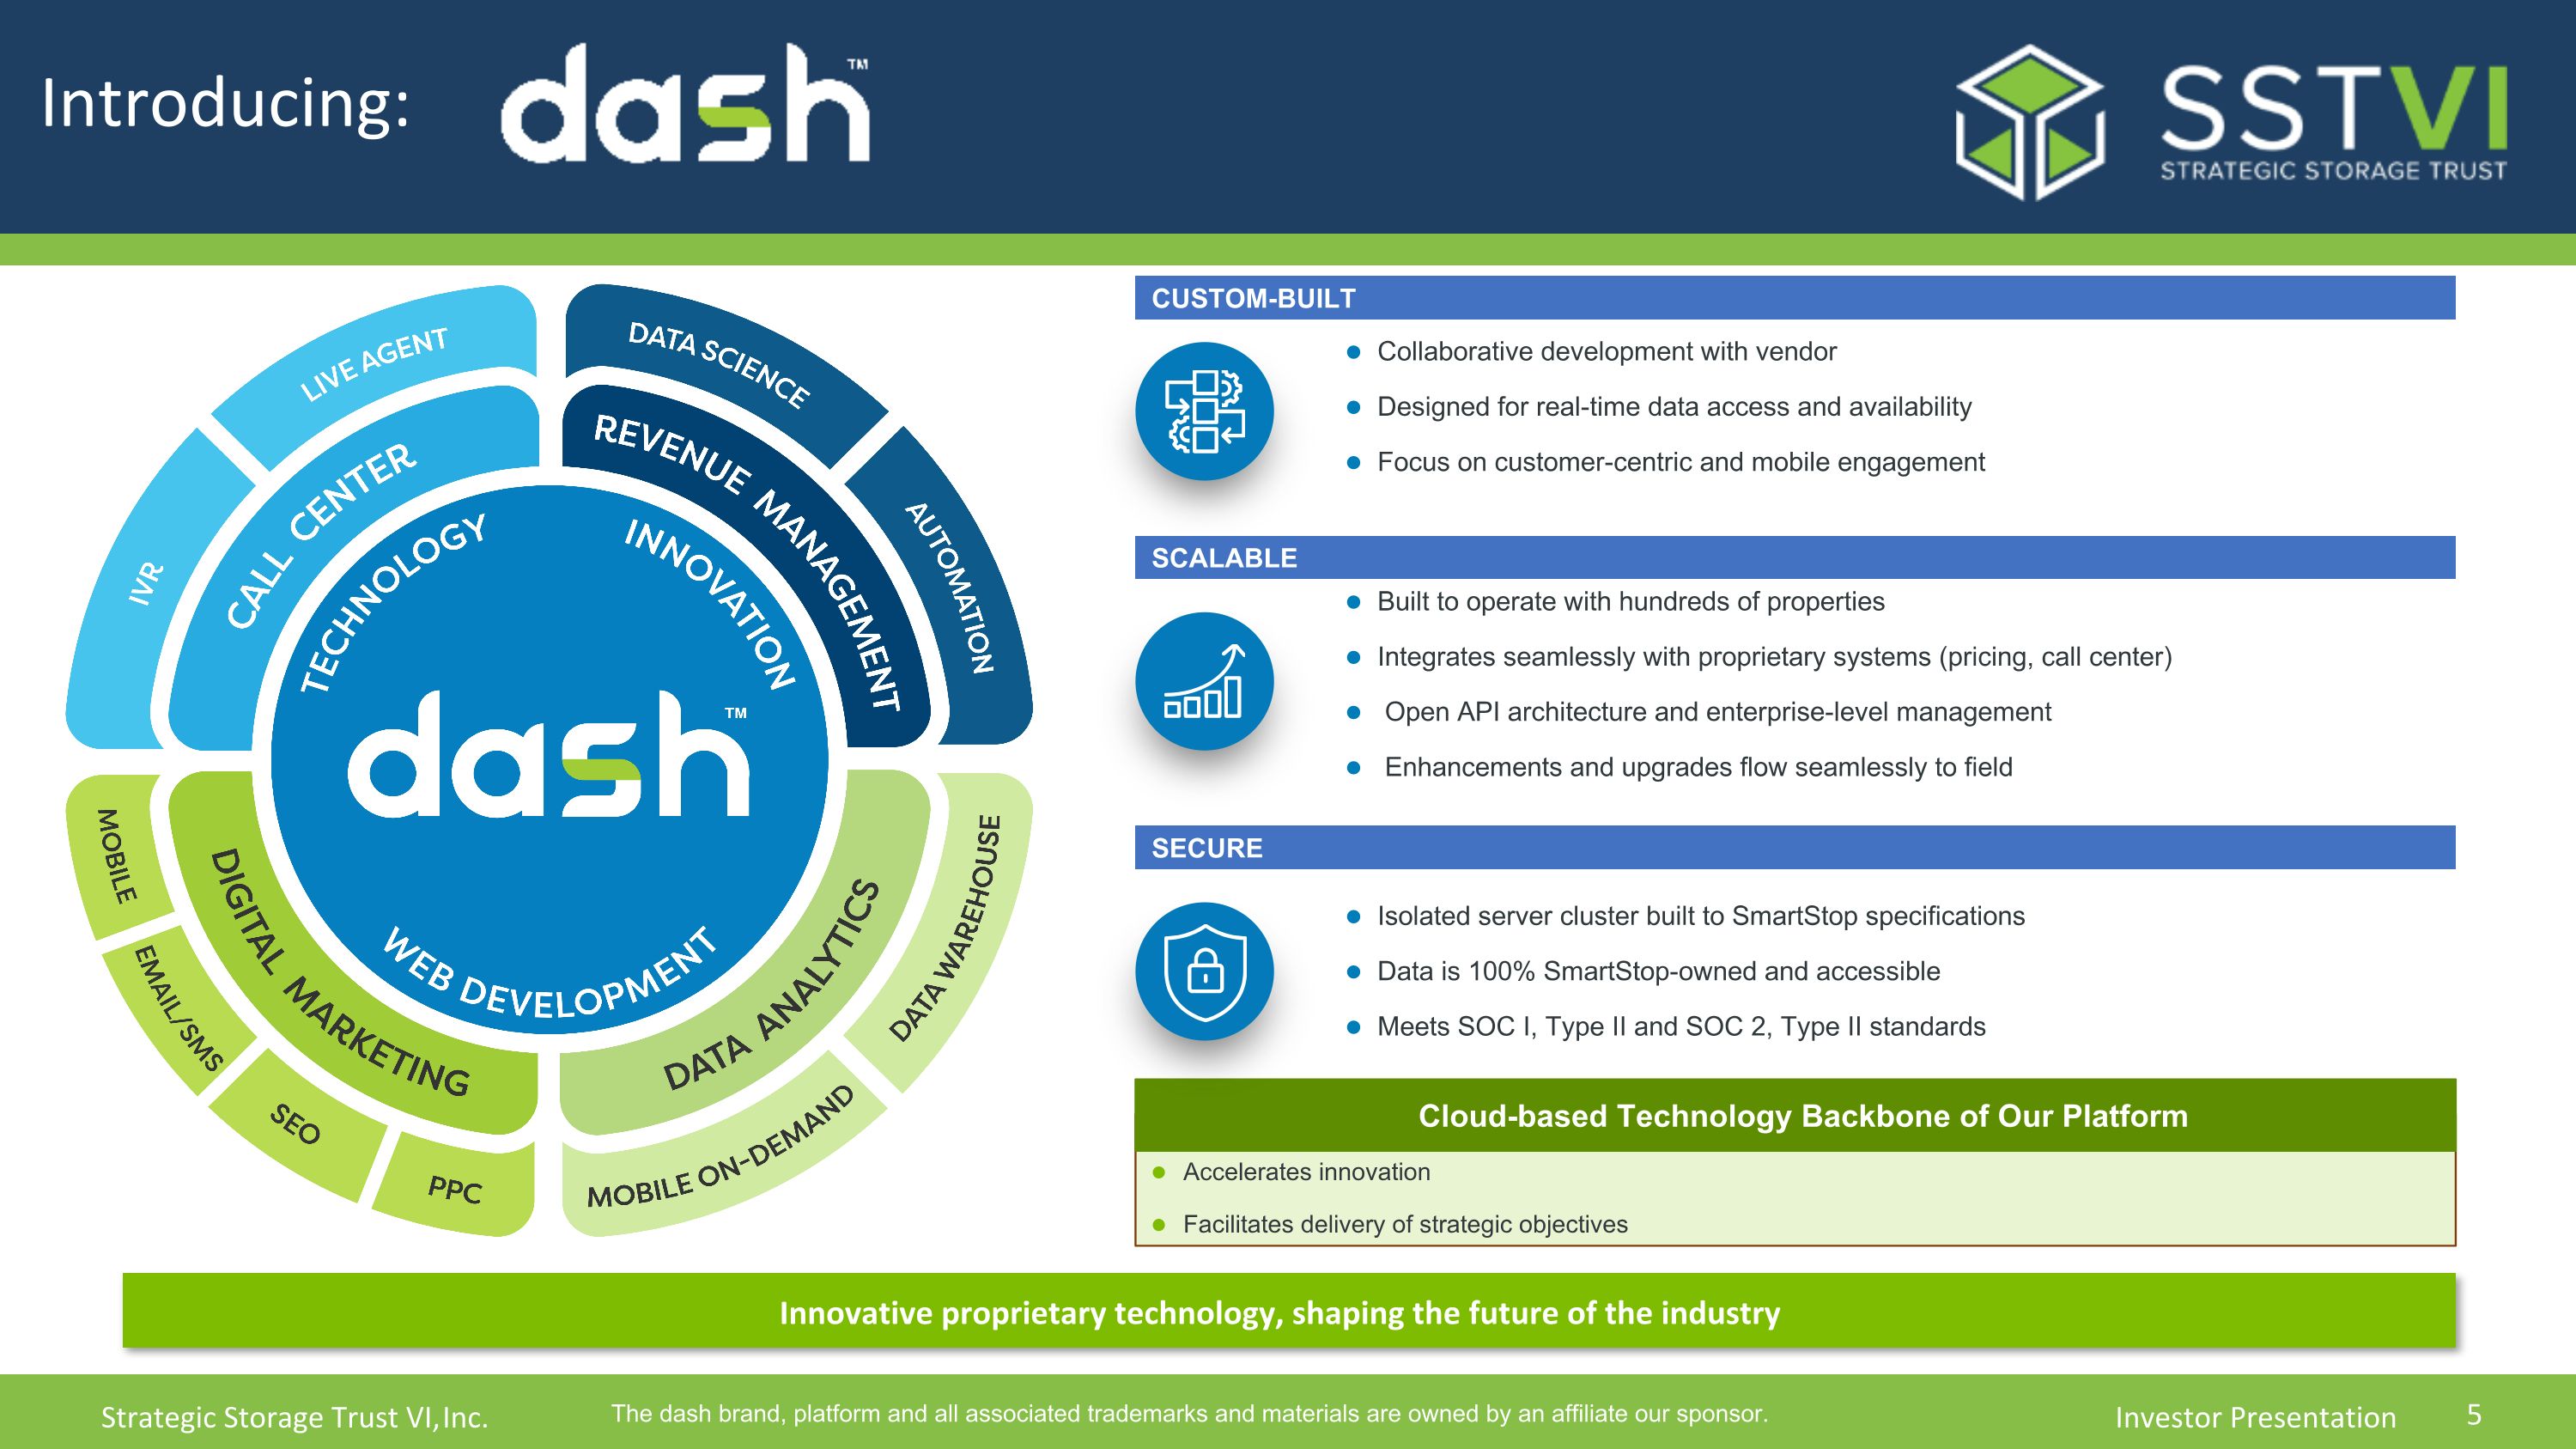
Introducing: Cloud-based Technology Backbone of Our Platform Accelerates innovation Facilitates delivery of strategic objectives Collaborative development with vendor Designed for real-time data access and availability Focus on customer-centric and mobile engagement Custom-built Built to operate with hundreds of properties Integrates seamlessly with proprietary systems (pricing, call center) Open API architecture and enterprise-level management Enhancements and upgrades flow seamlessly to field scalable Isolated server cluster built to SmartStop specifications Data is 100% SmartStop-owned and accessible Meets SOC I, Type II and SOC 2, Type II standards secure Innovative proprietary technology, shaping the future of the industry The dash brand, platform and all associated trademarks and materials are owned by an affiliate our sponsor.
Why Self Storage?
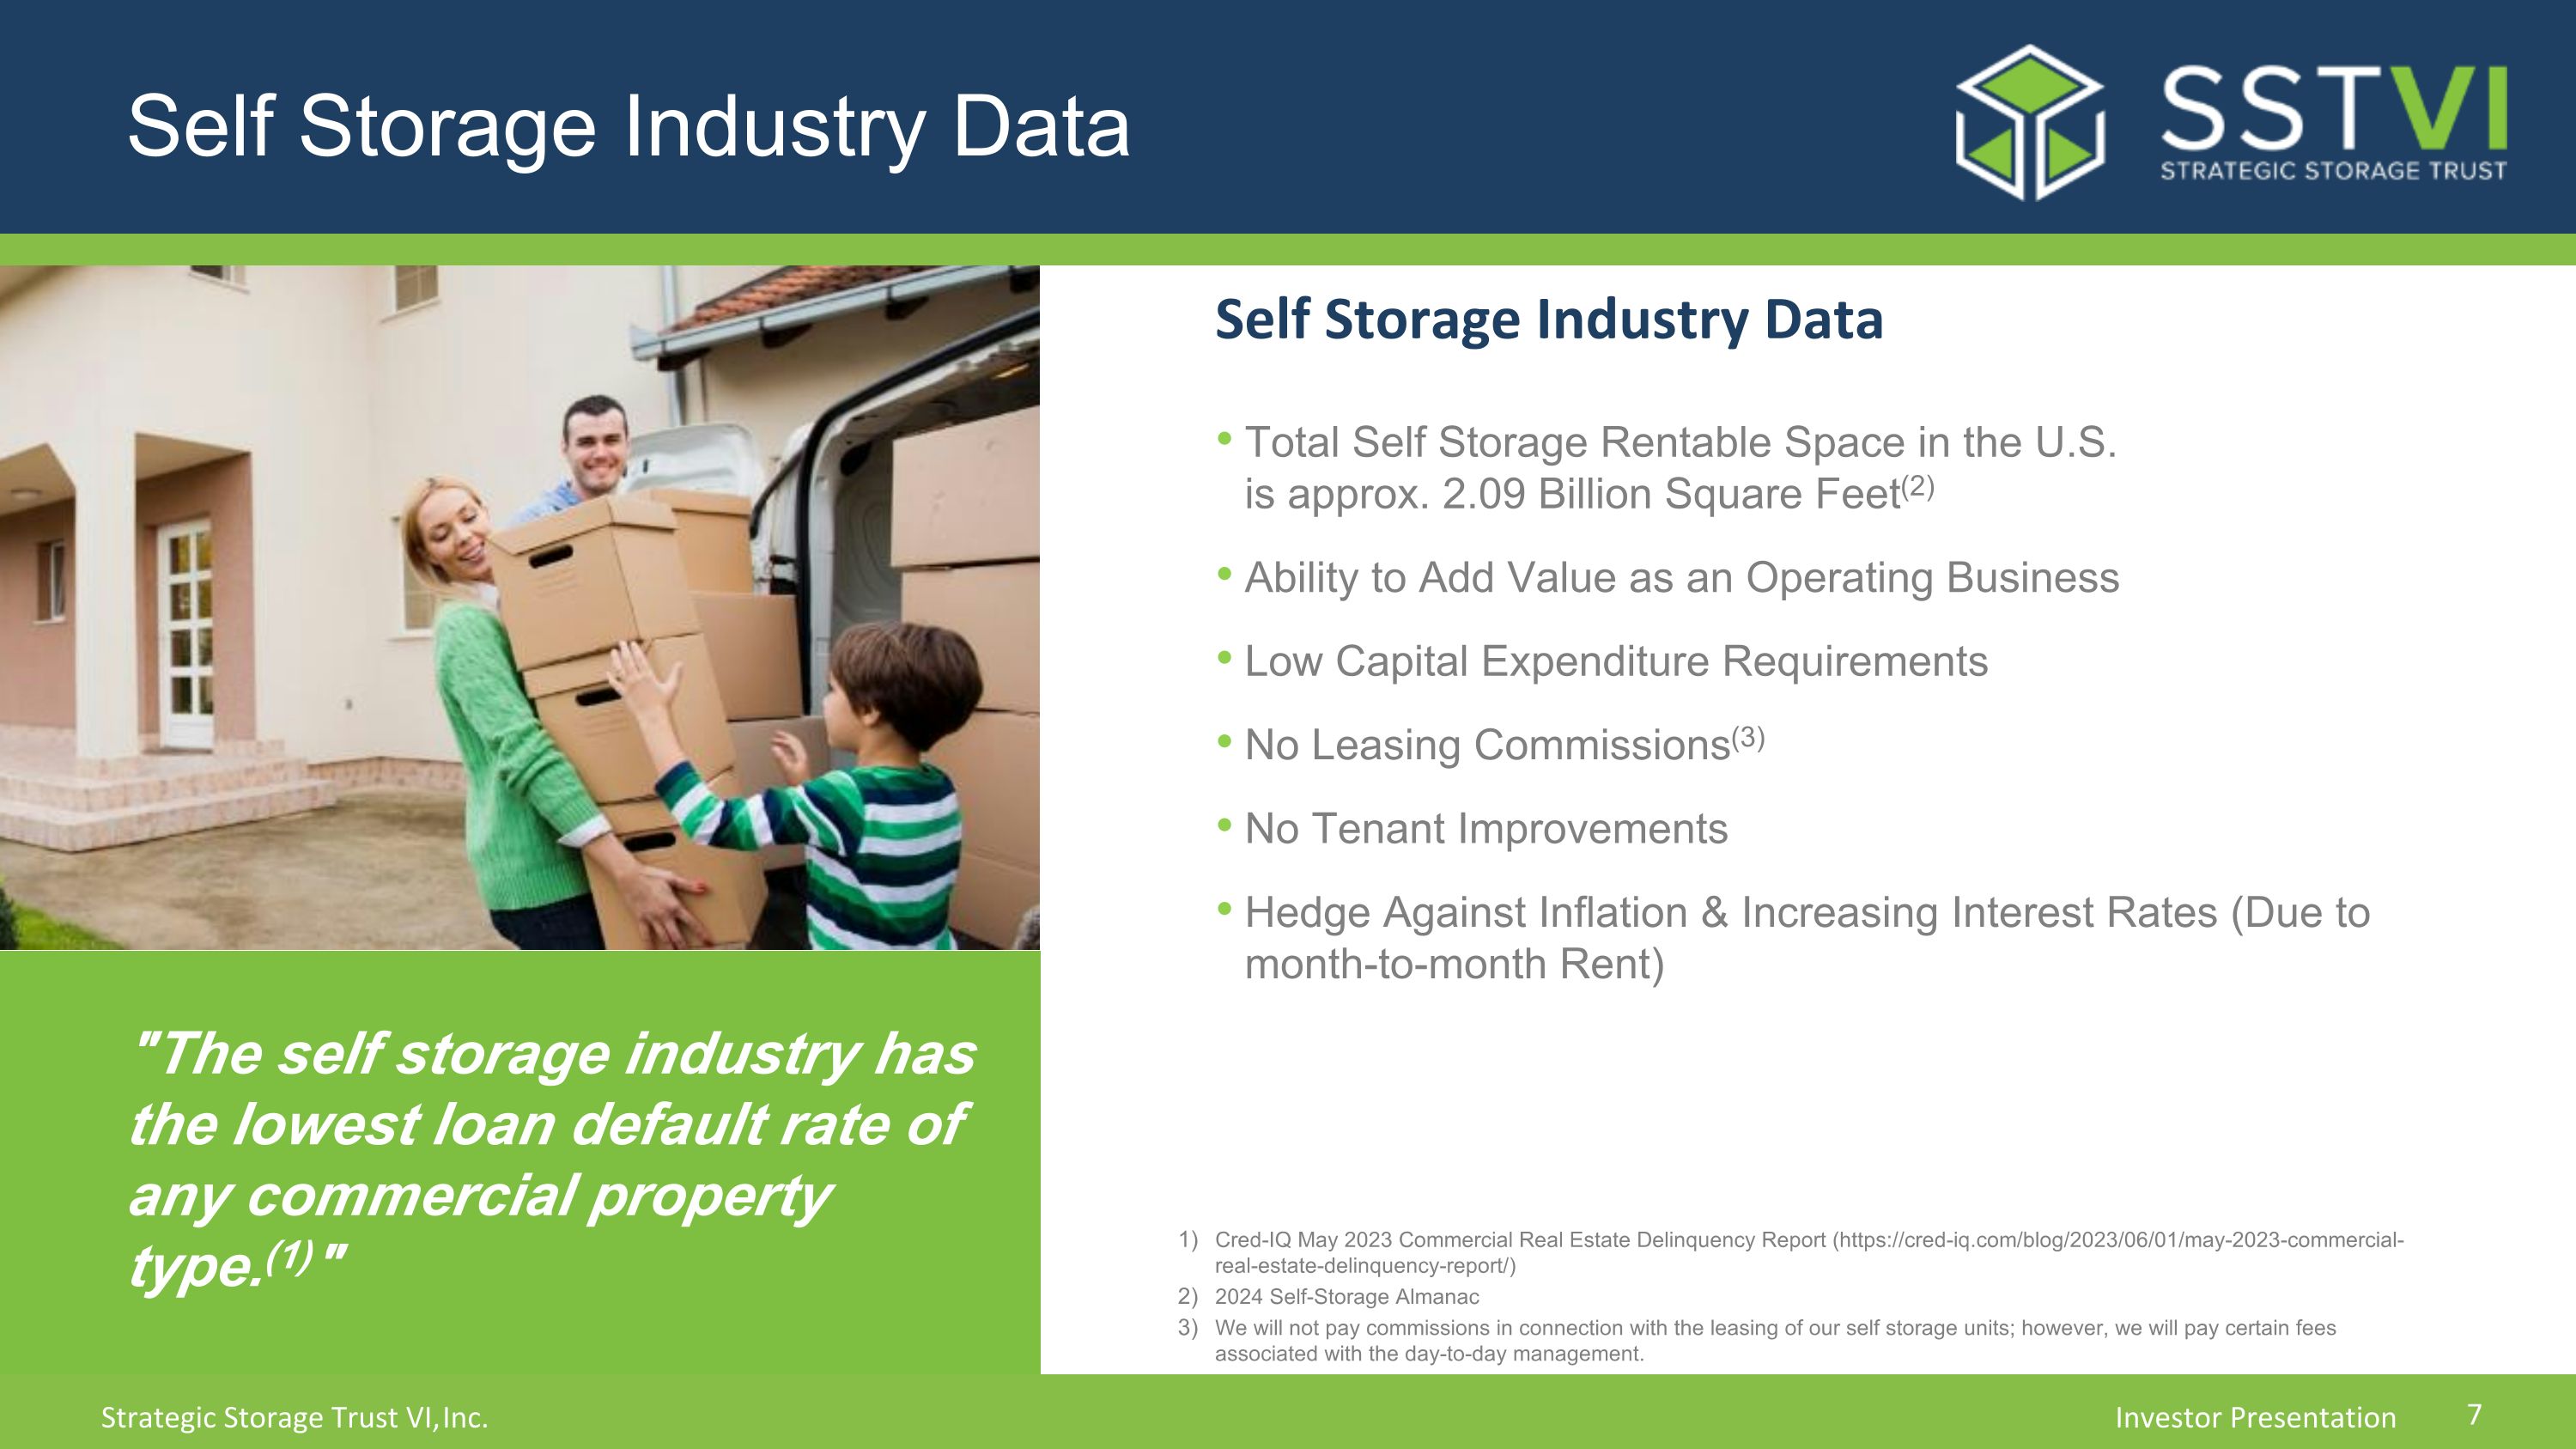
Self Storage Industry Data Self Storage Industry Data Total Self Storage Rentable Space in the U.S.�is approx. 2.09 Billion Square Feet(2) Ability to Add Value as an Operating Business Low Capital Expenditure Requirements No Leasing Commissions(3) No Tenant Improvements Hedge Against Inflation & Increasing Interest Rates (Due to month-to-month Rent) "The self storage industry has the lowest loan default rate of any commercial property type.(1)" Cred-IQ May 2023 Commercial Real Estate Delinquency Report (https://cred-iq.com/blog/2023/06/01/may-2023-commercial-real-estate-delinquency-report/) 2024 Self-Storage Almanac We will not pay commissions in connection with the leasing of our self storage units; however, we will pay certain fees associated with the day-to-day management.
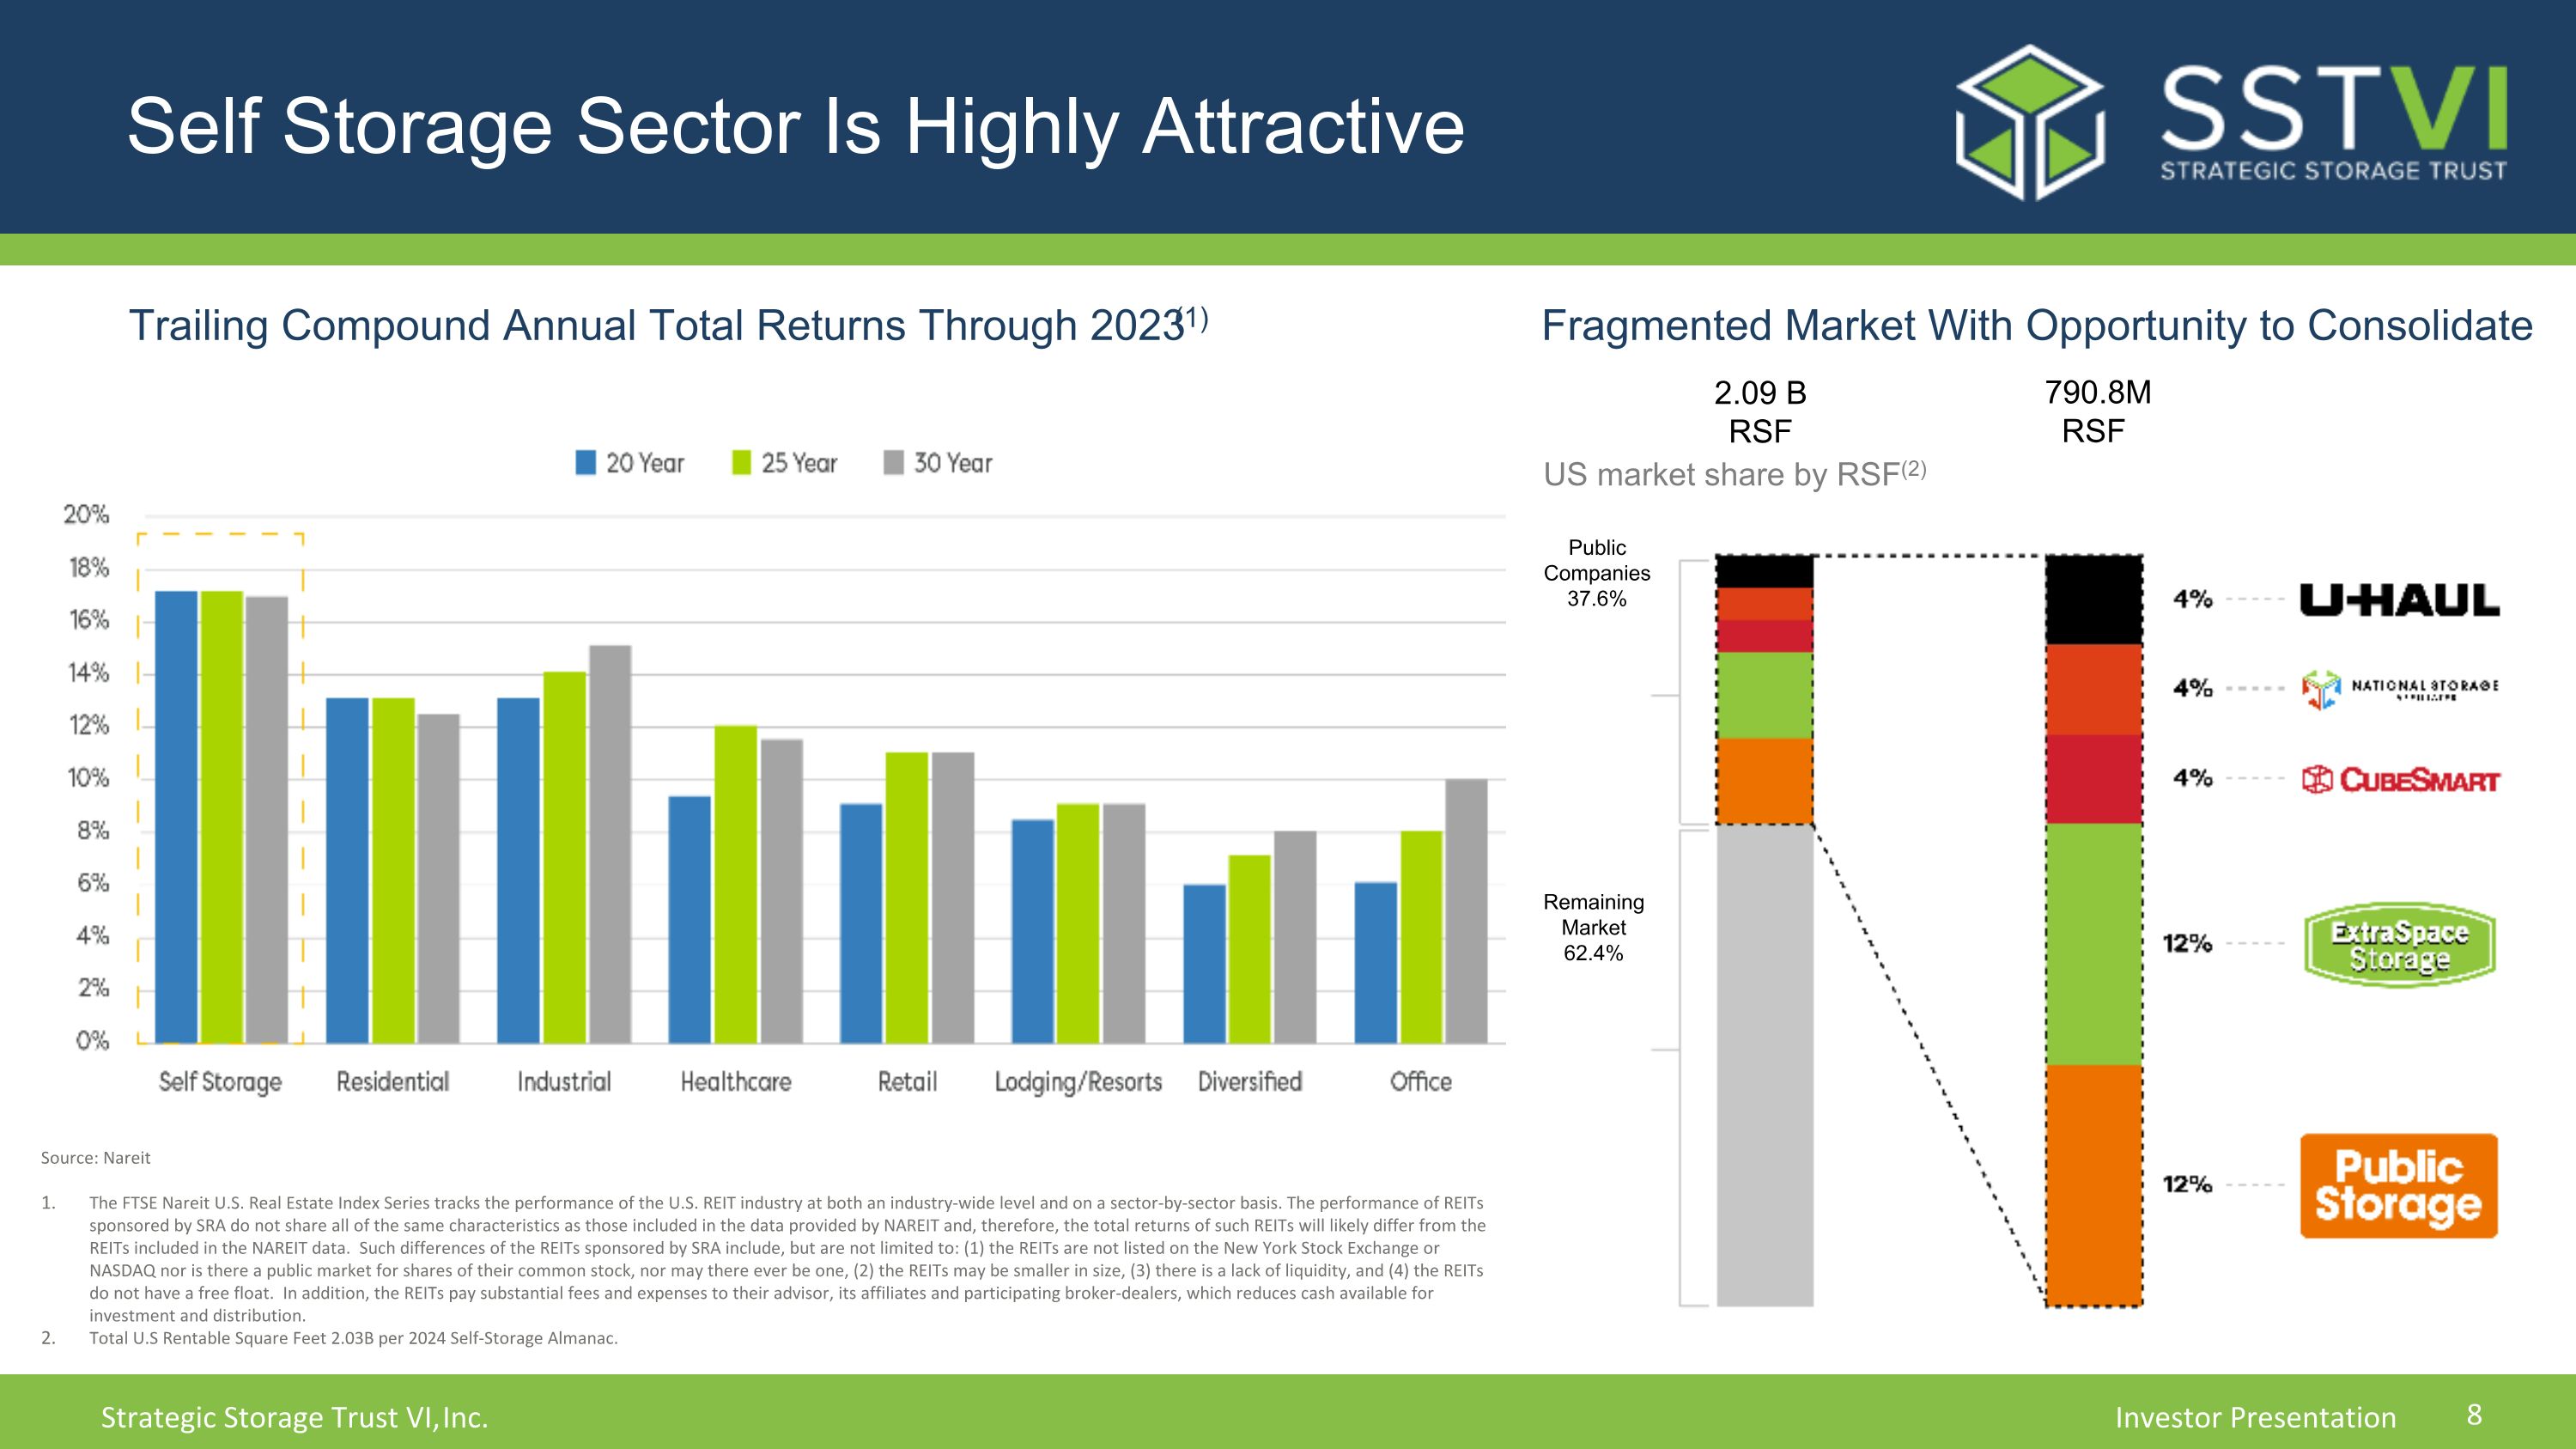
Self Storage Sector Is Highly Attractive Fragmented Market With Opportunity to Consolidate US market share by RSF(2) Trailing Compound Annual Total Returns Through 2023(1) Source: Nareit The FTSE Nareit U.S. Real Estate Index Series tracks the performance of the U.S. REIT industry at both an industry-wide level and on a sector-by-sector basis. The performance of REITs sponsored by SRA do not share all of the same characteristics as those included in the data provided by NAREIT and, therefore, the total returns of such REITs will likely differ from the REITs included in the NAREIT data. Such differences of the REITs sponsored by SRA include, but are not limited to: (1) the REITs are not listed on the New York Stock Exchange or NASDAQ nor is there a public market for shares of their common stock, nor may there ever be one, (2) the REITs may be smaller in size, (3) there is a lack of liquidity, and (4) the REITs do not have a free float. In addition, the REITs pay substantial fees and expenses to their advisor, its affiliates and participating broker-dealers, which reduces cash available for investment and distribution. Total U.S Rentable Square Feet 2.03B per 2024 Self-Storage Almanac. Public Companies 37.6% Remaining Market 62.4% 2.09 B RSF 790.8M RSF
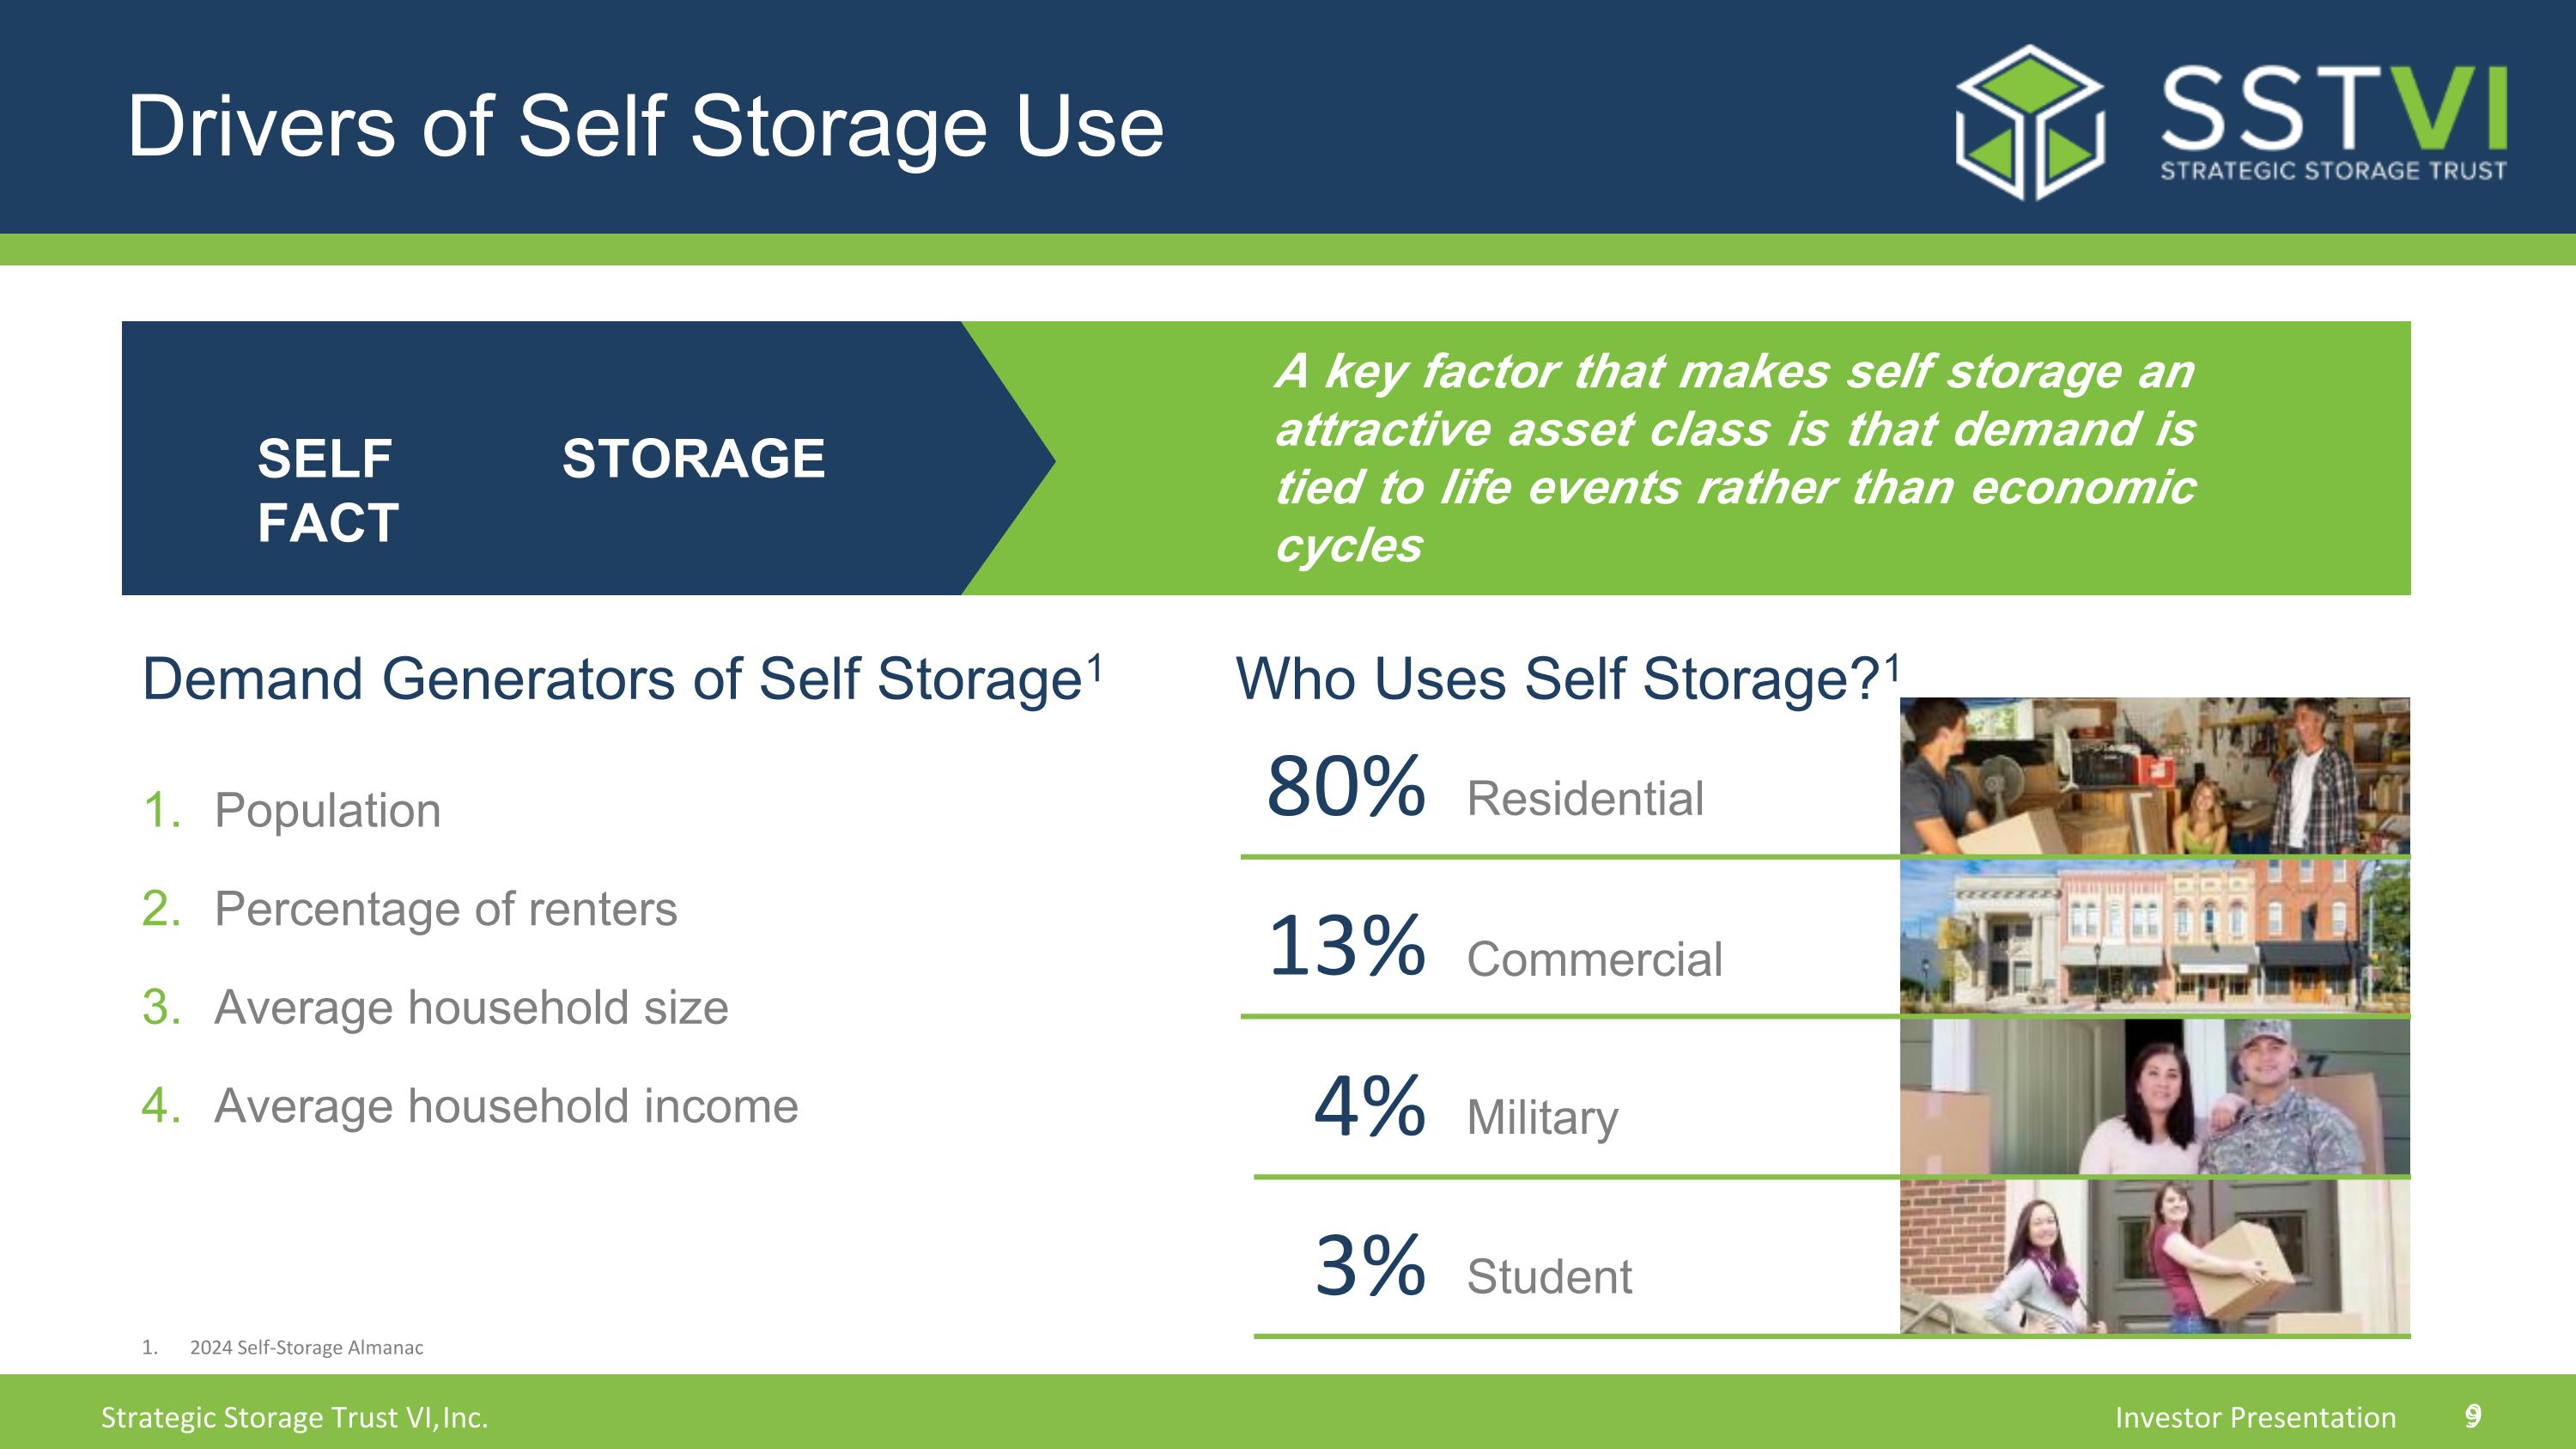
Drivers of Self Storage Use SELF STORAGE FACT A key factor that makes self storage an attractive asset class is that demand is tied to life events rather than economic cycles Demand Generators of Self Storage1 Population Percentage of renters Average household size Average household income Who Uses Self Storage?1 80% 13% 4% 3% Residential Commercial Military Student 2024 Self-Storage Almanac
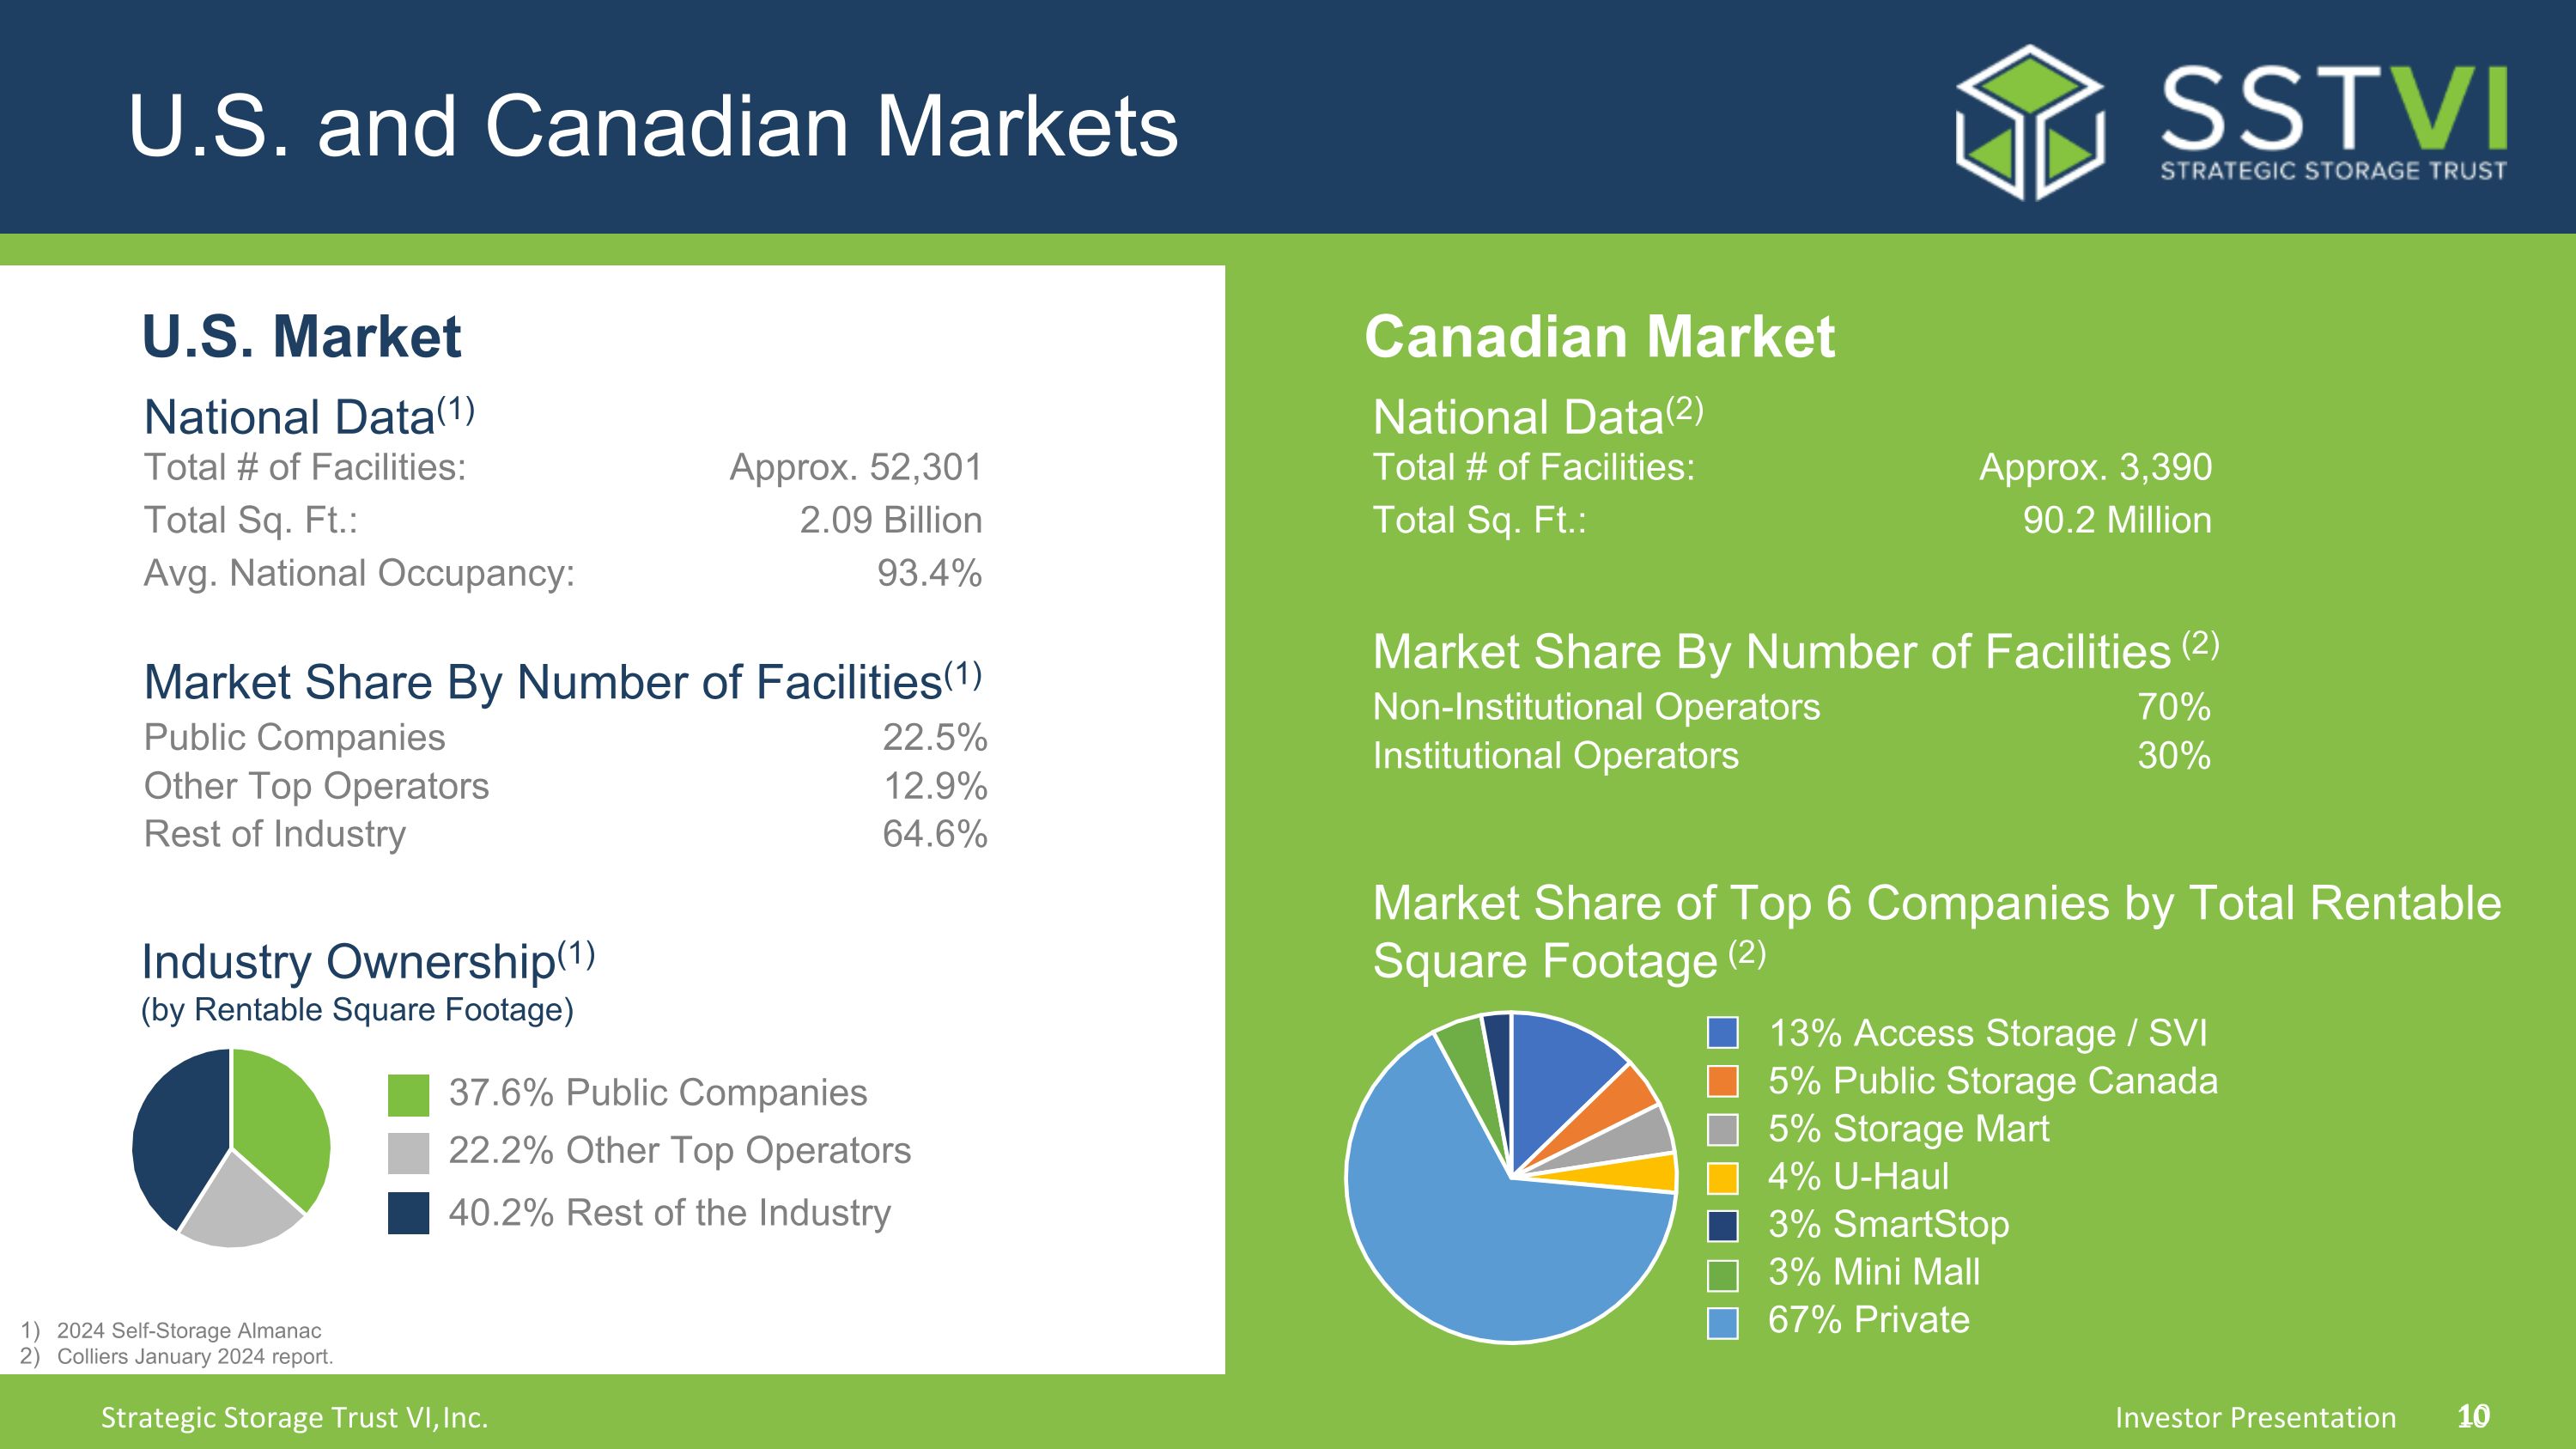
U.S. and Canadian Markets Canadian Market National Data(2) Total # of Facilities: Approx. 3,390 Total Sq. Ft.: 90.2 Million Market Share By Number of Facilities (2) Non-Institutional Operators 70% Institutional Operators 30% 13% Access Storage / SVI 5% Public Storage Canada 5% Storage Mart 4% U-Haul 3% SmartStop 3% Mini Mall 67% Private Market Share of Top 6 Companies by Total Rentable Square Footage (2) National Data(1) Total # of Facilities: Approx. 52,301 Total Sq. Ft.: 2.09 Billion Avg. National Occupancy: 93.4% Market Share By Number of Facilities(1) Public Companies 22.5% Other Top Operators 12.9% Rest of Industry 64.6% 2024 Self-Storage Almanac Colliers January 2024 report. Industry Ownership(1) (by Rentable Square Footage) 22.2% Other Top Operators 37.6% Public Companies 40.2% Rest of the Industry U.S. Market
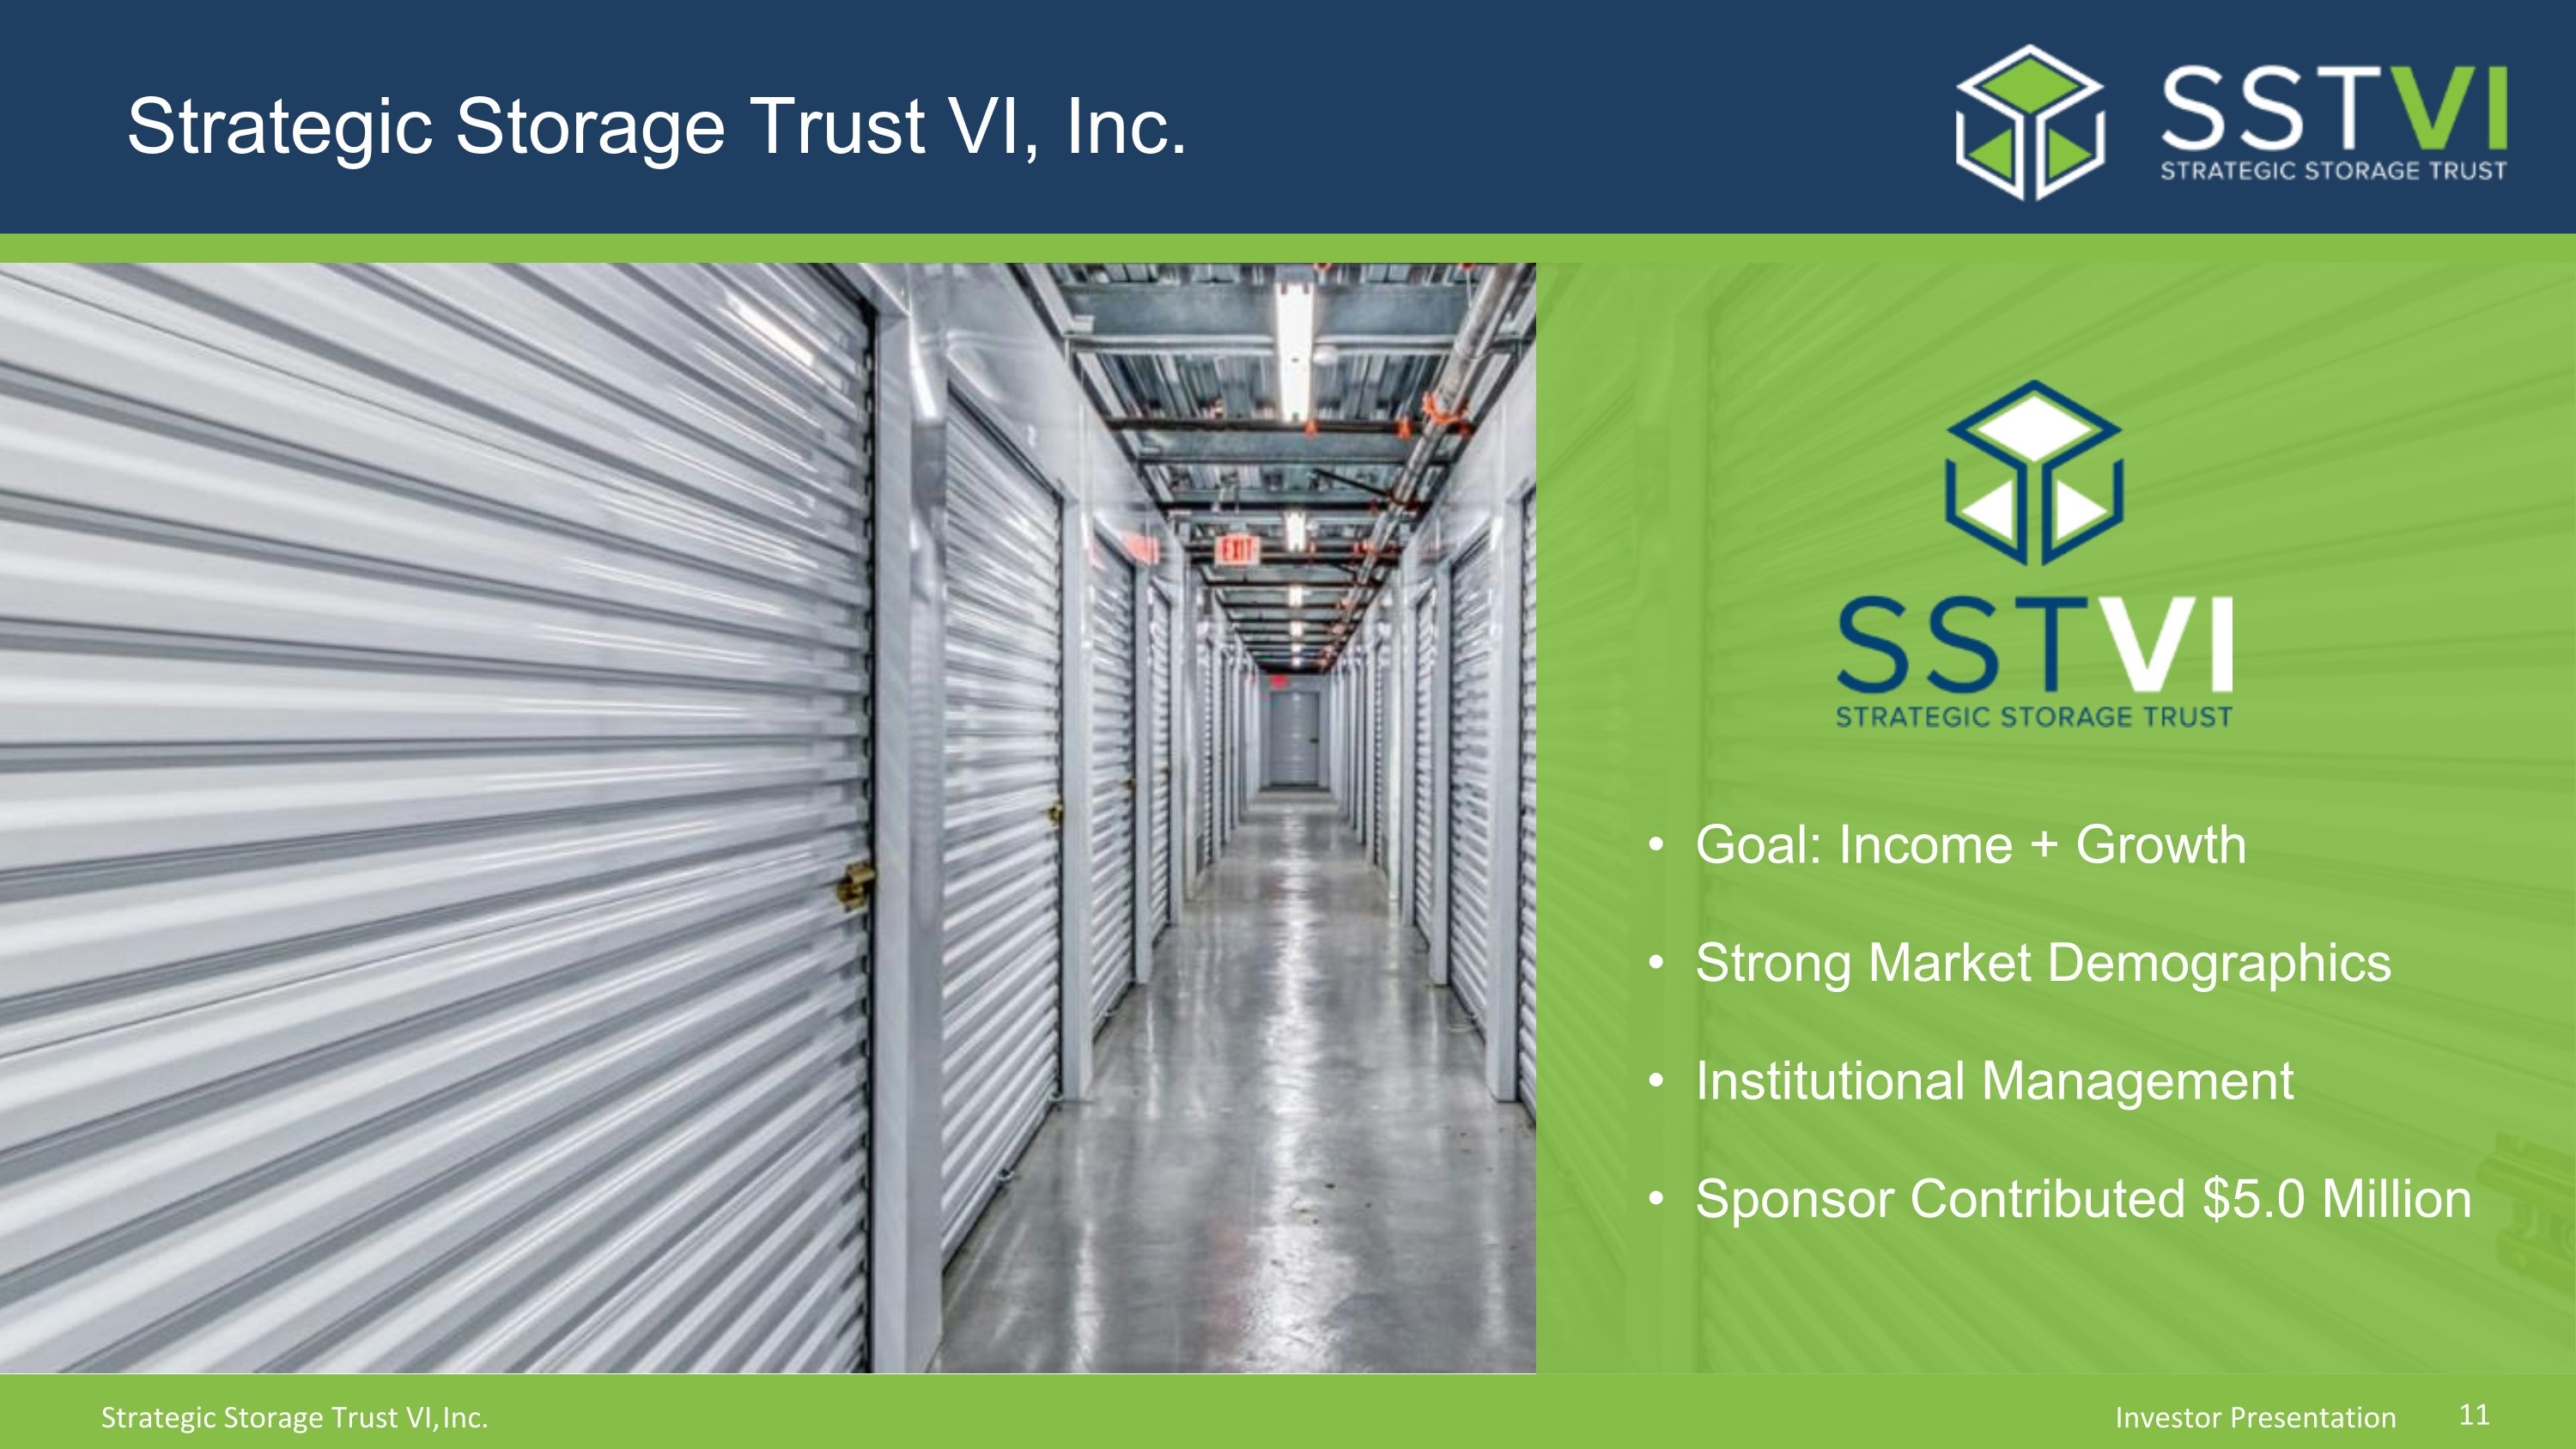
Strategic Storage Trust VI, Inc. Goal: Income + Growth Strong Market Demographics Institutional Management Sponsor Contributed $5.0 Million
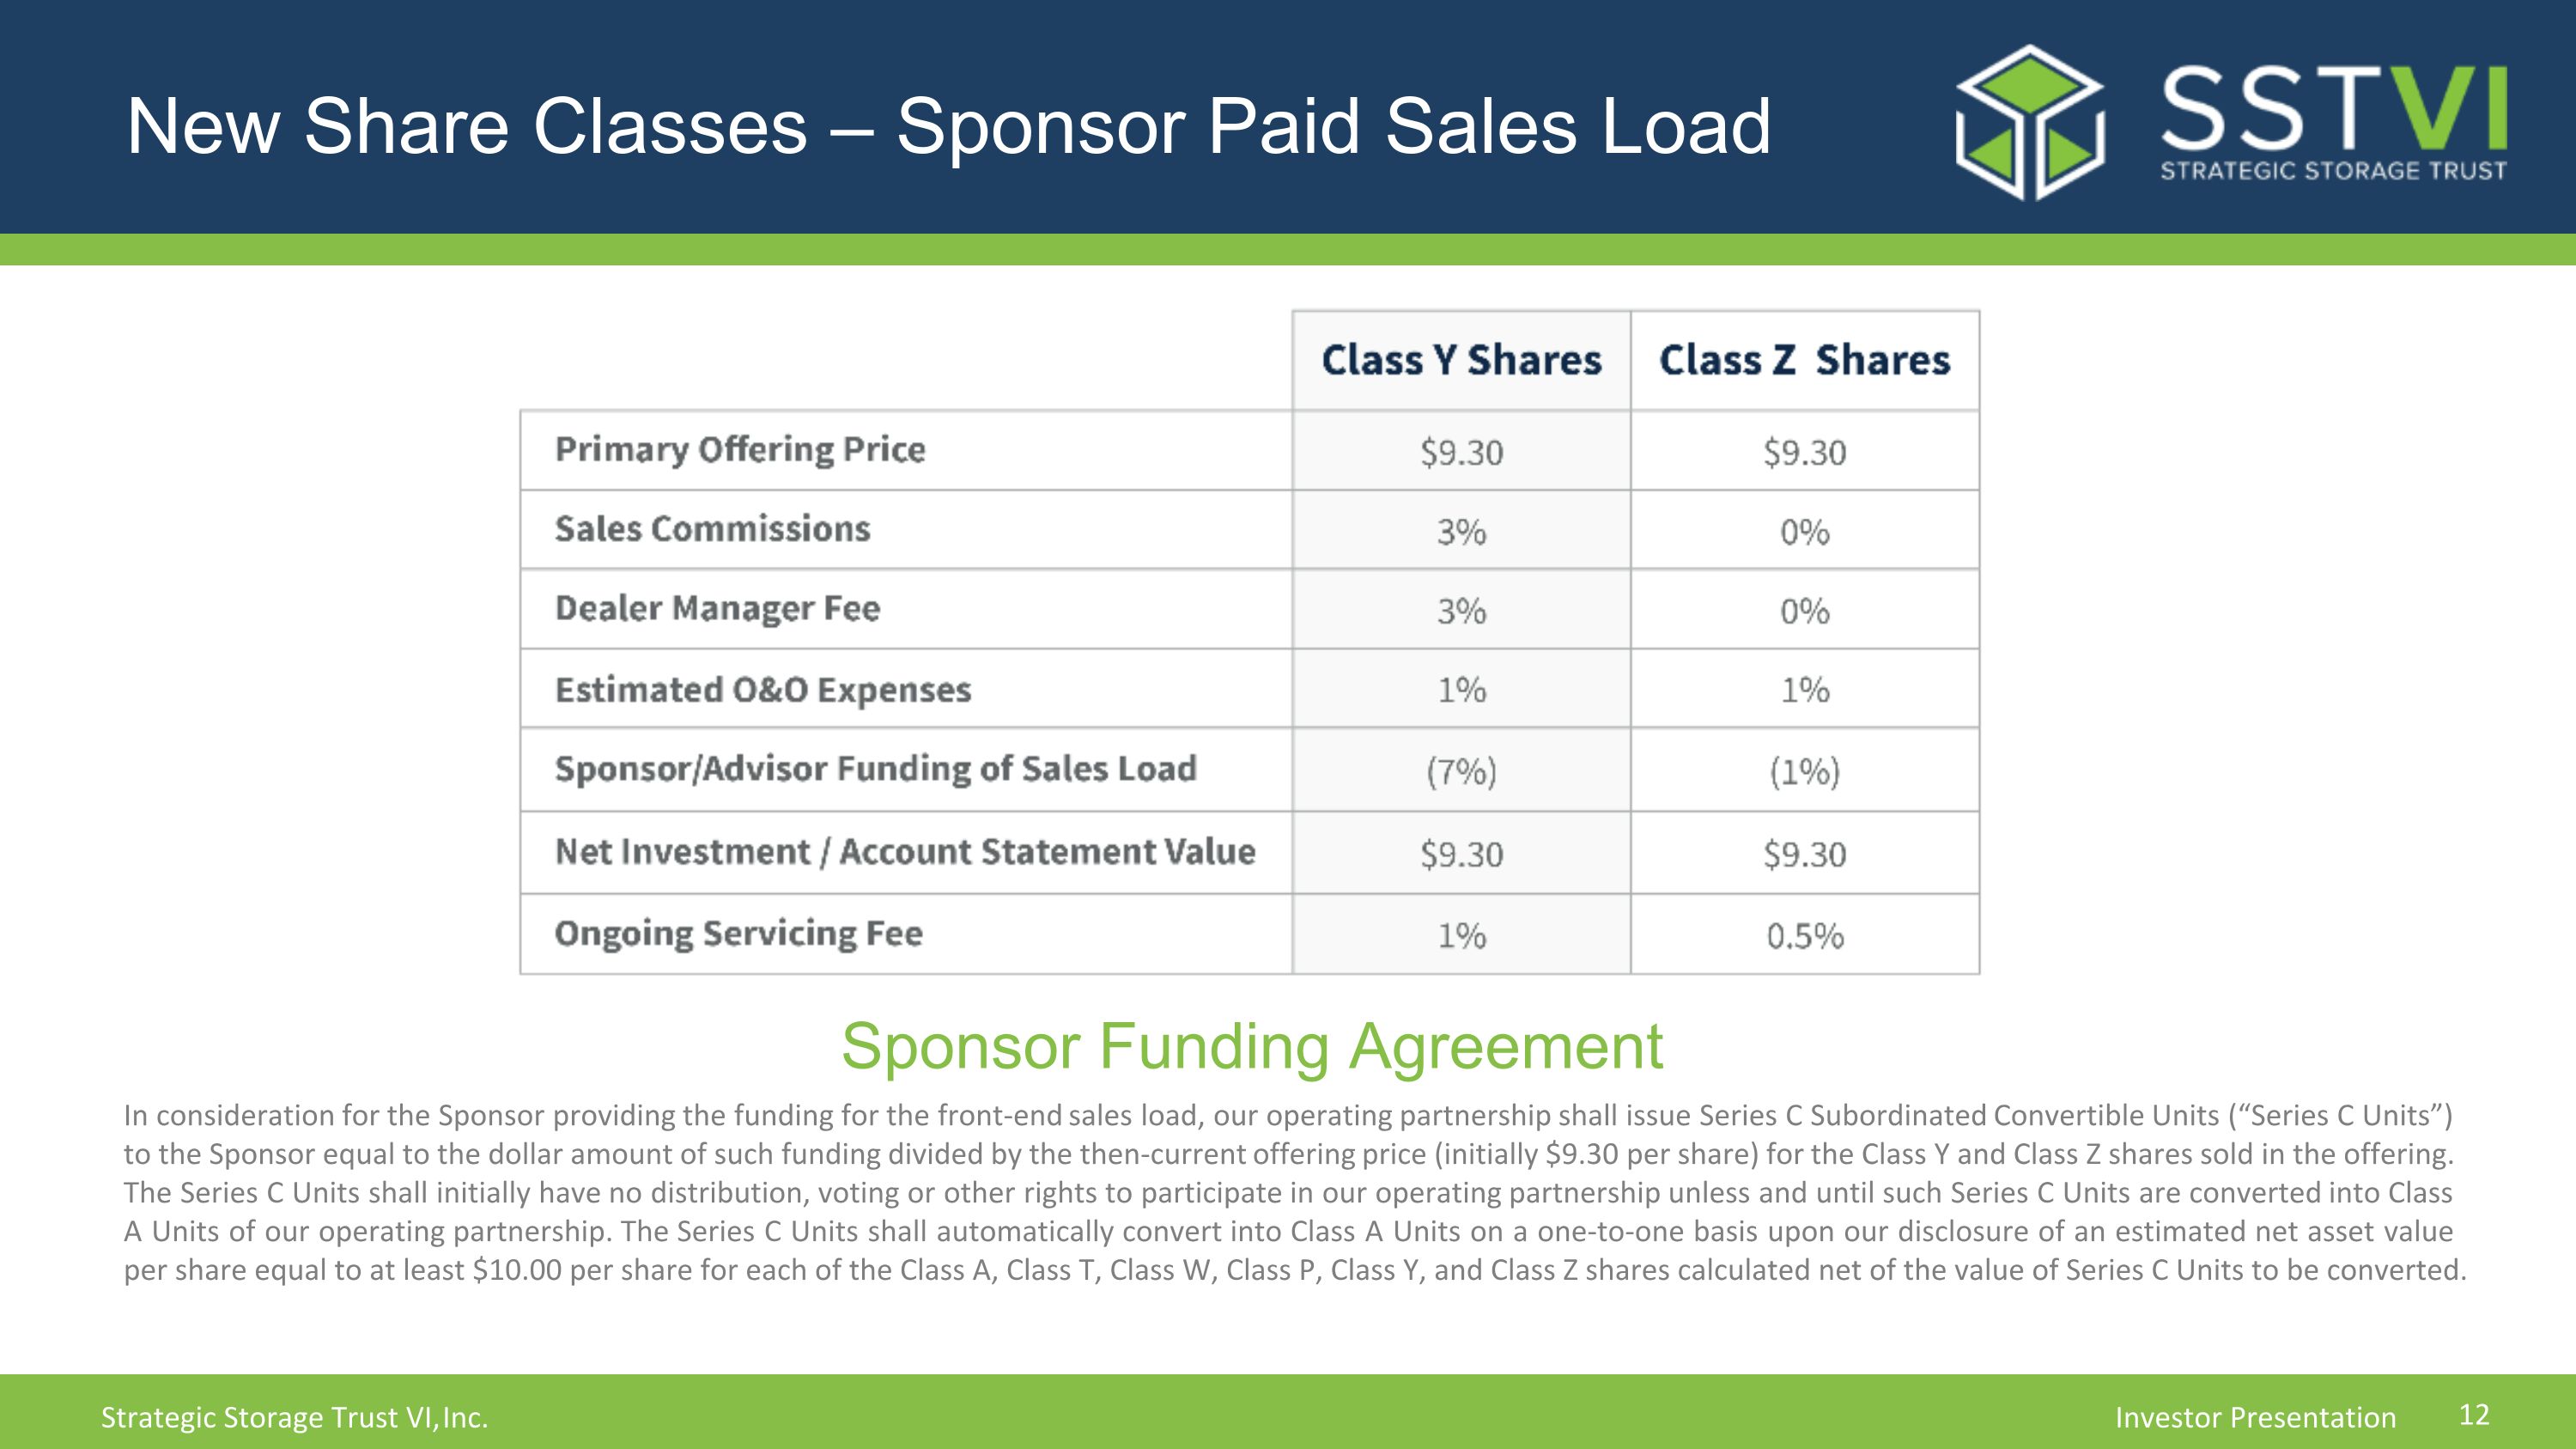
New Share Classes – Sponsor Paid Sales Load In consideration for the Sponsor providing the funding for the front-end sales load, our operating partnership shall issue Series C Subordinated Convertible Units (“Series C Units”) to the Sponsor equal to the dollar amount of such funding divided by the then-current offering price (initially $9.30 per share) for the Class Y and Class Z shares sold in the offering. The Series C Units shall initially have no distribution, voting or other rights to participate in our operating partnership unless and until such Series C Units are converted into Class A Units of our operating partnership. The Series C Units shall automatically convert into Class A Units on a one-to-one basis upon our disclosure of an estimated net asset value per share equal to at least $10.00 per share for each of the Class A, Class T, Class W, Class P, Class Y, and Class Z shares calculated net of the value of Series C Units to be converted. Sponsor Funding Agreement
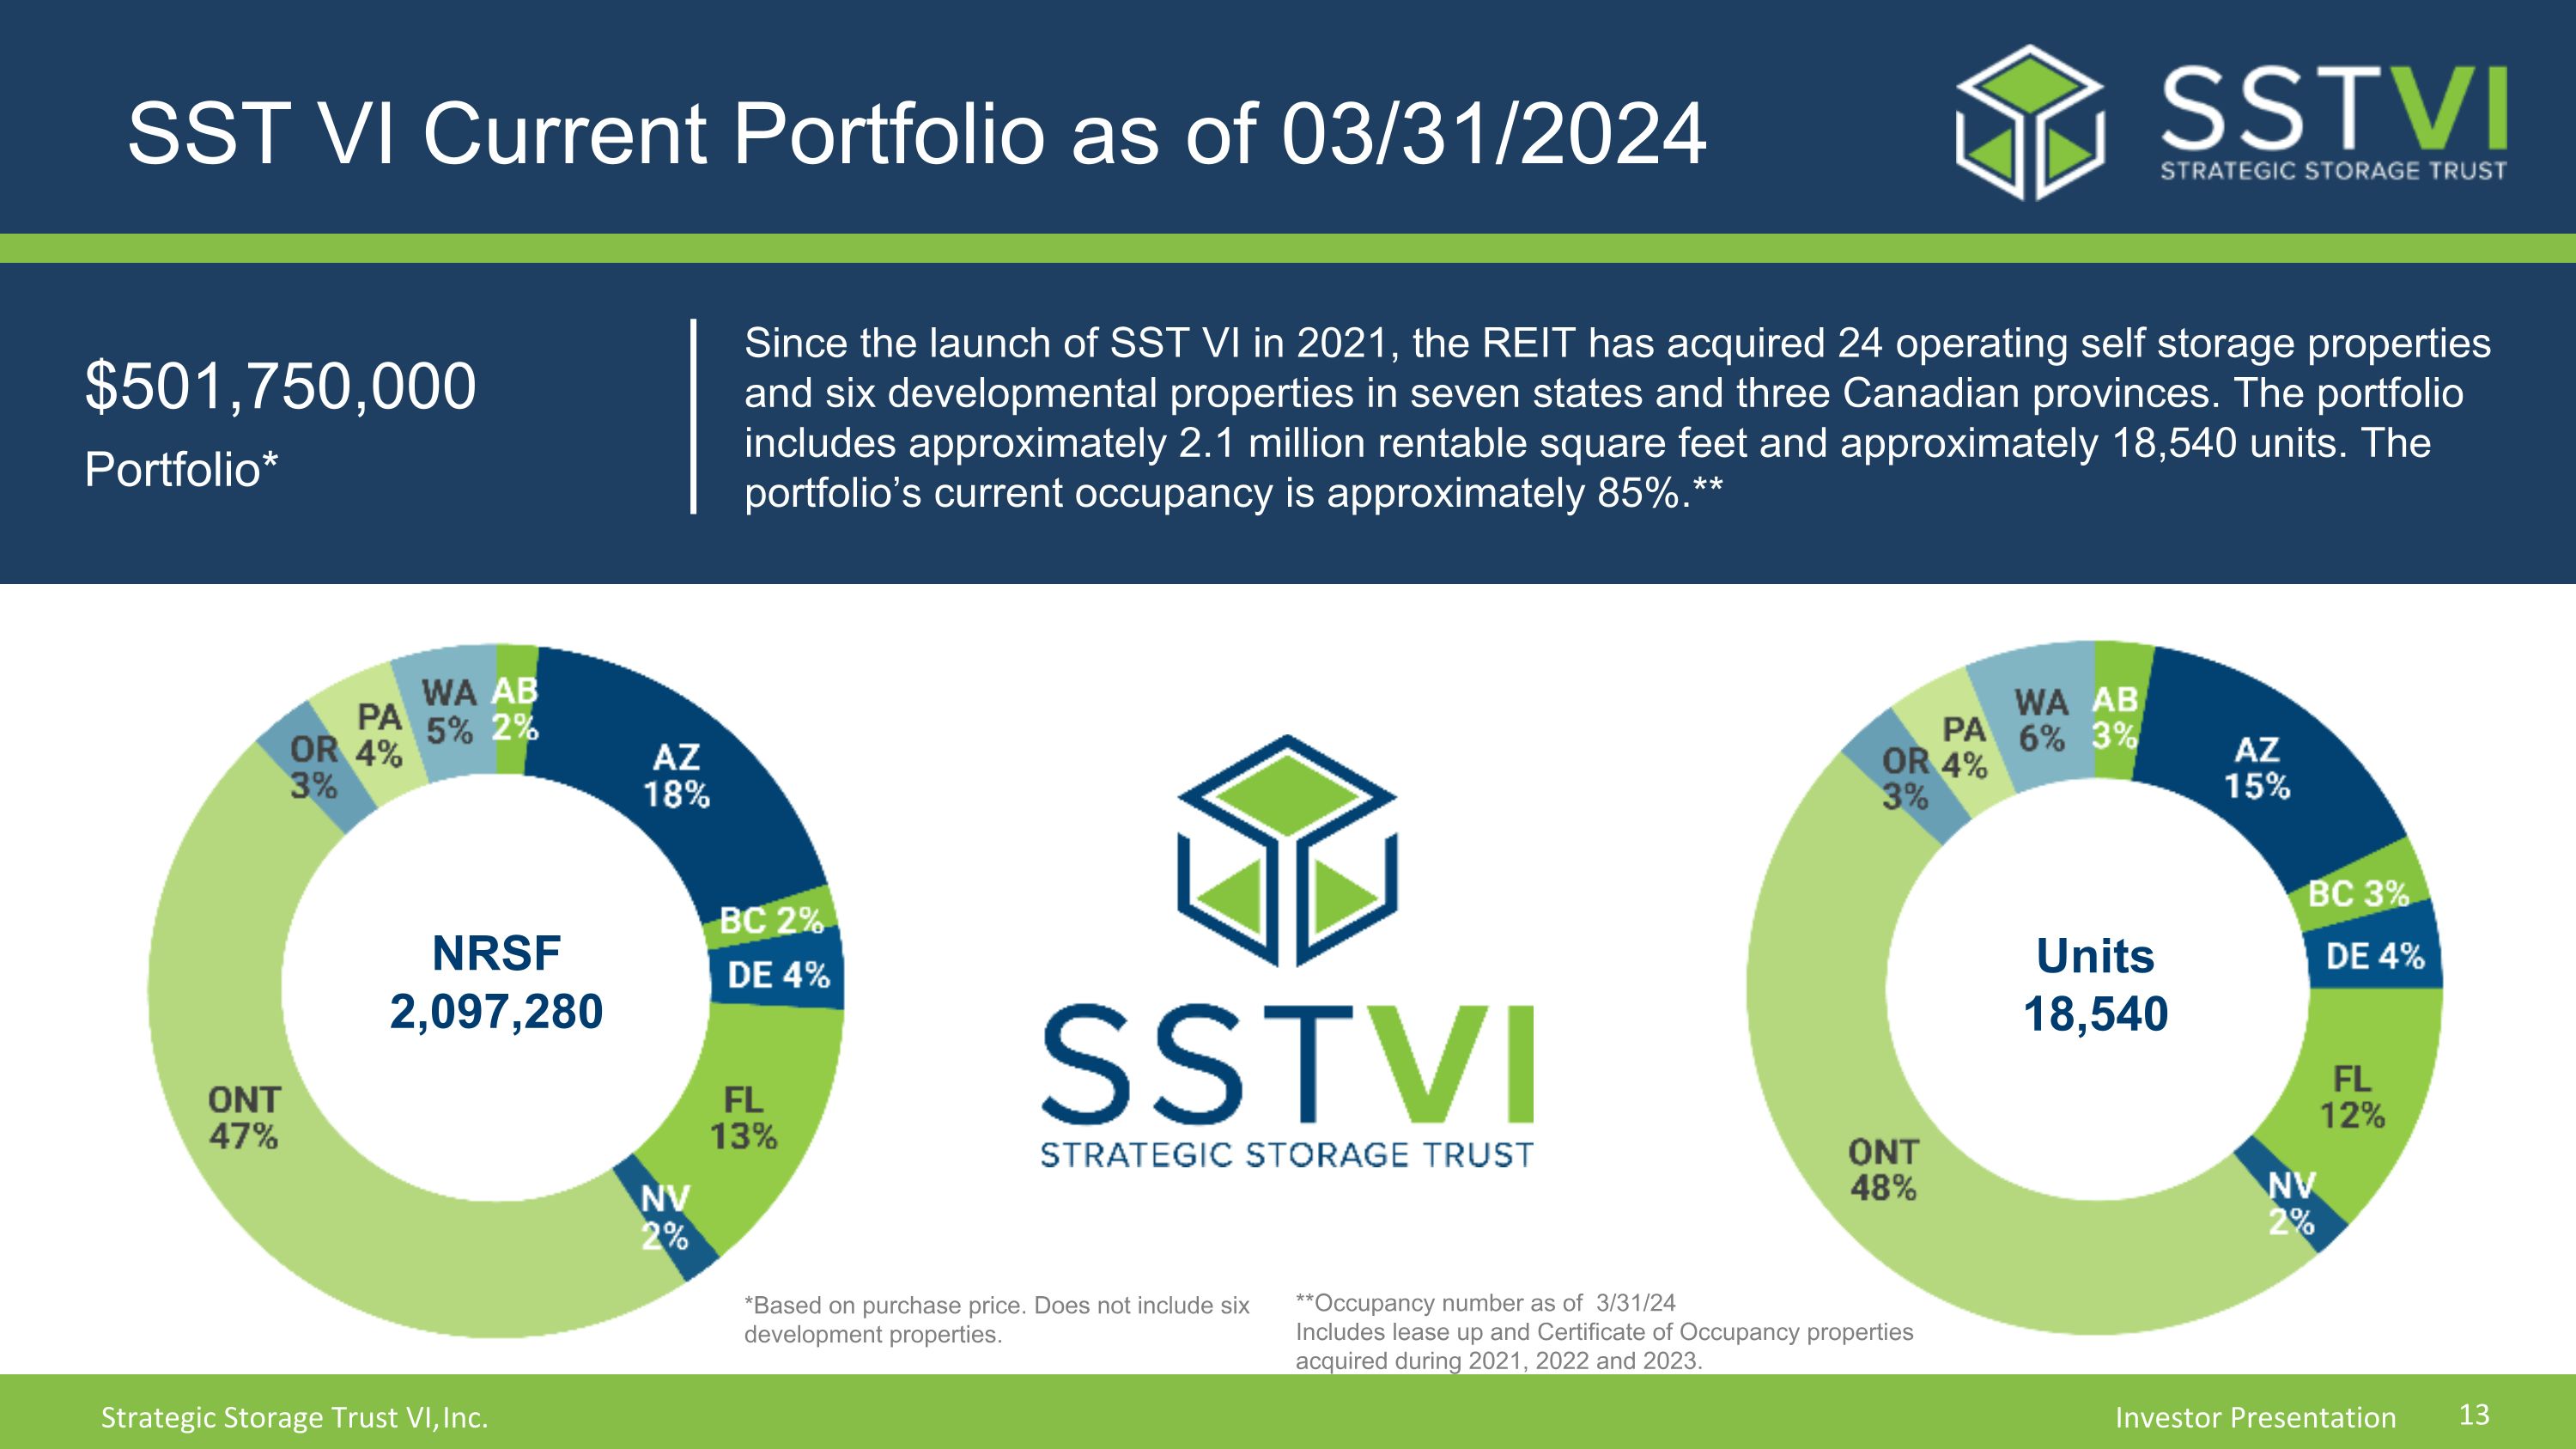
SST VI Current Portfolio as of 03/31/2024 $501,750,000 Portfolio* Since the launch of SST VI in 2021, the REIT has acquired 24 operating self storage properties and six developmental properties in seven states and three Canadian provinces. The portfolio includes approximately 2.1 million rentable square feet and approximately 18,540 units. The portfolio’s current occupancy is approximately 85%.** NRSF 2,097,280 Units 18,540 **Occupancy number as of 3/31/24 Includes lease up and Certificate of Occupancy properties acquired during 2021, 2022 and 2023. *Based on purchase price. Does not include six development properties.
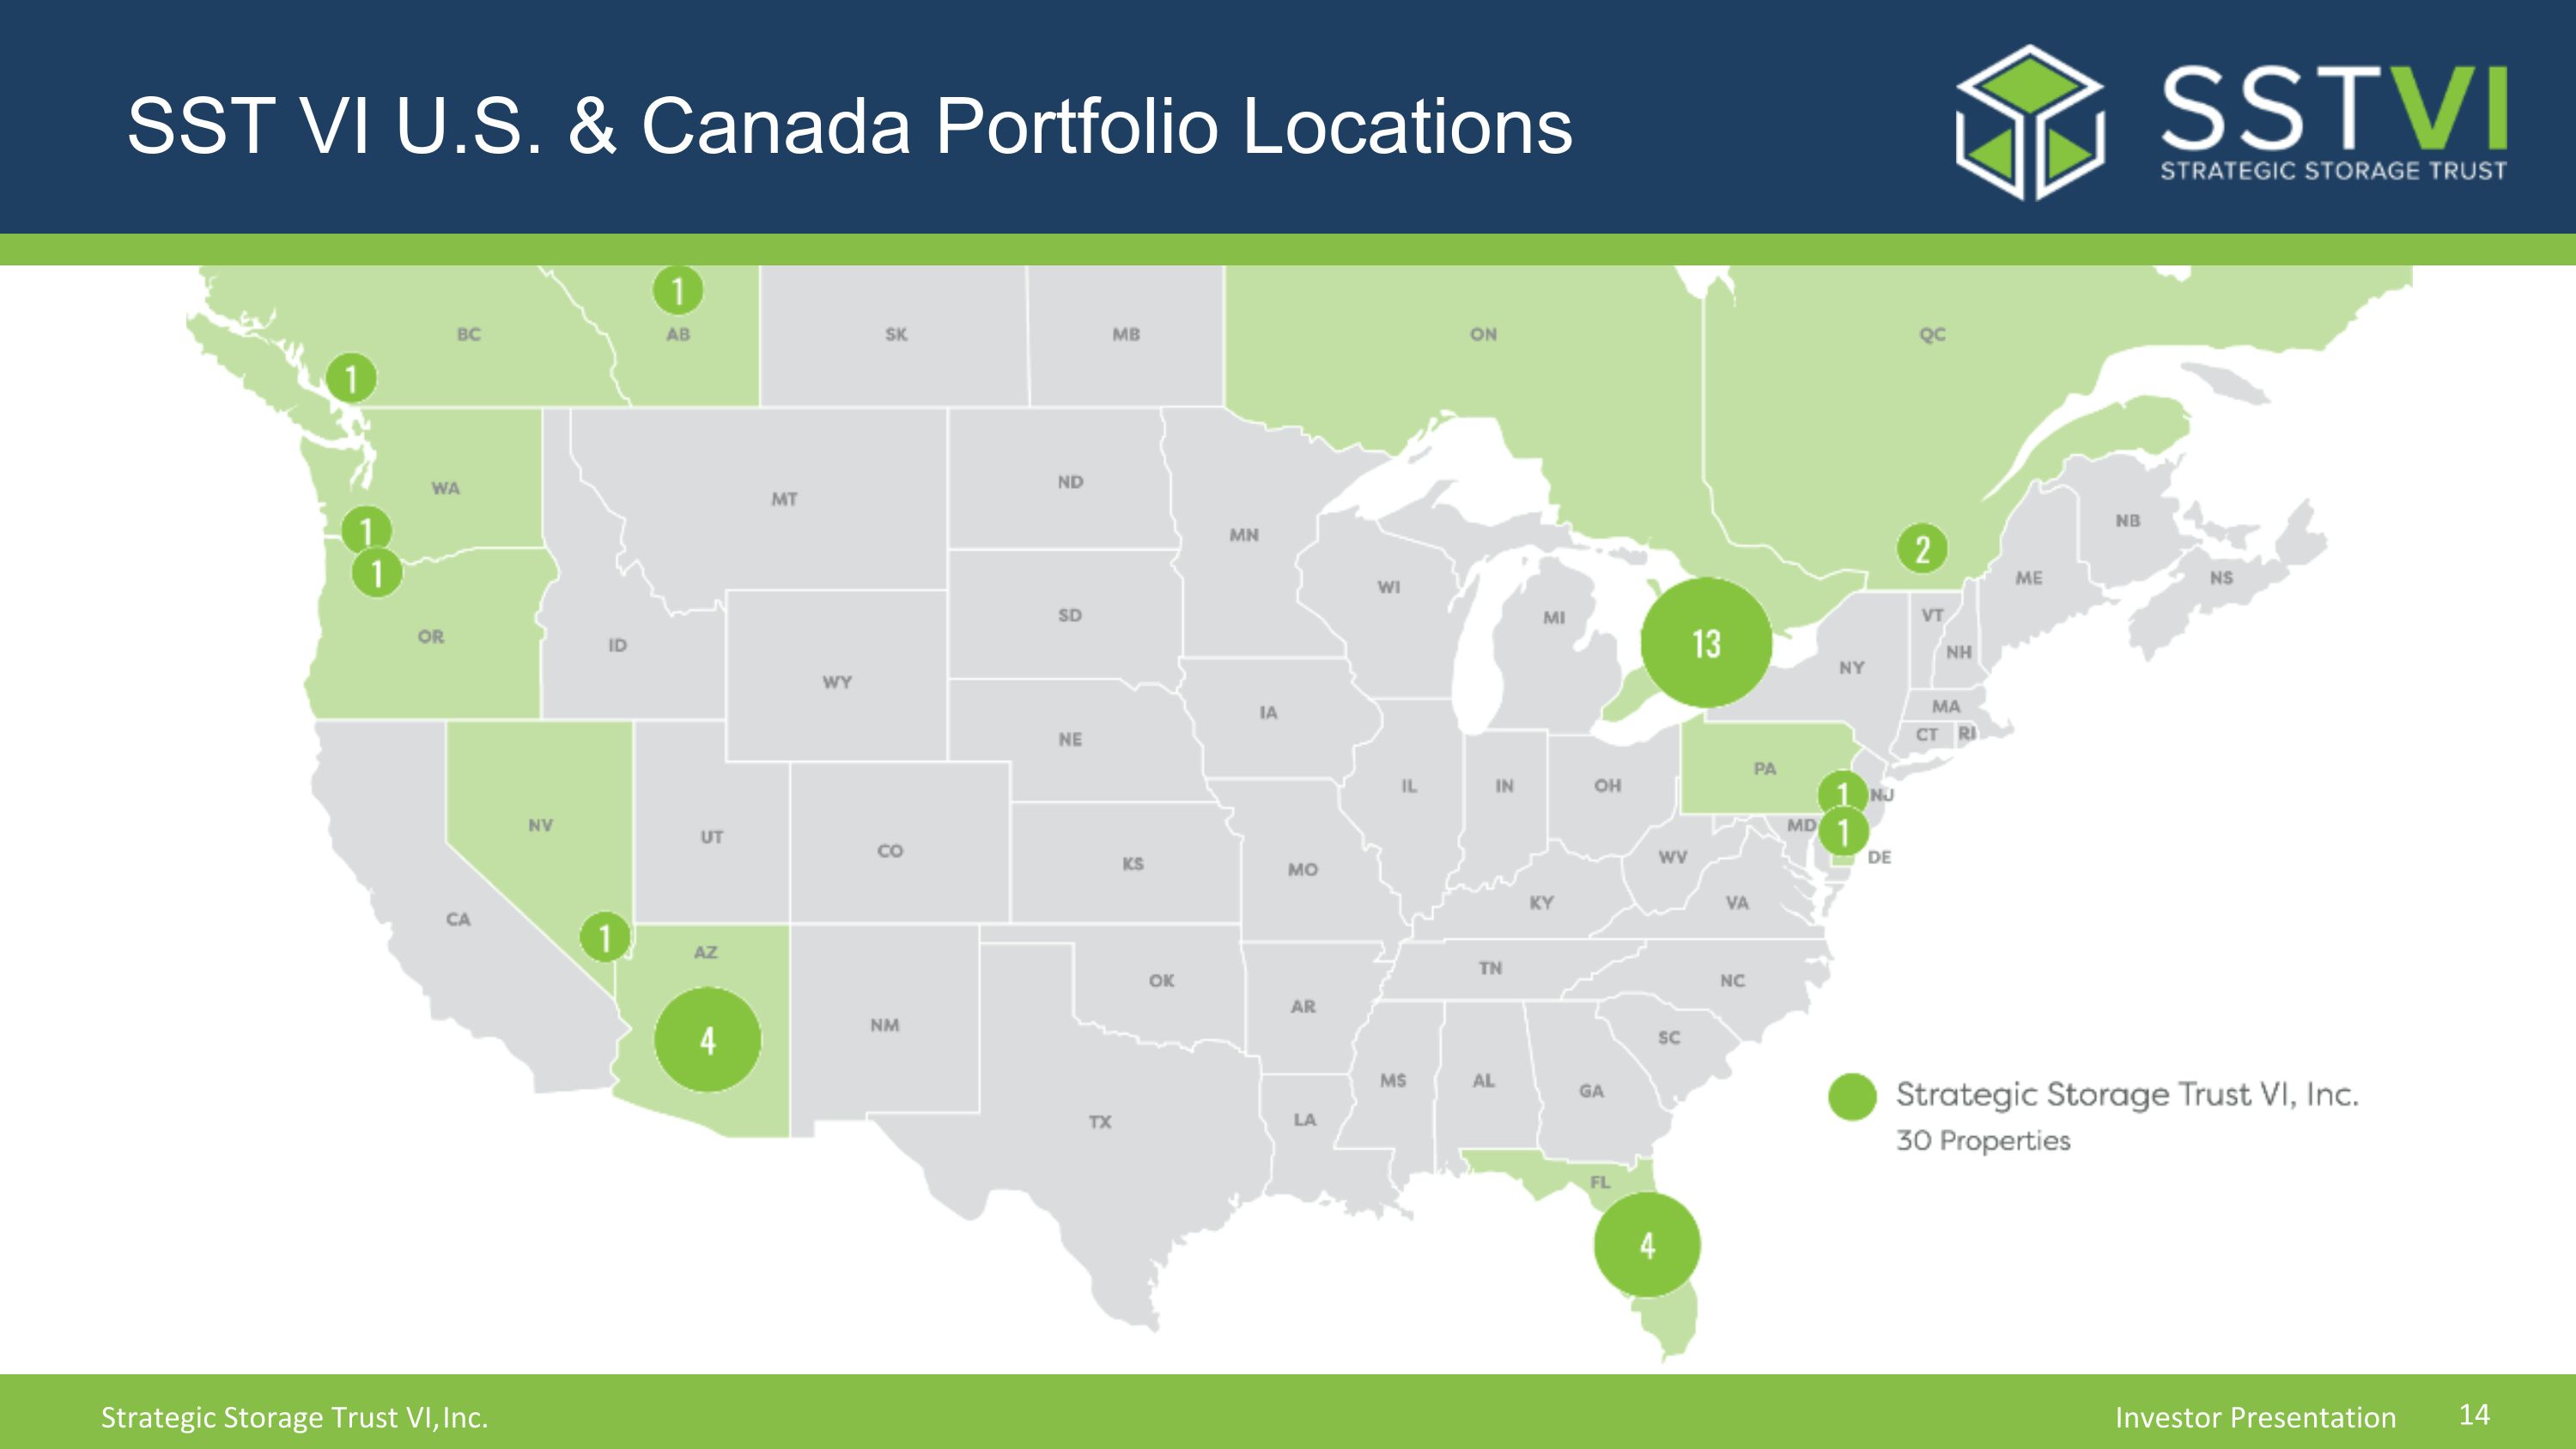
SST VI U.S. & Canada Portfolio Locations
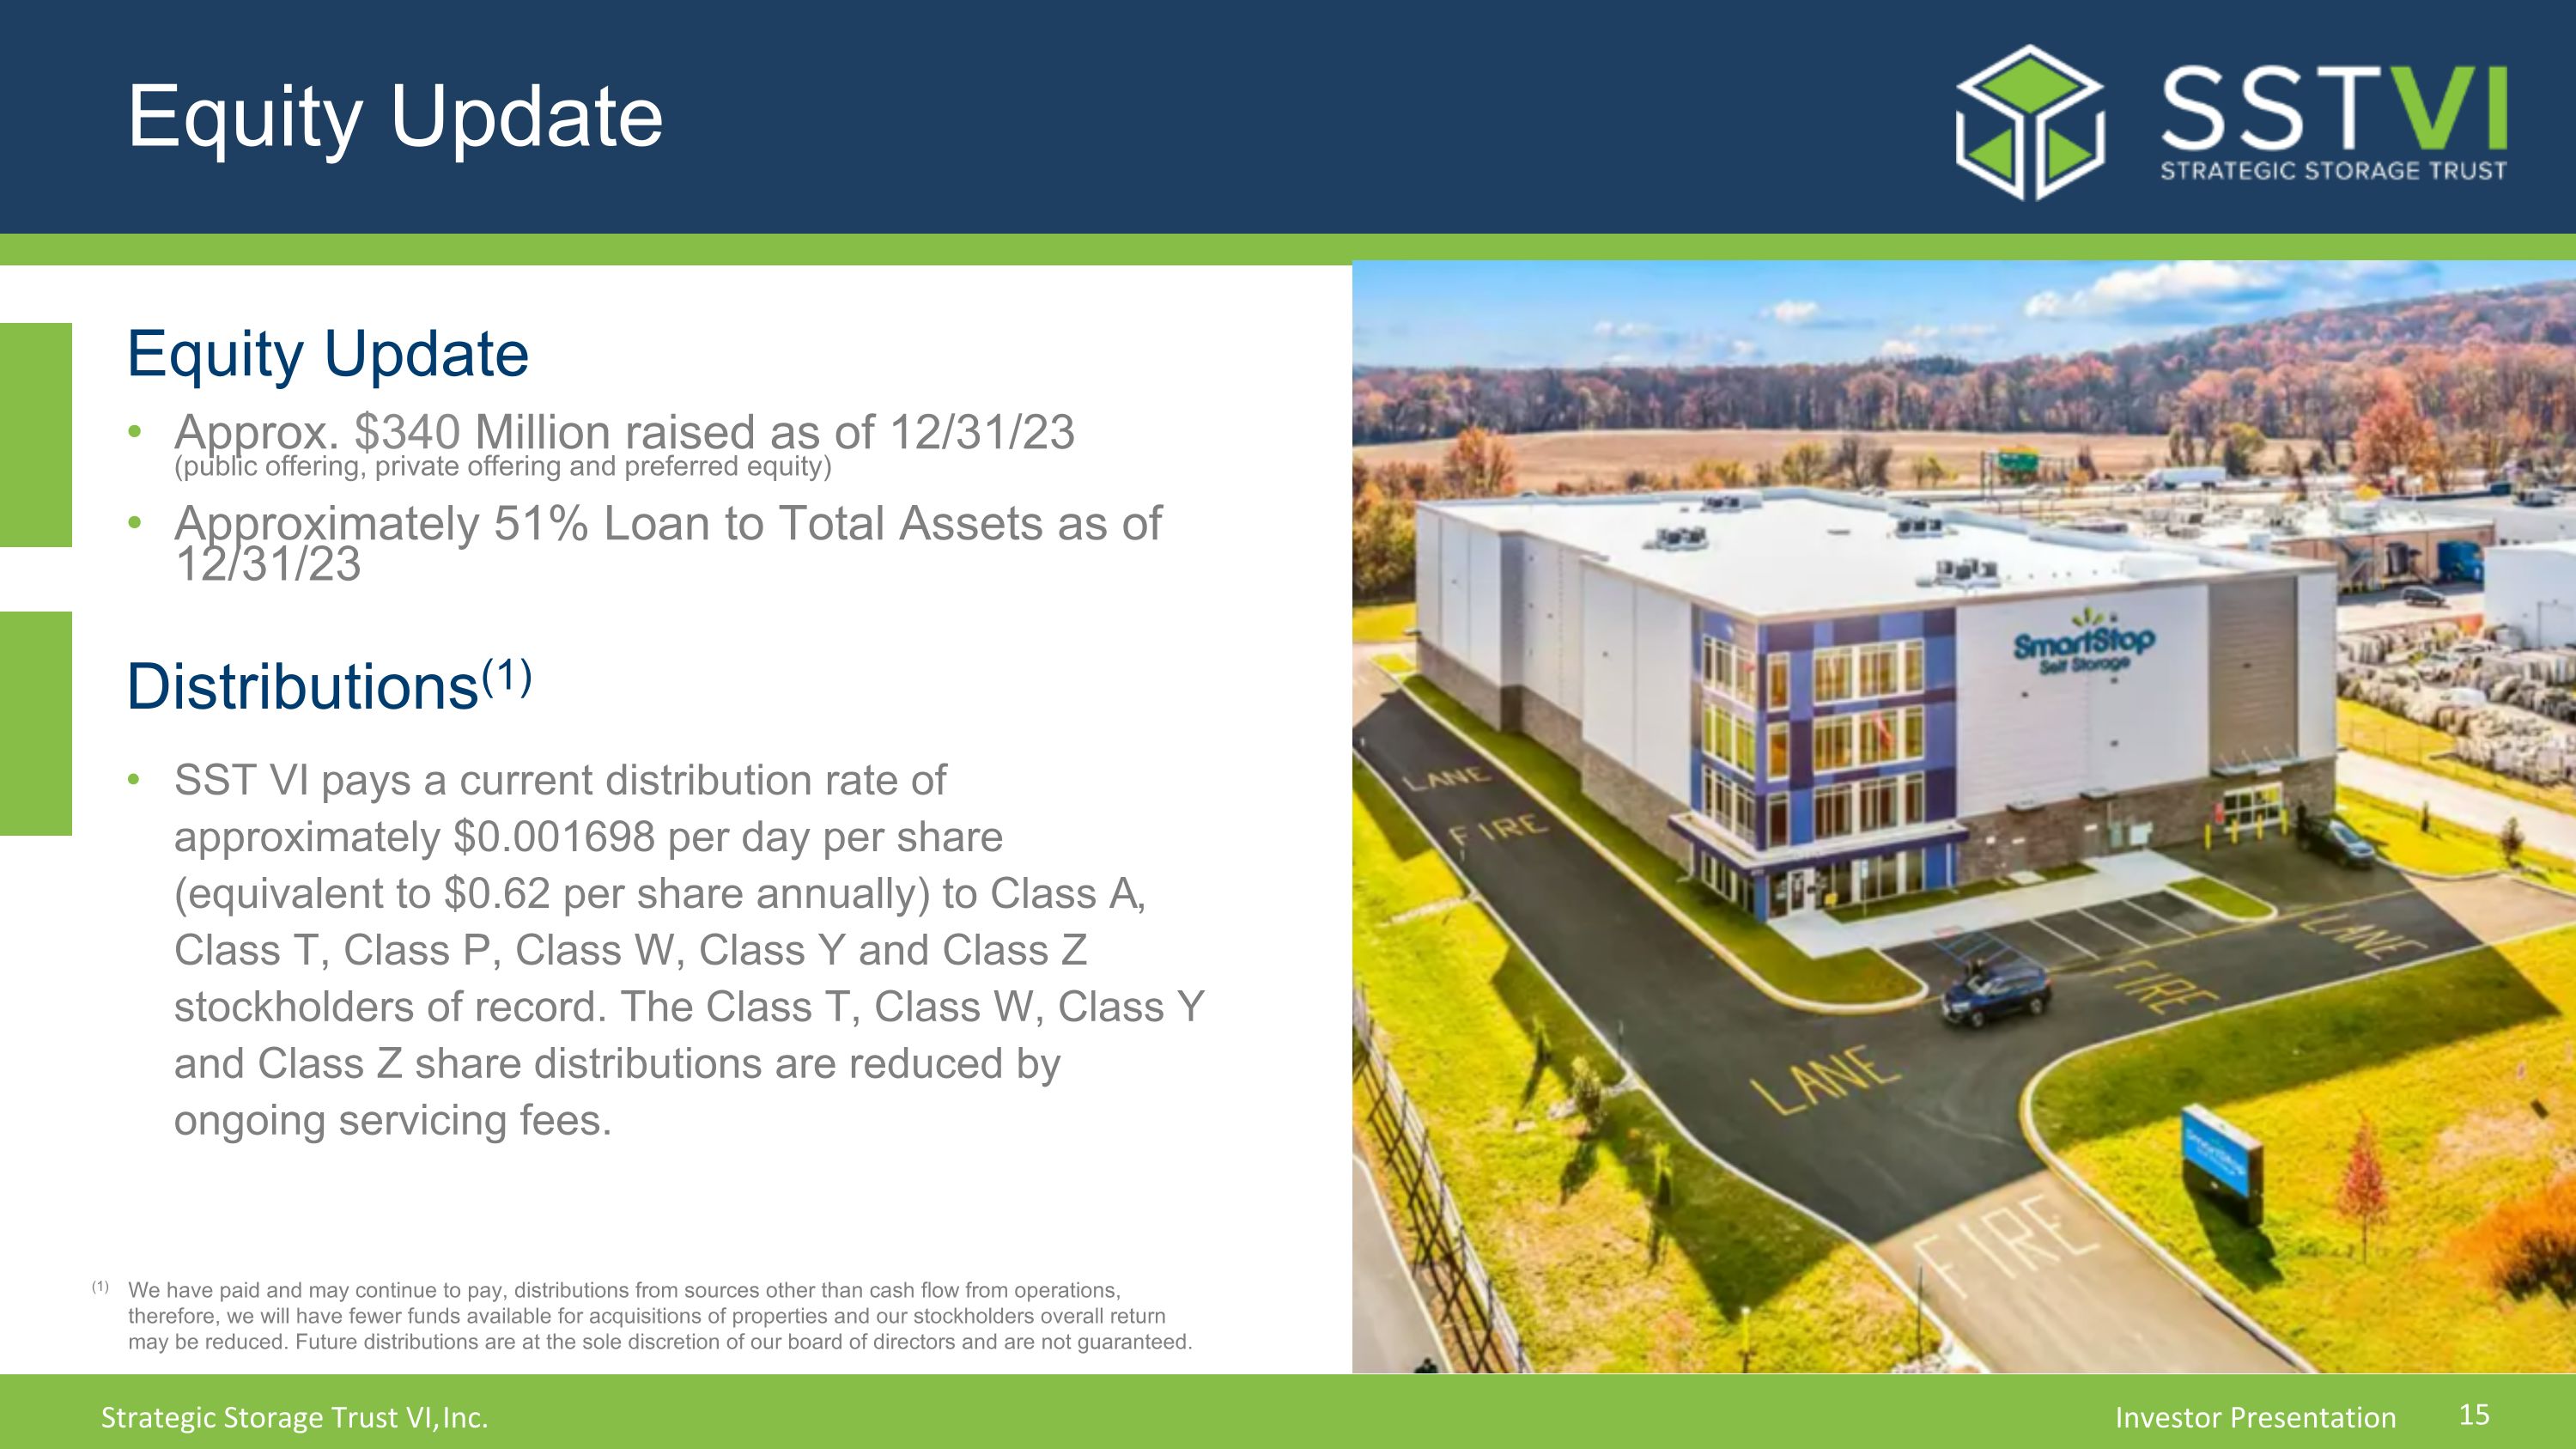
Equity Update Equity Update Approx. $340 Million raised as of 12/31/23 (public offering, private offering and preferred equity) Approximately 51% Loan to Total Assets as of 12/31/23 Distributions(1) SST VI pays a current distribution rate of approximately $0.001698 per day per share (equivalent to $0.62 per share annually) to Class A, Class T, Class P, Class W, Class Y and Class Z stockholders of record. The Class T, Class W, Class Y and Class Z share distributions are reduced by ongoing servicing fees. (1) We have paid and may continue to pay, distributions from sources other than cash flow from operations, therefore, we will have fewer funds available for acquisitions of properties and our stockholders overall return may be reduced. Future distributions are at the sole discretion of our board of directors and are not guaranteed.
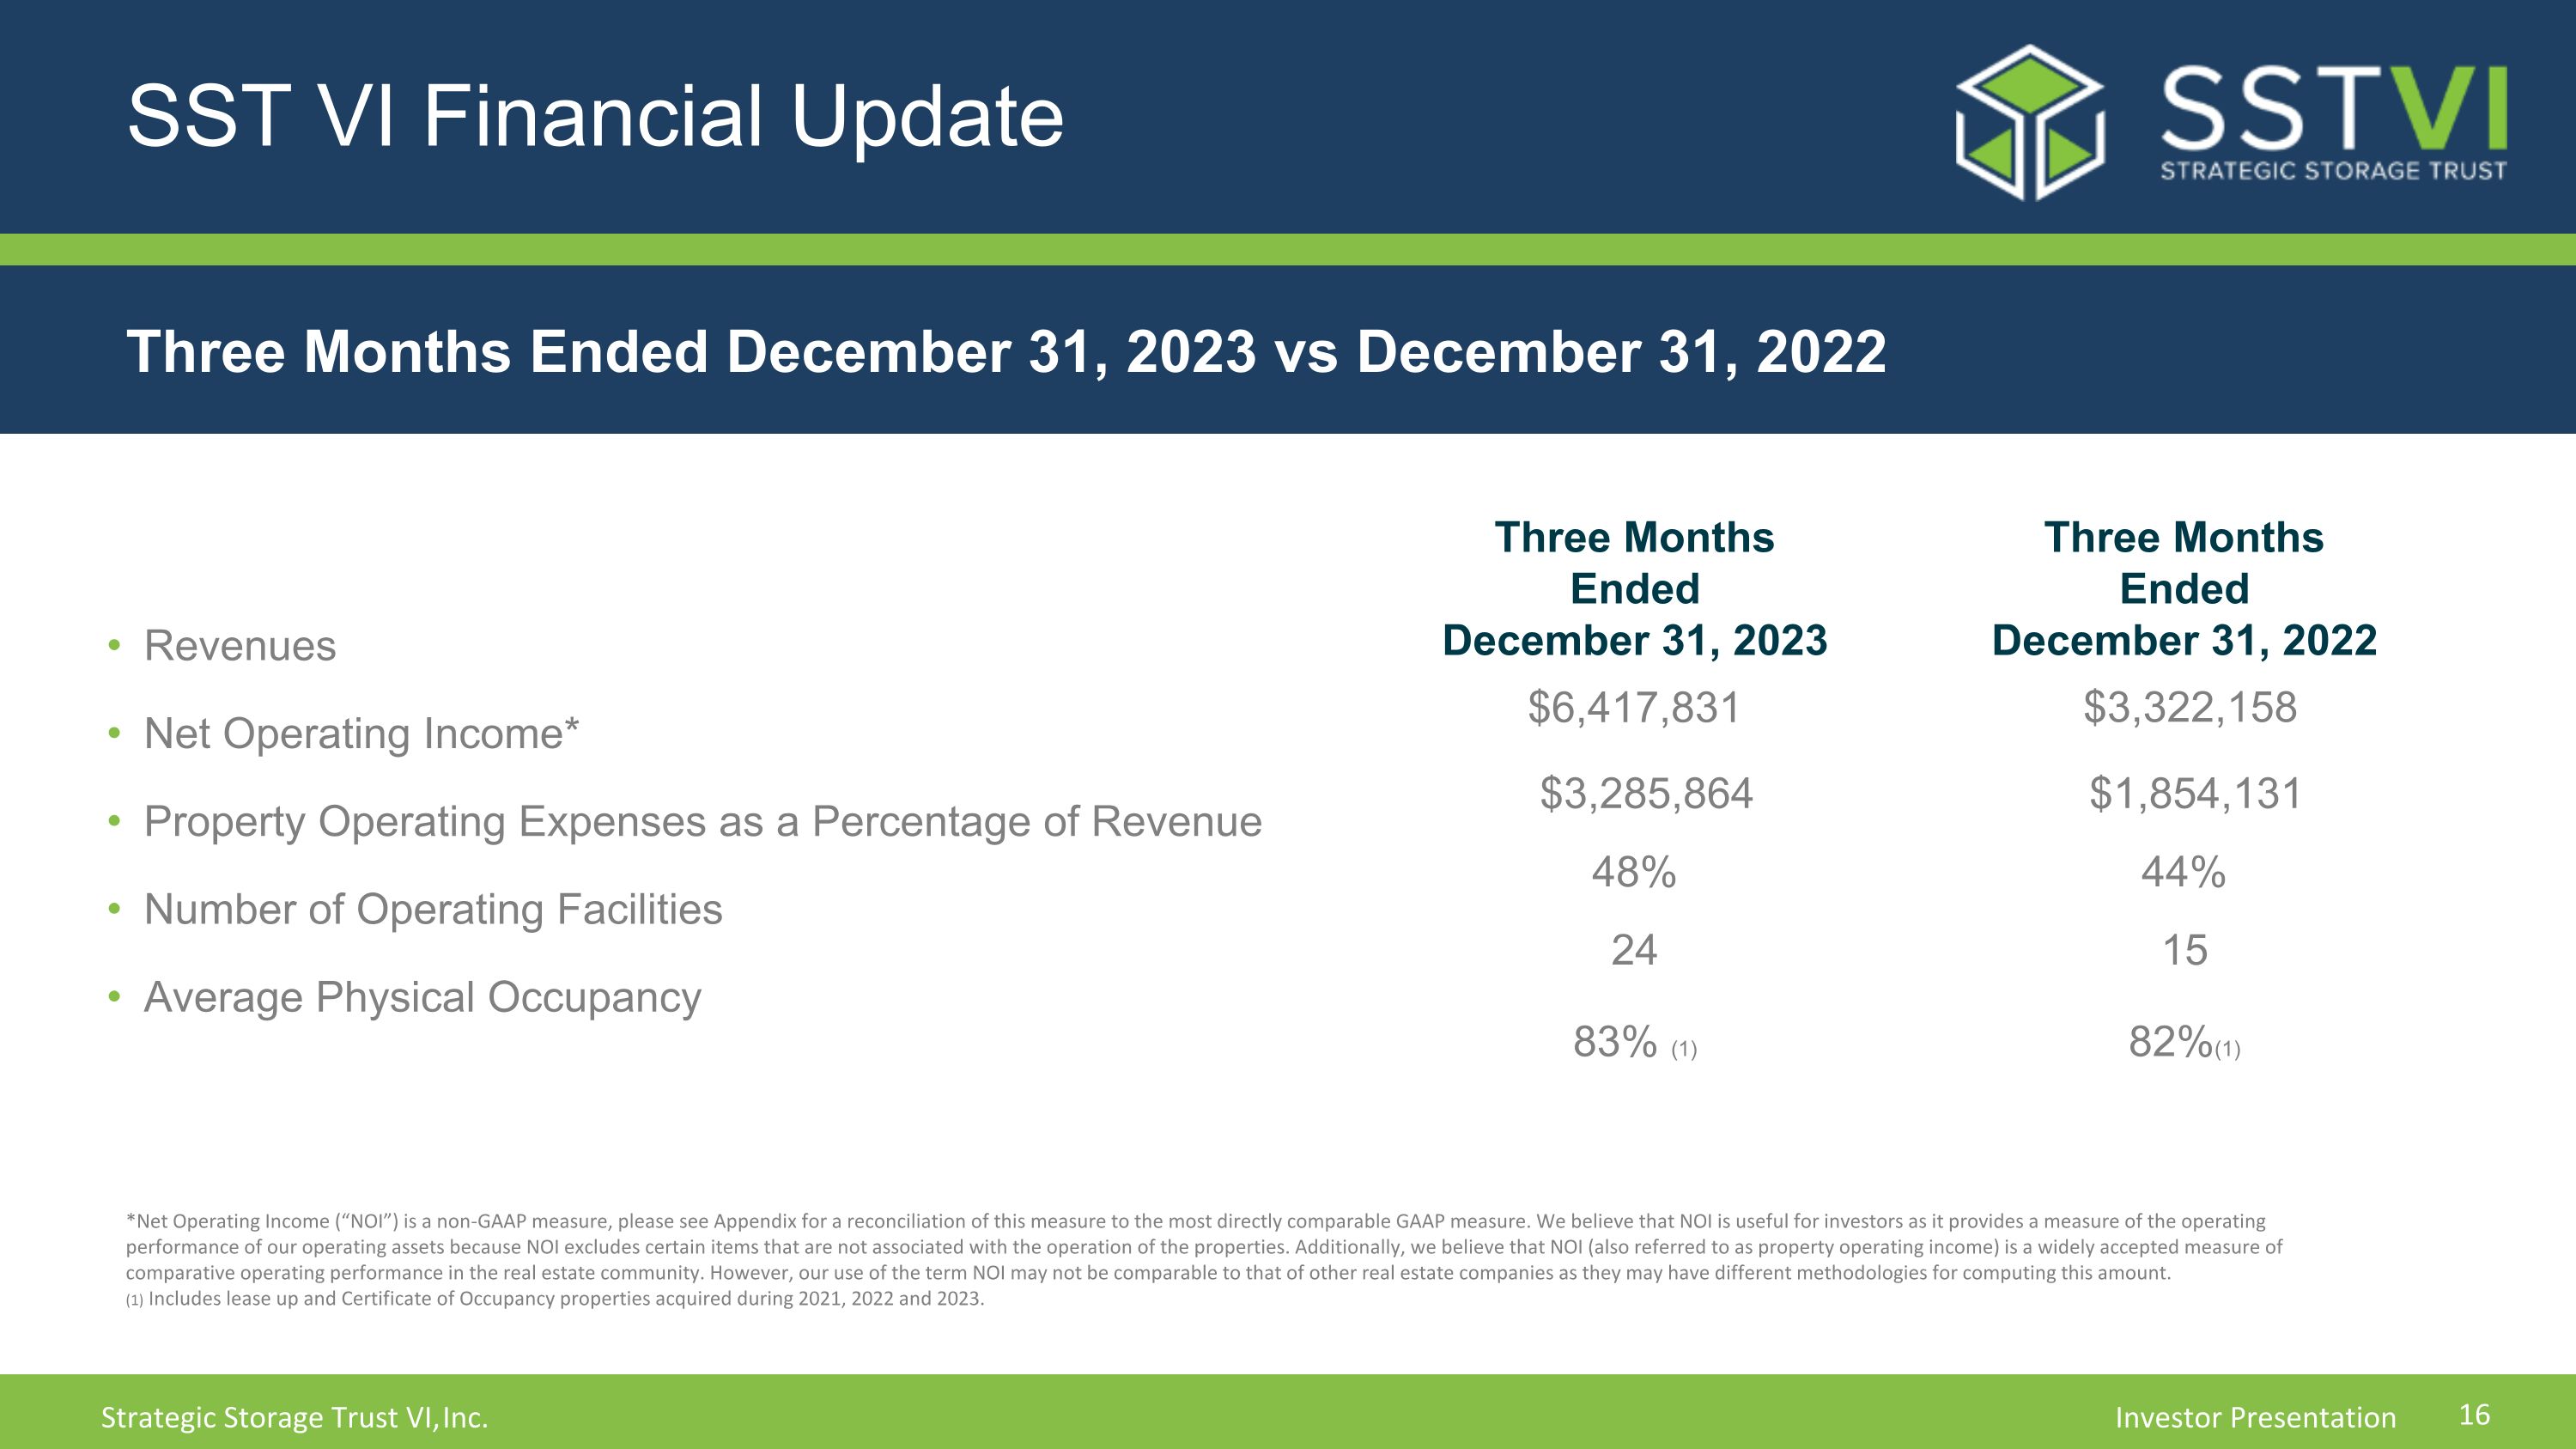
SST VI Financial Update Revenues Net Operating Income* Property Operating Expenses as a Percentage of Revenue Number of Operating Facilities Average Physical Occupancy Three Months Ended December 31, 2023 $6,417,831 $3,285,864 48% 24 83% (1) Three Months Ended December 31, 2022 $3,322,158 $1,854,131 44% 15 82%(1) *Net Operating Income (“NOI”) is a non-GAAP measure, please see Appendix for a reconciliation of this measure to the most directly comparable GAAP measure. We believe that NOI is useful for investors as it provides a measure of the operating performance of our operating assets because NOI excludes certain items that are not associated with the operation of the properties. Additionally, we believe that NOI (also referred to as property operating income) is a widely accepted measure of comparative operating performance in the real estate community. However, our use of the term NOI may not be comparable to that of other real estate companies as they may have different methodologies for computing this amount. (1) Includes lease up and Certificate of Occupancy properties acquired during 2021, 2022 and 2023. Three Months Ended December 31, 2023 vs December 31, 2022
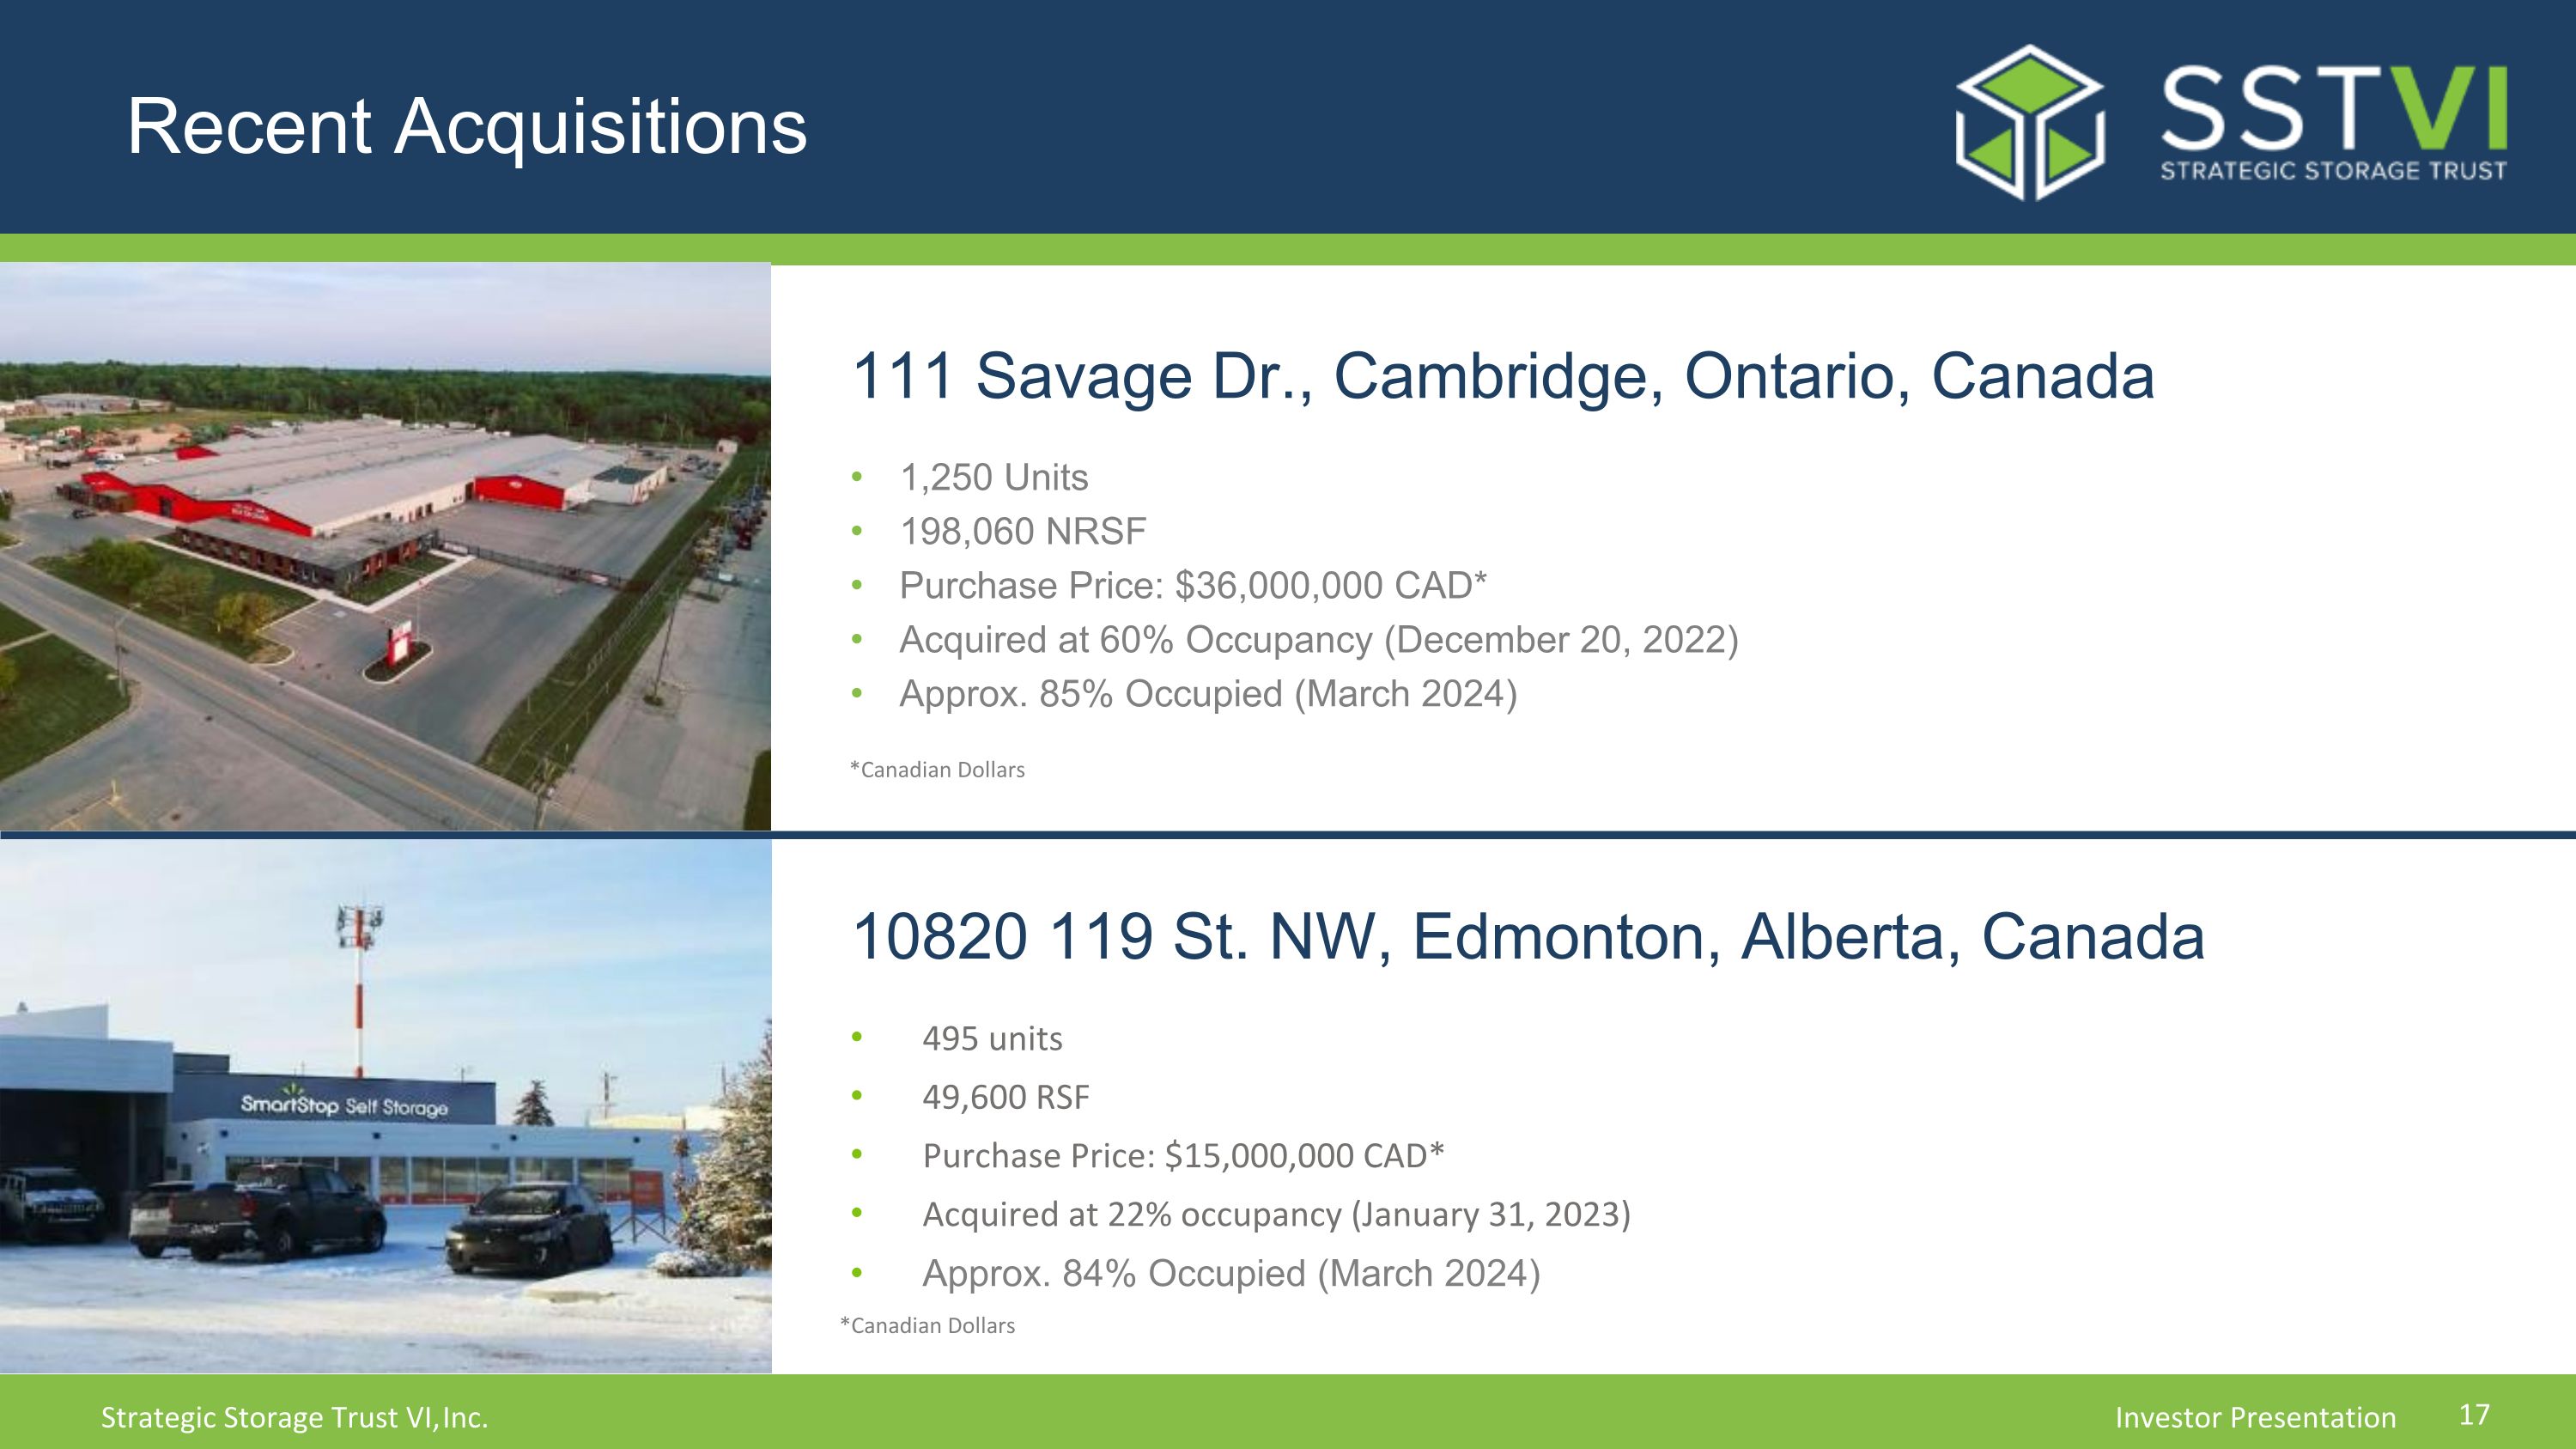
495 units 49,600 RSF Purchase Price: $15,000,000 CAD* Acquired at 22% occupancy (January 31, 2023) Approx. 84% Occupied (March 2024) Recent Acquisitions 111 Savage Dr., Cambridge, Ontario, Canada 10820 119 St. NW, Edmonton, Alberta, Canada *Canadian Dollars 1,250 Units 198,060 NRSF Purchase Price: $36,000,000 CAD* Acquired at 60% Occupancy (December 20, 2022) Approx. 85% Occupied (March 2024) *Canadian Dollars
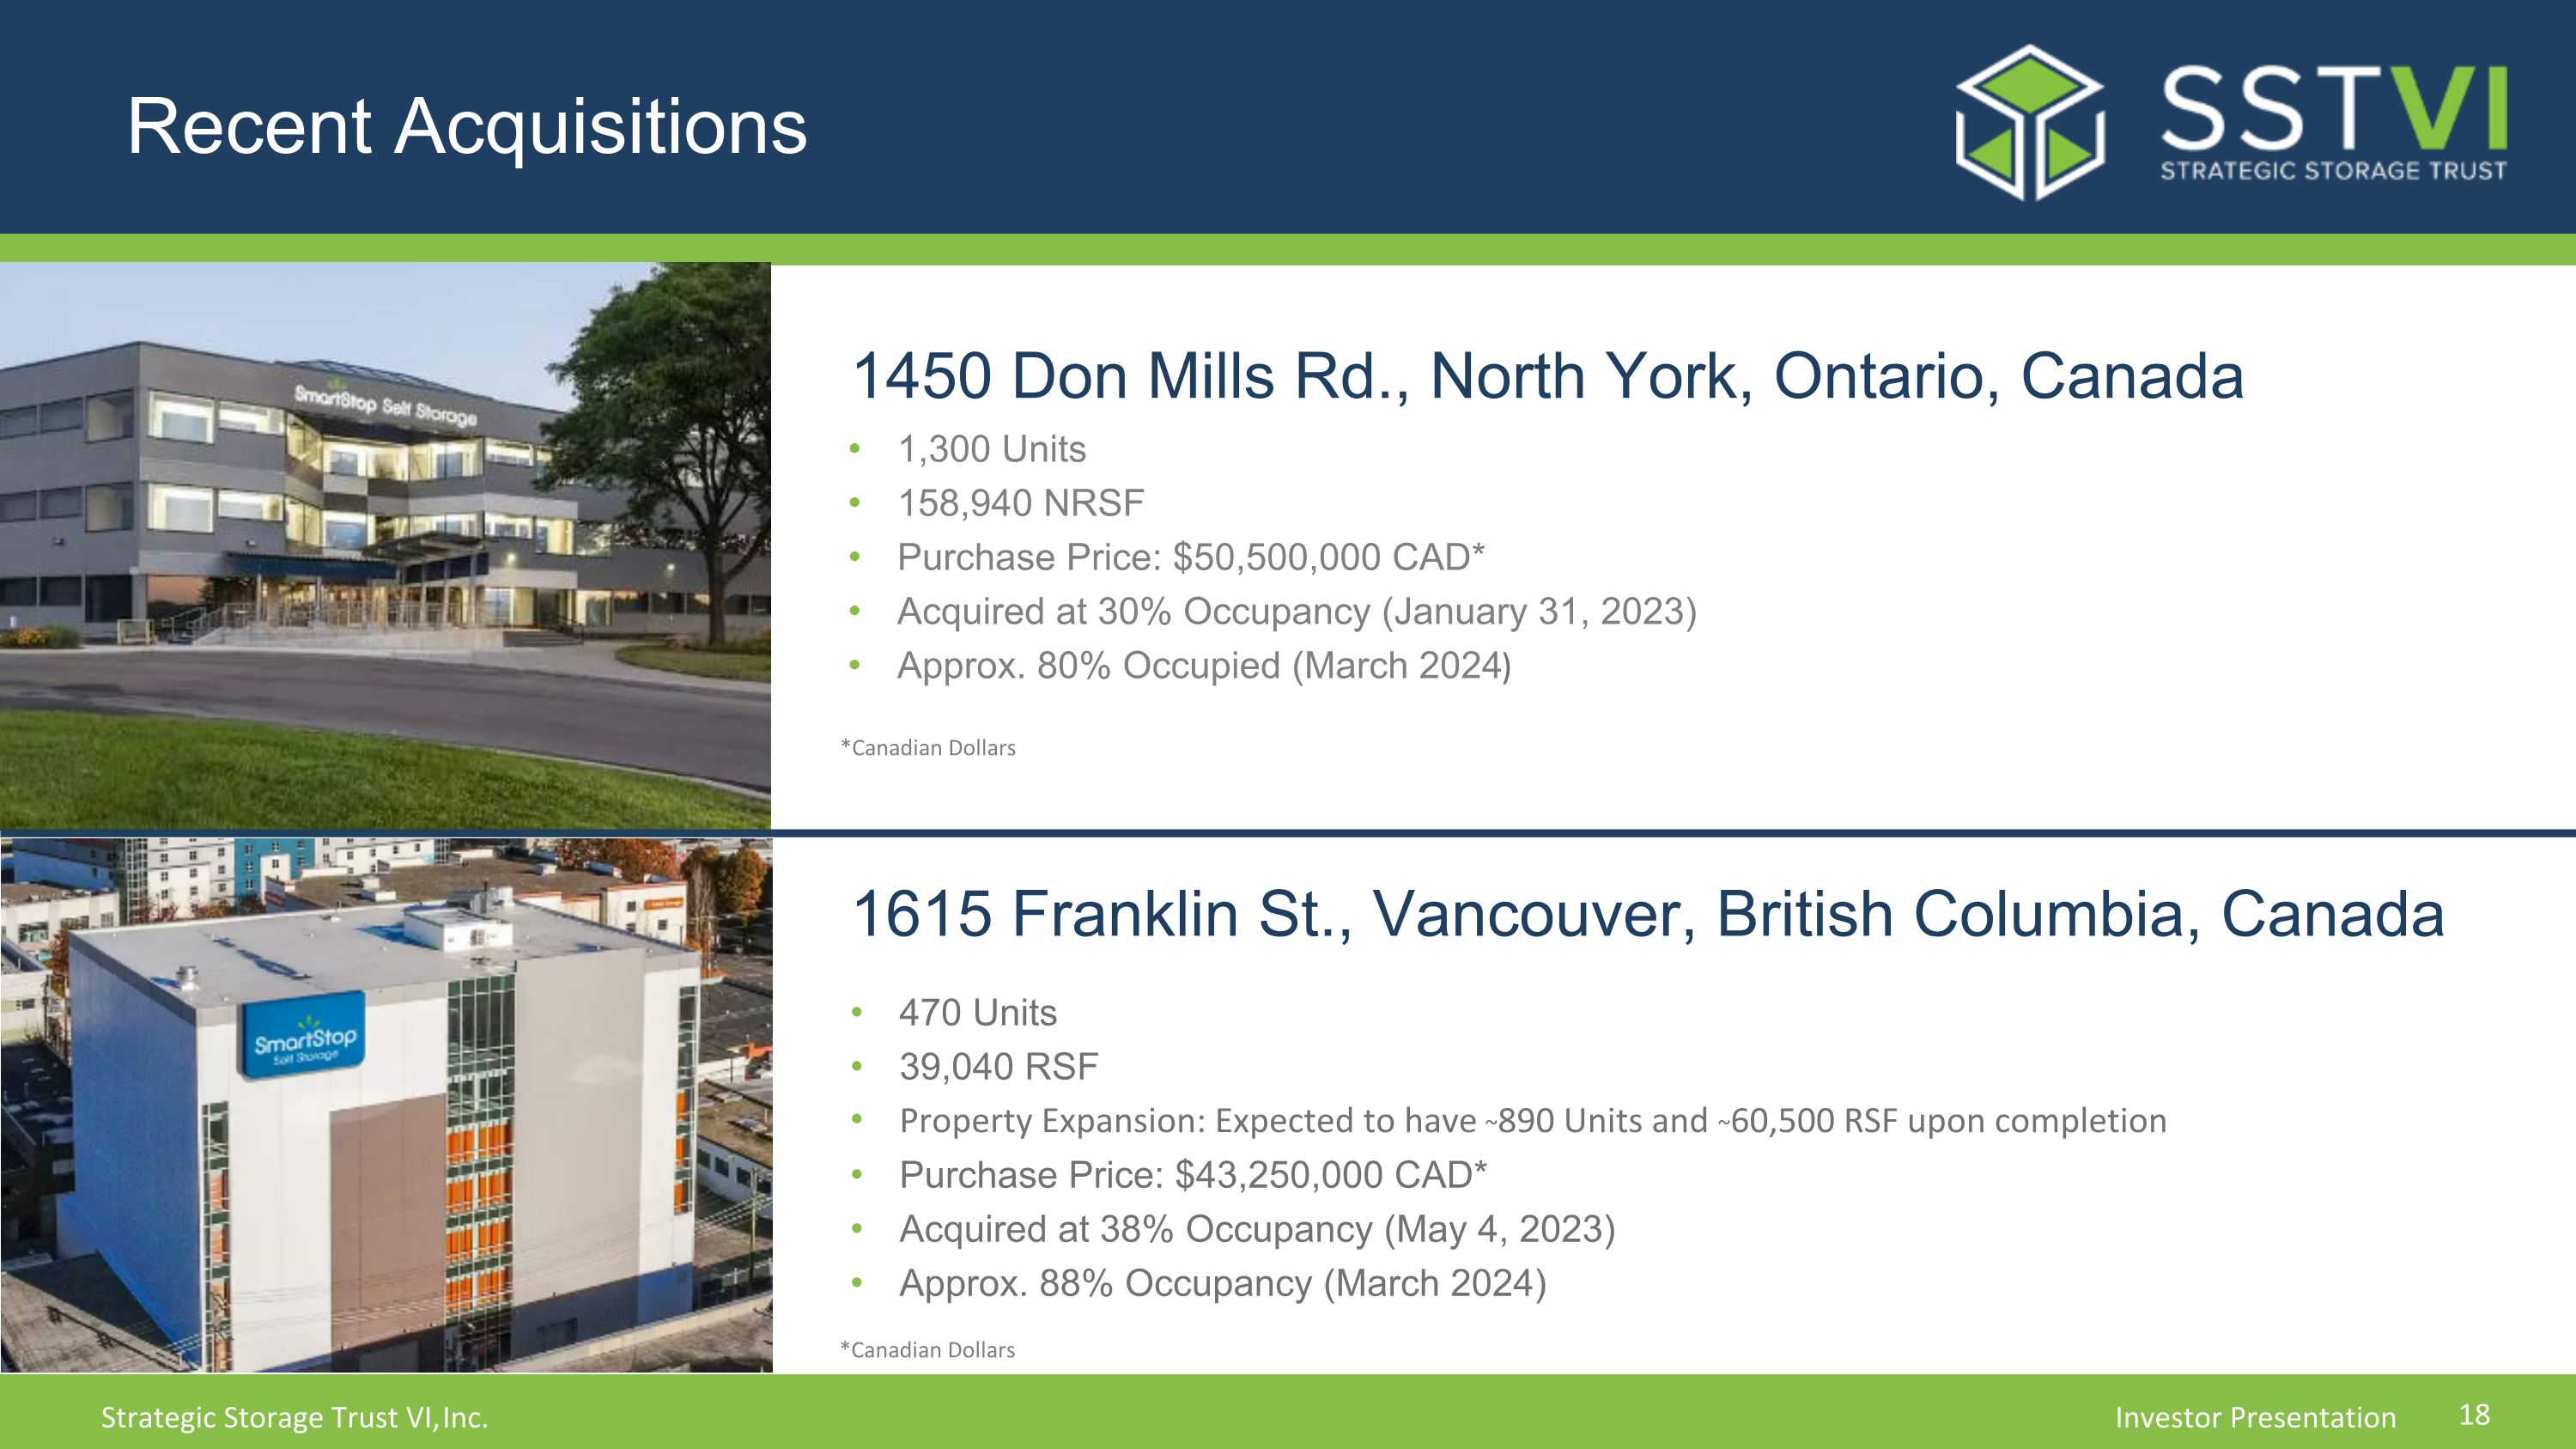
Recent Acquisitions 1450 Don Mills Rd., North York, Ontario, Canada *Canadian Dollars 1,300 Units 158,940 NRSF Purchase Price: $50,500,000 CAD* Acquired at 30% Occupancy (January 31, 2023) Approx. 80% Occupied (March 2024) 1615 Franklin St., Vancouver, British Columbia, Canada 470 Units 39,040 RSF Property Expansion: Expected to have ~890 Units and ~60,500 RSF upon completion Purchase Price: $43,250,000 CAD* Acquired at 38% Occupancy (May 4, 2023) Approx. 88% Occupancy (March 2024) *Canadian Dollars
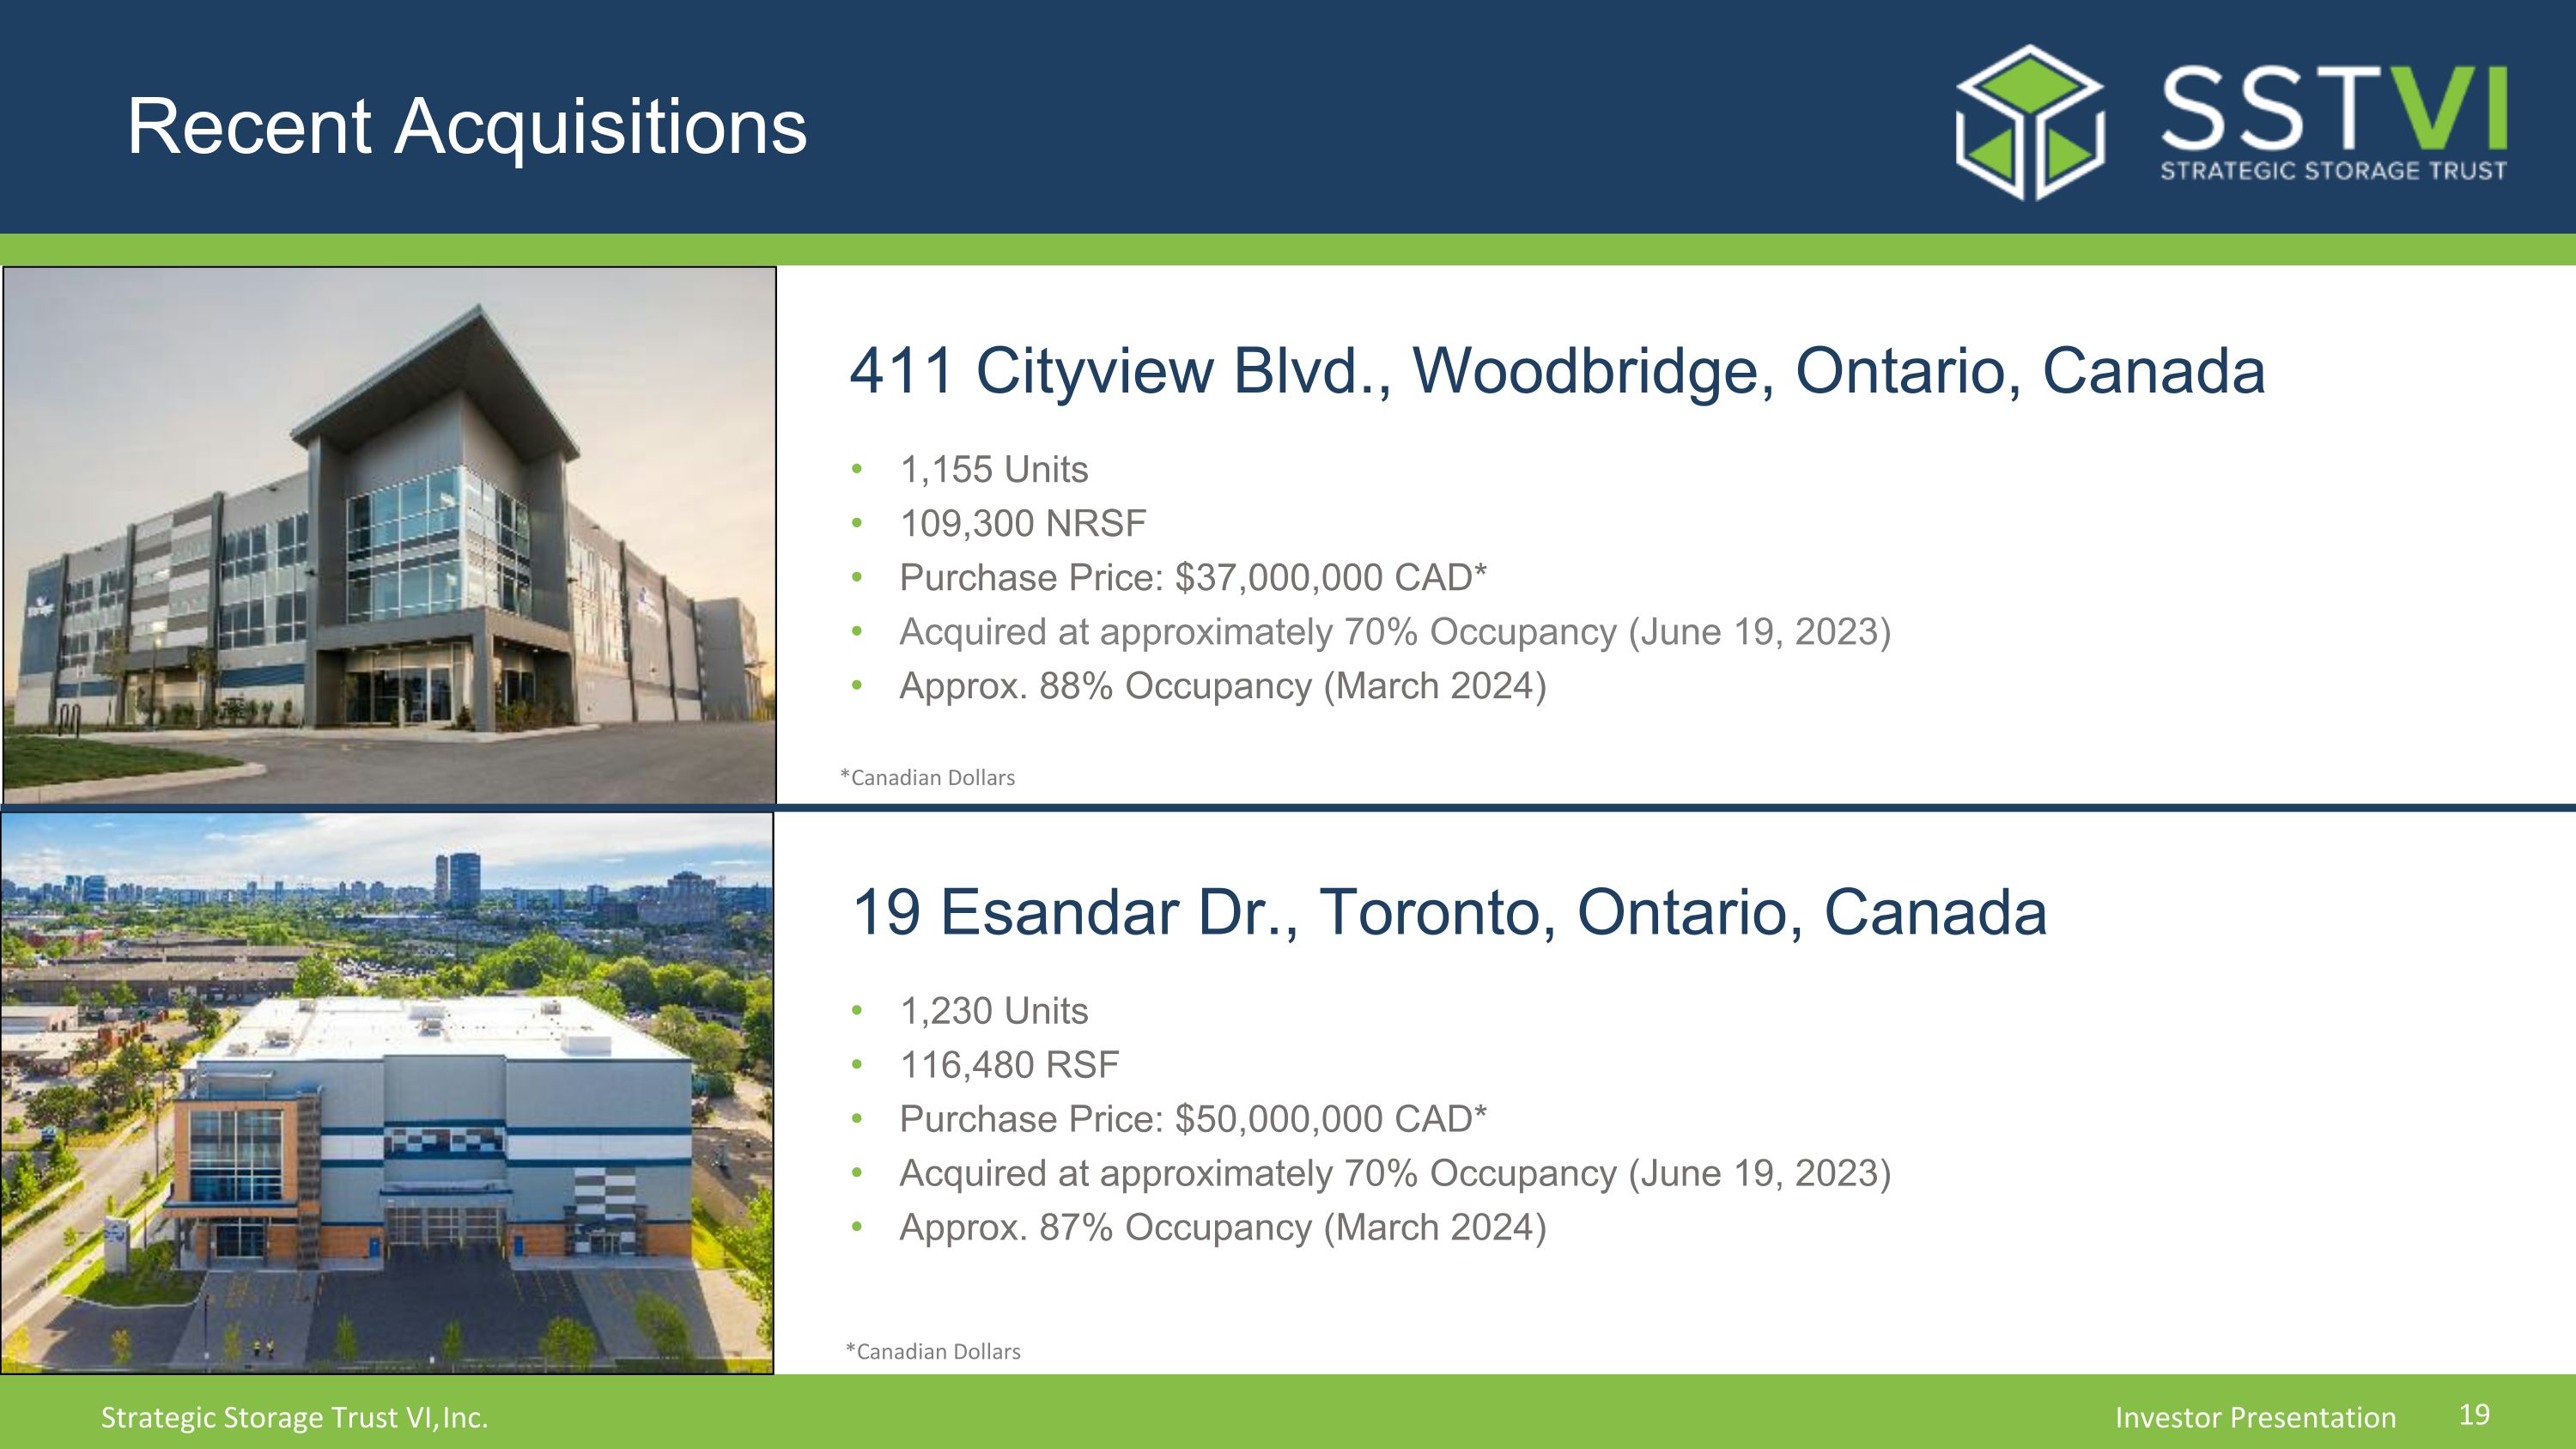
Recent Acquisitions 411 Cityview Blvd., Woodbridge, Ontario, Canada *Canadian Dollars 1,155 Units 109,300 NRSF Purchase Price: $37,000,000 CAD* Acquired at approximately 70% Occupancy (June 19, 2023) Approx. 88% Occupancy (March 2024) 19 Esandar Dr., Toronto, Ontario, Canada 1,230 Units 116,480 RSF Purchase Price: $50,000,000 CAD* Acquired at approximately 70% Occupancy (June 19, 2023) Approx. 87% Occupancy (March 2024) *Canadian Dollars
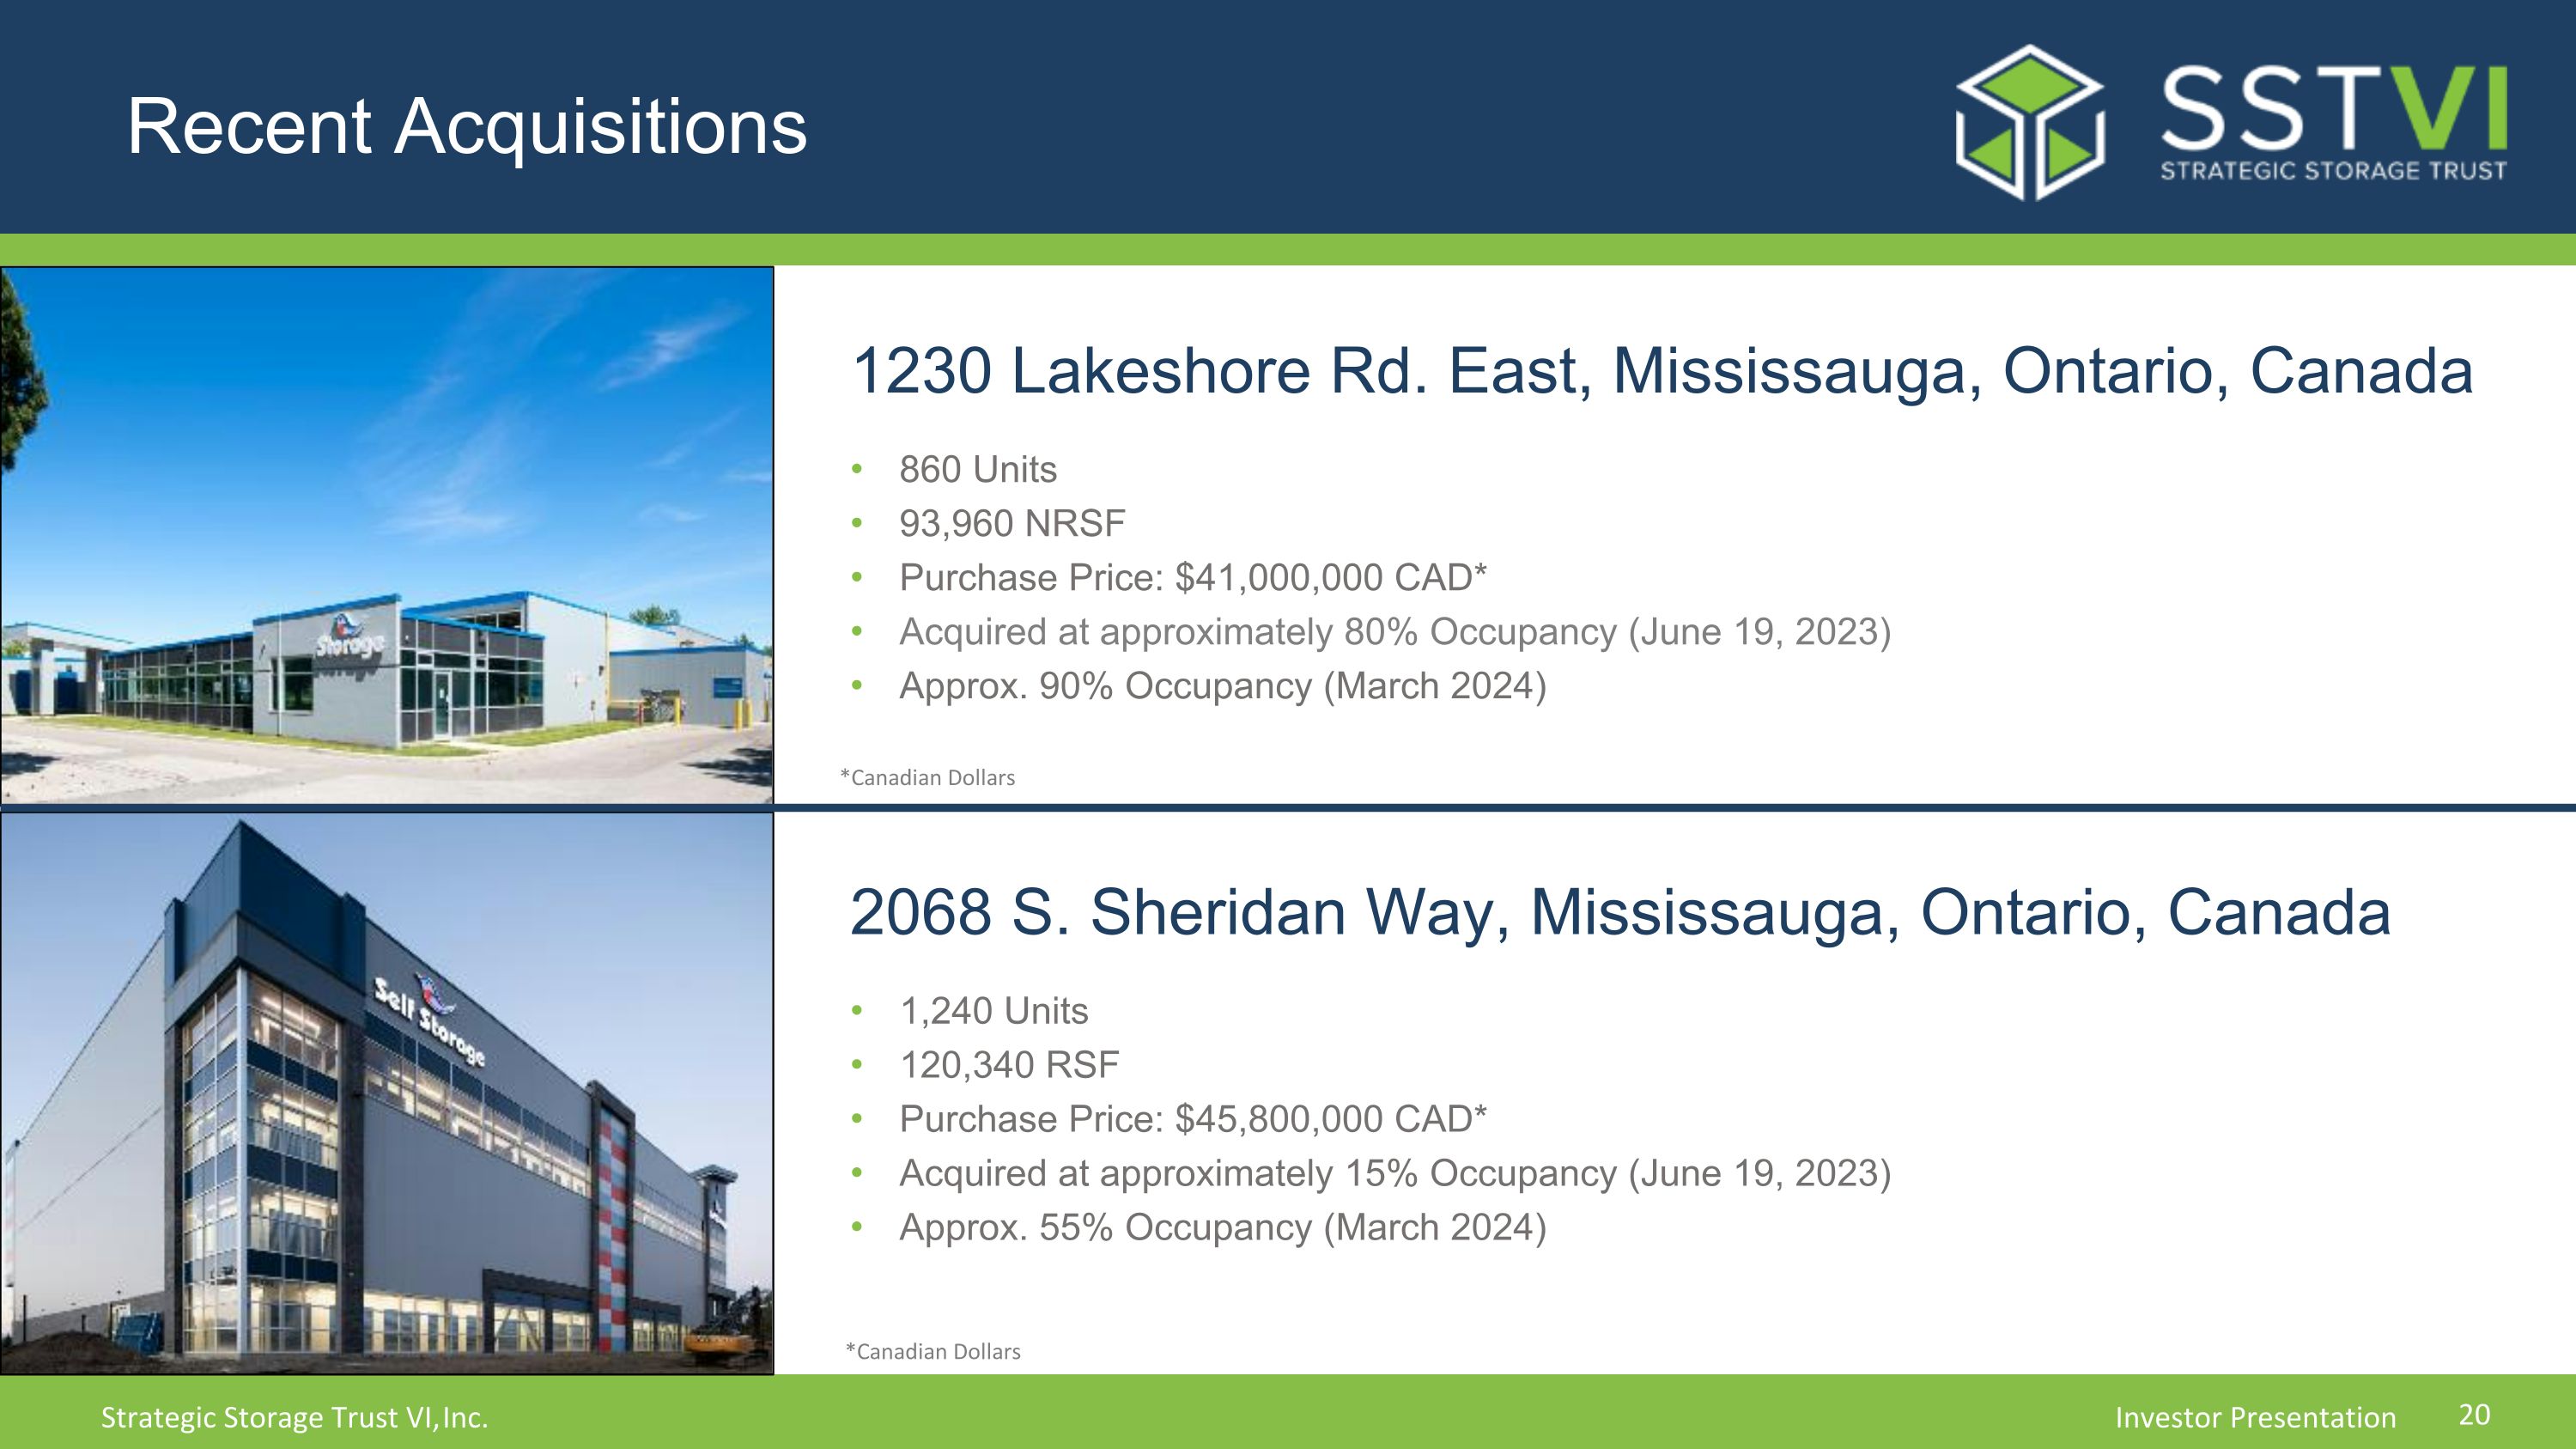
Recent Acquisitions 1230 Lakeshore Rd. East, Mississauga, Ontario, Canada *Canadian Dollars 860 Units 93,960 NRSF Purchase Price: $41,000,000 CAD* Acquired at approximately 80% Occupancy (June 19, 2023) Approx. 90% Occupancy (March 2024) 2068 S. Sheridan Way, Mississauga, Ontario, Canada 1,240 Units 120,340 RSF Purchase Price: $45,800,000 CAD* Acquired at approximately 15% Occupancy (June 19, 2023) Approx. 55% Occupancy (March 2024) *Canadian Dollars
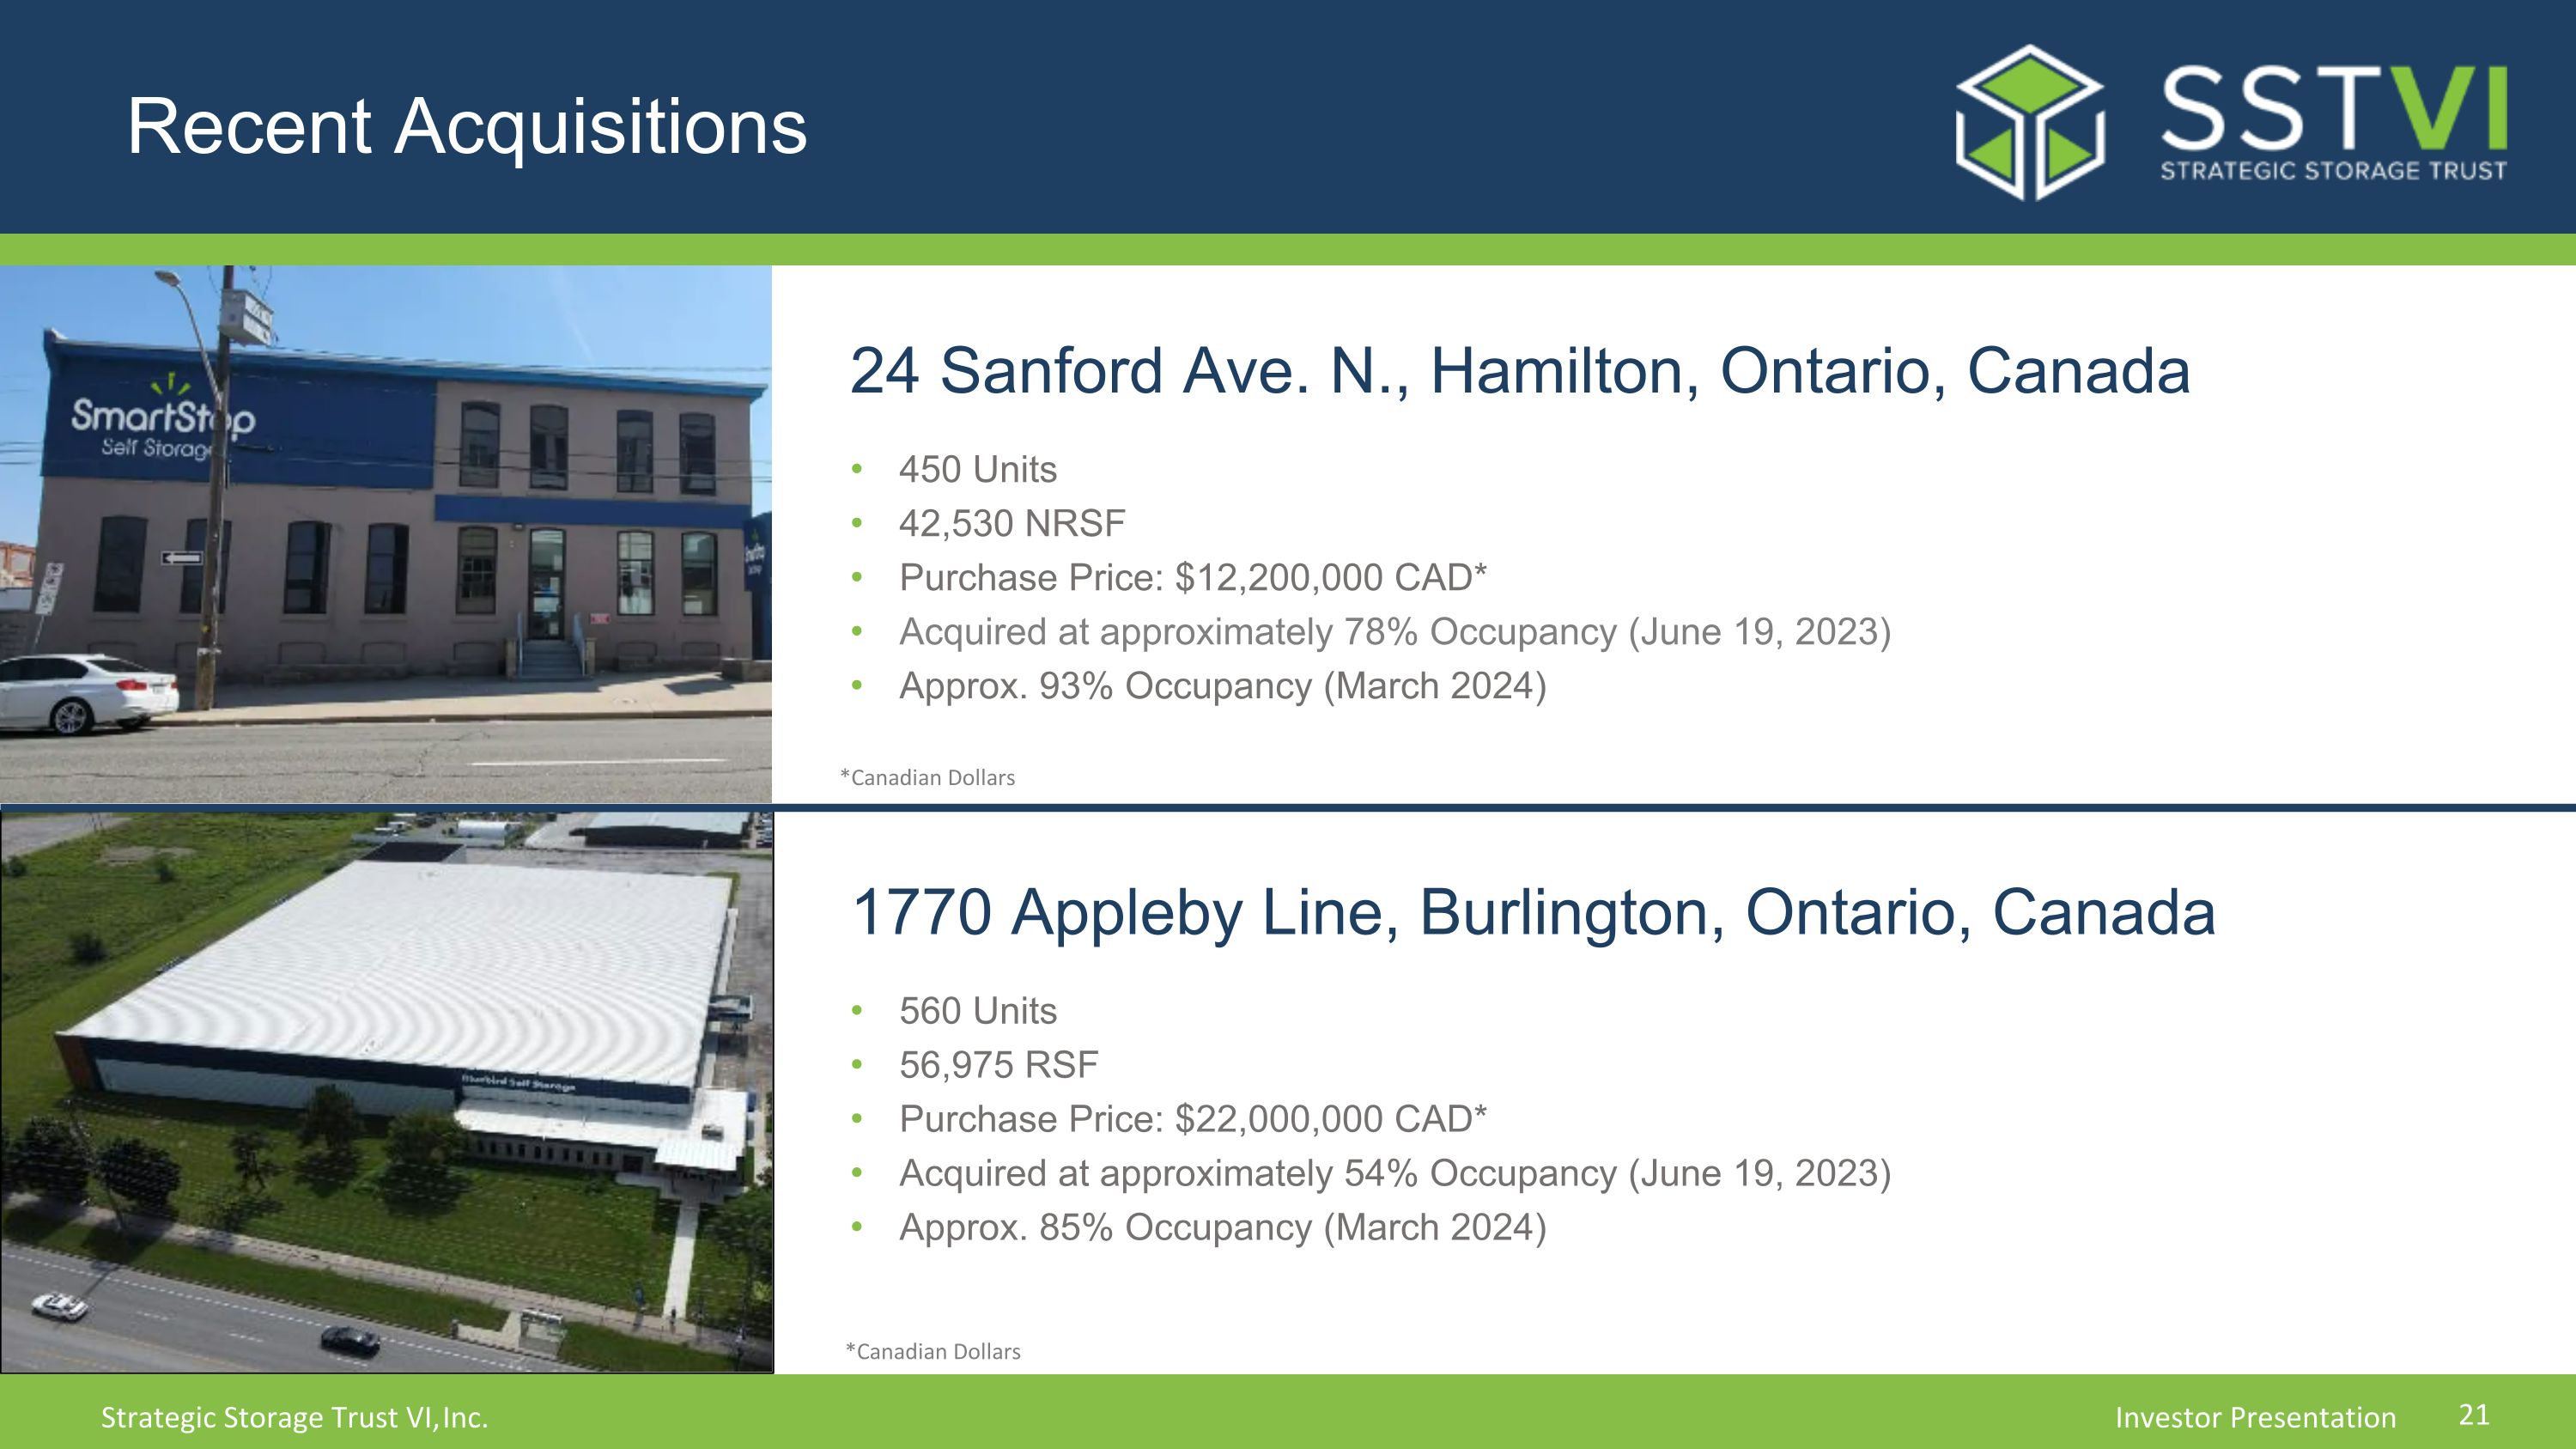
Recent Acquisitions 24 Sanford Ave. N., Hamilton, Ontario, Canada *Canadian Dollars 450 Units 42,530 NRSF Purchase Price: $12,200,000 CAD* Acquired at approximately 78% Occupancy (June 19, 2023) Approx. 93% Occupancy (March 2024) 1770 Appleby Line, Burlington, Ontario, Canada 560 Units 56,975 RSF Purchase Price: $22,000,000 CAD* Acquired at approximately 54% Occupancy (June 19, 2023) Approx. 85% Occupancy (March 2024) *Canadian Dollars
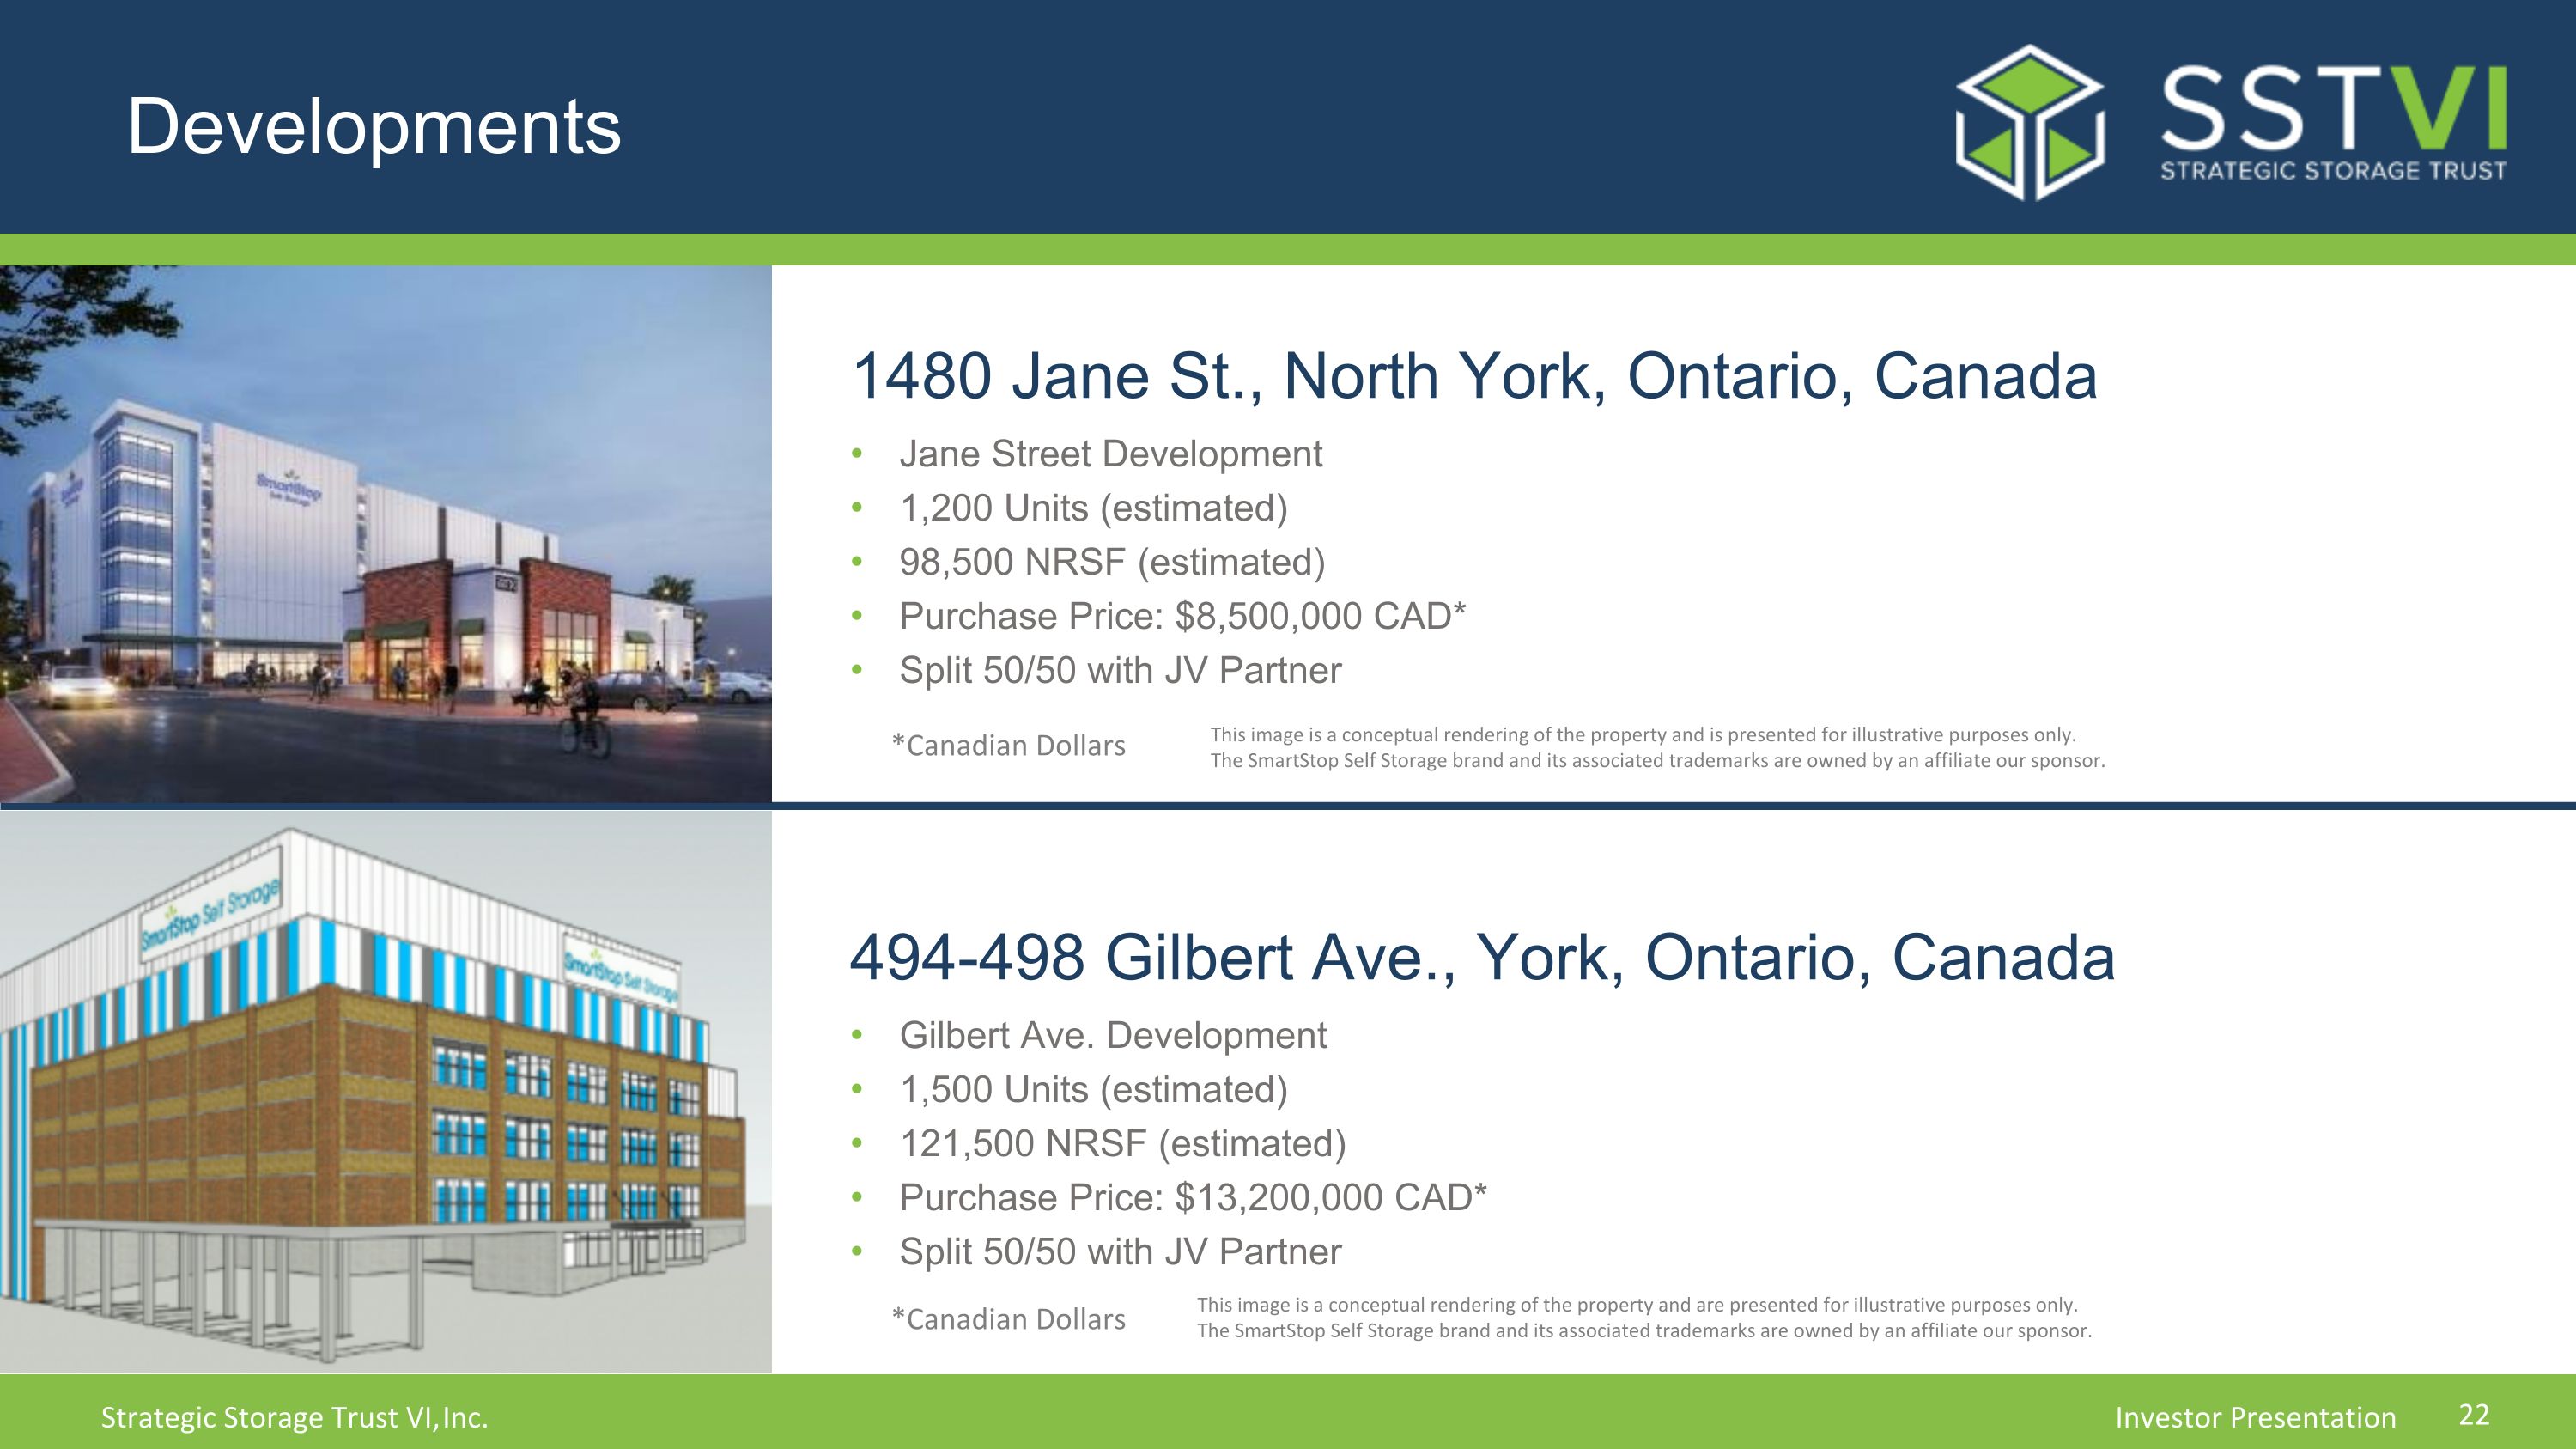
Developments 1480 Jane St., North York, Ontario, Canada Jane Street Development 1,200 Units (estimated) 98,500 NRSF (estimated) Purchase Price: $8,500,000 CAD* Split 50/50 with JV Partner This image is a conceptual rendering of the property and is presented for illustrative purposes only. �The SmartStop Self Storage brand and its associated trademarks are owned by an affiliate our sponsor. *Canadian Dollars 494-498 Gilbert Ave., York, Ontario, Canada Gilbert Ave. Development 1,500 Units (estimated) 121,500 NRSF (estimated) Purchase Price: $13,200,000 CAD* Split 50/50 with JV Partner *Canadian Dollars This image is a conceptual rendering of the property and are presented for illustrative purposes only. �The SmartStop Self Storage brand and its associated trademarks are owned by an affiliate our sponsor.
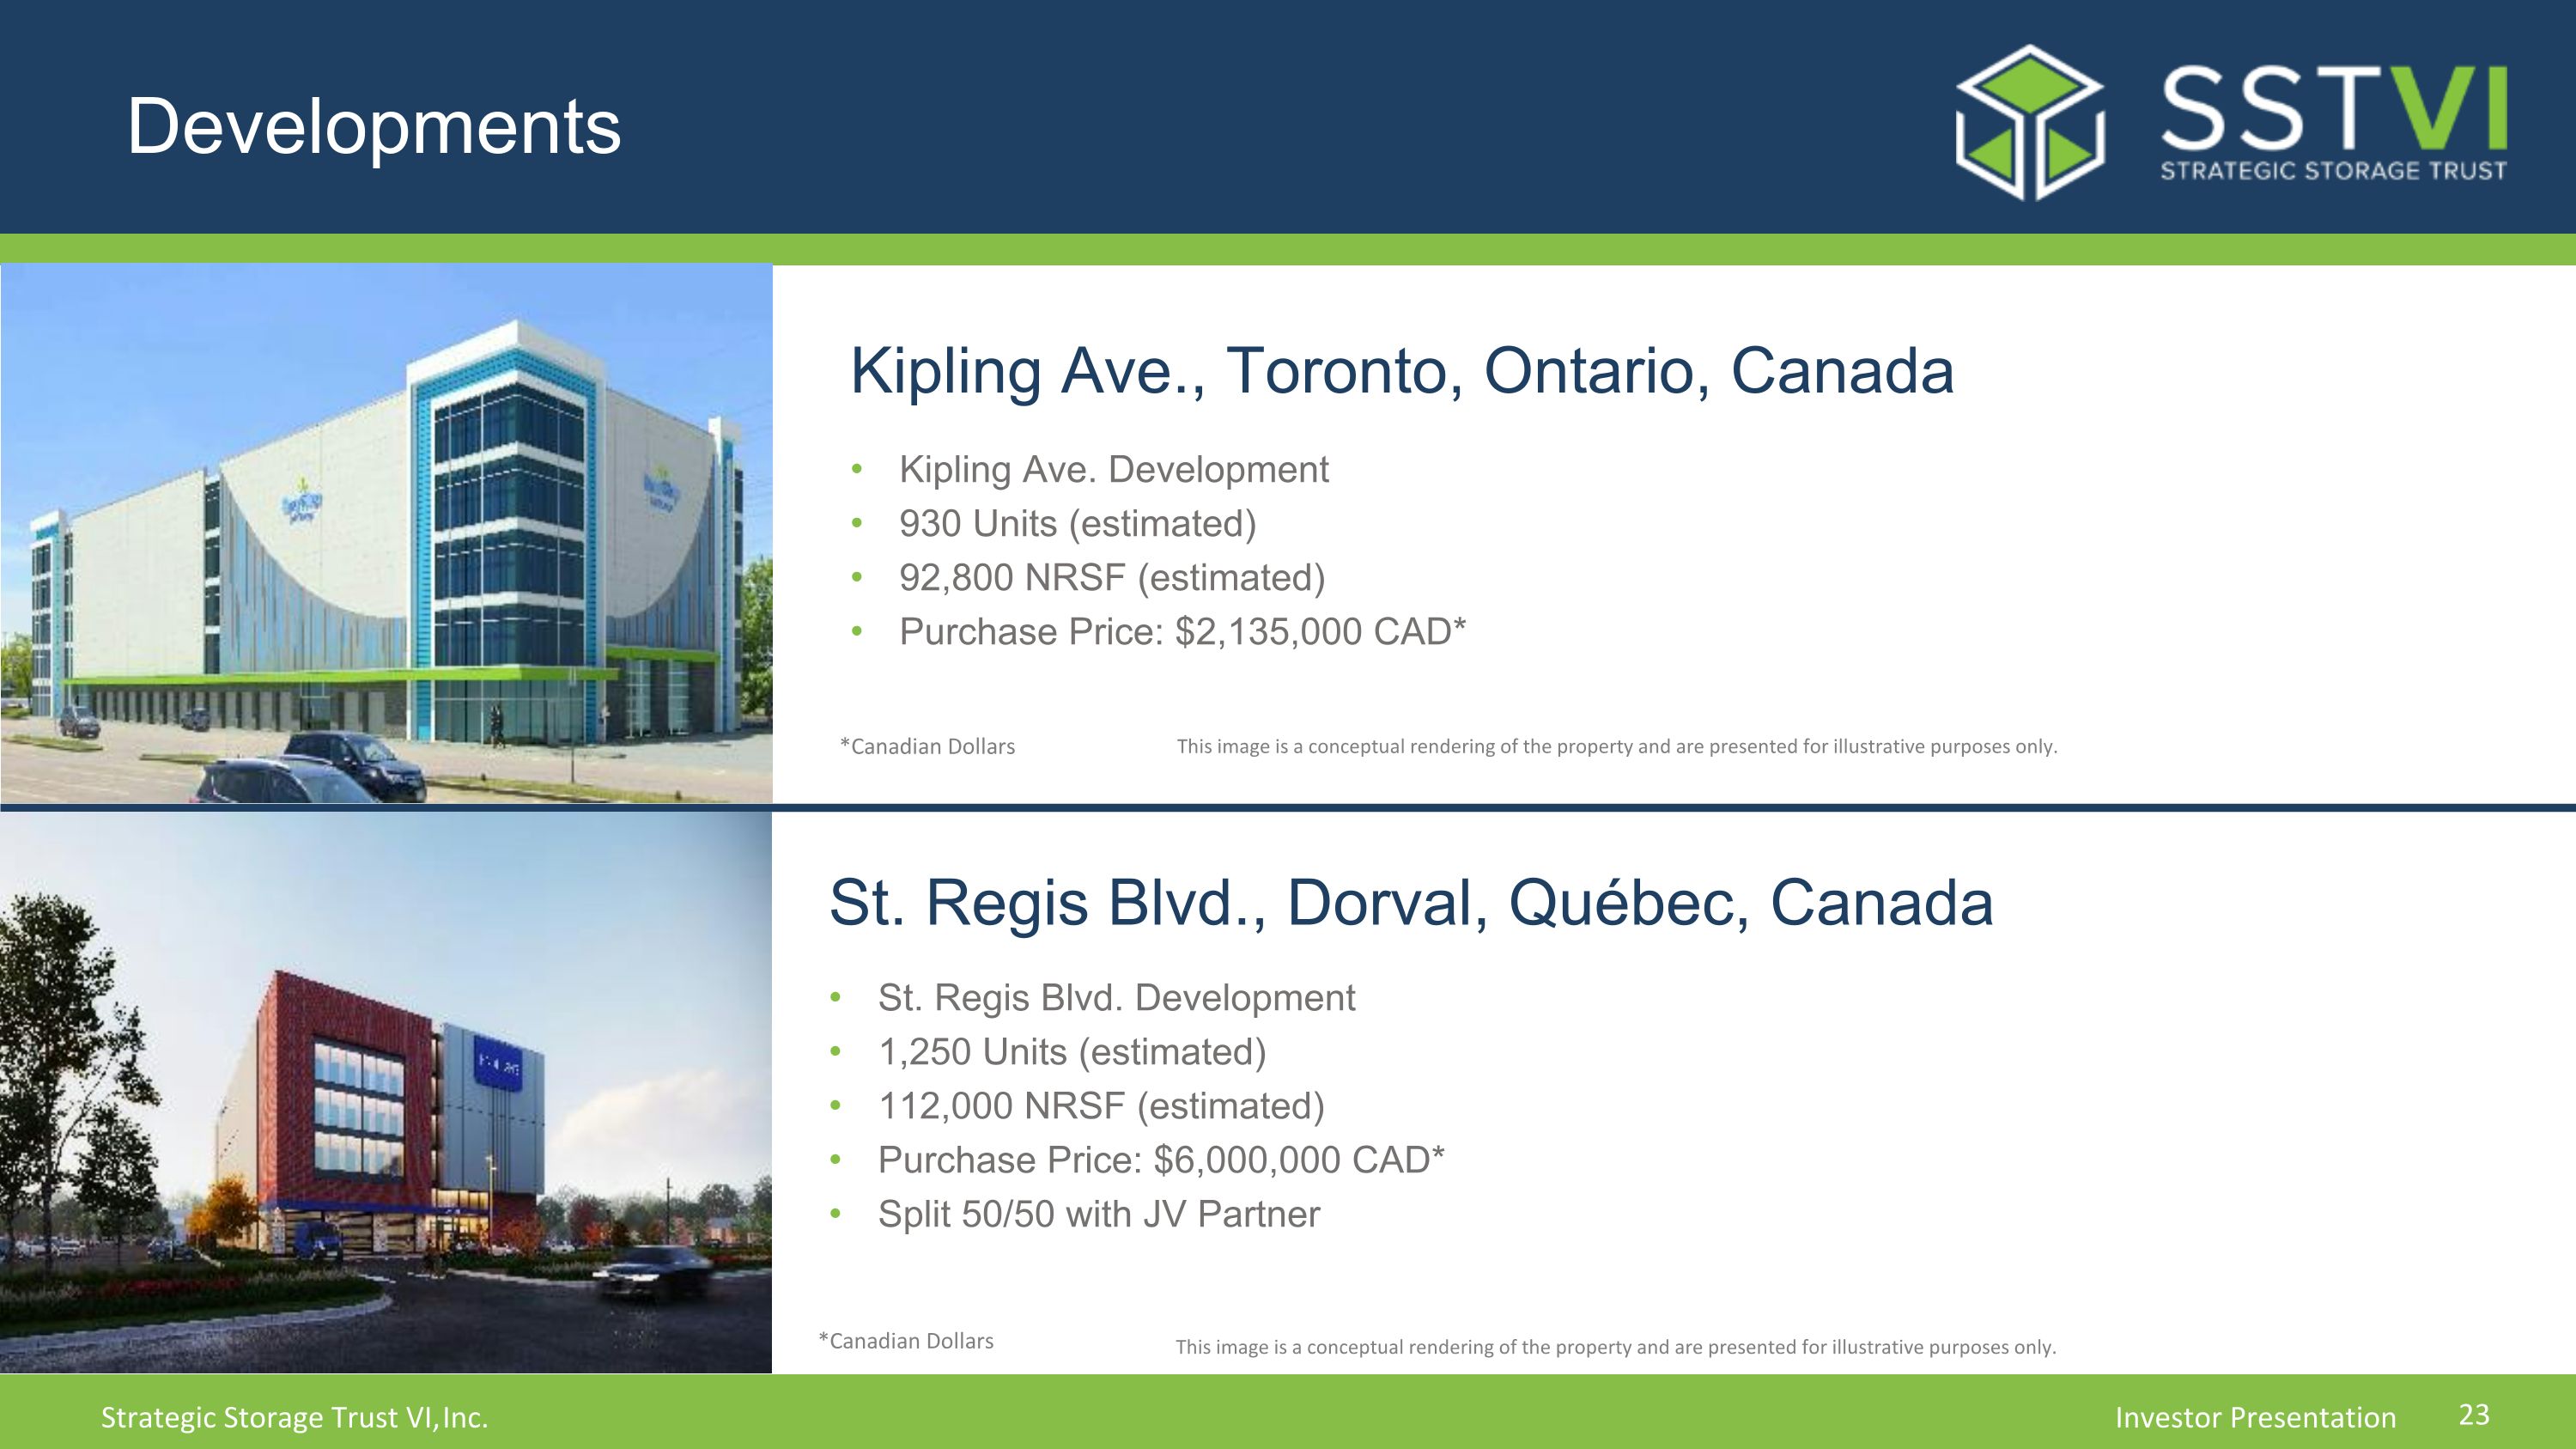
Developments Kipling Ave., Toronto, Ontario, Canada *Canadian Dollars Kipling Ave. Development 930 Units (estimated) 92,800 NRSF (estimated) Purchase Price: $2,135,000 CAD* This image is a conceptual rendering of the property and are presented for illustrative purposes only. St. Regis Blvd., Dorval, Québec, Canada *Canadian Dollars St. Regis Blvd. Development 1,250 Units (estimated) 112,000 NRSF (estimated) Purchase Price: $6,000,000 CAD* Split 50/50 with JV Partner This image is a conceptual rendering of the property and are presented for illustrative purposes only.
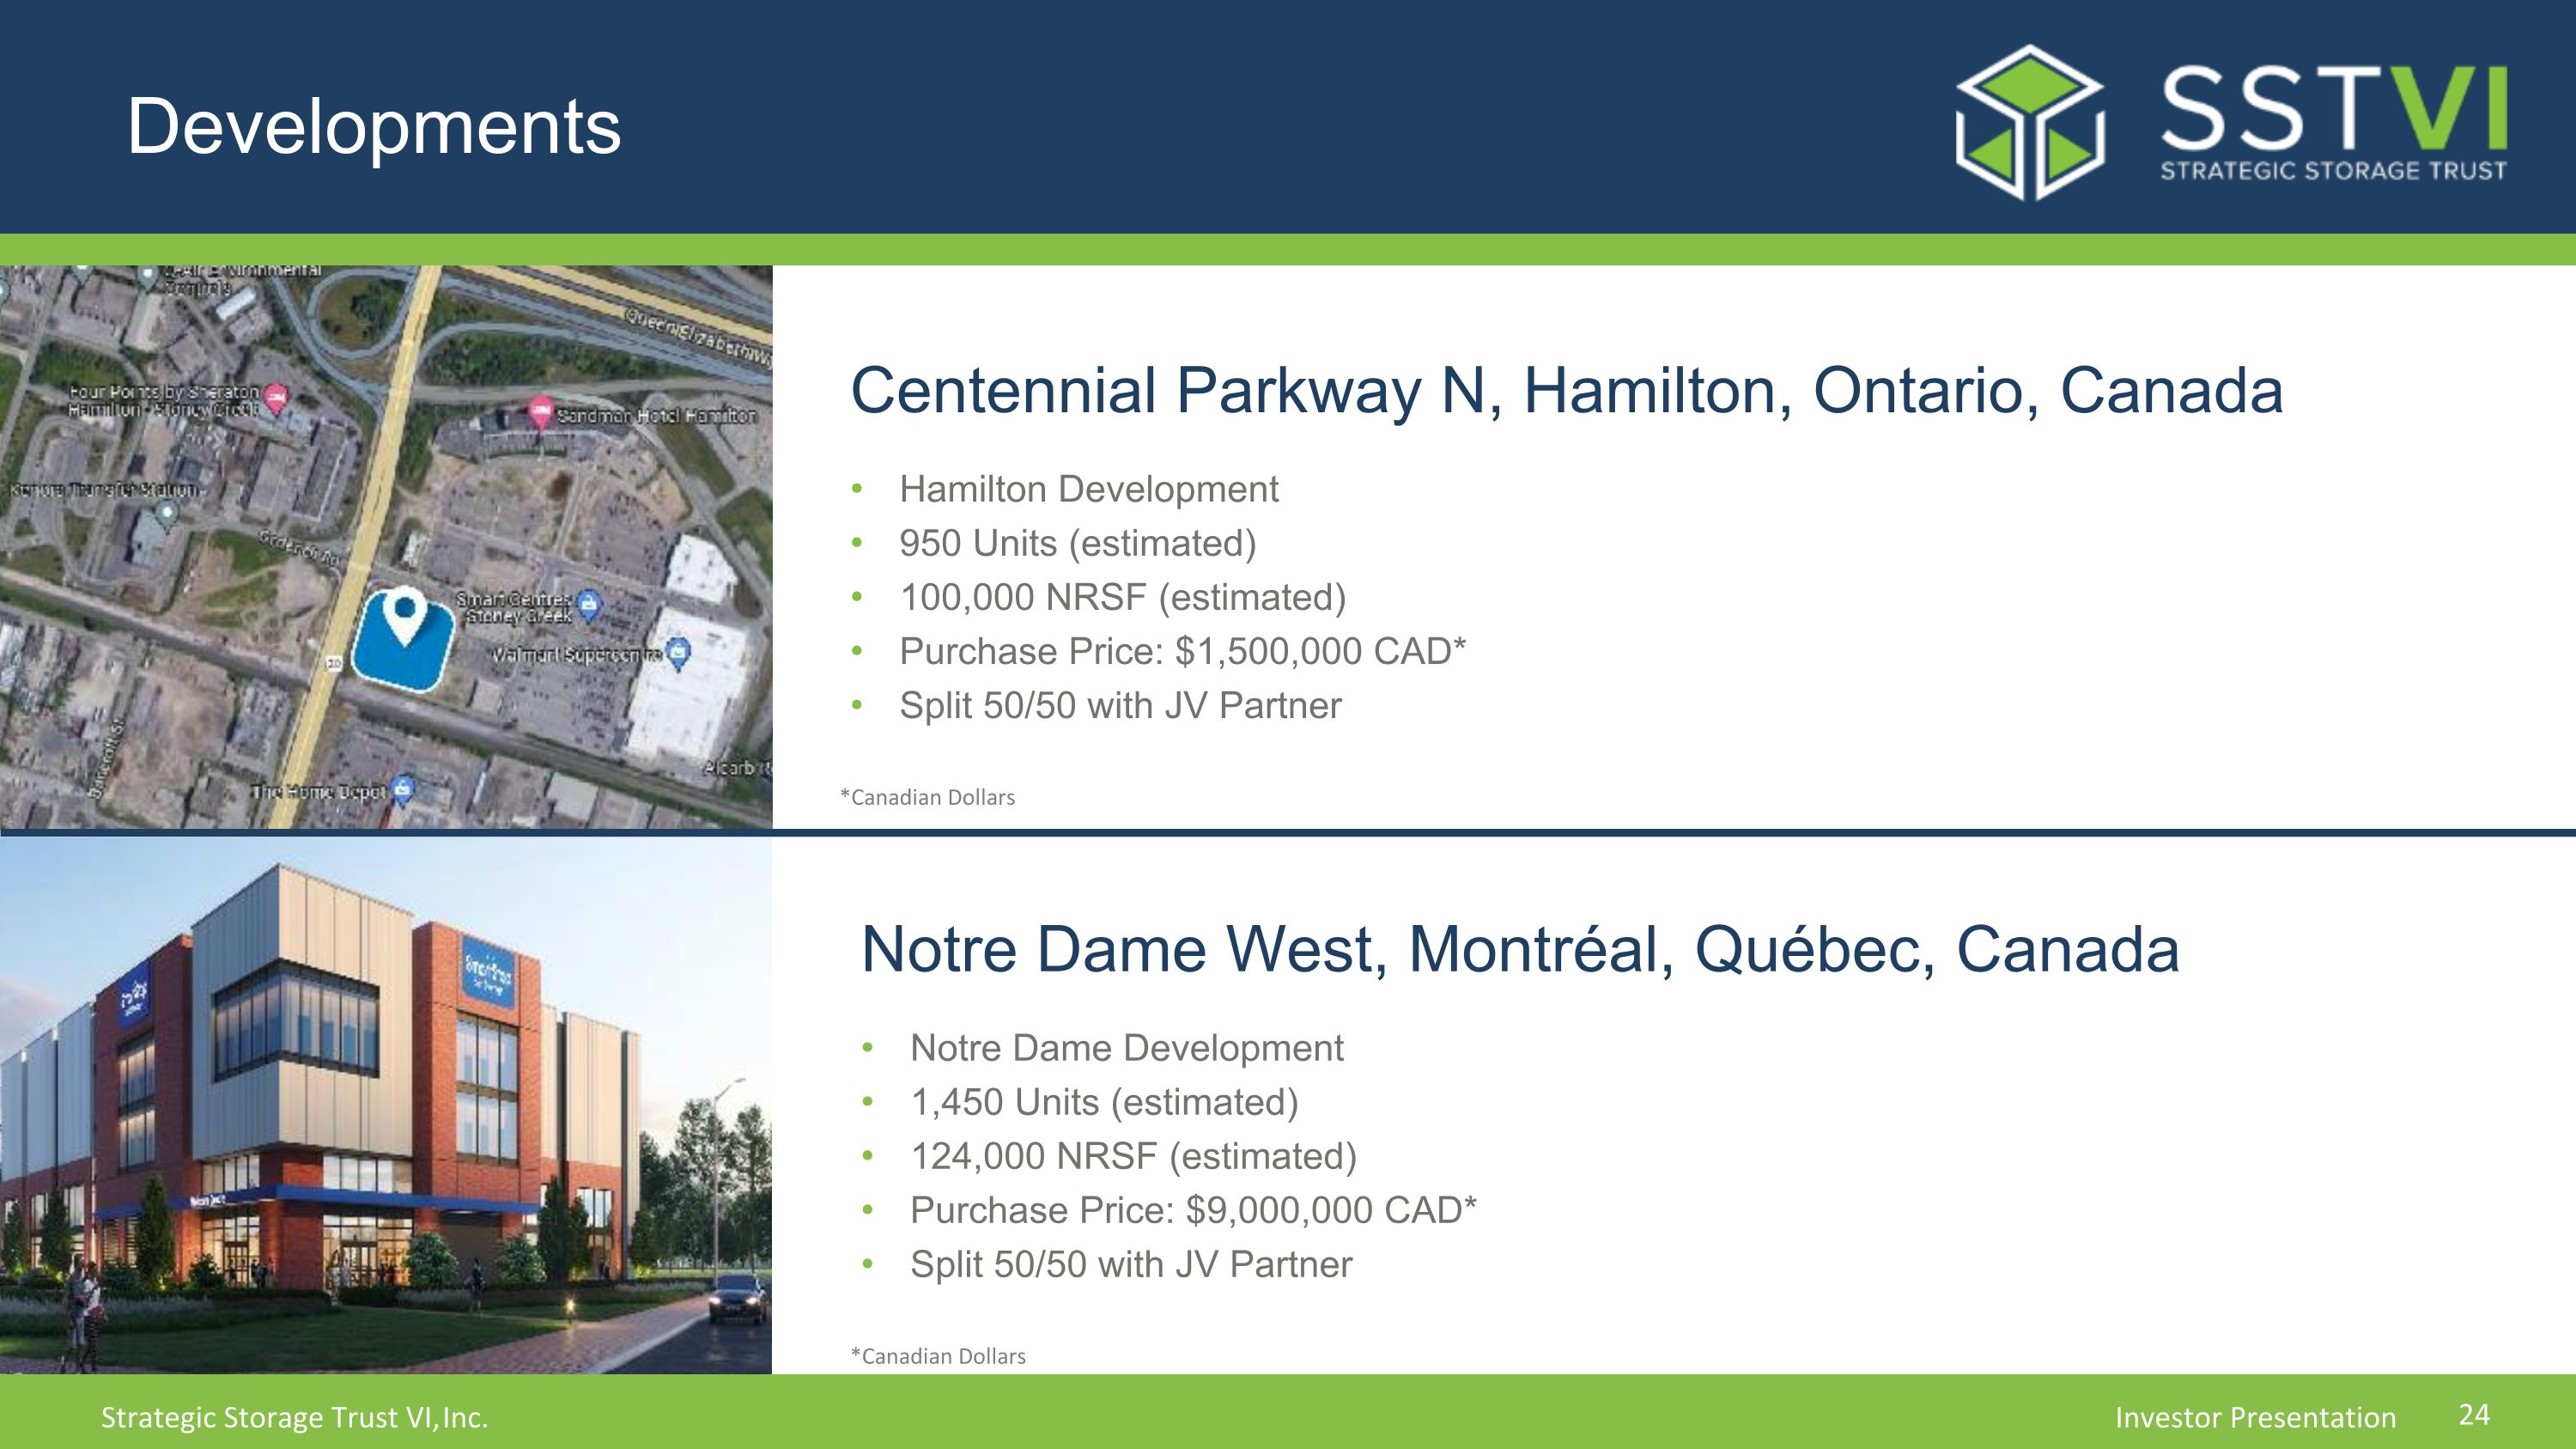
Developments Centennial Parkway N, Hamilton, Ontario, Canada *Canadian Dollars Hamilton Development 950 Units (estimated) 100,000 NRSF (estimated) Purchase Price: $1,500,000 CAD* Split 50/50 with JV Partner Notre Dame West, Montréal, Québec, Canada *Canadian Dollars Notre Dame Development 1,450 Units (estimated) 124,000 NRSF (estimated) Purchase Price: $9,000,000 CAD* Split 50/50 with JV Partner
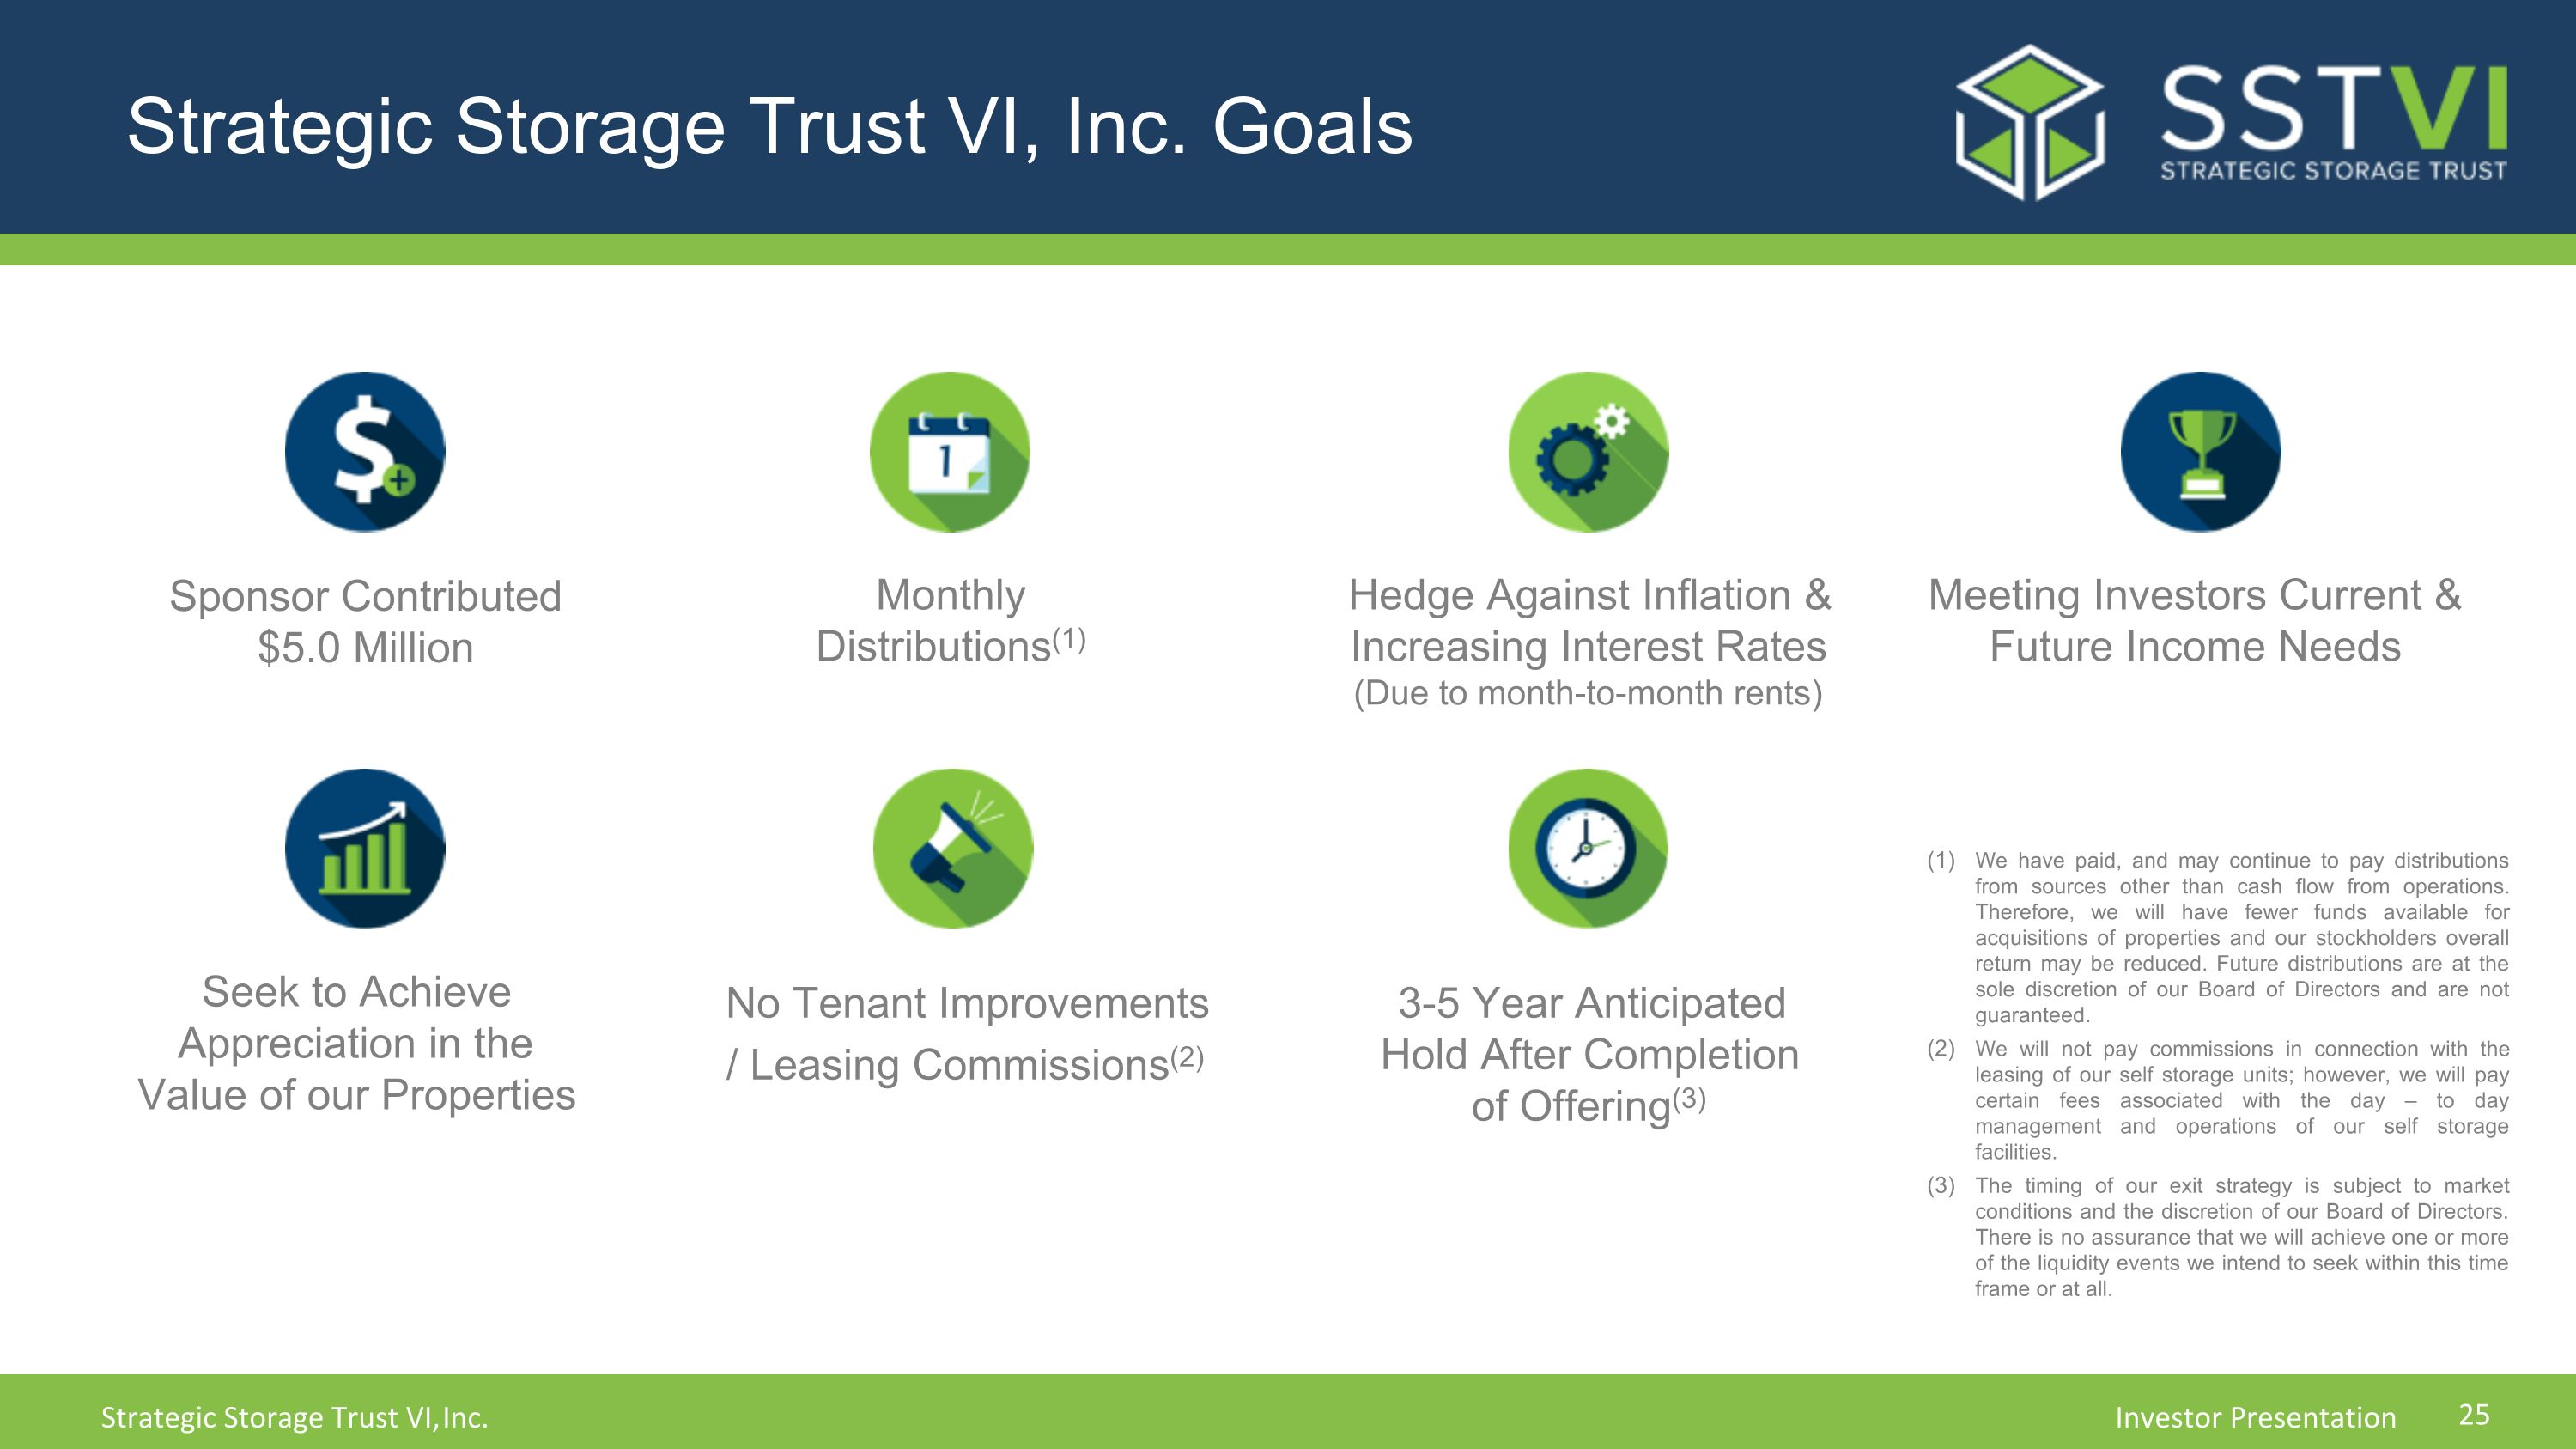
Strategic Storage Trust VI, Inc. Goals Monthly�Distributions(1) Seek to Achieve�Appreciation in the Value of our Properties Hedge Against Inflation & Increasing Interest Rates�(Due to month-to-month rents) No Tenant Improvements / Leasing Commissions(2) Meeting Investors Current & Future Income Needs 3-5 Year Anticipated�Hold After Completion�of Offering(3) We have paid, and may continue to pay distributions from sources other than cash flow from operations. Therefore, we will have fewer funds available for acquisitions of properties and our stockholders overall return may be reduced. Future distributions are at the sole discretion of our Board of Directors and are not guaranteed. We will not pay commissions in connection with the leasing of our self storage units; however, we will pay certain fees associated with the day – to day management and operations of our self storage facilities. The timing of our exit strategy is subject to market conditions and the discretion of our Board of Directors. There is no assurance that we will achieve one or more of the liquidity events we intend to seek within this time frame or at all. Sponsor Contributed $5.0 Million
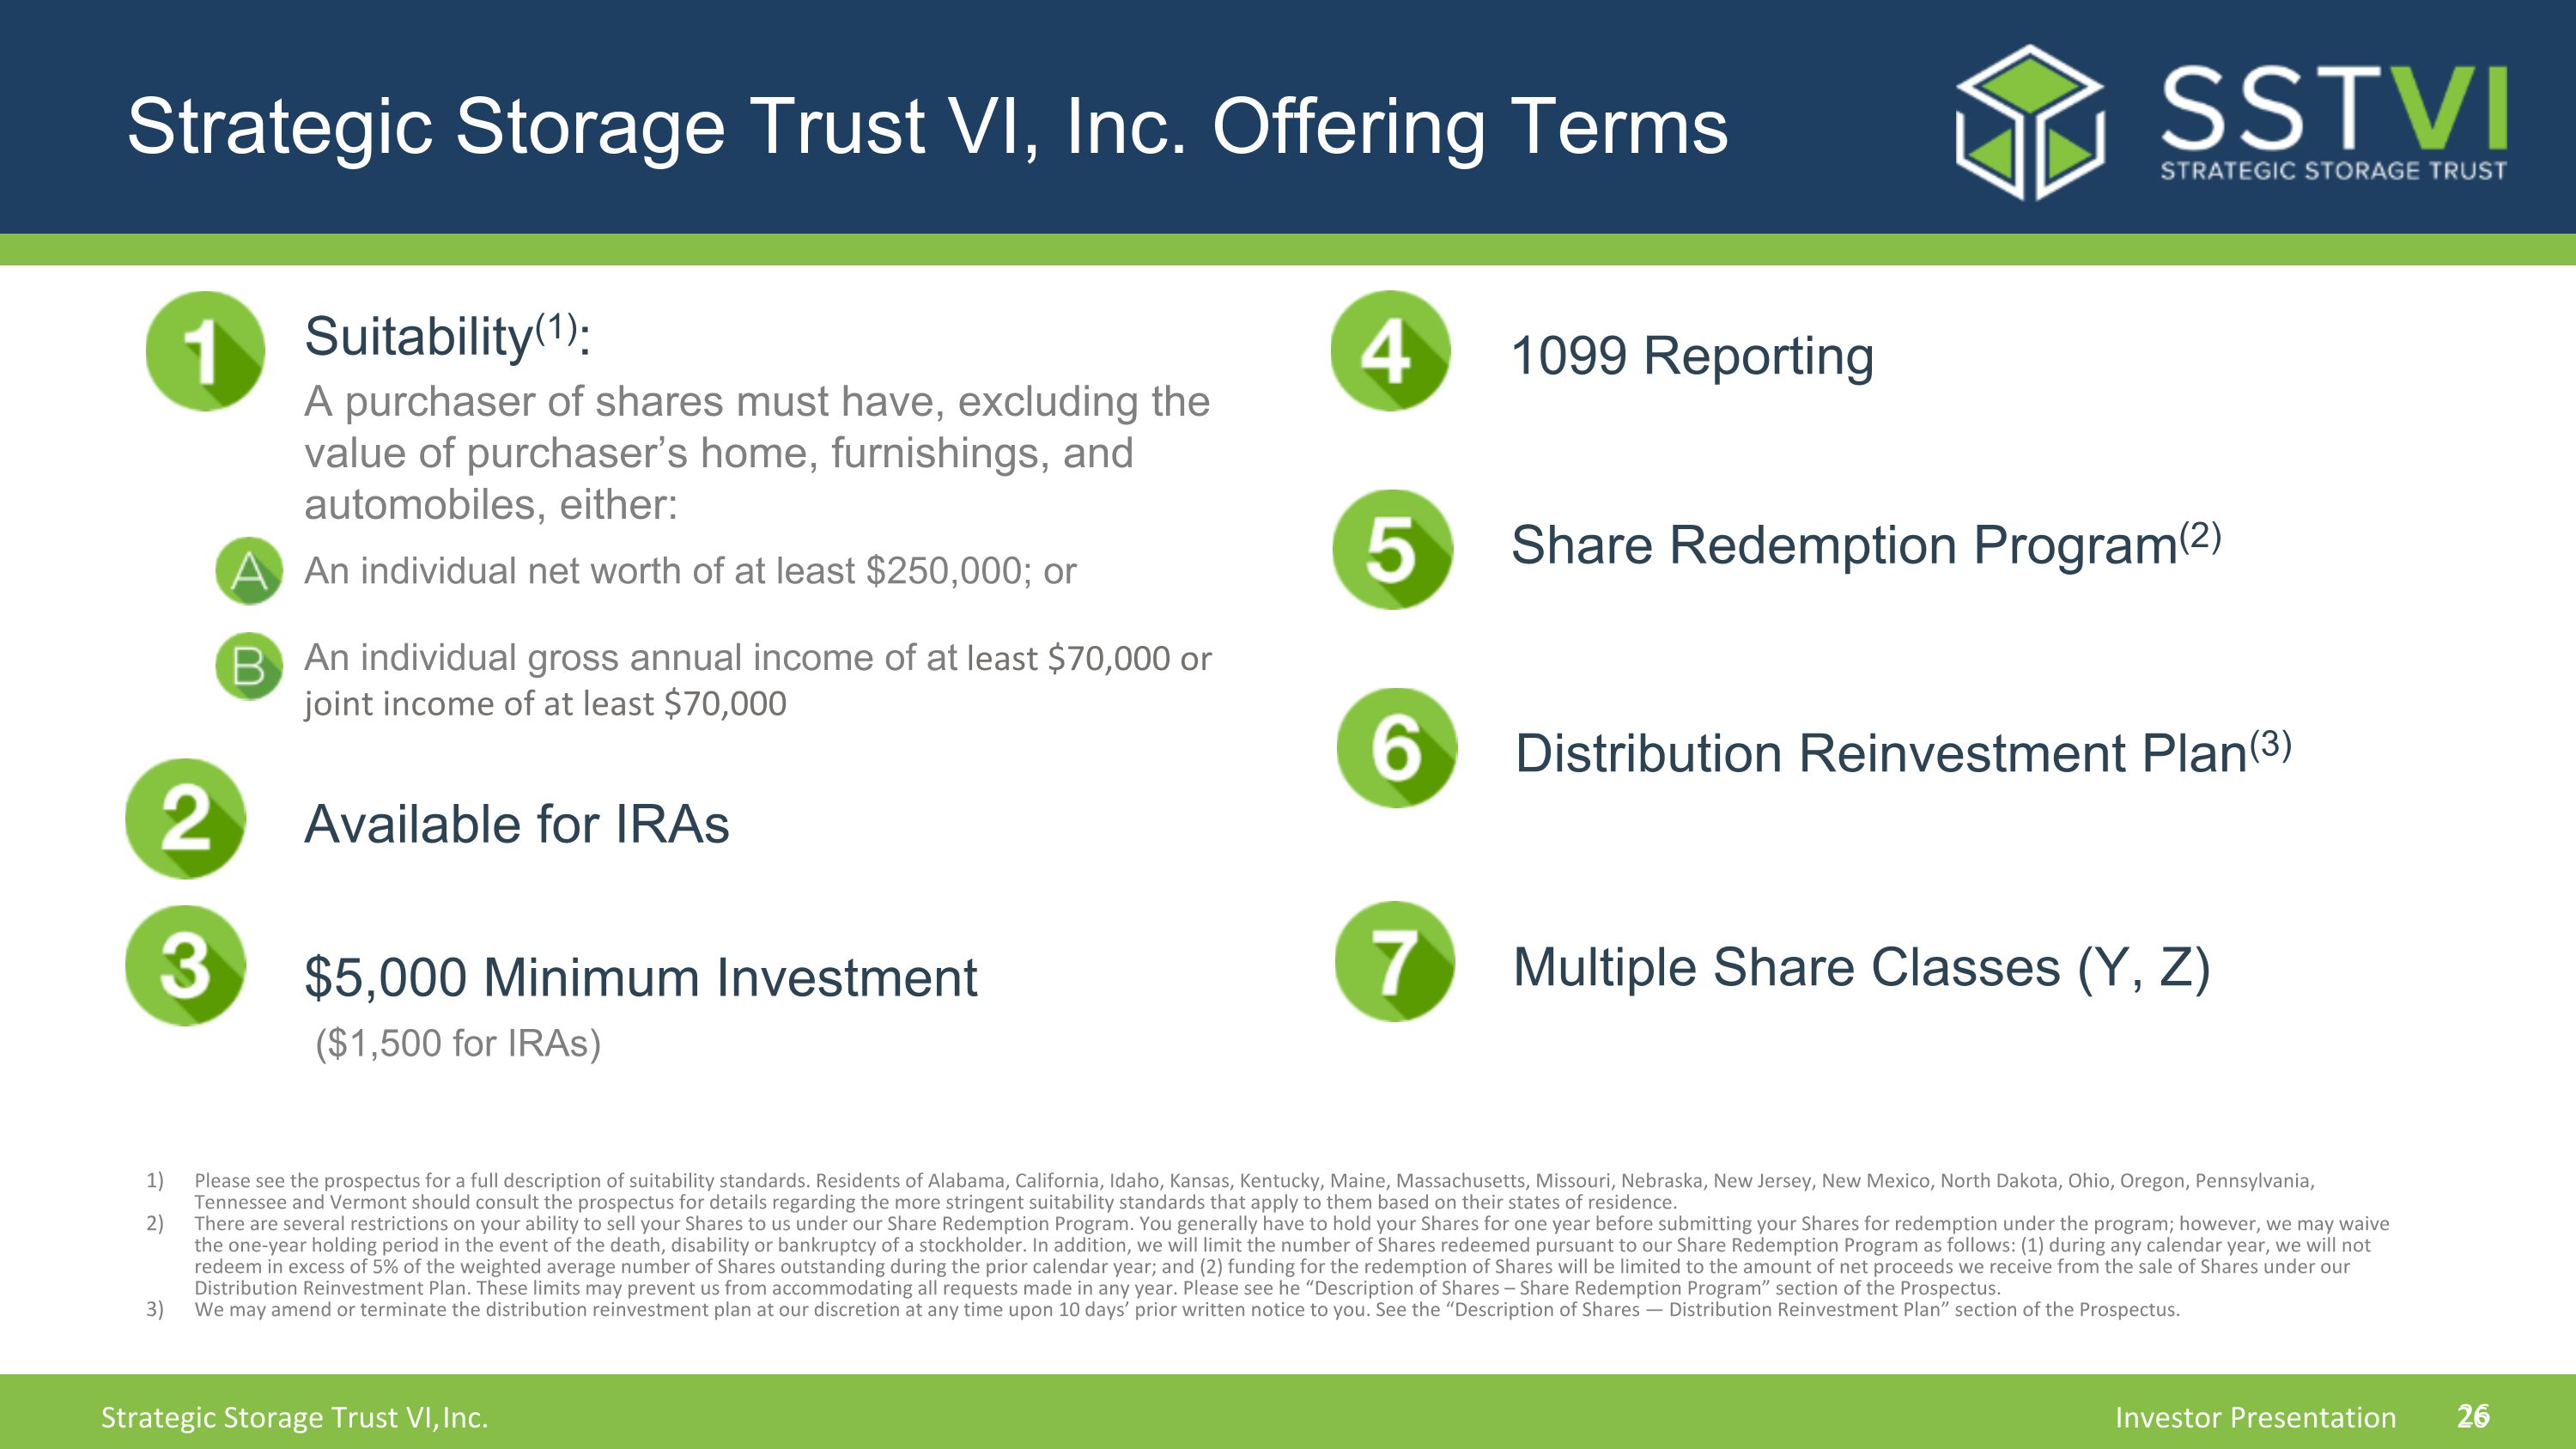
Strategic Storage Trust VI, Inc. Offering Terms Suitability(1): Please see the prospectus for a full description of suitability standards. Residents of Alabama, California, Idaho, Kansas, Kentucky, Maine, Massachusetts, Missouri, Nebraska, New Jersey, New Mexico, North Dakota, Ohio, Oregon, Pennsylvania, Tennessee and Vermont should consult the prospectus for details regarding the more stringent suitability standards that apply to them based on their states of residence. There are several restrictions on your ability to sell your Shares to us under our Share Redemption Program. You generally have to hold your Shares for one year before submitting your Shares for redemption under the program; however, we may waive the one-year holding period in the event of the death, disability or bankruptcy of a stockholder. In addition, we will limit the number of Shares redeemed pursuant to our Share Redemption Program as follows: (1) during any calendar year, we will not redeem in excess of 5% of the weighted average number of Shares outstanding during the prior calendar year; and (2) funding for the redemption of Shares will be limited to the amount of net proceeds we receive from the sale of Shares under our Distribution Reinvestment Plan. These limits may prevent us from accommodating all requests made in any year. Please see he “Description of Shares – Share Redemption Program” section of the Prospectus. We may amend or terminate the distribution reinvestment plan at our discretion at any time upon 10 days’ prior written notice to you. See the “Description of Shares — Distribution Reinvestment Plan” section of the Prospectus. An individual net worth of at least $250,000; or An individual gross annual income of at least $70,000 or joint income of at least $70,000 Available for IRAs $5,000 Minimum Investment A purchaser of shares must have, excluding the value of purchaser’s home, furnishings, and automobiles, either: 1099 Reporting Share Redemption Program(2) Distribution Reinvestment Plan(3) Multiple Share Classes (Y, Z) ($1,500 for IRAs)
Next Steps Main Office 10 Terrace Road Ladera Ranch, CA 92694 Sales Desk 866.412.5161 info@strategicreit.com Investor Services 833.404.4110 Shares Offered Through Pacific Oak Capital Markets, LLC Member FINRA | SIPC

QUESTIONS?
Appendix
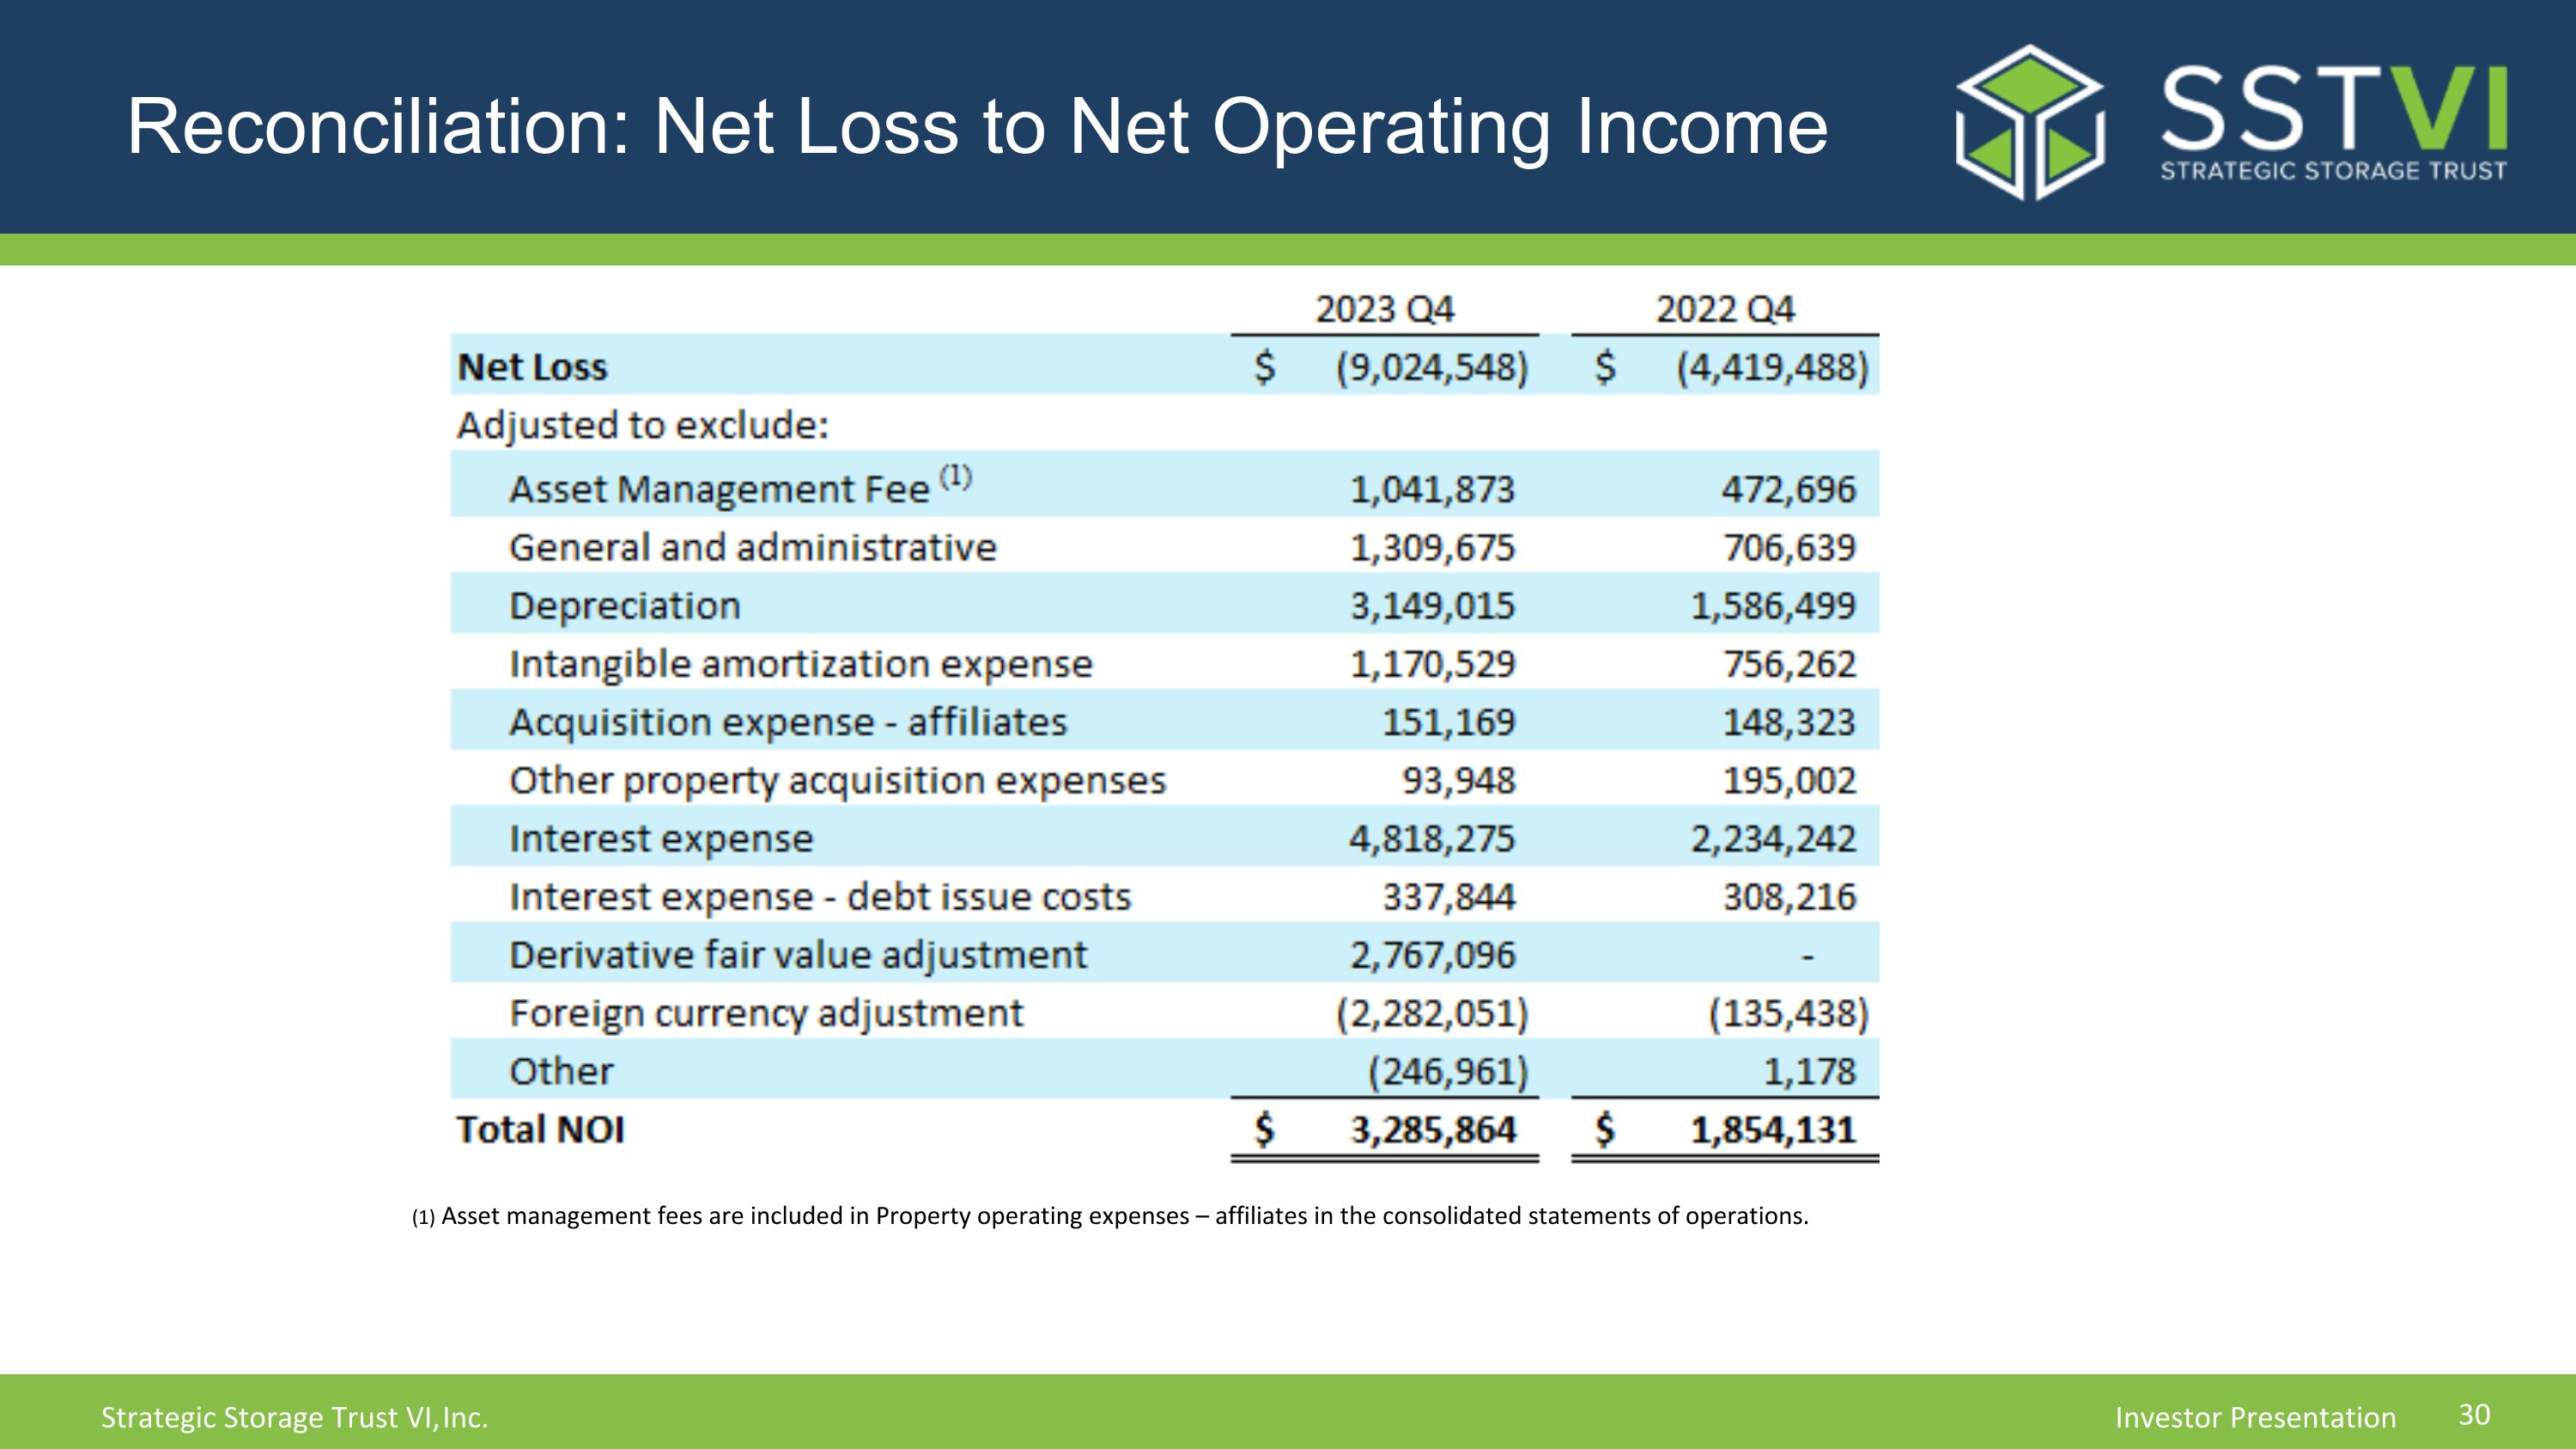
Reconciliation: Net Loss to Net Operating Income (1) Asset management fees are included in Property operating expenses – affiliates in the consolidated statements of operations.


