Exhibit 99.1
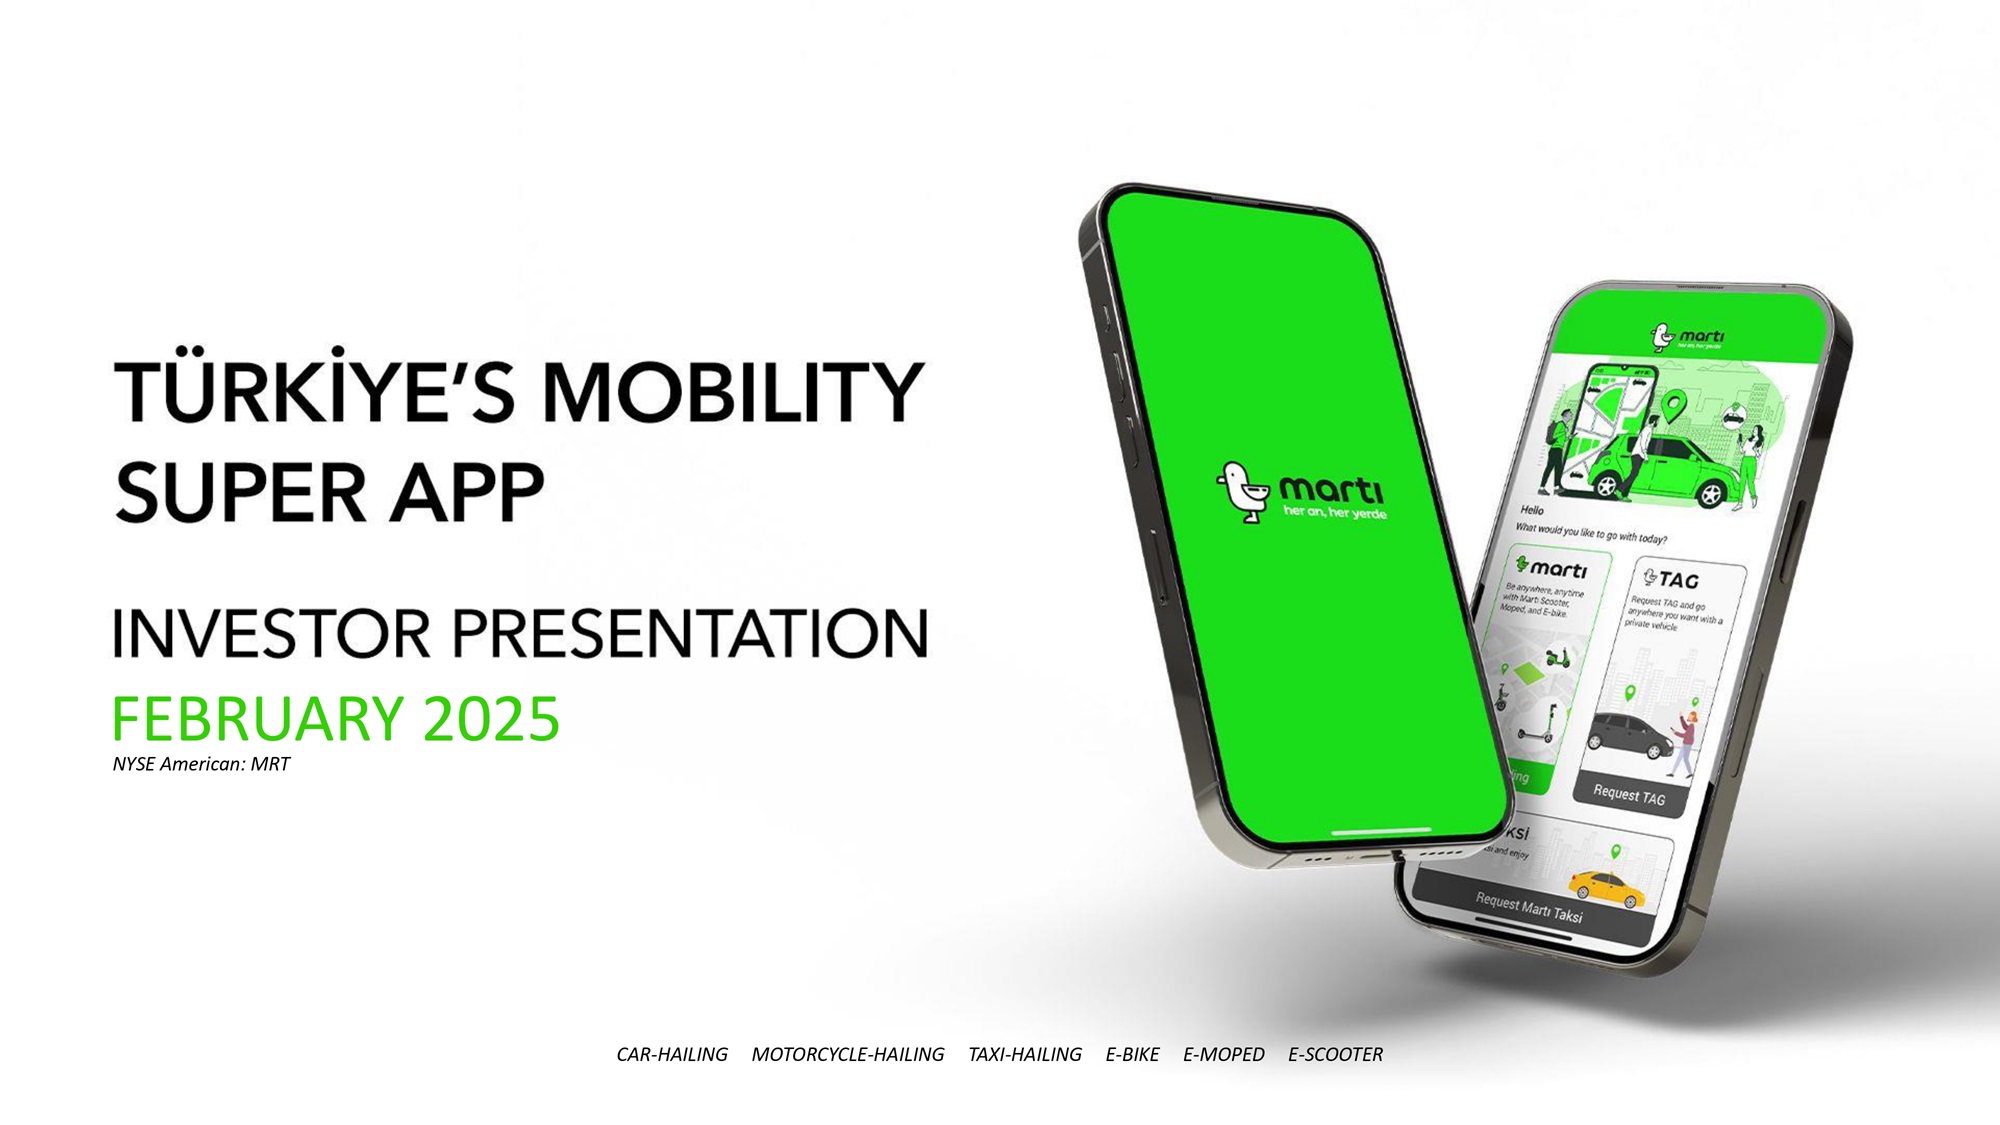
CAR - HAILING MOTORCYCLE - HAILING TAXI - HAILING E - BIKE E - MOPED E - SCOOTER FEBRUARY 2025 NYSE American: MRT

Forward Looking Statements This presentation, together with other statements and information publicly disseminated by the Company, contains certain forward - looking statements within the meaning of Section 27 A of the Securities Act of 1933 , as amended, and Section 21 E of the Securities Exchange Act of 1934 , as amended . The Company intends such forward - looking statements to be covered by the safe harbor provisions for forward - looking statements contained in the Private Securities Litigation Reform Act of 1995 and includes this statement for purposes of complying with these safe harbor provisions . Any statements made in this presentation or during the earnings call that are not statements of historical fact, including statements about our anticipated growth, including the number of riders and registered drivers, of the ride - hailing business, the full year 2024 guidance, and the expected future performance, operational efficiencies and market opportunities of Marti and its two - wheeled electric vehicle business and ride hailing business, are forward - looking statements and should be evaluated as such . Forward - looking statements include information concerning our anticipated future financial performance, our market opportunities and our expectations regarding our business plan and strategies . These statements often include words such as “anticipate,” “expect,” “suggests,” “plan,” “believe,” “intend,” “estimates,” “targets,” “projects,” “should,” “could,” “would,” “may,” “will,” “forecast,” “outlook,” “guidance” and other similar expressions . We base these forward - looking statements on our current expectations, plans, and assumptions that we have made in light of our experience in the industry, as well as our perceptions of historical trends, current conditions, expected future developments and other factors we believe are appropriate under the circumstances at such time . Although we believe that these forward - looking statements are based on reasonable assumptions at the time they are made, you should be aware that many factors could affect our business, results of operations and financial condition and could cause actual results to differ materially from those expressed in the forward - looking statements . These statements are not guarantees of future performance or results . The forward - looking statements are subject to and involve risks, uncertainties, and assumptions, and you should not place undue reliance on these forward - looking statements . These cautionary statements should not be construed by you to be exhaustive and the forward - looking statements are made only as of the date of this presentation . We undertake no obligation to update or revise any forward - looking statements, whether as a result of new information, future events or otherwise, except as required by applicable law . The full year 2024 and 2025 guidance and the ride - hailing targets provided herein are based on Marti’s current estimates and assumptions and are not a guarantee of future performance . The guidance provided and the ride - hailing targets are subject to significant risks and uncertainties, including the risk factors discussed in the Company's reports on file with the Securities and Exchange Commission, that could cause actual results to differ materially . There can be no assurance that the Company will achieve the results expressed by this guidance or the targets . Non - GAAP Measures This presentation contains non - GAAP financial measures such as adjusted EBITDA and adjusted EBITDA margin . These measures are not prepared in accordance with generally accepted accounting principles in the United States of America (“GAAP”) and have important limitations as analytical tools . Non - GAAP financial measures are supplemental, should only be used in conjunction with results presented in accordance with GAAP and should not be considered in isolation or as a substitute for such GAAP results . Refer to (i) the footnotes of this presentation for the definitions of the non - GAAP measures used in this presentation and (ii) the end of this presentation for a reconciliation of the non - GAAP financial measures used herein to the most directly comparable financial measures calculated and presented in accordance with GAAP . Disclaimers 2 The contents and appearance of this presentation are copyrighted and the trademarks and service marks are owned by Marti Technologies, Inc. All rights reserved.
3 Investment Highlights The Opportunity Our Services Our Performance and Future Plans Who We Are 2025 Guidance Non - GAAP Reconciliations

4 1. McKinsey and Company’s Turkish Consumer Mobility Market Assessment from 2021 2. As of December 2024 3. Financial forecast as provided on December 2, 2024 Investment Highlights * #1 urban mobility app in Türkiye, operating in a large and under - developed transportation market, a $9 - 12 billion opportunity annually 1 * Only at - scale ride - hailing operator in Türkiye, with 1.6 million unique riders and 255 thousand registered drivers 2 in ride - hailing, and 5.5 million total app riders, well - positioned as ride - hailing regulation develops over coming years * Shift from ride - hailing investment to monetization is a significant inflection point for growth and profitability : in 2025 , revenue to more than double, driving positive Adj EBITDA 3 * Proven leadership with a tr ack record of successful entrepreneurship, who recognized early that there was an unmet need for a mobility super app in Türkiye * Well - capitalized to execute strategy, with backing from U . S . and European institutional investors including Callaway, New Holland, BECO Capital, Gramercy, European Bank for Reconstruction & Development (EBRD), and Autotech Ventures Our Services car - hailing motorcycle - hailing taxi - hailing e - bikes e - mopeds e - scooters Ride - hailing Two - wheeled electric vehicles
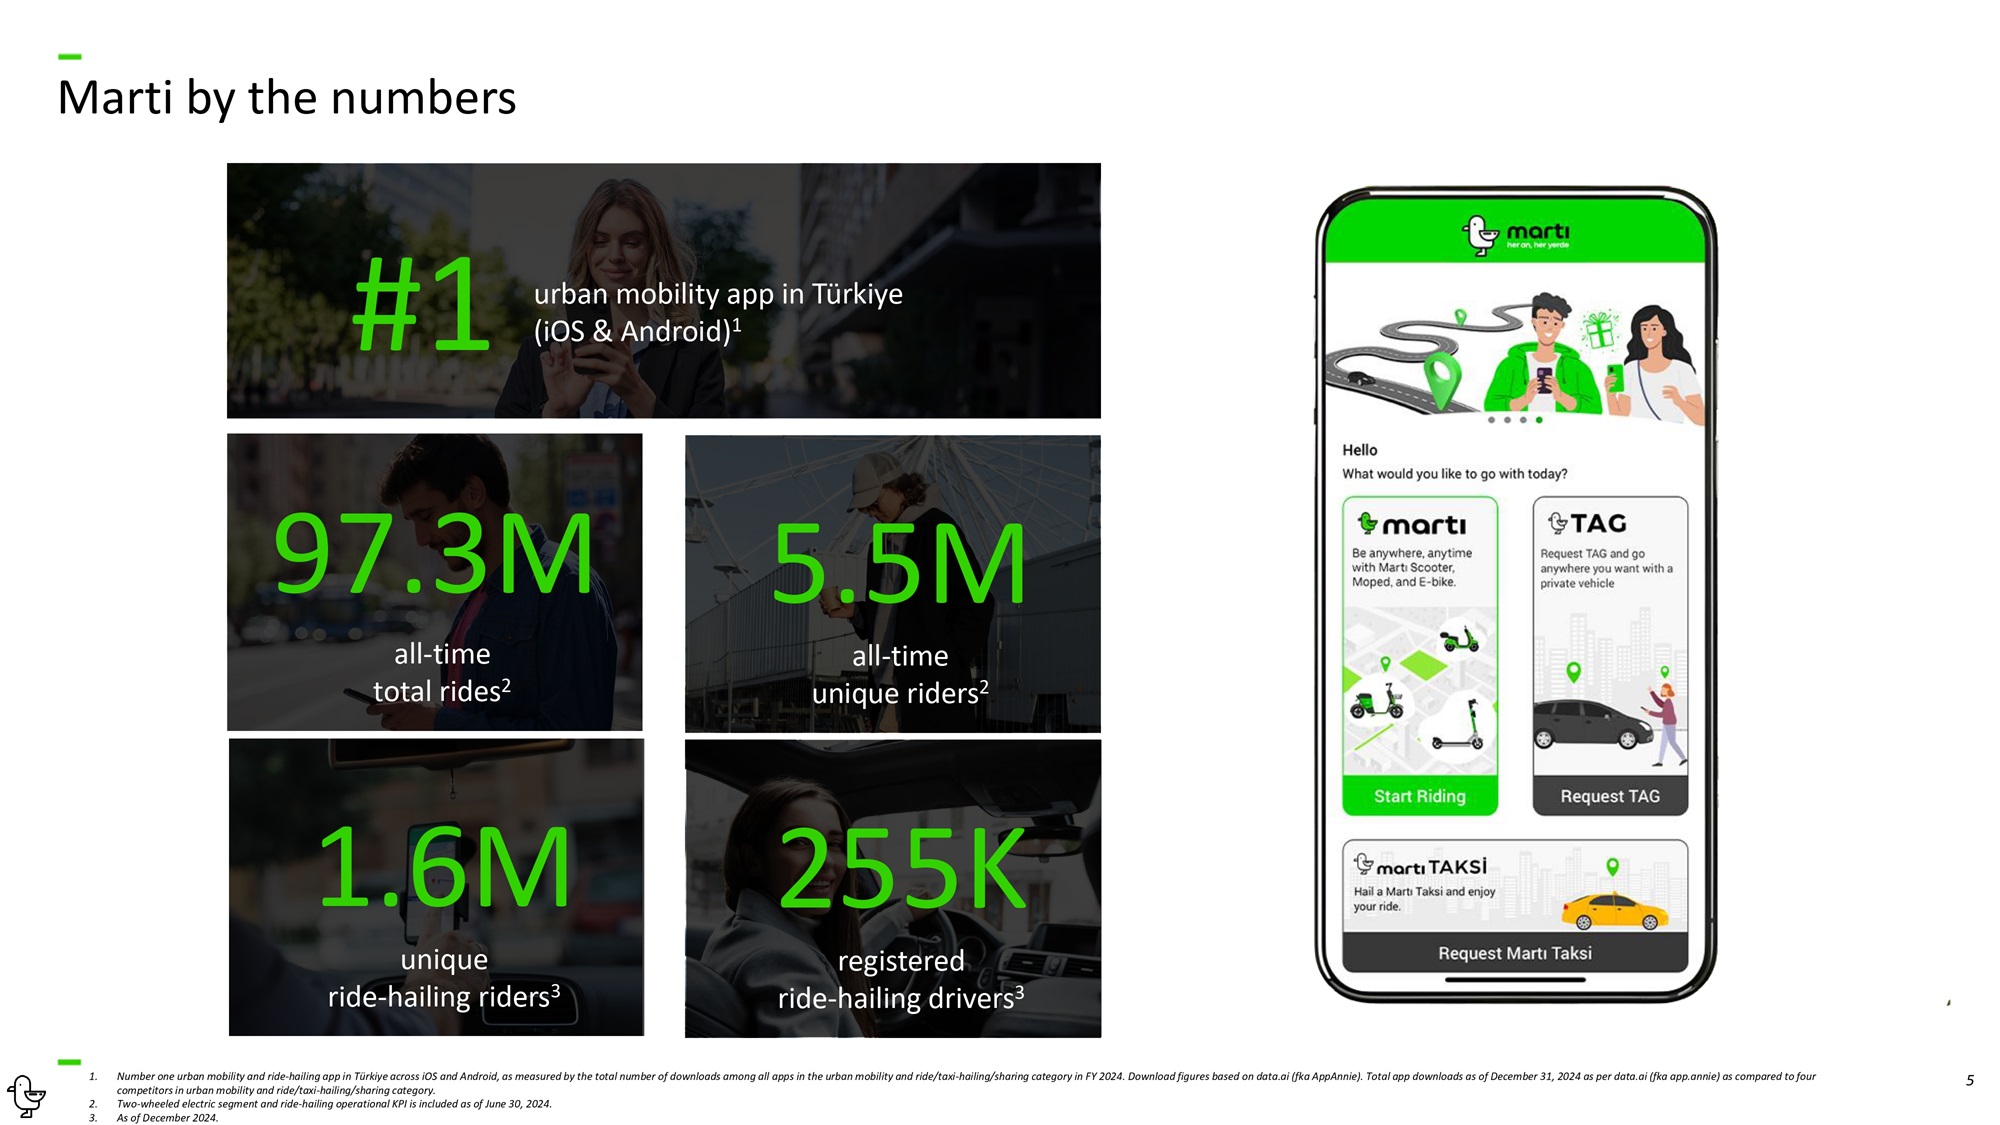
5 1. Number one urban mobility and ride - hailing app in Türkiye across iOS and Android, as measured by the total number of downloads among all apps in the urban mobility and ride/taxi - hailing/sharing category in FY 2024. Download figures based on data.ai (fka AppAnnie). Total app downloads as of December 31, 2024 as per data.ai (fka app.annie) as compared to four competitors in urban mobility and ride/taxi - hailing/sharing category. 2. Two - wheeled electric segment and ride - hailing operational KPI is included as of June 30, 2024. 3. As of December 2024. Marti by the numbers #1 urban mobility app in Türkiye (iOS & Android) 1 5.5M all - time unique riders 2 97.3M all - time total rides 2 1.6M unique ride - hailing riders 3 255K registered ride - hailing drivers 3

$ in millions $17.0 $25.0 $20.0 $16.6 $34.0 2021 2022 2023 2024E 2025E 6 1. Financial forecast as provided on December 2, 2024 Marti financials ($1.6) ($3.9) ($17.7) ($22.5) 2021 2022 2023 2024E 2025E Revenue > $25M Adj. EBITDA Ride - Hailing Investment Phase in the Absence of Monetization Ride - Hailing Monetization $3.0 2X

7 Investment Highlights The Opportunity Our Services Our Performance and Future Plans Who We Are 2025 Guidance Non - GAAP Reconciliations

8 Türkiye offers significant untapped mobility opportunities All of the top 20 world economies have an established mobility super app.
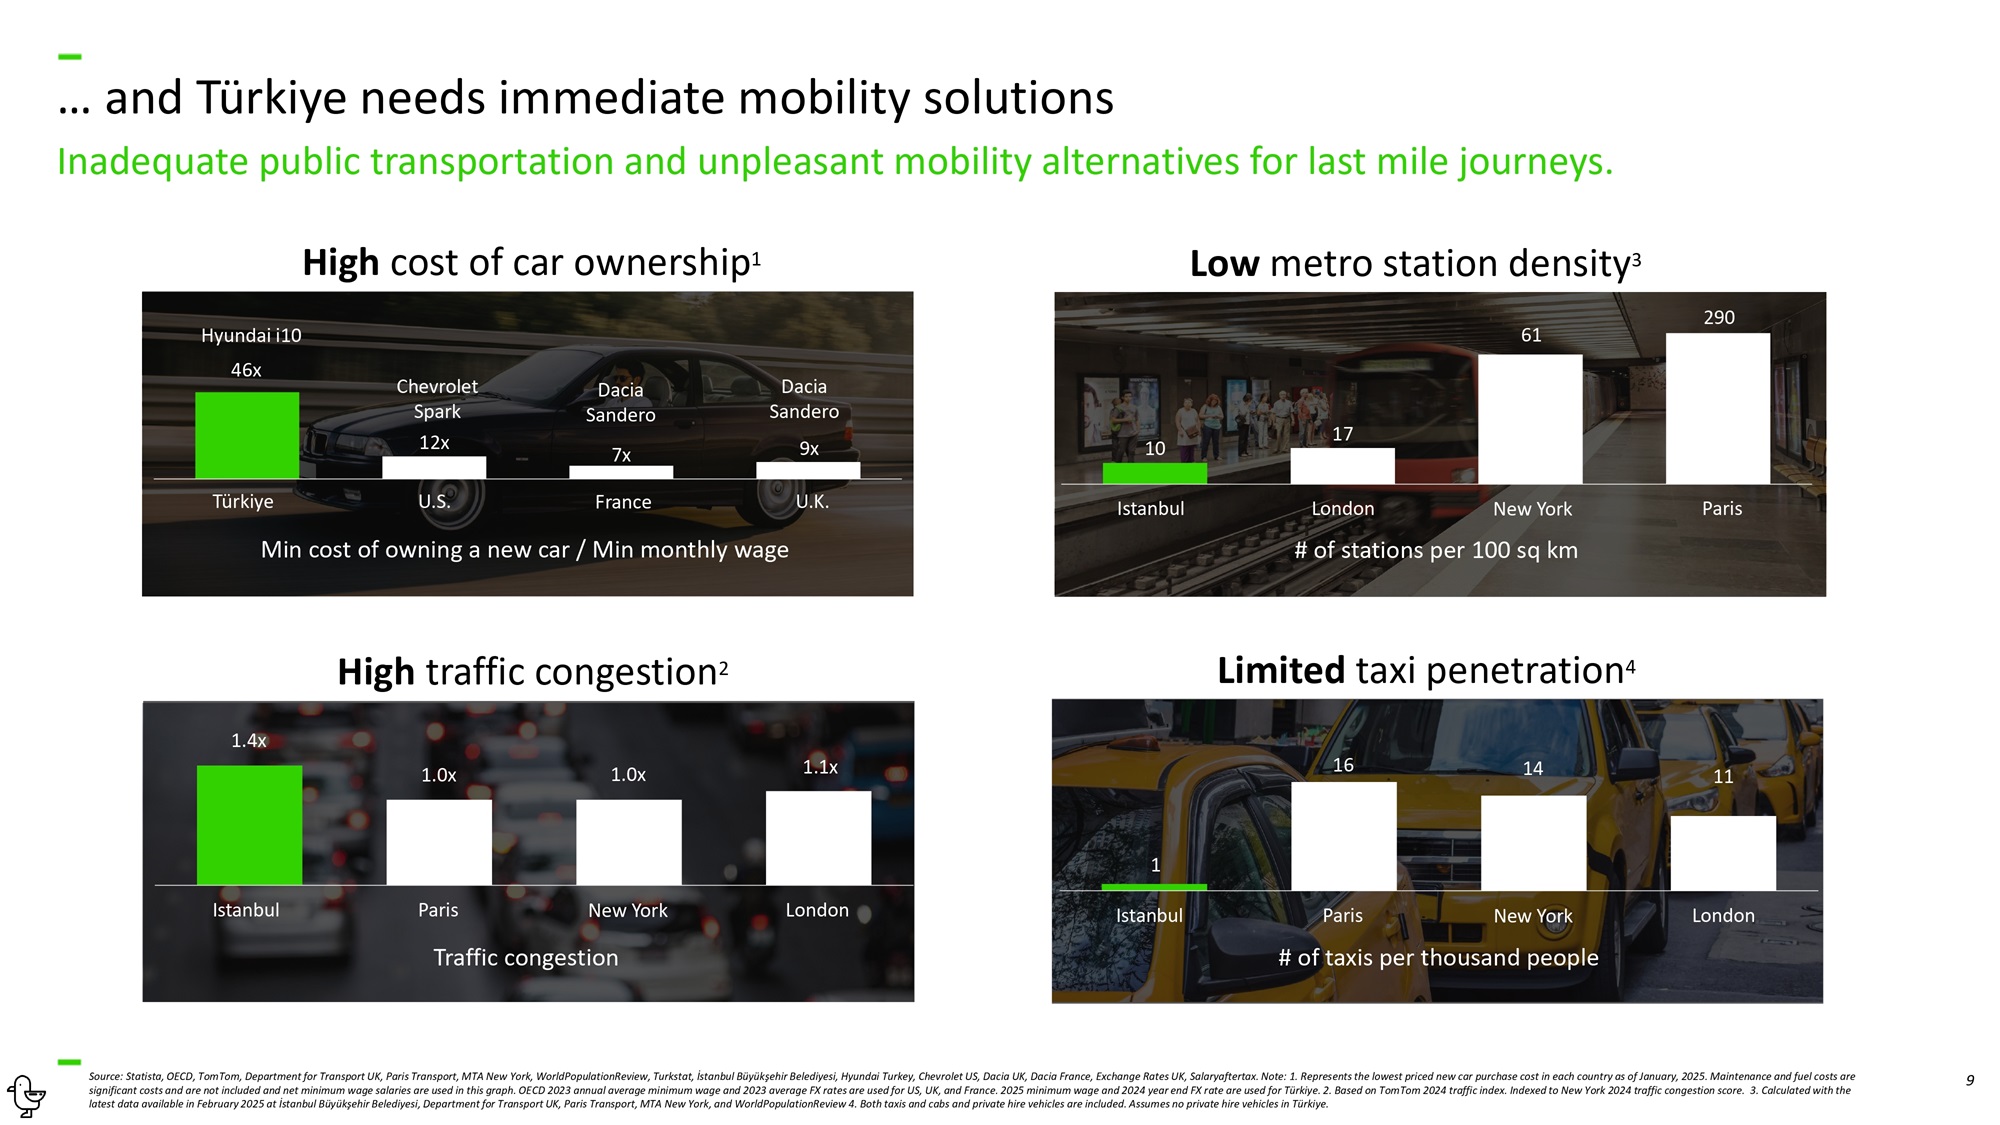
Türkiye U.S. France Min cost of owning a new car / Min monthly wage U.K. Chevrolet Spark 12x Dacia Sandero 7x Dacia Sandero 9x 9 Source: Statista, OECD, TomTom, Department for Transport UK, Paris Transport, MTA New York, WorldPopulationReview, Turkstat, İstanbul Büyükşehir Belediyesi, Hyundai Turkey, Chevrolet US, Dacia UK, Dacia France, Exchange Rates UK, Salaryaftertax. Note: 1. Represents the lowest priced new car purchase cost in each country as of January, 2025. Maintenance and fuel costs are significant costs and are not included and net minimum wage salaries are used in this graph. OECD 2023 annual average minimum wage and 2023 average FX rates are used for US, UK, and France. 2025 minimum wage and 2024 year end FX rate are used for Türkiye. 2. Based on TomTom 2024 traffic index. Indexed to New York 2024 traffic congestion score. 3. Calculated with the latest data available in February 2025 at İstanbul Büyükşehir Belediyesi, Department for Transport UK, Paris Transport, MTA New York, and WorldPopulationReview 4. Both taxis and cabs and private hire vehicles are included. Assumes no private hire vehicles in Türkiye. … and Türkiye needs immediate mobility solutions Inadequate public transportation and unpleasant mobility alternatives for last mile journeys. 1.4x 1.0x 1.0x 1.1x Istanbul London Paris New York Traffic congestion 10 17 Hyundai i10 61 46x 290 Istanbul Paris London New York # of stations per 100 sq km 1 16 14 11 Istanbul London Paris New York # of taxis per thousand people High cost of car ownership 1 Low metro station density 3 High traffic congestion 2 Limited taxi penetration 4
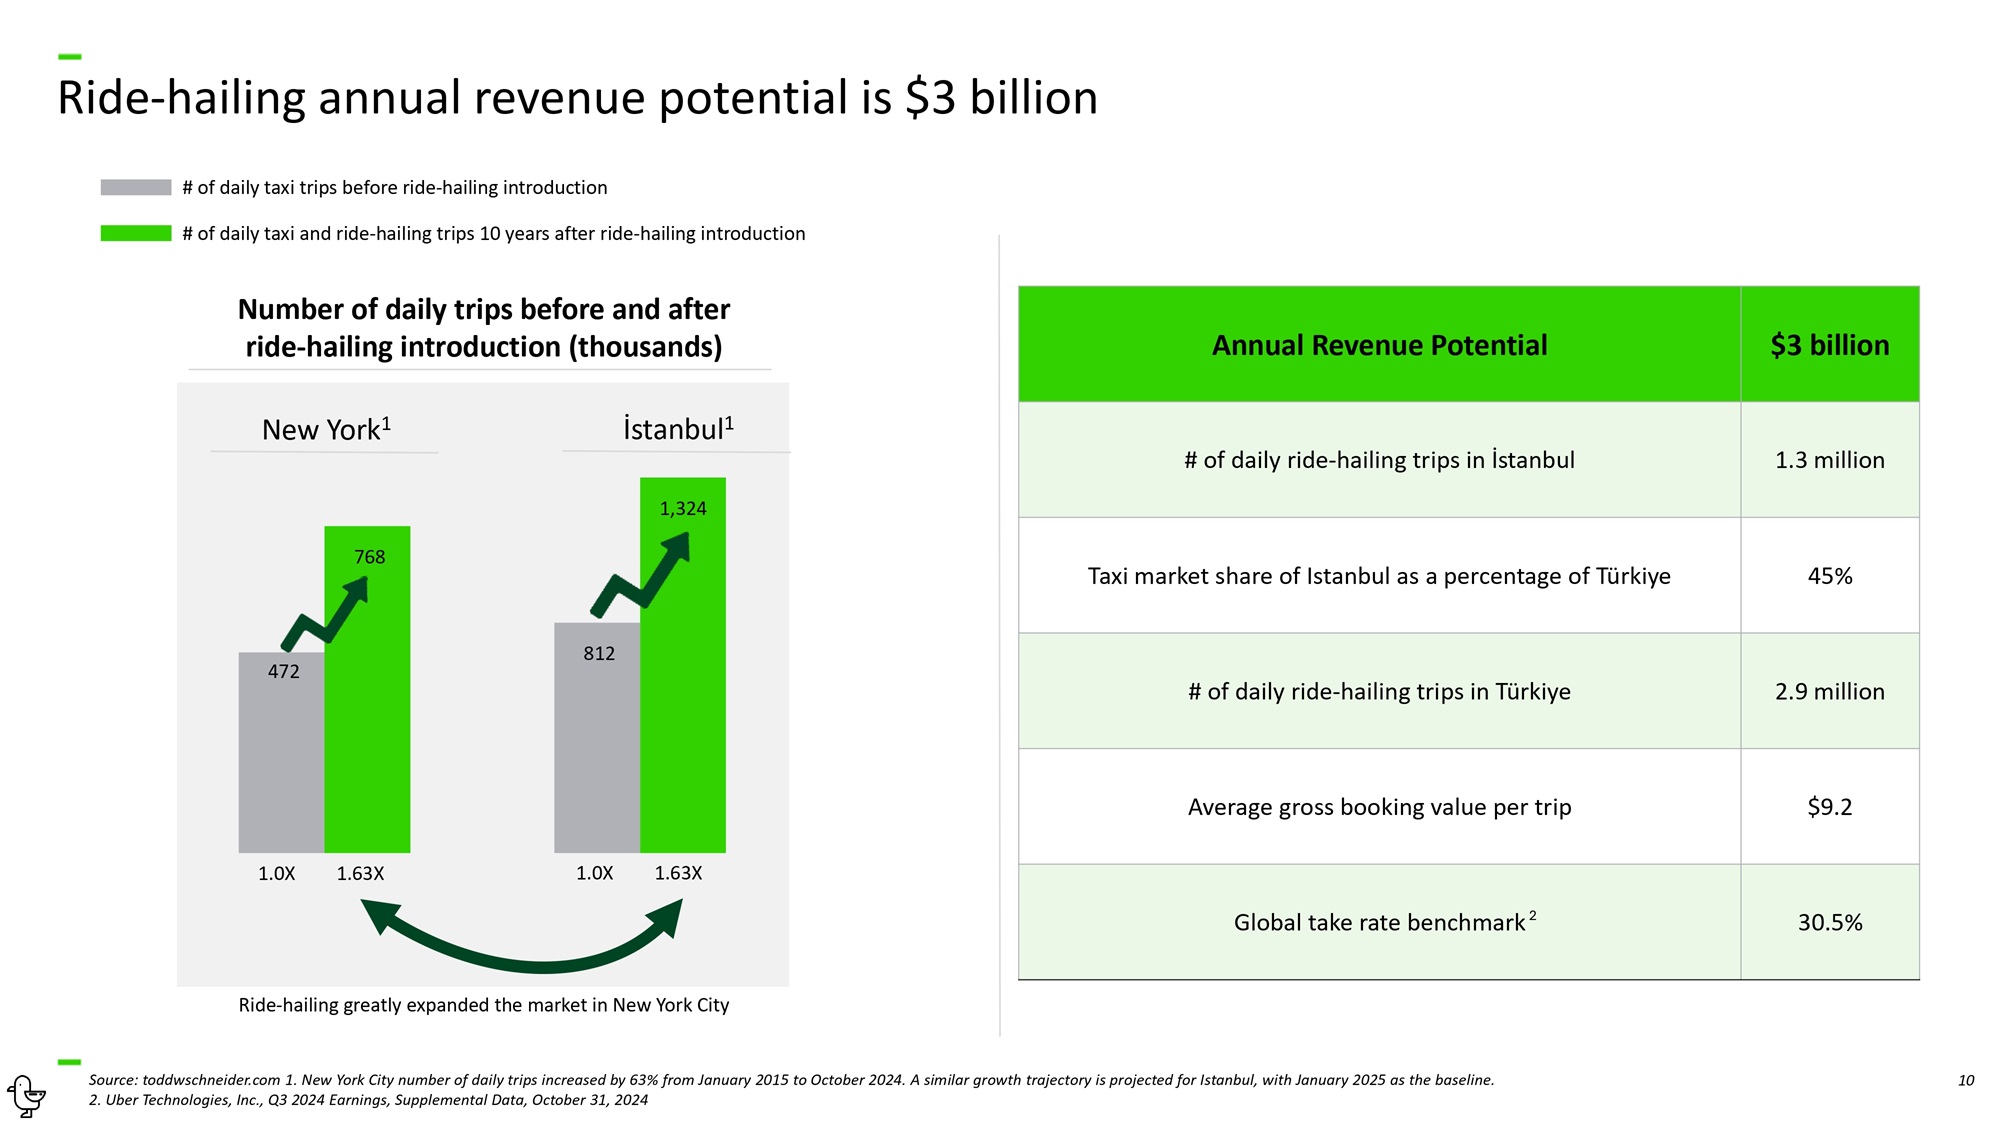
10 Ride - hailing annual revenue potential is $3 billion Source: toddwschneider.com 1. New York City number of daily trips increased by 63% from January 2015 to October 2024. A similar growth trajectory is projected for Istanbul, with January 2025 as the baseline. 2. Uber Technologies, Inc., Q3 2024 Earnings, Supplemental Data, October 31, 2024 812 472 # of daily taxi trips before ride - hailing introduction # of daily taxi and ride - hailing trips 10 years after ride - hailing introduction Number of daily trips before and after ride - hailing introduction (thousands) New York 1 İstanbul 1 1,324 768 1.0X 1.63X 1.0X 1.63X $3 billion Annual Revenue Potential 1.3 million # of daily ride - hailing trips in İstanbul 45% Taxi market share of Istanbul as a percentage of Türkiye 2.9 million # of daily ride - hailing trips in Türkiye $9.2 Average gross booking value per trip 30.5% Global take rate benchmark 2 Ride - hailing greatly expanded the market in New York City
11 Investment Highlights The Opportunity Our Services Our Performance and Future Plans Who We Are 2025 Guidance Non - GAAP Reconciliations
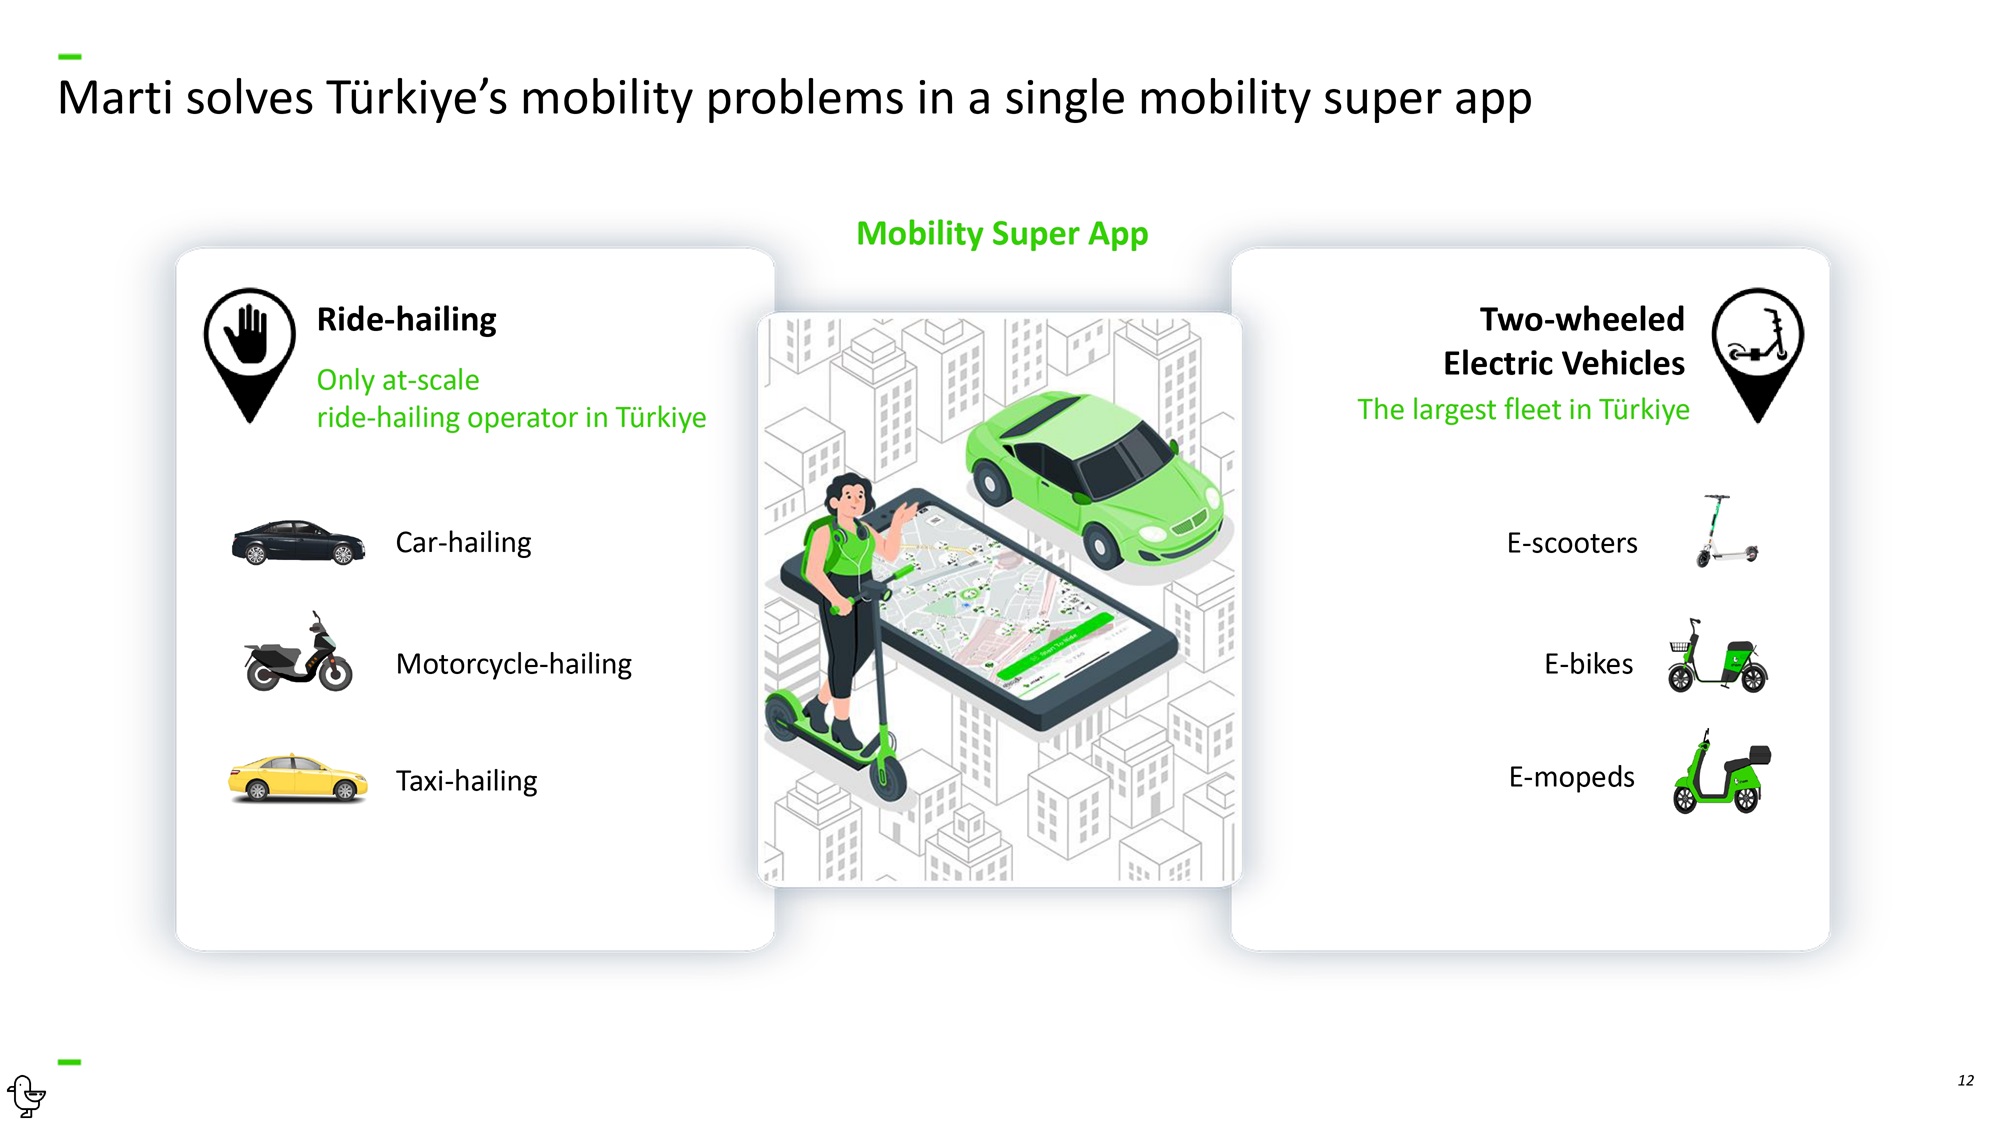
12 Marti solves Türkiye’s mobility problems in a single mobility super app Car - hailing Motorcycle - hailing Taxi - hailing Ride - hailing Only at - scale ride - hailing operator in Türkiye E - mopeds E - scooters E - bikes Two - wheeled Electric Vehicles The largest fleet in Türkiye Mobility Super App
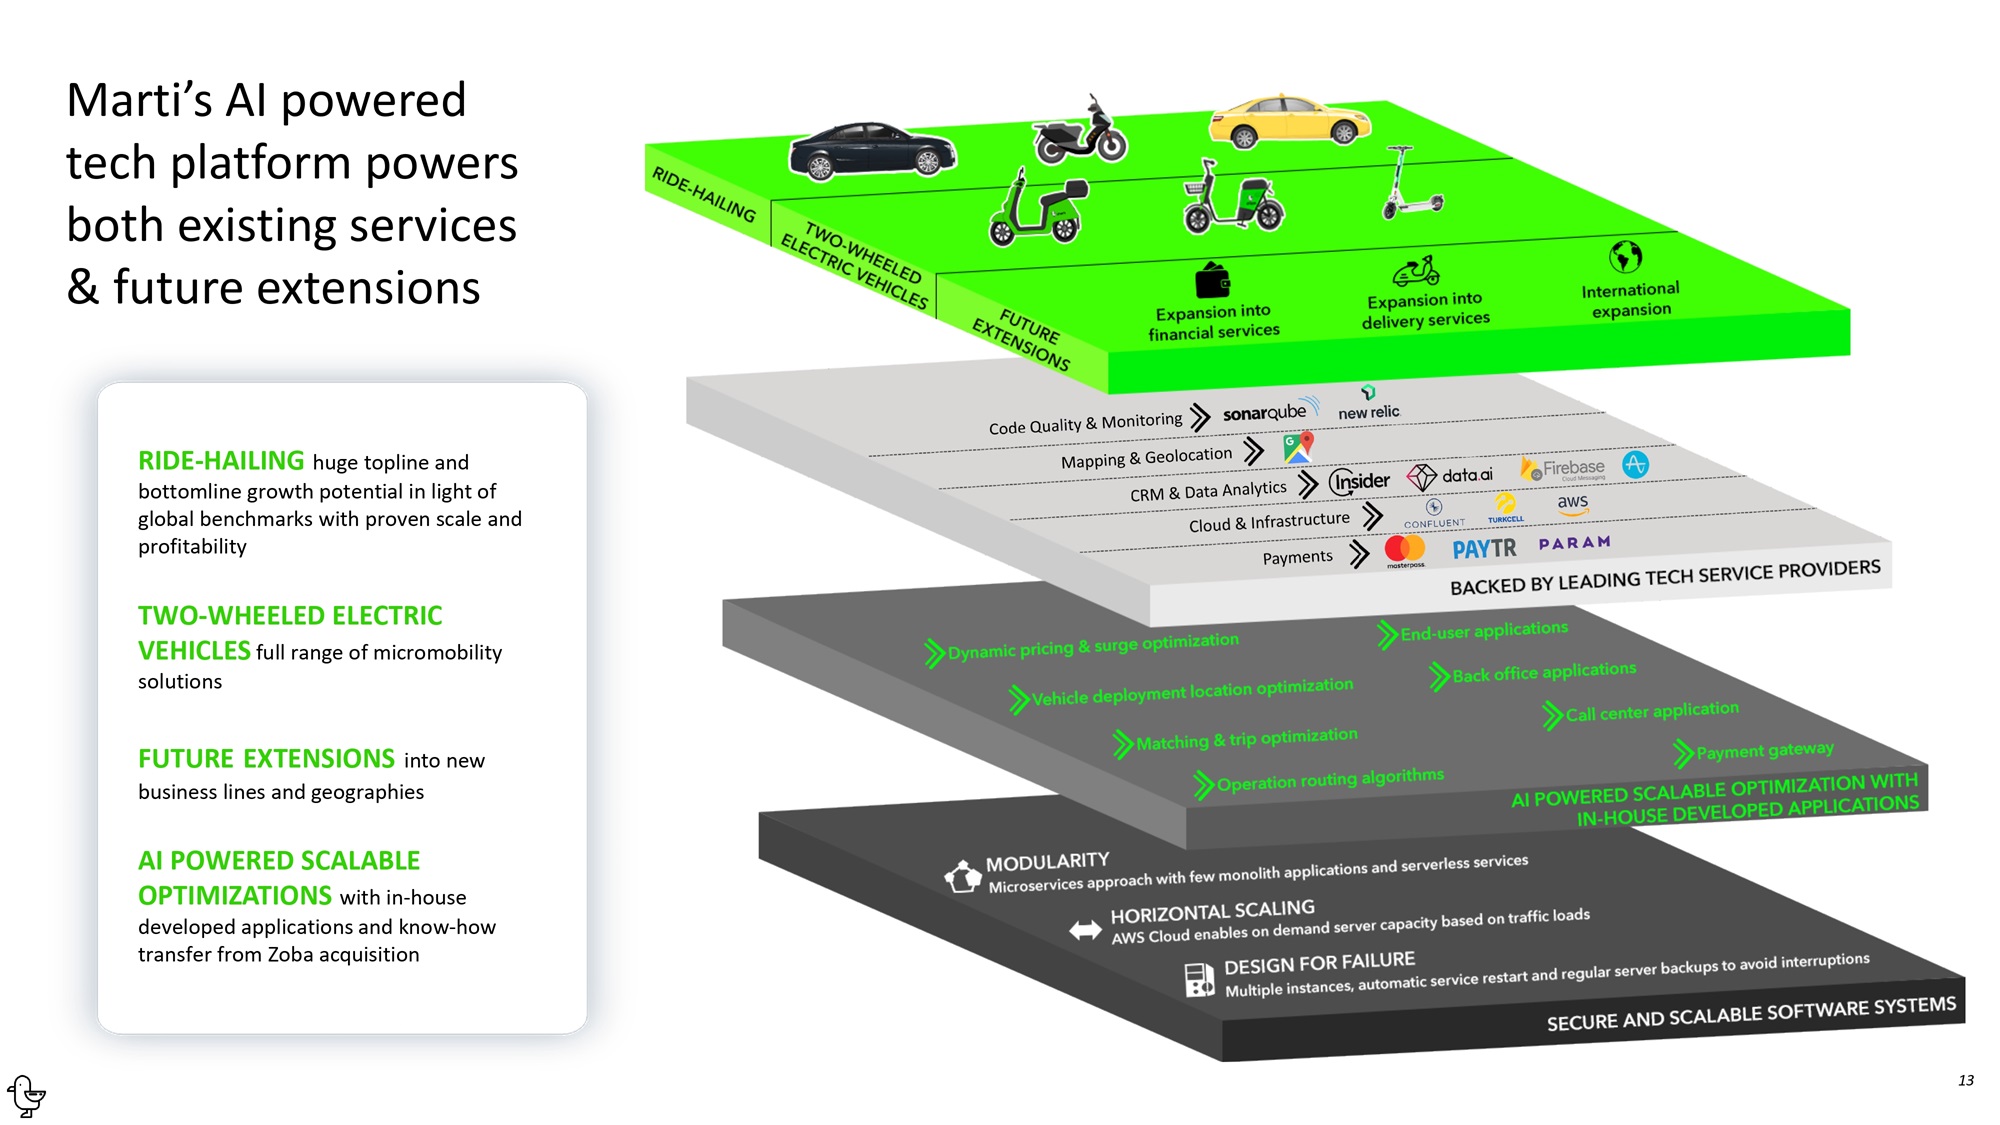
13 RIDE - HAILING huge topline and bottomline growth potential in light of global benchmarks with proven scale and profitability TWO - WHEELED ELECTRIC VEHICLES full range of micromobility solutions FUTURE EXTENSIONS into new business lines and geographies AI POWERED SCALABLE OPTIMIZATIONS with in - house developed applications and know - how transfer from Zoba acquisition Marti’s AI powered tech platform powers both existing services & future extensions
14 Investment Highlights The Opportunity Our Services Our Performance and Future Plans Who We Are 2025 Guidance Non - GAAP Reconciliations
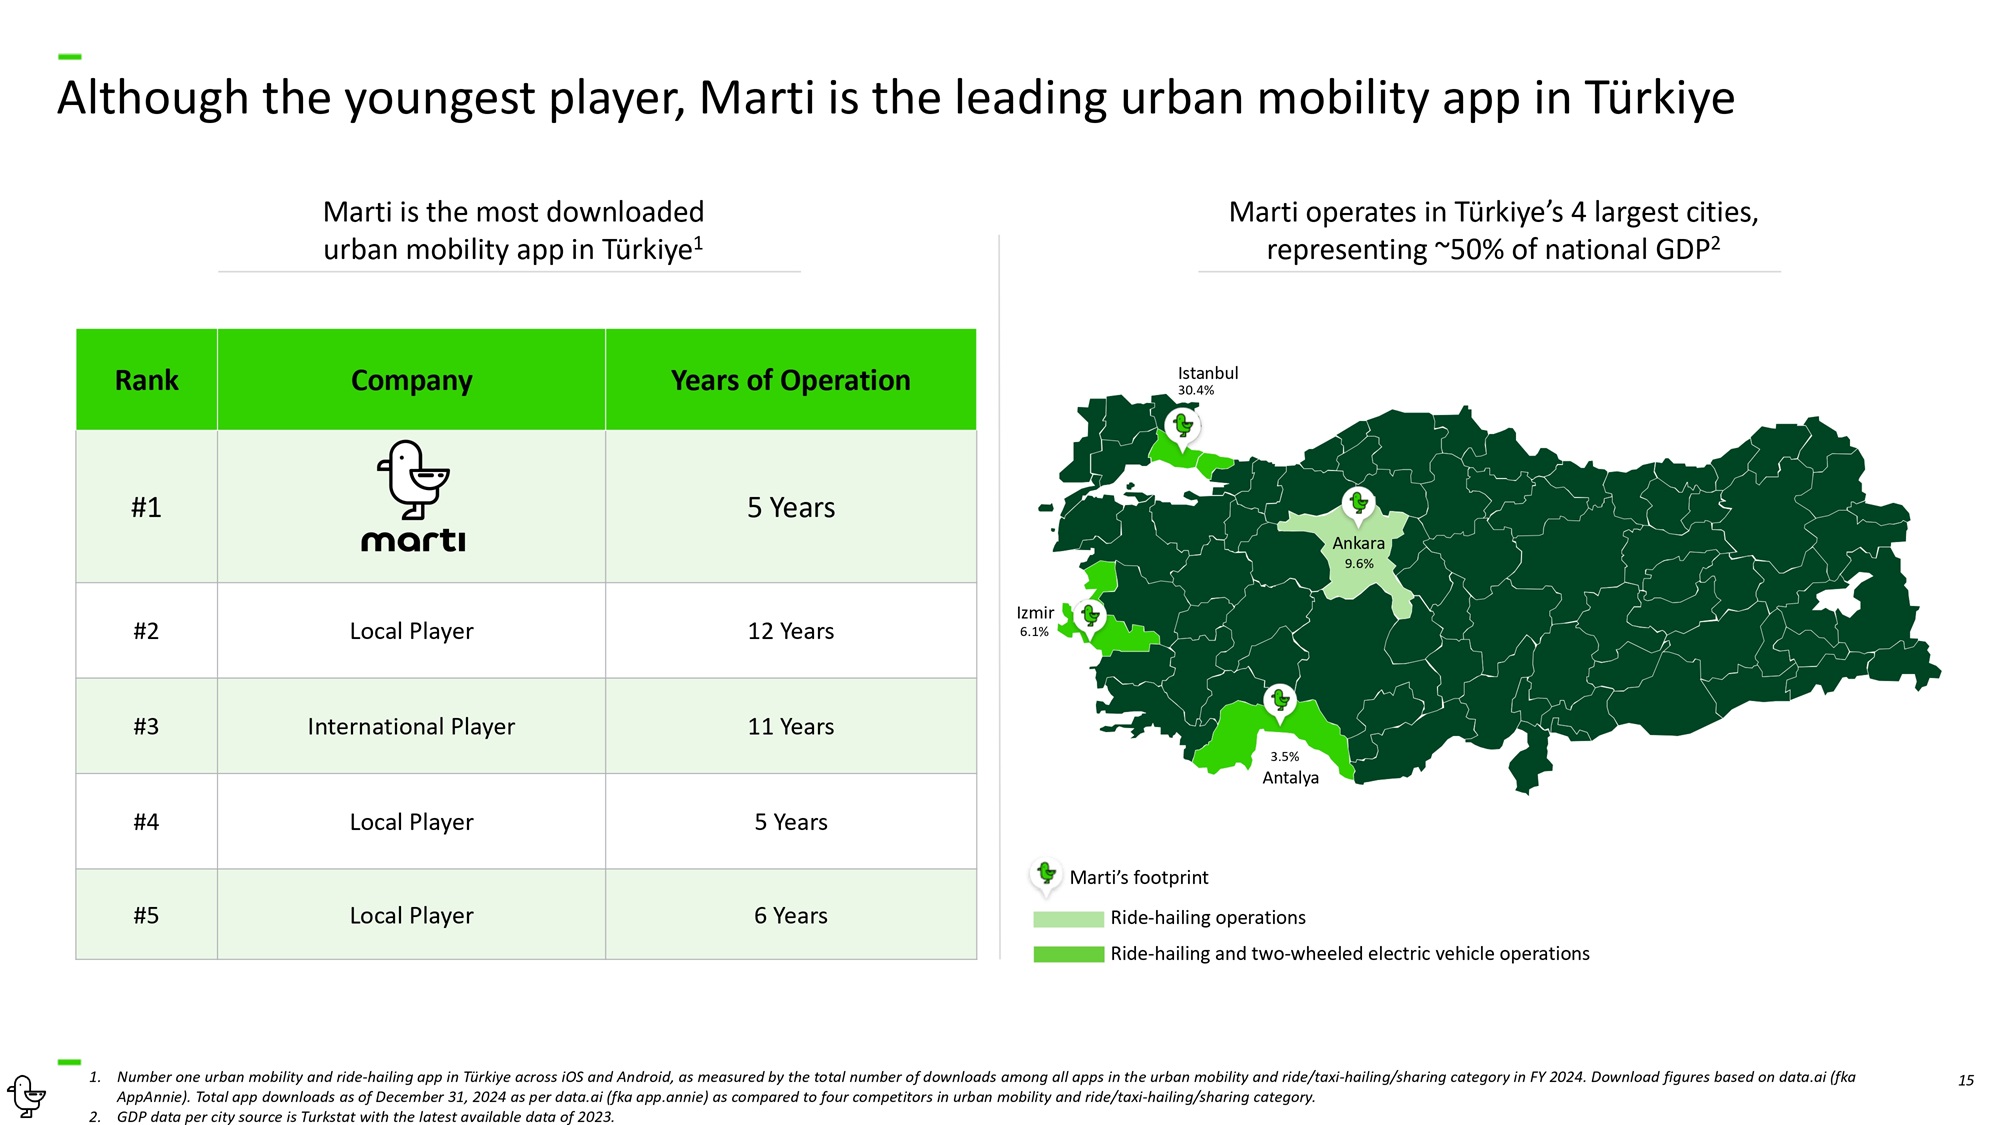
15 Although the youngest player, Marti is the leading urban mobility app in Türkiye 1. Number one urban mobility and ride - hailing app in Türkiye across iOS and Android, as measured by the total number of downloads among all apps in the urban mobility and ride/taxi - hailing/sharing category in FY 2024. Download figures based on data.ai (fka AppAnnie). Total app downloads as of December 31, 2024 as per data.ai (fka app.annie) as compared to four competitors in urban mobility and ride/taxi - hailing/sharing category. 2. GDP data per city source is Turkstat with the latest available data of 2023. Years of Operation Company Rank 5 Years #1 12 Years Local Player #2 11 Years International Player #3 5 Years Local Player #4 6 Years Local Player #5 Marti is the most downloaded urban mobility app in Türkiye 1 Marti operates in Türkiye’s 4 largest cities, representing ~50% of national GDP 2 Marti’s footprint Ride - hailing operations Ride - hailing and two - wheeled electric vehicle operations Istanbul 30.4% Ankara 9.6% Izmir 6.1% 3.5% Antalya
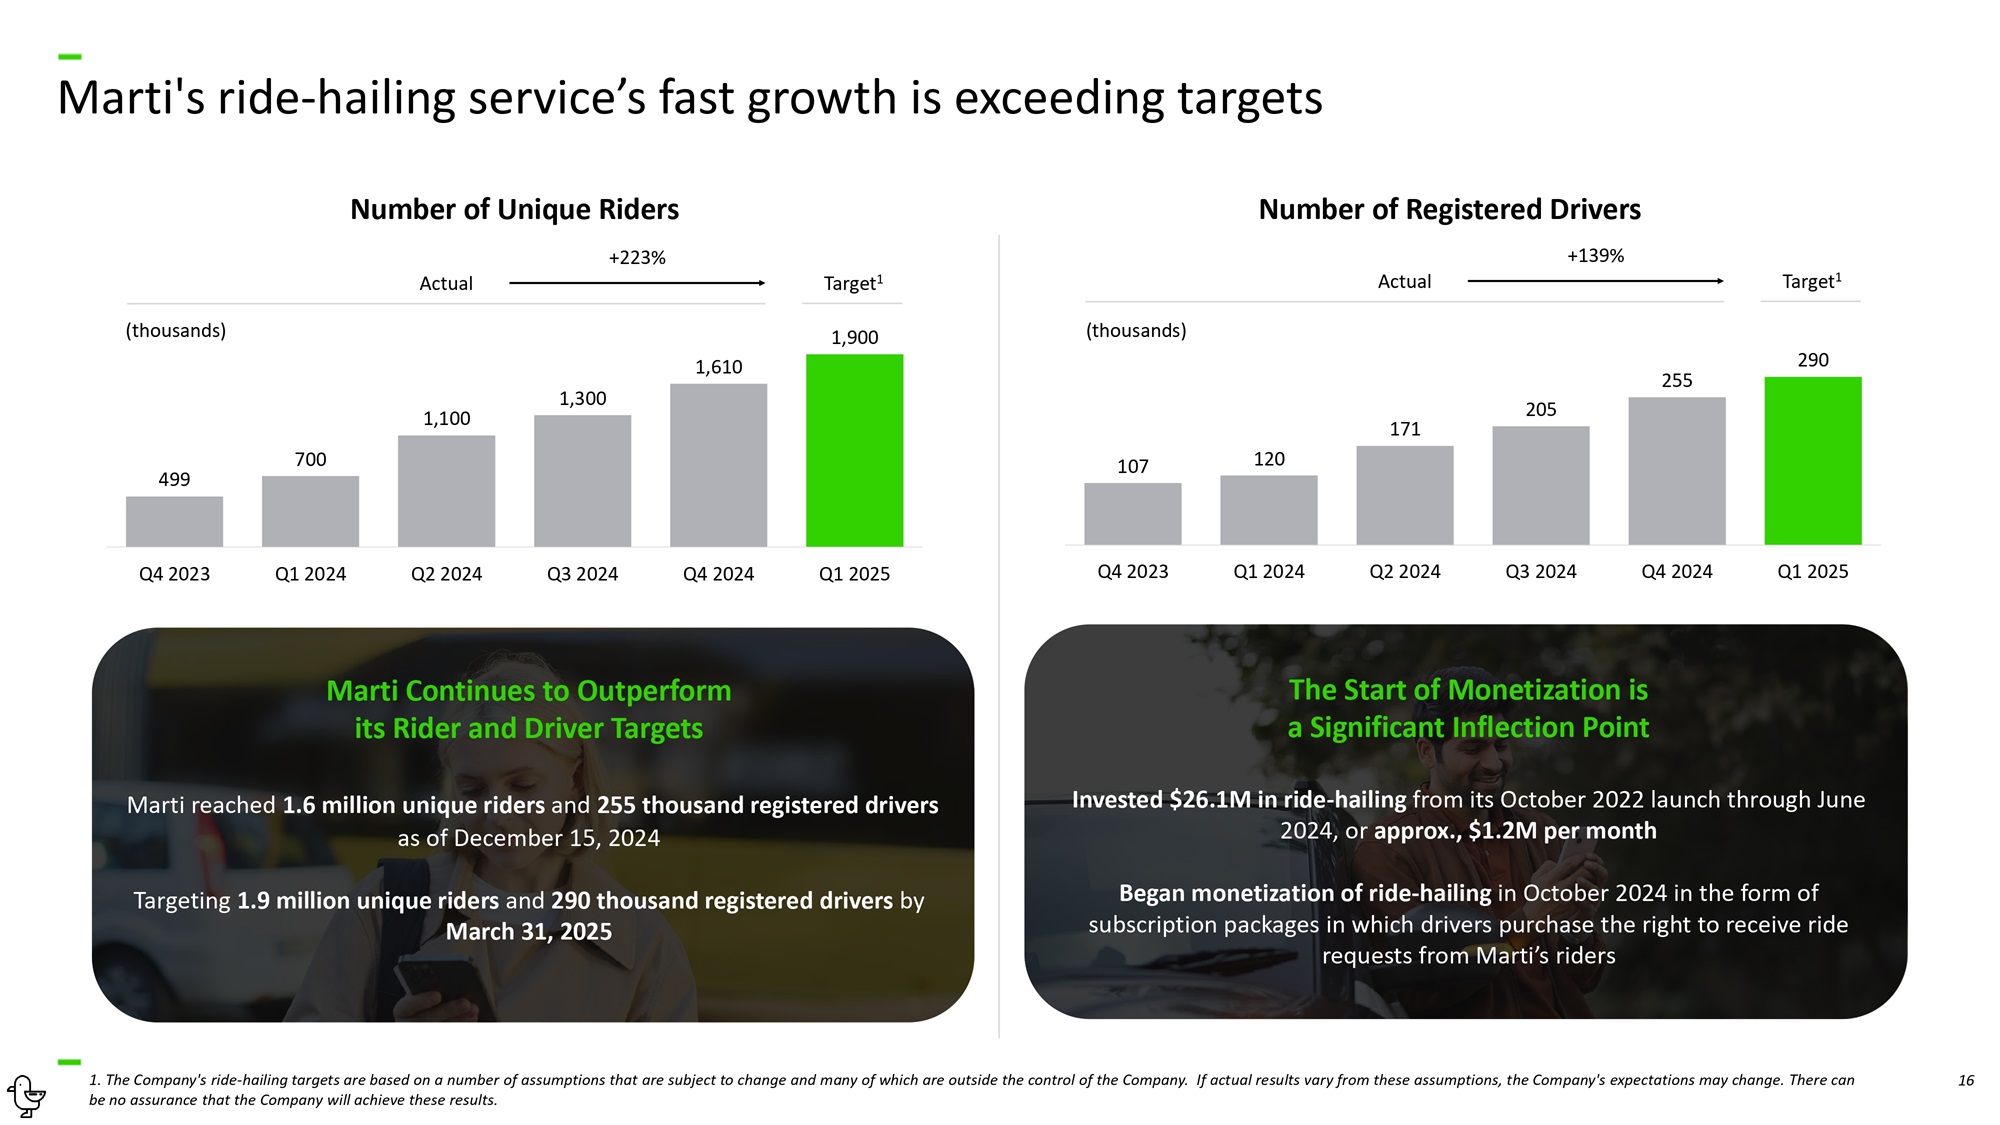
16 Marti's ride - hailing service’s fast growth is exceeding targets 1. The Company's ride - hailing targets are based on a number of assumptions that are subject to change and many of which are outside the control of the Company. If actual results vary from these assumptions, the Company's expectations may change. There can be no assurance that the Company will achieve these results. The Start of Monetization is a Significant Inflection Point Invested $26.1M in ride - hailing from its October 2022 launch through June 2024, or approx., $1.2M per month Began monetization of ride - hailing in October 2024 in the form of subscription packages in which drivers purchase the right to receive ride requests from Marti’s riders 499 700 1,100 1,300 1,610 1,900 Q4 2023 Q1 2024 Q2 2024 Q3 2024 Q4 2024 Q1 2025 Target 1 Number of Unique Riders +223% Actual Marti Continues to Outperform its Rider and Driver Targets Marti reached 1.6 million unique riders and 255 thousand registered drivers as of December 15, 2024 Targeting 1.9 million unique riders and 290 thousand registered drivers by March 31, 2025 107 120 171 205 255 290 Q4 2023 Q1 2024 Q2 2024 Q3 2024 Q4 2024 Q1 2025 Target 1 Number of Registered Drivers +139% Actual (thousands) (thousands)
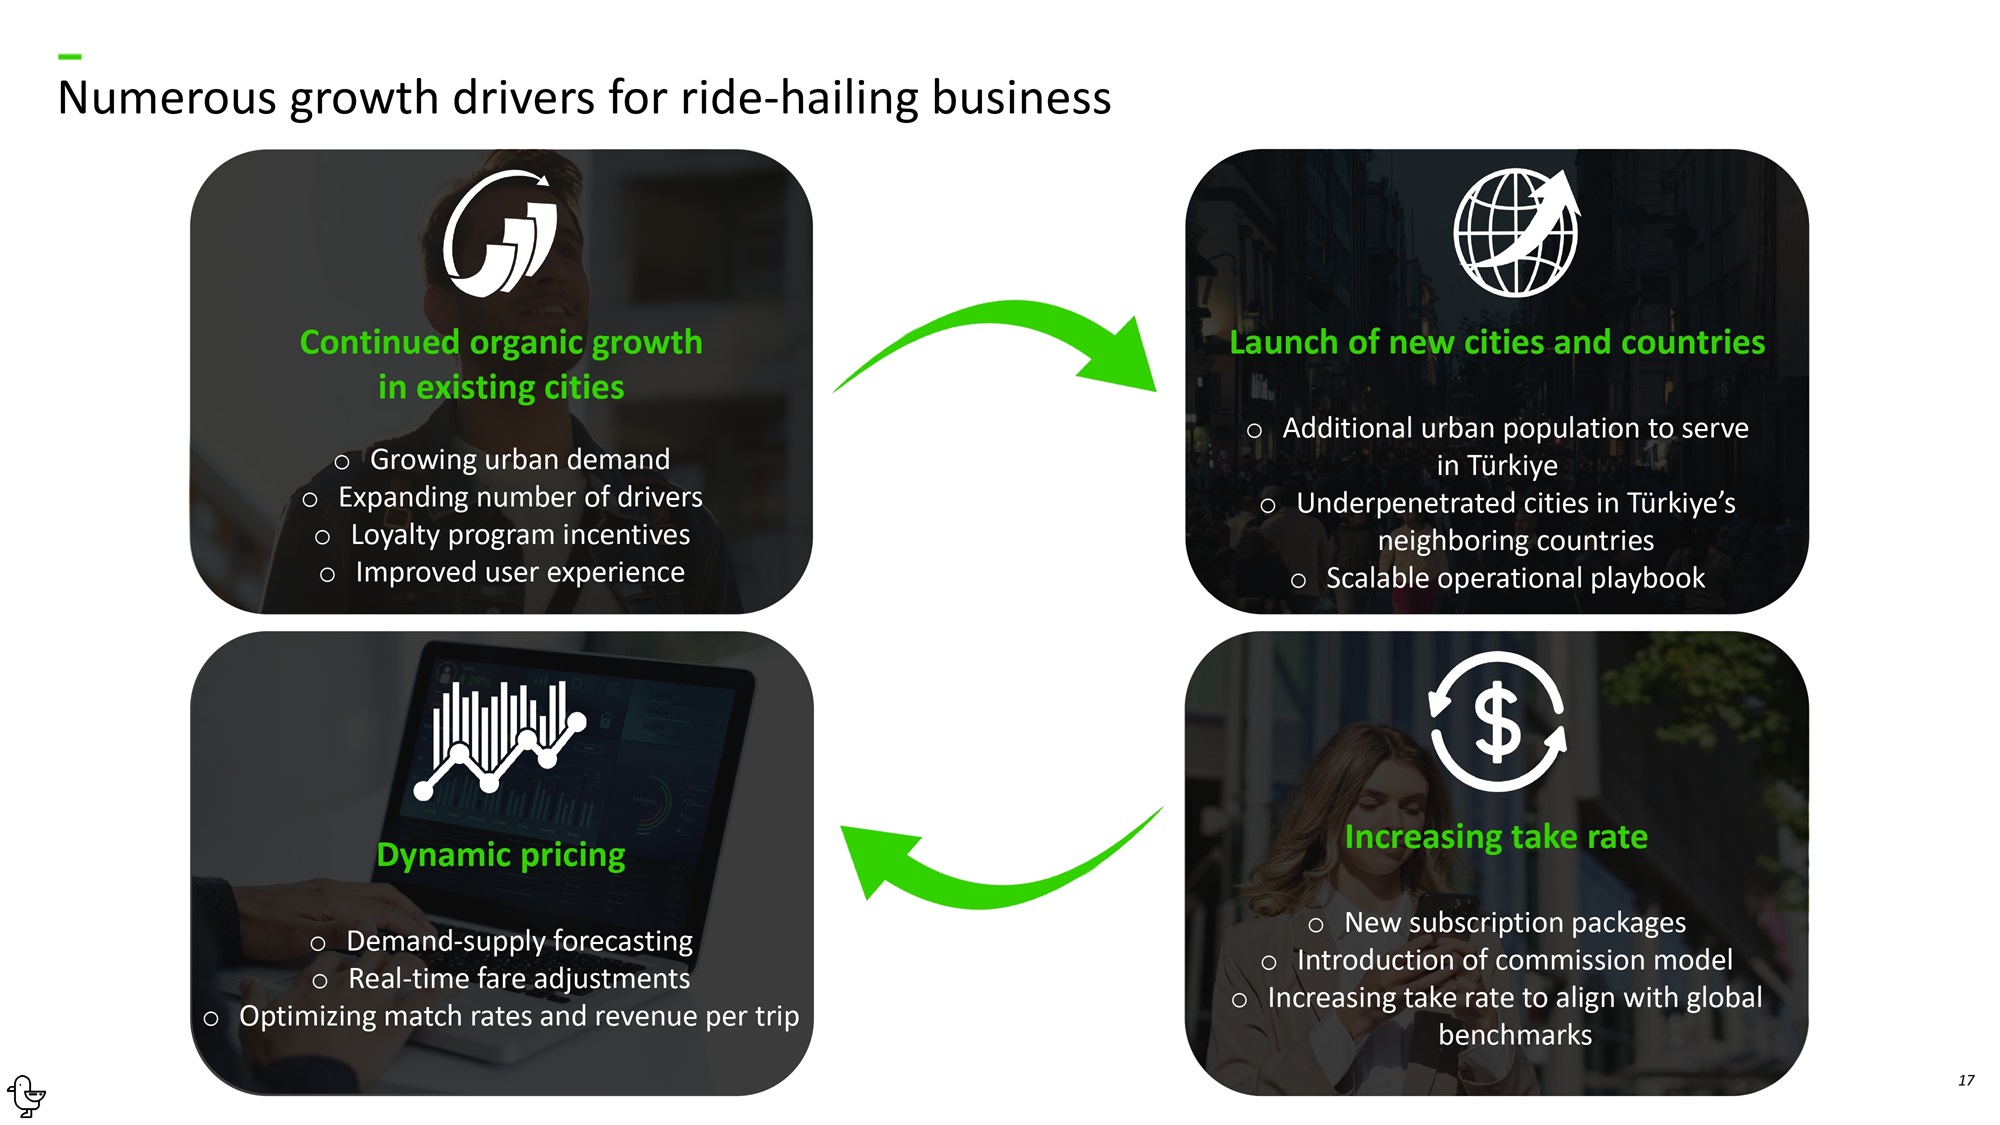
Continued organic growth in existing cities o Growing urban demand o Expanding number of drivers o Loyalty program incentives o Improved user experience Dynamic pricing o Demand - supply forecasting o Real - time fare adjustments o Optimizing match rates and revenue per trip Launch of new cities and countries o Additional urban population to serve in Türkiye o Underpenetrated cities in Türkiye’s neighboring countries o Scalable operational playbook Increasing take rate o New subscription packages o Introduction of commission model o Increasing take rate to align with global benchmarks 17 Numerous growth drivers for ride - hailing business

18 Marti is focused on operational efficiency in its two - wheeled electric vehicle business Operational efficiency projects decreased total cost of revenues by 35% y - o - y, despite managing a similarly sized fleet Operational developments o Operational efficiency projects produced a 35% year - over - year reduction in the total cost of revenues: o Optimizing field staff, repair and maintenance personnel, and logistics vehicle counts o On - field repairs o Increased usage of refurbished electronic and spare parts o Maintained monthly theft and vandalism rate below 0.1% of fleet o Will evaluate the opportunity to expand our fleet no earlier than the summer of 2026 Cost of revenues, excl. fleet depreciation (USD, thousands) Average number of v ehicles d eployed (thousands ) 8,734 5,711 34 35 27 28 29 30 31 32 33 34 35 10,000 9,000 8,000 7,000 6,000 5,000 4,000 3,000 2,000 1,000 0 1H 2023 1H 2024

19 Marti is focused on operational efficiency in its two - wheeled electric vehicle business Daily rides per vehicle deployed Operational efficiencies provided by Zoba acquisition o In February 2024, we acquired all of the intellectual property and software assets of Zoba, the leading AI - powered SaaS platform offering dynamic fleet optimization algorithms for two - wheeled electric vehicle operators, optimizing our : o Vehicle deployment locations o Vehicle rebalancing decisions o Battery swapping routing o Repair and maintenance routing o In Q 2 2024, our vehicles deployed with Zoba produced 2.4x higher daily rides per vehicle than non - Zoba deployment vehicles o Additional revenue generated by Zoba has already paid back its acquisition cost within 6 months of purchase o Future focus of scaling vehicles deployed with Zoba from current ~50% to 100% of deployments, and applying its logistics vehicle routing recommendations Q1 2024 Q2 2024 1X 1.7X 1X 2.4X Daily rides per vehicle deployed without Zoba Daily rides per vehicle deployed with Zoba

20 Numerous opportunities to expand beyond mobility and beyond Türkiye Expansion into financial services in Türkiye o Parcel deliveries o Restaurant deliveries o Grocery deliveries o Initially in transportation o Organically o M&A using public company currency o Wallet 1 o Peer - to - peer transfers 1 o Lending Expansion into delivery services in Türkiye International expansion 1. Proof - of - concept in place.

21 Investment Highlights The Opportunity Our Services Our Performance and Future Plans Who We Are 2025 Guidance Non - GAAP Reconciliations

22 Proven leadership with a track record of successful entrepreneurship Daniel Freifeld Director Co - founder of hedge fund Callaway Capital Senior Advisor to Special Envoy at U.S. Department of State and Program coordinator at U.S. Department of Defense Oğuz Alper Öktem Founder, CEO, Director 3x entrepreneur University of Chicago London School of Economics Cankut Durgun Co - founder, President, Director 3x entrepreneur MIT Stanford University Alex Spiro Director Leading advisor to businessmen and politicians Harvard University Kerry Healey Director Lieutenant governor of Massachusetts President Emerita of Babson College Harvard University Douglas Lute Director U.S. Ambassador to NATO Deputy National Security Advisor Harvard University Agah Ugur Director CEO of one of Türkiye's largest conglomerates, Borusan Holding Board member at Pegasus Airlines and Coca - Cola MENAT
23 Well - capitalized to execute strategy, with backing from U.S. and European institutional investors

24 Investment Highlights The Opportunity Our Services Our Performance and Future Plans Who We Are 2025 Guidance Non - GAAP Reconciliations
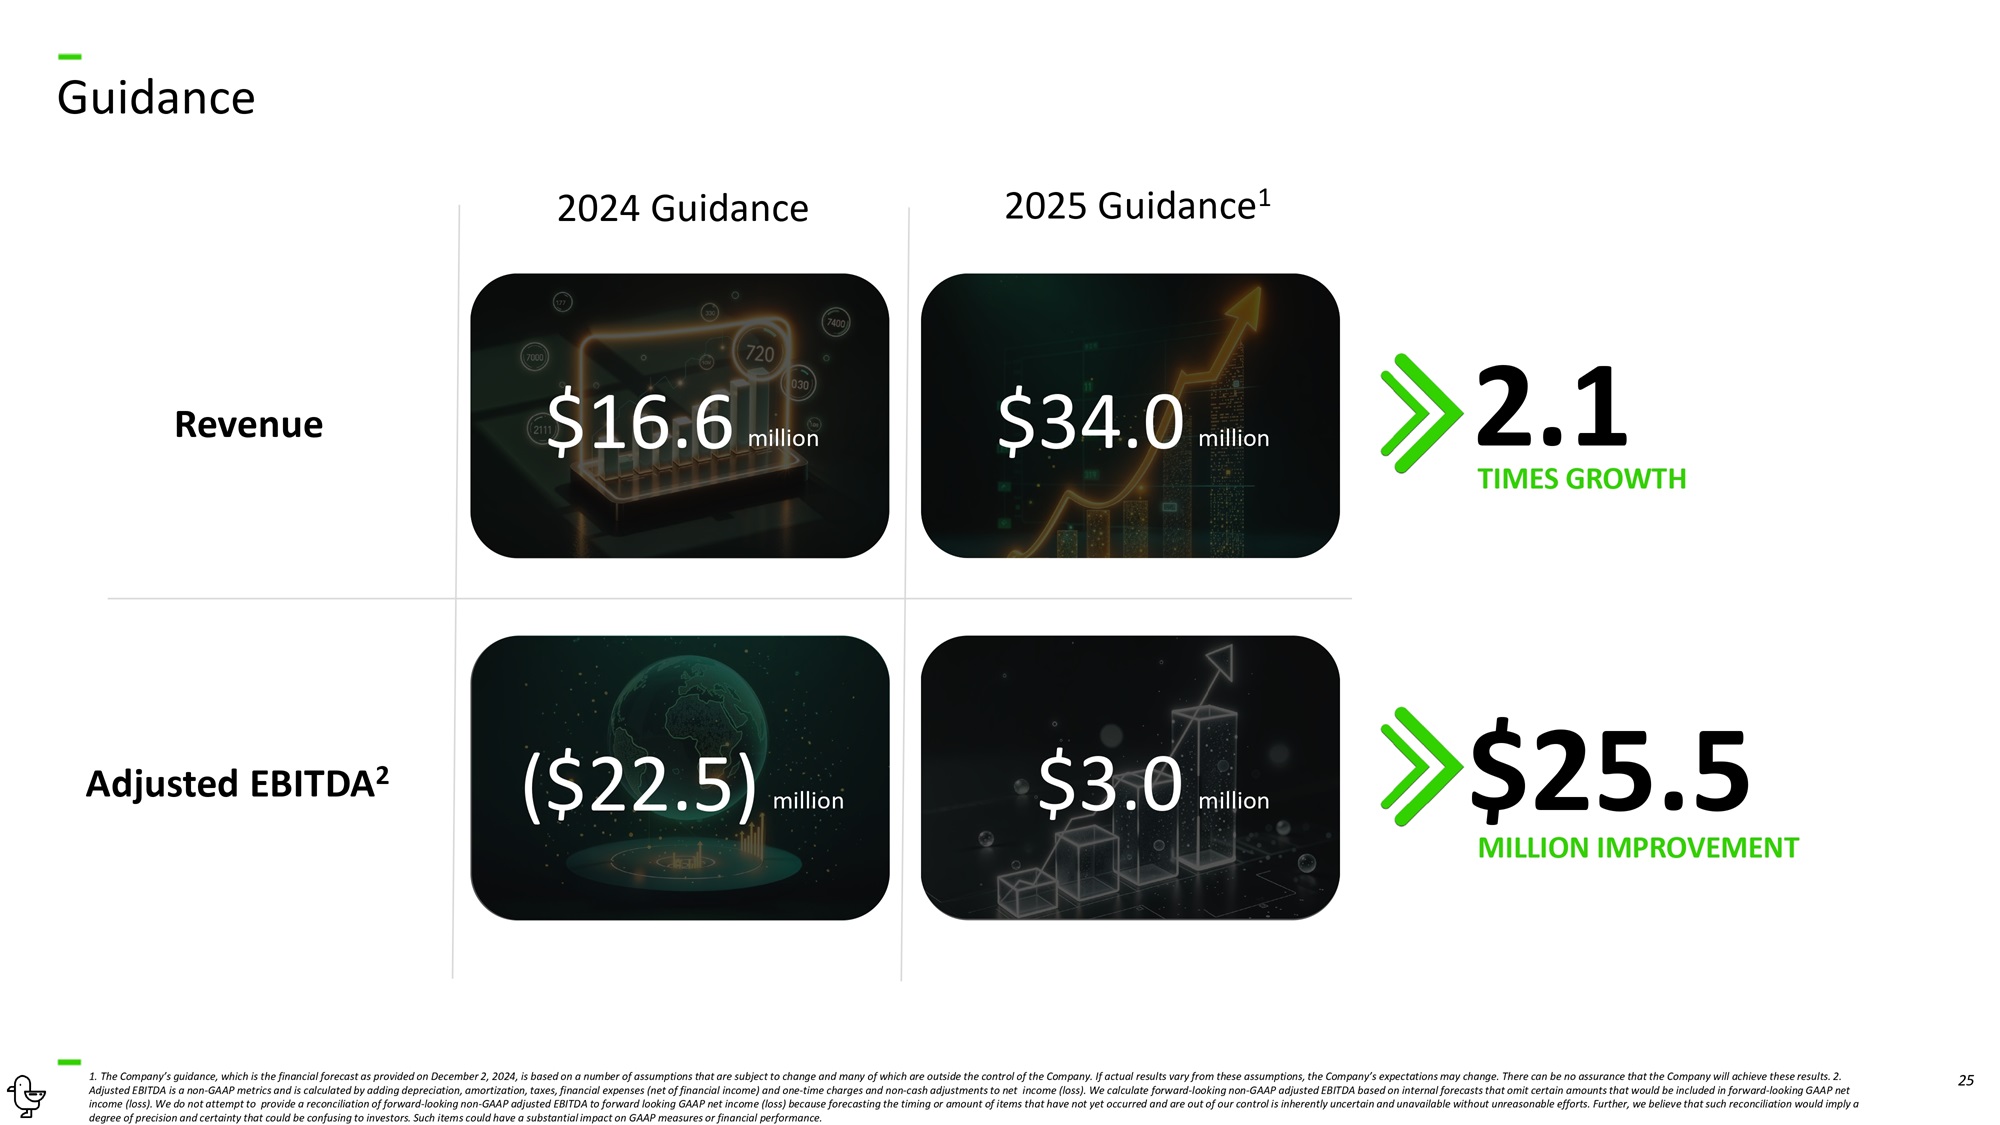
25 Guidance 1. The Company’s guidance, which is the financial forecast as provided on December 2, 2024, is based on a number of assumptions that are subject to change and many of which are outside the control of the Company. If actual results vary from these assumptions, the Company’s expectations may change. There can be no assurance that the Company will achieve these results. 2. Adjusted EBITDA is a non - GAAP metrics and is calculated by adding depreciation, amortization, taxes, financial expenses (net of financial income) and one - time charges and non - cash adjustments to net income (loss). We calculate forward - looking non - GAAP adjusted EBITDA based on internal forecasts that omit certain amounts that would be included in forward - looking GAAP net income (loss). We do not attempt to provide a reconciliation of forward - looking non - GAAP adjusted EBITDA to forward looking GAAP net income (loss) because forecasting the timing or amount of items that have not yet occurred and are out of our control is inherently uncertain and unavailable without unreasonable efforts. Further, we believe that such reconciliation would imply a degree of precision and certainty that could be confusing to investors. Such items could have a substantial impact on GAAP measures or financial performance. Revenue Adjusted EBITDA 2 2024 Guidance $34.0 million 2025 Guidance 1 $16.6 million $3.0 million ($22.5) million 2.1 TIMES GROWTH $25.5 MILLION IMPROVEMENT
26 Investment Highlights The Opportunity Our Services Our Performance and Future Plans Who We Are 2025 Guidance Non - GAAP Reconciliations

27 Non - GAAP Reconciliations - Consolidated December 31, 2023 December 31, 2022 December 31, 2021 (in thousands $) (33,815) (14,246) (14,472) Net loss 10,045 9,097 5,473 Depreciation and amortization - - - - 888 Income tax expense (3,561) (2,567) (180) Financial income 6,773 1,932 4,712 Financial expense 32 78 592 Customs tax provision expense 846 175 35 Lawsuit provision expense 1,989 1,658 852 Stock based compensation expense accrual - - - - 456 Other (17,692) (3,873) (1,645) Adjusted EBITDA 1 1. Adjusted EBITDA is a non - GAAP metrics and is calculated by adding depreciation, amortization, taxes, financial expenses (net of financial income) and one - time charges and non - cash adjustments to net income (loss).

MARTI INVESTOR RELATIONS investor.relations@marti.tech