Exhibit 99.1

Report Prepared For: 2022 Mineral Resources and Mineral Reserves of the Caraíba Operations, Curaçá Valley, Bahia, Brazil December 22, 2022 Rev. F Ero Copper Corp. | 1050 - 625 Howe Street Vancouver | BC, Canada, V6C 2T6 Authors and Qualified Persons: Porfírio Cabaleiro Rodriguez, FAIG Bernardo Horta de Cerqueira Viana, FAIG Fábio Valério Câmara Xavier, MAIG Ednie Rafael Moreira de Carvalho Fernandes, MAIG Dr. Beck Nader, FAIG Alejandro Sepulveda, (#0293) (Chilean Mining Commission) Effective Date: Signature Date: September 30, 2022 December 22, 2022
2022 M INERAL R ESOURCES AND M INERAL R ESERVES OF T HE C ARAÍBA O PERATIONS , C URAÇÁ V ALLEY , B AHIA , B RAZIL F ORM 43 - 101 F 1 T ECHNICAL R EPORT The effective date of this report is September 30 , 2022 . The issue date of this report is December 22 , 2022 . See Appendix A to this Report for certificates of Qualified Persons, as such term is defined under National Instrument 43 - 101 , Standards of Disclosure for Mineral Projects . December 22, 2022 Rev. F i
2022 M INERAL R ESOURCES AND M INERAL R ESERVES OF T HE C ARAÍBA O PERATIONS , C URAÇÁ V ALLEY , B AHIA , B RAZIL F ORM 43 - 101F1 T ECHNICAL R EPORT UPDATED MINERAL RESOURCES AND MINERAL RESERVES STATEMENTS FORM 43 - 101F1 TECHNICAL REPORT TABLE OF CONTENTS SECTION PAGE TABLE OF CONTENTS ............................................................................................................................. ... ............................ II LIST OF FIGURES AND ILLUSTRATIONS................................................................................................................ ... ..........X LIST OF TABLES ............................................................................................................................. ... .................................. XXI 1 EXECUTIVE SUMMARY...................................................................................................................... ... ................. 26 1.1 1.2 1.3 1.4 1.5 1.6 P ROPERTY D ESCRIPTION AND O WNERSHIP ................................................................................................. 27 G EOLOGY AND M INERALIZATION ................................................................................................................. 27 E XPLORATION S TATUS ............................................................................................................................. ... 28 D EVELOPMENT AND O PERATIONS ............................................................................................................... 28 D ATA V ERIFICATION AND QA/QC................................................................................................................ 29 M INERAL R ESOURCE AND M INERAL R ESERVE E STIMATES ......................................................................... 29 Mineral Resources .......................................................................................................... 30 Mineral Reserves............................................................................................................. 31 7. R ECOVERY M ETHODS ............................................................................................................................. ... .. 34 8. I NFRASTRUCTURE ............................................................................................................................. ... ........ 38 9. E NVIRONMENT ............................................................................................................................. ... ............. 38 10. C APITAL & O PERATING C OSTS ................................................................................................................... 39 11. C ONCLUSIONS ............................................................................................................................. ... ............. 40 Mineral Exploration and Geology ................................................................................. 40 QA/QC ............................................................................................................................. .. 40 Geological Model ............................................................................................................ 40 Grade Estimation ............................................................................................................ 41 Mineral Resource Estimate............................................................................................ 41 Mineral Reserve Estimate .............................................................................................. 41 Recommendations.......................................................................................................... 42 December 22, 2022 Rev. F ii 2 INTRODUCTION AND TERMS OF REFERENCE................................................................................................. 45 2.1 2.2 2.3 2.4 Q UALIFICATION , E XPERIENCE AND I NDEPENDENCE ..................................................................................... 46 M AIN S OURCES OF I NFORMATION ................................................................................................................ 47 E FFECTIVE D ATE ............................................................................................................................. ... ......... 48 U NITS OF M EASUREMENT ............................................................................................................................ 48 3 4 RELIANCE ON OTHER EXPERTS...................................................................................................................... ... 49 PROPERTY DESCRIPTION AND LOCATION ...................................................................................................... 50 4.1 P ROPERTY L OCATION ............................................................................................................................. ... . 50
2022 M INERAL R ESOURCES AND M INERAL R ESERVES OF T HE C ARAÍBA O PERATIONS , C URAÇÁ V ALLEY , B AHIA , B RAZIL F ORM 43 - 101F1 T ECHNICAL R EPORT 4.2 4.3 4.4 4.5 4.6 M INERAL T ITLE IN B RAZIL ........................................................................................................................... 52 M INING L EGISLATION , A DMINISTRATION , AND R IGHTS ................................................................................. 52 E XPLORATION L ICENSES ............................................................................................................................. 53 A NNUAL F EES AND R EPORTING R EQUIREMENTS ........................................................................................ 53 M INERAL T ITLES ............................................................................................................................. ... .......... 53 5 ACCESSIBILITY, CLIMATE, LOCAL RESOURCES, INFRASTRUCTURE AND PHYSIOGRAPHY ............... 57 5.1 5.2 5.3 5.4 5.5 A CCESSIBILITY ............................................................................................................................. ... ............ 57 P HYSIOGRAPHY ............................................................................................................................. ... ........... 57 C LIMATE ............................................................................................................................. ... ...................... 57 V EGETATION ............................................................................................................................. ... ................ 58 I NFRASTRUCTURE AND L OCAL R ESOURCES ................................................................................................ 58 6 HISTORY...................................................................................................................... ... .......................................... 59 6.1 H ISTORIC M INERAL R ESOURCE AND R ESERVE E STIMATES , P REVIOUSLY P UBLISHED T ECHNICAL R EPORTS ............................................................................................................................. ... ..................... 60 2017 Mineral Resource and Reserve Estimate ........................................................... 60 2018 Mineral Resource and Reserve Estimate ........................................................... 61 2019 Mineral Resource and Reserve Estimate ........................................................... 63 2020 Mineral Resource and Reserve Estimate ........................................................... 65 7 GEOLOGICAL SETTING AND MINERALIZATION............................................................................................... 69 7.1 7.2 7.3 7.4 7.5 7.6 7.7 R EGIONAL G EOLOGY ............................................................................................................................. ... .. 69 L OCAL G EOLOGY ............................................................................................................................. ... ........ 71 M INERALIZATION ............................................................................................................................. ... ......... 75 R EGIONAL S TRUCTURE ............................................................................................................................. .. 76 G EOCHRONOLOGY ............................................................................................................................. ... ...... 81 L OCAL G EOLOGY OF THE P ILAR M INE ......................................................................................................... 84 Lithology, Structure, and Alteration ............................................................................. 84 Mineralization............................................................................................................... ... . 87 L OCAL G EOLOGY OF THE S UÇUARANA D EPOSIT ........................................................................................ 89 Lithology, structure, and alteration .............................................................................. 89 Mineralization............................................................................................................... ... . 91 L OCAL G EOLOGY OF THE S URUBIM D ISTRICT (S URUBIM MINE , C12, C ERCADO V ELHO , L AGOA DA 7.8 M INA , T ERRA DO S AL )..................................................................................................................... 91 Lithology, structure, and alteration .............................................................................. 91 Mineralization............................................................................................................... ... . 95 7.9 L OCAL G EOLOGY OF THE V ERMELHOS D ISTRICT (S IRIEMA D EPOSIT , V ERMELHOS M INE , N8/N9 AND N10 D EPOSITS )............................................................................................................................ ... ..... 96 Lithology, Structure and Alteration .............................................................................. 96 December 22, 2022 Rev. F iii

2022 M INERAL R ESOURCES AND M INERAL R ESERVES OF T HE C ARAÍBA O PERATIONS , C URAÇÁ V ALLEY , B AHIA , B RAZIL F ORM 43 - 101F1 T ECHNICAL R EPORT 7.10 M INERALIZATION ............................................................................................................................. ... ....... 100 8 9 DEPOSIT TYPES........................................................................................................................ ... ......................... 104 EXPLORATION ............................................................................................................................. ... ...................... 107 9.1 9.2 G EOCHEMICAL S URVEYS ........................................................................................................................... 107 G EOLOGICAL M APPING , P ROSPECTING AND T RENCHING .......................................................................... 112 Pilar District Exploration .............................................................................................. 113 Surubim District Exploration ....................................................................................... 114 Vermelhos District Exploration ................................................................................... 115 10 DRILLING..................................................................................................................... ... ........................................ 117 1. D ENSITY ............................................................................................................................. ... .................... 121 2. P ILAR M INE E XPLORATION ........................................................................................................................ 122 3. S URUBIM D ISTRICT E XPLORATION ............................................................................................................. 123 4. V ERMELHOS M INE AND N EAR M INE E XPLORATION ................................................................................... 124 11 SAMPLE PREPARATION, ANALYSES AND SECURITY.................................................................................. 127 1. Q UALITY A SSURANCE AND Q UALITY C ONTROL (QA/QC) ......................................................................... 129 2018 - 2020 QAQC Validation ........................................................................................ 130 2020 - 2022 QAQC Validation ........................................................................................ 143 Project Honeypot - Post - mortem QA/QC Analysis................................................... 157 2. O PINION OF THE Q UALIFIED P ERSONS ....................................................................................................... 158 12 13 DATA VERIFICATION ............................................................................................................................. ... ........... 160 MINERAL PROCESSING AND METALLURGICAL TESTING .......................................................................... 162 1. I NTRODUCTION ............................................................................................................................. ... .......... 162 2. HIG M ILL R ECOVERY I MPROVEMENT ......................................................................................................... 162 Mineralogical Characterization Test work ................................................................. 162 Grind Size & Rougher Flotation Test work................................................................ 165 Ero Brasil Validation Test work................................................................................... 167 Operating HIG Mill Results .......................................................................................... 168 3. P ILAR UG M INE M ETALLURGICAL R ECOVERY ........................................................................................... 168 Deepening Extension ................................................................................................... 168 P1P2NE ........................................................................................................................... 169 P1P2W (part of the “West Limb”) ............................................................................... 170 MSB South (MSBS) ....................................................................................................... 170 GO2040 + Piloto 1.......................................................................................................... 171 Sill Pillar....................................................................................................................... ... 171 4. V ERMELHOS UG M INE M ETALLURGICAL R ECOVERY ................................................................................ 172 Vermelhos Geometallurgical Test Program .............................................................. 172 5. O RE S ORTING ............................................................................................................................. ... ............ 174 6. H YDROPHOBIC M INERAL S UPPRESSION WITH CMC.................................................................................. 177 December 22, 2022 Rev. F iv
2022 M INERAL R ESOURCES AND M INERAL R ESERVES OF T HE C ARAÍBA O PERATIONS , C URAÇÁ V ALLEY , B AHIA , B RAZIL F ORM 43 - 101F1 T ECHNICAL R EPORT 13.7 C ARAÍBA O RE C OMPETENCY T EST WORK – P LANT E XPANSION ............................................................... 177 14 MINERAL RESOURCE ESTIMATES ................................................................................................................... 179 1. I NTRODUCTION ............................................................................................................................. ... .......... 179 2. M INERAL R ESOURCE D ATABASE .............................................................................................................. 179 3. 2020 G EOLOGICAL M ODELLING ................................................................................................................ 180 Pilar District, 2022 Update............................................................................................ 180 Vermelhos District ........................................................................................................ 184 Surubim District ............................................................................................................ 186 4. 2022 C OMPOSITING ............................................................................................................................. ... ... 188 5. E XPLORATORY D ATA A NALYSIS , 2022 U PDATE ....................................................................................... 188 6. O UTLIER A NALYSIS , 2022 U PDATE ........................................................................................................... 191 7. V ARIOGRAPHY , 2022 U PDATE ................................................................................................................... 192 8. B LOCK M ODEL , 2022 U PDATE .................................................................................................................. 195 9. E STIMATION P ARAMETERS , U NCHANGED 2021 D OMAINS ......................................................................... 197 10. M INERAL R ESOURCE E STIMATION M ETHODOLOGY , 2022 U PDATE ........................................................... 199 Local Bias Validation via Swath Plot Method, 2022 Update ................................... 202 11. M INERAL R ESOURCE C LASSIFICATION , 2022 U PDATE .............................................................................. 204 12. M INERAL R ESOURCE E STIMATE , 2022 U PDATE ........................................................................................ 204 13. Q UALIFIED P ERSONS O PINION ................................................................................................................... 207 15 MINERAL RESERVE ESTIMATES.................................................................................................................... ... 209 1. M INERAL R ESERVES S UMMARY ................................................................................................................ 209 2. M INERAL R ESERVE E STIMATION M ETHODOLOGY , O PEN P IT ..................................................................... 212 Mineral Reserve Estimation Parameters ................................................................... 214 Open Pit Optimization .................................................................................................. 216 Final Pit Designs ........................................................................................................... 222 Modifying Factors, Open Pit Mining ........................................................................... 229 3. M INERAL R ESERVE E STIMATION M ETHODOLOGY , U NDERGROUND ........................................................... 232 Mineral Reserve Estimation Parameters ................................................................... 232 Pilar UG Mine ................................................................................................................. 234 Vermelhos UG Mine ...................................................................................................... 238 Surubim Mine, Underground Production .................................................................. 241 Modifying Factors, UG Mineral Reserves .................................................................. 241 4. Q UALIFIED P ERSONS O PINION ................................................................................................................... 245 16 MINING METHODS ............................................................................................................................. ... ................ 246 16.1 PILAR UG MINE ............................................................................................................................. ... ...... 246 Mining Methods, Pilar UG Mine................................................................................... 246 Mine Development & Pastefill Schedule, Pilar UG Mine.......................................... 254 December 22, 2022 Rev. F v
2022 M INERAL R ESOURCES AND M INERAL R ESERVES OF T HE C ARAÍBA O PERATIONS , C URAÇÁ V ALLEY , B AHIA , B RAZIL F ORM 43 - 101F1 T ECHNICAL R EPORT Mine Fleet, Pilar UG Mine ............................................................................................. 255 2. V ERMELHOS UG M INE ............................................................................................................................. .. 256 Mining Method, Vermelhos UG Mine.......................................................................... 256 Mine Development and Backfill Schedules, Vermelhos UG Mine ......................... 260 Mine Fleet, Vermelhos UG Mine.................................................................................. 261 3. S URUBIM M INE , U NDERGROUND P RODUCTION .......................................................................................... 262 Mining Methods, Surubim Mine .................................................................................. 262 Mine Development & Pastefill Schedule, Surubim UG Mine .................................. 263 Mine Fleet, Surubim Mine ............................................................................................ 263 4. E RO B RASIL O PEN P IT M INES (N8, N9, N5 - S IRIEMA , S URUBIM , C12 AND S UÇUARANA ) ........................ 263 Mining Methods, Open Pit............................................................................................ 263 Mine Equipment ............................................................................................................ 264 5. G EOTECHNICAL C ONSIDERATIONS ............................................................................................................ 264 Pilar District.................................................................................................................... 265 Surubim District ............................................................................................................ 273 Vermelhos District ........................................................................................................ 277 6. R EGIONAL H YDROGEOLOGICAL C ONSIDERATIONS ................................................................................... 280 7. I NTEGRATED P RODUCTION P LAN .............................................................................................................. 280 2022 Mineral Reserve LOM Plan ................................................................................. 280 2022 Strategic LOM Plan.............................................................................................. 283 17 RECOVERY METHODS ............................................................................................................................. ... ........ 285 1. C ARAÍBA M ILL F LOWSHEET AND P ROCESS D ESCRIPTION ......................................................................... 285 2. C RUSHING ............................................................................................................................. ... ................. 285 3. O RE B LENDING ............................................................................................................................. ... .......... 286 4. G RINDING ............................................................................................................................. ... .................. 287 5. H IGH F REQUENCY S CREENS AND R EGRINDING C IRCUIT ........................................................................... 287 6. F LOTATION AND D EWATERING .................................................................................................................. 288 7. L OADING AND T RANSPORTATION OF C ONCENTRATE FOR S ALE ................................................................ 290 Concentrate Shipment for Export Market.................................................................. 291 Delivery of Concentrate for Domestic Market........................................................... 292 8. C ARAÍBA M ILL P ERFORMANCE .................................................................................................................. 292 9. C ARAÍBA M ILL O PTIMIZATION & 4.2 M TPA E XPANSION ............................................................................. 294 Current Operations (3.2Mtpa)...................................................................................... 294 Third Ball Mill and Flotation Upgrades ...................................................................... 295 10. SX/EW P LANT ............................................................................................................................. ... .......... 298 December 22, 2022 Rev. F vi 18 PROJECT INFRASTRUCTURE ............................................................................................................................ 300 18.1 G ENERAL I NFRASTRUCTURE ..................................................................................................................... 300

2022 M INERAL R ESOURCES AND M INERAL R ESERVES OF T HE C ARAÍBA O PERATIONS , C URAÇÁ V ALLEY , B AHIA , B RAZIL F ORM 43 - 101F1 T ECHNICAL R EPORT 2. P ROCESS AND M INE W ATER S UPPLY ........................................................................................................ 300 3. S ITE P OWER ............................................................................................................................. ... .............. 301 4. C ARAÍBA M ILL ............................................................................................................................. ... ........... 303 5. W ASTE AND T AILINGS D ISPOSAL , P ILAR D ISTRICT .................................................................................... 304 6. P ILAR UG M INE I NFRASTRUCTURE ............................................................................................................ 304 Electrical Supply ........................................................................................................... 304 Water Management ....................................................................................................... 306 Communication ............................................................................................................. 308 Fleet Maintenance Facilities ........................................................................................ 309 Compressed Air ............................................................................................................ 311 Pastefill Plant ................................................................................................................. 312 Ventilation ...................................................................................................................... 313 Mine Cooling .................................................................................................................. 316 7. V ERMELHOS D ISTRICT I NFRASTRUCTURE .................................................................................................. 316 Electrical Supply ........................................................................................................... 318 Water management....................................................................................................... 318 Ventilation Infrastructure ............................................................................................. 319 Rockfill / CRF ................................................................................................................. 320 Tailings and Waste Disposal ....................................................................................... 321 8. S URUBIM D ISTRICT I NFRASTRUCTURE ....................................................................................................... 321 Electrical Supply ........................................................................................................... 321 Water Supply ................................................................................................................. 321 Fleet Maintenance ......................................................................................................... 321 Offices and other facilities ........................................................................................... 322 Tailings and Waste Disposal ....................................................................................... 323 9. P LANNED I NFRASTRUCTURE M ODIFICATIONS , D EEPENING P ROJECT ........................................................ 323 Electrical Supply ........................................................................................................... 324 Communication ............................................................................................................. 326 Pastefill ........................................................................................................................... 327 Materials Handling, Pilar Mine, New External Shaft ................................................. 327 Underground Crushing and Conveyance Systems ................................................. 329 Ventilation & Cooling.................................................................................................... 331 December 22, 2022 Rev. F vii 19 MARKET STUDIES AND CONTRACTS .............................................................................................................. 333 1. C OPPER D EMAND ............................................................................................................................. ... ...... 333 2. C OPPER S UPPLY ............................................................................................................................. ... ....... 333 3. C ARAÍBA O PERATIONS ............................................................................................................................. . 334 4. M ARKETS AND C ONTRACTS ...................................................................................................................... 334 20 ENVIRONMENTAL STUDIES, PERMITTING AND SOCIAL OR COMMUNITY IMPACT................................ 335 1. P ERMITTING R EQUIREMENTS ..................................................................................................................... 335 2. E RO B RASIL E NVIRONMENTAL S TUDIES AND B ACKGROUND I NFORMATION .............................................. 336
2022 M INERAL R ESOURCES AND M INERAL R ESERVES OF T HE C ARAÍBA O PERATIONS , C URAÇÁ V ALLEY , B AHIA , B RAZIL F ORM 43 - 101F1 T ECHNICAL R EPORT 3. S TATUS OF E RO B RASIL E NVIRONMENTAL P ERMITS & L ICENSES ............................................................. 340 Deepening Project Environmental Permitting .......................................................... 341 Water Rights .................................................................................................................. 341 4. E NVIRONMENTAL M ANAGEMENT – P OLLUTION C ONTROL ......................................................................... 342 Liquid Effluents ............................................................................................................. 342 Solid Waste .................................................................................................................... 342 Atmospheric Emissions............................................................................................... 343 5. D ISPOSAL OF T AILINGS ............................................................................................................................. 343 Disposal of tailings – Back - fill Open Stopes............................................................. 343 Disposal of tailings, Co - disposal of Tailings ............................................................ 344 Disposal of tailings – Exhausted Pits ........................................................................ 346 Dry - stack Tailing Deposition, Technical Evaluation Work...................................... 347 6. R ECLAMATION OF D EGRADED A REAS ....................................................................................................... 349 7. M INE C LOSURE C OST E STIMATE ............................................................................................................... 349 Caraíba Mine .................................................................................................................. 350 Surubim Mine................................................................................................................. 350 Angicos Mine ................................................................................................................. 351 Suçuarana Mine............................................................................................................. 351 Vermelhos UG Mine ...................................................................................................... 351 8. S OCIAL AND C OMMUNITY O UTREACH ........................................................................................................ 351 21 CAPITAL AND OPERATING COSTS................................................................................................................... 353 1. I NTRODUCTION ............................................................................................................................. ... .......... 353 2. C APITAL C OST E STIMATES ........................................................................................................................ 353 Capital Cost Summary.................................................................................................. 353 3. O PERATING C OST E STIMATES ................................................................................................................... 354 Operating Cost Summary ............................................................................................ 354 22 23 24 ECONOMIC ANALYSIS..................................................................................................................... ... ................. 356 ADJACENT PROPERTIES................................................................................................................... ... .............. 357 OTHER RELEVANT DATA AND INFORMATION............................................................................................... 358 1. I NTRODUCTION TO D EEPENING I NFERRED P ROJECT .................................................................................. 358 2. M INE D ESIGN , D EEPENING I NFERRED PROJECT ......................................................................................... 358 Inferred Mineral Resources and Modifying Factors, Deepening Extension Zone ............................................................................................................................. ... 358 Stope Optimization ....................................................................................................... 359 Mine Design ................................................................................................................... 361 Mine Development Schedules & Equipment Selection ........................................... 362 QP Opinion, Deepening Inferred Project ................................................................... 364 December 22, 2022 Rev. F viii 25 INTERPRETATION AND CONCLUSIONS .......................................................................................................... 365 25.1 M INERAL E XPLORATION AND G EOLOGY .................................................................................................... 365
2022 M INERAL R ESOURCES AND M INERAL R ESERVES OF T HE C ARAÍBA O PERATIONS , C URAÇÁ V ALLEY , B AHIA , B RAZIL F ORM 43 - 101F1 T ECHNICAL R EPORT 2. QA/QC........................................................................................................................ ... ........................... 365 3. G EOLOGICAL M ODEL ............................................................................................................................. ... 365 4. G RADE E STIMATION ............................................................................................................................. ... .. 366 5. M INERAL R ESOURCE E STIMATE ................................................................................................................ 366 6. M INERAL R ESERVE E STIMATE ................................................................................................................... 366 26 December 22, 2022 Rev. F ix RECOMMENDATIONS ............................................................................................................................. ... .......... 367 1. M INERAL R ESOURCE E STIMATION ............................................................................................................. 367 2. M INERAL R ESERVE E STIMATION ............................................................................................................... 368 27 REFERENCES................................................................................................................... ... .................................. 370
2022 M INERAL R ESOURCES AND M INERAL R ESERVES OF T HE C ARAÍBA O PERATIONS , C URAÇÁ V ALLEY , B AHIA , B RAZIL F ORM 43 - 101 F 1 T ECHNICAL R EPORT LIST OF FIGURES AND ILLUSTRATIONS FIGURE DESCRIPTION PAGE Figure 4 - 1 : Location of the Primary Mineral Districts, Caraíba Operations, Bahia State, Brazil (Ero Copper, 2022 ) ... 51 Figure 4 - 2 : Detailed Map of Caraíba Operations, Curaçá Valley, Bahia State, Brazil (Ero Copper, 2022 ) .................. 51 Figure 4 - 3 : Location of the Ero Brasil Mining & Exploration Rights in the Curaçá Valley (Ero Brasil, 2022 ) ................ 55 Figure 4 - 4: Status of the Mining Rights Related to the Vermelhos UG Mine, Surubim Mine, Angicos Mine, R22/R75 Mine, Caraíba Mine and the Suçuarana Mine (Ero Brasil, 2022) .................................................... 56 Figure 7 - 1: Simplified map showing the Archean to Paleoproterozoic Gaviao, Serrinha, Jequié and Itubuna - Salvador - Curaça blocks. Modified from Silveira (2015). The approximate location of Figure 7 - 2 is also shown. ............................................................................................................................. ... ........................ 69 Figure 7 - 2 : Regional geologic map of the Curaçá Valley and location of the Caraíba mine, Surubim, OP mine, Vermelhos UG mine . Note location of regional cross sections (AA’, EE’, I 1 I 1 ’ and I 2 I 2 ’) (prepared by Frugis 2017 , modified by Ero Brasil, 2018 ) ...................................................................................... 70 Figure 7 - 3: Orthogneissic migmatite - Amphibolite - clinopyroxene - biotite gneiss migmatite with magnetite (Frugis, 2017) ............................................................................................................................. ... ........................ 71 Figure 7 - 4: Bom Despacho Gneiss: Qtz - feldspathic Gneiss with intercalated sub - meter amphibolite bands and greenish diopsíde (Frugis, 2017) ..................................................................................................... 72 Figure 7 - 5: Arapuá Gneiss - Quartzo - feldspathic gneiss and levels of phlogopite - plagioclase - quartz gneiss with bands of amphibolite (Frugis, 2017)........................................................................................................... 72 Figure 7 - 6 : Vertical Cross - section of Toboggan and Sombrero mineralized bodies in ultramafic rock units from the Vermelhos Mine showing shallowly dipping mineralized zones associated with fold hinges in the gneiss (Ero Brasil, 2021 ) ................................................................................................................. 73 Figure 7 - 7 : Photos of deformed norite and gabbro units, locally injected by pyroxenite dykes . A) Foliated norite in Pilar open pit, north wall, B) Pyroxenite dykes injecting foliated norite and gneiss, Pilar open pit, north wall, C) Deformed gabbro in gneiss at airport outcrop, D) deformed gabbro units in gneiss at Vermelhos mine (Ero Brasil, 2018 ) .................................................................................................. 74 Figure 7 - 8 : Augen Gneiss – Grey mylonític (nebulític), granitic - gneiss with finely anastomosing, monolithic foliation (Frugis, 2017 ) ............................................................................................................................. ... .. 74 Figure 7 - 9 : Granitoid or “Granite G 3 ” – A) Reddish grey biotite granite containing tourmaline and B) Granite with garnet xenoliths and C) Itiúba syenite (Frugis, 2017 ) ................................................................................. 75 Figure 7 - 10 : Characteristics of Mineralization within the Curaça Valley Deposits (Ero Brasil, 2022 ) ........................... 75 Figure 7 - 11 : Outcrops of gneiss showing the tectonic foliations and folds . A) the composite S 0 - S 1 foliation forms intrafolial folds between NW - striking S 2 foliation planes ; B) the S 2 foliation is folded by F 3 fold plunging gently southerly (Desrochers, 2019 ) ................................................................................. 76 Figure 7 - 12 : Interference pattern of type 2 (Ramsay, 1967 ) highlighted by the deformed mafic units . Photo from Silva ( 1984 ), airport outcrop, north of the Pilar UG Mine .......................................................................... 77 Figure 7 - 13 : Geological section A - A’ in the south portion of the Curaçá Valley (Frugis, 2017 ) .................................... 78 Figure 7 - 14 : Geologic section E - E’ in the central portion of the Curaçá Valley (Frugis, 2017 ) .................................... 79 Figure 7 - 15 : Geologic sections I 1 - I 1 ’ and I 2 - I 2 ’ in the north portion of the Curaçá Valley (Frugis, 2017 ) .................... 80 December 22, 2022 Rev. F x
2022 M INERAL R ESOURCES AND M INERAL R ESERVES OF T HE C ARAÍBA O PERATIONS , C URAÇÁ V ALLEY , B AHIA , B RAZIL F ORM 43 - 101 F 1 T ECHNICAL R EPORT Figure 7 - 16 : Contact relationships between pyroxenite dykes and folded gneiss . A) P 3 folds crosscut at angle by the phlogopite - rich pyroxenite unit in the Suçuarana pit ; B) detailed of the lower fold of figure A) ; C) unfoliated mineralized pyroxenite cross - cutting a tight fold in gneiss, and D) mineralized pyroxenite dyke cross - cutting foliation in gneiss at high angle, Pilar mine (drillhole FC 4989 at 289 . 0 m) (Desrochers et al . , 2019 ) ................................................................................................................. 80 Figure 7 - 17 : Chart of age dates from the Curaçá Valley showing main episodes of magmatism and alteration/metamorphism (Desrochers et al . , 2019 ) ......................................................................... 83 Figure 7 - 18 : Surface geology map of Pilar Mine sector (Ero Brasil, 2022 ) .................................................................. 85 Figure 7 - 19 : Simplified vertical cross - section of the Pilar Mine with red and pink mafic / ultramafic units . Looking north (Ero Brasil, 2019 ) ............................................................................................................................. 86 Figure 7 - 20 : Photo of the types of alteration at the Pilar mine : A) albite and magnetite cross - cutting the gneissic fabric ; B) Diopside alteration overprinting gneissic fabric ; C) K - feldspar alteration ; D) carbonate in halo of chalcopyrite veinlet ; E) serpentinization ; F) Phlogopite band associated with chalcopyrite mineralization ; G) epidote alteration (Ero Brasil, 2018 ) ................................................................... 87 Figure 7 - 21 : Mineralization styles : A) Pyroxenite showing primary disseminated chalcopyrite ; B) Vein of chalcopyrite cross - cutting gneiss ; C) Massive chalcopyrite and bornite ; D) Pyroxenite with phlogopite ; E) Mining front with chalcopyrite and bornite in the pyroxenite (Ero Brasil, 2018 ) and F) Polished section showing abundant intergranular magnetite (mag), bornite (bo), and minor chalcopyrite in contact with massive chalcopyrite vein (cpy) (Tappert, 2020 ) ............................................................................. 88 Figure 7 - 22 : Vertical longitudinal section of the Pilar UG Mine showing the extent of the Cu mineralization as well as Deepening Extension Zone, Project Honeypot and the Upper Areas (Ero Brasil, 2021 ) ................. 89 Figure 7 - 23 : Surface geology map of the Suçuarana mine sector (Ero Brasil, 2019 ) .................................................. 90 Figure 7 - 24 : Photos of the geology of the Suçuarana Open Pit . A) general view of the historical open pit with altered mafic - ultramafic rock units injected into partly k - feldspar altered gneiss, looking south ; B) Phlogopite - rich unit that cross - cuts the foliated gneiss, a norite, and a k - feldspar altered gneiss ; C) Irregular injection of the phlogopite - rich unit that cross - cuts the gneiss and norite . (Desrochers et al . 2019 ) ............................................................................................................................. ... ........................ 91 Figure 7 - 25 : Geology of the Surubim district over satellite image with location of Cu deposits (Ero Brasil, 2022 ) ...... 92 Figure 7 - 26 : Level plan, + 350 m Level, Surubim Mine (Ero Brasil, 2022 ) .................................................................... 93 Figure 7 - 27: Vertical cross - section of the Surubim Mine, looking NE. The main geological units are shown. A portion of the Cu mineralization has been mined out as shown by the open pit contour (Ero Brasil, 2022) .... 94 Figure 7 - 28: Vertical cross - section for the C12 deposit, looking North. The major geological units are shown (Ero Brasil, 2022) ............................................................................................................................. ... ............... 94 Figure 7 - 29: A) Main hydrothermal alteration styles associated in the mineralization. B) Silicified/albitized gneiss; C) Calcite epidote gabbro D) Phlogopite schist with chalcopyrite veinlets (Ero Brasil, 2018) .............. 95 Figure 7 - 30: K - feldspar alteration of the ultramafic unit, south wall of the Cercado Velho open pit (Jacutinga, 2020) 96 Figure 7 - 31: A) Chalcopyrite in veinlets; B) disseminated chalcopyrite; C) Disseminated bornite and massive chalcopyrite veins (Ero Brasil, 2018) ............................................................................................... 96 Figure 7 - 32: Geology map of the Vermelhos District with location of known Cu deposits (Ero Brasil, 2022)............... 97 Figure 7 - 33: Photographs of NQ - size core showing the A) enderbitic gneiss and B) garnet gneiss. ........................... 98 December 22, 2022 Rev. F xi
2022 M INERAL R ESOURCES AND M INERAL R ESERVES OF T HE C ARAÍBA O PERATIONS , C URAÇÁ V ALLEY , B AHIA , B RAZIL F ORM 43 - 101 F 1 T ECHNICAL R EPORT Figure 7 - 34 : Vertical geological cross - section at Vermelhos Mine, looking North . The pyroxenite bodies and Cu mineralization of the Toboggan and Sombrero are sub - parallel to the foliation of the gneiss in the syncline fold sector .......................................................................................................................... 99 Figure 7 - 35 : Alteration facies at Vermelhos mine . A) K - feldspar alteration overprinting gneissic fabric ; B) Dark serpentinite alteration of ultramafic unit ; C) Intense garnet alteration ; D) Silica alteration on East side of the Vermelhos Mine overprinting the pegmatite unit ; D) Silica alteration on East side of the Vermelhos Mine with disseminated chalcopyrite ; and F) Phlogopite - rich alteration (darker) and pyroxenite (grey) with chalcopyrite veinlet (Ero Brasil, 2019 ) ........................................................ 100 Figure 7 - 36 : Type of mineralization at Vermelhos Mine . A) Typical disseminated chalcopyrite and bornite mineralization in pyroxenite grading to norite (top of the photo) (Ero Brasil, 2019 ) . B) Typical brecciated mineralization showing angular pyroxenite clasts within a chalcopyrite matrix (Ero Brasil, 2019 ), C) Sub - horizontal mineralized pyroxenite in contact with enderbitic gneiss . Copper mineralization is extruded in veins from the mineralized pyroxenite into the gneiss and crosscuts the gneissic fabric (Ero Brasil, 2022 ) ........................................................................................................................... 101 Figure 7 - 37 : Sulphide zonation within the Vermelhos District . A) Vermelhos UG Mine and B) and C) Siriema deposit (Ero Brasil, 2019 ) ........................................................................................................................... 102 Figure 7 - 38 : Malachite, typical copper mineralization in weathered zone (Ero Brasil 2019 ) ...................................... 102 Figure 7 - 39 : Polished slab of Vermelhos mineralization . A) Massive chalcopyrite in diffuse veins containing ultramafic country rock clasts and segregations of chromite and bornite in drillhole FVS - 163 at 157 . 8 m at Vermelhos deposit ; B) Detail of polished slab in FVS - 163 at 157 . 8 m ; and C) Dispersed chromite in massive chalcopyrite and pyrrhotite . Pyrrhotite contains some pentlandite (Tappert, 2020 ) ......... 103 Figure 9 - 1 : Map of the ground gravity surveys in the Curaçá Valley overlain on grey digital elevation model (DEM) (Ero Brasil, 2022 ) . Denser material shown in red to purple colors . ....................................................... 110 Figure 9 - 2 : Regional Induced Polarization (IP) map of the Curaçá Valley overlain on grey digital elevation model (DEM) (Ero Brasil, 2022 ) . Most chargeable material related to red and purple colors . ............................. 111 Figure 9 - 3 : Regional map of the magnetic analytical signal in Curaçá valley overlain on grey digital elevation model (DEM) (Ero Brasil, 2022 ) . .............................................................................................................. 112 Figure 9 - 4 : Example of a detailed geology map in the N 10 E exploration target, Vermelhos District . Individual foliation measurements reflect outcrops and thick E - W black lines cross - cutting the ultramafic units are mapped and sampled trenches (Ero Brasil, 2022 ) . ....................................................................... 113 Figure 9 - 5 : Detailed ground gravity (left) and IP (right) surveys overlain on grey digital elevation model (DEM) for the Pilar District with location of the exploration targets and the Caraíba Mine . Denser material that may represent mineralization and/or ultramafic bodies are highlighted by red to purple colors on the ground gravity map . Most chargeable material highlighted by red to purple colors on the IP map (Ero Brasil, 2022 ) . ............................................................................................................................. ... . 114 Figure 9 - 6 : Map of ground gravity survey (left), IP (center), and airborne EM survey (right) in the Surubim District overlain on grey digital elevation model (DEM) with location of the known Cu deposits (Ero Brasil, 2022 ) . Red to purple colors on all maps represent anomalies that could be associated with mineralized ultramafic units . .......................................................................................................... 115 Figure 9 - 7 : Map of detailed ground gravity survey (left) and airborne EM survey (right) in the Vermelhos District overlain on grey digital elevation model (DEM) with location of the known Cu deposits (Ero Brasil, 2022 ) . Red to purple colors on all maps represent anomalies that could be associated with mineralized ultramafic units ............................................................................................................................. ... ............... 116 Figure 10 - 1 : Surface drill rig operated by third - party (Ero Brasil, 2022 ) ..................................................................... 117 December 22, 2022 Rev. F xii
2022 M INERAL R ESOURCES AND M INERAL R ESERVES OF T HE C ARAÍBA O PERATIONS , C URAÇÁ V ALLEY , B AHIA , B RAZIL F ORM 43 - 101F1 T ECHNICAL R EPORT Figure 10 - 2: Underground drill - hole being performed by Caraíba personnel (Ero Brasil, 2022) ................................ 118 Figure 10 - 3: Maxibor equipment preparing for drill hole deviation readings (Ero Brasil, 2022).................................. 119 Figure 10 - 4: Giro Master equipment preparing for drill hole deviation readings (Ero Brasil, 2019)............................ 120 Figure 10 - 5: Density testing procedure (Ero Brasil, 2022) ........................................................................................ 122 Figure 10 - 6 : Longitudinal Section of the Pilar UG Mine Comparing Interpreted Primary Exploration Target Area Projected from the Deepening Extension Zone in 2021 and expansion realized in 2021 (Ero Brasil, 2022 ) ............................................................................................................................. ... ............. 123 Figure 10 - 7:Vertical cross - section looking North with recent drill intersections below the historic Lagoa da Mina Open Pit (Ero Brasil, 2021). .................................................................................................................... 124 Figure 10 - 8:Vertical longitudinal section, looking East, showing envelopes of mineral resources (2018 and 2021) and modelled structural trap exploration target (Ero Brasil, 2022). ...................................................... 125 Figure 10 - 9:Vertical cross - section of the Vermelhos Mine with new drill intersections below current underground development. Section looking North (Ero Brasil, 2022). ................................................................ 126 Figure 11 - 1: Core Sampling Procedures (Ero Brasil, 2022) ....................................................................................... 127 Figure 11 - 2: Transportation and Storage of Drill Core Samples (Surubim District) (Ero Brasil, 2022)....................... 128 Figure 11 - 3: Result of the Analysis of Blank Samples, August 1, 2018, to July 4, 2020 (Ero Brasil, 2022) ............... 130 Figure 11 - 4: Result of the QA/QC Analysis of CRM ITAK 809 August 1, 2018, to July 4, 2020 (Ero Brasil, 2022) ... 132 Figure 11 - 5: Result of the QA/QC Analysis of CRM ITAK 814 August 1, 2018, to July 4, 2020 (Ero Brasil, 2022) ... 133 Figure 11 - 6: Result of the QA/QC Analysis of CRM ITAK 821 August 1, 2018, to July 4, 2020 (Ero Brasil, 2022) ... 133 Figure 11 - 7: Result of the QA/QC Analysis of CRM ITAK 823 August 1, 2018, to July 4, 2020 (Ero Brasil, 2022) ... 134 Figure 11 - 8: Result of the QA/QC Analysis of CRM ITAK 824 August 1, 2018, to July 4, 2020 (Ero Brasil, 2022) ... 134 Figure 11 - 9: Result of the QA/QC Analysis of CRM ITAK 825 August 1, 2018, to July 4, 2020 (Ero Brasil, 2022) ... 135 Figure 11 - 10: Result of the QA/QC Analysis of CRM ITAK 833 August 1, 2018, to July 4, 2020 (Ero Brasil, 2022) . 135 Figure 11 - 11: Result of the QA/QC Analysis of CRM ITAK 842 August 1, 2018, to July 4, 2020 (Ero Brasil, 2022) . 136 Figure 11 - 12: Result of the QA/QC Analysis of CRM ITAK 843 August 1, 2018, to July 4, 2020 (Ero Brasil, 2022) . 136 Figure 11 - 13: Result of the QA/QC Analysis of CRM ITAK 844 August 1, 2018, to July 4, 2020 (Ero Brasil, 2022) . 137 Figure 11 - 14: Result of the QA/QC Analysis of CRM ITAK 847 August 1, 2018, to July 4, 2020 (Ero Brasil, 2022) . 137 Figure 11 - 15: Result of the QA/QC Analysis of CRM ITAK 848 August 1, 2018, to July 4, 2020 (Ero Brasil, 2022) . 138 Figure 11 - 16: Result of the QA/QC Analysis of CRM ITAK 849 August 1, 2018, to July 4, 2020 (Ero Brasil, 2022) . 138 Figure 11 - 17: Result of the QA/QC Analysis of CRM ITAK 850 (Ero Brasil, 2022) .................................................... 139 Figure 11 - 18: Result of the QA/QC Analysis of CRM ITAK 851 August 1, 2018, to July 4, 2020 (Ero Brasil, 2022) . 139 Figure 11 - 19: Result of the QA/QC Analysis of CRM CBM - 306 - 14 August 1, 2018, to July 4, 2020 (Ero Brasil, 2022) ............................................................................................................................. ... ...................... 140 Figure 11 - 20: Result of the QA/QC Analysis of CRM GBM - 907 - 14 August 1, 2018, to July 4, 2020 (Ero Brasil, 2022) ............................................................................................................................. ... ...................... 140 Figure 11 - 21: Analytical Result of the Crushed Duplicate Samples August 1, 2018, to July 4, 2020 (Ero Brasil, 2022) ............................................................................................................................. ... ...................... 141 December 22, 2022 Rev. F xiii

2022 M INERAL R ESOURCES AND M INERAL R ESERVES OF T HE C ARAÍBA O PERATIONS , C URAÇÁ V ALLEY , B AHIA , B RAZIL F ORM 43 - 101F1 T ECHNICAL R EPORT Figure 11 - 22: Analytical Result of the Pulverized Duplicate Samples August 1, 2018, to July 4, 2020 (Ero Brasil, 2022) ............................................................................................................................. ... ...................... 142 Figure 11 - 23: Analytical Result of the secondary laboratory August 1, 2018, to July 4, 2020 (Ero Brasil, 2022)....... 143 Figure 11 - 24: Result of the Analysis of Blank Samples (Ero Brasil, 2022)................................................................. 144 Figure 11 - 25: Result of the QA/QC Analysis of CRM ITAK 809 (Ero Brasil, 2022) .................................................... 146 Figure 11 - 26: Result of the QA/QC Analysis of CRM ITAK 814 (Ero Brasil, 2022) .................................................... 146 Figure 11 - 27: Result of the QA/QC Analysis of CRM ITAK 821 (Ero Brasil, 2022) .................................................... 147 Figure 11 - 28: Result of the QA/QC Analysis of CRM ITAK 823 (Ero Brasil, 2022) .................................................... 147 Figure 11 - 29: Result of the QA/QC Analysis of CRM ITAK 824 (Ero Brasil, 2022) .................................................... 148 Figure 11 - 30: Result of the QA/QC Analysis of CRM ITAK 828 (Ero Brasil, 2022) .................................................... 148 Figure 11 - 31: Result of the QA/QC Analysis of CRM ITAK 833 (Ero Brasil, 2022) .................................................... 149 Figure 11 - 32: Result of the QA/QC Analysis of CRM ITAK 842 (Ero Brasil, 2022) .................................................... 149 Figure 11 - 33: Result of the QA/QC Analysis of CRM ITAK 843 (Ero Brasil, 2022) .................................................... 150 Figure 11 - 34: Result of the QA/QC Analysis of CRM ITAK 844 (Ero Brasil, 2022) .................................................... 150 Figure 11 - 35: Result of the QA/QC Analysis of CRM ITAK 847 (Ero Brasil, 2022) .................................................... 151 Figure 11 - 36: Result of the QA/QC Analysis of CRM ITAK 848 (Ero Brasil, 2022) .................................................... 151 Figure 11 - 37: Result of the QA/QC Analysis of CRM ITAK 849 (Ero Brasil, 2022) .................................................... 152 Figure 11 - 38: Result of the QA/QC Analysis of CRM ITAK 850 (Ero Brasil, 2022) .................................................... 152 Figure 11 - 39: Result of the QA/QC Analysis of CRM ITAK 851 (Ero Brasil, 2022) .................................................... 153 Figure 11 - 40: Result of the QA/QC Analysis of CRM ITAK - 877 (Ero Brasil, 2022).................................................... 153 Figure 11 - 41: Result of the QA/QC Analysis of CRM ITAK - 878 (Ero Brasil, 2022).................................................... 154 Figure 11 - 42: Result of the QA/QC Analysis of CRM ITAK - 879 (Ero Brasil, 2022).................................................... 154 Figure 11 - 43: Analytical Result of the Crushed Duplicate Samples (Ero Brasil, 2022) .............................................. 155 Figure 11 - 44: Analytical Result of the Pulverized Duplicate Samples (Ero Brasil, 2022) ........................................... 156 Figure 11 - 45: Analytical Result of the secondary laboratory (Ero Brasil, 2022) ......................................................... 157 Figure 11 - 46: Analysis of the Duplicates Produced During the Post Mortem QA/QC, Project Honeypot................... 158 Figure 13 - 1: Mineralogical Composition, by Size Fraction for Concentrate (a) and Tailings (b) Samples (SJT MetMin, 2018) ............................................................................................................................. ... ............. 164 Figure 13 - 2: Calculated Copper Grades for the Concentrate and Tailings Sample, by Size Fraction (SJT MetMin, 2018) ............................................................................................................................. ... ...................... 165 Figure 13 - 3 : Rougher Concentrate Grade vs . Recovery Curves at Various Grind Sizes ........................................... 167 Figure 13 - 4 : Grade Recovery comparison from 2017 to 2022 (Ero Brasil, 2022 ) ...................................................... 168 Figure 13 - 5 : Metallurgical Test Work Results for Pilar UG Mine Zone : Deepening (Ero Brasil, 2019 ) ....................... 169 Figure 13 - 6 : Metallurgical Test Work Results for Pilar UG Mine Zone : P 1 P 2 NE (Ero Brasil, 2019 ) .......................... 169 Figure 13 - 7 : Metallurgical Test Work Results for Pilar UG Mine Zone : P 1 P 2 W (Ero Brasil, 2019 ) ............................ 170 December 22, 2022 Rev. F xiv

2022 M INERAL R ESOURCES AND M INERAL R ESERVES OF T HE C ARAÍBA O PERATIONS , C URAÇÁ V ALLEY , B AHIA , B RAZIL F ORM 43 - 101F1 T ECHNICAL R EPORT Figure 13 - 8: Metallurgical Test Work Results for Pilar UG Mine Zone: MSBS (Ero Brasil, 2019).............................. 170 Figure 13 - 9: Metallurgical Test Work Results for Pilar UG Mine Zone: GO2040 & Pilar Upper Levels (Ero Brasil, 2019) ............................................................................................................................. ... ...................... 171 Figure 13 - 10: Metallurgical Test Work Results for Pilar UG Mine Zone: Sill Pillar (Ero Brasil, 2019) ........................ 171 Figure 13 - 11: Metallurgical Test Work Results for Vermelhos UG Mine (Ero Brasil, 2019) ....................................... 172 Figure 13 - 12: Sample behavior According to Feed Source (GE21, 2019) ................................................................. 173 Figure 13 - 13: Mineral Association on UG1 (GE21, 2019).......................................................................................... 173 Figure 13 - 14: Relation Between MgO and K 2 O Bearing Lithology and Copper Recovery (GE21, 2019) .................. 173 Figure 13 - 15: Monthly CMC Dosage (grams per tonne) for 2021 and 2022 (Ero Brasil, 2022) ................................. 177 Figure 14 - 1: 3D high - grade models of the domains of the Pilar UG Mine shown on local coordinate system. Colors denote interpretation zones or domains for visual reference only (Ero Brasil, 2022) .................... 182 Figure 14 - 2: 3D model of Suçuarana domain (Sirgas 2000 – UTM coordinate system). Colors denote interpretation zones or domains for visual reference only (Ero Brasil, 2022) ...................................................... 183 Figure 14 - 3: 3D model of S3 domain (Sirgas 2000 – UTM coordinate system). Colors denote interpretation zones or domains for visual reference only (Ero Brasil, 2022) ..................................................................... 183 Figure 14 - 4: 3D grade shell model of North Curaça district (Sirgas 2000 – UTM coordinate system). Colors denote interpretation zones or domains for visual reference only (Ero Brasil, 2022) ................................ 185 Figure 14 - 5: 3D grade shell model of the Surubim domain in the Surubim District (Ero Brasil, 2022) ....................... 186 Figure 14 - 6: 3D grade shell model of Lagoa da Mina domain in the Surubim District (Ero Brasil, 2022)................... 187 Figure 14 - 7: 3D grade shell model of the C4 Domain in the Surubim District (Ero Brasil, 2022) ............................... 187 Figure 14 - 8: EDA – Cu grade composited samples for the N8 Deposit (Ero Brasil, 2022) ........................................ 189 Figure 14 - 9: Example of Variographic analysis – Deepening Domain, Pilar UG Mine (Ero Brasil, 2022) .................. 193 Figure 14 - 10: Swath Plot X CuT (%) – Deepening Domain (Ero Brasil, 2022) .......................................................... 203 Figure 14 - 11: Swath Plot Y CuT (%) – Deepening Domain (Ero Brasil, 2022) .......................................................... 203 Figure 14 - 12: Swath Plot Z CuT (%) – Deepening Domain (Ero Brasil, 2022)........................................................... 204 Figure 15 - 1: General map of the Caraíba Operations Open Pit projects (Ero Brasil, 2022) ...................................... 214 Figure 15 - 2: N8 Pit Optimization Results (Ero Brasil, 2022) ...................................................................................... 217 Figure 15 - 3: Final N8 Pit selected - Pit 38 (50) shown against the block model grade distribution. Block size of 2.5m x 5m x 5m for scale (Ero Brasil, 2022) ............................................................................................. 217 Figure 15 - 4: N9 Pit Optimization Results (Ero Brasil, 2022) ...................................................................................... 218 Figure 15 - 5: Final N9 Pit selected - Pit 32 (100) shown against the block model grade distribution. Block size of 2.5m x 5m x 5m for scale (Ero Brasil, 2022) .......................................................................................... 218 Figure 15 - 6: N5 (Siriema) Pit Optimization Results (Ero Brasil, 2022)....................................................................... 218 Figure 15 - 7: Final N5 Pit selected - Pit 22 (50) shown against the block model grade distribution. Block size of 2.5m x 5m x 5m for scale (Ero Brasil, 2022) ............................................................................................. 219 Figure 15 - 8: Surubim Pit Optimization Results (Ero Brasil, 2022) ............................................................................. 219 December 22, 2022 Rev. F xv
2022 M INERAL R ESOURCES AND M INERAL R ESERVES OF T HE C ARAÍBA O PERATIONS , C URAÇÁ V ALLEY , B AHIA , B RAZIL F ORM 43 - 101 F 1 T ECHNICAL R EPORT Figure 15 - 9: Final Surubim Pit selected – Pit 41 (50) shown against the block model grade distribution. Block size of 2.5m x 5m x 5m for scale (Ero Brasil, 2022).................................................................................. 220 Figure 15 - 10: C12 Pit Optimization Results (Ero Brasil, 2022) .................................................................................. 220 Figure 15 - 11: Final C12 Pit selected - Pit 35 (50) shown against the block model grade distribution. Block size of 2.5m x 5m x 5m for scale (Ero Brasil, 2022) .......................................................................................... 221 Figure 15 - 12: Suçuarana South Pit Optimization Results (Ero Brasil, 2022) ............................................................. 221 Figure 15 - 13: Final Suçuarana South Pit selected - Pit 43 (50) shown against the block model grade distribution. Block size of 2.5m x 5m x 5m for scale (Ero Brasil, 2022) ...................................................................... 222 Figure 15 - 14: Final Operational N8 (left) and N9 (right) Pits (Ero Brasil, 2022) ......................................................... 223 Figure 15 - 15: Operational N8 Pit Phases and Cu (%) grade distribution (Ero Brasil, 2022) ...................................... 224 Figure 15 - 16: Operational N9 Pit Phases and Cu (%) grade distribution. Block size of 2.5m x 5m x 5m for scale (Ero Brasil, 2022) ............................................................................................................................. ... .. 224 Figure 15 - 17: Final Operational N5 (Siriema) Pit (Ero Brasil, 2022) .......................................................................... 225 Figure 15 - 18: Operational N9 Pit Phases and Cu (%) grade distribution. Block size of 2.5m x 5m x 5m for scale (Ero Brasil, 2022) ............................................................................................................................. ... .. 225 Figure 15 - 19: Final Operational Surubim Pit (Ero Brasil, 2022) ................................................................................. 226 Figure 15 - 20: Operational Surubim Pit Phases and Cu (%) grade distribution. Block size of 2.5m x 5m x 5m for scale (Ero Brasil, 2022)........................................................................................................................ ... 226 Figure 15 - 21: Final Operational C12 Pit (Ero Brasil, 2022) ........................................................................................ 227 Figure 15 - 22: Operational C12 Pit Phases and Cu (%) grades . Block size of 2.5m x 5m x 5m for scale (Ero Brasil, 2022) ............................................................................................................................. ... ............. 227 Figure 15 - 23: Final Operational Suçuarana South Pits (Ero Brasil, 2022) ................................................................. 228 Figure 15 - 24: Operational Suçuarana Final Pit and Cu (%) grades. Block size of 2.5m x 5m x 5m for scale (Ero Brasil, 2022) ............................................................................................................................. ... ............. 228 Figure 15 - 25: Illustrative SMU Methodology (Ero Brasil, 2022) ................................................................................. 229 Figure 15 - 26: Metallurgical recovery curves as a function of copper grade, by District (Ero Brasil, 2022) ................ 231 Figure 15 - 27: Pilar UG Wireframe depletion model ................................................................................................... 235 Figure 15 - 28: Pilar UG Optimized Stopes .................................................................................................................. 236 Figure 15 - 29: Overall of Pilar UG Mine, including Honeypot, Upper Areas & Deepening Project Mineral Reserves (Ero Brasil, 2022) ............................................................................................................................. ... .. 237 Figure 15 - 30: General Layout of Honeypot & Upper Areas (Ero Brasil, 2022)........................................................... 238 Figure 15 - 31: Vermelhos UG Mine Depletion Wireframe ........................................................................................... 239 Figure 15 - 32 : Vermelhos UG Optimized Stopes detailing average planned copper grade per stope ........................ 240 Figure 15 - 33 : North - South schematic profile of the Vermelhos UG Mine (Ero Brasil, 2022 ) ..................................... 240 Figure 15 - 34 : Long - Section and plan - view of the Surubim UG Mine Mineral Reserve .............................................. 241 Figure 15 - 35 : Cross section shows 1 m in the hanging wall and footwall in Pilar UG Mine (Ero Brasil, 2022 ) ........... 242 Figure 15 - 36 : Illustrative example of overbreak and underbreak within the Vermelhos UG Mine (Ero Brasil, 2022 ) . 243 December 22, 2022 Rev. F xvi
2022 M INERAL R ESOURCES AND M INERAL R ESERVES OF T HE C ARAÍBA O PERATIONS , C URAÇÁ V ALLEY , B AHIA , B RAZIL F ORM 43 - 101 F 1 T ECHNICAL R EPORT Figure 15 - 37 : Metallurgical recovery curves as a function of grade Cu ( % ) (Ero Brasil, 2022 ) .................................. 244 Figure 16 - 1 : Pilar UG Mine long - section showing planned stopes by mining zone (Ero Brasil, 2022 ) ....................... 246 Figure 16 - 2 : VRM variant method schematic (Ero Brasil, 2022 ) ................................................................................ 247 Figure 16 - 3 : Proposed Mine Design for the Deepening Project (Ero Brasil, 2022 ) .................................................... 248 Figure 16 - 4 : Center - out mining sequence (Ero Brasil, 2022 ) ..................................................................................... 249 Figure 16 - 5: Honeypot & Upper Areas Sector 1 - General Layout (Ero Brasil, 2022) ............................................... 250 Figure 16 - 6: Honeypot & Upper Areas Sector 2 - General Layout (Ero Brasil, 2022) ............................................... 251 Figure 16 - 7: Honeypot & Upper Areas Baraúna Layout (Ero Brasil, 2022)................................................................ 251 Figure 16 - 8: Honeypot & Upper Areas P1P2 and R22 Layout (Ero Brasil, 2022) ...................................................... 252 Figure 16 - 9: Honeypot & Upper Areas: MSBW Layout (Ero Brasil, 2022) ................................................................. 252 Figure 16 - 10: Proposed Materials Handling System for Honeypot & Upper Areas (Ero Brasil, 2022) ...................... 253 Figure 16 - 11: North - South schematic profile of the Vermelhos UG Mine. Colors denote mining areas (Ero Brasil, 2022) ............................................................................................................................. ... ...................... 257 Figure 16 - 12: Tobogã orebody, Vermelhos UG Mine – Dimensions (Ero Brasil, 2022) ............................................. 257 Figure 16 - 13: Tobogã orebody, Vermelhos South area – Dimensions (Ero Brasil, 2022) ......................................... 258 Figure 16 - 14: Vertical stopes - drilling design schematic in the Vermelhos UG Mine (Ero Brasil, 2022) ................... 258 Figure 16 - 15: Vermelhos UG development size (Ero Brasil, 2022) ........................................................................... 259 Figure 16 - 16: Vermelhos UG Mine Waste Pile (Ero Brasil, 2022) ............................................................................. 260 Figure 16 - 17 : Surubim Mine long - section showing planned stopes (Ero Brasil, 2022 ) .............................................. 262 Figure 16 - 18 : Surubim Mine underground panel in perspective and cross section (Ero Brasil, 2022 ) ....................... 263 Figure 16 - 19 : East and West Main Faults (Ero Brasil, 2022 ) ..................................................................................... 266 Figure 16 - 20 : Seismic Monitoring System (Ero Brasil, 2022 ) ..................................................................................... 267 Figure 16 - 21 : Main Faults and existing Excavations for levels - 78 to - 400 , Project Honeypot (Ero Brasil, 2022 ) ...... 268 Figure 16 - 22 : Main Faults and existing Excavations for Baraúna (Ero Brasil, 2022 ) ................................................ 268 Figure 16 - 23 : Main Faults and existing Excavations for P 1 P 2 - R 22 (Ero Brasil, 2022 ) .............................................. 269 Figure 16 - 24 : Main Faults and existing Excavations for MSBW (Ero Brasil, 2022 ) .................................................... 269 Figure 16 - 25 : Rock Mass Ratings for Project Honeypot & Upper Areas (Ero Brasil, 2022 ) ....................................... 270 Figure 16 - 26 : Discontinuities and Contour Diagrams, Pilar UG Mine ........................................................................ 270 Figure 16 - 27 : Historic RMR Histogram for the Suçuarana OP Mine (Ero Brasil, 2022 ) ............................................. 271 Figure 16 - 28 : Histogram and safety factor for the Suçuarana OP Mine (Ero Brasil, 2022 ) ........................................ 272 Figure 16 - 29 : Discontinuities in Suçuarana OP Mine (Ero Brasil, 2022 ) .................................................................... 272 Figure 16 - 30 : Geotechnical sectors of the Surubim OP (Ero Brasil, 2022 ) ................................................................ 274 Figure 16 - 31 : Fracture pattern with predominant NE - SW and NW - SE directions and faults preferably NE - SW (Ero Brasil, 2022 ) ............................................................................................................................. ... .. 275 Figure 16 - 32 : Vermelhos RMR histogram (Ero Brasil, 2022 ) ..................................................................................... 277 December 22, 2022 Rev. F xvii
2022 M INERAL R ESOURCES AND M INERAL R ESERVES OF T HE C ARAÍBA O PERATIONS , C URAÇÁ V ALLEY , B AHIA , B RAZIL F ORM 43 - 101 F 1 T ECHNICAL R EPORT Figure 16 - 33 : Main structures from Vermelhos Mapping (Ero Brasil, 2022 ) .............................................................. 277 Figure 16 - 34 : Illustrative structural mapping of Vermelhos Mine (red showing mapped discontinuities and green completed development) (Ero Brasil, 2022 ) .................................................................................. 278 Figure 16 - 35 : Interaction mines/permanent gallery of UG 3 mining area, Vermelhos UG Mine (Ero Brasil, 2022 ) ..... 278 Figure 16 - 36 : Gallery/permanent gallery interaction (Ero Brasil, 2022 ) ..................................................................... 279 Figure 17 - 1 : Exterior and Interior of the Primary Concentrate Shed at the Caraíba Mill (Ero Brasil, 2020 ) ............... 291 Figure 17 - 2 : Salvador’s Port, where Caraíba Concentrate Departs for International Markets (Ero Brasil, 2017 ) ...... 292 Figure 17 - 3 : Simplified Process Flow - Sheet (Ero Brasil, 2022 ) ................................................................................. 295 Figure 17 - 4: Simplified Process Flowsheet, 4.2Mtpa (Ero Brasil, 2022) .................................................................... 296 Figure 17 - 5: Plant Expansion Layout (Ero Brasil, 2022) ............................................................................................ 298 Figure 18 - 1: Primary Caraíba Mine Infrastructure and Site Layout (Ero Brasil, 2017) ............................................... 300 Figure 18 - 2: Main Electrical Substation at the Caraíba Mill (Ero Brasil, 2019)........................................................... 301 Figure 18 - 3: Simplified power distribution schematic (Ero Brasil, 2020) .................................................................... 301 Figure 18 - 4: Location of equipment in Main Substation (Ero Brasil, 2020) ................................................................ 302 Figure 18 - 5: Loads served by the emergency generator system (Ero Brasil, 2020) .................................................. 303 Figure 18 - 6: A: 12TR001; B: 12TR002; C: 12TR003 (Ero Brasil, 2019) .................................................................... 304 Figure 18 - 7: A: Existing Shaft; B: Cables running through Shaft (Ero Brasil, 2019)................................................... 305 Figure 18 - 8: Service water schematic (green line) (Ero Brasil, 2020) ........................................................................ 307 Figure 18 - 9: Pumping line schematic (Ero Brasil, 2020) ............................................................................................ 307 Figure 18 - 10: Photo of a Main Pumping Station (Ero Brasil, 2020) ........................................................................... 308 Figure 18 - 11: Leaky Feeder Circuit 1, Main Ramp (Ero Brasil, 2020)........................................................................ 309 Figure 18 - 12: Leaky Feeder Circuit 2 via Shaft (Ero Brasil, 2020) ............................................................................. 309 Figure 18 - 13: Central Maintenance Facility on Surface, Pilar Mine (Ero Brasil, 2020) .............................................. 310 Figure 18 - 14: Schematic of the LHD Workshop at L - 137 (Ero Brasil, 2020).............................................................. 310 Figure 18 - 15: and Lubrification facility at L - 732 (Ero Brasil, 2020) ............................................................................ 311 Figure 18 - 16: Compressed air central station and pressure vessels at surface (Ero Brasil, 2020)............................ 311 Figure 18 - 17: Pilar UG Mine Pastefill Plant (Ero Brasil, 2020) ................................................................................... 313 Figure 18 - 18: Pilar UG Mine Pastefill Plant and Expansion, Block Flow Diagram (Ero Brasil, 2022) ........................ 313 Figure 18 - 19: Schematic of Ero Brasil’s Main Ventilation System (Ero Brasil, 2022)................................................. 314 Figure 18 - 20: P3 exhaust fans – model SOMAX (Ero Brasil, 2020) .......................................................................... 315 Figure 18 - 21: P1/P2 exhaust fans – model SOMAX (Ero Brasil, 2020) ..................................................................... 315 Figure 18 - 22: Old pit exhaust fans – model TECSIS (Ero Brasil, 2020)..................................................................... 316 Figure 18 - 23: Vermelhos Industrial Area (Ero Brasil, 2020)....................................................................................... 317 Figure 18 - 24: Vermelhos Office and Support Facilities (Ero Brasil, 2020) ................................................................. 317 December 22, 2022 Rev. F xviii
2022 M INERAL R ESOURCES AND M INERAL R ESERVES OF T HE C ARAÍBA O PERATIONS , C URAÇÁ V ALLEY , B AHIA , B RAZIL F ORM 43 - 101F1 T ECHNICAL R EPORT Figure 18 - 25: Vermelhos Infrastructure, Primary Electrical Supply (Ero Brasil, 2020) ............................................... 318 Figure 18 - 26: Industrial water circuit schematic (Ero Brasil, 2020) ............................................................................ 319 Figure 18 - 27: Vermelhos UG Mine pumping station locations (Ero Brasil, 2020) ...................................................... 319 Figure 18 - 28: Vermelhos UG Mine main ventilation circuit schematic (Ero Brasil, 2020) .......................................... 320 Figure 18 - 29: CRF Plant at Vermelhos UG Mine (Ero Brasil, 2020) .......................................................................... 321 Figure 18 - 30: Surubim maintenance facilities (Ero Brasil, 2020) ............................................................................... 322 Figure 18 - 31: Surubim security gate and parking lot (Ero Brasil, 2020)..................................................................... 322 Figure 18 - 32: Surubim geology core shack and telecom tower (Ero Brasil, 2020) .................................................... 323 Figure 18 - 33: Surubim cafeteria and support offices (Ero Brasil, 2020)..................................................................... 323 Figure 18 - 34: Pilar UG Mine Electrical Infrastructure (Ero Brasil, 2020) .................................................................... 326 Figure 18 - 35: Paste Plant Upgrade and Expansion Flow Diagram (Ero Brasil, 2022) ............................................... 327 Figure 18 - 36: Pilar Mine, New External Shaft Configuration, Cross - Section (a) and Permanent Arrangement (b) (Ero Brasil, 2022) ............................................................................................................................. ... .. 329 Figure 18 - 37: General Arrangement of the Crushing & Conveying System............................................................... 331 Figure 18 - 38: Modeled Wet Bulb Temperatures on Primary Ramp by Level (Ero Brasil, 2022) ................................ 332 Figure 19 - 1: Breakdown of Global Refined Copper Usage (S&P Global, 2022) ........................................................ 333 Figure 20 - 1 : Annual Rainfall – Period from 1978 to 2021 (Caraíba Station – Bahia State) . ...................................... 339 Figure 20 - 2 : Typical Caatinga Vegetation (Ero Brasil, 2020 ) ..................................................................................... 339 Figure 20 - 3 : Paste fill plant on surface and underground tailings disposal as cemented paste (Ero Brasil, 2022 ) .... 344 Figure 20 - 4 : Initial dike dimensions prepared for co - disposal (Ero Brasil, 2020 ) ....................................................... 345 Figure 20 - 5 : Illustrative scheme showing final dimensions of a typical co - disposal stockpile berm (Ero Brasil, 2020 ) ............................................................................................................................. ... ...................... 345 Figure 20 - 6: Photograph of Co - disposal Method on completion of Deposition (Ero Brasil, 2019) ............................. 346 Figure 20 - 7: R75 open pit after its exhaustion in 2010 (Ero Brasil, 2010).................................................................. 346 Figure 20 - 8: R75 open pit during filling in 2011 (Ero Brasil, 2011)............................................................................. 347 Figure 20 - 9: R75 open pit commencing revegetation in 2015 (Ero Brasil, 2015)....................................................... 347 Figure 20 - 10: R75 open pit revegetation in 2019 (Ero Brasil, 2019) .......................................................................... 347 Figure 20 - 11 : Site overview of sites located for future tailings disposal relative to the historic tailings facility (right in image) and the existing milling infrastructure (center left in image) . Grid spacing is 1 km by 1 km . (Ero Brasil, 2022 ) ............................................................................................................................. ... .. 348 Figure 20 - 12 : Location of South Pile design, location of Pile 18 and the historic tailings - dam showing additional locations identified for dry - stack tailings storage . Grid spacing is 1 km by 1 km . (Ero Brasil, 2022 ) . ............................................................................................................................. ... ...................... 349 Figure 24 - 1: Copper Grade Distribution (%), Deepening Inferred Project (Ero Brasil, 2022) ..................................... 360 Figure 24 - 2: 2D Schematic of stope design by mining method (blue = longitudinal, red = transverse) (Ero Brasil, 2022) ............................................................................................................................. ... ...................... 361 December 22, 2022 Rev. F xix
2022 M INERAL R ESOURCES AND M INERAL R ESERVES OF T HE C ARAÍBA O PERATIONS , C URAÇÁ V ALLEY , B AHIA , B RAZIL F ORM 43 - 101F1 T ECHNICAL R EPORT Figure 24 - 3: General Layout of Pilar UG Development, Deepening Extension Zone (Ero Brasil, 2022).................... 362 December 22, 2022 Rev. F xx
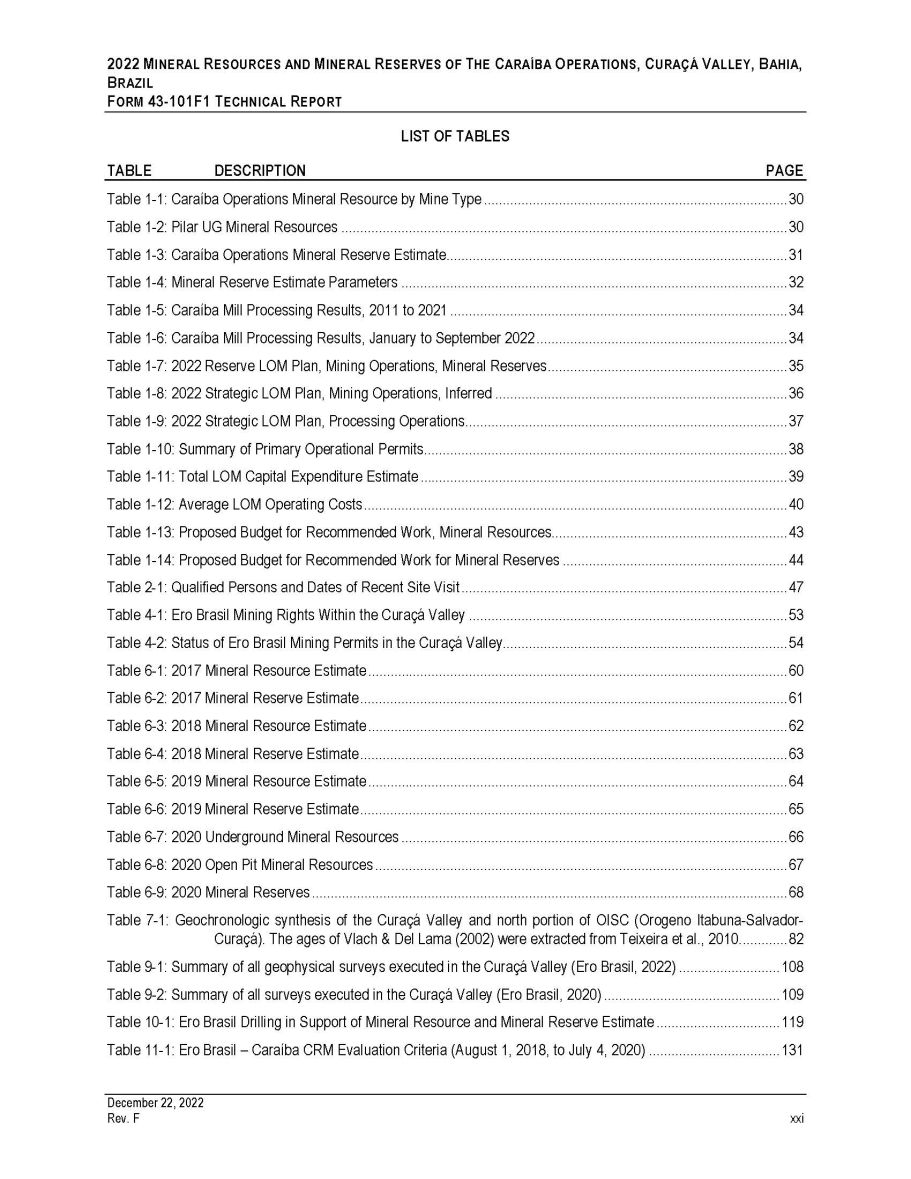
2022 M INERAL R ESOURCES AND M INERAL R ESERVES OF T HE C ARAÍBA O PERATIONS , C URAÇÁ V ALLEY , B AHIA , B RAZIL F ORM 43 - 101F1 T ECHNICAL R EPORT LIST OF TABLES TABLE DESCRIPTION PAGE Table 1 - 1: Caraíba Operations Mineral Resource by Mine Type ................................................................................. 30 Table 1 - 2: Pilar UG Mineral Resources ....................................................................................................................... 30 Table 1 - 3: Caraíba Operations Mineral Reserve Estimate........................................................................................... 31 Table 1 - 4: Mineral Reserve Estimate Parameters ....................................................................................................... 32 Table 1 - 5: Caraíba Mill Processing Results, 2011 to 2021 .......................................................................................... 34 Table 1 - 6: Caraíba Mill Processing Results, January to September 2022 ................................................................... 34 Table 1 - 7: 2022 Reserve LOM Plan, Mining Operations, Mineral Reserves................................................................ 35 Table 1 - 8: 2022 Strategic LOM Plan, Mining Operations, Inferred .............................................................................. 36 Table 1 - 9: 2022 Strategic LOM Plan, Processing Operations...................................................................................... 37 Table 1 - 10: Summary of Primary Operational Permits................................................................................................. 38 Table 1 - 11: Total LOM Capital Expenditure Estimate .................................................................................................. 39 Table 1 - 12: Average LOM Operating Costs ................................................................................................................. 40 Table 1 - 13: Proposed Budget for Recommended Work, Mineral Resources............................................................... 43 Table 1 - 14: Proposed Budget for Recommended Work for Mineral Reserves ............................................................ 44 Table 2 - 1: Qualified Persons and Dates of Recent Site Visit ....................................................................................... 47 Table 4 - 1: Ero Brasil Mining Rights Within the Curaçá Valley ..................................................................................... 53 Table 4 - 2: Status of Ero Brasil Mining Permits in the Curaçá Valley............................................................................ 54 Table 6 - 1: 2017 Mineral Resource Estimate ................................................................................................................ 60 Table 6 - 2: 2017 Mineral Reserve Estimate .................................................................................................................. 61 Table 6 - 3: 2018 Mineral Resource Estimate ................................................................................................................ 62 Table 6 - 4: 2018 Mineral Reserve Estimate .................................................................................................................. 63 Table 6 - 5: 2019 Mineral Resource Estimate ................................................................................................................ 64 Table 6 - 6: 2019 Mineral Reserve Estimate .................................................................................................................. 65 Table 6 - 7: 2020 Underground Mineral Resources ....................................................................................................... 66 Table 6 - 8: 2020 Open Pit Mineral Resources .............................................................................................................. 67 Table 6 - 9: 2020 Mineral Reserves ............................................................................................................................. .. 68 Table 7 - 1: Geochronologic synthesis of the Curaçá Valley and north portion of OISC (Orogeno Itabuna - Salvador - Curaçá). The ages of Vlach & Del Lama (2002) were extracted from Teixeira et al., 2010............. 82 Table 9 - 1: Summary of all geophysical surveys executed in the Curaçá Valley (Ero Brasil, 2022) ........................... 108 Table 9 - 2: Summary of all surveys executed in the Curaçá Valley (Ero Brasil, 2020) ............................................... 109 Table 10 - 1: Ero Brasil Drilling in Support of Mineral Resource and Mineral Reserve Estimate ................................. 119 Table 11 - 1: Ero Brasil – Caraíba CRM Evaluation Criteria (August 1, 2018, to July 4, 2020) ................................... 131 December 22, 2022 Rev. F xxi

2022 M INERAL R ESOURCES AND M INERAL R ESERVES OF T HE C ARAÍBA O PERATIONS , C URAÇÁ V ALLEY , B AHIA , B RAZIL F ORM 43 - 101F1 T ECHNICAL R EPORT Table 11 - 2: Deposit / Zones within the QAQC 2022 validation by GE21 ................................................................... 143 Table 11 - 3: Outliers named as blank samples removed from the analysis ................................................................ 144 Table 11 - 4: Ero Brasil 2020 - 2022 CRM Evaluation Criteria ....................................................................................... 145 Table 12 - 1: Summary of Density Estimates by Lithology ........................................................................................... 161 Table 13 - 1: Mill Performance ............................................................................................................................. ... ..... 162 Table 13 - 2: Chemical Analysis and Trace Element Composition (%) ........................................................................ 163 Table 13 - 3: HIG Mill size characterization test results ............................................................................................... 166 Table 13 - 4: Results of Ero Brasil Validation Test work .............................................................................................. 167 Table 13 - 5: XRF Test Results ............................................................................................................................. ... .... 174 Table 13 - 6: Ore Sorting Trial Campaign Results at Varying Mass Yields .................................................................. 176 Table 13 - 7: Sample Blends for Ore Competency Test Work (Ero Brasil 2022) ......................................................... 178 Table 13 - 8: Results of Ore Competency Test Work (Ero Brasil 2022)....................................................................... 178 Table 14 - 1: Summary of the Database Used in 2020 Mineral Resource Estimation ................................................. 180 Table 14 - 2: Basic statistics of sample interval size, 2022 Updated Domains ............................................................ 188 Table 14 - 3 Summary Statistics of Total Cu (CuT, %) by domain, 2020 Updated Domains ....................................... 190 Table 14 - 4 Summary of Outlier Analysis, 2022 Updated Domains ............................................................................ 192 Table 14 - 5: Summary of Variographic Analysis – Structures and Anisotropy, 2022 Update ..................................... 194 Table 14 - 6: Summary of Variographic Analysis – Ellipsoid Orientation, 2022 Update ............................................... 195 Table 14 - 7: Block Model Dimensions Summary ........................................................................................................ 196 Table 14 - 8: Block Model Attributes Summary ............................................................................................................ 196 Table 14 - 9: Summary of Variographic Analysis, Unchanged 2021 Domains............................................................. 197 Table 14 - 10: Block Model Summary, Unchanged 2021 Domains.............................................................................. 198 Table 14 - 11: Summary of grade estimate steps – distance (meters) and anisotropy, Unchanged 2021 Domains.... 199 Table 14 - 12: Summary of grade estimate steps – distance and anisotropy, 2022 Update ........................................ 201 Table 14 - 13: Open Pit Mining Optimization Pit Parameters ....................................................................................... 205 Table 14 - 14: Underground Mining Optimization Stope Parameters........................................................................... 206 Table 14 - 15: Caraíba Operations Mineral Resource by Mine Type ........................................................................... 206 Table 14 - 16: Pilar UG Mineral Resources ................................................................................................................. 207 Table 14 - 17: Analysis of Criterion Used for the Mineral Resource Classification ...................................................... 208 Table 15 - 1: Mineral Reserve Estimate Parameters ................................................................................................... 210 Table 15 - 2: Caraíba Operations Mineral Reserve Estimate, 2022............................................................................. 212 Table 15 - 3: Density Parameters - OP Optimization ................................................................................................... 214 Table 15 - 4: Geotechnical Pit Slopes Parameters - OP Optimization ......................................................................... 214 Table 15 - 5: Open Pit Mines - COG Calculation ......................................................................................................... 215 December 22, 2022 Rev. F xxii
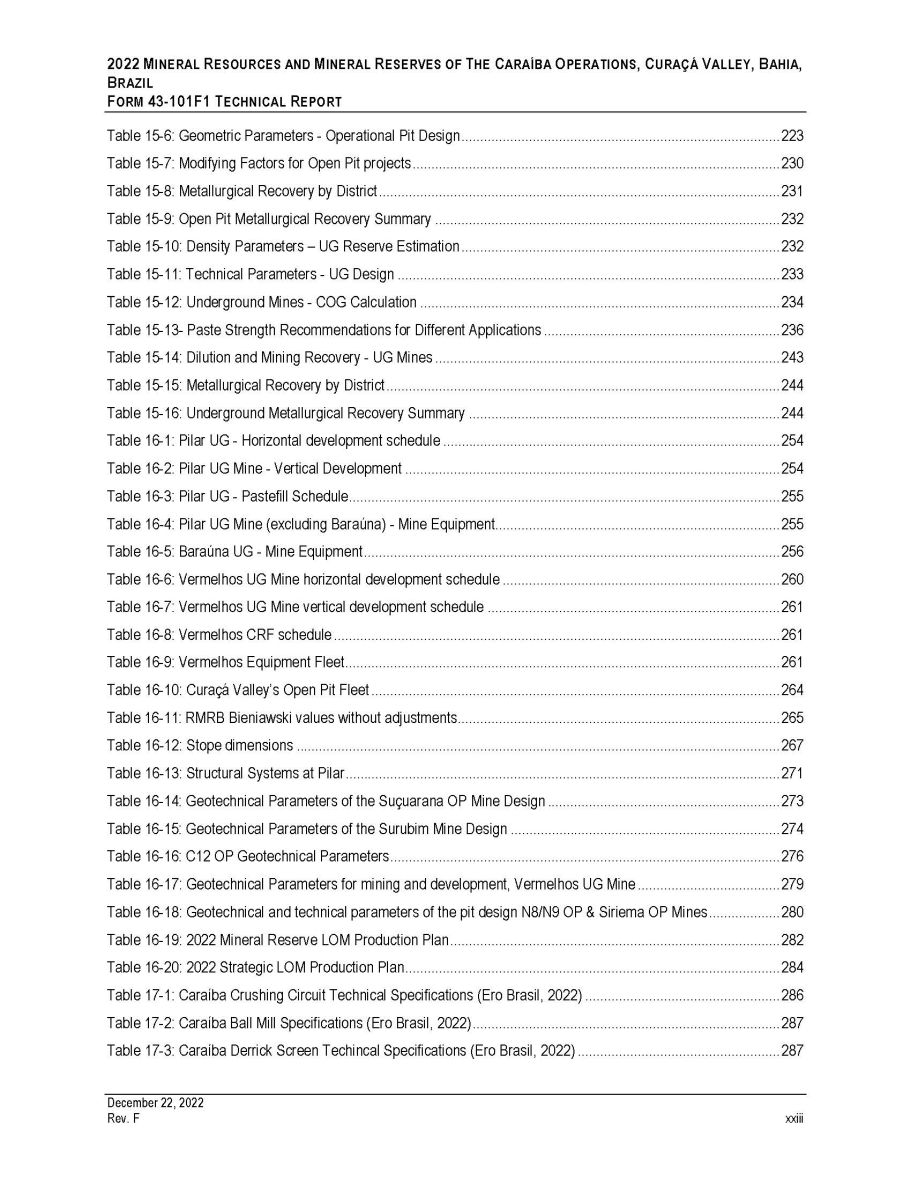
2022 M INERAL R ESOURCES AND M INERAL R ESERVES OF T HE C ARAÍBA O PERATIONS , C URAÇÁ V ALLEY , B AHIA , B RAZIL F ORM 43 - 101F1 T ECHNICAL R EPORT Table 15 - 6: Geometric Parameters - Operational Pit Design ..................................................................................... 223 Table 15 - 7: Modifying Factors for Open Pit projects .................................................................................................. 230 Table 15 - 8: Metallurgical Recovery by District ........................................................................................................... 231 Table 15 - 9: Open Pit Metallurgical Recovery Summary ............................................................................................ 232 Table 15 - 10: Density Parameters – UG Reserve Estimation ..................................................................................... 232 Table 15 - 11: Technical Parameters - UG Design ...................................................................................................... 233 Table 15 - 12: Underground Mines - COG Calculation ................................................................................................ 234 Table 15 - 13 - Paste Strength Recommendations for Different Applications ............................................................... 236 Table 15 - 14: Dilution and Mining Recovery - UG Mines ............................................................................................ 243 Table 15 - 15: Metallurgical Recovery by District ......................................................................................................... 244 Table 15 - 16: Underground Metallurgical Recovery Summary ................................................................................... 244 Table 16 - 1: Pilar UG - Horizontal development schedule .......................................................................................... 254 Table 16 - 2: Pilar UG Mine - Vertical Development .................................................................................................... 254 Table 16 - 3: Pilar UG - Pastefill Schedule................................................................................................................... 255 Table 16 - 4: Pilar UG Mine (excluding Baraúna) - Mine Equipment............................................................................ 255 Table 16 - 5: Baraúna UG - Mine Equipment ............................................................................................................... 256 Table 16 - 6: Vermelhos UG Mine horizontal development schedule .......................................................................... 260 Table 16 - 7: Vermelhos UG Mine vertical development schedule .............................................................................. 261 Table 16 - 8: Vermelhos CRF schedule ....................................................................................................................... 261 Table 16 - 9: Vermelhos Equipment Fleet.................................................................................................................... 261 Table 16 - 10: Curaçá Valley’s Open Pit Fleet ............................................................................................................. 264 Table 16 - 11: RMRB Bieniawski values without adjustments...................................................................................... 265 Table 16 - 12: Stope dimensions ............................................................................................................................. ... . 267 Table 16 - 13: Structural Systems at Pilar.................................................................................................................... 271 Table 16 - 14: Geotechnical Parameters of the Suçuarana OP Mine Design .............................................................. 273 Table 16 - 15: Geotechnical Parameters of the Surubim Mine Design ........................................................................ 274 Table 16 - 16: C12 OP Geotechnical Parameters........................................................................................................ 276 Table 16 - 17: Geotechnical Parameters for mining and development, Vermelhos UG Mine ...................................... 279 Table 16 - 18: Geotechnical and technical parameters of the pit design N8/N9 OP & Siriema OP Mines ................... 280 Table 16 - 19: 2022 Mineral Reserve LOM Production Plan ........................................................................................ 282 Table 16 - 20: 2022 Strategic LOM Production Plan.................................................................................................... 284 Table 17 - 1: Caraíba Crushing Circuit Technical Specifications (Ero Brasil, 2022) .................................................... 286 Table 17 - 2: Caraíba Ball Mill Specifications (Ero Brasil, 2022) .................................................................................. 287 Table 17 - 3: Caraíba Derrick Screen Techincal Specifications (Ero Brasil, 2022) ...................................................... 287 December 22, 2022 Rev. F xxiii
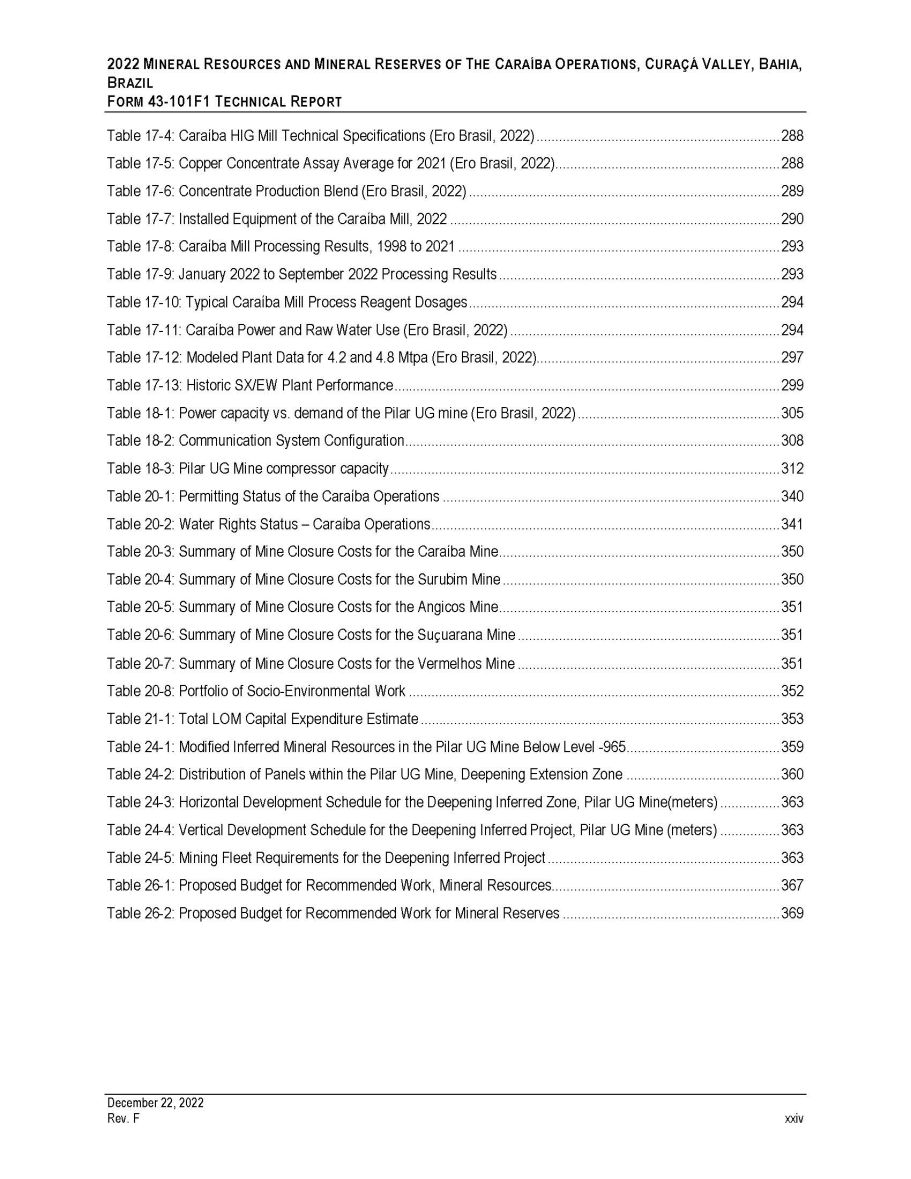
2022 M INERAL R ESOURCES AND M INERAL R ESERVES OF T HE C ARAÍBA O PERATIONS , C URAÇÁ V ALLEY , B AHIA , B RAZIL F ORM 43 - 101F1 T ECHNICAL R EPORT Table 17 - 4: Caraíba HIG Mill Technical Specifications (Ero Brasil, 2022) ................................................................. 288 Table 17 - 5: Copper Concentrate Assay Average for 2021 (Ero Brasil, 2022)............................................................ 288 Table 17 - 6: Concentrate Production Blend (Ero Brasil, 2022) ................................................................................... 289 Table 17 - 7: Installed Equipment of the Caraíba Mill, 2022 ........................................................................................ 290 Table 17 - 8: Caraíba Mill Processing Results, 1998 to 2021 ...................................................................................... 293 Table 17 - 9: January 2022 to September 2022 Processing Results ........................................................................... 293 Table 17 - 10: Typical Caraíba Mill Process Reagent Dosages ................................................................................... 294 Table 17 - 11: Caraíba Power and Raw Water Use (Ero Brasil, 2022) ........................................................................ 294 Table 17 - 12: Modeled Plant Data for 4.2 and 4.8 Mtpa (Ero Brasil, 2022)................................................................. 297 Table 17 - 13: Historic SX/EW Plant Performance....................................................................................................... 299 Table 18 - 1: Power capacity vs. demand of the Pilar UG mine (Ero Brasil, 2022) ...................................................... 305 Table 18 - 2: Communication System Configuration.................................................................................................... 308 Table 18 - 3: Pilar UG Mine compressor capacity........................................................................................................ 312 Table 20 - 1: Permitting Status of the Caraíba Operations .......................................................................................... 340 Table 20 - 2: Water Rights Status – Caraíba Operations ............................................................................................. 341 Table 20 - 3: Summary of Mine Closure Costs for the Caraíba Mine........................................................................... 350 Table 20 - 4: Summary of Mine Closure Costs for the Surubim Mine .......................................................................... 350 Table 20 - 5: Summary of Mine Closure Costs for the Angicos Mine........................................................................... 351 Table 20 - 6: Summary of Mine Closure Costs for the Su ç uarana Mine ...................................................................... 351 Table 20 - 7: Summary of Mine Closure Costs for the Vermelhos Mine ...................................................................... 351 Table 20 - 8: Portfolio of Socio - Environmental Work ................................................................................................... 352 Table 21 - 1: Total LOM Capital Expenditure Estimate ................................................................................................ 353 Table 24 - 1: Modified Inferred Mineral Resources in the Pilar UG Mine Below Level - 965......................................... 359 Table 24 - 2: Distribution of Panels within the Pilar UG Mine, Deepening Extension Zone ......................................... 360 Table 24 - 3: Horizontal Development Schedule for the Deepening Inferred Zone, Pilar UG Mine(meters) ................ 363 Table 24 - 4: Vertical Development Schedule for the Deepening Inferred Project, Pilar UG Mine (meters) ................ 363 Table 24 - 5: Mining Fleet Requirements for the Deepening Inferred Project .............................................................. 363 Table 26 - 1: Proposed Budget for Recommended Work, Mineral Resources............................................................. 367 Table 26 - 2: Proposed Budget for Recommended Work for Mineral Reserves .......................................................... 369 December 22, 2022 Rev. F xxiv
2022 M INERAL R ESOURCES AND M INERAL R ESERVES OF T HE C ARAÍBA O PERATIONS , C URAÇÁ V ALLEY , B AHIA , B RAZIL F ORM 43 - 101F1 T ECHNICAL R EPORT LIST OF APPENDICES APPENDIX DESCRIPTION A December 22, 2022 Rev. F xxv Technical Report QP Certificates B C Swath Plots Process Flowsheets D Infrastructure Maps of the Caraíba Operations E Mineral Permits F Standard Certificates
2022 M INERAL R ESOURCES AND M INERAL R ESERVES OF T HE C ARAÍBA O PERATIONS , C URAÇÁ V ALLEY , B AHIA , B RAZIL F ORM 43 - 101 F 1 T ECHNICAL R EPORT 1 EXECUTIVE SUMMARY Ero Copper Corp . (“Ero Copper”, “Ero” or the “Company”) is a Vancouver - based publicly listed copper mining company that trades on the Toronto and New York Stock Exchanges under the ticker “ERO” and exists under the British Columbia Business Corporations Act . Ero Copper’s principal asset is a 99 . 6 % interest in Mineração Caraíba S . A . (“MCSA”, or herein referred to as “Ero Brasil”), a Brazilian mining company operating in the Curaçá Valley, northeastern Bahia State, Brazil . The regional Ero Brasil operations in Bahia include fully integrated processing operations and, currently, three active producing mining locations within the Curaçá Valley . The active operations include the Caraíba Complex (comprised of the underground Pilar Mine (“Pilar UG Mine”), the underground Vermelhos Mine (“Vermelhos UG Mine”), the Surubim Mine and the integrated Caraíba Mill (which includes an inactive solvent extraction electrowinning plant (“SX/EW Plant”)) . The past producing operations include the open pit mines of R 22 (“R 22 Mine”) as well as the historic mines of Angicos (“Angicos Mine”) and Suçuarana (“Suçuarana Mine”) . Collectively the active and past - producing mines comprise the “Caraíba Operations” . Additionally, future operations are forecast to occur later in the production plan within the northern part of the Curaçá Valley including : the adjacent Vermelhos West (N 8 ) and Vermelhos East (N 9 ) open pits (collectively the “N 8 /N 9 OP Mine”), the Siriema open pit mine (“Siriema OP Mine”), collectively with the active Vermelhos UG Mine comprise the mineral reserves within the “Vermelhos District” . In the central part of the Curaçá Valley, future operations include : the expansion of the adjacent Surubim and C - 12 underground mine (the “C - 12 UG Mine”) and the C - 12 open pit (“C - 12 OP Mine”), collectively the Surubim Mine, which re - started operations during 2022 , comprise the stated mineral reserves of the “Surubim District” . In the southern part of the Curaçá Valley, the past producing Suçuarana open pit (“Suçuarana OP Mine”) and the R 22 W open pit (“R 22 W OP Mine”), collectively with the active Pilar UG Mine comprise the stated mineral reserves of the “Pilar District” . The Pilar District is located approximately 385 kilometers (“km”) north - northwest of Salvador and 90 km southeast of Petrolina, in the State of Bahia, Brazil . The center of the Surubim District is located approximately 33 km north of the Pilar UG Mine and Caraíba Mill (jointly referred to as the “Caraíba Mine”) at the Surubim Mine, while the center of the Vermelhos District and the Vermelhos UG Mine is located another 31 km north - northwest of the Surubim Mine . In aggregate, mining and development activities occur over approximately 100 km in strike length across the Curaçá Valley . The Caraíba Operations have an extensive operating history in the region . Open pit and processing operations started in 1979 , while underground mining operations commenced in 1986 . Ero Brasil owns a 100 % interest in the Caraíba Operations including the abovementioned mines, integrated processing facilities and all supporting infrastructure . The Pilar UG Mine currently produces a nominal 4 , 000 to 6 , 000 tonnes per day (“t/d”), or approximately 1 . 0 to 1 . 5 Mtpa from underground operations that, combined with the nominal 3 , 000 to 5 , 000 t/d, or approximately 1 . 5 Mtpa currently mined from satellite mining operations within the Caraíba Operations, including the Vermelhos UG Mine and the Surubim Mine, serves as feed for the Caraíba Mill . The Caraíba Mill is currently producing high quality, low impurity copper concentrate grading approximately 33 % - 35 % copper . The concentrate typically contains minor amounts of precious metals . Historical average grades of precious metals in concentrate are approximately 2 grams per tonne (“g/t” or “gpt”) gold and 43 g/t silver in concentrate . The Company's 2022 life of mine (“LOM”) planning process considers recently completed and ongoing investments in mining and milling infrastructure under the Company's "Pilar 3 . 0 ” initiative, which includes the integration of newly defined mineral resources and reserves in the upper levels of the Pilar UG Mine (efforts were focused on an area known as “Project Honeypot”) the ongoing construction of a new external shaft to access mineralization below level - 965 in the Pilar UG Mine (known as the “Deepening Project” or from a geological perspective, the “Deepening Extension Zone”), and the ongoing expansion of the Caraíba Mill to increase processing capacity to approximately 4 . 2 million tonnes per annum (“Mpta”) . As a result of the integration of Project Honeypot and the nature of the mineralization remaining in the upper levels of the Pilar Mine, and more broadly within the Company's underground operations, effective extraction of the mineral reserves necessitated the consideration of inferred mineral resources in the Company's long - term strategic planning efforts, particularly in the design of stopes that include measured, indicated and some inferred mineral resources - a process that has been utilized at the Pilar UG Mine since underground operations commenced in 1986 . Inferred mineral resources are considered too speculative geologically to have the economic considerations applied to them that would enable them to be categorized as mineral reserves . Mineral resources which are not mineral reserves do not have demonstrated economic viability . The Company has commenced a program to continue infill drilling of the Inferred resource to further upgrade this material ; however, until this work is completed, and the Inferred resources have been upgraded to reserves, there is no certainty this material will be converted into mineral reserves . December 22, 2022 Rev. F 26
2022 M INERAL R ESOURCES AND M INERAL R ESERVES OF T HE C ARAÍBA O PERATIONS , C URAÇÁ V ALLEY , B AHIA , B RAZIL F ORM 43 - 101 F 1 T ECHNICAL R EPORT The purpose of this report (“Report” or “Technical Report”) is to set out and to provide background and supporting information on the mineral resources and mineral reserves for the Caraíba Operations . The Report was prepared by GE 21 Consultoria Mineral Ltda . (“GE 21 ”), BNA Mining Solutions (“BNA”) and NCL Ingeniería y Construcción SpA (“NCL”) on behalf of Ero Copper . This Report and estimates herein have been prepared following the guidelines of the Canadian Securities Administrators’ National Instrument 43 - 101 – Standards of Disclosure for Mineral Projects (“NI 43 - 101 ”) and Form 43 - 101 F 1 – Technical Report (“Form 43 - 101 F 1 ”) . The effective date of this Report is September 30 , 2022 (the “Effective Date”) . The issue date of this Report is December 22 , 2022 . 1. P ROPERTY D ESCRIPTION AND O WNERSHIP The Caraíba Operations are located in northeastern Bahia State, Brazil, about 385 km north - northwest of the capital city of Salvador . The center of the Caraíba Operations is located at 9 º 52 ’ South, 39 º 52 ’ West . As of the Effective Date, Ero Brasil holds, has applications in process, or has negotiated agreements with third - parties for a north - trending set of 138 mineral exploration rights, six mining concessions and seven additional mining concessions are under application . The property, including mining and permits under application covers a total area of 185 , 865 . 0 hectares (“ha”) . The exploration rights held or with applications in process cover an area of 171 , 045 . 2 ha and consist of areas up for renewal as well as negotiated with third - parties under normal course of business . Ero Brasil holds 100 % legal and beneficial ownership of exploration rights for a period varying up to three years with three - year extensions provided annual reporting requirements are performed on the property . Within the exploration rights, Ero Brasil’s interests include the right to access the property, to engage in exploration, development, processing, and construction activities in support of mineral exploration and development . Where applicable, compensation is provided to the holder of surface rights for occupation or loss caused by the work . Mining and development activities are contained within seven mining concessions covering 3 , 299 . 6 ha . In addition, Ero Brasil has seven applications for mining covering 10 , 521 . 4 ha . Within the mining concessions, Ero Brasil holds 100 % legal and beneficial ownership . There are no time constraints provisioned with the mining concessions ; however, operating permits and licenses are extended and renewed in normal course of business according to the nature of each permit and requirements therein . Infrastructure maps of the Caraíba Operation and the broader Curaçá Valley are shown in Appendix D to the Report . 2. G EOLOGY AND M INERALIZATION The Curaçá Valley’s mafic - ultramafic complex is located within the Curaçá high - grade metamorphic gneissic terrain - part of the Salvador - Curaçá orogen, a northern extension of the Atlantic Coast Granulite Belt in the São Francisco Craton . The mining and development projects located within the Caraíba Operations lie within a Trans - Amazonian age belt bordered on the west by volcano - sedimentary rocks of the Jacobina Group and on the east by the Itiúba intrusive syenite rocks . Known copper deposits are hosted within the Rio Curaçá and Tanque Novo sequences, differentiated by metamorphic facies . The two sequences are located across the base of the Caraíba Operations and include the mafic - ultramafic rocks as well as granite, granodiorite and syenite . Pyroxenite has been described within the mafic - ultramafic lenses at the Caraíba Mine, R 22 W Mine, Angicos Mine, Suçuarana Mine, Surubim Mine and the Vermelhos UG Mine . The Cu - rich deposits are hosted by irregular - shaped intrusive bodies of pyroxenite (hypersthenite) and minor gabbro - norite that have been intruded into granulite facies gneiss and migmatite at the northern margin of the São Francisco Craton . The intrusions have been interpreted as either deformed sill - like bodies or irregular shaped intrusions into an anastomosing ductile shear zone . Mineralized textures include interstitial, net - textured, stringer and sulphide - rich matrix breccias . There is additional evidence throughout the Curaçá Valley of sulphide zonation, characterized as pyrrhotite +/ - pentlandite zoning to pyrrhotite +/ - pentlandite plus chalcopyrite and finally to chalcopyrite plus bornite . High - grade mineralization is often closely associated with phlogopite enrichment . Additional work is underway to evaluate recent observed occurrences of nickel, including the recently discovered Ni - rich Umburana System, as well as platinum group elements which have been documented throughout the Curaçá Valley . December 22, 2022 Rev. F 27
2022 M INERAL R ESOURCES AND M INERAL R ESERVES OF T HE C ARAÍBA O PERATIONS , C URAÇÁ V ALLEY , B AHIA , B RAZIL F ORM 43 - 101 F 1 T ECHNICAL R EPORT In late 2022 , subsequent to the Effective Date, Ero Copper announced the first documented nickel sulphide discovery in the Curaçá Valley as part of its ongoing regional exploration program . The nickel system, known as the "Umburana System", is located approximately 20 kilometers from the Caraíba Mill . The system was discovered using detailed field mapping and soil geochemistry collected during the Company's 2021 and 2022 exploration programs in conjunction with the Company's airborne electromagnetic ("AEM") survey . The ongoing program identified large intervals of disseminated and interstitial nickel sulphides as well as zones of high - grade semi - massive (containing approximately 30 % to 60 % sulphides) and massive sulphides (containing approximately 60 % to 80 % sulphides), with massive sulphide intercepts up to 1 . 5 meters in thickness grading up to 6 . 59 % nickel . Nickel mineralization has been identified as outcropping at surface, as evident in trenches and remains open down - plunge . As at the date of this Report, maximum depth of drilling within the Umburana System was approximately 300 meters below surface . 3. E XPLORATION S TATUS Following the commencement of open pit mining operations in 1979 , limited exploration work was performed regionally outside of the main Caraíba Mine area prior to Ero Copper’s acquisition of MCSA in 2016 . Where it did occur, such exploration work focused primarily on exploration permit renewal requirements . The Caraíba Operations were privatized in 1994 and further exploration work was limited until the formation of the Codelco Joint Venture in 2004 (the “Codelco JV”) which existed until 2008 . Under the Codelco JV, work was conducted on several prospects outside of the Caraíba Mine area including an airborne Versatile Time Domain Electromagnetic (“VTEM”) survey over the Vermelhos District . Ground Moving - loop Electromagnetic and Bore - hole Electromagnetic test surveys were also conducted . Near - surface copper mineralization in the Curaçá Valley has historically been well - defined by geochemical sampling methods . Mineralized mafic - ultramafic intrusions show anomalous copper, nickel, cobalt, gold and silver . Several soil geochemical surveys have been conducted regionally throughout the Curaçá Valley . Geochemistry leveling efforts undertaken by Ero Copper in 2018 to normalize multiple surveys into a central database have been successful and the dataset, supplemented with ongoing soil geochemistry campaigns, continues to be used to define areas of exploration potential . Historic regional exploration activities also included geophysical surveys performed locally on specific targets . These include ground magnetic, gravity and induced polarization (“IP”) surveys . Regional airborne geophysical surveys consist of a historic magnetic and radiometric survey flown by the Brazil National Department of Mineral Production (“DNPM” which was replaced in 2018 by the new federal mining agency of Brazil, the Agência Nacional de Mineração (“ANM”)) . Based on known deposits, mineralized mafic - ultramafic intrusions respond well to gravity, IP and electromagnetic (“EM”) surveys including the use of bore - hole EM (“BHEM”) . Since the acquisition of Mineração Caraíba in late 2016 , Ero Copper has worked extensively with the broader exploration team of Ero Brasil to compile, organize, validate, analyze and interpret the various historical data sets . A list of prioritized exploration targets using district - wide dataset compilation and validation for Ero Brasil’s exploration permits throughout the Curaçá Valley continues to be worked systematically . Priority targets occur in three main areas or “Districts” : the southern Pilar District, the northern Vermelhos District and the central Surubim District . In 2018 , Ero Copper advanced its exploration efforts and completed approximately 158 , 000 meters (“m”) of drilling with the objective of upgrading and increasing mineral resources and reserves as well as commenced testing new regional targets in the Curaçá Valley . Simultaneously, Ero Copper continued development and production from the Pilar UG Mine, Surubim Mine (which re - started operations in 2022 ) and commenced production from the Vermelhos UG Mine . In support of its regional exploration efforts, Ero Copper commissioned and completed a ~ 24 , 000 line - km airborne electromagnetic and gravity geophysical survey focused on high - grade discoveries throughout the Curaçá Valley . From 2019 through 2022 Ero Copper has continued to increase drilling activities, completing over 200 , 000 m of drilling each year . Drilling remains focused on upgrading and increasing mineral resources and reserves as well as testing of new regional copper and nickel sulphide targets throughout the Curaçá Valley . In support of the current mineral resource and mineral reserve estimate, a total of 1 , 413 , 124 m of diamond core drilling was incorporated into the geological model . 4. D EVELOPMENT AND O PERATIONS Mining operations within the Curaçá Valley are currently comprised of two core operations : the Pilar UG Mine and the Vermelhos UG Mine . Production from these two mines currently serves as primary feed for the Caraíba Mill with supplemental December 22, 2022 Rev. F 28

2022 M INERAL R ESOURCES AND M INERAL R ESERVES OF T HE C ARAÍBA O PERATIONS , C URAÇÁ V ALLEY , B AHIA , B RAZIL F ORM 43 - 101 F 1 T ECHNICAL R EPORT feed from the Surubim Mine . Ongoing development and exploration activities include : the continued advancement of the primary ramp and associated infrastructure of the Pilar and Vermelhos underground mines, the construction of the new external shaft to support the Deepening Project, as well as the completion of the Caraíba Mill expansion to 4 . 2 Mtpa, expected to be completed by the end of 2023 , in support of the LOM production plan . 5. D ATA V ERIFICATION AND QA/QC GE 21 has visited the Caraíba Operations on a regular basis since 2017 to assess Ero Brasil’s exploration data, including overall procedures for drilling, logging, sample handling, control, storage, quality - assurance quality - control (“QA/QC”), database preparation and density measures . Sample Preparation, Analyses and Security The Caraíba Operation’s sampling procedures are well - defined, in line with the industry best practices . Physical preparation and chemical analysis of core samples are performed by the Caraíba Operation’s on - site laboratory, following well - defined procedures . GE 21 evaluated the sample collection, analysis and security methods, as well as the procedures used by the Caraíba Operation’s internal laboratory . Quality Assurance and Quality Contro l Standard QA/QC procedures implemented by the Caraíba Operations were found to be complete and aligned with industry best practices . A selection of historic information (collected before the current QA/QC procedures were implemented in 2007 ) as well as historic drilling associated with Project Honeypot was verified by the authors of this Report via a post - mortem validation process . Data from historic drill holes that could not be validated were omitted from the mineral resource estimate . The QA/QC process implemented includes the analysis of blanks, standards, pulverized duplicates, coarse tailings duplicates, field duplicates and a second third - party laboratory check - assay . Check - assay analysis of copper grades by a second third - party laboratory was implemented as part of the Caraíba Operations’ QA/QC program in 2020 . As part of the validation process, GE 21 verified 377 holes totaling 96 , 417 m of drilling . Density information has been obtained for over 40 years, and measurement processes are aligned with standard industry practice . Based upon the validation process, GE 21 concluded that Caraíba’s exploration data is adequate for the current mineral resource and mineral reserve estimate . 6. M INERAL R ESOURCE AND M INERAL R ESERVE E STIMATES Mineral resource and mineral reserve estimates for the Caraíba Operations were classified and prepared in accordance with the Canadian Institute of Mining, Metallurgy and Petroleum (“CIM”) Definition Standards for Mineral Resources and Mineral Reserves, adopted by the CIM Council on May 10 , 2014 , as amended (the “CIM Standards”), and the CIM Estimation of Mineral Resources and Mineral Reserves Best Practice Guidelines, adopted by CIM Council on November 29 , 2019 , as amended (the “CIM Guidelines”) by Sr . Porfirio Cabaleiro Rodriguez, FAIG, with contributions from others at GE 21 . All are independent Qualified Persons as such term is defined under NI 43 - 101 . The authors of this Report validated the current mineral resource estimate that was prepared by Ero Brasil under the supervision of GE 21 , by preparing a separate 3 D model using Leapfrog Geo software, to define and interpolate geological domains . The variograms prepared by Ero Brasil under the supervision of GE 21 were reproduced and applied through an independent grade estimate, using Leapfrog Edge software . Resource classification was determined based upon the number of “passes” and results were used to compare the tonnage, grade and contained copper content within each geological domain . Differences of less than 5 % of the contained copper content was considered acceptable within each domain . The validation performed did not indicate any material differences between the two estimates . Mineral reserves were classified according to the CIM Standards and the CIM Guidelines by Dr . Beck Nader, FAIG, of BNA, and Alejandro Sepúlveda from NCL SpA . Both of whom are independent Qualified Persons as such term is defined under NI 43 - 101 . December 22, 2022 Rev. F 29
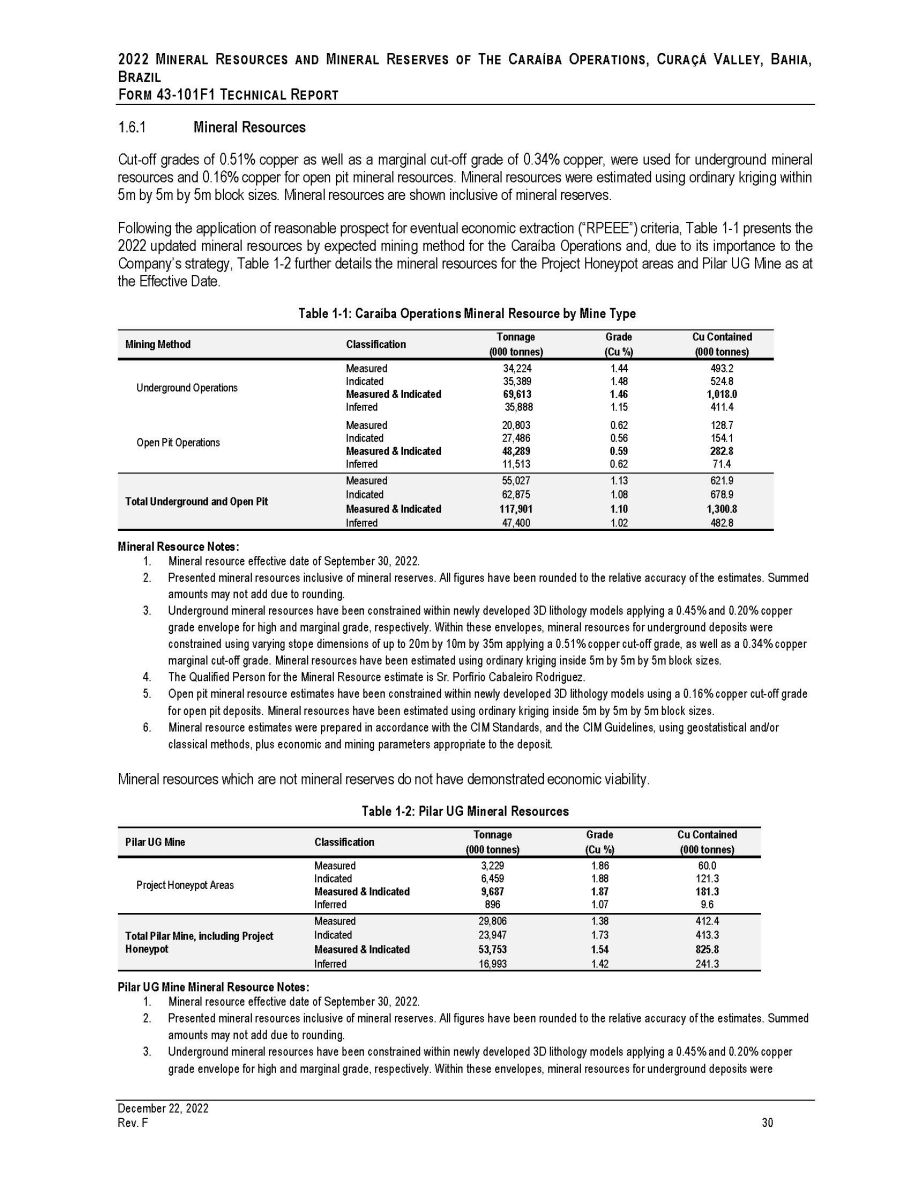
2022 M INERAL R ESOURCES AND M INERAL R ESERVES OF T HE C ARAÍBA O PERATIONS , C URAÇÁ V ALLEY , B AHIA , B RAZIL F ORM 43 - 101 F 1 T ECHNICAL R EPORT Mineral Resources Cut - off grades of 0 . 51 % copper as well as a marginal cut - off grade of 0 . 34 % copper, were used for underground mineral resources and 0 . 16 % copper for open pit mineral resources . Mineral resources were estimated using ordinary kriging within 5 m by 5 m by 5 m block sizes . Mineral resources are shown inclusive of mineral reserves . Following the application of reasonable prospect for eventual economic extraction (“RPEEE”) criteria, Table 1 - 1 presents the 2022 updated mineral resources by expected mining method for the Caraíba Operations and, due to its importance to the Company’s strategy, Table 1 - 2 further details the mineral resources for the Project Honeypot areas and Pilar UG Mine as at the Effective Date . Table 1 - 1: Caraíba Operations Mineral Resource by Mine Type Mining Method Classification Tonnage (000 tonnes) Grade (Cu %) Cu Contained (000 tonnes) Measured 34,224 1.44 493.2 Underground Operations Indicated 35,389 1.48 524.8 Measured & Indicated 69,613 1.46 1,018.0 Inferred 35,888 1.15 411.4 Measured 20,803 0.62 128.7 Open Pit Operations Indicated 27,486 0.56 154.1 Measured & Indicated 48,289 0.59 282.8 Inferred 11,513 0.62 71.4 Measured 55,027 1.13 621.9 Total Underground and Open Pit Indicated 62,875 1.08 678.9 Measured & Indicated 117,901 1.10 1,300.8 Inferred 47,400 1.02 482.8 December 22, 2022 Rev. F 30 Mineral Resource Notes: 1. Mineral resource effective date of September 30, 2022. 2. Presented mineral resources inclusive of mineral reserves. All figures have been rounded to the relative accuracy of the estimates. Summed amounts may not add due to rounding. 3. Underground mineral resources have been constrained within newly developed 3D lithology models applying a 0.45% and 0.20% copper grade envelope for high and marginal grade, respectively. Within these envelopes, mineral resources for underground deposits were constrained using varying stope dimensions of up to 20m by 10m by 35m applying a 0.51% copper cut - off grade, as well as a 0.34% copper marginal cut - off grade. Mineral resources have been estimated using ordinary kriging inside 5m by 5m by 5m block sizes. 4. The Qualified Person for the Mineral Resource estimate is Sr. Porfírio Cabaleiro Rodriguez. 5. Open pit mineral resource estimates have been constrained within newly developed 3D lithology models using a 0.16% copper cut - off grade for open pit deposits. Mineral resources have been estimated using ordinary kriging inside 5m by 5m by 5m block sizes. 6. Mineral resource estimates were prepared in accordance with the CIM Standards, and the CIM Guidelines, using geostatistical and/or classical methods, plus economic and mining parameters appropriate to the deposit. Mineral resources which are not mineral reserves do not have demonstrated economic viability. Table 1 - 2: Pilar UG Mineral Resources Pilar UG Mine Classification Tonnage (000 tonnes) Grade (Cu %) Cu Contained (000 tonnes) Measured 3,229 1.86 60.0 Project Honeypot Areas Indicated 6,459 1.88 121.3 Measured & Indicated 9,687 1.87 181.3 Inferred 896 1.07 9.6 Measured 29,806 1.38 412.4 Total Pilar Mine, including Project Indicated 23,947 1.73 413.3 Honeypot Measured & Indicated 53,753 1.54 825.8 Inferred 16,993 1.42 241.3 Pilar UG Mine Mineral Resource Notes: 1. Mineral resource effective date of September 30, 2022. 2. Presented mineral resources inclusive of mineral reserves. All figures have been rounded to the relative accuracy of the estimates. Summed amounts may not add due to rounding. 3. Underground mineral resources have been constrained within newly developed 3D lithology models applying a 0.45% and 0.20% copper grade envelope for high and marginal grade, respectively. Within these envelopes, mineral resources for underground deposits were
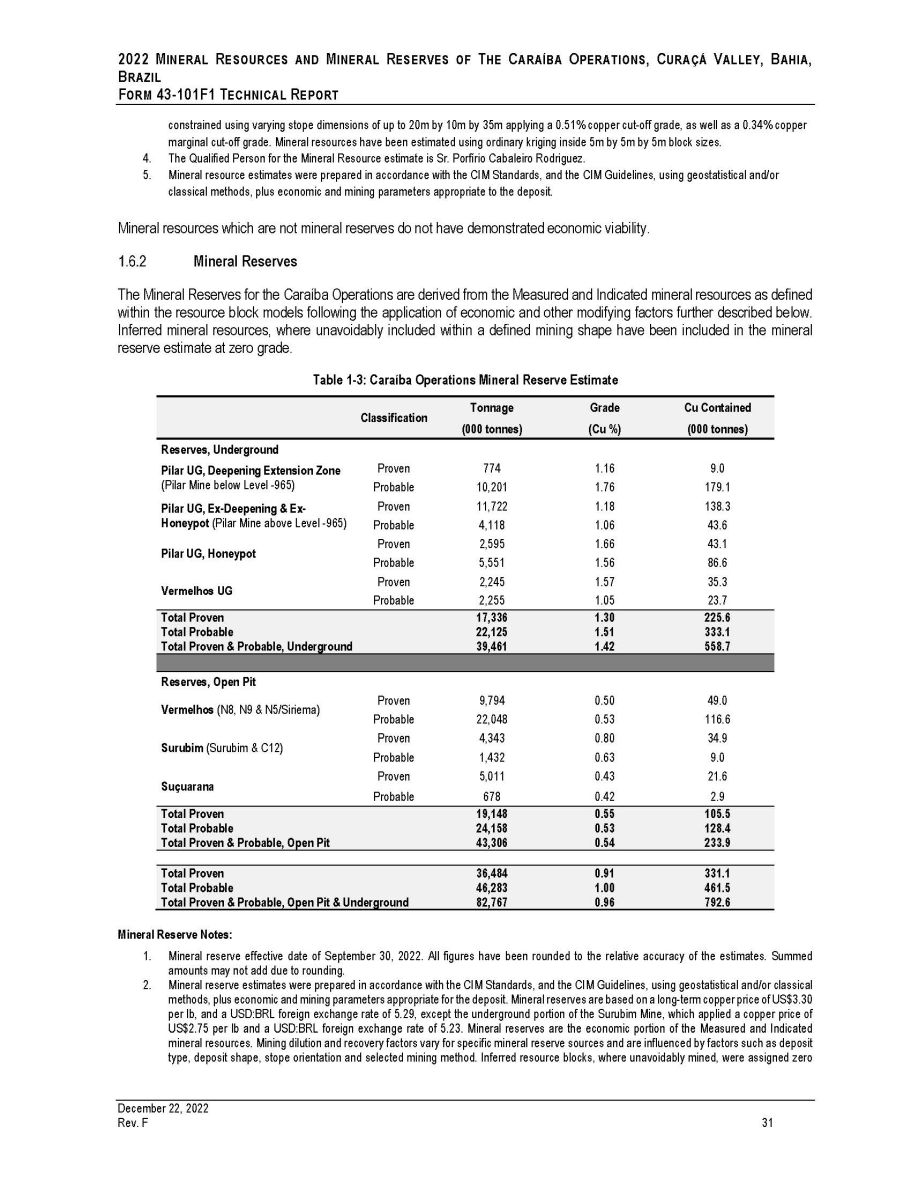
2022 M INERAL R ESOURCES AND M INERAL R ESERVES OF T HE C ARAÍBA O PERATIONS , C URAÇÁ V ALLEY , B AHIA , B RAZIL F ORM 43 - 101 F 1 T ECHNICAL R EPORT constrained using varying stope dimensions of up to 20m by 10m by 35m applying a 0.51% copper cut - off grade, as well as a 0.34% copper marginal cut - off grade. Mineral resources have been estimated using ordinary kriging inside 5m by 5m by 5m block sizes. 4. The Qualified Person for the Mineral Resource estimate is Sr. Porfírio Cabaleiro Rodriguez. 5. Mineral resource estimates were prepared in accordance with the CIM Standards, and the CIM Guidelines, using geostatistical and/or classical methods, plus economic and mining parameters appropriate to the deposit. Mineral resources which are not mineral reserves do not have demonstrated economic viability . Mineral Reserves The Mineral Reserves for the Caraíba Operations are derived from the Measured and Indicated mineral resources as defined within the resource block models following the application of economic and other modifying factors further described below . Inferred mineral resources, where unavoidably included within a defined mining shape have been included in the mineral reserve estimate at zero grade . Table 1 - 3: Caraíba Operations Mineral Reserve Estimate Classification Tonnage (000 tonnes) Grade (Cu %) Cu Contained (000 tonnes) Reserves, Underground Pilar UG, Deepening Extension Zone (Pilar Mine below Level - 965) Pilar UG, Ex - Deepening & Ex - Honeypot (Pilar Mine above Level - 965) Proven Probable Proven Probable Proven Probable Proven Probable 774 10,201 11,722 4,118 2,595 5,551 2,245 2,255 1.16 1.76 1.18 1.06 1.66 1.56 1.57 1.05 9.0 179.1 138.3 43.6 43.1 86.6 35.3 23.7 Pilar UG, Honeypot Vermelhos UG Total Proven Total Probable Total Proven & Probable, Underground 17,336 22,125 39,461 1.30 1.51 1.42 225.6 333.1 558.7 Reserves, Open Pit Vermelhos (N8, N9 & N5/Siriema) Proven Probable Proven Probable Proven Probable 9,794 22,048 4,343 1,432 5,011 678 0.50 0.53 0.80 0.63 0.43 0.42 49.0 116.6 34.9 9.0 21.6 2.9 Surubim (Surubim & C12) Suçuarana Total Proven Total Probable Total Proven & Probable, Open Pit 19,148 24,158 43,306 0.55 0.53 0.54 105.5 128.4 233.9 Total Proven 36,484 0.91 331.1 Total Probable 46,283 1.00 461.5 Total Proven & Probable, Open Pit & Underground 82,767 0.96 792.6 December 22, 2022 Rev. F 31 Mineral Reserve Notes : 1. Mineral reserve effective date of September 30 , 2022 . All figures have been rounded to the relative accuracy of the estimates . Summed amounts may not add due to rounding . 2. Mineral reserve estimates were prepared in accordance with the CIM Standards, and the CIM Guidelines, using geostatistical and/or classical methods, plus economic and mining parameters appropriate for the deposit . Mineral reserves are based on a long - term copper price of US $ 3 . 30 per lb, and a USD : BRL foreign exchange rate of 5 . 29 , except the underground portion of the Surubim Mine, which applied a copper price of US $ 2 . 75 per lb and a USD : BRL foreign exchange rate of 5 . 23 . Mineral reserves are the economic portion of the Measured and Indicated mineral resources . Mining dilution and recovery factors vary for specific mineral reserve sources and are influenced by factors such as deposit type, deposit shape, stope orientation and selected mining method . Inferred resource blocks, where unavoidably mined, were assigned zero
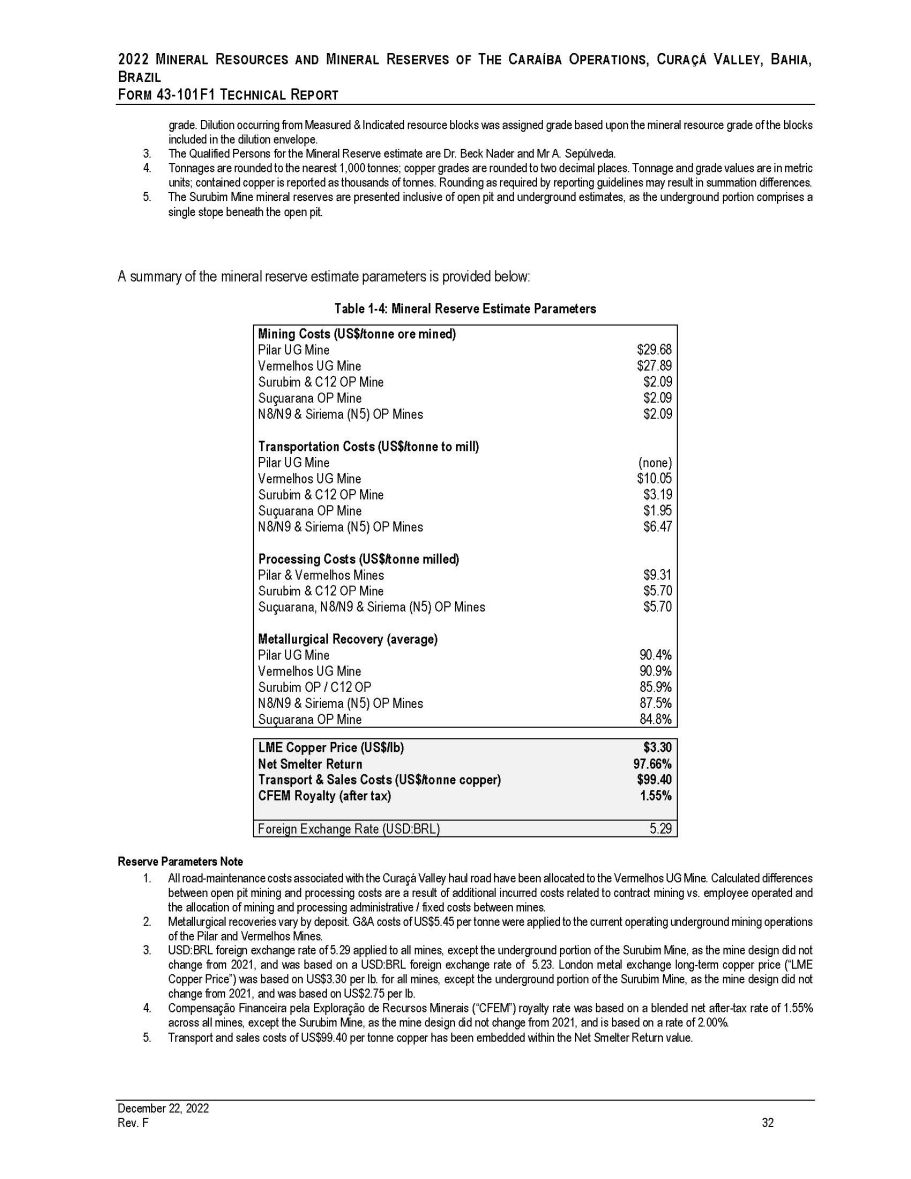
2022 M INERAL R ESOURCES AND M INERAL R ESERVES OF T HE C ARAÍBA O PERATIONS , C URAÇÁ V ALLEY , B AHIA , B RAZIL F ORM 43 - 101F1 T ECHNICAL R EPORT grade. Dilution occurring from Measured & Indicated resource blocks was assigned grade based upon the mineral resource grade of the blocks included in the dilution envelope. 3. The Qualified Persons for the Mineral Reserve estimate are Dr. Beck Nader and Mr A. Sepúlveda. 4. Tonnages are rounded to the nearest 1,000 tonnes; copper grades are rounded to two decimal places. Tonnage and grade values are in metric units; contained copper is reported as thousands of tonnes. Rounding as required by reporting guidelines may result in summation differences. 5. The Surubim Mine mineral reserves are presented inclusive of open pit and underground estimates, as the underground portion comprises a single stope beneath the open pit. A summary of the mineral reserve estimate parameters is provided below: Table 1 - 4: Mineral Reserve Estimate Parameters December 22, 2022 Rev. F 32 Mining Costs (US$/tonne ore mined) Pilar UG Mine $29.68 Vermelhos UG Mine $27.89 Surubim & C12 OP Mine $2.09 Suçuarana OP Mine $2.09 N8/N9 & Siriema (N5) OP Mines $2.09 Transportation Costs (US$/tonne to mill) Pilar UG Mine (none) Vermelhos UG Mine $10.05 Surubim & C12 OP Mine $3.19 Suçuarana OP Mine $1.95 N8/N9 & Siriema (N5) OP Mines $6.47 Processing Costs (US$/tonne milled) Pilar & Vermelhos Mines $9.31 Surubim & C12 OP Mine $5.70 Suçuarana, N8/N9 & Siriema (N5) OP Mines $5.70 Metallurgical Recovery (average) Pilar UG Mine 90.4% Vermelhos UG Mine 90.9% Surubim OP / C12 OP 85.9% N8/N9 & Siriema (N5) OP Mines 87.5% Suçuarana OP Mine 84.8% LME Copper Price (US$/lb) $3.30 Net Smelter Return 97.66% Transport & Sales Costs (US$/tonne copper) $99.40 CFEM Royalty (after tax) 1.55% Foreign Exchange Rate (USD:BRL) 5.29 Reserve Parameters Note 1. All road - maintenance costs associated with the Curaçá Valley haul road have been allocated to the Vermelhos UG Mine . Calculated differences between open pit mining and processing costs are a result of additional incurred costs related to contract mining vs . employee operated and the allocation of mining and processing administrative / fixed costs between mines . 2. Metallurgical recoveries vary by deposit . G&A costs of US $ 5 . 45 per tonne were applied to the current operating underground mining operations of the Pilar and Vermelhos Mines . 3. USD : BRL foreign exchange rate of 5 . 29 applied to all mines, except the underground portion of the Surubim Mine, as the mine design did not change from 2021 , and was based on a USD : BRL foreign exchange rate of 5 . 23 . London metal exchange long - term copper price (“LME Copper Price”) was based on US $ 3 . 30 per lb . for all mines, except the underground portion of the Surubim Mine, as the mine design did not change from 2021 , and was based on US $ 2 . 75 per lb . 4. Compensação Financeira pela Exploração de Recursos Minerais (“CFEM”) royalty rate was based on a blended net after - tax rate of 1 . 55 % across all mines, except the Surubim Mine, as the mine design did not change from 2021 , and is based on a rate of 2 . 00 % . 5. Transport and sales costs of US $ 99 . 40 per tonne copper has been embedded within the Net Smelter Return value .
2022 M INERAL R ESOURCES AND M INERAL R ESERVES OF T HE C ARAÍBA O PERATIONS , C URAÇÁ V ALLEY , B AHIA , B RAZIL F ORM 43 - 101 F 1 T ECHNICAL R EPORT Other modifying factors considered in the determination of the mineral reserve estimate include : A Selective Mining Unit (“SMU”) methodology for estimating dilution has been applied to N 8 ( 7 % dilution), N 9 ( 13 % ), N 5 OP ( 17 % ), Surubim Mine ( 17 % ), C 12 OP ( 12 % ) and Suçuarana OP Mine ( 4 % ) . The conventional definition of the SMU is the smallest volume of material on which ore/waste classification is determined and relates to the smallest unit that can be mined selectively . The Vermelhos UG Mine considers 10 % dilution, based on mining method and stope geometry . Within the Pilar UG Mine, a 1 . 0 m operational dilution method was applied to the hanging wall and footwall, except for the Deepening Project, which applied 0 . 5 m of operational dilution, resulting in a planned plus operational dilution of 27 % , on average . Project Honeypot and the Upper Levels of the Pilar UG Mine consider 32 % dilution, on average . Maximum bench height of 15 m for open pit mines . Maximum underground stope dimensions based on geotechnical assessments from previous studies and past operating experience within each mining area, combined with evaluation of induced stresses and the calculated rock mass rating (“RMR”) . Vertical retreat mining (“VRM”) method with cemented paste fill was selected for the Pilar UG Mine, where the method is currently in use . For the Vermelhos UG Mine, Sublevel stoping with cemented rock fill (“CRF”) is currently in use . These mining methods are based on consideration of dip, plunge and thickness of the orebodies, as well as the rock quality designation (“RQD”) and overall competence of the host rock . Mining recovery of 98 % (average) has been applied for open pit mines . The Pilar UG Mine and Vermelhos UG Mine assume 96 % and 95 % mine recovery, respectively . Within designed stopes, all contained material was assumed to be mined with no selectivity . Inferred mineral resources, where unavoidably included within a defined mining shape have been included in the mineral reserve estimate at zero grade . Mining dilution resulting from Measured and Indicated blocks was assigned the grade of those blocks captured in the dilution envelope using the estimated grade within the blocks of the dilution and development model . Additionally, GE 21 and BNA Mining Solutions presents the following accompanying comments to the mineral resource and mineral reserve estimate : Ero Brasil holds the surface rights required to support the mine operations considered in the Mineral Reserve estimate . Future development beyond the stated mineral reserves of these areas may require additional acquisition of surface rights . As of the date of this Report, Ero Brasil possesses the requisite permits to allow for current mining and processing operations from its core assets of the Pilar UG Mine, the Vermelhos UG Mine and the Surubim Mine is in the process of obtaining mining permits for future production areas commensurate with the envisioned production timelines of those areas as outlined in the LOM plan . Based upon the long operating history of Ero Brasil, the well - established timelines and procedures to obtain such permits, it is the opinion of the QPs that permitting of future production areas within the envisioned timelines does not pose a material risk for the development of the stated mineral reserves . Overall, GE 21 considers that the components of the mineral reserve estimate (including but not limited to geology, mining, processing, infrastructure, logistics, market, environmental and social considerations) have been conducted at a feasibility level of study and in accordance with NI 43 - 101 . It is the opinion of the QPs that there are no known mining, metallurgical, infrastructure, permitting, legal, political, environmental, title, taxation, socio - economic, marketing or other relevant factors that could materially affect the potential development of the stated mineral reserves . December 22, 2022 Rev. F 33
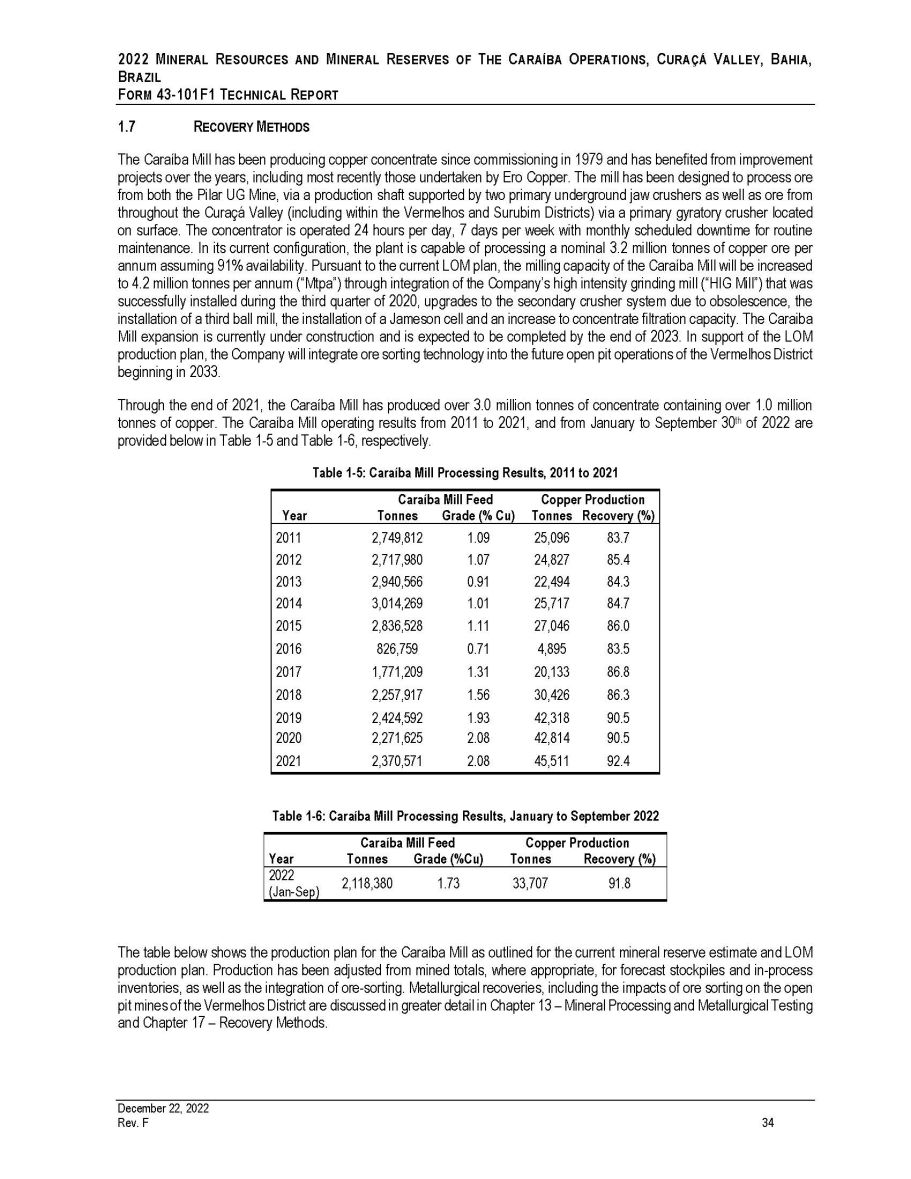
2022 M INERAL R ESOURCES AND M INERAL R ESERVES OF T HE C ARAÍBA O PERATIONS , C URAÇÁ V ALLEY , B AHIA , B RAZIL F ORM 43 - 101 F 1 T ECHNICAL R EPORT 1.7 R ECOVERY M ETHODS The Caraíba Mill has been producing copper concentrate since commissioning in 1979 and has benefited from improvement projects over the years, including most recently those undertaken by Ero Copper . The mill has been designed to process ore from both the Pilar UG Mine, via a production shaft supported by two primary underground jaw crushers as well as ore from throughout the Curaçá Valley (including within the Vermelhos and Surubim Districts) via a primary gyratory crusher located on surface . The concentrator is operated 24 hours per day, 7 days per week with monthly scheduled downtime for routine maintenance . In its current configuration, the plant is capable of processing a nominal 3 . 2 million tonnes of copper ore per annum assuming 91 % availability . Pursuant to the current LOM plan, the milling capacity of the Caraíba Mill will be increased to 4 . 2 million tonnes per annum (“Mtpa”) through integration of the Company’s high intensity grinding mill (“HIG Mill”) that was successfully installed during the third quarter of 2020 , upgrades to the secondary crusher system due to obsolescence, the installation of a third ball mill, the installation of a Jameson cell and an increase to concentrate filtration capacity . The Caraiba Mill expansion is currently under construction and is expected to be completed by the end of 2023 . In support of the LOM production plan, the Company will integrate ore sorting technology into the future open pit operations of the Vermelhos District beginning in 2033 . Through the end of 2021 , the Caraíba Mill has produced over 3 . 0 million tonnes of concentrate containing over 1 . 0 million tonnes of copper . The Caraíba Mill operating results from 2011 to 2021 , and from January to September 30 th of 2022 are provided below in Table 1 - 5 and Table 1 - 6 , respectively . Table 1 - 5: Caraíba Mill Processing Results, 2011 to 2021 Caraíba Mill Feed Copper Production Year Tonnes Grade (% Cu) Tonnes Recovery (%) 2011 2,749,812 1.09 25,096 83.7 2012 2,717,980 1.07 24,827 85.4 2013 2,940,566 0.91 22,494 84.3 2014 3,014,269 1.01 25,717 84.7 2015 2,836,528 1.11 27,046 86.0 2016 826,759 0.71 4,895 83.5 2017 1,771,209 1.31 20,133 86.8 2018 2,257,917 1.56 30,426 86.3 2019 2,424,592 1.93 42,318 90.5 2020 2,271,625 2.08 42,814 90.5 2021 2,370,571 2.08 45,511 92.4 December 22, 2022 Rev. F 34 Table 1 - 6: Caraíba Mill Processing Results, January to September 2022 Year Caraíba Mill Feed Tonnes Grade (%Cu) Copper Production Tonnes Recovery (%) 2022 (Jan - Sep) 2,118,380 1.73 33,707 91.8 The table below shows the production plan for the Caraíba Mill as outlined for the current mineral reserve estimate and LOM production plan . Production has been adjusted from mined totals, where appropriate, for forecast stockpiles and in - process inventories, as well as the integration of ore - sorting . Metallurgical recoveries, including the impacts of ore sorting on the open pit mines of the Vermelhos District are discussed in greater detail in Chapter 13 – Mineral Processing and Metallurgical Testing and Chapter 17 – Recovery Methods .
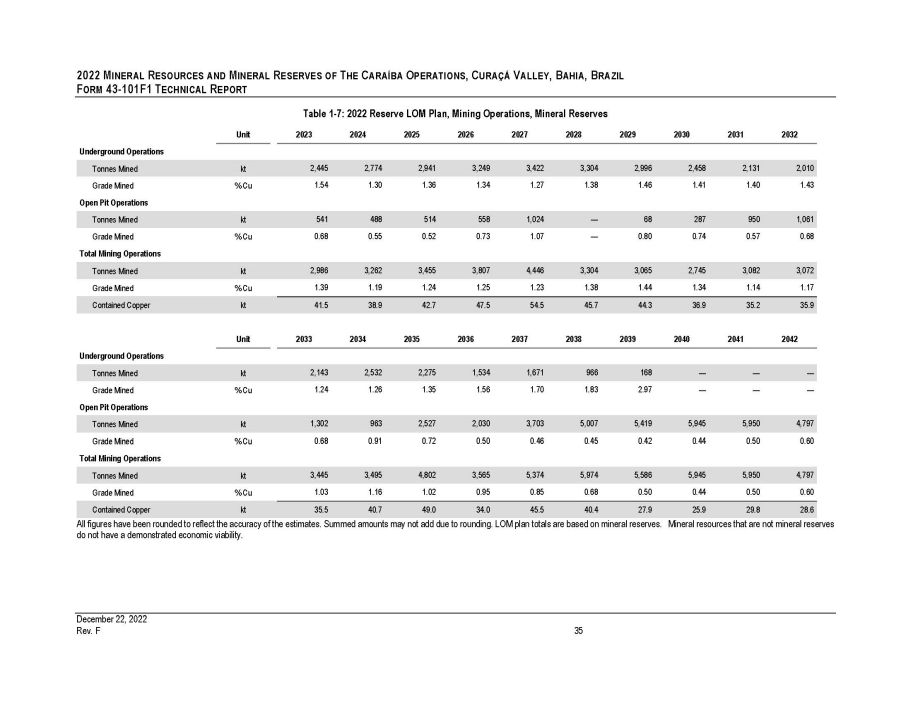
2022 M INERAL R ESOURCES AND M INERAL R ESERVES OF T HE C ARAÍBA O PERATIONS , C URAÇÁ V ALLEY , B AHIA , B RAZIL F ORM 43 - 101F1 T ECHNICAL R EPORT Table 1 - 7: 2022 Reserve LOM Plan, Mining Operations, Mineral Reserves Unit 2023 2024 2025 2026 2027 2028 2029 2030 2031 2032 Underground Operations Tonnes Mined kt 2,445 2,774 2,941 3,249 3,422 3,304 2,996 2,458 2,131 2,010 Grade Mined % Cu 1.54 1.30 1.36 1.34 1.27 1.38 1.46 1.41 1.40 1.43 Open Pit Operations Tonnes Mined kt 541 488 514 558 1,024 — 68 287 950 1,061 Grade Mined Total Mining Operations % Cu 0.68 0.55 0.52 0.73 1.07 — 0.80 0.74 0.57 0.68 Tonnes Mined kt 2,986 3,262 3,455 3,807 4,446 3,304 3,065 2,745 3,082 3,072 Grade Mined % Cu 1.39 1.19 1.24 1.25 1.23 1.38 1.44 1.34 1.14 1.17 Contained Copper kt 41.5 38.9 42.7 47.5 54.5 45.7 44.3 36.9 35.2 35.9 Unit 2033 2034 2035 2036 2037 2038 2039 2040 2041 2042 Underground Operations Tonnes Mined kt 2,143 2,532 2,275 1,534 1,671 966 168 — — — Grade Mined % Cu 1.24 1.26 1.35 1.56 1.70 1.83 2.97 — — — Open Pit Operations Tonnes Mined kt 1,302 963 2,527 2,030 3,703 5,007 5,419 5,945 5,950 4,797 Grade Mined Total Mining Operations % Cu 0.68 0.91 0.72 0.50 0.46 0.45 0.42 0.44 0.50 0.60 Tonnes Mined kt 3,445 3,495 4,802 3,565 5,374 5,974 5,586 5,945 5,950 4,797 Grade Mined % Cu 1.03 1.16 1.02 0.95 0.85 0.68 0.50 0.44 0.50 0.60 Contained Copper kt 35.5 40.7 49.0 34.0 45.5 40.4 27.9 25.9 29.8 28.6 December 22, 2022 Rev. F 35 All figures have been rounded to reflect the accuracy of the estimates. Summed amounts may not add due to rounding. LOM plan totals are based on mineral reserves. Mineral resources that are not mineral reserves do not have a demonstrated economic viability.
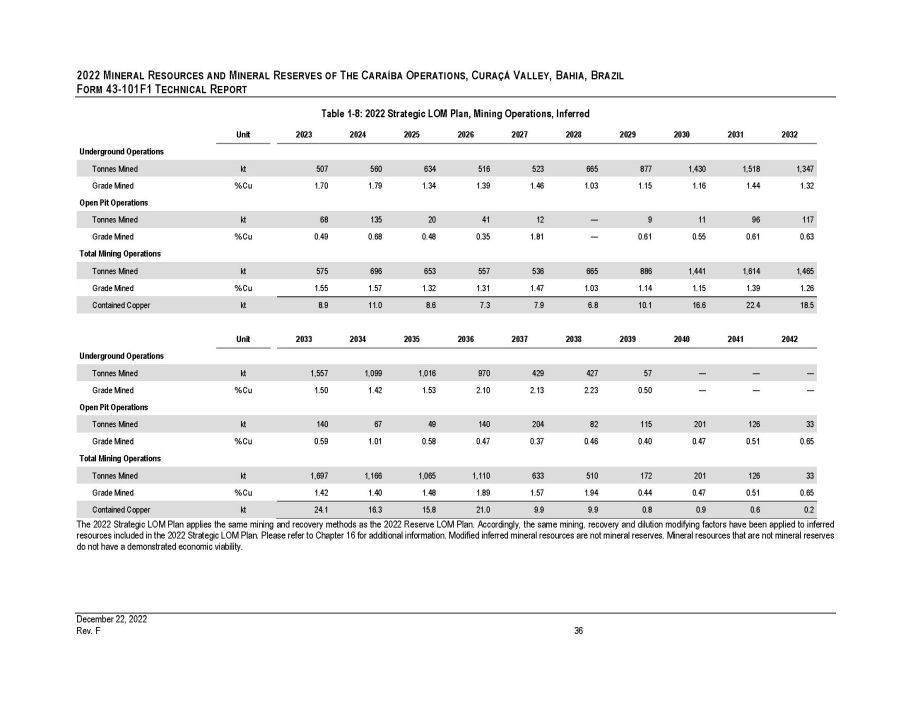
2022 M INERAL R ESOURCES AND M INERAL R ESERVES OF T HE C ARAÍBA O PERATIONS , C URAÇÁ V ALLEY , B AHIA , B RAZIL F ORM 43 - 101F1 T ECHNICAL R EPORT Table 1 - 8: 2022 Strategic LOM Plan, Mining Operations, Inferred Unit 2023 2024 2025 2026 2027 2028 2029 2030 2031 2032 Underground Operations Tonnes Mined kt 507 560 634 516 523 665 877 1,430 1,518 1,347 Grade Mined % Cu 1.70 1.79 1.34 1.39 1.46 1.03 1.15 1.16 1.44 1.32 Open Pit Operations Tonnes Mined kt 68 135 20 41 12 — 9 11 96 117 Grade Mined Total Mining Operations % Cu 0.49 0.68 0.48 0.35 1.81 — 0.61 0.55 0.61 0.63 Tonnes Mined kt 575 696 653 557 536 665 886 1,441 1,614 1,465 Grade Mined % Cu 1.55 1.57 1.32 1.31 1.47 1.03 1.14 1.15 1.39 1.26 Contained Copper kt 8.9 11.0 8.6 7.3 7.9 6.8 10.1 16.6 22.4 18.5 Unit 2033 2034 2035 2036 2037 2038 2039 2040 2041 2042 Underground Operations Tonnes Mined kt 1,557 1,099 1,016 970 429 427 57 — — — Grade Mined % Cu 1.50 1.42 1.53 2.10 2.13 2.23 0.50 — — — Open Pit Operations Tonnes Mined kt 140 67 49 140 204 82 115 201 126 33 Grade Mined % Cu 0.59 1.01 0.58 0.47 0.37 0.46 0.40 0.47 0.51 0.65 Total Mining Operations Tonnes Mined kt 1,697 1,166 1,065 1,110 633 510 172 201 126 33 Grade Mined % Cu 1.42 1.40 1.48 1.89 1.57 1.94 0.44 0.47 0.51 0.65 Contained Copper kt 24.1 16.3 15.8 21.0 9.9 9.9 0.8 0.9 0.6 0.2 December 22, 2022 Rev. F 36 The 2022 Strategic LOM Plan applies the same mining and recovery methods as the 2022 Reserve LOM Plan . Accordingly, the same mining, recovery and dilution modifying factors have been applied to inferred resources included in the 2022 Strategic LOM Plan . Please refer to Chapter 16 for additional information . Modified inferred mineral resources are not mineral reserves . Mineral resources that are not mineral reserves do not have a demonstrated economic viability .
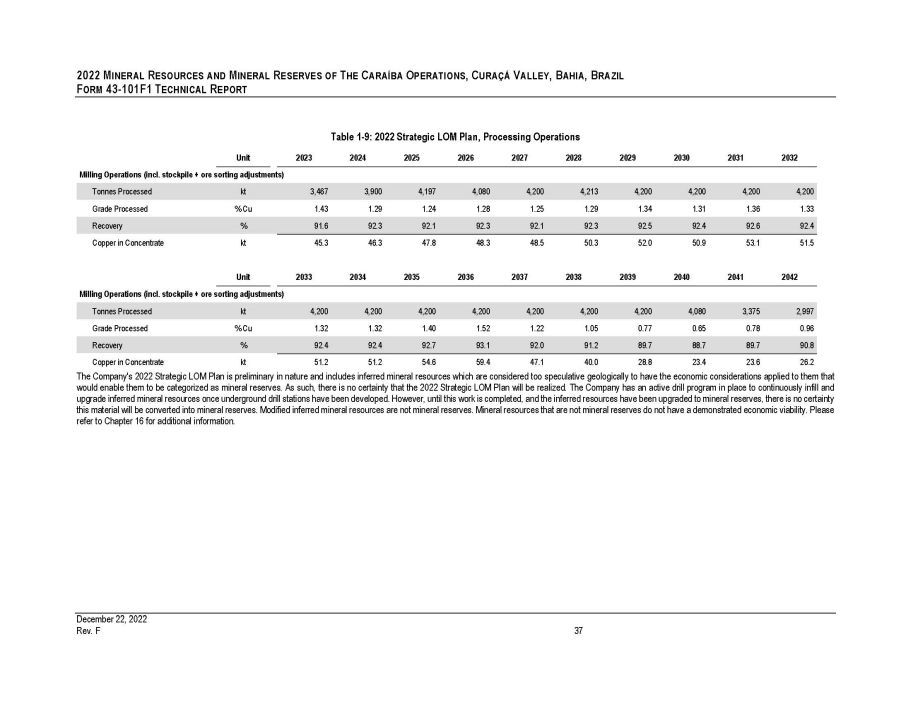
2022 M INERAL R ESOURCES AND M INERAL R ESERVES OF T HE C ARAÍBA O PERATIONS , C URAÇÁ V ALLEY , B AHIA , B RAZIL F ORM 43 - 101F1 T ECHNICAL R EPORT Table 1 - 9: 2022 Strategic LOM Plan, Processing Operations 2024 2025 2026 2027 2028 Unit 2023 2029 2030 2031 2032 Milling Operations (incl. stockpile + ore sorting adjustments) Tonnes Processed kt 3,467 3,900 4,197 4,080 4,200 4,213 4,200 4,200 4,200 4,200 Grade Processed % Cu 1.43 1.29 1.24 1.28 1.25 1.29 1.34 1.31 1.36 1.33 Recovery % 91.6 92.3 92.1 92.3 92.1 92.3 92.5 92.4 92.6 92.4 Copper in Concentrate kt 45.3 46.3 47.8 48.3 48.5 50.3 52.0 50.9 53.1 51.5 Unit 2033 2034 2035 2036 2037 2038 2039 2040 2041 2042 Milling Operations (incl. stockpile + ore sorting adjustments) Tonnes Processed kt 4,200 4,200 4,200 4,200 4,200 4,200 4,200 4,080 3,375 2,997 Grade Processed % Cu 1.32 1.32 1.40 1.52 1.22 1.05 0.77 0.65 0.78 0.96 Recovery % 92.4 92.4 92.7 93.1 92.0 91.2 89.7 88.7 89.7 90.8 Copper in Concentrate kt 51.2 51.2 54.6 59.4 47.1 40.0 28.8 23.4 23.6 26.2 December 22, 2022 Rev. F 37 The Company's 2022 Strategic LOM Plan is preliminary in nature and includes inferred mineral resources which are considered too speculative geologically to have the economic considerations applied to them that would enable them to be categorized as mineral reserves . As such, there is no certainty that the 2022 Strategic LOM Plan will be realized . The Company has an active drill program in place to continuously infill and upgrade inferred mineral resources once underground drill stations have been developed . However, until this work is completed, and the inferred resources have been upgraded to mineral reserves, there is no certainty this material will be converted into mineral reserves . Modified inferred mineral resources are not mineral reserves . Mineral resources that are not mineral reserves do not have a demonstrated economic viability . Please refer to Chapter 16 for additional information .
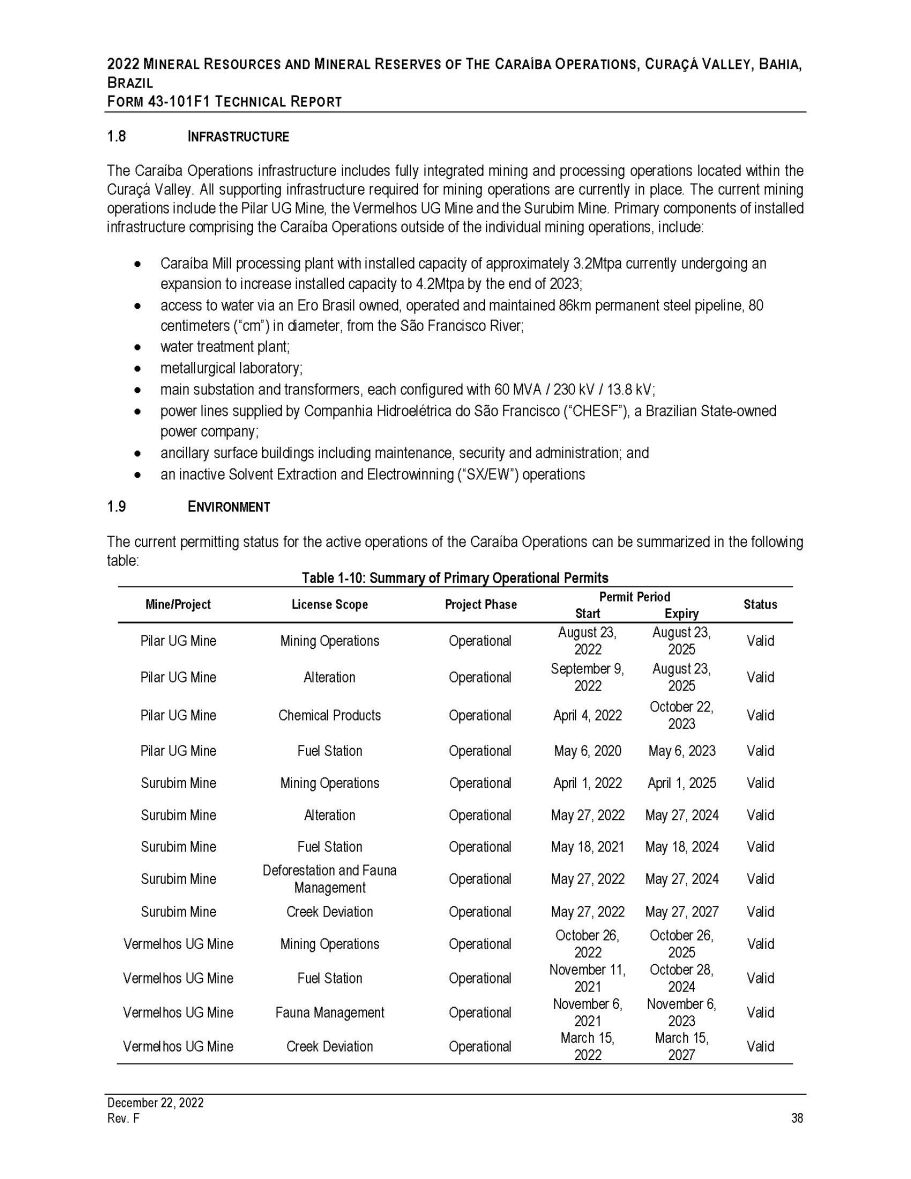
2022 M INERAL R ESOURCES AND M INERAL R ESERVES OF T HE C ARAÍBA O PERATIONS , C URAÇÁ V ALLEY , B AHIA , B RAZIL F ORM 43 - 101 F 1 T ECHNICAL R EPORT 1.8 I NFRASTRUCTURE The Caraíba Operations infrastructure includes fully integrated mining and processing operations located within the Curaçá Valley . All supporting infrastructure required for mining operations are currently in place . The current mining operations include the Pilar UG Mine, the Vermelhos UG Mine and the Surubim Mine . Primary components of installed infrastructure comprising the Caraíba Operations outside of the individual mining operations, include : Caraíba Mill processing plant with installed capacity of approximately 3.2Mtpa currently undergoing an expansion to increase installed capacity to 4.2Mtpa by the end of 2023; access to water via an Ero Brasil owned, operated and maintained 86km permanent steel pipeline, 80 centimeters (“cm”) in diameter, from the São Francisco River; water treatment plant; metallurgical laboratory; main substation and transformers, each configured with 60 MVA / 230 kV / 13.8 kV; power lines supplied by Companhia Hidroelétrica do São Francisco (“CHESF”), a Brazilian State - owned power company; ancillary surface buildings including maintenance, security and administration; and an inactive Solvent Extraction and Electrowinning (“SX/EW”) operations E NVIRONMENT December 22, 2022 Rev. F 38 1.9 The current permitting status for the active operations of the Caraíba Operations can be summarized in the following table: Table 1 - 10: Summary of Primary Operational Permits Mine/Project License Scope Project Phase Permit Period Status Start Expiry Pilar UG Mine Mining Operations Operational August 23, August 23, Valid 2022 2025 Pilar UG Mine Alteration Operational September 9, August 23, Valid 2022 April 4, 2022 2025 October 22, 2023 May 6, 2023 April 1, 2025 Pilar UG Mine Chemical Products Operational Valid Pilar UG Mine Surubim Mine Fuel Station Mining Operations Operational Operational May 6, 2020 April 1, 2022 Valid Valid Management Surubim Mine Alteration Operational May 27, 2022 Surubim Mine Fuel Station Operational May 18, 2021 Surubim Mine Deforestation and Fauna Operational May 27, 2022 May 27, 2024 Valid May 18, 2024 Valid May 27, 2024 Valid Surubim Mine Creek Deviation Operational May 27, 2022 May 27, 2027 Valid Vermelhos UG Mine Mining Operations Operational October 26, October 26, Valid 2022 2025 Vermelhos UG Mine Fuel Station Operational November 11, October 28, Valid 2021 2024 Vermelhos UG Mine Fauna Management Operational November 6, November 6, Valid 2021 2023 Vermelhos UG Mine Creek Deviation Operational March 15, March 15, Valid 2022 2027

2022 M INERAL R ESOURCES AND M INERAL R ESERVES OF T HE C ARAÍBA O PERATIONS , C URAÇÁ V ALLEY , B AHIA , B RAZIL F ORM 43 - 101 F 1 T ECHNICAL R EPORT Ero Brasil maintains an excellent relationship with the communities throughout the Curaçá Valley, having held regular meetings and consultation sessions with local stakeholders routinely for over 40 years . In support of this relationship, Ero Brasil undertakes several key initiatives annually focused on sustainable community development – it is a core pilar of the Company’s operating philosophy . 1.10 C APITAL & O PERATING C OSTS The total Mineral Reserve LOM Production Plan capital costs estimate is approximately US $ 1 , 083 M and have been based on supporting the requirements for the mining and processing operations of the current mineral reserves over the 20 - year estimated operating life of the Caraíba Operations . Total capital investments include capitalized mine development as well as ongoing capital requirements primarily in the form of equipment replacement at the end of each unit’s useful life . Capital cost projections are based upon vendor quotes and management estimates incorporating historical operating data and previously supplied quotes from the current operations . Capital expenditure estimates reflect the total cost for developing and extracting the current mineral reserves included in the Mineral Reserve LOM Production Plan . Total estimates by category are presented in USD in Table 1 - 11 . Table 1 - 11: Total LOM Capital Expenditure Estimate Category LOM Total (USD 000s)* UG Mine Development 346,019 OP Mine Pre - Stripping 151,551 Infrastructure 209,083 UG Equipment 79,273 OP Equipment 43,079 Mineral Processing 99,051 Tailings 44,075 Safety & Environment 73,306 IT & Services 3,799 Other Capital Costs 33,890 Total Capital Cost 1,083,126 December 22, 2022 Rev. F 39 (*) BRL amounts converted to USD at a USD : BRL foreign exchange rate of 5 . 29 . An operating cost model was generated using historic operating performance at the Caraíba Operations, incorporating specific consumption coefficients based on operational data, after application of adjustments for differences between ore sources in the Mineral Reserves LOM Production Plan . Cost estimates were built using first principles incorporating both fixed and variable components to account for production rate variations . Costs were adjusted annually based on the changes to ore sources including rock support, transport, and infrastructure requirements . Underground mining costs consist of the operational costs related to ore extraction at the Pilar UG Mine, Vermelhos UG Mine, and Surubim UG Mine . Direct mining costs include drilling, blasting, and mucking . Indirect costs include ore and waste transport, mine services, and mine supplies . A summary of the average LOM operating costs is presented in BRL per tonne in Table 1 - 12 .

2022 M INERAL R ESOURCES AND M INERAL R ESERVES OF T HE C ARAÍBA O PERATIONS , C URAÇÁ V ALLEY , B AHIA , B RAZIL F ORM 43 - 101F1 T ECHNICAL R EPORT Table 1 - 12: Average LOM Operating Costs Underground Operations Open Pit Operations Mine (BRL per tonne mined) (BRL per tonne moved) (BRL per tonne processed) Cost Parameter, Average LOM Pilar UG Vermelhos UG Mine Surubim Mine, underground Surubim Mine, open pit N8/N9 & N5 (Siriema) OP Mines Suçuarana OP Mine Mining Cost 157.07 147.54 153.36 11.06 11.06 11.06 Transport to Caraíba Mill n/a 53.16 16.88 16.88 34.23 10.32 Processing Costs* 49.25 49.25 30.15 30.15 30.15 30.15 Concentrate Transport (BRL per wet metric tonne of concentrate) 404.69 404.69 404.69 404.69 404.69 404.69 (*) Fixed processing costs are allocated to the Pilar UG and Vermelhos UG Mines which comprise the majority of Caraíba Mill feed. 1.11 C ONCLUSIONS Mineral Exploration and Geology The geological descriptions, sampling procedures and density tests that were evaluated were found to be of acceptable quality and in accordance with industry best practices . Data was stored in a standardized database, which was found to be secure and auditable . The complexity of the mineralization controls and the quantity and phases of data in the Curaçá Valley merits the use of visualization and data integration tools that are more advanced than those which had at its disposal at the time of this Technical Report . While GE 21 believes that the current QA/QC program can guarantee the quality of the exploration data used in the resource estimates, GE 21 suggests that a chain of custody program be implemented for good measure . GE 21 supervised the process through which density was determined and concluded that it aligns with industry best practices . QA/QC GE 21 performed the evaluation of the data generated after the last validation and concluded that the QA/QC procedures are being followed using the same standards . GE 21 considered the standard QA/QC procedures to be in accordance with mining industry best practice and appropriate for use in the current mineral resource estimation . It was observed tthroughout the 2021 review period by GE 21 , that the Caraíba Operations laboratory continues to display a tendency to underestimate the copper assay values when using certified reference material (“CRM”) ITAK 825 ; however, the results of the laboratory when using CRM ITAK 851 , which features a similar copper grade range, demonstrate better reproducibility . Geological Model The procedure that was adopted to produce the 3 D geological model (wireframes), consisting of generating triangulations between interpreted geological cross sections, was executed properly and in accordance with the opinions of GE 21 . Due to the plunge of the mineralized zone at the Pilar UG Mine towards the north and the east - west geological cross sections, a pattern of sub - vertical discontinuous lenses was created locally within the regions of lower drill hole density . December 22, 2022 Rev. F 40

2022 M INERAL R ESOURCES AND M INERAL R ESERVES OF T HE C ARAÍBA O PERATIONS , C URAÇÁ V ALLEY , B AHIA , B RAZIL F ORM 43 - 101 F 1 T ECHNICAL R EPORT GE 21 noted that, with respect to the integration and interpretation of geological data, limited lithostructural mapping (mine, surface and subsurface) had been undertaken . GE 21 also notes that the field interpretation and 3 D interpretation were historically focused on interpreting only copper grade, therefore, few vertical and horizontal lithostructural geological sections have been developed which may provide greater understanding and control of aspects relating to the geology and other potential metals of significance in the Curaçá Valley . In 2020 , the Caraíba Operations started to adopt 3 D implicit modelling techniques based upon grouped lithologies and copper grade shells using Leapfrog software . This methodology was used by GE 21 to create 3 D validation models and GE 21 encourages the expansion of this program at the Caraíba Operations . Grade Estimation The variograms that were used in the estimation method are satisfactory and consistent with respect to the grade estimation that was calculated via ordinary kriging, making use of search anisotropy determined in the variographic analysis . GE 21 considers the resource classification model and the analysis of criteria for the classification of those mineral resources, to be satisfactory although some processes could be improved . Such recommended improvements did not impose limitations on the classification of Measured and Indicated mineral resources . Mineral Resource Estimate The authors of this Report are not aware of any environmental, permitting, legal, title, taxation, socio - economic, marketing, political or other relevant factors which could materially affect the current mineral resource estimate . It is the opinion of GE 21 that the current drilling information is sufficiently reliable to interpret with confidence the boundaries of higher - grade mineralized domains and that the assay data is sufficiently reliable to support estimation of mineral resources . The authors of this Report that validated the mineral resource estimate did not identify overall or local grade biases, as demonstrated by Swath Plot analysis . The authors found that the quality of the data is appropriate for the classification of the mineral resource, in accordance with the CIM Standards and CIM Guidelines . Mineral Reserve Estimate GE 21 and BNA carried out a detailed review of the current mineral reserves for Curaçá Valley, aimed at demonstrating its technical and profitable extraction for the production and sale of copper concentrate . The results for this review, demonstrated a good adherence using detailed verification procedures performed by the authors of this Report . In general, resulting in differences of less than 1 % in the total copper metal contained, which BNA considered acceptable . Several observations related with the current mineral reserve are worth noting : The metallurgical recovery benefits from the commissioned and operational HIG Mill were applied to the underground mining operations of Ero Brasil ; Within the Vermelhos District ore sorting will be integrated within the open pit operations to reduce transport and processing costs . However, these potential savings have not been considered in current reserve estimation as the global Ero Brasil geology team continues to conduct additional project assessments as at the Effective Date of this Report ; The core operating mines of the Company (Pilar UG Mine and Vermelhos UG Mine) currently employ a joint reconciliation process in which it is difficult to accurately differentiate mine - to - mill reconciliation from one mine to another ; and, December 22, 2022 Rev. F 41
2022 M INERAL R ESOURCES AND M INERAL R ESERVES OF T HE C ARAÍBA O PERATIONS , C URAÇÁ V ALLEY , B AHIA , B RAZIL F ORM 43 - 101F1 T ECHNICAL R EPORT As at the date of this Report, the ventilation and cooling infrastructure for the Pilar UG Mine, is being upgraded according to the plans developed by Ero Brasil. The mineral reserve estimation has been performed according to industry best practice and conform to the CIM Standards and CIM Guidelines. BNA has not identified any mining, metallurgical, infrastructure, permitting, legal, political, environmental, technical, or other relevant factors that could materially affect the potential development of the current mineral reserves. Recommendations Regarding the mineral resource estimate, the authors recommend a work program to include the following, most of which can be completed at little or no cost. Estimated costs of the work program are shown in the table below. i. Formalize the use of implicit modelling internally throughout the Company, emphasizing structural geology and variation in lithology for domain definition and exploration target integration. December 22, 2022 Rev. F 42 iii. ii. Implement additional empirical criteria for resource classification, based on the ‘15% Rule’, as commonly attributed to Dr. Harry Parker and since expanded upon in multiple sources of geostatistical literature. Expand ongoing geometallurgical studies to encompass all deposits and blends therein to study mill feed interaction . Suggest including standardized laboratory tests as normal operating procedure . Additionally, it is recommended that the Company advance geometallurgical studies for inclusion in mineral reserve definition, in order to classify metallurgical recovery according to the different characteristics associated with each lithological domain rather than by deposit . iv. Validate of the certified grade for CRM ITAK 825 due to the observed inconsistencies in assay values, in contrast with the consistent results obtained when utilizing CRM ITAK 851 , which has a similar Cu grade range . v. Recommend standardizing QA/QC mass controls during assay sample crushing and grinding in order to evaluate the quality of the comminution procedures and ensure no sample loss during sample preparation . vi. Install a sample tower to improve the mine to mill reconciliation process for the current operating mines . Such an installation will allow differentiation of ore source reconciliation within the processing plant . vii. Improve systems for mineral reserve attribute database management to standardize fleet sizing, economic and consumable parameters, swell factors, dilution and mine call factors as well as store historic block model and design attributes including mathematical pit designs and supporting assumptions within a centralized validated database to improve the application of mineral reserve modifying factors in future studies .
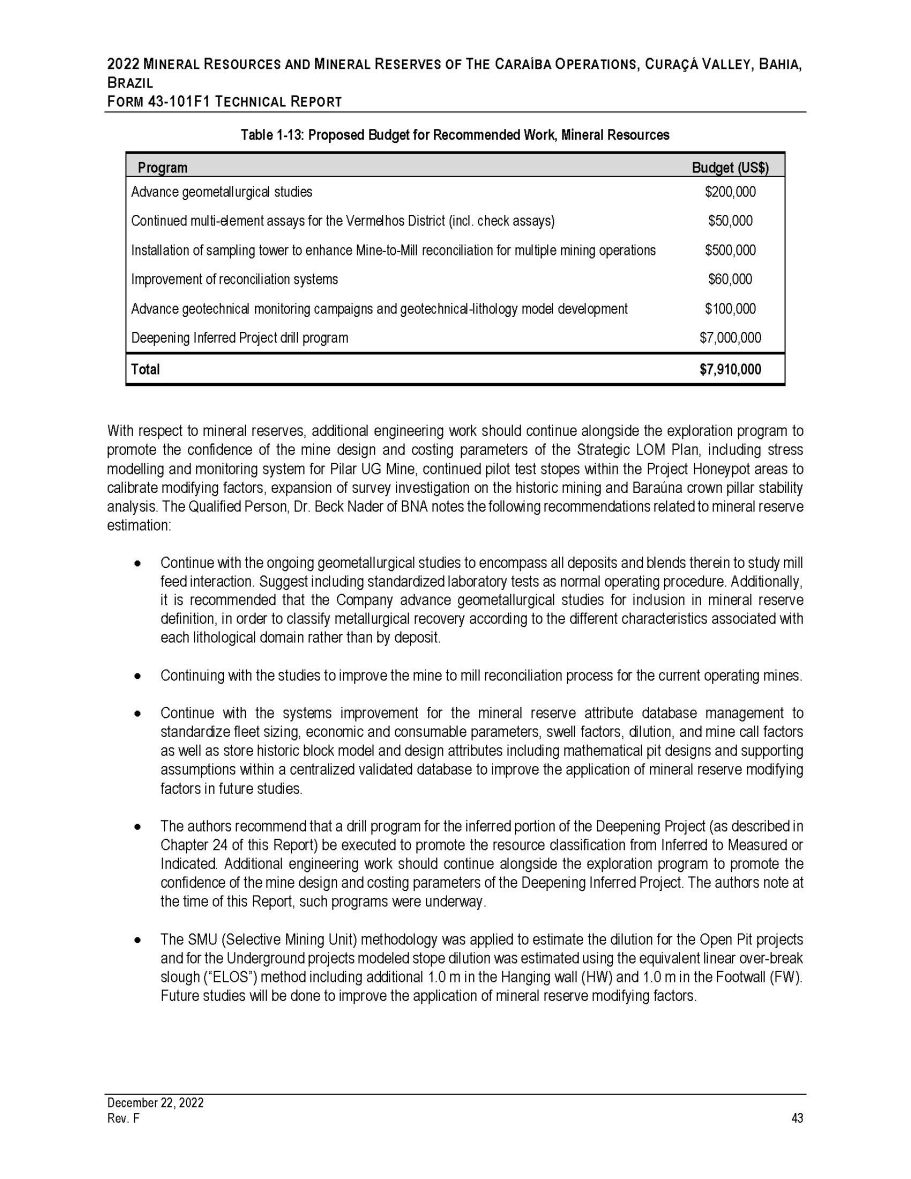
2022 M INERAL R ESOURCES AND M INERAL R ESERVES OF T HE C ARAÍBA O PERATIONS , C URAÇÁ V ALLEY , B AHIA , B RAZIL F ORM 43 - 101F1 T ECHNICAL R EPORT Table 1 - 13: Proposed Budget for Recommended Work, Mineral Resources Program Budget (US$) Advance geometallurgical studies $200,000 Continued multi - element assays for the Vermelhos District (incl. check assays) $50,000 Installation of sampling tower to enhance Mine - to - Mill reconciliation for multiple mining operations $500,000 Improvement of reconciliation systems $60,000 Advance geotechnical monitoring campaigns and geotechnical - lithology model development $100,000 Deepening Inferred Project drill program $7,000,000 Total $7,910,000 December 22, 2022 Rev. F 43 With respect to mineral reserves, additional engineering work should continue alongside the exploration program to promote the confidence of the mine design and costing parameters of the Strategic LOM Plan, including stress modelling and monitoring system for Pilar UG Mine, continued pilot test stopes within the Project Honeypot areas to calibrate modifying factors, expansion of survey investigation on the historic mining and Baraúna crown pillar stability analysis . The Qualified Person, Dr . Beck Nader of BNA notes the following recommendations related to mineral reserve estimation : Continue with the ongoing geometallurgical studies to encompass all deposits and blends therein to study mill feed interaction . Suggest including standardized laboratory tests as normal operating procedure . Additionally, it is recommended that the Company advance geometallurgical studies for inclusion in mineral reserve definition, in order to classify metallurgical recovery according to the different characteristics associated with each lithological domain rather than by deposit . Continuing with the studies to improve the mine to mill reconciliation process for the current operating mines. Continue with the systems improvement for the mineral reserve attribute database management to standardize fleet sizing, economic and consumable parameters, swell factors, dilution, and mine call factors as well as store historic block model and design attributes including mathematical pit designs and supporting assumptions within a centralized validated database to improve the application of mineral reserve modifying factors in future studies . The authors recommend that a drill program for the inferred portion of the Deepening Project (as described in Chapter 24 of this Report) be executed to promote the resource classification from Inferred to Measured or Indicated . Additional engineering work should continue alongside the exploration program to promote the confidence of the mine design and costing parameters of the Deepening Inferred Project . The authors note at the time of this Report, such programs were underway . The SMU (Selective Mining Unit) methodology was applied to estimate the dilution for the Open Pit projects and for the Underground projects modeled stope dilution was estimated using the equivalent linear over - break slough (“ELOS”) method including additional 1 . 0 m in the Hanging wall (HW) and 1 . 0 m in the Footwall (FW) . Future studies will be done to improve the application of mineral reserve modifying factors .
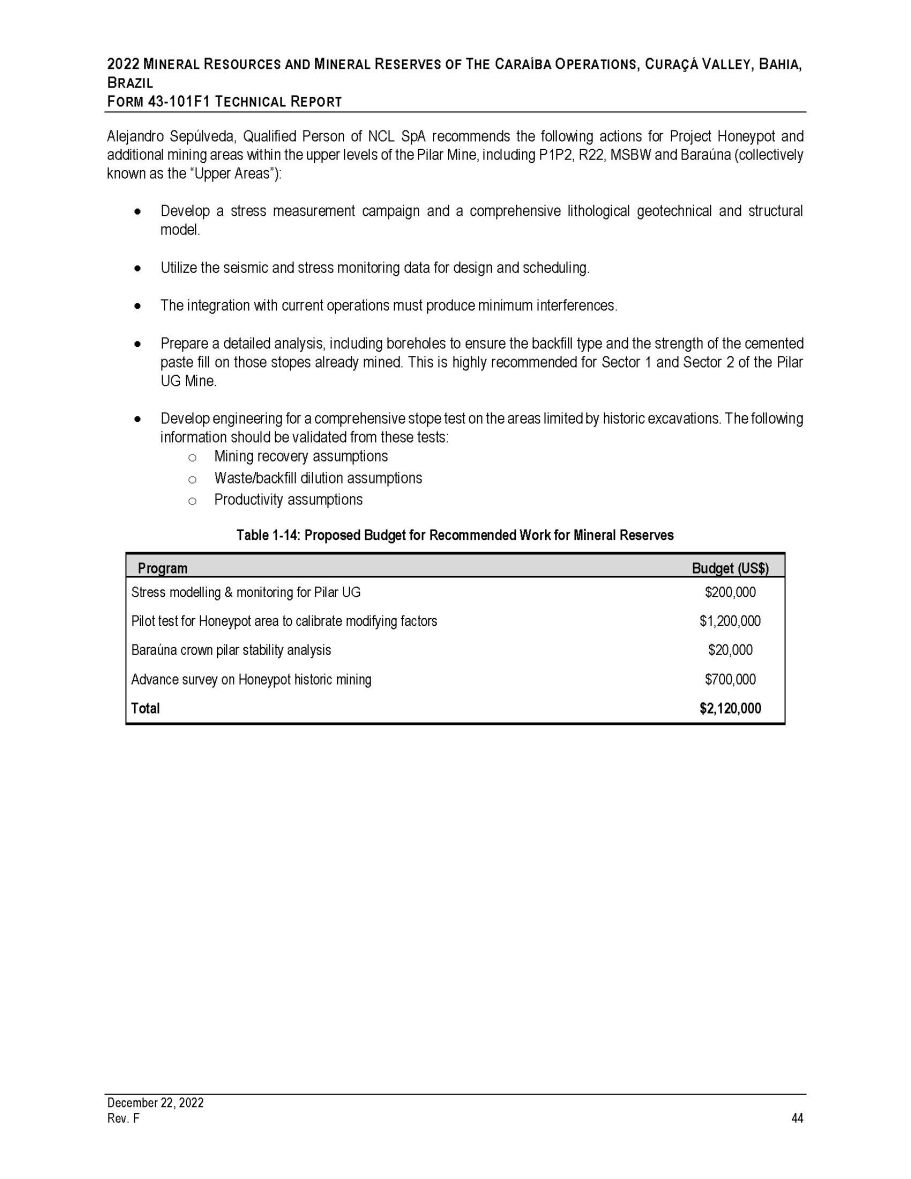
2022 M INERAL R ESOURCES AND M INERAL R ESERVES OF T HE C ARAÍBA O PERATIONS , C URAÇÁ V ALLEY , B AHIA , B RAZIL F ORM 43 - 101 F 1 T ECHNICAL R EPORT Alejandro Sepúlveda, Qualified Person of NCL SpA recommends the following actions for Project Honeypot and additional mining areas within the upper levels of the Pilar Mine, including P 1 P 2 , R 22 , MSBW and Baraúna (collectively known as the “Upper Areas”) : Develop a stress measurement campaign and a comprehensive lithological geotechnical and structural model . Utilize the seismic and stress monitoring data for design and scheduling. The integration with current operations must produce minimum interferences. Prepare a detailed analysis, including boreholes to ensure the backfill type and the strength of the cemented paste fill on those stopes already mined . This is highly recommended for Sector 1 and Sector 2 of the Pilar UG Mine . Develop engineering for a comprehensive stope test on the areas limited by historic excavations. The following information should be validated from these tests: o Mining recovery assumptions o Waste/backfill dilution assumptions o Productivity assumptions Table 1 - 14: Proposed Budget for Recommended Work for Mineral Reserves Program Budget (US$) Stress modelling & monitoring for Pilar UG $200,000 Pilot test for Honeypot area to calibrate modifying factors $1,200,000 Baraúna crown pilar stability analysis $20,000 Advance survey on Honeypot historic mining $700,000 Total $2,120,000 December 22, 2022 Rev. F 44
2022 M INERAL R ESOURCES AND M INERAL R ESERVES OF T HE C ARAÍBA O PERATIONS , C URAÇÁ V ALLEY , B AHIA , B RAZIL F ORM 43 - 101 F 1 T ECHNICAL R EPORT 2 INTRODUCTION AND TERMS OF REFERENCE Ero Copper Corp . (“Ero Copper”, “Ero” or the “Company”) is a Vancouver - based publicly listed copper mining company that trades on the Toronto and New York Stock Exchanges under the ticker “ERO” and exists under the British Columbia Business Corporations Act . Ero Copper’s principal asset is a 99 . 6 % interest in Mineração Caraíba S . A . (“MCSA”, or herein referred to as “Ero Brasil”), a Brazilian mining company operating in the Curaçá Valley, northeastern Bahia State, Brazil . The regional Ero Brasil operations in Bahia include fully integrated processing operations and, currently, three active producing mining locations within the Curaçá Valley . The active operations include the Caraíba Complex (comprised of the underground Pilar Mine (“Pilar UG Mine”), the underground Vermelhos Mine (“Vermelhos UG Mine”), the Surubim Mine and the integrated Caraíba Mill (which includes an inactive solvent extraction electrowinning plant (“SX/EW Plant”)) . The past producing operations include the open pit mines of R 22 (“R 22 Mine”) as well as the historic mines of Angicos (“Angicos Mine”) and Suçuarana (“Suçuarana Mine”) . Collectively the active and past - producing mines comprise the “Caraíba Operations” . Additionally, future operations are forecast to occur later in the production plan within the northern part of the Curaçá Valley including : the adjacent Vermelhos West (N 8 ) and Vermelhos East (N 9 ) open pits (collectively the “N 8 /N 9 OP Mine”), the Siriema open pit mine (“Siriema OP Mine”), collectively with the active Vermelhos UG Mine comprise the mineral reserves within the “Vermelhos District” . In the central part of the Curaçá Valley, future operations include : the expansion of the adjacent Surubim and C - 12 underground mine (the “C - 12 UG Mine”) and the C - 12 open pit (“C - 12 OP Mine”), collectively the Surubim Mine, which re - started operations during 2022 , comprise the stated mineral reserves of the “Surubim District” . In the southern part of the Curaçá Valley, the past producing Suçuarana open pit (“Suçuarana OP Mine”) and the R 22 W open pit (“R 22 W OP Mine”), collectively with the active Pilar UG Mine comprise the stated mineral reserves of the “Pilar District” . The Pilar District is located approximately 385 kilometers (“km”) north - northwest of Salvador and 90 km southeast of Petrolina, in the State of Bahia, Brazil . The center of the Surubim District is located approximately 33 km north of the Pilar UG Mine and Caraíba Mill (jointly referred to as the “Caraíba Mine”) at the Surubim Mine, while the center of the Vermelhos District and the Vermelhos UG Mine is located another 31 km north - northwest of the Surubim Mine . In aggregate, mining and development activities occur over approximately 100 km in strike length across the Curaçá Valley . The Caraíba Operations have an extensive operating history in the region . Open pit and processing operations started in 1979 , while underground mining operations commenced in 1986 . Ero Brasil owns a 100 % interest in the Caraíba Operations including the abovementioned mines, integrated processing facilities and all supporting infrastructure . The Pilar UG Mine currently produces a nominal 4 , 000 to 6 , 000 tonnes per day (“t/d”), or approximately 1 . 0 to 1 . 5 Mtpa from underground operations that, combined with the nominal 3 , 000 to 5 , 000 t/d, or approximately 1 . 5 Mtpa currently mined from satellite mining operations within the Caraíba Operations, including the Vermelhos UG Mine and the Surubim Mine, serves as feed for the Caraíba Mill . The Caraíba Mill is currently producing high quality, low impurity copper concentrate grading approximately 33 % - 35 % copper . The concentrate typically contains minor amounts of precious metals . Historical average grades of precious metals in concentrate are approximately 2 grams per tonne (“g/t” or “gpt”) gold and 43 g/t silver in concentrate . The Company's 2022 life of mine (“LOM”) planning process considers recently completed and ongoing investments in mining and milling infrastructure under the Company's "Pilar 3 . 0 ” initiative, which includes the integration of newly defined mineral resources and reserves in the upper levels of the Pilar UG Mine (efforts were focused on an area known as “Project Honeypot”), the ongoing construction of a new external shaft to access mineralization below level - 965 in the Pilar UG Mine (known as the “Deepening Project” or, from a geological perspective the “Deepening Extension Zone”), and the ongoing expansion of the Caraíba Mill to increase processing capacity to approximately 4 . 2 million tonnes per annum (“Mpta”) . As a result of the integration of Project Honeypot and the nature of the mineralization remaining in the upper levels of the Pilar Mine, and more broadly within the Company's underground operations, effective extraction of the mineral reserve necessitated the consideration of inferred mineral resources in the Company's long - term strategic planning efforts, particularly in the design of stopes that include measured, indicated and some inferred mineral resources - a process that has been utilized at the Pilar UG Mine since underground operations commenced in 1986 . Inferred mineral resources are considered too speculative geologically to have the December 22, 2022 Rev. F 45
2022 M INERAL R ESOURCES AND M INERAL R ESERVES OF T HE C ARAÍBA O PERATIONS , C URAÇÁ V ALLEY , B AHIA , B RAZIL F ORM 43 - 101 F 1 T ECHNICAL R EPORT economic considerations applied to them that would enable them to be categorized as mineral reserves . Mineral resources which are not mineral reserves do not have demonstrated economic viability . The Company has commenced a program to continue infill drilling of the Inferred resource to further upgrade this material ; however, until this work is completed, and the Inferred resources have been upgraded to reserves, there is no certainty this material will be converted into mineral reserves . The purpose of this report (“Report” or “Technical Report”) is to set out and to provide background and supporting information on the mineral resources and mineral reserves for the Caraíba Operations . The Report was prepared by GE 21 Consultoria Mineral Ltda . (“GE 21 ”), BNA Mining Solutions (“BNA”) and NCL Ingeniería y Construcción SpA (“NCL”) on behalf of Ero Copper . This Report and estimates herein have been prepared following the guidelines of the Canadian Securities Administrators’ National Instrument 43 - 101 – Standards of Disclosure for Mineral Projects (“NI 43 - 101 ”) and Form 43 - 101 F 1 – Technical Report (“Form 43 - 101 F 1 ”) . The effective date of this Report is September 30 , 2022 (the “Effective Date”) . The issue date of this Report is December 22 , 2022 . The scope of work undertaken by GE 21 included : Project management as lead QP of the Technical Report; review and validate the Company’s QA/QC program and data collected during the 2018 - 2020 drill programs; perform validation of the geological models prepared by Ero Brasil; update mineral resource block models using an industry standard geostatistical approach; classify the Company’s mineral resource into Measured, Indicated and Inferred categories, following CIM Standards and CIM Guidelines for the known copper sulphide mineralization of the Caraíba Operations; and, where relevant, GE21, reviewed work prepared by independent third - party consultants that constitute an integral component of current and planned operations as contemplated in this Report. The scope of work undertaken by BNA and NCL included : Review of updated mineral resource block models prepared by Ero Brasil, verified and classified with the support of GE21; review of mine design and planning on Measured and Indicated mineral resource for the deposits in support of the mineral reserve estimate; Where relevant, due to the operating nature of the Caraíba Operations and the Deepening Project, review work prepared by independent third - party consultants that constitute an integral component of current and planned operations as contemplated in this Report ; review and validate the economic analysis performed to verify economic feasibility in support of the mineral reserves ; and, compilation of the Technical Report detailing the mineral resource and mineral reserve for the Caraíba Operations incorporating the work performed by GE 21 and the work of the Ero Brasil technical team . Q UALIFICATION , E XPERIENCE AND I NDEPENDENCE December 22, 2022 Rev. F 46 2.1 GE 21 is an independent mineral consulting firm based in Brazil developed by a team of professionals accredited by the Australian Institute of Geoscientists (“AIG”), The Society for Mining, Metallurgy and Exploration, Inc . or Australasian Institute of Mining and Metallurgy as Qualified Persons for estimate of mineral resources and mineral reserves in accordance with NI 43 - 101 .
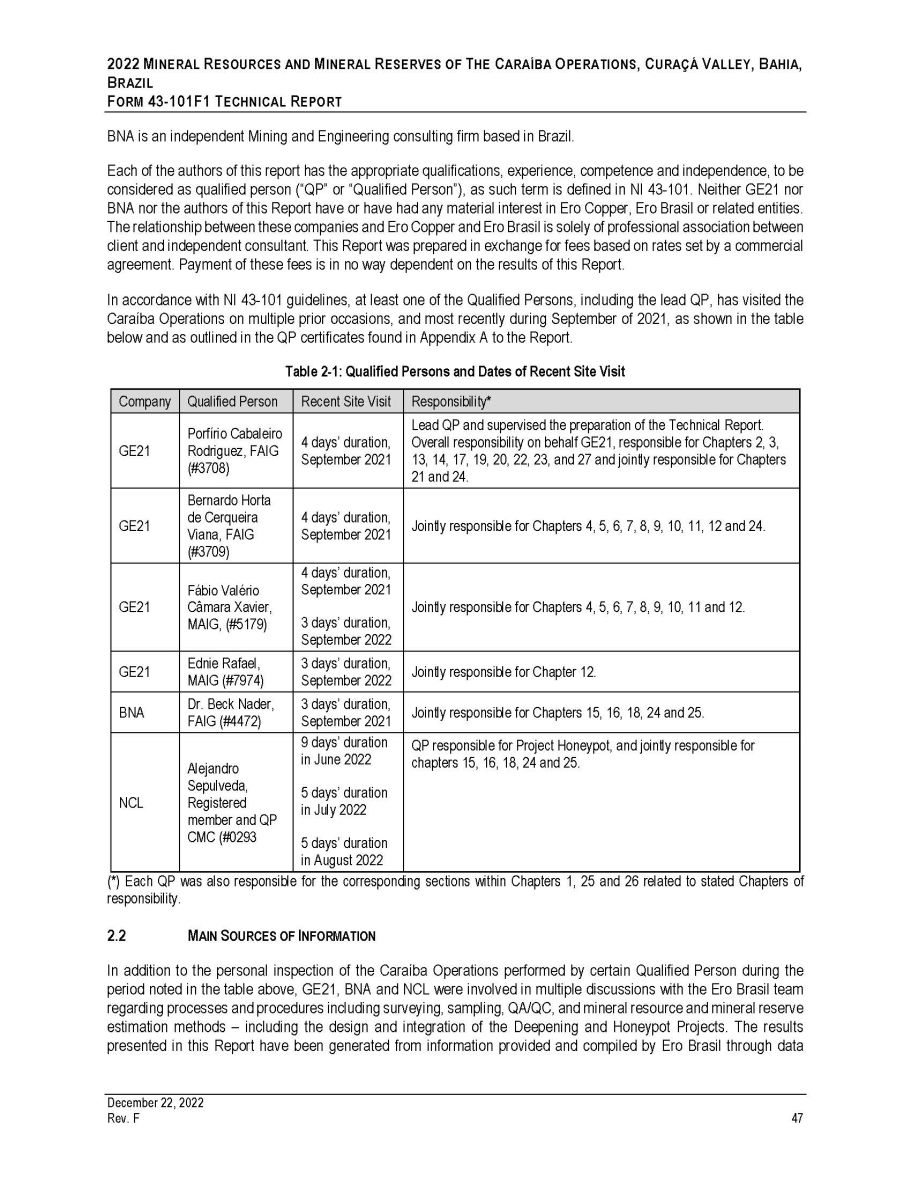
2022 M INERAL R ESOURCES AND M INERAL R ESERVES OF T HE C ARAÍBA O PERATIONS , C URAÇÁ V ALLEY , B AHIA , B RAZIL F ORM 43 - 101 F 1 T ECHNICAL R EPORT BNA is an independent Mining and Engineering consulting firm based in Brazil . Each of the authors of this report has the appropriate qualifications, experience, competence and independence, to be considered as qualified person (“QP” or “Qualified Person”), as such term is defined in NI 43 - 101 . Neither GE 21 nor BNA nor the authors of this Report have or have had any material interest in Ero Copper, Ero Brasil or related entities . The relationship between these companies and Ero Copper and Ero Brasil is solely of professional association between client and independent consultant . This Report was prepared in exchange for fees based on rates set by a commercial agreement . Payment of these fees is in no way dependent on the results of this Report . In accordance with NI 43 - 101 guidelines, at least one of the Qualified Persons, including the lead QP, has visited the Caraíba Operations on multiple prior occasions, and most recently during September of 2021 , as shown in the table below and as outlined in the QP certificates found in Appendix A to the Report . Table 2 - 1: Qualified Persons and Dates of Recent Site Visit Company Qualified Person Recent Site Visit Responsibility* GE21 Porfírio Cabaleiro Rodriguez, FAIG (# 3708 ) 4 days’ duration, September 2021 Lead QP and supervised the preparation of the Technical Report. Overall responsibility on behalf GE21, responsible for Chapters 2, 3, 13, 14, 17, 19, 20, 22, 23, and 27 and jointly responsible for Chapters 21 and 24. GE21 Bernardo Horta de Cerqueira Viana, FAIG (#3709) 4 days’ duration, September 2021 Jointly responsible for Chapters 4, 5, 6, 7, 8, 9, 10, 11, 12 and 24. GE21 Fábio Valério Câmara Xavier, MAIG, (#5179) 4 days’ duration, September 2021 3 days’ duration, September 2022 Jointly responsible for Chapters 4, 5, 6, 7, 8, 9, 10, 11 and 12. GE21 Ednie Rafael, MAIG (#7974) 3 days’ duration, September 2022 Jointly responsible for Chapter 12. BNA Dr. Beck Nader, FAIG (#4472) 3 days’ duration, September 2021 Jointly responsible for Chapters 15, 16, 18, 24 and 25. NCL Alejandro Sepulveda, Registered member and QP CMC (#0293 9 days’ duration in June 2022 5 days’ duration in July 2022 5 days’ duration in August 2022 QP responsible for Project Honeypot, and jointly responsible for chapters 15, 16, 18, 24 and 25. December 22, 2022 Rev. F 47 (*) Each QP was also responsible for the corresponding sections within Chapters 1 , 25 and 26 related to stated Chapters of responsibility . 2.2 M AIN S OURCES OF I NFORMATION In addition to the personal inspection of the Caraíba Operations performed by certain Qualified Person during the period noted in the table above, GE 21 , BNA and NCL were involved in multiple discussions with the Ero Brasil team regarding processes and procedures including surveying, sampling, QA/QC, and mineral resource and mineral reserve estimation methods – including the design and integration of the Deepening and Honeypot Projects . The results presented in this Report have been generated from information provided and compiled by Ero Brasil through data
2022 M INERAL R ESOURCES AND M INERAL R ESERVES OF T HE C ARAÍBA O PERATIONS , C URAÇÁ V ALLEY , B AHIA , B RAZIL F ORM 43 - 101 F 1 T ECHNICAL R EPORT organized in spreadsheets, internal and third - party technical reports, as well as supplemental information obtained from the Ero Brasil technical team . GE 21 , BNA and NCL have made all necessary inquiries to determine the integrity and authenticity of the information provided and identified herein . 3. E FFECTIVE D ATE The Effective Date of this Technical Report is September 30 , 2022 4. U NITS OF M EASUREMENT Unless otherwise stated, the units of measurement in this Report are all metrics in the International System of Units (“SI”) . All monetary units are expressed in BRL or United States Dollars (“US $ ” or “USD”), unless otherwise indicated . Although substantively all costs are incurred in BRL, where applicable, these amounts have been converted to USD for presentation purposes . The UTM projection, Zone 24 South, SIRGAS 2000 datum was adopted as a spatial reference for all mines and projects within the Curaçá Valley with the exception of the Pilar UG Mine, where Local Coordinates were adopted as the spatial reference . December 22, 2022 Rev. F 48
2022 M INERAL R ESOURCES AND M INERAL R ESERVES OF T HE C ARAÍBA O PERATIONS , C URAÇÁ V ALLEY , B AHIA , B RAZIL F ORM 43 - 101 F 1 T ECHNICAL R EPORT 3 RELIANCE ON OTHER EXPERTS The authors of this report are Qualified Persons as defined under NI 43 - 101 , with relevant experience in mineral exploration, data validation, mine planning and mineral resource and mineral reserve estimation . The information presented regarding the tenure, status and work permitted by permit type within the Caraíba Operations in Chapter 4 – Property Description and Location, is based on information published by the ANM of Brazil as at the Effective Date . The copper market conditions and key contracts as of the Effective Date included in Chapter 19 – Market Studies and Contracts and environmental licensing status information and work plans related to community and social outreach included in Chapter 20 – Environmental Studies, Permitting and Social or Community Impact, were prepared by Ero Brasil and Ero Copper and reviewed by GE 21 . GE 21 determined that the economic factors used in the determination of specific technical parameters of this Report, including copper, gold, silver and the USD : BRL assumptions used were in - line with industry norms, broader market consensus and are acceptable for use in the current mineral resource estimate and mineral reserve estimate . The authors of this Report have not identified any significant risks in the underlying assumptions . The forecast capital expenditures and operating costs as well as tax and royalty obligations included in Chapter 21 – Capital and Operating Costs were prepared by Ero Brasil and Ero Copper based on the extensive operating history of the operations and ongoing nature of the operations . The forecasts were reviewed against historic information and deemed to be reasonable and adequate for the purposes of NI 43 - 101 by the authors of this Report . December 22, 2022 Rev. F 49
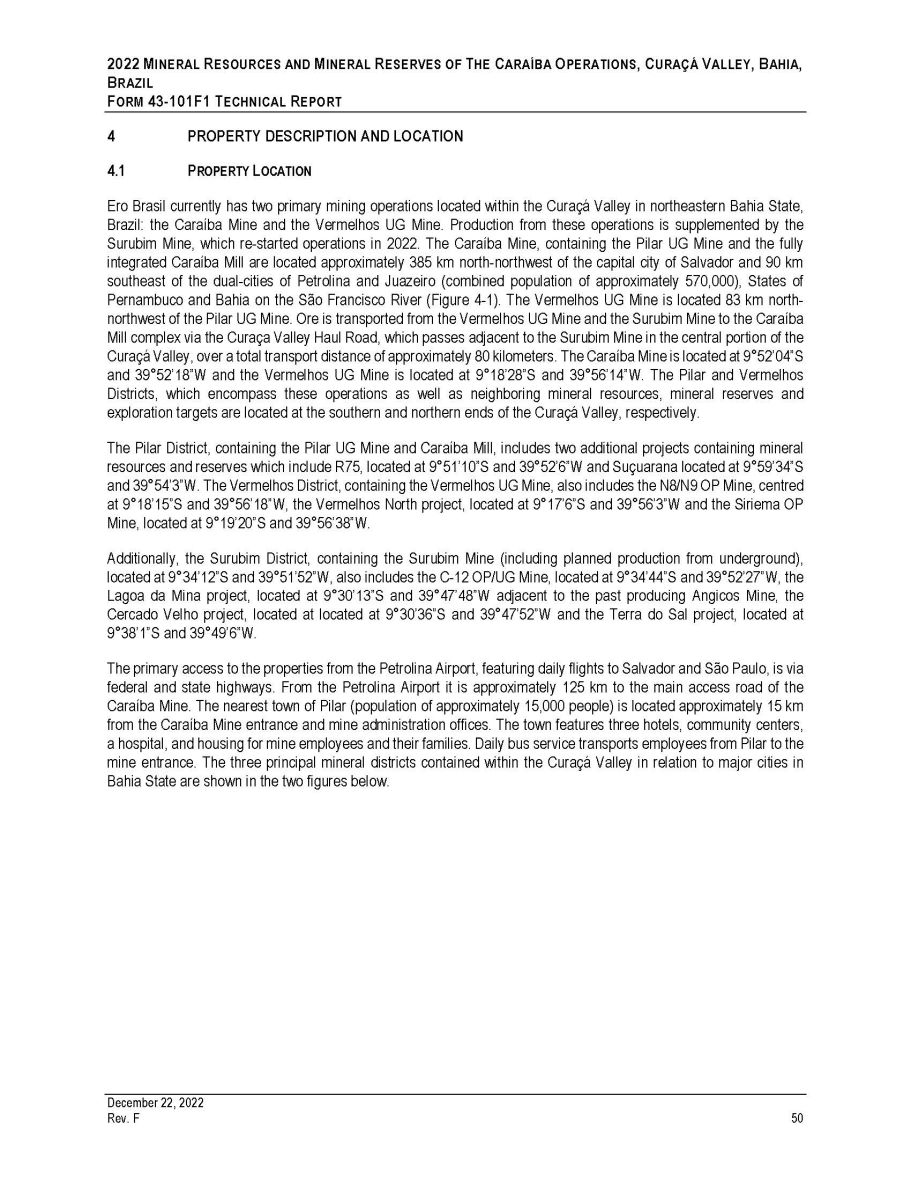
2022 M INERAL R ESOURCES AND M INERAL R ESERVES OF T HE C ARAÍBA O PERATIONS , C URAÇÁ V ALLEY , B AHIA , B RAZIL F ORM 43 - 101F1 T ECHNICAL R EPORT 4 4.1 December 22, 2022 Rev. F 50 PROPERTY DESCRIPTION AND LOCATION P ROPERTY L OCATION Ero Brasil currently has two primary mining operations located within the Curaçá Valley in northeastern Bahia State, Brazil : the Caraíba Mine and the Vermelhos UG Mine . Production from these operations is supplemented by the Surubim Mine, which re - started operations in 2022 . The Caraíba Mine, containing the Pilar UG Mine and the fully integrated Caraíba Mill are located approximately 385 km north - northwest of the capital city of Salvador and 90 km southeast of the dual - cities of Petrolina and Juazeiro (combined population of approximately 570 , 000 ), States of Pernambuco and Bahia on the São Francisco River (Figure 4 - 1 ) . The Vermelhos UG Mine is located 83 km north - northwest of the Pilar UG Mine . Ore is transported from the Vermelhos UG Mine and the Surubim Mine to the Caraíba Mill complex via the Curaça Valley Haul Road, which passes adjacent to the Surubim Mine in the central portion of the Curaçá Valley, over a total transport distance of approximately 80 kilometers . The Caraíba Mine is located at 9 ƒ 52 ’ 04 ”S and 39 ƒ 52 ’ 18 ”W and the Vermelhos UG Mine is located at 9 ƒ 18 ’ 28 ”S and 39 ƒ 56 ’ 14 ”W . The Pilar and Vermelhos Districts, which encompass these operations as well as neighboring mineral resources, mineral reserves and exploration targets are located at the southern and northern ends of the Curaçá Valley, respectively . The Pilar District, containing the Pilar UG Mine and Caraíba Mill, includes two additional projects containing mineral resources and reserves which include R 75 , located at 9 ƒ 51 ’ 10 ”S and 39 ƒ 52 ’ 6 ”W and Suçuarana located at 9 ƒ 59 ’ 34 ”S and 39 ƒ 54 ’ 3 ”W . The Vermelhos District, containing the Vermelhos UG Mine, also includes the N 8 /N 9 OP Mine, centred at 9 ƒ 18 ’ 15 ”S and 39 ƒ 56 ’ 18 ”W, the Vermelhos North project, located at 9 ƒ 17 ’ 6 ”S and 39 ƒ 56 ’ 3 ”W and the Siriema OP Mine, located at 9 ƒ 19 ’ 20 ”S and 39 ƒ 56 ’ 38 ”W . Additionally, the Surubim District, containing the Surubim Mine (including planned production from underground), located at 9 ƒ 34 ’ 12 ”S and 39 ƒ 51 ’ 52 ”W, also includes the C - 12 OP/UG Mine, located at 9 ƒ 34 ’ 44 ”S and 39 ƒ 52 ’ 27 ”W, the Lagoa da Mina project, located at 9 ƒ 30 ’ 13 ”S and 39 ƒ 47 ’ 48 ”W adjacent to the past producing Angicos Mine, the Cercado Velho project, located at located at 9 ƒ 30 ’ 36 ”S and 39 ƒ 47 ’ 52 ”W and the Terra do Sal project, located at 9 ƒ 38 ’ 1 ”S and 39 ƒ 49 ’ 6 ”W . The primary access to the properties from the Petrolina Airport, featuring daily flights to Salvador and São Paulo, is via federal and state highways . From the Petrolina Airport it is approximately 125 km to the main access road of the Caraíba Mine . The nearest town of Pilar (population of approximately 15 , 000 people) is located approximately 15 km from the Caraíba Mine entrance and mine administration offices . The town features three hotels, community centers, a hospital, and housing for mine employees and their families . Daily bus service transports employees from Pilar to the mine entrance . The three principal mineral districts contained within the Curaçá Valley in relation to major cities in Bahia State are shown in the two figures below .
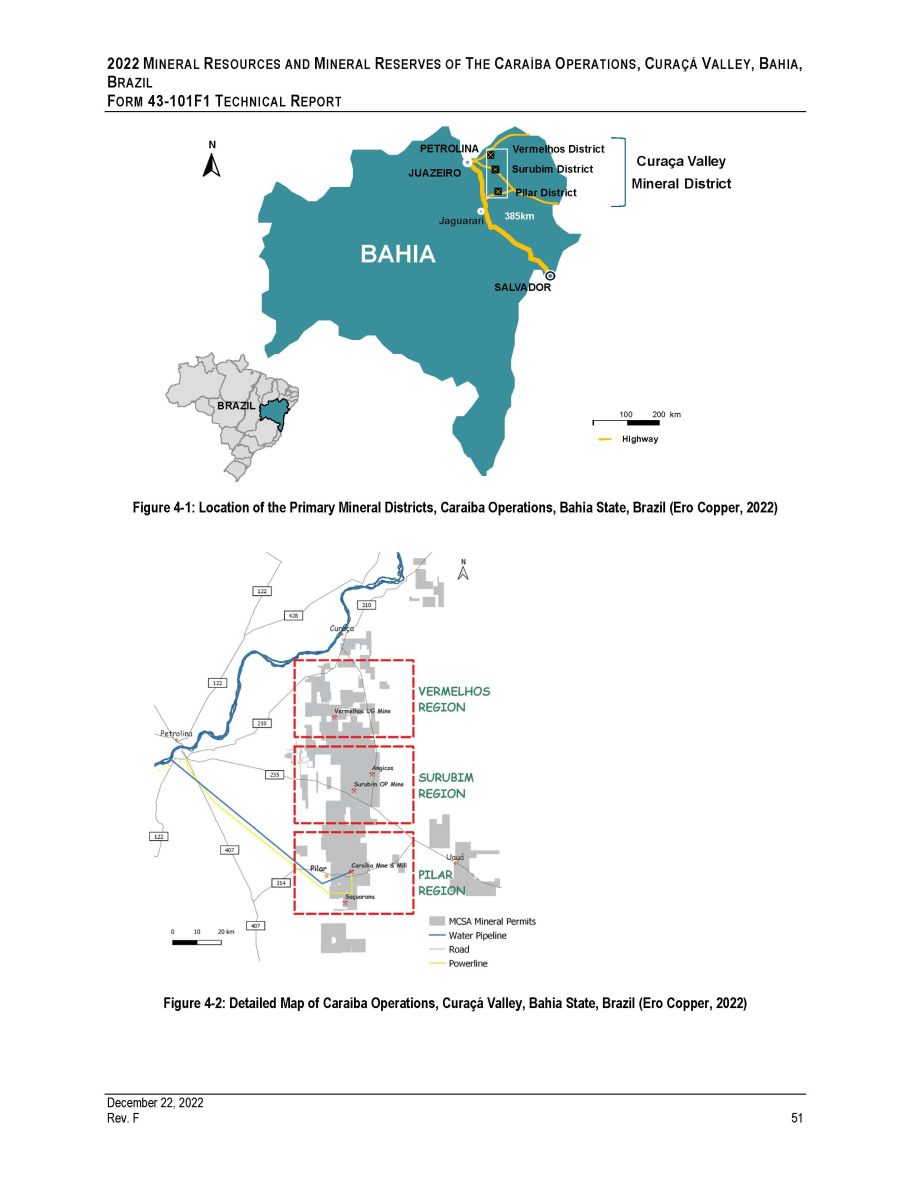
2022 M INERAL R ESOURCES AND M INERAL R ESERVES OF T HE C ARAÍBA O PERATIONS , C URAÇÁ V ALLEY , B AHIA , B RAZIL F ORM 43 - 101F1 T ECHNICAL R EPORT Figure 4 - 1: Location of the Primary Mineral Districts, Caraíba Operations, Bahia State, Brazil (Ero Copper, 2022) Figure 4 - 2: Detailed Map of Caraíba Operations, Curaçá Valley, Bahia State, Brazil (Ero Copper, 2022) SALVADOR JUAZEIRO Jaguarari 385km BAHIA PETROLINA Vermelhos District Surubim District Pilar District Curaça Valley Mineral District BRAZIL N 100 Highway 200 km December 22, 2022 Rev. F 51

2022 M INERAL R ESOURCES AND M INERAL R ESERVES OF T HE C ARAÍBA O PERATIONS , C URAÇÁ V ALLEY , B AHIA , B RAZIL F ORM 43 - 101 F 1 T ECHNICAL R EPORT 2. M INERAL T ITLE IN B RAZIL Mining legislation as it relates to mineral title in Brazil has been in place since 1967 , and the last significant amendment took place in 1996 . In 2017 , there were changes to the institutional framework and to the statutory royalty Compensação Financeira pela Exploração de Recursos Minerais (“CFEM”) legislation . Institutionally, a new National Mining Agency (Agência Nacional de Mineração, “ANM”) was created to replace the National Department for Mineral Production (Departamento Nacional de Produção Mineral, “DNPM”) . As it relates to the statutory royalty, new legislation enacted in December 2017 established new rates for mineral commodities and excluded certain deductions previously allowed, such as transportation and insurance costs . The royalty on copper producers remained the same at 2 . 00 % of the gross revenue from sales . In addition to the changes in legislation described above, in June 2018 , the Federal Government enacted new regulations to the Mining Code . The purpose of the new regulations was to modernize parts of the previous legislation that do not require legislative action (i . e . no amendments to the Mining Code are required) . In February 2022 , the Federal Government further amended regulations in an effort to streamline the analysis of processes and reduce bureaucracy to attract new investment for the mining sector . These changes did not affect the methods for granting mineral rights, nor establish new investment commitments per license, but rather sought to ease the transition process from Exploration to Mining Licenses in as much as the Mining Code allows, particularly as it relates to supplementary work performed after the submission of a final exploration report . As of the date of this Report, the authors do not anticipate any significant change in Brazil’s mining legislation that would adversely impact the operations of the Company . 3. M INING L EGISLATION , A DMINISTRATION , AND R IGHTS The primary mining legislations in Brazil are the 1988 Federal Constitution and the 1967 Federal Mining Code (Decree - law No . 227 ), as amended over time . Minerals on the ground are a property of the Federal Government, and, therefore, mining legislation can only be enacted at the federal level . The ANM is the federal agency entitled to manage, regulate and supervise mining activities in Brazil, along with the Ministry of Mines and Energy (“MME”) . By definition, exploration rights are granted by the ANM and, in most of the cases, mining concessions are granted by the MME . Landowners and governments (municipal, state and federal) are entitled to a royalty . The CFEM rate varies from 1 % to 3 . 5 % , depending on the commodity . If any minerals are extracted from private lands that are not owned by the titleholder, the landowner is entitled to a royalty equal to 50 % of the statutory CFEM royalty . Mining activities are subject to both federal and state level environmental licensing . Ero Brasil’s operations for copper (in the Curaçá Valley) are subject to a 2 % royalty on gross concentrate sales net of taxes levied on sales . Exploration license holders are entitled to access their license area and work on it whether it is public or privately held, but such holders must compensate the owner of the surface rights for losses caused by the work and for the occupation of the land (typically in the form of rent) . Compensation may be negotiated on a case - by - case basis, but the Mining Code provides that, should a court of law be required to set the amounts, the rent for occupation of the land cannot exceed the maximum net income that the owner would earn from its agricultural - pasture activity in the area of the property to be explored, and the losses caused by the work cannot exceed the assessed value of the area of the property intended for exploration . In response to the Brumadinho disaster, new regulations and laws regarding the design, operation and monitoring of tailings dams in Brazil were passed . Specifically, on October 1 , 2020 . Law No 14 , 066 / 2020 , which amended the National Dam Safety Policy, was enacted . As at the date of this Report, the Company continues to work with the ANM and state agencies to evaluate any potential operational changes and or additional monitoring or reporting requirements for its tailings facilities that may be required . The authors of this Report have reviewed the new legislation requirements and have not identified any material risk factors associated with compliance within the new legislation nor any potential adverse impact on the Company’s ability to extract the current mineral reserves . December 22, 2022 Rev. F 52

2022 M INERAL R ESOURCES AND M INERAL R ESERVES OF T HE C ARAÍBA O PERATIONS , C URAÇÁ V ALLEY , B AHIA , B RAZIL F ORM 43 - 101 F 1 T ECHNICAL R EPORT In response to the hardship experienced throughout Brazil during the COVID - 19 pandemic, a series of Resolutions published between 2020 and 2022 , resulted in the extension of procedural and administrative deadlines for exploration and mining concessions . Under the resolutions, administrative deadlines were extended for a maximum period of 560 days, from October 1 , 2021 . 4. E XPLORATION L ICENSES Exploration licenses are granted for up to three - year periods and may be renewed for another three years on the approval of an ANM inspection and satisfaction of certain environmental requirements . The size of an individual license area ranges from 50 ha to 10 , 000 ha depending on the state and the commodity . 5. A NNUAL F EES AND R EPORTING R EQUIREMENTS Annual license fees for Exploration Licenses are based on size and are calculated at R $ 3 . 55 /ha for the first license term and R $ 5 . 33 /ha in subsequent terms . Each license holder must submit an exploration plan, budget and timeline, although there is no work or expenditure requirement . Licenses require an interim report two - months prior to license expiration (if an extension is to be applied for), describing exploration results, interpretation and expenditures . The renewal of a license may be granted at the discretion of the ANM considering the exploration works undertaken by the holder . A final report is due at the end the term or on relinquishment of the license . 6. M INERAL T ITLES Mining rights in Brazil are governed by the Mining Code Decree Number 227 , dated February 27 , 1967 and via subsequent rules and amendments enacted by the ANM . As of the Effective Date, Ero Brasil holds, has applications in process, or has negotiated with third - parties for 153 mineral rights in the State of Bahia, shown by type in the table below and graphically in Figure 4 - 3 . Table 4 - 1: Ero Brasil Mining Rights Within the Curaçá Valley Permit Holder Mineral Permit Type Permits - Licenses Held Hectares (ha) Exploration* 138 171,045.2 Mineração Caraíba S.A. Right to Request Mining Grant 1 998.7 Mining Application 7 10.521.4 Mining 7 3,299.6 Total 153 185,865.0 December 22, 2022 Rev. F 53 *Includes Exploration permits under application and agreements with third - parties in place as of the Effective Date There are no time constraints provisioned with the mining concessions ; however, operating permits and licenses are extended and renewed in normal course of business according to the nature of each permit and requirements therein . Ero Brasil has all necessary licenses, permits, surface ownership and right of way where appropriate in place to conduct its current operations . The table below shows the overall status, as of the Effective Date, of the Mining Permits and Mining Application Permit in which the Caraíba Mine, R 22 W Mine, Surubim Mine, Vermelhos UG Mine, Angicos Mine and the Suçuarana Mine are located .
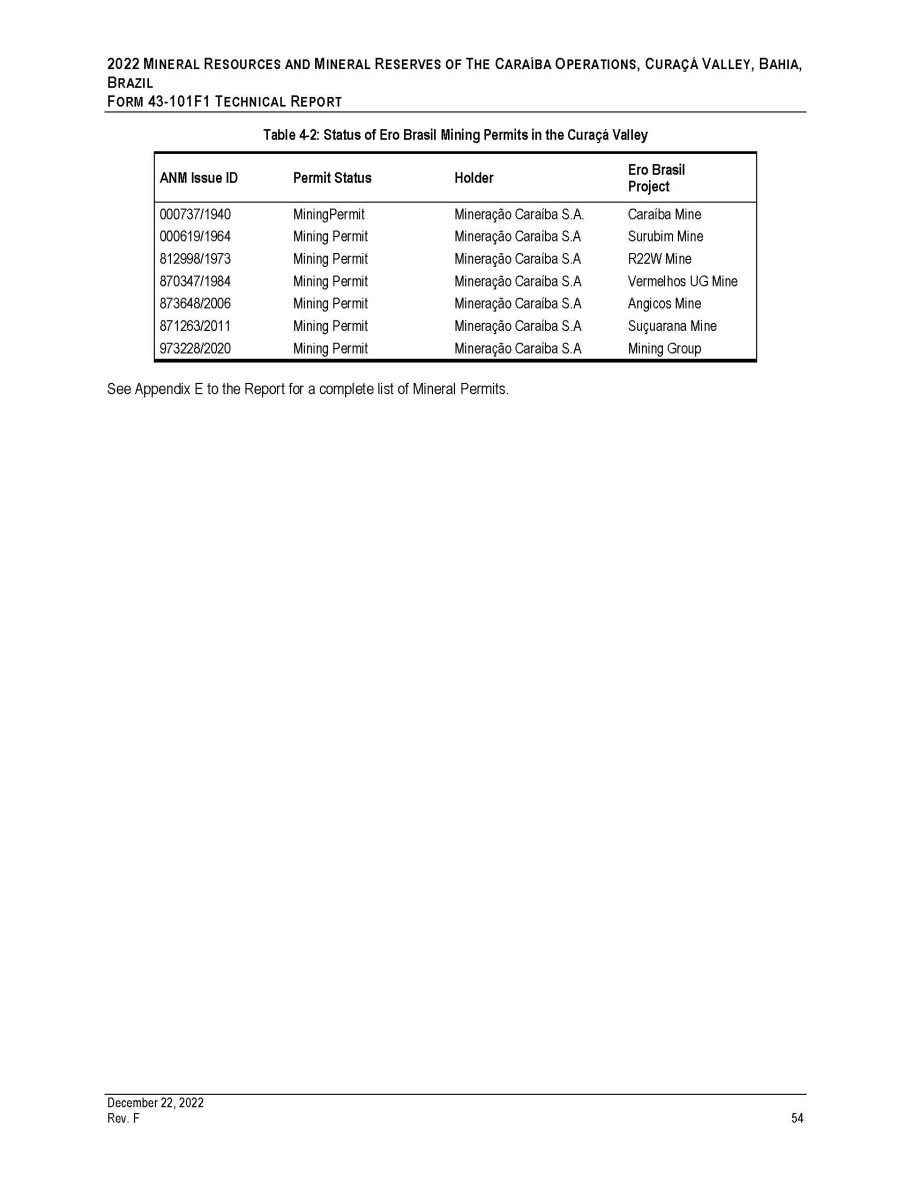
2022 M INERAL R ESOURCES AND M INERAL R ESERVES OF T HE C ARAÍBA O PERATIONS , C URAÇÁ V ALLEY , B AHIA , B RAZIL F ORM 43 - 101F1 T ECHNICAL R EPORT Table 4 - 2: Status of Ero Brasil Mining Permits in the Curaçá Valley ANM Issue ID Permit Status Holder Ero Brasil Project 000737/1940 MiningPermit Mineração Caraíba S.A. Caraíba Mine 000619/1964 Mining Permit Mineração Caraíba S.A Surubim Mine 812998/1973 Mining Permit Mineração Caraíba S.A R22W Mine 870347/1984 Mining Permit Mineração Caraíba S.A Vermelhos UG Mine 873648/2006 Mining Permit Mineração Caraíba S.A Angicos Mine 871263/2011 Mining Permit Mineração Caraíba S.A Suçuarana Mine 973228/2020 Mining Permit Mineração Caraíba S.A Mining Group December 22, 2022 Rev. F 54 See Appendix E to the Report for a complete list of Mineral Permits.
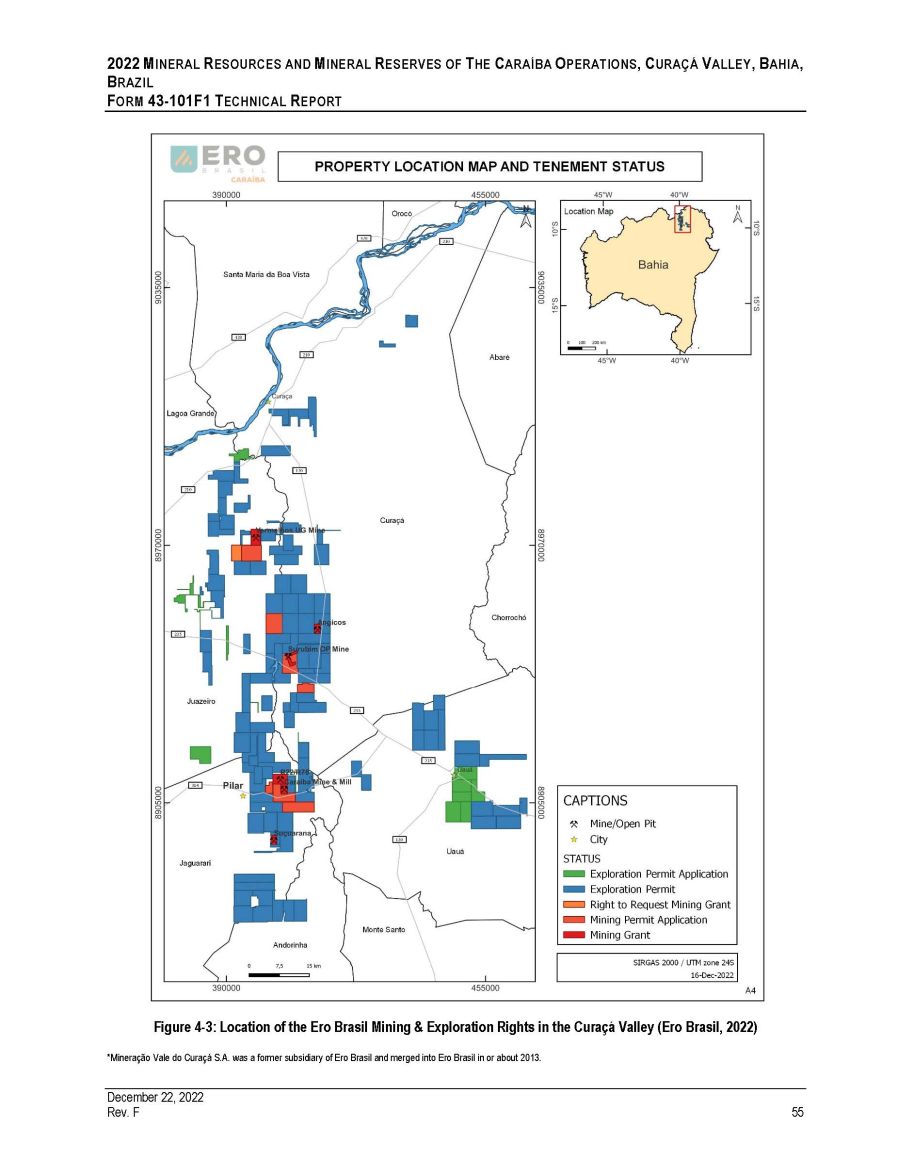
2022 M INERAL R ESOURCES AND M INERAL R ESERVES OF T HE C ARAÍBA O PERATIONS , C URAÇÁ V ALLEY , B AHIA , B RAZIL F ORM 43 - 101F1 T ECHNICAL R EPORT Figure 4 - 3: Location of the Ero Brasil Mining & Exploration Rights in the Curaçá Valley (Ero Brasil, 2022) *Mineração Vale do Curaçá S.A. was a former subsidiary of Ero Brasil and merged into Ero Brasil in or about 2013. December 22, 2022 Rev. F 55
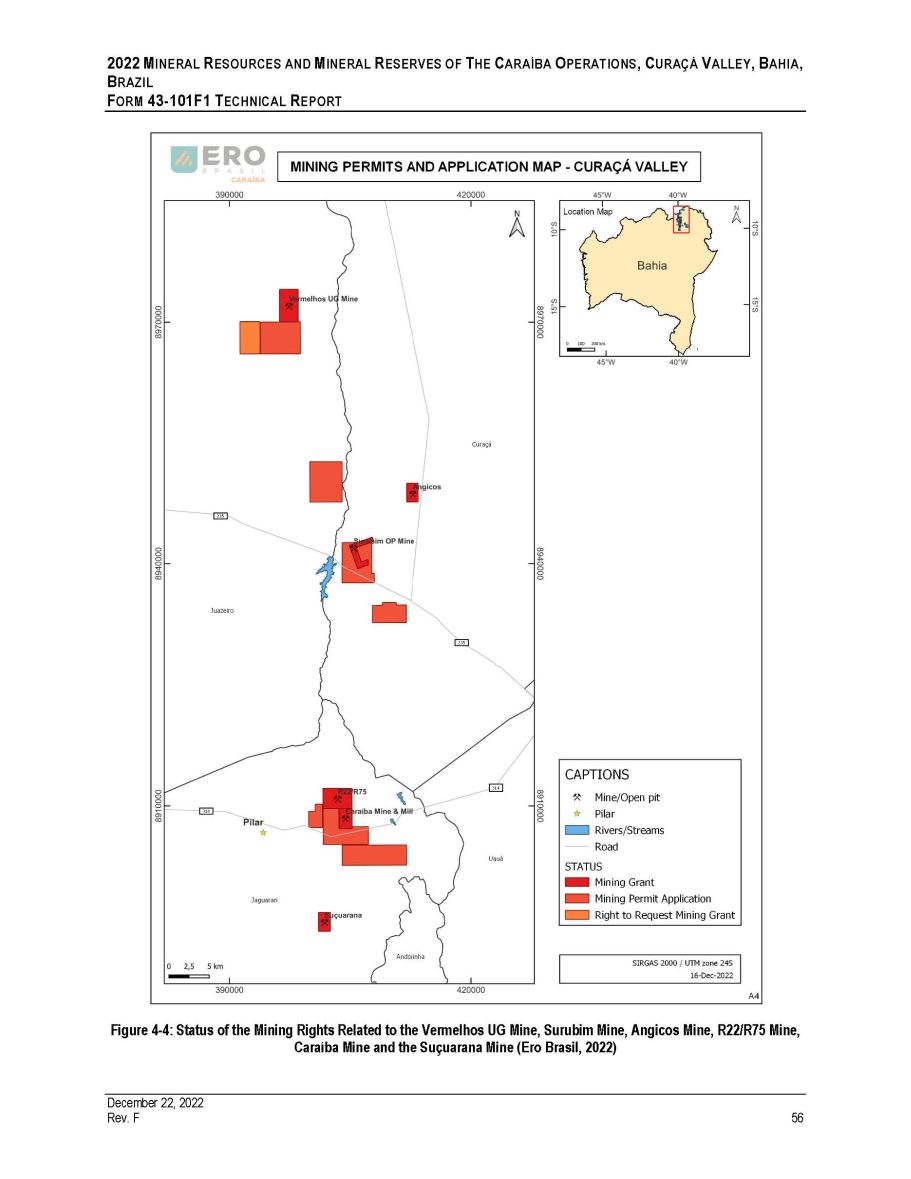
2022 M INERAL R ESOURCES AND M INERAL R ESERVES OF T HE C ARAÍBA O PERATIONS , C URAÇÁ V ALLEY , B AHIA , B RAZIL F ORM 43 - 101F1 T ECHNICAL R EPORT Figure 4 - 4: Status of the Mining Rights Related to the Vermelhos UG Mine, Surubim Mine, Angicos Mine, R22/R75 Mine, Caraíba Mine and the Suçuarana Mine (Ero Brasil, 2022) December 22, 2022 Rev. F 56
2022 M INERAL R ESOURCES AND M INERAL R ESERVES OF T HE C ARAÍBA O PERATIONS , C URAÇÁ V ALLEY , B AHIA , B RAZIL F ORM 43 - 101F1 T ECHNICAL R EPORT 5 5.1 December 22, 2022 Rev. F 57 ACCESSIBILITY, CLIMATE, LOCAL RESOURCES, INFRASTRUCTURE AND PHYSIOGRAPHY A CCESSIBILITY Ero Brasil’s properties are located in the Curaçá Valley in the northern part of the State of Bahia, Brazil . The closest major cities are Petrolina, located in the State of Pernambuco on the northern side of the São Francisco River, and Juazeiro, in the State of Bahia located on the southern side of the river . The combined population of the two cities is approximately 570 , 000 people . The Caraíba Mine can be accessed from Petrolina or Juazeiro via BR 407 south for 80 km to the village of Barrinha . From Barrinha, east on BA 314 for 45 km and the mine access road intersects BA 314 . Both BR 407 and BA 314 are paved roads . Mine employees live in the town of Pilar (population of approximately 15 , 000 ) located approximately 15 km from the mine entrance . Daily bus service transports Ero Brasil employees from Pilar to the Caraíba Mine main gate . The Vermelhos UG Mine property lies approximately 83 km north - northwest of the Caraíba Mine and can be accessed from Petrolina or Juazeiro by following BR 407 15 km to the intersection with BR 235 . BR 235 intersects the Curaçá Valley Haul Road near the Surubim Mine in the center of the Curaçá Valley . The Vermelhos UG Mine can be accessed by following the haul - road north for approximately 40 km . Construction of a permanent haul - road from Vermelhos UG Mine to the Surubim Mine occurred in late 2018 joining the previously constructed haul - road between the Caraíba Mill and the Surubim Mine, constructed prior to Ero Copper . The Curaçá Valley Haul Road facilitates transport of ore from the Vermelhos UG Mine and Surubim Mine to the Caraíba Mill and is wide enough to accommodate two - direction traffic . While the majority of the Curaçá Valley Haul Road is dirt, portions of the road located near small communities are paved, primarily for dust control . The nearest town to the Vermelhos UG Mine property is the town of Curaçá (population of approximately 30 , 000 ) . Daily bus service transports Ero Brasil employees working at the Vermelhos UG Mine from the town of Curaçá to the Vermelhos property . 2. P HYSIOGRAPHY The Curaçá Valley can be characterized as generally as flat - lying topography featuring scattered elongated ridges, isolated rock outcrops and inselbergs . The elevation ranges from 400 m to 600 m above mean sea level . The presence of inselbergs is indicative of an advanced erosional cycle, developed under arid to semi - arid conditions . The inselbergs within the Curaçá Valley have peak elevations of up to 600 m, approximately 100 m to 200 m above the valley floor . Drainage is from south to north by the Curaçá River, a tributary of the São Francisco River . Two important tributaries of the Curaçá River are the Esfomeado and Vaca Creeks, which drain the west side of the valley . The drainage pattern is reticular and largely fault controlled . 3. C LIMATE The region is classified as arid to semiarid, or BSh per the Köppen climate classification system . Within the mining and development properties, temperatures range from a low of 20 ƒ C in the winter months to a high of 40 ƒ C in the summer months . Summer average temperatures are 29 ƒ C while winter averages are 23 ƒ C . Annual rainfall is erratic and has a range of 100 to 900 millimetres (“mm”) . On average, total annual rainfall is less than 700 mm . Most precipitation occurs during the rainy season, December to March, in isolated high rainfall events associated with thunderstorm activity . The limited seasonal rainfall and temperate climate permit a year - around operating season for all activities of the Company including but not limited to mining, processing, transportation of ore on the Curaçá Valley Haul Road, shipments of final concentrate and all ongoing exploration programs .
2022 M INERAL R ESOURCES AND M INERAL R ESERVES OF T HE C ARAÍBA O PERATIONS , C URAÇÁ V ALLEY , B AHIA , B RAZIL F ORM 43 - 101 F 1 T ECHNICAL R EPORT 4. V EGETATION Northeastern Bahia is called the Sertão and can be characterized as having Caatinga - type vegetation, of low thorny plants and bushes adapted to the extreme arid climate . Predominant plants in the mining and development areas include cacti such as the mandacarú and xique - xique, as well as baraúna and umburana trees and bromeliads . The Curaçá Valley Caatinga vegetation ranges from shrubby, sparsely vegetated type to rocky, savanna type and typically ranges from 10 % to 60 % cover with lesser coverage typically associated in areas of goat farming activity . 5. I NFRASTRUCTURE AND L OCAL R ESOURCES Except for a short period in 2016 , the Caraíba Mine has been in continuous operation since 1979 and has all of the necessary infrastructure and skilled mine and processing personnel for continued operation . During construction of the Caraíba Mine, the town of Pilar was constructed to house mine employees and to provide logistical support for mining activities . Initially, Pilar consisted of approximately 1 , 800 houses with fresh water supply, electrical power, and a sewage system . Today, Pilar has a population of approximately 15 , 000 people providing support for Ero Brasil and its personnel in the form of outsourced labor and small local businesses . This district also has banks, a hospital and a health center, schools, a post office, a town hall and recreational facilities including clubs and sports stadiums . All of the streets are paved and the district has a reliable phone system . Daily bus service takes Ero Brasil employees from the center of Pilar to the Caraíba Mine main entrance . The main water supply for Pilar and the Caraíba Mill is brought from the São Francisco River via an 86 km pipeline that was constructed by and is owned and maintained by Ero Brasil . Electrical power is obtained from CHESF via a 13 . 8 kV substation connected to a 230 kV power transmission line . In the Brazilian northeast, Ero Brasil is the largest primary copper mining company . Throughout its operating history, a robust social and logistics infrastructure framework has been developed, sufficient to supply all of the industrial and labor needs related to the production of copper from the Caraíba Operations . December 22, 2022 Rev. F 58
2022 M INERAL R ESOURCES AND M INERAL R ESERVES OF T HE C ARAÍBA O PERATIONS , C URAÇÁ V ALLEY , B AHIA , B RAZIL F ORM 43 - 101 F 1 T ECHNICAL R EPORT 6 HISTORY The first documented occurrence of copper in the Curaçá Valley was located at Serra da Borracha, Curaçá County in 1782 . Samples were taken to Salvador for tests and were reported to contain “pure” copper . The information about the discovery was delivered to the Portuguese Crown in Lisbon . The then governor of Bahia authorized a company to exploit copper, but the company never began commercial production of copper . It would be another 180 years before a formal exploration program occurred on the property . In 1874 , engineer A . M . de Oliveira Bulhões reported copper occurrences in the vicinity of the Caraíba Mine in a series of documented accounts . Mr . Bulhões made this observation while he was working for the São Francisco Railroad and wrote “copper exists in abundance and in many places the mineral can be seen on top of the soil” . No formal copper exploration was completed on the property . In 1915 , the International Ore Corporation and the then landowner of the Caraíba Mine property signed a purchase option contract . No further work was done under the terms of the contract and very little exploration activity occurred beyond a preliminary test pit in 1915 and a surface sample program in 1938 . In 1962 , the DNPM conducted a regional exploration program in the Curaçá Valley and made a preliminary resource estimate based on that work . Mineral permits were obtained by the Pignatari Group in 1966 and the first feasibility studies were completed on the project in 1969 by Mr . Francisco Pignatari . In 1974 , the investment branch of the Brazilian National Economic and Social Development Bank (“BNDESPAR”) took control of the property, and between 1974 and 1978 , the property was developed by the Brazilian State - owned company Caraíba Metais S . A . Exploration work in support of the design and development of the mine was performed by Companhia Vale do Rio Doce (“CVRD”) . The Caraíba Mine began commercial production in 1979 . In addition to construction of mine and processing facilities, a smelter was constructed for refining copper concentrate into copper metal . Underground operations started in 1986 at the Pilar UG Mine and were conducted concurrently with open pit operations . The original open pit mine was depleted in 1998 , but underground mining continued and is still in operation today . In 1988 , the smelting and mining operations were split into two separate business units to simplify privatization . The smelting unit was privatized under the name Caraíba Metais S . A . and was later sold to Eluma S . A . Industria e Comercio (“Eluma”), a part of the Paranapanema Group in 1992 . The mining and processing units remained State owned and operated under the name Mineração Caraíba until 1994 , when Mineração Caraíba was placed in the National Privatization Program and later sold to Eluma as well . Between 1997 and 2004 , under new ownership, Mineração Caraíba did not invest in new acquisitions or expansions . Beginning in 2004 , Mineração Caraíba began a modest expansion and exploration effort within the Curaçá Valley . This resulted in the transfer of R 22 W Mine to Mineração Caraíba in 2005 from DOCEGEO, the exploration division of CVRD, and the formation of the Codelco JV joint venture in 2004 for further exploration of known copper occurrences within Curaçá Valley . In February 2008 , Codelco withdrew from the joint venture and received payment of R $ 5 . 6 million from Mineração Caraíba . In 2012 , Swiss - based Glencore International acquired a 28 . 5 % equity interest in Mineração Caraíba . In December 2016 , Ero Copper acquired approximately 85 . 0 % interest in Mineração Caraíba . In June 2017 , Ero acquired an additional 14 . 5 % by way of capital increase, for a total interest in Mineração Caraíba of approximately 99 . 5 % . In December 2017 , the Company acquired additional shares of Mineração Caraíba, increasing its ownership interest in Mineração Caraíba to 99 . 6 % . In 2022 , Mineração Caraíba undertook a rebranding initiative and is today known as Ero Brasil . Ero Copper commenced trading on the Toronto Stock Exchange under the stock symbol “ERO” on October 19 , 2017 , following completion of the Company’s initial public offering, and successfully listed on the New York Stock Exchange under the stock symbol “ERO” on June 15 , 2021 . December 22, 2022 Rev. F 59
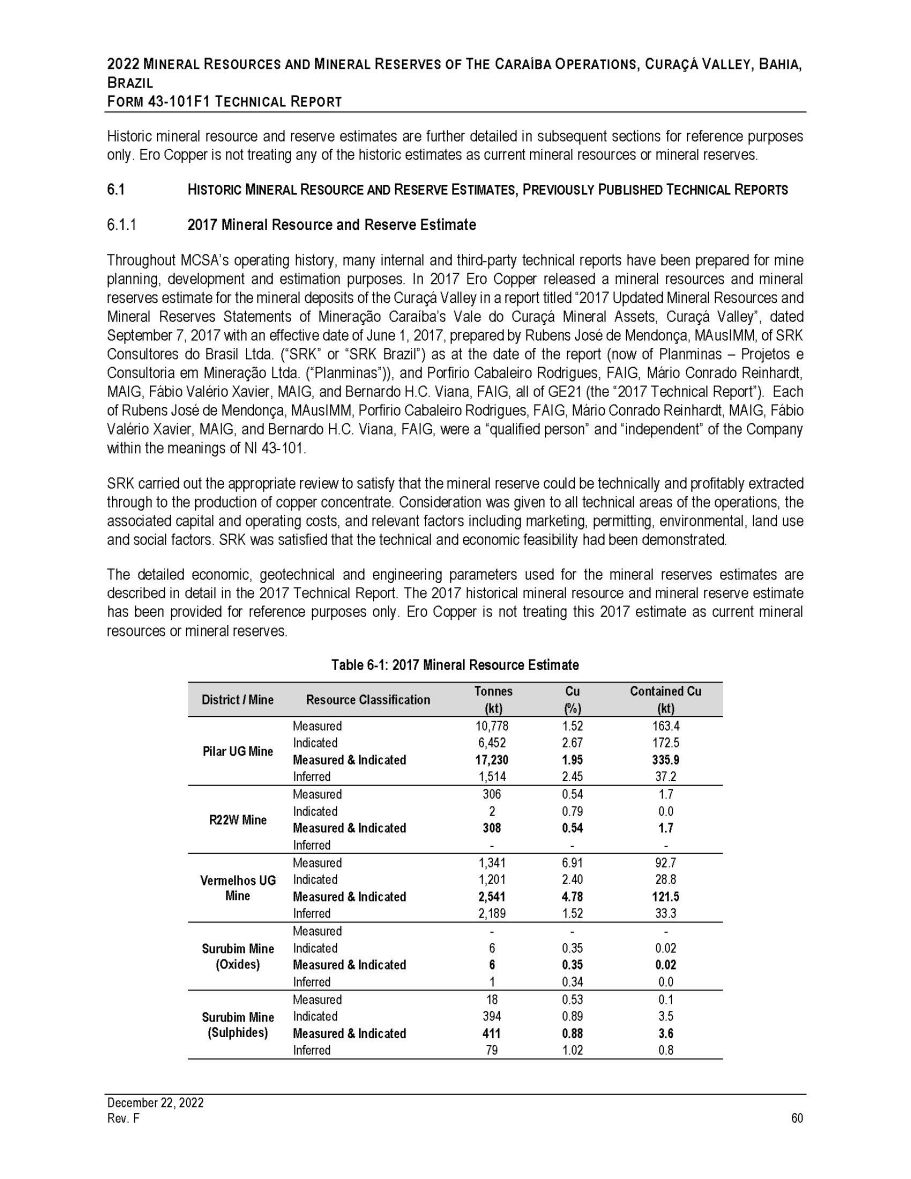
2022 M INERAL R ESOURCES AND M INERAL R ESERVES OF T HE C ARAÍBA O PERATIONS , C URAÇÁ V ALLEY , B AHIA , B RAZIL F ORM 43 - 101F1 T ECHNICAL R EPORT Historic mineral resource and reserve estimates are further detailed in subsequent sections for reference purposes only. Ero Copper is not treating any of the historic estimates as current mineral resources or mineral reserves. 6.1 H ISTORIC M INERAL R ESOURCE AND R ESERVE E STIMATES , P REVIOUSLY P UBLISHED T ECHNICAL R EPORTS 2017 Mineral Resource and Reserve Estimate Throughout MCSA’s operating history, many internal and third - party technical reports have been prepared for mine planning, development and estimation purposes . In 2017 Ero Copper released a mineral resources and mineral reserves estimate for the mineral deposits of the Curaçá Valley in a report titled “ 2017 Updated Mineral Resources and Mineral Reserves Statements of Mineração Caraíba’s Vale do Curaçá Mineral Assets, Curaçá Valley”, dated September 7 , 2017 with an effective date of June 1 , 2017 , prepared by Rubens José de Mendonça, MAusIMM, of SRK Consultores do Brasil Ltda . (“SRK” or “SRK Brazil”) as at the date of the report (now of Planminas – Projetos e Consultoria em Mineração Ltda . (“Planminas”)), and Porfirio Cabaleiro Rodrigues, FAIG, Mário Conrado Reinhardt, MAIG, Fábio Valério Xavier, MAIG, and Bernardo H . C . Viana, FAIG, all of GE 21 (the “ 2017 Technical Report”) . Each of Rubens José de Mendonça, MAusIMM, Porfirio Cabaleiro Rodrigues, FAIG, Mário Conrado Reinhardt, MAIG, Fábio Valério Xavier, MAIG, and Bernardo H . C . Viana, FAIG, were a “qualified person” and “independent” of the Company within the meanings of NI 43 - 101 . SRK carried out the appropriate review to satisfy that the mineral reserve could be technically and profitably extracted through to the production of copper concentrate . Consideration was given to all technical areas of the operations, the associated capital and operating costs, and relevant factors including marketing, permitting, environmental, land use and social factors . SRK was satisfied that the technical and economic feasibility had been demonstrated . The detailed economic, geotechnical and engineering parameters used for the mineral reserves estimates are described in detail in the 2017 Technical Report . The 2017 historical mineral resource and mineral reserve estimate has been provided for reference purposes only . Ero Copper is not treating this 2017 estimate as current mineral resources or mineral reserves . Table 6 - 1: 2017 Mineral Resource Estimate District / Mine Resource Classification Tonnes (kt) Cu (%) Contained Cu (kt) Measured 10,778 1.52 163.4 Pilar UG Mine Indicated 6,452 2.67 172.5 Measured & Indicated 17,230 1.95 335.9 Inferred 1,514 2.45 37.2 Measured 306 0.54 1.7 R22W Mine Indicated 2 0.79 0.0 Measured & Indicated 308 0.54 1.7 Inferred - - - Measured 1,341 6.91 92.7 Vermelhos UG Indicated 1,201 2.40 28.8 Mine Measured & Indicated 2,541 4.78 121.5 Inferred 2,189 1.52 33.3 Measured - - - Surubim Mine Indicated 6 0.35 0.02 (Oxides) Measured & Indicated 6 0.35 0.02 Inferred 1 0.34 0.0 Measured 18 0.53 0.1 Surubim Mine Indicated 394 0.89 3.5 (Sulphides) Measured & Indicated 411 0.88 3.6 Inferred 79 1.02 0.8 December 22, 2022 Rev. F 60
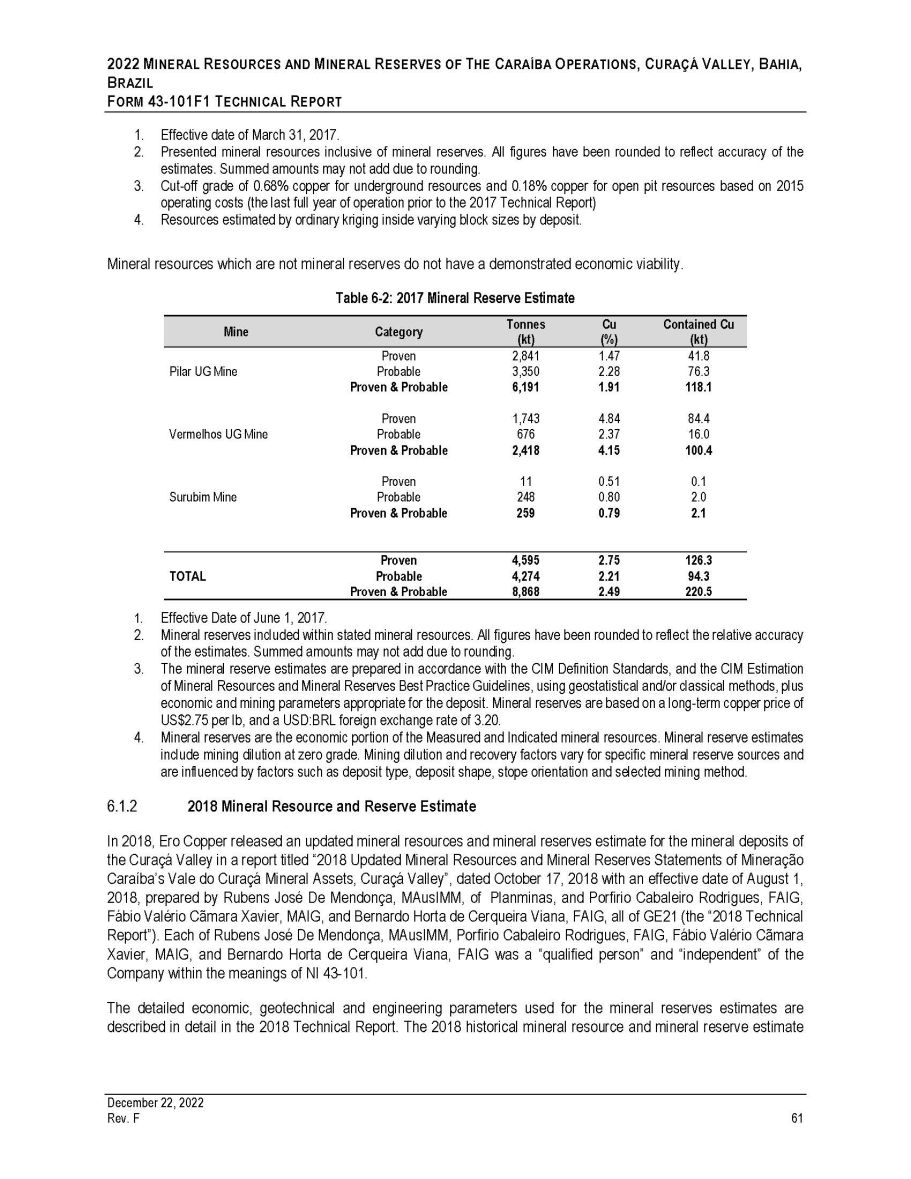
2022 M INERAL R ESOURCES AND M INERAL R ESERVES OF T HE C ARAÍBA O PERATIONS , C URAÇÁ V ALLEY , B AHIA , B RAZIL F ORM 43 - 101F1 T ECHNICAL R EPORT 1. Effective date of March 31, 2017. 2. Presented mineral resources inclusive of mineral reserves. All figures have been rounded to reflect accuracy of the estimates. Summed amounts may not add due to rounding. 3. Cut - off grade of 0.68% copper for underground resources and 0.18% copper for open pit resources based on 2015 operating costs (the last full year of operation prior to the 2017 Technical Report) 4. Resources estimated by ordinary kriging inside varying block sizes by deposit. Mineral resources which are not mineral reserves do not have a demonstrated economic viability. Table 6 - 2: 2017 Mineral Reserve Estimate Mine Category Tonnes (kt) Cu (%) Contained Cu (kt) Proven 2,841 1.47 41.8 Pilar UG Mine Probable 3,350 2.28 76.3 Proven & Probable 6,191 1.91 118.1 Proven 1,743 4.84 84.4 Vermelhos UG Mine Probable 676 2.37 16.0 Proven & Probable 2,418 4.15 100.4 Proven 11 0.51 0.1 Surubim Mine Probable 248 0.80 2.0 Proven & Probable 259 0.79 2.1 Proven 4,595 2.75 126.3 TOTAL Probable 4,274 2.21 94.3 Proven & Probable 8,868 2.49 220.5 1. Effective Date of June 1, 2017. 2. Mineral reserves included within stated mineral resources. All figures have been rounded to reflect the relative accuracy of the estimates. Summed amounts may not add due to rounding. 3. The mineral reserve estimates are prepared in accordance with the CIM Definition Standards, and the CIM Estimation of Mineral Resources and Mineral Reserves Best Practice Guidelines, using geostatistical and/or classical methods, plus economic and mining parameters appropriate for the deposit . Mineral reserves are based on a long - term copper price of US $ 2 . 75 per lb, and a USD : BRL foreign exchange rate of 3 . 20 . 4. Mineral reserves are the economic portion of the Measured and Indicated mineral resources . Mineral reserve estimates include mining dilution at zero grade . Mining dilution and recovery factors vary for specific mineral reserve sources and are influenced by factors such as deposit type, deposit shape, stope orientation and selected mining method . 2018 Mineral Resource and Reserve Estimate In 2018 , Ero Copper released an updated mineral resources and mineral reserves estimate for the mineral deposits of the Curaçá Valley in a report titled “ 2018 Updated Mineral Resources and Mineral Reserves Statements of Mineração Caraíba’s Vale do Curaçá Mineral Assets, Curaçá Valley”, dated October 17 , 2018 with an effective date of August 1 , 2018 , prepared by Rubens José De Mendonça, MAusIMM, of Planminas, and Porfirio Cabaleiro Rodrigues, FAIG, Fábio Valério Cãmara Xavier, MAIG, and Bernardo Horta de Cerqueira Viana, FAIG, all of GE 21 (the “ 2018 Technical Report”) . Each of Rubens José De Mendonça, MAusIMM, Porfirio Cabaleiro Rodrigues, FAIG, Fábio Valério Cãmara Xavier, MAIG, and Bernardo Horta de Cerqueira Viana, FAIG was a “qualified person” and “independent” of the Company within the meanings of NI 43 - 101 . The detailed economic, geotechnical and engineering parameters used for the mineral reserves estimates are described in detail in the 2018 Technical Report . The 2018 historical mineral resource and mineral reserve estimate December 22, 2022 Rev. F 61

2022 M INERAL R ESOURCES AND M INERAL R ESERVES OF T HE C ARAÍBA O PERATIONS , C URAÇÁ V ALLEY , B AHIA , B RAZIL F ORM 43 - 101F1 T ECHNICAL R EPORT has been provided for reference purposes only. Ero Copper is not treating this 2018 estimate as current mineral resources or mineral reserves. Table 6 - 3: 2018 Mineral Resource Estimate Mineral Resources Category Tonnage Grade Contained Cu (000 tonnes) (Cu %) (000 tonnes) Pilar UG Mine Measured 15,595 1.92 300.2 Indicated 9,254 1.85 171.5 Measured & Indicated 24,849 1.90 471.6 Inferred 1,761 2.07 36.4 Vermelhos UG Mine Measured 3,039 4.12 125.1 Indicated 1,523 1.97 30.1 Measured & Indicated 4,562 3.40 155.2 Inferred 1,995 1.19 23.6 Vermelhos West OP Measured 5,502 0.60 33.0 Indicated 2,645 0.60 15.9 Measured & Indicated 8,147 0.60 48.9 Inferred 2,490 0.83 20.7 Surubim Mine Measured 4,064 1.03 41.9 Indicated 497 1.03 5.1 Measured & Indicated 4,561 1.03 47.0 Inferred 83 0.85 0.7 R22W OP Measured 306 0.54 1.7 Indicated 2 0.79 0.0 Measured & Indicated Inferred 308 - 0.54 - 1.7 - Measured 28,506 1.76 501.8 Total Resources Indicated 13,921 1.60 222.6 Measured & Indicated 42,428 1.71 724.4 Inferred 6,328 1.29 81.4 1. Mineral resource effective date of July 1 , 2018 , for the Pilar UG and Surubim Mines, and May 31 , 2018 for the Vermelhos UG Mine, Vermelhos West OP and R 22 W OP . 2. Presented mineral resources inclusive of mineral reserves . All figures have been rounded to the relative accuracy of the estimates . Summed amounts may not add due to rounding . 3. Mineral resource copper cut - off grades of 0 . 68 % copper for underground mineral resources and 0 . 18 % for open pit mineral resources . Mineral resources have been estimated using ordinary kriging inside 5 m by 5 m by 5 m block sizes . The mineral resource estimates were prepared in accordance with CIM Standards and CIM Guidelines, using geostatistical and/or classical methods, plus economic and mining parameters appropriate to the deposit . Mineral resources which are not mineral reserves do not have a demonstrated economic viability. December 22, 2022 Rev. F 62
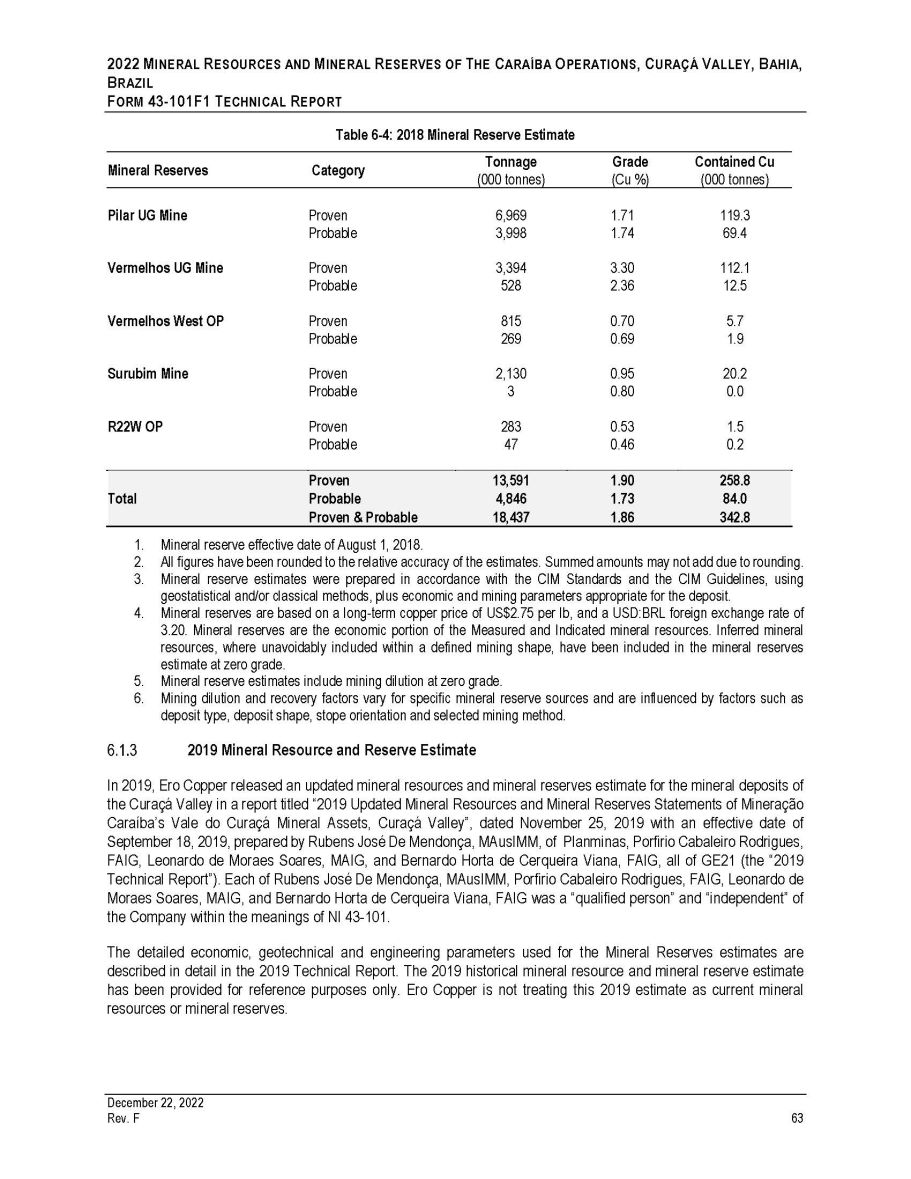
2022 M INERAL R ESOURCES AND M INERAL R ESERVES OF T HE C ARAÍBA O PERATIONS , C URAÇÁ V ALLEY , B AHIA , B RAZIL F ORM 43 - 101F1 T ECHNICAL R EPORT Table 6 - 4: 2018 Mineral Reserve Estimate Mineral Reserves Category Tonnage (000 tonnes) Grade (Cu %) Contained Cu (000 tonnes) Pilar UG Mine Proven 6,969 1.71 119.3 Probable 3,998 1.74 69.4 Vermelhos UG Mine Proven 3,394 3.30 112.1 Probable 528 2.36 12.5 Vermelhos West OP Proven 815 0.70 5.7 Probable 269 0.69 1.9 Surubim Mine Proven 2,130 0.95 20.2 Probable 3 0.80 0.0 R22W OP Proven 283 0.53 1.5 Probable 47 0.46 0.2 Proven 13,591 1.90 258.8 Total Probable 4,846 1.73 84.0 Proven & Probable 18,437 1.86 342.8 1. Mineral reserve effective date of August 1 , 2018 . 2. All figures have been rounded to the relative accuracy of the estimates . Summed amounts may not add due to rounding . 3. Mineral reserve estimates were prepared in accordance with the CIM Standards and the CIM Guidelines, using geostatistical and/or classical methods, plus economic and mining parameters appropriate for the deposit . 4. Mineral reserves are based on a long - term copper price of US $ 2 . 75 per lb, and a USD : BRL foreign exchange rate of 3 . 20 . Mineral reserves are the economic portion of the Measured and Indicated mineral resources . Inferred mineral resources, where unavoidably included within a defined mining shape, have been included in the mineral reserves estimate at zero grade . 5. Mineral reserve estimates include mining dilution at zero grade . 6. Mining dilution and recovery factors vary for specific mineral reserve sources and are influenced by factors such as deposit type, deposit shape, stope orientation and selected mining method . 2019 Mineral Resource and Reserve Estimate In 2019 , Ero Copper released an updated mineral resources and mineral reserves estimate for the mineral deposits of the Curaçá Valley in a report titled “ 2019 Updated Mineral Resources and Mineral Reserves Statements of Mineração Caraíba’s Vale do Curaçá Mineral Assets, Curaçá Valley”, dated November 25 , 2019 with an effective date of September 18 , 2019 , prepared by Rubens José De Mendonça, MAusIMM, of Planminas, Porfirio Cabaleiro Rodrigues, FAIG, Leonardo de Moraes Soares, MAIG, and Bernardo Horta de Cerqueira Viana, FAIG, all of GE 21 (the “ 2019 Technical Report”) . Each of Rubens José De Mendonça, MAusIMM, Porfirio Cabaleiro Rodrigues, FAIG, Leonardo de Moraes Soares, MAIG, and Bernardo Horta de Cerqueira Viana, FAIG was a “qualified person” and “independent” of the Company within the meanings of NI 43 - 101 . The detailed economic, geotechnical and engineering parameters used for the Mineral Reserves estimates are described in detail in the 2019 Technical Report . The 2019 historical mineral resource and mineral reserve estimate has been provided for reference purposes only . Ero Copper is not treating this 2019 estimate as current mineral resources or mineral reserves . December 22, 2022 Rev. F 63
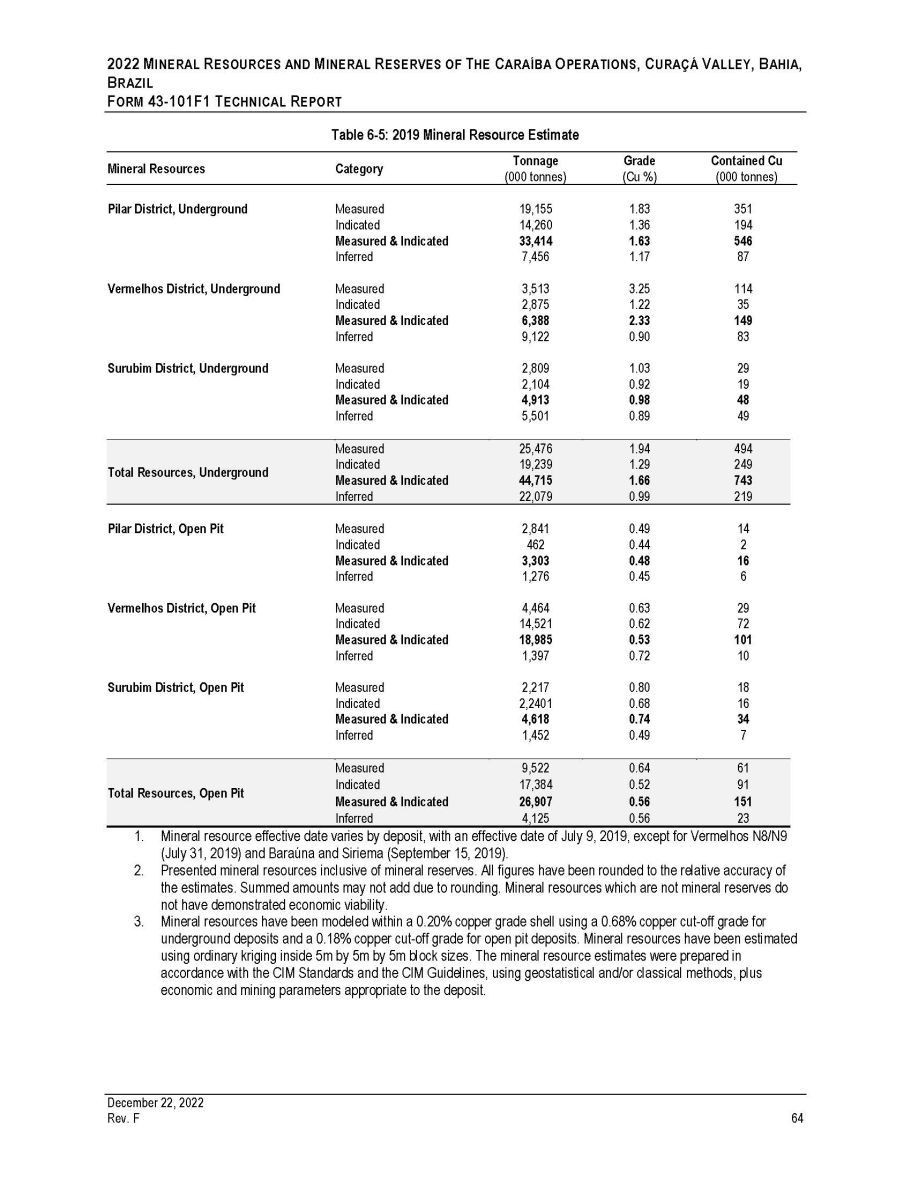
2022 M INERAL R ESOURCES AND M INERAL R ESERVES OF T HE C ARAÍBA O PERATIONS , C URAÇÁ V ALLEY , B AHIA , B RAZIL F ORM 43 - 101F1 T ECHNICAL R EPORT Table 6 - 5: 2019 Mineral Resource Estimate Mineral Resources Category Tonnage (000 tonnes) Grade (Cu %) Contained Cu (000 tonnes) Pilar District, Underground Measured 19,155 1.83 351 Indicated 14,260 1.36 194 Measured & Indicated 33,414 1.63 546 Inferred 7,456 1.17 87 Vermelhos District, Underground Measured 3,513 3.25 114 Indicated 2,875 1.22 35 Measured & Indicated 6,388 2.33 149 Inferred 9,122 0.90 83 Surubim District, Underground Measured 2,809 1.03 29 Indicated 2,104 0.92 19 Measured & Indicated 4,913 0.98 48 Inferred 5,501 0.89 49 Measured 25,476 1.94 494 Total Resources, Underground Indicated Measured & Indicated 19,239 44,715 1.29 1.66 249 743 Inferred 22,079 0.99 219 Pilar District, Open Pit Measured 2,841 0.49 14 Indicated 462 0.44 2 Measured & Indicated 3,303 0.48 16 Inferred 1,276 0.45 6 Vermelhos District, Open Pit Measured 4,464 0.63 29 Indicated 14,521 0.62 72 Measured & Indicated 18,985 0.53 101 Inferred 1,397 0.72 10 Surubim District, Open Pit Measured 2,217 0.80 18 Indicated 2,2401 0.68 16 Measured & Indicated 4,618 0.74 34 Inferred 1,452 0.49 7 Measured 9,522 0.64 61 Total Resources, Open Pit Indicated 17,384 0.52 91 Measured & Indicated 26,907 0.56 151 Inferred 4,125 0.56 23 1. Mineral resource effective date varies by deposit, with an effective date of July 9, 2019, except for Vermelhos N8/N9 (July 31, 2019) and Baraúna and Siriema (September 15, 2019). 2. Presented mineral resources inclusive of mineral reserves. All figures have been rounded to the relative accuracy of the estimates. Summed amounts may not add due to rounding. Mineral resources which are not mineral reserves do not have demonstrated economic viability. 3. Mineral resources have been modeled within a 0.20% copper grade shell using a 0.68% copper cut - off grade for underground deposits and a 0.18% copper cut - off grade for open pit deposits. Mineral resources have been estimated using ordinary kriging inside 5m by 5m by 5m block sizes. The mineral resource estimates were prepared in accordance with the CIM Standards and the CIM Guidelines, using geostatistical and/or classical methods, plus economic and mining parameters appropriate to the deposit. December 22, 2022 Rev. F 64

2022 M INERAL R ESOURCES AND M INERAL R ESERVES OF T HE C ARAÍBA O PERATIONS , C URAÇÁ V ALLEY , B AHIA , B RAZIL F ORM 43 - 101F1 T ECHNICAL R EPORT Table 6 - 6: 2019 Mineral Reserve Estimate Mineral Reserves Category Tonnage Grade Contained Cu (000 tonnes) (Cu %) (000 tonnes) Pilar District, Underground Proven 6,339 1.54 98 Probable 7,678 1.37 105 Vermelhos District, Underground Proven 3,787 2.57 97 Probable 1,269 1.24 16 Surubim District, Underground Proven 1,875 0.91 17 Probable 269 0.93 2 Proven 12,001 1.77 212 Total, Underground Probable 9,126 1.35 123 Proven & Probable 21,127 1.59 335 Pilar District, Open Pit Proven 1,623 0.42 7 Probable 328 0.46 2 Vermelhos District, Open Pit Proven 3,992 0.67 27 Probable 9,558 0.56 53 Surubim District, Open Pit Proven 798 1.03 8 Probable 548 0.81 4 Proven 6,408 0.65 42 Total, Open Pit Probable 10,434 0.57 59 Proven & Probable 16,843 0.60 101 1. Mineral Reserve effective date of September 18 , 2019 . 2. All figures have been rounded to the relative accuracy of the estimates . Summed amounts may not add due to rounding . 3. Mineral Reserve estimates were prepared in accordance with the CIM Standards and the CIM Guidelines, using geostatistical and/or classical methods, plus economic and mining parameters appropriate for the deposit . 4. Mineral Reserves are based on a long - term copper price of US $ 2 . 75 per lb, and a USD : BRL foreign exchange rate of 3 . 70 . Mineral reserves are the economic portion of the Measured and Indicated mineral resources . Inferred mineral resources, where unavoidably included within a defined mining shape, have been included in the mineral reserves estimate at zero grade . 5. Mineral reserve estimates include mining dilution at zero grade . 6. Mining dilution and recovery factors vary for specific mineral reserve sources and are influenced by factors such as deposit type, deposit shape, stope orientation and selected mining method . 2020 Mineral Resource and Reserve Estimate In 2020 , Ero Copper released an updated mineral resources and mineral reserves estimate for the mineral deposits of the Curaçá Valley in a report titled “ 2020 Updated Mineral Resources and Mineral Reserves Statements of Mineração Caraíba’s Vale do Curaçá Mineral Assets, Curaçá Valley”, dated January 14 , 2021 with an effective date of October 1 , 2020 , prepared by Porfírio Cabaleiro Rodriguez, FAIG, Bernardo Horta de Cerqueira Viana, FAIG, Paulo Roberto Bergmann, FAusIMM, Fábio Valério Câmara Xavier, MAIG, Dr . Beck Nader, FAIG and Dr . Augusto Ferreira Mendonça, RM SME (the “ 2020 Technical Report”), each a “qualified person” and “independent” of the Company within the meanings of NI 43 - 101 . The detailed economic, geotechnical and engineering parameters used for the Mineral Reserves estimates are described in detail in the 2020 Technical Report . The 2020 historical mineral resource and mineral reserve estimate December 22, 2022 Rev. F 65
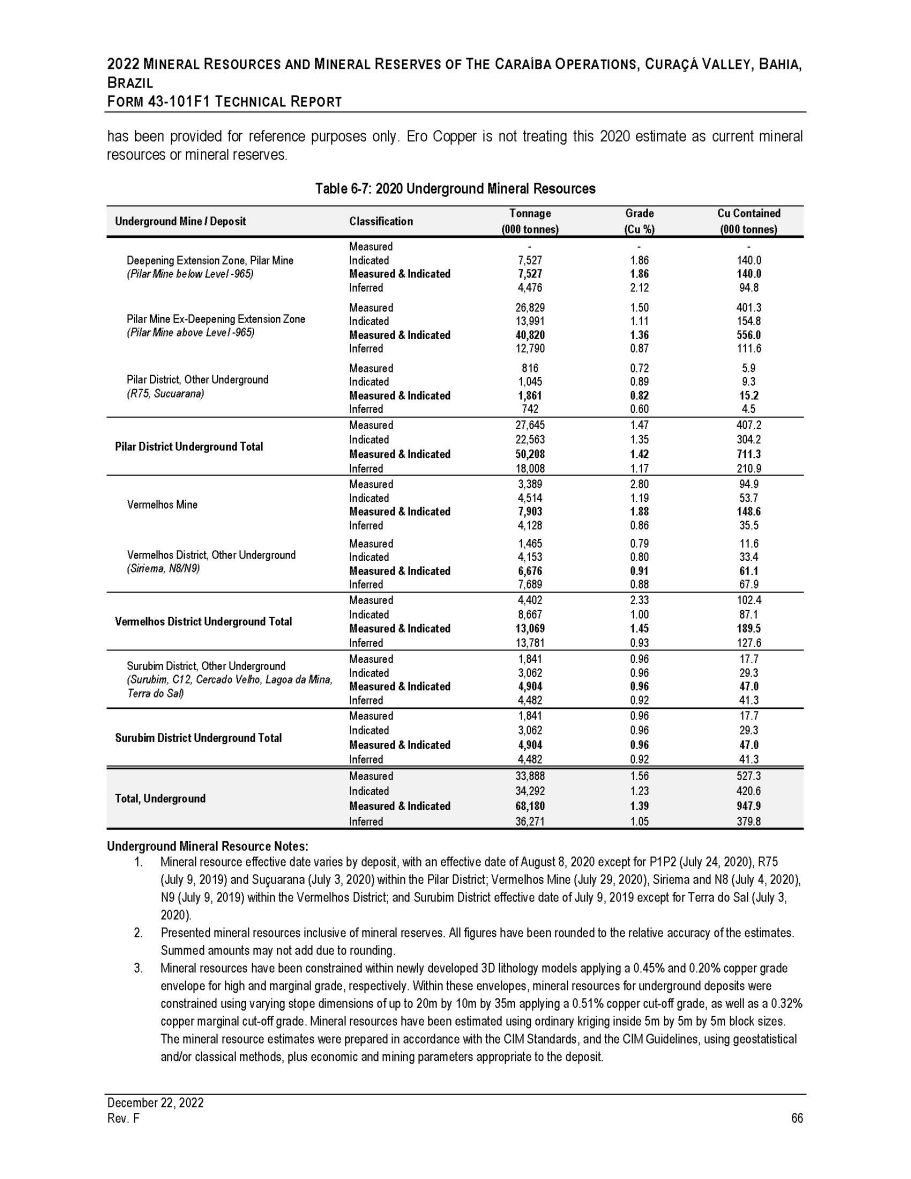
2022 M INERAL R ESOURCES AND M INERAL R ESERVES OF T HE C ARAÍBA O PERATIONS , C URAÇÁ V ALLEY , B AHIA , B RAZIL F ORM 43 - 101F1 T ECHNICAL R EPORT has been provided for reference purposes only. Ero Copper is not treating this 2020 estimate as current mineral resources or mineral reserves. Table 6 - 7: 2020 Underground Mineral Resources Underground Mine / Deposit Classification Tonnage (000 tonnes) Grade (Cu %) Cu Contained (000 tonnes) Measured - - - Deepening Extension Zone, Pilar Mine Indicated 7,527 1.86 140.0 (Pilar Mine below Level - 965) Measured & Indicated 7,527 1.86 140.0 Inferred 4,476 2.12 94.8 Measured 26,829 1.50 401.3 Pilar Mine Ex - Deepening Extension Zone Indicated 13,991 1.11 154.8 (Pilar Mine above Level - 965) Measured & Indicated 40,820 1.36 556.0 Inferred 12,790 0.87 111.6 Measured 816 0.72 5.9 Pilar District, Other Underground Indicated 1,045 0.89 9.3 (R75, Sucuarana) Measured & Indicated 1,861 0.82 15.2 Inferred 742 0.60 4.5 Measured 27,645 1.47 407.2 Pilar District Underground Total Indicated 22,563 1.35 304.2 Measured & Indicated 50,208 1.42 711.3 Inferred 18,008 1.17 210.9 Measured 3,389 2.80 94.9 Vermelhos Mine Indicated 4,514 1.19 53.7 Measured & Indicated 7,903 1.88 148.6 Inferred 4,128 0.86 35.5 Measured 1,465 0.79 11.6 Vermelhos District, Other Underground Indicated 4,153 0.80 33.4 (Siriema, N8/N9) Measured & Indicated 6,676 0.91 61.1 Inferred 7,689 0.88 67.9 Measured 4,402 2.33 102.4 Vermelhos District Underground Total Indicated 8,667 1.00 87.1 Measured & Indicated 13,069 1.45 189.5 Inferred 13,781 0.93 127.6 Surubim District, Other Underground Measured 1,841 0.96 17.7 (Surubim, C12, Cercado Velho, Lagoa da Mina, Indicated 3,062 0.96 29.3 Terra do Sal) Measured & Indicated 4,904 0.96 47.0 Inferred 4,482 0.92 41.3 Measured 1,841 0.96 17.7 Surubim District Underground Total Indicated 3,062 0.96 29.3 Measured & Indicated 4,904 0.96 47.0 Inferred 4,482 0.92 41.3 Measured 33,888 1.56 527.3 Total, Underground Indicated 34,292 1.23 420.6 Measured & Indicated 68,180 1.39 947.9 Inferred 36,271 1.05 379.8 December 22, 2022 Rev. F 66 Underground Mineral Resource Notes: 1. Mineral resource effective date varies by deposit, with an effective date of August 8, 2020 except for P1P2 (July 24, 2020), R75 (July 9, 2019) and Suçuarana (July 3, 2020) within the Pilar District; Vermelhos Mine (July 29, 2020), Siriema and N8 (July 4, 2020), N9 (July 9, 2019) within the Vermelhos District; and Surubim District effective date of July 9, 2019 except for Terra do Sal (July 3, 2020). 2. Presented mineral resources inclusive of mineral reserves. All figures have been rounded to the relative accuracy of the estimates. Summed amounts may not add due to rounding. 3. Mineral resources have been constrained within newly developed 3D lithology models applying a 0.45% and 0.20% copper grade envelope for high and marginal grade, respectively. Within these envelopes, mineral resources for underground deposits were constrained using varying stope dimensions of up to 20m by 10m by 35m applying a 0.51% copper cut - off grade, as well as a 0.32% copper marginal cut - off grade. Mineral resources have been estimated using ordinary kriging inside 5m by 5m by 5m block sizes. The mineral resource estimates were prepared in accordance with the CIM Standards, and the CIM Guidelines, using geostatistical and/or classical methods, plus economic and mining parameters appropriate to the deposit.

2022 M INERAL R ESOURCES AND M INERAL R ESERVES OF T HE C ARAÍBA O PERATIONS , C URAÇÁ V ALLEY , B AHIA , B RAZIL F ORM 43 - 101F1 T ECHNICAL R EPORT Mineral resources which are not mineral reserves do not have demonstrated economic viability. Table 6 - 8: 2020 Open Pit Mineral Resources Open Pit Mine / Deposit Classification Tonnage (000 tonnes) Grade (Cu %) Cu Contained (000 tonnes) Measured 3,172 0.49 15.4 Pilar District, Open Pit Indicated 365 0.45 1.6 (R22W, Suçuarana, R75) Measured & Indicated 3,537 0.48 17.0 Inferred 351 0.47 1.6 Measured 3,172 0.49 15.4 Pilar District Open Pit Total Indicated 365 0.45 1.6 Measured & Indicated 3,537 0.48 17.0 Inferred 351 0.47 1.6 Measured - - - Siriema Deposit Indicated 2,956 0.92 27.1 Measured & Indicated 2,956 0.92 27.1 Inferred 187 0.99 1.9 Measured 7,420 0.55 41.1 N8/N9 Deposits Indicated 13,562 0.48 64.9 Measured & Indicated 20,982 0.51 106.0 Inferred 858 0.40 3.4 Measured - - - Vermelhos North Indicated - - - Measured & Indicated - - - Inferred 121 0.88 1.1 Measured 7,420 0.55 41.1 Vermelhos District Open Pit Total Indicated 16,518 0.56 92.0 Measured & Indicated 23,938 0.56 133.1 Inferred 1,166 0.55 6.4 Measured 2,340 0.93 21.7 Surubim Mine Indicated 73 0.84 0.6 Measured & Indicated 2,413 0.92 22.3 Inferred 3 0.80 0.0 Measured 1,272 0.94 11.9 C12 Deposit Indicated 942 0.70 6.6 Measured & Indicated 2,214 0.84 18.6 Inferred 154 0.56 0.9 Surubim District, Other Open Pit Measured 1,067 0.61 6.5 (Cercado Velho, Lagoa da Mina, Terra Indicated 1,436 0.67 9.6 do Sal) Measured & Indicated 2,503 0.64 16.1 Inferred 1,255 0.15 1.9 Measured 4,678 0.86 40.1 Surubim District Open Pit Total Indicated 2,452 0.69 16.8 Measured & Indicated 7,130 0.80 56.9 Inferred 1,413 0.20 2.8 Measured 15,270 0.63 96.6 Total, Open Pit Indicated 19,335 0.57 110.5 Measured & Indicated 34,605 0.60 207.0 Inferred 2,930 0.37 10.8 December 22, 2022 Rev. F 67 Open Pit Mineral Resource Notes: 1. Mineral resource effective date varies by deposit, with an effective date of August 8, 2020, except for Suçuarana (July 3, 2020), R22W and R75 (July 9, 2019) within the Pilar District; Siriema and N8 (July 4, 2020), N9 and Vermelhos North (July 9, 2019) within the Vermelhos District; and an effective date of July 9, 2019, for the Surubim District except Terra do Sal (July 3, 2020). 2. Presented mineral resources inclusive of mineral reserves. All figures have been rounded to the relative accuracy of the estimates. Summed amounts may not add due to rounding. 3. Mineral resources have been constrained within newly developed 3D lithology models using a 0.21% copper cut - off grade for open pit deposits. Mineral resources have been estimated using ordinary kriging inside 5m by 5m by 5m block sizes. The mineral

2022 M INERAL R ESOURCES AND M INERAL R ESERVES OF T HE C ARAÍBA O PERATIONS , C URAÇÁ V ALLEY , B AHIA , B RAZIL F ORM 43 - 101F1 T ECHNICAL R EPORT resource estimates were prepared in accordance with the CIM Standards, and the CIM Guidelines, using geostatistical and/or classical methods, plus economic and mining parameters appropriate to the deposit. Mineral resources which are not mineral reserves do not have demonstrated economic viability. Table 6 - 9: 2020 Mineral Reserves Classification Tonnage (000 tonnes) Grade (Cu %) Cu Contained (000 tonnes) Reserves, Underground Deepening Extension Zone, Pilar UG Mine (Pilar Mine below Level - 965) December 22, 2022 Rev. F 68 Proven Probable - - - 7,432 1.68 125 Pilar UG Mine Ex - Deepening Extension Zone (Pilar Mine above Level - 965) Proven Probable 5,835 7,725 1.41 1.09 82 84 Vermelhos UG Mine Proven Probable 3,359 1,844 2.09 1.23 70 23 Surubim District, Underground Proven 513 1.09 6 (C12 Underground) Probable 515 0.83 4 Total Proven, Underground 9,707 1.63 158 Total Probable, Underground 17,516 1.34 236 Total Proven & Probable, Underground 27,224 1.45 394 Reserves, Open Pit N8/N9 OP Mine Proven 7,355 0.55 40 (Vermelhos District) Probable 8,012 0.54 44 Siriema OP Mine Proven - - - (Vermelhos District) Probable 3,011 0.88 26 Surubim District, Open Pit Proven 2,778 0.82 23 (Surubim & C12) Probable 123 0.55 1 Suçuarana South OP Mine Proven 1,623 0.42 7 (Pilar District) Probable 328 0.46 2 Total Proven, Open Pit 11,757 0.60 70 Total Probable, Open Pit 11,474 0.63 72 Total Proven & Probable, Open Pit 23,230 0.61 142 Mineral Reserve Notes: 1. Mineral reserve effective date of October 1, 2020. 2. All figures have been rounded to the relative accuracy of the estimates. Summed amounts may not add due to rounding. 3. Mineral reserve estimates were prepared in accordance with the CIM Standards, and the CIM Guidelines, using geostatistical and/or classical methods, plus economic and mining parameters appropriate for the deposit. Mineral reserves are based on a long - term copper price of US$2.75 per pound (“lb”), and a USD:BRL foreign exchange rate of 4.27, except for the C12 (Surubim District) and Suçuarana (Pilar District) open pit mines, whose design was not changed since 2019, and continued to assume a 3.70 USD:BRL foreign exchange rate. Mineral reserves are the economic portion of the Measured and Indicated mineral resources. Mining dilution and recovery factors vary for specific mineral reserve sources and are influenced by factors such as deposit type, deposit shape, stope orientation and selected mining method. Inferred resource blocks, where unavoidably mined, were assigned zero grade. Dilution occurring from Measured & Indicated resource blocks was assigned grade based upon the mineral resource grade of the blocks included in the dilution envelope.
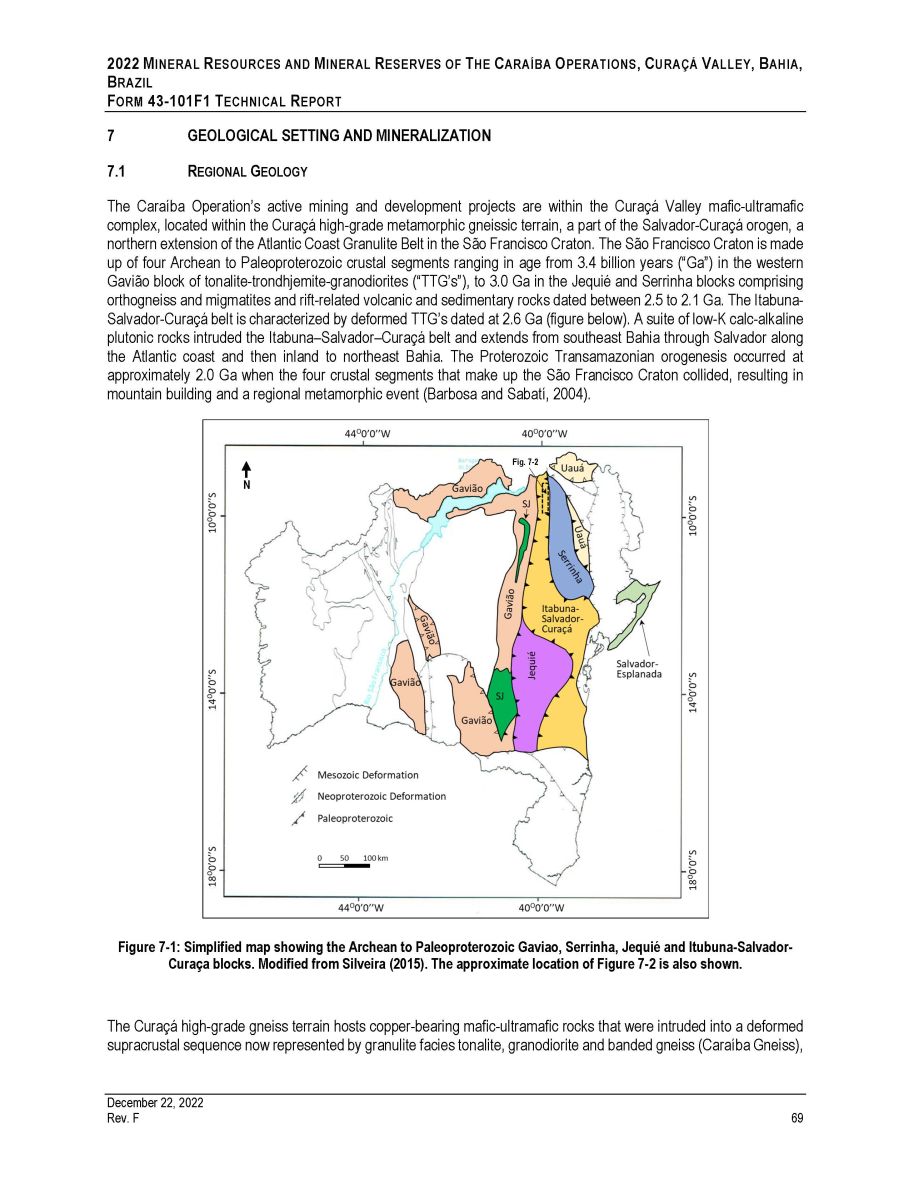
2022 M INERAL R ESOURCES AND M INERAL R ESERVES OF T HE C ARAÍBA O PERATIONS , C URAÇÁ V ALLEY , B AHIA , B RAZIL F ORM 43 - 101F1 T ECHNICAL R EPORT 7 7.1 GEOLOGICAL SETTING AND MINERALIZATION R EGIONAL G EOLOGY The Caraíba Operation’s active mining and development projects are within the Curaçá Valley mafic - ultramafic complex, located within the Curaçá high - grade metamorphic gneissic terrain, a part of the Salvador - Curaçá orogen, a northern extension of the Atlantic Coast Granulite Belt in the São Francisco Craton . The São Francisco Craton is made up of four Archean to Paleoproterozoic crustal segments ranging in age from 3 . 4 billion years (“Ga”) in the western Gavião block of tonalite - trondhjemite - granodiorites (“TTG’s”), to 3 . 0 Ga in the Jequié and Serrinha blocks comprising orthogneiss and migmatites and rift - related volcanic and sedimentary rocks dated between 2 . 5 to 2 . 1 Ga . The Itabuna - Salvador - Curaçá belt is characterized by deformed TTG’s dated at 2 . 6 Ga (figure below) . A suite of low - K calc - alkaline plutonic rocks intruded the Itabuna – Salvador – Curaçá belt and extends from southeast Bahia through Salvador along the Atlantic coast and then inland to northeast Bahia . The Proterozoic Transamazonian orogenesis occurred at approximately 2 . 0 Ga when the four crustal segments that make up the São Francisco Craton collided, resulting in mountain building and a regional metamorphic event (Barbosa and Sabatí, 2004 ) . Figure 7 - 1: Simplified map showing the Archean to Paleoproterozoic Gaviao, Serrinha, Jequié and Itubuna - Salvador - Curaça blocks. Modified from Silveira (2015). The approximate location of Figure 7 - 2 is also shown. The Curaçá high - grade gneiss terrain hosts copper - bearing mafic - ultramafic rocks that were intruded into a deformed supracrustal sequence now represented by granulite facies tonalite, granodiorite and banded gneiss (Caraíba Gneiss), N December 22, 2022 Rev. F 69 Fig. 7 - 2
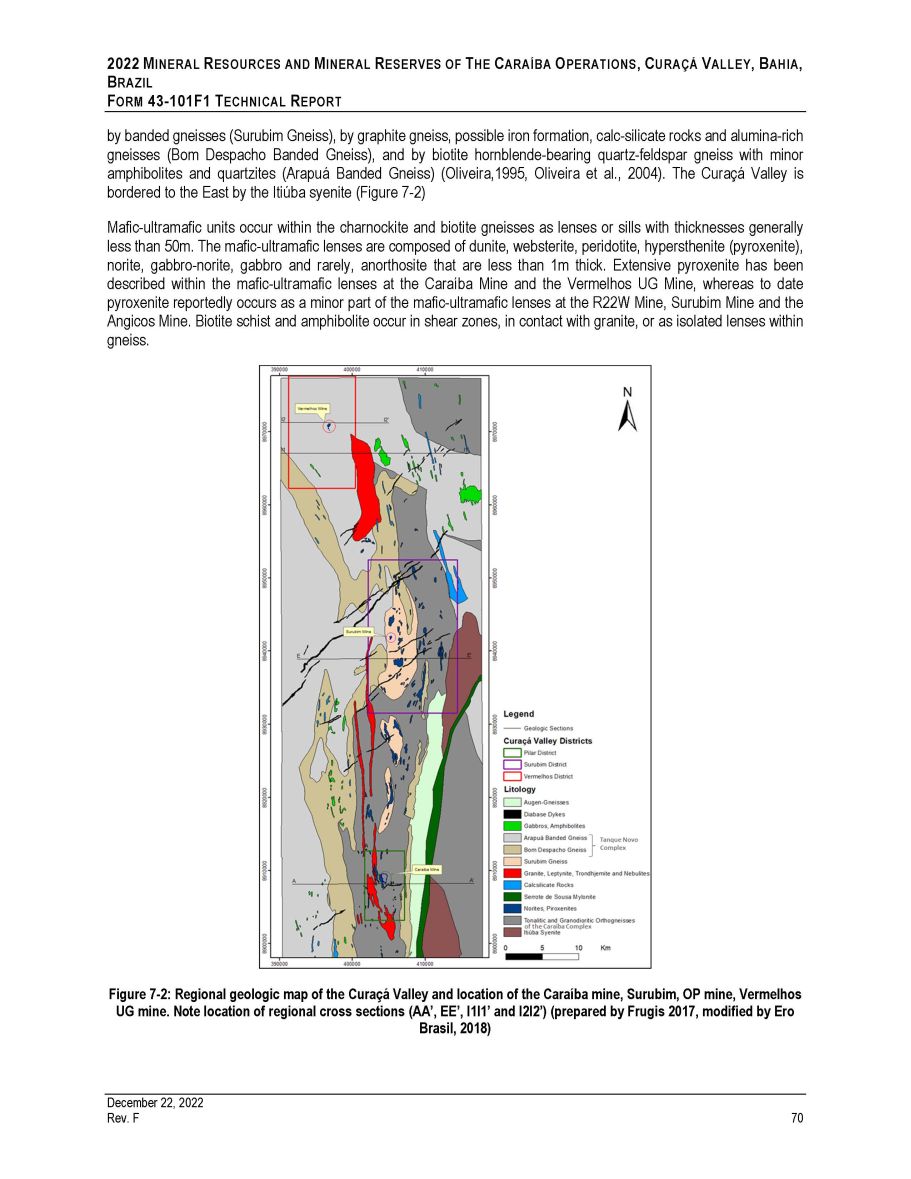
2022 M INERAL R ESOURCES AND M INERAL R ESERVES OF T HE C ARAÍBA O PERATIONS , C URAÇÁ V ALLEY , B AHIA , B RAZIL F ORM 43 - 101 F 1 T ECHNICAL R EPORT by banded gneisses (Surubim Gneiss), by graphite gneiss, possible iron formation, calc - silicate rocks and alumina - rich gneisses (Bom Despacho Banded Gneiss), and by biotite hornblende - bearing quartz - feldspar gneiss with minor amphibolites and quartzites (Arapuá Banded Gneiss) (Oliveira, 1995 , Oliveira et al . , 2004 ) . The Curaçá Valley is bordered to the East by the Itiúba syenite (Figure 7 - 2 ) Mafic - ultramafic units occur within the charnockite and biotite gneisses as lenses or sills with thicknesses generally less than 50 m . The mafic - ultramafic lenses are composed of dunite, websterite, peridotite, hypersthenite (pyroxenite), norite, gabbro - norite, gabbro and rarely, anorthosite that are less than 1 m thick . Extensive pyroxenite has been described within the mafic - ultramafic lenses at the Caraíba Mine and the Vermelhos UG Mine, whereas to date pyroxenite reportedly occurs as a minor part of the mafic - ultramafic lenses at the R 22 W Mine, Surubim Mine and the Angicos Mine . Biotite schist and amphibolite occur in shear zones, in contact with granite, or as isolated lenses within gneiss . Figure 7 - 2: Regional geologic map of the Curaçá Valley and location of the Caraíba mine, Surubim, OP mine, Vermelhos UG mine. Note location of regional cross sections (AA’, EE’, I1I1’ and I2I2’) (prepared by Frugis 2017, modified by Ero Brasil, 2018) December 22, 2022 Rev. F 70

2022 M INERAL R ESOURCES AND M INERAL R ESERVES OF T HE C ARAÍBA O PERATIONS , C URAÇÁ V ALLEY , B AHIA , B RAZIL F ORM 43 - 101 F 1 T ECHNICAL R EPORT 7.2 L OCAL G EOLOGY The geology of the north portion of the Curaçá Valley is divided into two major lithological complexes namely the Tanque Novo - Ipirá Complex to the west and the Caraíba Complex to the east . Several mafic - ultramafic intrusions and paleoprotozoic granitoid bodies intrude the deformed rock units of both complex . The Caraíba Complex is composed of orthogneisses and migmatites metamorphosed to upper amphibolite and granulite facies (Figure 7 - 3 ) . More specifically, the rock units are represented by hypersthene - gneiss tonalites, hypersthene - gneiss diorites, hypersthene - gneiss trondhjemites, monzodioritic gneisses and quartz diorites (Teixeira, 1997 ) . Geochemical studies suggest that these rocks are a product of recycled igneous crust (active continental margin) with varied levels of participation of sedimentary material (Teixeira, 1997 ) . Igneous crystals of zircon in enderbitic orthogneiss yielded an age of 2695 Ma and an age of 2634 Ma from the charnockitic orthogneiss . Peak granulitic metamorphism is estimated at 2072 Ma (Silva et al . , 1997 ) . Figure 7 - 3 : Orthogneissic migmatite - Amphibolite - clinopyroxene - biotite gneiss migmatite with magnetite (Frugis, 2017 ) The Tanque Novo Complex was divided originally into two formations, namely the Bom Despacho Formation located immediately to the west of the Caraíba Complex and the Arapuá Formation located further to the west (Figure 7 - 4 and Figure 7 - 5 ) . The Bom Despacho Formation is composed of quartz - feldspathic gneiss containing biotite - rich zones . zones and amphibolite units that are locally associated with and overprint ultramafic units (Figure 7 - 4 ) . The iron formations that were previously mapped in the Bom Despacho Formation, and were used to qualify this formation as paragneiss, have been recently reinterpreted by Ero Brasil’s geologists as weathered and altered ultramafic units comprising iron oxides with residual silica . The origin and characteristics of the Bom Despacho Formation are currently under review by Ero Brasil geologists as the units of this formation could corresponds to the continuity to the west of the Caraíba Complex units . The rock units are crosscut by many pegmatite dikes and intruded by granitic bodies . December 22, 2022 Rev. F 71
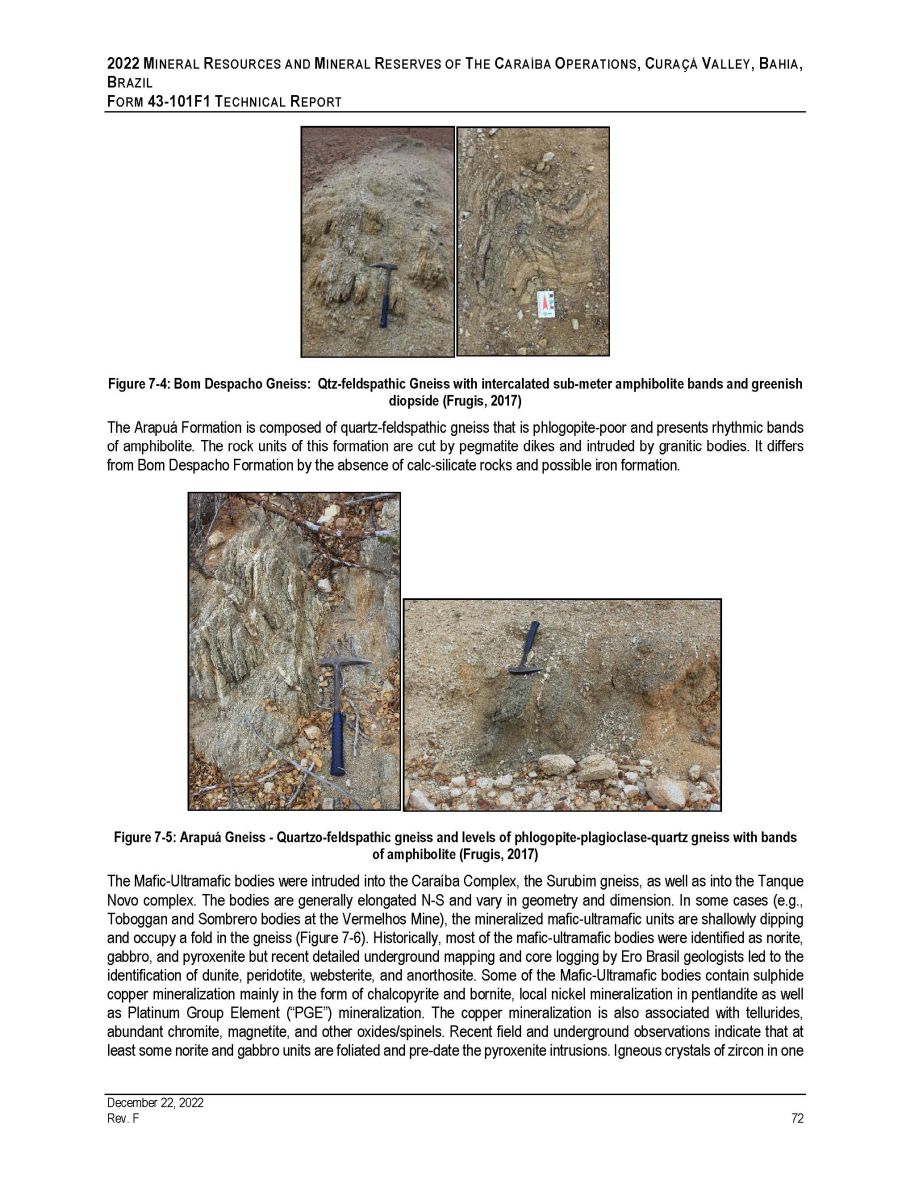
2022 M INERAL R ESOURCES AND M INERAL R ESERVES OF T HE C ARAÍBA O PERATIONS , C URAÇÁ V ALLEY , B AHIA , B RAZIL F ORM 43 - 101F1 T ECHNICAL R EPORT Figure 7 - 4 : Bom Despacho Gneiss : Qtz - feldspathic Gneiss with intercalated sub - meter amphibolite bands and greenish diopsíde (Frugis, 2017 ) The Arapuá Formation is composed of quartz - feldspathic gneiss that is phlogopite - poor and presents rhythmic bands of amphibolite . The rock units of this formation are cut by pegmatite dikes and intruded by granitic bodies . It differs from Bom Despacho Formation by the absence of calc - silicate rocks and possible iron formation . Figure 7 - 5 : Arapuá Gneiss - Quartzo - feldspathic gneiss and levels of phlogopite - plagioclase - quartz gneiss with bands of amphibolite (Frugis, 2017 ) The Mafic - Ultramafic bodies were intruded into the Caraíba Complex, the Surubim gneiss, as well as into the Tanque Novo complex . The bodies are generally elongated N - S and vary in geometry and dimension . In some cases (e . g . , Toboggan and Sombrero bodies at the Vermelhos Mine), the mineralized mafic - ultramafic units are shallowly dipping and occupy a fold in the gneiss (Figure 7 - 6 ) . Historically, most of the mafic - ultramafic bodies were identified as norite, gabbro, and pyroxenite but recent detailed underground mapping and core logging by Ero Brasil geologists led to the identification of dunite, peridotite, websterite, and anorthosite . Some of the Mafic - Ultramafic bodies contain sulphide copper mineralization mainly in the form of chalcopyrite and bornite, local nickel mineralization in pentlandite as well as Platinum Group Element (“PGE”) mineralization . The copper mineralization is also associated with tellurides, abundant chromite, magnetite, and other oxides/spinels . Recent field and underground observations indicate that at least some norite and gabbro units are foliated and pre - date the pyroxenite intrusions . Igneous crystals of zircon in one December 22, 2022 Rev. F 72
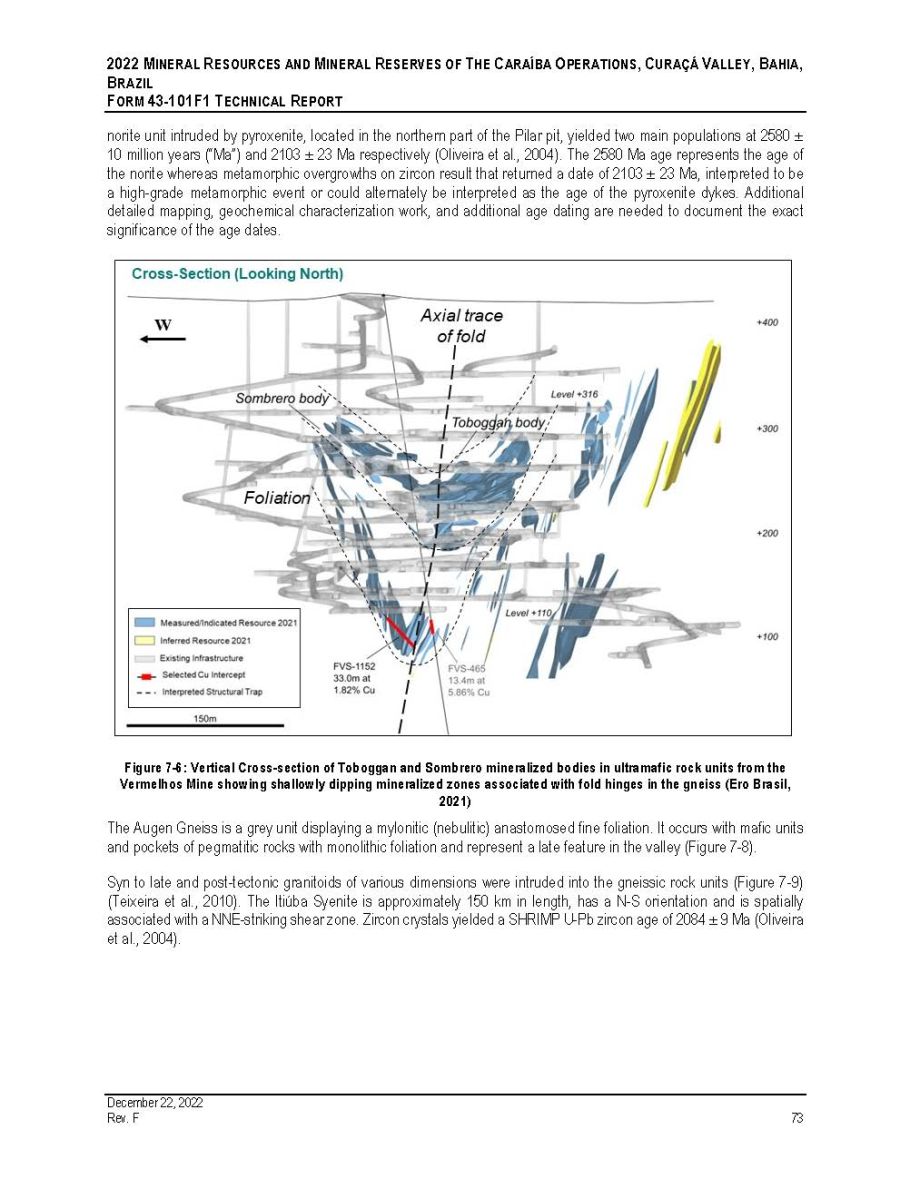
2022 M INERAL R ESOURCES AND M INERAL R ESERVES OF T HE C ARAÍBA O PERATIONS , C URAÇÁ V ALLEY , B AHIA , B RAZIL F ORM 43 - 101 F 1 T ECHNICAL R EPORT norite unit intruded by pyroxenite, located in the northern part of the Pilar pit, yielded two main populations at 2580 “ 10 million years (“Ma”) and 2103 “ 23 Ma respectively (Oliveira et al . , 2004 ) . The 2580 Ma age represents the age of the norite whereas metamorphic overgrowths on zircon result that returned a date of 2103 “ 23 Ma, interpreted to be a high - grade metamorphic event or could alternately be interpreted as the age of the pyroxenite dykes . Additional detailed mapping, geochemical characterization work, and additional age dating are needed to document the exact significance of the age dates . Figure 7 - 6: Vertical Cross - section of Toboggan and Sombrero mineralized bodies in ultramafic rock units from the Vermelhos Mine showing shallowly dipping mineralized zones associated with fold hinges in the gneiss (Ero Brasil, 2021) The Augen Gneiss is a grey unit displaying a mylonitic (nebulitic) anastomosed fine foliation . It occurs with mafic units and pockets of pegmatitic rocks with monolithic foliation and represent a late feature in the valley (Figure 7 - 8 ) . Syn to late and post - tectonic granitoids of various dimensions were intruded into the gneissic rock units (Figure 7 - 9 ) (Teixeira et al . , 2010 ) . The Itiúba Syenite is approximately 150 km in length, has a N - S orientation and is spatially associated with a NNE - striking shear zone . Zircon crystals yielded a SHRIMP U - Pb zircon age of 2084 “ 9 Ma (Oliveira et al . , 2004 ) . December 22, 2022 Rev. F 73
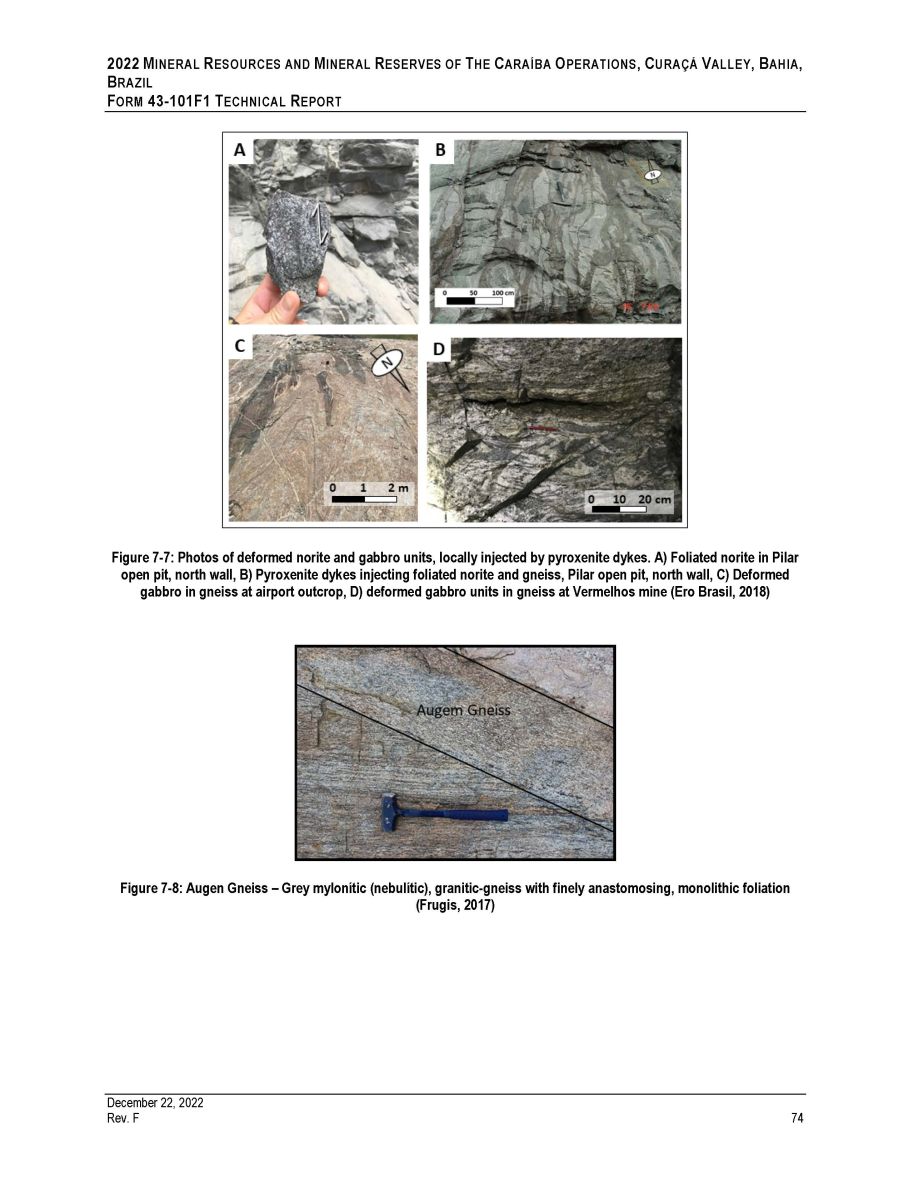
2022 M INERAL R ESOURCES AND M INERAL R ESERVES OF T HE C ARAÍBA O PERATIONS , C URAÇÁ V ALLEY , B AHIA , B RAZIL F ORM 43 - 101F1 T ECHNICAL R EPORT Figure 7 - 7: Photos of deformed norite and gabbro units, locally injected by pyroxenite dykes. A) Foliated norite in Pilar open pit, north wall, B) Pyroxenite dykes injecting foliated norite and gneiss, Pilar open pit, north wall, C) Deformed gabbro in gneiss at airport outcrop, D) deformed gabbro units in gneiss at Vermelhos mine (Ero Brasil, 2018) Figure 7 - 8: Augen Gneiss – Grey mylonític (nebulític), granitic - gneiss with finely anastomosing, monolithic foliation (Frugis, 2017) December 22, 2022 Rev. F 74
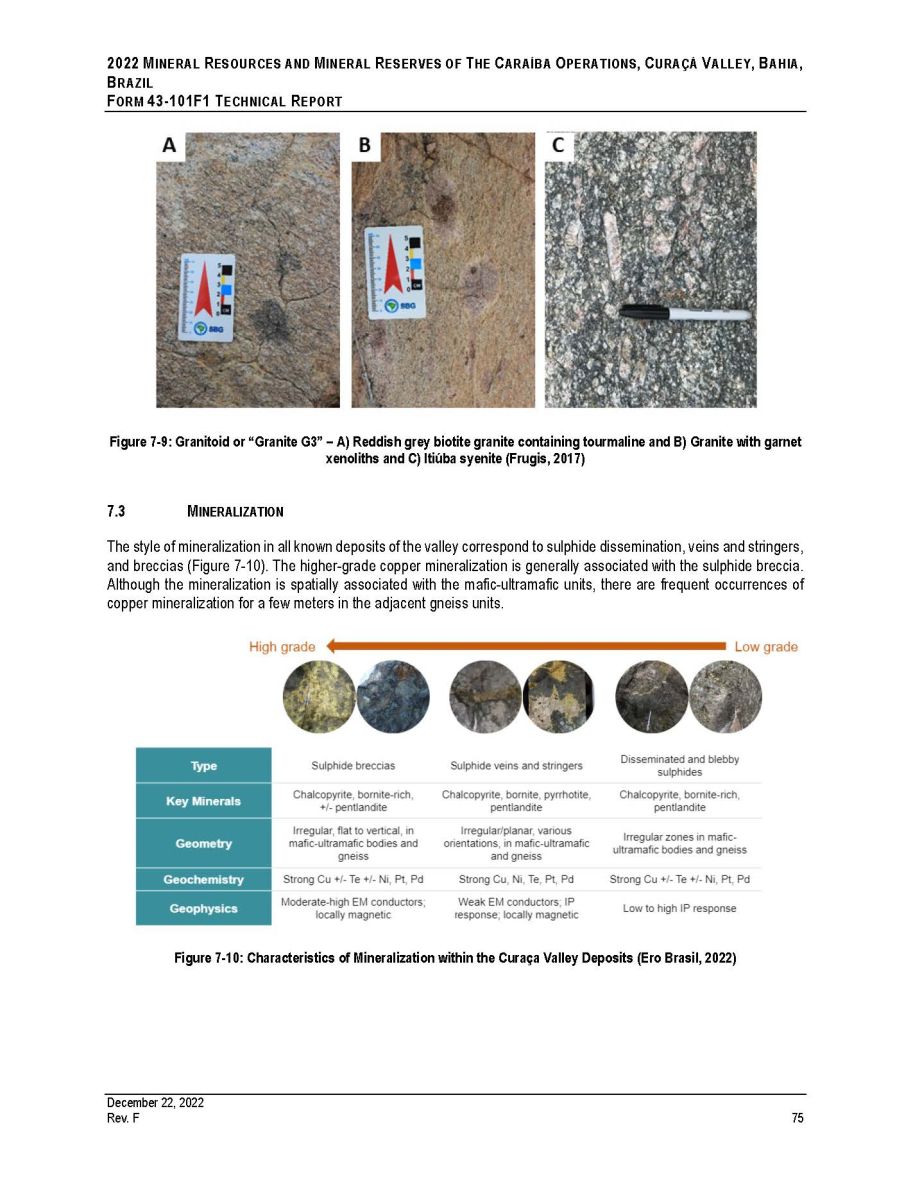
2022 M INERAL R ESOURCES AND M INERAL R ESERVES OF T HE C ARAÍBA O PERATIONS , C URAÇÁ V ALLEY , B AHIA , B RAZIL F ORM 43 - 101F1 T ECHNICAL R EPORT Figure 7 - 9: Granitoid or “Granite G3” – A) Reddish grey biotite granite containing tourmaline and B) Granite with garnet xenoliths and C) Itiúba syenite (Frugis, 2017) 7.3 M INERALIZATION The style of mineralization in all known deposits of the valley correspond to sulphide dissemination, veins and stringers, and breccias (Figure 7 - 10 ) . The higher - grade copper mineralization is generally associated with the sulphide breccia . Although the mineralization is spatially associated with the mafic - ultramafic units, there are frequent occurrences of copper mineralization for a few meters in the adjacent gneiss units . Figure 7 - 10: Characteristics of Mineralization within the Curaça Valley Deposits (Ero Brasil, 2022) December 22, 2022 Rev. F 75
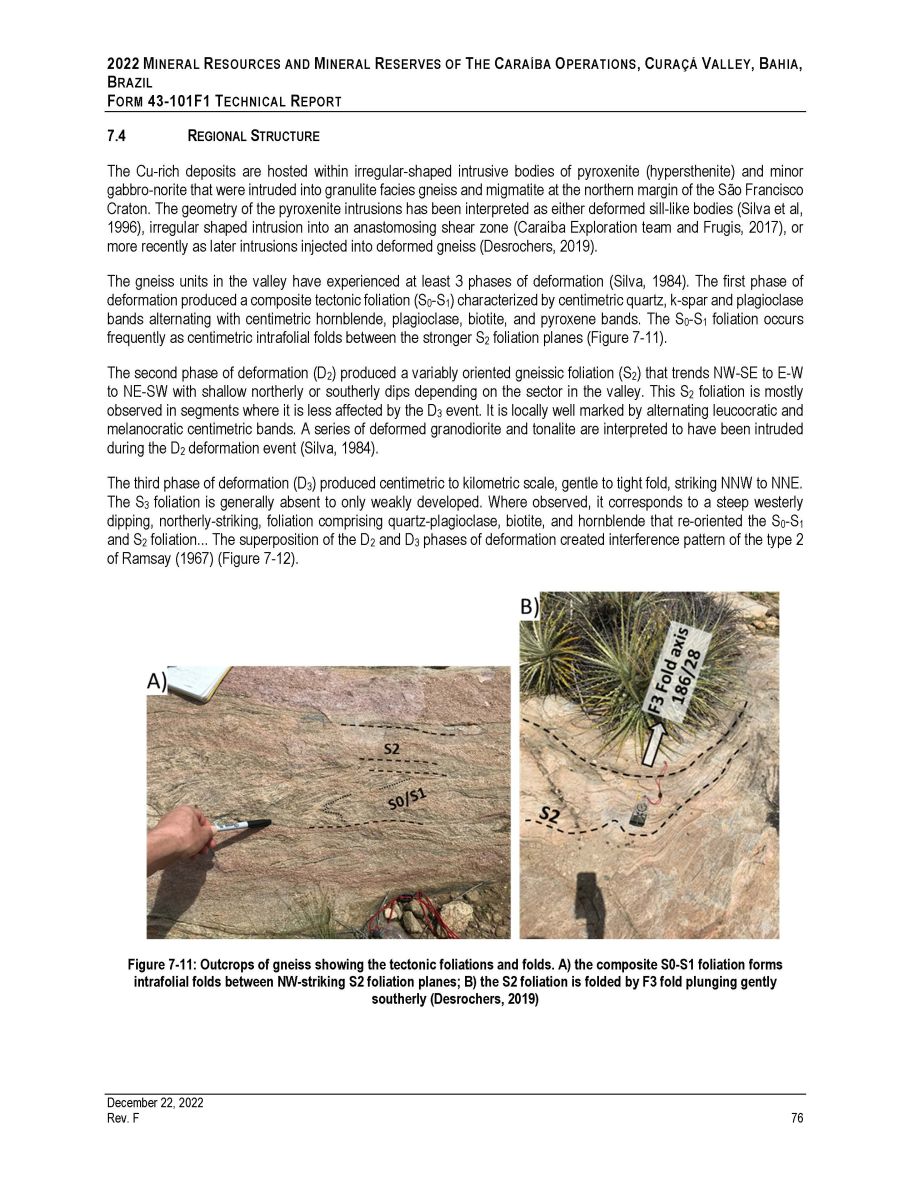
2022 M INERAL R ESOURCES AND M INERAL R ESERVES OF T HE C ARAÍBA O PERATIONS , C URAÇÁ V ALLEY , B AHIA , B RAZIL F ORM 43 - 101 F 1 T ECHNICAL R EPORT 7.4 R EGIONAL S TRUCTURE The Cu - rich deposits are hosted within irregular - shaped intrusive bodies of pyroxenite (hypersthenite) and minor gabbro - norite that were intruded into granulite facies gneiss and migmatite at the northern margin of the São Francisco Craton . The geometry of the pyroxenite intrusions has been interpreted as either deformed sill - like bodies (Silva et al, 1996 ), irregular shaped intrusion into an anastomosing shear zone (Caraíba Exploration team and Frugis, 2017 ), or more recently as later intrusions injected into deformed gneiss (Desrochers, 2019 ) . The gneiss units in the valley have experienced at least 3 phases of deformation (Silva, 1984 ) . The first phase of deformation produced a composite tectonic foliation (S 0 - S 1 ) characterized by centimetric quartz, k - spar and plagioclase bands alternating with centimetric hornblende, plagioclase, biotite, and pyroxene bands . The S 0 - S 1 foliation occurs frequently as centimetric intrafolial folds between the stronger S 2 foliation planes (Figure 7 - 11 ) . The second phase of deformation (D 2 ) produced a variably oriented gneissic foliation (S 2 ) that trends NW - SE to E - W to NE - SW with shallow northerly or southerly dips depending on the sector in the valley . This S 2 foliation is mostly observed in segments where it is less affected by the D 3 event . It is locally well marked by alternating leucocratic and melanocratic centimetric bands . A series of deformed granodiorite and tonalite are interpreted to have been intruded during the D 2 deformation event (Silva, 1984 ) . The third phase of deformation (D 3 ) produced centimetric to kilometric scale, gentle to tight fold, striking NNW to NNE . The S 3 foliation is generally absent to only weakly developed . Where observed, it corresponds to a steep westerly dipping, northerly - striking, foliation comprising quartz - plagioclase, biotite, and hornblende that re - oriented the S 0 - S 1 and S 2 foliation ... The superposition of the D 2 and D 3 phases of deformation created interference pattern of the type 2 of Ramsay ( 1967 ) (Figure 7 - 12 ) . Figure 7 - 11: Outcrops of gneiss showing the tectonic foliations and folds. A) the composite S0 - S1 foliation forms intrafolial folds between NW - striking S2 foliation planes; B) the S2 foliation is folded by F3 fold plunging gently southerly (Desrochers, 2019) December 22, 2022 Rev. F 76
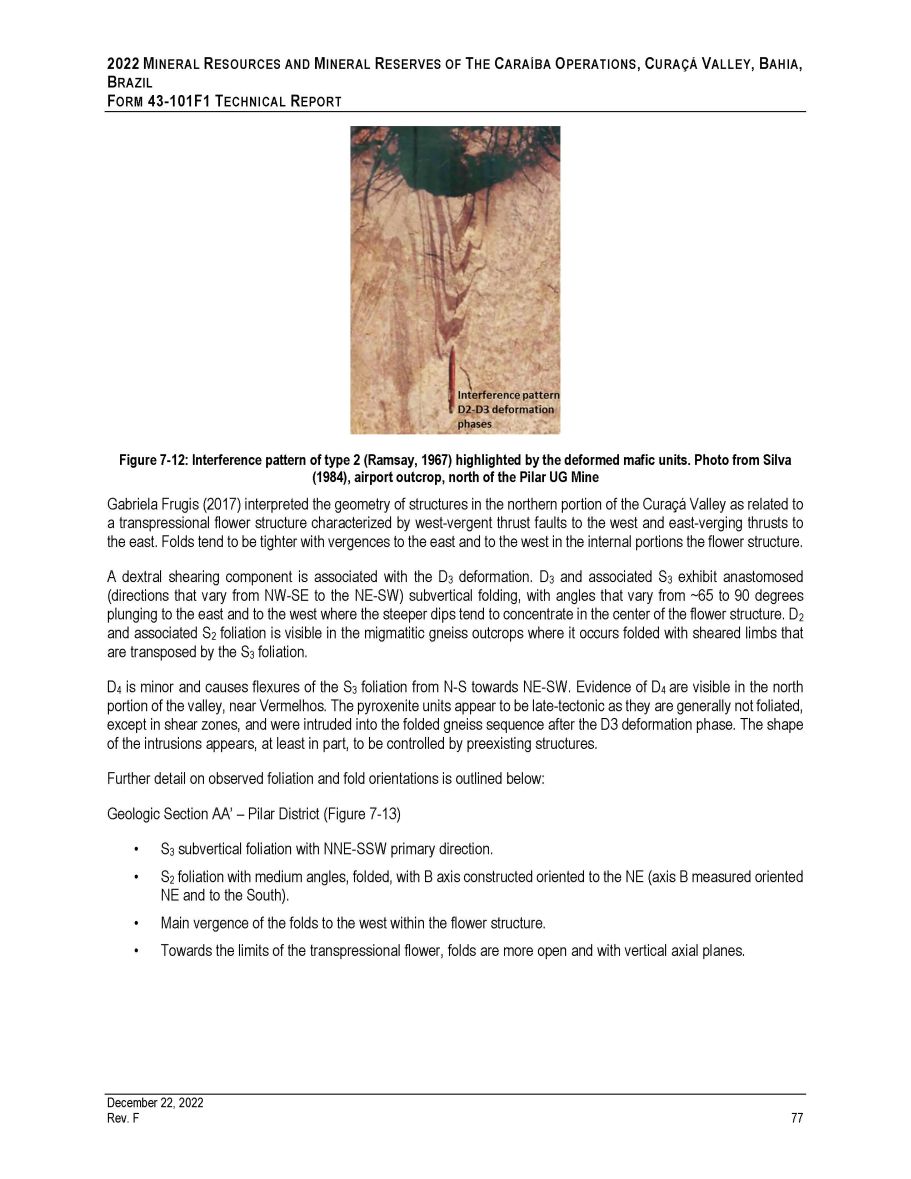
2022 M INERAL R ESOURCES AND M INERAL R ESERVES OF T HE C ARAÍBA O PERATIONS , C URAÇÁ V ALLEY , B AHIA , B RAZIL F ORM 43 - 101F1 T ECHNICAL R EPORT Figure 7 - 12 : Interference pattern of type 2 (Ramsay, 1967 ) highlighted by the deformed mafic units . Photo from Silva ( 1984 ), airport outcrop, north of the Pilar UG Mine Gabriela Frugis ( 2017 ) interpreted the geometry of structures in the northern portion of the Curaçá Valley as related to a transpressional flower structure characterized by west - vergent thrust faults to the west and east - verging thrusts to the east . Folds tend to be tighter with vergences to the east and to the west in the internal portions the flower structure . A dextral shearing component is associated with the D 3 deformation . D 3 and associated S 3 exhibit anastomosed (directions that vary from NW - SE to the NE - SW) subvertical folding, with angles that vary from ~ 65 to 90 degrees plunging to the east and to the west where the steeper dips tend to concentrate in the center of the flower structure . D 2 and associated S 2 foliation is visible in the migmatitic gneiss outcrops where it occurs folded with sheared limbs that are transposed by the S 3 foliation . D 4 is minor and causes flexures of the S 3 foliation from N - S towards NE - SW . Evidence of D 4 are visible in the north portion of the valley, near Vermelhos . The pyroxenite units appear to be late - tectonic as they are generally not foliated, except in shear zones, and were intruded into the folded gneiss sequence after the D 3 deformation phase . The shape of the intrusions appears, at least in part, to be controlled by preexisting structures . Further detail on observed foliation and fold orientations is outlined below : Geologic Section AA’ – Pilar District (Figure 7 - 13 ) • S 3 subvertical foliation with NNE - SSW primary direction. • S 2 foliation with medium angles, folded, with B axis constructed oriented to the NE (axis B measured oriented NE and to the South). • Main vergence of the folds to the west within the flower structure. • Towards the limits of the transpressional flower, folds are more open and with vertical axial planes. December 22, 2022 Rev. F 77
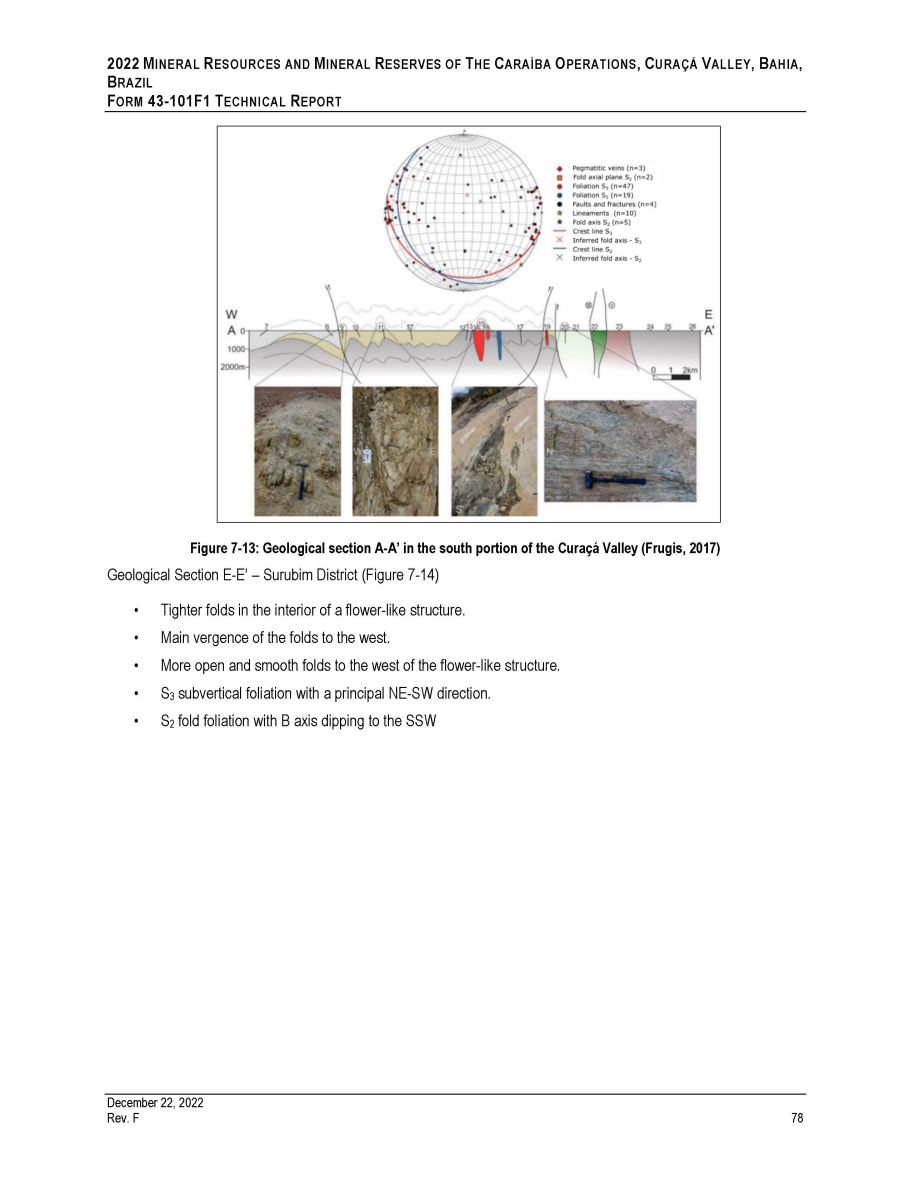
2022 M INERAL R ESOURCES AND M INERAL R ESERVES OF T HE C ARAÍBA O PERATIONS , C URAÇÁ V ALLEY , B AHIA , B RAZIL F ORM 43 - 101F1 T ECHNICAL R EPORT Figure 7 - 13: Geological section A - A’ in the south portion of the Curaçá Valley (Frugis, 2017) Geological Section E - E’ – Surubim District (Figure 7 - 14) • Tighter folds in the interior of a flower - like structure. • Main vergence of the folds to the west. • More open and smooth folds to the west of the flower - like structure. • S 3 subvertical foliation with a principal NE - SW direction. • S 2 fold foliation with B axis dipping to the SSW December 22, 2022 Rev. F 78
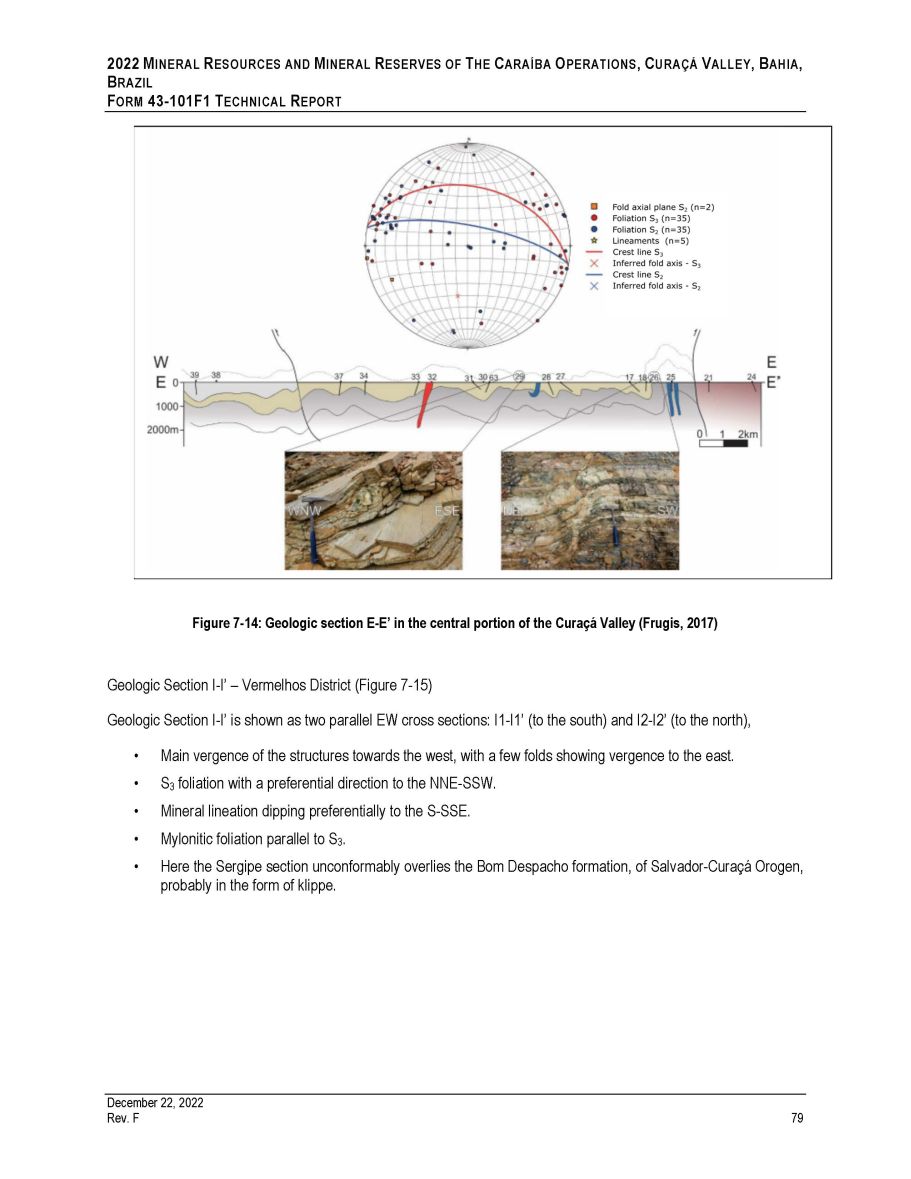
2022 M INERAL R ESOURCES AND M INERAL R ESERVES OF T HE C ARAÍBA O PERATIONS , C URAÇÁ V ALLEY , B AHIA , B RAZIL F ORM 43 - 101F1 T ECHNICAL R EPORT Figure 7 - 14: Geologic section E - E’ in the central portion of the Curaçá Valley (Frugis, 2017) Geologic Section I - I’ – Vermelhos District (Figure 7 - 15) Geologic Section I - I’ is shown as two parallel EW cross sections: I1 - I1’ (to the south) and I2 - I2’ (to the north), • Main vergence of the structures towards the west, with a few folds showing vergence to the east. • S 3 foliation with a preferential direction to the NNE - SSW. • Mineral lineation dipping preferentially to the S - SSE. • Mylonitic foliation parallel to S 3 . • Here the Sergipe section unconformably overlies the Bom Despacho formation, of Salvador - Curaçá Orogen, probably in the form of klippe. December 22, 2022 Rev. F 79
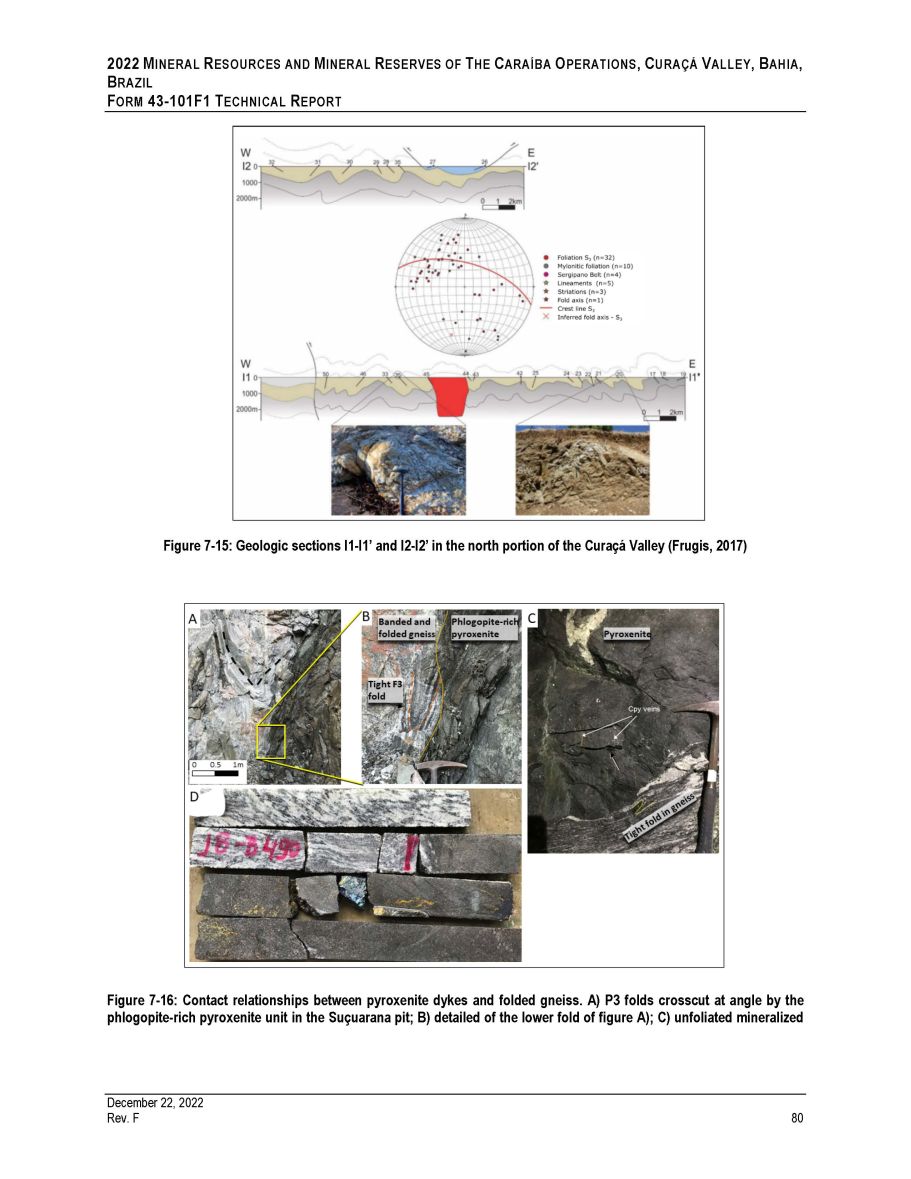
2022 M INERAL R ESOURCES AND M INERAL R ESERVES OF T HE C ARAÍBA O PERATIONS , C URAÇÁ V ALLEY , B AHIA , B RAZIL F ORM 43 - 101F1 T ECHNICAL R EPORT Figure 7 - 15: Geologic sections I1 - I1’ and I2 - I2’ in the north portion of the Curaçá Valley (Frugis, 2017) Figure 7 - 16: Contact relationships between pyroxenite dykes and folded gneiss. A) P3 folds crosscut at angle by the phlogopite - rich pyroxenite unit in the Suçuarana pit; B) detailed of the lower fold of figure A); C) unfoliated mineralized December 22, 2022 Rev. F 80
2022 M INERAL R ESOURCES AND M INERAL R ESERVES OF T HE C ARAÍBA O PERATIONS , C URAÇÁ V ALLEY , B AHIA , B RAZIL F ORM 43 - 101 F 1 T ECHNICAL R EPORT pyroxenite cross - cutting a tight fold in gneiss, and D) mineralized pyroxenite dyke cross - cutting foliation in gneiss at high angle, Pilar mine (drillhole FC 4989 at 289 . 0 m) (Desrochers et al . , 2019 ) 7.5 G EOCHRONOLOGY Table 7 - 1 summarizes age dates obtained on samples from various units of the Curaçá Valley . Silva et al . ( 1997 ) dated enderbitic orthogneiss ( 2695 “ 12 Ma), charnockites ( 2634 “ 19 Ma), and deformed norites ( 2580 “ 10 Ma) with U - Pb on zircon method (SHRIMP) . These rock units represent the oldest rocks dated in the valley (also refer to Figure 7 - 17 ) . The first phase of deformation is estimated to have occurred between 2 . 35 - 2 . 28 Ga (Silva et al . , 1996 ) and reached amphibolite facies as preserved in local boudins of metamorphosed mafic rocks . The second phase of deformation occurred around 2 . 25 Ga and was coeval with intrusions of G 2 tonalite in the Curaçá valley ( 2248 + - 36 Ma, D’el - Rey Silva et al . 1996 ) . The east - west gneissic foliation, including cordierite - sillimanite - garnet - biotite assemblage with local sapphirine, was developed at high temperature under granulite conditions (possibly as high as 900 o C ; Barbosa et al . , 2016 ) . The third phase of deformation (D 3 ) occurred around 2 . 10 Ga ( 2103 + - 23 Ma, Oliveira et al . , 2004 ) during a continent - continent collision involving the Gavião, Jequié, and Serrinha blocks, and the Itabuna - Salvador - Curaçá belt . The northerly - trending D 3 foliation is marked locally by biotite and hornblende which indicates amphibolite metamorphic conditions . The superposition of the D 3 on D 2 deformation produced fold interference patterns of type 2 (Ramsay, 1967 ) . The Itiuba syenite is located to the east of the Valley and was dated at 2084 + - 9 Ma (Oliveira et al . , 2004 ) . A later magmatic event includes the undeformed G 3 granites at the Caraíba mine ( 2044 . 5 + - 2 . 5 Ma in Garcia, 2017 ), a pyroxenite unit within the Baraúna zone on the southern extent of the Pilar UG Mine ( 2056 + - 9 . 2 Ma in Garcia, 2017 ), and a norite at the Surubim mine ( 2047 + - 11 Ma in Garcia et al . , 2018 ) . Zircon from quartz - microcline metasomatite in Caraíba mine, which returned similar ages ( 2042 + - 15 Ma in Garcia, 2013 ), may represent partial melts related intrusion of orthopyroxenite and sulphide concentration or alteration events related to external fluids . The reported ages appear to reflect broadly contemporaneous mafic/ultramafic intrusions, partial melts or alteration related to their emplacement, and granites all of which cut fabrics related to the major deformation events in the gneiss . It is likely that this also represents the age of the primary Cu - Ni mineralization in the Curaçá valley . Dating of phlogopite by Ar - Ar methods returned younger ages between 1 . 95 and 2 . 01 Ma ( 2011 + - 16 Ma and 1952 + - 15 Ma, Teixeira et al . , 2010 ) that may reflect late alteration events, or cooling during initial exhumation . Late alteration may have introduced or remobilized copper but currently there is no direct evidence to document a specific event . December 22, 2022 Rev. F 81
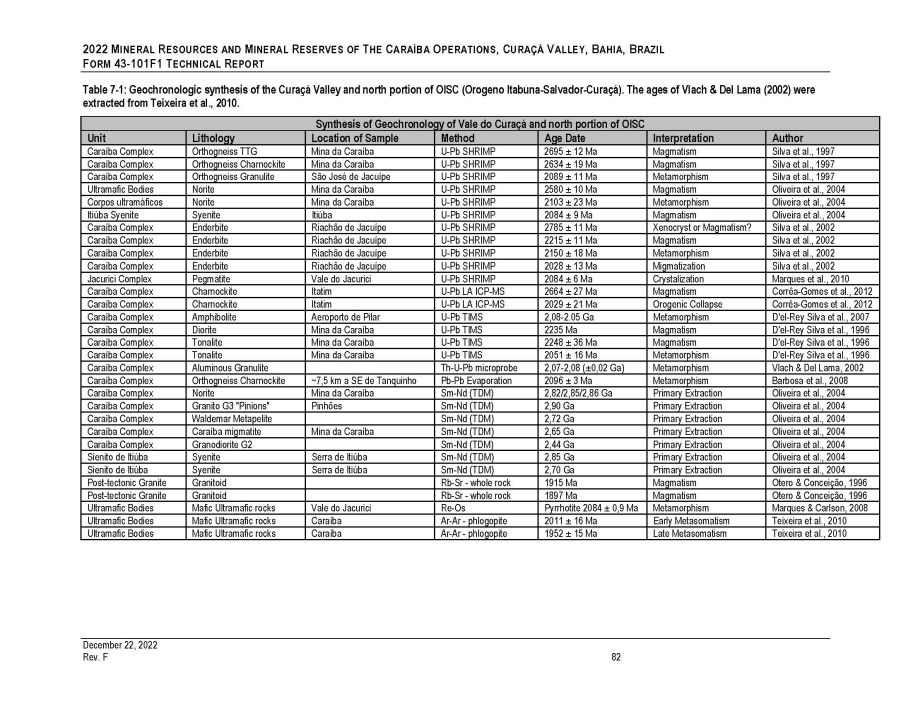
2022 M INERAL R ESOURCES AND M INERAL R ESERVES OF T HE C ARAÍBA O PERATIONS , C URAÇÁ V ALLEY , B AHIA , B RAZIL F ORM 43 - 101F1 T ECHNICAL R EPORT Table 7 - 1: Geochronologic synthesis of the Curaçá Valley and north portion of OISC (Orogeno Itabuna - Salvador - Curaçá). The ages of Vlach & Del Lama (2002) were extracted from Teixeira et al., 2010. Synthesis of Geochronology of Vale do Curaçá and north portion of OISC Unit Lithology Location of Sample Method Age Date Interpretation Author Caraíba Complex Orthogneiss TTG Mina da Caraíba U - Pb SHRIMP 2695 “ 12 Ma Magmatism Silva et al., 1997 Caraíba Complex Orthogneiss Charnockite Mina da Caraíba U - Pb SHRIMP 2634 “ 19 Ma Magmatism Silva et al., 1997 Caraíba Complex Orthogneiss Granulite São José de Jacuípe U - Pb SHRIMP 2089 “ 11 Ma Metamorphism Silva et al., 1997 Ultramafic Bodies Norite Mina da Caraíba U - Pb SHRIMP 2580 “ 10 Ma Magmatism Oliveira et al., 2004 Corpos ultramáficos Norite Mina da Caraíba U - Pb SHRIMP 2103 “ 23 Ma Metamorphism Oliveira et al., 2004 Itiúba Syenite Syenite Itiúba U - Pb SHRIMP 2084 “ 9 Ma Magmatism Oliveira et al., 2004 Caraíba Complex Enderbite Riachão de Jacuípe U - Pb SHRIMP 2785 “ 11 Ma Xenocryst or Magmatism? Silva et al., 2002 Caraíba Complex Enderbite Riachão de Jacuípe U - Pb SHRIMP 2215 “ 11 Ma Magmatism Silva et al., 2002 Caraíba Complex Enderbite Riachão de Jacuípe U - Pb SHRIMP 2150 “ 18 Ma Metamorphism Silva et al., 2002 Caraíba Complex Enderbite Riachão de Jacuípe U - Pb SHRIMP 2028 “ 13 Ma Migmatization Silva et al., 2002 Jacurici Complex Pegmatite Vale do Jacurici U - Pb SHRIMP 2084 “ 6 Ma Crystalization Marques et al., 2010 Caraíba Complex Charnockite Itatim U - Pb LA ICP - MS 2664 “ 27 Ma Magmatism Corrêa - Gomes et al., 2012 Caraíba Complex Charnockite Itatim U - Pb LA ICP - MS 2029 “ 21 Ma Orogenic Collapse Corrêa - Gomes et al., 2012 Caraíba Complex Amphibolite Aeroporto de Pilar U - Pb TIMS 2,08 - 2.05 Ga Metamorphism D'el - Rey Silva et al., 2007 Caraíba Complex Diorite Mina da Caraíba U - Pb TIMS 2235 Ma Magmatism D'el - Rey Silva et al., 1996 Caraíba Complex Tonalite Mina da Caraíba U - Pb TIMS 2248 “ 36 Ma Magmatism D'el - Rey Silva et al., 1996 Caraíba Complex Tonalite Mina da Caraíba U - Pb TIMS 2051 “ 16 Ma Metamorphism D'el - Rey Silva et al., 1996 Caraíba Complex Aluminous Granulite Th - U - Pb microprobe 2,07 - 2,08 ( “ 0,02 Ga) Metamorphism Vlach & Del Lama, 2002 Caraíba Complex Orthogneiss Charnockite ~7,5 km a SE de Tanquinho Pb - Pb Evaporation 2096 “ 3 Ma Metamorphism Barbosa et al., 2008 Caraíba Complex Norite Mina da Caraíba Sm - Nd (TDM) 2,82/2,85/2,86 Ga Primary Extraction Oliveira et al., 2004 Caraíba Complex Granito G3 "Pinions" Pinhões Sm - Nd (TDM) 2,90 Ga Primary Extraction Oliveira et al., 2004 Caraíba Complex Waldemar Metapelite Sm - Nd (TDM) 2,72 Ga Primary Extraction Oliveira et al., 2004 Caraíba Complex Caraíba migmatite Mina da Caraíba Sm - Nd (TDM) 2,65 Ga Primary Extraction Oliveira et al., 2004 Caraíba Complex Granodiorite G2 Sm - Nd (TDM) 2,44 Ga Primary Extraction Oliveira et al., 2004 Sienito de Itiúba Syenite Serra de Itiúba Sm - Nd (TDM) 2,85 Ga Primary Extraction Oliveira et al., 2004 Sienito de Itiúba Syenite Serra de Itiúba Sm - Nd (TDM) 2,70 Ga Primary Extraction Oliveira et al., 2004 Post - tectonic Granite Granitoid Rb - Sr - whole rock 1915 Ma Magmatism Otero & Conceição, 1996 Post - tectonic Granite Granitoid Rb - Sr - whole rock 1897 Ma Magmatism Otero & Conceição, 1996 Ultramafic Bodies Mafic Ultramafic rocks Vale do Jacurici Re - Os Pyrrhotite 2084 “ 0,9 Ma Metamorphism Marques & Carlson, 2008 Ultramafic Bodies Mafic Ultramafic rocks Caraíba Ar - Ar - phlogopite 2011 “ 16 Ma Early Metasomatism Teixeira et al., 2010 Ultramafic Bodies Mafic Ultramafic rocks Caraíba Ar - Ar - phlogopite 1952 “ 15 Ma Late Metasomatism Teixeira et al., 2010 December 22, 2022 Rev. F 82
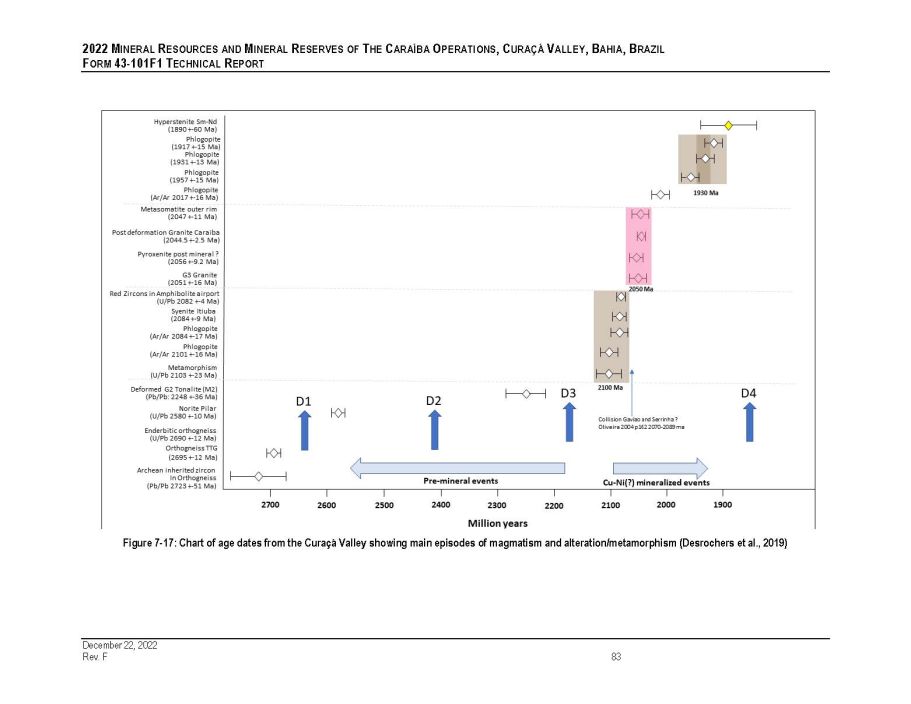
2022 M INERAL R ESOURCES AND M INERAL R ESERVES OF T HE C ARAÍBA O PERATIONS , C URAÇÁ V ALLEY , B AHIA , B RAZIL F ORM 43 - 101F1 T ECHNICAL R EPORT Figure 7 - 17: Chart of age dates from the Curaçá Valley showing main episodes of magmatism and alteration/metamorphism (Desrochers et al., 2019) December 22, 2022 Rev. F 83
2022 M INERAL R ESOURCES AND M INERAL R ESERVES OF T HE C ARAÍBA O PERATIONS , C URAÇÁ V ALLEY , B AHIA , B RAZIL F ORM 43 - 101F1 T ECHNICAL R EPORT 7.6 L OCAL G EOLOGY OF THE P ILAR M INE Lithology, Structure, and Alteration The Pilar Mine is located in the southern part of the Caraíba Operations within the Curaçá Valley . The geology of the mine consists of a high - grade metamorphic terrain, composed of gneiss and migmatite of the Caraíba Complex that were intruded by mafic, ultramafic and late granitic rocks (Figure 7 - 18 ) . The mafic and ultramafic intrusions are mainly composed of pyroxenite, norite, and gabbro . The melanorite is a term used for logging purpose to describe a host rock, either a gneiss, a gabbro or a norite, that is intruded by several mafic - ultramafic dykes that are too small individually to be logged separately (Figure 7 - 7 , B) . The gneissic country rocks have gone through 3 phases of deformation and show fold - interference patterns . The ultramafic units as well as the late granitic and pegmatite intrusions were emplaced after the 3 phases of deformation in the gneiss and generally dip steeply to the west and strike northerly (Figure 7 - 18 and Figure 7 - 19 ) . Underground mapping indicates that some of the pegmatite dykes were emplaced along faults (Ero Brasil, 2020 ) . The NW - striking diabase dykes and quartz veins crosscut the metamorphic and intrusive units . A series of shear zones, oriented NNE and NNW with moderate westerly dip, represent a late deformation event but their relative displacement is not well documented (D’El Rey Silva, 1984 , Frugis, 2017 ) . Finally, a series of late faults, oriented NE to ENE and NW, are also reported by D’El Rey Silva ( 1984 ) but with unclear sense and amount of displacement . The gneiss and migmatites, together with some intrusive bodies are affected by various alteration assemblages including potassic (phlogopite and K - feldspar), sodic (albite), calcsilicate (diopside), carbonate, as well as epidote and lesser garnet (Figure 7 - 20 ) . The alteration variably overprints the original texture of the rock units and it obliterates the gneissic foliation where the alteration is more intense . The phlogopite was generally developed later than the k - feldspar and the diopside alteration and is frequently associated with the copper mineralization . December 22 2022 84

2022 M INERAL R ESOURCES AND M INERAL R ESERVES OF T HE C ARAÍBA O PERATIONS , C URAÇÁ V ALLEY , B AHIA , B RAZIL F ORM 43 - 101F1 T ECHNICAL R EPORT Figure 7 - 18: Surface geology map of Pilar Mine sector (Ero Brasil, 2022) December 22 2022 85
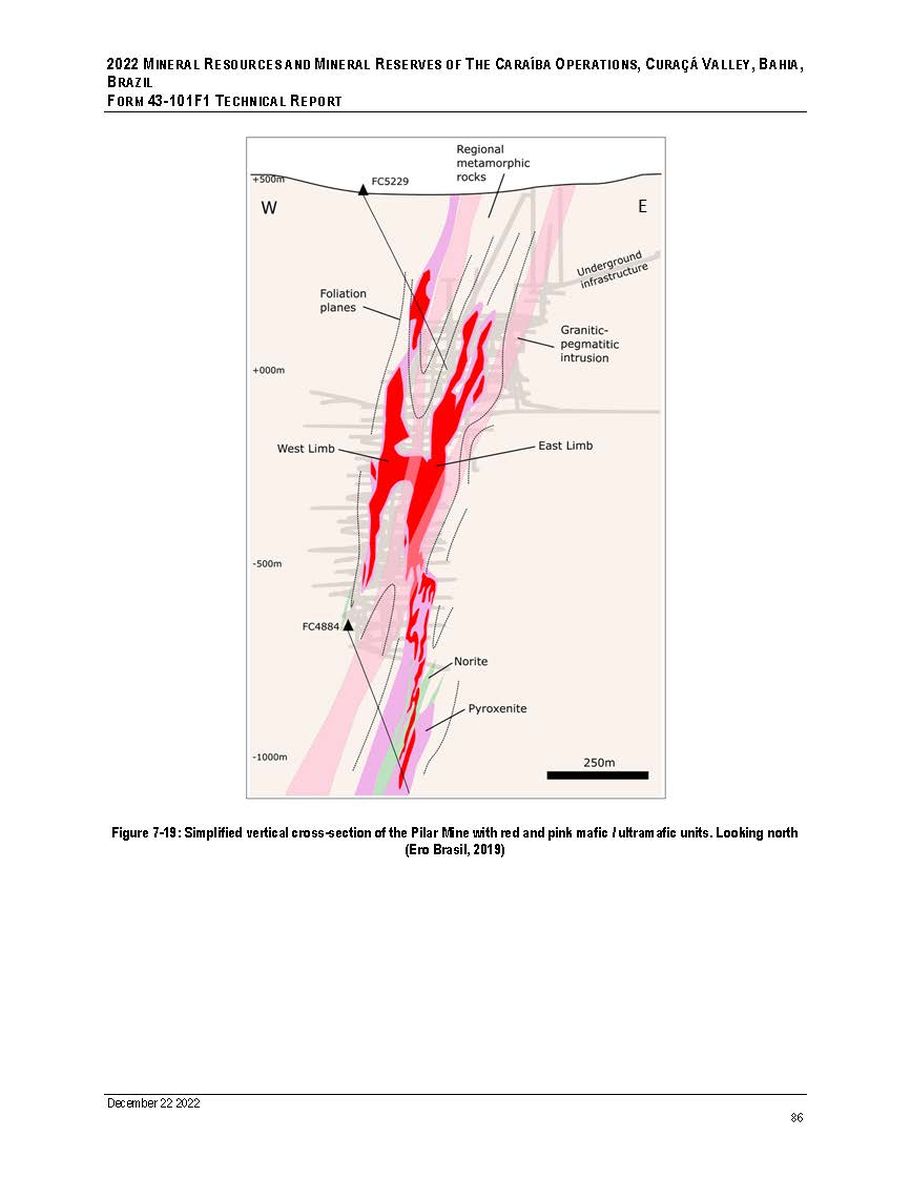
2022 M INERAL R ESOURCES AND M INERAL R ESERVES OF T HE C ARAÍBA O PERATIONS , C URAÇÁ V ALLEY , B AHIA , B RAZIL F ORM 43 - 101F1 T ECHNICAL R EPORT Figure 7 - 19: Simplified vertical cross - section of the Pilar Mine with red and pink mafic / ultramafic units. Looking north (Ero Brasil, 2019) December 22 2022 86
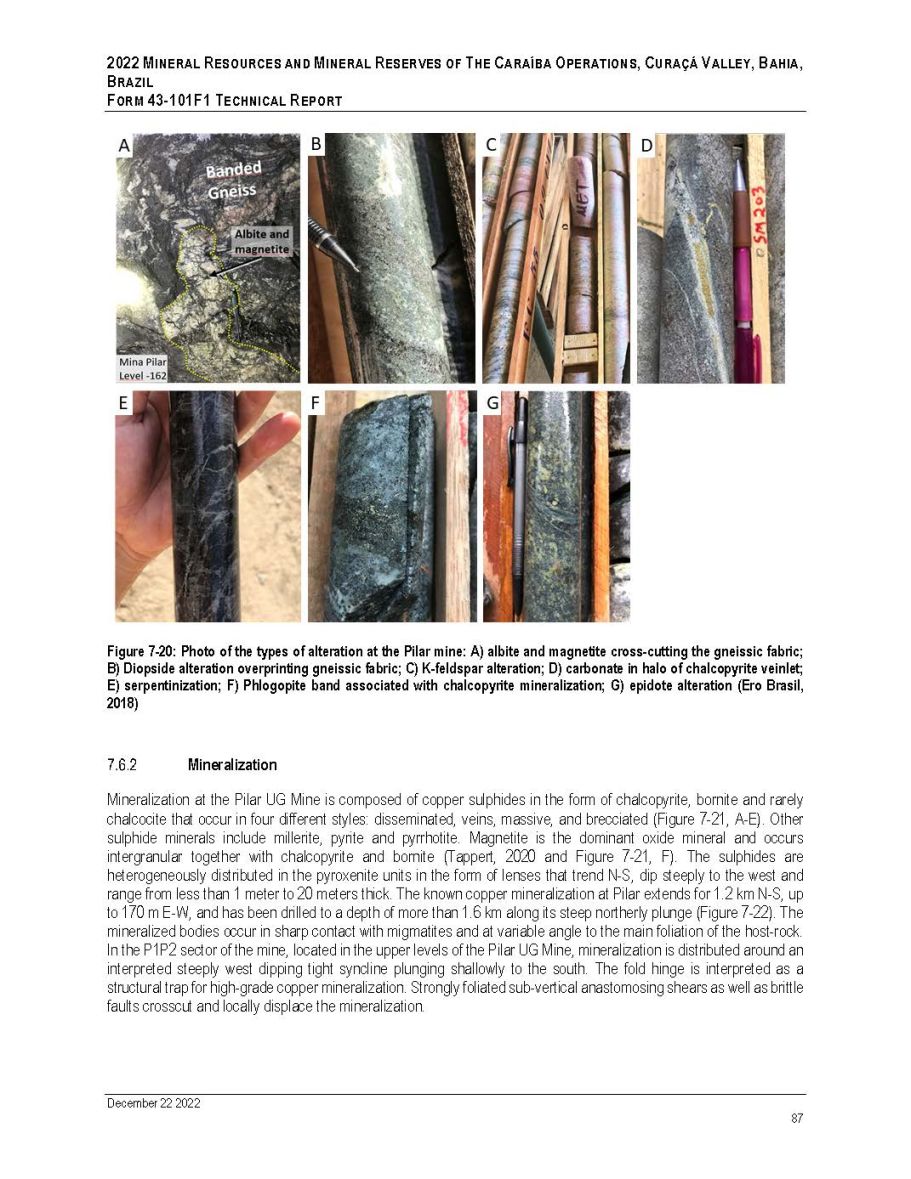
2022 M INERAL R ESOURCES AND M INERAL R ESERVES OF T HE C ARAÍBA O PERATIONS , C URAÇÁ V ALLEY , B AHIA , B RAZIL F ORM 43 - 101F1 T ECHNICAL R EPORT Figure 7 - 20: Photo of the types of alteration at the Pilar mine: A) albite and magnetite cross - cutting the gneissic fabric; B) Diopside alteration overprinting gneissic fabric; C) K - feldspar alteration; D) carbonate in halo of chalcopyrite veinlet; E) serpentinization; F) Phlogopite band associated with chalcopyrite mineralization; G) epidote alteration (Ero Brasil, 2018) Mineralization Mineralization at the Pilar UG Mine is composed of copper sulphides in the form of chalcopyrite, bornite and rarely chalcocite that occur in four different styles : disseminated, veins, massive, and brecciated (Figure 7 - 21 , A - E) . Other sulphide minerals include millerite, pyrite and pyrrhotite . Magnetite is the dominant oxide mineral and occurs intergranular together with chalcopyrite and bornite (Tappert, 2020 and Figure 7 - 21 , F) . The sulphides are heterogeneously distributed in the pyroxenite units in the form of lenses that trend N - S, dip steeply to the west and range from less than 1 meter to 20 meters thick . The known copper mineralization at Pilar extends for 1 . 2 km N - S, up to 170 m E - W, and has been drilled to a depth of more than 1 . 6 km along its steep northerly plunge (Figure 7 - 22 ) . The mineralized bodies occur in sharp contact with migmatites and at variable angle to the main foliation of the host - rock . In the P 1 P 2 sector of the mine, located in the upper levels of the Pilar UG Mine, mineralization is distributed around an interpreted steeply west dipping tight syncline plunging shallowly to the south . The fold hinge is interpreted as a structural trap for high - grade copper mineralization . Strongly foliated sub - vertical anastomosing shears as well as brittle faults crosscut and locally displace the mineralization . December 22 2022 87

2022 M INERAL R ESOURCES AND M INERAL R ESERVES OF T HE C ARAÍBA O PERATIONS , C URAÇÁ V ALLEY , B AHIA , B RAZIL F ORM 43 - 101F1 T ECHNICAL R EPORT Figure 7 - 21: Mineralization styles: A) Pyroxenite showing primary disseminated chalcopyrite; B) Vein of chalcopyrite cross - cutting gneiss; C) Massive chalcopyrite and bornite; D) Pyroxenite with phlogopite; E) Mining front with chalcopyrite and bornite in the pyroxenite (Ero Brasil, 2018) and F) Polished section showing abundant intergranular magnetite (mag), bornite (bo), and minor chalcopyrite in contact with massive chalcopyrite vein (cpy) (Tappert, 2020) December 22 2022 88
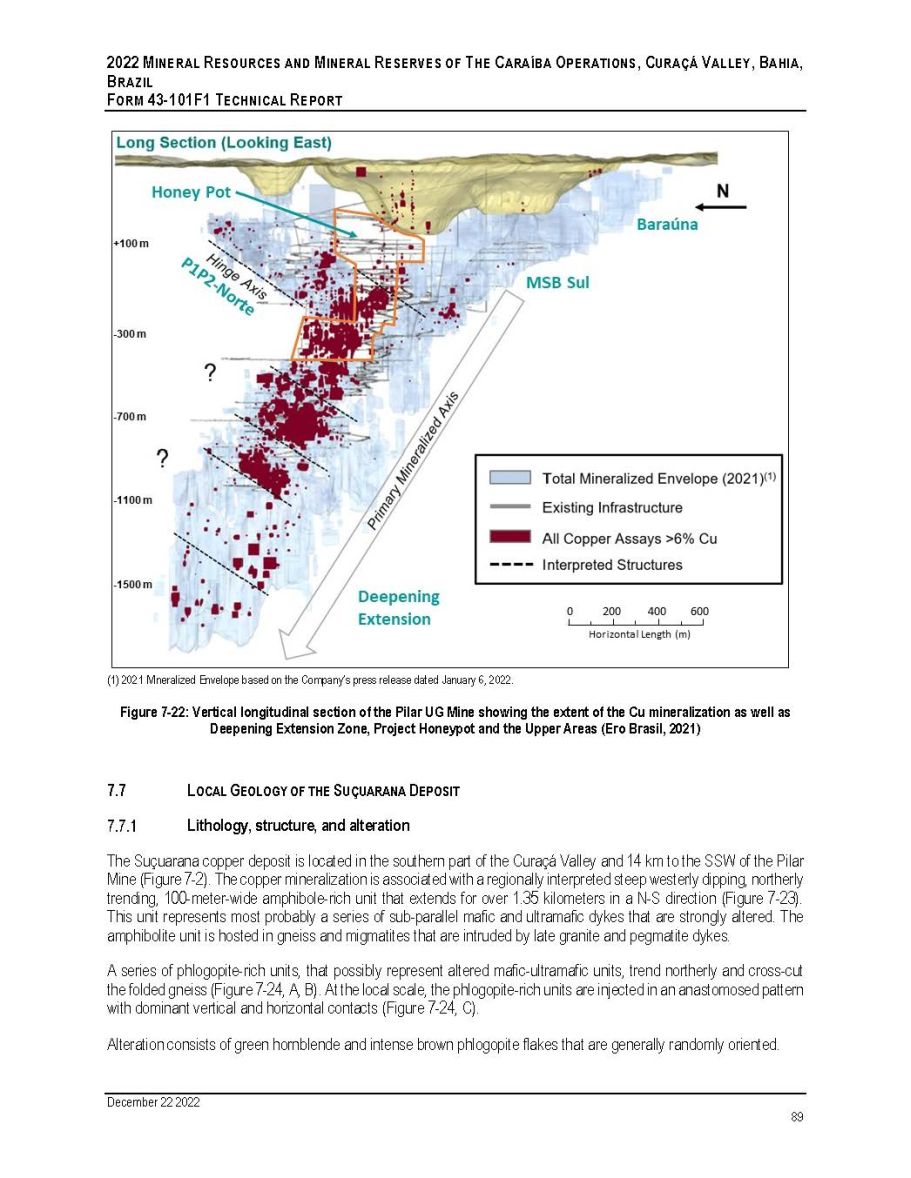
2022 M INERAL R ESOURCES AND M INERAL R ESERVES OF T HE C ARAÍBA O PERATIONS , C URAÇÁ V ALLEY , B AHIA , B RAZIL F ORM 43 - 101F1 T ECHNICAL R EPORT (1) 2021 Mineralized Envelope based on the Company’s press release dated January 6, 2022. Figure 7 - 22: Vertical longitudinal section of the Pilar UG Mine showing the extent of the Cu mineralization as well as Deepening Extension Zone, Project Honeypot and the Upper Areas (Ero Brasil, 2021) 7.7 L OCAL G EOLOGY OF THE S UÇUARANA D EPOSIT Lithology, structure, and alteration The Suçuarana copper deposit is located in the southern part of the Curaçá Valley and 14 km to the SSW of the Pilar Mine (Figure 7 - 2 ) . The copper mineralization is associated with a regionally interpreted steep westerly dipping, northerly trending, 100 - meter - wide amphibole - rich unit that extends for over 1 . 35 kilometers in a N - S direction (Figure 7 - 23 ) . This unit represents most probably a series of sub - parallel mafic and ultramafic dykes that are strongly altered . The amphibolite unit is hosted in gneiss and migmatites that are intruded by late granite and pegmatite dykes . A series of phlogopite - rich units, that possibly represent altered mafic - ultramafic units, trend northerly and cross - cut the folded gneiss (Figure 7 - 24 , A, B) . At the local scale, the phlogopite - rich units are injected in an anastomosed pattern with dominant vertical and horizontal contacts (Figure 7 - 24 , C) . Alteration consists of green hornblende and intense brown phlogopite flakes that are generally randomly oriented . December 22 2022 89
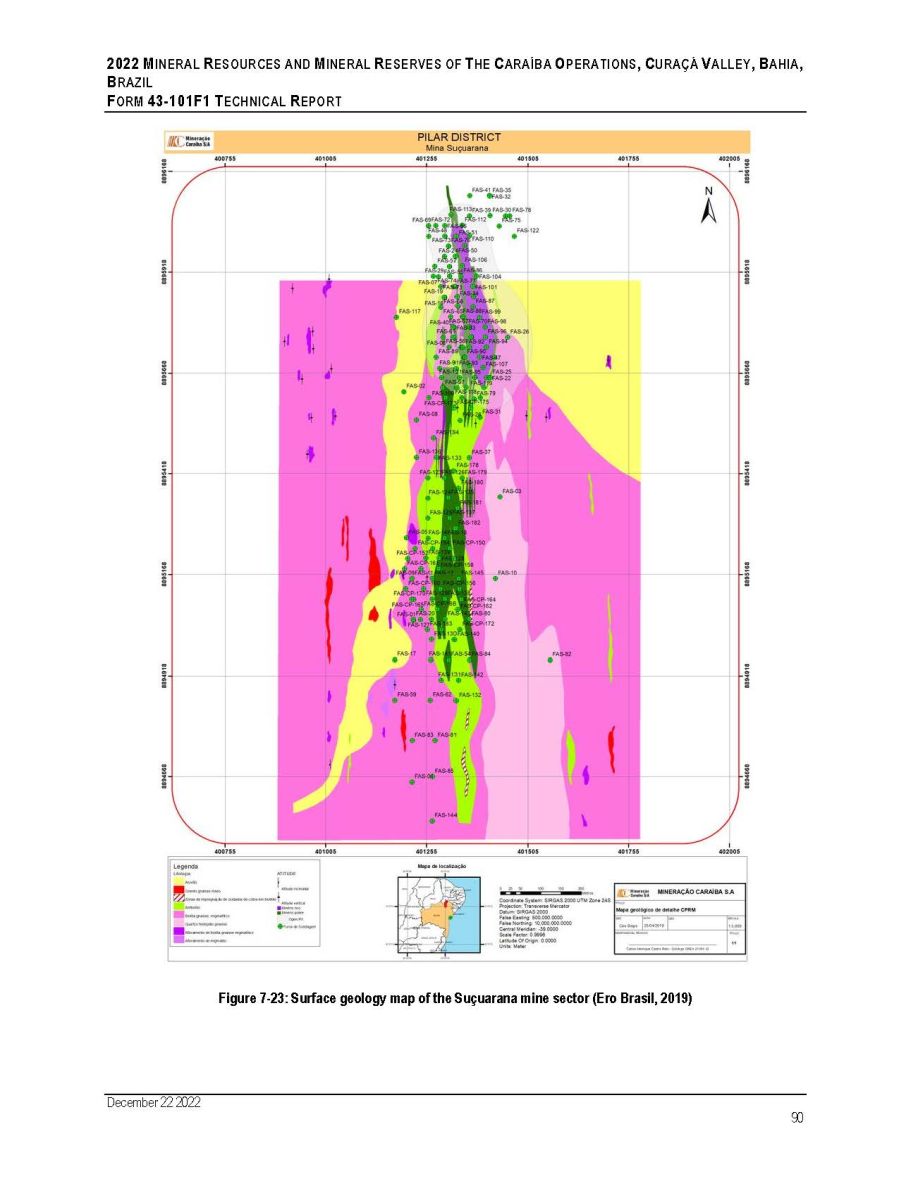
2022 M INERAL R ESOURCES AND M INERAL R ESERVES OF T HE C ARAÍBA O PERATIONS , C URAÇÁ V ALLEY , B AHIA , B RAZIL F ORM 43 - 101F1 T ECHNICAL R EPORT Figure 7 - 23: Surface geology map of the Suçuarana mine sector (Ero Brasil, 2019) December 22 2022 90
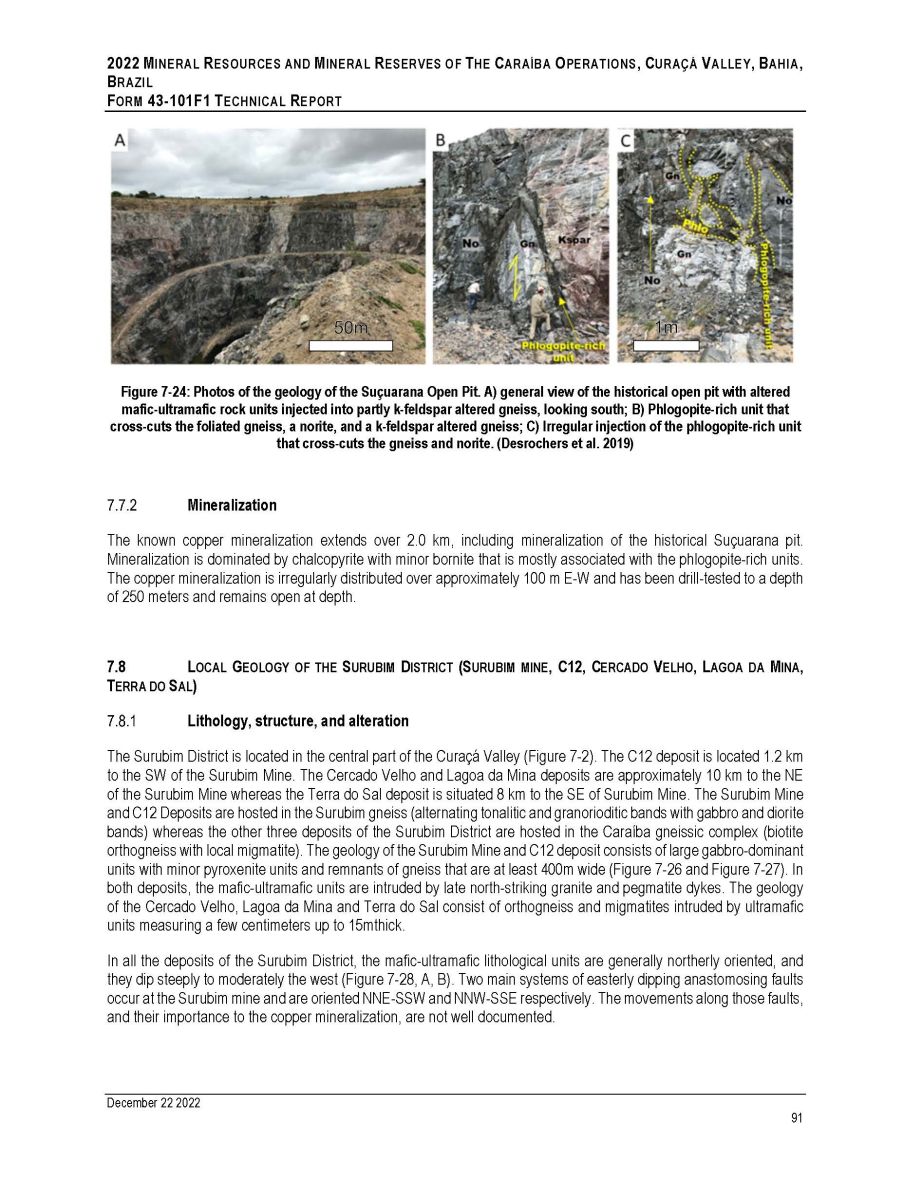
2022 M INERAL R ESOURCES AND M INERAL R ESERVES OF T HE C ARAÍBA O PERATIONS , C URAÇÁ V ALLEY , B AHIA , B RAZIL F ORM 43 - 101F1 T ECHNICAL R EPORT Figure 7 - 24: Photos of the geology of the Suçuarana Open Pit. A) general view of the historical open pit with altered mafic - ultramafic rock units injected into partly k - feldspar altered gneiss, looking south; B) Phlogopite - rich unit that cross - cuts the foliated gneiss, a norite, and a k - feldspar altered gneiss; C) Irregular injection of the phlogopite - rich unit that cross - cuts the gneiss and norite. (Desrochers et al. 2019) Mineralization The known copper mineralization extends over 2 . 0 km, including mineralization of the historical Suçuarana pit . Mineralization is dominated by chalcopyrite with minor bornite that is mostly associated with the phlogopite - rich units . The copper mineralization is irregularly distributed over approximately 100 m E - W and has been drill - tested to a depth of 250 meters and remains open at depth . 7.8 L OCAL G EOLOGY OF THE S URUBIM D ISTRICT (S URUBIM MINE , C12, C ERCADO V ELHO , L AGOA DA M INA , T ERRA DO S AL ) Lithology, structure, and alteration The Surubim District is located in the central part of the Curaçá Valley (Figure 7 - 2 ) . The C 12 deposit is located 1 . 2 km to the SW of the Surubim Mine . The Cercado Velho and Lagoa da Mina deposits are approximately 10 km to the NE of the Surubim Mine whereas the Terra do Sal deposit is situated 8 km to the SE of Surubim Mine . The Surubim Mine and C 12 Deposits are hosted in the Surubim gneiss (alternating tonalitic and granorioditic bands with gabbro and diorite bands) whereas the other three deposits of the Surubim District are hosted in the Caraíba gneissic complex (biotite orthogneiss with local migmatite) . The geology of the Surubim Mine and C 12 deposit consists of large gabbro - dominant units with minor pyroxenite units and remnants of gneiss that are at least 400 m wide (Figure 7 - 26 and Figure 7 - 27 ) . In both deposits, the mafic - ultramafic units are intruded by late north - striking granite and pegmatite dykes . The geology of the Cercado Velho, Lagoa da Mina and Terra do Sal consist of orthogneiss and migmatites intruded by ultramafic units measuring a few centimeters up to 15 mthick . In all the deposits of the Surubim District, the mafic - ultramafic lithological units are generally northerly oriented, and they dip steeply to moderately the west (Figure 7 - 28 , A, B) . Two main systems of easterly dipping anastomosing faults occur at the Surubim mine and are oriented NNE - SSW and NNW - SSE respectively . The movements along those faults, and their importance to the copper mineralization, are not well documented . December 22 2022 91
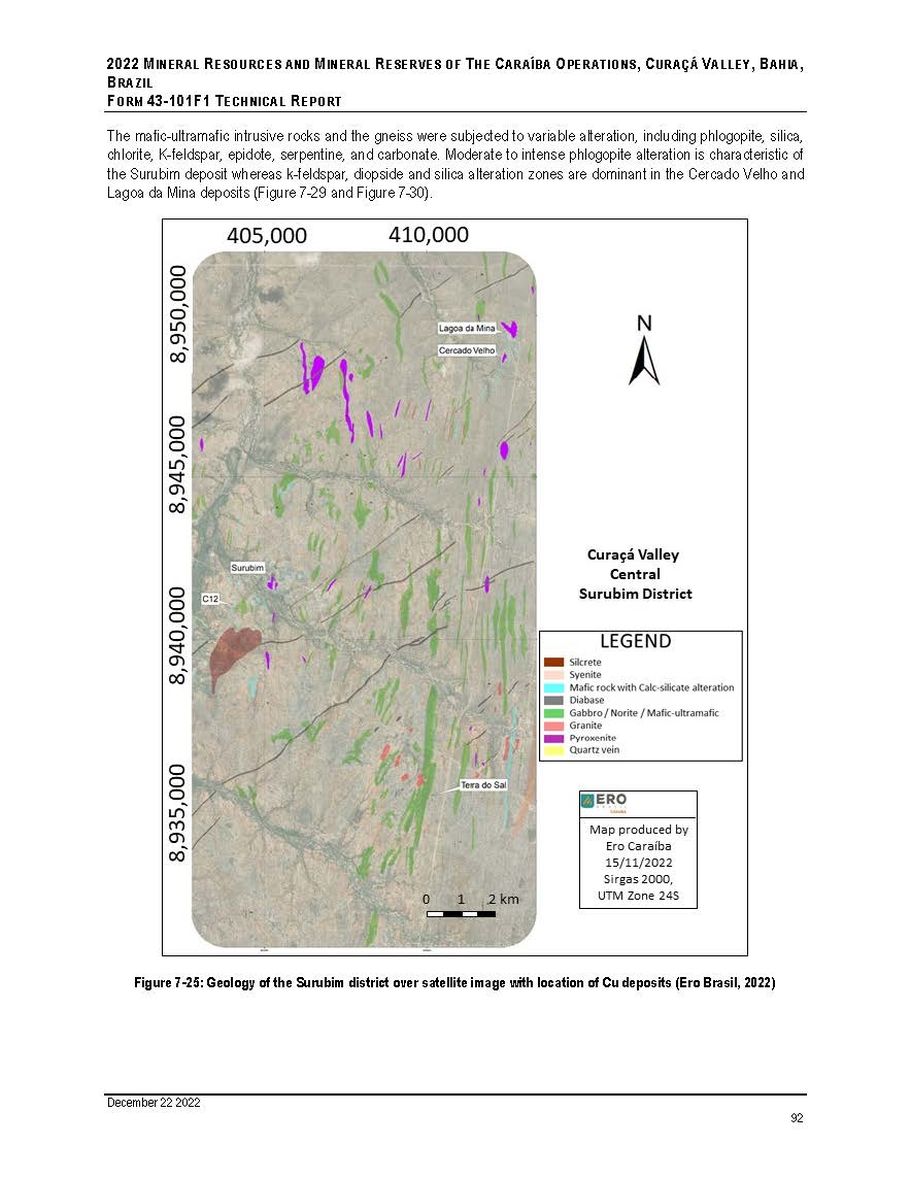
2022 M INERAL R ESOURCES AND M INERAL R ESERVES OF T HE C ARAÍBA O PERATIONS , C URAÇÁ V ALLEY , B AHIA , B RAZIL F ORM 43 - 101 F 1 T ECHNICAL R EPORT The mafic - ultramafic intrusive rocks and the gneiss were subjected to variable alteration, including phlogopite, silica, chlorite, K - feldspar, epidote, serpentine, and carbonate . Moderate to intense phlogopite alteration is characteristic of the Surubim deposit whereas k - feldspar, diopside and silica alteration zones are dominant in the Cercado Velho and Lagoa da Mina deposits (Figure 7 - 29 and Figure 7 - 30 ) . Figure 7 - 25: Geology of the Surubim district over satellite image with location of Cu deposits (Ero Brasil, 2022) December 22 2022 92
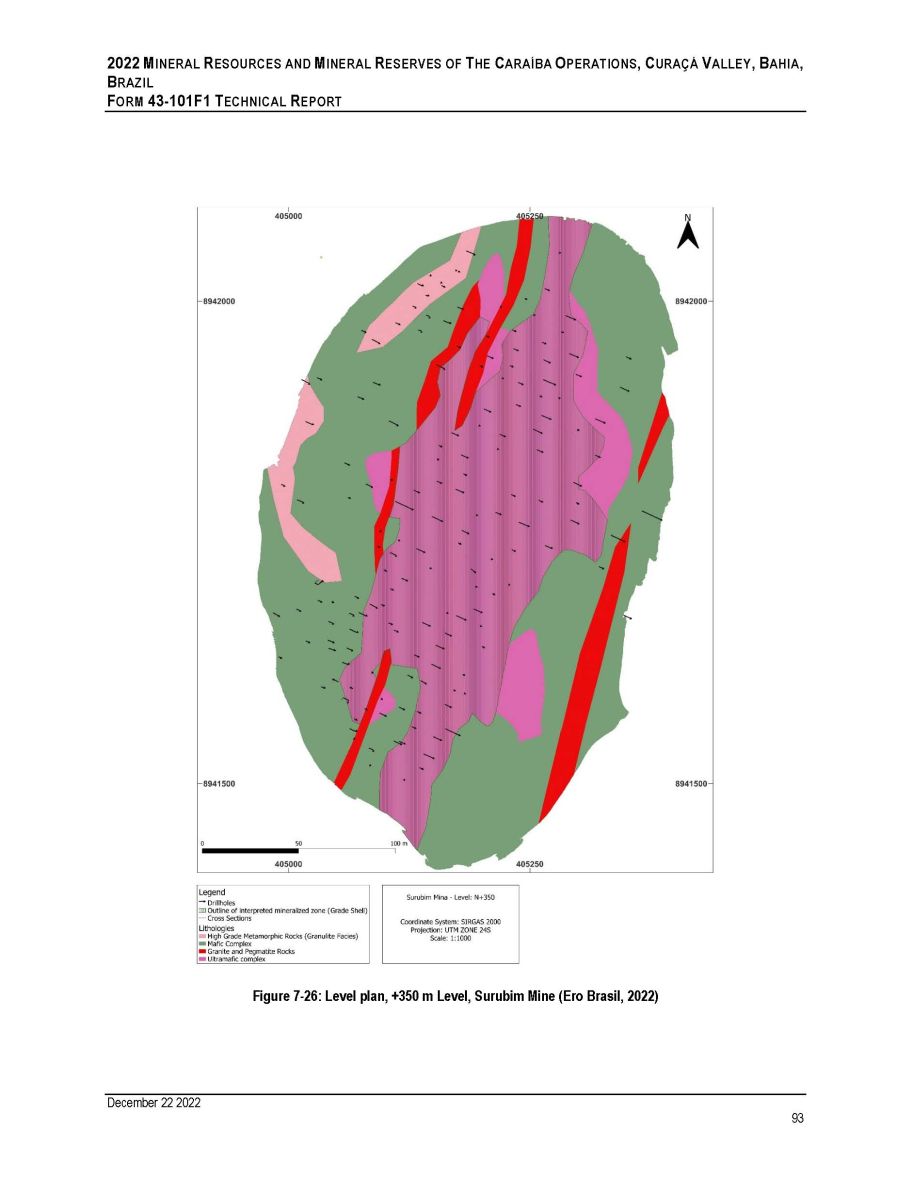
2022 M INERAL R ESOURCES AND M INERAL R ESERVES OF T HE C ARAÍBA O PERATIONS , C URAÇÁ V ALLEY , B AHIA , B RAZIL F ORM 43 - 101F1 T ECHNICAL R EPORT Figure 7 - 26: Level plan, +350 m Level, Surubim Mine (Ero Brasil, 2022) December 22 2022 93
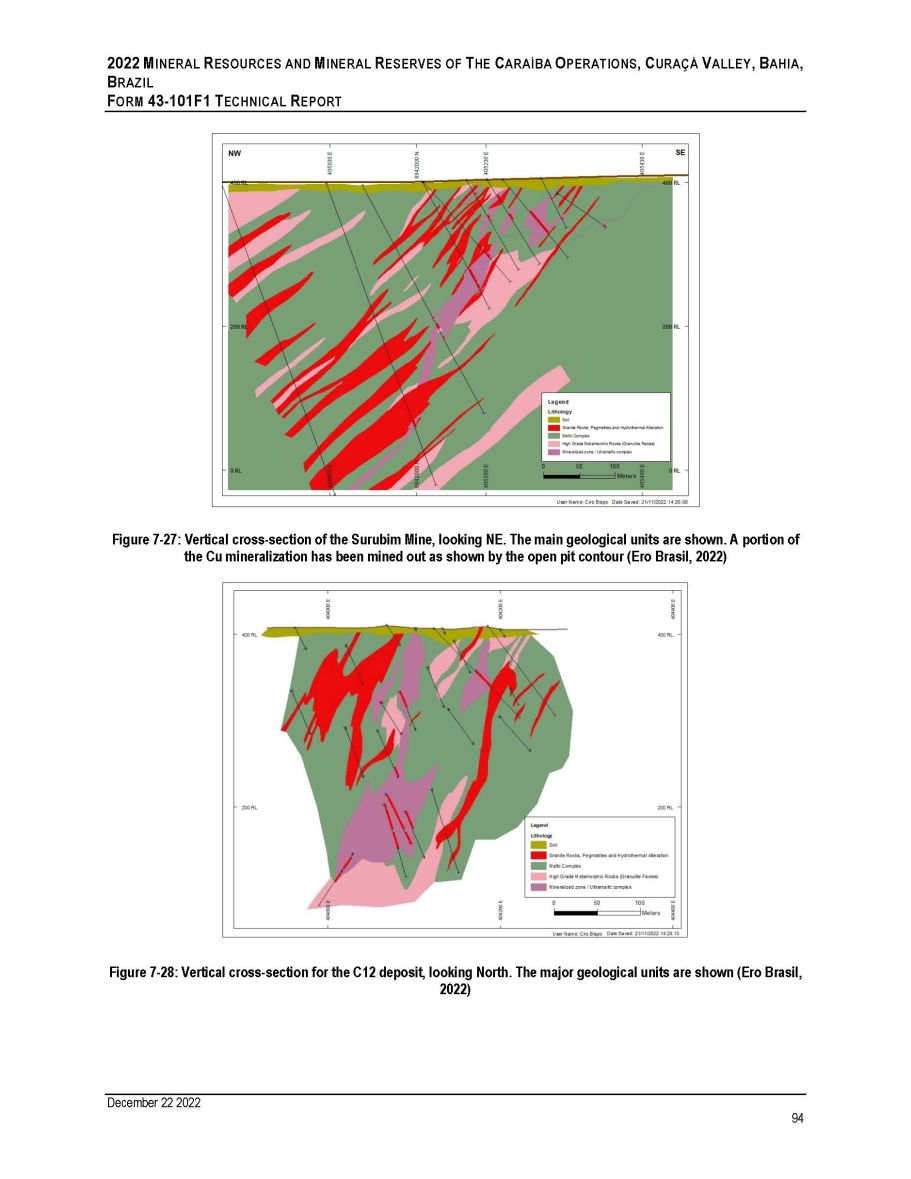
2022 M INERAL R ESOURCES AND M INERAL R ESERVES OF T HE C ARAÍBA O PERATIONS , C URAÇÁ V ALLEY , B AHIA , B RAZIL F ORM 43 - 101F1 T ECHNICAL R EPORT Figure 7 - 27: Vertical cross - section of the Surubim Mine, looking NE. The main geological units are shown. A portion of the Cu mineralization has been mined out as shown by the open pit contour (Ero Brasil, 2022) Figure 7 - 28: Vertical cross - section for the C12 deposit, looking North. The major geological units are shown (Ero Brasil, 2022) December 22 2022 94
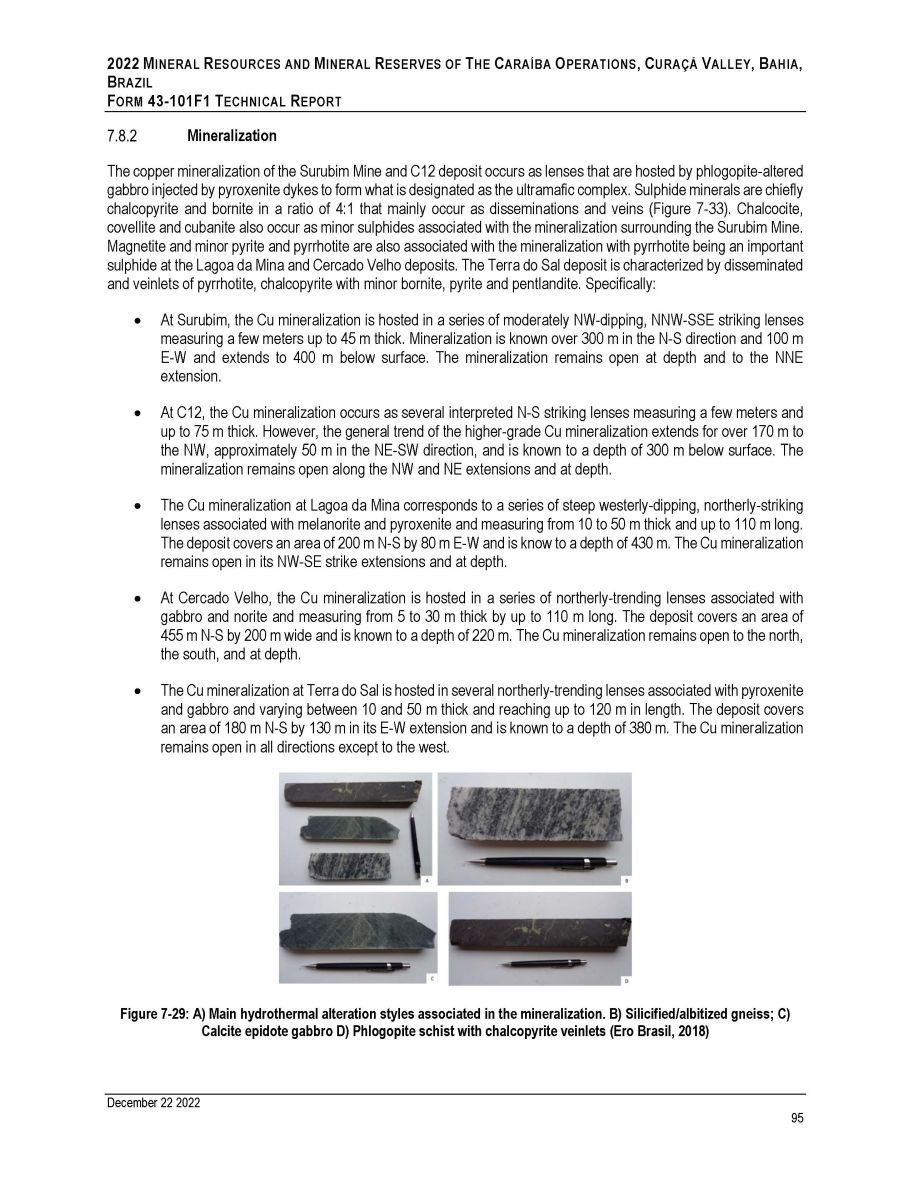
2022 M INERAL R ESOURCES AND M INERAL R ESERVES OF T HE C ARAÍBA O PERATIONS , C URAÇÁ V ALLEY , B AHIA , B RAZIL F ORM 43 - 101 F 1 T ECHNICAL R EPORT Mineralization The copper mineralization of the Surubim Mine and C 12 deposit occurs as lenses that are hosted by phlogopite - altered gabbro injected by pyroxenite dykes to form what is designated as the ultramafic complex . Sulphide minerals are chiefly chalcopyrite and bornite in a ratio of 4 : 1 that mainly occur as disseminations and veins (Figure 7 - 33 ) . Chalcocite, covellite and cubanite also occur as minor sulphides associated with the mineralization surrounding the Surubim Mine . Magnetite and minor pyrite and pyrrhotite are also associated with the mineralization with pyrrhotite being an important sulphide at the Lagoa da Mina and Cercado Velho deposits . The Terra do Sal deposit is characterized by disseminated and veinlets of pyrrhotite, chalcopyrite with minor bornite, pyrite and pentlandite . Specifically : At Surubim, the Cu mineralization is hosted in a series of moderately NW - dipping, NNW - SSE striking lenses measuring a few meters up to 45 m thick . Mineralization is known over 300 m in the N - S direction and 100 m E - W and extends to 400 m below surface . The mineralization remains open at depth and to the NNE extension . At C 12 , the Cu mineralization occurs as several interpreted N - S striking lenses measuring a few meters and up to 75 m thick . However, the general trend of the higher - grade Cu mineralization extends for over 170 m to the NW, approximately 50 m in the NE - SW direction, and is known to a depth of 300 m below surface . The mineralization remains open along the NW and NE extensions and at depth . The Cu mineralization at Lagoa da Mina corresponds to a series of steep westerly - dipping, northerly - striking lenses associated with melanorite and pyroxenite and measuring from 10 to 50 m thick and up to 110 m long . The deposit covers an area of 200 m N - S by 80 m E - W and is know to a depth of 430 m . The Cu mineralization remains open in its NW - SE strike extensions and at depth . At Cercado Velho, the Cu mineralization is hosted in a series of northerly - trending lenses associated with gabbro and norite and measuring from 5 to 30 m thick by up to 110 m long . The deposit covers an area of 455 m N - S by 200 m wide and is known to a depth of 220 m . The Cu mineralization remains open to the north, the south, and at depth . The Cu mineralization at Terra do Sal is hosted in several northerly - trending lenses associated with pyroxenite and gabbro and varying between 10 and 50 m thick and reaching up to 120 m in length . The deposit covers an area of 180 m N - S by 130 m in its E - W extension and is known to a depth of 380 m . The Cu mineralization remains open in all directions except to the west . Figure 7 - 29: A) Main hydrothermal alteration styles associated in the mineralization. B) Silicified/albitized gneiss; C) Calcite epidote gabbro D) Phlogopite schist with chalcopyrite veinlets (Ero Brasil, 2018) December 22 2022 95
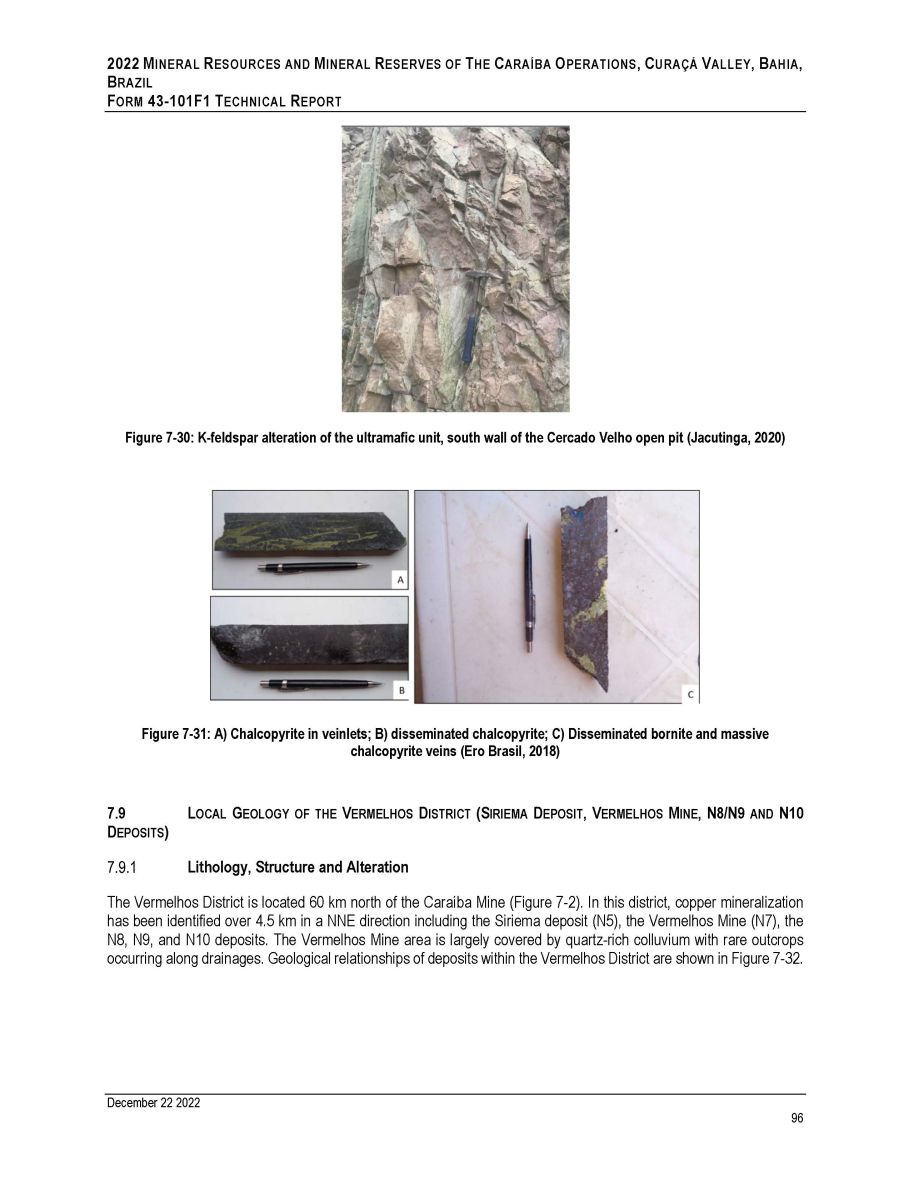
2022 M INERAL R ESOURCES AND M INERAL R ESERVES OF T HE C ARAÍBA O PERATIONS , C URAÇÁ V ALLEY , B AHIA , B RAZIL F ORM 43 - 101F1 T ECHNICAL R EPORT Figure 7 - 30: K - feldspar alteration of the ultramafic unit, south wall of the Cercado Velho open pit (Jacutinga, 2020) Figure 7 - 31: A) Chalcopyrite in veinlets; B) disseminated chalcopyrite; C) Disseminated bornite and massive chalcopyrite veins (Ero Brasil, 2018) 7.9 D EPOSITS ) L OCAL G EOLOGY OF THE V ERMELHOS D ISTRICT (S IRIEMA D EPOSIT , V ERMELHOS M INE , N8/N9 AND N10 Lithology, Structure and Alteration The Vermelhos District is located 60 km north of the Caraíba Mine (Figure 7 - 2 ) . In this district, copper mineralization has been identified over 4 . 5 km in a NNE direction including the Siriema deposit (N 5 ), the Vermelhos Mine (N 7 ), the N 8 , N 9 , and N 10 deposits . The Vermelhos Mine area is largely covered by quartz - rich colluvium with rare outcrops occurring along drainages . Geological relationships of deposits within the Vermelhos District are shown in Figure 7 - 32 . December 22 2022 96
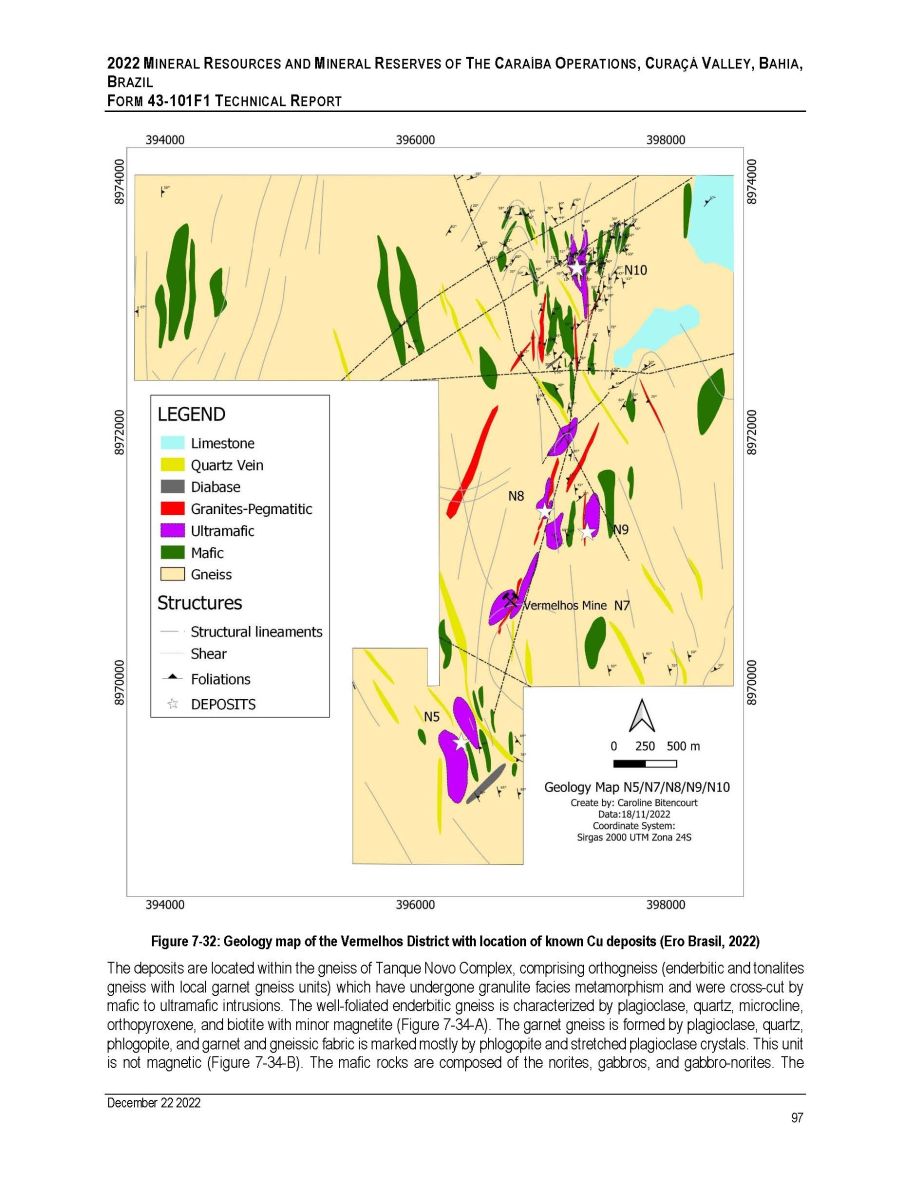
2022 M INERAL R ESOURCES AND M INERAL R ESERVES OF T HE C ARAÍBA O PERATIONS , C URAÇÁ V ALLEY , B AHIA , B RAZIL F ORM 43 - 101F1 T ECHNICAL R EPORT Figure 7 - 32 : Geology map of the Vermelhos District with location of known Cu deposits (Ero Brasil, 2022 ) The deposits are located within the gneiss of Tanque Novo Complex, comprising orthogneiss (enderbitic and tonalites gneiss with local garnet gneiss units) which have undergone granulite facies metamorphism and were cross - cut by mafic to ultramafic intrusions . The well - foliated enderbitic gneiss is characterized by plagioclase, quartz, microcline, orthopyroxene, and biotite with minor magnetite (Figure 7 - 34 - A) . The garnet gneiss is formed by plagioclase, quartz, phlogopite, and garnet and gneissic fabric is marked mostly by phlogopite and stretched plagioclase crystals . This unit is not magnetic (Figure 7 - 34 - B) . The mafic rocks are composed of the norites, gabbros, and gabbro - norites . The December 22 2022 97
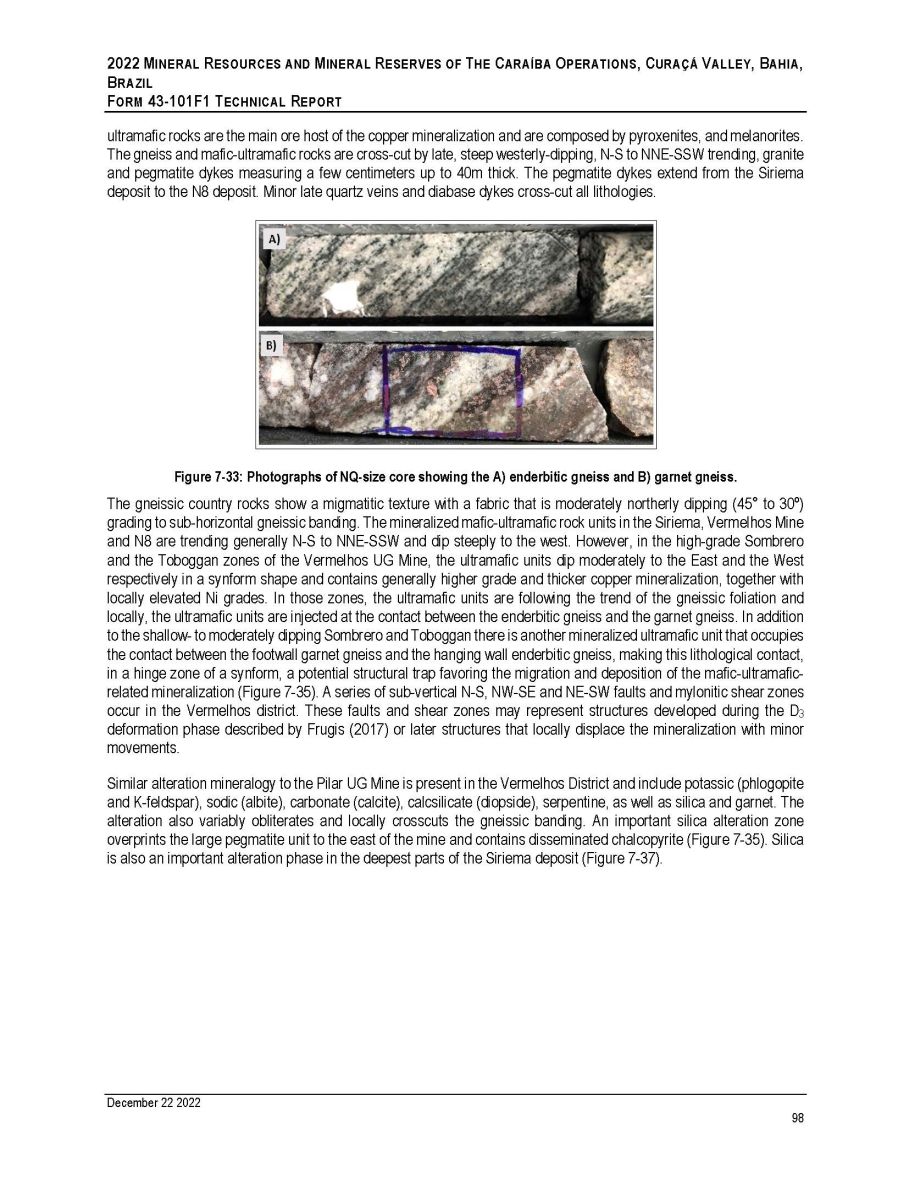
2022 M INERAL R ESOURCES AND M INERAL R ESERVES OF T HE C ARAÍBA O PERATIONS , C URAÇÁ V ALLEY , B AHIA , B RAZIL F ORM 43 - 101 F 1 T ECHNICAL R EPORT ultramafic rocks are the main ore host of the copper mineralization and are composed by pyroxenites, and melanorites . The gneiss and mafic - ultramafic rocks are cross - cut by late, steep westerly - dipping, N - S to NNE - SSW trending, granite and pegmatite dykes measuring a few centimeters up to 40 m thick . The pegmatite dykes extend from the Siriema deposit to the N 8 deposit . Minor late quartz veins and diabase dykes cross - cut all lithologies . Figure 7 - 33 : Photographs of NQ - size core showing the A) enderbitic gneiss and B) garnet gneiss . The gneissic country rocks show a migmatitic texture with a fabric that is moderately northerly dipping ( 45 ƒ to 30 º) grading to sub - horizontal gneissic banding . The mineralized mafic - ultramafic rock units in the Siriema, Vermelhos Mine and N 8 are trending generally N - S to NNE - SSW and dip steeply to the west . However, in the high - grade Sombrero and the Toboggan zones of the Vermelhos UG Mine, the ultramafic units dip moderately to the East and the West respectively in a synform shape and contains generally higher grade and thicker copper mineralization, together with locally elevated Ni grades . In those zones, the ultramafic units are following the trend of the gneissic foliation and locally, the ultramafic units are injected at the contact between the enderbitic gneiss and the garnet gneiss . In addition to the shallow - to moderately dipping Sombrero and Toboggan there is another mineralized ultramafic unit that occupies the contact between the footwall garnet gneiss and the hanging wall enderbitic gneiss, making this lithological contact, in a hinge zone of a synform, a potential structural trap favoring the migration and deposition of the mafic - ultramafic - related mineralization (Figure 7 - 35 ) . A series of sub - vertical N - S, NW - SE and NE - SW faults and mylonitic shear zones occur in the Vermelhos district . These faults and shear zones may represent structures developed during the D 3 deformation phase described by Frugis ( 2017 ) or later structures that locally displace the mineralization with minor movements . Similar alteration mineralogy to the Pilar UG Mine is present in the Vermelhos District and include potassic (phlogopite and K - feldspar), sodic (albite), carbonate (calcite), calcsilicate (diopside), serpentine, as well as silica and garnet . The alteration also variably obliterates and locally crosscuts the gneissic banding . An important silica alteration zone overprints the large pegmatite unit to the east of the mine and contains disseminated chalcopyrite (Figure 7 - 35 ) . Silica is also an important alteration phase in the deepest parts of the Siriema deposit (Figure 7 - 37 ) . December 22 2022 98
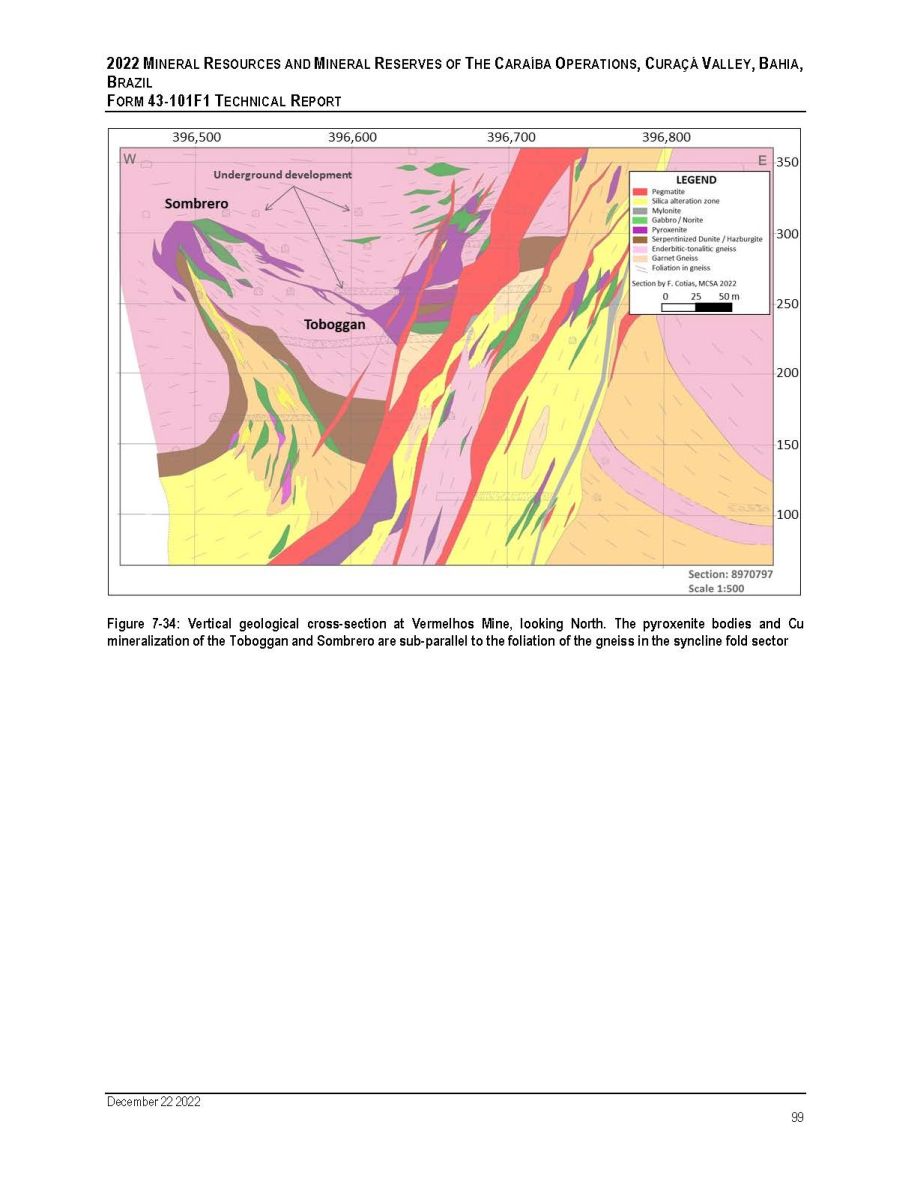
2022 M INERAL R ESOURCES AND M INERAL R ESERVES OF T HE C ARAÍBA O PERATIONS , C URAÇÁ V ALLEY , B AHIA , B RAZIL F ORM 43 - 101F1 T ECHNICAL R EPORT Figure 7 - 34: Vertical geological cross - section at Vermelhos Mine, looking North. The pyroxenite bodies and Cu mineralization of the Toboggan and Sombrero are sub - parallel to the foliation of the gneiss in the syncline fold sector December 22 2022 99

2022 M INERAL R ESOURCES AND M INERAL R ESERVES OF T HE C ARAÍBA O PERATIONS , C URAÇÁ V ALLEY , B AHIA , B RAZIL F ORM 43 - 101F1 T ECHNICAL R EPORT Figure 7 - 35: Alteration facies at Vermelhos mine. A) K - feldspar alteration overprinting gneissic fabric; B) Dark serpentinite alteration of ultramafic unit; C) Intense garnet alteration; D) Silica alteration on East side of the Vermelhos Mine overprinting the pegmatite unit; D) Silica alteration on East side of the Vermelhos Mine with disseminated chalcopyrite; and F) Phlogopite - rich alteration (darker) and pyroxenite (grey) with chalcopyrite veinlet (Ero Brasil, 2019) 7.10 M INERALIZATION The main sulphides of the deposits in the Vermelhos District consist of chalcopyrite (approximately 70 to 75 % ), bornite ( 20 to 25 % ) and minor chalcocite . The chalcopyrite contains low concentration of nickel (Tappert, 2020 ) . Copper sulphides are associated with minor pyrite, pyrrhotite, pentlandite as well as chromite and magnetite . Sulphide textures include interstitial, net - textured, stringer and sulphide - rich matrix breccias mostly concentrated in the mafic - ultramafic units but can also occur as veins and dissemination in the adjacent gneiss (Figure 7 - 36 . Evidence throughout the Curaçá Valley of sulphide zonation, characterized as pyrrhotite +/ - pentlandite zoning to pyrrhotite +/ - pentlandite plus chalcopyrite and finally to chalcopyrite plus bornite is more common in the Vermelhos District (Figure 7 - 38 ), both within the Vermelhos UG Mine and at Siriema . High - grade mineralization in the Vermelhos District is often closely associated with phlogopite enrichment . The nickel, cobalt and PGE content tends to be higher in the Siriema deposit than in Vermelhos and the N 8 and N 9 deposits, but further analytical work is needed to confirm these observations . The detailed textures observed on polished slabs of sulphides show intergrowths of chalcopyrite, pentlandite, chromite, pyrrhotite and bornite (Figure 7 - 3940 ) . Oxidized mineralization occurs as malachite (Figure 7 - 39 ) and chrysocolla within December 22 2022 100
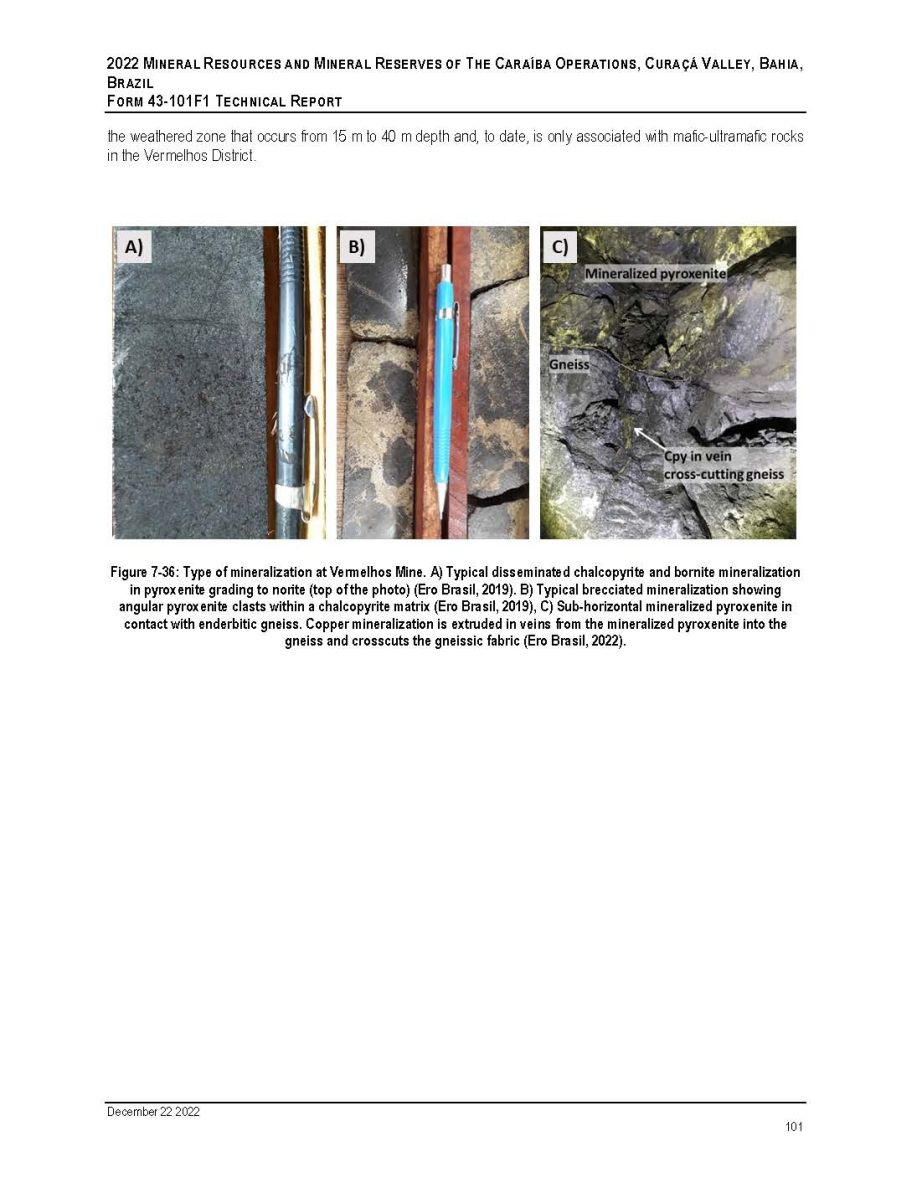
2022 M INERAL R ESOURCES AND M INERAL R ESERVES OF T HE C ARAÍBA O PERATIONS , C URAÇÁ V ALLEY , B AHIA , B RAZIL F ORM 43 - 101F1 T ECHNICAL R EPORT the weathered zone that occurs from 15 m to 40 m depth and, to date, is only associated with mafic - ultramafic rocks in the Vermelhos District. Figure 7 - 36: Type of mineralization at Vermelhos Mine. A) Typical disseminated chalcopyrite and bornite mineralization in pyroxenite grading to norite (top of the photo) (Ero Brasil, 2019). B) Typical brecciated mineralization showing angular pyroxenite clasts within a chalcopyrite matrix (Ero Brasil, 2019), C) Sub - horizontal mineralized pyroxenite in contact with enderbitic gneiss. Copper mineralization is extruded in veins from the mineralized pyroxenite into the gneiss and crosscuts the gneissic fabric (Ero Brasil, 2022). December 22 2022 101
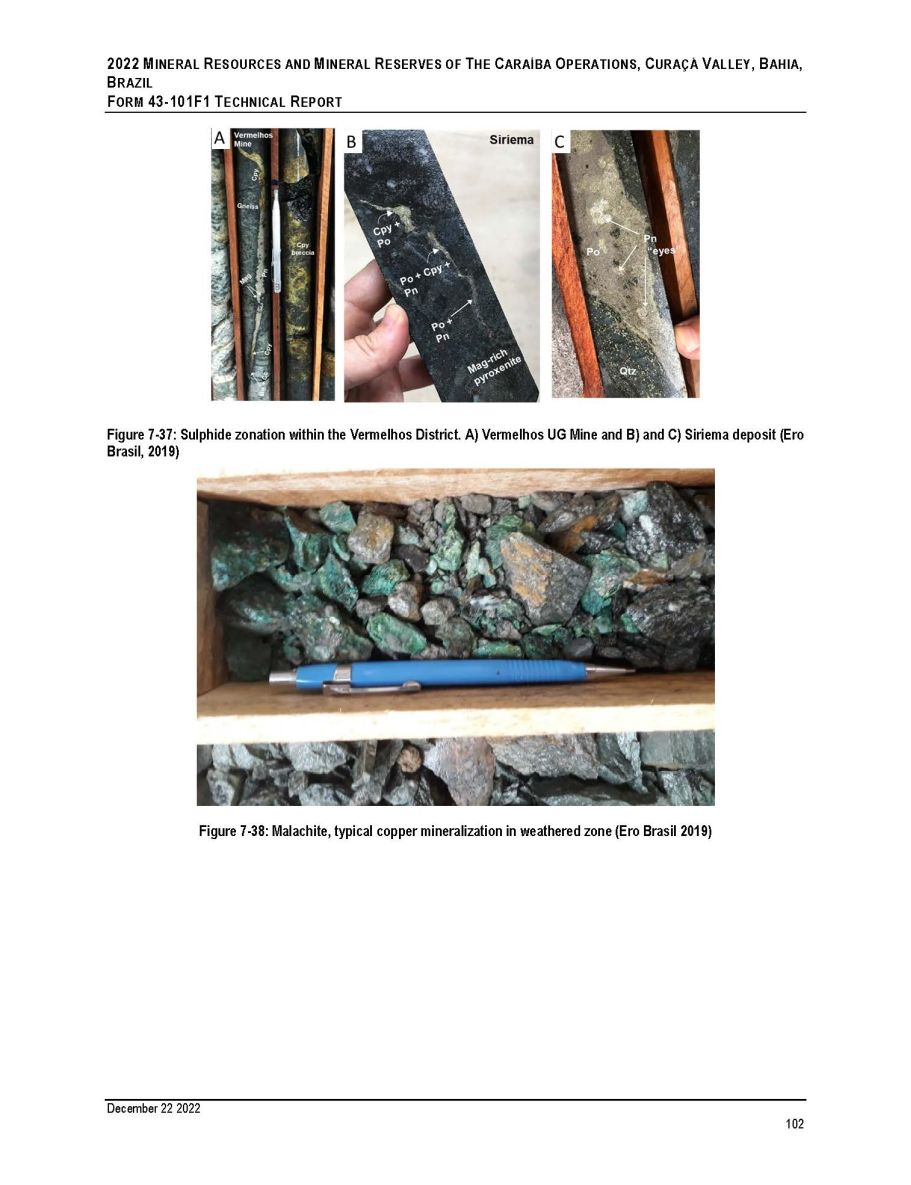
2022 M INERAL R ESOURCES AND M INERAL R ESERVES OF T HE C ARAÍBA O PERATIONS , C URAÇÁ V ALLEY , B AHIA , B RAZIL F ORM 43 - 101F1 T ECHNICAL R EPORT Figure 7 - 37: Sulphide zonation within the Vermelhos District. A) Vermelhos UG Mine and B) and C) Siriema deposit (Ero Brasil, 2019) Figure 7 - 38: Malachite, typical copper mineralization in weathered zone (Ero Brasil 2019) December 22 2022 102
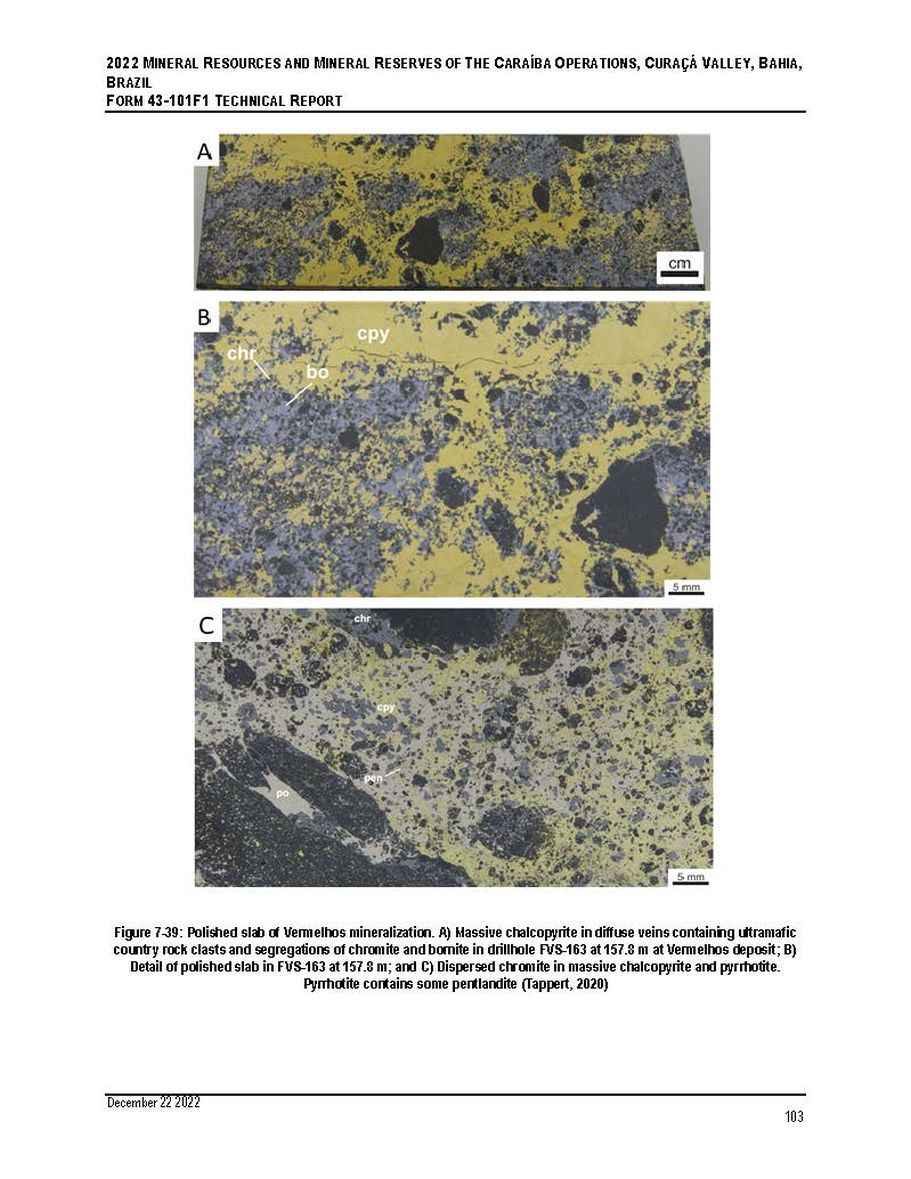
2022 M INERAL R ESOURCES AND M INERAL R ESERVES OF T HE C ARAÍBA O PERATIONS , C URAÇÁ V ALLEY , B AHIA , B RAZIL F ORM 43 - 101F1 T ECHNICAL R EPORT Figure 7 - 39: Polished slab of Vermelhos mineralization. A) Massive chalcopyrite in diffuse veins containing ultramafic country rock clasts and segregations of chromite and bornite in drillhole FVS - 163 at 157.8 m at Vermelhos deposit; B) Detail of polished slab in FVS - 163 at 157.8 m; and C) Dispersed chromite in massive chalcopyrite and pyrrhotite. Pyrrhotite contains some pentlandite (Tappert, 2020) December 22 2022 103
2022 M INERAL R ESOURCES AND M INERAL R ESERVES OF T HE C ARAÍBA O PERATIONS , C URAÇÁ V ALLEY , B AHIA , B RAZIL F ORM 43 - 101 F 1 T ECHNICAL R EPORT 8 DEPOSIT TYPES The Curaçá Valley deposits are complex with features that do not conform to conventional deposit models . The strong spatial association of mineralization in the Curaçá Valley deposits with mafic - ultramafic bodies, dominated by orthopyroxenite, and the common occurrence of some of the sulphide interstitial (“intercumulus”) to orthopyroxene, led several researchers to conclude that mineralization formed through orthomagmatic processes (e . g . , Maier and Barnes, 1996 ), and hence invoked a modified magmatic sulphide model . A number of features, however, are unusual for classical magmatic sulphide deposits including the high Cu/Ni ratio ; significant amounts of bornite in many deposits ; significant amounts of magnetite, most of which contains elevated Al, Cr, V, Ni and Zn ; the abundance of phlogopite in the orthopyroxenite and wall rocks locally associated with sulphides and in some cases also containing concentrations of apatite and zircon ; as well as the low S/Se ratio in sulphides . Maier and Barnes ( 1996 ) suggest various mechanisms to explain some of these features including sulfur loss resulting in the abundance of magnetite and the low S/Se ratio . In addition to phlogopite, potentially of more than one generation, extensive hydrothermal alteration has been recognized in some of the deposits in the Curaçá Valley, and in structures throughout the districts . Alteration includes zones of feldspar +/ - biotite (K - alteration) and albite - diopside (Na - Ca alteration), and siliceous alteration particularly in structures . The style of alteration and its local association with mineralization has been used as evidence for a potential iron oxide copper gold (“IOCG”) affiliation for deposits in the Curaçá valley (Garcia et al . , 2018 ; Teixeira et al . , 2010 ) . In addition, the presence of two generations of magnetite, reported scapolite, and elevated light rare earth elements (“LREE”) support a potential IOCG model (Teixeira et al . , 2010 ) . It is important to note that Ni - rich IOCG deposits are recognized in the Carajás district and thus Ni is not a discriminant between magmatic sulphide and IOCG deposits . As with the magmatic model, there are features in the Curaçá valley that are not consistent with the IOCG model, particularly the spatial association of the majority of known mineralization with orthopyroxenites, the relatively restricted alteration compared to major IOCG districts and the uncertain timing relationship of alteration with mineralization, and the lack of a multi - signature that is characteristic of IOCG mineralization (e . g . , U, Ba, F, REE in addition to Cu - Au - Ni - Co) . In the Curaçá valley, the majority of the magnetite contains highly elevated Al, Cr, Ti and V which is characteristic of magmatic magnetite (possibly reflecting crystallization under high pressures), while the second generation of magnetite contains very low concentrations of these elements . The second generation of magnetite occurs in veins, locally with bornite (Vazelhes, 2018 ) and is typical of hydrothermal magnetite . Multiple generations of magnetite with varying Ti+V contents have been documented in several IOCG deposits (e . g . , Mustafa et al . , 2020 ), but the concentration of these trace elements is significantly lower than first generation magnetite from the Curaçá valley . Recent studies on copper mineralization by Holwell et al . ( 2022 ) indicate that the Cu/Te ratio of the sulphide in the Curaçá valley of 500 to 1 , 000 are much lower than that of the IOCG (greater than 5 , 000 ) and the PGE content of the Curaçá valley deposits are much higher than that of the IOCG, which led the authors to favor the magmatic model . The depth of formation of the Curaçá Valley deposits has important implications for ore genetic processes and deposit models . The gneissic units have undergone granulite facies metamorphism and three deformation events . Granulite metamorphic mineralogy imply temperatures above 850 o C and pressures above 7 kbar (> 25 km) at approximately 2 . 07 - 2 . 08 Ga (Barbosa, 2002 ; Barbosa et al, 2016 ) . The mafic - ultramafic intrusions, dominated by orthopyroxenites, postdate most of the deformation and presumably peak metamorphism, however there are no clear constraints on pressure and temperature (“P - T”) conditions . Both orthopyroxene and magnetite mineral chemistry suggest elevated P - T, but existing data do not define precise conditions . If P - T conditions are elevated, there are potential implications for conventional magmatic sulphide and IOCG deposit models . Phlogopite is common in orthopyroxenite units in general and is abundant with sulphide both in orthopyroxenite and in gneissic wall - rocks . Phlogopite occurs with orthopyroxene crystals as well as with plagioclase and olivine in some cases without any indication of replacement, and is present in sulphide clots, where it also appears to be in equilibrium with chalcopyrite and bornite (Maier and Barnes, 1996 ) . Phlogopite therefore appears to have a close relationship to sulphide concentration in orthopyroxenite, and as currently understood, is distinct from K - alteration zones in gneiss . December 22 2022 104
2022 M INERAL R ESOURCES AND M INERAL R ESERVES OF T HE C ARAÍBA O PERATIONS , C URAÇÁ V ALLEY , B AHIA , B RAZIL F ORM 43 - 101 F 1 T ECHNICAL R EPORT Recent mineralogical studies identified frequent presence of carbonate and apatite, that together with the abundance of phlogopite, are suggestive of a volatile - rich alkalic magmatic sulfide system . Geochemical studies suggest that the source for the mineralized mafic - ultramafic units corresponds to an enriched and metasomatized mantle source that underwent a low degree of partial melting (Blanks and Holwell, 2021 , Nunes et al . , 2022 ) . There are number of potential analogues for the Curaçá valley deposits, depending on the preferred deposit model but the most similar analogue is the O’okiep district, Cape Province, South Africa . Other deposits that also contain some characteristics that are reminiscent to that of the deposits in the Curaçá Valley include the Nova Bollinger Ni - Cu deposit of Western Australia, the Coldwell deposit, Lake Superior, Canada, and the Santa Rita Deposit, in the southern part of the Itabuna - Salvador - Curaçá Belt in Brazil . The O’okiep deposits are also associated with orthopyroxenites and have high bornite and magnetite contents, and low S/Se in sulphides (Clifford and Barton, 2012 ; Born et al . , 1994 ; Cawthorn and Meyer, 1993 ) . Born et al . ( 1994 ) and Cawthorn and Meyer ( 1993 ) suggested that oxidation and desulfurization of a primary pyrrhotite - chalcopyrite resulted in the magnetite - bornite assemblage . This is not consistent, however, with the magnetite compositions in the Curaçá Valley deposits (elevated Cr, Ti and V), lack of hematite, and limited evidence for widespread replacement of pyrrhotite by magnetite (Maier and Barnes, 1996 ), and similar lack of evidence for chalcopyrite by bornite (observed in complex intergrowths in petrography) . Regardless, any model for the Curaçá Valley deposits must be broadly applicable to the O’okiep district given the number of similarities . The Nova Bollinger Ni - Cu deposit of Western Australia was formed by the injection of small tube - shaped mafic - ultramafic intrusions emplaced at mid - to lower crust into granulite facies migmatite gneisses . The mineralization consists of net - textured and leopard next - textured Ni - Cu sulphides within the mafic - ultramafic intrusions as well as sulphide veins, sulphide - matrix breccias, and infiltrations of disseminated sulphides in the foliated and folded gneisses . The depth of emplacement, potential slow cooling under high grade metamorphic conditions, and the late emplacement of the mineralized mafic - ultramafic units relative to the deformed host gneiss are very similar to the overall general setting of the Curaçá valley deposits . The setting of the Curaçá Valley is further complicated by the presence of significant alkaline intrusions . The most important is the Itiúba syenite complex located to the east of the main concentration of deposits in the Curaçá valley at the boundary between the Serrinha block and the Itabuna - Salvador - Curaçá belt . Alkaline intrusions of various types are known to host copper mineralization and generate fluids that may produce extensive K - Ca - Na - rich alteration similar to that found in IOCG districts . Limited available geochronology suggests that the Itiúba complex is approximately 30 Ma older than the Curaçá Valley deposits, and therefore is an unlikely source of fluids and metals in the district . Syenitic intrusions, however, occur throughout the Curaçá Valley and while they may be related to the Itiúba complex, currently there are no geochronological or petrological data to confirm this . If an alkaline intrusion is the source of fluids that generated K - and Na - Ca - rich alteration, the same arguments for and against an IOCG model will apply, particularly the importance of the orthopyroxenite and the relationship between alteration and mineralization . There are a variety of potential magmatic processes to explain for the Cu - dominant mineralization . The current working hypothesis invokes low degree partial melts, but regardless, protracted sulphide fractionation under regional high P - T metamorphic conditions was a probable mechanism for further separation of Cu, Ni and PGE - Au . Volatiles were clearly important in this process, explaining the abundance of phlogopite - carbonate . In additional, fluids may have been generated by granite - pegmatites and syenites in the region, at least some of which appear to be contemporaneous with mafic - ultramafic magmatism and sulphide crystallization . These fluids may have modified, remobilized, and added mineralization . Given uncertainties with the most likely deposit models for the Curaçá Valley copper deposits, it is quite possible that previously undocumented processes were responsible for mineralization and a new deposit model is required . December 22 2022 105
2022 M INERAL R ESOURCES AND M INERAL R ESERVES OF T HE C ARAÍBA O PERATIONS , C URAÇÁ V ALLEY , B AHIA , B RAZIL F ORM 43 - 101 F 1 T ECHNICAL R EPORT Current research argues in favor of a modified classic magmatic Cu+ - Ni . The deposits would have formed during magma crystallization and fractionation, possibly involving mixing of mafic - ultramafic with alkaline magmas either derived from a primary source or during crustal contamination (Nunes et al . , 2022 ) or alternatively could represent the Cu - rich parts of a highly fractionated system where the Ni - rich deposits are not discovered yet (Holwell et al . , 2022 ) . In late 2022 , subsequent to the Effective Date, Ero Copper announced the first documented nickel sulphide discovery in the Curaçá Valley as part of its ongoing regional exploration program . The nickel system, known as the "Umburana System", is located approximately 20 kilometers from the Caraíba Mill . The system was discovered using detailed field mapping and soil geochemistry collected during the Company's 2021 and 2022 exploration programs in conjunction with the Company's airborne electromagnetic ("AEM") survey . The ongoing program identified large intervals of disseminated and interstitial nickel sulphides as well as zones of high - grade semi - massive (containing approximately 30 % to 60 % sulphides) and massive sulphides (containing approximately 60 % to 80 % sulphides), with massive sulphide intercepts up to 1 . 5 meters in thickness grading up to 6 . 59 % nickel . Nickel mineralization has been identified as outcropping at surface, as evident in trenches and remains open down - plunge . As at the date of this Report, maximum depth of drilling was approximately 300 meters below surface . Ero Copper’s discovery of the Ni - rich Umburana System in 2022 supports the modified classic magmatic Cu+ - Ni interpretation . December 22 2022 106

2022 M INERAL R ESOURCES AND M INERAL R ESERVES OF T HE C ARAÍBA O PERATIONS , C URAÇÁ V ALLEY , B AHIA , B RAZIL F ORM 43 - 101 F 1 T ECHNICAL R EPORT 9 EXPLORATION The first well documented accounts of copper mineralization in the Curaçá Valley date back to 1871 and 1874 (Projeto Especial Caraíba, Relatório Final, Docegeo 1978 ) . However, exploration work was not conducted until 1944 by the DNPM . Results from these programs were published in 1964 (J . L . Melo Jr . and Ernesto B . Pouchain, 1964 ) who provided a historic estimate of 10 , 795 tonnes grading 1 . 0 % Cu at the Caraíba Mine . The parameters and assumptions used to determine this estimate are unknown . Additionally, this material was most likely contained within the mined - out open pit . Accordingly, Ero Copper is not treating this historical estimate, nor any portions of it, as relevant to the current mineral resources . From 1952 to 1953 , Northfield Mining Inc . conducted trenching and drilling at the Caraíba Mine and in 1960 , the Pignatari Industrial Group conducted systematic exploration work over the Caraíba Mine in association with T . Janer and Mitsubishi Metal Mining . In parallel, systematic investigations were carried throughout the Curaçá Valley by the DNPM (Projeto Especial Caraíba, Relatório Final, Docegeo 1978 ) . In 1965 , the “Projeto Cobre do Vale do Curaçá” was created by the DNPM and in 1974 the “Financiamento de Insumos Basicos SA” assumed control of the concessions and created the “Caraíba Project” . In 1975 Docegeo was contracted for the planning and execution of exploration of the area . Once open pit operations began in 1979 , very little exploration work was conducted outside of the main Caraíba Mine area . The open pit operated until 1998 and underground operations began in 1986 . The Caraíba operation was privatized in 1994 and again, between 2004 and 2007 , very little formal exploration work was conducted until the Codelco JV . Codelco conducted work on several prospects outside the Pilar UG Mine area including an airborne VTEM geophysical survey over the Vermelhos District . Oxide leach operations started in 2006 and operated continuously from 2007 to 2015 . Most of the exploration work was focused on (i) replacing mined reserves annually, and (ii) where they were performed regionally, they were focused on individual properties to maintain tenure ownership . Details of the exploration work and programs conducted at the Caraíba Operations by the Company since its acquisition of Mineração Caraíba in December, 2016 are set out in subsections below . 1. G EOCHEMICAL S URVEYS Near - surface copper mineralization in the Curaçá Valley is well - defined by geochemical sampling techniques including drainage (stream sediments) and soil surveys . Since there are very few outcrops in the valley and most of the area consists of thin soil cover, the soil sampling represents an effective exploration method . Mineralized ultramafic - mafic intrusions show anomalous Cu, Ni, Co, Cr, and Mg . Several drainage and soil geochemical surveys were conducted along the Curaçá Valley and soil sample collection is still an ongoing process . In 2017 , Ero Copper engaged Infotierra, specialists in geo - focused remote sensing and database management, to compile and validate geochemical data from the various surveys . Heberlein Geoconsulting, specialists in exploration geochemistry, were then contracted by Ero Copper in 2017 to further validate and perform levelling analysis on the historical soil and drainage sediment geochemistry datasets . Given the long history of the sampling programs, interpretation of anomalies and targets would not be possible without appropriate data levelling to remove artifacts caused by differences in laboratories and analytical methods across discrete surveys . The reinterpretation of copper results in soil based on historic geochemical surveys after z - score levelling has been performed . December 22, 2022 Rev. F 107
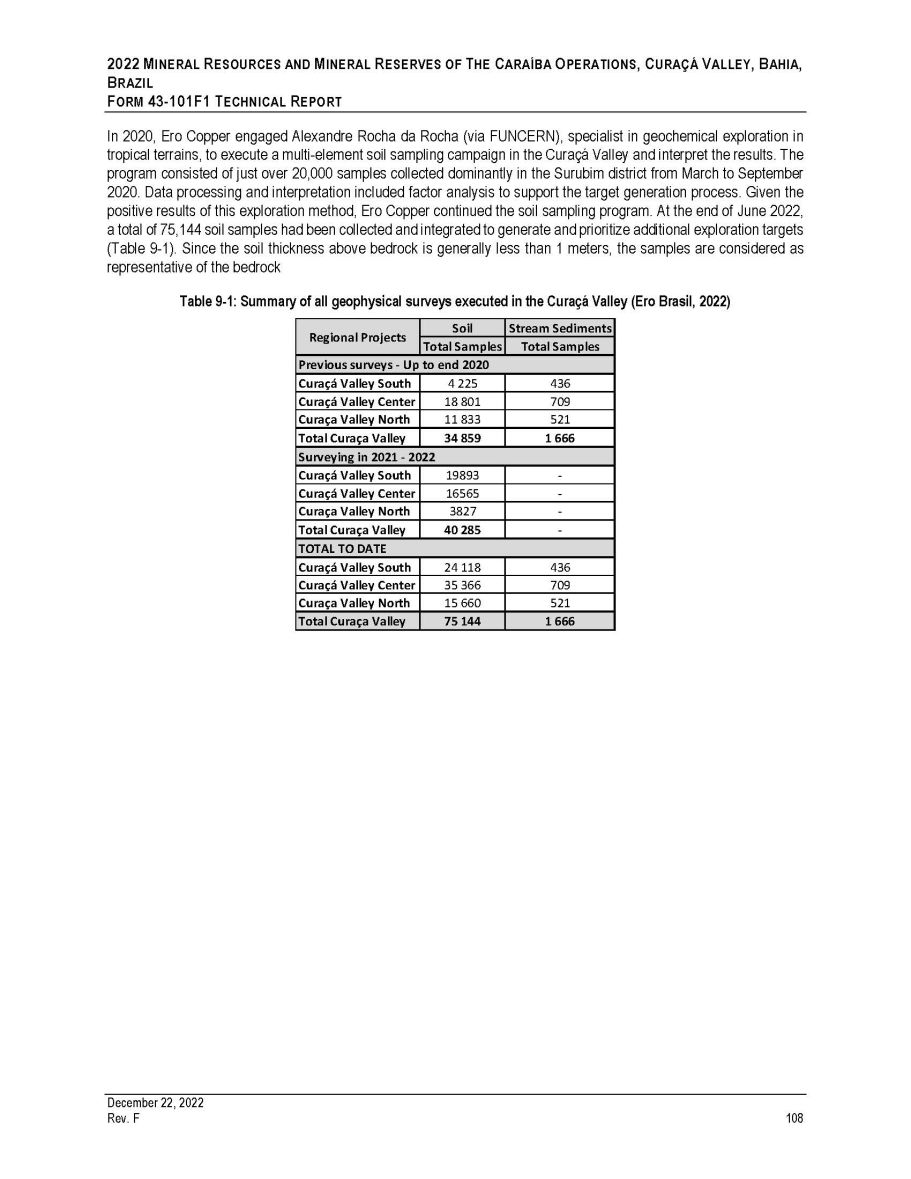
2022 M INERAL R ESOURCES AND M INERAL R ESERVES OF T HE C ARAÍBA O PERATIONS , C URAÇÁ V ALLEY , B AHIA , B RAZIL F ORM 43 - 101 F 1 T ECHNICAL R EPORT In 2020 , Ero Copper engaged Alexandre Rocha da Rocha (via FUNCERN), specialist in geochemical exploration in tropical terrains, to execute a multi - element soil sampling campaign in the Curaçá Valley and interpret the results . The program consisted of just over 20 , 000 samples collected dominantly in the Surubim district from March to September 2020 . Data processing and interpretation included factor analysis to support the target generation process . Given the positive results of this exploration method, Ero Copper continued the soil sampling program . At the end of June 2022 , a total of 75 , 144 soil samples had been collected and integrated to generate and prioritize additional exploration targets (Table 9 - 1 ) . Since the soil thickness above bedrock is generally less than 1 meters, the samples are considered as representative of the bedrock Table 9 - 1: Summary of all geophysical surveys executed in the Curaçá Valley (Ero Brasil, 2022) Regional Projects Soil Stream Sediments Total Samples Total Samples Previous surveys - Up to end 2020 Curaçá Valley South 4 225 436 Curaçá Valley Center 18 801 709 Curaça Valley North 11 833 521 Total Curaça Valley 34 859 1 666 Surveying in 2021 - 2022 Curaçá Valley South 19893 - Curaçá Valley Center 16565 - Curaça Valley North 3827 - Total Curaça Valley 40 285 - TOTAL TO DATE Curaçá Valley South 24 118 436 Curaçá Valley Center 35 366 709 Curaça Valley North 15 660 521 Total Curaça Valley 75 144 1 666 December 22, 2022 Rev. F 108
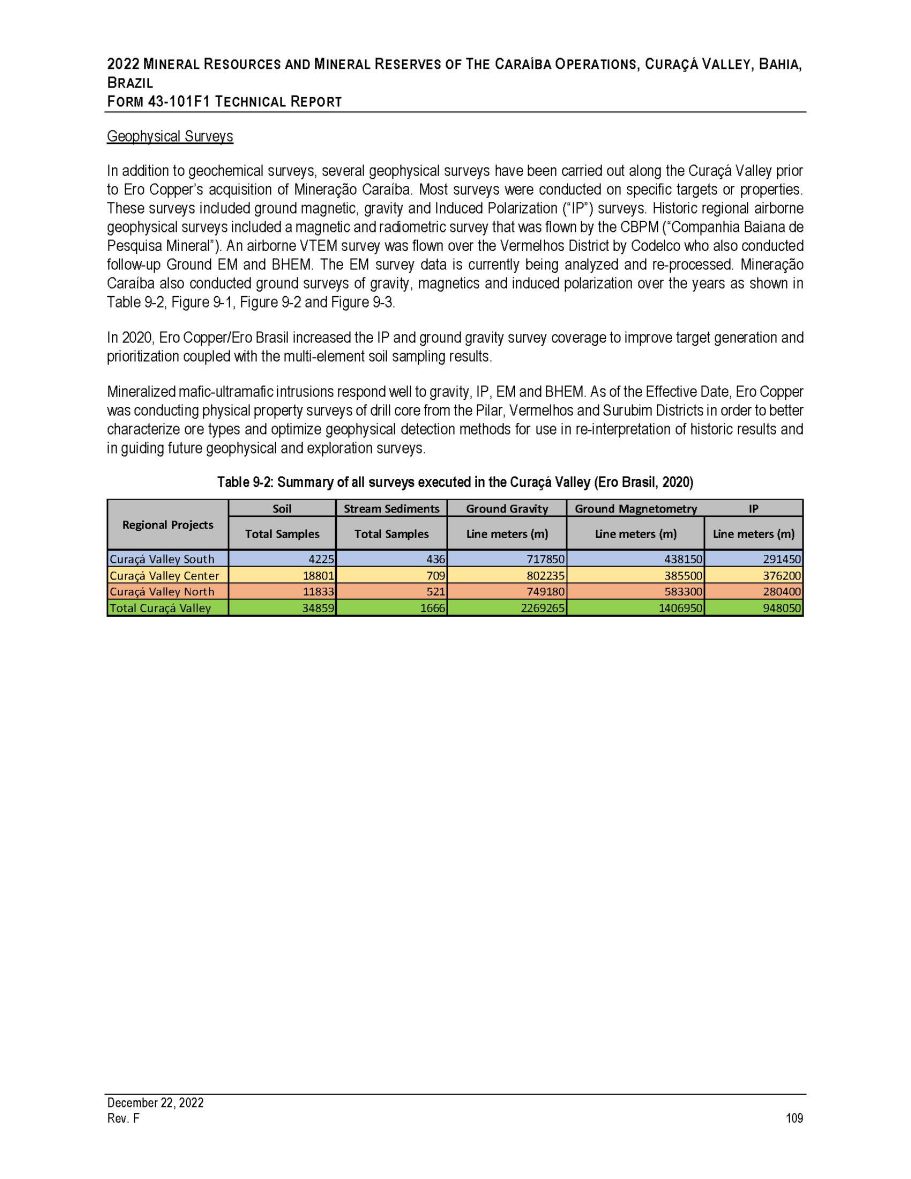
2022 M INERAL R ESOURCES AND M INERAL R ESERVES OF T HE C ARAÍBA O PERATIONS , C URAÇÁ V ALLEY , B AHIA , B RAZIL F ORM 43 - 101 F 1 T ECHNICAL R EPORT Geophysical Surveys In addition to geochemical surveys, several geophysical surveys have been carried out along the Curaçá Valley prior to Ero Copper’s acquisition of Mineração Caraíba . Most surveys were conducted on specific targets or properties . These surveys included ground magnetic, gravity and Induced Polarization (“IP”) surveys . Historic regional airborne geophysical surveys included a magnetic and radiometric survey that was flown by the CBPM (“Companhia Baiana de Pesquisa Mineral”) . An airborne VTEM survey was flown over the Vermelhos District by Codelco who also conducted follow - up Ground EM and BHEM . The EM survey data is currently being analyzed and re - processed . Mineração Caraíba also conducted ground surveys of gravity, magnetics and induced polarization over the years as shown in Table 9 - 2 , Figure 9 - 1 , Figure 9 - 2 and Figure 9 - 3 . In 2020 , Ero Copper/Ero Brasil increased the IP and ground gravity survey coverage to improve target generation and prioritization coupled with the multi - element soil sampling results . Mineralized mafic - ultramafic intrusions respond well to gravity, IP, EM and BHEM . As of the Effective Date, Ero Copper was conducting physical property surveys of drill core from the Pilar, Vermelhos and Surubim Districts in order to better characterize ore types and optimize geophysical detection methods for use in re - interpretation of historic results and in guiding future geophysical and exploration surveys . Table 9 - 2: Summary of all surveys executed in the Curaçá Valley (Ero Brasil, 2020) Regional Projects Soil Stream Sediments Ground Gravity Ground Magnetometry IP Total Samples Total Samples Line meters (m) Line meters (m) Line meters (m) Curaçá Valley South 4225 436 717850 438150 291450 Curaçá Valley Center 18801 709 802235 385500 376200 Curaçá Valley North 11833 521 749180 583300 280400 Total Curaçá Valley 34859 1666 2269265 1406950 948050 December 22, 2022 Rev. F 109
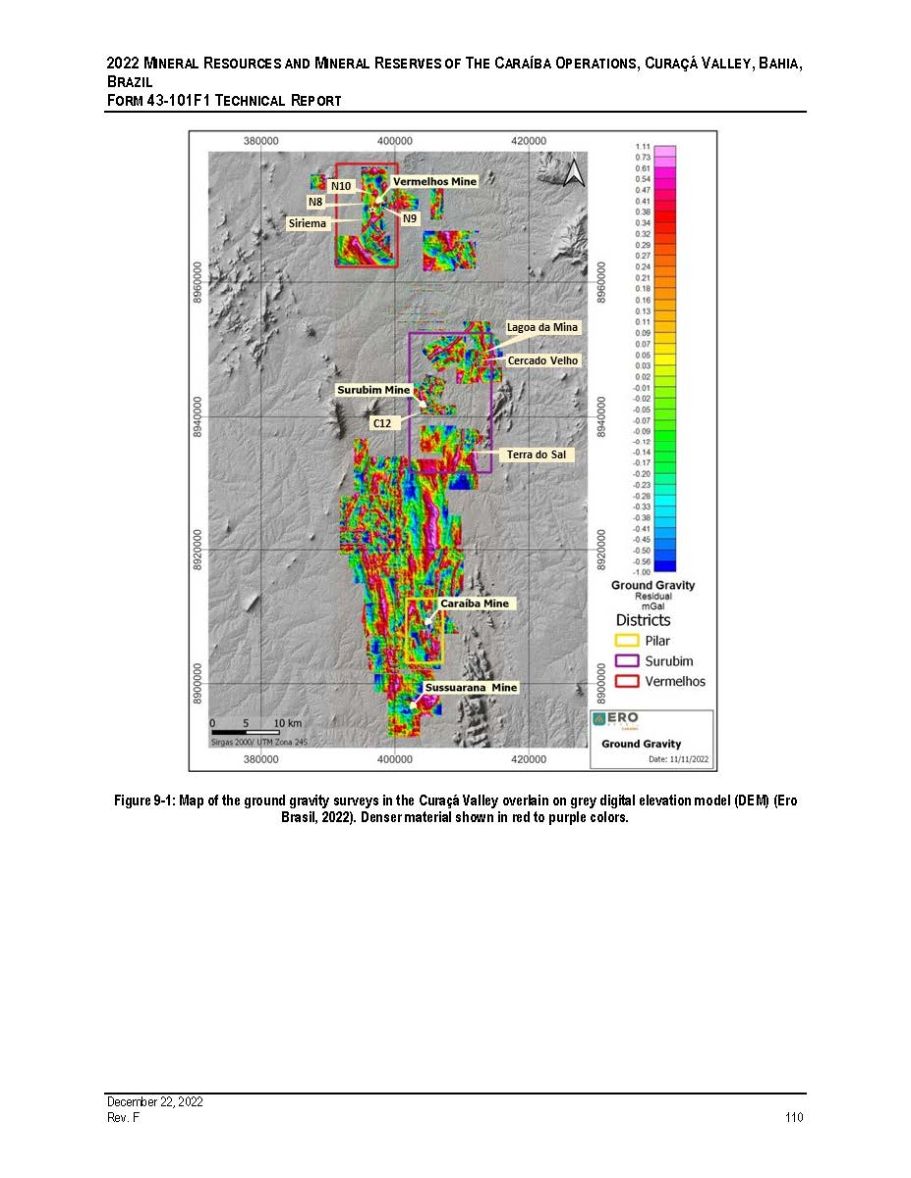
2022 M INERAL R ESOURCES AND M INERAL R ESERVES OF T HE C ARAÍBA O PERATIONS , C URAÇÁ V ALLEY , B AHIA , B RAZIL F ORM 43 - 101F1 T ECHNICAL R EPORT Figure 9 - 1: Map of the ground gravity surveys in the Curaçá Valley overlain on grey digital elevation model (DEM) (Ero Brasil, 2022). Denser material shown in red to purple colors. December 22, 2022 Rev. F 110
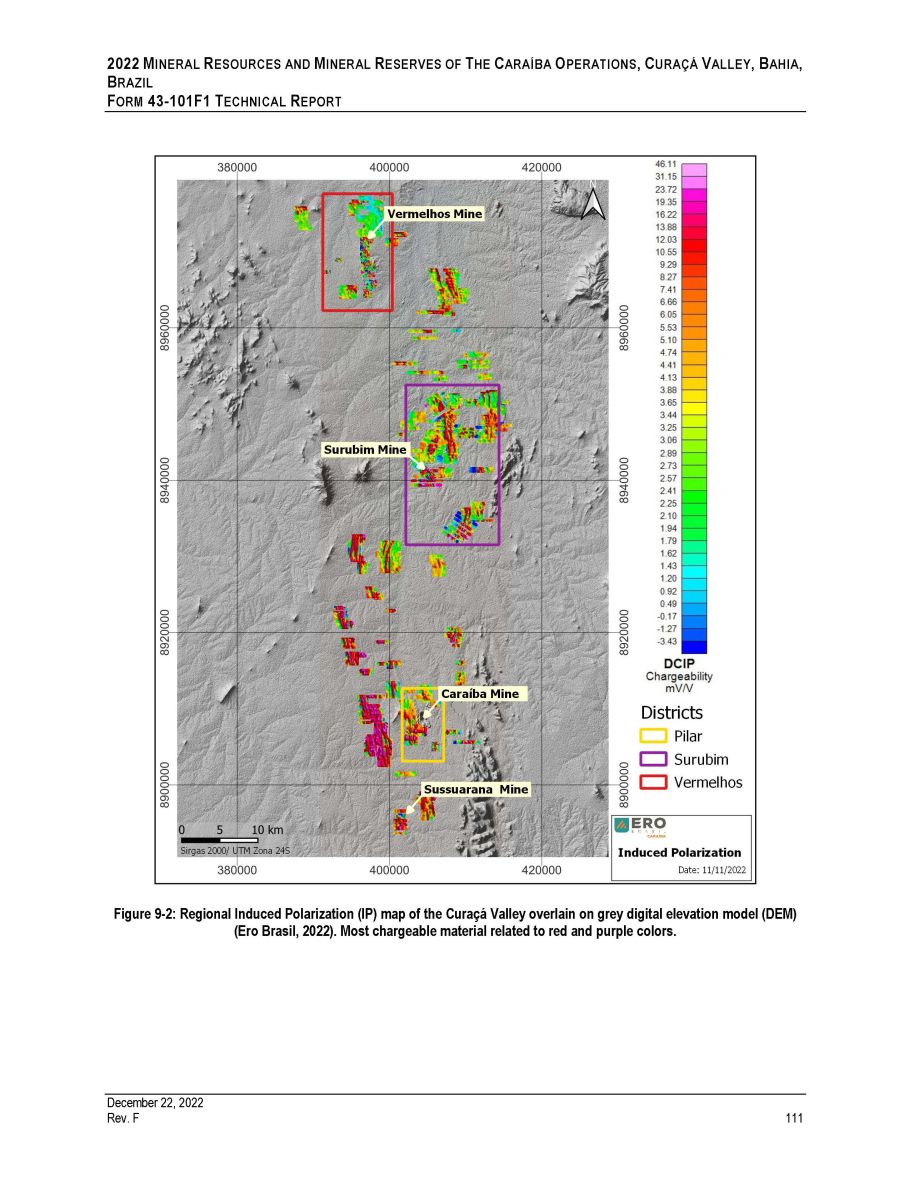
2022 M INERAL R ESOURCES AND M INERAL R ESERVES OF T HE C ARAÍBA O PERATIONS , C URAÇÁ V ALLEY , B AHIA , B RAZIL F ORM 43 - 101F1 T ECHNICAL R EPORT Figure 9 - 2: Regional Induced Polarization (IP) map of the Curaçá Valley overlain on grey digital elevation model (DEM) (Ero Brasil, 2022). Most chargeable material related to red and purple colors. December 22, 2022 Rev. F 111
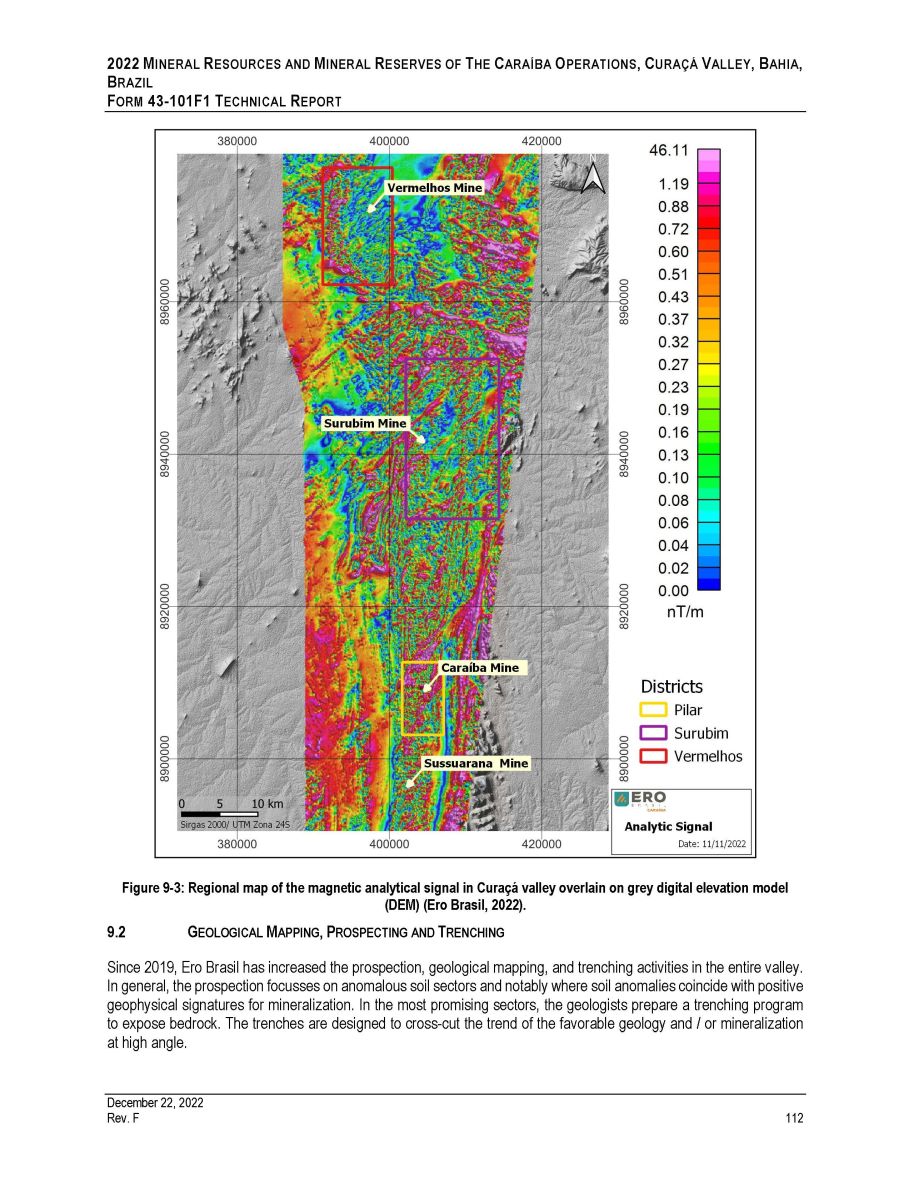
2022 M INERAL R ESOURCES AND M INERAL R ESERVES OF T HE C ARAÍBA O PERATIONS , C URAÇÁ V ALLEY , B AHIA , B RAZIL F ORM 43 - 101F1 T ECHNICAL R EPORT Figure 9 - 3: Regional map of the magnetic analytical signal in Curaçá valley overlain on grey digital elevation model (DEM) (Ero Brasil, 2022). 9.2 G EOLOGICAL M APPING , P ROSPECTING AND T RENCHING Since 2019 , Ero Brasil has increased the prospection, geological mapping, and trenching activities in the entire valley . In general, the prospection focusses on anomalous soil sectors and notably where soil anomalies coincide with positive geophysical signatures for mineralization . In the most promising sectors, the geologists prepare a trenching program to expose bedrock . The trenches are designed to cross - cut the trend of the favorable geology and / or mineralization at high angle . December 22, 2022 Rev. F 112
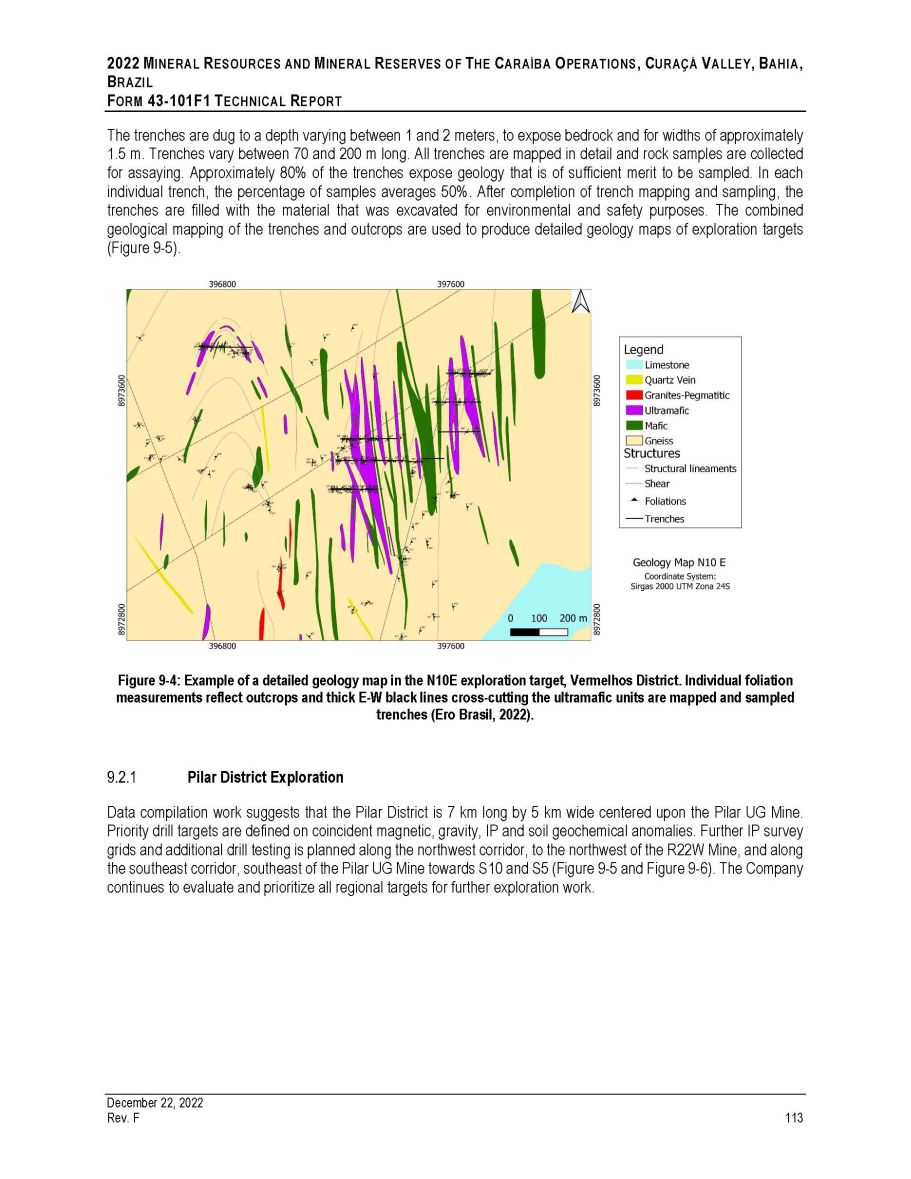
2022 M INERAL R ESOURCES AND M INERAL R ESERVES OF T HE C ARAÍBA O PERATIONS , C URAÇÁ V ALLEY , B AHIA , B RAZIL F ORM 43 - 101 F 1 T ECHNICAL R EPORT The trenches are dug to a depth varying between 1 and 2 meters, to expose bedrock and for widths of approximately 1 . 5 m . Trenches vary between 70 and 200 m long . All trenches are mapped in detail and rock samples are collected for assaying . Approximately 80 % of the trenches expose geology that is of sufficient merit to be sampled . In each individual trench, the percentage of samples averages 50 % . After completion of trench mapping and sampling, the trenches are filled with the material that was excavated for environmental and safety purposes . The combined geological mapping of the trenches and outcrops are used to produce detailed geology maps of exploration targets (Figure 9 - 5 ) . Figure 9 - 4: Example of a detailed geology map in the N10E exploration target, Vermelhos District. Individual foliation measurements reflect outcrops and thick E - W black lines cross - cutting the ultramafic units are mapped and sampled trenches (Ero Brasil, 2022). Pilar District Exploration Data compilation work suggests that the Pilar District is 7 km long by 5 km wide centered upon the Pilar UG Mine . Priority drill targets are defined on coincident magnetic, gravity, IP and soil geochemical anomalies . Further IP survey grids and additional drill testing is planned along the northwest corridor, to the northwest of the R 22 W Mine, and along the southeast corridor, southeast of the Pilar UG Mine towards S 10 and S 5 (Figure 9 - 5 and Figure 9 - 6 ) . The Company continues to evaluate and prioritize all regional targets for further exploration work . December 22, 2022 Rev. F 113
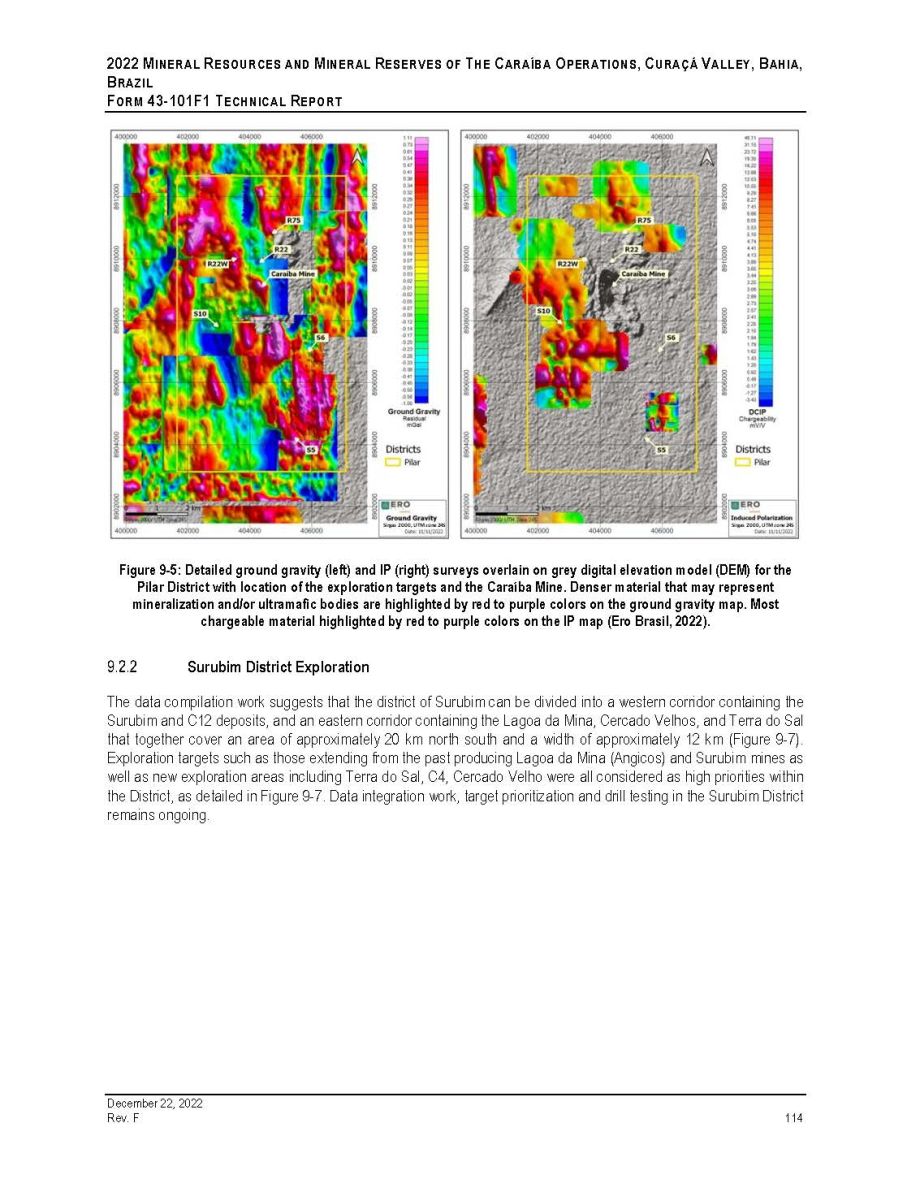
2022 M INERAL R ESOURCES AND M INERAL R ESERVES OF T HE C ARAÍBA O PERATIONS , C URAÇÁ V ALLEY , B AHIA , B RAZIL F ORM 43 - 101F1 T ECHNICAL R EPORT Figure 9 - 5: Detailed ground gravity (left) and IP (right) surveys overlain on grey digital elevation model (DEM) for the Pilar District with location of the exploration targets and the Caraíba Mine. Denser material that may represent mineralization and/or ultramafic bodies are highlighted by red to purple colors on the ground gravity map. Most chargeable material highlighted by red to purple colors on the IP map (Ero Brasil, 2022). Surubim District Exploration The data compilation work suggests that the district of Surubim can be divided into a western corridor containing the Surubim and C 12 deposits, and an eastern corridor containing the Lagoa da Mina, Cercado Velhos, and Terra do Sal that together cover an area of approximately 20 km north south and a width of approximately 12 km (Figure 9 - 7 ) . Exploration targets such as those extending from the past producing Lagoa da Mina (Angicos) and Surubim mines as well as new exploration areas including Terra do Sal, C 4 , Cercado Velho were all considered as high priorities within the District, as detailed in Figure 9 - 7 . Data integration work, target prioritization and drill testing in the Surubim District remains ongoing . December 22, 2022 Rev. F 114
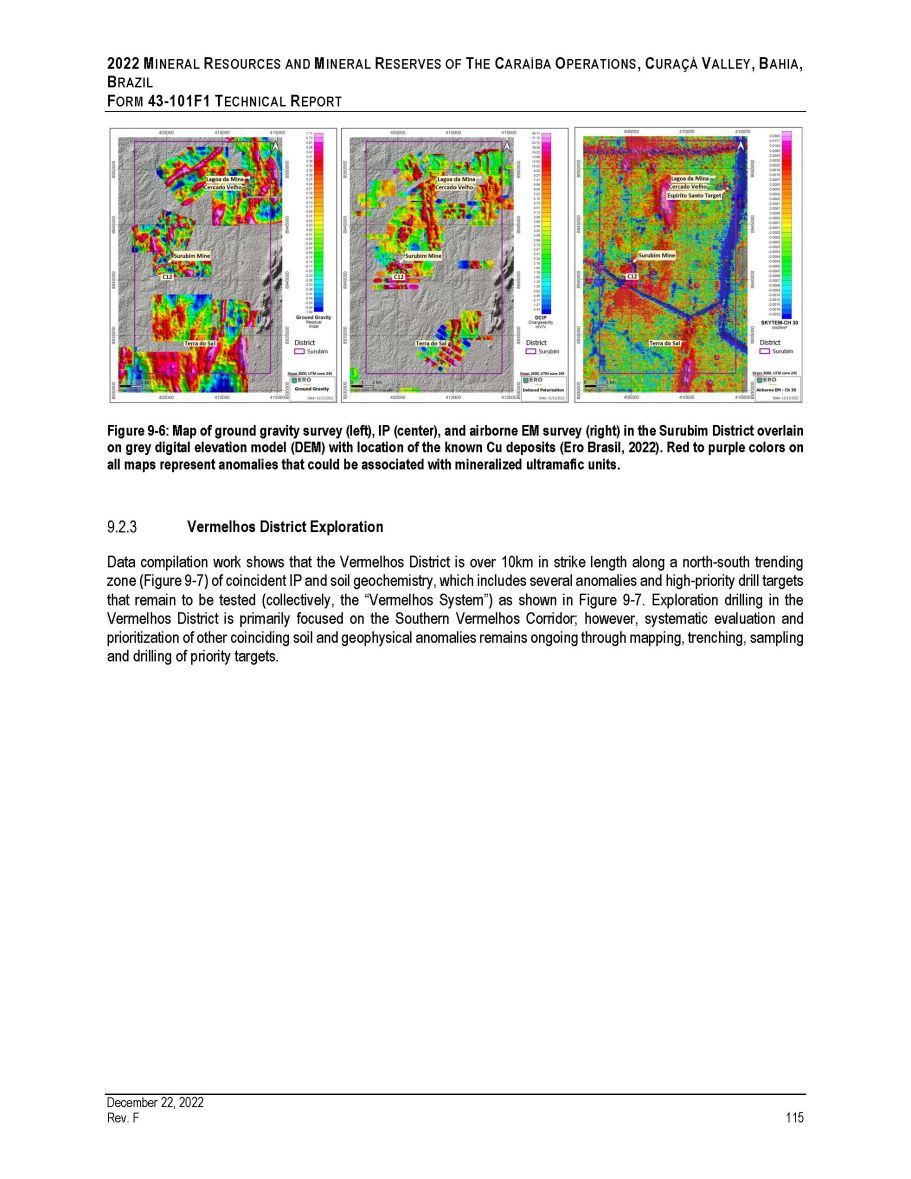
2022 M INERAL R ESOURCES AND M INERAL R ESERVES OF T HE C ARAÍBA O PERATIONS , C URAÇÁ V ALLEY , B AHIA , B RAZIL F ORM 43 - 101F1 T ECHNICAL R EPORT Figure 9 - 6 : Map of ground gravity survey (left), IP (center), and airborne EM survey (right) in the Surubim District overlain on grey digital elevation model (DEM) with location of the known Cu deposits (Ero Brasil, 2022 ) . Red to purple colors on all maps represent anomalies that could be associated with mineralized ultramafic units . Vermelhos District Exploration Data compilation work shows that the Vermelhos District is over 10 km in strike length along a north - south trending zone (Figure 9 - 7 ) of coincident IP and soil geochemistry, which includes several anomalies and high - priority drill targets that remain to be tested (collectively, the “Vermelhos System”) as shown in Figure 9 - 7 . Exploration drilling in the Vermelhos District is primarily focused on the Southern Vermelhos Corridor ; however, systematic evaluation and prioritization of other coinciding soil and geophysical anomalies remains ongoing through mapping, trenching, sampling and drilling of priority targets . December 22, 2022 Rev. F 115
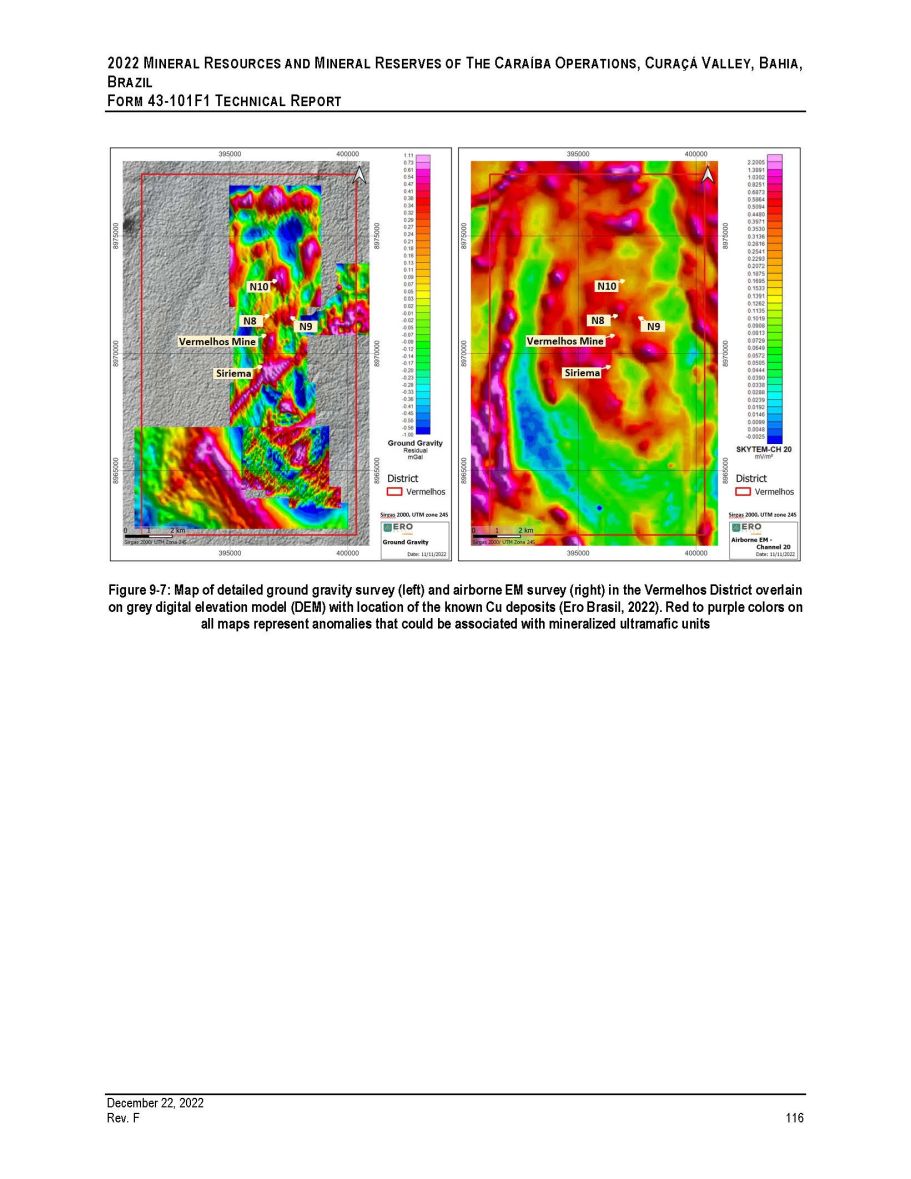
2022 M INERAL R ESOURCES AND M INERAL R ESERVES OF T HE C ARAÍBA O PERATIONS , C URAÇÁ V ALLEY , B AHIA , B RAZIL F ORM 43 - 101F1 T ECHNICAL R EPORT Figure 9 - 7: Map of detailed ground gravity survey (left) and airborne EM survey (right) in the Vermelhos District overlain on grey digital elevation model (DEM) with location of the known Cu deposits (Ero Brasil, 2022). Red to purple colors on all maps represent anomalies that could be associated with mineralized ultramafic units December 22, 2022 Rev. F 116
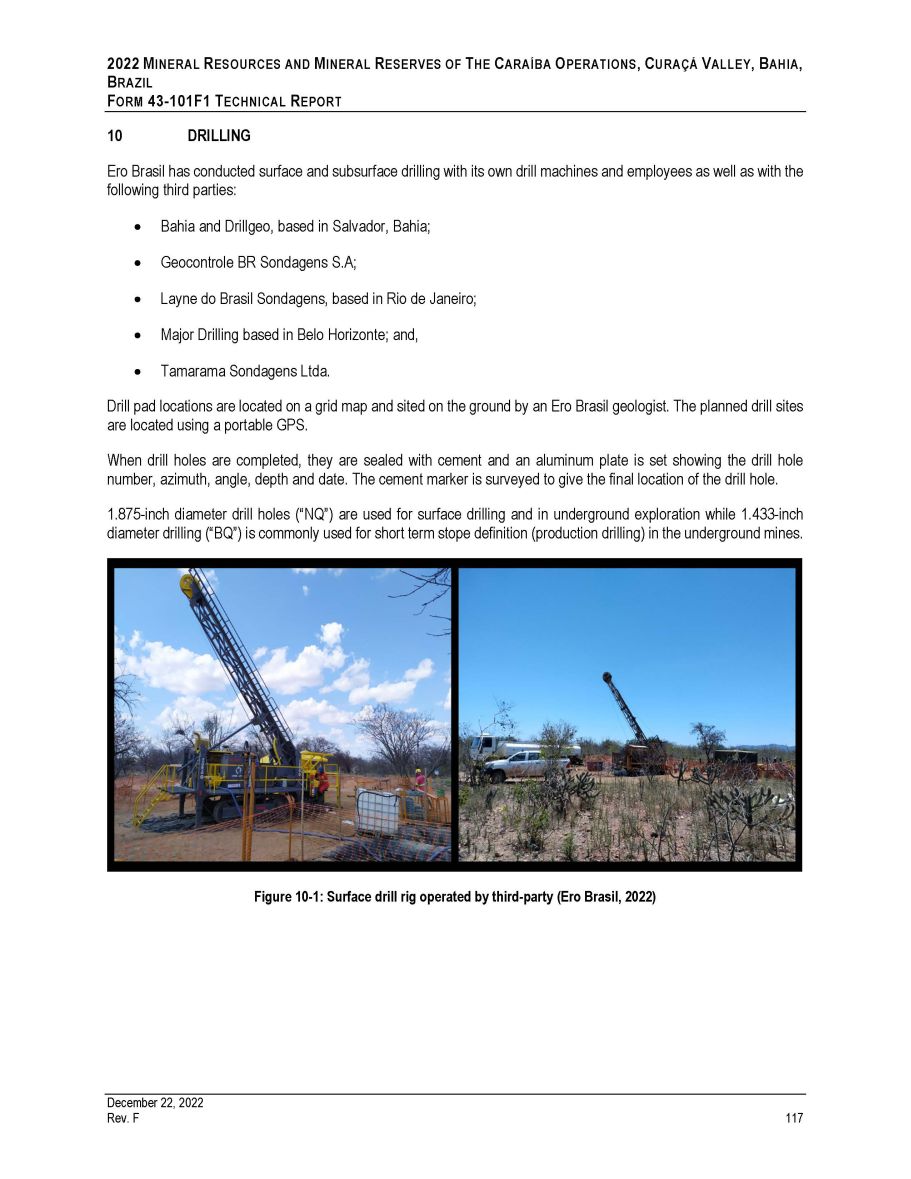
2022 M INERAL R ESOURCES AND M INERAL R ESERVES OF T HE C ARAÍBA O PERATIONS , C URAÇÁ V ALLEY , B AHIA , B RAZIL F ORM 43 - 101F1 T ECHNICAL R EPORT 10 DRILLING Ero Brasil has conducted surface and subsurface drilling with its own drill machines and employees as well as with the following third parties: Bahia and Drillgeo, based in Salvador, Bahia; Geocontrole BR Sondagens S.A; Layne do Brasil Sondagens, based in Rio de Janeiro; Major Drilling based in Belo Horizonte; and, Tamarama Sondagens Ltda. Drill pad locations are located on a grid map and sited on the ground by an Ero Brasil geologist. The planned drill sites are located using a portable GPS. When drill holes are completed, they are sealed with cement and an aluminum plate is set showing the drill hole number, azimuth, angle, depth and date. The cement marker is surveyed to give the final location of the drill hole. 1.875 - inch diameter drill holes (“NQ”) are used for surface drilling and in underground exploration while 1.433 - inch diameter drilling (“BQ”) is commonly used for short term stope definition (production drilling) in the underground mines. Figure 10 - 1: Surface drill rig operated by third - party (Ero Brasil, 2022) December 22, 2022 Rev. F 117
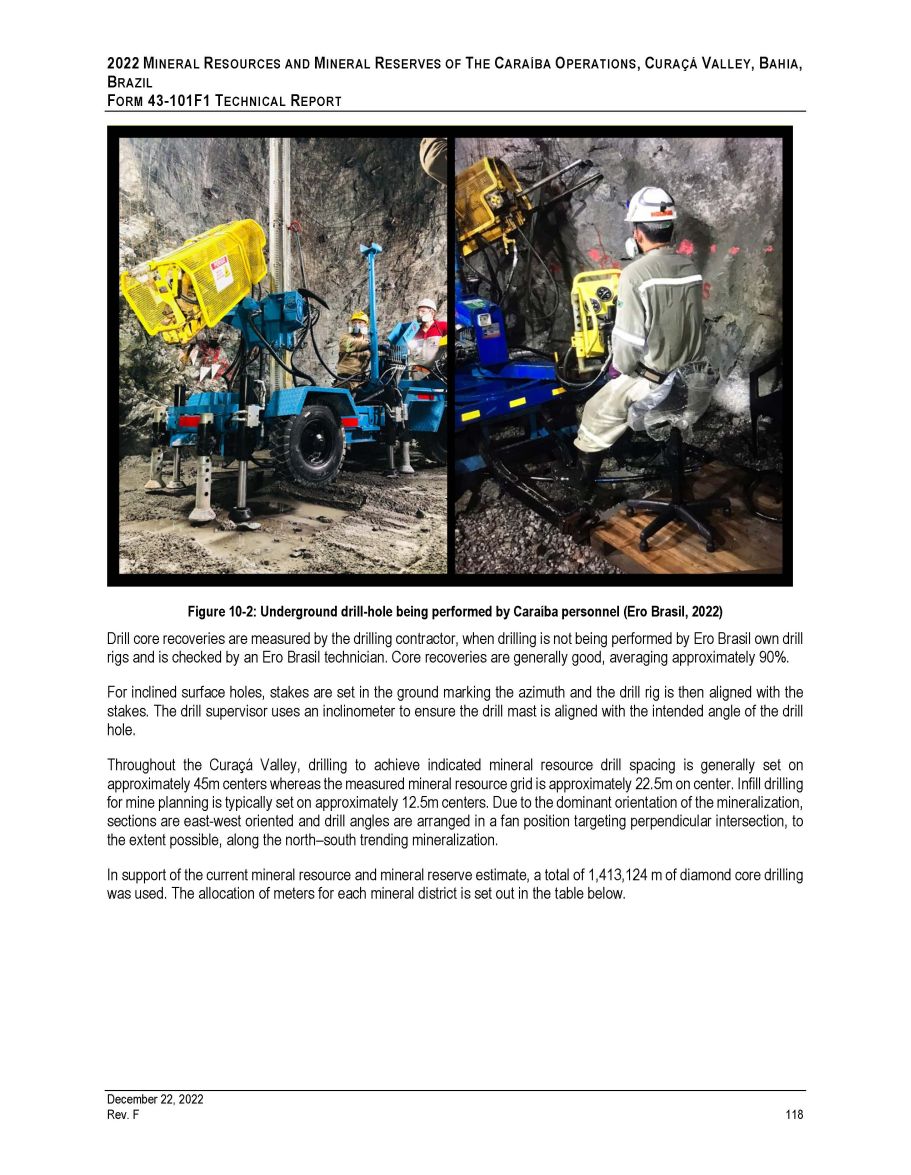
2022 M INERAL R ESOURCES AND M INERAL R ESERVES OF T HE C ARAÍBA O PERATIONS , C URAÇÁ V ALLEY , B AHIA , B RAZIL F ORM 43 - 101F1 T ECHNICAL R EPORT Figure 10 - 2: Underground drill - hole being performed by Caraíba personnel (Ero Brasil, 2022) Drill core recoveries are measured by the drilling contractor, when drilling is not being performed by Ero Brasil own drill rigs and is checked by an Ero Brasil technician . Core recoveries are generally good, averaging approximately 90 % . For inclined surface holes, stakes are set in the ground marking the azimuth and the drill rig is then aligned with the stakes . The drill supervisor uses an inclinometer to ensure the drill mast is aligned with the intended angle of the drill hole . Throughout the Curaçá Valley, drilling to achieve indicated mineral resource drill spacing is generally set on approximately 45 m centers whereas the measured mineral resource grid is approximately 22 . 5 m on center . Infill drilling for mine planning is typically set on approximately 12 . 5 m centers . Due to the dominant orientation of the mineralization, sections are east - west oriented and drill angles are arranged in a fan position targeting perpendicular intersection, to the extent possible, along the north – south trending mineralization . In support of the current mineral resource and mineral reserve estimate, a total of 1 , 413 , 124 m of diamond core drilling was used . The allocation of meters for each mineral district is set out in the table below . December 22, 2022 Rev. F 118

2022 M INERAL R ESOURCES AND M INERAL R ESERVES OF T HE C ARAÍBA O PERATIONS , C URAÇÁ V ALLEY , B AHIA , B RAZIL F ORM 43 - 101F1 T ECHNICAL R EPORT Table 10 - 1: Ero Brasil Drilling in Support of Mineral Resource and Mineral Reserve Estimate For all diamond drilling, deviation surveys are conducted using Giro Master equipment at 3 . 0 m intervals, and later analyzed using SPT Survey software following the completion of the survey . Two measurements are performed in the upper movement (out) to validate the readings, with a 3 . 0 % deviation between measurements admitted as the maximum permissible deviation according to the Company’s adopted standard operating procedures . Figure 10 - 3: Maxibor equipment preparing for drill hole deviation readings (Ero Brasil, 2022) December 22, 2022 Rev. F 119
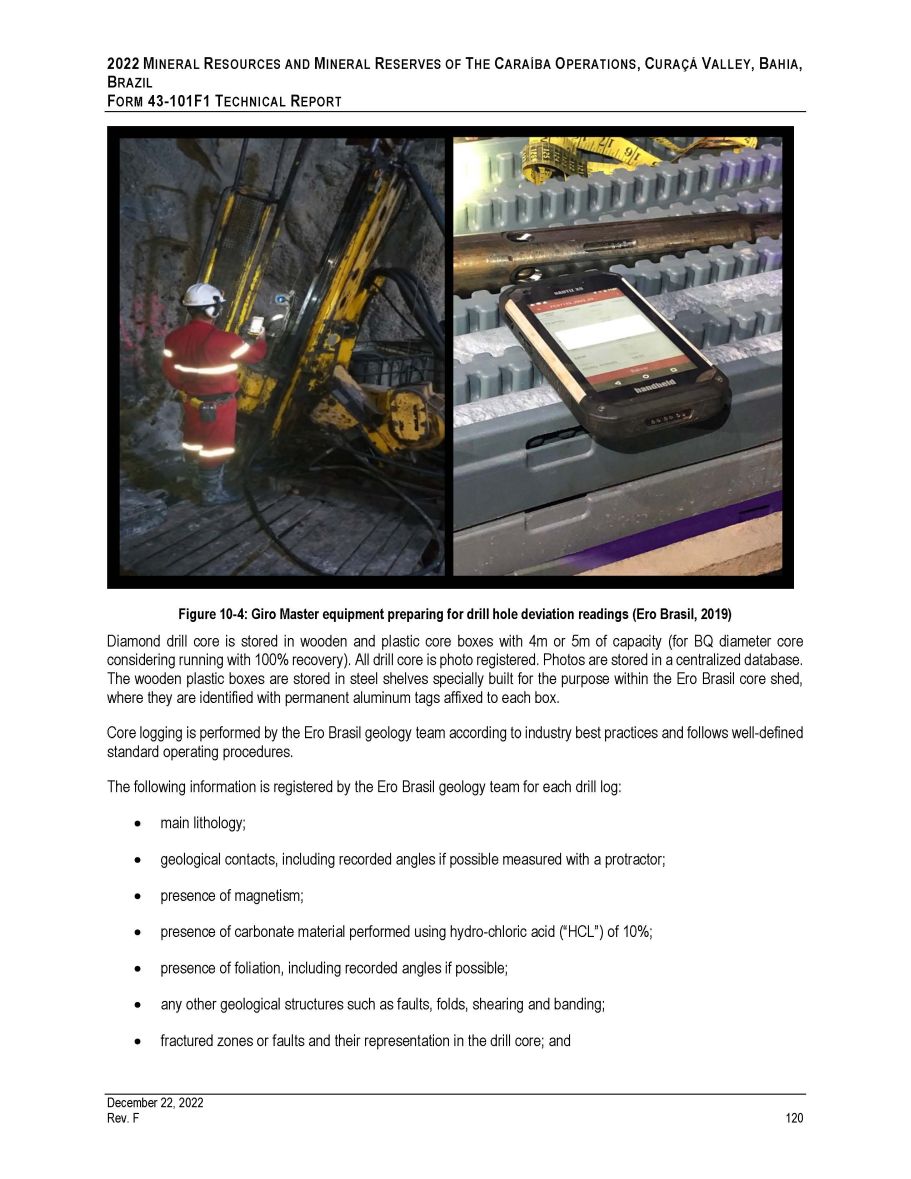
2022 M INERAL R ESOURCES AND M INERAL R ESERVES OF T HE C ARAÍBA O PERATIONS , C URAÇÁ V ALLEY , B AHIA , B RAZIL F ORM 43 - 101F1 T ECHNICAL R EPORT Figure 10 - 4 : Giro Master equipment preparing for drill hole deviation readings (Ero Brasil, 2019 ) Diamond drill core is stored in wooden and plastic core boxes with 4 m or 5 m of capacity (for BQ diameter core considering running with 100 % recovery) . All drill core is photo registered . Photos are stored in a centralized database . The wooden plastic boxes are stored in steel shelves specially built for the purpose within the Ero Brasil core shed, where they are identified with permanent aluminum tags affixed to each box . Core logging is performed by the Ero Brasil geology team according to industry best practices and follows well - defined standard operating procedures . The following information is registered by the Ero Brasil geology team for each drill log : main lithology; geological contacts, including recorded angles if possible measured with a protractor; presence of magnetism; presence of carbonate material performed using hydro - chloric acid (“HCL”) of 10%; presence of foliation, including recorded angles if possible; any other geological structures such as faults, folds, shearing and banding; fractured zones or faults and their representation in the drill core; and December 22, 2022 Rev. F 120
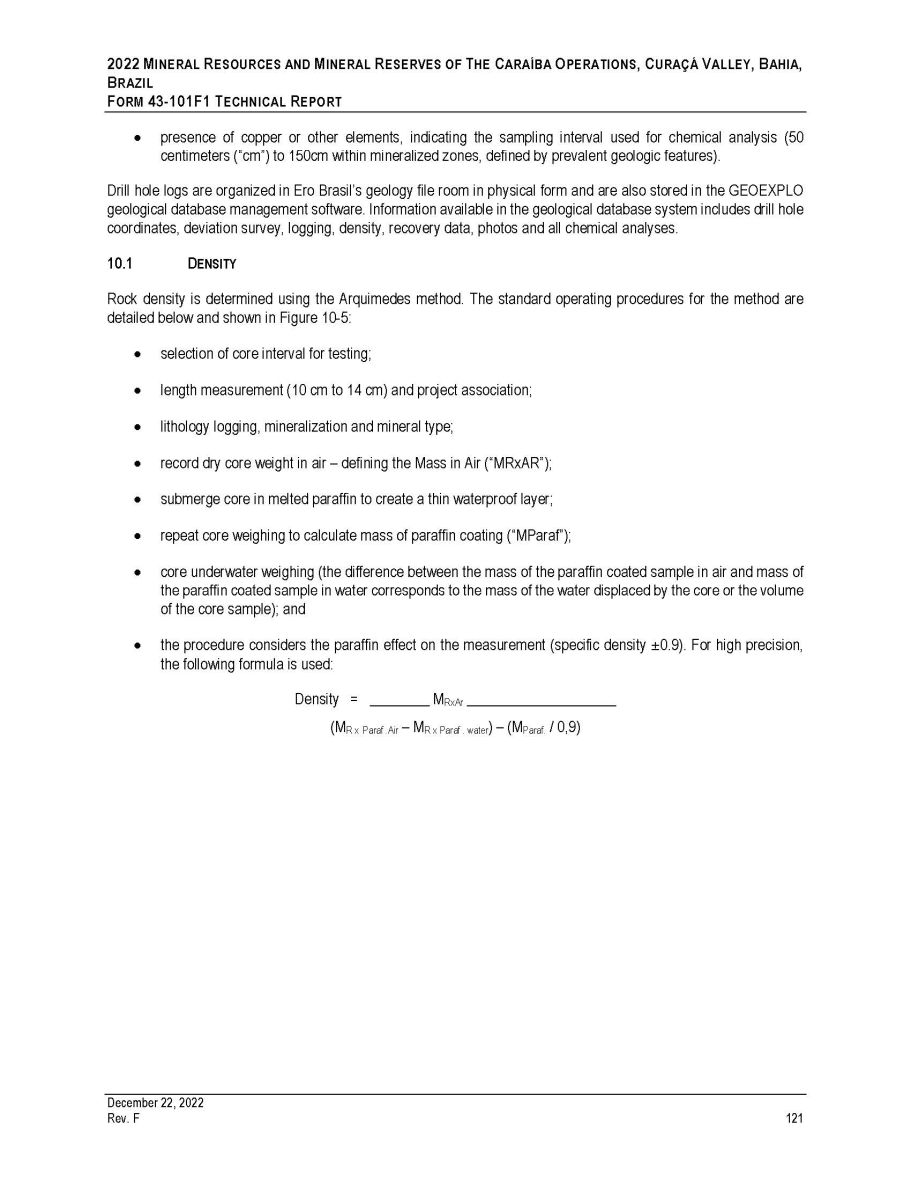
2022 M INERAL R ESOURCES AND M INERAL R ESERVES OF T HE C ARAÍBA O PERATIONS , C URAÇÁ V ALLEY , B AHIA , B RAZIL F ORM 43 - 101 F 1 T ECHNICAL R EPORT presence of copper or other elements, indicating the sampling interval used for chemical analysis ( 50 centimeters (“cm”) to 150 cm within mineralized zones, defined by prevalent geologic features) . Drill hole logs are organized in Ero Brasil’s geology file room in physical form and are also stored in the GEOEXPLO geological database management software . Information available in the geological database system includes drill hole coordinates, deviation survey, logging, density, recovery data, photos and all chemical analyses . 1. D ENSITY Rock density is determined using the Arquimedes method . The standard operating procedures for the method are detailed below and shown in Figure 10 - 5 : selection of core interval for testing; length measurement (10 cm to 14 cm) and project association; lithology logging, mineralization and mineral type; record dry core weight in air – defining the Mass in Air (“MRxAR”); submerge core in melted paraffin to create a thin waterproof layer; repeat core weighing to calculate mass of paraffin coating (“MParaf”); core underwater weighing (the difference between the mass of the paraffin coated sample in air and mass of the paraffin coated sample in water corresponds to the mass of the water displaced by the core or the volume of the core sample) ; and the procedure considers the paraffin effect on the measurement (specific density “ 0 . 9 ) . For high precision, the following formula is used : Density = December 22, 2022 Rev. F 121 M RxAr (M R x Paraf .Air – M R x Paraf . water ) – (M Paraf. / 0,9)

2022 M INERAL R ESOURCES AND M INERAL R ESERVES OF T HE C ARAÍBA O PERATIONS , C URAÇÁ V ALLEY , B AHIA , B RAZIL F ORM 43 - 101F1 T ECHNICAL R EPORT Figure 10 - 5: Density testing procedure (Ero Brasil, 2022) 10.2 P ILAR M INE E XPLORATION Exploration in the immediate Pilar UG Mine area focused successfully at extending known mineralization to depth, following the high - grade trend of mineralization which has been based upon a review of historical data and new drilling that intercepted mineralization above 8 . 0 % copper, including in previously mined areas . Using this information, the Company has developed an interpolated north - plunging structural zone of high - grade potential extending to depth, as shown in Figure 10 - 6 . Drilling from underground and surface utilizing directional drilling technology was completed to better evaluate mineralized continuity of this high - grade target area . During the Company’s 2021 - 2022 drill program, focus was on validating the mineralization within the Project Honeypot area of the Pilar UG Mine, where several zones were not extracted in the past and are now part of the new resource estimation (Figure 10 - 6 ) . December 22, 2022 Rev. F 122
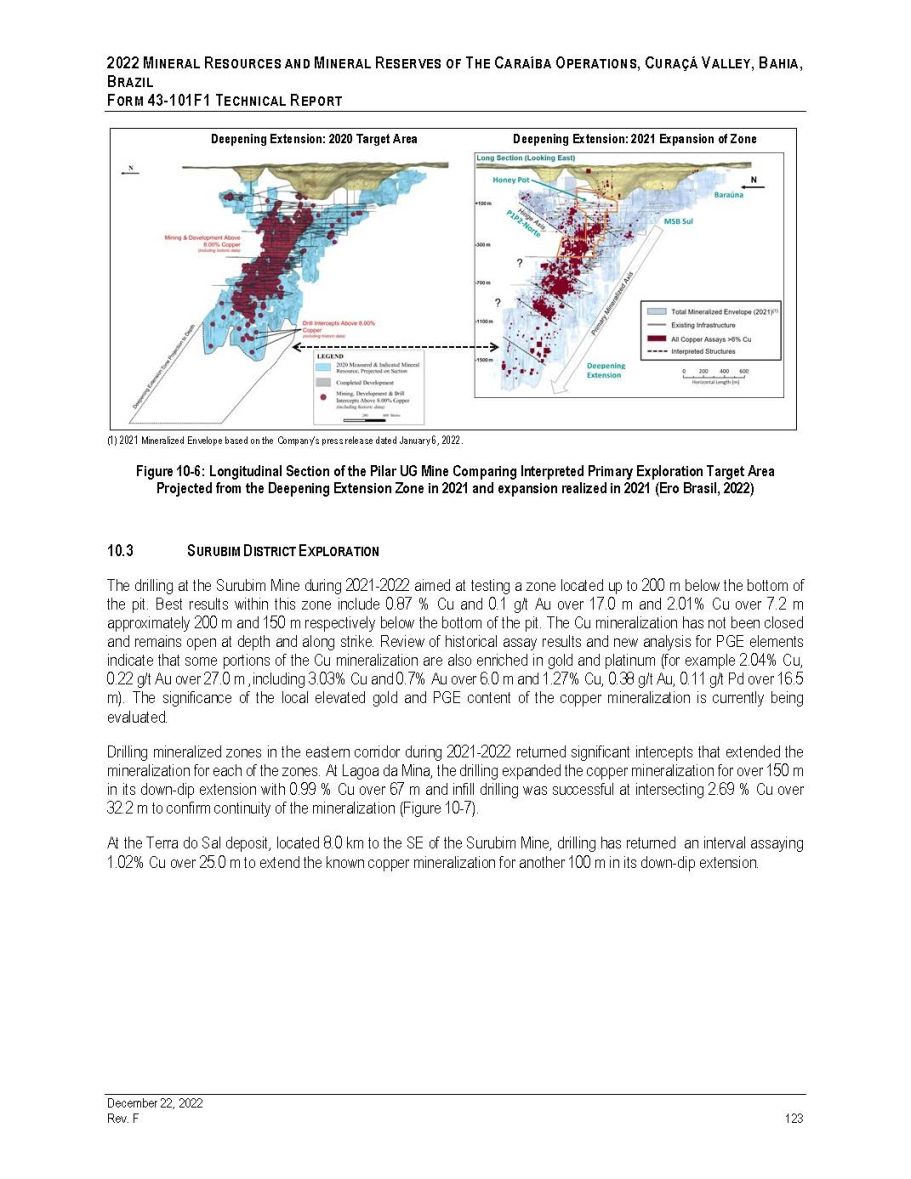
2022 M INERAL R ESOURCES AND M INERAL R ESERVES OF T HE C ARAÍBA O PERATIONS , C URAÇÁ V ALLEY , B AHIA , B RAZIL F ORM 43 - 101F1 T ECHNICAL R EPORT (1) 2021 Mineralized Envelope based on the Company’s press release dated January 6, 2022. Figure 10 - 6: Longitudinal Section of the Pilar UG Mine Comparing Interpreted Primary Exploration Target Area Projected from the Deepening Extension Zone in 2021 and expansion realized in 2021 (Ero Brasil, 2022) 10 . 3 S URUBIM D ISTRICT E XPLORATION The drilling at the Surubim Mine during 2021 - 2022 aimed at testing a zone located up to 200 m below the bottom of the pit . Best results within this zone include 0 . 87 % Cu and 0 . 1 g/t Au over 17 . 0 m and 2 . 01 % Cu over 7 . 2 m approximately 200 m and 150 m respectively below the bottom of the pit . The Cu mineralization has not been closed and remains open at depth and along strike . Review of historical assay results and new analysis for PGE elements indicate that some portions of the Cu mineralization are also enriched in gold and platinum (for example 2 . 04 % Cu, 0 . 22 g/t Au over 27 . 0 m ,including 3 . 03 % Cu and 0 . 7 % Au over 6 . 0 m and 1 . 27 % Cu, 0 . 38 g/t Au, 0 . 11 g/t Pd over 16 . 5 m) . The significance of the local elevated gold and PGE content of the copper mineralization is currently being evaluated . Drilling mineralized zones in the eastern corridor during 2021 - 2022 returned significant intercepts that extended the mineralization for each of the zones . At Lagoa da Mina, the drilling expanded the copper mineralization for over 150 m in its down - dip extension with 0 . 99 % Cu over 67 m and infill drilling was successful at intersecting 2 . 69 % Cu over 32 . 2 m to confirm continuity of the mineralization (Figure 10 - 7 ) . At the Terra do Sal deposit, located 8 . 0 km to the SE of the Surubim Mine, drilling has returned an interval assaying 1 . 02 % Cu over 25 . 0 m to extend the known copper mineralization for another 100 m in its down - dip extension . Deepening Extension: 2020 Target Area December 22, 2022 Rev. F 123 Deepening Extension: 2021 Expansion of Zone

2022 M INERAL R ESOURCES AND M INERAL R ESERVES OF T HE C ARAÍBA O PERATIONS , C URAÇÁ V ALLEY , B AHIA , B RAZIL F ORM 43 - 101F1 T ECHNICAL R EPORT Figure 10 - 7:Vertical cross - section looking North with recent drill intersections below the historic Lagoa da Mina Open Pit (Ero Brasil, 2021). 10.4 V ERMELHOS M INE AND N EAR M INE E XPLORATION Exploration potential within the Vermelhos UG Mine itself is primarily focused on extensions of known mineralization down plunge to the north as well as beneath the main orebodies of the Vermelhos UG Mine . In 2020 and 2021 , new near - mine target areas were identified near the Vermelhos UG Mine, known as the “Southern Vermelhos Corridor” which extends from Siriema to the UG 1 mining area, located at the southern limits of the Vermelhos UG Mine (Figure 10 - 8 ) . The target zone has a north - south strike length of approximately 700 meters . Drilling continues to demonstrate positive results highlighted recently by the Company’s drilling identified new copper mineralization below Toboggan and Sombrero bodies along the same fold trace with intercepts of 1 . 82 % Cu over 33 . 0 m and 5 . 86 % Cu over 13 . 4 m . Drill testing of the Southern Vermelhos corridor, and in - particular a modelled south - plunging structural trap continues to demonstrate the occurrence of high - grace copper mineralization at depth . The Company continues to conduct systematic BHEM beneath the Vermelhos main orebodies and has made Vermelhos UG Mine a top exploration priority for the 2023 exploration program . Mineralization of the Vermelhos UG Mine remains open to depth and along strike to the north and the south over a 5 . 5 km trend extending from the N 8 /N 9 OP Mine to the Siriema OP Mine to the south . December 22, 2022 Rev. F 124
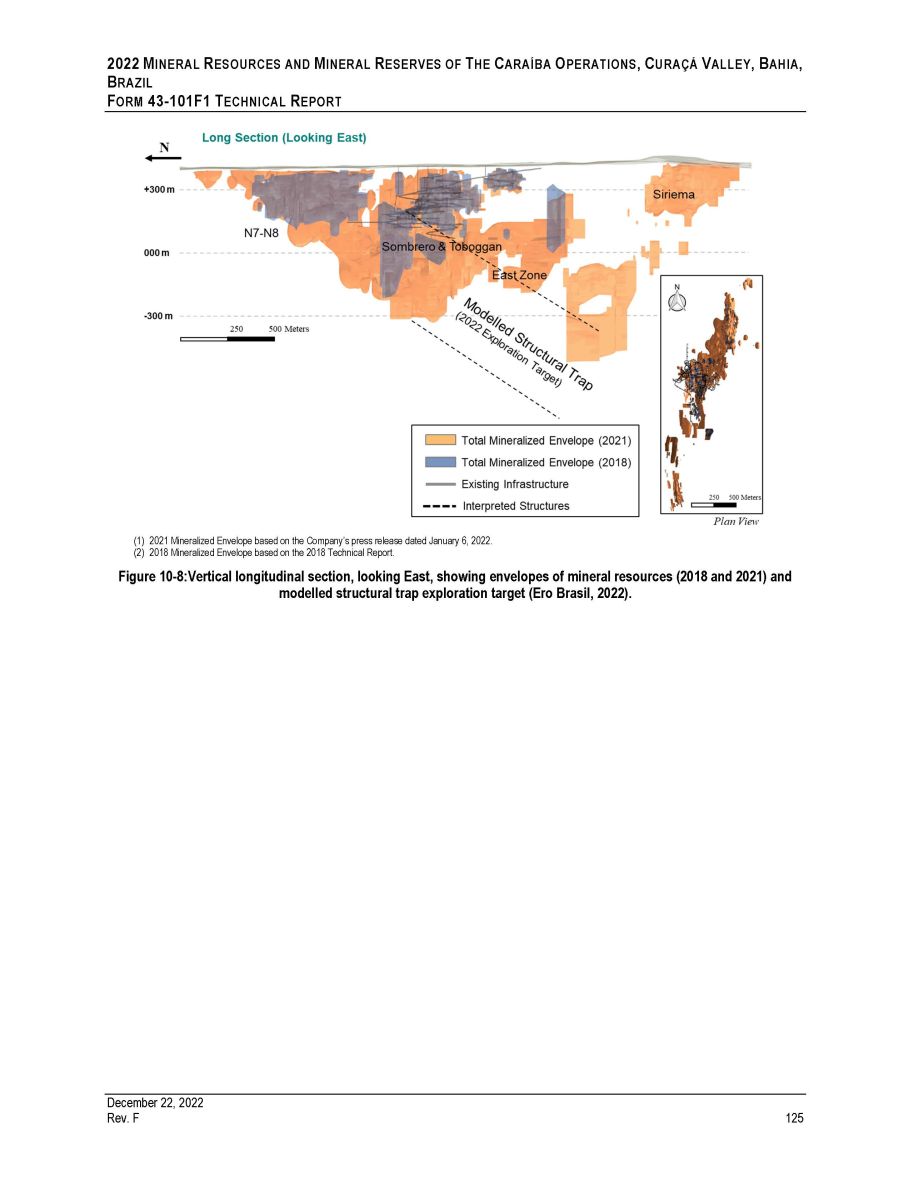
2022 M INERAL R ESOURCES AND M INERAL R ESERVES OF T HE C ARAÍBA O PERATIONS , C URAÇÁ V ALLEY , B AHIA , B RAZIL F ORM 43 - 101F1 T ECHNICAL R EPORT (1) 2021 Mineralized Envelope based on the Company’s press release dated January 6, 2022. (2) 2018 Mineralized Envelope based on the 2018 Technical Report. Figure 10 - 8:Vertical longitudinal section, looking East, showing envelopes of mineral resources (2018 and 2021) and modelled structural trap exploration target (Ero Brasil, 2022). December 22, 2022 Rev. F 125

2022 M INERAL R ESOURCES AND M INERAL R ESERVES OF T HE C ARAÍBA O PERATIONS , C URAÇÁ V ALLEY , B AHIA , B RAZIL F ORM 43 - 101F1 T ECHNICAL R EPORT Figure 10 - 9:Vertical cross - section of the Vermelhos Mine with new drill intersections below current underground development. Section looking North (Ero Brasil, 2022). December 22, 2022 Rev. F 126
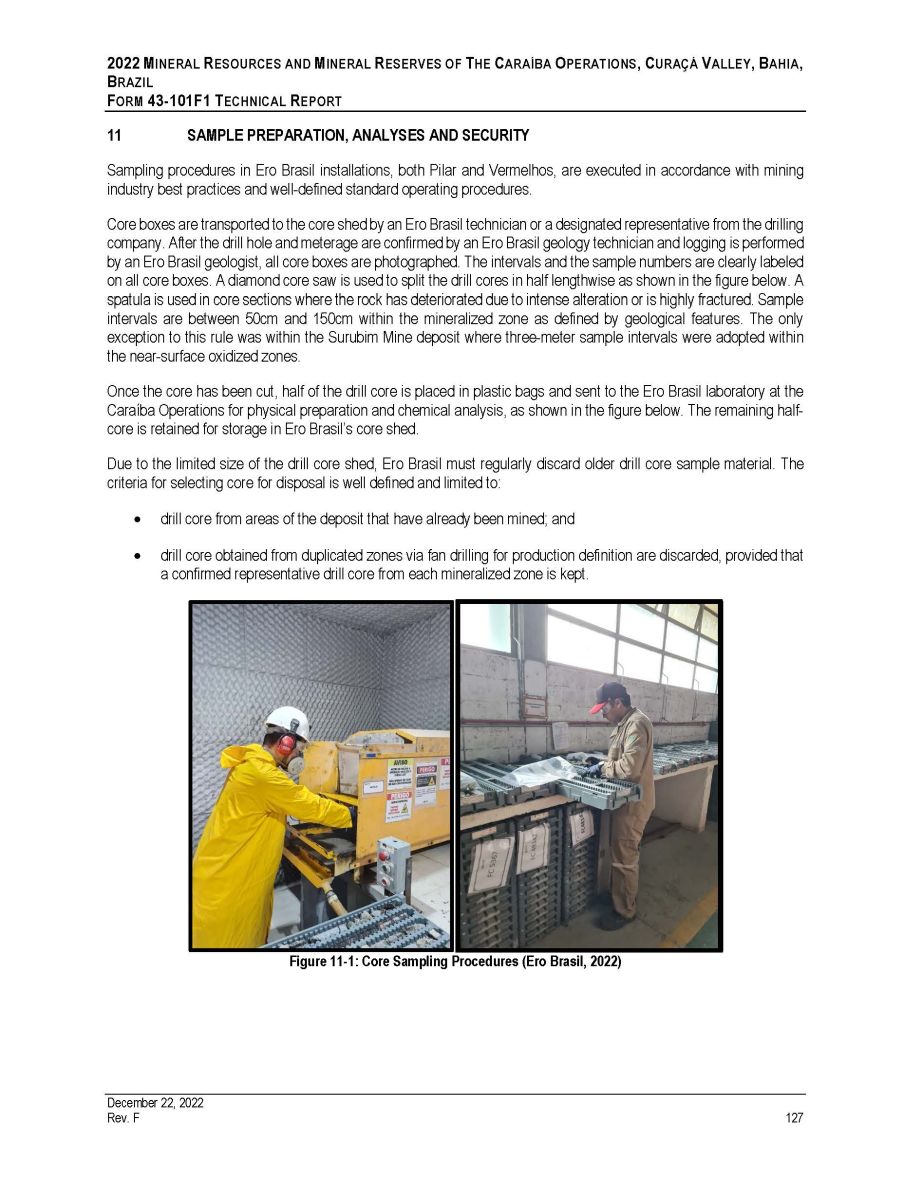
2022 M INERAL R ESOURCES AND M INERAL R ESERVES OF T HE C ARAÍBA O PERATIONS , C URAÇÁ V ALLEY , B AHIA , B RAZIL F ORM 43 - 101 F 1 T ECHNICAL R EPORT 11 SAMPLE PREPARATION, ANALYSES AND SECURITY Sampling procedures in Ero Brasil installations, both Pilar and Vermelhos, are executed in accordance with mining industry best practices and well - defined standard operating procedures . Core boxes are transported to the core shed by an Ero Brasil technician or a designated representative from the drilling company . After the drill hole and meterage are confirmed by an Ero Brasil geology technician and logging is performed by an Ero Brasil geologist, all core boxes are photographed . The intervals and the sample numbers are clearly labeled on all core boxes . A diamond core saw is used to split the drill cores in half lengthwise as shown in the figure below . A spatula is used in core sections where the rock has deteriorated due to intense alteration or is highly fractured . Sample intervals are between 50 cm and 150 cm within the mineralized zone as defined by geological features . The only exception to this rule was within the Surubim Mine deposit where three - meter sample intervals were adopted within the near - surface oxidized zones . Once the core has been cut, half of the drill core is placed in plastic bags and sent to the Ero Brasil laboratory at the Caraíba Operations for physical preparation and chemical analysis, as shown in the figure below . The remaining half - core is retained for storage in Ero Brasil’s core shed . Due to the limited size of the drill core shed, Ero Brasil must regularly discard older drill core sample material . The criteria for selecting core for disposal is well defined and limited to : drill core from areas of the deposit that have already been mined; and drill core obtained from duplicated zones via fan drilling for production definition are discarded, provided that a confirmed representative drill core from each mineralized zone is kept. Figure 11 - 1: Core Sampling Procedures (Ero Brasil, 2022) December 22, 2022 Rev. F 127
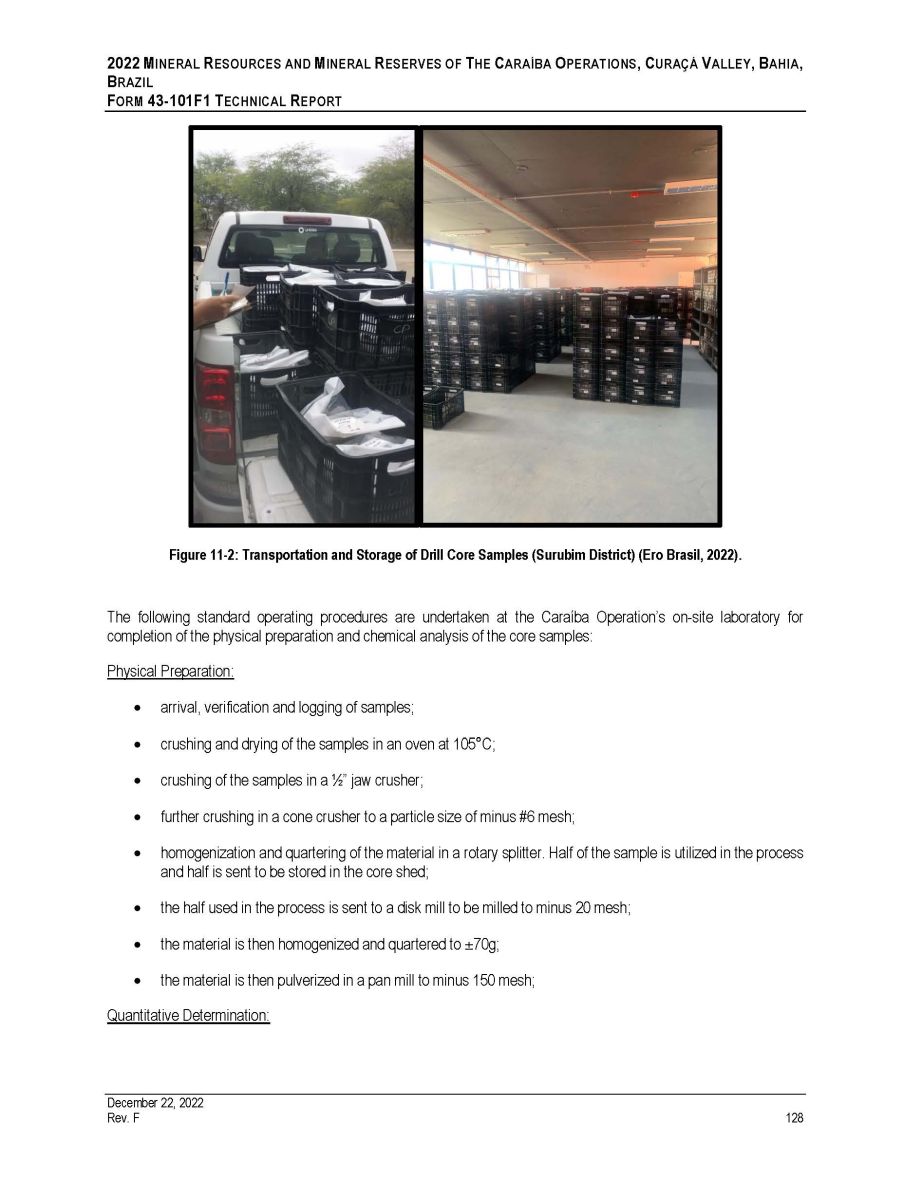
2022 M INERAL R ESOURCES AND M INERAL R ESERVES OF T HE C ARAÍBA O PERATIONS , C URAÇÁ V ALLEY , B AHIA , B RAZIL F ORM 43 - 101F1 T ECHNICAL R EPORT Figure 11 - 2: Transportation and Storage of Drill Core Samples (Surubim District) (Ero Brasil, 2022). The following standard operating procedures are undertaken at the Caraíba Operation’s on - site laboratory for completion of the physical preparation and chemical analysis of the core samples: Physical Preparation: arrival, verification and logging of samples; crushing and drying of the samples in an oven at 105 ƒ C; crushing of the samples in a ½” jaw crusher; further crushing in a cone crusher to a particle size of minus #6 mesh; homogenization and quartering of the material in a rotary splitter. Half of the sample is utilized in the process and half is sent to be stored in the core shed; the half used in the process is sent to a disk mill to be milled to minus 20 mesh; the material is then homogenized and quartered to “ 70g; the material is then pulverized in a pan mill to minus 150 mesh; Quantitative Determination: December 22, 2022 Rev. F 128
2022 M INERAL R ESOURCES AND M INERAL R ESERVES OF T HE C ARAÍBA O PERATIONS , C URAÇÁ V ALLEY , B AHIA , B RAZIL F ORM 43 - 101 F 1 T ECHNICAL R EPORT weigh 0.250g using an analytical scale and transfer the material to a 250 milliliter (“ml”) beaker; weigh one duplicate sample for every five samples weighed; apply an acid mixture to the material (5 ml of HNO 3 and 10 ml of HCl); heat the solution on a hotplate for 10 minutes; after 10 minutes, the solution is removed from the hotplate and 25 ml of distilled water is added. The solution is then allowed to cool for about five minutes until it reaches room temperature; filter paper, held in place by a retention band, is used to filter the solution and the filtered material is then homogenized; and the analysis for copper and nickel is conducted using an atomic absorption spectrometer (“AAS”). Ero Brasil has recently installed and implemented the use of multi - element Inductively Coupled Plasma - Optical Emission Spectrometry (“ICP - OES”) and X - Ray Diffraction (“XRD”) analysis that are being used primarily to further evaluate the recently observed presence of platinum group metals and for use in ongoing geometallurgical studies . GE 21 has evaluated the sample collection, analysis and security procedures, as well as the procedures that were executed by Ero Brasil’s internal laboratory, and found them to be sound, having been executed in accordance with industry best practices . Verification procedures, results of verification analysis and detailed comments are addressed in Chapter 12 – Data Verification of this Report . 1. Q UALITY A SSURANCE AND Q UALITY C ONTROL (QA/QC) Ero Brasil began to implement routine QA/QC procedures in its activities in 2007 . Thereafter, Ero Brasil has been perfecting these procedures based on continuous improvement initiatives implemented by Ero Brasil personnel and recommendations from external consultants . The QA/QC program covers each chemical analysis performed on drill core samples with the aim of : avoiding the use of poor - quality information during the construction of geological models and the execution of resource estimates; and promoting procedures for controlling and guaranteeing the quality and reliability of the samples that are prepared and of the chemical analytical result that are obtained in the laboratory. GE 21 conducted the validation of QA/QC data generated in the period from July 4 , 2020 to current Effective Date and data presented in the 2021 Technical Report (including data generated between August 18 , 2018 and July 4 , 2020 ), separately . Prior QA/QC data was validated by GE 21 , as detailed in prior technical studies including in the 2017 Technical Report and 2018 Technical Report . A QA/QC post - mortem analysis for Project Honeypot in the Pilar UG Mine was performed partly in 2019 and completed in 2022 for inclusion in this Report . For other target’s samples pre - dating the 2007 implementation of QA/QC procedures, a post - mortem analysis was conducted that involved re - analyzing a minimum of 10 % of the total number of samples with no corresponding QA/QC data that would be used in the resource and reserve grade estimation to validate the historic assays (before 2007 ) . Details of the post - mortem processes are included in the 2017 Technical Report . The current validation, corresponding 2018 - 2022 campaigns, included : December 22, 2022 Rev. F 129

2022 M INERAL R ESOURCES AND M INERAL R ESERVES OF T HE C ARAÍBA O PERATIONS , C URAÇÁ V ALLEY , B AHIA , B RAZIL F ORM 43 - 101 F 1 T ECHNICAL R EPORT ▪ Blanks ▪ Standards ▪ Pulverized Duplicates ▪ Coarse Tailings Duplicates ▪ Secondary Laboratory ▪ Post - mortem Duplicates (for HP target) 2018 - 2020 QAQC Validation 11.1.1.1 Blank Samples Mafic gneiss samples that are pulverized to minus 150 mesh at Ero Brasil’s laboratory are used as blank control samples . These samples are included with the aim of verifying the quantitative analysis undertaken by the laboratory . The blank samples are sent at an interval of one blank sample for every 10 samples within each batch (a rate of 10 % ) . The figure below presents the statistics and results associated with the blank control samples for period between August 1 , 2018 , to the July 4 , 2020 . Results from samples that underwent these quality control procedures and are within the quality control limits, were considered acceptable (Figure 11 - 3 ) . Figure 11 - 3: Result of the Analysis of Blank Samples, August 1, 2018, to July 4, 2020 (Ero Brasil, 2022) December 22, 2022 Rev. F 130
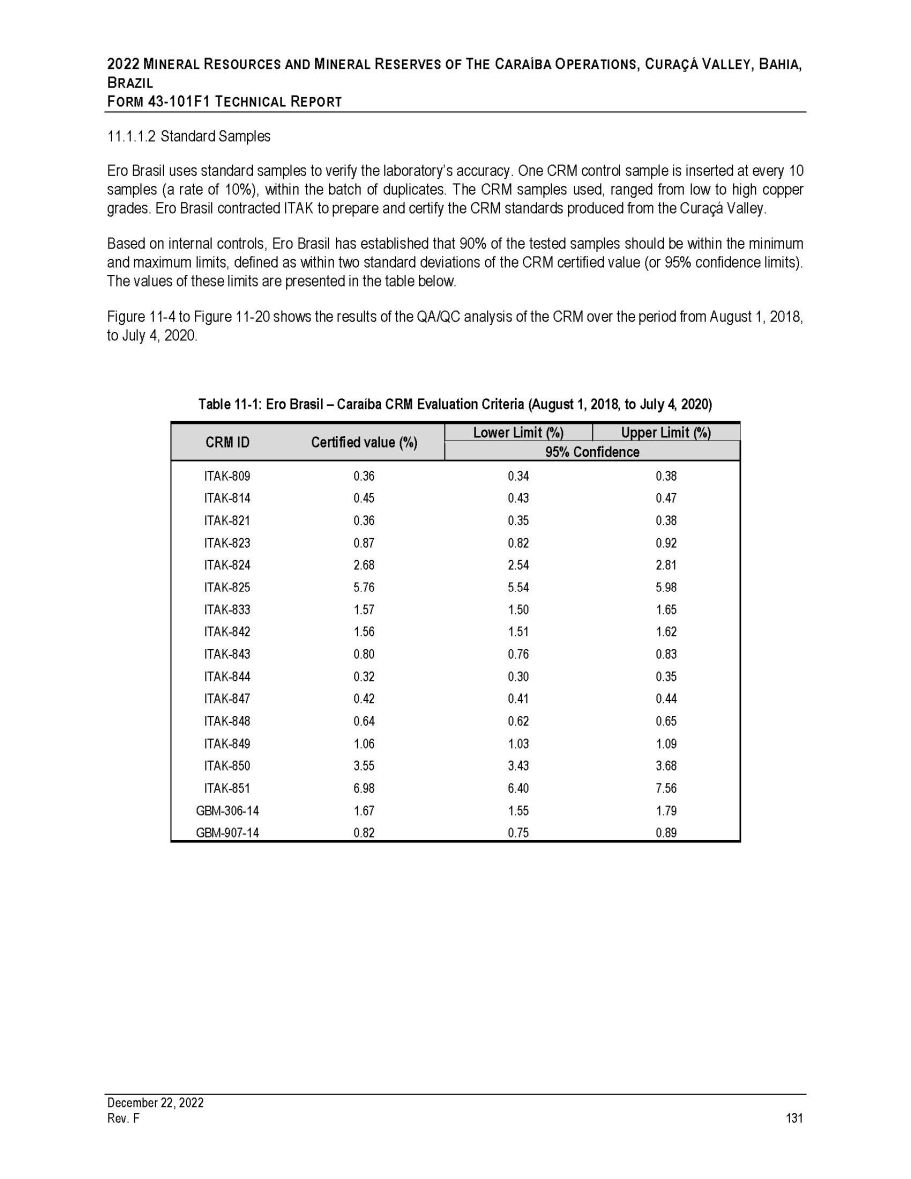
2022 M INERAL R ESOURCES AND M INERAL R ESERVES OF T HE C ARAÍBA O PERATIONS , C URAÇÁ V ALLEY , B AHIA , B RAZIL F ORM 43 - 101 F 1 T ECHNICAL R EPORT 11.1.1.2 Standard Samples Ero Brasil uses standard samples to verify the laboratory’s accuracy . One CRM control sample is inserted at every 10 samples (a rate of 10 % ), within the batch of duplicates . The CRM samples used, ranged from low to high copper grades . Ero Brasil contracted ITAK to prepare and certify the CRM standards produced from the Curaçá Valley . Based on internal controls, Ero Brasil has established that 90 % of the tested samples should be within the minimum and maximum limits, defined as within two standard deviations of the CRM certified value (or 95 % confidence limits) . The values of these limits are presented in the table below . Figure 11 - 4 to Figure 11 - 20 shows the results of the QA/QC analysis of the CRM over the period from August 1 , 2018 , to July 4 , 2020 . Table 11 - 1: Ero Brasil – Caraíba CRM Evaluation Criteria (August 1, 2018, to July 4, 2020) December 22, 2022 Rev. F 131 CRM ID Certified value (%) Lower Limit (%) Upper Limit (%) 95% Confidence ITAK - 809 0.36 0.34 0.38 ITAK - 814 0.45 0.43 0.47 ITAK - 821 0.36 0.35 0.38 ITAK - 823 0.87 0.82 0.92 ITAK - 824 2.68 2.54 2.81 ITAK - 825 5.76 5.54 5.98 ITAK - 833 1.57 1.50 1.65 ITAK - 842 1.56 1.51 1.62 ITAK - 843 0.80 0.76 0.83 ITAK - 844 0.32 0.30 0.35 ITAK - 847 0.42 0.41 0.44 ITAK - 848 0.64 0.62 0.65 ITAK - 849 1.06 1.03 1.09 ITAK - 850 3.55 3.43 3.68 ITAK - 851 6.98 6.40 7.56 GBM - 306 - 14 1.67 1.55 1.79 GBM - 907 - 14 0.82 0.75 0.89
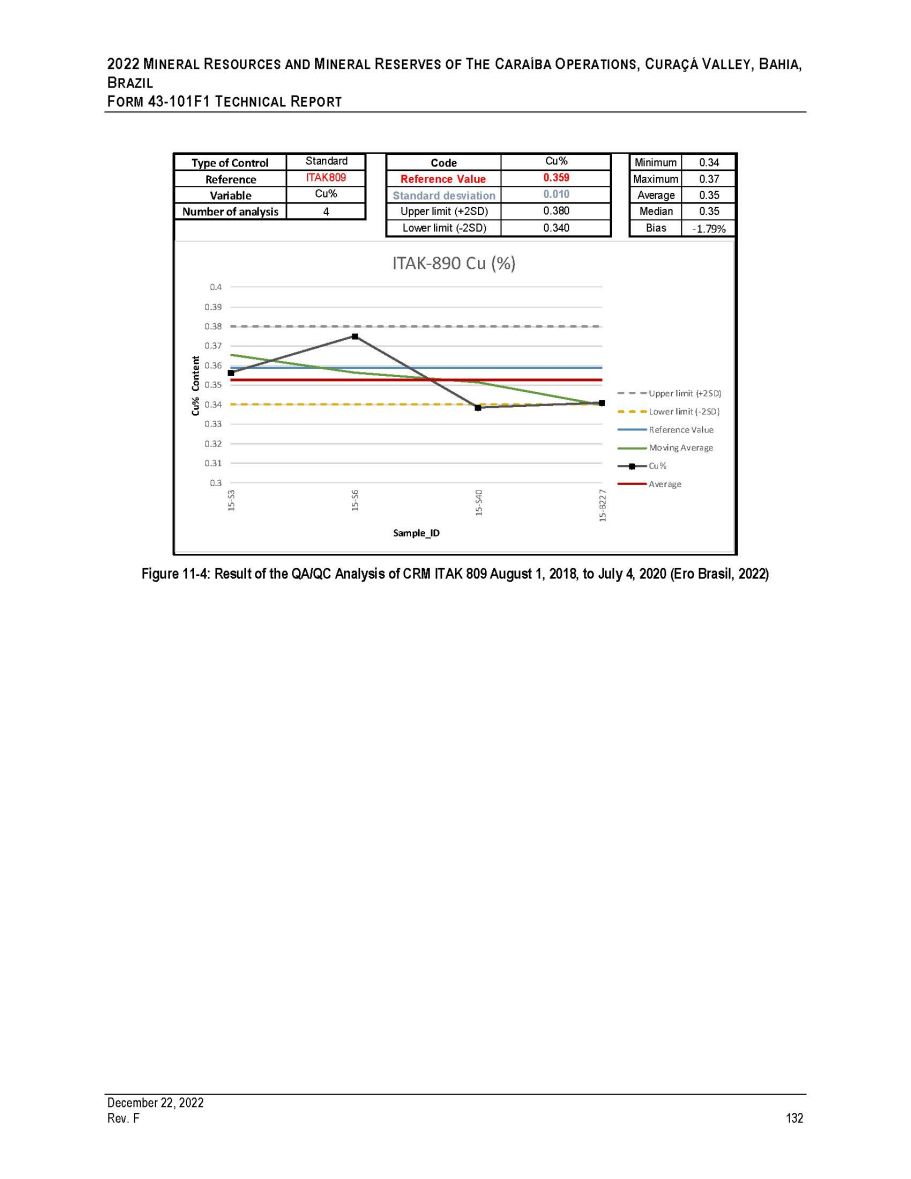
2022 M INERAL R ESOURCES AND M INERAL R ESERVES OF T HE C ARAÍBA O PERATIONS , C URAÇÁ V ALLEY , B AHIA , B RAZIL F ORM 43 - 101F1 T ECHNICAL R EPORT Figure 11 - 4: Result of the QA/QC Analysis of CRM ITAK 809 August 1, 2018, to July 4, 2020 (Ero Brasil, 2022) 15-S3 15-S6 15-S40 15-B227 Cu% Content Type of Control Standard Code Cu% Minimum 0.34 Reference ITAK809 Reference Value 0.359 Maximum 0.37 Variable Cu% Standard desviation 0.010 Average 0.35 Number of analysis 4 Upper limit (+2SD) 0.380 Median 0.35 Lower limit ( - 2SD) 0.340 Bias -1.79% ITAK-890 Cu (%) 0.4 0.39 0.38 0.37 0.36 0.35 Upper limit (+2SD) 0.34 Lower limit (-2SD) 0.33 Reference Value 0.32 Moving Average 0.31 Cu% 0.3 Average Sample_ID December 22, 2022 Rev. F 132
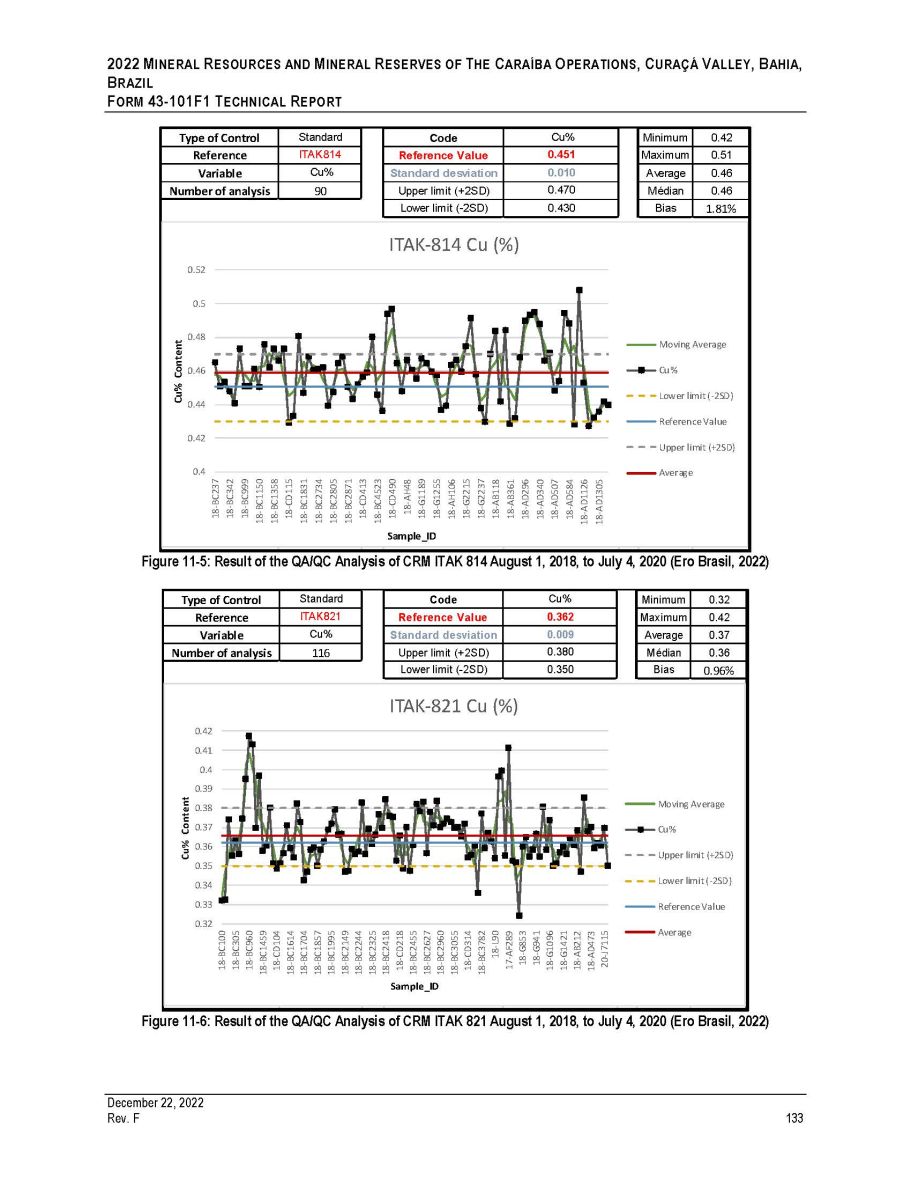
2022 M INERAL R ESOURCES AND M INERAL R ESERVES OF T HE C ARAÍBA O PERATIONS , C URAÇÁ V ALLEY , B AHIA , B RAZIL F ORM 43 - 101F1 T ECHNICAL R EPORT Type of Control Reference Variable Standard Code Cu% Minimum 0.42 ITAK814 Reference Value 0.451 Maximum 0.51 Cu% Standard desviation 0.010 Average 0.46 Number of analysis 90 Upper limit (+2SD) 0.470 Médian 0.46 1.81% 0.4 0.42 0.44 0.46 0.48 0.52 0.5 18-BC237 18-BC342 18-BC999 18-BC1150 18-BC1358 18-CD115 18-BC1831 18-BC2734 18-BC2805 18-BC2871 18-CD413 18-BC4523 18-CD490 18-AH48 18-G1189 18-G1255 18-AH106 18-G2215 18-G2237 18-AB118 18-AB361 18-AD296 18-AD340 18-AD507 18-AD584 18-AD1126 18-AD1305 Cu% Content Sample_ID Figure 11 - 5: Result of the QA/QC Analysis of CRM ITAK 814 August 1, 2018, to July 4, 2020 (Ero Brasil, 2022) Lower limit ( - 2SD) 0.430 Bias ITAK-814 Cu (%) Moving Average Cu% Lower limit (-2SD) Reference Value Upper limit (+2SD) Average Type of Control Standard Code Cu% Minimum 0.32 Reference ITAK821 Reference Value 0.362 Maximum 0.42 Variable Cu% Standard desviation 0.009 Average 0.37 Number of analysis 116 Upper limit (+2SD) 0.380 Médian 0.36 Lower limit ( - 2SD) 0.350 Bias 0.96% 0.32 0.33 0.34 0.35 0.36 0.37 0.38 0.42 0.41 0.4 0.39 18-BC100 18-BC305 18-BC960 18-BC1459 18-CD104 18-BC1614 18-BC1704 18-BC1857 18-BC1995 18-BC2149 18-BC2244 18-BC2325 18-BC2418 18-CD218 18-BC2455 18-BC2627 18-BC2960 18-BC3055 18-CD314 18-BC3782 18-L90 17-AF289 18-G853 18-G941 18-G1096 18-G1421 18-AB212 18-AD473 20-J7115 Cu% Content Sample_ID Figure 11 - 6: Result of the QA/QC Analysis of CRM ITAK 821 August 1, 2018, to July 4, 2020 (Ero Brasil, 2022) ITAK-821 Cu (%) Moving Average Cu% Upper limit (+2SD) Lower limit (-2SD) Reference Value Average December 22, 2022 Rev. F 133
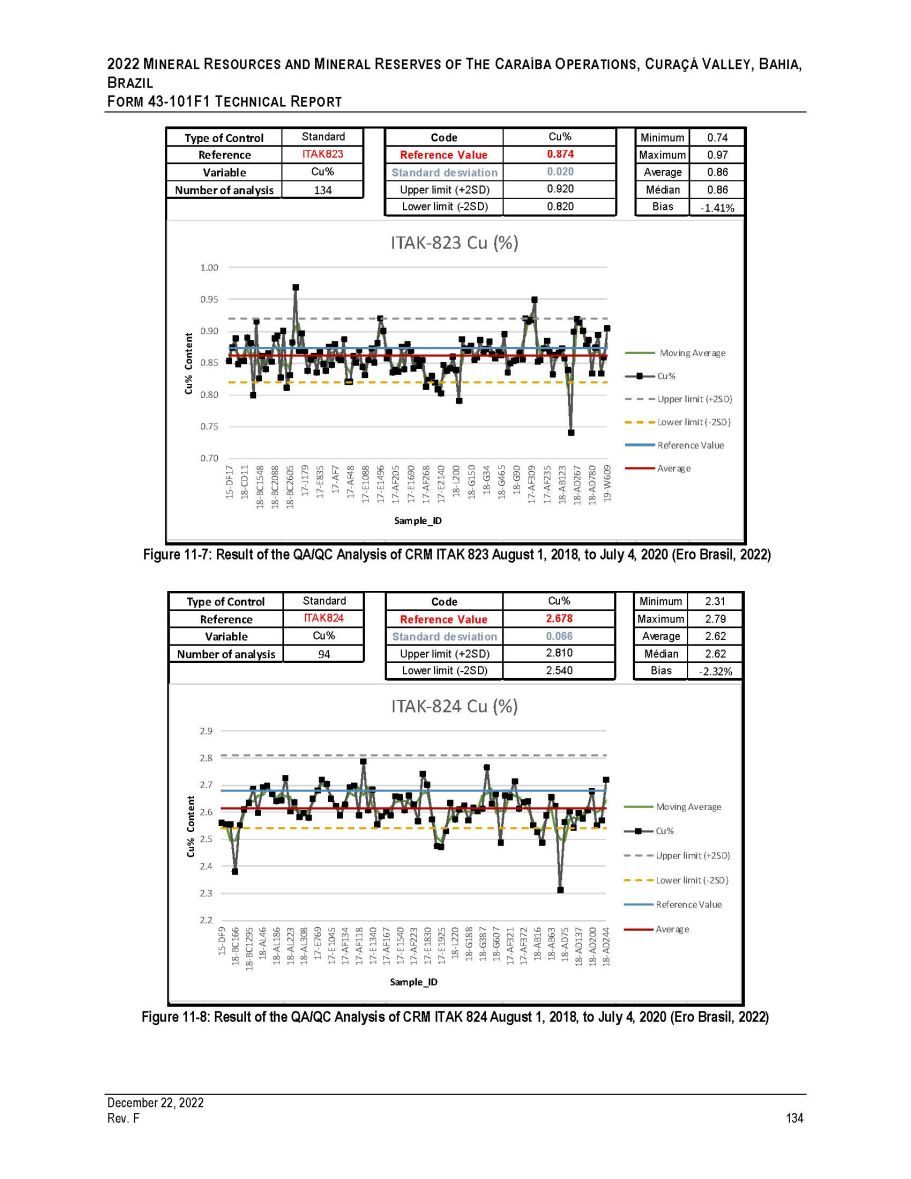
2022 M INERAL R ESOURCES AND M INERAL R ESERVES OF T HE C ARAÍBA O PERATIONS , C URAÇÁ V ALLEY , B AHIA , B RAZIL F ORM 43 - 101F1 T ECHNICAL R EPORT Type of Control Standard Code Cu% Minimum 0.74 Reference ITAK823 Reference Value 0.874 Maximum 0.97 Variable Cu% Standard desviation 0.020 Average 0.86 Number of analysis 134 Upper limit (+2SD) 0.920 Médian 0.86 Lower limit ( - 2SD) 0.820 Bias -1.41% 0.70 0.75 0.80 0.85 1.00 0.95 0.90 15-DF17 18-CD11 18-BC1548 18-BC2088 18-BC2605 17-J179 17-E835 17-AF7 17-AF48 17-E1088 17-E1496 17-AF205 17-E1690 17-AF268 17-E2140 18-L200 18-G150 18-G34 18-G465 18-G90 17-AF309 17-AF235 18-AB123 18-AD267 18-AD780 19-W609 Cu% Content Sample_ID Figure 11 - 7: Result of the QA/QC Analysis of CRM ITAK 823 August 1, 2018, to July 4, 2020 (Ero Brasil, 2022) ITAK-823 Cu (%) Moving Average Cu% Upper limit (+2SD) Lower limit (-2SD) Reference Value Average Type of Control Standard Code Cu% Minimum 2.31 Reference ITAK824 Reference Value 2.678 Maximum 2.79 Variable Cu% Standard desviation 0.066 Average 2.62 Number of analysis 94 Upper limit (+2SD) 2.810 Médian 2.62 Lower limit ( - 2SD) 2.540 Bias -2.32% 2.2 2.3 2.4 2.5 2.6 2.9 2.8 2.7 15-DF9 18-BC166 18-BC1295 18-AL46 18-AL186 18-AL223 18-AL308 17-E769 17-E1045 17-AF134 17-AF118 17-E1340 17-AF167 17-E1540 17-AF223 17-E1830 17-E1925 18-L220 18-G188 18-G387 18-G607 17-AF321 17-AF372 18-AB16 18-AB63 18-AD75 18-AD137 18-AD200 18-AD244 Cu% Content Sample_ID Figure 11 - 8: Result of the QA/QC Analysis of CRM ITAK 824 August 1, 2018, to July 4, 2020 (Ero Brasil, 2022) ITAK-824 Cu (%) Moving Average Cu% Upper limit (+2SD) Lower limit (-2SD) Reference Value Average December 22, 2022 Rev. F 134
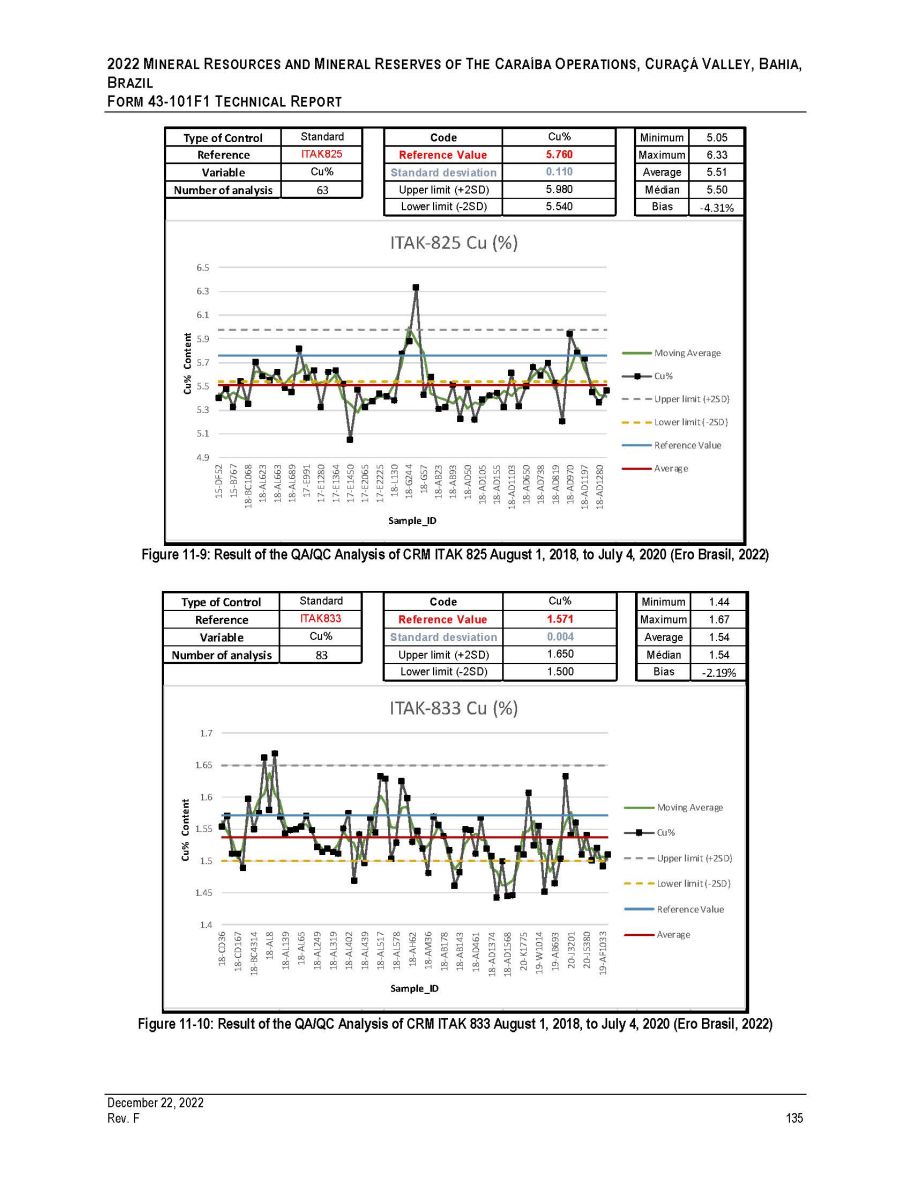
2022 M INERAL R ESOURCES AND M INERAL R ESERVES OF T HE C ARAÍBA O PERATIONS , C URAÇÁ V ALLEY , B AHIA , B RAZIL F ORM 43 - 101F1 T ECHNICAL R EPORT Type of Control Standard Code Cu% Minimum 5.05 Reference ITAK825 Reference Value 5.760 Maximum 6.33 Variable Cu% Standard desviation 0.110 Average 5.51 Number of analysis 63 Upper limit (+2SD) 5.980 Médian 5.50 Lower limit ( - 2SD) 5.540 Bias -4.31% 4.9 5.1 5.3 5.5 5.7 6.5 6.3 6.1 5.9 15-DF52 15-B767 18-BC1068 18-AL623 18-AL663 18-AL689 17-E991 17-E1280 17-E1364 17-E1450 17-E2065 17-E2225 18-L130 18-G244 18-G57 18-AB23 18-AB93 18-AD50 18-AD105 18-AD155 18-AD1103 18-AD650 18-AD738 18-AD819 18-AD970 18-AD1197 18-AD1280 Cu% Content Sample_ID Figure 11 - 9: Result of the QA/QC Analysis of CRM ITAK 825 August 1, 2018, to July 4, 2020 (Ero Brasil, 2022) ITAK-825 Cu (%) Moving Average Cu% Upper limit (+2SD) Lower limit (-2SD) Reference Value Average Type of Control Standard Code Cu% Minimum 1.44 Reference ITAK833 Reference Value 1.571 Maximum 1.67 Variable Cu% Standard desviation 0.004 Average 1.54 Number of analysis 83 Upper limit (+2SD) 1.650 Médian 1.54 Lower limit ( - 2SD) 1.500 Bias -2.19% 1.4 1.45 1.5 1.55 1.7 1.65 1.6 18-CD36 18-CD167 18-BC4314 18-AL8 18-AL139 18-AL65 18-AL249 18-AL319 18-AL402 18-AL439 18-AL517 18-AL578 18-AH62 18-AM36 18-AB178 18-AB143 18-AD461 18-AD1374 18-AD1568 20-K1775 19-W1014 19-AB693 20-J3201 20-J5380 19-AF1033 Cu% Content Sample_ID Figure 11 - 10: Result of the QA/QC Analysis of CRM ITAK 833 August 1, 2018, to July 4, 2020 (Ero Brasil, 2022) ITAK-833 Cu (%) Moving Average Cu% Upper limit (+2SD) Lower limit (-2SD) Reference Value Average December 22, 2022 Rev. F 135

2022 M INERAL R ESOURCES AND M INERAL R ESERVES OF T HE C ARAÍBA O PERATIONS , C URAÇÁ V ALLEY , B AHIA , B RAZIL F ORM 43 - 101F1 T ECHNICAL R EPORT Type of Control Standard Code Cu% Minimum 1.37 Reference ITAK842 Reference Value 1.562 Maximum 1.68 Variable Cu% Standard desviation 0.030 Average 1.56 Number of analysis 221 Upper limit (+2SD) 1.620 Médian 1.56 Lower limit ( - 2SD) 1.510 Bias 0.05% 1.3 1.35 1.4 1.45 1.5 1.7 1.65 1.6 1.55 18-BC3951 19-AN6 19-M881 18-G1786 19-AL12 19-BC52 18-AB467 19-AF218 18-AD521 19-AB60 19-BC82 19-AS497 19-AS531 20-K354 19-AW80 20-H229 19-AB715 20-J257 19-AB1790 19-AD19 19-AH347 19-CH493 19-AF1123 19-CH765 19-AF1361 19-CH812 19-AF1451 Cu% Content Sample_ID Figure 11 - 11: Result of the QA/QC Analysis of CRM ITAK 842 August 1, 2018, to July 4, 2020 (Ero Brasil, 2022) ITAK-842 Cu (%) Moving Average Cu% Upper limit (+2SD) Lower limit (-2SD) Average Reference Value Type of Control Standard Code Cu% Minimum 0.64 Reference ITAK843 Reference Value 0.796 Maximum 1.05 Variable Cu% Standard desviation 0.030 Average 0.81 Number of analysis 384 Upper limit (+2SD) 0.860 Médian 0.81 Lower limit ( - 2SD) 0.730 Bias 1.39% 1.1 1.05 1 0.95 0.9 0.85 0.8 0.75 0.7 0.65 0.6 18-BC3129 18-BC4720 19-M358 18-CD624 18-AL1376 18-G2526 18-G2857 18-AB253 18-AB697 19-AZ3 19-CH22 18-AD1785 19-AB212 19-AS783 20-CS13 18-BM18 20-H2534 19-AB541 20-B6390 20-J5304 20-J5777 REAN 19-CH237 20-S40 20-A5767 20-A7460 20-BG2095 20-A9895 20-R3211 20-R3561 Cu% Content Sample_ID Figure 11 - 12: Result of the QA/QC Analysis of CRM ITAK 843 August 1, 2018, to July 4, 2020 (Ero Brasil, 2022) ITAK-843 Cu (%) Moving Average Cu% Upper limit (+2SD) Lower limit (-2SD) Reference Value Average December 22, 2022 Rev. F 136
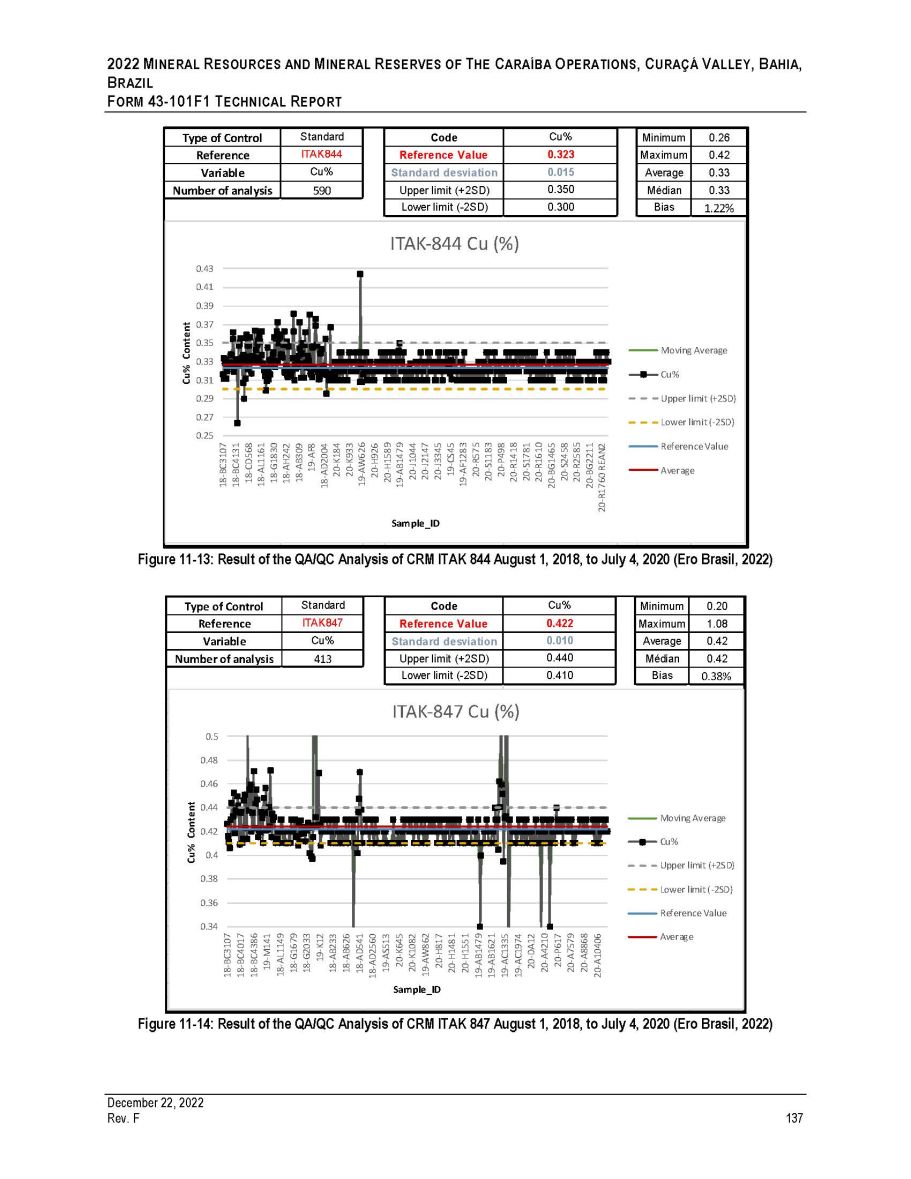
2022 M INERAL R ESOURCES AND M INERAL R ESERVES OF T HE C ARAÍBA O PERATIONS , C URAÇÁ V ALLEY , B AHIA , B RAZIL F ORM 43 - 101F1 T ECHNICAL R EPORT Type of Control Standard Code Cu% Minimum 0.26 Reference ITAK844 Reference Value 0.323 Maximum 0.42 Variable Cu% Standard desviation 0.015 Average 0.33 Number of analysis 590 Upper limit (+2SD) 0.350 Médian 0.33 Lower limit ( - 2SD) 0.300 Bias 1.22% 0.35 0.33 0.31 0.29 0.27 0.25 0.43 0.41 0.39 0.37 18-BC3107 18-BC4131 18-CD568 18-AL1161 18-G1830 18-AH242 18-AB309 19-AF8 18-AD2004 20-K184 20-K933 19-AW626 20-H926 20-H1589 19-AB1479 20-J1044 20-J2147 20-J3345 19-CS45 19-AF1283 20-R575 20-S1183 20-P498 20-R1418 20-S1781 20-R1610 20-BG1465 20-S2458 20-R2585 20-BG2211 20-R1760 REAN2 Cu% Content Sample_ID Figure 11 - 13: Result of the QA/QC Analysis of CRM ITAK 844 August 1, 2018, to July 4, 2020 (Ero Brasil, 2022) ITAK-844 Cu (%) Moving Average Cu% Upper limit (+2SD) Lower limit (-2SD) Reference Value Average Type of Control Standard Code Cu% Minimum 0.20 Reference ITAK847 Reference Value 0.422 Maximum 1.08 Variable Cu% Standard desviation 0.010 Average 0.42 Number of analysis 413 Upper limit (+2SD) 0.440 Médian 0.42 Lower limit ( - 2SD) 0.410 Bias 0.38% 0.34 0.36 0.38 0.4 0.42 0.5 0.48 0.46 0.44 18-BC3107 18-BC4017 18-BC4386 19-M141 18-AL1149 18-G1679 18-G2033 19-K12 18-AB233 18-AB626 18-AD541 18-AD2560 19-AS513 20-K645 20-K1082 19-AW862 20-H817 20-H1481 20-H1551 19-AB1479 19-AB1621 19-AC1335 19-AC1974 20-DA12 20-A4210 20-P617 20-A7579 20-A8868 20-A10406 Cu% Content Sample_ID Figure 11 - 14: Result of the QA/QC Analysis of CRM ITAK 847 August 1, 2018, to July 4, 2020 (Ero Brasil, 2022) ITAK-847 Cu (%) Moving Average Cu% Upper limit (+2SD) Lower limit (-2SD) Reference Value Average December 22, 2022 Rev. F 137
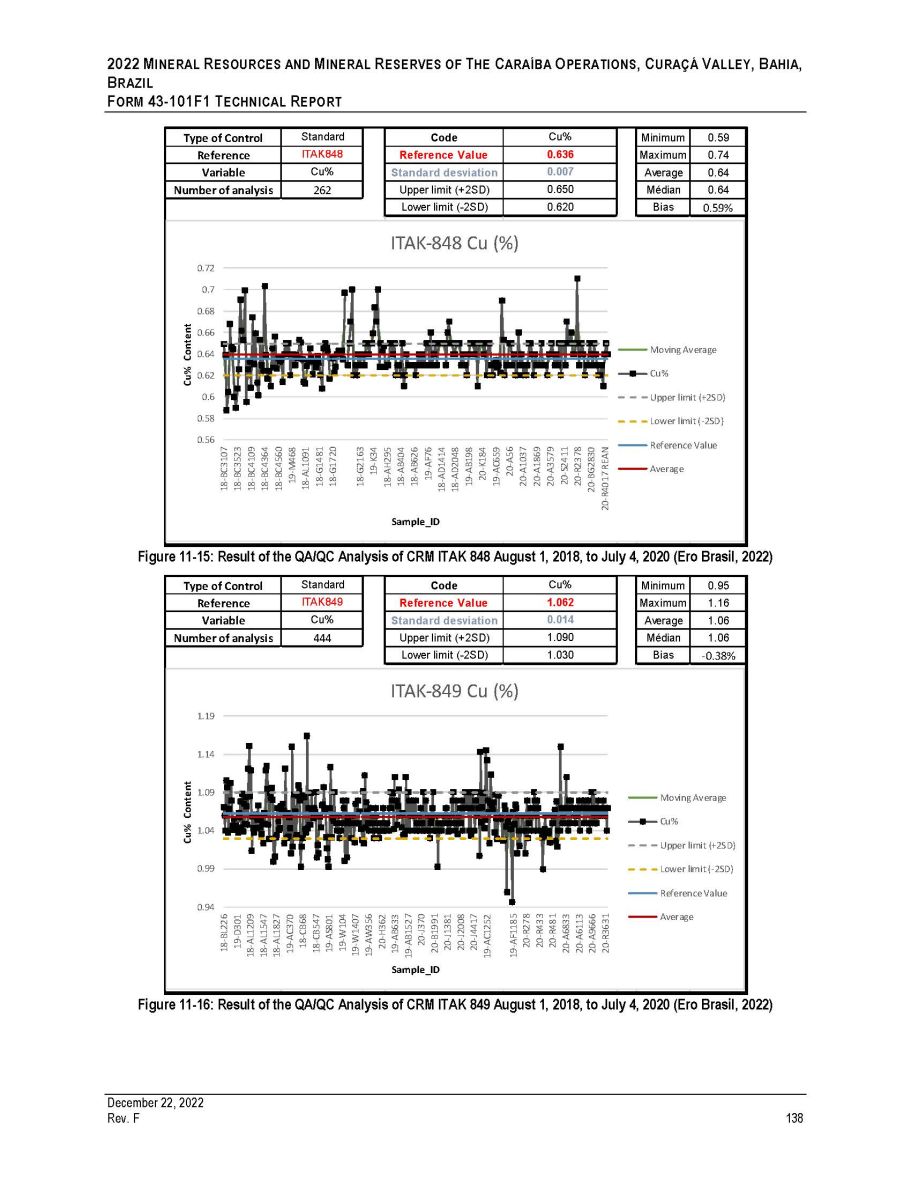
2022 M INERAL R ESOURCES AND M INERAL R ESERVES OF T HE C ARAÍBA O PERATIONS , C URAÇÁ V ALLEY , B AHIA , B RAZIL F ORM 43 - 101F1 T ECHNICAL R EPORT Type of Control Standard Code Cu% Minimum 0.59 Reference ITAK848 Reference Value 0.636 Maximum 0.74 Variable Cu% Standard desviation 0.007 Average 0.64 Number of analysis 262 Upper limit (+2SD) 0.650 Médian 0.64 Lower limit ( - 2SD) 0.620 Bias 0.59% 0.56 0.58 0.6 0.62 0.64 0.72 0.7 0.68 0.66 18-BC3107 18-BC3523 18-BC4109 18-BC4364 18-BC4560 19-M468 18-AL1091 18-G1481 18-G1720 18-G2163 19-K34 18-AH295 18-AB404 18-AB626 19-AF76 18-AD1414 18-AD2048 19-AB198 20-K184 19-AC659 20-A56 20-A1037 20-A1869 20-A3579 20-S2411 20-R2378 20-BG2830 20-R4017 REAN Cu% Content Sample_ID Figure 11 - 15: Result of the QA/QC Analysis of CRM ITAK 848 August 1, 2018, to July 4, 2020 (Ero Brasil, 2022) ITAK-848 Cu (%) Moving Average Cu% Upper limit (+2SD) Lower limit (-2SD) Reference Value Average Type of Control Reference Variable Standard Code Cu% Minimum 0.95 ITAK849 Reference Value 1.062 Maximum 1.16 Cu% Standard desviation 0.014 Average 1.06 Number of analysis 444 Upper limit (+2SD) 1.090 Médian 1.06 -0.38% 0.94 0.99 1.04 1.09 1.19 1.14 18-BL226 19-D301 18-AL1209 18-AL1547 18-AL1827 19-AC370 18-CB68 18-CB547 19-AS801 19-W104 19-W1407 19-AW356 20-H362 19-AB633 19-AB1527 20-J370 20-B1991 20-J1381 20-J2008 20-J4417 19-AC1252 19-AF1185 20-R278 20-R433 20-R481 20-A6833 20-A6113 20-A9666 20-R3631 Cu% Content Sample_ID Figure 11 - 16: Result of the QA/QC Analysis of CRM ITAK 849 August 1, 2018, to July 4, 2020 (Ero Brasil, 2022) Lower limit ( - 2SD) 1.030 Bias ITAK-849 Cu (%) Moving Average Cu% Upper limit (+2SD) Lower limit (-2SD) Reference Value Average December 22, 2022 Rev. F 138

2022 M INERAL R ESOURCES AND M INERAL R ESERVES OF T HE C ARAÍBA O PERATIONS , C URAÇÁ V ALLEY , B AHIA , B RAZIL F ORM 43 - 101F1 T ECHNICAL R EPORT Type of Control Standard Code Cu% Minimum 3.19 Reference ITAK850 Reference Value 3.554 Maximum 3.76 Variable Cu% Standard desviation 0.064 Average 3.53 Number of analysis 370 Upper limit (+2SD) 3.680 Médian 3.53 Lower limit ( - 2SD) 3.630 Bias -0.67% 3.1 3.2 3.3 3.4 3.5 3.8 3.7 3.6 18-CN34 18-AL1673 19-AC116 19-AC504 18-CB223 19-AG84 19-BC135 19-AW4 20-H3395 19-AB926 20-B677 20-J661 20-B2926 20-B4195 20-EG83 20-B7721 19-AC1230 19-AC1440 20-A437 19-AC2186 20-A1173 20-A2024 20-P338 20-R1143 20-BG695 20-A6156 20-S2359 20-R2459 20-BG2300 20-R3115 20-R4244 Cu% Content Sample_ID Figure 11 - 17: Result of the QA/QC Analysis of CRM ITAK 850 (Ero Brasil, 2022) ITAK-850 Cu (%) Moving Average Cu% Upper limit (+2SD) Lower limit (-2SD) Reference Value Average Type of Control Standard Code Cu% Minimum 5.97 Reference ITAK851 Reference Value 6.980 Maximum 7.48 Variable Cu% Standard desviation 0.290 Average 6.90 Number of analysis 113 Upper limit (+2SD) 7.560 Médian 6.91 Lower limit ( - 2SD) 6.400 Bias -1.21% 5.75 6.35 6.15 5.95 6.55 7.15 6.95 6.75 7.75 7.55 7.35 18-AL912 18-AL1490 19-AW579 19-AG480 20-B1843 20-B2557 20-B3363 20-B4624 20-B4996 20-B5202 20-B5397 20-B5518 20-B5833 20-B6652 20-A1332 20-A2698 20-A3722 20-S1436 20-R1545 20-R1739 20-R2231 20-A8685 20-A9027 20-A9728 20-A10575 20-R3730 Cu% Content Sample_ID Figure 11 - 18: Result of the QA/QC Analysis of CRM ITAK 851 August 1, 2018, to July 4, 2020 (Ero Brasil, 2022) ITAK-851 Cu (%) Moving Average Cu% Upper limit (+2SD) Lower limit (-2SD) Reference Value Average December 22, 2022 Rev. F 139
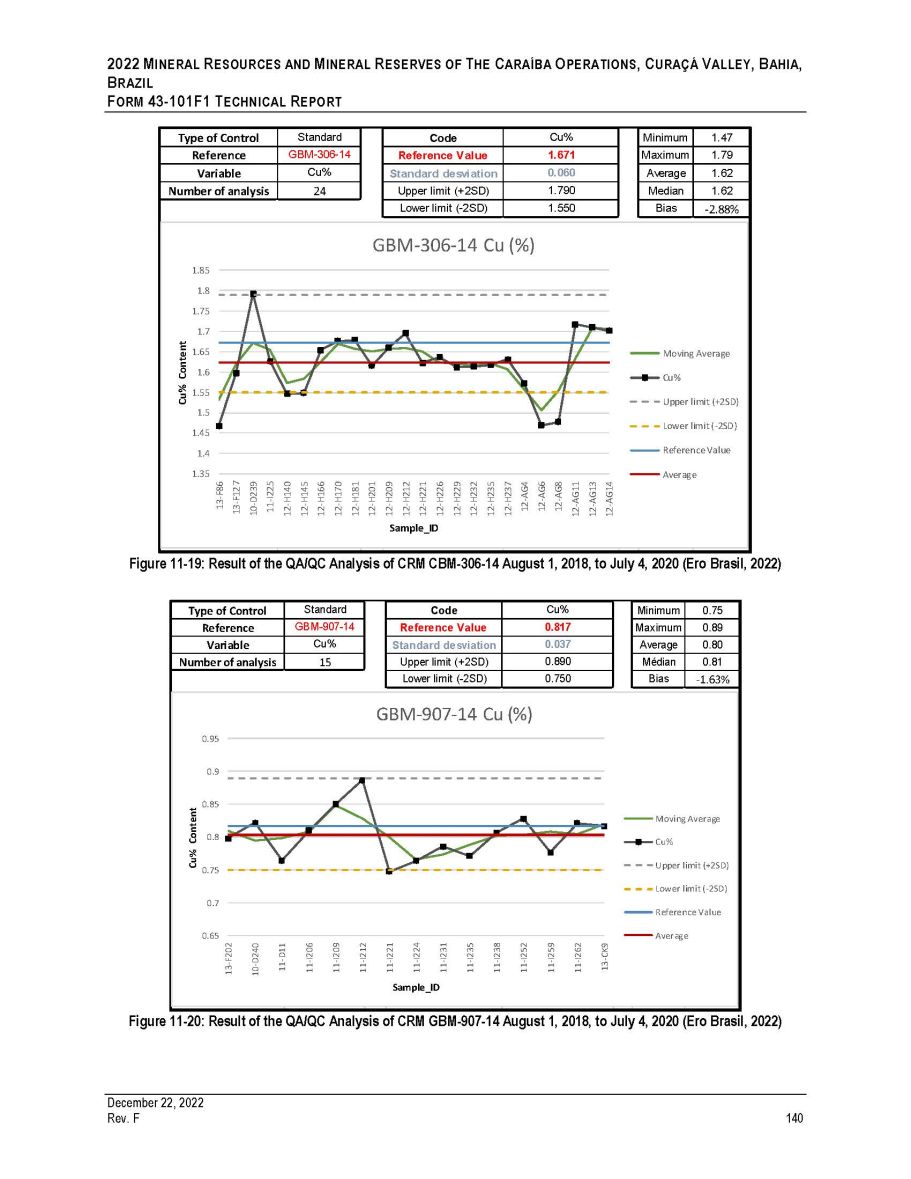
2022 M INERAL R ESOURCES AND M INERAL R ESERVES OF T HE C ARAÍBA O PERATIONS , C URAÇÁ V ALLEY , B AHIA , B RAZIL F ORM 43 - 101F1 T ECHNICAL R EPORT Type of Control Standard Code Cu% Minimum 1.47 Reference GBM - 306 - 14 Reference Value 1.671 Maximum 1.79 Variable Cu% Standard desviation 0.060 Average 1.62 Number of analysis 24 Upper limit (+2SD) 1.790 Median 1.62 Lower limit ( - 2SD) 1.550 Bias -2.88% 1.35 1.4 1.45 1.5 1.55 1.6 1.65 1.85 1.8 1.75 1.7 13-F86 13-F127 10-D239 11-I225 12-H140 12-H145 12-H166 12-H170 12-H181 12-H201 12-H209 12-H212 12-H221 12-H226 12-H229 12-H232 12-H235 12-H237 12-AG4 12-AG6 12-AG8 12-AG11 12-AG13 12-AG14 Cu% Content Sample_ID Figure 11 - 19: Result of the QA/QC Analysis of CRM CBM - 306 - 14 August 1, 2018, to July 4, 2020 (Ero Brasil, 2022) GBM-306-14 Cu (%) Moving Average Cu% Upper limit (+2SD) Lower limit (-2SD) Reference Value Average Type of Control Standard Code Cu% Minimum 0.75 Reference GBM - 907 - 14 Reference Value 0.817 Maximum 0.89 Variable Cu% Standard desviation 0.037 Average 0.80 Number of analysis 15 Upper limit (+2SD) 0.890 Médian 0.81 Lower limit ( - 2SD) 0.750 Bias -1.63% 0.65 0.7 0.75 0.8 0.95 0.9 0.85 13-F202 10-D240 11-D11 11-I206 11-I209 11-I212 11-I221 11-I224 11-I231 11-I235 11-I238 11-I252 11-I259 11-I262 13-CK9 Cu% Content Sample_ID Figure 11 - 20: Result of the QA/QC Analysis of CRM GBM - 907 - 14 August 1, 2018, to July 4, 2020 (Ero Brasil, 2022) GBM-907-14 Cu (%) Moving Average Cu% Upper limit (+2SD) Lower limit (-2SD) Reference Value Average December 22, 2022 Rev. F 140

2022 M INERAL R ESOURCES AND M INERAL R ESERVES OF T HE C ARAÍBA O PERATIONS , C URAÇÁ V ALLEY , B AHIA , B RAZIL F ORM 43 - 101 F 1 T ECHNICAL R EPORT Based upon the analysis of the QA/QC results it can be observed that the Ero Brasil laboratory provides good levels of accuracy at lower copper grades . Accuracy, in general, decreases as grades increase in part due to lower sample density . It was observed throughout the course of the GE 21 review period, that the Ero Brasil laboratory continues to display a tendency to underestimate the copper values when using CRM ITAK 825 ; however, the results for CRM ITAK 851 , which has similar Cu grade range to that of CRM ITAK 825 , demonstrates better reproducibility . GE 21 recommended a validation of the certified grade for CRM ITAK 825 due to the observed inconsistencies with the analysis in the Ero Brasil laboratory, which is in contrast with the consistent results obtained when utilizing CRM ITAK 851 , which has a similar Cu grade range . 11.1.1.3 Duplicate Samples The typical QA/QC program implemented at Ero Brasil involves sending duplicate batches of 2 millimeter (“mm”) coarse samples and pulverized 150 mesh samples to the internal laboratory . Samples are chosen to be representative of the sampling data . One sample is selected from the original batch of material at an interval of at least every 20 samples (a rate of 5 % ) . Analyzing the results of duplicate samples, the authors considered the following limits of acceptability : 20 % of the relative difference for coarse reject duplicates and 10 % of the relative difference for pulverized duplicates . Overall, the evaluation of Ero Brasil’s QA/QC procedures and lab results showed acceptable results for the period from August 1 , 2018 , to July 4 , 2020 , as illustrated in the two figures below (Figure 11 - 21 and Figure 11 - 22 ) . Figure 11 - 21: Analytical Result of the Crushed Duplicate Samples August 1, 2018, to July 4, 2020 (Ero Brasil, 2022) December 22, 2022 Rev. F 141
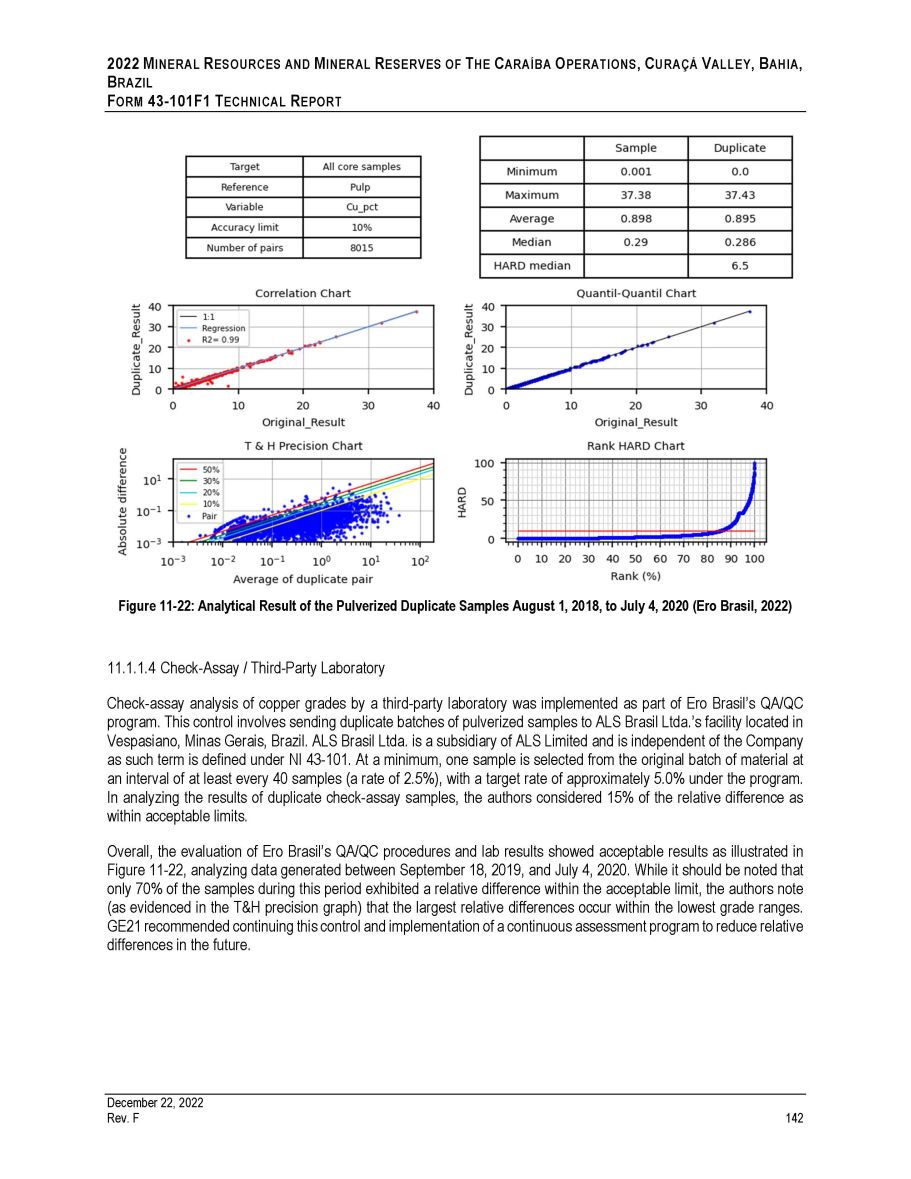
2022 M INERAL R ESOURCES AND M INERAL R ESERVES OF T HE C ARAÍBA O PERATIONS , C URAÇÁ V ALLEY , B AHIA , B RAZIL F ORM 43 - 101F1 T ECHNICAL R EPORT Figure 11 - 22: Analytical Result of the Pulverized Duplicate Samples August 1, 2018, to July 4, 2020 (Ero Brasil, 2022) 11.1.1.4 Check - Assay / Third - Party Laboratory Check - assay analysis of copper grades by a third - party laboratory was implemented as part of Ero Brasil’s QA/QC program . This control involves sending duplicate batches of pulverized samples to ALS Brasil Ltda . ’s facility located in Vespasiano, Minas Gerais, Brazil . ALS Brasil Ltda . is a subsidiary of ALS Limited and is independent of the Company as such term is defined under NI 43 - 101 . At a minimum, one sample is selected from the original batch of material at an interval of at least every 40 samples (a rate of 2 . 5 % ), with a target rate of approximately 5 . 0 % under the program . In analyzing the results of duplicate check - assay samples, the authors considered 15 % of the relative difference as within acceptable limits . Overall, the evaluation of Ero Brasil’s QA/QC procedures and lab results showed acceptable results as illustrated in Figure 11 - 22 , analyzing data generated between September 18 , 2019 , and July 4 , 2020 . While it should be noted that only 70 % of the samples during this period exhibited a relative difference within the acceptable limit, the authors note (as evidenced in the T&H precision graph) that the largest relative differences occur within the lowest grade ranges . GE 21 recommended continuing this control and implementation of a continuous assessment program to reduce relative differences in the future . December 22, 2022 Rev. F 142
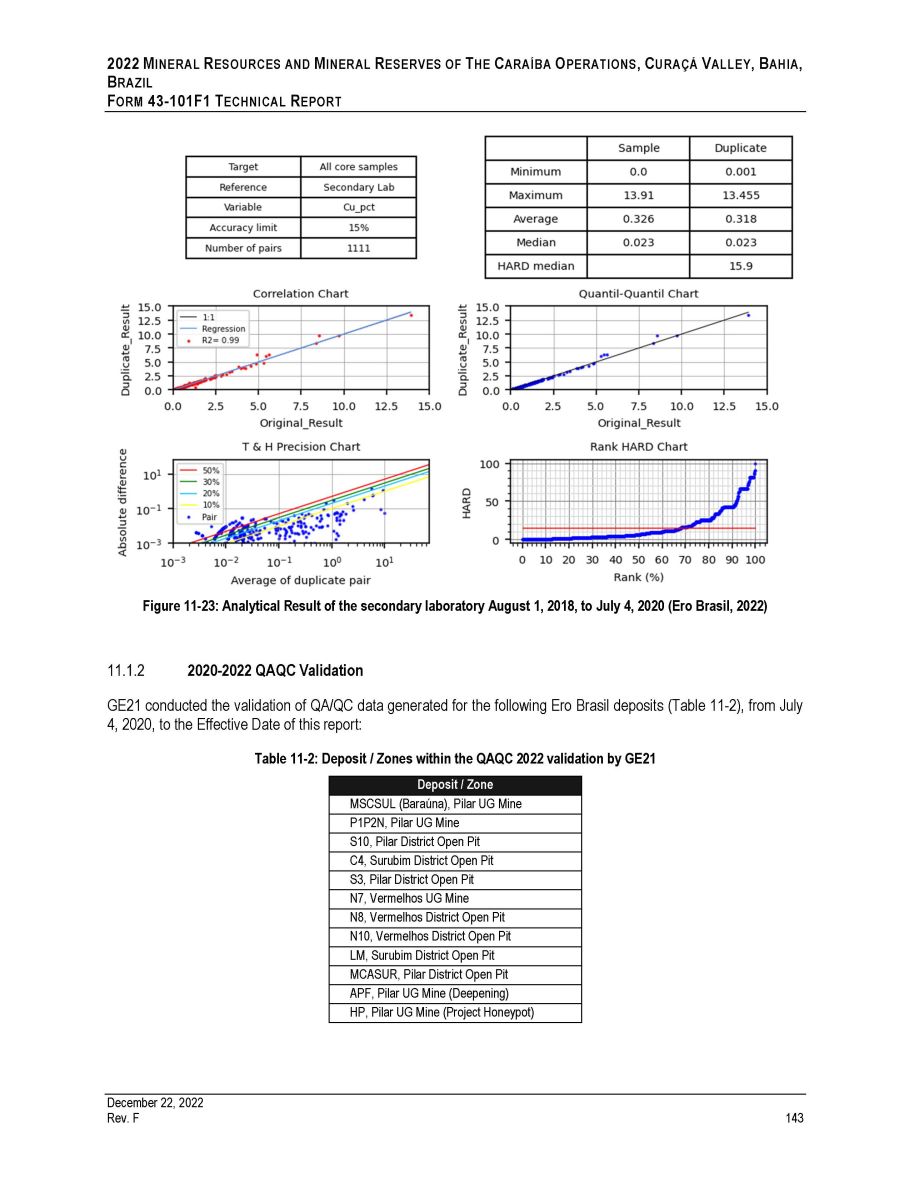
2022 M INERAL R ESOURCES AND M INERAL R ESERVES OF T HE C ARAÍBA O PERATIONS , C URAÇÁ V ALLEY , B AHIA , B RAZIL F ORM 43 - 101F1 T ECHNICAL R EPORT Figure 11 - 23: Analytical Result of the secondary laboratory August 1, 2018, to July 4, 2020 (Ero Brasil, 2022) 2020 - 2022 QAQC Validation GE21 conducted the validation of QA/QC data generated for the following Ero Brasil deposits (Table 11 - 2), from July 4, 2020, to the Effective Date of this report: Table 11 - 2: Deposit / Zones within the QAQC 2022 validation by GE21 Deposit / Zone MSCSUL (Baraúna), Pilar UG Mine P1P2N, Pilar UG Mine S10, Pilar District Open Pit C4, Surubim District Open Pit S3, Pilar District Open Pit N7, Vermelhos UG Mine N8, Vermelhos District Open Pit N10, Vermelhos District Open Pit LM, Surubim District Open Pit MCASUR, Pilar District Open Pit APF, Pilar UG Mine (Deepening) HP, Pilar UG Mine (Project Honeypot) December 22, 2022 Rev. F 143

2022 M INERAL R ESOURCES AND M INERAL R ESERVES OF T HE C ARAÍBA O PERATIONS , C URAÇÁ V ALLEY , B AHIA , B RAZIL F ORM 43 - 101 F 1 T ECHNICAL R EPORT 11.1.2.1 Blank Samples The blank samples are sent at an interval of one blank sample for every 10 samples within each batch (a rate of 10 % ) . Figure 11 - 24 presents the statistics and results associated with the blank control samples for period between July 4 , 2020 , to the Effective Date . Results from samples that underwent these quality control procedures, and are within the quality control limits, are considered acceptable . 12 samples were removed from the analysis because they were considered outliers, presenting mostly copper high grades (Table 11 - 3 ) . Figure 11 - 24: Result of the Analysis of Blank Samples (Ero Brasil, 2022) Table 11 - 3: Outliers named as blank samples removed from the analysis Target Sample Date Batch Lab Cu (%) HP 08 - H01116 25 - jun - 08 08 - H29 - 2 Mineração Caraíba 1.236 HP 08 - H01117 25 - jun - 08 08 - H29 - 2 Mineração Caraíba 1.246 HP 08 - H01119 25 - jun - 08 08 - H29 - 2 Mineração Caraíba 1.229 HP 08 - H01122 25 - jun - 08 08 - H29 - 2 Mineração Caraíba 1.217 HP 08 - H01123 25 - jun - 08 08 - H29 - 2 Mineração Caraíba 1.232 HP 08 - H01127 25 - jun - 08 08 - H29 - 2 Mineração Caraíba 1.250 HP 08 - H01129 25 - jun - 08 08 - H29 - 2 Mineração Caraíba 1.249 HP 08 - H01130 25 - jun - 08 08 - H29 - 2 Mineração Caraíba 1.266 HP 08 - H01136 25 - jun - 08 08 - H29 - 2 Mineração Caraíba 1.261 HP 08 - H01138 25 - jun - 08 08 - H29 - 2 Mineração Caraíba 1.252 HP 08 - H01326 08 - jul - 08 08 - H34 Mineração Caraíba 0.360 HP 08 - H01624 18 - ago - 08 08 - H45 - 3 Mineração Caraíba 0.344 December 22, 2022 Rev. F 144
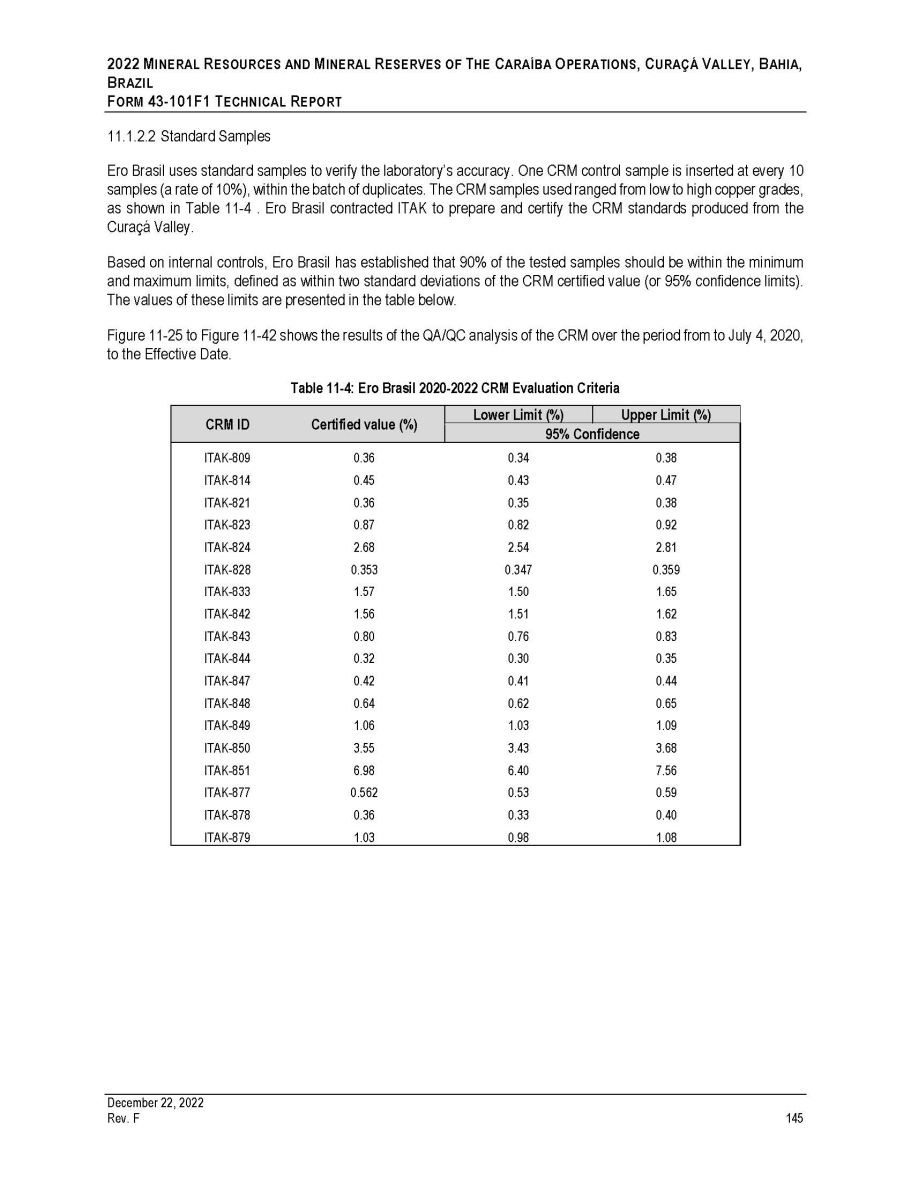
2022 M INERAL R ESOURCES AND M INERAL R ESERVES OF T HE C ARAÍBA O PERATIONS , C URAÇÁ V ALLEY , B AHIA , B RAZIL F ORM 43 - 101 F 1 T ECHNICAL R EPORT 11.1.2.2 Standard Samples Ero Brasil uses standard samples to verify the laboratory’s accuracy . One CRM control sample is inserted at every 10 samples (a rate of 10 % ), within the batch of duplicates . The CRM samples used ranged from low to high copper grades, as shown in Table 11 - 4 . Ero Brasil contracted ITAK to prepare and certify the CRM standards produced from the Curaçá Valley . Based on internal controls, Ero Brasil has established that 90 % of the tested samples should be within the minimum and maximum limits, defined as within two standard deviations of the CRM certified value (or 95 % confidence limits) . The values of these limits are presented in the table below . Figure 11 - 25 to Figure 11 - 42 shows the results of the QA/QC analysis of the CRM over the period from to July 4 , 2020 , to the Effective Date . Table 11 - 4: Ero Brasil 2020 - 2022 CRM Evaluation Criteria CRM ID Certified value (%) Lower Limit (%) Upper Limit (%) 95% Confidence ITAK - 809 0.36 0.34 0.38 ITAK - 814 0.45 0.43 0.47 ITAK - 821 0.36 0.35 0.38 ITAK - 823 0.87 0.82 0.92 ITAK - 824 2.68 2.54 2.81 ITAK - 828 0.353 0.347 0.359 ITAK - 833 1.57 1.50 1.65 ITAK - 842 1.56 1.51 1.62 ITAK - 843 0.80 0.76 0.83 ITAK - 844 0.32 0.30 0.35 ITAK - 847 0.42 0.41 0.44 ITAK - 848 0.64 0.62 0.65 ITAK - 849 1.06 1.03 1.09 ITAK - 850 3.55 3.43 3.68 ITAK - 851 6.98 6.40 7.56 ITAK - 877 0.562 0.53 0.59 ITAK - 878 0.36 0.33 0.40 ITAK - 879 1.03 0.98 1.08 December 22, 2022 Rev. F 145
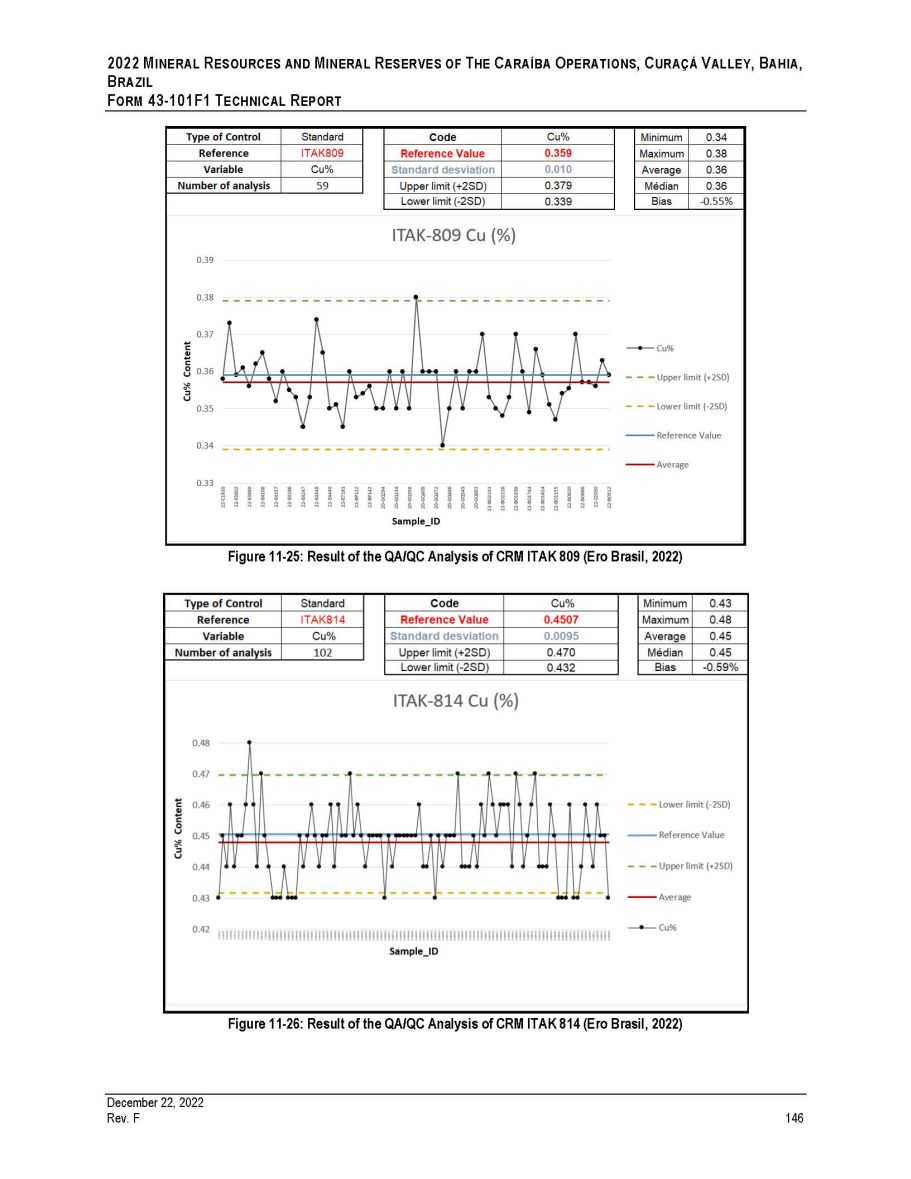
2022 M INERAL R ESOURCES AND M INERAL R ESERVES OF T HE C ARAÍBA O PERATIONS , C URAÇÁ V ALLEY , B AHIA , B RAZIL F ORM 43 - 101F1 T ECHNICAL R EPORT Figure 11 - 25: Result of the QA/QC Analysis of CRM ITAK 809 (Ero Brasil, 2022) Figure 11 - 26: Result of the QA/QC Analysis of CRM ITAK 814 (Ero Brasil, 2022) December 22, 2022 Rev. F 146
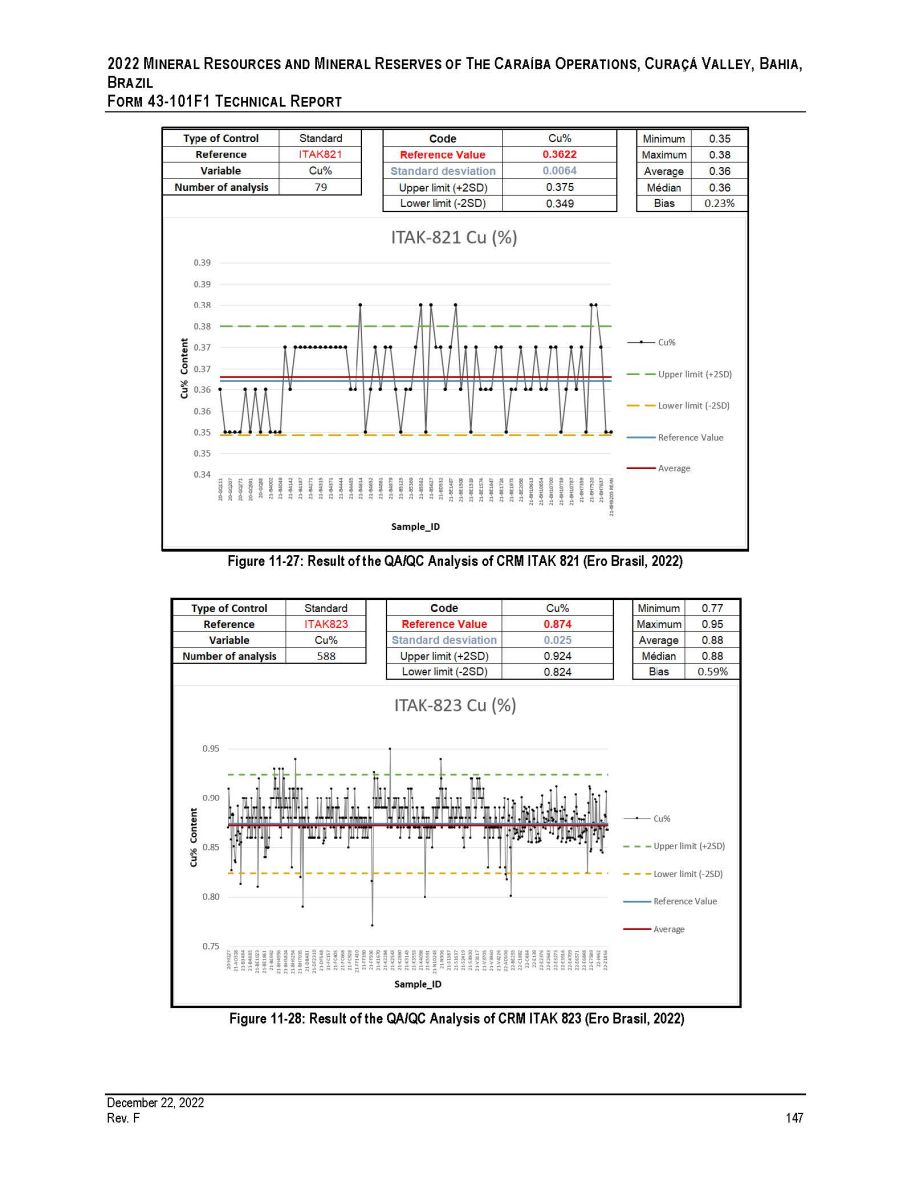
2022 M INERAL R ESOURCES AND M INERAL R ESERVES OF T HE C ARAÍBA O PERATIONS , C URAÇÁ V ALLEY , B AHIA , B RAZIL F ORM 43 - 101F1 T ECHNICAL R EPORT Figure 11 - 27: Result of the QA/QC Analysis of CRM ITAK 821 (Ero Brasil, 2022) Figure 11 - 28: Result of the QA/QC Analysis of CRM ITAK 823 (Ero Brasil, 2022) December 22, 2022 Rev. F 147

2022 M INERAL R ESOURCES AND M INERAL R ESERVES OF T HE C ARAÍBA O PERATIONS , C URAÇÁ V ALLEY , B AHIA , B RAZIL F ORM 43 - 101F1 T ECHNICAL R EPORT Figure 11 - 29: Result of the QA/QC Analysis of CRM ITAK 824 (Ero Brasil, 2022) Figure 11 - 30: Result of the QA/QC Analysis of CRM ITAK 828 (Ero Brasil, 2022) December 22, 2022 Rev. F 148
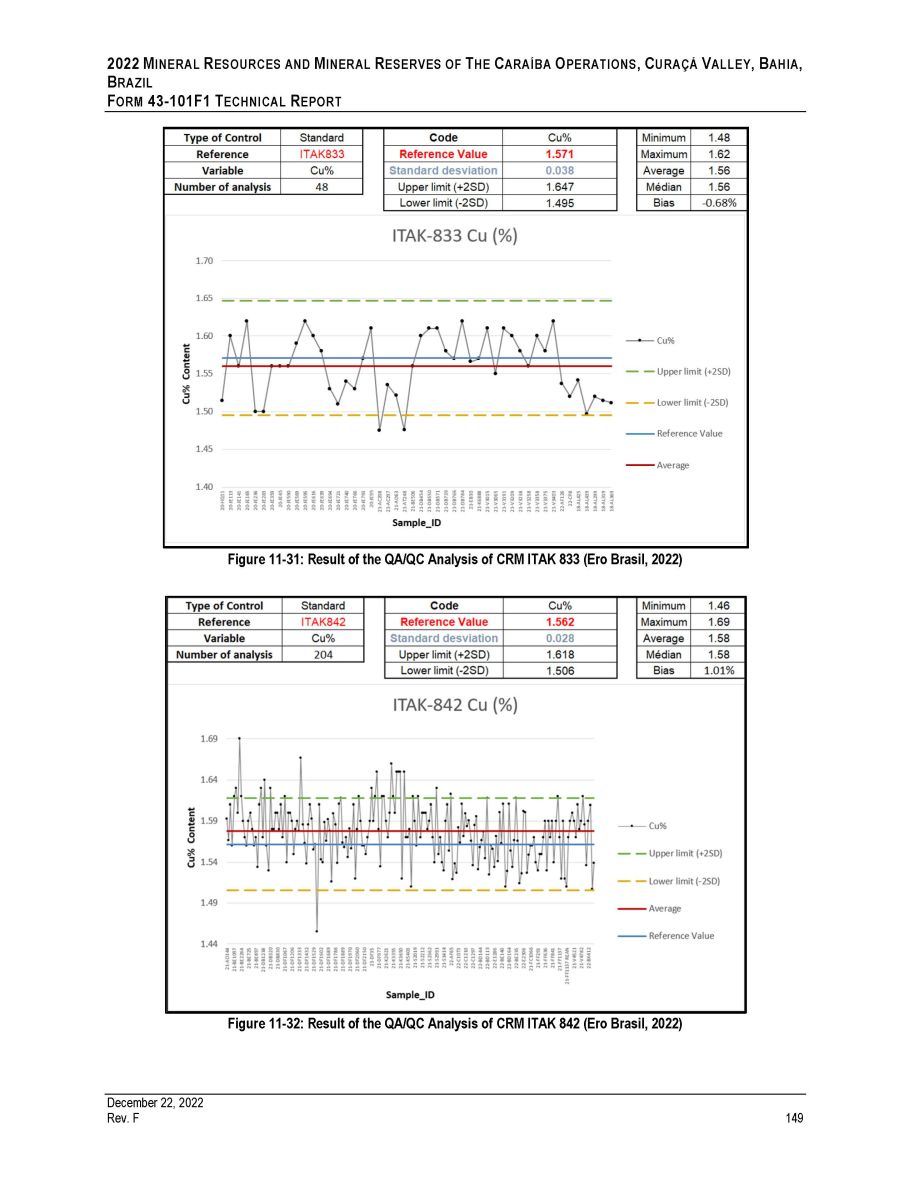
2022 M INERAL R ESOURCES AND M INERAL R ESERVES OF T HE C ARAÍBA O PERATIONS , C URAÇÁ V ALLEY , B AHIA , B RAZIL F ORM 43 - 101F1 T ECHNICAL R EPORT Figure 11 - 31: Result of the QA/QC Analysis of CRM ITAK 833 (Ero Brasil, 2022) Figure 11 - 32: Result of the QA/QC Analysis of CRM ITAK 842 (Ero Brasil, 2022) December 22, 2022 Rev. F 149
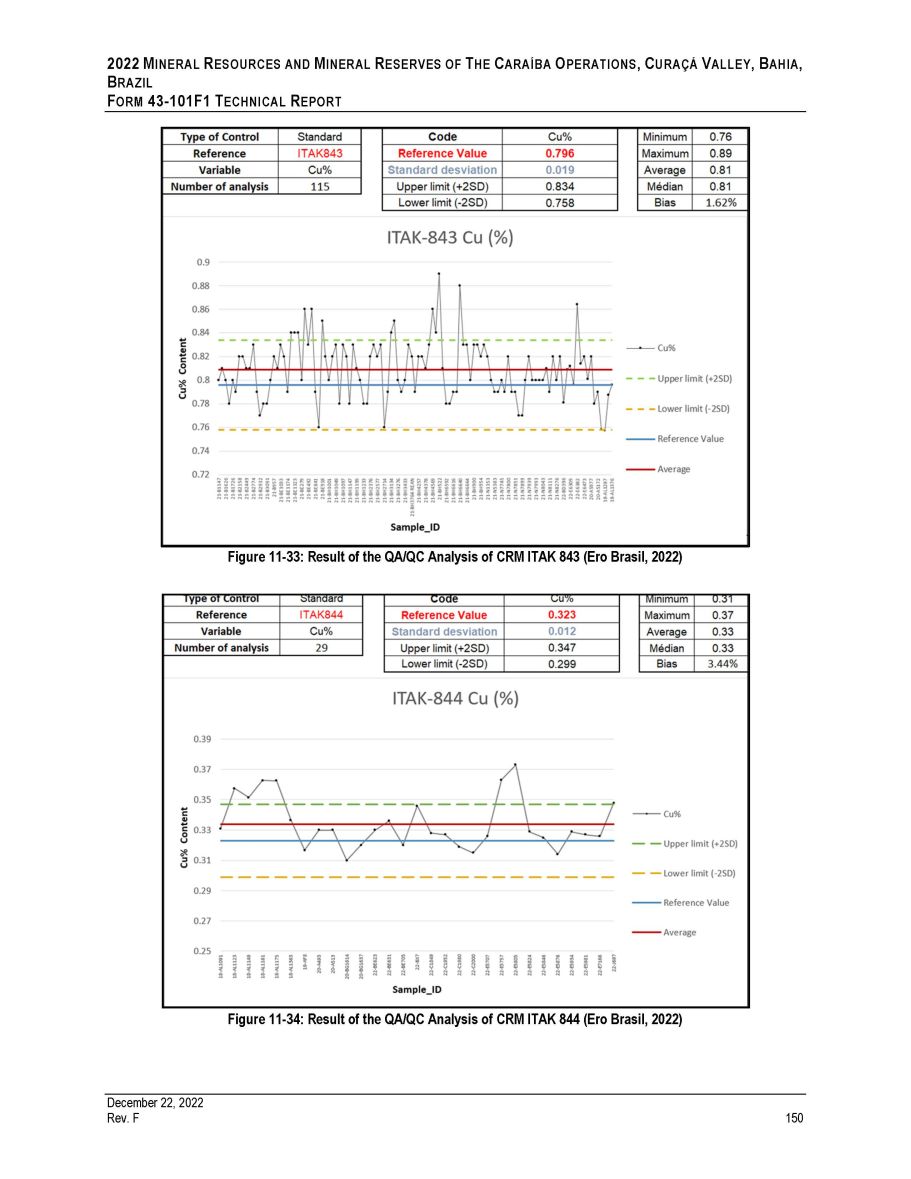
2022 M INERAL R ESOURCES AND M INERAL R ESERVES OF T HE C ARAÍBA O PERATIONS , C URAÇÁ V ALLEY , B AHIA , B RAZIL F ORM 43 - 101F1 T ECHNICAL R EPORT Figure 11 - 33: Result of the QA/QC Analysis of CRM ITAK 843 (Ero Brasil, 2022) Figure 11 - 34: Result of the QA/QC Analysis of CRM ITAK 844 (Ero Brasil, 2022) December 22, 2022 Rev. F 150
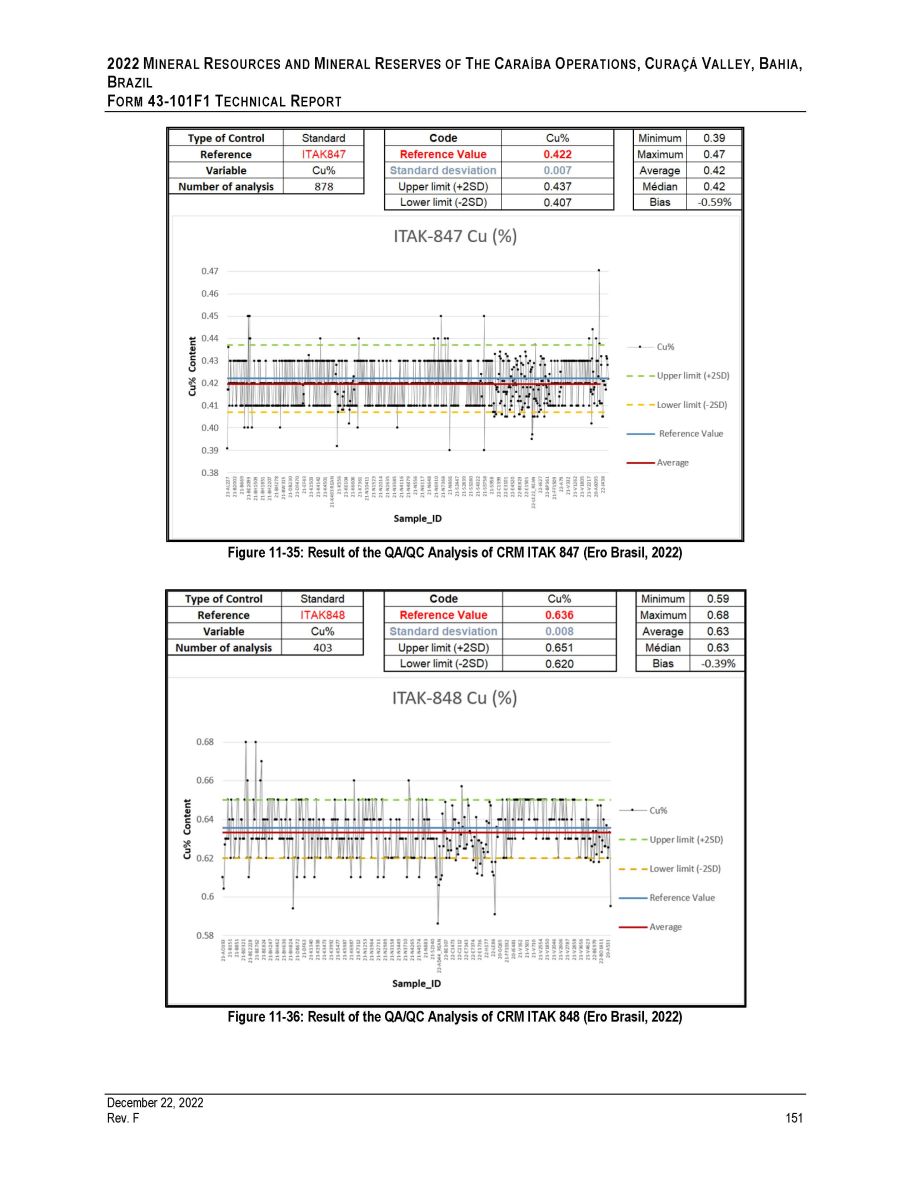
2022 M INERAL R ESOURCES AND M INERAL R ESERVES OF T HE C ARAÍBA O PERATIONS , C URAÇÁ V ALLEY , B AHIA , B RAZIL F ORM 43 - 101F1 T ECHNICAL R EPORT Figure 11 - 35: Result of the QA/QC Analysis of CRM ITAK 847 (Ero Brasil, 2022) Figure 11 - 36: Result of the QA/QC Analysis of CRM ITAK 848 (Ero Brasil, 2022) December 22, 2022 Rev. F 151
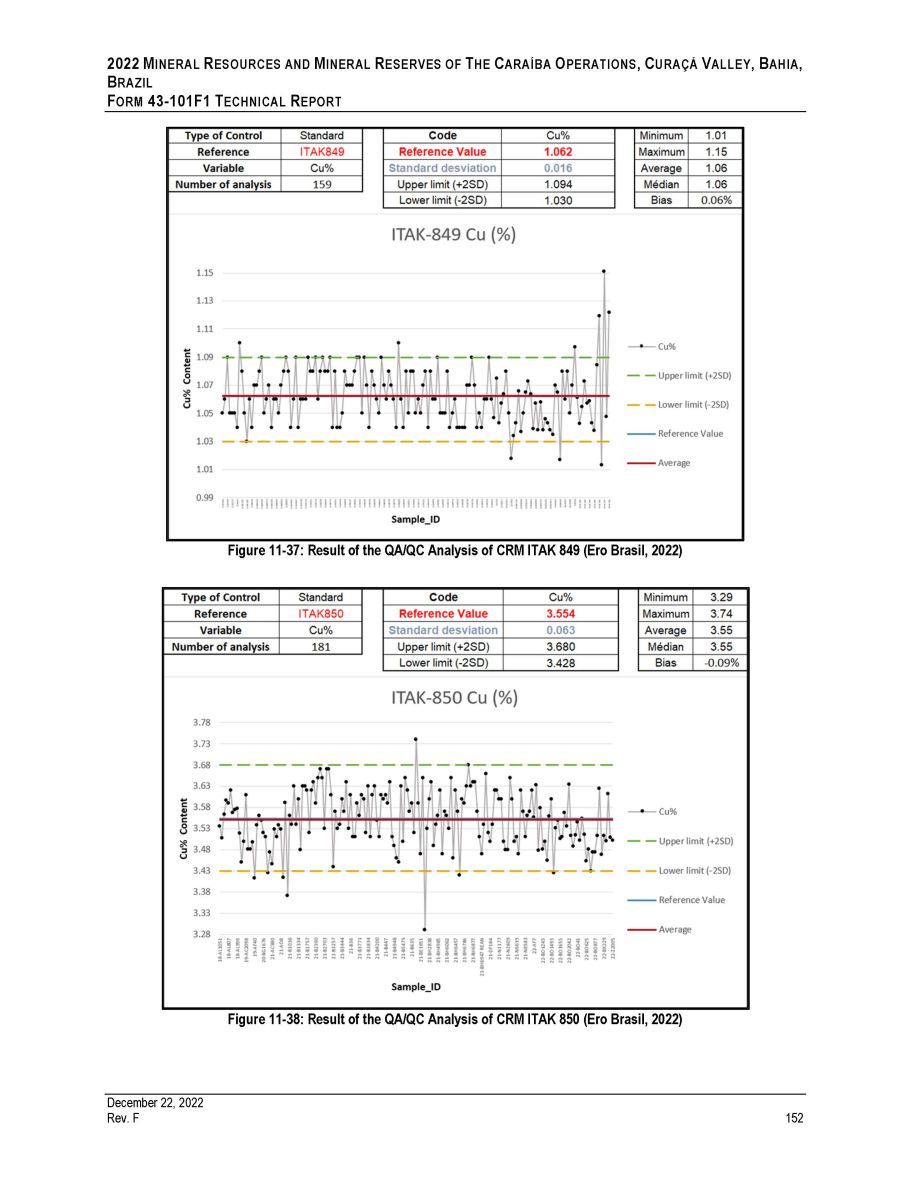
2022 M INERAL R ESOURCES AND M INERAL R ESERVES OF T HE C ARAÍBA O PERATIONS , C URAÇÁ V ALLEY , B AHIA , B RAZIL F ORM 43 - 101F1 T ECHNICAL R EPORT Figure 11 - 37: Result of the QA/QC Analysis of CRM ITAK 849 (Ero Brasil, 2022) Figure 11 - 38: Result of the QA/QC Analysis of CRM ITAK 850 (Ero Brasil, 2022) December 22, 2022 Rev. F 152
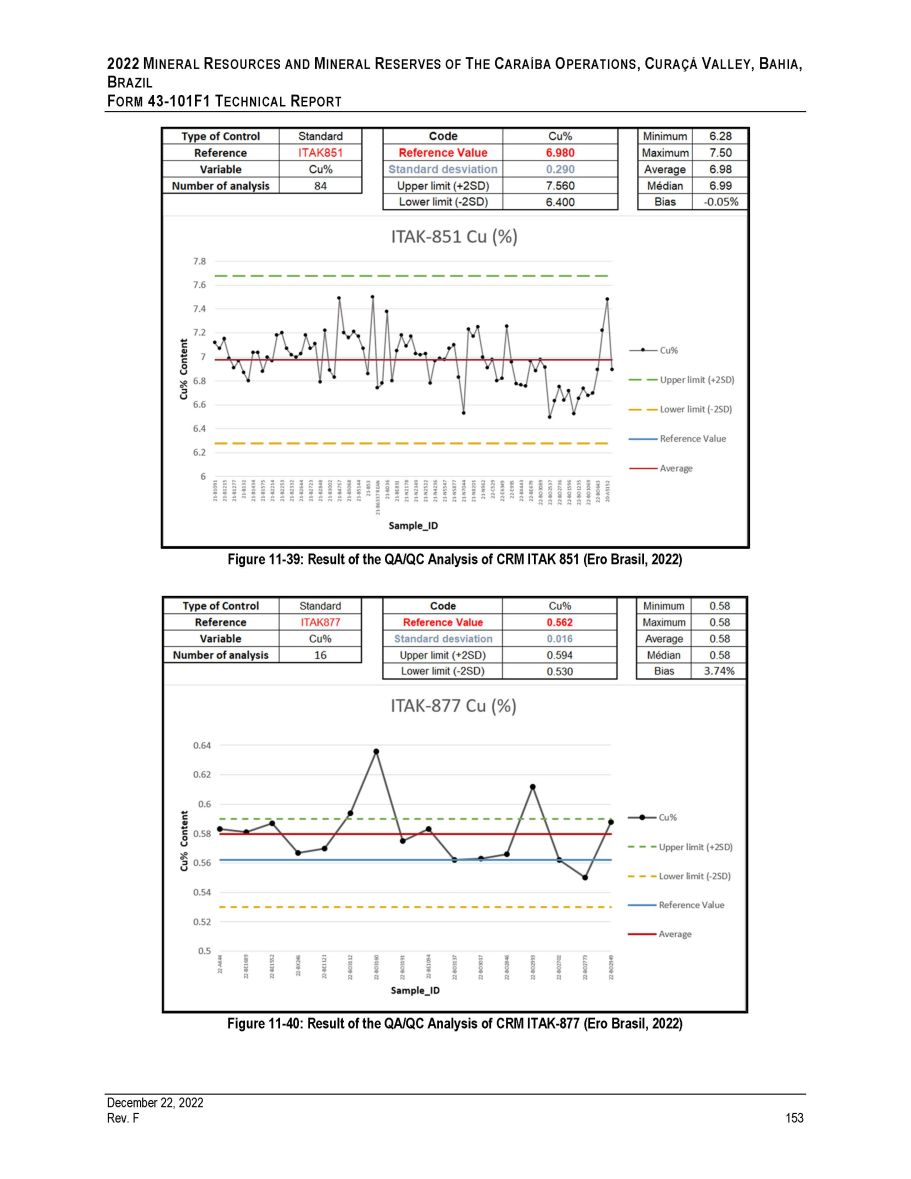
2022 M INERAL R ESOURCES AND M INERAL R ESERVES OF T HE C ARAÍBA O PERATIONS , C URAÇÁ V ALLEY , B AHIA , B RAZIL F ORM 43 - 101F1 T ECHNICAL R EPORT Figure 11 - 39: Result of the QA/QC Analysis of CRM ITAK 851 (Ero Brasil, 2022) Figure 11 - 40: Result of the QA/QC Analysis of CRM ITAK - 877 (Ero Brasil, 2022) December 22, 2022 Rev. F 153
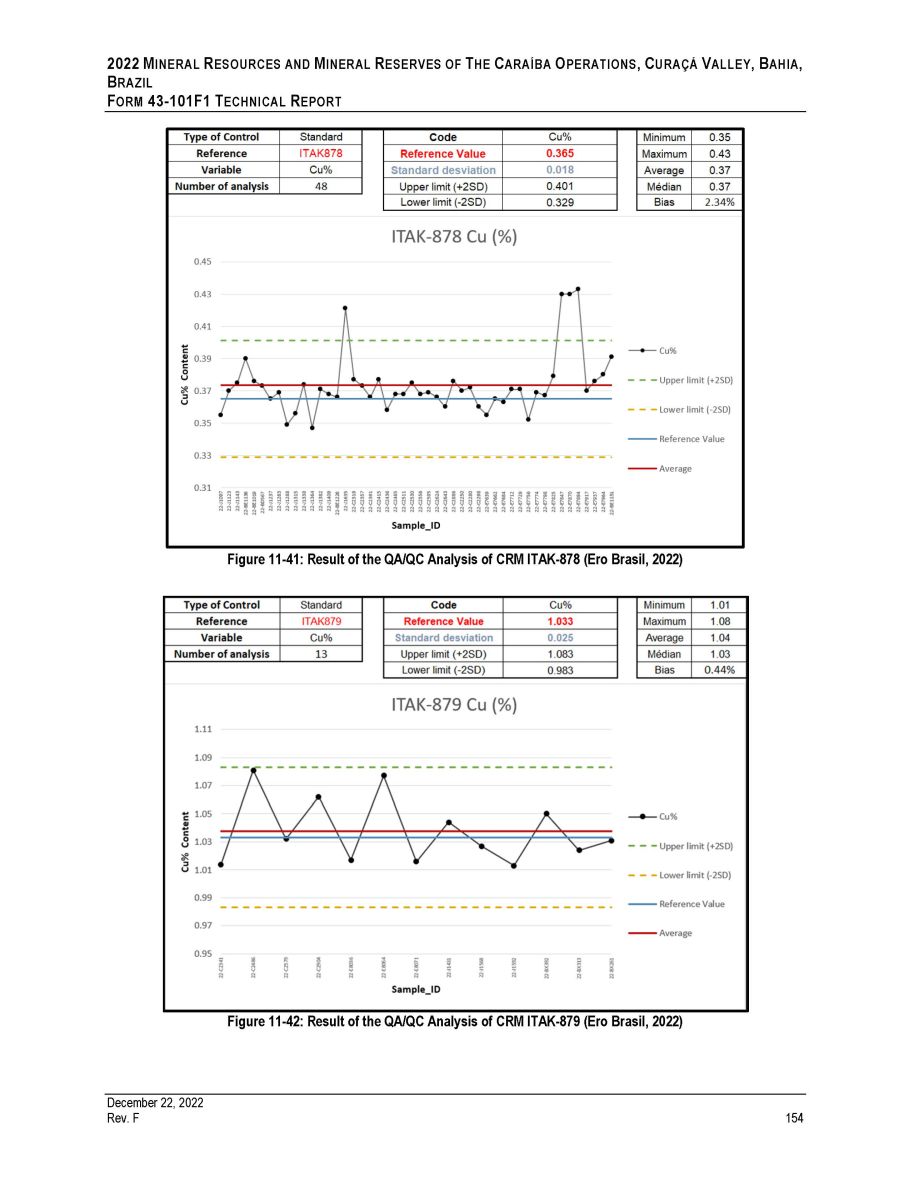
2022 M INERAL R ESOURCES AND M INERAL R ESERVES OF T HE C ARAÍBA O PERATIONS , C URAÇÁ V ALLEY , B AHIA , B RAZIL F ORM 43 - 101F1 T ECHNICAL R EPORT Figure 11 - 41: Result of the QA/QC Analysis of CRM ITAK - 878 (Ero Brasil, 2022) Figure 11 - 42: Result of the QA/QC Analysis of CRM ITAK - 879 (Ero Brasil, 2022) December 22, 2022 Rev. F 154

2022 M INERAL R ESOURCES AND M INERAL R ESERVES OF T HE C ARAÍBA O PERATIONS , C URAÇÁ V ALLEY , B AHIA , B RAZIL F ORM 43 - 101 F 1 T ECHNICAL R EPORT It is worth noting that the CRM ITAK 828 presented 51 % of the analyzed samples above the upper limit (+ 2 SD) . however, the results for CRM ITAK 878 , which has similar Cu grade range, demonstrates acceptable reproducibility . 11.1.2.3 Duplicate Samples The typical QA/QC program implemented at the Caraíba Operations involves sending duplicate batches of 2 millimeter (“mm”) coarse samples and pulverized 150 mesh samples to the laboratory . Samples are chosen to be representative of the sampling data . One sample is selected from the original batch of material at an interval of at least every 20 samples (a rate of 5 % ) . In analyzing the results of duplicate samples, the authors considered the following limits of acceptability : 20 % of the relative difference for the coarse reject duplicates and 10 % of the relative difference for the pulverized duplicates . Overall, the evaluation of Caraíba Operations’ QA/QC procedures and lab results show acceptable results (above 90 % ) for the period from July 4 , 2020 to Effective Date, as illustrated in Figure 11 - 43 and Figure 11 - 44 . Figure 11 - 43: Analytical Result of the Crushed Duplicate Samples (Ero Brasil, 2022) December 22, 2022 Rev. F 155
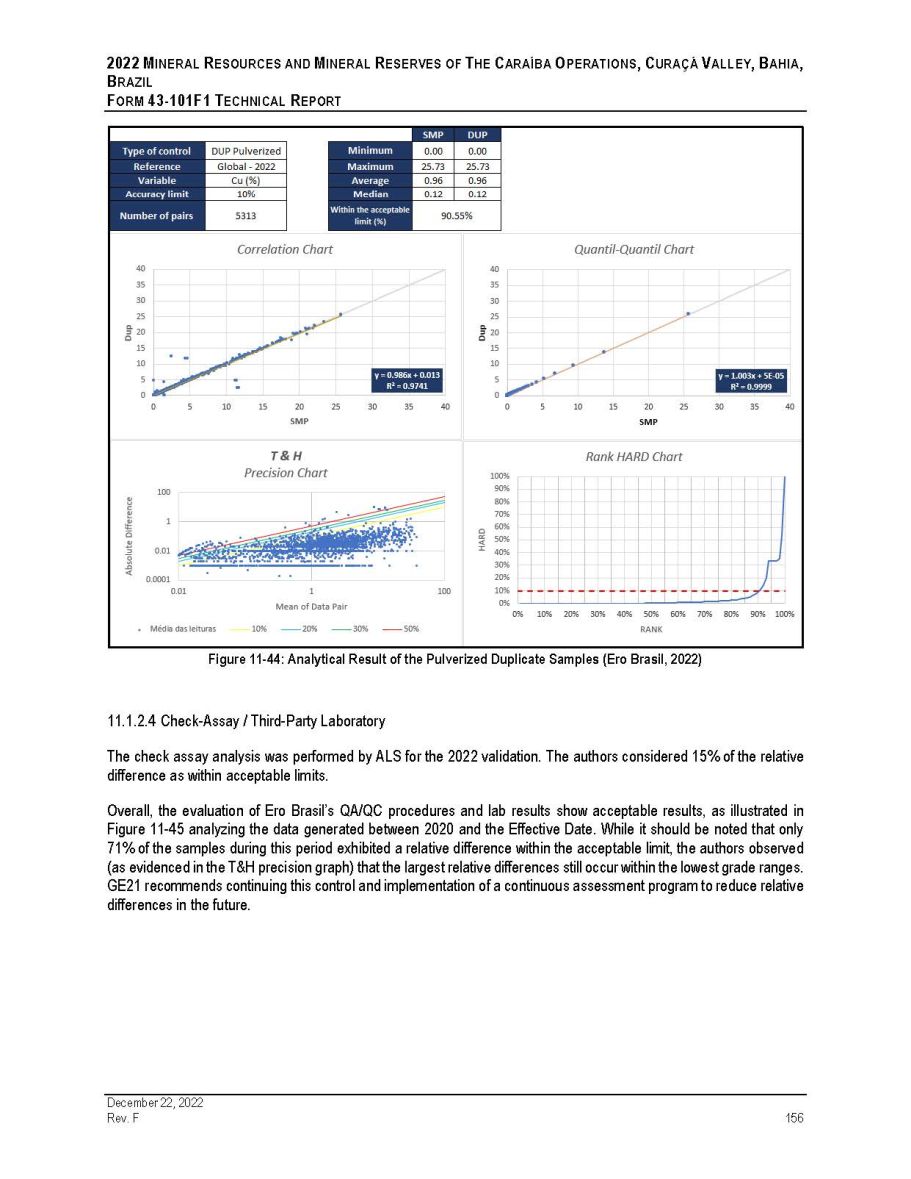
2022 M INERAL R ESOURCES AND M INERAL R ESERVES OF T HE C ARAÍBA O PERATIONS , C URAÇÁ V ALLEY , B AHIA , B RAZIL F ORM 43 - 101F1 T ECHNICAL R EPORT Figure 11 - 44: Analytical Result of the Pulverized Duplicate Samples (Ero Brasil, 2022) 11.1.2.4 Check - Assay / Third - Party Laboratory The check assay analysis was performed by ALS for the 2022 validation . The authors considered 15 % of the relative difference as within acceptable limits . Overall, the evaluation of Ero Brasil’s QA/QC procedures and lab results show acceptable results, as illustrated in Figure 11 - 45 analyzing the data generated between 2020 and the Effective Date . While it should be noted that only 71 % of the samples during this period exhibited a relative difference within the acceptable limit, the authors observed (as evidenced in the T&H precision graph) that the largest relative differences still occur within the lowest grade ranges . GE 21 recommends continuing this control and implementation of a continuous assessment program to reduce relative differences in the future . December 22, 2022 Rev. F 156
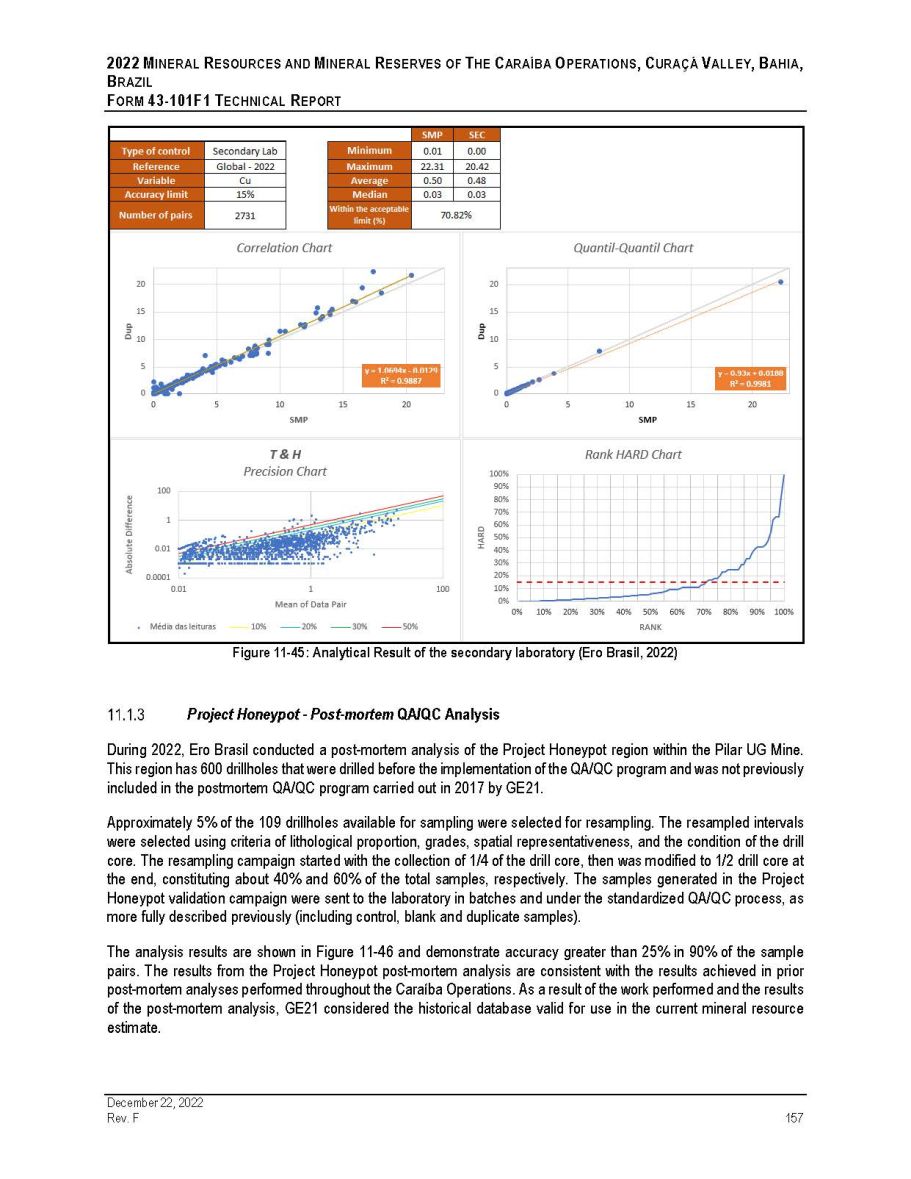
2022 M INERAL R ESOURCES AND M INERAL R ESERVES OF T HE C ARAÍBA O PERATIONS , C URAÇÁ V ALLEY , B AHIA , B RAZIL F ORM 43 - 101F1 T ECHNICAL R EPORT Figure 11 - 45: Analytical Result of the secondary laboratory (Ero Brasil, 2022) Project Honeypot - Post - mortem QA/QC Analysis During 2022 , Ero Brasil conducted a post - mortem analysis of the Project Honeypot region within the Pilar UG Mine . This region has 600 drillholes that were drilled before the implementation of the QA/QC program and was not previously included in the postmortem QA/QC program carried out in 2017 by GE 21 . Approximately 5 % of the 109 drillholes available for sampling were selected for resampling . The resampled intervals were selected using criteria of lithological proportion, grades, spatial representativeness, and the condition of the drill core . The resampling campaign started with the collection of 1 / 4 of the drill core, then was modified to 1 / 2 drill core at the end, constituting about 40 % and 60 % of the total samples, respectively . The samples generated in the Project Honeypot validation campaign were sent to the laboratory in batches and under the standardized QA/QC process, as more fully described previously (including control, blank and duplicate samples) . The analysis results are shown in Figure 11 - 46 and demonstrate accuracy greater than 25 % in 90 % of the sample pairs . The results from the Project Honeypot post - mortem analysis are consistent with the results achieved in prior post - mortem analyses performed throughout the Caraíba Operations . As a result of the work performed and the results of the post - mortem analysis, GE 21 considered the historical database valid for use in the current mineral resource estimate . December 22, 2022 Rev. F 157
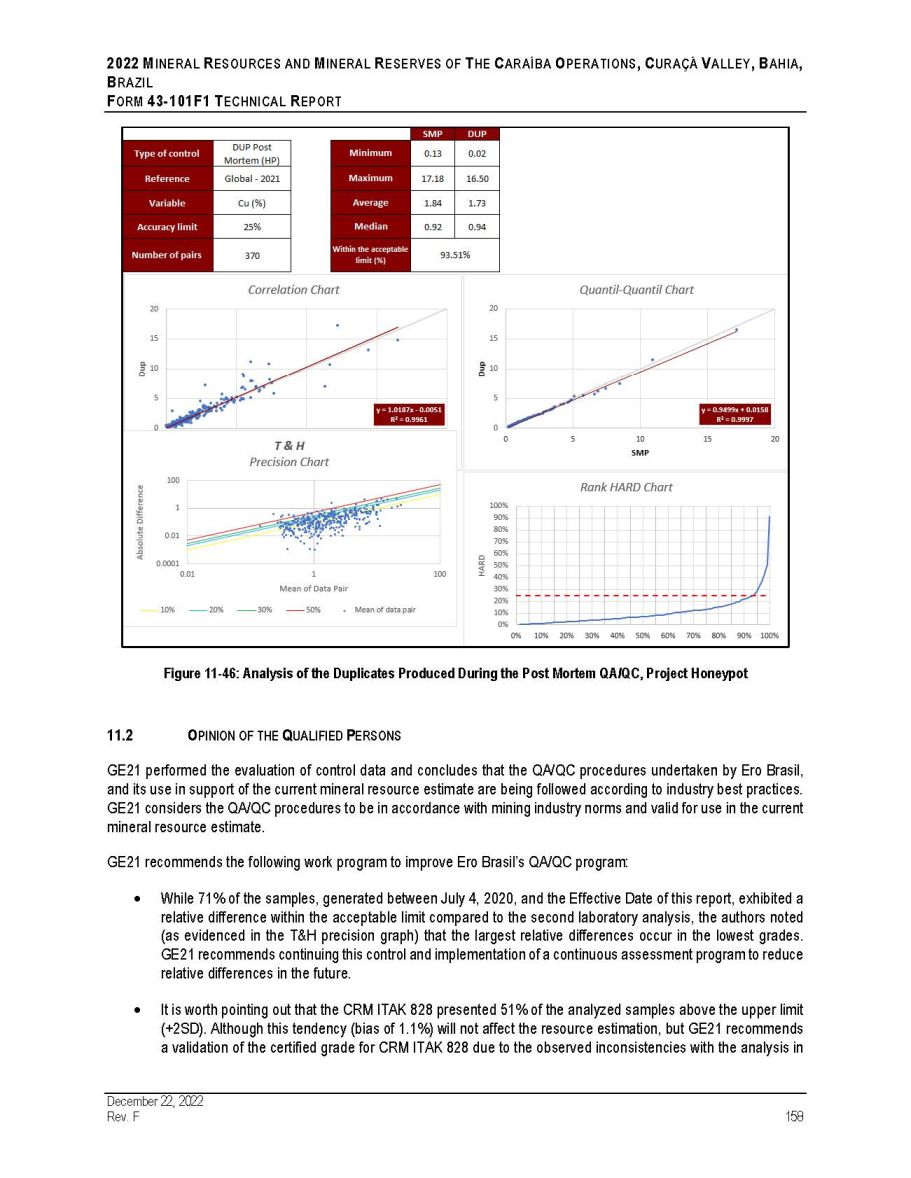
2022 M INERAL R ESOURCES AND M INERAL R ESERVES OF T HE C ARAÍBA O PERATIONS , C URAÇÁ V ALLEY , B AHIA , B RAZIL F ORM 43 - 101F1 T ECHNICAL R EPORT Figure 11 - 46: Analysis of the Duplicates Produced During the Post Mortem QA/QC, Project Honeypot 2. O PINION OF THE Q UALIFIED P ERSONS GE 21 performed the evaluation of control data and concludes that the QA/QC procedures undertaken by Ero Brasil, and its use in support of the current mineral resource estimate are being followed according to industry best practices . GE 21 considers the QA/QC procedures to be in accordance with mining industry norms and valid for use in the current mineral resource estimate . GE 21 recommends the following work program to improve Ero Brasil’s QA/QC program : While 71 % of the samples, generated between July 4 , 2020 , and the Effective Date of this report, exhibited a relative difference within the acceptable limit compared to the second laboratory analysis, the authors noted (as evidenced in the T&H precision graph) that the largest relative differences occur in the lowest grades . GE 21 recommends continuing this control and implementation of a continuous assessment program to reduce relative differences in the future . It is worth pointing out that the CRM ITAK 828 presented 51 % of the analyzed samples above the upper limit (+ 2 SD) . Although this tendency (bias of 1 . 1 % ) will not affect the resource estimation, but GE 21 recommends a validation of the certified grade for CRM ITAK 828 due to the observed inconsistencies with the analysis in December 22, 2022 Rev. F 158
2022 M INERAL R ESOURCES AND M INERAL R ESERVES OF T HE C ARAÍBA O PERATIONS , C URAÇÁ V ALLEY , B AHIA , B RAZIL F ORM 43 - 101F1 T ECHNICAL R EPORT the Caraíba Operations laboratory, which is in contrast with the consistent results obtained when utilizing CRM ITAK 878, which has a similar Cu grade range. GE 21 concluded that the result of the post - mortem QA/QC Analysis for the Project Honeypot zone was satisfactory, and considered the samples that pre - dated the implementation of the standard QA/QC program at Ero Brasil being acceptable for use in the current mineral resource estimate . December 22, 2022 Rev. F 159
2022 M INERAL R ESOURCES AND M INERAL R ESERVES OF T HE C ARAÍBA O PERATIONS , C URAÇÁ V ALLEY , B AHIA , B RAZIL F ORM 43 - 101 F 1 T ECHNICAL R EPORT 12 DATA VERIFICATION Professionals from GE 21 , including the majority of the authors of this Report, have conducted periodic field visits to the Caraíba Operations in the Curaçá Valley, since 2017 , to personally inspect the site infrastructure, the procedures used in data collection and resource estimation and the results that are obtained from the activities carried out by Ero Brasil personnel . Eng . Porfirio Rodriguez of GE 21 has conducted field visits since 2006 . Since then, Mr . Rodriguez has been involved with Ero Brasil and Ero Copper in the development of the resource estimation procedures that have been implemented by Ero Brasil’s staff that continue to be in use . For the 2022 updated mineral resource, site visits were conducted by Porfirio Rodriguez (September 27 to 30 , 2021 ) Fábio Xavier (September 27 to 30 , 2021 and February 10 to 12 , 2022 ), Bernardo Viana (September 27 to 30 , 2021 ) and Ednie Carvalho (February 10 to 12 , 2022 ) . GE 21 is of the opinion that the exploration data is adequate for use in the mineral resource and mineral reserve estimate . What follows below are some observations that were recorded by GE 21 personnel during the course of visits as it relates to the generation, collection, control and storage of exploration data on site at the Company’s Caraíba Operations : • Drill hole logging : this task is considered to be best industry practice . The Company implemented electronic core logging, which has been standardized at the Caraíba Operations since 2018 . GE 21 performed a review of logging procedures for randomly selected drill core and verified the completeness of the logs . Of the samples reviewed, not all drill holes recorded standard lithological codes and some geologic features were omitted from the logs ; however, considering the small number of omissions among the data set reviewed, Ero Brasil has demonstrated that it understands the geology and these omissions are not considered to be material . • Laboratory and chemical analyses : standardized QA/QC procedures were found to be complete and in - line with standard industry practice as more fully described in Chapter 11 – Sample Preparation, Analyses, and Security . Information collected before the current QA/QC procedures were put in place, including for Project Honeypot, has been verified via a post - mortem validation . Data from drill holes that could not be validated were omitted from the mineral resource estimate . • Database : recent data is stored in a standard commercial database . Historical records are well managed and, where applicable, have been migrated to the database . Data storage procedures at Ero Brasil are considered standard industry practice . As part of the validation process, GE 21 verified 377 holes totaling 96 , 417 m of drilling . Database validation was conducted with the help of Ero Brasil staff according to standard validation procedures including review of collar locations, drill hole deviations and database check - assay review . No inconsistencies were found in the database . • Density : There is considerable density information available for the Curaçá Valley due to the operating history of the mine(s) . The process for determining density is considered in - line with standard industry practice . The table below shows the density determined for each lithological unit . December 22, 2022 Rev. F 160

2022 M INERAL R ESOURCES AND M INERAL R ESERVES OF T HE C ARAÍBA O PERATIONS , C URAÇÁ V ALLEY , B AHIA , B RAZIL F ORM 43 - 101F1 T ECHNICAL R EPORT Table 12 - 1: Summary of Density Estimates by Lithology Lithology Max Density (g/cm³) Min Mean Deviation Number of Samples Amphibolite 3.06 2.96 3.01 0.1 55 Biotite Gneiss 3.2 2.88 2.7 0.14 2,894 Biotite 3.85 3.20 3.38 0.11 141 Calcium - silicate 4.14 3.00 3.39 0.15 117 Phlogopite 3.28 3.21 3.25 0.13 102 Gabbro 3.07 2.96 3.01 0.06 140 Gabbronorite 3.05 2.99 3.02 0.04 226 Gneiss Q - F 2.76 2.71 2.74 0.1 247 Tonalitic Gneiss 2.74 2.69 2.72 0.04 577 Granite 2.69 2.69 0.05 49 Gneissic granite 2.81 2.75 2.78 0.02 51 Melanorite 3.5 3.14 3.32 0.18 1,204 Metasomatite 2.91 2.76 2.82 0.13 877 Migmatite 2.91 2.75 2.83 0.12 181 Mylonite 3.38 2.92 3.1 0.19 26 Norite 3.32 2.99 3.15 0.15 1,054 Pegmatite 3.08 2.7 2.86 0.12 126 Pyroxenite 3.7 3.33 3.52 0.24 758 Serpentinite 3.6 3.03 3.3 0.18 322 Tonalite 2.7 2.48 2.6 0.03 8 Quartz vein 2.76 2.76 - 1 TOTAL 9,153 December 22, 2022 Rev. F 161
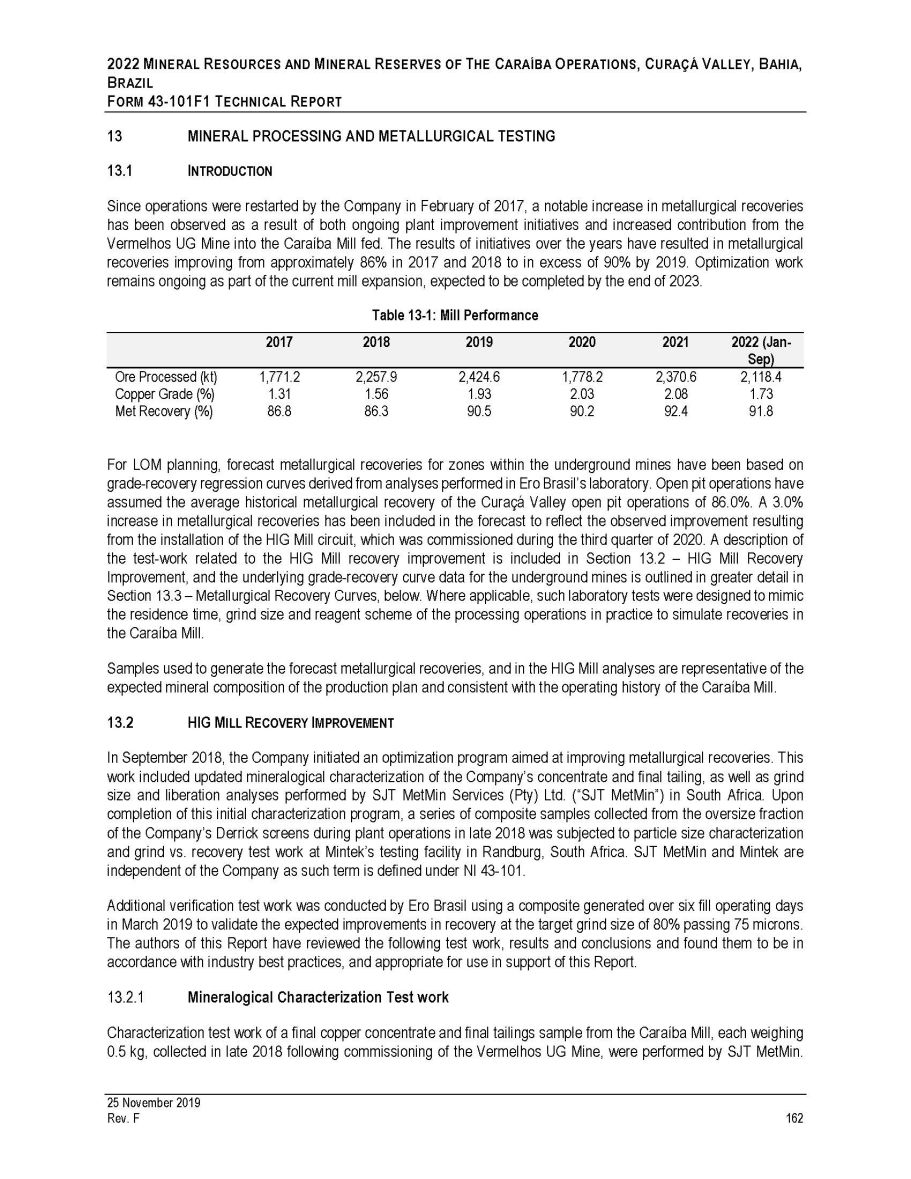
2022 M INERAL R ESOURCES AND M INERAL R ESERVES OF T HE C ARAÍBA O PERATIONS , C URAÇÁ V ALLEY , B AHIA , B RAZIL F ORM 43 - 101F1 T ECHNICAL R EPORT 13 13.1 MINERAL PROCESSING AND METALLURGICAL TESTING I NTRODUCTION Since operations were restarted by the Company in February of 2017 , a notable increase in metallurgical recoveries has been observed as a result of both ongoing plant improvement initiatives and increased contribution from the Vermelhos UG Mine into the Caraíba Mill fed . The results of initiatives over the years have resulted in metallurgical recoveries improving from approximately 86 % in 2017 and 2018 to in excess of 90 % by 2019 . Optimization work remains ongoing as part of the current mill expansion, expected to be completed by the end of 2023 . Table 13 - 1: Mill Performance 2017 2018 2019 2020 2021 2022 (Jan - Sep) Ore Processed (kt) 1,771.2 2,257.9 2,424.6 1,778.2 2,370.6 2,118.4 Copper Grade (%) 1.31 1.56 1.93 2.03 2.08 1.73 Met Recovery (%) 86.8 86.3 90.5 90.2 92.4 91.8 For LOM planning, forecast metallurgical recoveries for zones within the underground mines have been based on grade - recovery regression curves derived from analyses performed in Ero Brasil’s laboratory . Open pit operations have assumed the average historical metallurgical recovery of the Curaçá Valley open pit operations of 86 . 0 % . A 3 . 0 % increase in metallurgical recoveries has been included in the forecast to reflect the observed improvement resulting from the installation of the HIG Mill circuit, which was commissioned during the third quarter of 2020 . A description of the test - work related to the HIG Mill recovery improvement is included in Section 13 . 2 – HIG Mill Recovery Improvement, and the underlying grade - recovery curve data for the underground mines is outlined in greater detail in Section 13 . 3 – Metallurgical Recovery Curves, below . Where applicable, such laboratory tests were designed to mimic the residence time, grind size and reagent scheme of the processing operations in practice to simulate recoveries in the Caraíba Mill . Samples used to generate the forecast metallurgical recoveries, and in the HIG Mill analyses are representative of the expected mineral composition of the production plan and consistent with the operating history of the Caraíba Mill . 13.2 HIG M ILL R ECOVERY I MPROVEMENT In September 2018 , the Company initiated an optimization program aimed at improving metallurgical recoveries . This work included updated mineralogical characterization of the Company’s concentrate and final tailing, as well as grind size and liberation analyses performed by SJT MetMin Services (Pty) Ltd . (“SJT MetMin”) in South Africa . Upon completion of this initial characterization program, a series of composite samples collected from the oversize fraction of the Company’s Derrick screens during plant operations in late 2018 was subjected to particle size characterization and grind vs . recovery test work at Mintek’s testing facility in Randburg, South Africa . SJT MetMin and Mintek are independent of the Company as such term is defined under NI 43 - 101 . Additional verification test work was conducted by Ero Brasil using a composite generated over six fill operating days in March 2019 to validate the expected improvements in recovery at the target grind size of 80 % passing 75 microns . The authors of this Report have reviewed the following test work, results and conclusions and found them to be in accordance with industry best practices, and appropriate for use in support of this Report . Mineralogical Characterization Test work Characterization test work of a final copper concentrate and final tailings sample from the Caraíba Mill, each weighing 0.5 kg, collected in late 2018 following commissioning of the Vermelhos UG Mine, were performed by SJT MetMin. 25 November 2019 Rev. F 162

2022 M INERAL R ESOURCES AND M INERAL R ESERVES OF T HE C ARAÍBA O PERATIONS , C URAÇÁ V ALLEY , B AHIA , B RAZIL F ORM 43 - 101 F 1 T ECHNICAL R EPORT Mineralogical characterization work included chemical analysis for total copper and trace elements, XRD, Scanning Electron Microscopic Dispersive Spectrometric (“SEM - DES”) analysis and phase quantification of liberation and mineralogical composition . A complete table highlighting the chemical composition of the final concentrate and tailings samples used in the analysis is shown below . Table 13 - 2: Chemical Analysis and Trace Element Composition (%) XRD analysis indicated that the main copper - bearing phases in the concentrate sample are chalcopyrite, bornite and cubanite, while that of the tailings sample detected primarily chalcopyrite as the copper - bearing phase, with minor bornite . Gangue minerals in both the concentrate and tailings sample were pyroxene, plagioclase, talc, quartz and mica (biotite/phlogopite) . Particle size analysis performed on both samples highlighted the ratio of coarse particles (+ 150 micrometers (“micron” or “μm”)) in the tailings sample as compared to the final concentrate . This coarse size fraction only accounted for approximately 3 % of the final concentrate by mass, but approximately 30 % of the tailings, indicating a preferential reporting of coarse particles to tailings . Polished sections of the samples were analyzed to evaluate quantitative mineralogical compositions of both samples . SEM - EDS analysis of both samples confirmed the primary copper - bearing phases of chalcopyrite, cubanite and bornite, with trace amounts of chalcocite, digenite and covellite . The gangue phases in the concentrate sample were predominately present in the - 75 /+ 150 micron fractions, indicating insufficient liberation of gangue minerals from the copper - bearing sulphide minerals . The composition, by mass percent, is shown in Figure 13 - 1 . Calculated copper grades (determined using the mineralogical composition) showed that the highest copper grade of the concentrate sample was in the + 38 / - 75 micron size fraction (containing approximately 43 % of total contained copper), while the grade was lower in the + 75 / - 150 micron size fraction (containing approximately 32 % of total contained copper) and lowest in the + 150 micron size fraction (containing approximately 20 % of total contained 25 November 2019 Rev. F 163
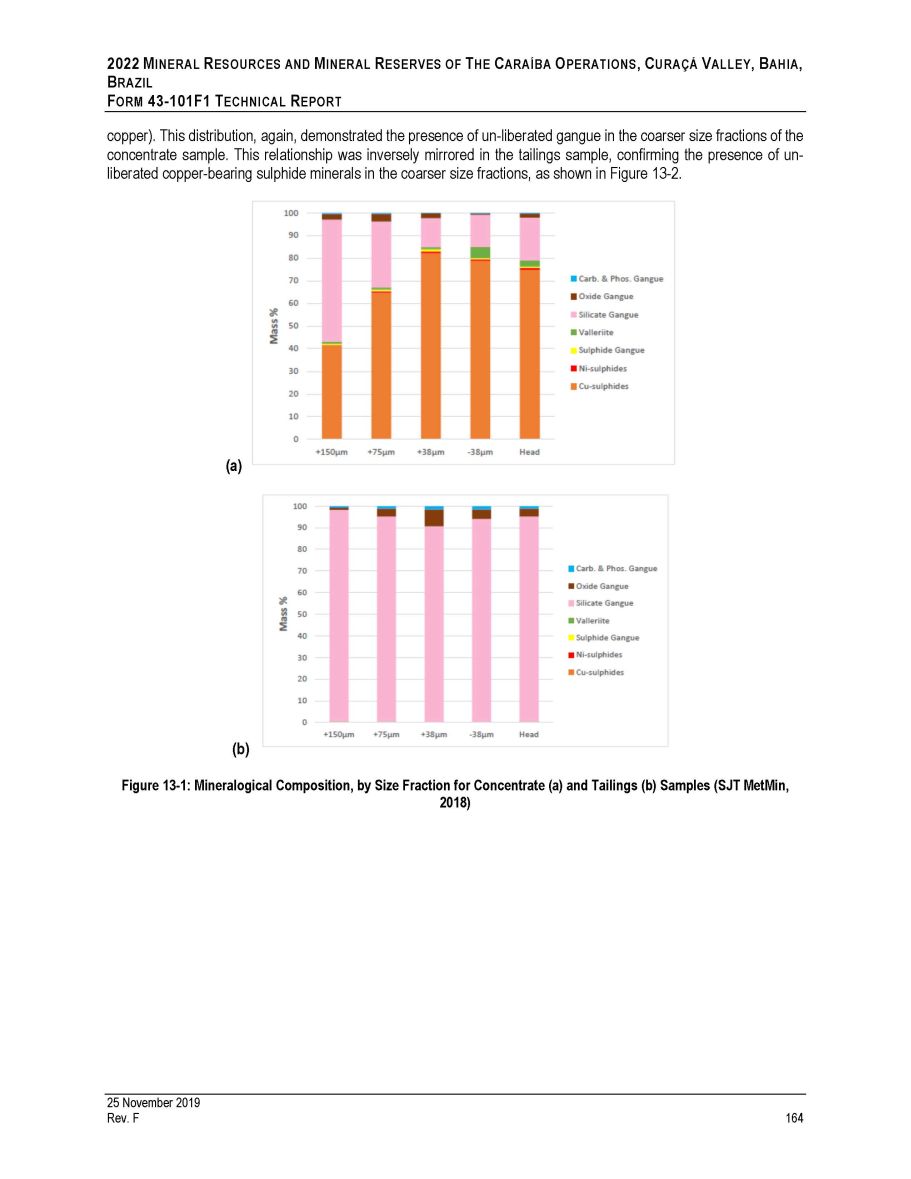
2022 M INERAL R ESOURCES AND M INERAL R ESERVES OF T HE C ARAÍBA O PERATIONS , C URAÇÁ V ALLEY , B AHIA , B RAZIL F ORM 43 - 101 F 1 T ECHNICAL R EPORT copper) . This distribution, again, demonstrated the presence of un - liberated gangue in the coarser size fractions of the concentrate sample . This relationship was inversely mirrored in the tailings sample, confirming the presence of un - liberated copper - bearing sulphide minerals in the coarser size fractions, as shown in Figure 13 - 2 . (a) (b) Figure 13 - 1: Mineralogical Composition, by Size Fraction for Concentrate (a) and Tailings (b) Samples (SJT MetMin, 2018) 25 November 2019 Rev. F 164
2022 M INERAL R ESOURCES AND M INERAL R ESERVES OF T HE C ARAÍBA O PERATIONS , C URAÇÁ V ALLEY , B AHIA , B RAZIL F ORM 43 - 101F1 T ECHNICAL R EPORT Figure 13 - 2 : Calculated Copper Grades for the Concentrate and Tailings Sample, by Size Fraction (SJT MetMin, 2018 ) Liberation analysis of the concentrate sample, which had a grade of 37 . 35 % copper, showed that the copper - bearing sulphide minerals were well liberated ; however, additional grinding of the + 75 micron particles would further improve liberation . The coarse size fraction represented approximately 29 % of the concentrate sample mass and had a calculated grade of 30 . 34 % copper, whereas the - 75 micron fraction had a calculated copper grade of 42 . 35 % . It was expected that a regrind of the + 75 micron fraction followed by additional cleaning flotation could improve concentrate grade without resulting in a significant copper loss . In the tailings sample, which had a grade of 0 . 23 % copper, most of the copper - bearing sulphide minerals were within locked or middling particles, except for the occasional fully - liberated copper - sulphide grain in the - 38 micron fraction . The + 75 micron size fraction represented approximately 62 % of the tailing sample mass and had a calculated copper grade of 0 . 26 % compared to the - 38 micron size fraction which had a copper grade of only 0 . 17 % . The + 150 micron size fraction represented approximately 30 % of the tailing sample mass and had a calculated grade of 0 . 30 % copper . Similarly, the liberation analysis of the tailings sample, pointed to a significant potential improvement in overall liberation and recoveries with re - grinding the + 75 micron size fraction . Grind Size & Rougher Flotation Test work Based on the mineralogical characterization work, a review of potential circuit improvements to retrofit and/or replace the Company’s existing Vertimill to improve overall grind size was conducted . The Company selected to further evaluate Outotec’s HIG Mill based on superior grinding performance characteristics for the ore of the Curaçá Valley . A composite sample of Derrick screen oversize material was prepared for testing during the operating days of September 20 th to September 22 nd , 2018 . The composite slurry sample, consisting of one 200 - liter drum, was tested in both Mintek’s laboratory and a sub - sample was provided to Outotec for HIG Mill sizing characterization . The table below shows the product particle size distribution as a function of energy input from the HIG Mill test results conducted by Outotec . Outotec is independent of the Company as such term is defined under NI 43 - 101 . 25 November 2019 Rev. F 165
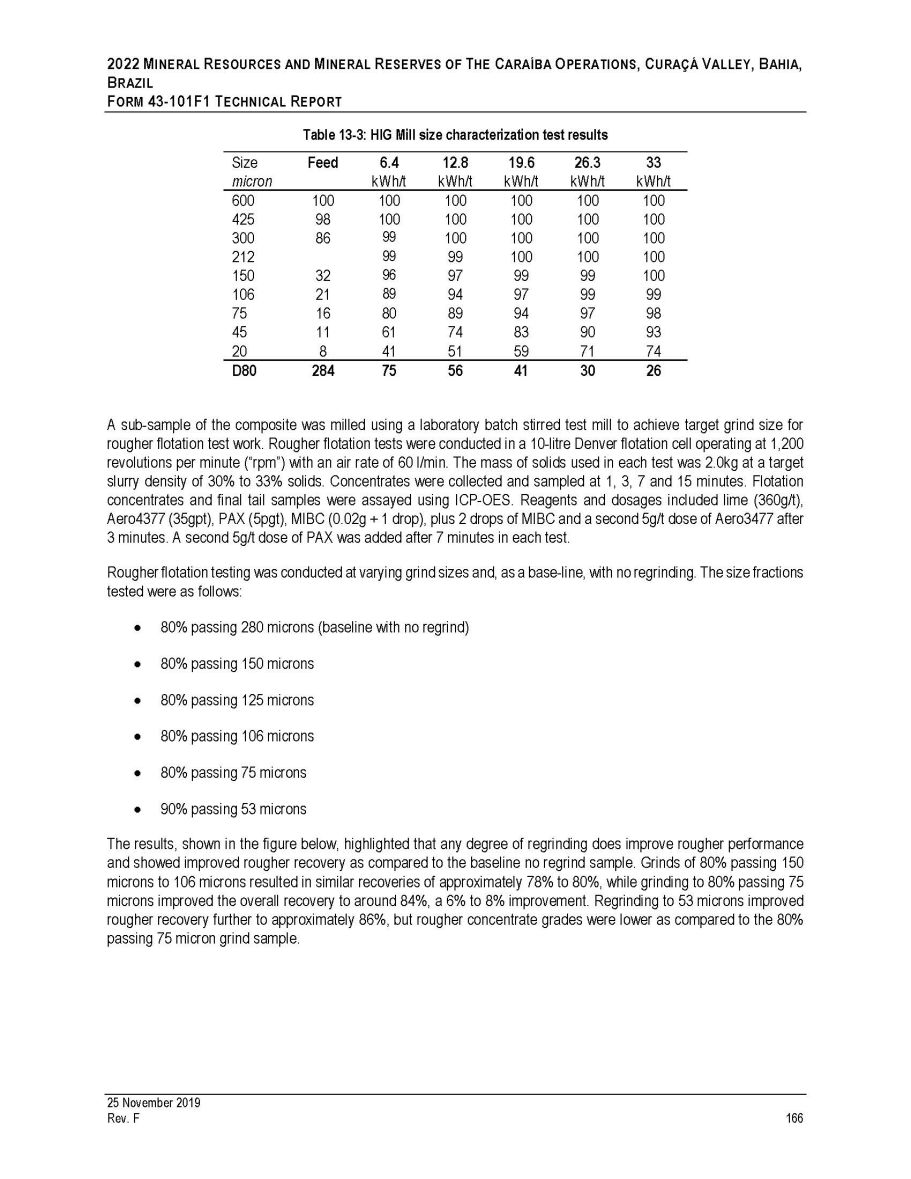
2022 M INERAL R ESOURCES AND M INERAL R ESERVES OF T HE C ARAÍBA O PERATIONS , C URAÇÁ V ALLEY , B AHIA , B RAZIL F ORM 43 - 101F1 T ECHNICAL R EPORT Table 13 - 3: HIG Mill size characterization test results Size micron Feed 6.4 kWh/t 12.8 kWh/t 19.6 kWh/t 26.3 kWh/t 33 kWh/t 600 100 100 100 100 100 100 425 98 100 100 100 100 100 300 86 99 100 100 100 100 212 99 99 100 100 100 150 32 96 97 99 99 100 106 21 89 94 97 99 99 75 16 80 89 94 97 98 45 11 61 74 83 90 93 20 8 41 51 59 71 74 D80 284 75 56 41 30 26 25 November 2019 Rev. F 166 A sub - sample of the composite was milled using a laboratory batch stirred test mill to achieve target grind size for rougher flotation test work . Rougher flotation tests were conducted in a 10 - litre Denver flotation cell operating at 1 , 200 revolutions per minute (“rpm”) with an air rate of 60 l/min . The mass of solids used in each test was 2 . 0 kg at a target slurry density of 30 % to 33 % solids . Concentrates were collected and sampled at 1 , 3 , 7 and 15 minutes . Flotation concentrates and final tail samples were assayed using ICP - OES . Reagents and dosages included lime ( 360 g/t), Aero 4377 ( 35 gpt), PAX ( 5 pgt), MIBC ( 0 . 02 g + 1 drop), plus 2 drops of MIBC and a second 5 g/t dose of Aero 3477 after 3 minutes . A second 5 g/t dose of PAX was added after 7 minutes in each test . Rougher flotation testing was conducted at varying grind sizes and, as a base - line, with no regrinding . The size fractions tested were as follows : 80% passing 280 microns (baseline with no regrind) 80% passing 150 microns 80% passing 125 microns 80% passing 106 microns 80% passing 75 microns 90% passing 53 microns The results, shown in the figure below, highlighted that any degree of regrinding does improve rougher performance and showed improved rougher recovery as compared to the baseline no regrind sample . Grinds of 80 % passing 150 microns to 106 microns resulted in similar recoveries of approximately 78 % to 80 % , while grinding to 80 % passing 75 microns improved the overall recovery to around 84 % , a 6 % to 8 % improvement . Regrinding to 53 microns improved rougher recovery further to approximately 86 % , but rougher concentrate grades were lower as compared to the 80 % passing 75 micron grind sample .
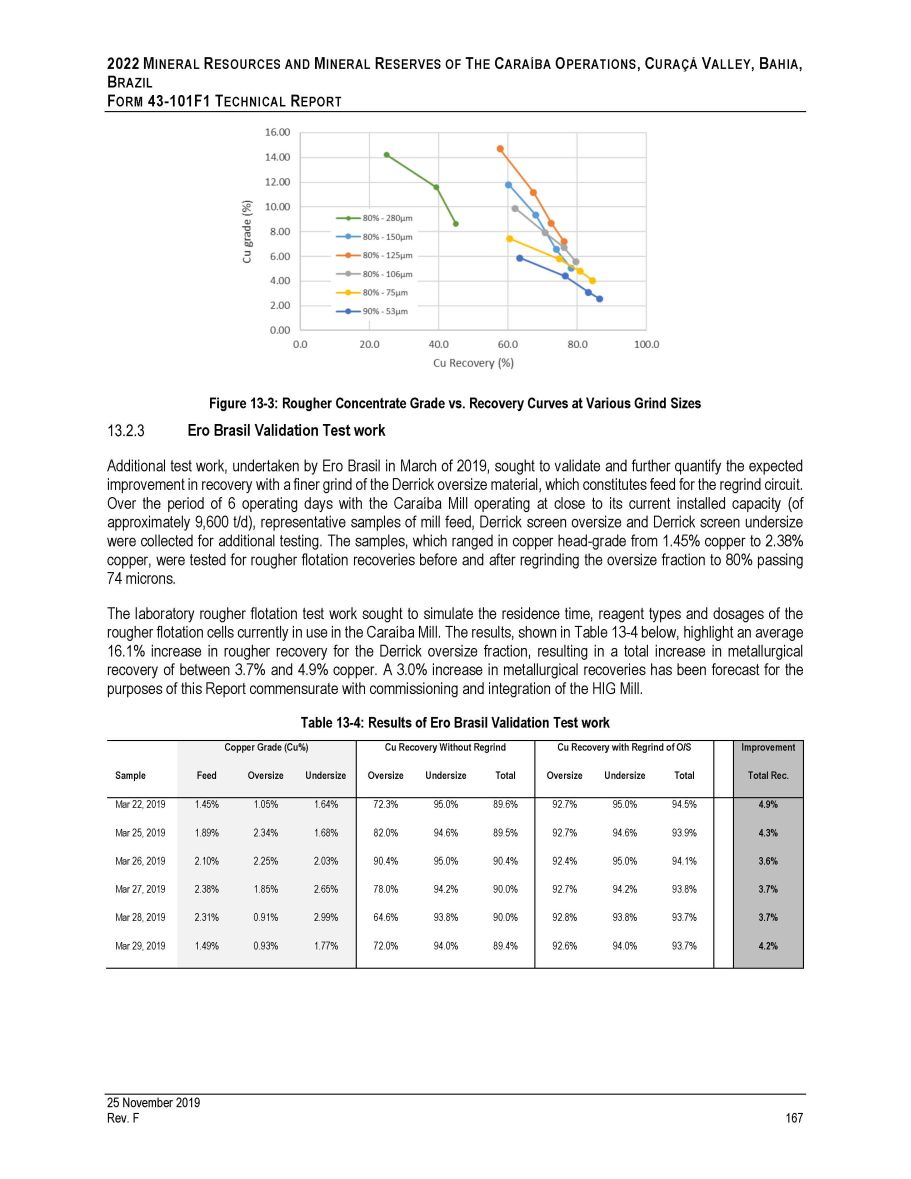
2022 M INERAL R ESOURCES AND M INERAL R ESERVES OF T HE C ARAÍBA O PERATIONS , C URAÇÁ V ALLEY , B AHIA , B RAZIL F ORM 43 - 101F1 T ECHNICAL R EPORT Figure 13 - 3: Rougher Concentrate Grade vs. Recovery Curves at Various Grind Sizes Ero Brasil Validation Test work Additional test work, undertaken by Ero Brasil in March of 2019 , sought to validate and further quantify the expected improvement in recovery with a finer grind of the Derrick oversize material, which constitutes feed for the regrind circuit . Over the period of 6 operating days with the Caraíba Mill operating at close to its current installed capacity (of approximately 9 , 600 t/d), representative samples of mill feed, Derrick screen oversize and Derrick screen undersize were collected for additional testing . The samples, which ranged in copper head - grade from 1 . 45 % copper to 2 . 38 % copper, were tested for rougher flotation recoveries before and after regrinding the oversize fraction to 80 % passing 74 microns . The laboratory rougher flotation test work sought to simulate the residence time, reagent types and dosages of the rougher flotation cells currently in use in the Caraíba Mill . The results, shown in Table 13 - 4 below, highlight an average 16 . 1 % increase in rougher recovery for the Derrick oversize fraction, resulting in a total increase in metallurgical recovery of between 3 . 7 % and 4 . 9 % copper . A 3 . 0 % increase in metallurgical recoveries has been forecast for the purposes of this Report commensurate with commissioning and integration of the HIG Mill . Table 13 - 4: Results of Ero Brasil Validation Test work Sample Feed Copper Grade (Cu%) Oversize Undersize Cu Recovery Without Regrind Oversize Undersize Total Cu Recovery with Regrind of O/S Oversize Undersize Total Improvement Total Rec. Mar 22, 2019 1.45% 1.05% 1.64% 72.3% 95.0% 89.6% 92.7% 95.0% 94.5% 4.9% Mar 25, 2019 1.89% 2.34% 1.68% 82.0% 94.6% 89.5% 92.7% 94.6% 93.9% 4.3% Mar 26, 2019 2.10% 2.25% 2.03% 90.4% 95.0% 90.4% 92.4% 95.0% 94.1% 3.6% Mar 27, 2019 2.38% 1.85% 2.65% 78.0% 94.2% 90.0% 92.7% 94.2% 93.8% 3.7% Mar 28, 2019 2.31% 0.91% 2.99% 64.6% 93.8% 90.0% 92.8% 93.8% 93.7% 3.7% Mar 29, 2019 1.49% 0.93% 1.77% 72.0% 94.0% 89.4% 92.6% 94.0% 93.7% 4.2% 25 November 2019 Rev. F 167
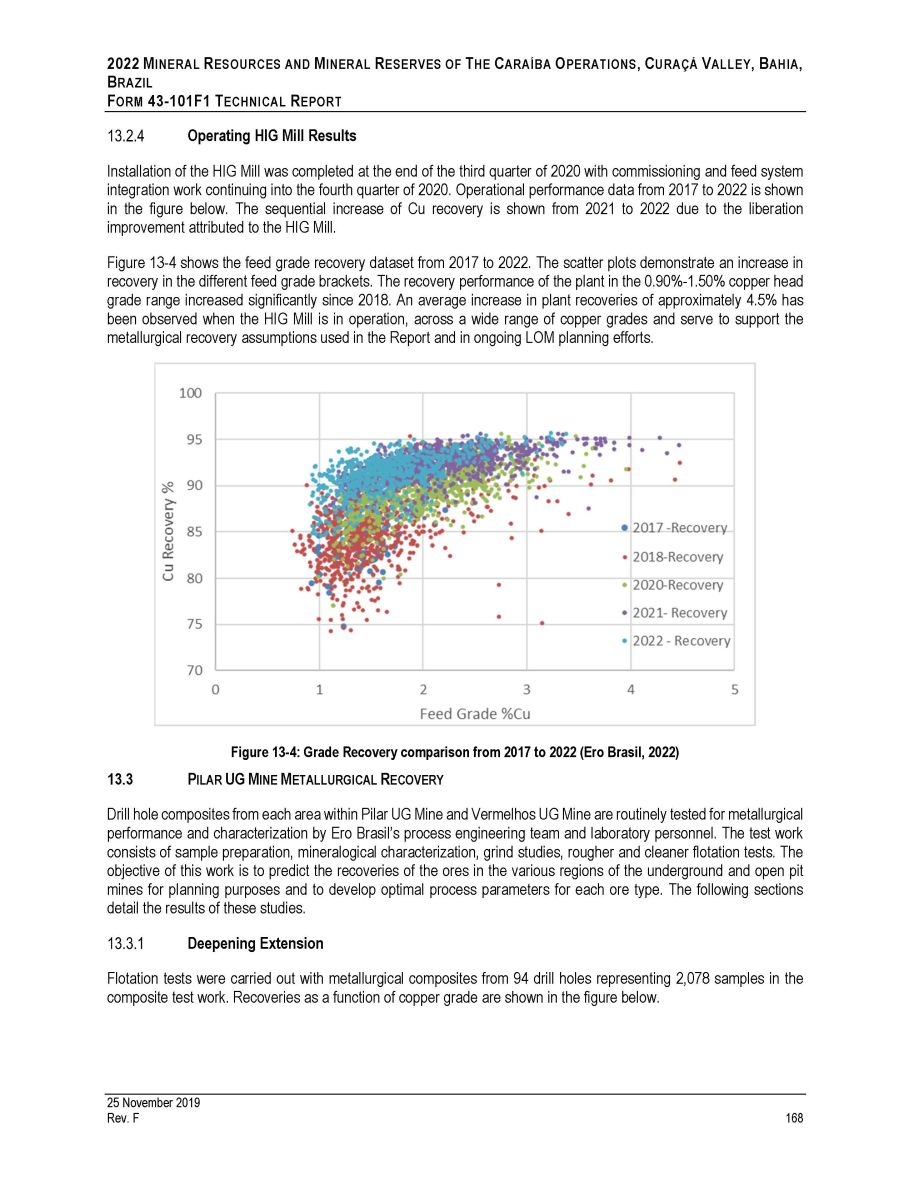
2022 M INERAL R ESOURCES AND M INERAL R ESERVES OF T HE C ARAÍBA O PERATIONS , C URAÇÁ V ALLEY , B AHIA , B RAZIL F ORM 43 - 101 F 1 T ECHNICAL R EPORT Operating HIG Mill Results Installation of the HIG Mill was completed at the end of the third quarter of 2020 with commissioning and feed system integration work continuing into the fourth quarter of 2020 . Operational performance data from 2017 to 2022 is shown in the figure below . The sequential increase of Cu recovery is shown from 2021 to 2022 due to the liberation improvement attributed to the HIG Mill . Figure 13 - 4 shows the feed grade recovery dataset from 2017 to 2022 . The scatter plots demonstrate an increase in recovery in the different feed grade brackets . The recovery performance of the plant in the 0 . 90 % - 1 . 50 % copper head grade range increased significantly since 2018 . An average increase in plant recoveries of approximately 4 . 5 % has been observed when the HIG Mill is in operation, across a wide range of copper grades and serve to support the metallurgical recovery assumptions used in the Report and in ongoing LOM planning efforts . Figure 13 - 4: Grade Recovery comparison from 2017 to 2022 (Ero Brasil, 2022) P ILAR UG M INE M ETALLURGICAL R ECOVERY 13.3 Drill hole composites from each area within Pilar UG Mine and Vermelhos UG Mine are routinely tested for metallurgical performance and characterization by Ero Brasil’s process engineering team and laboratory personnel . The test work consists of sample preparation, mineralogical characterization, grind studies, rougher and cleaner flotation tests . The objective of this work is to predict the recoveries of the ores in the various regions of the underground and open pit mines for planning purposes and to develop optimal process parameters for each ore type . The following sections detail the results of these studies . Deepening Extension Flotation tests were carried out with metallurgical composites from 94 drill holes representing 2 , 078 samples in the composite test work . Recoveries as a function of copper grade are shown in the figure below . 25 November 2019 Rev. F 168

2022 M INERAL R ESOURCES AND M INERAL R ESERVES OF T HE C ARAÍBA O PERATIONS , C URAÇÁ V ALLEY , B AHIA , B RAZIL F ORM 43 - 101F1 T ECHNICAL R EPORT Figure 13 - 5: Metallurgical Test Work Results for Pilar UG Mine Zone: Deepening (Ero Brasil, 2019) P1P2NE Flotation tests were carried out with metallurgical composites from 17 drill holes representing 573 samples in the composite test work. Recoveries as a function of copper grade are shown in the figure below. Figure 13 - 6: Metallurgical Test Work Results for Pilar UG Mine Zone: P1P2NE (Ero Brasil, 2019) 25 November 2019 Rev. F 169

2022 M INERAL R ESOURCES AND M INERAL R ESERVES OF T HE C ARAÍBA O PERATIONS , C URAÇÁ V ALLEY , B AHIA , B RAZIL F ORM 43 - 101F1 T ECHNICAL R EPORT P1P2W (part of the “West Limb”) Flotation tests were carried out with metallurgical composites from 10 holes representing 201 samples in the composite test work. Recoveries as a function of copper grade are shown in the figure below. Figure 13 - 7: Metallurgical Test Work Results for Pilar UG Mine Zone: P1P2W (Ero Brasil, 2019) MSB South (MSBS) Ore from MSBS mine area has been processed by the plant. Actual plant performance serves as the guide for forecast metallurgical results. Recoveries as a function of copper grade are shown in the figure below. Figure 13 - 8: Metallurgical Test Work Results for Pilar UG Mine Zone: MSBS (Ero Brasil, 2019) 25 November 2019 Rev. F 170
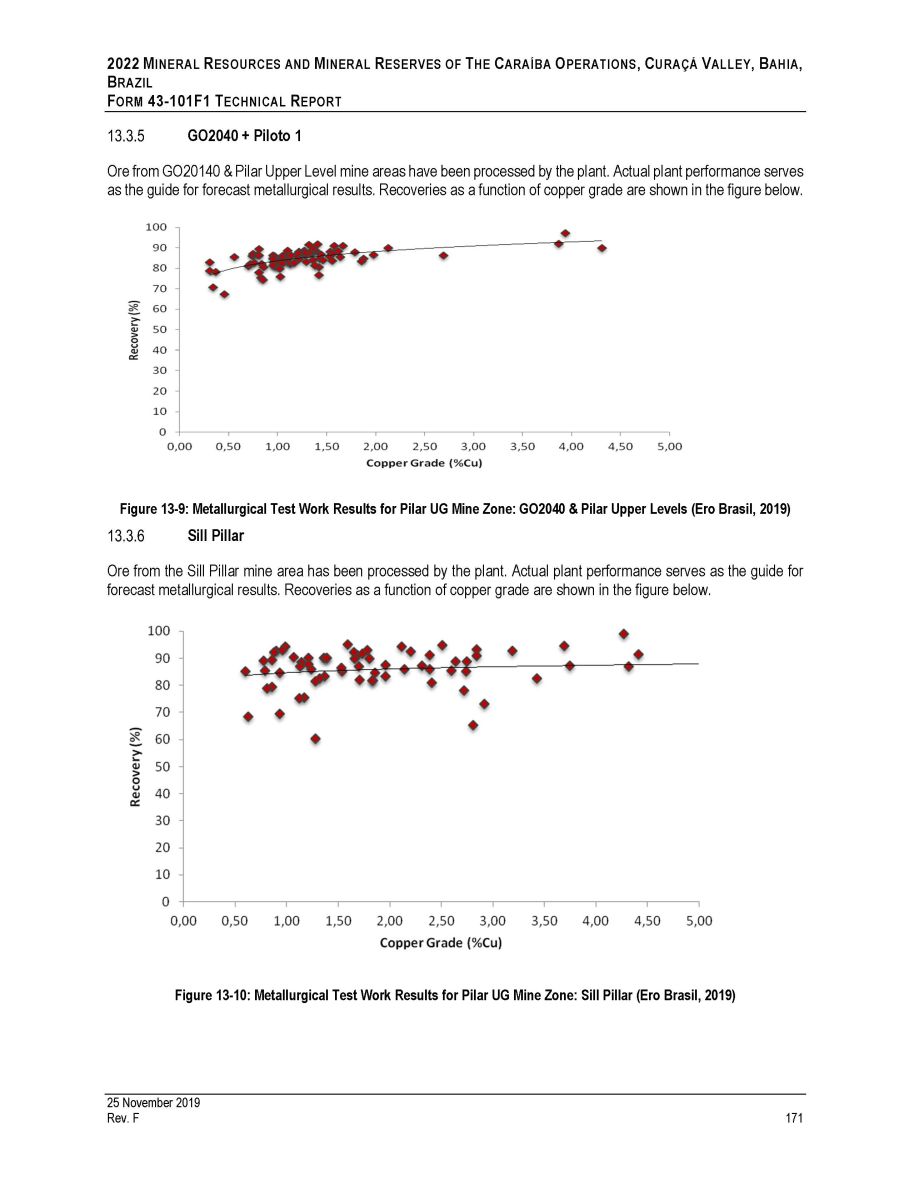
2022 M INERAL R ESOURCES AND M INERAL R ESERVES OF T HE C ARAÍBA O PERATIONS , C URAÇÁ V ALLEY , B AHIA , B RAZIL F ORM 43 - 101F1 T ECHNICAL R EPORT GO2040 + Piloto 1 Ore from GO20140 & Pilar Upper Level mine areas have been processed by the plant. Actual plant performance serves as the guide for forecast metallurgical results. Recoveries as a function of copper grade are shown in the figure below. Figure 13 - 9: Metallurgical Test Work Results for Pilar UG Mine Zone: GO2040 & Pilar Upper Levels (Ero Brasil, 2019) Sill Pillar Ore from the Sill Pillar mine area has been processed by the plant. Actual plant performance serves as the guide for forecast metallurgical results. Recoveries as a function of copper grade are shown in the figure below. Figure 13 - 10: Metallurgical Test Work Results for Pilar UG Mine Zone: Sill Pillar (Ero Brasil, 2019) 25 November 2019 Rev. F 171
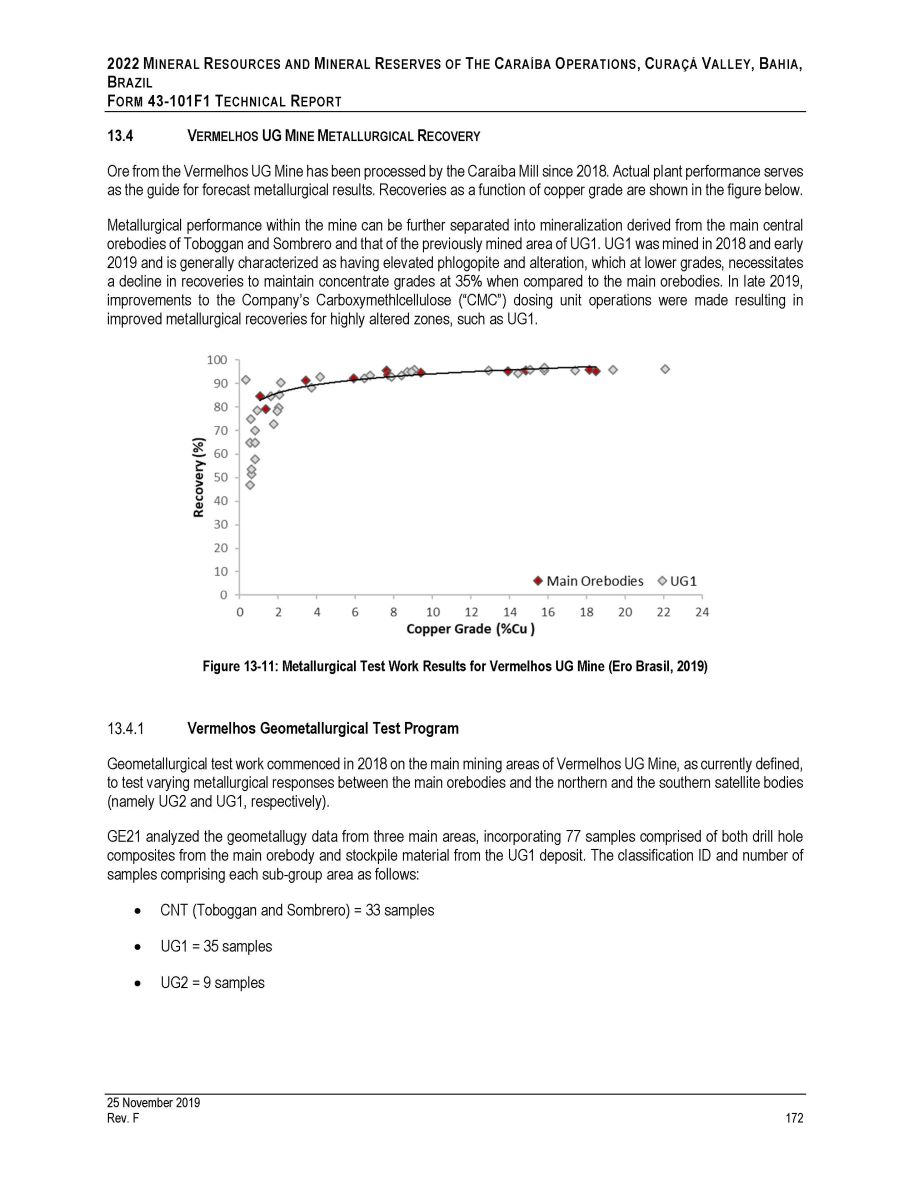
2022 M INERAL R ESOURCES AND M INERAL R ESERVES OF T HE C ARAÍBA O PERATIONS , C URAÇÁ V ALLEY , B AHIA , B RAZIL F ORM 43 - 101 F 1 T ECHNICAL R EPORT 13.4 V ERMELHOS UG M INE M ETALLURGICAL R ECOVERY Ore from the Vermelhos UG Mine has been processed by the Caraíba Mill since 2018 . Actual plant performance serves as the guide for forecast metallurgical results . Recoveries as a function of copper grade are shown in the figure below . Metallurgical performance within the mine can be further separated into mineralization derived from the main central orebodies of Toboggan and Sombrero and that of the previously mined area of UG 1 . UG 1 was mined in 2018 and early 2019 and is generally characterized as having elevated phlogopite and alteration, which at lower grades, necessitates a decline in recoveries to maintain concentrate grades at 35 % when compared to the main orebodies . In late 2019 , improvements to the Company’s Carboxymethlcellulose (“CMC”) dosing unit operations were made resulting in improved metallurgical recoveries for highly altered zones, such as UG 1 . Figure 13 - 11: Metallurgical Test Work Results for Vermelhos UG Mine (Ero Brasil, 2019) Vermelhos Geometallurgical Test Program Geometallurgical test work commenced in 2018 on the main mining areas of Vermelhos UG Mine, as currently defined, to test varying metallurgical responses between the main orebodies and the northern and the southern satellite bodies (namely UG 2 and UG 1 , respectively) . GE 21 analyzed the geometallugy data from three main areas, incorporating 77 samples comprised of both drill hole composites from the main orebody and stockpile material from the UG 1 deposit . The classification ID and number of samples comprising each sub - group area as follows : CNT (Toboggan and Sombrero) = 33 samples UG1 = 35 samples UG2 = 9 samples 25 November 2019 Rev. F 172
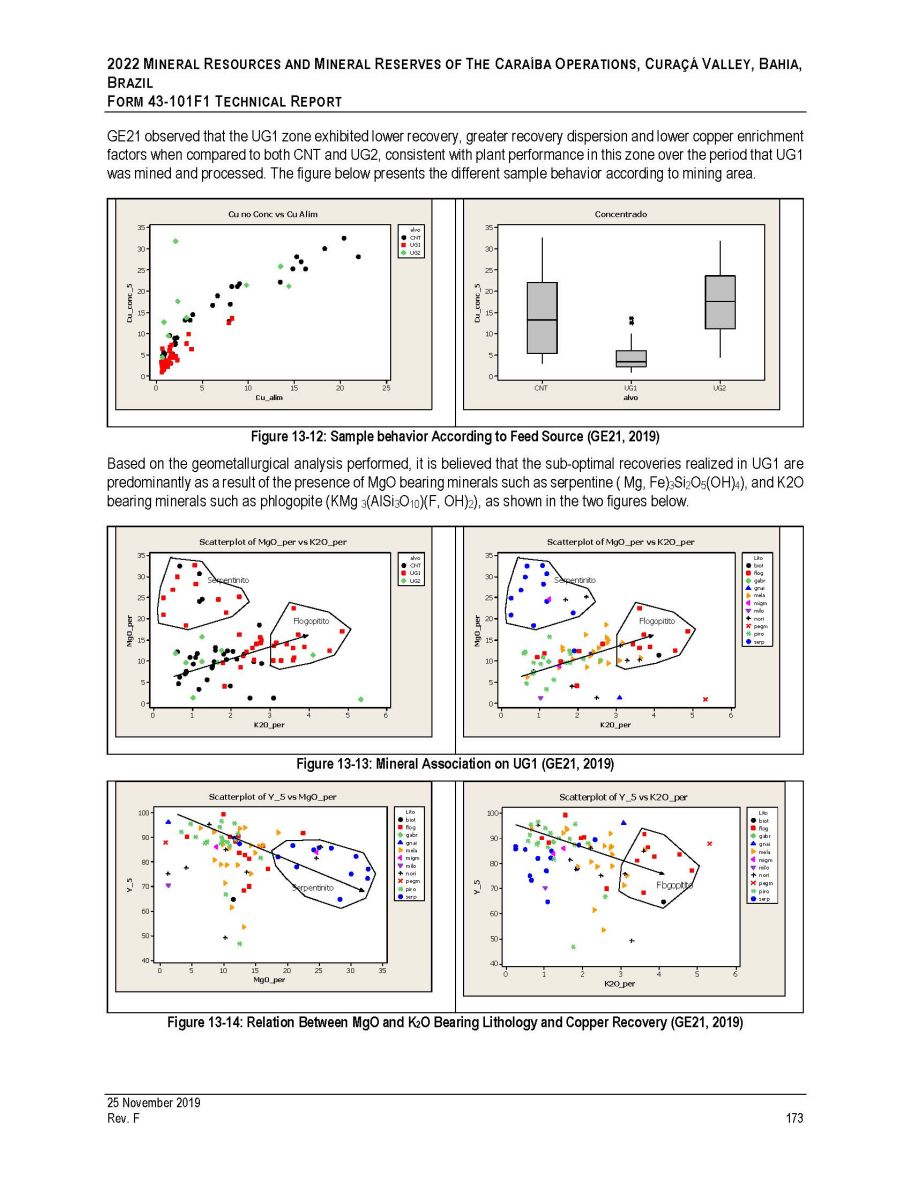
2022 M INERAL R ESOURCES AND M INERAL R ESERVES OF T HE C ARAÍBA O PERATIONS , C URAÇÁ V ALLEY , B AHIA , B RAZIL F ORM 43 - 101 F 1 T ECHNICAL R EPORT GE 21 observed that the UG 1 zone exhibited lower recovery, greater recovery dispersion and lower copper enrichment factors when compared to both CNT and UG 2 , consistent with plant performance in this zone over the period that UG 1 was mined and processed . The figure below presents the different sample behavior according to mining area . Figure 13 - 12 : Sample behavior According to Feed Source (GE 21 , 2019 ) Based on the geometallurgical analysis performed, it is believed that the sub - optimal recoveries realized in UG 1 are predominantly as a result of the presence of MgO bearing minerals such as serpentine ( Mg, Fe) 3 Si 2 O 5 (OH) 4 ), and K 2 O bearing minerals such as phlogopite (KMg 3 (AlSi 3 O 10 )(F, OH) 2 ), as shown in the two figures below . Figure 13 - 13: Mineral Association on UG1 (GE21, 2019) 6 5 4 2 1 0 100 90 80 70 60 50 40 3 K2O_per Y_5 Lito biot flog gabr gnai mela migm milo nori pegm piro serp Scatterplot of Y_5 vs K2O_per Flogopitito Figure 13 - 14: Relation Between MgO and K 2 O Bearing Lithology and Copper Recovery (GE21, 2019) 25 20 15 10 5 0 35 30 25 20 15 10 5 0 Cu_alim Cu_conc_5 alv o CNT UG 1 UG 2 Cu no Conc vs Cu Alim UG2 CNT 35 30 25 20 15 10 5 0 UG1 alvo Cu_conc_5 Concentrado 6 5 2 1 0 35 30 25 20 15 10 5 0 3 4 K2O_per MgO_per alv o CNT UG 1 UG 2 Scatterplot of MgO_per vs K2O_per Flogopitito Serpentinito 6 5 4 2 1 0 35 30 25 20 15 10 5 0 3 K2O_per MgO_per Lito biot flog gabr gnai mela migm milo nori pegm piro serp Scatterplot of MgO_per vs K2O_per Flogopitito Serpentinito 35 30 25 20 15 10 0 5 100 90 80 70 60 50 40 MgO_per Y_5 Lito biot flog gabr gnai mela migm milo nori pegm piro serp Scatterplot of Y_5 vs MgO_per 25 November 2019 Rev. F 173 Serpentinito
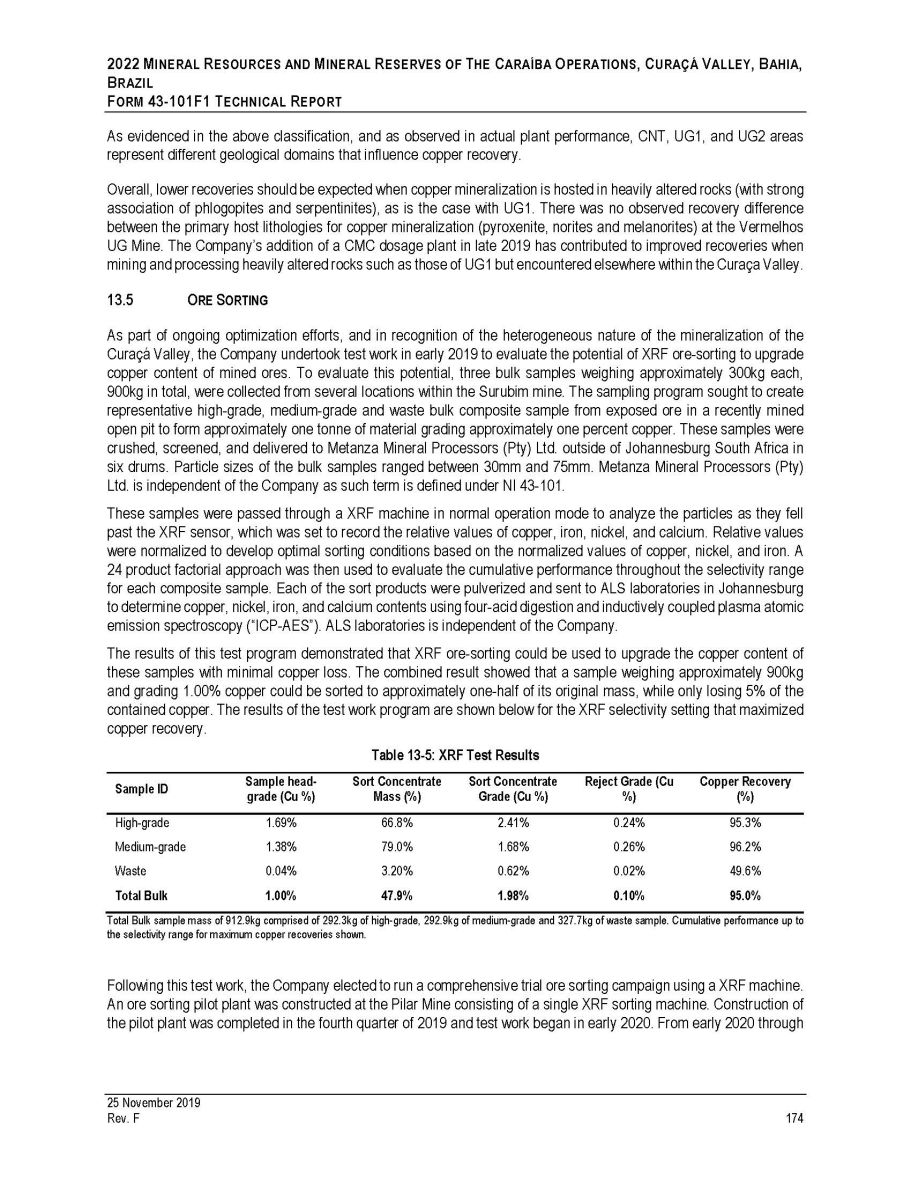
2022 M INERAL R ESOURCES AND M INERAL R ESERVES OF T HE C ARAÍBA O PERATIONS , C URAÇÁ V ALLEY , B AHIA , B RAZIL F ORM 43 - 101 F 1 T ECHNICAL R EPORT As evidenced in the above classification, and as observed in actual plant performance, CNT, UG 1 , and UG 2 areas represent different geological domains that influence copper recovery . Overall, lower recoveries should be expected when copper mineralization is hosted in heavily altered rocks (with strong association of phlogopites and serpentinites), as is the case with UG 1 . There was no observed recovery difference between the primary host lithologies for copper mineralization (pyroxenite, norites and melanorites) at the Vermelhos UG Mine . The Company’s addition of a CMC dosage plant in late 2019 has contributed to improved recoveries when mining and processing heavily altered rocks such as those of UG 1 but encountered elsewhere within the Curaça Valley . 13.5 O RE S ORTING As part of ongoing optimization efforts, and in recognition of the heterogeneous nature of the mineralization of the Curaçá Valley, the Company undertook test work in early 2019 to evaluate the potential of XRF ore - sorting to upgrade copper content of mined ores . To evaluate this potential, three bulk samples weighing approximately 300 kg each, 900 kg in total, were collected from several locations within the Surubim mine . The sampling program sought to create representative high - grade, medium - grade and waste bulk composite sample from exposed ore in a recently mined open pit to form approximately one tonne of material grading approximately one percent copper . These samples were crushed, screened, and delivered to Metanza Mineral Processors (Pty) Ltd . outside of Johannesburg South Africa in six drums . Particle sizes of the bulk samples ranged between 30 mm and 75 mm . Metanza Mineral Processors (Pty) Ltd . is independent of the Company as such term is defined under NI 43 - 101 . These samples were passed through a XRF machine in normal operation mode to analyze the particles as they fell past the XRF sensor, which was set to record the relative values of copper, iron, nickel, and calcium . Relative values were normalized to develop optimal sorting conditions based on the normalized values of copper, nickel, and iron . A 24 product factorial approach was then used to evaluate the cumulative performance throughout the selectivity range for each composite sample . Each of the sort products were pulverized and sent to ALS laboratories in Johannesburg to determine copper, nickel, iron, and calcium contents using four - acid digestion and inductively coupled plasma atomic emission spectroscopy (“ICP - AES”) . ALS laboratories is independent of the Company . The results of this test program demonstrated that XRF ore - sorting could be used to upgrade the copper content of these samples with minimal copper loss . The combined result showed that a sample weighing approximately 900 kg and grading 1 . 00 % copper could be sorted to approximately one - half of its original mass, while only losing 5 % of the contained copper . The results of the test work program are shown below for the XRF selectivity setting that maximized copper recovery . Table 13 - 5 : XRF Test Results Sample ID Sample head - Sort Concentrate Sort Concentrate Reject Grade (Cu Copper Recovery grade (Cu %) Mass (%) Grade (Cu %) %) (%) High - grade 1.69% 66.8% 2.41% 0.24% 95.3% Medium - grade 1.38% 79.0% 1.68% 0.26% 96.2% Waste 0.04% 3.20% 0.62% 0.02% 49.6% Total Bulk 1.00% 47.9% 1.98% 0.10% 95.0% 25 November 2019 Rev. F 174 Total Bulk sample mass of 912 . 9 kg comprised of 292 . 3 kg of high - grade, 292 . 9 kg of medium - grade and 327 . 7 kg of waste sample . Cumulative performance up to the selectivity range for maximum copper recoveries shown . Following this test work, the Company elected to run a comprehensive trial ore sorting campaign using a XRF machine . An ore sorting pilot plant was constructed at the Pilar Mine consisting of a single XRF sorting machine . Construction of the pilot plant was completed in the fourth quarter of 2019 and test work began in early 2020 . From early 2020 through
2022 M INERAL R ESOURCES AND M INERAL R ESERVES OF T HE C ARAÍBA O PERATIONS , C URAÇÁ V ALLEY , B AHIA , B RAZIL F ORM 43 - 101 F 1 T ECHNICAL R EPORT September 2020 , a total of approximately 29 , 000 tonnes of material from eight different sources of material throughout the Curaçá Valley were run at commercial throughput rates through the ore sorting pilot plant . For each deposit tested, and for material from the Angicos Mine stockpile, material was crushed and screened to between 30 mm and 90 mm and fed into the XRF sorting unit at a rate of approximately 20 tonnes per hour using a belt feeder to provide a consistent feed rate . Minus 30 mm material and fines generated during the crushing process were screened away from the ore sorting feed and sent directly to the mill . For each source tested, the trial campaign sought to model sorting performance at a variety of selectivity ranges (or 'set points') to determine the unique performance characteristics throughout the selectivity curve . Optimal mass yield, defined as the amount of material that is upgraded in the sort product, is based on maximizing the upgrade ratio, defined as sort product copper grade divided by feed grade, while minimizing copper loss of the sort product . Samples of both the sort product and sort reject were collected at routine intervals and assayed for total copper at the Company's on - site laboratory . Prior to changing selectivity set points and between each of the sources tested, the crushing and XRF sorting unit were cleaned to prevent contamination of results . Upgrade ratios were determined across a range of mass yields using the selectivity curves generated for each source . Results of the program across a range of mass yields are further detailed in the table below . 25 November 2019 Rev. F 175
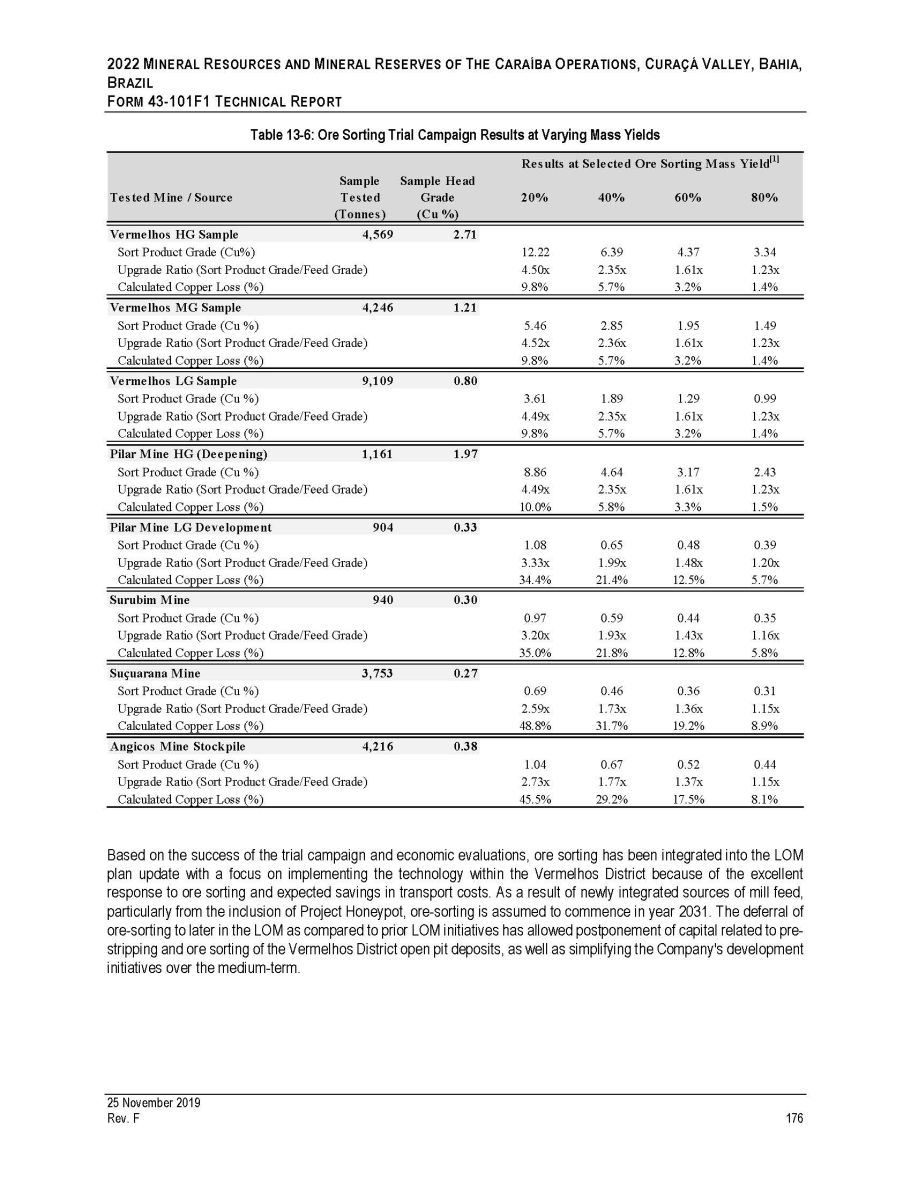
2022 M INERAL R ESOURCES AND M INERAL R ESERVES OF T HE C ARAÍBA O PERATIONS , C URAÇÁ V ALLEY , B AHIA , B RAZIL F ORM 43 - 101F1 T ECHNICAL R EPORT Table 13 - 6: Ore Sorting Trial Campaign Results at Varying Mass Yields Based on the success of the trial campaign and economic evaluations, ore sorting has been integrated into the LOM plan update with a focus on implementing the technology within the Vermelhos District because of the excellent response to ore sorting and expected savings in transport costs . As a result of newly integrated sources of mill feed, particularly from the inclusion of Project Honeypot, ore - sorting is assumed to commence in year 2031 . The deferral of ore - sorting to later in the LOM as compared to prior LOM initiatives has allowed postponement of capital related to pre - stripping and ore sorting of the Vermelhos District open pit deposits, as well as simplifying the Company's development initiatives over the medium - term . 25 November 2019 Rev. F 176 Tested Mine / Source Sample Te sted (Tonne s) Sample Head Grade (Cu %) Results at Selected Ore Sorting Mass Yield [1] 20% 40% 60% 80% Vermelhos HG Sample 4,569 2.71 Sort Product Grade (Cu%) Upgrade Ratio (Sort Product Grade/Feed Grade) Calculated Copper Loss (%) 12.22 4.50x 9.8% 6.39 2.35x 5.7% 4.37 1.61x 3.2% 3.34 1.23x 1.4% Vermelhos MG Sample 4,246 1.21 Sort Product Grade (Cu %) Upgrade Ratio (Sort Product Grade/Feed Grade) Calculated Copper Loss (%) 5.46 4.52x 9.8% 2.85 2.36x 5.7% 1.95 1.61x 3.2% 1.49 1.23x 1.4% Vermelhos LG Sample 9,109 0.80 Sort Product Grade (Cu %) Upgrade Ratio (Sort Product Grade/Feed Grade) Calculated Copper Loss (%) 3.61 4.49x 9.8% 1.89 2.35x 5.7% 1.29 1.61x 3.2% 0.99 1.23x 1.4% Pilar Mine HG (Deepening) 1,161 1.97 Sort Product Grade (Cu %) Upgrade Ratio (Sort Product Grade/Feed Grade) Calculated Copper Loss (%) 8.86 4.49x 10.0% 4.64 2.35x 5.8% 3.17 1.61x 3.3% 2.43 1.23x 1.5% Pilar Mine LG Development 904 0.33 Sort Product Grade (Cu %) Upgrade Ratio (Sort Product Grade/Feed Grade) Calculated Copper Loss (%) 1.08 3.33x 34.4% 0.65 1.99x 21.4% 0.48 1.48x 12.5% 0.39 1.20x 5.7% Surubim Mine 940 0.30 Sort Product Grade (Cu %) Upgrade Ratio (Sort Product Grade/Feed Grade) Calculated Copper Loss (%) 0.97 3.20x 35.0% 0.59 1.93x 21.8% 0.44 1.43x 12.8% 0.35 1.16x 5.8% Suҫuarana Mine 3,753 0.27 Sort Product Grade (Cu %) Upgrade Ratio (Sort Product Grade/Feed Grade) Calculated Copper Loss (%) 0.69 2.59x 48.8% 0.46 1.73x 31.7% 0.36 1.36x 19.2% 0.31 1.15x 8.9% Angicos Mine Stockpile 4,216 0.38 Sort Product Grade (Cu %) Upgrade Ratio (Sort Product Grade/Feed Grade) Calculated Copper Loss (%) 1.04 2.73x 45.5% 0.67 1.77x 29.2% 0.52 1.37x 17.5% 0.44 1.15x 8.1%
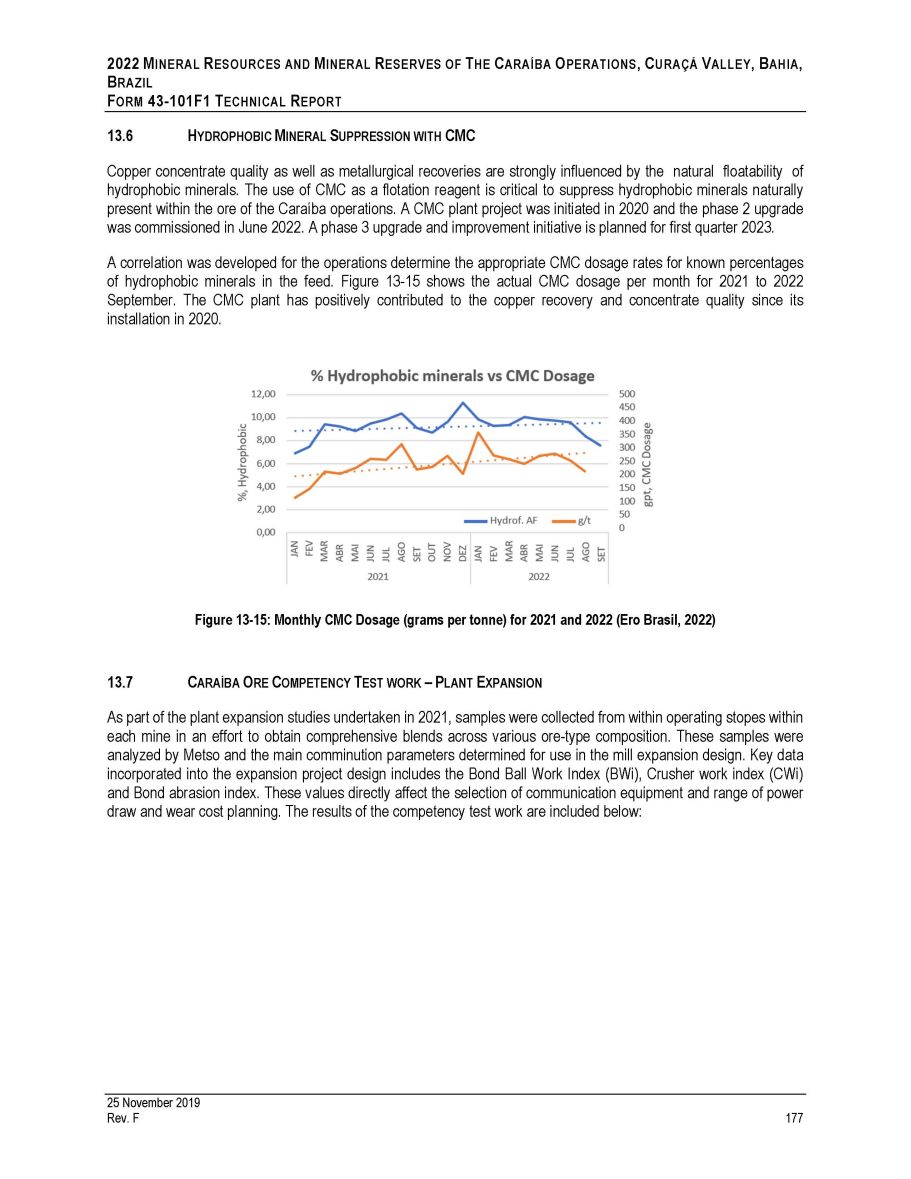
2022 M INERAL R ESOURCES AND M INERAL R ESERVES OF T HE C ARAÍBA O PERATIONS , C URAÇÁ V ALLEY , B AHIA , B RAZIL F ORM 43 - 101 F 1 T ECHNICAL R EPORT 13.6 H YDROPHOBIC M INERAL S UPPRESSION WITH CMC Copper concentrate quality as well as metallurgical recoveries are strongly influenced by the natural floatability of hydrophobic minerals . The use of CMC as a flotation reagent is critical to suppress hydrophobic minerals naturally present within the ore of the Caraíba operations . A CMC plant project was initiated in 2020 and the phase 2 upgrade was commissioned in June 2022 . A phase 3 upgrade and improvement initiative is planned for first quarter 2023 . A correlation was developed for the operations determine the appropriate CMC dosage rates for known percentages of hydrophobic minerals in the feed . Figure 13 - 15 shows the actual CMC dosage per month for 2021 to 2022 September . The CMC plant has positively contributed to the copper recovery and concentrate quality since its installation in 2020 . Figure 13 - 15: Monthly CMC Dosage (grams per tonne) for 2021 and 2022 (Ero Brasil, 2022) 13.7 C ARAÍBA O RE C OMPETENCY T EST WORK – P LANT E XPANSION As part of the plant expansion studies undertaken in 2021 , samples were collected from within operating stopes within each mine in an effort to obtain comprehensive blends across various ore - type composition . These samples were analyzed by Metso and the main comminution parameters determined for use in the mill expansion design . Key data incorporated into the expansion project design includes the Bond Ball Work Index (BWi), Crusher work index (CWi) and Bond abrasion index . These values directly affect the selection of communication equipment and range of power draw and wear cost planning . The results of the competency test work are included below : 25 November 2019 Rev. F 177
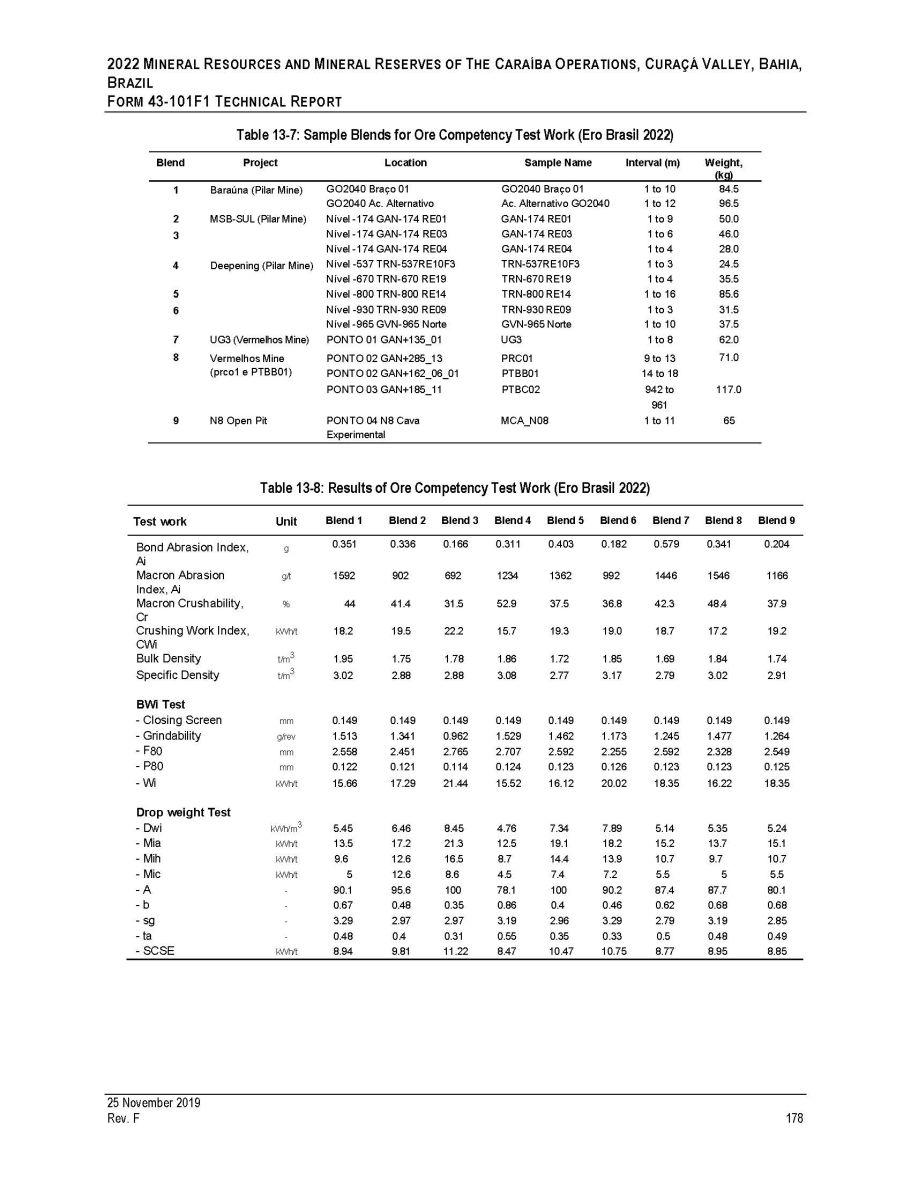
2022 M INERAL R ESOURCES AND M INERAL R ESERVES OF T HE C ARAÍBA O PERATIONS , C URAÇÁ V ALLEY , B AHIA , B RAZIL F ORM 43 - 101F1 T ECHNICAL R EPORT Table 13 - 7: Sample Blends for Ore Competency Test Work (Ero Brasil 2022) Blend Project Location Sample Name Interval (m) Weight, (kg) 1 Baraúna (Pilar Mine) GO2040 Braço 01 GO2040 Braço 01 1 to 10 84.5 GO2040 Ac. Alternativo Ac. Alternativo GO2040 1 to 12 96.5 2 MSB - SUL (Pilar Mine) Nível - 174 GAN - 174 RE01 GAN - 174 RE01 1 to 9 50.0 3 Nível - 174 GAN - 174 RE03 GAN - 174 RE03 1 to 6 46.0 Nível - 174 GAN - 174 RE04 GAN - 174 RE04 1 to 4 28.0 4 Deepening (Pilar Mine) Nível - 537 TRN - 537RE10F3 TRN - 537RE10F3 1 to 3 24.5 Nível - 670 TRN - 670 RE19 TRN - 670 RE19 1 to 4 35.5 5 Nível - 800 TRN - 800 RE14 TRN - 800 RE14 1 to 16 85.6 6 Nível - 930 TRN - 930 RE09 TRN - 930 RE09 1 to 3 31.5 Nível - 965 GVN - 965 Norte GVN - 965 Norte 1 to 10 37.5 7 UG3 (Vermelhos Mine) PONTO 01 GAN+135_01 UG3 1 to 8 62.0 8 Vermelhos Mine (prco1 e PTBB01) PONTO 02 GAN+285_13 PONTO 02 GAN+162_06_01 PRC01 PTBB01 9 to 13 14 to 18 71.0 PONTO 03 GAN+185_11 PTBC02 942 to 117.0 961 9 N8 Open Pit PONTO 04 N8 Cava MCA_N08 1 to 11 65 Experimental 25 November 2019 Rev. F 178 Table 13 - 8: Results of Ore Competency Test Work (Ero Brasil 2022) Test work Unit Blend 1 Blend 2 Blend 3 Blend 4 Blend 5 Blend 6 Blend 7 Blend 8 Blend 9 Bond Abrasion Index, g 0.351 0.336 0.166 0.311 0.403 0.182 0.579 0.341 0.204 Ai Macron Abrasion g/t 1592 902 692 1234 1362 992 1446 1546 1166 Index, Ai Macron Crushability, % 44 41.4 31.5 52.9 37.5 36.8 42.3 48.4 37.9 Cr Crushing Work Index, kWh/t 18.2 19.5 22.2 15.7 19.3 19.0 18.7 17.2 19.2 CWi Bulk Density t/m 3 1.95 1.75 1.78 1.86 1.72 1.85 1.69 1.84 1.74 Specific Density t/m 3 3.02 2.88 2.88 3.08 2.77 3.17 2.79 3.02 2.91 BWi Test - Closing Screen mm 0.149 0.149 0.149 0.149 0.149 0.149 0.149 0.149 0.149 - Grindability g/rev 1.513 1.341 0.962 1.529 1.462 1.173 1.245 1.477 1.264 - F 80 mm 2.558 2.451 2.765 2.707 2.592 2.255 2.592 2.328 2.549 - P 80 mm 0.122 0.121 0.114 0.124 0.123 0.126 0.123 0.123 0.125 - Wi kWh/t 15.66 17.29 21.44 15.52 16.12 20.02 18.35 16.22 18.35 Drop weight Test - Dwi kWh/m 3 5.45 6.46 8.45 4.76 7.34 7.89 5.14 5.35 5.24 - Mia kWh/t 13.5 17.2 21.3 12.5 19.1 18.2 15.2 13.7 15.1 - Mih kWh/t 9.6 12.6 16.5 8.7 14.4 13.9 10.7 9.7 10.7 - Mic kWh/t 5 12.6 8.6 4.5 7.4 7.2 5.5 5 5.5 - A - 90.1 95.6 100 78.1 100 90.2 87.4 87.7 80.1 - b - 0.67 0.48 0.35 0.86 0.4 0.46 0.62 0.68 0.68 - sg - 3.29 2.97 2.97 3.19 2.96 3.29 2.79 3.19 2.85 - ta - 0.48 0.4 0.31 0.55 0.35 0.33 0.5 0.48 0.49 - SCSE kWh/t 8.94 9.81 11.22 8.47 10.47 10.75 8.77 8.95 8.85
2022 M INERAL R ESOURCES AND M INERAL R ESERVES OF T HE C ARAÍBA O PERATIONS , C URAÇÁ V ALLEY , B AHIA , B RAZIL F ORM 43 - 101F1 T ECHNICAL R EPORT 14 14.1 25 November 2019 Rev. F 179 MINERAL RESOURCE ESTIMATES I NTRODUCTION This chapter describes the work undertaken by GE 21 and key assumptions and parameters used to prepare the mineral resource models for the three districts (or regions) within the Curaçá Valley : Pilar District (South Curaçá Valley), the Vermelhos District (North Curaçá Valley), and the Surubim District (Central Curaçá Valley), together with appropriate commentary regarding the merits and possible limitations of such assumptions . The three main mineral districts were divided into 8 target zones or deposits (or “domains”), which were the object of specific analysis as it relates to the current mineral resource estimate . For the 2022 mineral resource update, there are several domains for which no additional drilling or mining activity took place between the effective date of the 2021 Technical Report and the Effective Date of this Report . These domains include : the East Limb, West Limb, R 75 and Suçuarana of the Pilar UG Mine, C 12 , Cercado Velho and Terra do Sal within the Surubim District, and the N 9 (Vermelhos East) Deposit and N 5 (Siriema) deposit within the Vermelhos District . In these instances, the authors of this Report reviewed the mineral resource wireframes, drill hole databases and prior mineral resource estimates, which were prepared by GE 21 in connection with the 2021 Technical Report for validation and inclusion in the current mineral resource estimate . Additional technical information pertaining to the resource estimation parameters for those domains, which remain unchanged from 2021 , are detailed in Section 14 . 9 . Ero Brasil’s technical team prepared the geological models and grade interpolation shells using Datamine and Leapfrog software and performed the statistical and variography analysis, supported by Geovariance team, using Isatis Neo software . GE 21 validates the database and estimates by Ero Brasil . The authors of this Report are not aware of any environmental, permitting, legal, title, taxation, socio - economic, marketing, political or other relevant factors which could materially affect the current mineral resource estimate . GE 21 is of the opinion that the current drilling information is sufficiently reliable to interpret with confidence the boundaries of the higher - grade mineralization domains and that the assaying data is sufficiently reliable to support estimating mineral resources . 2. M INERAL R ESOURCE D ATABASE The Caraíba Operations geological database was provided by Ero Brasil in Datamine formats, including drill hole collar survey, geology, assay results and density estimates . The current drill hole database consists of over 1 million meters of drilling . The current mineral resource model incorporates a total of 420 , 000 individual assay samples . The table below shows a summary of the drill hole database by mine and domain . The drilling and assay data were loaded on a Geoexplo Database Manager software, and later converted to a Datamine software format, as well as Leapfrog for estimation and validation procedures . The validation procedures include : • Validation of data that was either duplicated or entered incorrectly; • Identification of any missing data; • Verification of the consistency of the “from - to” intervals (elimination of any gaps and overlaps).
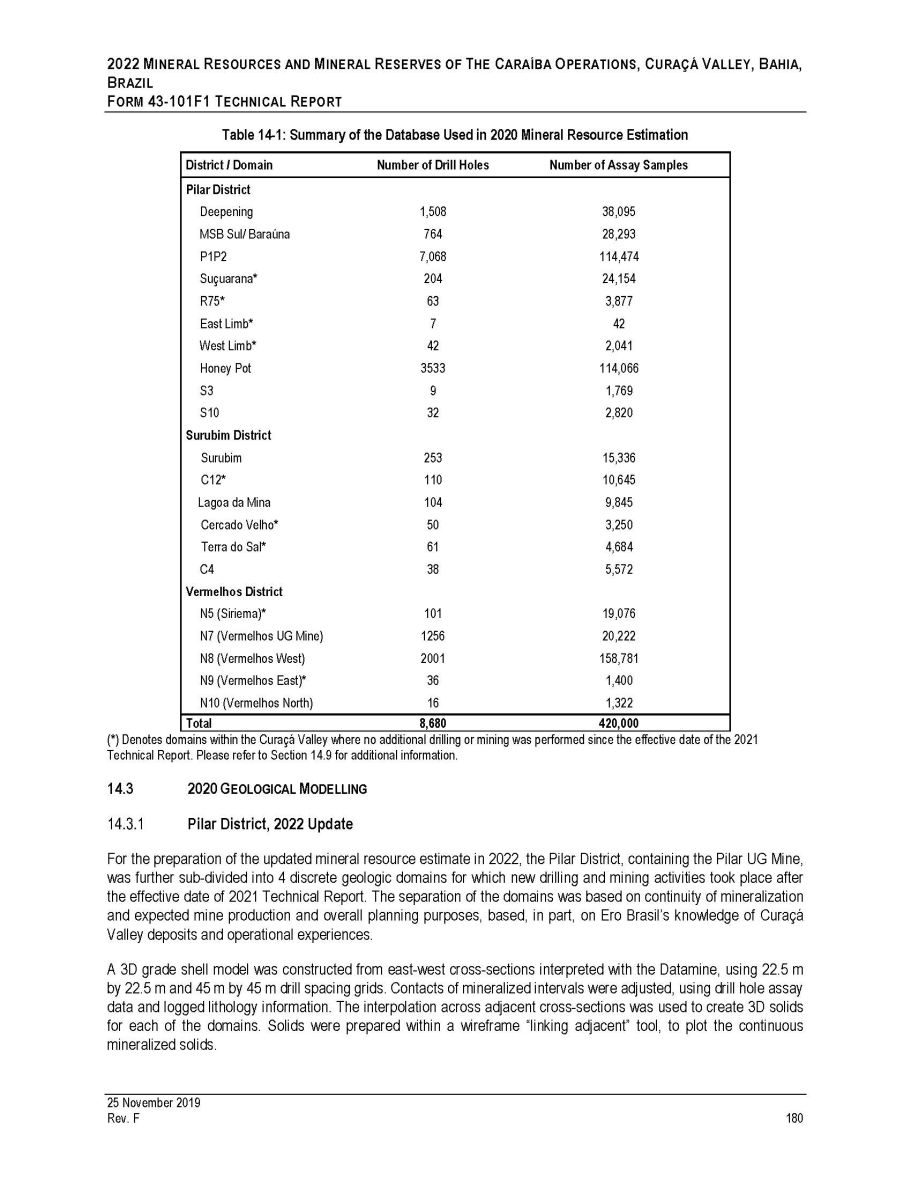
2022 M INERAL R ESOURCES AND M INERAL R ESERVES OF T HE C ARAÍBA O PERATIONS , C URAÇÁ V ALLEY , B AHIA , B RAZIL F ORM 43 - 101F1 T ECHNICAL R EPORT Table 14 - 1: Summary of the Database Used in 2020 Mineral Resource Estimation District / Domain Number of Drill Holes Number of Assay Samples Pilar District Deepening 1,508 38,095 MSB Sul/ Baraúna 764 28,293 P1P2 7,068 114,474 Suçuarana* 204 24,154 R75* 63 3,877 East Limb* 7 42 West Limb* 42 2,041 Honey Pot 3533 114,066 S3 9 1,769 S10 32 2,820 Surubim District Surubim 253 15,336 C12* 110 10,645 Lagoa da Mina 104 9,845 Cercado Velho* 50 3,250 Terra do Sal* 61 4,684 C4 38 5,572 Vermelhos District N5 (Siriema)* 101 19,076 N7 (Vermelhos UG Mine) 1256 20,222 N8 (Vermelhos West) 2001 158,781 N9 (Vermelhos East)* 36 1,400 N10 (Vermelhos North) 16 1,322 Total 8,680 420,000 (*) Denotes domains within the Curaçá Valley where no additional drilling or mining was performed since the effective date of the 2021 Technical Report. Please refer to Section 14.9 for additional information. 14.3 2020 G EOLOGICAL M ODELLING Pilar District, 2022 Update For the preparation of the updated mineral resource estimate in 2022 , the Pilar District, containing the Pilar UG Mine, was further sub - divided into 4 discrete geologic domains for which new drilling and mining activities took place after the effective date of 2021 Technical Report . The separation of the domains was based on continuity of mineralization and expected mine production and overall planning purposes, based, in part, on Ero Brasil’s knowledge of Curaçá Valley deposits and operational experiences . A 3 D grade shell model was constructed from east - west cross - sections interpreted with the Datamine, using 22 . 5 m by 22 . 5 m and 45 m by 45 m drill spacing grids . Contacts of mineralized intervals were adjusted, using drill hole assay data and logged lithology information . The interpolation across adjacent cross - sections was used to create 3 D solids for each of the domains . Solids were prepared within a wireframe “linking adjacent” tool, to plot the continuous mineralized solids . 25 November 2019 Rev. F 180

2022 M INERAL R ESOURCES AND M INERAL R ESERVES OF T HE C ARAÍBA O PERATIONS , C URAÇÁ V ALLEY , B AHIA , B RAZIL F ORM 43 - 101 F 1 T ECHNICAL R EPORT Figure 14 - 1 details the updated 3 D models of the Pilar UG Mine . The model corresponds to the local coordinate grid, used for the Pilar UG Mine and updated domains . Figure 14 - 2 and Figure 14 - 3 present, respectively, the grade shell 3 D models of S 3 and S 10 domains using Leapfrog software . 25 November 2019 Rev. F 181
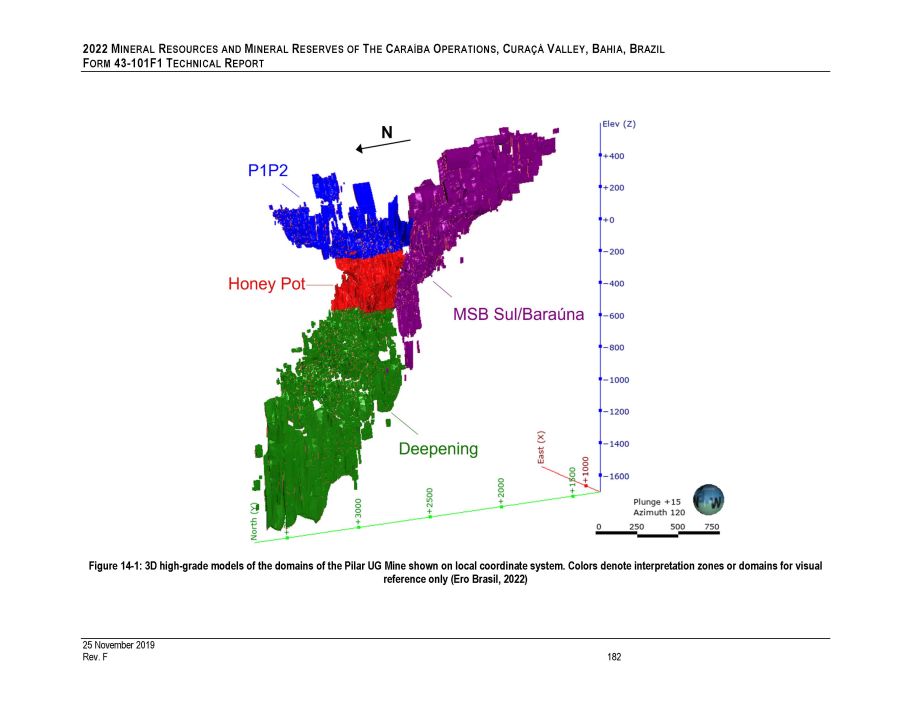
2022 M INERAL R ESOURCES AND M INERAL R ESERVES OF T HE C ARAÍBA O PERATIONS , C URAÇÁ V ALLEY , B AHIA , B RAZIL F ORM 43 - 101F1 T ECHNICAL R EPORT Figure 14 - 1: 3D high - grade models of the domains of the Pilar UG Mine shown on local coordinate system. Colors denote interpretation zones or domains for visual reference only (Ero Brasil, 2022) 25 November 2019 Rev. F 182
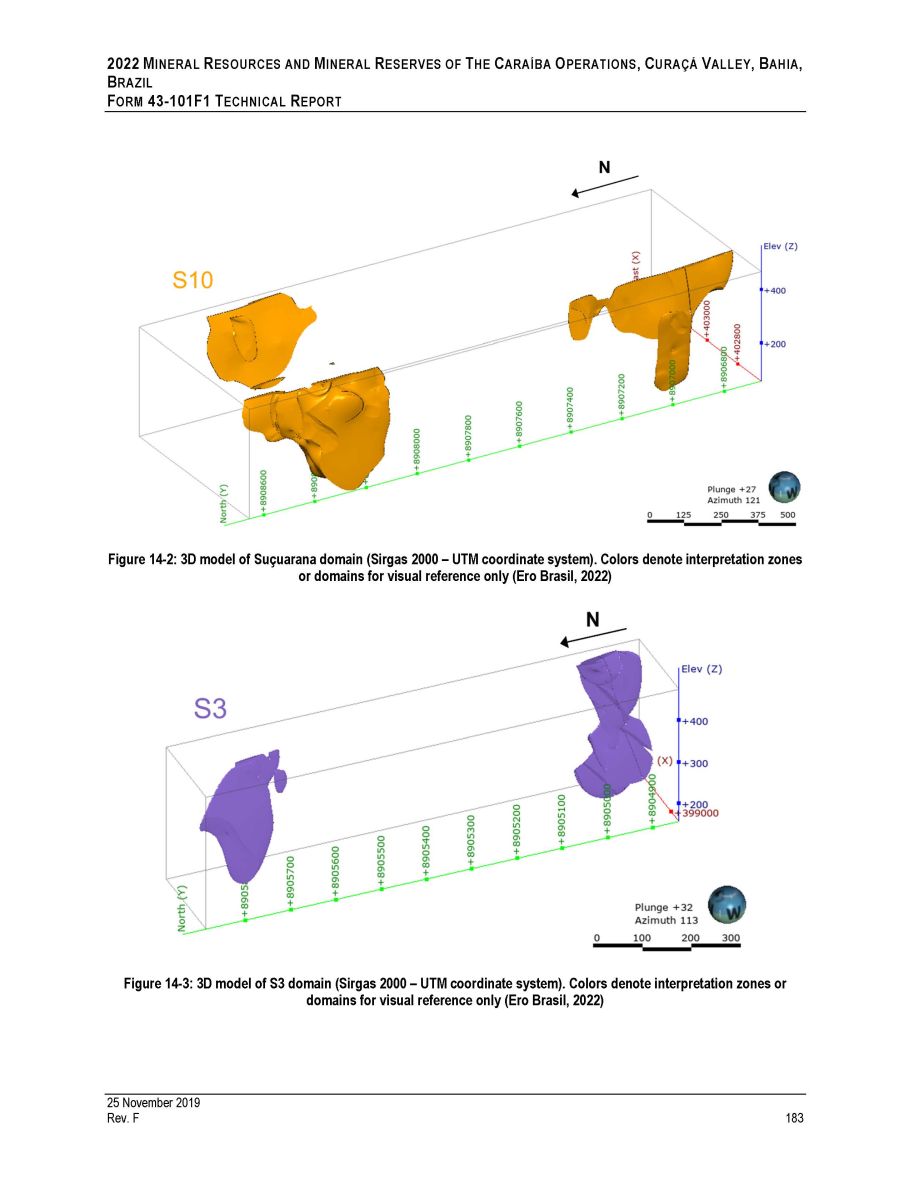
2022 M INERAL R ESOURCES AND M INERAL R ESERVES OF T HE C ARAÍBA O PERATIONS , C URAÇÁ V ALLEY , B AHIA , B RAZIL F ORM 43 - 101F1 T ECHNICAL R EPORT Figure 14 - 2: 3D model of Suçuarana domain (Sirgas 2000 – UTM coordinate system). Colors denote interpretation zones or domains for visual reference only (Ero Brasil, 2022) Figure 14 - 3: 3D model of S3 domain (Sirgas 2000 – UTM coordinate system). Colors denote interpretation zones or domains for visual reference only (Ero Brasil, 2022) 25 November 2019 Rev. F 183
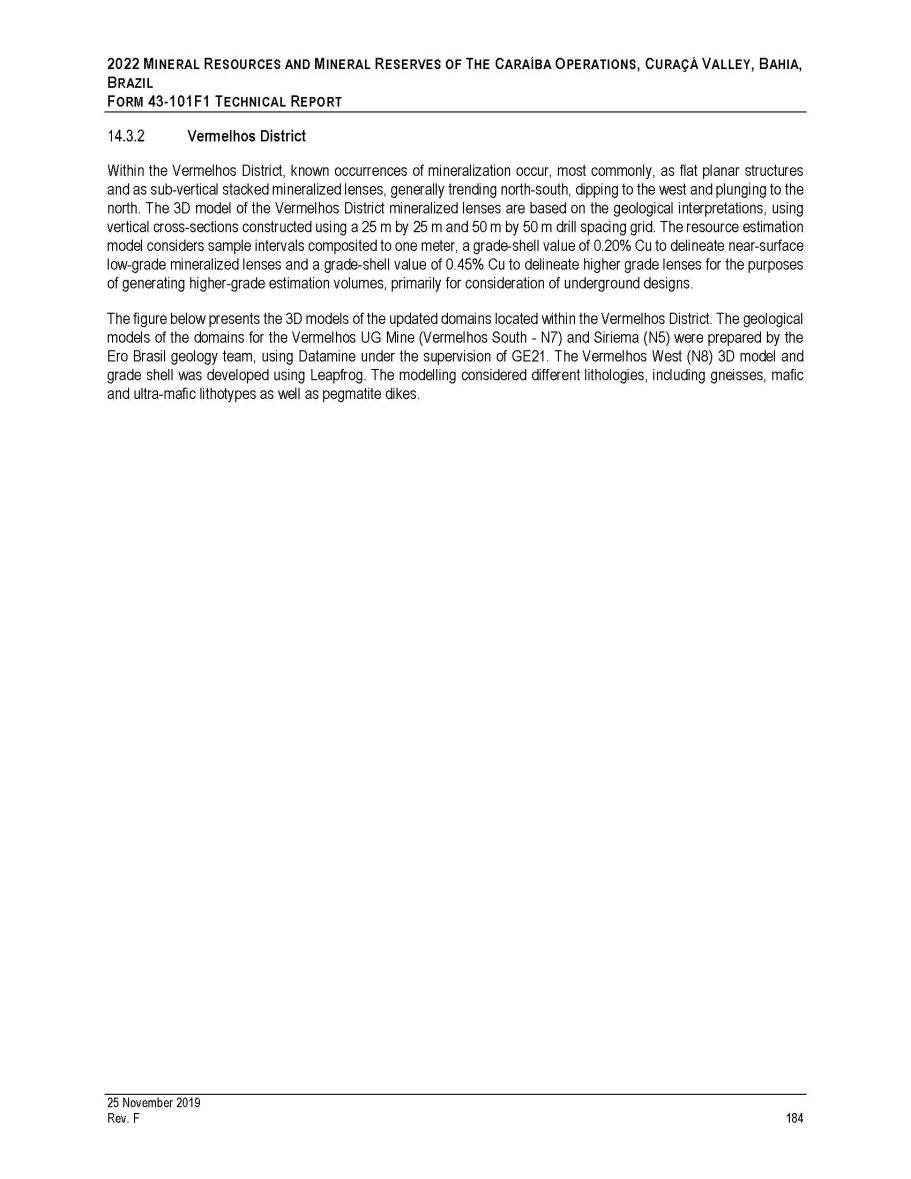
2022 M INERAL R ESOURCES AND M INERAL R ESERVES OF T HE C ARAÍBA O PERATIONS , C URAÇÁ V ALLEY , B AHIA , B RAZIL F ORM 43 - 101 F 1 T ECHNICAL R EPORT Vermelhos District Within the Vermelhos District, known occurrences of mineralization occur, most commonly, as flat planar structures and as sub - vertical stacked mineralized lenses, generally trending north - south, dipping to the west and plunging to the north . The 3 D model of the Vermelhos District mineralized lenses are based on the geological interpretations, using vertical cross - sections constructed using a 25 m by 25 m and 50 m by 50 m drill spacing grid . The resource estimation model considers sample intervals composited to one meter, a grade - shell value of 0 . 20 % Cu to delineate near - surface low - grade mineralized lenses and a grade - shell value of 0 . 45 % Cu to delineate higher grade lenses for the purposes of generating higher - grade estimation volumes, primarily for consideration of underground designs . The figure below presents the 3 D models of the updated domains located within the Vermelhos District . The geological models of the domains for the Vermelhos UG Mine (Vermelhos South - N 7 ) and Siriema (N 5 ) were prepared by the Ero Brasil geology team, using Datamine under the supervision of GE 21 . The Vermelhos West (N 8 ) 3 D model and grade shell was developed using Leapfrog . The modelling considered different lithologies, including gneisses, mafic and ultra - mafic lithotypes as well as pegmatite dikes . 25 November 2019 Rev. F 184

2022 M INERAL R ESOURCES AND M INERAL R ESERVES OF T HE C ARAÍBA O PERATIONS , C URAÇÁ V ALLEY , B AHIA , B RAZIL F ORM 43 - 101F1 T ECHNICAL R EPORT Figure 14 - 4: 3D grade shell model of North Curaça district (Sirgas 2000 – UTM coordinate system). Colors denote interpretation zones or domains for visual reference only (Ero Brasil, 2022) 25 November 2019 Rev. F 185
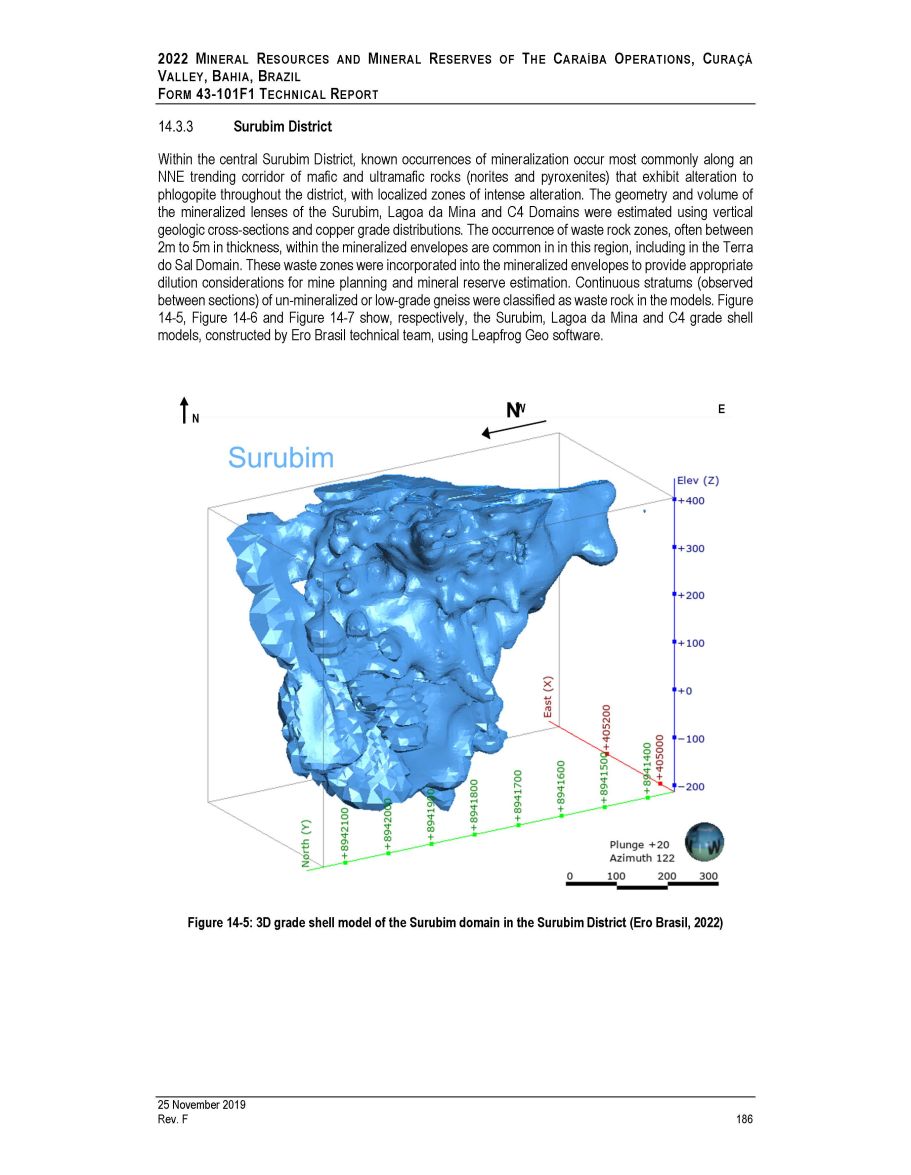
2022 M INERAL R ESOURCES AND M INERAL R ESERVES OF T HE C ARAÍBA O PERATIONS , C URAÇÁ V ALLEY , B AHIA , B RAZIL F ORM 43 - 101F1 T ECHNICAL R EPORT Surubim District Within the central Surubim District, known occurrences of mineralization occur most commonly along an NNE trending corridor of mafic and ultramafic rocks (norites and pyroxenites) that exhibit alteration to phlogopite throughout the district, with localized zones of intense alteration . The geometry and volume of the mineralized lenses of the Surubim, Lagoa da Mina and C 4 Domains were estimated using vertical geologic cross - sections and copper grade distributions . The occurrence of waste rock zones, often between 2 m to 5 m in thickness, within the mineralized envelopes are common in in this region, including in the Terra do Sal Domain . These waste zones were incorporated into the mineralized envelopes to provide appropriate dilution considerations for mine planning and mineral reserve estimation . Continuous stratums (observed between sections) of un - mineralized or low - grade gneiss were classified as waste rock in the models . Figure 14 - 5 , Figure 14 - 6 and Figure 14 - 7 show, respectively, the Surubim, Lagoa da Mina and C 4 grade shell models, constructed by Ero Brasil technical team, using Leapfrog Geo software . Figure 14 - 5: 3D grade shell model of the Surubim domain in the Surubim District (Ero Brasil, 2022) N 25 November 2019 Rev. F 186 W E
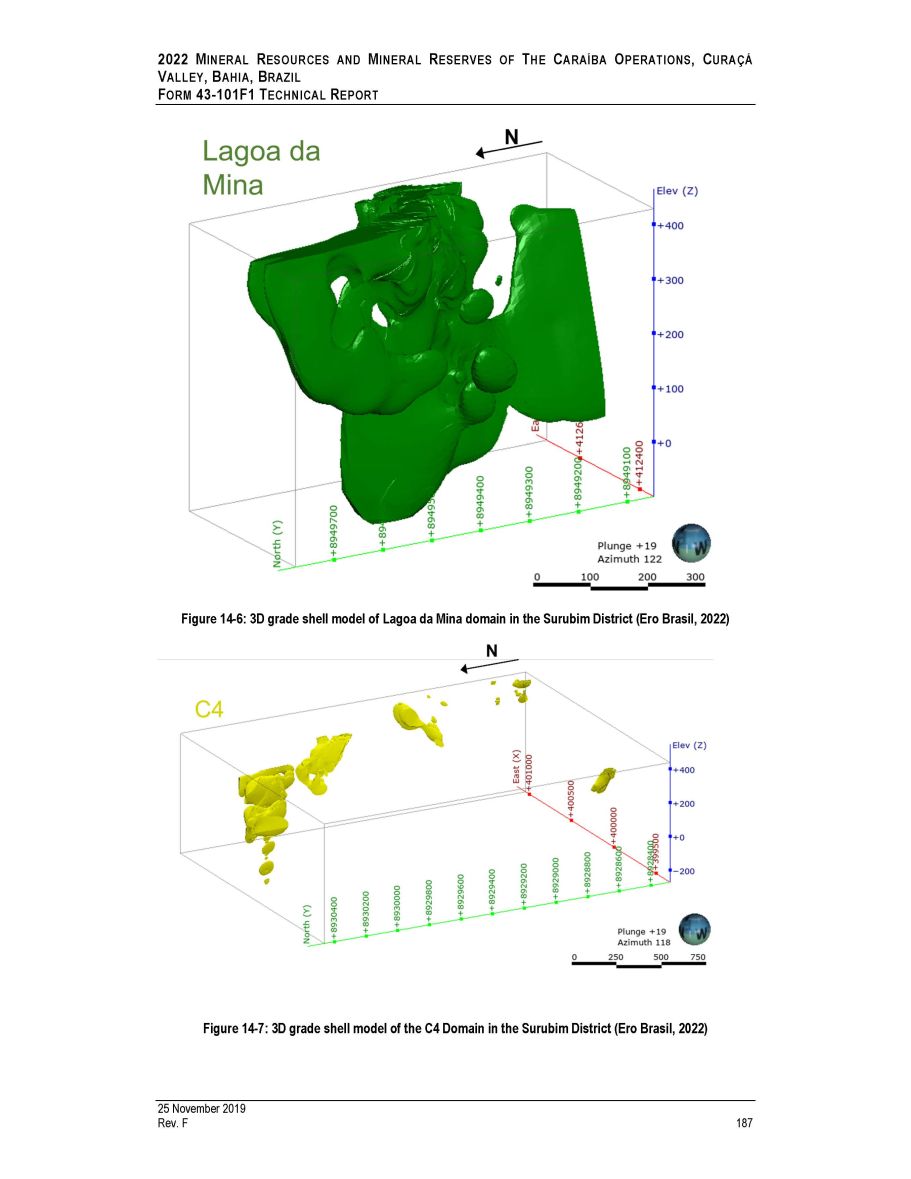
2022 M INERAL R ESOURCES AND M INERAL R ESERVES OF T HE C ARAÍBA O PERATIONS , C URAÇÁ V ALLEY , B AHIA , B RAZIL F ORM 43 - 101F1 T ECHNICAL R EPORT Figure 14 - 6: 3D grade shell model of Lagoa da Mina domain in the Surubim District (Ero Brasil, 2022) Figure 14 - 7: 3D grade shell model of the C4 Domain in the Surubim District (Ero Brasil, 2022) 25 November 2019 Rev. F 187
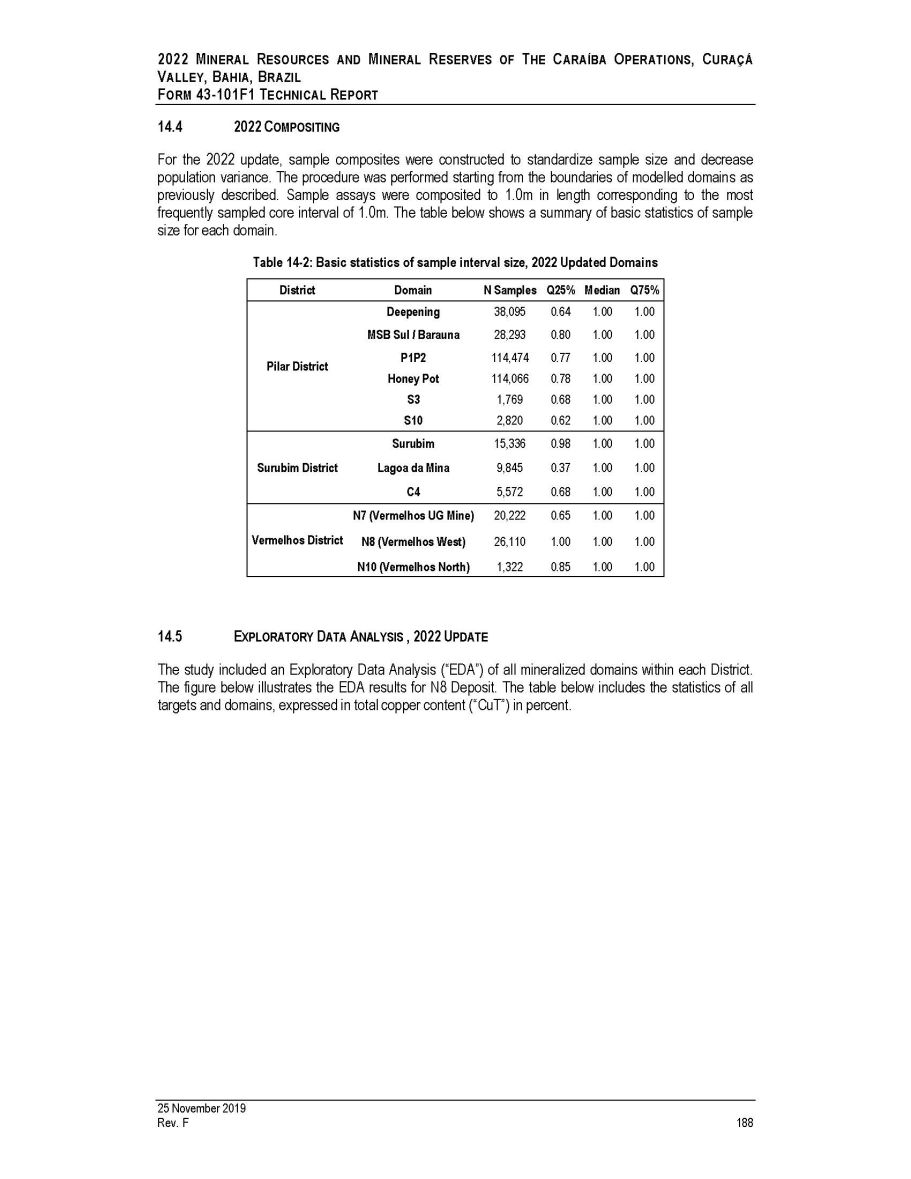
2022 M INERAL R ESOURCES AND M INERAL R ESERVES OF T HE C ARAÍBA O PERATIONS , C URAÇÁ V ALLEY , B AHIA , B RAZIL F ORM 43 - 101F1 T ECHNICAL R EPORT 14.4 2022 C OMPOSITING For the 2022 update, sample composites were constructed to standardize sample size and decrease population variance . The procedure was performed starting from the boundaries of modelled domains as previously described . Sample assays were composited to 1 . 0 m in length corresponding to the most frequently sampled core interval of 1 . 0 m . The table below shows a summary of basic statistics of sample size for each domain . Table 14 - 2: Basic statistics of sample interval size, 2022 Updated Domains District Domain N Samples Q25% Median Q75% Deepening 38,095 0.64 1.00 1.00 MSB Sul / Barauna 28,293 0.80 1.00 1.00 Pilar District P1P2 114,474 0.77 1.00 1.00 Honey Pot 114,066 0.78 1.00 1.00 S3 1,769 0.68 1.00 1.00 S10 2,820 0.62 1.00 1.00 Surubim 15,336 0.98 1.00 1.00 Surubim District Lagoa da Mina 9,845 0.37 1.00 1.00 C4 5,572 0.68 1.00 1.00 N7 (Vermelhos UG Mine) 20,222 0.65 1.00 1.00 Vermelhos District N8 (Vermelhos West) 26,110 1.00 1.00 1.00 N10 (Vermelhos North) 1,322 0.85 1.00 1.00 25 November 2019 Rev. F 188 14.5 E XPLORATORY D ATA A NALYSIS , 2022 U PDATE The study included an Exploratory Data Analysis (“EDA”) of all mineralized domains within each District . The figure below illustrates the EDA results for N 8 Deposit . The table below includes the statistics of all targets and domains, expressed in total copper content (“CuT”) in percent .
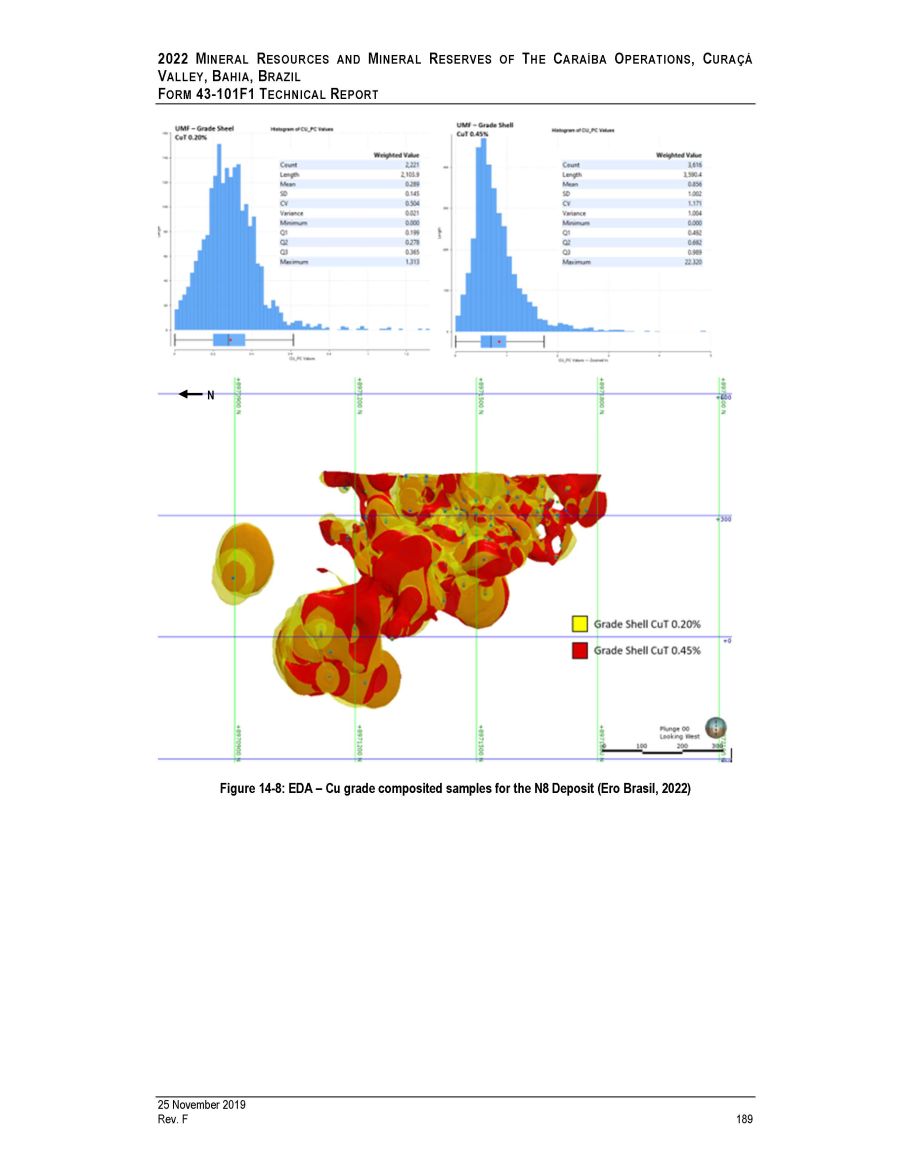
2022 M INERAL R ESOURCES AND M INERAL R ESERVES OF T HE C ARAÍBA O PERATIONS , C URAÇÁ V ALLEY , B AHIA , B RAZIL F ORM 43 - 101F1 T ECHNICAL R EPORT Figure 14 - 8: EDA – Cu grade composited samples for the N8 Deposit (Ero Brasil, 2022) N 25 November 2019 Rev. F 189
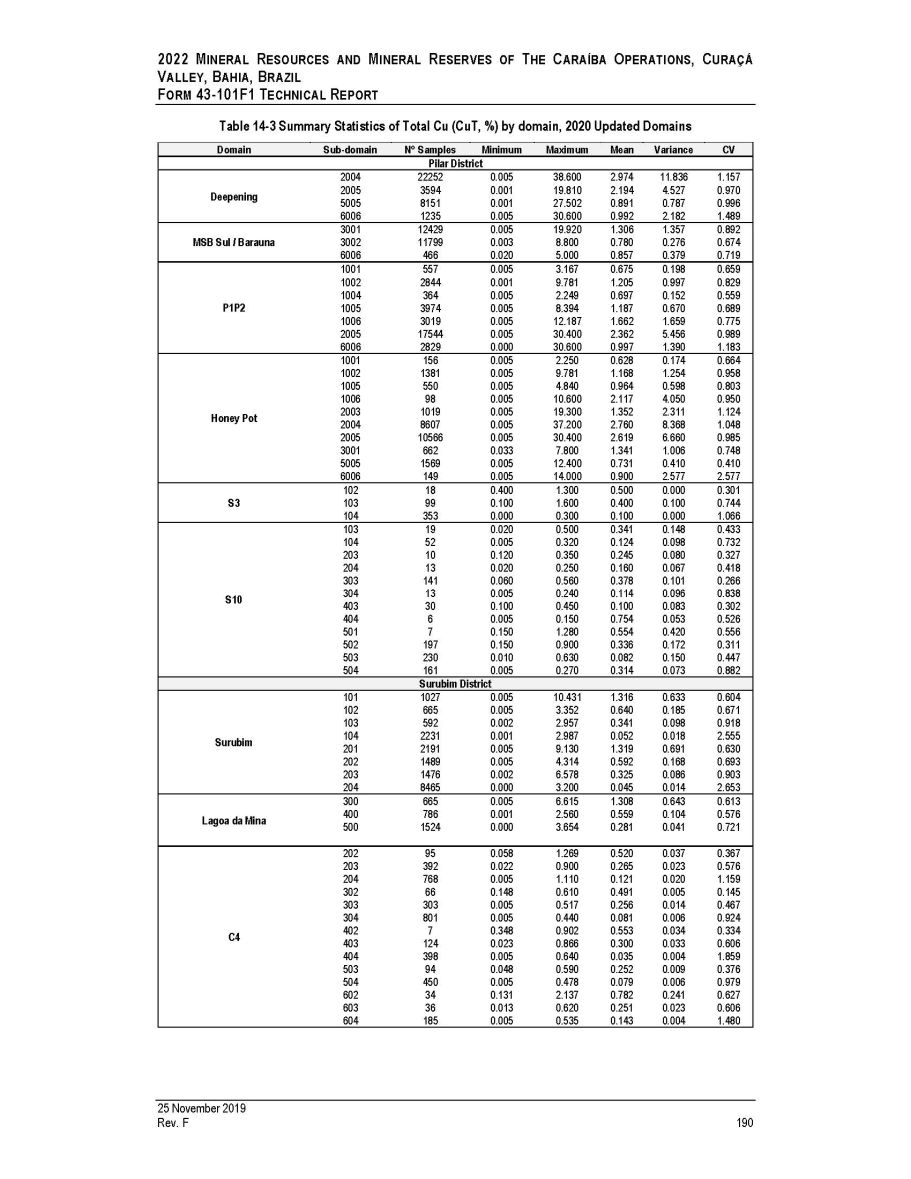
2022 M INERAL R ESOURCES AND M INERAL R ESERVES OF T HE C ARAÍBA O PERATIONS , C URAÇÁ V ALLEY , B AHIA , B RAZIL F ORM 43 - 101F1 T ECHNICAL R EPORT Table 14 - 3 Summary Statistics of Total Cu (CuT, %) by domain, 2020 Updated Domains Domain Sub - domain N ƒ Samples Minimum Maximum Mean Variance CV Pilar District 2004 22252 0.005 38.600 2.974 11.836 1.157 Deepening 2005 3594 0.001 19.810 2.194 4.527 0.970 5005 8151 0.001 27.502 0.891 0.787 0.996 6006 1235 0.005 30.600 0.992 2.182 1.489 3001 12429 0.005 19.920 1.306 1.357 0.892 MSB Sul / Barauna 3002 11799 0.003 8.800 0.780 0.276 0.674 6006 466 0.020 5.000 0.857 0.379 0.719 1001 557 0.005 3.167 0.675 0.198 0.659 1002 2844 0.001 9.781 1.205 0.997 0.829 1004 364 0.005 2.249 0.697 0.152 0.559 P1P2 1005 3974 0.005 8.394 1.187 0.670 0.689 1006 3019 0.005 12.187 1.662 1.659 0.775 2005 17544 0.005 30.400 2.362 5.456 0.989 6006 2829 0.000 30.600 0.997 1.390 1.183 1001 156 0.005 2.250 0.628 0.174 0.664 1002 1381 0.005 9.781 1.168 1.254 0.958 1005 550 0.005 4.840 0.964 0.598 0.803 1006 98 0.005 10.600 2.117 4.050 0.950 Honey Pot 2003 1019 0.005 19.300 1.352 2.311 1.124 2004 8607 0.005 37.200 2.760 8.368 1.048 2005 10566 0.005 30.400 2.619 6.660 0.985 3001 662 0.033 7.800 1.341 1.006 0.748 5005 1569 0.005 12.400 0.731 0.410 0.410 6006 149 0.005 14.000 0.900 2.577 2.577 102 18 0.400 1.300 0.500 0.000 0.301 S3 103 99 0.100 1.600 0.400 0.100 0.744 104 353 0.000 0.300 0.100 0.000 1.066 103 19 0.020 0.500 0.341 0.148 0.433 104 52 0.005 0.320 0.124 0.098 0.732 203 10 0.120 0.350 0.245 0.080 0.327 204 13 0.020 0.250 0.160 0.067 0.418 303 141 0.060 0.560 0.378 0.101 0.266 S10 304 13 0.005 0.240 0.114 0.096 0.838 403 30 0.100 0.450 0.100 0.083 0.302 404 6 0.005 0.150 0.754 0.053 0.526 501 7 0.150 1.280 0.554 0.420 0.556 502 197 0.150 0.900 0.336 0.172 0.311 503 230 0.010 0.630 0.082 0.150 0.447 504 161 0.005 0.270 0.314 0.073 0.882 Surubim District 101 1027 0.005 10.431 1.316 0.633 0.604 102 665 0.005 3.352 0.640 0.185 0.671 103 592 0.002 2.957 0.341 0.098 0.918 Surubim 104 2231 0.001 2.987 0.052 0.018 2.555 201 2191 0.005 9.130 1.319 0.691 0.630 202 1489 0.005 4.314 0.592 0.168 0.693 203 1476 0.002 6.578 0.325 0.086 0.903 204 8465 0.000 3.200 0.045 0.014 2.653 300 665 0.005 6.615 1.308 0.643 0.613 Lagoa da Mina 400 500 786 1524 0.001 0.000 2.560 3.654 0.559 0.281 0.104 0.041 0.576 0.721 202 95 0.058 1.269 0.520 0.037 0.367 203 392 0.022 0.900 0.265 0.023 0.576 204 768 0.005 1.110 0.121 0.020 1.159 302 66 0.148 0.610 0.491 0.005 0.145 303 303 0.005 0.517 0.256 0.014 0.467 304 801 0.005 0.440 0.081 0.006 0.924 C4 402 7 0.348 0.902 0.553 0.034 0.334 403 124 0.023 0.866 0.300 0.033 0.606 404 398 0.005 0.640 0.035 0.004 1.859 503 94 0.048 0.590 0.252 0.009 0.376 504 450 0.005 0.478 0.079 0.006 0.979 602 34 0.131 2.137 0.782 0.241 0.627 603 36 0.013 0.620 0.251 0.023 0.606 604 185 0.005 0.535 0.143 0.004 1.480 25 November 2019 Rev. F 190
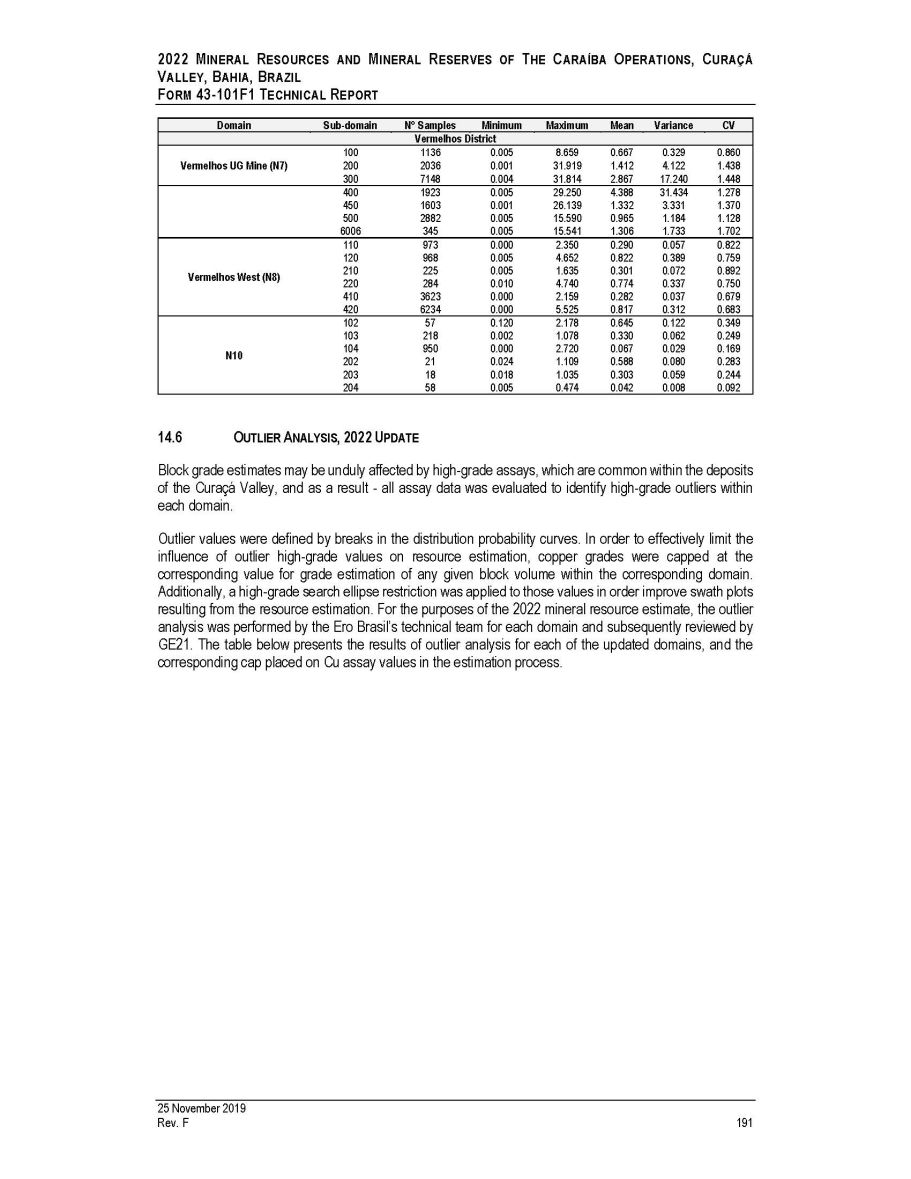
2022 M INERAL R ESOURCES AND M INERAL R ESERVES OF T HE C ARAÍBA O PERATIONS , C URAÇÁ V ALLEY , B AHIA , B RAZIL F ORM 43 - 101F1 T ECHNICAL R EPORT Domain Sub - domain N ƒ Samples Minimum Maximum Mean Variance CV Vermelhos District Vermelhos UG Mine (N7) 100 200 300 1136 2036 7148 0.005 0.001 0.004 8.659 31.919 31.814 0.667 1.412 2.867 0.329 4.122 17.240 0.860 1.438 1.448 400 1923 0.005 29.250 4.388 31.434 1.278 450 1603 0.001 26.139 1.332 3.331 1.370 500 2882 0.005 15.590 0.965 1.184 1.128 6006 345 0.005 15.541 1.306 1.733 1.702 110 973 0.000 2.350 0.290 0.057 0.822 120 968 0.005 4.652 0.822 0.389 0.759 Vermelhos West (N8) 210 225 0.005 1.635 0.301 0.072 0.892 220 284 0.010 4.740 0.774 0.337 0.750 410 3623 0.000 2.159 0.282 0.037 0.679 420 6234 0.000 5.525 0.817 0.312 0.683 102 57 0.120 2.178 0.645 0.122 0.349 103 218 0.002 1.078 0.330 0.062 0.249 104 950 0.000 2.720 0.067 0.029 0.169 N10 202 21 0.024 1.109 0.588 0.080 0.283 203 18 0.018 1.035 0.303 0.059 0.244 204 58 0.005 0.474 0.042 0.008 0.092 25 November 2019 Rev. F 191 14.6 O UTLIER A NALYSIS , 2022 U PDATE Block grade estimates may be unduly affected by high - grade assays, which are common within the deposits of the Curaçá Valley, and as a result - all assay data was evaluated to identify high - grade outliers within each domain . Outlier values were defined by breaks in the distribution probability curves . In order to effectively limit the influence of outlier high - grade values on resource estimation, copper grades were capped at the corresponding value for grade estimation of any given block volume within the corresponding domain . Additionally, a high - grade search ellipse restriction was applied to those values in order improve swath plots resulting from the resource estimation . For the purposes of the 2022 mineral resource estimate, the outlier analysis was performed by the Ero Brasil’s technical team for each domain and subsequently reviewed by GE 21 . The table below presents the results of outlier analysis for each of the updated domains, and the corresponding cap placed on Cu assay values in the estimation process .
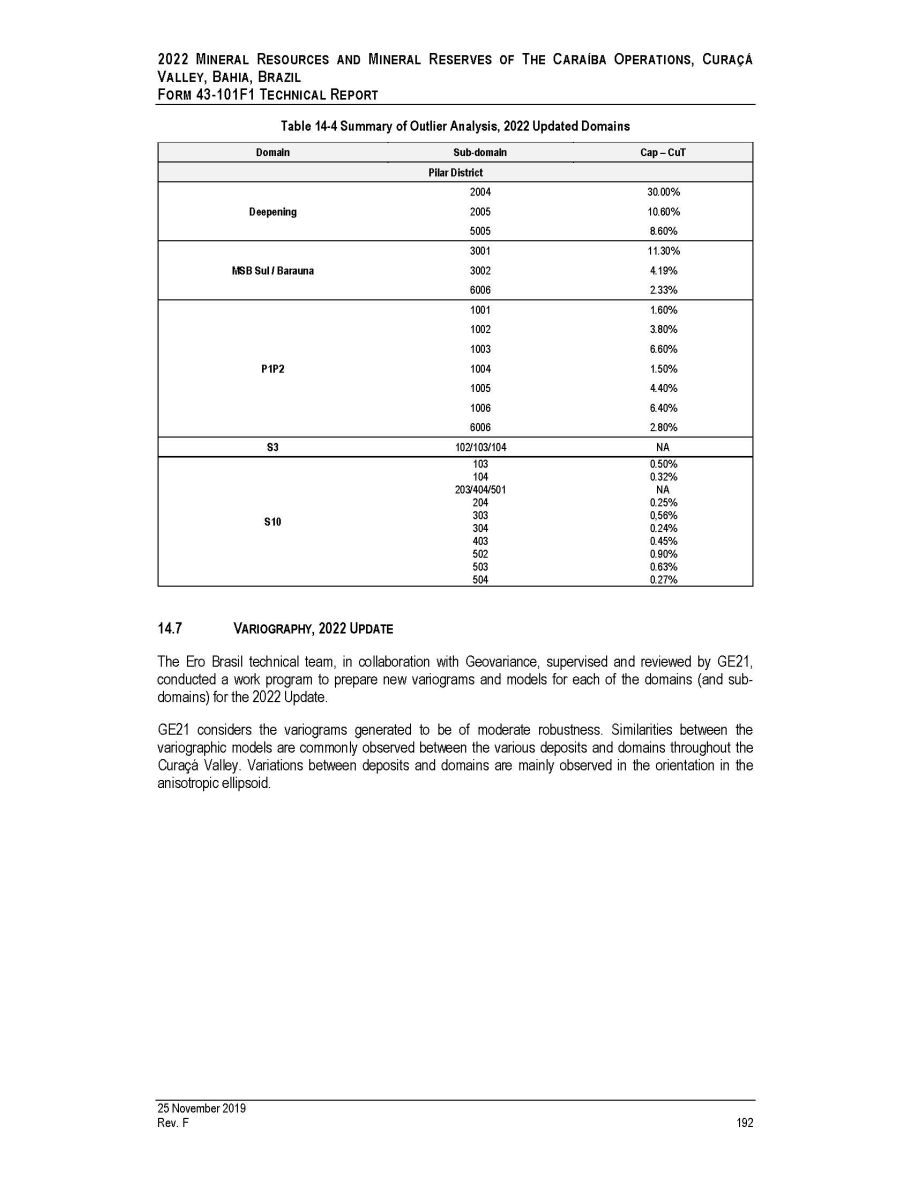
2022 M INERAL R ESOURCES AND M INERAL R ESERVES OF T HE C ARAÍBA O PERATIONS , C URAÇÁ V ALLEY , B AHIA , B RAZIL F ORM 43 - 101F1 T ECHNICAL R EPORT Table 14 - 4 Summary of Outlier Analysis, 2022 Updated Domains Domain Sub - domain Cap – CuT Pilar District 2004 30.00% Deepening 2005 10.60% 5005 8.60% 3001 11.30% MSB Sul / Barauna 3002 4.19% 6006 2.33% 1001 1.60% 1002 3.80% 1003 6.60% P1P2 1004 1.50% 1005 4.40% 1006 6.40% 6006 2.80% S3 102/103/104 NA 103 0.50% 104 0.32% 203/404/501 NA 204 0.25% S10 303 0,56% 304 0.24% 403 0.45% 502 0.90% 503 0.63% 504 0.27% 25 November 2019 Rev. F 192 14.7 V ARIOGRAPHY , 2022 U PDATE The Ero Brasil technical team, in collaboration with Geovariance, supervised and reviewed by GE 21 , conducted a work program to prepare new variograms and models for each of the domains (and sub - domains) for the 2022 Update . GE 21 considers the variograms generated to be of moderate robustness . Similarities between the variographic models are commonly observed between the various deposits and domains throughout the Curaçá Valley . Variations between deposits and domains are mainly observed in the orientation in the anisotropic ellipsoid .

2022 M INERAL R ESOURCES AND M INERAL R ESERVES OF T HE C ARAÍBA O PERATIONS , C URAÇÁ V ALLEY , B AHIA , B RAZIL F ORM 43 - 101F1 T ECHNICAL R EPORT Figure 14 - 9: Example of Variographic analysis – Deepening Domain, Pilar UG Mine (Ero Brasil, 2022) 25 November 2019 Rev. F 193
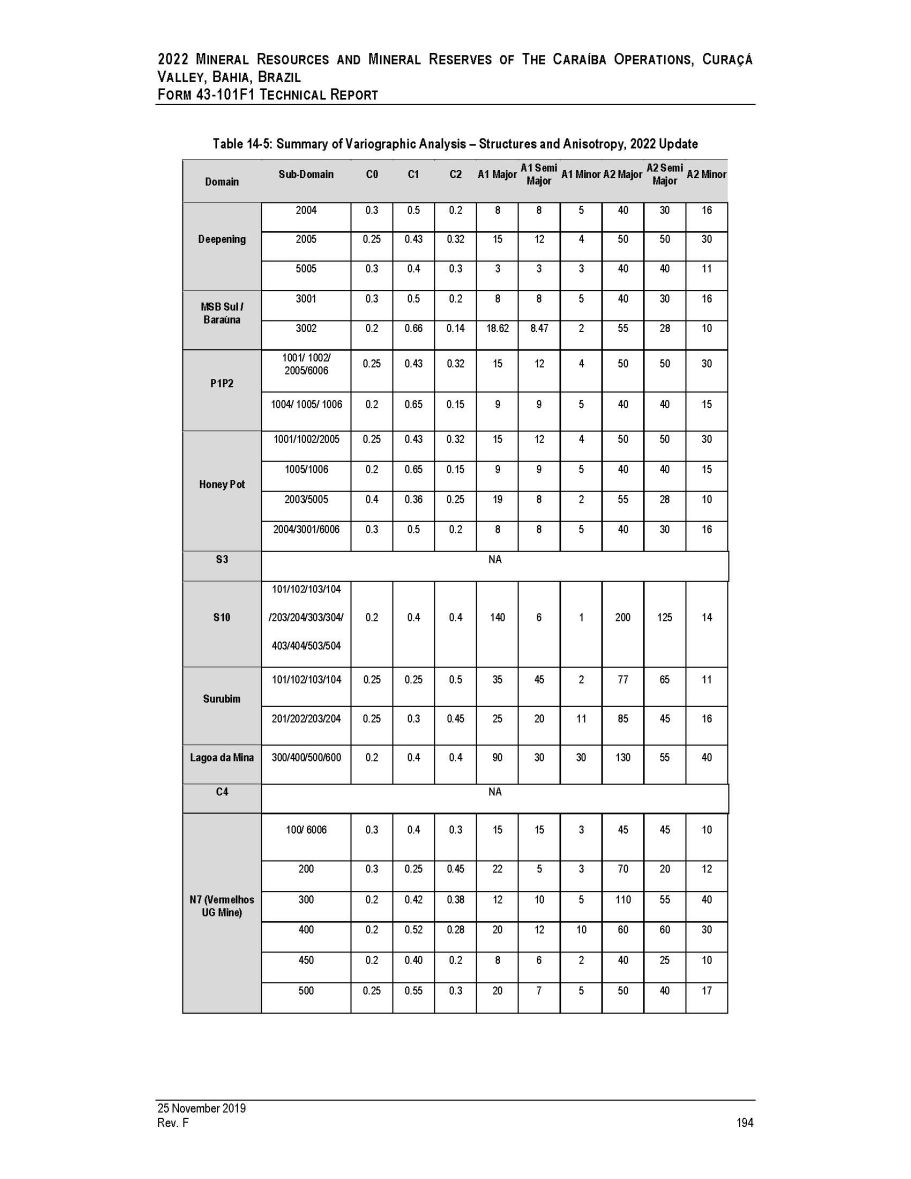
2022 M INERAL R ESOURCES AND M INERAL R ESERVES OF T HE C ARAÍBA O PERATIONS , C URAÇÁ V ALLEY , B AHIA , B RAZIL F ORM 43 - 101F1 T ECHNICAL R EPORT Table 14 - 5: Summary of Variographic Analysis – Structures and Anisotropy, 2022 Update Domain Sub - Domain C0 C1 C2 A1 Major A1 Semi A1 Minor A2 Major Major A2 Semi Major A2 Minor Deepening 2004 0.3 0.5 0.2 8 8 5 40 30 16 2005 0.25 0.43 0.32 15 12 4 50 50 30 5005 0.3 0.4 0.3 3 3 3 40 40 11 MSB Sul / Baraúna 3001 0.3 0.5 0.2 8 8 5 40 30 16 3002 0.2 0.66 0.14 18.62 8.47 2 55 28 10 1001/ 1002/ 2005/6006 0.25 0.43 0.32 15 12 4 50 50 30 P1P2 1004/ 1005/ 1006 0.2 0.65 0.15 9 9 5 40 40 15 Honey Pot 1001/1002/2005 0.25 0.43 0.32 15 12 4 50 50 30 1005/1006 0.2 0.65 0.15 9 9 5 40 40 15 2003/5005 0.4 0.36 0.25 19 8 2 55 28 10 2004/3001/6006 0.3 0.5 0.2 8 8 5 40 30 16 S3 NA 101/102/103/104 S10 /203/204/303/304/ 0.2 0.4 0.4 140 6 1 200 125 14 403/404/503/504 Surubim 101/102/103/104 0.25 0.25 0.5 35 45 2 77 65 11 201/202/203/204 0.25 0.3 0.45 25 20 11 85 45 16 Lagoa da Mina 300/400/500/600 0.2 0.4 0.4 90 30 30 130 55 40 C4 NA N7 (Vermelhos UG Mine) 100/ 6006 0.3 0.4 0.3 15 15 3 45 45 10 200 0.3 0.25 0.45 22 5 3 70 20 12 300 0.2 0.42 0.38 12 10 5 110 55 40 400 0.2 0.52 0.28 20 12 10 60 60 30 450 0.2 0.40 0.2 8 6 2 40 25 10 500 0.25 0.55 0.3 20 7 5 50 40 17 25 November 2019 Rev. F 194
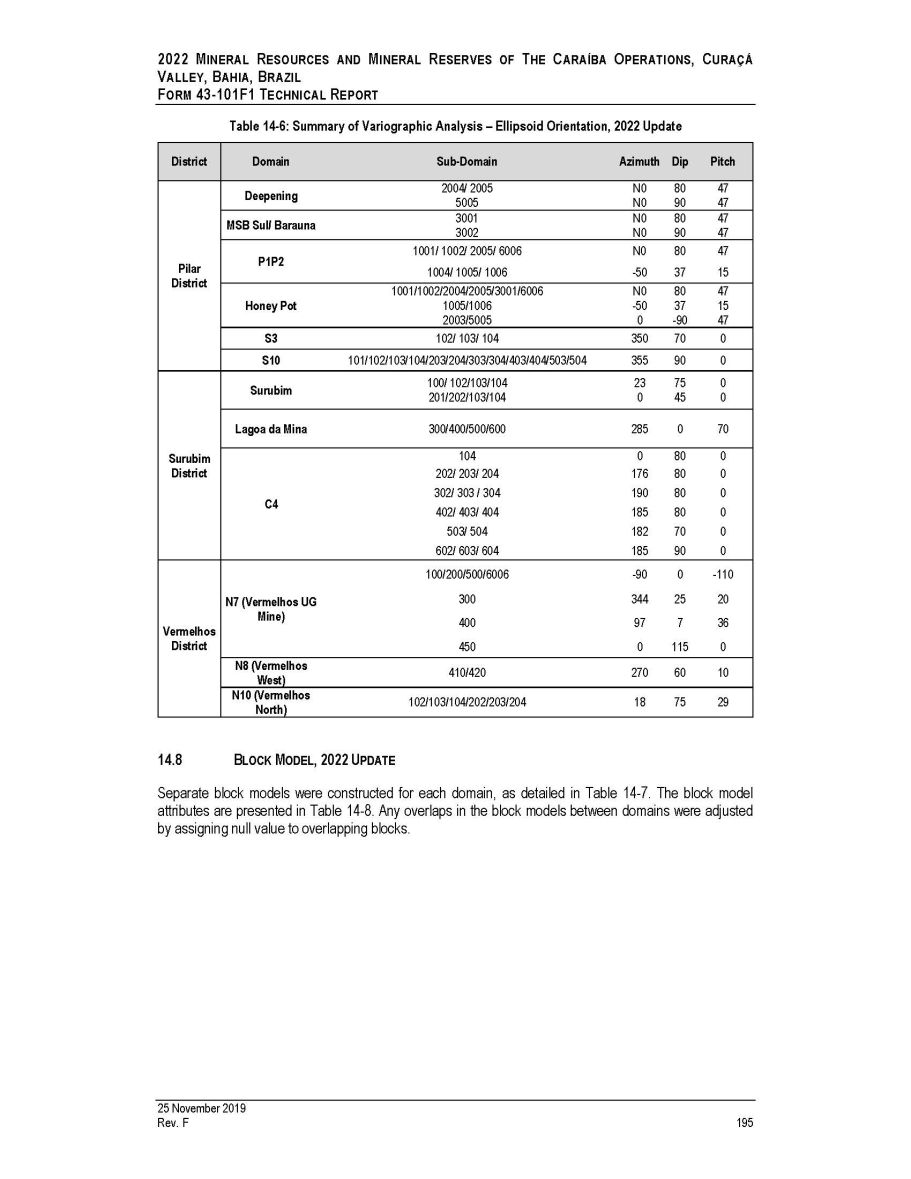
2022 M INERAL R ESOURCES AND M INERAL R ESERVES OF T HE C ARAÍBA O PERATIONS , C URAÇÁ V ALLEY , B AHIA , B RAZIL F ORM 43 - 101F1 T ECHNICAL R EPORT Table 14 - 6: Summary of Variographic Analysis – Ellipsoid Orientation, 2022 Update District Domain Sub - Domain Azimuth Dip Pitch Deepening 2004/ 2005 N0 80 47 5005 N0 90 47 MSB Sul/ Barauna 3001 N0 80 47 3002 N0 90 47 1001/ 1002/ 2005/ 6006 N0 80 47 Pilar District P1P2 1004/ 1005/ 1006 - 50 37 15 1001/1002/2004/2005/3001/6006 N0 80 47 Honey Pot 1005/1006 - 50 37 15 2003/5005 0 - 90 47 S3 102/ 103/ 104 350 70 0 S10 101/102/103/104/203/204/303/304/403/404/503/504 355 90 0 Surubim 100/ 102/103/104 23 75 0 201/202/103/104 0 45 0 Lagoa da Mina 300/400/500/600 285 0 70 Surubim 104 0 80 0 District 202/ 203/ 204 176 80 0 302/ 303 / 304 190 80 0 C4 402/ 403/ 404 185 80 0 503/ 504 182 70 0 602/ 603/ 604 185 90 0 100/200/500/6006 - 90 0 - 110 N7 (Vermelhos UG 300 344 25 20 Vermelhos District Mine) 400 450 97 0 7 115 36 0 N8 (Vermelhos West) 410/420 270 60 10 N10 (Vermelhos North) 102/103/104/202/203/204 18 75 29 25 November 2019 Rev. F 195 14.8 B LOCK M ODEL , 2022 U PDATE Separate block models were constructed for each domain, as detailed in Table 14 - 7 . The block model attributes are presented in Table 14 - 8 . Any overlaps in the block models between domains were adjusted by assigning null value to overlapping blocks .
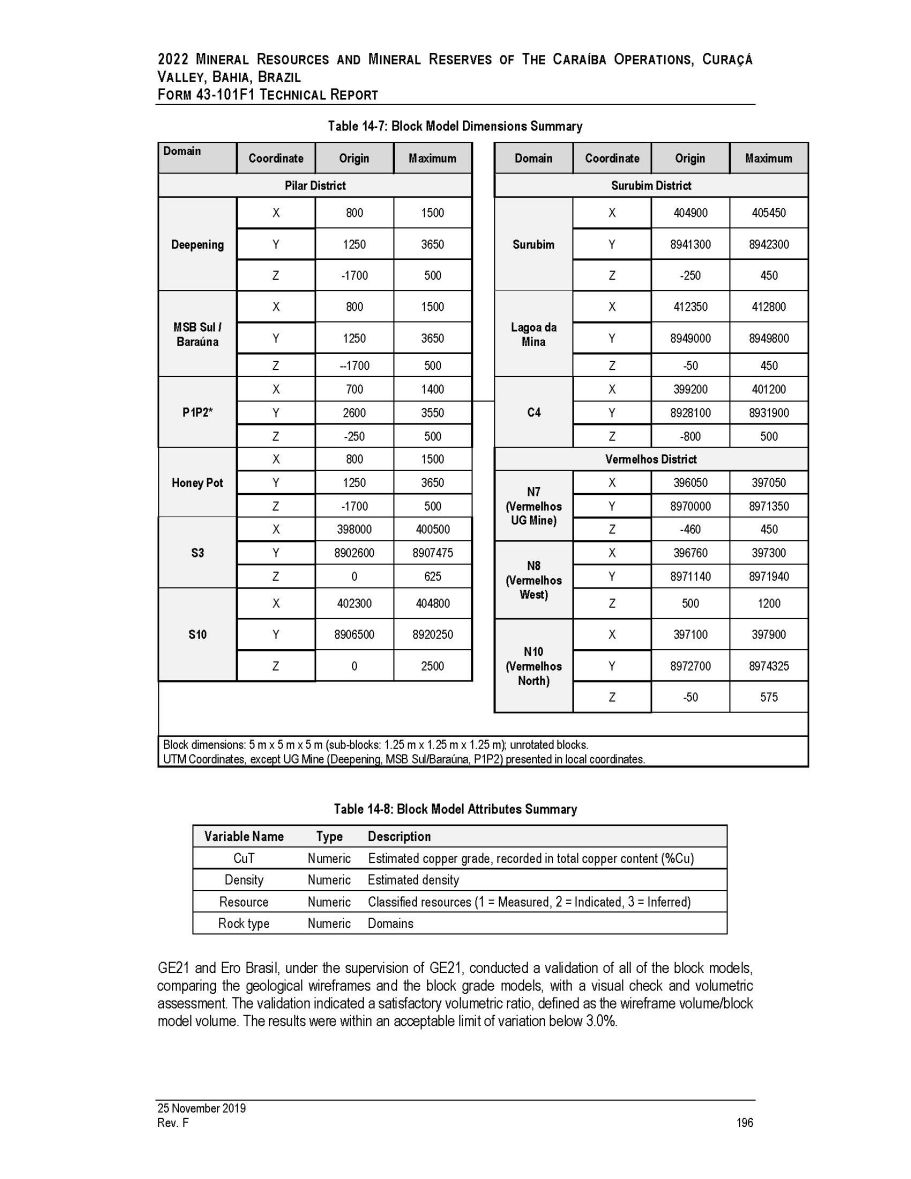
2022 M INERAL R ESOURCES AND M INERAL R ESERVES OF T HE C ARAÍBA O PERATIONS , C URAÇÁ V ALLEY , B AHIA , B RAZIL F ORM 43 - 101F1 T ECHNICAL R EPORT Table 14 - 7: Block Model Dimensions Summary Domain Coordinate Origin Maximum Domain Coordinate Origin Maximum Pilar District Surubim District Deepening X 800 1500 Surubim X 404900 405450 Y 1250 3650 Y 8941300 8942300 Z - 1700 500 Z - 250 450 MSB Sul / Baraúna X 800 1500 Lagoa da Mina X 412350 412800 Y 1250 3650 Y 8949000 8949800 Z -- 1700 500 Z - 50 450 P1P2* X 700 1400 C4 X 399200 401200 Y 2600 3550 Y 8928100 8931900 Z - 250 500 Z - 800 500 Honey Pot X 800 1500 Vermelhos District Y 1250 3650 N7 (Vermelhos UG Mine) X 396050 397050 Z - 1700 500 Y 8970000 8971350 S3 X 398000 400500 Z - 460 450 Y 8902600 8907475 N8 (Vermelhos West) X 396760 397300 Z 0 625 Y 8971140 8971940 S10 X 402300 404800 Z 500 1200 Y 8906500 8920250 N10 (Vermelhos North) X 397100 397900 Z 0 2500 Y 8972700 8974325 Z - 50 575 Block dimensions: 5 m x 5 m x 5 m (sub - blocks: 1.25 m x 1.25 m x 1.25 m); unrotated blocks. UTM Coordinates, except UG Mine (Deepening, MSB Sul/Baraúna, P1P2) presented in local coordinates. 25 November 2019 Rev. F 196 Table 14 - 8: Block Model Attributes Summary Variable Name Type Description CuT Numeric Estimated copper grade, recorded in total copper content (%Cu) Density Numeric Estimated density Resource Numeric Classified resources (1 = Measured, 2 = Indicated, 3 = Inferred) Rock type Numeric Domains GE 21 and Ero Brasil, under the supervision of GE 21 , conducted a validation of all of the block models, comparing the geological wireframes and the block grade models, with a visual check and volumetric assessment . The validation indicated a satisfactory volumetric ratio, defined as the wireframe volume/block model volume . The results were within an acceptable limit of variation below 3 . 0 % .
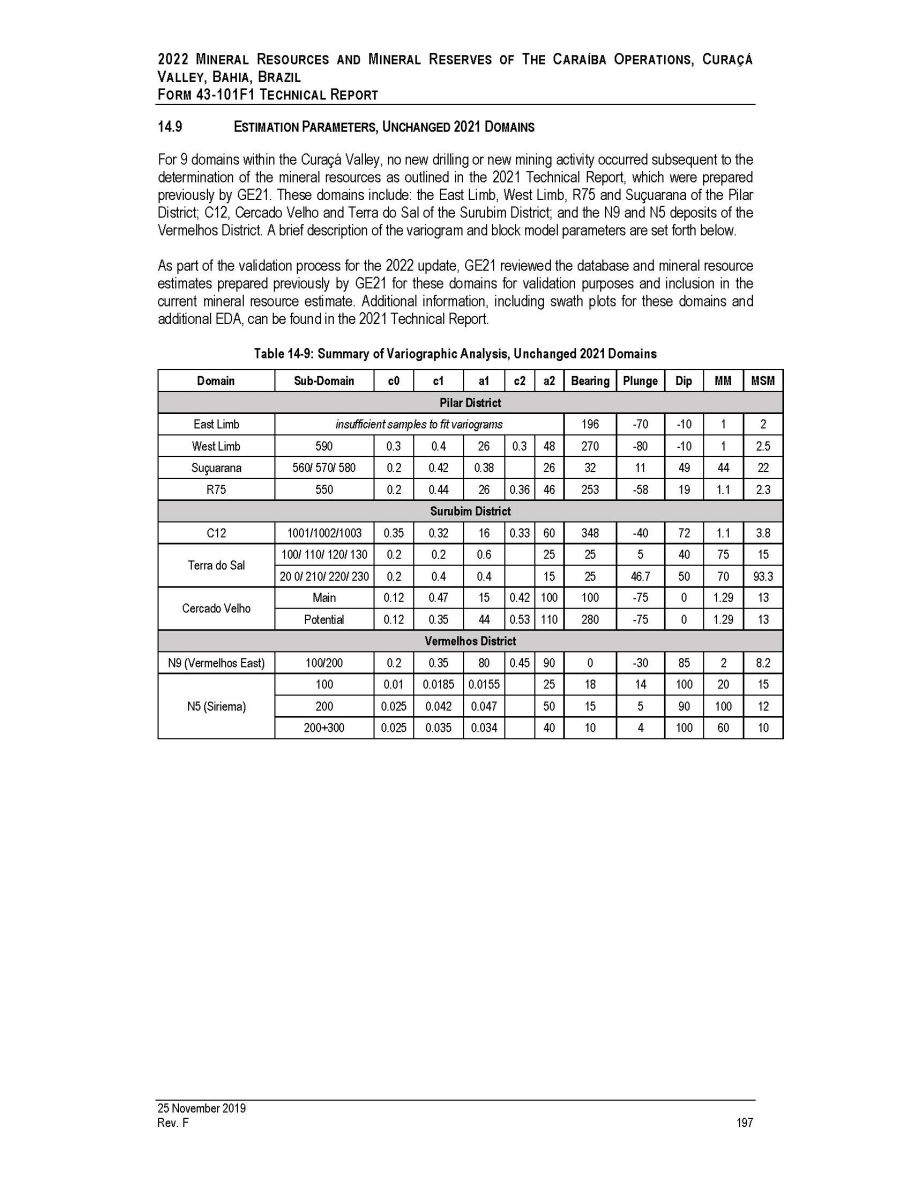
2022 M INERAL R ESOURCES AND M INERAL R ESERVES OF T HE C ARAÍBA O PERATIONS , C URAÇÁ V ALLEY , B AHIA , B RAZIL F ORM 43 - 101F1 T ECHNICAL R EPORT 14.9 E STIMATION P ARAMETERS , U NCHANGED 2021 D OMAINS For 9 domains within the Curaçá Valley, no new drilling or new mining activity occurred subsequent to the determination of the mineral resources as outlined in the 2021 Technical Report, which were prepared previously by GE 21 . These domains include : the East Limb, West Limb, R 75 and Suçuarana of the Pilar District ; C 12 , Cercado Velho and Terra do Sal of the Surubim District ; and the N 9 and N 5 deposits of the Vermelhos District . A brief description of the variogram and block model parameters are set forth below . As part of the validation process for the 2022 update, GE 21 reviewed the database and mineral resource estimates prepared previously by GE 21 for these domains for validation purposes and inclusion in the current mineral resource estimate . Additional information, including swath plots for these domains and additional EDA, can be found in the 2021 Technical Report . Table 14 - 9: Summary of Variographic Analysis, Unchanged 2021 Domains Domain Sub - Domain c0 c1 a1 c2 a2 Bearing Plunge Dip MM MSM Pilar District East Limb insufficient samples to fit variograms 196 - 70 - 10 1 2 West Limb 590 0.3 0.4 26 0.3 48 270 - 80 - 10 1 2.5 Suçuarana 560/ 570/ 580 0.2 0.42 0.38 26 32 11 49 44 22 R75 550 0.2 0.44 26 0.36 46 253 - 58 19 1.1 2.3 Surubim District C12 1001/1002/1003 0.35 0.32 16 0.33 60 348 - 40 72 1.1 3.8 Terra do Sal 100/ 110/ 120/ 130 0.2 0.2 0.6 25 25 5 40 75 15 20 0/ 210/ 220/ 230 0.2 0.4 0.4 15 25 46.7 50 70 93.3 Cercado Velho Main 0.12 0.47 15 0.42 100 100 - 75 0 1.29 13 Potential 0.12 0.35 44 0.53 110 280 - 75 0 1.29 13 Vermelhos District N9 (Vermelhos East) 100/200 0.2 0.35 80 0.45 90 0 - 30 85 2 8.2 N5 (Siriema) 100 0.01 0.0185 0.0155 25 18 14 100 20 15 200 0.025 0.042 0.047 50 15 5 90 100 12 200+300 0.025 0.035 0.034 40 10 4 100 60 10 25 November 2019 Rev. F 197
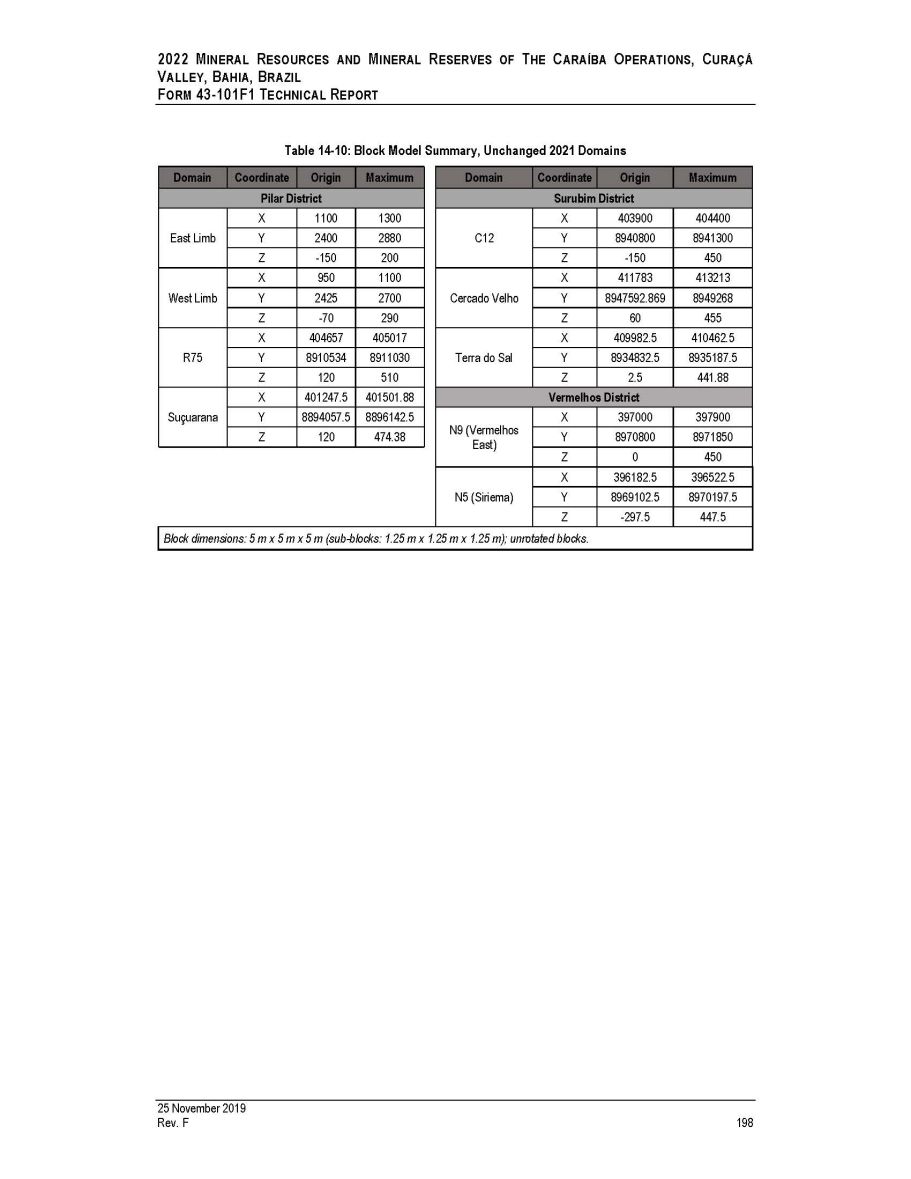
2022 M INERAL R ESOURCES AND M INERAL R ESERVES OF T HE C ARAÍBA O PERATIONS , C URAÇÁ V ALLEY , B AHIA , B RAZIL F ORM 43 - 101F1 T ECHNICAL R EPORT Table 14 - 10: Block Model Summary, Unchanged 2021 Domains Domain Coordinate Origin Maximum Pilar District East Limb X 1100 1300 Y 2400 2880 Z - 150 200 West Limb X 950 1100 Y 2425 2700 Z - 70 290 R75 X 404657 405017 Y 8910534 8911030 Z 120 510 Suçuarana X 401247.5 401501.88 Y 8894057.5 8896142.5 Z 120 474.38 25 November 2019 Rev. F 198 Domain Coordinate Origin Maximum Surubim District C12 X 403900 404400 Y 8940800 8941300 Z - 150 450 Cercado Velho X 411783 413213 Y 8947592.869 8949268 Z 60 455 Terra do Sal X 409982.5 410462.5 Y 8934832.5 8935187.5 Z 2.5 441.88 Vermelhos District N9 (Vermelhos East) X 397000 397900 Y 8970800 8971850 Z 0 450 N5 (Siriema) X 396182.5 396522.5 Y 8969102.5 8970197.5 Z - 297.5 447.5 Block dimensions: 5 m x 5 m x 5 m (sub - blocks: 1.25 m x 1.25 m x 1.25 m); unrotated blocks.
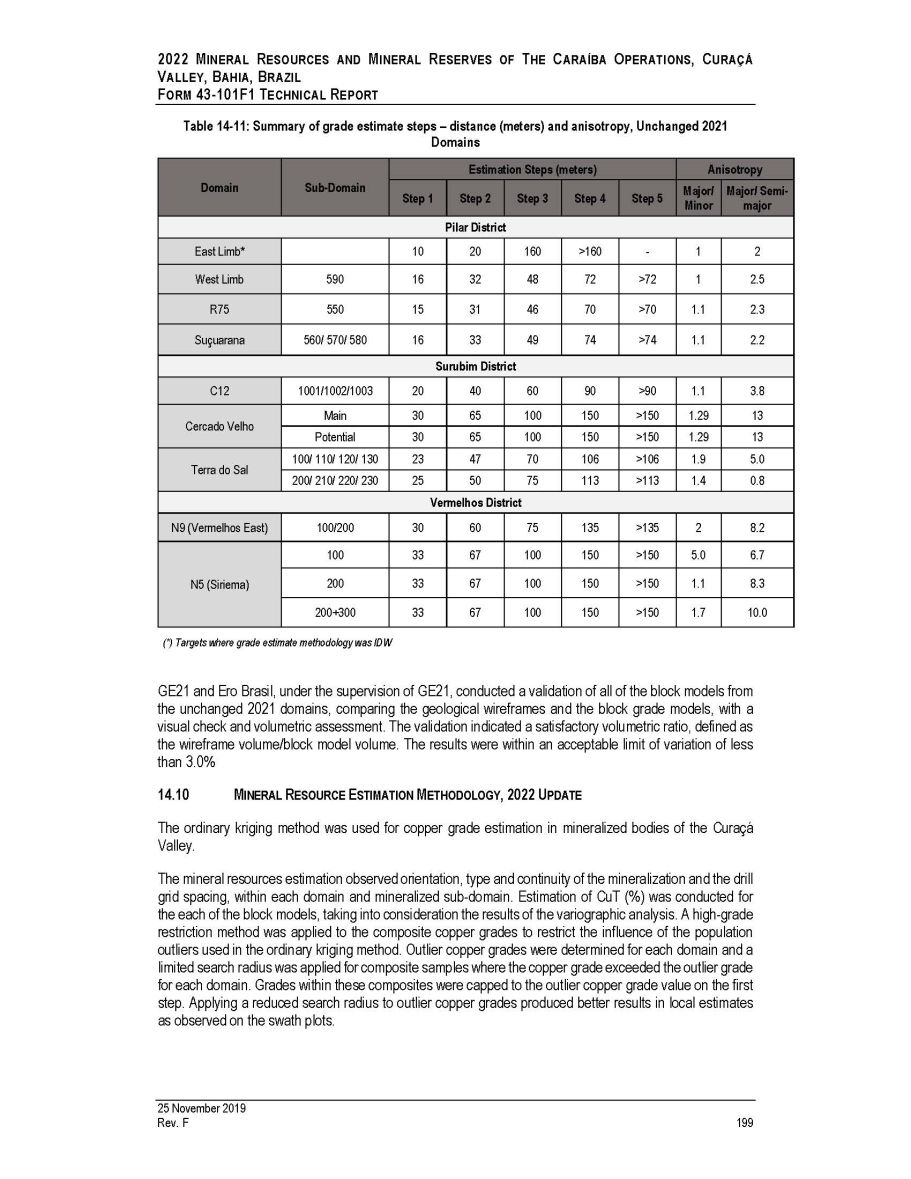
2022 M INERAL R ESOURCES AND M INERAL R ESERVES OF T HE C ARAÍBA O PERATIONS , C URAÇÁ V ALLEY , B AHIA , B RAZIL F ORM 43 - 101F1 T ECHNICAL R EPORT Table 14 - 11: Summary of grade estimate steps – distance (meters) and anisotropy, Unchanged 2021 Domains Domain Sub - Domain Estimation Steps (meters) Anisotropy Step 1 Step 2 Step 3 Step 4 Step 5 Major/ Minor Major/ Semi - major Pilar District East Limb* 10 20 160 >160 - 1 2 West Limb 590 16 32 48 72 >72 1 2.5 R75 550 15 31 46 70 >70 1.1 2.3 Suçuarana 560/ 570/ 580 16 33 49 74 >74 1.1 2.2 Surubim District C12 1001/1002/1003 20 40 60 90 >90 1.1 3.8 Cercado Velho Main 30 65 100 150 >150 1.29 13 Potential 30 65 100 150 >150 1.29 13 Terra do Sal 100/ 110/ 120/ 130 23 47 70 106 >106 1.9 5.0 200/ 210/ 220/ 230 25 50 75 113 >113 1.4 0.8 Vermelhos District N9 (Vermelhos East) 100/200 30 60 75 135 >135 2 8.2 N5 (Siriema) 100 33 67 100 150 >150 5.0 6.7 200 33 67 100 150 >150 1.1 8.3 200+300 33 67 100 150 >150 1.7 10.0 25 November 2019 Rev. F 199 (*) Targets where grade estimate methodology was IDW GE 21 and Ero Brasil, under the supervision of GE 21 , conducted a validation of all of the block models from the unchanged 2021 domains, comparing the geological wireframes and the block grade models, with a visual check and volumetric assessment . The validation indicated a satisfactory volumetric ratio, defined as the wireframe volume/block model volume . The results were within an acceptable limit of variation of less than 3 . 0 % 14.10 M INERAL R ESOURCE E STIMATION M ETHODOLOGY , 2022 U PDATE The ordinary kriging method was used for copper grade estimation in mineralized bodies of the Curaçá Valley . The mineral resources estimation observed orientation, type and continuity of the mineralization and the drill grid spacing, within each domain and mineralized sub - domain . Estimation of CuT ( % ) was conducted for the each of the block models, taking into consideration the results of the variographic analysis . A high - grade restriction method was applied to the composite copper grades to restrict the influence of the population outliers used in the ordinary kriging method . Outlier copper grades were determined for each domain and a limited search radius was applied for composite samples where the copper grade exceeded the outlier grade for each domain . Grades within these composites were capped to the outlier copper grade value on the first step . Applying a reduced search radius to outlier copper grades produced better results in local estimates as observed on the swath plots .
2022 M INERAL R ESOURCES AND M INERAL R ESERVES OF T HE C ARAÍBA O PERATIONS , C URAÇÁ V ALLEY , B AHIA , B RAZIL F ORM 43 - 101F1 T ECHNICAL R EPORT Kriging involved five steps, based on the maximum variographic range distance and the variographic anisotropic distances for each domain . The first step, (applied grade restriction), used approximately 1 / 3 of maximum variographic range ; the second step : approximately 2 / 3 of maximum variographic range and third step equaled the maximum variographic range . The fourth step used 150 % of the maximum variographic range . The last step included any blocks that were not considered in steps one, two or three . Neighborhood search strategy for grade estimation applied restrictions on the minimum number of samples ( 4 ), maximum number of samples ( 12 ) and maximum number of samples by any single drill hole as ( 2 ) . An outlier capped value was not applied in domains where individual assay - values significantly above the mean are not frequent . In those domains, ordinary kriging estimation steps were applied without any outlier treatment honoring the variographic output for those domains . The table below summarizes steps of grade estimation . The first step has no anisotropy applied . Orientation of anisotropy ellipsoids for steps 2 to 4 is based on results of variographic analysis . . 25 November 2019 Rev. F 200
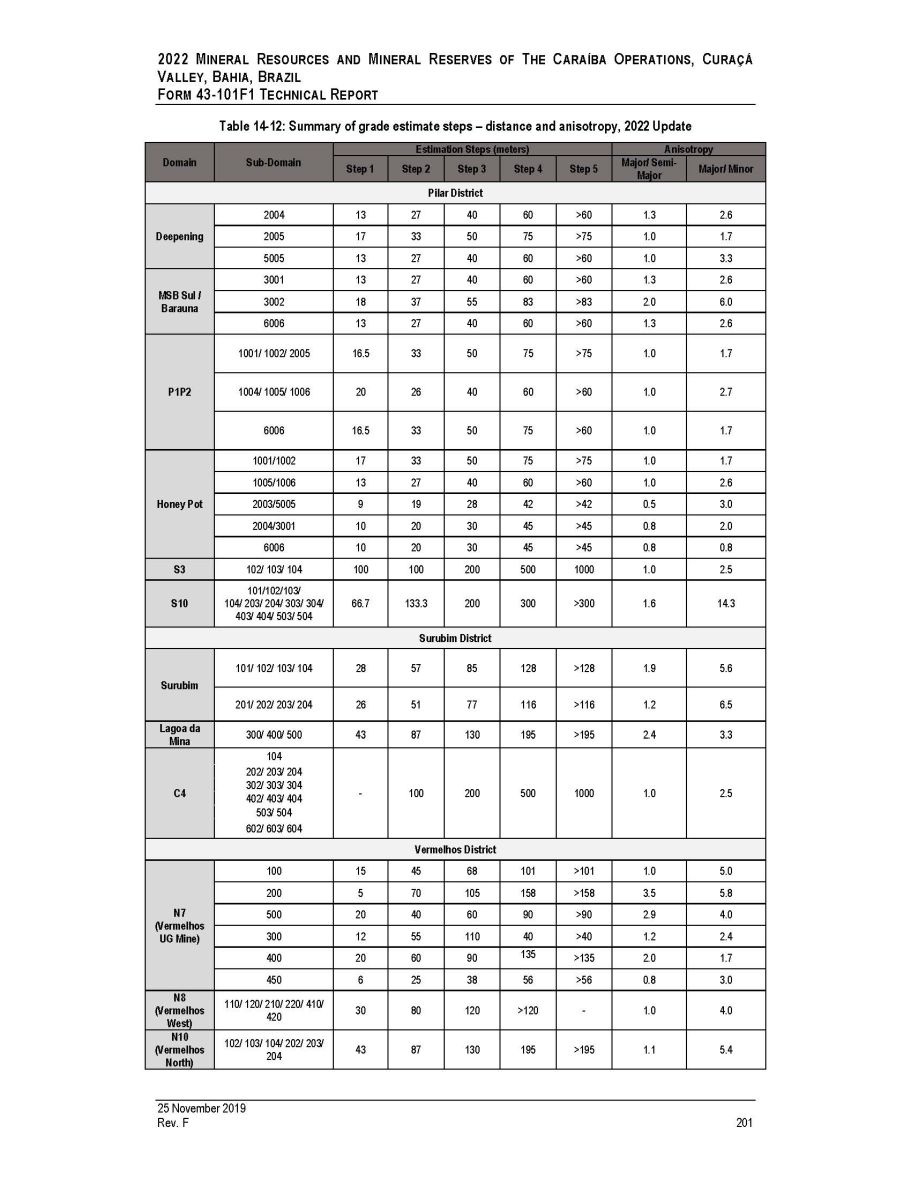
2022 M INERAL R ESOURCES AND M INERAL R ESERVES OF T HE C ARAÍBA O PERATIONS , C URAÇÁ V ALLEY , B AHIA , B RAZIL F ORM 43 - 101F1 T ECHNICAL R EPORT Table 14 - 12: Summary of grade estimate steps – distance and anisotropy, 2022 Update Domain Sub - Domain Estimation Steps (meters) Anisotropy Step 1 Step 2 Step 3 Step 4 Step 5 Major/ Semi - Major Major/ Minor Pilar District Deepening 2004 13 27 40 60 >60 1.3 2.6 2005 17 33 50 75 >75 1.0 1.7 5005 13 27 40 60 >60 1.0 3.3 MSB Sul / Barauna 3001 13 27 40 60 >60 1.3 2.6 3002 18 37 55 83 >83 2.0 6.0 6006 13 27 40 60 >60 1.3 2.6 P1P2 1001/ 1002/ 2005 16.5 33 50 75 >75 1.0 1.7 1004/ 1005/ 1006 20 26 40 60 >60 1.0 2.7 6006 16.5 33 50 75 >60 1.0 1.7 Honey Pot 1001/1002 17 33 50 75 >75 1.0 1.7 1005/1006 13 27 40 60 >60 1.0 2.6 2003/5005 9 19 28 42 >42 0.5 3.0 2004/3001 10 20 30 45 >45 0.8 2.0 6006 10 20 30 45 >45 0.8 0.8 S3 102/ 103/ 104 100 100 200 500 1000 1.0 2.5 S10 101/102/103/ 104/ 203/ 204/ 303/ 304/ 403/ 404/ 503/ 504 66.7 133.3 200 300 >300 1.6 14.3 Surubim District Surubim 101/ 102/ 103/ 104 28 57 85 128 >128 1.9 5.6 201/ 202/ 203/ 204 26 51 77 116 >116 1.2 6.5 Lagoa da Mina 300/ 400/ 500 43 87 130 195 >195 2.4 3.3 C4 104 202/ 203/ 204 302/ 303/ 304 402/ 403/ 404 503/ 504 602/ 603/ 604 - 100 200 500 1000 1.0 2.5 Vermelhos District N7 (Vermelhos UG Mine) 100 15 45 68 101 >101 1.0 5.0 200 5 70 105 158 >158 3.5 5.8 500 20 40 60 90 >90 2.9 4.0 300 12 55 110 40 >40 1.2 2.4 400 20 60 90 135 >135 2.0 1.7 450 6 25 38 56 >56 0.8 3.0 N8 (Vermelhos West) 110/ 120/ 210/ 220/ 410/ 420 30 80 120 >120 - 1.0 4.0 N10 (Vermelhos North) 102/ 103/ 104/ 202/ 203/ 204 43 87 130 195 >195 1.1 5.4 25 November 2019 Rev. F 201
2022 M INERAL R ESOURCES AND M INERAL R ESERVES OF T HE C ARAÍBA O PERATIONS , C URAÇÁ V ALLEY , B AHIA , B RAZIL F ORM 43 - 101F1 T ECHNICAL R EPORT Local Bias Validation via Swath Plot Method, 2022 Update Local validation via the Swath Plot method was performed to analyze the occurrence of any localized biases . The method sought to compare the average in estimated grades for the mineral resources model obtained using the ordinary kriging methodology, with the grades that were estimated using the Nearest Neighbor (“NN”) method for the same x, y or z coordinates . Grade scatter plots were developed for copper grades versus coordinates, and no significant localized biases were observed when comparing the ordinary kriging to NN methods for the Measured and Indicated mineral resource estimate . See Appendix B of this Report for Swath Plot and NN analysis results for the updated 2022 mineral resource models . Figure 14 - 10 to Figure 14 - 12 provide example swath plots for the Deepening Domain, whereby : “N_SAMPS” = number of samples; “N_CELLS/50” = number of blocks; “S_CUT” = Cu sample; “M_CUT” = Cu estimated by Ordinary Kriging; and, “M_CUNN” = Cu estimated by Nearest Neighbor. The local bias in the x - axis estimate was not material. 25 November 2019 Rev. F 202
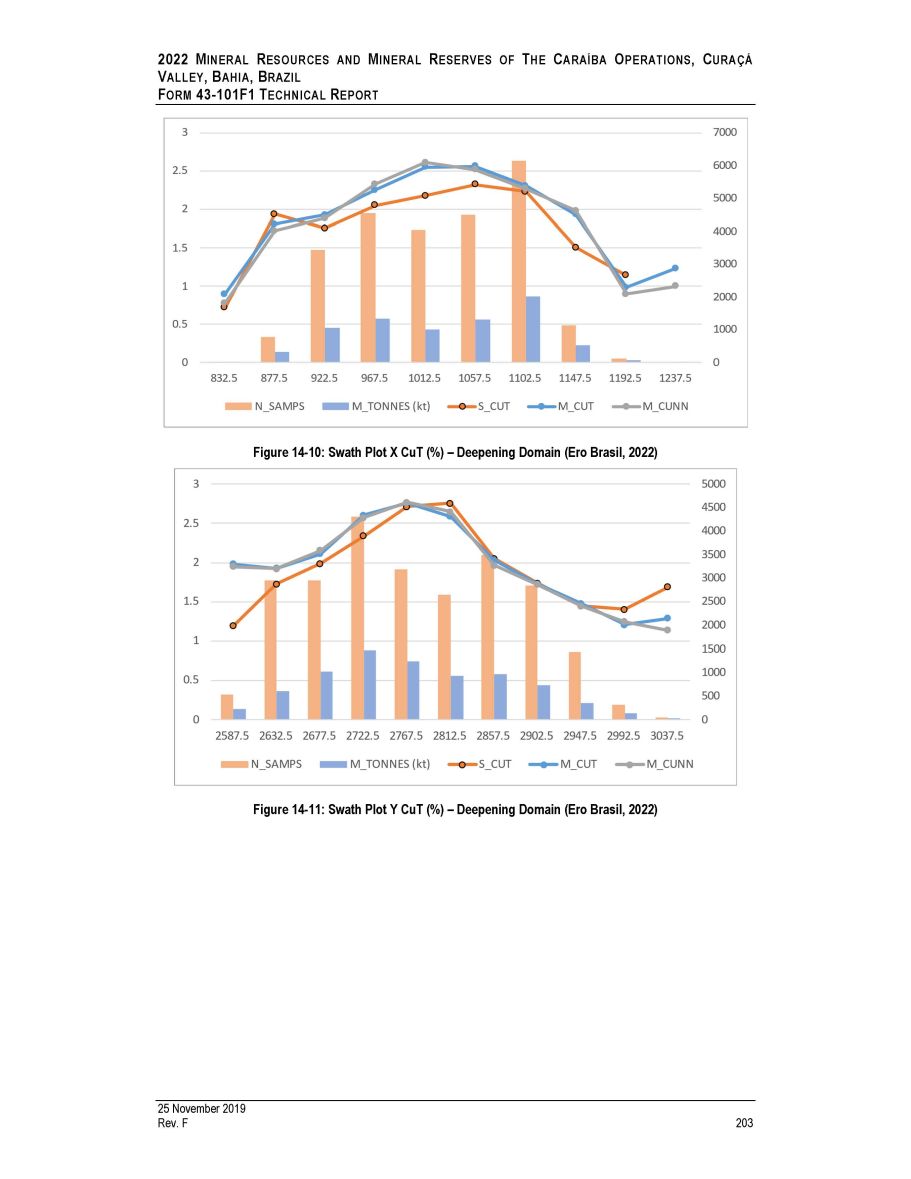
2022 M INERAL R ESOURCES AND M INERAL R ESERVES OF T HE C ARAÍBA O PERATIONS , C URAÇÁ V ALLEY , B AHIA , B RAZIL F ORM 43 - 101F1 T ECHNICAL R EPORT Figure 14 - 10: Swath Plot X CuT (%) – Deepening Domain (Ero Brasil, 2022) Figure 14 - 11: Swath Plot Y CuT (%) – Deepening Domain (Ero Brasil, 2022) 25 November 2019 Rev. F 203
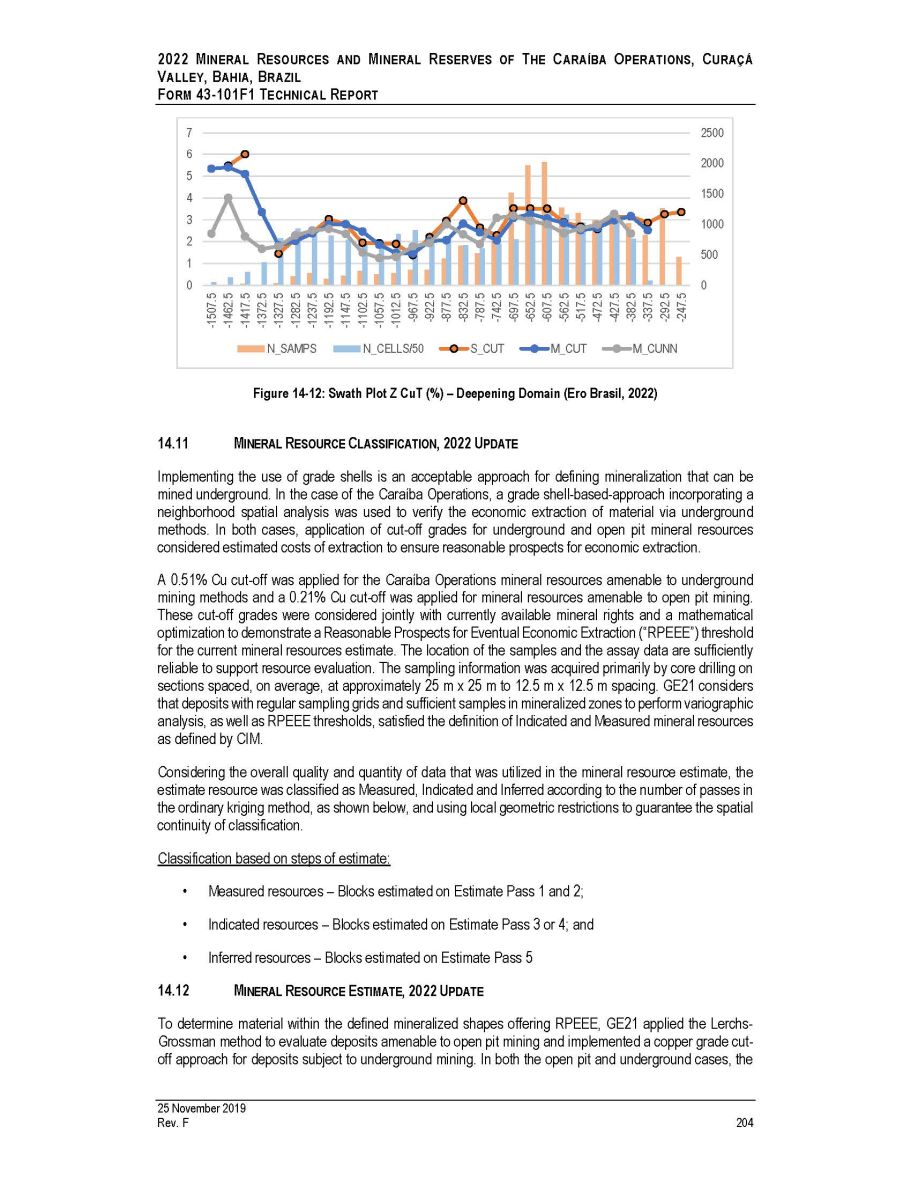
2022 M INERAL R ESOURCES AND M INERAL R ESERVES OF T HE C ARAÍBA O PERATIONS , C URAÇÁ V ALLEY , B AHIA , B RAZIL F ORM 43 - 101F1 T ECHNICAL R EPORT Figure 14 - 12: Swath Plot Z CuT (%) – Deepening Domain (Ero Brasil, 2022) 14.11 M INERAL R ESOURCE C LASSIFICATION , 2022 U PDATE Implementing the use of grade shells is an acceptable approach for defining mineralization that can be mined underground . In the case of the Caraíba Operations, a grade shell - based - approach incorporating a neighborhood spatial analysis was used to verify the economic extraction of material via underground methods . In both cases, application of cut - off grades for underground and open pit mineral resources considered estimated costs of extraction to ensure reasonable prospects for economic extraction . A 0 . 51 % Cu cut - off was applied for the Caraíba Operations mineral resources amenable to underground mining methods and a 0 . 21 % Cu cut - off was applied for mineral resources amenable to open pit mining . These cut - off grades were considered jointly with currently available mineral rights and a mathematical optimization to demonstrate a Reasonable Prospects for Eventual Economic Extraction (“RPEEE”) threshold for the current mineral resources estimate . The location of the samples and the assay data are sufficiently reliable to support resource evaluation . The sampling information was acquired primarily by core drilling on sections spaced, on average, at approximately 25 m x 25 m to 12 . 5 m x 12 . 5 m spacing . GE 21 considers that deposits with regular sampling grids and sufficient samples in mineralized zones to perform variographic analysis, as well as RPEEE thresholds, satisfied the definition of Indicated and Measured mineral resources as defined by CIM . Considering the overall quality and quantity of data that was utilized in the mineral resource estimate, the estimate resource was classified as Measured, Indicated and Inferred according to the number of passes in the ordinary kriging method, as shown below, and using local geometric restrictions to guarantee the spatial continuity of classification . Classification based on steps of estimate : • Measured resources – Blocks estimated on Estimate Pass 1 and 2; 14.12 • Indicated resources – Blocks estimated on Estimate Pass 3 or 4; and • Inferred resources – Blocks estimated on Estimate Pass 5 M INERAL R ESOURCE E STIMATE , 2022 U PDATE To determine material within the defined mineralized shapes offering RPEEE, GE 21 applied the Lerchs - Grossman method to evaluate deposits amenable to open pit mining and implemented a copper grade cut - off approach for deposits subject to underground mining . In both the open pit and underground cases, the 2500 2000 1500 1000 500 0 7 6 5 4 3 2 1 0 - 1507.5 - 1462.5 - 1417.5 - 1372.5 - 1327.5 - 1282.5 - 1237.5 - 1192.5 - 1147.5 - 1102.5 - 1057.5 - 1012.5 - 967.5 - 922.5 - 877.5 - 832.5 - 787.5 - 742.5 - 697.5 - 652.5 - 607.5 - 562.5 - 517.5 - 472.5 - 427.5 - 382.5 - 337.5 - 292.5 - 247.5 N_SAMPS N_CELLS/50 S_CUT M_CUT M_CUNN 25 November 2019 Rev. F 204
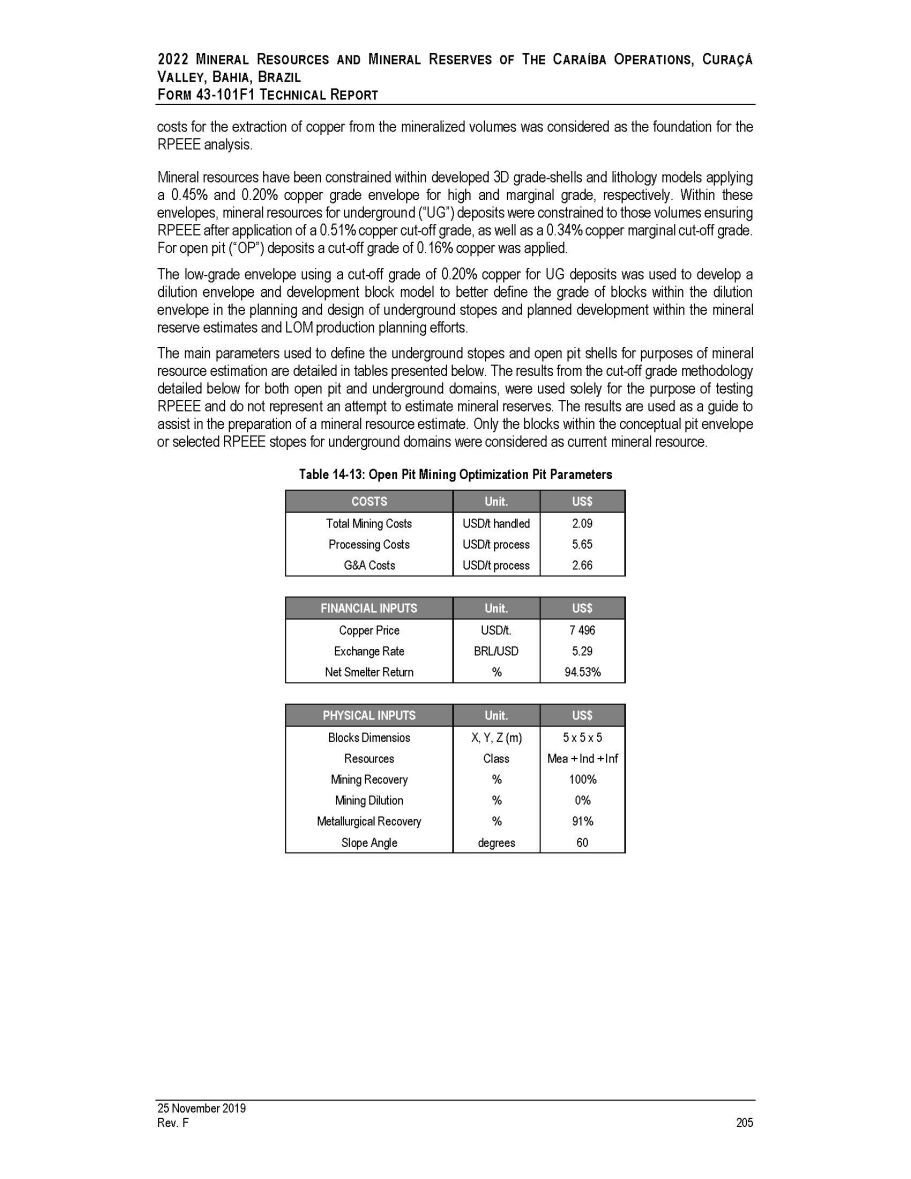
2022 M INERAL R ESOURCES AND M INERAL R ESERVES OF T HE C ARAÍBA O PERATIONS , C URAÇÁ V ALLEY , B AHIA , B RAZIL F ORM 43 - 101F1 T ECHNICAL R EPORT costs for the extraction of copper from the mineralized volumes was considered as the foundation for the RPEEE analysis. Mineral resources have been constrained within developed 3 D grade - shells and lithology models applying a 0 . 45 % and 0 . 20 % copper grade envelope for high and marginal grade, respectively . Within these envelopes, mineral resources for underground (“UG”) deposits were constrained to those volumes ensuring RPEEE after application of a 0 . 51 % copper cut - off grade, as well as a 0 . 34 % copper marginal cut - off grade . For open pit (“OP”) deposits a cut - off grade of 0 . 16 % copper was applied . The low - grade envelope using a cut - off grade of 0 . 20 % copper for UG deposits was used to develop a dilution envelope and development block model to better define the grade of blocks within the dilution envelope in the planning and design of underground stopes and planned development within the mineral reserve estimates and LOM production planning efforts . The main parameters used to define the underground stopes and open pit shells for purposes of mineral resource estimation are detailed in tables presented below . The results from the cut - off grade methodology detailed below for both open pit and underground domains, were used solely for the purpose of testing RPEEE and do not represent an attempt to estimate mineral reserves . The results are used as a guide to assist in the preparation of a mineral resource estimate . Only the blocks within the conceptual pit envelope or selected RPEEE stopes for underground domains were considered as current mineral resource . Table 14 - 13: Open Pit Mining Optimization Pit Parameters COSTS Unit. US$ Total Mining Costs USD/t handled 2.09 Processing Costs USD/t process 5.65 G&A Costs USD/t process 2.66 25 November 2019 Rev. F 205 FINANCIAL INPUTS Unit. US$ Copper Price USD/t. 7 496 Exchange Rate BRL/USD 5.29 Net Smelter Return % 94.53% PHYSICAL INPUTS Unit. US$ Blocks Dimensios X, Y, Z (m) 5 x 5 x 5 Resources Class Mea + Ind + Inf Mining Recovery % 100% Mining Dilution % 0% Metallurgical Recovery % 91% Slope Angle degrees 60
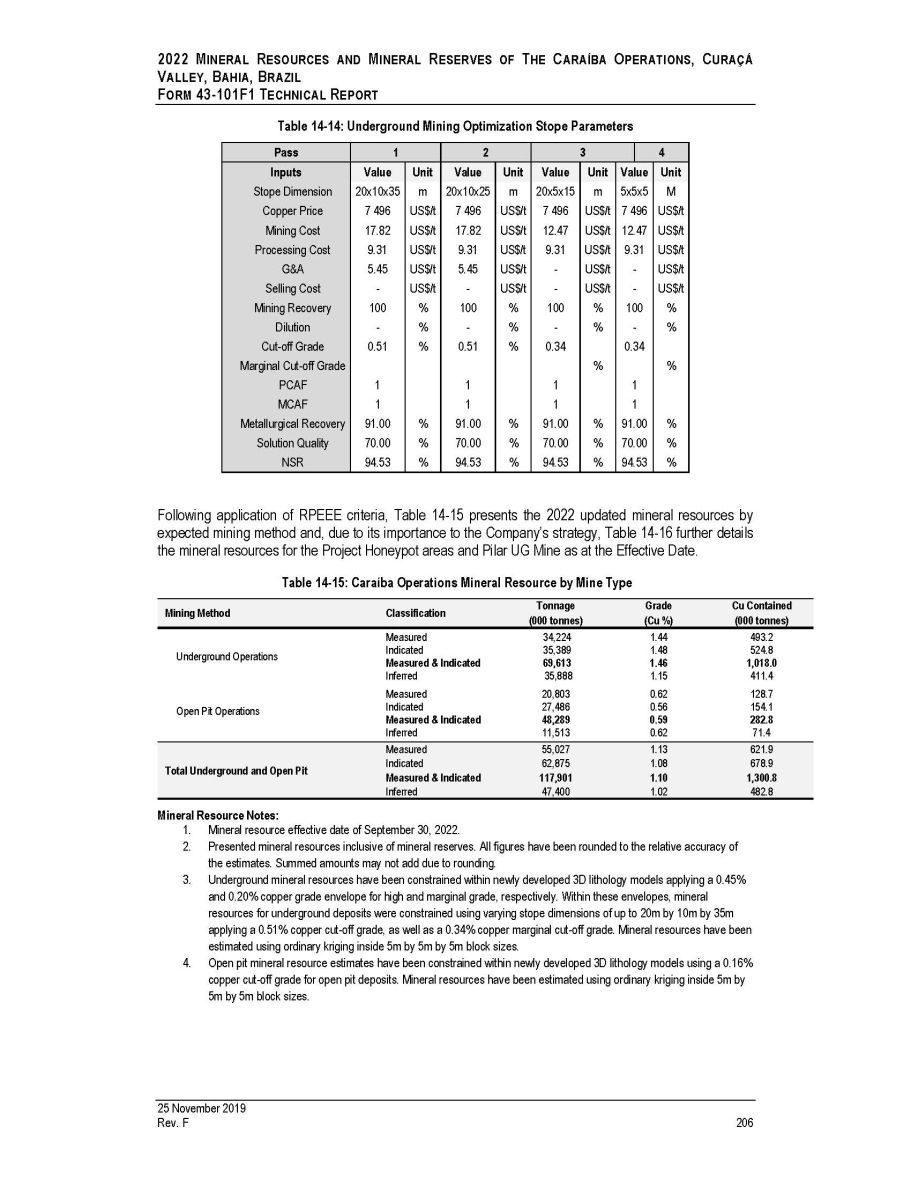
2022 M INERAL R ESOURCES AND M INERAL R ESERVES OF T HE C ARAÍBA O PERATIONS , C URAÇÁ V ALLEY , B AHIA , B RAZIL F ORM 43 - 101F1 T ECHNICAL R EPORT Table 14 - 14: Underground Mining Optimization Stope Parameters Pass 1 2 3 4 Inputs Stope Dimension Copper Price Mining Cost Processing Cost G&A Selling Cost Mining Recovery Dilution Cut - off Grade Marginal Cut - off Grade PCAF MCAF Metallurgical Recovery Solution Quality NSR Value Unit Value Unit Value Unit Value Unit 20x10x35 m 20x10x25 m 20x5x15 m 5x5x5 M 7 496 US$/t 7 496 US$/t 7 496 US$/t 7 496 US$/t 17.82 US$/t 17.82 US$/t 12.47 US$/t 12.47 US$/t 9.31 US$/t 9.31 US$/t 9.31 US$/t 9.31 US$/t 5.45 US$/t 5.45 US$/t - US$/t - US$/t - US$/t - US$/t - US$/t - US$/t 100 % 100 % 100 % 100 % - % - % - % - % 0.51 % 0.51 % 0.34 0.34 % % 1 1 1 1 1 1 1 1 91.00 % 91.00 % 91.00 % 91.00 % 70.00 % 70.00 % 70.00 % 70.00 % 94.53 % 94.53 % 94.53 % 94.53 % Following application of RPEEE criteria, Table 14 - 15 presents the 2022 updated mineral resources by expected mining method and, due to its importance to the Company’s strategy, Table 14 - 16 further details the mineral resources for the Project Honeypot areas and Pilar UG Mine as at the Effective Date . Table 14 - 15: Caraíba Operations Mineral Resource by Mine Type Mining Method Classification Tonnage (000 tonnes) Grade (Cu %) Cu Contained (000 tonnes) Measured 34,224 1.44 493.2 Underground Operations Indicated 35,389 1.48 524.8 Measured & Indicated 69,613 1.46 1,018.0 Inferred 35,888 1.15 411.4 Measured 20,803 0.62 128.7 Open Pit Operations Indicated 27,486 0.56 154.1 Measured & Indicated 48,289 0.59 282.8 Inferred 11,513 0.62 71.4 Measured 55,027 1.13 621.9 Total Underground and Open Pit Indicated 62,875 1.08 678.9 Measured & Indicated 117,901 1.10 1,300.8 Inferred 47,400 1.02 482.8 25 November 2019 Rev. F 206 Mineral Resource Notes: 1. Mineral resource effective date of September 30, 2022. 2. Presented mineral resources inclusive of mineral reserves. All figures have been rounded to the relative accuracy of the estimates. Summed amounts may not add due to rounding. 3. Underground mineral resources have been constrained within newly developed 3D lithology models applying a 0.45% and 0.20% copper grade envelope for high and marginal grade, respectively. Within these envelopes, mineral resources for underground deposits were constrained using varying stope dimensions of up to 20m by 10m by 35m applying a 0.51% copper cut - off grade, as well as a 0.34% copper marginal cut - off grade. Mineral resources have been estimated using ordinary kriging inside 5m by 5m by 5m block sizes. 4. Open pit mineral resource estimates have been constrained within newly developed 3D lithology models using a 0.16% copper cut - off grade for open pit deposits. Mineral resources have been estimated using ordinary kriging inside 5m by 5m by 5m block sizes.
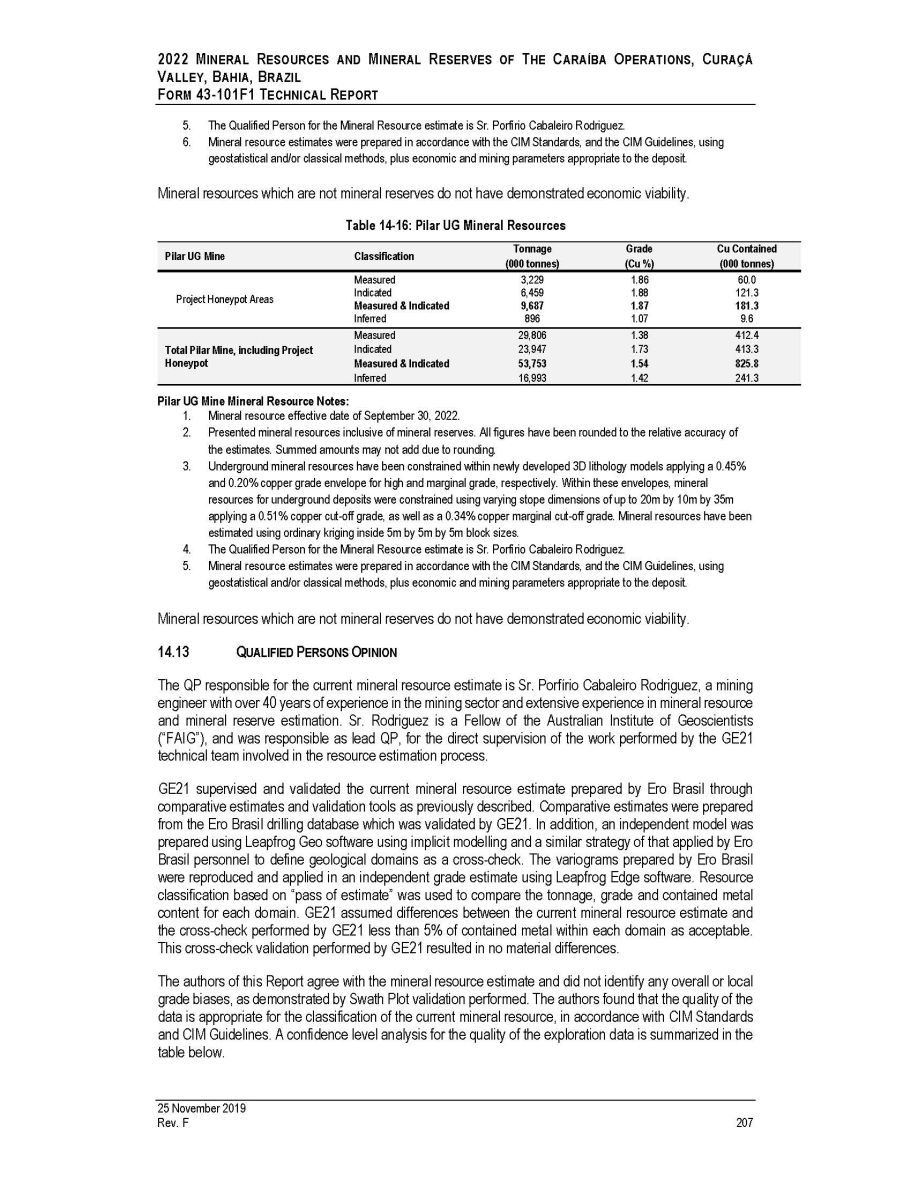
2022 M INERAL R ESOURCES AND M INERAL R ESERVES OF T HE C ARAÍBA O PERATIONS , C URAÇÁ V ALLEY , B AHIA , B RAZIL F ORM 43 - 101F1 T ECHNICAL R EPORT 5. The Qualified Person for the Mineral Resource estimate is Sr. Porfírio Cabaleiro Rodriguez. 6. Mineral resource estimates were prepared in accordance with the CIM Standards, and the CIM Guidelines, using geostatistical and/or classical methods, plus economic and mining parameters appropriate to the deposit. Mineral resources which are not mineral reserves do not have demonstrated economic viability. Table 14 - 16: Pilar UG Mineral Resources Pilar UG Mine Classification Tonnage (000 tonnes) Grade (Cu %) Cu Contained (000 tonnes) Measured 3,229 1.86 60.0 Project Honeypot Areas Indicated 6,459 1.88 121.3 Measured & Indicated 9,687 1.87 181.3 Inferred 896 1.07 9.6 Measured 29,806 1.38 412.4 Total Pilar Mine, including Project Indicated 23,947 1.73 413.3 Honeypot Measured & Indicated 53,753 1.54 825.8 Inferred 16,993 1.42 241.3 25 November 2019 Rev. F 207 Pilar UG Mine Mineral Resource Notes: 1. Mineral resource effective date of September 30, 2022. 2. Presented mineral resources inclusive of mineral reserves. All figures have been rounded to the relative accuracy of the estimates. Summed amounts may not add due to rounding. 3. Underground mineral resources have been constrained within newly developed 3D lithology models applying a 0.45% and 0.20% copper grade envelope for high and marginal grade, respectively. Within these envelopes, mineral resources for underground deposits were constrained using varying stope dimensions of up to 20m by 10m by 35m applying a 0.51% copper cut - off grade, as well as a 0.34% copper marginal cut - off grade. Mineral resources have been estimated using ordinary kriging inside 5m by 5m by 5m block sizes. 4. The Qualified Person for the Mineral Resource estimate is Sr. Porfírio Cabaleiro Rodriguez. 5. Mineral resource estimates were prepared in accordance with the CIM Standards, and the CIM Guidelines, using geostatistical and/or classical methods, plus economic and mining parameters appropriate to the deposit. Mineral resources which are not mineral reserves do not have demonstrated economic viability . 14.13 Q UALIFIED P ERSONS O PINION The QP responsible for the current mineral resource estimate is Sr . Porfírio Cabaleiro Rodriguez, a mining engineer with over 40 years of experience in the mining sector and extensive experience in mineral resource and mineral reserve estimation . Sr . Rodriguez is a Fellow of the Australian Institute of Geoscientists (“FAIG”), and was responsible as lead QP, for the direct supervision of the work performed by the GE 21 technical team involved in the resource estimation process . GE 21 supervised and validated the current mineral resource estimate prepared by Ero Brasil through comparative estimates and validation tools as previously described . Comparative estimates were prepared from the Ero Brasil drilling database which was validated by GE 21 . In addition, an independent model was prepared using Leapfrog Geo software using implicit modelling and a similar strategy of that applied by Ero Brasil personnel to define geological domains as a cross - check . The variograms prepared by Ero Brasil were reproduced and applied in an independent grade estimate using Leapfrog Edge software . Resource classification based on “pass of estimate” was used to compare the tonnage, grade and contained metal content for each domain . GE 21 assumed differences between the current mineral resource estimate and the cross - check performed by GE 21 less than 5 % of contained metal within each domain as acceptable . This cross - check validation performed by GE 21 resulted in no material differences . The authors of this Report agree with the mineral resource estimate and did not identify any overall or local grade biases, as demonstrated by Swath Plot validation performed . The authors found that the quality of the data is appropriate for the classification of the current mineral resource, in accordance with CIM Standards and CIM Guidelines . A confidence level analysis for the quality of the exploration data is summarized in the table below .
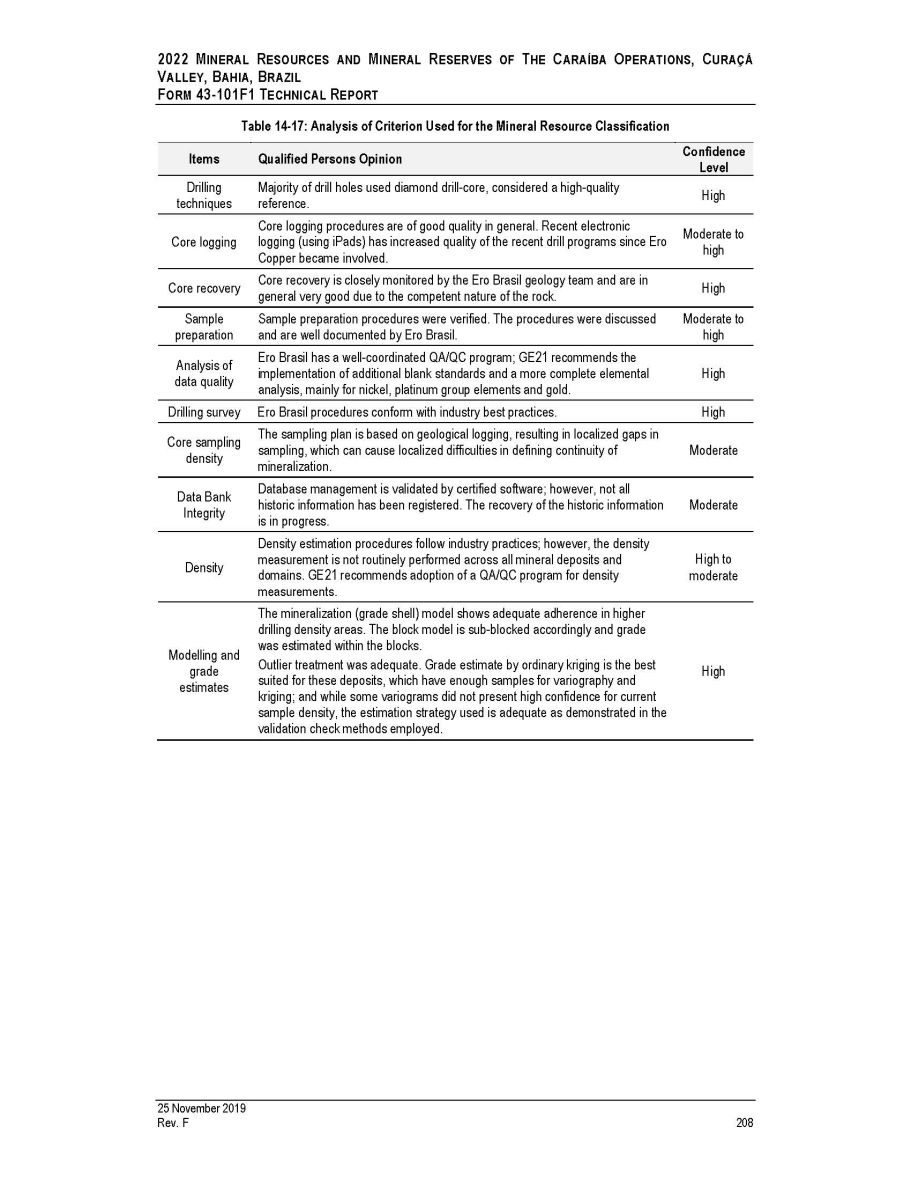
2022 M INERAL R ESOURCES AND M INERAL R ESERVES OF T HE C ARAÍBA O PERATIONS , C URAÇÁ V ALLEY , B AHIA , B RAZIL F ORM 43 - 101F1 T ECHNICAL R EPORT Table 14 - 17: Analysis of Criterion Used for the Mineral Resource Classification Items Qualified Persons Opinion Confidence Level Drilling techniques Majority of drill holes used diamond drill - core, considered a high - quality reference. High Core logging Core logging procedures are of good quality in general. Recent electronic logging (using iPads) has increased quality of the recent drill programs since Ero Copper became involved. Moderate to high Core recovery Core recovery is closely monitored by the Ero Brasil geology team and are in general very good due to the competent nature of the rock. High Sample preparation Sample preparation procedures were verified. The procedures were discussed and are well documented by Ero Brasil. Moderate to high Analysis of data quality Ero Brasil has a well - coordinated QA/QC program; GE21 recommends the implementation of additional blank standards and a more complete elemental analysis, mainly for nickel, platinum group elements and gold. High Drilling survey Ero Brasil procedures conform with industry best practices. High Core sampling density The sampling plan is based on geological logging, resulting in localized gaps in sampling, which can cause localized difficulties in defining continuity of mineralization. Moderate Data Bank Integrity Database management is validated by certified software; however, not all historic information has been registered. The recovery of the historic information is in progress. Moderate Density Density estimation procedures follow industry practices; however, the density measurement is not routinely performed across all mineral deposits and domains. GE21 recommends adoption of a QA/QC program for density measurements. High to moderate Modelling and grade estimates The mineralization (grade shell) model shows adequate adherence in higher drilling density areas . The block model is sub - blocked accordingly and grade was estimated within the blocks . Outlier treatment was adequate. Grade estimate by ordinary kriging is the best suited for these deposits, which have enough samples for variography and kriging; and while some variograms did not present high confidence for current sample density, the estimation strategy used is adequate as demonstrated in the validation check methods employed. High 25 November 2019 Rev. F 208
2022 M INERAL R ESOURCES AND M INERAL R ESERVES OF T HE C ARAÍBA O PERATIONS , C URAÇÁ V ALLEY , B AHIA , B RAZIL F ORM 43 - 101F1 T ECHNICAL R EPORT 15 MINERAL RESERVE ESTIMATES This chapter presents the mineral reserve estimate for Ero Brasil’s mineral assets of the Caraíba Operations comprising the underground mines (UG) and open pit mines (OP) within the Pilar, Vermelhos and Surubim Districts of the Curaçá Valley, State of Bahia, Brazil . The mineral reserve estimate is that portion of the mineral resource estimate that has been identified as having demonstrated economic viability within open pit and/or underground mine designs after incorporating modifying factors such as mining recovery, waste dilution and economic considerations . The mineral reserve estimate forms the basis for the production plan . The mineral reserves for the Pilar District (which includes Pilar UG Mine and Suçuarana OP), Vermelhos District (which includes Vermelhos UG Mine, N 8 /N 9 OP Mine and the N 5 (Siriema) OP Mine) and Surubim District (which includes the Surubim Mine and C 12 OP Mine) are derived from the Measured and Indicated mineral resources as defined within the resource block models following the application of economic and other modifying factors further described below . Inferred mineral resources, where unavoidably mined within a defined mining shape have been assigned zero grade . Dilution occurring from Measured and Indicated resource blocks within the mineral reserve plan was assigned grade based upon the estimated mineral resource grade of the blocks included in the dilution envelope . Total combined Underground Proven and Probable Mineral Reserves are estimated to be 39 , 461 kt at 1 . 42 % Cu as at the Effective Date compared to the 2021 mineral reserve of 29 , 974 kt grading 1 . 44 % copper, with additions from underground drilling success being offset by the year’s mine depletion . Total combined Open Pit Proven and Probable Mineral reserves are estimated to be 43 , 306 kt grading 0 . 54 % Cu compared to the 2021 estimate of 29 , 306 kt grading 0 . 60 % copper . The mineral reserve increase is largely due to Project Honeypot, which added 8 . 1 Mt grading 1 . 59 % copper to the reserve framework, and an additional 4 . 6 Mt grading 1 . 08 % copper was added within the Upper Level areas . Mineral reserves were classified according to the CIM Standards and the CIM Guidelines . 1. M INERAL R ESERVES S UMMARY Mineral reserve cost assumptions are based on actual operating cost data during the 18 - month period from January 1 , 2021 , to June 30 , 2022 . The USD : BRL rate of 5 . 29 was selected based on the average rate during this same period . A summary of the mineral reserve estimate parameters is provided below : 25 November 2019 Rev. F 209
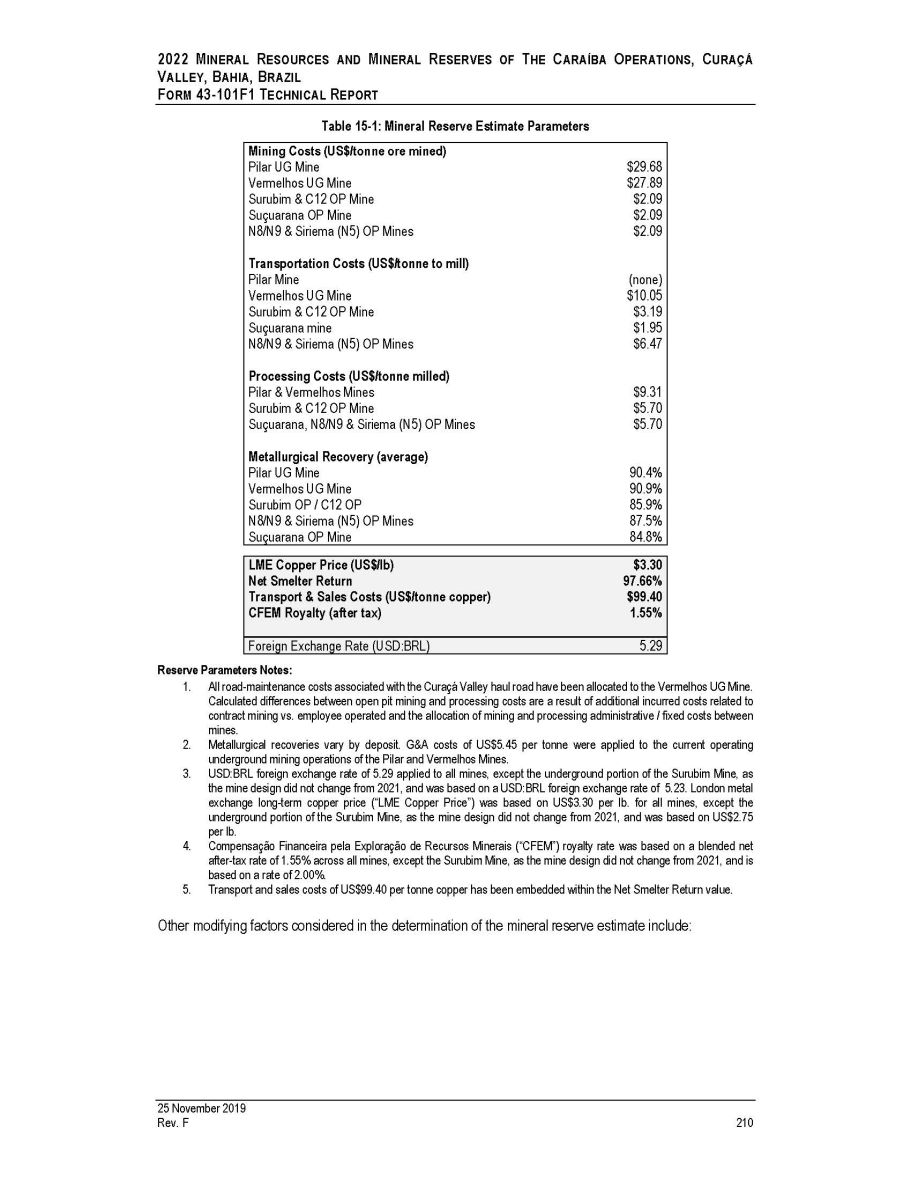
2022 M INERAL R ESOURCES AND M INERAL R ESERVES OF T HE C ARAÍBA O PERATIONS , C URAÇÁ V ALLEY , B AHIA , B RAZIL F ORM 43 - 101F1 T ECHNICAL R EPORT Table 15 - 1: Mineral Reserve Estimate Parameters Mining Costs (US$/tonne ore mined) Pilar UG Mine $29.68 Vermelhos UG Mine $27.89 Surubim & C12 OP Mine $2.09 Suçuarana OP Mine $2.09 N8/N9 & Siriema (N5) OP Mines $2.09 Transportation Costs (US$/tonne to mill) Pilar Mine (none) Vermelhos UG Mine $10.05 Surubim & C12 OP Mine $3.19 Suçuarana mine $1.95 N8/N9 & Siriema (N5) OP Mines $6.47 Processing Costs (US$/tonne milled) Pilar & Vermelhos Mines $9.31 Surubim & C12 OP Mine $5.70 Suçuarana, N8/N9 & Siriema (N5) OP Mines $5.70 Metallurgical Recovery (average) Pilar UG Mine 90.4% Vermelhos UG Mine 90.9% Surubim OP / C12 OP 85.9% N8/N9 & Siriema (N5) OP Mines 87.5% Suçuarana OP Mine 84.8% LME Copper Price (US$/lb) $3.30 Net Smelter Return 97.66% Transport & Sales Costs (US$/tonne copper) $99.40 CFEM Royalty (after tax) 1.55% Foreign Exchange Rate (USD:BRL) 5.29 25 November 2019 Rev. F 210 Reserve Parameters Notes : 1. All road - maintenance costs associated with the Curaçá Valley haul road have been allocated to the Vermelhos UG Mine . Calculated differences between open pit mining and processing costs are a result of additional incurred costs related to contract mining vs . employee operated and the allocation of mining and processing administrative / fixed costs between mines . 2. Metallurgical recoveries vary by deposit . G&A costs of US $ 5 . 45 per tonne were applied to the current operating underground mining operations of the Pilar and Vermelhos Mines . 3. USD : BRL foreign exchange rate of 5 . 29 applied to all mines, except the underground portion of the Surubim Mine, as the mine design did not change from 2021 , and was based on a USD : BRL foreign exchange rate of 5 . 23 . London metal exchange long - term copper price (“LME Copper Price”) was based on US $ 3 . 30 per lb . for all mines, except the underground portion of the Surubim Mine, as the mine design did not change from 2021 , and was based on US $ 2 . 75 per lb . 4. Compensação Financeira pela Exploração de Recursos Minerais (“CFEM”) royalty rate was based on a blended net after - tax rate of 1 . 55 % across all mines, except the Surubim Mine, as the mine design did not change from 2021 , and is based on a rate of 2 . 00 % . 5. Transport and sales costs of US $ 99 . 40 per tonne copper has been embedded within the Net Smelter Return value . Other modifying factors considered in the determination of the mineral reserve estimate include :

2022 M INERAL R ESOURCES AND M INERAL R ESERVES OF T HE C ARAÍBA O PERATIONS , C URAÇÁ V ALLEY , B AHIA , B RAZIL F ORM 43 - 101F1 T ECHNICAL R EPORT A SMU dilution methodology for estimating dilution has been applied to N 8 ( 7 % dilution), N 9 ( 13 % ), N 5 OP ( 17 % ), Surubim Mine ( 17 % ), C 12 OP ( 12 % ) and Suçuarana OP Mine ( 4 % ) . The conventional definition of the SMU is the smallest volume of material on which ore/waste classification is determined and relates to the smallest unit that can be mined selectively . The Vermelhos UG Mine considers 10 % dilution, based on mining method and stope geometry . Within the Pilar UG Mine, a 1 . 0 m operational dilution method was applied to the hanging wall and footwall, except for the Deepening Project, which applied 0 . 5 m of operational dilution, resulting in a planned plus operational dilution of 27 % , on average . Project Honeypot and the Upper Levels of the Pilar UG Mine consider 32 % dilution, on average . Maximum bench height of 15 m for open pit mines . Maximum underground stope dimensions based on geotechnical assessments from previous studies and past operating experience within each mining area, combined with evaluation of induced stresses and the RMR . VRM method with cemented paste fill was selected for the Pilar UG Mine, where the method is currently in use . For the Vermelhos UG Mine, Sublevel with CRF is the mining method currently in use on consideration of the dip, plunge and thickness of the orebodies, the RQD and overall competence of the host rock . Mining recovery of approximately 98 % (avg . ) has been applied for open pit mines . The Pilar UG Mine and Vermelhos UG Mine assume 96 % and 95 % mine recovery, respectively . Within designed stopes, all contained material was assumed to be mined with no selectivity . Inferred mineral resources, where unavoidably included within a defined mining shape have been included in the mineral reserves estimate at zero grade . Mining dilution resulting from Measured and Indicated blocks was assigned the grade of those blocks captured in the dilution envelope using the estimated grade within the blocks of the dilution and development model . The 2022 updated mineral reserve estimate for the underground and open pit deposits and mines of the Curaçá Valley are shown in the table below: 25 November 2019 Rev. F 211
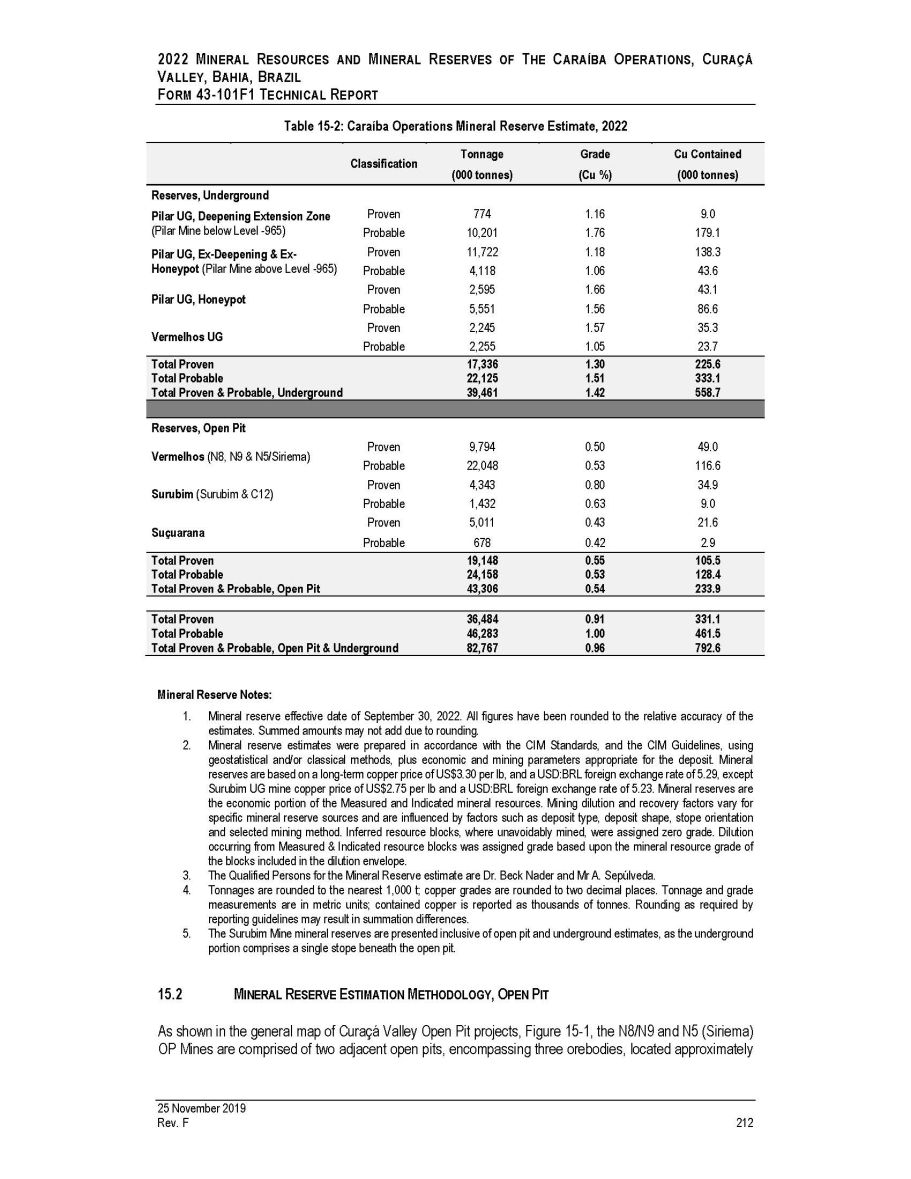
2022 M INERAL R ESOURCES AND M INERAL R ESERVES OF T HE C ARAÍBA O PERATIONS , C URAÇÁ V ALLEY , B AHIA , B RAZIL F ORM 43 - 101F1 T ECHNICAL R EPORT Table 15 - 2: Caraíba Operations Mineral Reserve Estimate, 2022 Classification Tonnage (000 tonnes) Grade (Cu %) Cu Contained (000 tonnes) Reserves, Underground Pilar UG, Deepening Extension Zone (Pilar Mine below Level - 965) Pilar UG, Ex - Deepening & Ex - Honeypot (Pilar Mine above Level - 965) Proven Probable Proven Probable Proven Probable Proven Probable 774 10,201 11,722 4,118 2,595 5,551 2,245 2,255 1.16 1.76 1.18 1.06 1.66 1.56 1.57 1.05 9.0 179.1 138.3 43.6 43.1 86.6 35.3 23.7 Pilar UG, Honeypot Vermelhos UG Total Proven Total Probable Total Proven & Probable, Underground 17,336 22,125 39,461 1.30 1.51 1.42 225.6 333.1 558.7 Reserves, Open Pit Vermelhos (N8, N9 & N5/Siriema) Proven Probable 9,794 22,048 0.50 0.53 49.0 116.6 Surubim (Surubim & C12) Proven Probable 4,343 1,432 0.80 0.63 34.9 9.0 Suçuarana Proven Probable 5,011 678 0.43 0.42 21.6 2.9 Total Proven 19,148 0.55 105.5 Total Probable 24,158 0.53 128.4 Total Proven & Probable, Open Pit 43,306 0.54 233.9 25 November 2019 Rev. F 212 Total Proven 36,484 0.91 331.1 Total Probable 46,283 1.00 461.5 Total Proven & Probable, Open Pit & Underground 82,767 0.96 792.6 Mineral Reserve Notes : 1. Mineral reserve effective date of September 30 , 2022 . All figures have been rounded to the relative accuracy of the estimates . Summed amounts may not add due to rounding . 2. Mineral reserve estimates were prepared in accordance with the CIM Standards, and the CIM Guidelines, using geostatistical and/or classical methods, plus economic and mining parameters appropriate for the deposit . Mineral reserves are based on a long - term copper price of US $ 3 . 30 per lb, and a USD : BRL foreign exchange rate of 5 . 29 , except Surubim UG mine copper price of US $ 2 . 75 per lb and a USD : BRL foreign exchange rate of 5 . 23 . Mineral reserves are the economic portion of the Measured and Indicated mineral resources . Mining dilution and recovery factors vary for specific mineral reserve sources and are influenced by factors such as deposit type, deposit shape, stope orientation and selected mining method . Inferred resource blocks, where unavoidably mined, were assigned zero grade . Dilution occurring from Measured & Indicated resource blocks was assigned grade based upon the mineral resource grade of the blocks included in the dilution envelope . 3. The Qualified Persons for the Mineral Reserve estimate are Dr . Beck Nader and Mr A . Sepúlveda . 4. Tonnages are rounded to the nearest 1 , 000 t ; copper grades are rounded to two decimal places . Tonnage and grade measurements are in metric units ; contained copper is reported as thousands of tonnes . Rounding as required by reporting guidelines may result in summation differences . 5. The Surubim Mine mineral reserves are presented inclusive of open pit and underground estimates, as the underground portion comprises a single stope beneath the open pit . 15.2 M INERAL R ESERVE E STIMATION M ETHODOLOGY , O PEN P IT As shown in the general map of Curaçá Valley Open Pit projects, Figure 15 - 1 , the N 8 /N 9 and N 5 (Siriema) OP Mines are comprised of two adjacent open pits, encompassing three orebodies, located approximately
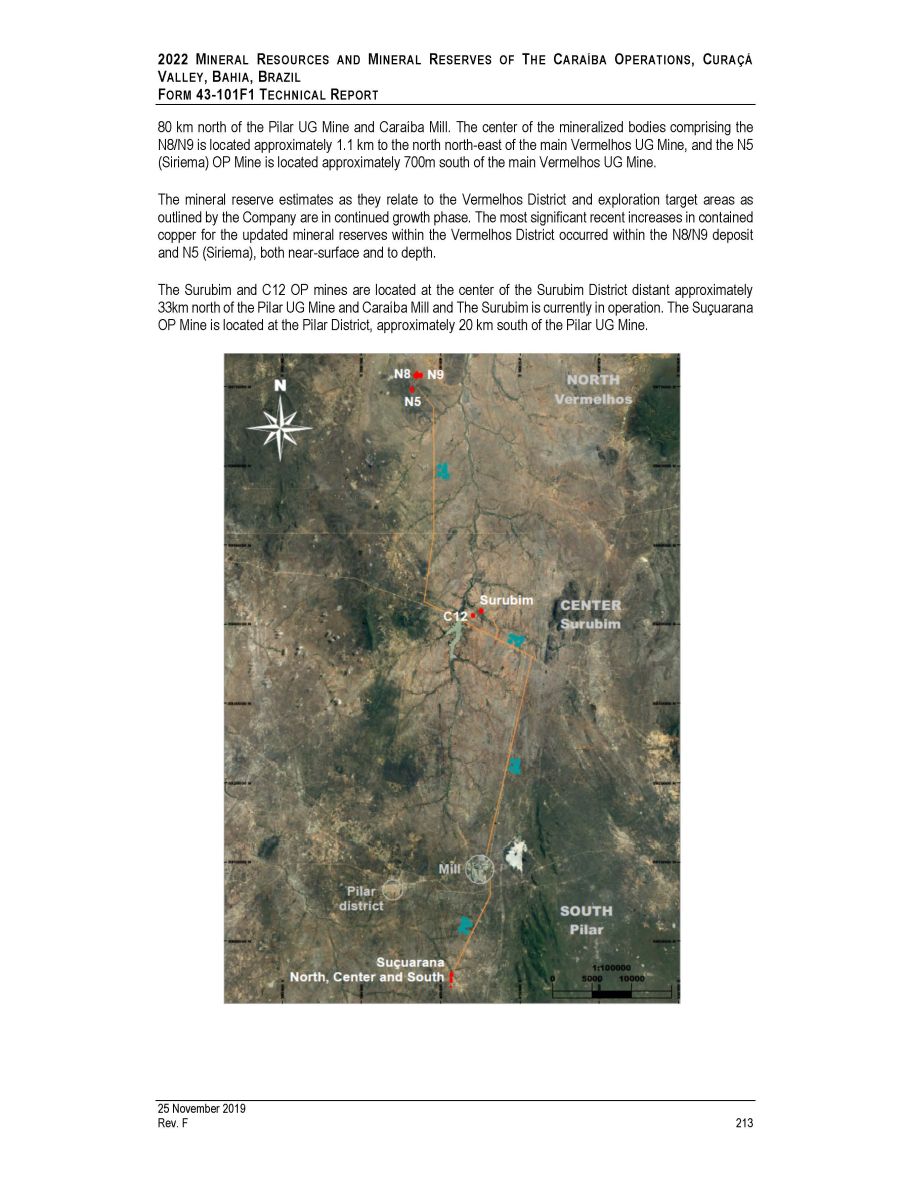
2022 M INERAL R ESOURCES AND M INERAL R ESERVES OF T HE C ARAÍBA O PERATIONS , C URAÇÁ V ALLEY , B AHIA , B RAZIL F ORM 43 - 101F1 T ECHNICAL R EPORT 80 km north of the Pilar UG Mine and Caraíba Mill . The center of the mineralized bodies comprising the N 8 /N 9 is located approximately 1 . 1 km to the north north - east of the main Vermelhos UG Mine, and the N 5 (Siriema) OP Mine is located approximately 700 m south of the main Vermelhos UG Mine . The mineral reserve estimates as they relate to the Vermelhos District and exploration target areas as outlined by the Company are in continued growth phase . The most significant recent increases in contained copper for the updated mineral reserves within the Vermelhos District occurred within the N 8 /N 9 deposit and N 5 (Siriema), both near - surface and to depth . The Surubim and C 12 OP mines are located at the center of the Surubim District distant approximately 33 km north of the Pilar UG Mine and Caraíba Mill and The Surubim is currently in operation . The Suçuarana OP Mine is located at the Pilar District, approximately 20 km south of the Pilar UG Mine . 25 November 2019 Rev. F 213
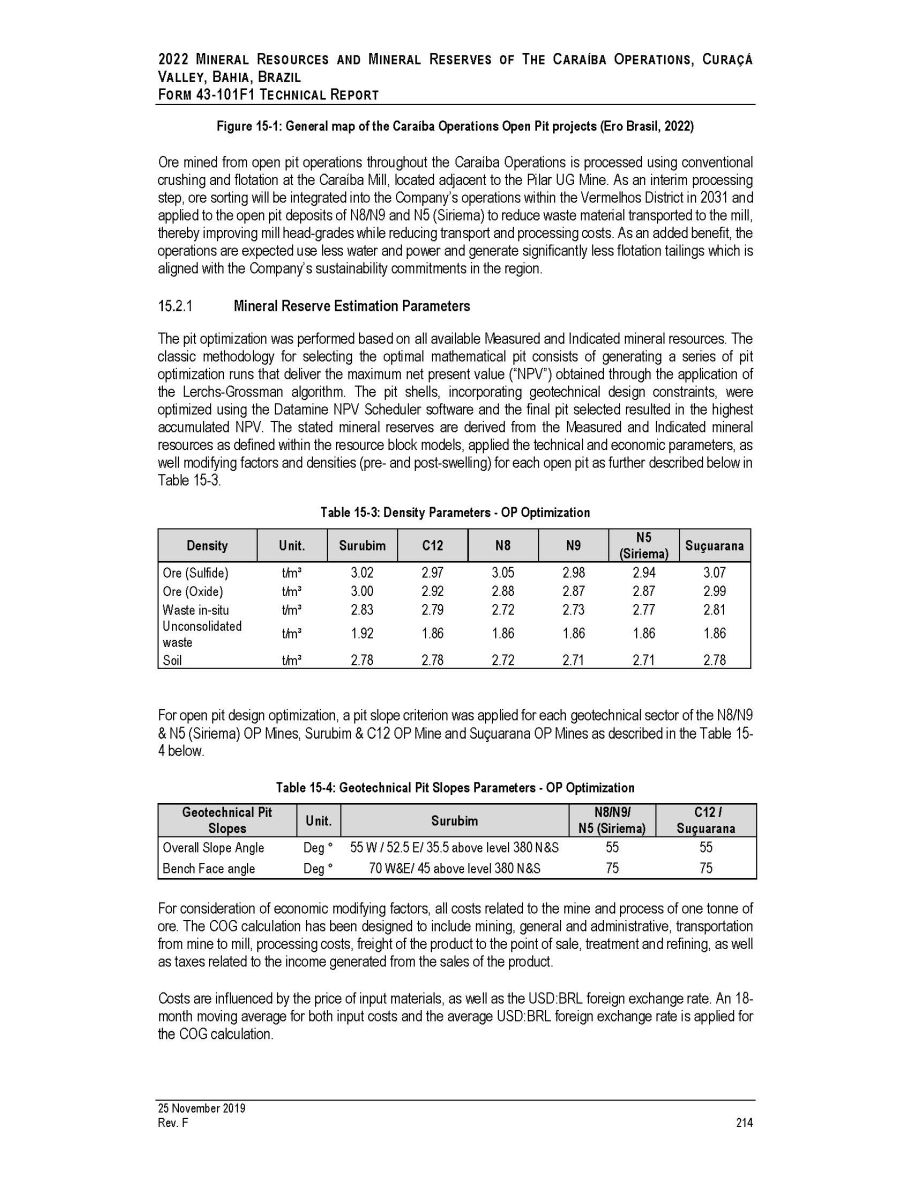
2022 M INERAL R ESOURCES AND M INERAL R ESERVES OF T HE C ARAÍBA O PERATIONS , C URAÇÁ V ALLEY , B AHIA , B RAZIL F ORM 43 - 101F1 T ECHNICAL R EPORT Figure 15 - 1: General map of the Caraíba Operations Open Pit projects (Ero Brasil, 2022) Ore mined from open pit operations throughout the Caraíba Operations is processed using conventional crushing and flotation at the Caraíba Mill, located adjacent to the Pilar UG Mine . As an interim processing step, ore sorting will be integrated into the Company’s operations within the Vermelhos District in 2031 and applied to the open pit deposits of N 8 /N 9 and N 5 (Siriema) to reduce waste material transported to the mill, thereby improving mill head - grades while reducing transport and processing costs . As an added benefit, the operations are expected use less water and power and generate significantly less flotation tailings which is aligned with the Company’s sustainability commitments in the region . Mineral Reserve Estimation Parameters The pit optimization was performed based on all available Measured and Indicated mineral resources . The classic methodology for selecting the optimal mathematical pit consists of generating a series of pit optimization runs that deliver the maximum net present value (“NPV”) obtained through the application of the Lerchs - Grossman algorithm . The pit shells, incorporating geotechnical design constraints, were optimized using the Datamine NPV Scheduler software and the final pit selected resulted in the highest accumulated NPV . The stated mineral reserves are derived from the Measured and Indicated mineral resources as defined within the resource block models, applied the technical and economic parameters, as well modifying factors and densities (pre - and post - swelling) for each open pit as further described below in Table 15 - 3 . Table 15 - 3: Density Parameters - OP Optimization 25 November 2019 Rev. F 214 Density Unit. Surubim C12 N8 N9 N5 (Siriema) Suçuarana Ore (Sulfide) t/m³ 3.02 2.97 3.05 2.98 2.94 3.07 Ore (Oxide) t/m³ 3.00 2.92 2.88 2.87 2.87 2.99 Waste in - situ t/m³ 2.83 2.79 2.72 2.73 2.77 2.81 Unconsolidated waste t/m³ 1.92 1.86 1.86 1.86 1.86 1.86 Soil t/m³ 2.78 2.78 2.72 2.71 2.71 2.78 For open pit design optimization, a pit slope criterion was applied for each geotechnical sector of the N 8 /N 9 & N 5 (Siriema) OP Mines, Surubim & C 12 OP Mine and Suçuarana OP Mines as described in the Table 15 - 4 below . Table 15 - 4: Geotechnical Pit Slopes Parameters - OP Optimization Geotechnical Pit Slopes Unit. Surubim N8/N9/ N5 (Siriema) C12 / Suçuarana Overall Slope Angle Deg ƒ 55 W / 52.5 E/ 35.5 above level 380 N&S 55 55 Bench Face angle Deg ƒ 70 W&E/ 45 above level 380 N&S 75 75 For consideration of economic modifying factors, all costs related to the mine and process of one tonne of ore . The COG calculation has been designed to include mining, general and administrative, transportation from mine to mill, processing costs, freight of the product to the point of sale, treatment and refining, as well as taxes related to the income generated from the sales of the product . Costs are influenced by the price of input materials, as well as the USD : BRL foreign exchange rate . An 18 - month moving average for both input costs and the average USD : BRL foreign exchange rate is applied for the COG calculation .
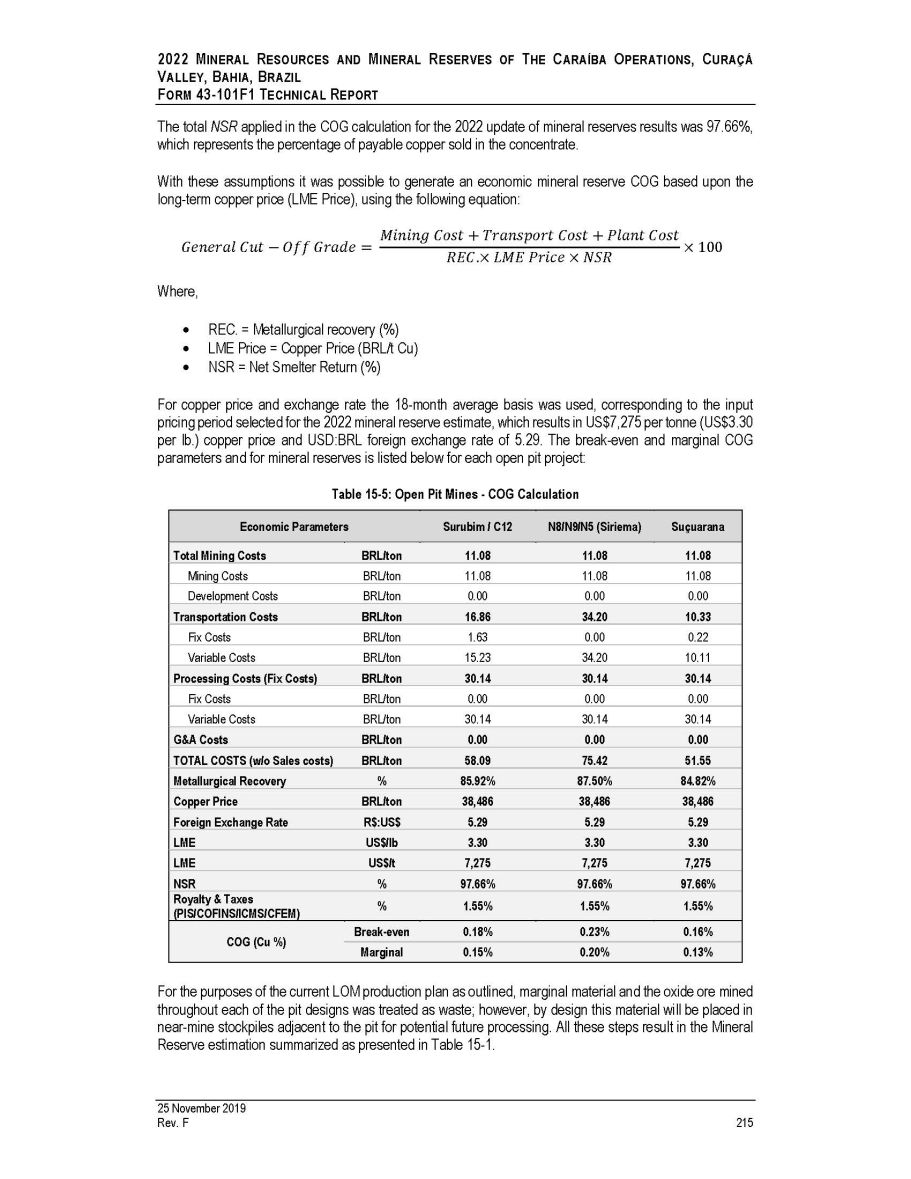
2022 M INERAL R ESOURCES AND M INERAL R ESERVES OF T HE C ARAÍBA O PERATIONS , C URAÇÁ V ALLEY , B AHIA , B RAZIL F ORM 43 - 101F1 T ECHNICAL R EPORT The total NSR applied in the COG calculation for the 2022 update of mineral reserves results was 97.66%, which represents the percentage of payable copper sold in the concentrate. With these assumptions it was possible to generate an economic mineral reserve COG based upon the long - term copper price (LME Price), using the following equation: ܩ ݁ ݊ ݁ ݎ ܽ ݈ ܥ ݑ ݐ - ܱ ݂ ݂ ܩ ݎ ܽ ݀ ݁ = ܯ ݅ ݊ ݅ ݊ ݃ ܥ ݏ ݐ + ܶ ݎ ܽ ݊ ݏ ݎ ݐ ܥ ݏ ݐ + ܲ ݈ ܽ ݊ ݐ ܥ ݏ ݐ x 100 ܴ ܧ ܥ .x ܮ ܯ ܧ ܲ ݎ ݅ ܿ ݁ x ܰ ܵ ܴ Where, REC. = Metallurgical recovery (%) LME Price = Copper Price (BRL/t Cu) NSR = Net Smelter Return (%) For copper price and exchange rate the 18 - month average basis was used, corresponding to the input pricing period selected for the 2022 mineral reserve estimate, which results in US $ 7 , 275 per tonne (US $ 3 . 30 per lb . ) copper price and USD : BRL foreign exchange rate of 5 . 29 . The break - even and marginal COG parameters and for mineral reserves is listed below for each open pit project : Table 15 - 5: Open Pit Mines - COG Calculation 25 November 2019 Rev. F 215 Economic Parameters Surubim / C12 N8/N9/N5 (Siriema) Suçuarana Total Mining Costs BRL/ton 11.08 11.08 11.08 Mining Costs BRL/ton 11.08 11.08 11.08 Development Costs BRL/ton 0.00 0.00 0.00 Transportation Costs BRL/ton 16.86 34.20 10.33 Fix Costs BRL/ton 1.63 0.00 0.22 Variable Costs BRL/ton 15.23 34.20 10.11 Processing Costs (Fix Costs) BRL/ton 30.14 30.14 30.14 Fix Costs BRL/ton 0.00 0.00 0.00 Variable Costs BRL/ton 30.14 30.14 30.14 G&A Costs BRL/ton 0.00 0.00 0.00 TOTAL COSTS (w/o Sales costs) BRL/ton 58.09 75.42 51.55 Metallurgical Recovery % 85.92% 87.50% 84.82% Copper Price BRL/ton 38,486 38,486 38,486 Foreign Exchange Rate R$:US$ 5.29 5.29 5.29 LME US$/lb 3.30 3.30 3.30 LME US$/t 7,275 7,275 7,275 NSR % 97.66% 97.66% 97.66% Royalty & Taxes % (PIS/COFINS/ICMS/CFEM) 1.55% 1.55% 1.55% COG (Cu %) Break - even 0.18% 0.23% 0.16% Marginal 0.15% 0.20% 0.13% For the purposes of the current LOM production plan as outlined, marginal material and the oxide ore mined throughout each of the pit designs was treated as waste ; however, by design this material will be placed in near - mine stockpiles adjacent to the pit for potential future processing . All these steps result in the Mineral Reserve estimation summarized as presented in Table 15 - 1 .
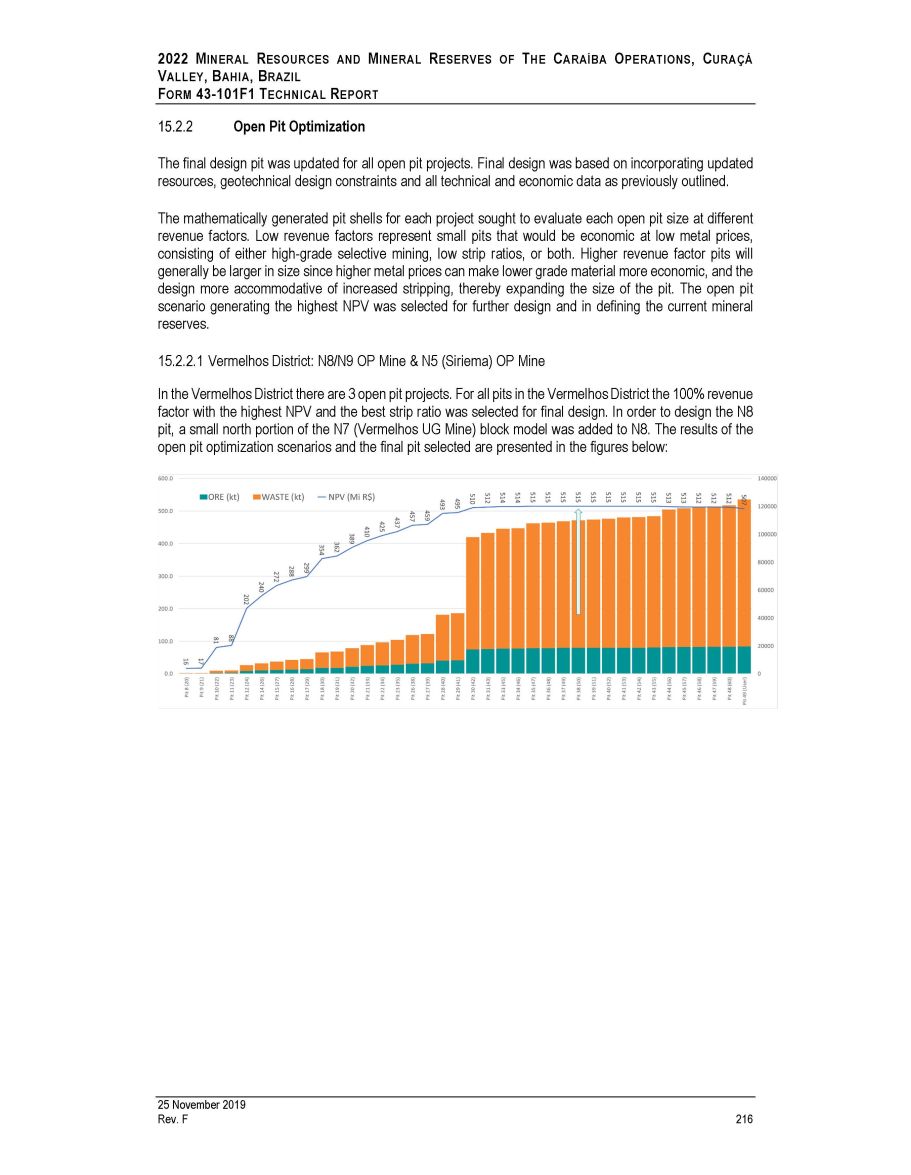
2022 M INERAL R ESOURCES AND M INERAL R ESERVES OF T HE C ARAÍBA O PERATIONS , C URAÇÁ V ALLEY , B AHIA , B RAZIL F ORM 43 - 101F1 T ECHNICAL R EPORT Open Pit Optimization The final design pit was updated for all open pit projects . Final design was based on incorporating updated resources, geotechnical design constraints and all technical and economic data as previously outlined . The mathematically generated pit shells for each project sought to evaluate each open pit size at different revenue factors . Low revenue factors represent small pits that would be economic at low metal prices, consisting of either high - grade selective mining, low strip ratios, or both . Higher revenue factor pits will generally be larger in size since higher metal prices can make lower grade material more economic, and the design more accommodative of increased stripping, thereby expanding the size of the pit . The open pit scenario generating the highest NPV was selected for further design and in defining the current mineral reserves . 15.2.2.1 Vermelhos District: N8/N9 OP Mine & N5 (Siriema) OP Mine In the Vermelhos District there are 3 open pit projects . For all pits in the Vermelhos District the 100 % revenue factor with the highest NPV and the best strip ratio was selected for final design . In order to design the N 8 pit, a small north portion of the N 7 (Vermelhos UG Mine) block model was added to N 8 . The results of the open pit optimization scenarios and the final pit selected are presented in the figures below : 25 November 2019 Rev. F 216
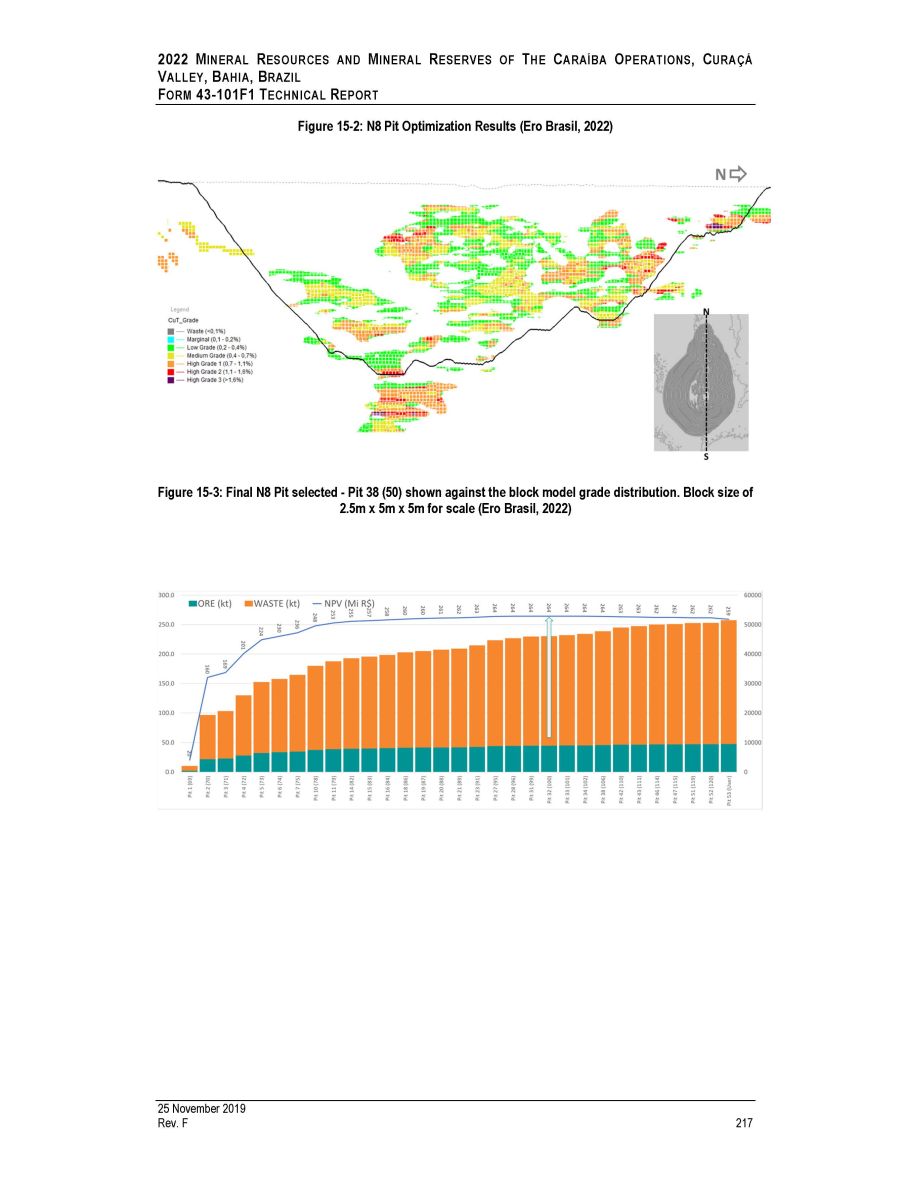
2022 M INERAL R ESOURCES AND M INERAL R ESERVES OF T HE C ARAÍBA O PERATIONS , C URAÇÁ V ALLEY , B AHIA , B RAZIL F ORM 43 - 101F1 T ECHNICAL R EPORT Figure 15 - 2: N8 Pit Optimization Results (Ero Brasil, 2022) Figure 15 - 3: Final N8 Pit selected - Pit 38 (50) shown against the block model grade distribution. Block size of 2.5m x 5m x 5m for scale (Ero Brasil, 2022) 25 November 2019 Rev. F 217
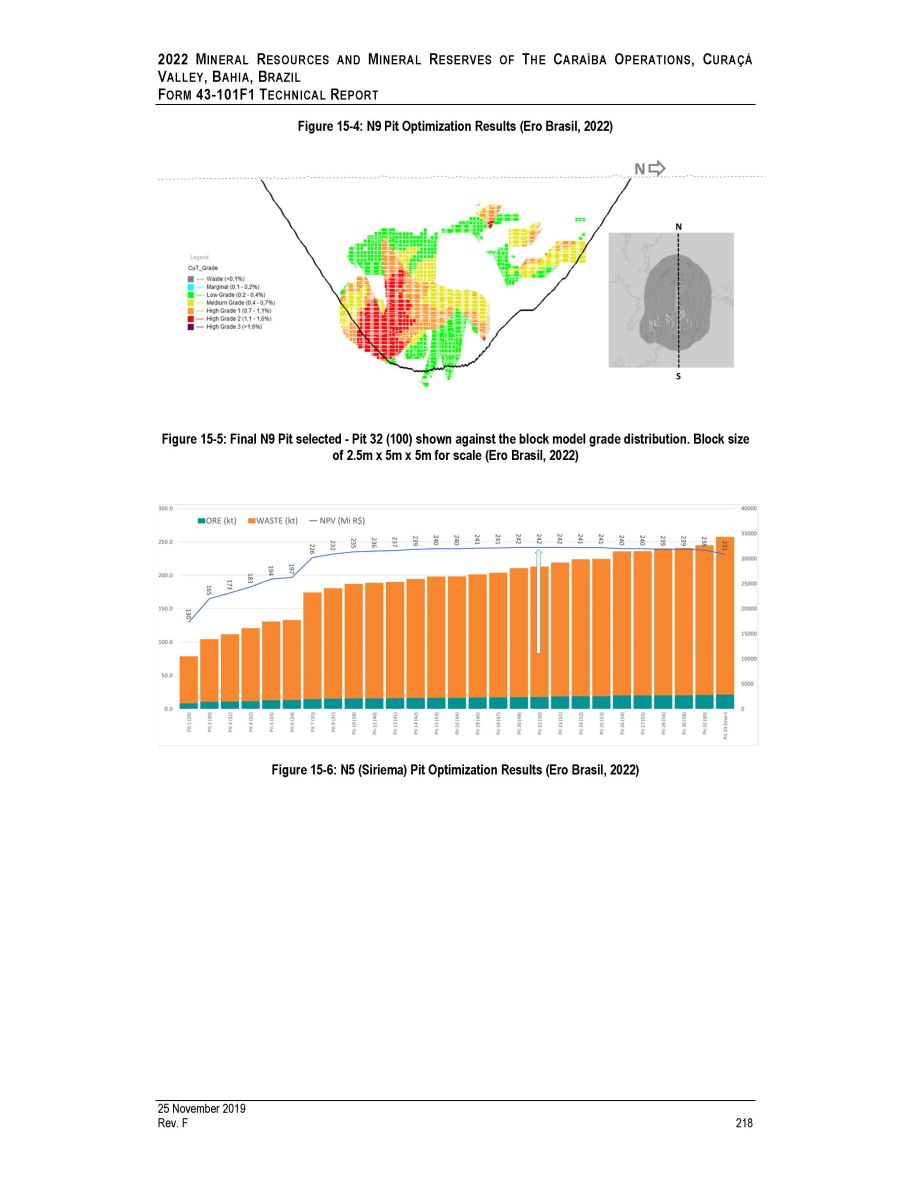
2022 M INERAL R ESOURCES AND M INERAL R ESERVES OF T HE C ARAÍBA O PERATIONS , C URAÇÁ V ALLEY , B AHIA , B RAZIL F ORM 43 - 101F1 T ECHNICAL R EPORT Figure 15 - 4: N9 Pit Optimization Results (Ero Brasil, 2022) Figure 15 - 5: Final N9 Pit selected - Pit 32 (100) shown against the block model grade distribution. Block size of 2.5m x 5m x 5m for scale (Ero Brasil, 2022) Figure 15 - 6: N5 (Siriema) Pit Optimization Results (Ero Brasil, 2022) 25 November 2019 Rev. F 218
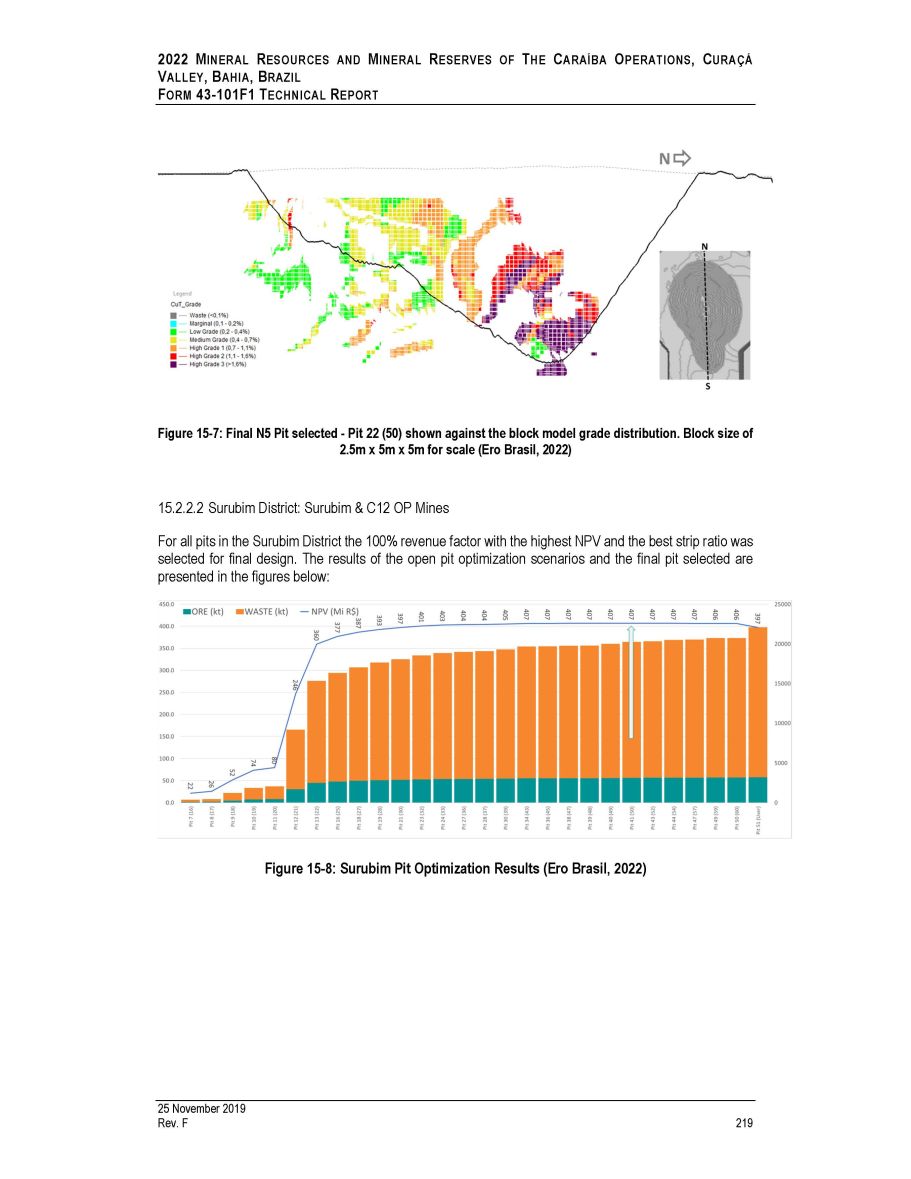
2022 M INERAL R ESOURCES AND M INERAL R ESERVES OF T HE C ARAÍBA O PERATIONS , C URAÇÁ V ALLEY , B AHIA , B RAZIL F ORM 43 - 101F1 T ECHNICAL R EPORT Figure 15 - 7: Final N5 Pit selected - Pit 22 (50) shown against the block model grade distribution. Block size of 2.5m x 5m x 5m for scale (Ero Brasil, 2022) 15.2.2.2 Surubim District: Surubim & C12 OP Mines For all pits in the Surubim District the 100 % revenue factor with the highest NPV and the best strip ratio was selected for final design . The results of the open pit optimization scenarios and the final pit selected are presented in the figures below : Figure 15 - 8: Surubim Pit Optimization Results (Ero Brasil, 2022) 25 November 2019 Rev. F 219
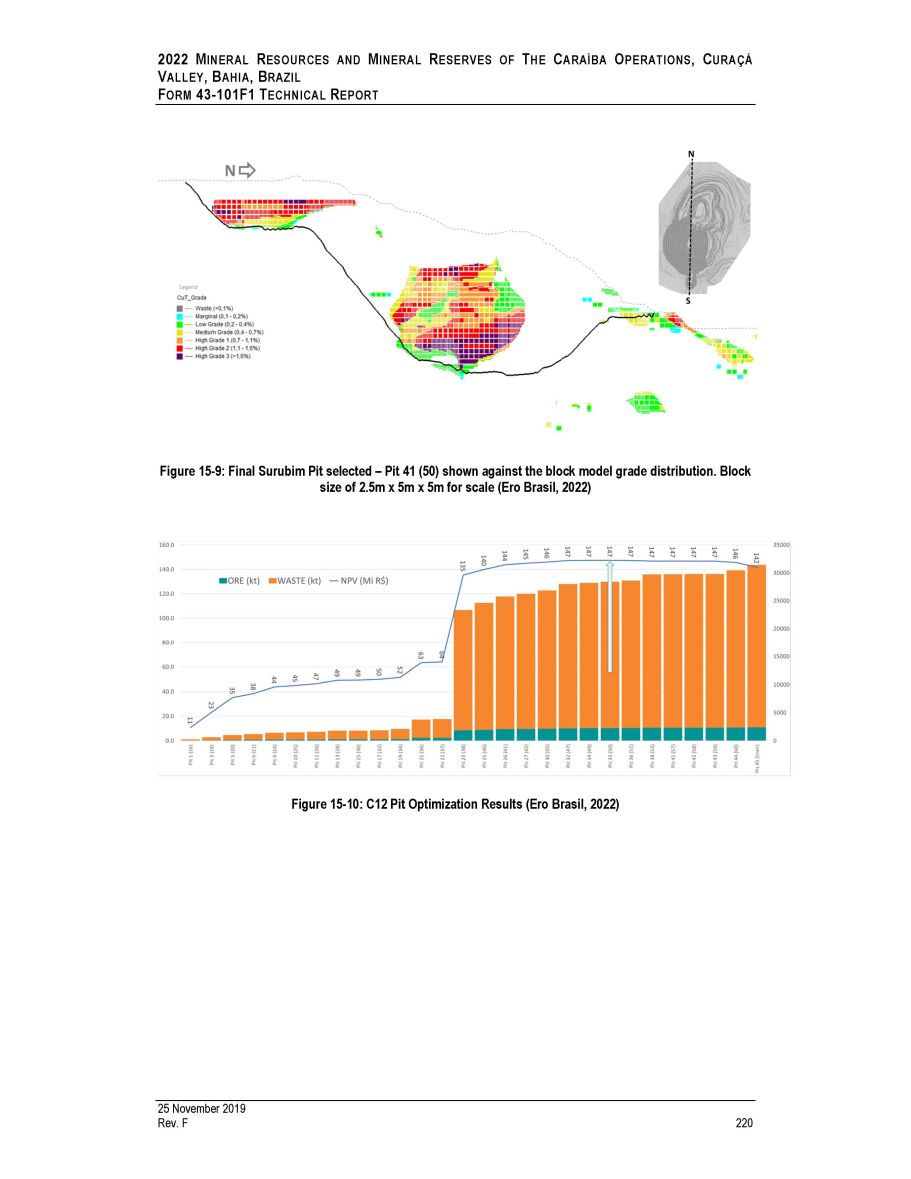
2022 M INERAL R ESOURCES AND M INERAL R ESERVES OF T HE C ARAÍBA O PERATIONS , C URAÇÁ V ALLEY , B AHIA , B RAZIL F ORM 43 - 101F1 T ECHNICAL R EPORT Figure 15 - 9: Final Surubim Pit selected – Pit 41 (50) shown against the block model grade distribution. Block size of 2.5m x 5m x 5m for scale (Ero Brasil, 2022) Figure 15 - 10: C12 Pit Optimization Results (Ero Brasil, 2022) 25 November 2019 Rev. F 220
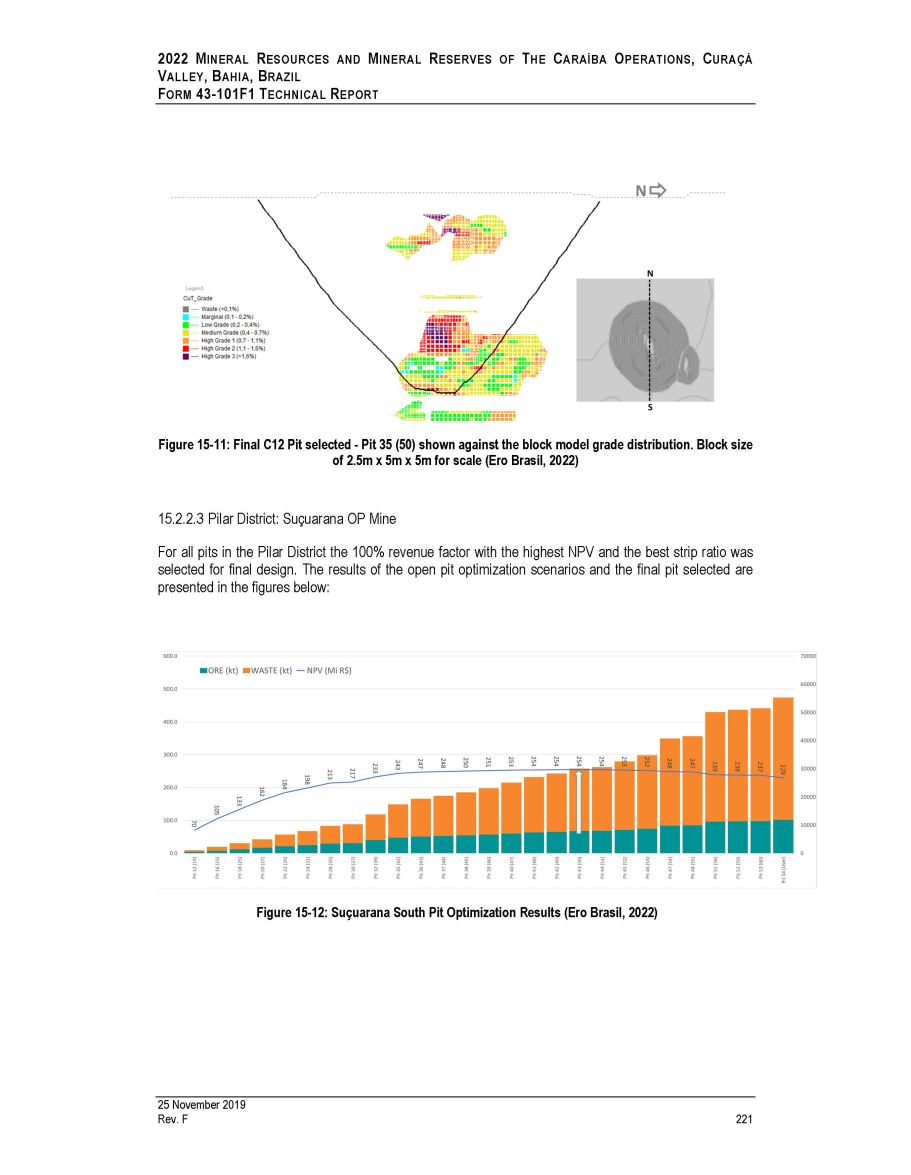
2022 M INERAL R ESOURCES AND M INERAL R ESERVES OF T HE C ARAÍBA O PERATIONS , C URAÇÁ V ALLEY , B AHIA , B RAZIL F ORM 43 - 101F1 T ECHNICAL R EPORT Figure 15 - 11: Final C12 Pit selected - Pit 35 (50) shown against the block model grade distribution. Block size of 2.5m x 5m x 5m for scale (Ero Brasil, 2022) 15.2.2.3 Pilar District: Suçuarana OP Mine For all pits in the Pilar District the 100 % revenue factor with the highest NPV and the best strip ratio was selected for final design . The results of the open pit optimization scenarios and the final pit selected are presented in the figures below : Figure 15 - 12: Suçuarana South Pit Optimization Results (Ero Brasil, 2022) 25 November 2019 Rev. F 221
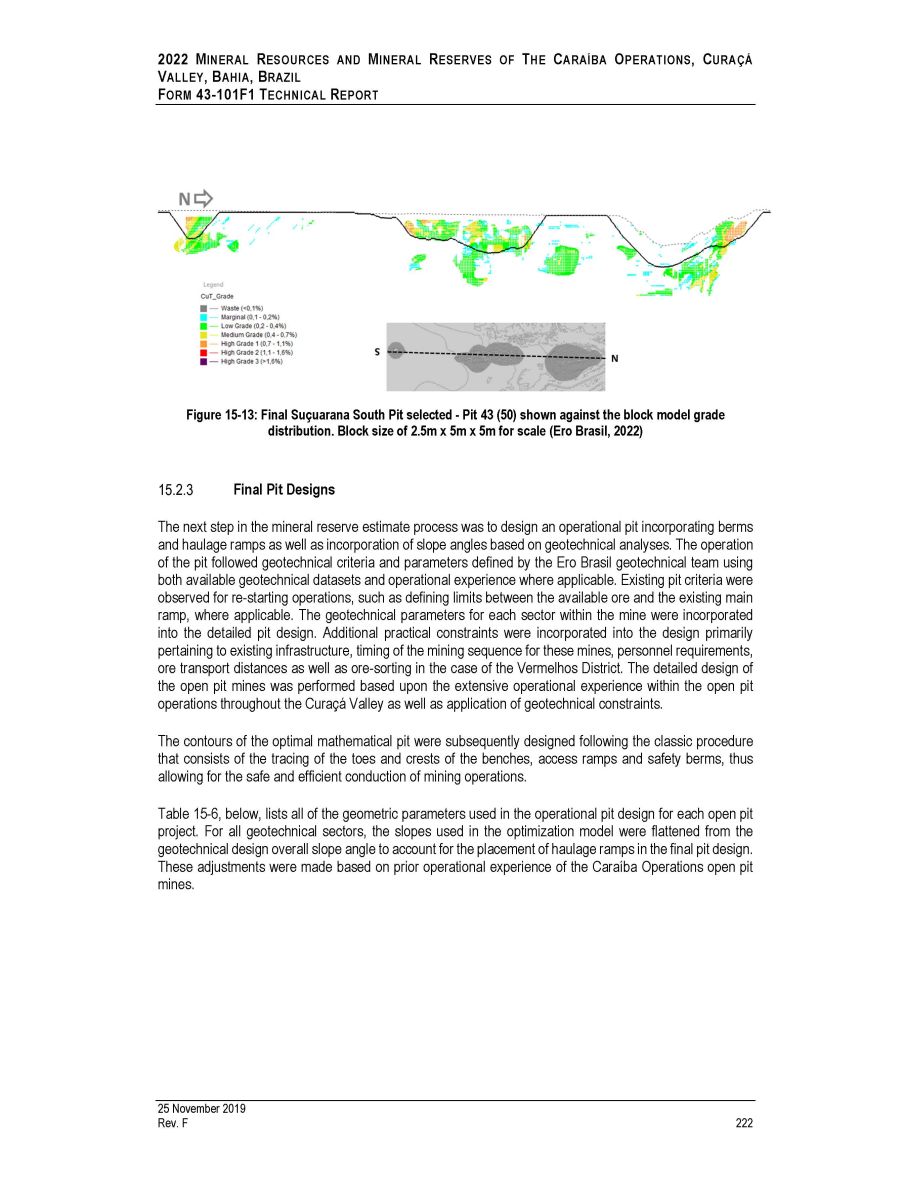
2022 M INERAL R ESOURCES AND M INERAL R ESERVES OF T HE C ARAÍBA O PERATIONS , C URAÇÁ V ALLEY , B AHIA , B RAZIL F ORM 43 - 101F1 T ECHNICAL R EPORT Figure 15 - 13: Final Suçuarana South Pit selected - Pit 43 (50) shown against the block model grade distribution. Block size of 2.5m x 5m x 5m for scale (Ero Brasil, 2022) Final Pit Designs The next step in the mineral reserve estimate process was to design an operational pit incorporating berms and haulage ramps as well as incorporation of slope angles based on geotechnical analyses . The operation of the pit followed geotechnical criteria and parameters defined by the Ero Brasil geotechnical team using both available geotechnical datasets and operational experience where applicable . Existing pit criteria were observed for re - starting operations, such as defining limits between the available ore and the existing main ramp, where applicable . The geotechnical parameters for each sector within the mine were incorporated into the detailed pit design . Additional practical constraints were incorporated into the design primarily pertaining to existing infrastructure, timing of the mining sequence for these mines, personnel requirements, ore transport distances as well as ore - sorting in the case of the Vermelhos District . The detailed design of the open pit mines was performed based upon the extensive operational experience within the open pit operations throughout the Curaçá Valley as well as application of geotechnical constraints . The contours of the optimal mathematical pit were subsequently designed following the classic procedure that consists of the tracing of the toes and crests of the benches, access ramps and safety berms, thus allowing for the safe and efficient conduction of mining operations . Table 15 - 6 , below, lists all of the geometric parameters used in the operational pit design for each open pit project . For all geotechnical sectors, the slopes used in the optimization model were flattened from the geotechnical design overall slope angle to account for the placement of haulage ramps in the final pit design . These adjustments were made based on prior operational experience of the Caraíba Operations open pit mines . 25 November 2019 Rev. F 222
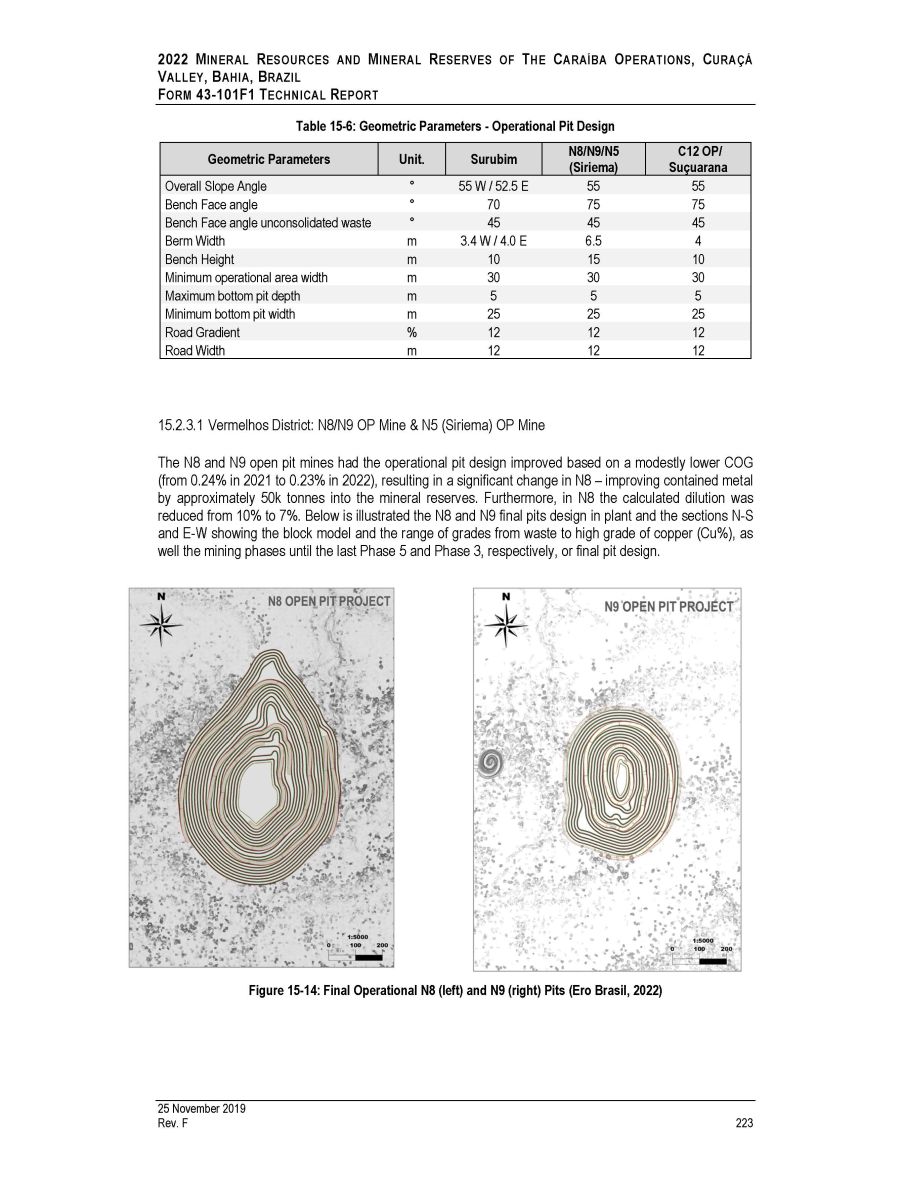
2022 M INERAL R ESOURCES AND M INERAL R ESERVES OF T HE C ARAÍBA O PERATIONS , C URAÇÁ V ALLEY , B AHIA , B RAZIL F ORM 43 - 101F1 T ECHNICAL R EPORT Table 15 - 6: Geometric Parameters - Operational Pit Design Geometric Parameters Unit. Surubim N8/N9/N5 (Siriema) C12 OP/ Suçuarana Overall Slope Angle ƒ 55 W / 52.5 E 55 55 Bench Face angle ƒ 70 75 75 Bench Face angle unconsolidated waste ƒ 45 45 45 Berm Width m 3.4 W / 4.0 E 6.5 4 Bench Height m 10 15 10 Minimum operational area width m 30 30 30 Maximum bottom pit depth m 5 5 5 Minimum bottom pit width m 25 25 25 Road Gradient % 12 12 12 Road Width m 12 12 12 15.2.3.1 Vermelhos District: N8/N9 OP Mine & N5 (Siriema) OP Mine The N 8 and N 9 open pit mines had the operational pit design improved based on a modestly lower COG (from 0 . 24 % in 2021 to 0 . 23 % in 2022 ), resulting in a significant change in N 8 – improving contained metal by approximately 50 k tonnes into the mineral reserves . Furthermore, in N 8 the calculated dilution was reduced from 10 % to 7 % . Below is illustrated the N 8 and N 9 final pits design in plant and the sections N - S and E - W showing the block model and the range of grades from waste to high grade of copper (Cu % ), as well the mining phases until the last Phase 5 and Phase 3 , respectively, or final pit design . Figure 15 - 14: Final Operational N8 (left) and N9 (right) Pits (Ero Brasil, 2022) 25 November 2019 Rev. F 223
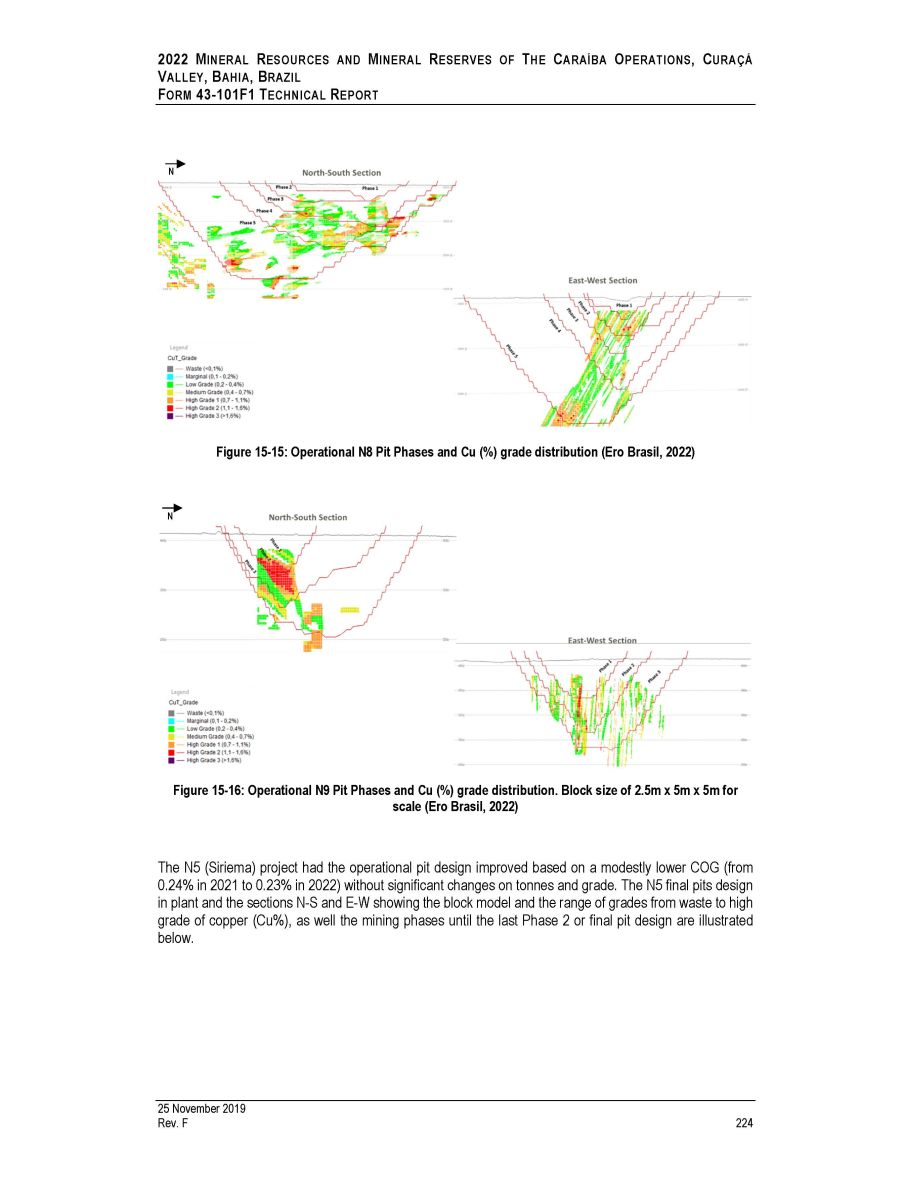
2022 M INERAL R ESOURCES AND M INERAL R ESERVES OF T HE C ARAÍBA O PERATIONS , C URAÇÁ V ALLEY , B AHIA , B RAZIL F ORM 43 - 101F1 T ECHNICAL R EPORT Figure 15 - 15: Operational N8 Pit Phases and Cu (%) grade distribution (Ero Brasil, 2022) Figure 15 - 16: Operational N9 Pit Phases and Cu (%) grade distribution. Block size of 2.5m x 5m x 5m for scale (Ero Brasil, 2022) The N 5 (Siriema) project had the operational pit design improved based on a modestly lower COG (from 0 . 24 % in 2021 to 0 . 23 % in 2022 ) without significant changes on tonnes and grade . The N 5 final pits design in plant and the sections N - S and E - W showing the block model and the range of grades from waste to high grade of copper (Cu % ), as well the mining phases until the last Phase 2 or final pit design are illustrated below . N N 25 November 2019 Rev. F 224
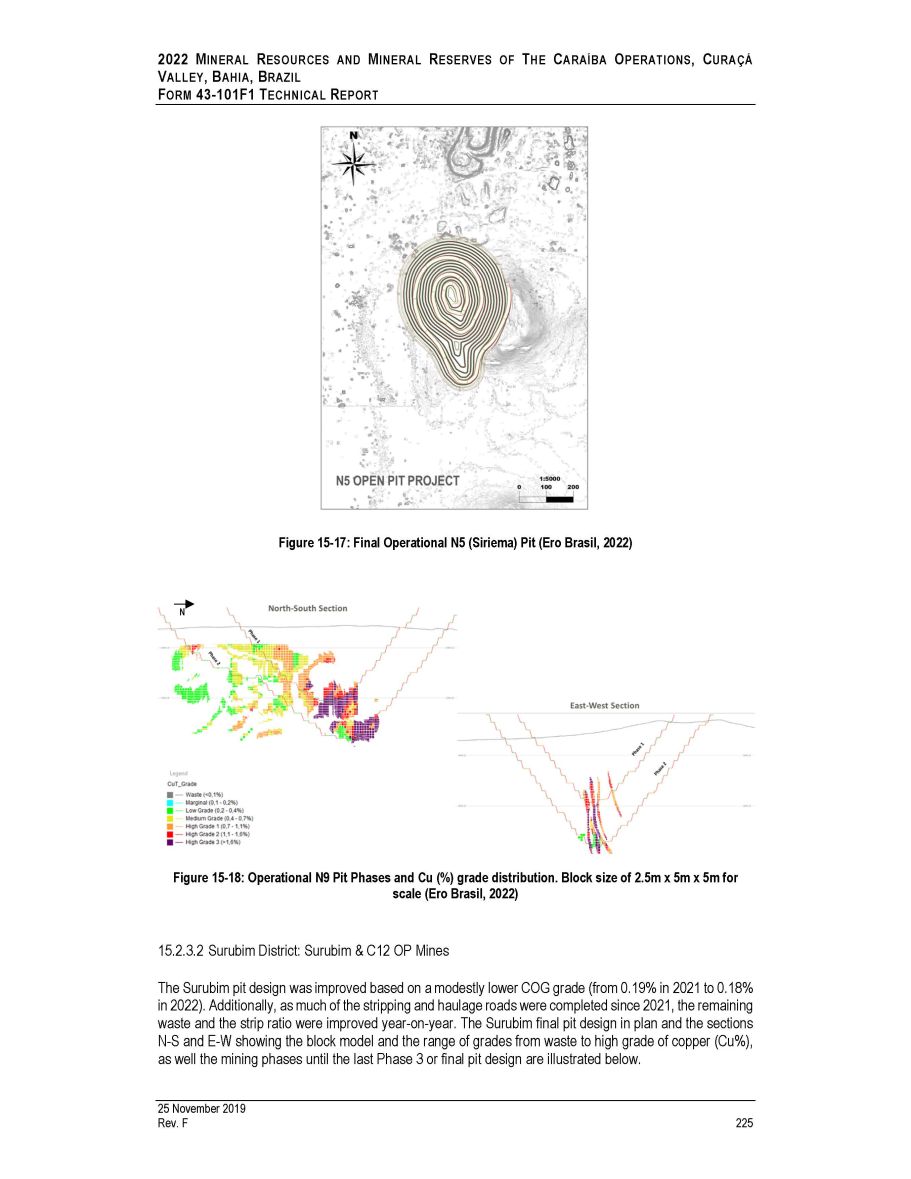
2022 M INERAL R ESOURCES AND M INERAL R ESERVES OF T HE C ARAÍBA O PERATIONS , C URAÇÁ V ALLEY , B AHIA , B RAZIL F ORM 43 - 101F1 T ECHNICAL R EPORT Figure 15 - 17: Final Operational N5 (Siriema) Pit (Ero Brasil, 2022) Figure 15 - 18: Operational N9 Pit Phases and Cu (%) grade distribution. Block size of 2.5m x 5m x 5m for scale (Ero Brasil, 2022) 15.2.3.2 Surubim District: Surubim & C12 OP Mines The Surubim pit design was improved based on a modestly lower COG grade (from 0 . 19 % in 2021 to 0 . 18 % in 2022 ) . Additionally, as much of the stripping and haulage roads were completed since 2021 , the remaining waste and the strip ratio were improved year - on - year . The Surubim final pit design in plan and the sections N - S and E - W showing the block model and the range of grades from waste to high grade of copper (Cu % ), as well the mining phases until the last Phase 3 or final pit design are illustrated below . N 25 November 2019 Rev. F 225

2022 M INERAL R ESOURCES AND M INERAL R ESERVES OF T HE C ARAÍBA O PERATIONS , C URAÇÁ V ALLEY , B AHIA , B RAZIL F ORM 43 - 101F1 T ECHNICAL R EPORT Figure 15 - 19: Final Operational Surubim Pit (Ero Brasil, 2022) Figure 15 - 20: Operational Surubim Pit Phases and Cu (%) grade distribution. Block size of 2.5m x 5m x 5m for scale (Ero Brasil, 2022) N 25 November 2019 Rev. F 226

2022 M INERAL R ESOURCES AND M INERAL R ESERVES OF T HE C ARAÍBA O PERATIONS , C URAÇÁ V ALLEY , B AHIA , B RAZIL F ORM 43 - 101F1 T ECHNICAL R EPORT The C 12 pit design similar to the Surubim Mine, had an improvement in the operational design based on a modestly lower COG grade (from 0 . 19 % in 2021 to 0 . 18 % in 2022 ), however without significant changes on tonnes but with a lower strip ratio . The C 12 final pit design in plan and the sections N - S and E - W showing the block model and the range of grades from waste to high grade of copper (Cu % ), as well the mining phases until the last Phase 2 or final pit design is illustrated below . Figure 15 - 21: Final Operational C12 Pit (Ero Brasil, 2022) Figure 15 - 22: Operational C12 Pit Phases and Cu (%) grades . Block size of 2.5m x 5m x 5m for scale (Ero Brasil, 2022) N 25 November 2019 Rev. F 227
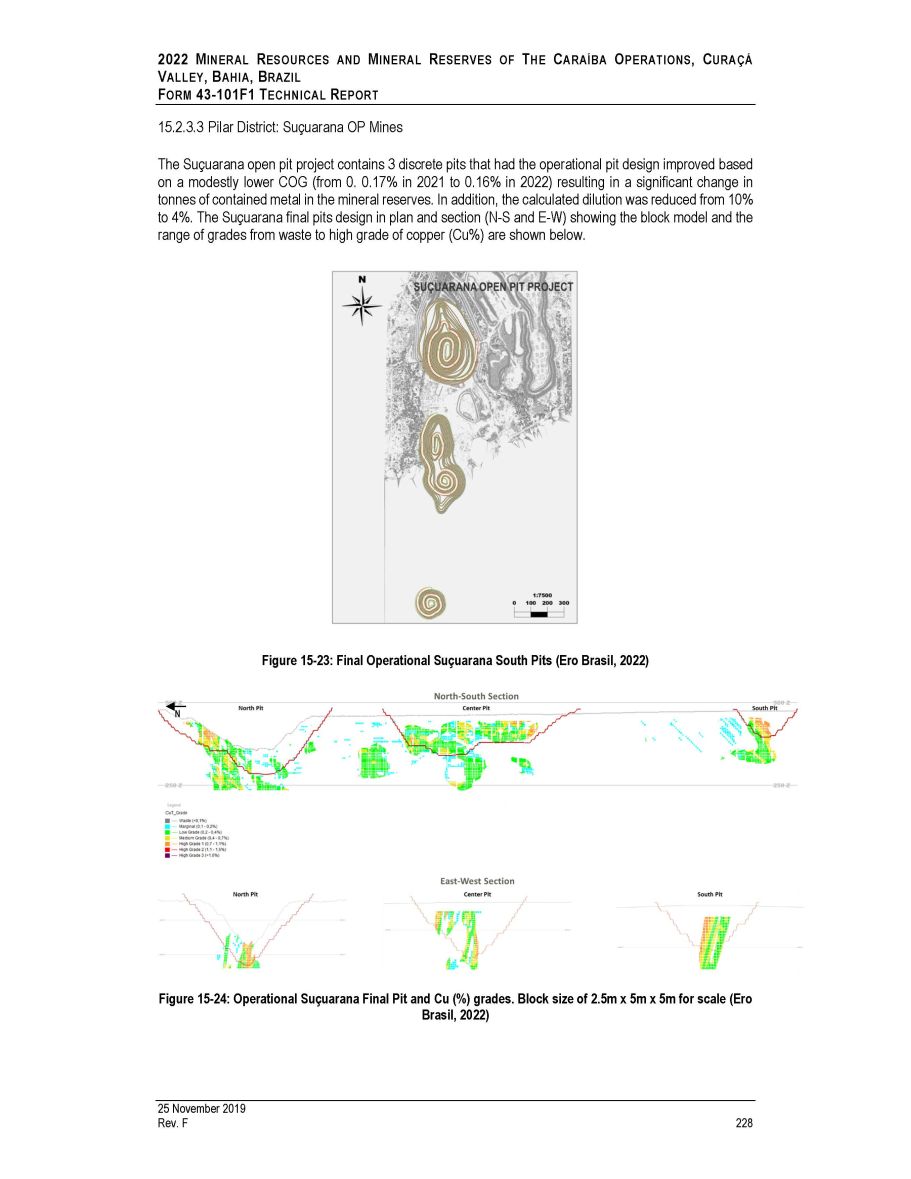
2022 M INERAL R ESOURCES AND M INERAL R ESERVES OF T HE C ARAÍBA O PERATIONS , C URAÇÁ V ALLEY , B AHIA , B RAZIL F ORM 43 - 101F1 T ECHNICAL R EPORT 15.2.3.3 Pilar District: Suçuarana OP Mines The Suçuarana open pit project contains 3 discrete pits that had the operational pit design improved based on a modestly lower COG (from 0 . 0 . 17 % in 2021 to 0 . 16 % in 2022 ) resulting in a significant change in tonnes of contained metal in the mineral reserves . In addition, the calculated dilution was reduced from 10 % to 4 % . The Suçuarana final pits design in plan and section (N - S and E - W) showing the block model and the range of grades from waste to high grade of copper (Cu % ) are shown below . Figure 15 - 23: Final Operational Suçuarana South Pits (Ero Brasil, 2022) Figure 15 - 24: Operational Suçuarana Final Pit and Cu (%) grades. Block size of 2.5m x 5m x 5m for scale (Ero Brasil, 2022) N 25 November 2019 Rev. F 228
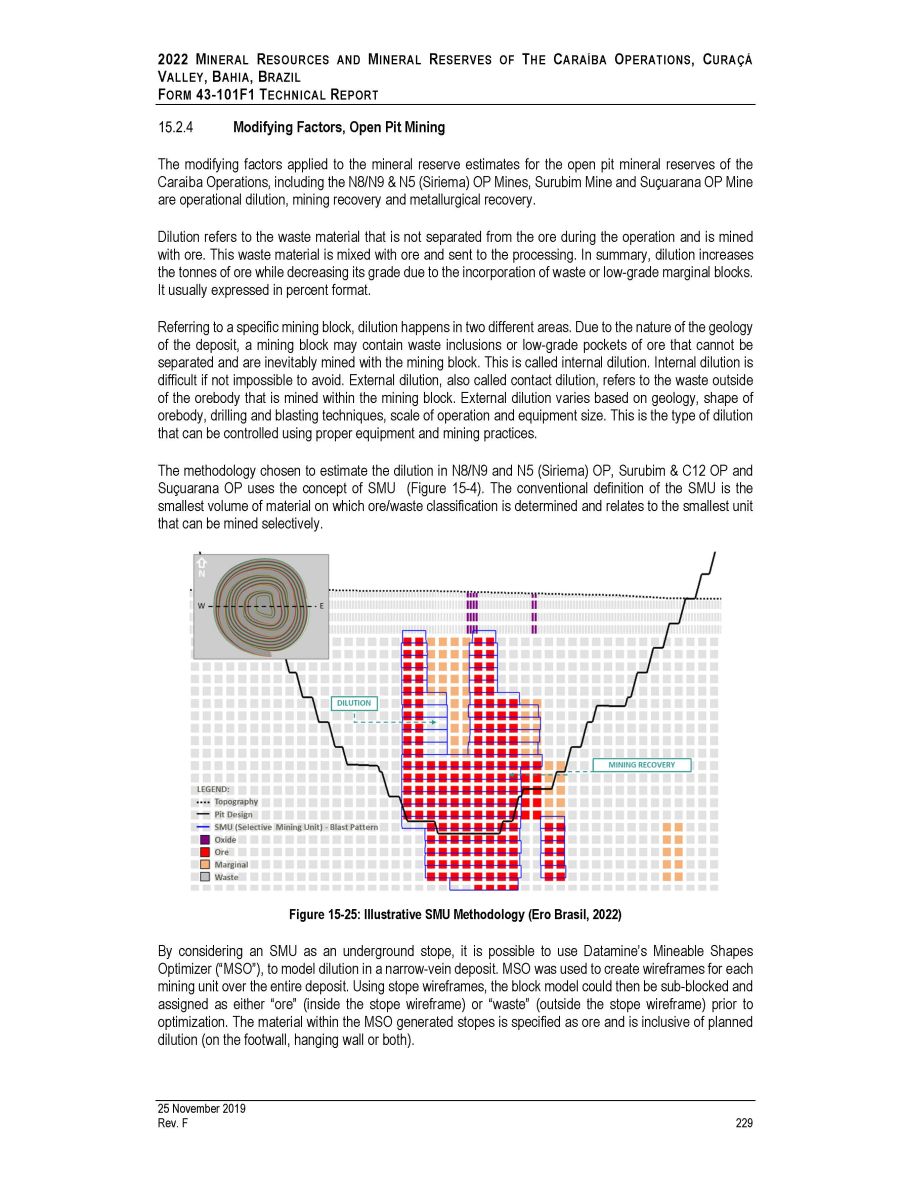
2022 M INERAL R ESOURCES AND M INERAL R ESERVES OF T HE C ARAÍBA O PERATIONS , C URAÇÁ V ALLEY , B AHIA , B RAZIL F ORM 43 - 101F1 T ECHNICAL R EPORT Modifying Factors, Open Pit Mining The modifying factors applied to the mineral reserve estimates for the open pit mineral reserves of the Caraíba Operations, including the N 8 /N 9 & N 5 (Siriema) OP Mines, Surubim Mine and Suçuarana OP Mine are operational dilution, mining recovery and metallurgical recovery . Dilution refers to the waste material that is not separated from the ore during the operation and is mined with ore . This waste material is mixed with ore and sent to the processing . In summary, dilution increases the tonnes of ore while decreasing its grade due to the incorporation of waste or low - grade marginal blocks . It usually expressed in percent format . Referring to a specific mining block, dilution happens in two different areas . Due to the nature of the geology of the deposit, a mining block may contain waste inclusions or low - grade pockets of ore that cannot be separated and are inevitably mined with the mining block . This is called internal dilution . Internal dilution is difficult if not impossible to avoid . External dilution, also called contact dilution, refers to the waste outside of the orebody that is mined within the mining block . External dilution varies based on geology, shape of orebody, drilling and blasting techniques, scale of operation and equipment size . This is the type of dilution that can be controlled using proper equipment and mining practices . The methodology chosen to estimate the dilution in N 8 /N 9 and N 5 (Siriema) OP, Surubim & C 12 OP and Suçuarana OP uses the concept of SMU (Figure 15 - 4 ) . The conventional definition of the SMU is the smallest volume of material on which ore/waste classification is determined and relates to the smallest unit that can be mined selectively . Figure 15 - 25: Illustrative SMU Methodology (Ero Brasil, 2022) By considering an SMU as an underground stope, it is possible to use Datamine’s Mineable Shapes Optimizer (“MSO”), to model dilution in a narrow - vein deposit . MSO was used to create wireframes for each mining unit over the entire deposit . Using stope wireframes, the block model could then be sub - blocked and assigned as either “ore” (inside the stope wireframe) or “waste” (outside the stope wireframe) prior to optimization . The material within the MSO generated stopes is specified as ore and is inclusive of planned dilution (on the footwall, hanging wall or both) . 25 November 2019 Rev. F 229
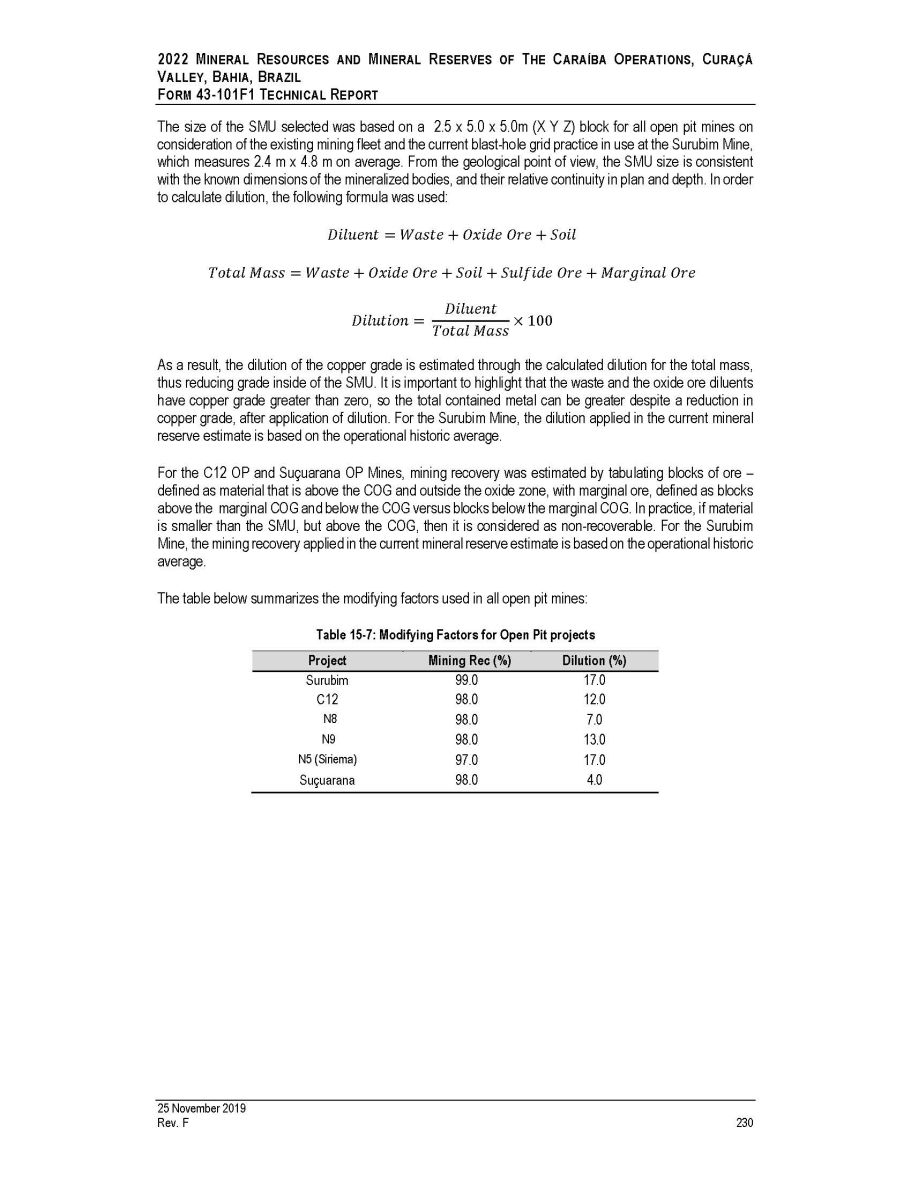
2022 M INERAL R ESOURCES AND M INERAL R ESERVES OF T HE C ARAÍBA O PERATIONS , C URAÇÁ V ALLEY , B AHIA , B RAZIL F ORM 43 - 101F1 T ECHNICAL R EPORT The size of the SMU selected was based on a 2 . 5 x 5 . 0 x 5 . 0 m (X Y Z) block for all open pit mines on consideration of the existing mining fleet and the current blast - hole grid practice in use at the Surubim Mine, which measures 2 . 4 m x 4 . 8 m on average . From the geological point of view, the SMU size is consistent with the known dimensions of the mineralized bodies, and their relative continuity in plan and depth . In order to calculate dilution, the following formula was used : ܦ ݅ ݈ ݑ ݁ ݊ ݐ = ܹ ܽ ݏ ݐ ݁ + ܱ ݔ ݅ ݀ ݁ ܱ ݎ ݁ + ܵ ݅ ݈ ܶ ݐ ܽ ݈ ܯ ܽ ݏ ݏ = ܹ ܽ ݏ ݐ ݁ + ܱ ݔ ݅ ݀ ݁ ܱ ݎ ݁ + ܵ ݅ ݈ + ܵ ݑ ݈ ݂ ݅ ݀ ݁ ܱ ݎ ݁ + ܯ ܽ ݎ ݃ ݅ ݊ ܽ ݈ ܱ ݎ ݁ ܦ ݅ ݈ ݑ ݐ ݅ ݊ = ܦ ݅ ݈ ݑ ݁ ݊ ݐ ܶ ݐ ܽ ݈ ܯ ܽ ݏ ݏ x 100 25 November 2019 Rev. F 230 As a result, the dilution of the copper grade is estimated through the calculated dilution for the total mass, thus reducing grade inside of the SMU . It is important to highlight that the waste and the oxide ore diluents have copper grade greater than zero, so the total contained metal can be greater despite a reduction in copper grade, after application of dilution . For the Surubim Mine, the dilution applied in the current mineral reserve estimate is based on the operational historic average . For the C 12 OP and Suçuarana OP Mines, mining recovery was estimated by tabulating blocks of ore – defined as material that is above the COG and outside the oxide zone, with marginal ore, defined as blocks above the marginal COG and below the COG versus blocks below the marginal COG . In practice, if material is smaller than the SMU, but above the COG, then it is considered as non - recoverable . For the Surubim Mine, the mining recovery applied in the current mineral reserve estimate is based on the operational historic average . The table below summarizes the modifying factors used in all open pit mines: Table 15 - 7: Modifying Factors for Open Pit projects Project Mining Rec (%) Dilution (%) Surubim 99.0 17.0 C12 98.0 12.0 N8 98.0 7.0 N9 98.0 13.0 N5 (Siriema) 97.0 17.0 Suçuarana 98.0 4.0
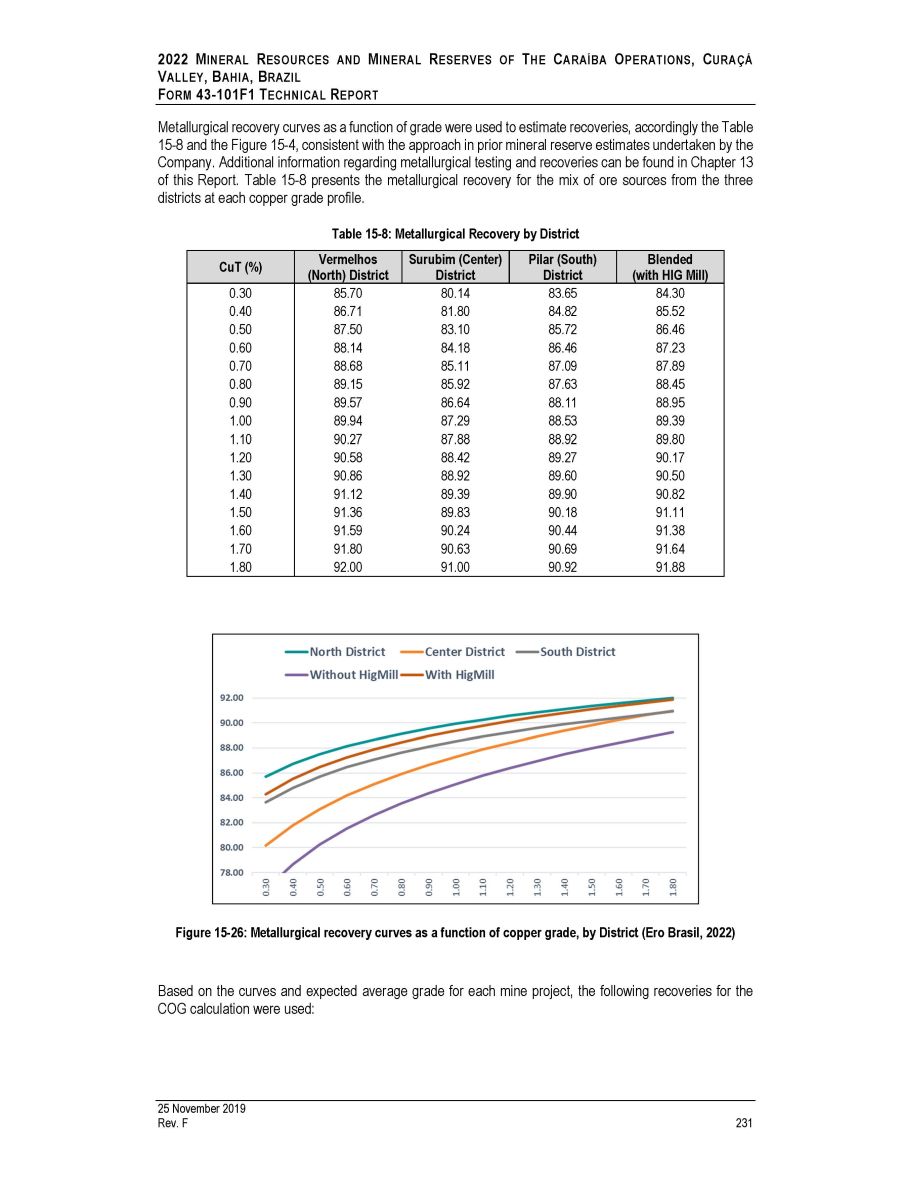
2022 M INERAL R ESOURCES AND M INERAL R ESERVES OF T HE C ARAÍBA O PERATIONS , C URAÇÁ V ALLEY , B AHIA , B RAZIL F ORM 43 - 101F1 T ECHNICAL R EPORT Metallurgical recovery curves as a function of grade were used to estimate recoveries, accordingly the Table 15 - 8 and the Figure 15 - 4 , consistent with the approach in prior mineral reserve estimates undertaken by the Company . Additional information regarding metallurgical testing and recoveries can be found in Chapter 13 of this Report . Table 15 - 8 presents the metallurgical recovery for the mix of ore sources from the three districts at each copper grade profile . Table 15 - 8: Metallurgical Recovery by District CuT (%) Vermelhos (North) District Surubim (Center) District Pilar (South) District Blended (with HIG Mill) 0.30 85.70 80.14 83.65 84.30 0.40 86.71 81.80 84.82 85.52 0.50 87.50 83.10 85.72 86.46 0.60 88.14 84.18 86.46 87.23 0.70 88.68 85.11 87.09 87.89 0.80 89.15 85.92 87.63 88.45 0.90 89.57 86.64 88.11 88.95 1.00 89.94 87.29 88.53 89.39 1.10 90.27 87.88 88.92 89.80 1.20 90.58 88.42 89.27 90.17 1.30 90.86 88.92 89.60 90.50 1.40 91.12 89.39 89.90 90.82 1.50 91.36 89.83 90.18 91.11 1.60 91.59 90.24 90.44 91.38 1.70 91.80 90.63 90.69 91.64 1.80 92.00 91.00 90.92 91.88 Figure 15 - 26: Metallurgical recovery curves as a function of copper grade, by District (Ero Brasil, 2022) Based on the curves and expected average grade for each mine project, the following recoveries for the COG calculation were used: 25 November 2019 Rev. F 231
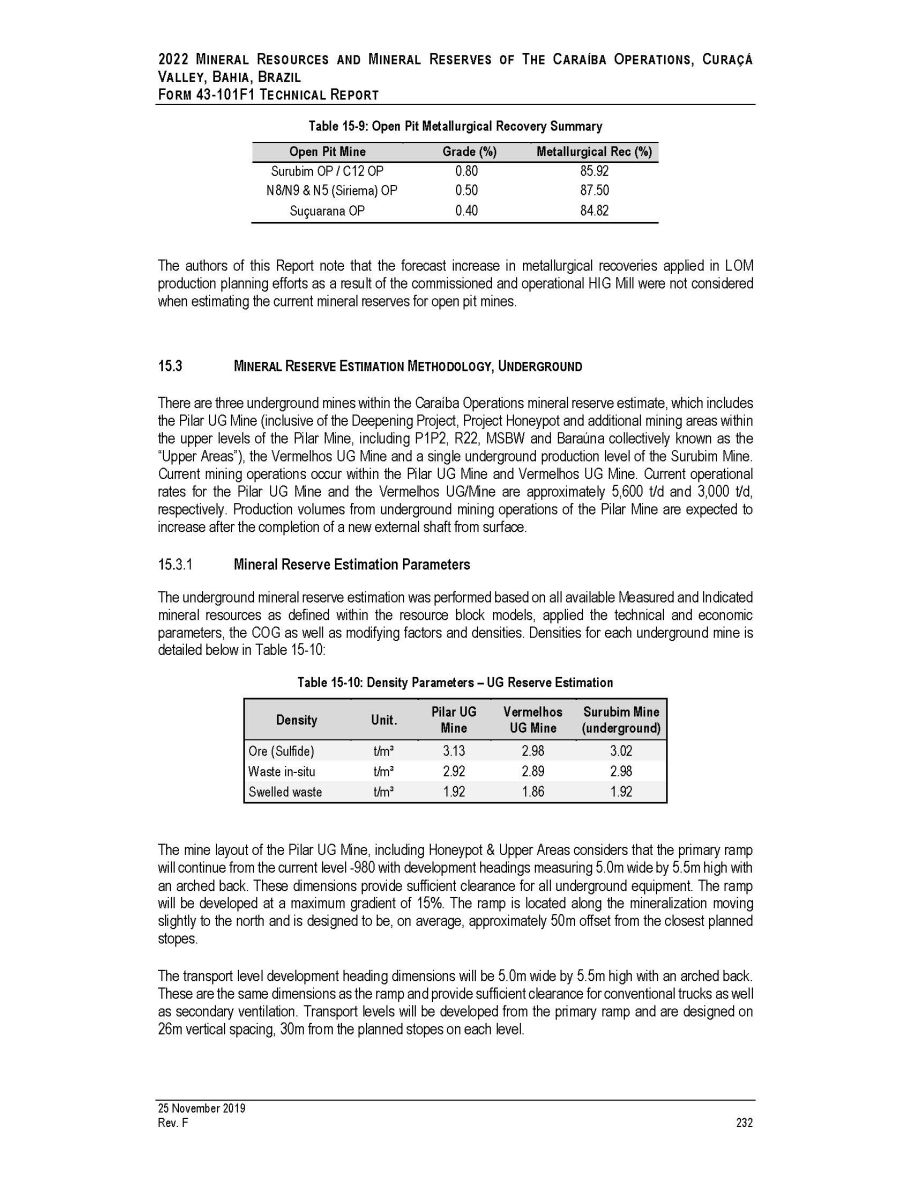
2022 M INERAL R ESOURCES AND M INERAL R ESERVES OF T HE C ARAÍBA O PERATIONS , C URAÇÁ V ALLEY , B AHIA , B RAZIL F ORM 43 - 101F1 T ECHNICAL R EPORT Table 15 - 9: Open Pit Metallurgical Recovery Summary Open Pit Mine Grade (%) Metallurgical Rec (%) Surubim OP / C12 OP 0.80 85.92 N8/N9 & N5 (Siriema) OP 0.50 87.50 Suçuarana OP 0.40 84.82 The authors of this Report note that the forecast increase in metallurgical recoveries applied in LOM production planning efforts as a result of the commissioned and operational HIG Mill were not considered when estimating the current mineral reserves for open pit mines . 15.3 M INERAL R ESERVE E STIMATION M ETHODOLOGY , U NDERGROUND There are three underground mines within the Caraíba Operations mineral reserve estimate, which includes the Pilar UG Mine (inclusive of the Deepening Project, Project Honeypot and additional mining areas within the upper levels of the Pilar Mine, including P 1 P 2 , R 22 , MSBW and Baraúna collectively known as the “Upper Areas”), the Vermelhos UG Mine and a single underground production level of the Surubim Mine . Current mining operations occur within the Pilar UG Mine and Vermelhos UG Mine . Current operational rates for the Pilar UG Mine and the Vermelhos UG/Mine are approximately 5 , 600 t/d and 3 , 000 t/d, respectively . Production volumes from underground mining operations of the Pilar Mine are expected to increase after the completion of a new external shaft from surface . Mineral Reserve Estimation Parameters The underground mineral reserve estimation was performed based on all available Measured and Indicated mineral resources as defined within the resource block models, applied the technical and economic parameters, the COG as well as modifying factors and densities . Densities for each underground mine is detailed below in Table 15 - 10 : Table 15 - 10: Density Parameters – UG Reserve Estimation 25 November 2019 Rev. F 232 Density Unit. Pilar UG Mine Vermelhos UG Mine Surubim Mine (underground) Ore (Sulfide) t/m³ 3.13 2.98 3.02 Waste in - situ t/m³ 2.92 2.89 2.98 Swelled waste t/m³ 1.92 1.86 1.92 The mine layout of the Pilar UG Mine, including Honeypot & Upper Areas considers that the primary ramp will continue from the current level - 980 with development headings measuring 5 . 0 m wide by 5 . 5 m high with an arched back . These dimensions provide sufficient clearance for all underground equipment . The ramp will be developed at a maximum gradient of 15 % . The ramp is located along the mineralization moving slightly to the north and is designed to be, on average, approximately 50 m offset from the closest planned stopes . The transport level development heading dimensions will be 5 . 0 m wide by 5 . 5 m high with an arched back . These are the same dimensions as the ramp and provide sufficient clearance for conventional trucks as well as secondary ventilation . Transport levels will be developed from the primary ramp and are designed on 26 m vertical spacing, 30 m from the planned stopes on each level .
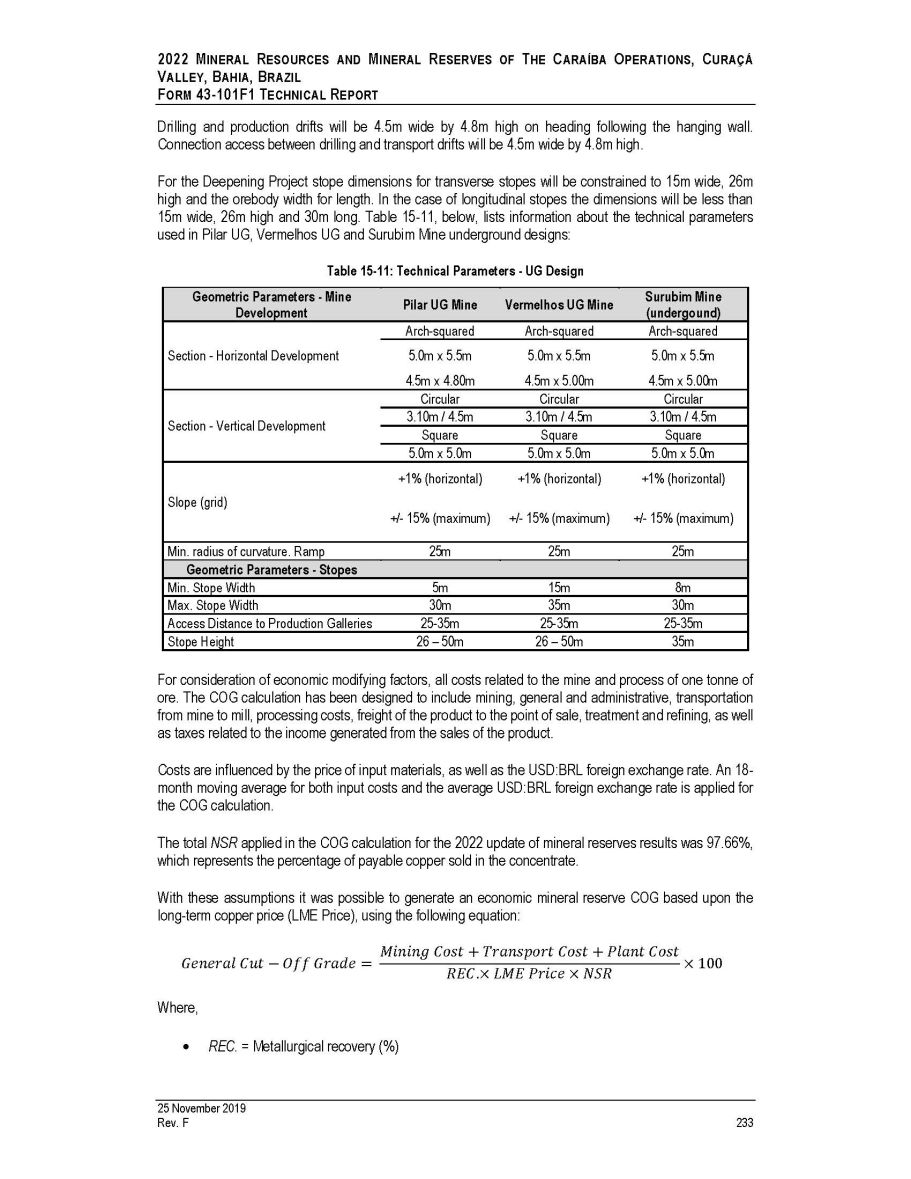
2022 M INERAL R ESOURCES AND M INERAL R ESERVES OF T HE C ARAÍBA O PERATIONS , C URAÇÁ V ALLEY , B AHIA , B RAZIL F ORM 43 - 101F1 T ECHNICAL R EPORT Drilling and production drifts will be 4 . 5 m wide by 4 . 8 m high on heading following the hanging wall . Connection access between drilling and transport drifts will be 4 . 5 m wide by 4 . 8 m high . For the Deepening Project stope dimensions for transverse stopes will be constrained to 15 m wide, 26 m high and the orebody width for length . In the case of longitudinal stopes the dimensions will be less than 15 m wide, 26 m high and 30 m long . Table 15 - 11 , below, lists information about the technical parameters used in Pilar UG, Vermelhos UG and Surubim Mine underground designs : Table 15 - 11: Technical Parameters - UG Design Geometric Parameters - Mine Development Pilar UG Mine Vermelhos UG Mine Surubim Mine (undergound) Section - Horizontal Development Arch - squared Arch - squared Arch - squared 5.0m x 5.5m 4.5m x 4.80m 5.0m x 5.5m 4.5m x 5.00m 5.0m x 5.5m 4.5m x 5.00m Section - Vertical Development Circular Circular Circular 3.10m / 4.5m 3.10m / 4.5m 3.10m / 4.5m Square Square Square 5.0m x 5.0m 5.0m x 5.0m 5.0m x 5.0m Slope (grid) +1% (horizontal) +/ - 15% (maximum) +1% (horizontal) +/ - 15% (maximum) +1% (horizontal) +/ - 15% (maximum) Min. radius of curvature. Ramp 25m 25m 25m Geometric Parameters - Stopes Min. Stope Width 5m 15m 8m Max. Stope Width 30m 35m 30m Access Distance to Production Galleries 25 - 35m 25 - 35m 25 - 35m Stope Height 26 – 50m 26 – 50m 35m For consideration of economic modifying factors, all costs related to the mine and process of one tonne of ore . The COG calculation has been designed to include mining, general and administrative, transportation from mine to mill, processing costs, freight of the product to the point of sale, treatment and refining, as well as taxes related to the income generated from the sales of the product . Costs are influenced by the price of input materials, as well as the USD : BRL foreign exchange rate . An 18 - month moving average for both input costs and the average USD : BRL foreign exchange rate is applied for the COG calculation . The total NSR applied in the COG calculation for the 2022 update of mineral reserves results was 97 . 66 % , which represents the percentage of payable copper sold in the concentrate . With these assumptions it was possible to generate an economic mineral reserve COG based upon the long - term copper price (LME Price), using the following equation : ܩ ݁ ݊ ݁ ݎ ܽ ݈ ܥ ݑ ݐ - ܱ ݂ ݂ ܩ ݎ ܽ ݀ ݁ = ܯ ݅ ݊ ݅ ݊ ݃ ܥ ݏ ݐ + ܶ ݎ ܽ ݊ ݏ ݎ ݐ ܥ ݏ ݐ + ܲ ݈ ܽ ݊ ݐ ܥ ݏ ݐ x 100 ܴ ܧ ܥ .x ܮ ܯ ܧ ܲ ݎ ݅ ܿ ݁ x ܰ ܵ ܴ Where, REC. = Metallurgical recovery (%) 25 November 2019 Rev. F 233
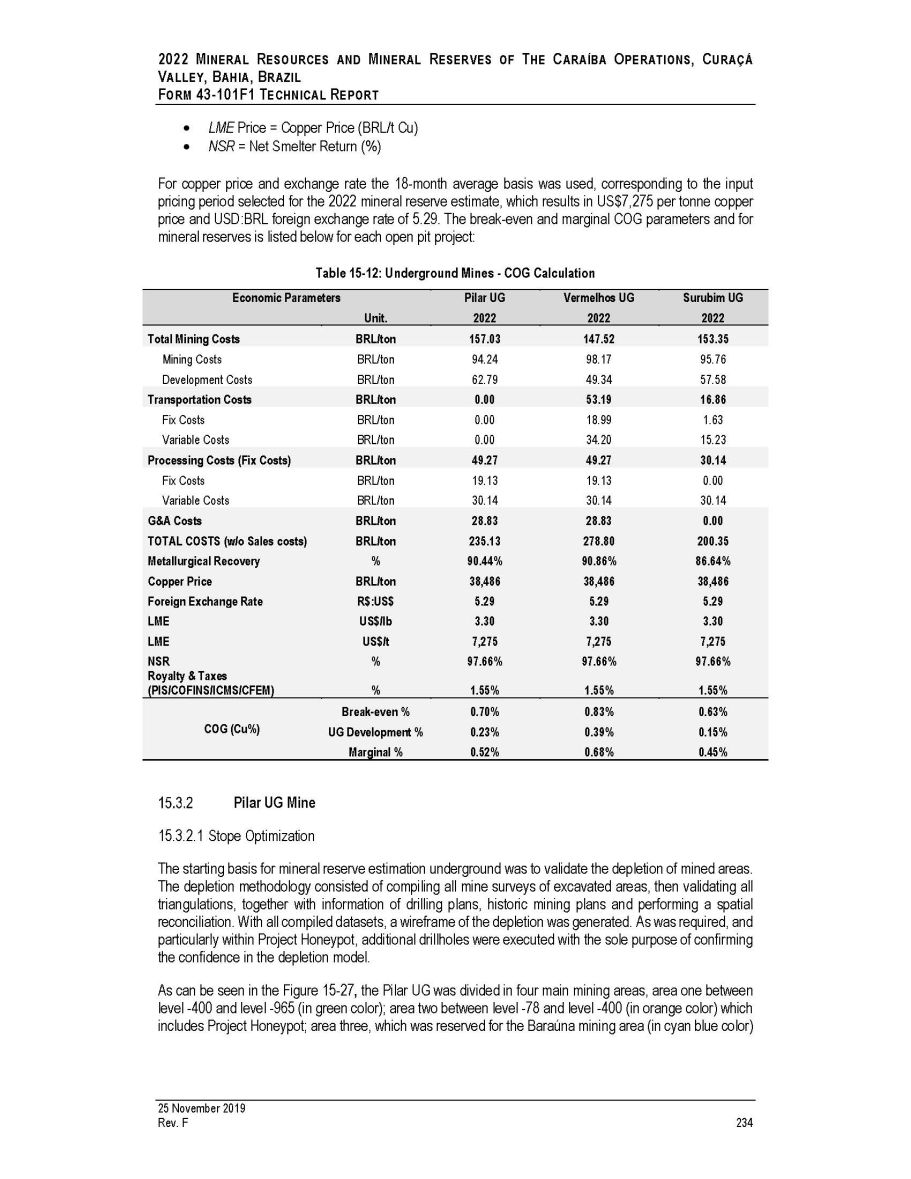
2022 M INERAL R ESOURCES AND M INERAL R ESERVES OF T HE C ARAÍBA O PERATIONS , C URAÇÁ V ALLEY , B AHIA , B RAZIL F ORM 43 - 101F1 T ECHNICAL R EPORT LME Price = Copper Price (BRL/t Cu) NSR = Net Smelter Return (%) For copper price and exchange rate the 18 - month average basis was used, corresponding to the input pricing period selected for the 2022 mineral reserve estimate, which results in US $ 7 , 275 per tonne copper price and USD : BRL foreign exchange rate of 5 . 29 . The break - even and marginal COG parameters and for mineral reserves is listed below for each open pit project : Table 15 - 12: Underground Mines - COG Calculation Economic Parameters Unit. Pilar UG 2022 Vermelhos UG 2022 Surubim UG 2022 Total Mining Costs BRL/ton 157.03 147.52 153.35 Mining Costs BRL/ton 94.24 98.17 95.76 Development Costs BRL/ton 62.79 49.34 57.58 Transportation Costs BRL/ton 0.00 53.19 16.86 Fix Costs BRL/ton 0.00 18.99 1.63 Variable Costs BRL/ton 0.00 34.20 15.23 Processing Costs (Fix Costs) BRL/ton 49.27 49.27 30.14 Fix Costs BRL/ton 19.13 19.13 0.00 Variable Costs BRL/ton 30.14 30.14 30.14 G&A Costs BRL/ton 28.83 28.83 0.00 TOTAL COSTS (w/o Sales costs) BRL/ton 235.13 278.80 200.35 Metallurgical Recovery % 90.44% 90.86% 86.64% Copper Price BRL/ton 38,486 38,486 38,486 Foreign Exchange Rate R$:US$ 5.29 5.29 5.29 LME US$/lb 3.30 3.30 3.30 LME US$/t 7,275 7,275 7,275 NSR % 97.66% 97.66% 97.66% Royalty & Taxes (PIS/COFINS/ICMS/CFEM) % 1.55% 1.55% 1.55% Break - even % 0.70% 0.83% 0.63% COG (Cu%) UG Development % 0.23% 0.39% 0.15% Marginal % 0.52% 0.68% 0.45% Pilar UG Mine 15.3.2.1 Stope Optimization The starting basis for mineral reserve estimation underground was to validate the depletion of mined areas . The depletion methodology consisted of compiling all mine surveys of excavated areas, then validating all triangulations, together with information of drilling plans, historic mining plans and performing a spatial reconciliation . With all compiled datasets, a wireframe of the depletion was generated . As was required, and particularly within Project Honeypot, additional drillholes were executed with the sole purpose of confirming the confidence in the depletion model . As can be seen in the Figure 15 - 27 , the Pilar UG was divided in four main mining areas, area one between level - 400 and level - 965 (in green color) ; area two between level - 78 and level - 400 (in orange color) which includes Project Honeypot ; area three, which was reserved for the Baraúna mining area (in cyan blue color) 25 November 2019 Rev. F 234
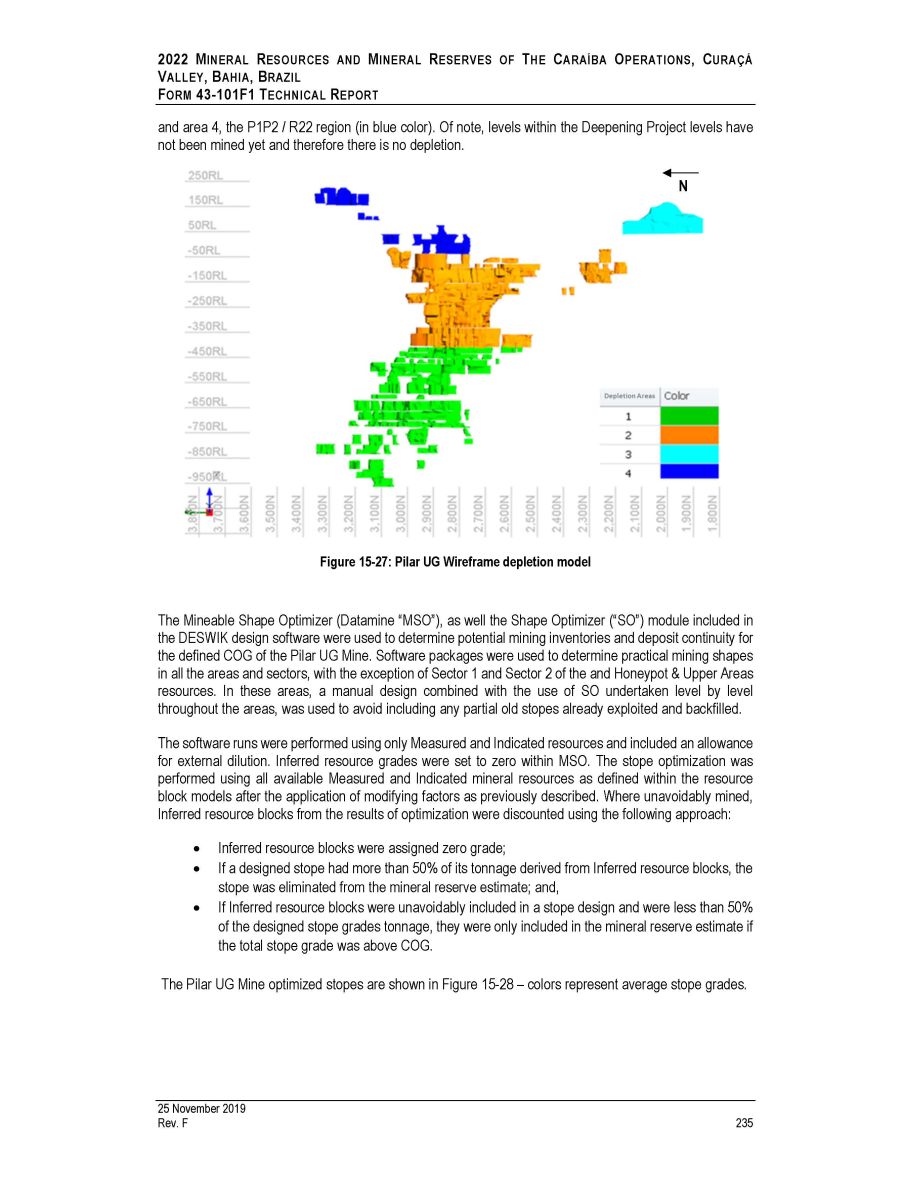
Figure 15 - 27: Pilar UG Wireframe depletion model The Mineable Shape Optimizer (Datamine “MSO”), as well the Shape Optimizer (“SO”) module included in the DESWIK design software were used to determine potential mining inventories and deposit continuity for the defined COG of the Pilar UG Mine . Software packages were used to determine practical mining shapes in all the areas and sectors, with the exception of Sector 1 and Sector 2 of the and Honeypot & Upper Areas resources . In these areas, a manual design combined with the use of SO undertaken level by level throughout the areas, was used to avoid including any partial old stopes already exploited and backfilled . The software runs were performed using only Measured and Indicated resources and included an allowance for external dilution . Inferred resource grades were set to zero within MSO . The stope optimization was performed using all available Measured and Indicated mineral resources as defined within the resource block models after the application of modifying factors as previously described . Where unavoidably mined, Inferred resource blocks from the results of optimization were discounted using the following approach : Inferred resource blocks were assigned zero grade ; If a designed stope had more than 50 % of its tonnage derived from Inferred resource blocks, the stope was eliminated from the mineral reserve estimate ; and, If Inferred resource blocks were unavoidably included in a stope design and were less than 50 % of the designed stope grades tonnage, they were only included in the mineral reserve estimate if the total stope grade was above COG . The Pilar UG Mine optimized stopes are shown in Figure 15 - 28 – colors represent average stope grades. 2022 M INERAL R ESOURCES AND M INERAL R ESERVES OF T HE C ARAÍBA O PERATIONS , C URAÇÁ V ALLEY , B AHIA , B RAZIL F ORM 43 - 101F1 T ECHNICAL R EPORT and area 4, the P1P2 / R22 region (in blue color). Of note, levels within the Deepening Project levels have not been mined yet and therefore there is no depletion. N 25 November 2019 Rev. F 235
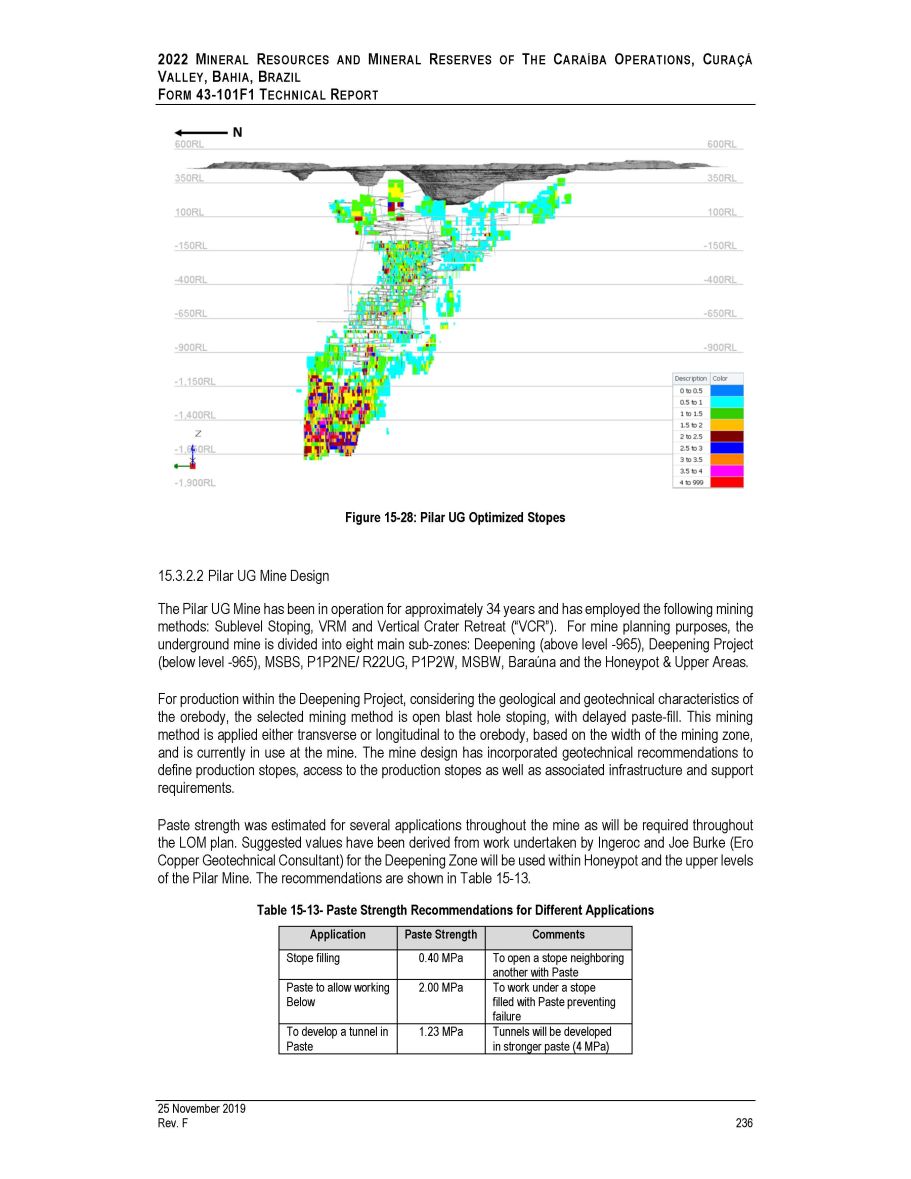
2022 M INERAL R ESOURCES AND M INERAL R ESERVES OF T HE C ARAÍBA O PERATIONS , C URAÇÁ V ALLEY , B AHIA , B RAZIL F ORM 43 - 101F1 T ECHNICAL R EPORT Figure 15 - 28: Pilar UG Optimized Stopes 15.3.2.2 Pilar UG Mine Design The Pilar UG Mine has been in operation for approximately 34 years and has employed the following mining methods : Sublevel Stoping, VRM and Vertical Crater Retreat (“VCR”) . For mine planning purposes, the underground mine is divided into eight main sub - zones : Deepening (above level - 965 ), Deepening Project (below level - 965 ), MSBS, P 1 P 2 NE/ R 22 UG, P 1 P 2 W, MSBW, Baraúna and the Honeypot & Upper Areas . For production within the Deepening Project, considering the geological and geotechnical characteristics of the orebody, the selected mining method is open blast hole stoping, with delayed paste - fill . This mining method is applied either transverse or longitudinal to the orebody, based on the width of the mining zone, and is currently in use at the mine . The mine design has incorporated geotechnical recommendations to define production stopes, access to the production stopes as well as associated infrastructure and support requirements . Paste strength was estimated for several applications throughout the mine as will be required throughout the LOM plan . Suggested values have been derived from work undertaken by Ingeroc and Joe Burke (Ero Copper Geotechnical Consultant) for the Deepening Zone will be used within Honeypot and the upper levels of the Pilar Mine . The recommendations are shown in Table 15 - 13 . Table 15 - 13 - Paste Strength Recommendations for Different Applications Application Paste Strength Comments Stope filling 0.40 MPa To open a stope neighboring another with Paste Paste to allow working Below 2.00 MPa To work under a stope filled with Paste preventing failure To develop a tunnel in Paste 1.23 MPa Tunnels will be developed in stronger paste (4 MPa) 25 November 2019 Rev. F 236
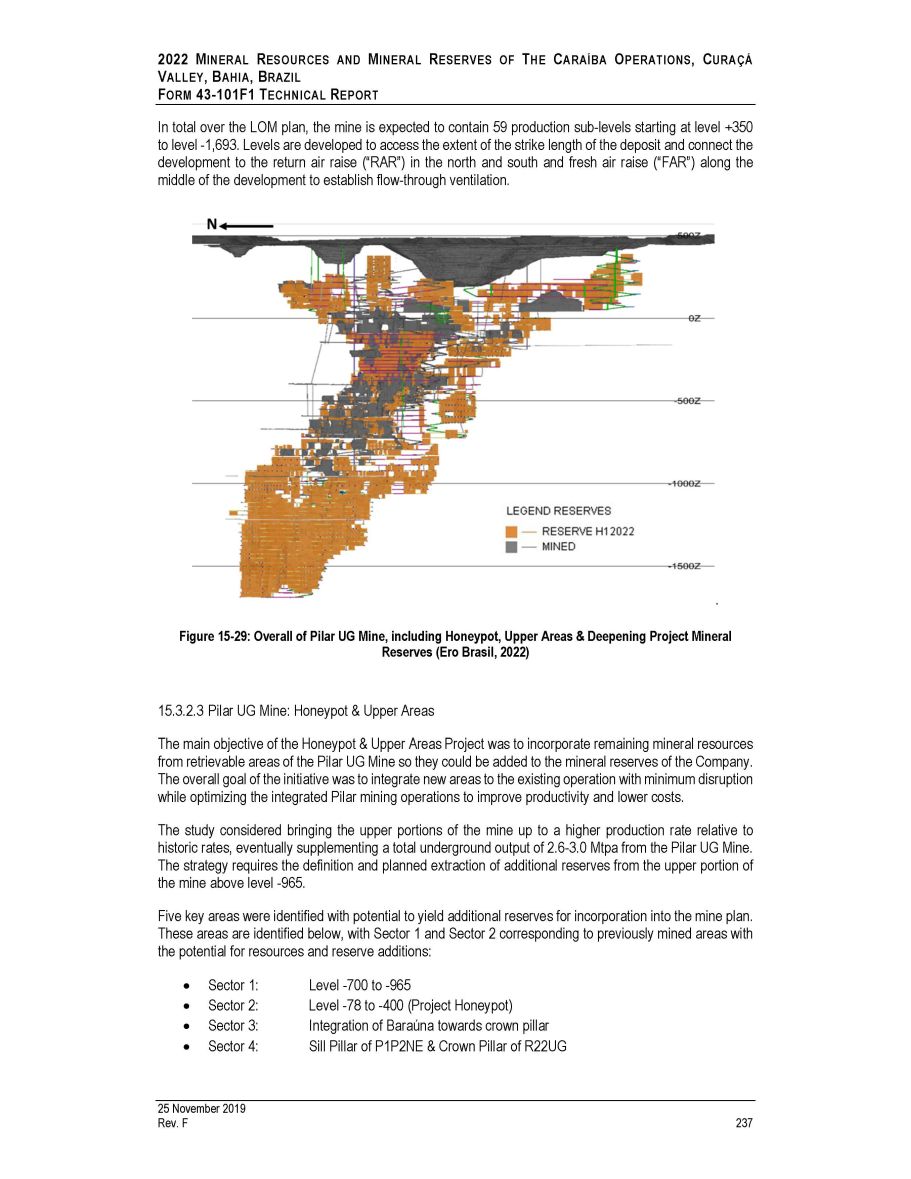
2022 M INERAL R ESOURCES AND M INERAL R ESERVES OF T HE C ARAÍBA O PERATIONS , C URAÇÁ V ALLEY , B AHIA , B RAZIL F ORM 43 - 101F1 T ECHNICAL R EPORT In total over the LOM plan, the mine is expected to contain 59 production sub - levels starting at level + 350 to level - 1 , 693 . Levels are developed to access the extent of the strike length of the deposit and connect the development to the return air raise (“RAR”) in the north and south and fresh air raise (“FAR”) along the middle of the development to establish flow - through ventilation . . Figure 15 - 29: Overall of Pilar UG Mine, including Honeypot, Upper Areas & Deepening Project Mineral Reserves (Ero Brasil, 2022) 15.3.2.3 Pilar UG Mine: Honeypot & Upper Areas The main objective of the Honeypot & Upper Areas Project was to incorporate remaining mineral resources from retrievable areas of the Pilar UG Mine so they could be added to the mineral reserves of the Company . The overall goal of the initiative was to integrate new areas to the existing operation with minimum disruption while optimizing the integrated Pilar mining operations to improve productivity and lower costs . The study considered bringing the upper portions of the mine up to a higher production rate relative to historic rates, eventually supplementing a total underground output of 2 . 6 - 3 . 0 Mtpa from the Pilar UG Mine . The strategy requires the definition and planned extraction of additional reserves from the upper portion of the mine above level - 965 . Five key areas were identified with potential to yield additional reserves for incorporation into the mine plan . These areas are identified below, with Sector 1 and Sector 2 corresponding to previously mined areas with the potential for resources and reserve additions : Sector 1: Sector 2: Sector 3: Sector 4: Level - 700 to - 965 Level - 78 to - 400 (Project Honeypot) Integration of Baraúna towards crown pillar Sill Pillar of P1P2NE & Crown Pillar of R22UG 25 November 2019 Rev. F 237
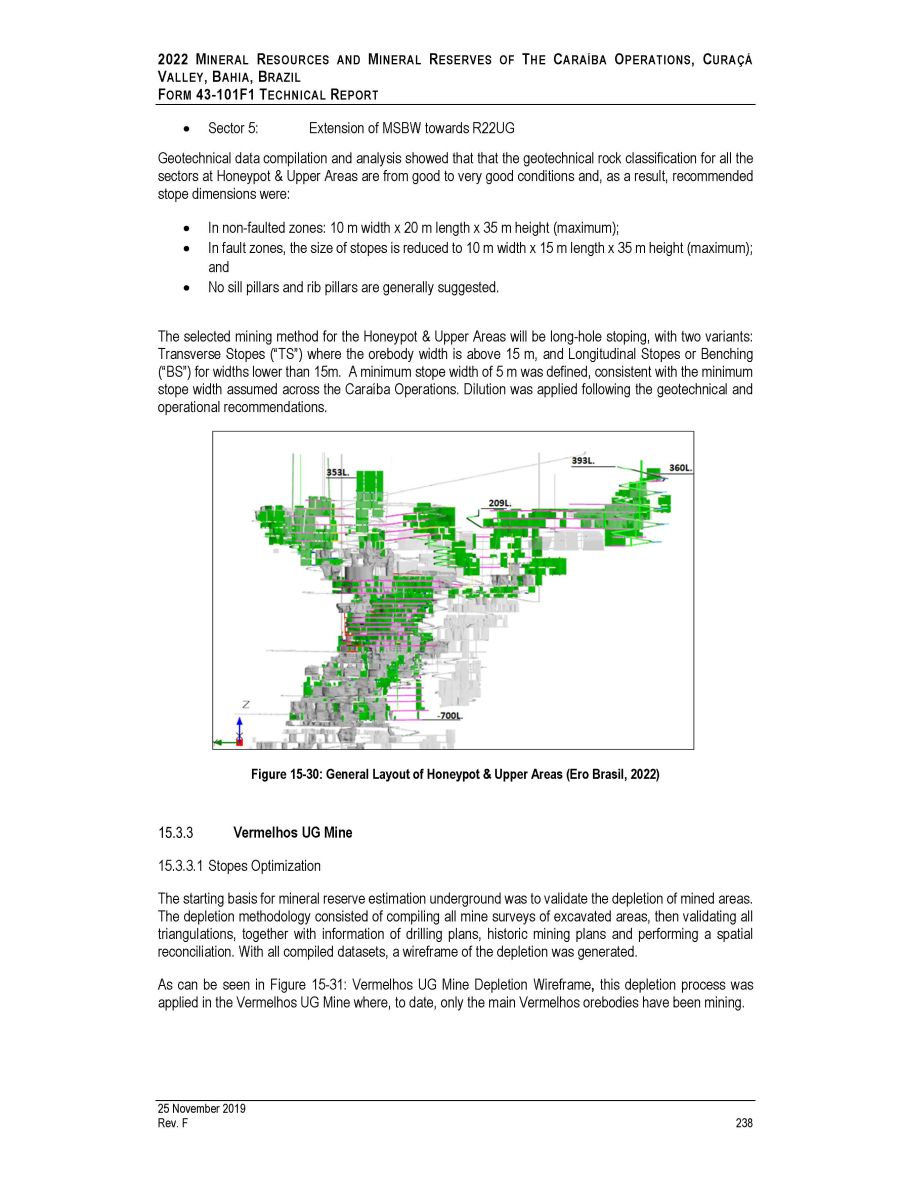
2022 M INERAL R ESOURCES AND M INERAL R ESERVES OF T HE C ARAÍBA O PERATIONS , C URAÇÁ V ALLEY , B AHIA , B RAZIL F ORM 43 - 101F1 T ECHNICAL R EPORT Sector 5: Extension of MSBW towards R22UG Geotechnical data compilation and analysis showed that that the geotechnical rock classification for all the sectors at Honeypot & Upper Areas are from good to very good conditions and, as a result, recommended stope dimensions were : In non - faulted zones: 10 m width x 20 m length x 35 m height (maximum); In fault zones, the size of stopes is reduced to 10 m width x 15 m length x 35 m height (maximum); and No sill pillars and rib pillars are generally suggested. The selected mining method for the Honeypot & Upper Areas will be long - hole stoping, with two variants : Transverse Stopes (“TS”) where the orebody width is above 15 m, and Longitudinal Stopes or Benching (“BS”) for widths lower than 15 m . A minimum stope width of 5 m was defined, consistent with the minimum stope width assumed across the Caraíba Operations . Dilution was applied following the geotechnical and operational recommendations . Figure 15 - 30: General Layout of Honeypot & Upper Areas (Ero Brasil, 2022) Vermelhos UG Mine 15.3.3.1 Stopes Optimization The starting basis for mineral reserve estimation underground was to validate the depletion of mined areas . The depletion methodology consisted of compiling all mine surveys of excavated areas, then validating all triangulations, together with information of drilling plans, historic mining plans and performing a spatial reconciliation . With all compiled datasets, a wireframe of the depletion was generated . As can be seen in Figure 15 - 31 : Vermelhos UG Mine Depletion Wireframe , this depletion process was applied in the Vermelhos UG Mine where, to date, only the main Vermelhos orebodies have been mining . 25 November 2019 Rev. F 238
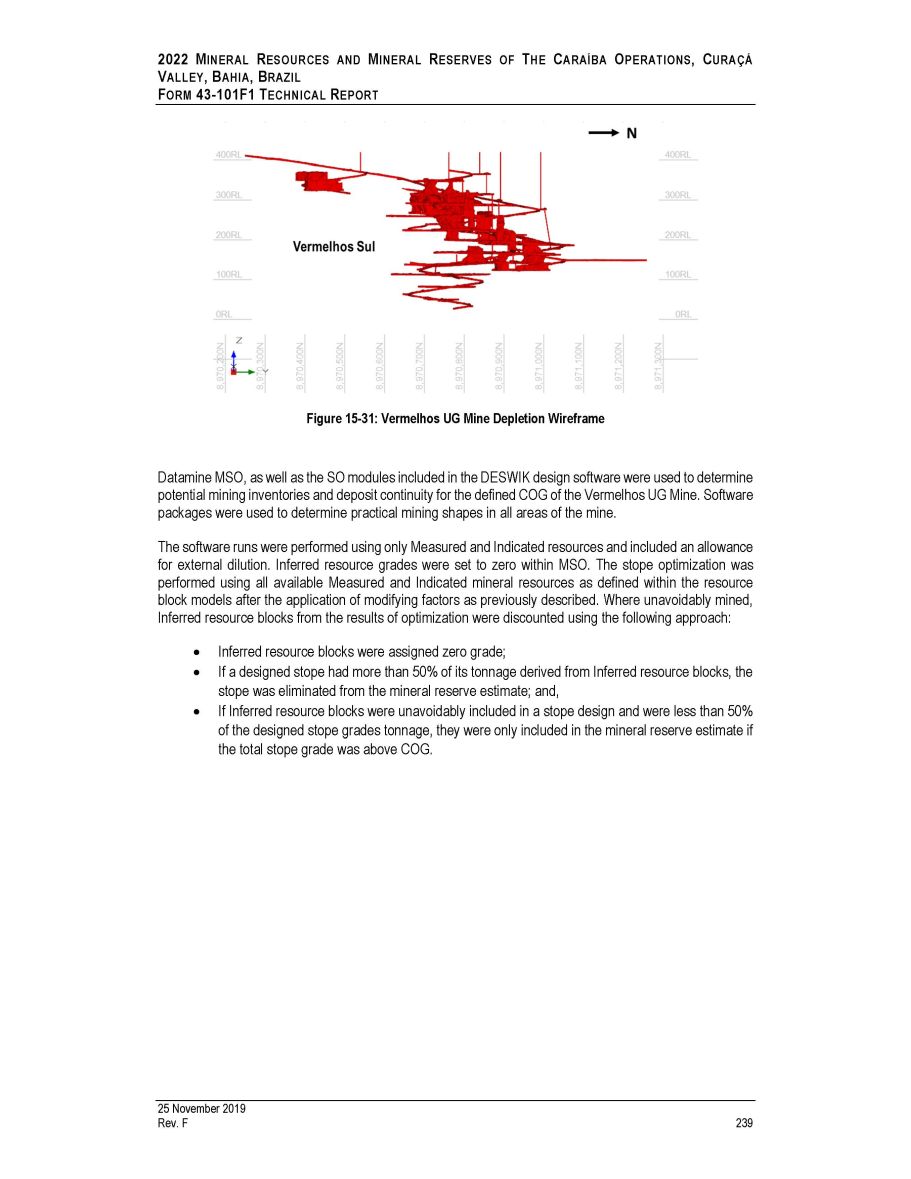
2022 M INERAL R ESOURCES AND M INERAL R ESERVES OF T HE C ARAÍBA O PERATIONS , C URAÇÁ V ALLEY , B AHIA , B RAZIL F ORM 43 - 101F1 T ECHNICAL R EPORT Figure 15 - 31: Vermelhos UG Mine Depletion Wireframe Datamine MSO, as well as the SO modules included in the DESWIK design software were used to determine potential mining inventories and deposit continuity for the defined COG of the Vermelhos UG Mine . Software packages were used to determine practical mining shapes in all areas of the mine . The software runs were performed using only Measured and Indicated resources and included an allowance for external dilution . Inferred resource grades were set to zero within MSO . The stope optimization was performed using all available Measured and Indicated mineral resources as defined within the resource block models after the application of modifying factors as previously described . Where unavoidably mined, Inferred resource blocks from the results of optimization were discounted using the following approach : Inferred resource blocks were assigned zero grade ; If a designed stope had more than 50 % of its tonnage derived from Inferred resource blocks, the stope was eliminated from the mineral reserve estimate ; and, If Inferred resource blocks were unavoidably included in a stope design and were less than 50 % of the designed stope grades tonnage, they were only included in the mineral reserve estimate if the total stope grade was above COG . 25 November 2019 Rev. F 239

2022 M INERAL R ESOURCES AND M INERAL R ESERVES OF T HE C ARAÍBA O PERATIONS , C URAÇÁ V ALLEY , B AHIA , B RAZIL F ORM 43 - 101F1 T ECHNICAL R EPORT Figure 15 - 32: Vermelhos UG Optimized Stopes detailing average planned copper grade per stope 15.3.3.2 Vermelhos UG Mine Design After completion of the SO runs, the Studio UG module of Datamine software was used to perform detailed design of the Vermelhos UG Mine mineral reserves . Mineral reserves for the Vermelhos UG Mine were divided into two primary mine planning areas given the nature of the operations and the planned development to extract the East Zone as currently envisioned . The mineral reserves are based upon the Measured and Indicated mineral resources in Vermelhos UG Mine design . The mineral reserve estimate considered the technical and economic parameters needed to define the stopes and mining development, as previously outlined . Considering the geological and geotechnical characteristics of the deposit, the recommended mining method for the Vermelhos UG Mine is sub - level open stoping (“SOS”) method, with rock - fill being used to fill previously mined stopes . Figure 15 - 33: North - South schematic profile of the Vermelhos UG Mine (Ero Brasil, 2022) 25 November 2019 Rev. F 240
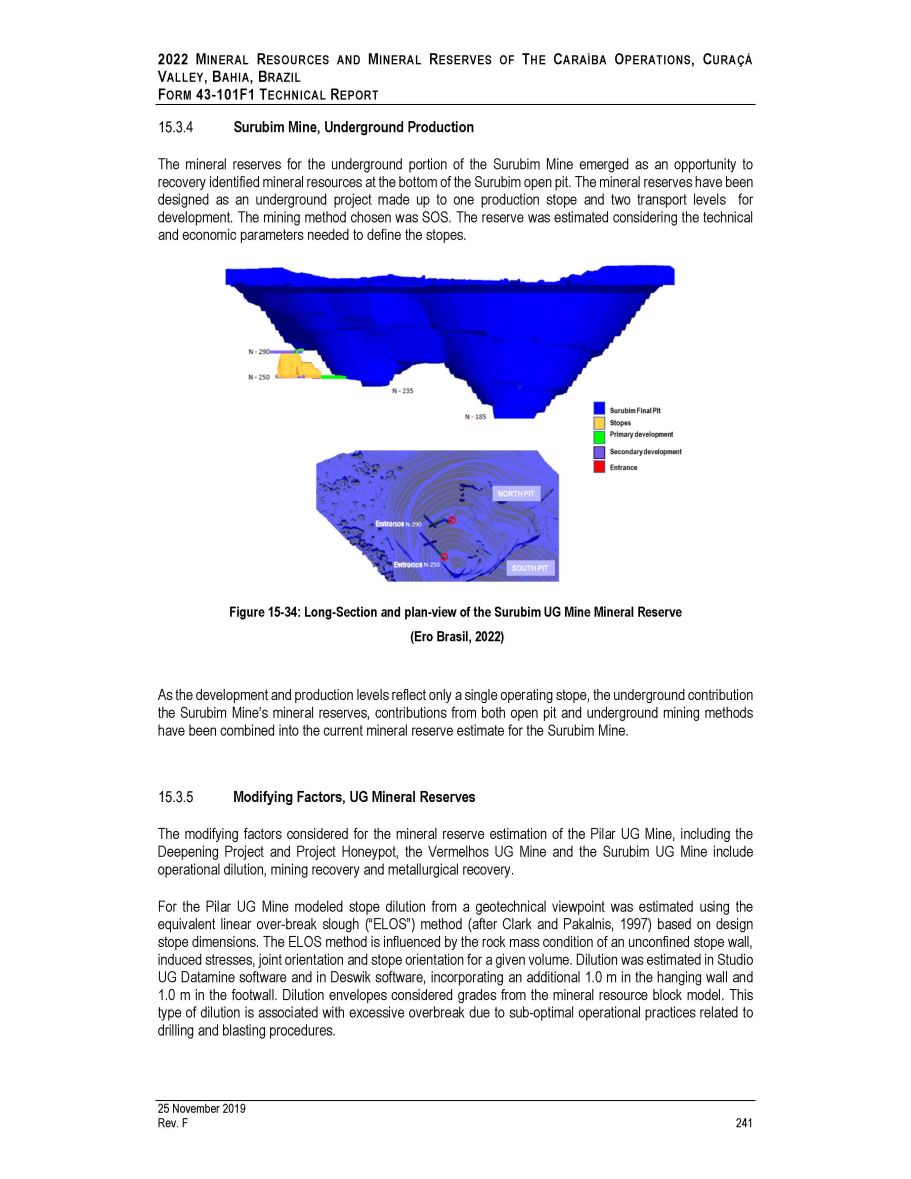
2022 M INERAL R ESOURCES AND M INERAL R ESERVES OF T HE C ARAÍBA O PERATIONS , C URAÇÁ V ALLEY , B AHIA , B RAZIL F ORM 43 - 101F1 T ECHNICAL R EPORT Surubim Mine, Underground Production The mineral reserves for the underground portion of the Surubim Mine emerged as an opportunity to recovery identified mineral resources at the bottom of the Surubim open pit . The mineral reserves have been designed as an underground project made up to one production stope and two transport levels for development . The mining method chosen was SOS . The reserve was estimated considering the technical and economic parameters needed to define the stopes . Figure 15 - 34: Long - Section and plan - view of the Surubim UG Mine Mineral Reserve (Ero Brasil, 2022) As the development and production levels reflect only a single operating stope, the underground contribution the Surubim Mine’s mineral reserves, contributions from both open pit and underground mining methods have been combined into the current mineral reserve estimate for the Surubim Mine . Modifying Factors, UG Mineral Reserves The modifying factors considered for the mineral reserve estimation of the Pilar UG Mine, including the Deepening Project and Project Honeypot, the Vermelhos UG Mine and the Surubim UG Mine include operational dilution, mining recovery and metallurgical recovery . For the Pilar UG Mine modeled stope dilution from a geotechnical viewpoint was estimated using the equivalent linear over - break slough (“ELOS”) method (after Clark and Pakalnis, 1997 ) based on design stope dimensions . The ELOS method is influenced by the rock mass condition of an unconfined stope wall, induced stresses, joint orientation and stope orientation for a given volume . Dilution was estimated in Studio UG Datamine software and in Deswik software, incorporating an additional 1 . 0 m in the hanging wall and 1 . 0 m in the footwall . Dilution envelopes considered grades from the mineral resource block model . This type of dilution is associated with excessive overbreak due to sub - optimal operational practices related to drilling and blasting procedures . 25 November 2019 Rev. F 241

2022 M INERAL R ESOURCES AND M INERAL R ESERVES OF T HE C ARAÍBA O PERATIONS , C URAÇÁ V ALLEY , B AHIA , B RAZIL F ORM 43 - 101F1 T ECHNICAL R EPORT Figure 15 - 35: Cross section shows 1m in the hanging wall and footwall in Pilar UG Mine (Ero Brasil, 2022) For Vermelhos UG Mine and underground portion of the Surubim Mine, SOS, the mining method currently in use at Vermelhos, was considered . Application of the method is based upon considerations of dip, plunge and thickness of the orebodies, RQD and overall competence of the host rock . Variations of this method are in use within the central high - grade area of the Vermelhos UG Mine for the maximum possible recovery via introduction of cemented rockfill matrix filling (“CRF”) which enables the recovery of secondary stopes . Overbreak occurs during the drilling and blasting stages through the mine operation . This factor can be influenced by geotechnical structures (failures, fractures in the rock mass), drilling deviations, explosive action during blasting or imperfections in the execution in the drill and blast design . Within the overbreak volume there is mass of waste and mass of mineralized material . The portion of waste material included within the overbreak is called the operational dilution . In 2022 , a dilution model utilizing a marginal cut - off grade, was developed and incorporated into the mine planning stage of the current mineral reserve estimate and LOM production plan . Underbreak, also called ore loss, is caused when the blasting efficiency is low, drilling is not accurate (length and deviation) and/or imperfections exist within the drill and blast design . The load - haul - dump machine (LHD) will have difficulty mucking the stope corners and near the walls, particularly under remote control operation . The inverse calculation of the underbreak is called mining recovery ( 100 % - underbreak % ) . 5 % underbreak ( 95 % of mining recovery) was applied for the mineral reserve estimate for the Vermelhos UG Mine and the Surubim Mine while 4 % underbreak ( 96 % of mining recovery) for the Pilar UG Mine and Deepening Project was applied based on operational performance . For Project Honeypot and other Upper Areas of the Pilar UG Mine, where the projected stopes will be in direct contact with previously extracted historic stopes, a mining recovery factor of 90 % was used . The figure below shows an Example of overbreak and underbreak in Vermelhos UG Mine . 25 November 2019 Rev. F 242
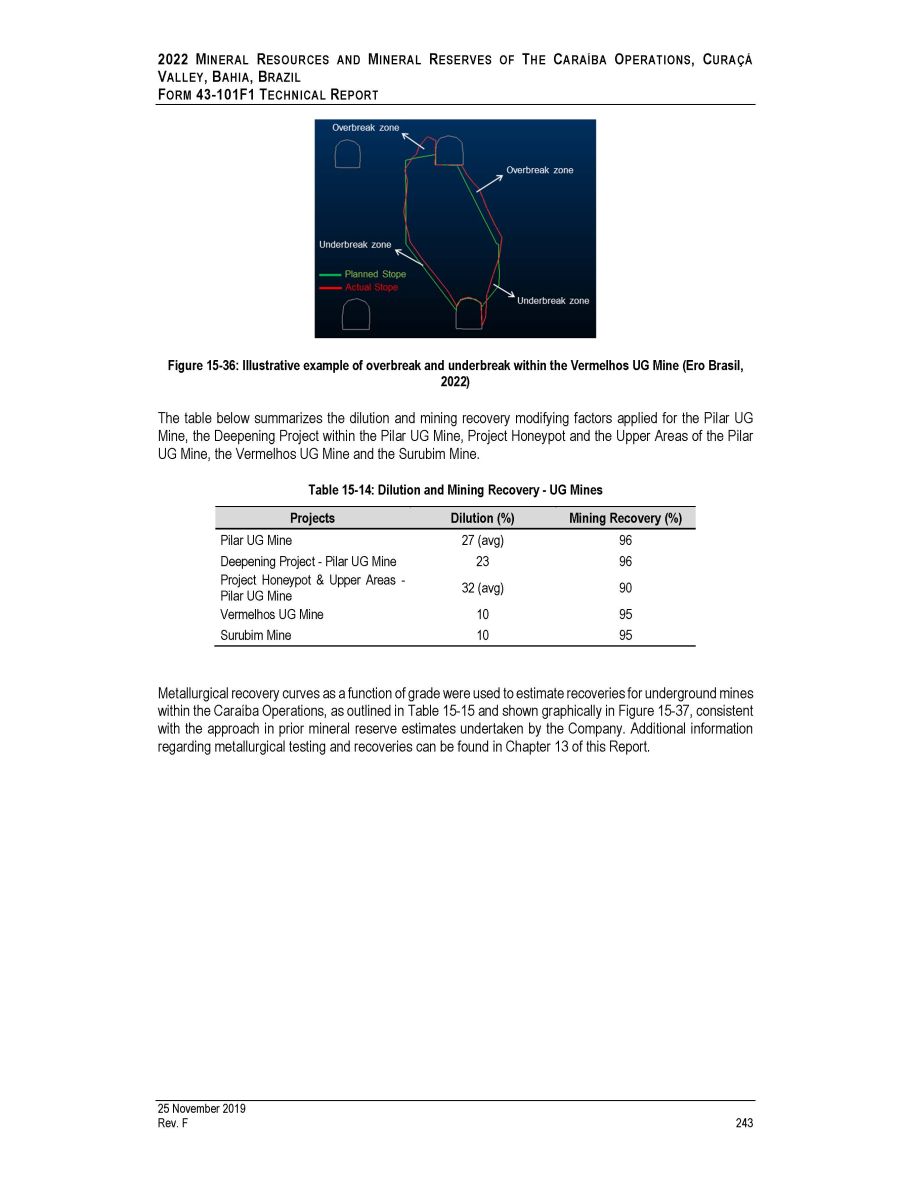
2022 M INERAL R ESOURCES AND M INERAL R ESERVES OF T HE C ARAÍBA O PERATIONS , C URAÇÁ V ALLEY , B AHIA , B RAZIL F ORM 43 - 101F1 T ECHNICAL R EPORT Figure 15 - 36: Illustrative example of overbreak and underbreak within the Vermelhos UG Mine (Ero Brasil, 2022) The table below summarizes the dilution and mining recovery modifying factors applied for the Pilar UG Mine, the Deepening Project within the Pilar UG Mine, Project Honeypot and the Upper Areas of the Pilar UG Mine, the Vermelhos UG Mine and the Surubim Mine . Table 15 - 14: Dilution and Mining Recovery - UG Mines Projects Dilution (%) Mining Recovery (%) Pilar UG Mine 27 (avg) 96 Deepening Project - Pilar UG Mine 23 96 Project Honeypot & Upper Areas - Pilar UG Mine Vermelhos UG Mine Surubim Mine 32 (avg) 10 10 90 95 95 Metallurgical recovery curves as a function of grade were used to estimate recoveries for underground mines within the Caraíba Operations, as outlined in Table 15 - 15 and shown graphically in Figure 15 - 37 , consistent with the approach in prior mineral reserve estimates undertaken by the Company . Additional information regarding metallurgical testing and recoveries can be found in Chapter 13 of this Report . 25 November 2019 Rev. F 243

2022 M INERAL R ESOURCES AND M INERAL R ESERVES OF T HE C ARAÍBA O PERATIONS , C URAÇÁ V ALLEY , B AHIA , B RAZIL F ORM 43 - 101F1 T ECHNICAL R EPORT Table 15 - 15: Metallurgical Recovery by District CuT (%) Vermelhos (North) District Surubim (Center) District Pilar (South) District Blended (with Hig Mill) 0.30 85.70 80.14 83.65 84.30 0.40 86.71 81.80 84.82 85.52 0.50 87.50 83.10 85.72 86.46 0.60 88.14 84.18 86.46 87.23 0.70 88.68 85.11 87.09 87.89 0.80 89.15 85.92 87.63 88.45 0.90 89.57 86.64 88.11 88.95 1.00 89.94 87.29 88.53 89.39 1.10 90.27 87.88 88.92 89.80 1.20 90.58 88.42 89.27 90.17 1.30 90.86 88.92 89.60 90.50 1.40 91.12 89.39 89.90 90.82 1.50 91.36 89.83 90.18 91.11 1.60 91.59 90.24 90.44 91.38 1.70 91.80 90.63 90.69 91.64 1.80 92.00 91.00 90.92 91.88 Figure 15 - 37: Metallurgical recovery curves as a function of grade Cu (%) (Ero Brasil, 2022) Based on the curves and expected average grade for each underground mine within the Caraíba Operation, the following metallurgical recoveries were applied for the COG calculation. Table 15 - 16: Underground Metallurgical Recovery Summary Project Grade (%) Metallurgical Rec (%) Pilar UG 1.60 90.44 Vermelhos UG 1.30 90.86 Surubim UG 0.90 86.64 25 November 2019 Rev. F 244

2022 M INERAL R ESOURCES AND M INERAL R ESERVES OF T HE C ARAÍBA O PERATIONS , C URAÇÁ V ALLEY , B AHIA , B RAZIL F ORM 43 - 101F1 T ECHNICAL R EPORT The authors of this Report note that the forecast increase in metallurgical recoveries applied in the LOM production plan as a result of the recently commissioned HIG Mill were considered when estimating the current mineral reserves . Other modifying factors considered in the determination of the mineral reserve estimate include : Maximum underground stope dimensions based on geotechnical assessments from previous studies and past operating experience within each mining area, combined with evaluation of induced stresses and the RMR . VRM method with cemented paste fill was selected for the Pilar UG Mine, where the method is currently in use . Within designed stopes, all contained material was assumed to be mined with no selectivity . Inferred mineral resources, where unavoidably included within a defined mining shape have been included in the mineral reserves estimate at zero grade . Mining dilution resulting from Measured and Indicated blocks was assigned the grade of those blocks captured in the dilution envelope using the current mineral resource estimate . 15.4 Q UALIFIED P ERSONS O PINION The QPs responsible for the current mineral reserve estimate are Dr . Beck Nader of BNA, and Alejandro Sepúlveda from NCL SpA . The QPs have checked the data used to construct the current mineral reserve models and considers the models to be suitable to support advanced mining studies and the current mining operations as currently envisioned . BNA and NCL SpA supervised and validated the current mineral reserves estimate prepared by Ero Brasil through comparative estimates and validation tools . Comparative estimates were prepared from the open pit and underground stope optimization, and tonnage reports for cross - checks . The QPs have not identified any metallurgical, infrastructure, permitting, legal, political, environmental, title, taxation, socio - economic, marketing, or other relevant factors that could materially affect the potential development of the stated mineral reserves . Dr . Beck Nader of BNA and Alejandro Sepúlveda from NCL SpA are of the opinion that the mineral reserve estimation has been performed to industry best practices and conform to the requirements of the CIM Standards and CIM Guidelines . 25 November 2019 Rev. F 245
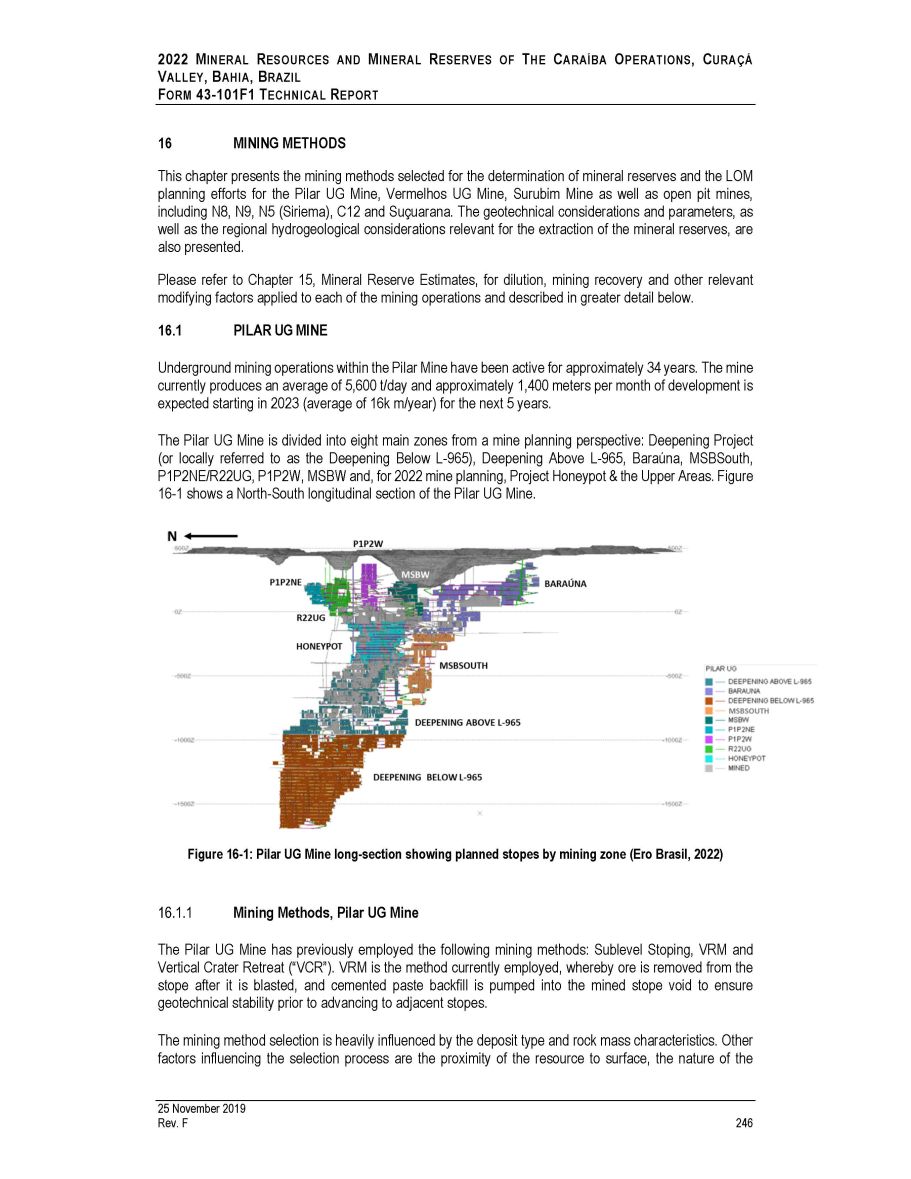
2022 M INERAL R ESOURCES AND M INERAL R ESERVES OF T HE C ARAÍBA O PERATIONS , C URAÇÁ V ALLEY , B AHIA , B RAZIL F ORM 43 - 101F1 T ECHNICAL R EPORT 16 MINING METHODS This chapter presents the mining methods selected for the determination of mineral reserves and the LOM planning efforts for the Pilar UG Mine, Vermelhos UG Mine, Surubim Mine as well as open pit mines, including N 8 , N 9 , N 5 (Siriema), C 12 and Suçuarana . The geotechnical considerations and parameters, as well as the regional hydrogeological considerations relevant for the extraction of the mineral reserves, are also presented . Please refer to Chapter 15 , Mineral Reserve Estimates, for dilution, mining recovery and other relevant modifying factors applied to each of the mining operations and described in greater detail below . 1. PILAR UG MINE Underground mining operations within the Pilar Mine have been active for approximately 34 years . The mine currently produces an average of 5 , 600 t/day and approximately 1 , 400 meters per month of development is expected starting in 2023 (average of 16 k m/year) for the next 5 years . The Pilar UG Mine is divided into eight main zones from a mine planning perspective : Deepening Project (or locally referred to as the Deepening Below L - 965 ), Deepening Above L - 965 , Baraúna, MSBSouth, P 1 P 2 NE/R 22 UG, P 1 P 2 W, MSBW and, for 2022 mine planning, Project Honeypot & the Upper Areas . Figure 16 - 1 shows a North - South longitudinal section of the Pilar UG Mine . Figure 16 - 1: Pilar UG Mine long - section showing planned stopes by mining zone (Ero Brasil, 2022) Mining Methods, Pilar UG Mine The Pilar UG Mine has previously employed the following mining methods : Sublevel Stoping, VRM and Vertical Crater Retreat (“VCR”) . VRM is the method currently employed, whereby ore is removed from the stope after it is blasted, and cemented paste backfill is pumped into the mined stope void to ensure geotechnical stability prior to advancing to adjacent stopes . The mining method selection is heavily influenced by the deposit type and rock mass characteristics . Other factors influencing the selection process are the proximity of the resource to surface, the nature of the 25 November 2019 Rev. F 246
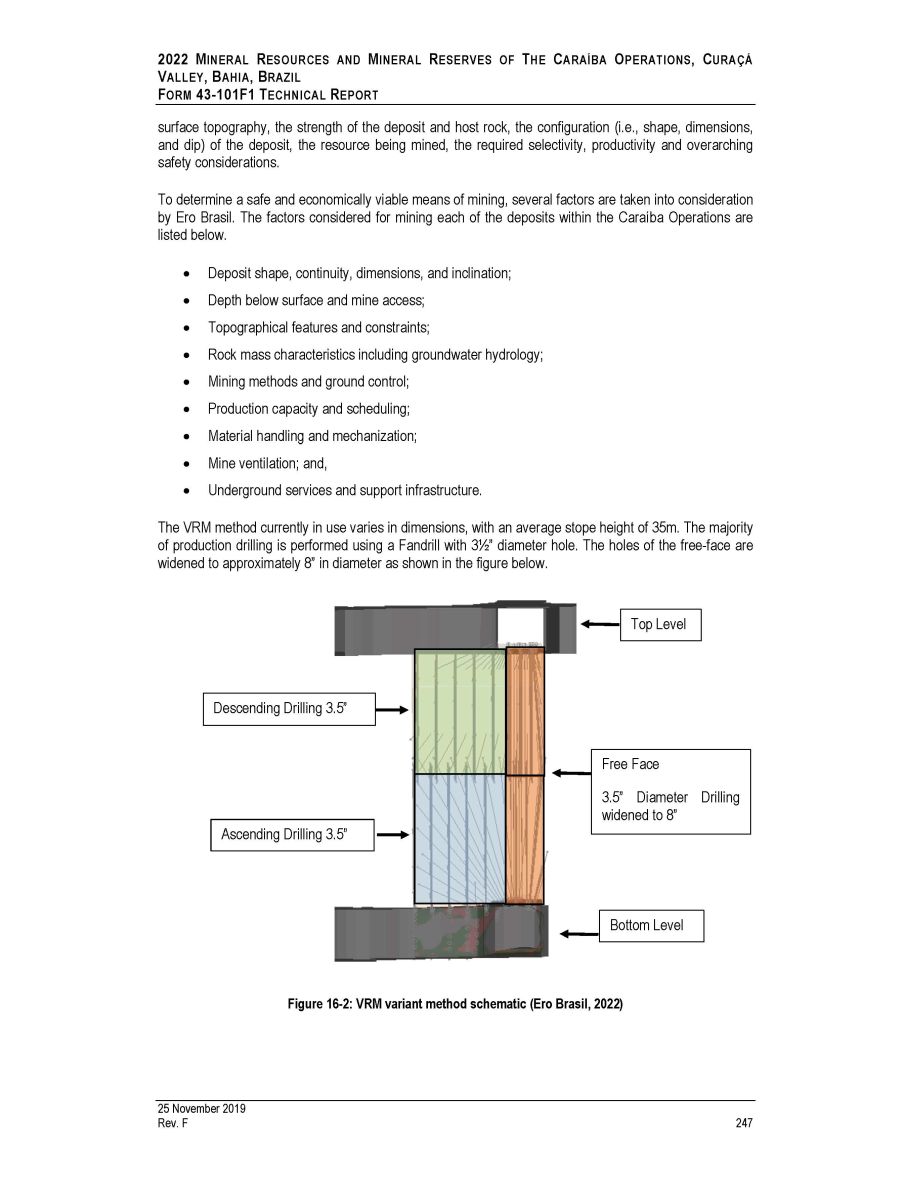
2022 M INERAL R ESOURCES AND M INERAL R ESERVES OF T HE C ARAÍBA O PERATIONS , C URAÇÁ V ALLEY , B AHIA , B RAZIL F ORM 43 - 101F1 T ECHNICAL R EPORT surface topography, the strength of the deposit and host rock, the configuration (i . e . , shape, dimensions, and dip) of the deposit, the resource being mined, the required selectivity, productivity and overarching safety considerations . To determine a safe and economically viable means of mining, several factors are taken into consideration by Ero Brasil . The factors considered for mining each of the deposits within the Caraíba Operations are listed below . Deposit shape, continuity, dimensions, and inclination; Depth below surface and mine access; Topographical features and constraints; Rock mass characteristics including groundwater hydrology; Mining methods and ground control; Production capacity and scheduling; Material handling and mechanization; Mine ventilation; and, Underground services and support infrastructure. The VRM method currently in use varies in dimensions, with an average stope height of 35 m . The majority of production drilling is performed using a Fandrill with 3 ½” diameter hole . The holes of the free - face are widened to approximately 8 ” in diameter as shown in the figure below . Figure 16 - 2: VRM variant method schematic (Ero Brasil, 2022) Top Level Bottom Level Free Face 3.5” Diameter Drilling widened to 8” Descending Drilling 3.5” Ascending Drilling 3.5” 25 November 2019 Rev. F 247
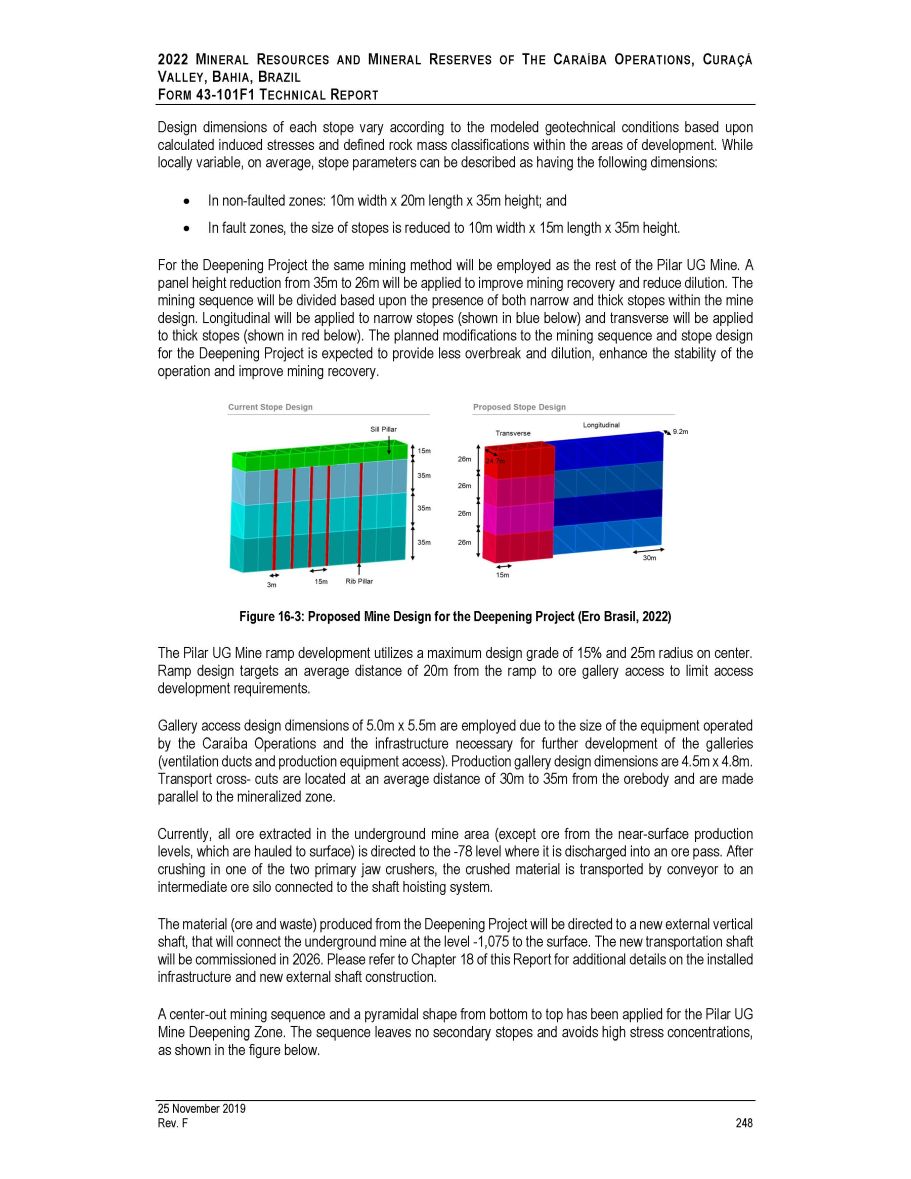
2022 M INERAL R ESOURCES AND M INERAL R ESERVES OF T HE C ARAÍBA O PERATIONS , C URAÇÁ V ALLEY , B AHIA , B RAZIL F ORM 43 - 101F1 T ECHNICAL R EPORT Design dimensions of each stope vary according to the modeled geotechnical conditions based upon calculated induced stresses and defined rock mass classifications within the areas of development . While locally variable, on average, stope parameters can be described as having the following dimensions : In non - faulted zones: 10m width x 20m length x 35m height; and In fault zones, the size of stopes is reduced to 10m width x 15m length x 35m height. For the Deepening Project the same mining method will be employed as the rest of the Pilar UG Mine . A panel height reduction from 35 m to 26 m will be applied to improve mining recovery and reduce dilution . The mining sequence will be divided based upon the presence of both narrow and thick stopes within the mine design . Longitudinal will be applied to narrow stopes (shown in blue below) and transverse will be applied to thick stopes (shown in red below) . The planned modifications to the mining sequence and stope design for the Deepening Project is expected to provide less overbreak and dilution, enhance the stability of the operation and improve mining recovery . Figure 16 - 3: Proposed Mine Design for the Deepening Project (Ero Brasil, 2022) The Pilar UG Mine ramp development utilizes a maximum design grade of 15 % and 25 m radius on center . Ramp design targets an average distance of 20 m from the ramp to ore gallery access to limit access development requirements . Gallery access design dimensions of 5 . 0 m x 5 . 5 m are employed due to the size of the equipment operated by the Caraíba Operations and the infrastructure necessary for further development of the galleries (ventilation ducts and production equipment access) . Production gallery design dimensions are 4 . 5 m x 4 . 8 m . Transport cross - cuts are located at an average distance of 30 m to 35 m from the orebody and are made parallel to the mineralized zone . Currently, all ore extracted in the underground mine area (except ore from the near - surface production levels, which are hauled to surface) is directed to the - 78 level where it is discharged into an ore pass . After crushing in one of the two primary jaw crushers, the crushed material is transported by conveyor to an intermediate ore silo connected to the shaft hoisting system . The material (ore and waste) produced from the Deepening Project will be directed to a new external vertical shaft, that will connect the underground mine at the level - 1 , 075 to the surface . The new transportation shaft will be commissioned in 2026 . Please refer to Chapter 18 of this Report for additional details on the installed infrastructure and new external shaft construction . A center - out mining sequence and a pyramidal shape from bottom to top has been applied for the Pilar UG Mine Deepening Zone . The sequence leaves no secondary stopes and avoids high stress concentrations, as shown in the figure below . 25 November 2019 Rev. F 248
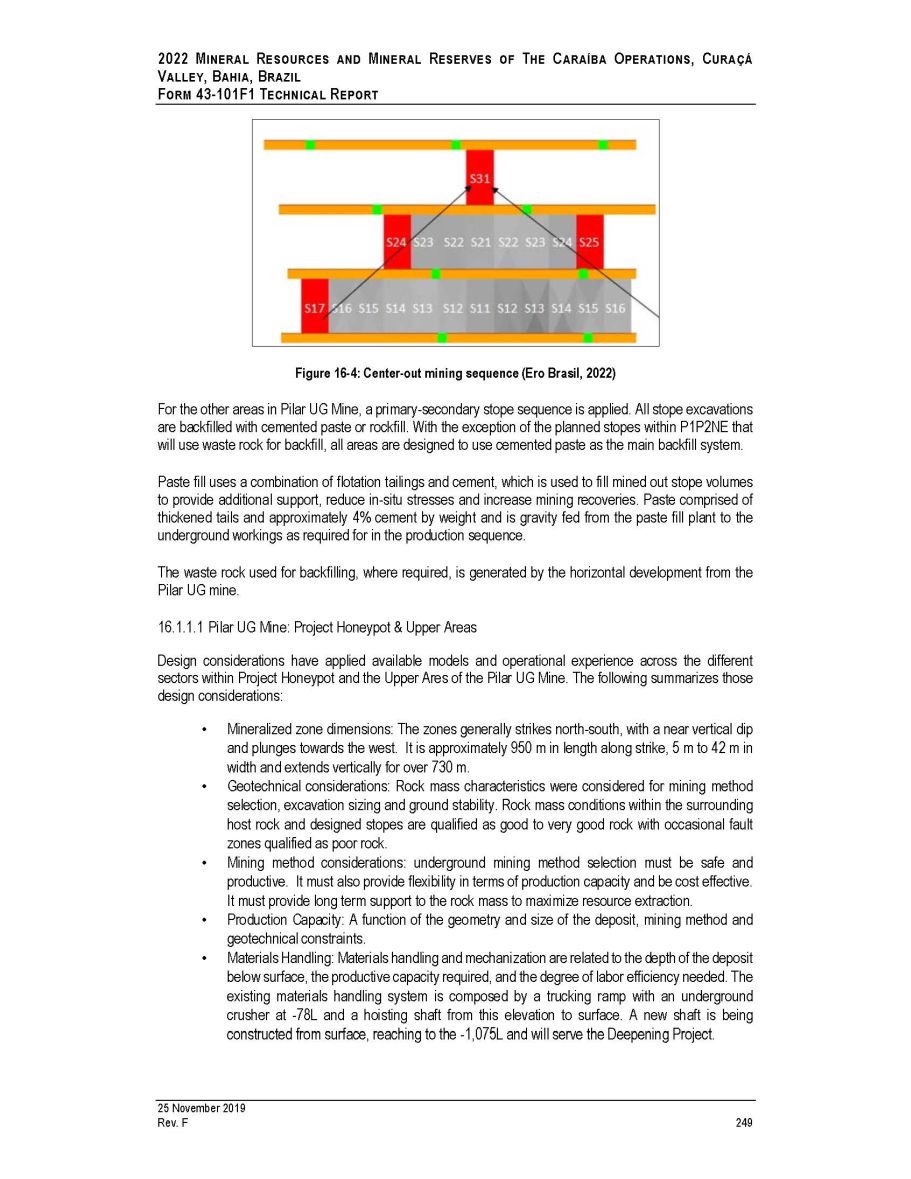
2022 M INERAL R ESOURCES AND M INERAL R ESERVES OF T HE C ARAÍBA O PERATIONS , C URAÇÁ V ALLEY , B AHIA , B RAZIL F ORM 43 - 101F1 T ECHNICAL R EPORT Figure 16 - 4: Center - out mining sequence (Ero Brasil, 2022) For the other areas in Pilar UG Mine, a primary - secondary stope sequence is applied . All stope excavations are backfilled with cemented paste or rockfill . With the exception of the planned stopes within P 1 P 2 NE that will use waste rock for backfill, all areas are designed to use cemented paste as the main backfill system . Paste fill uses a combination of flotation tailings and cement, which is used to fill mined out stope volumes to provide additional support, reduce in - situ stresses and increase mining recoveries . Paste comprised of thickened tails and approximately 4 % cement by weight and is gravity fed from the paste fill plant to the underground workings as required for in the production sequence . The waste rock used for backfilling, where required, is generated by the horizontal development from the Pilar UG mine . 1. Pilar UG Mine: Project Honeypot & Upper Areas Design considerations have applied available models and operational experience across the different sectors within Project Honeypot and the Upper Ares of the Pilar UG Mine . The following summarizes those design considerations : • Mineralized zone dimensions : The zones generally strikes north - south, with a near vertical dip and plunges towards the west . It is approximately 950 m in length along strike, 5 m to 42 m in width and extends vertically for over 730 m . • Geotechnical considerations : Rock mass characteristics were considered for mining method selection, excavation sizing and ground stability . Rock mass conditions within the surrounding host rock and designed stopes are qualified as good to very good rock with occasional fault zones qualified as poor rock . • Mining method considerations : underground mining method selection must be safe and productive . It must also provide flexibility in terms of production capacity and be cost effective . It must provide long term support to the rock mass to maximize resource extraction . • Production Capacity : A function of the geometry and size of the deposit, mining method and geotechnical constraints . • Materials Handling : Materials handling and mechanization are related to the depth of the deposit below surface, the productive capacity required, and the degree of labor efficiency needed . The existing materials handling system is composed by a trucking ramp with an underground crusher at - 78 L and a hoisting shaft from this elevation to surface . A new shaft is being constructed from surface, reaching to the - 1 , 075 L and will serve the Deepening Project . 25 November 2019 Rev. F 249
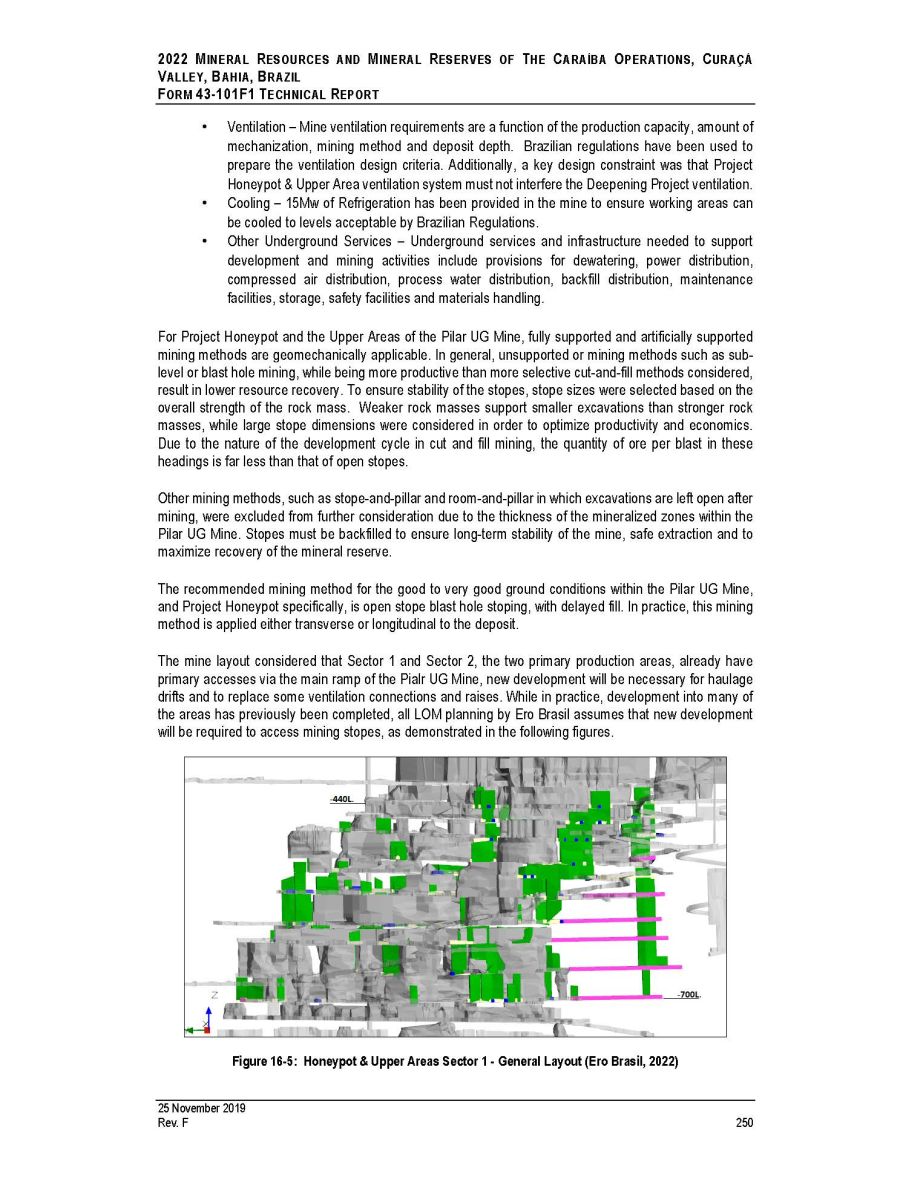
2022 M INERAL R ESOURCES AND M INERAL R ESERVES OF T HE C ARAÍBA O PERATIONS , C URAÇÁ V ALLEY , B AHIA , B RAZIL F ORM 43 - 101F1 T ECHNICAL R EPORT • Ventilation – Mine ventilation requirements are a function of the production capacity, amount of mechanization, mining method and deposit depth . Brazilian regulations have been used to prepare the ventilation design criteria . Additionally, a key design constraint was that Project Honeypot & Upper Area ventilation system must not interfere the Deepening Project ventilation . • Cooling – 15 Mw of Refrigeration has been provided in the mine to ensure working areas can be cooled to levels acceptable by Brazilian Regulations . • Other Underground Services – Underground services and infrastructure needed to support development and mining activities include provisions for dewatering, power distribution, compressed air distribution, process water distribution, backfill distribution, maintenance facilities, storage, safety facilities and materials handling . For Project Honeypot and the Upper Areas of the Pilar UG Mine, fully supported and artificially supported mining methods are geomechanically applicable . In general, unsupported or mining methods such as sub - level or blast hole mining, while being more productive than more selective cut - and - fill methods considered, result in lower resource recovery . To ensure stability of the stopes, stope sizes were selected based on the overall strength of the rock mass . Weaker rock masses support smaller excavations than stronger rock masses, while large stope dimensions were considered in order to optimize productivity and economics . Due to the nature of the development cycle in cut and fill mining, the quantity of ore per blast in these headings is far less than that of open stopes . Other mining methods, such as stope - and - pillar and room - and - pillar in which excavations are left open after mining, were excluded from further consideration due to the thickness of the mineralized zones within the Pilar UG Mine . Stopes must be backfilled to ensure long - term stability of the mine, safe extraction and to maximize recovery of the mineral reserve . The recommended mining method for the good to very good ground conditions within the Pilar UG Mine, and Project Honeypot specifically, is open stope blast hole stoping, with delayed fill . In practice, this mining method is applied either transverse or longitudinal to the deposit . The mine layout considered that Sector 1 and Sector 2 , the two primary production areas, already have primary accesses via the main ramp of the Pialr UG Mine, new development will be necessary for haulage drifts and to replace some ventilation connections and raises . While in practice, development into many of the areas has previously been completed, all LOM planning by Ero Brasil assumes that new development will be required to access mining stopes, as demonstrated in the following figures . Figure 16 - 5: Honeypot & Upper Areas Sector 1 - General Layout (Ero Brasil, 2022) 25 November 2019 Rev. F 250
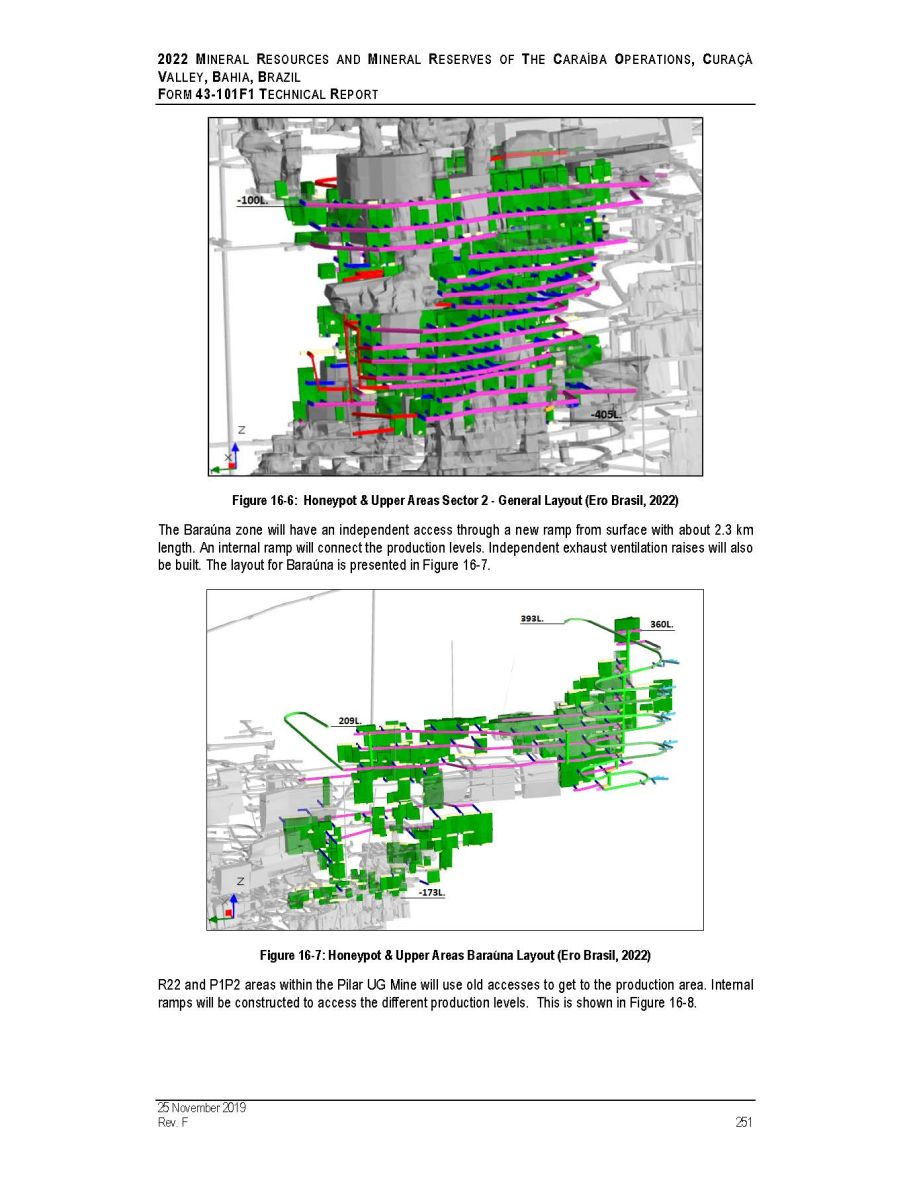
2022 M INERAL R ESOURCES AND M INERAL R ESERVES OF T HE C ARAÍBA O PERATIONS , C URAÇÁ V ALLEY , B AHIA , B RAZIL F ORM 43 - 101F1 T ECHNICAL R EPORT Figure 16 - 6: Honeypot & Upper Areas Sector 2 - General Layout (Ero Brasil, 2022) The Baraúna zone will have an independent access through a new ramp from surface with about 2 . 3 km length . An internal ramp will connect the production levels . Independent exhaust ventilation raises will also be built . The layout for Baraúna is presented in Figure 16 - 7 . Figure 16 - 7: Honeypot & Upper Areas Baraúna Layout (Ero Brasil, 2022) R22 and P1P2 areas within the Pilar UG Mine will use old accesses to get to the production area. Internal ramps will be constructed to access the different production levels. This is shown in Figure 16 - 8. 25 November 2019 Rev. F 251
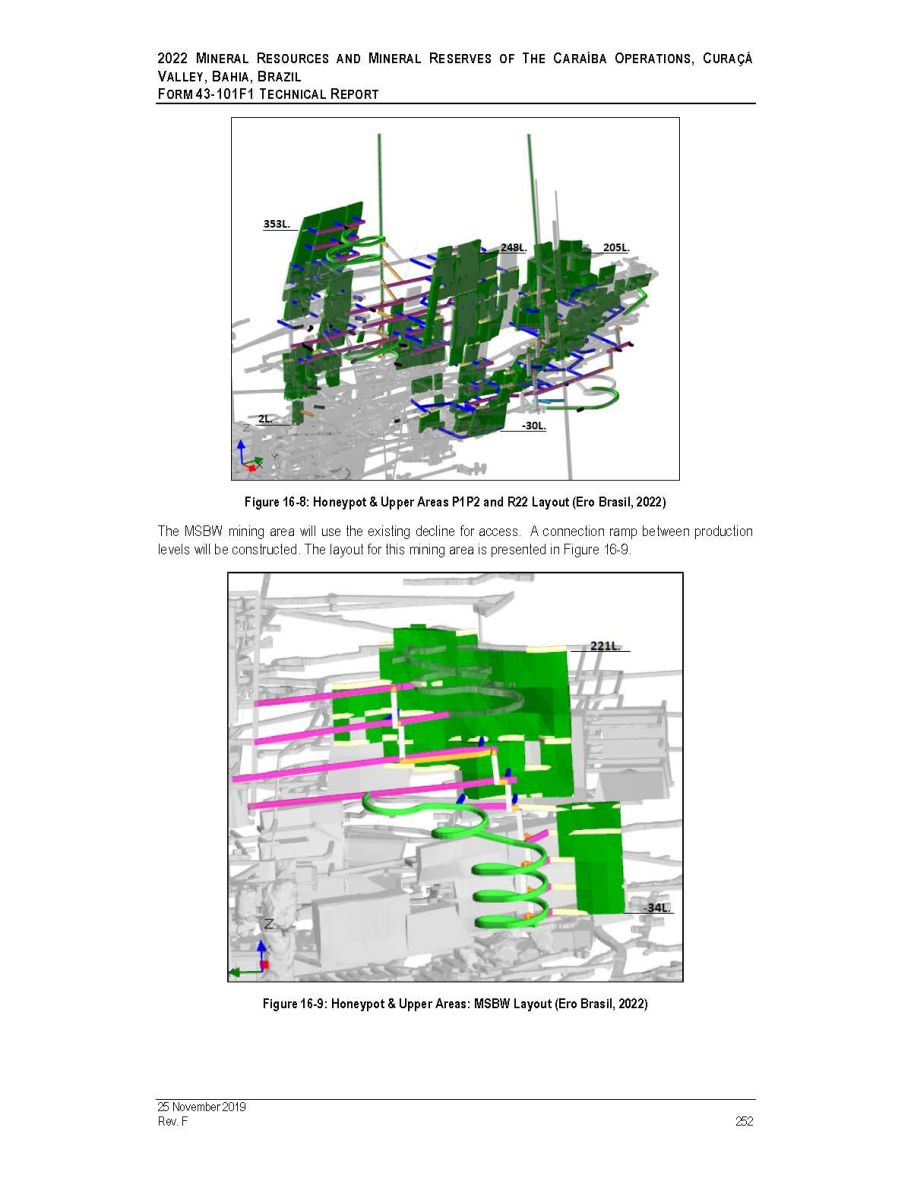
2022 M INERAL R ESOURCES AND M INERAL R ESERVES OF T HE C ARAÍBA O PERATIONS , C URAÇÁ V ALLEY , B AHIA , B RAZIL F ORM 43 - 101F1 T ECHNICAL R EPORT Figure 16 - 8: Honeypot & Upper Areas P1P2 and R22 Layout (Ero Brasil, 2022) The MSBW mining area will use the existing decline for access. A connection ramp between production levels will be constructed. The layout for this mining area is presented in Figure 16 - 9. Figure 16 - 9: Honeypot & Upper Areas: MSBW Layout (Ero Brasil, 2022) 25 November 2019 Rev. F 252
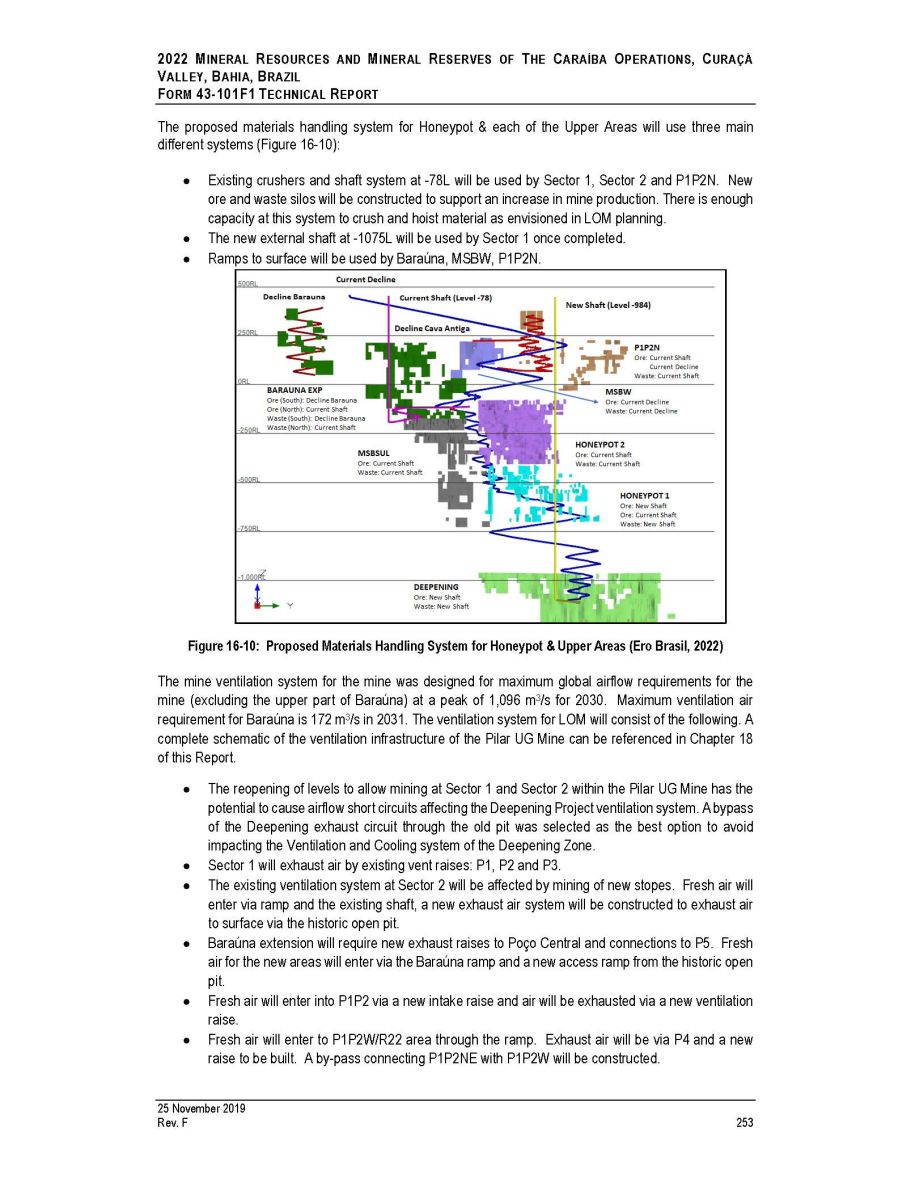
2022 M INERAL R ESOURCES AND M INERAL R ESERVES OF T HE C ARAÍBA O PERATIONS , C URAÇÁ V ALLEY , B AHIA , B RAZIL F ORM 43 - 101F1 T ECHNICAL R EPORT The proposed materials handling system for Honeypot & each of the Upper Areas will use three main different systems (Figure 16 - 10): Existing crushers and shaft system at - 78 L will be used by Sector 1 , Sector 2 and P 1 P 2 N . New ore and waste silos will be constructed to support an increase in mine production . There is enough capacity at this system to crush and hoist material as envisioned in LOM planning . The new external shaft at - 1075 L will be used by Sector 1 once completed . Ramps to surface will be used by Baraúna, MSBW, P 1 P 2 N . Figure 16 - 10: Proposed Materials Handling System for Honeypot & Upper Areas (Ero Brasil, 2022) The mine ventilation system for the mine was designed for maximum global airflow requirements for the mine (excluding the upper part of Baraúna) at a peak of 1 , 096 m 3 /s for 2030 . Maximum ventilation air requirement for Baraúna is 172 m 3 /s in 2031 . The ventilation system for LOM will consist of the following . A complete schematic of the ventilation infrastructure of the Pilar UG Mine can be referenced in Chapter 18 of this Report . The reopening of levels to allow mining at Sector 1 and Sector 2 within the Pilar UG Mine has the potential to cause airflow short circuits affecting the Deepening Project ventilation system . A bypass of the Deepening exhaust circuit through the old pit was selected as the best option to avoid impacting the Ventilation and Cooling system of the Deepening Zone . Sector 1 will exhaust air by existing vent raises : P 1 , P 2 and P 3 . The existing ventilation system at Sector 2 will be affected by mining of new stopes . Fresh air will enter via ramp and the existing shaft, a new exhaust air system will be constructed to exhaust air to surface via the historic open pit . Baraúna extension will require new exhaust raises to Poço Central and connections to P 5 . Fresh air for the new areas will enter via the Baraúna ramp and a new access ramp from the historic open pit . Fresh air will enter into P 1 P 2 via a new intake raise and air will be exhausted via a new ventilation raise . Fresh air will enter to P 1 P 2 W/R 22 area through the ramp . Exhaust air will be via P 4 and a new raise to be built . A by - pass connecting P 1 P 2 NE with P 1 P 2 W will be constructed . 25 November 2019 Rev. F 253
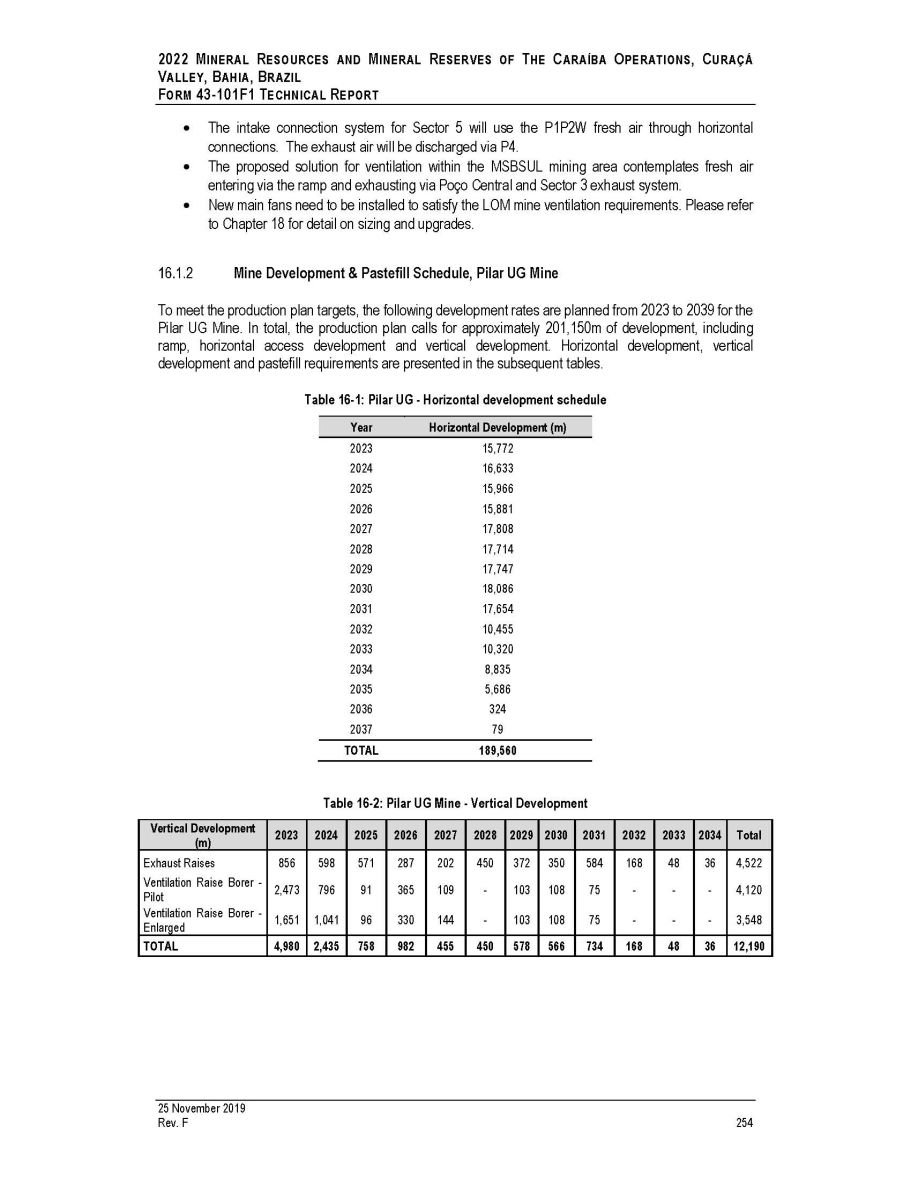
2022 M INERAL R ESOURCES AND M INERAL R ESERVES OF T HE C ARAÍBA O PERATIONS , C URAÇÁ V ALLEY , B AHIA , B RAZIL F ORM 43 - 101F1 T ECHNICAL R EPORT The intake connection system for Sector 5 will use the P1P2W fresh air through horizontal connections. The exhaust air will be discharged via P4. The proposed solution for ventilation within the MSBSUL mining area contemplates fresh air entering via the ramp and exhausting via Poço Central and Sector 3 exhaust system. New main fans need to be installed to satisfy the LOM mine ventilation requirements. Please refer to Chapter 18 for detail on sizing and upgrades. Mine Development & Pastefill Schedule, Pilar UG Mine To meet the production plan targets, the following development rates are planned from 2023 to 2039 for the Pilar UG Mine . In total, the production plan calls for approximately 201 , 150 m of development, including ramp, horizontal access development and vertical development . Horizontal development, vertical development and pastefill requirements are presented in the subsequent tables . Table 16 - 1: Pilar UG - Horizontal development schedule 25 November 2019 Rev. F 254 Year Horizontal Development (m) 2023 15,772 2024 16,633 2025 15,966 2026 15,881 2027 17,808 2028 17,714 2029 17,747 2030 18,086 2031 17,654 2032 10,455 2033 10,320 2034 8,835 2035 5,686 2036 324 2037 79 TOTAL 189,560 Table 16 - 2: Pilar UG Mine - Vertical Development Vertical Development (m) 2023 2024 2025 2026 2027 2028 2029 2030 2031 2032 2033 2034 Total Exhaust Raises 856 598 571 287 202 450 372 350 584 168 48 36 4,522 Ventilation Raise Borer - Pilot 2,473 796 91 365 109 - 103 108 75 - - - 4,120 Ventilation Raise Borer - Enlarged 1,651 1,041 96 330 144 - 103 108 75 - - - 3,548 TOTAL 4,980 2,435 758 982 455 450 578 566 734 168 48 36 12,190
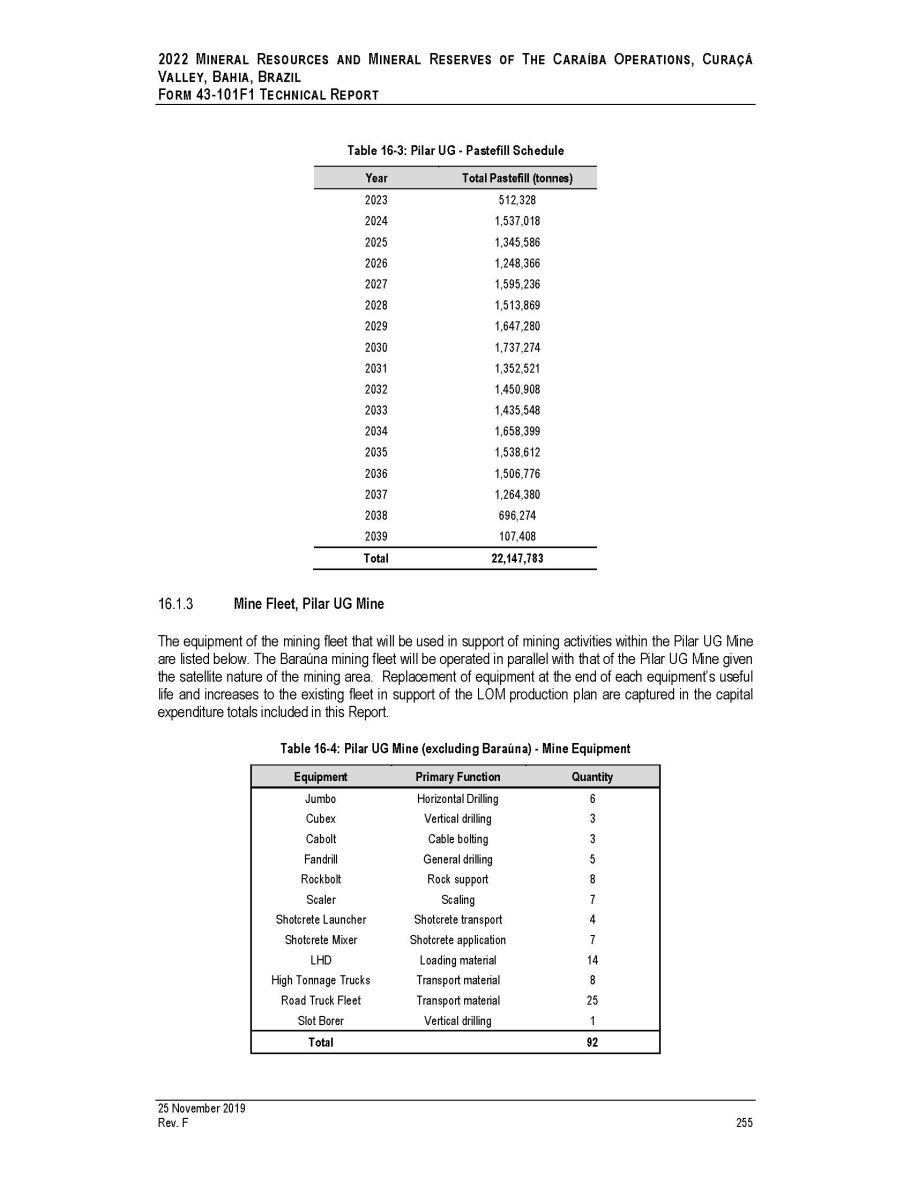
2022 M INERAL R ESOURCES AND M INERAL R ESERVES OF T HE C ARAÍBA O PERATIONS , C URAÇÁ V ALLEY , B AHIA , B RAZIL F ORM 43 - 101F1 T ECHNICAL R EPORT Table 16 - 3: Pilar UG - Pastefill Schedule Year Total Pastefill (tonnes) 2023 512,328 2024 1,537,018 2025 1,345,586 2026 1,248,366 2027 1,595,236 2028 1,513,869 2029 1,647,280 2030 1,737,274 2031 1,352,521 2032 1,450,908 2033 1,435,548 2034 1,658,399 2035 1,538,612 2036 1,506,776 2037 1,264,380 2038 696,274 2039 107,408 Total 22,147,783 Mine Fleet, Pilar UG Mine The equipment of the mining fleet that will be used in support of mining activities within the Pilar UG Mine are listed below . The Baraúna mining fleet will be operated in parallel with that of the Pilar UG Mine given the satellite nature of the mining area . Replacement of equipment at the end of each equipment’s useful life and increases to the existing fleet in support of the LOM production plan are captured in the capital expenditure totals included in this Report . Table 16 - 4: Pilar UG Mine (excluding Baraúna) - Mine Equipment 25 November 2019 Rev. F 255 Equipment Primary Function Quantity Jumbo Horizontal Drilling 6 Cubex Vertical drilling 3 Cabolt Cable bolting 3 Fandrill General drilling 5 Rockbolt Rock support 8 Scaler Scaling 7 Shotcrete Launcher Shotcrete transport 4 Shotcrete Mixer Shotcrete application 7 LHD Loading material 14 High Tonnage Trucks Transport material 8 Road Truck Fleet Transport material 25 Slot Borer Vertical drilling 1 Total 92

2022 M INERAL R ESOURCES AND M INERAL R ESERVES OF T HE C ARAÍBA O PERATIONS , C URAÇÁ V ALLEY , B AHIA , B RAZIL F ORM 43 - 101F1 T ECHNICAL R EPORT Table 16 - 5: Baraúna UG - Mine Equipment Equipment Primary Function Quantity Jumbo Horizontal Drilling 1 Cubex Vertical drilling 0 Cabolt Cable bolting 1 Fandrill General drilling 2 Rockbolt Rock support 1 Scaler Scaling 1 Shotcrete Launcher Shotcrete transport 1 Shotcrete Mixer Shotcrete application 1 LHD Loading material 2 High Tonnage Trucks Transport material 0 Road Truck Fleet Transport material 6 Slot Borer Vertical drilling 0 Total 16 All development for the Deepening Project will be performed utilizing Ero Brasil’s own equipment and personnel . Production activities will be performed using radial long - hole drills for blast holes, while the drop raises will be constructed mechanically with Slot Borer Machine . Loading (mucking) will be performed using long haul dump trucks (“LHDs”) and 27 tonne conventional trucks will be used for ore haulage . Production crews will share emulsion loading vehicles for blasting of the stopes . Loading and transportation will be done with 10 cubic yard LHDs between stopes in the production levels and stockpiles . From the stockpiles the material will be directly loaded to trucks with 10 cubic yard LHDs . Transportation to the underground crusher will be done using 27 tonne conventional trucks . The proposed mucking/haulage fleet was selected to accommodate excavations 5 . 0 m wide by 5 . 5 m high . For the purposes of this Report, the existing loader and truck combination fleet type was selected for operational synergies . For waste haulage, the same trucks will be used as are currently in operation . 16.2 V ERMELHOS UG M INE The Vermelhos UG Mine is located approximately 80 km north of the Pilar UG Mine and the Caraíba Mill, and it has been in operation since 2018 . The main Vermelhos UG Mine deposit remains open along strike and at depth, and Ero Brasil is actively exploring extensions of the deposit to depth, and to the south of the main Vermelhos UG Mine in an area known as the Southern Vermelhos Corridor . Mining Method, Vermelhos UG Mine The SOS method was chosen as the mining method at Vermelhos UG Mine considering the dip, plunge and thickness of the orebodies as well as the rock quality designation and overall competence of the host rock . Variations of this method are planned for the central area for maximum possible recovery using the CRF technique . The mine design is based on current mining practice and entails mining panels of 15 m to 35 m, on average, in the vertical dimension without the need for rib pillars to support the open excavations . In the central and western high - grade areas (known as Toboggan and Sombrero) mining occurs using sub - horizontal stopes . In these areas, the panel size has been reduced to 25 m and is filled using CRF to maximize mining 25 November 2019 Rev. F 256
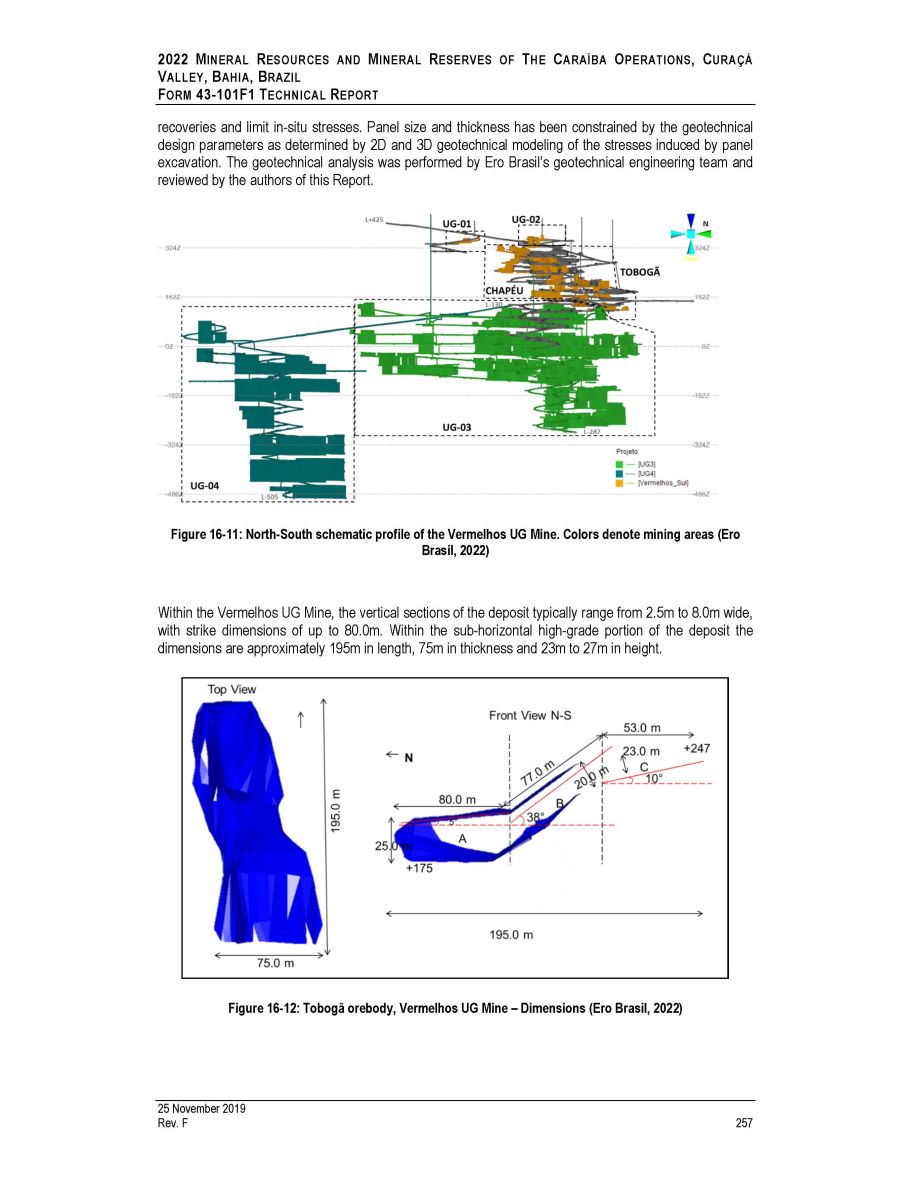
2022 M INERAL R ESOURCES AND M INERAL R ESERVES OF T HE C ARAÍBA O PERATIONS , C URAÇÁ V ALLEY , B AHIA , B RAZIL F ORM 43 - 101F1 T ECHNICAL R EPORT recoveries and limit in - situ stresses . Panel size and thickness has been constrained by the geotechnical design parameters as determined by 2 D and 3 D geotechnical modeling of the stresses induced by panel excavation . The geotechnical analysis was performed by Ero Brasil’s geotechnical engineering team and reviewed by the authors of this Report . Figure 16 - 11: North - South schematic profile of the Vermelhos UG Mine. Colors denote mining areas (Ero Brasil, 2022) Within the Vermelhos UG Mine, the vertical sections of the deposit typically range from 2 . 5 m to 8 . 0 m wide, with strike dimensions of up to 80 . 0 m . Within the sub - horizontal high - grade portion of the deposit the dimensions are approximately 195 m in length, 75 m in thickness and 23 m to 27 m in height . Figure 16 - 12: Tobogã orebody, Vermelhos UG Mine – Dimensions (Ero Brasil, 2022) 25 November 2019 Rev. F 257
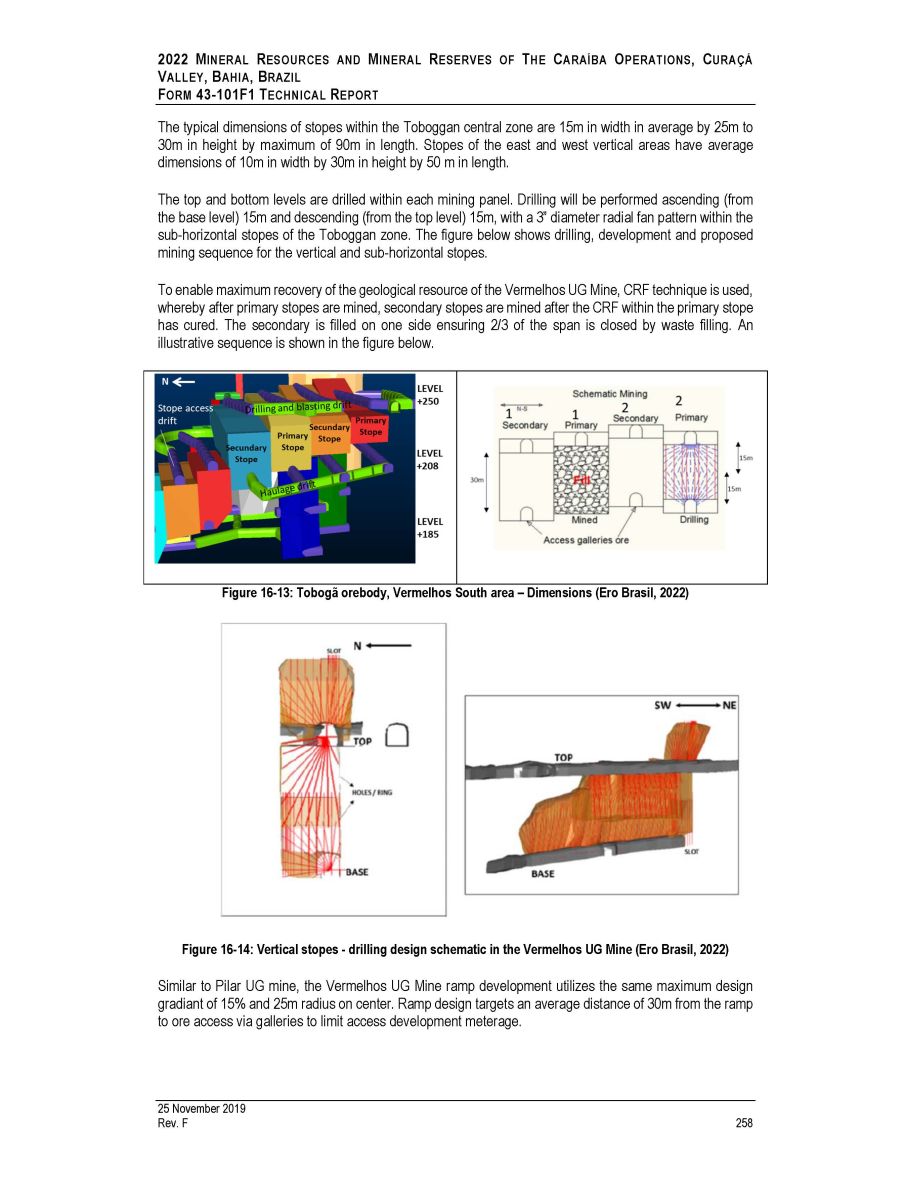
2022 M INERAL R ESOURCES AND M INERAL R ESERVES OF T HE C ARAÍBA O PERATIONS , C URAÇÁ V ALLEY , B AHIA , B RAZIL F ORM 43 - 101F1 T ECHNICAL R EPORT The typical dimensions of stopes within the Toboggan central zone are 15 m in width in average by 25 m to 30 m in height by maximum of 90 m in length . Stopes of the east and west vertical areas have average dimensions of 10 m in width by 30 m in height by 50 m in length . The top and bottom levels are drilled within each mining panel . Drilling will be performed ascending (from the base level) 15 m and descending (from the top level) 15 m, with a 3 ” diameter radial fan pattern within the sub - horizontal stopes of the Toboggan zone . The figure below shows drilling, development and proposed mining sequence for the vertical and sub - horizontal stopes . To enable maximum recovery of the geological resource of the Vermelhos UG Mine, CRF technique is used, whereby after primary stopes are mined, secondary stopes are mined after the CRF within the primary stope has cured . The secondary is filled on one side ensuring 2 / 3 of the span is closed by waste filling . An illustrative sequence is shown in the figure below . Figure 16 - 13: Tobogã orebody, Vermelhos South area – Dimensions (Ero Brasil, 2022) Figure 16 - 14: Vertical stopes - drilling design schematic in the Vermelhos UG Mine (Ero Brasil, 2022) Similar to Pilar UG mine, the Vermelhos UG Mine ramp development utilizes the same maximum design gradiant of 15 % and 25 m radius on center . Ramp design targets an average distance of 30 m from the ramp to ore access via galleries to limit access development meterage . 25 November 2019 Rev. F 258
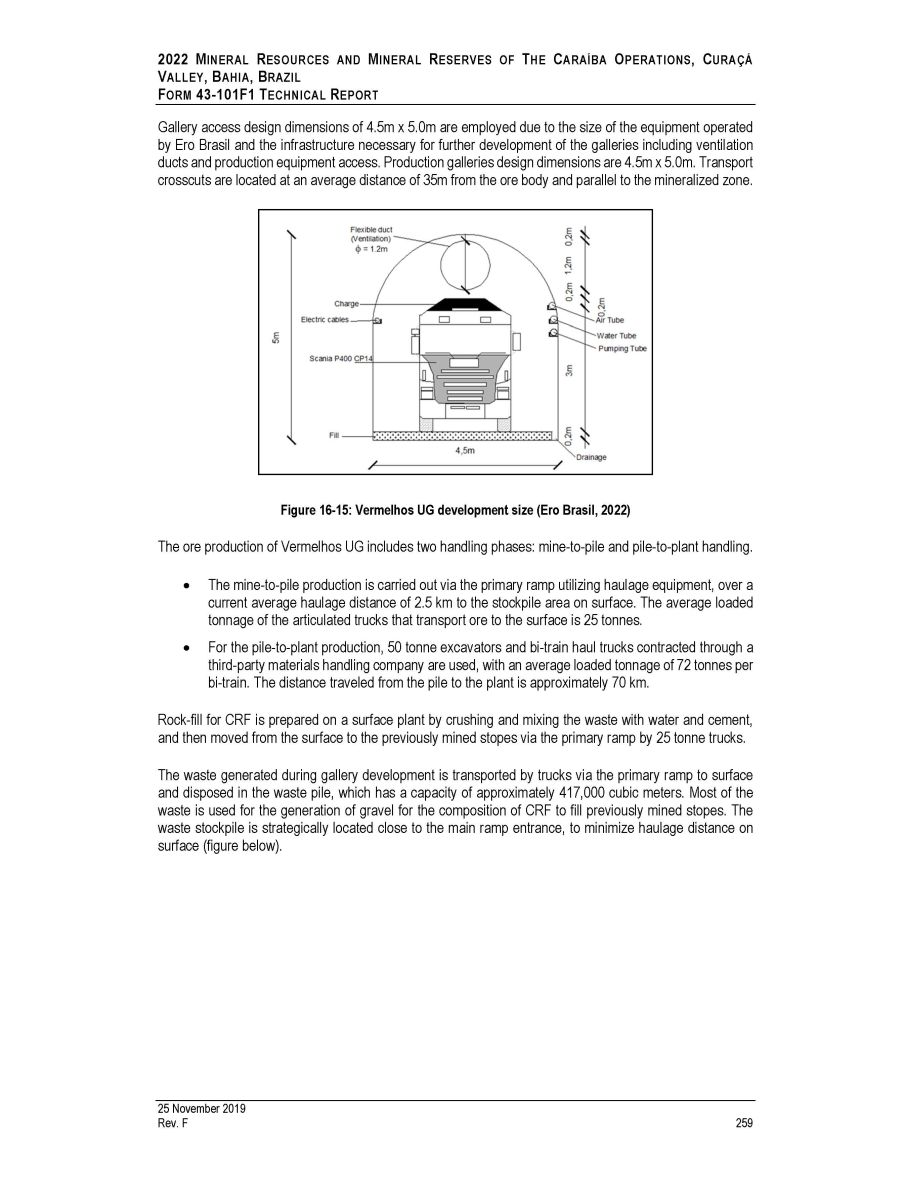
2022 M INERAL R ESOURCES AND M INERAL R ESERVES OF T HE C ARAÍBA O PERATIONS , C URAÇÁ V ALLEY , B AHIA , B RAZIL F ORM 43 - 101F1 T ECHNICAL R EPORT Gallery access design dimensions of 4 . 5 m x 5 . 0 m are employed due to the size of the equipment operated by Ero Brasil and the infrastructure necessary for further development of the galleries including ventilation ducts and production equipment access . Production galleries design dimensions are 4 . 5 m x 5 . 0 m . Transport crosscuts are located at an average distance of 35 m from the ore body and parallel to the mineralized zone . Figure 16 - 15: Vermelhos UG development size (Ero Brasil, 2022) The ore production of Vermelhos UG includes two handling phases: mine - to - pile and pile - to - plant handling. The mine - to - pile production is carried out via the primary ramp utilizing haulage equipment, over a current average haulage distance of 2 . 5 km to the stockpile area on surface . The average loaded tonnage of the articulated trucks that transport ore to the surface is 25 tonnes . For the pile - to - plant production, 50 tonne excavators and bi - train haul trucks contracted through a third - party materials handling company are used, with an average loaded tonnage of 72 tonnes per bi - train . The distance traveled from the pile to the plant is approximately 70 km . Rock - fill for CRF is prepared on a surface plant by crushing and mixing the waste with water and cement, and then moved from the surface to the previously mined stopes via the primary ramp by 25 tonne trucks. The waste generated during gallery development is transported by trucks via the primary ramp to surface and disposed in the waste pile, which has a capacity of approximately 417 , 000 cubic meters . Most of the waste is used for the generation of gravel for the composition of CRF to fill previously mined stopes . The waste stockpile is strategically located close to the main ramp entrance, to minimize haulage distance on surface (figure below) . 25 November 2019 Rev. F 259

2022 M INERAL R ESOURCES AND M INERAL R ESERVES OF T HE C ARAÍBA O PERATIONS , C URAÇÁ V ALLEY , B AHIA , B RAZIL F ORM 43 - 101F1 T ECHNICAL R EPORT Figure 16 - 16: Vermelhos UG Mine Waste Pile (Ero Brasil, 2022) Mine Development and Backfill Schedules, Vermelhos UG Mine To meet the production plan targets, the following development rates are planned from 2023 to 2027 for the Vermelhos UG Mine (Table 16 - 6 ) . In total, the production plan calls for approximately 50 , 000 m of development, including ramp, horizontal access development and vertical development . Horizontal development, vertical development and CRF requirements are presented in the subsequent tables . Table 16 - 6: Vermelhos UG Mine horizontal development schedule Year Horizontal Development (m) 2023 4,610 2024 4,553 2025 4,451 2026 4,962 2027 5,009 2028 5,035 2029 4,933 2030 4,185 2031 2,054 2032 3,909 2033 2,749 TOTAL 46,450 25 November 2019 Rev. F 260

2022 M INERAL R ESOURCES AND M INERAL R ESERVES OF T HE C ARAÍBA O PERATIONS , C URAÇÁ V ALLEY , B AHIA , B RAZIL F ORM 43 - 101F1 T ECHNICAL R EPORT Table 16 - 7: Vermelhos UG Mine vertical development schedule Vertical Development (m) 2023 2024 2025 2026 2027 2028 2029 2030 2031 2032 2033 Total Exhaust Raises 265 107 220 120 92 295 94 115 90 91 57 1,547 Ventilation Raise Borer 92 859 413 318 332 64 0 0 0 0 0 2,078 TOTAL 357 966 633 437 424 359 94 115 90 91 57 3,625 Table 16 - 8: Vermelhos CRF schedule Year Total CRF (tonnes) 2023 578,492 2024 608,933 2025 387,139 2026 487,299 2027 370,204 2028 387,135 2029 378,992 2030 379,625 2031 378,134 2032 167,661 2033 368,674 2034 256,295 2035 110,346 Total 4,858,929 Mine Fleet, Vermelhos UG Mine The Vermelhos UG Mine equipment fleet has been determined based on actual operating experience since commissioning of the mine in 2018 as well as achieved availabilities and useful life of the equipment within the Pilar UG Mine . Table 16 - 9: Vermelhos Equipment Fleet 25 November 2019 Rev. F 261 Equipment Primary Function Quantity Jumbo Horizontal Drilling 2 Cubex Vertical drilling 1 Fandrill General drilling 1 Rockbolt Rock support 1 Scaler Scaling 2 Shotcrete Mixer Shotcrete application 1 LHD Loading material 4 High Tonnage Trucks Transport material 1 Road Truck Fleet Transport material 11 Slot Borer Vertical drilling 1 Total 25
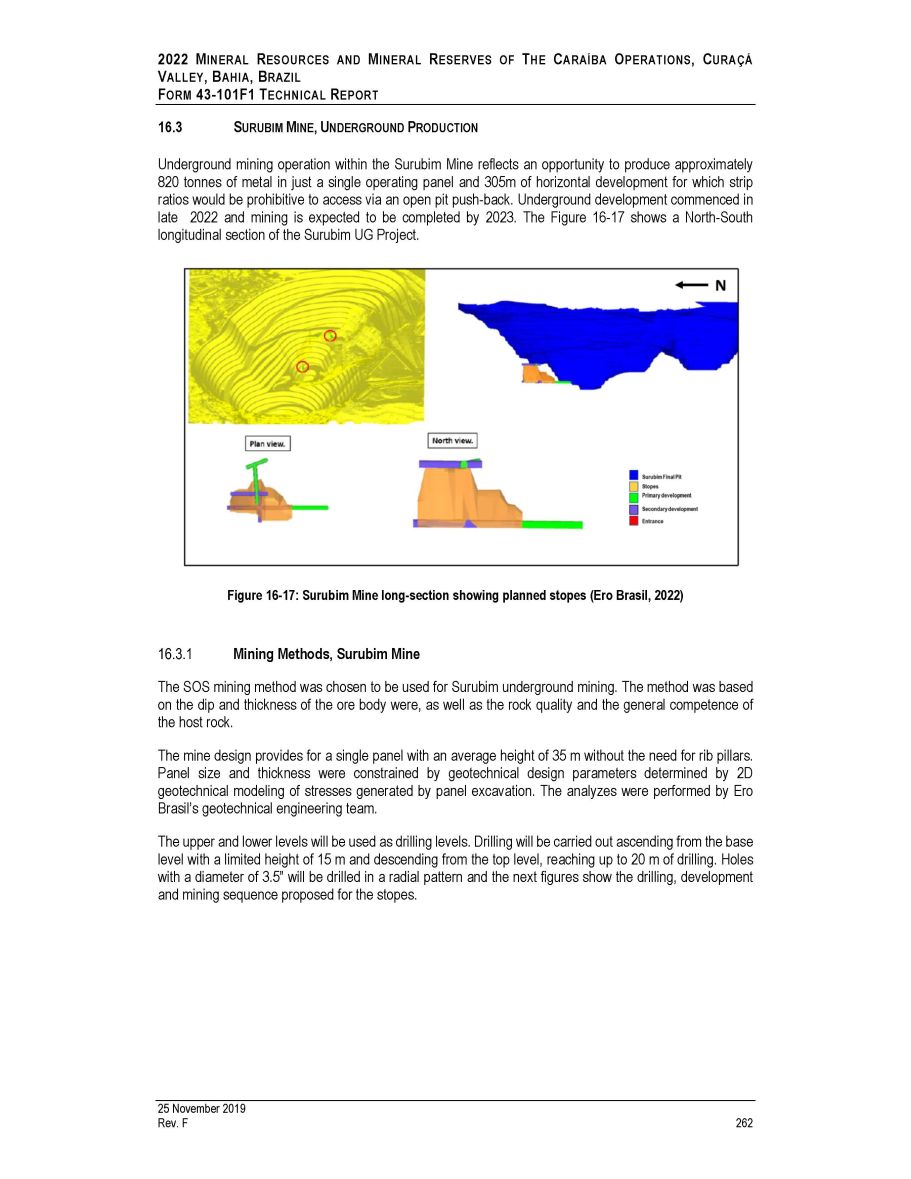
2022 M INERAL R ESOURCES AND M INERAL R ESERVES OF T HE C ARAÍBA O PERATIONS , C URAÇÁ V ALLEY , B AHIA , B RAZIL F ORM 43 - 101F1 T ECHNICAL R EPORT 16.3 S URUBIM M INE , U NDERGROUND P RODUCTION Underground mining operation within the Surubim Mine reflects an opportunity to produce approximately 820 tonnes of metal in just a single operating panel and 305 m of horizontal development for which strip ratios would be prohibitive to access via an open pit push - back . Underground development commenced in late 2022 and mining is expected to be completed by 2023 . The Figure 16 - 17 shows a North - South longitudinal section of the Surubim UG Project . Figure 16 - 17: Surubim Mine long - section showing planned stopes (Ero Brasil, 2022) Mining Methods, Surubim Mine The SOS mining method was chosen to be used for Surubim underground mining . The method was based on the dip and thickness of the ore body were, as well as the rock quality and the general competence of the host rock . The mine design provides for a single panel with an average height of 35 m without the need for rib pillars . Panel size and thickness were constrained by geotechnical design parameters determined by 2 D geotechnical modeling of stresses generated by panel excavation . The analyzes were performed by Ero Brasil’s geotechnical engineering team . The upper and lower levels will be used as drilling levels . Drilling will be carried out ascending from the base level with a limited height of 15 m and descending from the top level, reaching up to 20 m of drilling . Holes with a diameter of 3 . 5 ” will be drilled in a radial pattern and the next figures show the drilling, development and mining sequence proposed for the stopes . 25 November 2019 Rev. F 262
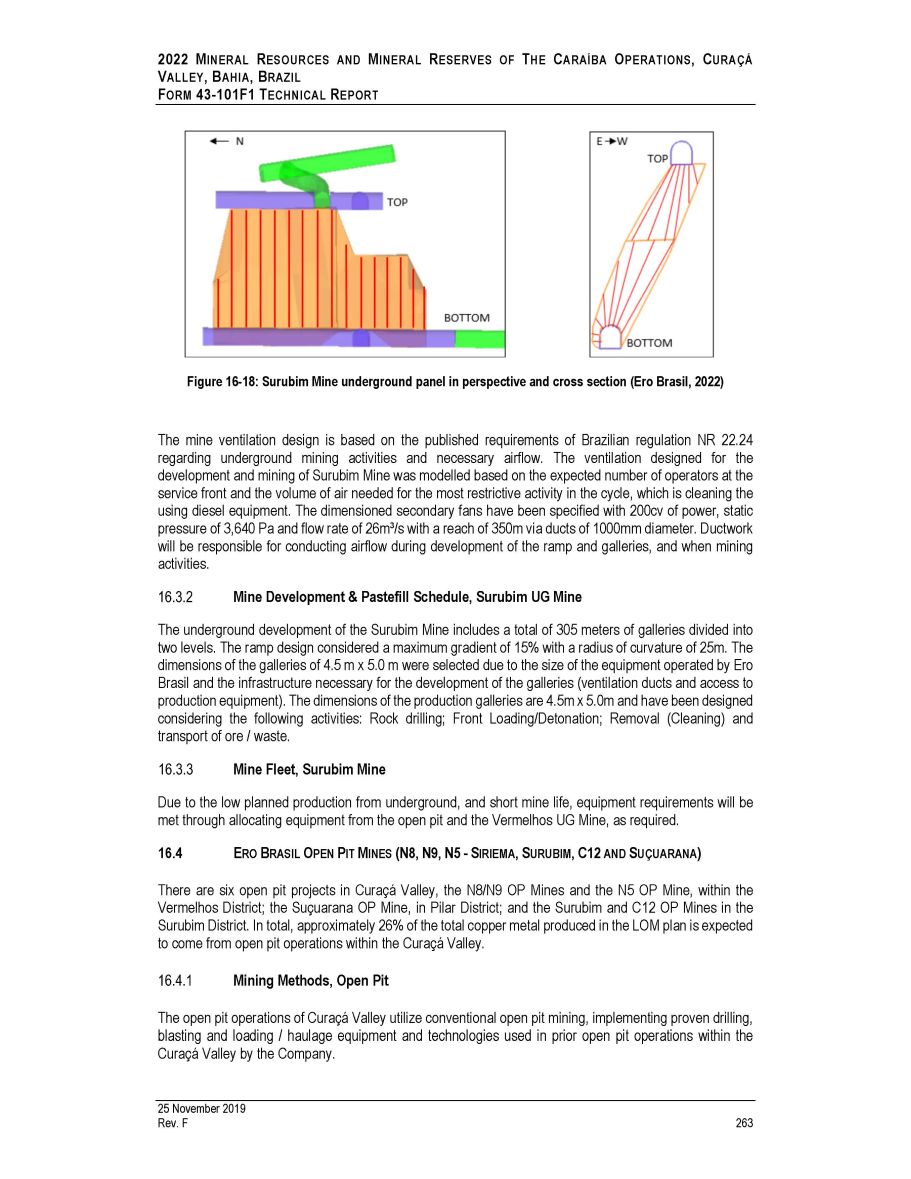
2022 M INERAL R ESOURCES AND M INERAL R ESERVES OF T HE C ARAÍBA O PERATIONS , C URAÇÁ V ALLEY , B AHIA , B RAZIL F ORM 43 - 101F1 T ECHNICAL R EPORT Figure 16 - 18: Surubim Mine underground panel in perspective and cross section (Ero Brasil, 2022) The mine ventilation design is based on the published requirements of Brazilian regulation NR 22 . 24 regarding underground mining activities and necessary airflow . The ventilation designed for the development and mining of Surubim Mine was modelled based on the expected number of operators at the service front and the volume of air needed for the most restrictive activity in the cycle, which is cleaning the using diesel equipment . The dimensioned secondary fans have been specified with 200 cv of power, static pressure of 3 , 640 Pa and flow rate of 26 m³/s with a reach of 350 m via ducts of 1000 mm diameter . Ductwork will be responsible for conducting airflow during development of the ramp and galleries, and when mining activities . Mine Development & Pastefill Schedule, Surubim UG Mine The underground development of the Surubim Mine includes a total of 305 meters of galleries divided into two levels . The ramp design considered a maximum gradient of 15 % with a radius of curvature of 25 m . The dimensions of the galleries of 4 . 5 m x 5 . 0 m were selected due to the size of the equipment operated by Ero Brasil and the infrastructure necessary for the development of the galleries (ventilation ducts and access to production equipment) . The dimensions of the production galleries are 4 . 5 m x 5 . 0 m and have been designed considering the following activities : Rock drilling ; Front Loading/Detonation ; Removal (Cleaning) and transport of ore / waste . Mine Fleet, Surubim Mine Due to the low planned production from underground, and short mine life, equipment requirements will be met through allocating equipment from the open pit and the Vermelhos UG Mine, as required . 16.4 E RO B RASIL O PEN P IT M INES (N8, N9, N5 - S IRIEMA , S URUBIM , C12 AND S UÇUARANA ) There are six open pit projects in Curaçá Valley, the N 8 /N 9 OP Mines and the N 5 OP Mine, within the Vermelhos District ; the Suçuarana OP Mine, in Pilar District ; and the Surubim and C 12 OP Mines in the Surubim District . In total, approximately 26 % of the total copper metal produced in the LOM plan is expected to come from open pit operations within the Curaçá Valley . Mining Methods, Open Pit The open pit operations of Curaçá Valley utilize conventional open pit mining, implementing proven drilling, blasting and loading / haulage equipment and technologies used in prior open pit operations within the Curaçá Valley by the Company . 25 November 2019 Rev. F 263
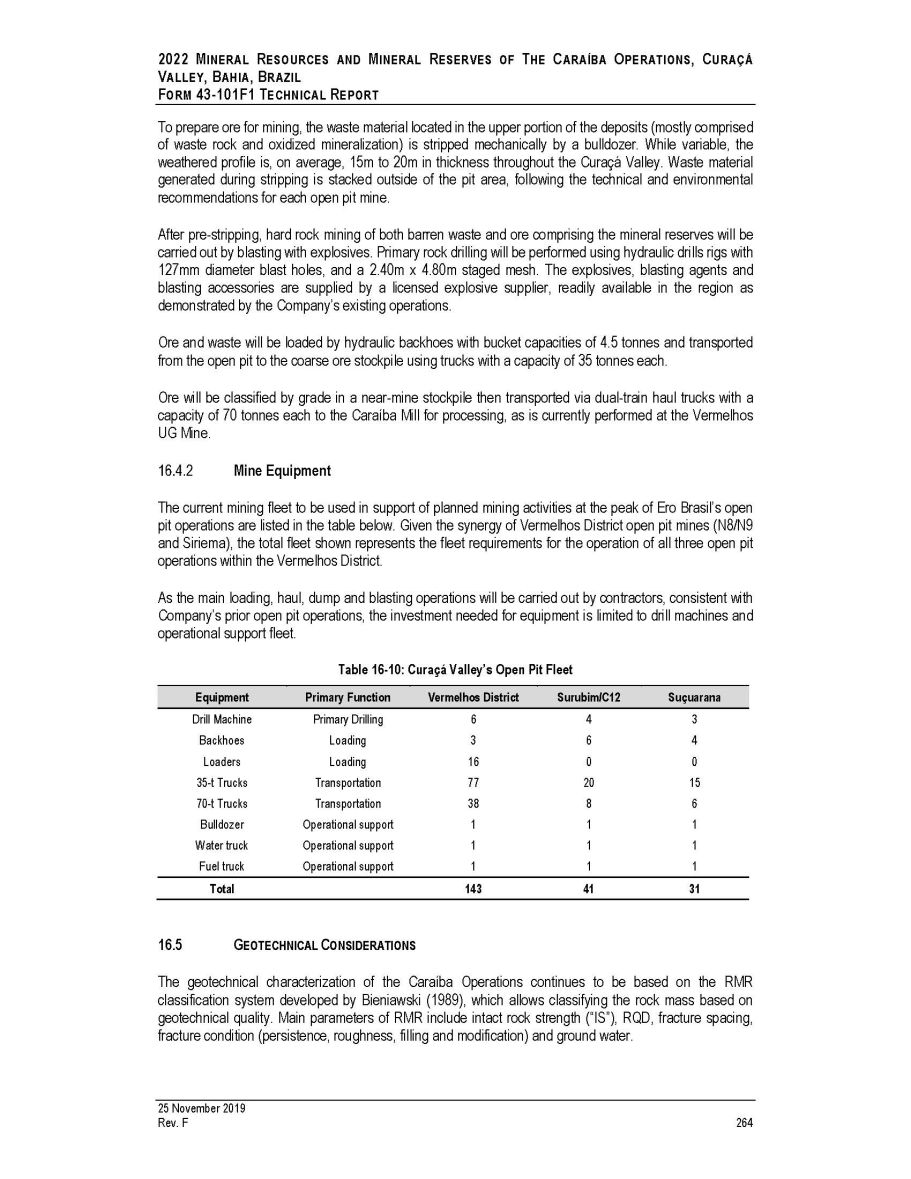
2022 M INERAL R ESOURCES AND M INERAL R ESERVES OF T HE C ARAÍBA O PERATIONS , C URAÇÁ V ALLEY , B AHIA , B RAZIL F ORM 43 - 101F1 T ECHNICAL R EPORT To prepare ore for mining, the waste material located in the upper portion of the deposits (mostly comprised of waste rock and oxidized mineralization) is stripped mechanically by a bulldozer . While variable, the weathered profile is, on average, 15 m to 20 m in thickness throughout the Curaçá Valley . Waste material generated during stripping is stacked outside of the pit area, following the technical and environmental recommendations for each open pit mine . After pre - stripping, hard rock mining of both barren waste and ore comprising the mineral reserves will be carried out by blasting with explosives . Primary rock drilling will be performed using hydraulic drills rigs with 127 mm diameter blast holes, and a 2 . 40 m x 4 . 80 m staged mesh . The explosives, blasting agents and blasting accessories are supplied by a licensed explosive supplier, readily available in the region as demonstrated by the Company’s existing operations . Ore and waste will be loaded by hydraulic backhoes with bucket capacities of 4 . 5 tonnes and transported from the open pit to the coarse ore stockpile using trucks with a capacity of 35 tonnes each . Ore will be classified by grade in a near - mine stockpile then transported via dual - train haul trucks with a capacity of 70 tonnes each to the Caraíba Mill for processing, as is currently performed at the Vermelhos UG Mine . Mine Equipment The current mining fleet to be used in support of planned mining activities at the peak of Ero Brasil’s open pit operations are listed in the table below . Given the synergy of Vermelhos District open pit mines (N 8 /N 9 and Siriema), the total fleet shown represents the fleet requirements for the operation of all three open pit operations within the Vermelhos District . As the main loading, haul, dump and blasting operations will be carried out by contractors, consistent with Company’s prior open pit operations, the investment needed for equipment is limited to drill machines and operational support fleet . Table 16 - 10: Curaçá Valley’s Open Pit Fleet 25 November 2019 Rev. F 264 Equipment Primary Function Vermelhos District Surubim/C12 Suçuarana Drill Machine Primary Drilling 6 4 3 Backhoes Loading 3 6 4 Loaders Loading 16 0 0 35 - t Trucks Transportation 77 20 15 70 - t Trucks Transportation 38 8 6 Bulldozer Operational support 1 1 1 Water truck Operational support 1 1 1 Fuel truck Operational support 1 1 1 Total 143 41 31 16.5 G EOTECHNICAL C ONSIDERATIONS The geotechnical characterization of the Caraíba Operations continues to be based on the RMR classification system developed by Bieniawski ( 1989 ), which allows classifying the rock mass based on geotechnical quality . Main parameters of RMR include intact rock strength (“IS”), RQD, fracture spacing, fracture condition (persistence, roughness, filling and modification) and ground water .
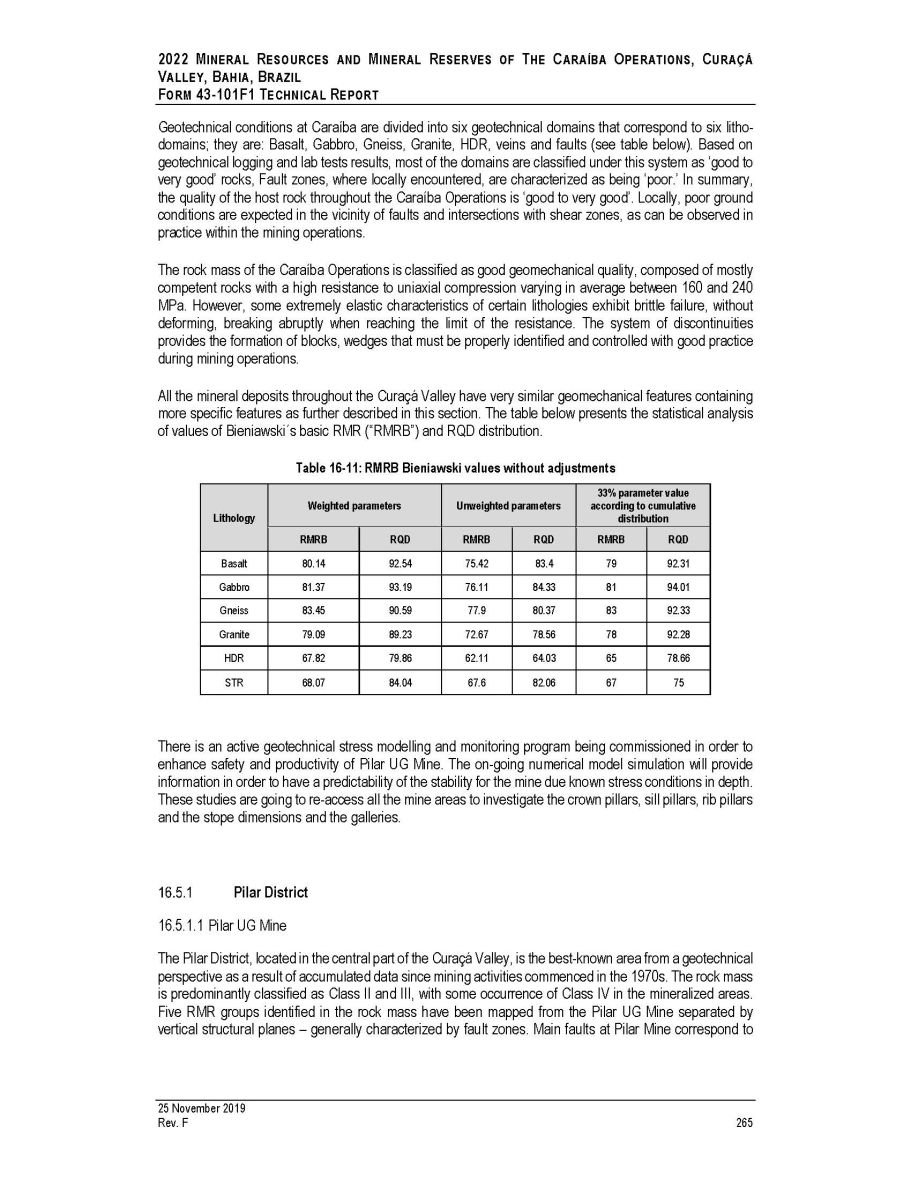
2022 M INERAL R ESOURCES AND M INERAL R ESERVES OF T HE C ARAÍBA O PERATIONS , C URAÇÁ V ALLEY , B AHIA , B RAZIL F ORM 43 - 101F1 T ECHNICAL R EPORT Geotechnical conditions at Caraíba are divided into six geotechnical domains that correspond to six litho - domains ; they are : Basalt, Gabbro, Gneiss, Granite, HDR, veins and faults (see table below) . Based on geotechnical logging and lab tests results, most of the domains are classified under this system as ‘good to very good’ rocks, Fault zones, where locally encountered, are characterized as being ‘poor . ’ In summary, the quality of the host rock throughout the Caraíba Operations is ‘good to very good’ . Locally, poor ground conditions are expected in the vicinity of faults and intersections with shear zones, as can be observed in practice within the mining operations . The rock mass of the Caraíba Operations is classified as good geomechanical quality, composed of mostly competent rocks with a high resistance to uniaxial compression varying in average between 160 and 240 MPa . However, some extremely elastic characteristics of certain lithologies exhibit brittle failure, without deforming, breaking abruptly when reaching the limit of the resistance . The system of discontinuities provides the formation of blocks, wedges that must be properly identified and controlled with good practice during mining operations . All the mineral deposits throughout the Curaçá Valley have very similar geomechanical features containing more specific features as further described in this section . The table below presents the statistical analysis of values of Bieniawski s basic RMR (“RMRB”) and RQD distribution . Table 16 - 11: RMRB Bieniawski values without adjustments Lithology Weighted parameters Unweighted parameters 33% parameter value according to cumulative distribution RMRB RQD RMRB RQD RMRB RQD Basalt 80.14 92.54 75.42 83.4 79 92.31 Gabbro 81.37 93.19 76.11 84.33 81 94.01 Gneiss 83.45 90.59 77.9 80.37 83 92.33 Granite 79.09 89.23 72.67 78.56 78 92.28 HDR 67.82 79.86 62.11 64.03 65 78.66 STR 68.07 84.04 67.6 82.06 67 75 There is an active geotechnical stress modelling and monitoring program being commissioned in order to enhance safety and productivity of Pilar UG Mine . The on - going numerical model simulation will provide information in order to have a predictability of the stability for the mine due known stress conditions in depth . These studies are going to re - access all the mine areas to investigate the crown pillars, sill pillars, rib pillars and the stope dimensions and the galleries . Pilar District 16.5.1.1 Pilar UG Mine The Pilar District, located in the central part of the Curaçá Valley, is the best - known area from a geotechnical perspective as a result of accumulated data since mining activities commenced in the 1970 s . The rock mass is predominantly classified as Class II and III, with some occurrence of Class IV in the mineralized areas . Five RMR groups identified in the rock mass have been mapped from the Pilar UG Mine separated by vertical structural planes – generally characterized by fault zones . Main faults at Pilar Mine correspond to 25 November 2019 Rev. F 265
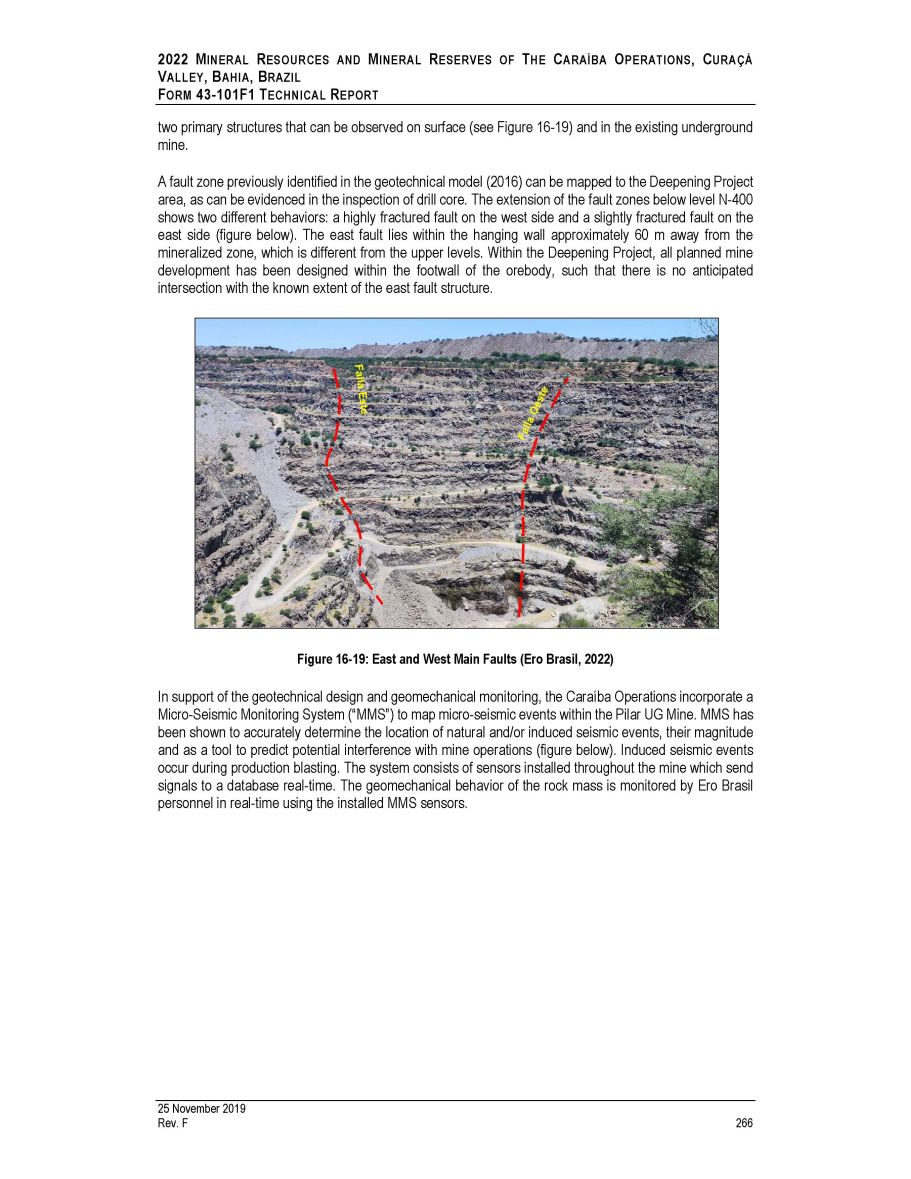
2022 M INERAL R ESOURCES AND M INERAL R ESERVES OF T HE C ARAÍBA O PERATIONS , C URAÇÁ V ALLEY , B AHIA , B RAZIL F ORM 43 - 101F1 T ECHNICAL R EPORT two primary structures that can be observed on surface (see Figure 16 - 19 ) and in the existing underground mine . A fault zone previously identified in the geotechnical model ( 2016 ) can be mapped to the Deepening Project area, as can be evidenced in the inspection of drill core . The extension of the fault zones below level N - 400 shows two different behaviors : a highly fractured fault on the west side and a slightly fractured fault on the east side (figure below) . The east fault lies within the hanging wall approximately 60 m away from the mineralized zone, which is different from the upper levels . Within the Deepening Project, all planned mine development has been designed within the footwall of the orebody, such that there is no anticipated intersection with the known extent of the east fault structure . Figure 16 - 19: East and West Main Faults (Ero Brasil, 2022) In support of the geotechnical design and geomechanical monitoring, the Caraíba Operations incorporate a Micro - Seismic Monitoring System (“MMS”) to map micro - seismic events within the Pilar UG Mine . MMS has been shown to accurately determine the location of natural and/or induced seismic events, their magnitude and as a tool to predict potential interference with mine operations (figure below) . Induced seismic events occur during production blasting . The system consists of sensors installed throughout the mine which send signals to a database real - time . The geomechanical behavior of the rock mass is monitored by Ero Brasil personnel in real - time using the installed MMS sensors . 25 November 2019 Rev. F 266
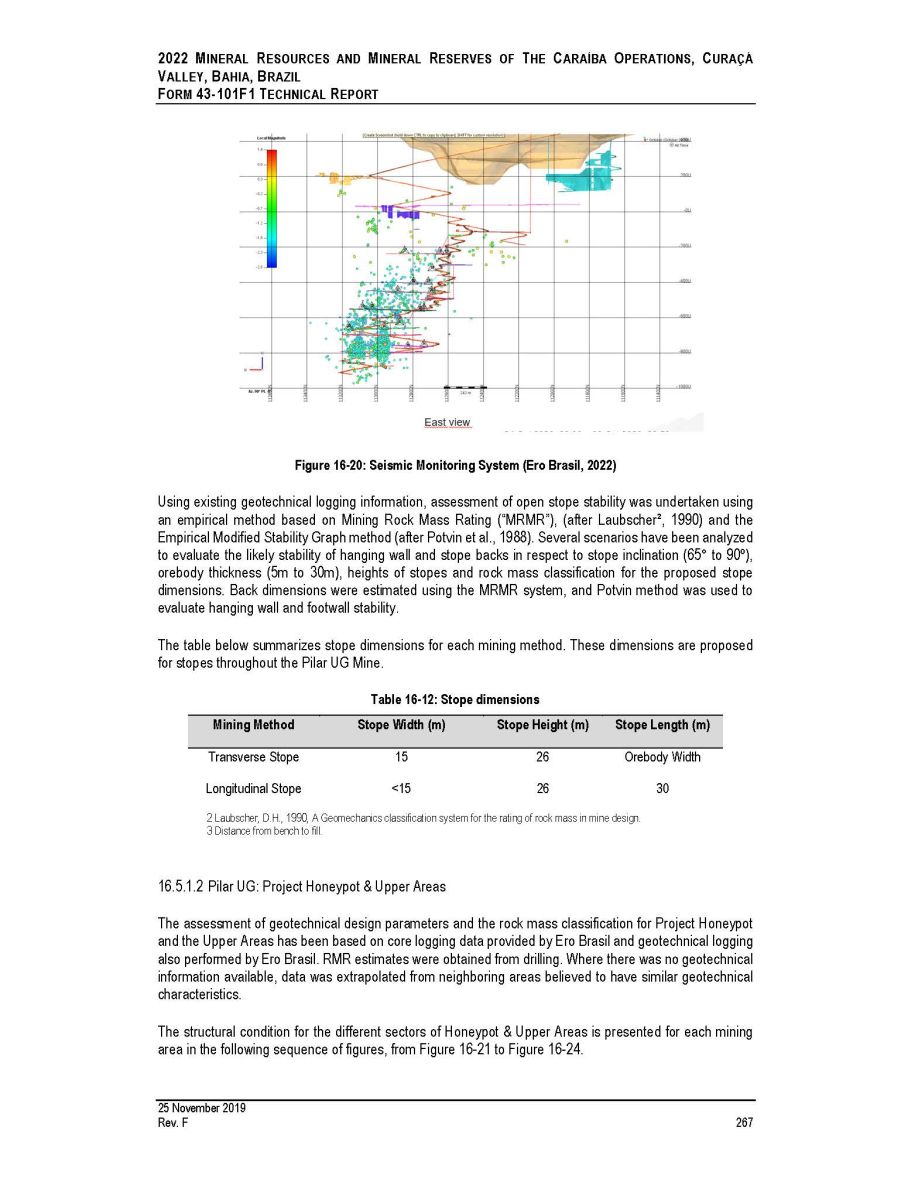
2022 M INERAL R ESOURCES AND M INERAL R ESERVES OF T HE C ARAÍBA O PERATIONS , C URAÇÁ V ALLEY , B AHIA , B RAZIL F ORM 43 - 101F1 T ECHNICAL R EPORT Figure 16 - 20: Seismic Monitoring System (Ero Brasil, 2022) Using existing geotechnical logging information, assessment of open stope stability was undertaken using an empirical method based on Mining Rock Mass Rating (“MRMR”), (after Laubscher², 1990 ) and the Empirical Modified Stability Graph method (after Potvin et al . , 1988 ) . Several scenarios have been analyzed to evaluate the likely stability of hanging wall and stope backs in respect to stope inclination ( 65 ƒ to 90 º), orebody thickness ( 5 m to 30 m), heights of stopes and rock mass classification for the proposed stope dimensions . Back dimensions were estimated using the MRMR system, and Potvin method was used to evaluate hanging wall and footwall stability . The table below summarizes stope dimensions for each mining method . These dimensions are proposed for stopes throughout the Pilar UG Mine . Table 16 - 12: Stope dimensions Mining Method Stope Width (m) Stope Height (m) Stope Length (m) Transverse Stope 15 26 Orebody Width Longitudinal Stope <15 26 30 2 Laubscher, D.H., 1990, A Geomechanics classification system for the rating of rock mass in mine design. 3 Distance from bench to fill. 16.5.1.2 Pilar UG: Project Honeypot & Upper Areas The assessment of geotechnical design parameters and the rock mass classification for Project Honeypot and the Upper Areas has been based on core logging data provided by Ero Brasil and geotechnical logging also performed by Ero Brasil . RMR estimates were obtained from drilling . Where there was no geotechnical information available, data was extrapolated from neighboring areas believed to have similar geotechnical characteristics . The structural condition for the different sectors of Honeypot & Upper Areas is presented for each mining area in the following sequence of figures, from Figure 16 - 21 to Figure 16 - 24 . 25 November 2019 Rev. F 267
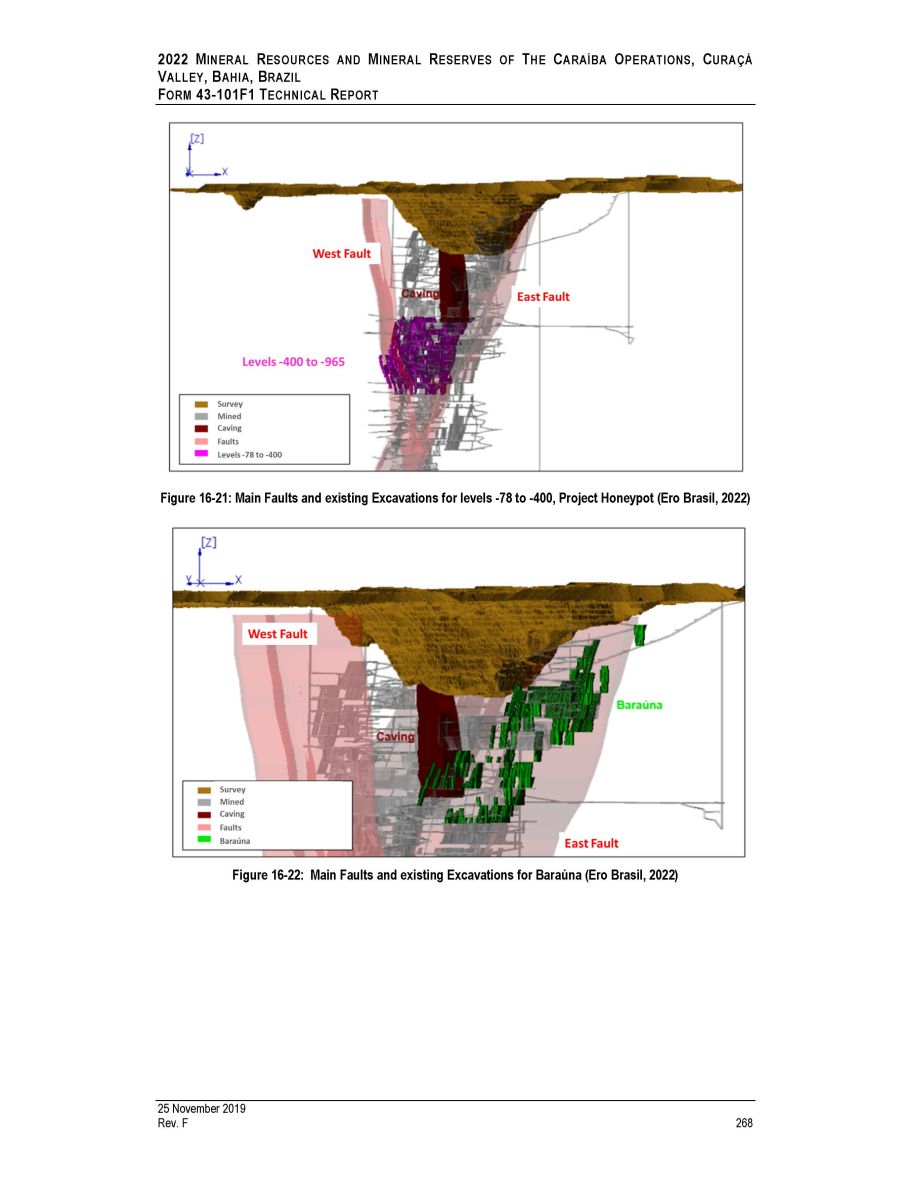
2022 M INERAL R ESOURCES AND M INERAL R ESERVES OF T HE C ARAÍBA O PERATIONS , C URAÇÁ V ALLEY , B AHIA , B RAZIL F ORM 43 - 101F1 T ECHNICAL R EPORT Figure 16 - 21: Main Faults and existing Excavations for levels - 78 to - 400, Project Honeypot (Ero Brasil, 2022) Figure 16 - 22: Main Faults and existing Excavations for Baraúna (Ero Brasil, 2022) 25 November 2019 Rev. F 268

2022 M INERAL R ESOURCES AND M INERAL R ESERVES OF T HE C ARAÍBA O PERATIONS , C URAÇÁ V ALLEY , B AHIA , B RAZIL F ORM 43 - 101F1 T ECHNICAL R EPORT Figure 16 - 23: Main Faults and existing Excavations for P1P2 - R22 (Ero Brasil, 2022) Figure 16 - 24: Main Faults and existing Excavations for MSBW (Ero Brasil, 2022) 25 November 2019 Rev. F 269
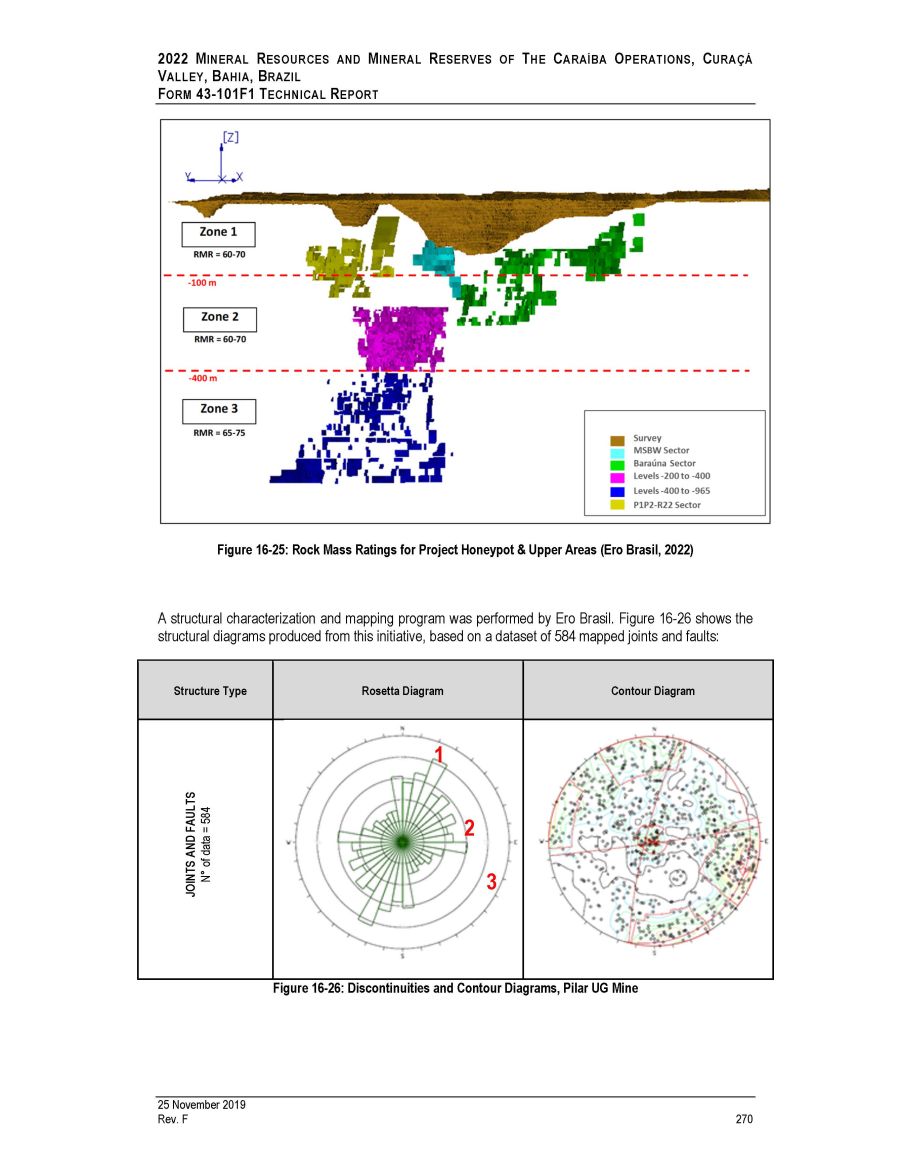
2022 M INERAL R ESOURCES AND M INERAL R ESERVES OF T HE C ARAÍBA O PERATIONS , C URAÇÁ V ALLEY , B AHIA , B RAZIL F ORM 43 - 101F1 T ECHNICAL R EPORT Figure 16 - 25: Rock Mass Ratings for Project Honeypot & Upper Areas (Ero Brasil, 2022) A structural characterization and mapping program was performed by Ero Brasil. Figure 16 - 26 shows the structural diagrams produced from this initiative, based on a dataset of 584 mapped joints and faults: Figure 16 - 26: Discontinuities and Contour Diagrams, Pilar UG Mine Structure Type Rosetta Diagram Contour Diagram JOINTS AND FAULTS N ƒ of data = 584 1 2 3 25 November 2019 Rev. F 270
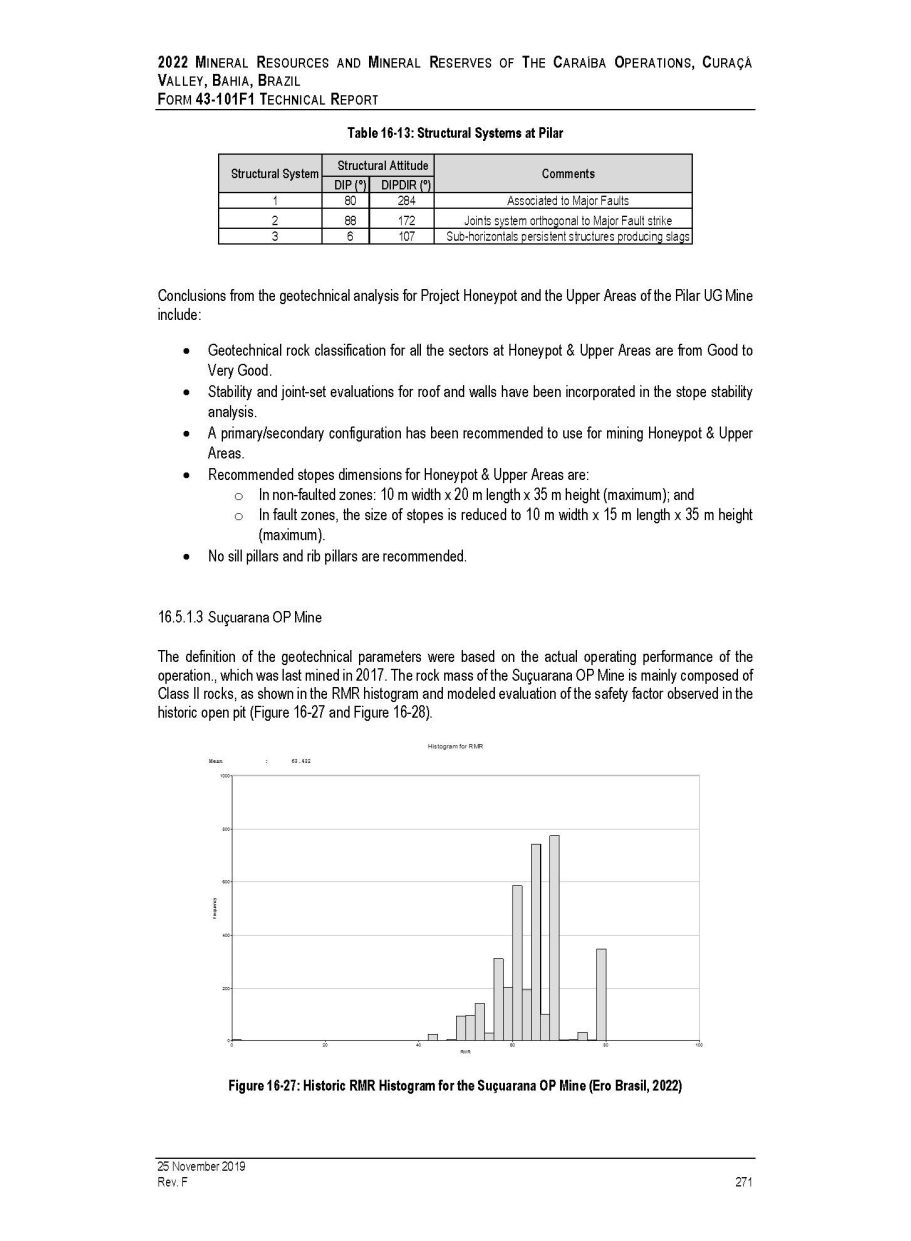
2022 M INERAL R ESOURCES AND M INERAL R ESERVES OF T HE C ARAÍBA O PERATIONS , C URAÇÁ V ALLEY , B AHIA , B RAZIL F ORM 43 - 101F1 T ECHNICAL R EPORT Table 16 - 13: Structural Systems at Pilar Structural System Structural Attitude Comments DIP ( ƒ ) DIPDIR ( ƒ ) 1 80 284 Associated to Major Faults 2 88 172 Joints system orthogonal to Major Fault strike 3 6 107 Sub - horizontals persistent structures producing slags Conclusions from the geotechnical analysis for Project Honeypot and the Upper Areas of the Pilar UG Mine include : Geotechnical rock classification for all the sectors at Honeypot & Upper Areas are from Good to Very Good. Stability and joint - set evaluations for roof and walls have been incorporated in the stope stability analysis. A primary/secondary configuration has been recommended to use for mining Honeypot & Upper Areas. Recommended stopes dimensions for Honeypot & Upper Areas are: o In non - faulted zones: 10 m width x 20 m length x 35 m height (maximum); and o In fault zones, the size of stopes is reduced to 10 m width x 15 m length x 35 m height (maximum). No sill pillars and rib pillars are recommended. 16.5.1.3 Suçuarana OP Mine The definition of the geotechnical parameters were based on the actual operating performance of the operation . , which was last mined in 2017 . The rock mass of the Suçuarana OP Mine is mainly composed of Class II rocks, as shown in the RMR histogram and modeled evaluation of the safety factor observed in the historic open pit (Figure 16 - 27 and Figure 16 - 28 ) . Figure 16 - 27: Historic RMR Histogram for the Suçuarana OP Mine (Ero Brasil, 2022) 25 November 2019 Rev. F 271
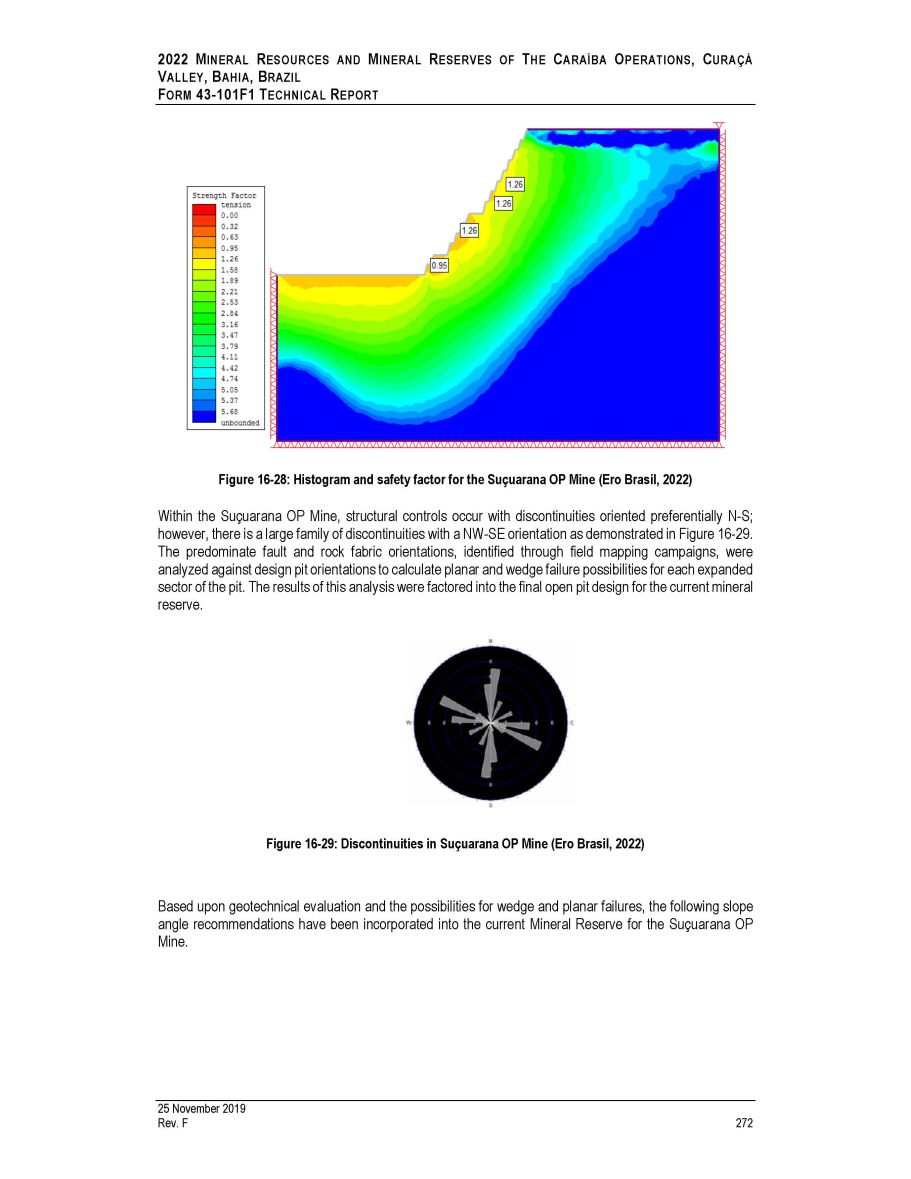
2022 M INERAL R ESOURCES AND M INERAL R ESERVES OF T HE C ARAÍBA O PERATIONS , C URAÇÁ V ALLEY , B AHIA , B RAZIL F ORM 43 - 101F1 T ECHNICAL R EPORT Figure 16 - 28: Histogram and safety factor for the Suçuarana OP Mine (Ero Brasil, 2022) Within the Suçuarana OP Mine, structural controls occur with discontinuities oriented preferentially N - S ; however, there is a large family of discontinuities with a NW - SE orientation as demonstrated in Figure 16 - 29 . The predominate fault and rock fabric orientations, identified through field mapping campaigns, were analyzed against design pit orientations to calculate planar and wedge failure possibilities for each expanded sector of the pit . The results of this analysis were factored into the final open pit design for the current mineral reserve . Figure 16 - 29: Discontinuities in Suçuarana OP Mine (Ero Brasil, 2022) Based upon geotechnical evaluation and the possibilities for wedge and planar failures, the following slope angle recommendations have been incorporated into the current Mineral Reserve for the Suçuarana OP Mine . 25 November 2019 Rev. F 272
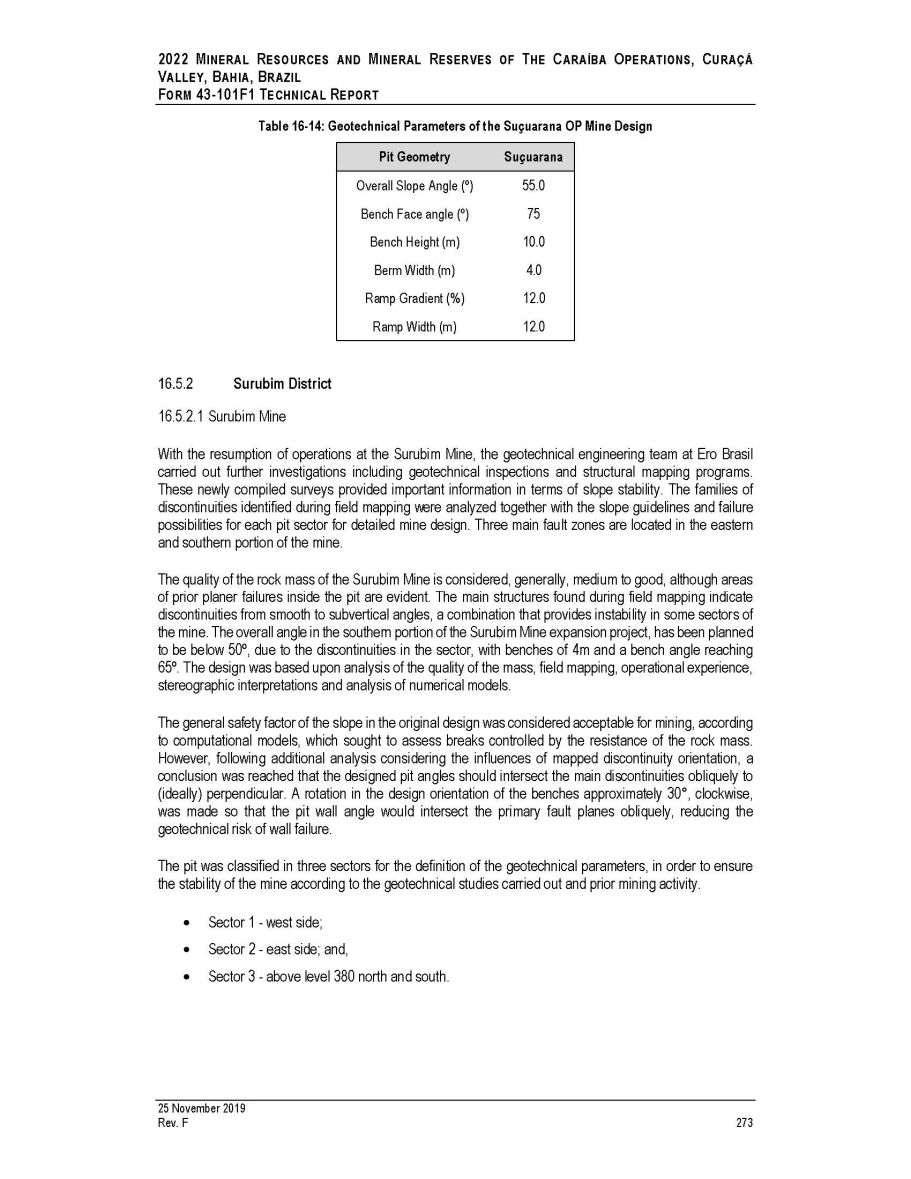
2022 M INERAL R ESOURCES AND M INERAL R ESERVES OF T HE C ARAÍBA O PERATIONS , C URAÇÁ V ALLEY , B AHIA , B RAZIL F ORM 43 - 101F1 T ECHNICAL R EPORT Table 16 - 14: Geotechnical Parameters of the Suçuarana OP Mine Design Pit Geometry Suçuarana Overall Slope Angle (º) 55.0 Bench Face angle (º) 75 Bench Height (m) 10.0 Berm Width (m) 4.0 Ramp Gradient (%) 12.0 Ramp Width (m) 12.0 Surubim District 1. Surubim Mine With the resumption of operations at the Surubim Mine, the geotechnical engineering team at Ero Brasil carried out further investigations including geotechnical inspections and structural mapping programs . These newly compiled surveys provided important information in terms of slope stability . The families of discontinuities identified during field mapping were analyzed together with the slope guidelines and failure possibilities for each pit sector for detailed mine design . Three main fault zones are located in the eastern and southern portion of the mine . The quality of the rock mass of the Surubim Mine is considered, generally, medium to good, although areas of prior planer failures inside the pit are evident . The main structures found during field mapping indicate discontinuities from smooth to subvertical angles, a combination that provides instability in some sectors of the mine . The overall angle in the southern portion of the Surubim Mine expansion project, has been planned to be below 50 º, due to the discontinuities in the sector, with benches of 4 m and a bench angle reaching 65 º . The design was based upon analysis of the quality of the mass, field mapping, operational experience, stereographic interpretations and analysis of numerical models . The general safety factor of the slope in the original design was considered acceptable for mining, according to computational models, which sought to assess breaks controlled by the resistance of the rock mass . However, following additional analysis considering the influences of mapped discontinuity orientation, a conclusion was reached that the designed pit angles should intersect the main discontinuities obliquely to (ideally) perpendicular . A rotation in the design orientation of the benches approximately 30 ƒ , clockwise, was made so that the pit wall angle would intersect the primary fault planes obliquely, reducing the geotechnical risk of wall failure . The pit was classified in three sectors for the definition of the geotechnical parameters, in order to ensure the stability of the mine according to the geotechnical studies carried out and prior mining activity . Sector 1 - west side; Sector 2 - east side; and, Sector 3 - above level 380 north and south. 25 November 2019 Rev. F 273
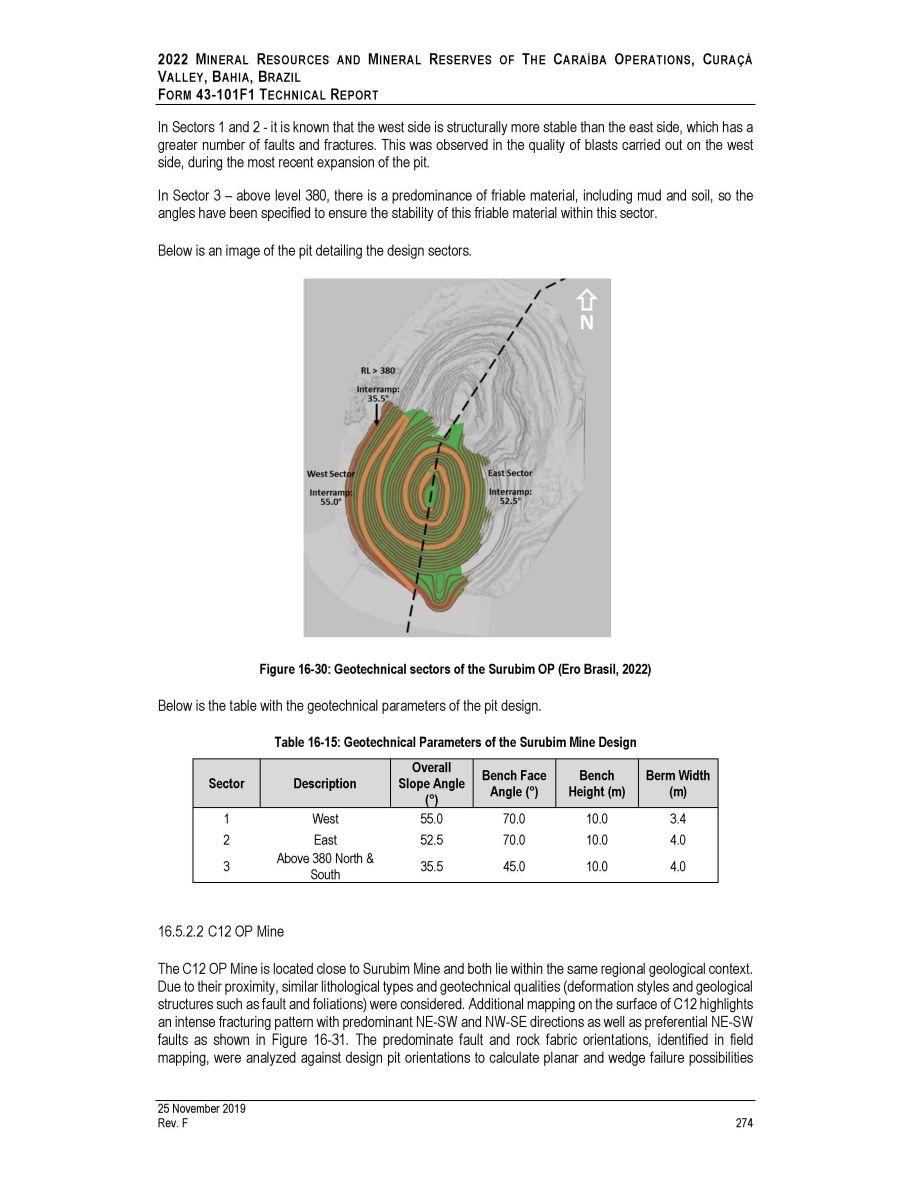
2022 M INERAL R ESOURCES AND M INERAL R ESERVES OF T HE C ARAÍBA O PERATIONS , C URAÇÁ V ALLEY , B AHIA , B RAZIL F ORM 43 - 101F1 T ECHNICAL R EPORT In Sectors 1 and 2 - it is known that the west side is structurally more stable than the east side, which has a greater number of faults and fractures . This was observed in the quality of blasts carried out on the west side, during the most recent expansion of the pit . In Sector 3 – above level 380 , there is a predominance of friable material, including mud and soil, so the angles have been specified to ensure the stability of this friable material within this sector . Below is an image of the pit detailing the design sectors . Figure 16 - 30: Geotechnical sectors of the Surubim OP (Ero Brasil, 2022) Below is the table with the geotechnical parameters of the pit design. Table 16 - 15: Geotechnical Parameters of the Surubim Mine Design Sector Description Overall Slope Angle ( ƒ ) Bench Face Angle ( ƒ ) Bench Height (m) Berm Width (m) 1 West 55.0 70.0 10.0 3.4 2 East 52.5 70.0 10.0 4.0 3 Above 380 North & South 35.5 45.0 10.0 4.0 16.5.2.2 C12 OP Mine The C 12 OP Mine is located close to Surubim Mine and both lie within the same regional geological context . Due to their proximity, similar lithological types and geotechnical qualities (deformation styles and geological structures such as fault and foliations) were considered . Additional mapping on the surface of C 12 highlights an intense fracturing pattern with predominant NE - SW and NW - SE directions as well as preferential NE - SW faults as shown in Figure 16 - 31 . The predominate fault and rock fabric orientations, identified in field mapping, were analyzed against design pit orientations to calculate planar and wedge failure possibilities 25 November 2019 Rev. F 274
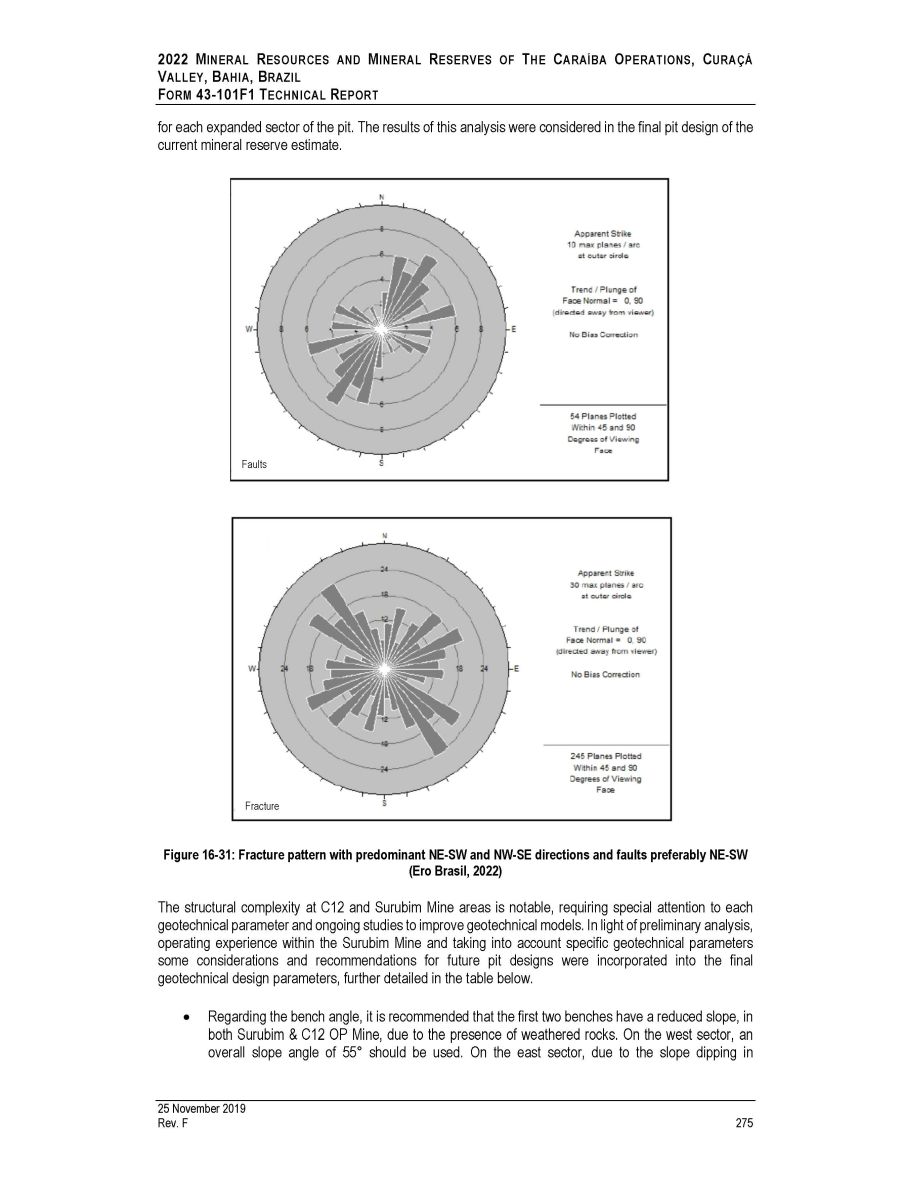
2022 M INERAL R ESOURCES AND M INERAL R ESERVES OF T HE C ARAÍBA O PERATIONS , C URAÇÁ V ALLEY , B AHIA , B RAZIL F ORM 43 - 101F1 T ECHNICAL R EPORT for each expanded sector of the pit. The results of this analysis were considered in the final pit design of the current mineral reserve estimate. Figure 16 - 31: Fracture pattern with predominant NE - SW and NW - SE directions and faults preferably NE - SW (Ero Brasil, 2022) The structural complexity at C 12 and Surubim Mine areas is notable, requiring special attention to each geotechnical parameter and ongoing studies to improve geotechnical models . In light of preliminary analysis, operating experience within the Surubim Mine and taking into account specific geotechnical parameters some considerations and recommendations for future pit designs were incorporated into the final geotechnical design parameters, further detailed in the table below . Regarding the bench angle, it is recommended that the first two benches have a reduced slope, in both Surubim & C 12 OP Mine, due to the presence of weathered rocks . On the west sector, an overall slope angle of 55 ƒ should be used . On the east sector, due to the slope dipping in Faults 25 November 2019 Rev. F 275 Fracture
2022 M INERAL R ESOURCES AND M INERAL R ESERVES OF T HE C ARAÍBA O PERATIONS , C URAÇÁ V ALLEY , B AHIA , B RAZIL F ORM 43 - 101F1 T ECHNICAL R EPORT accordance with the weakness planes of the foliations, which dip predominantly to the west, an overall slope angle of 55 ƒ should be used; 10 m high benches; Berms width of 4 m and 12 m for the ramp . The parameters of the proposed project will be kept until the next studies and field monitoring indicate a different scenario, in which the teams should discuss suitable changes and improvements ; Ramp gradient of 12%. And finally, it is advisable to set the ramp entrances on the west side of the open pits, preferably in the NW quadrant, in order to avoid the greatest risk of instability . Table 16 - 16: C12 OP Geotechnical Parameters Pit Geometry C12 Overall Slope Angle (º) 55.0 Bench Face angle (º) 75 Bench Height (m) 10.0 Berm Width (m) 4.0 Ramp Gradient (%) 12.0 Ramp Width (m) 12.0 25 November 2019 Rev. F 276 16.5.2.3 Surubim Mine, Underground Geotechnical characterization work indicates a rock mass of good quality . The underground portion of the Surubim Mine has an average RQD of 75 % , being classified as massive type II based on the RMR geomechanical classification system . The minimum containment recommendations for the project, taking into account the good quality of the rock mass, include : Use of shotcrete on the face of the slope where the entrance to the underground mine will be built, and for the first 15 meters of development, the recommended support will be the use of shotcrete, screens and systematic rockbolts in the standard 1 . 5 x 1 . 5 mesh . After this interval, the standard support of ramps, transport galleries and ore production galleries, will be used 1 . 5 x 1 . 5 mesh rockbolts and screens . Numerical simulations were carried out to assess the stability conditions of the excavations, as well as to obtain the safety factors for the dimensioning of the mining pillars . Based on the numerical stress and strain simulations performed, the safety factors of the pillars in the Surubim Mine underground development project are expected to be above 1 . 5 and are considered acceptable for temporary underground excavations .

2022 M INERAL R ESOURCES AND M INERAL R ESERVES OF T HE C ARAÍBA O PERATIONS , C URAÇÁ V ALLEY , B AHIA , B RAZIL F ORM 43 - 101F1 T ECHNICAL R EPORT Vermelhos District 16.5.3.1 Vermelhos UG Mine The quality of the rock mass was determined based on geotechnical drill logging and the resulting RMR geomechanical classification system by Bieniawski ( 1989 ) . At Vermelhos, RMR values are typically above 60 , indicating a rock mass of good quality that can be classified as Type II . Development and production activities to date, have confirmed the quality of the rock mass in underground mapping and production stopes . Figure 16 - 32: Vermelhos RMR histogram (Ero Brasil, 2022) Throughout the mine, geotechnical mapping is carried out to determine the main structural considerations of the mine . Structural control in Vermelhos indicates a dominant N - S orientation of major discontinuities related to lithology contacts of the mineralized zone and NE - SW fractures and faults . (Figure 16 - 34 and Figure 16 - 35 ) . Figure 16 - 33: Main structures from Vermelhos Mapping (Ero Brasil, 2022) 25 November 2019 Rev. F 277
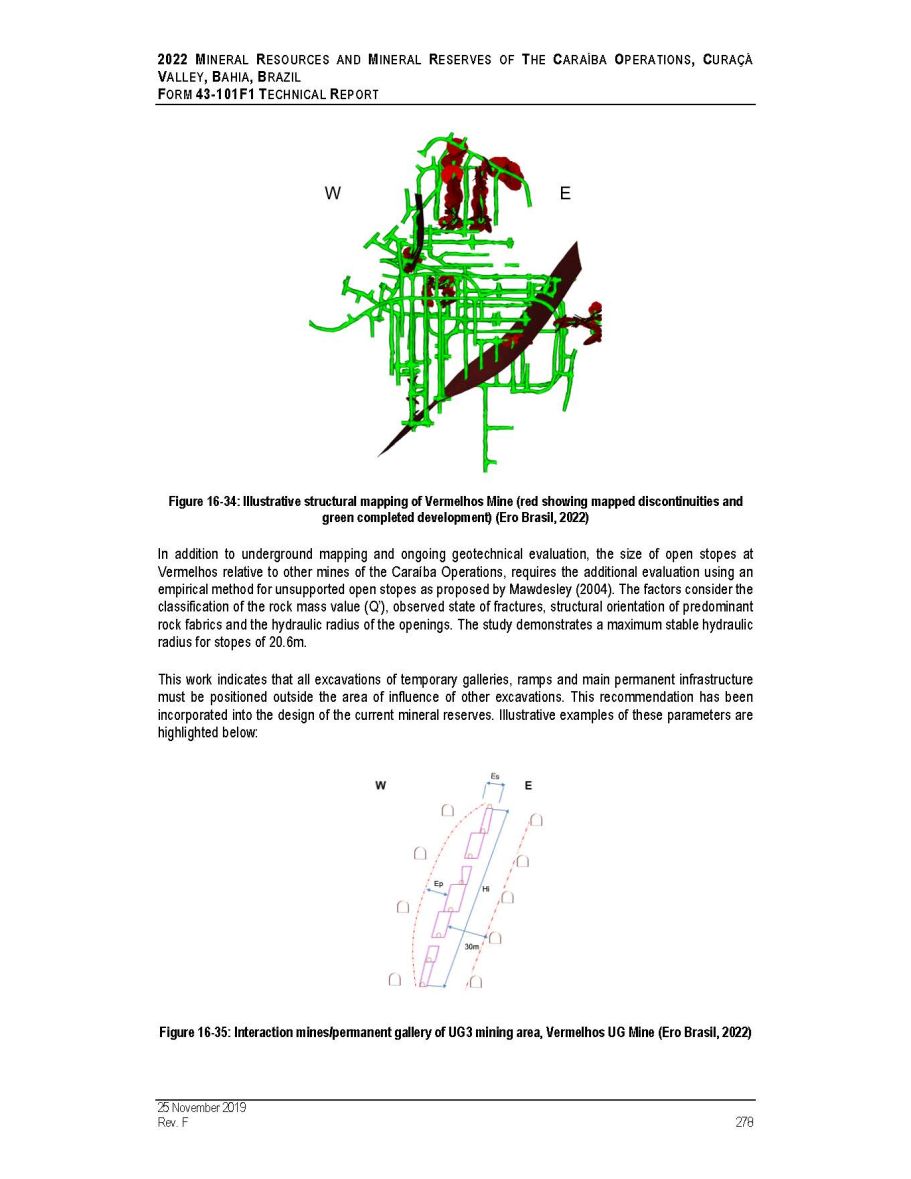
2022 M INERAL R ESOURCES AND M INERAL R ESERVES OF T HE C ARAÍBA O PERATIONS , C URAÇÁ V ALLEY , B AHIA , B RAZIL F ORM 43 - 101F1 T ECHNICAL R EPORT Figure 16 - 34: Illustrative structural mapping of Vermelhos Mine (red showing mapped discontinuities and green completed development) (Ero Brasil, 2022) In addition to underground mapping and ongoing geotechnical evaluation, the size of open stopes at Vermelhos relative to other mines of the Caraíba Operations, requires the additional evaluation using an empirical method for unsupported open stopes as proposed by Mawdesley ( 2004 ) . The factors consider the classification of the rock mass value (Q’), observed state of fractures, structural orientation of predominant rock fabrics and the hydraulic radius of the openings . The study demonstrates a maximum stable hydraulic radius for stopes of 20 . 6 m . This work indicates that all excavations of temporary galleries, ramps and main permanent infrastructure must be positioned outside the area of influence of other excavations . This recommendation has been incorporated into the design of the current mineral reserves . Illustrative examples of these parameters are highlighted below : Figure 16 - 35: Interaction mines/permanent gallery of UG3 mining area, Vermelhos UG Mine (Ero Brasil, 2022) 25 November 2019 Rev. F 278
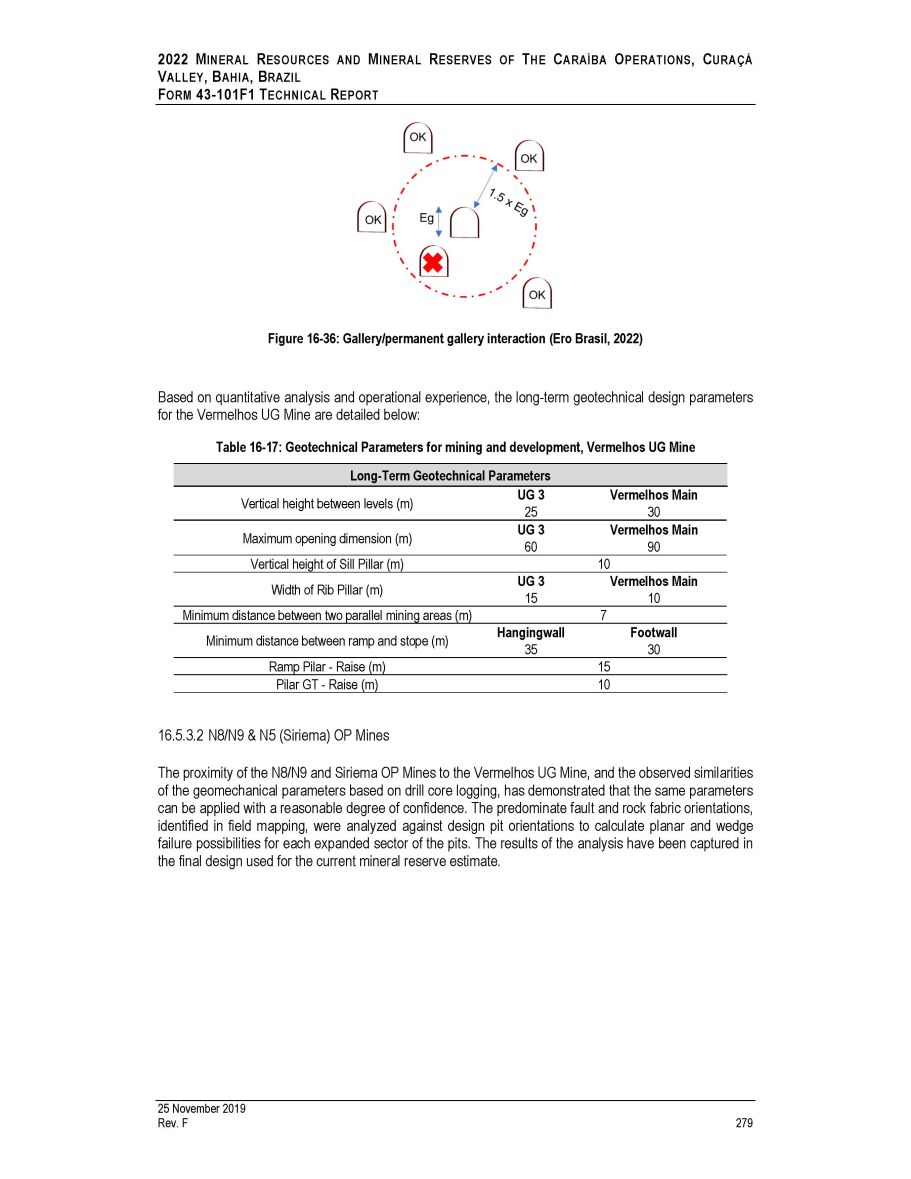
2022 M INERAL R ESOURCES AND M INERAL R ESERVES OF T HE C ARAÍBA O PERATIONS , C URAÇÁ V ALLEY , B AHIA , B RAZIL F ORM 43 - 101F1 T ECHNICAL R EPORT Figure 16 - 36: Gallery/permanent gallery interaction (Ero Brasil, 2022) Based on quantitative analysis and operational experience, the long - term geotechnical design parameters for the Vermelhos UG Mine are detailed below: Table 16 - 17: Geotechnical Parameters for mining and development, Vermelhos UG Mine Long - Term Geotechnical Parameters Vertical height between levels (m) UG 3 25 Vermelhos Main 30 Maximum opening dimension (m) UG 3 60 Vermelhos Main 90 Vertical height of Sill Pillar (m) 10 Width of Rib Pillar (m) UG 3 15 Vermelhos Main 10 Minimum distance between two parallel mining areas (m) 7 Minimum distance between ramp and stope (m) Hangingwall 35 Footwall 30 Ramp Pilar - Raise (m) 15 Pilar GT - Raise (m) 10 16.5.3.2 N8/N9 & N5 (Siriema) OP Mines The proximity of the N 8 /N 9 and Siriema OP Mines to the Vermelhos UG Mine, and the observed similarities of the geomechanical parameters based on drill core logging, has demonstrated that the same parameters can be applied with a reasonable degree of confidence . The predominate fault and rock fabric orientations, identified in field mapping, were analyzed against design pit orientations to calculate planar and wedge failure possibilities for each expanded sector of the pits . The results of the analysis have been captured in the final design used for the current mineral reserve estimate . 25 November 2019 Rev. F 279
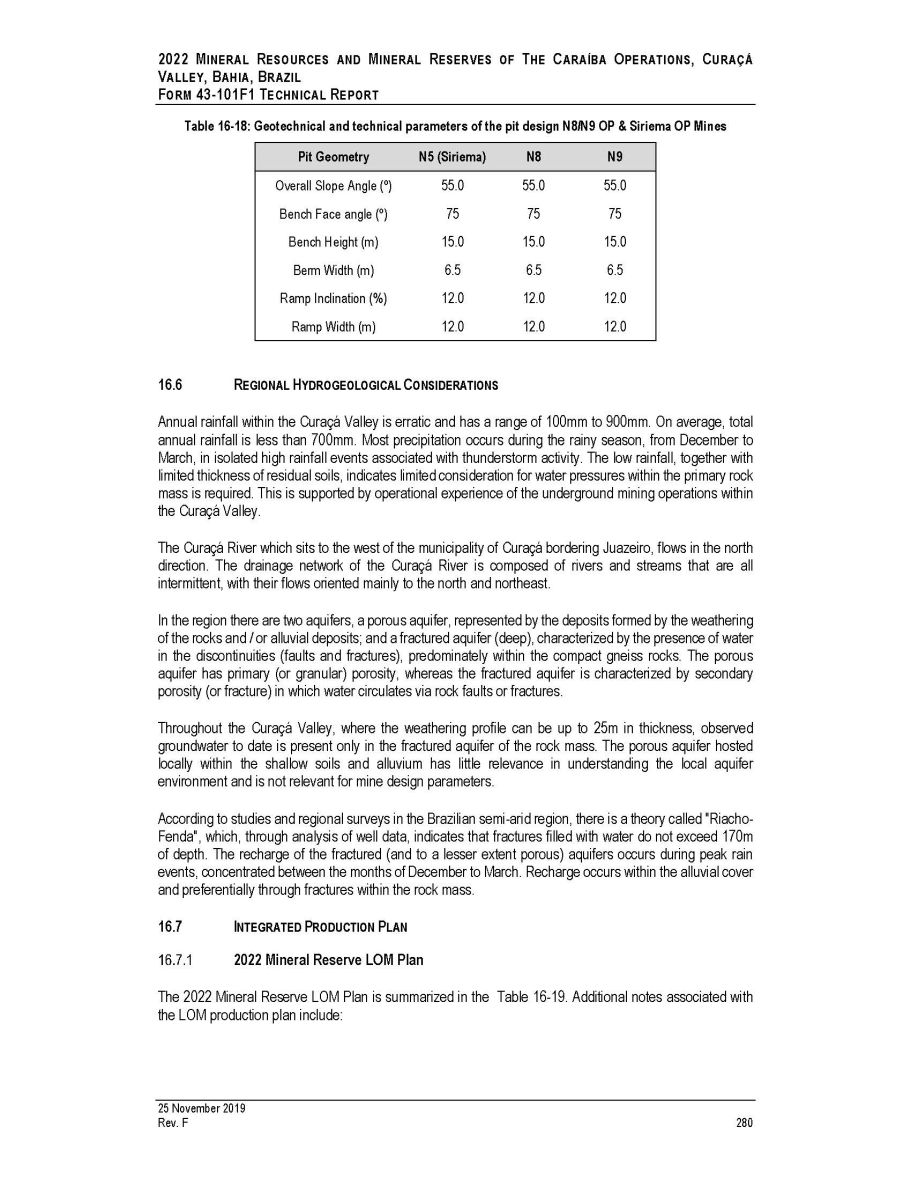
2022 M INERAL R ESOURCES AND M INERAL R ESERVES OF T HE C ARAÍBA O PERATIONS , C URAÇÁ V ALLEY , B AHIA , B RAZIL F ORM 43 - 101F1 T ECHNICAL R EPORT Table 16 - 18: Geotechnical and technical parameters of the pit design N8/N9 OP & Siriema OP Mines Pit Geometry N5 (Siriema) N8 N9 Overall Slope Angle (º) 55.0 55.0 55.0 Bench Face angle (º) 75 75 75 Bench Height (m) 15.0 15.0 15.0 Berm Width (m) 6.5 6.5 6.5 Ramp Inclination (%) 12.0 12.0 12.0 Ramp Width (m) 12.0 12.0 12.0 6. R EGIONAL H YDROGEOLOGICAL C ONSIDERATIONS Annual rainfall within the Curaçá Valley is erratic and has a range of 100 mm to 900 mm . On average, total annual rainfall is less than 700 mm . Most precipitation occurs during the rainy season, from December to March, in isolated high rainfall events associated with thunderstorm activity . The low rainfall, together with limited thickness of residual soils, indicates limited consideration for water pressures within the primary rock mass is required . This is supported by operational experience of the underground mining operations within the Curaçá Valley . The Curaçá River which sits to the west of the municipality of Curaçá bordering Juazeiro, flows in the north direction . The drainage network of the Curaçá River is composed of rivers and streams that are all intermittent, with their flows oriented mainly to the north and northeast . In the region there are two aquifers, a porous aquifer, represented by the deposits formed by the weathering of the rocks and / or alluvial deposits ; and a fractured aquifer (deep), characterized by the presence of water in the discontinuities (faults and fractures), predominately within the compact gneiss rocks . The porous aquifer has primary (or granular) porosity, whereas the fractured aquifer is characterized by secondary porosity (or fracture) in which water circulates via rock faults or fractures . Throughout the Curaçá Valley, where the weathering profile can be up to 25 m in thickness, observed groundwater to date is present only in the fractured aquifer of the rock mass . The porous aquifer hosted locally within the shallow soils and alluvium has little relevance in understanding the local aquifer environment and is not relevant for mine design parameters . According to studies and regional surveys in the Brazilian semi - arid region, there is a theory called "Riacho - Fenda", which, through analysis of well data, indicates that fractures filled with water do not exceed 170 m of depth . The recharge of the fractured (and to a lesser extent porous) aquifers occurs during peak rain events, concentrated between the months of December to March . Recharge occurs within the alluvial cover and preferentially through fractures within the rock mass . 7. I NTEGRATED P RODUCTION P LAN 2022 Mineral Reserve LOM Plan The 2022 Mineral Reserve LOM Plan is summarized in the Table 16 - 19 . Additional notes associated with the LOM production plan include : 25 November 2019 Rev. F 280
2022 M INERAL R ESOURCES AND M INERAL R ESERVES OF T HE C ARAÍBA O PERATIONS , C URAÇÁ V ALLEY , B AHIA , B RAZIL F ORM 43 - 101F1 T ECHNICAL R EPORT Q4 2022 production outlines the mineral reserve schedule for the three months from the Effective Date to December 31, 2022; All figures have been rounded to the relative accuracy of the estimates. Summed amounts may not add up due to rounding. The mine production exceeding mill capacity in 2027 will be stockpiled in the ore blending yard. 25 November 2019 Rev. F 281
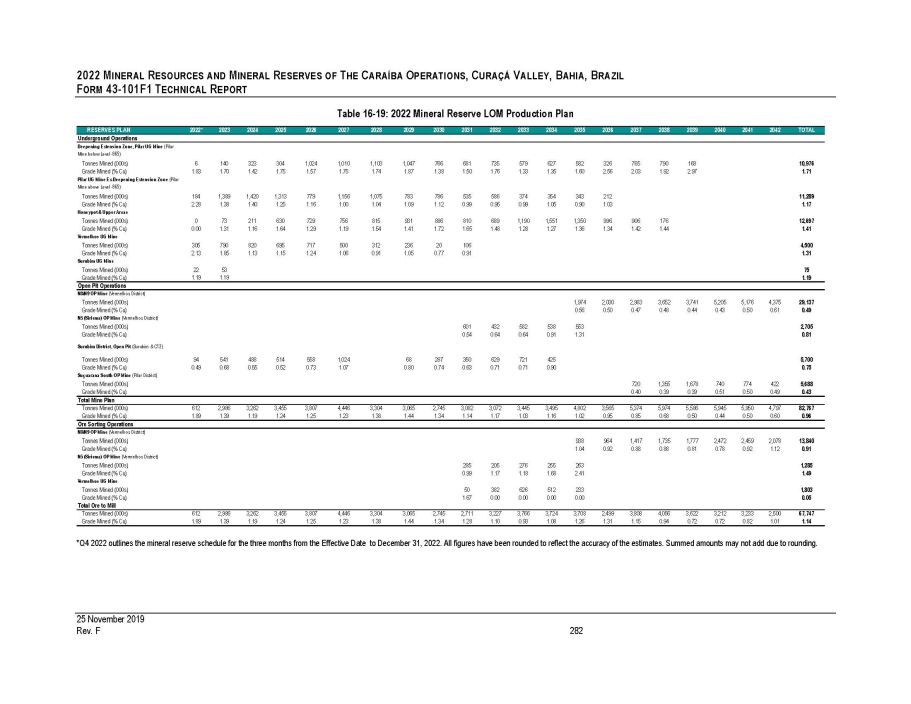
2022 M INERAL R ESOURCES AND M INERAL R ESERVES OF T HE C ARAÍBA O PERATIONS , C URAÇÁ V ALLEY , B AHIA , B RAZIL F ORM 43 - 101F1 T ECHNICAL R EPORT Table 16 - 19: 2022 Mineral Reserve LOM Production Plan 25 November 2019 Rev. F 282 *Q4 2022 outlines the mineral reserve schedule for the three months from the Effective Date to December 31, 2022. All figures have been rounded to reflect the accuracy of the estimates. Summed amounts may not add due to rounding. RESERVES PLAN 2022* 2023 2024 2025 2026 2027 2028 2029 2030 2031 2032 2033 2034 2035 2036 2037 2038 2039 2040 2041 2042 TOTAL Underground Operations Deepening Extension Zone, Pilar UG Mine (Pilar Mine below Level - 965) Tonnes Mined (000s) 6 140 323 304 1,024 1,010 1,103 1,047 766 681 735 579 627 582 326 765 790 168 10,976 Grade Mined (% Cu) 1.83 1.70 1.42 1.75 1.57 1.75 1.74 1.87 1.38 1.50 1.76 1.33 1.35 1.60 2.56 2.03 1.92 2.97 1.71 Pilar UG Mine Ex - Deepening Extension Zone (Pilar Mine above Level - 965) Tonnes Mined (000s) 184 1,389 1,420 1,313 779 1,156 1,075 783 786 535 586 374 354 343 212 11,289 Grade Mined (% Cu) 2.28 1.38 1.40 1.25 1.16 1.00 1.04 1.09 1.12 0.99 0.95 0.99 1.05 0.90 1.03 1.17 Honeypot & Upper Areas Tonnes Mined (000s) 0 73 211 630 729 756 815 931 886 810 689 1,190 1,551 1,350 996 906 176 12,697 Grade Mined (% Cu) 0.00 1.31 1.16 1.64 1.29 1.19 1.54 1.41 1.72 1.65 1.48 1.28 1.27 1.36 1.34 1.42 1.44 1.41 Vermelhos UG Mine Tonnes Mined (000s) 305 790 820 695 717 500 312 236 20 106 4,500 Grade Mined (% Cu) 2.13 1.85 1.13 1.15 1.24 1.06 0.91 1.05 0.77 0.91 1.31 Surubim UG Mine Tonnes Mined (000s) 22 53 75 Grade Mined (% Cu) 1.19 1.19 1.19 Open Pit Operations N8/N9 OP Mine (Vermelhos District) Tonnes Mined (000s) 1,974 2,030 2,983 3,652 3,741 5,205 5,176 4,375 29,137 Grade Mined (% Cu) 0.56 0.50 0.47 0.48 0.44 0.43 0.50 0.61 0.49 N5 (Siriema) OP Mine (Vermelhos District) Tonnes Mined (000s) 601 432 582 538 553 2,705 Grade Mined (% Cu) 0.54 0.64 0.64 0.91 1.31 0.81 Surubim District, Open Pit (Surubim & C12) Tonnes Mined (000s) 94 541 488 514 558 1,024 68 287 350 629 721 425 5,700 Grade Mined (% Cu) 0.49 0.68 0.55 0.52 0.73 1.07 0.80 0.74 0.63 0.71 0.71 0.90 0.75 Suçuarana South OP Mine (Pilar District) Tonnes Mined (000s) 720 1,355 1,678 740 774 422 5,688 Grade Mined (% Cu) 0.40 0.39 0.39 0.51 0.50 0.49 0.43 Total Mine Plan Tonnes Mined (000s) 612 2,986 3,262 3,455 3,807 4,446 3,304 3,065 2,745 3,082 3,072 3,445 3,495 4,802 3,565 5,374 5,974 5,586 5,945 5,950 4,797 82,767 Grade Mined (% Cu) 1.89 1.39 1.19 1.24 1.25 1.23 1.38 1.44 1.34 1.14 1.17 1.03 1.16 1.02 0.95 0.85 0.68 0.50 0.44 0.50 0.60 0.96 Ore Sorting Operations N8/N9 OP Mine (Vermelhos District) Tonnes Mined (000s) 938 964 1,417 1,735 1,777 2,472 2,459 2,078 13,840 Grade Mined (% Cu) 1.04 0.92 0.88 0.88 0.81 0.78 0.92 1.12 0.91 N5 (Siriema) OP Mine (Vermelhos District) Tonnes Mined (000s) 285 205 276 255 263 1,285 Grade Mined (% Cu) 0.99 1.17 1.18 1.68 2.41 1.49 Vermelhos UG Mine Tonnes Mined (000s) 50 382 626 512 233 1,803 Grade Mined (% Cu) Total Ore to Mill 1.67 0.00 0.00 0.00 0.00 0.05 Tonnes Mined (000s) 612 2,986 3,262 3,455 3,807 4,446 3,304 3,065 2,745 2,711 3,227 3,766 3,724 3,708 2,499 3,808 4,056 3,622 3,212 3,233 2,500 67,747 Grade Mined (% Cu) 1.89 1.39 1.19 1.24 1.25 1.23 1.38 1.44 1.34 1.28 1.10 0.93 1.08 1.26 1.31 1.15 0.94 0.72 0.72 0.82 1.01 1.14
25 November 2019 Rev. F 283 2022 M INERAL R ESOURCES AND M INERAL R ESERVES OF T HE C ARAÍBA O PERATIONS , C URAÇÁ V ALLEY , B AHIA , B RAZIL F ORM 43 - 101 F 1 T ECHNICAL R EPORT 2022 Strategic LOM Plan The Strategic LOM Plan presented in Table below expands the ore amounts of the Reserves Plan (Table 16 - 19 ), by including the corresponding Inferred Resources of each of the Projects, given the intrinsic synergies associated with the operations . The Company's 2022 LOM planning process considers recently completed and ongoing investments in mining and milling infrastructure under the Company's Pilar 3 . 0 initiative . As a result of the integration of Project Honeypot and the nature of the mineralization remaining in the upper levels of the Pilar Mine, and more broadly within the Company's underground operations, effective extraction of the mineral reserve necessitated the consideration of inferred mineral resources in the Company's long - term strategic planning efforts, particularly in the design of stopes that include measured, indicated and some inferred mineral resources - a process that has been utilized at the Pilar Mine since underground operations commenced in 1986 . Inferred mineral resources are considered too speculative geologically to have the economic considerations applied to them that would enable them to be categorized as mineral reserves . Mineral resources which are not mineral reserves do not have demonstrated economic viability .
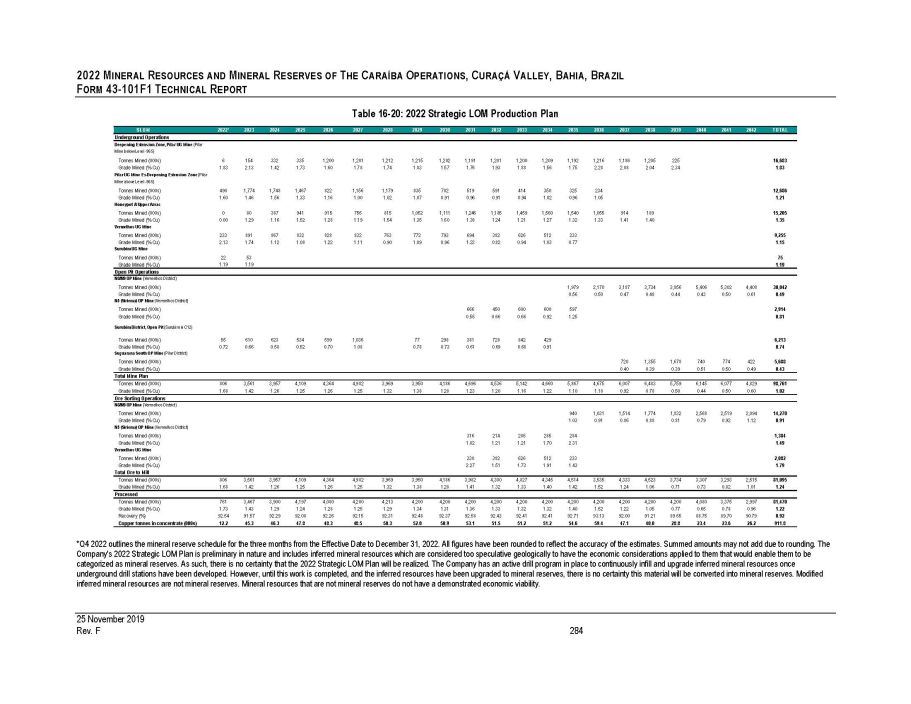
2022 M INERAL R ESOURCES AND M INERAL R ESERVES OF T HE C ARAÍBA O PERATIONS , C URAÇÁ V ALLEY , B AHIA , B RAZIL F ORM 43 - 101F1 T ECHNICAL R EPORT Table 16 - 20: 2022 Strategic LOM Production Plan 25 November 2019 Rev. F 284 *Q4 2022 outlines the mineral reserve schedule for the three months from the Effective Date to December 31, 2022. All figures have been rounded to reflect the accuracy of the estimates. Summed amounts may not add due to rounding. The Company's 2022 Strategic LOM Plan is preliminary in nature and includes inferred mineral resources which are considered too speculative geologically to have the economic considerations applied to them that would enable them to be categorized as mineral reserves. As such, there is no certainty that the 2022 Strategic LOM Plan will be realized. The Company has an active drill program in place to continuously infill and upgrade inferred mineral resources once underground drill stations have been developed. However, until this work is completed, and the inferred resources have been upgraded to mineral reserves, there is no certainty this material will be converted into mineral reserves. Modified inferred mineral resources are not mineral reserves. Mineral resources that are not mineral reserves do not have a demonstrated economic viability. Ore SLOM 2022* 2023 2024 2025 2026 2027 2028 2029 2030 2031 2032 2033 2034 2035 2036 2037 2038 2039 2040 2041 2042 TOTAL Underground Operations Deepening Extension Zone, Pilar UG Mine (Pilar Mine below Level - 965) Tonnes Mined (000s) 6 154 332 335 1,200 1,201 1,212 1,215 1,202 1,191 1,201 1,200 1,209 1,192 1,216 1,186 1,205 225 16,683 Grade Mined (% Cu) 1.83 2.13 1.42 1.73 1.60 1.78 1.74 1.83 1.57 1.76 1.93 1.88 1.56 1.75 2.28 2.08 2.04 2.34 1.83 Pilar UG Mine Ex - Deepening Extension Zone (Pilar Mine above Level - 965) Tonnes Mined (000s) 490 1,774 1,748 1,467 822 1,156 1,179 835 782 519 591 414 350 325 234 12,686 Grade Mined (% Cu) 1.60 Honeypot & Upper Areas 1.46 1.56 1.33 1.16 1.00 1.02 1.07 0.91 0.96 0.91 0.94 1.02 0.96 1.05 1.21 Tonnes Mined (000s) 0 80 387 941 915 756 815 1,052 1,111 1,246 1,185 1,459 1,560 1,540 1,055 914 189 15,205 Grade Mined (% Cu) 0.00 Vermelhos UG Mine 1.29 1.16 1.52 1.28 1.19 1.54 1.35 1.60 1.38 1.24 1.21 1.27 1.32 1.33 1.41 1.40 1.35 Tonnes Mined (000s) 233 891 867 832 828 832 763 772 793 694 382 626 512 233 9,255 Grade Mined (% Cu) 2.13 1.74 1.12 1.08 1.22 1.11 0.90 1.09 0.96 1.23 0.82 0.94 1.03 0.77 1.15 Surubim UG Mine Tonnes Mined (000s) 22 53 75 Grade Mined (% Cu) 1.19 1.19 1.19 Open Pit Operations N8/N9 OP Mine (Vermelhos District) Tonnes Mined (000s) 1,979 2,170 3,187 3,734 3,856 5,406 5,302 4,408 30,042 Grade Mined (% Cu) 0.56 0.50 0.47 0.48 0.44 0.43 0.50 0.61 0.49 N5 (Siriema) OP Mine (Vermelhos District) Tonnes Mined (000s) 666 450 600 600 597 2,914 Grade Mined (% Cu) 0.55 0.66 0.66 0.92 1.25 0.81 Surubim District, Open Pit (Surubim & C12) Tonnes Mined (000s) 55 610 623 534 599 1,036 77 298 381 728 842 429 6,213 Grade Mined (% Cu) 0.72 0.66 0.58 0.52 0.70 1.08 0.78 0.73 0.61 0.69 0.68 0.91 0.74 Suçuarana South OP Mine (Pilar District) Tonnes Mined (000s) 720 1,355 1,678 740 774 422 5,688 Grade Mined (% Cu) 0.40 0.39 0.39 0.51 0.50 0.49 0.43 Total Mine Plan Tonnes Mined (000s) 806 3,561 3,957 4,109 4,364 4,982 3,969 3,950 4,186 4,696 4,536 5,142 4,660 5,867 4,675 6,007 6,483 5,759 6,145 6,077 4,829 98,761 Grade Mined (% Cu) 1.68 1.42 1.26 1.25 1.26 1.25 1.32 1.38 1.28 1.23 1.20 1.16 1.22 1.10 1.18 0.92 0.78 0.50 0.44 0.50 0.60 1.02 Ore Sorting Operations N8/N9 OP Mine (Vermelhos District) Tonnes Mined (000s) 940 1,031 1,514 1,774 1,832 2,568 2,519 2,094 14,270 Grade Mined (% Cu) N5 (Siriema) OP Mine (Vermelhos District) 1.03 0.91 0.86 0.88 0.81 0.79 0.92 1.12 0.91 Tonnes Mined (000s) 316 214 285 285 284 1,384 Grade Mined (% Cu) 1.02 1.21 1.21 1.70 2.31 1.49 Vermelhos UG Mine Tonnes Mined (000s) 330 382 626 512 233 2,082 Grade Mined (% Cu) Total Ore to Mill 2.27 1.51 1.73 1.91 1.43 1.79 Tonnes Mined (000s) 806 3,561 3,957 4,109 4,364 4,982 3,969 3,950 4,186 3,982 4,300 4,827 4,345 4,514 3,535 4,333 4,523 3,734 3,307 3,293 2,515 81,095 Grade Mined (% Cu) 1.68 1.42 1.26 1.25 1.26 1.25 1.32 1.38 1.28 1.41 1.32 1.33 1.40 1.42 1.52 1.24 1.06 0.71 0.73 0.82 1.01 1.24 Processed Tonnes Mined (000s) 761 3,467 3,900 4,197 4,080 4,200 4,213 4,200 4,200 4,200 4,200 4,200 4,200 4,200 4,200 4,200 4,200 4,200 4,080 3,375 2,997 81,470 Grade Mined (% Cu) 1.73 1.43 1.29 1.24 1.28 1.25 1.29 1.34 1.31 1.36 1.33 1.32 1.32 1.40 1.52 1.22 1.05 0.77 0.65 0.78 0.96 1.22 Recovery (%) 92.54 91.57 92.29 92.08 92.26 92.15 92.31 92.48 92.37 92.58 92.43 92.41 92.41 92.71 93.13 92.00 91.21 89.65 88.75 89.70 90.79 0.92 Copper tonnes in concentrate (000s) 12.2 45.3 46.3 47.8 48.3 48.5 50.3 52.0 50.9 53.1 51.5 51.2 51.2 54.6 59.4 47.1 40.0 28.8 23.4 23.6 26.2 911.8

2022 M INERAL R ESOURCES AND M INERAL R ESERVES OF T HE C ARAÍBA O PERATIONS , C URAÇÁ V ALLEY , B AHIA , B RAZIL F ORM 43 - 101F1 T ECHNICAL R EPORT 17 17.1 25 November 2019 Rev. F 285 RECOVERY METHODS C ARAÍBA M ILL F LOWSHEET AND P ROCESS D ESCRIPTION The Caraíba Mill was designed and built by Milder Kaiser, a Canadian engineering, design and construction company . Processing operations commenced in 1979 and the plant has since had the benefit of decades of process optimization work performed by the Caraíba’s process engineering team with the support of third - party consultants as needed . The concentrator is operated 24 hours per day, seven days per week with monthly scheduled downtime to perform routine maintenance . In its current configuration, the plant has capacity to treat a nominal 3 . 2 million tonnes of copper bearing ore per annum, assuming 91 % total availability . The Caraíba concentrator plant is composed of a three - stage crushing, two - stage milling and flotation design . Three - stage crushing is used to prepare a nominal 12 . 5 mm top size crushed feed for the ball milling circuit that also feeds the regrind mill circuit prior to being sent to flotation for the recovery of copper - bearing minerals . Final flotation concentrate is filtered to a design target of 7 . 5 % moisture and is transported via highway for smelting and refining either (i) locally at Paranapanema Company, located in Dias D’Ávila, or (ii) sold via international export markets from Salvador’s port, both approximately 475 km from the Caraíba Mill . Installed equipment of the Caraíba Mill are detailed in Table 17 - 7 . A process flowsheet showing major unit operations is further detailed in Appendix C to the Report . 17 . 2 C RUSHING There are two primary crushing operations . Ore from other mining sites is delivered to the surface primary gyro crusher, featuring a nominal capacity of 1 , 600 t/h . Ore from underground mining is crushed underground by one of two primary jaw crushers with a nominal capacity of 400 t/h each . Feed enters the primary crushing operations with maximum size of 48 ” and is discharged with maximum size of 10 ” . The blended product of the primary crushing operations is transported via conveyors to a feeder stockpile with a capacity of 12 , 000 tonnes . The stockpile feeds two primary double deck screens, configured with 100 mm aperture on the top and 40 mm aperture on the bottom decks . The material over 40 mm feeds one of two secondary cone crushers (seven - feet (“ft . ”) standard Symons ; 1 , 400 t/h of capacity each) set to 28 mm aperture . Screen undersize and secondary crushers products discharge onto one conveyor in an open circuit configuration . The Symons Cone crushers will be replaced by Metso HP 500 Cone crusher during the execution of the planned mill expansion project, scheduled for completion in 2023 . Secondary cone crusher discharge and primary screen fines are blended with tertiary crusher discharge and are conveyed to the seven secondary double screen decks, configured with 25 mm aperture on the top and 16 mm aperture on the bottom decks . Tertiary crushing is performed with four standard CH 660 Sandvik cone crushers (capacity of 350 t/h each) set to 20 mm aperture . Oversize material passes to the tertiary crushers operating in a closed - circuit configuration . Final product from the combined crushing and screening operations is 88 % passing 1 / 2 ” . The technical specifications of the crushing circuit are included below in Table 17 - 1 .
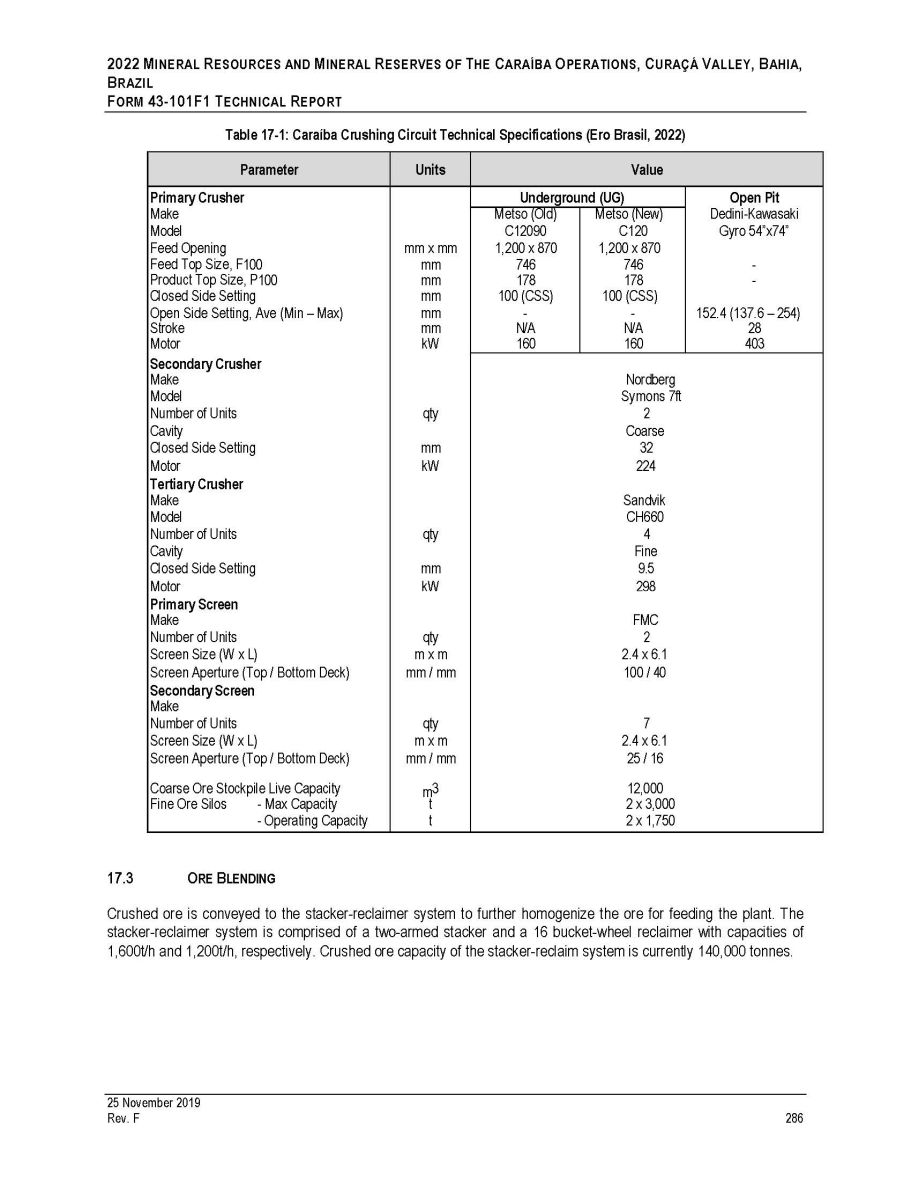
2022 M INERAL R ESOURCES AND M INERAL R ESERVES OF T HE C ARAÍBA O PERATIONS , C URAÇÁ V ALLEY , B AHIA , B RAZIL F ORM 43 - 101F1 T ECHNICAL R EPORT Table 17 - 1: Caraíba Crushing Circuit Technical Specifications (Ero Brasil, 2022) Parameter Units Value Primary Crusher mm x mm mm mm mm mm mm kW qty mm kW qty mm kW qty m x m mm / mm qty m x m mm / mm m 3 t t Underground (UG) Open Pit Make Dedini - Kawasaki Metso (Old) Metso (New) Model C12090 C120 Gyro 54”x74” Feed Opening 1,200 x 870 1,200 x 870 Feed Top Size, F 100 746 746 - Product Top Size, P 100 Closed Side Setting 178 100 (CSS) 178 100 (CSS) - Open Side Setting, Ave (Min – Max) - - 152.4 (137.6 – 254) Stroke N/A N/A 28 Motor 160 160 403 Secondary Crusher Make Nordberg Model Symons 7ft Number of Units 2 Cavity Coarse Closed Side Setting 32 Motor 224 Tertiary Crusher Make Sandvik Model CH660 Number of Units 4 Cavity Fine Closed Side Setting 9.5 Motor 298 Primary Screen Make FMC Number of Units 2 Screen Size (W x L) 2.4 x 6.1 Screen Aperture (Top / Bottom Deck) 100 / 40 Secondary Screen Make Number of Units 7 Screen Size (W x L) 2.4 x 6.1 Screen Aperture (Top / Bottom Deck) 25 / 16 Coarse Ore Stockpile Live Capacity 12,000 Fine Ore Silos - Max Capacity 2 x 3,000 - Operating Capacity 2 x 1,750 25 November 2019 Rev. F 286 17.3 O RE B LENDING Crushed ore is conveyed to the stacker - reclaimer system to further homogenize the ore for feeding the plant . The stacker - reclaimer system is comprised of a two - armed stacker and a 16 bucket - wheel reclaimer with capacities of 1 , 600 t/h and 1 , 200 t/h, respectively . Crushed ore capacity of the stacker - reclaim system is currently 140 , 000 tonnes .

2022 M INERAL R ESOURCES AND M INERAL R ESERVES OF T HE C ARAÍBA O PERATIONS , C URAÇÁ V ALLEY , B AHIA , B RAZIL F ORM 43 - 101 F 1 T ECHNICAL R EPORT 17.4 G RINDING The grinding circuit consists of two identical lines operating with a primary ball mill operating in closed circuit with a dedicated battery of 26 ” hydro - cyclones . Each ball mill is 5 . 0 m by 7 . 6 m, charged with 90 mm in diameter high chrome cast steel balls . The nominal grinding capacity of each mill is 200 t/h each . Typical ball consumption is 340 g/t . Blended ore from the stacker reclaimer is withdrawn through belt feeders below one of the 3 , 000 tonne ore silos that are interconnected . Ore is delivered to the ball mill over a belt weightometer to control and measure the mass of ore sent to each mill for metallurgical accounting purposes . The coarse fraction from the cyclone underflow recycles to the ball mill feed chute for further grinding . Overflow from both grinding lines combines as feed to the high frequency screeners and regrinding circuit . Table 17 - 2: Caraíba Ball Mill Specifications (Ero Brasil, 2022) Parameter Units Ball Mill 3 Ball Mill 4 Diameter – Inside Shell m 5.03 5.03 Effective Grinding Length m 7.62 7.62 Imperial Measurements L : D Ratio ft x ft 16.5 x 25.0 1.51 16.5 x 25.0 1.51 Discharge Arrangement Overflow Overflow Speed rpm 13.8 13.8 % Nc 71.6 71.6 Liner Thickness – New mm 100 100 Ball Addition Size mm 100 100 Ball Addition Rates kg/t 0.355 0.355 Operating Ball Charge % Vol 32 32 Maximum Ball Charge % Vol 40 40 Operating Power kW 2,900 2,900 Installed Power kW 3,100 3,100 25 November 2019 Rev. F 287 17.5 H IGH F REQUENCY S CREENS AND R EGRINDING C IRCUIT The cyclone oversize is pumped to high frequency screening operations comprised of eight screens with five decks each of 210 + micron aperture . The high frequency screening coarse fraction is gravity fed to the vertical mill (STM HIG Mill HIG 2300 / 23000 ) for regrinding, operating in an open circuit . Table 17 - 3: Caraíba Derrick Screen Techincal Specifications (Ero Brasil, 2022) Parameter Units Design Number of Units qty 8 Number of Decks per Unit No 5 Aperture micron 210 Estimated Capacity Unit t/h 70 – 95 Estimated Total Capacity t/h 550 - 750 The HIG Mill was commission in September 2020. The screening operation fines combine with the regrind mill product and are pumped to the flotation circuit. Technical specifications for the HIG Mill circuit are shown below in Table 17 - 4.
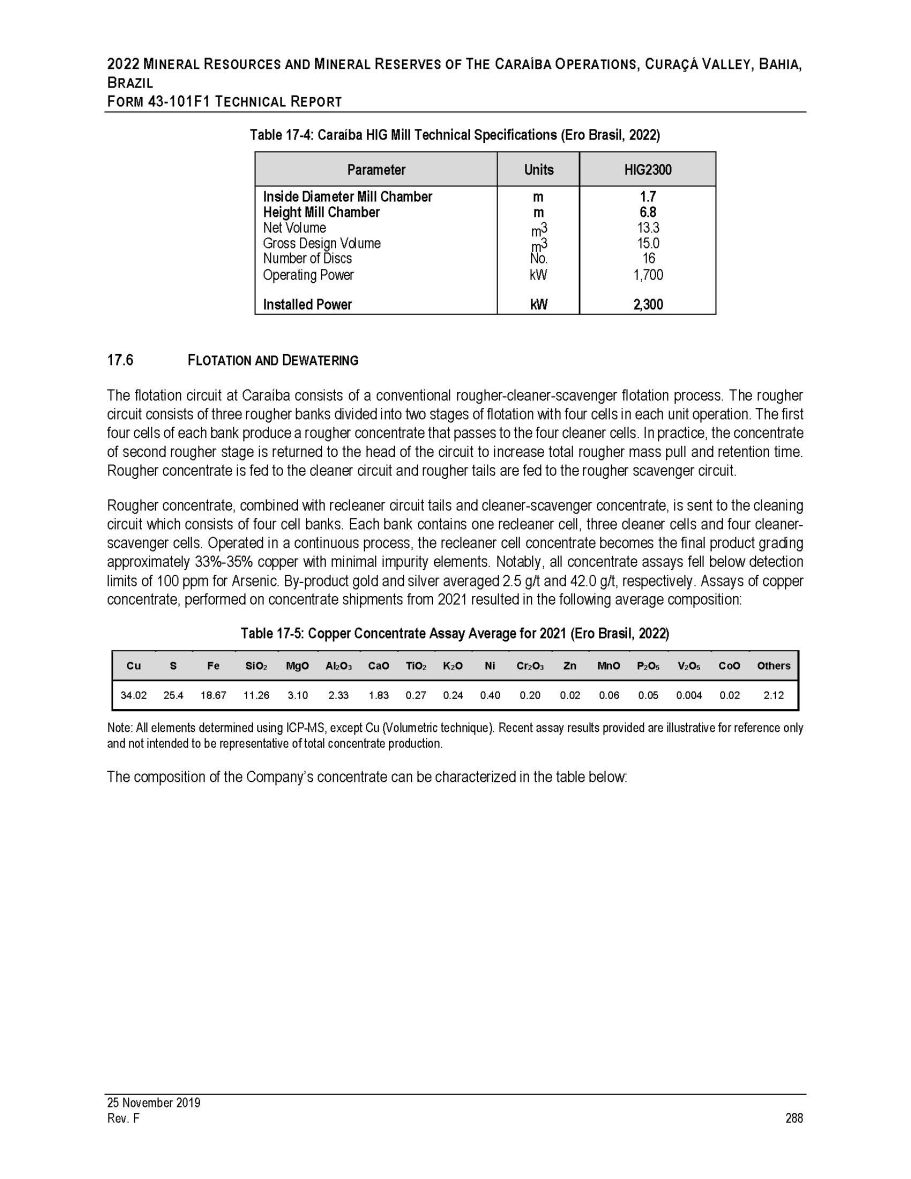
2022 M INERAL R ESOURCES AND M INERAL R ESERVES OF T HE C ARAÍBA O PERATIONS , C URAÇÁ V ALLEY , B AHIA , B RAZIL F ORM 43 - 101F1 T ECHNICAL R EPORT Table 17 - 4: Caraíba HIG Mill Technical Specifications (Ero Brasil, 2022) Parameter Units HIG2300 Inside Diameter Mill Chamber m 1.7 Height Mill Chamber m 6.8 Net Volume Gross Design Volume Number of Discs m 3 m 3 No . 13.3 15.0 16 Operating Power kW 1,700 Installed Power kW 2,300 17.6 F LOTATION AND D EWATERING The flotation circuit at Caraíba consists of a conventional rougher - cleaner - scavenger flotation process . The rougher circuit consists of three rougher banks divided into two stages of flotation with four cells in each unit operation . The first four cells of each bank produce a rougher concentrate that passes to the four cleaner cells . In practice, the concentrate of second rougher stage is returned to the head of the circuit to increase total rougher mass pull and retention time . Rougher concentrate is fed to the cleaner circuit and rougher tails are fed to the rougher scavenger circuit . Rougher concentrate, combined with recleaner circuit tails and cleaner - scavenger concentrate, is sent to the cleaning circuit which consists of four cell banks . Each bank contains one recleaner cell, three cleaner cells and four cleaner - scavenger cells . Operated in a continuous process, the recleaner cell concentrate becomes the final product grading approximately 33 % - 35 % copper with minimal impurity elements . Notably, all concentrate assays fell below detection limits of 100 ppm for Arsenic . By - product gold and silver averaged 2 . 5 g/t and 42 . 0 g/t, respectively . Assays of copper concentrate, performed on concentrate shipments from 2021 resulted in the following average composition : Table 17 - 5: Copper Concentrate Assay Average for 2021 (Ero Brasil, 2022) Cu S Fe SiO 2 MgO Al 2 O 3 CaO TiO 2 K 2 O Ni Cr 2 O 3 Zn MnO P 2 O 5 V 2 O 5 CoO Others 34.02 25.4 18.67 11.26 3.10 2.33 1.83 0.27 0.24 0.40 0.20 0.02 0.06 0.05 0.004 0.02 2.12 25 November 2019 Rev. F 288 Note: All elements determined using ICP - MS, except Cu (Volumetric technique). Recent assay results provided are illustrative for reference only and not intended to be representative of total concentrate production. The composition of the Company’s concentrate can be characterized in the table below:
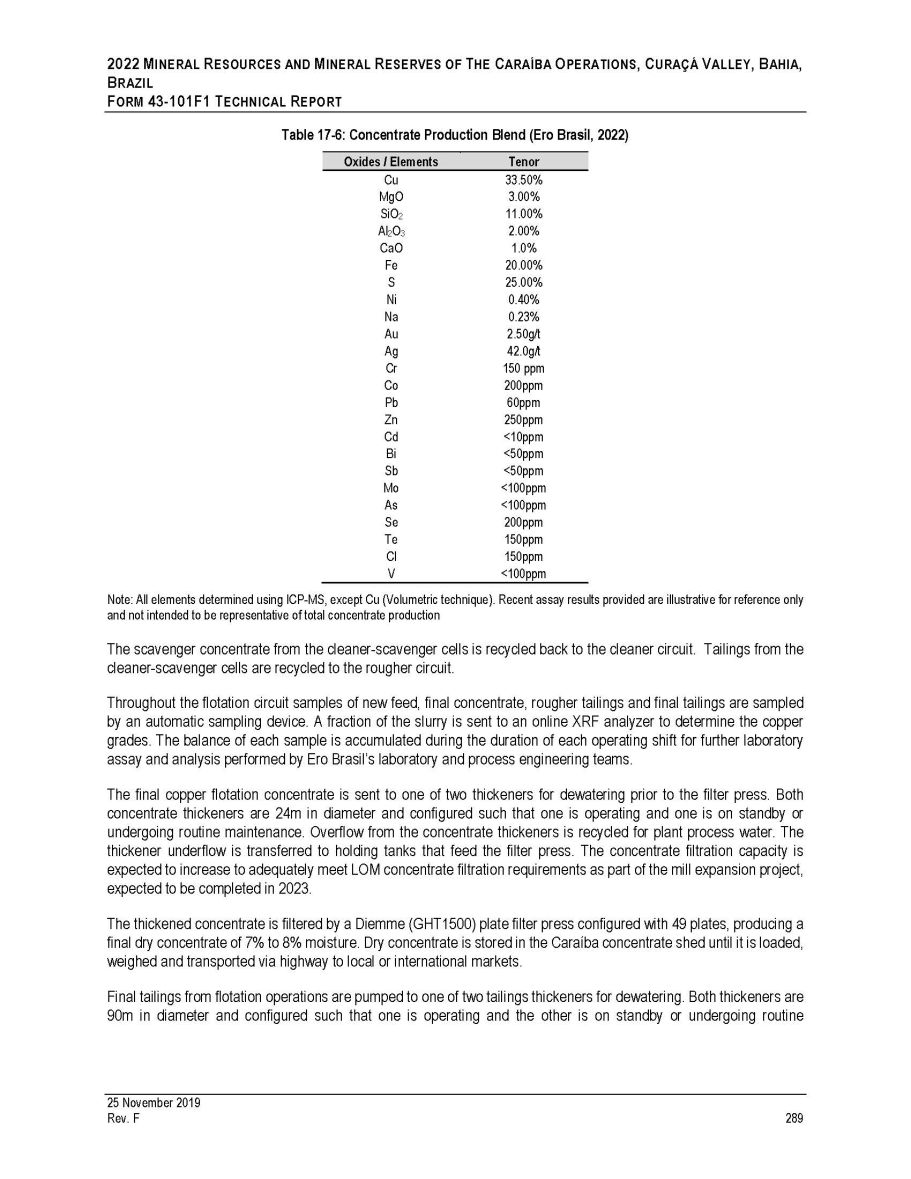
2022 M INERAL R ESOURCES AND M INERAL R ESERVES OF T HE C ARAÍBA O PERATIONS , C URAÇÁ V ALLEY , B AHIA , B RAZIL F ORM 43 - 101F1 T ECHNICAL R EPORT Table 17 - 6: Concentrate Production Blend (Ero Brasil, 2022) Oxides / Elements Tenor Cu 33.50% MgO 3.00% SiO 2 11.00% Al 2 O 3 2.00% CaO 1.0% Fe 20.00% S 25.00% Ni 0.40% Na 0.23% Au 2.50g/t Ag 42.0g/t Cr 150 ppm Co 200ppm Pb 60ppm Zn 250ppm Cd <10ppm Bi <50ppm Sb <50ppm Mo <100ppm As <100ppm Se 200ppm Te 150ppm Cl 150ppm V <100ppm 25 November 2019 Rev. F 289 Note : All elements determined using ICP - MS, except Cu (Volumetric technique) . Recent assay results provided are illustrative for reference only and not intended to be representative of total concentrate production The scavenger concentrate from the cleaner - scavenger cells is recycled back to the cleaner circuit . Tailings from the cleaner - scavenger cells are recycled to the rougher circuit . Throughout the flotation circuit samples of new feed, final concentrate, rougher tailings and final tailings are sampled by an automatic sampling device . A fraction of the slurry is sent to an online XRF analyzer to determine the copper grades . The balance of each sample is accumulated during the duration of each operating shift for further laboratory assay and analysis performed by Ero Brasil’s laboratory and process engineering teams . The final copper flotation concentrate is sent to one of two thickeners for dewatering prior to the filter press . Both concentrate thickeners are 24 m in diameter and configured such that one is operating and one is on standby or undergoing routine maintenance . Overflow from the concentrate thickeners is recycled for plant process water . The thickener underflow is transferred to holding tanks that feed the filter press . The concentrate filtration capacity is expected to increase to adequately meet LOM concentrate filtration requirements as part of the mill expansion project, expected to be completed in 2023 . The thickened concentrate is filtered by a Diemme (GHT 1500 ) plate filter press configured with 49 plates, producing a final dry concentrate of 7 % to 8 % moisture . Dry concentrate is stored in the Caraíba concentrate shed until it is loaded, weighed and transported via highway to local or international markets . Final tailings from flotation operations are pumped to one of two tailings thickeners for dewatering . Both thickeners are 90 m in diameter and configured such that one is operating and the other is on standby or undergoing routine
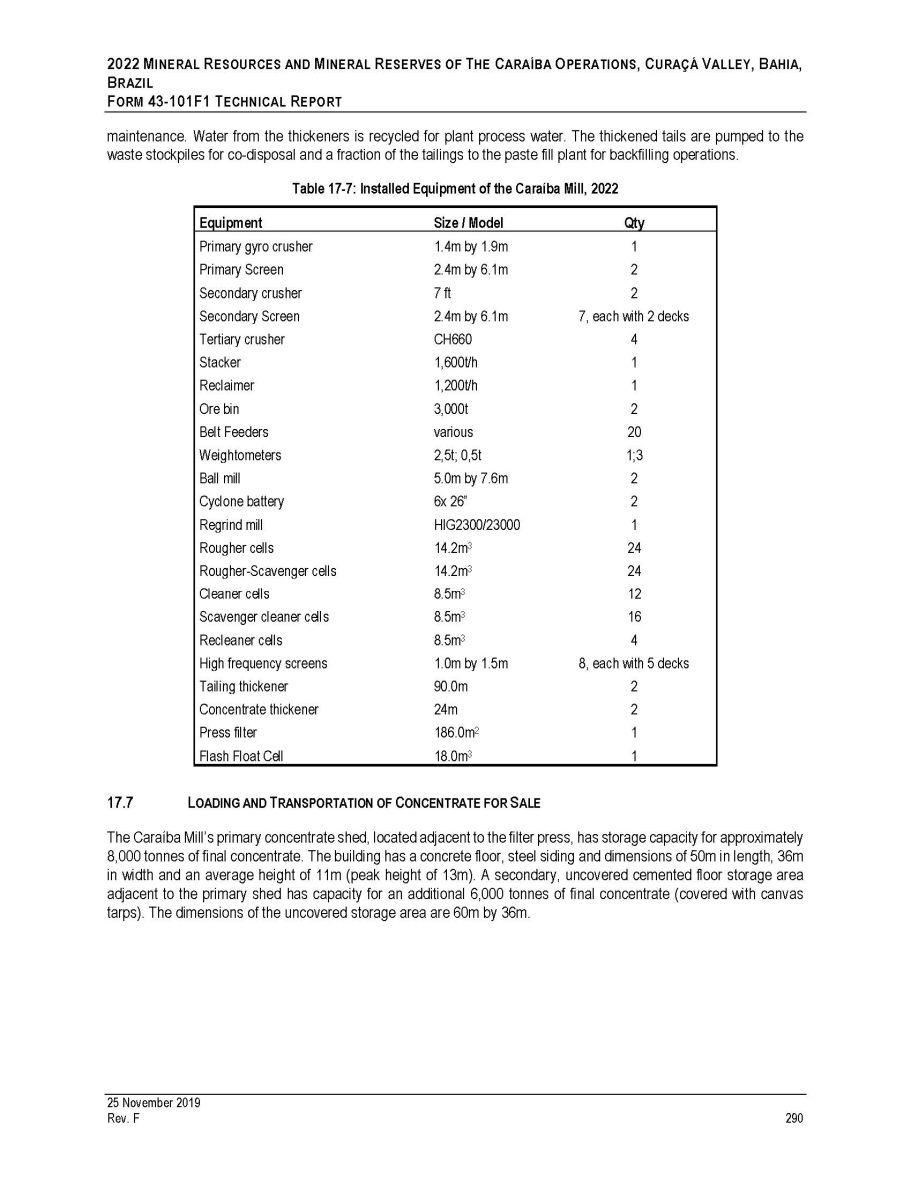
2022 M INERAL R ESOURCES AND M INERAL R ESERVES OF T HE C ARAÍBA O PERATIONS , C URAÇÁ V ALLEY , B AHIA , B RAZIL F ORM 43 - 101F1 T ECHNICAL R EPORT maintenance. Water from the thickeners is recycled for plant process water. The thickened tails are pumped to the waste stockpiles for co - disposal and a fraction of the tailings to the paste fill plant for backfilling operations. Table 17 - 7: Installed Equipment of the Caraíba Mill, 2022 Equipment Size / Model Qty Primary gyro crusher 1.4m by 1.9m 1 Primary Screen 2.4m by 6.1m 2 Secondary crusher 7 ft 2 Secondary Screen 2.4m by 6.1m 7, each with 2 decks Tertiary crusher CH660 4 Stacker 1,600t/h 1 Reclaimer 1,200t/h 1 Ore bin 3,000t 2 Belt Feeders various 20 Weightometers 2,5t; 0,5t 1;3 Ball mill 5.0m by 7.6m 2 Cyclone battery 6x 26” 2 Regrind mill HIG2300/23000 1 Rougher cells 14.2m 3 24 Rougher - Scavenger cells 14.2m 3 24 Cleaner cells 8.5m 3 12 Scavenger cleaner cells 8.5m 3 16 Recleaner cells 8.5m 3 4 High frequency screens 1.0m by 1.5m 8, each with 5 decks Tailing thickener 90.0m 2 Concentrate thickener 24m 2 Press filter 186.0m 2 1 Flash Float Cell 18.0m 3 1 25 November 2019 Rev. F 290 17.7 L OADING AND T RANSPORTATION OF C ONCENTRATE FOR S ALE The Caraíba Mill’s primary concentrate shed, located adjacent to the filter press, has storage capacity for approximately 8 , 000 tonnes of final concentrate . The building has a concrete floor, steel siding and dimensions of 50 m in length, 36 m in width and an average height of 11 m (peak height of 13 m) . A secondary, uncovered cemented floor storage area adjacent to the primary shed has capacity for an additional 6 , 000 tonnes of final concentrate (covered with canvas tarps) . The dimensions of the uncovered storage area are 60 m by 36 m .
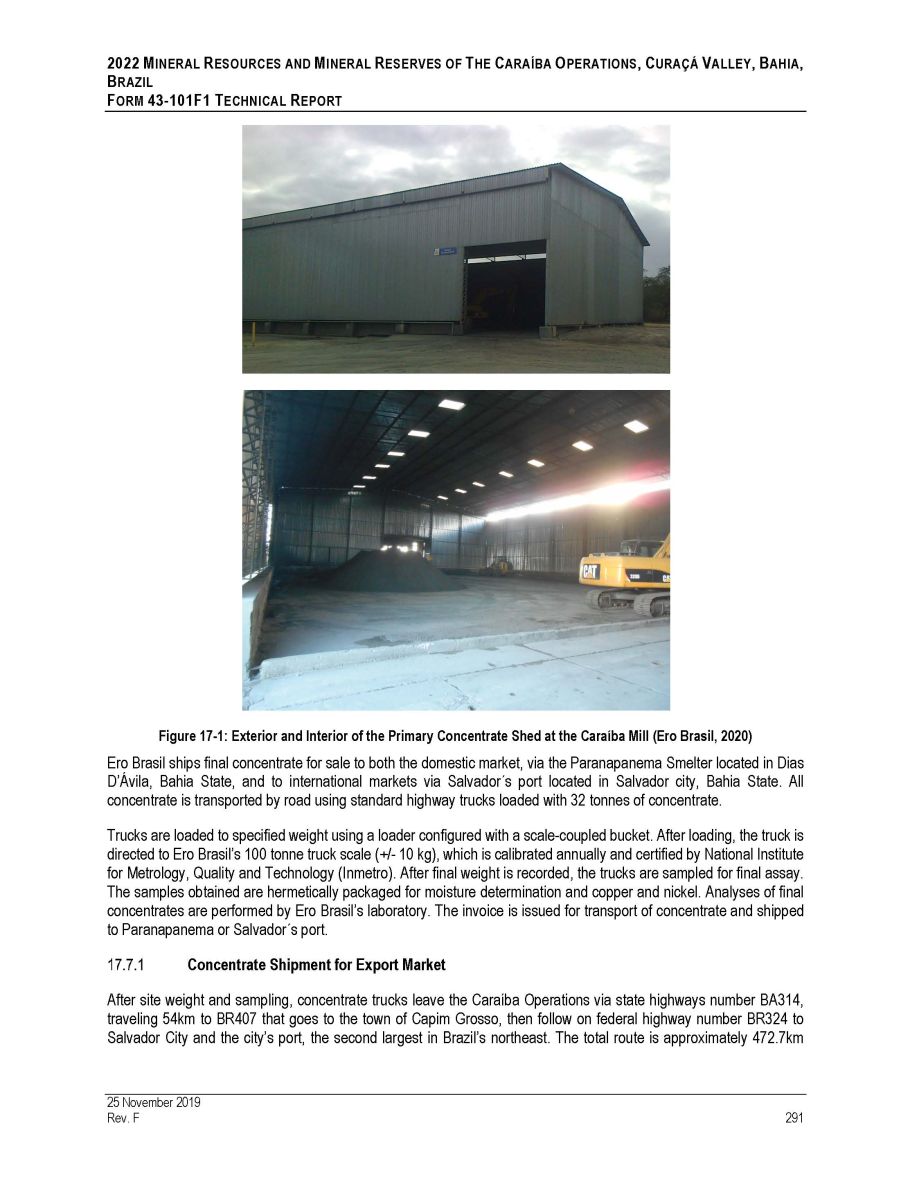
2022 M INERAL R ESOURCES AND M INERAL R ESERVES OF T HE C ARAÍBA O PERATIONS , C URAÇÁ V ALLEY , B AHIA , B RAZIL F ORM 43 - 101F1 T ECHNICAL R EPORT Figure 17 - 1 : Exterior and Interior of the Primary Concentrate Shed at the Caraíba Mill (Ero Brasil, 2020 ) Ero Brasil ships final concentrate for sale to both the domestic market, via the Paranapanema Smelter located in Dias D’Ávila, Bahia State, and to international markets via Salvador s port located in Salvador city, Bahia State . All concentrate is transported by road using standard highway trucks loaded with 32 tonnes of concentrate . Trucks are loaded to specified weight using a loader configured with a scale - coupled bucket . After loading, the truck is directed to Ero Brasil’s 100 tonne truck scale (+/ - 10 kg), which is calibrated annually and certified by National Institute for Metrology, Quality and Technology (Inmetro) . After final weight is recorded, the trucks are sampled for final assay . The samples obtained are hermetically packaged for moisture determination and copper and nickel . Analyses of final concentrates are performed by Ero Brasil’s laboratory . The invoice is issued for transport of concentrate and shipped to Paranapanema or Salvador s port . Concentrate Shipment for Export Market After site weight and sampling, concentrate trucks leave the Caraíba Operations via state highways number BA 314 , traveling 54 km to BR 407 that goes to the town of Capim Grosso, then follow on federal highway number BR 324 to Salvador City and the city’s port, the second largest in Brazil’s northeast . The total route is approximately 472 . 7 km 25 November 2019 Rev. F 291
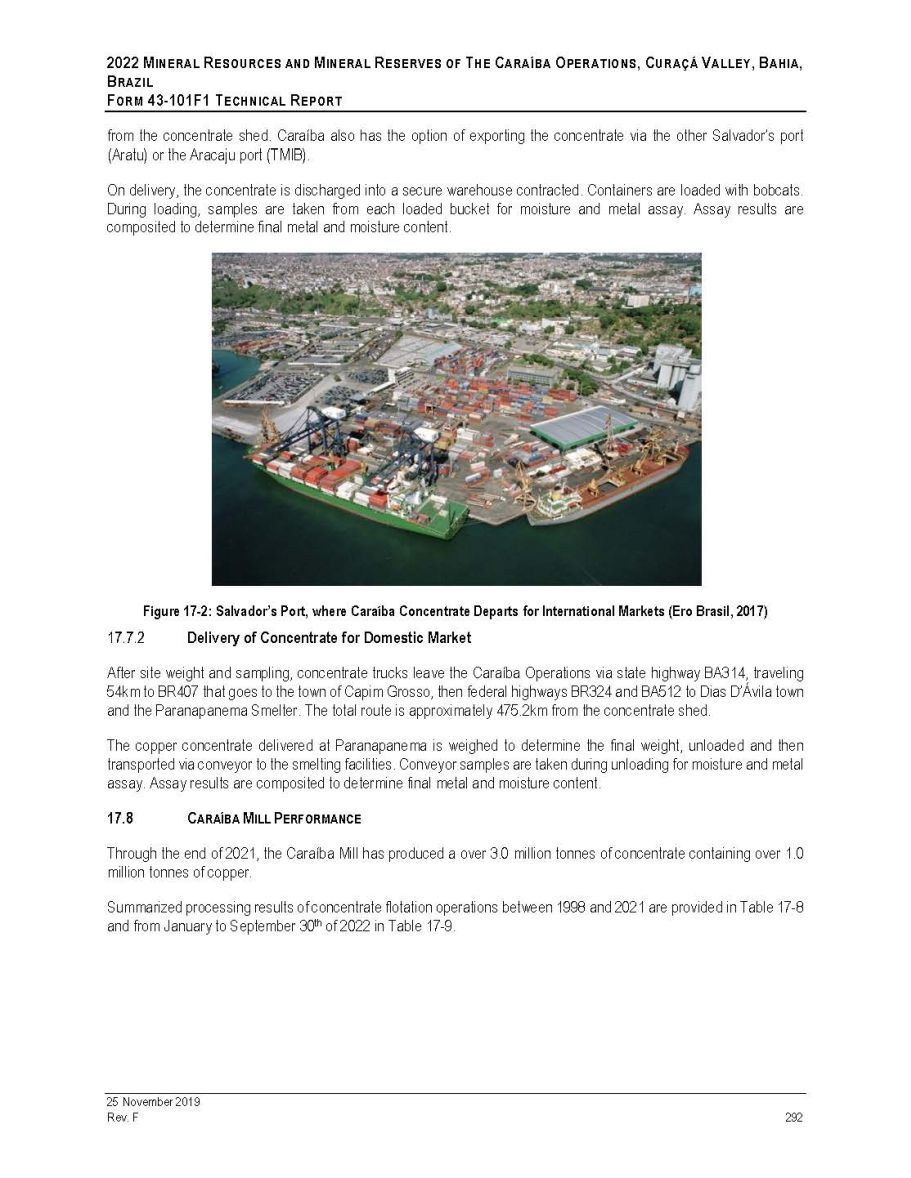
2022 M INERAL R ESOURCES AND M INERAL R ESERVES OF T HE C ARAÍBA O PERATIONS , C URAÇÁ V ALLEY , B AHIA , B RAZIL F ORM 43 - 101 F 1 T ECHNICAL R EPORT from the concentrate shed . Caraíba also has the option of exporting the concentrate via the other Salvador’s port (Aratu) or the Aracaju port (TMIB) . On delivery, the concentrate is discharged into a secure warehouse contracted . Containers are loaded with bobcats . During loading, samples are taken from each loaded bucket for moisture and metal assay . Assay results are composited to determine final metal and moisture content . Figure 17 - 2: Salvador’s Port, where Caraíba Concentrate Departs for International Markets (Ero Brasil, 2017) Delivery of Concentrate for Domestic Market After site weight and sampling, concentrate trucks leave the Caraíba Operations via state highway BA 314 , traveling 54 km to BR 407 that goes to the town of Capim Grosso, then federal highways BR 324 and BA 512 to Dias D’Ávila town and the Paranapanema Smelter . The total route is approximately 475 . 2 km from the concentrate shed . The copper concentrate delivered at Paranapanema is weighed to determine the final weight, unloaded and then transported via conveyor to the smelting facilities . Conveyor samples are taken during unloading for moisture and metal assay . Assay results are composited to determine final metal and moisture content . 17.8 C ARAÍBA M ILL P ERFORMANCE Through the end of 2021 , the Caraíba Mill has produced a over 3 . 0 million tonnes of concentrate containing over 1 . 0 million tonnes of copper . Summarized processing results of concentrate flotation operations between 1998 and 2021 are provided in Table 17 - 8 and from January to September 30 th of 2022 in Table 17 - 9 . 25 November 2019 Rev. F 292
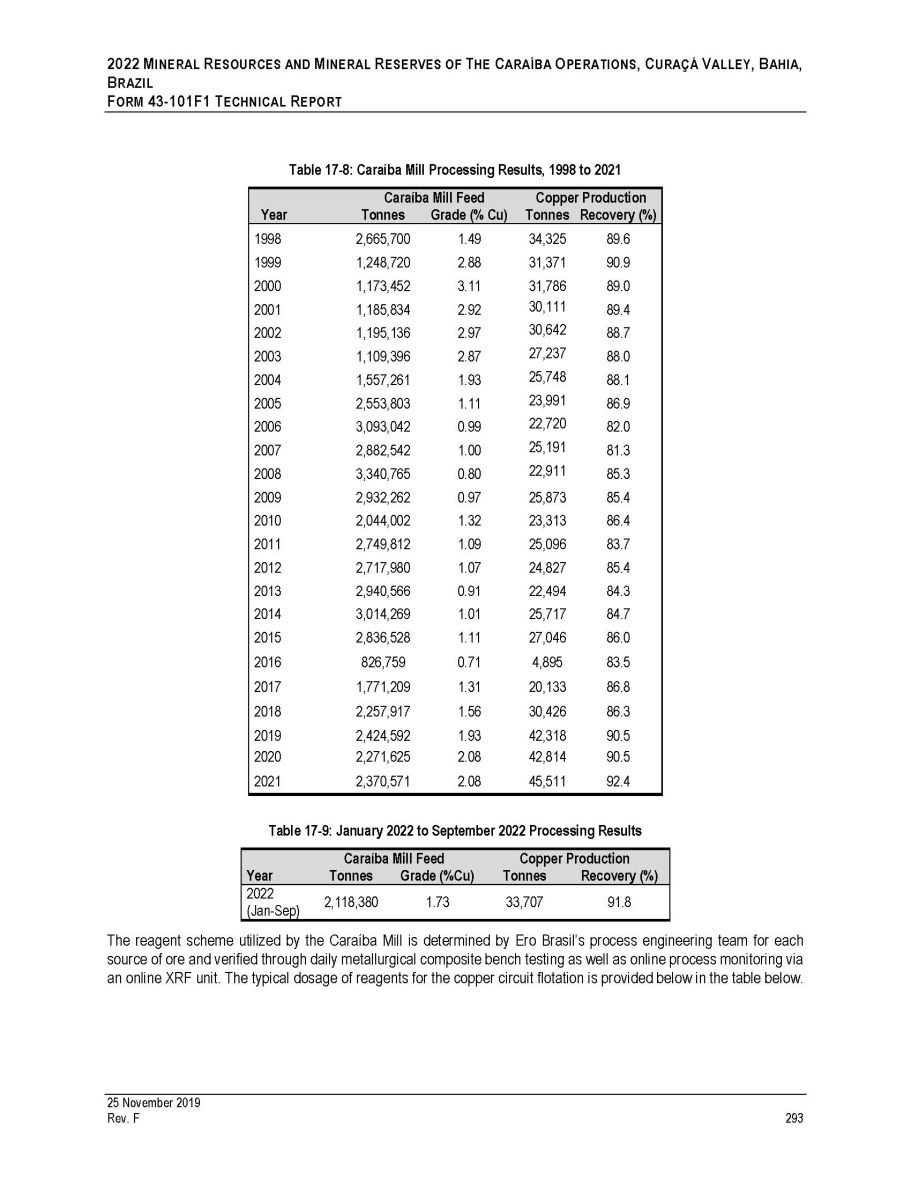
2022 M INERAL R ESOURCES AND M INERAL R ESERVES OF T HE C ARAÍBA O PERATIONS , C URAÇÁ V ALLEY , B AHIA , B RAZIL F ORM 43 - 101F1 T ECHNICAL R EPORT Table 17 - 8: Caraíba Mill Processing Results, 1998 to 2021 25 November 2019 Rev. F 293 Caraíba Mill Feed Copper Production Year Tonnes Grade (% Cu) Tonnes Recovery (%) 1998 2,665,700 1.49 34,325 89.6 1999 1,248,720 2.88 31,371 90.9 2000 1,173,452 3.11 31,786 89.0 2001 1,185,834 2.92 30,111 89.4 2002 1,195,136 2.97 30,642 88.7 2003 1,109,396 2.87 27,237 88.0 2004 1,557,261 1.93 25,748 88.1 2005 2,553,803 1.11 23,991 86.9 2006 3,093,042 0.99 22,720 82.0 2007 2,882,542 1.00 25,191 81.3 2008 3,340,765 0.80 22,911 85.3 2009 2,932,262 0.97 25,873 85.4 2010 2,044,002 1.32 23,313 86.4 2011 2,749,812 1.09 25,096 83.7 2012 2,717,980 1.07 24,827 85.4 2013 2,940,566 0.91 22,494 84.3 2014 3,014,269 1.01 25,717 84.7 2015 2,836,528 1.11 27,046 86.0 2016 826,759 0.71 4,895 83.5 2017 1,771,209 1.31 20,133 86.8 2018 2,257,917 1.56 30,426 86.3 2019 2,424,592 1.93 42,318 90.5 2020 2,271,625 2.08 42,814 90.5 2021 2,370,571 2.08 45,511 92.4 Table 17 - 9: January 2022 to September 2022 Processing Results Year Caraíba Mill Feed Tonnes Grade (%Cu) Copper Production Tonnes Recovery (%) 2022 (Jan - Sep) 2,118,380 1.73 33,707 91.8 The reagent scheme utilized by the Caraíba Mill is determined by Ero Brasil’s process engineering team for each source of ore and verified through daily metallurgical composite bench testing as well as online process monitoring via an online XRF unit . The typical dosage of reagents for the copper circuit flotation is provided below in the table below .
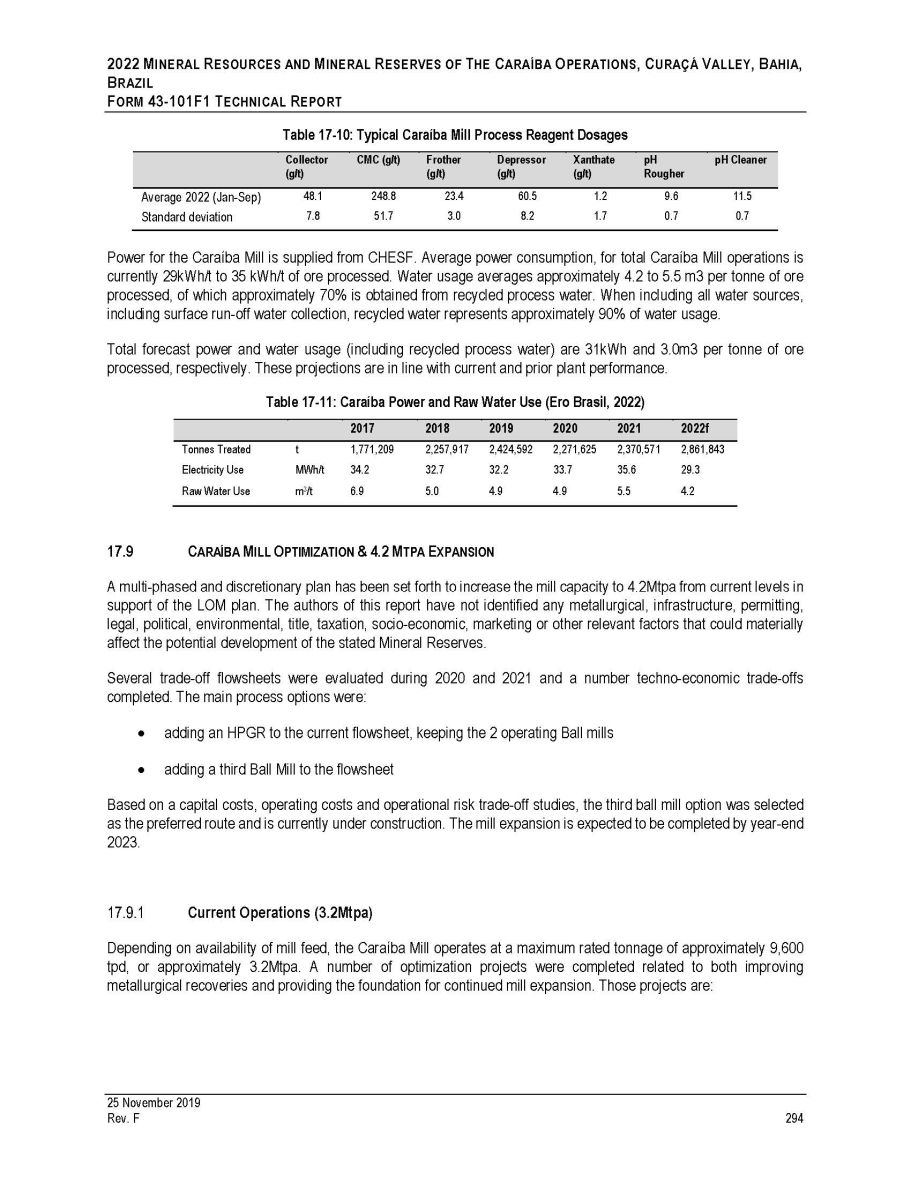
2022 M INERAL R ESOURCES AND M INERAL R ESERVES OF T HE C ARAÍBA O PERATIONS , C URAÇÁ V ALLEY , B AHIA , B RAZIL F ORM 43 - 101F1 T ECHNICAL R EPORT Table 17 - 10: Typical Caraíba Mill Process Reagent Dosages Collector (g/t) CMC (g/t) Frother (g/t) Depressor (g/t) Xanthate (g/t) pH Rougher pH Cleaner Average 2022 (Jan - Sep) 48.1 248.8 23.4 60.5 1.2 9.6 11.5 Standard deviation 7.8 51.7 3.0 8.2 1.7 0.7 0.7 Power for the Caraíba Mill is supplied from CHESF . Average power consumption, for total Caraíba Mill operations is currently 29 kWh/t to 35 kWh/t of ore processed . Water usage averages approximately 4 . 2 to 5 . 5 m 3 per tonne of ore processed, of which approximately 70 % is obtained from recycled process water . When including all water sources, including surface run - off water collection, recycled water represents approximately 90 % of water usage . Total forecast power and water usage (including recycled process water) are 31 kWh and 3 . 0 m 3 per tonne of ore processed, respectively . These projections are in line with current and prior plant performance . Table 17 - 11: Caraíba Power and Raw Water Use (Ero Brasil, 2022) 2017 2018 2019 2020 2021 2022f Tonnes Treated t 1,771,209 2,257,917 2,424,592 2,271,625 2,370,571 2,861,843 Electricity Use MWh/t 34.2 32.7 32.2 33.7 35.6 29.3 Raw Water Use m 3 /t 6.9 5.0 4.9 4.9 5.5 4.2 17.9 C ARAÍBA M ILL O PTIMIZATION & 4.2 M TPA E XPANSION A multi - phased and discretionary plan has been set forth to increase the mill capacity to 4 . 2 Mtpa from current levels in support of the LOM plan . The authors of this report have not identified any metallurgical, infrastructure, permitting, legal, political, environmental, title, taxation, socio - economic, marketing or other relevant factors that could materially affect the potential development of the stated Mineral Reserves . Several trade - off flowsheets were evaluated during 2020 and 2021 and a number techno - economic trade - offs completed . The main process options were : adding an HPGR to the current flowsheet, keeping the 2 operating Ball mills adding a third Ball Mill to the flowsheet Based on a capital costs, operating costs and operational risk trade - off studies, the third ball mill option was selected as the preferred route and is currently under construction . The mill expansion is expected to be completed by year - end 2023 . Current Operations (3.2Mtpa) Depending on availability of mill feed, the Caraíba Mill operates at a maximum rated tonnage of approximately 9 , 600 tpd, or approximately 3 . 2 Mtpa . A number of optimization projects were completed related to both improving metallurgical recoveries and providing the foundation for continued mill expansion . Those projects are : 25 November 2019 Rev. F 294
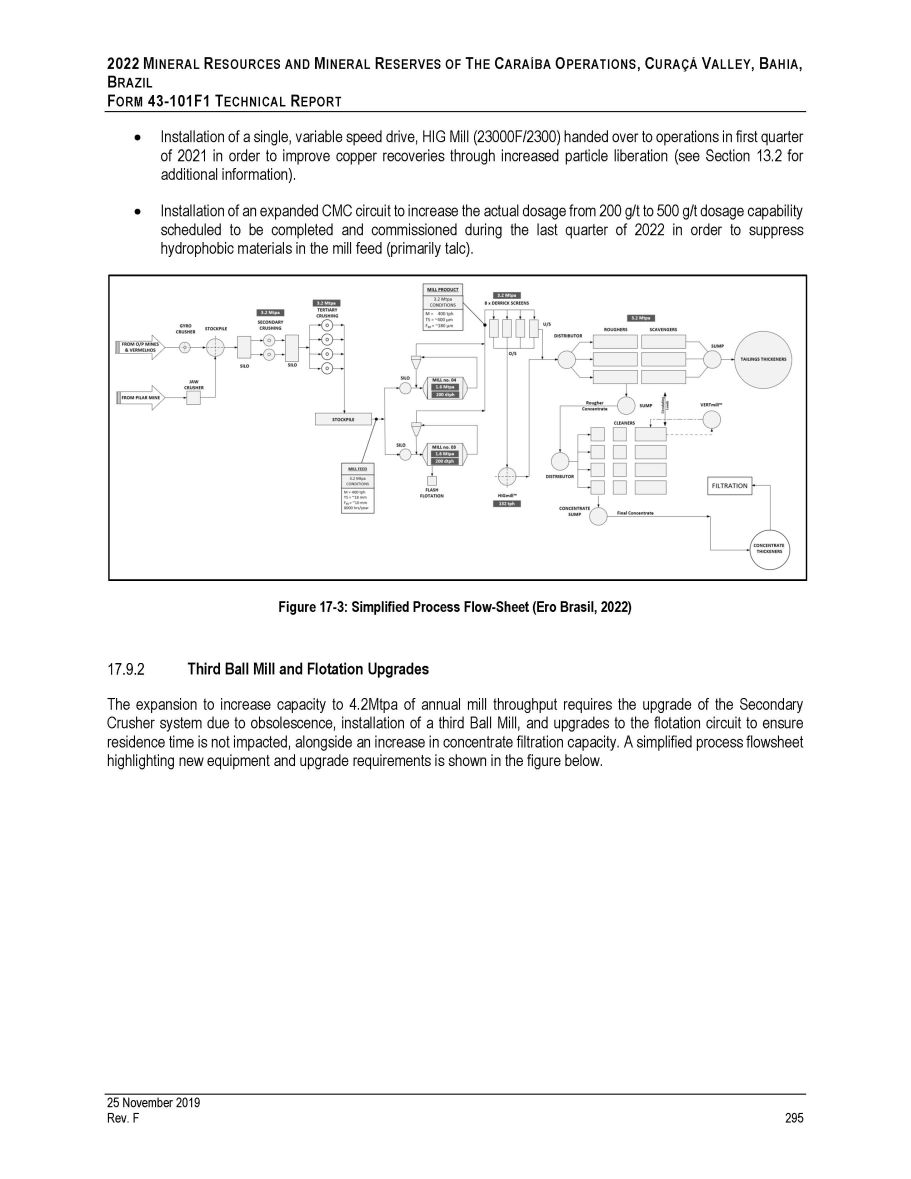
2022 M INERAL R ESOURCES AND M INERAL R ESERVES OF T HE C ARAÍBA O PERATIONS , C URAÇÁ V ALLEY , B AHIA , B RAZIL F ORM 43 - 101F1 T ECHNICAL R EPORT Installation of a single, variable speed drive, HIG Mill ( 23000 F/ 2300 ) handed over to operations in first quarter of 2021 in order to improve copper recoveries through increased particle liberation (see Section 13 . 2 for additional information) . Installation of an expanded CMC circuit to increase the actual dosage from 200 g/t to 500 g/t dosage capability scheduled to be completed and commissioned during the last quarter of 2022 in order to suppress hydrophobic materials in the mill feed (primarily talc) . Figure 17 - 3: Simplified Process Flow - Sheet (Ero Brasil, 2022) Third Ball Mill and Flotation Upgrades The expansion to increase capacity to 4 . 2 Mtpa of annual mill throughput requires the upgrade of the Secondary Crusher system due to obsolescence, installation of a third Ball Mill, and upgrades to the flotation circuit to ensure residence time is not impacted, alongside an increase in concentrate filtration capacity . A simplified process flowsheet highlighting new equipment and upgrade requirements is shown in the figure below . 25 November 2019 Rev. F 295

2022 M INERAL R ESOURCES AND M INERAL R ESERVES OF T HE C ARAÍBA O PERATIONS , C URAÇÁ V ALLEY , B AHIA , B RAZIL F ORM 43 - 101F1 T ECHNICAL R EPORT Figure 17 - 4 : Simplified Process Flowsheet, 4 . 2 Mtpa (Ero Brasil, 2022 ) Based on current power consumption, the installed HIG Mill power is adequate for the 3 . 2 Mtpa production level based on the specific grinding energy (“SGE”) of 14 - 16 kwh/t measured . Power upgrades are needed for the expansion of the mill to 4 . 2 Mtpa . An increase to 3 . 5 MW from 2 . 3 MW of installed power has been included as part of the ongoing mill expansion project, expected to be completed by the end of 2023 . The modeled power draw for 4 . 2 Mtpa was simulated as shown in Table 17 - 12 . The total operating work index was simulated at approximately 22 kwh/t for flotation feed of 92 microns . Studies show that the capability of the expanded mill will have the capacity to process approximately 4 . 8 Mtpa at an increased flotation feed P 80 of 102 microns by the end of 2023 . The third ball mill option adds flexibility to the Caraíba Operations processing circuit providing increased capacities without complicating the circuit relative to alternative configurations evaluated . 25 November 2019 Rev. F 296
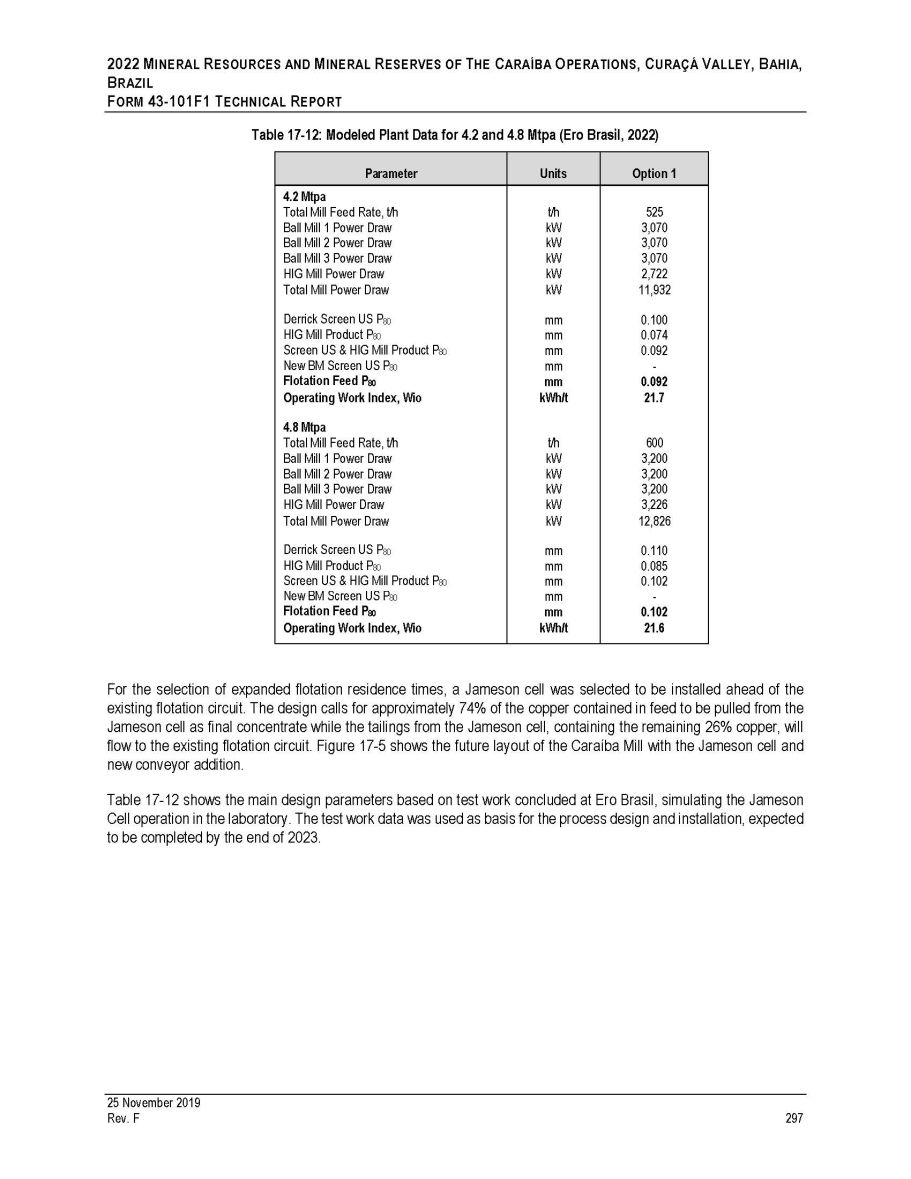
2022 M INERAL R ESOURCES AND M INERAL R ESERVES OF T HE C ARAÍBA O PERATIONS , C URAÇÁ V ALLEY , B AHIA , B RAZIL F ORM 43 - 101F1 T ECHNICAL R EPORT Table 17 - 12: Modeled Plant Data for 4.2 and 4.8 Mtpa (Ero Brasil, 2022) Parameter Units Option 1 4.2 Mtpa Total Mill Feed Rate, t/h t/h 525 Ball Mill 1 Power Draw kW 3,070 Ball Mill 2 Power Draw kW 3,070 Ball Mill 3 Power Draw kW 3,070 HIG Mill Power Draw kW 2,722 Total Mill Power Draw kW 11,932 Derrick Screen US P 80 mm 0.100 HIG Mill Product P 80 mm 0.074 Screen US & HIG Mill Product P 80 mm 0.092 New BM Screen US P 80 mm - Flotation Feed P 80 mm 0.092 Operating Work Index, Wio kWh/t 21.7 4.8 Mtpa Total Mill Feed Rate, t/h t/h 600 Ball Mill 1 Power Draw kW 3,200 Ball Mill 2 Power Draw kW 3,200 Ball Mill 3 Power Draw kW 3,200 HIG Mill Power Draw kW 3,226 Total Mill Power Draw kW 12,826 Derrick Screen US P 80 mm 0.110 HIG Mill Product P 80 mm 0.085 Screen US & HIG Mill Product P 80 mm 0.102 New BM Screen US P 80 mm - Flotation Feed P 80 mm 0.102 Operating Work Index, Wio kWh/t 21.6 25 November 2019 Rev. F 297 For the selection of expanded flotation residence times, a Jameson cell was selected to be installed ahead of the existing flotation circuit . The design calls for approximately 74 % of the copper contained in feed to be pulled from the Jameson cell as final concentrate while the tailings from the Jameson cell, containing the remaining 26 % copper, will flow to the existing flotation circuit . Figure 17 - 5 shows the future layout of the Caraíba Mill with the Jameson cell and new conveyor addition . Table 17 - 12 shows the main design parameters based on test work concluded at Ero Brasil, simulating the Jameson Cell operation in the laboratory . The test work data was used as basis for the process design and installation, expected to be completed by the end of 2023 .
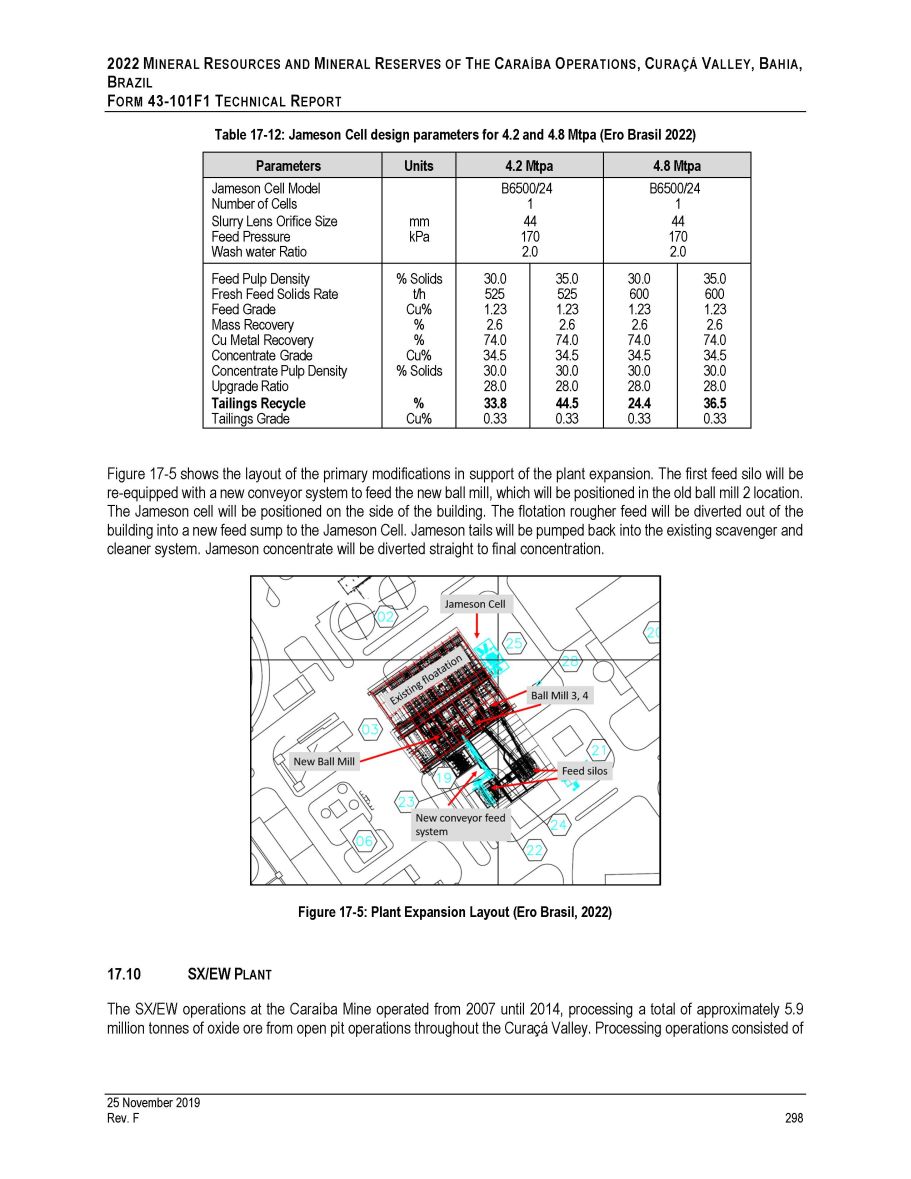
2022 M INERAL R ESOURCES AND M INERAL R ESERVES OF T HE C ARAÍBA O PERATIONS , C URAÇÁ V ALLEY , B AHIA , B RAZIL F ORM 43 - 101F1 T ECHNICAL R EPORT Table 17 - 12: Jameson Cell design parameters for 4.2 and 4.8 Mtpa (Ero Brasil 2022) Parameters Units 4.2 Mtpa 4.8 Mtpa Jameson Cell Model B6500/24 B6500/24 Number of Cells 1 1 Slurry Lens Orifice Size mm 44 44 Feed Pressure Wash water Ratio kPa 170 2.0 170 2.0 Feed Pulp Density % Solids 30.0 35.0 30.0 35.0 Fresh Feed Solids Rate t/h 525 525 600 600 Feed Grade Cu% 1.23 1.23 1.23 1.23 Mass Recovery % 2.6 2.6 2.6 2.6 Cu Metal Recovery % 74.0 74.0 74.0 74.0 Concentrate Grade Cu% 34.5 34.5 34.5 34.5 Concentrate Pulp Density % Solids 30.0 30.0 30.0 30.0 Upgrade Ratio 28.0 28.0 28.0 28.0 Tailings Recycle % 33.8 44.5 24.4 36.5 Tailings Grade Cu% 0.33 0.33 0.33 0.33 Figure 17 - 5 shows the layout of the primary modifications in support of the plant expansion . The first feed silo will be re - equipped with a new conveyor system to feed the new ball mill, which will be positioned in the old ball mill 2 location . The Jameson cell will be positioned on the side of the building . The flotation rougher feed will be diverted out of the building into a new feed sump to the Jameson Cell . Jameson tails will be pumped back into the existing scavenger and cleaner system . Jameson concentrate will be diverted straight to final concentration . Figure 17 - 5: Plant Expansion Layout (Ero Brasil, 2022) 17.10 SX/EW P LANT The SX/EW operations at the Caraíba Mine operated from 2007 until 2014, processing a total of approximately 5.9 million tonnes of oxide ore from open pit operations throughout the Curaçá Valley. Processing operations consisted of 25 November 2019 Rev. F 298

2022 M INERAL R ESOURCES AND M INERAL R ESERVES OF T HE C ARAÍBA O PERATIONS , C URAÇÁ V ALLEY , B AHIA , B RAZIL F ORM 43 - 101 F 1 T ECHNICAL R EPORT crushing, agglomeration / pre - treatment, heap leaching, solvent extraction (“SX”) and electrowinning (“EW”) producing a copper cathode . The EW unit operation has a maximum installed capacity of 430 t of copper cathode per month . In practice, crushed oxide ore was pre - treated with 98 % sulphuric acid and water to agglomerate the material prior to placement on one of 22 heaps used for leaching . Each heap had approximate dimensions of 130 m by 12 m . Design heap height was initially 4 m, but later reduced to 2 m in practice . Leaching was performed over a period of 45 to 60 days, producing a pregnant leach solution (“PLS”) of 5 - 7 grams per liter (“g/l”) of copper in solution prior to SX/EW unit operations . Recovery of copper from PLS averaged 96 % , with global metallurgical recoveries of 70 . 5 % . Historic operating data from the SXEW operations is shown in the table below . At the time of the Effective Date, there is no copper cathode production included in the production plan, economic projections, nor have oxide Mineral Resources been defined in sufficient quantities to incorporate economic projections . An ongoing analysis to rehabilitate and permanently decommission the existing facility is ongoing . Table 17 - 13: Historic SX/EW Plant Performance Oxide Ore Treated Cu Cathode Production Year Tonnes Grade (% Cu) Tonnes Recovery (%) Acid Consumption (kg / tonne ore) (kg / kg Cu) 2007 117,533 0.72 913.0 60.0 28.0 3.6 2008 758,456 0.77 3,807.8 68.6 38.0 7.6 2009 891,934 0.73 4,398.0 74.9 35.7 7.2 2010 895,145 0.66 4,496.8 75.6 34.4 6.9 2011 943,580 0.68 4,549.8 77.4 30.6 6.3 2012 982,055 0.62 4,374.3 76.9 34.2 7.7 2013 1,077,577 0.57 3,999.2 71.2 36.3 9.8 2014 214,946 0.41 685.3 62.4 35.9 11.3 Total 5,881,231 0.66 27,224.2 70.5 34.7 7.5 25 November 2019 Rev. F 299
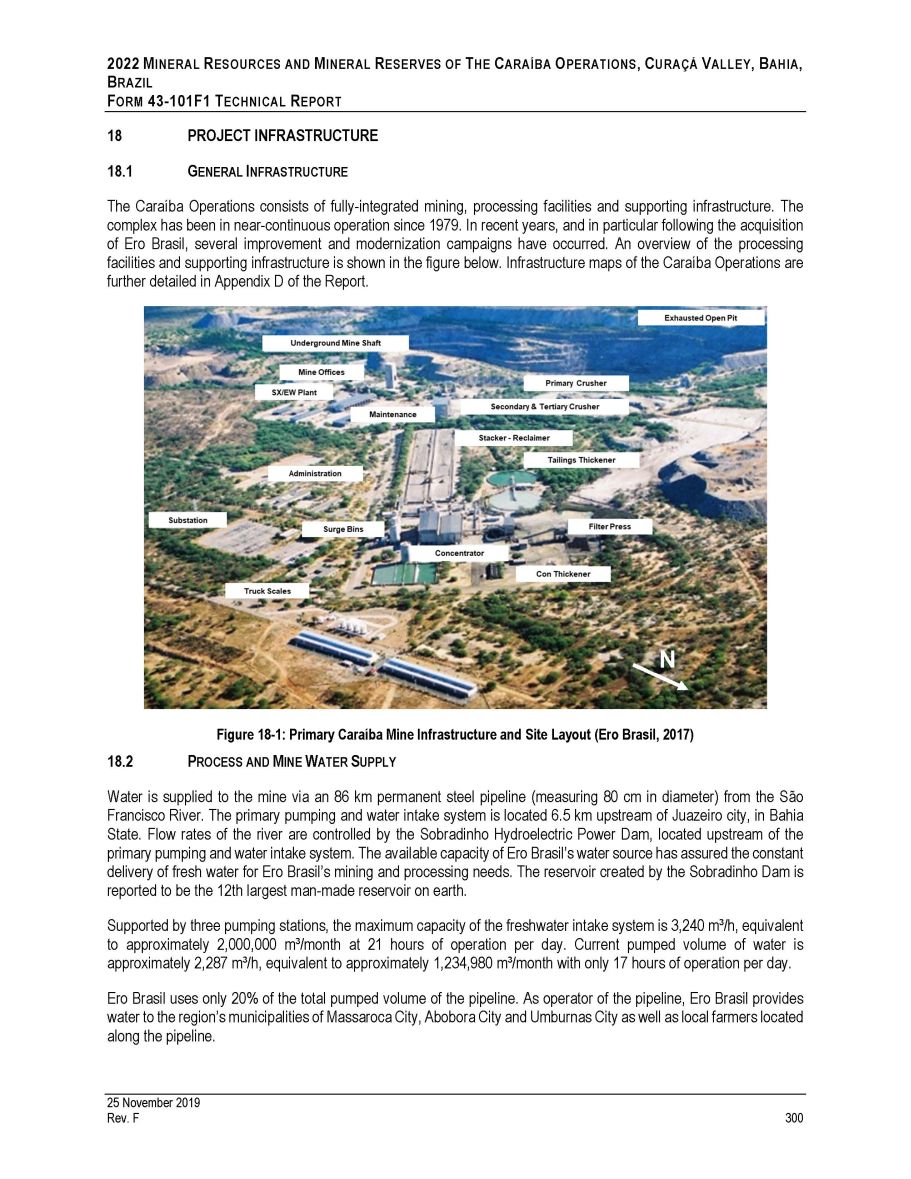
2022 M INERAL R ESOURCES AND M INERAL R ESERVES OF T HE C ARAÍBA O PERATIONS , C URAÇÁ V ALLEY , B AHIA , B RAZIL F ORM 43 - 101F1 T ECHNICAL R EPORT 18 18.1 PROJECT INFRASTRUCTURE G ENERAL I NFRASTRUCTURE The Caraíba Operations consists of fully - integrated mining, processing facilities and supporting infrastructure . The complex has been in near - continuous operation since 1979 . In recent years, and in particular following the acquisition of Ero Brasil, several improvement and modernization campaigns have occurred . An overview of the processing facilities and supporting infrastructure is shown in the figure below . Infrastructure maps of the Caraíba Operations are further detailed in Appendix D of the Report . Figure 18 - 1: Primary Caraíba Mine Infrastructure and Site Layout (Ero Brasil, 2017) P ROCESS AND M INE W ATER S UPPLY 18.2 Water is supplied to the mine via an 86 km permanent steel pipeline (measuring 80 cm in diameter) from the São Francisco River . The primary pumping and water intake system is located 6 . 5 km upstream of Juazeiro city, in Bahia State . Flow rates of the river are controlled by the Sobradinho Hydroelectric Power Dam, located upstream of the primary pumping and water intake system . The available capacity of Ero Brasil’s water source has assured the constant delivery of fresh water for Ero Brasil’s mining and processing needs . The reservoir created by the Sobradinho Dam is reported to be the 12 th largest man - made reservoir on earth . Supported by three pumping stations, the maximum capacity of the freshwater intake system is 3 , 240 m³/h, equivalent to approximately 2 , 000 , 000 m³/month at 21 hours of operation per day . Current pumped volume of water is approximately 2 , 287 m³/h, equivalent to approximately 1 , 234 , 980 m³/month with only 17 hours of operation per day . Ero Brasil uses only 20 % of the total pumped volume of the pipeline . As operator of the pipeline, Ero Brasil provides water to the region’s municipalities of Massaroca City, Abobora City and Umburnas City as well as local farmers located along the pipeline . N 25 November 2019 Rev. F 300

2022 M INERAL R ESOURCES AND M INERAL R ESERVES OF T HE C ARAÍBA O PERATIONS , C URAÇÁ V ALLEY , B AHIA , B RAZIL F ORM 43 - 101 F 1 T ECHNICAL R EPORT 18.3 S ITE P OWER Energy is supplied to the Caraíba Operations by CHESF via an overhead transmission line from the Sobradinho Hydroelectric Power Dam at 230 kV . Ero Brasil has a long - term contract with CHESF and the provision of power for the operations is not a relevant risk to the current or future development plans of the Company . Power from CHESF is fed to the primary substation at Caraíba, which is comprised of two transformers configured with 60 MVA/ 230 kV/ 13 . 8 kV that serve to distribute power to the Caraíba Mine, Caraíba Mill, processing support facilities and administration offices . The figure below shows the primary power substation on the property which was installed and commissioned in 1978 . Mine Figure 18 - 2 : Main Electrical Substation at the Caraíba Mill (Ero Brasil, 2019 ) Currently, Ero Brasil uses less than 25 % of its primary substation capacity . Further expansions of the Pilar UG Mine including cooling and ventilation requirements, as well as the increased milling capacity up to 4 . 2 Mtpa currently envisioned, will result in less than 50 % of the installed power of the primary substation capacity . No further investments of the power supply infrastructure are anticipated . The Ero Brasil power supply infrastructure features a step - down substation (the “Main Electrical Substation”) containing two 40 / 50 / 60 MVA ONAF power transformers (forced ventilation) and 230 / 13 . 8 kV transformation ratio in order to distribute power to the Pilar UG Mine, the Caraíba Mill, administrative and support offices located on site as well as the local town of Pilar . The distribution of power follows the schematic illustrated below . Figure 18 - 3: Simplified power distribution schematic (Ero Brasil, 2020) The Electrical reticulation is designed with a ring feed system so that there is 100 % redundancy and only one circuit is in operation at any given time, with the second duplicate circuit on stand - by . The circuits are responsible for supplying two buses (“Bus A” and “Bus B”), from which 20 circuits are available for delivery of power with medium voltage cubicles 25 November 2019 Rev. F 301
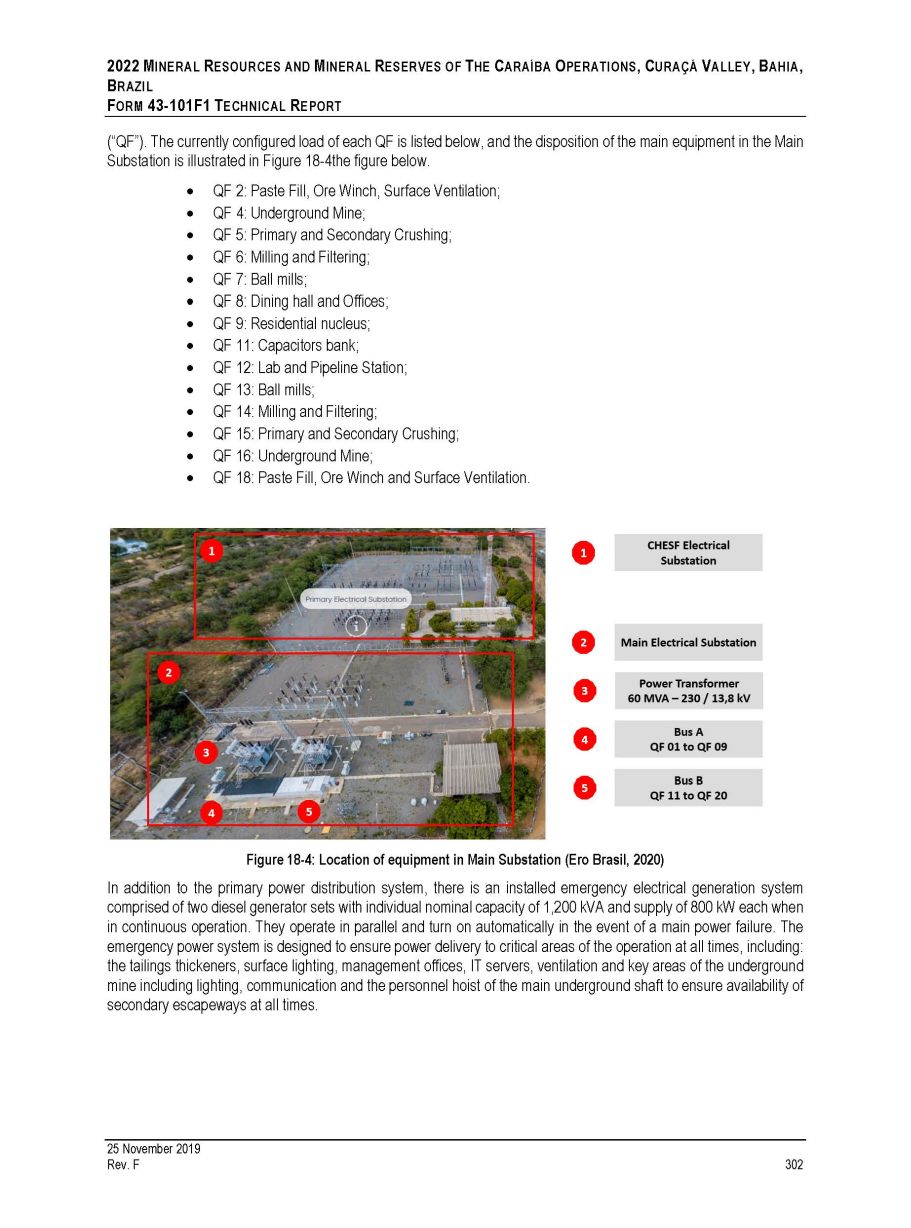
2022 M INERAL R ESOURCES AND M INERAL R ESERVES OF T HE C ARAÍBA O PERATIONS , C URAÇÁ V ALLEY , B AHIA , B RAZIL F ORM 43 - 101F1 T ECHNICAL R EPORT (“QF”). The currently configured load of each QF is listed below, and the disposition of the main equipment in the Main Substation is illustrated in Figure 18 - 4the figure below. QF 2: Paste Fill, Ore Winch, Surface Ventilation; QF 4: Underground Mine; QF 5: Primary and Secondary Crushing; QF 6: Milling and Filtering; QF 7: Ball mills; QF 8: Dining hall and Offices; QF 9: Residential nucleus; QF 11: Capacitors bank; QF 12: Lab and Pipeline Station; QF 13: Ball mills; QF 14: Milling and Filtering; QF 15: Primary and Secondary Crushing; QF 16: Underground Mine; QF 18: Paste Fill, Ore Winch and Surface Ventilation. Figure 18 - 4 : Location of equipment in Main Substation (Ero Brasil, 2020 ) In addition to the primary power distribution system, there is an installed emergency electrical generation system comprised of two diesel generator sets with individual nominal capacity of 1 , 200 kVA and supply of 800 kW each when in continuous operation . They operate in parallel and turn on automatically in the event of a main power failure . The emergency power system is designed to ensure power delivery to critical areas of the operation at all times, including : the tailings thickeners, surface lighting, management offices, IT servers, ventilation and key areas of the underground mine including lighting, communication and the personnel hoist of the main underground shaft to ensure availability of secondary escapeways at all times . 25 November 2019 Rev. F 302
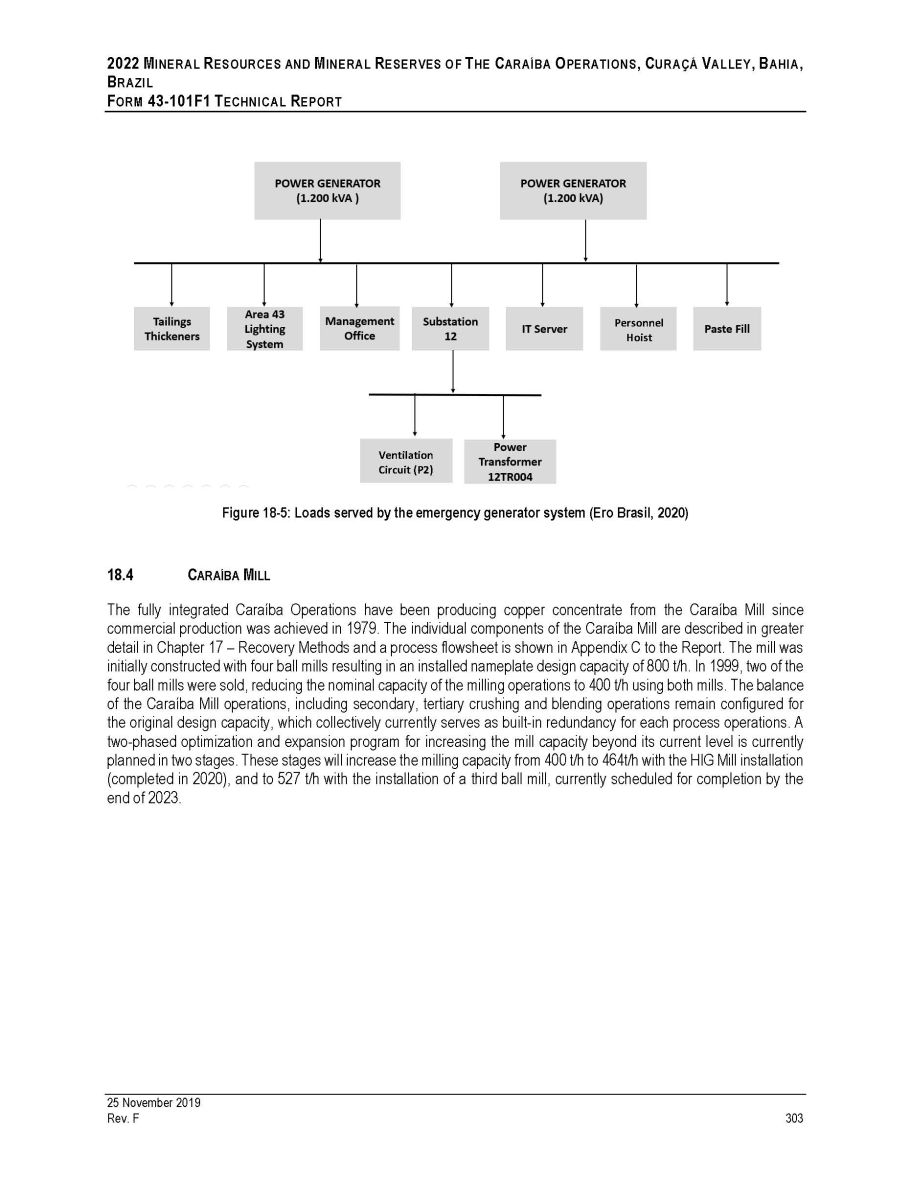
2022 M INERAL R ESOURCES AND M INERAL R ESERVES OF T HE C ARAÍBA O PERATIONS , C URAÇÁ V ALLEY , B AHIA , B RAZIL F ORM 43 - 101F1 T ECHNICAL R EPORT Figure 18 - 5: Loads served by the emergency generator system (Ero Brasil, 2020) 18.4 C ARAÍBA M ILL The fully integrated Caraíba Operations have been producing copper concentrate from the Caraíba Mill since commercial production was achieved in 1979 . The individual components of the Caraíba Mill are described in greater detail in Chapter 17 – Recovery Methods and a process flowsheet is shown in Appendix C to the Report . The mill was initially constructed with four ball mills resulting in an installed nameplate design capacity of 800 t/h . In 1999 , two of the four ball mills were sold, reducing the nominal capacity of the milling operations to 400 t/h using both mills . The balance of the Caraíba Mill operations, including secondary, tertiary crushing and blending operations remain configured for the original design capacity, which collectively currently serves as built - in redundancy for each process operations . A two - phased optimization and expansion program for increasing the mill capacity beyond its current level is currently planned in two stages . These stages will increase the milling capacity from 400 t/h to 464 t/h with the HIG Mill installation (completed in 2020 ), and to 527 t/h with the installation of a third ball mill, currently scheduled for completion by the end of 2023 . Personnel Hoist 25 November 2019 Rev. F 303 Ventilation Circuit (P2)
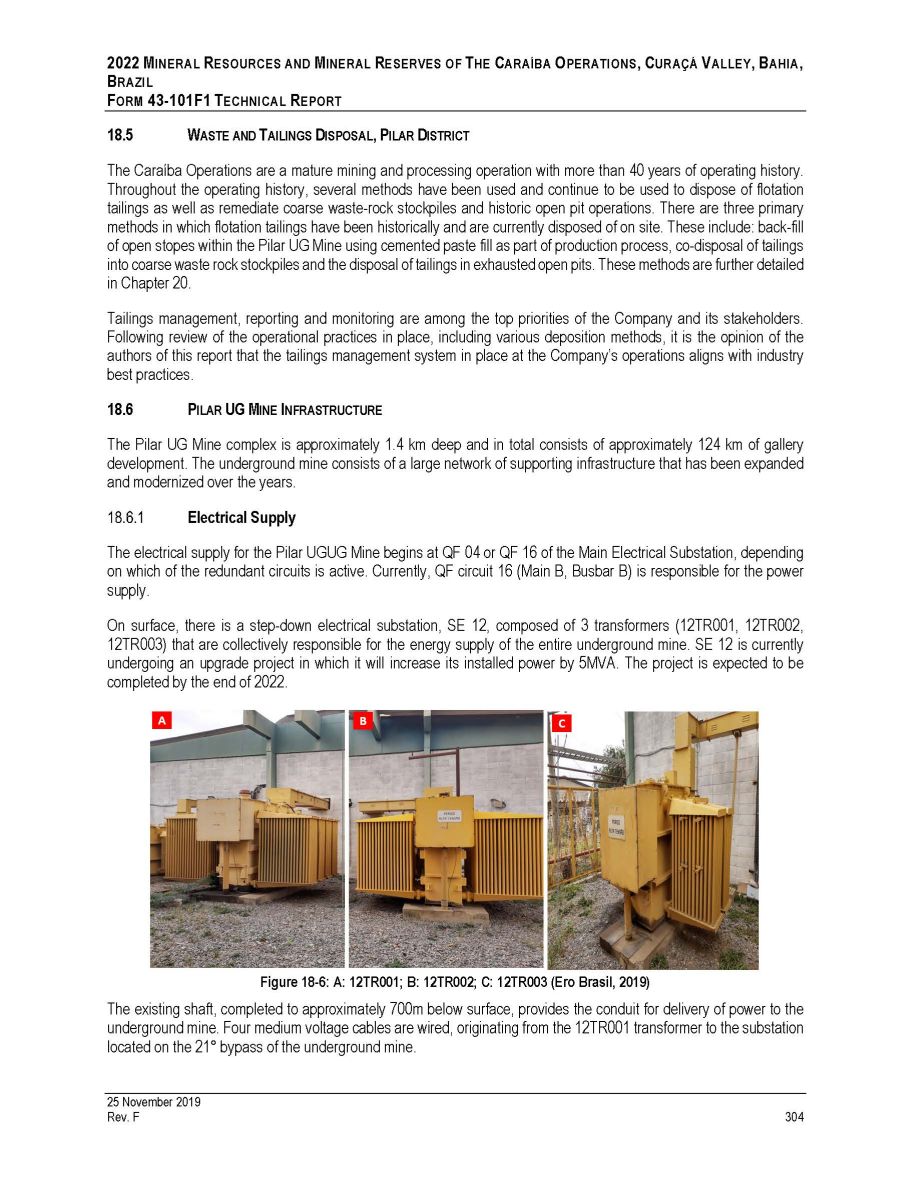
2022 M INERAL R ESOURCES AND M INERAL R ESERVES OF T HE C ARAÍBA O PERATIONS , C URAÇÁ V ALLEY , B AHIA , B RAZIL F ORM 43 - 101 F 1 T ECHNICAL R EPORT 5. W ASTE AND T AILINGS D ISPOSAL , P ILAR D ISTRICT The Caraíba Operations are a mature mining and processing operation with more than 40 years of operating history . Throughout the operating history, several methods have been used and continue to be used to dispose of flotation tailings as well as remediate coarse waste - rock stockpiles and historic open pit operations . There are three primary methods in which flotation tailings have been historically and are currently disposed of on site . These include : back - fill of open stopes within the Pilar UG Mine using cemented paste fill as part of production process, co - disposal of tailings into coarse waste rock stockpiles and the disposal of tailings in exhausted open pits . These methods are further detailed in Chapter 20 . Tailings management, reporting and monitoring are among the top priorities of the Company and its stakeholders . Following review of the operational practices in place, including various deposition methods, it is the opinion of the authors of this report that the tailings management system in place at the Company’s operations aligns with industry best practices . 6. P ILAR UG M INE I NFRASTRUCTURE The Pilar UG Mine complex is approximately 1 . 4 km deep and in total consists of approximately 124 km of gallery development . The underground mine consists of a large network of supporting infrastructure that has been expanded and modernized over the years . Electrical Supply The electrical supply for the Pilar UGUG Mine begins at QF 04 or QF 16 of the Main Electrical Substation, depending on which of the redundant circuits is active . Currently, QF circuit 16 (Main B, Busbar B) is responsible for the power supply . On surface, there is a step - down electrical substation, SE 12 , composed of 3 transformers ( 12 TR 001 , 12 TR 002 , 12 TR 003 ) that are collectively responsible for the energy supply of the entire underground mine . SE 12 is currently undergoing an upgrade project in which it will increase its installed power by 5 MVA . The project is expected to be completed by the end of 2022 . Figure 18 - 6 : A : 12 TR 001 ; B : 12 TR 002 ; C : 12 TR 003 (Ero Brasil, 2019 ) The existing shaft, completed to approximately 700 m below surface, provides the conduit for delivery of power to the underground mine . Four medium voltage cables are wired, originating from the 12 TR 001 transformer to the substation located on the 21 ƒ bypass of the underground mine . 25 November 2019 Rev. F 304
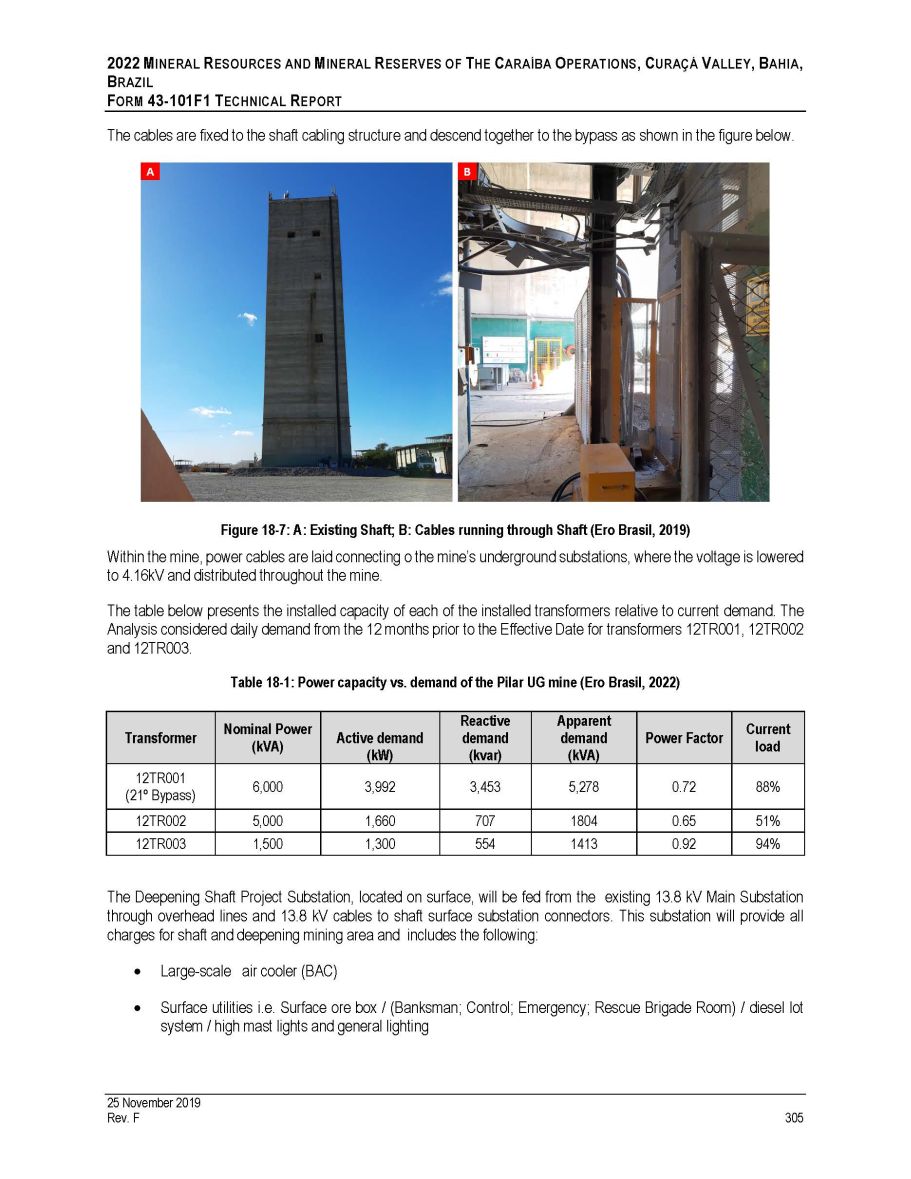
2022 M INERAL R ESOURCES AND M INERAL R ESERVES OF T HE C ARAÍBA O PERATIONS , C URAÇÁ V ALLEY , B AHIA , B RAZIL F ORM 43 - 101F1 T ECHNICAL R EPORT The cables are fixed to the shaft cabling structure and descend together to the bypass as shown in the figure below. Figure 18 - 7: A: Existing Shaft; B: Cables running through Shaft (Ero Brasil, 2019) Within the mine, power cables are laid connecting o the mine’s underground substations, where the voltage is lowered to 4 . 16 kV and distributed throughout the mine . The table below presents the installed capacity of each of the installed transformers relative to current demand . The Analysis considered daily demand from the 12 months prior to the Effective Date for transformers 12 TR 001 , 12 TR 002 and 12 TR 003 . Table 18 - 1: Power capacity vs. demand of the Pilar UG mine (Ero Brasil, 2022) The Deepening Shaft Project Substation, located on surface, will be fed from the existing 13 . 8 kV Main Substation through overhead lines and 13 . 8 kV cables to shaft surface substation connectors . This substation will provide all charges for shaft and deepening mining area and includes the following : Large - scale air cooler (BAC) Surface utilities i.e. Surface ore box / (Banksman; Control; Emergency; Rescue Brigade Room) / diesel lot system / high mast lights and general lighting Transformer Nominal Power (kVA) Active demand (kW) Reactive demand (kvar) Apparent demand (kVA) Power Factor Current load 12TR001 (21º Bypass) 6,000 3,992 3,453 5,278 0.72 88% 12TR002 5,000 1,660 707 1804 0.65 51% 12TR003 1,500 1,300 554 1413 0.92 94% 25 November 2019 Rev. F 305
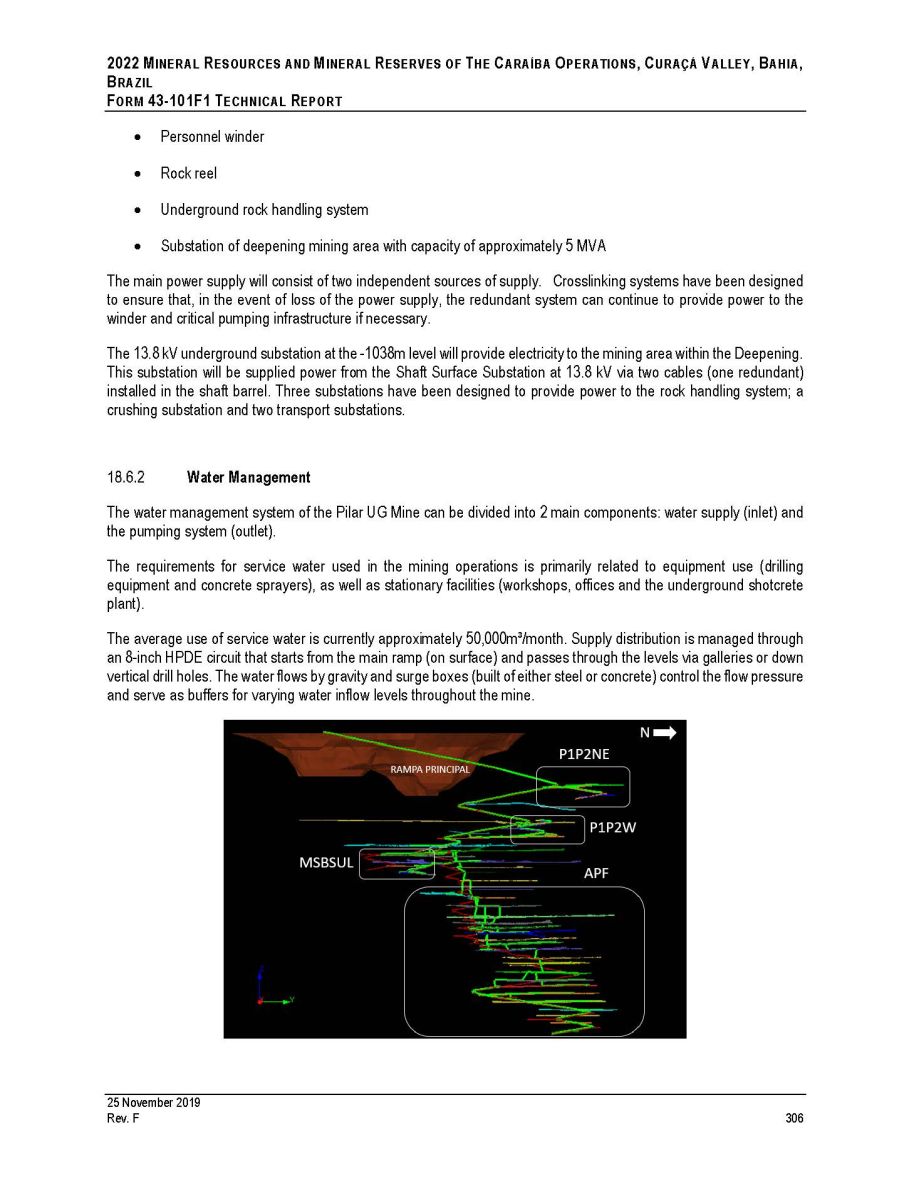
2022 M INERAL R ESOURCES AND M INERAL R ESERVES OF T HE C ARAÍBA O PERATIONS , C URAÇÁ V ALLEY , B AHIA , B RAZIL F ORM 43 - 101 F 1 T ECHNICAL R EPORT Personnel winder Rock reel Underground rock handling system Substation of deepening mining area with capacity of approximately 5 MVA The main power supply will consist of two independent sources of supply . Crosslinking systems have been designed to ensure that, in the event of loss of the power supply, the redundant system can continue to provide power to the winder and critical pumping infrastructure if necessary . The 13 . 8 kV underground substation at the - 1038 m level will provide electricity to the mining area within the Deepening . This substation will be supplied power from the Shaft Surface Substation at 13 . 8 kV via two cables (one redundant) installed in the shaft barrel . Three substations have been designed to provide power to the rock handling system ; a crushing substation and two transport substations . Water Management The water management system of the Pilar UG Mine can be divided into 2 main components : water supply (inlet) and the pumping system (outlet) . The requirements for service water used in the mining operations is primarily related to equipment use (drilling equipment and concrete sprayers), as well as stationary facilities (workshops, offices and the underground shotcrete plant) . The average use of service water is currently approximately 50 , 000 m³/month . Supply distribution is managed through an 8 - inch HPDE circuit that starts from the main ramp (on surface) and passes through the levels via galleries or down vertical drill holes . The water flows by gravity and surge boxes (built of either steel or concrete) control the flow pressure and serve as buffers for varying water inflow levels throughout the mine . 25 November 2019 Rev. F 306
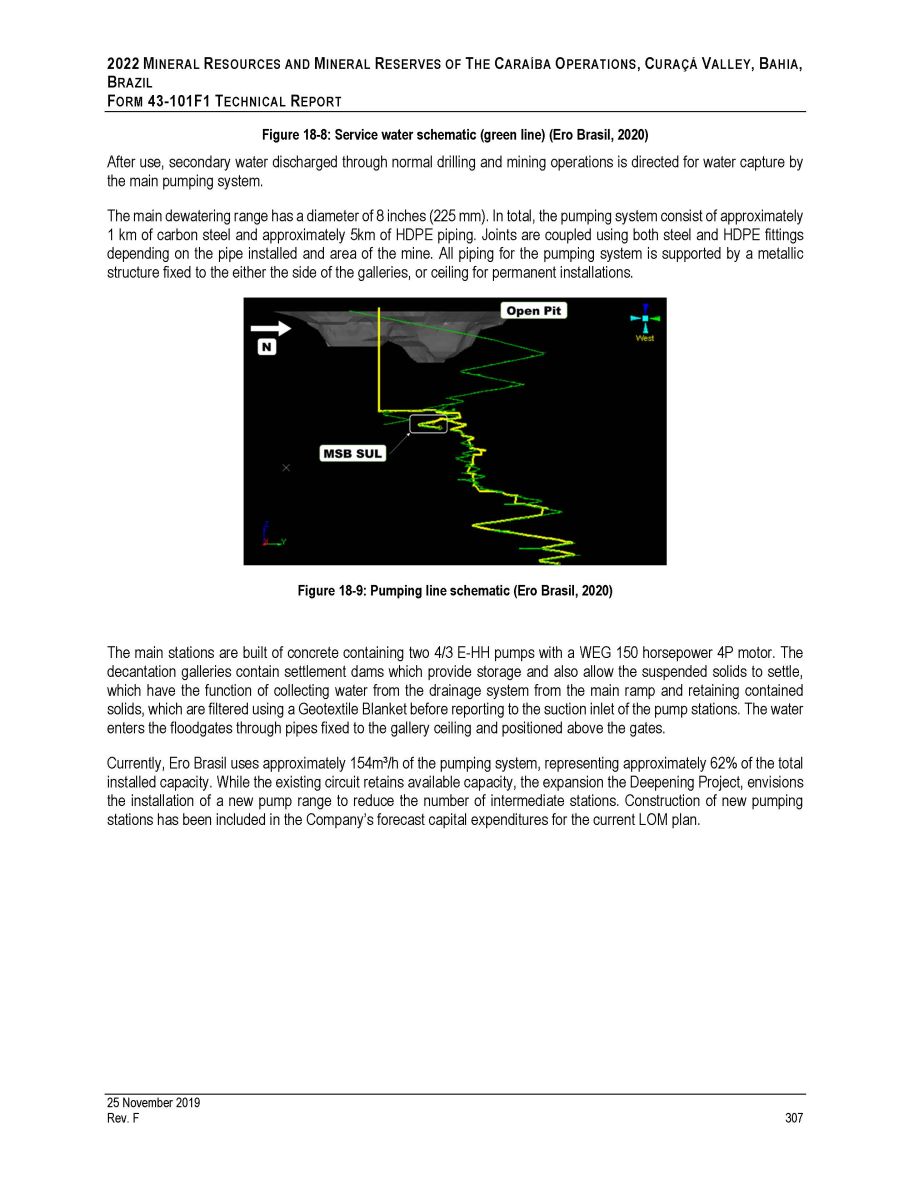
2022 M INERAL R ESOURCES AND M INERAL R ESERVES OF T HE C ARAÍBA O PERATIONS , C URAÇÁ V ALLEY , B AHIA , B RAZIL F ORM 43 - 101 F 1 T ECHNICAL R EPORT Figure 18 - 8: Service water schematic (green line) (Ero Brasil, 2020) After use, secondary water discharged through normal drilling and mining operations is directed for water capture by the main pumping system . The main dewatering range has a diameter of 8 inches ( 225 mm) . In total, the pumping system consist of approximately 1 km of carbon steel and approximately 5 km of HDPE piping . Joints are coupled using both steel and HDPE fittings depending on the pipe installed and area of the mine . All piping for the pumping system is supported by a metallic structure fixed to the either the side of the galleries, or ceiling for permanent installations . Figure 18 - 9: Pumping line schematic (Ero Brasil, 2020) The main stations are built of concrete containing two 4 / 3 E - HH pumps with a WEG 150 horsepower 4 P motor . The decantation galleries contain settlement dams which provide storage and also allow the suspended solids to settle, which have the function of collecting water from the drainage system from the main ramp and retaining contained solids, which are filtered using a Geotextile Blanket before reporting to the suction inlet of the pump stations . The water enters the floodgates through pipes fixed to the gallery ceiling and positioned above the gates . Currently, Ero Brasil uses approximately 154 m³/h of the pumping system, representing approximately 62 % of the total installed capacity . While the existing circuit retains available capacity, the expansion the Deepening Project, envisions the installation of a new pump range to reduce the number of intermediate stations . Construction of new pumping stations has been included in the Company’s forecast capital expenditures for the current LOM plan . 25 November 2019 Rev. F 307
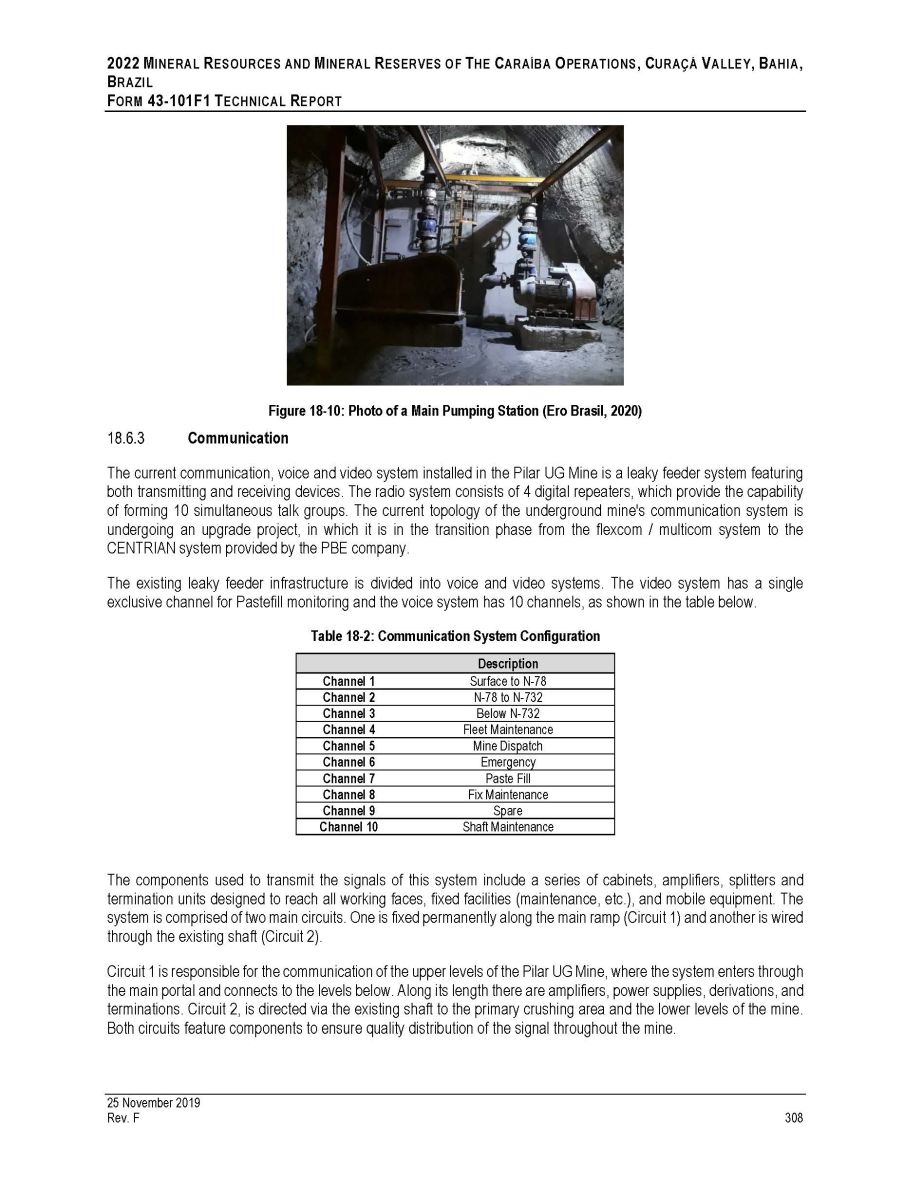
2022 M INERAL R ESOURCES AND M INERAL R ESERVES OF T HE C ARAÍBA O PERATIONS , C URAÇÁ V ALLEY , B AHIA , B RAZIL F ORM 43 - 101F1 T ECHNICAL R EPORT Figure 18 - 10: Photo of a Main Pumping Station (Ero Brasil, 2020) Communication The current communication, voice and video system installed in the Pilar UG Mine is a leaky feeder system featuring both transmitting and receiving devices . The radio system consists of 4 digital repeaters, which provide the capability of forming 10 simultaneous talk groups . The current topology of the underground mine's communication system is undergoing an upgrade project, in which it is in the transition phase from the flexcom / multicom system to the CENTRIAN system provided by the PBE company . The existing leaky feeder infrastructure is divided into voice and video systems . The video system has a single exclusive channel for Pastefill monitoring and the voice system has 10 channels, as shown in the table below . Table 18 - 2: Communication System Configuration Description Channel 1 Surface to N - 78 Channel 2 N - 78 to N - 732 Channel 3 Below N - 732 Channel 4 Fleet Maintenance Channel 5 Mine Dispatch Channel 6 Emergency Channel 7 Paste Fill Channel 8 Fix Maintenance Channel 9 Spare Channel 10 Shaft Maintenance The components used to transmit the signals of this system include a series of cabinets, amplifiers, splitters and termination units designed to reach all working faces, fixed facilities (maintenance, etc . ), and mobile equipment . The system is comprised of two main circuits . One is fixed permanently along the main ramp (Circuit 1 ) and another is wired through the existing shaft (Circuit 2 ) . Circuit 1 is responsible for the communication of the upper levels of the Pilar UG Mine, where the system enters through the main portal and connects to the levels below . Along its length there are amplifiers, power supplies, derivations, and terminations . Circuit 2 , is directed via the existing shaft to the primary crushing area and the lower levels of the mine . Both circuits feature components to ensure quality distribution of the signal throughout the mine . 25 November 2019 Rev. F 308
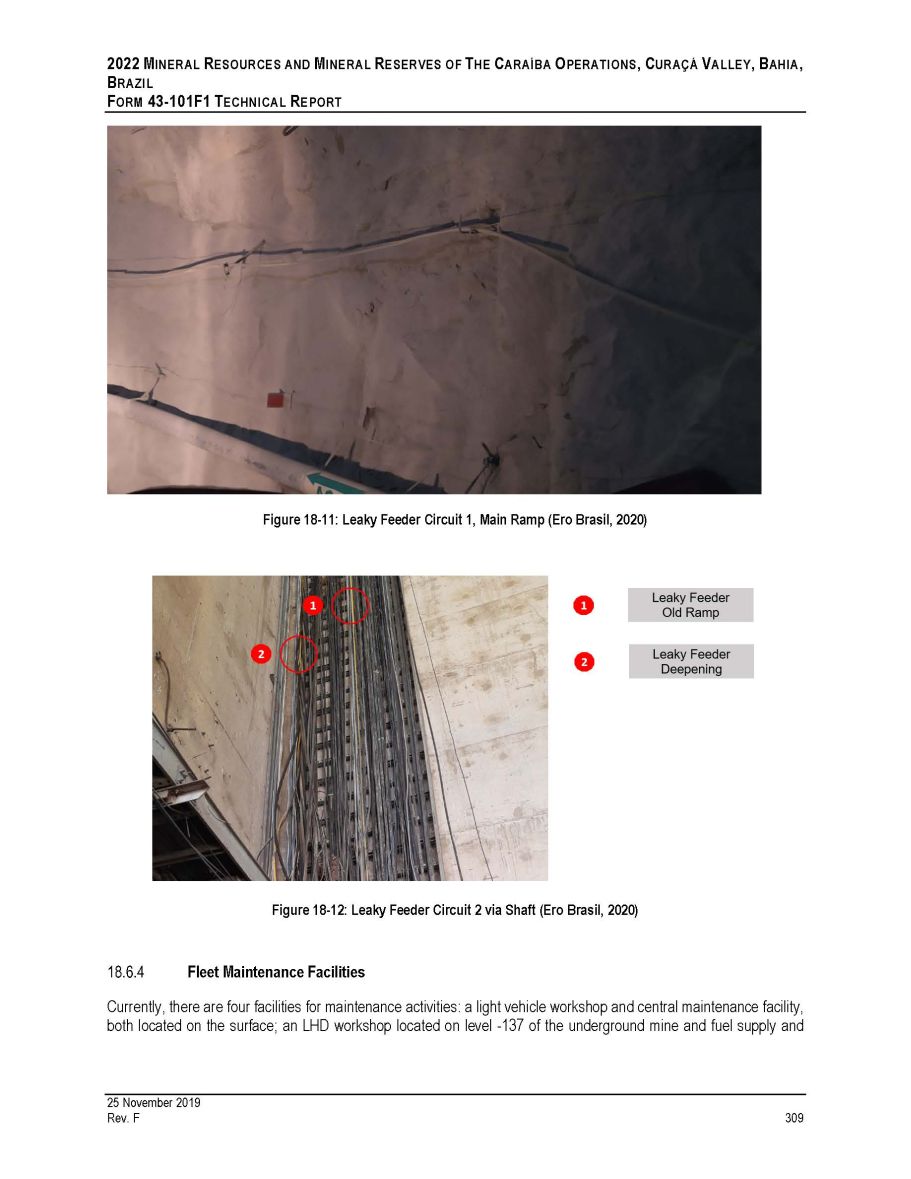
2022 M INERAL R ESOURCES AND M INERAL R ESERVES OF T HE C ARAÍBA O PERATIONS , C URAÇÁ V ALLEY , B AHIA , B RAZIL F ORM 43 - 101F1 T ECHNICAL R EPORT Figure 18 - 11: Leaky Feeder Circuit 1, Main Ramp (Ero Brasil, 2020) Figure 18 - 12: Leaky Feeder Circuit 2 via Shaft (Ero Brasil, 2020) Fleet Maintenance Facilities Currently, there are four facilities for maintenance activities: a light vehicle workshop and central maintenance facility, both located on the surface; an LHD workshop located on level - 137 of the underground mine and fuel supply and 25 November 2019 Rev. F 309

2022 M INERAL R ESOURCES AND M INERAL R ESERVES OF T HE C ARAÍBA O PERATIONS , C URAÇÁ V ALLEY , B AHIA , B RAZIL F ORM 43 - 101 F 1 T ECHNICAL R EPORT lubrication area located on level - 732 of the underground mine . There is also a support location for performing truck tire changes on level - 200 of the underground mine . The central maintenance facility, located on the surface, consists of 7 large maintenance bays . One of the bays has been designed for the maintenance of platforms, two are reserved for preventive maintenance of drilling equipment, two for preventive maintenance of LHDs and support equipment and two other bays are designed for various maintenance and repair work . In addition to the maintenance bays, there is a subassembly maintenance area, meeting rooms for maintenance planning and control team, a central supplies warehouse as well as machining and welding areas . Most of the heavy maintenance performed for the operations of the Curaçá Valley is performed at the central maintenance facility . Figure 18 - 13 : Central Maintenance Facility on Surface, Pilar Mine (Ero Brasil, 2020 ) The underground LHD workshop, located at L - 137 in the underground mine serves as an area for preventive and corrective maintenance of the underground fleet . The workshop also serves as the staging area for the Company’s underground ambulance . In addition, one bay is used as storage for spare parts and consumables used in the mining operation and maintenance processes . Figure 18 - 14: Schematic of the LHD Workshop at L - 137 (Ero Brasil, 2020) 25 November 2019 Rev. F 310

2022 M INERAL R ESOURCES AND M INERAL R ESERVES OF T HE C ARAÍBA O PERATIONS , C URAÇÁ V ALLEY , B AHIA , B RAZIL F ORM 43 - 101F1 T ECHNICAL R EPORT In addition to the LHD workshop, there is a maintenance facility located at L - 732 primarily used for fleet lubrification. The facility on L - 137 is currently the deepest fixed facility in Pilar UG mine. Figure 18 - 15: and Lubrification facility at L - 732 (Ero Brasil, 2020) Compressed Air To serve the underground mine, there is a central compressed air station located on the surface featuring six compressors working in parallel that are capable of generating a combined 8 , 852 m³/h of compressed air . Compressed air leaving the compressors is stored in two 30 m³ pressure vessels . These vessels store and deliver compressed air to the underground mine through compressed air piping and hoses passed through the shaft to meet the various working areas within the Pilar UG Mine . Figure 18 - 16: Compressed air central station and pressure vessels at surface (Ero Brasil, 2020) 25 November 2019 Rev. F 311

2022 M INERAL R ESOURCES AND M INERAL R ESERVES OF T HE C ARAÍBA O PERATIONS , C URAÇÁ V ALLEY , B AHIA , B RAZIL F ORM 43 - 101F1 T ECHNICAL R EPORT Table 18 - 3: Pilar UG Mine compressor capaci ty Compressor Manufacturer Model Nominal Capacity (m³/h) Working pressure (bar) 36CA001 Atlas Copco GA160 1,677 7.40 36CA002 Atlas Copco GA160 1,508 9.10 36CA003 Atlas Copco GA110 1,128 9.10 36CA004 Atlas Copco GA160 1,517 9.10 36CA005 Atlas Copco GA160 1,511 9.10 36CA006 Atlas Copco GA160 1,511 9.10 TOTAL 8,852 Currently, approximately 8 , 000 m³ of the total the air generated by the compressors is used by the primary drilling fleet ( 80 % of total use), concrete production ( 10 % of total use) and other fixed facilities ( 10 % of total use) . To ensure that the current installation can fulfill the air requirements of the LOM plan, the replacement of drill machines from air to electro - hydraulic has been implemented as the existing rigs are replaced at the end of their useful life along with improvements to the compressed air system . Pastefill Plant Ero Brasil implemented the use of pastefill in mined out stopes beginning in 1998 . There are three main objectives of the pastefill production and delivery system : (i) increase the structural integrity of mining operations, (ii) reduce the deposition of tailings in the waste piles, pits or tailings dam and (iii) maximize mineral extraction . Paste is produced on surface in the Company’s pastefill plant, where the tailings are conditioned and mixed with a binder (Portland cement) to form suitable paste according to specification for each application and then gravity fed into the stopes of the Pilar UG Mine . Currently, the pastefill plant has a batch capacity of 70 m³/h . The capacity of the plant will be increased by an additional 90 m³/h in each of Phase 1 and Phase 2 expansions of the facility . The main components of the existing facility includes : 1 bulk storage tank, 2 disk filters, 1 pulp conditioner, 1 pulp mixer, 5 cement storage silos, conveyor belts, weighing machines and other associated mechanical equipment . 25 November 2019 Rev. F 312
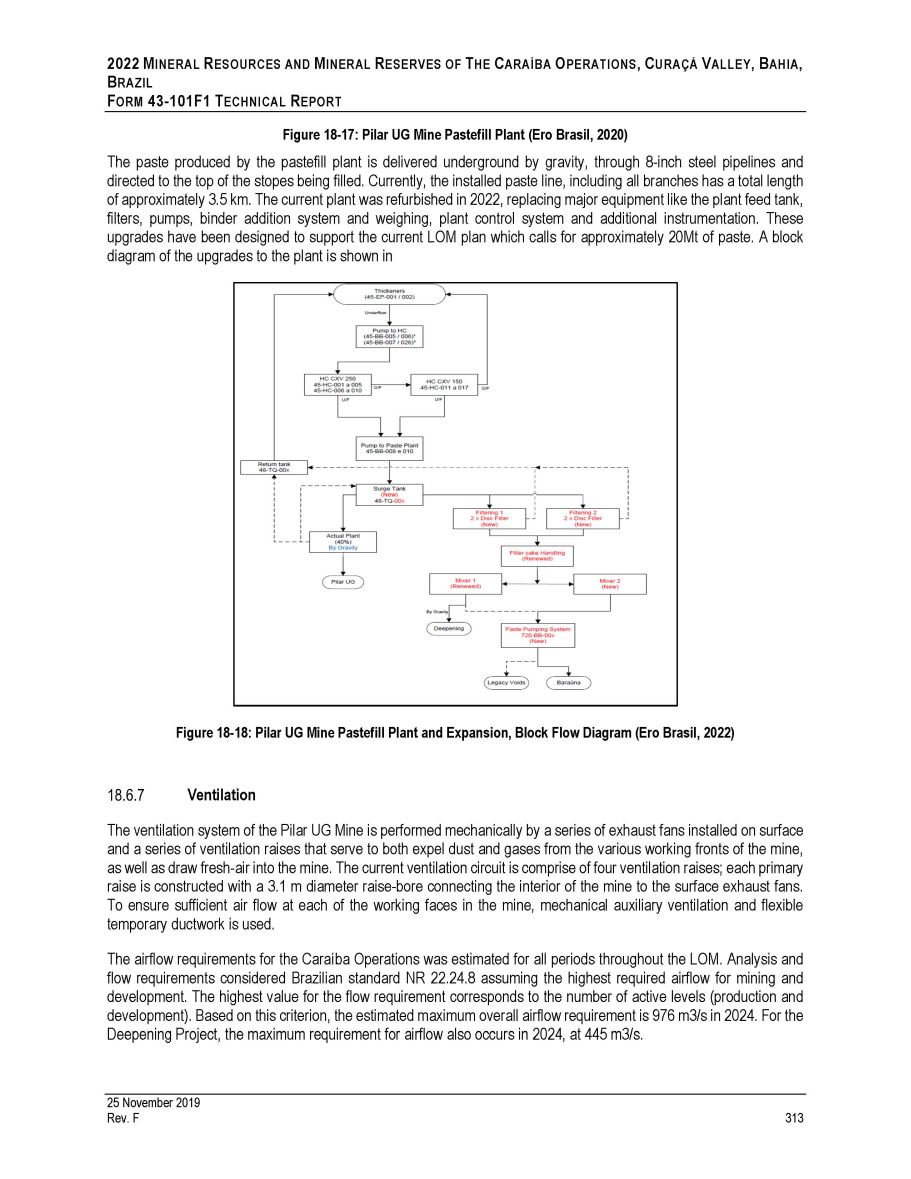
2022 M INERAL R ESOURCES AND M INERAL R ESERVES OF T HE C ARAÍBA O PERATIONS , C URAÇÁ V ALLEY , B AHIA , B RAZIL F ORM 43 - 101 F 1 T ECHNICAL R EPORT Figure 18 - 17 : Pilar UG Mine Pastefill Plant (Ero Brasil, 2020 ) The paste produced by the pastefill plant is delivered underground by gravity, through 8 - inch steel pipelines and directed to the top of the stopes being filled . Currently, the installed paste line, including all branches has a total length of approximately 3 . 5 km . The current plant was refurbished in 2022 , replacing major equipment like the plant feed tank, filters, pumps, binder addition system and weighing, plant control system and additional instrumentation . These upgrades have been designed to support the current LOM plan which calls for approximately 20 Mt of paste . A block diagram of the upgrades to the plant is shown in Figure 18 - 18: Pilar UG Mine Pastefill Plant and Expansion, Block Flow Diagram (Ero Brasil, 2022) Ventilation The ventilation system of the Pilar UG Mine is performed mechanically by a series of exhaust fans installed on surface and a series of ventilation raises that serve to both expel dust and gases from the various working fronts of the mine, as well as draw fresh - air into the mine . The current ventilation circuit is comprise of four ventilation raises ; each primary raise is constructed with a 3 . 1 m diameter raise - bore connecting the interior of the mine to the surface exhaust fans . To ensure sufficient air flow at each of the working faces in the mine, mechanical auxiliary ventilation and flexible temporary ductwork is used . The airflow requirements for the Caraíba Operations was estimated for all periods throughout the LOM . Analysis and flow requirements considered Brazilian standard NR 22 . 24 . 8 assuming the highest required airflow for mining and development . The highest value for the flow requirement corresponds to the number of active levels (production and development) . Based on this criterion, the estimated maximum overall airflow requirement is 976 m 3 /s in 2024 . For the Deepening Project, the maximum requirement for airflow also occurs in 2024 , at 445 m 3 /s . 25 November 2019 Rev. F 313
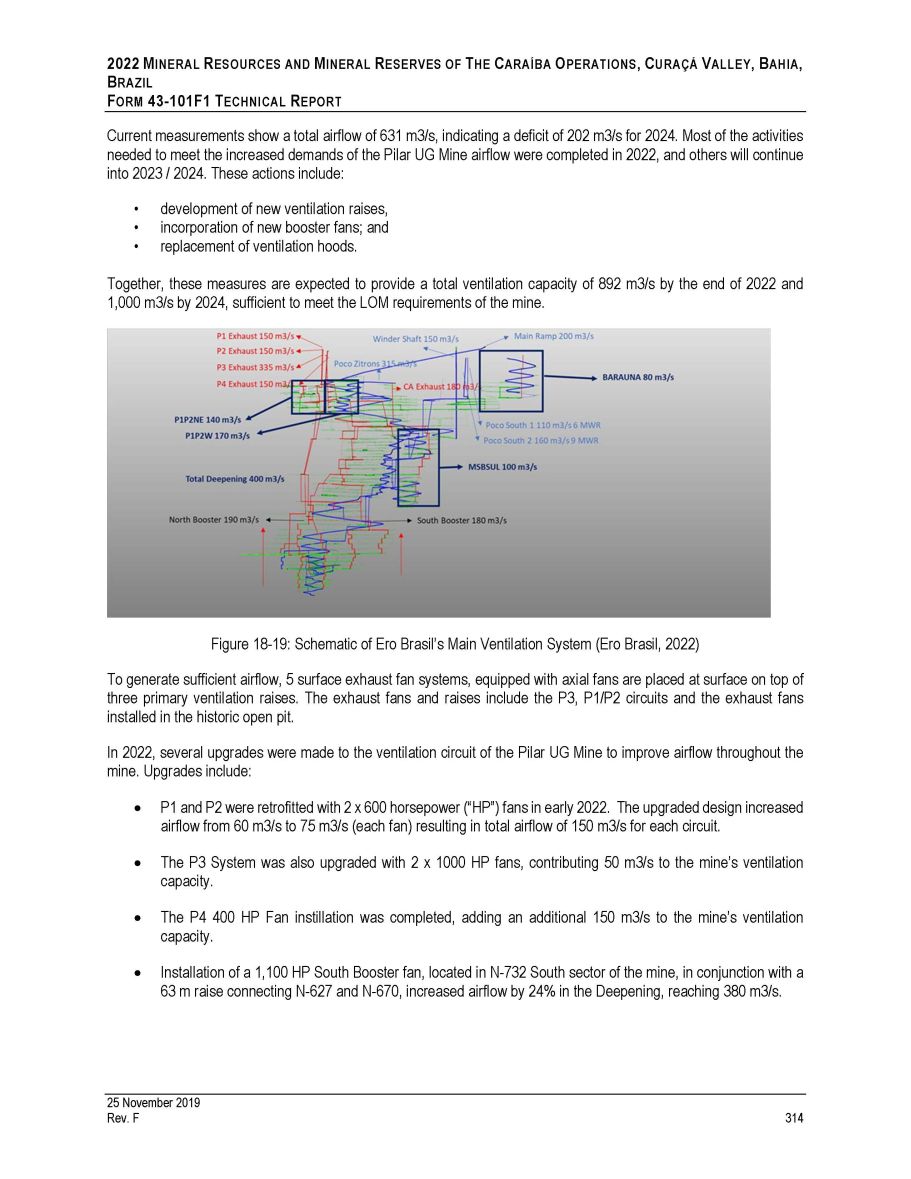
2022 M INERAL R ESOURCES AND M INERAL R ESERVES OF T HE C ARAÍBA O PERATIONS , C URAÇÁ V ALLEY , B AHIA , B RAZIL F ORM 43 - 101 F 1 T ECHNICAL R EPORT Current measurements show a total airflow of 631 m 3 /s, indicating a deficit of 202 m 3 /s for 2024 . Most of the activities needed to meet the increased demands of the Pilar UG Mine airflow were completed in 2022 , and others will continue into 2023 / 2024 . These actions include : • development of new ventilation raises, • incorporation of new booster fans; and • replacement of ventilation hoods. Together, these measures are expected to provide a total ventilation capacity of 892 m 3 /s by the end of 2022 and 1 , 000 m 3 /s by 2024 , sufficient to meet the LOM requirements of the mine . Figure 18 - 19: Schematic of Ero Brasil’s Main Ventilation System (Ero Brasil, 2022) To generate sufficient airflow, 5 surface exhaust fan systems, equipped with axial fans are placed at surface on top of three primary ventilation raises . The exhaust fans and raises include the P 3 , P 1 /P 2 circuits and the exhaust fans installed in the historic open pit . In 2022 , several upgrades were made to the ventilation circuit of the Pilar UG Mine to improve airflow throughout the mine . Upgrades include : P1 and P2 were retrofitted with 2 x 600 horsepower (“HP”) fans in early 2022. The upgraded design increased airflow from 60 m3/s to 75 m3/s (each fan) resulting in total airflow of 150 m3/s for each circuit. The P3 System was also upgraded with 2 x 1000 HP fans, contributing 50 m3/s to the mine’s ventilation capacity. The P4 400 HP Fan instillation was completed, adding an additional 150 m3/s to the mine’s ventilation capacity. Installation of a 1,100 HP South Booster fan, located in N - 732 South sector of the mine, in conjunction with a 63 m raise connecting N - 627 and N - 670, increased airflow by 24% in the Deepening, reaching 380 m3/s. 25 November 2019 Rev. F 314

2022 M INERAL R ESOURCES AND M INERAL R ESERVES OF T HE C ARAÍBA O PERATIONS , C URAÇÁ V ALLEY , B AHIA , B RAZIL F ORM 43 - 101 F 1 T ECHNICAL R EPORT In 2024 , installation of the 1 , 100 HP North Booster fan is scheduled . The booster is located on the same level N - 732 , in the north sector of the mine When paired with a new 326 m vertical ventilation raise, 410 m 3 /s of airflow to support the Deepening Project is expected . Figure 18 - 20: P3 exhaust fans – model SOMAX (Ero Brasil, 2020) Figure 18 - 21: P1/P2 exhaust fans – model SOMAX (Ero Brasil, 2020) 25 November 2019 Rev. F 315
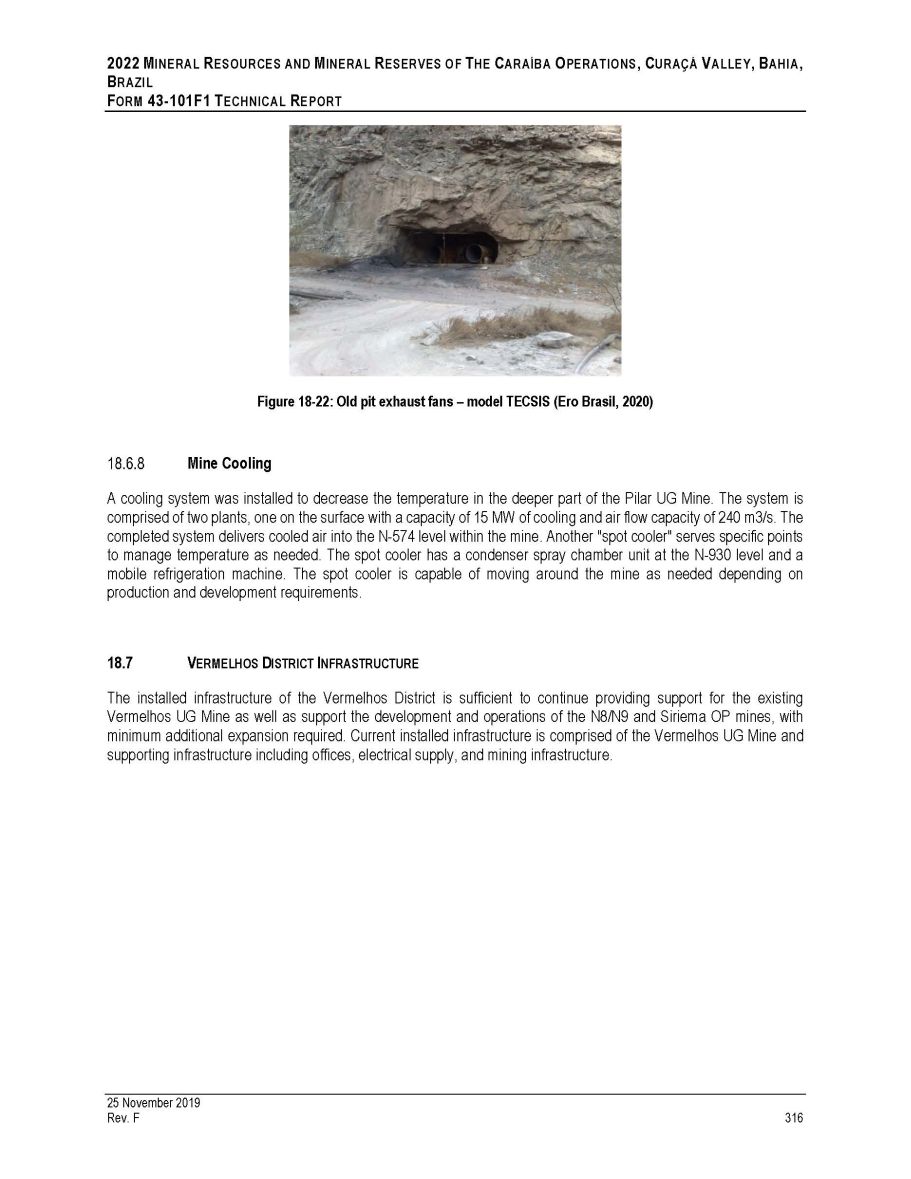
2022 M INERAL R ESOURCES AND M INERAL R ESERVES OF T HE C ARAÍBA O PERATIONS , C URAÇÁ V ALLEY , B AHIA , B RAZIL F ORM 43 - 101F1 T ECHNICAL R EPORT Figure 18 - 22: Old pit exhaust fans – model TECSIS (Ero Brasil, 2020) Mine Cooling A cooling system was installed to decrease the temperature in the deeper part of the Pilar UG Mine . The system is comprised of two plants, one on the surface with a capacity of 15 MW of cooling and air flow capacity of 240 m 3 /s . The completed system delivers cooled air into the N - 574 level within the mine . Another "spot cooler" serves specific points to manage temperature as needed . The spot cooler has a condenser spray chamber unit at the N - 930 level and a mobile refrigeration machine . The spot cooler is capable of moving around the mine as needed depending on production and development requirements . 18.7 V ERMELHOS D ISTRICT I NFRASTRUCTURE The installed infrastructure of the Vermelhos District is sufficient to continue providing support for the existing Vermelhos UG Mine as well as support the development and operations of the N 8 /N 9 and Siriema OP mines, with minimum additional expansion required . Current installed infrastructure is comprised of the Vermelhos UG Mine and supporting infrastructure including offices, electrical supply, and mining infrastructure . 25 November 2019 Rev. F 316

Figure 18 - 23: Vermelhos Industrial Area (Ero Brasil, 2020) Figure 18 - 24: Vermelhos Office and Support Facilities (Ero Brasil, 2020) Rockfill Plant 2022 M INERAL R ESOURCES AND M INERAL R ESERVES OF T HE C ARAÍBA O PERATIONS , C URAÇÁ V ALLEY , B AHIA , B RAZIL F ORM 43 - 101F1 T ECHNICAL R EPORT Vermelhos Office / Offices Support UG Mine Entry Waste Dumps Geology Core Shad Parking Lot Workshop and Storage Administrative Offices Canteen Storage Changing Room Storage Scale Fuel Station 25 November 2019 Rev. F 317
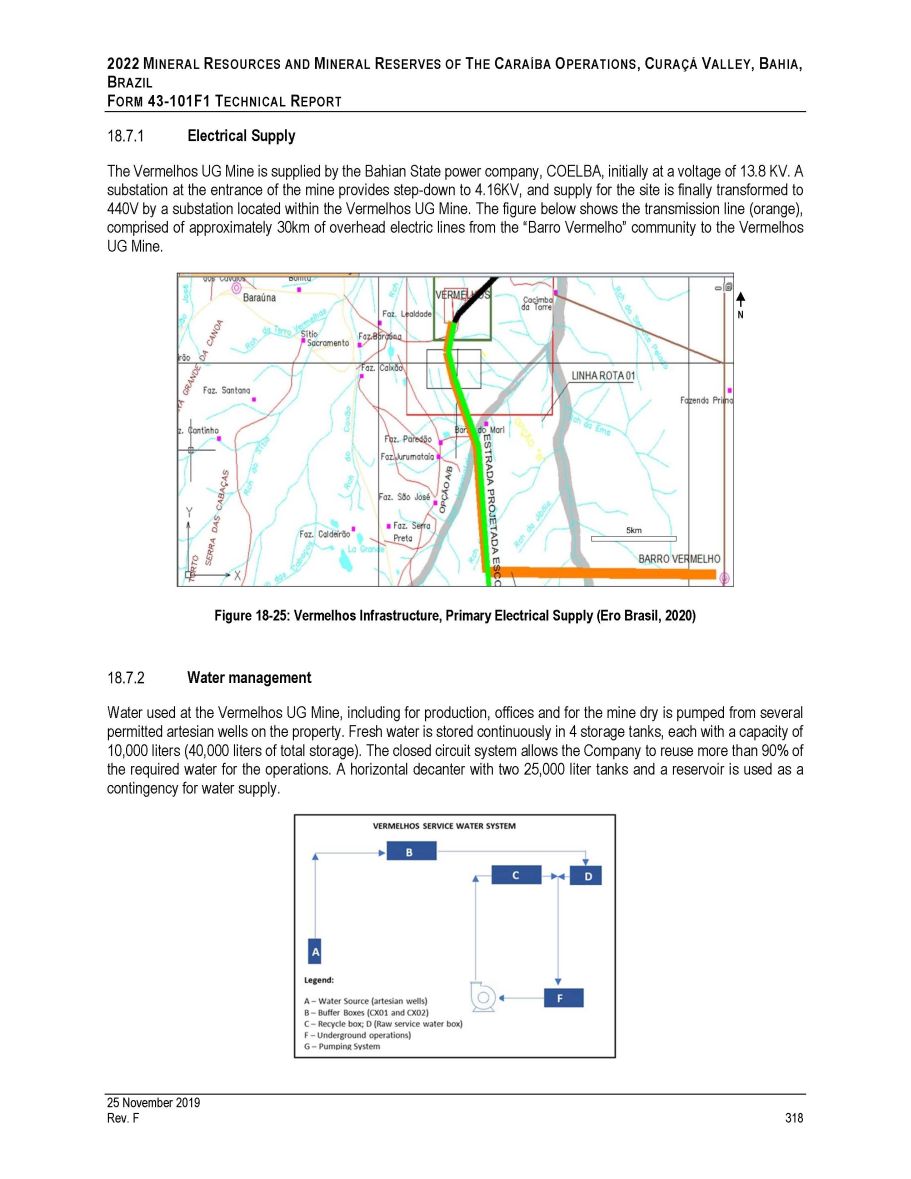
2022 M INERAL R ESOURCES AND M INERAL R ESERVES OF T HE C ARAÍBA O PERATIONS , C URAÇÁ V ALLEY , B AHIA , B RAZIL F ORM 43 - 101 F 1 T ECHNICAL R EPORT Electrical Supply The Vermelhos UG Mine is supplied by the Bahian State power company, COELBA, initially at a voltage of 13 . 8 KV . A substation at the entrance of the mine provides step - down to 4 . 16 KV, and supply for the site is finally transformed to 440 V by a substation located within the Vermelhos UG Mine . The figure below shows the transmission line (orange), comprised of approximately 30 km of overhead electric lines from the “Barro Vermelho” community to the Vermelhos UG Mine . Figure 18 - 25: Vermelhos Infrastructure, Primary Electrical Supply (Ero Brasil, 2020) Water management Water used at the Vermelhos UG Mine, including for production, offices and for the mine dry is pumped from several permitted artesian wells on the property . Fresh water is stored continuously in 4 storage tanks, each with a capacity of 10 , 000 liters ( 40 , 000 liters of total storage) . The closed circuit system allows the Company to reuse more than 90 % of the required water for the operations . A horizontal decanter with two 25 , 000 liter tanks and a reservoir is used as a contingency for water supply . N 25 November 2019 Rev. F 318
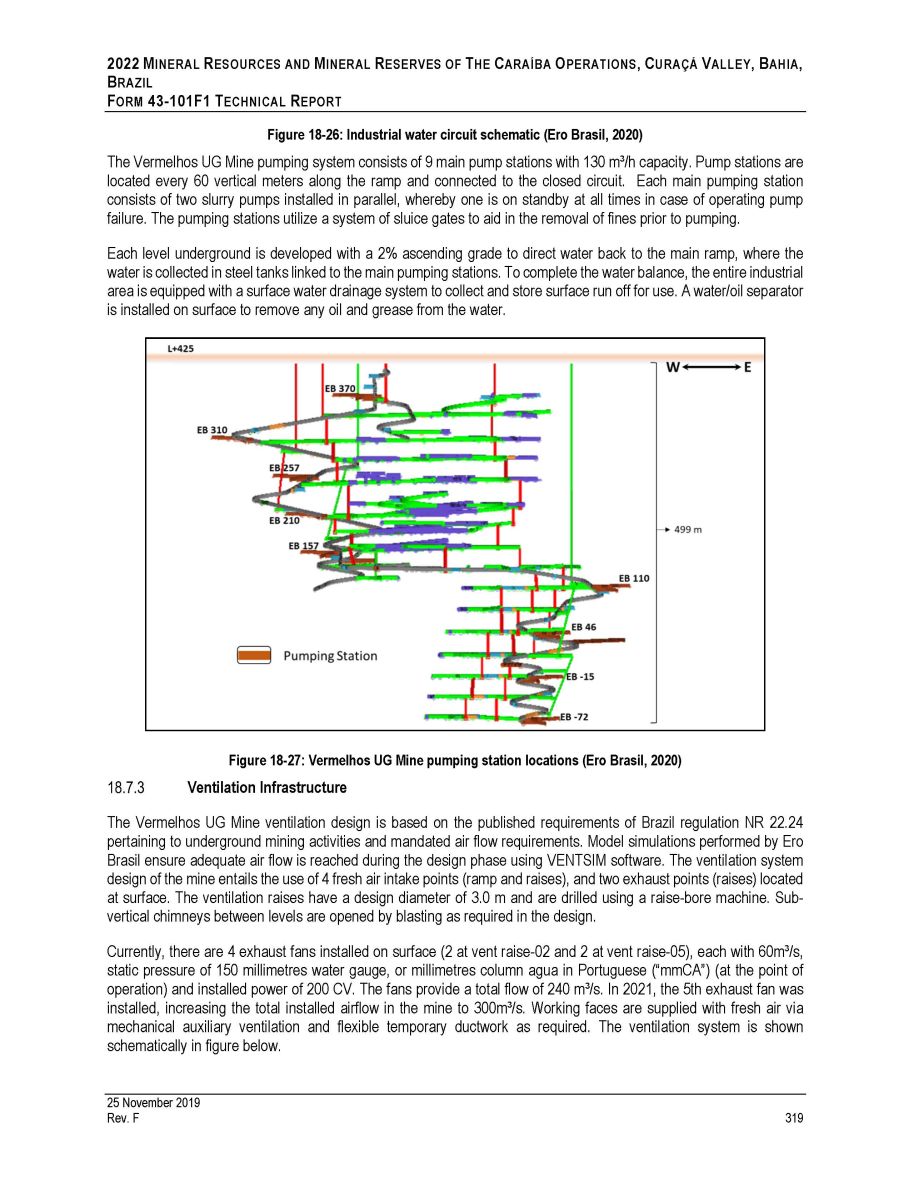
2022 M INERAL R ESOURCES AND M INERAL R ESERVES OF T HE C ARAÍBA O PERATIONS , C URAÇÁ V ALLEY , B AHIA , B RAZIL F ORM 43 - 101 F 1 T ECHNICAL R EPORT Figure 18 - 26 : Industrial water circuit schematic (Ero Brasil, 2020 ) The Vermelhos UG Mine pumping system consists of 9 main pump stations with 130 m³/h capacity . Pump stations are located every 60 vertical meters along the ramp and connected to the closed circuit . Each main pumping station consists of two slurry pumps installed in parallel, whereby one is on standby at all times in case of operating pump failure . The pumping stations utilize a system of sluice gates to aid in the removal of fines prior to pumping . Each level underground is developed with a 2 % ascending grade to direct water back to the main ramp, where the water is collected in steel tanks linked to the main pumping stations . To complete the water balance, the entire industrial area is equipped with a surface water drainage system to collect and store surface run off for use . A water/oil separator is installed on surface to remove any oil and grease from the water . Figure 18 - 27: Vermelhos UG Mine pumping station locations (Ero Brasil, 2020) Ventilation Infrastructure The Vermelhos UG Mine ventilation design is based on the published requirements of Brazil regulation NR 22 . 24 pertaining to underground mining activities and mandated air flow requirements . Model simulations performed by Ero Brasil ensure adequate air flow is reached during the design phase using VENTSIM software . The ventilation system design of the mine entails the use of 4 fresh air intake points (ramp and raises), and two exhaust points (raises) located at surface . The ventilation raises have a design diameter of 3 . 0 m and are drilled using a raise - bore machine . Sub - vertical chimneys between levels are opened by blasting as required in the design . Currently, there are 4 exhaust fans installed on surface ( 2 at vent raise - 02 and 2 at vent raise - 05 ), each with 60 m³/s, static pressure of 150 millimetres water gauge, or millimetres column agua in Portuguese (“mmCA”) (at the point of operation) and installed power of 200 CV . The fans provide a total flow of 240 m³/s . In 2021 , the 5 th exhaust fan was installed, increasing the total installed airflow in the mine to 300 m³/s . Working faces are supplied with fresh air via mechanical auxiliary ventilation and flexible temporary ductwork as required . The ventilation system is shown schematically in figure below . 25 November 2019 Rev. F 319
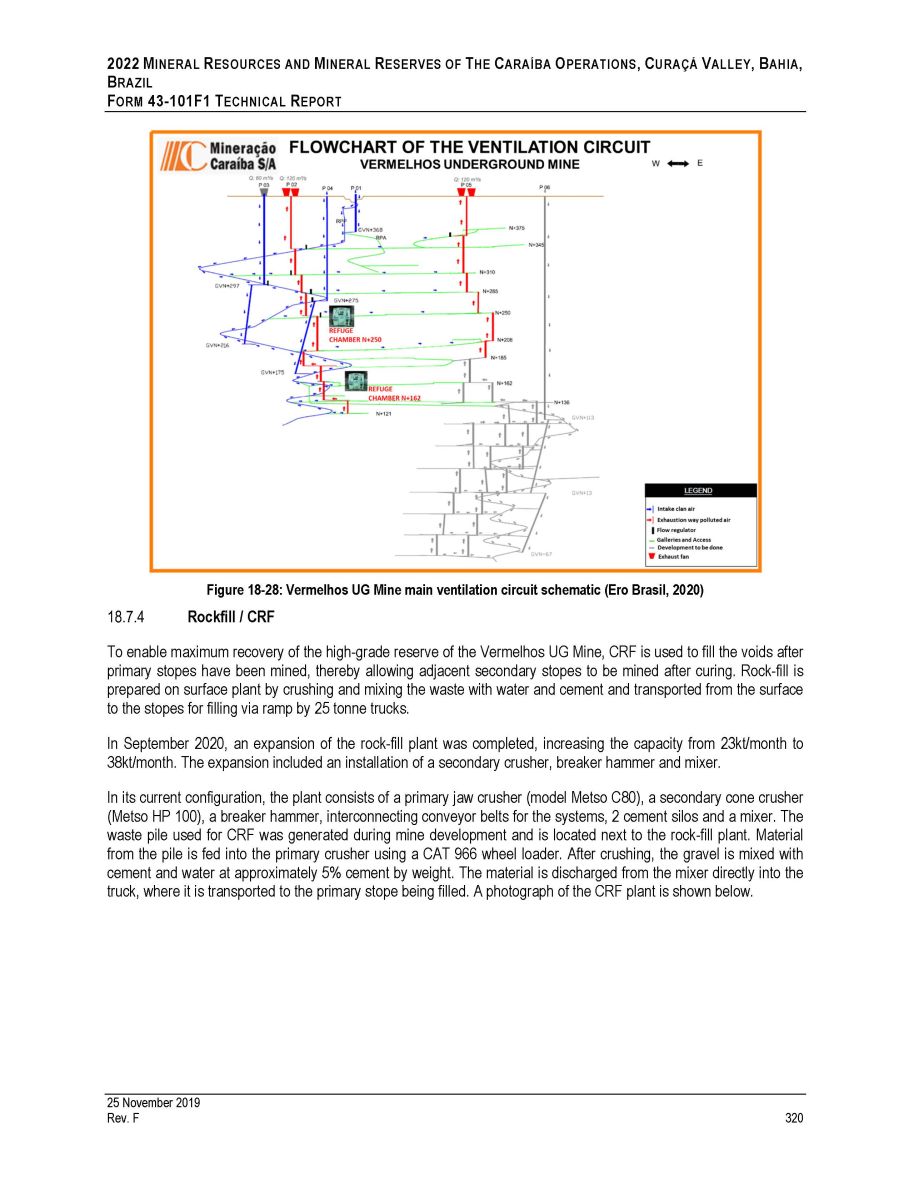
2022 M INERAL R ESOURCES AND M INERAL R ESERVES OF T HE C ARAÍBA O PERATIONS , C URAÇÁ V ALLEY , B AHIA , B RAZIL F ORM 43 - 101F1 T ECHNICAL R EPORT Figure 18 - 28: Vermelhos UG Mine main ventilation circuit schematic (Ero Brasil, 2020) Rockfill / CRF To enable maximum recovery of the high - grade reserve of the Vermelhos UG Mine, CRF is used to fill the voids after primary stopes have been mined, thereby allowing adjacent secondary stopes to be mined after curing . Rock - fill is prepared on surface plant by crushing and mixing the waste with water and cement and transported from the surface to the stopes for filling via ramp by 25 tonne trucks . In September 2020 , an expansion of the rock - fill plant was completed, increasing the capacity from 23 kt/month to 38 kt/month . The expansion included an installation of a secondary crusher, breaker hammer and mixer . In its current configuration, the plant consists of a primary jaw crusher (model Metso C 80 ), a secondary cone crusher (Metso HP 100 ), a breaker hammer, interconnecting conveyor belts for the systems, 2 cement silos and a mixer . The waste pile used for CRF was generated during mine development and is located next to the rock - fill plant . Material from the pile is fed into the primary crusher using a CAT 966 wheel loader . After crushing, the gravel is mixed with cement and water at approximately 5 % cement by weight . The material is discharged from the mixer directly into the truck, where it is transported to the primary stope being filled . A photograph of the CRF plant is shown below . 25 November 2019 Rev. F 320
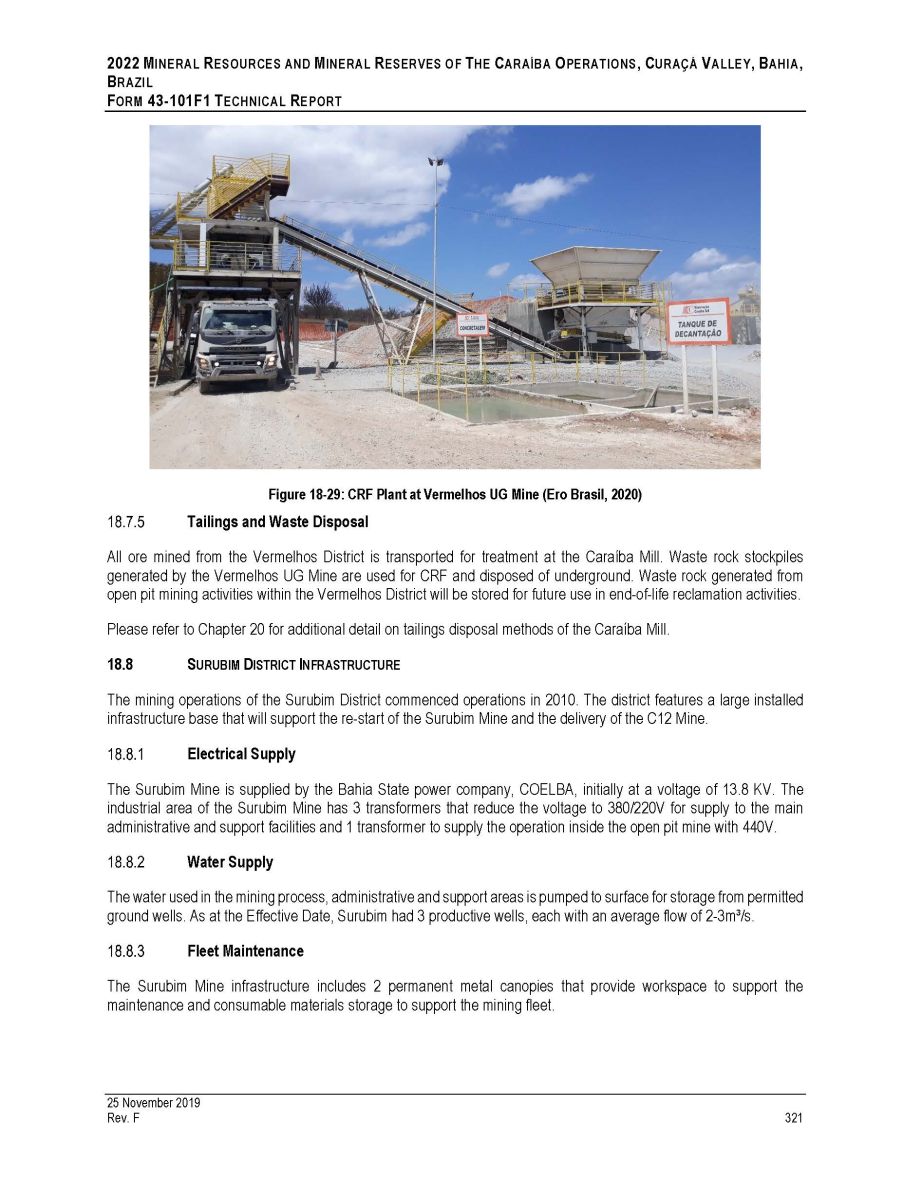
2022 M INERAL R ESOURCES AND M INERAL R ESERVES OF T HE C ARAÍBA O PERATIONS , C URAÇÁ V ALLEY , B AHIA , B RAZIL F ORM 43 - 101F1 T ECHNICAL R EPORT Figure 18 - 29: CRF Plant at Vermelhos UG Mine (Ero Brasil, 2020) Tailings and Waste Disposal All ore mined from the Vermelhos District is transported for treatment at the Caraíba Mill . Waste rock stockpiles generated by the Vermelhos UG Mine are used for CRF and disposed of underground . Waste rock generated from open pit mining activities within the Vermelhos District will be stored for future use in end - of - life reclamation activities . Please refer to Chapter 20 for additional detail on tailings disposal methods of the Caraíba Mill . 18.8 S URUBIM D ISTRICT I NFRASTRUCTURE The mining operations of the Surubim District commenced operations in 2010. The district features a large installed infrastructure base that will support the re - start of the Surubim Mine and the delivery of the C12 Mine. Electrical Supply The Surubim Mine is supplied by the Bahia State power company, COELBA, initially at a voltage of 13 . 8 KV . The industrial area of the Surubim Mine has 3 transformers that reduce the voltage to 380 / 220 V for supply to the main administrative and support facilities and 1 transformer to supply the operation inside the open pit mine with 440 V . Water Supply The water used in the mining process, administrative and support areas is pumped to surface for storage from permitted ground wells. As at the Effective Date, Surubim had 3 productive wells, each with an average flow of 2 - 3m³/s. Fleet Maintenance The Surubim Mine infrastructure includes 2 permanent metal canopies that provide workspace to support the maintenance and consumable materials storage to support the mining fleet. 25 November 2019 Rev. F 321
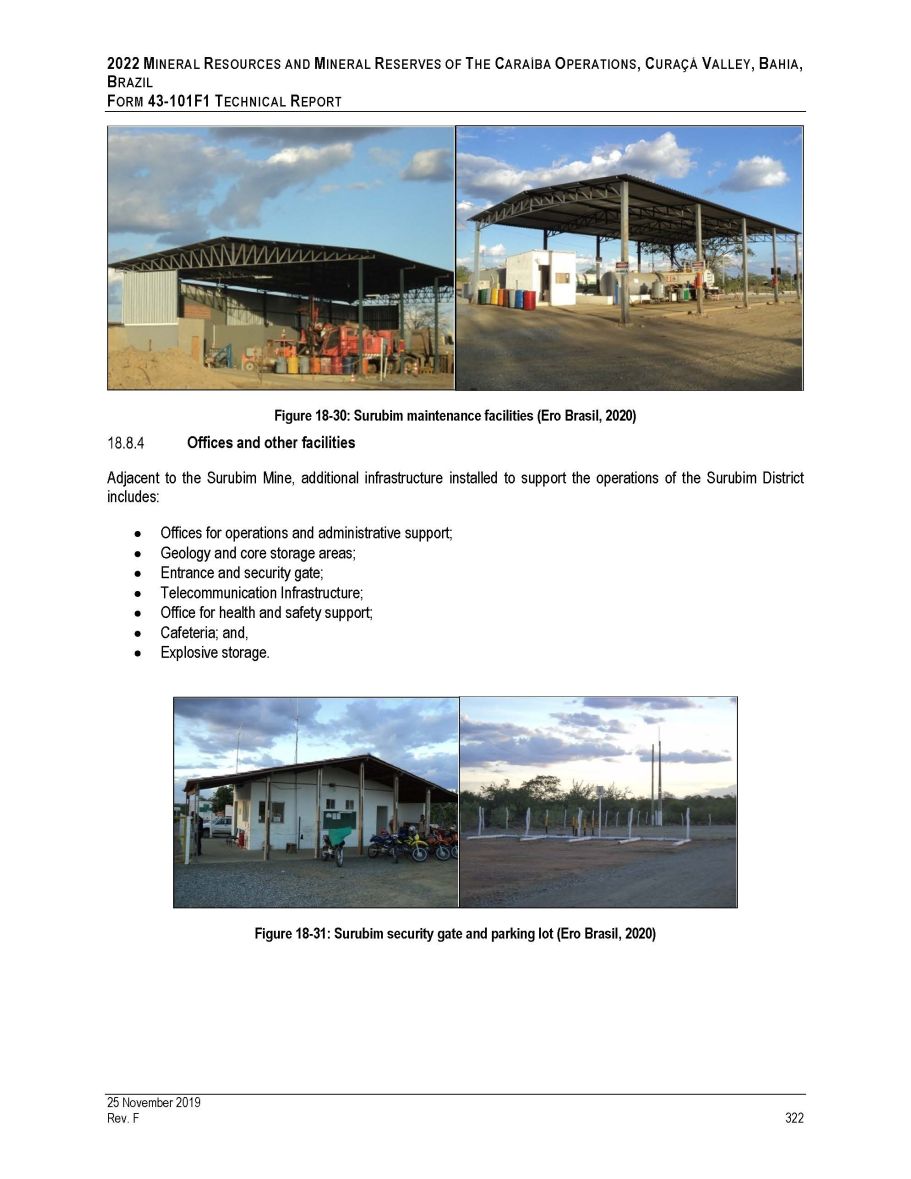
2022 M INERAL R ESOURCES AND M INERAL R ESERVES OF T HE C ARAÍBA O PERATIONS , C URAÇÁ V ALLEY , B AHIA , B RAZIL F ORM 43 - 101F1 T ECHNICAL R EPORT Figure 18 - 30: Surubim maintenance facilities (Ero Brasil, 2020) Offices and other facilities Adjacent to the Surubim Mine, additional infrastructure installed to support the operations of the Surubim District includes: Offices for operations and administrative support; Geology and core storage areas; Entrance and security gate; Telecommunication Infrastructure; Office for health and safety support; Cafeteria; and, Explosive storage. Figure 18 - 31: Surubim security gate and parking lot (Ero Brasil, 2020) 25 November 2019 Rev. F 322
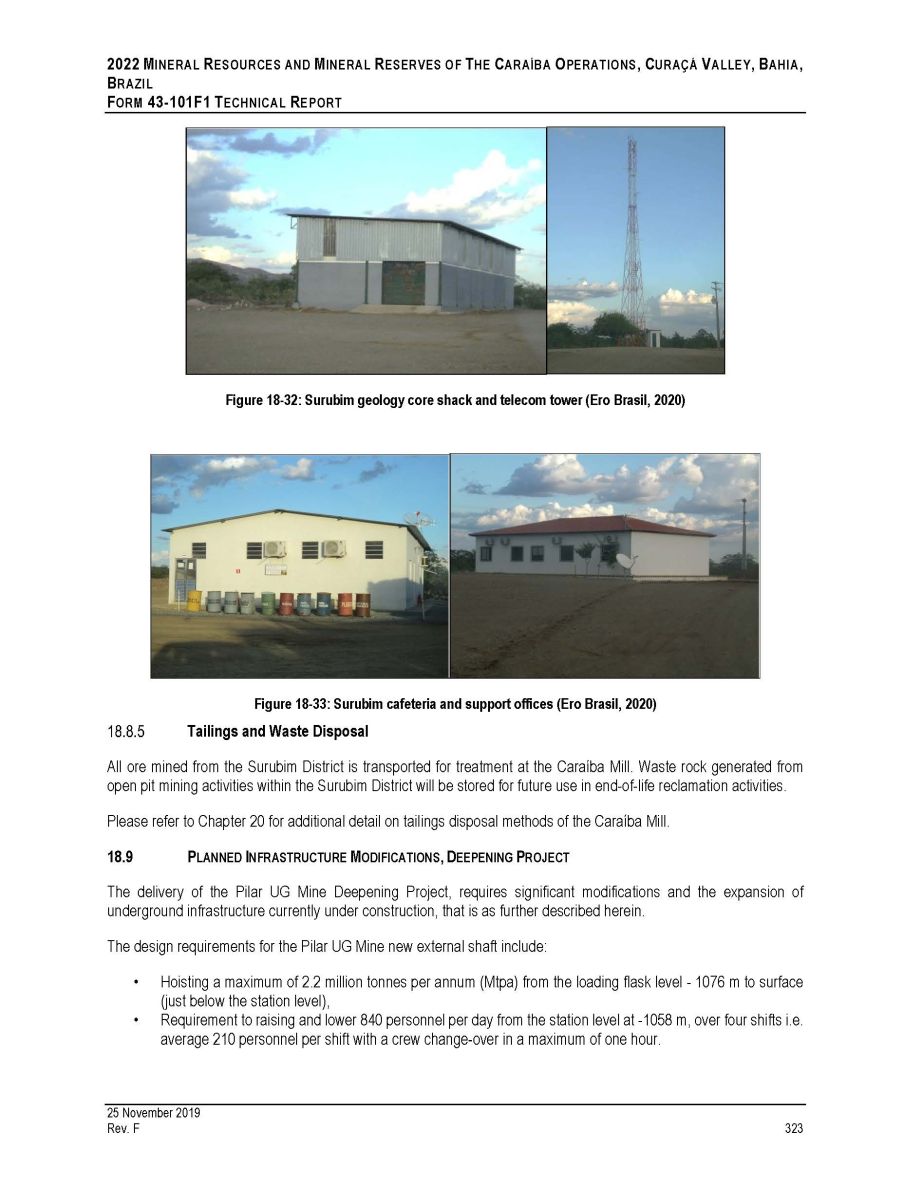
2022 M INERAL R ESOURCES AND M INERAL R ESERVES OF T HE C ARAÍBA O PERATIONS , C URAÇÁ V ALLEY , B AHIA , B RAZIL F ORM 43 - 101F1 T ECHNICAL R EPORT Figure 18 - 32: Surubim geology core shack and telecom tower (Ero Brasil, 2020) Figure 18 - 33: Surubim cafeteria and support offices (Ero Brasil, 2020) Tailings and Waste Disposal All ore mined from the Surubim District is transported for treatment at the Caraíba Mill. Waste rock generated from open pit mining activities within the Surubim District will be stored for future use in end - of - life reclamation activities. Please refer to Chapter 20 for additional detail on tailings disposal methods of the Caraíba Mill. 18.9 P LANNED I NFRASTRUCTURE M ODIFICATIONS , D EEPENING P ROJECT The delivery of the Pilar UG Mine Deepening Project, requires significant modifications and the expansion of underground infrastructure currently under construction, that is as further described herein. The design requirements for the Pilar UG Mine new external shaft include: • Hoisting a maximum of 2.2 million tonnes per annum (Mtpa) from the loading flask level - 1076 m to surface (just below the station level), • Requirement to raising and lower 840 personnel per day from the station level at - 1058 m, over four shifts i.e. average 210 personnel per shift with a crew change - over in a maximum of one hour. 25 November 2019 Rev. F 323

2022 M INERAL R ESOURCES AND M INERAL R ESERVES OF T HE C ARAÍBA O PERATIONS , C URAÇÁ V ALLEY , B AHIA , B RAZIL F ORM 43 - 101 F 1 T ECHNICAL R EPORT The mine layout considers that the ramp will continue from Level - 1010 at 5 . 0 m wide by 5 . 5 m high with an arched profile . These dimensions provide enough space for conventional transport trucks with a capacity of 30 t . The ramp is developed at a maximum gradient of 15 % . The infrastructure developed through the ramp was maintained per standard practice for the Pilar UG Mine, which includes : • collection bays, • dewatering stations, • electrical substations, • water boxes and passage bays. The Deepening Project contains 28 sublevels, starting at - 965 L through - 1693 L . The levels are developed to access the extent of the dive direction of the deposit and connect the development to the air return raise (“RAR”) in the north and south and a fresh air raise (“FAR”) in the middle of the deposit in order to establish direct flow ventilation . The planned mine ventilation system for the Deepening Project consists of the following : • Two vertical raises injecting fresh air, named South Well 1 and 2. • Hoisting shaft injecting fresh air. • Main RAR connecting to the surface where the fans are installed. The remaining sections of the mine ventilation system include the mine ramp and the connection levels of the internal raises. Materials handling management will consist of a new external 6 . 3 m (final dimension with coating) in diameter shaft with a well of 6 . 9 m (excavation diameter) extending from the surface to the loading station at the bottom of the shaft, which is located at a depth of 1552 . 75 m below the collar . Access to the Deepening Project mining faces for all personnel will be conducted via the same shaft . The management of the ore and underground sterile will consist of two ore deposits and two Run - of - Mine ore silos (ROM), a sterile deposit and sterile silo, an ore crushing chamber (with two crushers), a crushed ore silo, transfer from the ore silos and sterile to the well feeder belt and transfer to the loading system . Two jaw crushers will be installed, identical to the existing underground crusher . The following Mine Services were designed for the Deepening Project • Water supply • Materials handling from the mine • Underground electrical distribution • Compressed air • Fuel storage and distribution • Maintenance of mobile equipment • Concrete plant • New electrical substation in the lower part of the mine. Electrical Supply A complete review of the forecast power demands of the Pilar UG Mine, including the Deepening Project cooling and ventilation systems was performed as part of the LOM planning efforts. The Deepening Project Shaft Surface Substation will be fed from the Main Mine Substation (Existing) via 13.8 kV overhead lines and 13.8 kV Cables to the installed electrical supply of the new external shaft. The distribution network 25 November 2019 Rev. F 324

2022 M INERAL R ESOURCES AND M INERAL R ESERVES OF T HE C ARAÍBA O PERATIONS , C URAÇÁ V ALLEY , B AHIA , B RAZIL F ORM 43 - 101 F 1 T ECHNICAL R EPORT of the shaft has been designed as a fully redundant system with two separate supplies to each of the substations in a ring arrangement . Each supply will be adequately sized to cater for the full demand of the Deepening Project power requirements . The Deepening Shaft Surface Substation is fully equipped with 15 kV metal clad switchgear . The normal power supply for all loads for the mining area for the Deepening Project will be derived from the Deepening Shaft Surface Substation . This facility includes : • 15 kV single busbar switchboard ,with two Incomers; two Power Factor Correction (PFC); two Metering; one Busbar Coupler and 18 Feeder Panels. • Metering, Protection, Tele - communications, and Supervisory control and data acquisition (SCADA) equipment. • An allowance has been made for the installation of smoke and heat detection systems inside the substation building. • The substation has been designed with a fire detection system. Key loads that are to be supplied directly from the Deepening Shaft Surface Substation are : • Bulk Air Cooler Plant (BAC) • Utilities – Surface ore bin / (Banksman; Control; Emergency; Proto Room) / Diesel batch system / High mast Lights and general lighting • Personnel and Rock winders • Underground Ore handling system • Deepening Project Underground Substation (Deeps Production Stopes) total +/ - 5 MVA Emergency power for the personnel winder has been designed as part of the Winder installation . The man winder and ventilation fans will be supplied via a redundant system . The main power supply will consist of two independent sources of supply . The reticulation systems have been designed to ensure that in the event of the loss of power supply from the main source, the redundant system continues to supply power to the Personnel Winder and critical pumping if required . The following loads were calculated for the Deepening Project . For the new shaft hoisting system, the project’s load has been calculated incorporating the latest mine production estimates based on the LOM Strategic Plan : Personnel Winder Mechanical Power required = 840 kW Personnel Winder Aux Transformer = 212 kW Rock Winder Mechanical Power required = 6083 kW Rock Winder Aux Transformer = 297 kW Total 7,432 kW 25 November 2019 Rev. F 325 For the Underground Ore Handling (Crushing, conveying) = 879 kW The Deepening Project Underground Production Total (Booster fans, BAC) = 3,376 kW
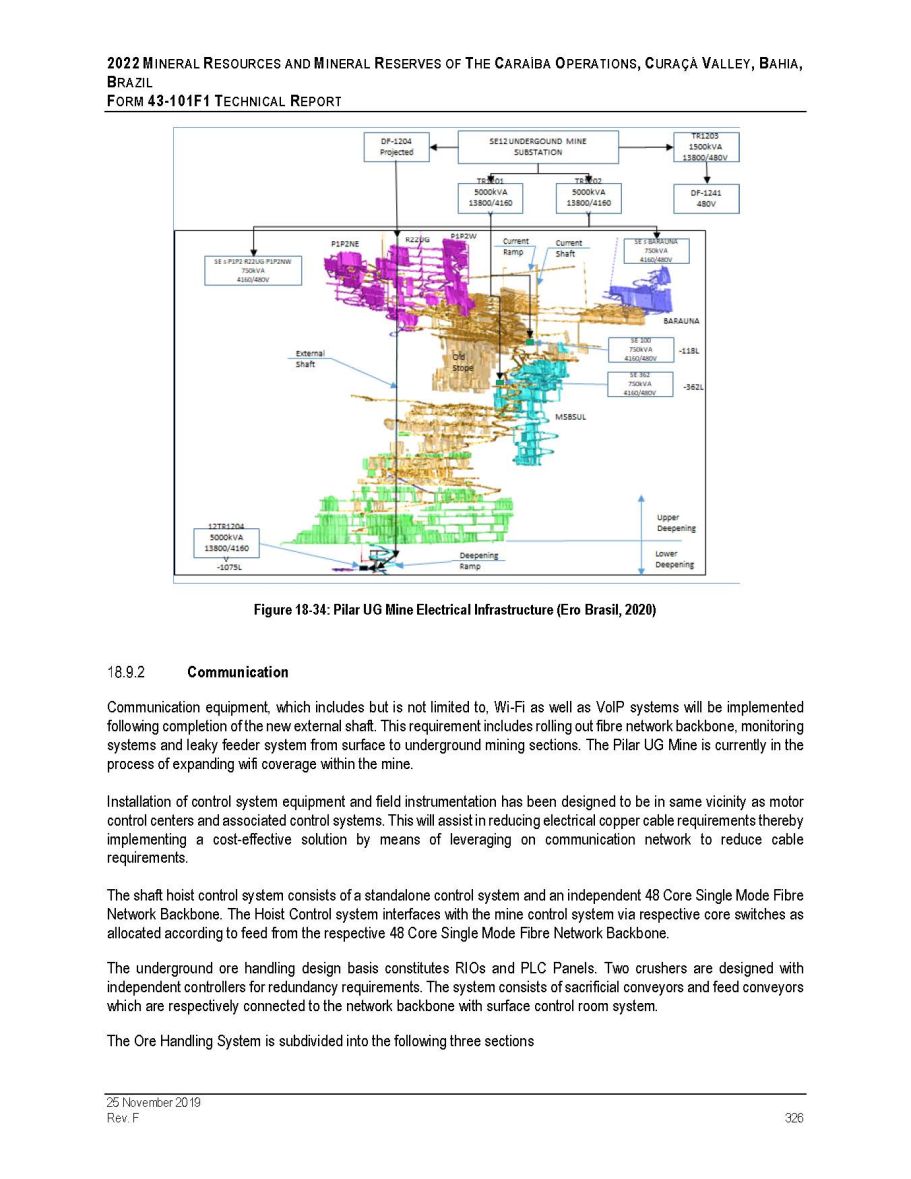
2022 M INERAL R ESOURCES AND M INERAL R ESERVES OF T HE C ARAÍBA O PERATIONS , C URAÇÁ V ALLEY , B AHIA , B RAZIL F ORM 43 - 101F1 T ECHNICAL R EPORT Figure 18 - 34: Pilar UG Mine Electrical Infrastructure (Ero Brasil, 2020) Communication Communication equipment, which includes but is not limited to, Wi - Fi as well as VoIP systems will be implemented following completion of the new external shaft . This requirement includes rolling out fibre network backbone, monitoring systems and leaky feeder system from surface to underground mining sections . The Pilar UG Mine is currently in the process of expanding wifi coverage within the mine . Installation of control system equipment and field instrumentation has been designed to be in same vicinity as motor control centers and associated control systems . This will assist in reducing electrical copper cable requirements thereby implementing a cost - effective solution by means of leveraging on communication network to reduce cable requirements . The shaft hoist control system consists of a standalone control system and an independent 48 Core Single Mode Fibre Network Backbone . The Hoist Control system interfaces with the mine control system via respective core switches as allocated according to feed from the respective 48 Core Single Mode Fibre Network Backbone . The underground ore handling design basis constitutes RIOs and PLC Panels . Two crushers are designed with independent controllers for redundancy requirements . The system consists of sacrificial conveyors and feed conveyors which are respectively connected to the network backbone with surface control room system . The Ore Handling System is subdivided into the following three sections 25 November 2019 Rev. F 326
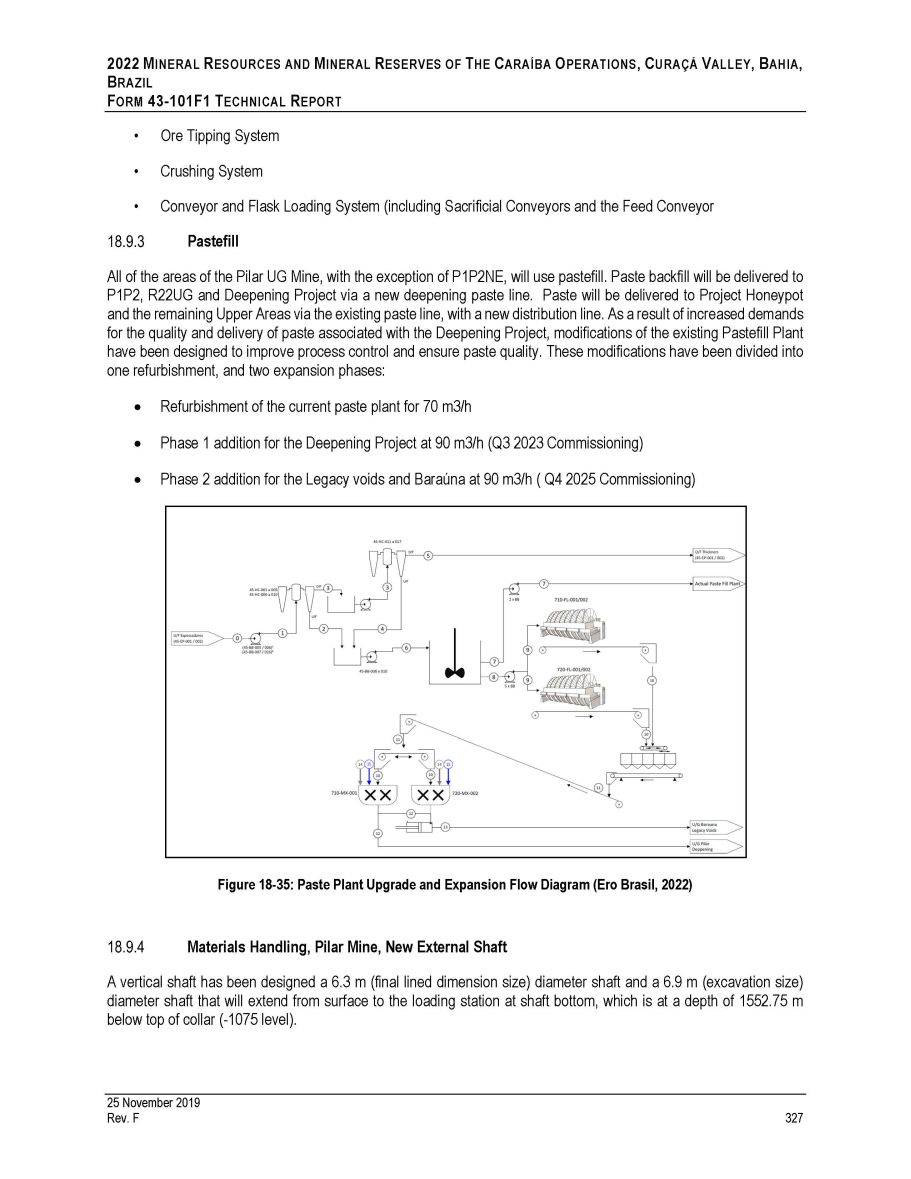
2022 M INERAL R ESOURCES AND M INERAL R ESERVES OF T HE C ARAÍBA O PERATIONS , C URAÇÁ V ALLEY , B AHIA , B RAZIL F ORM 43 - 101 F 1 T ECHNICAL R EPORT • Ore Tipping System • Crushing System • Conveyor and Flask Loading System (including Sacrificial Conveyors and the Feed Conveyor Pastefill All of the areas of the Pilar UG Mine, with the exception of P 1 P 2 NE, will use pastefill . Paste backfill will be delivered to P 1 P 2 , R 22 UG and Deepening Project via a new deepening paste line . Paste will be delivered to Project Honeypot and the remaining Upper Areas via the existing paste line, with a new distribution line . As a result of increased demands for the quality and delivery of paste associated with the Deepening Project, modifications of the existing Pastefill Plant have been designed to improve process control and ensure paste quality . These modifications have been divided into one refurbishment, and two expansion phases : Refurbishment of the current paste plant for 70 m3/h Phase 1 addition for the Deepening Project at 90 m3/h (Q3 2023 Commissioning) Phase 2 addition for the Legacy voids and Baraúna at 90 m3/h ( Q4 2025 Commissioning) Figure 18 - 35: Paste Plant Upgrade and Expansion Flow Diagram (Ero Brasil, 2022) Materials Handling, Pilar Mine, New External Shaft A vertical shaft has been designed a 6 . 3 m (final lined dimension size) diameter shaft and a 6 . 9 m (excavation size) diameter shaft that will extend from surface to the loading station at shaft bottom, which is at a depth of 1552 . 75 m below top of collar ( - 1075 level) . 25 November 2019 Rev. F 327
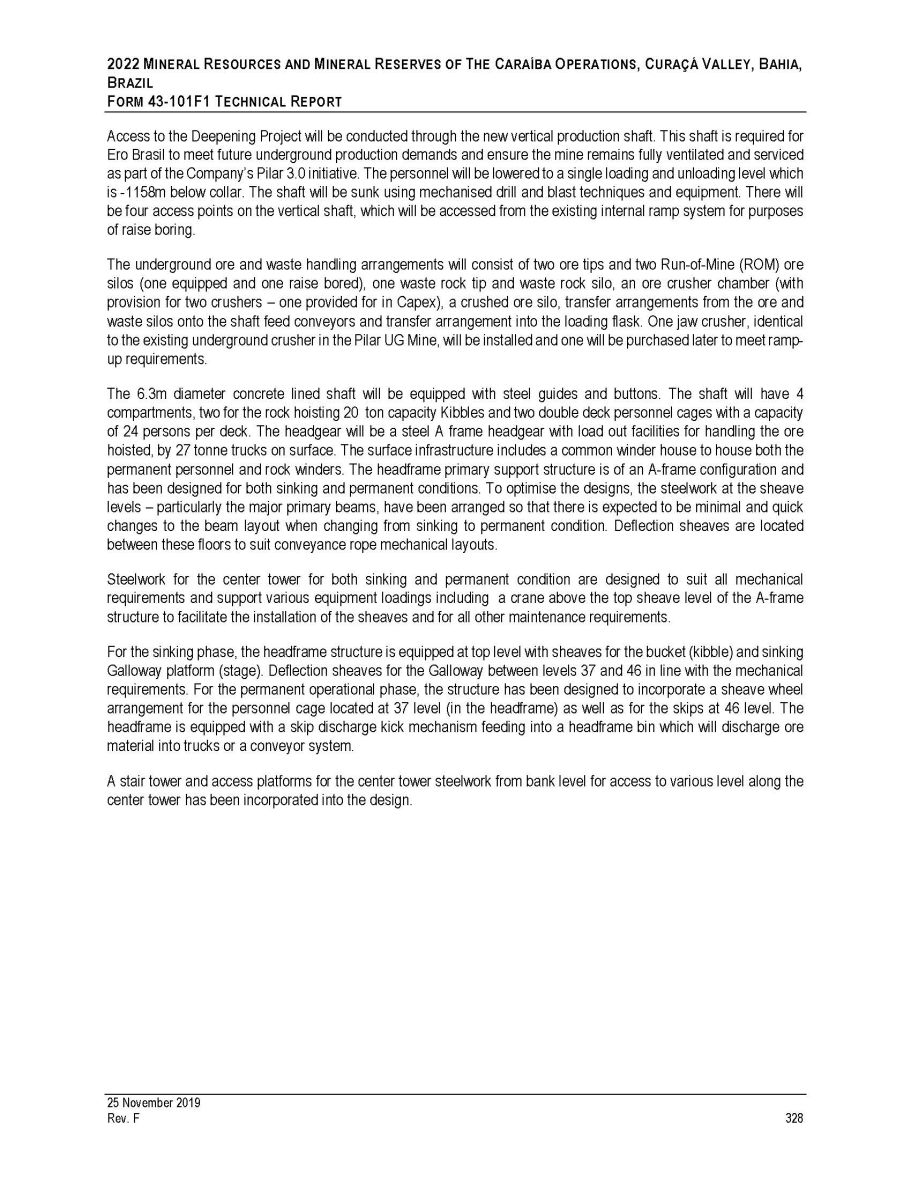
2022 M INERAL R ESOURCES AND M INERAL R ESERVES OF T HE C ARAÍBA O PERATIONS , C URAÇÁ V ALLEY , B AHIA , B RAZIL F ORM 43 - 101 F 1 T ECHNICAL R EPORT Access to the Deepening Project will be conducted through the new vertical production shaft . This shaft is required for Ero Brasil to meet future underground production demands and ensure the mine remains fully ventilated and serviced as part of the Company’s Pilar 3 . 0 initiative . The personnel will be lowered to a single loading and unloading level which is - 1158 m below collar . The shaft will be sunk using mechanised drill and blast techniques and equipment . There will be four access points on the vertical shaft, which will be accessed from the existing internal ramp system for purposes of raise boring . The underground ore and waste handling arrangements will consist of two ore tips and two Run - of - Mine (ROM) ore silos (one equipped and one raise bored), one waste rock tip and waste rock silo, an ore crusher chamber (with provision for two crushers – one provided for in Capex), a crushed ore silo, transfer arrangements from the ore and waste silos onto the shaft feed conveyors and transfer arrangement into the loading flask . One jaw crusher, identical to the existing underground crusher in the Pilar UG Mine, will be installed and one will be purchased later to meet ramp - up requirements . The 6 . 3 m diameter concrete lined shaft will be equipped with steel guides and buttons . The shaft will have 4 compartments, two for the rock hoisting 20 ton capacity Kibbles and two double deck personnel cages with a capacity of 24 persons per deck . The headgear will be a steel A frame headgear with load out facilities for handling the ore hoisted, by 27 tonne trucks on surface . The surface infrastructure includes a common winder house to house both the permanent personnel and rock winders . The headframe primary support structure is of an A - frame configuration and has been designed for both sinking and permanent conditions . To optimise the designs, the steelwork at the sheave levels – particularly the major primary beams, have been arranged so that there is expected to be minimal and quick changes to the beam layout when changing from sinking to permanent condition . Deflection sheaves are located between these floors to suit conveyance rope mechanical layouts . Steelwork for the center tower for both sinking and permanent condition are designed to suit all mechanical requirements and support various equipment loadings including a crane above the top sheave level of the A - frame structure to facilitate the installation of the sheaves and for all other maintenance requirements . For the sinking phase, the headframe structure is equipped at top level with sheaves for the bucket (kibble) and sinking Galloway platform (stage) . Deflection sheaves for the Galloway between levels 37 and 46 in line with the mechanical requirements . For the permanent operational phase, the structure has been designed to incorporate a sheave wheel arrangement for the personnel cage located at 37 level (in the headframe) as well as for the skips at 46 level . The headframe is equipped with a skip discharge kick mechanism feeding into a headframe bin which will discharge ore material into trucks or a conveyor system . A stair tower and access platforms for the center tower steelwork from bank level for access to various level along the center tower has been incorporated into the design . 25 November 2019 Rev. F 328

2022 M INERAL R ESOURCES AND M INERAL R ESERVES OF T HE C ARAÍBA O PERATIONS , C URAÇÁ V ALLEY , B AHIA , B RAZIL F ORM 43 - 101F1 T ECHNICAL R EPORT (a) (b) Figure 18 - 36: Pilar Mine, New External Shaft Configuration, Cross - Section (a) and Permanent Arrangement (b) (Ero Brasil, 2022) Underground Crushing and Conveyance Systems The underground ore and waste handling arrangements consist of two ore tips and two Run - of - Mine (ROM) ore silos, one waste rock tip and waste rock silo, an ore crusher chamber (with two crushers), a crushed ore silo, transfer arrangements from the ore and waste silos onto the shaft feed conveyors and transfer arrangement into the loading flask . The arrangements are illustrated in Figure 18 - 37 . 25 November 2019 Rev. F 329

2022 M INERAL R ESOURCES AND M INERAL R ESERVES OF T HE C ARAÍBA O PERATIONS , C URAÇÁ V ALLEY , B AHIA , B RAZIL F ORM 43 - 101 F 1 T ECHNICAL R EPORT Two jaw crushers, identical to the existing underground crusher, will be installed . The facilities include ; two primary crusher arrangements and two transfer conveys . There are two independent crushing circuits transferring ore from the ROM silos into the crushed ore silo as illustrated . Run of Mine ore is fed from the ROM ore silo via a bulkhead side - discharge and kick onto a vibrating grizzly feeder that controls the flow of ore into the primary jaw crusher . The kick work includes a radial door to isolate the vibrating grizzly from the silo for maintenance purposes . The radial door is actuated by pneumatic cylinders . The vibrating grizzly also screens out the - 200 mm ore through the grizzly section to ensure that only oversize ore is fed to the jaw crusher, the undersize material is directed via a kick to the transfer conveyor . The Primary Crusher has a design capacity of 366 t/h and the unit can accept a maximum feed size of 700 mm while producing a - 250 mm product . The crusher is installed with a 160 kW electric motor . The product is discharged through a kick onto the Transfer Conveyor . There are two independent ROM silos and truck - tip arrangements . The ROM Silo Is a vertical storage silo with a total capacity of 1 , 300 t and a live capacity of 1 , 180 t . The ROM Silo Tips are located above the silo on - 984 m Level and consists of a double - sided truck tip to accommodate the current 27 t trucks (and the potential to accommodate 35 t trucks) tipping onto a fixed grizzly with sloped edges where the trucks tip and a center flat section . The sloped edges allow undersize material to fall through into the silo while oversize rock will roll to the center, clearing the tipping area for next truck . A fixed rock breaker, with associated control and hydraulic systems, is located next to the center of the grizzly to allow access to break any oversize rocks . The rock breaker is sized to have an operating envelope that will allow it to reach and function anywhere within the tip grizzly with a vertical orientation of the hydraulic hammer over the flat portion of the grizzly . The 1 , 050 mm wide transfer conveyor transfers material from the vibrating grizzly feeder underflow and the primary crusher discharge into the crushed ore silo . A self - cleaning cross - belt arranged belt magnet will be installed at the head end of the conveyor to remove tramp metal . Transfer Conveyor No . 1 – a sacrificial conveyor, transfers material from the Crusher Ore Silo or the Waste silo to Transfer Conveyor No . 2 . This conveyor has a design capacity is 522 t/h at a belt speed of 1 . 2 m/s . The conveyor is approximately 80 m long with a lift of 7 . 5 m and installed with a 45 kW shaft - mounted drive unit mounted to the head/drive pulley . A self - cleaning cross - belt arranged belt magnet will be installed at the head end of the conveyor to remove tramp metal . Transfer Conveyor No . 2 transfers material from Transfer Conveyor No . 1 to the Shaft Loading Station measuring flasks . The Shaft Feed Conveyor is a 1050 mm wide conveyor with class 800 , 4 ply fabric belting with a 10 mm top cover and a 5 mm bottom cover based on the preliminary conveyor design . The design capacity is 522 t/h at a belt speed of 1 . 2 m/s . The conveyor is approximately 240 m long with a lift of 9 . 0 m and is installed with a 75 kW drive unit mounted to the head/drive pulley . Two ROM ore passes/silo 5 . 1 m diameter lined with 530 m³ ( 1 , 044 t) of live capacity each (one fully equipped and one unequipped only raise bored ore pass), and one ROM 5 . 1 m diameter lined waste pass fully equipped . The waste pass will have a live capacity of 1 , 624 m³ ( 3 , 118 t) . The two ROM ore passes will feed the crushed ore into the 8 . 1 m lined diameter crushed ore silo . The silo will have a live capacity of 2 , 030 m³ ( 4 , 000 t) . The crusher chamber has made provision for one 500 t/h crusher plant (with capacity for two crushers) . 25 November 2019 Rev. F 330
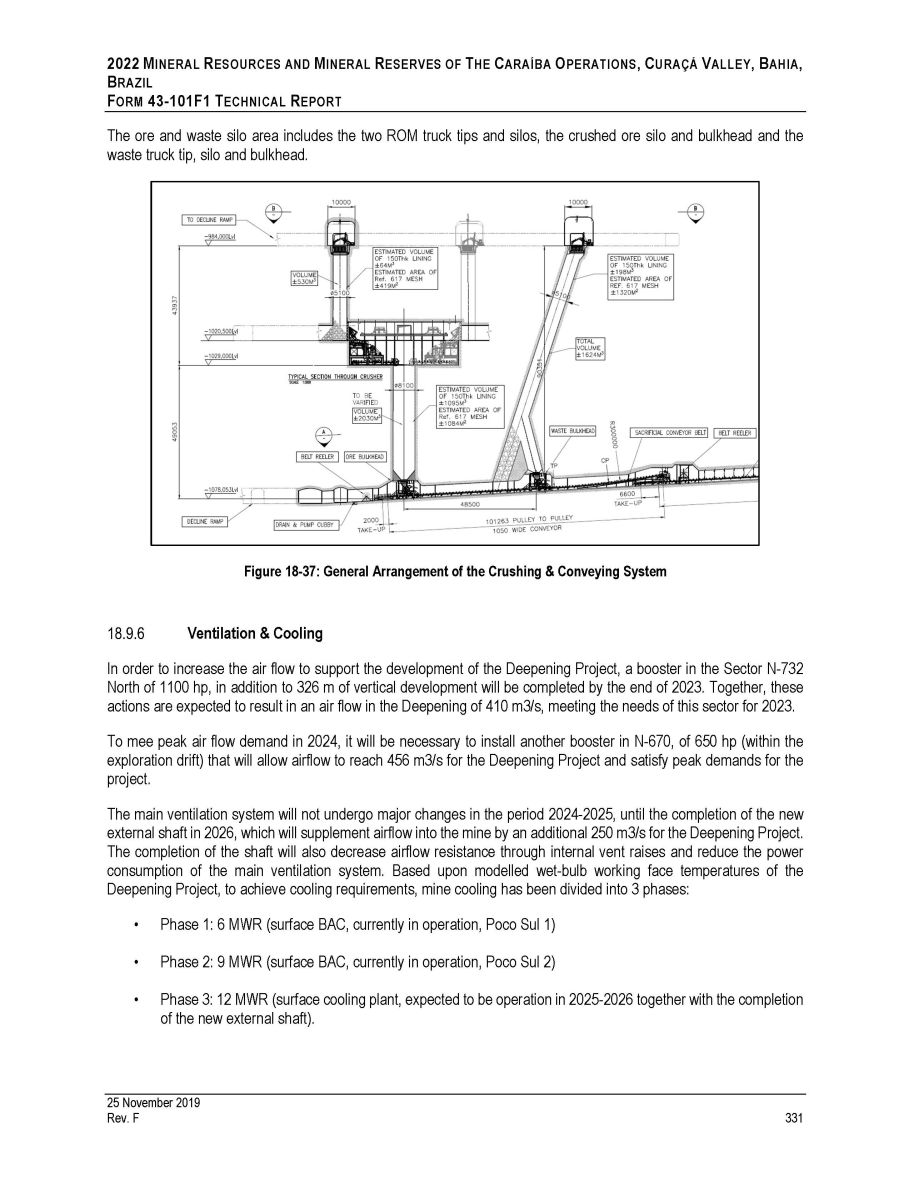
2022 M INERAL R ESOURCES AND M INERAL R ESERVES OF T HE C ARAÍBA O PERATIONS , C URAÇÁ V ALLEY , B AHIA , B RAZIL F ORM 43 - 101F1 T ECHNICAL R EPORT The ore and waste silo area includes the two ROM truck tips and silos, the crushed ore silo and bulkhead and the waste truck tip, silo and bulkhead. Figure 18 - 37: General Arrangement of the Crushing & Conveying System Ventilation & Cooling In order to increase the air flow to support the development of the Deepening Project, a booster in the Sector N - 732 North of 1100 hp, in addition to 326 m of vertical development will be completed by the end of 2023 . Together, these actions are expected to result in an air flow in the Deepening of 410 m 3 /s, meeting the needs of this sector for 2023 . To mee peak air flow demand in 2024 , it will be necessary to install another booster in N - 670 , of 650 hp (within the exploration drift) that will allow airflow to reach 456 m 3 /s for the Deepening Project and satisfy peak demands for the project . The main ventilation system will not undergo major changes in the period 2024 - 2025 , until the completion of the new external shaft in 2026 , which will supplement airflow into the mine by an additional 250 m 3 /s for the Deepening Project . The completion of the shaft will also decrease airflow resistance through internal vent raises and reduce the power consumption of the main ventilation system . Based upon modelled wet - bulb working face temperatures of the Deepening Project, to achieve cooling requirements, mine cooling has been divided into 3 phases : • Phase 1: 6 MWR (surface BAC, currently in operation, Poco Sul 1) • Phase 2: 9 MWR (surface BAC, currently in operation, Poco Sul 2) • Phase 3: 12 MWR (surface cooling plant, expected to be operation in 2025 - 2026 together with the completion of the new external shaft). 25 November 2019 Rev. F 331
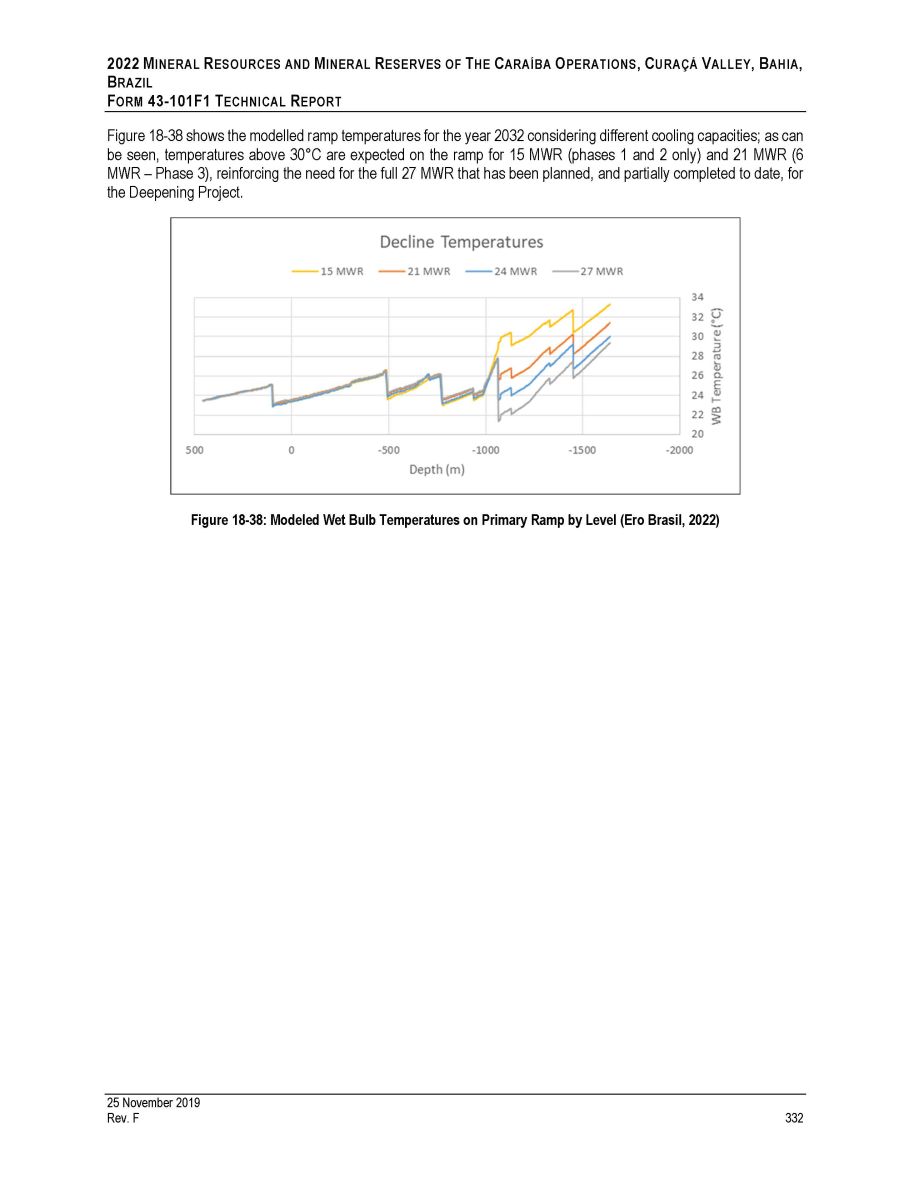
2022 M INERAL R ESOURCES AND M INERAL R ESERVES OF T HE C ARAÍBA O PERATIONS , C URAÇÁ V ALLEY , B AHIA , B RAZIL F ORM 43 - 101 F 1 T ECHNICAL R EPORT Figure 18 - 38 shows the modelled ramp temperatures for the year 2032 considering different cooling capacities ; as can be seen, temperatures above 30 ƒ C are expected on the ramp for 15 MWR (phases 1 and 2 only) and 21 MWR ( 6 MWR – Phase 3 ), reinforcing the need for the full 27 MWR that has been planned, and partially completed to date, for the Deepening Project . Figure 18 - 38: Modeled Wet Bulb Temperatures on Primary Ramp by Level (Ero Brasil, 2022) 25 November 2019 Rev. F 332
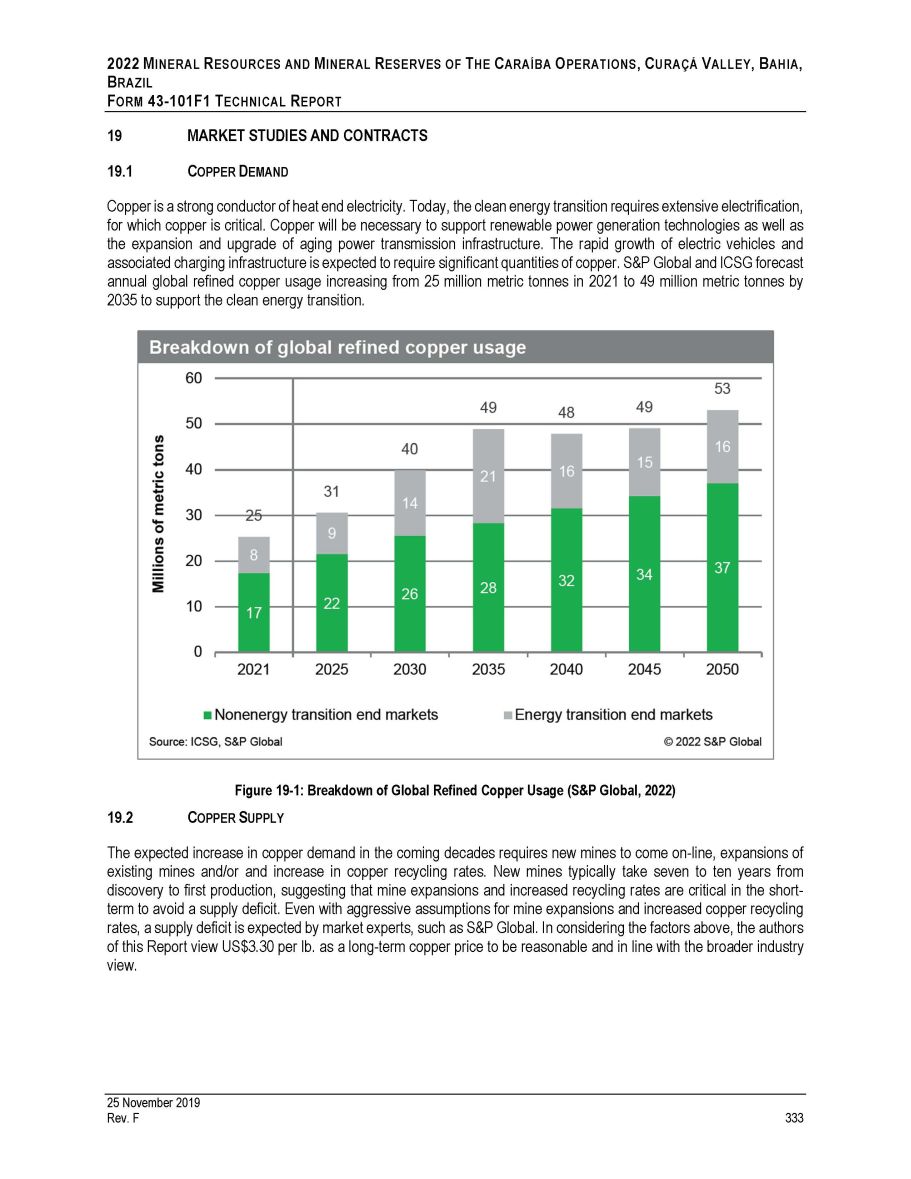
2022 M INERAL R ESOURCES AND M INERAL R ESERVES OF T HE C ARAÍBA O PERATIONS , C URAÇÁ V ALLEY , B AHIA , B RAZIL F ORM 43 - 101F1 T ECHNICAL R EPORT 19 19.1 MARKET STUDIES AND CONTRACTS C OPPER D EMAND Copper is a strong conductor of heat end electricity . Today, the clean energy transition requires extensive electrification, for which copper is critical . Copper will be necessary to support renewable power generation technologies as well as the expansion and upgrade of aging power transmission infrastructure . The rapid growth of electric vehicles and associated charging infrastructure is expected to require significant quantities of copper . S&P Global and ICSG forecast annual global refined copper usage increasing from 25 million metric tonnes in 2021 to 49 million metric tonnes by 2035 to support the clean energy transition . Figure 19 - 1: Breakdown of Global Refined Copper Usage (S&P Global, 2022) C OPPER S UPPLY 19.2 The expected increase in copper demand in the coming decades requires new mines to come on - line, expansions of existing mines and/or and increase in copper recycling rates . New mines typically take seven to ten years from discovery to first production, suggesting that mine expansions and increased recycling rates are critical in the short - term to avoid a supply deficit . Even with aggressive assumptions for mine expansions and increased copper recycling rates, a supply deficit is expected by market experts, such as S&P Global . In considering the factors above, the authors of this Report view US $ 3 . 30 per lb . as a long - term copper price to be reasonable and in line with the broader industry view . 25 November 2019 Rev. F 333
2022 M INERAL R ESOURCES AND M INERAL R ESERVES OF T HE C ARAÍBA O PERATIONS , C URAÇÁ V ALLEY , B AHIA , B RAZIL F ORM 43 - 101 F 1 T ECHNICAL R EPORT 3. C ARAÍBA O PERATIONS The Caraíba Operations currently produce a copper concentrate that grades approximately 33 % - 35 % copper and contains low levels of impurity elements . Premium copper concentrates, such as those produced by Caraíba, have shown to be attractive to both smelters and metal traders . In the current market environment, and considering the factors above, demand for Caraíba’s concentrate is expected to remain robust . Concentrate produced by the Caraíba Operations has historically been sold either to Paranapanema Smelter located in Dias D’Avila, near Salvador, or to international markets via the port in Salvador . 4. M ARKETS AND C ONTRACTS The quality of the copper concentrate produced by the Caraíba Operations is desired by smelters and metal traders due to the high copper content and low levels of deleterious elements . Copper concentrate from the Caraíba Operations is expected to continue to be sold via internation and domestic sales channels . Existing contracts are renewed and/or re - negotiated from time - to - time commensurate with contracting under the normal course of business . The authors of this Report relied on Ero Brasil and Ero Copper for commodity price forecasts . The QPs of this report are of the opinion that the information and studies provided by Ero Brasil and Ero Copper support the assumptions in the Report . Pricing and contract terms relied upon are within generally acceptable industry norms and consistent with prior operating performance of the Company . 25 November 2019 Rev. F 334
2022 M INERAL R ESOURCES AND M INERAL R ESERVES OF T HE C ARAÍBA O PERATIONS , C URAÇÁ V ALLEY , B AHIA , B RAZIL F ORM 43 - 101 F 1 T ECHNICAL R EPORT 20 ENVIRONMENTAL STUDIES, PERMITTING AND SOCIAL OR COMMUNITY IMPACT This chapter presents a brief overview of the environmental and social aspects related to Ero Brasil’s operations in the Curaçá Valley, addressing : Permitting requirements and the status of key permits and pending permit applications; A brief summary of the results of the environmental studies and overview of environmental and social considerations, if any, that could materially impact the Company’s ability to extract the current mineral reserves ; Conditions (and plans) for waste and tailings disposal, including monitoring and wastewater management ; Overview of the social and community related requirements for the successful operation of the mine(s) ; and, Mine closure (remediation and reclamation) requirements and costs. 1. P ERMITTING R EQUIREMENTS Environmental licensing requirements were introduced in Brazil by the National Environmental Policy (“PNMA”) issued in 1981 , and subsequently restated by the 1988 Federal Constitution . Currently, environmental licensing is regulated by a comprehensive framework of federal, state and municipal laws, notably by resolutions 01 / 1986 and 237 / 1997 issued by National Environmental Council (“CONAMA”) . The Brazilian environmental and safety management system (“SISNAMA”) is regulated by the Federal Decree 99 . 274 , which defines the roles and authorities of all environmental agencies, at the federal, state and municipal levels, including CONAMA and the Institute of the Environment and Renewable Natural Resources (“IBAMA”) that acts as the federal executive agency as well as numerous state (sectional) and municipal (local) agencies . IBAMA is in charge of licensing activities that may cause national or regional environmental impacts . Brazil has a singular environmental licensing procedure, with licensing conducted in three stages, including the Preliminary Environmental License (“LP”), Installation License (“LI”) and Operating License (“LO”) . The LO is the most relevant phase for the operations of the Caraíba Operations, which is in production . In practice, the LO is granted, or renewed (“RLO”), after the project sponsor demonstrates compliance with all requirements and conditions set out in the prior licenses, including social issues, when applicable . The LO must be renewed on a regular basis under normal operating procedures, with the renewal period varying from two to ten years depending on the nature of the operations . Each state and municipality have their own environmental agencies that are responsible for the application of their own supplementary environmental norms and standards within their respective jurisdictions and are responsible for ensuring compliance with all related federal norms . The Ero Brasil operations are licensed by the Bahia State environmental agency (Instituto do Meio Ambiente e Recursos Hídricos, “INEMA”) in accordance with Bahia State environmental legislation, notably State Laws 10 . 431 / 2006 and 11 . 612 / 2009 , and State Decree 15 , 682 / 2014 that regulates environmental permitting procedures in the state of Bahia . The Caraíba Mine (within the Pilar District) feasibility studies were initiated in the late 60 ’s and the mine started commercial operations in 1979 , prior to the formation of the current environmental legislation in Brazil . As a result, the Pilar District environmental management plans, (including reclamation plan and closure plans), were developed in their current form after the mine was commissioned, following the formation of environmental legislation in Brazil . More 25 November 2019 Rev. F 335
2022 M INERAL R ESOURCES AND M INERAL R ESERVES OF T HE C ARAÍBA O PERATIONS , C URAÇÁ V ALLEY , B AHIA , B RAZIL F ORM 43 - 101F1 T ECHNICAL R EPORT recent operations, including those within the Surubim District and the Vermelhos District, were subject to formal environmental permitting processes including environmental impact studies, as more fully described in the next section. 2. E RO B RASIL E NVIRONMENTAL S TUDIES AND B ACKGROUND I NFORMATION A list of relevant environmental and social impact studies for each of the primary mining Districts of Pilar, Surubim and Vermelhos are detailed below: Main Environmental and Social Studies – Pilar District BRANDT MEIO AMBIENTE . 2006 . Closure plan : Pilar district – Jaguarari, BA – MINERAÇÃO CARAÍBA S/A . Nova Lima, MG, 2006 . BRANDT MEIO AMBIENTE . 2007 ª . Degraded areas reclamation plan to the targets R - 22 and R - 75 : Pilar district – Jaguarari, BA – MINERAÇÃO CARAÍBA S/A . Nova Lima, MG, 2007 . BRANDT MEIO AMBIENTE . 2007 b . Environmental reclamation of Curaçá River, Sulapa Creek and Pedra de Fogo in the Mineração Caraíba S/A – Plan for desilting of river bed affected areas and revegetation of APP with native species of Caatinga biome : Distrito Pilar – Jaguarari, BA – MINERAÇÃO CARAÍBA S/A . Nova Lima, MG, 2007 . BRANDT MEIO AMBIENTE . 2008 . Environmental resources agreement term attendance – open pit mines, waste piles and marginal ore : Jaguarari, BA – MINERAÇÃO CARAÍBA S/A . Nova Lima, MG, 2008 b . BRANDT MEIO AMBIENTE . 2008 . Environmental resources agreement term attendance to the tailing dam : Jaguarari, BA – MINERAÇÃO CARAÍBA S/A . Nova Lima, MG, 2008 . BRANDT MEIO AMBIENTE . 2008 . Environmental resources agreement term attendance . Item VIII – socioeconomic issues – Núcleo Habitacional de Pilar / Município de Jaguarari Bahia . Jaguarari, BA – MINERAÇÃO CARAÍBA S/A . Nova Lima, MG, 2008 . BRANDT MEIO AMBIENTE. 2013. Review of degraded areas reclamation plan – Pilar unit. Distrito Pilar – Jaguarari – BA. Nova Lima, MG, 2013. MINERAÇÃO CARAÍBA S/A. 2016. Characterization of the enterprise – Pilar unit. Jaguarari – BA, 2016. MINERAÇÃO CARAÍBA S/A. 2010. Attendance survey of the obligations included in the Environmental resources agreement term. Jaguarari – BA, 2010. MINERAÇÃO CARAÍBA S/A. 2015. Attendance report of the obligations included in the environmental resources agreement term. Jaguarari – BA, 2015. CAROSO, CARLOS Et al. 2013. Socioeconomics and cultural diagnosis. Audits of the sociocultural actuation in the influence area of Mineração Caraíba S/A. Jaguarari – BA, 2013. NUNES, JACINTO, 2016. Project of tailings disposal in waste piles of Caraíba Mines. April, 2016. BRANDT MEIO AMBIENTE. 2017. Review of degraded areas reclamation plan – Pilar unit. Distrito Pilar – Jaguarari – BA. Nova Lima, MG, 2017 25 November 2019 Rev. F 336
2022 M INERAL R ESOURCES AND M INERAL R ESERVES OF T HE C ARAÍBA O PERATIONS , C URAÇÁ V ALLEY , B AHIA , B RAZIL F ORM 43 - 101F1 T ECHNICAL R EPORT BRANDT MEIO AMBIENTE. 2020. Review Closure plan: Pilar district – Jaguarari, BA – MINERAÇÃO CARAÍBA S/A. Nova Lima, MG, 2020. MINERAÇÃO CARAÍBA S/A, 2020. Review Project of tailings disposal in waste piles of Caraíba Mines. December, 2020. MINERAÇÃO CARAÍBA S/A, 2019 Review of degraded areas reclamation plan – Pilar unit. Distrito Pilar – Jaguarari – BA, 2019. MINERAÇÃO CARAÍBA S/A, 2022 Review of degraded areas reclamation plan – Pilar unit. Distrito Pilar – Jaguarari – BA, 2022 SETE Soluções e Tecnologia Ambiental LTDA. 2021. Conceptual mining closure plan review – Pilar Unit – Jaguarari, BA. Belo Horizonte, MG, 2021. Main Environmental and Social Studies – Surubim Mine COPA CONSULTORIA EM PROJETOS AMBIENTAIS. 2008. Environmental Impact Study – EIA. Copper Ore Mining. Surubim Project. Distrito de Poço de Fora Curaçá – BA. Salvador, BA, 2008. BRANDT MEIO AMBIENTE. 2008ª. Environmental Impact Study (EIA) – Copper ore mining for extraction of 5.6 million tons in the Surubim Target: Distrito Poço de Fora – Curaçá, BA – MINERAÇÃO CARAÍBA S/A. Nova Lima, MG, 2008ª. BRANDT MEIO AMBIENTE. 2014. Closure Plan – Surubim Mine. Curaçá, BA. MINERAÇÃO CARAÍBA S/A. Nova Lima, MG, 2014. BRANDT MEIO AMBIENTE. 2017. Review of degraded areas reclamation plan – Surubim mine. Distrito Pilar – Jaguarari – BA. Nova Lima, MG, 2017. MINERAÇÃO CARAÍBA S/A. 2017. Characterization of the enterprise – Surubim Mine. Jaguarari – BA, 2017. BRANDT MEIO AMBIENTE. 2020. Review Closure Plan – Surubim Mine. Curaçá, BA. MINERAÇÃO CARAÍBA S/A. Nova Lima, MG, 2020. SETE Soluções e Tecnologia Ambiental LTDA. 2021. Conceptual mining closure plan review – Surubim mine – Curaçá, BA. Belo Horizonte, MG, 2021. MINERAÇÃO CARAÍBA S/A, 2022 Review of degraded areas reclamation plan – Surubim mine – Curaçá, BA. 2022 25 November 2019 Rev. F 337 Main Environmental and Social Studies – Vermelhos UG Mine MINERAÇÃO VALE DO CURAÇÁ. 2015. Medium Environmental Impact Study – EMI – Projeto Vermelhos. Juazeiro – BA, 2015.
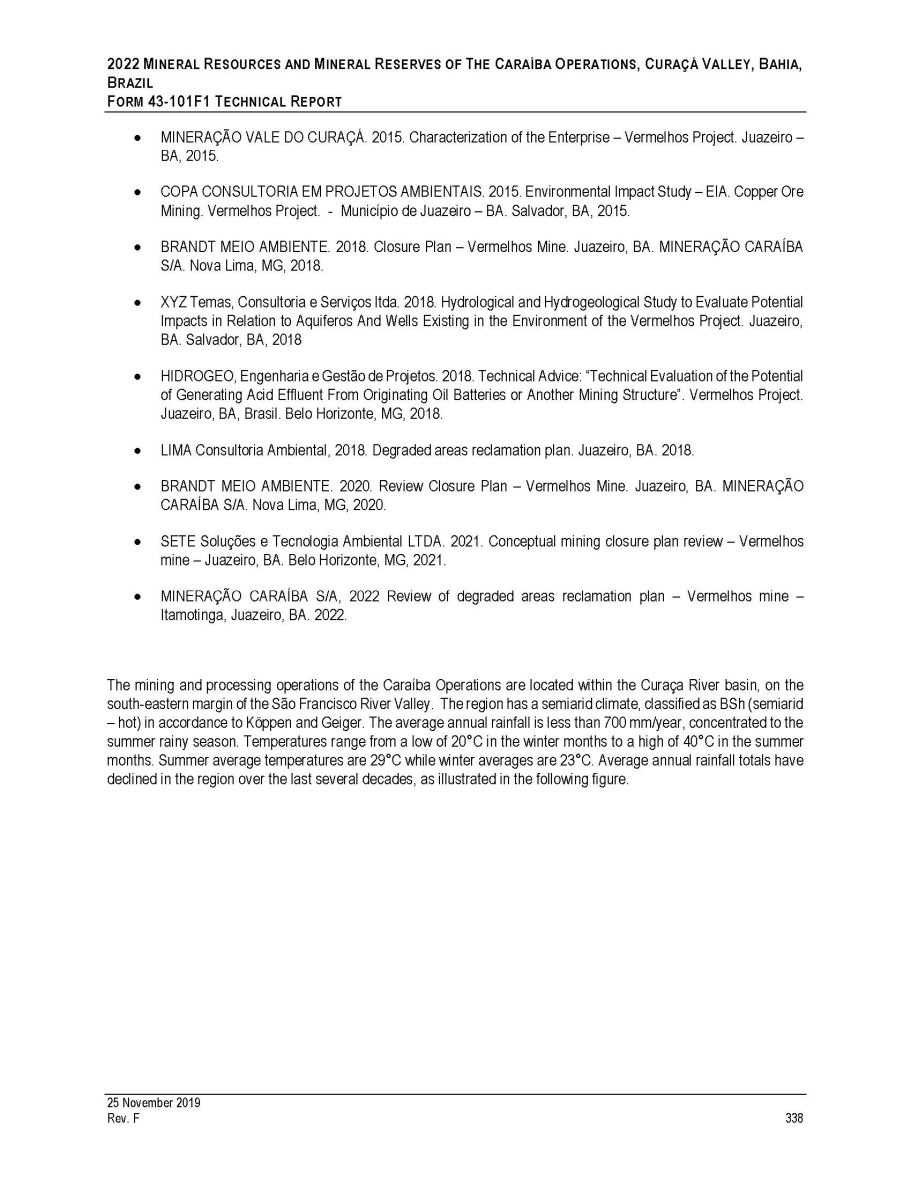
2022 M INERAL R ESOURCES AND M INERAL R ESERVES OF T HE C ARAÍBA O PERATIONS , C URAÇÁ V ALLEY , B AHIA , B RAZIL F ORM 43 - 101F1 T ECHNICAL R EPORT MINERAÇÃO VALE DO CURAÇÁ . 2015 . Characterization of the Enterprise – Vermelhos Project . Juazeiro – BA, 2015 . COPA CONSULTORIA EM PROJETOS AMBIENTAIS . 2015 . Environmental Impact Study – EIA . Copper Ore Mining . Vermelhos Project . - Município de Juazeiro – BA . Salvador, BA, 2015 . BRANDT MEIO AMBIENTE. 2018. Closure Plan – Vermelhos Mine. Juazeiro, BA. MINERAÇÃO CARAÍBA S/A. Nova Lima, MG, 2018. XYZ Temas, Consultoria e Serviços ltda . 2018 . Hydrological and Hydrogeological Study to Evaluate Potential Impacts in Relation to Aquiferos And Wells Existing in the Environment of the Vermelhos Project . Juazeiro, BA . Salvador, BA, 2018 HIDROGEO, Engenharia e Gestão de Projetos . 2018 . Technical Advice : “Technical Evaluation of the Potential of Generating Acid Effluent From Originating Oil Batteries or Another Mining Structure” . Vermelhos Project . Juazeiro, BA, Brasil . Belo Horizonte, MG, 2018 . LIMA Consultoria Ambiental, 2018. Degraded areas reclamation plan. Juazeiro, BA. 2018. BRANDT MEIO AMBIENTE. 2020. Review Closure Plan – Vermelhos Mine. Juazeiro, BA. MINERAÇÃO CARAÍBA S/A. Nova Lima, MG, 2020. SETE Soluções e Tecnologia Ambiental LTDA. 2021. Conceptual mining closure plan review – Vermelhos mine – Juazeiro, BA. Belo Horizonte, MG, 2021. MINERAÇÃO CARAÍBA S/A, 2022 Review of degraded areas reclamation plan – Vermelhos mine – Itamotinga, Juazeiro, BA. 2022. The mining and processing operations of the Caraíba Operations are located within the Curaça River basin, on the south - eastern margin of the São Francisco River Valley . The region has a semiarid climate, classified as BSh (semiarid – hot) in accordance to Köppen and Geiger . The average annual rainfall is less than 700 mm/year, concentrated to the summer rainy season . Temperatures range from a low of 20 ƒ C in the winter months to a high of 40 ƒ C in the summer months . Summer average temperatures are 29 ƒ C while winter averages are 23 ƒ C . Average annual rainfall totals have declined in the region over the last several decades, as illustrated in the following figure . 25 November 2019 Rev. F 338
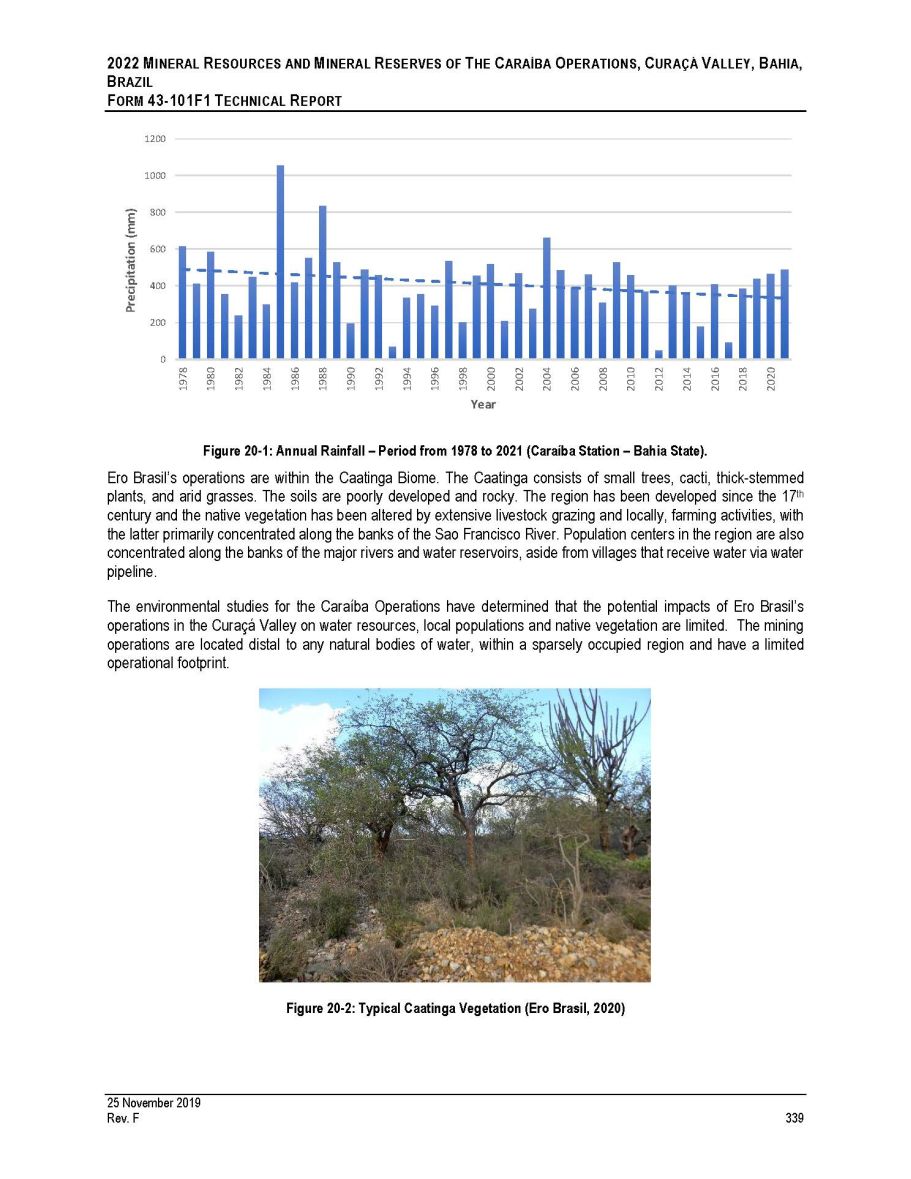
Figure 20 - 2: Typical Caatinga Vegetation (Ero Brasil, 2020) 1978 1980 1982 1984 1986 1988 1990 1992 1994 1996 1998 2000 2002 2004 2006 2008 2010 2012 2014 2016 2018 2020 Precipitation (mm) 2022 M INERAL R ESOURCES AND M INERAL R ESERVES OF T HE C ARAÍBA O PERATIONS , C URAÇÁ V ALLEY , B AHIA , B RAZIL F ORM 43 - 101 F 1 T ECHNICAL R EPORT 1200 1000 800 600 400 200 0 Year Figure 20 - 1 : Annual Rainfall – Period from 1978 to 2021 (Caraíba Station – Bahia State) . Ero Brasil’s operations are within the Caatinga Biome . The Caatinga consists of small trees, cacti, thick - stemmed plants, and arid grasses . The soils are poorly developed and rocky . The region has been developed since the 17 th century and the native vegetation has been altered by extensive livestock grazing and locally, farming activities, with the latter primarily concentrated along the banks of the Sao Francisco River . Population centers in the region are also concentrated along the banks of the major rivers and water reservoirs, aside from villages that receive water via water pipeline . The environmental studies for the Caraíba Operations have determined that the potential impacts of Ero Brasil’s operations in the Curaçá Valley on water resources, local populations and native vegetation are limited . The mining operations are located distal to any natural bodies of water, within a sparsely occupied region and have a limited operational footprint . 25 November 2019 Rev. F 339
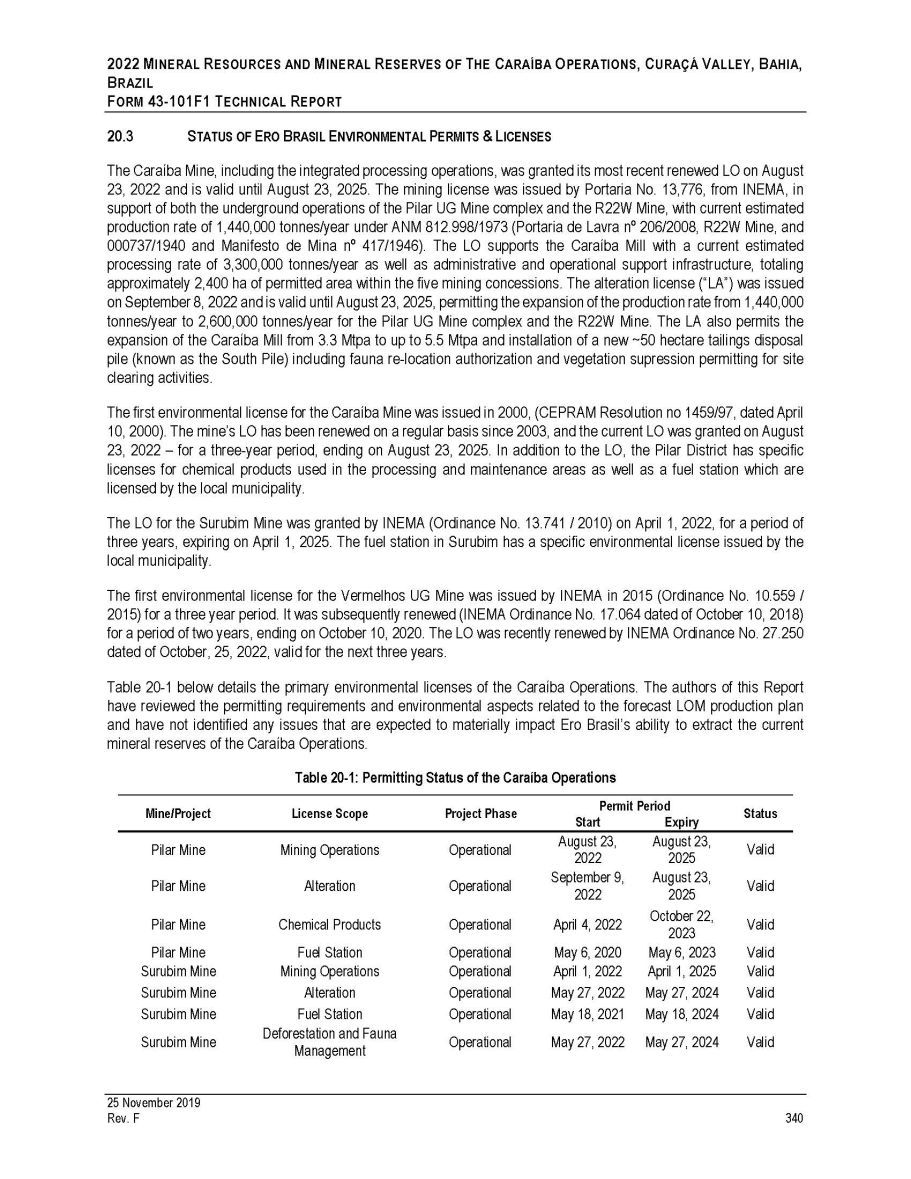
2022 M INERAL R ESOURCES AND M INERAL R ESERVES OF T HE C ARAÍBA O PERATIONS , C URAÇÁ V ALLEY , B AHIA , B RAZIL F ORM 43 - 101 F 1 T ECHNICAL R EPORT 20.3 S TATUS OF E RO B RASIL E NVIRONMENTAL P ERMITS & L ICENSES The Caraíba Mine, including the integrated processing operations, was granted its most recent renewed LO on August 23 , 2022 and is valid until August 23 , 2025 . The mining license was issued by Portaria No . 13 , 776 , from INEMA, in support of both the underground operations of the Pilar UG Mine complex and the R 22 W Mine, with current estimated production rate of 1 , 440 , 000 tonnes/year under ANM 812 . 998 / 1973 (Portaria de Lavra nº 206 / 2008 , R 22 W Mine, and 000737 / 1940 and Manifesto de Mina nº 417 / 1946 ) . The LO supports the Caraíba Mill with a current estimated processing rate of 3 , 300 , 000 tonnes/year as well as administrative and operational support infrastructure, totaling approximately 2 , 400 ha of permitted area within the five mining concessions . The alteration license (“LA”) was issued on September 8 , 2022 and is valid until August 23 , 2025 , permitting the expansion of the production rate from 1 , 440 , 000 tonnes/year to 2 , 600 , 000 tonnes/year for the Pilar UG Mine complex and the R 22 W Mine . The LA also permits the expansion of the Caraíba Mill from 3 . 3 Mtpa to up to 5 . 5 Mtpa and installation of a new ~ 50 hectare tailings disposal pile (known as the South Pile) including fauna re - location authorization and vegetation supression permitting for site clearing activities . The first environmental license for the Caraíba Mine was issued in 2000 , (CEPRAM Resolution no 1459 / 97 , dated April 10 , 2000 ) . The mine’s LO has been renewed on a regular basis since 2003 , and the current LO was granted on August 23 , 2022 – for a three - year period, ending on August 23 , 2025 . In addition to the LO, the Pilar District has specific licenses for chemical products used in the processing and maintenance areas as well as a fuel station which are licensed by the local municipality . The LO for the Surubim Mine was granted by INEMA (Ordinance No . 13 . 741 / 2010 ) on April 1 , 2022 , for a period of three years, expiring on April 1 , 2025 . The fuel station in Surubim has a specific environmental license issued by the local municipality . The first environmental license for the Vermelhos UG Mine was issued by INEMA in 2015 (Ordinance No . 10 . 559 / 2015 ) for a three year period . It was subsequently renewed (INEMA Ordinance No . 17 . 064 dated of October 10 , 2018 ) for a period of two years, ending on October 10 , 2020 . The LO was recently renewed by INEMA Ordinance No . 27 . 250 dated of October, 25 , 2022 , valid for the next three years . Table 20 - 1 below details the primary environmental licenses of the Caraíba Operations . The authors of this Report have reviewed the permitting requirements and environmental aspects related to the forecast LOM production plan and have not identified any issues that are expected to materially impact Ero Brasil’s ability to extract the current mineral reserves of the Caraíba Operations . Table 20 - 1: Permitting Status of the Caraíba Operations Mine/Project License Scope Project Phase Permit Period Status Start Expiry Pilar Mine Mining Operations Operational August 23, August 23, Valid 2022 2025 Pilar Mine Alteration Operational September 9, August 23, Valid 25 November 2019 Rev. F 340 2022 April 4, 2022 May 6, 2020 April 1, 2022 May 27, 2022 May 18, 2021 May 27, 2022 2025 October 22, 2023 May 6, 2023 April 1, 2025 May 27, 2024 May 18, 2024 May 27, 2024 Pilar Mine Pilar Mine Surubim Mine Surubim Mine Surubim Mine Surubim Mine Chemical Products Fuel Station Mining Operations Alteration Fuel Station Deforestation and Fauna Management Operational Operational Operational Operational Operational Operational Valid Valid Valid Valid Valid Valid
Surubim Mine Creek Deviation Operational Vermelhos UG Mine Mining Operations Operational Vermelhos UG Mine Fuel Station Operational Vermelhos UG Mine Fauna Management Operational Vermelhos UG Mine Creek Deviation Operational 2022 M INERAL R ESOURCES AND M INERAL R ESERVES OF T HE C ARAÍBA O PERATIONS , C URAÇÁ V ALLEY , B AHIA , B RAZIL F ORM 43 - 101F1 T ECHNICAL R EPORT lid lid lid lid lid May 27, 2022 May 27, 2027 Va October 26, October 26, Va 2022 2025 November 11, October 28, Va 2021 2024 November 6, November 6, Va 2021 2023 March 15, March 15, Va 2022 2027 The Operation Licenses for the Pilar, Surubim, and Vermelhos Mines are valid and in compliance with the applicable legislation, specifically the State Decree 15 , 682 / 2014 that regulates environmental permitting in the Bahia State . All environmental licenses issued by INEMA have a series of clauses detailing the environmental management procedures to be followed by Ero Brasil, and in some cases, deadlines to present additional studies or to conclude reclamation actions, among others . The Caraíba Mine license has 24 clauses/conditions, the Surubim License has 23 clauses and the Vermelhos License 37 clauses . The Ero Brasil environmental team presented an overview of the status of all clauses of the referred licenses, including conditions that could affect the renewal process . The Ero Brasil environmental team confirmed that the Company complies with all terms of the licenses and it is the opinion of the authors of this Report that there are no identified issues that could adversely impact the renewal of the licenses . All environmental licenses issued by INEMA have a series of clauses detailing the environmental management procedures to be followed by Caraíba, and in some cases, deadlines to present additional studies or to conclude reclamation actions, among others . The Pilar Mine License (RLO)has 29 clauses/conditions, the Surubim License (RLO) has 37 clauses and the Vermelhos License (RLO) 35 clauses . The Caraíba environmental team confirmed that the Company complies with all terms of the licenses and it is the opinion of the authors of this Report that there are no identified issues that could adversely impact the renewal of the licenses . Deepening Project Environmental Permitting The Deepening Project is considered part of the existing Pilar UG Mine and does not require a material expansion of the existing infrastructure that would require additional permitting . This includes the processing plant, power and water supply systems . The Deepening Project, as currently defined, is not expected to create additional environmental or additional social impacts . Therefore, there is no specific or additional permitting required for the Deepening Project other than periodic renewal requirements obtained in the ordinary course of business . Nevertheless, all information of the Deepening Expansion project was reported to the agency in the renewal process of the LO . Water Rights Ero Brasil has the water rights needed to conduct ongoing mining operations . The main water right was issued by the National Water Agency (Resolution nº 18 dated of January 8 , 2016 ), valid for 10 years, allowing the use of up to 1 , 690 , 000 m³/month from the São Francisco River via an 86 km water pipeline connecting the pumping station to the Pilar Mine . As noted in Chapter 18 , Project Infrastructure, Ero Brasil does not use all of the water pumped from the São Francisco River in its mining and processing operations and provides excess water to several communities located along the pipeline . Ero Brasil also has water rights to exploit three wells in the Vermelhos UG Mine site, granted by INEMA Ordinance No . 10 , 554 / 2015 and INEMA Ordinance No . 19 , 285 / 2019 , as summarized in the table below . Mine/Project Table 20 - 2: Water Rights Status – Caraíba Operations Water Right Granted Period Status 25 November 2019 Rev. F 341
2022 M INERAL R ESOURCES AND M INERAL R ESERVES OF T HE C ARAÍBA O PERATIONS , C URAÇÁ V ALLEY , B AHIA , B RAZIL F ORM 43 - 101F1 T ECHNICAL R EPORT Start End Caraíba Mine Water Use Permit (São Francisco River) Groundwater Use Permit (Well # 1) Effluent Discharge Permit Effluent Discharge Permit (C12) Effluent Discharge Permit Effluent Discharge Permit Groundwater Use Permit (Wells # 1 and 2) Groundwater Use Permit (Well # 3) January 8, 2016 September 13, January 8, 2026 Valid September 13, Valid Surubim Mine 2019 March 20, 2019 2023 March 20, 2023 Valid August 10, 2019 August 10, 2023 Valid March 20, 2019 March 20, 2023 Valid September 15, 2020 September 15, 2025 Valid May 28, 2021 May 28, 2025 Valid Surubim Mine Surubim Mine Sucuarana Mine Vermelhos OP Mine Vermelhos UG Mine Vermelhos UG Mine October 5, 2019 October 5, 2023 Valid Vermelhos UG Mine Groundwater Use Permit (Wells # 4, #5 and #6) April 6, 2022 April 6, 2026 Valid The authors of this Report have reviewed the permitting requirements and environmental aspects related to the LOM production plans proposed by Ero Brasil, and has not identified an issues that could materially impact Ero Brasil’s ability to extract the current mineral reserves presented in this Report . 20.4 E NVIRONMENTAL M ANAGEMENT – P OLLUTION C ONTROL Ero Brasil conducts several pollution control measures, including treatment and monitoring of effluent solutions, emissions reduction measures and air quality monitoring, among others, to ensure compliance within the Brazilian standards established by CONAMA as well as specific permitting terms defined by INEMA . Liquid Effluents The effluent discharge system of the Caraíba Mine consists of reclamation pumping, thickeners and treatment facilities to maintain site - wide water quality and reduce consumption of raw water through effluent recycle . Monthly sampling and analysis of effluent solutions is carried out in an effluent monitoring network, all performed in accordance with the Water Resources Quality Monitoring Plan approved under INEMA Ordinance No . 13 . 776 / 2017 . Lubricating oils and hydraulic fluids are collected, stored and sent to third - parties for proper disposal or sold to recycling companies for re - use . Solid Waste Ero Brasil operates a controlled landfill for non - hazardous and non - recyclable waste, a composting unit for organic waste and a warehouse for the temporary storage of recyclable waste, all licensed by INEMA through Ordinance 13 . 776 / 2017 . Hazardous waste produced on site is removed from site and sent for proper disposal by licensed third - parties . For human waste, distal operations such as the Surubim Mine and the Vermelhos UG Mine utilize a combination of chemical toilets and septic systems to collect and treat organic effluent as established by the Brazilian Association of Technical Standards, through standards NBR 7 , 229 and NBR 13 , 969 . 25 November 2019 Rev. F 342
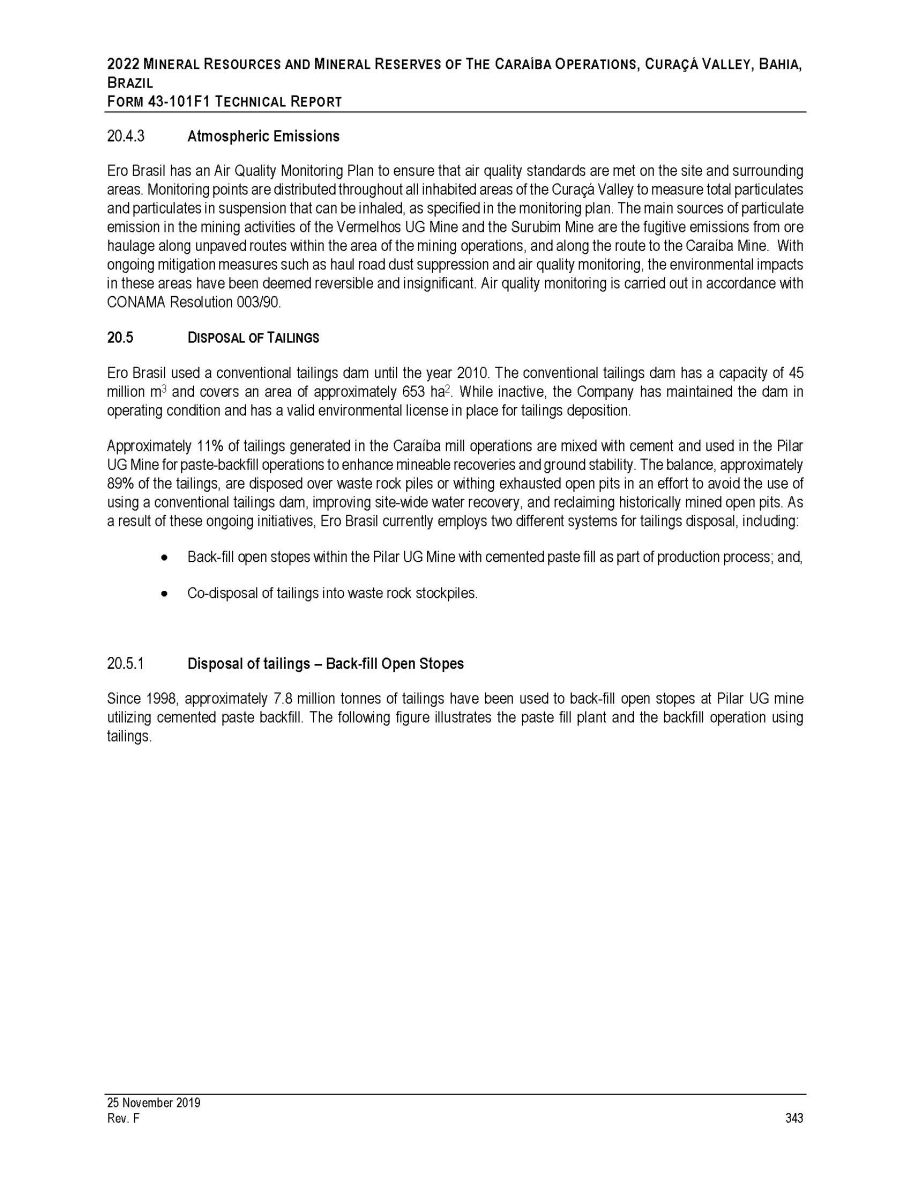
2022 M INERAL R ESOURCES AND M INERAL R ESERVES OF T HE C ARAÍBA O PERATIONS , C URAÇÁ V ALLEY , B AHIA , B RAZIL F ORM 43 - 101 F 1 T ECHNICAL R EPORT Atmospheric Emissions Ero Brasil has an Air Quality Monitoring Plan to ensure that air quality standards are met on the site and surrounding areas . Monitoring points are distributed throughout all inhabited areas of the Curaçá Valley to measure total particulates and particulates in suspension that can be inhaled, as specified in the monitoring plan . The main sources of particulate emission in the mining activities of the Vermelhos UG Mine and the Surubim Mine are the fugitive emissions from ore haulage along unpaved routes within the area of the mining operations, and along the route to the Caraíba Mine . With ongoing mitigation measures such as haul road dust suppression and air quality monitoring, the environmental impacts in these areas have been deemed reversible and insignificant . Air quality monitoring is carried out in accordance with CONAMA Resolution 003 / 90 . 20.5 D ISPOSAL OF T AILINGS Ero Brasil used a conventional tailings dam until the year 2010 . The conventional tailings dam has a capacity of 45 million m 3 and covers an area of approximately 653 ha 2 . While inactive, the Company has maintained the dam in operating condition and has a valid environmental license in place for tailings deposition . Approximately 11 % of tailings generated in the Caraíba mill operations are mixed with cement and used in the Pilar UG Mine for paste - backfill operations to enhance mineable recoveries and ground stability . The balance, approximately 89 % of the tailings, are disposed over waste rock piles or withing exhausted open pits in an effort to avoid the use of using a conventional tailings dam, improving site - wide water recovery, and reclaiming historically mined open pits . As a result of these ongoing initiatives, Ero Brasil currently employs two different systems for tailings disposal, including : Back - fill open stopes within the Pilar UG Mine with cemented paste fill as part of production process; and, Co - disposal of tailings into waste rock stockpiles. Disposal of tailings – Back - fill Open Stopes Since 1998 , approximately 7 . 8 million tonnes of tailings have been used to back - fill open stopes at Pilar UG mine utilizing cemented paste backfill . The following figure illustrates the paste fill plant and the backfill operation using tailings . 25 November 2019 Rev. F 343

2022 M INERAL R ESOURCES AND M INERAL R ESERVES OF T HE C ARAÍBA O PERATIONS , C URAÇÁ V ALLEY , B AHIA , B RAZIL F ORM 43 - 101F1 T ECHNICAL R EPORT Figure 20 - 3: Paste fill plant on surface and underground tailings disposal as cemented paste (Ero Brasil, 2022) Disposal of tailings, Co - disposal of Tailings Since 2011 , approximately 17 . 2 million tonnes of tailings, have been sent for co - disposal within the surface waste rock stockpiles . The co - disposal method entails utilizing the inherent void space within the waste rock stockpiles by allowing tailings to permeate the piles and, after fully filled, covering the final surface of the co - disposal pile with soils suitable for revegetation . The process is shown graphically in Figure 20 - 4 to Figure 20 - 6 and described in greater detail below . The method has produced excellent results, allowing increased water recovery, significantly reduced pumping costs, creating a substrate for revegetation of the waste rock stockpiles, and, since implementation, has eliminated the need for conventional tailings dam storage . In practice, waste tailings, after thickening to approximately 65 % solids, are pumped to the waste rock stockpiles for co - disposal . Small discrete compacted start rock berms are created along each stockpile to allow the material to be retained when first disposed on the pile . When the berm is completed, pumping maintains 1 m of freeboard along the berm . Operation then is stopped after an initial 21 days to allow time for percolation and drying of the material . After this first cycle, an excavator raises the dike on the top of the initial rock berm according to the design parameters . This lifting process is carried out continuously until the structure reaches the expected final dimensions, as shown in Figure 20 - 5 . Multiple discrete ponds are prepared to allow operators to fill multiple sections according to natural drying sequence, accommodate various percolation rates, and enhance control of the co - disposal process . Revegetation with native plant species of Caatinga is conducted on the fully - completed piles . 25 November 2019 Rev. F 344

2022 M INERAL R ESOURCES AND M INERAL R ESERVES OF T HE C ARAÍBA O PERATIONS , C URAÇÁ V ALLEY , B AHIA , B RAZIL F ORM 43 - 101F1 T ECHNICAL R EPORT Figure 20 - 4: Initial dike dimensions prepared for co - disposal (Ero Brasil, 2020) Figure 20 - 5: Illustrative scheme showing final dimensions of a typical co - disposal stockpile berm (Ero Brasil, 2020) Based on Ero Brasil’s operating history of co - disposal, the system has the following benefits: Eliminated the need to utilize the Company’s conventional - tailings dam; Recover up to 90% of the water from the tailings produced, reducing the freshwater make - up requirements of the operations; Reduced pumping costs due to waste rock stockpiles’ proximity to the Caraíba Mill; and Recontoured berms containing a mixture of coarse and fine particles create an enhanced substrate for revegetation efforts. 25 November 2019 Rev. F 345
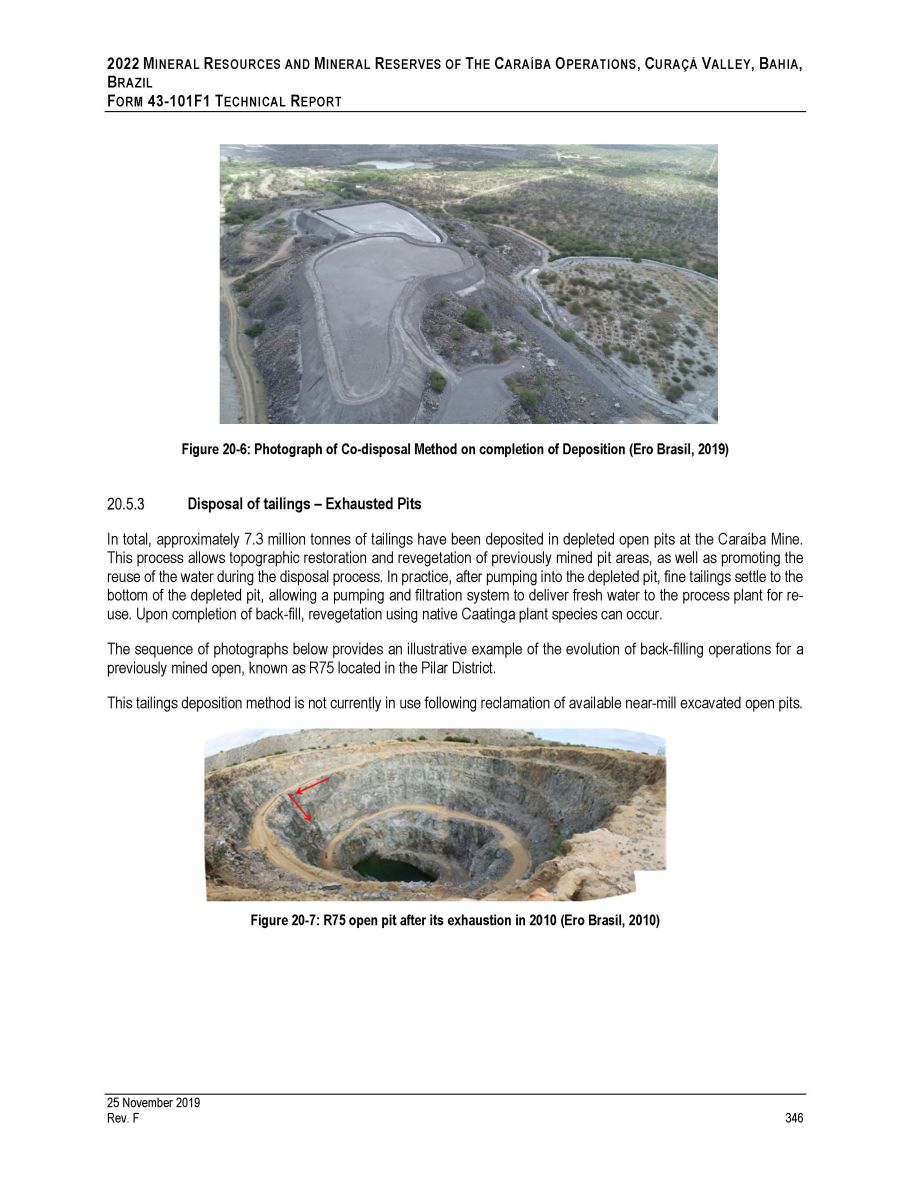
2022 M INERAL R ESOURCES AND M INERAL R ESERVES OF T HE C ARAÍBA O PERATIONS , C URAÇÁ V ALLEY , B AHIA , B RAZIL F ORM 43 - 101F1 T ECHNICAL R EPORT Figure 20 - 6: Photograph of Co - disposal Method on completion of Deposition (Ero Brasil, 2019) Disposal of tailings – Exhausted Pits In total, approximately 7 . 3 million tonnes of tailings have been deposited in depleted open pits at the Caraíba Mine . This process allows topographic restoration and revegetation of previously mined pit areas, as well as promoting the reuse of the water during the disposal process . In practice, after pumping into the depleted pit, fine tailings settle to the bottom of the depleted pit, allowing a pumping and filtration system to deliver fresh water to the process plant for re - use . Upon completion of back - fill, revegetation using native Caatinga plant species can occur . The sequence of photographs below provides an illustrative example of the evolution of back - filling operations for a previously mined open, known as R 75 located in the Pilar District . This tailings deposition method is not currently in use following reclamation of available near - mill excavated open pits . Figure 20 - 7: R75 open pit after its exhaustion in 2010 (Ero Brasil, 2010) 25 November 2019 Rev. F 346
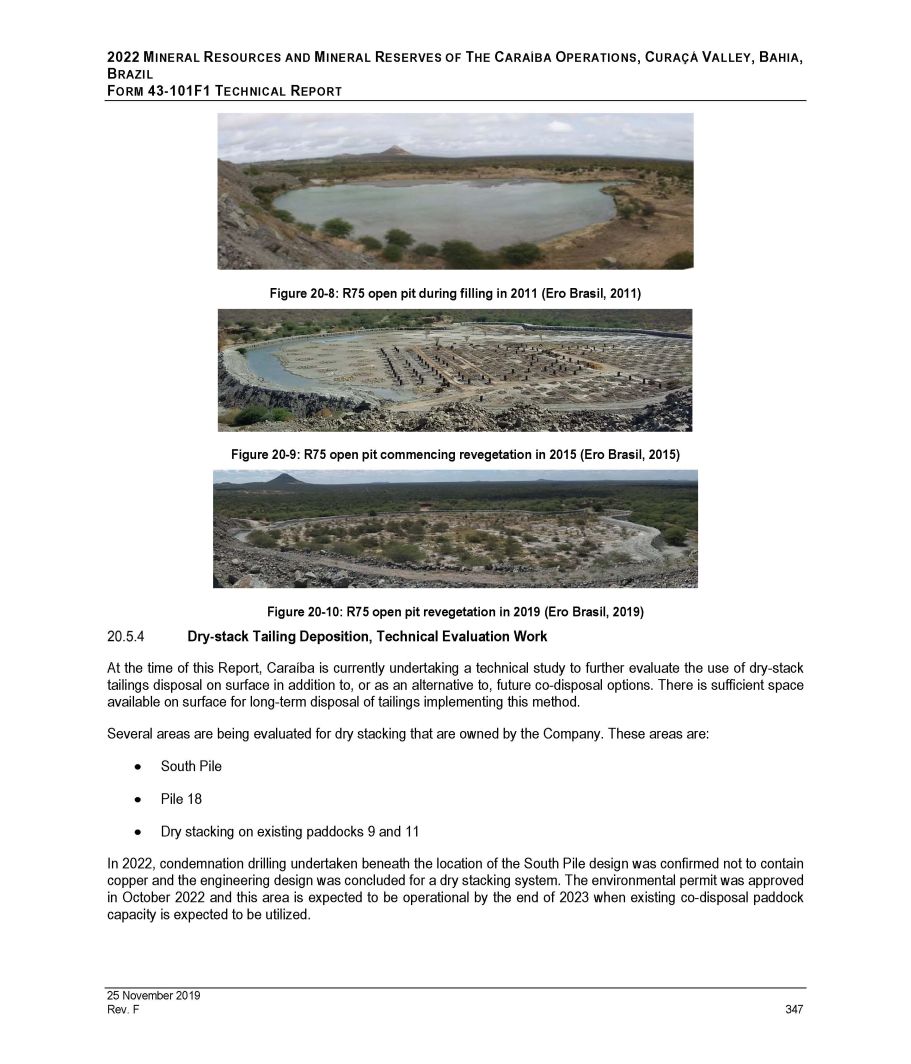
2022 M INERAL R ESOURCES AND M INERAL R ESERVES OF T HE C ARAÍBA O PERATIONS , C URAÇÁ V ALLEY , B AHIA , B RAZIL F ORM 43 - 101F1 T ECHNICAL R EPORT Figure 20 - 8: R75 open pit during filling in 2011 (Ero Brasil, 2011) Figure 20 - 9: R75 open pit commencing revegetation in 2015 (Ero Brasil, 2015) Figure 20 - 10: R75 open pit revegetation in 2019 (Ero Brasil, 2019) Dry - stack Tailing Deposition, Technical Evaluation Work At the time of this Report, Caraíba is currently undertaking a technical study to further evaluate the use of dry - stack tailings disposal on surface in addition to, or as an alternative to, future co - disposal options . There is sufficient space available on surface for long - term disposal of tailings implementing this method . Several areas are being evaluated for dry stacking that are owned by the Company . These areas are : South Pile Pile 18 Dry stacking on existing paddocks 9 and 11 In 2022 , condemnation drilling undertaken beneath the location of the South Pile design was confirmed not to contain copper and the engineering design was concluded for a dry stacking system . The environmental permit was approved in October 2022 and this area is expected to be operational by the end of 2023 when existing co - disposal paddock capacity is expected to be utilized . 25 November 2019 Rev. F 347

2022 M INERAL R ESOURCES AND M INERAL R ESERVES OF T HE C ARAÍBA O PERATIONS , C URAÇÁ V ALLEY , B AHIA , B RAZIL F ORM 43 - 101F1 T ECHNICAL R EPORT Pile 18 was also identified as a dry stacking area and a conceptual study is being done to apply for an environmental permit. Dry stacking on existing paddocks is also in design for approval. Figure 20 - 11: Site overview of sites located for future tailings disposal relative to the historic tailings facility (right in image) and the existing milling infrastructure (center left in image). Grid spacing is 1km by 1km. (Ero Brasil, 2022) N 25 November 2019 Rev. F 348
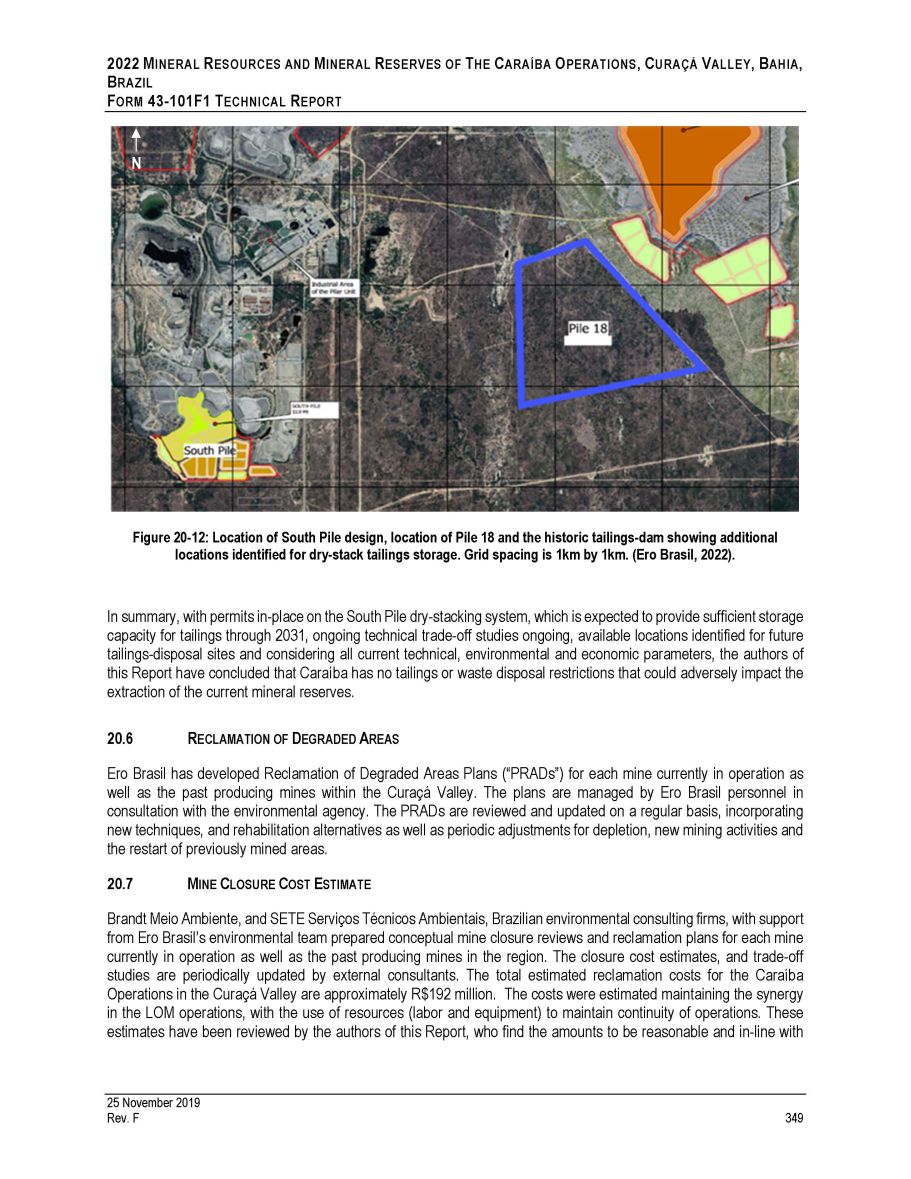
2022 M INERAL R ESOURCES AND M INERAL R ESERVES OF T HE C ARAÍBA O PERATIONS , C URAÇÁ V ALLEY , B AHIA , B RAZIL F ORM 43 - 101F1 T ECHNICAL R EPORT Figure 20 - 12: Location of South Pile design, location of Pile 18 and the historic tailings - dam showing additional locations identified for dry - stack tailings storage. Grid spacing is 1km by 1km. (Ero Brasil, 2022). In summary, with permits in - place on the South Pile dry - stacking system, which is expected to provide sufficient storage capacity for tailings through 2031 , ongoing technical trade - off studies ongoing, available locations identified for future tailings - disposal sites and considering all current technical, environmental and economic parameters, the authors of this Report have concluded that Caraíba has no tailings or waste disposal restrictions that could adversely impact the extraction of the current mineral reserves . 6. R ECLAMATION OF D EGRADED A REAS Ero Brasil has developed Reclamation of Degraded Areas Plans (“PRADs”) for each mine currently in operation as well as the past producing mines within the Curaçá Valley . The plans are managed by Ero Brasil personnel in consultation with the environmental agency . The PRADs are reviewed and updated on a regular basis, incorporating new techniques, and rehabilitation alternatives as well as periodic adjustments for depletion, new mining activities and the restart of previously mined areas . 7. M INE C LOSURE C OST E STIMATE Brandt Meio Ambiente, and SETE Serviços Técnicos Ambientais, Brazilian environmental consulting firms, with support from Ero Brasil’s environmental team prepared conceptual mine closure reviews and reclamation plans for each mine currently in operation as well as the past producing mines in the region . The closure cost estimates, and trade - off studies are periodically updated by external consultants . The total estimated reclamation costs for the Caraíba Operations in the Curaçá Valley are approximately R $ 192 million . The costs were estimated maintaining the synergy in the LOM operations, with the use of resources (labor and equipment) to maintain continuity of operations . These estimates have been reviewed by the authors of this Report, who find the amounts to be reasonable and in - line with N 25 November 2019 Rev. F 349

2022 M INERAL R ESOURCES AND M INERAL R ESERVES OF T HE C ARAÍBA O PERATIONS , C URAÇÁ V ALLEY , B AHIA , B RAZIL F ORM 43 - 101 F 1 T ECHNICAL R EPORT expectations given the nature of the operations and operational history of previously performed and ongoing reclamation activities . Caraíba Mine The estimated reclamation costs for the Caraíba Mine, excluding operations elsewhere in the Curaçá Valley, totals approximately R $ 144 million . The estimate includes the removal of surface infrastructure, re - contouring, revegetation and reclamation of the SX/EW plant and associated infrastructure . Detail is shown in the table below . Table 20 - 3: Summary of Mine Closure Costs for the Caraíba Mine Caraíba Mine Structures Estimated Reclamation Cost (R$ 000s) Socio - Economic Programs R$ 11,187 Waste Stockpiles R$ 11,139 Administrative Structures and Other Areas R$ 8,835 Underground Mine R$ 9,120 Open Pits R$ 8,857 Tailings Dam R$ 41,282 Industrial area R$ 24,973 Total Caraíba Mine Structures R$ 115,394 Oxide Leach Facilities Oxidized Waste Stockpiles R$ 23,364 Administrative and Support Structures R$ 3,018 Sumps and tanks R$ 2,173 Total Oxide Leach Facilities R$ 28,554 Total, Caraíba Mine R$ 143,948 Surubim Mine The estimated reclamation cost for the Surubim Mine totals approximately R$10.9 million. The estimate includes the removal of surface infrastructure, re - contouring, and revegetation. Detail is shown in the table below. Table 20 - 4: Summary of Mine Closure Costs for the Surubim Mine Structures Estimated Reclamation Cost (R$ 000s) Open Pit Administrative and Support Structures Underground Mine Waste Stockpiles and Sump R$ 1,507 R$ 1,142 R$ 3,619 R$ 4,627 Total R$ 10,894 25 November 2019 Rev. F 350
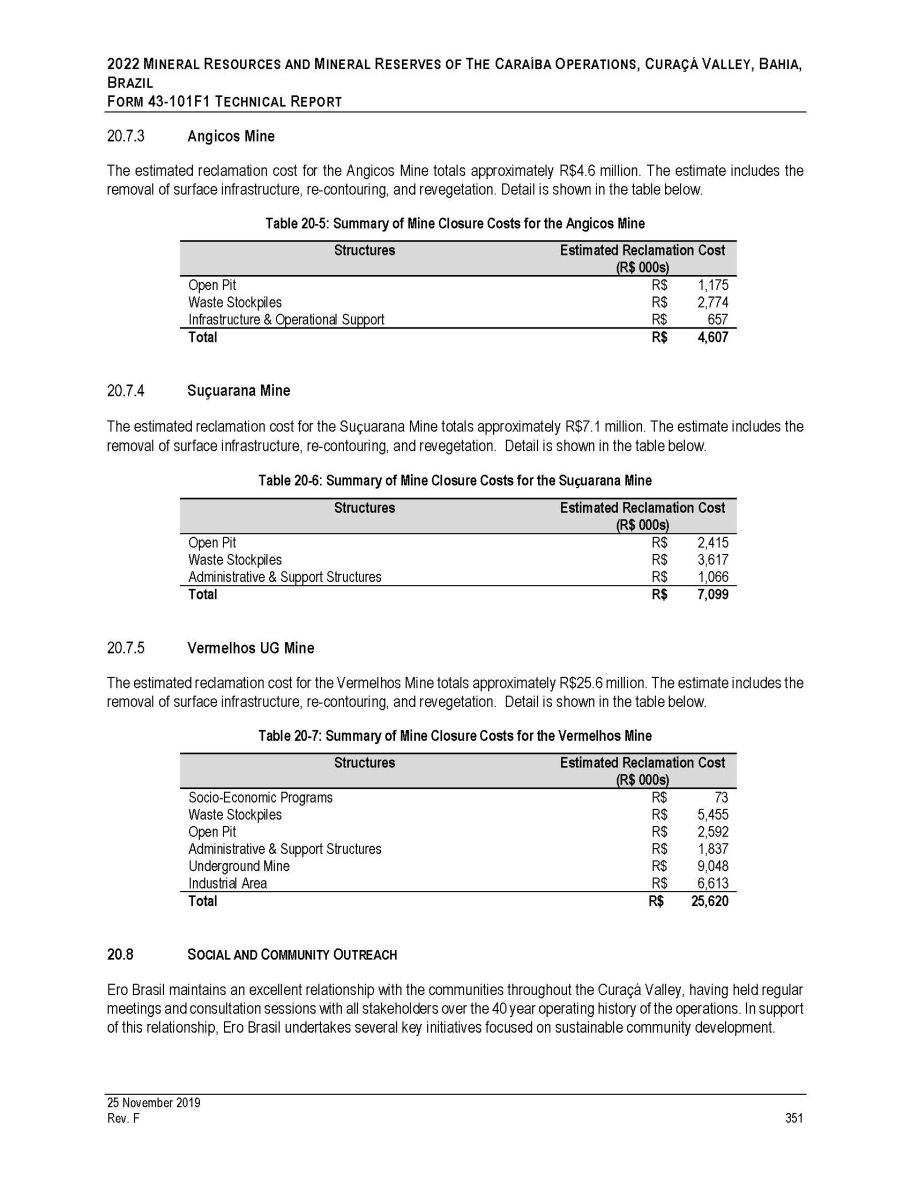
2022 M INERAL R ESOURCES AND M INERAL R ESERVES OF T HE C ARAÍBA O PERATIONS , C URAÇÁ V ALLEY , B AHIA , B RAZIL F ORM 43 - 101F1 T ECHNICAL R EPORT Angicos Mine The estimated reclamation cost for the Angicos Mine totals approximately R$4.6 million. The estimate includes the removal of surface infrastructure, re - contouring, and revegetation. Detail is shown in the table below. Table 20 - 5: Summary of Mine Closure Costs for the Angicos Mine Structures Estimated Reclamation Cost (R$ 000s) Open Pit R$ 1,175 Waste Stockpiles R$ 2,774 Infrastructure & Operational Support R$ 657 Total R$ 4,607 Suçuarana Mine The estimated reclamation cost for the Su ç uarana Mine totals approximately R$7.1 million. The estimate includes the removal of surface infrastructure, re - contouring, and revegetation. Detail is shown in the table below. Table 20 - 6: Summary of Mine Closure Costs for the Su ç uarana Mine Structures Estimated Reclamation Cost (R$ 000s) Open Pit R$ 2,415 Waste Stockpiles R$ 3,617 Administrative & Support Structures R$ 1,066 Total R$ 7,099 Vermelhos UG Mine The estimated reclamation cost for the Vermelhos Mine totals approximately R$25.6 million. The estimate includes the removal of surface infrastructure, re - contouring, and revegetation. Detail is shown in the table below. Table 20 - 7: Summary of Mine Closure Costs for the Vermelhos Mine Structures Estimated Reclamation Cost (R$ 000s) Socio - Economic Programs Waste Stockpiles Open Pit Administrative & Support Structures Underground Mine Industrial Area Total R$ 73 R$ 5,455 R$ 2,592 R$ 1,837 R$ 9,048 R$ 6,613 R$ 25,620 20.8 S OCIAL AND C OMMUNITY O UTREACH Ero Brasil maintains an excellent relationship with the communities throughout the Curaçá Valley, having held regular meetings and consultation sessions with all stakeholders over the 40 year operating history of the operations . In support of this relationship, Ero Brasil undertakes several key initiatives focused on sustainable community development . 25 November 2019 Rev. F 351
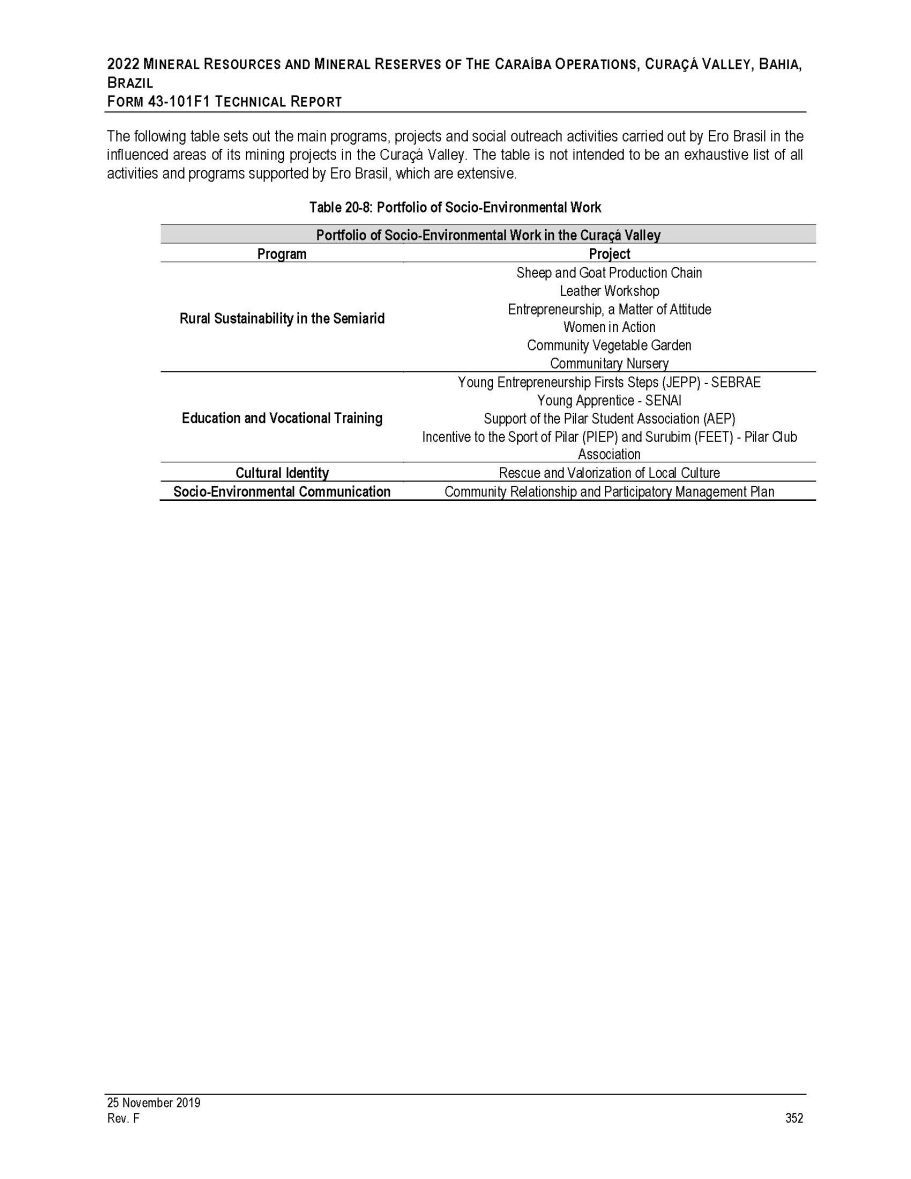
2022 M INERAL R ESOURCES AND M INERAL R ESERVES OF T HE C ARAÍBA O PERATIONS , C URAÇÁ V ALLEY , B AHIA , B RAZIL F ORM 43 - 101 F 1 T ECHNICAL R EPORT The following table sets out the main programs, projects and social outreach activities carried out by Ero Brasil in the influenced areas of its mining projects in the Curaçá Valley . The table is not intended to be an exhaustive list of all activities and programs supported by Ero Brasil, which are extensive . Table 20 - 8: Portfolio of Socio - Environmental Work Portfolio of Socio - Environmental Work in the Curaçá Valley Program Project Rural Sustainability in the Semiarid Sheep and Goat Production Chain Leather Workshop Entrepreneurship, a Matter of Attitude Women in Action Community Vegetable Garden Communitary Nursery Education and Vocational Training Young Entrepreneurship Firsts Steps (JEPP) - SEBRAE Young Apprentice - SENAI Support of the Pilar Student Association (AEP) Incentive to the Sport of Pilar (PIEP) and Surubim (FEET) - Pilar Club Association Cultural Identity Rescue and Valorization of Local Culture Socio - Environmental Communication Community Relationship and Participatory Management Plan 25 November 2019 Rev. F 352
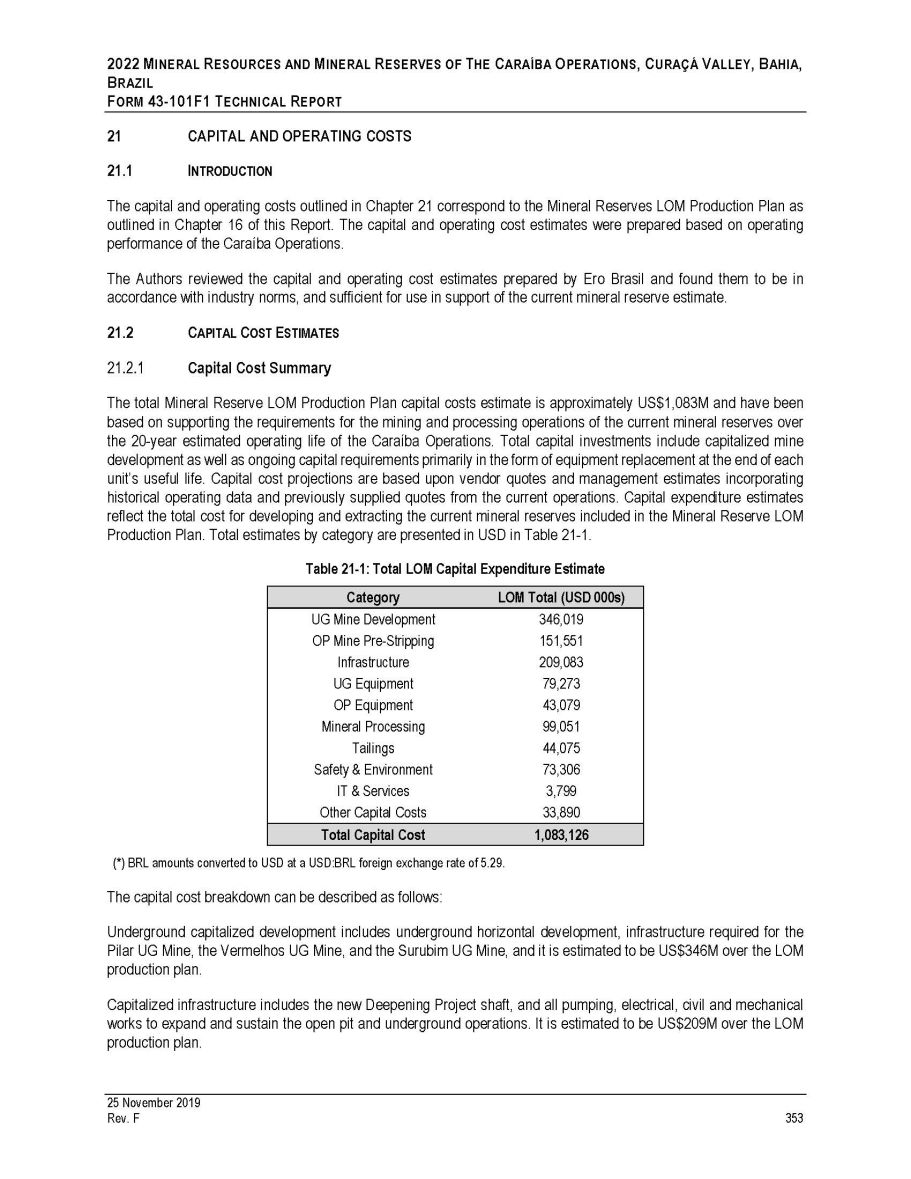
2022 M INERAL R ESOURCES AND M INERAL R ESERVES OF T HE C ARAÍBA O PERATIONS , C URAÇÁ V ALLEY , B AHIA , B RAZIL F ORM 43 - 101F1 T ECHNICAL R EPORT 21 21.1 CAPITAL AND OPERATING COSTS I NTRODUCTION The capital and operating costs outlined in Chapter 21 correspond to the Mineral Reserves LOM Production Plan as outlined in Chapter 16 of this Report . The capital and operating cost estimates were prepared based on operating performance of the Caraíba Operations . The Authors reviewed the capital and operating cost estimates prepared by Ero Brasil and found them to be in accordance with industry norms, and sufficient for use in support of the current mineral reserve estimate . 21.2 C APITAL C OST E STIMATES Capital Cost Summary The total Mineral Reserve LOM Production Plan capital costs estimate is approximately US $ 1 , 083 M and have been based on supporting the requirements for the mining and processing operations of the current mineral reserves over the 20 - year estimated operating life of the Caraíba Operations . Total capital investments include capitalized mine development as well as ongoing capital requirements primarily in the form of equipment replacement at the end of each unit’s useful life . Capital cost projections are based upon vendor quotes and management estimates incorporating historical operating data and previously supplied quotes from the current operations . Capital expenditure estimates reflect the total cost for developing and extracting the current mineral reserves included in the Mineral Reserve LOM Production Plan . Total estimates by category are presented in USD in Table 21 - 1 . Table 21 - 1: Total LOM Capital Expenditure Estimate 25 November 2019 Rev. F 353 Category LOM Total (USD 000s) UG Mine Development 346,019 OP Mine Pre - Stripping 151,551 Infrastructure 209,083 UG Equipment 79,273 OP Equipment 43,079 Mineral Processing 99,051 Tailings 44,075 Safety & Environment 73,306 IT & Services 3,799 Other Capital Costs 33,890 Total Capital Cost 1,083,126 (*) BRL amounts converted to USD at a USD : BRL foreign exchange rate of 5 . 29 . The capital cost breakdown can be described as follows : Underground capitalized development includes underground horizontal development, infrastructure required for the Pilar UG Mine, the Vermelhos UG Mine, and the Surubim UG Mine, and it is estimated to be US $ 346 M over the LOM production plan . Capitalized infrastructure includes the new Deepening Project shaft, and all pumping, electrical, civil and mechanical works to expand and sustain the open pit and underground operations . It is estimated to be US $ 209 M over the LOM production plan .

2022 M INERAL R ESOURCES AND M INERAL R ESERVES OF T HE C ARAÍBA O PERATIONS , C URAÇÁ V ALLEY , B AHIA , B RAZIL F ORM 43 - 101 F 1 T ECHNICAL R EPORT Total mineral processing capital costs are estimated at US $ 99 M, which consists primarily of the mill expansion and the construction of the ore sorting facility for implementation by 2031 . Other capital consists primarily of equipment rebuilds, equipment replacements, and ongoing reclamation work . Safety and environmental costs are estimated at US $ 73 M and it include all requirements for mine, tails and waste dump recoveries, licensing & permitting expenditures, and safety investments (refugee chambers, materials, scape ways, fire suppression systems, and other protection systems) . An additional US $ 44 M has been estimated for tailings expansion investments over the LOM . Capital costs do not include project financing and interest charges, working capital, capitalized exploration or capital costs estimated to be required to upgrade the inferred mineral resources of the Strategic LOM Plan . The differential capital between the Mineral Reserves LOM Production Plan capital requirements and that of the Strategic LOM Plan is estimated to be an incremental US $ 160 M, primarily for underground development . 21.3 O PERATING C OST E STIMATES Operating Cost Summary An operating cost model was generated based on actual historic operating performance at the Caraíba Operations, utilizing specific consumption coefficients based on operational data, after application of adjustments for differences between ore sources in the Mineral Reserves LOM Production Plan . Cost estimates are built using first principles incorporating both fixed and variable components to account for production rate variations . Costs were adjusted annually based on the changes to ore sources including rock support, transport, and infrastructure requirements . Underground mining costs consist of the operational costs related to ore extraction at the Pilar UG Mine, Vermelhos UG Mine, and Surubim UG Mine . Direct mining costs include drilling, blasting, and mucking . Indirect costs include ore and waste transport, mine services, and mine supplies Open pit mining costs consist of the operational costs related to ore extraction at the Surubim OP, C 12 OP, N 8 / N 9 OP, and N 5 (Siriema) OP Mines . Direct mining costs include drilling, loading, and mucking . Indirect mining costs include ore and waste transport, mine services, and mine supplies . Operating costs for all mines consider the differential transport component to deliver ore to the Caraíba Mill as well as any costs associated with ore sorting . The Caraíba Mill is a conventional three - stage crush and flotation operation producing a high - grade copper concentrate . The plant operates 24 hours per day, seven days per week . The primary components of plant costs are salaries, operating materials, and power . For the purposes of differentiating operating mines, fixed costs associated with the Caraíba Mill are allocated to the Pilar UG Mine and the Vermelhos UG Mine, which correspond to the majority of mill feed . The operating cost estimates rely on the following assumptions : The specific consumption coefficients for all consumables for mining and processing were analyzed based on historical usage over the last 18 months and projected forward incorporating changes in the production plan, as well as continuous improvement projects, assuring alignment with the mine production and capital improvement projects . Power costs were calculated based on power capacity load of each equipment and area, considering the availability, utilization, and power factor . The prices were based on the contract for demand and supply . General and administrative (G&A) costs consider the mine supporting functions, such as human resources, accounting, HSEC, IT, general services, security and procurement . It also includes sales expenses related to 25 November 2019 Rev. F 354
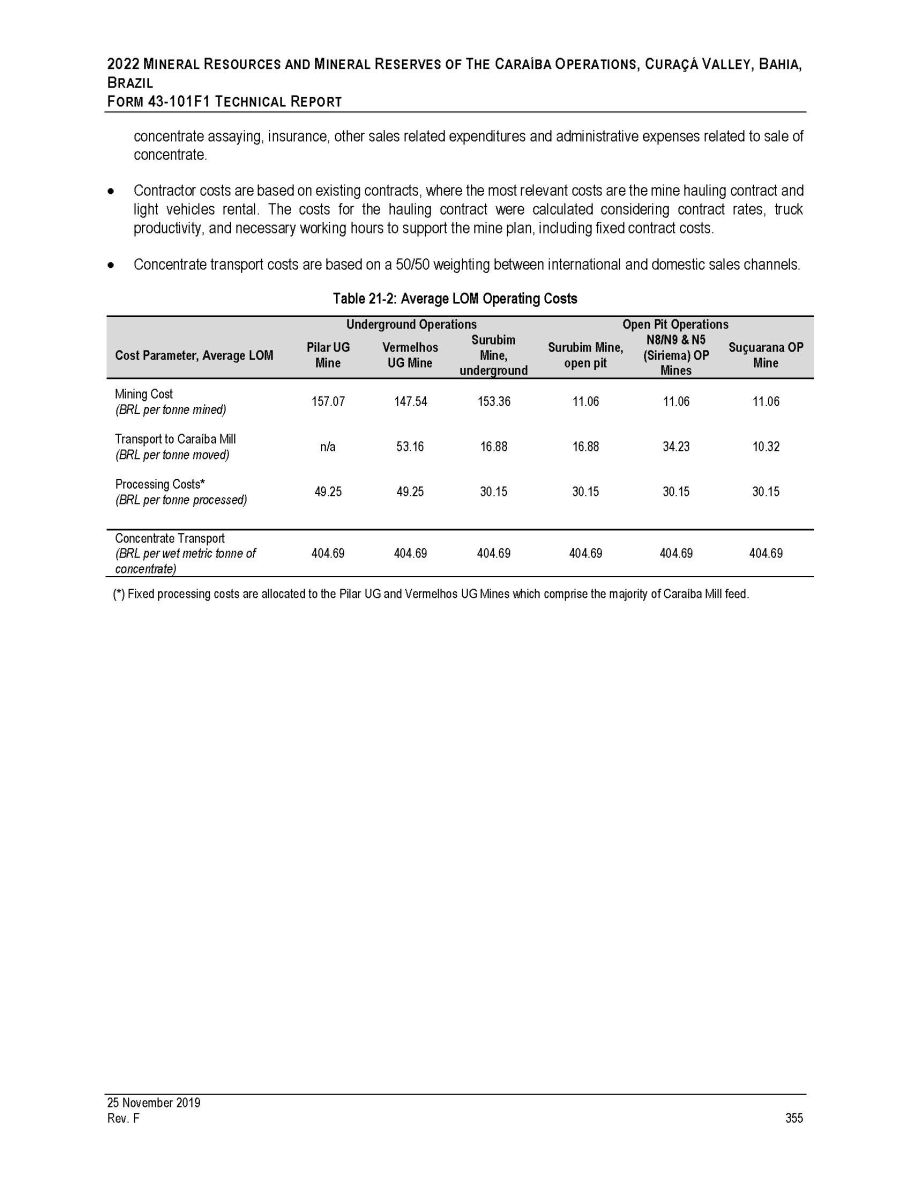
2022 M INERAL R ESOURCES AND M INERAL R ESERVES OF T HE C ARAÍBA O PERATIONS , C URAÇÁ V ALLEY , B AHIA , B RAZIL F ORM 43 - 101F1 T ECHNICAL R EPORT concentrate assaying, insurance, other sales related expenditures and administrative expenses related to sale of concentrate. Contractor costs are based on existing contracts, where the most relevant costs are the mine hauling contract and light vehicles rental . The costs for the hauling contract were calculated considering contract rates, truck productivity, and necessary working hours to support the mine plan, including fixed contract costs . Concentrate transport costs are based on a 50/50 weighting between international and domestic sales channels. Table 21 - 2: Average LOM Operating Costs Underground Operations Open Pit Operations Mine (BRL per tonne mined) (BRL per tonne moved) (BRL per tonne processed) Cost Parameter, Average LOM Pilar UG Vermelhos UG Mine Surubim Mine, underground Surubim Mine, open pit N8/N9 & N5 (Siriema) OP Mines Suçuarana OP Mine Mining Cost 157.07 147.54 153.36 11.06 11.06 11.06 Transport to Caraíba Mill n/a 53.16 16.88 16.88 34.23 10.32 Processing Costs* 49.25 49.25 30.15 30.15 30.15 30.15 Concentrate Transport (BRL per wet metric tonne of concentrate) 404.69 404.69 404.69 404.69 404.69 404.69 (*) Fixed processing costs are allocated to the Pilar UG and Vermelhos UG Mines which comprise the majority of Caraíba Mill feed. 25 November 2019 Rev. F 355
2022 M INERAL R ESOURCES AND M INERAL R ESERVES OF T HE C ARAÍBA O PERATIONS , C URAÇÁ V ALLEY , B AHIA , B RAZIL F ORM 43 - 101F1 T ECHNICAL R EPORT 22 ECONOMIC ANALYSIS Financial information has been excluded as Ero Copper is a producing issuer, as such term is defined under NI 43 - 101. The Caraíba Operations are currently in production and no material expansion of operations is currently planned. 25 November 2019 Rev. F 356
2022 M INERAL R ESOURCES AND M INERAL R ESERVES OF T HE C ARAÍBA O PERATIONS , C URAÇÁ V ALLEY , B AHIA , B RAZIL F ORM 43 - 101F1 T ECHNICAL R EPORT 23 ADJACENT PROPERTIES The information contained in this Report is based solely on the Caraíba Operations and the mineral assets therein. 25 November 2019 Rev. F 357
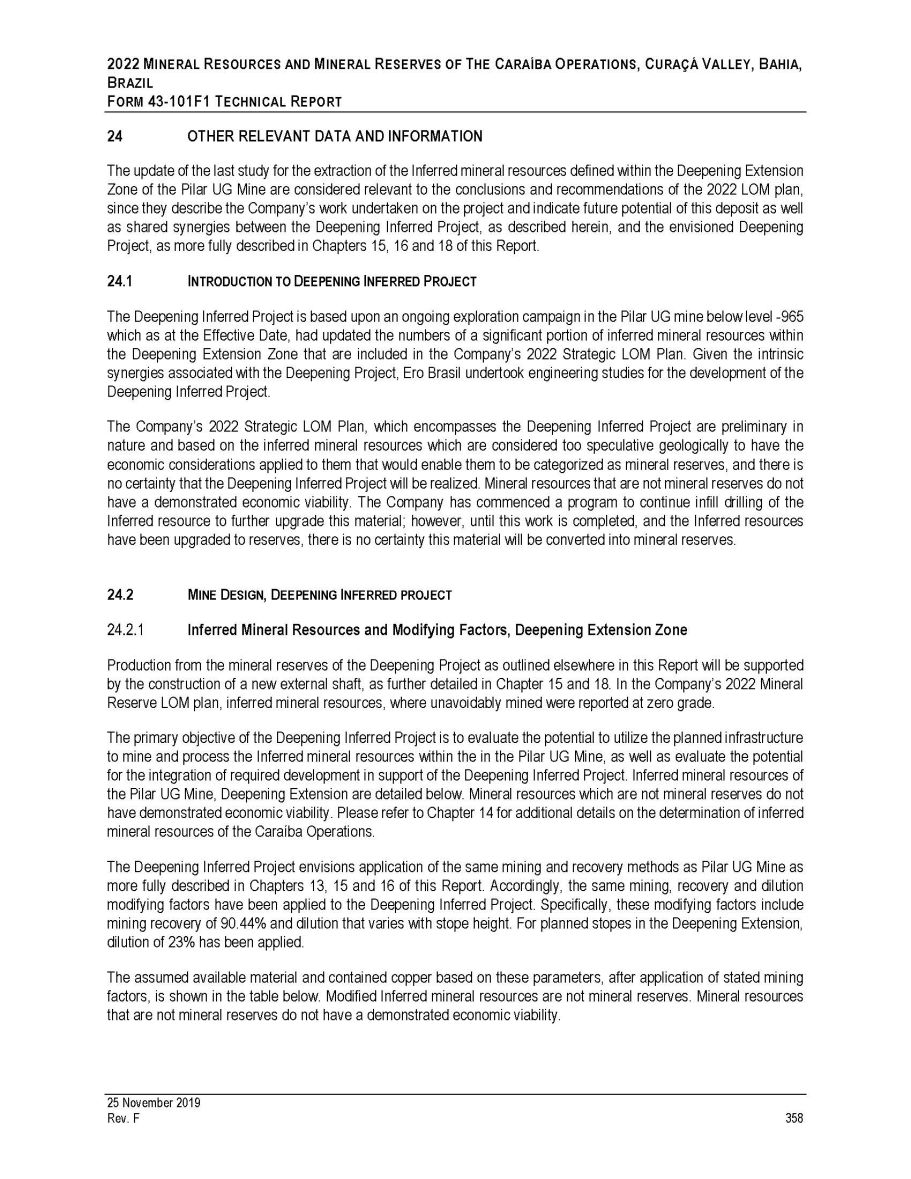
2022 M INERAL R ESOURCES AND M INERAL R ESERVES OF T HE C ARAÍBA O PERATIONS , C URAÇÁ V ALLEY , B AHIA , B RAZIL F ORM 43 - 101 F 1 T ECHNICAL R EPORT 24 OTHER RELEVANT DATA AND INFORMATION The update of the last study for the extraction of the Inferred mineral resources defined within the Deepening Extension Zone of the Pilar UG Mine are considered relevant to the conclusions and recommendations of the 2022 LOM plan, since they describe the Company’s work undertaken on the project and indicate future potential of this deposit as well as shared synergies between the Deepening Inferred Project, as described herein, and the envisioned Deepening Project, as more fully described in Chapters 15 , 16 and 18 of this Report . 1. I NTRODUCTION TO D EEPENING I NFERRED P ROJECT The Deepening Inferred Project is based upon an ongoing exploration campaign in the Pilar UG mine below level - 965 which as at the Effective Date, had updated the numbers of a significant portion of inferred mineral resources within the Deepening Extension Zone that are included in the Company’s 2022 Strategic LOM Plan . Given the intrinsic synergies associated with the Deepening Project, Ero Brasil undertook engineering studies for the development of the Deepening Inferred Project . The Company’s 2022 Strategic LOM Plan, which encompasses the Deepening Inferred Project are preliminary in nature and based on the inferred mineral resources which are considered too speculative geologically to have the economic considerations applied to them that would enable them to be categorized as mineral reserves, and there is no certainty that the Deepening Inferred Project will be realized . Mineral resources that are not mineral reserves do not have a demonstrated economic viability . The Company has commenced a program to continue infill drilling of the Inferred resource to further upgrade this material ; however, until this work is completed, and the Inferred resources have been upgraded to reserves, there is no certainty this material will be converted into mineral reserves . 2. M INE D ESIGN , D EEPENING I NFERRED PROJECT Inferred Mineral Resources and Modifying Factors, Deepening Extension Zone Production from the mineral reserves of the Deepening Project as outlined elsewhere in this Report will be supported by the construction of a new external shaft, as further detailed in Chapter 15 and 18 . In the Company’s 2022 Mineral Reserve LOM plan, inferred mineral resources, where unavoidably mined were reported at zero grade . The primary objective of the Deepening Inferred Project is to evaluate the potential to utilize the planned infrastructure to mine and process the Inferred mineral resources within the in the Pilar UG Mine, as well as evaluate the potential for the integration of required development in support of the Deepening Inferred Project . Inferred mineral resources of the Pilar UG Mine, Deepening Extension are detailed below . Mineral resources which are not mineral reserves do not have demonstrated economic viability . Please refer to Chapter 14 for additional details on the determination of inferred mineral resources of the Caraíba Operations . The Deepening Inferred Project envisions application of the same mining and recovery methods as Pilar UG Mine as more fully described in Chapters 13 , 15 and 16 of this Report . Accordingly, the same mining, recovery and dilution modifying factors have been applied to the Deepening Inferred Project . Specifically, these modifying factors include mining recovery of 90 . 44 % and dilution that varies with stope height . For planned stopes in the Deepening Extension, dilution of 23 % has been applied . The assumed available material and contained copper based on these parameters, after application of stated mining factors, is shown in the table below . Modified Inferred mineral resources are not mineral reserves . Mineral resources that are not mineral reserves do not have a demonstrated economic viability . 25 November 2019 Rev. F 358
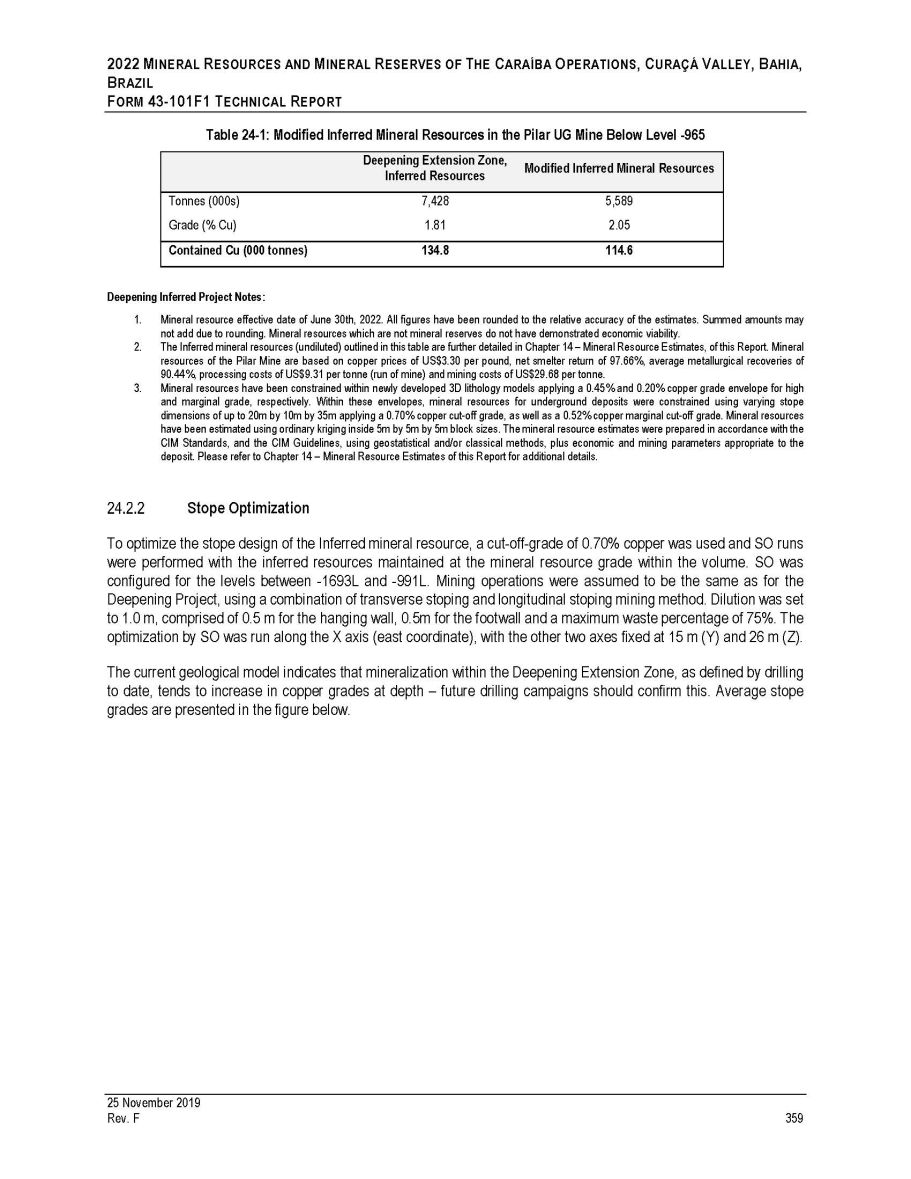
2022 M INERAL R ESOURCES AND M INERAL R ESERVES OF T HE C ARAÍBA O PERATIONS , C URAÇÁ V ALLEY , B AHIA , B RAZIL F ORM 43 - 101F1 T ECHNICAL R EPORT Table 24 - 1: Modified Inferred Mineral Resources in the Pilar UG Mine Below Level - 965 Deepening Extension Zone, Inferred Resources Modified Inferred Mineral Resources Tonnes (000s) 7,428 5,589 Grade (% Cu) 1.81 2.05 Contained Cu (000 tonnes) 134.8 114.6 Deepening Inferred Project Notes : 1. Mineral resource effective date of June 30 th, 2022 . All figures have been rounded to the relative accuracy of the estimates . Summed amounts may not add due to rounding . Mineral resources which are not mineral reserves do not have demonstrated economic viability . 2. The Inferred mineral resources (undiluted) outlined in this table are further detailed in Chapter 14 – Mineral Resource Estimates, of this Report . Mineral resources of the Pilar Mine are based on copper prices of US $ 3 . 30 per pound, net smelter return of 97 . 66 % , average metallurgical recoveries of 90 . 44 % , processing costs of US $ 9 . 31 per tonne (run of mine) and mining costs of US $ 29 . 68 per tonne . 3. Mineral resources have been constrained within newly developed 3 D lithology models applying a 0 . 45 % and 0 . 20 % copper grade envelope for high and marginal grade, respectively . Within these envelopes, mineral resources for underground deposits were constrained using varying stope dimensions of up to 20 m by 10 m by 35 m applying a 0 . 70 % copper cut - off grade, as well as a 0 . 52 % copper marginal cut - off grade . Mineral resources have been estimated using ordinary kriging inside 5 m by 5 m by 5 m block sizes . The mineral resource estimates were prepared in accordance with the CIM Standards, and the CIM Guidelines, using geostatistical and/or classical methods, plus economic and mining parameters appropriate to the deposit . Please refer to Chapter 14 – Mineral Resource Estimates of this Report for additional details . Stope Optimization To optimize the stope design of the Inferred mineral resource, a cut - off - grade of 0 . 70 % copper was used and SO runs were performed with the inferred resources maintained at the mineral resource grade within the volume . SO was configured for the levels between - 1693 L and - 991 L . Mining operations were assumed to be the same as for the Deepening Project, using a combination of transverse stoping and longitudinal stoping mining method . Dilution was set to 1 . 0 m, comprised of 0 . 5 m for the hanging wall, 0 . 5 m for the footwall and a maximum waste percentage of 75 % . The optimization by SO was run along the X axis (east coordinate), with the other two axes fixed at 15 m (Y) and 26 m (Z) . The current geological model indicates that mineralization within the Deepening Extension Zone, as defined by drilling to date, tends to increase in copper grades at depth – future drilling campaigns should confirm this . Average stope grades are presented in the figure below . 25 November 2019 Rev. F 359
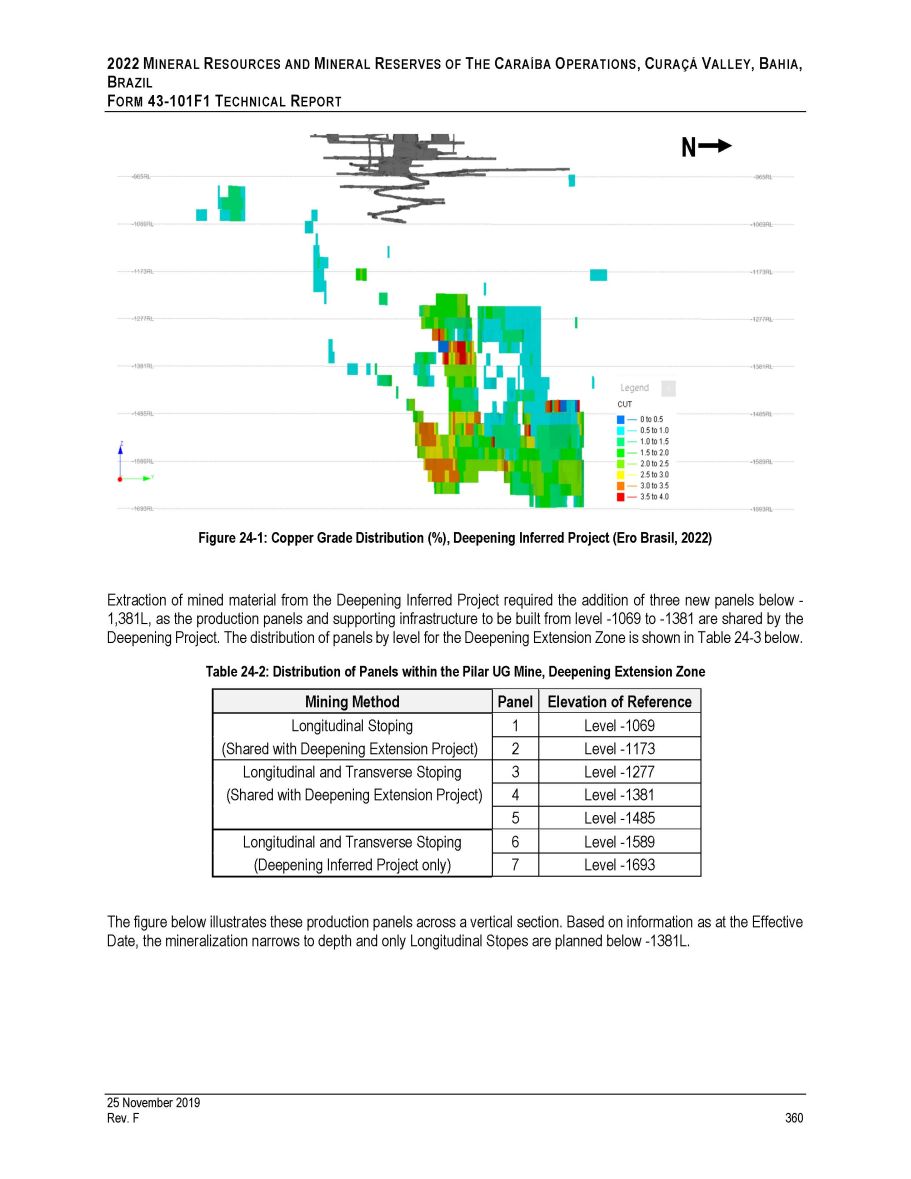
2022 M INERAL R ESOURCES AND M INERAL R ESERVES OF T HE C ARAÍBA O PERATIONS , C URAÇÁ V ALLEY , B AHIA , B RAZIL F ORM 43 - 101F1 T ECHNICAL R EPORT Figure 24 - 1: Copper Grade Distribution (%), Deepening Inferred Project (Ero Brasil, 2022) Extraction of mined material from the Deepening Inferred Project required the addition of three new panels below - 1 , 381 L, as the production panels and supporting infrastructure to be built from level - 1069 to - 1381 are shared by the Deepening Project . The distribution of panels by level for the Deepening Extension Zone is shown in Table 24 - 3 below . Table 24 - 2: Distribution of Panels within the Pilar UG Mine, Deepening Extension Zone Mining Method Panel Elevation of Reference Longitudinal Stoping (Shared with Deepening Extension Project) 1 Level - 1069 2 Level - 1173 Longitudinal and Transverse Stoping (Shared with Deepening Extension Project) 3 Level - 1277 4 Level - 1381 5 Level - 1485 Longitudinal and Transverse Stoping (Deepening Inferred Project only) 6 Level - 1589 7 Level - 1693 The figure below illustrates these production panels across a vertical section. Based on information as at the Effective Date, the mineralization narrows to depth and only Longitudinal Stopes are planned below - 1381L. N 25 November 2019 Rev. F 360
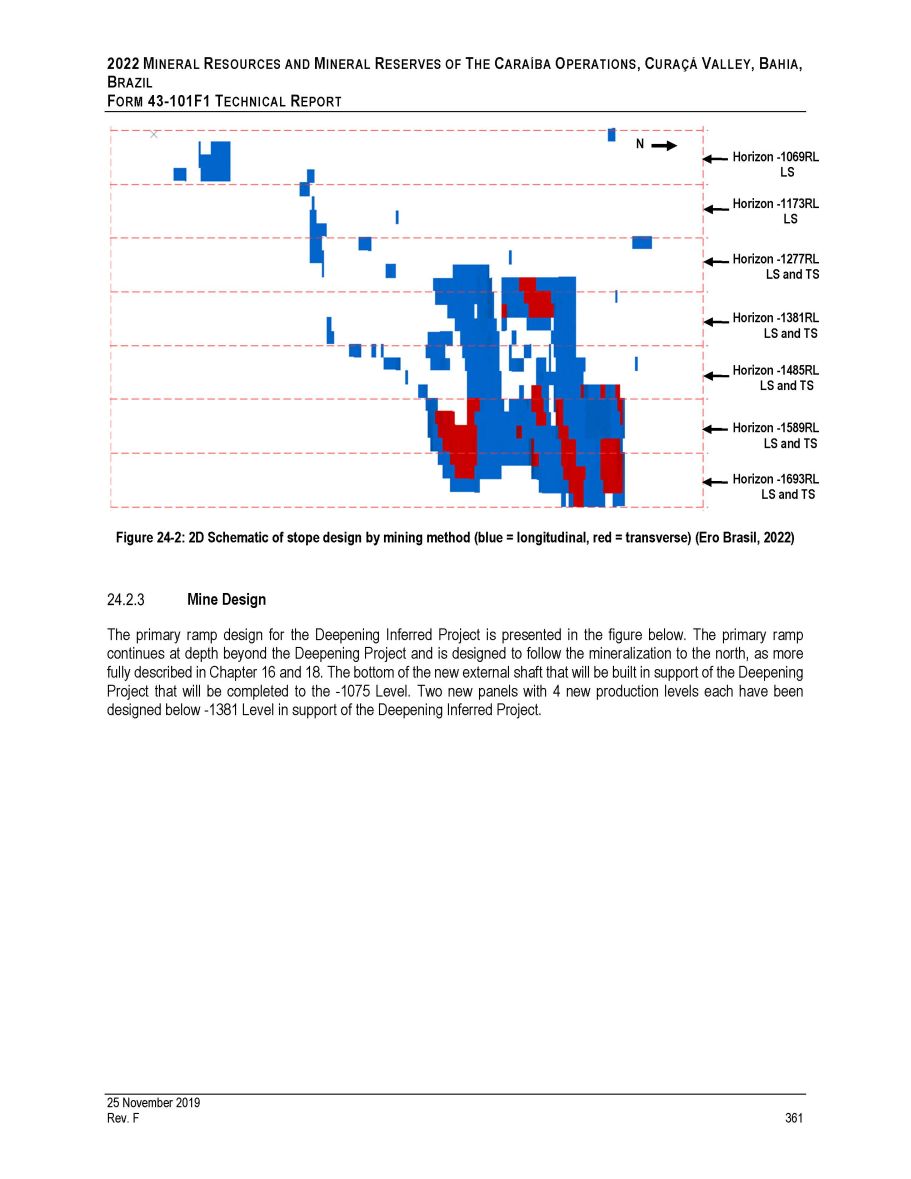
Mine Design The primary ramp design for the Deepening Inferred Project is presented in the figure below . The primary ramp continues at depth beyond the Deepening Project and is designed to follow the mineralization to the north, as more fully described in Chapter 16 and 18 . The bottom of the new external shaft that will be built in support of the Deepening Project that will be completed to the - 1075 Level . Two new panels with 4 new production levels each have been designed below - 1381 Level in support of the Deepening Inferred Project . 2022 M INERAL R ESOURCES AND M INERAL R ESERVES OF T HE C ARAÍBA O PERATIONS , C URAÇÁ V ALLEY , B AHIA , B RAZIL F ORM 43 - 101F1 T ECHNICAL R EPORT N Horizon - 1069RL LS Horizon - 1173RL LS Horizon - 1277RL LS and TS Horizon - 1381RL LS and TS Horizon - 1485RL LS and TS Horizon - 1589RL LS and TS Horizon - 1693RL LS and TS Figure 24 - 2: 2D Schematic of stope design by mining method (blue = longitudinal, red = transverse) (Ero Brasil, 2022) 25 November 2019 Rev. F 361
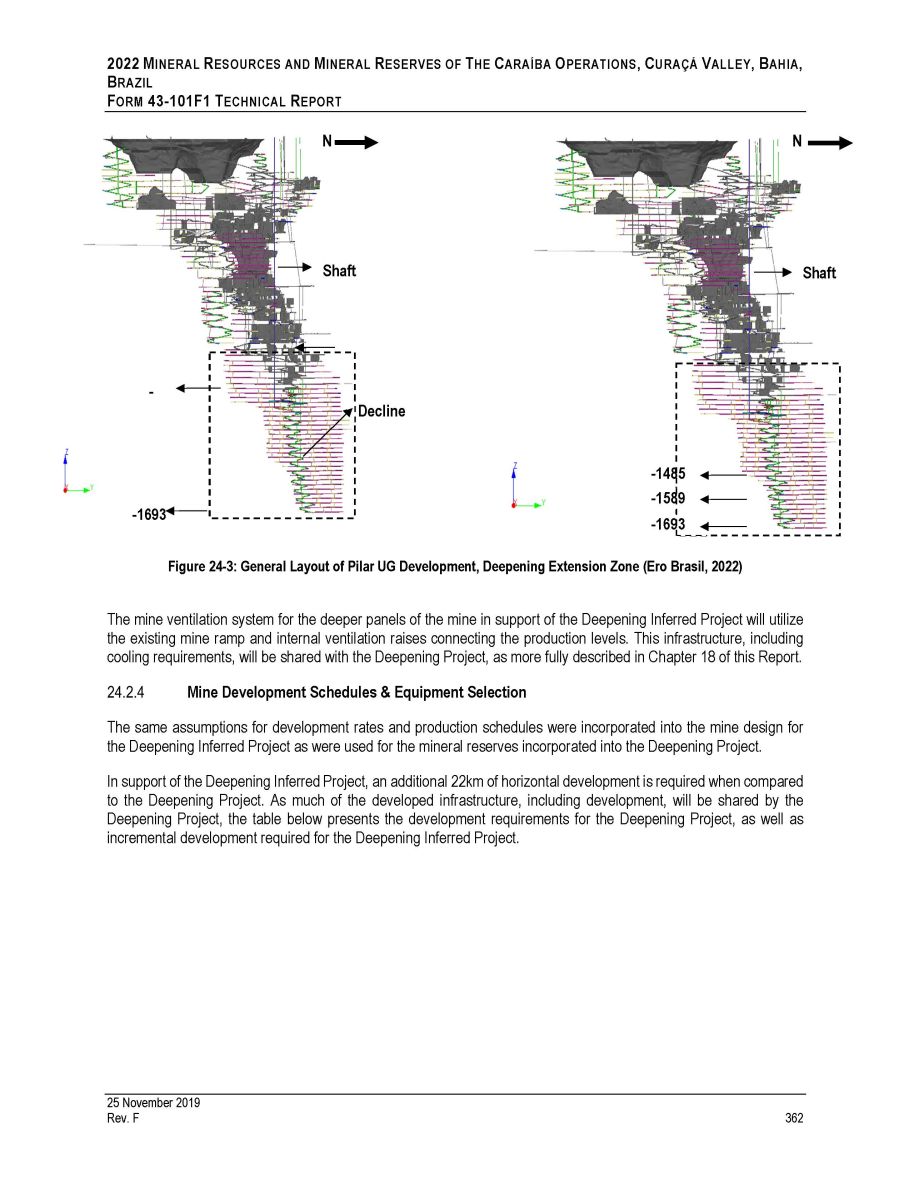
Figure 24 - 3: General Layout of Pilar UG Development, Deepening Extension Zone (Ero Brasil, 2022) The mine ventilation system for the deeper panels of the mine in support of the Deepening Inferred Project will utilize the existing mine ramp and internal ventilation raises connecting the production levels . This infrastructure, including cooling requirements, will be shared with the Deepening Project, as more fully described in Chapter 18 of this Report . Mine Development Schedules & Equipment Selection The same assumptions for development rates and production schedules were incorporated into the mine design for the Deepening Inferred Project as were used for the mineral reserves incorporated into the Deepening Project . In support of the Deepening Inferred Project, an additional 22 km of horizontal development is required when compared to the Deepening Project . As much of the developed infrastructure, including development, will be shared by the Deepening Project, the table below presents the development requirements for the Deepening Project, as well as incremental development required for the Deepening Inferred Project . Decline - - 1693 Shaft 2022 M INERAL R ESOURCES AND M INERAL R ESERVES OF T HE C ARAÍBA O PERATIONS , C URAÇÁ V ALLEY , B AHIA , B RAZIL F ORM 43 - 101F1 T ECHNICAL R EPORT N N - 1485 - 1589 - 1693 Shaft 25 November 2019 Rev. F 362
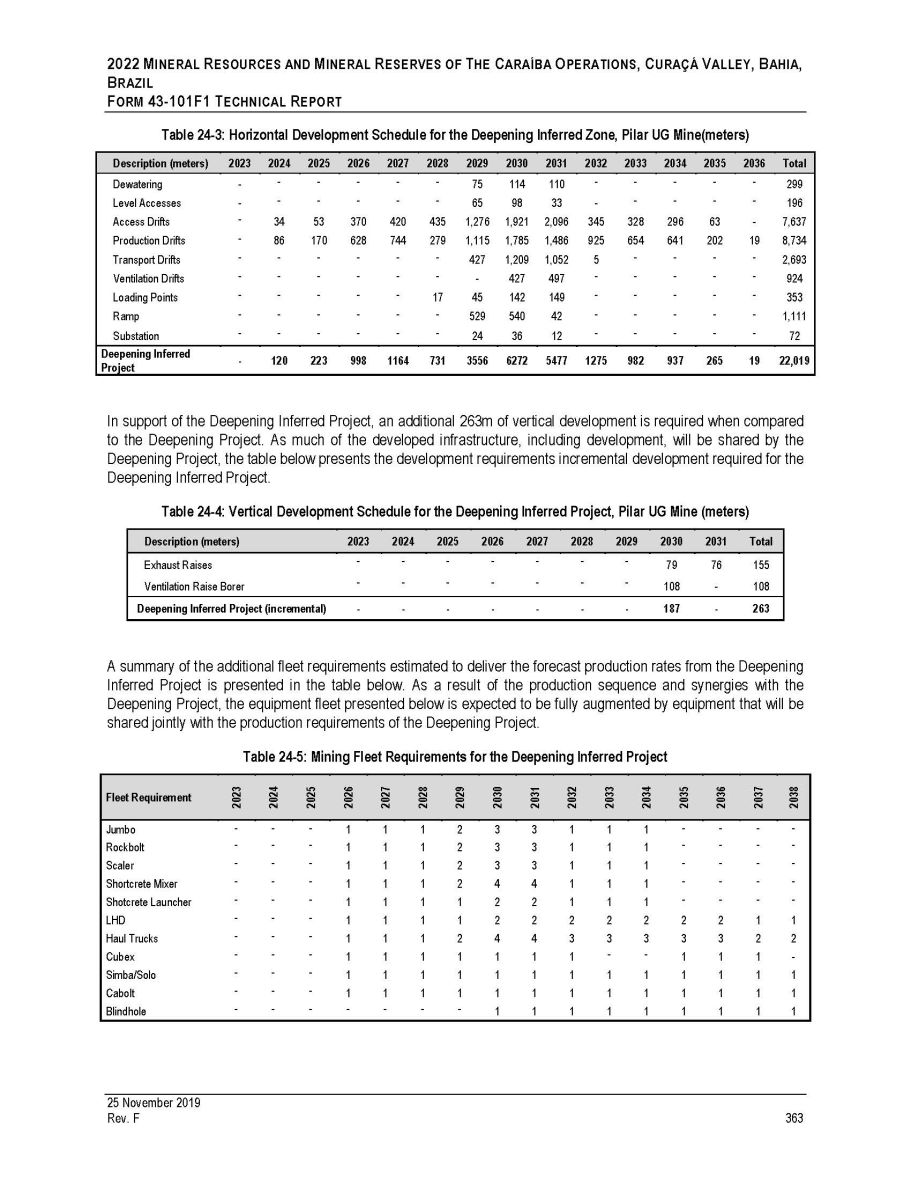
2022 M INERAL R ESOURCES AND M INERAL R ESERVES OF T HE C ARAÍBA O PERATIONS , C URAÇÁ V ALLEY , B AHIA , B RAZIL F ORM 43 - 101F1 T ECHNICAL R EPORT Table 24 - 3: Horizontal Development Schedule for the Deepening Inferred Zone, Pilar UG Mine(meters) Description (meters) 2023 2024 2025 2026 2027 2028 2029 2030 2031 2032 2033 2034 2035 2036 Total Dewatering - - - - - - 75 114 110 - - - - - 299 Level Accesses - - - - - - 65 98 33 - - - - - 196 Access Drifts - 34 53 370 420 435 1,276 1,921 2,096 345 328 296 63 - 7,637 Production Drifts - 86 170 628 744 279 1,115 1,785 1,486 925 654 641 202 19 8,734 Transport Drifts - - - - - - 427 1,209 1,052 5 - - - - 2,693 Ventilation Drifts - - - - - - - 427 497 - - - - - 924 Loading Points - - - - - 17 45 142 149 - - - - - 353 Ramp - - - - - - 529 540 42 - - - - - 1,111 Substation - - - - - - 24 36 12 - - - - - 72 Deepening Inferred Project - 120 223 998 1164 731 3556 6272 5477 1275 982 937 265 19 22,019 25 November 2019 Rev. F 363 In support of the Deepening Inferred Project, an additional 263 m of vertical development is required when compared to the Deepening Project . As much of the developed infrastructure, including development, will be shared by the Deepening Project, the table below presents the development requirements incremental development required for the Deepening Inferred Project . Table 24 - 4: Vertical Development Schedule for the Deepening Inferred Project, Pilar UG Mine (meters) Description (meters) 2023 2024 2025 2026 2027 2028 2029 2030 2031 Total Exhaust Raises Ventilation Raise Borer - - - - - - - - - - - - - - 79 108 76 - 155 108 Deepening Inferred Project (incremental) - - - - - - - 187 - 263 A summary of the additional fleet requirements estimated to deliver the forecast production rates from the Deepening Inferred Project is presented in the table below . As a result of the production sequence and synergies with the Deepening Project, the equipment fleet presented below is expected to be fully augmented by equipment that will be shared jointly with the production requirements of the Deepening Project . Table 24 - 5: Mining Fleet Requirements for the Deepening Inferred Project Fleet Requirement 2023 2024 2025 2026 2027 2028 2029 2030 2031 2032 2033 2034 2035 2036 2037 2038 Jumbo - - - 1 1 1 2 3 3 1 1 1 - - - - Rockbolt - - - 1 1 1 2 3 3 1 1 1 - - - - Scaler - - - 1 1 1 2 3 3 1 1 1 - - - - Shortcrete Mixer - - - 1 1 1 2 4 4 1 1 1 - - - - Shotcrete Launcher - - - 1 1 1 1 2 2 1 1 1 - - - - LHD - - - 1 1 1 1 2 2 2 2 2 2 2 1 1 Haul Trucks - - - 1 1 1 2 4 4 3 3 3 3 3 2 2 Cubex - - - 1 1 1 1 1 1 1 - - 1 1 1 - Simba/Solo - - - 1 1 1 1 1 1 1 1 1 1 1 1 1 Cabolt - - - 1 1 1 1 1 1 1 1 1 1 1 1 1 Blindhole - - - - - - - 1 1 1 1 1 1 1 1 1
2022 M INERAL R ESOURCES AND M INERAL R ESERVES OF T HE C ARAÍBA O PERATIONS , C URAÇÁ V ALLEY , B AHIA , B RAZIL F ORM 43 - 101 F 1 T ECHNICAL R EPORT QP Opinion, Deepening Inferred Project The authors of this Report have reviewed the Deepening Inferred Project technical parameters and found them to be in - line with industry best - practices . The Deepening Inferred Project is preliminary in nature and based on the Inferred mineral resources of the Deepening Extension Zone which are considered too speculative geologically to have the economic considerations applied to them that would enable them to be categorized as mineral reserves, and there is no certainty that the Deepening Inferred Project will be realized as part of the Company’s Strategic LOM Production Plan . Mineral resources that are not mineral reserves do not have a demonstrated economic viability . The Company has commenced a program to continue infill drilling of the Inferred resource to further upgrade this material ; however, until this work is completed, and the Inferred resources have been upgraded to reserves, there is no certainty this material will be converted into mineral reserves . The authors of this Report recommend that the planned drill program be executed to promote the resource classification from Inferred to Measured or Indicated . Additionally, engineering work should continue alongside the exploration program to promote the confidence of the mine design and costing parameters . 25 November 2019 Rev. F 364
2022 M INERAL R ESOURCES AND M INERAL R ESERVES OF T HE C ARAÍBA O PERATIONS , C URAÇÁ V ALLEY , B AHIA , B RAZIL F ORM 43 - 101F1 T ECHNICAL R EPORT 25 25.1 25 November 2019 Rev. F 365 INTERPRETATION AND CONCLUSIONS M INERAL E XPLORATION AND G EOLOGY In general terms, the geological descriptions, sampling procedures and density tests that were evaluated were found to be of acceptable quality and in accordance with industry best practices . It was noted that the data collection process was executed with the aim of maintaining data security . Data was stored in a standardized database, which was found to be secure and auditable . The complexity of the mineralization controls and the quantity and phases of data in the Curaçá Valley merits the use of visualization and data integration tools that are more advanced than those which Ero Brasil had at its disposal at the time of this Technical Report . While GE 21 believes that the current QA/QC program can guarantee the quality of the exploration data used in the resource estimates, GE 21 suggests that a chain of custody program be implemented for good measure . GE 21 supervised the process through which density was determined and concluded that it was in conformity with industry best practices . 2. QA/QC GE 21 performed the evaluation of the data generated after the last validation and concludes that the QAQC procedures are being followed using the same standards . GE 21 considered the standard QA/QC procedures to be in accordance with mining industry best practice and appropriate for use in the current mineral resource estimate . It was observed throughout the GE 21 review period, that the Ero Brasil laboratory continues to display a tendency to systematically underestimate the copper assay values when using CRM ITAK 825 ; however, the results of the laboratory when using CRM ITAK 851 , which features a similar copper grade range, demonstrate better reproducibility . 3. G EOLOGICAL M ODEL The procedure that was adopted to produce the 3 D geological model (wireframes), consisting of generating triangulations between interpreted geological cross sections, was executed properly and in accordance with the opinions of GE 21 staff . Due to the plunge of the mineralized zone at the Pilar UG Mine towards the north and the east - west geological cross sections, a pattern of sub - vertical discontinuous lenses was created locally within the regions of lower drill hole density . Despite these occurrences, verification of the mineralized zone interpretation was performed within regions of denser drill spacing . GE 21 noted that, with respect to the integration and interpretation of geological data, limited lithostructural mapping (mine, surface and subsurface) had been undertaken and no supporting petrographic data was used . GE 21 also notes that the field interpretation and 3 D interpretation were historically focused on interpreting only copper grade, therefore, few vertical and horizontal lithostructural geological sections were developed which may provide greater understanding and control of aspects relating to the geology and other potential metals of significance in the Curaçá Valley . In 2020 , Ero Brasil started to adopt 3 D implicit modelling techniques based upon grouped lithologies and copper grade shells using Leapfrog software . This methodology was used by GE 21 to create 3 D validation models . GE 21 believes this methodology of modelling helps to standardize the modelling of different targets by different teams .
2022 M INERAL R ESOURCES AND M INERAL R ESERVES OF T HE C ARAÍBA O PERATIONS , C URAÇÁ V ALLEY , B AHIA , B RAZIL F ORM 43 - 101 F 1 T ECHNICAL R EPORT 4. G RADE E STIMATION The variograms that were used in the estimation method are satisfactory and consistent with respect to the grade estimation that was calculated via Ordinary Kriging, making use of search anisotropy determined in the variographic study . The Kriging estimation strategy that was chosen made it possible to classify the resource in accordance with an empirically calculated search radius and the requisite data density for resource classification. GE 21 considers the resource classification model and the analysis of criteria for the classification of those Mineral Resources, to be satisfactory although some items could be improved . Such recommended improvements did not impose limitations on the classification of Measured and Indicated Resources . 5. M INERAL R ESOURCE E STIMATE GE21 has not identified any mining, metallurgical, infrastructure, permitting, legal, political, environmental, technical, or other relevant factors that could materially affect the potential development of Mineral Resources. 6. M INERAL R ESERVE E STIMATE BNA and NCL SpA carried out a detailed review of the current mineral reserves for Curaçá Valley, aimed at demonstrating its technical and profitable extraction for the production and sale of copper concentrate . The results for this review, demonstrated a good adherence using detailed verification procedures performed by the authors of this Report . In general resulting in differences of less than 1 % in the total copper metal contained, which BNA considered acceptable . The authors of this Report note the following related to the current mineral reserve: The metallurgical recovery benefits from the commissioned and operational HIG Mill were applied to the underground mining operations of Ero Brasil ; Within the Vermelhos District ore sorting will be integrated within the open pit operations to reduce transport and processing costs . However, these potential savings have not been considered in current reserve estimation as the global Ero Brasil geology team continues to conduct additional project assessments as at the Effective Date of this Report ; The core operating mines of the Company (Pilar UG Mine and Vermelhos UG Mine) currently employ a joint reconciliation process in which it is difficult to accurately differentiate mine - to - mill reconciliation from one mine to another ; and, As at the date of this Report, the ventilation and cooling infrastructure for the Pilar UG Mine, is being upgraded according to the plans developed by Ero Brasil . The mineral reserve estimation has been performed according to industry best practice and conform to the CIM Standards and CIM Guidelines. BNA has not identified any mining, metallurgical, infrastructure, permitting, legal, political, environmental, technical, or other relevant factors that could materially affect the potential development of the current mineral reserves. 25 November 2019 Rev. F 366

2022 M INERAL R ESOURCES AND M INERAL R ESERVES OF T HE C ARAÍBA O PERATIONS , C URAÇÁ V ALLEY , B AHIA , B RAZIL F ORM 43 - 101F1 T ECHNICAL R EPORT 26 26.1 25 November 2019 Rev. F 367 RECOMMENDATIONS M INERAL R ESOURCE E STIMATION Regarding the mineral resource estimate, the authors recommend a work program to include the following, most of which can be completed at little or no cost. Estimated costs of the work program are shown in the table below. i. Formalize the use of implicit modelling internally throughout the Company, emphasizing structural geology and variation in lithology for domain definition and exploration target integration. ii. Implement additional empirical criteria for resource classification, based on the ‘15% Rule’, as commonly attributed to Dr. Harry Parker and since expanded upon in multiple sources of geostatistical literature. iii. Expand ongoing geometallurgical studies to encompass all deposits and blends therein to study mill feed interaction . Suggest including standardized laboratory tests as normal operating procedure . Additionally, it is recommended that the Company advance geometallurgical studies for inclusion in mineral reserve definition, in order to classify metallurgical recovery according to the different characteristics associated with each lithological domain rather than by deposit . iv. Validate of the certified grade for CRM ITAK 825 due to the observed inconsistencies in assay values, in contrast with the consistent results obtained when utilizing CRM ITAK 851 , which has a similar Cu grade range . v. Recommend standardizing QA/QC mass controls during assay sample crushing and grinding in order to evaluate the quality of the comminution procedures and ensure no sample loss during sample preparation . vi. Install a sample tower to improve the mine to mill reconciliation process for the current operating mines . Such an installation will allow differentiation of ore source reconciliation within the processing plant . vii. Improve systems for mineral reserve attribute database management to standardize fleet sizing, economic and consumable parameters, swell factors, dilution and mine call factors as well as store historic block model and design attributes including mathematical pit designs and supporting assumptions within a centralized validated database to improve the application of mineral reserve modifying factors in future studies . Table 26 - 1: Proposed Budget for Recommended Work, Mineral Resources Program Budget (US$) Advance geometallurgical studies $200,000 Continued multi - element assays for the Vermelhos District (incl. check assays) $50,000 Installation of sampling tower to enhance Mine - to - Mill reconciliation for multiple mining operations $500,000 Improvement of reconciliation systems $60,000 Advance geotechnical monitoring campaigns and geotechnical - lithology model development $100,000 Deepening Inferred Project drill program $7,000,000 Total $7,910,000
2022 M INERAL R ESOURCES AND M INERAL R ESERVES OF T HE C ARAÍBA O PERATIONS , C URAÇÁ V ALLEY , B AHIA , B RAZIL F ORM 43 - 101 F 1 T ECHNICAL R EPORT 2. M INERAL R ESERVE E STIMATION Additional engineering work should continue alongside the exploration program to promote the confidence of the mine design and costing parameters of the Strategic LOM Production Plan, including stress modelling & monitoring system for the Pilar UG Mine, pilot test for stopes in the Honeypot area to calibrate modifying factors, expansion of survey investigation on the historic mining and Baraúna crown pillar stability analysis . The Qualified Person, Dr . Beck Nader of BNA notes the following recommendations related to mineral reserve estimation : Continue with the ongoing geometallurgical studies to encompass all deposits and blends therein to study mill feed interaction . Suggest including standardized laboratory tests as normal operating procedure . Additionally, it is recommended that the Company advance geometallurgical studies for inclusion in mineral reserve definition, in order to classify metallurgical recovery according to the different characteristics associated with each lithological domain rather than by deposit . Continuing with the studies to improve the mine to mill reconciliation process for the current operating mines. Continue with the system improvements for the mineral reserve attribute database management to standardize fleet sizing, economic and consumable parameters, swell factors, dilution, and mine call factors as well as store historic block model and design attributes including mathematical pit designs and supporting assumptions within a centralized validated database to improve the application of mineral reserve modifying factors in future studies . The authors recommend that a drill program for the Deepening Inferred Project be executed to promote the resource classification from Inferred to Measured or Indicated . Additional engineering work should continue alongside the exploration program to promote the confidence of the mine design and costing parameters of the Deepening Inferred Project . The authors note at the time of this Report, such programs were underway . The SMU methodology was applied to estimate the dilution for the Open Pit projects and for the Underground projects modeled stope dilution was estimated using the equivalent linear over - break slough (“ELOS”) method including additional 1 . 0 m in the Hangingwall (HW) and 1 . 0 m in the Footwall (FW) . Future studies should be done to improve the application of mineral reserve modifying factors . Alejandro Sepúlveda, Qualified Person of NCL SpA recommends the following actions for Project Honeypot and the Upper Areas of the Pilar UG Mine : Develop a stress measurement campaign and a comprehensive lithological geotechnical and structural model . Utilize the seismic and stress monitoring data for design and scheduling. The integration with current operations must produce minimum interferences. Prepare a detailed analysis, including boreholes to ensure the backfill type and the strength of the cemented paste fill on those stopes already mined . This is highly recommended for Sector 1 and Sector 2 of the Pilar UG Mine . Develop engineering for a comprehensive stope test on the areas limited by historic excavations . The following information should be validated from these tests : 25 November 2019 Rev. F 368
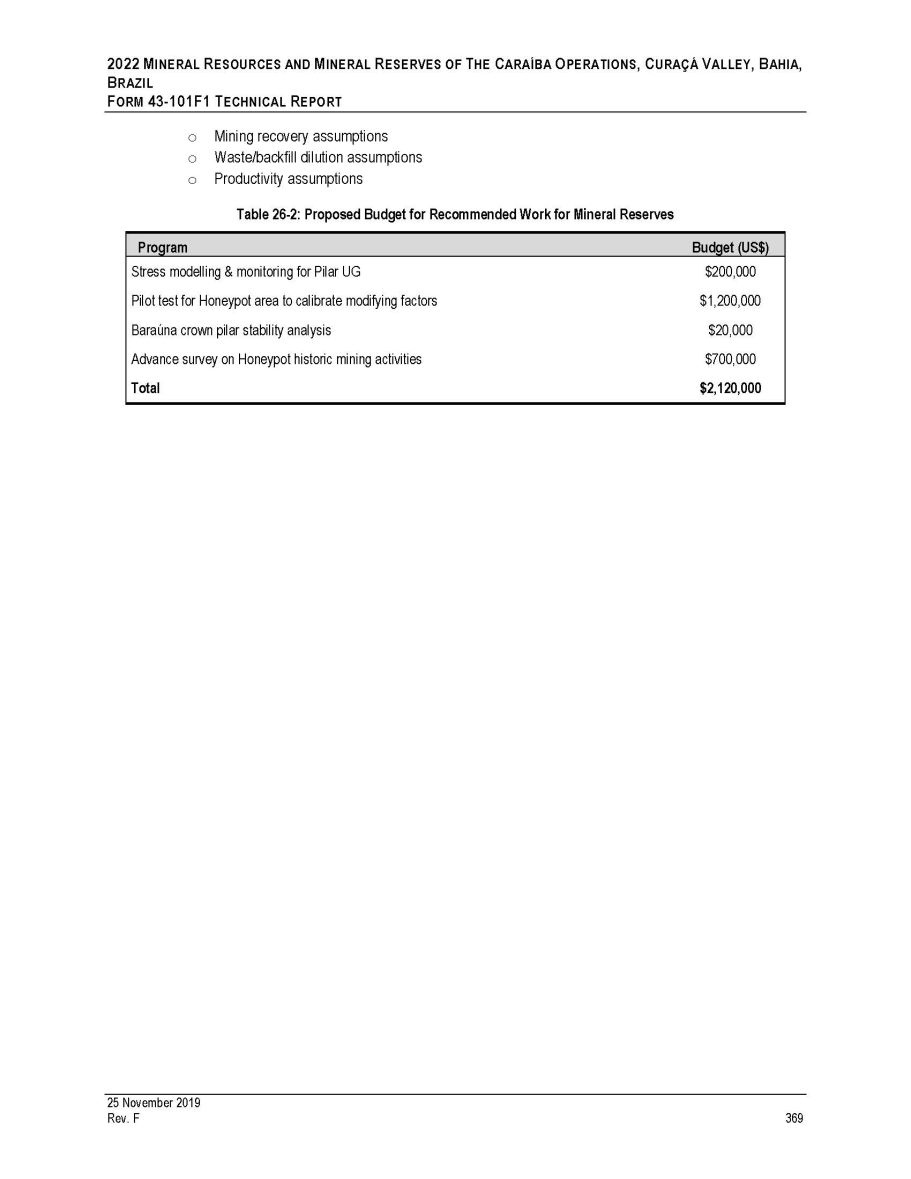
2022 M INERAL R ESOURCES AND M INERAL R ESERVES OF T HE C ARAÍBA O PERATIONS , C URAÇÁ V ALLEY , B AHIA , B RAZIL F ORM 43 - 101F1 T ECHNICAL R EPORT o Mining recovery assumptions o Waste/backfill dilution assumptions o Productivity assumptions Table 26 - 2: Proposed Budget for Recommended Work for Mineral Reserves Program Budget (US$) Stress modelling & monitoring for Pilar UG $200,000 Pilot test for Honeypot area to calibrate modifying factors $1,200,000 Baraúna crown pilar stability analysis $20,000 Advance survey on Honeypot historic mining activities $700,000 Total $2,120,000 25 November 2019 Rev. F 369
2022 M INERAL R ESOURCES AND M INERAL R ESERVES OF T HE C ARAÍBA O PERATIONS , C URAÇÁ V ALLEY , B AHIA , B RAZIL F ORM 43 - 101F1 T ECHNICAL R EPORT 27 25 November 2019 Rev. F 370 REFERENCES Barbosa, J . S . F . and Sabaté, P . 2002 . Geological features and the Paleoproterozoic colic collision of four Archean crustal segments of the São Francisco Craton, Bahia, Brazil . A Synthesis . Annals of the Brazilian Academy of Sciences, vol 74 , pp . 434 - 359 . Barbosa, J . S . F . and Sabaté, P . 2004 , Archean and Paleoproterozoic crust of the São Francisco Craton, Bahia, Brazil : geodynamic features, in : Precambrian Research, Volume 133 , Issues 1 - 2 , Abstract . Barbosa, J . S . F . , Leal, A . B . de M . , 2016 . Ultrahigh - temperature metamorphism of 2 . 0 Ga - old sapphirine - bearing granulite from the Itabuna - Salvador - Curaçá block, Bahia, Brazil . Revista do Instituto de Geosciencias – USP v . 17 , n . 1 , pp . 89 - 108 . Born, R . H . , Meyer, F . M . & Cawthorn, R . G . 1994 . Stable isotopic evidence for crustal contamination and desulfidation of the cupriferous Koperberg Suite, Namaqualand, South Africa . Geochim Cosmochim Acta, vol . 58 , pp . 2677 - 2687 . Cawrthorn, R . G . & Meyer, F . M . , 1993 . Petrochemistry of the Okiep copper district basic intrusive bodies, northwestern Cape province, South Africa . Economic Geology, vol . 88 , pp . 590 - 605 Clifford, T . N . and Barton, E . S . , 2012 . The O’okiep Copper District, Namaqualand, South Africa : a review of the geology with emphasis on the petrogenesis of the cupriferous Koperberg Suite . Miner Deposita, vol . 47 , pp . 837 – 857 . Conceiçao, H . and Otero, O . M . F . 1996 . Magmatismo granítico e alcalino no estado da Bahia : uma epítome do tema . Salvador, SGM, pp . 152 . Correa - Gomes, L . C . , Santiago, S . , Pereira, G . M . , Barbosa, Peucat, J - J . , Paquette, J - L . , Simões, C . B . , 2012 . Novos dados U/Pb para as idades dos protólitos e da colisão entre os Blocos Jequié e Itabuna - Salvador - Curaçá, Cráton do São Francisco, no centro - leste do estado da Bahia, Brasil . In : SBG, CONGRESSO BRASILEIRO DE GEOLOGIA, 46 , Santos . D’El Rey Silva L . J . H . , 1984 . Geologia e controle structural do depósito cuprífero Caraíba, Vale do Curaçá, Bahia, Brasil . Dissertação de mestrado, Universidade Federal da Bahia . 158 pages . D’El Rey Silva L . J . H . , Oliveira J . G . , Gaal E . G . , 1996 . Implication of the Caraíba deposit’s structural controls on the emplacement of the Cu bearing hypersthenites of the Curaçá Valley, Bahia - Brazil . Revista Brasileira de Geociências 26 ( 3 ), pp . 181 - 196 . D’El Rey Silva L . J . H . , Cavalcante P . R . B . , Mota R . R . , Rocha A . M . R da, 1988 . Controle estrutural da mina de cobre Caraíba : implicações na lavra e na tectônica das faixas moveis do Proterozóico inferior . XXXV Congresso Brasileiro de Geologia, Belem, Anais, SBG 1 : 16 - 29 . Desrochers, J - P . 2019 . Core observations, Vermelhos UG visit, Suçuarana OP visit, and regional field visits . Internal presentation for Ero Brasil . 9 pages . Desrochers, J - P . , Porto, F . , Napier, S . , and Thompson, J . F . H, 2020 . Curaca Valley Copper Deposits – Geological and exploration review . Internal Ero Brasil report . 29 pages . Frugis G . L . 2017 . Levantamento estrutural do Vale do Rio Curaçá . Relatório Interno . Mineração Caraíba S . A . Garcia . , P . , 2013 . Metalogenese dos depositos cupriferos de Caraiba, Surubim, Vermelhos e Suçuarana, Vale do Curaca, Bahia, Brasil . M . Sc . thesis . 220 pages . Garcia . , P . , 2017 . A Provincia Cuprifera do Nordeste dos processos e modelos metalogeneticos . Ph . D . thesis . 287 pages .
2022 M INERAL R ESOURCES AND M INERAL R ESERVES OF T HE C ARAÍBA O PERATIONS , C URAÇÁ V ALLEY , B AHIA , B RAZIL F ORM 43 - 101F1 T ECHNICAL R EPORT Garcia, P . M . de P . , Teixeira, J . B . G . , Misi, A . , Silva, J . H . and Silva, M da G . , 2018 . Tectonic and metallogenic evolution of the Curaçá valley copper province, Bahia, Brazil : a review based on new SHRIMP zircon U - Pb dating and sulfur isotope geochemistry . Ore Geology Reviews, vol . 93 , pp . 361 - 381 . Jacutinga, E . , 2020 . Brownfield exploration – Angicos Deposit . Internal MCS report, 10 pages . Ladeira E . A . and Brockes H . Jr . , 1969 . Geologia das quadrículas de Poço de Fora, Esfomesdo, Tanque Novo e Lages, Distrito cuprífero do rio Curaçá, Bahia . Belo Horizonte, DNPM/GEOSOL, Projeto Cobre, Relatório, fev . , Unpublished Report . Mach L . , 2008 . Mineral Resources Update Report - Surubim Project - Bahia, Brazil – SRK Consulting Engineers and Scientists – Project Reference No . 175601 Marques J . C . , Carlson R . W . , 2008 . Re - Os Geochronology of the Várzea do Macaco chromite deposit and Ni prospect, Jacurici Complex, Brazil . Geochim . Cosmochim . Acta . 72 : A 593 . Marques, J . C . and Filho, C . F . F . , 2003 . The Chromite Deposit of the Ipueira - Medrado Sill, São Francisco Craton, Bahia State, Brazil, in : Economic Geology, Volume 98 , pp . 87 - 100 . Marques J . C . , Frantz J . C . , Pimentel M . M . , Dias J . R . P . , Henrichs I . A . , 2010 . U - Pb Zircon Geochronology of alkaline pegmatites : new constraints on the age of the Jacurici Complex, São Francisco Craton, Brazil . In : South American Symposium on Isotope Geology . Brasilia . Maier W . D, and Barnes S . J, 1996 . Unusually High Concentrations of Magnetite at Caraíba and other Cu - Sulphide Deposits in the Curaçá Valley, Bahia, Brazil . The Canadian Mineralogist, Volume 34 , pp . 717 - 731 . Mayer W . D, and Barnes S . J, 1999 . The origin of Cu sulphide deposits in the Curaçá Valley, Bahia – Brazil : Evidence from Cu, Ni, Se and platinum - group element concentration . Economic Geology, vol . 94 , pp . 165 - 184 . Oliveira, E . P . et al . , 2004 . Contrasting copper and chromium metallogenic evolution of terranes in the Paleoproterozoic Itabuna - Salvador - Curaçá orogeny, São Francisco craton, Brazil : new zircon (SHRIMP) and Sm - Nd (model) ages and their significance for orogeny parallel escape tectonics . Precambrian Research, Volume 128 , pp . 143 - 165 . Ramsay, J . G . , 1967 . Folding and Fracturing of Rocks . McGraw - Hill, New York, 568 pages . Silva, L . C . et al . , 1997 . U - Pb SHRIMP ages in the Itabuna - Caraíba TTG high - grade complex : the first window beyond the paleoproterozoic overprinting of the eastern Jequié Craton, NE Brazil . In : Intern . Simp . Granites and Assoc . Mineralizations, 2 , Salvador, Extended Abstracts, pp . 282 , 283 . Silva, L . C . et al . , 2002 . Reavaliação da evolução geológica em terrenos pré - cambrianos brasileiros, com base em novos dados U - Pb SHRIMP, Parte I : Limite centro - oriental do Cráton do São Francisco na Bahia . Revista Brasileira de Geociências, Volume 32 , pp . 501 - 512 . Tappert, R . , 2020 . Petrography of polished drill core slabs from the Siriema deposit, the Vermelhos and Pilar mines, and the Santo Antônio exploration target . Internal report for Ero Copper . Hyperspectral Intelligence Inc . 214 pages . Teixeira, J . B . G . et al . , 2010 . Depósitos de Cobre da região do Vale do Rio Curaçá Bahia . In : BRITO, R . S . C . de ; SILVA, M . G . da ; KUYUMIJAN, R . M . Modelos de Depósitos de Cobre no Brasil e sua resposta ao intemperismo . São Paulo, CPRM . Vazelhes, V . de B . , Bedard, E . and Beaudoin, G . , 2018 . Petrography and mineral chemistry of magnetite . Internal report for Ero Copper . An Introduction to Cut - Off Grade Estimation - Jean - Michel Rendu, SME, 2008 . 115 p . 25 November 2019 Rev. F 371
2022 M INERAL R ESOURCES AND M INERAL R ESERVES OF T HE C ARAÍBA O PERATIONS , C URAÇÁ V ALLEY , B AHIA , B RAZIL F ORM 43 - 101F1 T ECHNICAL R EPORT Hartman, H.L.; Mutmansky, J.M. Introductory to mining engineering. 2nd ed. 2002. 622 p. Hustrulid, W.; Kuchta, M. Open pit mine planning and design. 2nd. ed. London : Taylor and Francis, 2006.v. 1: Fundamentals. SME - AIME (1992) SME Mining engineering handbook. 2nd edition, ed. Hartman, H. L., Littleton, 2v. Underground Mining Methods, William A. Hustrulid, Richard L. Bullock, SME, 2001 - 718 p. 25 November 2019 Rev. F 372
2022 M INERAL R ESOURCES AND M INERAL R ESERVES OF T HE C ARAÍBA O PERATIONS , C URAÇÁ V ALLEY , B AHIA , B RAZIL F ORM 43 - 101F1 T ECHNICAL R EPORT Effective Date: September 30, 2022 Report Date: December 22, 2022 <signed & sealed in the original> Porfírio Cabaleiro Rodriguez, FAIG <signed & sealed in the original> Bernardo Horta de Cerqueira Viana, FAIG <signed & sealed in the original> Fábio Valério Câmara Xavier, MAIG <signed & sealed in the original> Ednie Rafael Moreira de Carvalho Fernandes, MAIG <signed & sealed in the original> Dr. Beck Nader, FAIG <signed & sealed in the original> Alejandro Sepulveda, (#0293) (Chilean Mining Commission) 25 November 2019 Rev. F 373
2022 M INERAL R ESOURCES AND M INERAL R ESERVES OF T HE C ARAÍBA O PERATIONS , C URAÇÁ V ALLEY , B AHIA , B RAZIL F ORM 43 - 101F1 T ECHNICAL R EPORT APPENDIX A Technical Report QP Certificates 25 November 2019 Rev. F 374

2022 M INERAL R ESOURCES AND M INERAL R ESERVES OF T HE C ARAÍBA O PERATIONS , C URAÇÁ V ALLEY , B AHIA , B RAZIL F ORM 43 - 101 F 1 T ECHNICAL R EPORT I, Porfirio Cabaleiro Rodriguez, FAIG, (# 3708 ), as an author of the technical report titled “ 2022 Mineral Resources and Mineral Reserves of the Caraíba Operations, Curaçá Valley, Bahia, Brazil”, dated December 22 , 2022 , with an effective date of September 30 , 2022 (the “Technical Report”), prepared for Ero Copper Corp . (the “Issuer”), do hereby certify that :: 1) I am a Mining Engineer and Director for GE 21 Consultoria Mineral Ltda . , which is located on Avenida Afonso Pena, 3130 , 12 th floor, Savassi, Belo Horizonte, MG, Brazil - CEP 30130 - 910 . 2) I am a graduate of the Federal University of Minas Gerais, located in Belo Horizonte, Brazil, and hold a Bachelor of Science Degree in Mining Engineering ( 1978 ) . I have practised my profession continuously since 1979 . 3) I am a Professional enrolled with the Australian Institute of Geoscientists (“AIG”) - (“FAIG”) #3708. 4) I am a professional Mining Engineer, with more than 42 years’ relevant experience in Mineral Resource and Mineral Reserves estimation, which includes numerous mineral properties in Brazil, including copper properties . 5) I have read the definition of “qualified person” set out in National Instrument 43 - 101 – Standards of Disclosure for Mineral Projects (“NI 43 - 101 ”) and certify that, by reason of my education, affiliation with a professional association as defined in NI 43 - 101 , and past relevant work experience, I fulfill the requirements to be a “qualified person” for the purposes of NI 43 - 101 . 6) I have supervised the preparation of the Technical Report. I am responsible for Chapters 2, 3, 13 14, 17, 19, 20, 21, 22, 23, and 27 and jointly responsible for Chapter 24. I am also responsible for the corresponding sections within Chapters 1, 25 and 26 that are related to the foregoing Chapters of this Technical Report. 7) I have maintained a close technical relationship with the property that is the subject of this Technical Report since 2006 , while still working under the name of Geoexplore, and subsequently Coffey Mining . I was also hired as a consultant by companies interested in negotiating with Mineração Caraíba S . A . (“MCSA”) . I was also an author of the independent technical report titled “ 2017 Updated Mineral Resources and Mineral Reserves Statements of Mineração Caraíba’s Vale do Curaçá Mineral Assets, Curaçá Valley”, dated September 7 , 2017 , with an effective date of June 1 , 2017 ; an author of the independent technical report titled “ 2018 Updated Mineral Resources and Mineral Reserves Statements of Mineração Caraíba’s Vale do Curaçá Mineral Assets, Curaçá Valley”, dated October 17 , 2018 , with an effective date of August 1 , 2018 ; an author of the independent technical report titled “ 2019 Updated Mineral Resources and Mineral Reserves Statements of Minera ç ão Caraíba’s Vale do Cura ç á Mineral Assets, Cura ç á Valley” dated November 25 , 2019 , with an effective date of September 18 , 2019 ; and an author of the independent technical report titled “ 2020 Updated Mineral Resources and Mineral Reserves Statements of Mineração Caraíba’s Vale do Curaçá Mineral Assets, Curaçá Valley”, dated January 14 , 2021 , with an effective date of October 1 , 2020 , each prepared for the Issuer . The relationship with the Issuer and its subsidiary, MCSA, was solely for professional works in exchange for fees based on rates set by commercial agreement . Payment of these fees is in no way dependent on the results of the Technical Report . 8) I personally inspected the property that is the subject of this Technical Report in visits with four days’ duration in September 2021 and three days’ duration in February 2020 , June 2019 , July 2018 and January 2017 . 9) As of the effective date of the Technical Report, to the best of my knowledge, information, and belief, the sections of the Technical Report that I have authored and am responsible for contain all scientific and technical information that is required to be disclosed to make the Technical Report not misleading . 25 November 2019 Rev. F 375
2022 M INERAL R ESOURCES AND M INERAL R ESERVES OF T HE C ARAÍBA O PERATIONS , C URAÇÁ V ALLEY , B AHIA , B RAZIL F ORM 43 - 101F1 T ECHNICAL R EPORT 10) I have no personal knowledge, as of the date of this certificate, of any material fact or material change which is not reflected in this Technical Report. 11) I am independent of the Issuer, applying all the tests in section 1.5 of NI 43 - 101. 12) I have read NI 43 - 101 and Form 43 - 101F1 – Technical Report, and the Technical Report has been prepared in compliance with such instrument and form. Belo Horizonte, Brazil, December 22, 2022 <signed & sealed in the original> Porfirio Cabaleiro Rodriguez, FAIG 25 November 2019 Rev. F 376
2022 M INERAL R ESOURCES AND M INERAL R ESERVES OF T HE C ARAÍBA O PERATIONS , C URAÇÁ V ALLEY , B AHIA , B RAZIL F ORM 43 - 101 F 1 T ECHNICAL R EPORT I, Bernardo Horta de Cerqueira Viana, FAIG, (# 3709 ), as an author of the technical report titled “ 2022 Mineral Resources and Mineral Reserves of the Caraíba Operations, Curaçá Valley, Bahia, Brazil”, dated December 22 , 2022 , with an effective date of September 30 , 2022 (the “Technical Report”), prepared for Ero Copper Corp . (the “Issuer”), do hereby certify that : 1) I am a Geologist and Director for GE 21 Consultoria Mineral Ltda . , which is located on Avenida Afonso Pena, 3130 , 12 th floor, Savassi, Belo Horizonte, MG, Brazil - CEP 30130 - 910 . 2) I am a graduate of the Federal University of Minas Gerais, located in Belo Horizonte, Brazil, and hold a Bachelor of Science Degree in Geology ( 2002 ) . I have practiced my profession continuously since 2002 . 3) I am a Professional enrolled with the Australian Institute of Geoscientists (“AIG”) - (“FAIG”) #3709. 4) I am a professional Geologist, with more than 20 years’ relevant experience in ore resource estimation and geology exploration, which includes numerous mineral properties in Brazil, including copper properties . 5) I have read the definition of “qualified person” set out in National Instrument 43 - 101 – Standards of Disclosure for Mineral Projects (“NI 43 - 101 ”) and certify that, by reason of my education, affiliation with a professional association as defined in NI 43 - 101 , and past relevant work experience, I fulfill the requirements to be a “qualified person” for the purposes of NI 43 - 101 . 6) I am jointly responsible for Chapters 4 , 5 , 6 , 7 , 8 , 9 , 10 , 11 , 12 and 24 . I am also responsible for the corresponding sections within Chapters 1 , 25 and 26 that are related to the foregoing Chapters of this Technical Report . 7) I have maintained a close technical relationship with the property that is the subject of this Technical Report since 2006 , while still working under the name of Geoexplore, and subsequently Coffey Mining . I was also hired as a consultant by companies interested in negotiating with Mineração Caraíba S . A . (“MCSA”) . I was also an author of the independent technical report titled “ 2017 Updated Mineral Resources and Mineral Reserves Statements of Mineração Caraíba’s Vale do Curaçá Mineral Assets, Curaçá Valley”, dated September 7 , 2017 , with an effective date of June 1 , 2017 ; an author of the independent technical report titled “ 2018 Updated Mineral Resources and Mineral Reserves Statements of Mineração Caraíba’s Vale do Curaçá Mineral Assets, Curaçá Valley”, dated October 17 , 2018 , with an effective date of August 1 , 2018 ; an author of the independent technical report titled “ 2019 Updated Mineral Resources and Mineral Reserves Statements of Minera ç ão Caraíba’s Vale do Cura ç á Mineral Assets, Cura ç á Valley” dated November 25 , 2019 , with an effective date of September 18 , 2019 ; and an author of the independent technical report titled “ 2020 Updated Mineral Resources and Mineral Reserves Statements of Mineração Caraíba’s Vale do Curaçá Mineral Assets, Curaçá Valley”, dated January 14 , 2021 , with an effective date of October 1 , 2020 , each prepared for the Issuer . The relationship with the Issuer and its subsidiary, MCSA, was solely for professional works in exchange for fees based on rates set by commercial agreement . Payment of these fees is in no way dependent on the results of the Technical Report . 8) I personally inspected the property that is the subject of this Technical Report in visits with four days’ duration in September, 2021 and three days’ duration in February 2020 , June 2019 , July 2018 and January 2017 . 9) As of the effective date of the Technical Report, to the best of my knowledge, information, and belief, the sections of the Technical Report that I have authored and am responsible for contain all scientific and technical information that is required to be disclosed to make the Technical Report not misleading . 10) I have no personal knowledge, as of the date of this certificate, of any material fact or material change which is not reflected in this Technical Report . 25 November 2019 Rev. F 377
2022 M INERAL R ESOURCES AND M INERAL R ESERVES OF T HE C ARAÍBA O PERATIONS , C URAÇÁ V ALLEY , B AHIA , B RAZIL F ORM 43 - 101F1 T ECHNICAL R EPORT 11) I am independent of the Issuer, applying all the tests in section 1.5 of NI 43 - 101. 12) I have read NI 43 - 101 and Form 43 - 101F1 – Technical Report, and the Technical Report has been prepared in compliance with such instrument and form. Belo Horizonte, Brazil, December 22, 2022 <signed & sealed in the original> Bernardo Horta de Cerqueira Viana, FAIG 25 November 2019 Rev. F 378
2022 M INERAL R ESOURCES AND M INERAL R ESERVES OF T HE C ARAÍBA O PERATIONS , C URAÇÁ V ALLEY , B AHIA , B RAZIL F ORM 43 - 101 F 1 T ECHNICAL R EPORT I, Fábio Valério Câmara Xavier, MAIG, (# 5179 ), as an author of the technical report titled “ 2022 Mineral Resources and Mineral Reserves of the Caraíba Operations, Curaçá Valley, Bahia, Brazil”, dated December 22 , 2022 , with an effective date of September 30 , 2022 (the “Technical Report”), prepared for Ero Copper Corp . (the “Issuer”), do hereby certify that : 1) I am a Geologist for GE 21 Consultoria Mineral Ltda . , which is located on Avenida Afonso Pena, 3130 , 12 th floor, Savassi, Belo Horizonte, MG, Brazil - CEP 30130 - 910 . 2) I am a graduate of the Federal University of Rio Grande do Norte, located in Natal, Brazil, and hold a Bachelor of Science Degree in Geology ( 2003 ) . I have practised my profession continuously since 2003 . 3) I am a Professional enrolled with the Australian Institute of Geoscientists (“AIG”) - (“MAIG”) #5179. 4) I am a professional Geologist, with more than 19 years’ relevant experience in resource estimation and geology exploration, which includes numerous mineral properties in Brazil, including copper properties . 5) I have read the definition of “qualified person” set out in National Instrument 43 - 101 – Standards of Disclosure for Mineral Projects (“NI 43 - 101 ”) and certify that, by reason of my education, affiliation with a professional association as defined in NI 43 - 101 , and past relevant work experience, I fulfill the requirements to be a “qualified person” for the purposes of NI 43 - 101 . 6) I am jointly responsible for Chapters 4 , 5 , 6 , 7 , 8 , 9 , 10 , 11 and 12 . I am also responsible for the corresponding sections within Chapters 1 , 25 and 26 that are related to the foregoing Chapters of this Technical Report . 7) I have had prior involvement with the property that is the subject of this Technical Report as an author of the independent technical report titled “ 2017 Updated Mineral Resources and Mineral Reserves Statements of Mineração Caraíba’s Vale do Curaçá Mineral Assets, Curaçá Valley”, dated September 7 , 2017 , with an effective date of June 1 , 2017 ; as an author of the independent technical report titled “ 2018 Updated Mineral Resources and Mineral Reserves Statements of Mineração Caraíba’s Vale do Curaçá Mineral Assets, Curaçá Valley”, dated October 17 , 2018 , with an effective date of August 1 , 2018 ; and an author of the independent technical report titled “ 2020 Updated Mineral Resources and Mineral Reserves Statements of Mineração Caraíba’s Vale do Curaçá Mineral Assets, Curaçá Valley”, dated January 14 , 2021 , with an effective date of October 1 , 2020 , each prepared for the Issuer . The relationship with the Issuer and its subsidiary, MCSA, was solely for professional works in exchange for fees based on rates set by commercial agreement . Payment of these fees is in no way dependent on the results of the Technical Report . 8) I personally inspected the property that is the subject of this Technical Report in visits with three days’ duration in May 2022 , four days’ duration in September 2021 , five days’ duration in July 2018 , five days’ duration in June 2018 and two days’ duration in June 2017 . 9) As of the effective date of the Technical Report, to the best of my knowledge, information, and belief, the sections of the Technical Report that I have authored and am responsible for contain all scientific and technical information that is required to be disclosed to make the Technical Report not misleading . 10) I have no personal knowledge, as of the date of this certificate, of any material fact or material change which is not reflected in this Technical Report . 11) I am independent of the Issuer, applying all the tests in section 1.5 of NI 43 - 101. 12) I have read NI 43 - 101 and Form 43 - 101 F 1 – Technical Report, and the Technical Report has been prepared in compliance with such instrument and form . 25 November 2019 Rev. F 379
2022 M INERAL R ESOURCES AND M INERAL R ESERVES OF T HE C ARAÍBA O PERATIONS , C URAÇÁ V ALLEY , B AHIA , B RAZIL F ORM 43 - 101F1 T ECHNICAL R EPORT Belo Horizonte, Brazil, December 22, 2022 <signed & sealed in the original> Fábio Valério Câmara Xavier, MAIG 25 November 2019 Rev. F 380
2022 M INERAL R ESOURCES AND M INERAL R ESERVES OF T HE C ARAÍBA O PERATIONS , C URAÇÁ V ALLEY , B AHIA , B RAZIL F ORM 43 - 101 F 1 T ECHNICAL R EPORT I, Ednie Rafael Moreira de Carvalho Fernandes, MAIG, (# 7974 ), as an author of the technical report titled “ 2022 Mineral Resources and Mineral Reserves of the Caraíba Operations, Curaçá Valley, Bahia, Brazil”, dated December 22 , 2022 , with an effective date of September 30 , 2022 (the “Technical Report”), prepared for Ero Copper Corp . (the “Issuer”), do hereby certify that : 1) I am a geologist for GE21 Consultoria Mineral Ltda., which is located on Avenida Afonso Pena, 3130, 12 th floor, Savassi, Belo Horizonte, MG, Brazil - CEP 30130 - 910. 2) I am a graduate of the Federal University of Bahia. I have practiced my profession continuously since 2011. 3) I am a Professional enrolled with the Australian Institute of Geoscientists (“AIG”) - (“MAIG”) #7974. 4) I am a professional Geologist, with more than 11 years’ relevant experience in geology exploration, which includes numerous mineral properties in Brazil, including copper properties. 5) I have read the definition of “qualified person” set out in National Instrument 43 - 101 – Standards of Disclosure for Mineral Projects (“NI 43 - 101 ”) and certify that, by reason of my education, affiliation with a professional association as defined in NI 43 - 101 , and past relevant work experience, I fulfill the requirements to be a “qualified person” for the purposes of NI 43 - 101 . 6) I am jointly responsible for Chapter 12. I am also responsible for the corresponding sections within Chapters 1, 25 and 26 that are related to the foregoing Chapter of this Technical Report. 7) I have no prior involvement with the property that is the subject of this Technical Report. 8) I personally inspected the property that is the subject of this Technical Report in a visit with two days’ duration in May 2022. 9) As of the effective date of the Technical Report, to the best of my knowledge, information, and belief, the section of the Technical Report that I have authored and am responsible for contains all scientific and technical information that is required to be disclosed to make the Technical Report not misleading . 10) I have no personal knowledge, as of the date of this certificate, of any material fact or material change which is not reflected in this Technical Report. 11) I am independent of the Issuer, applying all the tests in section 1.5 of NI 43 - 101. 12) I have read NI 43 - 101 and Form 43 - 101F1 – Technical Report, and the Technical Report has been prepared in compliance with such instrument and form. 25 November 2019 Rev. F 381

2022 M INERAL R ESOURCES AND M INERAL R ESERVES OF T HE C ARAÍBA O PERATIONS , C URAÇÁ V ALLEY , B AHIA , B RAZIL F ORM 43 - 101F1 T ECHNICAL R EPORT Belo Horizonte, Brazil, December 22, 2022 <signed & sealed in the original> Ednie Rafael Moreira de Carvalho Fernandes, MAIG 25 November 2019 Rev. F 382

2022 M INERAL R ESOURCES AND M INERAL R ESERVES OF T HE C ARAÍBA O PERATIONS , C URAÇÁ V ALLEY , B AHIA , B RAZIL F ORM 43 - 101 F 1 T ECHNICAL R EPORT I, Dr . Beck Nader, FAIG (# 4472 ), as an author of the technical report titled “ 2022 Mineral Resources and Mineral Reserves of the Caraíba Operations, Curaçá Valley, Bahia, Brazil”, dated December 22 , 2022 , with an effective date of September 30 , 2022 (the “Technical Report”), prepared for Ero Copper Corp . (the “Issuer”), do hereby certify that : 1) I am a Mining Engineer for BNA Mining Solutions., which is located on Rua Desembargador Leão Starling, 200, Ouro Preto, Belo Horizonte, MG, Brazil - CEP 31310 - 370. 2) I am a graduate of the University of São Paulo - USP, located in São Paulo - SP, Brazil, and hold a Bachelor of Science Degree in Mining Engineering ( 1981 ) . I hold a Master of Science Degree in Mineral Technology and a Doctoral of Science Degree in Mineral Engineering . I have practiced my profession continuously since 1982 . 3) I am a Fellow enrolled with the Australian Institute of Geoscientists (“AIG”) - (“FAIG” #4472). 4) I am a professional Mining Engineer, with more than 40 years’ relevant experience in Mineral Resource and Mineral Reserves estimation, which includes numerous mineral properties in Brazil, including copper properties . 5) I have read the definition of “qualified person” set out in National Instrument 43 - 101 – Standards of Disclosure for Mineral Projects (“NI 43 - 101 ”) and certify that, by reason of my education, affiliation with a professional association as defined in NI 43 - 101 , and past relevant work experience, I fulfill the requirements to be a “qualified person” for the purposes of NI 43 - 101 . 6) I am jointly responsible for Chapters 15, 16, 18 and 24. I am also responsible for the corresponding sections within Chapters 1, 25 and 26 that are related to the foregoing Chapters of this Technical Report. 7) I was an author of the independent technical report titled “ 2020 Updated Mineral Resources and Mineral Reserves Statements of Mineração Caraíba’s Vale do Curaçá Mineral Assets, Curaçá Valley”, dated January 14 , 2021 , with an effective date of October 1 , 2020 . 8) I personally inspected the property that is the subject of this Technical Report in a visit with three days’ duration in September, 2021. 9) As of the effective date of the Technical Report, to the best of my knowledge, information, and belief, the sections of the Technical Report that I have authored and am responsible for contain all scientific and technical information that is required to be disclosed to make the Technical Report not misleading . 10) I have no personal knowledge, as of the date of this certificate, of any material fact or material change which is not reflected in this Technical Report. 11) I am independent of the Issuer, applying all the tests in section 1.5 of NI 43 - 101. 12) I have read NI 43 - 101 and Form 43 - 101F1 – Technical Report, and the Technical Report has been prepared in compliance with such instrument and form. 25 November 2019 Rev. F 383
2022 M INERAL R ESOURCES AND M INERAL R ESERVES OF T HE C ARAÍBA O PERATIONS , C URAÇÁ V ALLEY , B AHIA , B RAZIL F ORM 43 - 101F1 T ECHNICAL R EPORT Belo Horizonte, Brazil, December 22, 2022 <signed & sealed in the original> Dr. Beck Nader, FAIG 25 November 2019 Rev. F 384

2022 M INERAL R ESOURCES AND M INERAL R ESERVES OF T HE C ARAÍBA O PERATIONS , C URAÇÁ V ALLEY , B AHIA , B RAZIL F ORM 43 - 101 F 1 T ECHNICAL R EPORT I, Alejandro Sepulveda, Registered Member (# 0293 ) (Chilean Mining Commission), as an author of the technical report titled “ 2022 Mineral Resources and Mineral Reserves of the Caraíba Operations, Curaçá Valley, Bahia, Brazil”, dated December 22 , 2022 , with an effective date of September 30 , 2022 (the “Technical Report”), prepared for Ero Copper Corp . (the “Issuer”), do hereby certify that : 1) I am a Mining Engineer and Board President for NCL Ingeniería y Construcción SpA (“NCL”), which is located on General del Canto 230, of 401, Providencia, Santiago, Chile. 2) I am a graduate of the Universidad de Chile. I have practiced my profession continuously since 1981. 3) I am a Registered Member enrolled with the Comision Calificadora de Competencias en Recursos y Reservas Mineras (Chilean Mining Commission) (#0293). 4) I am a professional Engineer, with more than 39 years’ relevant experience in reviews and reports as a consultant on numerous explorations, mining operation and projects around the world for due diligence and regulatory requirements and have extensive experience in mining engineering, which includes numerous mineral properties in Brazil, including copper properties . 5) I have read the definition of “qualified person” set out in National Instrument 43 - 101 – Standards of Disclosure for Mineral Projects (“NI 43 - 101 ”) and certify that, by reason of my education, affiliation with a professional association as defined in NI 43 - 101 , and past relevant work experience, I fulfill the requirements to be a “qualified person” for the purposes of NI 43 - 101 . 6) I am jointly responsible for Chapters 15, 16, 18 and 24. I am also responsible for the corresponding sections within Chapters 1, 25 and 26 that are related to the foregoing Chapter of this Technical Report. 7) I have no prior involvement with the property that is the subject of this Technical Report. 8) I personally inspected the property that is the subject of this Technical Report in a visit with five days’ duration in August 2022, five days’ duration in July 2022 and nine days’ duration in June 2022. 9) As of the effective date of the Technical Report, to the best of my knowledge, information, and belief, the section of the Technical Report that I have authored and am responsible for contains all scientific and technical information that is required to be disclosed to make the Technical Report not misleading . 10) I have no personal knowledge, as of the date of this certificate, of any material fact or material change which is not reflected in this Technical Report. 11) I am independent of the Issuer, applying all the tests in section 1.5 of NI 43 - 101. 12) I have read NI 43 - 101 and Form 43 - 101F1 – Technical Report, and the Technical Report has been prepared in compliance with such instrument and form. 25 November 2019 Rev. F 385

2022 M INERAL R ESOURCES AND M INERAL R ESERVES OF T HE C ARAÍBA O PERATIONS , C URAÇÁ V ALLEY , B AHIA , B RAZIL F ORM 43 - 101F1 T ECHNICAL R EPORT Belo Horizonte, Brazil, December 22, 2022 <signed & sealed in the original> Alejandro Sepulveda, (#0293) (Chilean Mining Commission) NCL Ingeniería y Construcción SpA 25 November 2019 Rev. F 386
2022 M INERAL R ESOURCES AND M INERAL R ESERVES OF T HE C ARAÍBA O PERATIONS , C URAÇÁ V ALLEY , B AHIA , B RAZIL F ORM 43 - 101F1 T ECHNICAL R EPORT APPENDIX B Swath Plots 25 November 2019 Rev. F 387

2022 M INERAL R ESOURCES AND M INERAL R ESERVES OF T HE C ARAÍBA O PERATIONS , C URAÇÁ V ALLEY , B AHIA , B RAZIL F ORM 43 - 101F1 T ECHNICAL R EPORT Swath Plot X axis – Deepening Domain, Total Swath Plot Y axis – Deepening Domain, Total Swath Plot Z axis – Deepening Domain, Total 25 November 2019 Rev. F 388
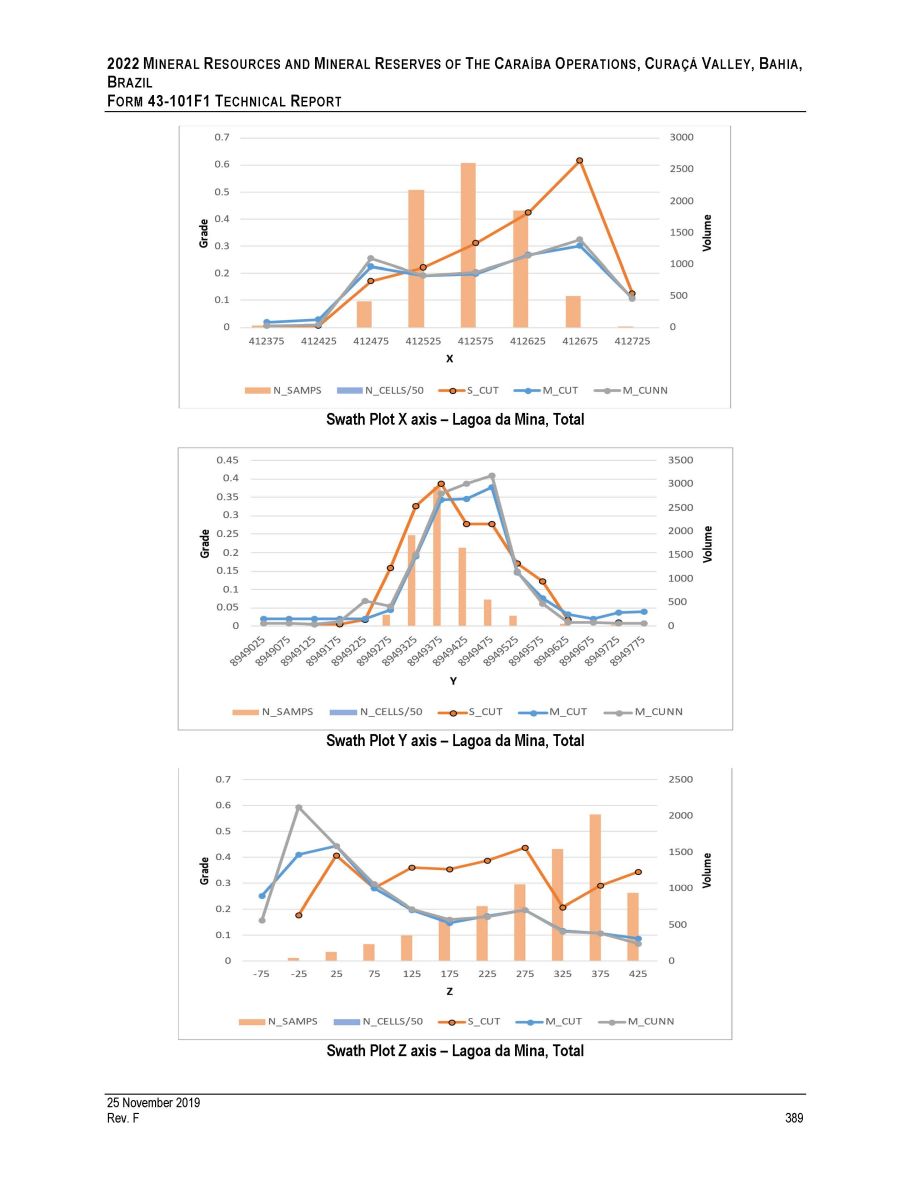
2022 M INERAL R ESOURCES AND M INERAL R ESERVES OF T HE C ARAÍBA O PERATIONS , C URAÇÁ V ALLEY , B AHIA , B RAZIL F ORM 43 - 101F1 T ECHNICAL R EPORT Swath Plot X axis – Lagoa da Mina, Total Swath Plot Y axis – Lagoa da Mina, Total Swath Plot Z axis – Lagoa da Mina, Total 25 November 2019 Rev. F 389
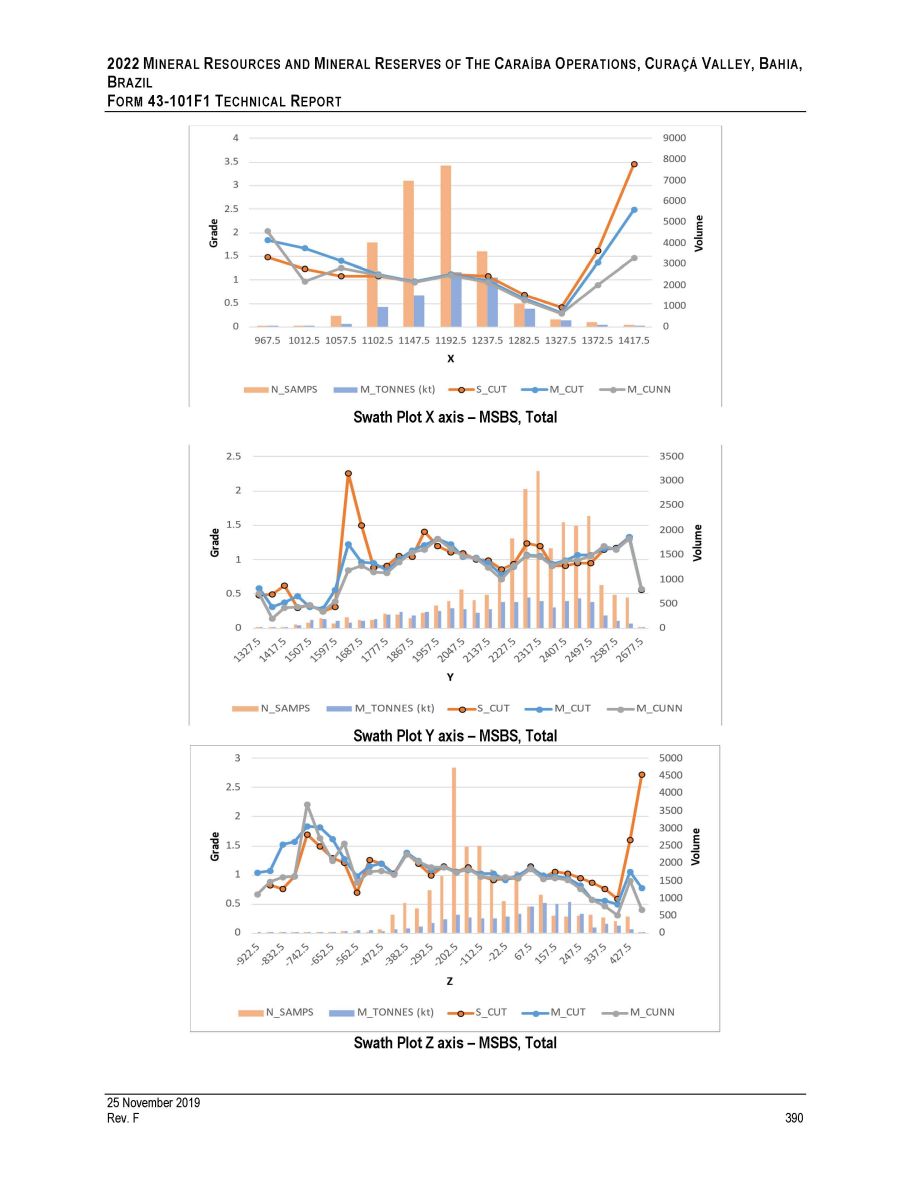
2022 M INERAL R ESOURCES AND M INERAL R ESERVES OF T HE C ARAÍBA O PERATIONS , C URAÇÁ V ALLEY , B AHIA , B RAZIL F ORM 43 - 101F1 T ECHNICAL R EPORT Swath Plot X axis – MSBS, Total Swath Plot Y axis – MSBS, Total Swath Plot Z axis – MSBS, Total 25 November 2019 Rev. F 390
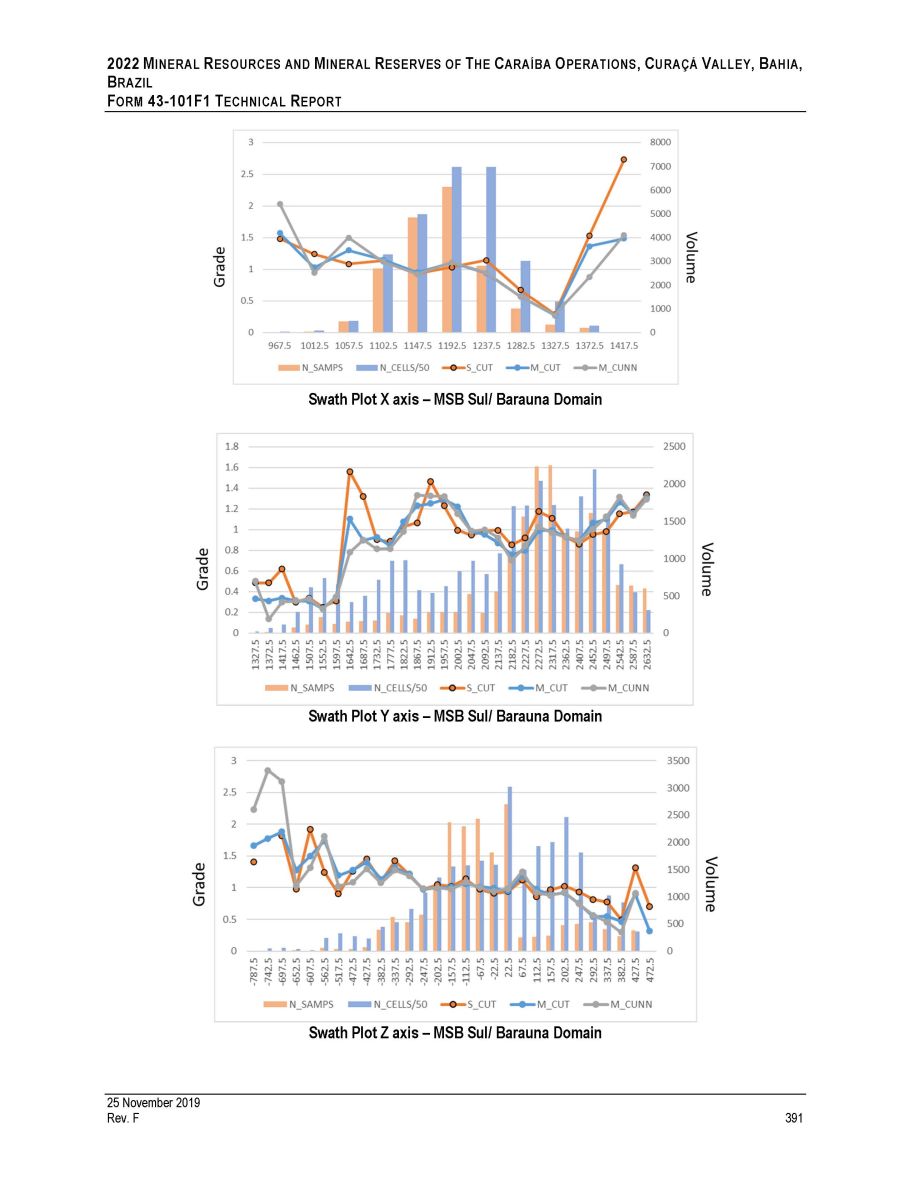
2022 M INERAL R ESOURCES AND M INERAL R ESERVES OF T HE C ARAÍBA O PERATIONS , C URAÇÁ V ALLEY , B AHIA , B RAZIL F ORM 43 - 101F1 T ECHNICAL R EPORT Swath Plot X axis – MSB Sul/ Barauna Domain Swath Plot Y axis – MSB Sul/ Barauna Domain Swath Plot Z axis – MSB Sul/ Barauna Domain 25 November 2019 Rev. F 391
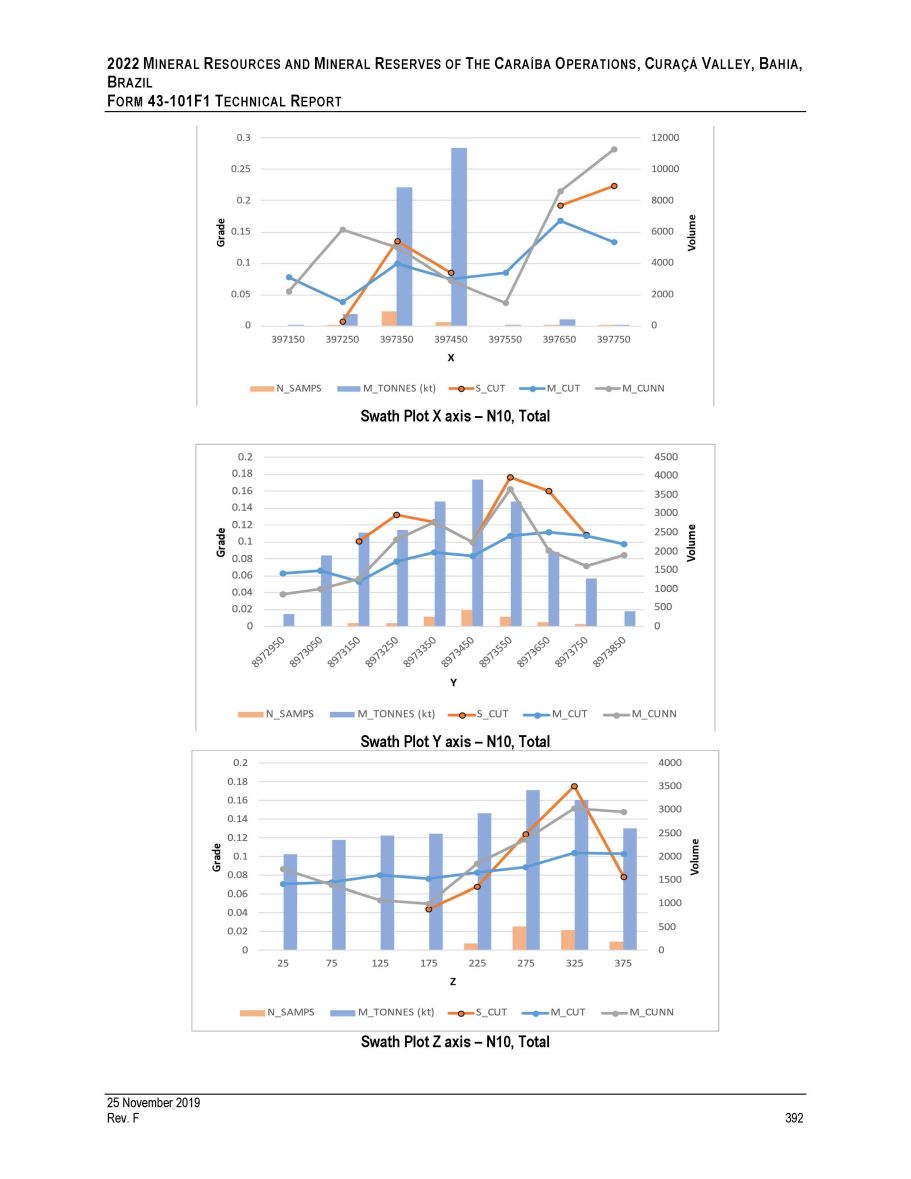
2022 M INERAL R ESOURCES AND M INERAL R ESERVES OF T HE C ARAÍBA O PERATIONS , C URAÇÁ V ALLEY , B AHIA , B RAZIL F ORM 43 - 101F1 T ECHNICAL R EPORT Swath Plot X axis – N10, Total Swath Plot Y axis – N10, Total Swath Plot Z axis – N10, Total 25 November 2019 Rev. F 392
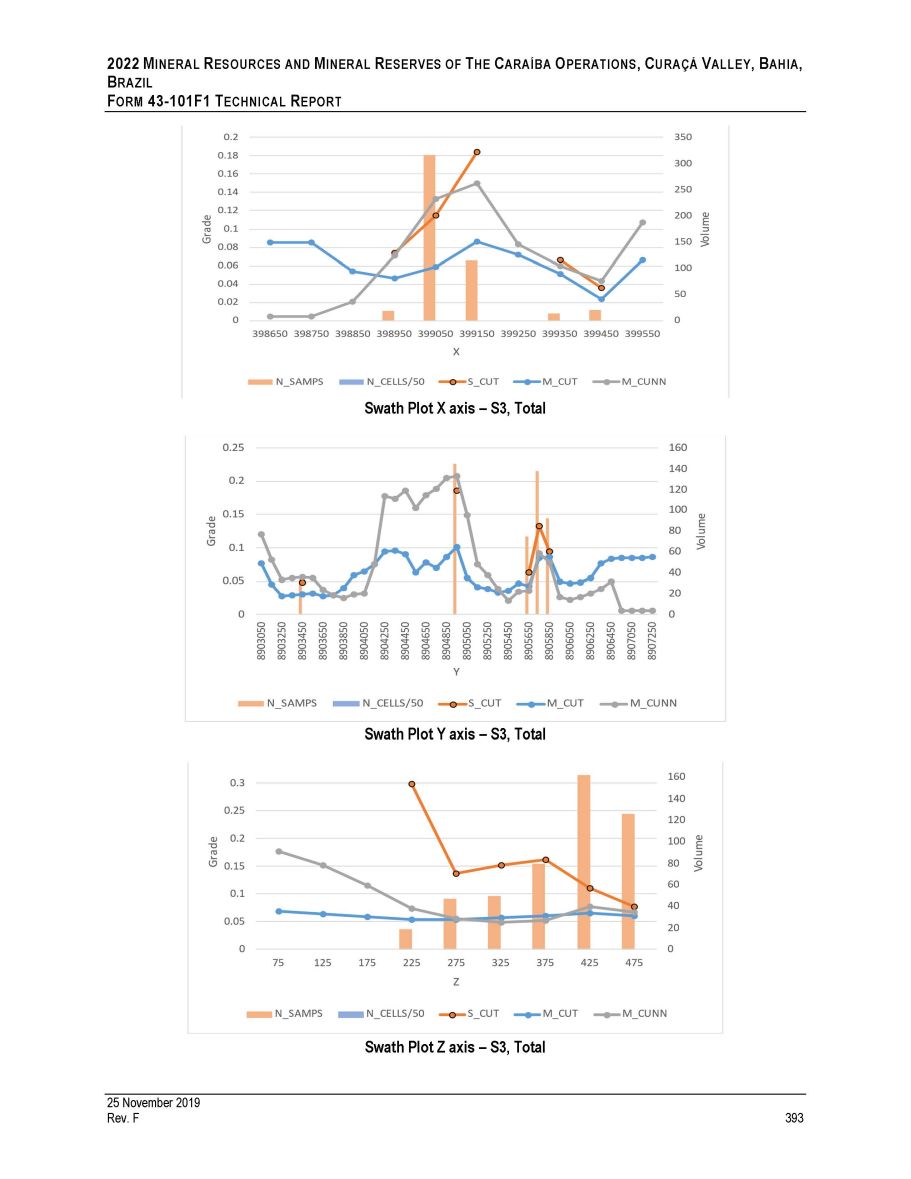
2022 M INERAL R ESOURCES AND M INERAL R ESERVES OF T HE C ARAÍBA O PERATIONS , C URAÇÁ V ALLEY , B AHIA , B RAZIL F ORM 43 - 101F1 T ECHNICAL R EPORT Swath Plot X axis – S3, Total Swath Plot Y axis – S3, Total Swath Plot Z axis – S3, Total 25 November 2019 Rev. F 393
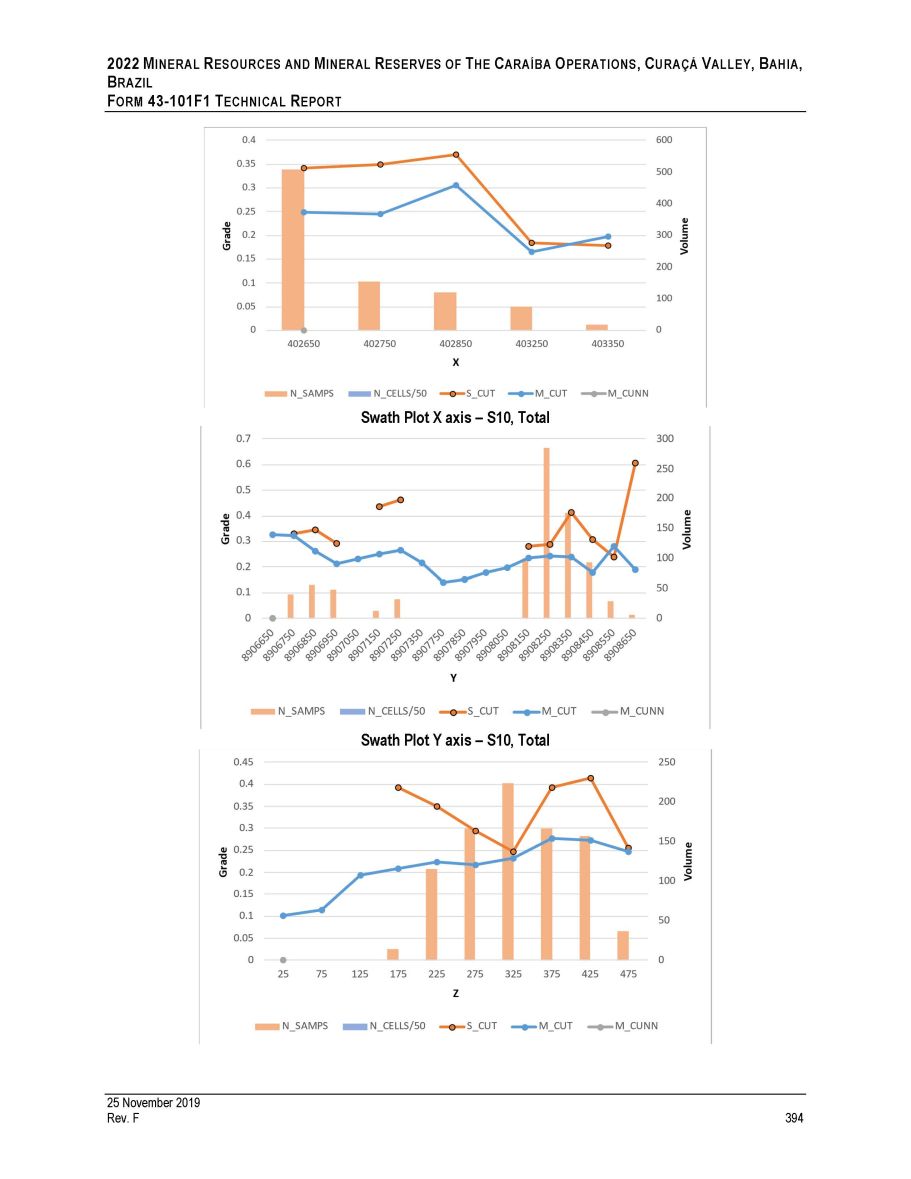
2022 M INERAL R ESOURCES AND M INERAL R ESERVES OF T HE C ARAÍBA O PERATIONS , C URAÇÁ V ALLEY , B AHIA , B RAZIL F ORM 43 - 101F1 T ECHNICAL R EPORT Swath Plot X axis – S10, Total Swath Plot Y axis – S10, Total 25 November 2019 Rev. F 394

2022 M INERAL R ESOURCES AND M INERAL R ESERVES OF T HE C ARAÍBA O PERATIONS , C URAÇÁ V ALLEY , B AHIA , B RAZIL F ORM 43 - 101F1 T ECHNICAL R EPORT Swath Plot Z axis – S10, Total Swath Plot X axis – Honey Pot, Total Swath Plot Y axis – Honey Pot, Total Swath Plot Z axis – Honey Pot, Total 25 November 2019 Rev. F 395
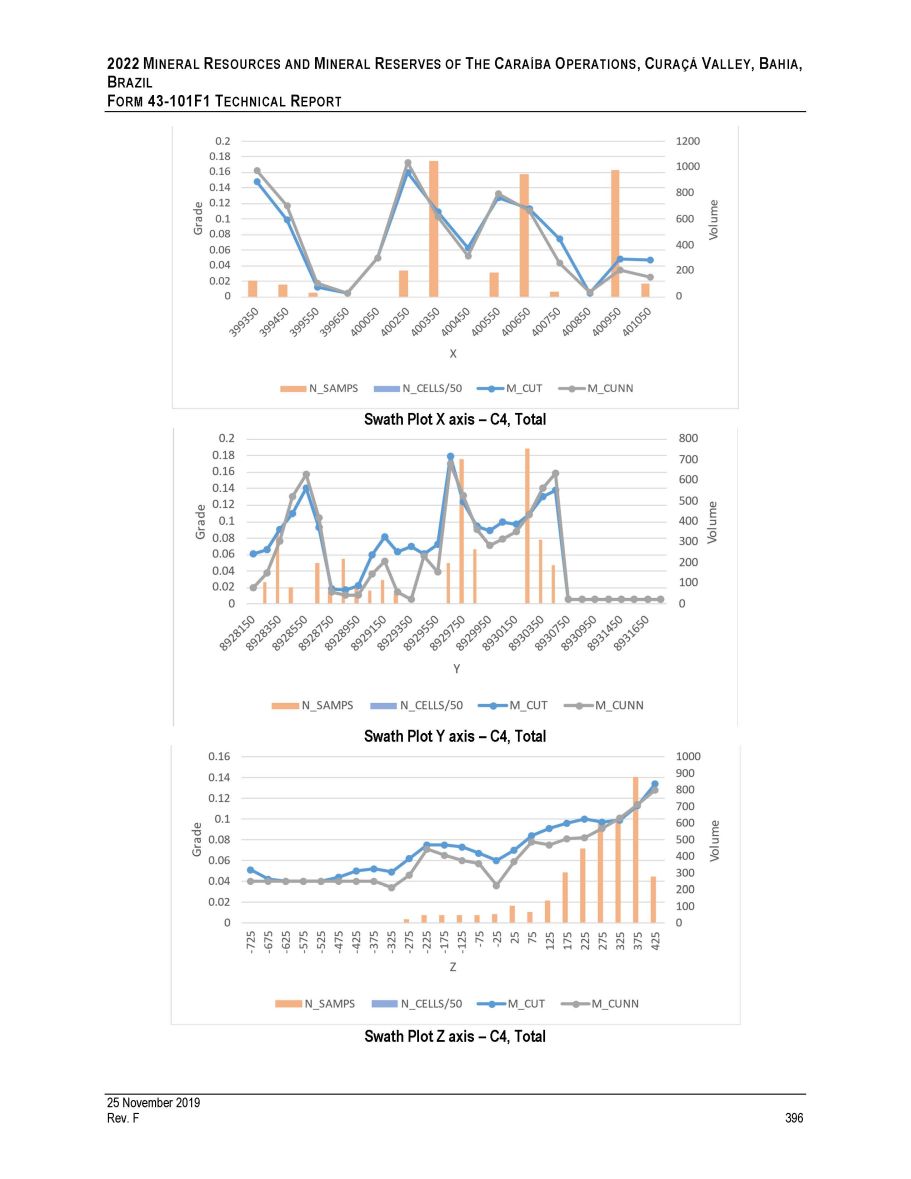
2022 M INERAL R ESOURCES AND M INERAL R ESERVES OF T HE C ARAÍBA O PERATIONS , C URAÇÁ V ALLEY , B AHIA , B RAZIL F ORM 43 - 101F1 T ECHNICAL R EPORT Swath Plot X axis – C4, Total Swath Plot Y axis – C4, Total Swath Plot Z axis – C4, Total 25 November 2019 Rev. F 396
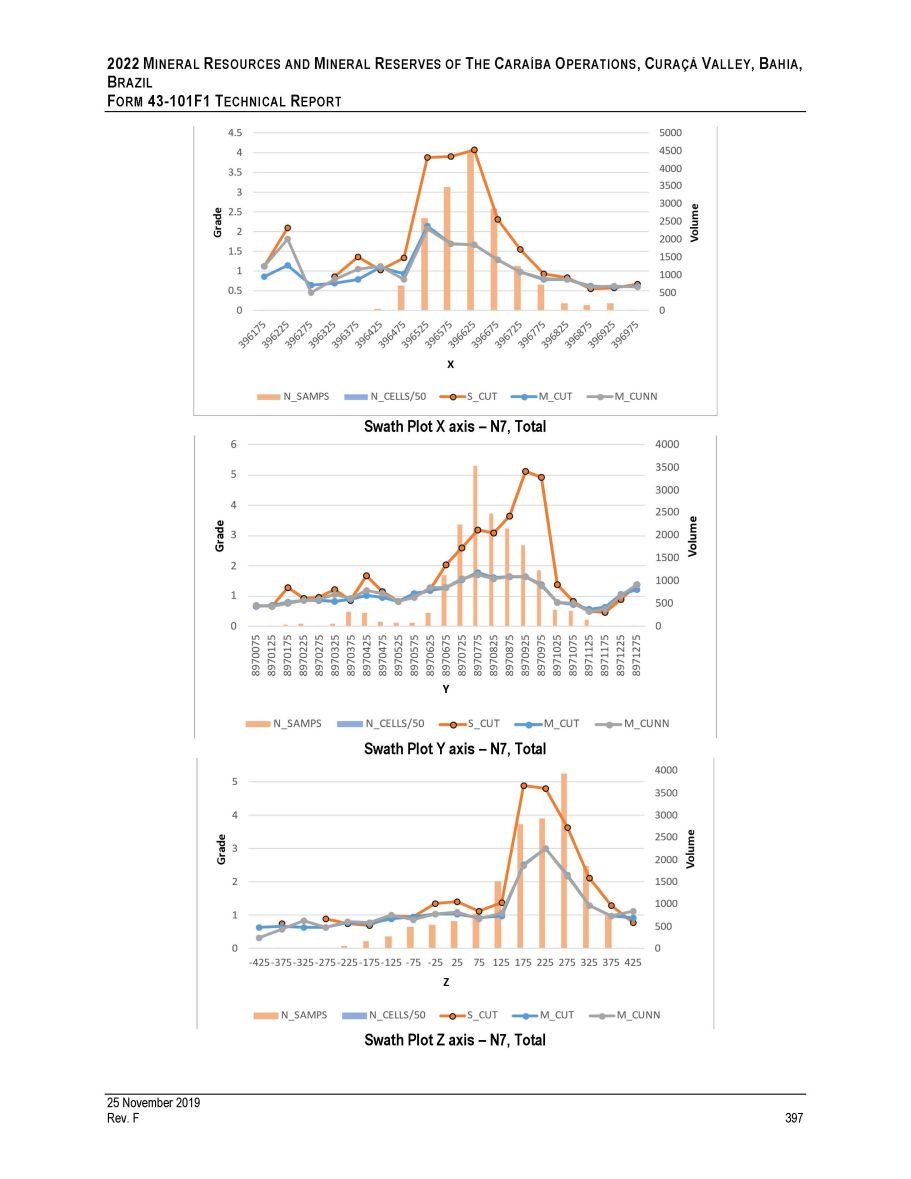
2022 M INERAL R ESOURCES AND M INERAL R ESERVES OF T HE C ARAÍBA O PERATIONS , C URAÇÁ V ALLEY , B AHIA , B RAZIL F ORM 43 - 101F1 T ECHNICAL R EPORT Swath Plot X axis – N7, Total Swath Plot Y axis – N7, Total Swath Plot Z axis – N7, Total 25 November 2019 Rev. F 397
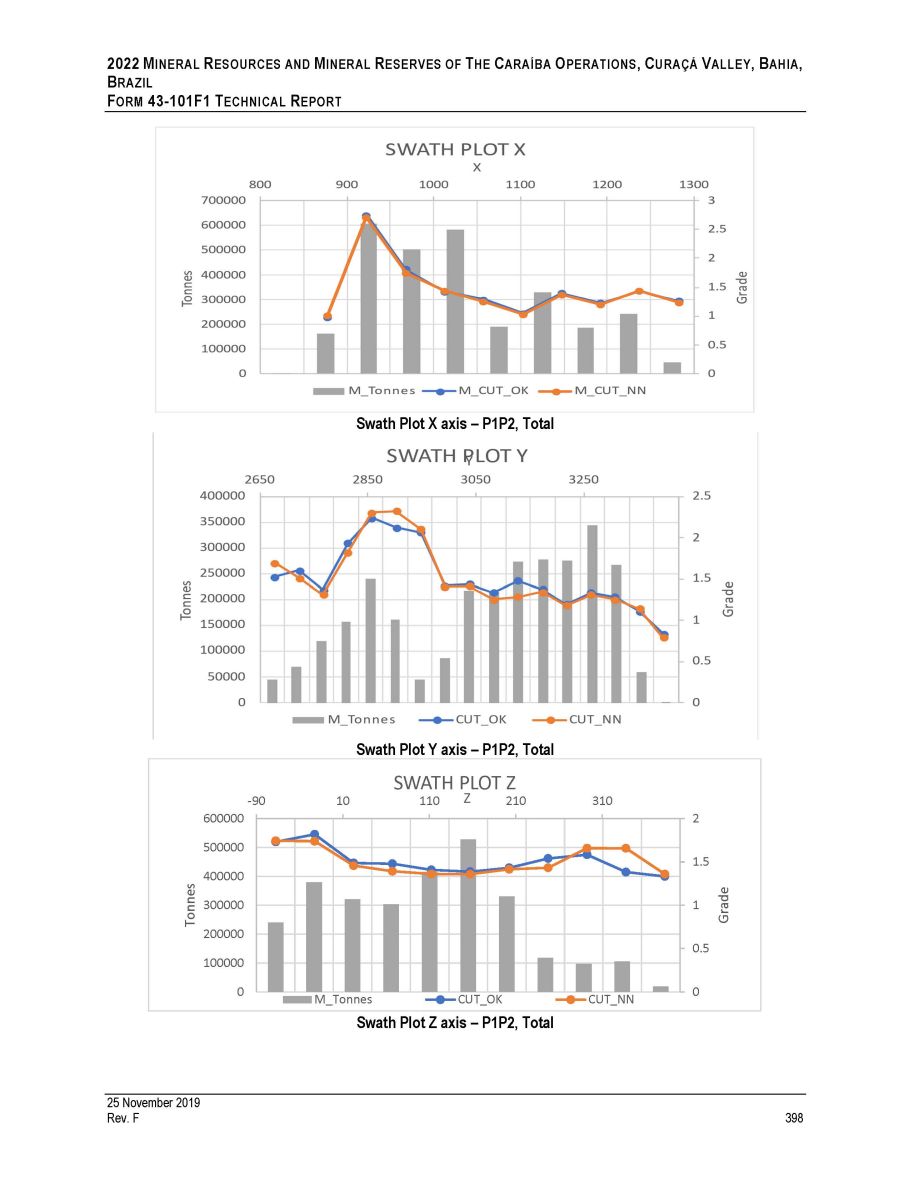
2022 M INERAL R ESOURCES AND M INERAL R ESERVES OF T HE C ARAÍBA O PERATIONS , C URAÇÁ V ALLEY , B AHIA , B RAZIL F ORM 43 - 101F1 T ECHNICAL R EPORT Swath Plot X axis – P1P2, Total -90 10 210 310 0 100000 0 600000 2 500000 1.5 400000 300000 1 200000 0.5 110 Z Grade Tonnes Swath Plot Y axis – P1P2, Total SWATH PLOT Z M_Tonnes CUT_OK Swath Plot Z axis – P1P2, Total CUT_NN 25 November 2019 Rev. F 398
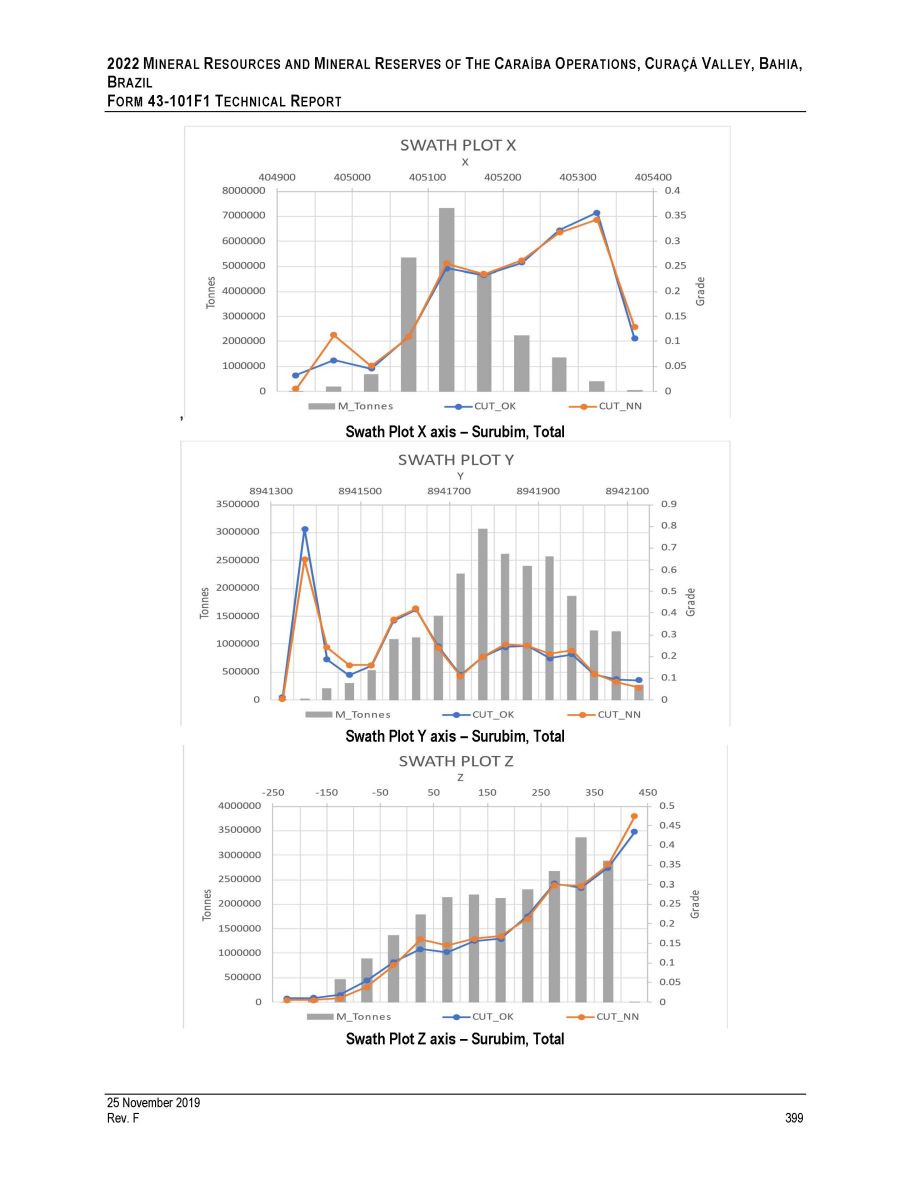
2022 M INERAL R ESOURCES AND M INERAL R ESERVES OF T HE C ARAÍBA O PERATIONS , C URAÇÁ V ALLEY , B AHIA , B RAZIL F ORM 43 - 101F1 T ECHNICAL R EPORT , Swath Plot X axis – Surubim, Total Swath Plot Y axis – Surubim, Total Swath Plot Z axis – Surubim, Total 25 November 2019 Rev. F 399
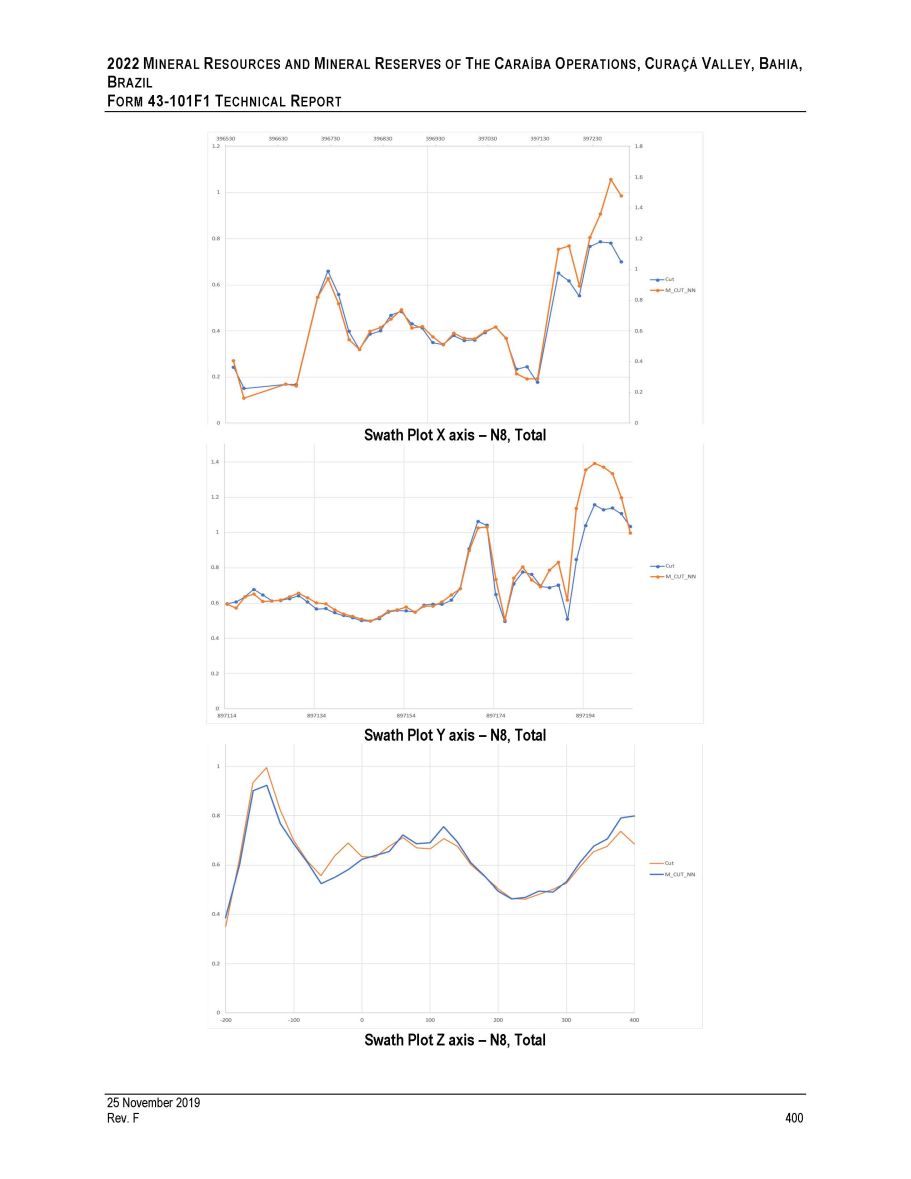
2022 M INERAL R ESOURCES AND M INERAL R ESERVES OF T HE C ARAÍBA O PERATIONS , C URAÇÁ V ALLEY , B AHIA , B RAZIL F ORM 43 - 101F1 T ECHNICAL R EPORT Swath Plot X axis – N8, Total Swath Plot Y axis – N8, Total Swath Plot Z axis – N8, Total 25 November 2019 Rev. F 400
2022 M INERAL R ESOURCES AND M INERAL R ESERVES OF T HE C ARAÍBA O PERATIONS , C URAÇÁ V ALLEY , B AHIA , B RAZIL F ORM 43 - 101F1 T ECHNICAL R EPORT APPENDIX C Process Flowsheets 25 November 2019 Rev. F 401
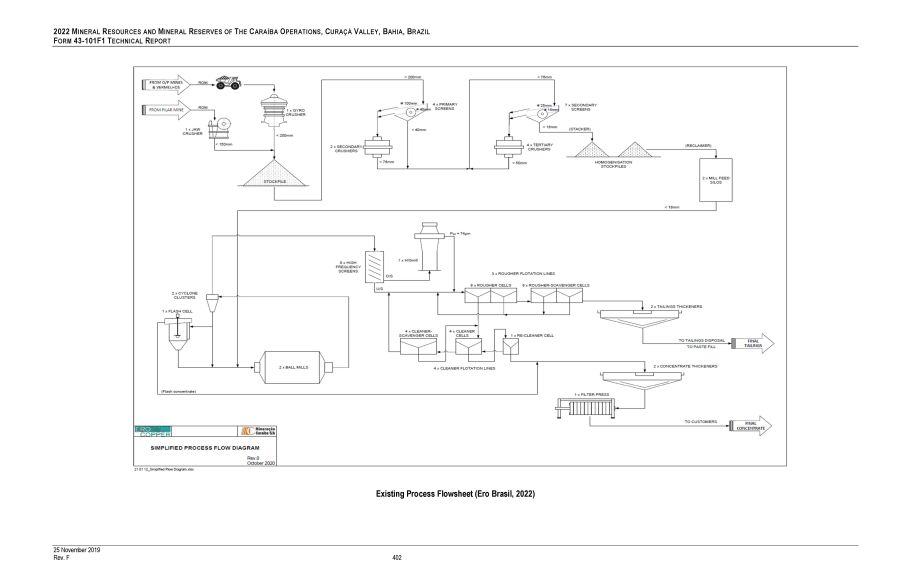
2022 M INERAL R ESOURCES AND M INERAL R ESERVES OF T HE C ARAÍBA O PERATIONS , C URAÇÁ V ALLEY , B AHIA , B RAZIL F ORM 43 - 101F1 T ECHNICAL R EPORT Existing Process Flowsheet (Ero Brasil, 2022) 25 November 2019 Rev. F 402

2022 M INERAL R ESOURCES AND M INERAL R ESERVES OF T HE C ARAÍBA O PERATIONS , C URAÇÁ V ALLEY , B AHIA , B RAZIL F ORM 43 - 101F1 T ECHNICAL R EPORT Expansion Process Flowsheet (Ero Brasil, 2022) 25 November 2019 Rev. F 403
2022 M INERAL R ESOURCES AND M INERAL R ESERVES OF T HE C ARAÍBA O PERATIONS , C URAÇÁ V ALLEY , B AHIA , B RAZIL F ORM 43 - 101F1 T ECHNICAL R EPORT APPENDIX D Infrastructure Maps of the Curaçá Valley 25 November 2019 Rev. F 404
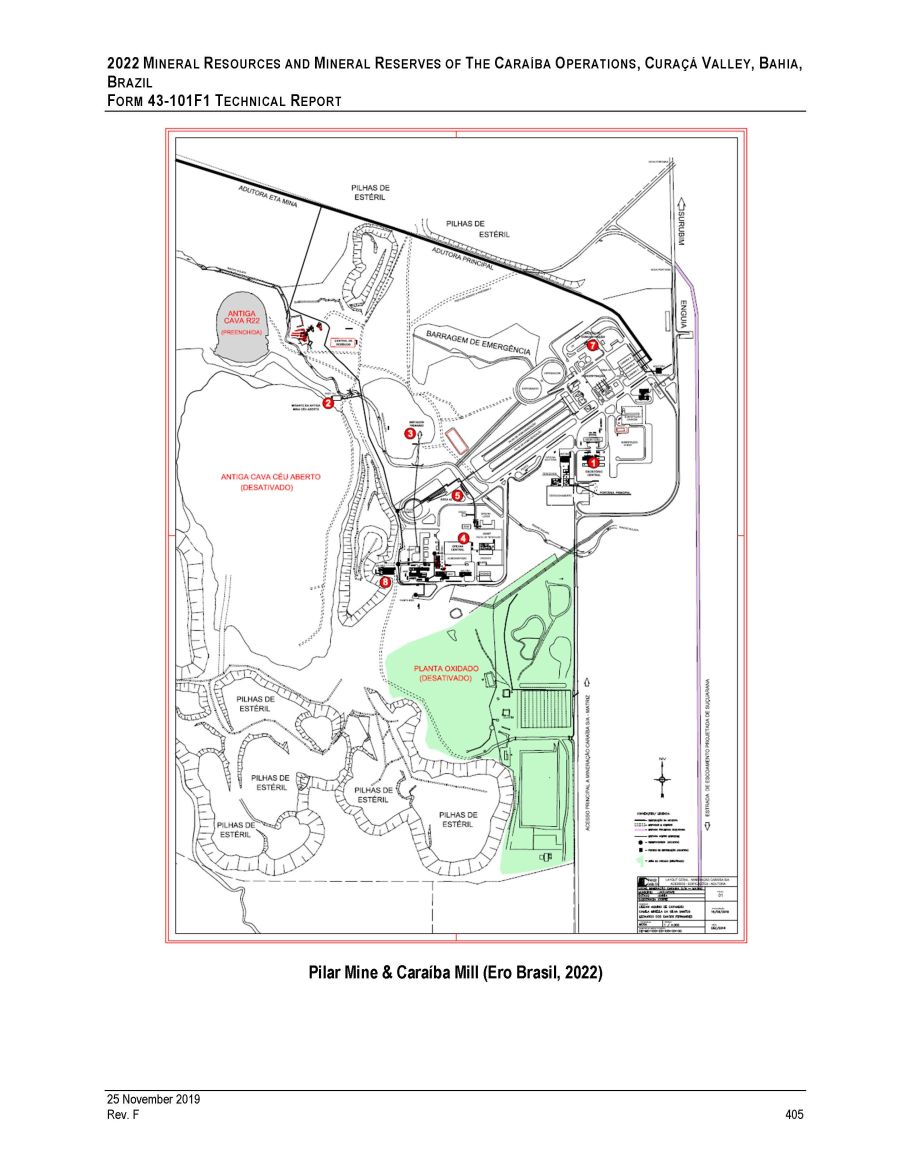
2022 M INERAL R ESOURCES AND M INERAL R ESERVES OF T HE C ARAÍBA O PERATIONS , C URAÇÁ V ALLEY , B AHIA , B RAZIL F ORM 43 - 101F1 T ECHNICAL R EPORT Pilar Mine & Caraíba Mill (Ero Brasil, 2022) 25 November 2019 Rev. F 405
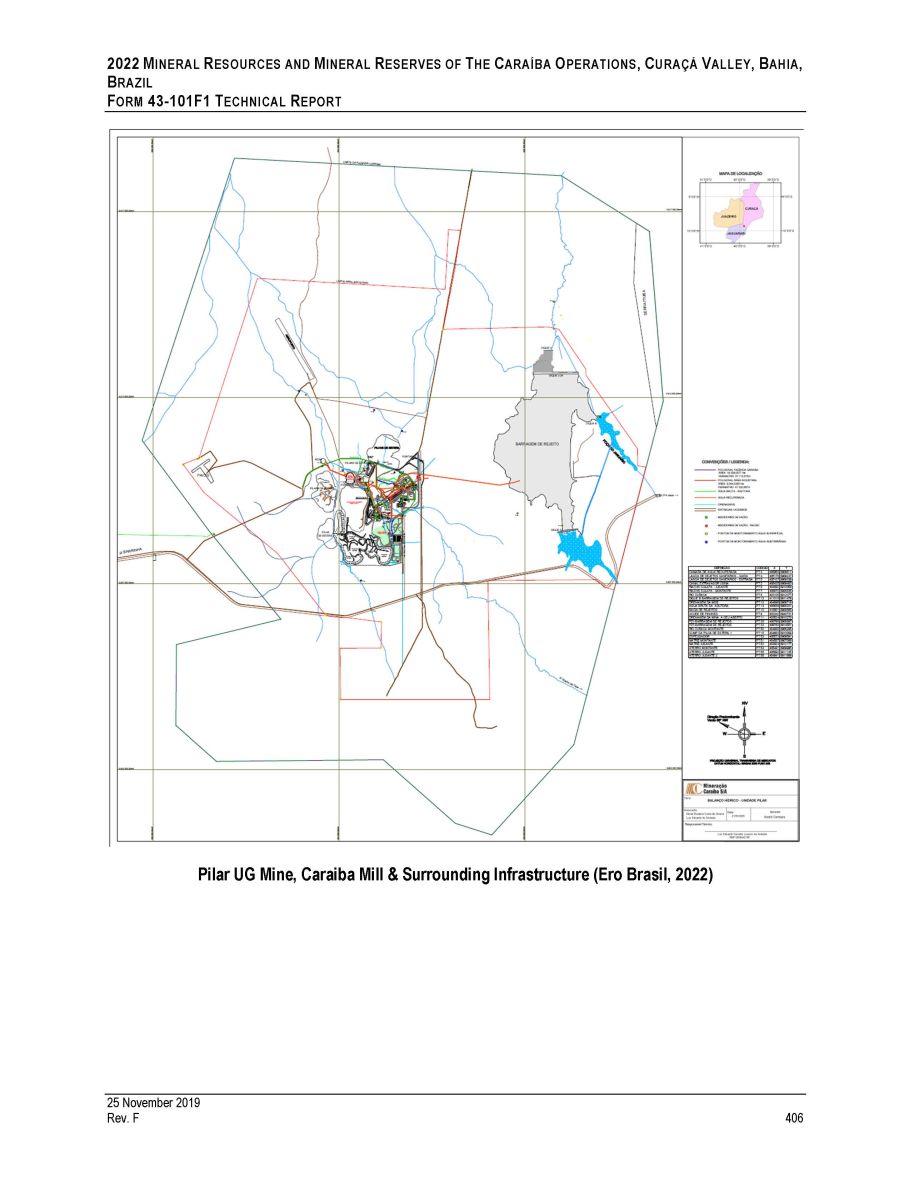
2022 M INERAL R ESOURCES AND M INERAL R ESERVES OF T HE C ARAÍBA O PERATIONS , C URAÇÁ V ALLEY , B AHIA , B RAZIL F ORM 43 - 101F1 T ECHNICAL R EPORT Pilar UG Mine, Caraiba Mill & Surrounding Infrastructure (Ero Brasil, 2022) 25 November 2019 Rev. F 406
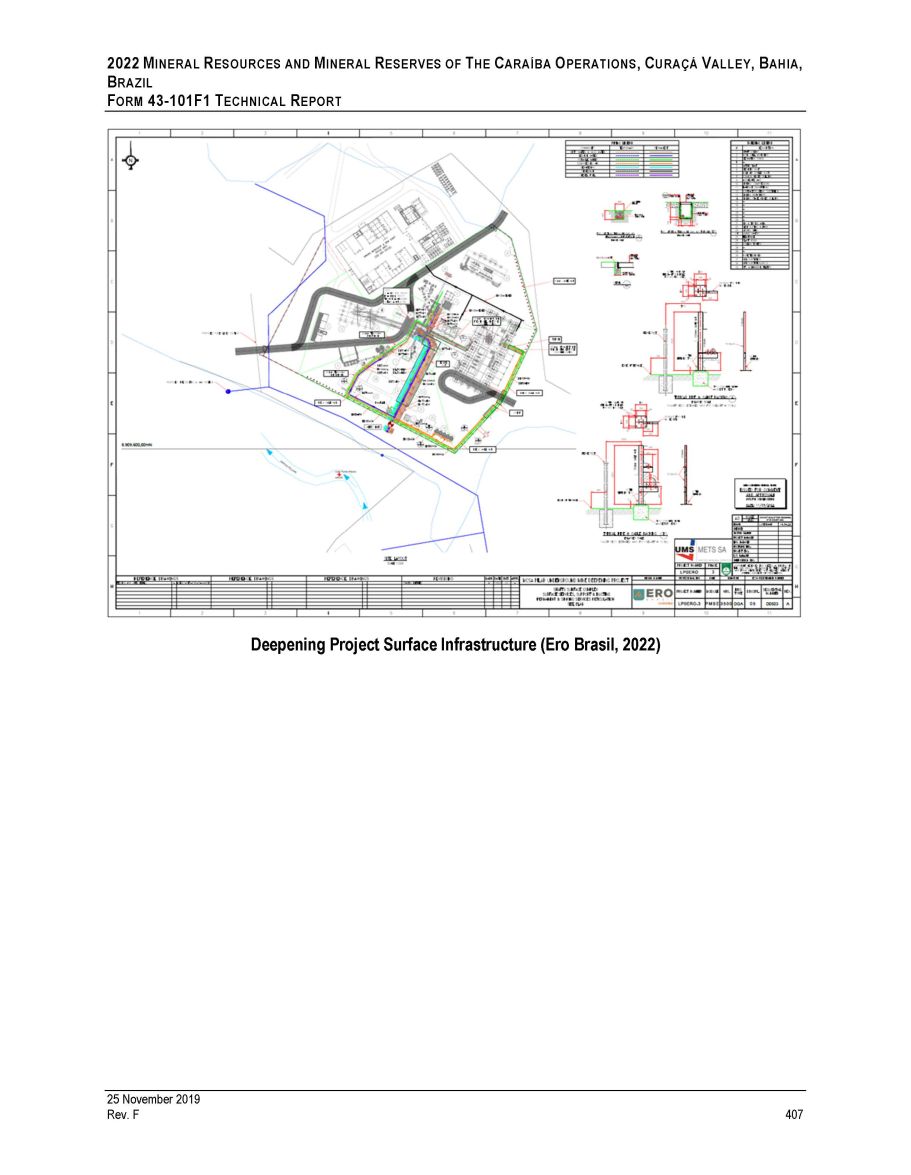
2022 M INERAL R ESOURCES AND M INERAL R ESERVES OF T HE C ARAÍBA O PERATIONS , C URAÇÁ V ALLEY , B AHIA , B RAZIL F ORM 43 - 101F1 T ECHNICAL R EPORT Deepening Project Surface Infrastructure (Ero Brasil, 2022) 25 November 2019 Rev. F 407
2022 M INERAL R ESOURCES AND M INERAL R ESERVES OF T HE C ARAÍBA O PERATIONS , C URAÇÁ V ALLEY , B AHIA , B RAZIL F ORM 43 - 101F1 T ECHNICAL R EPORT APPENDIX E Mineral Permits 25 November 2019 Rev. F 408
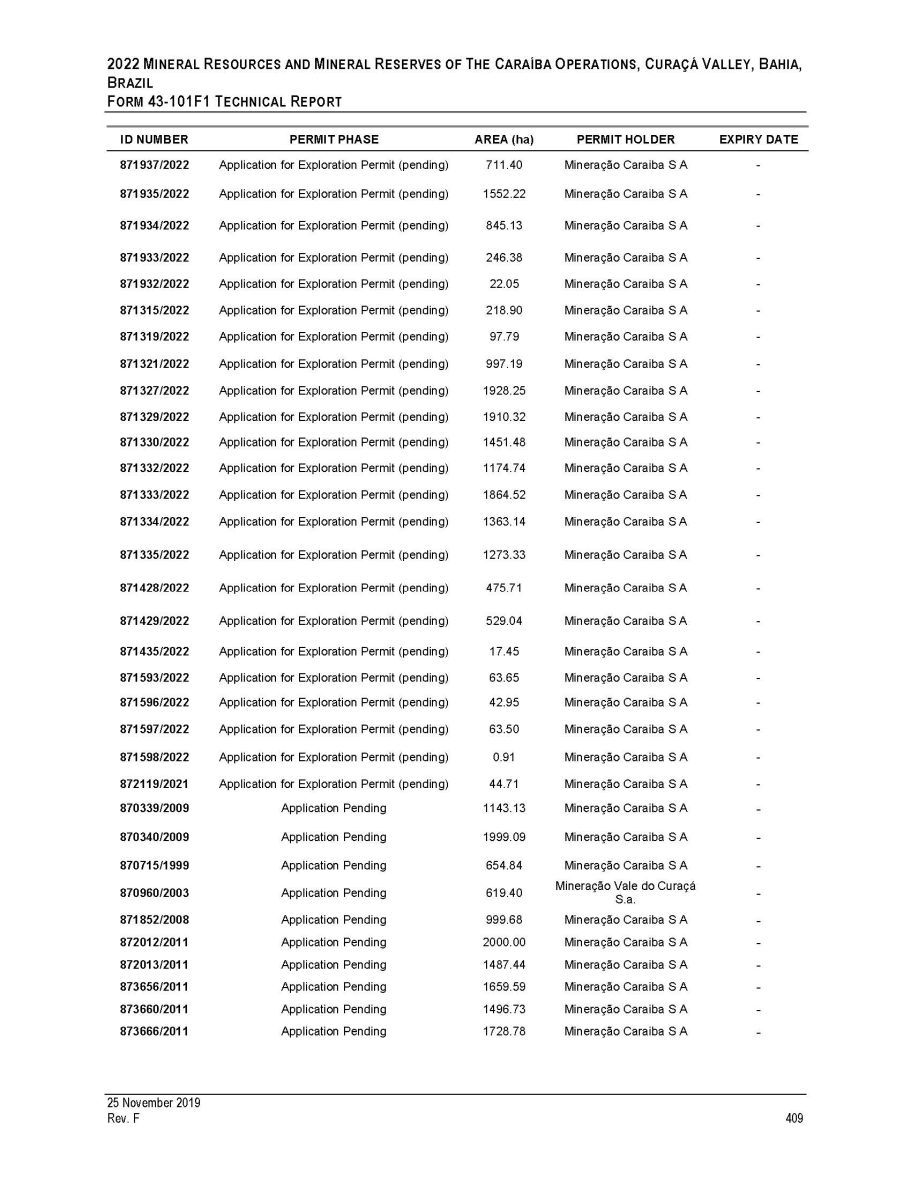
2022 M INERAL R ESOURCES AND M INERAL R ESERVES OF T HE C ARAÍBA O PERATIONS , C URAÇÁ V ALLEY , B AHIA , B RAZIL F ORM 43 - 101F1 T ECHNICAL R EPORT ID NUMBER PERMIT PHASE AREA (ha) PERMIT HOLDER EXPIRY DATE 871937/2022 Application for Exploration Permit (pending) 711.40 Mineração Caraiba S A - 871935/2022 Application for Exploration Permit (pending) 1552.22 Mineração Caraiba S A - 871934/2022 Application for Exploration Permit (pending) 845.13 Mineração Caraiba S A - 871933/2022 Application for Exploration Permit (pending) 246.38 Mineração Caraiba S A - 871932/2022 Application for Exploration Permit (pending) 22.05 Mineração Caraiba S A - 871315/2022 Application for Exploration Permit (pending) 218.90 Mineração Caraiba S A - 871319/2022 Application for Exploration Permit (pending) 97.79 Mineração Caraiba S A - 871321/2022 Application for Exploration Permit (pending) 997.19 Mineração Caraiba S A - 871327/2022 Application for Exploration Permit (pending) 1928.25 Mineração Caraiba S A - 871329/2022 Application for Exploration Permit (pending) 1910.32 Mineração Caraiba S A - 871330/2022 Application for Exploration Permit (pending) 1451.48 Mineração Caraiba S A - 871332/2022 Application for Exploration Permit (pending) 1174.74 Mineração Caraiba S A - 871333/2022 Application for Exploration Permit (pending) 1864.52 Mineração Caraiba S A - 871334/2022 Application for Exploration Permit (pending) 1363.14 Mineração Caraiba S A - 871335/2022 Application for Exploration Permit (pending) 1273.33 Mineração Caraiba S A - 871428/2022 Application for Exploration Permit (pending) 475.71 Mineração Caraiba S A - 871429/2022 Application for Exploration Permit (pending) 529.04 Mineração Caraiba S A - 871435/2022 Application for Exploration Permit (pending) 17.45 Mineração Caraiba S A - 871593/2022 Application for Exploration Permit (pending) 63.65 Mineração Caraiba S A - 871596/2022 Application for Exploration Permit (pending) 42.95 Mineração Caraiba S A - 871597/2022 Application for Exploration Permit (pending) 63.50 Mineração Caraiba S A - 871598/2022 Application for Exploration Permit (pending) 0.91 Mineração Caraiba S A - 872119/2021 Application for Exploration Permit (pending) 44.71 Mineração Caraiba S A - 870339/2009 Application Pending 1143.13 Mineração Caraiba S A - 870340/2009 Application Pending 1999.09 Mineração Caraiba S A - 870715/1999 Application Pending 654.84 Mineração Caraiba S A - 870960/2003 Application Pending 619.40 Mineração Vale do Curaçá S.a. - 871852/2008 Application Pending 999.68 Mineração Caraiba S A - 872012/2011 Application Pending 2000.00 Mineração Caraiba S A - 872013/2011 Application Pending 1487.44 Mineração Caraiba S A - 873656/2011 Application Pending 1659.59 Mineração Caraiba S A - 873660/2011 Application Pending 1496.73 Mineração Caraiba S A - 873666/2011 Application Pending 1728.78 Mineração Caraiba S A - 25 November 2019 Rev. F 409
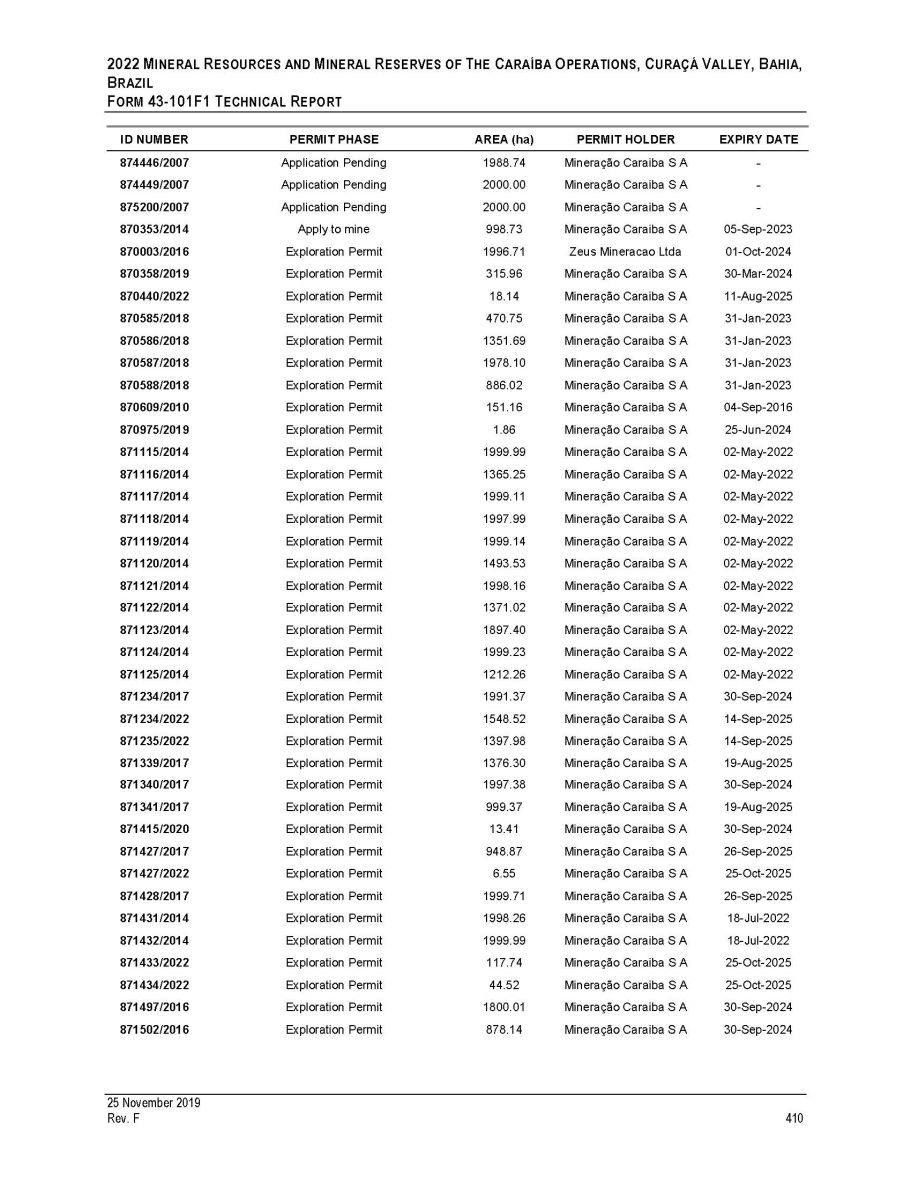
2022 M INERAL R ESOURCES AND M INERAL R ESERVES OF T HE C ARAÍBA O PERATIONS , C URAÇÁ V ALLEY , B AHIA , B RAZIL F ORM 43 - 101F1 T ECHNICAL R EPORT ID NUMBER PERMIT PHASE AREA (ha) PERMIT HOLDER EXPIRY DATE 874446/2007 Application Pending 1988.74 Mineração Caraiba S A - 874449/2007 Application Pending 2000.00 Mineração Caraiba S A - 875200/2007 Application Pending 2000.00 Mineração Caraiba S A - 870353/2014 Apply to mine 998.73 Mineração Caraiba S A 05 - Sep - 2023 870003/2016 Exploration Permit 1996.71 Zeus Mineracao Ltda 01 - Oct - 2024 870358/2019 Exploration Permit 315.96 Mineração Caraiba S A 30 - Mar - 2024 870440/2022 Exploration Permit 18.14 Mineração Caraiba S A 11 - Aug - 2025 870585/2018 Exploration Permit 470.75 Mineração Caraiba S A 31 - Jan - 2023 870586/2018 Exploration Permit 1351.69 Mineração Caraiba S A 31 - Jan - 2023 870587/2018 Exploration Permit 1978.10 Mineração Caraiba S A 31 - Jan - 2023 870588/2018 Exploration Permit 886.02 Mineração Caraiba S A 31 - Jan - 2023 870609/2010 Exploration Permit 151.16 Mineração Caraiba S A 04 - Sep - 2016 870975/2019 Exploration Permit 1.86 Mineração Caraiba S A 25 - Jun - 2024 871115/2014 Exploration Permit 1999.99 Mineração Caraiba S A 02 - May - 2022 871116/2014 Exploration Permit 1365.25 Mineração Caraiba S A 02 - May - 2022 871117/2014 Exploration Permit 1999.11 Mineração Caraiba S A 02 - May - 2022 871118/2014 Exploration Permit 1997.99 Mineração Caraiba S A 02 - May - 2022 871119/2014 Exploration Permit 1999.14 Mineração Caraiba S A 02 - May - 2022 871120/2014 Exploration Permit 1493.53 Mineração Caraiba S A 02 - May - 2022 871121/2014 Exploration Permit 1998.16 Mineração Caraiba S A 02 - May - 2022 871122/2014 Exploration Permit 1371.02 Mineração Caraiba S A 02 - May - 2022 871123/2014 Exploration Permit 1897.40 Mineração Caraiba S A 02 - May - 2022 871124/2014 Exploration Permit 1999.23 Mineração Caraiba S A 02 - May - 2022 871125/2014 Exploration Permit 1212.26 Mineração Caraiba S A 02 - May - 2022 871234/2017 Exploration Permit 1991.37 Mineração Caraiba S A 30 - Sep - 2024 871234/2022 Exploration Permit 1548.52 Mineração Caraiba S A 14 - Sep - 2025 871235/2022 Exploration Permit 1397.98 Mineração Caraiba S A 14 - Sep - 2025 871339/2017 Exploration Permit 1376.30 Mineração Caraiba S A 19 - Aug - 2025 871340/2017 Exploration Permit 1997.38 Mineração Caraiba S A 30 - Sep - 2024 871341/2017 Exploration Permit 999.37 Mineração Caraiba S A 19 - Aug - 2025 871415/2020 Exploration Permit 13.41 Mineração Caraiba S A 30 - Sep - 2024 871427/2017 Exploration Permit 948.87 Mineração Caraiba S A 26 - Sep - 2025 871427/2022 Exploration Permit 6.55 Mineração Caraiba S A 25 - Oct - 2025 871428/2017 Exploration Permit 1999.71 Mineração Caraiba S A 26 - Sep - 2025 871431/2014 Exploration Permit 1998.26 Mineração Caraiba S A 18 - Jul - 2022 871432/2014 Exploration Permit 1999.99 Mineração Caraiba S A 18 - Jul - 2022 871433/2022 Exploration Permit 117.74 Mineração Caraiba S A 25 - Oct - 2025 871434/2022 Exploration Permit 44.52 Mineração Caraiba S A 25 - Oct - 2025 871497/2016 Exploration Permit 1800.01 Mineração Caraiba S A 30 - Sep - 2024 871502/2016 Exploration Permit 878.14 Mineração Caraiba S A 30 - Sep - 2024 25 November 2019 Rev. F 410
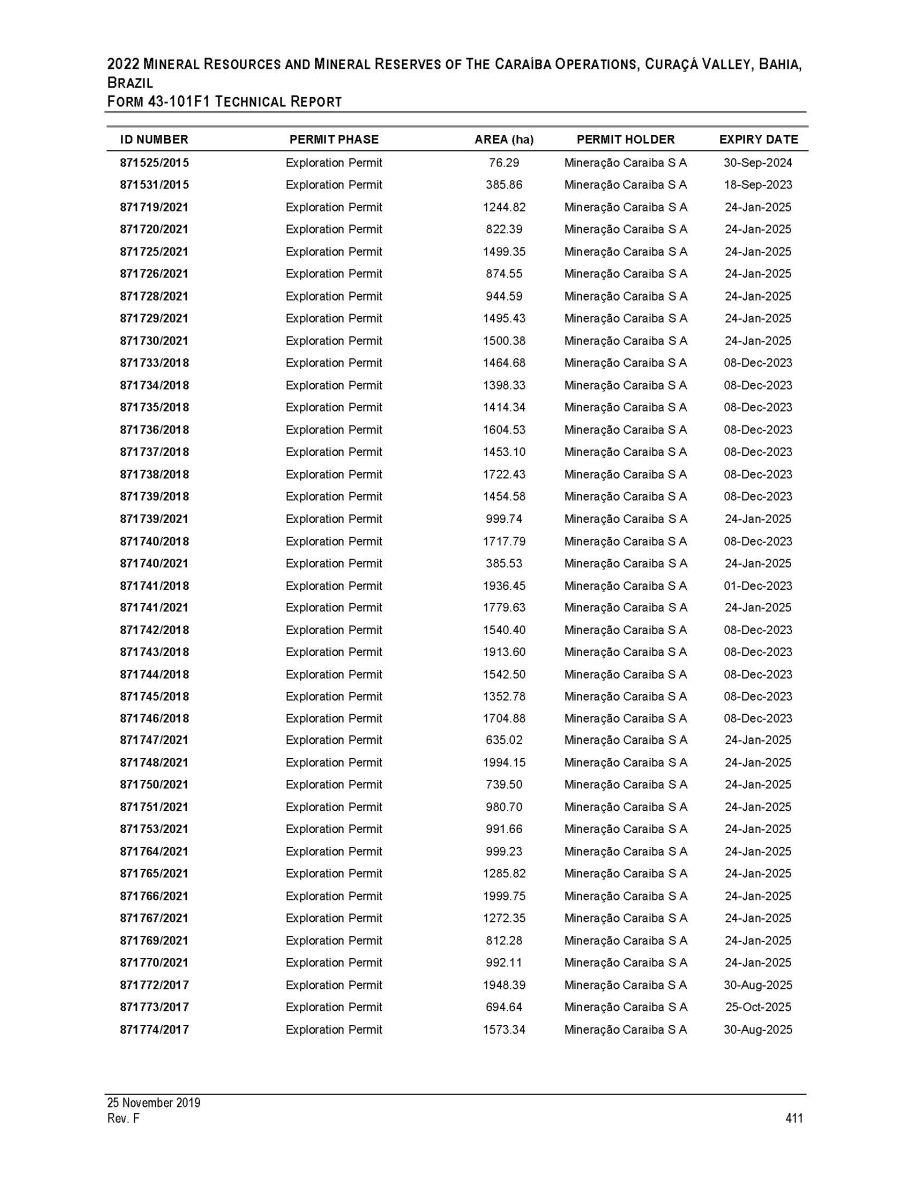
2022 M INERAL R ESOURCES AND M INERAL R ESERVES OF T HE C ARAÍBA O PERATIONS , C URAÇÁ V ALLEY , B AHIA , B RAZIL F ORM 43 - 101F1 T ECHNICAL R EPORT ID NUMBER PERMIT PHASE AREA (ha) PERMIT HOLDER EXPIRY DATE 871525/2015 Exploration Permit 76.29 Mineração Caraiba S A 30 - Sep - 2024 871531/2015 Exploration Permit 385.86 Mineração Caraiba S A 18 - Sep - 2023 871719/2021 Exploration Permit 1244.82 Mineração Caraiba S A 24 - Jan - 2025 871720/2021 Exploration Permit 822.39 Mineração Caraiba S A 24 - Jan - 2025 871725/2021 Exploration Permit 1499.35 Mineração Caraiba S A 24 - Jan - 2025 871726/2021 Exploration Permit 874.55 Mineração Caraiba S A 24 - Jan - 2025 871728/2021 Exploration Permit 944.59 Mineração Caraiba S A 24 - Jan - 2025 871729/2021 Exploration Permit 1495.43 Mineração Caraiba S A 24 - Jan - 2025 871730/2021 Exploration Permit 1500.38 Mineração Caraiba S A 24 - Jan - 2025 871733/2018 Exploration Permit 1464.68 Mineração Caraiba S A 08 - Dec - 2023 871734/2018 Exploration Permit 1398.33 Mineração Caraiba S A 08 - Dec - 2023 871735/2018 Exploration Permit 1414.34 Mineração Caraiba S A 08 - Dec - 2023 871736/2018 Exploration Permit 1604.53 Mineração Caraiba S A 08 - Dec - 2023 871737/2018 Exploration Permit 1453.10 Mineração Caraiba S A 08 - Dec - 2023 871738/2018 Exploration Permit 1722.43 Mineração Caraiba S A 08 - Dec - 2023 871739/2018 Exploration Permit 1454.58 Mineração Caraiba S A 08 - Dec - 2023 871739/2021 Exploration Permit 999.74 Mineração Caraiba S A 24 - Jan - 2025 871740/2018 Exploration Permit 1717.79 Mineração Caraiba S A 08 - Dec - 2023 871740/2021 Exploration Permit 385.53 Mineração Caraiba S A 24 - Jan - 2025 871741/2018 Exploration Permit 1936.45 Mineração Caraiba S A 01 - Dec - 2023 871741/2021 Exploration Permit 1779.63 Mineração Caraiba S A 24 - Jan - 2025 871742/2018 Exploration Permit 1540.40 Mineração Caraiba S A 08 - Dec - 2023 871743/2018 Exploration Permit 1913.60 Mineração Caraiba S A 08 - Dec - 2023 871744/2018 Exploration Permit 1542.50 Mineração Caraiba S A 08 - Dec - 2023 871745/2018 Exploration Permit 1352.78 Mineração Caraiba S A 08 - Dec - 2023 871746/2018 Exploration Permit 1704.88 Mineração Caraiba S A 08 - Dec - 2023 871747/2021 Exploration Permit 635.02 Mineração Caraiba S A 24 - Jan - 2025 871748/2021 Exploration Permit 1994.15 Mineração Caraiba S A 24 - Jan - 2025 871750/2021 Exploration Permit 739.50 Mineração Caraiba S A 24 - Jan - 2025 871751/2021 Exploration Permit 980.70 Mineração Caraiba S A 24 - Jan - 2025 871753/2021 Exploration Permit 991.66 Mineração Caraiba S A 24 - Jan - 2025 871764/2021 Exploration Permit 999.23 Mineração Caraiba S A 24 - Jan - 2025 871765/2021 Exploration Permit 1285.82 Mineração Caraiba S A 24 - Jan - 2025 871766/2021 Exploration Permit 1999.75 Mineração Caraiba S A 24 - Jan - 2025 871767/2021 Exploration Permit 1272.35 Mineração Caraiba S A 24 - Jan - 2025 871769/2021 Exploration Permit 812.28 Mineração Caraiba S A 24 - Jan - 2025 871770/2021 Exploration Permit 992.11 Mineração Caraiba S A 24 - Jan - 2025 871772/2017 Exploration Permit 1948.39 Mineração Caraiba S A 30 - Aug - 2025 871773/2017 Exploration Permit 694.64 Mineração Caraiba S A 25 - Oct - 2025 871774/2017 Exploration Permit 1573.34 Mineração Caraiba S A 30 - Aug - 2025 25 November 2019 Rev. F 411
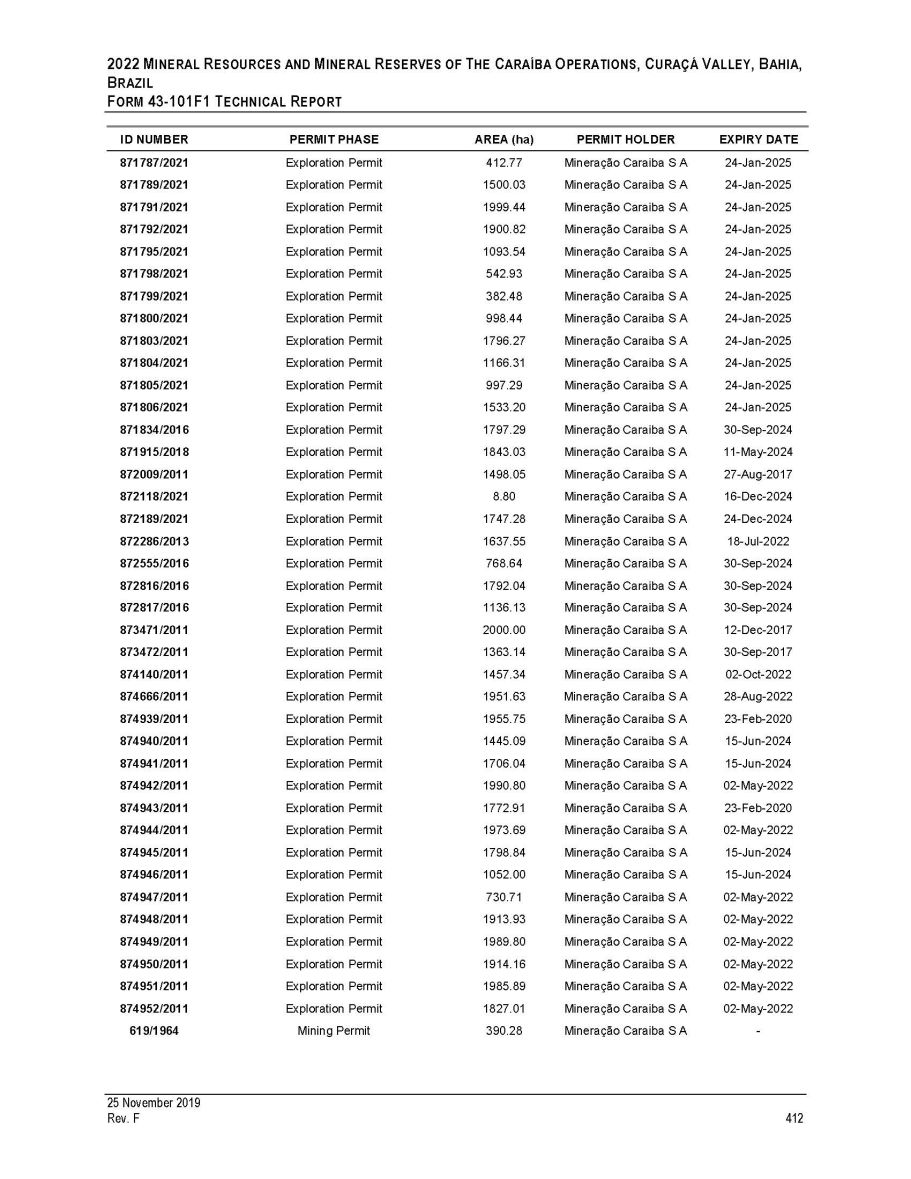
2022 M INERAL R ESOURCES AND M INERAL R ESERVES OF T HE C ARAÍBA O PERATIONS , C URAÇÁ V ALLEY , B AHIA , B RAZIL F ORM 43 - 101F1 T ECHNICAL R EPORT ID NUMBER PERMIT PHASE AREA (ha) PERMIT HOLDER EXPIRY DATE 871787/2021 Exploration Permit 412.77 Mineração Caraiba S A 24 - Jan - 2025 871789/2021 Exploration Permit 1500.03 Mineração Caraiba S A 24 - Jan - 2025 871791/2021 Exploration Permit 1999.44 Mineração Caraiba S A 24 - Jan - 2025 871792/2021 Exploration Permit 1900.82 Mineração Caraiba S A 24 - Jan - 2025 871795/2021 Exploration Permit 1093.54 Mineração Caraiba S A 24 - Jan - 2025 871798/2021 Exploration Permit 542.93 Mineração Caraiba S A 24 - Jan - 2025 871799/2021 Exploration Permit 382.48 Mineração Caraiba S A 24 - Jan - 2025 871800/2021 Exploration Permit 998.44 Mineração Caraiba S A 24 - Jan - 2025 871803/2021 Exploration Permit 1796.27 Mineração Caraiba S A 24 - Jan - 2025 871804/2021 Exploration Permit 1166.31 Mineração Caraiba S A 24 - Jan - 2025 871805/2021 Exploration Permit 997.29 Mineração Caraiba S A 24 - Jan - 2025 871806/2021 Exploration Permit 1533.20 Mineração Caraiba S A 24 - Jan - 2025 871834/2016 Exploration Permit 1797.29 Mineração Caraiba S A 30 - Sep - 2024 871915/2018 Exploration Permit 1843.03 Mineração Caraiba S A 11 - May - 2024 872009/2011 Exploration Permit 1498.05 Mineração Caraiba S A 27 - Aug - 2017 872118/2021 Exploration Permit 8.80 Mineração Caraiba S A 16 - Dec - 2024 872189/2021 Exploration Permit 1747.28 Mineração Caraiba S A 24 - Dec - 2024 872286/2013 Exploration Permit 1637.55 Mineração Caraiba S A 18 - Jul - 2022 872555/2016 Exploration Permit 768.64 Mineração Caraiba S A 30 - Sep - 2024 872816/2016 Exploration Permit 1792.04 Mineração Caraiba S A 30 - Sep - 2024 872817/2016 Exploration Permit 1136.13 Mineração Caraiba S A 30 - Sep - 2024 873471/2011 Exploration Permit 2000.00 Mineração Caraiba S A 12 - Dec - 2017 873472/2011 Exploration Permit 1363.14 Mineração Caraiba S A 30 - Sep - 2017 874140/2011 Exploration Permit 1457.34 Mineração Caraiba S A 02 - Oct - 2022 874666/2011 Exploration Permit 1951.63 Mineração Caraíba S A 28 - Aug - 2022 874939/2011 Exploration Permit 1955.75 Mineração Caraiba S A 23 - Feb - 2020 874940/2011 Exploration Permit 1445.09 Mineração Caraiba S A 15 - Jun - 2024 874941/2011 Exploration Permit 1706.04 Mineração Caraiba S A 15 - Jun - 2024 874942/2011 Exploration Permit 1990.80 Mineração Caraiba S A 02 - May - 2022 874943/2011 Exploration Permit 1772.91 Mineração Caraiba S A 23 - Feb - 2020 874944/2011 Exploration Permit 1973.69 Mineração Caraiba S A 02 - May - 2022 874945/2011 Exploration Permit 1798.84 Mineração Caraiba S A 15 - Jun - 2024 874946/2011 Exploration Permit 1052.00 Mineração Caraiba S A 15 - Jun - 2024 874947/2011 Exploration Permit 730.71 Mineração Caraiba S A 02 - May - 2022 874948/2011 Exploration Permit 1913.93 Mineração Caraiba S A 02 - May - 2022 874949/2011 Exploration Permit 1989.80 Mineração Caraiba S A 02 - May - 2022 874950/2011 Exploration Permit 1914.16 Mineração Caraiba S A 02 - May - 2022 874951/2011 Exploration Permit 1985.89 Mineração Caraiba S A 02 - May - 2022 874952/2011 Exploration Permit 1827.01 Mineração Caraiba S A 02 - May - 2022 619/1964 Mining Permit 390.28 Mineração Caraiba S A - 25 November 2019 Rev. F 412
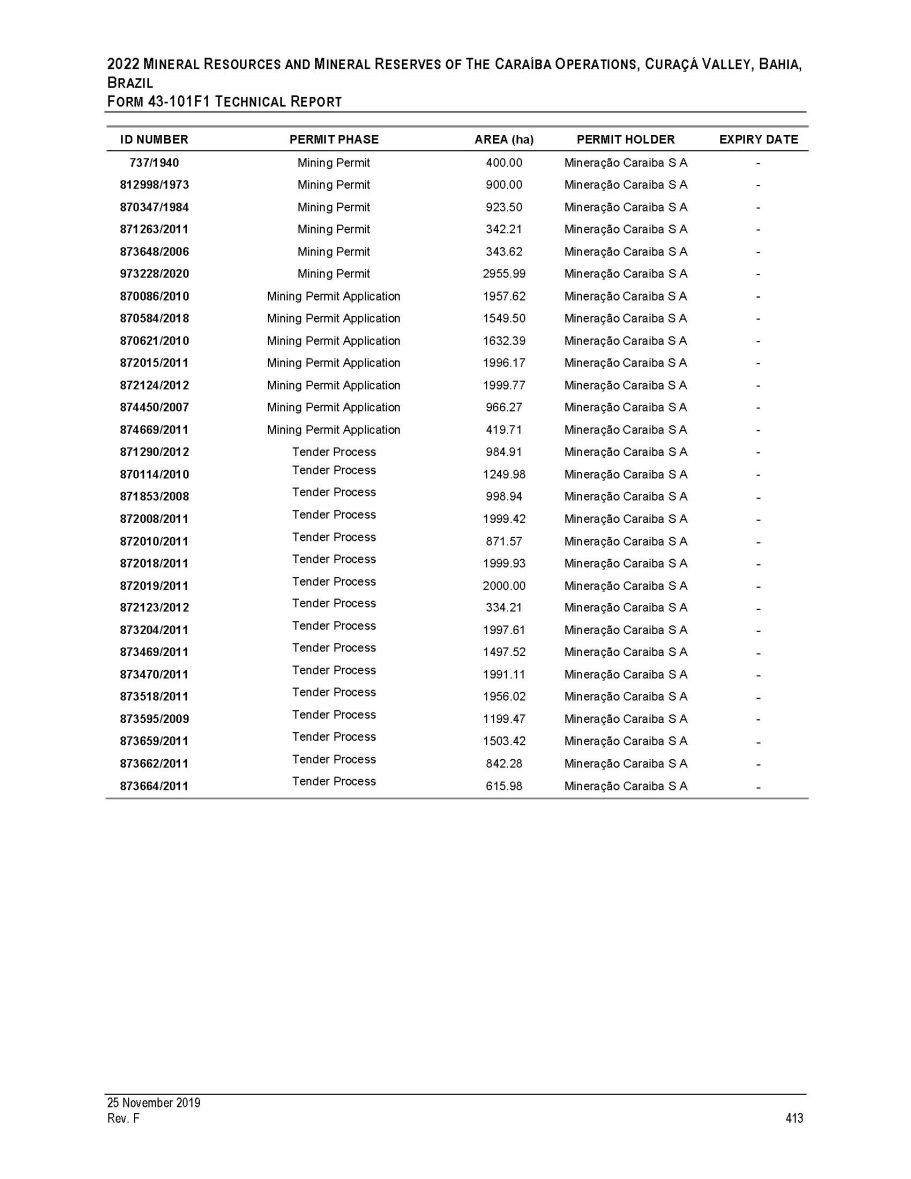
2022 M INERAL R ESOURCES AND M INERAL R ESERVES OF T HE C ARAÍBA O PERATIONS , C URAÇÁ V ALLEY , B AHIA , B RAZIL F ORM 43 - 101F1 T ECHNICAL R EPORT ID NUMBER PERMIT PHASE AREA (ha) PERMIT HOLDER EXPIRY DATE 737/1940 Mining Permit 400.00 Mineração Caraiba S A - 812998/1973 Mining Permit 900.00 Mineração Caraiba S A - 870347/1984 Mining Permit 923.50 Mineração Caraiba S A - 871263/2011 Mining Permit 342.21 Mineração Caraiba S A - 873648/2006 Mining Permit 343.62 Mineração Caraiba S A - 973228/2020 Mining Permit 2955.99 Mineração Caraiba S A - 870086/2010 Mining Permit Application 1957.62 Mineração Caraiba S A - 870584/2018 Mining Permit Application 1549.50 Mineração Caraiba S A - 870621/2010 Mining Permit Application 1632.39 Mineração Caraiba S A - 872015/2011 Mining Permit Application 1996.17 Mineração Caraiba S A - 872124/2012 Mining Permit Application 1999.77 Mineração Caraiba S A - 874450/2007 Mining Permit Application 966.27 Mineração Caraiba S A - 874669/2011 Mining Permit Application 419.71 Mineração Caraiba S A - 871290/2012 Tender Process 984.91 Mineração Caraiba S A - 870114/2010 Tender Process 1249.98 Mineração Caraiba S A - 871853/2008 Tender Process 998.94 Mineração Caraiba S A - 872008/2011 Tender Process 1999.42 Mineração Caraiba S A - 872010/2011 Tender Process 871.57 Mineração Caraiba S A - 872018/2011 Tender Process 1999.93 Mineração Caraiba S A - 872019/2011 Tender Process 2000.00 Mineração Caraiba S A - 872123/2012 Tender Process 334.21 Mineração Caraiba S A - 873204/2011 Tender Process 1997.61 Mineração Caraiba S A - 873469/2011 Tender Process 1497.52 Mineração Caraiba S A - 873470/2011 Tender Process 1991.11 Mineração Caraiba S A - 873518/2011 Tender Process 1956.02 Mineração Caraiba S A - 873595/2009 Tender Process 1199.47 Mineração Caraiba S A - 873659/2011 Tender Process 1503.42 Mineração Caraiba S A - 873662/2011 Tender Process 842.28 Mineração Caraiba S A - 873664/2011 Tender Process 615.98 Mineração Caraiba S A - 25 November 2019 Rev. F 413
2022 M INERAL R ESOURCES AND M INERAL R ESERVES OF T HE C ARAÍBA O PERATIONS , C URAÇÁ V ALLEY , B AHIA , B RAZIL F ORM 43 - 101F1 T ECHNICAL R EPORT APPENDIX F Standard Certificates 25 November 2019 Rev. F 414
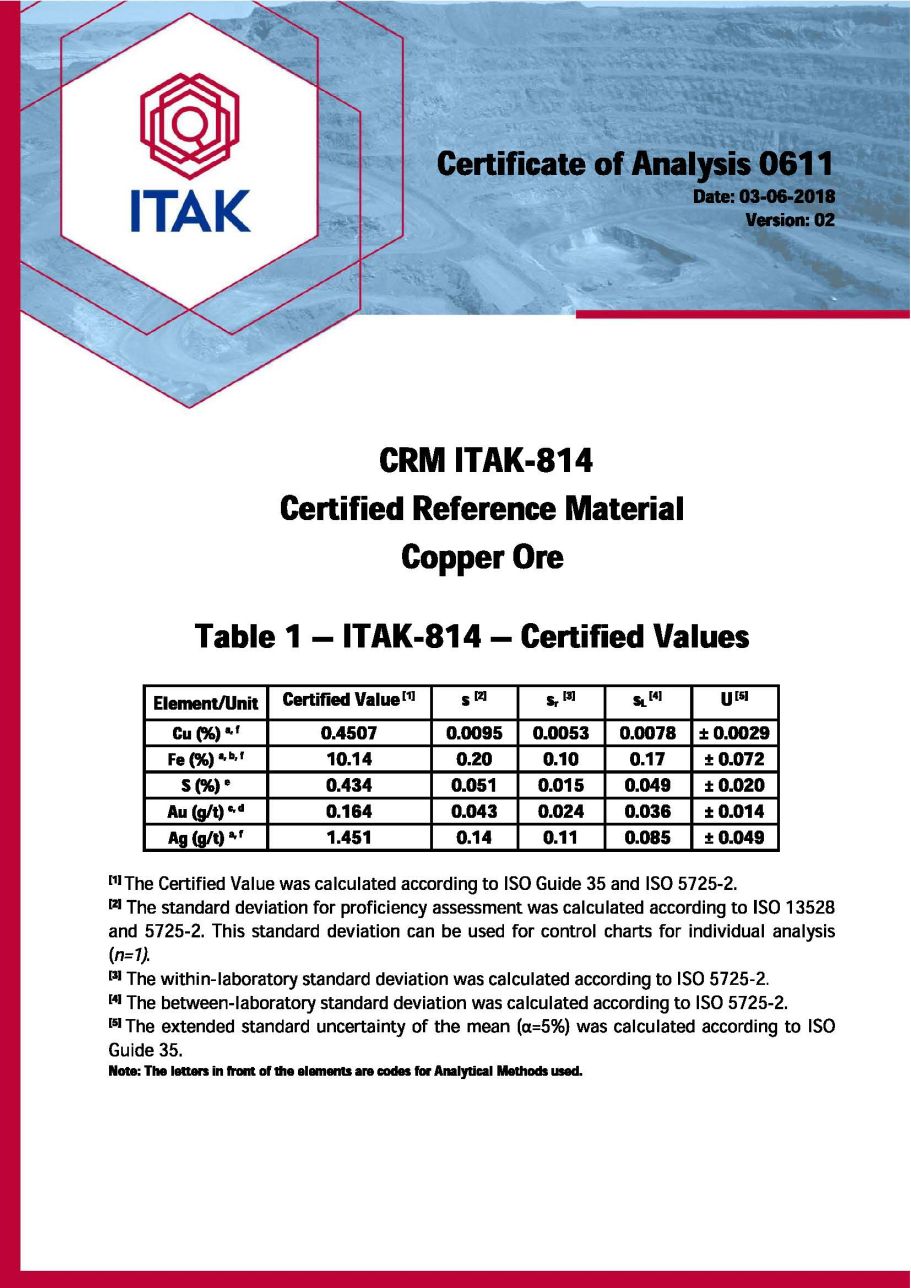

2
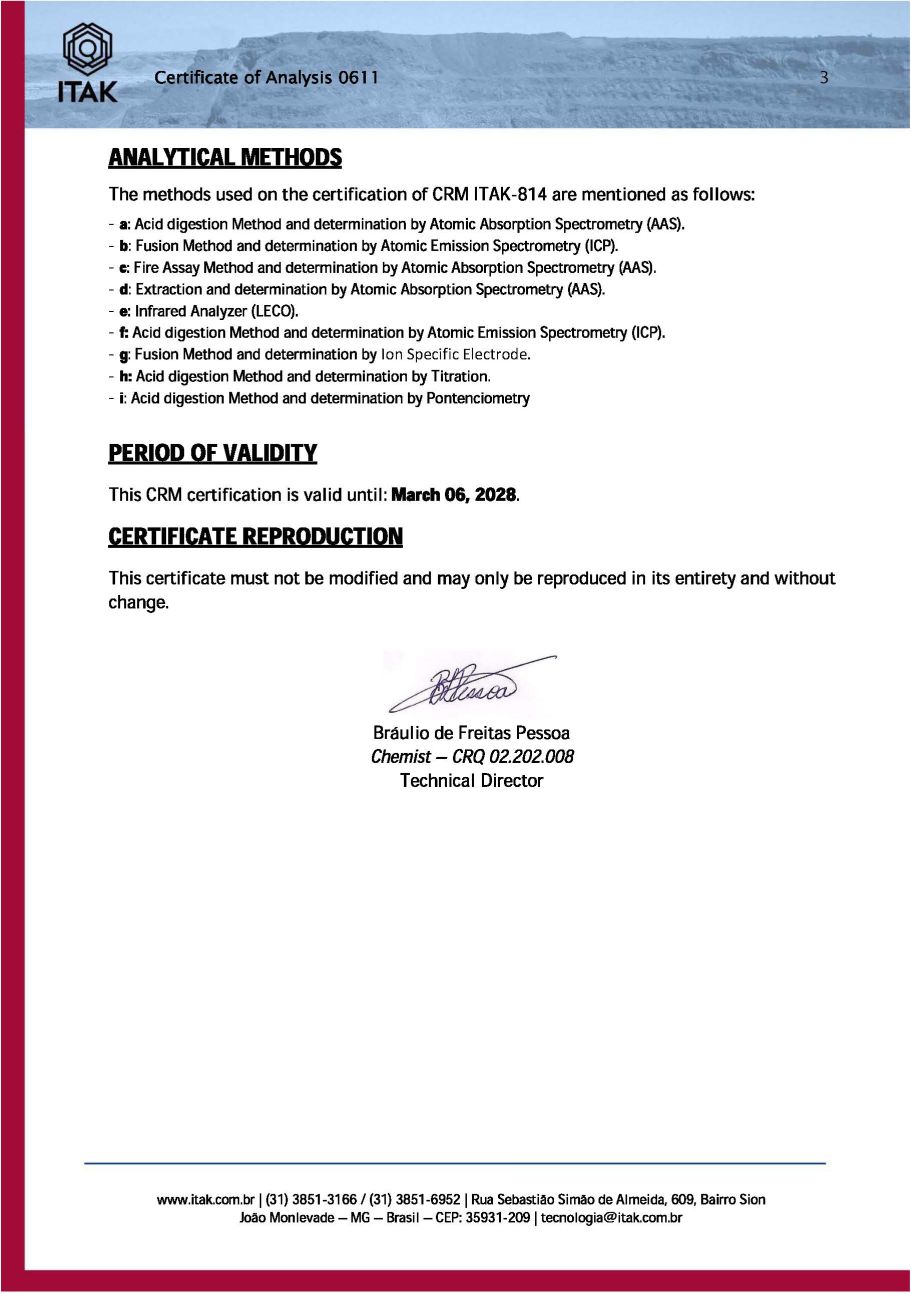
3 Ion Specific Electrode - - - - - - - - -
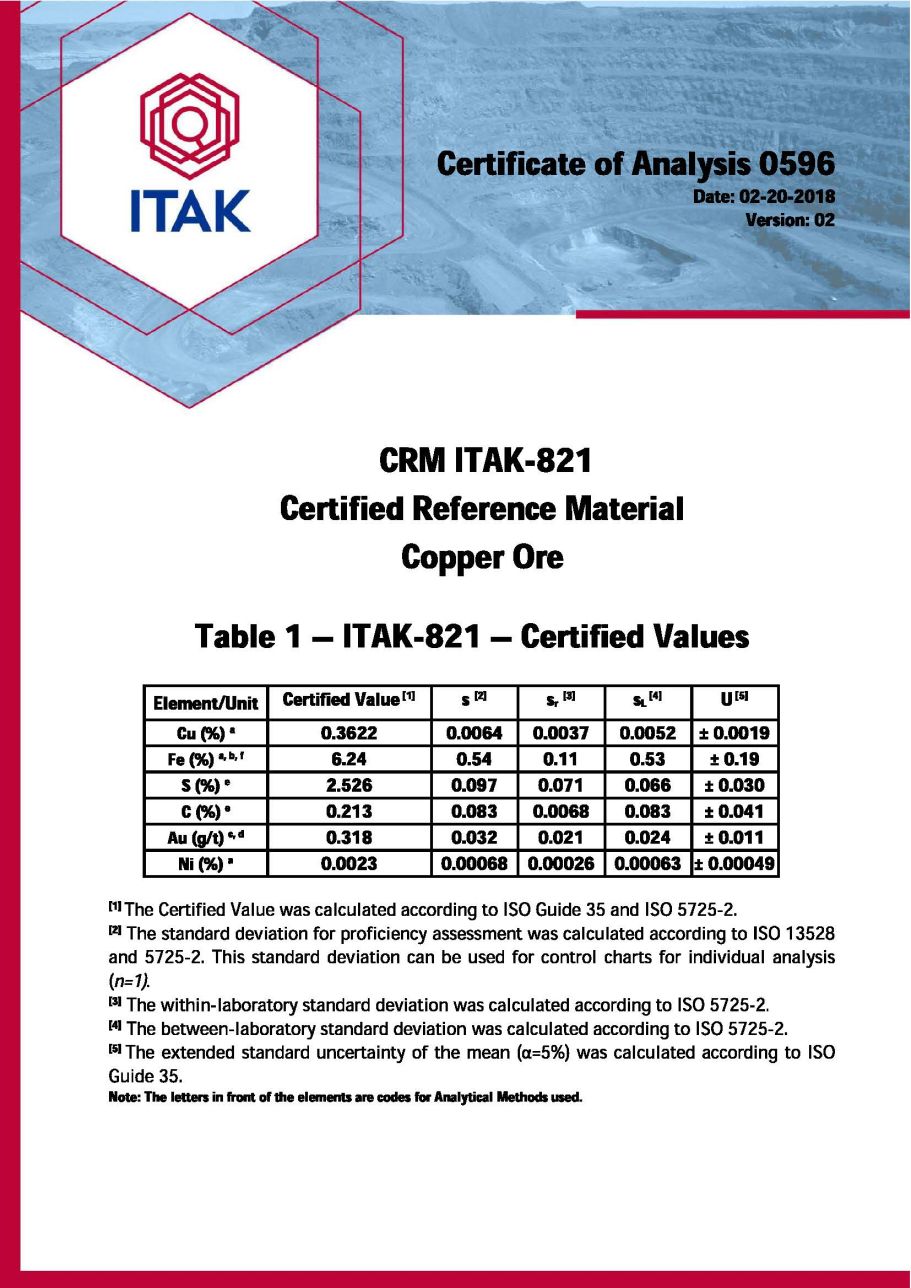
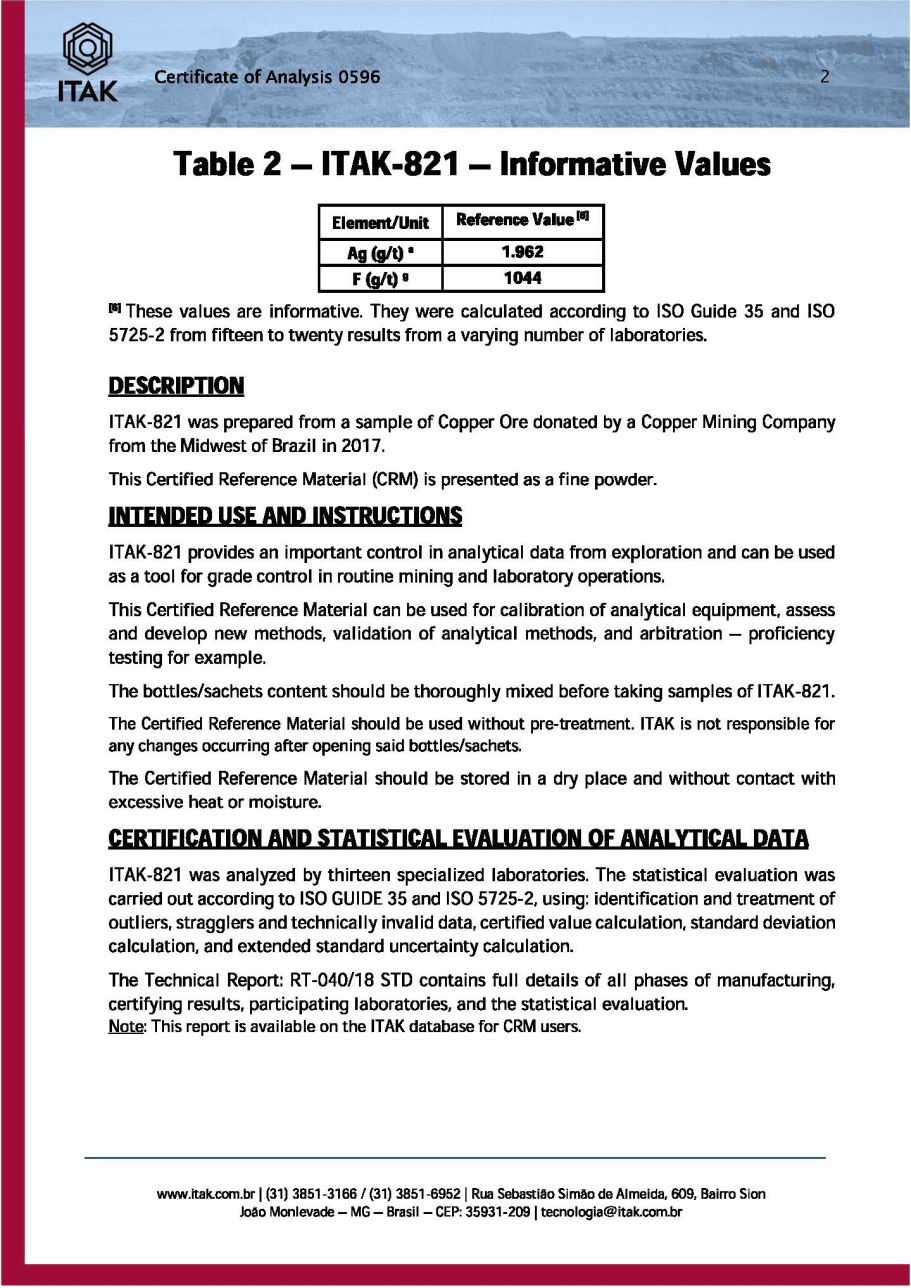
2
3 - - - - - - - Ion specific electrode
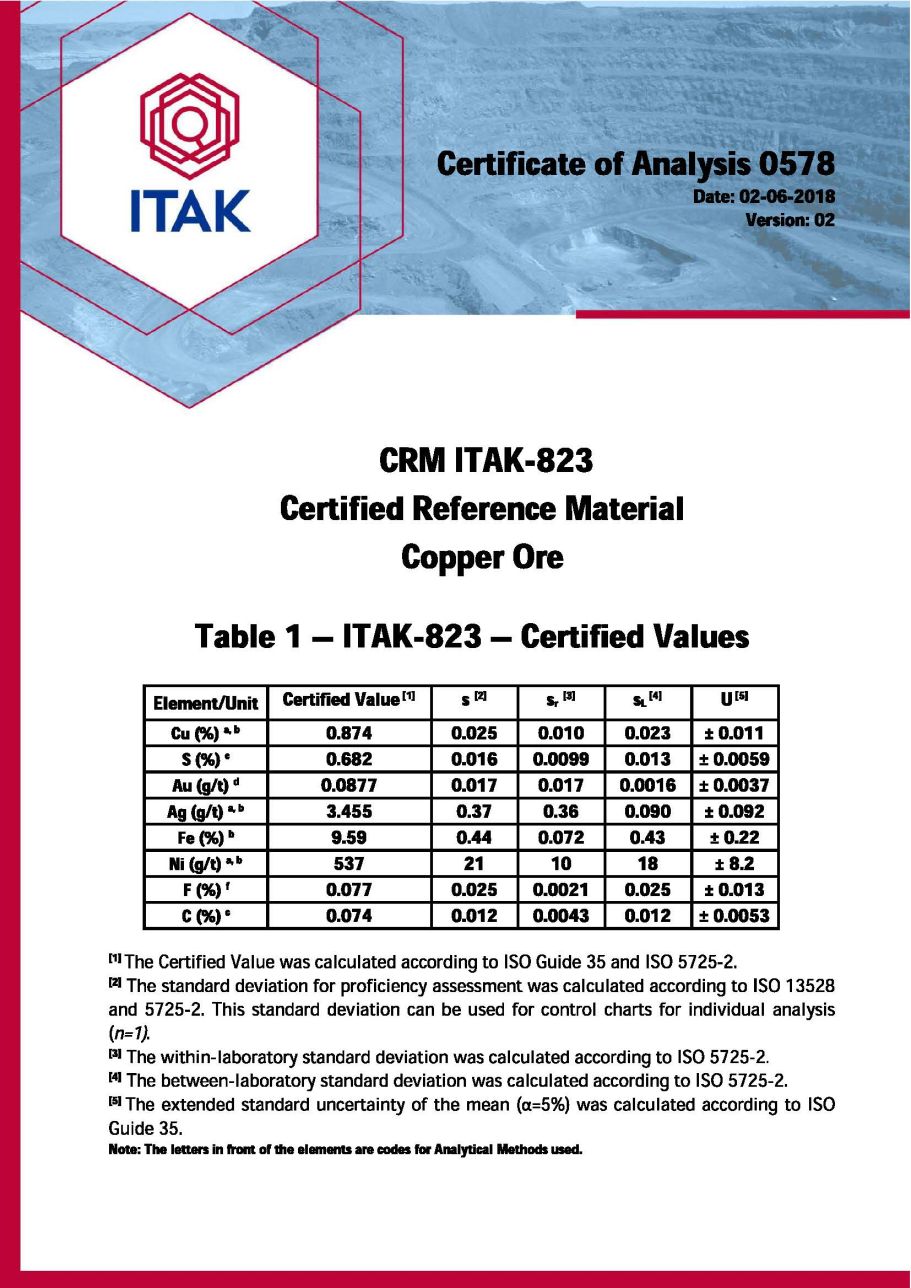
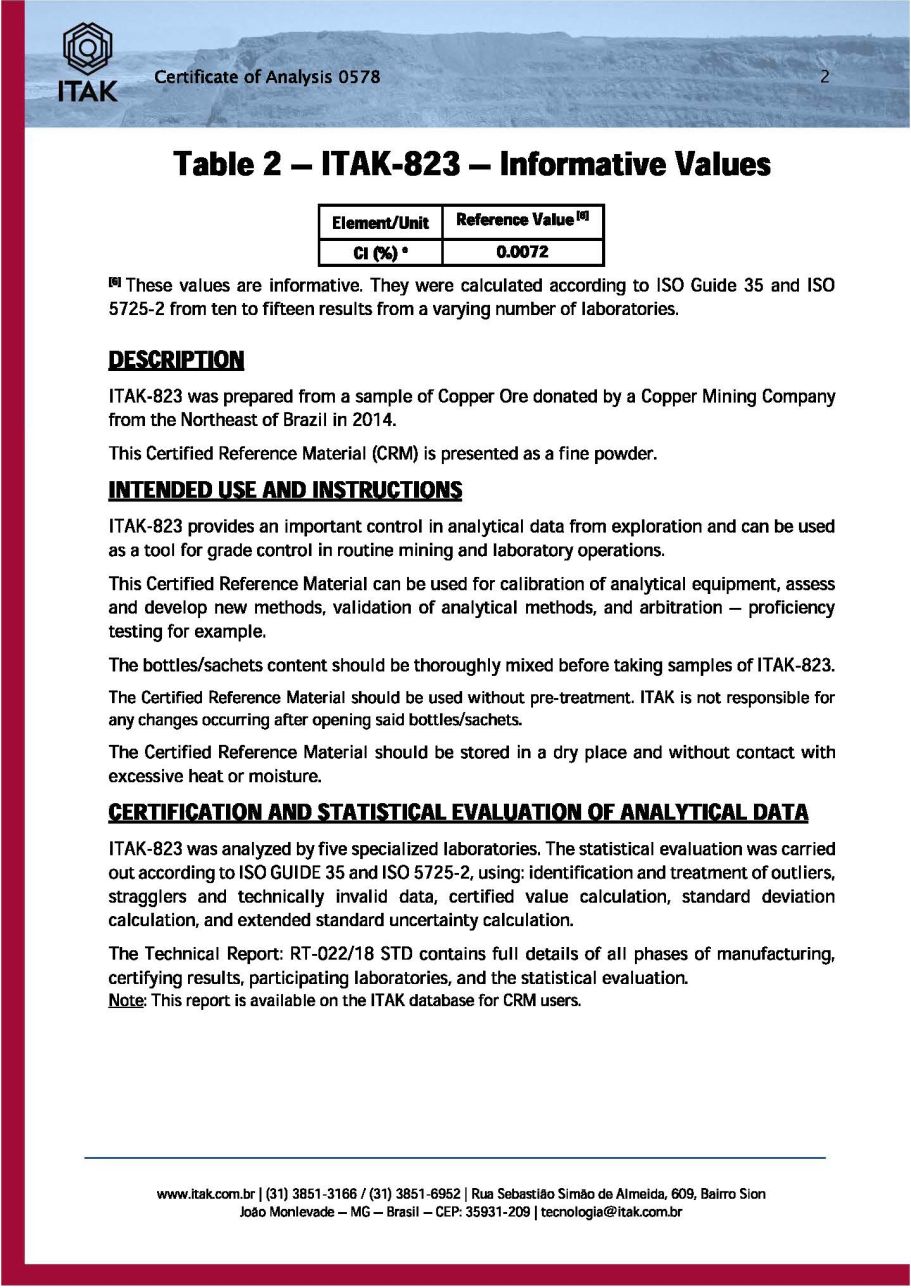
2

3 - - - - - - Ion specific electrode
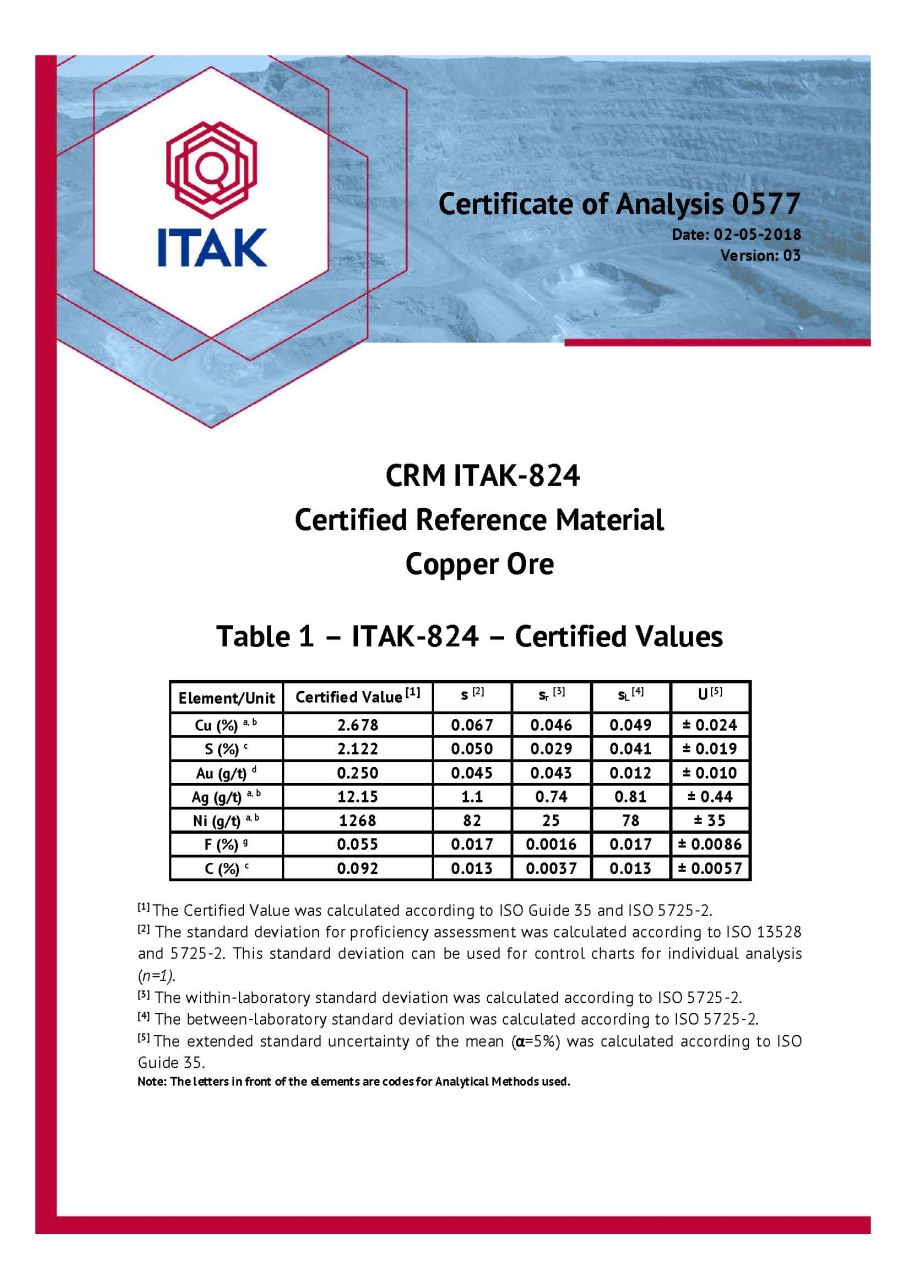
Certificate of Analysis 0577 Date: 02 - 05 - 2018 Version: 03 CRM ITAK - 824 Certified Reference Material Copper Ore Table 1 – ITAK - 824 – Certified Values Element/Unit Certified Value [1] s [2] s r [3] s L [4] U [5] Cu (%) a, b 2.678 0.067 0.046 0.049 ц 0.024 S (%) c 2.122 0.050 0.029 0.041 ц 0.019 Au (g/t) d 0.250 0.045 0.043 0.012 ц 0.010 Ag (g/t) a, b 12.15 1.1 0.74 0.81 ц 0.44 Ni (g/t) a, b 1268 82 25 78 ц 35 F (%) g 0.055 0.017 0.0016 0.017 ц 0.0086 C (%) c 0.092 0.013 0.0037 0.013 ц 0.0057 [ 1 ] The Certified Value was calculated according to ISO Guide 35 and ISO 5725 - 2 . [ 2 ] The standard deviation for proficiency assessment was calculated according to ISO 13528 and 5725 - 2 . This standard deviation can be used for control charts for individual analysis ( n= 1 ) . [ 3 ] The within - laboratory standard deviation was calculated according to ISO 5725 - 2 . [ 4 ] The between - laboratory standard deviation was calculated according to ISO 5725 - 2 . [ 5 ] The extended standard uncertainty of the mean ( = 5 % ) was calculated according to ISO Guide 35 . Note: The letters in front of the elements are codes for Analytical Methods used.

Certificate of Analysis 0577 www.itak.com.br | (31) 3851 - 3166 / (31) 3851 - 6952 | Rua Sebastião Simão de Almeida, 609, Bairro Sion João Monlevade – MG – Brasil – CEP: 35931 - 209 | tecnologia@itak.com.br 2 Table 2 – ITAK - 824 – Informative Values Element/Unit Reference Value [6] Fe (%) a, b 13.39 As (g/t) b < 30 Cl (g/t) e, f 80 Th (g/t) b < 20 U (g/t) b < 30 [6] These values are informative. They were calculated according to ISO Guide 35 and ISO 5725 - 2 from ten to twenty results from a varying number of laboratories. DESCRIPTION ITAK - 824 was prepared from a sample of Copper Ore donated by a Copper Mining Company from the Northeast of Brazil in 2014 . This Certified Reference Material (CRM) is presented as a fine powder. INTENDED USE AND INSTRUCTIONS ITAK - 824 provides an important control in analytical data from exploration and can be used as a tool for grade control in routine mining and laboratory operations . This Certified Reference Material can be used for calibration of analytical equipment, assess and develop new methods, validation of analytical methods, and arbitration – proficiency testing for example . The bottles/sachets content should be thoroughly mixed before taking samples of ITAK - 824. The Certified Reference Material should be used without pre - treatment. ITAK is not responsible for any changes occurring after opening said bottles/sachets. The Certified Reference Material should be stored in a dry place and without contact with excessive heat or moisture. CERTIFICATION AND STATISTICAL EVALUATION OF ANALYTICAL DATA ITAK - 824 was analyzed by five specialized laboratories . The statistical evaluation was carried out according to ISO GUIDE 35 and ISO 5725 - 2 , using : identification and treatment of outliers, stragglers and technically invalid data, certified value calculation, standard deviation calculation, and extended standard uncertainty calculation . The Technical Report : RT - 021 / 18 STD contains full details of all phases of manufacturing, certifying results, participating laboratories, and the statistical evaluation . Note : This report is available on the ITAK database for CRM users .

Certificate of Analysis 0577 3 ANALYTICAL METHODS The methods used on the certification of CRM ITAK - 824 are mentioned as follows: - a : Acid digestion Method and determination by Atomic Absorption Spectrometry (AAS). - b : Acid digestion Method and determination by Atomic Emission Spectrometry (ICP). - c : Infrared Analyzer (LECO). - d : Fire Assay Method and determination by Atomic Absorption Spectrometry (AAS). - e : Acid digestion Method and determination by Titration. - f : Neutron Activation Method. - g : Acid digestion Method and determination by Ion specific electrode . PERIOD OF VALIDITY This CRM certification is valid until: February 05, 2028 . CERTIFICATE REPRODUCTION This certificate must not be modified and may only be reproduced in its entirety and without change. www.itak.com.br | (31) 3851 - 3166 / (31) 3851 - 6952 | Rua Sebastião Simão de Almeida, 609, Bairro Sion João Monlevade – MG – Brasil – CEP: 35931 - 209 | tecnologia@itak.com.br Bráulio de Freitas Pessoa Chemist – CRQ 02.202.008 Technical Director
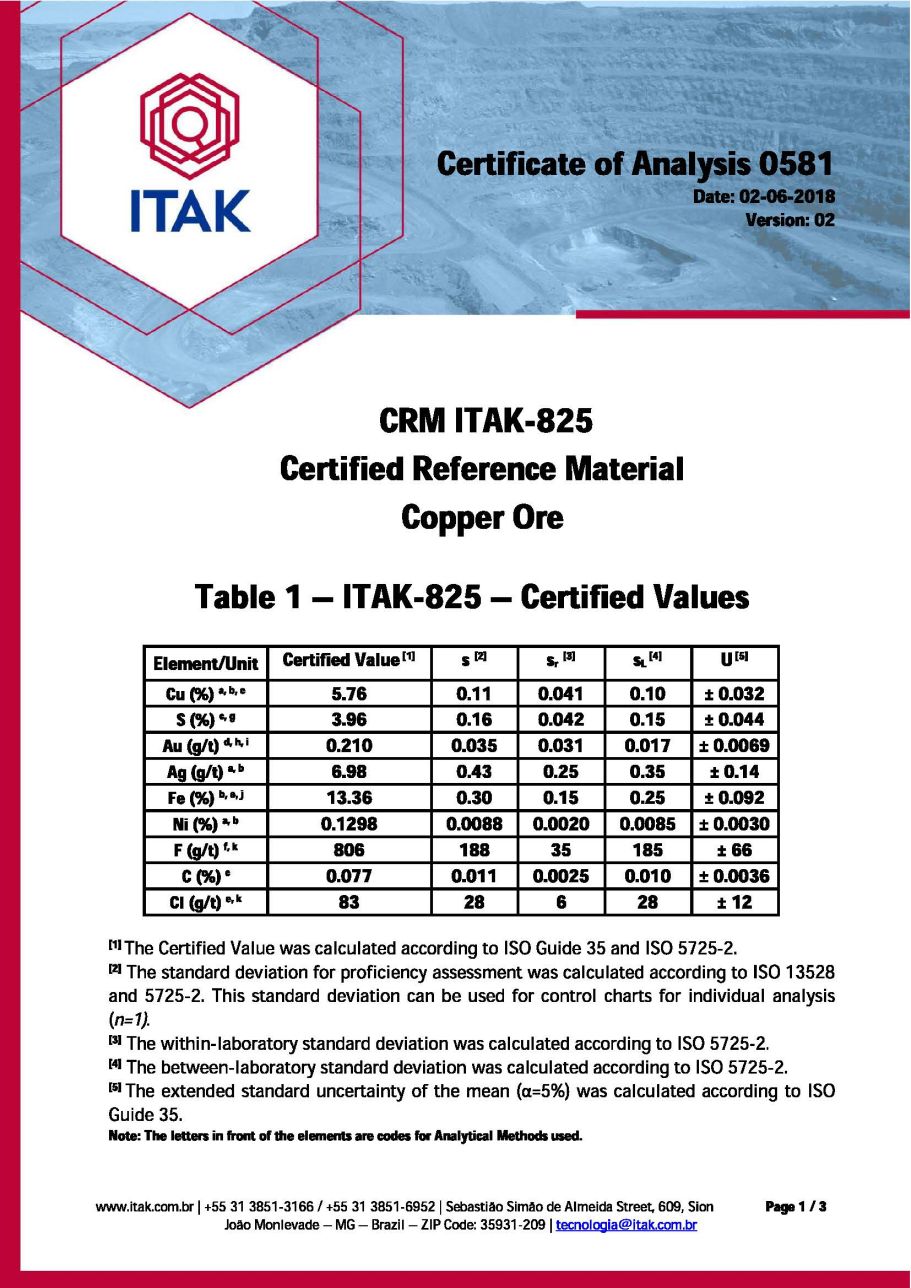
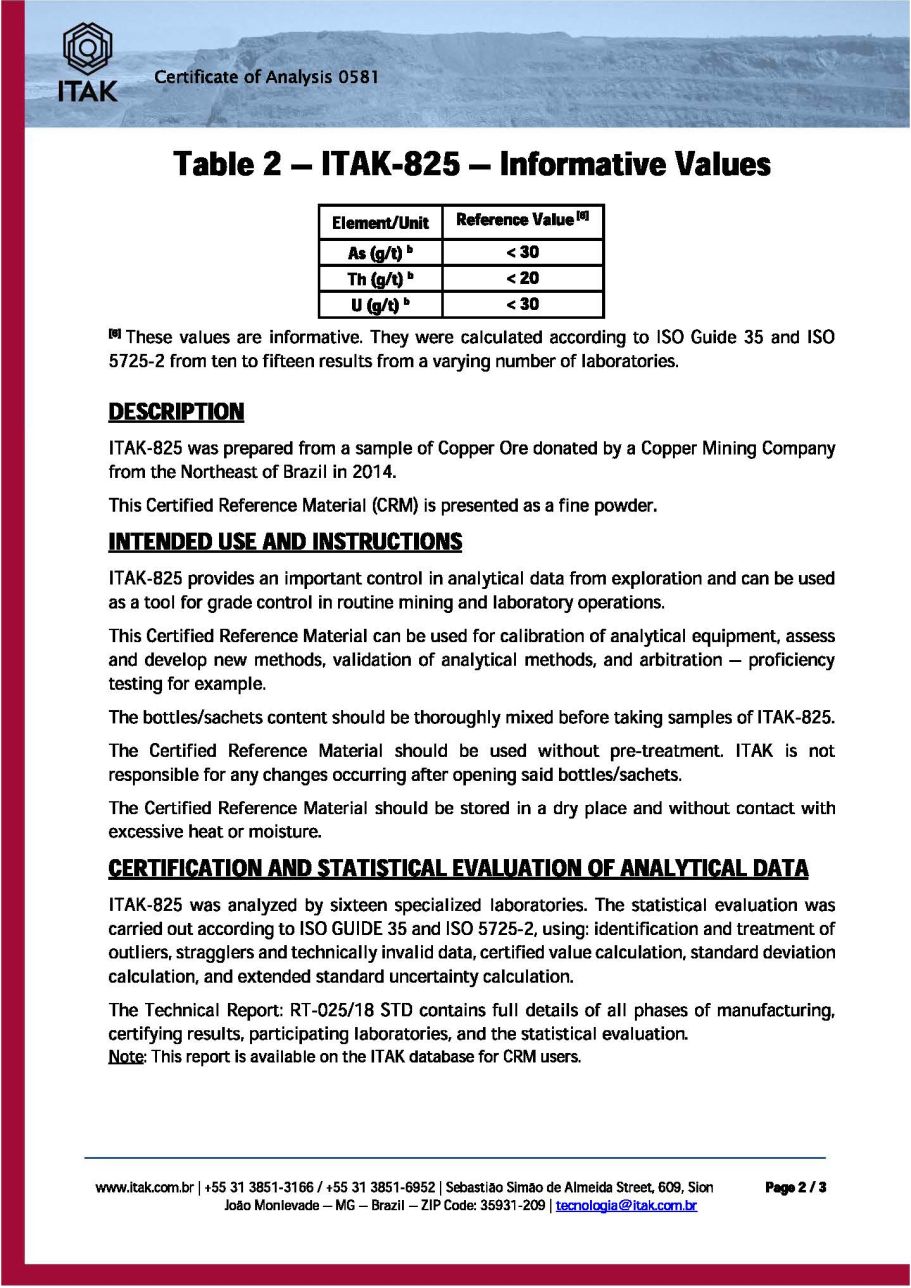
Ion specific electrode - - - - - - - - - - -
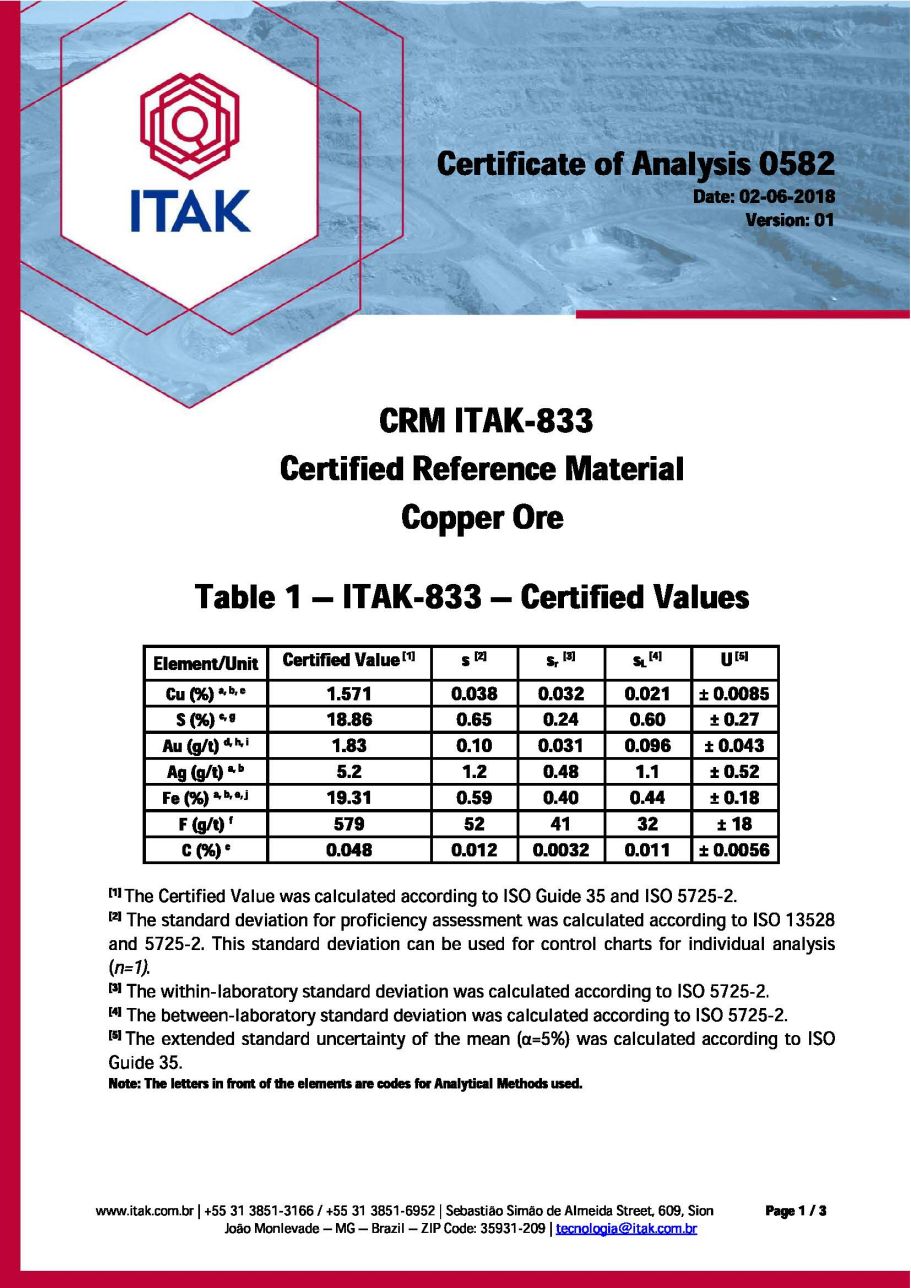
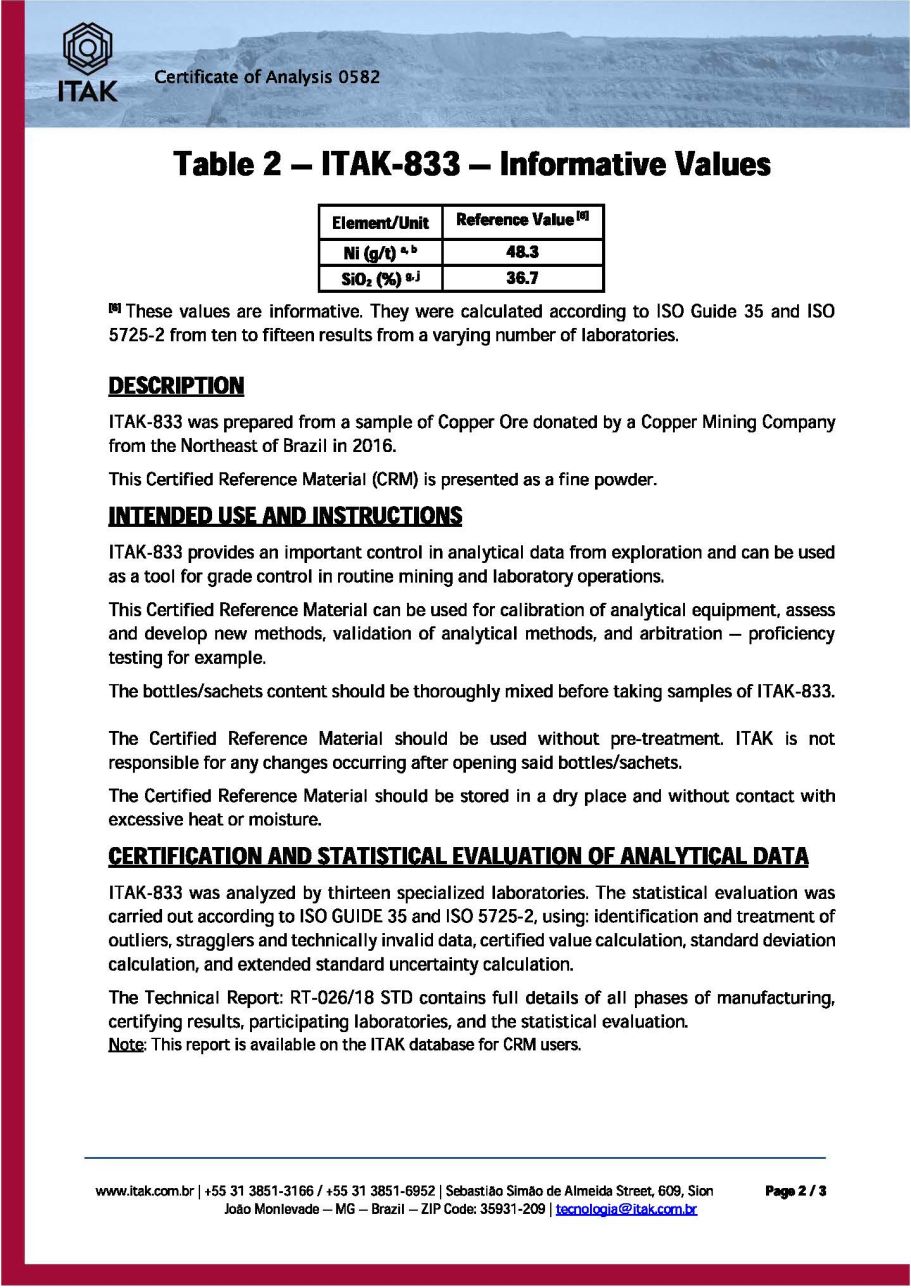
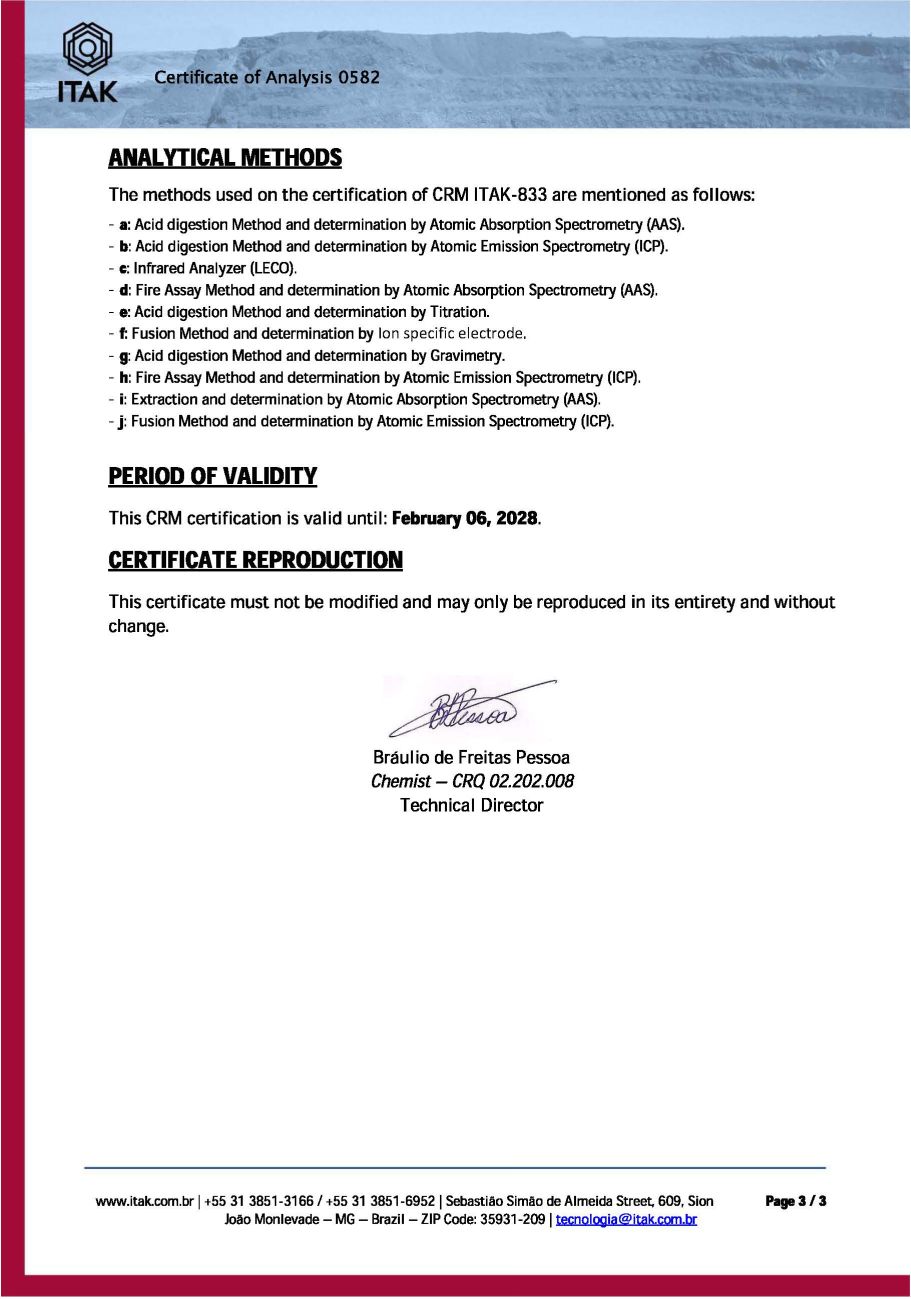
Ion specific electrode - - - - - - - - - -


-

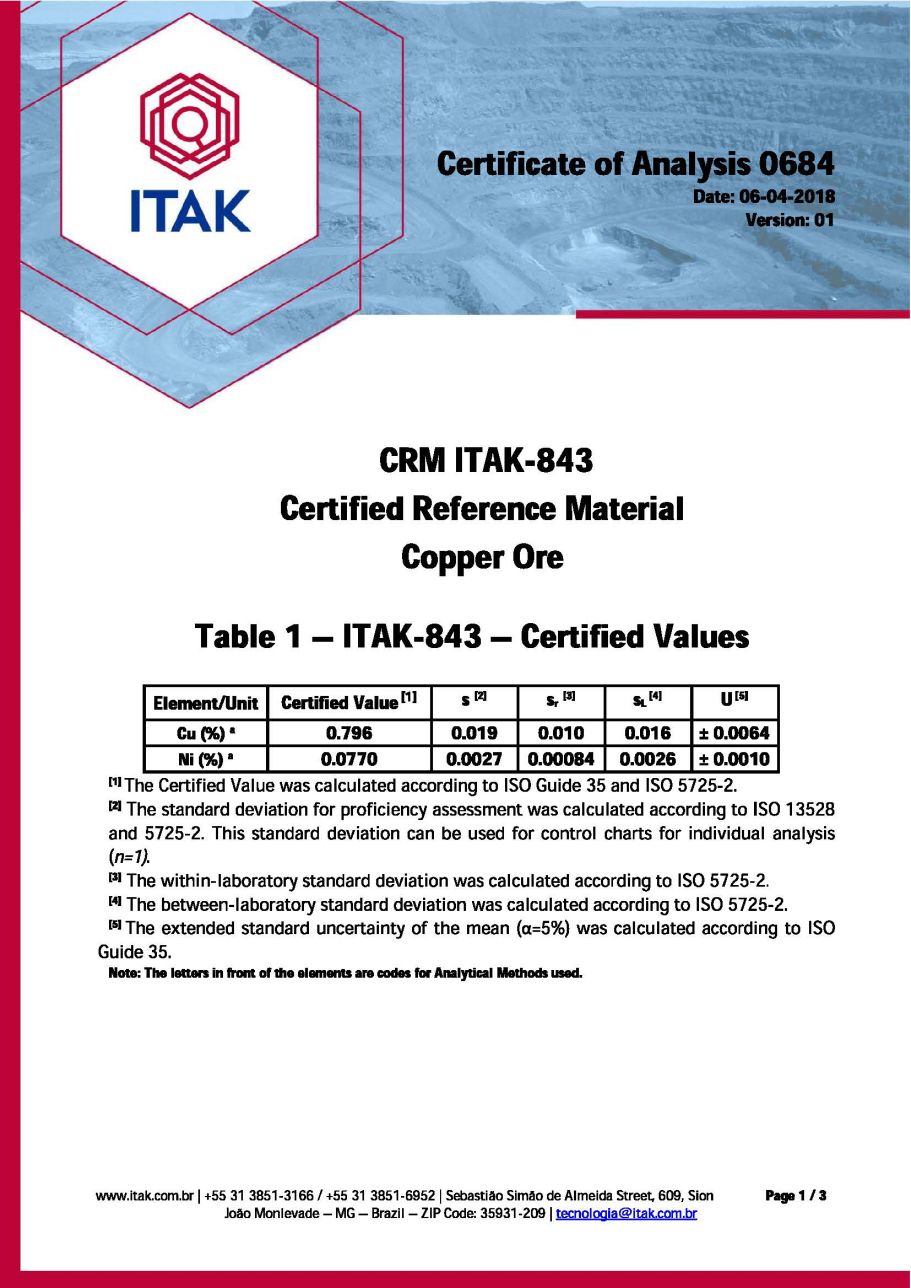
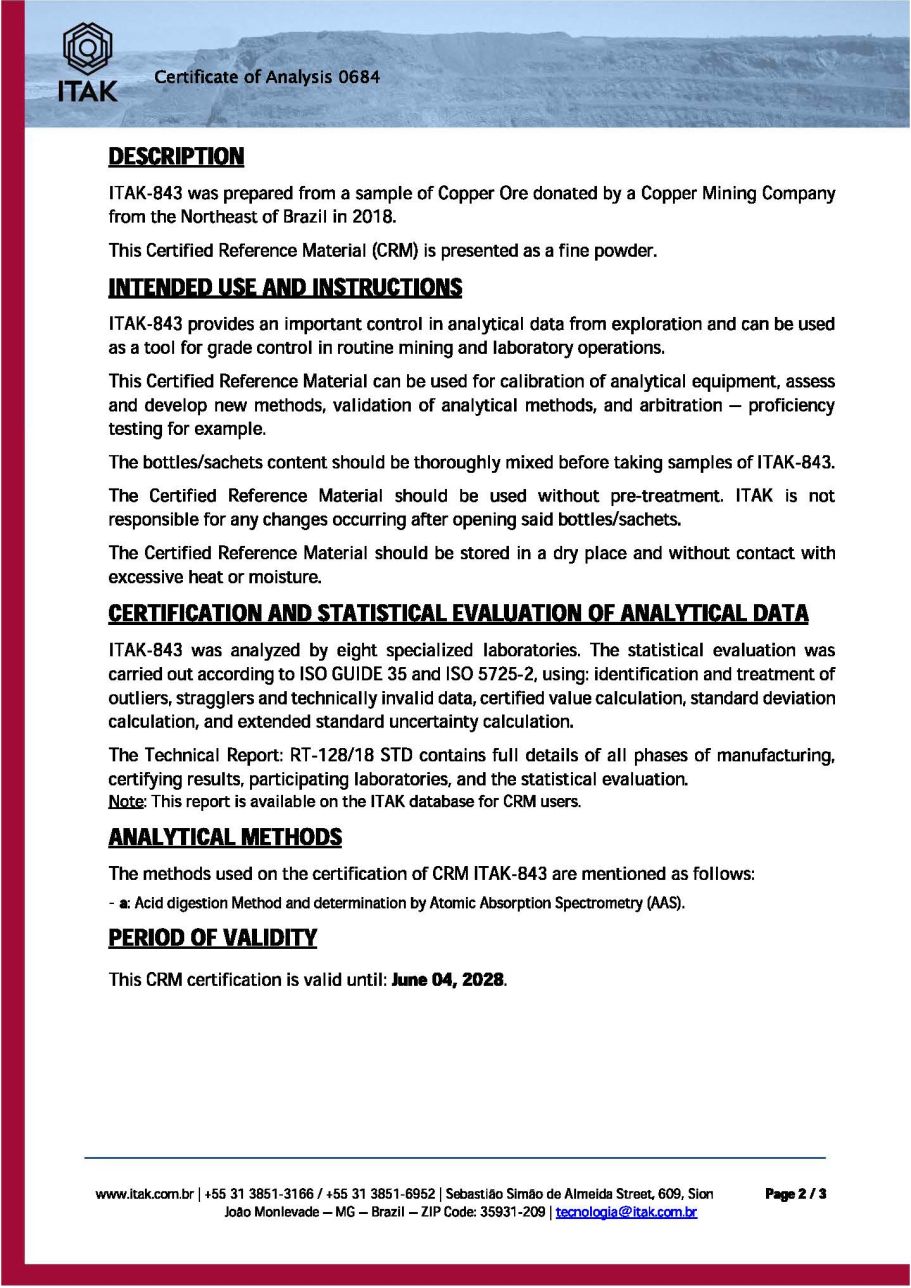
-
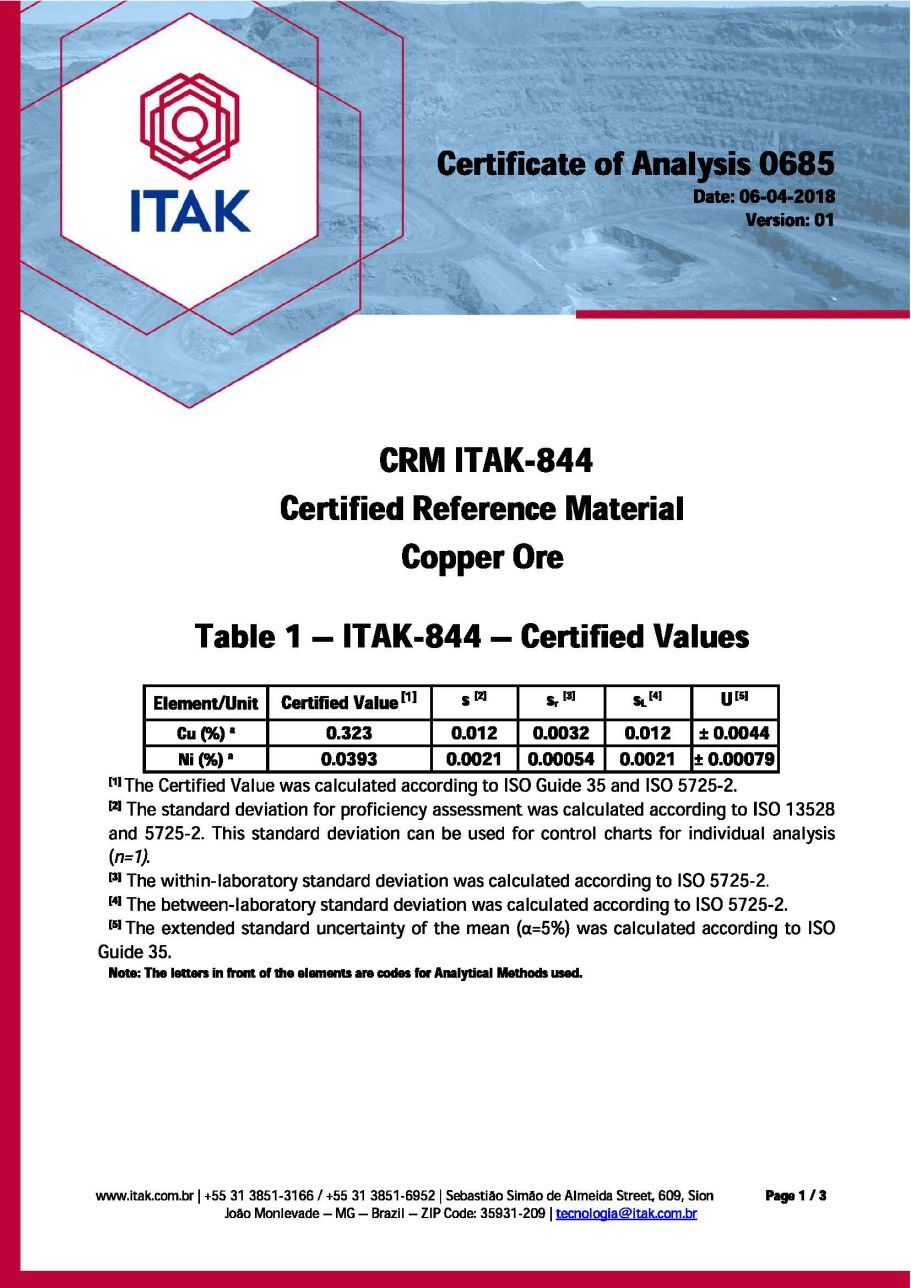
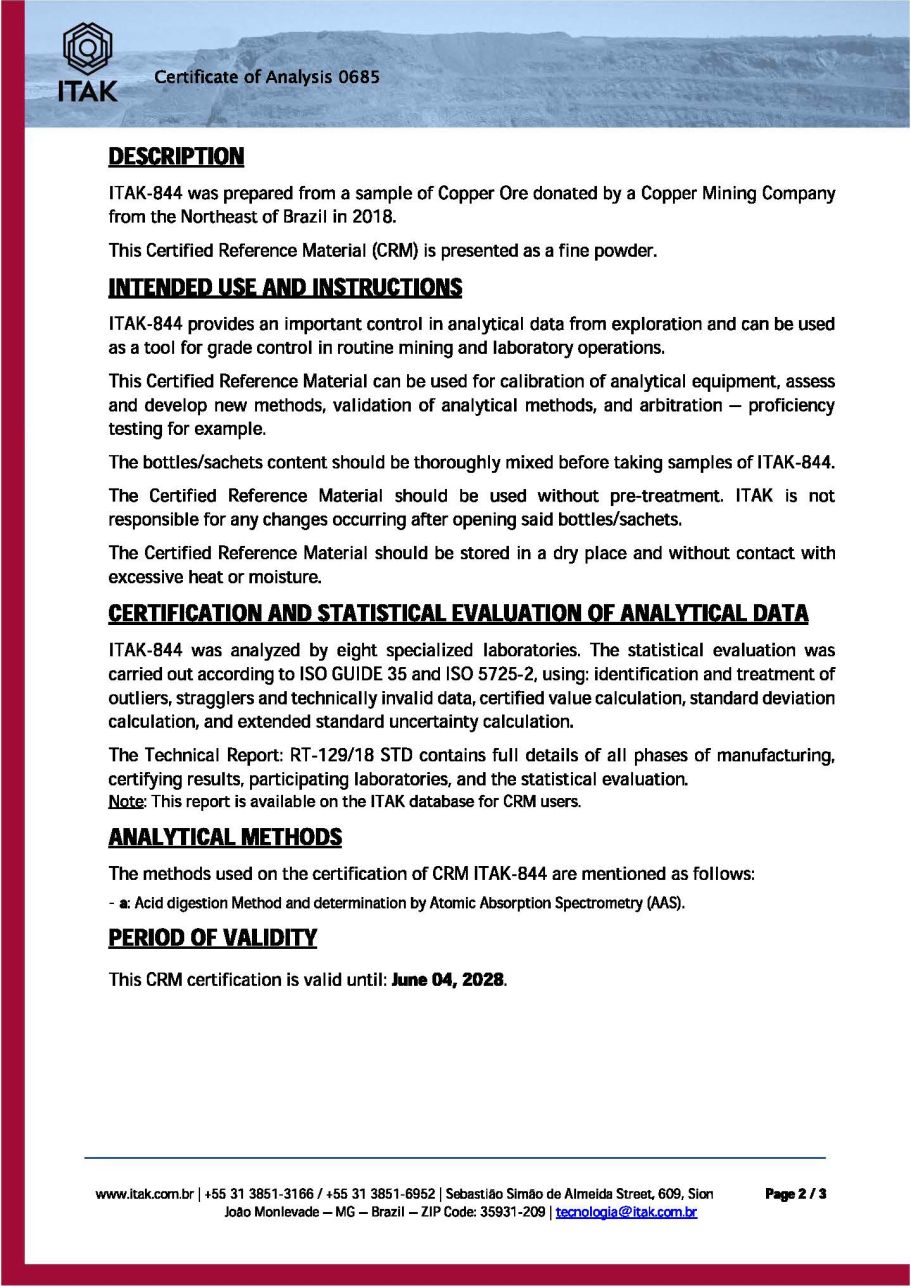
-


- -

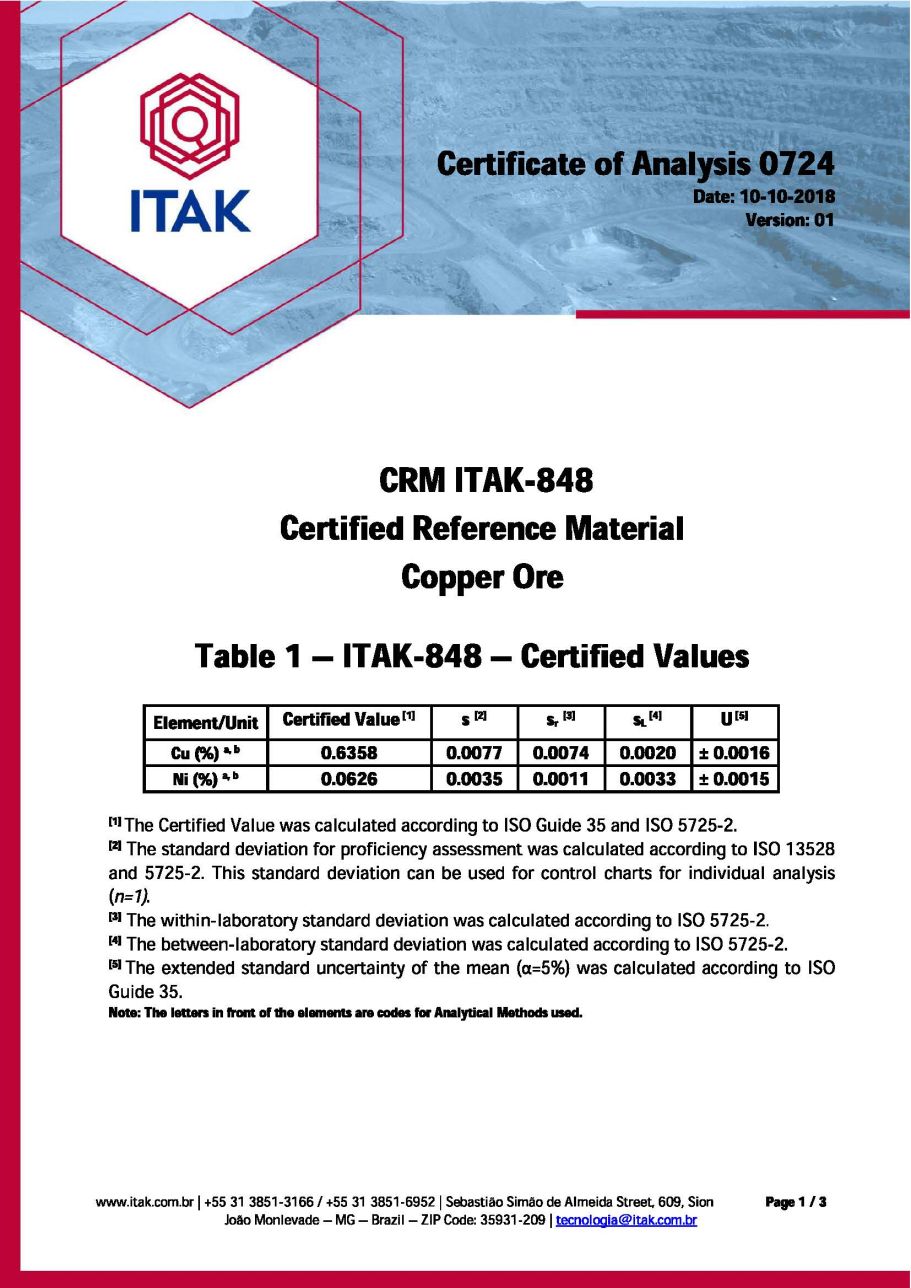
- -


- -
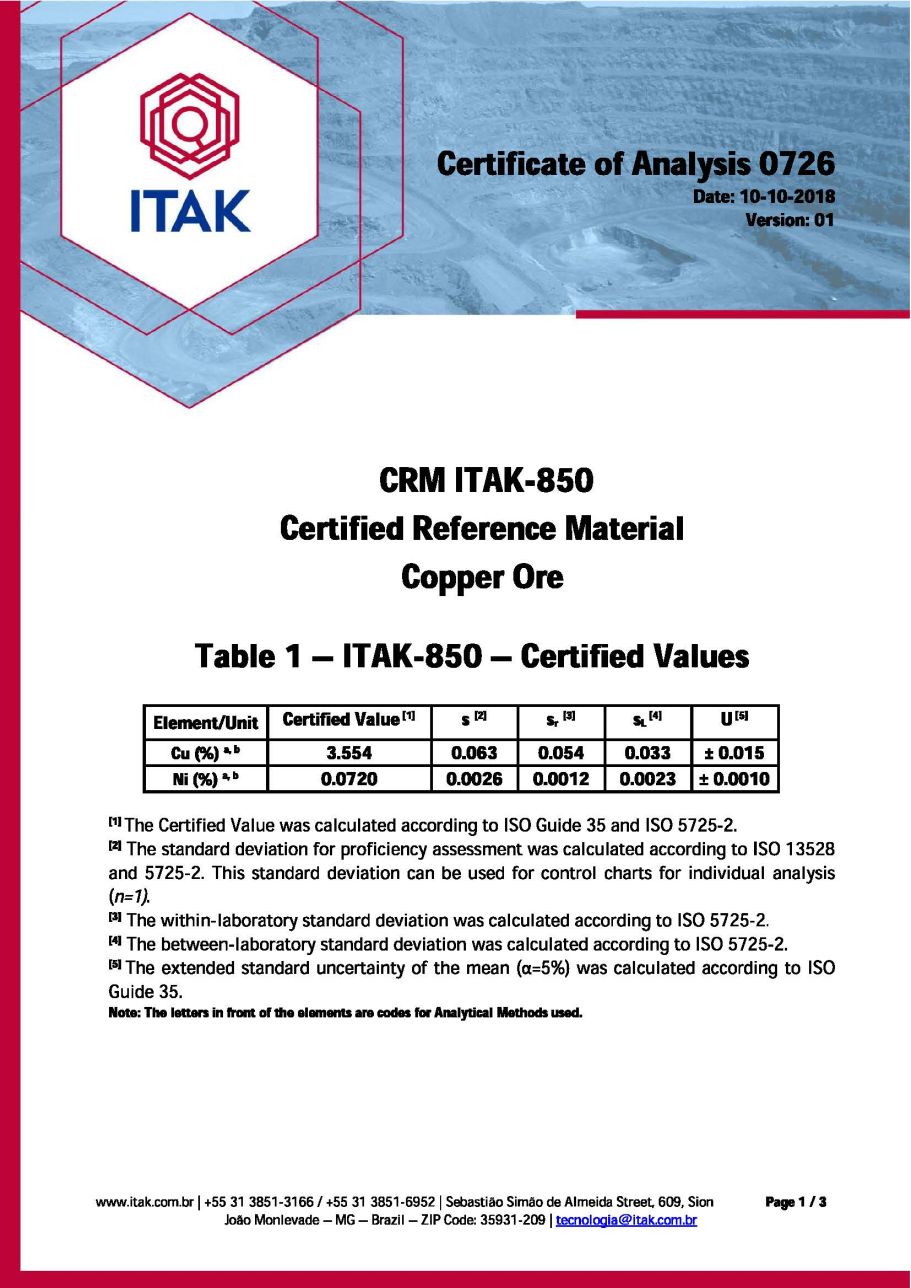
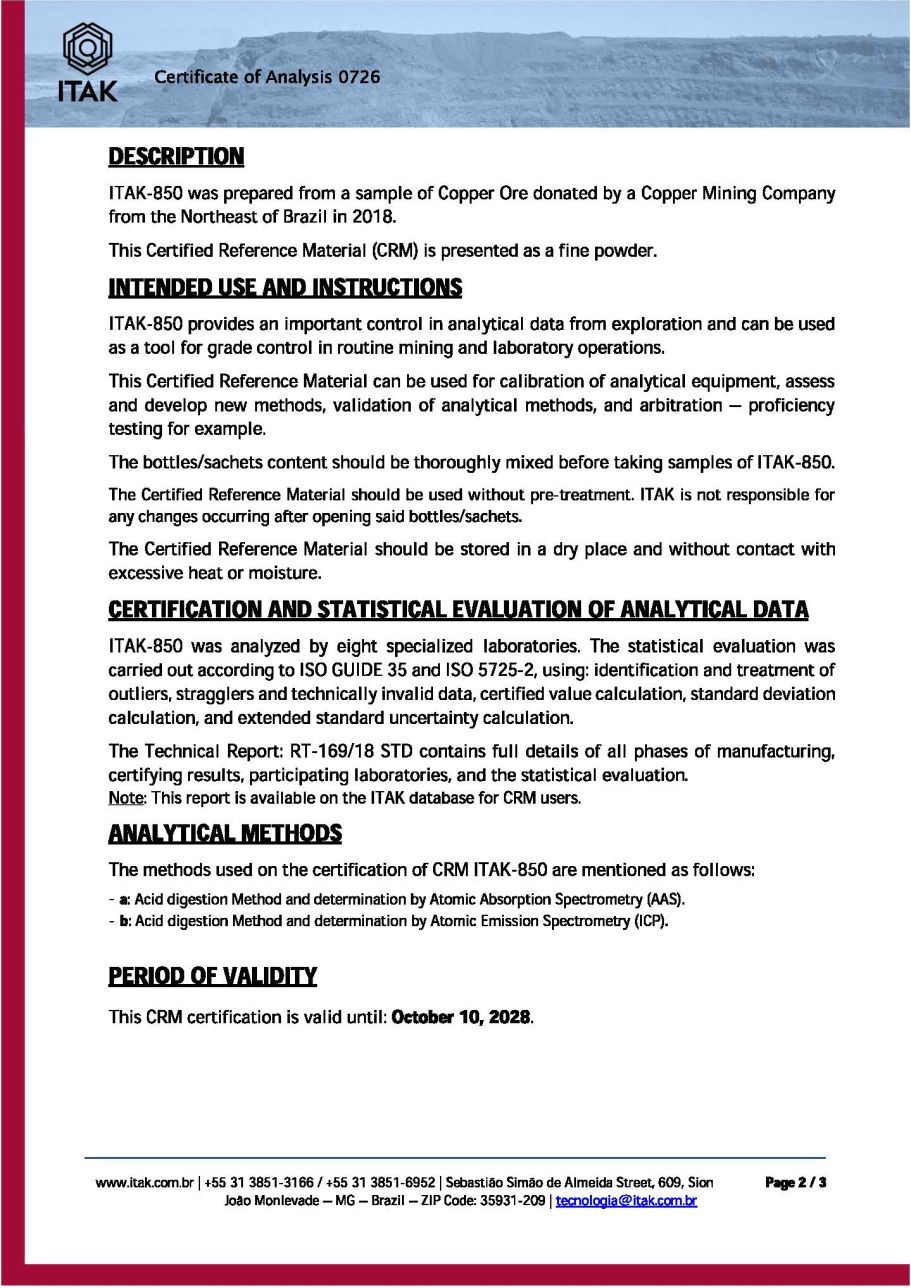
- -


- -

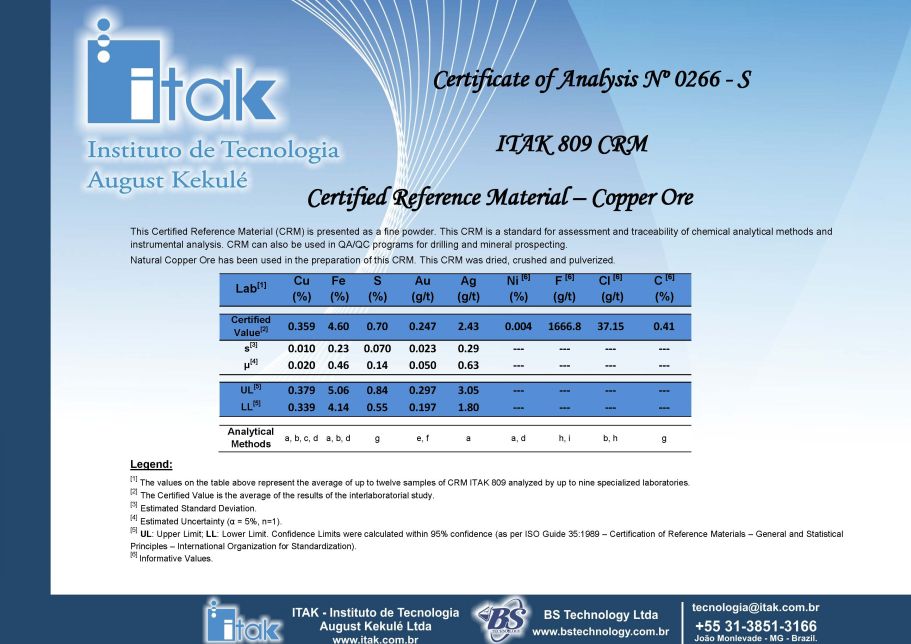
Certificate of Analysis Nº 0266 - S ITAK 809 CRM Certified Reference Material – Copper Ore This Certified Reference Material (CRM) is presented as a fine powder. This CRM is a standard for assessment and traceability of chemical analytical methods and instrumental analysis. CRM can also be used in QA/QC programs for drilling and mineral prospecting. Natural Copper Ore has been used in the preparation of this CRM. This CRM was dried, crushed and pulverized. Lab (%) Value [2] [1] Cu Fe (%) S (%) Au (g/t) Ag (g/t) Ni [6] (%) F [6] (g/t) Cl [6] (g/t) C [6] (%) Certified 0.359 4.60 0.70 0.247 2.43 0.004 1666.8 37.15 0.41 s [3] 0.010 0.23 0.070 0.023 0.29 -- - -- - -- - -- - µ [4] 0.020 0.46 0.14 0.050 0.63 -- - -- - -- - -- - UL [5] LL [5] 0.379 0.339 5.06 4.14 0.84 0.55 0.297 3.05 -- - -- - -- - -- - 0.197 1.80 -- - -- - -- - -- - Analytical Methods a, b, c, d a, b, d g e, f a a, d h, i b, h g Legend: [1] The values on the table above represent the average of up to twelve samples of CRM ITAK 809 analyzed by up to nine specialized laboratories. [2] The Certified Value is the average of the results of the interlaboratorial study. [3] Estimated Standard Deviation. [4] Estimated Uncertainty (α = 5%, n=1). [5] UL : Upper Limit; LL : Lower Limit. Confidence Limits were calculated within 95% confidence (as per ISO Guide 35:1989 – Certification of Reference Materials – General and Statistical Principles – International Organization for Standardization). [6] Informative Values.
Analytical Methods: [ ª ] Atomic Absorption Spectrometry (AAS) b. Titrimetric Method. c. Electrogravimetric Method. d. Inductively Coupled Plasma Optical Emission Spectrometry (ICP - OES). e. Fire Assay Method / Atomic Absorption Spectrometry. f. Fire Assay Method / Gravimetric Method. g. Infrared Analyzer (Leco) h. Potenciometric Determination i. Spectrometric Determination PLANNING. PREPARATION AND ANALYSIS This CRM was crushed, pulverized and tested for homogeneity by the INSTITUTO DE TECNOLOGIA AUGUST KEKULÉ – ITAK. The preparation of this CRM (including drying, comminution, homogenization and quartering) was coordinated by the Chemist Smarck de Jesus Lelis, B . Sc . , Technical Director . The statistical evaluations were coordinated by the Chemist Bráulio de Freitas Pessoa B . Sc . , Innovation and Technology Director , both being aided by the ITAK Certified Reference Materials Production Department Technical Team . CRM registered in Technical Report: RT - 005/13 STD. This certificate may only be reproduced in its entirety and without change. This certificate of this CRM is valid until: January 16, 2023 João Monlevade. January 16, 2013. Bráulio de Freitas Pessoa Innovation and Technology Director Instituto de Tecnologia August Kekulé Chemist – CRQ 02.202.008 Smarck de Jesus Lelis Technical Director Instituto de Tecnologia August Kekulé Chemist – CRQ 02.100.694

Certificate of Analysis 0928 Date: 05 - 16 - 2022 Version: 01 www.itak.com.br | +55 31 3851 - 3166 / +55 31 3851 - 6952 | Sebastião Simão de Almeida Street, 609, Sion João Monlevade – MG – Brazil – ZIP Code: 35931 - 209 | tecnologia@itak.com.br Page 1 / 3 CRM ITAK - 876 Certified Reference Material Copper Ore Table 1 – ITAK - 876 – Certified Values Element/Unit Certified Value [1] s [2] s r [3] s L [4] U [5] Cu (%) a 0.182 0.011 0.0050 0.0099 ц 0.0037 Ni (%) a 0.0635 0.0073 0.0017 0.0071 ц 0.0027 [1] The Certified Value was calculated according to ISO Guide 35 and ISO 5725 - 2. [2] The standard deviation for proficiency assessment was calculated according to ISO 13528 and 5725 - 2. This standard deviation can be used for control charts for individual analysis ( n=1) . [3] The within - laboratory standard deviation was calculated according to ISO 5725 - 2. [4] The between - laboratory standard deviation was calculated according to ISO 5725 - 2. [5] The extended standard uncertainty of the mean (α=5%) was calculated according to ISO Guide 35. Note: The letters in front of the elements are codes for Analytical Methods used.
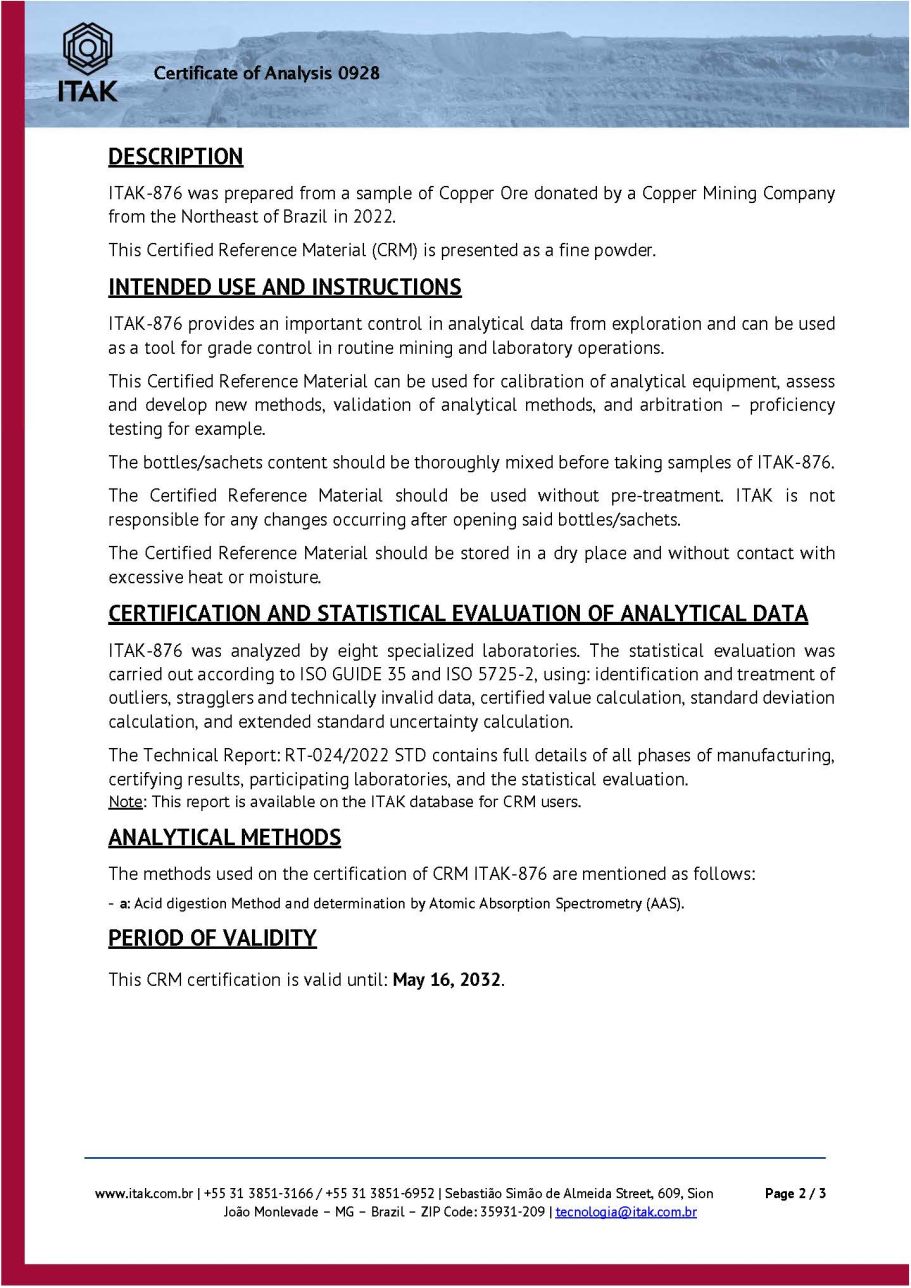
Certificate of Analysis 0928 DESCRIPTION ITAK - 876 was prepared from a sample of Copper Ore donated by a Copper Mining Company from the Northeast of Brazil in 2022 . This Certified Reference Material (CRM) is presented as a fine powder. INTENDED USE AND INSTRUCTIONS ITAK - 876 provides an important control in analytical data from exploration and can be used as a tool for grade control in routine mining and laboratory operations . This Certified Reference Material can be used for calibration of analytical equipment, assess and develop new methods, validation of analytical methods, and arbitration – proficiency testing for example . The bottles/sachets content should be thoroughly mixed before taking samples of ITAK - 876. The Certified Reference Material should be used without pre - treatment. ITAK is not responsible for any changes occurring after opening said bottles/sachets. The Certified Reference Material should be stored in a dry place and without contact with excessive heat or moisture. CERTIFICATION AND STATISTICAL EVALUATION OF ANALYTICAL DATA ITAK - 876 was analyzed by eight specialized laboratories . The statistical evaluation was carried out according to ISO GUIDE 35 and ISO 5725 - 2 , using : identification and treatment of outliers, stragglers and technically invalid data, certified value calculation, standard deviation calculation, and extended standard uncertainty calculation . The Technical Report : RT - 024 / 2022 STD contains full details of all phases of manufacturing, certifying results, participating laboratories, and the statistical evaluation . Note : This report is available on the ITAK database for CRM users . ANALYTICAL METHODS The methods used on the certification of CRM ITAK - 876 are mentioned as follows : - a : Acid digestion Method and determination by Atomic Absorption Spectrometry (AAS) . PERIOD OF VALIDITY This CRM certification is valid until : May 16 , 2032 . www.itak.com.br | +55 31 3851 - 3166 / +55 31 3851 - 6952 | Sebastião Simão de Almeida Street, 609, Sion João Monlevade – MG – Brazil – ZIP Code: 35931 - 209 | tecnologia@itak.com.br Page 2 / 3
Certificate of Analysis 0928 CERTIFICATE REPRODUCTION This certificate must not be modified and may only be reproduced in its entirety and without change. www.itak.com.br | +55 31 3851 - 3166 / +55 31 3851 - 6952 | Sebastião Simão de Almeida Street, 609, Sion João Monlevade – MG – Brazil – ZIP Code: 35931 - 209 | tecnologia@itak.com.br Page 3 / 3 Bráulio de Freitas Pessoa Chemist – CRQ 02.202.008 Technical Director

Certificate of Analysis 0929 Date: 05 - 16 - 2022 Version: 01 www.itak.com.br | +55 31 3851 - 3166 / +55 31 3851 - 6952 | Sebastião Simão de Almeida Street, 609, Sion João Monlevade – MG – Brazil – ZIP Code: 35931 - 209 | tecnologia@itak.com.br Page 1 / 3 CRM ITAK - 877 Certified Reference Material Copper Ore Table 1 – ITAK - 877 – Certified Values Element/Unit Certified Value [1] s [2] s r [3] s L [4] U [5] Cu (%) a 0.562 0.016 0.015 0.0031 ц 0.0030 Ni (%) a 0.0662 0.0090 0.0018 0.0088 ц 0.0034 [1] The Certified Value was calculated according to ISO Guide 35 and ISO 5725 - 2. [2] The standard deviation for proficiency assessment was calculated according to ISO 13528 and 5725 - 2. This standard deviation can be used for control charts for individual analysis ( n=1) . [3] The within - laboratory standard deviation was calculated according to ISO 5725 - 2. [4] The between - laboratory standard deviation was calculated according to ISO 5725 - 2. [5] The extended standard uncertainty of the mean (α=5%) was calculated according to ISO Guide 35. Note: The letters in front of the elements are codes for Analytical Methods used.

Certificate of Analysis 0929 DESCRIPTION ITAK - 877 was prepared from a sample of Copper Ore donated by a Copper Mining Company from the Northeast of Brazil in 2022 . This Certified Reference Material (CRM) is presented as a fine powder. INTENDED USE AND INSTRUCTIONS ITAK - 877 provides an important control in analytical data from exploration and can be used as a tool for grade control in routine mining and laboratory operations . This Certified Reference Material can be used for calibration of analytical equipment, assess and develop new methods, validation of analytical methods, and arbitration – proficiency testing for example . The bottles/sachets content should be thoroughly mixed before taking samples of ITAK - 877. The Certified Reference Material should be used without pre - treatment. ITAK is not responsible for any changes occurring after opening said bottles/sachets. The Certified Reference Material should be stored in a dry place and without contact with excessive heat or moisture. CERTIFICATION AND STATISTICAL EVALUATION OF ANALYTICAL DATA ITAK - 877 was analyzed by eight specialized laboratories . The statistical evaluation was carried out according to ISO GUIDE 35 and ISO 5725 - 2 , using : identification and treatment of outliers, stragglers and technically invalid data, certified value calculation, standard deviation calculation, and extended standard uncertainty calculation . The Technical Report : RT - 025 / 2022 STD contains full details of all phases of manufacturing, certifying results, participating laboratories, and the statistical evaluation . Note : This report is available on the ITAK database for CRM users . ANALYTICAL METHODS The methods used on the certification of CRM ITAK - 877 are mentioned as follows : - a : Acid digestion Method and determination by Atomic Absorption Spectrometry (AAS) . PERIOD OF VALIDITY This CRM certification is valid until : May 16 , 2032 . www.itak.com.br | +55 31 3851 - 3166 / +55 31 3851 - 6952 | Sebastião Simão de Almeida Street, 609, Sion João Monlevade – MG – Brazil – ZIP Code: 35931 - 209 | tecnologia@itak.com.br Page 2 / 3

Certificate of Analysis 0929 CERTIFICATE REPRODUCTION This certificate must not be modified and may only be reproduced in its entirety and without change. www.itak.com.br | +55 31 3851 - 3166 / +55 31 3851 - 6952 | Sebastião Simão de Almeida Street, 609, Sion João Monlevade – MG – Brazil – ZIP Code: 35931 - 209 | tecnologia@itak.com.br Page 3 / 3 Bráulio de Freitas Pessoa Chemist – CRQ 02.202.008 Technical Director

Certificate of Analysis 0930 Date: 05 - 16 - 2022 Version: 01 www.itak.com.br | +55 31 3851 - 3166 / +55 31 3851 - 6952 | Sebastião Simão de Almeida Street, 609, Sion João Monlevade – MG – Brazil – ZIP Code: 35931 - 209 | tecnologia@itak.com.br Page 1 / 3 CRM ITAK - 878 Certified Reference Material Copper Ore Table 1 – ITAK - 878 – Certified Values Element/Unit Certified Value [1] s [2] s r [3] s L [4] U [5] Cu (%) a 0.365 0.018 0.016 0.0067 ц 0.0035 Ni (%) a 0.0241 0.0018 0.00075 0.0016 ц 0.00065 [1] The Certified Value was calculated according to ISO Guide 35 and ISO 5725 - 2. [2] The standard deviation for proficiency assessment was calculated according to ISO 13528 and 5725 - 2. This standard deviation can be used for control charts for individual analysis ( n=1) . [3] The within - laboratory standard deviation was calculated according to ISO 5725 - 2. [4] The between - laboratory standard deviation was calculated according to ISO 5725 - 2. [5] The extended standard uncertainty of the mean (α=5%) was calculated according to ISO Guide 35. Note: The letters in front of the elements are codes for Analytical Methods used.
Certificate of Analysis 0930 DESCRIPTION ITAK - 878 was prepared from a sample of Copper Ore donated by a Copper Mining Company from the Northeast of Brazil in 2022 . This Certified Reference Material (CRM) is presented as a fine powder. INTENDED USE AND INSTRUCTIONS ITAK - 878 provides an important control in analytical data from exploration and can be used as a tool for grade control in routine mining and laboratory operations . This Certified Reference Material can be used for calibration of analytical equipment, assess and develop new methods, validation of analytical methods, and arbitration – proficiency testing for example . The bottles/sachets content should be thoroughly mixed before taking samples of ITAK - 878. The Certified Reference Material should be used without pre - treatment. ITAK is not responsible for any changes occurring after opening said bottles/sachets. The Certified Reference Material should be stored in a dry place and without contact with excessive heat or moisture. CERTIFICATION AND STATISTICAL EVALUATION OF ANALYTICAL DATA ITAK - 878 was analyzed by eight specialized laboratories . The statistical evaluation was carried out according to ISO GUIDE 35 and ISO 5725 - 2 , using : identification and treatment of outliers, stragglers and technically invalid data, certified value calculation, standard deviation calculation, and extended standard uncertainty calculation . The Technical Report : RT - 026 / 2022 STD contains full details of all phases of manufacturing, certifying results, participating laboratories, and the statistical evaluation . Note : This report is available on the ITAK database for CRM users . ANALYTICAL METHODS The methods used on the certification of CRM ITAK - 878 are mentioned as follows : - a : Acid digestion Method and determination by Atomic Absorption Spectrometry (AAS) . PERIOD OF VALIDITY This CRM certification is valid until : May 16 , 2032 . www.itak.com.br | +55 31 3851 - 3166 / +55 31 3851 - 6952 | Sebastião Simão de Almeida Street, 609, Sion João Monlevade – MG – Brazil – ZIP Code: 35931 - 209 | tecnologia@itak.com.br Page 2 / 3

Certificate of Analysis 0930 CERTIFICATE REPRODUCTION This certificate must not be modified and may only be reproduced in its entirety and without change. www.itak.com.br | +55 31 3851 - 3166 / +55 31 3851 - 6952 | Sebastião Simão de Almeida Street, 609, Sion João Monlevade – MG – Brazil – ZIP Code: 35931 - 209 | tecnologia@itak.com.br Page 3 / 3 Bráulio de Freitas Pessoa Chemist – CRQ 02.202.008 Technical Director

Certificate of Analysis 0931 Date: 05 - 16 - 2022 Version: 01 www.itak.com.br | +55 31 3851 - 3166 / +55 31 3851 - 6952 | Sebastião Simão de Almeida Street, 609, Sion João Monlevade – MG – Brazil – ZIP Code: 35931 - 209 | tecnologia@itak.com.br Page 1 / 3 CRM ITAK - 879 Certified Reference Material Copper Ore Table 1 – ITAK - 879 – Certified Values Element/Unit Certified Value [1] s [2] s r [3] s L [4] U [5] Cu (%) a 1.033 0.025 0.015 0.020 ц 0.0088 Ni (%) a 0.0531 0.0038 0.0010 0.0037 ц 0.0014 [1] The Certified Value was calculated according to ISO Guide 35 and ISO 5725 - 2. [2] The standard deviation for proficiency assessment was calculated according to ISO 13528 and 5725 - 2. This standard deviation can be used for control charts for individual analysis ( n=1) . [3] The within - laboratory standard deviation was calculated according to ISO 5725 - 2. [4] The between - laboratory standard deviation was calculated according to ISO 5725 - 2. [5] The extended standard uncertainty of the mean (α=5%) was calculated according to ISO Guide 35. Note: The letters in front of the elements are codes for Analytical Methods used.

Certificate of Analysis 0931 DESCRIPTION ITAK - 879 was prepared from a sample of Copper Ore donated by a Copper Mining Company from the Northeast of Brazil in 2022 . This Certified Reference Material (CRM) is presented as a fine powder. INTENDED USE AND INSTRUCTIONS ITAK - 879 provides an important control in analytical data from exploration and can be used as a tool for grade control in routine mining and laboratory operations . This Certified Reference Material can be used for calibration of analytical equipment, assess and develop new methods, validation of analytical methods, and arbitration – proficiency testing for example . The bottles/sachets content should be thoroughly mixed before taking samples of ITAK - 879. The Certified Reference Material should be used without pre - treatment. ITAK is not responsible for any changes occurring after opening said bottles/sachets. The Certified Reference Material should be stored in a dry place and without contact with excessive heat or moisture. CERTIFICATION AND STATISTICAL EVALUATION OF ANALYTICAL DATA ITAK - 879 was analyzed by eight specialized laboratories . The statistical evaluation was carried out according to ISO GUIDE 35 and ISO 5725 - 2 , using : identification and treatment of outliers, stragglers and technically invalid data, certified value calculation, standard deviation calculation, and extended standard uncertainty calculation . The Technical Report : RT - 027 / 2022 STD contains full details of all phases of manufacturing, certifying results, participating laboratories, and the statistical evaluation . Note : This report is available on the ITAK database for CRM users . ANALYTICAL METHODS The methods used on the certification of CRM ITAK - 879 are mentioned as follows : - a : Acid digestion Method and determination by Atomic Absorption Spectrometry (AAS) . PERIOD OF VALIDITY This CRM certification is valid until : May 16 , 2032 . www.itak.com.br | +55 31 3851 - 3166 / +55 31 3851 - 6952 | Sebastião Simão de Almeida Street, 609, Sion João Monlevade – MG – Brazil – ZIP Code: 35931 - 209 | tecnologia@itak.com.br Page 2 / 3

Certificate of Analysis 0931 CERTIFICATE REPRODUCTION This certificate must not be modified and may only be reproduced in its entirety and without change. www.itak.com.br | +55 31 3851 - 3166 / +55 31 3851 - 6952 | Sebastião Simão de Almeida Street, 609, Sion João Monlevade – MG – Brazil – ZIP Code: 35931 - 209 | tecnologia@itak.com.br Page 3 / 3 Bráulio de Freitas Pessoa Chemist – CRQ 02.202.008 Technical Director