Boa Esperança Project
NI 43-101 Technical Report on
Feasibility Study Update
Southern Pará State, Brazil
Effective Date: 31 August 2021
Prepared for: Ero Copper Corp.
1050 – 625 Howe Street, Vancouver, Canada
Prepared by: Ausenco Engineering Canada Inc.
1050 West Pender, Vancouver, Canada
List of Qualified Persons: Kevin Murray, P. Eng., Ausenco; Erin L. Patterson, P.E., Ausenco; Scott Elfen, P. Eng., Ausenco; Emerson Ricardo Ré, MAusIMM (CP), Ero Copper Corp.; Carlos Guzman, FAusIMM RM CMC, NCL.
CERTIFICATE OF QUALIFIED PERSON
Kevin Murray, P. Eng.
I, Kevin Murray, P.Eng., certify that:
1.I am employed as a Manager Process Engineering with Ausenco Engineering Canada Inc. (“Ausenco”), with an office address of 1050 West Pender Street, Suite 1200, Vancouver, BC Canada, V6E 3T4.
2.This certificate applies to the technical report titled “Boa Esperança Project NI 43-101 Technical Report on Feasibility Study Update,” that has an effective date of August 31, 2021, (the “Technical Report”).
3.I graduated from the University of New Brunswick, Fredericton NB, in 1995 with a Bachelor of Science in Chemical Engineering. I am a member in good standing of Engineers and Geoscientists British Columbia, License# 32350.
4.I have practiced my profession for 21 years. I have been directly involved in all levels of engineering studies from preliminary economic analysis to feasibility studies. I have been directly involved with test work and flowsheet development from preliminary testing through to detailed design and construction.
5.I have read the definition of “Qualified Person” set out in the National Instrument 43-101 Standards of Disclosure for Mineral Projects (“NI 43-101”) and certify that by virtue of my education, affiliation to a professional association and past relevant work experience, I fulfill the requirements to be a “Qualified Person” for those sections of the Technical Report that I am responsible for preparing.
6.I have not visited the Boa Esperança Project.
7.I am responsible for sections 1.2, 1.8, 1.13, 1.16, 1.17, 1.20, 1.21, 2, 3, 13, 17, 21.1 - 21.1.6, 21.1.8 - 21.1.11, 21.2.1, 21.2.3 -21.2.5, 25.5, 25.10, 25.14, 25.15, 25.17-25.17.1.1, 25.17.2 - 25.17.2.1, 25.18, 25.2, 25.3, 25.4, 25.6, 26 and 27 of the Technical Report.
8.I am independent of Ero Copper Corp., as independence is defined in Section 1.5 of NI 43-101. I have had no previous involvement with Boa Esperança Project.
9.I have read NI 43-101 and the sections of the Technical Report for which I am responsible have been prepared in compliance with that Instrument.
10.As of the effective date of the Technical Report, to the best of my knowledge, information and belief, the sections of the Technical Report for which I am responsible contain all scientific and technical information that is required to be disclosed to make those sections of the Technical Report not misleading.
Dated this 12th day of November of 2021.
“Signed and sealed”
Kevin Murray, P.Eng.
CERTIFICATE OF QUALIFIED PERSON
Erin L. Patterson, P. E.
I, Erin L. Patterson, P.E., certify that:
1.I am employed as a Senior Study Manager with Ausenco Engineering USA South Inc. (“Ausenco USA”), an affiliate of Ausenco Engineering Canada Inc., with an office address of 4701 Port Chicago Highway, Suite 120, Concord, CA 94520.
2.This certificate applies to the technical report titled “Boa Esperança Project NI 43-101 Technical Report on Feasibility Study Update,” that has an effective date of August 31, 2021, (the “Technical Report”).
3.I am a graduate of the University of Arizona and received a Bachelor of Science in Chemical Engineering in 2005.
4.I am a registered professional Engineer in the state of Arizona, License No. 54243.
5.I have practiced my profession for 16 years. I have been directly involved in all levels of engineering studies from conceptual studies to feasibility studies as well as mineral projects in the construction and operation stages. The works I have been directly involved in include the mineral commodities copper, nickel, gold, and silver. I have been directly involved with process design, including testwork interpretation and flowsheet development, design specifications, cost estimating, and execution of mineral projects.
6.I have read the definition of “Qualified Person” set out in the National Instrument 43-101 Standards of Disclosure for Mineral Projects (“NI 43-101”) and certify that by virtue of my education, affiliation to a professional association and past relevant work experience, I fulfill the requirements to be a “Qualified Person” for those sections of the Technical Report that I am responsible for preparing.
7.I have not visited the Boa Esperança Project.
8.I am responsible for sections 1.18, 1.19, 2, 3, 22, 24, 25.16, 25.17-25.17.1.1, 25.17.2 - 25.17.2.1, 25.18, 26, and 27 of the Technical Report.
9.I am independent of Ero Copper Corp., as independence is defined in Section 1.5 of NI 43-101. I have had no previous involvement with Boa Esperança Project.
10.I have read NI 43-101 and Form 43-101F1, and the sections of the Technical Report for which I am responsible have been prepared in compliance with that Instrument and form.
11.As of the effective date of the Technical Report, to the best of my knowledge, information and belief, the sections of the Technical Report for which I am responsible contain all scientific and technical information that is required to be disclosed to make those sections of the Technical Report not misleading.
Dated this 12th day of November, 2021.
“Signed and sealed”
Erin L. Patterson, P.E.
CERTIFICATE OF QUALIFIED PERSON
Scott C. Elfen, P.E.
I, Scott C. Elfen, P.E., do hereby certify that:
1.I am the Global Lead Geotechnical and Civil Services of Ausenco Engineering Canada Inc., 855 Homer Street, Vancouver, BC V6B 2W2, Canada.
2.This certificate applies to the technical report titled “Boa Esperança Project NI 43-101 Technical Report on Feasibility Study Update” that has an effective date of August 31, 2021 (the “Technical Report”).
3.I graduated from the University of California, Davis with a Bachelor of Science degree in Civil Engineering (Geotechnical) in 1991.
4.I am a Registered Civil Engineer in the State of California (No. C56527) by exam since 1996 and I am also a member of the American Society of Civil Engineers (ASCE), Society for Mining, Metallurgy & Exploration (SME) that are all in good standing.
5.I have practiced my profession continuously for 24 years and have been involved in geotechnical, civil, hydrological, and environmental aspects for the development of mining projects, including feasibility studies on numerous underground and open pit base metal and precious metal deposits in North America, Central and South America, Africa and Australia.
6.I have read the definition of “Qualified Person” set out in National Instrument 43-101 Standards of Disclosure for Mineral Projects (“NI 43-101”) and certify that by virtue of my education, affiliation with a professional association (as defined in NI 43-101) and past relevant work experience, I fulfill the requirements to be a “Qualified Person” for those sections of the Technical Report that I am responsible for preparing.
7.I have not visited Boa Esperança Project Site.
8.I am responsible for sections 1.11, 1.14, 2, 3, 15.2.4, 18, 25.8, 25.11, 25.17 - 25.17.1.1, 25.17.1.3, 25.17.2 - 25.17.2.1, 25.17.2.3, 25.18, 26.2.1, 26.5 and 27 of the Technical Report.
9.I am independent of Ero Copper Corp. as independence is defined in Section 1.5 of NI 43-101.
10.I have had no prior involvement with the Boa Esperança Project.
11.I have read NI 43-101 and the sections of the Technical Report for which I am responsible have been prepared in compliance with that Instrument.
12.As of the effective date of the Technical Report, to the best of my knowledge, information and belief, the sections of the Technical Report for which I am responsible contain all scientific and technical information that is required to be disclosed to make those sections of the Technical Report not misleading.
Dated this 12th day of November of 2021.
“Signed and Sealed”
_____________________________________
Scott C. Elfen, P.E.
CERTIFICATE OF QUALIFIED PERSON
Emerson Ricardo Re, MAusIMM (CP)
I, Emerson Ricardo Re, MAusIMM (CP), certify that I am employed as a Resources Manager of Ero Copper Corp., with an office address of 625 Howe Street, Suite 1050, Vancouver – BC, Canada. This certificate applies to the technical report titled, “Boa Esperança Project NI 43-101 Technical Report on Feasibility Study Update,” that has an effective date of 31 August 2021, (the “Technical Report”).
I graduated from São Paulo State University with a degree in geology in 1999 and received a master’s in mining engineering at Polytechnic School - São Paulo University in 2002. I am a chartered professional by MAusIMM (CP) (No. 305892) and by the Chilean Mining Commission (No. 0138). I have practiced my profession for 22 years. I have been directly involved in the mineral sector as I have worked directly in management of mineral resources, generating the organic growth of mineral reserves, ensuring the health of the mineral enterprise through the implementation of strategic exploration routines (Life of Exploration ) and mining plan integrated with the production plan and customer requirements.
With experience in open pit and underground projects and operations, I was involved in the development of projects in the embryonic stage, feasibility and operation restructuring which I can cite as examples:
–Guaju Mine - Titanium (Millennium) - Open pit
–Morro do Ouro - Ouro (Kinross Gold) - Open pit
–Jacobina Mine - Gold (Yamana Gold) – Underground
–San Andres Mine - Gold (Yamana Gold, Honduras) - Open pit
–Chapada Mine - Copper and Gold (Yamana Gold) - Open pit
–Fazenda Brasileiro Mine - Ouro (Brio Gold) - Open pit and Underground
–Caraíba Mine - Copper (Ero Copper) - Open pit and Underground
–Boa Esperança Project - Copper (Ero Copper) - Open pit
I highlight the multidisciplinary team management and implementation of ESG procedures as the basis for the actions taken that culminated in the success achieved in the projects listed above.
I have read the definition of “Qualified Person” set out in the National Instrument 43-101 Standards of Disclosure for Mineral Projects (“NI 43-101”) and certify that by virtue of my education, affiliation to a professional association and past relevant work experience, I fulfill the requirements to be a “Qualified Person” for those sections of the Technical Report that I am responsible for preparing.
I visited the Boa Esperança Project between 29 September to 1 October 2020 for a visit duration of 3 days. I am responsible for sections 1.1, 1.3, 1.4, 1.5, 1.6, 1.7, 1.9, 1.15, 2, 3 - 12, 14, 19, 20, 23, 25.1, 25.2 – 25.4, 25.6, 25.12, 25.13, 25.17 - 25.17.1.1, 25.17.2 - 25.17.2.1, 25.18, 26, and 27 of the Technical Report.
I am not independent of the Company as defined by Section 1.5 of NI 43-101.
I have had prior involvement with the property that is the subject of this Technical Report in my role at the Company since September 2019 .
I have read NI 43-101 and the sections of the Technical Report for which I am responsible have been prepared in compliance with that Instrument. As of the effective date of the Technical Report, to the best of my knowledge, information and belief, the sections of the Technical Report for which I am responsible contain all scientific and technical information that is required to be disclosed to make those sections of the Technical Report not misleading.
Dated this 12th day of November, 2021.
“Signed and sealed”
Emerson Ricardo Re,
Resources Manager of the Ero Copper Corp.
MAusIMM (CP) (No. 305892)
Chilean Mining Commission (No. 0138)
CERTIFICATE OF QUALIFIED PERSON
Carlos Guzmán, FAusIMM RM CMC
I, Carlos Guzmán, FAusIMM RM CMC, certify that I am employed as Principal and Project Director with NCL Ingeniería y Construcción SpA (“NCL”), with an office address of General del Canto 230, of 401, Providencia, Santiago, Chile. This certificate applies to the technical report titled “Boa Esperança Project, NI 43-101 Technical Report on Feasibility Study” that has an effective date of August 31, 2021. (the “Technical Report”).
I graduated from Universidad de Chile with a degree in Mining Engineering. I am a FAusIMM of the Australasian Institute of Mining and Metallurgy (229036) and a RM CMC of the Chilean Mining Commission (0119). I have practiced my profession for 26 years. I have been directly involved in reviews and reports as a consultant on numerous explorations, mining operation and projects around the world for due diligence and regulatory requirements and have extensive experience in mining engineering.
I have read the definition of “Qualified Person” set out in the National Instrument 43-101 Standards of Disclosure for Mineral Projects (“NI 43-101”) and certify that by virtue of my education, affiliation to a professional association and past relevant work experience, I fulfill the requirements to be a “Qualified Person” for those sections of the Technical Report that I am responsible for preparing.
I have not visited the Boa Esperança Project. I am responsible for Sections 1.10, 1.12, 2, 3, 15, 16, 21.1.7, 21.2.2, 25.7, 25.9, 25.17 - 25.17.1.2, 25.17.2 - 25.17.2.2, 25.18 and 26.1 of the Technical Report.
I am independent of Ero Copper Corp. as independence is defined in Section 1.5 of NI 43-101. I have had no previous involvement with the Boa Esperança Project.
I have read NI 43-101 and the sections of the Technical Report for which I am responsible have been prepared in compliance with that Instrument. As of the effective date of the Technical Report, to the best of my knowledge, information and belief, the sections of the Technical Report for which I am responsible contain all scientific and technical information that is required to be disclosed to make those sections of the Technical Report not misleading.
Dated this 12th day of November, 2021.
“Signed and sealed”
Carlos Guzmán
Mining Engineer, FAusIMM (229036), RM CMC (0119)
Important Notice
This report was prepared as National Instrument 43-101 Technical Report for insert Ero Copper (Ero Copper) by Ausenco Engineering Canada Inc. (Ausenco). The quality of information, conclusions, and estimates contained herein is consistent with the level of effort involved in Ausenco’s services, based on i) information available at the time of preparation, ii) data supplied by outside sources, and iii) the assumptions, conditions, and qualifications set forth in this report. This report is intended for use by Ero Copper subject to terms and conditions of its contract with Ausenco. Except for the purposed legislated under Canadian provincial and territorial securities law, any other uses of this report by any third party is at that party’s sole risk.
Table of Contents
| | | | | |
1 Summary | |
1.1 Introduction | |
1.1.1 Key Outcomes | |
1.2 Terms of Reference | |
1.3 Property Description and Location | |
1.4 Ownership | |
1.5 Geology and Mineralization | |
1.6 Exploration | |
1.7 Data Verification | |
1.8 Metallurgical Testing | |
1.9 Mineral Resource Estimation | |
1.10 Mineral Reserve Estimation | |
1.11 Open Pit Geotechnical | |
1.12 Mining Methods | |
1.13 Recovery Methods | |
1.14 Project Infrastructure | |
1.14.1 Accessibility | |
1.14.1.1 Road | |
1.14.1.2 Rail | |
1.14.1.3 Air | |
1.14.2 Power | |
1.14.3 Accommodation | |
1.14.4 Waste Rock Facility | |
1.14.5 Low-Grade Stockpile | |
1.14.6 Tailings Storage Facilities | |
1.14.7 Water Management | |
1.14.8 Water Supply | |
1.14.9 Environmental and Social Considerations | |
1.14.10 Closure and Reclamation Considerations | |
1.14.11 Social Considerations | |
1.15 Markets and Contracts | |
1.16 Capital Cost Estimates | |
1.17 Operating Cost Estimates | |
1.18 Economic Analysis | |
1.19 Sensitivity Analysis | |
1.20 Interpretation and Conclusions | |
1.21 Recommendations | |
| | | | | |
| Boa Esperança Project | Page i |
| NI 43-101 Technical Report Feasibility Study Update | October 2021 |
| | | | | |
2 Introduction | |
2.1 Introduction | |
2.2 Terms of Reference | |
2.3 Qualified Persons | |
2.4 Site Visits and Scope of Personal Inspection | |
2.5 Effective Dates | |
2.6 Previous Technical Reports | |
2.7 Abbreviations | |
3 Reliance on other experts | |
3.1 Introduction | |
3.2 Property Agreements, Mineral Tenure, Surface Rights and Royalties | |
3.3 Environmental, Permitting, Closure, and Social and Community Impacts | |
3.4 Taxation | |
3.5 Markets | |
4 Property description and location | |
4.1 Property Description and Location | |
4.2 Mineral Title | |
4.3 Land Access and Surface Rights | |
5 Accessibility, climate, local resources, infrastructure, and physiography | |
5.1 Topography, Elevation and Vegetation | |
5.1.1 Air | |
5.2 Climate and Length of Operating Season | |
5.3 Local Resources & Infrastructure | |
6 History | |
6.1 Mapping and Sampling (Codelco) | |
6.2 Geophysical Surveys (Codelco) | |
6.3 Surveys and Investigations | |
6.4 2017 Mineral Resource and Mineral Reserve Estimates | |
6.5 2017 Mineral Reserve Estimate | |
7 geological Setting and Mineralization | |
7.1 Regional Geology | |
7.2 Local Geology | |
7.3 Deposit Geology | |
7.3.1 Lithologies | |
7.3.2 Mineralization | |
8 Deposit Types | |
8.1 Introduction | |
8.2 Geological Model | |
| | | | | |
| Boa Esperança Project | Page ii |
| NI 43-101 Technical Report Feasibility Study Update | October 2021 |
| | | | | |
9 Exploration | |
10 Drilling | |
10.1 Drilling by CODELCO (2003-2006) | |
10.1.1 Drilling Methodology | |
10.1.2 Drillhole Deviation | |
10.1.3 Core Logging Procedures | |
10.1.4 Core Storage | |
10.2 Drilling by MCSA (2008-2013) | |
10.2.1 Drilling Methodology | |
10.2.2 Drillhole Deviation | |
10.2.3 Core Logging Procedures | |
10.2.4 Core Storage | |
11 Sample Preparation, Analyses, and Security | |
11.1 Methods | |
11.2 Security Measures | |
11.3 Sample Preparation | |
11.4 Analysis | |
11.5 Quality Assurance and Quality Control Programs | |
11.6 QP Comments | |
12 Data verification | |
12.1 Procedures | |
12.2 Verification of Analytical Quality Control Data | |
12.3 Data Adequacy | |
13 Mineral Processing and Metallurgical Testing | |
13.1 Introduction | |
13.2 Sample Selection | |
13.3 Mineralogy | |
13.4 Head Grade Analysis | |
13.5 Sample Characteristics | |
13.5.1 Crushability and Grindability | |
13.6 Pre-Concentration Test | |
13.6.1 2015 SGS Geosol Jigging Test | |
13.7 Flotation Testwork | |
13.7.1 Flotation Condition Tests | |
13.7.1.1 Primary Grind Size | |
13.7.1.2 Rougher Flotation pH | |
13.7.1.3 Rougher Kinetics | |
13.7.1.4 Cleaner Kinetics | |
| | | | | |
| Boa Esperança Project | Page iii |
| NI 43-101 Technical Report Feasibility Study Update | October 2021 |
| | | | | |
13.7.2 Rougher Variability Flotation Tests | |
13.7.3 Open Circuit Cleaner Flotation Tests | |
13.7.4 Locked-Cycle Flotation Tests | |
13.7.4.1 LCT General Flowsheet | |
13.7.4.2 LCT Test Conditions | |
13.7.4.3 LCT Test Results | |
13.8 Magnetic Separation Test | |
13.9 Concentrate Quality | |
13.9.1 Copper Concentrate Quality | |
13.9.2 Pyrite Concentrate Quality | |
13.9.3 Iron Concentrate Quality | |
13.10 Thickening and Filtration | |
13.10.1 Copper Concentrate Thickening and Filtration Tests | |
13.10.2 Final Tailings and Pyrite Concentrate Thickening Tests | |
13.11 Pre-Concentration Assessment | |
13.12 Copper Recovery Projections | |
14 Mineral resource estimates | |
14.1 Introduction | |
14.2 Modeling Coordinate System | |
14.3 Drillhole Data Analysis | |
14.4 Topography | |
14.5 Geologic Model | |
14.6 Exploration Data Analysis | |
14.7 Contact Analysis | |
14.8 Specific Gravity | |
14.9 Variogram Analysis and Modeling | |
14.10 Block Model | |
14.11 Estimation Methodology | |
14.12 Model Validation | |
14.13 Resource Classification | |
14.14 Mineral Resource Statement | |
14.15 Mineral Resource Sensitivity | |
15 Mineral Reserve Estimates | |
15.1 Block Model | |
15.2 Open Pit Assumptions and Considerations | |
15.2.1 Block Size Analysis | |
15.2.2 Topography | |
15.2.3 Design Criteria | |
15.2.4 Geotechnical Considerations | |
| | | | | |
| Boa Esperança Project | Page iv |
| NI 43-101 Technical Report Feasibility Study Update | October 2021 |
| | | | | |
15.2.5 Geotechnical Program | |
15.2.6 Geotechnical Work plan | |
15.2.7 Pit Slope Analysis | |
15.2.8 Recommended Pit Slope Configuration | |
15.3 Cut-off Grades | |
15.3.1 Mining Loss and Dilution | |
15.4 Pit Limit Analysis | |
15.4.1 Pit Limit Sensitivities | |
15.5 Mineral Reserves Statement | |
15.6 Factors that May Affect the Mineral Reserves | |
16 Mining Methods | |
16.1 Overview | |
16.2 Pit Design | |
16.2.1 Geotechnical Considerations | |
16.2.2 Design Parameters | |
16.2.3 Mining Phases and Final Pit Designs | |
16.3 Production Schedule | |
16.4 Mining Equipment | |
16.4.1 General | |
16.4.2 Time Definition | |
16.4.3 Drilling Equipment | |
16.4.4 Loading Equipment | |
16.4.5 Hauling Equipment | |
16.4.5.1 Haulage Profile Estimation | |
16.4.5.2 Haul Truck Speeds | |
16.4.5.3 Fixed Time | |
16.4.6 Ancillary and Support Equipment | |
16.4.7 Total Mine Fleet Requirement | |
17 Recovery methods | |
17.1 Overview | |
17.2 Process Flow Sheet | |
17.3 Plant Design Criteria | |
17.4 Unit Process Description | |
17.4.1 ROM Ore Handling and Crushing | |
17.4.2 Crushed Ore Stockpile | |
17.4.3 Ball Mill Grinding | |
17.4.4 Flotation | |
17.4.4.1 Copper Flotation | |
17.4.4.2 Pyrite Flotation | |
| | | | | |
| Boa Esperança Project | Page v |
| NI 43-101 Technical Report Feasibility Study Update | October 2021 |
| | | | | |
17.4.5 Concentrate Regrind | |
17.4.6 Concentrate Dewatering | |
17.4.7 Concentrate Storage and Load Out | |
17.4.8 Pyrite Tailings Dewatering | |
17.4.9 Pyrite Concentrate Pond Water Reclaim | |
17.4.10 Reagents and Consumables | |
17.5 Sampling and Metallurgical Laboratory | |
17.6 Plant Services | |
17.6.1 Water Supply and Distribution | |
17.6.1.1 Raw Water | |
17.6.1.2 Fire Water | |
17.6.1.3 Potable Water | |
17.6.1.4 Process Water | |
17.6.2 Air Supply and Distribution | |
17.7 Process Control System | |
18 Project infrastructure | |
18.1 Project Infrastructure | |
18.2 Power | |
18.2.1 Electrical Power Demand | |
18.2.2 Electrical Power Source | |
18.2.3 Main Substation | |
18.2.4 Electric Power Distribution | |
18.3 Process Plant Water Consumption | |
18.4 Ancillary Buildings and Facilities | |
18.4.1 Administration Building and Offices | |
18.4.2 Laboratory | |
18.4.3 Warehouse and Yard Storage | |
18.4.4 Process Operations Workshop | |
18.4.5 Mine Dry | |
18.4.6 Mine Equipment Maintenance Shop (Truck Shop) | |
18.4.7 Truck Wash | |
18.4.8 Explosive Storage Magazine | |
18.4.9 Gatehouse and Weight-Scale | |
18.4.10 Core Shed | |
18.4.11 First Aid Clinic and Fire Protection Building | |
18.4.12 Fire Protection | |
18.4.13 Canteen | |
18.4.14 Sewage Treatment | |
18.4.15 Refuse Storage | |
| | | | | |
| Boa Esperança Project | Page vi |
| NI 43-101 Technical Report Feasibility Study Update | October 2021 |
| | | | | |
18.4.16 Communications | |
18.5 Water Management Plan | |
18.5.1 Climate | |
18.5.2 Topography | |
18.5.3 Mine Facilities - Footprints | |
18.5.3.1 Run-off and Capture Coefficients | |
18.5.4 Water Balance | |
18.5.4.1 Contact Water Estimate | |
18.5.5 Facilities | |
18.5.5.1 Open Pit | |
18.5.5.2 Waste Rock Facility | |
18.5.5.3 TSF | |
18.5.5.4 Dry-Stack Filtered Tailings Facility | |
18.5.5.5 Stockpile, Administrative and Process Plant Area | |
18.5.6 Hydrogeology | |
18.5.6.1 Groundwater Setting | |
18.5.6.2 Pit Inflow | |
18.5.6.3 Numerical Groundwater Modelling | |
18.5.7 Schematics | |
18.5.8 Treatment Plant Selection | |
18.6 Water Supply | |
18.7 Tailings Storage Facilities | |
18.7.1 Hazard Classification | |
18.7.2 Design Criteria | |
18.7.3 Dry-Stack Tailings Storage Facility and Pyrite Tailings Storage Facility Study | |
18.7.4 Geotechnical Field and Laboratory Investigation | |
18.7.5 Non-Pyrite Dry Stack Tailings Facility Design and Operation | |
18.7.6 Pyrite Tailings Storage Facility Design and Operation | |
18.7.7 Stability Analysis of Dry-Stack Tailings Storage Facility and Pyrite Tailings Storage Facility | |
18.7.8 Waste Rock Facility and Stockpiles | |
18.7.9 Closure and Post-Closure of the Tailings Storage Facilities | |
18.7.9.1 Closure of the Tailing Storage Facility | |
18.7.9.2 Closure of the Dry Stack Tailing Facility | |
18.8 Concentrate Transport Logistics | |
18.9 Built Infrastructure (Access Road) | |
19 Market studies and contracts | |
19.1 Market Studies | |
19.2 Contracts | |
20 Environmental Studies, Permitting, and Social or Community Impact | |
| | | | | |
| Boa Esperança Project | Page vii |
| NI 43-101 Technical Report Feasibility Study Update | October 2021 |
| | | | | |
20.1 Environmental Laws and Licensing | |
20.1.1 Reclamation of Degraded Areas | |
20.2 Environmental Licenses | |
20.3 Physiography, Flora and Fauna | |
20.3.1 Soil Types | |
20.3.2 Local Hydrography | |
20.3.3 Water Availability | |
20.3.4 Flora and Fauna | |
20.4 Environmental Studies | |
20.4.1 Classification of Areas of Influence | |
20.4.2 Agrarian Reform Areas | |
20.5 Environmental Impact Issues | |
20.5.1 Water Quality | |
20.5.2 Acid Rock Drainage | |
20.6 Environmental Compensation | |
20.7 Stakeholder Communications | |
20.7.1 Program for the Monitoring of Socio-Economic Indicators | |
20.7.2 Social Communication Program | |
20.7.3 Education, Job Training & Employment | |
20.7.4 Environmental Education | |
20.7.5 Labor Jobsite Hiring | |
20.8 Mining Closure and Reclamation | |
21 Capital and operating costs | |
21.1 Capital Costs | |
21.1.1 Basis of Estimate | |
21.1.2 Summary | |
21.1.3 Definition of Costs | |
21.1.4 General Methodology | |
21.1.5 Exchange Rates | |
21.1.6 Market Availability | |
21.1.7 Mine Capital Costs | |
21.1.8 Processing Capital Costs | |
21.1.9 Tailings/Reclaim Facilities | |
21.1.10 On-Site Infrastructure | |
21.1.11 Off-Site Infrastructure | |
21.2 Operating Cost Estimate | |
21.2.1 Summary | |
21.2.2 Mining Costs | |
21.2.3 Processing | |
| | | | | |
| Boa Esperança Project | Page viii |
| NI 43-101 Technical Report Feasibility Study Update | October 2021 |
| | | | | |
21.2.3.1 Power | |
21.2.3.2 Consumables | |
21.2.3.3 Maintenance Consumables | |
21.2.3.4 Labour | |
21.2.4 General and Administration | |
21.2.5 Dry Stack Tailings Facility | |
22 Economic analysis | |
22.1 Cautionary Statement | |
22.2 Methodology Used | |
22.3 Financial Model Parameters | |
22.3.1 Taxes | |
22.3.2 Royalties | |
22.3.3 Working Capital | |
22.3.4 Closure Costs | |
22.4 Economic Analysis | |
22.5 Sensitivity Analysis | |
22.6 QP Comments on “Item 22: Economic Analysis” | |
23 Adjacent properties | |
24 Other relevant data and information | |
24.1 Project Execution Plan | |
24.1.1 Project Milestones | |
24.1.2 Scope, Approach and Objectives | |
24.1.3 Access Road | |
24.1.4 Mining | |
24.1.5 Process Plant and Infrastructure | |
24.1.6 Camp Facilities | |
24.1.7 Power Generation | |
24.1.8 Schedule | |
25 Interpretation and conclusions | |
25.1 Introduction | |
25.2 Mineral Tenure, Surface Rights, Water Rights, Royalties and Agreements | |
25.3 Geology and Mineralization | |
25.4 Exploration, Drilling and Analytical Data Collection in Support of Mineral Resource Estimation | |
25.5 Mineral Processing and Metallurgical Testing | |
25.6 Mineral Resource Estimates | |
25.7 Mineral Reserve Estimates | |
25.8 Open Pit Geotechnical | |
25.9 Mine Plan | |
25.10 Recovery Plan | |
| | | | | |
| Boa Esperança Project | Page ix |
| NI 43-101 Technical Report Feasibility Study Update | October 2021 |
| | | | | |
25.11 Infrastructure – Tailings Storage Facilities | |
25.12 Environmental, Permitting and Social Considerations | |
25.12.1 Environmental Considerations | |
25.12.2 Closure and Reclamation Considerations | |
25.13 Markets and Contracts | |
25.14 Capital Cost Estimates | |
25.15 Operating Cost Estimates | |
25.16 Economic Analysis | |
25.17 Risks and Opportunities | |
25.17.1 Risks | |
25.17.1.1 General | |
25.17.1.2 Mining | |
25.17.1.3 Tailings Storage Facilities | |
25.17.2 Opportunities | |
25.17.2.1 General | |
25.17.2.2 Mining | |
25.17.2.3 Tailings Storage Facilities | |
25.18 Conclusions | |
26 Recommendations | |
26.1 Mineral Reserves | |
26.2 Mining | |
26.2.1 Open Pit Geotechnical | |
26.3 Geochemistry | |
26.4 Metallurgical Testing | |
26.5 Tailings Storage Facilities | |
27 References | |
List of Tables
| | | | | |
Table 1-1: Mineral Resource Statement as of 31 August 2021 | |
Table 1-2: Mineral Reserves Statement as of 31 August 2021 | |
Table 1-3: Pit Slope Geometry | |
Table 1-4: Key Production Parameters | |
Table 1-5: Mine Production Schedule (yearly) | |
Table 1-6: Plant Feed Schedule (yearly) | |
Table 1-7: Contact Water Estimate | |
Table 1-8: Capital Cost Estimate | |
| | | | | |
| Boa Esperança Project | Page x |
| NI 43-101 Technical Report Feasibility Study Update | October 2021 |
| | | | | |
Table 1-9: Forecast Average Annual Operating Cost Estimate Summary | |
Table 1-10: Summary, Projected LOM Cashflow Assumptions and Results | |
Table 2-1: FSU Sections and Parties Responsible | |
Table 2-2: Name Abbreviations | |
Table 2-3: Unit Abbreviations | |
Table 4-1: Boa Esperança Exploration Permit | |
Table 6-1: Summary of Historic Exploration Works | |
Table 6-2: 2017 Mineral Resource Estimate | |
Table 6-3: 2017 Mineral Reserve Estimate | |
Table 7-1: Boa Esperança Copper Deposit Rock Types | |
Table 7-2: Mineralization Types | |
Table 9-1: Gap Zone Drilling Results, Subsequent to Effective Date | |
Table 10-1: Summary of Codelco drilling programs | |
Table 10-2: Summary of MCSA drill programs | |
Table 11-1: Specifications of Standard Reference Materials Used by MCSA for the Boa Esperança Copper Project | |
Table 12-1: Summary of Analytical Quality Control Data Produced by MCSA on the Boa Esperança Copper Project | |
Table 13-1: 2012 SGS Geosol Sample Compositions Summary | |
Table 13-2: 2015 SGS Sample Compositions Summary | |
Table 13-3: Main Mineral Composition for Boa Esperança Test Composite | |
Table 13-4: Mass Mineralogical Composition of the Copper Sulphides | |
Table 13-5: Sample Head Assays | |
Table 13-6: Hardness and Abrasion Test Results | |
Table 13-7: 2015 SGS Jigging Test Results | |
Table 13-8: Summary of 2009 and 2012 Flotation Tests Results | |
Table 13-9: Flotation pH Condition Results – 2009 CIMM | |
Table 13-10: LCT Test Conditions For All Test Work Programs | |
Table 13-11: CIMM LCTs Test Results Summary | |
Table 13-12: SGS LCTs Test Results Summary – 2012 and 2015 | |
Table 13-13: Pilot Magnetic Separation Tests – SGS Geosol 2015 | |
Table 13-14: Copper Concentrate Chemical Elemental Assays – SGS 2012 and 2015 | |
Table 13-15: Pyrite Concentrate Chemical Elemental Assays – SGS 2015 | |
Table 13-16: Iron Concentrate Chemical Elemental Assays – SGS 2015 (MAG CLN L8) | |
Table 13-17: Concentrate Chemical Elemental Assays | |
Table 13-18: Copper Recovery and Grade Projections | |
Table 14-1: Drillhole Statistics | |
| | | | | |
| Boa Esperança Project | Page xi |
| NI 43-101 Technical Report Feasibility Study Update | October 2021 |
| | | | | |
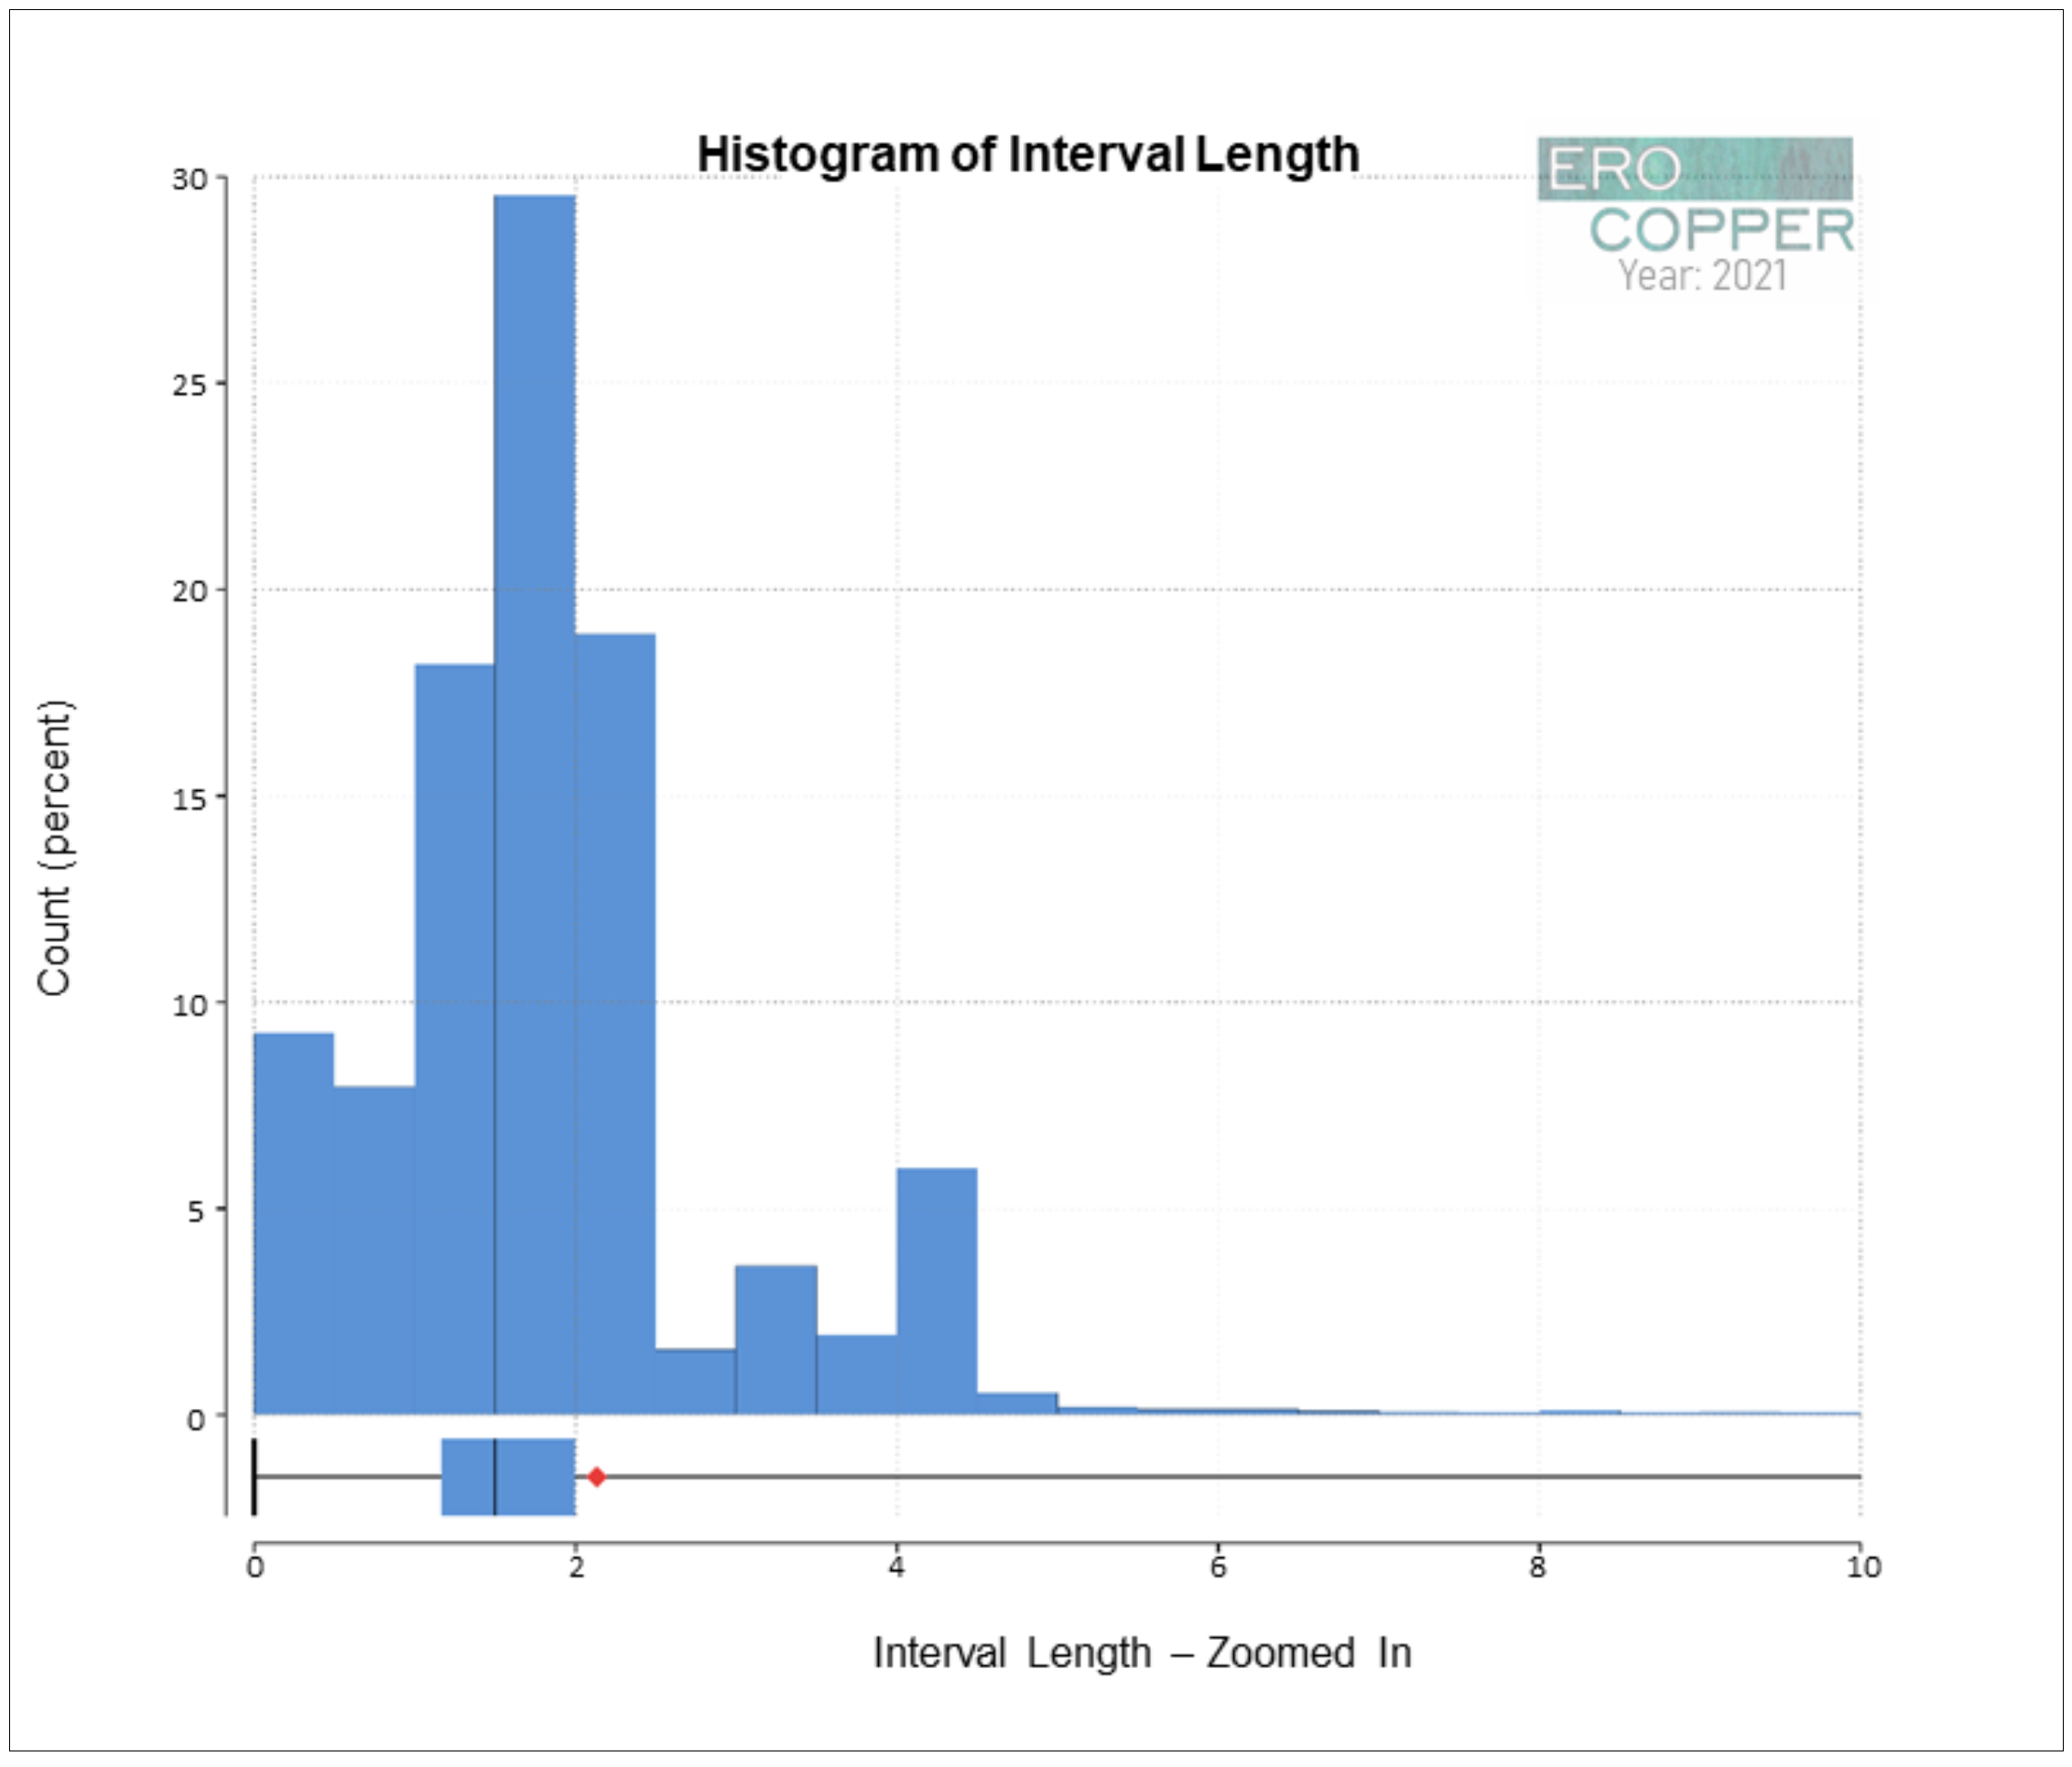
Basic statistics for coper and the assay interval length are shown in Table 14-2. The lithology codes and a description of the codes are shown in Table 14-3. Sulfide intervals were broken down based on the relative abundance of chalcopyrite and pyrite as shown in Table 14-6. | |
Table 14-4: Statistics for copper and assay interval length | |
Table 14-5: Lithology codes | |
Table 14-6: Mineralization codes | |
Table 14-7: Statistics of assay data within the wireframes | |
Table 14-8: Statistics of Composite Data within the Wireframes | |
Table 14-9: Variogram Parameters for Copper (High Grade) | |
Table 14-10: Variogram Parameters for Copper (Low Grade) | |
Table 14-11: Variogram Parameters for Iron (High Grade) | |
Table 14-12: Variogram Parameters for Iron (Low Grade) | |
Table 14-13: Block Model Summary | |
Table 14-14: Summary of Estimation Parameters for Copper and Iron | |
Table 14-15: Comparison between composite and block Cu grades (High-Grade and Low-Grade Domains) | |
Table 14-16: Stope Optimization Summary | |
Table 14-17: Mineral Resource Statement, Boa Esperança Copper Project, Pará State, Brazil, Ero Copper, August 31, 2021 | |
Table 15-1: Pit Optimisation Design Criteria | |
Table 15-2: Pit Slope Geometry | |
Table 15-3: Overall Dilution and Losses | |
Table 15-4: Mineral Reserves Statement as of 31 August 2021 | |
Table 16-1: Key Proposed Production Parameters | |
Table 16-2: Bench Configuration for Mine Design | |
Table 16-3: In-Pit Tonnages and Grades per Mining Phase | |
Table 16-4: Whittle pit vs Mine Design | |
Table 16-5: Planned Processing Plant Ramp-up | |
Table 16-6: Proposed Mine Schedule Summary (Yearly) | |
Table 16-7: Proposed Mine Schedule Summary (Quarterly) | |
Table 16-8: Proposed Mine Schedule Summary (Quarterly) – Material Movements by Mining Phase | |
Table 16-9: Proposed Plant Feed Summary (Quarterly) | |
Table 16-10: Proposed Plant Feed Summary (Yearly) | |
Table 16-11: Proposed Plant Feed Summary by Ore Type (Quarterly) | |
Table 16-12: Proposed Plant Feed Summary by Ore Type (Yearly) | |
Table 16-13: Proposed Operating Time and Index Definition | |
Table 16-14: Proposed Drilling Patterns | |
Table 16-15: Proposed Material Densities | |
Table 16-16: Proposed Haul Truck Speeds | |
Table 16-17: Total Proposed Mine Fleet Requirement | |
| | | | | |
| Boa Esperança Project | Page xii |
| NI 43-101 Technical Report Feasibility Study Update | October 2021 |
| | | | | |
Table 17-1: Boa Esperança Process Design Criteria | |
Table 18-1: Facility Footprints | |
Table 18-2: Runoffs Coefficient | |
Table 18-3: Contact Water Estimate | |
Table 18-4: Expected Water Treatment Demand | |
Table 18-5: Design Criteria TSF and DSTF | |
Table 20-1: Closure & reclamation activities and estimated costs, presented in BRL and USD, millions | |
Table 21-1: Estimate Summary Level 1 Major Facility | |
Table 21-2: Estimate by Major Discipline | |
Table 21-3: Assumed Equipment Prices and Life | |
Table 21-4: Projected Mine Capital Costs | |
Table 21-5: Projected Ore Handling and Processing Plant Costs | |
Table 21-6: Direct Tailings/Reclaim Capital Costs | |
Table 21-7: Projected On-Site Infrastructure Costs | |
Table 21-8: Projected Off-Site Infrastructure Costs | |
Table 21-9: Forecast Average Annual Operating Cost Estimate Summary | |
Table 21-10: Forecast Diesel Consumption Rates (L/h) | |
Table 21-11: Forecast Explosives Prices | |
Table 21-12: Proposed Mine Workforce | |
Table 21-13: Forecast Total Operating Expenses (‘000 US$) | |
Table 21-14: Forecast Unit Mine Operating Cost | |
Table 21-15: Forecast Capitalized Waste | |
Table 21-16: Forecast Total Operating Expenses Excluding Capitalized Waste (US$ x 1,000) | |
Table 21-17: Unit Mine Operating Cost excluding Capitalized Waste | |
Table 21-18: Processing Costs – Power, Consumables and Labour | |
Table 21-19: Forecast Processing Reagents and Consumable Costs | |
Table 21-20: Forecast Costs for Liners and Media | |
Table 21-21: Forecast Reagent Costs | |
Table 21-22: Labour Costs | |
Table 21-23: Forecast Dry Stack Tailings Facility Cost Summary | |
Table 22-1: Summary, Projected LOM Cashflow Assumptions and Results | |
Table 22-2: Projected Cashflow on an Annualized Basis | |
Table 22-3: Pre- and Post-Tax Sensitivity (base case is highlighted) | |
Table 24-1: Boa Esperança Milestones | |
| | | | | |
| Boa Esperança Project | Page xiii |
| NI 43-101 Technical Report Feasibility Study Update | October 2021 |
List of Figures | | | | | |
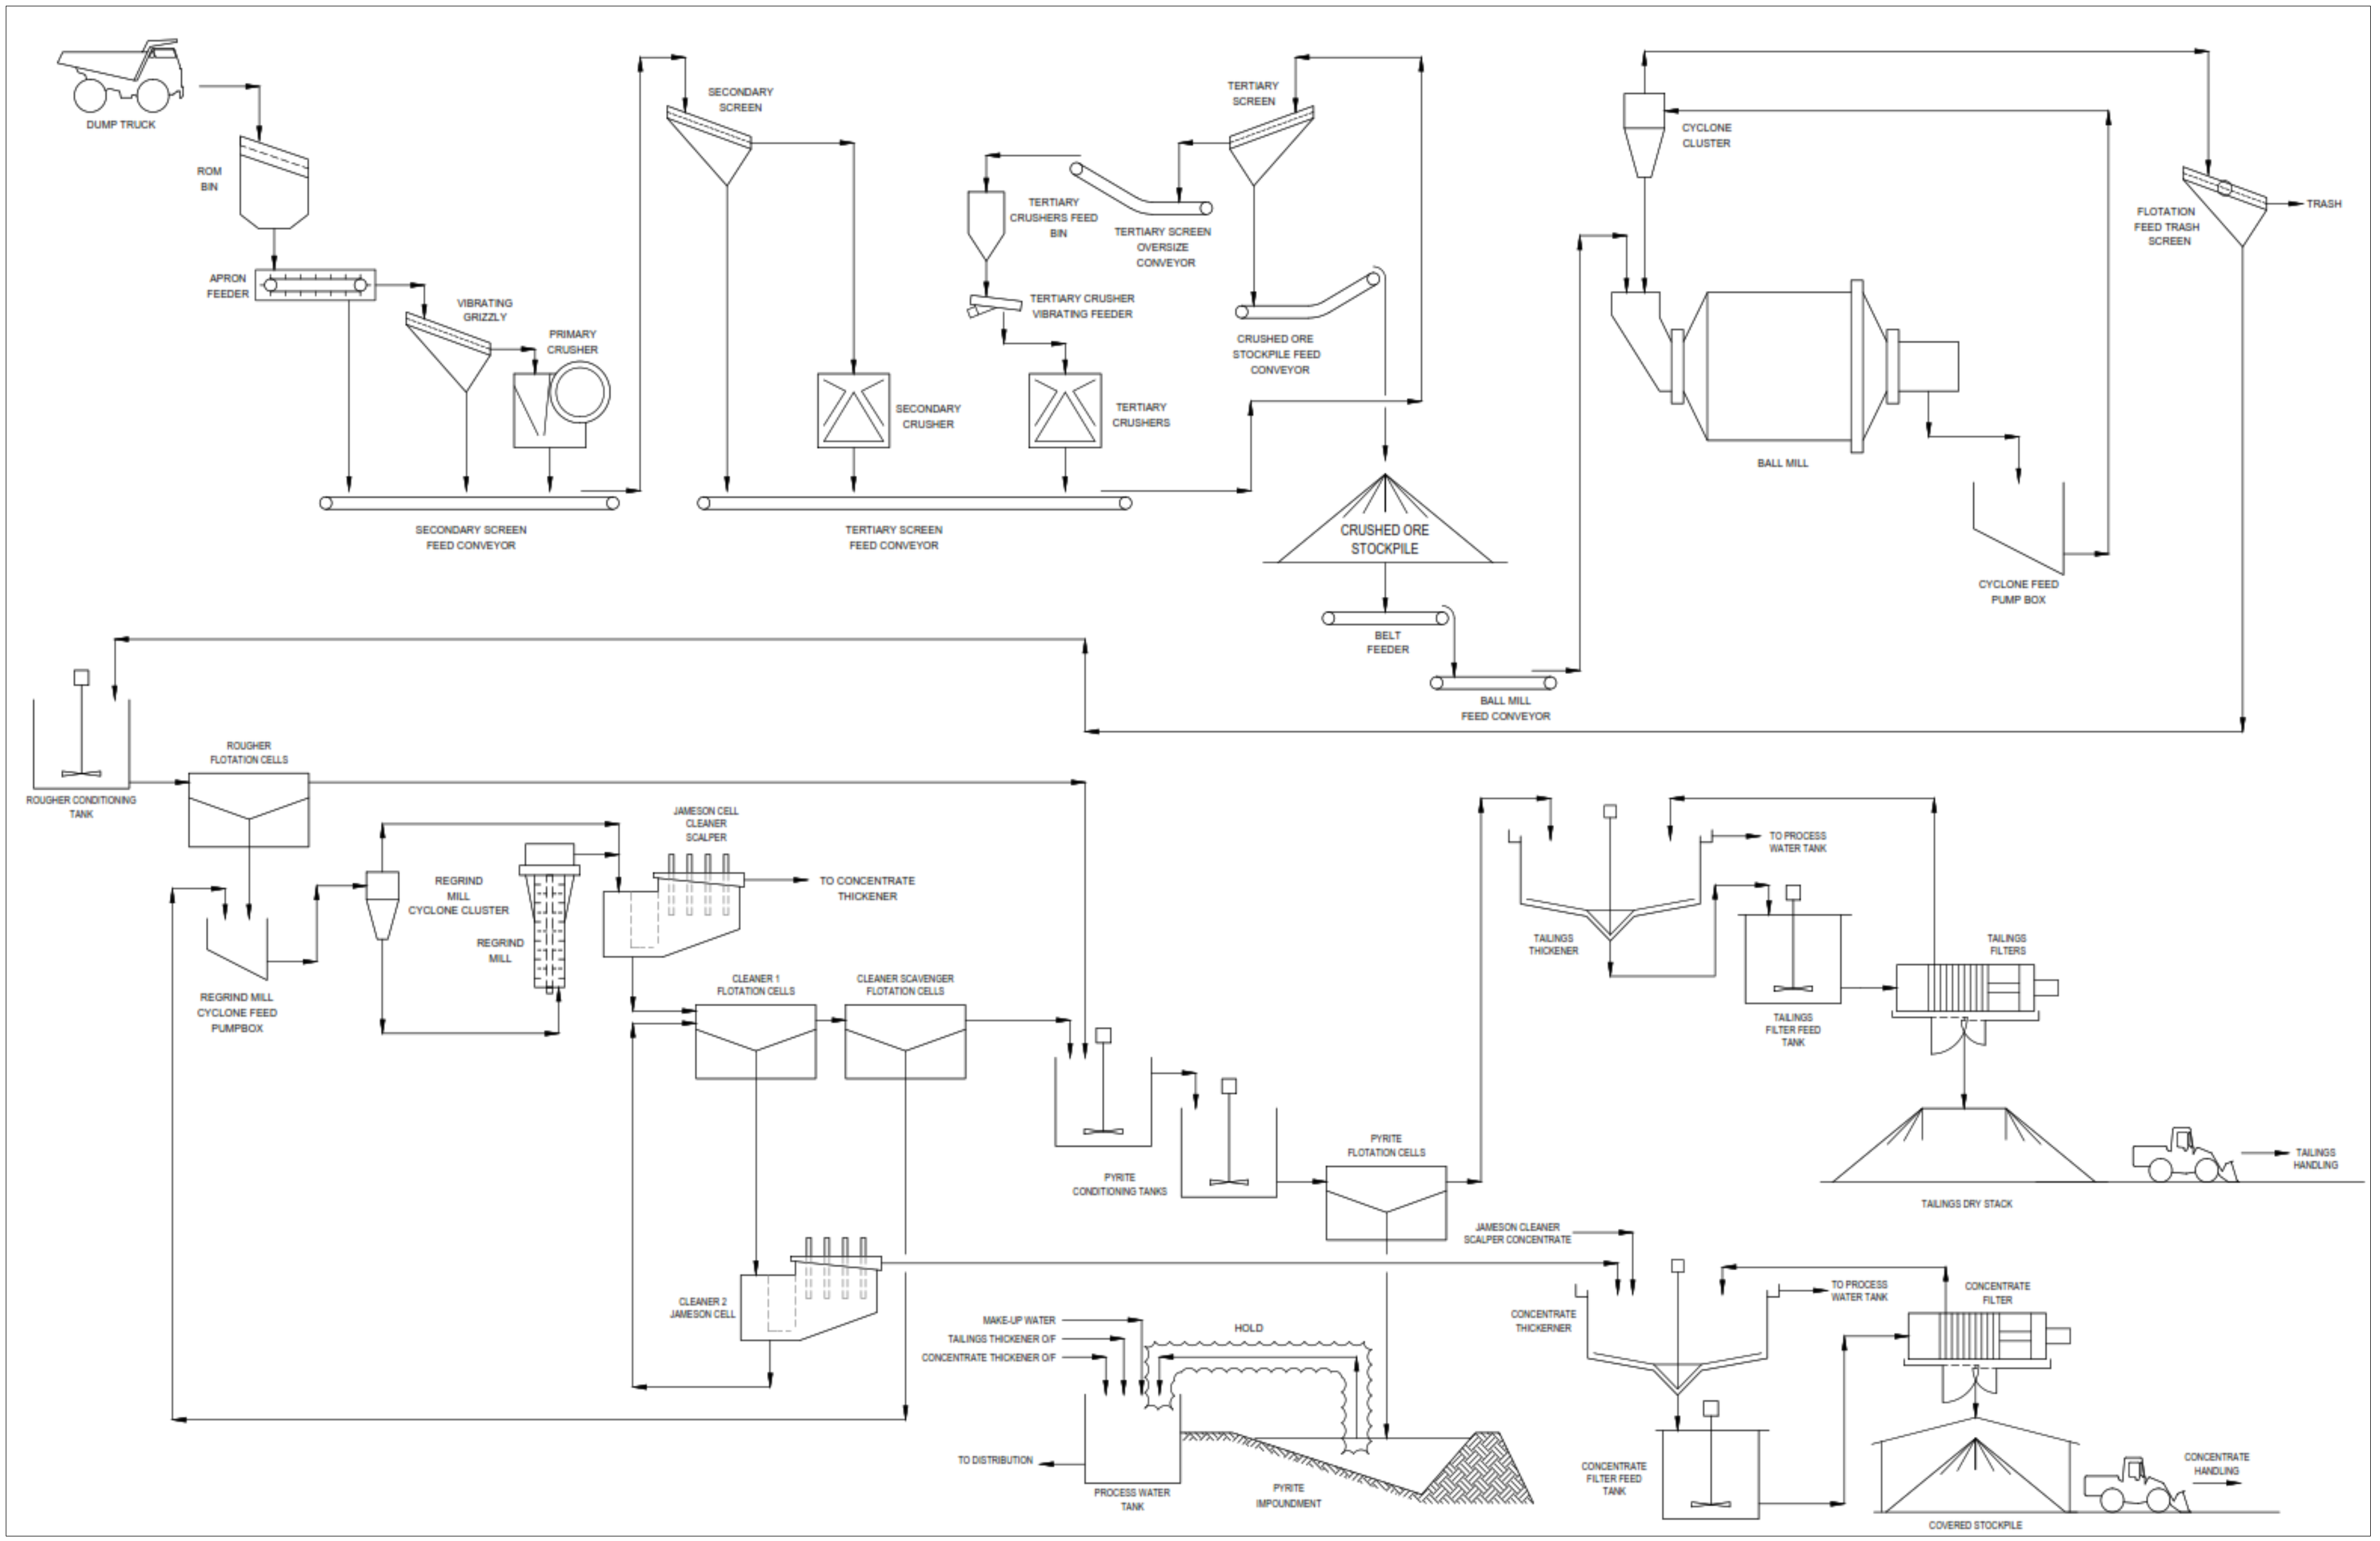
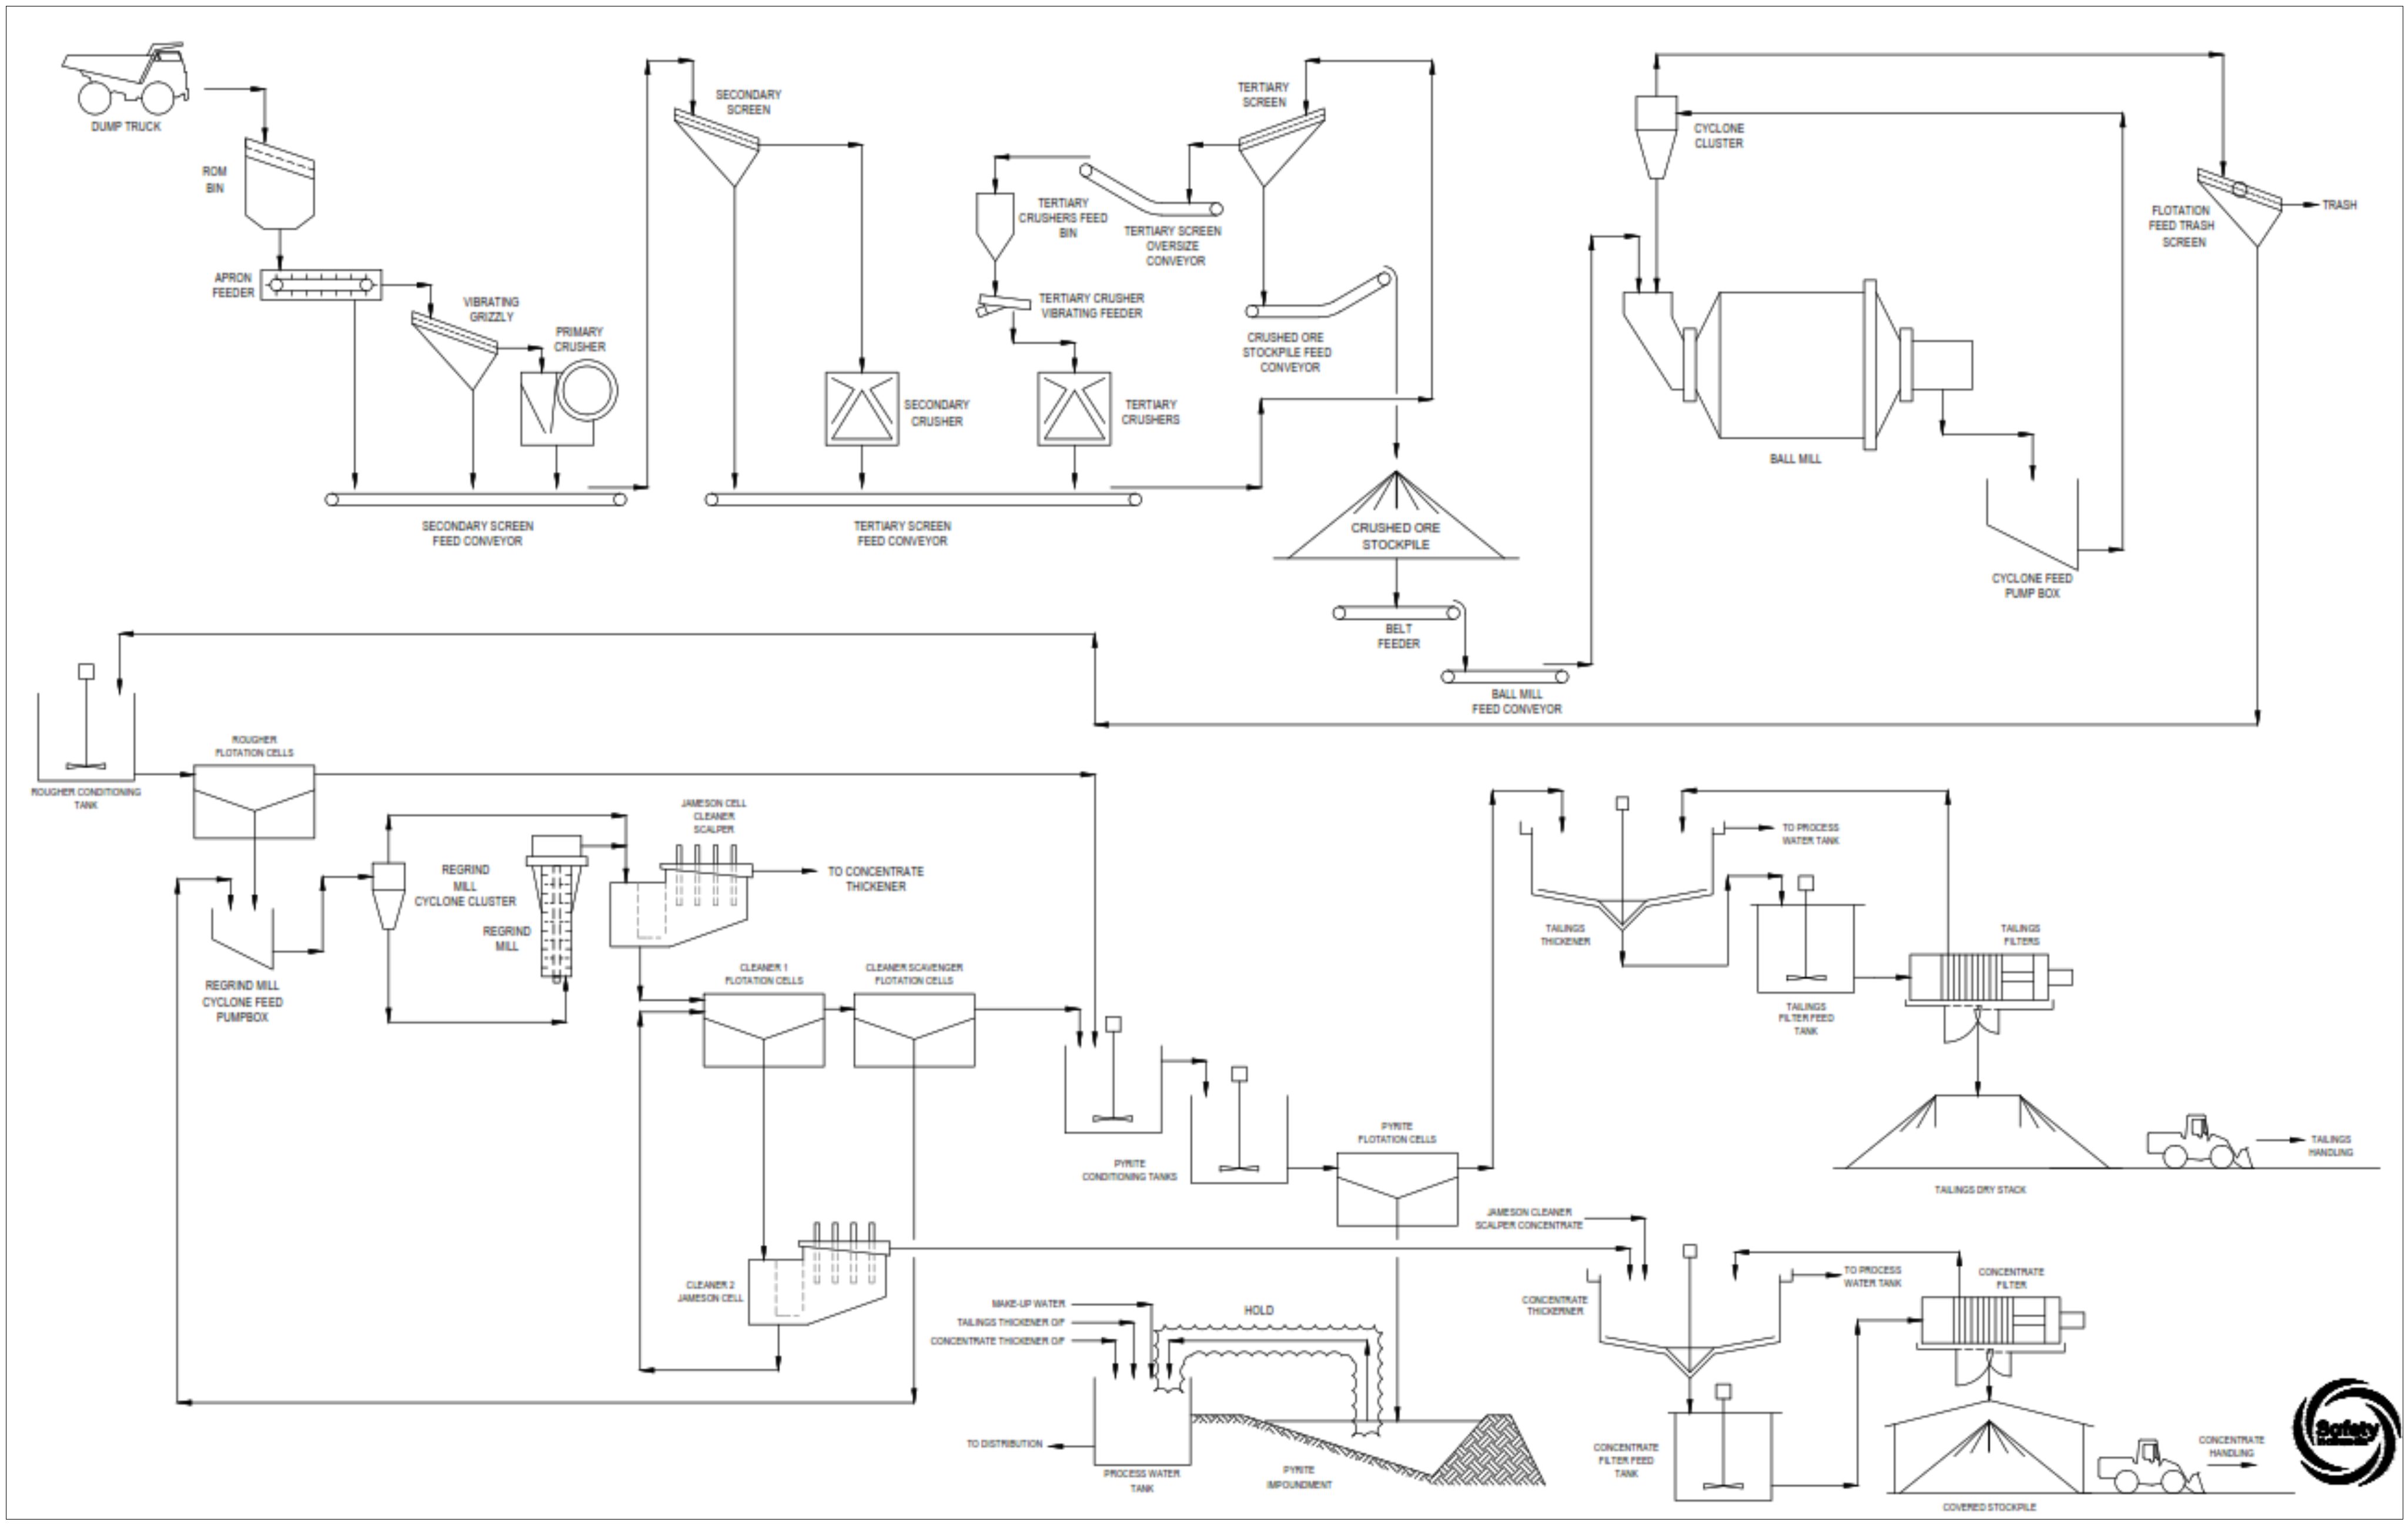
Figure 1-1: Overall Process Flowsheet | |
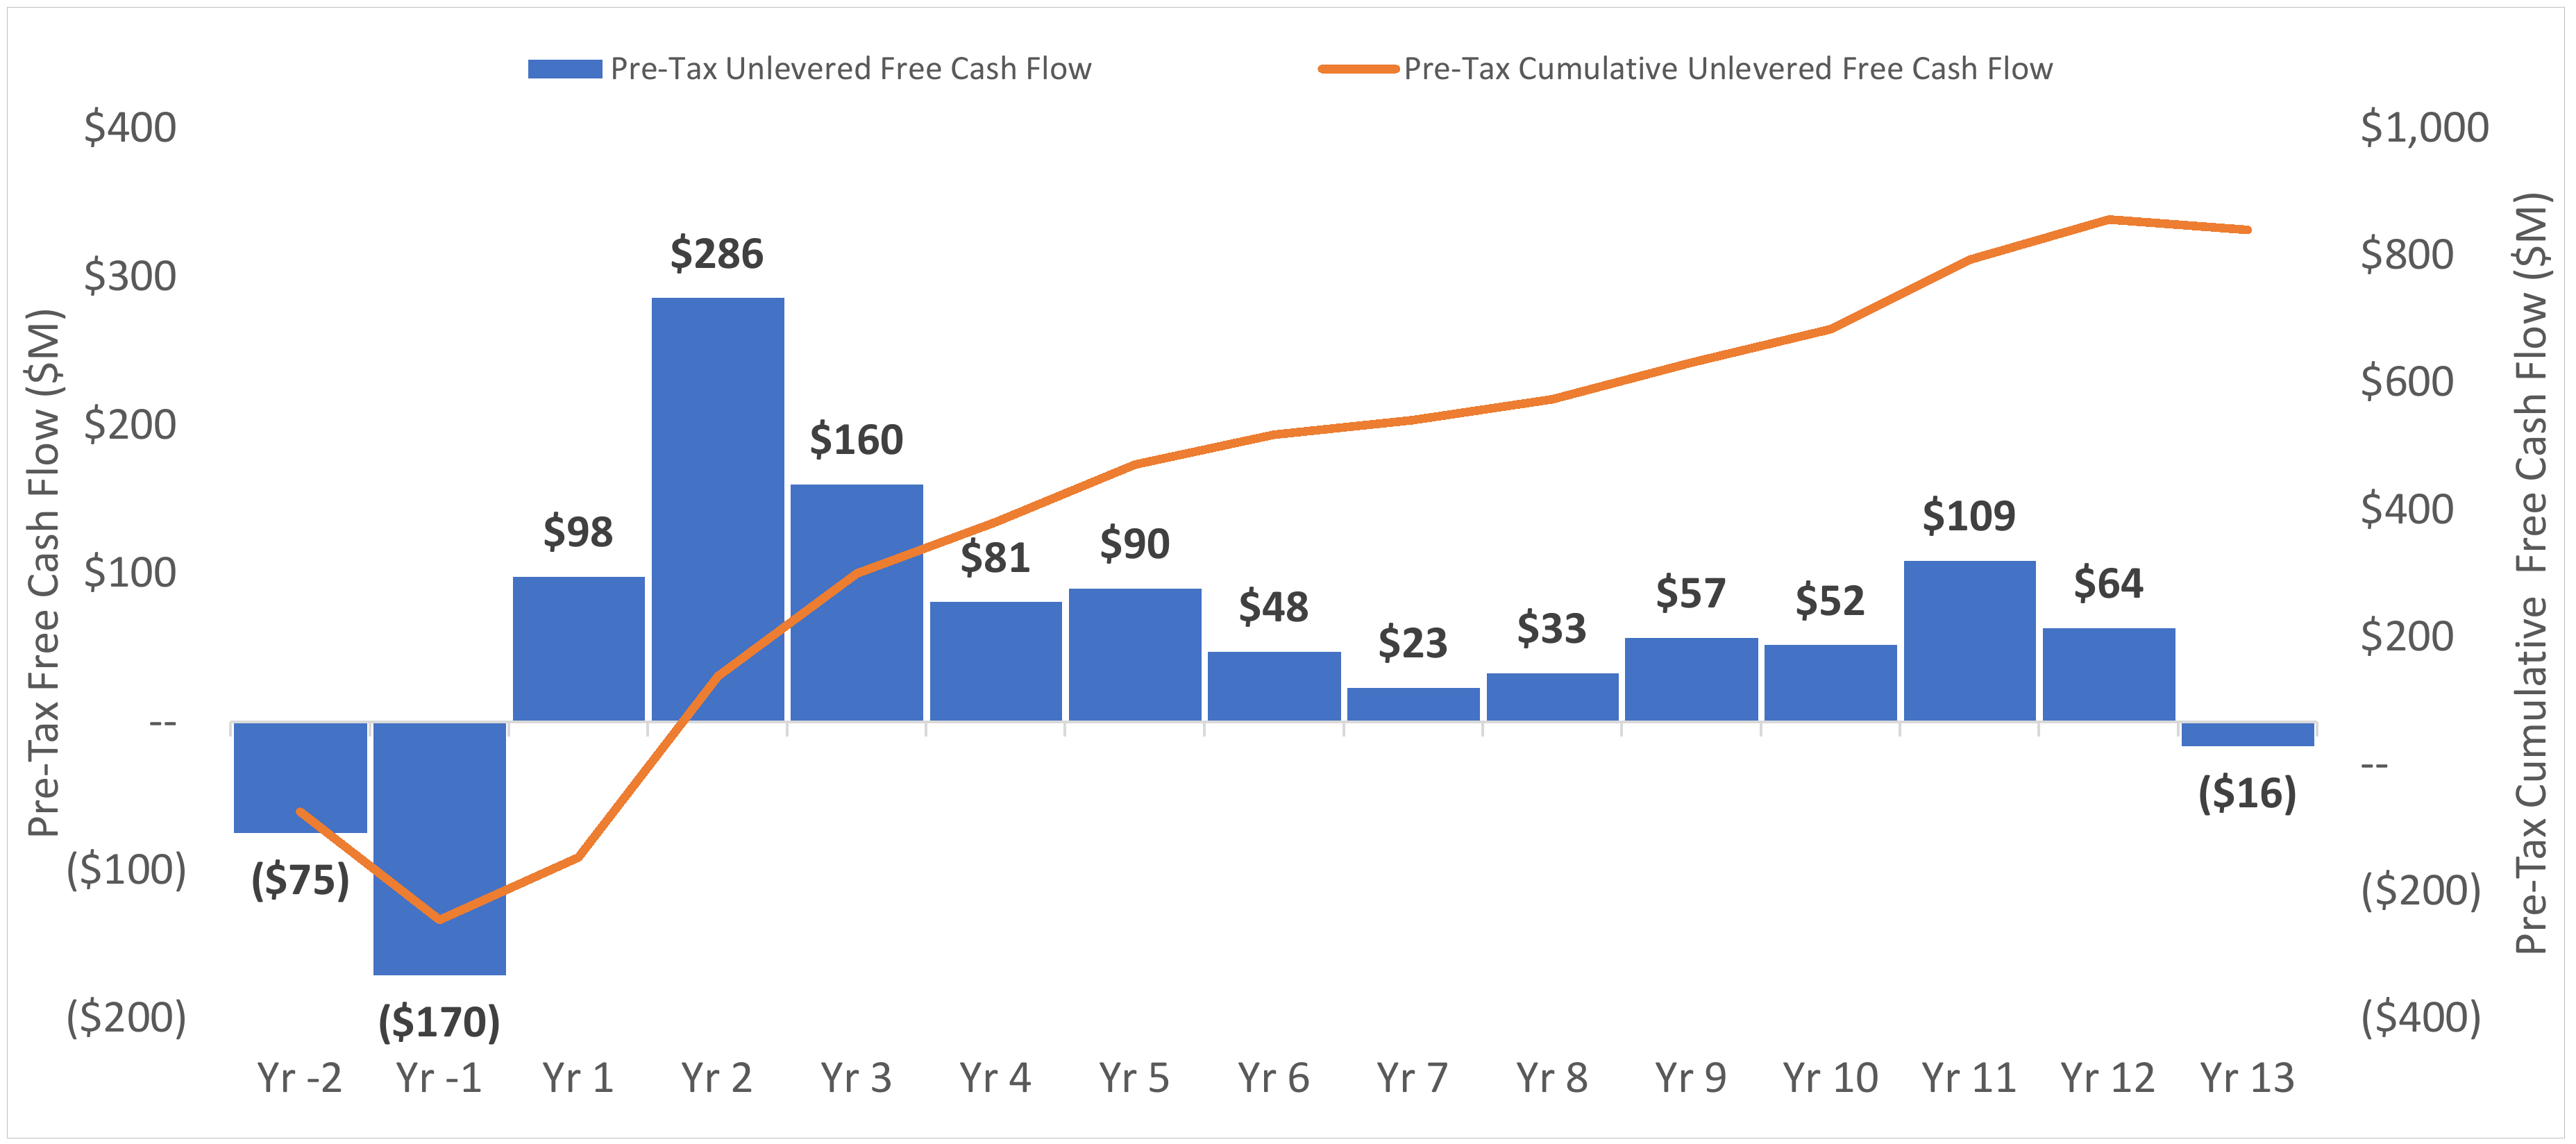
Figure 1-2: Projected LOM Pre-Tax Cashflow | |
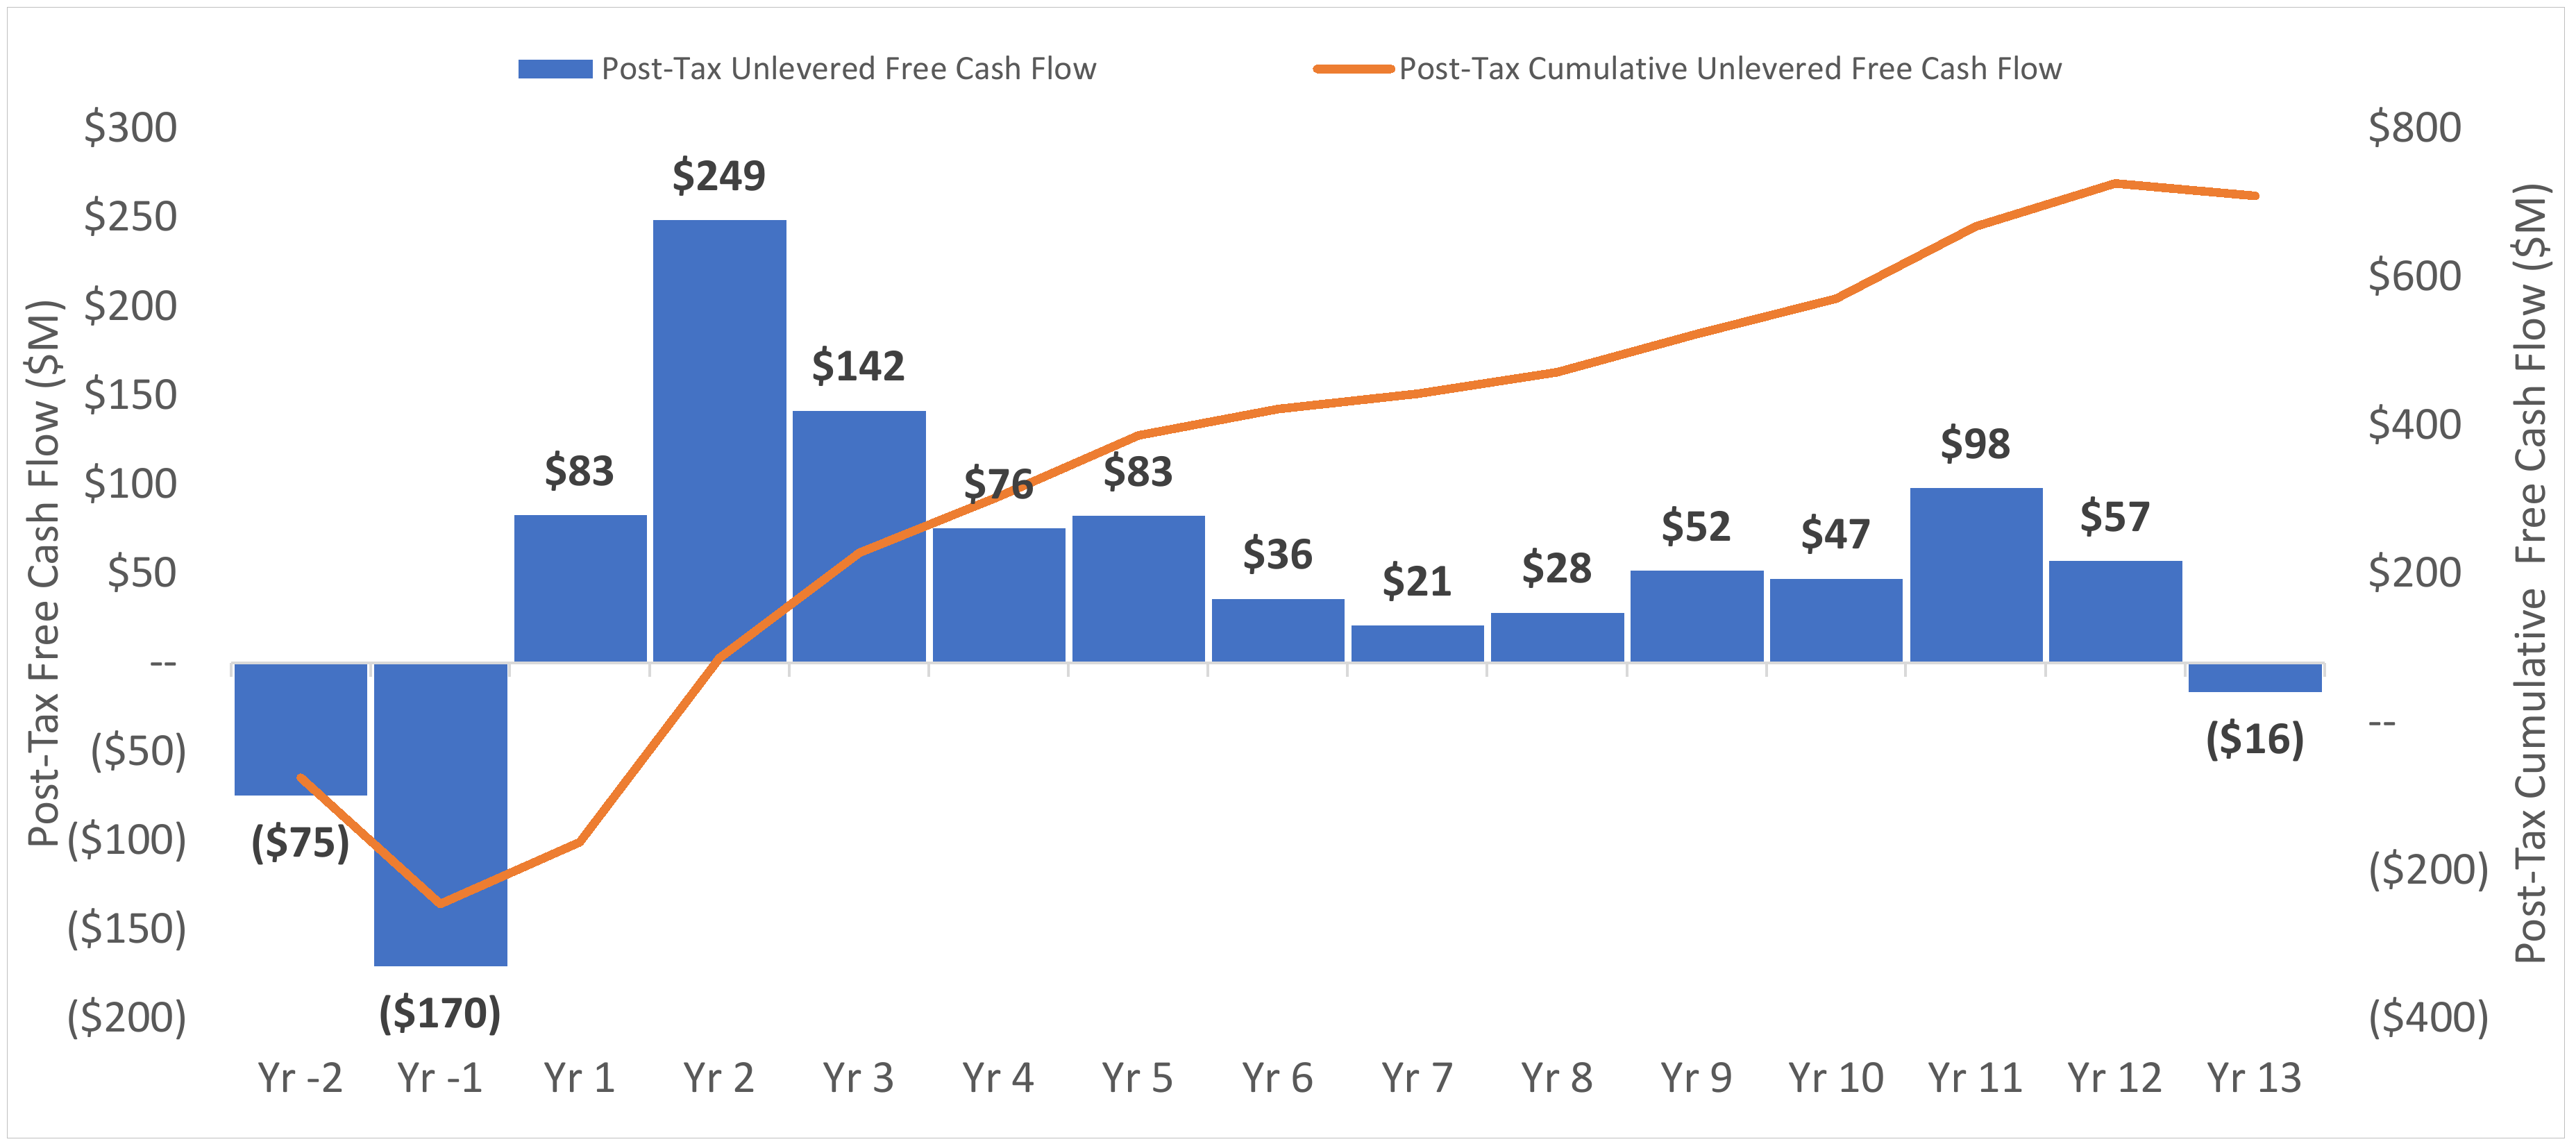
Figure 1-3: Projected LOM Post-Tax Cashflow | |
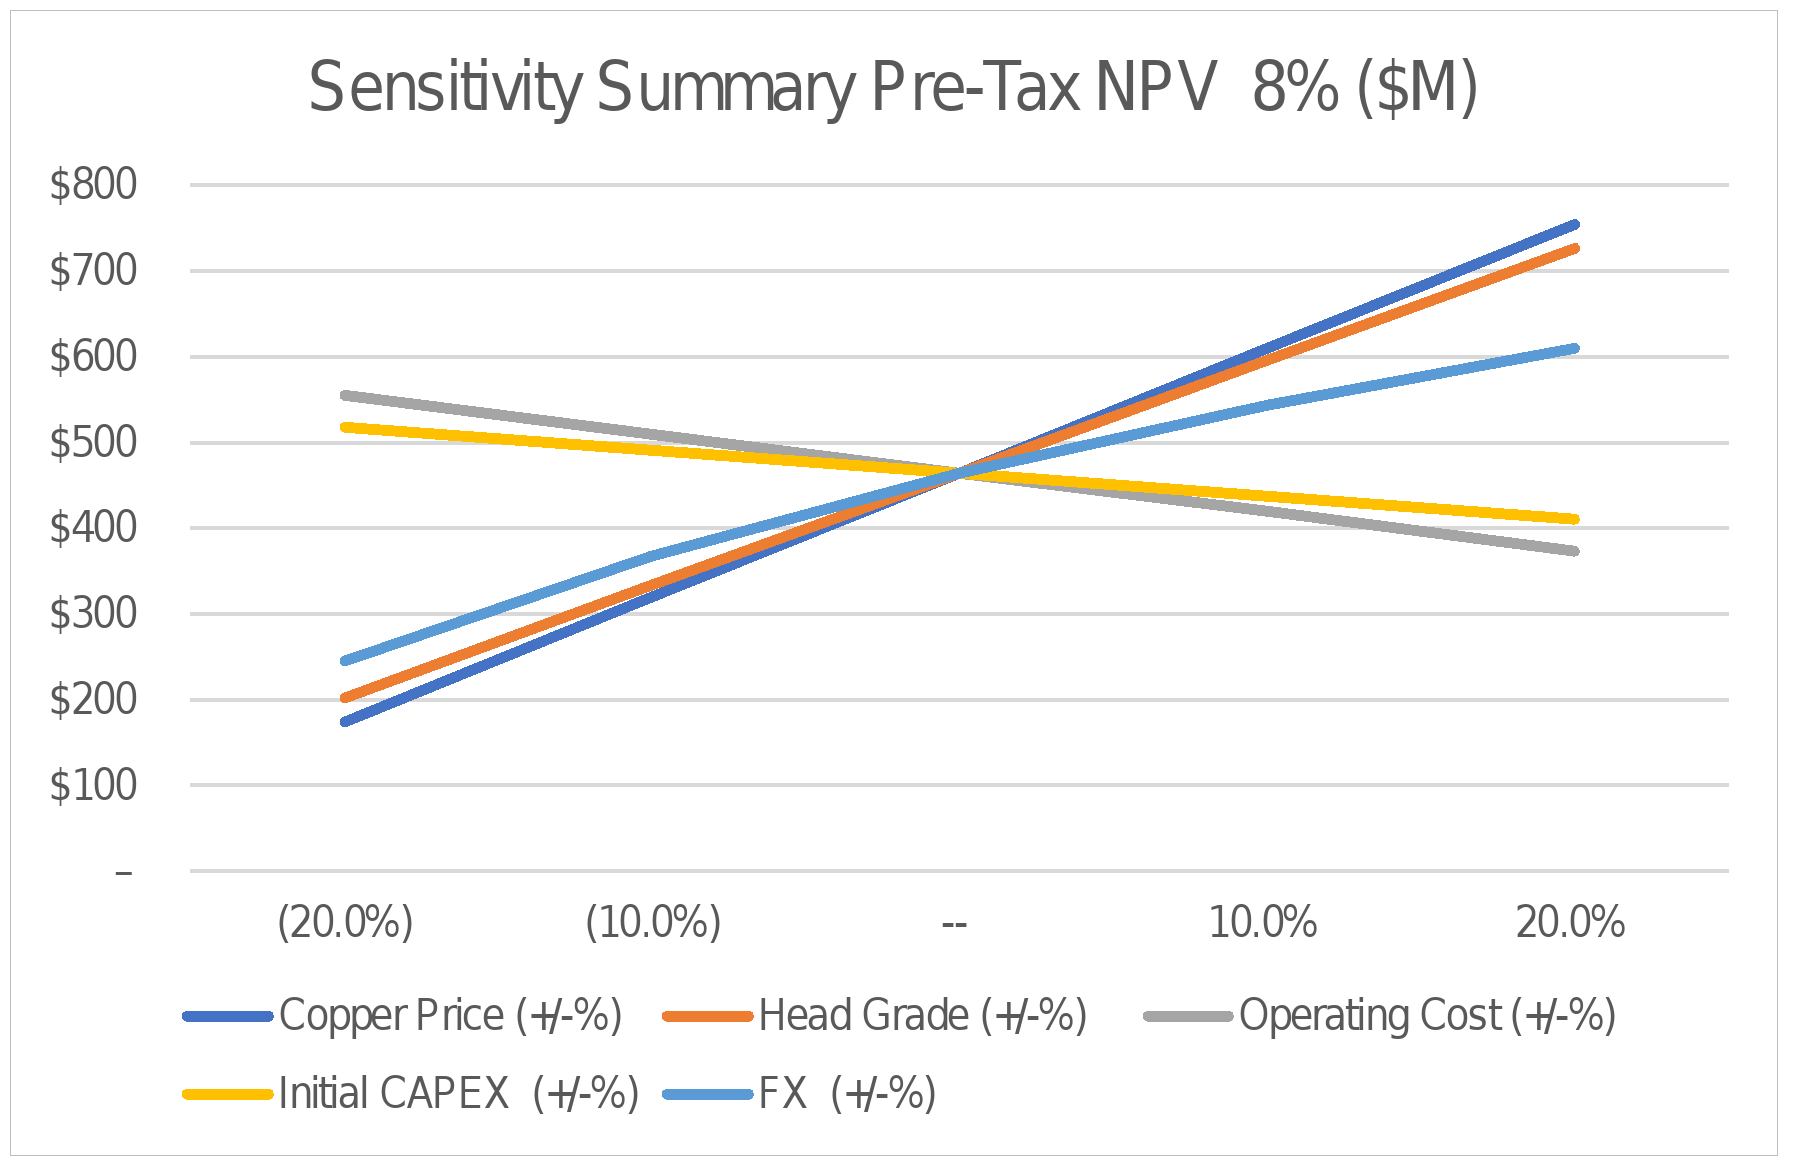
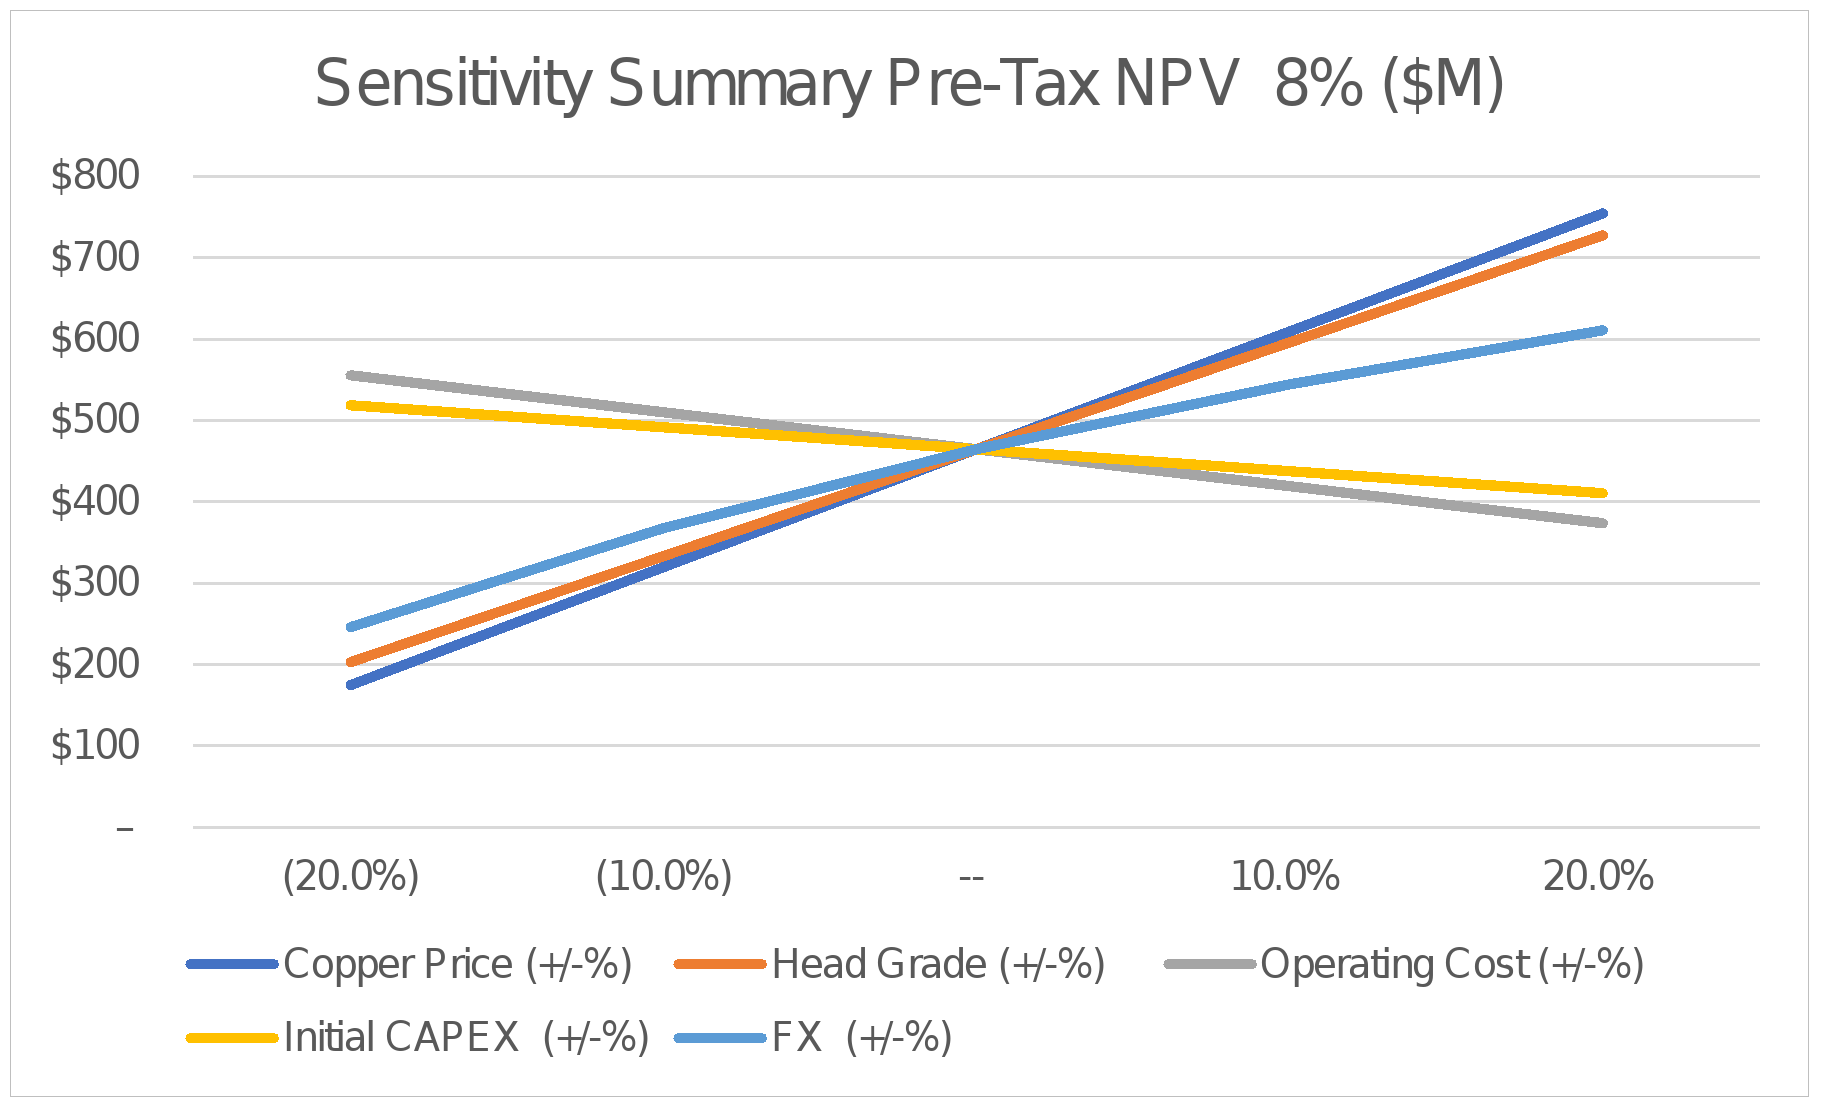
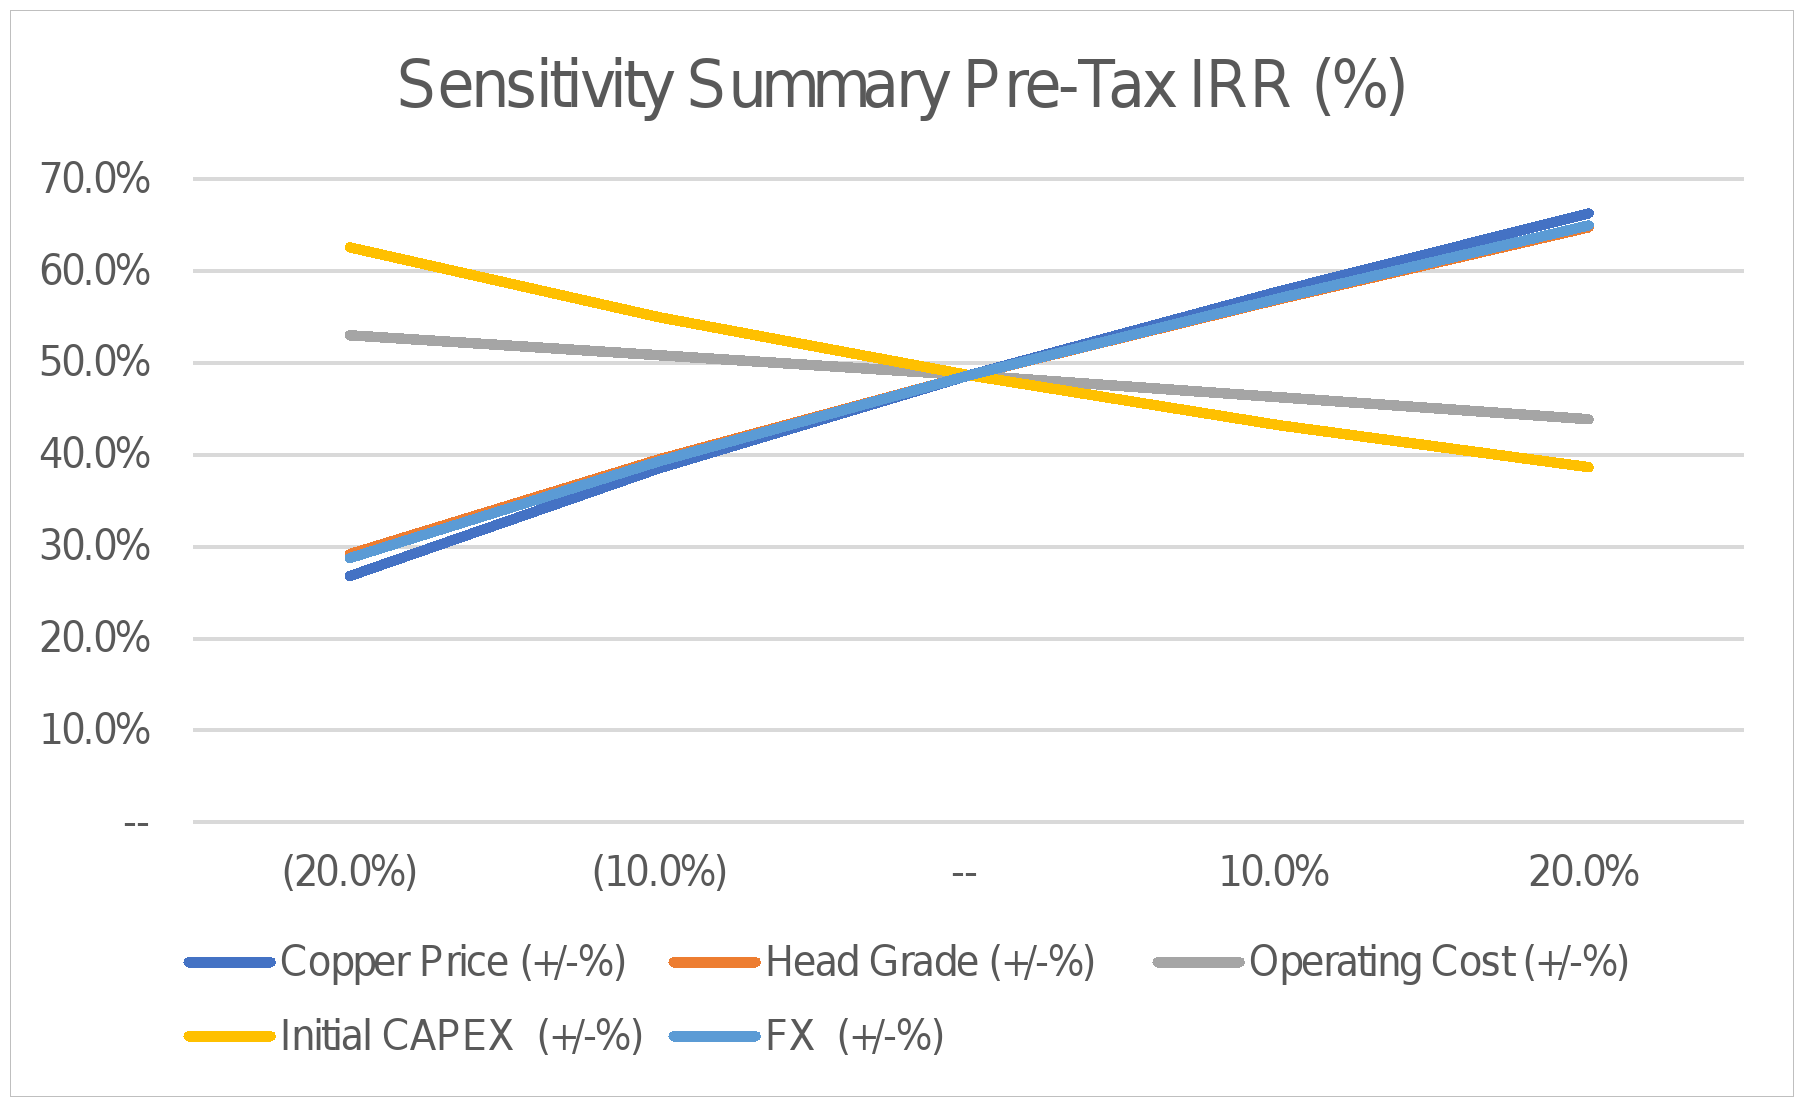
Figure 1-4: NPV & IRR Sensitivity Results | |
Figure 4-1: Location of the Boa Esperança Project | |
Figure 6-1: Soil Sampling Coloured by Copper Grade (ppm). Yellow contours are wireframes of the modelled lower grade mineralization at elevation 350 m above sea level | |
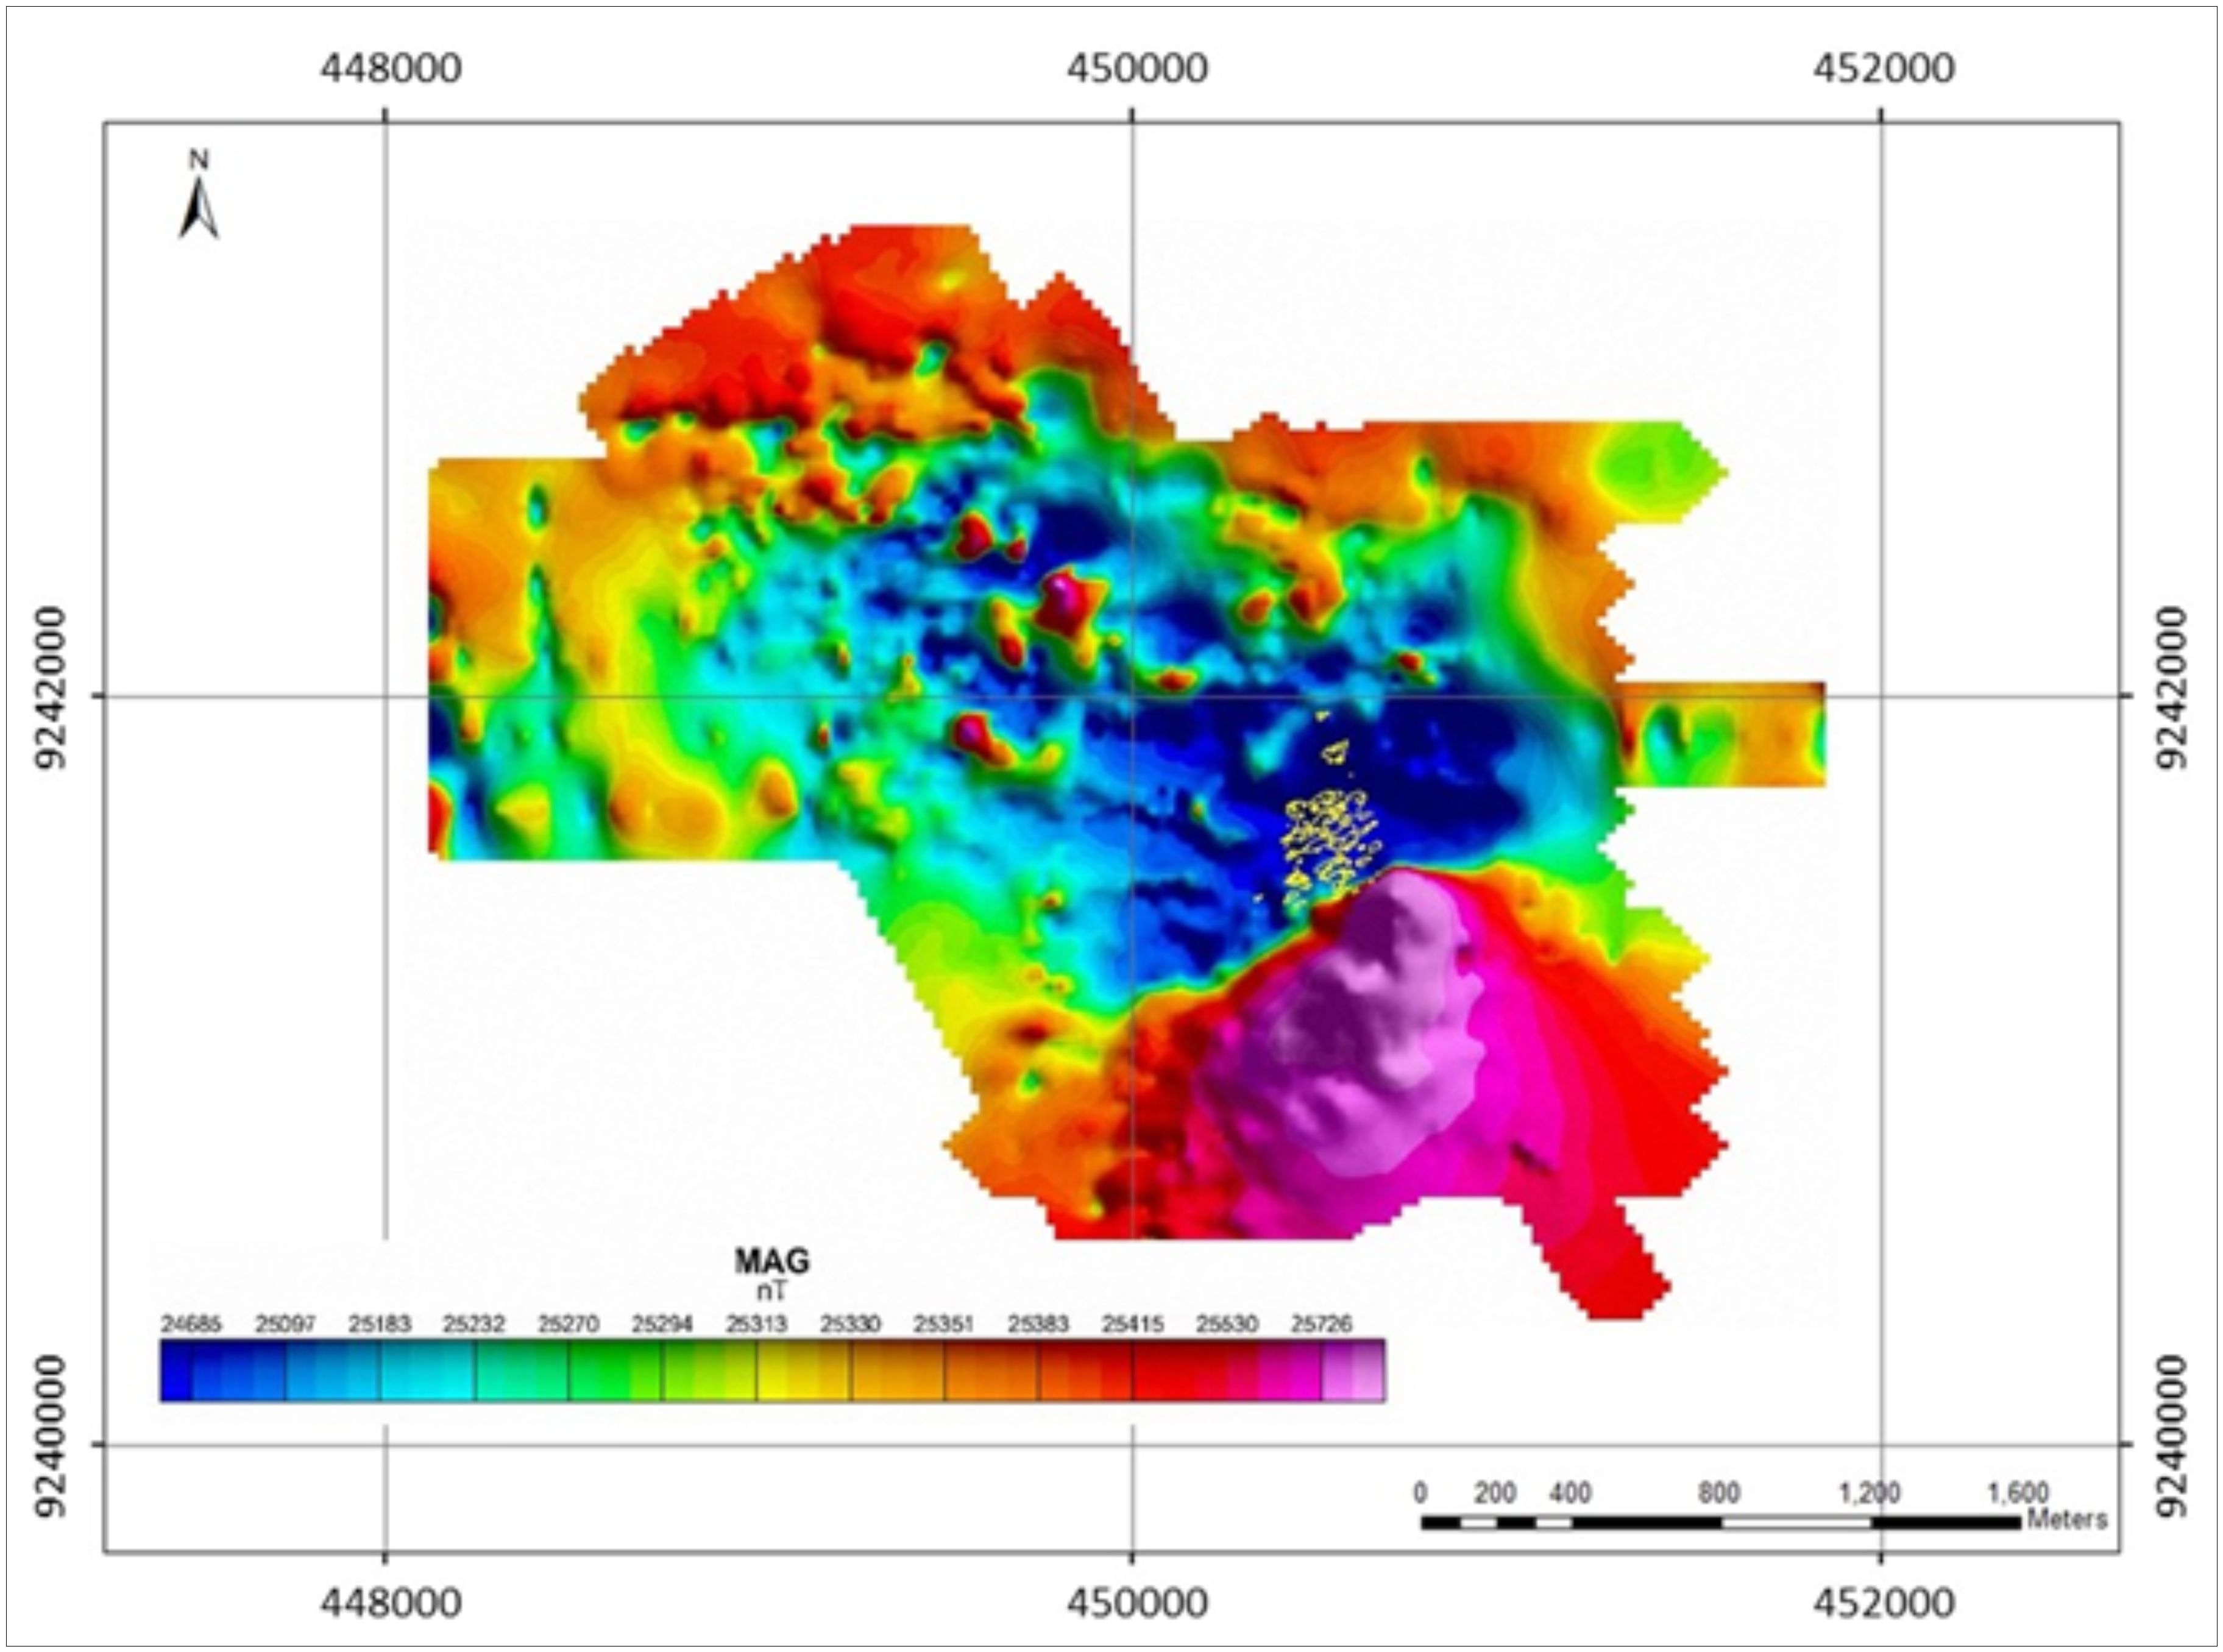
Figure 6-2: Total Magnetic Intensity Map of Boa Esperança Project. | |
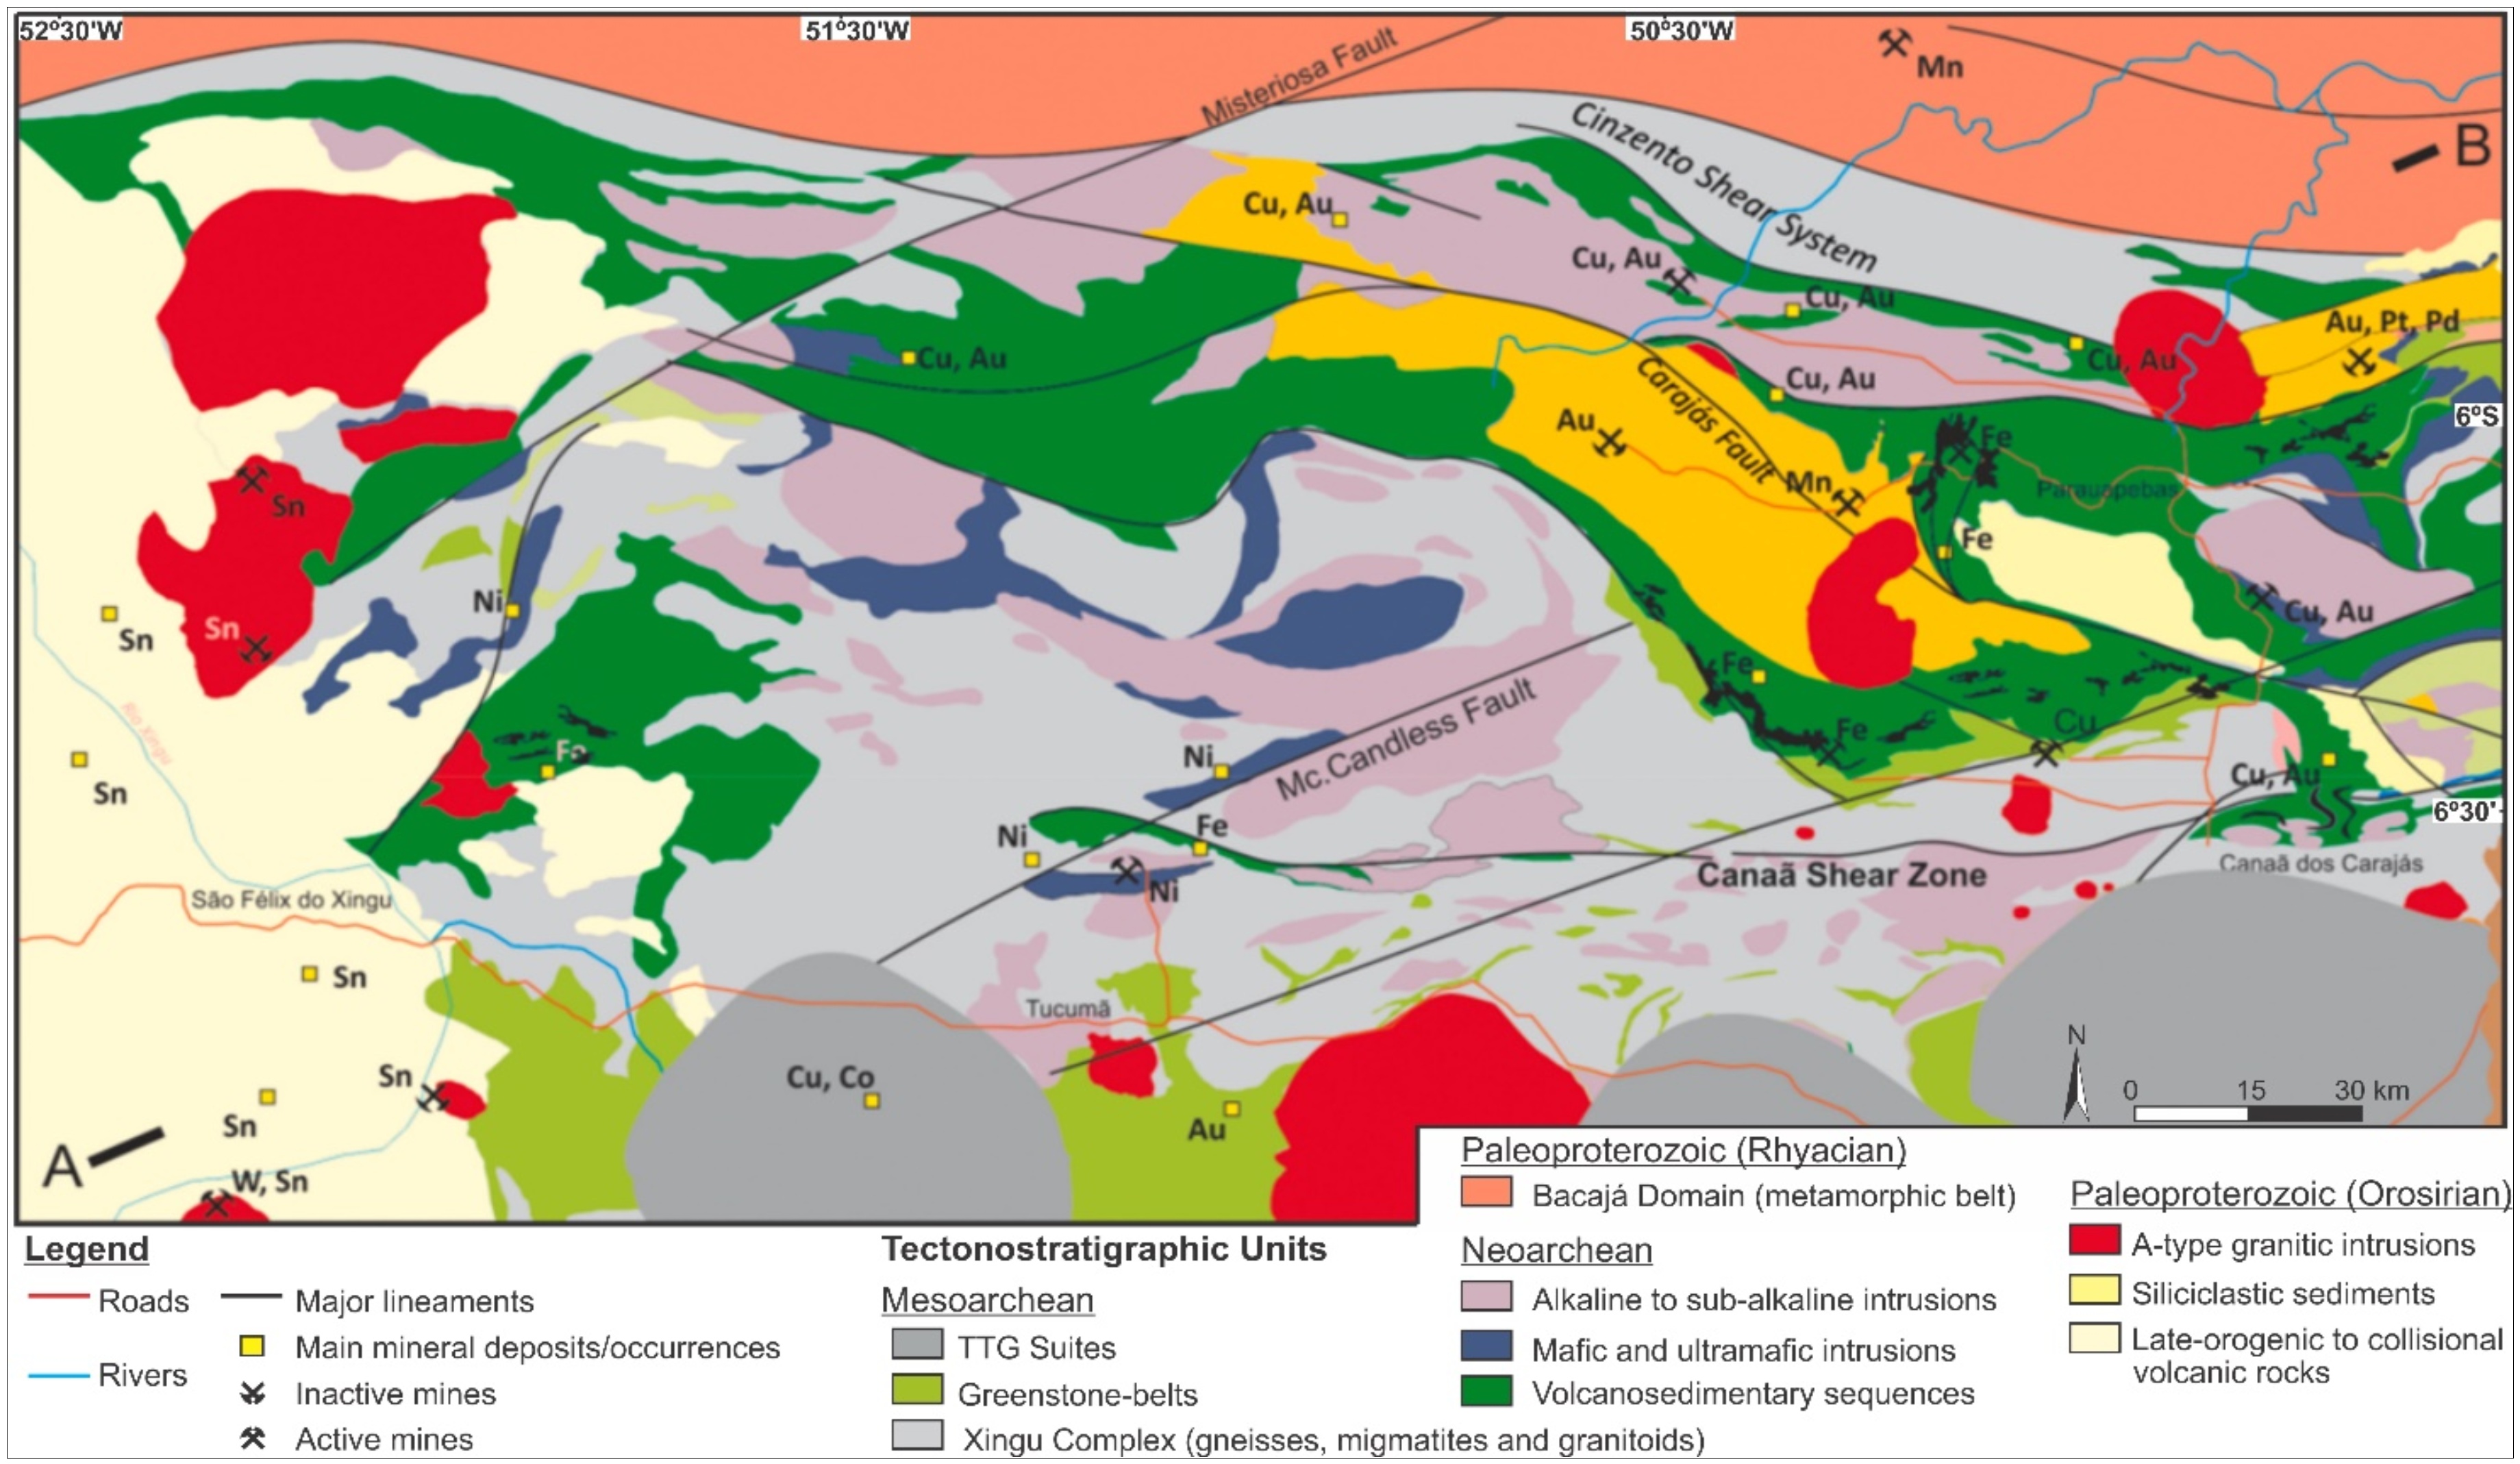
Figure 7-1: Geologic Map of the Carajás and Rio Maria Domains, with the Main Tectonostratigraphic Units and Volcano Sedimentary Cover | |
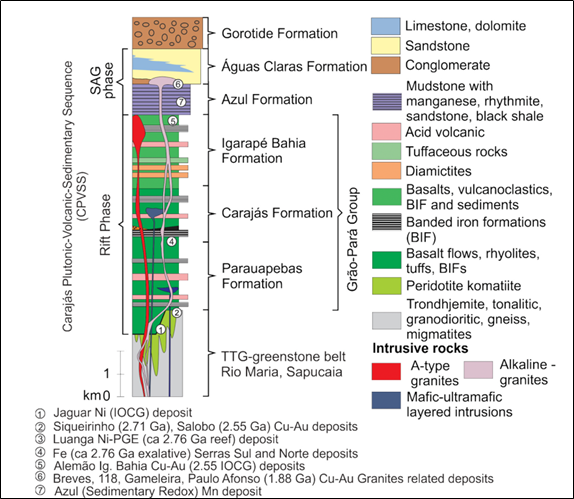
Figure 7-2: Summarized Lithostratigraphic Column of the Carajás Domain after Teixeira et al. (2021) | |
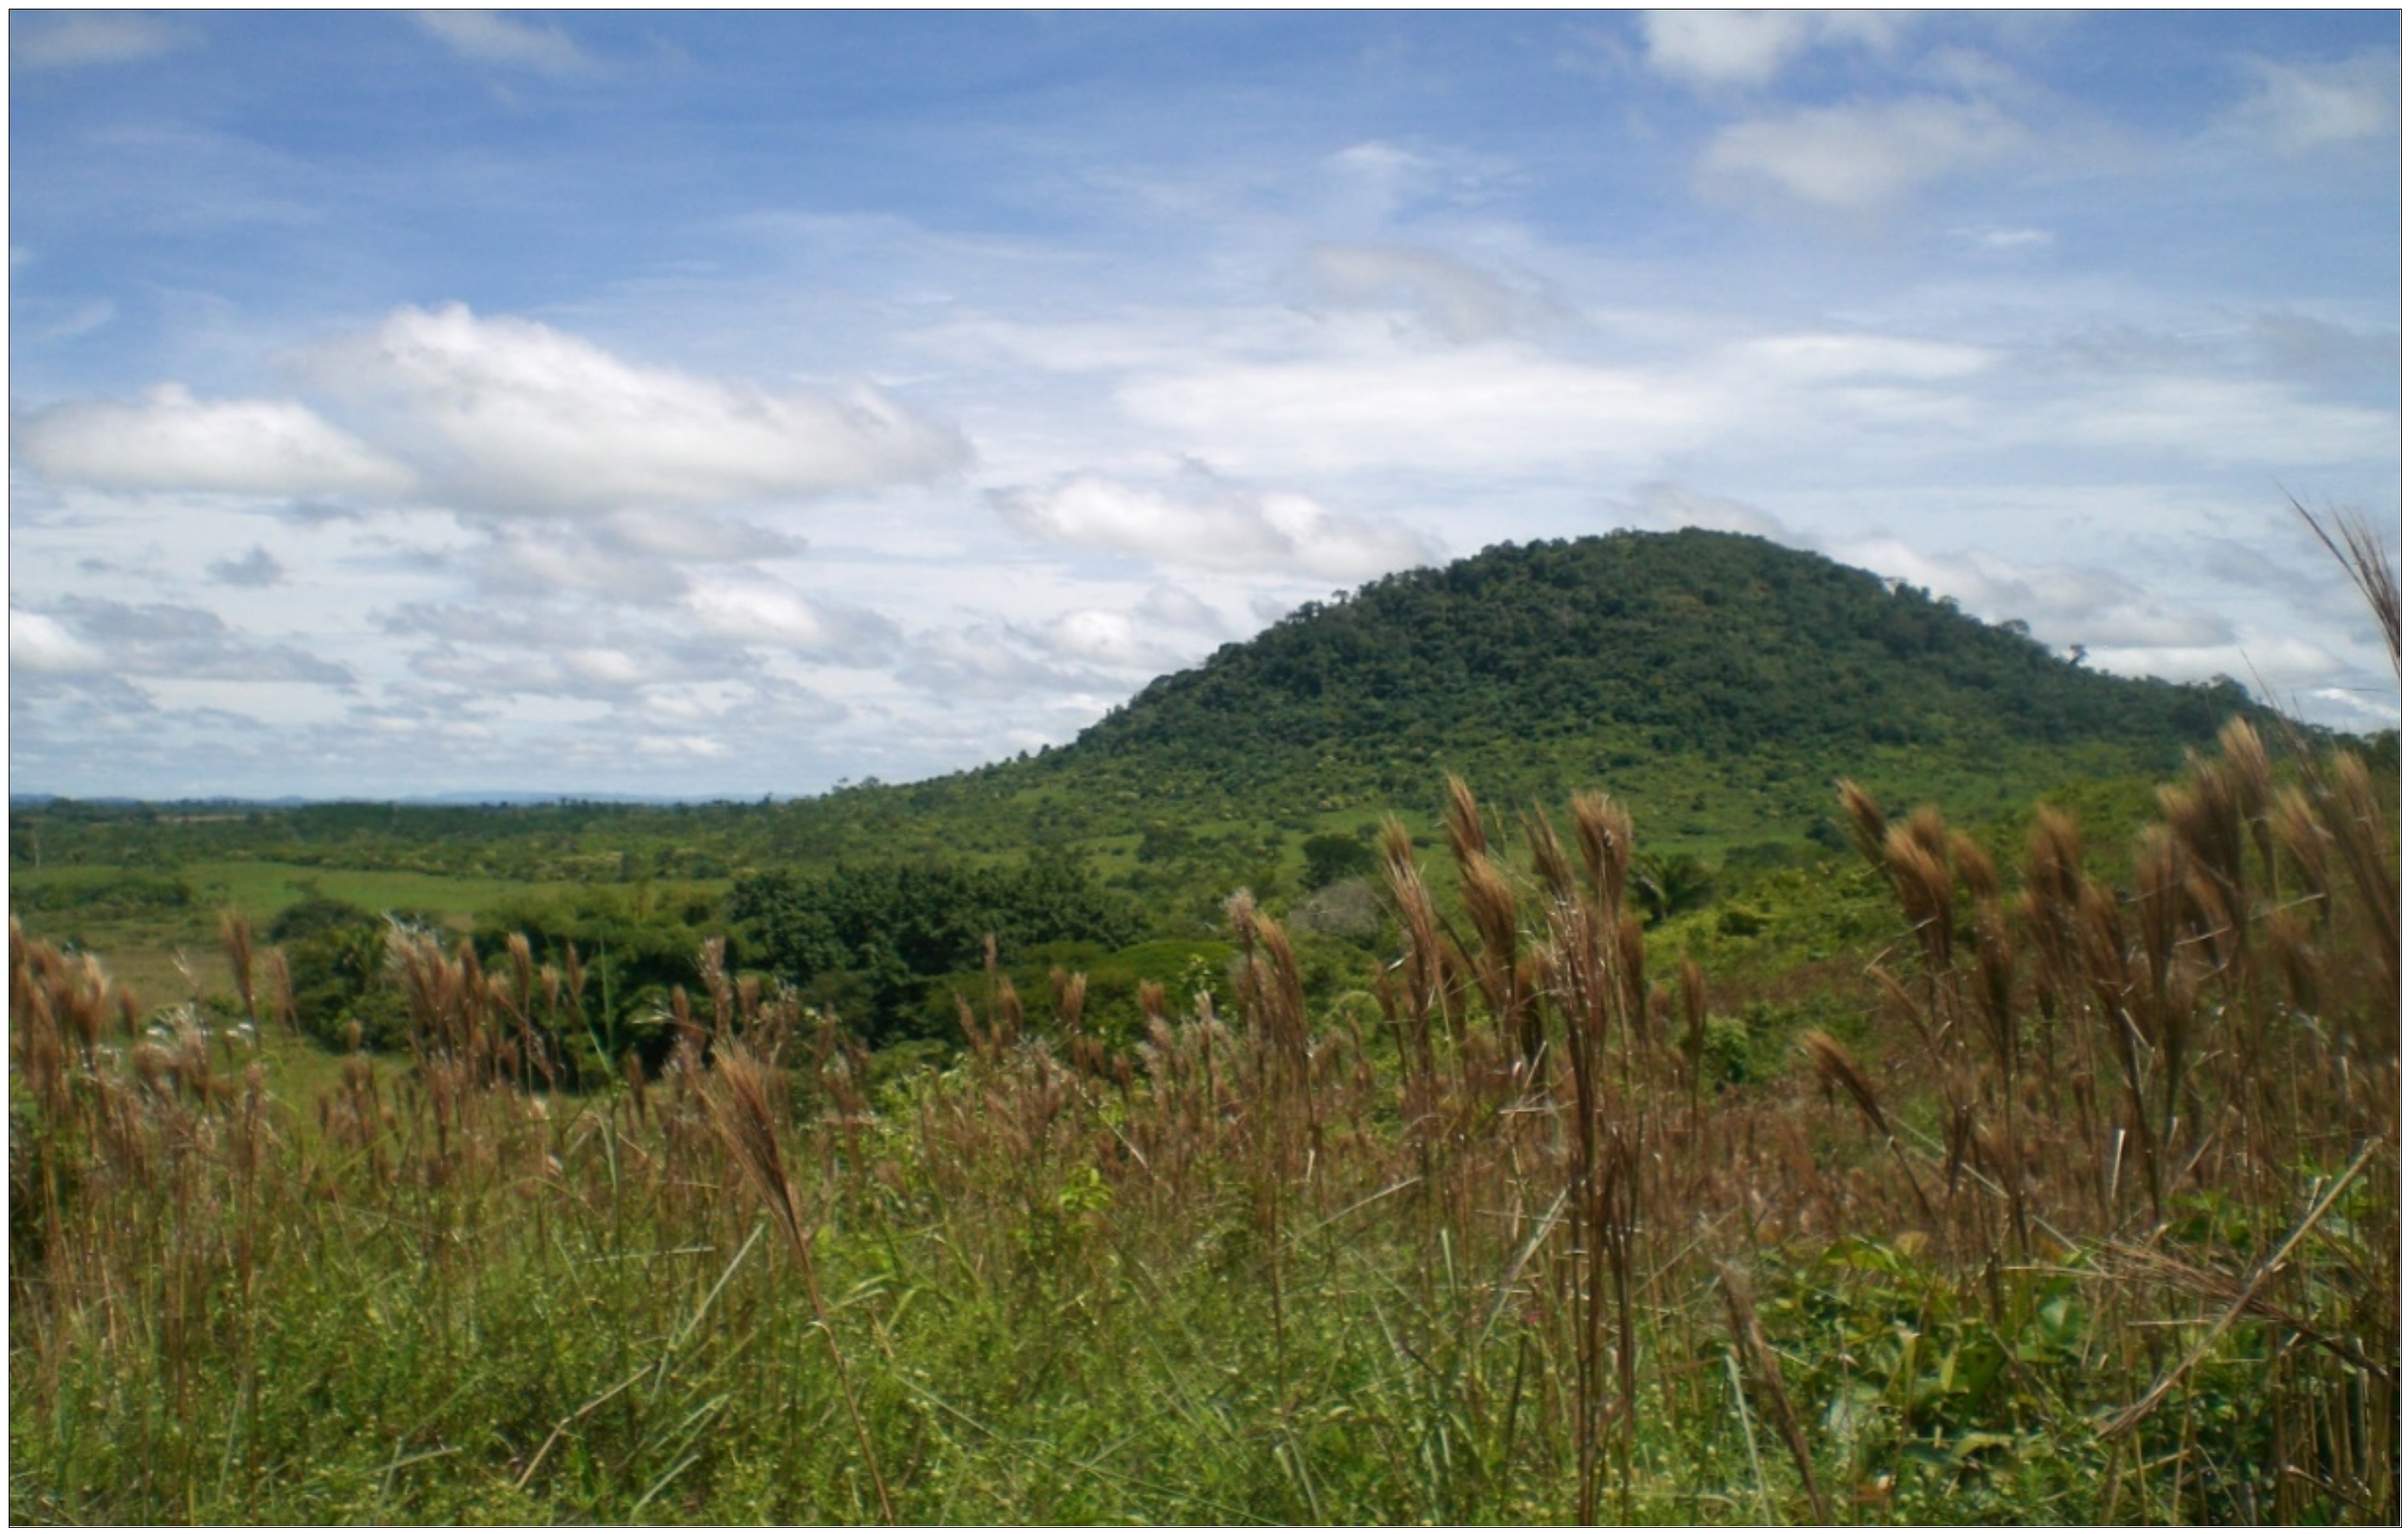
Figure 7-3: General Overview Boa Esperança hill (looking NW) | |
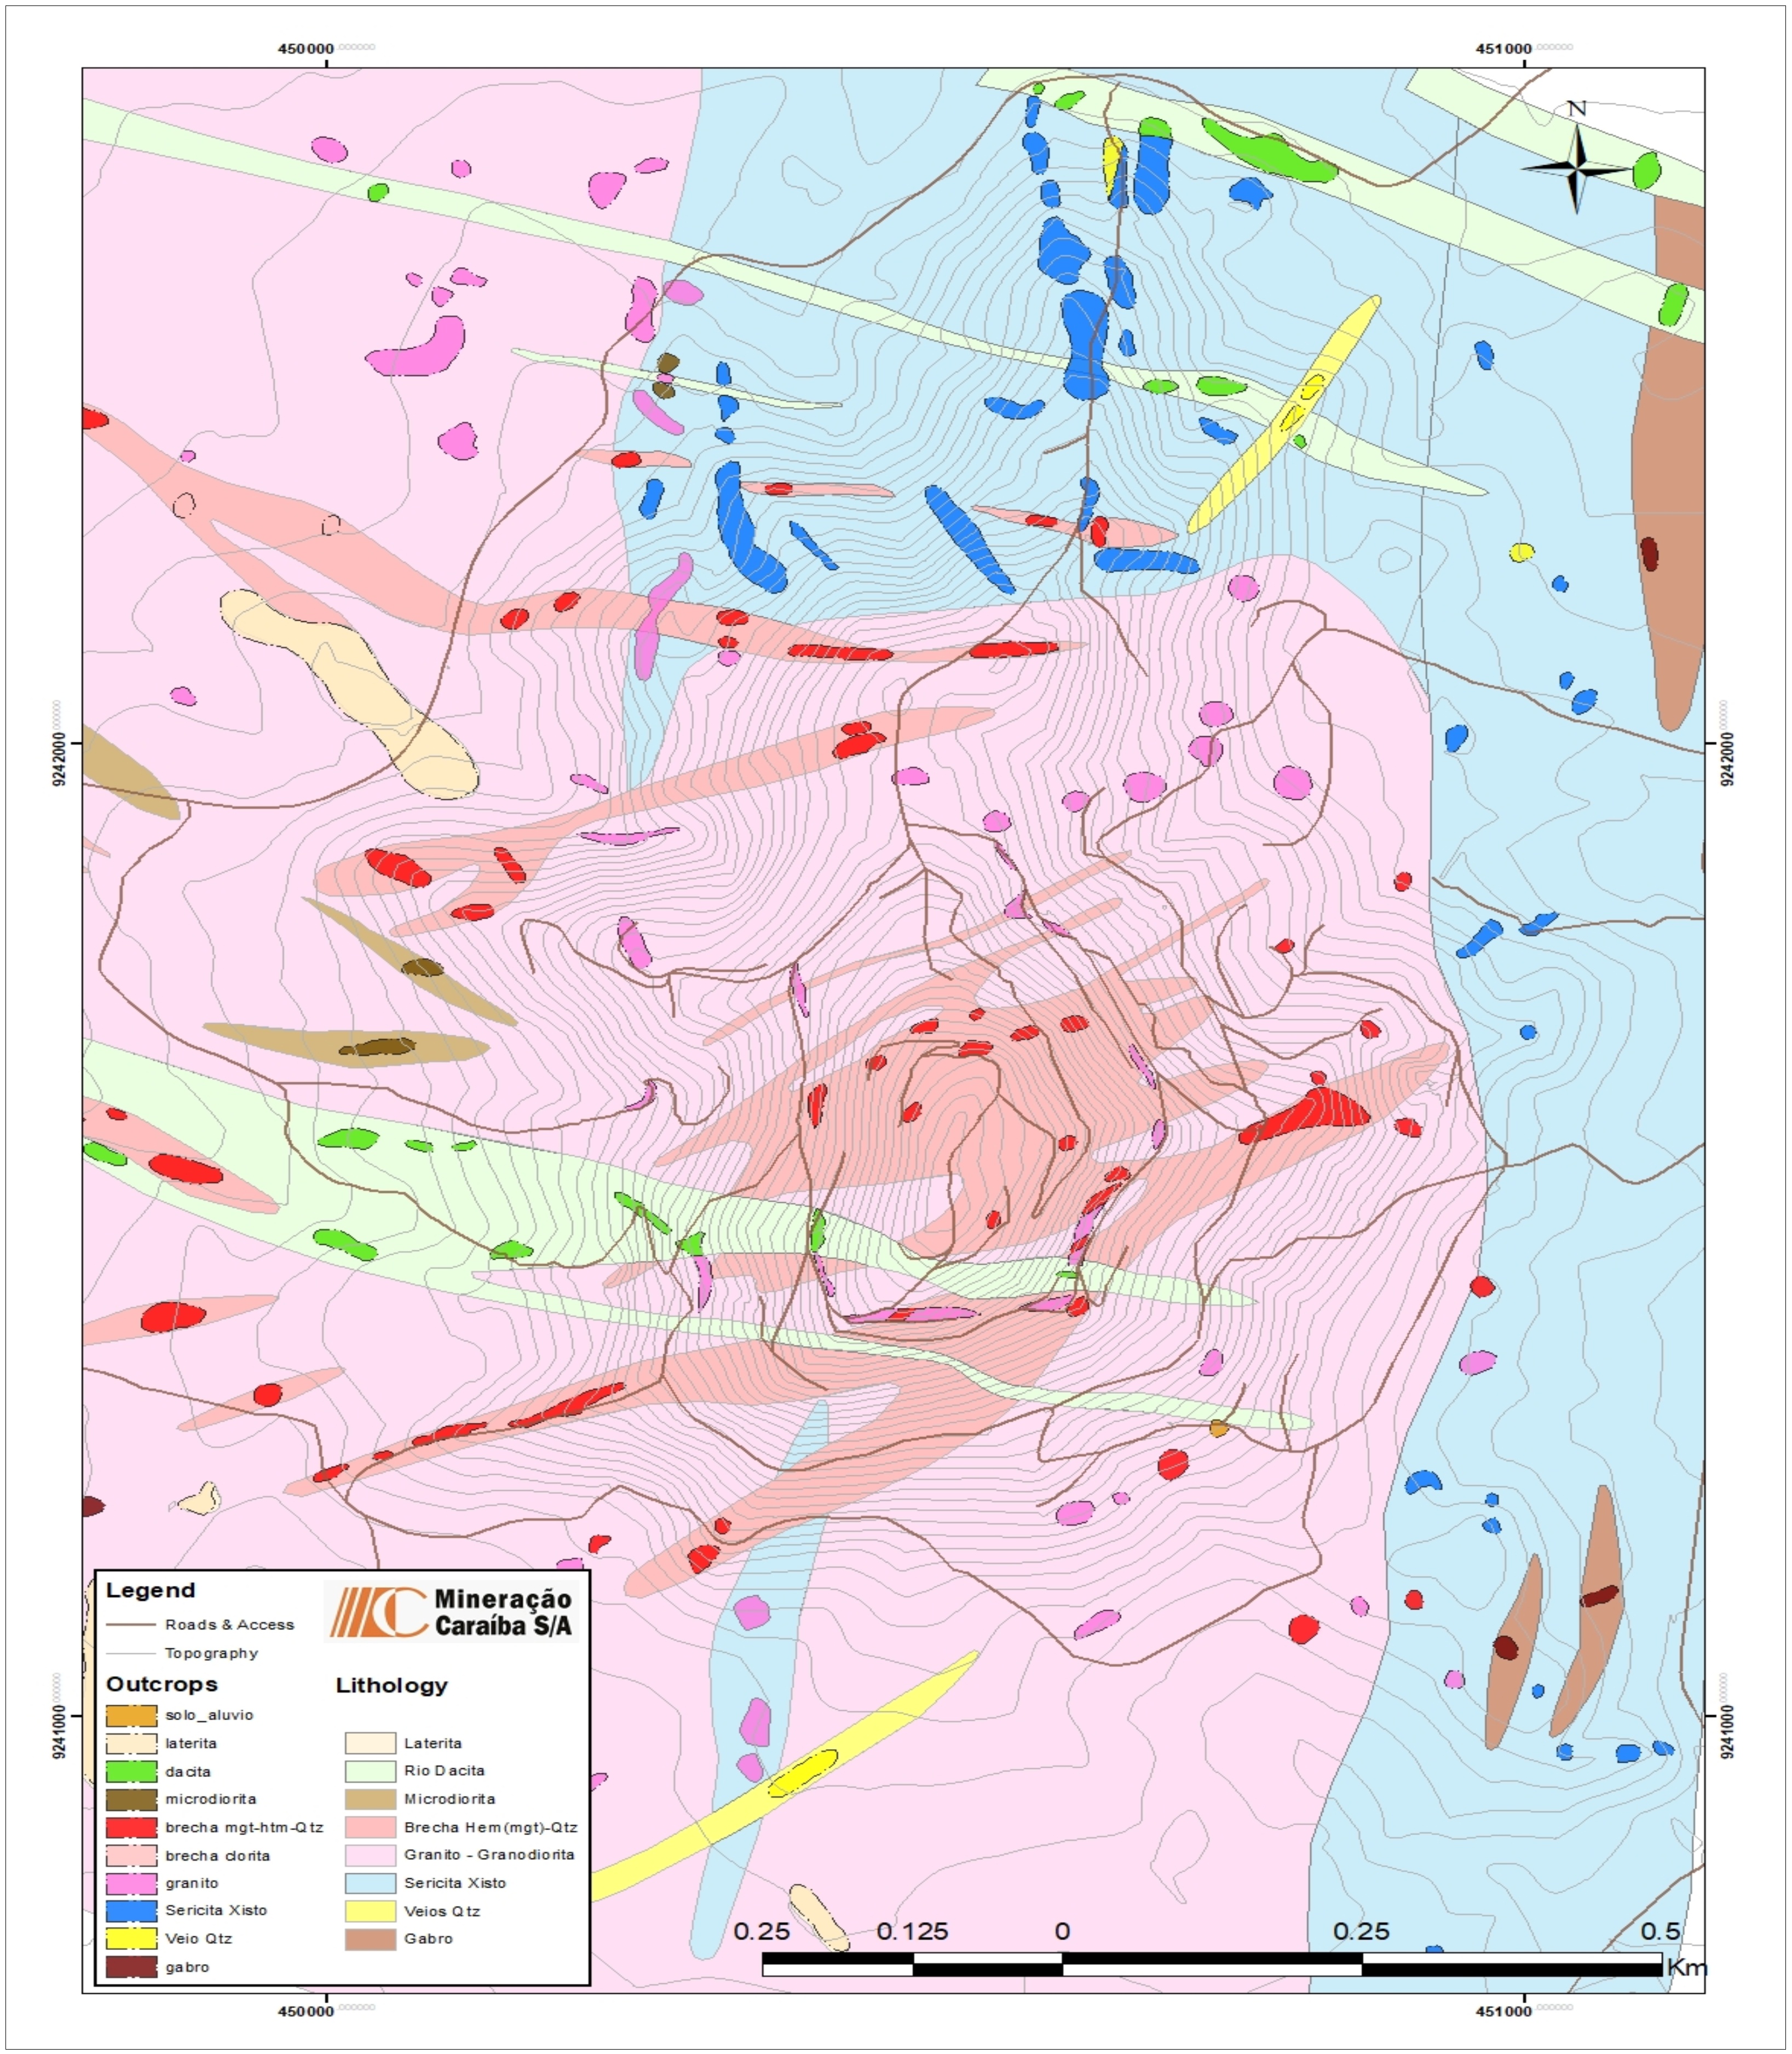
Figure 7-4: Detailed Geology of the Boa Esperança Deposit | |
Figure 7-5: Granite Outcrop Cut by Anastomosed Breccia Veins | |
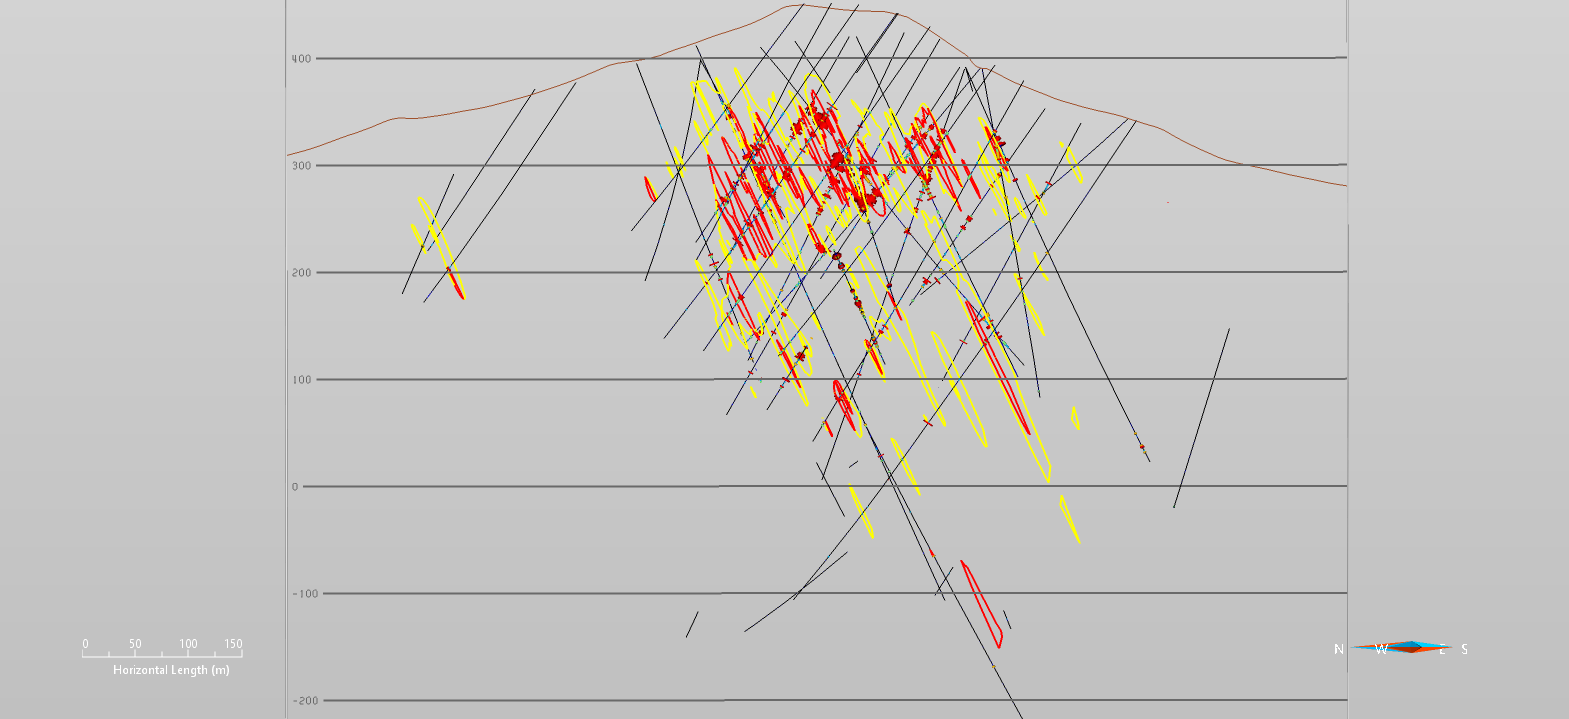
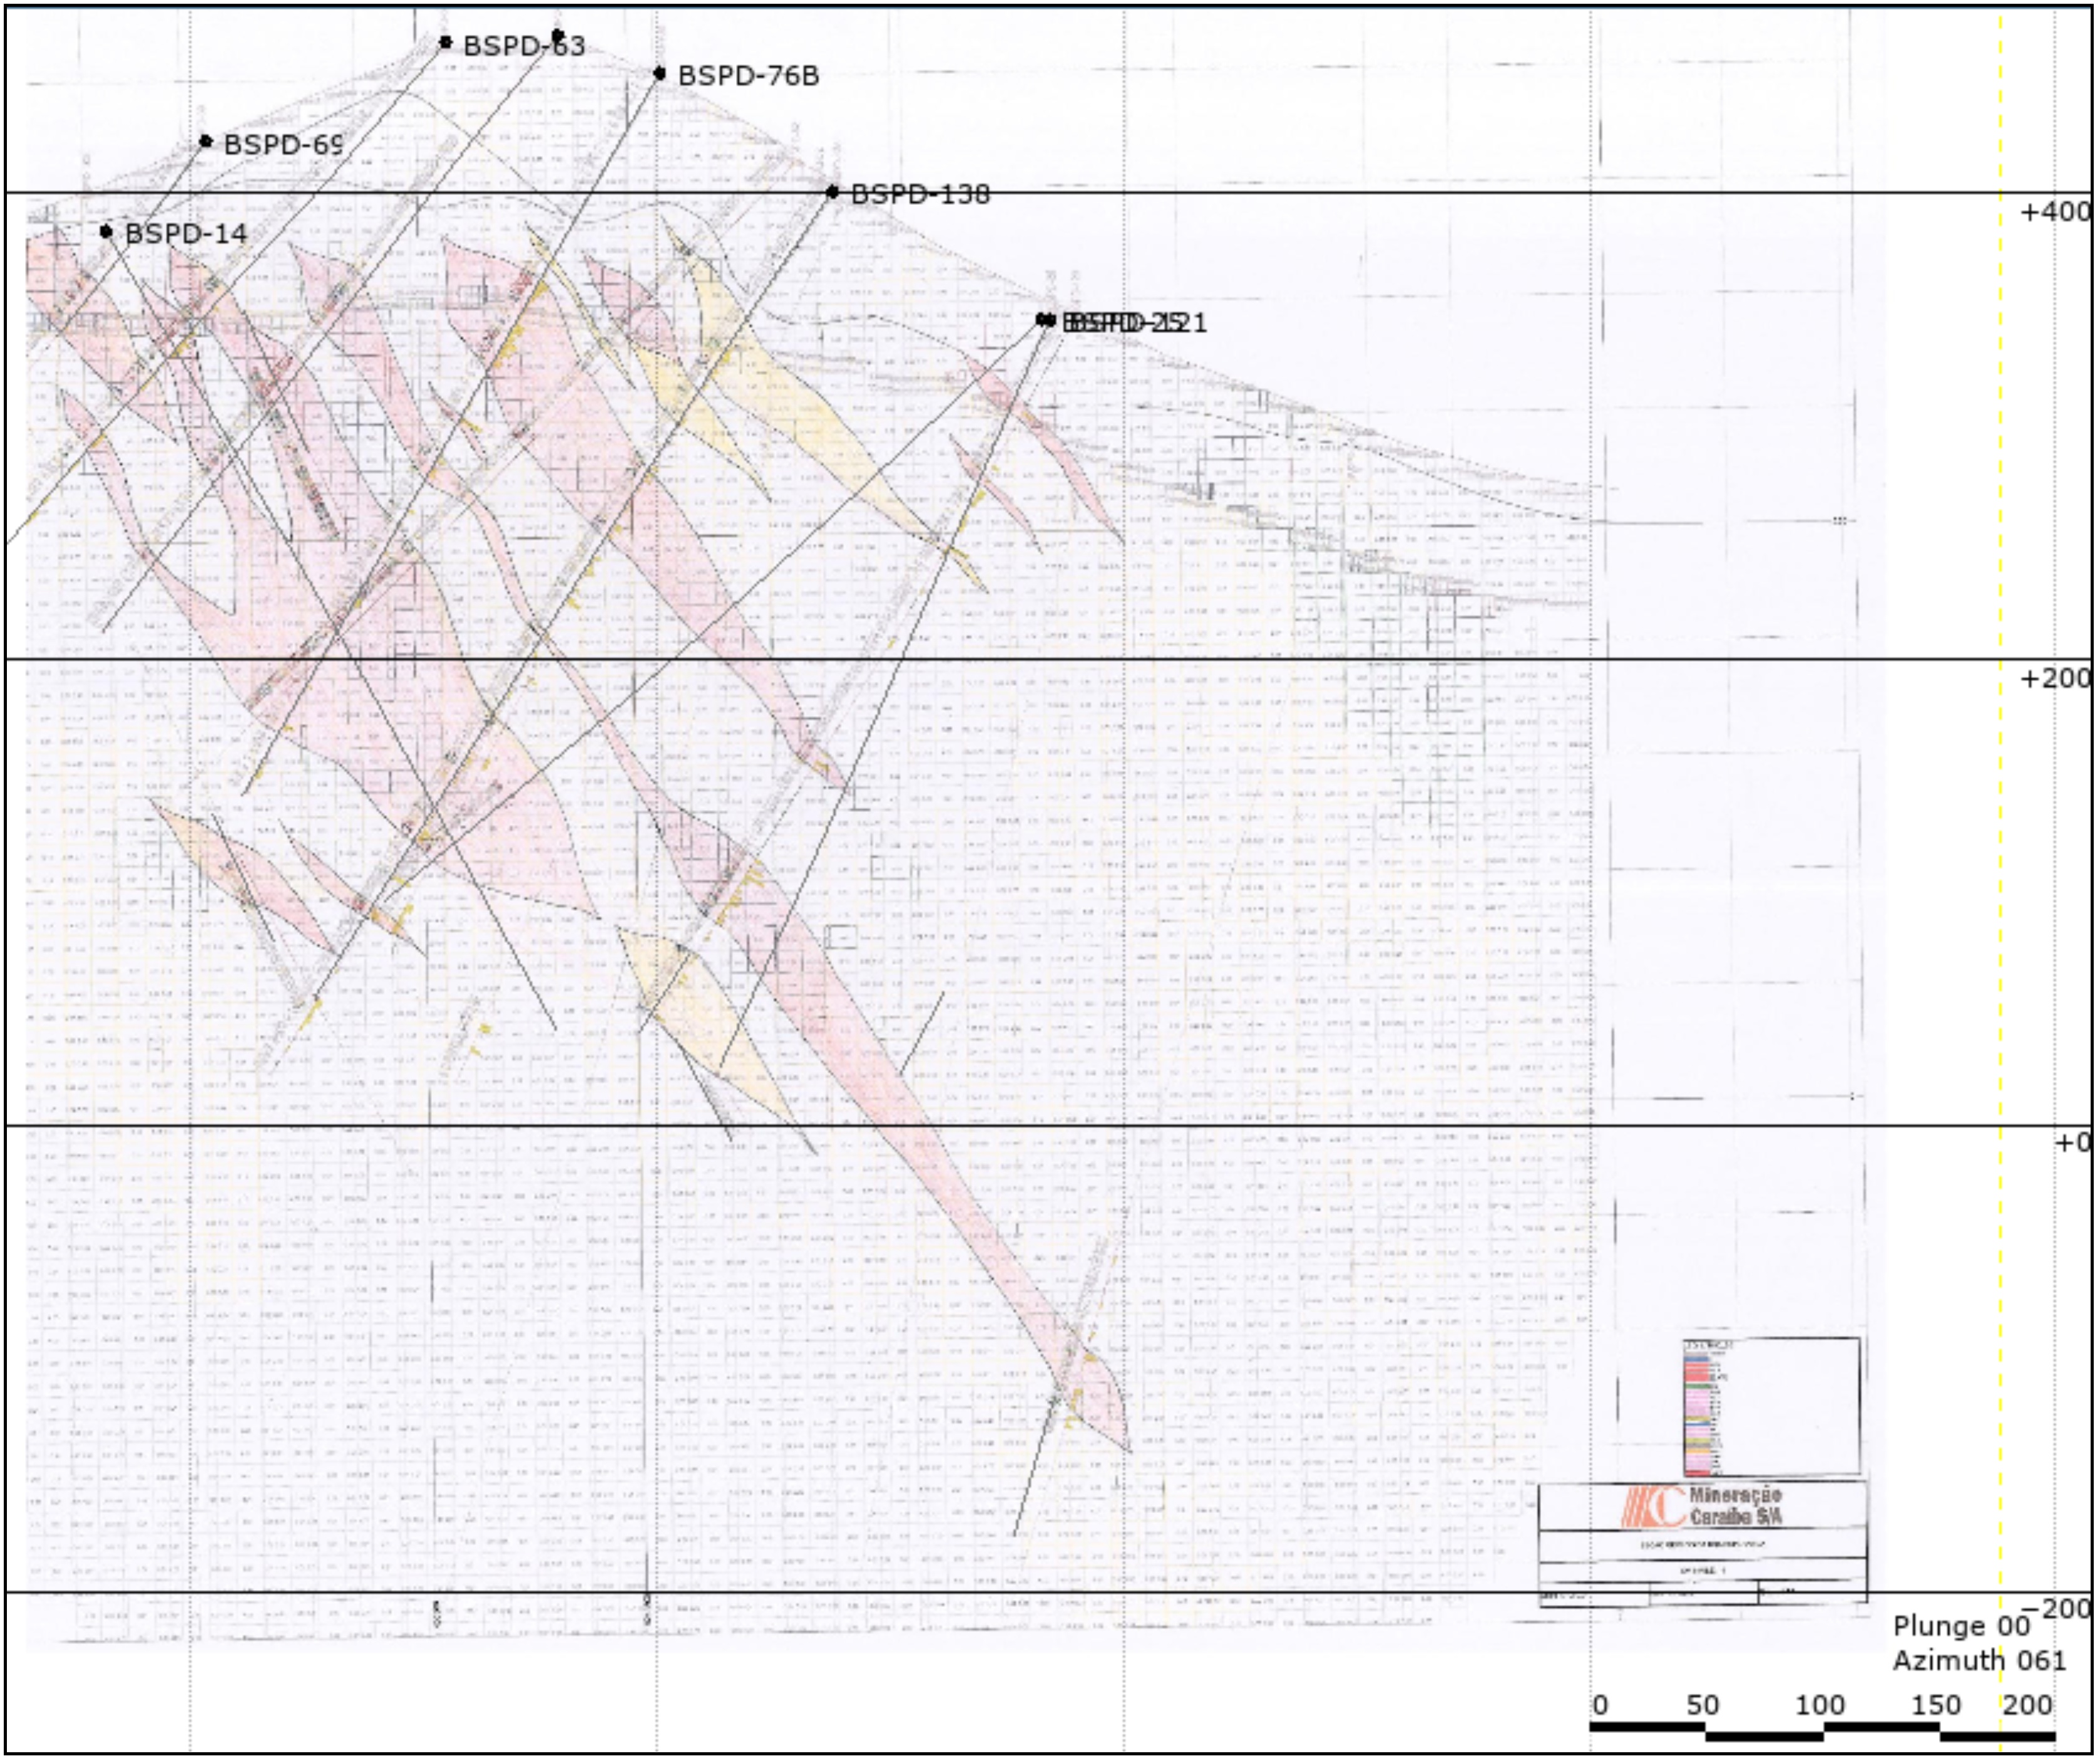
Figure 7-6: Vertical Section 10,000 High-Grade (in red) and Low-Grade (in yellow) Zones view looking North | |
Figure 7-7: Plan View at 150 m Showing the High Grade (in red) and Low Grade (in yellow) Zones | |
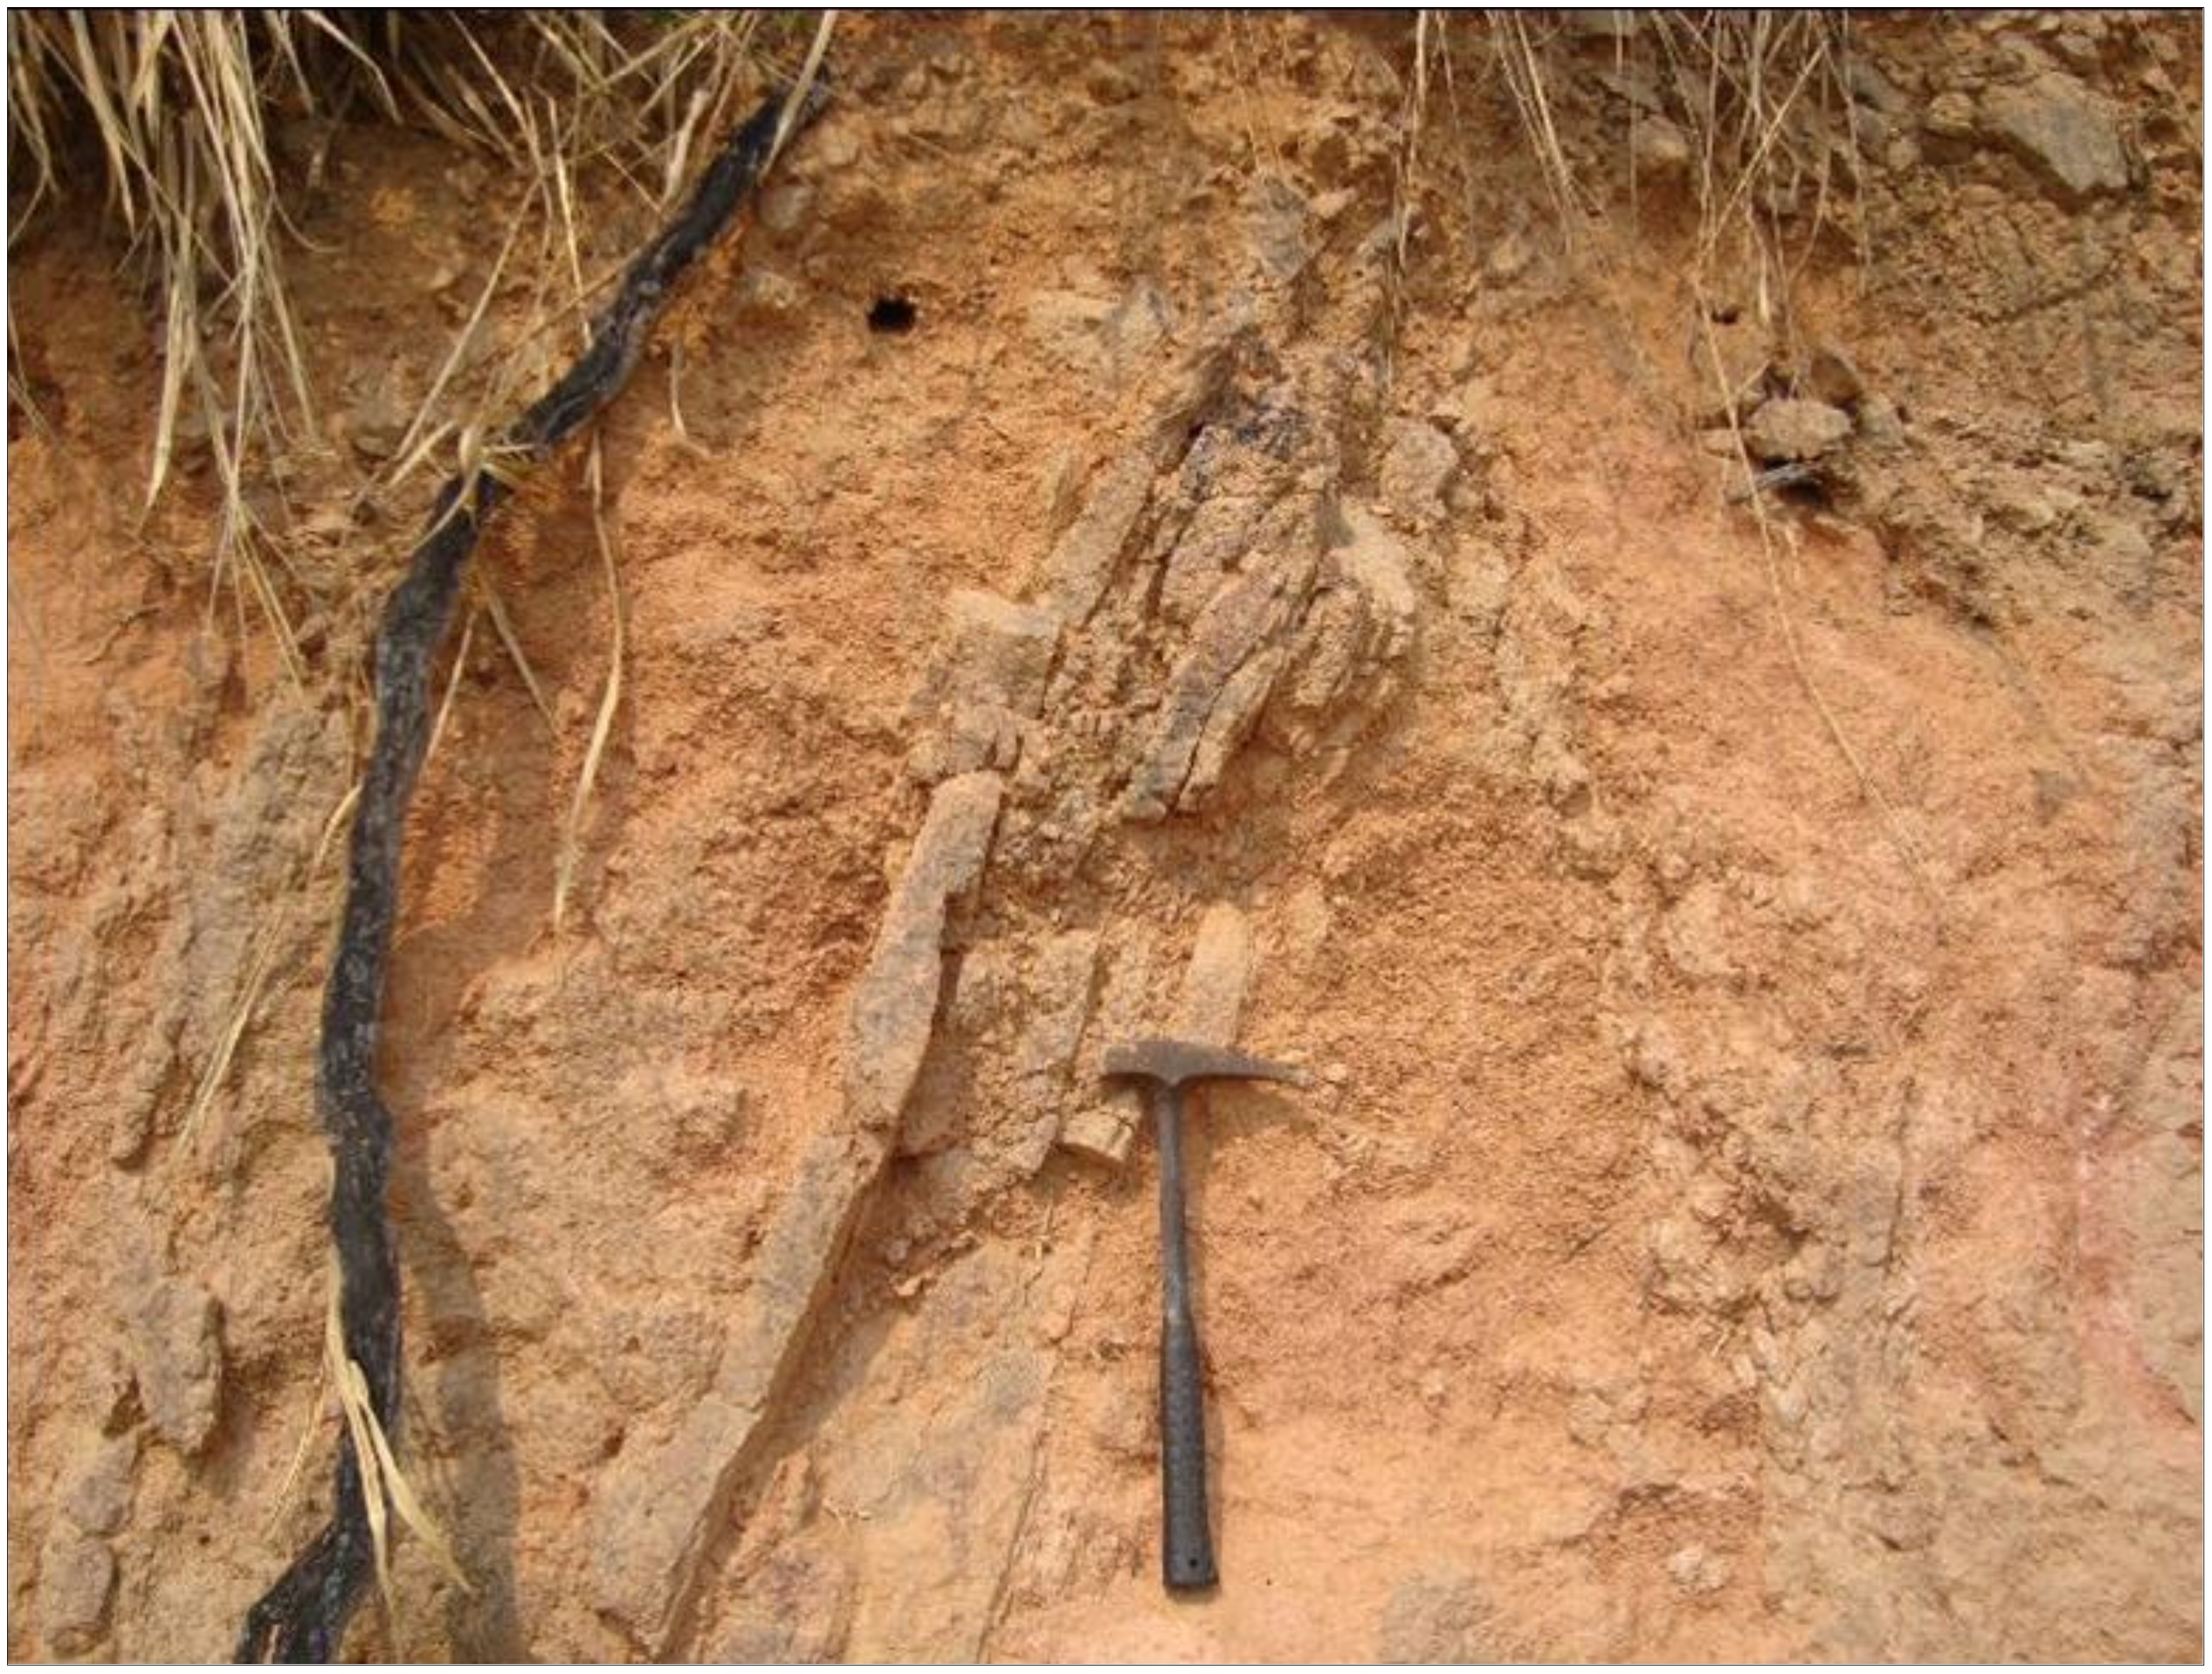
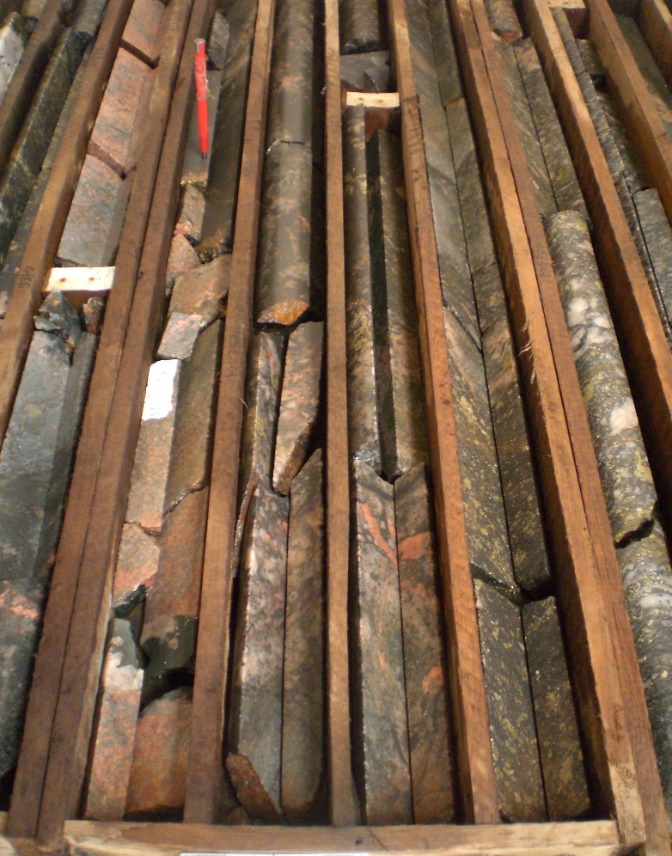
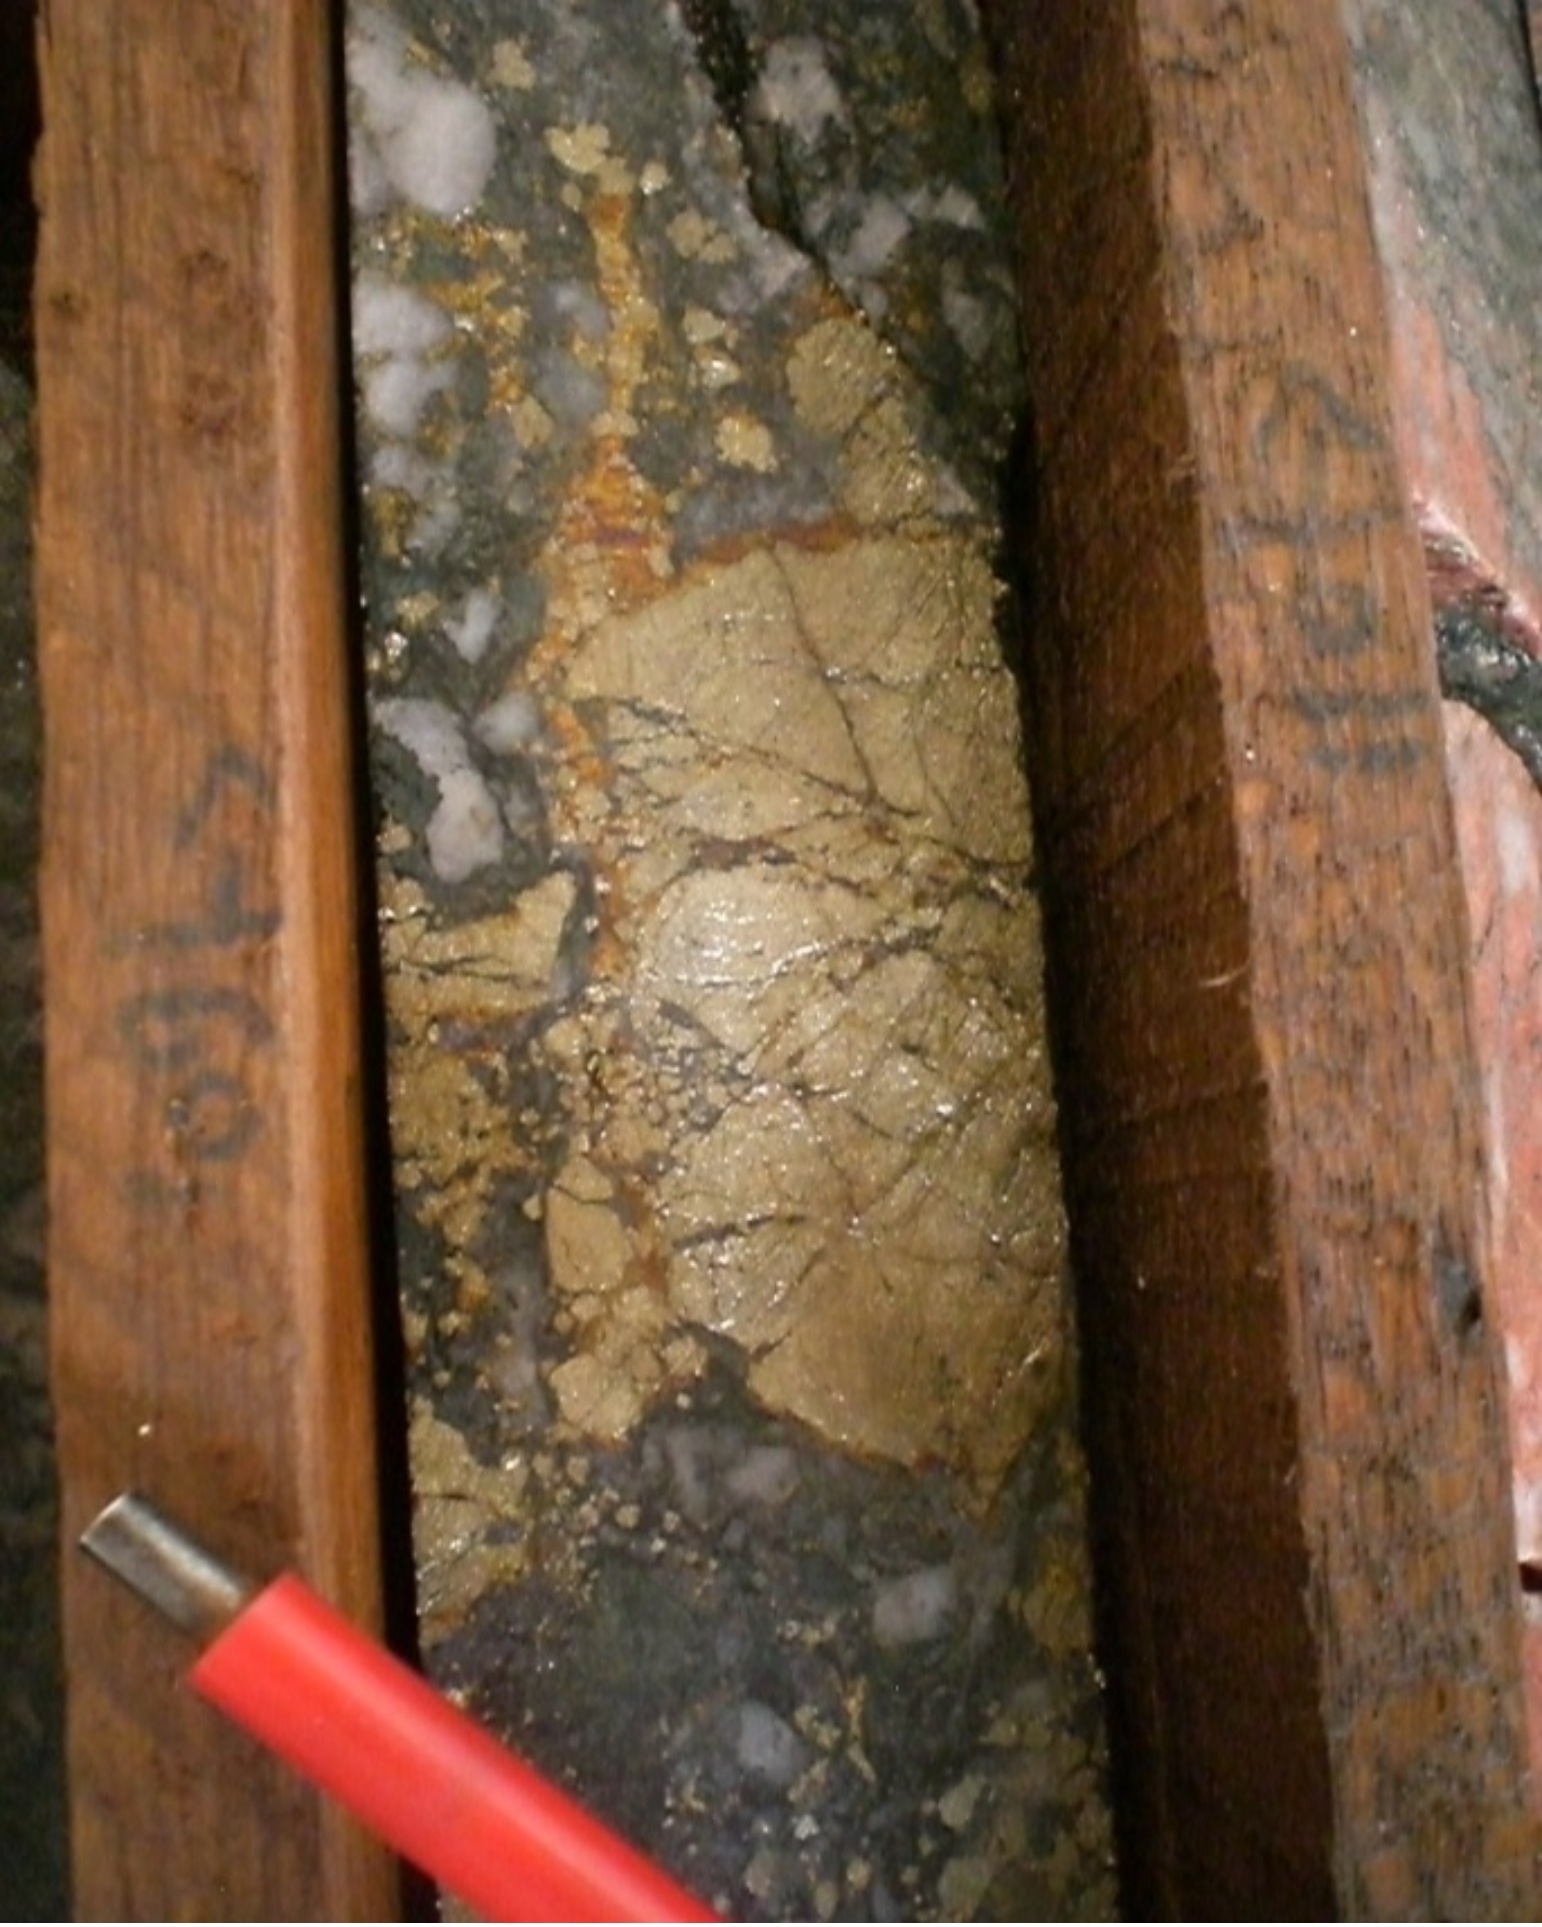
Figure 7-8: A - Chalcopyrite-pyrite ore from drillhole BSPD-162 (99.50 to 103.20 m); B - Pyrite-chalcopyrite ore in quartz magnetitic breccia from drillhole BSPD-162 (109.00 m). | |
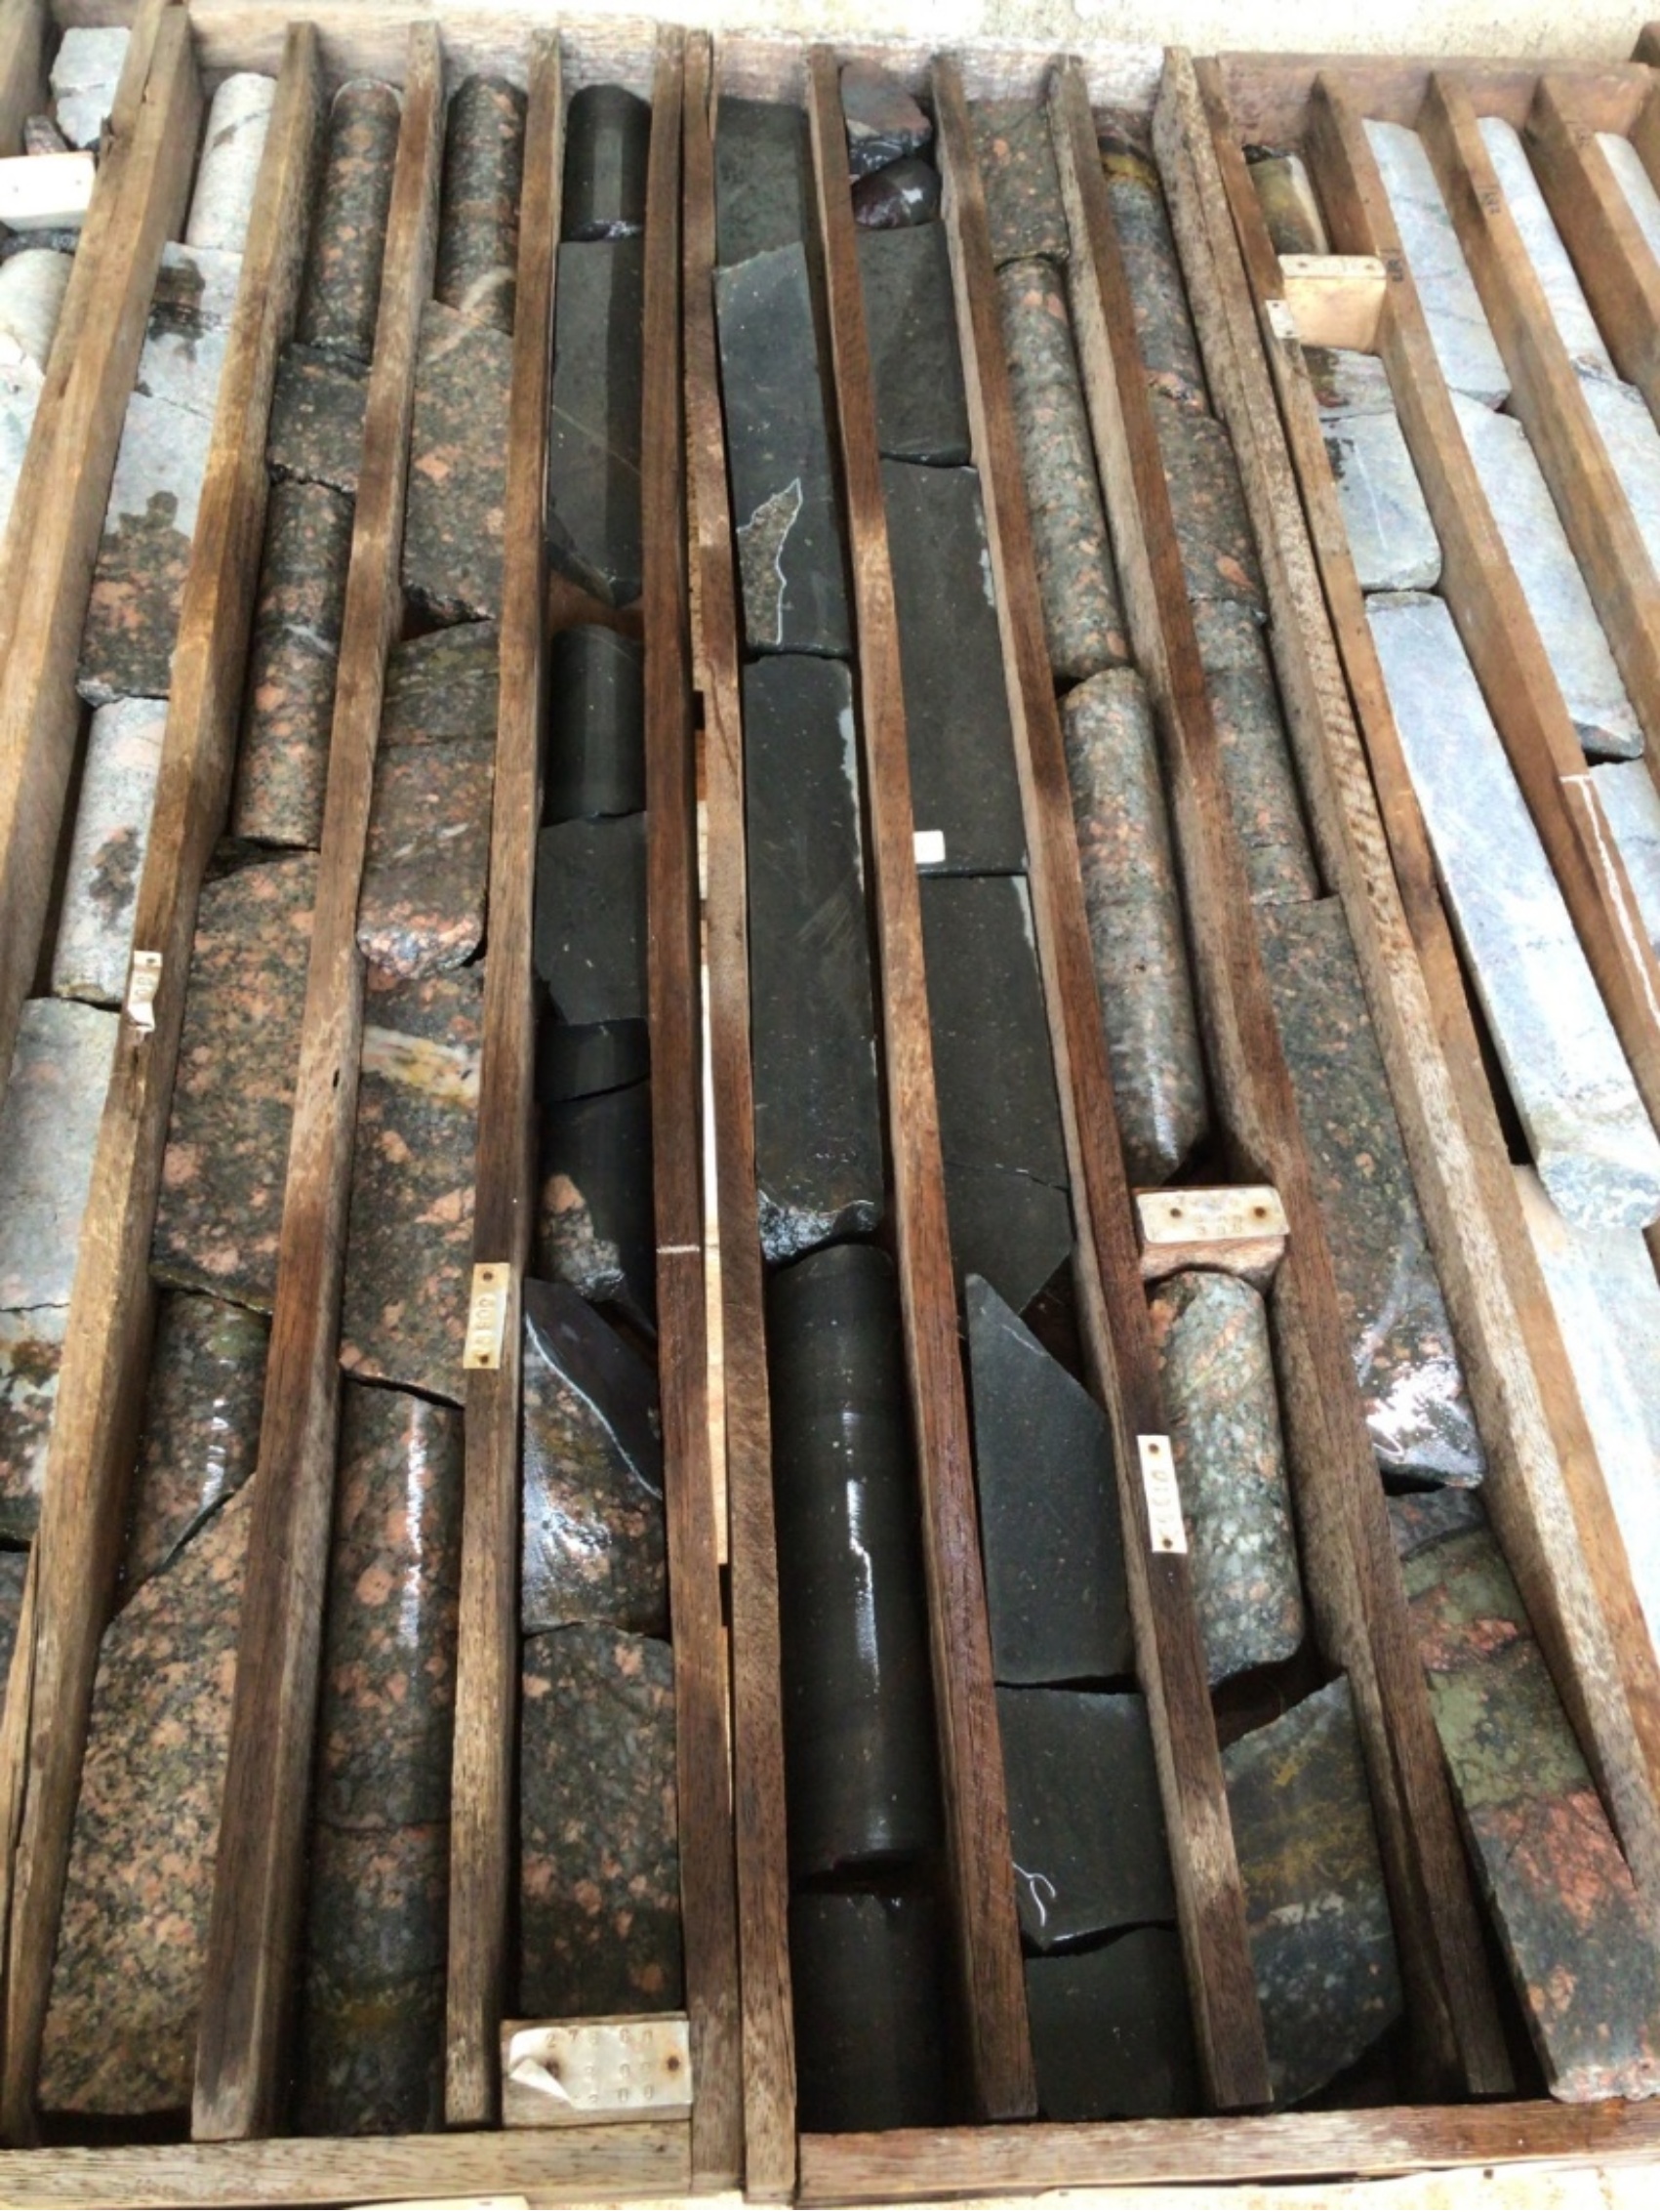
Figure 7-9: Intrusive Volcanic Dike from Drillhole BSPD-59 | |
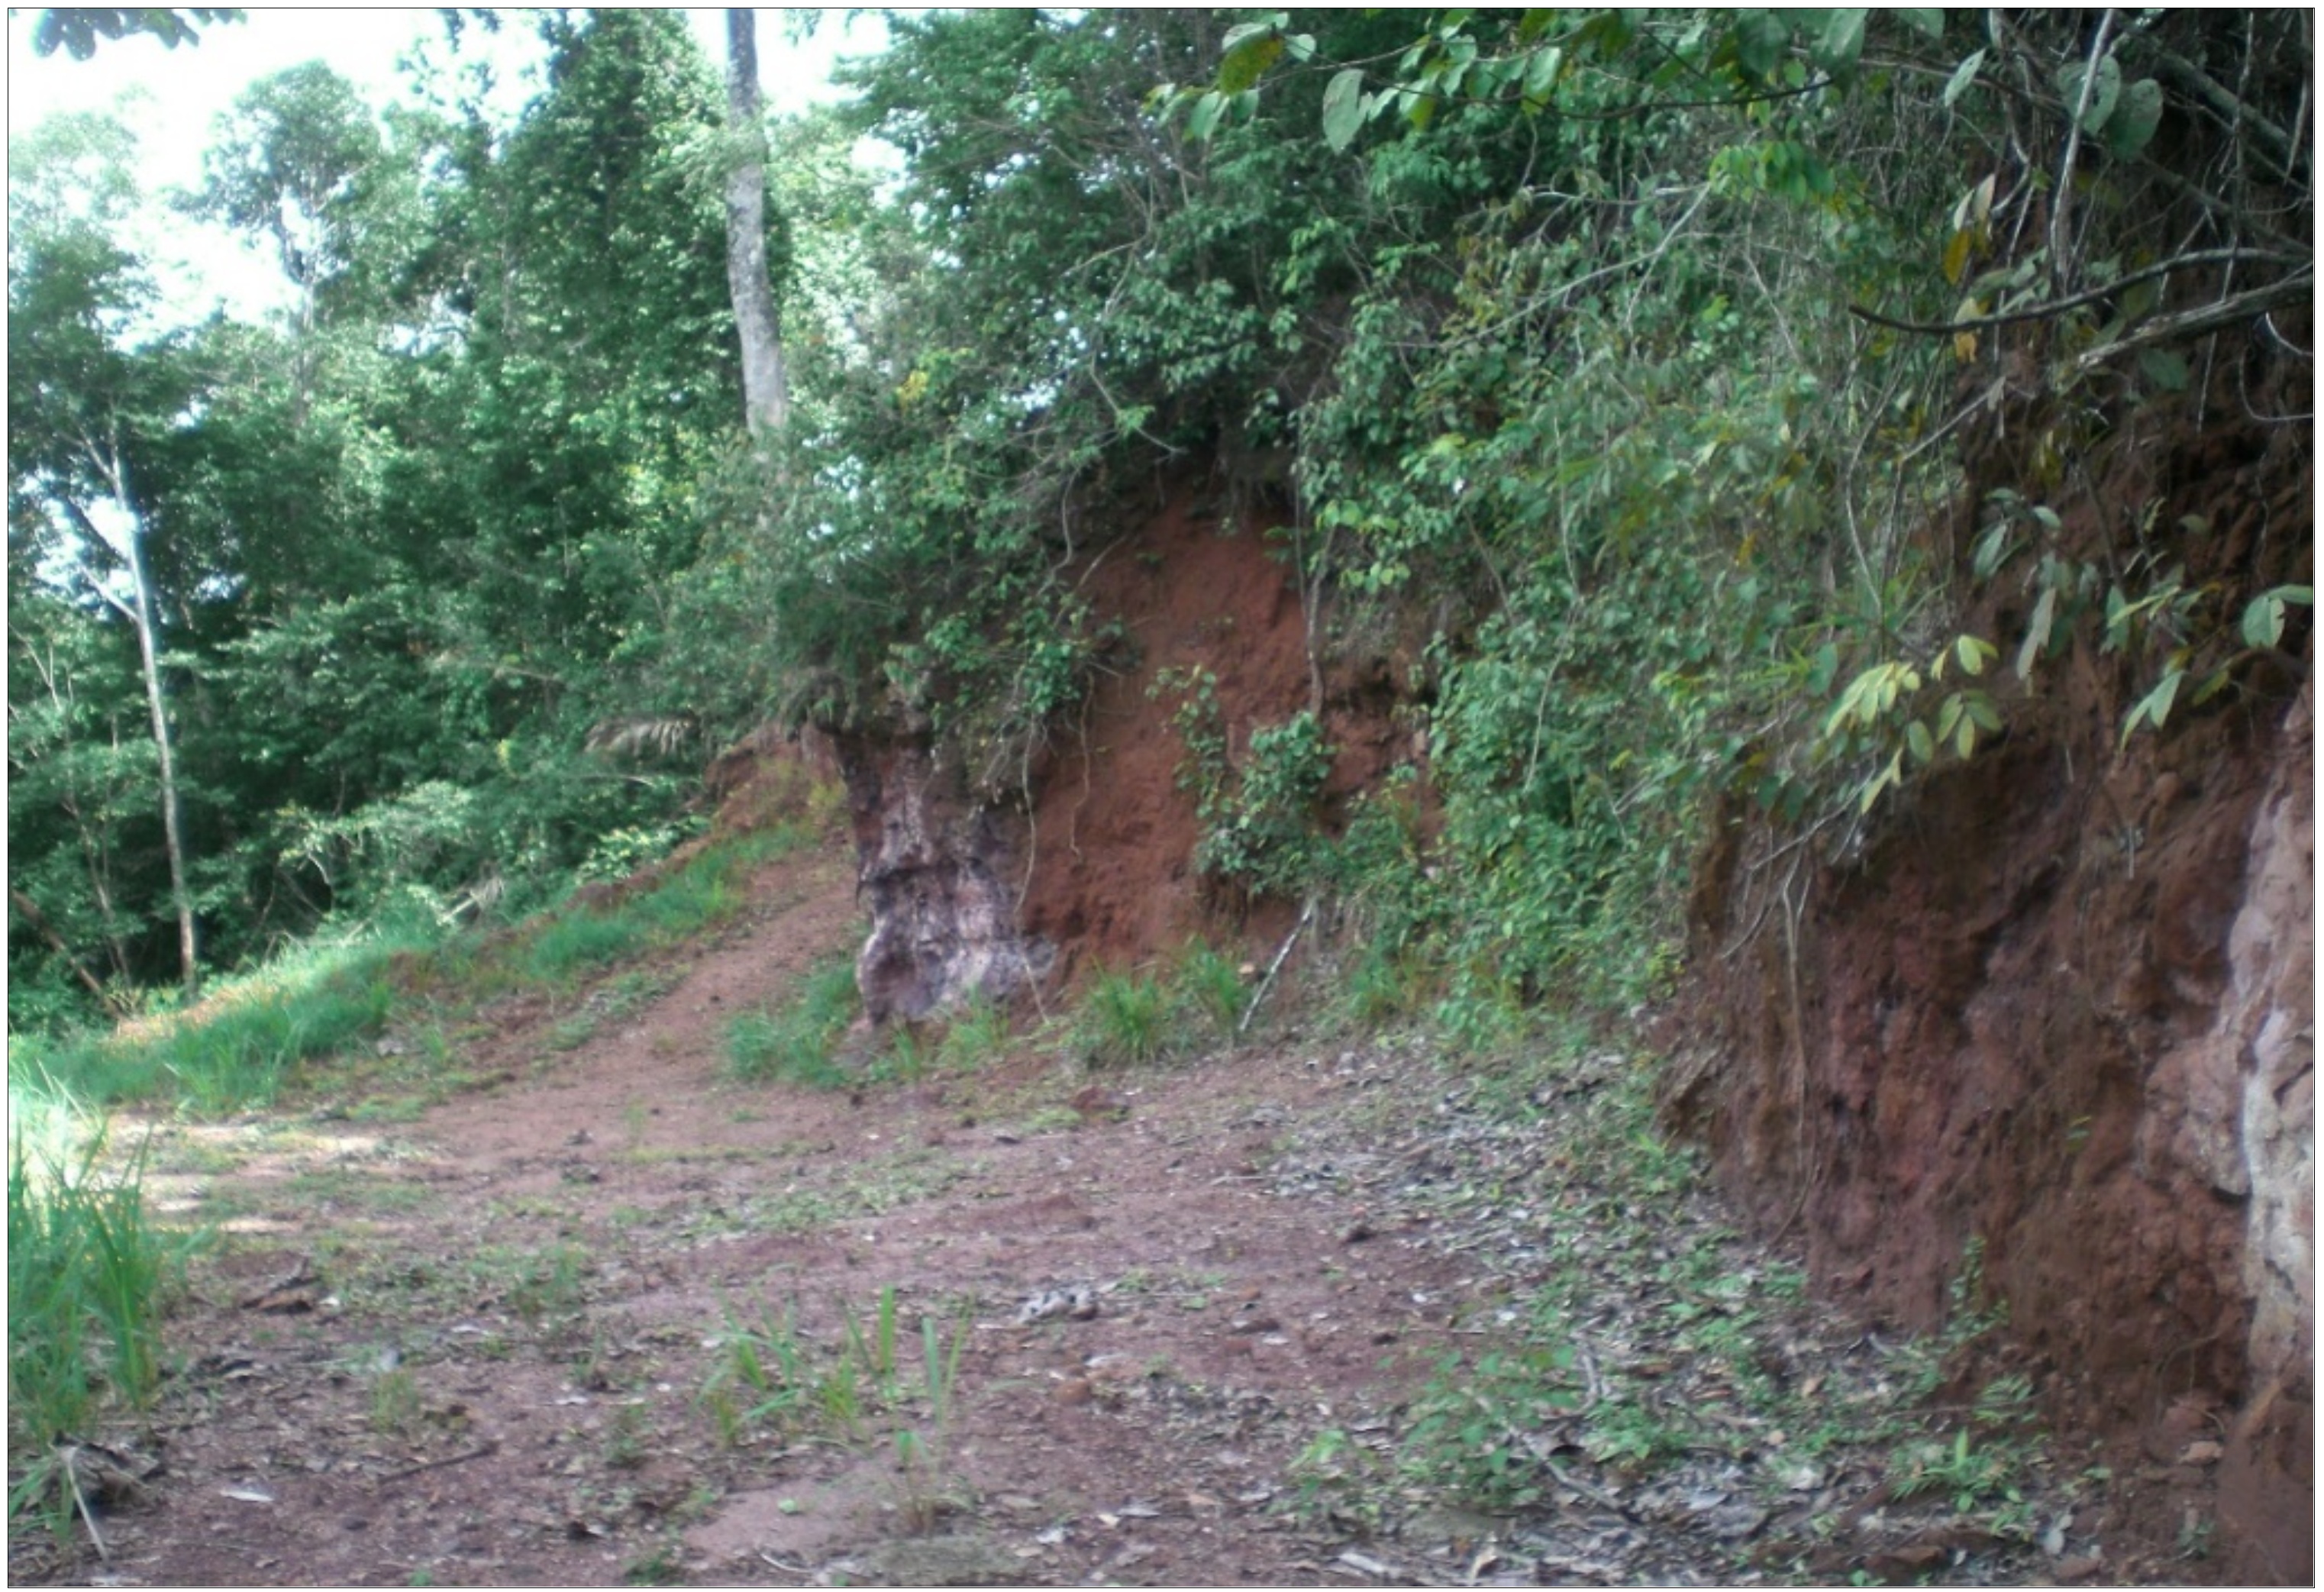
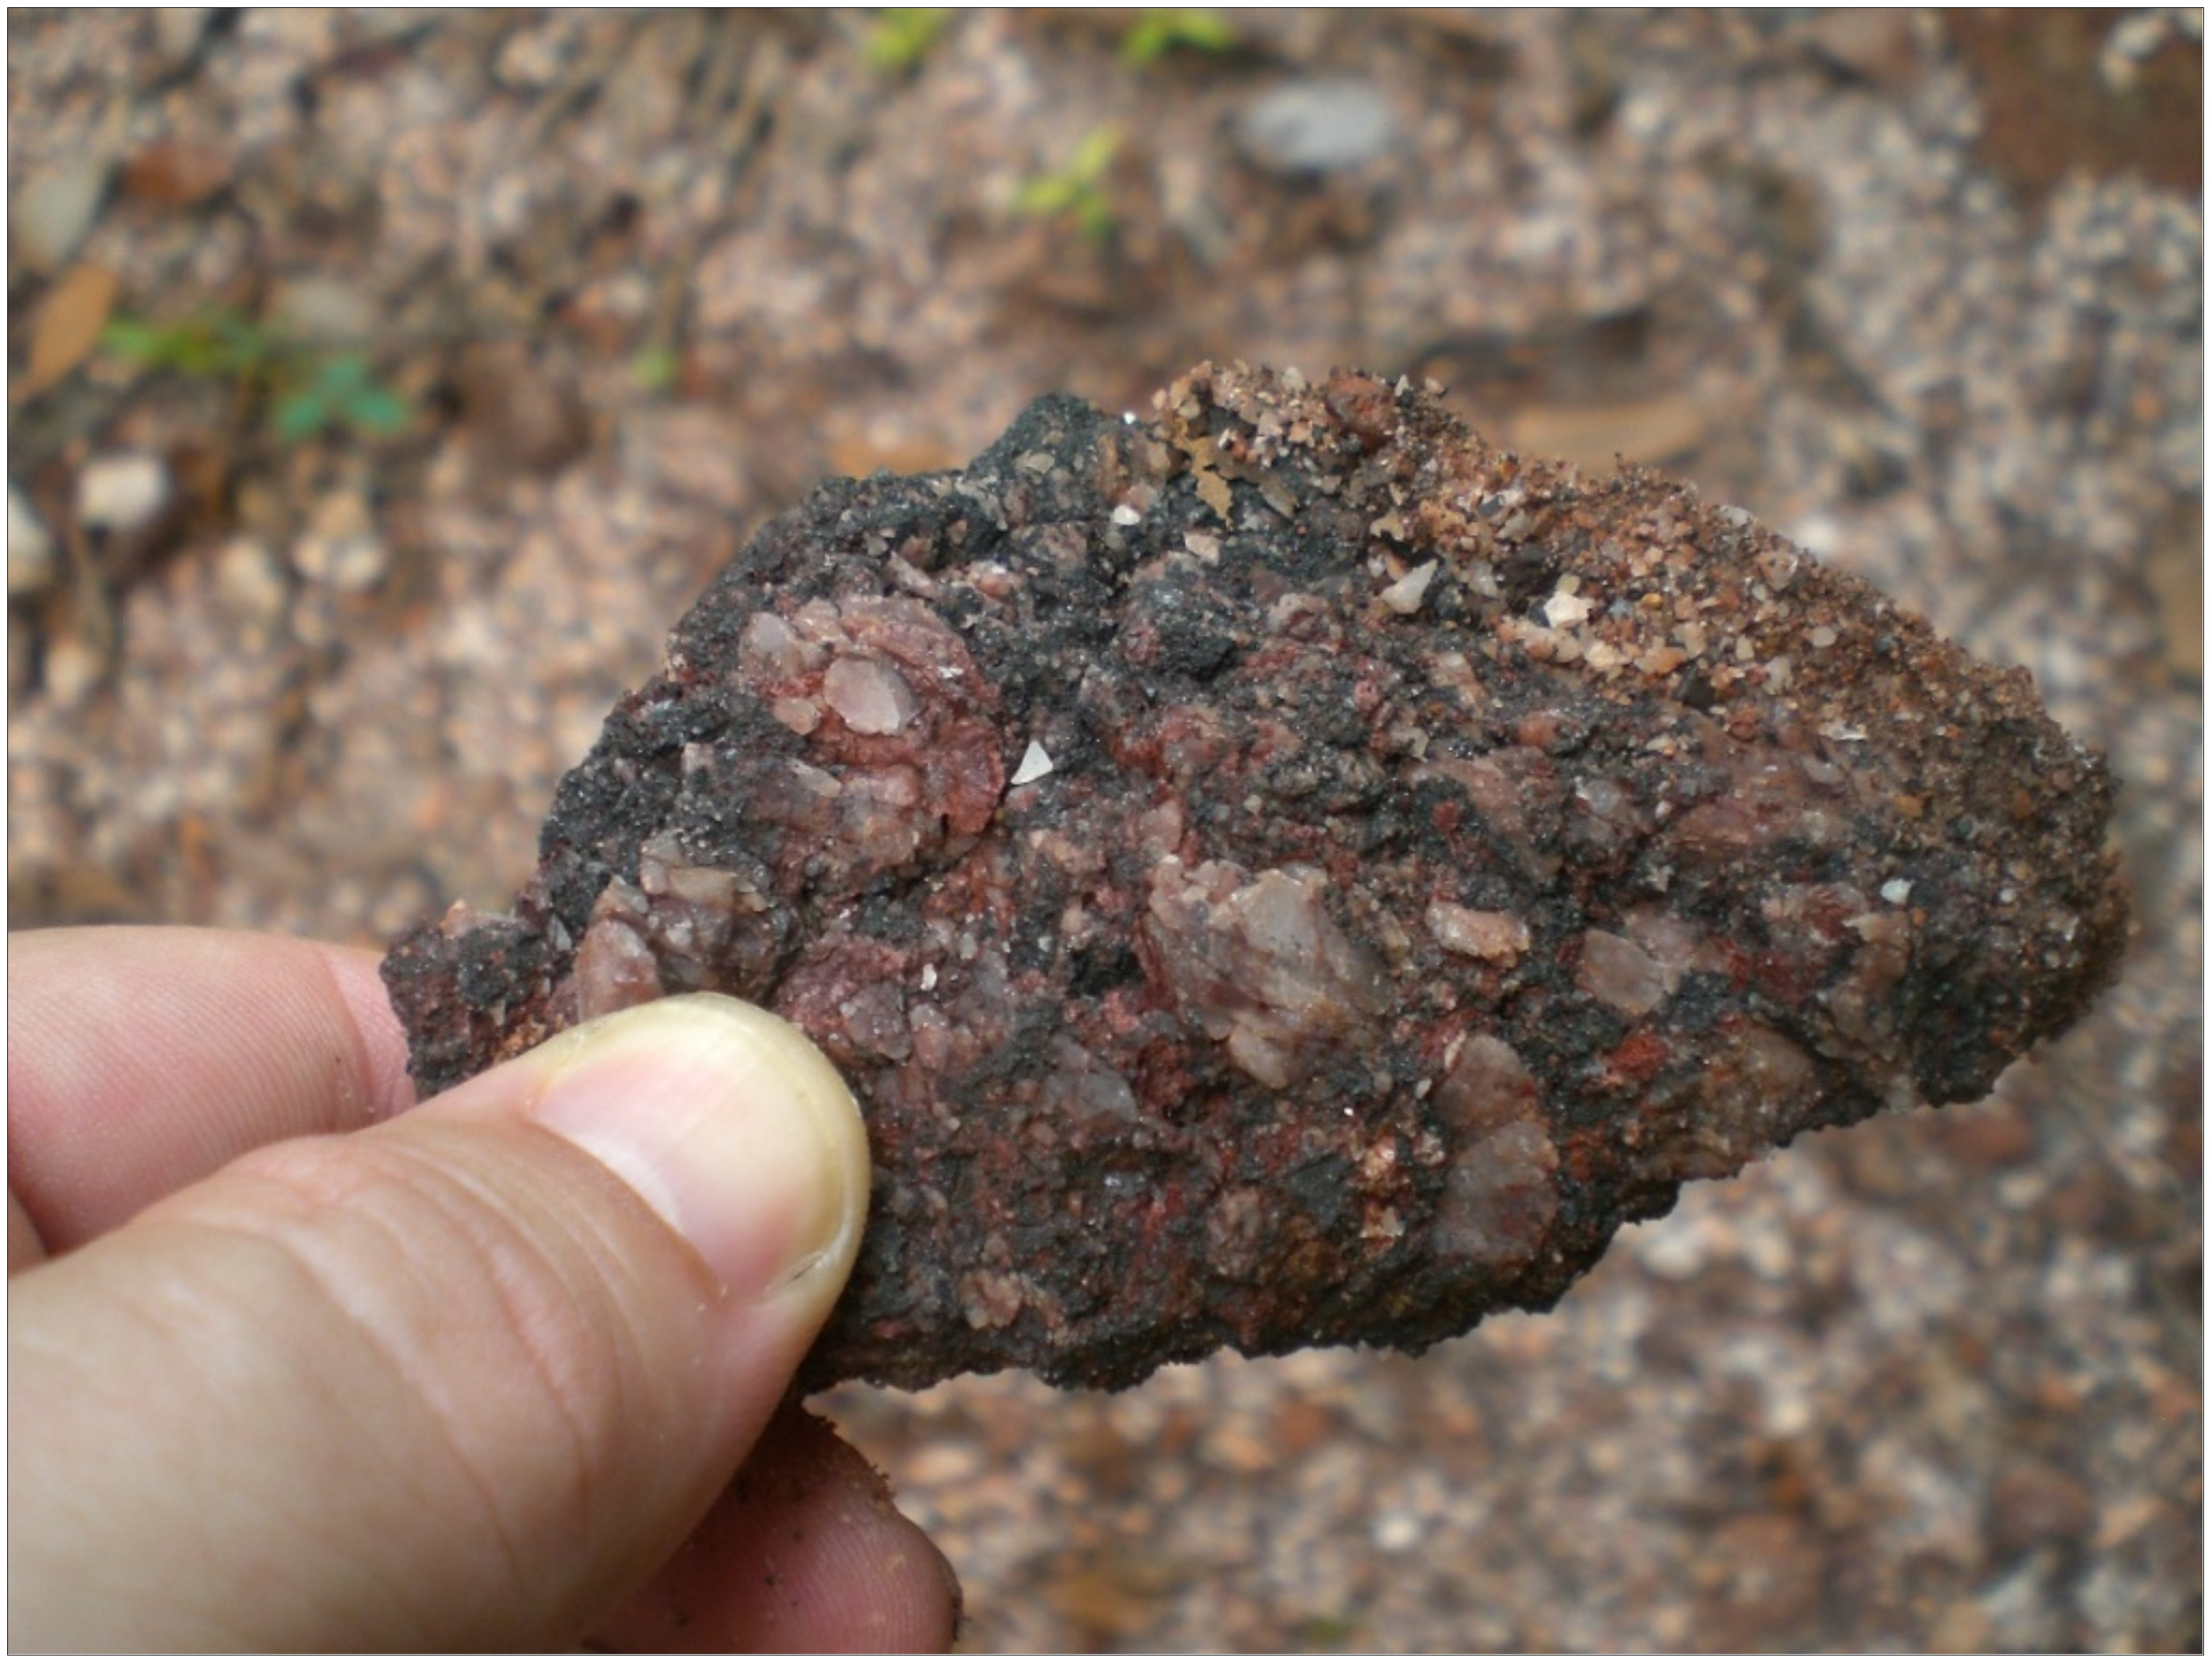
Figure 7-10: Top of Mineralized Zone, Leached Material Composed of Quartz Magnetitic Breccia | |
Figure 7-11: Detail of the Quartz Magnetitic Breccia Leached at Top | |
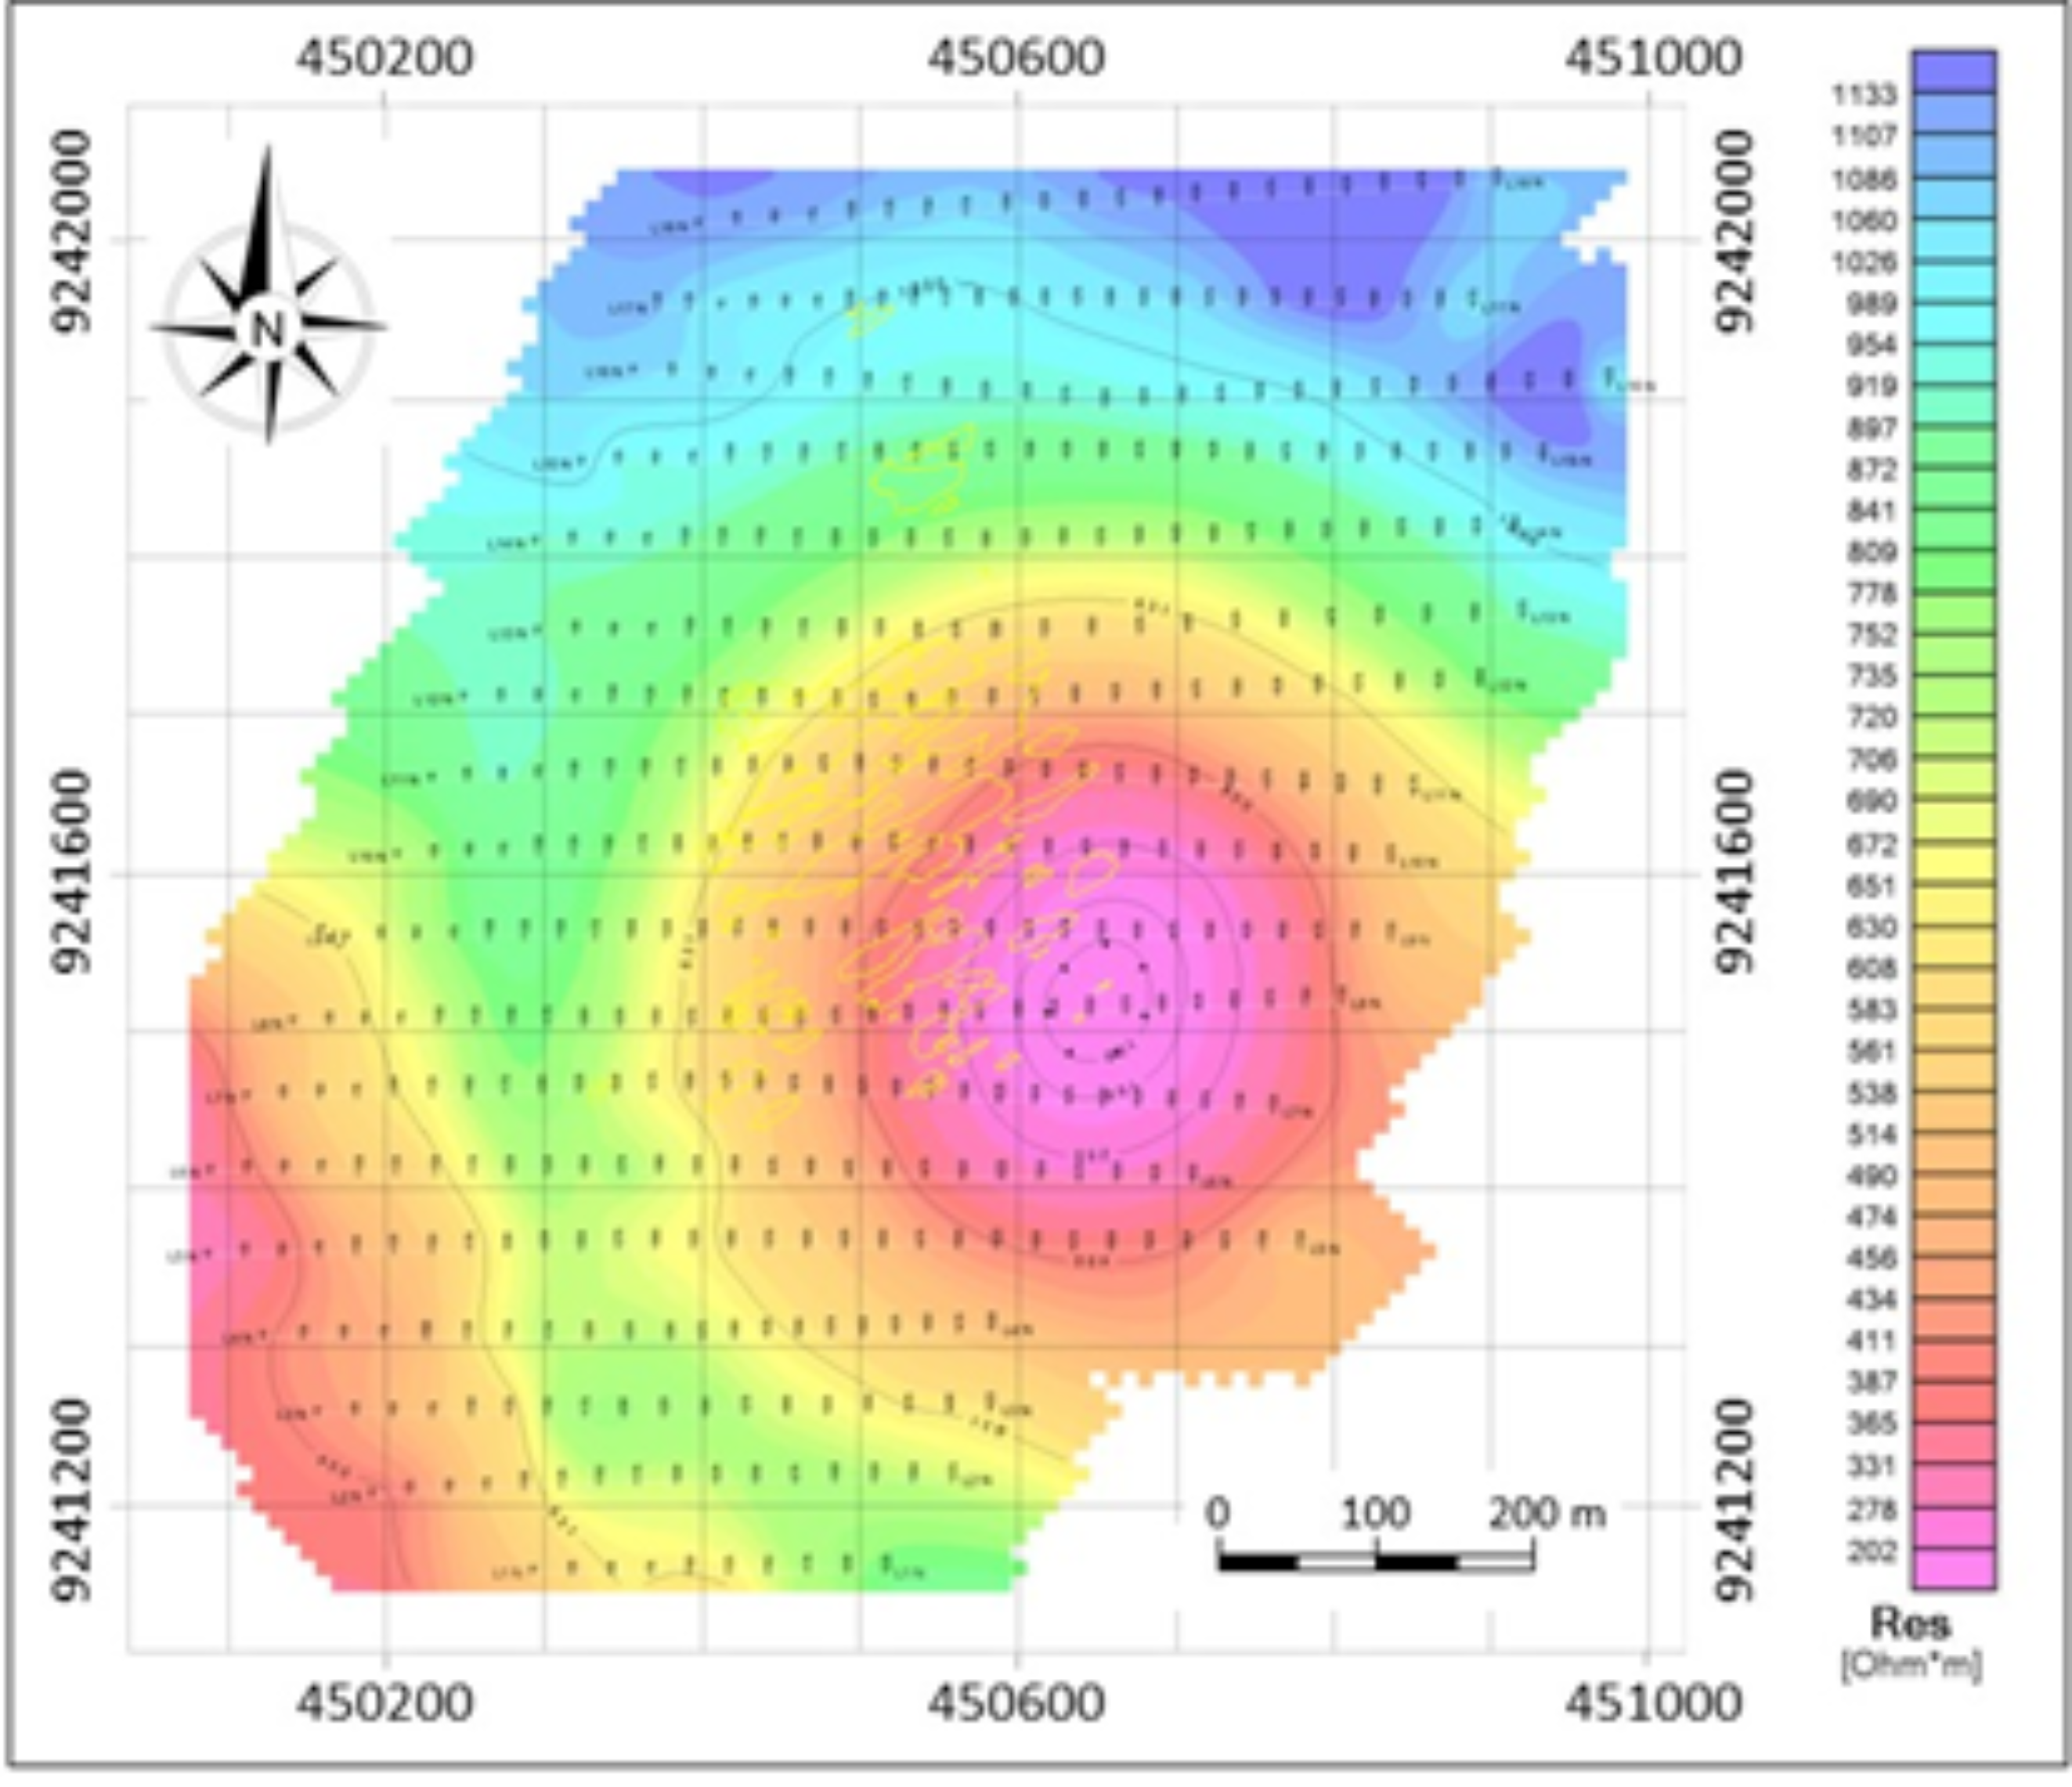
Figure 9-1: Resistivity map of the mise-à-la-masse survey. Yellow contours are wireframes of the modelled lower grade mineralization at elevation 350 m above sea level | |
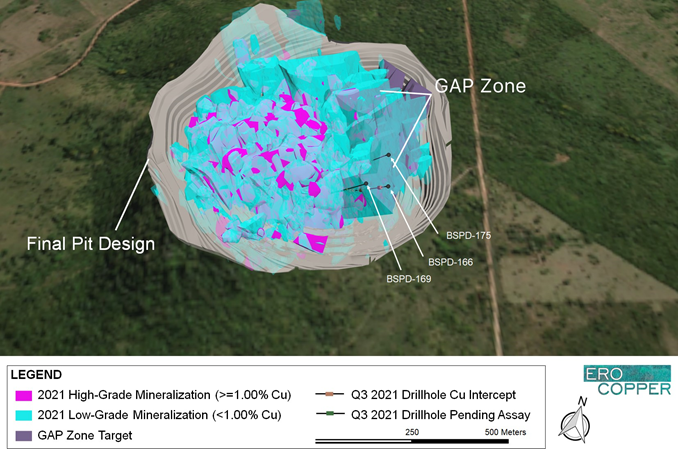
Figure 9-2: Boa Esperança, Plan View looking North | |
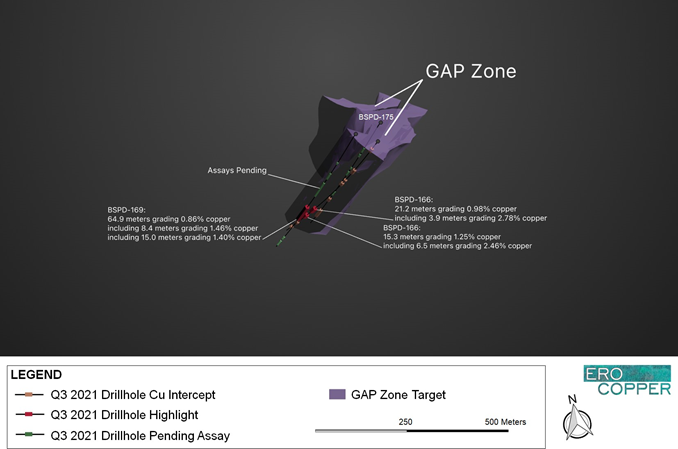
Figure 9-3: Boa Esperança VRIFY 3D Model, Gap Zone Results, view looking North | |
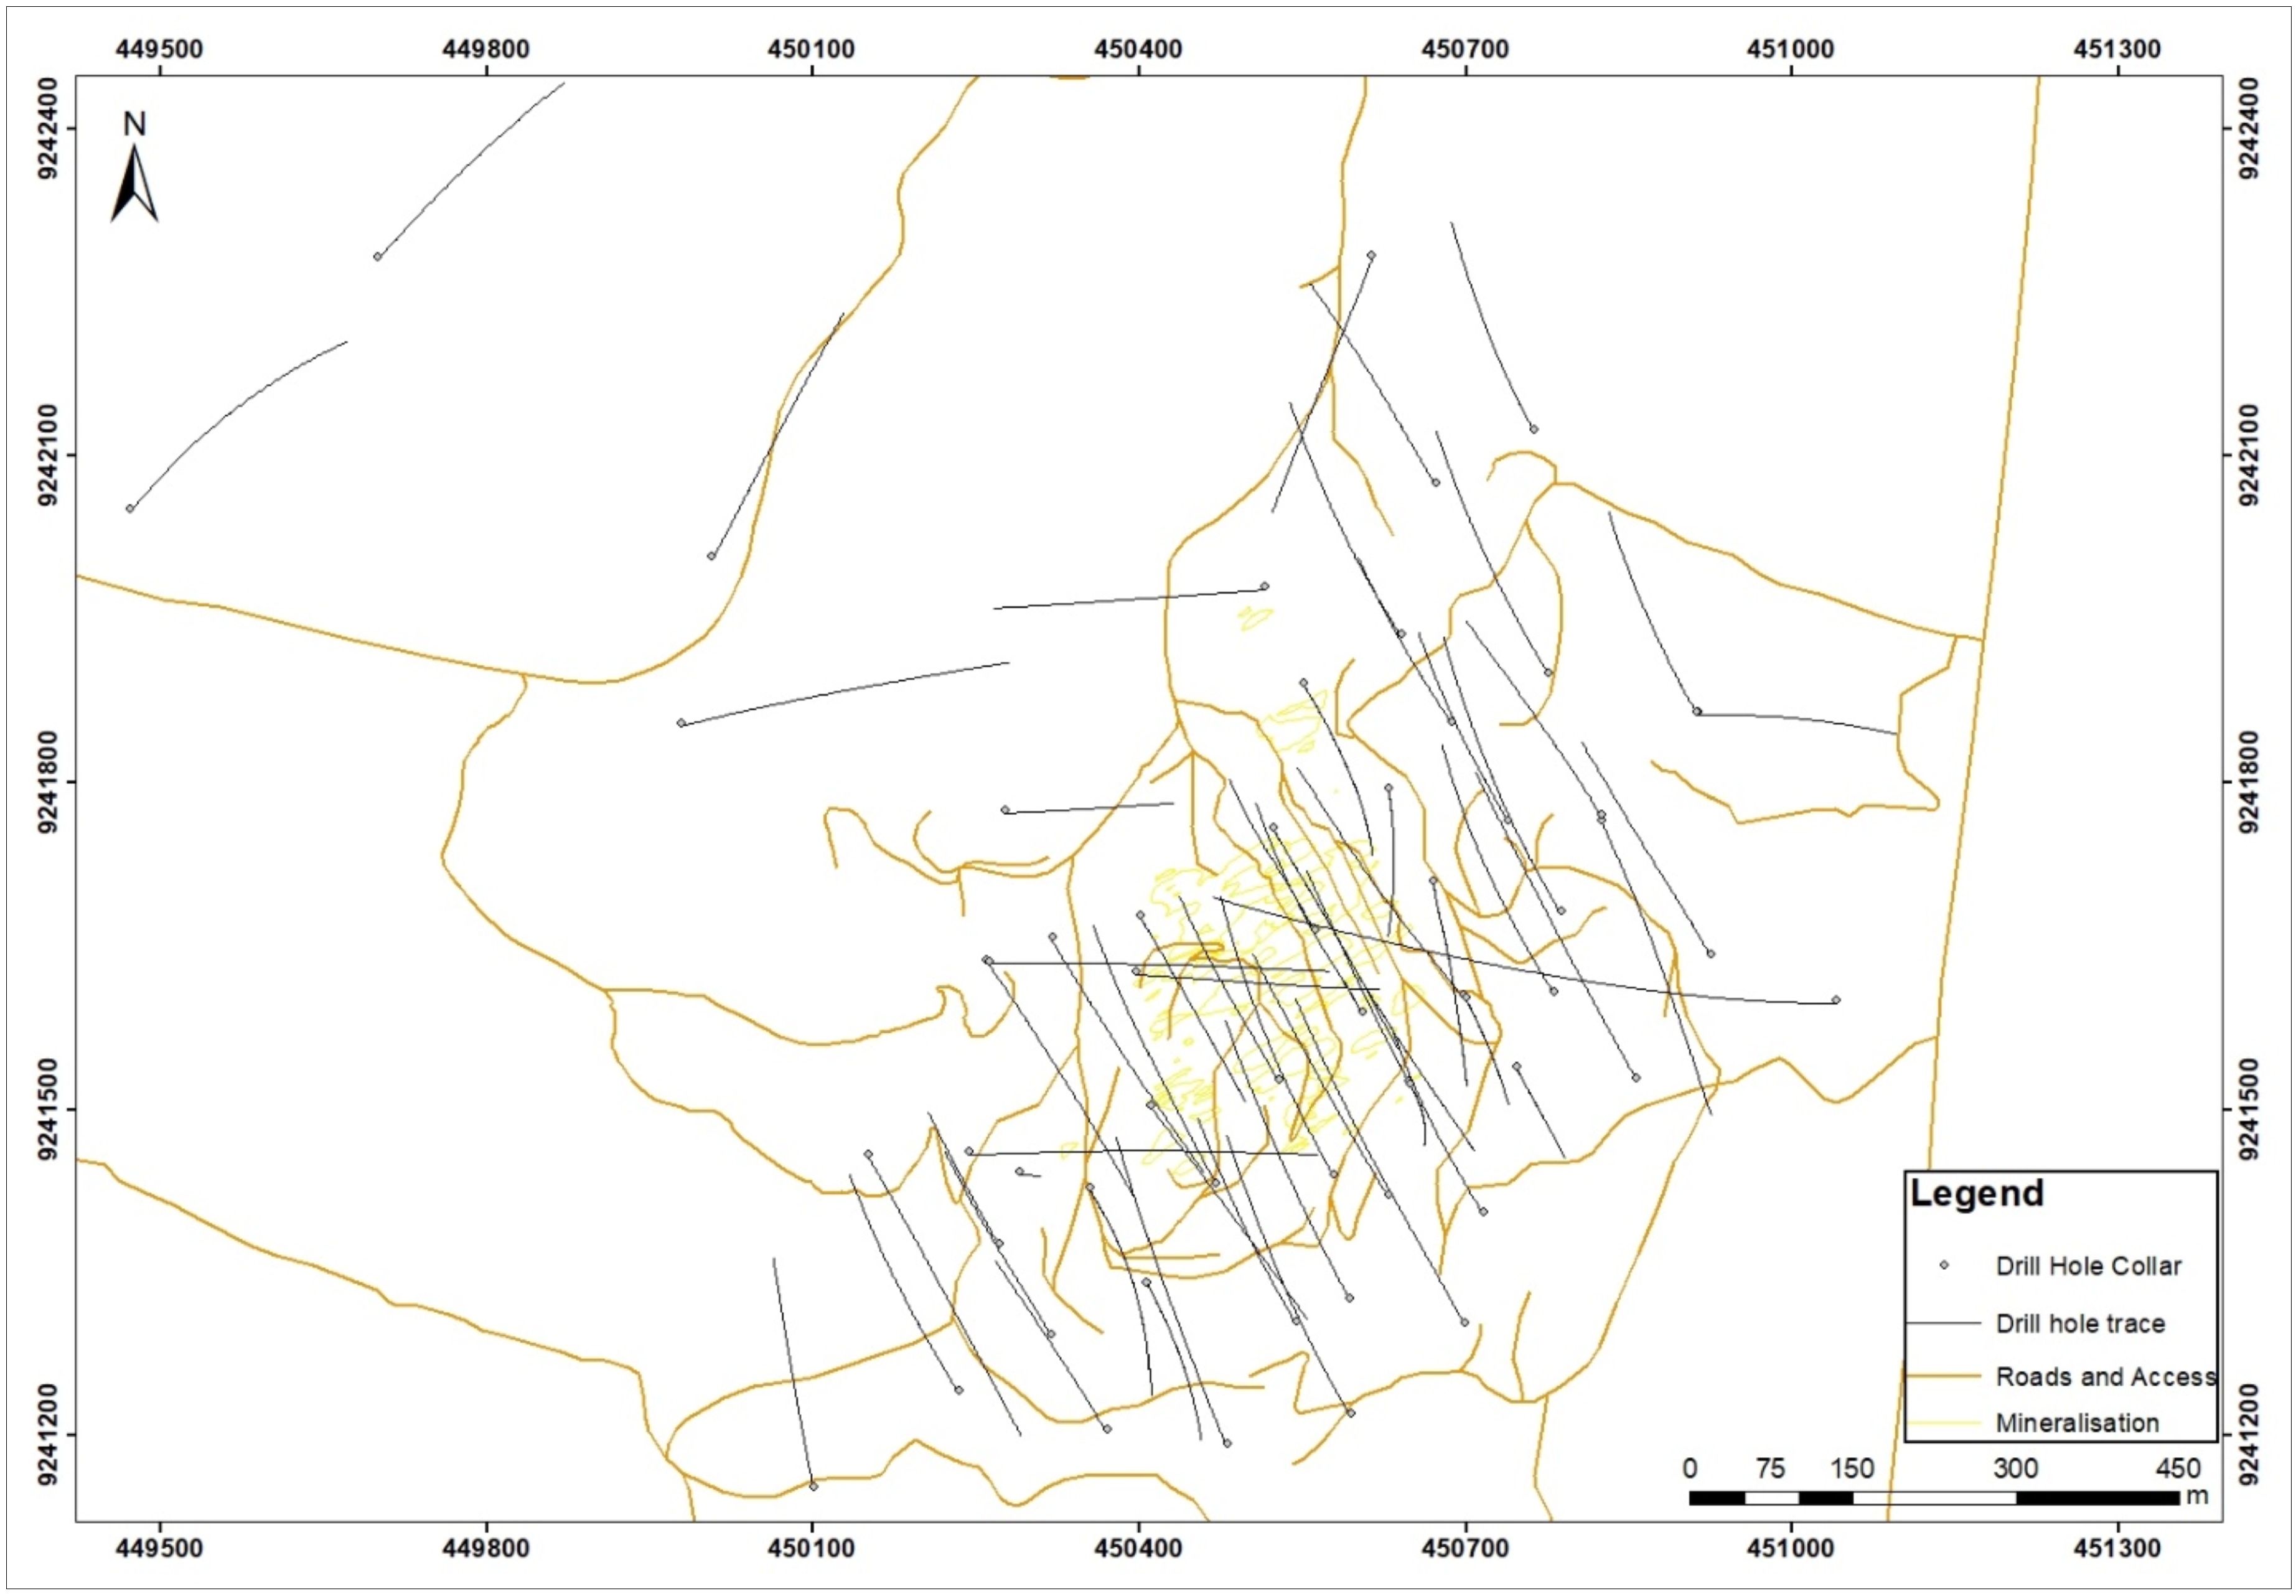
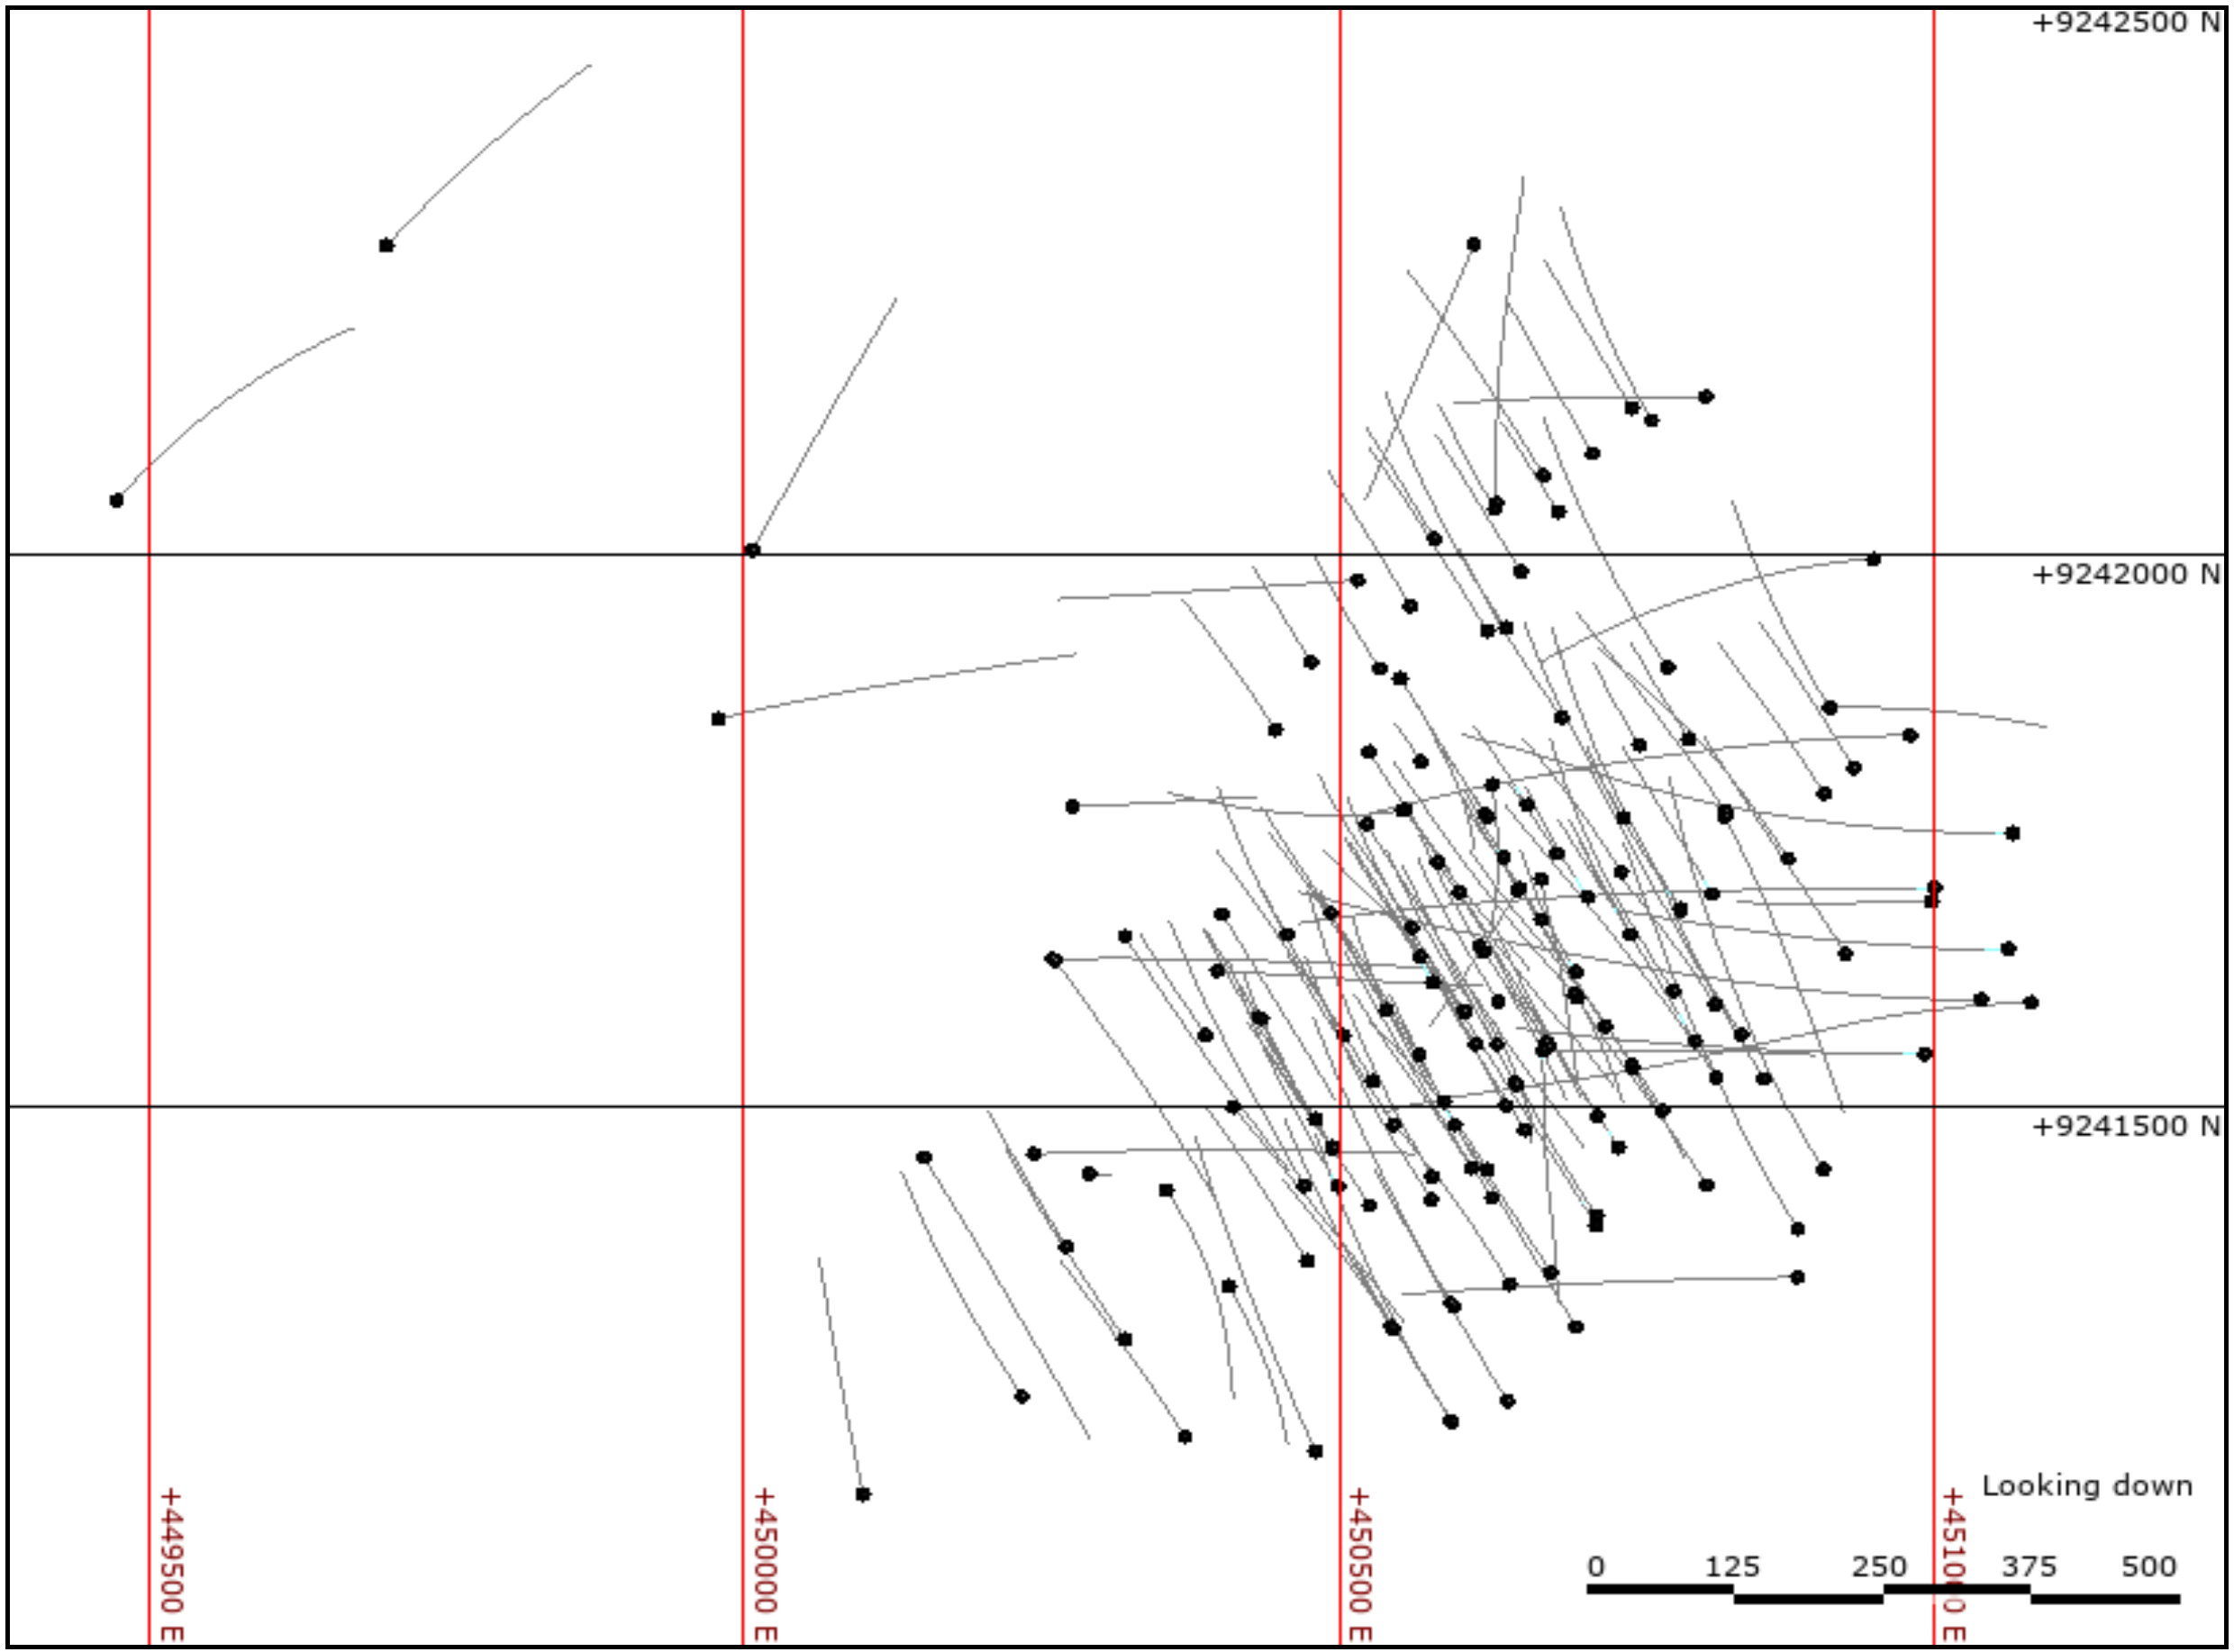
Figure 10-1: Surface map of drill holes on the Boa Esperança Project | |
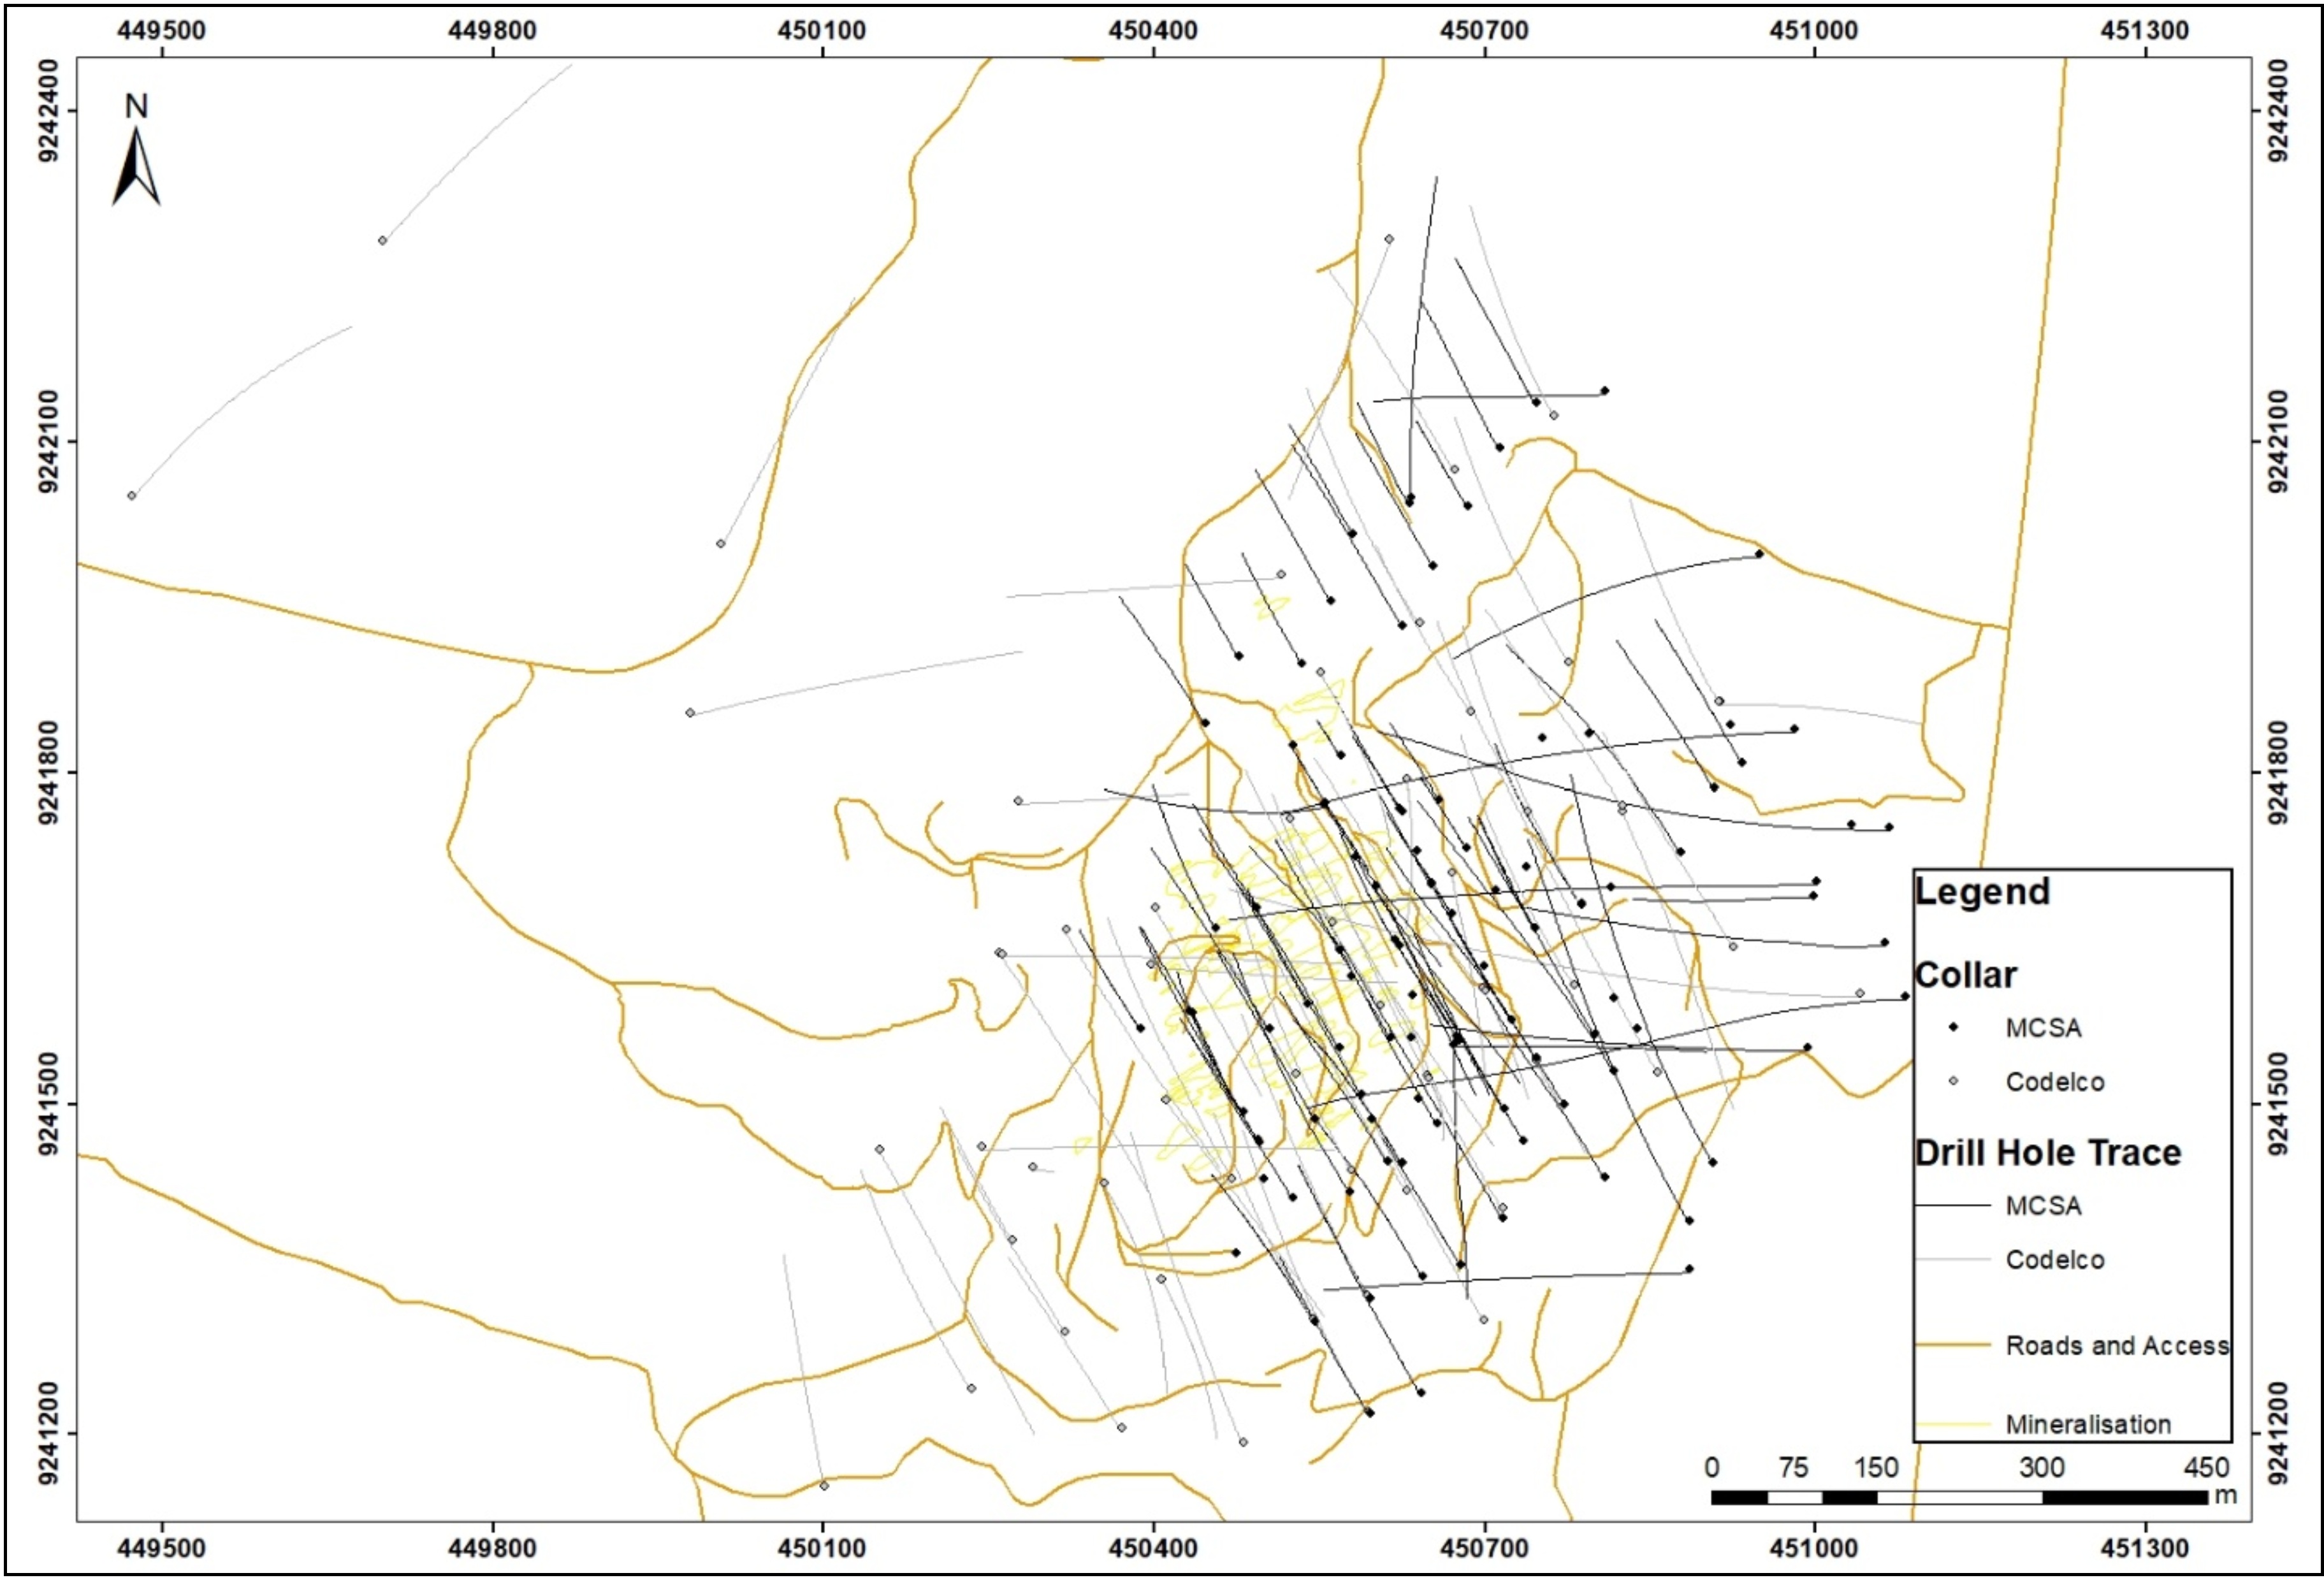
Figure 10-2: Surface map of drill holes by MCSA (black) and Codelco (grey) on the Boa Esperança Project | |
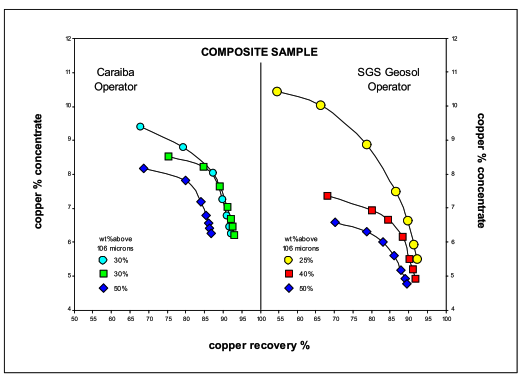
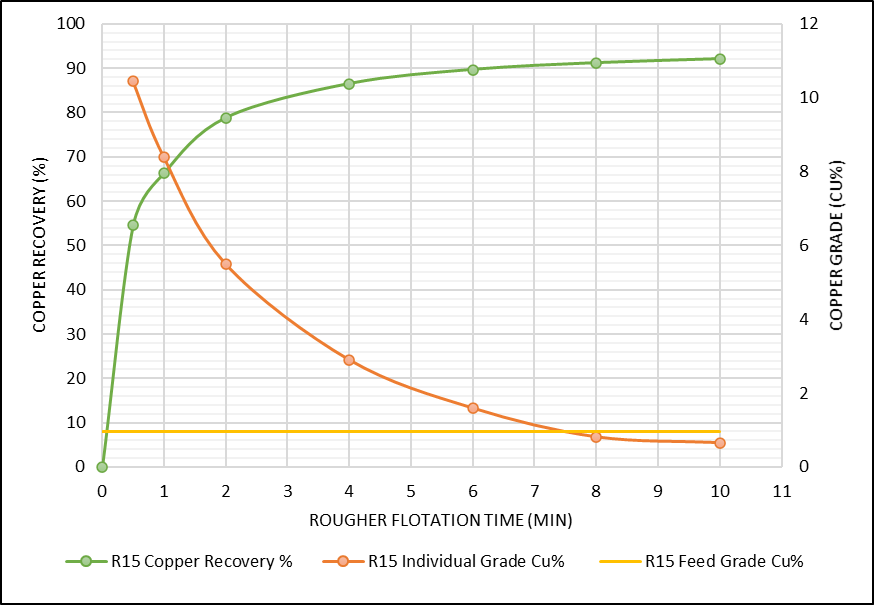
Figure 13-1: 2012 SGS Geosol Rougher Copper Recovery and Grade | |
Figure 13-2: 2009 CIMM Rougher Kinetics | |
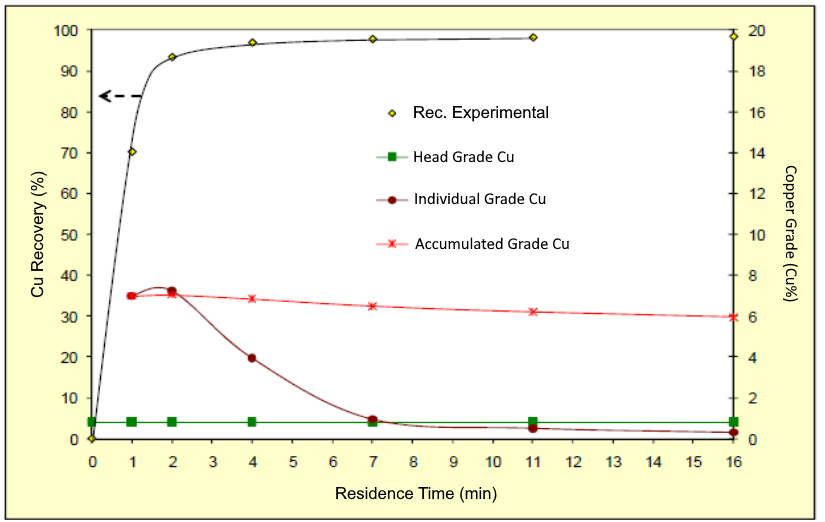
Figure 13-3: 2012 SGS Geosol Rougher Kinetics with 25%+106 µm Master Sample | |
Figure 13-4: Cleaner Flotation Kinetics (a) reground rougher concentrate samples with regrind (b) reground rougher concentrate samples without regrind | |
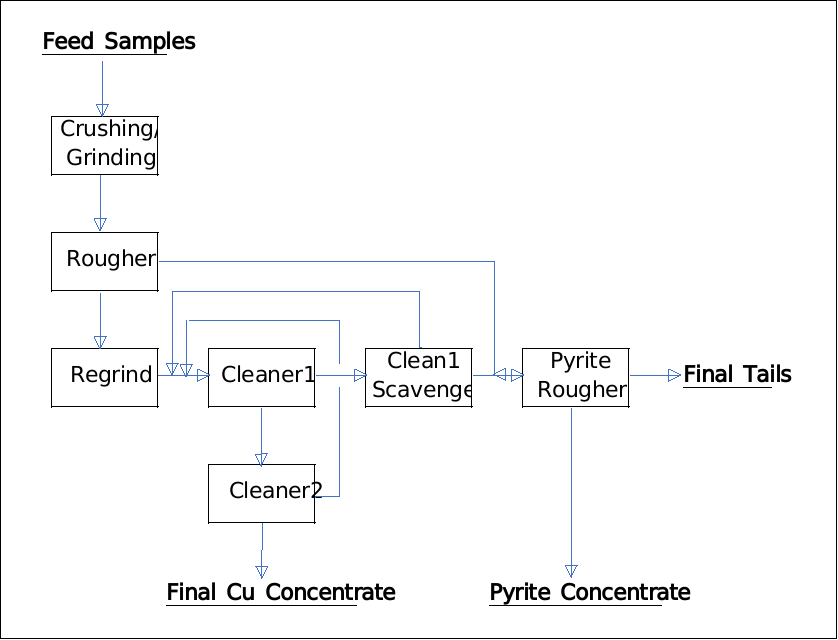
Figure 13-5: Locked Cycle Flotation Test Flowsheet During The 2012 SGS Test Program | |
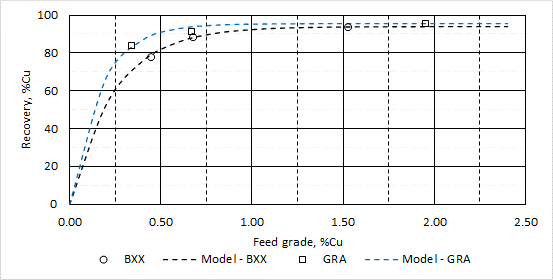
Figure 13-6: Copper Recovery vs. Copper Feed Grade | |
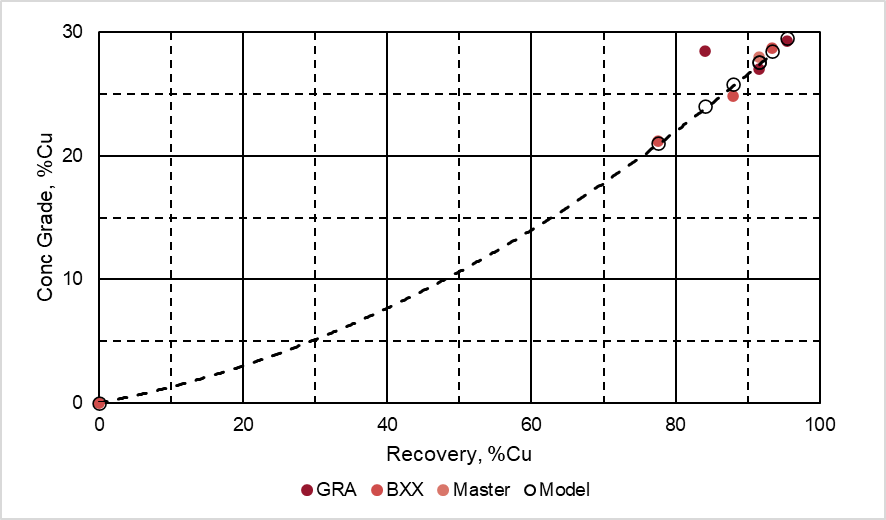
Figure 13-7: Copper Recovery and Copper Concentrate Grade | |
Figure 14-1: Drillhole Location Map, Drilling Used in Mineral Resource Estimation | |
Figure 14-2: Illustrative digitization of hand-drawn vertical section SV_NWSE_14 used for geological model interpretation. Mineralized material is represented in pink and yellow colours | |
| | | | | |
| Boa Esperança Project | Page xiv |
| NI 43-101 Technical Report Feasibility Study Update | October 2021 |
| | | | | |
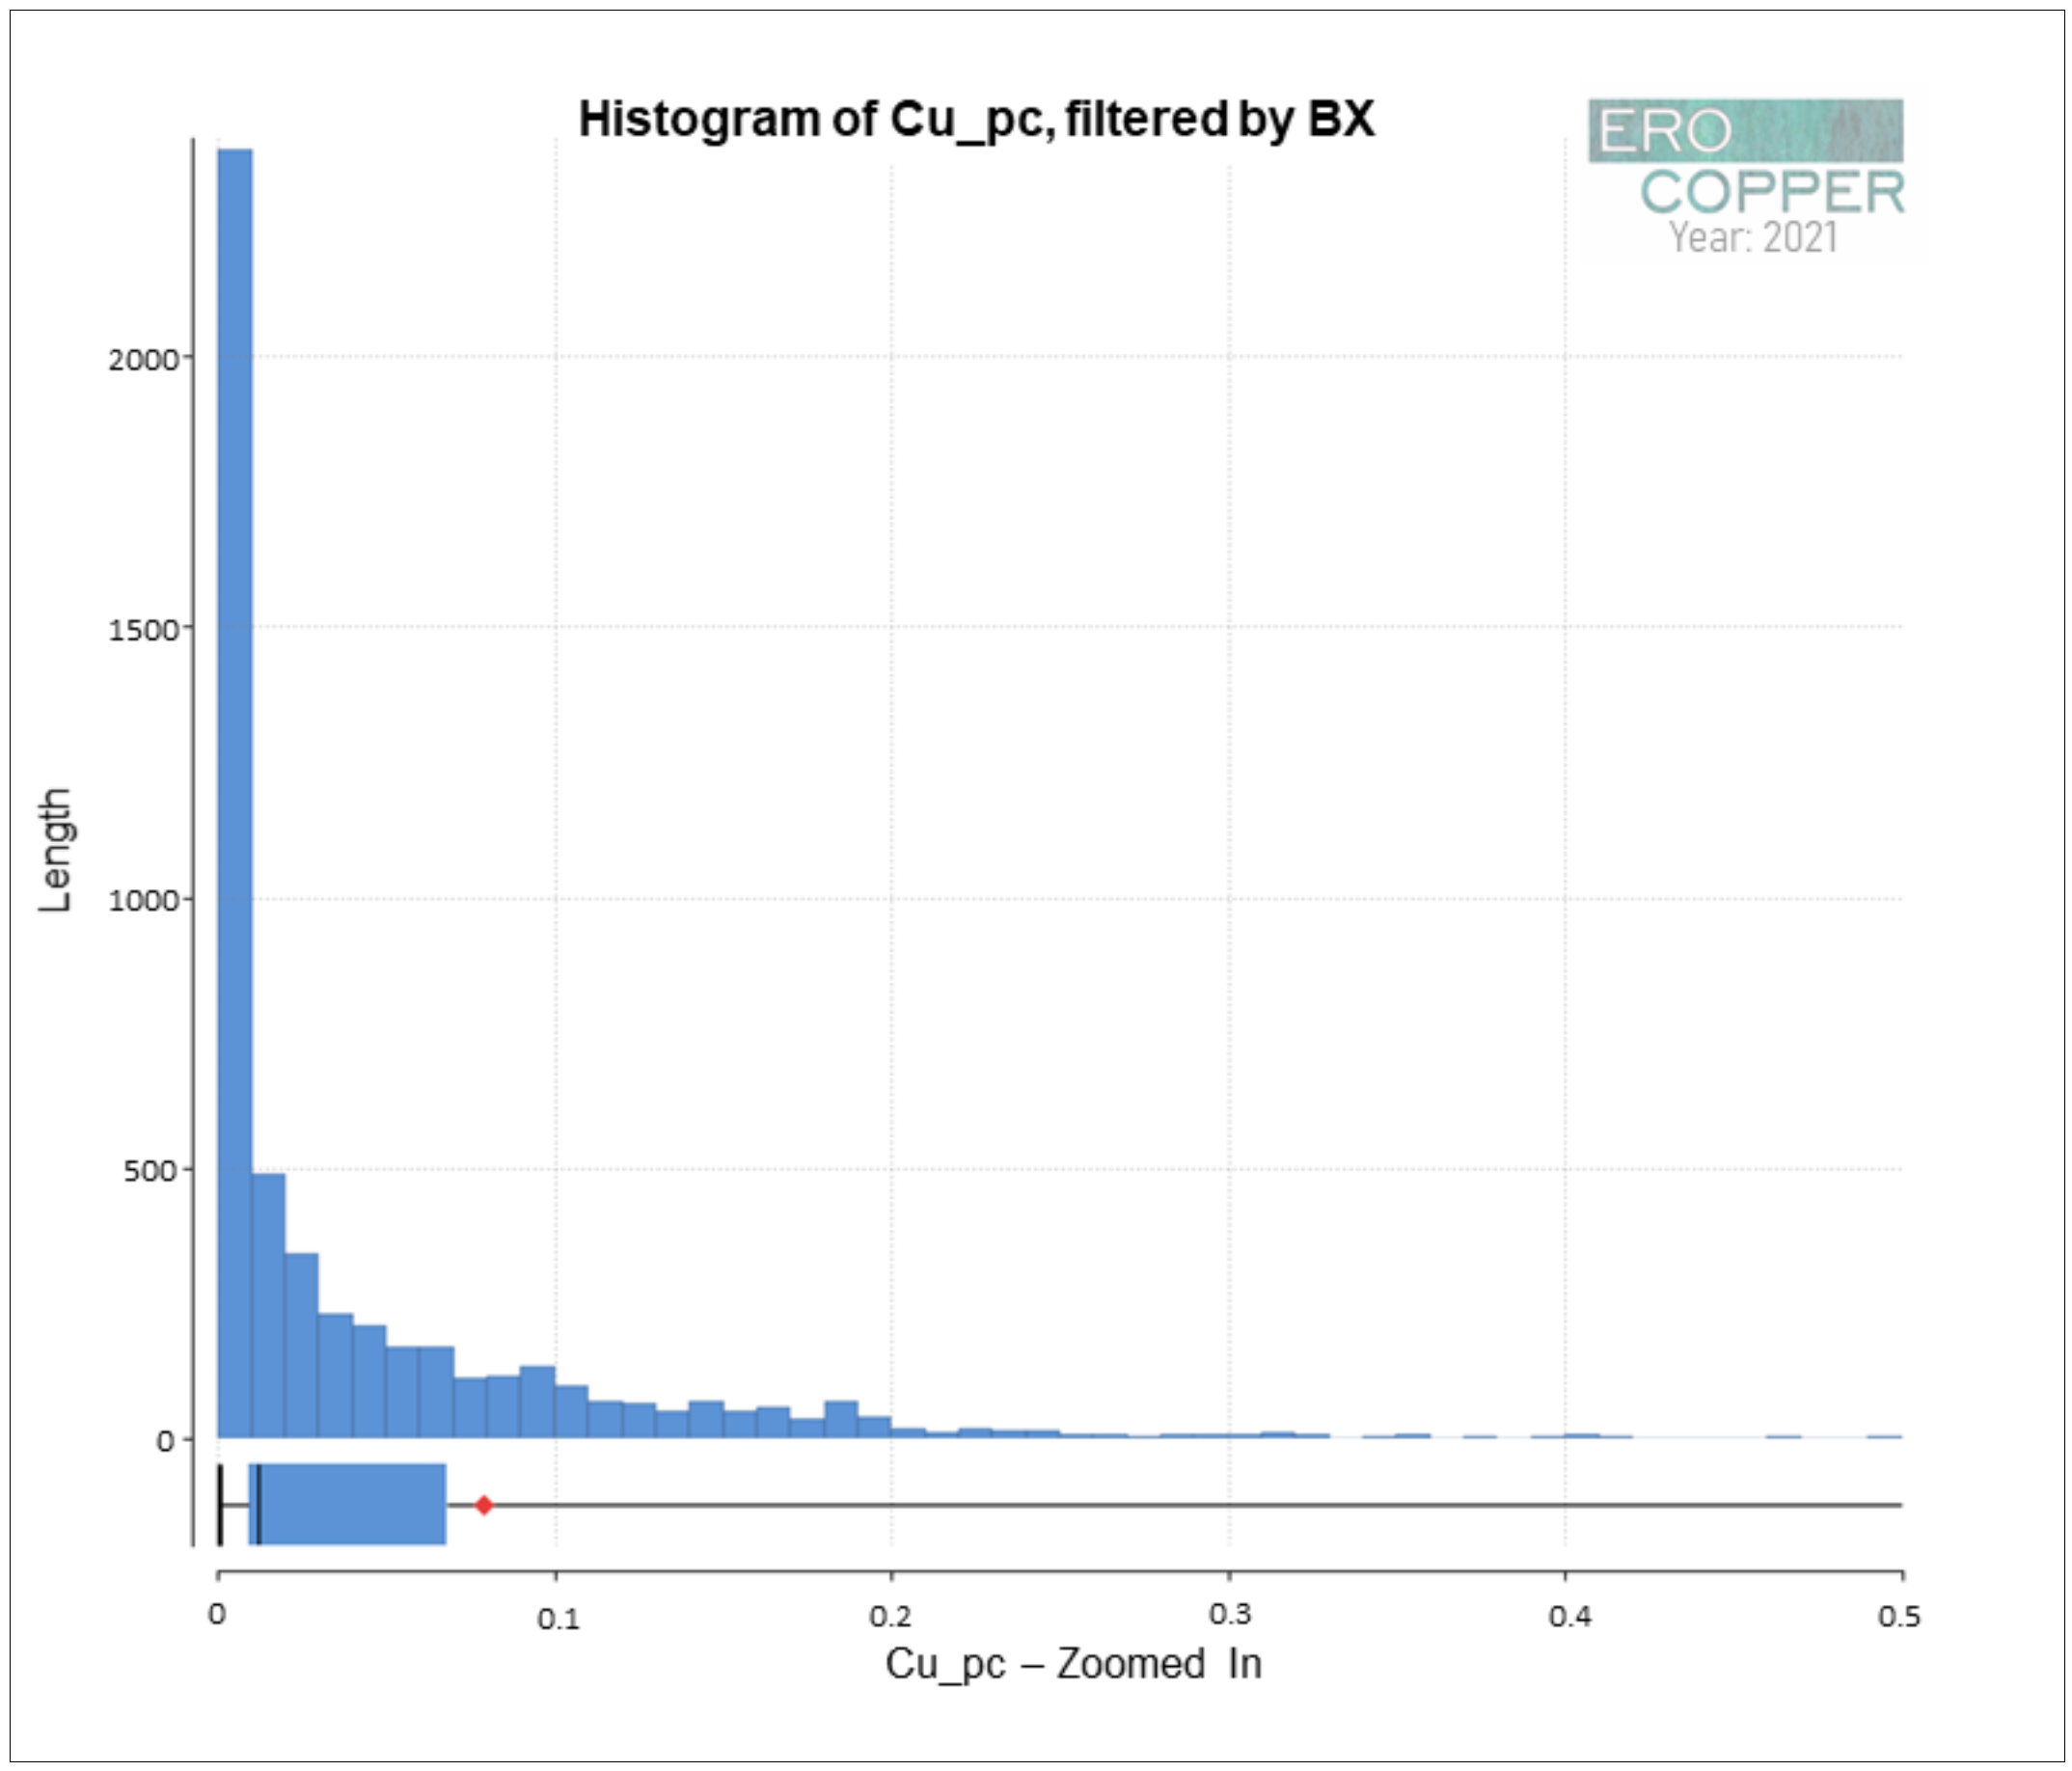
Figure 14-3: Histogram of Cu_pc, filtered by BX | |
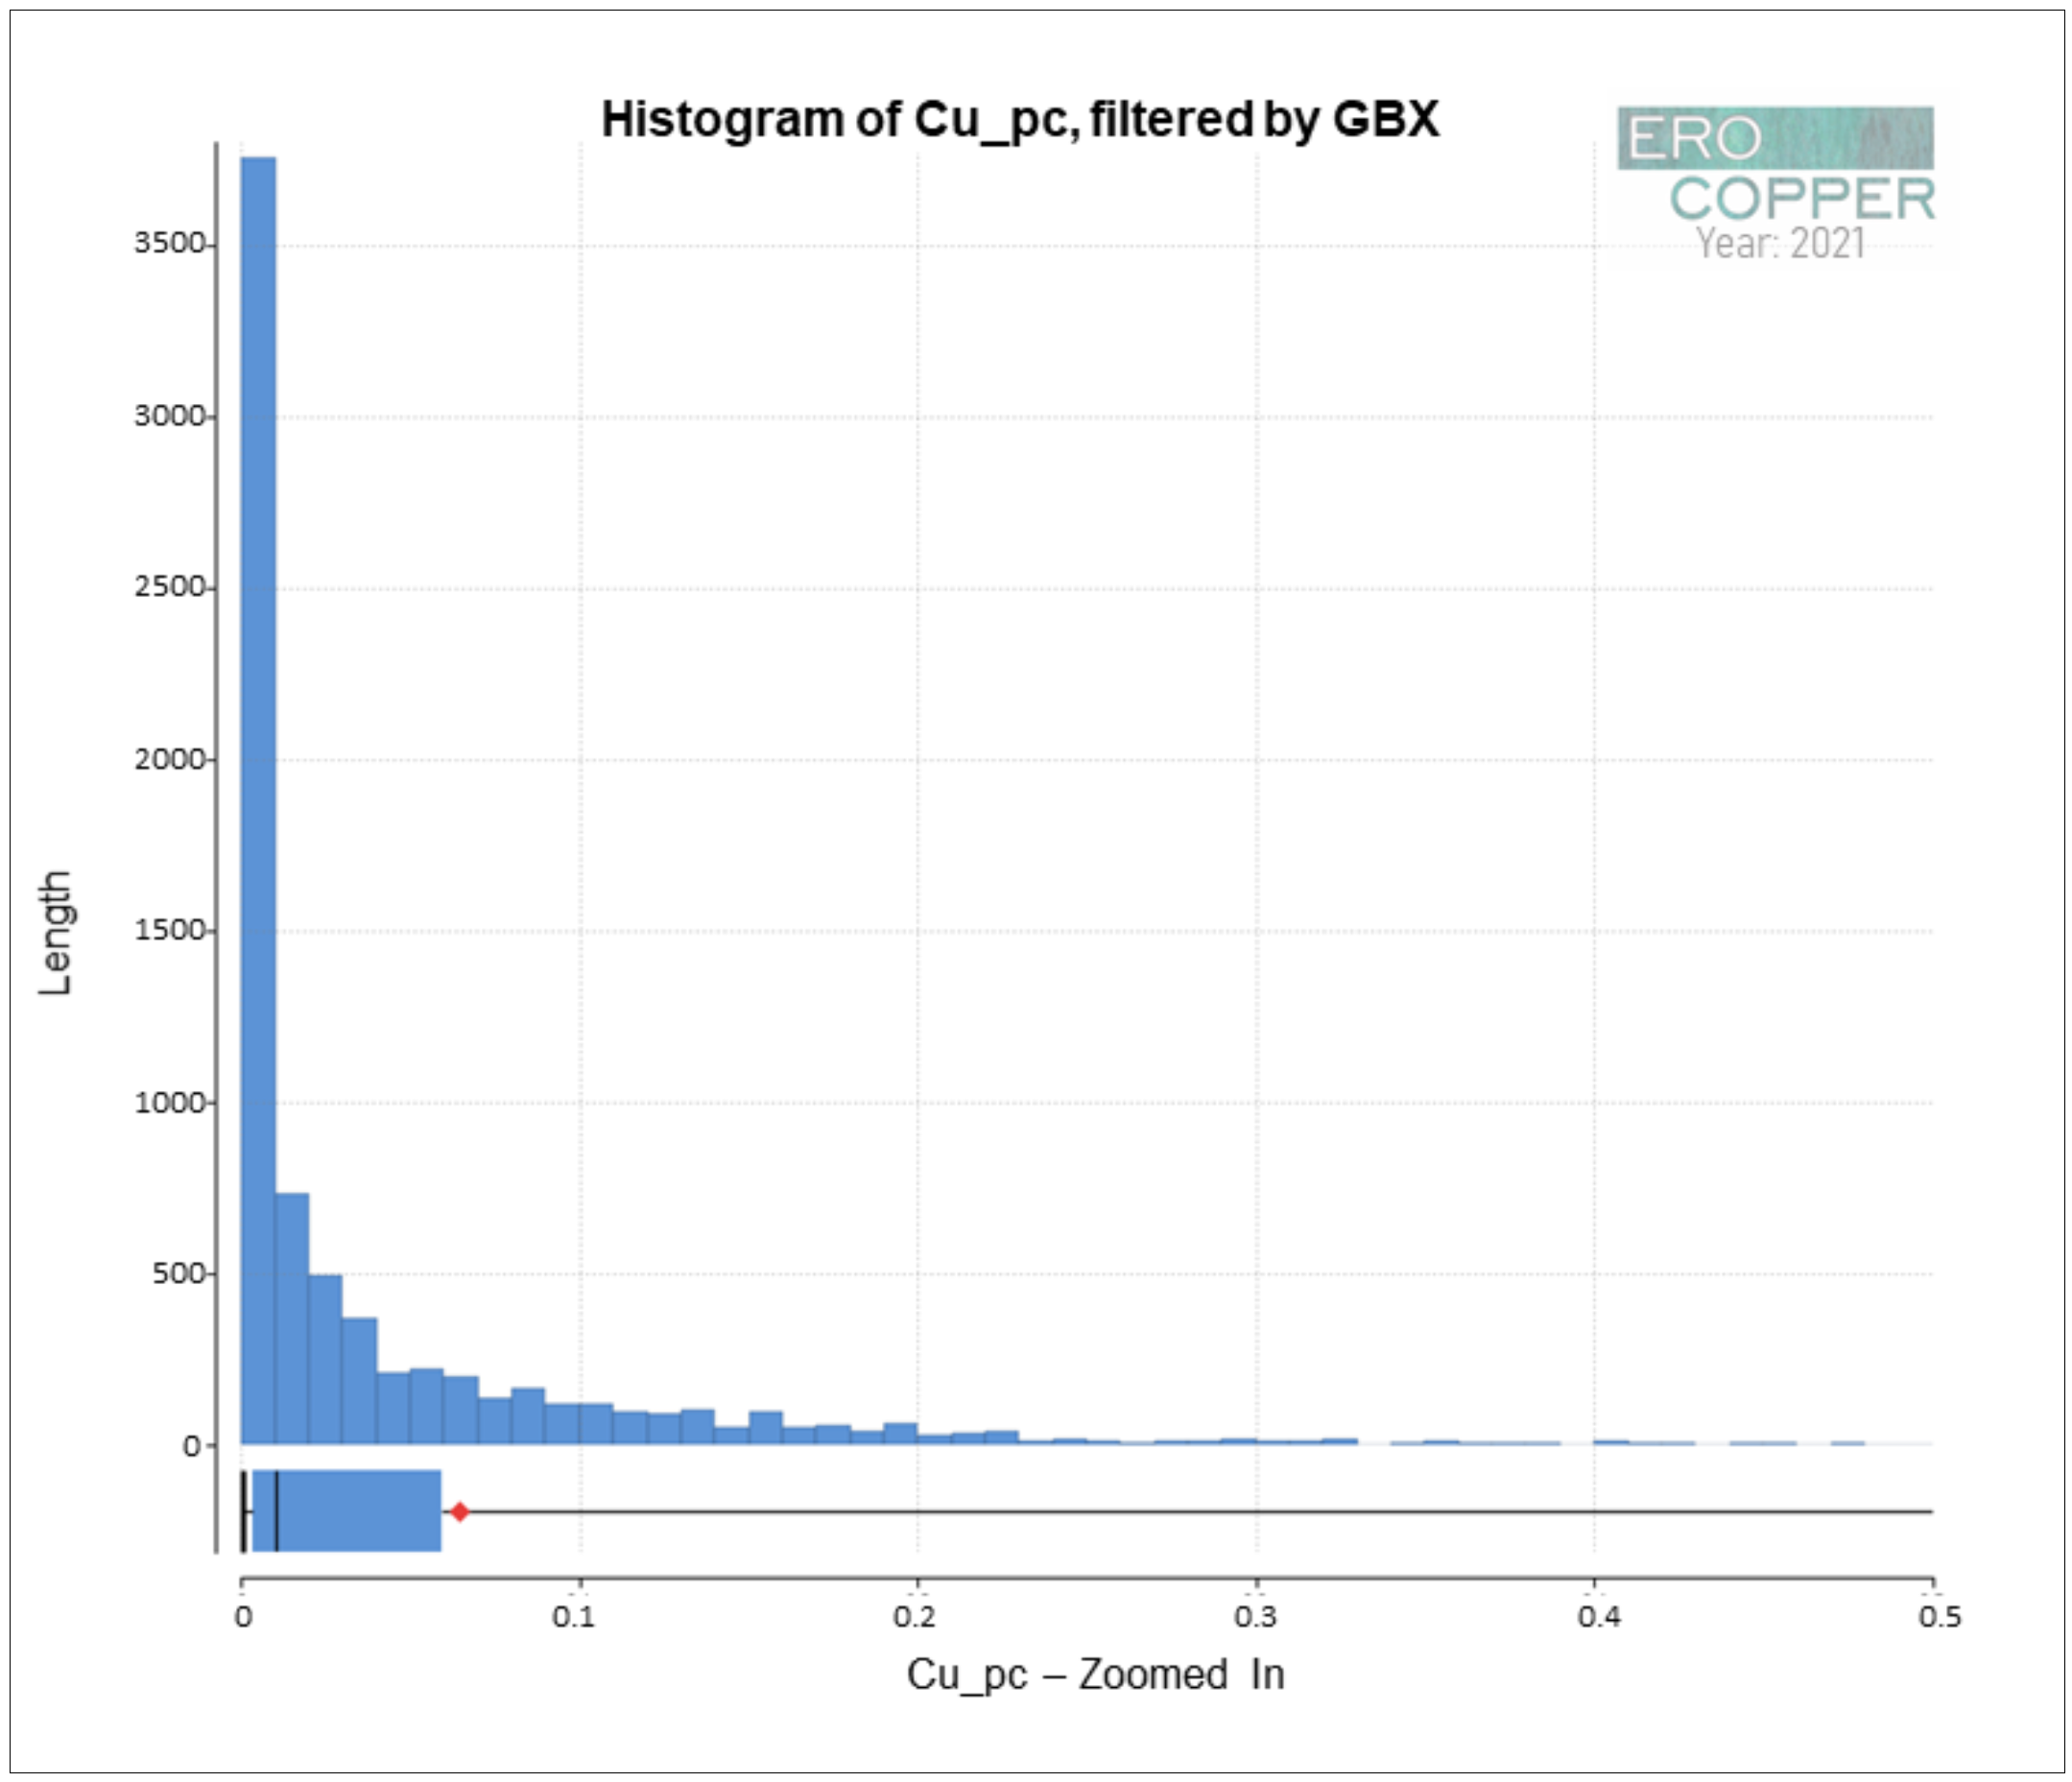
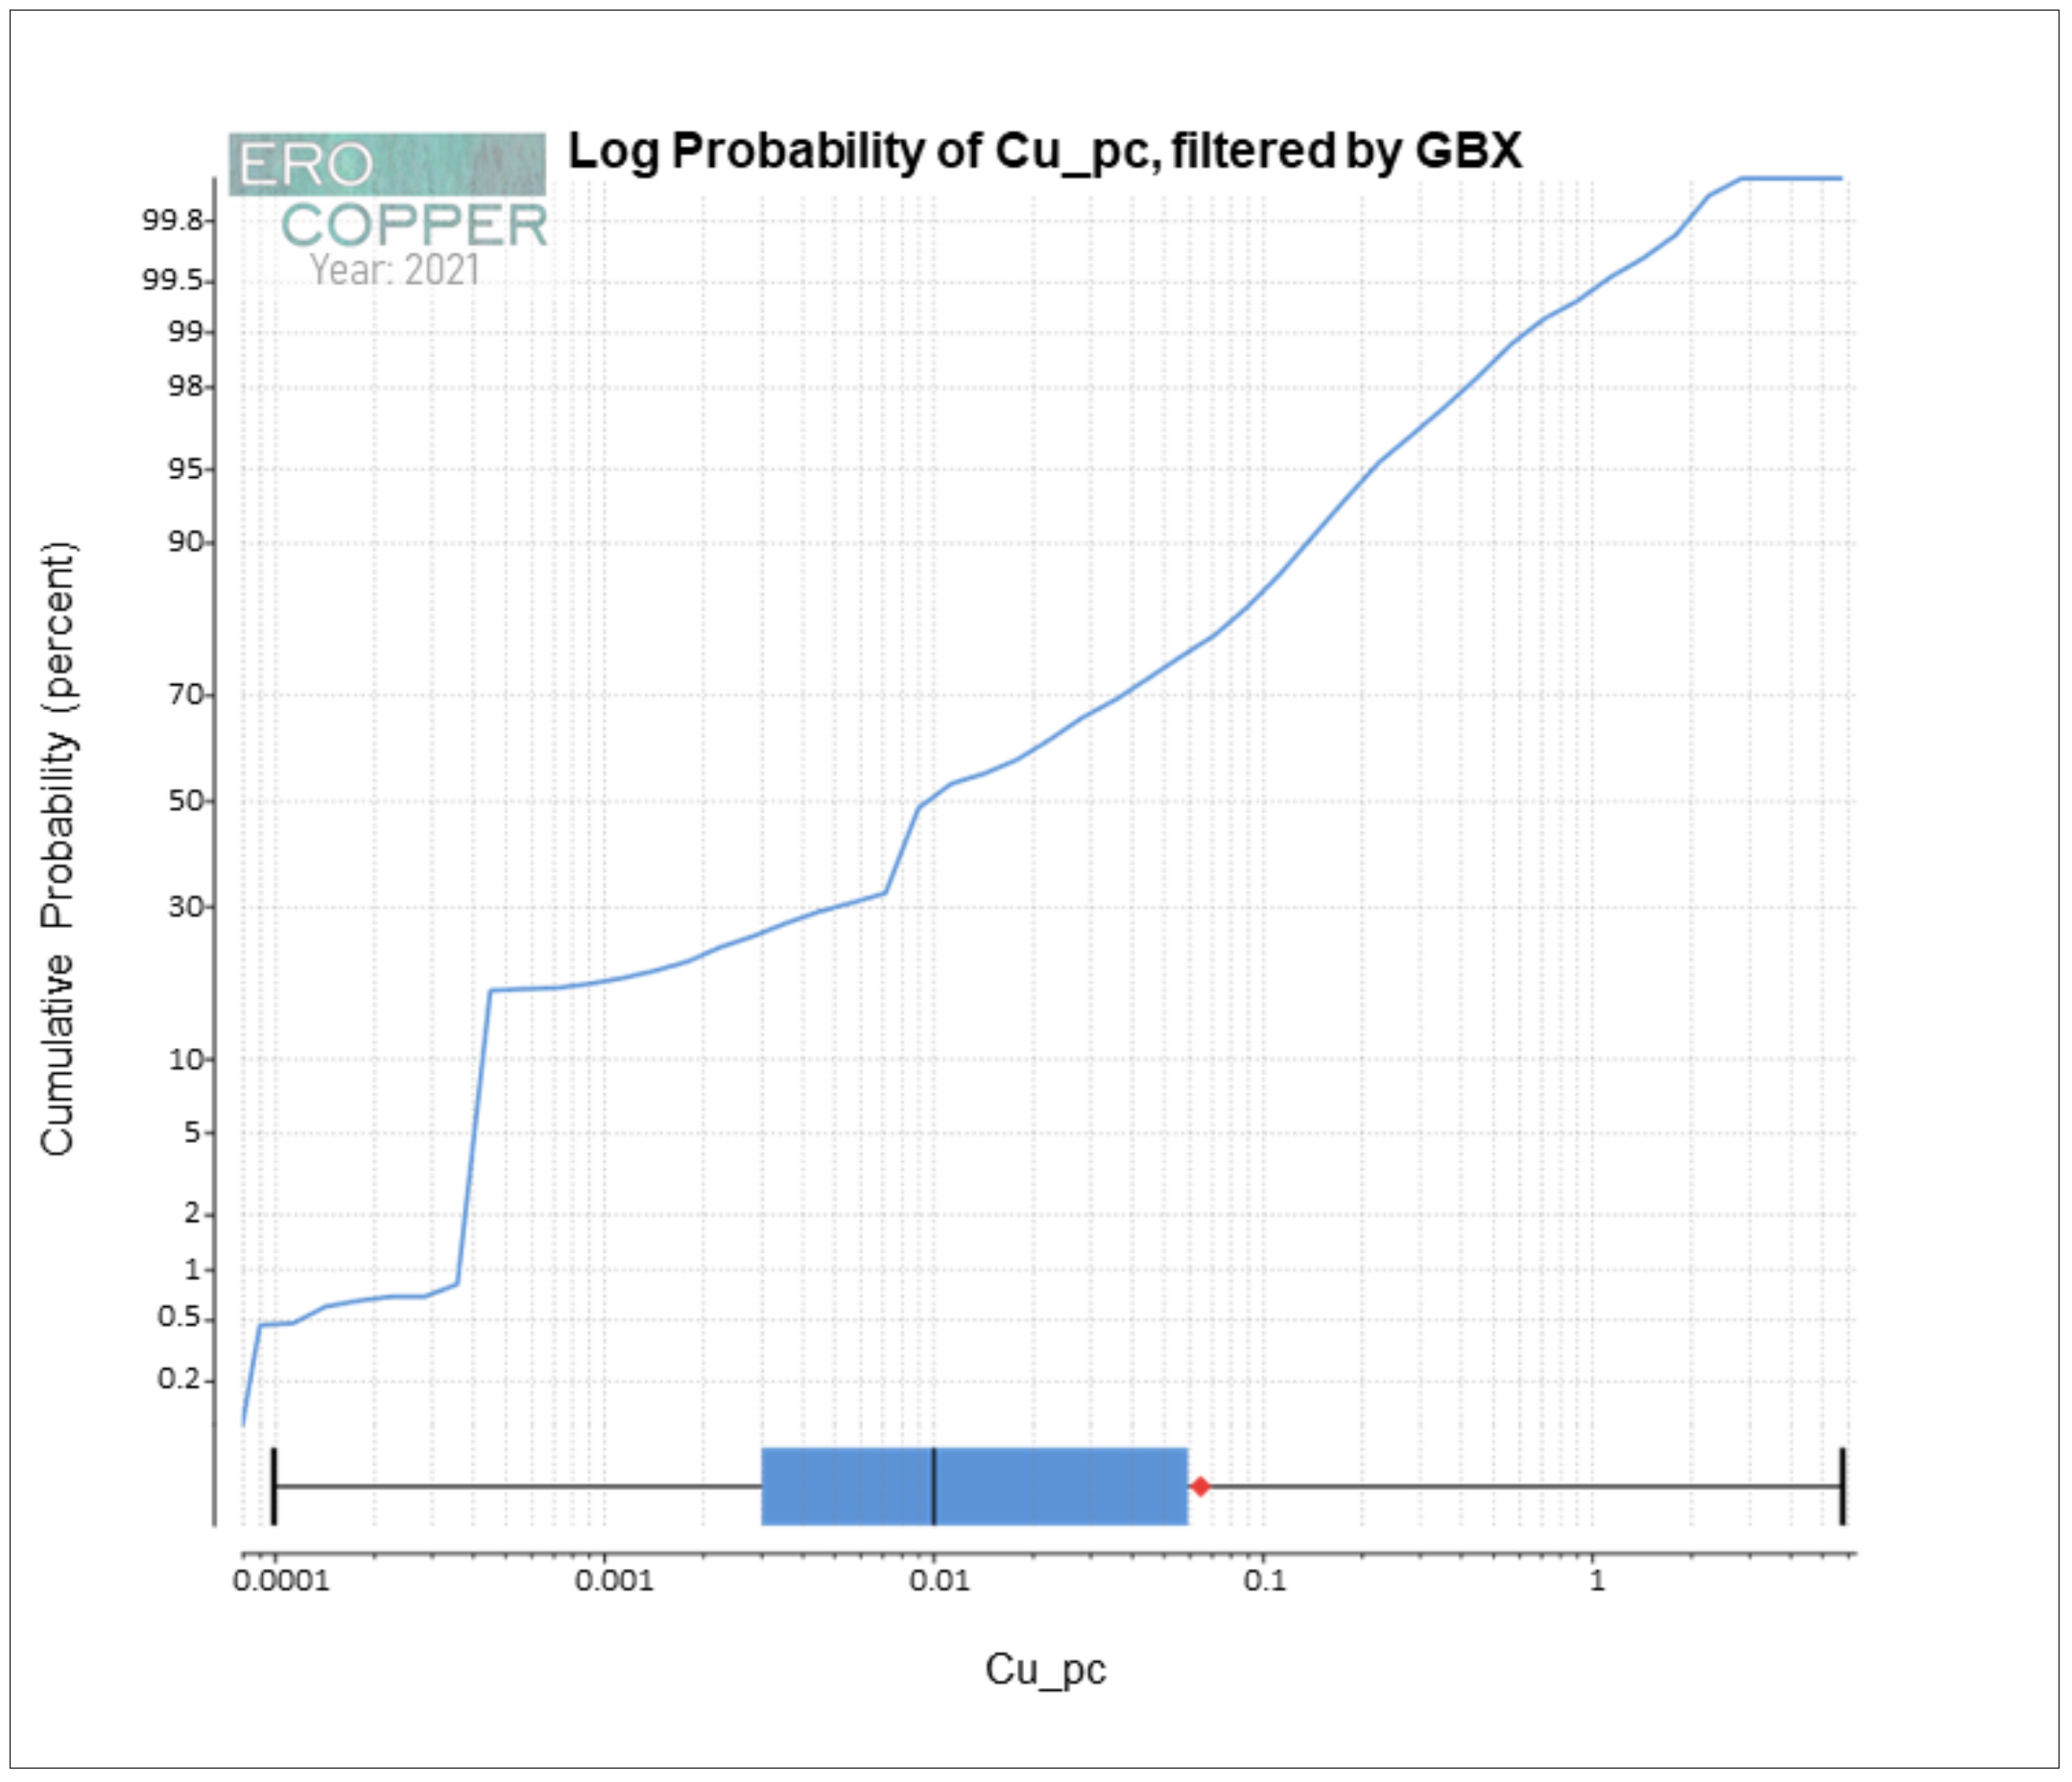
Figure 14-4: Histogram of Cu_pc, filtered by GBX | |
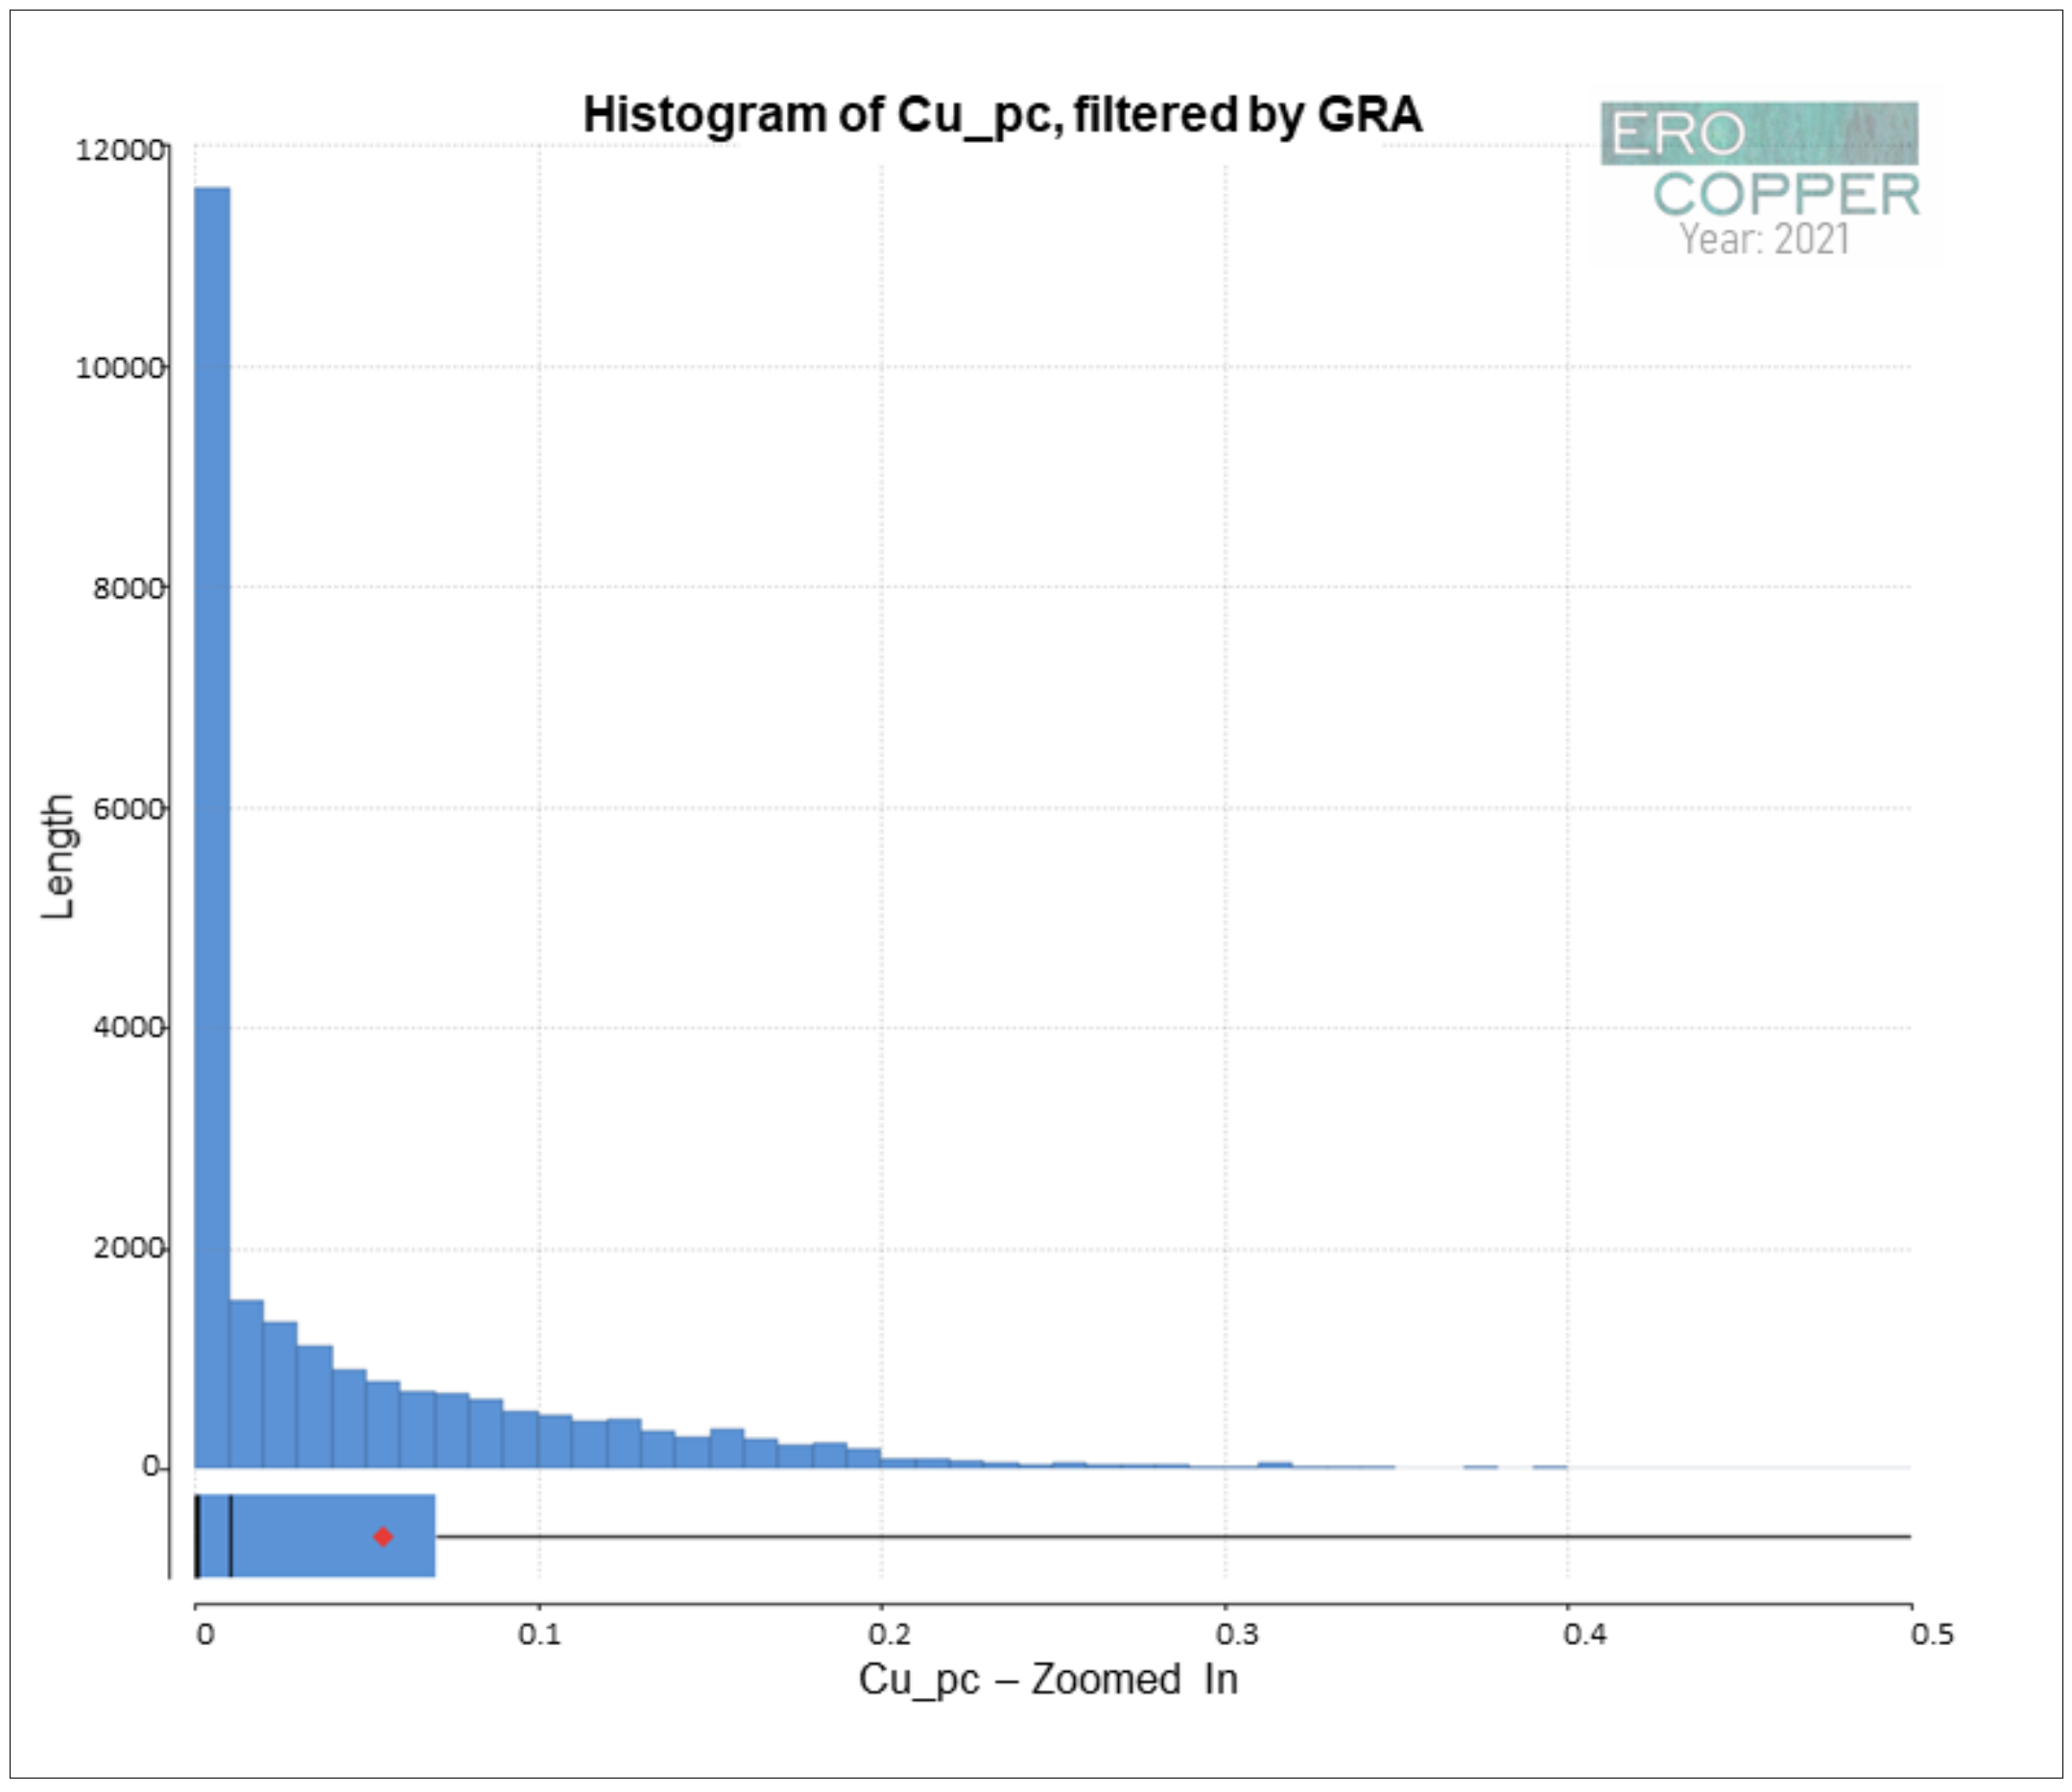
Figure 14-5: Histogram of Cu_pc, filtered by GRA | |
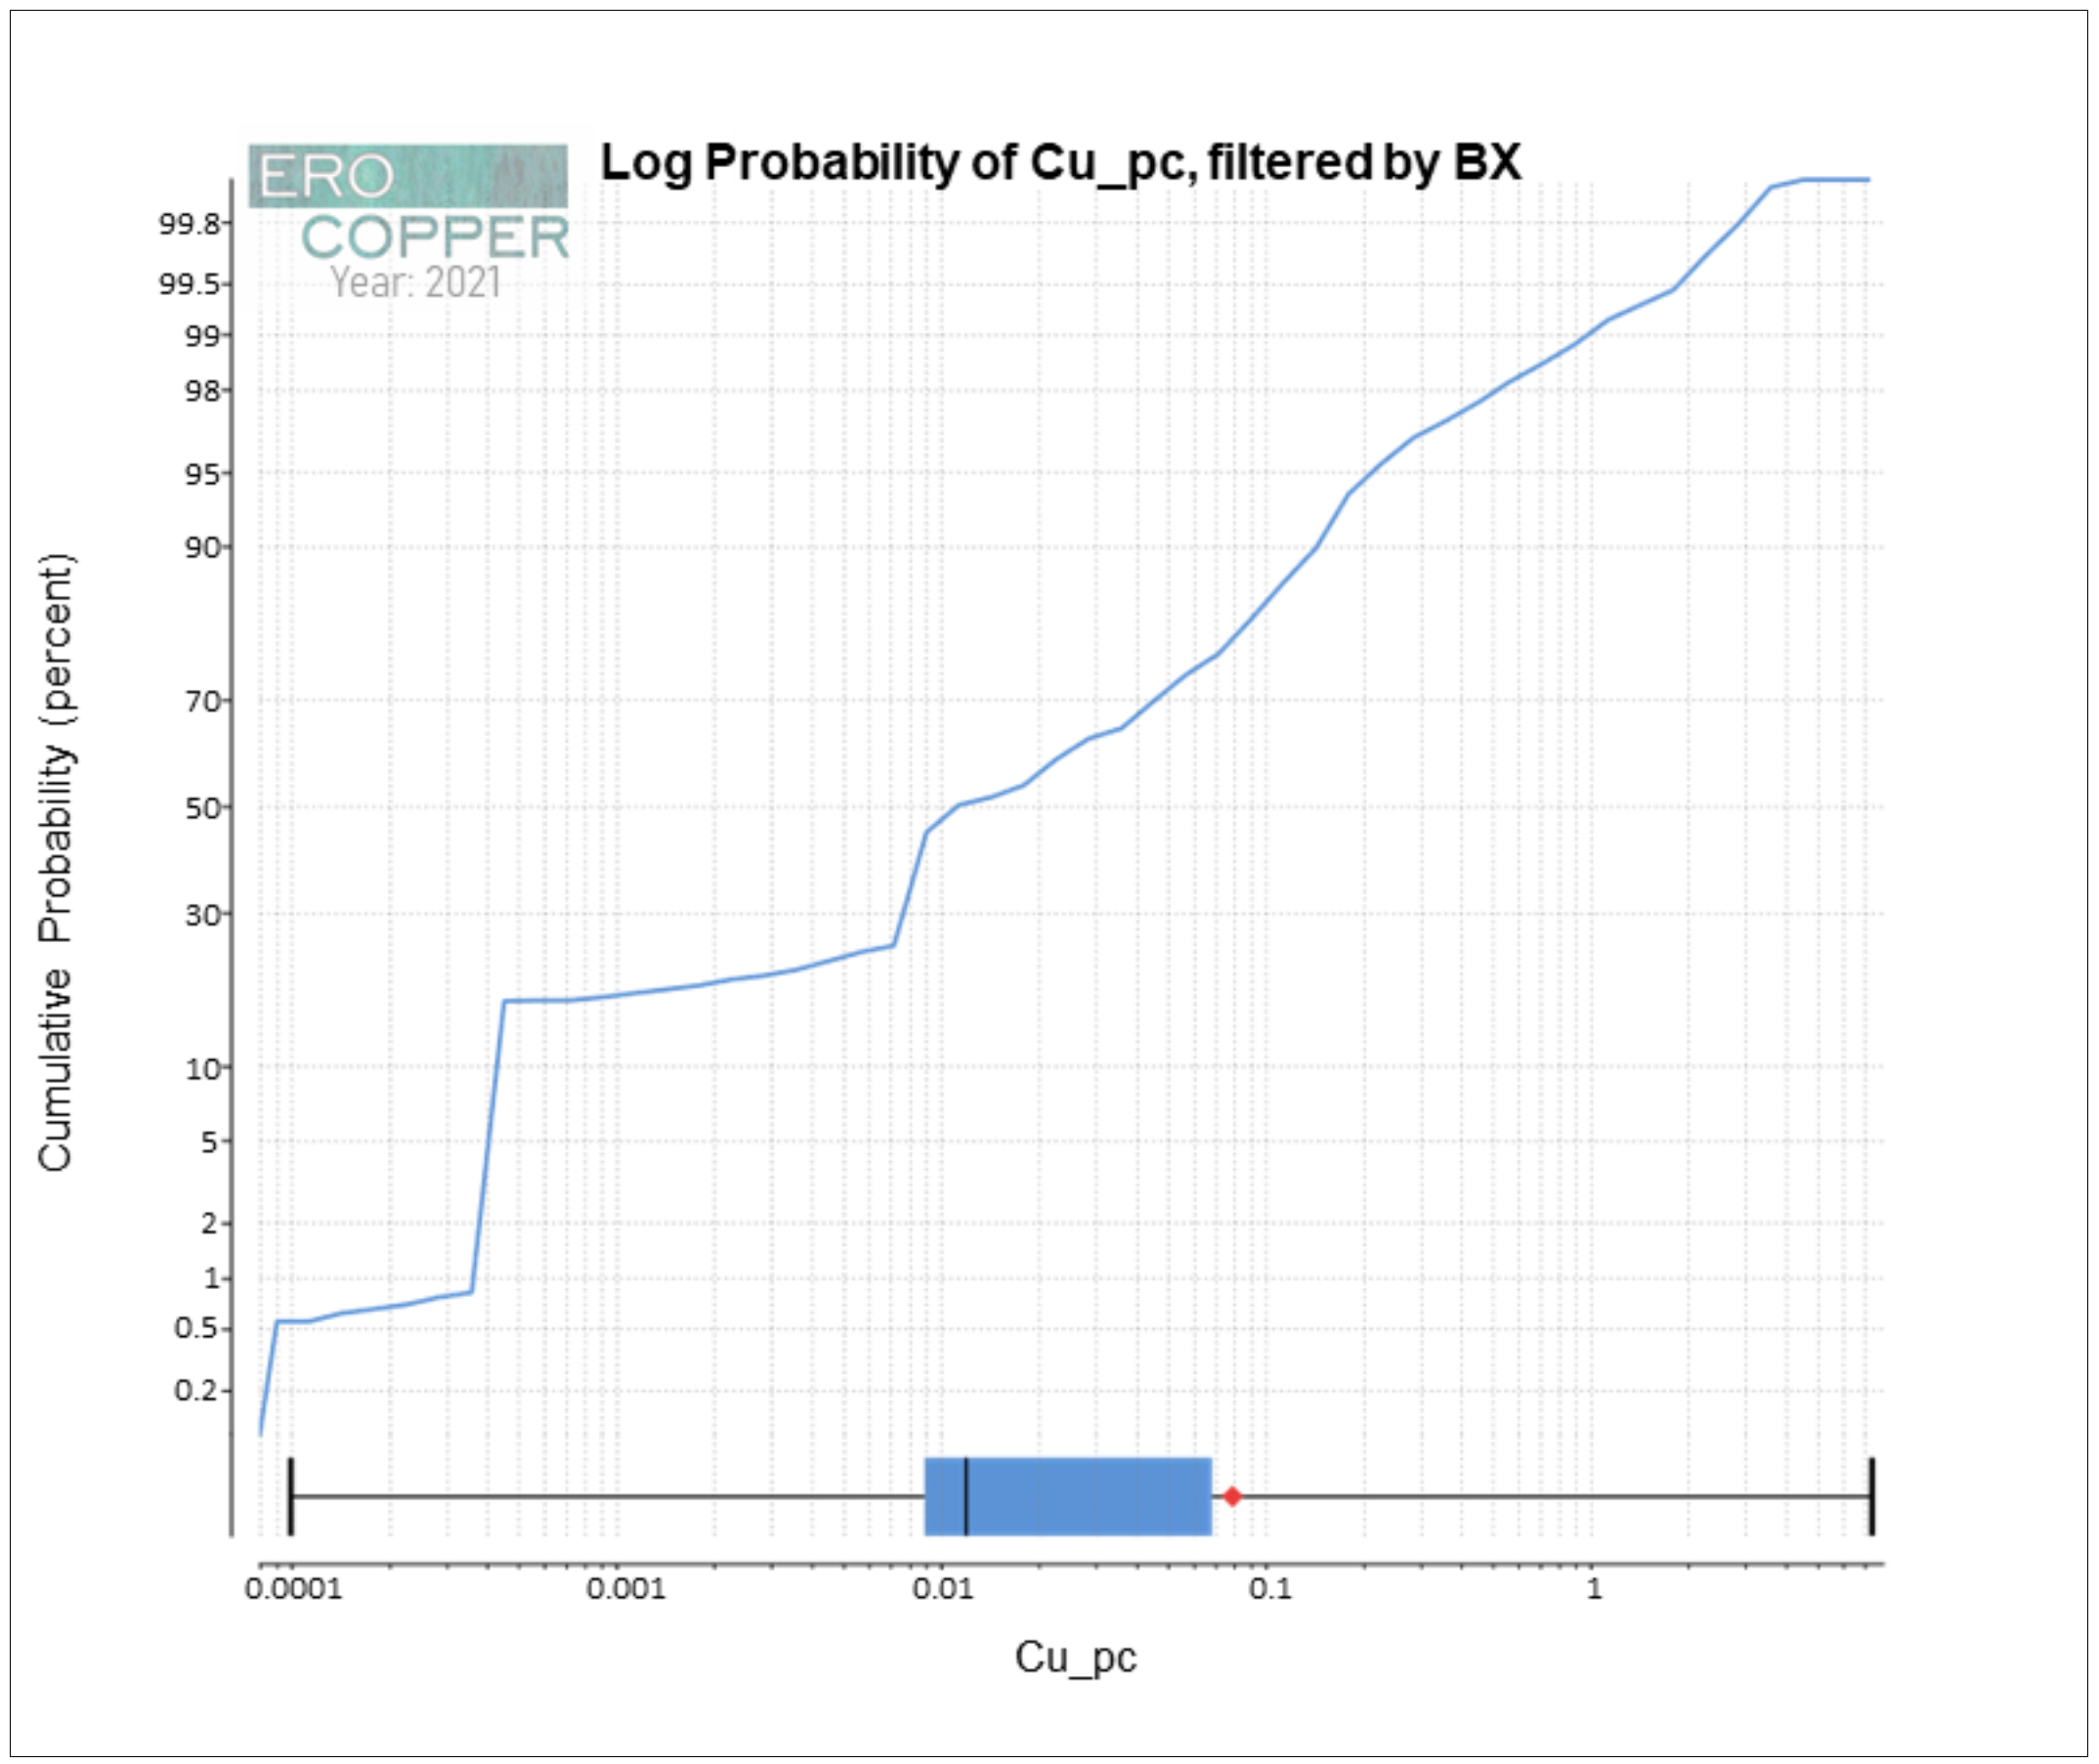
Figure 14-6: Log Probability of Cu_pc, filtered by BX | |
Figure 14-7: Log Probability of Cu_pc, filtered by BX | |
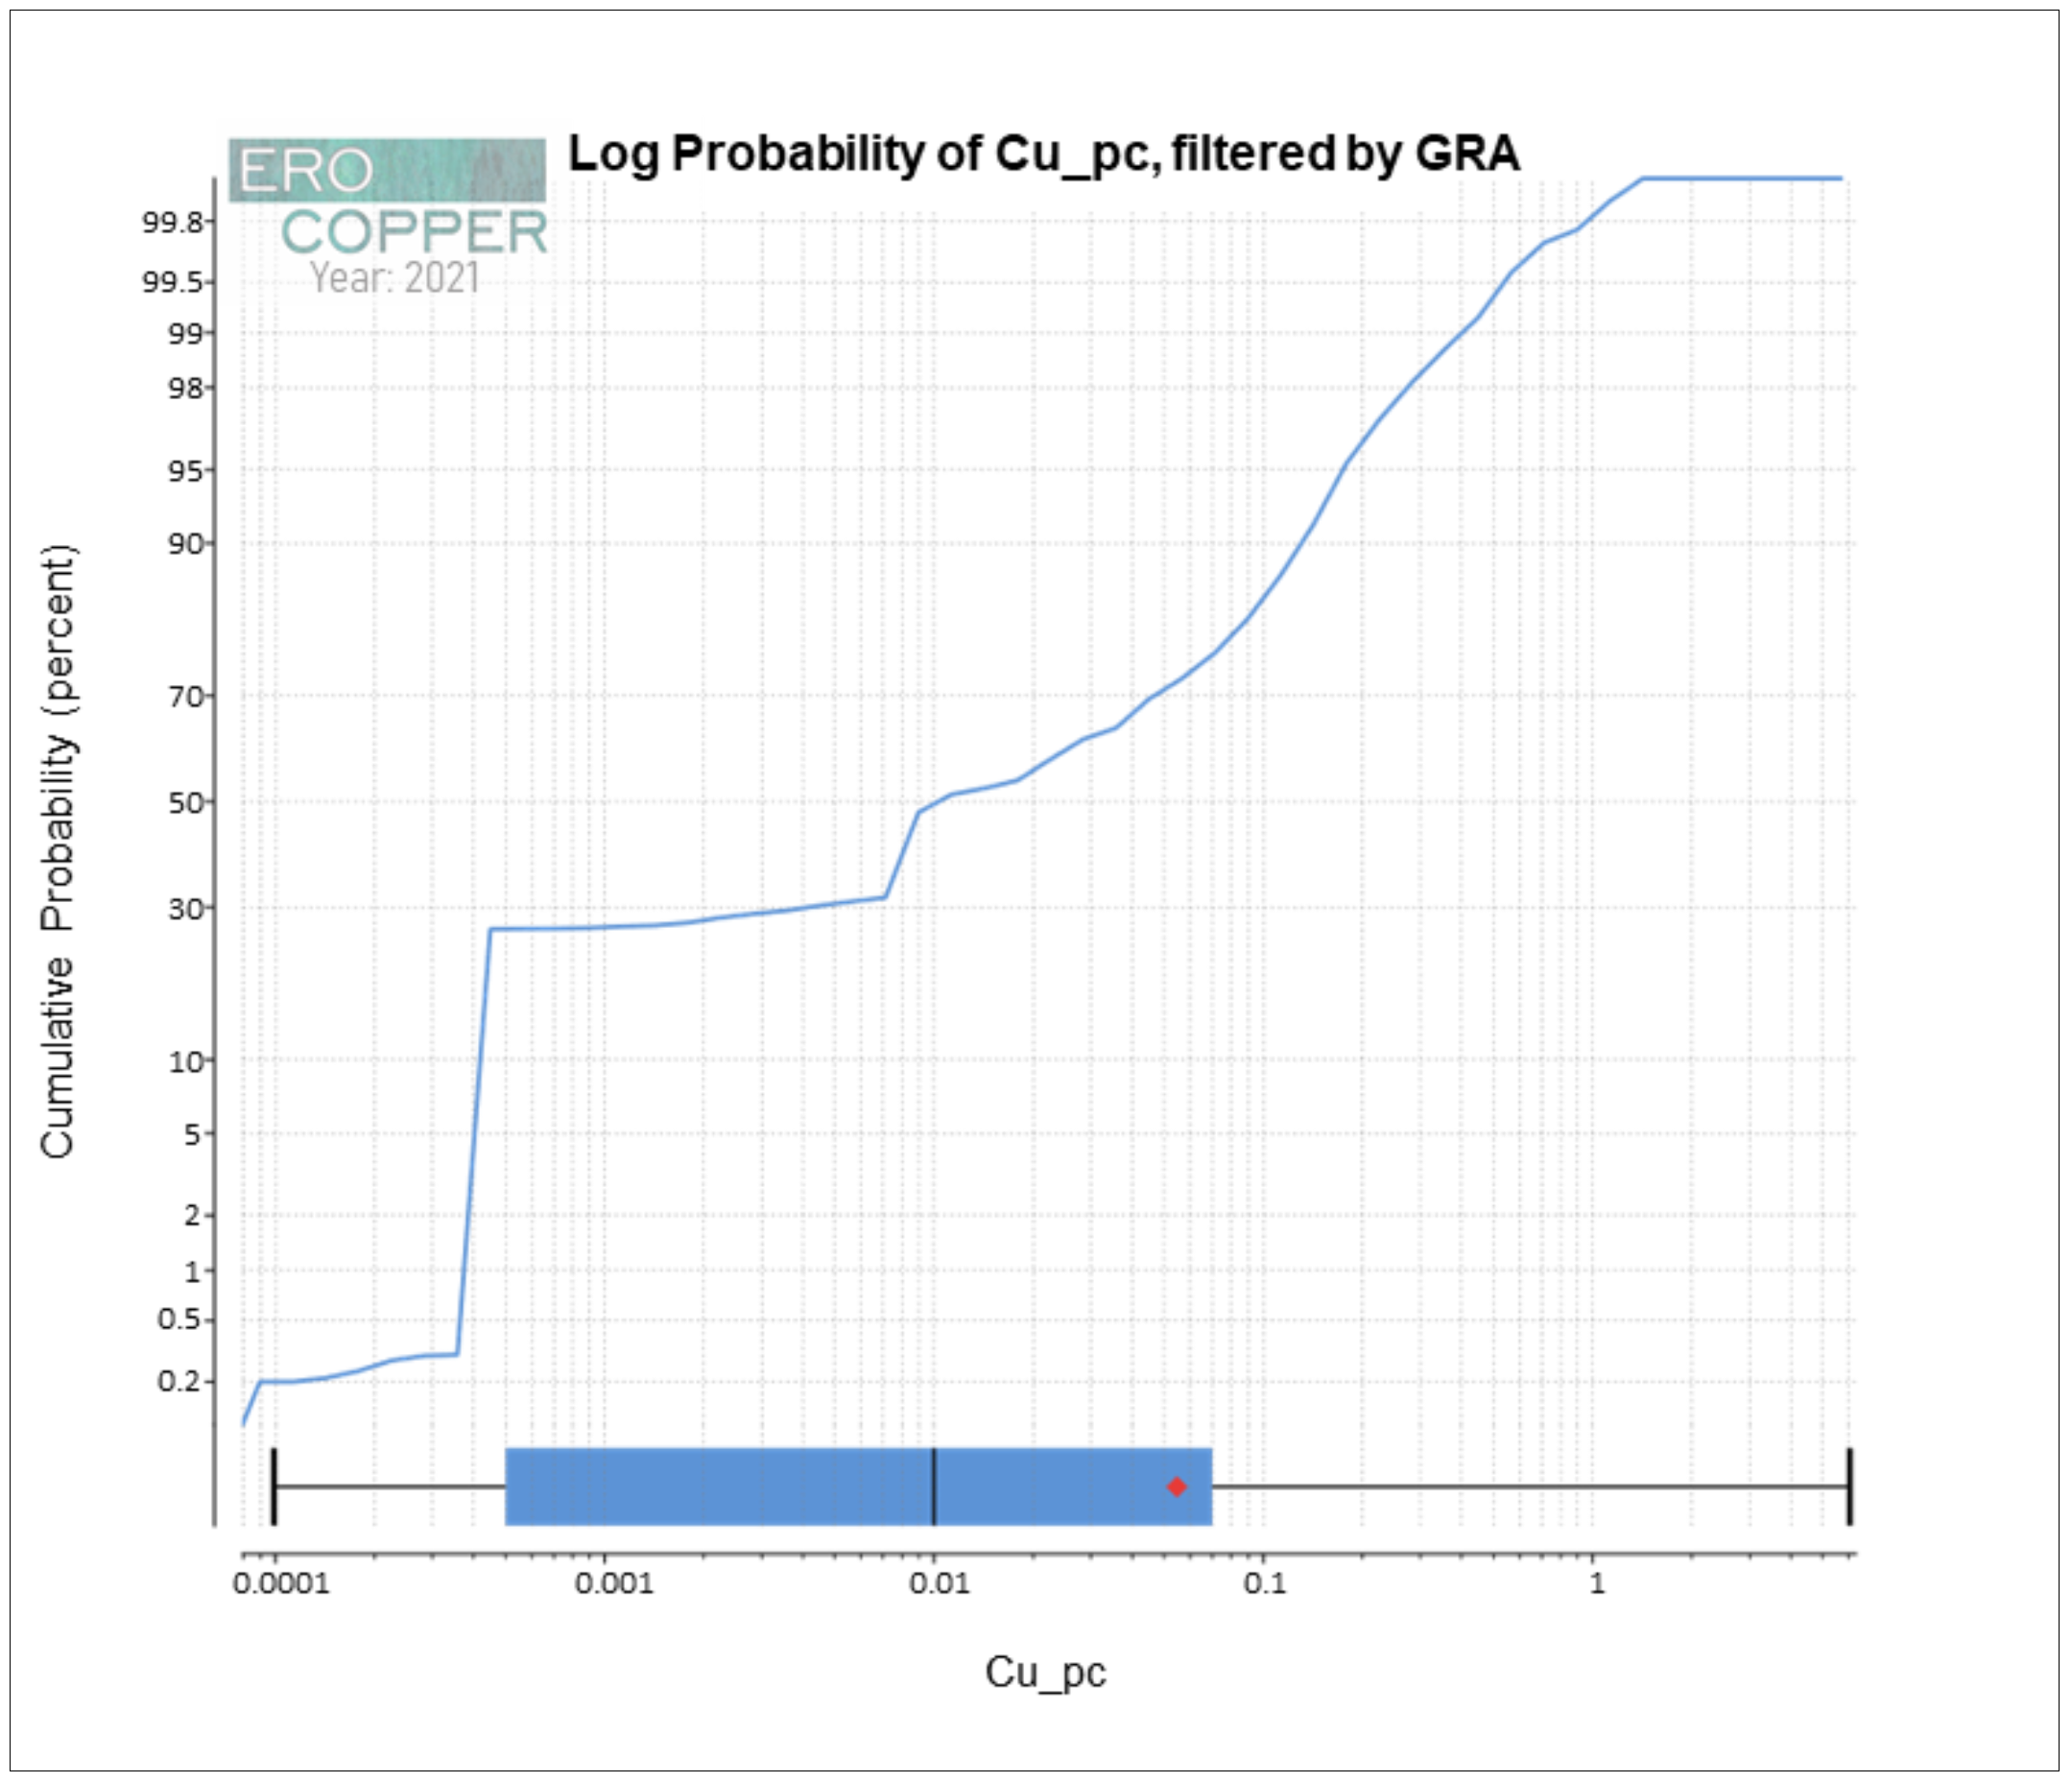
Figure 14-8: Log Probability of Cu_pc, filtered by GRA | |
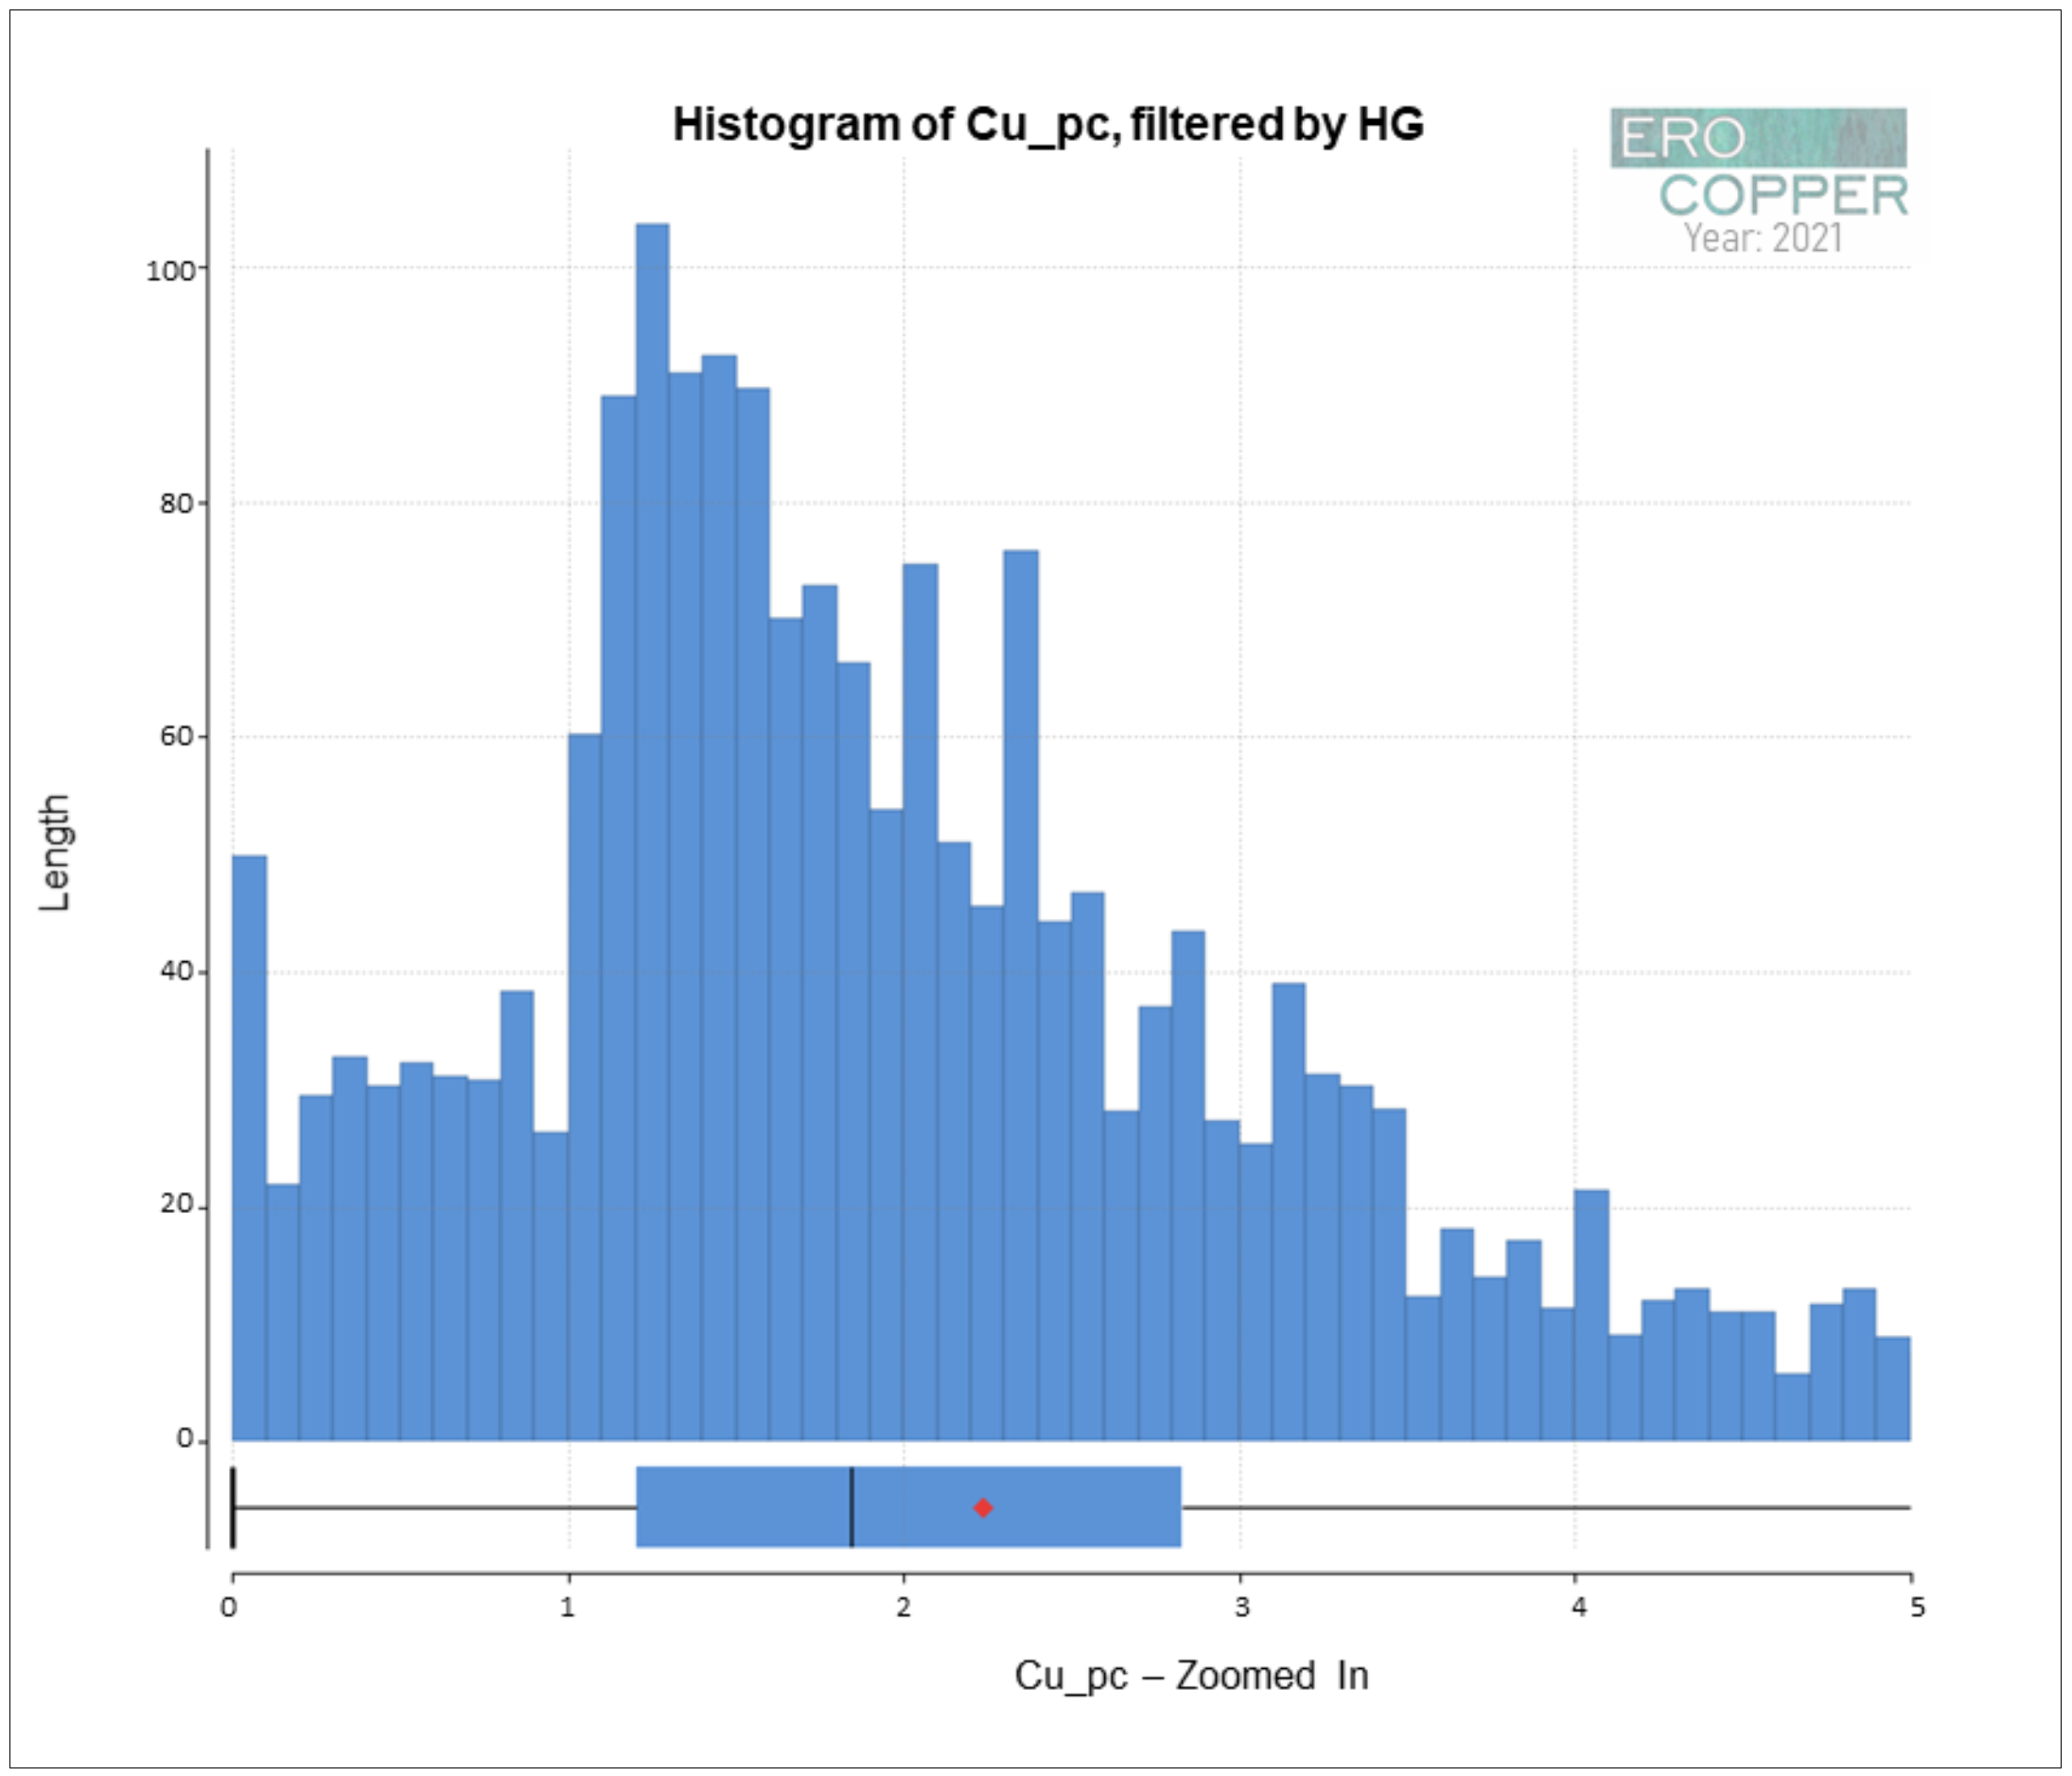
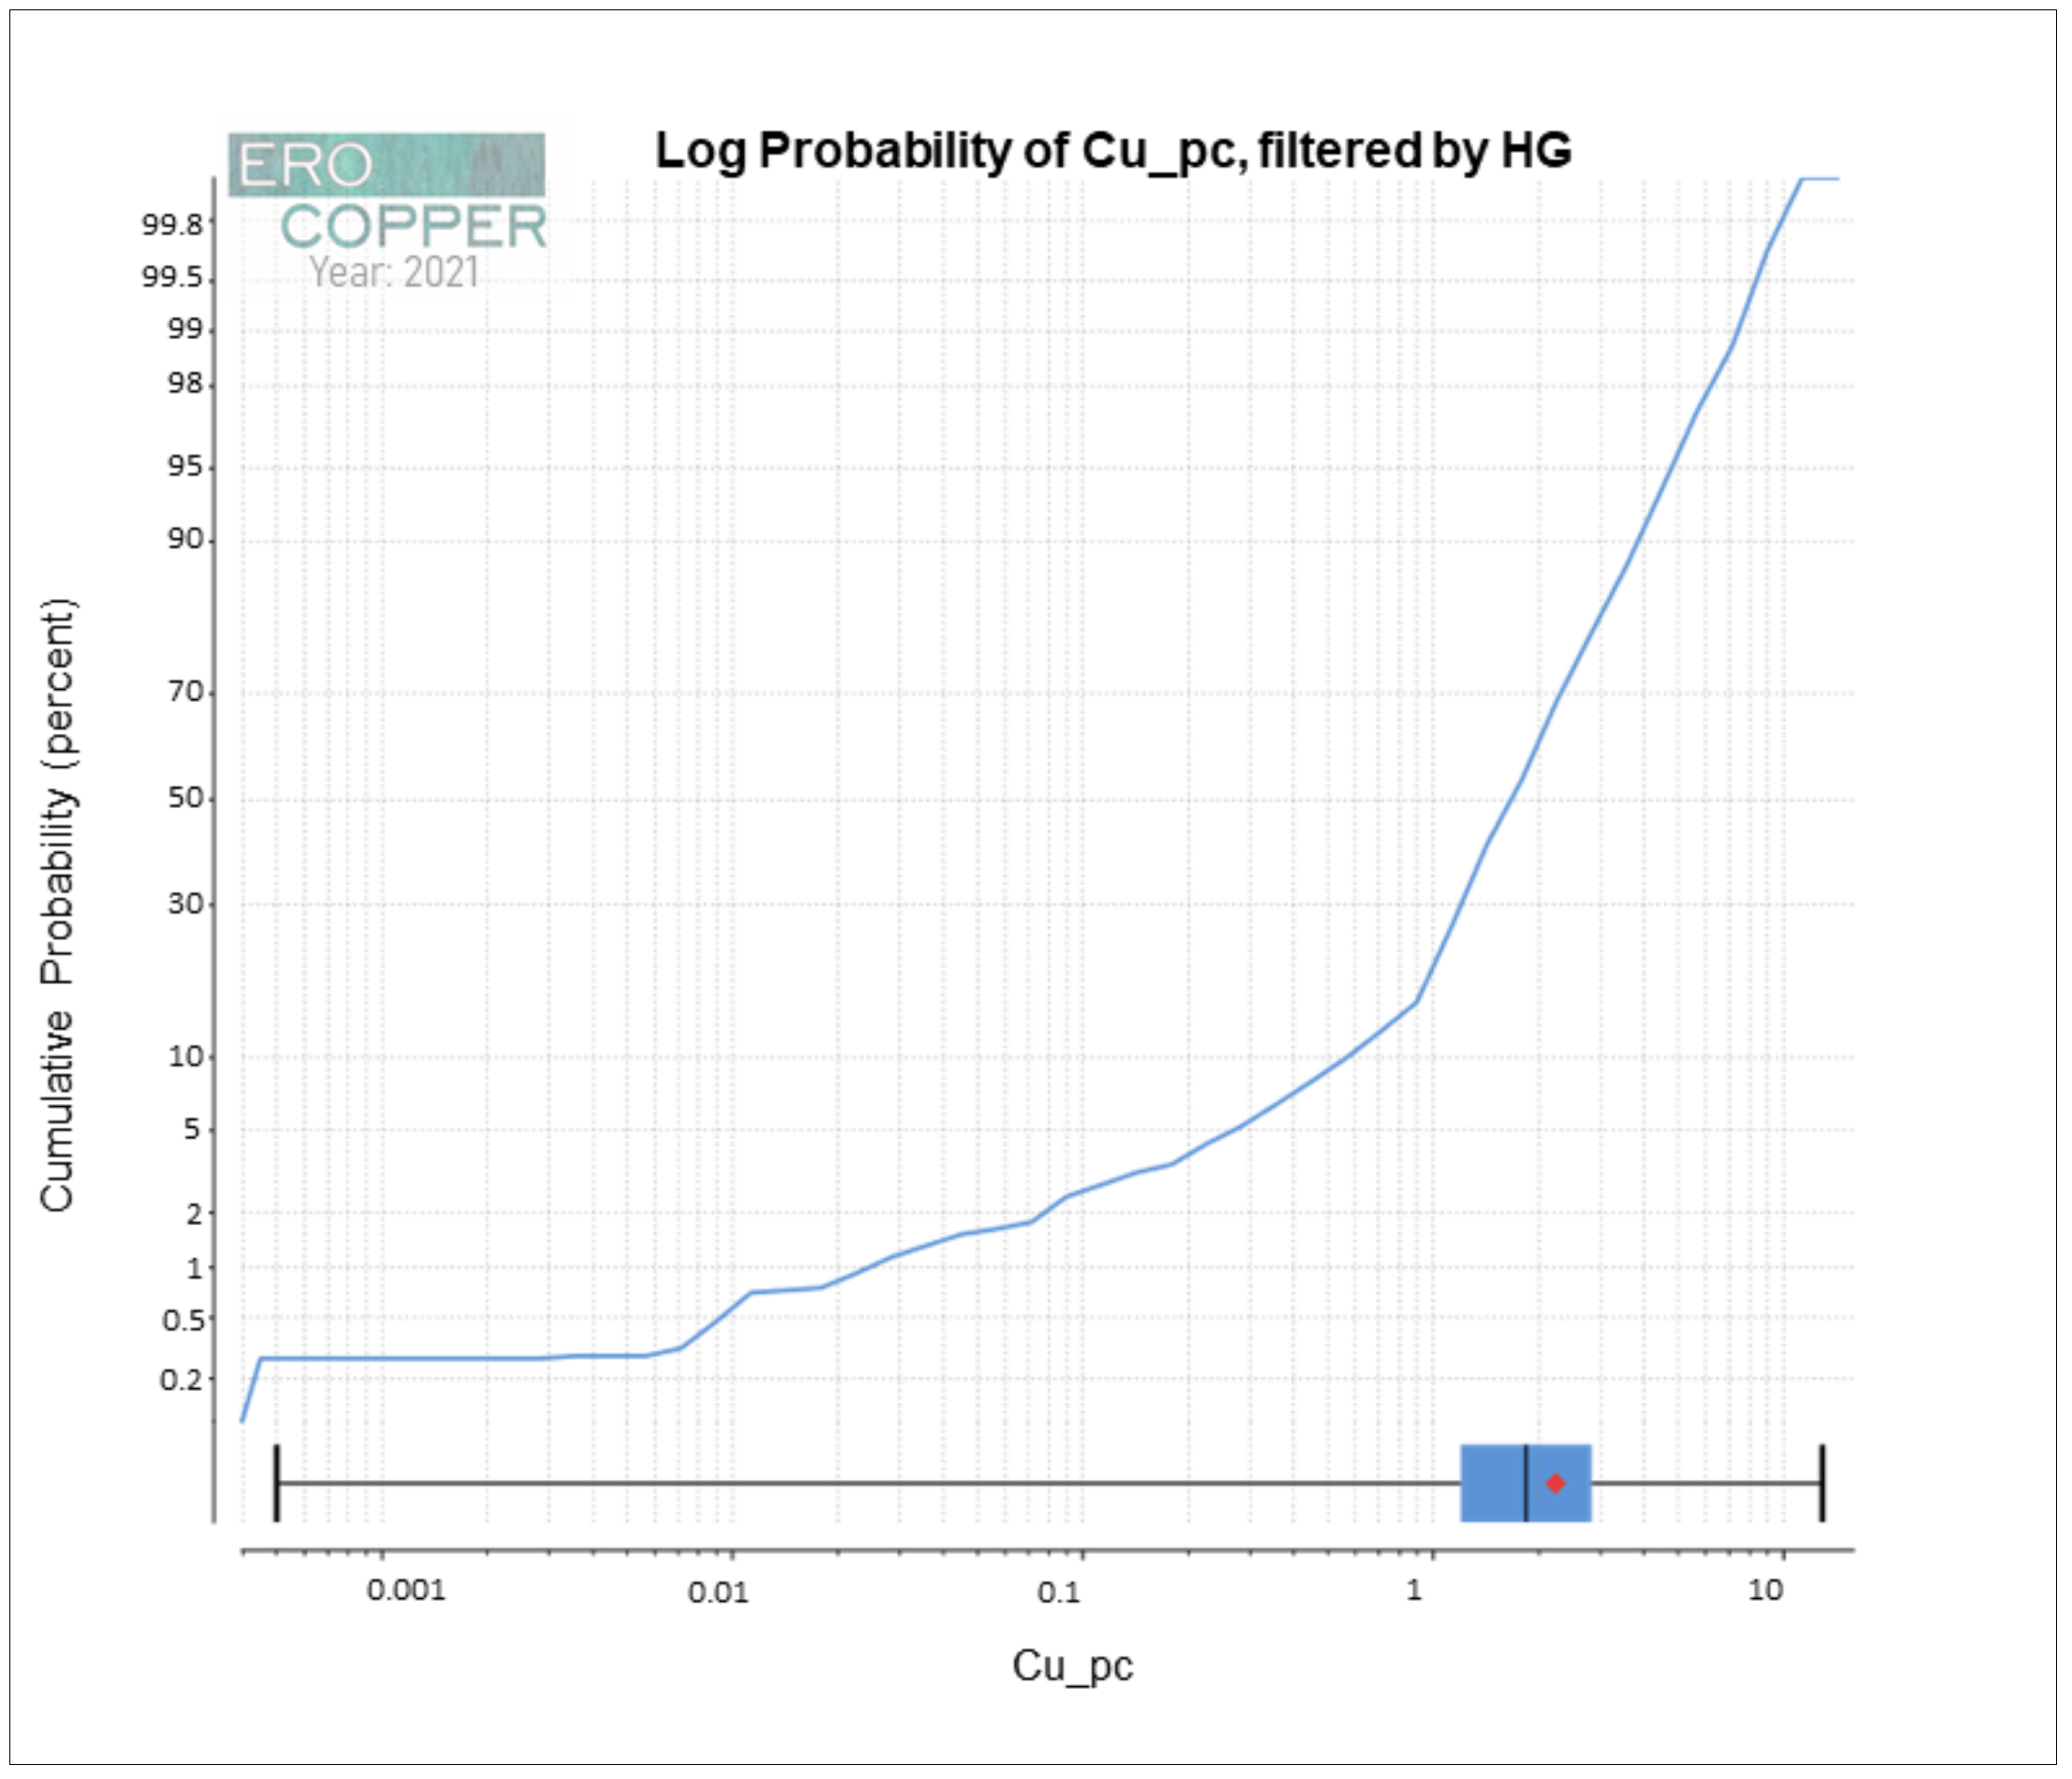
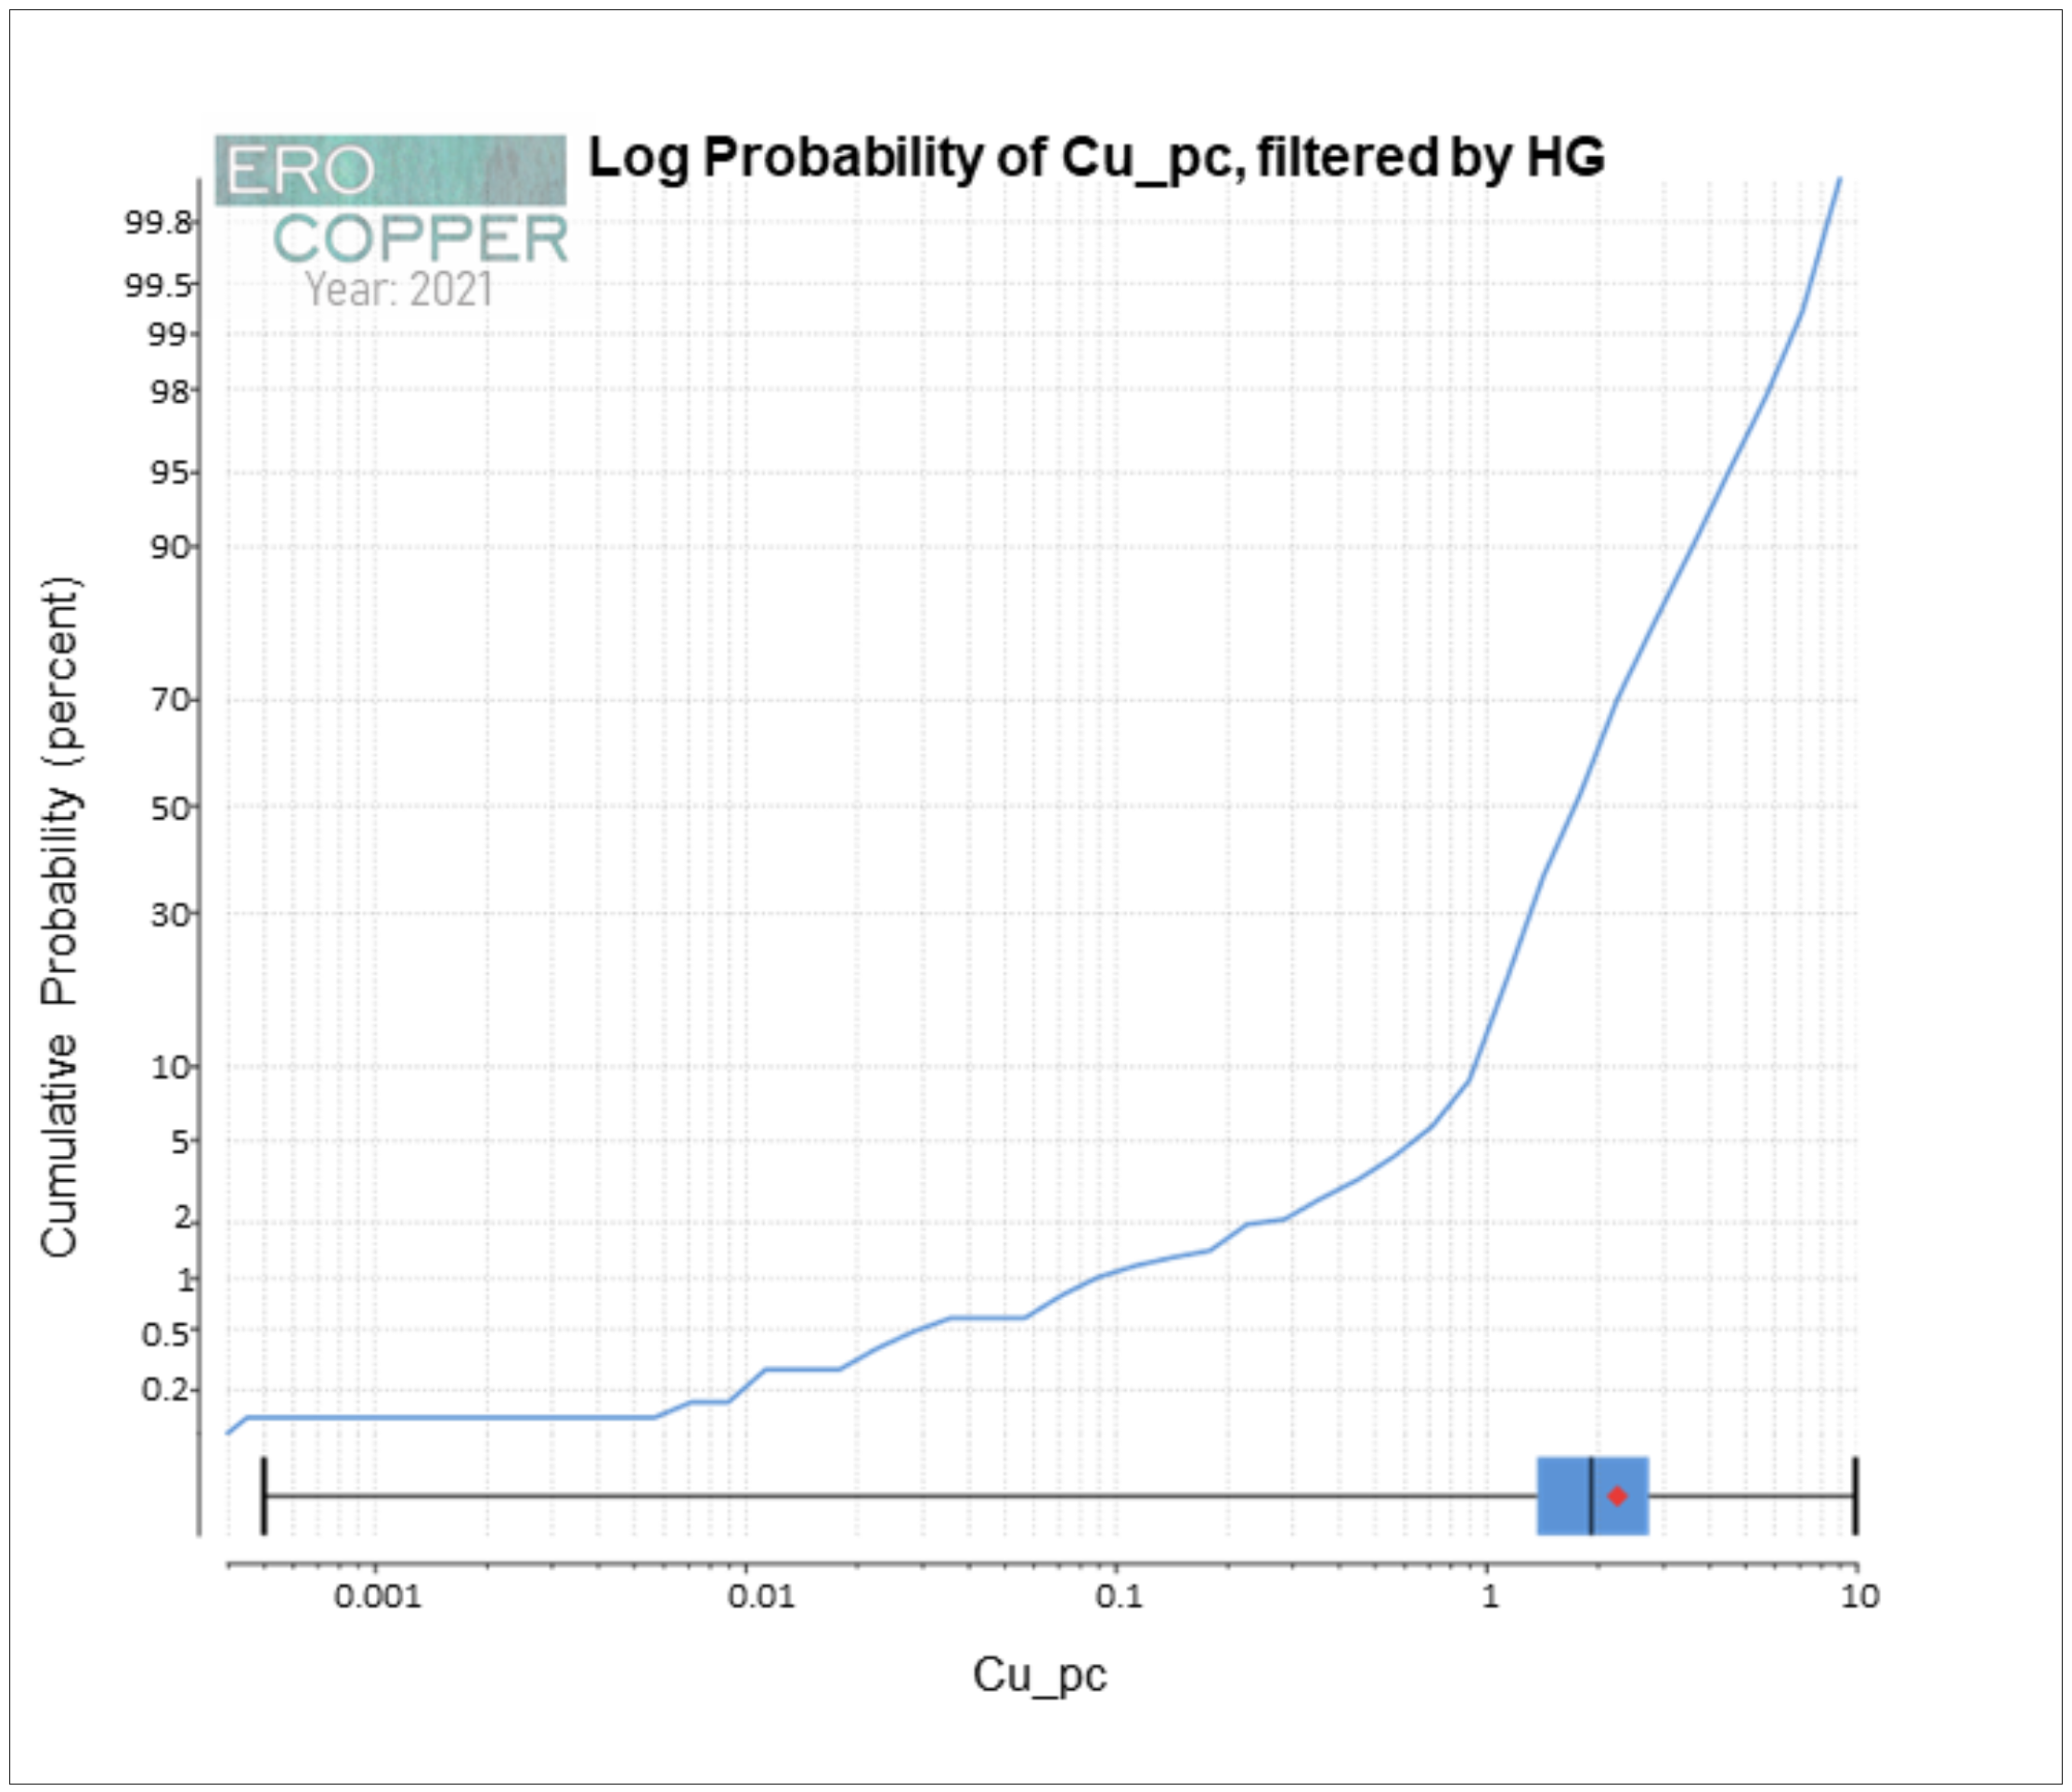
Figure 14-9: Histogram of Cu_pc, filtered by HG | |
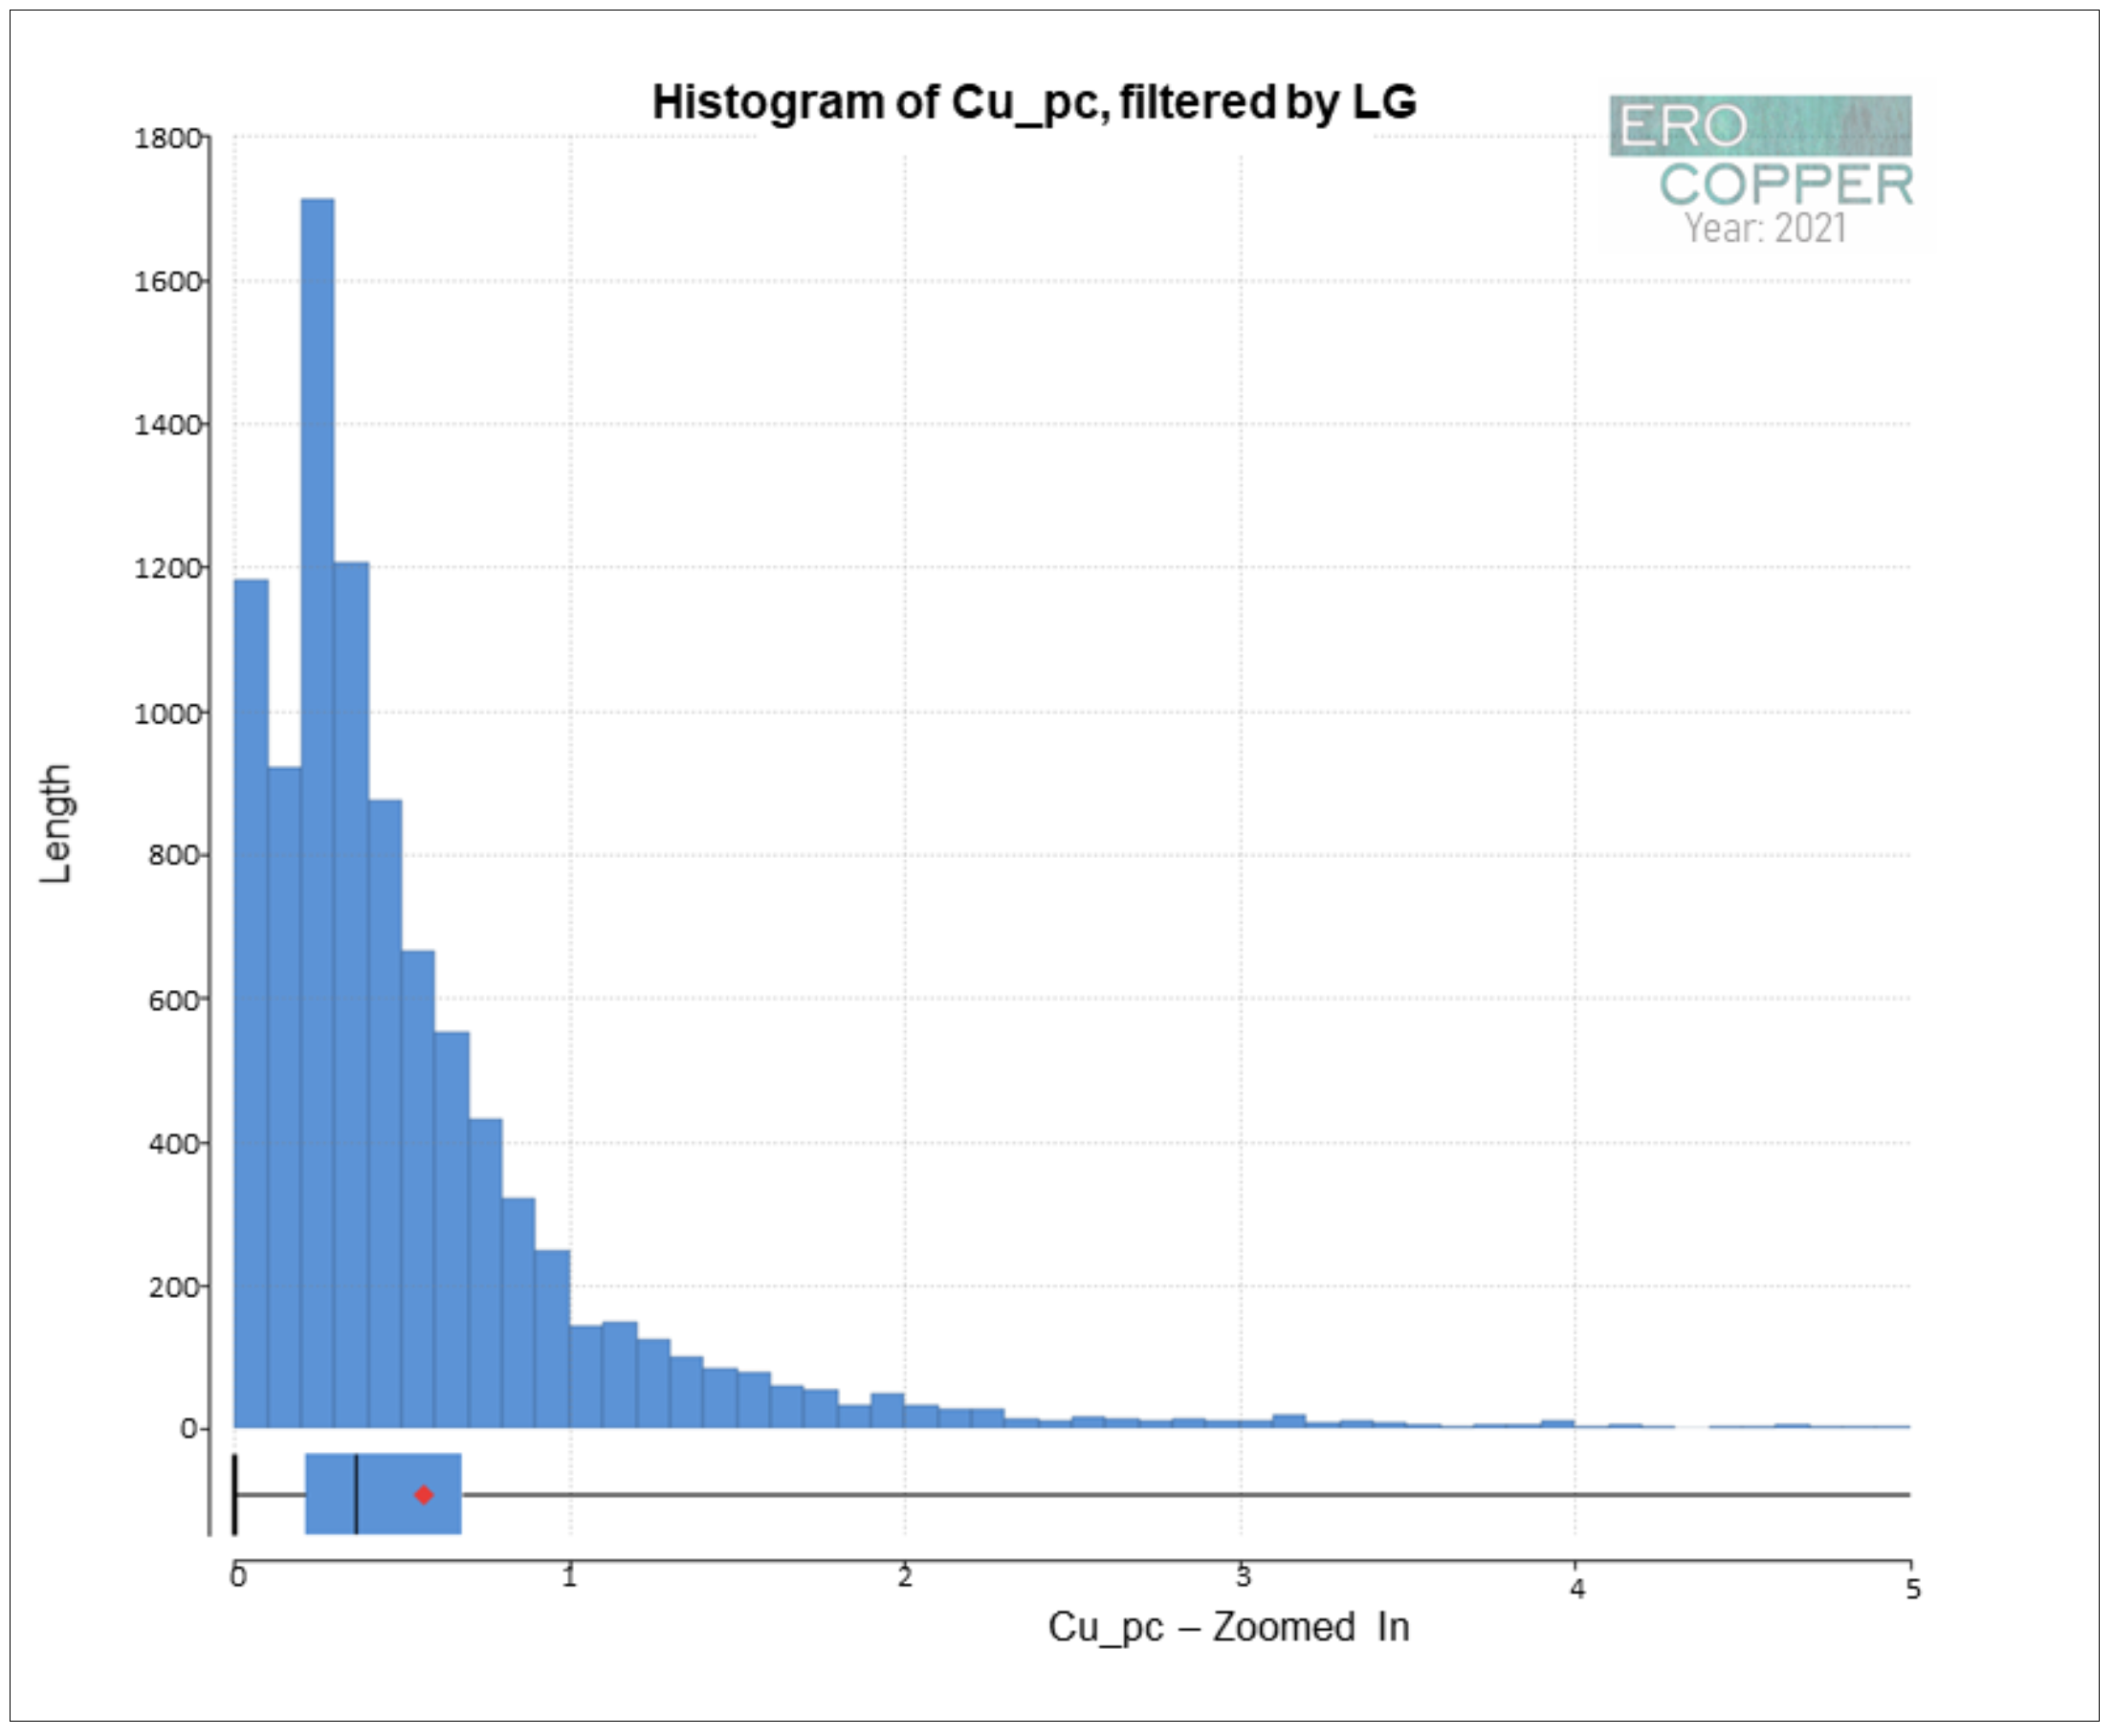
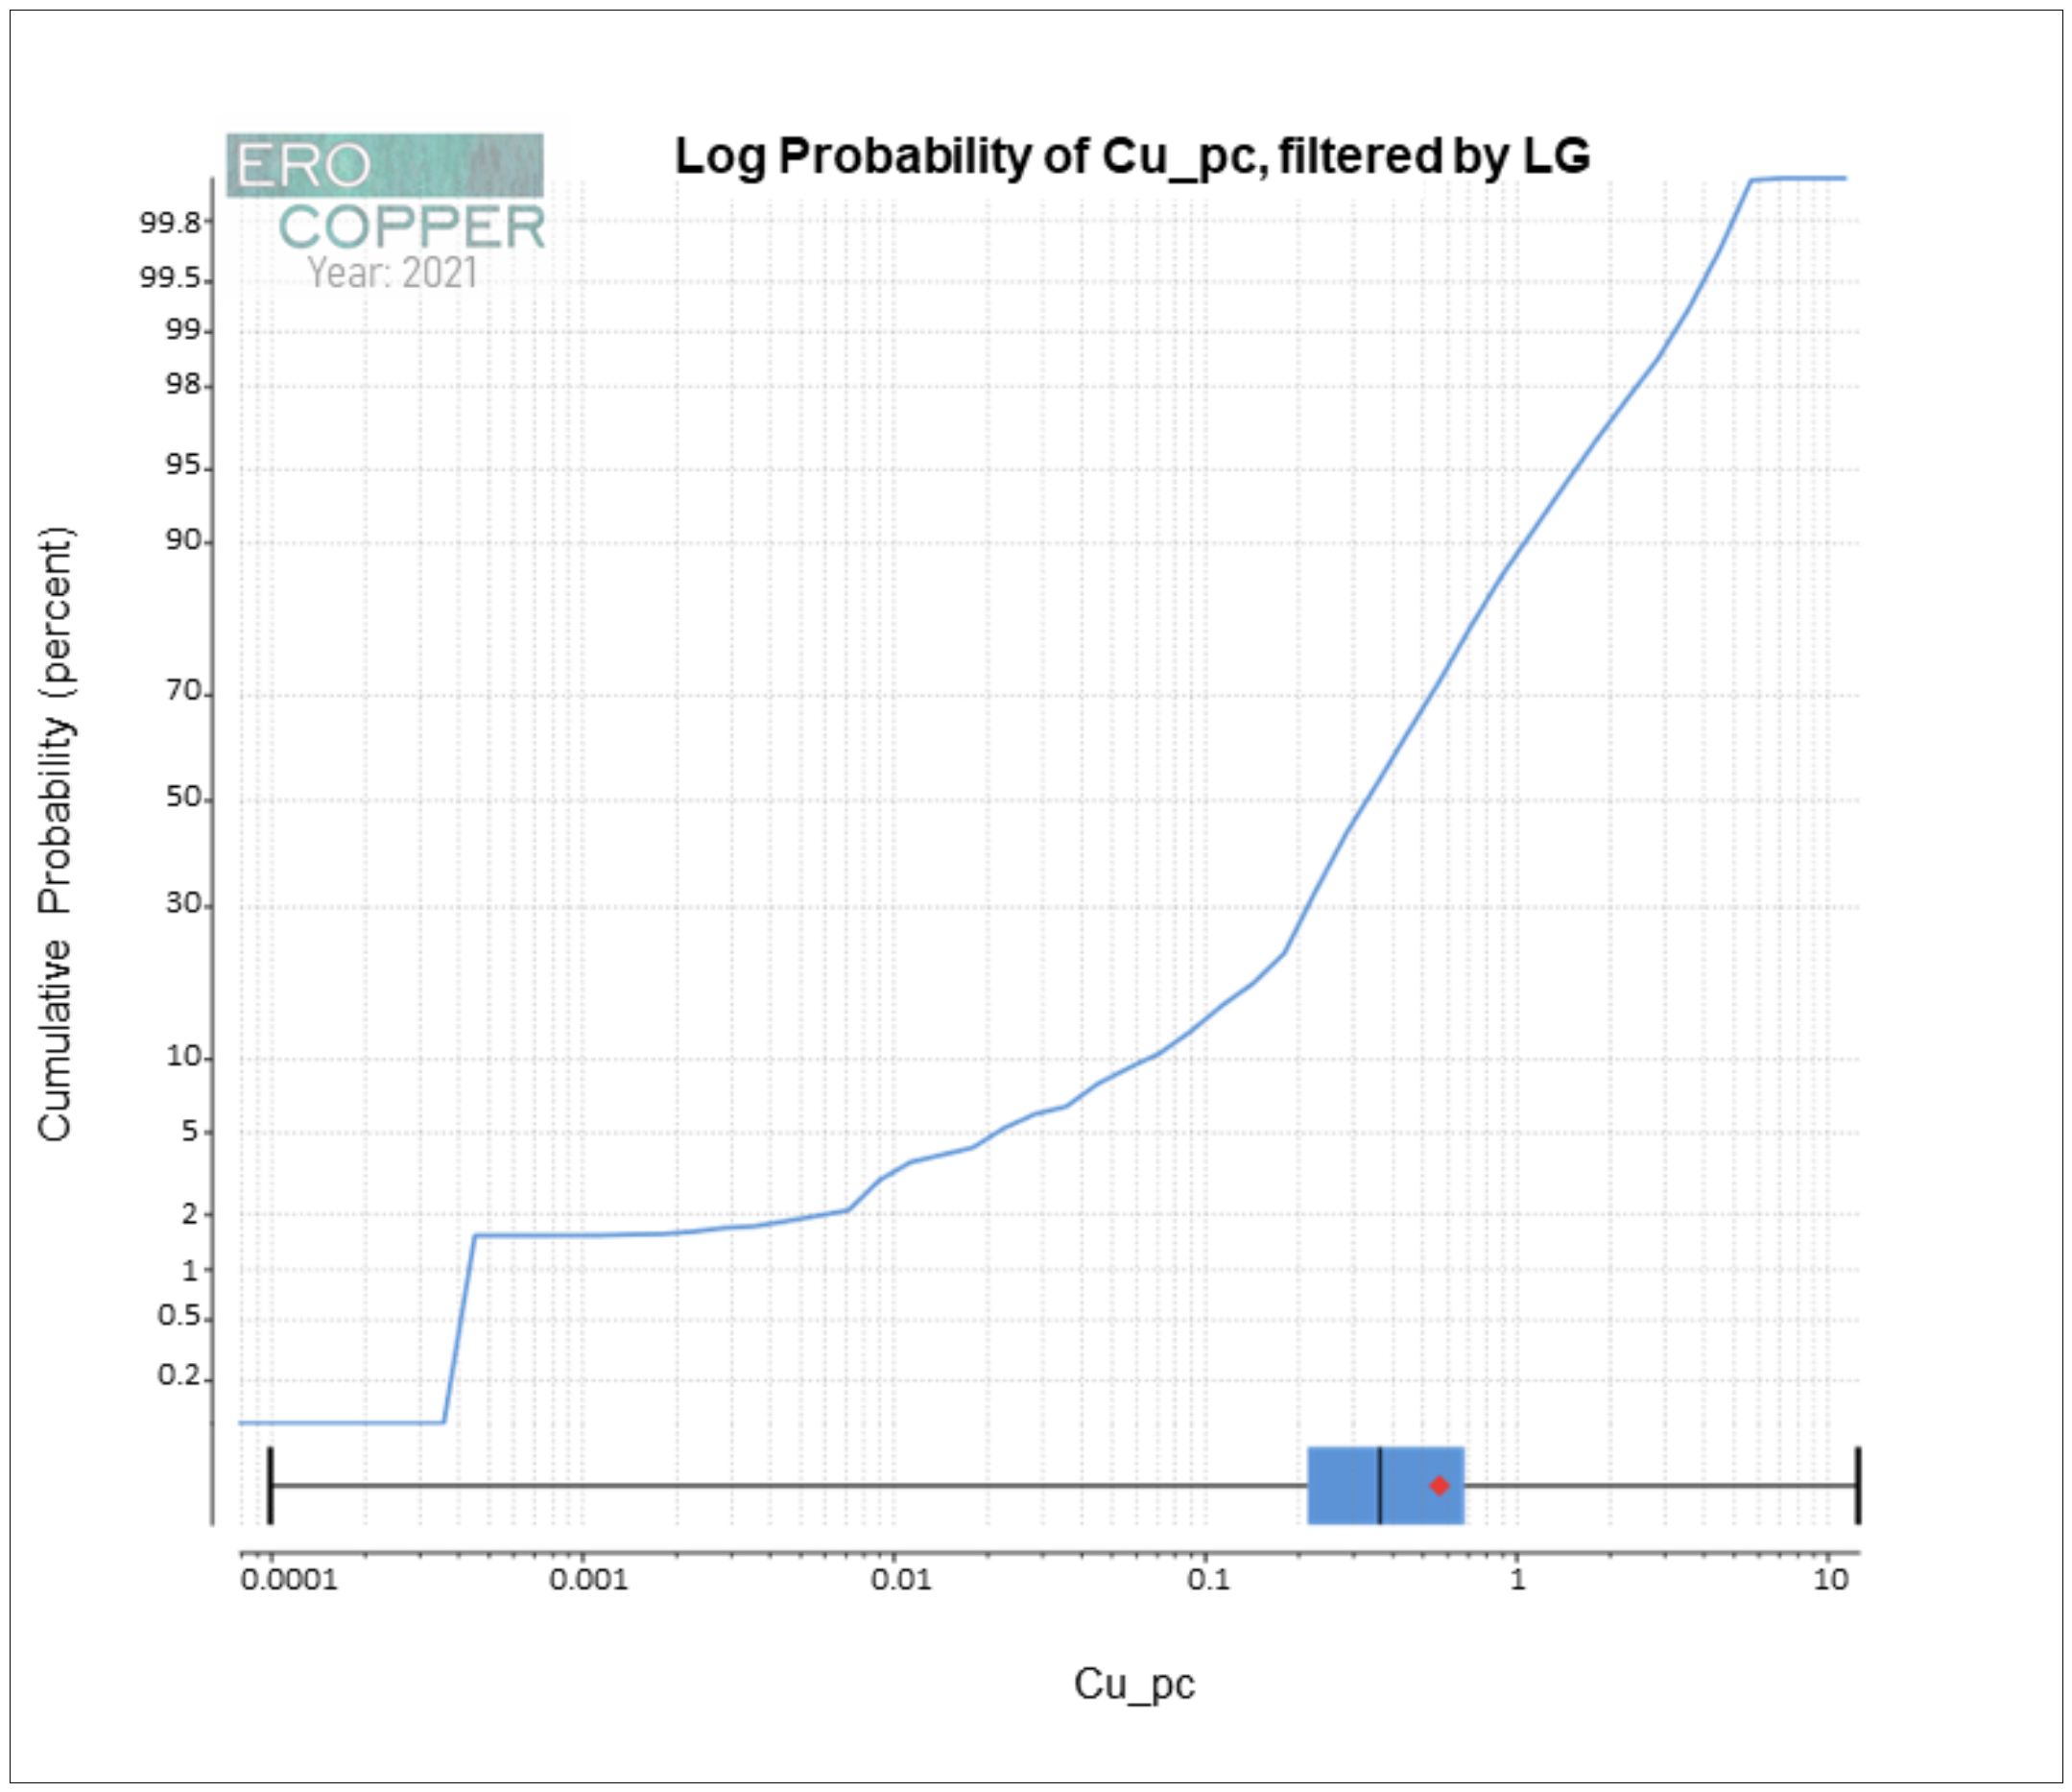
Figure 14-10: Histogram of Cu_pc, filtered by LG | |
Figure 14-11: Log Probability of Cu_pc, filtered by HG | |
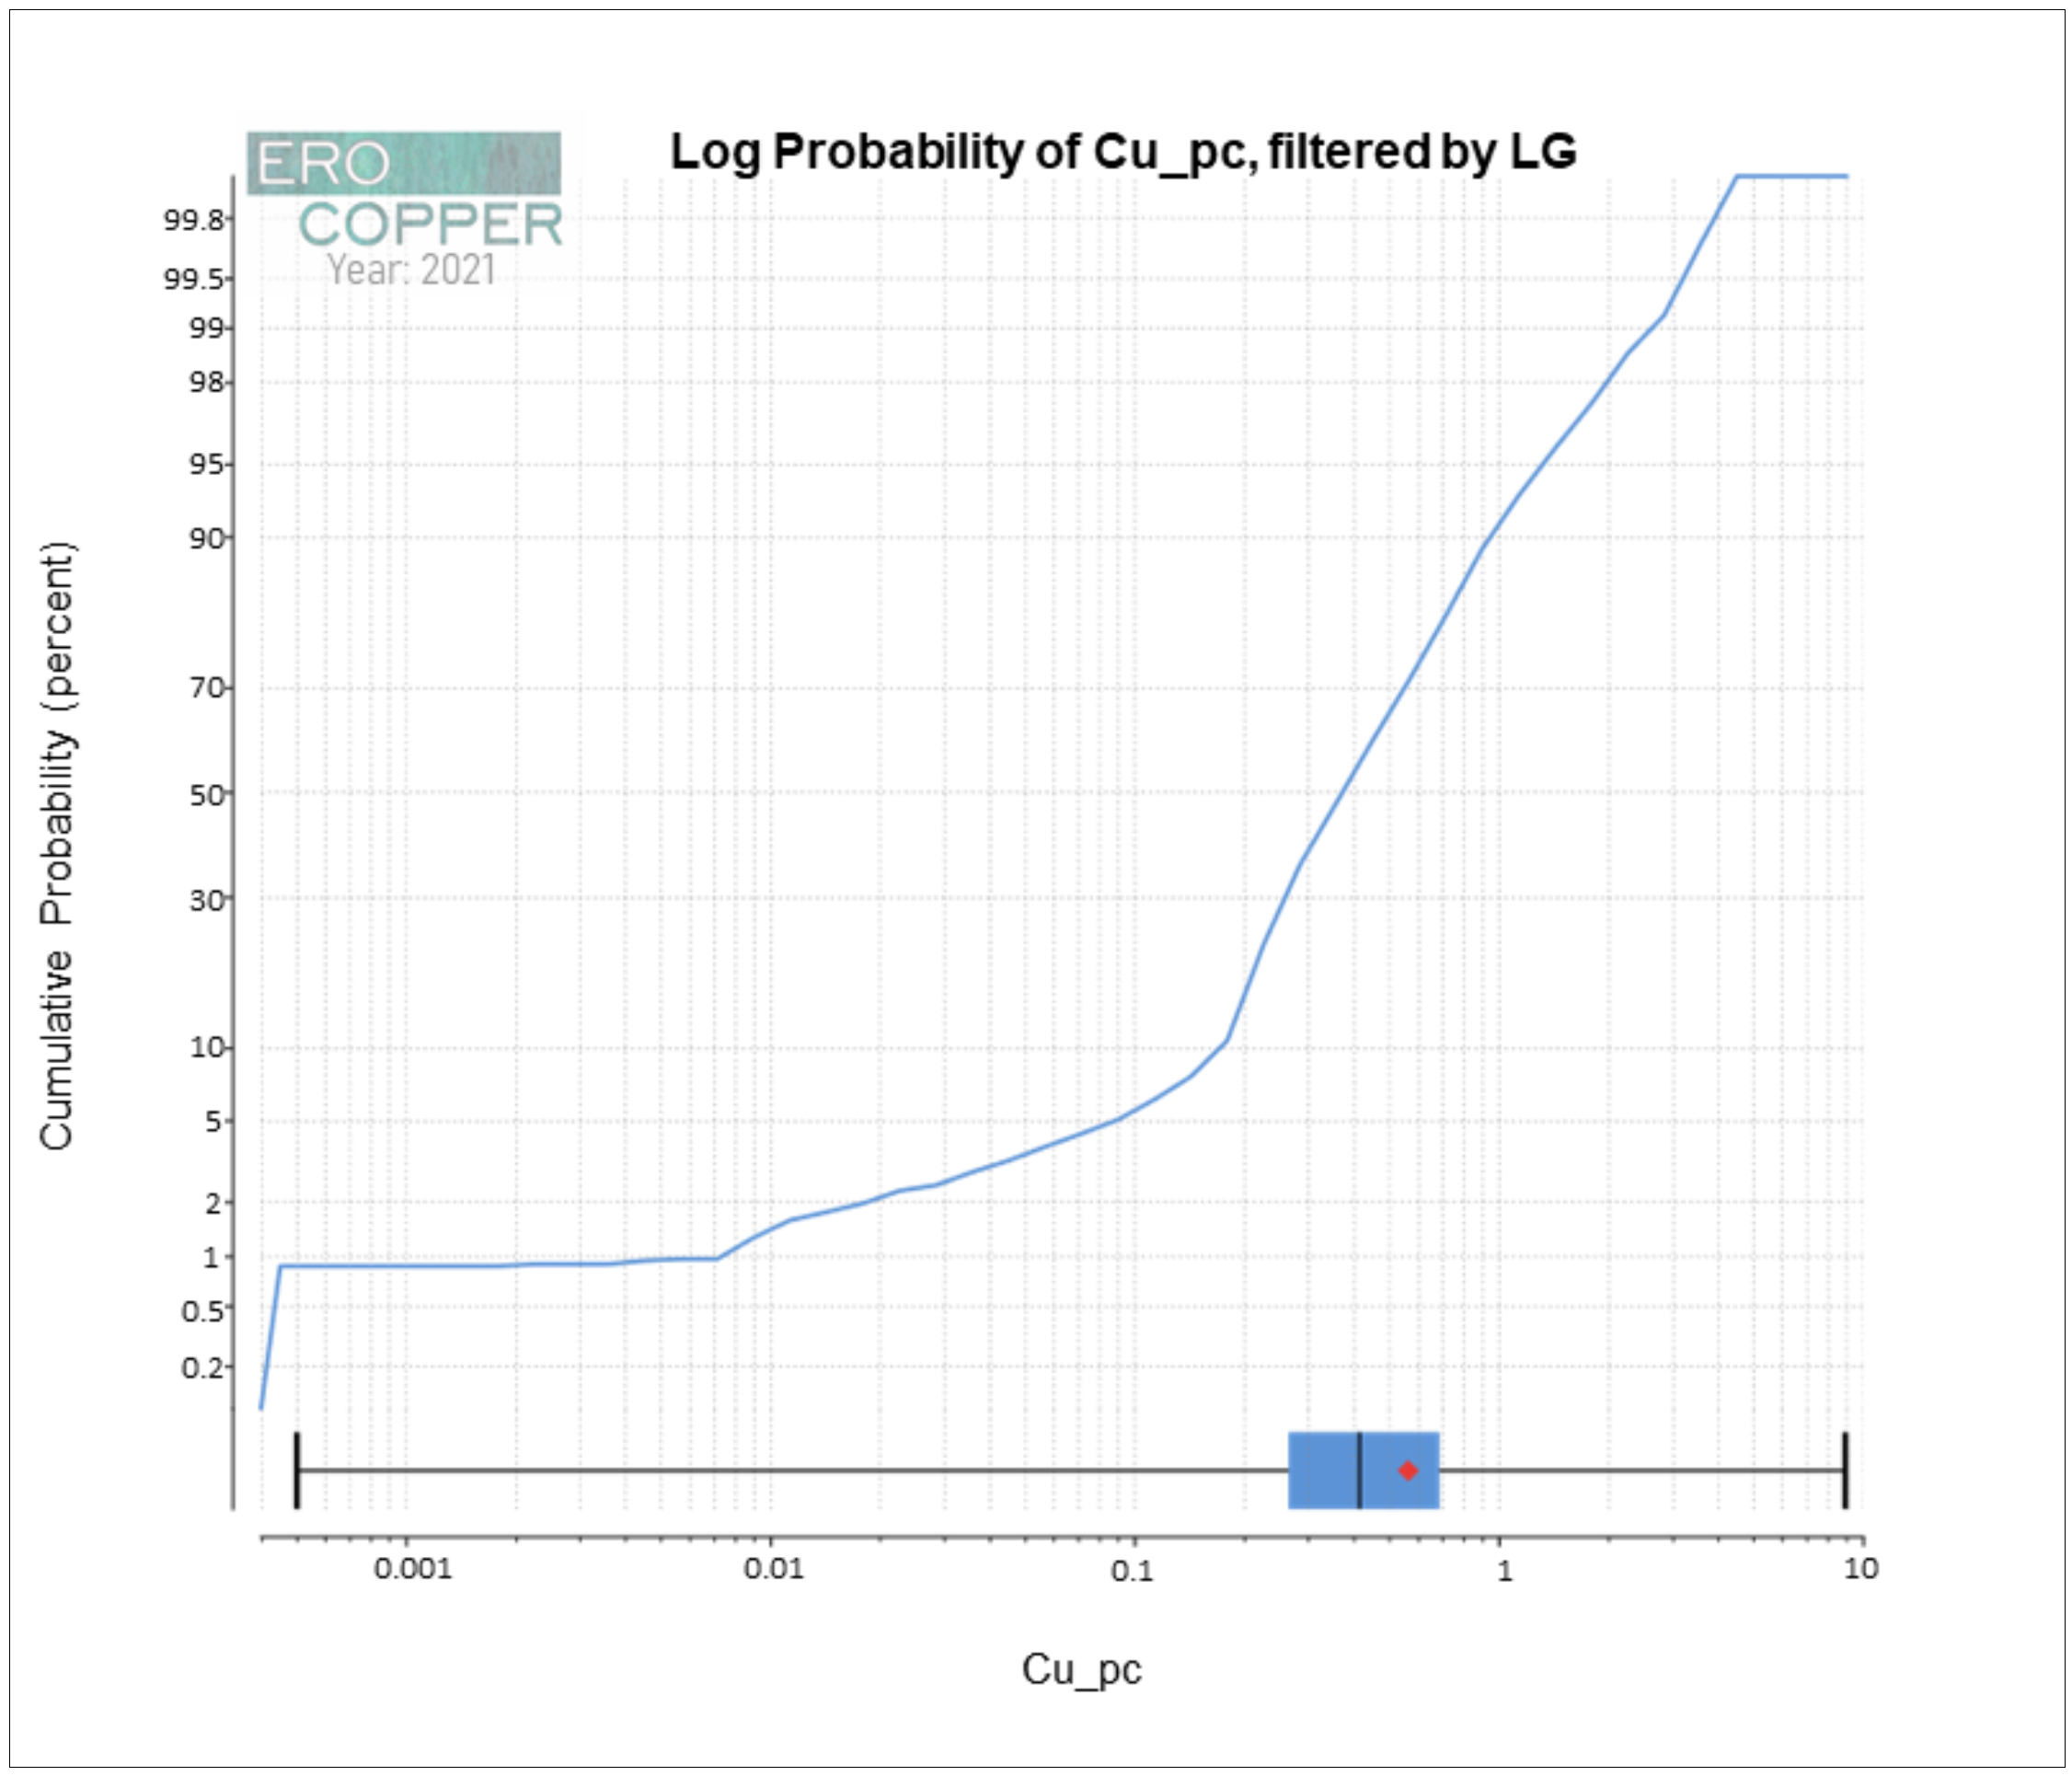
Figure 14-12: Log Probability of Cu_pc, filtered by LG | |
Figure 14-13: Length Histogram Graph from Raw Assay Data | |
Figure 14-14: Log Probability of Cu_pc, filtered by HG | |
Figure 14-15: Log Probability of Cu_pc, filtered by LG | |
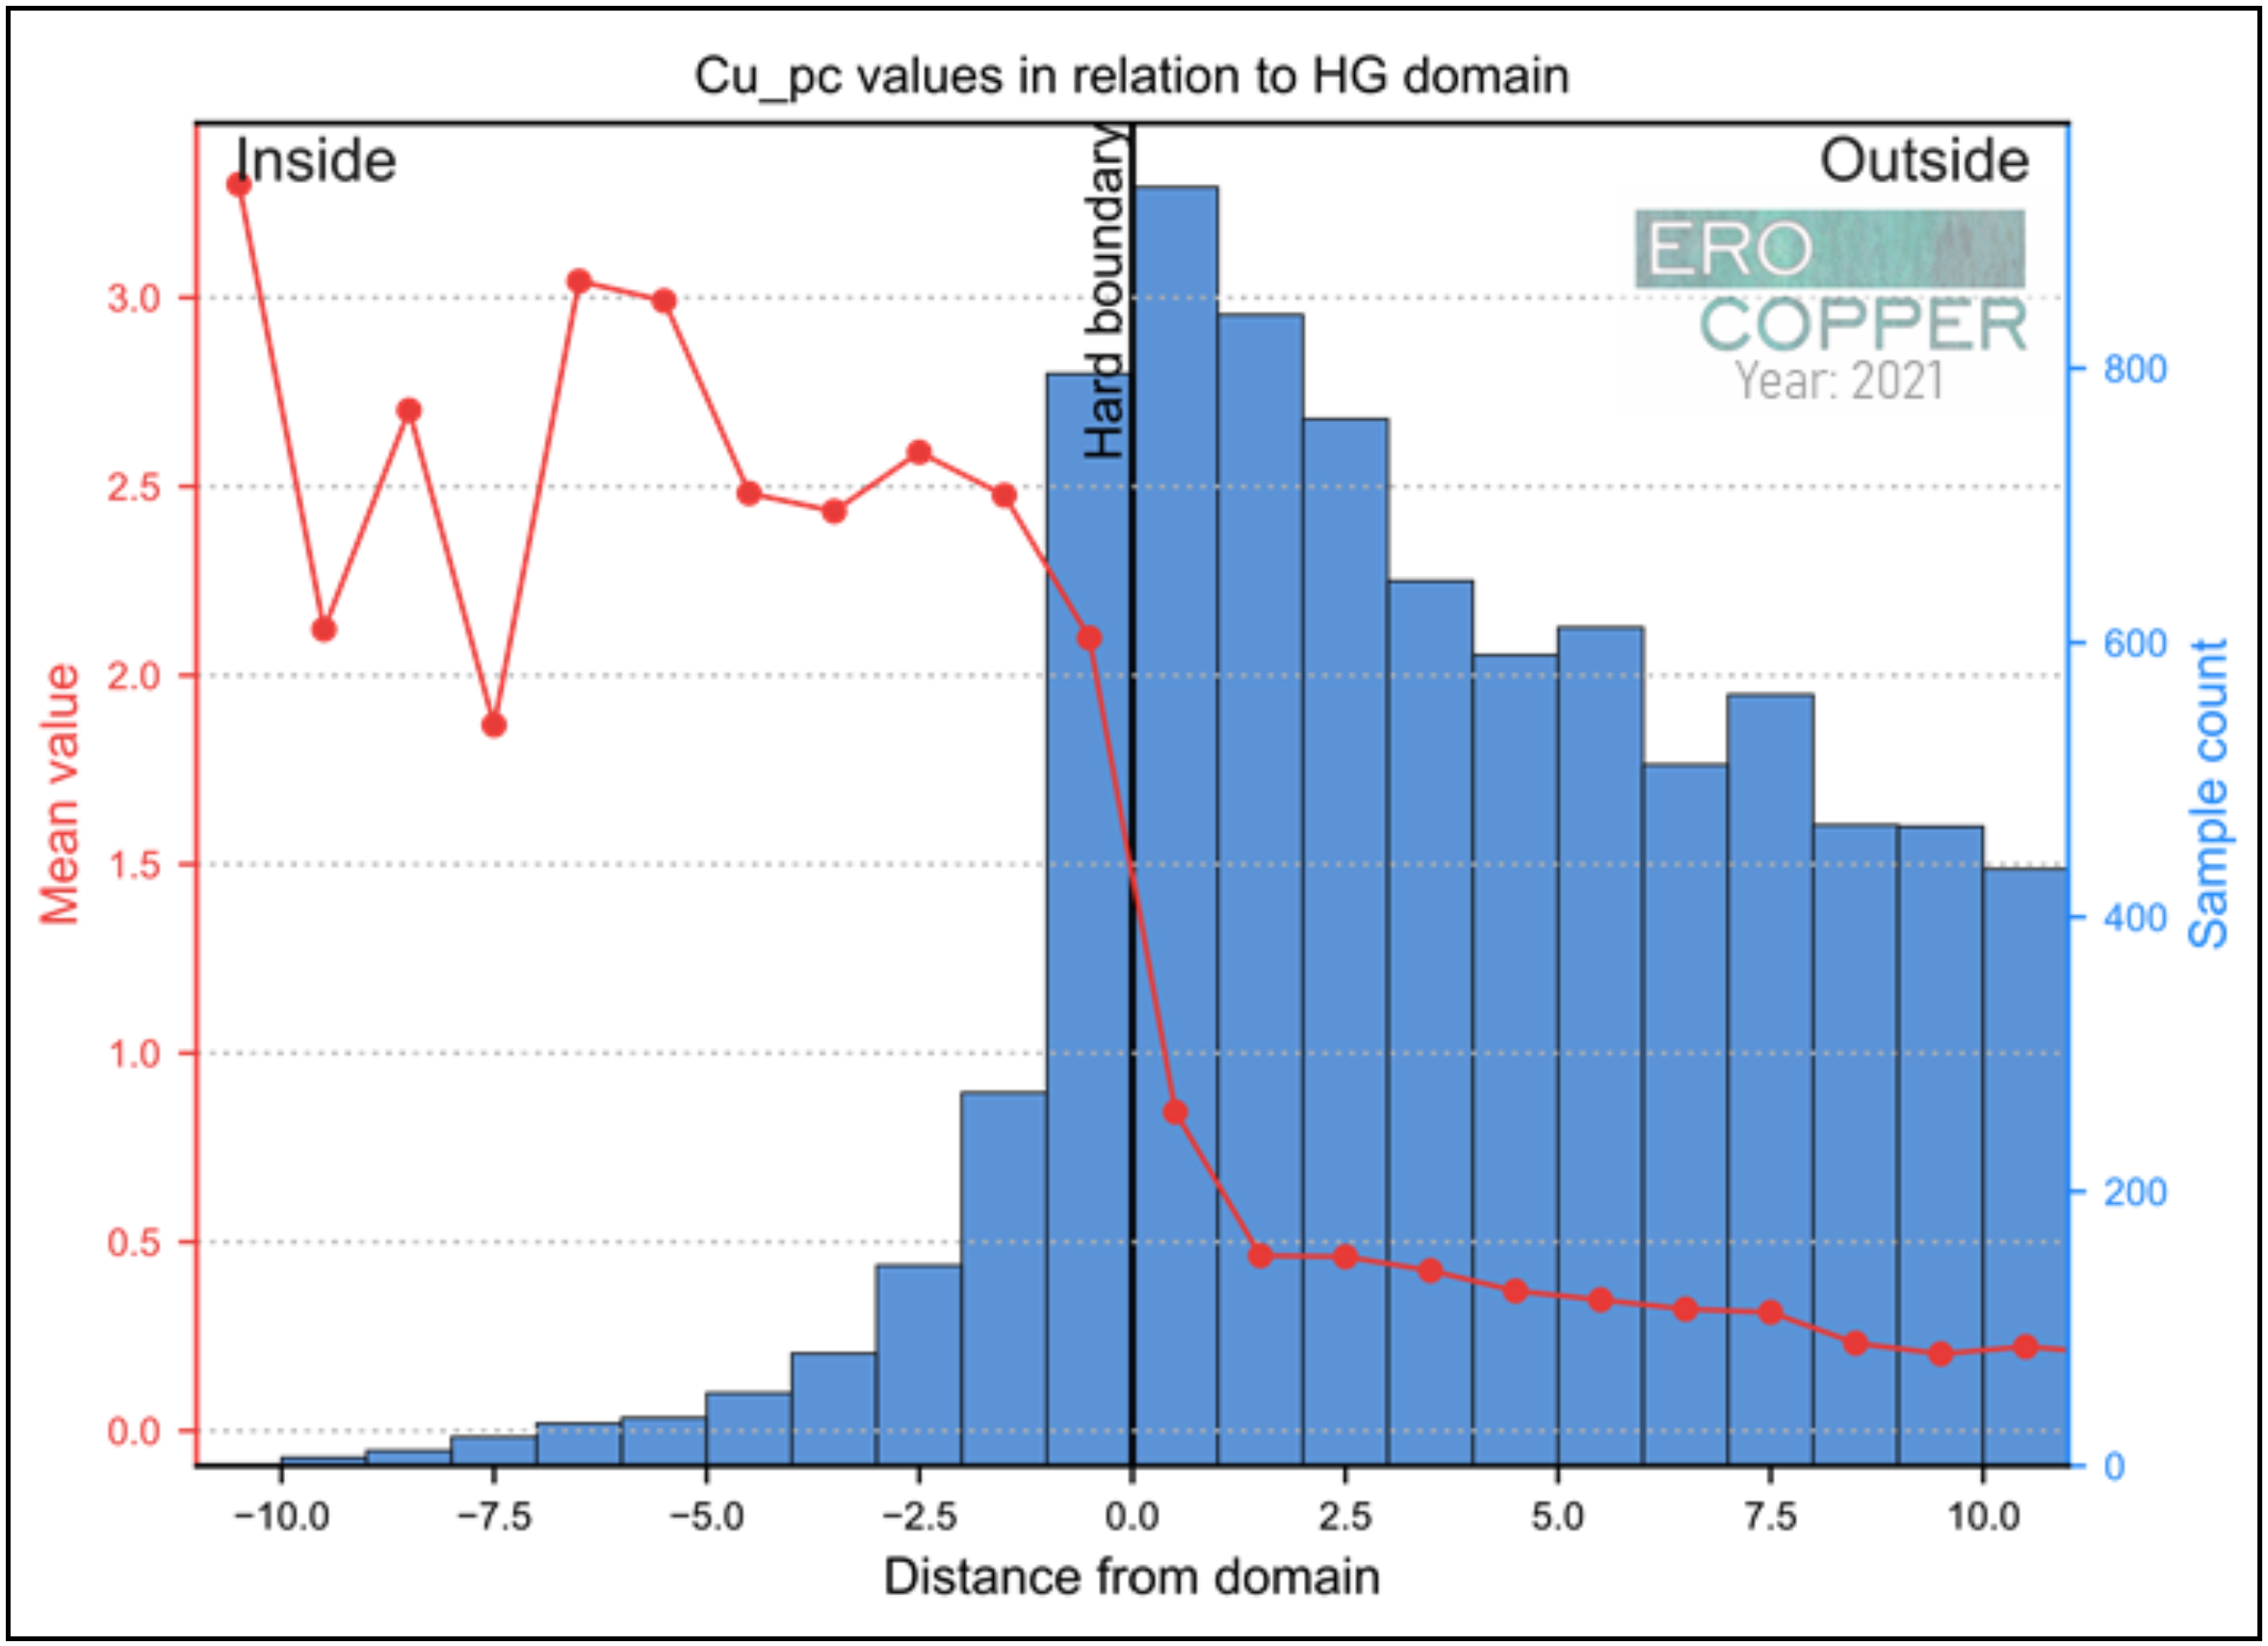
Figure 14-16: Cu_pc values in relation to HG domain | |
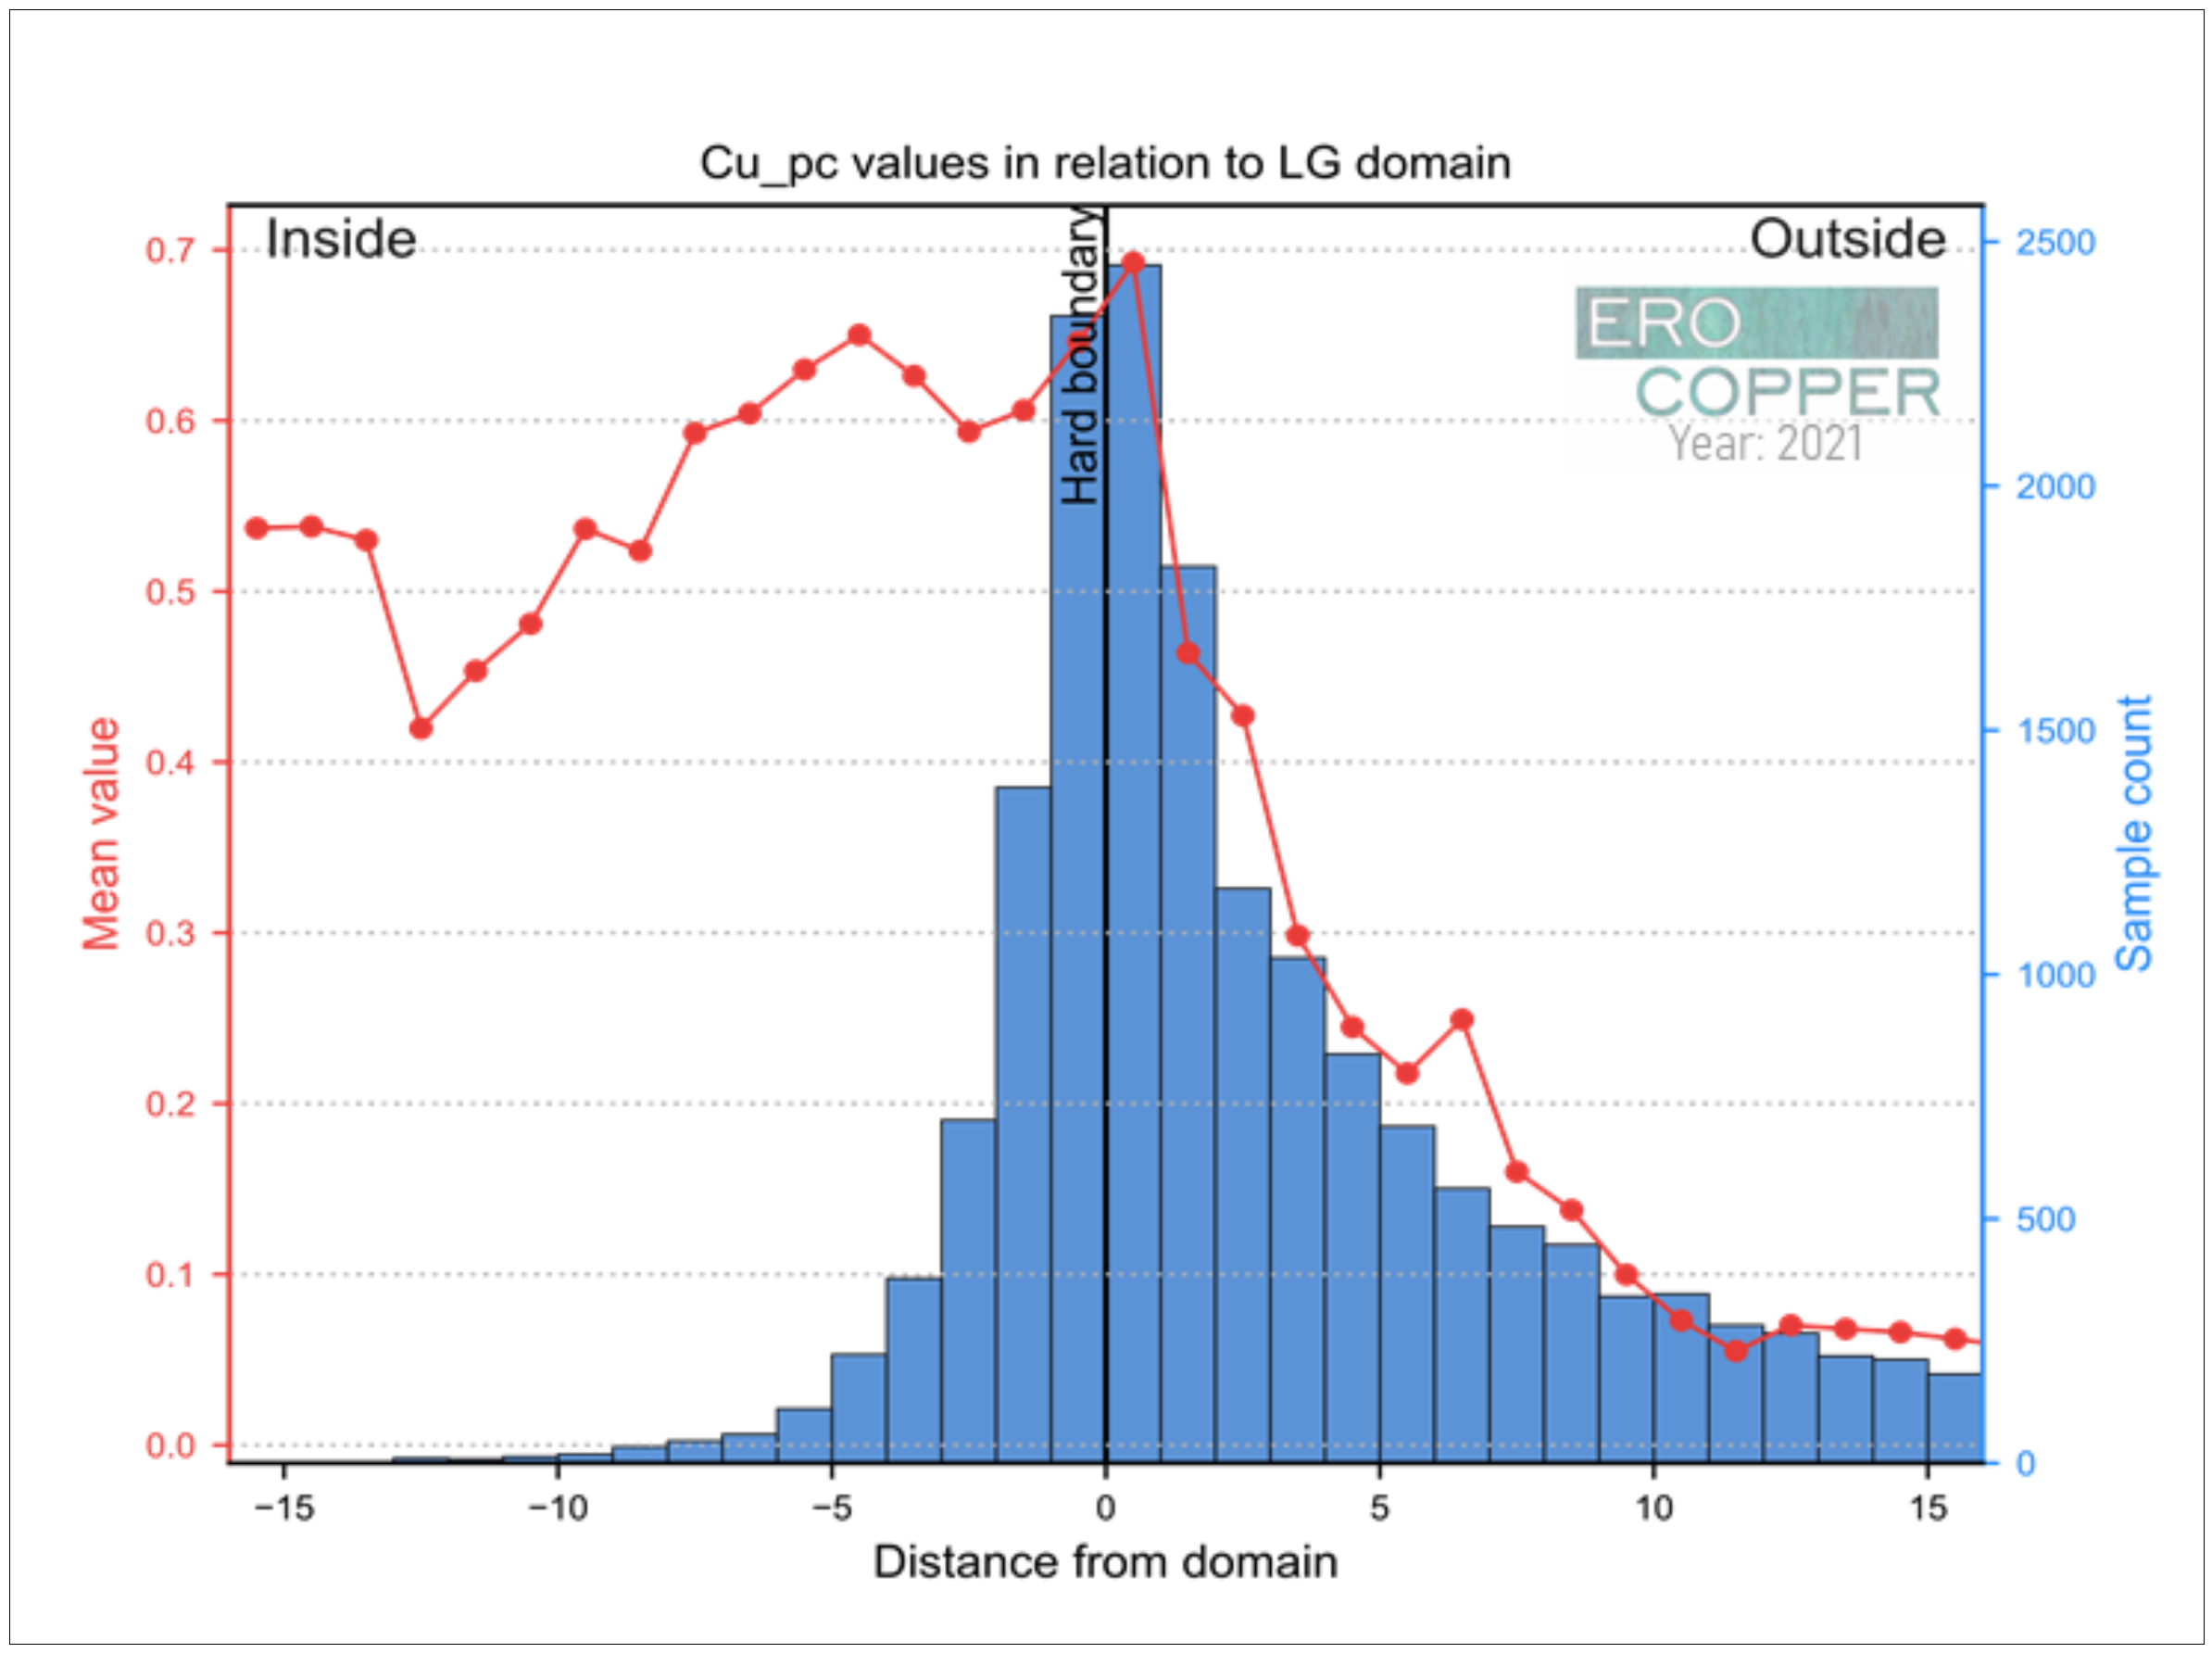
Figure 14-17: Cu_pc values in relation to LG domain | |
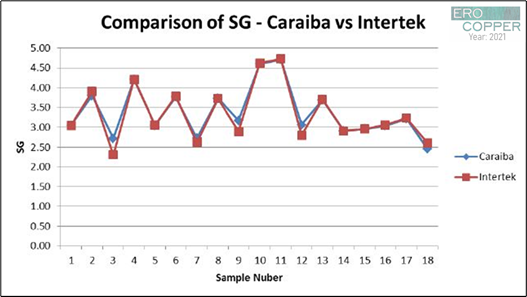
Figure 14-18: Comparison of SG results – MCSA vs. Intertek | |
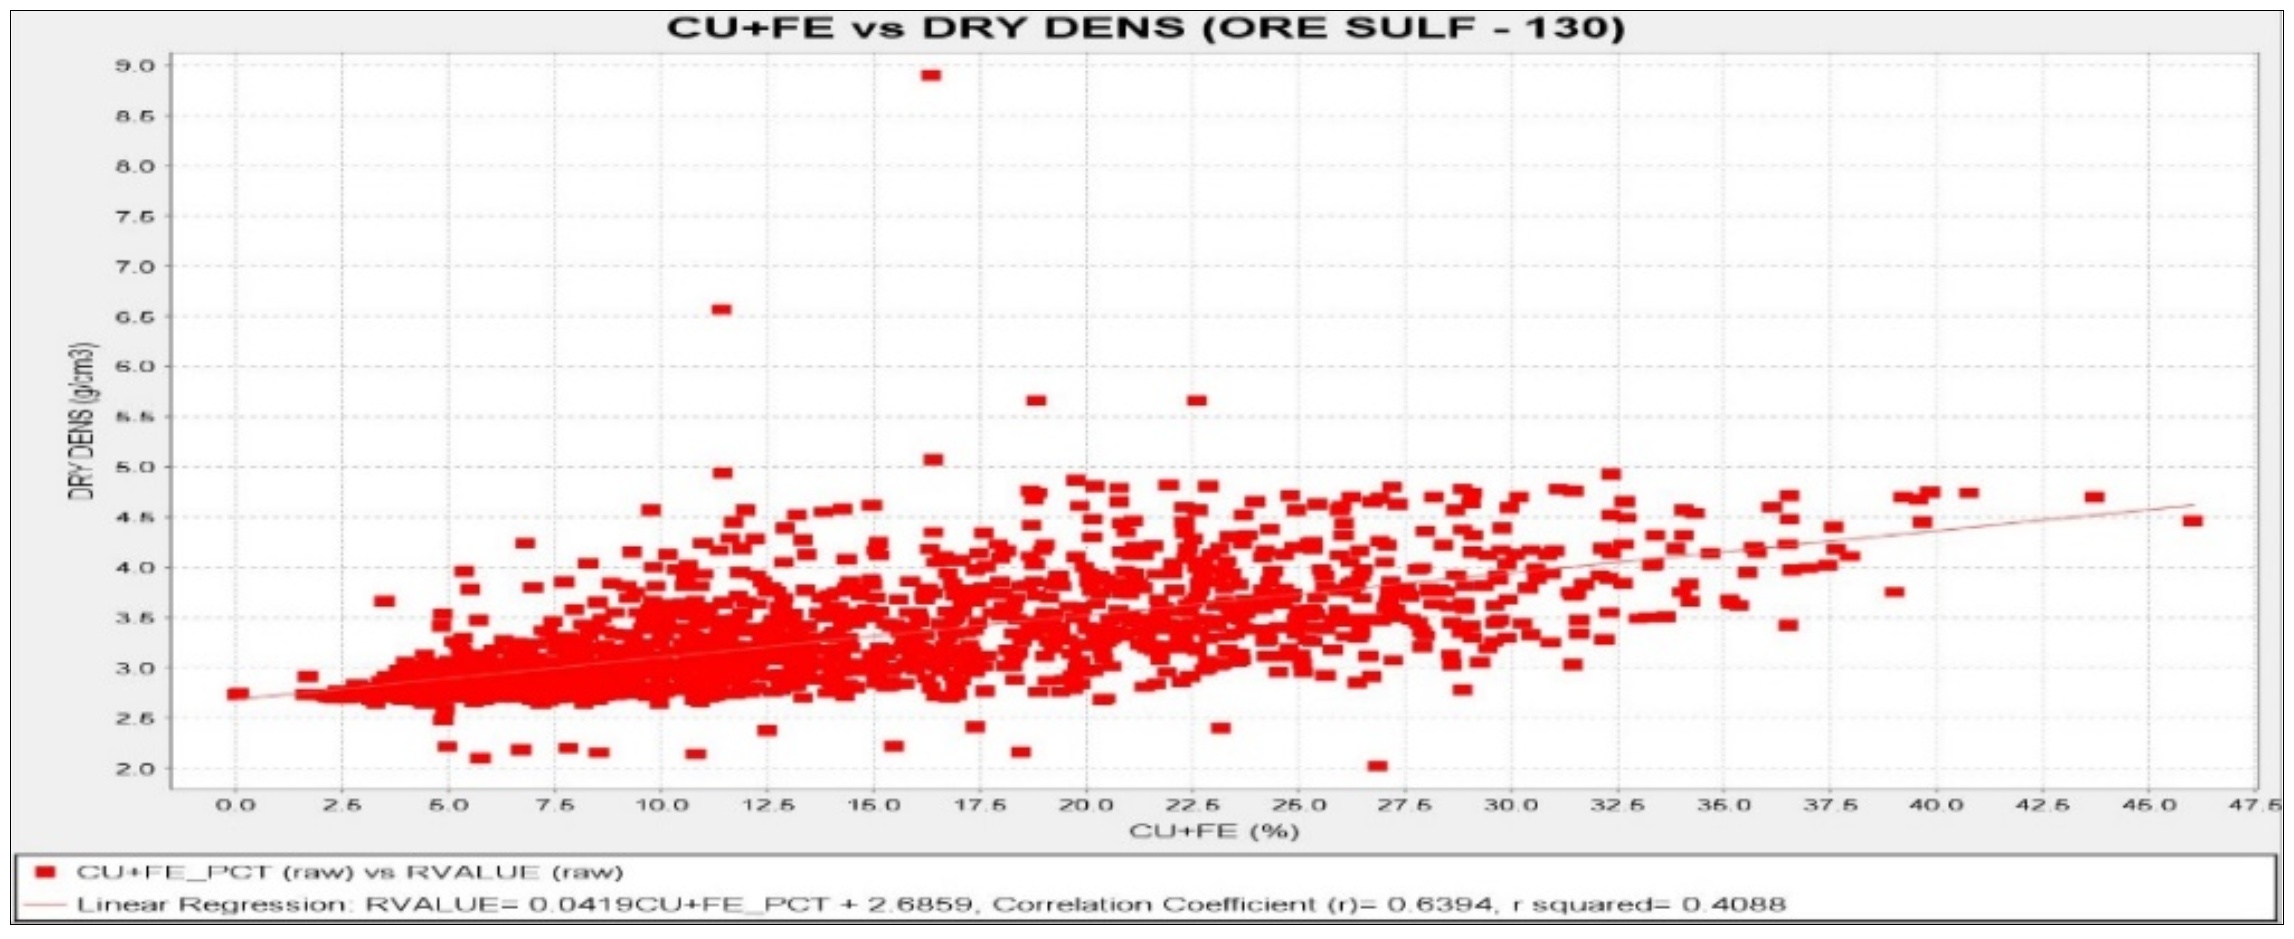
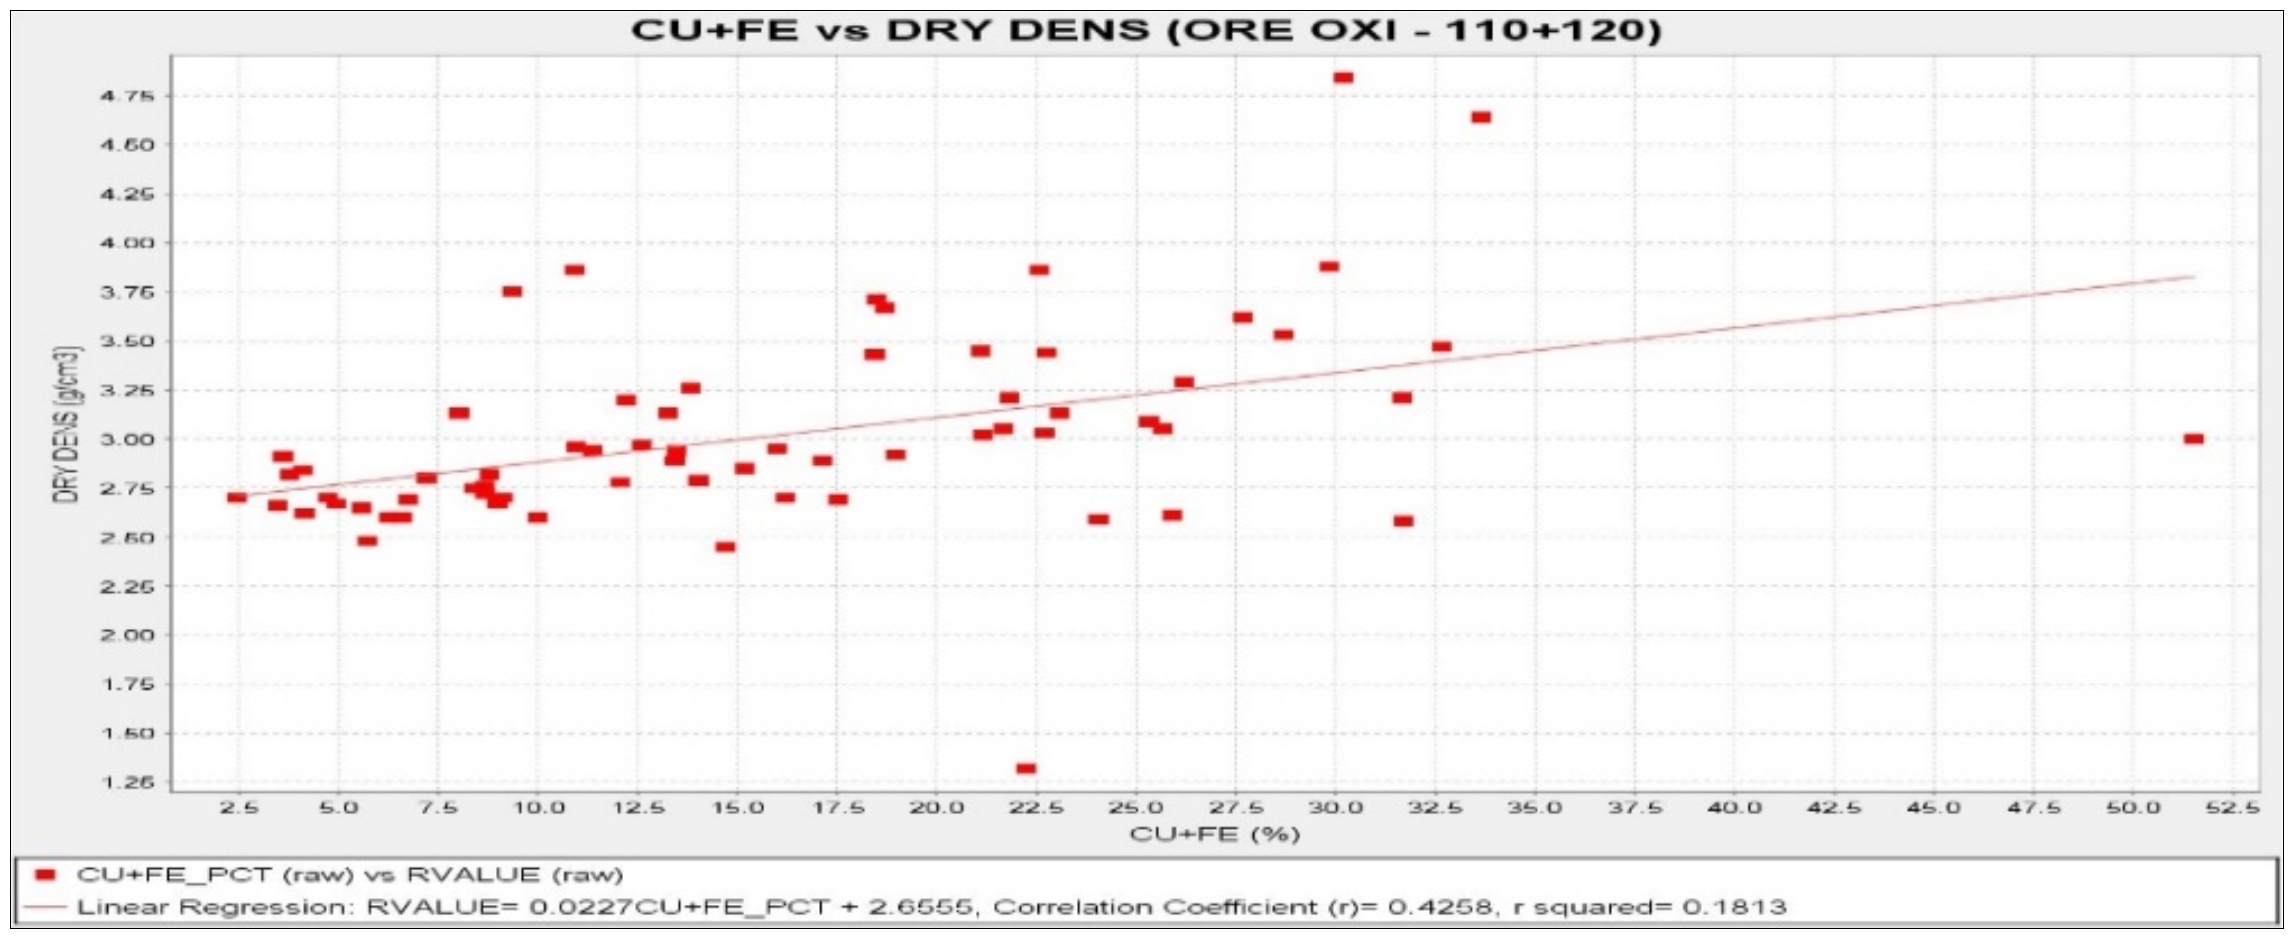
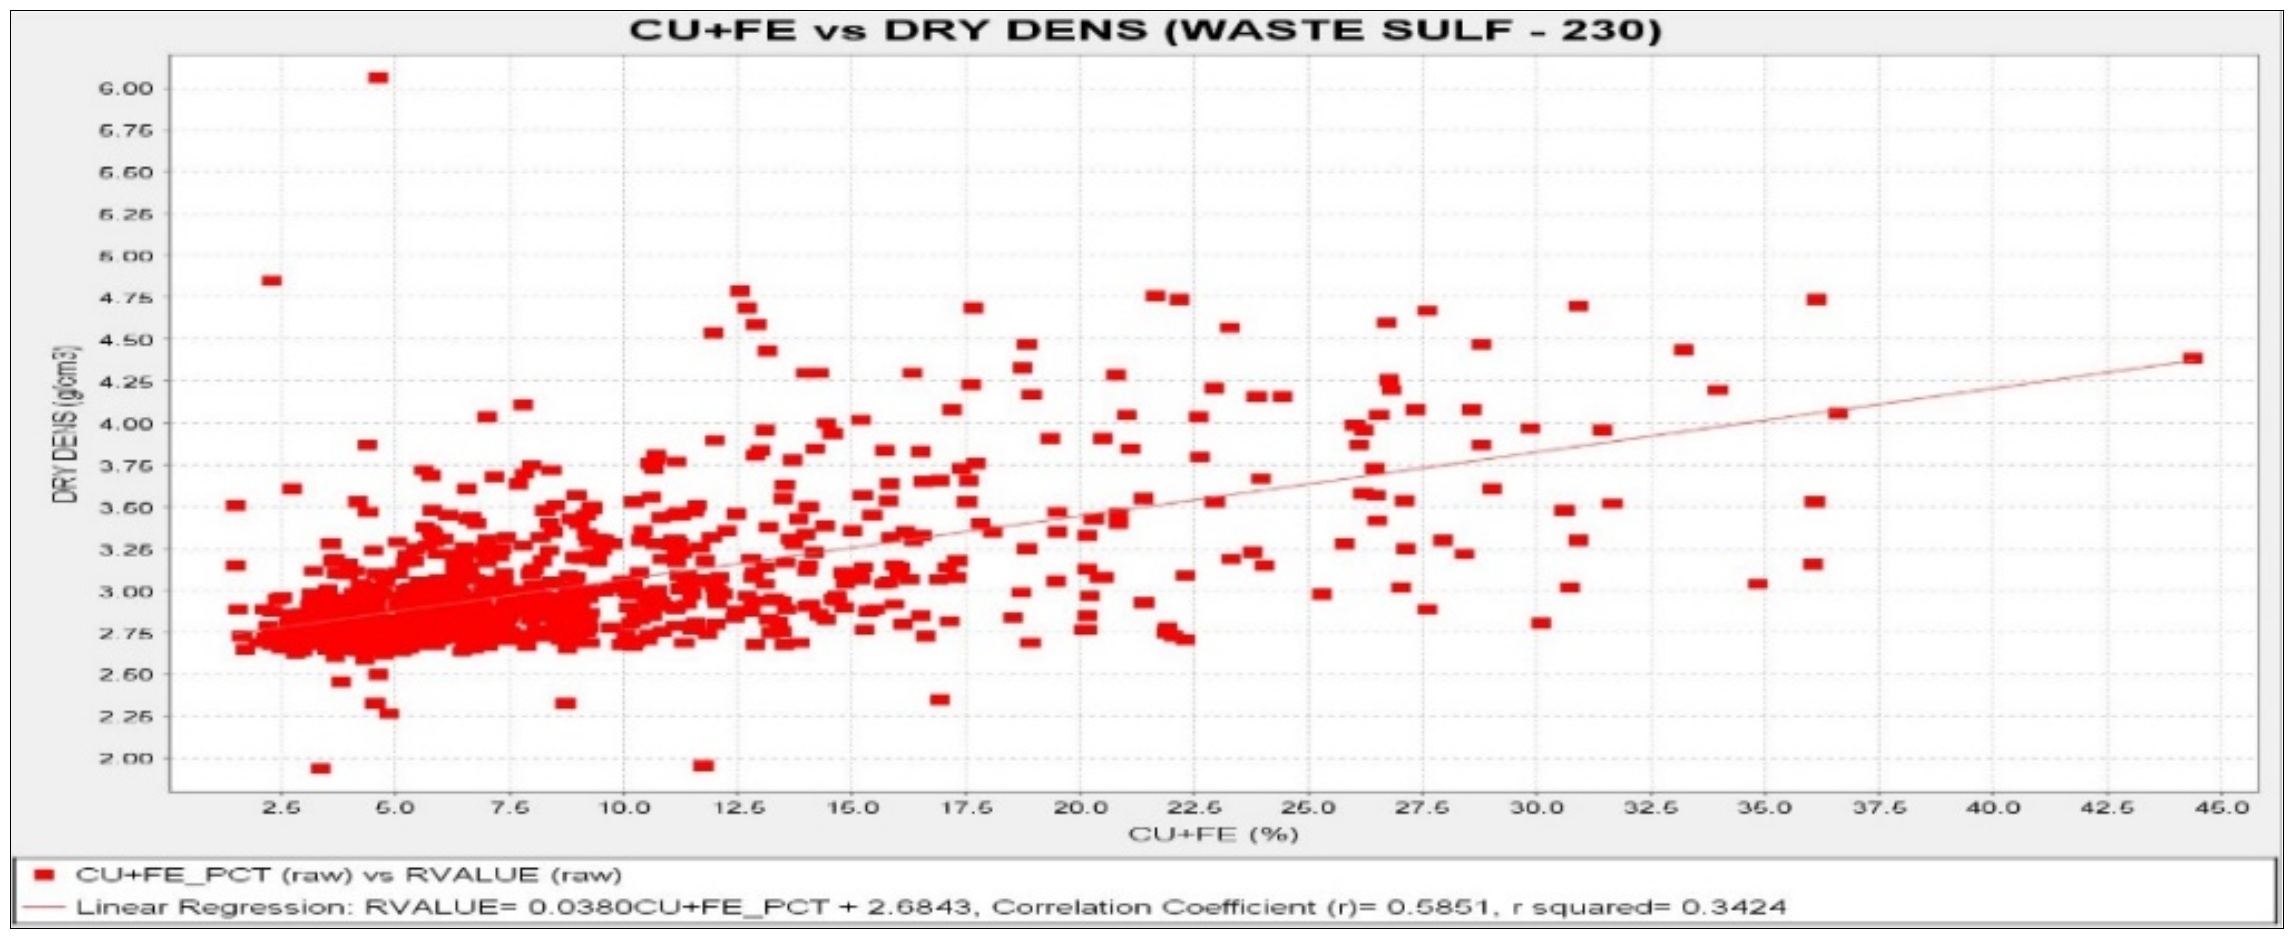
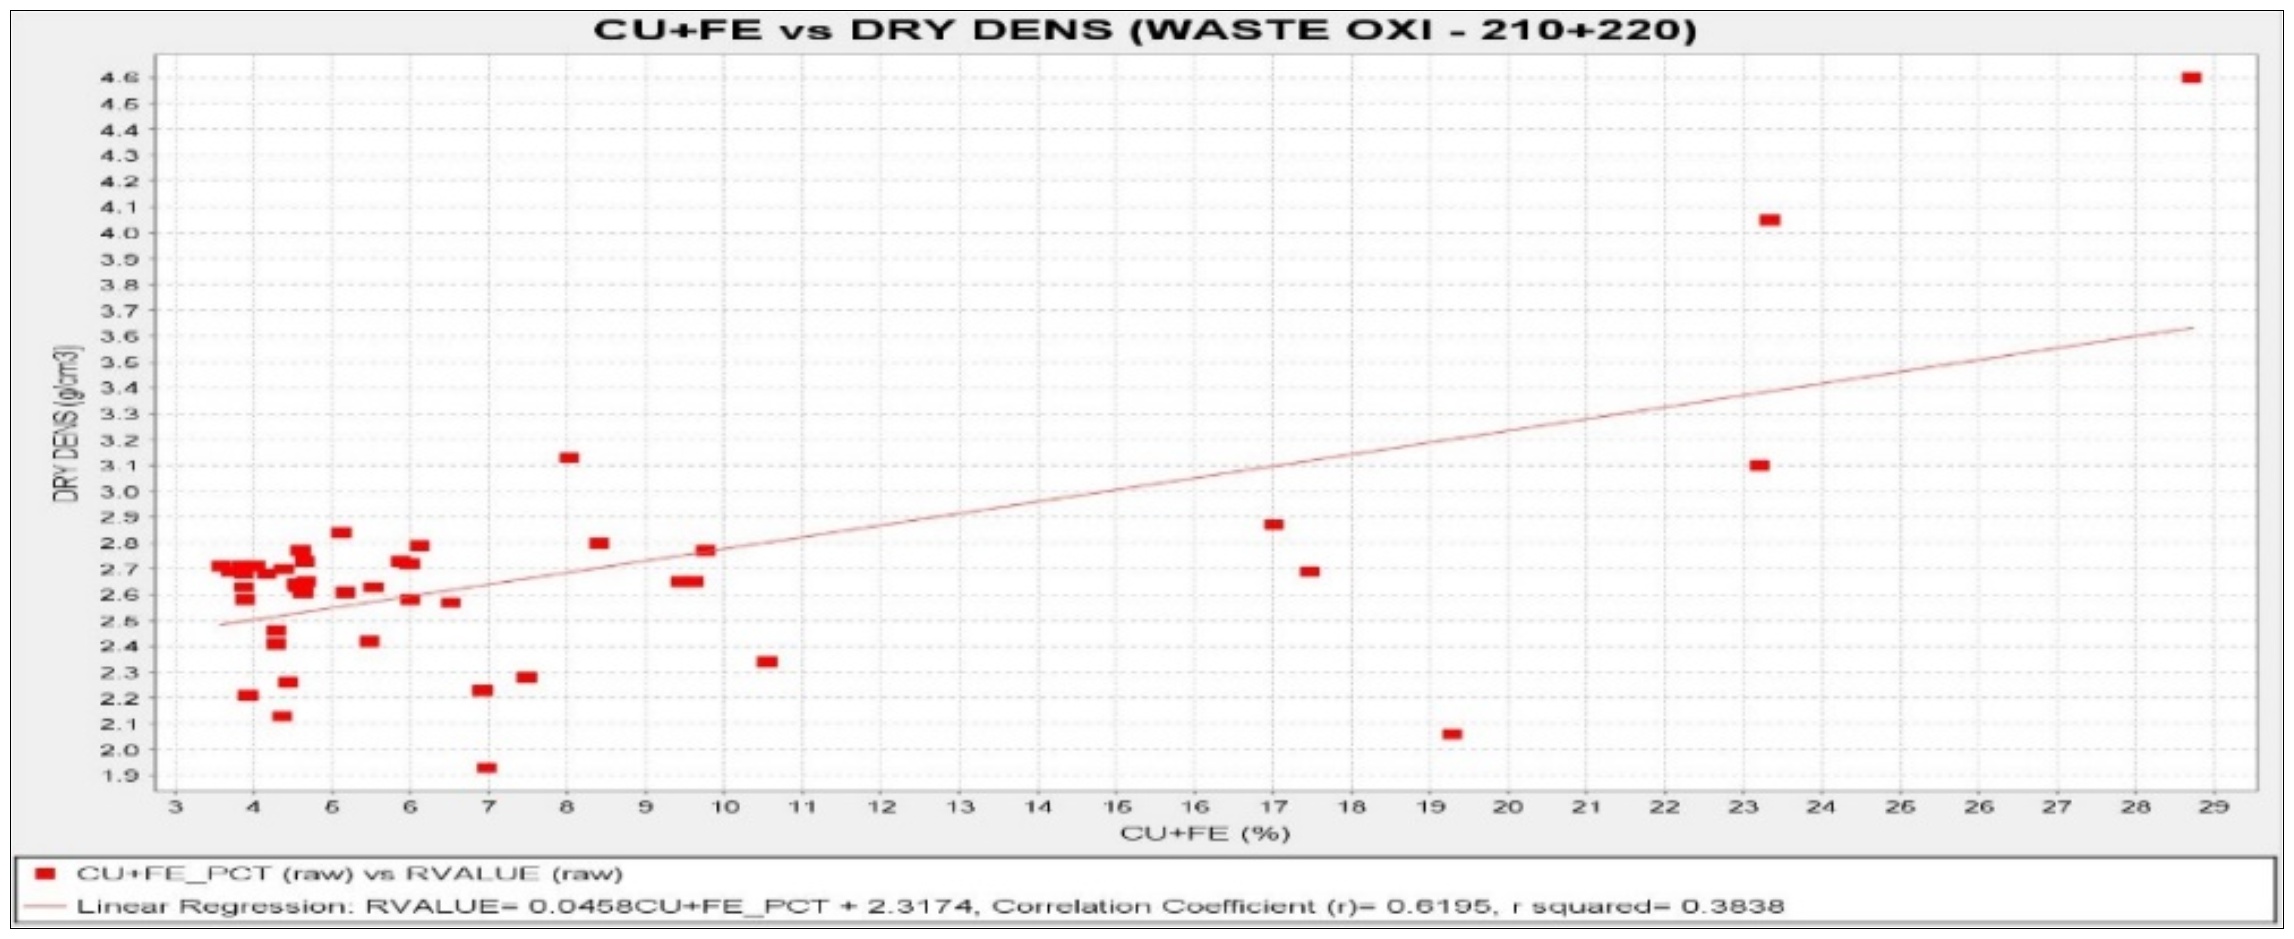
Figure 14-19: Scatter plots of SG vs. Cu + Fe | |
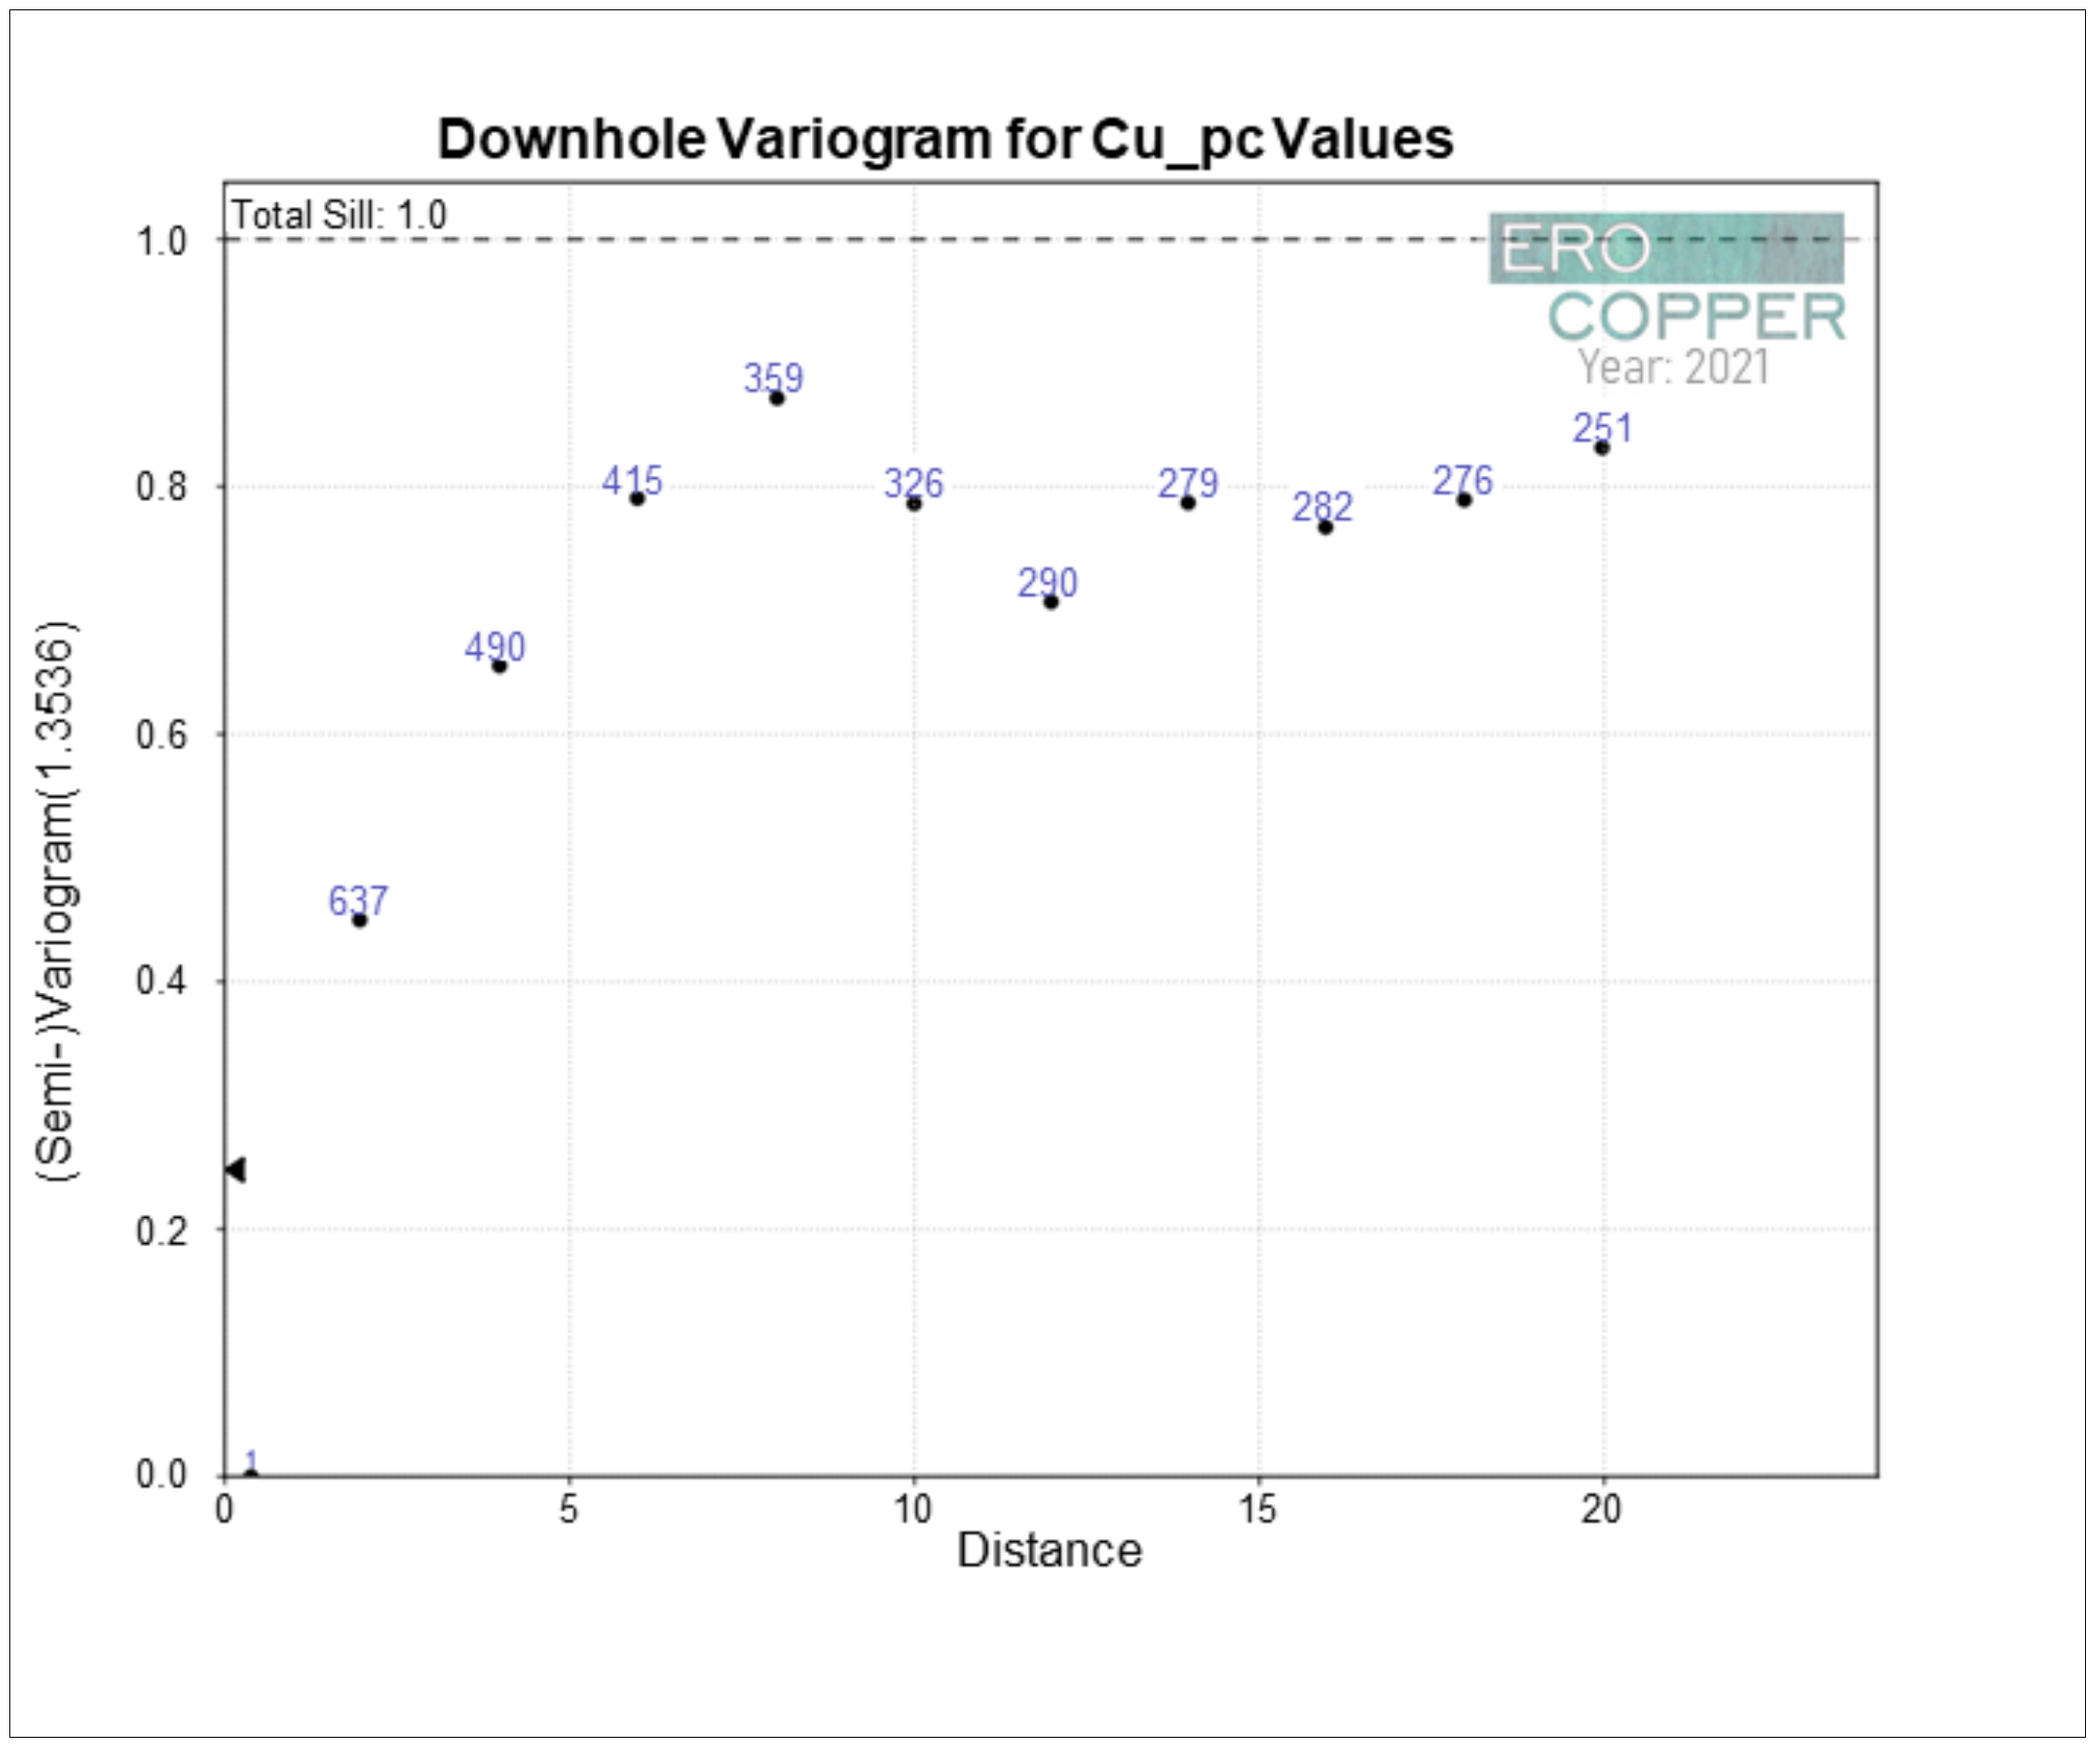
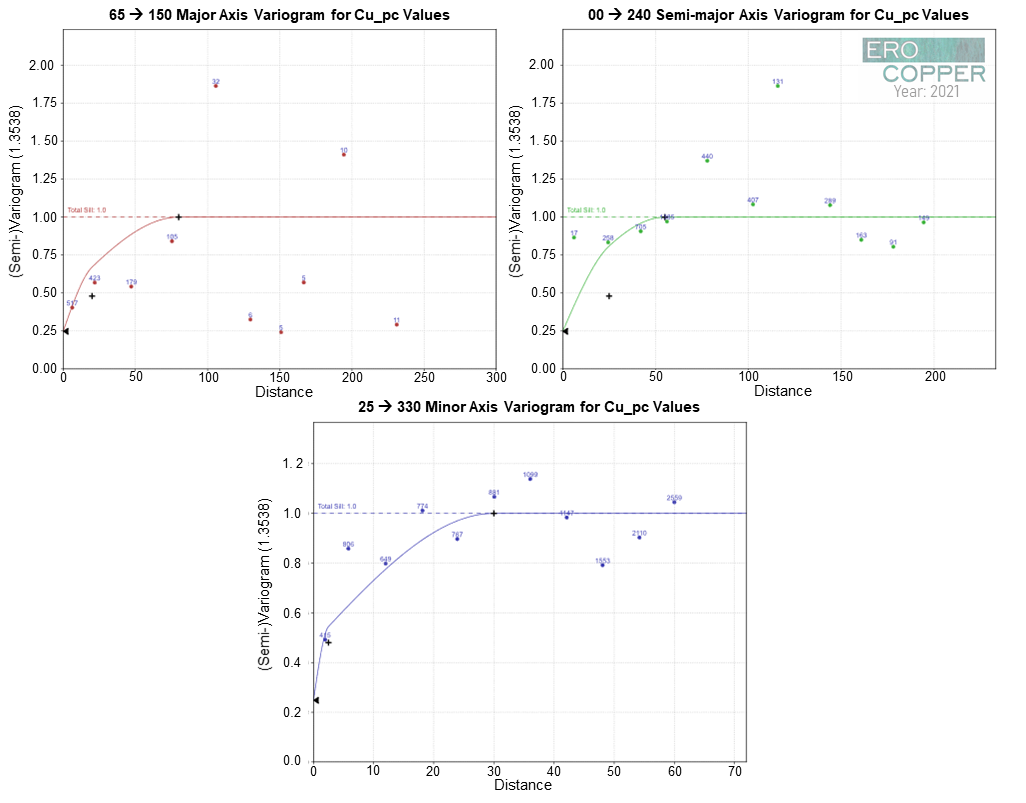
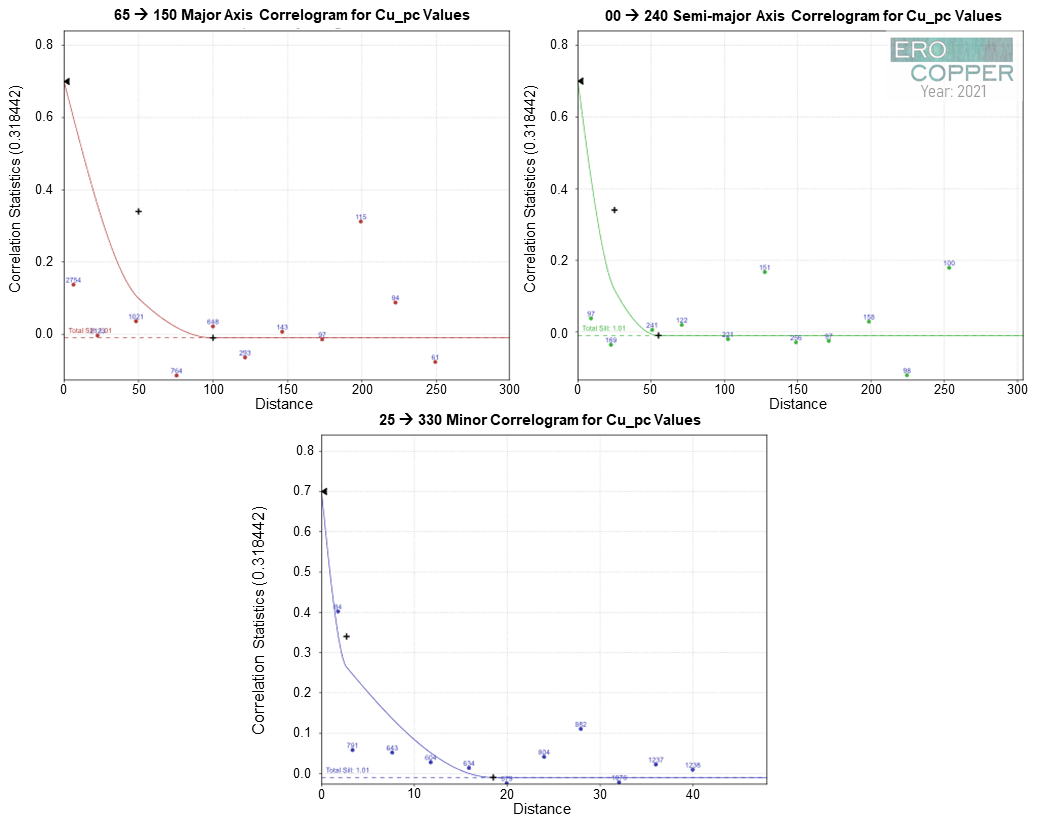
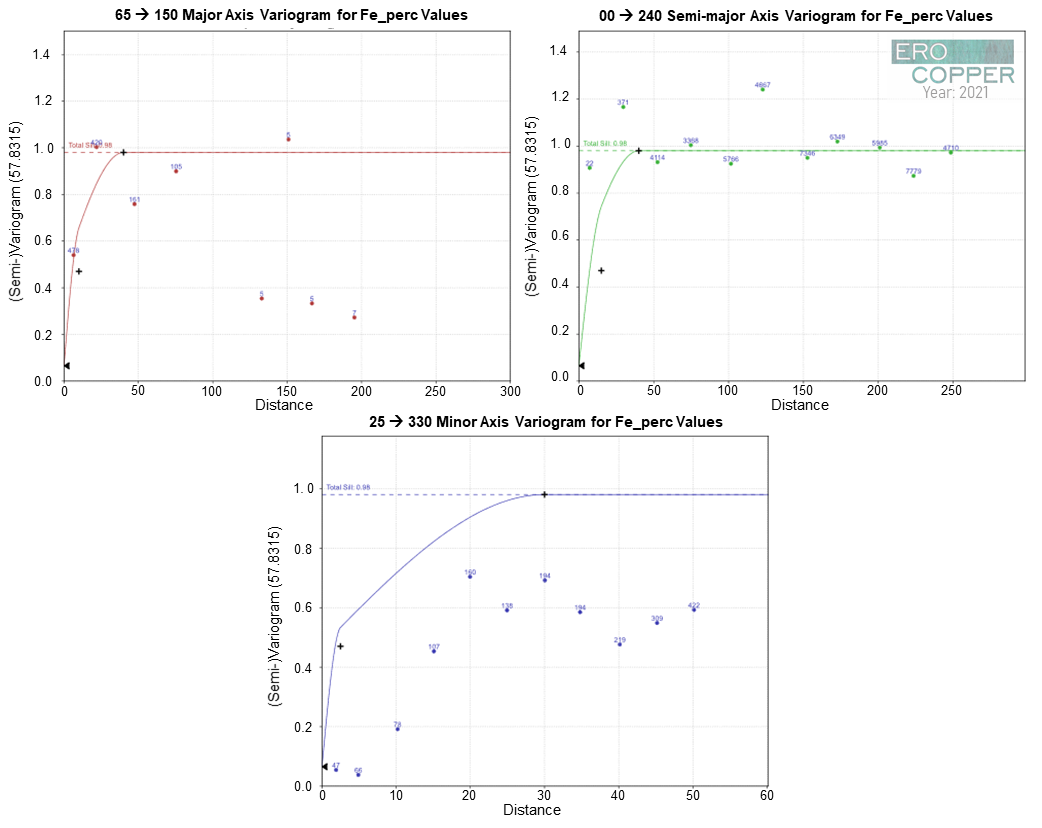
Figure 14-20: Downhole Variogram for Cu_pc Values | |
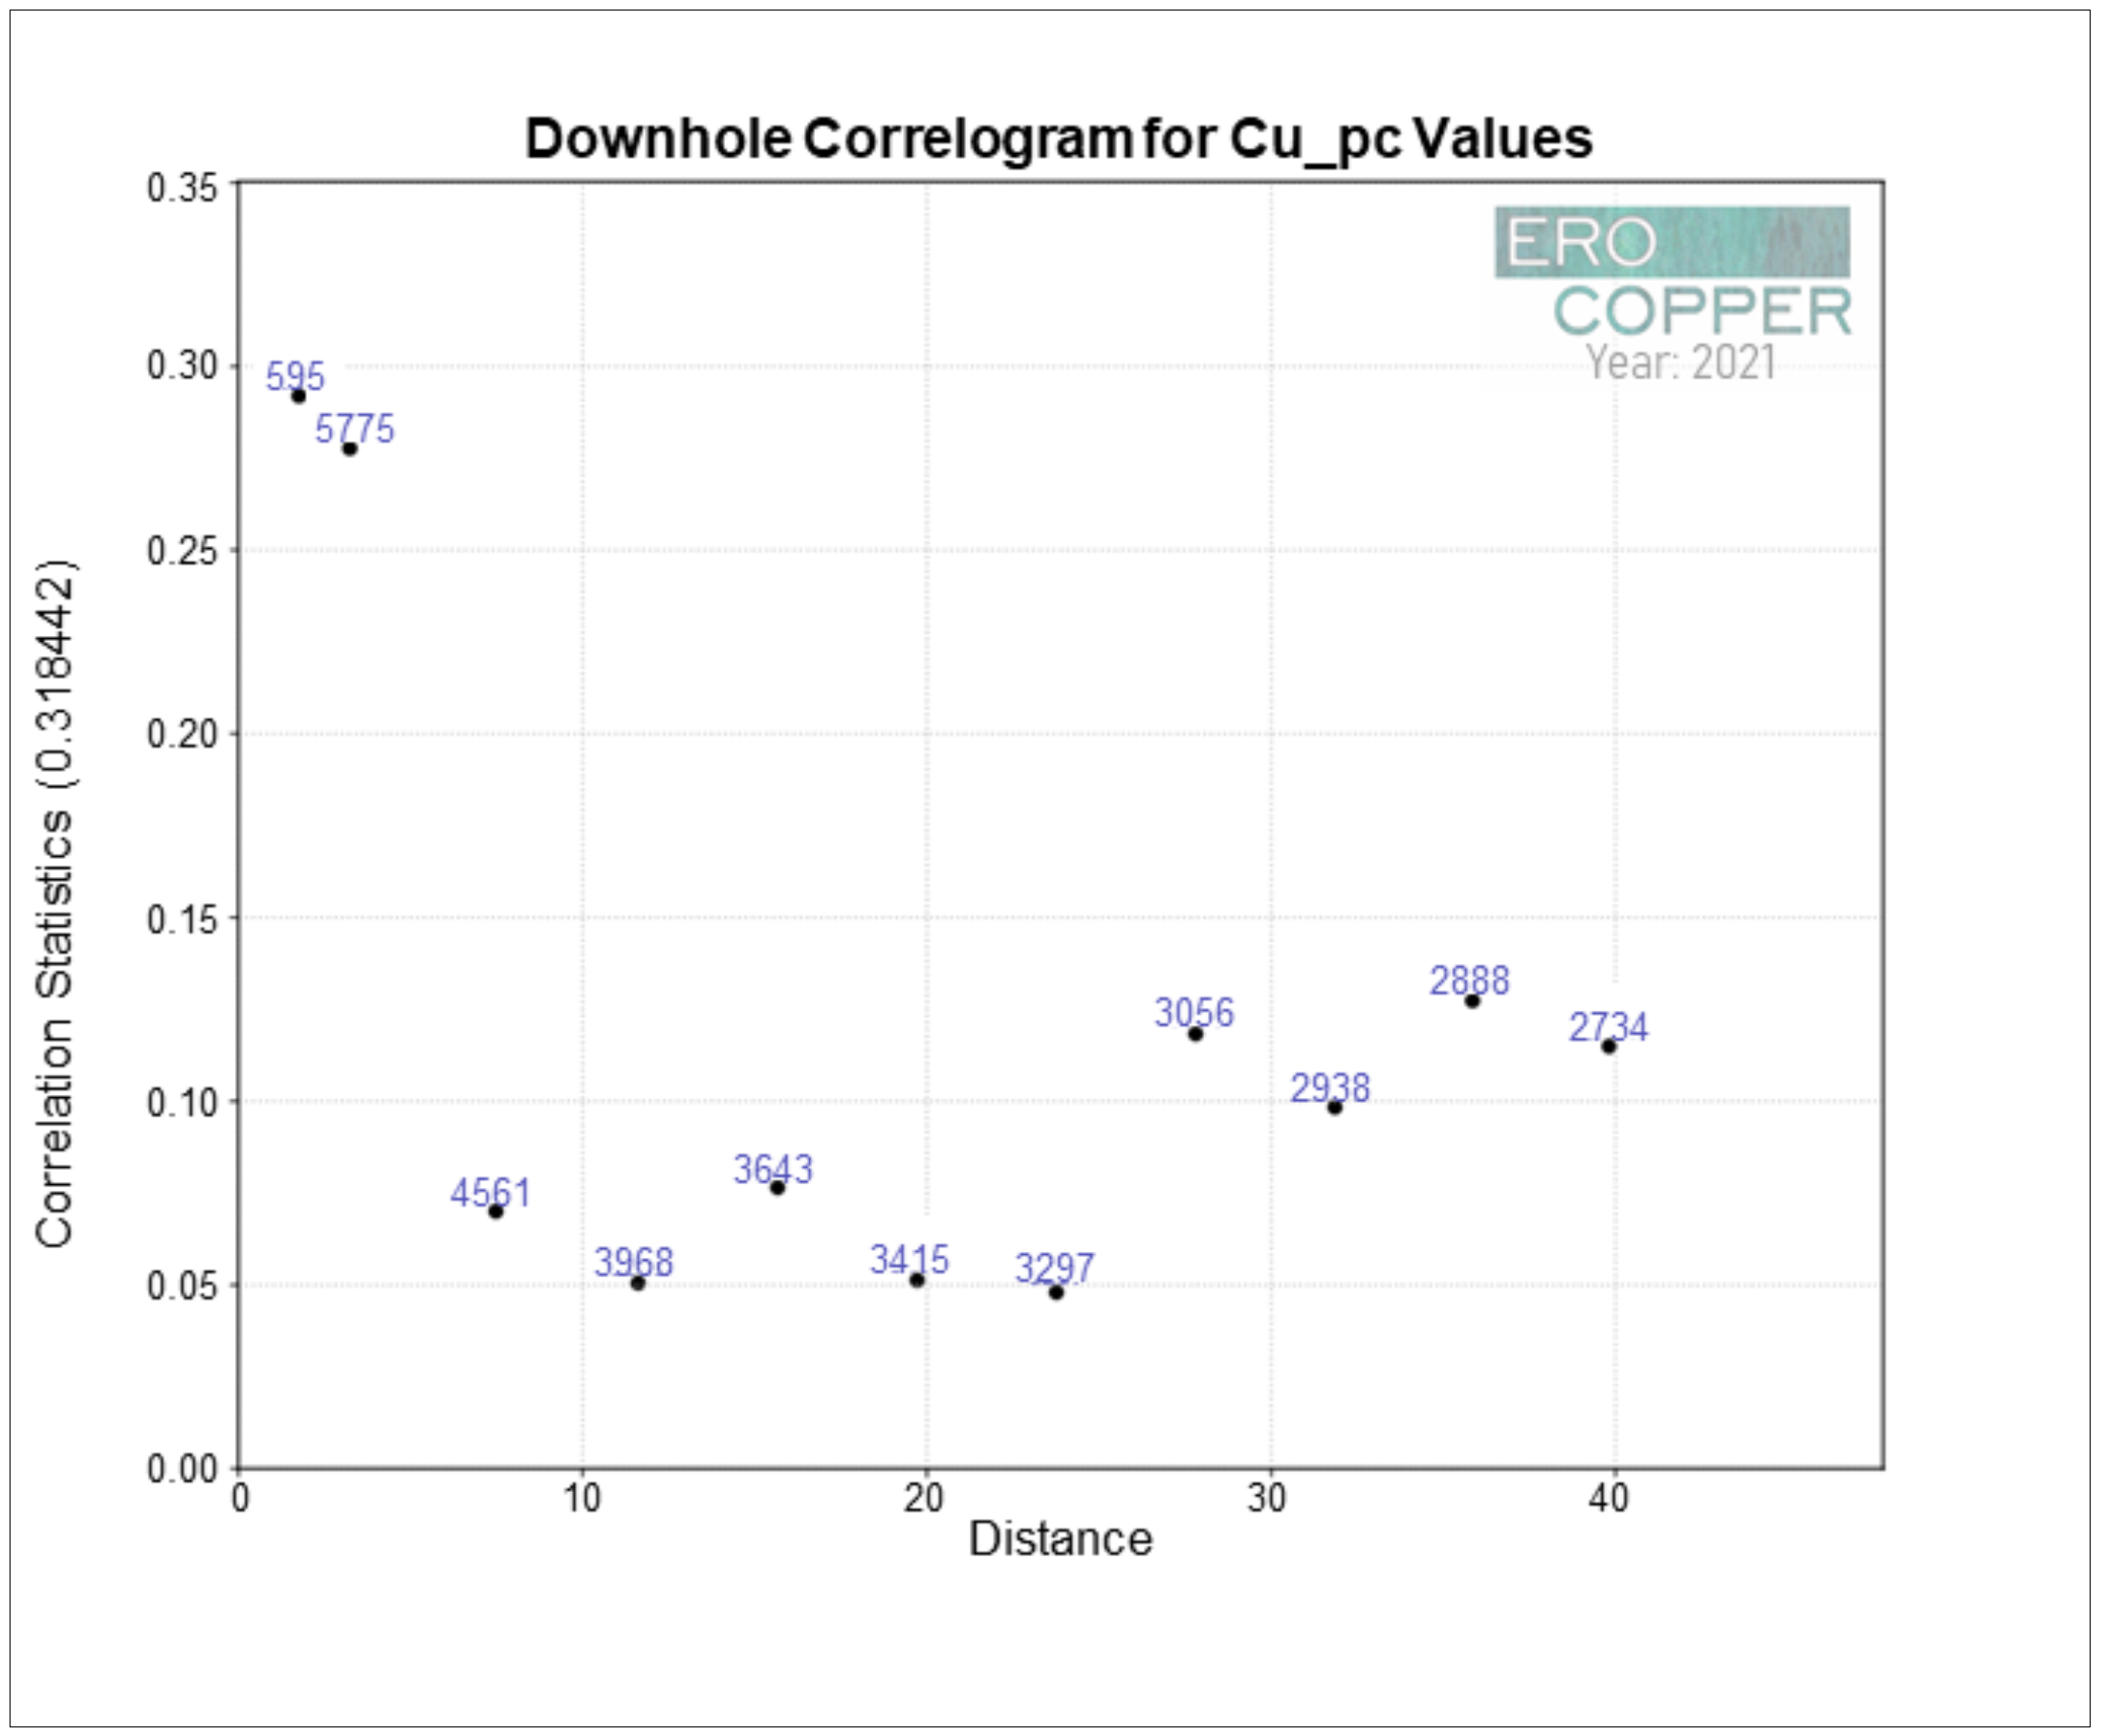
Figure 14-21: Downhole Correlogram for Cu_pc Values | |
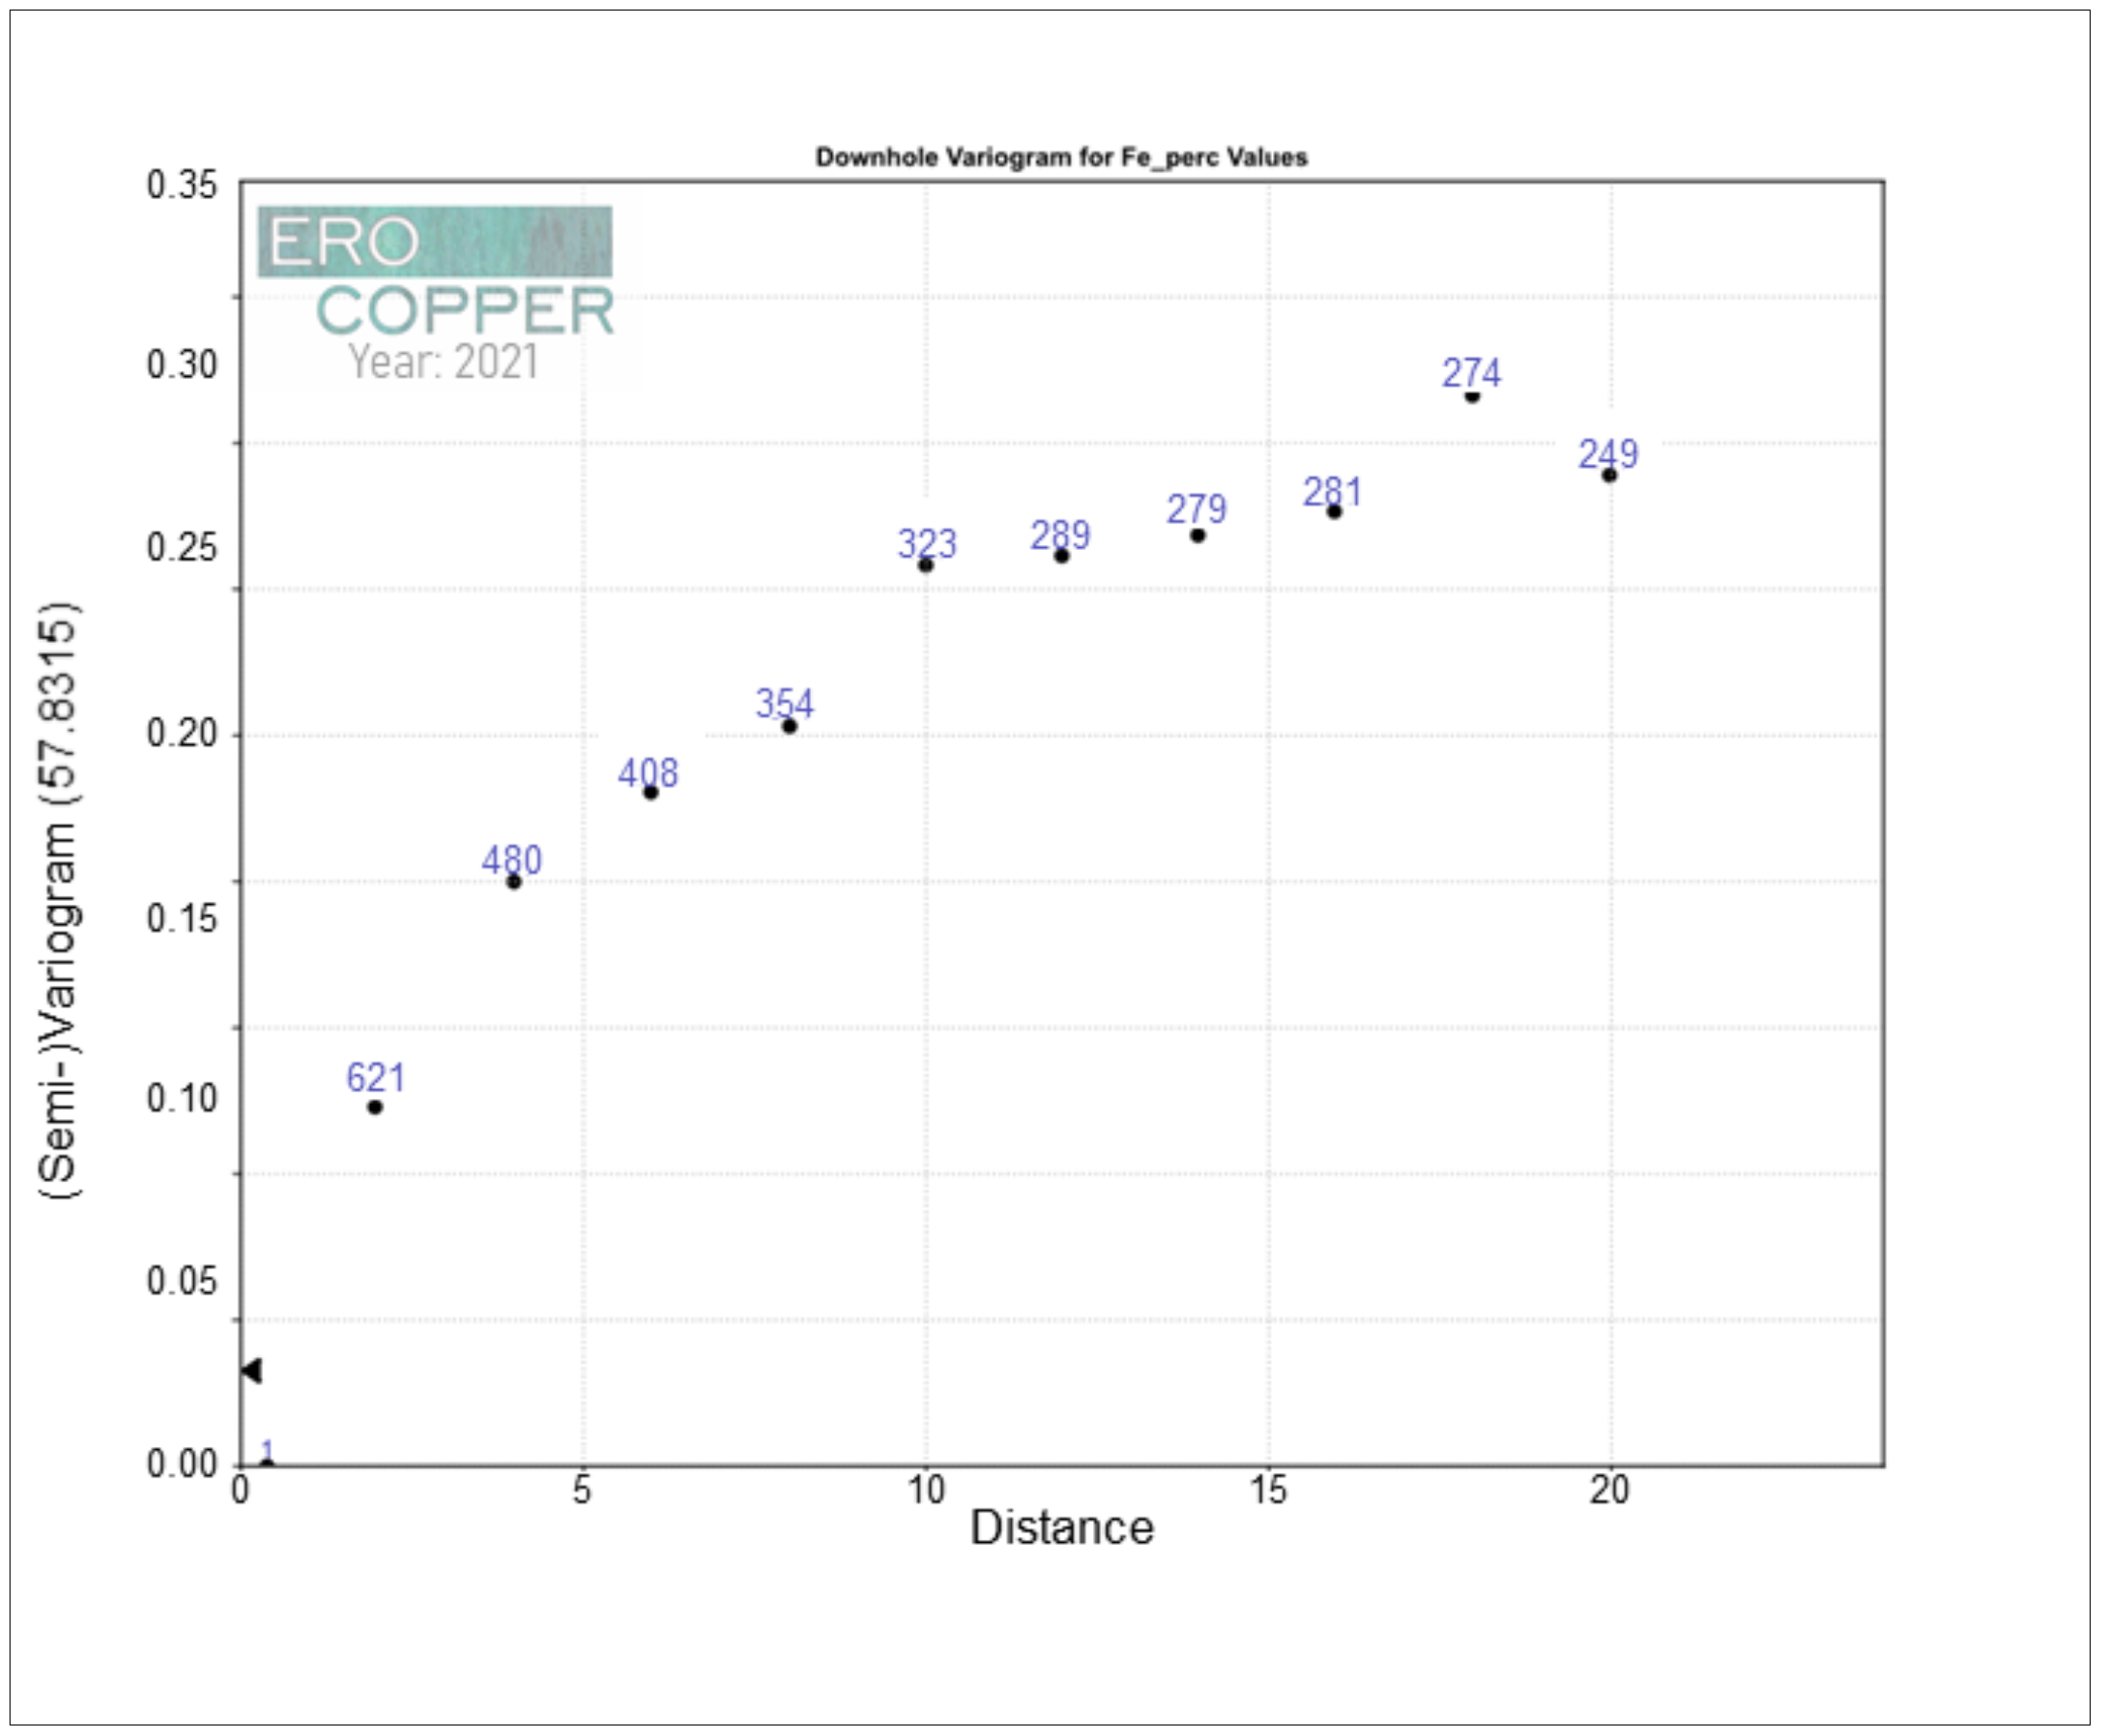
Figure 14-22: Down hole Variogram for Fe_pc Values | |
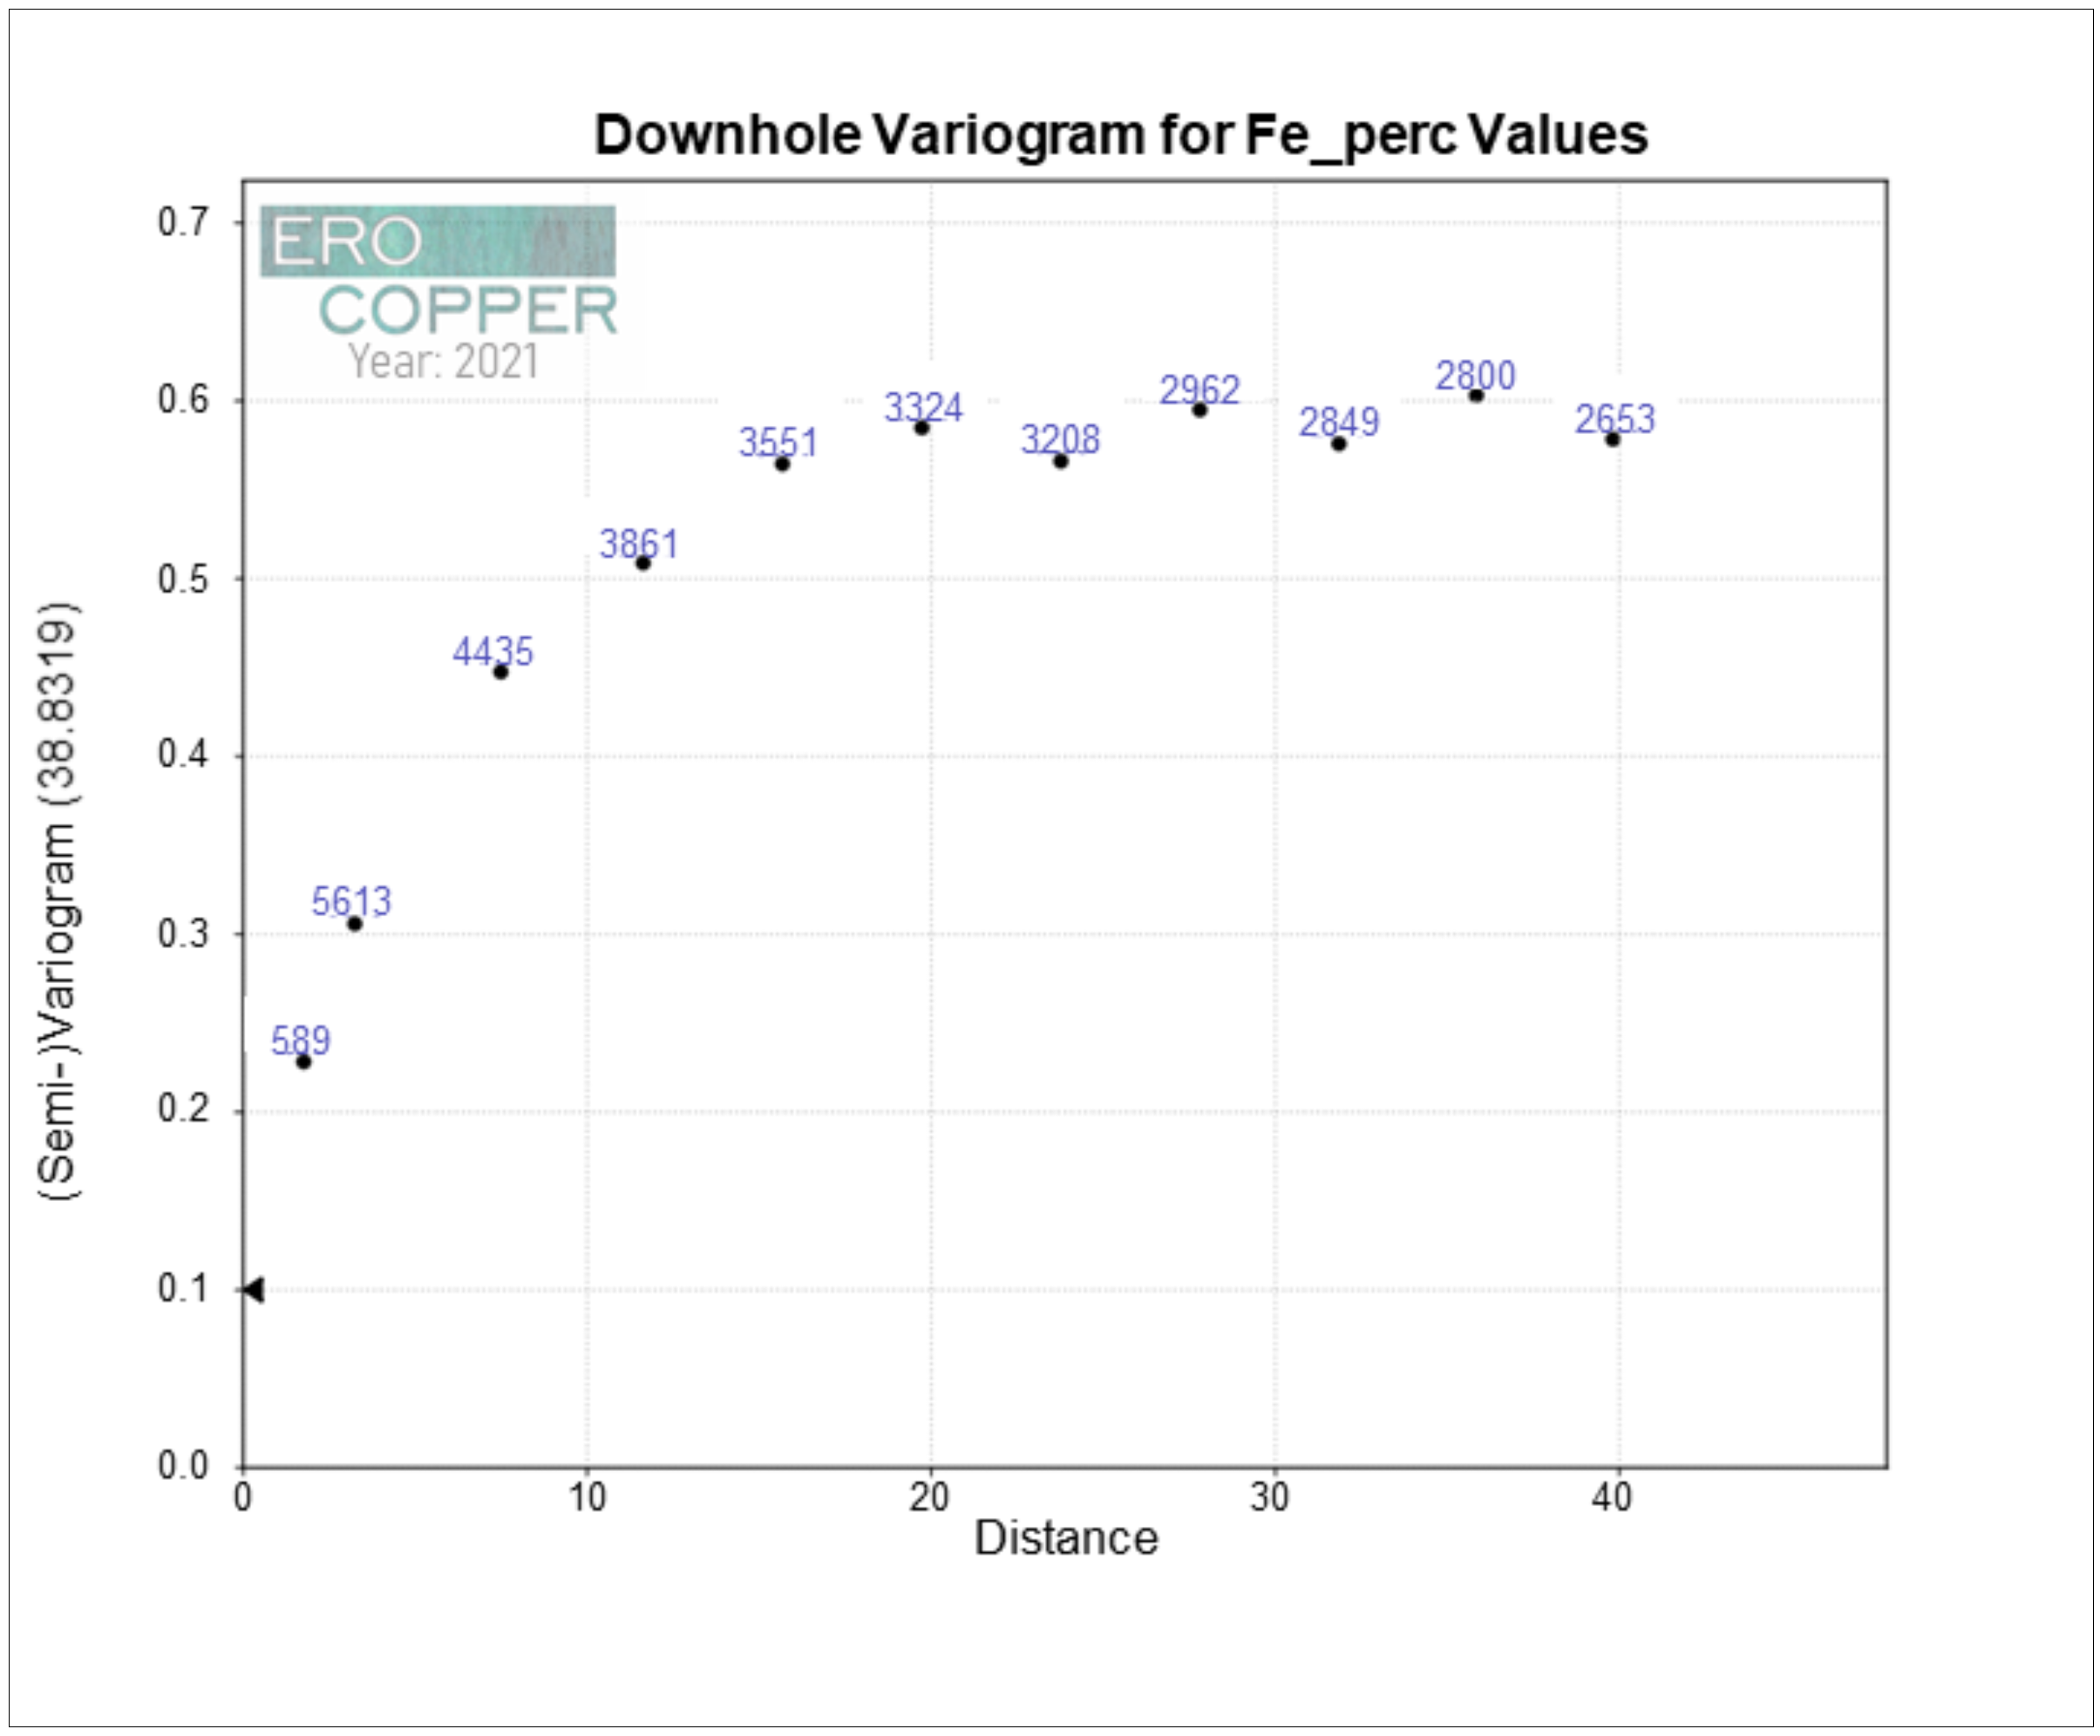
Figure 14-23: Downhole Variogram for Fe_pc Values | |
Figure 14-24: Directional Variogram for Copper (high-grade domain) | |
Figure 14-25: Directional Variogram for Copper (low-grade domain) | |
Figure 14-26:�� Directional Variogram for Iron (high-grade domain) | |
Figure 14-27: Directional Variogram for Iron (low-grade domain) | |
Figure 14-28: Copper Search Ellipses (blue) for high-grade (red) and low-grade (yellow) Domains | |
Figure 14-29: Wireframes With Block Model Outline in Section View | |
Figure 14-30: Swath plot in X, 1 block spacing | |
Figure 14-31: Swath plot in Y, 1 block spacing | |
Figure 14-32: Swath plot in Z, 1 block spa | |
Figure 14-33: Comparison between block model and composites in vertical section. | |
Figure 14-34: Mineral Resources Open Pit Shell and Stope Optimizer Rounds | |
Figure 14-35: Mineral Resources Within Open Pit Shell and Stopes | |
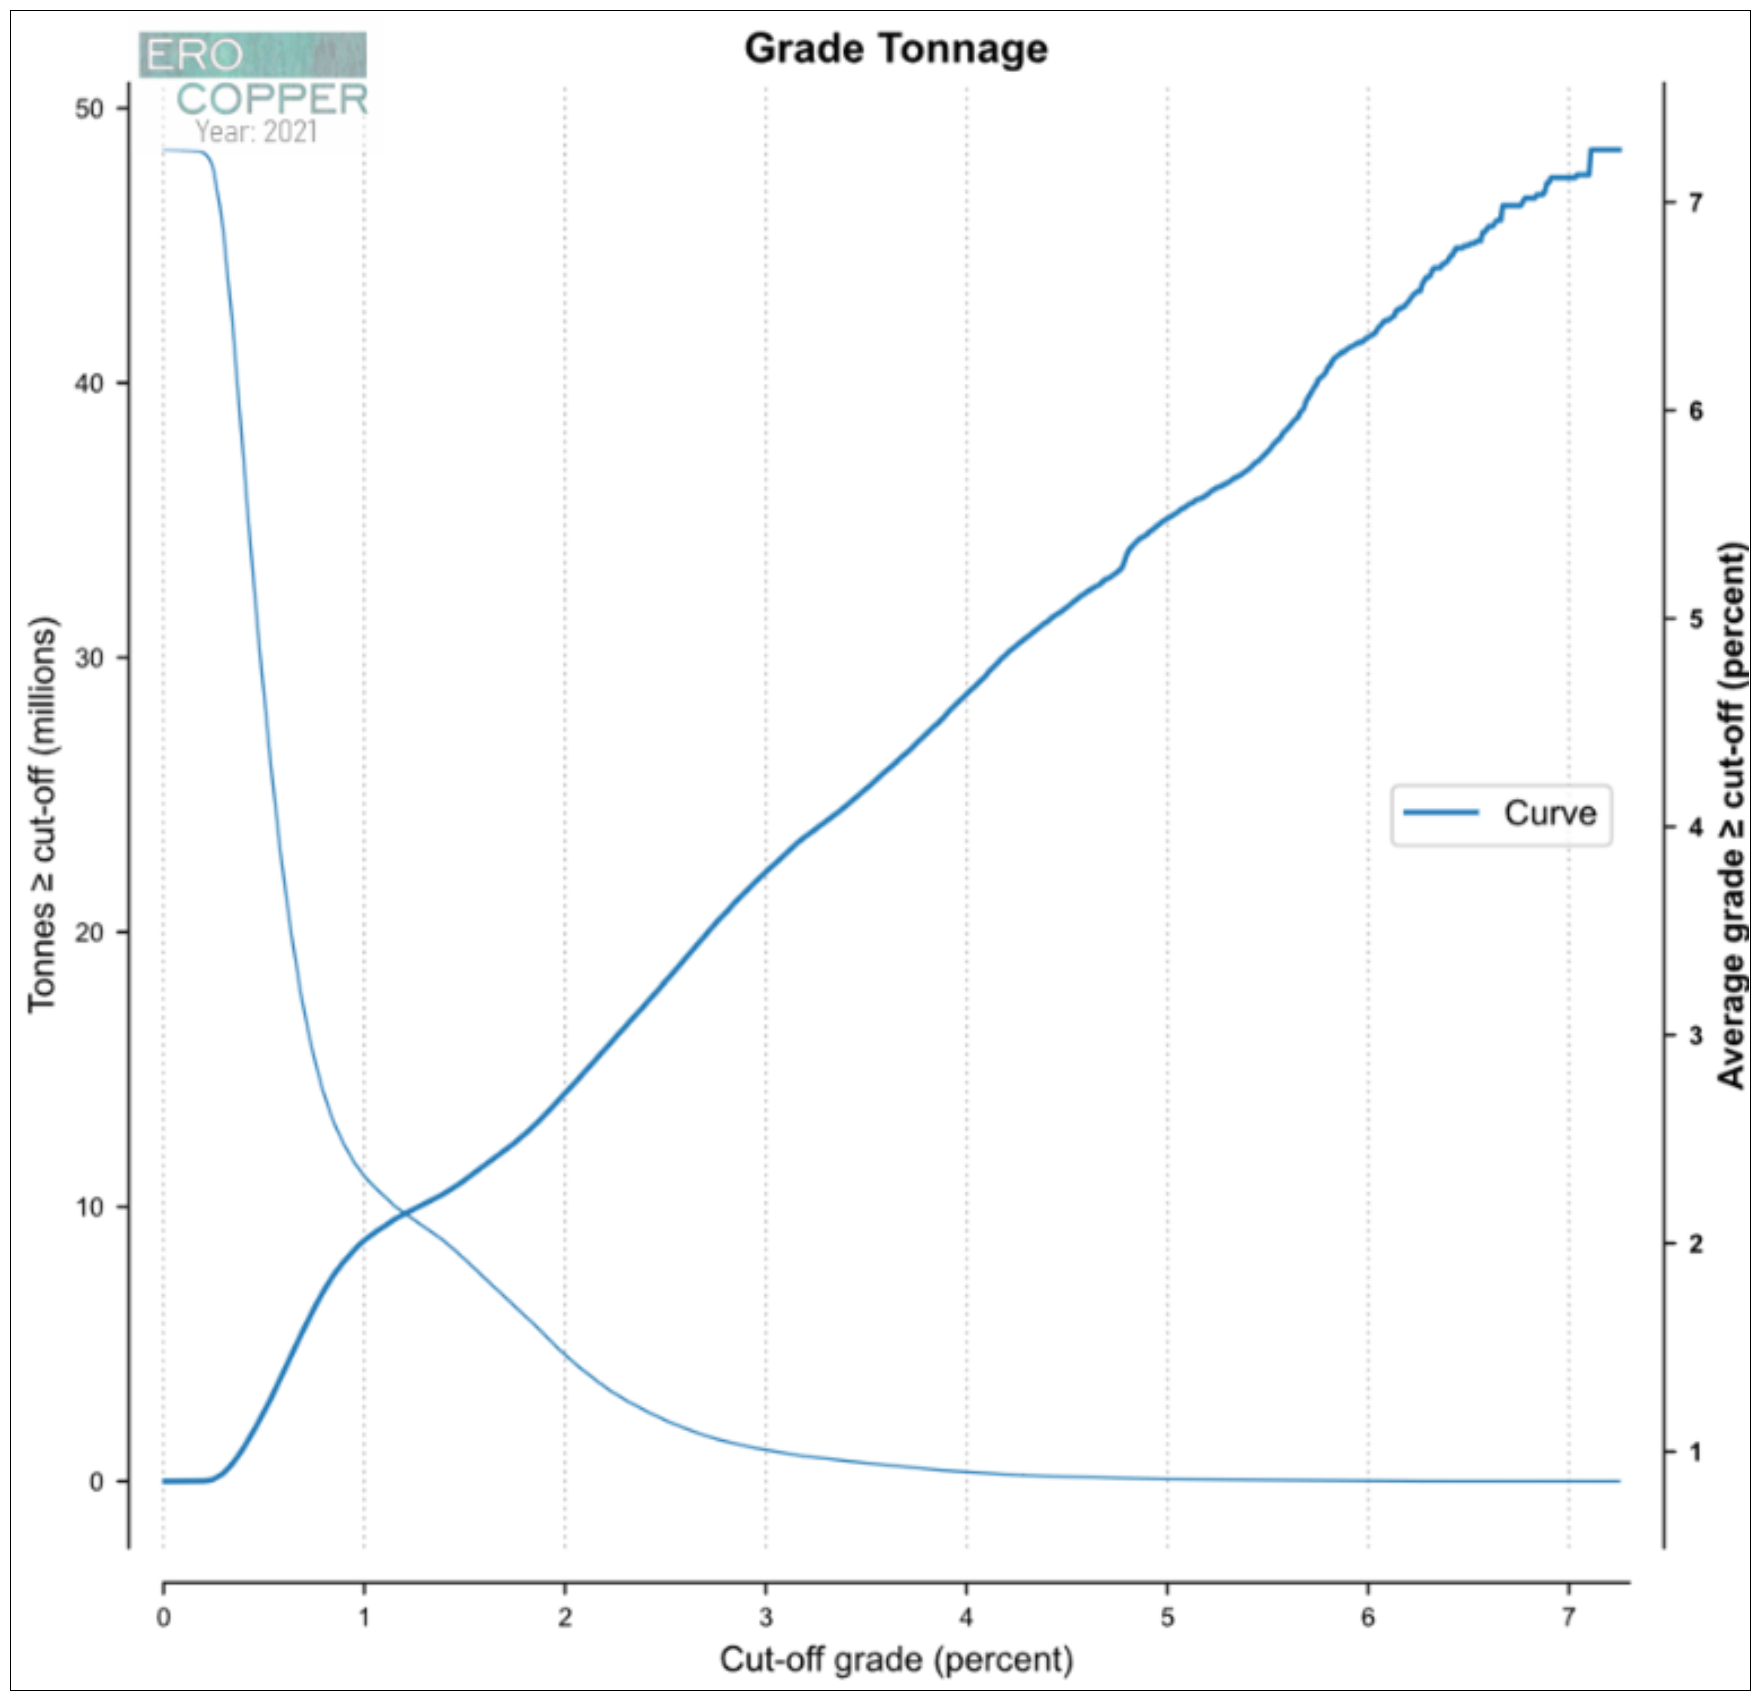
Figure 14-36: Grade Tonnage Sensitivity to Cut-off Grade, Measured & Indicated Resource | |
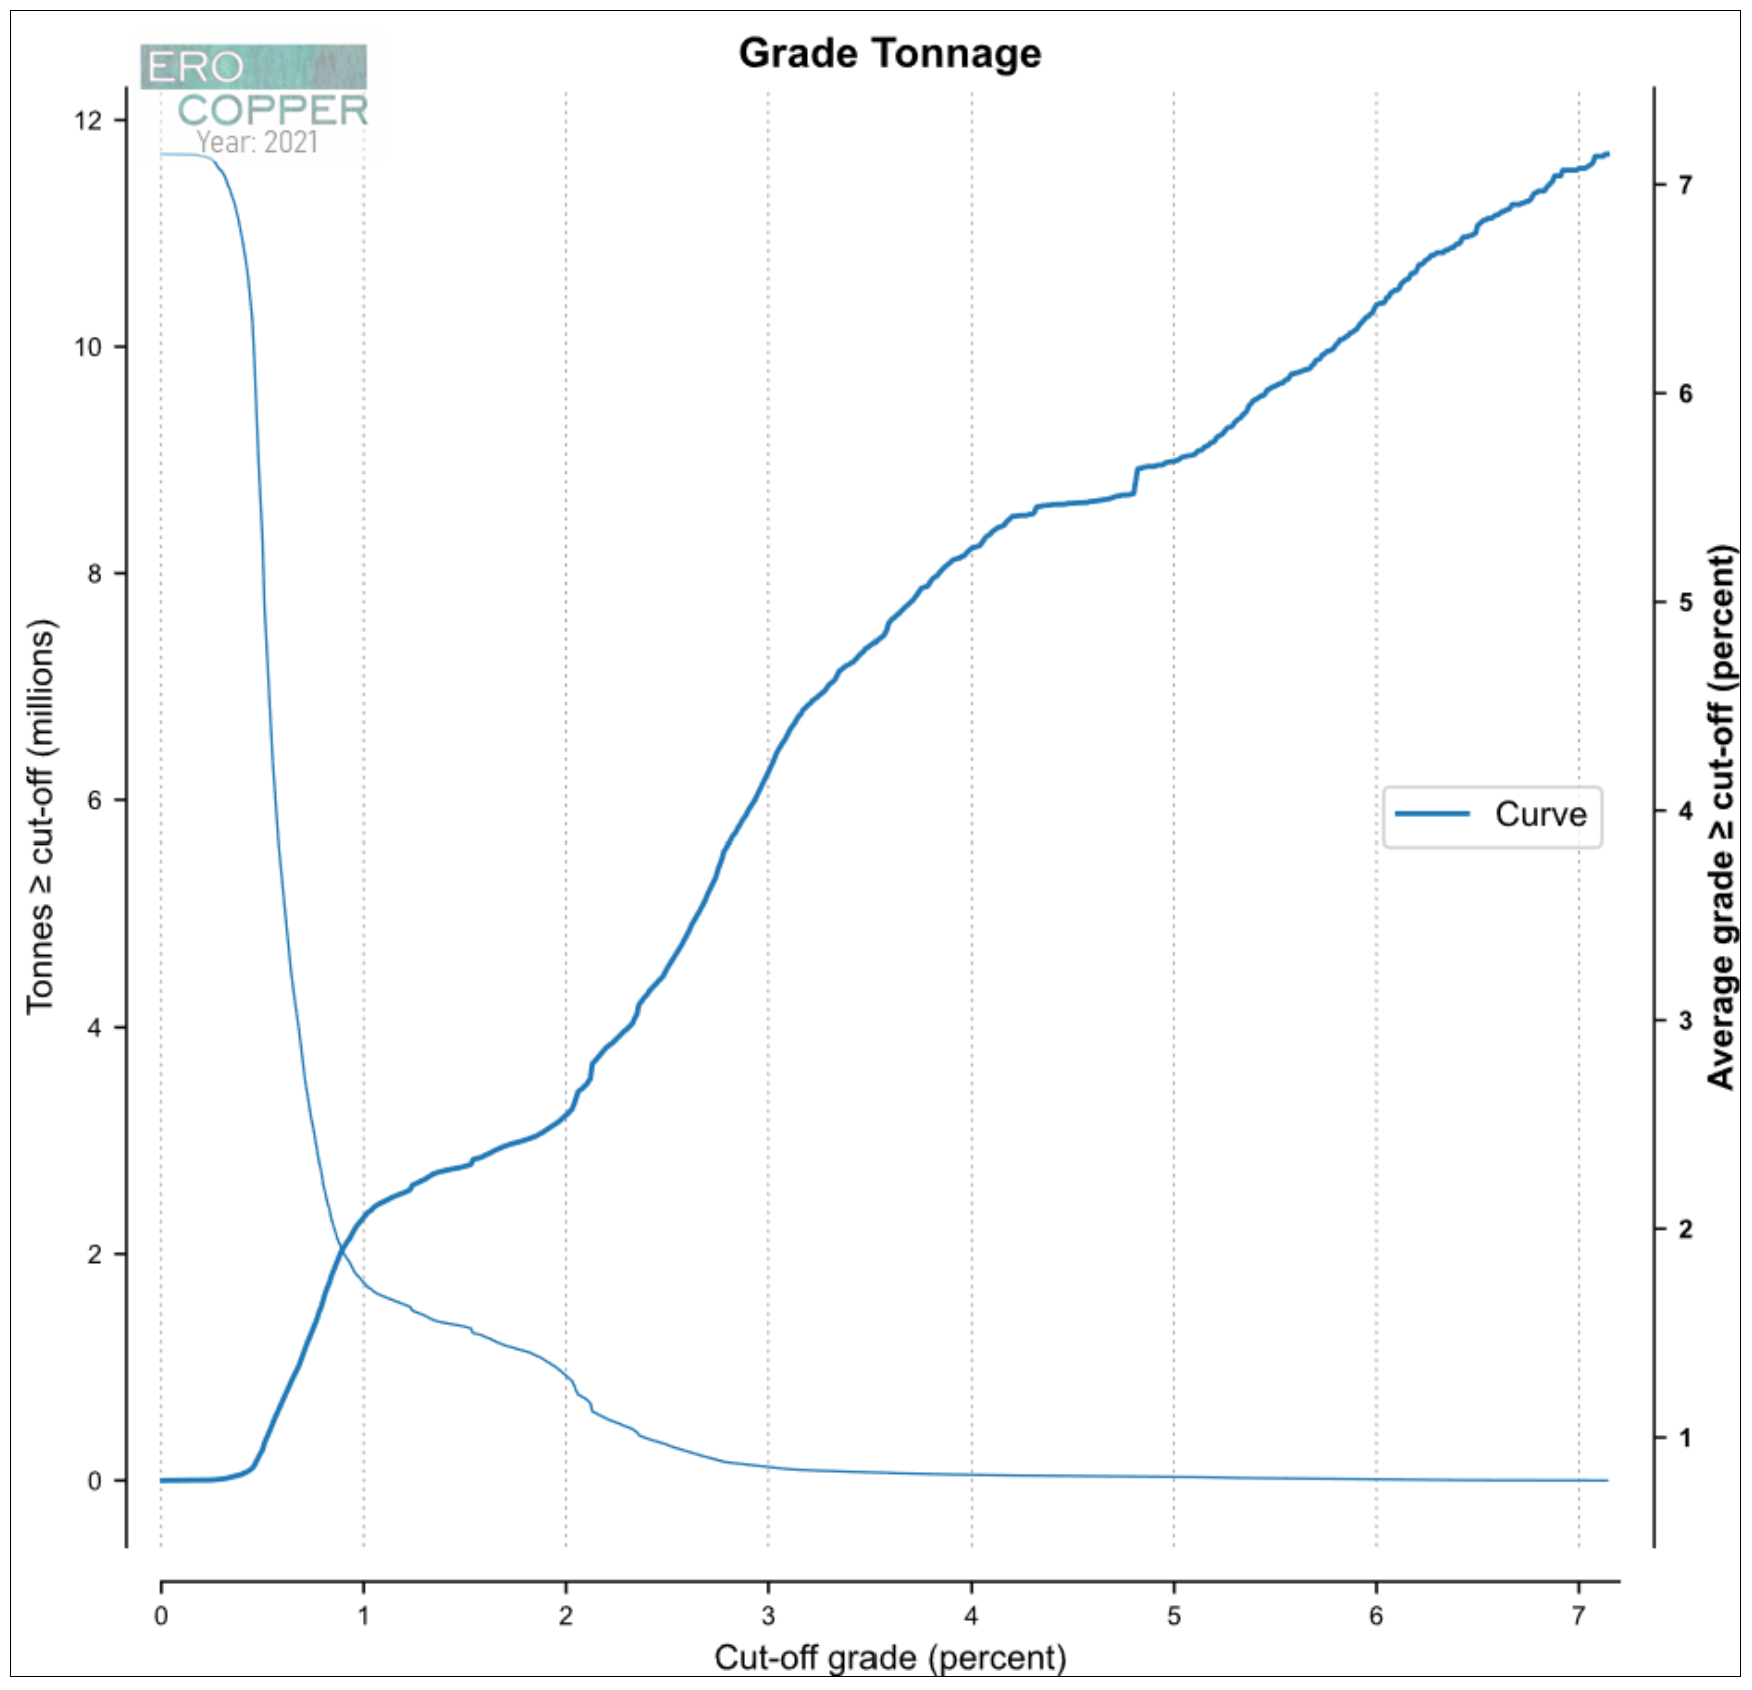
Figure 14-37: Grade – Tonnage Sensitivity to Cut=off Grade, Inferred Resource | |
Figure 15-1: Boa Esperança Surface Topography | |
Figure 15-2: Mining Shapes Results for Selected Bench | |
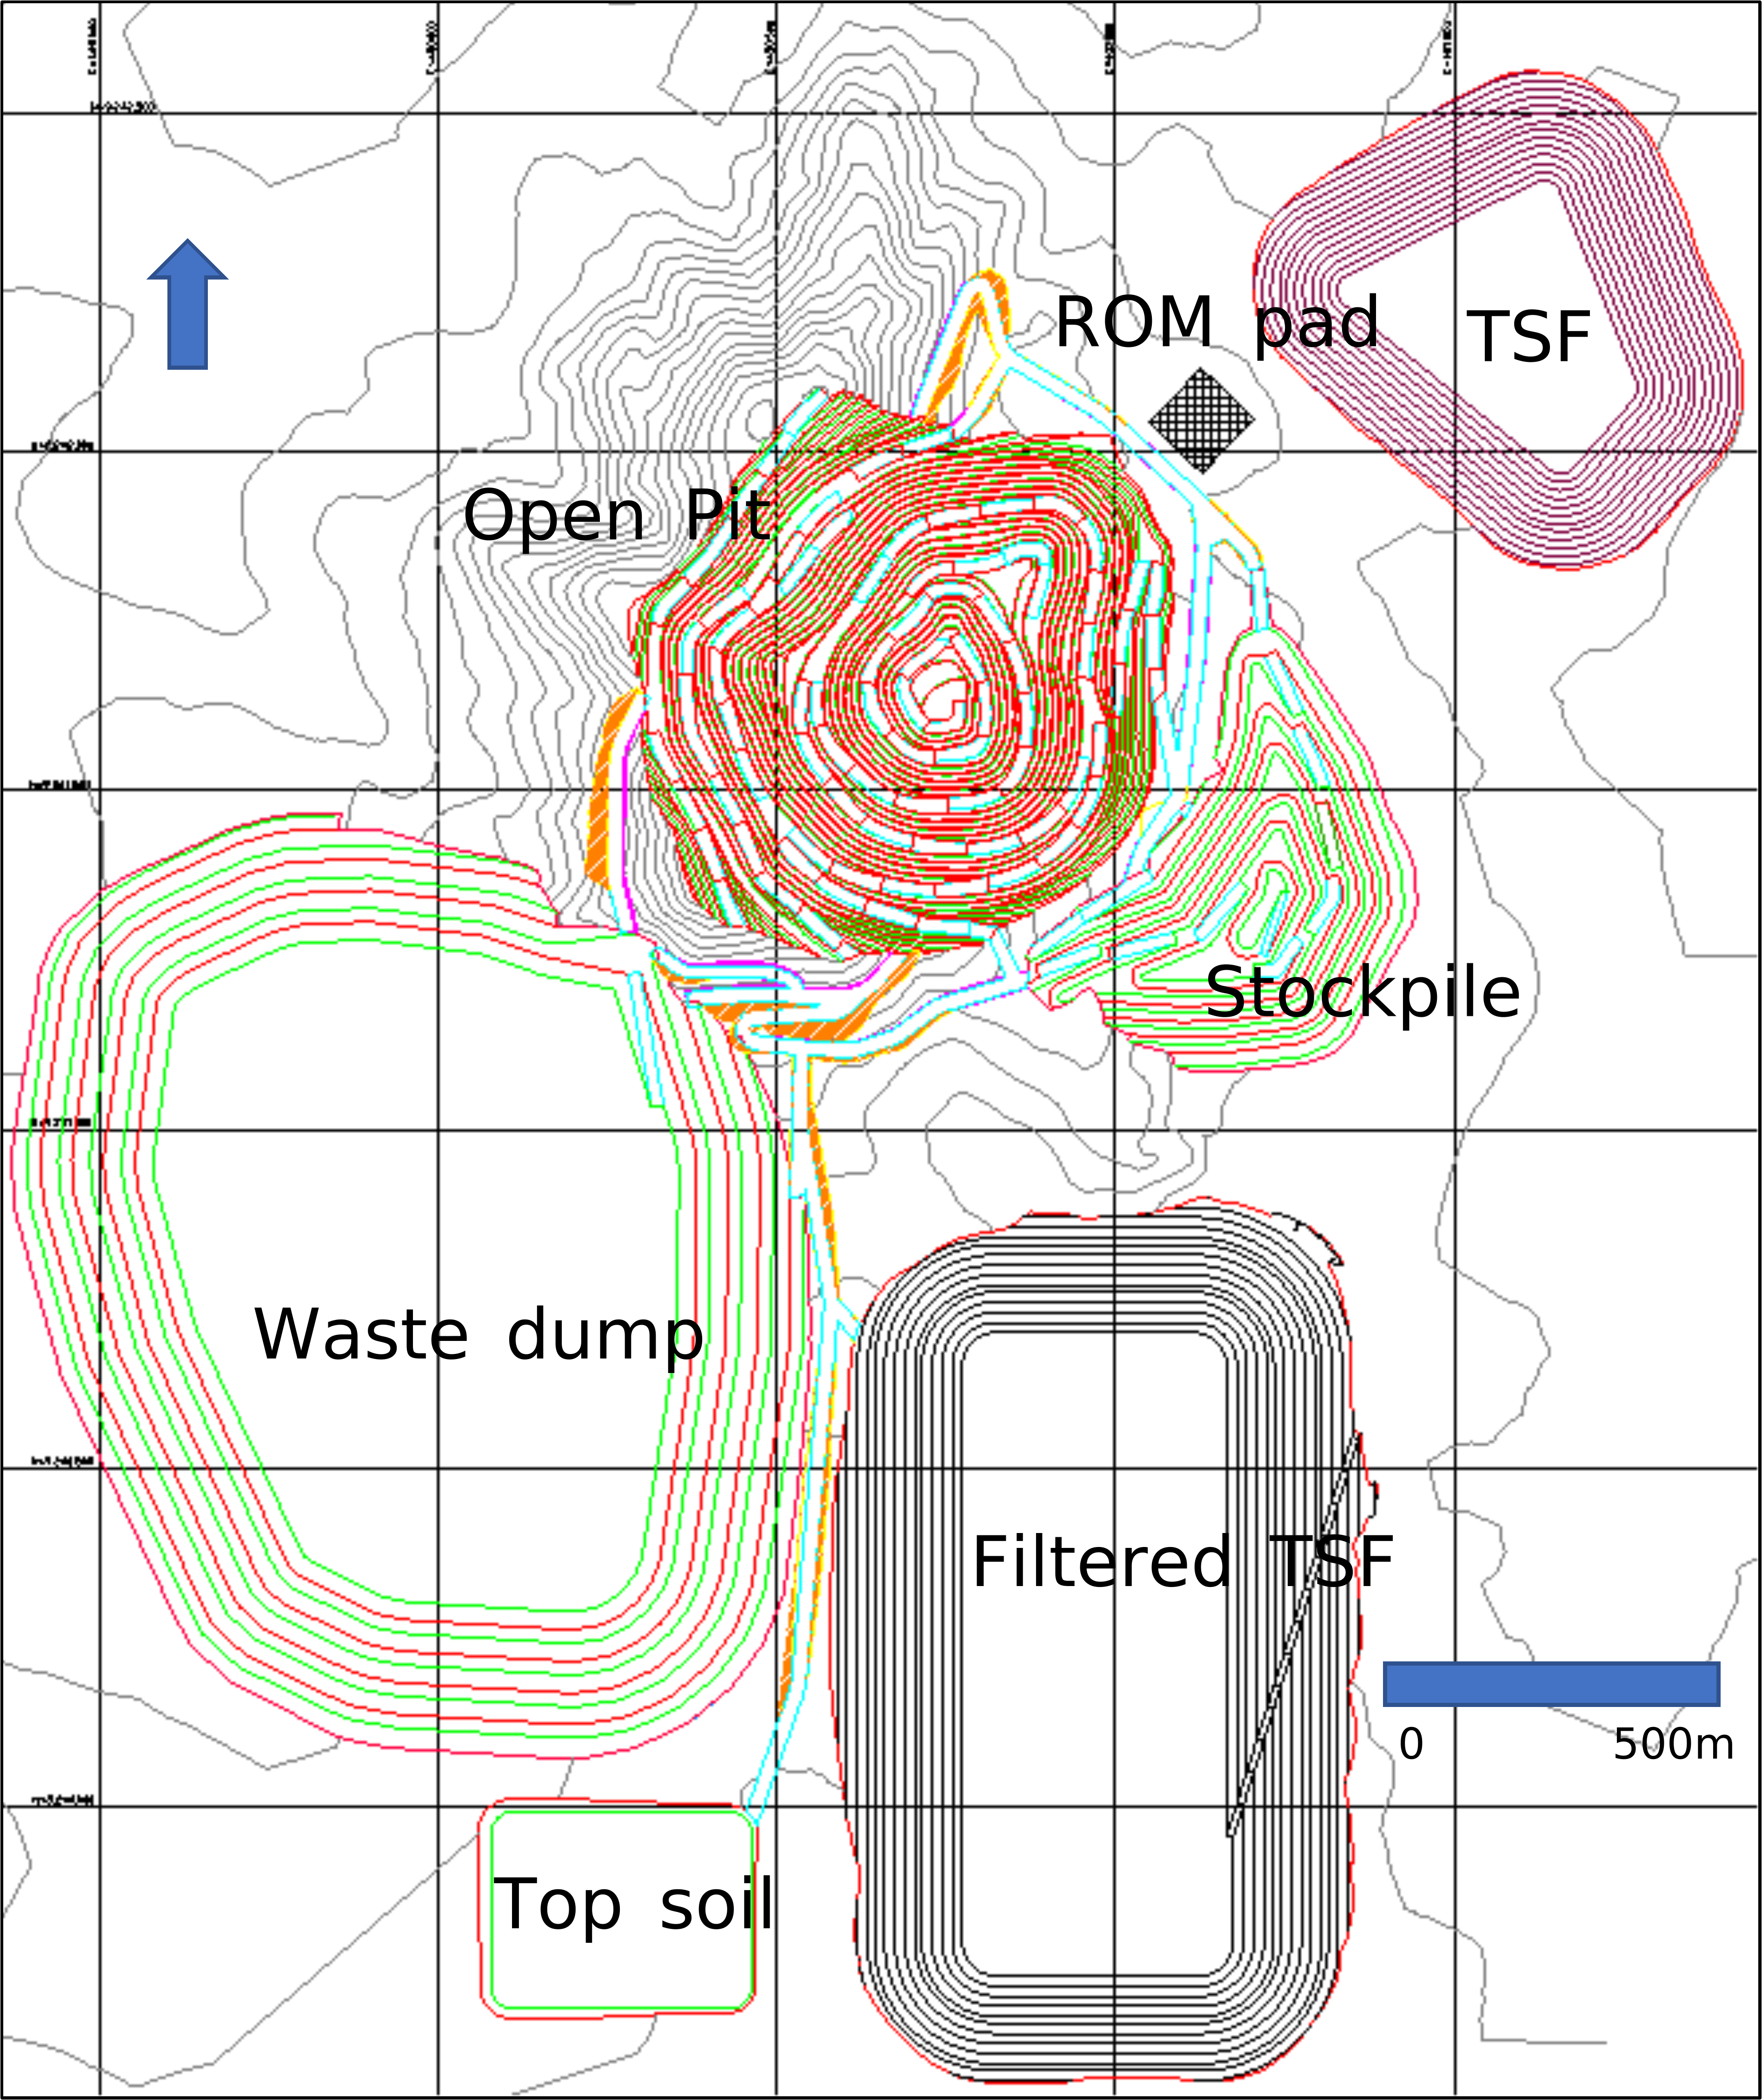
Figure 16-1: Planned General Mine Layout | |
| | | | | |
| Boa Esperança Project | Page xv |
| NI 43-101 Technical Report Feasibility Study Update | October 2021 |
| | | | | |
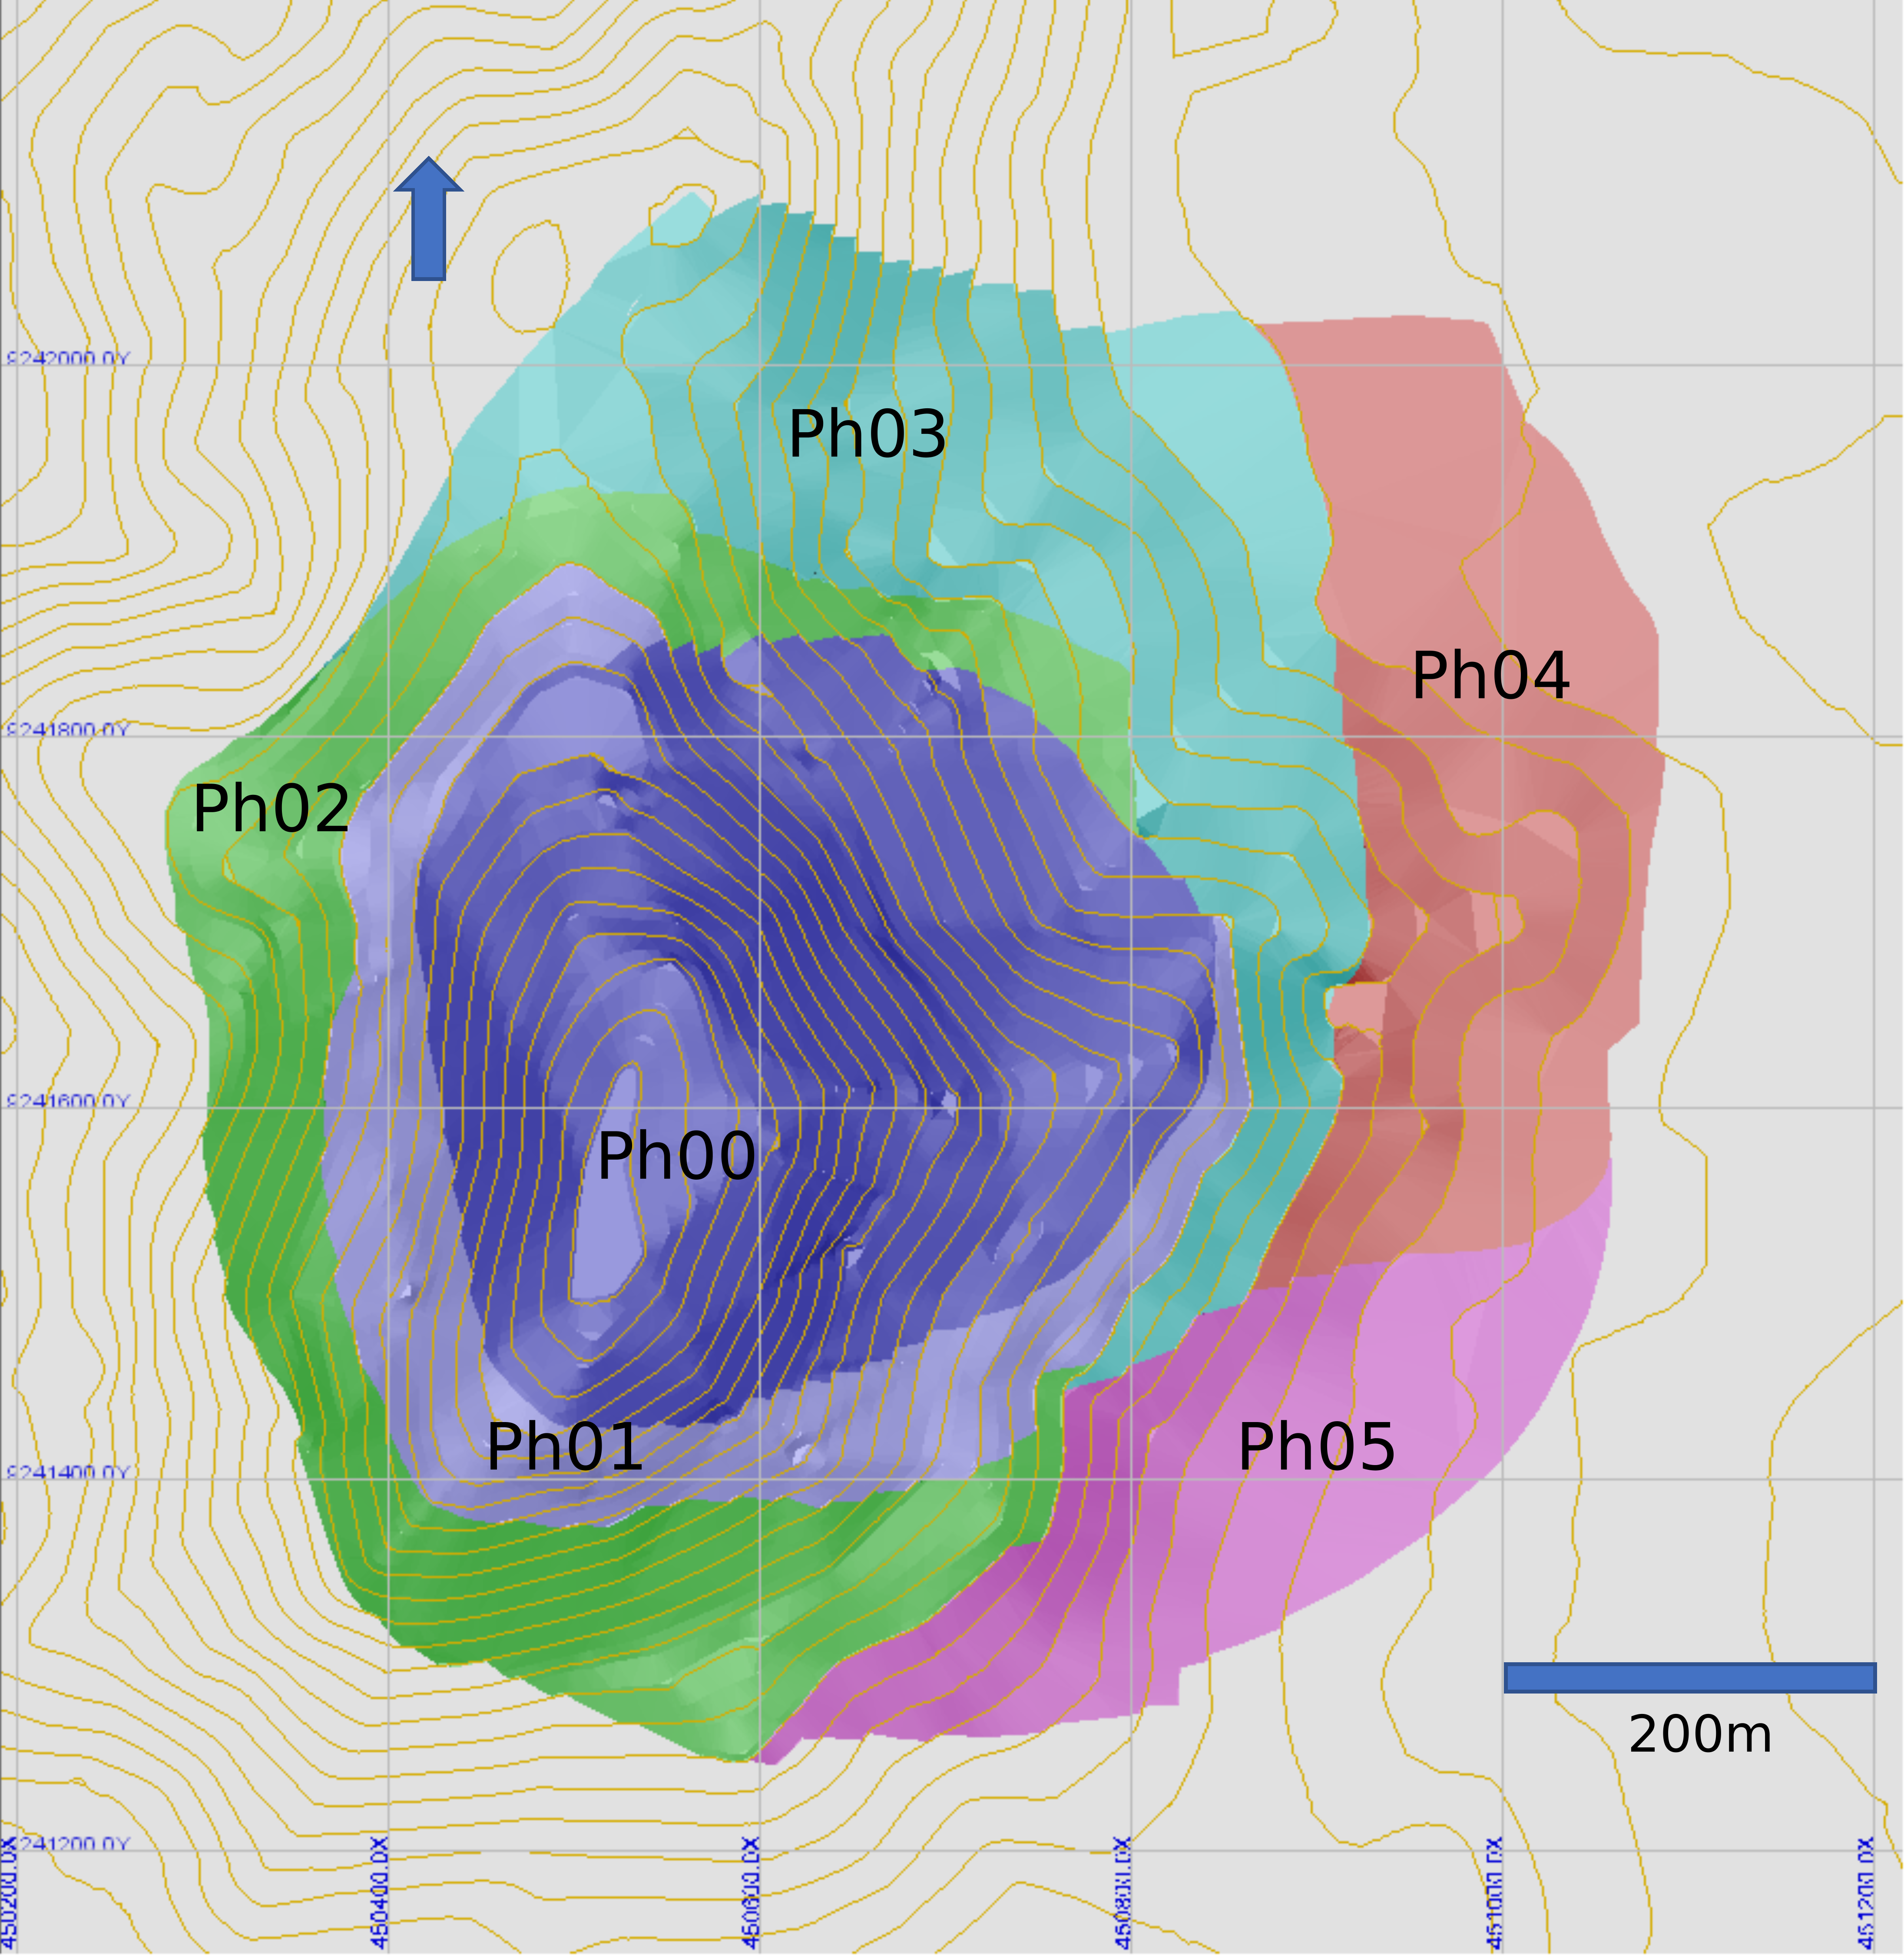
Figure 16-2: Phase Designs – Plan View Projection | |
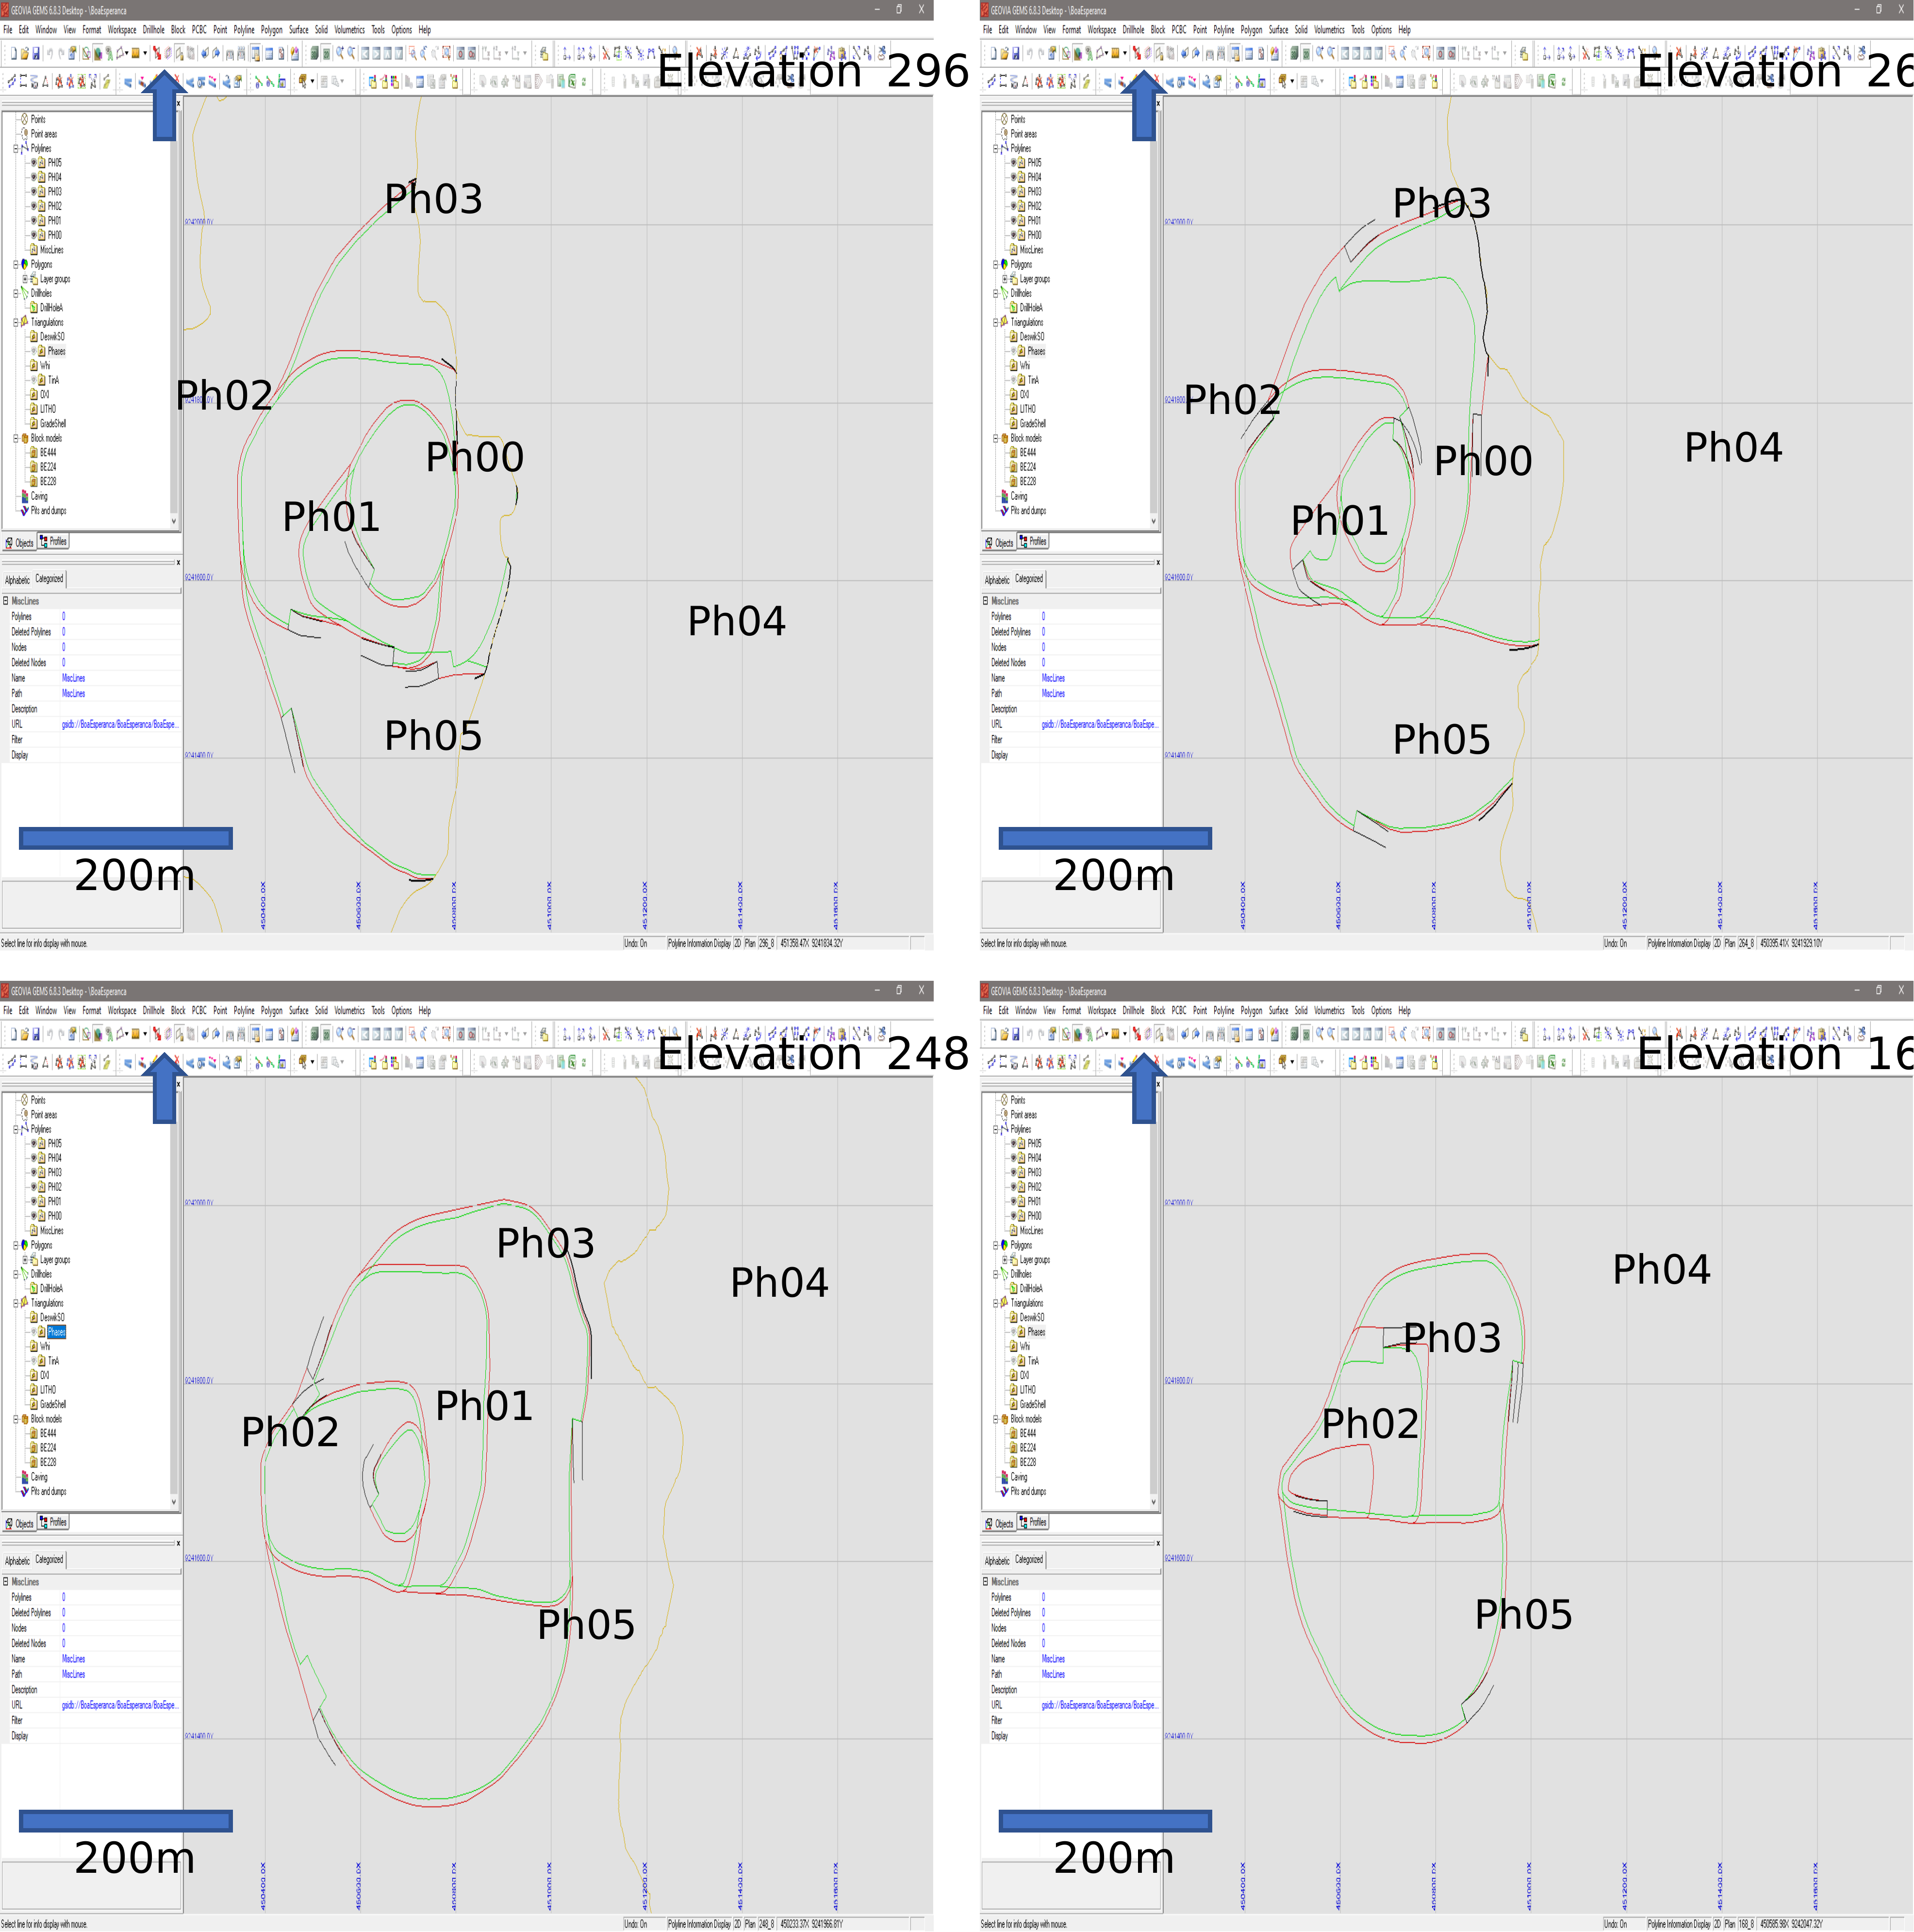
Figure 16-3: Phases Designs at Selected Elevations | |
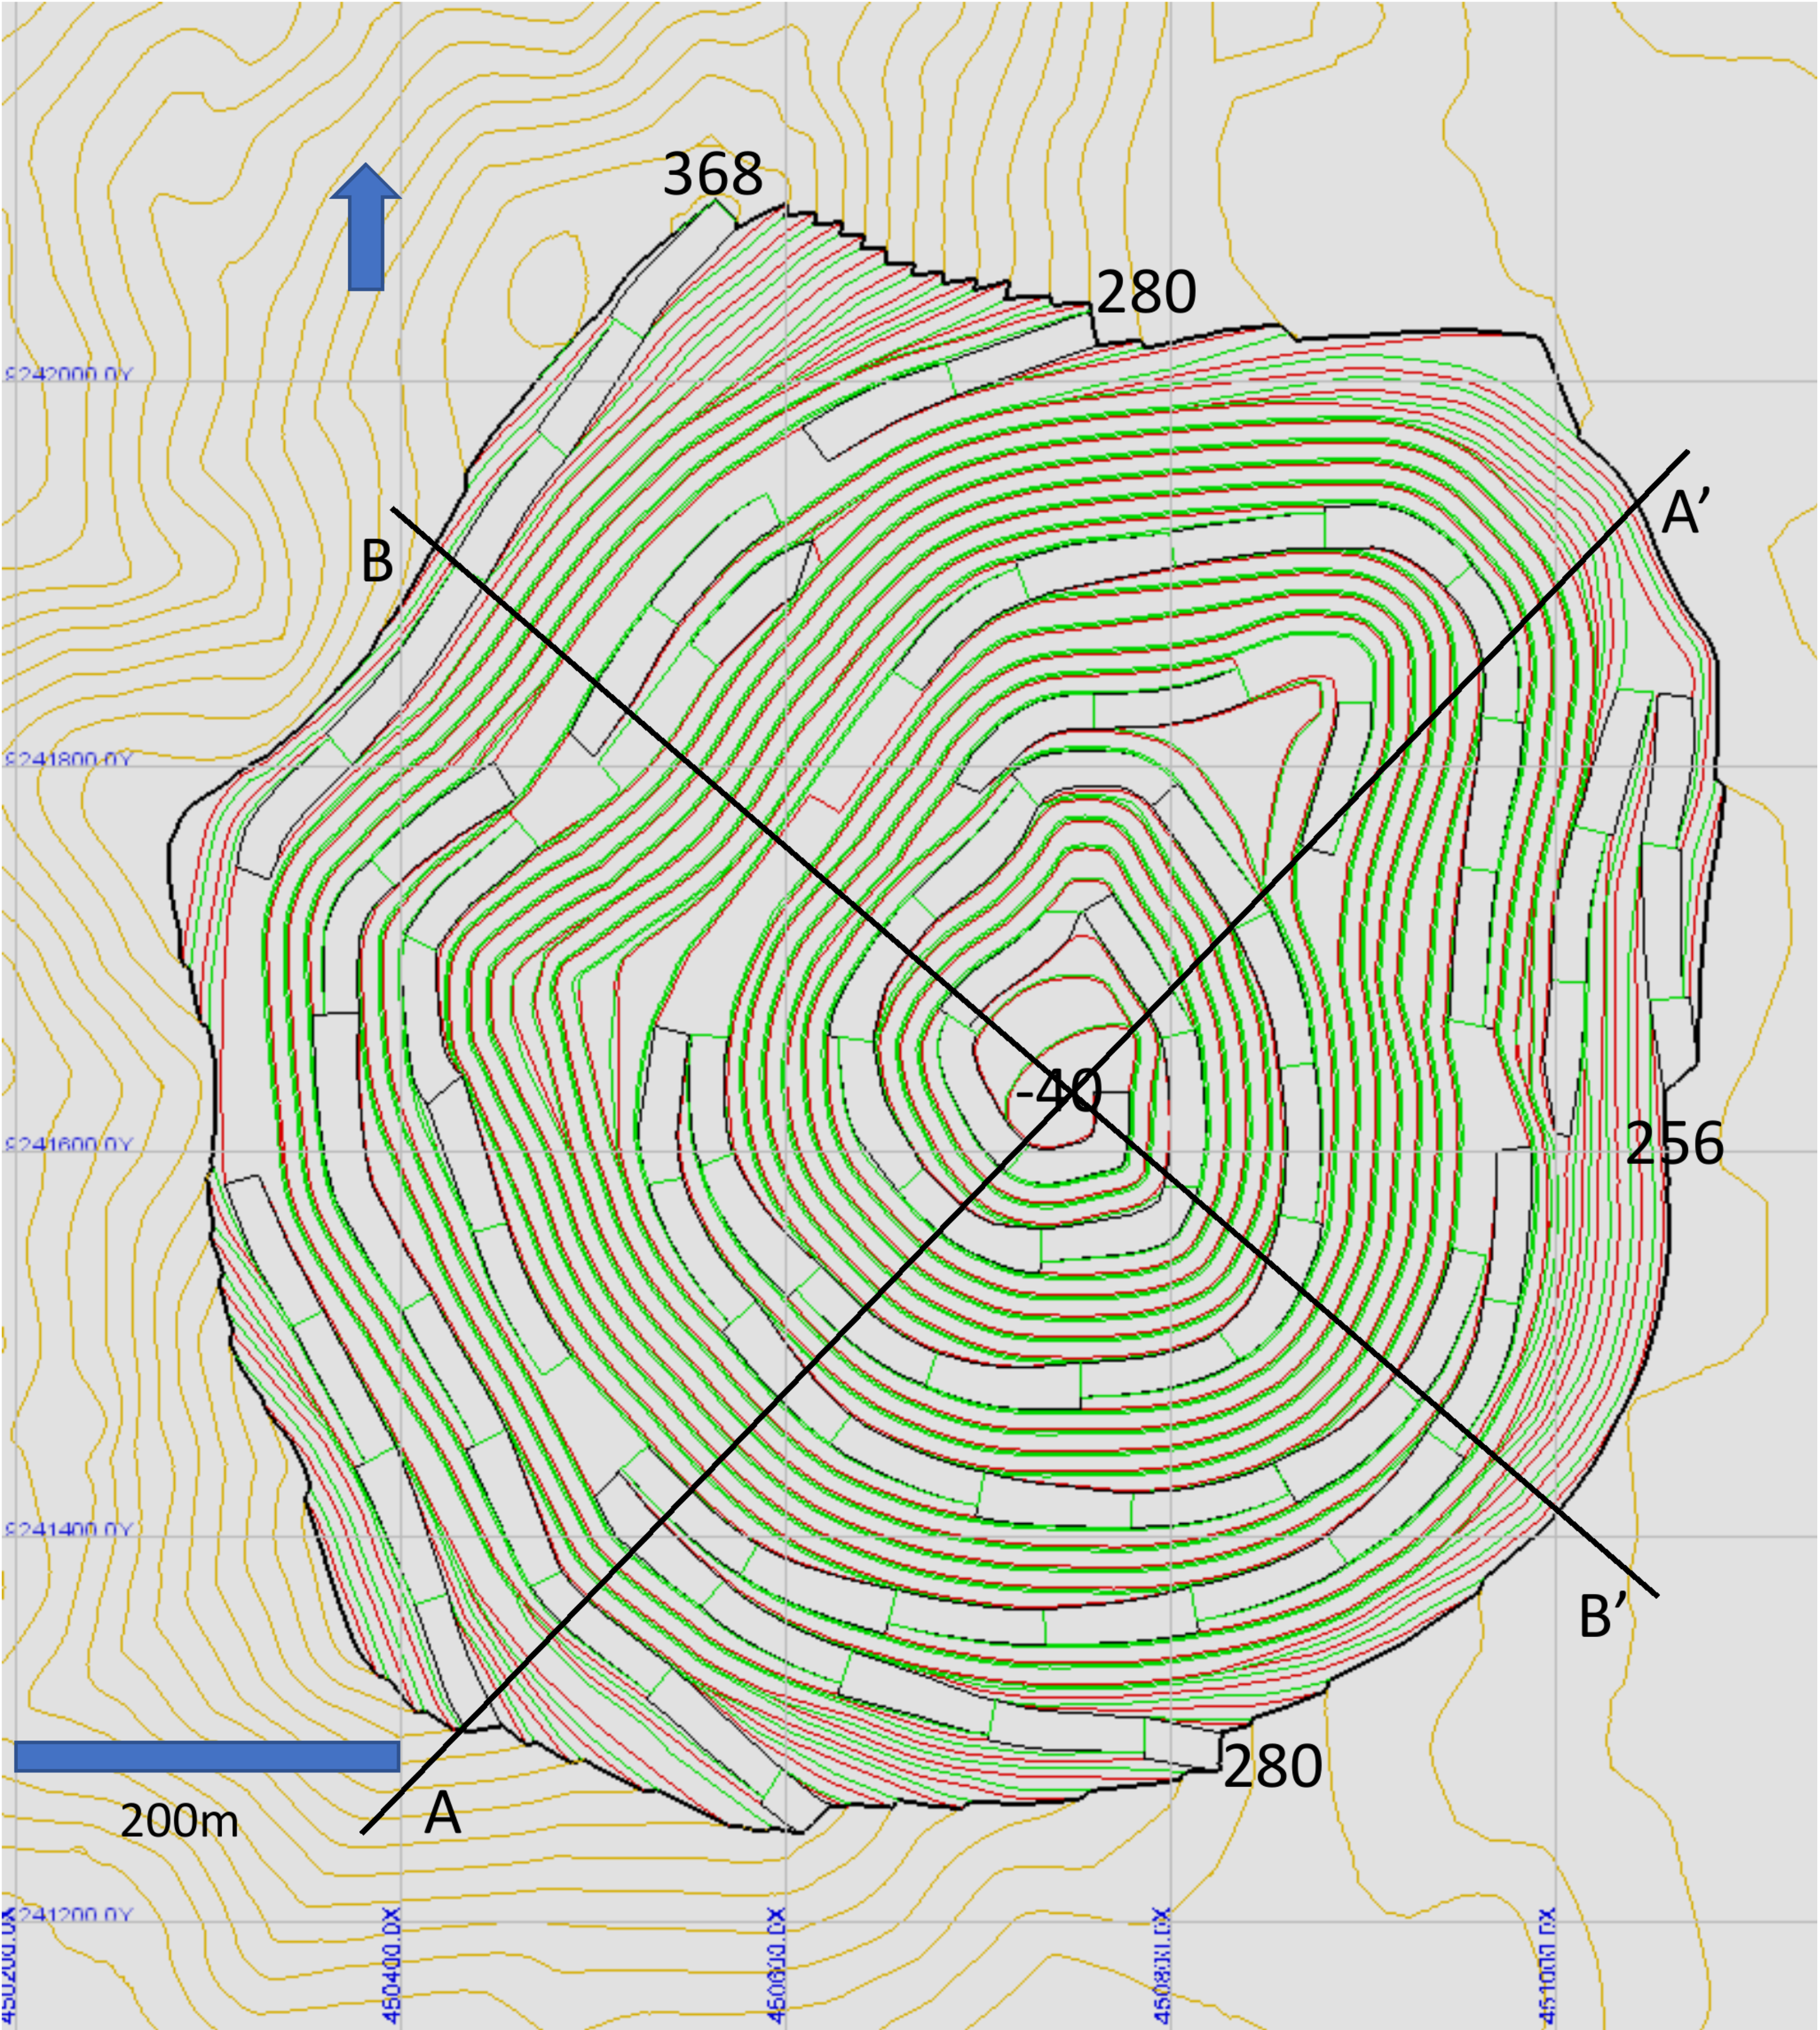
Figure 16-4: Final Pit | |
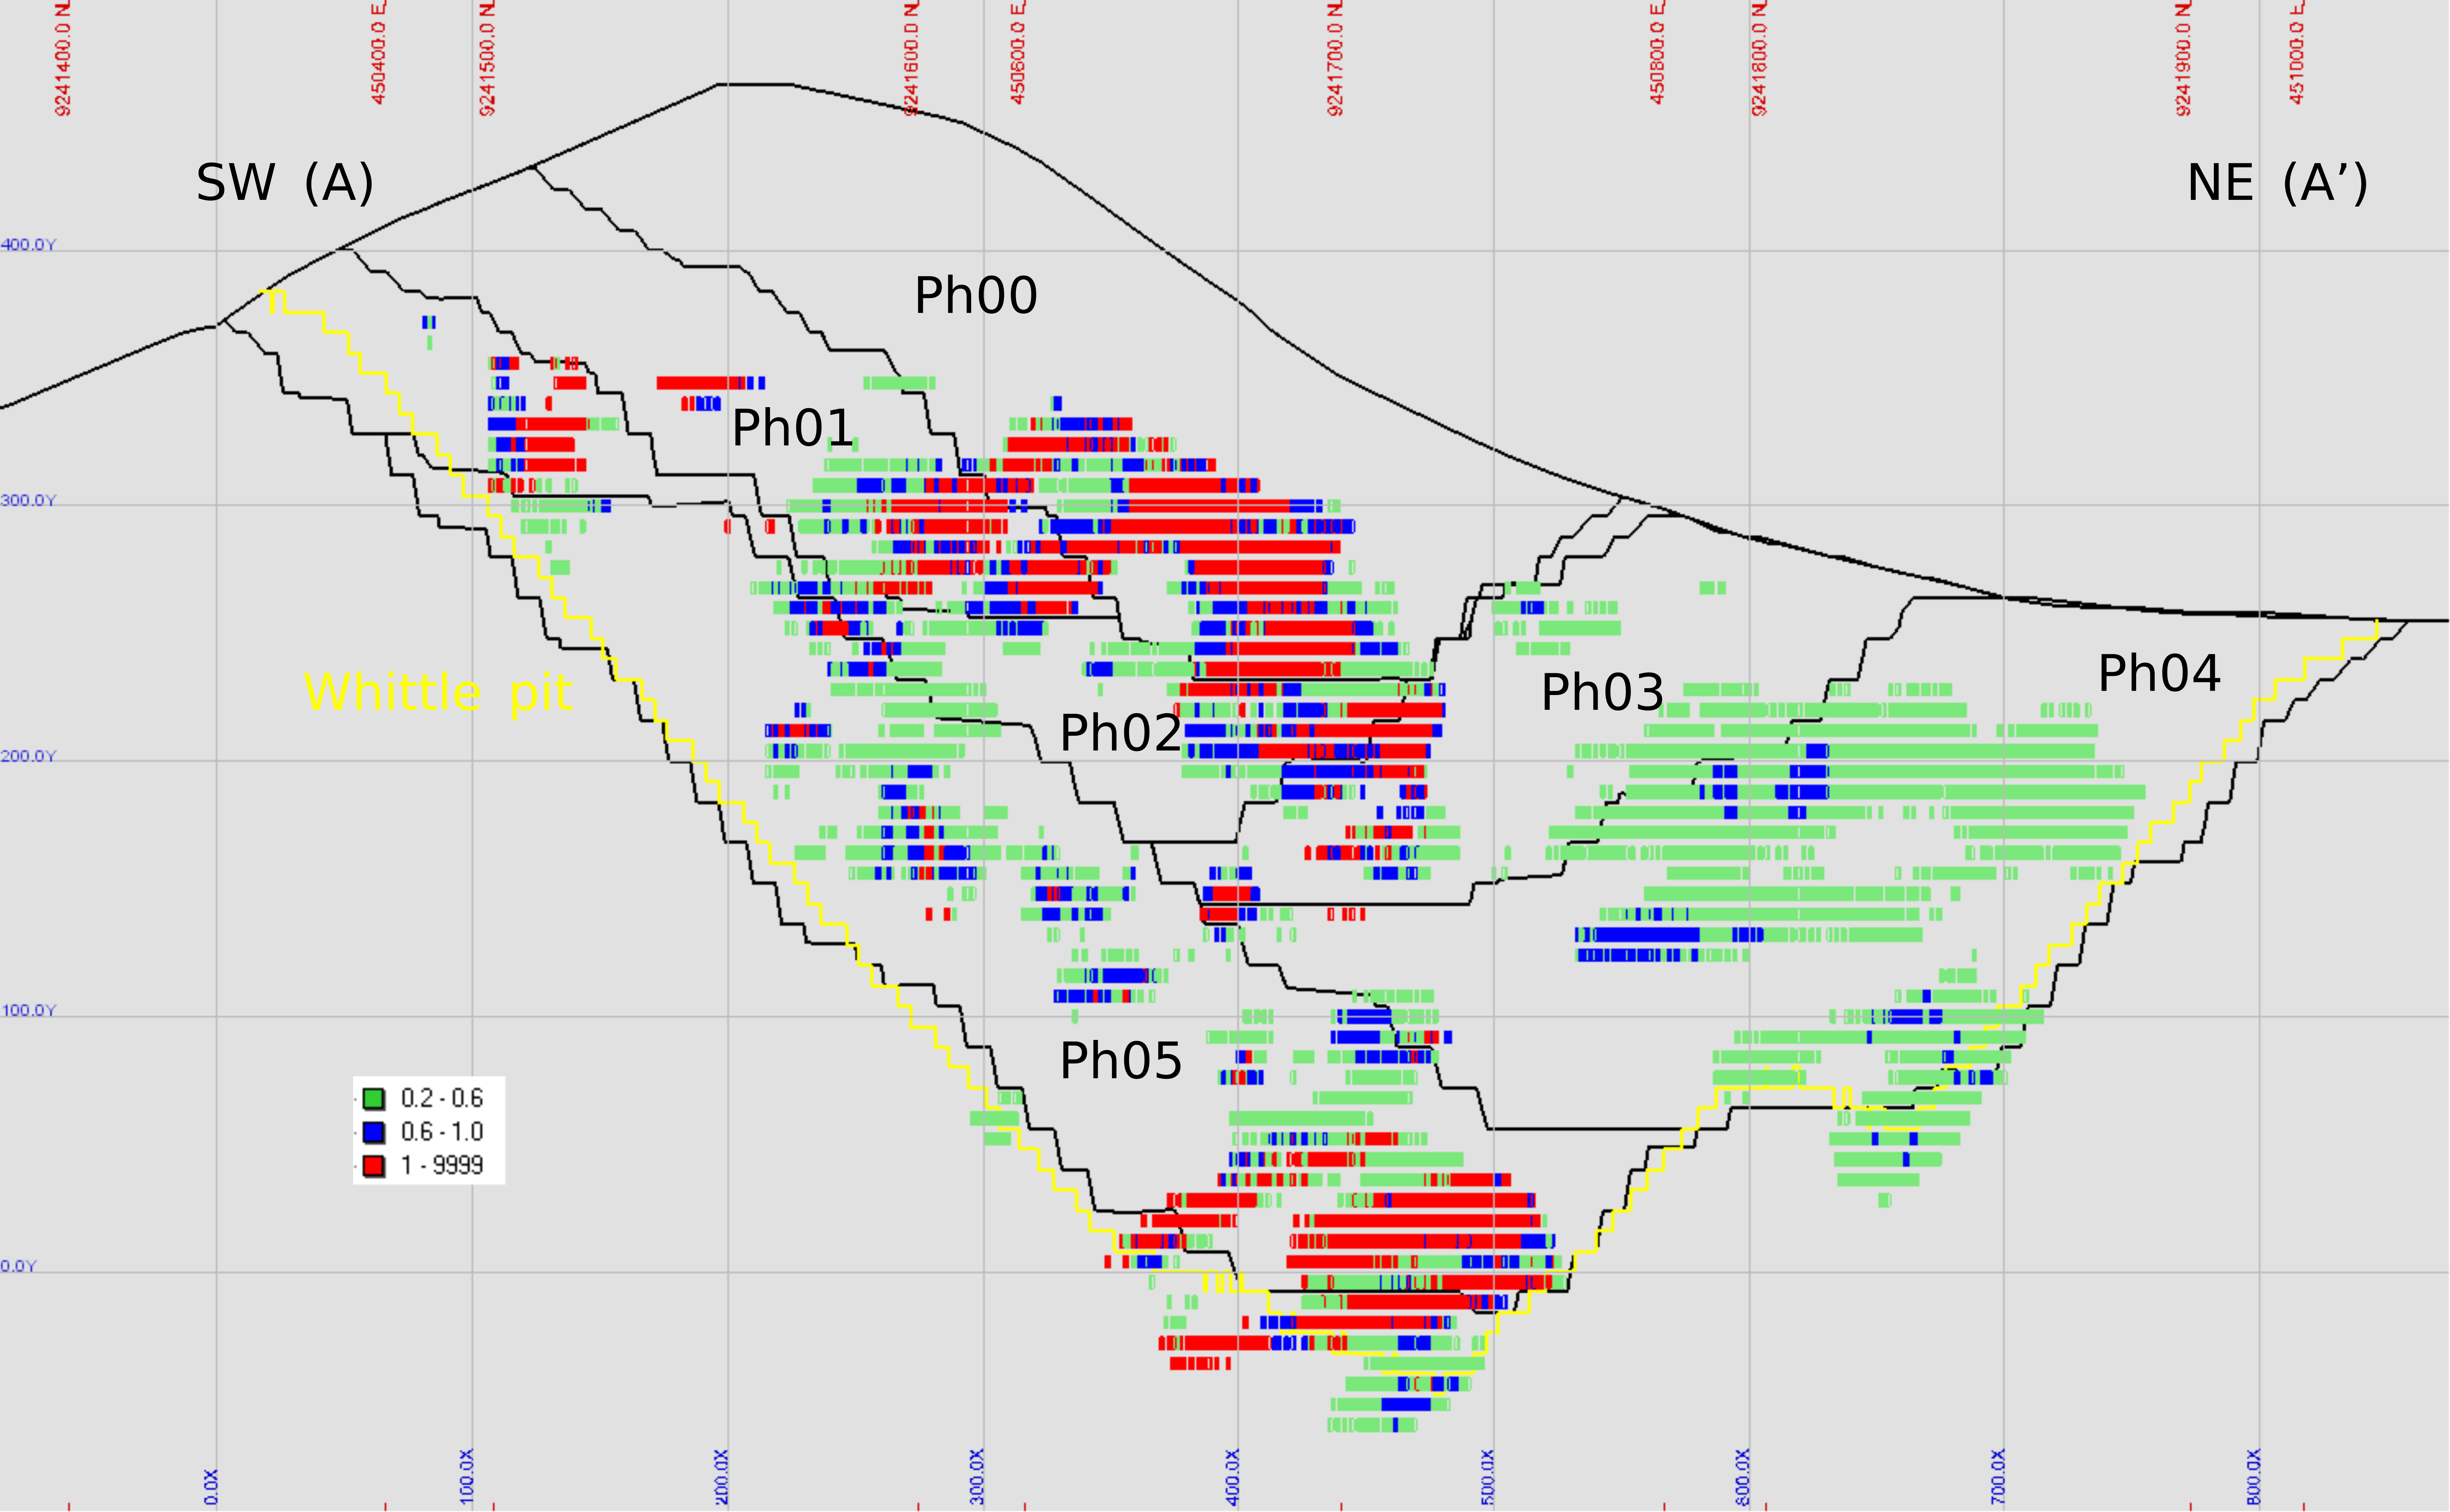
Figure 16-5: Phases designs and Whittle pit - Cross Section (A-A') | |
Figure 16-6: Phases designs and Whittle pit - Cross Section (B-B') | |
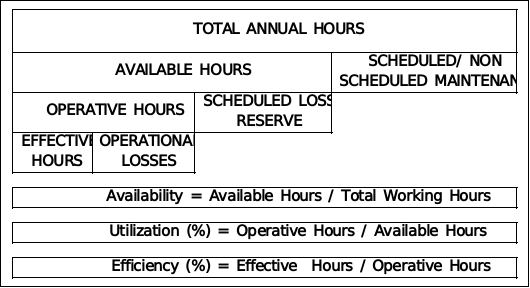
Figure 16-7: Operating Time and Index Definition | |
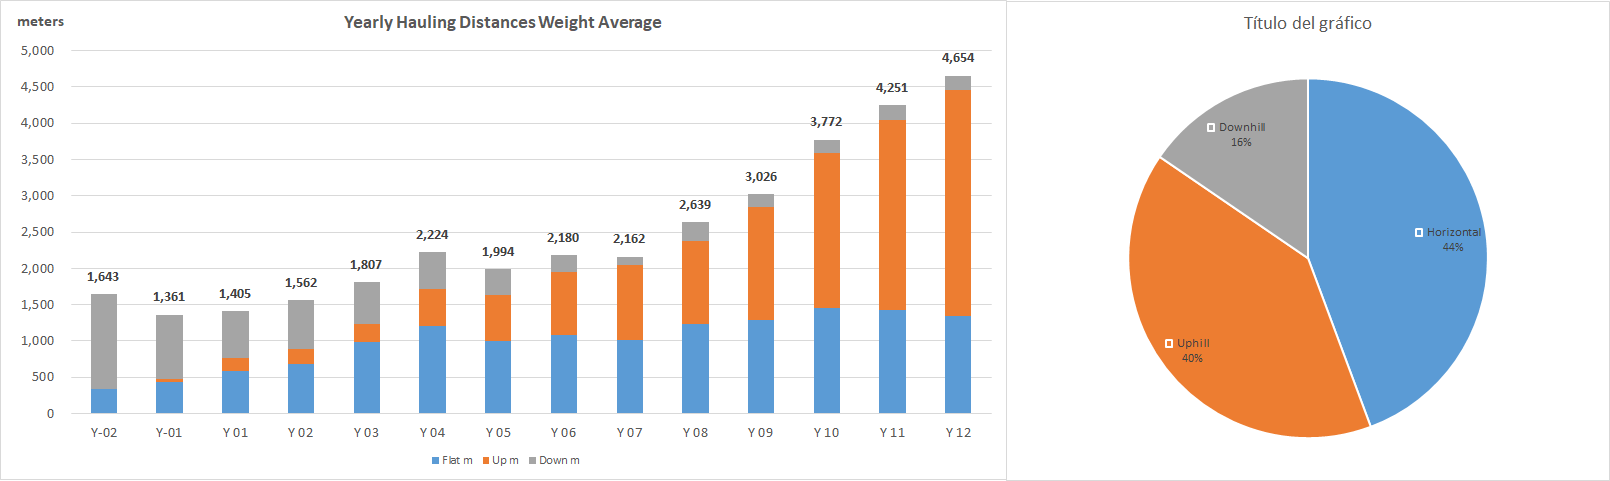
Figure 16-8: Proposed Hauling Distances Summary | |
Figure 17-1: Overall Process Flowsheet | |
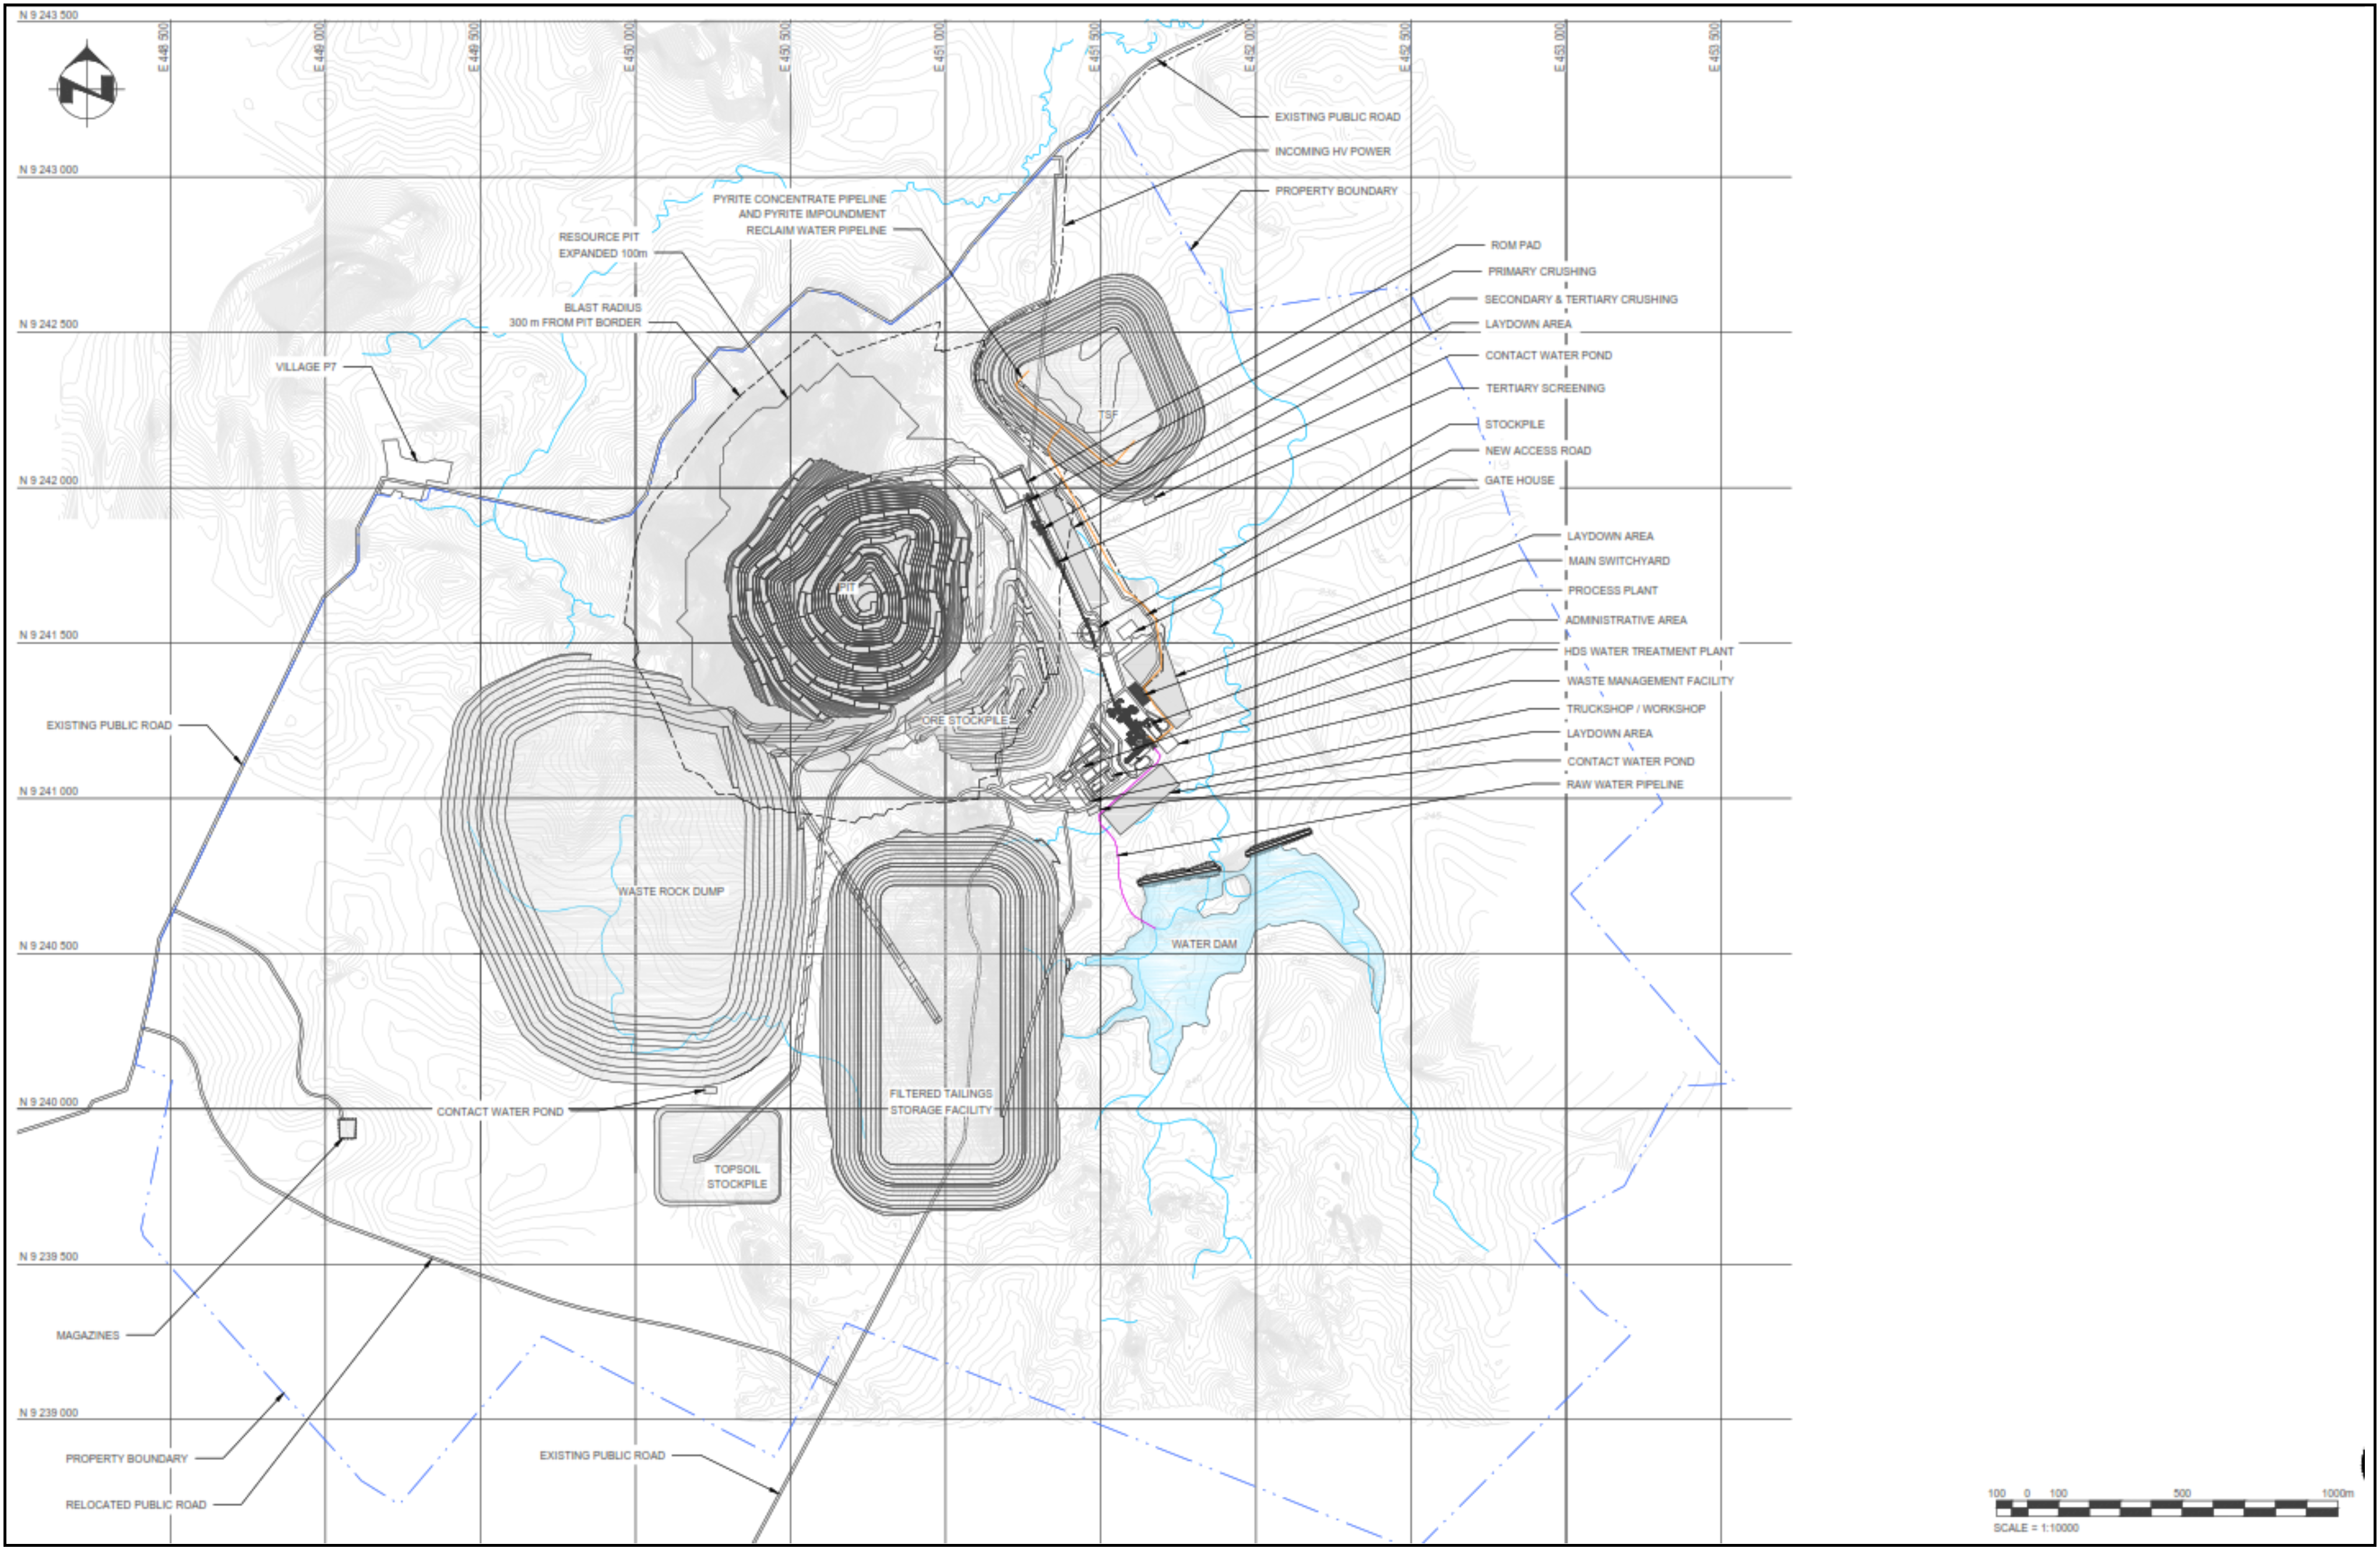
Figure 18-1: Project Area Layout | |
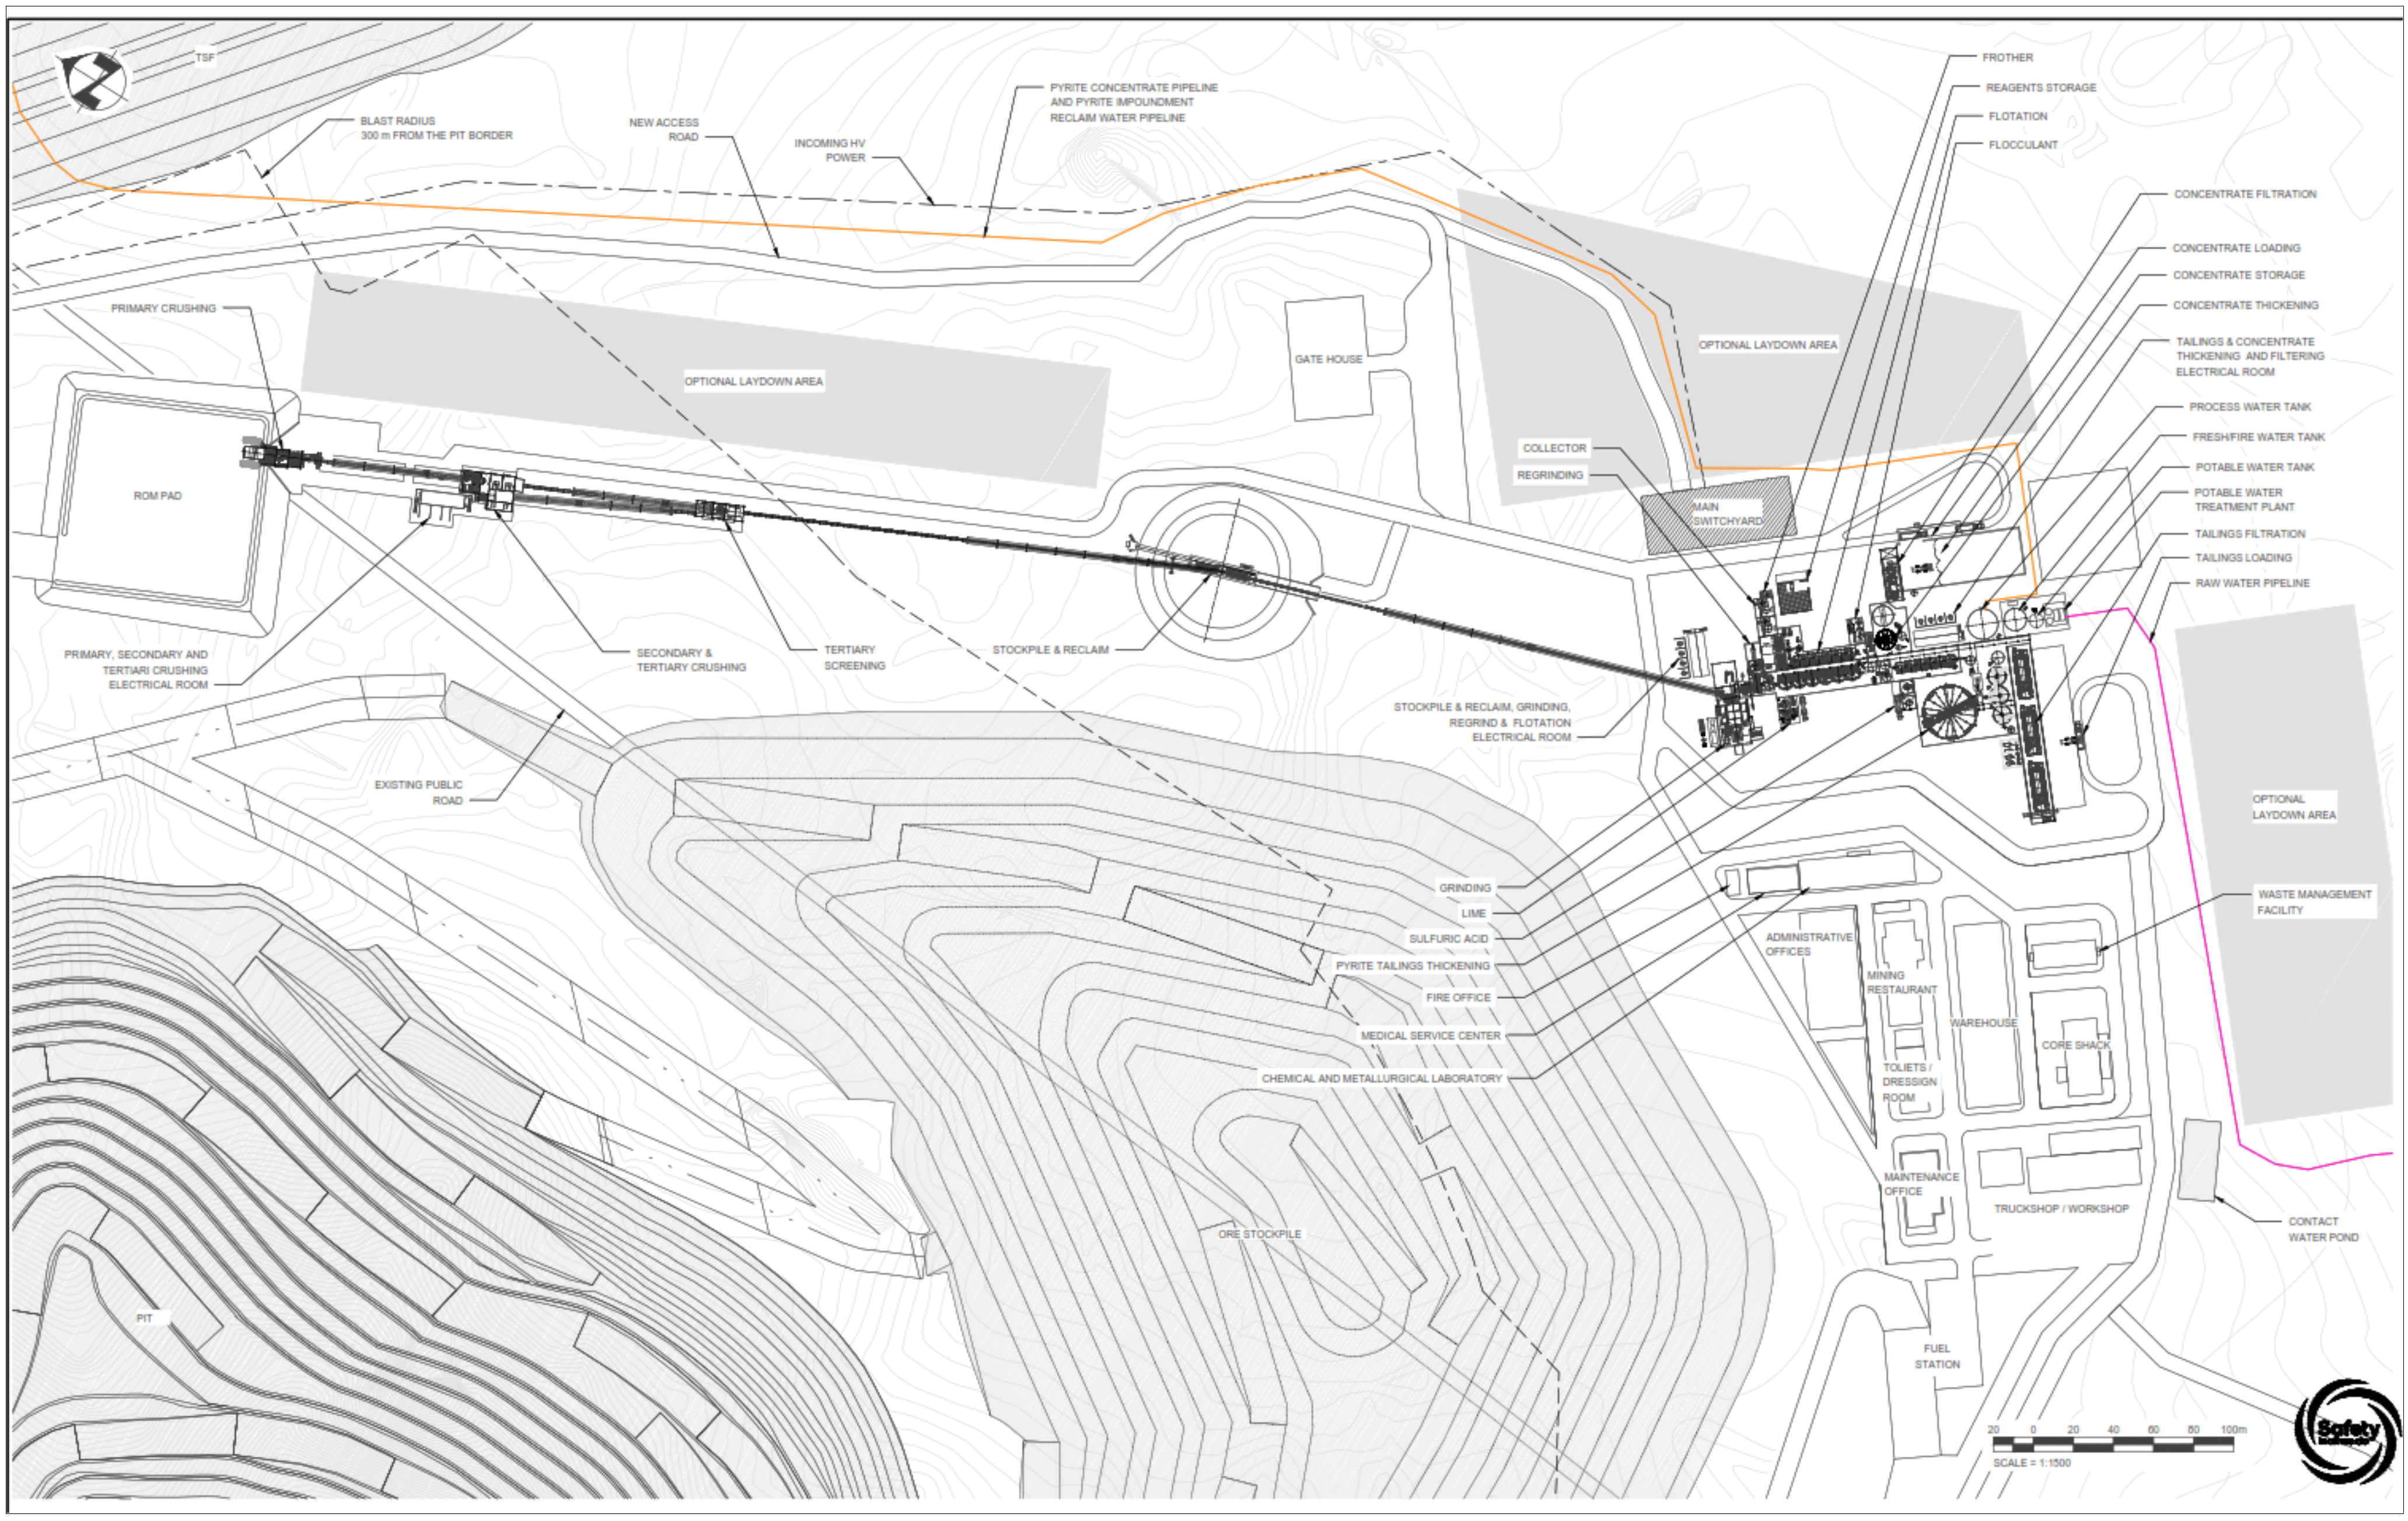
Figure 18-2: Proposed Plant Site Layout (Ausenco 2021) | |
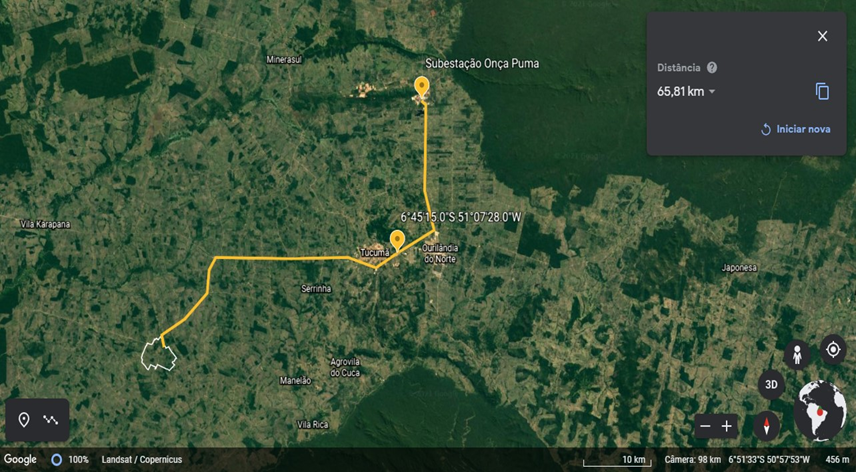
Figure 18-3: Preliminary Power Transmission Line Route to Project Site | |
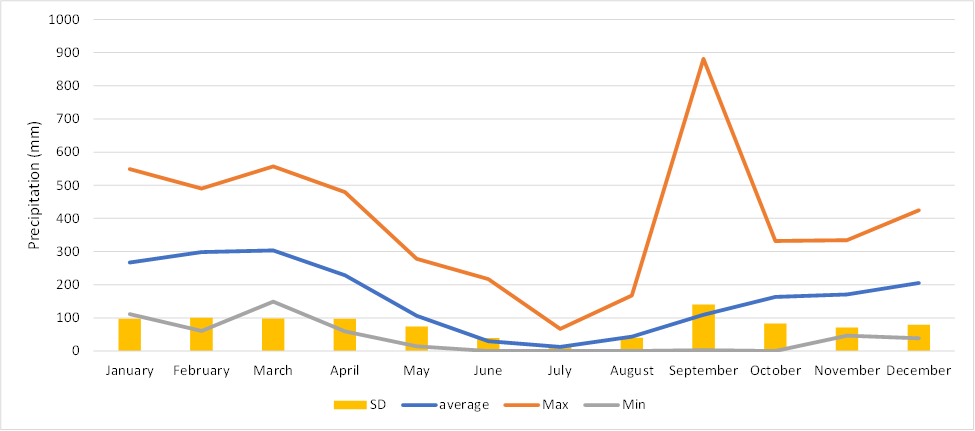
Figure 18-4: Pluviometric data (1975-2020) | |
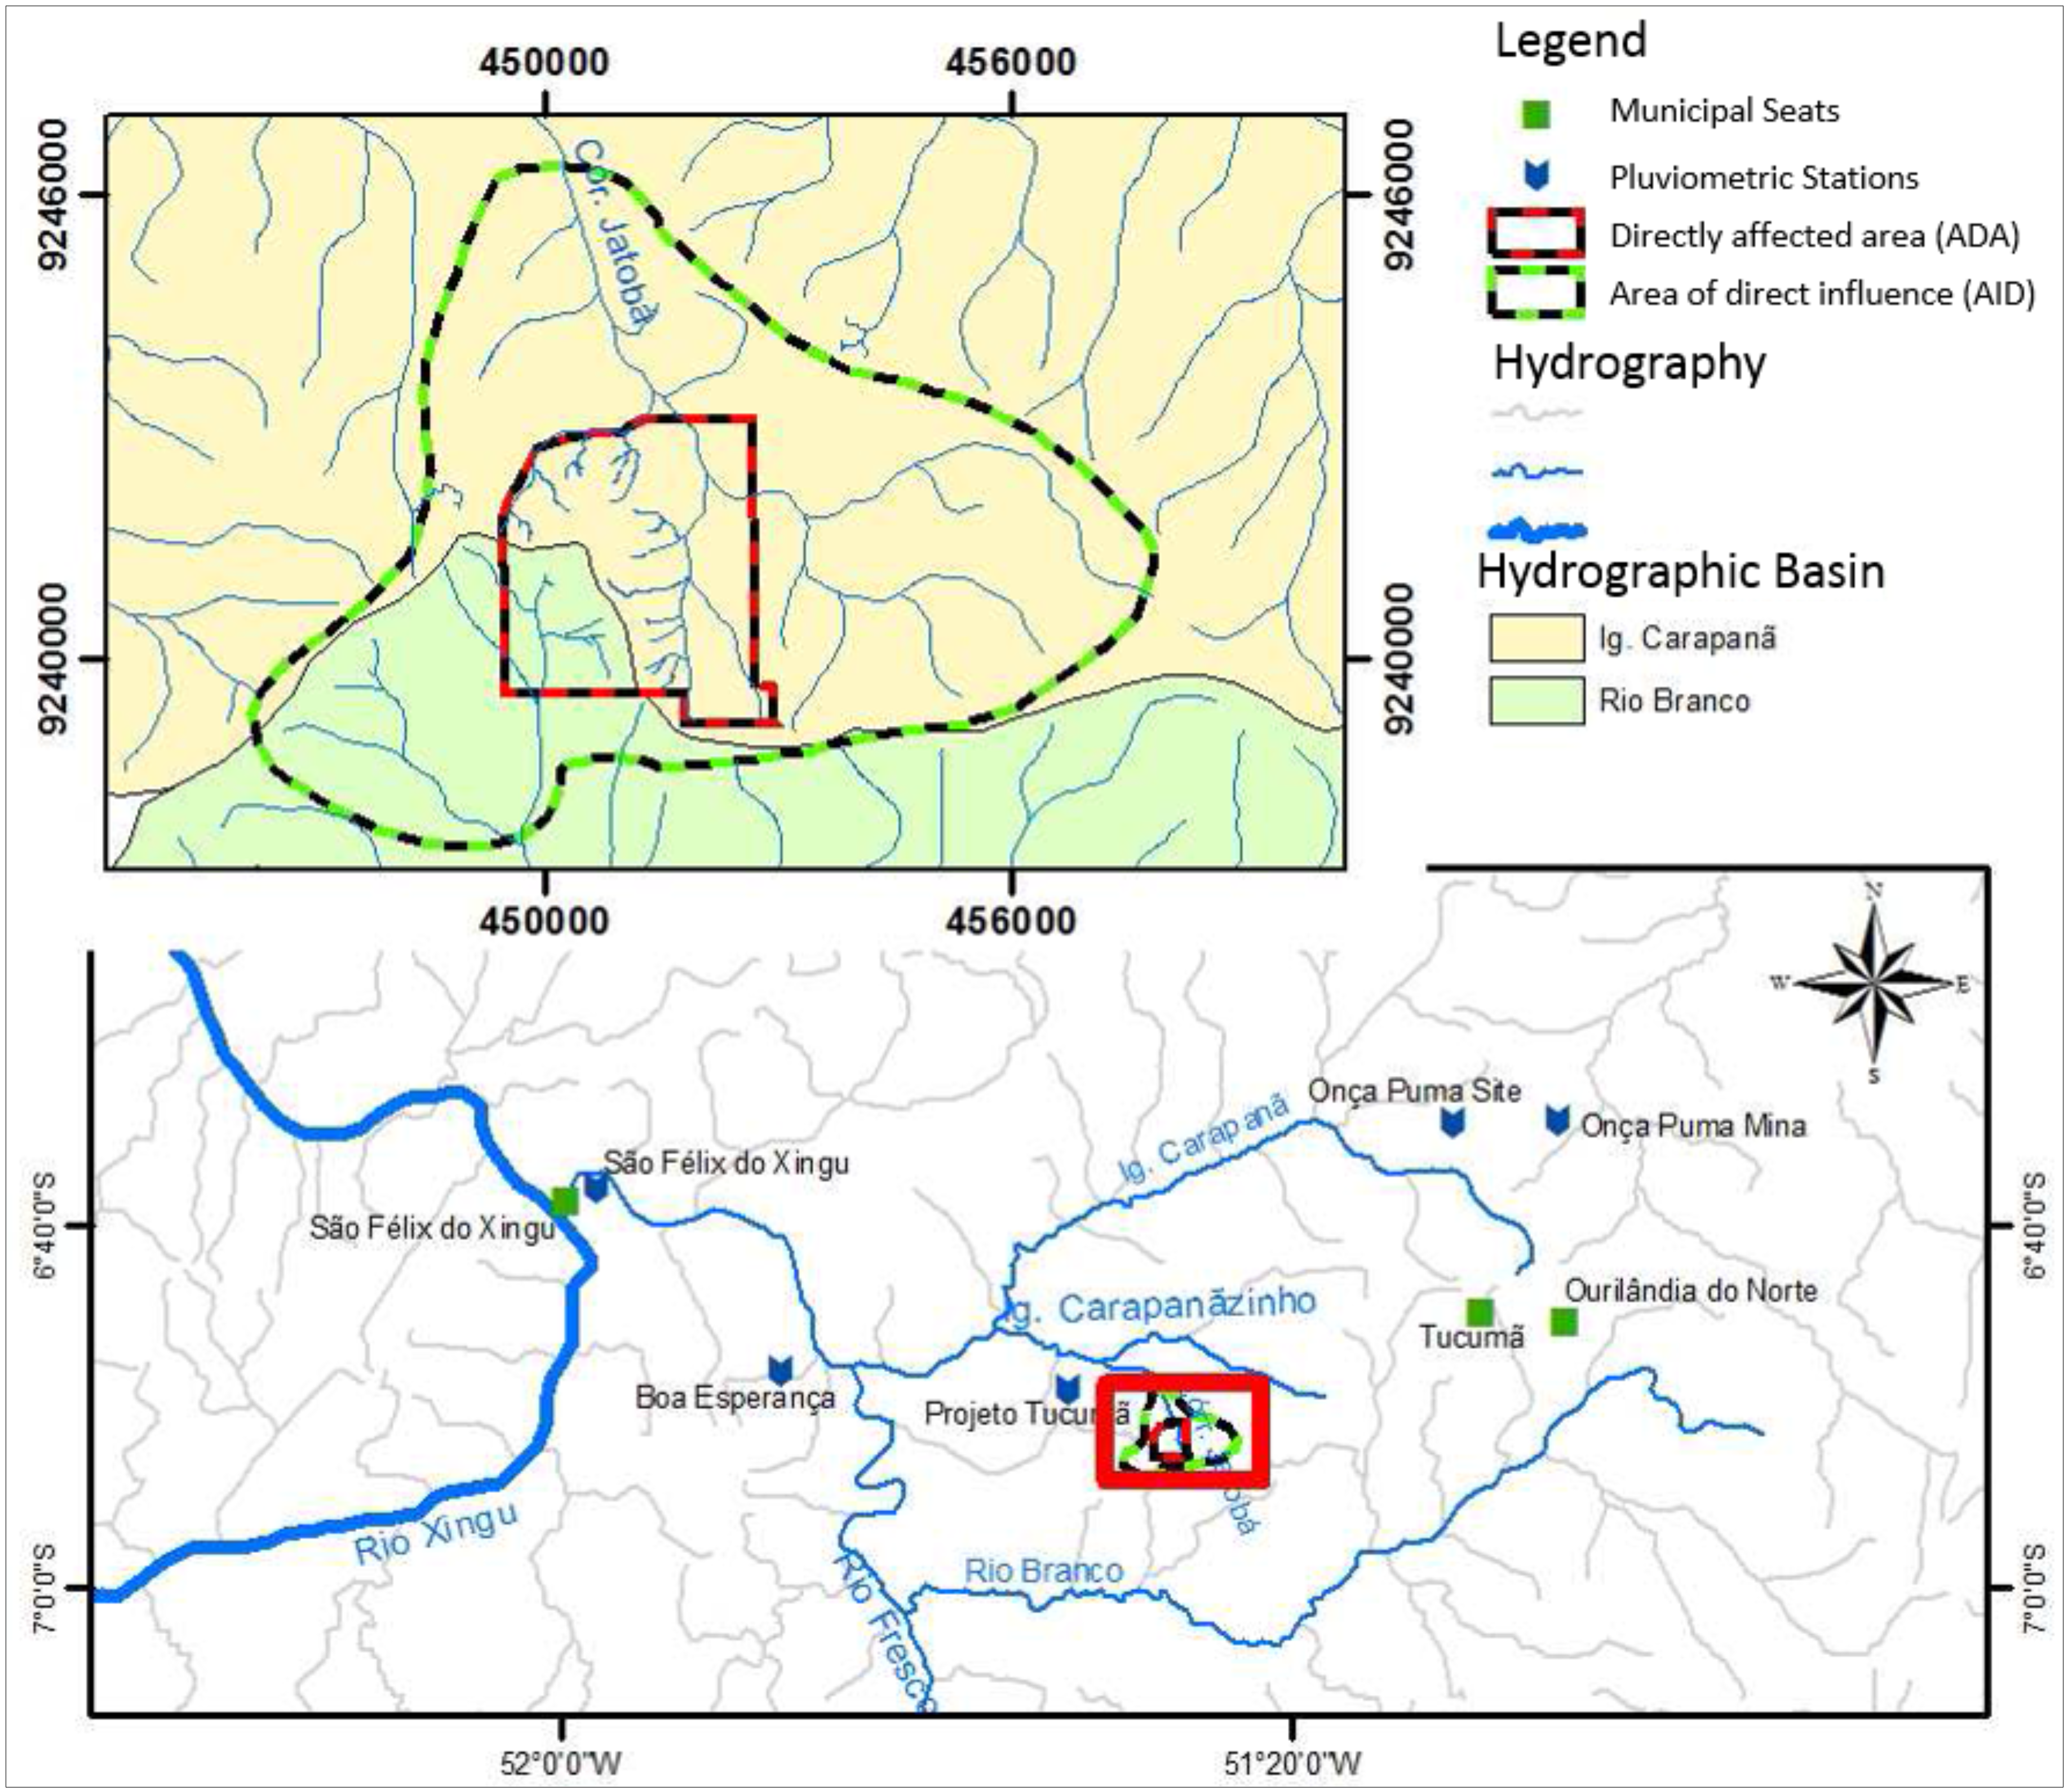
Figure 18-5: Location Map, Proposed Mine Site Facilities in Relation To Existing Water Courses | |
Figure 18-6: Intercepted Water as Contact Water, by Season | |
Figure 18-7: Water Balance Schematic (start-up) | |
Figure 18-8: Water balance schematic (year 5) | |
Figure 18-9: Water Balance Schematic (ultimate) | |
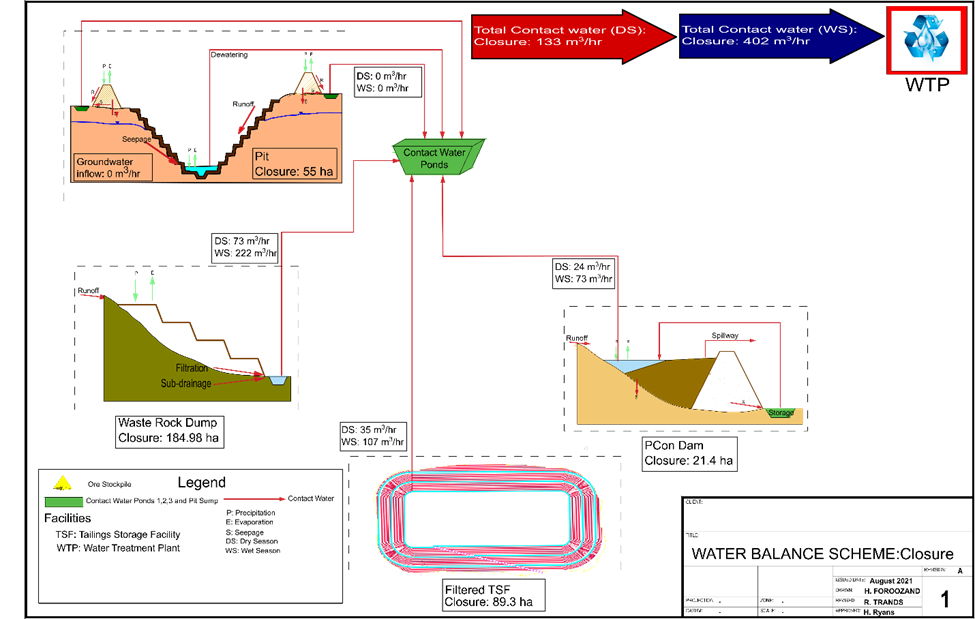
Figure 18-10: Water Balance Schematic (closure) | |
Figure 18-11: Non-Pyrite DSTF and Pyrite TSF | |
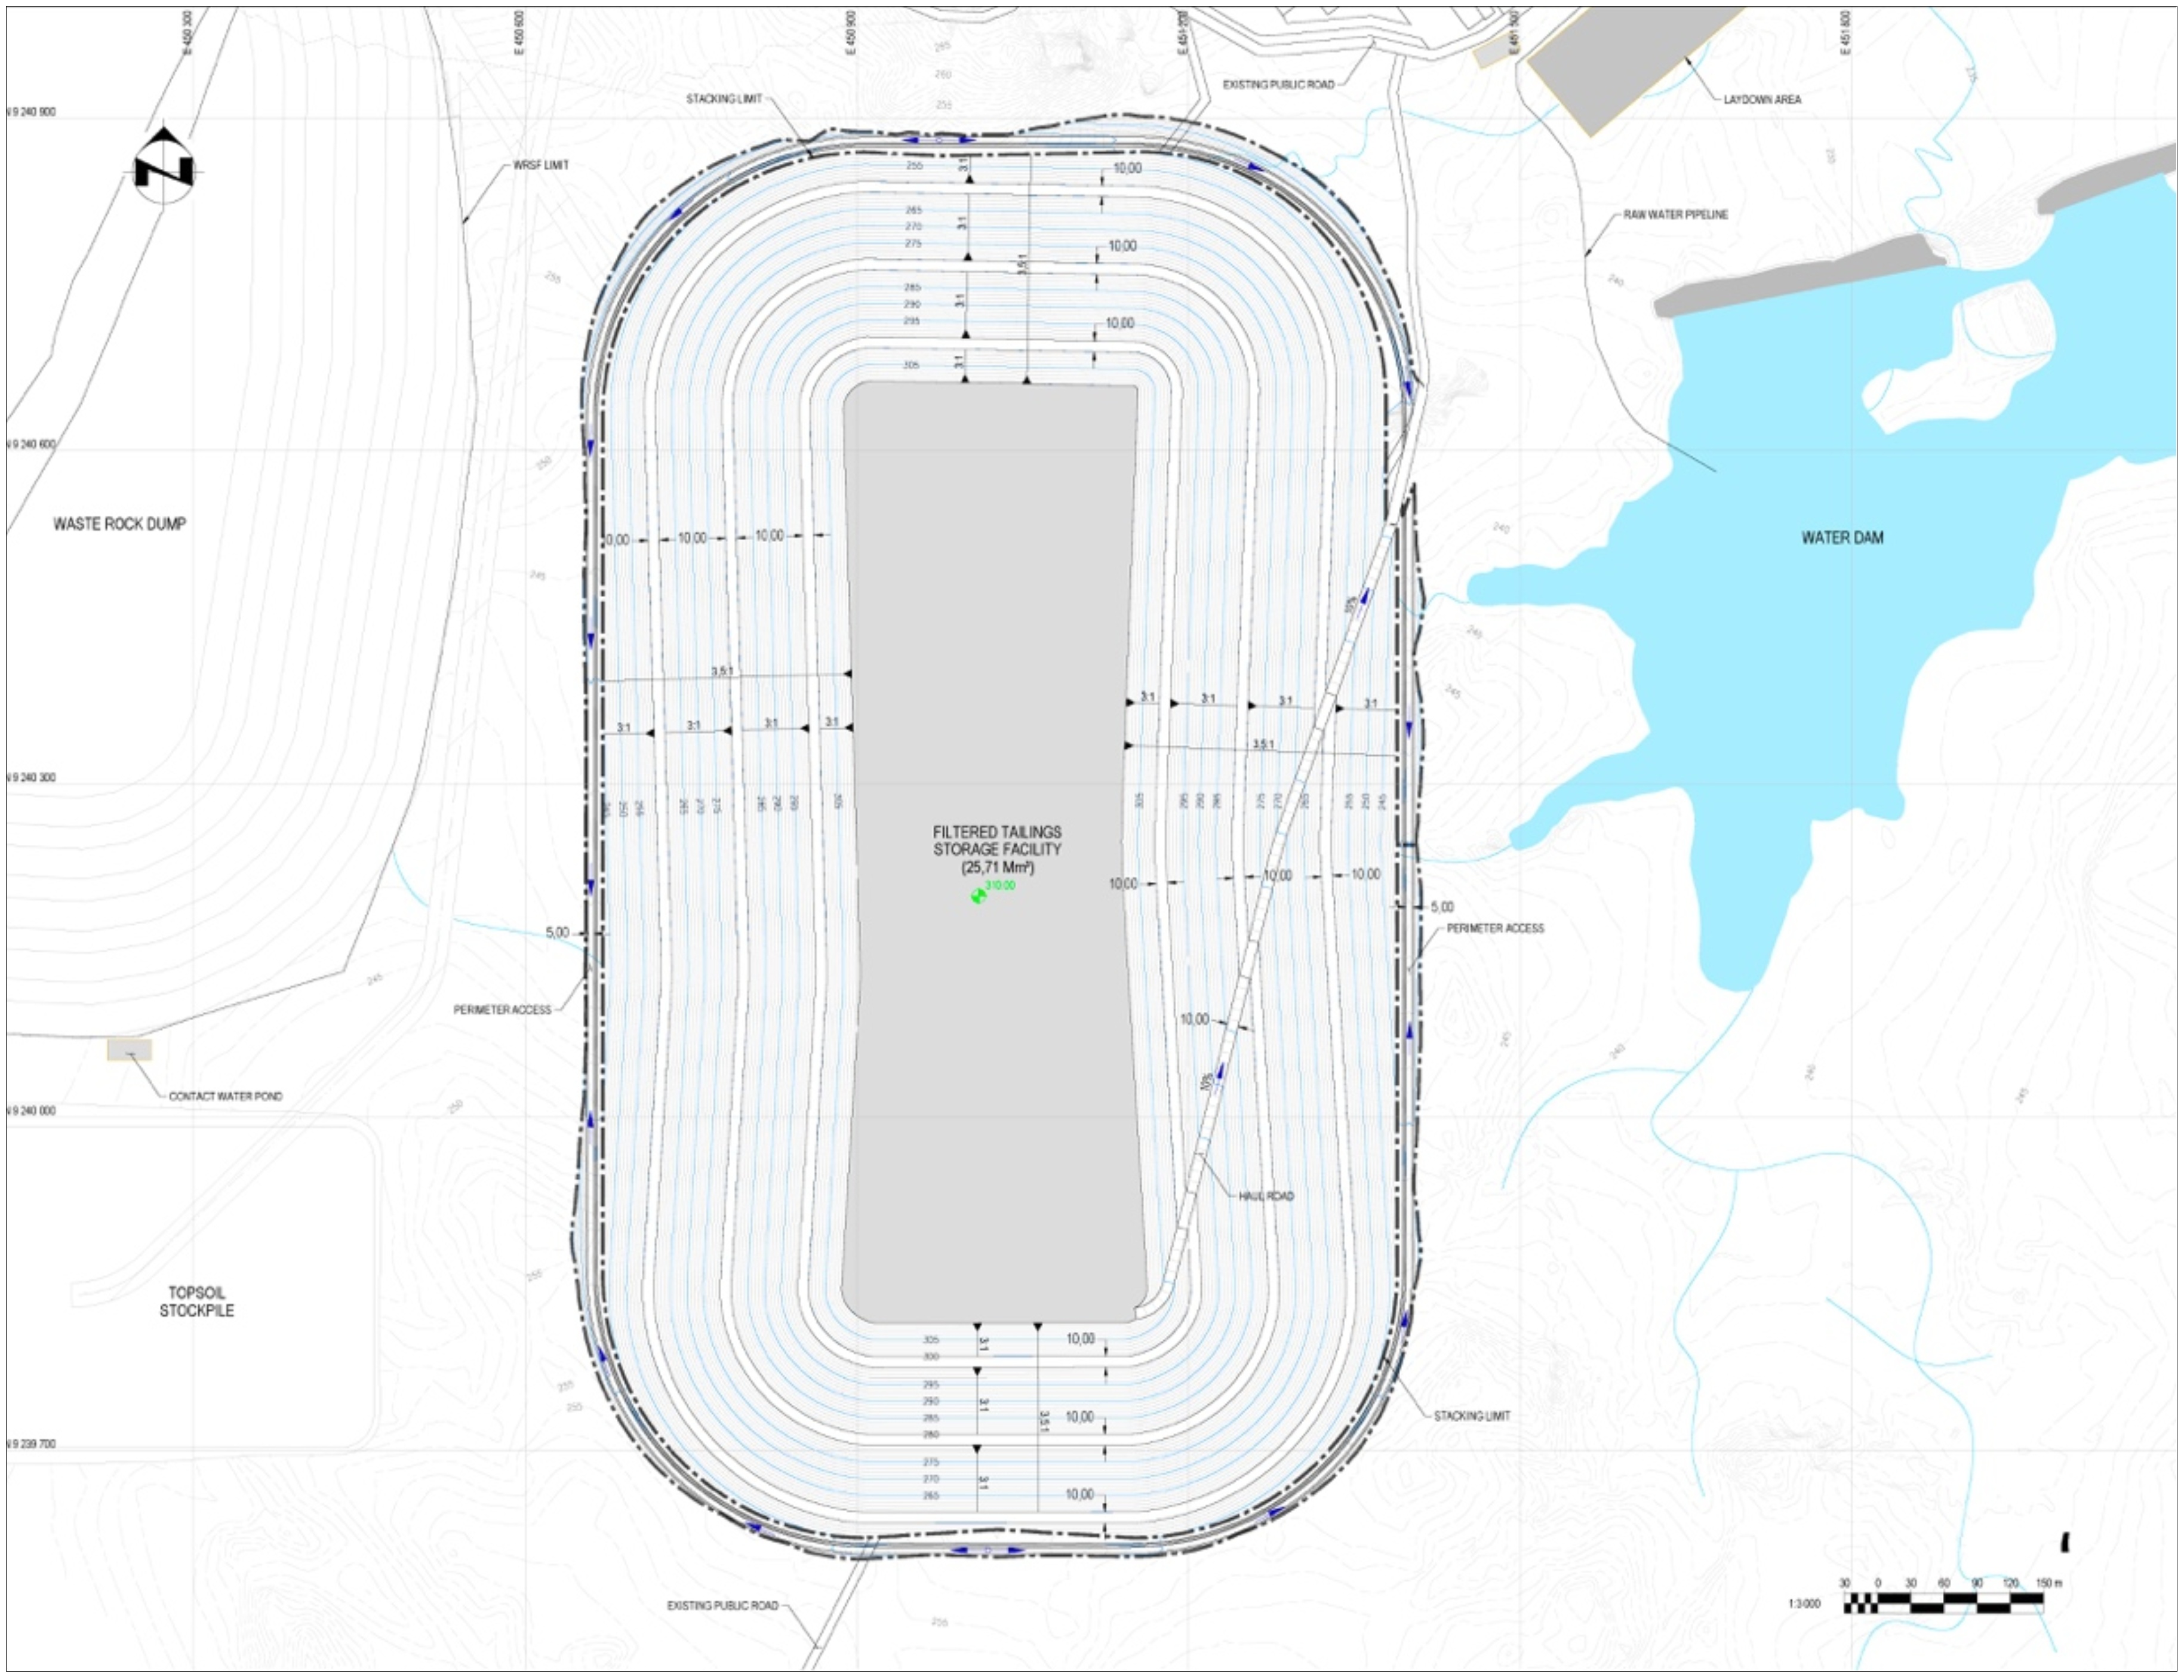
Figure 18-12: Proposed Non-Pyrite Dry Stack Tailings Facility Layout | |
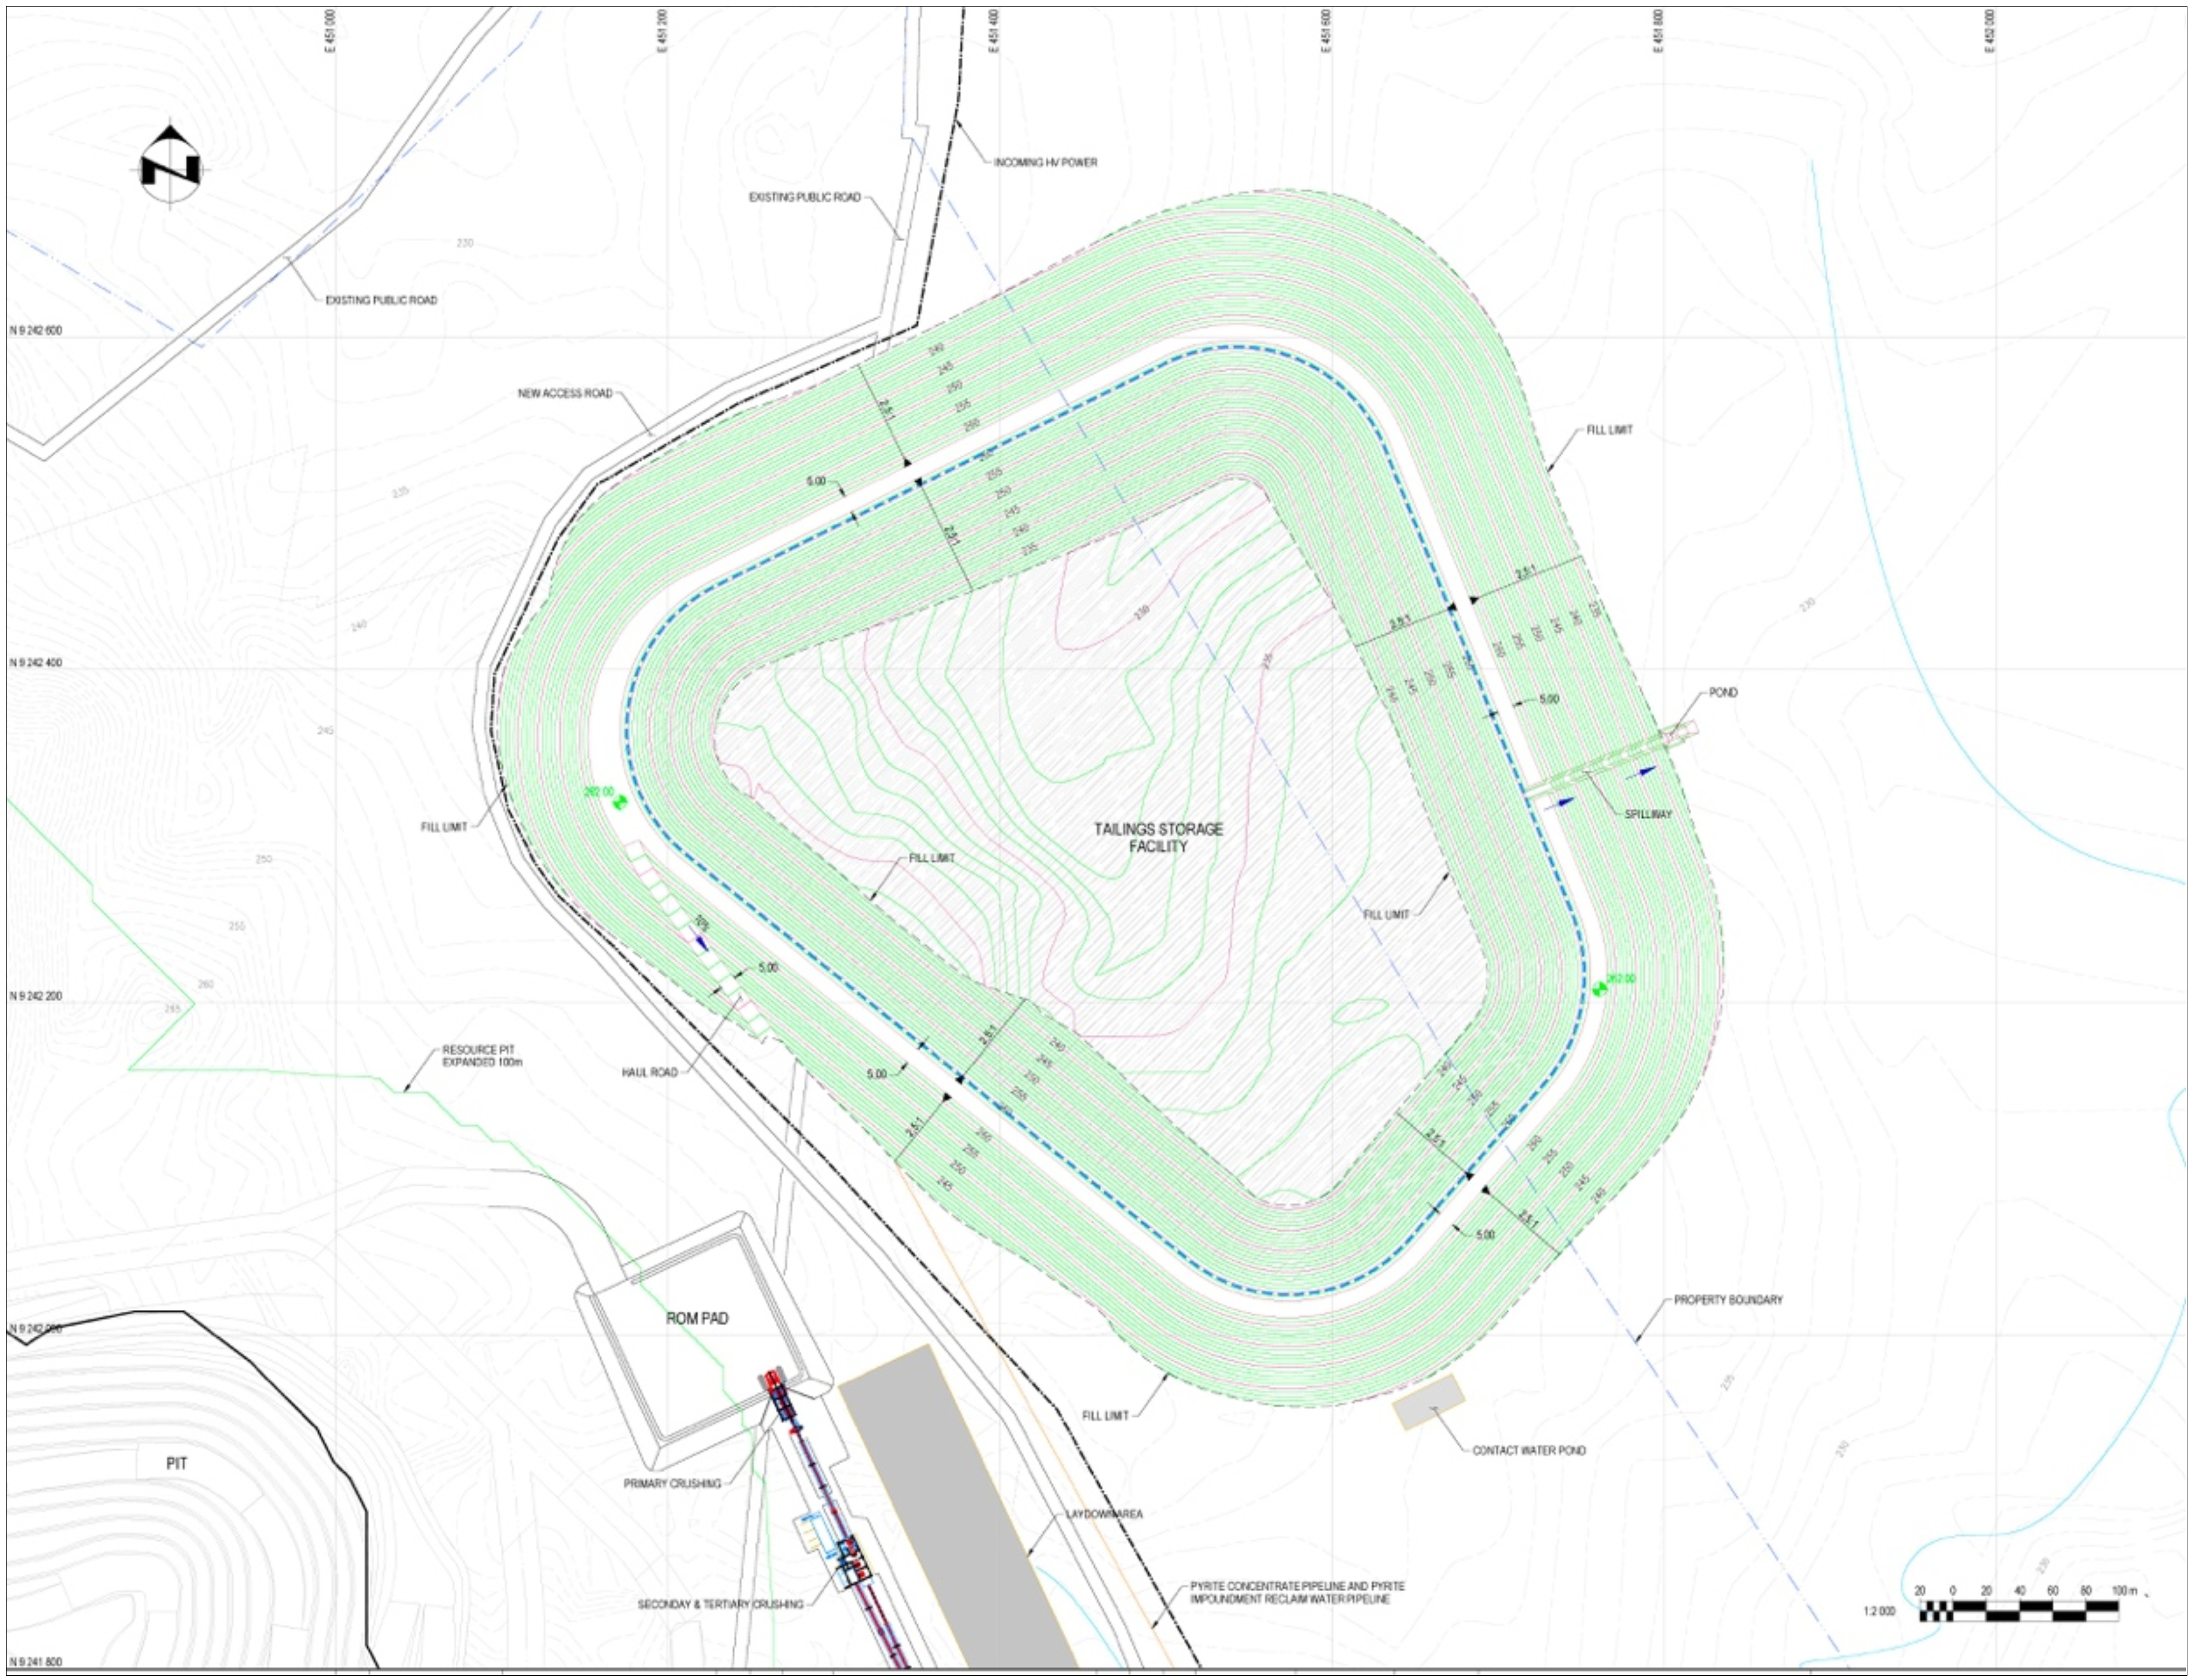
Figure 18-13: Pyrite Tailings Storage Facility | |
Figure 18-14: Final Pit, Waste Rock Facility and Stockpile Configuration | |
Figure 19-1: Analyst Consensus Copper Price Outlook | |
Figure 20-1: Local and Regional Drainage Network | |
Figure 22-1: Projected LOM Pre-Tax Cashflow | |
Figure 22-2: Projected LOM Post-Tax Cashflow | |
Figure 22-3: NPV & IRR Sensitivity Results | |
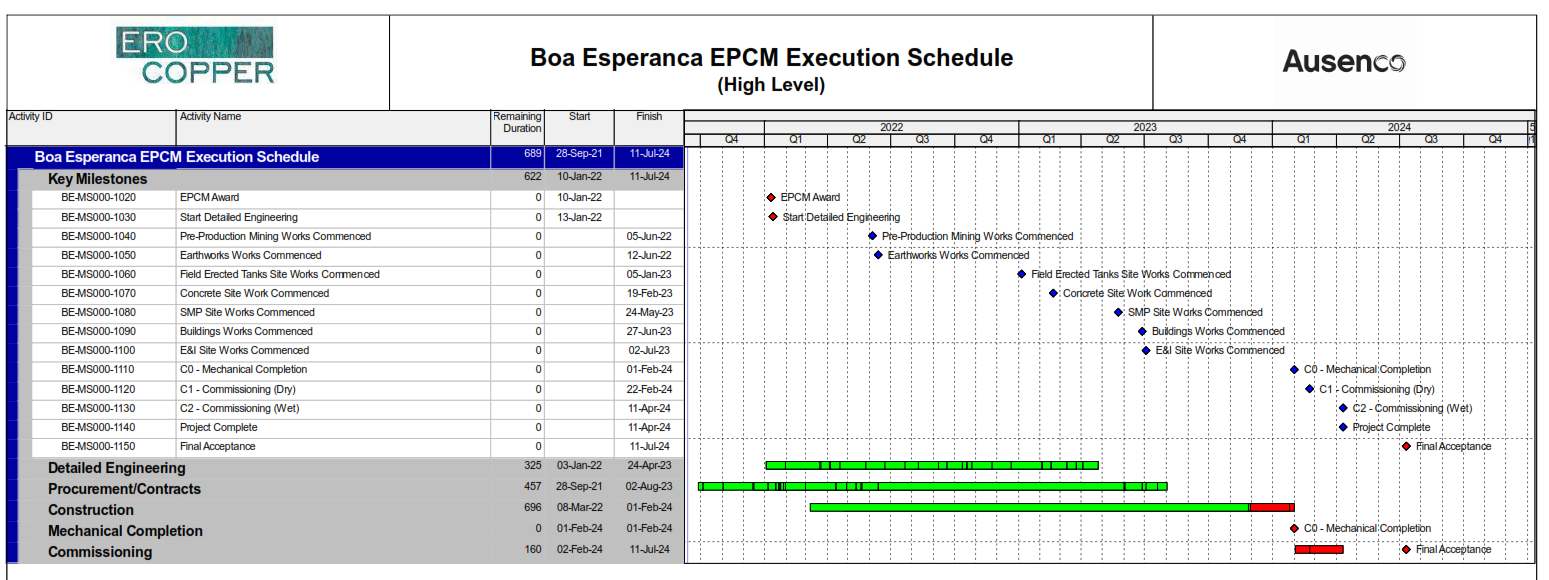
Figure 24-1: High Level Project Execution Schedule | |
| | | | | |
| Boa Esperança Project | Page xvi |
| NI 43-101 Technical Report Feasibility Study Update | October 2021 |
1SUMMARY
1.1Introduction
Ero Copper Corp. (Ero) commissioned Ausenco Engineering Canada Inc. (Ausenco) to compile a Technical Report (the Report) for a Feasibility Study Update (FSU) on the Boa Esperança deposit, part of the Boa Esperança Project (the Project) in the Southern Pará State of Brazil.
1.1.1Key Outcomes
The Project demonstrates the financial outcomes (US dollars) summarized below based on Cu prices of $3.80/Ib in 2024, $3.95/Ib in 2025 and $3.40/Ib in 2026+:
•Pre-tax
•NPV of $464.6 million at an 8% discount rate
•IRR of 48.6%
•Payback period of 1.3 years
•Post-tax
•NPV of $379.6 million at an 8% discount rate
•IRR of 41.8%
•Payback period of 1.4 years
•Total capital costs of $507 million, comprised of:
•Initial capital cost of $294 million
•Sustaining capital cost of $196 million
•Closure cost of $24 million
•Salvage value of $7 million
•Total operating costs of $801 million
| | | | | |
| Boa Esperança Project | Page 1 |
| NI 43-101 Technical Report Feasibility Study Update | October 2021 |
1.2Terms of Reference
The Report supports disclosure by Ero Copper Corp. in the news release dated September 28, 2021, entitled, “Ero Copper Announces Results of Optimized Feasibility Study for Boa Esperança Project – Longer Mine Life and Higher Annual Copper Production.”
The firms, companies and consultants who are providing Qualified Persons (QPs) responsible for the content of this Report, which is based on the Feasibility Study Update completed in 2021 (the 2021 FSU or FSU) and supporting documents prepared for the 2021 FSU, are, in alphabetical order: Ausenco Engineering Canada Inc. (Ausenco); Ero Copper Corp. (Ero), and NCL Ingeniería y Construcción SpA. (NCL).
The Report presents Mineral Resource and Mineral Reserve estimates for the Project, and an economic assessment based on open pit mining operations and a conventional processing circuit that would produce copper concentrate.
All units of measurement in this Report are metric, unless otherwise stated. The monetary units are in US dollars, unless otherwise stated.
1.3Property Description and Location
The Boa Esperança copper deposit is in the municipality of Tucumã, Pará State, Brazil. The site is located approximately 40 km to the southwest of the town. Tucumã can be accessed by state highway PA-279, which connects the town of Xinguara to the town of São Felix do Xingu, along a stretch of road that runs for approximately 160 km. The junction of PA-279 with federal highway BR-155 is in Xinguara, which is the main highway leading to the city of Marabá, situated approximately 220 km north of Xinguara.
1.4Ownership
Mineração Caraíba S.A. (MCSA) acquired the Boa Esperança copper deposit concession from Corporación Nacional del Cobre (Codelco) in 2007 and became the legal owner of the mineral rights to the Boa Esperança copper deposit. In December 2016, Ero acquired approximately 85.0% interest in MCSA. In June 2017, Ero acquired an additional 14.5% by subscribing for shares from treasury for a total interest in MCSA of approximately 99.5%.In December 2017, the Company acquired additional shares of MCSA, increasing its ownership interest in MCSA to approximately 99.6%.
The legal status of MCSA’s mining rights is as follows:
•The Final Exploration Report was presented to the Agência Nacional de Mineraçãoor (ANM) on April 10, 2008 and was approved by the ANM on July 30, 2009;
•MCSA applied for a Mining Concession by filing an Economic Exploitation Plan (Plano de Aproveitamento Econômico or PAE) with the ANM on May 5, 2010;
•The preliminary environmental license was filed with the ANM on March 22, 2012;
•The PAE technical analysis was completed and considered suitable for granting on July 30, 2013;
•Ero received the Installation License (LI) on August 30, 2021, which will allow for the commencement of surface and civil construction activities
| | | | | |
| Boa Esperança Project | Page 2 |
| NI 43-101 Technical Report Feasibility Study Update | October 2021 |
•A formal request with the Para State environmental agency, Secretaria de Estado de Meio Ambiente e Sustentabilidade (SEMAS) will be made to incorporate changes in the Project's scope as outlined in the FSU.
•SEMAS is the agency responsible for approval of the Operating License (LO) for the Project, which is planned to be issued at the time of commercial production; and
•The estimated Mineral Resources and Mineral Reserves disclosed in this Report are completely contained within the Boa Esperança mineral rights held by MCSA. MCSA is the holder of required surface rights for the envisioned operations. It is expected that full title to the land will be transferred to MCSA after conclusion of an administrative procedure with the National Institute of Colonization and Land Reform (INCRA) to clear such surface rights from its prior classification as a resettlement area.
The site is free and clear of any environmental liabilities, and all required permits for construction activities are encompassed by the Installation License issued on August 30, 2021.
1.5Geology and Mineralization
The Carajás Mineral Province, where the Boa Esperança copper deposit is located, is on the east side of the Amazon Craton and is considered one of the most important mineral provinces in Brazil. It is a region of high economic importance, as it hosts the world’s largest known high-grade Fe deposits, as well as world-class Cu-Au deposits, such as Salobo, Sossego, 118, Cristalino and Igarapé Bahia-Alemão. Deposits of Mn, Ni, Cr, Al and Zn have also been identified in the province. The existence of high-grade significant deposits elsewhere in the region provides no assurance regarding the size, extent, grade, or value of any deposits or prospective deposits within the area of the Boa Esperanҫa Project.
The Carajás Mineral Province encompasses two distinct tectonic domains, both Archean in age. The South Block, which is the older of the two (3.0 to 2.86 Ga) and where the Boa Esperança deposit is located, is called the Rio Maria Block, and contains a typical granite-greenstone belt terrain. The North Block, which is the younger domain (2.8 to 2.5 Ga), is called Carajás and is composed of volcano-sedimentary rocks and granitoids, which host the large Fe, Cu-Au, Mn, Ni and Zn deposits in the province. These two blocks are products of the juxtaposition of volcanic island arcs and plutonic-like Andes environments, associated with an intra-continental mantle plume.
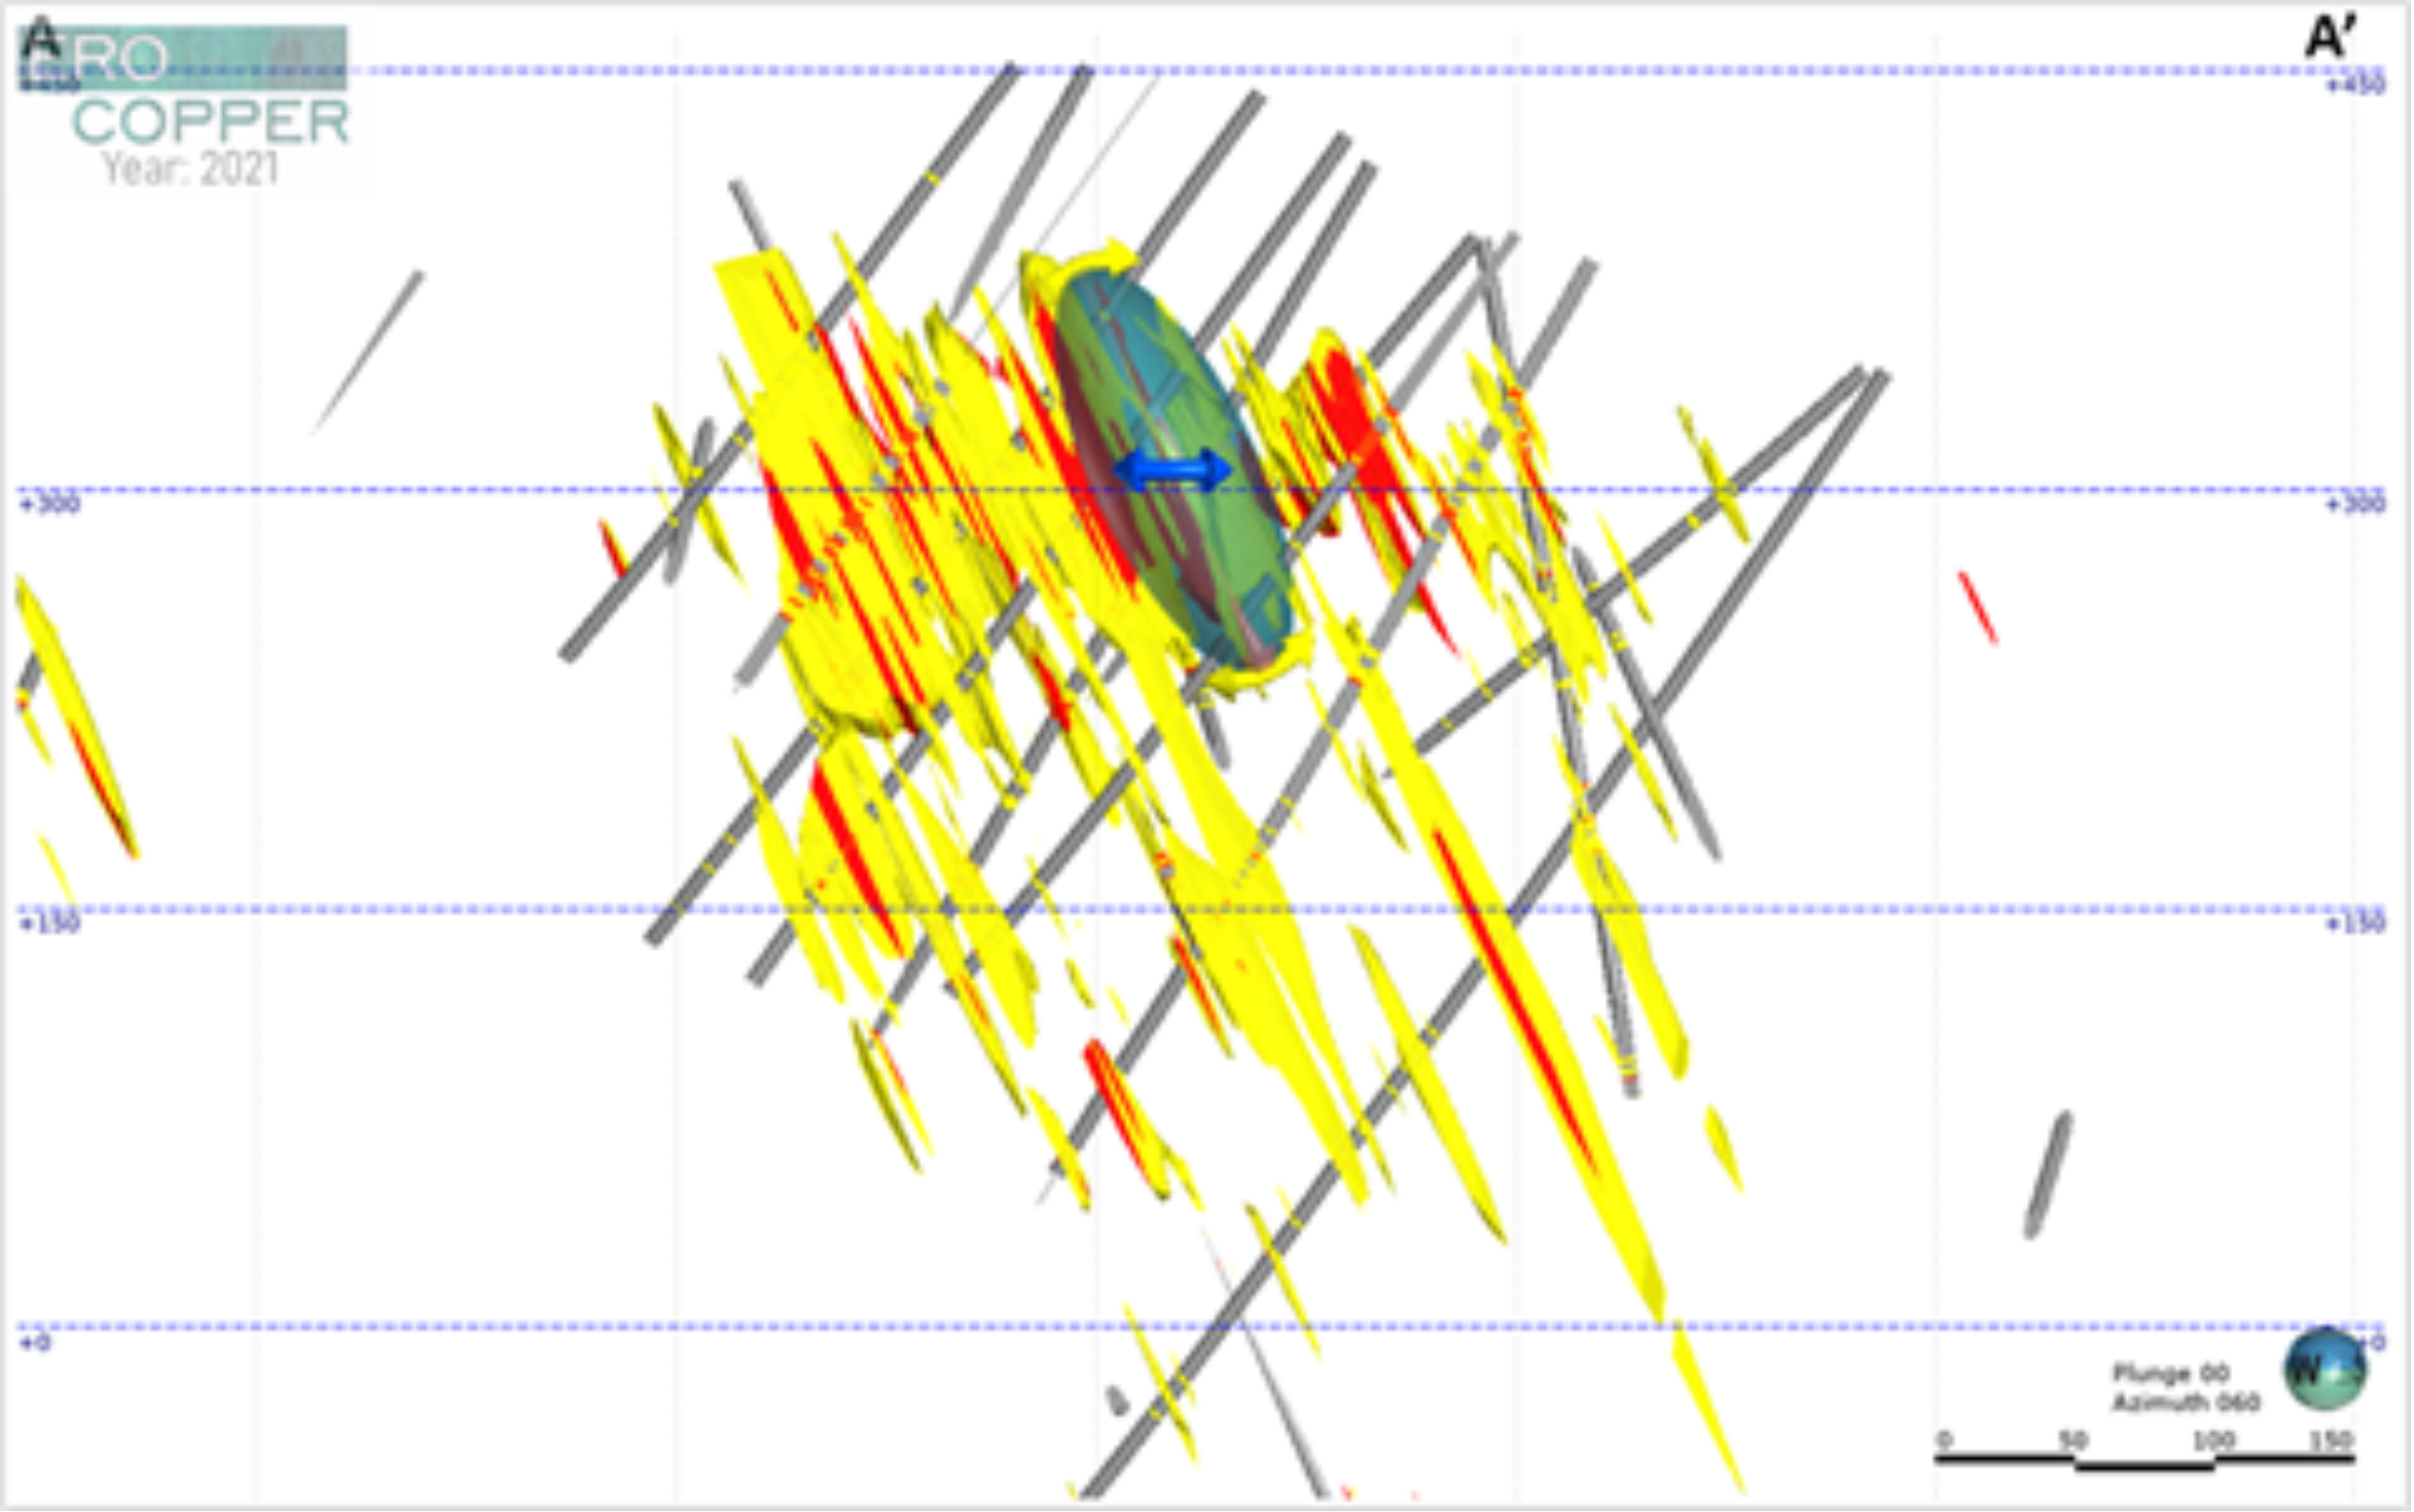
The Boa Esperança copper deposit occurs within an isolated hill, which is elongated in an NNE direction and located 38km SW following a straight line from the town of Tucumã. The topographic high is mainly comprised of breccias composed of quartz and magnetite, which cut the Neoarchean biotite-granite (2.78 Ga), the host of the copper mineralization. The Neoarchean biotite granite intrudes into the Mesoarchean Rio Maria granodiorite (2.85 Ga).
Mineralization consists of a series of brecciated zones, which are aligned N60°-70°E and incline in a SE direction (60°-70°SE).
1.6Exploration
Over the years, Project exploration has consisted of multiple campaigns of ground geological mapping and sampling, soil geochemistry, ground geophysical surveys and exploration drilling conducted by both Codelco, MCSA, and more recently Ero. Available exploration datasets used in the FSU include detailed topography surveys, soil geochemistry surveys, geological mapping, magnetic surveys, induced polarization (IP) surveys, as well as a drill core database totalling approximately 58,000 meters of drilling, petrographic studies, and radiometric dating drilling and sampling.
| | | | | |
| Boa Esperança Project | Page 3 |
| NI 43-101 Technical Report Feasibility Study Update | October 2021 |
Between 2003 and 2013 a total of 165 core drill holes totaling approximately 57,972 m were completed. Drilling was executed by Codelco over four drillhole campaigns in 2003–2004, 2005 and 2006, consisting of 62 core drillholes, totaling 21,956.12 m on a 200 x 200 m drilling grid that was infill drilled to 100 x 100 m. MCSA completed 103 core holes between 2008–2013, totaling 36,016.13 m. Infill drilling was completed to approximately 50 and 25 m centers for the core of the deposit in support of the Project. In 2021, Ero commenced an exploration program to further extend the known limits of the deposit. There were no results available from the 2021 exploration program to incorporate into the FSU.
All exploration drilling was conducted using l core methods. Holes were drilled at an HQ size (63.5 mm core diameter) through soil, saprolite and weathered rock and were reduced to NQ size (47.6 mm) upon reaching fresh rock. Average drill core recoveries were reported as exceeding 98%.
Sampling intervals were identified and marked in the core boxes according to the sampling plan, thus providing a physical register of sample identification and location. The core was split in half using a diamond saw and then quartered, with one quarter sent for analysis and the remaining three quarters stored for future reference. At the end of the sampling process the identifying description on each sample bag was verified by comparing the description in the core boxes to the corresponding location. If correct, the sample was sealed in the bag for dispatch.
Codelco used the SGS Geosol laboratory in Parauapebas, Pará, Brazil (SGS Parauapebas) to prepare all samples from the 2003–2006 drilling campaigns. MCSA used the same laboratory to prepare all samples from the 2008–2009, 2012 and 2013 drilling campaigns. Sample analyses were carried out by SGS Geosol in Vespasiano, Minas Gerais, Brazil (SGS Vespasiano) for these campaigns. SGS Geosol is an internationally recognized mineral testing laboratory and is independent of the Company.
MCSA used the Intertek laboratory in Parauapebas, Pará, Brazil (Intertek) to prepare all samples from the 2010 drilling campaign. Intertek is an internationally recognized mineral testing laboratory and is independent of the Company.
1.7Data Verification
MCSA provided Ausenco with external analytical control data containing the assay results of the quality control samples from the Boa Esperança copper project. All data was provided in Microsoft Excel spreadsheets. Control samples (blank and standard reference materials) were summarized in time-series plots to highlight their performance. Paired data (pulp duplicates) were analysed using bias charts, quantile-quantile plots, and relative precision plots. The external quality control data produced for this project represent approximately 5% of the total number of samples assayed.
MCSA used one standard reference material (High-Grade) during the 2008/2009 campaign. In more recent years, three standard reference materials (Low-Grade, Medium-Grade and High-Grade) were used.
SGS and Intertek delivered consistent Cu results, mostly within two standard deviations. The results for the High-Grade (HG) standard reference material shows consistently lower values than expected in all drilling campaigns. This shows that there is a negative bias for the HG standard reference material.
Paired assay data examined by Ausenco show that assay results can be reproduced by the SGS Geosol and Intertek laboratories from duplicate pulp with high confidence. In general, Ausenco considers the analytical quality control data delivered by the laboratories used by MCSA and reviewed by Ausenco to be sufficiently reliable for the purpose of resource estimation.
MCSA is currently including the use of certified blank samples and certified standard reference materials in its quality control programs.
| | | | | |
| Boa Esperança Project | Page 4 |
| NI 43-101 Technical Report Feasibility Study Update | October 2021 |
1.8Metallurgical Testing
Boa Esperança copper deposit is considered as a variant of an Iron Oxide Copper Gold (IOCG) deposit type, with the presence of higher sulphur minerals and a high quartz content, the absence of pervasive hydrothermal alterations of the host rock, and the absence of gold. Granite (GRA) and breccia (BXX) are two main rock types recognized from the deposit.
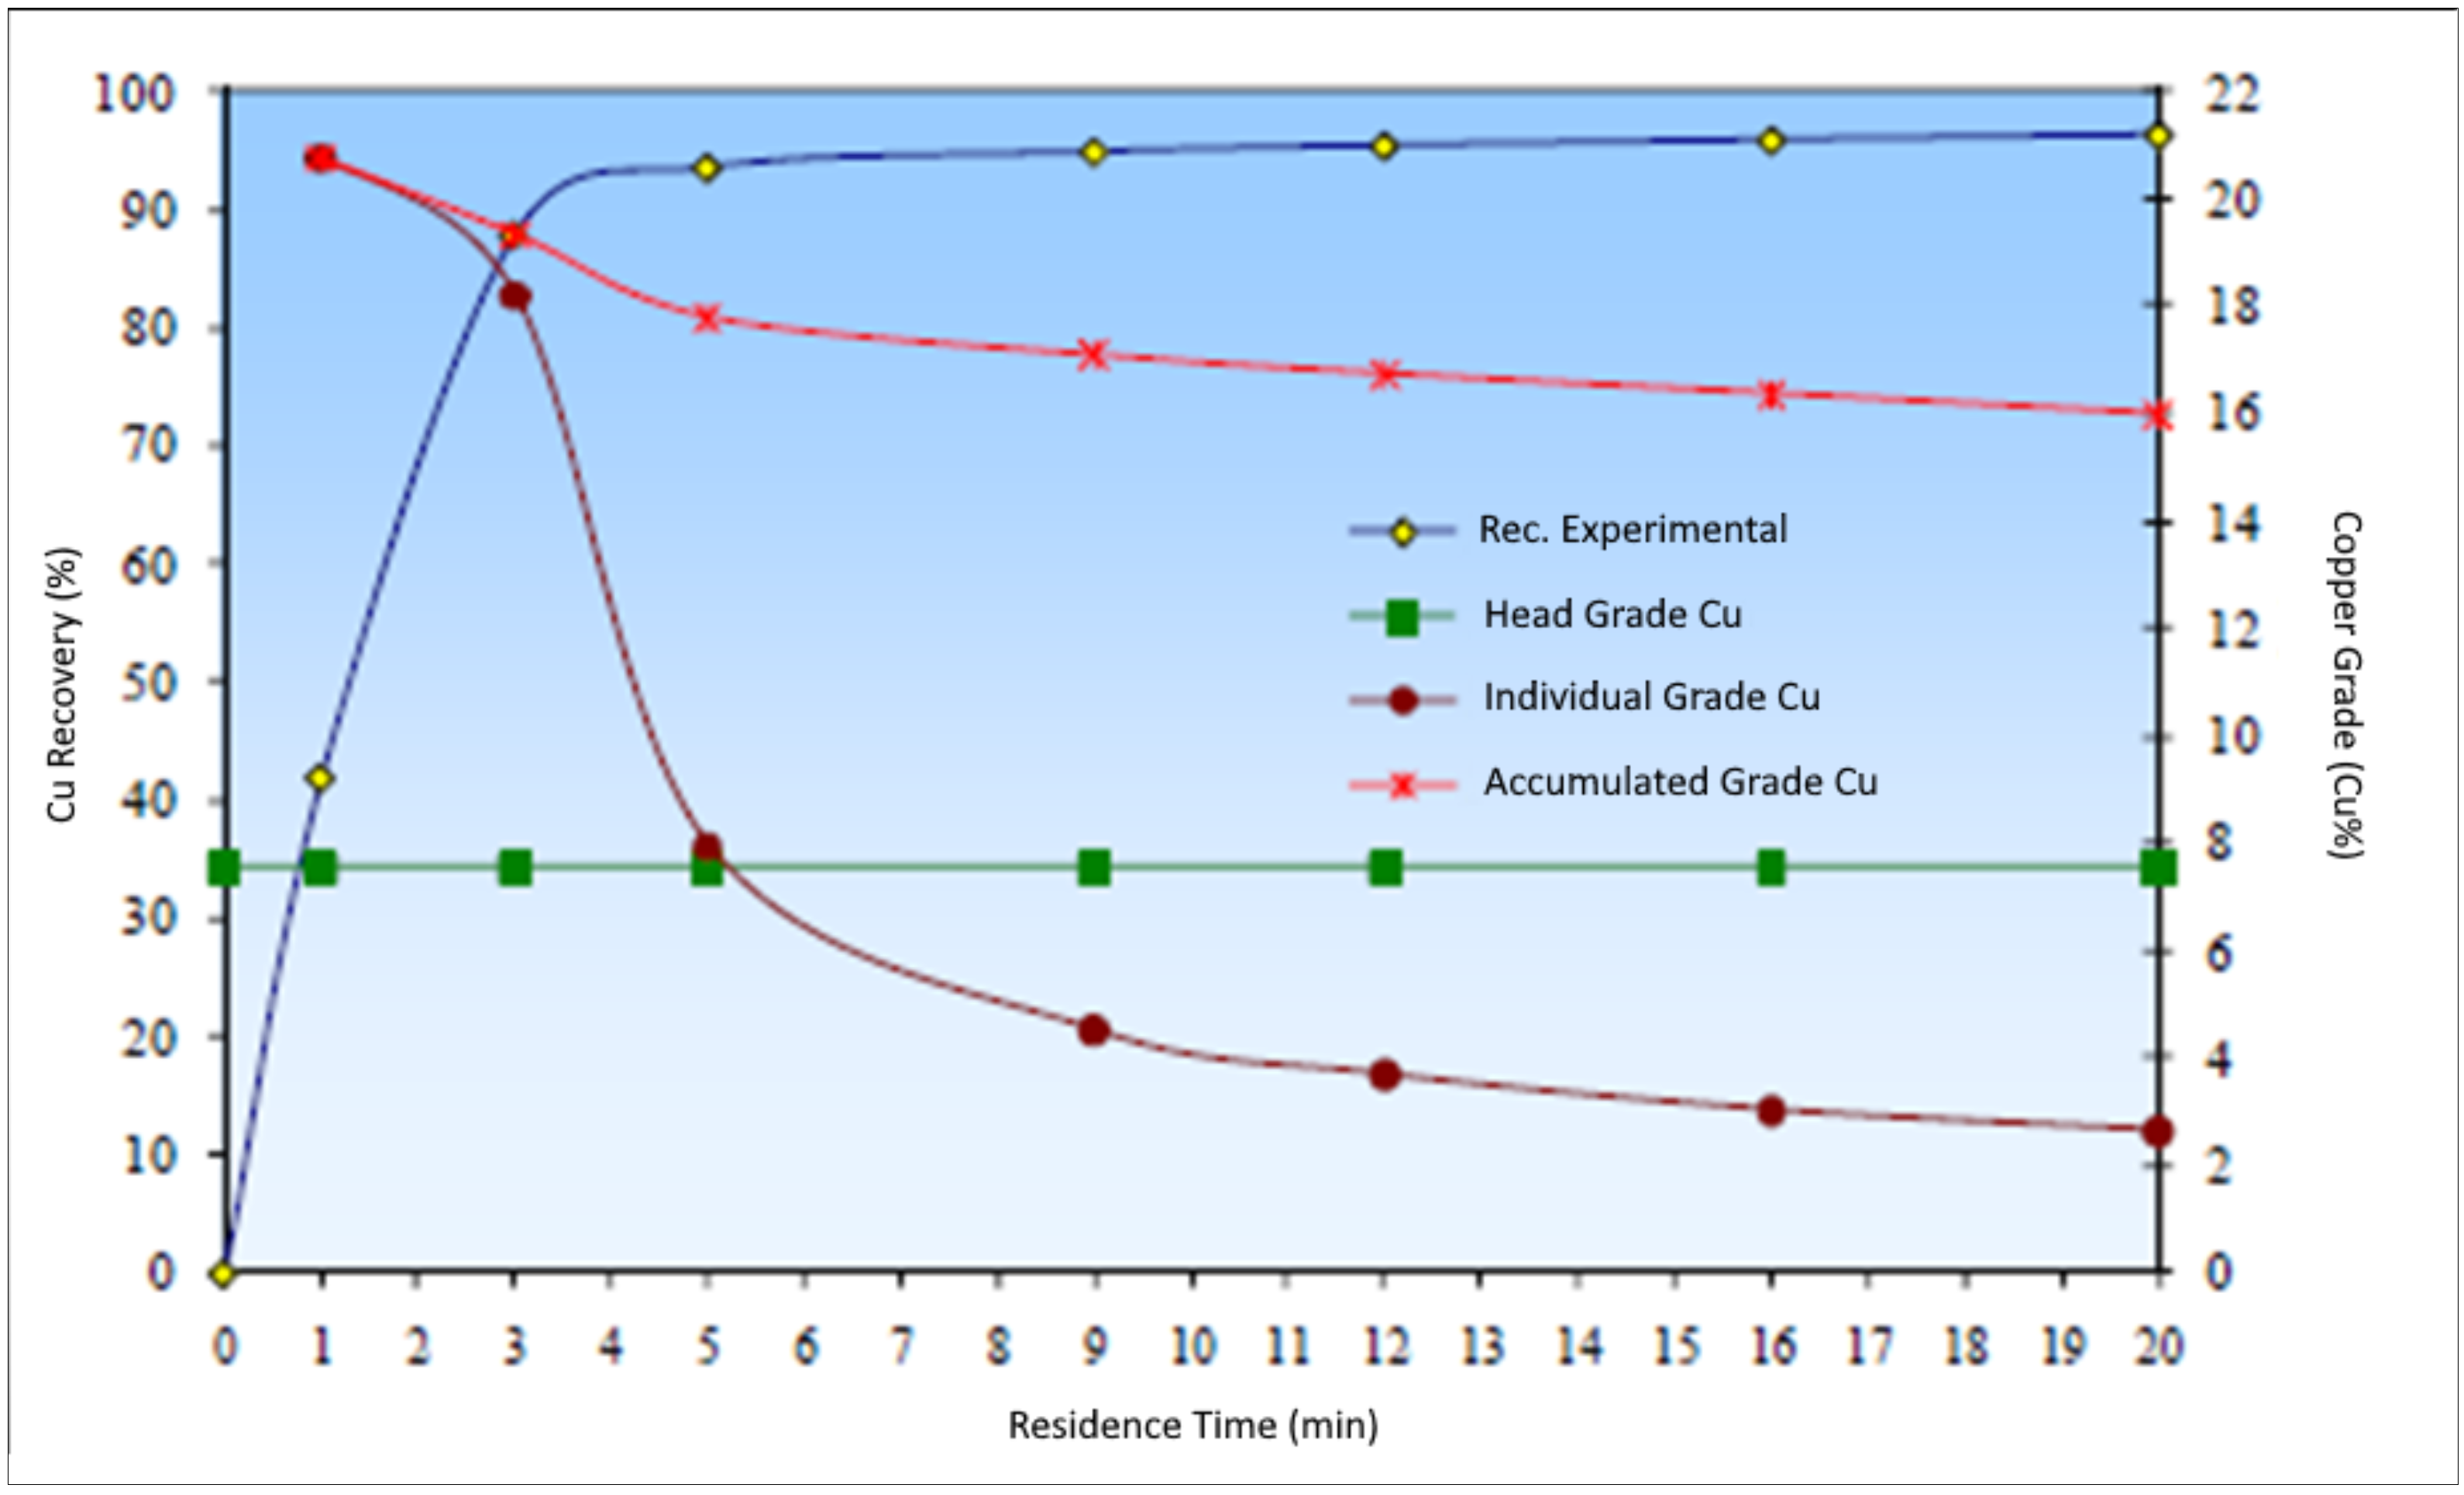
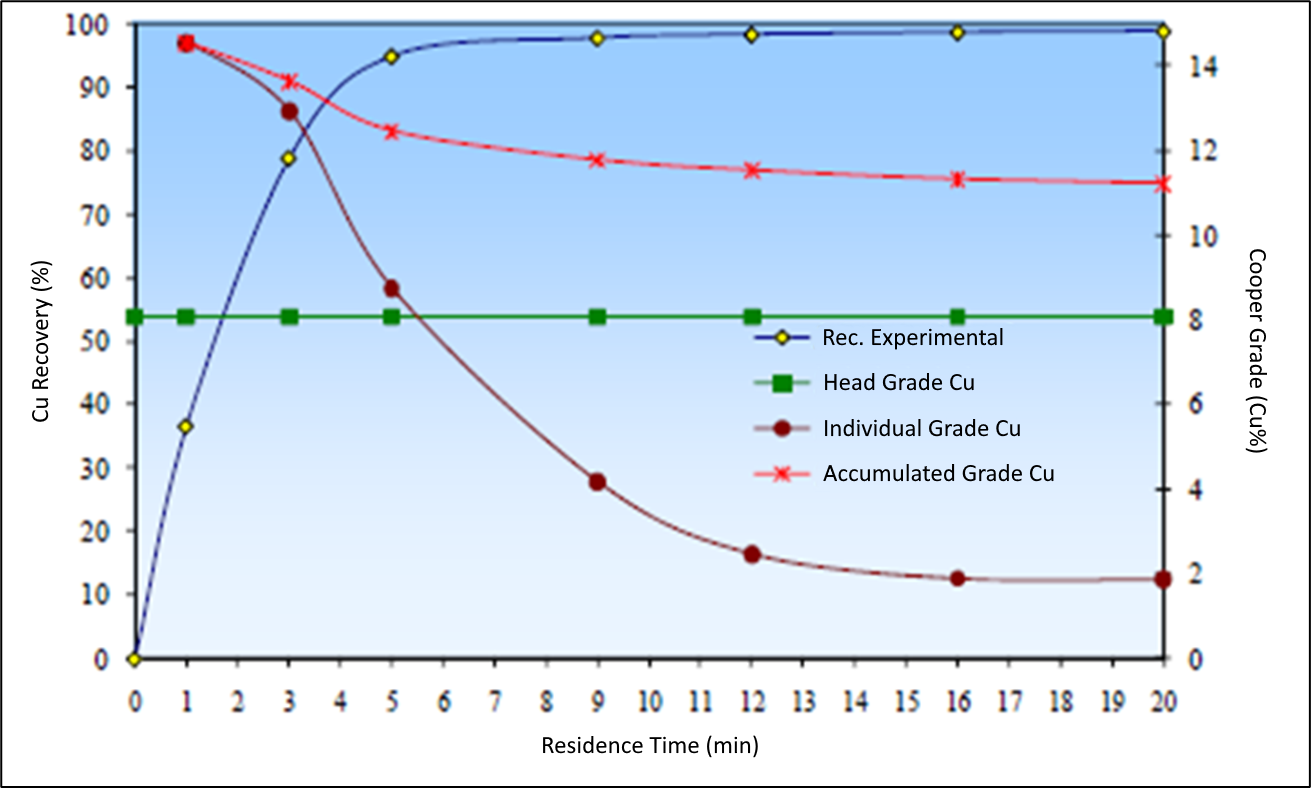
A series of metallurgical test programs were performed between 2007 and 2015 to assess the metallurgical responses of the mineral samples from the deposit. In the tests reviewed, master composite samples were constructed as a blend of 50% GRA and 50% BXX, while variability composite samples were prepared to represent the individual GRA and BXX rock types.
The initial test programs by Centro de Investigation’s Minero Metalúrgicas (CIMM) were conducted with one master sample which confirmed the selection of a sequential flotation flowsheet. In 2012, SGS Geosol (SGS) verified the flowsheet by using variability samples. Later in 2015, SGS investigated the amenability of a jigging pre-concentration step, and conducted subsequent flotation tests on the pre-concentrated samples, as well as the treatment of the flotation tailings. The main observations from the tests are shown as follows:
•Copper concentrate grade assaying at 28% Cu or higher were achieved from master samples. The 2015 SGS test program with a pre-concentration stage produced the highest concentrate grade of 28.9% Cu.
•Copper recovery to the head feed of 95.5% and 91.5% were achieved in the CIMM and 2012 SGS test work programs, respectively. The 2015 SGS tests produced a lower recovery of 85.1% to the head feed because of the pre-concentration stage, even though a similar copper stage recovery of 91.7% was achieved.
•Copper recovery and copper concentrate grade achieved from tests on variability samples in the 2012 SGS test program varied significantly. Copper grade ranged between 21.2 and 29.3% Cu while copper recovery varied between 77.5 and 95.4%.
•Copper concentrate samples present only trace-level deleterious elements.
Additional test programs were performed by equipment suppliers to determine the crushability and grindability of the ore samples, as well as the dewatering characteristics of the flotation concentrate and tailings samples. A fast-settling rate was observed for both copper concentrate and final tailings. The copper concentrate filtration can achieve a moisture level between 8 – 10%; no filtration tests were performed on tailings samples.
As part of this study, Ausenco completed a circuit review to determine the viability of including jigging pre-concentration. The evaluation indicates that the mass rejection in the jigging circuit does not result in significant reduction of the downstream plant and the associated capital cost requirements. The copper contained in the pre-concentration tailings can add significant value to the project when recovered to the final copper concentrate. As a result, a sequential flotation process with no pre-concentration stage is selected for the project. This flowsheet as well as the relevant locked cycle flotation test results comprise the basis for the copper recovery projection.
1.9Mineral Resource Estimation
Mineral Resources are detailed in Table 1-1 and have an effective date of 31 August 2021; they are presented inclusive of Mineral Reserves. Mineral Resources that are not Mineral Reserves have no demonstrated economic viability.
| | | | | |
| Boa Esperança Project | Page 5 |
| NI 43-101 Technical Report Feasibility Study Update | October 2021 |
The mineral resource estimates were prepared in accordance with the Canadian Institute of Mining, Metallurgy and Petroleum (“CIM”) Definition Standards for Mineral Resources and Mineral Reserves, adopted by the CIM Council on May 10, 2014 (the “CIM Standards”), and the CIM Estimation of Mineral Resources and Mineral Reserves Best Practice Guidelines, adopted by CIM Council on November 23, 2003 (the ‘CIM Guidelines”), using geostatistical and/or classical methods, plus economic and mining parameters appropriate to the deposit.
Block model tonnage and grade estimates for the Boa Esperança Project were classified according to the CIM Standards and the CIM Guidelines by Mr. Emerson Ricardo Re, RM CMC (0138) and MAusIMM (CP) (305892), Ero Resource Manager and QP as defined under NI 43-101.
A 3D geologic model was developed for the Boa Esperança Project. Geologically constrained grade shells were developed using various copper cut-off grades to generate a 3D mineralization model of the Boa Esperança Project. Within the grade shells, mineral resources were estimated using ordinary kriging within a 2.0 m by 2.0 m by 4.0 m block size. Within the optimized resource open pit limits, a cut-off grade of 0.20% copper was applied based upon a copper price of US$6,400 per tonne, net smelter return ("NSR") of 94.53%, average metallurgical recoveries of 90.7%, mining recovery of 91.0%, dilution of 5.0%, mining costs of US$3.10 per tonne mined run of mine ("ROM"), processing and costs of US$5.65 per tonne ROM, and G&A costs of US$5.65 per tonne ROM. Unconstrained inferred mineral resources have been stated at a cut-off grade of 0.51% copper with a marginal cut-off grade of 0.32% copper based upon a copper price of US$6,400 per tonne, NSR of 94.53%, mining recovery of 100%, average metallurgical recoveries of 90.7%, mining costs of US$14.71 per tonne ROM, processing and costs of US$5.70 per tonne ROM, and G&A costs of US$2.60 per tonne ROM. Stated mineral resources estimates are inclusive of mineral reserves.
Table 1-1: Mineral Resource Statement as of 31 August 2021
| | | | | | | | | | | | | | | | | | | | | | | | | | | | | | | | | | | | | | |
| Boa Esperança Copper Project | Measured Resources | Indicated Resources | Measured and Indicated Resources | Inferred Resources |
| Tonnes | Grade | Contained | Tonnes | Grade | Contained | Tonnes | Grade | Contained | Tonnes | Grade | Contained |
| (000's) | (%) | (000's) | (000's) | (%) | (000's) | (000's) | (%) | (000's) | (000's) | (%) | (000's) |
| Open Pit High-Grade | 7,117 | 2.16 | 153.65 | 1,661 | 2.27 | 37.63 | 8,778 | 2.18 | 191.3 | 40.5 | 2.69 | 1.09 |
| Open Pit Low-Grade | 25,476 | 0.60 | 152.00 | 13,433 | 0.51 | 68.43 | 38,909 | 0.57 | 220.4 | 514.4 | 0.49 | 2.51 |
| Subtotal Mineral Resources | 32,593 | 0.94 | 305.65 | 15,095 | 0.70 | 106.06 | 47,687 | 0.86 | 411.7 | 554.8 | 0.65 | 3.60 |
| Underground High-Grade | | | | | | | | | | 1,354 | 2.24 | 30.38 |
| Underground Low-Grade | | | | | | | | | | 9,681 | 0.60 | 58.24 |
| Subtotal Mineral Resources | | | | | | | | | | 11,035 | 0.80 | 88.62 |
| Total Copper Mineral Resources | 32,593 | 0.94 | 305.65 | 15,095 | 0.70 | 106.06 | 47,687 | 0.86 | 411.71 | 11,590 | 0.80 | 92.22 |
Notes to Accompany Mineral Resource Estimate:
•Mineral Resources have an effective date of 31 August 2021 and were prepared by Emerson Ricardo Re, MSc, MBA, MAusIMM (CP) (No. 305892), Registered Member (No. 0138) (Chilean Mining Commission), Resource Manager of Ero and a QP as such term is defined under NI 43-101.
•Tonnes and grade are rounded to reflect approximation.
•Open Pit Mineral Resources are stated at a cut-off grade of 0.20% Cu and are fully contained within an optimized pit shell.
•Underground Mineral Resources are stated within an optimized stopes below the pit shell. A cut-off grade of 0.51% Cu and a marginal cut-off grade of 0.32% Cu were applied in the stope optimization.
•Stated Mineral Resources are inclusive of Mineral Reserves.
•Mineral Resources that are not Mineral Reserves and have not demonstrated economic viability. Mineral Resource estimates do not account for mineability, selectivity, mining loss and dilution. These Mineral Resource estimates include Inferred Mineral Resources that are normally considered too geologically speculative to allow for the application of economic considerations that would see them categorized as Mineral Reserves. There is
| | | | | |
| Boa Esperança Project | Page 6 |
| NI 43-101 Technical Report Feasibility Study Update | October 2021 |
also no certainty that these Inferred Mineral Resources will be converted to Measured and Indicated categories through further drilling or into Mineral Reserves once economic considerations have been applied.
1.10Mineral Reserve Estimation
Mineral Reserves are detailed in Table 1-2 and have an effective date of 31 August 2021. These are based on the 2021 FSU production schedule, which was constrained by a designed pit. Measured and Indicated Mineral Resources were used to support the statement of Proven and Probable Mineral Reserves. Measured Resources were converted to Proven Mineral Reserves, and Indicated Mineral Resources were converted into Probable Mineral Reserves. These are reported as delivered to the mill and are therefore fully diluted.
Table 1-2: Mineral Reserves Statement as of 31 August 2021
| | | | | | | | | | | | | | | | | |
| Reserves Category | Tonnage t '000 | Copper %Cu | Contained Copper t ‘000 | |
| Proven Reserves | 30,674 | 0.89 | 273.2 | |
| Probable Reserves | 12,378 | 0.67 | 83.4 | |
| Total Mineral Reserves | 43,052 | 0.83 | 356.6 | |
| Notes to Accompany Mineral Reserves Estimate: | |
1.Mineral Reserves have an effective date of 31 August 2021 and were prepared by Mr. Carlos Guzman, RM CMC (0119) and FAusIMM (229036), an employee of NCL and a QP as such term is defined under NI 43-101. 2.Mineral Reserves are reported as constrained within Measured and Indicated pit designs and are supported by a mine plan featuring a constant throughput rate and cut-off optimization. The pit designs and mine plan were optimized using the following economic and technical parameters: copper price of US$3.00/lb; average recovery to concentrate is 91.3%; copper concentrate logistics costs of US$108.2/wmt; transport losses of 0.2%; copper concentrate treatment charges of US$59.5/dmt, U$0.0595/lb of copper refining charges; copper payability of 96.3%; average mining cost of US$2.47/t-mined; process cost of US$7.74/t-processed and G&A costs of US$3.83/t-processed; average pit slope angles that range from 30º to 50º and 2% royalty. 3.Mineral Reserves estimate considered an SMU of 2m x 2m x 8m, an overall dilution of 3.3% and a metal loss of 0.3%. 4.Rounding as required by reporting guidelines may result in apparent summation differences between tonnes, grades, and metal content. 5.Tonnage measurements are in metric units. Copper grades are reported as percentages and payable copper as tonnes. | |
Mineral Reserves were derived by incorporating modifying factors into the Mineral Resource model. Design and production scheduling were then undertaken within mine planning software. This process incorporated appropriate modifying factors and the application of cut-off policies and economic analysis. These results were then incorporated into the 2021 FSU, which supports the statement of Mineral Reserves at the project.
Previously stated Mineral Reserves as of June 1, 2017, were 19.5 Mt at 0.95 %Cu. (refer to Chapter 6.0 for further detail). The increase of the current estimate to almost double the contained copper is mainly because of the increased throughput, higher metallurgical recoveries as a result of removing the jigging unit operation, and the Mineral Resource modelling technique, which applied a more selective approach and with less added in-situ dilution than used in 2017.
| | | | | |
| Boa Esperança Project | Page 7 |
| NI 43-101 Technical Report Feasibility Study Update | October 2021 |
1.11Open Pit Geotechnical
Geotechnical investigations for previous feasibility studies for the Boa Esperança project were completed in 2012 and 2017. The overall objective of the evaluation was to determine the pit slope geometries. Design recommendations for the pit slope angles were provided.
A field data collection program was designed and carried out for the Project with the primary objective of rock mass characterization and discontinuity orientation to serve as the basis of geotechnical model development. Geotechnical logging, point load testing, and orientation of discontinuities intersected by core recovered from four boreholes were conducted by MCSA geologists to support this investigation. Rock quality designation (RQD) data for a total of 109 previous resource and condemnation drillholes was also analysed and used in the development of the geotechnical model and subsequent analyses.
Geomechanical testing was conducted on rock core samples obtained from the two geotechnical drillholes to determine strength characteristics for the in-situ materials. The overall laboratory program consisted of direct shear, uniaxial and triaxial compressive strength, direct tensile strength tests, and measurements of unit weight and elastic properties. A total of 56 laboratory tests were conducted on samples selected to represent the range of the rock conditions observed in the two geotechnical holes.
In addition to the rock core testing program, two relatively undisturbed block samples of saprolite were obtained from within the open pit area and tested by Pattrol Laboratory, located in Belo Horizonte, Brazil. The saprolite testing program included triaxial shear strength and classification testing.
At Boa Esperança, three distinct domains of rock quality exist, i.e., the upper, saprolite and weathered rock (Saprock) and the fresh granitic rock below (Fresh Rock). The depth of the saprolite and weathered rock zone varies across the site from approximately 15 m around the outer edges of the deposit, up to 125 m in the Boa Esperança hill in the central portion of the deposit. The saprolite materials logged generally classify as completely weathered rock to residual soils.
Below the Saprolite and Saprock Zones, the bedrock is generally fresh, showing few signs of oxidation and minimal fracturing resulting in a very competent rock mass. Rock mass ratings (RMR) for the fresh rock ranged between 49 and 80 with an average value of 69 according to the Bieniawski (1989) criteria. Hydrothermal breccia structures and rhyodacite dikes within the rock mass are generally well healed and expected to be of similar competency as the granitic host rock and consequentially have been included within the Fresh Rock domain.
In addition to the granitic rock, a schist unit exists at the surface to the north and east, potentially outcropping in the upper final north pit wall. Currently, the schist unit is poorly understood with very few actual drill core intercepts. The few drillhole intercepts with this unit at depth suggest a rock mass similarly competent to the granite host rocks, without strong cleavage or well-developed foliation.
Based on the oriented core data, the primary discontinuity sets at Boa Esperança are sub-vertical, northeast, and northwest striking and sub-horizontal. A secondary, moderately northwest dipping set also appears but relatively infrequent compared to the other sets.
To optimize the slope design at Boa Esperança, both global and bench scale stability for the proposed open pit were performed. Overall slopes were analysed with limit equilibrium methods using the Hoek-Brown (2002) rock mass shear strength criteria for the Fresh Rock and Mohr-Coulomb criteria for the highly weathered Saprolite Zone. Saprolite slopes were considered to be drained and conservatively high groundwater surfaces were used in the Fresh Rock.
| | | | | |
| Boa Esperança Project | Page 8 |
| NI 43-101 Technical Report Feasibility Study Update | October 2021 |
Overall and high inter-ramp slopes were analyzed using commercially available geotechnical modelling software packages Slide 6.0 and Phase2. The limit equilibrium analysis results for the current final feasibility pit design showed a very low probability of failure and relatively high factors of safety (average of 2.1) for even the conservatively high phreatic surface assumed (10 to 25 m behind pit face). A safety factor of 1.7 was also demonstrated with Phase2 using the mean rock mass parameter values. This confirms that stable slopes at Boa Esperança, within the Fresh Rock, will be controlled primarily by geologic structure below the oxide boundary and not by rock mass strength. Stable slopes within the saprolite zone are anticipated to be controlled primarily by groundwater pressures which will be relieved with horizontal drain holes.
Slope kinematics were evaluated with a qualitative risk assessment for each pit sector. The purpose of the assessment was to judge the risk or likelihood of plane shear and wedge type failures occurring in a given pit sector. Based on the wall orientations of the current pit design and the steep dip angle of the primary structures at Boa Esperança, all sectors were identified as having very low to low risk of structural instabilities.
Table 1-3 shows the pit slope geometry proposed by Ausenco for each material type.
Table 1-3: Pit Slope Geometry
| | | | | | | | | | | |
| Saprolite | Saprock | Fresh Rock |
| Bench Height (m) | 8 | 8 | 16 |
| Minimum Bench Width (m) | 6 | 6 | 8 |
Bench Face Angle (O) | 50 | 65 | 81 |
Maximum Inter-ramp Angle (O) | 35 | 45 | 56 |
Maximum Overall Slope Angle (O) | - | 40 | 50 |
| Maximum Slope Height (m) | 50 | 100 | 200 |
1.12Mining Methods
A mine plan was developed by NCL. The plan is focused on a single mine area, mined through consecutive mining phases or pushbacks. The mill throughput assumption is based on an economic assessment study, resulting in an average throughput of 4.0 Mt per year of sulphide ore and a ramp-up period of 12 months that assumes a production rate of 3.2 Mt in the first year of production. Plan production (ramp-up) starts after commissioning during the second quarter of Year 1 to avoid the rainy season.
The required pre-stripping amounts to 13.2 Mt, and activities have been scheduled over 24 months. The mining schedule requires a maximum mine extraction of 20 Mt per year. The mine movement decreases from Year 10 until the mining operations are completed in Year 12. The production parameters for the Boa Esperança Project are summarised in Table 1-4.
| | | | | |
| Boa Esperança Project | Page 9 |
| NI 43-101 Technical Report Feasibility Study Update | October 2021 |
Table 1-4: Key Production Parameters
| | | | | |
| Parameter | Quantity |
| Proven and Probable Mineral Reserves | 43.1 Mt at 0.83 %Cu |
| LOM production | Copper: 717.9 M lb (Year 1 - Year 12) |
| Pre-stripping | 13.2 Mt (24 months) |
| Maximum material movement | 20 Mt/anuum (without rehandling) |
| Mine life | 12 years |
The adopted mining operation strategy for this study corresponds to contract mining from pre-stripping through Year 5 of operation and transition to Owner mining in Year 6 to the life of mine. The preferred timing of the transition to Owner mining will be analyzed in future studies.
The mine is scheduled to work on a 7-days-a-week, three 8-hour shift basis, 365 days a year and 12 lost days per year due to weather conditions. The operation will include normal drilling, blasting, loading with 5.2 m3 / 3.9 m3 (waste/ore) backhoe configured excavator and 38 t conventional trucks over an 8-m bench height (double bench of 16 m in fresh rock in interim and final slopes). Mining will be performed on a sub-bench or flitch basis. All mining processes in the ore areas will apply processes commensurate with selective mining to mitigate ore dilution and losses. Mining will include supporting functions such as ancillary activities, dewatering, grade control, and equipment maintenance. Table 1-5 and Table 1-6 summarise the mine and plant feed production schedules.
| | | | | |
| Boa Esperança Project | Page 10 |
| NI 43-101 Technical Report Feasibility Study Update | October 2021 |
Table 1-5: Mine Production Schedule (yearly)
| | | | | | | | | | | | | | | | | | | | | | | | | | | | | | | | |
| Year | Total Mined Ore | Mineralised material to stockpile | Total to Waste Dump | Total Mined |
| Mine to Mill | Mine to Stockpile | Total Ore | Fresh Waste | Topsoil | Saprolite | Weathered | Total Waste |
| kt | kt | kt | kt | kt | | kt | kt | kt | kt |
| PP | - | 53 | 53 | 29 | 48 | 363 | 9,568 | 3,111 | 13,089 | 13,171 |
| Y01 | 2,168 | 95 | 2,263 | 286 | 1,036 | 60 | 1,643 | 2,978 | 5,718 | 8,267 |
| Y02 | 3,964 | 281 | 4,245 | 408 | 2,465 | 149 | 3,287 | 1,802 | 7,703 | 12,357 |
| Y03 | 3,876 | 271 | 4,148 | 1,013 | 9,190 | 139 | 1,888 | 2,729 | 13,944 | 19,105 |
| Y04 | 4,000 | 126 | 4,126 | 1,010 | 10,524 | 182 | 2,186 | 1,972 | 14,864 | 20,000 |
| Y05 | 4,000 | 400 | 4,400 | 1,096 | 10,967 | 120 | 1,806 | 1,612 | 14,504 | 20,000 |
| Y06 | 3,853 | - | 3,853 | 971 | 10,037 | 190 | 2,445 | 2,269 | 14,941 | 19,765 |
| Y07 | 3,153 | - | 3,153 | 2,107 | 12,871 | 10 | 404 | 767 | 14,053 | 19,313 |
| Y08 | 4,000 | 43 | 4,043 | 1,133 | 14,209 | - | 56 | 560 | 14,825 | 20,000 |
| Y09 | 3,903 | - | 3,903 | 1,367 | 14,730 | - | - | - | 14,730 | 20,000 |
| Y10 | 4,000 | 170 | 4,170 | 1,044 | 12,706 | - | - | - | 12,706 | 17,921 |
| Y11 | 3,267 | - | 3,267 | 530 | 6,523 | - | - | - | 6,523 | 10,320 |
| Y12 | 1,429 | - | 1,429 | 123 | 1,308 | - | - | - | 1,308 | 2,859 |
| Y13 | - | - | - | - | - | - | - | - | - | - |
| Y14 | - | - | - | - | - | - | - | - | - | - |
| Y15 | - | - | - | - | - | - | - | - | - | - |
| Totals | 41,613 | 1,439 | 43,052 | 11,116 | 106,614 | 1,213 | 23,282 | 17,800 | 148,909 | 203,076 |
Note:
All tonnes in report are dry tonnes, unless stated.
Mineralised material corresponds to in-pit contained Inferred Mineral Resources and Measured or Indicated Mineral Resources with copper grade in the range 0.10 – 0.22 %Cu.
| | | | | |
| Boa Esperança Project | Page 11 |
| NI 43-101 Technical Report Feasibility Study | October 2021 |
Table 1-6: Plant Feed Schedule (yearly)
| | | | | | | | | | | | | | |
| Period | Total To Mill |
| kt | %Cu | REC (%) | Payable Cu (Klb) |
| Y01 | 2,182 | 1.34 | 93.2 | 57,944 |
| Y02 | 3,990 | 1.33 | 92.8 | 104,412 |
| Y03 | 4,000 | 1.08 | 92.1 | 83,984 |
| Y04 | 4,000 | 0.77 | 90.6 | 59,047 |
| Y05 | 4,000 | 0.82 | 91.8 | 64,070 |
| Y06 | 4,000 | 0.70 | 90.7 | 54,132 |
| Y07 | 4,000 | 0.49 | 87.2 | 36,520 |
| Y08 | 4,000 | 0.56 | 89.9 | 42,309 |
| Y09 | 4,000 | 0.64 | 90.4 | 48,705 |
| Y10 | 4,000 | 0.63 | 91.2 | 48,462 |
| Y11 | 3,451 | 0.90 | 91.3 | 59,743 |
| Y12 | 1,429 | 1.11 | 91.5 | 30,623 |
| Totals | 43,052 | 0.83 | 91.3 | 689,953 |
1.13Recovery Methods
The process plant is designed to treat a nominal 4 Mt/a Run-of-Mine (ROM) ore from an open pit mine operation to produce a copper concentrate. A sequential flotation process was selected for the project, which is based on the review of the previous processing and metallurgical tests and the circuit evaluation by Ausenco as described in Section 13.0. The selected unit processes involve a conventional three-stage crushing and a ball milling comminution process, followed by sequential flotation stages of copper flotation and pyrite floatation circuits, as well as the dewatering circuits for both the final copper concentrate and pyrite tailings for dry stacking. The pyrite concentrate separated from the pyrite flotation will be impounded separately.
The process plant will operate on the basis of three 8-hour shifts per day, 365 days a year. The operational availability is set at 70% for crushing, 92% for grinding and flotation, as well as 84% in average for concentrate and tailings filtration.
A simplified process flowsheet is shown in Figure 1-1. The ROM ore will be hauled from the open pit mine to a surface crushing plant, where it will be crushed to a P80 of 12 mm via a three-stage crushing circuit. The crushed ore will be transferred to a stockpile prior to being ground in a ball mill which is in a closed circuit with classifying cyclones. The cyclone overflow with a desired P80 of 110 µm will gravitate to a copper flotation circuit.
The copper flotation circuit will consist of a conventional rougher flotation stage, a regrind circuit to further reduce the particle size of the combined rougher concentrate and cleaner scavenger concentrate to a P80 of 38 µm, and the subsequent cleaner flotation circuit. The cleaner flotation circuit will involve a cleaner scalper stage followed by two stages of cleaner flotation. The copper concentrate from the cleaner scalper and second cleaner stages will be the final product, which will be thickened in a high-rate thickener and then filtered in conventional vertical plate pressure filters for dewatering.
Tailings from the copper rougher flotation circuit will combine with tailings from the copper cleaner-scavenger flotation circuit as the feed for the pyrite flotation circuit. The pyrite concentrate will be stored in a dedicated pyrite impoundment. The final tailings from the pyrite flotation will be thickened and filtered to be stored at a dry stacking facility.
| | | | | |
| Boa Esperança Project | Page 12 |
| NI 43-101 Technical Report Feasibility Study | October 2021 |
Figure 1-1: Overall Process Flowsheet
Note: Figure prepared by Ausenco, 2021.
| | | | | |
| Boa Esperança Project | Page 13 |
| NI 43-101 Technical Report Feasibility Study | October 2021 |
1.14Project Infrastructure
The proposed Boa Esperança mine is a greenfield site but is located in a region of reasonable infrastructure. On-site and off-site infrastructure that will be required for mining and processing operations will include:
•On-site
•Open pit mine
•Stockpiles and waste rock facilities
•Process plant with three-stage crushing
•Dry stacked tailings facility (DSTF);
•Wet or pyrite tailings storage facility (TSF);
•Water treatment plant (WTP);
•Water collection and containment structures
•Administration building and offices
•Laboratory
•Warehouse and yard storage
•Process operations workshop
•Truck shop
•Mine dry
•Truck wash
•Explosive storage magazine
•Gate house and weigh scale
•Core shed
•First aid clinic and fire protection building
•Canteen
•Sewage treatment
•Refuse storage
| | | | | |
| Boa Esperança Project | Page 14 |
| NI 43-101 Technical Report on Feasibility Study | October 2021 |
•Off-site
•Access road upgrade and public road bypass
•Power transmission line
1.14.1Accessibility
1.14.1.1Road
Access to the Project by road is from Ourilândia do Norte, which features commercial flights, and Tucumã. From Tucumã state highway PA-150 can be followed for approximately 25 km until reaching the intersection with P-3. From the intersection with P-3, a secondary road can be followed for approximately 20 km in a southwest direction to reach Morro Boa Esperança, where the Project is located.
Vila do Conde, Barcarena, PA, near the city of Belem is the only port complex from which seaborne loads can be transported to and from the site location. Loads can be transported via road. Copper concentrate loading and transportation from the mine site to the Port of Vila do Conde will be performed via truck by a selected contractor.
1.14.1.2Rail
The closest rail infrastructure to the Project is the Carajas railroad, which connects Sao Luis, Maranhao to Carajas, Pará. The railway covers approximately 892 km and is operated and 100% owned by Vale.
1.14.1.3Air
The nearest commercial airstrip is in Ourilândia do Norte (CKS), located 12 km from the town of Tucuma, and approximately 45km by road to the Project.
1.14.2Power
The public electricity supplier, Equatorial Energia Pará, supplies the region with electrical power. Equatorial Energia confirmed the feasibility of supplying power based on a peak demand load of 25 MW by means of a 138 kV power line between the main substation at the mine site and the existing nearby Tucumã substation. The power line will be approximately 45 km long and take 21 months to complete.
Equatorial Energia will oversee the power line route, design, construction and commissioning, landowners’ approach, and land acquisition. Their battery limit will be the termination at the main mine site substation.
Power will be distributed from the main substation to area substations and e-houses as listed:
•Crushing area
•Grinding, Thickening, Flotation, Reagents and Water Distribution
•Tailings Filtering
•General Area Substation (Offices, Workshop, Canteen, First Aid Clinic, Laboratory, etc.)
•Wastewater Capture Substation
| | | | | |
| Boa Esperança Project | Page 15 |
| NI 43-101 Technical Report on Feasibility Study | October 2021 |
•Raw Water Intake
1.14.3Accommodation
There will be no on-site camp provided. Instead, contractors and EPCM staff will secure board and lodging in the nearby town of Tucumã and commute daily to the work site. Ourilândia do Norte, a municipality located approximately 10 km to the east of Tucumã, hosts much of the workforce for Vale’s Onça Puma Nickel operations. Together, these two cities form a mining community with a population of more than 70,000 people offering skilled labor and sufficient board and lodging. During operations it is expected that personnel will be hired from local communities.
1.14.4Waste Rock Facility
Waste rock from mining activities including pre-stripping, will be trucked to a designated waste rock dump. The dump will be built in 20-m lifts. Each lift will be constructed at an approximate angle of repose of 37°. A 10-m set-back between each lift will maintain the overall slope at 1.8:1 to facilitate reclamation and long-term stability. A constant 30% swell factor (after natural compaction) was assumed in the design. The facility was designed to support 160 Mt, 8% additional capacity than the 148 Mt of waste of the mine plan. Once the deposit has been exhausted it is estimated the dump will cover an area of 185 ha.
A separate facility was designed to the south of the main waste rock facility (WRF) for the topsoil, to be used for later reclamation. The total estimated topsoil is 1.2 Mt for the life of mine.
1.14.5Low-Grade Stockpile
Low-grade stockpiles will be created close to the process plant and to the east of the pit. The stockpiles are designed with 10-m lifts and 10-m setbacks to facilitate later re-handling.
1.14.6Tailings Storage Facilities
The tailings produced from mineral extraction will be segregated in the pyrite flotation cells to form two tailings streams; pyrite tailings and non-pyrite tailings. The tailings streams are segregated to assist with managing the smaller amount of potentially acid-generating (PAG) material using a Best Management Practice approach.
The PAG slurry tailings will be discharged in a geomembrane-lined tailings storage facility (TSF) located to the north of the primary crusher. Approximately 4.3 Mt of slurry tailings will be discharged sub-aqueously over the life of the project within the TSF. The TSF impoundment requires ring embankment that will be constructed in phases to contain the tailings.
The non-acid generating (NAG) tailings will be filtered to reclaim water at the plant for reuse and create a filter cake that can be placed in a dry stack tailings facility (DSTF). After filtering, the dewatered tailings will be transported to the DSTF in haul trucks and compacted in relatively thin lifts. Approximately 38.7 Mt of filtered tailings will be placed in the DSTF over the life of the project.
All non-contact water near these facilities will be diverted around and discharged into natural drainages. All contact water from these facilities will be collected and conveyed to contact water/seepage ponds.
1.14.7Water Management
The water management plan is based largely on the water balance calculated in August – September 2021 and includes discussion of contact water as well as opportunities that may be actioned to improve the confidence in the estimates of
| | | | | |
| Boa Esperança Project | Page 16 |
| NI 43-101 Technical Report on Feasibility Study | October 2021 |
contact water quantities as well as water quality. The water management plan requires the geochemical assessment of waste and tailings prior to finalization, and this work is underway.
A surface water management system will be constructed to segregate contact and non-contact water. Non-contact water will be diverted around mine infrastructure to natural drainage structures. Contact water will be diverted to ponds followed by treatment prior to release. The estimated contact water from mine infrastructure is presented in Table 1-7.
Table 1-7: Contact Water Estimate
| | | | | | | | | | | | | | | | | | | | | | | | | | |
| Average Wet Season | Average Dry Season |
All values in m3/h | Start-up | Y5 | Ultimate | Closure | Start-up | Y5 | Ultimate | Closure |
Waste Rock Dump (runoff & seepage) | 260 | 420 | 602 | 222 | 86 | 139 | 199 | 73 |
| LG Stockpile and admin area | 72 | 72 | 72 | 0 | 24 | 24 | 24 | 0 |
| Pit (sump) | 96 | 283 | 349 | 0 | 41 | 223 | 248 | 0 |
| TSF (runoff) | 51 | 58 | 73 | 73 | 17 | 19 | 24 | 24 |
| Tailings (runoff) | 154 | 306 | 306 | 107 | 51 | 101 | 101 | 35 |
Total contact water (m3/h) | 634 | 1140 | 1402 | 402 | 218 | 505 | 595 | 133 |
The capital cost estimate for the Project includes use of a high-density sludge (HDS) water treatment plant (WTP) to treat contact water. HDS is based on lime neutralization to induce precipitation of metals and salts via pH change. Seepage from the waste rock dump and other contact water is treated by adding lime, followed by coagulation/co-precipitation with ferric iron, flocculation, clarification, and pH adjustment (if required). Sludge from the WTP will be disposed in the TSF. Completion of the proposed geochemistry program may inform modifications in the treatment plant selection and sizing as currently envisioned.
1.14.8Water Supply
Raw water at a maximum flowrate of 170 m3/h will be pumped from a reservoir created by installing a water dam at Jatobá creek.
1.14.9Environmental and Social Considerations
As outlined in this FSU, the Project has been designed using Best Management Practice to protect the environment, surface waters, and groundwater in the area.
The raw water for the Project will be sourced from a reservoir dam constructed in the Jatobá river to stabilize water availability throughout the seasons. The water reservoir will have the purpose of storing clean water to meet the demand of the plant, estimated at a flow of 154 m³/h, working for a year without interruption. The water pond will restrict the flow of Jatobá river and will be constructed within the property owned by Ero Copper.
1.14.10Closure and Reclamation Considerations
The primary objective of the closure and reclamation initiatives will be to eventually return the DSTF and TSF to self-sustaining facilities that satisfy the end land-use objectives. The DSTF and TSF are designed to maintain long-term physical and chemical stability, protect the downstream environment, and manage surface water. In addition, the closure plan needs to be compatible with a premature closure event. At the end of the mine life, the water cover over the tailings of the TSF
| | | | | |
| Boa Esperança Project | Page 17 |
| NI 43-101 Technical Report on Feasibility Study | October 2021 |
will be drained and a capped will be constructed using non-acid generating material, topsoil and topsoil to limit ingress of oxygen and water to the PAG tailings.
The DSTF will utilize progressive closure measure to facilitate closure along with reducing erosion in area where exterior slopes are completed during the life of mine. Both the TSF and DSTF meet both operational and post-closure physical and geochemical and protect the downstream environment along with surface water management.
Closure and reclamation costs have been estimated by Ero at approximately $24 M, which is partially offset by an estimate salvage value of $7 M. Closure costs have been based upon detailed costing performed in 2017 for the Project’s Plano de Recuperação de Áreas Degradadas (PRAD) and have been adjusted for scope and inflation using Ero’s current reclamation activities and operations in Bahia, Brazil as a reference check for key input costs. Closure activities for the Project include:
•Retrenchment;
•Demolition of surface sites;
•De-mobilization of equipment;
•Open pit reclamation;
•DTSF recontouring and reclamation;
•Waste dump recontouring and reclamation; and,
•PAG reclamation.
1.14.11Social Considerations
Ero and its subsidiaries have an extensive operating background in Brazil and a strong history of community engagement. Social programs will be developed for the Project that align with the Company’s policies and vision to create value for all stakeholders. Programs that will be developed are expected to be similar to existing programs in place at Ero’s operations in Bahia State and Mato Grosso State which focus on socio-economic development, effective communication, and job training to foster local employment, among others.
1.15Markets and Contracts
The Boa Esperança copper concentrate is generally expected to be of high quality with low levels of deleterious elements. As such, combined with Ero’s experience selling copper concentrate from its Curaçá Valley operations, Ero expects that the copper concentrate from Boa Esperança will be in high demand from traders and smelters.
The metal price assumptions selected for the 2021 FSU are based on the analyst consensus copper price outlook:
•$3.80/lb in 2024, $3.95/lb in 2025, $3.40 in 2026+
Ero has assumed that the Boa Esperança concentrate will incur similar TC/RCs to that of its Curaçá Valley operations with forecast TCs of $21/t of concentrate and RCs of $0.021 (2.10 cents) per pound of copper (2021 benchmark). Presented prices are nominal.
Copper concentrate loading and transportation from the mine site to the Port of Vila do Conde will be performed by a selected contractor. Total transport costs for the concentrate are estimated at $146.9/wet metric tonne (wmt).
| | | | | |
| Boa Esperança Project | Page 18 |
| NI 43-101 Technical Report on Feasibility Study | October 2021 |
1.16Capital Cost Estimates
The capital cost estimate for the Project has an estimated accuracy of ±15% and uses third-quarter, 2021 US dollars as the base currency. The total estimated initial capital cost for the design, construction, installation, and commissioning of the Boa Esperança Project is estimated to be $294.2 million. A summary of the estimated capital cost is shown in Table 1-8.
Table 1-8: Capital Cost Estimate
| | | | | | | | |
| Cost Type | Description | Pre-Production Capital (USD M) with Taxes |
| Direct | Open pit mine (including Truck Shop) | 55.0 |
| Ore handling | 22.8 |
| Processing plant | 62.6 |
| Tailings (DSTF and TSF)/reclaim | 14.6 |
| On-site infrastructure | 42.4 |
| Off-site infrastructure | 28.7 |
| Direct total | 226.1 |
| Indirect | Owner’s costs | 13.8 |
| Indirect costs | 32.4 |
| Contingency | 21.9 |
| Indirect total | 68.1 |
| Total Pre-Production Capital | 294.2 |
The total sustaining capital cost estimate is $196 million for the 12-year LOM which includes equipment, tailings and other items. Closure costs were estimated to be $24 million.
1.17Operating Cost Estimates
The operating cost estimates use US dollars as the base currency and has an estimated accuracy of ±15%. The average annual operating cost was estimated for the Boa Esperança Project based on the proposed mining schedule. These costs included mining, processing, maintenance, G&A and cost of operating the dry stacked tailings facility.
The average annual operating cost for the Boa Esperança Project is estimated to be $18.6/ t processed. The breakdown of costs in Table 1-9 is estimated based on a mill feed rate of 4 Mt/a.
| | | | | |
| Boa Esperança Project | Page 19 |
| NI 43-101 Technical Report on Feasibility Study | October 2021 |
Table 1-9: Forecast Average Annual Operating Cost Estimate Summary
| | | | | | | | |
| Operating Cost | Annual Cost
($M) | Annual Cost
($/t processed) |
| Mining | 37.80 | 9.45 |
| Processing | 22.93 | 5.73 |
| Plant Maintenance | 5.68 | 1.42 |
| G&A | 6.08 | 1.52 |
| Dry stack tailings (excludes workforce) | 1.91 | 0.48 |
| Total | 74.2 | 18.6 |
All pre-production costs have been included in capital costs.
1.18Economic Analysis
The results of the economic analyses discussed in this section represent forward- looking information as defined under Canadian securities law. The results depend on inputs that are subject to a number of known and unknown risks, uncertainties and other factors that may cause actual results to differ materially from those presented here. Information that is forward-looking includes:
•Mineral Resource and reserve estimates;
•Assumed commodity prices and exchange rates;
•The proposed mine production plan;
•Projected mining and process recovery rates;
•Sustaining costs and proposed operating costs;
•Assumptions as to closure costs and closure requirements; and
•Assumptions as to environmental, permitting and social risks.
Additional risks to the forward-looking information include:
•Changes to costs of production from what are estimated;
•Unrecognized environmental risks;
•Unanticipated reclamation expenses;
•Unexpected variations in quantity of mineralized material, grade or recovery rates;
•Geotechnical or hydrogeological considerations during mining being different from what was assumed;
•Failure of mining methods to operate as anticipated;
| | | | | |
| Boa Esperança Project | Page 20 |
| NI 43-101 Technical Report on Feasibility Study | October 2021 |
•Failure of plant, equipment, or processes to operate as anticipated;
•Changes to assumptions as to the availability of electrical power, and the power rates used in the operating cost estimates and financial analysis;
•Ability to maintain the social licence to operate;
•Accidents, labour disputes and other risks of the mining industry;
•Changes to interest rates;
•Changes to tax rates.
The Project assumes that permits have to be obtained in support of operations, and approval for development to be provided by Ero Copper’s Board.
An engineering economic model was developed to estimate annual pre-tax and post-tax cash flows and sensitivities of the Project based on an 8% discount rate. It must be noted, however, that tax estimates involve many complex variables that can only be accurately calculated during operations and, as such, the after-tax results are only approximations. Sensitivity analysis was performed to assess impact of variations in metal prices, head grades, operating costs and capital costs. The capital and operating cost estimates were developed specifically for this Project and are summarised in Section 21 of this Report (presented in 2021 US dollars). The economic analysis has been run with no inflation (constant dollar basis).
The economic analysis was performed using the following assumptions:
•Construction period of 2 years;
•Mine life of 12 years;
•Consensus copper price forecast based on the average analyst copper price estimate from 26 financial institutions as of the Effective Date, resulting in $3.80 per pound in 2024, $3.95 per pound in 2025, and $3.40 per pound in 2026 and thereafter. The forecasts used are meant to reflect the average metal price expectation over the life of the Project. No price inflation or escalation factors were taken into account. Commodity prices can be volatile, and there is the potential for deviation from the forecast;
•Brazilian real to United States Dollar exchange rate assumption of 5.00 (R$/US$)
•Cost estimates in constant Q3 2021 US$ with no inflation or escalation factors considered;
•Results are based on 100% ownership with 2% Compensação Financeira pela Exploração de Recursos Minerais (CFEM) net smelter return (NSR);
•Capital costs funded with 100% equity (i.e. no financing costs assumed);
•All cash flows discounted to start of construction;
•All metal products are assumed sold in the same year they are produced;
•Project revenue is derived from the sale of copper concentrate into the international marketplace;
•No contractual arrangements for smelting or refining currently exist.
The economic analysis was performed using an 8% discount rate. The 8% pre-tax NPV is $464.6M, the internal rate of return (IRR) is 48.6%, and payback is 1.3 years. On an after-tax basis, the NPV 8% is $379.6M, the IRR is 41.8% and the payback is 1.4 years.
A summary of the Project economics is included in Table 1-10 and shown graphically in Figure 1-2. The cashflow on an annualized basis is provided in Table 22-2.
| | | | | |
| Boa Esperança Project | Page 21 |
| NI 43-101 Technical Report on Feasibility Study | October 2021 |
Table 1-10: Summary, Projected LOM Cashflow Assumptions and Results
| | | | | | | | |
| Units | Values |
| General Assumptions |
| Copper Price | (US$/lb) | $3.80/lb in 2024, $3.95/lb in 2025, $3.40 in 2026+ |
| FX | (R$/US$) | 5.0 |
| Mine Life | (years) | 12 |
| Total Waste Tonnes Mined | (kt) | 160,025 |
| Total Mill Feed Tonnes | (kt) | 43,052 |
| Strip Ratio | w:o | 3.72x |
| Net smelter royalty | (%) | 2% |
| Production |
| Mill Head Grade | (%) | 0.83% |
| Mill Recovery Rate | (%) | 91.3% |
| Total Mill Copper Recovered | (mmlb) | 718 |
| Total Payable Copper | (mmlb) | 690 |
| Average Annual Payable Copper | (mmlb) | 62 |
| Operating Costs |
| Mining Cost excl. Pre-Strip | ($/t mined) | $2.13 |
| Processing Cost | ($/t milled) | $5.73 |
| G&A Costs (Operations) | ($/t milled) | $0.97 |
| G&A Cost (Admin) | ($/t milled) | $0.55 |
| Refining & Transport Cost | ($/t milled) | $0.19 |
| Total Operating Costs | ($/t milled) | $18.61 |
| C1 Cost (per payable lb Cu)* | ($/lb) | $1.41 |
| C3 Cost (per payable lb Cu)** | ($/lb) | $1.88 |
| C1 Cost (per recovered lb Cu)* | ($/lb) | $1.36 |
| C3 Cost (per recovered lb Cu)** | ($/lb) | $1.81 |
| Capital Costs |
| Initial capex | ($M) | $294 |
| Sustaining capex | ($M) | $196 |
| Closure capex | ($M) | $24 |
| Salvage Value | ($M) | $7 |
| Economics |
| Pre-tax NPV (8%) | ($M) | $464.6 |
| Pre-tax IRR | (%) | 48.6% |
| Pre-tax payback period | (years) | 1.3 |
| After-tax NPV (8%) | ($M) | $379.6 |
| After-tax IRR | (%) | 41.8% |
| After-tax payback period | (years) | 1.4 |
* C1 includes mining costs, processing costs, mine-level G&A (Operations) and transportation (haulage & port fees only) and royalties
** C3 includes C1 costs (incl. total transport) plus mine-level G&A (Admin), sustaining capital and closure costs
| | | | | |
| Boa Esperança Project | Page 22 |
| NI 43-101 Technical Report on Feasibility Study | October 2021 |
Figure 1-2: Projected LOM Pre-Tax Cashflow
Note: Figure prepared by Ausenco, 2021
Figure 1-3: Projected LOM Post-Tax Cashflow
Note: Figure prepared by Ausenco, 2021
| | | | | |
| Boa Esperança Project | Page 23 |
| NI 43-101 Technical Report on Feasibility Study | October 2021 |
1.19Sensitivity Analysis
A sensitivity analysis was conducted on the base case pre-tax and after-tax NPV and IRR of the Project, using the following variables: metal price, discount rate, exchange rate, capital costs, and operating costs. Figure 1-4 shows the pre-tax and post sensitivity analysis findings. Analysis revealed that the Project is most sensitive to changes in metal prices and head grade, than, to a lesser extent, the exchange rate, operating costs and capital costs.
Figure 1-4: NPV & IRR Sensitivity Results
1.20Interpretation and Conclusions
The Boa Esperana deposit will be mined over 12 years with 2 years of pre-strip. The total LOM tonnage, including pre-strip, is 203 million tonnes, with an overall stripping ratio of 3.7:1. Ore will be processed by conventional methods to annually produce (LOM) over 27,000 tonnes of copper, with the first five years of production averaging approximately 35,000 tonnes per annum. Waste and tailings materials will be stored and placed in surface facilities, which will be closed and reclaimed at the end of the mine; contact water will be treated and discharged to the environment throughout the life of mine. Copper concentrates are expected to have trace-level deleterious elements.
No contractual arrangements for smelting or refining currently exist.
| | | | | |
| Boa Esperança Project | Page 24 |
| NI 43-101 Technical Report on Feasibility Study | October 2021 |
Under the assumptions presented in this Report, the Project shows positive economics.
The site is free and clear of any environmental liabilities and all required permits for construction activities are encompassed by the Installation License issued on August 30, 2021.
In terms of project execution, the mine requires nominally two years of pre-strip operations, two years of construction of processing and infrastructure facilities including TSF starter dam development, access road upgrade and water supply development before actual production mining operations can commence.
For pre-strip work to start, site tree and bush clearing will be required and achieved by accessing the site using the existing access road.
1.21Recommendations
To support the next phase of the project, early works and future project execution, a program of work is recommended, which will include:
•Geotechnical investigations and refinement of pit, earthworks and foundation designs.
•Geochemistry investigations and studies in support of water management, water treatment, waste rock, TSF and DSTF designs.
•Update hydrogeological models and groundwater management plans in support of operational phases.
•Additional metallurgical test work to support detailed engineering and design parameters related to the process flow sheet.
The budget for this work is estimated to be $2 million.
| | | | | |
| Boa Esperança Project | Page 25 |
| NI 43-101 Technical Report on Feasibility Study | October 2021 |
2INTRODUCTION
2.1Introduction
Ausenco was commissioned by Ero to prepare a technical report on the 2021 FSU for the Boa Esperança deposit as part of the Boa Esperança Project located in Pará, Brazil. The Project was acquired by Mineraҫão Caraíba S.A. (MCSA) from Corporación Nacional Del Cobre (Codelco) in 2007 and is 100% owned by MCSA. In December 2016, Ero acquired an approximately 85% interest in MCSA. In June 2017, Ero acquired an additional 14.5% by subscribing for shares from treasury for a total interest in MCSA of approximately 99.5%. In December 2017, the Company acquired additional shares of MCSA, increasing its ownership interest in MCSA to approximately 99.6%.
2.2Terms of Reference
Mineral Resources are reported in accordance with the Canadian Institute of Mining, Metallurgy and Petroleum (CIM) Definition Standards for Mineral Resources and Mineral Reserves (May 2014; the 2014 CIM Definition Standards).
2.3Qualified Persons
The following serve as the qualified persons for this Technical Report as defined in National Instrument 43-101, Standards of Disclosure for Mineral Projects, and in compliance with Form 43-101F1:
Table 2-1: FSU Sections and Parties Responsible
| | | | | | | | | | | |
| Section | Operating Cost | Responsible Party | Qualified Persons |
| Certificate of Authors | All parties provided input | All |
| Signature Pages | All parties provided input | All |
| 1 | Summary | All parties provided input | All |
| 2 | Introduction | Ero | Ricardo Ré, MAusIMM (CP) |
| 3 | Reliance on Other Experts | All parties provided input | All |
| 4 | Property Description and Location | Ero | Ricardo Ré, MAusIMM (CP) |
| 5 | Accessibility, Climate, Local Resource Infrastructure and Physiography | Ero | Ricardo Ré, MAusIMM (CP) |
| 6 | History | Ero | Ricardo Ré, MAusIMM (CP) |
| 7 | Geological Setting and Mineralization | Ero | Ricardo Ré, MAusIMM (CP) |
| 8 | Deposit Types | Ero | Ricardo Ré, MAusIMM (CP) |
| 9 | Exploration | Ero | Ricardo Ré, MAusIMM (CP) |
| 10 | Drilling | Ero | Ricardo Ré, MAusIMM (CP) |
| 11 | Sample Preparation, Analysis and Security | Ero | Ricardo Ré, MAusIMM (CP) |
| 12 | Data Verification | Ero | Ricardo Ré, MAusIMM (CP) |
| 13 | Mineral Processing and Metallurgical Testing | Ausenco | Kevin Murray, P.Eng. |
| | | | | |
| Boa Esperança Project | Page 26 |
| NI 43-101 Technical Report on Feasibility Study | October 2021 |
| | | | | | | | | | | |
| Section | Operating Cost | Responsible Party | Qualified Persons |
| | | |
| | | |
| | | |
| | | |
| | | |
| | | |
| | | |
| | | |
| | | |
| | | |
| | | |
| | | |
| | | |
| | | |
| | | |
| 14 | Mineral Resource Estimates | Ero | Ricardo Ré, MAusIMM (CP) |
| 15 | Mineral Reserve Estimates | NCL | Carlos Guzman, FAusIMM |
| 16 | Mining Methods | NCL | Carlos Guzman, FAusIMM |
| 17 | Recovery Methods | Ausenco | Kevin Murray, P.Eng. |
| 18 | Infrastructure | Ausenco | Scott C. Elfen, PE |
| 19 | Market Studies and Contracts | Ero | Ricardo Ré, MAusIMM (CP) |
| 20 | Environmental Studies, Permitting and Social or Community Impact | Ero | Ricardo Ré, MAusIMM (CP) |
| 21 | Capital and Operating Costs | Ausenco/NCL | Kevin Murray, P.Eng./Carlos Guzman, FAusIMM |
| 22 | Economic Analysis | Ausenco | Erin L. Patterson, PE |
| 23 | Adjacent Properties | Ero | Ricardo Ré, MAusIMM (CP) |
| 24 | Other Relevant Data and Information | Ausenco | Erin L. Patterson, PE |
| 25 | Conclusions and Interpretations | All parties provided input | All |
| 26 | Recommendations | All parties provided input | All |
| 27 | References | All parties provided input | All |
2.4Site Visits and Scope of Personal Inspection
The QPs for this report (Kevin Murray, Scott C. Elfen, Erin L. Patterson and Carlos Guzman) have relied on the site visit conducted by Mr. Emerson Ricardo Re as a source of information.
For the FSU, Emerson Ricardo Ré, Resource Manager of Ero and a QP as defined under NI 43-101 visited the Project between 29 September to 1 October 2020. During his visit, Mr. Ré viewed the site area, outcrops, the drilling position and the access roads. Additionally, he reviewed selected drill core samples, logging the core shed and associated infrastructure for the Project.
Site visits by remaining QPs of the FSU were not conducted due to the COVID-19 pandemic.
2.5Effective Dates
The overall effective date of this report is August 31, 2021 (the Effective Date).
2.6Previous Technical Reports
Technical reports completed on the Project, prior to the include:
•2012 Feasibility Study Technical Report, Boa Esperança Copper Project, Pará State Brazil, prepared by SRK Consulting (U.S.), Lakewood, CO, USA prepared for MCSA (prior to its acquisition by Ero in 2016).
•2015 Bankable Feasibility Study Technical Report, Boa Esperança Copper Project, Pará State Brazil, prepared by SRK Consulting, Belo Horizonte, Minas Gerais, Brazil prepared for Ero.
| | | | | |
| Boa Esperança Project | Page 27 |
| NI 43-101 Technical Report on Feasibility Study | October 2021 |
•2017 Feasibility Study Technical Report, Boa Esperança Copper Project, Pará State Brazil, prepared by SRK Consulting, Belo Horizonte, Minas Gerais, Brazil.
2.7Abbreviations
Table 2-2: Name Abbreviations
| | | | | |
| Abbreviation | Description |
| AIL | Action item list |
| Al | Aluminum |
| ANM | Agência Nacional de Mineração |
| AR | Accounts Receivable |
| Au | Gold |
| BXX | Breccia |
| CAPEX | Capital cost estimate |
| CFEM | Compensação Financeira pela Exploração de Recursos Minerais |
| CIM | Canadian Institute of Mining, Metallurgy and Petroleum |
| CIMM | Centro de Investigation de Minero Metalúrgicas |
| CP | Certified Professional |
| Cr | Chromium |
| Cu | Copper |
| DAM | Delegation of Authority Manual |
| DNPM | Departamento Nacional de Produção Mineral |
| DSTF | Dry stacked tailing facility |
| Fe | Iron |
| FEL | Front end loading |
| FS | Feasibility Study |
| FSU | Feasibility Study Update |
| G&A | General and Administrative |
| GHS | Globally Harmonized System |
| GRA | Granite |
| HDS | High-density slude |
| HG | High-Grade |
| INCRA | National Institute of Colonization and Land Reform |
| IOCG | Iron oxide–copper–gold |
| IRR | Internal rate of return |
| JSEA | Job Safety and Environmental Analysis |
| KOM | Kick-off Meeting |
| KPI | Key Performance Indicator |
| LO | Operating license |
| LOM | Life of Mine |
| MCSA | Mineração Caraiba S.A. |
| MEL | Mechanical equipment list |
| | | | | |
| Boa Esperança Project | Page 28 |
| NI 43-101 Technical Report on Feasibility Study | October 2021 |
| | | | | |
| MET | Metamorphic rocks |
| MEWPS | Mobile elevated work platform |
| Mn | Manganese |
| MOM | Meeting of Minutes |
| MS | Management System |
| MTO | Material Quantity Take-offs |
| Ni | Nickel |
| NPV | Net present value |
| NSR | Net smelter return |
| O&M | Operations & Management |
| OECD | Organization of Economic Co-operation and Development |
| OPEX | Operating cost estimate |
| PAG | Potentially acid-generating |
| PDC | Process Design Criteria |
| PEA | Preliminary Economic Assessment |
| PFD | Process Flow Diagrams |
| PFS | Pre-feasibility Study |
| PRAD | Plano de Recuperação de Áreas Degradadas |
| QA/QC | Quality Assurance/Quality Control |
| QP | Qualified Person |
| RDQ | Rock quality proposal |
| RM | Risk matrix |
| RMR | Rock mass ratio |
| ROI | Return on investment |
| ROM | Run of Mine |
| SEMAS | Secretaria de Estado de Meio Ambiente e Sustentabilidade |
| SIP | Study Implementation Plan |
| SM | Study Manager |
| SME | Subject Matter Expert |
| SOE | State owned enterprise |
| TC/RC | Treatment charge/Refining charge |
| TGG | Tonalite–trondhjemite–granodiorite |
| TOS | Trade-off Study |
| TSF | Tailings Storage Facility |
| WTP | Water Treatment Plant |
| WHMIS | Workplace Hazardous Materials Information System |
| WIP | Work in Progress |
| Wmt | Wet metric tonne |
| Zn | Zinc |
Table 2-3: Unit Abbreviations
| | | | | |
| Abbreviation | Description |
| R$ | Brazilian real |
| | | | | |
| Boa Esperança Project | Page 29 |
| NI 43-101 Technical Report on Feasibility Study | October 2021 |
| | | | | |
| US$ | United States dollar |
| C$ | Canadian dollar |
| º | degree |
| °C | degree Celsius |
| °F | degree Fahrenheit |
| % | percent |
| μ | micro |
| μm | micrometre |
| cm | centimetre |
| ft | feet |
ft2 | square feet |
| g | gram |
| gpt | grams per tonne |
| ha | hectare |
| hr | hour |
| HP | horsepower |
| km | kilometre (Canada) kilometer (US) |
| koz | thousand ounces |
| kV | kilovolt |
| kW | kilowatt |
| kWh | kilowatt-hour |
| kWh/t | kilowatt per tonne |
kN/m3 | kilonewton per cubic metre |
| kPa | kilopascal |
| kcmil | thousand circular mills |
| kN | kilonewton |
| L/s | litre per second |
| lb | pounds |
| m | metre / meter |
| M | million |
m2 | square meters |
m3 | cubic meters |
| m/a | metres per annum |
| masl | metres above sea level |
| mamsl | metres above mean sea level |
| lb | pound |
| mm | millimetres |
| Moz | million ounces |
| Mt | million tonnes |
| MW | megawatt |
| oz | ounce |
| ppb | parts per billion |
| ppm | parts per million |
| | | | | |
| Boa Esperança Project | Page 30 |
| NI 43-101 Technical Report on Feasibility Study | October 2021 |
| | | | | |
| st | short ton |
| t | metric tonne |
| ppb | parts per billion |
| ppm | parts per million |
| ton | short ton |
| t/hr | tonnes per hour |
| t/d | tonnes per day |
| t/a | tonnes per annum |
| w/w/ w/s | gravimetric moisture content (weight of water/weight of soil) |
| wt | weight |
3 RELIANCE ON OTHER EXPERTS3.1Introduction
The QPs have relied upon the following other experts , including the relevant professionals within Ero and those of its subsidiary MCSA, , which provided information regarding mineral rights, surface rights, property agreements, royalties, environmental, permitting, social licence, closure, taxation, and marketing for sections of this Report.
Ero and its subsidiaries have extensive operating history in Brazil, with relevant in-house expertise in local permitting, legal matters, finance, accounting and copper concentrate marketing. Inputs provided by Ero were deemed acceptable by the QPs on this basis. Where necessary, inputs provided by Ero were deemed acceptable by the QPs on this basis. Were necessary, inputs provided by Ero were cross-checked by the QPs of this report to ensure assumptions aligned generally with current operational performance, sales and marketing contracts as applicable.
3.2Property Agreements, Mineral Tenure, Surface Rights and Royalties
The QPs have not independently reviewed ownership of the Project area and any underlying property agreements, mineral tenure, surface rights, or royalties. The QPs have fully relied upon, and disclaim responsibility for, information derived from Ero. This information is used in Section 4 of the Report. The information is also used in support of the discussion in Section 24 related to project implementation timelines and other relevant considerations.
3.3Environmental, Permitting, Closure, and Social and Community Impacts
The QPs have fully relied upon, and disclaim responsibility for, information supplied by Ero for information related to environmental permitting, permitting, closure planning and related cost estimation, and social and community impacts.
This information is used in Section 4 and Section 20. The information is also used in support of the financial analysis in Section 22.
3.4Taxation
The QPs have fully relied upon, and disclaim responsibility for, information supplied by Ero for information related to taxation as applied to the financial model.
This information is used in Section 22 of the Report.
3.5Markets
The QPs have not independently reviewed the marketing information. The QPs have fully relied upon, and disclaim responsibility for, information derived from Ero. This information is used in Section 19 and the financial analysis presented
| | | | | |
| Boa Esperança Project | Page 31 |
| NI 43-101 Technical Report on Feasibility Study | October 2021 |
in Section 22.
4.PROPERTY DESCRIPTION AND LOCATION
4.1Property Description and Location
The Boa Esperança copper deposit is in the municipality of Tucumã, Pará State, Brazil. The site totals approximately 4,000 hectares and is located approximately 40 km to the southwest of the town of Tucumã. The centroid of the Project is situated at 6o51’43” S and 51o26’54” W. The location of the Project is shown in Figure 4-1.
Figure 4-1: Location of the Boa Esperança Project
Note: Figure prepared by Ero Copper, 2017.
| | | | | |
| Boa Esperança Project | Page 32 |
| NI 43-101 Technical Report on Feasibility Study | October 2021 |
4.2Mineral Title
Current mining legislation in Brazil, as it relates to mineral title is based on the Federal Constitution and the Mining Code (Decree-law No. 227, of 28 February 1967).
The Federal Constitution provides, in essence, that: (i) the mineral resources are separate from the land and are the property of the Federal Government; (ii) the Federal Government shall grant authorizations for exploration activities and concessions for mining, (iii) the titleholder shall acquire property of the mineral substances once extracted; (iv) the States and Municipalities are entitled to a statutory royalty (Compensação Financeira pela Exploração de Recursos Minerais or CFEM); (v) a landowner may also be entitled to a royalty as and when such cases exist; and (vi) whomever exploits the mineral resource shall provide for the restoration of areas degraded by such extraction.
The last significant regulatory amendments to the Mining Code took place in 1996 and in 2020, the latter of which was designed to address tailings and environmental obligations of mining companies in Brazil, primarily in response to the Brumadinho disaster.
In 2017, there were changes to the institutional framework and to statutory royalty CFEM legislation. Institutionally, a new National Mining Agency (Agência Nacional de Mineração, or ANM) was created to replace the National Department for Mineral Production (Departamento Nacional de Produção Mineral, or DNPM). As it relates to the statutory royalty, legislation enacted in December 2017 established new rates for mineral commodities and excluded certain deductions previously allowed, such as transportation and insurance costs. Results of this study are presented inclusive of the current CFEM legislation, which carries a rate of 2.0% for copper as of the Effective Date. There are no other royalties on the Project.
In addition to the changes in legislation described above, in June 2018, the Federal Government enacted new regulations to the Mining Code. The purpose of the regulations was to modernize parts of the previous legislation that did not require legislative action. These modernizations did not change the methods for granting exploration rights (first-come, first-served basis), nor establish investment commitments per license, but rather sought to ease the transition process from Exploration to Mining Licenses in as much as the Mining Code allows, particularly as it relates to supplementary work performed after the submission of a final exploration report.
Table 4-1 presents the mineral rights held by MCSA that cover the Boa Esperança deposit, which is in process of transitioning from an exploration license into a full mining concession commensurate with the legislative process in Brazil.
Table 4-1: Boa Esperança Exploration Permit
| | | | | | | | | | | | | | | | | | | | |
| Concession | Area (ha) | Permit | Start Date | End Date | Renewal | Final Exploration Report Filed |
| 855815/1996 | 4,033.81 | 19/07/1996 | 13/07/2000 | 13/07/2003 | 12/04/2005 | 10/04/2008 |
The legal status Boa Esperança’s mineral rights is as follows:
•The Final Exploration Report was presented to the ANM on April 10, 2008, and was approved by the ANM on July 30, 2009;
•MCSA then applied for a Mining Concession by filing a PAE with the ANM on May 5, 2010;
•The preliminary environmental license was filed with the ANM on March 22, 2012;
| | | | | |
| Boa Esperança Project | Page 33 |
| NI 43-101 Technical Report on Feasibility Study | October 2021 |
•The PAE technical analysis was completed and considered suitable to issue the mining concession on July, 30, 2013, pending issuance of the environmental Installation License, which was issued to the Company on August 30, 2021 by SEMAS. A formal request to SEMAS will be made to incorporate changes in the Project's scope as outlined in the FSU;
•All criteria to have the full Mining Concession issued have been fulfilled and MCSA is awaiting the granting of a full Mining Concession by the Ministry of Mines and Energy;
4.3Land Access and Surface Rights
The estimated Mineral Resources and Mineral Reserves disclosed in this Report are completely contained within the Boa Esperança mineral rights held by MCSA. MCSA is the holder of required surface rights for the envisioned operations. It is expected that full title to the land will be transferred to MCSA after an administrative procedure with the National Institute of Colonization and Land Reform (INCRA) has concluded, which will clear such surface rights from its prior classification as a resettlement area.
The site is free and clear of any environmental liabilities, and all required permits for construction activities are encompassed by the Installation License issued on August 30, 2021.
| | | | | |
| Boa Esperança Project | Page 34 |
| NI 43-101 Technical Report on Feasibility Study | October 2021 |
5ACCESSIBILITY, CLIMATE, LOCAL RESOURCES, INFRASTRUCTURE, AND PHYSIOGRAPHY
5.1Topography, Elevation and Vegetation
The Boa Esperança deposit occurs on a prominent isolated hill which is elongated in the north–northeast direction in a relatively flat agricultural plain.
Access to the Project by road form Ouilândia do Norte, which features commercial flights, and Tucumã. From Tucumã, state highway PA-150 can be followed for approximately 25 km until reaching the intersection with P-3. From the intersection with P-3, a secondary road can be followed for approximately 20 km in a southwest direction to reach Morro Boa Esperança, where the project is located.
Vila do Conde, Barcarena, PA near the city of Belem is the only port complex from which seaborne loads can be transported to and from the site location. Loads can be transported via road. Copper concentrate loading and transportation from the mine site to the Port of Vila do Conde will be performed by a selected contractor. The closest rail infrastructure to the Project is the Carajas railroad, which connects Sao Luis, Maranhao to Carajas, Pará. The railway covers approximately 892 km and is operated and 100% owned by Vale.
The nearest commercial airstrip is in Ourilândia do Norte (CKS) located approximately 1 km from the town of Tucuma, and approximately 45km by road to the Project.
5.1.1Air
The nearest commercial airstrip is in Ouilândia do Norte (CKS), located 12 km from the town of Tucumã, and approximately 45 km by road to the Project.
5.2Climate and Length of Operating Season
The climate in the region of the Project is classified as ‘humid tropical’ according to Köppen’s climate classification system (Keystone, 2008). The dry season runs from May to September, and the wet season from October to April. The majority of the rainfall occurs from January to April, with an average annual rainfall of about 2,006 mm. The average annual temperature range is from approximately 24.9–26.2ºC.
Mining operations are forecast to be conducted year-round.
5.3Local Resources & Infrastructure
The proposed Boa Esperança mine is a greenfield site, but is a relatively short distance from available infrastructure, including the town of Tucuma, where contractors and EPCM staff will secure board and lodging and commute daily to the work site. Ourilândia do Norte, a municipality located approximately 10km to east from Tucumã, hosts much of the workforce for Vale’s Onça Puma Nickel operations. Together, these two cities form a mining community with a population of more than 70,000 people, offering skilled labor and sufficient board and lodging. During operations it is expected that personnel will be hired from local communities.
| | | | | |
| Boa Esperança Project | Page 35 |
| NI 43-101 Technical Report on Feasibility Study | October 2021 |
The public electricity supplier, Equatorial Energia Pará, supplies the region with electrical power. Equatorial Energia confirmed the feasibility of supplying power based on a peak demand load of 25 MW by means of a 138 kV power line between the main substation at the mine site and the existing nearby Tucumã substation. The power line will be approximately 45 km long and take 21 months to complete. The closest water source for use during operations is the Jatobá stream located approximately 800 m from the Project, inside MCSA’s property boundary. MCSA drilled a 100m depth water well with 7m³/h capacity that is in operation currently supporting exploration and administrative activities.
| | | | | |
| Boa Esperança Project | Page 36 |
| NI 43-101 Technical Report on Feasibility Study | October 2021 |
6HISTORY
The area encompassing the Boa Esperança copper deposit previously belonged to the Chilean company Codelco. Codelco conducted an exploration program from 2003 to 2006 at Boa Esperança. In the second half of 2007, Codelco, through its subsidiary in Brazil, initiated a competitive process to sell the Boa Esperança mineral rights. MCSA acquired the contract and became the legal owner of the mineral rights to the Boa Esperança copper deposit.
In December 2016, Ero acquired an approximately 85.0% interest in MCSA. In June 2017, Ero acquired an additional 14.5% by subscribing for shares from treasury for a total interest in MCSA of approximately 99.5%. In December 2017, the Company acquired additional shares of MCSA, increasing its ownership interest in MCSA to approximately 99.6%.
Ero Copper commenced trading on the Toronto Stock Exchange under the stock symbol “ERO” on October 19, 2017 following completion of the Company’s initial public offering and dual-listed on the New York Stock Exchange on June 15, 2021.
Historic mineral resource and reserve estimates are further detailed in subsequent sections for reference purposes only. Ero Copper is not treating any of the historic estimates as current mineral resources or mineral reserves.
The Codelco exploration efforts consisted of geological mapping and sampling, soils geochemistry, ground geophysical surveys and exploration drilling. Ground geophysical surveys completed include magnetic and gravity surveys and induced polarization electrical surveys. Table 6-1 summarizes the explorations works carried out at Boa Esperança Project.
Table 6-1: Summary of Historic Exploration Works
| | | | | | | | | | | |
| Survey | Quantity | Comments | Product |
| Topography | 7,000 stations | Includes 10 geodesic stations installed | Detailed topographic map |
| Soil samples | 1,134 samples | 100 m (proximal portion) to 200 m (distal portion) spacing lines | Multi-elements soil geochemistry maps |
| Geological mapping | 5 km² | Systematic detailed outcrop and alteration mapping | Geological map - 1 : 5,000 |
| Ground magnetic survey | 91 km | 100 x 100 m regular grid | Magnetic maps and sections |
| Ground gravity survey | 684 stations | 200 x 100 m regular grid | Gravimetric maps and sections |
| Induced polaritazion (IP) | 35 km | IP lines to better define the drill targets | Chargeability and resistivity sections |
| Core drilling | 57,972.25 m | 165 drillholes up to 1,000 m depth* details in section 10 | Geological, geochemical, and geophysical anomalies was followed by a core drilling campaign during the period 2003–2013. |
| Petrographic study | 74 thin sections | Full description of transparent and opaque minerals, textural relationships and report with coloured photomicrographs | Petrographic characterization reports |
| Radiometric dating | 1 | Re-Os in Molybdenite | Arizona University note |
| | | | | |
| Boa Esperança Project | Page 37 |
| NI 43-101 Technical Report on Feasibility Study | October 2021 |
6.1Mapping and Sampling (Codelco)
Early exploration works carried out by Codelco included mapping 5.0 km2 at a scale of 1:5,000 and surface sampling at 100 x 200 m spacing, collecting approximately 1,100 soil samples. The geological mapping and sampling identified a copper anomaly (Figure 6-1).
Figure 6-1: Soil Sampling Coloured by Copper Grade (ppm). Yellow contours are wireframes of the modelled lower grade mineralization at elevation 350 m above sea level
Note: prepared by MCSA, 2021
6.2 Geophysical Surveys (Codelco)
Ground-based magnetic surveys were completed over 91 linear km on 100 m-spaced lines (Figure 9‑2) and a gravity survey was completed with over approximately 680-point measurements on 200 m-spaced lines (Figure 9‑3). Both the magnetic and the gravity surveys show a good correlation between the known mineralization and the geophysical anomalies. An Induced polarization electrical surveys were conducted over approximately 35 linear km.
| | | | | |
| Boa Esperança Project | Page 38 |
| NI 43-101 Technical Report on Feasibility Study | October 2021 |
Figure 6-2: Total Magnetic Intensity Map of Boa Esperança Project.
Note: Figure prepared by MCSA, 2021. The deposit sits in a relative magnetic low despite the presence of magnetite in the deposit and this reverse magnetic dipole effect is caused by the remanent magnetism. Yellow contours are wireframes of the modelled lower grade mineralization at elevation 350 m above sea level
| | | | | |
| Boa Esperança Project | Page 39 |
| NI 43-101 Technical Report on Feasibility Study | October 2021 |
6.3Surveys and Investigations
A topographic surface was obtained using high-precision global positioning system (GPS) instrument with an accuracy of <5 cm and a total station system, using two Trimble 5700 GPS receivers and a TOPCON GPT 3007W Total Station. Two companies were contracted for the topographic and drill collar surveying: Topovale Serviços Topográficos Ltda. and Master Planejamento Ltda.
6.42017 Mineral Resource and Mineral Reserve Estimates
In 2017, Ero released a Mineral Resource and Mineral Reserves estimate for the Boa Esperança Project in a report entitled “Feasibility Study Technical Report for the Boa Esperança Copper Project, Pará State, Brazil”, dated September 7, 2017, with an effective date of June 1, 2017, prepared by Rubens Mendonça, MAusIMM of SRK Consultores do Brasil Ltda. (SRK) and Carlos Barbosa, MAIG, and Girogio di Tomi, MAusIMM, both of SRK Brazil, and each aQP and independent of Ero within the meanings of NI 43-101.
SRK carried out the appropriate review to satisfy that the mineral reserve could be technically and profitably extracted through to the production of copper concentrate. Consideration was given to all technical areas of the operations, the associated capital and operating costs, and relevant factors including marketing, permitting, environmental, land use and social factors. SRK was satisfied that the technical and economic feasibility had been demonstrated.
The detailed economic, geotechnical and engineering parameters used for the Mineral Reserve estimates are described in detail in the 2017 Technical Report. The 2017 historical mineral resource and mineral reserve estimate has been provided for reference purposes only. Ero is not treating this 2017 estimate as current mineral resources or mineral reserves.
Table 6-2: 2017 Mineral Resource Estimate
| | | | | | | | | | | | | | |
| Domain | Category | Quantity (Mt) | Cu % | Contained Cu (tonnes) |
| Sulfide | Measured | 41.00 | 0.81 | 332,100 |
| Indicated | 26.17 | 0.62 | 162,254 |
| Measured + Indicated | 67.17 | 0.73 | 490,341 |
| Inferred | 1.35 | 0.56 | 7,560 |
| Secondary Sulfide | Inferred | 2.05 | 0.69 | 14,145 |
| Total | Measured | 41.00 | 0.81 | 332,100 |
| Indicated | 26.17 | 0.62 | 162,254 |
| Measured + Indicated | 67.17 | 0.73 | 490,341 |
| Inferred | 3.40 | 0.64 | 21,760 |
Source: Figure prepared by SRK, 2017.
Effective Date: June 1, 2017
(1) Tonnes and grade are rounded to reflect approximation.
(2) Mineral Resources are stated at a cut-off grade of 0.2% Cu and are fully contained within an optimized pit shell.
(3) Stated Mineral Resources are inclusive of Mineral Reserves.
| | | | | |
| Boa Esperança Project | Page 40 |
| NI 43-101 Technical Report on Feasibility Study | October 2021 |
Mineral Resources are not Mineral Reserves and have not demonstrated economic viability. Mineral Resource estimates do not account for mineability, selectivity, mining loss and dilution. These Mineral Resource estimates include Inferred Mineral Resources that are normally considered too geologically speculative to allow for the application of economic considerations that would see them categorized as Mineral Reserves. There is also no certainty that these Inferred Mineral Resources will be converted to Measured and Indicated categories through further drilling or into Mineral Reserves once economic considerations have been applied.
6.52017 Mineral Reserve Estimate
The Mineral Reserves were calculated based on a cut-off grade of 0.28% Cu and a life of mine (LOM) copper price of US$ 7,000/t LME Cu.
In accordance with the CIM classification guidelines, only Measured and Indicated Mineral Resource categories are converted to Proven and Probable Mineral Reserves respectively (through inclusion within the open-pit mining limits). Inferred Mineral Resources, where unavoidably mined, have been treated as waste, and assigned zero grade.
Table 6-3 shows the Boa Esperança mine open pit ore reserve statement.
Table 6-3: 2017 Mineral Reserve Estimate
| | | | | | | | | | | | | | | | | |
| Mineral Reserve Classification | Volume | Density | Dry Tonnes | Cu | Contained Cu |
| m3 x 1,000 | t/m3 | t x 1,000 | % | t x 1,000 |
| Proven | 5,744.50 | 3.225 | 18,528.1 | 0.96 | 178.05 |
| Probable | 315.6 | 3.089 | 975.0 | 0.72 | 7.02 |
| Total | 6,060.10 | 3.218 | 19,503.1 | 0.95 | 185.07 |
Note: Figure prepared by SRK, 2017.
Effective Date: June 1, 2017
Open pit Mineral Reserves assume full mine recovery;
Open pit Mineral Reserves are diluted along lithological boundaries and assume selective mining unit of 2.5 m x 2.5 m x 5 m;
The strip ratio was calculated to be 1.93 (waste to ore);
Reserves are based on a price of US$ 7,000/t LME Cu throughout the life of the mine;
Reserves are based on a cut-off grade of 0.28% Cu;
Mineral Resource tonnage and contained metal have been rounded to reflect the accuracy of the estimate. As a result of this rounding, the numbers may not add up;
Contained copper is reported as in-situ and does not include process recovery; and
The Mineral Reserve estimate was calculated by Rubens Mendonça, BSc, MBA, Chartered Professional Member of the AusIMM, Mining Manager of SRK Consultores do Brasil, in accordance with the standards set out in CSA, NI 43-101 and generally accepted CIM “Estimation of Mineral Resource and Mineral Reserves Best Practices guidelines.”
| | | | | |
| Boa Esperança Project | Page 41 |
| NI 43-101 Technical Report on Feasibility Study | October 2021 |
7GEOLOGICAL SETTING AND MINERALIZATION
The Boa Esperança Project is situated on the eastern side of the Amazonian Craton, in the Carajás Province (Santos et al., 2000). The province is divided into two distinct Archean tectonic domains: the Carajás (2.8 to 2.5 Ga) and the Rio Maria Figure 7-1. The Carajás domain (Figure 7-1) hosts base and precious metal deposits associated with granitic rocks, ultramafic intrusions, and metasedimentary sequences. The Rio Maria domain is geologically less constrained than the Carajás domain and encompasses Mesoarchean granite–greenstone belts terrains intruded by a variety of Archean granitoids, with Paleoproterozoic fissure-controlled volcanic rocks.
7.1Regional Geology
The Carajás domain comprises a protracted geologic history that commenced with an initial rift-phase, with submarine volcanism and sedimentation, which evolved to a sag-phase characterized by siliciclastic sequences, both structured on Mesoarchean tonalite–trondhjemite–granodiorite (TTG) and greenstone belt terrains that correlate with the Rio Maria domain (Teixeira et al., 2021). The Grão Pará Group marks the onset of the rift phase at ca. 2.76 Ga. The basal portion, the Parauapebas Formation, consists of komatiitic lava flows, lesser acid volcanic units and shales and sandstones. The Carajás Formation (ca. 2.74 Ga) overlies the Parauapebas Formation and consists of banded iron formation (BIF) sequences, with minor rare volcanic units. The Igarapé Bahia Formation, characterized by mafic lava flows with minor explosive units, and associated shales and BIFs overlies the Carajás Formation. The Azul Formation is deposited on top of the Grão Pará Group and marks the transition towards a shallower marine environment, consisting primarily of shales and siliceous sediments. The Águas Claras and Gorotire Formations, comprising fluvial sandstones and conglomerates, represent the final sedimentation of the sag-phase at ca. 2.37 – 2.4 Ga and are discordantly deposited on top of the Azul Formation.
The entire sequence is affected by metamorphism that can reach amphibolite facies. Late Paleoproterozoic (ca. 1.88 Ga) A-type granites cross-cut the entire sequence. A summary of the main lithostratigraphic units is presented on Figure 7-2.
| | | | | |
| Boa Esperança Project | Page 42 |
| NI 43-101 Technical Report on Feasibility Study | October 2021 |
Figure 7-1: Geologic Map of the Carajás and Rio Maria Domains, with the Main Tectonostratigraphic Units and Volcano Sedimentary Cover
Note: Figure from Costa et al. (2017)
| | | | | |
| Boa Esperança Project | Page 43 |
| NI 43-101 Technical Report on Feasibility Study | October 2021 |
Figure 7-2: Summarized Lithostratigraphic Column of the Carajás Domain after Teixeira et al. (2021)
Note: Figure from Teixeira et al., 2021
The Rio Maria domain is generally interpreted to represent the basement of the Carajás domain; however, the transition between both tectonic domains is still debatable. It has been interpreted to be either an abrupt transition as a result of the juxtaposition of two different terrains, or as a gradational transition in view of the similarities of the basement rocks (Dall’Agnol et al., 2013; Fernandes et al., 2011). The Rio Maria domain consists of a Mesoarchean nucleus (3.0–2.86 Ga) comprising greenstone belt terrains of the Tucumã and São Félix Groups, TTG suites, and a variety of late Mesoarchean granitoids (Silva et al., 2016). The greenstone sequences consist of metamafic (komatiitic and basaltic, with minor intermediate compositions) lava flows, with interlaid BIF and chert. Almeida et al. (2020) grouped the granitic rocks (2.98–2.86 Ga) into four subtypes as follows:
•Group I: TTGs (stricto sensu) that encompasses the Arco Verde, Mogno, Caracol, Marizinha and Água Fria granitoids, with ages that vary from 2.96 to 2.86 Ga;
| | | | | |
| Boa Esperança Project | Page 44 |
| NI 43-101 Technical Report on Feasibility Study | October 2021 |
•Group II: high-Mg (sanukitic) such as the Rio Maria Granodiorite of ca. 2.87 Ga;
•Group III: potassic leucogranites represented by the Xinguara and Mata Surrão plutons (2.86 Ga);
•Group IV: high-barium and strontium leucogranites and granodiorites of ca. 2.87 Ga.
The Rio Maria granodiorite occupies a ductile shear zone and is limited to the east and west by the Xingu Complex TTGs. It consists of leuco- to mesocratic, equigranular to porphyritic granites and granodiorites composed of plagioclase, K-feldspar, quartz, biotite, hornblende and accessory minerals. Granitic rocks that crosscut the greenstone sequence are intensely deformed and metamorphosed to amphibolite facies (Macambira and Vale, 1997). The Boa Esperança copper deposit is hosted by the Boa Esperança granite, a subunit of the Rio Maria granodiorite.
Paleoproterozoic magmatism of 1.88 Ga is recorded in the Rio Maria domain, represented by the Seringa, Gradaús, São João, Jamon, Musa, Marajoara, Manda Saia, Bannach and Redenção plutons (Silva et al., 2016), and synchronous intermediate to acid volcanic rocks of the Sobreiro and Santa Rosa Formations, observed predominantly as dikes.
7.2Local Geology
The Boa Esperança deposit crops out as an isolated hill, which is a north–northeast elongated (Figure 7-3). The topographic high is formed by quartz and magnetite breccias, which cut the Neoarchean biotite granite, the host of the copper mineralization. (2.85 Ga). Figure 7-4 shows the detailed geology of the area and the Boa Esperança copper deposit.
Mineralization consists of a series of brecciated zones, which are aligned N60°–70°E and dips to the southeast at 60°–70. An alignment of approximately N40°E can be observed in the field and coincides with the strike direction of the Boa Esperança hill.
The major rock types in the Boa Esperança deposit area are shown in Table 7-1. The mineralization types are described in Table 7-2.
| | | | | |
| Boa Esperança Project | Page 45 |
| NI 43-101 Technical Report on Feasibility Study | October 2021 |
Figure 7-3: General Overview Boa Esperança hill (looking NW)
Note: Figure provided by Ero/MCSA, 2021.
| | | | | |
| Boa Esperança Project | Page 46 |
| NI 43-101 Technical Report on Feasibility Study | October 2021 |
Figure 7-4: Detailed Geology of the Boa Esperança Deposit
Note: Figure prepared by MCSA, 2021.
| | | | | |
| Boa Esperança Project | Page 47 |
| NI 43-101 Technical Report on Feasibility Study | October 2021 |
Table 7-1: Boa Esperança Copper Deposit Rock Types
| | | | | | | | |
| Group Code | Rock Code | Description |
| SDAT | SDAT | No data. No sample recovered. |
| DIQ | DIQ | Dikes of uncertain composition. |
| DAC | Dacitic dikes. Veins associated with the most recent structure, N75W direction. |
| MDI | MDI | Microdiorites. Veins associated with the most recent structure, N75W direction. |
| BXX | BXX | Hydrothermal breccia, with a matrix composed of magnetite (mag), biotite (bio) and chalcopyrite (cpy). Fragments of quartz (atz), granite and pyrite (py). |
| BXQ | Breccia with predominant fragments of qtz, mag matrix, bio, cpy, py. |
| BXG | Breccia with predominant fragments of granite, mag matrix, bio, cpy, py. |
| VET | Massive sulfide veins, with a greater composition of py and smaller quantities of cpy, mag. |
| GRA | GRA | Granite, host rock |
| GRB | Brecciated granite. Incipient brecciation or intervals of granite alternating with smaller intervals of breccia. |
| GRG | Coarse granite. Porphyritic granite |
| PGR | Granitic porphyry. |
| TON | Tonalite. Possibly represents host rock not affected by potassic alteration. |
| TOF | Fine tonalite. Variation of TON unit (?) |
| TOB | Brecciated tonalite. |
| GRF | Foliated granite. Rock affected by dynamic metamorphism. |
| MIL | Mylonite. Rock associated with faults in ductile environment. |
| GRM | Mylonitic granite. Evidence of ductile faulting in granite. |
| MET | MET | Metamorphic rock with strong compositional banding. Unknown protolith. |
| | | | | |
| Boa Esperança Project | Page 48 |
| NI 43-101 Technical Report on Feasibility Study | October 2021 |
Table 7-2: Mineralization Types
| | | | | | | | |
| Mineralization Codes |
| Interpreted Code | Intensity | Description |
|
| SDAT | | No data. Interval was not recovered or was contaminated. |
| EST | 0 | Waste. Minerals associated with soils (with organic matter). |
| LIX | 1 | Leached zone found at the top of the deposit. The intensity of the mineralization depends on the limonite content and the degree of supergene alteration of the rock. |
| 2 |
| 3 |
| OXI | 1 | Copper oxide zone. Located next to sulfide breccias and/or associated with dams that control the precipitation of copper oxides (geochemical barriers). The intensity depends on the quantity of copper oxide observed. |
| 2 |
| 3 |
| MIX | 1 | Mix of oxide and sulfide copper minerals (chalcocite (cc), py and cpy) |
| 2 |
| 3 |
| ENR | 1 | Rich zone with secondary copper sulfides (mainly cc) and varying quantities of cpy and py. |
| 2 |
| 3 |
| CPY | 3 | Unit composed of abundant cpy and of generally large quantities of py. The intervals usually have average Cu grades >1%. |
| CPYPY | 1 | Cpy is the dominant copper mineral, with greater amounts of py. The intensity refers to cpy. |
| 2 |
| PYCPY | 1 | Py is the dominant mineral with trace amounts of cpy. The intensity refers to the amount of py. |
| 2 |
| 3 |
| PY | 1 | Mineralization composed solely of py. Cpy is not observed or is absent. Intensity refers to the quantity of py. |
| 2 |
| 3 |
The breccias are concentrated around the top of the hill, occupying an area of approximately 450 x 350 m. The copper mineralization, based on drilling to date, has a geometric shape similar to an inverted cone. Currently known mineralization lies between elevations of 350 m to -200 masl.
This geometry is very similar to that suggested by the breccia observed in outcrops (Figure 7-5) and is characteristic of a ductile-rupture stage. The breccias are distributed throughout the barren pink granite lenses. A cross-section showing the mineralization is provided at vertical section 10,000, shown in Figure 7-6. Figure 7-7 shows the general orientation of the mineralized zone.
The breccias are composed of magnetite, quartz, biotite, chalcopyrite, and pyrite, with minor molybdenite. The alteration zones around the breccias are small (about a third of the breccia thickness) and consist of chlorite with epidote and potassium feldspar.
| | | | | |
| Boa Esperança Project | Page 49 |
| NI 43-101 Technical Report on Feasibility Study | October 2021 |
Figure 7-5: Granite Outcrop Cut by Anastomosed Breccia Veins
Note: Photograph by SRK, 2012.
| | | | | |
| Boa Esperança Project | Page 50 |
| NI 43-101 Technical Report on Feasibility Study | October 2021 |
Figure 7-6: Vertical Section 10,000 High-Grade (in red) and Low-Grade (in yellow) Zones view looking North
Note: Figure by MCSA, 2021.
Figure 7-7: Plan View at 150 m Showing the High Grade (in red) and Low Grade (in yellow) Zones
Note: Figure Figure by MCSA, 2021.
| | | | | |
| Boa Esperança Project | Page 51 |
| NI 43-101 Technical Report on Feasibility Study | October 2021 |
7.3Deposit Geology
The Boa Esperança deposit extends for approximately 850 meters in a WSW-ENE direction, for 640 meters in NNW-SSE direction, and is currently known to a depth of 780 meters below surface through drilling. It has a steep SE plunge and remains open in this direction. The deposit is hosted in a series of breccias cross-cutting a granite intrusion.
7.3.1Lithologies
The stratigraphy, from the oldest unit to the youngest, is as follows:
•Metamorphic Rocks (MET) – Strongly banded and silicified rocks varying in colour from light brown to gray. These rocks contain chlorite and epidote and are located in the western area of the deposit and are surrounded by intrusive rocks with large xenoliths.
•Boa Esperança Granite (GRA) – This group of intrusive rocks of varying compositional and textural types hosts the copper mineralization and intrudes into the metamorphic rocks.
•Granite (GRA) – Corresponds to a granitic body, which encompasses the alteration/mineralization. Macroscopically; it is a biotite granite with a hypidiomorphic granular texture and an average composition consisting of feldspar (40%), silica (35%), plagioclase (10%) and biotite (15%) (Figure 7-8). The biotite displays a weak alteration to chlorite. The granite has feldspar, quartz and pyrite veins of with epidote halos. There is granodiorite along the edge of the granite, which likely indicates that the granite is the result of a hydrothermal alteration phase, representing potassic alteration consisting of biotite–sericite–K-feldspar.
Figure 7-8: A - Chalcopyrite-pyrite ore from drillhole BSPD-162 (99.50 to 103.20 m); B - Pyrite-chalcopyrite ore in quartz magnetitic breccia from drillhole BSPD-162 (109.00 m).
Note: Photograph by MCSA, 2021.
| | | | | |
| Boa Esperança Project | Page 52 |
| NI 43-101 Technical Report on Feasibility Study | October 2021 |
•Granite breccia (GRB) – Corresponds to granite with a weak incipient brecciation.
•Coarse-grained granite (GRG) – In the northern area of the deposit, there is an intrusive porphyritic granite rock, with phenocrysts of zoned feldspar up to 2 cm in size, in a matrix of quartz and feldspar. No contact relationships with the enclosing granite have been observed, but it may correspond to a change in composition from the same intrusive event.
•Granite porphyry (PGR) – Displays porphyritic texture, with phenocrysts of feldspar in an aphanitic crystalline matrix. Contacts with the enclosing granite range from passive to diffuse.
•Tonalite (TON) – Intrusive rock that occurs in the western area of the deposit, of tonalitic composition. It is interpreted to be part of the host intrusive complex. There are textural variations, such as fine texture (TOF), on the edge of the intrusive body, or variations of the degree of brecciation as in the tonalite breccia (TOB), which show small areas of a strong incipient brecciation.
•Mylonite (MIL) – Mylonite occurs in the areas north, east and northeast of the main deposit area. Mylonite is characterized by the occurrence of sericite schists, interstratified with quartzite. It exhibits mild folding, with attitudes ranging from N15°W to N10°E and dips between 30º–80º E. Macroscopically, the rock is a sericite–quartz mylonite, fine-grained, white to yellowish in colour, foliated, and nonmagnetic, with large translucent quartz crystals surrounded by clusters of light-yellow sericite. The petrographic analysis described a foliated rock of medium to coarse crystallinity, that was intensely sheared and hydrothermally altered, featuring a cataclastic texture with few traces of the original rock texture remaining. The mineralogical composition is as follows: quartz (60%), which occurs as oriented and deformed medium-grained to coarse-grained anhedral crystals displaying strong undulatory extinction in thin sections and as granoblastic aggregates, which were formed following cataclasis and partial recrystallization; sericite (38%), which occurs as sheets that form small aggregates surrounding oriented quartz crystals; locally, prismatic and subhedral pseudomorphs replace feldspar; rutile (2%) is observed as fine prismatic crystals that are included in aggregates of sericite; and zircon (trace), as a fine-grained accessory mineral disseminated in the rock. The mylonites correspond to the local deformation of the granite, or sheared equivalent, which would have occurred before the brecciation.
•Mylonitic Granite (GRM) – Consists of intrusive rocks affected by mylonitization, with occurrences of foliation defined by biotite and quartz. Texturally, this rock corresponds to a medium-grained rock, which is similar to the granite. GRM is pale pink in colour, with abundant microcline, quartz, plagioclase, and epidote crystals. Microscopically, it is a sheared and altered granite, medium-grained, strongly deformed, and hydrothermally altered to microcline, sericite, and epidote, which have granular and hypidiomorphic granophyric relict textures. The mineralogical composition is: quartz (25%), allanite (1%), microcline (30%), zirconium (trace), plagioclase (15%), apatite (trace), sericite (19%), opaques (trace), biotite (3%), chlorite (trace), epidote (5%), calcite (trace), and sphene (2%). The GRM represents an intermediate phase between the granite and mylonites, in which the deformation is not so severe. This unit is also called foliated granite (GRF).
•Boa Esperança Breccia (BXX) – Corresponds to a hydrothermal breccia, strongly controlled by tectonic shear structures, in which the open spaces allowed for the later introduction of hydrothermal mineralization. The first pulse of mineralization introduced quartz–pyrite, which is found in some areas as massive replacement deposits. The characteristics of these units, its composition and degree of foliation indicate that the first pulse would have been formed in a brittle structural setting (Figure 7-8). The second pulse of mineralization introduced magnetite, biotite and copper. Biotite appears to be the first event of the second pulse, showing a fluid texture interpreted as syn-shearing. Magnetite has a massive and only faintly fluid texture, invading the biotite and leaving, in some cases, elongated clasts of biotite. Pyrite and chalcopyrite were deposited on the edges of the breccia fractures, perhaps suggesting that the solutions from this event were low in sulfur.
| | | | | |
| Boa Esperança Project | Page 53 |
| NI 43-101 Technical Report on Feasibility Study | October 2021 |
•Dikes (DIQ) – The dikes are primarily dacitic in composition; however, some dikes are intermediate to acidic in composition. They are associated with the younger intrusive volcanic event (Uatumã) of a probable age of 1.8 Ga.
•Dactitic dikes (DAC) – These are porphyritic dacites, striking generally N70°W, and whose general direction is similar to the major regional structural lineaments. Macroscopically, the dikes are dark-coloured rocks with feldspar crystals which have concentric zoning, "eyes" of clear quartz with recesses (resorption), chloritized mafic minerals (biotite), as well as abundant xenoliths (1–4cm in size) of rounded granite (Figure 7-9). The matrix is medium- to fine-grained, composed of aggregates of potassium feldspar, quartz and mafic minerals. In some locations, this unit is moderately chloritized and sericitized. In the area of the Boa Esperança hill, this unit exhibits supergene alteration to clay, as a result of oxidation of sulfides in the breccia and granite.
•Intermediate to acidic dikes (DIQ) – These are dikes of variable composition and are related to the regional structures.
•Microdiorites (MDI) – Microdiorites are present as a series of dikes with a general N50°W to N70°W direction, are of dioritic composition with a fine granular texture, and consist of an aggregate of plagioclase and mafic minerals. The rock corresponds to a lamprophyre dike of sub-volcanic emplacement. It exhibits strong hydrothermal alteration to chlorite and saussurite, without deformation, showing original porphyritic, amygdaloidal, and well-preserved panidiomorphic granular textures
Figure 7-9: Intrusive Volcanic Dike from Drillhole BSPD-59
Note: prepared by MCSA, 2021.
| | | | | |
| Boa Esperança Project | Page 54 |
| NI 43-101 Technical Report on Feasibility Study | October 2021 |
7.3.2Mineralization
The Boa Esperança deposit displays primary and secondary zoning. The primary zoning corresponds to a distal zone, where pyrite (py) dominates, grading towards copper mineralized zones of pyrite–chalcopyrite (py–cpy), chalcopyrite–pyrite (cpy–py) and chalcopyrite (cpy).
The secondary zoning is a supergene alteration and consists of sub-horizontal and discontinuous lenses of a barren leached zone (LIX), a copper oxide zone (OXI) and a mixed zone (MIX) of oxides and primary copper sulfides. The barren leached zone crops out at the hill top (Figure 7-10 and Figure 7-11), and is composed of hematite, goethite and clay minerals. Despite the large amount of sulfide boxworks found in this area, the leached zone does not contain copper in economic concentrations. The copper oxide zone is located immediately beneath the leached zone and consists of malachite and copper-bearing clays. Below the copper oxide zone is an area of mixed oxides, carbonates, secondary supergene sulfides (chalcocite and covellite) and primary sulfides (pyrite and chalcopyrite).
The bottommost layer, beneath the mixed oxide zone, is a copper-enriched (ENR) zone consisting of sub-horizontal 5–10m-thick lenses extending up to 20–30 m and formed by primary and secondary sulfides.
Geochemical associations were identified. Cobalt is concentrated on the surface. However, there is no correlation between copper and cobalt grades in the mineralization. The cobalt is intimately associated with sulfur and iron, suggesting that this element is in the mineral structure of pyrite. Iron is more abundant in the pyrite and chalcopyrite zones, and a higher molybdenum content is found in the chalcopyrite–pyrite mineralization and in the leached zone.
Figure 7-10: Top of Mineralized Zone, Leached Material Composed of Quartz Magnetitic Breccia
Note: Photograph by SRK, 2012. Road cut exposure is approximately 8 meters long.
| | | | | |
| Boa Esperança Project | Page 55 |
| NI 43-101 Technical Report on Feasibility Study | October 2021 |
Figure 7-11: Detail of the Quartz Magnetitic Breccia Leached at Top
Note: Photograph by SRK, 2012.
| | | | | |
| Boa Esperança Project | Page 56 |
| NI 43-101 Technical Report on Feasibility Study | October 2021 |
8DEPOSIT TYPES
8.1Introduction
The presence of abundant (>10%) hydrothermally precipitated magnetite with associated copper–iron sulfides in the breccias hosting the mineralization suggests a deposit type such as an iron oxide–copper–gold (IOCG). However, there are features of the Boa Esperança deposit that do not match the proposed IOCG deposit type. Among these are the presence of high sulfur mineral assemblage (chalcopyrite–pyrite), rather than the low sulfur copper sulfide mineral assemblage characteristic of the IOCG deposit type (chalcopyrite–bornite–chalcocite), as well as the high quartz content, the absence of pervasive hydrothermal alteration of the host rock, specifically sodic (albite) alteration, and the absence of gold.
As such, the Boa Esperança copper deposit is interpreted to be a variant of an IOCG deposit type.
8.2Geological Model
IOCG deposits are metasomatic expressions of large crustal-scale alteration events driven by intrusive activity. The deposit type was first recognized, though not named as IOCG, by discovery and study of the Olympic Dam copper–gold–uranium deposit and South American examples.
IOCG deposits are classified as separate from other large intrusive-related copper deposits such as porphyry copper deposits and other porphyry metal deposits, primarily due to their substantial accumulations of iron oxide minerals, association with felsic–intermediate type intrusions (Na-Ca rich granitoids), and lack of the complex zonation in alteration mineral assemblies commonly associated with porphyry deposits.
IOCG deposits are still relatively loosely defined, and, as such, some large and small deposits of various types may or may not fit within this deposit classification. IOCG deposits may have skarn-like affinities, although they are not strictly skarns in that they are not metasomatites.
IOCG deposits can express a wide variety of deposit morphologies and alteration types depending on their host stratigraphy, and the tectonic processes operating at the time (e.g., some provinces show a preference for development within shears and structural zones), and have been recognized within epithermal regimes (caldera and maar styles) through to brittle–ductile regimes deeper within the crust (e.g.; Prominent Hill, some Mount Isa examples, Brazilian examples). What is common in IOCGs is their genesis within magmatic-driven crustal-scale hydrothermal systems.
IOCG deposits typically occur at the margins of large igneous bodies, which intrude into sedimentary strata. As such, IOCG deposits form pipe-like, mantle-like or extensive breccia-vein sheets within the host stratigraphy. Morphology is often not an important criterion of the deposit itself and is determined by the host stratigraphy and structures.
IOCG deposits are usually associated with distal zones of large-scale igneous events; for instance, a particular suite or supersuite of granites, or intermediate mafic intrusions of a particular age. Often the mineralizing intrusive event becomes a diagnostic association for expressions of IOCG mineralization within a given province.
| | | | | |
| Boa Esperança Project | Page 57 |
| NI 43-101 Technical Report on Feasibility Study | October 2021 |
Mineralization may accumulate within metasomatized wall rocks, within brecciated maar or caldera structures, faults or shears, or the aureole of an intrusive event (possibly as a skarn) and is typically accompanied by a substantial enrichment in iron oxide minerals (hematite, magnetite). IOCG deposits tend to accumulate within iron-rich rocks such as BIFs or iron schists, although iron enrichment of siliciclastic rocks by metasomatism is also recognized within some areas.
Supergene profiles can be developed above weathered examples of IOCG deposits, as exemplified by the Sossego deposit, Pará State, Brazil, and at Boa Esperança, where typical oxidized copper minerals are present, e.g., malachite, cuprite, native copper, and minor amounts of digenite and chalcocite.
Gangue minerals are typically some forms of iron oxide mineral, classically hematite, but also magnetite. This is typically associated with gangue sulfides of pyrite, with subordinate pyrrhotite and other base metal sulfides. Silicate gangue minerals include actinolite, pyroxene, tourmaline, epidote, and chlorite, with apatite, allanite, and other phosphate minerals common in some IOCG provinces.
| | | | | |
| Boa Esperança Project | Page 58 |
| NI 43-101 Technical Report on Feasibility Study | October 2021 |
9EXPLORATION
Since the acquisition of the project in 2007, MCSA conducted one geophysical survey as well as diamond drilling. The mise-à-la-masse electric geophysical survey was completed from September 30 to October 12, 2008, by Geodatos of Brazil. This period of the year corresponds to the rainy season which favored good electrical conduction through the surface environment of leached rock oxides, resulting in resistivity and chargeability data of excellent quality.
The objective of the survey was to evaluate the continuity and orientation of the mineralization intersected with drillhole BSPD-29. The current was injected into dipole of electrodes consisting of one electrode at 160 m down the hole BSPD-29, coinciding with the copper mineralization intersection and the second electrode set at 1818.18 m east of drillhole BSPD-29. The remote electrode for potential readings was set at 859.68 m to the west of drillhole BSPD-29. The survey consisted of 18 lines spaced at 50 m and oriented E-W. Individual readings along the lines were at every 25 m. The results show a well-defined low-resistivity anomaly with no preferred orientation that is limited in all directions except in the southeast direction.
Figure 9-1: Resistivity map of the mise-à-la-masse survey. Yellow contours are wireframes of the modelled lower grade mineralization at elevation 350 m above sea level
Note : prepared by MCSA, 2021 from map produced by Geodatos.
| | | | | |
| Boa Esperança Project | Page 59 |
| NI 43-101 Technical Report on Feasibility Study | October 2021 |
Subsequent to the Effective Date, ten exploration drill holes were drilled within the western portion of the final designed FSU in an area known as the Gap Zone, all of which show mineralization. As of September 28th, assay results had been
received for three of these holes. Results are highlighted by hole BSPD-166 that intercepted 21.2 meters grading 0.98% copper and 15.3 meters grading 1.25% copper, including 6.5 meters grading 2.46% copper, hole BSPD-169 that intercepted 64.9 meters grade 0.86% copper, including 15.0 meters grading 1.40% copper and hole BSPD-175 that intercepted 14.1 meters grading 0.73% copper including 5.7 meters grading 1.59% copper. Please refer to the Company’s press release dated September 28, 2021 for additional information.
Table 9-1: Gap Zone Drilling Results, Subsequent to Effective Date
| | | | | | | | | | | | | | | | | | | | | | | |
| Hole ID | From (m) | To (m) | Length (m) | Cu (%) |
| GAP Zone - Assay Results |
| BSPD-166 | 31.0 | 44.0 | 13.0 | 0.25 |
| and | 125.4 | 141.3 | 15.9 | 0.44 |
| and | 174.0 | 179.2 | 5.2 | 1.27 |
| and | 189.7 | 200.6 | 10.9 | 0.67 |
| and | 339.5 | 360.7 | 21.2 | 0.98 |
| including | 339.5 | 343.3 | 3.9 | 2.78 |
| and | 383.5 | 398.8 | 15.3 | 1.25 |
| including | 386.3 | 392.8 | 6.5 | 2.46 |
| and | 435.4 | 445.6 | 10.3 | 1.27 |
| including | 435.4 | 439.8 | 4.4 | 2.21 |
| and | 467.8 | 476.6 | 8.8 | 0.39 |
| BSPD-169 | 317.2 | 382.0 | 64.9 | 0.86 |
| including | 346.5 | 354.9 | 8.4 | 1.46 |
| and including | 367.0 | 382.0 | 15.0 | 1.40 |
| BSPD-175 | 336.8 | 350.8 | 14.1 | 0.73 |
| including | 345.1 | 350.8 | 5.7 | 1.59 |
| and | 401.0 | 438.0 | 37.0 | 0.20 |
GAP Zone - Additional Mineralized Intervals for Above Drill Holes (Assay Results Pending as of September 28th) |
| BSPD-169 | 112.0 | 119.0 | 7.0 | assays pending |
| and | 158.5 | 183.0 | 24.5 | assays pending |
| and | 201.0 | 263.0 | 62.0 | assays pending |
| and | 484.0 | 499.0 | 15.0 | assays pending |
| and | 509.0 | 536.0 | 27.0 | assays pending |
| BSPD-175 | 101.0 | 117.9 | 16.9 | assays pending |
| and | 127.0 | 138.0 | 11.0 | assays pending |
| and | 185.0 | 192.5 | 7.5 | assays pending |
| and | 203.8 | 220.7 | 16.9 | assays pending |
| and | 302.0 | 320.3 | 18.3 | assays pending |
Gap Zone drill results from BSPD-166, BSPD-169 and BSPD-175, as referenced herein, reflects mineralization not captured in the mineral resource and mineral reserve models developed for the 2021 FSU. There had been insufficient work and analysis surrounding Gap Zone drilling to define a mineral resource and it is uncertain if further exploration and analysis will result in such targets being delineated as a mineral resource.
| | | | | |
| Boa Esperança Project | Page 60 |
| NI 43-101 Technical Report on Feasibility Study | October 2021 |
Figure 9-2 shows high-grade and low-grade mineralization, as well as the Gap Zone exploration target area within the final pit design of the Project. Figure 9-3 highlights recent Gap Zone drilling results.
Figure 9-2: Boa Esperança, Plan View looking North
Note: Ero Copper, 2021. The center of the final pit design is located at UTM Easting 450722.00 and UTM Northing 9241657.00. Boa Esperança mineralization based on data compilation work which includes review of geological controls, structural analysis and copper mineralization identified during the Company’s technical programs. The interpretation and boundary limits do not imply continuity of mineralization or actual thickness of mineralization. Mineral resources which are not mineral reserves do not have demonstrated economic viability.
| | | | | |
| Boa Esperança Project | Page 61 |
| NI 43-101 Technical Report on Feasibility Study | October 2021 |
Figure 9-3: Boa Esperança VRIFY 3D Model, Gap Zone Results, view looking North
Note: Ero Copper, 2021. The center of the final pit design is located at UTM Easting 450722.00 and UTM Northing 9241657.00. The GAP Zone volume is shown to demonstrate a future area of exploration within the Boa Esperança final pit design. The shape is based on data compilation work which includes review of geological controls and structural analysis during the Company’s technical programs. The interpretation and boundary limits do not imply continuity of mineralization or actual thickness of mineralization.
Ero is currently drilling at the Project from surface with core drill rigs operated by a third- party contractor. Third-party drill rigs are operated by DrillGeo Geologia e Sondagem Ltda., who is independent of Ero. Drill core is logged, photographed, and split in half using a diamond saw and then quartered. One half is sent for analysis and the remaining half is sent for storage at the secure core logging and storage facilities for the Project located in the city of Tucumã, Para State, Brazil. Samples are collected on one-and-a-half-meter sample intervals unless an interval crosses a geological contact. At the completion of sample batching, individual sample bags are placed into plastic bags which are numbered and labelled with the respective sample interval and batch identification. Sample batches are transported to a third-party laboratory for preparation and analyses, along with a sample submission form.
Total copper and gold analysis is performed at ALS Brasil Ltda’s (ALS) facilities in Parauapebas, Brazil (physical) and Lima, Peru (analytical). Total copper is determined using a hydrofluoric, nitric, perchloric acid digestion and HCl leach and analysed using Inductively Coupled Plasma - Mass Spectrometry (ICP-MS) and Atomic Absorption Spectrometry (AAS). Gold values are determined using lead collection fire assay and Inductively Coupled Plasma – Optical Emission Spectrometry (ICP-OES). ALS is a subsidiary of ALS Limited and is independent of Ero. All sample results during the period have been monitored through a quality assurance, quality control program that includes the insertion of certified standards, blanks, and field duplicate samples.
| | | | | |
| Boa Esperança Project | Page 62 |
| NI 43-101 Technical Report on Feasibility Study | October 2021 |
10DRILLING
The drilling was conducted from 2003 to 2006 in four diamond drill programs by Codelco and was followed by another four diamond drill programs by MCSA between 2008 and 2013. The total amount of drill holes is 165 for 57,972.25 meters.
10.1Drilling by CODELCO (2003-2006)
10.1.1Drilling Methodology
From December 2003 to October 2006 Codelco completed four diamond drilling campaigns comprising 21,956.12 meters in 62 diamond drillholes at Boa Esperança Project (Table 10-1 and Figure 10-1). The purpose of this drilling was to verify and later delineate the target based on the geochemical and geophysical anomalies and to provide the essential technical information for the understanding of the deposit and support Mineral Resource and Reserve Estimations, for further economic assessment. For these programs, Codelco determined the collar coordinates using Total Station following internal procedures. A total of 11,922 samples were collected during the four drill programs completed by Codelco, without certified reference material and blanks (Table 10-1).
Table 10-1: Summary of Codelco drilling programs
| | | | | | | | | | | | | | | | | | | | |
| Company | Year | Number of DDH | Meters | Drillhole Series | Number of samples | Comments |
| Codelco | 2003-2004 | 8 | 2,865.95 | BSPD-01 to 08 | 1,588 | |
| Codelco | 2004 | 8 | 2,990.30 | BSPD-09 to 16 | 1,955 | |
| Codelco | 2005 | 19 | 7,798.45 | BSPD-17 to 34 | 4.136 | Includes BSPD-17 and -17A |
| Codelco | 2006 | 27 | 8,301.42 | BSPD-36 to 60 | 4.243 | Includes BSPD-45 and -45A |
| Total Codelco | 62 | 21,956.12 | | 11,922 | |
| | | | | |
| Boa Esperança Project | Page 63 |
| NI 43-101 Technical Report Feasibility Study | October 2021 |
Figure 10-1: Surface map of drill holes on the Boa Esperança Project
Note: Figure prepared by MCSA, 2021.
Drilling for the Codelco programs was carried out by Geoserv Pesquisas Geológicas S.A. using wire-line hydraulic diamond rigs, drilling NQ and HQ core when all drill holes were drilled at -43⁰ to -80⁰ towards either 330⁰ or 150⁰ to be as perpendicular to the mineralized zones as possible. All drill holes started with HQ diameter to pass through the soil and saprolite zones (that can reach up to 80 meters thick at the top of the hill) and then NQ was used to end of the holes. After each drilling run of 3 meters, the core was removed from the rods and placed in a tray to be measured and inserted in the core boxes. Each drilling run length and core recovery were recorded by the drillers both in the core boxes and in drilling production sheet log. The core boxes were then closed and transported to the core shed in Tucumã at the end of each shift.
During drilling, a trained technician was responsible to supervise the program, routinely checking each run length versus the correspondent core length to determine core recovery. Geologists oversaw the operation to determine drill sequence and when each hole should be concluded.
| | | | | |
| Boa Esperança Project | Page 64 |
| NI 43-101 Technical Report Feasibility Study | October 2021 |
10.1.2Drillhole Deviation
Drillholes were surveyed using Maxibor equipment, in a reading frequency of 3 meters and data was received as excel and csv exported spreadsheets. The Maxibor is an instrument that is frequently used in magnetic rocks such as those at Boa Esperança because it is not affected by magnetism. The Maxibor instrument uses an electronic camera that measures the vertical and horizontal displacements of 3 rings inside the probe. The degree of bending of the probe that is lowered inside the drill rods is measured by the camera and recorded in a microprocessor for each run of 3 meters. The cumulative difference is compared with the starting azimuth and plunge of the drillhole and the trace of the hole can be defined.
10.1.3Core Logging Procedures
All the geological logging of drill cores was carried out by geologists from Codelco. All drill core was described for lithology, main mineralogy, grain size, texture, alteration, and sulphide mineralogy. This information was writing on sheets of paper and the entered-on Excel spreadsheets. For geotechnical purposes every drill core was logged by a trained mining technician who examined each drilling run and recording the recovery, the RQD, the weathering profile, the resistance, the hardness, the degree of fracturing, and infill minerals. This information was writing also on sheets of paper and the entered-on Excel spreadsheets The RQD index was calculated as a percentage of the cumulative length of core pieces greater than 10 cm long (standard for HQ and NQ) over the total length of the run (3 meters). Note that a “piece” of core is a length of core between two natural breaks, rather than using breaks in the core that resulted from drilling or subsequent handling. Core recovery is also calculated as a percentage. Recovery of 100% means that 3 meters of core has been placed into the box between the two blocks representing a 3-meter run.
10.1.4Core Storage
All core from the Codelco drilling was kept at the Codelco core facility in Tucumã and organized in racks. Subsequent to the purchase of the Project from Codelco, all the core from the Codelco program was transferred to the MCSA facility in Tucumã, and is kept stored in organized racks.
10.2Drilling by MCSA (2008-2013)
Shortly after acquiring the project in 2007, MCSA managed four additional diamond drilling programs adding 103 drillholes and 36,016.13 meters at Boa Esperança Project (Table 10-2 and Figure 10-2). The objectives of these campaigns include infill drilling on a 50 m x 50 m for the main portion of the deposit, in pit geotechnical drilling, and condemnation drilling (2011) and to provide sufficient material to support the metallurgical testwork for the Feasibility Studies of 2012 and 2015. A total of 10,514 samples was collected during the four drill programs completed by MCSA, without certified reference material and blanks (Table 10-2).
Table 10-2: Summary of MCSA drill programs
| | | | | | | | | | | | | | | | | | | | |
| Company | Year | Number of DDH | Meters | Drillhole Series | Number of samples | Comments |
| MCSA | 2008-2010 | 43 | 13,497.58 | BSPD-61 to 103 | 4,262 | Includes BSPD-64 and BSPD-64B |
| MCSA | 2011 | 5 | 1,672.15 | BSPD-104 to 108 | 112 | |
| MCSA | 2012 | 38 | 15,475.00 | BSPD-109 to 146 | 4.534 | |
| MCSA | 2013 | 17 | 5,371.40 | BSPD-147 to 165 | 1,606 | |
| Total MCSA | 103 | 36,016.13 | | 10,514 | |
| | | | | |
| Boa Esperança Project | Page 65 |
| NI 43-101 Technical Report Feasibility Study | October 2021 |
Figure 10-2: Surface map of drill holes by MCSA (black) and Codelco (grey) on the Boa Esperança Project
Note: Figure prepared by MCS, 2021.
10.2.1Drilling Methodology
The drilling was carried out by Minexplor - Serviços e Consultoria Mineral Ltda and Willemita Sondagens (2008), by Rede Engenharia e Sondagens S.A. (2010, 2011 and 2013) and Servitec Foraco Sondagem S.A (2012), all of whom are independent of MCSA. All drilling was performed using wire-line hydraulic diamond rigs, drilling NQ and HQ core. All drill holes were drilled oriented as inclinations of -45⁰ to -75⁰ and azimuths of either 330⁰ or 150⁰ to be as perpendicular to the mineralized zones as possible. All drill holes started with HQ diameter to pass through the soil and saprolite zones (that can reach up to 80 meters thick at the top of the hill) and then NQ was used to end of the holes.
After each drill run core was removed from the rods and placed into a tray to be measured, then inserted in a core box for storage. Core length and recovery were recorded by the drill technicians, labeled on the core boxes and in drilling production sheet log. The core boxes were then transported to the core shed in Tucumã at the end of each shift.
| | | | | |
| Boa Esperança Project | Page 66 |
| NI 43-101 Technical Report Feasibility Study | October 2021 |
10.2.2Drillhole Deviation
Drillholes were surveyed for their deviation using Maxibor equipment. During drilling, the down‐hole trace of the drill hole was monitored and compared to what was planned in order to reach the designated target within acceptable tolerances. When required by the field technician, preliminary readings were done every 100-150 meters down-hole during the progression of the hole to ensure proper tracking of the drill trace. All surveys were cross‐checked before entering the database. At the end of the drill hole, two surveys (in and out) with readings every 3 meters were performed to have the most accurate trace of the hole.
For the 2012 in pit geotechnical drilling, MCSA implemented the use of Reflex ACTII tool for core orientation.
10.2.3Core Logging Procedures
All the geological logging of drill cores was carried out by geologists from MCSA. Drill core was described for lithology, main mineralogy, grain size, texture, alteration, and sulphide mineralogy. For geotechnical purposes every drill core was logged by a trained mining technician who examined each drill run to record core recovery, RQD, weathering profile, resistance, hardness, degree of fracturing, and minerals occurrences. RQD was calculated as a percentage of the cumulative length of core pieces greater than 10 cm long (standard for HQ and NQ) over the total length of the run (typically 3 meters). Recovery was also calculated as a percent of drill core run placed into the core box. Recovery of 100% indicates that 3 meters of core had been placed into the core box for a 3-meter drill core run.
10.2.4Core Storage
A permanent an aluminum tag was attached to the front of each core box, identifying the drill hole number, from-to interval and the sequential box number. All the core boxes were sent for storage at the secure core logging and storage facilities of MCSA, located in Tucumã, Pará State.
| | | | | |
| Boa Esperança Project | Page 67 |
| NI 43-101 Technical Report Feasibility Study | October 2021 |
11SAMPLE PREPARATION, ANALYSES, AND SECURITY
11.1Methods
Core sampling from drill programs began when the drill core boxes were delivered to Codelco or MCSA’s logging facility in Tucumã. A technician checked for length and recovery, then marked the core boxes with metre-by-metre intervals and photographed the core.
Core was logged off for both geotechnical and geological parameters. Logging was performed by a trained technician and a geologist. Geologists selected intervals for density measurements and samples for laboratory assaying. Lithological contacts and mineralization styles defined sample intervals. Sampling was performeda maximum sample length of 1.5 m in the mineralized zones and 4 m in the non-mineralized zones.
Sampling intervals were identified and marked in the core boxes according to the sampling plan, thus providing a physical register of sample identification and location. The core was split in half using a diamond saw and then quartered, with one quarter sent for analysis and the remaining three quarters stored in the secure logging facilities.
Each sample bag was verified by comparing the description in the core boxes to the corresponding location of the collected sample. If correct, the sample was sealed in the bag for dispatch to the laboratory.
Codelco used SGS Geosol laboratory in Parauapebas, Pará, Brazil (SGS Parauapebas) to prepare all samples from the 2003–2006 drilling campaigns. MCSA used the same laboratory to prepare all samples from the 2008–2009, 2012, and 2013 drilling campaigns. Sample analyses were carried out by SGS Geosol in Vespasiano, Minas Gerais, Brazil (SGS Vespasiano) for these drill campaigns. SGS Geosol is an internationally recognized mineral testing laboratory. Its management system was accredited in the ISO 9001:2008 certification standards by ABS Quality Evaluation Inc., Texas, USA.
MCSA used the Intertek laboratory in Parauapebas, Pará, Brazil (Intertek) to prepare all samples from the 2010 drilling campaign. Intertek is an internationally recognized mineral testing laboratory. Its management system is accredited in the ISO 9001:2008 certification standards by ABS Quality Evaluation Inc. Texas, USA.
All analytical laboratories involved in sample preparation and analyses were independent from Codelco and MCSA.
11.2Security Measures
Samples were in Codelco’s and MCSA’s possession from the time the core boxes were delivered by the drilling company until the one-quarter cut core samples were delivered to the SGS Parauapebas or Intertek preparation laboratories. The drilling company provided sample security at the drill site, and Codelco and MCSA provided sample security during the geological logging process and through the core quartering to generate assay samples. The laboratories provided sample security from the time of delivery to the preparation laboratories.
| | | | | |
| Boa Esperança Project | Page 68 |
| NI 43-101 Technical Report Feasibility Study | October 2021 |
11.3Sample Preparation
SGS Parauapebas used the following preparation procedures for the Codelco and MCSA samples during 2008–2009. Samples were crushed to a size of 2 mm, then separated into a 0.5 kg sample. The 0.5 kg sample was pulverized to 85 % passing a 150-mesh sieve. A 50 g sample was taken from the 0.5 kg pulp and sent to SGS Geosol for analysis by atomic absorption. The samples from the 2010 drilling campaign were sent to Intertek, which used similar preparation and analytical procedure.
Samples from 2012 and 2013 were sent for sample preparation to SGS Parauapebas and after that for analytical analysis at SGS Vespasiano. The same procedures that were used for sample preparation and analysis the 2008–2009 drilling campaign were used for the 2012 and 2013 campaign samples.
11.4Analysis
SGS Vespasiano and Intertek completed copper, cobalt, molybdenum, iron, and sulphur analyses on 50 g pulp samples.
The samples were analysed for copper using atomic absorption spectroscopy (AAS) at the SGS Vespasiano (method AAS40B for samples with Cu <0.5 % and method AAS41B for samples with Cu >0.5%) and Intertek (method GA50 for samples with Cu <0.5% and method GA51 for samples with Cu >0.5%) laboratories. Samples were also analysed for cobalt, molybdenum, iron using AAS and for sulphur using a Leco analyser (method CSA17V).
The QP is of the opinion that the sample preparation, quality assurance and quality (QA/QC) procedures and the use of industry standard analytical techniques for copper analysis can be considered adequate for mineral resource estimation for the 2021 FSU.
11.5Quality Assurance and Quality Control Programs
QA/QC measures were established to ensure the reliability of the exploration drilling database. These measures include written field procedures and independent verifications of aspects such as drilling, surveying, sampling and assaying, data management and database integrity. Appropriate documentation of quality control measures and regular analysis of quality control data are important safeguards of project data and form the basis for the quality assurance program implemented during exploration.
Analytical control measures involve internal and external laboratory control measures, implemented to monitor the precision and accuracy of the sampling, preparation and assaying. They are also important in preventing sample mix-up and monitoring the voluntary or inadvertent contamination of samples.
Assaying protocols typically involve regularly duplicating and replicating assays and inserting quality control samples to monitor the reliability of assaying results throughout the sampling and assaying process. Check assaying is performed as an additional test of the reliability of the assaying results; it generally involves re-assaying a set number of sample rejects and pulps at a secondary umpire laboratory.
MCSA relied on the internal analytical quality control measures implemented by the SGS Vespasiano and Intertek laboratories. Additionally, MCSA implemented external analytical control measures consisting of inserting control samples (standard reference and blank material and replicate assays) in all sample batches submitted to these laboratories for assaying.
| | | | | |
| Boa Esperança Project | Page 69 |
| NI 43-101 Technical Report Feasibility Study | October 2021 |
The blank material used by MCSA is not a certified material; it consists of rhyolite and rhyodacite dikes from the Boa Esperança project area. These samples were prepared internally.
MCSA implemented three copper standards obtained from SGS Geosol in Belo Horizonte, Brazil. Their characteristics are listed in Table 11-1. Control samples were inserted in one of approximately every seven samples; analyses of replicate pulp assays of mineralized rock were also completed. Each batch of drilling samples (40 samples per batch) consisted of one duplicate sample, one blank sample, and three standards. MCSA did not use an umpire laboratory during the drilling campaigns.
Table 11-1: Specifications of Standard Reference Materials Used by MCSA for the Boa Esperança Copper Project
| | | | | | | | | | | | | | |
| Standard Reference Material | Source | Reference Value (Cu%) | Standard Deviation | Number of Samples |
| SGS LG | SGS | 0.2048 | 0.0037 | 177 |
| SGS MG | SGS | 0.6063 | 0.0137 | 172 |
| SGS HG | SGS | 1.1018 | 0.0691 | 251 |
11.6QP Comments
It is the QP’s opinion that the sampling preparation, security, and analytical procedures used by MCSA, SGS Geosol and Intertek laboratories are consistent with generally accepted industry best practices. The QP considers the exploration data collected by Codelco and MCSA to be of sufficient quality to support Mineral Resource estimation.
| | | | | |
| Boa Esperança Project | Page 70 |
| NI 43-101 Technical Report Feasibility Study | October 2021 |
12DATA VERIFICATION
12.1Procedures
Ausenco verified the database by checking more than 10% of the database against the original laboratory certificates and found no significant errors. About 25% of the drillhole collars were also checked against original certificates for accuracy.
MCSA had a QA/QC program in place and regularly monitored the results.
12.2Verification of Analytical Quality Control Data
MCSA provided Ausenco with external analytical control data containing the assay results of the quality control samples from the Boa Esperança copper project. All data were provided in Microsoft Excel spreadsheets. Control samples (blank and standard reference materials) were summarized in time-series plots to highlight their performance. Paired data (pulp duplicates) were analysed using bias charts, quantile-quantile plots and relative precision plots.
The external analytical quality control data produced for the Boa Esperança copper project are summarized in Table 12-1. The external quality control data produced for this Project represent around 5% of the total number of samples assayed.
Table 12-1: Summary of Analytical Quality Control Data Produced by MCSA on the Boa Esperança Copper Project
| | | | | | | | |
| Total | (%) |
| Sample count | 22,436 | |
| Blanks | 270 | 1.20% |
| Standards | 600 | 2.67% |
| Pulp replicates | 268 | 1.19% |
| Total QC Samples | 1,138 | 5.07% |
Blank samples were analysed for five elements (Cu, Co, Mo, Fe and S). The most relevant of these elements, Cu, particularly in the latest drilling campaigns, yielded values below the 0.1% warning limit. In the blank results for the 2008–2009 drilling campaign, more than 20% of the results are above the upper limit. According to SRK (SRK, 2012), MCSA reported that some of the blanks from this campaign were from a contaminated blank material, and the material had been changed.
All blank results from the 2010 and 2012 drilling campaigns were below the upper limit. In the 2013 drilling campaign, 3% of samples were above the upper limit.
MCSA used one high-grade standard reference material during the 2008–2009 campaign. In more recent years, three standard reference materials (low-grade, medium-grade and high-grade) were used.
| | | | | |
| Boa Esperança Project | Page 71 |
| NI 43-101 Technical Report Feasibility Study | October 2021 |
SGS and Intertek delivered consistent copper results, mostly within two standard deviations. The results for the high-grade standard reference material show consistently lower values than expected in all drilling campaigns. This shows that there is a negative bias for the high-grade standard reference material.
In the 2010 drilling campaign there are two results for the medium-grade standard reference material that appear to be mislabeled. This is also the case for the low-grade and medium-grade standard reference materials during the 2012 drilling campaign.
Paired assay data examined by Ausenco show that assay results can be reproduced by the SGS Geosol and Intertek laboratories from duplicate pulp with high confidence. Rank half absolute difference (HARD) plots show that for the 2008–2009 samples, 74% have a HARD below 10%, while for 2010 samples, 75% have a HARD below 10%, for 2012 samples, 88% have a HARD below 10 % and for 2013 samples, 84.6% have a HARD below10 %. In addition, all duplicate pairs have a correlation coefficient of 0.98 or higher.
MCSA did not use an umpire laboratory for testing.
In general, Ausenco considers the analytical quality control data delivered by the laboratories used by MCSA and reviewed by Ausenco to be sufficiently reliable for the purpose of Mineral Resource estimation.
12.3Data Adequacy
The database used to derive the geological model included topographical data, information from the drill hole database and data for each sampling interval (test values for each controlled variable, lithological descriptions and deviation measures when appropriate). These data were obtained by application of industry best practices and verified by a consistent QA/QC routine, which was applied not only to data but also to the estimation methodology as a whole.
The systems and procedures used by Codelco and MCSA limit the possibility of errors occurring in the data. To validate the database, randomly-selected drill holes were audited against the original logs and assay reports. The database was then imported to Micromine software where the data were tested using specific procedures to find the following possible errors:
•The drillhole name appears in the collar file, but is not missing from the analytical database;
•The drillhole name appears in the analytical database, but is missing from the collar file;
•The drillhole name is duplicated in the analytical database and in the collar file;
•The drillhole name is missing from the collar file and the analytical database;
•One or more coordinates are missing in the collar file;
•FROM or TO are missing in the analytical database;
•FROM > TO in the analytical database;
•Sample intervals are not continuous in the analytical database (there are breaks between the records);
•Sample intervals overlap in analytical database;
| | | | | |
| Boa Esperança Project | Page 72 |
| NI 43-101 Technical Report Feasibility Study | October 2021 |
•The first sample does not correspond to 0 m in the analytical database;
•The azimuth is not in the range of 0–360 degrees;
•The dip angle is not in the range of 0–90 degrees;
•Azimuth or dip angle are missing;
•The total depth of the hole is shorter than the last sample depth.
The analytical database consists of Cu, Co, Mo, Fe and S assay data. Intervals that were not sampled in drillholes were assigned a sample prefix “NS” and those missing intervals were assigned numerical values corresponding to half of the lower detection limit for each element.
Assay values below the lower detection limit were assigned numerical values corresponding to half of the lower detection limit for each element.
It is the QP’s opinion that the database was adequately verified and is suitable for use in Mineral Resource estimation.
| | | | | |
| Boa Esperança Project | Page 73 |
| NI 43-101 Technical Report Feasibility Study | October 2021 |
13MINERAL PROCESSING AND METALLURGICAL TESTING
13.1Introduction
A series of metallurgical test work programs have been performed on samples from the deposit since MCSA purchased the property in 2007. The initial test programs by Centro de Investigaciones Minero Metalúrgicas (CIMM) in 2007 and 2009 were preliminary and focused on the selection of flotation methods by comparing a bulk and a sequential flotation flowsheet. The recommended sequential flotation was further investigated in 2012 by SGS Geosol on variability samples. In 2015, SGS Geosol completed a complex test program to investigate the amenability of the mineralization to pre-concentration by jigging, flotation tests on the pre-concentrated samples, rougher flotation, and magnetic separation on flotation tailings.
Additional test programs were performed to determine the crushability and grindability of the samples, as well as the dewatering characteristics of the flotation concentrate and tailings samples by equipment suppliers.
13.2Sample Selection
Two main rock types were recognized, granite (GRA) and breccia (BXX). In all the testwork, master composite samples were constructed as a blend of 50% GRA and 50% BXX, while variability composite samples in the 2012 SGS Geosol tests were prepared to represent the individual GRA and BXX rock types. Sample selection is described as follows:
•2009 CIMM testwork program was based on one master composite sample that represented the average mineralization;
•2012 SGS test program included a single 200-kg master composite sample and six 50-kg variability samples. These samples represented low-, medium-, and high-grade GRA and BXX rock types. Table 13-1 summarizes the sample composition, lithology, and copper grades.
•2015 SGS Geosol samples were composited from an additional drilling program to assess the pre-concentration stage. Twenty-eight holes were drilled to generate the jigging samples, with approximately 2,500 kg per sample for each rock type. As summarized in Table 13-2, the GRA sample grade is low ranging 0.27–0.45% Cu whereas the BXX sample grade is >1% Cu.
| | | | | |
| Boa Esperança Project | Page 74 |
| NI 43-101 Technical Report Feasibility Study | October 2021 |
Table 13-1: 2012 SGS Geosol Sample Compositions Summary
| | | | | | | | | | | | | | | | | |
| Composite Sample | Drill Holes | Lithology | Intervals | Interval Samples | Cu % Range |
| Master | BSPD61, 62b, 63–66 | BXX, BXQ | 44.4–229.5 | 36 | 0.9–2.8 |
| BSPD85–95, 103 | GRA, GRB, GRF | 64.1–319.6 | 78 | 0.3–3.0 |
| BSPD96–101 | BXG, BXQ, BXX, GRA, GRB | 79.1–484.2 | 55 | 0.3–3.9 |
| GRA-AT | BSPD73, 78, 80–83, 85, 86, 88, 94 | GRA, GRB | 91.3–335.5 | 28 | 0.9–2.6 |
| GRA-MT | BSPD71, 79, 81, 82, 84, 85, 87, 90, 96, 97, 100, 102, 103 | GRA, GRB, GRF | 68.6–384.1 | 23 | 0.5-0.8 |
| BSPD94 | GRB | 98.8–106.3 | 4 | 1.9–6.0 |
| GRA-BT | BSPD80–84 | GRA, GRB | 62.6–396.8 | 16 | 0.3–0.5 |
| BXX-AT | BSPD70, 71, 73 | BXX, BXQ | 112.8–337.6 | 23 | 0.9–3.6 |
| BXX-MT | BSPD61, 62b, 63, 64, 66, 80, 84, 85, 93, 96, 97 | BXX, BXQ | 60.1–417.6 | 21 | 0.6–0.9 |
| BXX-BT | BSPD62b, 66 ,67, 70, 71, 78–80 | BXX, BXQ | 68.7–293.2 | 18 | 0.3–0.5 |
Table 13-2: 2015 SGS Sample Compositions Summary
| | | | | | | | | | | | | | | | | | | | | | | |
| Composite Sample | Drilling Holes | Lithology | Intervals | Interval Samples | Mass (kg) | Cu % Range | Cu % Ave |
| GRA | BSPD-127, 137–143, 150–156, 161 | Granite | 25.0–390.4 | 679 | 2,527 | 0.22–0.48 | 0.33 |
| BXX | BSPD128, 129, 131–139, 141, 146–156, 161 | Breccia | 36.7–387.4 | 748 | 2,569 | 0.34–4.11 | 1.11 |
13.3Mineralogy
A preliminary mineralogical evaluation was performed by CIMM on master samples. The results are shown in Table 13-3 and Table 13-4. Chalcopyrite is the dominant copper sulphide mineral accounting for approximately 94% of the copper sulphides. Digenite and covellite are two other copper-bearing minerals, each contributing 3% to the copper bearing minerals.
| | | | | |
| Boa Esperança Project | Page 75 |
| NI 43-101 Technical Report Feasibility Study | October 2021 |
Table 13-3: Main Mineral Composition for Boa Esperança Test Composite
| | | | | | | | | | | | | | | | | |
| Minerals | % Mass | % S | % Cu | % Fe | % Mo |
| Chalcopyrite | 2.06 | 0.72 | 0.71 | 0.63 | - |
| Digente | 0.07 | 0.01 | 0.05 | - | - |
| Covellite | 0.07 | 0.02 | 0.04 | - | - |
| Pyrite | 7.72 | 4.13 | - | 3.59 | - |
| Molybdenite | 0.013 | 0.005 | - | - | 0.008 |
| Magnetite | 10.50 | - | - | 7.60 | - |
| Hematite | 0.35 | - | - | 0.24 | - |
| Limonite | 0.02 | - | - | 0.01 | - |
| Rutile | 0.07 | - | - | - | - |
| Silicate gangue | 79.13 | (*) | - | (*) | - |
| TOTAL | 100.00 | 4.89 | 0.81 | 12.08 | 0.01 |
Table 13-4: Mass Mineralogical Composition of the Copper Sulphides
| | | | | | | | | | | | | | | | | |
| Minerals | % Weight | % S | % Cu | % Fe | %Zn |
| Chalcopyrite | 93.97 | 32.83 | 32.55 | 28.59 | - |
| Digenite | 3.00 | 0.66 | 2.35 | - | - |
| Covellite | 3.03 | 1.01 | 2.01 | - | - |
| TOTAL | 100.00 | 34.51 | 36.91 | 28.59 | - |
13.4Head Grade Analysis
Multiple elemental analyses were performed on head samples tested during the 2009–2015 testwork programs. Table 13-5 lists the main grades of copper, total iron, and total sulphur, together with other relevant elements that may be potentially recoverable or deleterious. the following observations can be made:
•Copper assays of the master samples in the 2009 CIMM and 2012 SGS Geosol tests were similar, as 0.81% Cu and 0.86% Cu, respectively. Although the 2015 SGS Geosol master sample contained a lower copper grade of 0.66% Cu, the pre-concentrated master sample had a similar copper concentration at 0.90% Cu;
•Molybdenum and cobalt are present in the tested samples at levels that could be economically recovered. Elevated iron is also noted especially with BXX samples;
•Arsenic, antimony, fluorine, mercury, and bismuth levels are not at concentrations that would cause these elements to be deleterious.
| | | | | |
| Boa Esperança Project | Page 76 |
| NI 43-101 Technical Report Feasibility Study | October 2021 |
Table 13-5: Sample Head Assays
| | | | | | | | | | | | | | | | | | | | | | | | | | | | | | | | | | | | | | |
| Grade | 2009 CIMM | 2012 SGS Geosol | 2015 SGS Geosol |
| Master | Master | GRA-AT | GRA-MT | GRA-BT | BXX-AT | BXX-MT | BXX-BT | Master3 | GRA3 | BXX3 | Pre-Concentrated Master |
| Cu (%) | 0.81 | 0.86 | 1.95 | 0.67 | 0.34 | 1.53 | 0.68 | 0.45 | 0.67 | 0.32 | 1.03 | 0.90 |
| Fe (%) | 12.90 | 14.80 | 15.00 | 11.20 | 7.60 | 23.90 | 19.70 | 20.10 | 13.4 | 10.4 | 16.4 | 18.50 |
| S (%) | 4.89 | 4.60 | 6.90 | 3.10 | 1.70 | 12.00 | 7.60 | 6.00 | 5.2 | 3.3 | 7.1 | 6.32 |
| Co (%) | 0.025 | 0.024 | 0.037 | 0.023 | 0.010 | 0.036 | 0.037 | 0.040 | n/a | n/a | n/a | 0.044 |
| Mo (%) | 0.010 | 0.007 | 0.004 | <0.001 | <0.001 | 0.018 | 0.041 | 0.009 | n/a | n/a | n/a | 0.010 |
| As (%) | <0.005 | 0.0001 | 0.0003 | 0.0002 | 0.0002 | 0.0002 | 0.0002 | 0.0001 | n/a | n/a | n/a | 0.002 |
| Sb (ppm) | <0.005% | <0.05 | <0.05 | <0.05 | <0.05 | <0.05 | <0.05 | <0.05 | n/a | n/a | n/a | <10 |
| Zn (%) | n/a | 0.009 | 0.007 | 0.025 | 0.013 | 0.020 | 0.009 | 0.018 | n/a | n/a | n/a | 0.001 |
| Pb (%) | 0.005 | 0.008 | 0.007 | 0.013 | 0.011 | 0.012 | 0.006 | 0.015 | n/a | n/a | n/a | 0.003 |
| Hg (ppm) | n/a | 0.02 | 0.02 | 0.04 | 0.23 | 0.10 | 0.02 | 0.02 | n/a | n/a | n/a | n/a |
| Bi (ppm) | <0.005% | 1.02 | 1.24 | 0.85 | 0.74 | 1.78 | 1.06 | 0.85 | n/a | n/a | n/a | 22 |
| Cl (%) | <0.010 | 0.02 | 0.01 | 0.006 | 0.014 | 0.006 | 0.006 | 0.008 | n/a | n/a | n/a | n/a |
| F (%) | n/a | 0.16 | 0.08 | 0.12 | 0.14 | 0.16 | 0.52 | 0.30 | n/a | n/a | n/a | n/a |
Notes:
1.GRA-AT: GRA high-grade sample; GRA-Mt: GRA medium-grade sample; GRA-BT: GRA low-grade sample
2. BXX-AT: BXX high-grade sample; BXX-Mt: BXX medium-grade sample; BXX-BT: BXX low-grade sample
3. Feed grades in 2015 SGS Geosol testwork obtained from pilot scale jigging tests
13.5Sample Characteristics
13.5.1Crushability and Grindability
The head samples were subjected to comminution testing during the 2009 CIMM and 2012 SGS Geosol test programs to establish comminution characteristic parameters. Comminution testing consisted of the determinations of crusher work index (CWi), crushability MACON (Cr), Bond rod mill work index (RWi), Bond ball mill work index (BWi), and Bond abrasion index (Ai). Table 13-6 summarizes the results of both test programs, which indicate that the samples are abrasive, and should be considered as easy/medium materials for crushing and medium/hard for ball milling process. Specific observations of these results are as follows:
•The 2009 CIMM samples had a CWi of 8.1 kWh/t, obtained from a low energy impact test, and a BWi of 15.8 kWh/t;
•The 2012 SGS Geosol samples had a Cr range from 34–47%, a RWi range from 14.9–18.1 kWh/t with an average of 16.7 kWh/t, BWis ranged from 13.9–17.0 kWh/t with an average of 15.7 kWh/t. The average Ais ranged from 0.321–0.536 g with an average of 0.419 g;
•The 2015 SGS Geosol pre-concentrated master sample was harder than the master composite samples used in the 2009 CIMM and 2012 SGS Geosol testing programs.
| | | | | |
| Boa Esperança Project | Page 77 |
| NI 43-101 Technical Report Feasibility Study | October 2021 |
Table 13-6: Hardness and Abrasion Test Results
| | | | | | | | | | | | | | | | | | | | | | | | | | |
| Test Program | Test Lab | Composite Sample | CWi (kWh/t) | Cr (MACON) (%) | RWi (kWh/t) | BWi (kWh/t) | Ai (g) | Specific Gravity |
| 2009 CIMM | SGS | Master | 8.1 | n/a | n/a | 15.76 | 0.356 | 2.95 |
| 2012 SGS Geosol | Metso | Master | n/a | 38.87 | 16.59 | 15.83 | 0.430 | 3.23 |
| GRA-AT | n/a | 40.11 | 16.36 | 13.92 | 0.438 | 3.08 |
| GRA-MT | n/a | 39.10 | 17.08 | 16.46 | 0.467 | 3.00 |
| GRA-BT | n/a | 33.85 | 18.07 | 17.01 | 0.536 | 2.98 |
| BXX-AT | n/a | 46.59 | 14.93 | 14.68 | 0.419 | 3.40 |
| BXX-MT | n/a | 41.89 | 16.97 | 17.03 | 0.321 | 2.92 |
| BXX-BT | n/a | 40.79 | 16.81 | 15.19 | 0.397 | 2.90 |
| 2015 SGS Geosol | SGS | Pre-concentrated master | n/a | n/a | n/a | 17.25 | n/a | n/a |
13.6Pre-Concentration Test
Initial pre-concentration tests were performed by a team led by Dr. Jose de Aquino and Mintec. Test results indicated that a pre-concentration process could separate significant gangue minerals from the tested GRA and BXX samples. A comprehensive jigging test campaign was completed in 2015 by SGSV espasiano.
13.6.12015 SGS Geosol Jigging Test
Batch-scale and pilot-scale jigging tests were performed on GRA and BXX lithology samples as well as the master samples using the size fraction -12.5 + 3 mm. Results from these tests are shown in Table 13-7. A review of the results indicated that:
•In the batch-scale jigging tests, about 50% of the feed was rejected to the gravity separation tailings as observed for all the tested samples. In the pilot jigging tests, mass split to tailings ranged from 42– 48%, which is still considered to be a high rejection;
•Copper loss to tailings was observed to be highest with GRA samples and lowest with BXX samples.
Table 13-7: 2015 SGS Jigging Test Results
| | | | | | | | | | | | | | | | | | | | | | | | | | | | | | | | |
| Samples | Batch Scale | Pilot Scale1 |
Feed 2 Cu (%) | Con Cu (%) | Mass% Split to Tail | Tail Cu (%) | Cu Rec (%) | Feed 2 Cu (%) | Con Cu (%) | Mass% Split to Tail | Tail Cu (%) | Cu Rec (%) |
| GRA | 0.25 | 0.40 | 50.0 | 0.10 | 80.2 | 0.22 | 0.31 | 41.7 | 0.10 | 81.9 |
| BXX | 0.93 | 1.72 | 50.0 | 0.14 | 92.6 | 0.83 | 1.37 | 45.8 | 0.19 | 89.5 |
Master1 | 0.58 | 1.00 | 50.0 | 0.15 | 86.6 | 0.54 | 0.90 | 47.7 | 0.15 | 87.0 |
Notes: 1. Average jigging results; 2. Calculated feed grade
| | | | | |
| Boa Esperança Project | Page 78 |
| NI 43-101 Technical Report Feasibility Study | October 2021 |
13.7Flotation Testwork
13.7.1Flotation Condition Tests
13.7.1.1Primary Grind Size
The impacts of primary grind size on copper recovery were investigated by CIMM and SGS Geosol. The 2009 CIMM test included rougher flotation, and one-stage cleaner flotation on the rougher concentrate without regrind. The 2012 SGS Geosol tests included only a rougher flotation stage.
As seen in Table 13-8, both testwork programs indicated that rougher copper recovery was less dependent on the primary grind size. The rougher flotation recovery (R1 to R3) from the 2012 SGS Geosol tests was lower than the 2009 CIMM tests, which was further optimized in tests R4 toR9. The resultant rougher copper recovery is 94.3% on average, which is comparable with the CIMM work, however, at a lower rougher concentrate copper grade.
Table 13-8: Summary of 2009 and 2012 Flotation Tests Results
| | | | | | | | | | | | | | | | | | | | | | | | | | | | | | | | |
| 2009 CIMM | 2012 SGS Geosol |
| Test | Primary Grind | Cu Rou Rec (%) | Rou Con Cu (%) | Cu Cleaner Rec1 (%) | Cleaner Con Cu (%) | Test | Primary Grind | Cu Rou Rec (%) | Rou Con Cu (%) | |
| T-1 | 30% +106 µm | 98.6 | 7.80 | 92.4 | 20.4 | R1 | 50% +106 µm | 87.1 | 7.08 | |
| T-2 | 45% +106 µm | 98.4 | 8.11 | 79.5 | 22.4 | R2 | 40% +106 µm | 86.7 | 8.33 | |
| | | | | | R3 | 25% +106 µm | 87.5 | 9.62 | |
| | | | | | R4-92 | 25% +106 µm | 94.3 | 3.95 | |
Notes:
1. Cleaner recovery to head grades
2. Weighted average tests R4 to R9 of 2012 SGS Geosol test program
Additional comparative rougher flotation tests were conducted on the 2012 SGS Geosol sample by Caraiba and SGS Geosol operators to verify the initial observations made on the primary grind size impacts. The rougher grade–recovery curve is shown in Figure 13-1. It is evident that finer primary grind produces a better rougher concentrate grade. However, rougher concentrate recovery and copper grade achieved in the 2012 SGS Geosol testwork program were lower than those achieved in the 2009 CIMM tests.
| | | | | |
| Boa Esperança Project | Page 79 |
| NI 43-101 Technical Report Feasibility Study | October 2021 |
Figure 13-1: 2012 SGS Geosol Rougher Copper Recovery and Grade
Note: Figure prepared by SGS Geosol, 2012.
13.7.1.2Rougher Flotation pH
The influence of pH in rougher flotation was investigated in the 2009 CIMM test work program. Results from these tests indicated that rougher copper recovery was not sensitive to the tested pH levels of 8.4, 9.5 and 10.5. However, variations in the pH had relatively more significant impacts on cleaner flotation. The cleaner copper concentrate obtained at a lower rougher pH of 8.4 was 73.9% copper recovery grading 15.9% Cu, which was inferior to the concentrates obtained at a higher rougher pH of 10.5 with a 93.7% copper recovery grading 20.4% Cu.
A lower rougher pH was more favourable for molybdenum recovery. Two additional optimization tests (T-7 and T-8) were conducted with a rougher pH of 7.0, which showed that rougher molybdenum recovery of >70% could be achieved. Flotation pH condition results are shown in Table 13-9.
| | | | | |
| Boa Esperança Project | Page 80 |
| NI 43-101 Technical Report Feasibility Study | October 2021 |
Table 13-9: Flotation pH Condition Results – 2009 CIMM
| | | | | | | | | | | | | | | | | | | | | | | | | | | | | |
| Test | Primary Grind | Rougher pH | Cleaner pH | Rougher Rec (%) | Cleaner Rec1 (%) | Cleaner Con Grade (%) |
| Cu | Mo | Cu | Mo | Cu | Mo |
| T-5 | 30% +106 µm | 7.0 | 11.0 | 99.0 | 70.2 | 49.7 | 30.5 | 8.2 | 0.05 |
| T-3 | 30% +106 µm | 8.4 | 11.0 | 97.5 | 51.7 | 73.9 | 49.5 | 15.9 | 0.08 |
| T-4 | 30% +106 µm | 9.5 | 11.0 | 98.3 | 51.6 | 80.4 | 53.2 | 12.9 | 0.09 |
| T-1 | 30% +106 µm | 10.5 | 11.0 | 98.6 | 44.7 | 93.7 | 41.2 | 20.44 | 0.05 |
Notes:
1. Cleaner recovery to head grades.
13.7.1.3Rougher Kinetics
Both SGS Geosol and CIMM tested the rougher flotation kinetics using different conditions. The test program and results are described as follows:
•The CIMM testing program conducted rougher flotation kinetics tests on the master samples at a pH of 7.0 to produce a bulk rougher concentrate. The solids density of the rougher flotation was 38% by weight, and the sample size P80 was 127 µm (or 30%+106 µm). The rougher kinetics data plot is presented in Figure 13-2. It can be seen that a total of seven minutes was required for the bulk rougher flotation at the specified conditions;
Figure 13-2: 2009 CIMM Rougher Kinetics
Note: Figure prepared by CIMM, 2009.
| | | | | |
| Boa Esperança Project | Page 81 |
| NI 43-101 Technical Report Feasibility Study | October 2021 |
•The 2012 SGS Geosol flotation kinetics tests (Figure 13-3) were conducted at a solids density of 35% by weight, pH 10.5 to produce a copper concentrate. Three samples particle size were tested, including 25%, 40%, and 50% particles >106 µm. Figure 13-3 shows the finer grind size samples. It appears that after approximately eight minutes, the rougher flotation had reached completion as the incremental concentrate copper grade is equal to the feed copper grade.
Figure 13-3: 2012 SGS Geosol Rougher Kinetics with 25%+106 µm Master Sample
Note: Figure prepared by SGS Geosol, 2012.
•The 2015 SGS Geosol testwork program was conducted on pre-concentrated samples. Results for rougher flotation kinetics indicated that after six minutes of flotation, copper recovery of 98% at 6.72% Cu could be achieved. This aligns with the 2009 CIMM rougher dynamic test results.
13.7.1.4Cleaner Kinetics
CIMM performed two cleaner flotation kinetics tests (TA-02 and TA-03) using the consequential flotation flowsheet. Test TA-02 was performed on the reground rougher concentrate at P80 of 325 Tyler mesh or 44 µm. Test conditions for TA-03 were similar to those for TA-02 except that TA-03 was conducted on the rougher concentrate samples without regrinding. The results obtained from these two tests are shown for comparison in Figure 13-4.
| | | | | |
| Boa Esperança Project | Page 82 |
| NI 43-101 Technical Report Feasibility Study | October 2021 |
Figure 13-4: Cleaner Flotation Kinetics (a) reground rougher concentrate samples with regrind (b) reground rougher concentrate samples without regrind
Note: Figure prepared by CIMM, 2009.
| | | | | |
| Boa Esperança Project | Page 83 |
| NI 43-101 Technical Report Feasibility Study | October 2021 |
The results indicate that a total of five minutes was required for the cleaner flotation on the reground rougher concentrates. A copper concentrate with 20.7% Cu was produced after one minute of flotation with mass pull as high as 43.5%. Without regrinding, the cleaner flotation still required a retention time of 5.5 minutes. However, the copper concentrate grade dropped to 14.6% Cu at a higher mass pull of 54.6%
13.7.2Rougher Variability Flotation Tests
Several rougher flotation tests were conducted by SGS Geosol on variability samples. The test conditions included:
•8 minutes retention time;
•35% solids density;
•pH level of 10.5;
•25% +106 primary grind size.
Results from these tests indicated that the high-grade samples, GRA-AT and BXX-AT, produced a much lower copper recovery of 72% and 68% respectively compared to the medium- and low-grade samples that had recoveries ranging from 88–93%. The enrichment ratio of the high-grade samples was also found to be lower at 3.6 and 3.5 when compared to the 5.0–5.8 ratio of the lower-grade samples. This suggested that flotation conditions for the high-grade samples could be optimized.
13.7.3Open Circuit Cleaner Flotation Tests
In the 2012 SGS Geosol testing program, the cleaner flotation tests conducted included optimization work for test conditions on both master and variability samples, and cleaner verification tests at the optimized test conditions using variability samples. The optimization testing investigated air flow rate, pH level, flotation retention time, and reagent dosage. The regrind size was fixed as a P80 of 38 µm, with no further testing conducted on regrinding of the rougher concentrate.
The following observations were made:
•Similar to the observations from the rougher variability tests, higher-grade samples required longer retention times and higher collector dosages. The reported rougher flotation time was between 6–12 minutes with a collector dosage of 27 g/t or 35 g/t;
•Rougher pH, at 10.0 and 10.5, had little impacts on rougher recovery as observed from all the samples; however, higher pH seemed to be beneficial for the cleaner flotation process, producing a higher grade or recovery;
•Under similar test conditions, the GRA samples exhibited better metallurgical performance by producing higher copper grades in the final concentrate.
13.7.4Locked-Cycle Flotation Tests
A sequential flotation concept was employed in all three reviewed testwork programs to produce a copper concentrate and a pyrite concentrate. The pyrite concentrate was produced to separate the high sulphur materials with acid-generating potential for tailings management purposes. Bench-scale locked cycle tests were conducted by CIMM and SGS Geosol to investigate the metallurgical performance. CIMM completed a mini-pilot locked cycle test (LCT). However, the results were not considered representative due to technical issues encountered during the mini-pilot testing.
13.7.4.1LCT General Flowsheet
Figure 13-5 shows a simplified process flowsheet employed in the 2012 SGS Geosol testing. The copper separation process consisted of a rougher flotation stage, rougher concentrate regrind, and a two-stage cleaner flotation. The second cleaner flotation tailings and the cleaner scavenger concentrate were recirculated to the first cleaner flotation stage. Rougher tailings were combined with cleaner scavenger tailings and sent to the pyrite flotation circuit to produce pyrite concentrate for a separate disposal plan.
| | | | | |
| Boa Esperança Project | Page 84 |
| NI 43-101 Technical Report Feasibility Study | October 2021 |
The other two testwork programs used a similar flowsheet to the 2012 SGS Geosol test program. The 2009 CIMM flowsheet included a cleaner pyrite flotation stage whereas the 2015 SGS Geosol flowsheet had a magnetic separation stage to treat the pyrite flotation tailings.
Figure 13-5: Locked Cycle Flotation Test Flowsheet During The 2012 SGS Test Program
Note: Figure prepared by SGS Geosol, 2012.
13.7.4.2LCT Test Conditions
A comparison of locked cycle test conditions established during all testwork programs are summarized in Table 13-10, which includes grind size, solids density, pH level and flotation time for copper and pyrite flotation, as well as magnetic separation field strength. It should be noted that the 2012 SGS Geosol test conditions refer to tests conducted on master samples only.
| | | | | |
| Boa Esperança Project | Page 85 |
| NI 43-101 Technical Report Feasibility Study | October 2021 |
Table 13-10: LCT Test Conditions For All Test Work Programs
| | | | | | | | | | | | | | |
| Items | | 2009 CIMM Bench Scale LCT | 2012 SGS Geosol LCT | 2015 SGS Geosol LCT |
| Primary grind | P80 | 129 µm | 113 µm | 106 µm |
| Copper rougher | Solids % | 38% | 35% | - |
| pH | 10.5 | 10.9 | 11.1 |
| Time | 8 min | 8 min | 6 min |
| Regrind | P80 | 45 µm | 38 µm | 45 µm |
Copper 1st cleaner | pH | 11.0 | 10.9 | 11.5 |
| Time | 4 min | 3 min | 2 min |
| Copper cleaner scavenger | pH | 11.0 | 10.7 | 11.5 |
| Time | 7 min | 6 min | 4 min |
| Copper re-cleaner | pH | pH 11.0 | 11.1 | 11.5 |
| Time | 4 min | 3 min | 2.5 min |
| Pyrite rougher | Solids % | 38% | 35% | - |
| pH | 7.0 | 7.0 | 7.5 |
| Time | 7 min – TC 01 4 min – TC 02 | 8 min | 5 min |
| Pyrite cleaner | pH | 7.0 | Not included | Not included |
| Time | 4 min | Not included | Not included |
| Magnetic separation | Strength | Not included | Not included | 1,000 Gauss |
13.7.4.3LCT Test Results
Table 13-11 and Table 13-12 summarize the locked cycle flotation results obtained from the CIMM and SGS Geosol testwork programs. The following observations can be made:
•Copper concentrate grade assaying at 28% Cu or higher was achieved from the tested master samples. The 2015 SGS Geosol test program with a pre-concentration stage produced the highest concentrate grade of 28.9% Cu;
•Copper recoveries to the head feed of 95.5% and 91.5% were achieved in the CIMM and 2012 SGS Geosol testwork programs, respectively. The 2015 SGS Geosol tests produced a lower recovery of 85.1% to the head feed because of the pre-concentration stage, even though a similar copper stage recovery of 91.7% was achieved;
•Copper recovery and copper grade achieved from tests done on variability samples in the 2012 SGS Geosol test program varied significantly. Copper grades ranged between 21.2–29.3% Cu while copper recoveries varied from 77.5–95.4%.
Table 13-11: CIMM LCTs Test Results Summary
| | | | | | | | | | | | | | | | | | | | |
| Mass Pull, % | Cu Grade, Cu% | Cu Recovery, % |
| TC 01 | TC 02 | TC 01 | TC 02 | TC 01 | TC 02 |
| Final Cu concentrate | 2.81 | 3.18 | 28.39 | 26.30 | 95.5 | 97.6 |
| Final pyrite concentrate | 6.40 | 6.18 | 0.20 | 0.17 | 1.5 | 1.2 |
| Final rails | 90.79 | 90.64 | 0.027 | 0.011 | 2.9 | 1.2 |
| Feed | 100.0 | 100.0 | 0.84 | 0.86 | 100.0 | 100.0 |
| | | | | |
| Boa Esperança Project | Page 86 |
| NI 43-101 Technical Report Feasibility Study | October 2021 |
Table 13-12: SGS LCTs Test Results Summary – 2012 and 2015
| | | | | | | | | | | | | | | | | | | | | | | | | | | | | | | | | | | | | | | | | |
| Year | Sample | Feed | Final Concentrate | Pyrite Concentrate | Final Tail |
| Wt% | Cu% | Wt% | Cu% | Cu Dist% | Wt% | Cu% | Cu Dist% | Wt% | Cu% | Cu Dist% |
| 2015 | Pre-concentrated master | 100 | 0.90 | 2.88 | 28.9 | 91.7 | 16.8 | 0.32 | 5.9 | 80.4 | 0.03 | 2.4 |
| 2012 | Master | 100 | 0.95 | 3.10 | 28.0 | 91.5 | 10.75 | 0.52 | 5.9 | 86.15 | 0.03 | 2.7 |
| GRA -AT | 100 | 1.95 | 6.35 | 29.3 | 95.4 | 13.15 | 0.56 | 3.8 | 80.50 | 0.02 | 0.8 |
| GRA -MT | 100 | 0.72 | 2.44 | 27.0 | 91.5 | 9.87 | 0.42 | 5.8 | 87.69 | 0.02 | 2.7 |
| GRA -BT | 100 | 0.35 | 1.03 | 28.5 | 84.1 | 6.92 | 0.47 | 9.2 | 92.06 | 0.03 | 6.7 |
| BXX-AT | 100 | 1.54 | 5.00 | 28.7 | 93.3 | 21.17 | 0.42 | 5.7 | 73.83 | 0.02 | 1.0 |
| BXX-MT | 100 | 0.65 | 2.30 | 24.8 | 87.9 | 15.72 | 0.42 | 10.2 | 81.93 | 0.02 | 2.5 |
| BXX-BT | 100 | 0.45 | 1.69 | 21.2 | 77.5 | 14.21 | 0.58 | 18.1 | 84.10 | 0.02 | 4.3 |
13.8Magnetic Separation Test
Further magnetic separation tests were conducted on the pyrite flotation tailings by SGS Geosol in 2015. Bench-scale tests were conducted in a Davis tube under a magnetic field strength 1,000 Gauss, and then using a Inbras-Eriez WHC-01B separator at field strength of 2,000–14,000 Gauss.
The bench-scale results showed that a lower magnetic field strength was beneficial for both rougher and scavenger magnetic separation. Based on this observation, a pilot magnetic test was performed at 1,000 Gauss in a rougher and two-stage cleaner configuration. These test results are summarized in Table 13-13. A high iron grade of 67% was reported in the 1st cleaner concentrate that could meet a marketable grade.
| | | | | |
| Boa Esperança Project | Page 87 |
| NI 43-101 Technical Report Feasibility Study | October 2021 |
Table 13-13: Pilot Magnetic Separation Tests – SGS Geosol 2015
| | | | | | | | | | | | | | |
| Wt % | Fe % | Fe Dis % | S% |
| Feed | 100.0 | 12.9 | 100.0 | 0.14 |
| Rougher concentrate | 16.0 | 60.2 | 74.8 | 0.04 |
| Rougher tail | 84.0 | 3.9 | 25.2 | 0.13 |
| 1st cleaner concentrate | 14.2 | 67.0 | 74.0 | 0.04 |
| 1st cleaner tail | 1.8 | 5.7 | 0.8 | 0.12 |
| 2nd cleaner concentrate | 14.2 | 67.2 | 73.9 | 0.04 |
| 2nd cleaner tail | 0.1 | 15.0 | 0.1 | 0.09 |
13.9Concentrate Quality
13.9.1Copper Concentrate Quality
Multiple elemental inductively-coupled plasma (ICP) results from the flotation concentrate produced by the 2012 and 2015 SGS Geosol samples are presented in Table 13-15. The main deleterious elements were shown to occur in trace quantities during this program.
Table 13-14: Copper Concentrate Chemical Elemental Assays – SGS 2012 and 2015
| | | | | | | | | | | | | | | | | | | | | | | | | | | | | | | | | | | | | | | | | |
| Year | Sample | Cu (%) | Fe (%) | S (%) | As (ppm) | Sb (ppm) | U (ppm) | Zn (ppm) | Pb (ppm) | Hg (ppm) | Bi (ppm) | Cl (ppm) | F (ppm) |
| 2015 | Pre-concentrated master | 28.9 | 32.1 | 34.6 | 47 | <10 | <20 | 27 | <0.001 | 0.07 | <10 | <20 | <50 |
| 2012 | Master | 28.0 | 28.1 | 37.9 | 2 | <0.05 | 94 | 0.002 | 0.07 | 0.02 | 18.4 | 59 | 105 |
| GRA-AT | 29.3 | 28.6 | 34.2 | 2 | 0.06 | 20 | 0.003 | 0.02 | 0.10 | 4.72 | 50 | 100 |
| GRA-MT | 27.0 | 27.6 | 34.5 | 3 | 0.10 | 51 | 0.002 | 0.04 | 0.04 | 6.39 | 119 | 150 |
| GRA-BT | 28.5 | 28.0 | 34.2 | 3 | 0.07 | 22 | 0.002 | 0.03 | 0.05 | 5.34 | 90 | 113 |
| BXX-AT | 28.7 | 30.3 | 37.4 | 2 | 0.12 | 25 | 0.001 | 0.06 | 0.05 | 5.40 | <20 | 195 |
| BXX-MT | 24.8 | 29.0 | 37.2 | 4 | 0.19 | 32 | 0.003 | 0.05 | 0.08 | 4.14 | 78 | 171 |
| BXX-BT | 21.2 | 30.1 | 40.9 | 4 | 0.12 | 112 | 0.001 | 0.11 | 0.05 | 5.46 | 63 | 217 |
13.9.2Pyrite Concentrate Quality
The 2015 SGS Geosol test program included an ICP elemental analysis of the pyrite concentrate samples. The results are summarized in Table 13-15. Elevated concentrations of cobalt, molybdenum, and vanadium were identified. These main deleterious elements, including fluorine, chlorine, uranium, arsenic, phosphorous, lead and zinc, were found to be at low concentrations levels.
| | | | | |
| Boa Esperança Project | Page 88 |
| NI 43-101 Technical Report Feasibility Study | October 2021 |
Table 13-15: Pyrite Concentrate Chemical Elemental Assays – SGS 2015
| | | | | | | | | | | | | | | | | | | | | | | | | | | | | | | | | | | |
| Sample | Cu (%) | Fe (%) | Co (ppm) | Mo (ppm) | V (ppm) | As (ppm) | Sb (ppm) | U (ppm) | Zn (ppm) | Pb (ppm) | Bi (ppm) |
| Pyrite Concentrate | 0.46 | >15 | 2,867 | 225 | 33 | <10 | <10 | <20 | 22 | 44 | <20 |
13.9.3Iron Concentrate Quality
An elemental analysis was conducted on the iron concentrate in the 2015 SGS Geosol testwork program and results are presented in Table 13-16.
Table 13-16: Iron Concentrate Chemical Elemental Assays – SGS 2015 (MAG CLN L8)
| | | | | | | | | | | | | | | | | | | | | | | | | | | | | | | | |
| Sample | Fe (%) | SiO2 (%) | Al2O3 (%) | P (%) | Ti (%) | Mn (%) | Ca (%) | Mg (%) | Na (%) | K (%) |
| Magnetic Concentrate Samples | 66.7 | 5.8 | 0.82 | 0.005 | 0.07 | 0.04 | 0.22 | 0.18 | <0.07 | 0.15 |
13.10Thickening and Filtration
13.10.1Copper Concentrate Thickening and Filtration Tests
Diemme Filtration R&D (Diemme) conducted testing to establish thickening and filtration properties of the copper concentrate. Test samples were received in the form of dry powder and test preparation methods included pulp samples of 10% solids for the settling tests and 55% solids for filtration testing.
A fast-settling rate was observed when Praestol-Ashland flocculant was used at a dosage of 50 g/t. Diemme proposed a settling rate of 0.26 t/h/m2. The filtration tests were able to achieve a moisture of 8–10% with a mixed pack of membrane filter plates with additional air-drying process. The reported cake thickness was 50 mm.
13.10.2Final Tailings and Pyrite Concentrate Thickening Tests
Outotec completed dynamic thickening tests to evaluate the settling performance of the pyrite concentrate and final tailings samples. Flocculant screening tests were performed on pyrite concentrate samples, indicating that Flocculant SNF Flonex 910SH generated a faster settling rate than flocculant SNF EM230. The dynamic thickening tests were performed using this reagent for both samples, and the results are shown in Table 13-17. Feed solids density of the pyrite concentrate samples was 21% as received, although the recommended feed solids was 24% as per the Outotec report. The tailings samples feed solids density was diluted to 18%.
| | | | | |
| Boa Esperança Project | Page 89 |
| NI 43-101 Technical Report Feasibility Study | October 2021 |
Table 13-17: Concentrate Chemical Elemental Assays
| | | | | | | | | | | | | | | | | | | | | | | | | | | | | | | | | | | | | | |
| Pyrite Concentrate | Final Tailings |
| Test | Feed Solids (%) | Settling Rate (t/h/m2) | Flocculant Dosage (g/t1) | U/F Solids (%) | O/F Solids (ppm) | Test | Diluted Feed Solids (%) | Settling Rate (t/h/m2) | Flocculant Dosage (g/t1) | U/F Solids (%) | O/F Solids (ppm) | |
| 1 | 21 | 1.0 | 10 | 62.2 | <250 | 1 | 18 | 0.7 | 15 | 72.4 | <250 | |
| 2 | 21 | 0.7 | 10 | 65.5 | <250 | 2 | 18 | 0.7 | 5 | 70.3 | 500 | |
| 3 | 21 | 0.7 | 5 | 64.8 | <250 | 3 | 18 | 1.0 | 5 | 69.7 | 800 | |
Notes:
1. Dosage based on thickener feed
13.11Pre-Concentration Assessment
During the Project gap analysis stage, Ausenco completed a circuit review memorandum to determine the viability of pre-concentration option using jigging and whether it would be able to achieve better business performance, as well as alternative comminution circuit designs for the 2021 FSU. The 2015 FS design formed the basis of the assessment. The capital and operating cost requirements, along with a strength, weakness, opportunities, and threats analysis was compared between the base case of 3CB + jigging pre-concentration, 3CB option with whole ore feed, and SABC option with whole ore feed.
The evaluation recommended that the jigging pre-concentration step be removed from the process flowsheet for the following observations:
•The mass rejection considered for the project does not result in significant reduction of the downstream plant and the associated capital cost reequipments;
•The copper contained in the preconcentration tailings can add significant value to the project when recovered to the final copper concentrate.
13.12Copper Recovery Projections
Copper recovery projection is based on a sequential flotation process flowsheet including rougher flotation, rougher concentrate regrind and two-stage cleaner flotation steps. The pre-concentration is not considered in the process. In this case, the 2012 SGS Geosol locked-cycle flotation test results were selected to evaluate the metallurgical performance of the copper mineralization. Figure 13-6 And Figure 13-7 present copper recovery and copper grade at varied feed grades based on the 2012 SGS Geosol locked-cycle test results.
| | | | | |
| Boa Esperança Project | Page 90 |
| NI 43-101 Technical Report Feasibility Study | October 2021 |
Figure 13-6: Copper Recovery vs. Copper Feed Grade
Note: Figure prepared by Ausenco, 2021.
Figure 13-7: Copper Recovery and Copper Concentrate Grade
Note: Figure prepared by Ausenco, 2021.
| | | | | |
| Boa Esperança Project | Page 91 |
| NI 43-101 Technical Report Feasibility Study | October 2021 |
A regression statistical tool was used to analyse the test data to derive the relationship between copper recovery and feed grade, as well as the copper grade and copper recovery. The equations based on this analysis are presented in Table 13-18.
Table 13-18: Copper Recovery and Grade Projections
| | | | | | | | | | | |
Copper Head Grade | GRA Copper Recovery | BXX Copper Recovery | Copper Concentrate Grade |
| 0.3 to 2.0% Cu | 95.4 x (1-exp Feed Cu% x (- 6.0)) | 93.79 x (1-exp Feed Cu% x (- 4.1)) | 0.0021 x Cu Rec%2 + 0.1089 x Cu Rec% |
| >2.0% Cu | 95.4% | 93.8% | 29.5% |
| | | | | |
| Boa Esperança Project | Page 92 |
| NI 43-101 Technical Report Feasibility Study | October 2021 |
14MINERAL RESOURCE ESTIMATES
14.1Introduction
The Mineral Resource estimate was prepared by and supervised by SDPM Mining Consulting Geologist João Estevão Júnior; Mr. Estevão is independent of MCSA as defined by NI 43-101. Work was performed under the direct supervision of Emerson Ricardo Re, MSc, MBA, MAusIMM (CP) (No. 305892), Registered Member (No. 0138) (Chilean Mining Commission), Resource Manager of Ero and a QP as such term is defined under NI 43-101.
The Mineral Resource estimate was prepared using a three-dimensional block model of 4 m x 4 m x 4 m with subblocks of 2 m x 2 m x 4 m. In addition, oxidation state and resource classification codes were assigned to each block. The resource estimate was prepared using Leapfrog Edge software.
The general procedure used for resource estimation can be described as follows:
•The drillhole data were imported into Leapfrog Geo and examined for data errors, such as overlapping intervals, missing interval data, etc. Important issues were corrected by MCSA geologists under the direct supervision of Emerson Ricard Re;
•The geological model was built in Leapfrog Geo and the lithologic domains modelled were grouped as saprolite, dike, breccia, granite-breccia, and granite;
•Low-grade wireframes were constructed at a cut-off grade of 0.2% Cu, and high-grade wireframes were constructed using a 1.00% Cu cut-off. The wireframes were built inside lithological domains, adjusting for the inclination of the mineralization, based on geological controls;
•Statistics were completed for assays within the grade shell and lithology wireframes and lognormal probability plots were examined for data outliers;
•Assays were composited into 2 m lengths from the top of the drillhole. Statistics were completed for the composites within the wireframes;
•Block grades were estimated for copper and iron using ordinary kriging (OK) with composites inside the grade shell and geological model wireframes. Nearest neighbour grades were also estimated to provide a comparative model to validate the OK grades;
•Mineral Resources were classified in accordance with the estimation pass and the anisotropic distance to the nearest composite;
•The elements considered in this study were Cu and Fe. Lessor elements of Co, Mo, S had no exploratory data analysis or resource estimates performed.
14.2Modeling Coordinate System
The drillhole collar coordinates were surveyed using UTM Zone 22/SAD-69 coordinates. The block model was constructed in the same UTM coordinate system.
| | | | | |
| Boa Esperança Project | Page 93 |
| NI 43-101 Technical Report Feasibility Study | October 2021 |
14.3Drillhole Data Analysis
The drillhole database used for Mineral Resource estimation was provided by MCSA as a database file with collar coordinate tables, down-hole surveys, lithologic codes, and assay data. The data included drillholes BSPD-01 through BSPD-163. Basic statistics for the drillhole database are shown in Table 14-1 and a drillhole location map for the drillholes used in the Mineral Resource estimate is shown in Figure 14-1.
Table 14-1: Drillhole Statistics
| | | | | | | | | | | | | | |
| Drill Hole (m) |
| Minimum Total Depth | Maximum Total Depth | Average Total Depth | Total Metres Drilled |
| 162 | 27.95 | 1,005.95 | 350.41 | 56,767.30 |
Figure 14-1: Drillhole Location Map, Drilling Used in Mineral Resource Estimation
Note: Ero Copper, 2021.
The database used for Mineral Resource estimation included the following information:
Collar data – Including drillhole identification, easting, northing, elevation and total depth.
Downhole Surveys – Conducted during drilling to measure the depth of the survey, azimuth and inclination of the drillhole. All drillholes in the main orebody were angled toward either the northwest or southeast with inclinations between 45° and 65°. The down-hole survey used was a Maxibor II instrument with reading taken every 3 m.
Assay – Including the following headings: sample number, from, to, assay interval, copper, and iron. Basic statistics for copper and the assay interval length are shown in Table 14-4.
| | | | | |
| Boa Esperança Project | Page 94 |
| NI 43-101 Technical Report Feasibility Study | October 2021 |
Mineralization – Mineralization codes were defined by the type of sulfide in drill logs.
Basic statistics for coper and the assay interval length are shown in Table 14-2. The lithology codes and a description of the codes are shown in Table 14-3. Sulfide intervals were broken down based on the relative abundance of chalcopyrite and pyrite as shown in Table 14-6.
Table 14-4: Statistics for copper and assay interval length
| | | | | | | | | | | | | | | | | |
| Type | Number | Minimum | Maximum | Average | Total Meters |
| Interval | 22,436 | 0.2 m | 212.750 m | 2.48 m | 55.609.90 |
| Cu | 22,436 | 0.00% | 12.90% | 0.22% | 55.609.90 |
Table 14-5: Lithology codes
| | | | | | | | |
| Type | Code | Description |
| No Data | SDAT | No data; no drilling recovery |
| Dike | DIQ | Dke of unknown composition |
| DAC | Dacitic dikes associated with recent structural hydrothermal systems, trending N75W |
| Microdiorite | MDI | Microdiorites; lodes associated with the most recent structural system, trending N75W |
| Breccia | BXX | Hydrothermal breccia, with a matrix composed of magnetite (mag), biotite (bio), chalcopyrite (cpy), quartz (qtz), and pyrite (py) |
| BXQ | Breccia mainly composed of quartz fragments with a matrix of mag, bio, cpy and py |
| BXG | Breccia mainly composed of granite fragments with a matrix of mag, bio, cpy, py |
| VET | Massive sulfide veins, composed predominantly of py with minor cpy and mag |
| Granite | GRA | Granite, host rock |
| GRB | Brecciated granite |
| GRG | Coarse-grained granite; porphyritic in the northern region |
| PGR | Porphyritic granite with abundant potassic feldspar |
| TON | Tonalite; possibly the host rock unaffected by potassic alteration |
| TOF | Fine-grained tonalite |
| TOB | Brecciated tonalite |
| GRF | Foliated granite which has undergone dynamic metamorphism |
| MIL | Mylonite associated with fold structures |
| GRM | Mylonitic granite associated with ductile faults |
| Metamorphic | MET | Metamorphic rock with strong compositional banding; unknown protolith |
| | | | | |
| Boa Esperança Project | Page 95 |
| NI 43-101 Technical Report Feasibility Study | October 2021 |
Table 14-6: Mineralization codes
| | | | | |
| Type | Description |
| Cpy | Abundant cpy and major py; generally, over 1% Cu |
| Cpypy | Dominant cpy and major py; generally greater than 0.3% Cu |
| Pycpy | Dominant py with traces of cpy |
| Py | Sulfide is exclusively py |
14.4Topography
The topography was obtained by Topvale Serviços Topográficos LTDA. (Topvale) using a high-precision GPS with an accuracy of <5 cm and a total station instrument. Topvale also surveyed the collar coordinates of MCSA’s drillholes. Master Planejamento LTDA. surveyed the collars of the Codelco drillholes.
MCSA supplied the topography as a DXF file of contour lines.
14.5Geologic Model
Geological models were generated by MCSA under the direct supervision of Emerson Ricardo Re. MCSA created an oxidation surface to separate the sulfide portion of the deposit from the oxide portion. The top of the sulfide was determined based on drillhole logging. Above the oxide/sulfide surface, the rock is predominantly weathered rock, saprolite, or soil.
Grade shells were built inside the host lithologies, using the geological model to constrain the shells. The lithologic domains used were breccia, granite-breccia, and granite.
SDPM, together with MCSA geologists, under the supervision of Emerson Ricardo Re, built the vertical sections and plan views at a cut-off of 0.2% Cu. The wireframes were created using 3D interpolation of samples inside the lithologic domains.
An interpreted vertical section is shown in Figure 14-2.
SDPM reviewed the copper data using histogram and probability plots inside unmineralized host rocks (Figure 14-4 - Figure 14-8). The reasons for the irregular steps in the raw data lognormal probability plot for the host rocks are the detection limits (0.0005% Cu) and defaults for missing assays.
| | | | | |
| Boa Esperança Project | Page 96 |
| NI 43-101 Technical Report Feasibility Study | October 2021 |
Figure 14-2: Illustrative digitization of hand-drawn vertical section SV_NWSE_14 used for geological model interpretation. Mineralized material is represented in pink and yellow colours
Note: Figure prepared by Ero Copper, 2021.
Interpreted mineralized zones are shown in the section as red or yellow outlines.
| | | | | |
| Boa Esperança Project | Page 97 |
| NI 43-101 Technical Report Feasibility Study | October 2021 |
Figure 14-3: Histogram of Cu_pc, filtered by BX
Note: Figure prepared by Ero Copper, 2021
Figure 14-4: Histogram of Cu_pc, filtered by GBX
Note: Figure prepared by Ero Copper, 2021
| | | | | |
| Boa Esperança Project | Page 98 |
| NI 43-101 Technical Report Feasibility Study | October 2021 |
Figure 14-5: Histogram of Cu_pc, filtered by GRA
Note: Figure prepared by Ero Copper, 2021
Figure 14-6: Log Probability of Cu_pc, filtered by BX
Note: Figure prepared by Ero Copper, 2021
| | | | | |
| Boa Esperança Project | Page 99 |
| NI 43-101 Technical Report Feasibility Study | October 2021 |
Figure 14-7: Log Probability of Cu_pc, filtered by BX
Note: Figure prepared by Ero Copper, 2021
Figure 14-8: Log Probability of Cu_pc, filtered by GRA
Note: Figure prepared by Ero Copper, 2021
| | | | | |
| Boa Esperança Project | Page 100 |
| NI 43-101 Technical Report Feasibility Study | October 2021 |
14.6Exploration Data Analysis
The raw copper assay data were first plotted on histogram and cumulative distribution graphs to understand the basic statistical distribution. The copper histogram for high-grade and low-grade domains shows positive skewness and the cumulative distribution curve illustrates the copper population for both wireframes (Figure 14-9 through Figure 14-12).
Table 14-7 presents statistics for the assays within the wireframes grouped by saprolite, dyke, high-grade, low-grade, breccia, granite breccia and granite.
Figure 14-9: Histogram of Cu_pc, filtered by HG
Note: HG denotes high-grade and LG denotes Low Grade. Ero Copper, 2021.
| | | | | |
| Boa Esperança Project | Page 101 |
| NI 43-101 Technical Report Feasibility Study | October 2021 |
Figure 14-10: Histogram of Cu_pc, filtered by LG
Note: HG denotes high-grade and LG denotes Low Grade. Ero Copper, 2021.
Figure 14-11: Log Probability of Cu_pc, filtered by HG
Note: HG denotes high-grade and LG denotes Low Grade. Ero Copper, 2021.
| | | | | |
| Boa Esperança Project | Page 102 |
| NI 43-101 Technical Report Feasibility Study | October 2021 |
Figure 14-12: Log Probability of Cu_pc, filtered by LG
Note: HG denotes high-grade and LG denotes Low Grade. Ero Copper, 2021.
Table 14-7: Statistics of assay data within the wireframes
| | | | | | | | | | | | | | | | | | | | | | | | | | |
| Assay |
| Element | Material | Mean | Std. Dev. | Coef. of Var. | Max. | Min. | Variance | No. of Data |
| Cu (%) | Saprolite | 0.03 | 0.14 | 4.87 | 4.00 | 0.00 | 0.02 | 1,316 |
| Dyke | 0.03 | 0.18 | 5.27 | 2.81 | 0.00 | 0.03 | 391 |
| Domain – high grade | 2.24 | 1.62 | 0.73 | 12.90 | 0.00 | 2.63 | 1,814 |
| Domain – low grade | 0.57 | 0.70 | 1.24 | 12.50 | 0.00 | 0.49 | 7,183 |
| Breccia | 0.08 | 0.29 | 3.67 | 7.33 | 0.00 | 0.08 | 3,128 |
| Granite breccia | 0.07 | 0.21 | 3.18 | 5.75 | 0.00 | 0.04 | 3,676 |
| Granite | 0.06 | 0.13 | 2.36 | 6.04 | 0.00 | 0.02 | 9,698 |
| Saprolite | 2.66 | 4.70 | 1.76 | 40.10 | 0.00 | 22.05 | 1316 |
| Dyke | 2.85 | 3.02 | 1.06 | 14.72 | 0.00 | 9.09 | 391 |
| Domain – high grade | 18.22 | 8.25 | 0.45 | 49.09 | 0.00 | 68.09 | 1778 |
| Fe (%) | Domain – low grade | 9.14 | 6.75 | 0.74 | 45.08 | 0.00 | 45.56 | 7068 |
| Breccia | 7.98 | 6.85 | 0.86 | 50.6 | 0.00 | 46.93 | 3079 |
| Granite breccia | 5.89 | 3.04 | 0.82 | 35.99 | 0.00 | 23.56 | 3643 |
| Granite | 3.20 | 3.97 | 0.95 | 41.99 | 0.00 | 9.27 | 9596 |
| | | | | |
| Boa Esperança Project | Page 103 |
| NI 43-101 Technical Report Feasibility Study | October 2021 |
The purpose of compositing raw assay samples is to provide composites of nearly equal length for grade estimation. The average length of the samples was 2.14 m (Figure 14-13). SDPM selected 2 m as the compositing length. The raw assay data were composited from the top of the drillhole at intervals of 2 m with breaks at the wireframe boundaries. Composites less than 1 m in length were not used in statistical calculation or resource estimates. The lognormal probability plot of the composited samples does not show a significant break in the population distribution to apply capping in the samples. Table 14-8 presents the statistical results of the composites within the wireframes for saprolite, dyke, high-grade, low-grade, breccia, granite breccia and granite.
Figure 14-13: Length Histogram Graph from Raw Assay Data
Note: Ero Copper, 2021.
| | | | | |
| Boa Esperança Project | Page 104 |
| NI 43-101 Technical Report Feasibility Study | October 2021 |
Table 14-8: Statistics of Composite Data within the Wireframes
| | | | | | | | | | | | | | | | | | | | | | | | | | |
| Element | Material | Composites |
| Mean | Std. Dev. | Coef. of Var. | Max. | Min. | Variance | No. of Data |
| Cu (%) | Saprolite | 0.03 | 0.13 | 4.41 | 4.00 | 0.00 | 0.02 | 2,778 |
| Dyke | 0.03 | 0.17 | 4.93 | 2.54 | 0.00 | 0.03 | 637 |
| Domain – high grade | 2.25 | 1.39 | 0.62 | 9.90 | 0.00 | 1.94 | 1,114 |
| Domain – low grade | 0.56 | 0.54 | 0.96 | 8.92 | 0.00 | 0.29 | 4,905 |
| Breccia | 0.08 | 0.24 | 3.12 | 5.76 | 0.00 | 0.06 | 2,704 |
| Granite breccia | 0.06 | 0.17 | 2.74 | 4.34 | 0.00 | 0.03 | 3,885 |
| Granite | 0.05 | 0.11 | 1.97 | 3.54 | 0.00 | 0.01 | 12,173 |
| Fe (%) | Saprolite | 2.66 | 4.53 | 1.70 | 37.58 | 0.00 | 20.53 | 2,778 |
| Dyke | 2.84 | 2.94 | 1.04 | 14.72 | 0.00 | 8.64 | 637 |
| Domain – high grade | 18.31 | 7.60 | 0.42 | 48.49 | 0.00 | 57.81 | 1,090 |
| Domain – low grade | 9.10 | 6.22 | 0.68 | 42.63 | 0.00 | 38.66 | 4,799 |
| Breccia | 7.95 | 6.48 | 0.82 | 44.31 | 0.00 | 42.03 | 2,663 |
| Granite breccia | 5.88 | 4.46 | 0.76 | 35.26 | 0.00 | 19.89 | 3,847 |
| Granite | 3.18 | 2.85 | 0.90 | 39.15 | 0.00 | 8.13 | 12,019 |
Table 14-7 and Table 14-8 showed that the coefficient of variation for copper has decreased in the composites. The average grade of the assays and composites for copper showed a similar trend.
Figure 14-14: Log Probability of Cu_pc, filtered by HG
Note: HG denotes high-grade and LG denotes low-grade. Ero Copper, 2021.
| | | | | |
| Boa Esperança Project | Page 105 |
| NI 43-101 Technical Report Feasibility Study | October 2021 |
Figure 14-15: Log Probability of Cu_pc, filtered by LG
Note: HG denotes high-grade and LG denotes low-grade. Ero Copper, 2021.
14.7Contact Analysis
SDPM conducted a contact analysis for the high-grade and low-grade domains using composites ≥2 m. The study shows abrupt contacts between the domains (Figure 14-16).
| | | | | |
| Boa Esperança Project | Page 106 |
| NI 43-101 Technical Report Feasibility Study | October 2021 |
Figure 14-16: Cu_pc values in relation to HG domain
Figure 14-17: Cu_pc values in relation to LG domain
Note: Figure prepared by Ero Copper, 2021.
| | | | | |
| Boa Esperança Project | Page 107 |
| NI 43-101 Technical Report Feasibility Study | October 2021 |
14.8Specific Gravity
The specific gravity (SG) database consists of 193 core sample measurements completed by Codelco and 2,429 measurements completed by MCSA. MCSA requested that the SGS Geosol and Intertek laboratories conduct SG measurements on core pieces that MCSA had previously measured. SGS conducted the measurements twice, as their first data set was inconsistent with MCSA. While the second data set was closer, results produced by SGS were inconsistent with MCSA’s and also inconsistent with the first set. The SGS data were therefore considered unreliable. Intertek’s results were similar to MCSA’s, but returned slightly lower results, as shown in Figure 14-18.
Figure 14-18: Comparison of SG results – MCSA vs. Intertek
Note: Ero Copper, 2021
Figure 14-19 shows plots of SG versus Cu + Fe grades in the sulfide and secondary (oxide) grade shells. SDPM assigned SG values to the block model based on the following conditions:
•Saprolite: SG = 1.80 g/cm³;
•Weathered rock: SG = 2.20 g/cm³;
•Sulfide outside grade shells: SG = 2.68 + (Cu + Fe) x 0.038;
•Sulfide inside grade shells: SG = 2.69 + (Cu + Fe) x 0.042;
•Dyke: 3.10 g/cm³.
| | | | | |
| Boa Esperança Project | Page 108 |
| NI 43-101 Technical Report Feasibility Study | October 2021 |
Figure 14-19: Scatter plots of SG vs. Cu + Fe
| | | | | |
| Boa Esperança Project | Page 109 |
| NI 43-101 Technical Report Feasibility Study | October 2021 |
14.9Variogram Analysis and Modeling
SDPM calculated a variogram for the composite data contained within the sulfide grade shells, using a length of 2 m,. Figure 14-20 and Figure 14-22 show downhole variograms for copper and iron, respectively. Figure 14-24 and Figure 14-25 show the directional variograms used in the resource estimation for copper and iron, respectively. The variogram parameters for copper and iron are given in Table 14-9 through Table 14-12, respectively. Figure 14-28 shows the copper search ellipses for sulfide mineralization in vertical section and plan view.
Figure 14-20: Downhole Variogram for Cu_pc Values
Note: Figure prepared by Ero Copper, 2021.
| | | | | |
| Boa Esperança Project | Page 110 |
| NI 43-101 Technical Report Feasibility Study | October 2021 |
Figure 14-21: Downhole Correlogram for Cu_pc Values
Note: Figure prepared by Ero Copper, 2021.
Figure 14-22: Down hole Variogram for Fe_pc Values
Note: Ero Copper, 2021
| | | | | |
| Boa Esperança Project | Page 111 |
| NI 43-101 Technical Report Feasibility Study | October 2021 |
Figure 14-23: Downhole Variogram for Fe_pc Values
Note: Figure prepared by Ero Copper, 2021
| | | | | |
| Boa Esperança Project | Page 112 |
| NI 43-101 Technical Report Feasibility Study | October 2021 |
Figure 14-24: Directional Variogram for Copper (high-grade domain)
Note: Figure prepared by Ero Copper, 2021
| | | | | |
| Boa Esperança Project | Page 113 |
| NI 43-101 Technical Report Feasibility Study | October 2021 |
Figure 14-25: Directional Variogram for Copper (low-grade domain)
Note: Figure prepared by Ero Copper, 2021
| | | | | |
| Boa Esperança Project | Page 114 |
| NI 43-101 Technical Report Feasibility Study | October 2021 |
Figure 14-26: Directional Variogram for Iron (high-grade domain)
Note: Figure prepared by Ero Copper, 2021
| | | | | |
| Boa Esperança Project | Page 115 |
| NI 43-101 Technical Report Feasibility Study | October 2021 |
Figure 14-27: Directional Variogram for Iron (low-grade domain)
Note: Figure prepared by Ero Copper, 2021
| | | | | |
| Boa Esperança Project | Page 116 |
| NI 43-101 Technical Report Feasibility Study | October 2021 |
Table 14-9: Variogram Parameters for Copper (High Grade)
| | | | | | | | | | | | | | | | | |
| High-Grade %Cu |
| Rotation Method | Azimuth | Dip | 2nd Azimuth |
| Azimuth (DIP direction Az), DIP, Azimuth (2nd direction) | 150 | 65 | 60 |
| Search Type | Anisotropy | Axes | X' | Y' | Z' |
| Quadrant | Range (1st search *) | Ranges (m) | 53 | 35 | 20 |
| Quadrant | Range (2nd search **) | Ranges (m) | 80 | 55 | 30 |
| Quadrant | Range (3rd search ***) | Ranges (m) | 120 | 85 | 45 |
| - | Range(4th search****) | Ranges (m) | 500 | 345 | 200 |
| Variogram Modeled | Model | | Range X’ | Range Y’ | Range Z’ |
| Nugget | 0.25 | - | - | - |
| 1st Sph | 0.31 | 20 | 25 | 2.5 |
| 2nd Sph | 0.70 | 80 | 55 | 30 |
Table 14-10: Variogram Parameters for Copper (Low Grade)
| | | | | | | | | | | | | | | | | |
| Low-Grade %Cu |
| Rotation Method | Azimuth | Dip | 2nd Azimuth |
| GEMS ADA: Azimuth (DIP direction Az), DIP, Azimuth (2nd direction) | 150 | 65 | 60 |
| Search Type | Anisotropy | Axes | X' | Y' | Z' |
| Quadrant | Range (1st search *) | Ranges (m) | 66 | 35 | 15 |
| Quadrant | Range (2nd search **) | Ranges (m) | 100 | 55 | 20 |
| Quadrant | Range (3rd search ***) | Ranges (m) | 150 | 85 | 30 |
| - | Range(4th search***) | Ranges (m) | 500 | 345 | 200 |
| Variogram Modeled | Model | Sill | Range X' | Range Y' | Range Z' |
| Nugget | 0.10 | - | - | - |
| 1st Sph | 0.12 | 50.00 | 25.00 | 2.50 |
| 2nd Sph | 0.11 | 100.00 | 55.00 | 18.50 |
| | | | | |
| Boa Esperança Project | Page 117 |
| NI 43-101 Technical Report Feasibility Study | October 2021 |
Table 14-11: Variogram Parameters for Iron (High Grade)
| | | | | | | | | | | | | | | | | |
| High-Grade %Fe |
| Rotation Method | Azimuth | Dip | 2nd Azimuth |
| Azimuth (DIP direction Az), DIP, Azimuth (2nd direction) | 150 | 65 | 60 |
| Search Type | Anisotropy | Axes | X' | Y' | Z' |
| Quadrant | Range (1st search *) | Ranges (m) | 53 | 35 | 20 |
| Quadrant | Range (2nd search **) | Ranges (m) | 80 | 55 | 30 |
| Quadrant | Range (3rd search ***) | Ranges (m) | 120 | 85 | 45 |
| - | Range (4th search ****) | Ranges (m) | 500 | 345 | 200 |
| Variogram Modeled | Model | Sill | Range X' | Range Y' | Range Z' |
| Nugget | 3.78 | - | - | - |
| 1st Sph | 23.40 | 10.00 | 15.00 | 2.50 |
| 2nd Sph | 29.49 | 40.00 | 40.00 | 30.00 |
Table 14-12: Variogram Parameters for Iron (Low Grade)
| | | | | | | | | | | | | | | | | |
| Low-Grade %Fe |
| Rotation Method | Azimuth | Dip | 2nd Azimuth |
| GEMS ADA: Azimuth (DIP direction Az), DIP, Azimuth (2nd direction) | 150 | 65 | 60 |
| Search Type | Anisotropy | Axes | X' | Y' | Z' |
| Quadrant | Range (1st search *) | Ranges (m) | 66 | 35 | 15 |
| Quadrant | Range (2nd search **) | Ranges (m) | 100 | 55 | 20 |
| Quadrant | Range (3rd search ***) | Ranges (m) | 150 | 85 | 30 |
| - | Range (4th search ****) | Ranges (m) | 500 | 345 | 200 |
| Variogram Modeled | Model | Sill | Range X' | Range Y' | Range Z' |
| Nugget | 3.88 | - | - | - |
| 1st Sph | 17.05 | 10.00 | 25.00 | 9.00 |
| 2nd Sph | 19.37 | 65.00 | 65.00 | 35.00 |
| | | | | |
| Boa Esperança Project | Page 118 |
| NI 43-101 Technical Report Feasibility Study | October 2021 |
Figure 14-28: Copper Search Ellipses (blue) for high-grade (red) and low-grade (yellow) Domains
Note: Figure Prepared by Ero Copper, 2021
| | | | | |
| Boa Esperança Project | Page 119 |
| NI 43-101 Technical Report Feasibility Study | October 2021 |
14.10Block Model
A Leapfrog Edge block model was created with no rotation. Table 14-13 shows the characteristics of the block model. Figure 14-29shows the wireframes and an outline of the block model in section view.
Table 14-13: Block Model Summary
| | | | | | | | | | | | | | |
| Column | Code | Description |
| LITHO | 100 | Saprolite |
| 200 | Dyke |
| 300 | Breccia |
| 400 | Granite-Breccia |
| 500 | Granite |
| GS | 10 | High-Grade Domain |
| 20 | Low-Grade Domain |
| CLASS | 1 | Measured Resources |
| 2 | Indicated Resources |
| 3 | Inferred Resources |
| Cu_pct | | Copper Grade (%) |
| Fe_pct | | Iron Grade (%) |
| SULPHIDE | Cpy | Abundant cpy and major py |
| Cpypy | Dominant cpy and major py |
| Pycpy | Dominant py with traces of cpy |
| Py | Sulfide is exclusively py |
| OXI | 1 | Oxidation zone |
| 2 | Fresh rock zone |
| DENSITY | | Block Density |
| Prototype | East (X) | North (Y) | Elevation (Z) |
| Minimum Centroid | 450190.301 | 9241164.031 | 480 |
| Block size (m) | 4 | 4 | 4 |
| Sub-block size (m) | 2 | 2 | 4 |
| Number of Blocks | 248 | 310 | 263 |
| Rotation (°) | - |
| | | | | |
| Boa Esperança Project | Page 120 |
| NI 43-101 Technical Report Feasibility Study | October 2021 |
Figure 14-29: Wireframes With Block Model Outline in Section View
Note: Figure prepared by Ero Copper, 2021. HG domains shown in red. LG domains shown in yellow. The saprolite unit, shown in brown, does not have any estimated copper grades.
14.11Estimation Methodology
Table 14-14: Summary of Estimation Parameters for Copper and Iron
| | | | | | | | | | | | | | | | | | | | | | | | | | | | | |
| Estimation Pass | Number of Composites | Search Type & Parameters | Range (meter) |
| Min. | Max. | Max. Comps / Borehole | Quadrant Search | Min. No. Quadrant | Max. Data / Quadrant | X | Y | Z |
| High Grade |
| 1 | 4 | 12 | 2 | Yes | 2 | 6 | 53 | 35 | 20 |
| 2 | 4 | 12 | 2 | Yes | 2 | 6 | 80 | 55 | 30 |
| 3 | 4 | 12 | 2 | Yes | 2 | 6 | 120 | 85 | 45 |
| 4 | 1 | 12 | - | No | - | - | 500 | 345 | 200 |
| Low Grade |
| 1 | 4 | 12 | 2 | Yes | 2 | 6 | 66 | 35 | 15 |
| 2 | 4 | 12 | 2 | Yes | 2 | 6 | 100 | 55 | 20 |
| 3 | 4 | 12 | 2 | Yes | 2 | 6 | 150 | 85 | 30 |
| 4 | 1 | 12 | 2 | No | - | - | 500 | 415 | 180 |
The composites used during the Mineral Resource estimation were those within the wireframes of ≥2 m in length.
| | | | | |
| Boa Esperança Project | Page 121 |
| NI 43-101 Technical Report Feasibility Study | October 2021 |
A second estimate was run for blocks outside the mineralization wireframes for later use as dilution in mine planning. The estimation methodology was the same as described above, only composites outside the mineralization wireframes were used.
14.12Model Validation
The block model was validated using three methodologies:
•Comparison of statistics for blocks and composites;
•Swath plots between blocks (OK) and the nearest neighbour estimate (NN);
•Visual comparison via vertical and horizontal sections.
The statistic comparison between blocks and composites (Table 14-15) shows that the block grades were lower than the composite grades.
The swath plots compared the OK and NN estimates using only Measured and Indicated Mineral Resources in 4 m bands from south to north, east to west and in 4 m bands by elevation. Figure 14-30 through Figure 14-32 show the swath plots.
The swath plots demonstrated good agreement between nearest neighbor estimates and block grades, with the block grades being slightly smoothed in all three sets.
Table 14-15: Comparison between composite and block Cu grades (High-Grade and Low-Grade Domains)
| | | | | | | | |
| Statistic | Sulfide |
| Composite | Block |
| Average | 0.86 | 0.77 |
| Minimum | 0.001 | 0.001 |
| Maximum | 9.90 | 7.25 |
| Std Dev | 1.00 | 0.69 |
| Coef. of Var. | 1.16 | 0.90 |
| Number of Samples | 6,019 | 940,653 |
Block grades were compared to composite grades in cross-sections. The comparison demonstrates good agreement between block and composite grades. Figure 14-33 and Error! Reference source not found. show typical cross-sections.
| | | | | |
| Boa Esperança Project | Page 122 |
| NI 43-101 Technical Report Feasibility Study | October 2021 |
Figure 14-30: Swath plot in X, 1 block spacing
Figure 14-31: Swath plot in Y, 1 block spacing
| | | | | |
| Boa Esperança Project | Page 123 |
| NI 43-101 Technical Report Feasibility Study | October 2021 |
Figure 14-32: Swath plot in Z, 1 block spa
Note: Figure prepared by Ero Copper, 2021
Figure 14-33: Comparison between block model and composites in vertical section.
| | | | | |
| Boa Esperança Project | Page 124 |
| NI 43-101 Technical Report Feasibility Study | October 2021 |
Note: Figure prepared by Ero Copper, 2021. The block model has the same legend Colors as the composites. Transparency was applied to help the viewing
14.13Resource Classification
Mineral Resources were classified under the categories Measured, Indicated, and Inferred using the 2014 CIM Standards. The classification of the Mineral Resources reflected the relative confidence in the grade estimates. QP Comments on Mineral Resources Estimation
The Mineral Resources were constrained to a pit and stope optimization runs with the following parameters:
•Open Pit:
•Copper price (US$/t): $6,400;
•Mining cost (US$/t moved): $3.10;
•Processing cost + transport (US$/t Run-of-Mine [ROM]): $5.65;
•SG&A (US$/t ROM): $2.66;
•Mining recovery: 95%;
•Dilution: 5.0%;
•Cut-off grade: 0.20% copper;
•Metallurgical recovery: 90.70%;
•Net smelter return (as % of copper price): 94.53%;
•Overall slope angle (degrees):
•Saprolite: 30º;
•Fresh rock: 53º;
•Underground:
•Copper price (US$/t): $6,400;
•Mining cost (US$/t moved): $14.71;
•Processing cost + transport (US$/t ROM): $5.70;
•SG&A (US$/t ROM): $2.60;
•Mining recovery: 100%;
•Cut-off grade: 0.51% copper;
•Marginal cut-off grade: 0.32% copper;
•Metallurgical recovery: 90.70%;
•Net smelter return (% of copper price): 94.53%.
The underground study was built from the high-grade and low-grade domains that exist beneath the mineral resource pit shell and inside the fresh rock zone. Table 14-16 details the stope optimization summary.
| | | | | |
| Boa Esperança Project | Page 125 |
| NI 43-101 Technical Report Feasibility Study | October 2021 |
Table 14-16: Stope Optimization Summary
| | | | | | | | | | | | | | | | | | | | |
| Pass | | 1 | 2 | 3 | 4 | Total |
| Inputs | Unit | Value | Value | Value | Value | Value |
| Stope dimension | m | 5 x 5 x 24 | 5 x 5 x 12 | 5 x 5 x 12 | 5 x 5 x 4 | — |
| Copper price | US$/t | 6 400.00 | 6 400.00 | 6 400.00 | 6 400.00 | 6 400.00 |
| Mining cost | US$/t | 17.30 | 17.30 | 12.12 | 12.12 | 14.71 |
| Processing cost | US$/t | 5.70 | 5.70 | 5.70 | 5.70 | 5.70 |
| G&A | US$/t | 5.20 | 5.20 | - | - | 2.60 |
| Mining recovery | % | 100 | 100 | 100 | 100 | 100 |
| Cut-off grade | % | 0.51 | 0.51 | - | - | 0.51 |
| Marginal cut-off grade | % | - | - | 0.32 | 0.32 | 0.32 |
| Metallurgical recovery | % | 90.70 | 90.70 | 90.70 | 90.70 | 90.70 |
| Net smelter return (NSR) | % | 94.53 | 94.53 | 94.53 | 94.53 | 94.53 |
14.14Mineral Resource Statement
The Mineral Resource estimate was prepared by SDPM Mining Consulting Geologist João Estevão Júnior under the direct supervision of Emerson Ricardo Ré, Mr. Estevão is independent of Emerson Ricard Re. the estimate has an effective date of August 31, 2021.
The Measured, Indicated and Inferred Resources within the pit and stope optimization are presented in Table 14-17. Mineral Resources are reported inclusive of Mineral Reserves. Mineral Resources that are not Mineral Reserves do not have demonstrated economic viability.
| | | | | |
| Boa Esperança Project | Page 126 |
| NI 43-101 Technical Report Feasibility Study | October 2021 |
Table 14-17: Mineral Resource Statement, Boa Esperança Copper Project, Pará State, Brazil, Ero Copper, August 31, 2021
| | | | | | | | | | | | | | | | | | | | | | | | | | | | | | | | | | | | | | |
| Boa Esperança Copper Project | Measured Resources | Indicated Resources | Measured and Indicated Resources | Inferred Resources |
| Tonnes | Grade | Contained | Tonnes | Grade | Contained | Tonnes | Grade | Contained | Tonnes | Grade | Contained |
| (000's) | (%) | (000's) | (000's) | (%) | (000's) | (000's) | (%) | (000's) | (000's) | (%) | (000's) |
| Open Pit High-Grade | 7,117 | 2.16 | 153.65 | 1,661 | 2.27 | 37.63 | 8,778 | 2.18 | 191.28 | 40.45 | 2.69 | 1.09 |
| Open Pit Low-Grade | 25,476 | 0.60 | 152.00 | 13,433 | 0.51 | 68.43 | 38,909 | 0.57 | 220.43 | 514.37 | 0.49 | 2.51 |
| Subtotal Mineral Resources | 32,593 | 0.94 | 305.65 | 15,095 | 0.70 | 106.06 | 47,687 | 0.86 | 411.71 | 554.82 | 0.65 | 3.60 |
| Underground High-Grade | | | | | | | | | | 1,354 | 2.24 | 30.38 |
| Underground Low-Grade | | | | | | | | | | 9,681 | 0.60 | 58.24 |
| Subtotal Mineral Resources | | | | | | | | | | 11,035 | 0.80 | 88.62 |
| Total Copper Mineral Resources | 32,593 | 0.94 | 305.65 | 15,095 | 0.70 | 106.06 | 47,687 | 0.86 | 411.71 | 11,590 | 0.80 | 92.22 |
Notes to Accompany Mineral Resource Estimate:
1.Mineral Resources have an effective date August 31, 2021 and were prepared by Emerson Ricardo Re, MSc, MBA, MAusIMM (CP) (No. 305892), Registered Member (No. 0138) (Chilean Mining Commission), Resource Manager of Ero and a QP as such term is defined under NI 43-101.
2.Tonnes and grade are rounded to reflect approximation.
3.Open Pit Mineral Resources are stated at a cut-off grade of 0.20% Cu and are fully contained within an optimized pit shell.
4.Underground Mineral Resources are stated within optimized stopes below the pit shell. A cut-off grade of 0.51% Cu and a marginal cut-off grade of 0.32% Cu were applied in the stope optimization.
5.Stated Mineral Resources are inclusive of Mineral Reserves.
6.Mineral Resources that are not Mineral Reserves and have not demonstrated economic viability. Mineral Resource estimates do not account for mineability, selectivity, mining loss and dilution. These Mineral Resource estimates include Inferred Mineral Resources that are normally considered too geologically speculative to allow for the application of economic considerations that would see them categorized as Mineral Reserves. There is also no certainty that these Inferred Mineral Resources will be converted to Measured and Indicated categories through further drilling or into Mineral Reserves once economic considerations have been applied.
| | | | | |
| Boa Esperança Project | Page 127 |
| NI 43-101 Technical Report Feasibility Study | October 2021 |
The stope optimizer rounds are shown in Figure 14-34.
Figure 14-34: Mineral Resources Open Pit Shell and Stope Optimizer Rounds
Note: Figure prepared by Ero Copper, 2021.
The final Mineral Resources are represented in Figure 14-35 below.
Figure 14-35: Mineral Resources Within Open Pit Shell and Stopes
Note: Figure prepared by Ero Copper, 2021.
| | | | | |
| Boa Esperança Project | Page 128 |
| NI 43-101 Technical Report Feasibility Study | October 2021 |
14.15Mineral Resource Sensitivity
Grade tonnage curves for Measured, Indicated and Inferred Mineral Resources are shown in Figure 14-36 and Figure 14-37.
Figure 14-36: Grade Tonnage Sensitivity to Cut-off Grade, Measured & Indicated Resource
Note: Ero Copper, 2021
Figure 14-37: Grade – Tonnage Sensitivity to Cut=off Grade, Inferred Resource
Note: Ero Copper, 2021
| | | | | |
| Boa Esperança Project | Page 129 |
| NI 43-101 Technical Report Feasibility Study | October 2021 |
15MINERAL RESERVE ESTIMATES
15.1Block Model
NCL was provided with the June 2021 updated resource block model that included Mineral Resources classified as Measured, Indicated or Inferred. Pit optimization, mine design and mine planning were carried out using this block model and did not include consideration of material classified as Inferred. Inferred Mineral Resources were treated as waste.
The block model was a sub-celled type, with parent block of 4 m E x 4 m N x 4 m Z and minimum cell of 2 m E x 2 m N x 4 m Z. The block size and associated sub-blocking was commensurate with the planned selective mining using the methods described in this Report.
15.2Open Pit Assumptions and Considerations
Additional information on the pit design is provided in Section 16.
15.2.1Block Size Analysis
Pit optimisation study was developed using Whittle software. Initial runs were performed to analyse the effect of the block size to the pit limits, considering different block regularisation and reblocking strategies. The selected block model configuration for the final pit optimisation run was 2 m E x 2 m N x 8 m Z regularised model and reblocked to 4 m E x 4 m N x 8 m Z.
Results indicated that vertical dilution had only a minor effect since comparable results were obtained with 4 m or 8 m block heights. Horizontal dilution had a higher impact, with more ore at lower grades and overall, less payable copper seen in the 8 x 8 m horizontal configurations.
15.2.2Topography
Surface topography was provided to NCL by Ero as a DXF format file, as shown in Figure 15-1.
| | | | | |
| Boa Esperança Project | Page 130 |
| NI 43-101 Technical Report Feasibility Study | October 2021 |
Figure 15-1: Boa Esperança Surface Topography
Note: Figure prepared by NCL, 2021.
| | | | | |
| Boa Esperança Project | Page 131 |
| NI 43-101 Technical Report Feasibility Study | October 2021 |
15.2.3Design Criteria
Table 15-1 summarises the design criteria parameters agreed to between Ero, Ausenco, and NCL for the Whittle pit limit analysis.
Table 15-1: Pit Optimisation Design Criteria
| | | | | | | | | | | |
| Item | Unit | Value | Comments |
| Block Model | | BOA_BM_4x4x4m_210608_rv1 | Parent block 4m x 4m x 4m
Minimum cell 2m x 2m x 4m |
| Resource Categories Included in Analysis | | Measured & Indicated | Inferred & potential resources considered as waste at 0%Cu |
| Overall slope angles | | | |
| Saprolite | ° | 30 | |
| Weathered | ° | 42 | |
| Fresh rock | ° | 50 | |
| Mining cost | | | |
| Reference | US$/tmined | 2.20 | |
| Incremental bench cost | US$/tmined/8m | 0.028 | |
| Average | US$/tmined | 2.47 | Result of pit optimisation |
| Processing details | | | |
| Process throughput | Mtpa | 4.0 | |
| Metallurgical recoveries | | | |
| Granite / Granite Breccia | % | 95.4 x [1-exp (%Cu x (-6))] | |
| Breccia | % | 93.79 x [1-exp (%Cu x (-4.1))] | |
| Process Cost | US$/tproc | 7.74 | |
| Power | US$/tproc | 3.00 | |
| Labour | US$/tproc | 1.13 | |
| Reagents | US$/tproc | 0.71 | |
| Spare parts | US$/tproc | 0.59 | |
| Consumables | US$/tproc | 2.31 | |
| G&A Cost | US$/tproc | 3.83 | |
| Total Process + G&A | US$/tproc | 11.57 | |
| Selling details | | | |
| Copper price | US$/lbpay | 3.0 | lbpay: payable pound of copper |
| Transportation losses | % | 0.2 | |
| Concentrate grade | % | 27.0 | |
| Moisture Content | % | 9.0 | |
| Selling Costs (for Whittle) | US$/lb-pay | 0.424 | |
| Logistics | US$/wmt | 108.2 | wmt: wet metric tonne of concentrate |
| Treatment | US$/dmt | 59.5 | dmt: dry metric tonne of concentrate |
| Refining | US$/lbpay | 0.0595 | |
| Payable | % | 96.3 | |
| Royalty | % | 2.0 | Applied to copper price less other selling costs |
| Royalty | US$/lbpay | 0.053 | |
| | | | | |
| Boa Esperança Project | Page 132 |
| NI 43-101 Technical Report Feasibility Study | October 2021 |
Note: The treatment and refining costs evolved during the 2021 FSU. The final costs of the Project are reflected in the economic analysis, Section 22.
15.2.4Geotechnical Considerations
Geotechnical investigations for previous feasibility studies for the Boa Esperança project were completed in 2012 and 2017. The overall objective of the evaluation was to determine the pit slope geometries.
15.2.5Geotechnical Program
The primary objectives of the Feasibility-level geotechnical evaluation for the Boa Esperança project were:
To collect geotechnical information pertaining to the in situ materials appropriate for a Feasibility level evaluation;
•To characterize geotechnical conditions in and around the area of the proposed open pits;
•To undertake laboratory testing of geomechanical properties of representative samples of the in situ materials;
•To develop a geotechnical model to serve as the basis for the geomechanical evaluation;
•To conduct geomechanical analyses; and
•To make recommendations pertaining to optimal slope angles and pit architecture for mine design purposes.
15.2.6Geotechnical Work plan
The principal stages of the geotechnical evaluation work program were comprised of the following:
•Recommendation of the number, location and orientation of core holes sufficient for a Feasibility-level characterization of in situ materials in the open pit area;
•Geotechnical core logging and orientation (oriented core) of discontinuities intersecting core recovered from the drillholes;
•Selection of representative drill core samples from the respective lithological units encountered in the geotechnical drillholes for laboratory testing;
•Submission of the representative samples to the University of Arizona Rock Mechanics Laboratory in Tucson, Arizona, for geomechanical testing;
•Analyses and interpretation of the geotechnical data and laboratory test results to produce a comprehensive analytical model of in situ properties;
15.2.7Pit Slope Analysis
A field data collection program was designed and carried out for the Project with the primary objective of rock mass characterization and discontinuity orientation to serve as the basis of geotechnical model development. Geotechnical logging, point load testing and orientation of discontinuities intersected by core recovered from four boreholes were conducted by Mineração Caraiba S.A. (MCSA) geologists to support this investigation. Rock quality designation (RQD) data for a total of 109 previous resource and condemnation drillholes was also analyzed and used in the development of the geotechnical model and subsequent analyses.
| | | | | |
| Boa Esperança Project | Page 133 |
| NI 43-101 Technical Report Feasibility Study | October 2021 |
Geomechanical testing was conducted on rock core samples obtained from the two geotechnical drillholes to determine strength characteristics for the in-situ materials. The overall laboratory program consisted of direct shear, uniaxial and triaxial compressive strength, direct tensile strength tests and measurements of unit weight and elastic properties. A total of 56 laboratory tests were conducted on samples selected to represent the range of the rock conditions observed in the two geotechnical holes.
In addition to the rock core testing program, two relatively undisturbed block samples of saprolite were obtained from within the open pit area and tested by Pattrol Laboratory located in Belo Horizonte, Brazil. The saprolite testing program included triaxial shear strength and classification testing.
At Boa Esperança, three distinct domains of rock quality exist, i.e., the upper, saprolite and weathered rock (Saprock) and the fresh granitic rock below (Fresh Rock). The depth of the saprolite and weathered rock zone varies across the site from approximately 15 m around the outer edges of the deposit up to 125 m in the Boa Esperança hill in the central portion of the deposit. The saprolite materials logged generally classify as completely weathered rock to residual soils.
Below the Saprolite and Saprock Zones, the bedrock is generally fresh, showing few signs of oxidation and minimal fracturing resulting in a very competent rock mass. Rock mass ratings (RMR) for the fresh rock ranged between 49 and 80 with an average value of 69 according to the Bieniawski (1989) criteria. Hydrothermal breccia structures and rhyodacite dikes within the rock mass are generally well healed and expected to be of similar competency as the granitic host rock and consequentially have been included within the Fresh Rock domain.
In addition to the granitic rock, a schist unit exists at the surface to the north and east, potentially outcropping in the upper final north pit wall. Currently, the schist unit is poorly understood with very few actual drill core intercepts. The few drillhole intercepts with this unit at depth suggest a rock mass similarly competent to the granite host rocks, without strong cleavage or well-developed foliation.
Based on the oriented core data, the primary discontinuity sets at Boa Esperança are sub-vertical, northeast and northwest striking and sub-horizontal. A secondary, moderately northwest dipping set also appears but relatively infrequent compared to the other sets.
To optimize the slope design at Boa Esperança, both global and bench scale stability for the proposed open pit were performed. Overall slopes were analyzed with limit equilibrium methods using the Hoek-Brown (2002) rock mass shear strength criteria for the Fresh Rock and Mohr-Coulomb criteria for the highly weathered Saprolite Zone. Saprolite slopes were considered to be drained and conservatively high groundwater surfaces were used in the Fresh Rock.
Overall and high inter-ramp slopes were analysed using the commercially available geotechnical modeling software packages Slide 6.0 and Phase2. The limit equilibrium analysis results for the current final feasibility pit design showed a very low probability of failure and relatively high factors of safety (average of 2.1) for even the conservatively high phreatic surface assumed (10 to 25 m behind pit face). A safety factor of 1.7 was also demonstrated with Phase2 using the mean rock mass parameter values. This confirms that stable slopes at Boa Esperança, within the Fresh Rock, will be controlled primarily by geologic structure below the oxide boundary and not by rock mass strength. Stable slopes within the saprolite zone are anticipated to be controlled primarily by groundwater pressures which will be relieved with horizontal drain holes.
Slope kinematics were evaluated with a qualitative risk assessment for each pit sector. The purpose of the assessment was to judge the risk or likelihood of plane shear and wedge type failures occurring in a given pit sector. Based on the wall orientations of the current pit design and the steep dip angle of the primary structures at Boa Esperança, all sectors were identified as having very low to low risk of structural instabilities.
| | | | | |
| Boa Esperança Project | Page 134 |
| NI 43-101 Technical Report Feasibility Study | October 2021 |
15.2.8Recommended Pit Slope Configuration
Three distinct layers of materials were identified: saprolite, saprock and fresh rock. Table 15-2 shows the pit slope geometry proposed by Ausenco for each material type.
Table 15-2: Pit Slope Geometry
| | | | | | | | | | | |
| Parameters | Saprolite | Saprock | Fresh Rock |
| Bench Height (m) | 8 | 8 | 16 |
| Minimum Bench Width (m) | 6 | 6 | 8 |
Bench Face Angle (O) | 50 | 65 | 81 |
Maximum Inter-ramp Angle (O) | 35 | 45 | 56 |
Maximum Overall Slope Angle (O) | - | 42 | 50 |
| Maximum Slope Height (m) | 50 | 100 | 200 |
15.3Cut-off Grades
For mine production scheduling purposes, a copper recovered grade in % (CuREC, where %CuREC= copper grade (%) x metallurgical recovery (%)) was calculated to take into account the variable metallurgical recoveries for each type of mineralised material, as described in Table 15-1.
The internal (or mill) cut-off of 0.21% CuREC calculation incorporated the processing cost and the off-site costs (transport, smelting and refining). Mining was treated as a sunk cost for the purposes of the cut-off determination. This internal cut-off was applied to material contained within the mining phases, defining the difference between ore and waste.
The developed mine and plant feed production schedules considered a stockpiling strategy, sending the highest available grades to the plant in the early years and later reclaiming of the stockpiled low-grade material. An additional reclaiming cost of US$0.70/t was considered, increasing the cut-off for the material sent to the stockpile to 0.22% CuREC.
The 0.21%CuREC equated to a cut-off of 0.275% Cu for Granite and Granite Breccia materials, and 0.313% Cu for Breccia.
15.3.1 Mining Loss and Dilution
Recoveries were calculated on a block-by-block basis and a recovered copper grade was calculated as the copper grade times the recovery and therefore a single cut-off was be applied to the entire Mineral Reserve.
The pit optimisation study used a regularised block model of 2 x 2 x 8 m. The regularisation process did not impact the pit limit, but added dilution and losses compared to the Mineral Resource model. At a 0.20% cut-off, the 2 x 2 x 8 m model added 3.3% dilution, 5.3% lower grade and an overall metal loss of 2.2%.
| | | | | |
| Boa Esperança Project | Page 135 |
| NI 43-101 Technical Report Feasibility Study | October 2021 |
It is recognised that the operation will not be able to selectively mine a 2 x 2 m horizontal configuration, but a regularisation into larger blocks would overestimate the contact dilution. A methodology using Deswik-SO software was applied to estimate the horizontal dilution.
The program was configured considering a fixed mining shape of 8 m height and 10 m along the primary direction of the orebody (N50°E) and a variable width for the perpendicular to the primary direction (N40°W). The system optimized along this perpendicular direction using a minimum of 6 m and included contact dilution of 0.5 m per side.
The optimisation was performed using a 0.20% CuREC cut-off and across all the benches of the final pit. Figure 15‑2 shows for selected benches the obtained outlines of the mining shapes and inside the blocks of the model coloured by grade ranges. The white areas correspond to waste that can be mined selectively to the waste dump. White areas inside the outlines without blocks correspond to internal waste that needs to be mined together with the ore (dilution). Isolated blocks without outlines correspond to mining losses.
Figure 15-2: Mining Shapes Results for Selected Bench
Note: Figure prepared by NCL, 2021.
The tonnages and grades of “ore-ore” plus “waste-ore” blocks were reported for each mining bench and compared against the tonnages and grades above cut-off of the original model, and dilution factors were calculated.
NCL recommends using the average results for diluted tonnages and grades obtained with Deswik-SO. The obtained factors are 1.063 for the tonnage and 0.930 for the grade.
The methodology generated a diluted tonnage/grade distribution of the resources and by combining the diluted tonnages and grades obtain a single factor to be applied directly to the grades of the 2 x 2 x 8 m block model, which will simultaneously account for tonnage and grade dilution.
The overall recommended dilution factor to be applied to the 2 x 2 x 8 m block model was 98.05%.
| | | | | |
| Boa Esperança Project | Page 136 |
| NI 43-101 Technical Report Feasibility Study | October 2021 |
The operational concept behind this procedure is supported by the constant throughput of the mill for a certain period of mine planning. During that period, the mine planners will be using a diluted model based on short term grade control and/or operational practices. In a single bench for example, they will be looking at higher tonnages at lower grades compared to the long term model, therefore they will apply a higher cut-off to satisfy the mill throughput and the result will be at a certain lower average grade.
For this methodology, the short term block model is represented by the Deswik-SO® mining shapes and the higher tonnages and lower grades by the diluted distribution obtained by applying the overall dilution factors.
Dilution and losses are necessary items that need to be specified when reporting reserves under NI 43-101.
•Dilution and losses should be stated based on a comparison between Mineral Resources and Mineral Reserves.
•Boa Esperança Mineral Resources estimate are based on the sub-celled 4 m E x 4 m N x 4 m Z block model, dated June 8, 2021 (minimum cell at 2 m E x 2 m N x 4 m Z).
•Mineral Reserves estimate is based on a diluted 2 m E x 2 m N x 8 m Z block model.
•The diluted Mineral reserve model was built in two main steps. First, a vertical regularisation from the 2 m E x 2 m N x 4 m Z Resource Model into 2 m E x 2 m N x 8 m Z. Second, the application of an overall grade factor, which simultaneously combine the tonnage and grade dilution and losses.
•Overall dilution and losses within the Mineral Reserve estimate amounts to 3.3% and 0.3% respectively, as detailed in Table 15-3.
Table 15-3: Overall Dilution and Losses
| | | | | | | | | | | |
| Item | Unit | Resource model (2x2x4) | Diluted Reserves model (2x2x8 - diluted) |
| Tonnage at cut-off | Mt | 42.5 | 43.9 |
| Grade at cut-off | %CuREC | 0.803 | 0.740 |
| Dilution - Tonnage factor | % | 3.3% |
| Grade factor | % | -7.9% |
| Losses - Metal factor | % | -0.3% |
| %CuREC: Copper recovered grade = Copper grade x metallurgical recovery |
15.4Pit Limit Analysis
The final pit limit analysis run was performed for revenue factors varying from 0.20 to 1.50, every 0.02. As copper is the only identified payable metal, the series of pit shells can be interpreted as the those obtained for ascending copper prices from US$ 1.08/lb (pit shell 1) to US$ 3.00/lb (pit shell 33). There was a marked difference in tonnages at pit shell 21 versus pit shell 22, with the latter shell showing a significant tonnage increase.
The “best net present value (NPV)” and “worst NPV” for each pit shell were calculated as defined by Whittle, using an 8% yearly discount rate and a mill throughput assumption of 4.0 Mtpa. A similar profile to that of the pit shells using the copper price was noted.
| | | | | |
| Boa Esperança Project | Page 137 |
| NI 43-101 Technical Report Feasibility Study | October 2021 |
The series of nested pit shells were analysed graphically to geometrically understand the mining sequence provided by Whittle.
The sequence begins at the central portion of the orebody, targeting high-grade mineralization down to elevation 200 masl (pit shell 3). The following shells increase marginally around the perimeter and then pit shell 21 expands to the north and to the final limit towards the west.
The identified increase obtained with pit shell 22, corresponds to an expansion simultaneously towards the north, east and south, of around 120 to 140 m wide.
Pit shell 31 is an expansion to the northeast, targeting a low-grade ore zone at elevation 70 masl. Pit shell 33 (revenue factor 1.0) corresponds to an expansion to an almost independent sector to the north of a low-grade zone with a high strip ratio
Pit shell 31, which used a copper price of US$2.88/lb (revenue factor 0.96) was selected as final pit limit. This shell did not include the marginal expansion to the north obtained with pit shell 33.
The geometric information provided by the progression of the pit shells used for intermediate phases design purposes.
15.4.1Pit Limit Sensitivities
A sensitivity analysis was carried out by performing pit limit runs for variations of ±10% and ±20% on processing costs, mining costs and metallurgical recoveries. Sensitivity to slopes angles was also examined, for variations of ±3°
Metallurgical recoveries were the most sensitive and were equivalent to variations in copper grade or copper price. A 20% decrease in the metallurgical recovery generated a 15% reduction in the mineralization tonnage, 25% decrease in the payable copper and 38% decrease in the pit value. A 20% increase in metallurgical recoveries had the opposite effect on payable copper and pit value (+23% and +39%, respectively), but resulted in only a 5% increase in the mineralization tonnages because there no more resources reported in the model.
Processing and mining costs had minor and similar effects on payable copper and pit value. The increase in the processing cost had a more significant effect on the mineralization tonnage because of the presence of high volumes of low-grade material, which became non-economic at that level of costs.
Variations on slope angles had a minor effect on mineralization tonnage and payable copper, but a big impact on the pit value as with variations of ±3° the total contained material increased/decreased accordingly, and therefore the overall value of the pit changed due to variations in the total mining cost.
15.5Mineral Reserves Statement
Estimation of the Mineral Reserve consisted of the following steps which are discussed in detail in sections 13, 14, 15 and 16:
•Development of the Mineral Resource model;
•Pit shell optimization to support the pit design;
•Design of the ultimate pit and internal phases;
| | | | | |
| Boa Esperança Project | Page 138 |
| NI 43-101 Technical Report Feasibility Study | October 2021 |
•Development of the modifying factors as part of the feasibility study process;
•Mine and mill production scheduling based on the application of modifying factors and confidence classification.
•Completion of the 2021 FSU.
•Reporting of the Mineral Reserve in accordance with the 2014 CIM Definition Standards.
Sensitivity analyses were also conducted on the Mineral Reserve to determine the potential impact of changes in costs and prices.
Mineral Reserves are detailed in Table 15‑3 and have an effective date of 31 August 2021. These are based on the 2021 FSU production schedule, which was constrained by a designed pit. Measured and Indicated Mineral Resources were used to support the statement of Proven and Probable Mineral Reserves. Measured Resources were converted to Proven Mineral Reserves and Indicated Mineral Resources were converted into Probable Mineral Reserves. These are reported as delivered to the mill and are therefore fully diluted.
Table 15-4: Mineral Reserves Statement as of 31 August 2021
| | | | | | | | | | | | | | | | | |
| Reserves Category | Tonnage t '000 | Copper %Cu | Contained Copper T ‘000 | |
| Proven Reserves | 30,674 | 0.89 | 273.21 | |
| Probable Reserves | 12,378 | 0.67 | 83.35 | |
| Total Mineral Reserves | 43,052 | 0.83 | 356.56 | |
| Notes to Accompany Mineral Reserves Estimate: | |
1.Mineral Reserves have an effective date of 31 August 2021 and were prepared by Mr. Carlos Guzman, RM CMC (0119) and FAusIMM (229036), an employee of NCL and a QP as such term is defined under NI 43-101. 2.Mineral Reserves are reported as constrained within Measured and Indicated pit designs and are supported by a mine plan featuring a constant throughput rate and cut-off optimization. The pit designs and mine plan were optimized using the following economic and technical parameters: copper price of US$3.00/lb; average recovery to concentrate is 91.3%; copper concentrate logistics costs of US$108.20/wmt; transport losses of 0.2%; copper concentrate treatment charges of US$59.5/dmt, U$0.0595/lb of copper refining charges; copper payability of 96.3%; average mining cost of US$2.47/t-mined; process cost of US$7.74/t-processed and G&A costs of US$3.83/t-processed; average pit slope angles that range from 30º to 50º and a 2% royalty. 3.Mineral Reserves estimate considered an SMU of 2 x 2 x 8m, an overall dilution of 3.3% and a metal loss of 0.3%. 4.Rounding as required by reporting guidelines may result in apparent summation differences between tonnes, grades, and metal content. 5.Tonnage measurements are in metric units. Copper grades are reported as percentages and payable copper as million pounds. | |
Mineral Reserves were derived by incorporating modifying factors into the Mineral Resource model. Design and production scheduling were then undertaken within mine planning software. This process incorporated appropriate modifying factors and the application of cut-off policies and economic analysis. These results were then incorporated into the 2021 FSU, which supports the estimation of Mineral Reserves for the Project.
The increase of the current estimate to that previously reported in 2017 by almost double of the contained copper is mainly because of the increased throughput, higher metallurgical recoveries and the Mineral Resource modelling technique, being more selective and with less added in-situ dilution than used in 2017.
| | | | | |
| Boa Esperança Project | Page 139 |
| NI 43-101 Technical Report Feasibility Study | October 2021 |
15.6Factors that May Affect the Mineral Reserves
•Changes to the metal price assumptions;
•Changes to the estimated Measured and Indicated Mineral Resources used to generate the mine plan;
•Changes in the metallurgical recovery factors;
•Changes in the geotechnical assumptions used to determine the overall wall angles;
•Changes to the operating cut-off assumptions for mill feed or stockpile feed;
•Changes to the input assumptions used to derive the open pit outline and the mine plan that is based on that open pit design;
•Ability to obtain social and environmental license to operate;
•Changes to the assumed permitting and regulatory environment under which the mine plan was developed;
There are no other known environmental, legal, title, taxation, socioeconomic, marketing, political or other relevant factors that would materially affect the estimation of Mineral Reserves that are not discussed in this Report.
| | | | | |
| Boa Esperança Project | Page 140 |
| NI 43-101 Technical Report Feasibility Study | October 2021 |
16MINING METHODS
16.1Overview
Initial pit design considerations are included in Section 15.
The mine plan was developed by NCL. The plan is focused on a single mine area, mined through consecutive mining phases or pushbacks. The mill throughput is based on an economic throughput assessment study, resulting in an average throughput of 4.0 Mtpa of sulphide ore and a ramp-up period of 12 months that assumes a production rate of 3.2 Mt in the first year of production. Production starts during the second quarter of Year 1 to avoid the rainy season.
The required pre-stripping amounts to 13.2 Mt, and activities have been scheduled over 24 months, starting in Year -2 quarter 2, through Year 1 quarter 1. The mining schedule requires an average mine extraction of 20 Mtpa. The mine movement decreases from Year 10 until the mining operations are completed in Year 12.
The forecast production parameters for the Boa Esperança Project are summarised in Table 16-1.
Table 16-1: Key Proposed Production Parameters
| | | | | |
| Parameter | Quantity |
| Proven and Probable Mineral Reserves | 43.1 Mt at 0.83 %Cu |
| Life-of-mine production | Copper: 717.9 M lb (Year 1 - Year 12) |
| Pre-stripping | 13.2 Mt (24 months) |
| Maximum material movement | 20 Mtpa (without rehandling) |
| Mine life | 12 years |
The adopted mining operation strategy for this study corresponds to contract mining from pre-stripping through Year 5 of operation and transition to Owner mining in Year 6 to the end of the life of mine (LOM). The preferred timing of the transition to Owner mining will be analyzed in future studies.
The mine is scheduled to work on a seven-days-a-week, three 8-hour shift basis, for 365 days per year. The operation will include normal drilling, blasting, loading with 5.2 m3/3.9 m3 (waste/ore) backhoe configured excavator and 38 t conventional trucks over an 8 m bench height (double bench of 16 m in fresh rock in interim and final slopes). Mining will be performed on a sub-bench or flitch basis. Mining will include supporting functions such as ancillary activities, dewatering, grade control, and equipment maintenance.
The proposed general mine layout is shown in Figure 16-1.
| | | | | |
| Boa Esperança Project | Page 141 |
| NI 43-101 Technical Report Feasibility Study | October 2021 |
Figure 16-1: Planned General Mine Layout
Note: Figure prepared by NCL, 2021.
| | | | | |
| Boa Esperança Project | Page 142 |
| NI 43-101 Technical Report Feasibility Study | October 2021 |
16.2Pit Design
16.2.1Geotechnical Considerations
Geotechnical considerations used in the mine design were provided in Section 15.2.4.
16.2.2Design Parameters
Pit shell 31, obtained at revenue factor 0.96, corresponding to a copper price of US$ 2.88/lb, was selected as final pit limit and guide for mine design. Table 16-2 details the bench configuration used for mine design.
Table 16-2: Bench Configuration for Mine Design
| | | | | | | | | | | | | | | | | | | | |
| Zone | IRA (*)
(°) | Face
angle (°) | Bench
height (m) | Berm
width (m) | Slope
height (m) | Catch
berm (m) |
| Saprolite | 35 | 50 | 8.0 | 4.7 | 160 | 16.0 |
| Weathered rock | 45 | 65 | 8.0 | 4.3 | 160 | 16.0 |
| Fresh rock | 56 | 81 | 16.0 | 8.3 | 160 | 16.0 |
(*) IRA: Inter-ramp angle (**) Additional 16 m berm if the slope height exceeds 160 m |
Lower inter-ramp angles were considered for initial phases that do not reach the final limit. Angles were reduced by 3° for each zone of these phases by extending the width of the berms.
The loading operation is envisaged using 8 m benches with 5.2 m3 excavators for waste and 3.9 m3 for ore (higher density) and double flitching to improve selectivity. The best match between loading and hauling was considered, using 38 t conventional trucks as these are common with mining contractors and have low unit costs. This equipment type of is very common in Brazil because the trucks are manufactured in-country and do not carry high import duties.
Mine design assumed 18 m ramps at a 10% maximum gradient, allowing double traffic for this truck type and enough space for the drainage system and protection at the crest of the ramp. No tapering was considered in the ramp direction going down, allowing access to the berms for cleaning purposes and as escape exits for operational safety.
16.2.3Mining Phases and Final Pit Designs
The pit shell sequence provided by Whittle was used as guide for the mining phase designs, providing interconnection between the phases. In general, double access was considered to reduce traffic congestion with exits to the north for the ore to the plant and to the south for the waste. The final pit is the result of the phase designs.
A total of six phases were designed. Pit shell 3 was used for phase 1, but an inner initial phase 0 was manually designed targeting ore to start production with less associated waste down to elevation 232 masl. Phase 2 was an expansion to the north, west and south, reaching the final limit to the west and going down to elevation 168 masl. Phase 3 expanded to east and north to the final limit and going down to elevation 144 masl. Phase 4 corresponded to the final upper north sector, expanding to the final limit in the east wall and going down to elevation 56 masl. The last expansion corresponded to Phase 5, reaching final limit at the south and southeast pit walls and going down to elevation -40 masl.
Figure 16-2 through Figure 16-6 show plan views and cross sections of the phases designs, the final pit and compared against the selected Whittle pit shell.
| | | | | |
| Boa Esperança Project | Page 143 |
| NI 43-101 Technical Report Feasibility Study | October 2021 |
Figure 16-2: Phase Designs – Plan View Projection
Note: Figure prepared by NCL, 2021.
| | | | | |
| Boa Esperança Project | Page 144 |
| NI 43-101 Technical Report Feasibility Study | October 2021 |
Figure 16-3: Phases Designs at Selected Elevations
Note: Figure prepared by NCL, 2021.
| | | | | |
| Boa Esperança Project | Page 145 |
| NI 43-101 Technical Report Feasibility Study | October 2021 |
Figure 16-4: Final Pit
Note: Figure prepared by NCL, 2021.
| | | | | |
| Boa Esperança Project | Page 146 |
| NI 43-101 Technical Report Feasibility Study | October 2021 |
Figure 16-5: Phases designs and Whittle pit - Cross Section (A-A')
Note: Figure prepared by NCL, 2021.
Figure 16-6: Phases designs and Whittle pit - Cross Section (B-B')
Note: Figure prepared by NCL, 2021.
| | | | | |
| Boa Esperança Project | Page 147 |
| NI 43-101 Technical Report Feasibility Study | October 2021 |
Table 16-3 summarises the in pit tonnages and grades, by mining phase and applying a cut-off grade of 0.21% Cu recovered, obtaining a total of 43.1 Mt of ore at 0.84% Cu and 159.9 Mt of waste material. Table 16-4 compares the Whittle pit against the mine design, with 2% less ore, 7% more waste and -3% less contained copper. This comparison is considered acceptable for the 2021 FSU.
Table 16-3: In-Pit Tonnages and Grades per Mining Phase
| | | | | | | | | | | | | | | | | |
| Mining Phase | Ore | Waste kt | Strip ratio | Total kt |
| kt | %Cu |
| PH00 | 4,606 | 1.257 | 14,902 | 3.2 | 19,508 |
| PH01 | 4,371 | 1.312 | 8,593 | 2.0 | 12,964 |
| PH02 | 7,185 | 0.854 | 26,370 | 3.7 | 33,555 |
| PH03 | 6,325 | 0.629 | 21,859 | 3.5 | 28,184 |
| PH04 | 8,819 | 0.500 | 27,517 | 3.1 | 36,335 |
| PH05 | 11,828 | 0.815 | 60,702 | 5.1 | 72,530 |
| TOTAL | 43,133 | 0.827 | 159,944 | 3.7 | 203,077 |
|
Table 16-4: Whittle pit vs Mine Design
| | | | | | | | | | | | | | |
| | Whittle pit | Mine design | Difference |
| Total material | Mt | 193.6 | 203.1 | 5% |
| Ore | Mt | 43.9 | 43.1 | -2% |
| %Cu | 0.85 | 0.84 | |
| Contained metal | kt Cu | 374.1 | 356.8 | -4.6% |
| Waste | Mt | 149.7 | 159.9 | 7% |
| Strip ratio | t/t | 3.4 | 3.7 | |
| Cut-off grade: 0.21%Cu recovered |
16.3Production Schedule
The block model flagged by the operative designs and the technical and economic parameters were loaded into Minemax Scheduler. Minemax Scheduler results were analysed, comparing NPVs of the different scenarios, stockpile strategy and suggested mining and processing rates.
Minemax was configured with the economic parameters of the design criteria (Section 15.2.3), constant 4.0 Mtpa mill throughput, ramp-up for Year 1 and constraining the vertical development rate to 8 mining benches per phase and per year. Several different scenarios of mining strategy were tested, consisting of constraining the maximum mining rate and the amount of material to be mined during pre-stripping. Minemax indicated a 13.1 Mt pre-stripping, a mining rate of 20 Mtpa, and a high-grading strategy on the early years.
The plant ramp-up was considered to take a 12-month period to achieve 100% of designed capacity and including tonnage and process recovery, as shown in Table 16-5.
| | | | | |
| Boa Esperança Project | Page 148 |
| NI 43-101 Technical Report Feasibility Study | October 2021 |
Table 16-5: Planned Processing Plant Ramp-up
| | | | | | | | |
| Month | Tonnage Factor(%) | Process Recovery Factor (%) |
| 1 | 30 | 51 |
| 2 | 48 | 70 |
| 3 | 60 | 78 |
| 4 | 70 | 85 |
| 5 | 79 | 90 |
| 6 | 85 | 92 |
| 7 | 90 | 94 |
| 8 | 93 | 95.5 |
| 9 | 96 | 96.5 |
| 10 | 98 | 97.5 |
| 11 | 99 | 98.5 |
| 12 | 100 | 100 |
| Percentages of designed capacity |
The same basis used with Minemax Scheduler was loaded into MinePlan, an NCL in-house system to generate mine schedules. The mining rate through time obtained with Minemax was smoothed to avoid peaks and troughs, considering a quarterly basis from pre-stripping through Year 3 and yearly from Year 4 to the end of the LOM. The periods assessed on a quarterly basis were to support analysis of the pit geometry throughout the rainy seasons of the early years, ensuring ore feed to the plant (quarters 1 and 4 of each year).
The final mine and plant feed schedules, based on Proven and Probable Mineral Reserves are shown in Table 16-6 to Table 16-12.
| | | | | |
| Boa Esperança Project | Page 149 |
| NI 43-101 Technical Report Feasibility Study | October 2021 |
Table 16-6: Proposed Mine Schedule Summary (Yearly)
| | | | | | | | | | | | | | | | | | | | | | | | | | | | | | | | |
| Year | Total Mined Ore | Mineralised Material to Stockpile | Total to Waste Dump | Total Mined |
| Mine to mill | Mine to Stockpile | Total Ore | Fresh Waste | Topsoil | Saprolite | Weathered | Total Waste |
| kt | kt | kt | kt | kt | | kt | kt | kt | kt |
| PP | - | 53 | 53 | 29 | 48 | 363 | 9,568 | 3,111 | 13,089 | 13,171 |
| Y01 | 2,168 | 95 | 2,263 | 286 | 1,036 | 60 | 1,643 | 2,978 | 5,718 | 8,267 |
| Y02 | 3,964 | 281 | 4,245 | 408 | 2,465 | 149 | 3,287 | 1,802 | 7,703 | 12,357 |
| Y03 | 3,876 | 271 | 4,148 | 1,013 | 9,190 | 139 | 1,888 | 2,729 | 13,944 | 19,105 |
| Y04 | 4,000 | 126 | 4,126 | 1,010 | 10,524 | 182 | 2,186 | 1,972 | 14,864 | 20,000 |
| Y05 | 4,000 | 400 | 4,400 | 1,096 | 10,967 | 120 | 1,806 | 1,612 | 14,504 | 20,000 |
| Y06 | 3,853 | - | 3,853 | 971 | 10,037 | 190 | 2,445 | 2,269 | 14,941 | 19,765 |
| Y07 | 3,153 | - | 3,153 | 2,107 | 12,871 | 10 | 404 | 767 | 14,053 | 19,313 |
| Y08 | 4,000 | 43 | 4,043 | 1,133 | 14,209 | - | 56 | 560 | 14,825 | 20,000 |
| Y09 | 3,903 | - | 3,903 | 1,367 | 14,730 | - | - | - | 14,730 | 20,000 |
| Y10 | 4,000 | 170 | 4,170 | 1,044 | 12,706 | - | - | - | 12,706 | 17,921 |
| Y11 | 3,267 | - | 3,267 | 530 | 6,523 | - | - | - | 6,523 | 10,320 |
| Y12 | 1,429 | - | 1,429 | 123 | 1,308 | - | - | - | 1,308 | 2,859 |
| Y13 | - | - | - | - | - | - | - | - | - | - |
| Y14 | - | - | - | - | - | - | - | - | - | - |
| Y15 | - | - | - | - | - | - | - | - | - | - |
| Totals | 41,613 | 1,439 | 43,052 | 11,116 | 106,614 | 1,213 | 23,282 | 17,800 | 148,909 | 203,076 |
| | | | | |
| Boa Esperança Project | Page 150 |
| NI 43-101 Technical Report Feasibility Study | October 2021 |
Table 16-7: Proposed Mine Schedule Summary (Quarterly)
| | | | | | | | | | | | | | | | | | | | | | | | | | | | | | | | |
| Period | Total Mined Ore | Mineralised Material to stockpile | Total to Waste Dump | Total Mined |
| Mine to mill | Mine to Stockpile | Total Ore | Fresh Waste | Topsoil | Saprolite | Weathered | Total Waste |
| kt | kt | kt | kt | kt | | kt | kt | kt | kt |
| Y-2Q2 | - | - | - | - | - | 53 | 447 | - | 500 | 500 |
| Y-2Q3 | - | - | - | - | - | 38 | 962 | - | 1,000 | 1,000 |
| Y-2Q4 | - | - | - | - | - | 45 | 1,470 | 2 | 1,517 | 1,517 |
| Y-1Q1 | - | - | - | - | - | 58 | 1,686 | 177 | 1,921 | 1,921 |
| Y-1Q2 | - | - | - | - | - | 42 | 1,447 | 544 | 2,033 | 2,033 |
| Y-1Q3 | - | - | - | - | - | 40 | 1,251 | 709 | 2,000 | 2,000 |
| Y-1Q4 | - | 3 | 3 | 4 | 4 | 53 | 1,353 | 684 | 2,093 | 2,100 |
| Y01Q1 | - | 49 | 49 | 25 | 44 | 34 | 953 | 995 | 2,026 | 2,100 |
| Y01Q2 | 445 | - | 445 | 85 | 224 | 31 | 739 | 1,164 | 2,158 | 2,687 |
| Y01Q3 | 786 | 28 | 813 | 62 | 270 | 17 | 516 | 481 | 1,284 | 2,159 |
| Y01Q4 | 938 | 67 | 1,004 | 139 | 543 | 13 | 389 | 1,333 | 2,277 | 3,421 |
| Y02Q1 | 950 | 8 | 959 | 66 | 590 | 19 | 307 | 326 | 1,242 | 2,267 |
| Y02Q2 | 997 | 180 | 1,177 | 72 | 695 | 28 | 643 | 117 | 1,482 | 2,732 |
| Y02Q3 | 1,008 | 25 | 1,033 | 87 | 486 | 44 | 1,055 | 267 | 1,851 | 2,972 |
| Y02Q4 | 1,008 | 68 | 1,076 | 183 | 694 | 58 | 1,283 | 1,093 | 3,128 | 4,386 |
| Y03Q1 | 995 | 50 | 1,045 | 256 | 1,401 | 48 | 616 | 1,234 | 3,299 | 4,599 |
| Y03Q2 | 995 | 52 | 1,047 | 254 | 2,016 | 35 | 591 | 764 | 3,407 | 4,707 |
| Y03Q3 | 1,006 | 41 | 1,047 | 233 | 2,823 | 26 | 334 | 349 | 3,532 | 4,811 |
| Y03Q4 | 882 | 127 | 1,009 | 270 | 2,949 | 30 | 347 | 382 | 3,707 | 4,987 |
| Y04 | 4,000 | 126 | 4,126 | 1,010 | 10,524 | 182 | 2,186 | 1,972 | 14,864 | 20,000 |
| Y05 | 4,000 | 400 | 4,400 | 1,096 | 10,967 | 120 | 1,806 | 1,612 | 14,504 | 20,000 |
| Y06 | 3,853 | - | 3,853 | 971 | 10,037 | 190 | 2,445 | 2,269 | 14,941 | 19,765 |
| Y07 | 3,153 | - | 3,153 | 2,107 | 12,871 | 10 | 404 | 767 | 14,053 | 19,313 |
| Y08 | 4,000 | 43 | 4,043 | 1,133 | 14,209 | - | 56 | 560 | 14,825 | 20,000 |
| Y09 | 3,903 | - | 3,903 | 1,367 | 14,730 | - | - | - | 14,730 | 20,000 |
| Y10 | 4,000 | 170 | 4,170 | 1,044 | 12,706 | - | - | - | 12,706 | 17,921 |
| Y11 | 3,267 | - | 3,267 | 530 | 6,523 | - | - | - | 6,523 | 10,320 |
| Y12 | 1,429 | - | 1,429 | 123 | 1,308 | - | - | - | 1,308 | 2,859 |
| Y13 | - | - | - | - | - | - | - | - | - | - |
| Y14 | - | - | - | - | - | - | - | - | - | - |
| Y15 | - | - | - | - | - | - | - | - | - | - |
| Totals | 41,613 | 1,439 | 43,052 | 11,116 | 106,614 | 1,213 | 23,282 | 17,800 | 148,909 | 203,076 |
| | | | | |
| Boa Esperança Project | Page 151 |
| NI 43-101 Technical Report Feasibility Study | October 2021 |
Table 16-8: Proposed Mine Schedule Summary (Quarterly) – Material Movements by Mining Phase
| | | | | | | | | | | | | | | | | | | | | | | | | | | | | | | | | | | | | | | | | | | | | | | | | | | | | | | | | | | |
| Period | Ph00 | Ph01 | Ph02 | Ph03 | Ph04 | Ph05 | Totals |
| Total | Sink Rate | Bench | Total | Sink Rate | Bench | Total | Sink Rate | Bench | Total | Sink Rate | Bench | Total | Sink Rate | Bench | Total | Sink Rate | Bench | Total |
| kt | | kt | | kt | | kt | | kt | | kt | | kt |
| Y-2Q2 | 500 | 3.5 | 440 | | | | | | | | | | | | | | | | 500 |
| Y-2Q3 | 1,000 | 2.2 | 424 | | | | | | | | | | | | | | | | 1,000 |
| Y-2Q4 | 1,500 | 2.3 | 400 | 17 | 1.4 | 432 | | | | | | | | | | | | | 1,517 |
| Y-1Q1 | 1,771 | 2.2 | 384 | 150 | 1.8 | 416 | | | | | | | | | | | | | 1,921 |
| Y-1Q2 | 1,583 | 1.9 | 368 | 450 | 2.0 | 400 | | | | | | | | | | | | | 2,033 |
| Y-1Q3 | 1,300 | 1.6 | 360 | 700 | 1.8 | 392 | | | | | | | | | | | | | 2,000 |
| Y-1Q4 | 1,000 | 1.2 | 352 | 1,100 | 1.6 | 376 | | | | | | | | | | | | | 2,100 |
| Y01Q1 | 1,036 | 1.1 | 336 | 1,064 | 1.4 | 360 | | | | | | | | | | | | | 2,100 |
| Y01Q2 | 1,989 | 1.9 | 320 | 699 | 1.0 | 352 | | | | | | | | | | | | | 2,687 |
| Y01Q3 | 2,159 | 2.0 | 304 | | | 352 | | | | | | | | | | | | | 2,159 |
| Y01Q4 | 1,916 | 2.0 | 288 | 1,505 | 2.0 | 336 | | | | | | | | | | | | | 3,421 |
| Y02Q1 | 455 | 0.6 | 288 | 1,762 | 2.0 | 320 | 50 | 2.0 | 392 | | | | | | | | | | 2,267 |
| Y02Q2 | 627 | 0.8 | 280 | 1,751 | 2.0 | 304 | 354 | 2.0 | 376 | | | | | | | | | | 2,732 |
| Y02Q3 | 378 | 0.5 | 280 | 1,358 | 2.0 | 288 | 1,236 | 2.0 | 360 | | | | | | | | | | 2,972 |
| Y02Q4 | 219 | 0.3 | 272 | 1,204 | 2.0 | 272 | 2,964 | 2.0 | 344 | | | | | | | | | | 4,386 |
| Y03Q1 | 792 | 1.4 | 264 | 505 | 1.0 | 264 | 3,206 | 1.5 | 336 | 96 | 1.0 | 352 | | | | | | | 4,599 |
| Y03Q2 | 568 | 1.3 | 248 | 469 | 1.1 | 256 | 3,479 | 1.5 | 320 | 191 | 1.0 | 344 | | | | | | | 4,707 |
| Y03Q3 | 370 | 1.2 | 240 | 232 | 0.9 | <End> | 3,555 | 2.0 | 304 | 655 | 2.0 | 328 | | | | | | | 4,811 |
| Y03Q4 | 346 | 1.8 | <End> | | | | 3,180 | 2.0 | 288 | 852 | 2.0 | 312 | | | | 609 | 1.0 | 320 | 4,986 |
| Y04 | | | | | | | 10,003 | 8.0 | 224 | 9,997 | 7.5 | 256 | | | | | | 320 | 20,000 |
| Y05 | | | | | | | 4,868 | 6.0 | 176 | 6,782 | 4.5 | 216 | 718 | 3.0 | 264 | 7,632 | 5.1 | 272 | 20,000 |
| Y06 | | | | | | | 661 | 2.0 | <End> | 8,310 | 8.0 | 152 | 5,724 | 4.0 | 232 | 5,070 | 2.3 | 256 | 19,765 |
| Y07 | | | | | | | | | | 1,301 | 2.0 | <End> | 13,163 | 8.0 | 176 | 4,849 | 1.9 | 240 | 19,313 |
| Y08 | | | | | | | | | | | | | 6,306 | 4.3 | 136 | 13,694 | 5.7 | 200 | 20,000 |
| Y09 | | | | | | | | | | | | | 2,874 | 1.7 | 120 | 17,126 | 8.0 | 136 | 20,000 |
| Y10 | | | | | | | | | | | | | 6,490 | 6.4 | 72 | 11,431 | 7.0 | 80 | 17,921 |
| Y11 | | | | | | | | | | | | | 1,061 | 2.6 | <End> | 9,259 | 8.0 | 16 | 10,320 |
| Y12 | | | | | | | | | | | | | | | | 2,859 | 7.0 | <End> | 2,859 |
| Totals | 19,508 | | | 12,964 | | | 33,555 | | | 28,184 | | | 36,336 | | | 72,530 | | | 203,077 |
| | | | | |
| Boa Esperança Project | Page 152 |
| NI 43-101 Technical Report Feasibility Study | October 2021 |
Sink rate corresponds to the number of 8 m benches mined per period.
Table 16-9: Proposed Plant Feed Summary (Quarterly)
| | | | | | | | | | | | | | | | | | | | | | | | | | | | | | | | | | | | | | | | | | | | | | | |
| Period | Total to Mill | High-grade (CuREC(%)>=0.6) | Medium-grade (0.4<=CuREC(%)<0.6) | Low-grade (0.22<=CuREC(%)<0.4) | Total |
| In | Out | Level | In | Out | Level | In | Out | Level | In | Out |
| kt | %Cu | REC (%) | Payable Cu (Klb) | kt | kt | kt | kt | kt | kt | kt | kt | kt | kt | kt |
| Y01Q2 | 459 | 1.29 | 93.0 | 11,711 | | 14 | 26 | | | 6 | | | 7 | | 14 |
| Y01Q3 | 786 | 1.35 | 93.2 | 21,001 | | | 26 | | | 6 | 28 | | 34 | 28 | |
| Y01Q4 | 938 | 1.36 | 93.2 | 25,232 | | | 26 | 28 | | 33 | 39 | | 74 | 67 | |
| Y02Q1 | 976 | 1.22 | 92.4 | 23,319 | | 26 | | | | 33 | 8 | | 82 | 8 | 26 |
| Y02Q2 | 997 | 1.37 | 93.1 | 27,014 | | | | 90 | | 124 | 89 | | 171 | 180 | |
| Y02Q3 | 1,008 | 1.37 | 92.7 | 27,084 | | | | | | 124 | 25 | | 197 | 25 | |
| Y02Q4 | 1,008 | 1.36 | 92.8 | 26,995 | | | | | | 124 | 68 | | 265 | 68 | |
| Y03Q1 | 995 | 1.24 | 92.7 | 24,235 | | | | | | 124 | 50 | | 315 | 50 | |
| Y03Q2 | 995 | 1.15 | 92.3 | 22,327 | | | | | | 124 | 52 | | 367 | 52 | |
| Y03Q3 | 1,006 | 0.98 | 91.7 | 19,198 | | | | | | 124 | 41 | | 409 | 41 | |
| Y03Q4 | 1,006 | 0.93 | 91.5 | 18,224 | | | | | 124 | | 127 | | 536 | 127 | 124 |
| Y04 | 4,000 | 0.77 | 90.6 | 59,047 | | | | | | | 126 | | 662 | 126 | |
| Y05 | 4,000 | 0.82 | 91.8 | 64,070 | | | | 146 | | 146 | 254 | | 916 | 400 | |
| Y06 | 4,000 | 0.70 | 90.7 | 54,132 | | | | | | 146 | | 147 | 769 | | 147 |
| Y07 | 4,000 | 0.49 | 87.2 | 36,520 | | | | | 146 | | | 701 | 68 | | 847 |
| Y08 | 4,000 | 0.56 | 89.9 | 42,309 | | | | | | | 43 | | 111 | 43 | |
| Y09 | 4,000 | 0.64 | 90.4 | 48,705 | | | | | | | | 97 | 14 | | 97 |
| Y10 | 4,000 | 0.63 | 91.2 | 48,462 | 10 | | 10 | 64 | | 64 | 96 | | 110 | 170 | |
| Y11 | 3,451 | 0.90 | 91.3 | 59,743 | | 10 | | | 64 | | | 110 | | | 184 |
| Y12 | 1,429 | 1.11 | 91.5 | 30,623 | | | | | | | | | | | |
| Totals | 43,052 | 0.83 | 91.3 | 689,953 | 50 | 50 | | 334 | 334 | | 1,055 | 1,055 | | 1,439 | 1,439 |
| | | | | |
| Boa Esperança Project | Page 153 |
| NI 43-101 Technical Report Feasibility Study | October 2021 |
Table 16-10: Proposed Plant Feed Summary (Yearly)
| | | | | | | | | | | | | | | | | | | | | | | | | | | | | | | | | | | | | | | | | | | | | | | |
| Period | Total to Mill | High-grade (CuREC(%)>=0.6) | Medium-grade (0.4<=CuREC(%)<0.6) | Low-grade (0.22<=CuREC(%)<0.4) | Total |
| In | Out | Level | In | Out | Level | In | Out | Level | In | Out |
| kt | %Cu | REC (%) | Payable Cu (Klb) | kt | kt | kt | kt | kt | kt | kt | kt | kt | kt | kt |
| Y01 | 2,182 | 1.34 | 93.2 | 57,944 | | 14 | 26 | 28 | | 33 | 67 | | 74 | 95 | 14 |
| Y02 | 3,990 | 1.33 | 92.8 | 104,412 | | 26 | | 90 | | 124 | 191 | | 265 | 281 | 26 |
| Y03 | 4,000 | 1.08 | 92.1 | 83,984 | | | | | 124 | | 271 | | 536 | 271 | 124 |
| Y04 | 4,000 | 0.77 | 90.6 | 59,047 | | | | | | | 126 | | 662 | 126 | 0 |
| Y05 | 4,000 | 0.82 | 91.8 | 64,070 | | | | 146 | | 146 | 254 | | 916 | 400 | 0 |
| Y06 | 4,000 | 0.70 | 90.7 | 54,132 | | | | | | 146 | | 147 | 769 | 0 | 147 |
| Y07 | 4,000 | 0.49 | 87.2 | 36,520 | | | | | 146 | | | 701 | 68 | 0 | 847 |
| Y08 | 4,000 | 0.56 | 89.9 | 42,309 | | | | | | | 43 | | 111 | 43 | 0 |
| Y09 | 4,000 | 0.64 | 90.4 | 48,705 | | | | | | | | 97 | 14 | 0 | 97 |
| Y10 | 4,000 | 0.63 | 91.2 | 48,462 | 10 | | 10 | 64 | | 64 | 96 | | 110 | 170 | 0 |
| Y11 | 3,451 | 0.90 | 91.3 | 59,743 | | 10 | | | 64 | | | 110 | | 0 | 184 |
| Y12 | 1,429 | 1.11 | 91.5 | 30,623 | | | | | | | | | | 0 | 0 |
| Totals | 43,052 | 0.83 | 91.3 | 689,953 | 50 | 50 | | 334 | 334 | | 1,055 | 1,055 | | 1,439 | 1,439 |
| | | | | |
| Boa Esperança Project | Page 154 |
| NI 43-101 Technical Report Feasibility Study | October 2021 |
Table 16-11: Proposed Plant Feed Summary by Ore Type (Quarterly)
| | | | | | | | | | | | | | | | | | | | | | | | | | | | | | | | | | | | | | |
| Period | Crusher | Crusher | Crusher |
| Breccia | Granite Breccia | Granite |
| kt | %Cu | REC (%) | Payable Cu (Klb) | kt | %Cu | REC (%) | Payable Cu (Klb) | kt | %Cu | REC (%) | Payable Cu (Klb) |
| Y01Q2 | 249 | 1.55 | 92.6 | 7,571 | 149 | 1.01 | 93.8 | 2,990 | 61 | 0.96 | 93.4 | 1,151 |
| Y01Q3 | 483 | 1.64 | 93.1 | 15,583 | 175 | 0.94 | 93.6 | 3,252 | 128 | 0.85 | 93.6 | 2,165 |
| Y01Q4 | 648 | 1.60 | 93.2 | 20,527 | 134 | 0.97 | 93.9 | 2,577 | 156 | 0.70 | 92.9 | 2,129 |
| Y02Q1 | 719 | 1.38 | 92.3 | 19,465 | 157 | 0.87 | 93.3 | 2,697 | 100 | 0.59 | 91.7 | 1,157 |
| Y02Q2 | 728 | 1.60 | 93.2 | 22,957 | 179 | 0.84 | 92.9 | 2,948 | 90 | 0.63 | 92.3 | 1,109 |
| Y02Q3 | 808 | 1.48 | 92.6 | 23,470 | 139 | 0.99 | 93.2 | 2,721 | 61 | 0.74 | 93.2 | 894 |
| Y02Q4 | 791 | 1.48 | 92.7 | 22,990 | 143 | 1.04 | 93.4 | 2,923 | 75 | 0.74 | 92.9 | 1,081 |
| Y03Q1 | 750 | 1.39 | 92.6 | 20,519 | 117 | 0.85 | 93.0 | 1,944 | 127 | 0.71 | 92.6 | 1,773 |
| Y03Q2 | 713 | 1.32 | 92.3 | 18,459 | 133 | 0.73 | 92.3 | 1,895 | 148 | 0.68 | 92.4 | 1,973 |
| Y03Q3 | 645 | 1.16 | 91.5 | 14,449 | 177 | 0.70 | 92.5 | 2,448 | 183 | 0.65 | 91.8 | 2,301 |
| Y03Q4 | 662 | 1.05 | 91.1 | 13,373 | 214 | 0.74 | 92.7 | 3,111 | 129 | 0.69 | 92.1 | 1,740 |
| Y04 | 2,010 | 1.02 | 90.8 | 39,439 | 778 | 0.58 | 91.4 | 8,767 | 1,212 | 0.47 | 88.9 | 10,841 |
| Y05 | 1,251 | 1.42 | 92.8 | 34,930 | 796 | 0.71 | 92.6 | 11,040 | 1,953 | 0.49 | 89.4 | 18,101 |
| Y06 | 1,226 | 1.06 | 90.9 | 24,964 | 776 | 0.68 | 92.4 | 10,375 | 1,998 | 0.50 | 89.6 | 18,794 |
| Y07 | 1,087 | 0.55 | 82.7 | 10,449 | 577 | 0.61 | 91.8 | 6,866 | 2,336 | 0.44 | 88.2 | 19,205 |
| Y08 | 525 | 1.03 | 91.0 | 10,388 | 1,245 | 0.51 | 90.2 | 12,090 | 2,229 | 0.47 | 89.1 | 19,830 |
| Y09 | 915 | 0.90 | 89.8 | 15,741 | 1,786 | 0.61 | 91.6 | 21,085 | 1,299 | 0.48 | 89.2 | 11,879 |
| Y10 | 251 | 1.47 | 93.1 | 7,299 | 1,808 | 0.66 | 92.0 | 23,357 | 1,940 | 0.48 | 89.4 | 17,806 |
| Y11 | 1,742 | 1.12 | 90.9 | 37,571 | 1,094 | 0.77 | 92.9 | 16,639 | 614 | 0.48 | 89.0 | 5,533 |
| Y12 | 1,248 | 1.18 | 91.6 | 28,663 | 123 | 0.54 | 90.5 | 1,275 | 58 | 0.61 | 90.9 | 685 |
| Totals | 17,450 | 1.21 | 91.7 | 408,808 | 10,702 | 0.67 | 92.2 | 140,997 | 14,900 | 0.50 | 89.5 | 140,148 |
| | | | | |
| Boa Esperança Project | Page 155 |
| NI 43-101 Technical Report Feasibility Study | October 2021 |
Table 16-12: Proposed Plant Feed Summary by Ore Type (Yearly)
| | | | | | | | | | | | | | | | | | | | | | | | | | | | | | | | | | | | | | |
| Period | Crusher | Crusher | Crusher |
| Breccia | Granite Breccia | Granite |
| kt | %Cu | REC (%) | Payable Cu (Klb) | kt | %Cu | REC (%) | Payable Cu (Klb) | kt | %Cu | REC (%) | Payable Cu (Klb) |
| Y01 | 1,380 | 1.61 | 93.0 | 43,681 | 457 | 0.97 | 93.8 | 8,818 | 344 | 0.80 | 93.3 | 5,446 |
| Y02 | 3,046 | 1.49 | 92.7 | 88,883 | 618 | 0.93 | 93.2 | 11,288 | 326 | 0.66 | 92.5 | 4,241 |
| Y03 | 2,770 | 1.24 | 92.0 | 66,800 | 642 | 0.75 | 92.6 | 9,397 | 588 | 0.68 | 92.2 | 7,788 |
| Y04 | 2,010 | 1.02 | 90.8 | 39,439 | 778 | 0.58 | 91.4 | 8,767 | 1,212 | 0.47 | 88.9 | 10,841 |
| Y05 | 1,251 | 1.42 | 92.8 | 34,930 | 796 | 0.71 | 92.6 | 11,040 | 1,953 | 0.49 | 89.4 | 18,101 |
| Y06 | 1,226 | 1.06 | 90.9 | 24,964 | 776 | 0.68 | 92.4 | 10,375 | 1,998 | 0.50 | 89.6 | 18,794 |
| Y07 | 1,087 | 0.55 | 82.7 | 10,449 | 577 | 0.61 | 91.8 | 6,866 | 2,336 | 0.44 | 88.2 | 19,205 |
| Y08 | 525 | 1.03 | 91.0 | 10,388 | 1,245 | 0.51 | 90.2 | 12,090 | 2,229 | 0.47 | 89.1 | 19,830 |
| Y09 | 915 | 0.90 | 89.8 | 15,741 | 1,786 | 0.61 | 91.6 | 21,085 | 1,299 | 0.48 | 89.2 | 11,879 |
| Y10 | 251 | 1.47 | 93.1 | 7,299 | 1,808 | 0.66 | 92.0 | 23,357 | 1,940 | 0.48 | 89.4 | 17,806 |
| Y11 | 1,742 | 1.12 | 90.9 | 37,571 | 1,094 | 0.77 | 92.9 | 16,639 | 614 | 0.48 | 89.0 | 5,533 |
| Y12 | 1,248 | 1.18 | 91.6 | 28,663 | 123 | 0.54 | 90.5 | 1,275 | 58 | 0.61 | 90.9 | 685 |
| Totals | 17,450 | 1.21 | 91.7 | 408,808 | 10,702 | 0.67 | 92.2 | 140,997 | 14,900 | 0.50 | 89.5 | 140,148 |
| | | | | |
| Boa Esperança Project | Page 156 |
| NI 43-101 Technical Report Feasibility Study | October 2021 |
16.4Mining Equipment
16.4.1General
The planned Boa Esperança mine will use conventional open pit mining techniques and diesel mining equipment to mine a total of 203 Mt of material over the LOM. This will consist of 54 Mt of ore and 149 Mt of waste material. Selective mine practices will be applied avoiding dilution.
The operation will include normal drilling, blasting loading with 5.2 m3/3.9m3 (waste/ore) backhoe configured excavator and 38 t conventional trucks over an 8 m bench height (double bench of 16 m in fresh rock in interim and final slopes). Mining will be performed on a sub-bench of flitch basis to improve selectivity.
Two different phases were defined to mine Boa Esperança:
•Phase 1: Pre-production and five initial periods of production will be performed by contractor;
•Phase 2: From year 6 on, the mine will be operated with Owner equipment and labor.
Future studies will confirm the preferred time for contractor to Owner transition.
Blasting operations will be performed by a blasting specialist company.
Conventional drill, blast, load and haul, plus all the regular services of face and roads maintenance will be used. Equipment selection considered the following:
•Commensurate with the region and mine capacity;
•Ability to selectively mine;
•Fleet size commensurate with contractor capabilities.
The following type and size of main equipment was selected, taking into consideration the size of the mine, the geometry of the phases and the production requirements.
•Drill rig : 127mm diam (type Sandvik DP1500)
•Backhoe shovel: 3.9–5.2 m3 (type Cat 395)
•Frontal end loader: 5.4 m3 (type Cat 980)
•38 t conventional trucks (type 8x4 FMX)
•Ancillary equipment:
•Bulldozer (type Cat D8)
•Wheel dozer (type Cat WD824)
•Graders (type Cat 12 K)
•Water truck 18 m3
At this stage there is no selection of supplier or model, the types noted are only for reference purposes.
Other minor equipment and mining investments were also considered as follows:
•Soil compactor;
•Forklifts;
•Dispatch system;
•Mining software;
•Fuel truck;
| | | | | |
| Boa Esperança Project | Page 157 |
| NI 43-101 Technical Report Feasibility Study | October 2021 |
•Lowboy truck;
16.4.2Time Definition
The total annual hours or calendar time was based on 353 days/year. For every year, 12 days of losses due to weather conditions were considered. Each day will consist of three 8-hours shifts. Four mining crews will rotate to cover the operation.
Definitions used for equipment time allocation and calculation of the main operational indices are presented in Figure 16-7:
Figure 16-7: Operating Time and Index Definition
A job efficiency factor (operational losses), to allow for operational losses, was used to estimate all major units of equipment and productivities. Table 16-1 presents the operating time and indexes estimation for the main equipment.
| | | | | |
| Boa Esperança Project | Page 158 |
| NI 43-101 Technical Report Feasibility Study | October 2021 |
Table 16-13: Proposed Operating Time and Index Definition
| | | | | | | | | | | | | | | | | |
| Time factor | | Hydraulic Excavator | Front End Loader | Haul Truck | Diesel Drill |
| | Cat 395 | Cat 980 | Volvo8X4 FMX | DP 1500i |
| | | | | |
| Calendar time | d/y | 365 | 365 | 365 | 365 |
| Scheduled shutdown | d/y | 12 | 12 | 12 | 12 |
| Unscheduled days down | d/y | 0 | 0 | 0 | 0 |
| Mine work days | d/y | 353 | 353 | 353 | 353 |
| Shift per day | sh/d | 3 | 3 | 3 | 3 |
| Hours per shift | h/sh | 8 | 8 | 8 | 8 |
| Calendar time | h/y | 8,472 | 8,472 | 8,472 | 8,472 |
| Availability | % | 85.0% | 85.0% | 85.0% | 85.0% |
| Available time | h/y | 7,201 | 7,201 | 7,201 | 7,201 |
| Standby | | | | | |
| Meals | min/sh | 60 | 60 | 60 | 60 |
| Shift changes | min/sh | 15 | 15 | 10 | 15 |
| Others | min/sh | 5 | 5 | 0 | 20 |
| Total Standby | min/sh | 80 | 80 | 70 | 95 |
| Total standby | h/sft | 1.3 | 1.3 | 1.2 | 1.6 |
| Total standby | h/y | 1,412 | 1,412 | 1,236 | 1,677 |
| Gross operating hours | h/y | 5,789 | 5,789 | 5,966 | 5,524 |
| Utilization | % | 80.4% | 80.4% | 82.8% | 76.7% |
| Operational losses | | | | | |
| Blasting | min/sh | 20 | 20 | 20 | 20 |
| Fueling | min/sh | 20 | 20 | 20 | 20 |
| Others | min/sh | 15 | 15 | 17 | 12 |
| Total operational losses | min/sh | 55 | 55 | 57 | 52 |
| Total operational losses | h/sh | 0.9 | 0.9 | 0.9 | 0.9 |
| Total operational losses | h/y | 969 | 969 | 997 | 925 |
| Net operating hours | h/y | 4,820 | 4,820 | 4,968 | 4,600 |
| Efficiency factor | % | 83.9% | 83.9% | 83.9% | 84.0% |
| Op h/day | 19.3 | 19.3 | 19.9 | 18.4 |
| Net h/day | 16.1 | 16.1 | 16.6 | 15.3 |
| | | | | |
| Boa Esperança Project | Page 159 |
| NI 43-101 Technical Report Feasibility Study | October 2021 |
16.4.3Drilling Equipment
There is no available specific drill-and-blast study. Based on NCL’s experience, the drilling patterns and penetration rates in Table 16-14 are suggested for the different types of material in the pit:
Table 16-14: Proposed Drilling Patterns
| | | | | | | | | | | | | | | | | |
| Drilling Patterns | un | Ore | Waste | Saprolite | Weathered |
| Drilling diameter | mm | 127.0 | 127.0 | 127.0 | 127.0 |
| Bench Height | m | 8.0 | 8.0 | 8.0 | 8.0 |
| Subdrill | m | 1.0 | 1.0 | 0.5 | 0.5 |
| Stemming | m | 4.9 | 4.0 | 3.2 | 4.8 |
| Burden | m | 3.0 | 4.0 | 5.0 | 5.0 |
| Spacing | m | 3.0 | 4.0 | 5.0 | 5.0 |
| Specific drilling | m3/m | 8.0 | 14.2 | 23.5 | 23.5 |
| Redrill | % | 3% | 3% | 3% | 3% |
| Penetration rate | m/h | 30 | 40 | 45 | 40 |
Wall control for stability purposes and reverse circulation (RC) grade control drillholes were also estimated; the same drilling rigs will be used for both areas.
16.4.4Loading Equipment
Material to be mined from the pit will have different densities (Table 16-15)
Table 16-15: Proposed Material Densities
| | | | | | | | | | | | | | | | | |
| Moisture (%) | In situ dry density (t/m3) | Dry swelled (1) density (t/m3) | Wet density in situ (t/m3) | Wet swelled (1) density (t/m3) |
| Ore | 3 | 3.16 | 2.34 | 3.26 | 2.41 |
| Waste | 3 | 2.85 | 2.11 | 2.94 | 2.18 |
| Saprolite | 12 | 1.82 | 1.34 | 2.06 | 1.53 |
| Weathered | 8 | 2.21 | 1.64 | 2.41 | 1.78 |
| Topsoil | 9 | 1.80 | 1.34 | 1.98 | 1.47 |
(1): Corresponds to swelled density in the bucket
Loading equipment capacities were adjusted according to the ore, waste, saprolite and weathered material densities. This was done respecting maximum weights and volumes to be supported by the machines. Thus, the backhoe was dimensioned with a 5.2 m3 bucket for waste, topsoil and saprolite and a 3.9 m3 bucket for ore.
| | | | | |
| Boa Esperança Project | Page 160 |
| NI 43-101 Technical Report Feasibility Study | October 2021 |
16.4.5Hauling Equipment
16.4.5.1Haulage Profile Estimation
Using NCL’s in-house software, the haulage profiles were calculated for different material types (ore or waste), source (pit, phase, bench, stockpile) and destinations (ROM pad, stockpile, waste dump, crusher) depending on the mine plan Figure 16-8 show a summary of the horizontal, uphill and downhill weighted average haulage distances.
Figure 16-8: Proposed Hauling Distances Summary
Note: Figure prepared by NCL, 2021.
16.4.5.2Haul Truck Speeds
Truck speeds were determined using typical values obtained from supplier information and similar operations. Different speeds were used for wet and dry seasons. The values used are shown in Table 16-16.
Table 16-16: Proposed Haul Truck Speeds
| | | | | | | | | | | | | | |
| Sector | Dry Season | Wet Season |
| Loaded | Empty | Loaded | Empty |
| Flat | 40.0 | 45.0 | 32.0 | 36.0 |
| Uphill | 14.0 | 25.0 | 11.0 | 20.0 |
| Downhill | 25.0 | 45.0 | 20.0 | 36.0 |
16.4.5.3Fixed Time
Fixed times are basically loading, dumping, spot and queuing times. The values for loading are 3.3 minutes for all materials, with the exception of saprolite where 4.0 minutes are estimated. Three minutes were added to every cycle for dumping and spotting time at the destination.
| | | | | |
| Boa Esperança Project | Page 161 |
| NI 43-101 Technical Report Feasibility Study | October 2021 |
16.4.6Ancillary and Support Equipment
The ancillary equipment selection took into account the size and type of the main fleet for loading and hauling, the geometry and size of the pits, and the number of roads and waste dumps that will operate at the same time. Additional works such as drainage, roads construction, waste construction, and weather conditions were allowed. This fleet will consist of trackdozers, wheeldozers, motorgraders and water trucks.
The primary function of the auxiliary equipment will be to support the major production units and provide safe and clean working areas. The primary duties that will be assigned to the auxiliary equipment include:
•Mine development including access roads, drop cuts, temporary service ramps, safety berms;
•Waste rock storage area control; this includes maintaining access to the dumping areas and maintaining the travel surfaces;
•Ore stockpile area control; this includes maintaining access to the stockpile areas and maintaining the travel surfaces;
•Maintenance and clean-up in the mine and waste storage areas;
•Maintenance and clean-up of water diversion channels around the dumps and open pit;
•Drilling for pre-split blasting;
•Equipment types included in the auxiliary mine fleet are as follows or as equivalent models:
•Caterpillar D8 track dozer: 231 KW;
•Caterpillar 824 wheel dozer 302 KW;
•Caterpillar 12 grader 136 KW;
•Water truck Volvo 18 m3;
•Sandvik: DP 1500 127 mm,
Additional equipment to support mining activities was estimated, types of equipment is as follows:
•Backhoe/hammer: Caterpillar 420;
•Fuel truck: 20 m3;
•Lube truck: Volvo 4 x 2;
•Support truck;
•Mobil crane: Volvo 10 t;
•Lowboy truck: Volvo 6 x 4;
•Tire handler: Caterpillar 938;
•Lighting plant: 4 x 1000W,
| | | | | |
| Boa Esperança Project | Page 162 |
| NI 43-101 Technical Report Feasibility Study | October 2021 |
16.4.7Total Mine Fleet Requirement
The number of equipment units required was obtained by diving the annual capacity of each equipment by the corresponding required tonnage by period to move.
The total planned main equipment requirements for the Project for every year of the mine plan are summarised in Table 16-17.
| | | | | |
| Boa Esperança Project | Page 163 |
| NI 43-101 Technical Report Feasibility Study | October 2021 |
Table 16-17: Total Proposed Mine Fleet Requirement
| | | | | | | | | | | | | | | | | | | | | | | | | | | | | | | | | | | | | | | | | | | | | | | |
| | Y-02 | Y-01 | Y 01 | Y 01 | Y 02 | Y 03 | Y 04 | Y 05 | Y 06 | Y 07 | Y 08 | Y 09 | Y 10 | Y 11 | Y 12 |
| | Preproduction | Contractor | Own Equipment |
| | | | | | | | | | | | | | | | |
| FEL CAT 980 | 1 | 1 | 1 | 1 | 2 | 2 | 2 | 2 | 2 | 2 | 2 | 2 | 1 | 1 | 1 |
| Backhoe CAT 395 | 2 | 3 | 3 | 4 | 5 | 5 | 5 | 5 | 5 | 5 | 5 | 5 | 4 | 3 | 2 |
| Haul trucks 38t | 11 | 14 | 14 | 19 | 25 | 27 | 30 | 28 | 31 | 29 | 32 | 36 | 39 | 26 | 23 |
| Production Diesel Drill | 1 | 1 | 1 | 3 | 3 | 4 | 4 | 4 | 4 | 4 | 4 | 4 | 4 | 3 | 2 |
| Presplit Diesel Drill | 1 | 1 | 1 | 1 | 1 | 1 | 1 | 1 | 1 | 1 | 1 | 1 | 1 | 1 | 1 |
| Bulldozer CAT D8 | 2 | 2 | 2 | 4 | 5 | 5 | 5 | 5 | 5 | 5 | 5 | 5 | 5 | 4 | 4 |
| Wheel dozer CAT 824K | 1 | 1 | 1 | 2 | 3 | 3 | 3 | 3 | 3 | 3 | 3 | 3 | 3 | 2 | 2 |
| Motor grader CAT 12 K | 1 | 1 | 1 | 1 | 2 | 3 | 4 | 4 | 4 | 4 | 4 | 4 | 4 | 4 | 4 |
Water Truck 18 m3 | 1 | 1 | 1 | 1 | 1 | 1 | 1 | 1 | 1 | 1 | 1 | 1 | 1 | 1 | 1 |
| Backhoe/Hammer 420 (1 yd3) | 1 | 1 | 1 | 1 | 1 | 1 | 1 | 1 | 1 | 1 | 1 | 1 | 1 | 1 | 1 |
Fuel Truck 20 m3 | 1 | 1 | 1 | 1 | 1 | 1 | 1 | 1 | 1 | 1 | 1 | 1 | 1 | 1 | 1 |
| Lube Truck 4x2 | 1 | 1 | 1 | 1 | 1 | 1 | 1 | 1 | 1 | 1 | 1 | 1 | 1 | 1 | 1 |
| Support Truck | 1 | 1 | 1 | 1 | 1 | 1 | 1 | 1 | 1 | 1 | 1 | 1 | 1 | 1 | 1 |
| Mobile Crane 10t | 1 | 1 | 1 | 1 | 1 | 1 | 1 | 1 | 1 | 1 | 1 | 1 | 1 | 1 | 1 |
| Lowboy Truck Volvo 6x4 | 1 | 1 | 1 | 1 | 1 | 1 | 1 | 1 | 1 | 1 | 1 | 1 | 1 | 1 | 1 |
| Tire Handler CAT 938H | 1 | 1 | 1 | 1 | 1 | 1 | 1 | 1 | 1 | 1 | 1 | 1 | 1 | 1 | 1 |
| Lightning Plant 4x1000w | 6 | 7 | 7 | 9 | 11 | 12 | 12 | 12 | 12 | 12 | 12 | 12 | 11 | 8 | 7 |
| | | | | |
| Boa Esperança Project | Page 164 |
| NI 43-101 Technical Report Feasibility Study | October 2021 |
17RECOVERY METHODS
17.1Overview
The Boa Esperança mineral processing plant is designed to treat 4 Mtpa of ore from an open pit mine and will produce copper concentrate over a 12-year mine life. The process plant will operate three shifts per day, 365 d/y with an overall plant availability of 92%. The surface crushing plant will operate at 70% availability or 6,132 h/y. Concentrate and pyrite tailings filtration will operate at 84.4% and 82.8% availability or 7,390 h/y and 7,253 h/y respectively.
The resulting design criteria were based on metallurgical testwork conducted by SGS Geosol, Metso-Outotec and Diemme and used to design the process plant as well as Ausenco’s extensive database and in-house modelling programs.
The primary crushing station will include a conventional three-stage crushing circuit. Crushed ore will be transferred to a stockpile via conveyor that will then feed the grinding circuit consisting of a ball mill and ball mill discharge screen in closed circuit with a classifying cyclone cluster.
Copper flotation will consist of conventional rougher flotation followed by rougher concentrate regrind, Jameson cleaner scalper and finally two stages of cleaner flotation to produce a final copper concentrate. The copper rougher tailings combined with the copper cleaner scavenger tailings to be fed directly to the pyrite flotation circuit.
Copper concentrate will be thickened by way of a high-rate thickener and then filtered in a conventional vertical plate pressure filter.
Similarly, tailings from the pyrite flotation cells will be subjected to pyrite tailings thickening and filtration and stored at the dry stack tailings facility.
Water from the process plant will be supplied from Jataba Creek and will be stored in a raw water reservoir. Raw water will then be withdrawn from the reservoir to a tank to be used for raw water, gland water and potable water, which will first be treated in a potable water treatment plant.
17.2Process Flow Sheet
As shown in Figure 17-1, the process plant will consist of the following:
•Run-of-mine (ROM) bin;
•Three-stage crushing circuit;
•Crushed ore stockpile with reclaim system;
•Ball mill grinding in closed with hydrocyclones;
•Copper flotation with conventional concentrate regrind and cleaner scalper, and two stages of cleaning;
| | | | | |
| Boa Esperança Project | Page 165 |
| NI 43-101 Technical Report Feasibility Study | October 2021 |
•Pyrite flotation;
•Copper concentrate thickening and filtration;
•Copper concentrate load-out and storage;
•Pyrite tailings thickening and filtration;
•Tailings dry stack stockpile facility;
•Reagent and grinding media;
•Plant services including water and air services; and
•Water storage facilities for raw water and pyrite impoundment reclaim water.
| | | | | |
| Boa Esperança Project | Page 166 |
| NI 43-101 Technical Report Feasibility Study | October 2021 |
Figure 17-1: Overall Process Flowsheet
Figure prepared by Ausenco, 2021.
| | | | | |
| Boa Esperança Project | Page 167 |
| NI 43-101 Technical Report Feasibility Study | October 2021 |
17.3Plant Design Criteria
The key process design criteria for the mineral processing facilities are listed in Table 17-1, which also summarizes the grade and recovery data.
The key criteria for the process plant design are:
•Design plant treatment rate of 4.0 Mtpa
•Design availability of 92%, which equates to 8,059 operating hours per year, with standby equipment in critical areas;
•Concentrate filtration availability of 84.4% or 7,390 operating hours per year; and
•Pyrite tailings filtration availability of 82.8% or 7,253 operating hours per year.
Table 17-1: Boa Esperança Process Design Criteria
| | | | | | | | |
| Description | Units | Value |
| Ore Throughput | Mtpa | 4.0 |
| Year 1-4 average feed grade, Cu | % | 1.3 |
| Design feed grade, Cu | % | 2.2 |
| Recovery to concentrate, Cu | % | 95.4 |
| Concentrate grade, Cu | % | 29.5 |
| Recovery to concentrate, mass | % plant feed | 7.1 |
| Operating Schedule | | |
| Crusher availability | % | 70 |
| Plant availability | % | 92 |
| Concentrate filter plant availability | % | 84 |
| Pyrite tailings filter plant availability | % | 83 |
| Daily throughput | t/d | 10,959 |
| Comminution Characteristics | | |
| Crushing work index Cr(MACON) | % | 35 |
| Bond rod mill work index (RWi) | kWh/t | 17.6 |
| Bond ball mill work index (BWi) | kWh/t | 17.6 |
| Bond abrasion index (Ai) | g | 0.356 |
| Crushing and Grinding | | |
| Crushing plant type | - | 3-stage |
| Grinding circuit type | - | ball mill in closed circuit with hydrocyclones |
Grinding circuit feed size, F100 | mm | 13 |
Grinding circuit product size, P80 | µm | 110 |
| | | | | |
| Boa Esperança Project | Page 168 |
| NI 43-101 Technical Report Feasibility Study | October 2021 |
| | | | | | | | |
| Description | Units | Value |
| | |
| | |
| | |
| | |
| | |
| | |
| | |
| | |
| | |
| | |
| | |
| | |
| | |
| | |
| | |
| | |
| | |
| | |
| | |
| | |
| | |
| | |
| Flotation Stage Recovery to Concentrate | | |
| Rougher flotation | % Cu | 98.2 |
| Cleaner scalper | % Cu | 50.0 |
| Cleaner 1 | % Cu | 71.5 |
| Cleaner scavenger | % Cu | 82.7 |
| Cleaner 2 | % Cu | 90.4 |
| Pyrite | % S | 98.3 |
| Concentrate Regrind | | |
Feed size, F80 | µm | 78 |
Product size, P80 | µm | 38 |
| Specific grinding energy (SGE) | kWh/t | 10.4 |
| Concentrate Dewatering | | |
| Thickener underflow density | % w/w | 60 |
| Filter cake moisture | % w/w | 10 |
| Pyrite Tailings Dewatering | | |
| Pyrite tailings disposal method | | dry stacking |
| Pyrite concentrate disposal method | - | sub-aqueous deposition |
| Thickener underflow density | % w/w | 70 |
| Filter cake moisture | % w/w | 15 |
17.4Unit Process Description
17.4.1ROM Ore Handling and Crushing
The crushing facility will be a conventional three-stage crushing circuit that will process ROM ore at a processing rate of 10,959 t/d. ROM ore will be trucked from the open pit and fed directly to the ROM ore bin or stockpiled on the storage pad, which can be reclaimed by a front-end-loader (FEL) for continuous feed. The ROM ore bin will be equipped with a fixed grizzly and will have a 200-t live capacity. Large rocks will be broken using a mobile rock breaker.
The ROM ore from the ROM bin will be withdrawn by the grizzly feeder where the coarse oversize will report directly to a single jaw crusher. The feed material will be crushed by the jaw crusher to reduce feed size P80 from 684 mm to 185 mm. The crushed material from the primary jaw crusher will be combined with the grizzly feeder undersize and will be conveyed to the double-deck secondary screen. Secondary screen oversize from the two decks will be fed directly to a 450-kW secondary cone crusher, while its undersize will report to tertiary crushing.
Two 450-kW tertiary cone crushers will operate in closed circuit with two double-deck tertiary screens. Feed to the two tertiary screens will be a combination of secondary screen undersize, secondary crusher discharge and tertiary crushers discharge. The tertiary screen oversize will report to tertiary crushing feed bins to be withdrawn by vibrating feeders to feed the two tertiary crushers. Each tertiary crushing feed bin will have a live capacity of 74 t or approximately 15 minutes of live storage.
Secondary crushing and tertiary crushing will reduce feed size P80 to 47 mm and 12 mm, respectively.
Undersize from the two tertiary screens will be discharged onto the crushed ore stockpile feed conveyor delivering material to the crushed ore stockpile.
| | | | | |
| Boa Esperança Project | Page 169 |
| NI 43-101 Technical Report Feasibility Study | October 2021 |
17.4.2Crushed Ore Stockpile
Tertiary screen undersize will be stored in a single conical crushed ore stockpile. Crushed ore from the stockpile will be reclaimed by two belt feeders to feed the process plant.
The crushed ore stockpile will have a total storage capacity of 36,750 t and a live capacity of approximately 7,497 t, equivalent to approximately 15 hours at nominal throughput. The stockpile will provide adequate surge capacity for the open pit mining and process plant for throughput fluctuations as well as maintenance activities.
The two belt feeders are designed with a unit capacity to handle 100% of the design rate to the ball mill. Both belt feeders will operate at a nominal 50% capacity. The belt feeders will discharge crushed ore directly onto the ball mill feed conveyor. A weightometer will be installed to the feed conveyor to monitor the plant feed rates.
A spile bar machine will be located on the upper floor of the reclaim tunnel to allow the belt feeders to be isolated from the stockpile for critical maintenance activities.
The reclaim tunnel will be equipped with an exhaust fan and trolley hoists for ventilation and maintenance purposes.
17.4.3Ball Mill Grinding
The grinding circuit will consist of a ball mill operating in closed circuit with a classifying cyclone cluster. The ball mill circulating load will be a nominal 300% of new feed. The grinding circuit is designed for a product size 80% passing size (P80) of 110 µm where the cyclone overflow pulp density will be 35% (by weight).
The 9.0-kW ball mill will be a single pinion overflow mill with an inside diameter of 6.7 m and an effective grinding length (EGL) of 10.7 m. The ball mill will receive crushed ore and process water will be added at a variable flowrate to achieve the target pulp density. Ball mill discharge will flow through a slotted trommel screen with an aperture size of 12 x 45 mm to remove any trash or broken mill balls, which will then be discharged to a concrete ball mill scats bunker.
Undersize from the ball mill trommel screen will discharge directly into the cyclone feed pump box, where it will be diluted with process water and pumped to the cyclone distribution manifold via a cyclone feed pump. Cyclones will classify the feed slurry to achieve overflow stream of 35% solids (by weight) comprising product sized particles. The cyclone underflow will report back to the ball mill feed chute to be ground in the ball mill.
The cyclone overflow will report to a trash screen via gravity, which will remove trash to a trash bin. Trash screen undersize will be sampled and analysed by an on-stream analyser (OSA) and a particle size indicator (PSI) prior to the rougher flotation circuit.
Provisions will be made for the addition of lime to the ball mill feed chute to adjust the pH of the slurry in the grinding circuit prior to the flotation process.
Steel balls will be used as grinding media with diameter of 50–75 mm by means of hoist and ball kibble. The grinding media will be transferred by FEL from the storage bunker into kibbles via a ball loading chute. A ball loading hoist will be utilized to lift the kibbles and discharge the grinding media into the ball mill ball loading hopper. A ball feeder will also be used to add the grinding media periodically to the ball mill feed chute at a controlled rate.
A feed chute transporter will be used to remove the feed chutes from the ball mill for maintenance and reline tasks. A mill liner handler and hydraulic liner bolt removal tools will be utilized to service the ball mill. These tools will be provided by the ball mill supplier.
| | | | | |
| Boa Esperança Project | Page 170 |
| NI 43-101 Technical Report Feasibility Study | October 2021 |
17.4.4Flotation
17.4.4.1Copper Flotation
The copper flotation circuit will recover copper-bearing minerals into the final copper concentrate. The flotation circuit will consist of rougher flotation, rougher concentrate regrind, cleaner scalper, and two stages of cleaning.
Cyclone overflow from the primary cyclone will report to a conditioning tank where collectors will be added and blended with the feed slurry before feeding a bank of six rougher flotation cells. The rougher flotation cell type will be forced-air tank cells, each with a volume of 130 m3. The bank of flotation cells will provide a total retention time of approximately 25 minutes. Concentrate from the rougher launder will be sampled and advance to the rougher concentrate regrind mill cyclone cluster. Similarly, tailings from the rougher cells will be sampled prior to advancing to the pyrite flotation circuit.
A cleaner–scalper flotation circuit will be included in the flotation configuration and will consist of a single Jameson cell to produce a high-grade concentrate. The Jameson cleaner–scalper feed will consist of rougher concentrate regrind circuit product and its tailings recycle. The Jameson cleaner–scalper concentrate will be sampled prior to gravity flow to the final concentrate pump box, while the tailings will be discharged to the cleaner circuit.
Cleaner 1 and cleaner–scavenger flotation will consist of a total of six 50 m3 forced-air tank cells. The first three cleaner 1 cells will provide a total retention time of approximately 14 minutes and the remaining cleaner–scavenger cells will have a total retention time of approximately 10 minutes.
Cleaner–scalper tailings will be combined with cleaner 2 tailings to feed the cleaner 1 flotation cells. Cleaner 1 concentrate will be discharged to the cleaner 1 concentrate launder before reporting to the cleaner 2 feed pump box. Similarly, cleaner–scavenger concentrate will be discharged to the cleaner–scavenger concentrate launder and then to a pump box to be pumped back to the rougher concentrate regrind circuit. The tailings from cleaner–scavenger flotation cells will be sampled and combined with the tailings from rougher flotation in a pump box to be fed to the pyrite flotation circuit.
Cleaner 2 flotation will consist of a single Jameson cell. Cleaner 1 concentrate will feed the cleaner 2 Jameson cell, where its concentrate will be sampled and combined with the cleaner–scalper Jameson concentrate in the final concentrate pump box prior to concentrate dewatering. Tailings from cleaner 2 will return to cleaner 1.
17.4.4.2Pyrite Flotation
Final tailings from the copper flotation circuit will be fed to a bank of six flotation cells to separate the pyrite concentrate so that it can be stored in a lined pond due to the high sulphur level. The final tailings will be conditioned in a series of two conditioning tanks to ensure the required pH level is achieved and to add flotation collector. The pyrite flotation tank cells will each have a volume of 130 m3 and a total retention time of approximately 20 minutes. The pyrite rougher concentrate will be discharged to the pyrite concentrate launder and sampled prior to being pumped to the pyrite impoundment. Similarly, tailings from the pyrite flotation cells will be sampled and pumped to the pyrite tailings thickener.
| | | | | |
| Boa Esperança Project | Page 171 |
| NI 43-101 Technical Report Feasibility Study | October 2021 |
17.4.5Concentrate Regrind
The concentrate regrind circuit will consist of a regrind cyclone cluster in open circuit with the regrind mill. The proposed regrind mill is a HIG1200. The size of the regrind mill is based on a maximum specific energy of 10.4 kWh/t and a design circuit feed rate of 99.3 t/h. The proposed HIG mill will be able to reduce the grind size of the copper rougher concentrate and copper cleaner scavenger concentrate to a P80 of 38 µm.
Concentrate from the copper rougher flotation cells will be combined with the copper cleaner scavenger concentrate in the regrind mill pump box to be pumped to the regrind mill cyclone cluster. Particles finer that the target P80 will report as cyclone overflow whereas coarser particles will report as cyclone underflow and will be fed to the regrind HIG mill. Cyclone overflow will be combined with the regrind mill discharge in a pump box to be pumped to the cleaner–scalper Jameson cell.
Ceramic regrind media will be charged to the HIG mill via the media feed hopper. A media hoist will load grinding media into the media hopper, which will be equipped with two gravity discharge outlets, to enable the addition of media after the mill maintenance, as well as media make-up during operation. In the event of the mill inspections and maintenance, the regrind media will be manually drained into bulk bags.
17.4.6Concentrate Dewatering
Final concentrate from the copper flotation circuit will be pumped to the concentrate dewatering circuit to reduce the moisture of the final copper concentrate to approximately 10% solids (by weight). The concentrate dewatering circuit will be comprised of a high-rate thickener, filter feed tank and a vertical plate pressure filter.
A trash screen will be located prior to the concentrate thickener to remove any material that may damage or block downstream equipment into a trash bin. Trash screen undersize will gravity flow to the concentrate thickener feed de-aeration tank to release the entrained air in the concentrate slurry. Filtrate from the downstream filter unit will also return to the concentrate filtrate pump box and will be pumped to the process water tank. Flocculant will be diluted with process water in the in-line mixer to 0.025 %w/v and added to the thickener feed stream to enhance settling.
The concentrate thickener overflow will report to the process water tank and the underflow will be pumped to the agitated concentrate filter feed tank. The filter feed tank will provide 24-hour surge capacity at nominal production rates to allow for filter maintenance without affecting mill throughput.
Filter feed will be pumped to a vertical plate pressure filter to produce a filter cake of 10% w/w moisture. The filter cake will be discharged directly to the concentrate filter bunker.
Raw water will also be used for cloth washing while plant air will be used to flush the filter manifold (top blow). Filtrate, cloth wash and manifold flushing water will be returned to the concentrate thickener via the concentrate filtrate pump box and pump.
High pressure air for the concentrate filter will be supplied by a dedicated filter air compressor and filter air receiver.
17.4.7Concentrate Storage and Load Out
The dewatered concentrate will be discharged to a covered storage building with a storage capacity of 15 days. FELs will be used to reclaim concentrate and load the concentrate into containers mounted on a standard AB-triple road train. The road train will be positioned on a seven-deck weighbridge prior to loading. The weighbridge will give feedback to the FEL operator as the containers are being filled. When the containers become full, the container lids will be re-fitted using mobile equipment and the containers will be manually washed by the operator. When all three containers on the road train become full, covered and washed, the concentrate will then be transported to an off-site facility.
A truck wash station will service the concentrate trucks with the washdown collected by a sump and return into the concentrate dewatering system.
| | | | | |
| Boa Esperança Project | Page 172 |
| NI 43-101 Technical Report Feasibility Study | October 2021 |
17.4.8Pyrite Tailings Dewatering
The pyrite tailings dewatering circuit will reduce the moisture of the final tailings from pyrite flotation to 14–16% solids (by weight). The pyrite tailings dewatering circuit will comprise a high-rate thickener, filter feed tank and vertical plate pressure filters.
The final tailings from the pyrite flotation circuit will be pumped to the pyrite tailings thickener feed box and gravitate to the pyrite tailings thickener. Filtrate from the downstream filter units will return to the tailings filtrate pump box to be pumped back to the pyrite tailings thickener. Flocculant will be diluted with process water in the in-line mixer to 0.025 %w/v and subsequently added to the feed stream to facilitate solids settling and maintain overflow clarity.
The pyrite tailings thickener supernatant overflow will report to the process water tank for plant process water applications, while the underflow will be pumped to the agitated filter feed tank. The filter feed tank will provide an approximate 6-hour surge capacity at nominal production rate.
Filter feed will then be pumped to three vertical plate pressure filters to produce a filter cake with 14–16% w/w moisture. The filter cake will be discharged and conveyed to a tailings dry stack facility. FELs will be used to reclaim and load tailings haulage trucks from the dry stack facility.
17.4.9Pyrite Concentrate Pond Water Reclaim
The pyrite concentrate will be stored in a lined pond, which is discussed in Section 18.5.5.3. Water released from the pyrite concentrate solids will be reclaimed by using float-mounted barge pumps to a reclaim water storage tank, where lime can be added to control the pH level. The treated water will be pumped to the process water tank for re-use in the process plant.
17.4.10Reagents and Consumables
The reagents will be prepared and stored in separate self-contained areas within the process plant and delivered by individual dosing pumps to the required addition points for the reagents. Reagents will include:
•pH modifier: Hydrated lime will be received onsite from bulk road tankers, and pneumatically transferred into a silo. The purpose of lime in the process will be as a pH modifier in flotation. Lime will be mixed in a tank as required to create a slurry with a density of 20% w/w solids and stored in a separate tank for distribution to required dosing points by dedicated slurry pumps.
•pH modifier: Sulfuric acid will be used to adjust the level of pH and will be supplied in a bulk road tanker in liquid form with an acid solution strength concentration of 98%. Sulfuric acid will be pumped to a storage tank and then transferred to a mixing tank to be mixed with raw water. It will be distributed to required flotation dosing points by dedicated dosing pumps.
•Collector: PAX is a sulphide mineral collector and will be supplied in 850-kg bulk bags as a dry reagent. PAX will be stored in the reagent storage area of the process plant and delivered to the PAX mixing area. Water will be added to an agitated tank to produce a solution concentration of 10% w/w. The diluted mix will be transferred to the collector distribution tank. The collector will be distributed to required flotation dosing points by dedicated dosing pumps.
•Collector: DTF is a copper sulphide mineral collector and will be supplied in 850-kg IBC totes in liquid form. DTF will be delivered to required flotation dosing points directly from the IBC totes by dedicated dosing pumps.
•Frother: F-810 Flomin (or similar) will be used to provide a stable froth in the flotation cells. The frother will be supplied in 960-kg IBC totes and delivered to required flotation dosing points directly from the IBC totes by dedicated dosing pumps.
| | | | | |
| Boa Esperança Project | Page 173 |
| NI 43-101 Technical Report Feasibility Study | October 2021 |
•Flocculant: A flocculant mixing, and dosing system will be located in a separate self-contained area within the process plant will be provided to facilitate concentrate and pyrite tailings thickening. The flocculant will be supplied in 25-kg bags and will be shipped as a dry reagent. The bags will be lifted and loaded into the flocculant feed bin. Loose flocculant will be transported via a screw feeder to flocculant mixing tanks. Water will be added to the agitated mixing tank to produce a solution concentration of 0.25% w/w. The flocculant will be pumped by way of metering pumps to an in-line mixer where the solution will be further diluted to 0.025% w/w and fed to the concentrate thickener and pyrite tailings thickener.
17.5Sampling and Metallurgical Laboratory
The process plant will be equipped with automatic samplers to collect shift and routine samples. Samples collected will include head, intermediate products, pyrite concentrate and pyrite tailings. The data obtained will be used for product quality control, metal accounting and process optimization.
The metallurgical laboratory will perform metallurgical tests for quality control and optimization of the process flowsheet. The laboratory will include equipment such as laboratory crushers, ball mill, sieve screens, bottle rollers, leach reactors, balances, dissolved oxygen meters, and pH meters.
Samples from the metallurgical samplers and slurry samplers will be sent to an OSA via high-grade and low-grade multiplexers. Shift composite samples will be taken by the multiplexers and a vacuum filter unit will be provided to automatically dewater up to six samples collected by the multiplexers.
The OSA will be used to monitor metal contents and solids concentrations in these streams to allow operators to optimize reagent additions and flotation performance.
The rougher feed and regrind mill discharge will be sampled and analysed by the PSI to monitor grinding performance.
See section 18.4.2 for further details of the laboratory, which will also process mine reverse circulation samples.
17.6Plant Services
Plant water and air supply and distribution are presented below. For further information on water and power supply refer to Section 18.
| | | | | |
| Boa Esperança Project | Page 174 |
| NI 43-101 Technical Report Feasibility Study | October 2021 |
17.6.1Water Supply and Distribution
17.6.1.1Raw Water
Raw water with high total dissolved solids from Jataba Creek will be stored in a raw water reservoir. The raw water will be withdrawn from the reservoir to a tank with a live capacity of 90 minutes. An inline filter will be installed on the pipeline from the reservoir to the tank to reduce the total suspended solids.
The filtered raw water will be stored in the raw water tanks and distributed to the following services:
•Gland water applications;
•Raw water for reagent preparations and filter cloth washing;
•Make-up water for the process water;
•Potable water applications (after potable water treatment);
•Dust control at the coarse ore stockpile; and
•Miscellaneous equipment (e.g., Jameson cell and concentrate filters).
17.6.1.2Fire Water
Fire water will be supplied from the filtered raw water tank that contains a dedicated firewater reserve with a design capacity of two hours. The firewater pumping system will comprise three fire water pumps (electric, jockey and diesel) to provide failsafe supply of fire water to fire hydrants and hose reels via a dedicated fire water piping network.
The fire water jockey pump will be a small electric pump that will maintain system pressure in the firewater distribution system. The electric fire water pump will be capable of supplying fire water to the fire hydrant/hose reel network. The diesel fire water pump will deliver the same flow and pressure as the electric pump but will be driven by a diesel engine to provide back-up to the electric pump in the event of a power failure.
17.6.1.3Potable Water
Filtered raw water will be further treated with chlorine to produce potable water in the potable water treatment plant with a treatment capacity of 12 hours.
Potable water will then be stored in a tank and potable water pumps will be used to distribute potable water for general use around site and supply the safety shower system.
17.6.1.4Process Water
Process water will be made from pyrite tailings thickener overflow, concentrate thickener overflow, pyrite impoundment reclaim water and raw water make-up as required.
Process water will be stored in the process water tank with a nominal live capacity of 30 minutes. Process water pumps will be utilized to distribute process water to the required points within the process plant.
| | | | | |
| Boa Esperança Project | Page 175 |
| NI 43-101 Technical Report Feasibility Study | October 2021 |
17.6.2Air Supply and Distribution
Two plant air compressors (operating as duty and standby) will provide high pressure air for plant instruments and general service points. Compressed air will be dried and filtered to instrument air quality prior to storage in plant air receivers from where it will be reticulated around the plant. High pressure air will also be supplied to the concentrate and pyrite tailings filtration area via air receivers.
Low pressure air for the copper and pyrite flotation circuits will be supplied by two multi-stage centrifugal blowers (operating as duty and standby).
17.7Process Control System
A programmable logic controller (PLC) will be installed in the process plant to stabilize and optimize the operation of the process plant. The process control system will consist of individual locally mounted control panels located near the equipment and a PC-based operator interface station (OIS) located in the following control room:
•Primary crusher control room;
•Secondary and tertiary crushing control room; and
•Central control room in the process plant.
The local control panels will act as a local point for monitoring and control of the nearby equipment and instrumentation. They will also act as the distribution point of power for instrumentation. Programmable logic controllers (PLCs) or other control systems supplied as part of mechanical package, will be interfaced to the main process control system.
Process control strategies are described as follows:
•Major process performances, including process rates, mill power draw, and motor variable speeds, will be displayed in the centralized control room. Alarm annunciation will be local to the major equipment or located on the local control panel.
•The PLC and OIS will perform process control and data management through equipment and processing interlocking, control, alarming, trending, event logging, and report generation. In this manner, the process plant will be monitored and operated automatically from operator workstations in conjunction with control systems.
•Closed circuit television (CCTV) cameras will be installed at various locations to support remote process monitoring, such as crushing area, stockpile reclaim area, ball mill grinding area, flotation area, and concentrate handling area. The cameras will be monitored from the plant control room.
•Security access levels, including a password system, will be configured in the process control to provide suitable access and protection to system settings, controls and set points.
| | | | | |
| Boa Esperança Project | Page 176 |
| NI 43-101 Technical Report Feasibility Study | October 2021 |
18PROJECT INFRASTRUCTURE
18.1Project Infrastructure
The proposed Boa Esperança mine is a greenfield site but is located in a region of available infrastructure. On-site and off-site infrastructure that will be required for mining and processing operations will include:
•On-site
•Open pit mine
•Stockpiles and waste rock facilities
•Process plant with three stage crushing
•Dry stacked tailings facility (DSTF);
•Wet or pyrite tailings storage facility (TSF);
•Water treatment plant (WTP);
•Water collection and containment structures
•Administration building and offices
•Laboratory
•Warehouse and yard storage
•Process operations workshop
•Truck shop
•Mine dry
•Truck wash
•Explosive storage magazine
•Gate house and weigh scale
•Core shed
•First aid clinic and fire protection building
•Canteen
•Sewage treatment
•Refuse storage
| | | | | |
| Boa Esperança Project | Page 177 |
| NI 43-101 Technical Report Feasibility Study | October 2021 |
•Off-site
•Access road upgrade and public road bypass
•Power transmission line
Figure 18-1 shows the proposed site layout and Figure 18-2 shows the proposed locations of the process plant, mine and process services buildings (collectively referred to as the plant site area).
| | | | | |
| Boa Esperança Project | Page 178 |
| NI 43-101 Technical Report Feasibility Study | October 2021 |
Figure 18-1: Project Area Layout
| | | | | |
| Boa Esperança Project | Page 179 |
| NI 43-101 Technical Report Feasibility Study | October 2021 |
Figure 18-2: Proposed Plant Site Layout (Ausenco 2021)
Note: Figure prepared by Ausenco, 2021.
| | | | | |
| Boa Esperança Project | Page 180 |
| NI 43-101 Technical Report Feasibility Study | October 2021 |
18.2Power
18.2.1Electrical Power Demand
The estimated power demand to support operations is approximately 25 MW at peak demand.
18.2.2Electrical Power Source
The public electricity supplier, Equatorial Energia Pará (Equatorial Energia), supplies the region with electrical power. Formal technical consultations were completed with Equatorial Energia during this phase of the Project. A technical feasibility request form with proposed mine details and the estimated power demand were submitted for technical and commercial assessment. Equatorial Energia conducted studies to investigate electrical connections to the mine through the local supplier or through the basic network of the interconnected national system (SIN). Equatorial Energia confirmed the feasibility of supplying power based on a peak demand load of 25 MW by means of a 138 kV power line between the main substation at the proposed mine site and the existing nearby Tucumã substation. The power line will be approximately 45 km long and take 21 months to complete.
The substation in Tucumã has a 138 kV sector with a power line connecting it to the Onça Puma 138/230 kV substation, which is part of the SIN (electrical grid). Figure 18-3 shows the preliminary power transmission line route to the Project site.
Equatorial Energia will oversee the power line route, design, construction and commissioning, landowners’ approach, and land acquisition. Their battery limit will be the termination at the main mine site substation.
Figure 18-3: Preliminary Power Transmission Line Route to Project Site
Note: Figure prepared by Ausenco, 2021.
| | | | | |
| Boa Esperança Project | Page 181 |
| NI 43-101 Technical Report Feasibility Study | October 2021 |
18.2.3Main Substation
The transmission line will terminate at the main substation (6870-SE-01) at the mine site.
The main substation will include high voltage equipment, power transformer, power factor correction and harmonic filtering equipment, metering instrument and control room.
The following systems will be integrated with the main substation set:
•External area
•Grounding Grid;
•Lightning Protection System;
•Ground Resistor for Short-Circuit Current Limitation;
•High Voltage Disconnect Switch;
•HV Circuit Breaker;
•Protection Relay;
•Outdoor measuring and protection transformers (TP’s and TC’s).
•Control Room
•Measuring transformers (TP’s and TC’s) for billing meter;
•Common and emergency lighting;
•Supervision, control, and protection;
•Fire detection, alarm, and complete firefighting system;
•Air conditioning and pressurization;
•Safety signalling and escape routes.
The main substation transformer type will be oil immersed, rated voltage 138/13.8 kV, rated power 25/30 MVA and have ONAN (Oil Natural Air Natural) / ONAF (Oil Natural Air Forced) cooling.
The system will be grounded through grounding resistors, ensuring low value short circuit earth phases and a high degree of system reliability, i.e., energy availability.
The main substation will feed six secondary substations for the following powered locations:
•6890-SE-01 – Crushing Area Substation;
•6900-SE-01 – Grinding, Regrinding, Thickening, Flotation, Water Distribution, Reagents and Air Distribution Area Substation;
•6910-SE-01 – Tailings Filtering Substation;
•6930-SE-01 – Raw Water Capture Substation;
•6940-SE-01 – Wastewater Capture Substation;
•6920-SE-01 – General Area Substation (Office, Workshop, Canteen, Health Center, Labor, etc).
All the secondary substations will have transformers for lighting the industrial areas, administration area and feeding the non-industrial power with secondary voltage of 380/220/127 V.
For instrumentation, control and automation systems feeding a secondary voltage transformer with an output of 220/115 Vac will be installed.
| | | | | |
| Boa Esperança Project | Page 182 |
| NI 43-101 Technical Report Feasibility Study | October 2021 |
Capacitor banks for power factor corrections will be installed in the 13.8 kV medium voltage busbar by the main substation, to maintain the power factor of the system above the required standards.
18.2.4Electric Power Distribution
The electric power distribution will be through medium voltage 13.8 kV compact lines between the main and secondary substations. The compact distribution lines will use shielded cables and spacers and will be hung on concrete poles. The proposed infrastructure for distribution lines will be used to facilitate street lighting and telecommunication circuits.
Buried ducts or suspended lines with insulated cabling are considered to prevent accidents in the proximity of equipment or the possibility of involuntary contact.
The feed circuits will use insulated cables and their path between the substation and the load will be the primary cables route (cables trays or ducts networks).
Power cabling will preferably be arranged in appropriate conduits (cable tray and conduits) but may be embedded in sections of the floor.
The installation of low voltage cables overhead lines will be for lighting circuits only, and in this case multiplexed cabling will be used.
18.3Process Plant Water Consumption
The process plant water balance was used to determine the water requirements for both raw water and recycled process water. A nominal raw water requirement of 154 m3/h was estimated, with 95.8 m3/h to be used as plant make-up water, and 58.2 m3/h for gland seal water, water for reagents, and potable water. A nominal overall process plant water requirement of 1,510 m3/h was estimated, of which 1,332 m3/h would be provided as recycled process water from the overflow streams of the concentrate and tailings thickeners and 178 m3/h would be for plant make-up water, with 95.8 m3/h from the raw water supply and 82.2 m3/h from the pyrite concentrate dam reclaim. Water losses of 70 m3/h were estimated.
The raw water will be sourced from a reservoir dam constructed in the Jatobá River to stabilize water availability throughout the seasons and be pumped to the process plant. The water reservoir will have the purpose of storing clean water to meet the demand of the plant, estimated at a flow of 154 m³/h, working for a year without interruption. The water pond will restrict the flow of the Jatobá River and will be constructed within the property owned by Ero.
The dike embankments for the reservoir dam will consist of a homogeneous section of compacted soil. The defined geometry shows a dam crest at elev. 240.0 m with 10.0 m width. The upstream and downstream slopes will have a declivity of 1V:2.0H.
| | | | | |
| Boa Esperança Project | Page 183 |
| NI 43-101 Technical Report Feasibility Study | October 2021 |
18.4Ancillary Buildings and Facilities
18.4.1Administration Building and Offices
The administration building will be a 1,340 m² single-story building, made of concrete block with a galvanized steel tile roof and a ceiling height of 3 m. The building will accommodate the operation’s general manager, administrative, operation and maintenance management teams. This will include human resources, IT, accounting, exploration, mining, geology, processing, environmental, quality control, legal and engineering personnel.
Additionally, the building will have several conference rooms, a training room for 40 people, a front desk with a waiting area and a copy area, an internal garden, a break room, a cleaning supply storage room and restrooms (male, female and one for people with special needs).
18.4.2Laboratory
The laboratory will be a 715 m² single-story building, made of concrete block with a galvanized steel tile roof and a ceiling height of 3 m. The laboratory will be designed to provide three essential functions: monitoring of the mine and plant operations; ongoing plant balances and facilitating investigations for operational improvements.
The space will be divided into three areas. The main area will be for sample receiving, slurry preparation, scale room, X-ray room, physical and chemical analytical laboratory with reagent and sample storage rooms. The second area will be for dry sample crushing, grinding, and screening. The third area will consist of an office for laboratory staff, accommodating six people, a front desk with a waiting area, a meeting room, a break room, a cleaning supply storage room, and restrooms (male, female and one for people with special needs).
18.4.3Warehouse and Yard Storage
The warehouse complex will consist of a building and a fenced-in open yard. The building will be 960 m², 5 m high, combining concrete block and steel siding walls and a galvanized steel tile roof. Part of the upper wall of the warehouse storage area will be made of translucent panels.
The building space will be divided into a receiving area, a distribution area, a secure storage room and covered storage area. Additionally, there will be offices for the warehousing staff, accommodating up to nine people, male and female restrooms, a cleaning supply storage room, and a break room.
The external open storage will have an area of 1,200 m² for bulk and large items storage, as necessary. This area will be secured by a 2 m tall galvanized chain-link fence. This yard space will be accessible either through the warehouse building or from an external gate.
18.4.4Process Operations Workshop
The process operation workshop building will be a 567 m2, 6 m high, with concrete block and steel siding walls and a galvanized steel tile roof. The building will be divided into a work area and a storage/office area, that are separated by a concrete block wall.
The workshop work area will be outfitted to perform maintenance and repair services for process plant equipment. It will be equipped with a 3-t bridge crane that can span the length of the shop floor. The work area itself will be partitioned into specific work stalls to accommodate cutting, drilling, lathing, planning, and welding operations. Additionally, there will be specific work areas for assembly and work rooms for electrical and instrumentation equipment. The workshop will have a boiler room. In a separate area, outside the workshop, there will be storage and distribution systems for acetylene and liquid oxygen.
The storage/office area will include rooms for tools and components and offices for staff, accommodating seven people. Additionally, a break room and restroom facilities will be provided.
| | | | | |
| Boa Esperança Project | Page 184 |
| NI 43-101 Technical Report Feasibility Study | October 2021 |
18.4.5Mine Dry
The mine dry will be a 360 m2 single-story building, with concrete block and a galvanized steel tile roof. The ceiling height is 3 meters.
The building will have a hall that gives access to a female changing room (with lockers, showers, and lavatory facilities for 60 women), and a male changing room (with lockers, showers, and lavatory facilities for 400 men). Special needs male and female changing rooms will be provided. A cleaning supply storage room will be included.
18.4.6 Mine Equipment Maintenance Shop (Truck Shop)
The mine equipment maintenance shop will be a 648 m2 steel structure building for maintenance bays, 10 m high, with steel siding walls and galvanized steel tile roof. Part of the upper wall of the building will be made of translucent panels.
The building will have four (6 x 12 m) bays for light and heavy vehicle repairs, one (6 x 12m) bay for track equipment repairs with railed floor, one (6 x 12 m) bay for tire changing, one (7 x 12 m) bay for big vehicle repairs and one (6 x 12 m) bay for lubrication, and a tire storage area.
The maintenance bays will be served with a 10-t bridge crane. The floor will have collection trenches leading to an in-floor collection sump with oil/water separator to capture the wash runoff.
The connected building will be a two-story structure with a first-floor area of 430 m2 and a second-floor area of 240 m2. The building will have concrete block exterior walls, a sound-insulated common wall, and a galvanized steel tile roof.
The first floor will accommodate a compressor room, an electrical substation, tire storage and tire changing equipment, a machine shop, a welding shop, an electrical shop, acetylene and oxygen cylinder storage, parts storage, lube container storage, restroom facilities, a cleaning supply storage room and a break room. On the second floor, there will be offices for electrical and mechanical maintenance managers, meeting rooms, male and female restrooms and a break room.
18.4.7Truck Wash
The truck wash building will be a 340 m2 steel structure building, 9.75 m high and with two bays: a 6 x 17 m bay for rubber tire equipment and an 8 x 17 m bay for tracked equipment.
The building will have steel siding walls and galvanized steel tile roof. There will be three raised platforms: two platforms will be at the outer sides of the bays and one common platform will be shared by both bays. The floor under each bay will have a collection trench at each end and a center pit. Collected wash water will be treated by an oil/water separator. The tracked equipment bay will be reinforced with rails.
| | | | | |
| Boa Esperança Project | Page 185 |
| NI 43-101 Technical Report Feasibility Study | October 2021 |
18.4.8Explosive Storage Magazine
The explosive storage area will have a small reception cabin, a building for an office, a break room and male and female changing rooms and two warehouses, one for explosives and one for explosive accessories.
The explosive warehouse will be a 64 m² single-story building and the explosive accessories building will be 48 m². Both will be 3.20 m high, built with concrete blocks with fiber cement tile roof. The buildings will have screened openings for natural ventilation and will be raised about 1 m from ground floor. The buildings will be located inside a 3 m high trapezoidal-shaped ground barricade.
18.4.9Gatehouse and Weight-Scale
The gatehouse will be a 410 m² steel structure building, with a galvanized steel tile roof and 5.5 m high. The gatehouse will provide access control to the mine property. All visitors will be required to enter and exit through this facility.
The 85 m² reception building will be built with concrete blocks and a concrete ceiling slab, with a room for security personnel, a training room, an inspection room, a break room and accessible male and female restrooms.
The security cabin will be 33m², built with concrete blocks and concrete ceiling slab, with a room for two watchmen and a toilet.
18.4.10Core Shed
The core shed will be a 1,200 m² steel structure building, 3 m high, with concrete block and steel siding walls and a galvanized steel tile roof. Part of the upper wall of the warehouse storage area will be made of translucent panels.
This building will have areas for receiving, preparing and storing about 250,000 m of core, and will include a break room, male and female restroom, a cleaning supply storage room and rooms for topography survey and geology staff.
18.4.11First Aid Clinic and Fire Protection Building
The operations will be supported by a first aid clinic and fire brigade. Both services will share a common building. The single-story building will be a 235 m2 concrete block structure with galvanized steel tile roof. The ceiling height will be 3 m, and the ambulance/fire truck parking will be 4.6 m high.
The first aid clinic will have a hall/waiting room with male and female accessible restrooms, a nursery for two people and an individual nursery, a doctor´s office with a toilet, an audiometry room, immunization and blood collection rooms, a nursing station, medicine storage and medical facilities, male and female changing rooms for the staff, cleaning supply storage room and a break room.
The fire brigade will have an office, a toilet, and an equipment storage room.
18.4.12Fire Protection
The firewater distribution system will consist of a dedicated buried fire water main and hydrant system. The system will be designed to meet the requirements of NFPA 14. Water will be stored in a shared raw water/fire water tank (1,500 m3 capacity). The distribution system will be sized for a rated flow of 114 m3/h at 50 m and will consist of an electric firewater pump (primary), a diesel firewater pump (back-up) and incorporate a jockey pump (3.6 m3/h at 125 m) to maintain line pressure.
Fire alarm panels, flow devices, pressure switches, alarm valves, pull stations, detectors and audible alarms will be installed at fire protected areas. Hose stations will be located near hydrants equipped with two valves, each connected with 60 m, 2½ inch diameter hoses and adjustable jet to fog nozzles.
| | | | | |
| Boa Esperança Project | Page 186 |
| NI 43-101 Technical Report Feasibility Study | October 2021 |
18.4.13Canteen
The canteen will provide meals to 615 persons per day, based on 512 operational staff plus a 20% overcapacity. This building will be a 610 m2 single level, made from concrete block with galvanized steel tile roof. The ceiling height will be 3 m.
The dining hall will have a seating capacity for 110 occupants.
The building will have a receiving dock to accept incoming supplies. There will be frozen facilities to store meats, vegetables, and dairy foods. There will be supply rooms, an office and male and female changing rooms, for the staff.
The kitchen will have separate preparation areas for meats, vegetables, snacks, cereals and desserts and pasta, cooking, and dishwashing areas.
Additional facilities will include restrooms – male, female and one for people with special needs, a dry garbage room and some cleaning supply storage rooms.
18.4.14Sewage Treatment
Sewage generated will be collected and treated.
For the administrative area, processing plant and gatehouse there will be a compact sanitary effluent treatment station, using an activated sludge process.
For the mine area, there will be a primary treatment system, consisting of a septic tank and an anaerobic filter.
In both cases, the treated liquid effluent will report to sinkholes.
18.4.15Refuse Storage
Over the life cycle of the operation, several forms of domestic and industrial waste will be generated. With an effort to reduce, reuse and recycle such waste materials, the operations will separate and store these refuse items per the requirements of ABNT NBR 10004 – Solid Waste Classification. To support the classification of materials, the site will have a multi-bay building to segregate refuse items.
The steel structure building will be 5 m high, combining concrete block and steel siding walls with galvanized steel tile roof, with an area of about 306 m2.
The building will have 10 bays of varying sizes, accessible by a center corridor. The bays are designated to store the following recyclable materials and/or contaminants:
•Oil;
•Grease;
•Batteries;
•Light bulbs;
•Wood;
•Unusable items;
•Aluminum;
•Copper;
•Plastics;
•Paper.
The bays used for storing lubricating and contaminant products will be provided with appropriate coatings and incorporate a containment channel leading to an oil / water separator / collector.
| | | | | |
| Boa Esperança Project | Page 187 |
| NI 43-101 Technical Report Feasibility Study | October 2021 |
18.4.16Communications
The telecommunications design will incorporate proven, reliable systems to ensure personnel at the mine site will have adequate data, voice, and other communications channels available. The base system will be installed during the construction phase then expanded to encompass the operating site.
The design will include:
•Two-way radio communications at site;
•Single-channel radio communications;
•A Voice-over Internet protocol (VoIP) telephone system; and
•Satellite internet access.
Technologies and services to be provided will include the following:
Construction phase:
•Radio communication via Motorola, model EP450 portable two-way radio will be used at the site. Connectivity is enhanced with on-site repeater to extend radio coverage between the Boa Esperança and Tucumã;
•Single-channel radio communications via Brasco, model MAO-XV or Audiocodes Gateway equipment. This is temporary and will be replaced with VoIP telephone;
•VoIP telephone via an Intelbras, model Impacta 68, for direct line dial with 6 to 8 phone lines;
•Internet service via local supplier, bandwidth 2MB limit;
•Mobile telephone – no service.
The Operations phase will include:
•Radio communication maintains the services from above;
•VoIP telephone to migrate to a Siemens HiPath Series 3800 to increase capacity to 30 channels;
•Internet service via local supplier, bandwidth 4MB via satellite or optical fiber;
•Mobile telephone – service implementation to be investigated in the future.
| | | | | |
| Boa Esperança Project | Page 188 |
| NI 43-101 Technical Report Feasibility Study | October 2021 |
18.5Water Management Plan
As part of the feasibility study for Boa Esperança, Ausenco drafted a preliminary water management plan (WMP) to supplement the capital cost estimate. The water management plan is based largely on the water balance calculated by Ausenco in August-September 2021 and includes discussion of contact water as well as opportunities that may be addressed to improve the confidence in the estimates of contact water quantities as well as water quality. The water management plan requires geochemical assessment of waste and tailings to be complete prior to finalisation. A geochemical program is currently underway. The water management plan is based on what is currently understood and may be updated once additional information is available.
18.5.1Climate
The site is in the southern tropical zone in the state of Pará, Brazil. The climate is ‘humid tropical’ according to Köppen’s climate classification system, with rainy summers, dry winters and intense rainfall between January and April. The wet season is October–April, and rainfall in the wet season constitutes 84% of yearly rainfall. The dry season is May–August and rainfall in the dry season constitutes only 16% of annual rainfall. The maximum rainfall in September shown in
Figure 18-4 is an acknowledged anomaly in the data but is associated with a three-day 1-1,000 year event in which over 800 mm of rain fell. The data were collected at the São Felix do Xingu weather station from 1975 to 2020.
Figure 18-4: Pluviometric data (1975-2020)
Note: Figure prepared by Ausenco 2021
| | | | | |
| Boa Esperança Project | Page 189 |
| NI 43-101 Technical Report Feasibility Study | October 2021 |
18.5.2Topography
The deposit is contained in an isolated, north–northeasterly-trending elongated hill that is located 38 km southwest of Tucumã. The general arrangement places the mine facility buildings and most infrastructure at about 250 masl, and the peak elevation of the hill is 450 masl.
The original tropical rainforest vegetation of the has been significantly altered by human activity and the Project area is now largely grazing or agricultural.
Within the mine lease boundary, the following mining facilities will dominate the landscape:
•Open pit – 55 ha
•Waste rock dump (WRD) – 185 ha
•TSF or pyrite concentrate storage facility – 21.4 ha
•Dry stack/filtered tailings facility – 89.3 ha
•Stockpile, administrative and process plant area – 22 ha
Each facility will interact differently with incident rainfall. Figure 18-5 shows the locations of the proposed facilities in relation to the existing water courses.
| | | | | |
| Boa Esperança Project | Page 190 |
| NI 43-101 Technical Report Feasibility Study | October 2021 |
Figure 18-5: Location Map, Proposed Mine Site Facilities in Relation To Existing Water Courses
Note: Figure prepared by Ausenco, 2021.
18.5.3Mine Facilities - Footprints
The major mine facility footprints (that will intercept rainfall) are listed in Table 18-1.
Table 18-1: Facility Footprints
| | | | | | | | | | | | | | |
| Facility | Startup (m2) | Year 5 (m2) | Ultimate (m2) | Closure (m2) |
| Waste rock dump | 800,000 | 1,291,600 | 1,849,800 | 1,849,800 |
| Low grade stockpile | 220,000 | 220,000 | 220,000 | 220,000 |
| Pit | 300,000 | 330,000 | 550,000 | 550,000 |
| TSF | 149,000 | 170,000 | 214,000 | 214,000 |
| Filtered TSF | 450,000 | 893,000 | 893,000 | 893,000 |
| | | | | |
| Boa Esperança Project | Page 191 |
| NI 43-101 Technical Report Feasibility Study | October 2021 |
18.5.3.1Run-off and Capture Coefficients
Each facility will generate different quantities of contact water per unit of rain received. Runoff coefficients or capture coefficients assumed for each facility over the LOM and closure periods are shown in Table 18-2.
Table 18-2: Runoffs Coefficient
| | | | | | | | |
| Facility | Coefficient (LOM) | Coefficient (closure) |
| Waste rock dump | 0.95 | 0.35 |
| Low grade stockpile | 0.95 | 0 |
| Pit | 0.8 | 0 |
| TSF | 1 | 1 |
| Filtered TSF | 1 | 0.35 |
The magnitude of each coefficient is based on previous experience with mine sites in tropical climates or approximations based on expected topographic relief. The key assumptions and justifications include.
•Open pit (LOM):
•80% of incident rainfall reports to sump
•20% of incident rainfall lost to evaporation and groundwater
•Open pit and high-wall (Closure):
•All incident rainfall reports to pit lake – no water from pit requiring treatment
•Waste rock dump (LOM):
•5% loss to evaporation
•95% of incident precipitation reports as contact water
•Waste rock dump (Closure):
•10% of incident precipitation is lost to evapotranspiration
•55% is shed as runoff (non-contact)
•35% infiltrates and carries geochemical character reflective of advanced maturity waste
•TSF facility (LOM):
•100% of intercepted water (80% as run-on, and 20% as runoff) is assumed to be contact
•TSF facility (Closure):
•all water that is intercepted by the facility is assumed to require treatment (it is not known yet how this facility can be remediated)
•Filtered tailings (LOM)
•100% of intercepted water is contact water
•Filtered tailings (Closure)
•10% of intercepted water is lost to evapotranspiration
•55% is shed as non-contact runoff
•35% of all intercepted water infiltrates and reports at the toe carrying a geochemical signature.
•Stockpile area (LOM):
•5% of incident rainfall assumed to be lost to evaporation
| | | | | |
| Boa Esperança Project | Page 192 |
| NI 43-101 Technical Report Feasibility Study | October 2021 |
•95% of water intercepted by the stockpile and disturbed area assumed to required treatment
•Stockpile area (Closure):
•100% remediated (no intercepted water requires treatment)
18.5.4Water Balance
18.5.4.1Contact Water Estimate
The contact water balance was compiled based on assumptions listed in 18.5.3.1 A tabulated water balance for the contact water that will be generated (m3/h) is shown in Table 18-3 and Figure 18-6.
Table 18-3: Contact Water Estimate
| | | | | | | | | | | | | | | | | | | | | | | | | | |
| Average Wet Season | Average Dry Season |
All values in m3/h | Startup | Y5 | Ultimate | Closure | Startup | Y5 | Ultimate | Closure |
Waste Rock Dump (runoff & seepage) | 260 | 420 | 602 | 222 | 86 | 139 | 199 | 73 |
| LG Low-grade stockpile and admin area | 72 | 72 | 72 | 0 | 24 | 24 | 24 | 0 |
| Pit (sump) | 96 | 283 | 349 | 0 | 41 | 223 | 248 | 0 |
| TSF (runoff) | 51 | 58 | 73 | 73 | 17 | 19 | 24 | 24 |
| Tailings (runoff) | 154 | 306 | 306 | 107 | 51 | 101 | 101 | 35 |
Total contact water (m3/h) | 634 | 1140 | 1402 | 402 | 218 | 505 | 595 | 133 |
Note: based on the process water balance, it is expected that 20 m3/h of contact water may be used in the process.
| | | | | |
| Boa Esperança Project | Page 193 |
| NI 43-101 Technical Report Feasibility Study | October 2021 |
Figure 18-6: Intercepted Water as Contact Water, by Season
Table 18-4: Expected Water Treatment Demand
| | | | | | | | | | | | | | | | | | | | | | | | | | |
| Average Wet Season | Average Dry Season |
All values in m3/h | Startup | Y5 | Ultimate | Closure | Startup | Y5 | Ultimate | Closure |
| Total contact water | 634 | 1140 | 1402 | 402 | 218 | 505 | 595 | 133 |
| Contact water re-use | 20 | 20 | 20 | 0 | 20 | 20 | 20 | 0 |
| Treatment demand | 613 | 1119 | 1381 | 402 | 198 | 485 | 575 | 133 |
The water balance for contact water is conservative. Geochemical and predictive water quality studies may help reduce expected demand for water treatment. The following subjects could be explored to aid in reducing water treatment plant sizing:
•Waste maturity and aging – the period prior to acidification (pre-lag) may be identified and used to avoid excessive treatment demands in early mine-life. Acidification ‘lags’ placement where there are buffering agents present in the source material. Consumption of local buffering agents signals acid onset.
•Contact water ‘intensity’ – some contact water may only carry the faintest geochemical signature, while other contact water may carry a much heavier geochemical signature, including metals and acid. Residence time of water in contact with materials undergoing sulfide oxidation is a strong indicator of how affected water may be; however, an alternative to this process is that strong geochemical signatures can be picked from pit wall interactions if sufficient time has passed to allow geochemical reactions to occur between successive rainfall events.
•Characterisation of seepage – some seepage may be easily treated using pH adjustment, however, other seepage which carries a significant quantity of salts may not be so easily treated. Predictive characterisation of the seepage is based on the geochemical conceptual model and subsequent geochemical modelling; in situ monitoring will confirm the characterisation.
| | | | | |
| Boa Esperança Project | Page 194 |
| NI 43-101 Technical Report Feasibility Study | October 2021 |
A high-level discussion of each facility in terms of contact water generation and intensity can be seen in Section 18.5.5.
18.5.5Facilities
This section discusses the facilities or areas that will generate contact water.
18.5.5.1Open Pit
The 55 ha (at ultimate) open pit will generate contact water which reports to the pit sump at the base of the pit. The extremities of the pit mouth will naturally slope away from the pit eliminating the need for diversion systems. The runoff external to the pit mouth will report to the base of the hill and follow natural topographic slopes to collection points downstream.
Non-contact water should be routed by natural means as much as possible to near the mine lease boundary.
Incident rainfall within the pit mouth will be contact water, and this water will pick up geochemical signatures from exposed material on the pit face. Sulfide oxidation and metal leaching will occur during all months of the year, and based on temperature records, will unlikely see slow periods. Sulfide oxidation may be associated with acidification if there is insufficient buffering material present on or downstream of the mineralised rock. Estimates of pit water include estimates of groundwater as described in Section 18.5.6.2
Water collected in the excavated pit sumps will be pumped to a transfer pond where it will be routed to a larger holding pond prior to treatment.
Pit-related contact water is likely to be moderately to intensely affected. Water quality modelling including geochemical source terms is recommended to assess the expected water quality of the pit sump collection water. Pit sump contact water is assumed to require treatment until confirmed via modelling that there is an alternative handling method.
In closure, the pit is assumed not to be dewatered, and hence, any intercepted water accumulates in the pit void.
18.5.5.2Waste Rock Facility
The waste rock facility is likely to be the single largest source of contact water. With a predicted 185 ha footprint in the ultimate configuration, and housing a large quantity of material, it is highly probable that the waste rock facility will generate a significant quantity of medium- to intensely-affected contact water. Water that is shed from the surface of the waste rock facility via grading or surface collection ditches may result in mild- to moderately-affected water and may be managed without treatment. However, water which infiltrates past the engineered surface will be exposed to geochemically-reactive material for a longer period of time (three months to a few years of residence time) resulting in significantly-affected contact water. The rate at which the higher risk materials will generate acid, or whether a lag time is to be expected, is not known at this time. It is highly probable that based on the geological descriptions that the materials in the waste rock facility will impart geochemical character to the seepage water. A complete geochemical assessment of the waste rock had not been completed as of August 31st, 2021, and this work is underway.
It is likely that all seepage water will need to be treated. Runoff water quality should be confirmed with geochemical and water quality modelling.
| | | | | |
| Boa Esperança Project | Page 195 |
| NI 43-101 Technical Report Feasibility Study | October 2021 |
18.5.5.3TSF
The TSF or pyrite concentrate storage facility will be relatively small at 21.4 ha and will be located in the northeast of the mine lease. The pyrite concentrate facility will receive the highest-risk potential tailings that consist of the pyrite scavenged from the other tailings stream. The intention of reducing pyrite in the filtered tailings results in a highly-reactive stream and a low reactivity stream that can be handled in a less sensitive manner. The pyrite concentrate facility will be lined and deposition will be entirely sub-aqueous. The sub-aqueous deposition method will result in reduced oxygen exposure and effectively isolate the potentially highest-risk materials in a non-reactive (low/no oxygen) state.
The pyrite concentrate facility is likely to have an inwardly sloping surface profile that will generate a portion of runoff reporting to the surface pond, while the remainder will report to the external toe of the facility as light- to moderately-affected contact water.
Runoff water from the pyrite concentrate storage facility may not require treatment; however, this should be confirmed with modelling, and construction material geochemical stability needs to be confirmed. Until this is confirmed, it is assumed that this water will require treatment.
18.5.5.4Dry-Stack Filtered Tailings Facility
The dry stack tailings facility will be 89.3 ha at ultimate size and produce runoff and seepage of lightly- to moderately-affected contact water. There is uncertainty about the DSTF geochemical response, however, and geochemical testing of the tailings is recommended, and a test program is currently underway. The runoff and seepage from the dry stack are assumed to need treatment.
18.5.5.5Stockpile, Administrative and Process Plant Area
The stockpile and administrative/process plant areas will comprise a 22 ha footprint, and the intercepted rainfall is likely to produce a variable response depending on the construction materials used, the quantity and age of stockpiled ore, and preceding weather conditions which could aggravate dust, etc.
For the purposes of assessing water treatment needs, it is assumed that the runoff from the stockpile and administrative/process areas will require treatment.
18.5.6Hydrogeology
18.5.6.1Groundwater Setting
The deposit stratigraphy comprises a weathered soil-like mantle (saprolite), from 20–40 m-thick, underlain by moderately weathered and fractured bedrock (saprock), about 20 m-thick, and then fresh bedrock. The saprolite is generally a clay-rich, low permeability material whereas the saprock is moderately and considered as the primary aquifer. A pumping test completed in the pit area indicated average hydraulic conductivity (K) of 3E-06 m/s and storativity of 0.1% (MDGEO Hydrogeological Services Ltd., 2011). Higher-conductivity values can be influenced by faults and fracture zones. Groundwater depths measured in the pit area range from 5–10 m below surface. Local communities use springs and wells for their water supply. The pit and waste storage facilities will potentially affect the water resource and may require alternative sources to be provided.
| | | | | |
| Boa Esperança Project | Page 196 |
| NI 43-101 Technical Report Feasibility Study | October 2021 |
18.5.6.2Pit Inflow
A 2D analytical model was used to estimate pit inflows based on Year 1, Year 5 and ultimate pit. In early mining, groundwater seepage comes from the western pit wall but as the pit expands and deepens, groundwater is expected to come from all surrounding areas. In Year1 the estimated inflow rate is 14 m3/hr (4 L/s); from Year 5 to end of mining, the inflow rate is estimated at 200 m3/hr (55 L/s). This does not include precipitation into the pit.
18.5.6.3Numerical Groundwater Modelling
Improved confidence in pit inflow estimates will be provided by using a calibrated 3D numerical model (in development), which will include additional groundwater information collected from further geotechnical investigation. Pit dewatering/depressurization will be simulated using the model to determine the optimal approach for dewatering the deposit. The model can also be used to predict changes in groundwater levels in the surrounding areas and changes in base flow to nearby streams.
18.5.7Schematics
The water balance for the major water flows is shown in Figure 18-7 through Figure 18-10. Note at this time the site water balance is considered developmental and further development leading to a final solution is planned in the next phase of the Project.
Figure 18-7: Water Balance Schematic (start-up)
| | | | | |
| Boa Esperança Project | Page 197 |
| NI 43-101 Technical Report Feasibility Study | October 2021 |
Figure 18-8: Water balance schematic (year 5)
Figure 18-9: Water Balance Schematic (ultimate)
| | | | | |
| Boa Esperança Project | Page 198 |
| NI 43-101 Technical Report Feasibility Study | October 2021 |
Figure 18-10: Water Balance Schematic (closure)
18.5.8Treatment Plant Selection
The capital cost estimate includes use of a high-density sludge (HDS) water treatment plant (WTP). HDS is based on lime neutralization to induce precipitation of metals and salts via pH change. Seepage from the waste rock facility and other contact water is treated by lime addition, followed by coagulation/co-precipitation with ferric iron, flocculation, clarification, and pH adjustment (if required). Completion of the proposed geochemistry program is needed to better inform the treatment plant selection and sizing.
18.6Water Supply
Hydrogeological studies were conducted by the MDGEO Hydrogeology Services from January to November 2011, consisting of the following steps:
•Inventory of water sources and users;
•Flow measurements in major drainages;
•Preparation of hydrogeological conceptual model;
•Evaluation of impacts to water resources;
•Assessment of water availability; and
•Projection of the monitoring network.
The registered water sources and users consisted of resurgences of underground water, headwater drainage, piezometers, deep tubular wells, wells, ponds, drainage galleries, slope drains, drains and other structures for water capture.
| | | | | |
| Boa Esperança Project | Page 199 |
| NI 43-101 Technical Report Feasibility Study | October 2021 |
The results of the aquifer tests and studies were used to develop a conceptual hydrogeological model of the area. The model was used to understand the behavior of the underground water system, and to provide information for a preliminary assessment of water resources in the region as possible water supply alternatives.
The hydrogeological system in the region has the typical characteristics of formations located in crystalline basement aquifers. This is an aquifer consisting of a shallow weathered mantle with metric thickness (porous aquifer), superimposed over the crystalline basement (fractured aquifer), deformed and fractured.
Water for construction activities will be sourced from the underground aquifer via semi-artesian wells to a depth of 80 m. These wells have a production rate of 7.6 m3/h, which is believed sufficient to support the non-potable water needs during the construction phase. During construction, it will be the responsibility of the contractor to supply the necessary potable water requirements.
The initial plan was to divert water from Carapanãzinho Creek to provide the raw water for the operations. However, studies have shown that the use of Carapanãzinho Creek, as well as other streams within the area surrounding the Project, is not viable due to their intermittent depth and flow. Instead, a water pond will be created with a dike in Jatobá stream, within the area owned by MCSA. The water from this pond will meet the needs for gland service water, potable water, raw water and fire water. The raw water will be treated prior to potable water use.
18.7Tailings Storage Facilities
During ore processing the tailings will go through a pyrite flotation circuit to segregate the tailings into two streams: non-pyrite tailings (non-acid generating - NAG) and pyrite tailings (potential acid generating – PAG). The primary objective is to reduce the amount of PAG tailings to be stored in a lined facility while the bulk of the tailings will be placed in an unlined facility.
The primary design objectives for the TSFs are secure containment of the NAG and PAG tailings and protection of the regional groundwater and surface water during both mine operations and post-closure. Approximately 47 Mt of tailings will be produced over the LOM, including 4.3 Mt of PAG tailings and 38.7 Mt of NAG tailings. The design of the TSFs and water management facilities has taken into account the following:
•Pyrite tailings in a geosynthetic lining TSF to limit seepage
•Sub-aqueous deposition of pyrite tailings to minimize the potential for acid generation and metal leaching
•Non-pyrite tailings will be filtered and deposited in a dry stack tailings facility (DSTF)
•Staged development of these facilities over the life of the Project
•Flexibility to accommodate operational variability in the filtered tailings (filter plant shutdowns
•and ore variability, along with placement during variable climate conditions)
•Control, collection, and removal of water from the facilities during operations for recycle as process water to the maximum practical extent
| | | | | |
| Boa Esperança Project | Page 200 |
| NI 43-101 Technical Report Feasibility Study | October 2021 |
18.7.1Hazard Classification
The design standards for the development of the TSFs are based on both Brazilian and international standards. The following regulations and guidelines were used to determine the dam hazard classification and suggested minimum target levels for some design criteria, such as the inflow design flood (IDF) and earthquake design ground motion (EDGM):
•Canadian Dam Association (CDA) Technical Bulletin – Application of Dam Safety Guidelines to Mining Dams (CDA, 2019)
•ABNT NBR 10.004/2006
The two TSFs will behave differently if there is a failure of these facilities, since one of the facilities is a wet pyrite TSF and the other is a non-pyrite dry-stack TSF. A wet TSF breach will behave as a fluid where both water and tailings can travel a few to several kilometers based on several factors and the dry stack TSF would be a slump-type failure that would move 50–200 m from the toe.
A dam break analysis was performed on the pyrite TSF since a breach could carry tailings a large distance. Based on the analysis, the mine facilities will not be impacted and there are no populations or infrastructure direct in the path of any flow from this facility. However, the tailings are PAG and would impact the environment, but could be cleaned up. Therefore, the pyrite TSF was assigned a hazard classification of very high. The non-pyrite DSTF, based on a slope failure and the runoff out distance, was assigned a hazard classification of significant.
The pyrite TSF is designed for the IDF during operations of 2/3rd between the 1:1,000 year return period and the probable maximum flood (PMF) and the PMF after closure along with the design earthquake during operation of halfway between the 1:2,475 year return period and the 1:10,000 year return period (or MCE) and after closure the MCE.
The DSTF is designed for the IDF during operations of 1:100 year return period and after closure of 1/3 between the 1:1,000 year return period and the PMF along with and design earthquake during operations of 1:100-year return period and after closure of 1:2,475 year return period.
18.7.2Design Criteria
The designs for both TSF and DSTF are based on an assumed 12-year LOM, with total mined ore tonnages of 43.1 Mt and a maximum annual mining rate of 4 Mt/y for 12 years. Of the tailings produced, approximately 38.7 Mt will be non-pyrite tailings (approximately 90% of total mill throughput) that would be filtered and placed in a DSTF and 4.3 Mt of pyrite tailings (approximately 10% of the total mill throughput) would be stored in a sub-aqueous TSF. The dry density of the placed filtered tailings was assumed to be 1.65 t/m3 for volumetric calculations and the dry density of the placed slurried tailings was assumed to be 1.45 t/m3. The key TSF and DSTF design criteria are summarized in Table 18-5.
| | | | | |
| Boa Esperança Project | Page 201 |
| NI 43-101 Technical Report Feasibility Study | October 2021 |
Table 18-5: Design Criteria TSF and DSTF
| | | | | | | | |
| Criteria | Units | Description |
| General |
| Annual Mined Ore | t/a | 4,000,000 |
| Total Mined Ore | t | 43,052,000 |
| Life of Mine | yr | 12 |
| Static Factor of Safety | | 1.5 |
| Pseudo-Static Factor of Safety | | >1 |
| Post-Earthquake Factor of Safety | | >1.1 |
| General Non-Pyrite Filtered Tailings Storage Facility |
| Annual Non-Pyrite Filtered Tailings | t/a | 3,600,000 |
| Total Non-Pyrite Filtered Tailings | t | 38,746,800 |
| Target Moisture Content | % | 15 |
| Placed Filtered Dry Density | t/m3 | 1.65 |
| Tailings Acid Generation Potential | NAG/PAG | NAG |
| Design Storm Event | 1:xxx | 100 |
| Design Seismic Event | 1:xxx | 100 |
| Filtered Tailings Transport | | Truck |
| Filter Tailings Spread/Compaction | | Dozer and Compactor |
| General Pyrite Tailings Storage Facility |
| Annual Pyrite Tailings | t/a | 400,000 |
| Total Filtered Tailings | t | 4,305,200 |
| Target Percent Solids | % | 35 |
| Placed Filtered Dry Density | t/m3 | 1.45 |
| Tailings Acid Generation Potential | NAG/PAG | PAG |
| Design Storm Event | 1:xxx | 2/3rd between the 1/1000-year return period flood and the probable maximum flood (PMF) |
| Design Seismic Event | 1:xxx | halfway between the 1/2,475-year and the 1/10,000-year return period |
| Tailings Conveyance | | Slurry in pipeline |
| Tailings Deposition Method | Sub-Aerial/Sub-Aqueous | Sub-Aqueous |
18.7.3Dry-Stack Tailings Storage Facility and Pyrite Tailings Storage Facility Study
As part of the development of the DSTF and the TSF, a siting study was performed. Due to the lack of site wide geotechnical investigations for the Project there were a limited number of sites available for TSF’s without performing a geotechnical investigation as part of the FSU. Figure 18-11 show the final locations selected for the non-pyrite DSTF and the pyrite TSF.
| | | | | |
| Boa Esperança Project | Page 202 |
| NI 43-101 Technical Report Feasibility Study | October 2021 |
Figure 18-11: Non-Pyrite DSTF and Pyrite TSF
Source: Ausenco, 2021
18.7.4Geotechnical Field and Laboratory Investigation
A geotechnical field and laboratory program was performed for the two TSF locations selected as part of previous studies. The program consisted of boreholes, test pits and laboratory programs to characterize the foundation soils along with potential construction borrow sources. The foundation consisted of clayey soils near the surface and bedrock typically greater than 10 m below the surface. There are sufficient low permeability soils in the area for a composite liner system (low permeability soil and geomembrane) for the TSF and compacted subgrade below the DSTF. Based on the mine production schedule there is no waste rock available during the initial years of operations, therefore the starter dam for the TSF will need to be constructed with low permeability soils in the area surrounding the facility and the DSTF will require compaction of the subgrade soils.
18.7.5Non-Pyrite Dry Stack Tailings Facility Design and Operation
The non-pyrite DTSF is designed and to be operated as a dry stack), in which filtered tailings are spread, compacted and graded for erosion control and stability (Figure 18-12). Dry-stacking of tailings was selected for the Boa Esperança Project as it is an effective way to create a safe facility for the non-pyrite tailings that will, upon closure, become a long-term stable geomorphic form in the landscape.
| | | | | |
| Boa Esperança Project | Page 203 |
| NI 43-101 Technical Report Feasibility Study | October 2021 |
Figure 18-12: Proposed Non-Pyrite Dry Stack Tailings Facility Layout
Source: Ausenco, 2021
Dewatering of the tailings will be through a filter plant, a proven technology used by many industries for many decades. The water content of the tailings is reduced to approximately 15% by weight through this process. After filtering, the dewatered tailings will be transported to the DSTF in haul trucks and compacted in relatively thin lifts.
Before tailings placement, the area of the DSTF footprint will be prepared by the removal and stockpiling of organic topsoil and unsuitable soil (soft soil) for use in final reclamation. The foundation area will be further prepared by construction of underdrains, perimeter contact water channels and contact water/seepage ponds.
The DSTF will be constructed and operated over the mine life, which is estimated to be about twelve years. Operation includes receiving the filter tailings from the plant, hauling and placement of tailings, compacting the tailings, and constructing additional surface water management facilities to accommodate the expansion of the DSTF.
Upgradient surface water control facilities will divert and control upgradient, non-contact surface water runoff; this runoff will be discharged from the DSTF area into natural drainages. Contact surface water is diverted to ponds followed by treatment prior to release. Shallow downslope-migrating groundwater and infiltrating surface water that contacts the dry stacked tailings will be intercepted by underdrains and conveyed to ponds where sediments can drop out and then the
| | | | | |
| Boa Esperança Project | Page 204 |
| NI 43-101 Technical Report Feasibility Study | October 2021 |
water can discharge into the environment. The TSF design includes the provision for capture, storage and pumping of collected waters to treatment facilities, if necessary, or the water can be used as process water.
Instrumentation consisting of vibrating wire piezometers, survey monuments and slope inclinometers will be installed within the foundation and DSTF slopes during operations. The instrumentation will be monitored to verify the performance of the facility.
Ongoing reclamation of the dry stack will be undertaken during construction as final exterior slopes become available to reduce erosion of the DSTF exterior slopes. As successive lifts of filtered tailings are placed, the lower slopes are covered with stockpiled topsoil and revegetated. Therefore, at all stages of operation, the outer slope of the DSTF is a vegetated slope that replicates slopes in the immediate vicinity of the project.
18.7.6Pyrite Tailings Storage Facility Design and Operation
Based on a trade-off study between various potential disposal sites and technologies for pyrite tailings storage, the sub-aqueous tailings deposition method was selected. The tailings disposal concept has distinct advantages over other options, most notably it is one of the best practices for tailings containing sulfides that are likely to oxidize, mobilize metals, and produce acid. By placing the tailings underwater, it restricts oxygen to the tailings preventing oxidation and minimizing environmental problems associated with acid generation and metal leaching.
The design basis for the TSF is based on input from the mine schedule, industry-accepted best practices, previous project studies (including geotechnical investigations), and anticipated mine site conditions. The TSF embankment concept has been developed to meet both national and international standards for the design of TSFs (CDA, 2019).
The embankments will include adequate freeboard to provide ongoing tailings storage, operational water management (water cover), temporary environmental design storm storage and conveyance up to and including the IDF through a spillway. The TSF was designed to provide storage of PAG tailings over the 12-year LOM.
Before the TSF is constructed, the footprint will be prepared by the removal and stockpiling of organic topsoil and unsuitable soil (soft soil) for use in final reclamation.
The started TSF embankments will be constructed from local clay or alluvial soils since during initial operations no waste rock is generated from the open pit. Subsequent phases will be constructed using downstream construction method for tailings embankments. The outer rock shell will be constructed with NAG waste rock with an interior filter zone and low permeability soils liner. Since the tailings are acid generating and metal leaching, if exposed to air and water, the interior of the tailings storage facility be lined with a composite liner (low permeability soil liner and a LLDPE geomembrane liner). In addition, the facility includes a 2 m water cover during operations to prevent oxidation of the tailings Figure 18-13.
A starter embankment to store the first two years of tailings will be constructed during pre-production with local soils due to the lack of waste rock during this period. Then subsequent embankment raises will use downstream construction methodology.
Tailings will be pumped as a slurry (25% solids content by weight) from the process plant to the TSF via pipeline. Tailings will be deposited in multiple locations from a floating barge to facilitate sub-aqueous deposition. The tailings deposition strategy will allow for even filling of the basin, maintain a water cover over the tailings, and maximize tailings storage within the impoundment. Water from the TSF will be reclaimed and sent to the process plant.
Instrumentation consisting of vibrating wire piezometers, survey monuments and slope inclinometers will be installed within the foundation and embankment during operations. The instrumentation will be monitored to verify embankment performance.
Upgradient surface water control facilities will divert and control upgradient non-contact surface water runoff; this runoff will be discharged from TSF area into natural drainages. Contact surface water from the embankment will be diverted to a pond followed by treatment prior to release.
| | | | | |
| Boa Esperança Project | Page 205 |
| NI 43-101 Technical Report Feasibility Study | October 2021 |
Figure 18-13: Pyrite Tailings Storage Facility
Source: Ausenco, 2021
| | | | | |
| Boa Esperança Project | Page 206 |
| NI 43-101 Technical Report Feasibility Study | October 2021 |
18.7.7Stability Analysis of Dry-Stack Tailings Storage Facility and Pyrite Tailings Storage Facility
Stability analyses were carried out to confirm the stability of the both the DSTF and TSF under both static and seismic loading conditions. These analyses comprised checking the stability of the TSF embankments and the DSTF external slopes for the following cases:
•Static conditions during operations and post-closure;
•Earthquake loading from the maximum design earthquake (MDE);
•Post-earthquake conditions.
The stability analyses results satisfy the factors of safety design criteria in accordance with the CDA “Dam Safety Guidelines” and shows the proposed design meets both short term (operational) and long term (post-closure) stability criteria. The seismic analyses indicate that the TSF embankments and DSTF external slope deformations during earthquake loading from the MDE would be minor and would not have a significant impact on the available TSF embankments freeboard or result in any loss of the TSF embankments and DSTF external slopes integrity.
Instrumentation will be installed within the TSF embankments and DSTF external slopes to measure movement, seepage rates and water levels. The instrumentation will be monitored as part of the detailed monitoring program to be developed for both the TSF and DSTF.
18.7.8Waste Rock Facility and Stockpiles
One waste rock facility (WRF), to be located to the southeast of the pit, was designed for the Project. The final configuration is shown in
Figure 18-14.
The pre-stripping activities will generate approximately 13.1 Mt of waste rock that will be transported by trucks to the WRF.
The facility was designed in 20 m lifts. Each lift will be constructed at an approximate angle of repose of 37°. A 10 m set-back between each lift will maintain the overall slope at 1.8:1 to facilitate reclamation and long-term stability. A constant 30% swell factor (after natural compaction) was assumed in the design. The facility was designed to support 160 Mt, 8% more additional capacity than the 148 Mt of waste scheduled in the mine plan.
A separate facility was designed to the south of the main WRF for the topsoil, to be used for later reclamation. The total estimated topsoil is 1.2 Mt for the LOM.
During the pre-production period, the ROM pad area will be constructed to the north of the primary crusher for later re-handling for the start of the plant. The total ore to be stockpiled during this period amounts to 40,300 t.
The low-grade ore stockpile will be located to the east of the pit. The stockpiles was designed with 10 m lifts and 10 m setbacks in order to facilitate later re-handling.
The construction sequence of the mine waste storage areas will be from bottom to top. The waste storage areas and stockpiles were divided into modules, with the horizontal extension of the full areas and the capacity of each section calculated for every lift. The general strategy applied was to reduce long horizontal and uphill hauling distances within the waste storage area when mining occurs at greater depths in the pit. The destination assignment to the different mine waste modules was based on the minimum cycle time.
| | | | | |
| Boa Esperança Project | Page 207 |
| NI 43-101 Technical Report Feasibility Study | October 2021 |
Figure 18-14: Final Pit, Waste Rock Facility and Stockpile Configuration
Note: Figure prepared by NCL, 2021.
| | | | | |
| Boa Esperança Project | Page 208 |
| NI 43-101 Technical Report Feasibility Study | October 2021 |
18.7.9Closure and Post-Closure of the Tailings Storage Facilities
The Project has two different tailings storage facilities: the non-pyrite DSTF and the pyrite sub-aqueous TSF. Both facilities will have different approaches to closure; however, the general concept for both is to protect the environment, surface waters and groundwater in the area. The primary objective of the closure and reclamation initiatives will be to eventually return the DSTF and TSF to self-sustaining facilities that satisfy the end land-use objectives. The DSTF and TSF are designed to maintain long-term physical and chemical stability, protect the downstream environment, and manage surface water. In addition, the closure plan needs to be compatible with a premature closure event.
18.7.9.1Closure of the Tailing Storage Facility
Closure and reclamation for the TSF cannot start until the last embankment raise is completed. General aspects of the TSF closure plan include:
•Commence reclamation of the exterior slopes after the final embankment raise. The slopes will be covered with a transition material and a soil cover to promote a vegetative cover. In addition, a surface drainage system will be constructed to promote surface runoff and prevent erosion of the vegetative cover.
•Drain the water cover system over the tailings and place an engineered tailings capping system that promotes surface runoff and limits ingress of water and oxygen into the tailings.
•Dismantle and remove the tailings and reclaim delivery systems, and all pipelines, structures and equipment not required beyond mine closure
•Modify the contact surface and seepage collection pond to an exfiltration pond to re-establish groundwater flow recharge
•Implement monitoring and maintenance plan during post-closure
18.7.9.2Closure of the Dry Stack Tailing Facility
Closure and reclamation for the non-pyrite DSTF can be closed progressively during stacking operations. This facility will be constructed in lifts. Once a lift is completed the exterior slopes can be land formed and cover system can be placed. General aspects of the DSTF closure plan include:
•Progressive closure of the final slopes completed. The slopes will be covered with a soil cover to promote a vegetative growth medium. In addition, a surface drainage system will be constructed to promote surface runoff and prevent erosion of the vegetative cover.
•Dismantle and remove structures and equipment not required beyond mine closure
•Modify the contact surface/seepage collection ponds to exfiltration ponds to re-establish groundwater flow recharge
•Implement monitoring and maintenance plan during post-closure.
18.8Concentrate Transport Logistics
Based on the estimated production volume of copper concentrates, a logistics study completed by C. Steinweg Hundelsveem analysed alternative concentrate transport routes and modes of transport to determine the most economic and efficient route between the Project and the port of Vila do Conde, in Barcarena, Pará State. Trucking was determined to be the only viable ground transportation method. Although Pará State is crossed by the Carajás’ railway and the Tocantins River, both ways present some elements that may hinder the utilization of those routes.
•Road transport: Pará State has several truck companies accustomed to handle mineral cargoes, including copper concentrates. Therefore, truck availability will not be an issue for the transport of copper concentrates as bulk or in containers;
•Warehouses: the port area of Vila do Conde has several warehouses and some of them already handle copper concentrates in containers. There are companies with capacity to receive, handle, store and load the cargo;
| | | | | |
| Boa Esperança Project | Page 209 |
| NI 43-101 Technical Report Feasibility Study | October 2021 |
•Container stuffing at the plant was found to be uneconomic mainly due to the cost of transporting containers by truck. It was recommended to perform container stuffing at the port area;
•If container stuffing occurs at the port, the selected warehouse must have a covered area/warehouse area with suitable conditions to stockpile a minimum of two export parcels;
•Port operators are used to handling solid bulk cargoes, but not concentrates. Presently, there is only one loading system available at the port for concentrates, consisting of metallic boxes and grabs. At present, there are no bulk copper concentrate exports from Vila do Conde;
•The port of Vila do Conde is one of the main ports in the North region of Brazil and has received investments in recent years. The port has eight berths with one dedicated to containers (401) and two for solid bulk operations (301 and 402). The present conditions at the port (acceptable draft and moderate congestion at bulk berths) are satisfactory for the desired operations;
•Ocean Freight: Copper concentrates can be exported in bulk or in container (when in containers, preferably in 20-foot containers). For container operations there are five shipping lines operating at the port with weekly services to worldwide destinations. Regarding bulk shipments, the port is used to handle solid bulk cargoes and there are regular shipments of parcels of 10,000 dmt (especially manganese ore);
•Three possible logistics alternatives for exporting copper concentrates were considered;
•Alternative A, trucking from plant to warehouse in bulk, storage in warehouse, port operations, ocean freight
•Alternative B, trucking from plant to warehouse in bulk, storage in warehouse, container stuffing, ocean freight
•Alternative C, container stuffing at plant, trucking from plant to port and ocean freight
•The most cost-effective Alternative was B and the total transport cost of $146.90 to a Chinese port was established;
•Outsourcing all logistics services needed outside of the plant was recommended. Furthermore, buying own infrastructure (warehouse), equipment (trucks, handling devices) and hiring own personnel (truckers, operators) was not recommended. There are plenty of trucking companies and warehouses in the region suitable for the Project’s needs. The project can even establish medium and/or long-term contracts with logistics operators to avoid unnecessary capital expenditure and assure good quality services.
| | | | | |
| Boa Esperança Project | Page 210 |
| NI 43-101 Technical Report Feasibility Study | October 2021 |
18.9Built Infrastructure (Access Road)
An unpaved public road to the Project site exists but requires upgrading and a portion requires rerouting to retain public use and to bypass the Project site.
| | | | | |
| Boa Esperança Project | Page 211 |
| NI 43-101 Technical Report Feasibility Study | October 2021 |
19MARKET STUDIES AND CONTRACTS
19.1Market Studies
The copper market has experienced tremendous volatility over the past two years with the onset of the COVID-19 pandemic in early 2020 curbing demand, while also restricting supply due to temporary suspensions of many mining operations. Since the first half of 2020, the spot copper price has experienced a significant increase driven primarily by demand related to clean energy initiatives, of which copper is a critical component, and expectations of major infrastructure projects in large markets such as China and the United States.
Copper is one of the most electrically and thermally conductive metals. As such, large quantities are required to transition away from fossil fuels to cleaner energy alternatives with copper cable being required to connect wind turbines, solar cells and energy systems. Copper is also a critical metal in electric vehicle batteries as well as related charging infrastructure. Copper demand is expected to remain high as global decarbonization efforts progress.
On the supply side, a significant supply shortfall is expected in the medium term due to depletion of ore reserves at existing copper mining operations and a lack of new mines coming into production. New copper discoveries will need to be made and new mining projects will need to be developed and constructed to increase supply. However, historically, seven to ten years are required to bring a new mine into production so copper supply is expected to remain tight in the medium term.
Analyst consensus copper price outlook was used to forecast copper price assumptions in the 2021 FSU. The metal prices used for the purposes of the 2021 FSU were:
•Copper: $3.80/lb in 2024, $3.95/lb in 2025, $3.40 in 2026+
| | | | | |
| Boa Esperança Project | Page 212 |
| NI 43-101 Technical Report Feasibility Study | October 2021 |
Figure 19-1: Analyst Consensus Copper Price Outlook
Note: Sell-side analyst equity research reports as of August 31, 2021.
The long-term copper price of $3.40/lb used in this report represents a 21% discount to the LME copper price of $4.29/lb at the Effective Date of this report.
Ero has assumed that the Boa Esperança concentrate will incur similar treatment costs and refining charges to that of its Curaçá Valley operations with forecast TCs of US$21/dmt of concentrate and RCs of US$0.021 (2.10 cents) per pound of copper (2021 benchmark). Presented prices are nominal.
| | | | | |
| Boa Esperança Project | Page 213 |
| NI 43-101 Technical Report Feasibility Study | October 2021 |
19.2Contracts
The copper concentrate that will be produced at Boa Esperança is expected to be high quality, with copper concentrate grades of 28% or higher and only trace levels of deleterious elements. As such and combined with Ero’s experience selling copper concentrate from its Curaçá Valley operations, Ero expects that the copper concentrate from Boa Esperança will be highly desired by traders and smelters. Ero anticipates that 100% of copper concentrate sales from Boa Esperança will be into the export market due to the large distances and logistical challenges associated with transporting this concentrate within Brazil to national copper smelters. No contracts are currently in place for Boa Esperança’s production of copper concentrate.
The mine plan assumes that contractors will operate the mine from pre-production to Year 5 of production. Thereafter, mining operations will be Owner-operated. Ero currently uses contract mining for its active open pit mining operations at its Curaçá Valley operations located in Bahia State, Brazil. No contracts are currently in place for contract mining at Boa Esperança, however Ero is confident that it will be able to secure qualified contract miners at standard market rates.
No other contracts are in place. Significant contracts required for the successful construction and operation of the Project include:
•EPCM contract during the construction phase;
•Mining and material movement contract during the construction and operational phases;
•Various operational and supply contract for both mill and mine consumables during the operational phase including diesel, electrical power, blasting materials, etc.;
•Concentrate transport and handling contracts during the operational phase; and
•Contractual arrangement for smelting and refining.
The QPs of this Report relied on Ero for commodity price forecasts and the expected treatment costs and refining charges used in the economic analysis contained in Chapter 22 – Economic Analysis. The QPs of this report are of the opinion that the information and studies provided by Ero support the assumptions in the Report. Pricing and contract terms relied upon are within generally acceptable industry norms and consistent with prior operating results.
| | | | | |
| Boa Esperança Project | Page 214 |
| NI 43-101 Technical Report Feasibility Study | October 2021 |
20ENVIRONMENTAL STUDIES, PERMITTING, AND SOCIAL OR COMMUNITY IMPACT
20.1Environmental Laws and Licensing
As at the time of the Effective Date of this Report, as required by the Brazilian National Environmental Policy established on August 31, 1981 (Federal Law ref. No. 6,938), all activities that cause pollution or have the potential to pollute are subject to environmental licensing. Applicable rules regarding licensing procedures were established by the National Council for the Environment (CONAMA) under Resolution 237 of December 19, 1997.
It is by means of this licensing procedure that the issuing agency determines the conditions, limits and measures for the control and use of natural resources and allows the installation and implementation of a mining project. Depending on the nature of the operation and geographic localization, licenses are required to be issued by federal, state, or municipal agencies.
•Federal entities are responsible for licensing activities that may cause national or regional environmental impacts (where more than one federal state is affected);
•State entities, including the federal districts, are responsible for the environmental licensing of potentially polluting activities not compatible with the criteria defined in licensing laws by the municipalities;
•Municipal entities are responsible for licensing activities that may cause local environmental impacts, as defined by the state environmental agency.
Other criteria are also considered, such as the administrative responsibility for the management of protected areas including sustainable forests, water resources, conservation, and other protected areas.
20.1.1Reclamation of Degraded Areas
As of the Effective Date of this Report, Article 225 of the federal constitution (1998) states that “Those who exploit Mineral Resources shall be required to restore the degraded environment, in accordance with the technical solutions demanded by the competent public agency, as provided by law”. This recovery, as expressed in IBAMA's Recovery of Areas Degraded by Mining guide "means that the degraded site is returned to a form of use in accordance with the predetermined plan for use of the soil. It implies that a stable condition is obtained in accordance with the environmental, aesthetic, and social criteria for the surrounding country. It also means that the degraded site will have the minimal conditions required to establish a new dynamic equilibrium, including the development of new soil and a new landscape".
The reclamation project must include (in chronological order) the objectives to be achieved in the short, medium, and long term. Short-term goals involve topographic restoration of the land, erosion control, replanting of vegetation and waste control, among others. In the medium term it seeks to restructure the physical and chemical properties of the soil, recycle nutrients, and encourage the reappearance of fauna. And finally, in the long-term, the self-sustaining recovery process must be aided, along with the soil-plant-animal inter-relationship and the future use of the area.
| | | | | |
| Boa Esperança Project | Page 215 |
| NI 43-101 Technical Report Feasibility Study | October 2021 |
20.2Environmental Licenses
The Pará Sate Environmental Agency (SEMAS) granted a Preliminary License to MCSA on March 7, 2012, which was subsequently renewed on June 19, 2013. MCSA filed for an Implementation License request on April 1, 2013, which was granted by SEMAS on August 30 ,2021. It is valid for a four-year period, expiring on August 29, 2025.,
A deforestation permit (ASV) was granted by SEMAS on the same day as the IL approval, covering 332.19 ha, with the same four-year validity. A fauna handling and monitoring permit (AU) was granted with a one-year validity, which is the maximum allowed by law. The AU can be renewed annually.
The Rural Environmental Register (Cadastro Ambiental Rural – CAR) was updated in 2021.
20.3Physiography, Flora and Fauna
20.3.1Soil Types
There are two main soil types present in the Project area, which extend over an extensive area of approximately 70 km in length to the northeast. These soil types can be described as red-yellow clay soils and eutrophic red clay soils. Among other attributes, these soil types typically feature low fertility levels relative to elsewhere in the region.
During the dry season, controlling dust levels can be an issue due to the fine-grained nature of the soil, and fugitive dust prevention will be a focus of management during pre-stripping and operational activities.
20.3.2Local Hydrography
The Boa Esperança ridge is situated in the Fresco River basin, between the tributaries of the Carapanãzinho and Rio Branco creeks within the Xingu hydrographical region. Drainage in the immediate consists of small creeks (Figure 20-1), which fill during periods of heavy rainfall.
| | | | | |
| Boa Esperança Project | Page 216 |
| NI 43-101 Technical Report Feasibility Study | October 2021 |
Figure 20-1: Local and Regional Drainage Network
Note: prepared by MDGEO, 2011.
20.3.3Water Availability
MCSA currently draws water from a 100m well that produces approximately 7m³/h to support exploration and administrative activities on the Project site.
Water for use during operations is available within the Project area and has been designed as part of the FSU. Raw water for use during operations will be sourced from a reservoir dam constructed in the Jatobá river to stabilize water availability throughout the seasons. The water reservoir will have the purpose of storing clean water to meet the demand
| | | | | |
| Boa Esperança Project | Page 217 |
| NI 43-101 Technical Report Feasibility Study | October 2021 |
of the plant, estimated at a flow of 154 m³/h, working for a year without interruption. Refer to Section 18 for additional detail and water balance.
20.3.4Flora and Fauna
The Project is located in a heavily-populated area within the Amazon region where human development and agriculture has previously disturbed the original native forest ecosystem. Biodiversity losses, including the extirpation and extinction of several species within the broader region has been linked to past anthropogenic activities and associated impacts, caused by widespread grazing by livestock, as well as agricultural development.
The vegetation in the Boa Esperança Project area is of the Humid Tropical Forest type, or the Equatorial Forest Broadleaf. Large areas of pasture occur in low-lying areas within the vicinity of the Project due to the expansion of agriculture and logging activities over the years. Where less developed, typically along major rivers, the region has gallery forests along the waterways and in areas subject to flooding lowland forests and swamps can be found.
20.4Environmental Studies
20.4.1Classification of Areas of Influence
The baseline characterization studies and environmental impact assessment (EIA) for the Boa Esperança Project were prepared by Keystone Ltd/Geomma and submitted to SEMA in 2008.
The EIA attempted to estimate the potential impacts of the Project on the physical environment and/or local communities in comparison with baseline conditions. The EIA included an evaluation of the positive and negative aspects of the Project, using a scale of high, moderate, low, or insignificant. Depending on the probability of an identified adverse impact, mitigating measures were developed to reduce the potential impacts to an acceptable level.
Changes to the project area were made as a result of requests made by SEMAS during the review of the LP application. Changes included adding villages within the Project’s area of influence, and the addition of drainages and springs
The Environmental Control Plan (PCA) was submitted to the environmental agency in April 2013 and resubmitted in 2021 reflecting these changes.
20.4.2Agrarian Reform Areas
The Project area is near the municipality of Tucumã, which originated through a settlement program by the Brazilian government created through the National Institute for Agrarian Reform (INCRA) during the 1970s. From 1985 onwards, there was a significant population increase due to an increase in gold prospecting during the Brazilian gold rush.
A second increase in population and agricultural activities (namely livestock grazing), occurred beginning with Vale’s Onça Puma Project in 2005.
MCSA is the holder of required surface rights for the envisioned operations. It is expected that full title to the land will be transferred to MCSA after conclusion of an administrative procedure before INCRA to clear such surface rights from its prior classification as a resettlement area.
| | | | | |
| Boa Esperança Project | Page 218 |
| NI 43-101 Technical Report Feasibility Study | October 2021 |
20.5Environmental Impact Issues
Investigations into groundwater and surface water were carried out from 2008 to 2010. According to CONAMA Normative Resolution # 357 (2005), water surrounding the Boa Esperança Project has a class 3 quality classification, meaning it can be used for the following purposes:
1)Human consumption, after conventional or advanced treatment;
2)Irrigation of trees, cereals and forage;
3)Recreational fishing;
4)Secondary contact recreation;
5)Consumption by livestock.
Pre-operational monitoring will be continued, with the aim of better establishing the background water geochemistry prior to mining, providing data to support planned mitigation measures, and provide a baseline reference for use in closure planning. The sampling should be extended to ensure that the entire directly affected area, and the area of Project direct influence is covered, and that all elements of potential concern, such as cobalt, molybdenum and arsenic have been adequately documented prior to construction or operations.
20.5.1Water Quality
Investigations into groundwater and surface water were carried out from 2008 to 2010. According to the results of the studies and based on CONAMA Normative Resolution # 357 (2005), water surrounding the Boa Esperança Project has a class 3 quality classification, meaning it can be used for human consumption following conventional or advanced water treatment.
During this period, sampling campaigns were performed to establish the surface water quality within and surrounding the Project area. Groundwater quality sampling tests were also carried out.
When compared with the Class 3 quality water parameters as defined by CONANMA, some base-line parameters were in exceedance, largely related to agricultural activities in the region. These parameters included:
•Elevated iron content, reflecting lateritization of iron rich soils. The levels of the other metals tested (specifically lead, copper, nickel and zinc) were below defined limits;
•Elevated sulfides and sulfates due to ranching activities;
•Elevated phosphorus and nitrite levels due to the use of phosphate-based fertilizers in the region;
•Naturally occurring slightly acidic pH readings;
•Low biochemical oxygen demand, and low dissolved oxygen levels; and,
•Elevated total dissolved or suspended solids.
All the water samples were analyzed for the presence of cyanide, mercury, oils, and greases. The results show that these substances are virtually absent from the samples.
Pre-operational monitoring of water quality will continue during the pre-operational phase, with the aim of better establishing current background water quality prior to mining and to enhance available data to support planned mitigation measures. Additionally, water quality monitoring during the pre-operational and operational phases of the project will provide a more robust baseline reference for use in closure planning.
| | | | | |
| Boa Esperança Project | Page 219 |
| NI 43-101 Technical Report Feasibility Study | October 2021 |
20.5.2Acid Rock Drainage
In January 2015 tests were carried out by SGS Geosol to evaluate the potential for acid drainage generation. Results were evaluated using a worst-case scenario approach, where it was assumed that all of the sulfur contained in the sample was in the form of sulfide. Samples with a sulfur content <0.1% were found to be incapable of generating acid, regardless of the potential for neutralization. The pyrite waste sample had the potential to neutralize its own acid generation. In general, the samples showed no potential for acid generation. However, kinetic testing of waste samples were recommended due to their low neutralization potential in relation to its sulfur content.
A program to develop a geochemical model for the operational phase of the Project commenced in 2021. The sampling program includes a number of tests, including acid-base accounting (ABA), whole rock analyses and sample mineralogy, non-acid generating tests, metal mobility and kinetic tests.
20.6Environmental Compensation
When an IL is issued for a project, under Brazilian law, companies must make an environmental compensation payment, that is determined based upon a percentage of the total Project capital cost. The calculation methodology for the Project was based on an environmental impact ranking calculation for environmental compensation resubmitted by MCSA to SEMAS in 2021. The Project percentage investment approved by SEMAS was 0.697813%. The capital cost considered as the basis for the calculation of the environmental compensation was based upon prior capital estimates of US$200.7 M. Adjustments to the payment amount will occur due to increases in the Project based on the FSU and an incremental payment will be made to SEMAS.
The environmental compensation calculation was derived from the environmental impacts established by Law # 9.985 / 2000 (art.36), with the new wording of Federal Decree # 6.848 /09 (art. 24), VI, VII, VIII of the Federal Constitution, Law # 6,938 /81 and the CONAMA resolution and terms of reference attached to Normative Instruction # 43 of October 5, 2010, replaced by Normative Instruction # 05/ 2014.
20.7Stakeholder Communications
MCSA presented programs during the LI process related to stakeholder engagement, socio-economic indicators, communication, education and job training as well as local economic development. These programs are similar to those in place at Ero’s operations in Bahia and Mato Grosso States.
20.7.1Program for the Monitoring of Socio-Economic Indicators
The program used to monitor socio-economic indicators will implement the following action plans:
•Implement regular use of questionnaires relating to the living conditions of the population and perceptions of the Project and Company within the area of influence;
•Establishment of partnerships with the municipal administration, creating opportunity for dialogue;
•Monitor education indicators, health initiatives, housing, public safety, infrastructure, population and labor activities in the city of Tucumã;
•Identify social and economic changes resulting from the Project and incorporate new programs to mitigate any observed adverse impacts.
Biannual meetings are planned with municipal administrators to exchange information about the Project’s interference in the lives of surrounding communities. Economic indicators to be monitored in partnership with the municipalities include enrollment in municipal schools, morbidity and mortality, diseases, migration, population growth, housing (rent, sanitation, and housing development), among others.
| | | | | |
| Boa Esperança Project | Page 220 |
| NI 43-101 Technical Report Feasibility Study | October 2021 |
20.7.2Social Communication Program
The social communication program seeks to foster awareness, dialogue, understanding and integration between employees of the project, the government, and the community and is based on the following action plan:
•Maintain channels of communication with the community and local government;
•Respect local culture, knowledge and organizations;
•Include and encourage contributions from community participation and local government;
•Communicate in a way that fosters accessibility, transparency, ethics and sustainability; and,
•Develop grievance mechanisms for all stakeholders.
20.7.3Education, Job Training & Employment
This program aims to hire, whenever possible and within the requirements of the production process, labor that resides in the project area and to influence and train people with the potential to take jobs that require formal technical education.
Caraíba has already estimated the future contracted positions shown in the EIA / RIMA. This will allow for the development of their procurement program and local workforce training with a focus on social responsibility and sustainability guidelines and policies.
20.7.4Environmental Education
Environmental education within the environmental licensing process is governed by Decree # 4281, 2002, which regulates the National Environmental Education Policy (Law # 9.795 / 1999), according to which environmental education programs should be set up, maintained, implemented and integrated into the licensing activity for potentially polluting activities.
CONAMA Resolution # 422/2010 establishes guidelines for environmental education projects. An Environmental Education Program (PEA) was presented during the LI process of the Boa Esperança Project and is intended to develop educational activities with the project developers, the community and schools, in line with the demands of the project and with respect to environmental matters.
The PEA should establish partnerships with governmental and non-governmental organizations, both local and state, to assist with their actions and improve their results.
Environmental consultants will be hired to coordinate environmental education teams that will ensure the qualified and responsible development of the projects that constitute the program.
The PEA monitoring and evaluation process should be undertaken using specific instruments at the end of each activity, with reports of all actions being produced.
The program should adopt the ISO 14031 (Environmental Performance Assessment) guidelines.
| | | | | |
| Boa Esperança Project | Page 221 |
| NI 43-101 Technical Report Feasibility Study | October 2021 |
20.7.5Labor Jobsite Hiring
This program aims to hire, whenever possible and within the requirements of the production process, labor that resides in the project area and to influence and train people with the potential to take jobs that require formal technical education.
Caraíba has already estimated the future contracted positions shown in the EIA / RIMA. This will allow for the development of their procurement program and local workforce training with a focus on social responsibility and sustainability guidelines and policies.
The steps in this program are described as follows:
•Establishing the required manpower profile; consolidating information on the profile of the manual labor required to operate the project;
•Demand disclosure required for the project: the company will publish the required manpower profile. To avoid speculation and disorderly displacement of people to the area, this publication will be undertaken judiciously;
•Registration of candidates in Tucumã: the registry will feed a database for the recruitment of manual labor;
•Candidate profile analysis: The suitability of candidates in relation to the project’s requirements through qualification and training in partnership with public and private institutions and through the monitoring of hired labor and the updating of the database.
This program will be monitored in partnership with the local government of Tucumã.
20.8Mining Closure and Reclamation
The primary objective of the closure and reclamation initiatives will be to eventually return the DSTF and TSF to self-sustaining facilities that satisfy the end land-use objectives. The DSTF and TSF are designed to maintain long-term physical and chemical stability, protect the downstream environment, and manage surface water. In addition, the closure plan needs to be compatible with a premature closure event. At the end of the mine life, the water cover over the tailings of the TSF will be drained and a capped will be constructed using non-acid generating material, topsoil and topsoil to limit ingress of oxygen and water to the PAG tailings.
The DSTF will utilize progressive closure measure to facilitate closure along with reducing erosion in area where exterior slopes are completed during the life of mine. Both the TSF and DSTF meet both operational and post-closure physical and geochemical and protect the downstream environment along with surface water management.
Closure and reclamation costs have been estimated by Ero at approximately $24 M, which is partially offset by an estimate salvage value of $7 M. Closure costs have been based upon detailed costing performed in 2017 for the Project’s Plano de Recuperação de Áreas Degradadas (PRAD) and have been adjusted for scope and inflation using Ero’s current reclamation activities and operations in Bahia, Brazil as a reference check for key input costs.
Closure activities and estimated costs of these activities are provided in Table 20-1 below:
| | | | | |
| Boa Esperança Project | Page 222 |
| NI 43-101 Technical Report Feasibility Study | October 2021 |
Table 20-1: Closure & reclamation activities and estimated costs, presented in BRL and USD, millions
| | | | | | | | |
| Closure & Reclamation | Estimated Cost (BRL $M) | Estimated Cost (USD $M) |
| Retrenchment | 25.0 | 5.0 |
| Demolition of surface sites | 3.4 | 0.7 |
| De-mobilization of equipment | 86.0 | 17.2 |
| Open pit reclamation (including revegetation) | 1.1 | 5.0 |
| DTSF recontouring and reclamation | 1.6 | 0.3 |
| Waste dump recontouring and reclamation | 1.1 | 0.2 |
| PAG recontouring and reclamation | 1.6 | 0.3 |
| Total | 119.8 | 24.0 |
Note: USD totals shown based on USD to BRL foreign exchange rate of 5.00
| | | | | |
| Boa Esperança Project | Page 223 |
| NI 43-101 Technical Report Feasibility Study | October 2021 |
21CAPITAL AND OPERATING COSTS
21.1Capital Costs
21.1.1Basis of Estimate
The capital cost estimate has an accuracy of ±15% in accordance with AACE Class 3 estimate guidelines. This includes the cost to complete the design, procurement, construction and commissioning of all facilities. The estimate was based on a traditional engineering, procurement and construction management (EPCM) approach where the EPCM contractor will oversee the delivery of the completed project from detailed engineering and procurement to handover of the working facility.
The estimate was arranged by major area, area, major facility, and facility. Each sub-area was further broken down into disciplines such as earthworks, concrete etc. Each discipline line item was defined into resources such as labour, materials, equipment, etc., so that each line consisted of all the elements required to complete each task. The work breakdown structure (WBS) was developed in sufficient detail to provide the required level of confidence and accuracy and to provide the basis for further development as the project moves into execution phase.
21.1.2Summary
Table 21-1 and Table 21-2 summarize the capital cost estimate.
Table 21-1: Estimate Summary Level 1 Major Facility
| | | | | | | | |
| Cost Type | Description | Pre-Production Capital (USD M) with Taxes |
| Direct | Open pit mine (including Truck Shop) | 55.0 |
| Ore handling | 22.8 |
| Processing plant | 62.6 |
| Tailings (TSF and DSTF) /reclaim | 14.6 |
| On-site infrastructure | 42.4 |
| Off-site infrastructure | 28.7 |
| Direct total | 226.1 |
| Indirect | Owner’s costs | 13.8 |
| Indirect costs | 32.4 |
| Contingency | 21.9 |
| Indirect total | 68.1 |
| Total Pre-Production Capital | 294.2 |
| | | | | |
| Boa Esperança Project | Page 224 |
| NI 43-101 Technical Report Feasibility Study | October 2021 |
Table 21-2: Estimate by Major Discipline
| | | | | | | | |
| Cost Type | Description | Pre-Production Capital (USD M) with Taxes |
| Direct | Mechanical equipment | 40.6 |
| Electrical & electrical equipment | 4.4 |
| Instrumentation & automation | 1.4 |
| Main substation | 5.0 |
| Secondary substation | 6.4 |
| Telecommunications | 1.2 |
| Platework | 2.7 |
| Structural steel | 5.7 |
| Piping | 2.9 |
| Electromechanical erection/assembly | 30.8 |
| Earthworks | 9.6 |
| Civil works | 13.4 |
| Ancillary facilities | 6.5 |
| 138kv Power supply | 3.7 |
| Mine | 53.6 |
| Effluent treatment (contact water treatment) | 18.3 |
| Tailings | 13.2 |
| Laboratory equipment | 0.3 |
| Mobile equipment | 3.0 |
| Rerouted public road | 1.4 |
| Reservoir dam | 2.0 |
| Direct total | 226.1 |
| Indirect | EPCM (excluding mine) | 15.0 |
| Supervision by vendor | 1.0 |
| Commissioning and start-up | 1.5 |
| Spare parts and special tools | 1.5 |
| Owners’ costs | 13.8 |
| Freight | 2.9 |
| First fills | 2.3 |
| Indirect field construction | 6.8 |
| Engineering, construction & civil responsibility risk insurance | 1.4 |
| Contingency | 21.9 |
| Indirect total | 68.1 |
| Total pre-production capital | 294.2 |
| | | | | |
| Boa Esperança Project | Page 225 |
| NI 43-101 Technical Report Feasibility Study | October 2021 |
21.1.3Definition of Costs
The initial capital cost estimate was broken into direct and indirect costs, whereby:
•Initial capital was the capital expenditure required to start up a business to a standard where it is ready for initial production;
•Sustaining capital costs were the costs associated with the periodic addition of new plant, equipment or services required to maintain production and operations at their existing levels;
•Direct costs were the costs pertaining to the permanent equipment, materials and labor associated with the physical construction of the process facility, infrastructure, utilities, and buildings. Indirect costs included construction facilities, spare parts, vendor costs, EPCM costs, pre-commissioning and commissioning costs, and provision for engineering risk insurance
•Indirect costs included those associated with the implementation of the process plant and incurred by the Owner, engineer or consultants in the Project design, procurement, construction, and commissioning phases.
•Owner costs included Owner-incurred costs such as operational, overhead and corporate costs.
21.1.4General Methodology
The estimate was developed based on a mix of detailed material take-offs and factored quantities and costs, detailed unit costs supported by contractor bids and budgetary quotations for major equipment supply.
The structure of the estimate was a build-up of the direct and indirect costs of the current quantities; this included the electromechanical erection/assembly costs, consisting of structural, mechanical, platework, piping, electrical and instrumentation installation. Also included, bulk and miscellaneous material and equipment costs, any subcontractor costs, freight, and growth costs.
21.1.5Exchange Rates
The exchange rates used in the estimate provided by Ero or derived from information provided by the Brazilian Central Bank (August 2021) are as follows:
•United States Dollar: R$5,00 (Ero Information);
•Australian Dollar: R$3,8369 (Brazilian Central Bank);
•Canadian Dollar: R$4,1244 (Brazilian Central Bank);
•European Euro: R$6,028 (Brazilian Central Bank).
21.1.6Market Availability
The pricing and delivery information for quoted equipment, material and services were provided by suppliers based on the market conditions and expectations applicable at the time of developing the estimate.
The market conditions will be susceptible to the impact of demand and availability at the time of purchase and could result in variations in the supply conditions to those assumed in this Report. The estimate in this Report was based on information provided by suppliers in Q3 2021 and assumed that there would be no problems associated with the supply and availability of equipment and services during the execution phase.
| | | | | |
| Boa Esperança Project | Page 226 |
| NI 43-101 Technical Report Feasibility Study | October 2021 |
21.1.7Mine Capital Costs
Mine capital costs consisted of pioneering works, pre-production, capitalized waste and equipment.
Pre-production and pioneering works will be developed by contractors. Indicative quotes were received from contractors based on initial quantities. NCL analysed the technical and economic valuation of the contractor quotes to generate an equalised estimate.
NCL developed a cost model based on first principles for the mining equipment, plus fixed and demobilisation costs and owners cost of supervising the contractor operation. The model was fine tuned to match the equalised contractor quotations. Pre-production quantities from the mining schedule were used in the corresponding pre-production capital cost estimate.
Mine equipment requirements were estimated and budgetary quotations from vendors were obtained. Prices consider ready to work equipment. Assumed prices and life of equipment are presented in Table 21-3.
Table 21-3: Assumed Equipment Prices and Life
| | | | | | | | | | | | | | |
| Equipment | Brand | Model | Price | Equipment Life |
| | | US$ | hrs |
| Diesel drill | Sandvik | DP 1500i | 712,620 | 25,000 |
Backhoe (6,8 yd3) | CAT | 395 | 1,669,200 | 50,000 |
FEL (7 yd3) | CAT | 980 | 860,900 | 50,000 |
| Haul truck (38 t) | Volvo | 8X4 FMX | 211,600 | 25,000 |
| Bulldozer | CAT | D8 | 619,600 | 40,000 |
| Wheel dozer | CAT | 824K | 800,000 | 40,000 |
| Motor grader | CAT | 12 K | 300,000 | 40,000 |
| Water truck | Volvo | 18 m3 | 203,400 | 25,000 |
| Backhoe/hammer | CAT | 420 (1 yd3) | 140,000 | 25,000 |
| Fuel truck | | 20 m3 | 170,000 | 25,000 |
| Lube truck | Volvo | 4x2 | 127,200 | 25,000 |
| Support truck | | | 95,000 | 25,000 |
| Mobile crane | Volvo | 10t | 250,400 | 25,000 |
| Lowboy truck | Volvo | 6x4 | 190,400 | 25,000 |
| Tire handler | CAT | 938H | 371,500 | 25,000 |
| Lightning plant | | 4x1000w | 10,000 | 15,000 |
| | | | | |
| Boa Esperança Project | Page 227 |
| NI 43-101 Technical Report Feasibility Study | October 2021 |
As was explained before, initial capital includes all the material moved during the pre-production period. During the production period, capitalized waste was estimated allowing for a maximum of the average stripping ratio by pushback. Total sustaining capital expenses for the excess of waste by period were estimated.
Total mine capital costs were estimated at $229.4 M. Mine capital costs were split into initial and sustaining capital estimates, and are presented in Table 21-4:
Table 21-4: Projected Mine Capital Costs
| | | | | | | | | | | |
| | Initial Capital $M | Sustaining Capital $M | Total Capital $M |
| Capital | Capital | Capital |
| Pre-Stripping | 48.2 | - | 48.2 |
| Capitalized Waste | - | 137.2 | 137.2 |
| Mining Equipment | 3.5 | 35.6 | 39.2 |
| Pioneering | 0.9 | 1.3 | 2.2 |
| Others | 0.9 | 1.7 | 2.6 |
| | 53.5 | 175.8 | 229.4 |
21.1.8Processing Capital Costs
The capital cost estimate for the process plant included provision for all mechanical and electrical equipment, as well as quantities for bulks such as concrete, steel, piping, electrical and instrumentation. The direct ore handling and processing plant capital costs are presented in Table 21-5.
Table 21-5: Projected Ore Handling and Processing Plant Costs
| | | | | | | | |
| Cost Type | Description | Pre-Production Capital (US$ M) with Taxes |
| Ore Handling | Primary crushing | 6.7 |
| Secondary crushing | 1.2 |
| Tertiary crushing | 10.1 |
| Fine ore stockpile | 4.8 |
| Ore handling total | 22.8 |
| Processing Plant | Grinding and classification | 15.2 |
| Flotation and regrinding | 20.7 |
| Product dewatering and storage | 8.7 |
| Tailings pumping, dewatering and storage | 12.7 |
| Regents | 2.2 |
| Utilities, control and communication systems | 3.1 |
| Process plant total | 62.6 |
| Total ore handling and processing plant direct capital Cost | 85.4 |
| | | | | |
| Boa Esperança Project | Page 228 |
| NI 43-101 Technical Report Feasibility Study | October 2021 |
21.1.9Tailings/Reclaim Facilities
The direct tailings/reclaim capital costs are presented in Table 21-6.
Table 21-6: Direct Tailings/Reclaim Capital Costs
| | | | | | | | |
| Cost Type | Description | Pre-Production Capital (USD M) with Taxes |
| Tailings/Reclaim | TSF | 5.9 |
| DSTF | 7.3 |
| Pumping and pipelines | 1.4 |
| Tailings/Reclaim total | 14.6 |
21.1.10On-Site Infrastructure
On-site infrastructure costs of $42.4 M were carried for the on-site infrastructure area, consisting of allocations for earthworks and drainage, roads, buildings, mobile equipment, water storage, fire detection and prevention, sewage treatment, on-site electrical distribution and main substation, and area electrical rooms. The direct on-site infrastructure costs are presented in Table 21-7.
| | | | | |
| Boa Esperança Project | Page 229 |
| NI 43-101 Technical Report Feasibility Study | October 2021 |
Table 21-7: Projected On-Site Infrastructure Costs
| | | | | | | | |
| Cost Type | Description | Pre-Production Capital (USD M) with Taxes |
| On-site Infrastructure | Earthworks and Drainage | 11.3 |
| Roads | 0.7 |
| Buildings | 9.0 |
| Mobile equipment | 3.0 |
| Water storage | 0.2 |
| Fire Protection and Prevention | 0.9 |
| Sewage treatment | 0.6 |
| On-site Electrical Distribution and Main Substation | 5.9 |
| Area electrical rooms | 10.8 |
| Total on-site infrastructure direct capital cost | 42.4 |
21.1.11Off-Site Infrastructure
Off-site infrastructure costs of $28.7 M were estimated for the off-site infrastructure area, consisting of off-site roads and water diversions, freshwater storage and pipelines, contact water treatment plant and power supply and transmission. The direct off-site infrastructure costs are presented in Table 21-7.
Table 21-8: Projected Off-Site Infrastructure Costs
| | | | | | | | |
| Cost Type | Description | Pre-Production Capital (USD M) with Taxes |
| Off-site Infrastructure | Off-site roads and water diversions | 3.1 |
| Freshwater storage and pipelines | 3.6 |
| Contact water treatment plant | 18.3 |
| Power supply and transmission | 3.7 |
| Total off-site infrastructure direct capital cost | 28.7 |
21.2Operating Cost Estimate
21.2.1Summary
The operating cost estimate provided in Table 21-9 is based on a combination of first-principal calculations, Ausenco and QP experience, reference projects and factors as appropriate for the 2021 FSU.
| | | | | |
| Boa Esperança Project | Page 230 |
| NI 43-101 Technical Report Feasibility Study | October 2021 |
Table 21-9: Forecast Average Annual Operating Cost Estimate Summary
| | | | | | | | |
| Operating Cost | Annual Cost
($M) | Annual Cost
($/t processed) |
| Mining | 37.80 | 9.45 |
| Processing | 22.93 | 5.73 |
| Maintenance | 5.68 | 1.42 |
| G&A | 6.08 | 1.52 |
| Dry stack tailings (excludes manpower) | 1.91 | 1.48 |
| Total | 74.2 | 18.6 |
21.2.2Mining Costs
The mine plan assumes that contractors will operate the mine from pre-production to Year 5 of production. Thereafter, mining operations will be Owner-operated.
Initial mining operating costs were developed from first principles, in a bottom-up unit cost approach. This broke down the mining cycle into specific mining tasks with the associated materials and consumables and built up the operating costs from the smallest available units.
Equipment operating costs were estimated by determining the parts, wear steel, tires, contracted services and lubrication costs by period. Fuel costs were separately estimated. Fuel and lubricant consumptions were based on the estimated annual equipment operating hours and the typical fuel and lubricant consumption for each piece of equipment. The annual operating hours for the equipment type were determined from the annual production statistics. Fuel consumptions were determined after consultation with equipment suppliers (original equipment manufacturers) and based on NCL experience. The hourly equipment maintenance, tires and wear steal costs were determined using NCL’s database and equipment supplier information.
The adopted diesel consumption rates for the mine main equipment are presented in Table 21-10.
Table 21-10: Forecast Diesel Consumption Rates (L/h)
| | | | | | | | |
| Mine Equipment | Reference Model | Fuel Consumption |
| Top hammer drill | DP 1500i | 50 |
| Backhoe hydraulic excavator | CAT 395 | 51 |
| Loader | CAT 980 | 30 |
| On highway truck | Volvo 8x4 | 28* |
| Bulldozer | CAT D8 | 52 |
| Wheeldozer | CAT 824K | 55 |
| Motorgrader | CAT 12K | 22 |
| Water truck | Volvo 18 m3 | 20 |
| Services truck | ScaniaP250 DB4x2 | 10 |
| Fuel/lube truck | Volvo 4x2 | 15 |
| Flatbed truck | Volvo 6x4 | 20 |
| Tyre handler | CAT 938H | 25 |
| Portable lightning tower | 4x1000W | 9 |
(*): Average for the LOM. Diesel consumption for trucks is variable according to the yearly routes
A diesel cost of US$0.87/L was used in the diesel cost estimation.
| | | | | |
| Boa Esperança Project | Page 231 |
| NI 43-101 Technical Report Feasibility Study | October 2021 |
Supply, storage, handling and charging of explosives into the holes will be responsibility of a specialized outsourced company, which will operate through a service contract. Formal quotes were received from Enaex and Orica. Explosives prices including freight are presented in Table 21-11:
Table 21-11: Forecast Explosives Prices
| | | | | | | | |
| Explosives | Unit | Price |
| Emulsion + freight | US$/kg | 0.93 |
| ENALINE | US$/kg | 4.61 |
| Explosive cord | US$/m | 0.17 |
| Starter line | US$/unit | 0.25 |
| Boosters | US$/unit | 2.46 |
| Delays | US$/unit | 21.51 |
| Surface connector | US$/unit | 1.79 |
A fixed cost of $490,000/y was included in the blasting cost estimate.
Maintenance costs included the main components and spare parts prices for the useful life provided by equipment suppliers and from NCL database.
Tires, wear parts and drilling materials hourly costs were estimated using prices from vendors and life usage from NCL’s experience.
Pit dewatering costs were estimated analyzing the exposed areas for the end of year periods, including removing water from sumps in the bottom areas of the pit.
The standard shift will be 8 hours long and the work rotation will depend on the job requirements. Mine operators, maintenance technicians and management who rotate with the crews will be on a 7 day working period. Administration and staff people will work 5 days followed by 2 days off regime.
Mine labor was calculated by each period including the total workforce for the mining activities. The required labor by period is presented in Table 21-12.
| | | | | |
| Boa Esperança Project | Page 232 |
| NI 43-101 Technical Report Feasibility Study | October 2021 |
Table 21-12: Proposed Mine Workforce
| | | | | | | | | | | | | | | | | | | | | | | | | | | | | | | | | | | | | | | | | | | | | | | |
| Period | Y-02 | Y-01 | Y 01 | Y 01 | Y 02 | Y 03 | Y 04 | Y 05 | Y 06 | Y 07 | Y 08 | Y 09 | Y 10 | Y 11 | Y 12 |
| Direct Labour Operators | | | | | | | | | | | | | | | |
| Loading | | | | | | | | | | | | | | | |
FEL (7 yd3) 980 | 3 | 4 | 4 | 5 | 9 | 9 | 9 | 9 | 9 | 9 | 9 | 9 | 5 | 4 | 5 |
Excavator (6,8 yd3) 395 | 9 | 14 | 14 | 18 | 23 | 23 | 23 | 23 | 23 | 23 | 23 | 23 | 18 | 14 | 9 |
| Hauling | | | | | | | | | | | | | | | |
| Haul trucks | 47 | 56 | 56 | 76 | 98 | 105 | 115 | 107 | 119 | 119 | 123 | 138 | 149 | 100 | 88 |
| Drilling | | | | | | | | | | | | | | | |
| Production Diesel Drill Operator | 4 | 5 | 5 | 14 | 14 | 18 | 18 | 18 | 18 | 18 | 18 | 18 | 18 | 14 | 9 |
| Production Diesel Drill Helper | 4 | 5 | 5 | 14 | 14 | 18 | 18 | 18 | 18 | 18 | 18 | 18 | 18 | 14 | 9 |
| Ancillary | | | | | | | | | | | | | | | |
| Bulldozer 1 D8 | 9 | 9 | 9 | 18 | 23 | 23 | 23 | 23 | 23 | 23 | 23 | 23 | 23 | 18 | 18 |
| Wheeldozer 1 824K | 5 | 5 | 5 | 9 | 14 | 14 | 14 | 14 | 14 | 14 | 14 | 14 | 14 | 9 | 9 |
| Motorgrader 1 12 K | 5 | 5 | 5 | 5 | 9 | 14 | 18 | 18 | 18 | 18 | 18 | 18 | 18 | 18 | 18 |
| Water Truck 18 m3 | 5 | 5 | 5 | 5 | 5 | 5 | 5 | 5 | 5 | 5 | 5 | 5 | 5 | 5 | 5 |
| Support | | | | | | | | | | | | | | | |
| Backhoe/Hammer 420 (1 yd3) | 5 | 5 | 5 | 5 | 5 | 5 | 5 | 5 | 5 | 5 | 5 | 5 | 5 | 5 | 5 |
| Fuel Truck 20 m3 | 3 | 3 | 3 | 3 | 3 | 3 | 3 | 3 | 3 | 3 | 3 | 3 | 3 | 3 | 3 |
| Lube Truck 4x2 | 3 | 3 | 3 | 3 | 3 | 3 | 3 | 3 | 3 | 3 | 3 | 3 | 3 | 3 | 3 |
| Support Truck | 3 | 3 | 3 | 3 | 3 | 3 | 3 | 3 | 3 | 3 | 3 | 3 | 3 | 3 | 3 |
| Mobile Crane 10t | 3 | 3 | 3 | 3 | 3 | 3 | 3 | 3 | 3 | 3 | 3 | 3 | 3 | 3 | 3 |
| Lowboy Truck 6x4 | 3 | 3 | 3 | 3 | 3 | 3 | 3 | 3 | 3 | 3 | 3 | 3 | 3 | 3 | 3 |
| Tire Handler 938H | 3 | 3 | 3 | 3 | 3 | 3 | 3 | 3 | 3 | 3 | 3 | 3 | 3 | 3 | 3 |
| Total Operators | 114 | 131 | 131 | 187 | 232 | 252 | 266 | 258 | 270 | 270 | 274 | 289 | 291 | 219 | 193 |
| Maintenance Labour | | | | | | | | | | | | | | | |
| On Site | 4 | 10 | 10 | 16 | 18 | 20 | 20 | 20 | 20 | 20 | 20 | 20 | 18 | 14 | 10 |
| Work Shop | 35 | 43 | 43 | 59 | 78 | 84 | 92 | 87 | 95 | 95 | 97 | 107 | 114 | 79 | 72 |
| Total Maintenance Labour | 39 | 53 | 53 | 75 | 96 | 104 | 112 | 107 | 115 | 115 | 117 | 127 | 132 | 93 | 82 |
| Mine Administration Labour | | | | | | | | | | | | | | | |
| Mine Manager Overhead | | | | | | | | | | | | | | | |
| | | | | |
| Boa Esperança Project | Page 233 |
| NI 43-101 Technical Report Feasibility Study | October 2021 |
| | | | | | | | | | | | | | | | | | | | | | | | | | | | | | | | | | | | | | | | | | | | | | | |
| Mine Manager | 1 | 1 | 1 | 1 | 1 | 1 | 1 | 1 | 1 | 1 | 1 | 1 | 1 | 1 | 1 |
| Administrative Assistant | 1 | 1 | 1 | 1 | 1 | 1 | 1 | 1 | 1 | 1 | 1 | 1 | 1 | 1 | 1 |
| Mine Operation Overhead | | | | | | | | | | | | | | | |
| Mine Operations Coordinator | 1 | 1 | 1 | 1 | 1 | 1 | 1 | 1 | 1 | 1 | 1 | 1 | 1 | 1 | 1 |
| Senior Operation Engineer | 1 | 1 | 1 | 1 | 1 | 1 | 1 | 1 | 1 | 1 | 1 | 1 | 1 | 1 | 1 |
| Junior Operation Engineer | 1 | 0 | 0 | 0 | 0 | 0 | 0 | 0 | 1 | 1 | 1 | 1 | 1 | 1 | 1 |
| Operational Technician | 1 | 0 | 0 | 0 | 0 | 0 | 0 | 0 | 3 | 3 | 3 | 3 | 3 | 3 | 3 |
| Senior Drill&Blast Engineer | 3 | 0 | 0 | 0 | 0 | 0 | 0 | 0 | 1 | 1 | 1 | 1 | 1 | 1 | 1 |
| Operation Supervisor | 0 | 0 | 0 | 0 | 0 | 0 | 0 | 0 | 4 | 4 | 4 | 4 | 4 | 4 | 4 |
| Equipment Instructor | 0 | 0 | 0 | 0 | 0 | 0 | 0 | 0 | 1 | 1 | 1 | 1 | 1 | 1 | 1 |
| Dispatch Operator | 1 | 1 | 1 | 1 | 1 | 1 | 1 | 1 | 4 | 4 | 4 | 4 | 4 | 4 | 4 |
| Bit Sharpener | 4 | 0 | 0 | 0 | 0 | 0 | 0 | 0 | 2 | 2 | 2 | 2 | 2 | 2 | 2 |
| Mine Maintenance Overhead | | | | | | | | | | | | | | | |
| Mine Maintenance Coordinator | 0 | 0 | 0 | 0 | 0 | 0 | 0 | 0 | 1 | 1 | 1 | 1 | 1 | 1 | 1 |
| Mechanical Maintenance Supervisor | 0 | 0 | 0 | 0 | 0 | 0 | 0 | 0 | 4 | 4 | 4 | 4 | 4 | 4 | 4 |
| Sênior Mechanic Technician | 0 | 0 | 0 | 0 | 0 | 0 | 0 | 0 | 1 | 1 | 1 | 1 | 1 | 1 | 1 |
| Júnior Mechanic Technician | 0 | 0 | 0 | 0 | 0 | 0 | 0 | 0 | 1 | 1 | 1 | 1 | 1 | 1 | 1 |
| Welder | 0 | 0 | 0 | 0 | 0 | 0 | 0 | 0 | 4 | 4 | 4 | 4 | 4 | 4 | 4 |
| Preventive Maintenance Supervisor | 0 | 0 | 0 | 0 | 0 | 0 | 0 | 0 | 1 | 1 | 1 | 1 | 1 | 1 | 1 |
| Preventive Maintenance Mechanic | 0 | 0 | 0 | 0 | 0 | 0 | 0 | 0 | 5 | 5 | 5 | 5 | 5 | 5 | 5 |
| Preventive Maintenance Electrician | 0 | 0 | 0 | 0 | 0 | 0 | 0 | 0 | 5 | 5 | 5 | 5 | 5 | 5 | 5 |
| Preventive Maintenance Helper | 0 | 0 | 0 | 0 | 0 | 0 | 0 | 0 | 5 | 5 | 5 | 5 | 5 | 5 | 3 |
| Tires Specialist | 0 | 0 | 0 | 0 | 0 | 0 | 0 | 0 | 1 | 1 | 1 | 1 | 1 | 1 | 1 |
| Tire Repairman | 0 | 0 | 0 | 0 | 0 | 0 | 0 | 0 | 3 | 3 | 3 | 3 | 3 | 3 | 3 |
| Boilermaker | 0 | 0 | 0 | 0 | 0 | 0 | 0 | 0 | 4 | 4 | 4 | 4 | 4 | 4 | 4 |
| Turner | 0 | 0 | 0 | 0 | 0 | 0 | 0 | 0 | 4 | 4 | 4 | 4 | 4 | 4 | 4 |
| Maintenance Planning Supervisor | 0 | 0 | 0 | 0 | 0 | 0 | 0 | 0 | 1 | 1 | 1 | 1 | 1 | 1 | 1 |
| Mechanical Maintenance Planner | 1 | 1 | 0 | 0 | 0 | 0 | 0 | 0 | 2 | 2 | 2 | 2 | 2 | 2 | 1 |
| Electrical Maintenance Planner | 1 | 1 | 0 | 0 | 0 | 0 | 0 | 0 | 2 | 2 | 2 | 2 | 2 | 2 | 1 |
| Predictive Mechanical Maintenance Technician | 1 | 1 | 0 | 0 | 0 | 0 | 0 | 0 | 1 | 1 | 1 | 1 | 1 | 1 | 1 |
| | | | | |
| Boa Esperança Project | Page 234 |
| NI 43-101 Technical Report Feasibility Study | October 2021 |
| | | | | | | | | | | | | | | | | | | | | | | | | | | | | | | | | | | | | | | | | | | | | | | |
| Predictive Electrical Maintenance Technician | 1 | 1 | 0 | 0 | 0 | 0 | 0 | 0 | 1 | 1 | 1 | 1 | 1 | 1 | 1 |
| Equipment Inspector | 1 | 1 | 0 | 0 | 0 | 0 | 0 | 0 | 4 | 4 | 4 | 4 | 4 | 4 | 2 |
| Mine Infrastructure Overhead | | | | | | | | | | | | | | | |
| Mine Infrastructure Coordinator | 2 | 2 | 1 | 1 | 1 | 1 | 1 | 1 | 1 | 1 | 1 | 1 | 1 | 1 | 0 |
| Senior Operational Technician | 1 | 1 | 1 | 1 | 1 | 1 | 1 | 1 | 1 | 1 | 1 | 1 | 1 | 1 | 0 |
| Junior Operational Technician | 0 | 1 | 1 | 1 | 1 | 1 | 1 | 1 | 1 | 1 | 1 | 1 | 1 | 1 | 1 |
| Grader Operator | 1 | 2 | 2 | 2 | 2 | 2 | 2 | 2 | 2 | 2 | 2 | 2 | 2 | 2 | 2 |
| Water Truck Operator | 2 | 2 | 2 | 2 | 2 | 2 | 2 | 2 | 2 | 2 | 2 | 2 | 2 | 2 | 2 |
| Fornt&Load Operator | 2 | 2 | 2 | 2 | 2 | 2 | 2 | 2 | 2 | 2 | 2 | 2 | 2 | 2 | 2 |
| Truck Driver | 2 | 2 | 2 | 2 | 2 | 2 | 2 | 2 | 2 | 2 | 2 | 2 | 2 | 2 | 2 |
| Mechanic Pumping | 2 | 2 | 1 | 1 | 1 | 1 | 1 | 1 | 1 | 1 | 1 | 1 | 1 | 1 | 1 |
| Operational Helper | 1 | 1 | 1 | 1 | 1 | 1 | 1 | 1 | 1 | 1 | 1 | 1 | 1 | 1 | 1 |
| Geology & Planning Overhead | | | | | | | | | | | | | | | |
| Geology & Planning Manager | 1 | 1 | 1 | 1 | 1 | 1 | 1 | 1 | 1 | 1 | 1 | 1 | 1 | 1 | 0 |
| Administrative Assistant | 1 | 1 | 1 | 1 | 1 | 1 | 1 | 1 | 1 | 1 | 1 | 1 | 1 | 1 | 0 |
| Geology Coordinator | 0 | 1 | 1 | 1 | 1 | 1 | 1 | 1 | 1 | 1 | 1 | 1 | 1 | 1 | 1 |
| Senior Geologist | 1 | 1 | 1 | 1 | 1 | 1 | 1 | 1 | 1 | 1 | 1 | 1 | 1 | 1 | 0 |
| Medium Geologist | 0 | 1 | 1 | 1 | 1 | 1 | 1 | 1 | 1 | 1 | 1 | 1 | 1 | 1 | 1 |
| Junior Geologist | 1 | 1 | 1 | 1 | 1 | 1 | 1 | 1 | 1 | 1 | 1 | 1 | 1 | 1 | 1 |
| Geology Technician | 1 | 2 | 2 | 5 | 5 | 5 | 5 | 5 | 5 | 5 | 5 | 5 | 5 | 5 | 3 |
| Sampler | 3 | 4 | 4 | 9 | 9 | 9 | 9 | 9 | 9 | 9 | 9 | 9 | 9 | 9 | 9 |
| Oper. helper (drill cores) | 9 | 9 | 1 | 3 | 3 | 3 | 3 | 3 | 3 | 3 | 3 | 3 | 3 | 3 | 3 |
| Senior Planning Engineer | 1 | 1 | 1 | 1 | 1 | 1 | 1 | 1 | 1 | 1 | 1 | 1 | 1 | 1 | 0 |
| Medium Planning Engineer | 0 | 1 | 1 | 1 | 1 | 1 | 1 | 1 | 1 | 1 | 1 | 1 | 1 | 1 | 1 |
| Junior Planning Engineer | 1 | 1 | 1 | 1 | 1 | 1 | 1 | 1 | 1 | 1 | 1 | 1 | 1 | 1 | 0 |
| Senior Geotechnical Engineer | 0 | 1 | 1 | 1 | 1 | 1 | 1 | 1 | 1 | 1 | 1 | 1 | 1 | 1 | 1 |
| Topography Supervisor | 1 | 1 | 1 | 1 | 1 | 1 | 1 | 1 | 1 | 1 | 1 | 1 | 1 | 1 | 1 |
| Topography Technician | 1 | 1 | 1 | 2 | 2 | 2 | 2 | 2 | 2 | 2 | 2 | 2 | 2 | 2 | 1 |
| Topography Helper | 2 | 2 | 2 | 5 | 5 | 5 | 5 | 5 | 5 | 5 | 5 | 5 | 5 | 5 | 3 |
| Total Mine Administration Labour | 55 | 54 | 39 | 53 | 53 | 53 | 53 | 53 | 118 | 118 | 118 | 118 | 118 | 118 | 100 |
| Contractor Administration Labour | | | | | | | | | | | | | | | |
| | | | | |
| Boa Esperança Project | Page 235 |
| NI 43-101 Technical Report Feasibility Study | October 2021 |
| | | | | | | | | | | | | | | | | | | | | | | | | | | | | | | | | | | | | | | | | | | | | | | |
| Manager | 1 | 1 | 1 | 1 | 1 | 1 | 1 | 1 | | | | | | | |
| Planning | 2 | 2 | 2 | 2 | 2 | 2 | 2 | 2 | | | | | | | |
| Supervisor | 3 | 3 | 3 | 3 | 3 | 3 | 3 | 3 | | | | | | | |
| Boss | 2 | 2 | 2 | 2 | 2 | 2 | 2 | 2 | | | | | | | |
| Surveyor | 1 | 1 | 1 | 1 | 1 | 1 | 1 | 1 | | | | | | | |
| Safety Tech | 3 | 3 | 3 | 3 | 3 | 3 | 3 | 3 | | | | | | | |
| Admin Assistant | 2 | 2 | 2 | 2 | 2 | 2 | 2 | 2 | | | | | | | |
| Planning Tech | 1 | 1 | 1 | 1 | 1 | 1 | 1 | 1 | | | | | | | |
| Mining Tech | 3 | 3 | 3 | 3 | 3 | 3 | 3 | 3 | | | | | | | |
| Production Control | 1 | 1 | 1 | 1 | 1 | 1 | 1 | 1 | | | | | | | |
| Forrest Ident/Weight | 1 | 1 | 1 | 1 | 1 | 1 | 1 | 1 | | | | | | | |
| Forrest Operator | 1 | 1 | 1 | 1 | 1 | 1 | 1 | 1 | | | | | | | |
| Pointer | 6 | 6 | 6 | 6 | 6 | 6 | 6 | 6 | | | | | | | |
| Assistant | 27 | 27 | 27 | 27 | 27 | 27 | 27 | 27 | | | | | | | |
| Bus Drivers | 10 | 10 | 10 | 10 | 10 | 10 | 10 | 10 | | | | | | | |
| Watchman | 2 | 2 | 2 | 2 | 2 | 2 | 2 | 2 | | | | | | | |
| Warehouse | 1 | 1 | 1 | 1 | 1 | 1 | 1 | 1 | | | | | | | |
| Survey helper | 2 | 2 | 2 | 2 | 2 | 2 | 2 | 2 | | | | | | | |
| Total Contractor Administration Labour | 69 | 69 | 69 | 69 | 69 | 69 | 69 | 69 | | | | | | | |
| Total Mine Labor | 277 | 307 | 292 | 384 | 450 | 478 | 500 | 487 | 503 | 503 | 509 | 534 | 541 | 430 | 375 |
Total operating expenses are summarized in Table 21-13.
| | | | | |
| Boa Esperança Project | Page 236 |
| NI 43-101 Technical Report Feasibility Study | October 2021 |
Table 21-13: Forecast Total Operating Expenses (‘000 US$)
| | | | | | | | | | | | | | | | | | | | | | | | | | | | | | | | | | | | | | | | | |
| Y 01 | Y 02 | Y 03 | Y 04 | Y 05 | Y 06 | Y 07 | Y 08 | Y 09 | Y 10 | Y 11 | Y 12 | Total |
| Labour | 4,807 | 7,343 | 8,544 | 9,061 | 8,827 | 16,609 | 16,609 | 16,790 | 17,550 | 17,732 | 14,292 | 7,696 | 145,862 |
| Maintenance | 2,610 | 3,542 | 4,350 | 5,596 | 4,920 | 3,301 | 6,341 | 5,805 | 4,783 | 5,758 | 4,358 | 1,176 | 52,540 |
| Fuel | 3,492 | 5,075 | 7,120 | 8,641 | 8,908 | 9,929 | 9,923 | 10,198 | 11,317 | 11,857 | 8,349 | 2,522 | 97,331 |
| Lube & grease | 370 | 554 | 762 | 858 | 826 | 873 | 832 | 877 | 933 | 951 | 672 | 203 | 8,710 |
| Tires | 353 | 529 | 686 | 778 | 750 | 793 | 772 | 804 | 857 | 893 | 683 | 208 | 8,106 |
| Structure & undercarriage | 562 | 807 | 1,004 | 1,022 | 1,023 | 1,016 | 990 | 1,013 | 1,010 | 973 | 739 | 212 | 10,371 |
| Bucket & gets | 386 | 580 | 759 | 811 | 804 | 818 | 805 | 776 | 776 | 729 | 560 | 163 | 7,968 |
| Body | 141 | 216 | 326 | 388 | 363 | 400 | 376 | 416 | 464 | 498 | 329 | 99 | 4,015 |
| Drill steel | 364 | 610 | 891 | 944 | 963 | 920 | 925 | 990 | 997 | 902 | 537 | 157 | 9,201 |
| Explosives | 1,662 | 2,742 | 4,073 | 4,319 | 4,377 | 4,231 | 4,231 | 4,459 | 4,496 | 4,052 | 2,379 | 681 | 41,700 |
| Blasting accessories | 1,163 | 1,848 | 2,695 | 2,821 | 2,857 | 2,765 | 2,711 | 2,873 | 2,875 | 2,619 | 1,567 | 465 | 27,259 |
| Blasting service | 365 | 485 | 485 | 485 | 485 | 485 | 485 | 485 | 485 | 485 | 485 | 159 | 5,370 |
| Secondary blasting | 459 | 861 | 841 | 837 | 893 | 782 | 640 | 820 | 792 | 846 | 663 | 290 | 8,723 |
| G&A | 1,473 | 2,244 | 2,516 | 2,636 | 2,596 | 2,958 | 2,927 | 2,998 | 3,097 | 3,134 | 2,624 | 786 | 29,989 |
| Pit dewatering | 25 | 32 | 37 | 47 | 194 | 215 | 215 | 209 | 239 | 239 | 239 | 243 | 1,933 |
| RC drilling | 147 | 292 | 456 | 501 | 513 | 486 | 521 | 546 | 562 | 504 | 290 | 80 | 4,899 |
| 6Eng. & Adm (Contractor) | 5,558 | 8,130 | 10,299 | 11,725 | 11,474 | - | - | - | - | - | - | - | 47,186 |
| Equipment possession | 2,404 | 3,598 | 4,854 | 5,296 | 5,171 | - | - | - | - | - | - | - | 21,323 |
| Mine contractor fee | 1,065 | 1,585 | 2,080 | 2,405 | 2,348 | - | - | - | - | - | - | - | 9,483 |
| Contractors indirects (Mob+Demob) | 325 | 325 | 125 | 100 | 1,825 | - | - | - | - | - | - | - | 2,700 |
| TOTAL | 27,731 | 41,398 | 52,904 | 59,271 | 60,115 | 46,581 | 49,303 | 50,059 | 51,232 | 52,172 | 38,764 | 15,140 | 544,668 |
| | | | | |
| Boa Esperança Project | Page 237 |
| NI 43-101 Technical Report Feasibility Study | October 2021 |
The LOM operating cost was estimated to be $2.87t of total mined material and summarized in Table 21-14:
Table 21-14: Forecast Unit Mine Operating Cost
| | | | | |
| Unit Operation | $/t |
| Loading | 0.21 |
| Hauling | 0.69 |
| Drilling | 0.21 |
| Blasting | 0.44 |
| Ancillary | 0.35 |
| Support | 0.13 |
| Eng. & Adm (Owner Cost) | 0.37 |
| Eng. & Adm (Contractor) | 0.25 |
| Pit Dewatering | 0.01 |
| RC Drilling | 0.03 |
| Equipment Possession | 0.11 |
| Mine contractor fee | 0.05 |
| Contractors Indirects (Mob+Demob) | 0.01 |
| Total Mine Operating Cost | 2.87 |
A portion of the waste was capitalized by analyzing the mine schedule by phase and reviewing when the average stripping ratio was higher than the average for the LOM (3.72), the differential in waste was included as capital. Applying this criteria, 50.5 Mt of waste was capitalized. A summary of the capitalized waste by phase and period is shown in Table 21-15:
| | | | | |
| Boa Esperança Project | Page 238 |
| NI 43-101 Technical Report Feasibility Study | October 2021 |
Table 21-15: Forecast Capitalized Waste
| | | | | | | | | | | | | | | | | | | | | | | | | | | | | | | | | | | |
| | Y 01 | Y 02 | Y 03 | Y 04 | Y 05 | Y 06 | Y 07 | Y 08 | Y 09 | Y 10 | Total |
| Ph00 | - | - | - | - | - | - | - | - | - | - | - |
| Ph01 | 1,624,513 | - | - | - | - | - | - | - | - | - | 1,624,513 |
| Ph02 | - | 4,287,325 | 5,633,240 | - | - | - | - | - | - | - | 9,920,565 |
| Ph03 | - | - | 1,680,558 | 5,128,285 | - | - | - | - | - | - | 6,808,843 |
| Ph04 | - | - | - | - | 717,769 | 4,714,396 | 1,684,071 | - | - | - | 7,116,236 |
| Ph05 | - | - | 565,516 | - | 5,385,509 | 3,508,483 | 3,191,965 | 6,007,145 | 3,515,429 | 2,857,141 | 25,031,187 |
| Total | 1,624,513 | 4,287,325 | 7,879,314 | 5,128,285 | 6,103,278 | 8,222,879 | 4,876,035 | 6,007,145 | 3,515,429 | 2,857,141 | 50,501,344 |
Total operating expenses excluding the costs for capitalized waste are presented in Table 21-16.
| | | | | |
| Boa Esperança Project | Page 239 |
| NI 43-101 Technical Report Feasibility Study | October 2021 |
Table 21-16: Forecast Total Operating Expenses Excluding Capitalized Waste (US$ x 1,000)
| | | | | | | | | | | | | | | | | | | | | | | | | | | | | | | | | | | | | | | | | |
| Y 01 | Y 02 | Y 03 | Y 04 | Y 05 | Y 06 | Y 07 | Y 08 | Y 09 | Y 10 | Y 11 | Y 12 | Total |
| Labour | 3,929 | 5,014 | 5,040 | 6,738 | 6,133 | 9,750 | 12,592 | 11,747 | 14,481 | 14,905 | 14,292 | 7,696 | 112,317 |
| Maintenance | 2,136 | 2,419 | 2,568 | 4,161 | 3,419 | 1,938 | 4,807 | 4,062 | 3,946 | 4,840 | 4,358 | 1,176 | 39,829 |
| Fuel | 2,848 | 3,437 | 4,205 | 6,425 | 6,189 | 5,829 | 7,523 | 7,135 | 9,338 | 9,967 | 8,349 | 2,522 | 73,767 |
| Lube & Grease | 301 | 374 | 450 | 638 | 574 | 512 | 631 | 613 | 769 | 800 | 672 | 203 | 6,537 |
| Tires | 288 | 361 | 405 | 579 | 521 | 466 | 585 | 562 | 707 | 750 | 683 | 208 | 6,116 |
| Structure & Undercarriage | 461 | 552 | 593 | 760 | 711 | 597 | 751 | 708 | 833 | 818 | 739 | 212 | 7,735 |
| Bucket & Gets | 315 | 395 | 448 | 603 | 558 | 480 | 611 | 543 | 641 | 613 | 560 | 163 | 5,929 |
| Body | 114 | 143 | 193 | 288 | 252 | 235 | 285 | 291 | 383 | 419 | 329 | 99 | 3,031 |
| Drill Steel | 295 | 410 | 526 | 702 | 669 | 540 | 701 | 693 | 823 | 758 | 537 | 157 | 6,812 |
| Explosives | 1,351 | 1,843 | 2,405 | 3,211 | 3,041 | 2,484 | 3,207 | 3,120 | 3,710 | 3,406 | 2,379 | 681 | 30,838 |
| Blasting Accessories | 945 | 1,242 | 1,592 | 2,098 | 1,985 | 1,623 | 2,055 | 2,010 | 2,372 | 2,202 | 1,567 | 465 | 20,156 |
| Blasting Service | 297 | 326 | 286 | 360 | 337 | 284 | 367 | 339 | 400 | 407 | 485 | 159 | 4,047 |
| Secondary Blasting | 373 | 579 | 497 | 622 | 620 | 459 | 485 | 574 | 653 | 711 | 663 | 290 | 6,526 |
| G&A | 1,212 | 1,573 | 1,477 | 1,960 | 1,804 | 1,736 | 2,219 | 2,097 | 2,555 | 2,635 | 2,624 | 786 | 22,678 |
| Pit Dewatering | 21 | 22 | 22 | 35 | 135 | 126 | 163 | 147 | 197 | 201 | 239 | 243 | 1,550 |
| RC Drilling | 120 | 196 | 274 | 373 | 357 | 285 | 395 | 382 | 464 | 423 | 290 | 80 | 3,639 |
| Eng. & Adm (Contractor) | 4,537 | 5,525 | 6,075 | 8,719 | 7,973 | - | - | - | - | - | - | - | 32,828 |
| Equipment (Possession for Owner) | 1,951 | 2,398 | 2,854 | 3,938 | 3,593 | - | - | - | - | - | - | - | 14,734 |
| Mine contractor fee | 868 | 1,070 | 1,228 | 1,788 | 1,631 | - | - | - | - | - | - | - | 6,585 |
| Contractors Indirects (Mob + Demob) | 238 | 143 | 62 | 74 | 1,268 | - | - | - | - | - | - | - | 1,787 |
| TOTAL | 22,602 | 28,022 | 31,198 | 44,073 | 41,770 | 27,345 | 37,378 | 35,023 | 42,271 | 43,854 | 38,764 | 15,140 | 407,440 |
| | | | | |
| Boa Esperança Project | Page 240 |
| NI 43-101 Technical Report Feasibility Study | October 2021 |
A total of $137 M was capitalized as sustaining capital costs. Total unit mine costs excluding the capitalized waste are $2.13/t of material ROM. Detail by unit operation is presented in Table 21-17:
Table 21-17: Unit Mine Operating Cost excluding Capitalized Waste
| | | | | |
| Unit Operation | US$/t |
| Loading | 0.16 |
| Hauling | 0.53 |
| Drilling | 0.15 |
| Blasting | 0.32 |
| Ancillary | 0.27 |
| Support | 0.10 |
| Eng. & Adm (Owner Cost) | 0.28 |
| Eng. & Adm (Contractor) | 0.17 |
| Pit Dewatering | 0.01 |
| RC Drilling | 0.02 |
| Equipment Possession | 0.08 |
| Mine contractor fee | 0.03 |
| Contractors Indirects (Mob+Demob) | 0.01 |
| Total Mine Operating Cost | 2.13 |
21.1.3Processing
Processing costs based on for power, consumables, maintenance consumables and labour are summarised in Table 21-18.
Table 21-18: Processing Costs – Power, Consumables and Labour
| | | | | | | | |
| Processing Cost item | Annual Cost
($ M) | Annual Cost
($/t processed) |
| Power | 10.75 | 2.69 |
| Operating consumables | 9.13 | 2.28 |
| Maintenance consumables | 2.31 | 0.58 |
| Labour | 6.12 | 1.53 |
| Total | 28.30 | 7.08 |
21.1.3.1Power
Power costs were calculated from an estimate of annual power consumption and applying a unit cost of $0.066/kWh.
Power consumption was derived from calculated power draw from the mechanical equipment list. The average on-line power draw is estimated at 21 MW.
Annual energy consumption is estimated at 163,133 MWh, or about $10.75 M.
| | | | | |
| Boa Esperança Project | Page 241 |
| NI 43-101 Technical Report Feasibility Study | October 2021 |
21.1.3.2Consumables
Processing reagents and consumable costs were estimated based on plant throughput. Costs are summarised in Table 21-19.
Costs for liners were estimated based on vendor information, benchmarking from similar plants and information from previous project studies. Costs for the expected consumption of mill balls were based on a design abrasion index (Ai) of 0.356 and a unit cost of $1.01/kg including freight. These costs are summarised in Table 21-20.
Reagent costs were based on:
•Consumption rates determined in previous test work;
•Data base unit costs for the reagents;
•An allowance of 8.5% of reagent costs for freight.
Reagent costs are summarised in Table 21-21.
Table 21-19: Forecast Processing Reagents and Consumable Costs
| | | | | |
| Consumable Item | Annual Costs
($M) |
| Grizzly bars | 0.02 |
| Liners and media | 6.17 |
| Screen deck panels | 0.27 |
| Reagents | 2.67 |
| Total | 9.13 |
Table 21-20: Forecast Costs for Liners and Media
| | | | | | | | |
| Consumable Item | Annual Consumption | Annual Cost
($000) |
| Primary crusher liners | 3 sets | 56 |
| Secondary crusher liners | 4 sets | 103 |
| Tertiary crusher liners | 4 sets | 103 |
| Ball mill liners | 1 set | 319 |
| HIG mill liners | 1 set | 107 |
| Ball mill balls | 1.12 kg/t | 4,521 |
| HIG mill balls | 0.104 kg/t | 957 |
| Total | | 6,166 |
| | | | | |
| Boa Esperança Project | Page 242 |
| NI 43-101 Technical Report Feasibility Study | October 2021 |
Table 21-21: Forecast Reagent Costs
| | | | | | | | |
| Reagent | Addition Rate
(kg/t) | Annual Cost
($000) |
| Flocculant | 0.055 | 797 |
| Collector 1: PAX | 0.020 | 218 |
| Collector 2: DTF | 0.035 | 366 |
| Frother: F-810 Flomin | 0.040 | 390 |
| Hydrated Lime | 0.700 | 316 |
| Sulfuric Acid | 0.500 | 584 |
| Total | | 2,671 |
21.1.3.3Maintenance Consumables
Annual maintenance spares and consumable costs were calculated at 5% of the mechanical equipment cost ($46.3 M). This resulted in an estimated annual maintenance spares and consumable cost of $2.31 M.
21.1.3.4Labour
Labour costs included all production and maintenance labour to operate and maintain the plant (Table 21-22).
Costs were estimated from a breakdown of staffing positions, estimated at a total of 175 personnel, excluding G&A manpower. Costs were average salaries inclusive of all burden applicable to the region.
Table 21-22: Labour Costs
| | | | | | | | |
| Cost Centre | Number | Annual Cost
(C$M) |
| Plant Production Labour | 96 | 3.057 |
| Plant Maintenance Labour | 79 | 3.062 |
| Total | 175 | 6.120 |
21.1.4General and Administration
The G&A operating costs were estimated based on benchmarked data from similar projects in Brazil. Costs included G&A personnel, off-site offices, contract services, and vehicle maintenance, as well as miscellaneous project costs. The annual G&A cost was estimated at $6.08 M.
21.1.5Dry Stack Tailings Facility
Costs associated with the dry stack tailings facility were estimated based on vehicle maintenance and consumables. Labour costs were excluded as it is part of the process plant labour.
Vehicle maintenance costs include fuel consumption and tires changeout. The consumable costs include facility consumables and truck shop equipment.
Dry stack tailings facility costs are summarised in Table 21-23.
| | | | | |
| Boa Esperança Project | Page 243 |
| NI 43-101 Technical Report Feasibility Study | October 2021 |
Table 21-23: Forecast Dry Stack Tailings Facility Cost Summary
| | | | | | | | |
| Cost Centre | Annual Cost
($M) | Annual Cost
($/t Processed) |
| Dry stack vehicles maintenance | 1.25 | 0.31 |
| Dry stack consumables | 0.66 | 0.16 |
| Total | 1.91 | 0.48 |
| | | | | |
| Boa Esperança Project | Page 244 |
| NI 43-101 Technical Report Feasibility Study | October 2021 |
22ECONOMIC ANALYSIS
22.1Cautionary Statement
The results of the economic analyses discussed in this section represent forward- looking information as defined under Canadian securities law. The results depend on inputs that are subject to several known and unknown risks, uncertainties and other factors that may cause actual results to differ materially from those presented here. Information that is forward-looking includes:
•Mineral Resource and Mineral Reserve estimates;
•Assumed commodity prices and exchange rates;
•The proposed mine production plan;
•Projected mining and process recovery rates;
•Sustaining costs and proposed operating costs;
•Assumptions as to closure costs and closure requirements;
•Assumptions as to environmental, permitting and social risks.
Additional risks to the forward-looking information include:
•Changes to costs of production from what are estimated;
•Unrecognized environmental and social risks;
•Unanticipated reclamation expenses;
•Unexpected variations in quantity of mineralized material, grade or recovery rates;
•Geotechnical or hydrogeological considerations during mining being different from what was assumed;
•Failure of mining methods to operate as anticipated;
•Failure of plant, equipment or processes to operate as anticipated;
•Changes to assumptions as to the availability of electrical power, and the power rates used in the operating cost estimates and financial analysis;
•Ability to maintain the social licence to operate;
•Accidents, labour disputes and other risks of the mining industry;
•Changes to interest rates;
•Changes to tax rates and incentive programs
This FSU assumes that permits have to be obtained in support of operations, and approval for development to be provided by Ero’s Board.
| | | | | |
| Boa Esperança Project | Page 245 |
| NI 43-101 Technical Report Feasibility Study | October 2021 |
22.2Methodology Used
An economic model was developed to estimate annual pre-tax and post-tax cash flows and sensitivities of the Project based on an 8% discount rate. Tax estimates involve complex variables that can only be accurately calculated during operations and, as such, the after-tax results reflect approximations relative to the current tax environment in Brazil. Sensitivity analysis was performed to assess impact of variations in metal prices, head grades, operating costs and capital costs. The capital and operating cost estimates were developed specifically for this Project and are summarized in Section 21 of this Report (presented in 2021 dollars). The economic analysis has been completed without inflation (constant dollar basis).
22.3Financial Model Parameters
The economic analysis was performed using the following inputs from the mine plan and input assumptions:
•Construction period of two years;
•Mine life of 12 years;
•Consensus copper price forecast based on the average analyst copper price estimate from 26 financial institutions as of the Effective Date, resulting in $3.80 per pound in 2024, $3.95 per pound in 2025 and $3.40 per pound in 2026 and thereafter. The forecasts used are meant to reflect the average metal price expectation over the life of the Project. No price inflation or escalation factors were considered. Commodity prices can be volatile, and there is the potential for deviation from the forecast;
•Brazilian real to United States Dollar exchange rate assumption of 5.00 (R$/US$)
•Cost estimates in constant Q3 2021 US$ with no inflation or escalation factors considered;
•Results are based on 100% ownership with a 2.0% CFEM royalty;
•Capital costs funded with 100% equity (i.e., no financing costs assumed);
•All cash flows discounted to start of construction;
•All metal products are assumed sold in the same year they are produced;
•Project revenue is derived from the sale of copper concentrate into the international marketplace;
| | | | | |
| Boa Esperança Project | Page 246 |
| NI 43-101 Technical Report Feasibility Study | October 2021 |
22.3.1Taxes
The Project was evaluated on an after-tax basis. The calculations are based on the tax regime as of the effective date of this Report and consider application of the Superintendência do Desenvolvimento da Amazônia (SUDAM) tax benefit upon start of production. This tax incentive applies to companies that are part of economic sectors considered as priorities for regional development within the region and is applicable to the Project.
As of the Report effective date, the Project was assumed to be subject to the following tax regime:
•Brazilian corporate income tax of 25%;
•SUDAM Benefit allowing for a reduction of 75% of the income tax (resulting net income tax of 6.25%);
•Social Contribution of 9%.
Considering an effective tax rate of 15.25% total tax payments are estimated to be approximately $131 M over the life of mine.
22.3.2Royalties
The Project is subject to a 2.0% CFEM royalty, as more fully described in Section 4.0. There are no other royalties or encumbrances on the Project.
22.3.3Working Capital
A high-level estimation of working capital was incorporated into the cash flow based on accounts receivable (0 days), inventories (30 days) and accounts payable (30 days).
22.3.4Closure Costs
The total closure cost is estimated to be approximately $24 M which is partially offset by an estimated salvage value of $7M.
22.4Economic Analysis
The economic analysis was performed using an 8% discount rate. The pre-tax NPV 8% is $464.6 M, the internal rate of return (IRR) is 48.6%, and payback is 1.3 years. On an after-tax basis, the NPV 8% is $379.6 M, the IRR is 41.8% and the payback is 1.4 years.
A summary of the Project economics is included in Table 22-1 and shown graphically in Figure 22-1. The cashflow on an annualized basis is provided in Table 22-2.
| | | | | |
| Boa Esperança Project | Page 247 |
| NI 43-101 Technical Report Feasibility Study | October 2021 |
Table 22-1: Summary, Projected LOM Cashflow Assumptions and Results
| | | | | | | | |
| Units | Values |
| General Assumptions |
| Copper Price | (US$/lb) | $3.80/lb in 2024, $3.95/lb in 2025, $3.40 in 2026+ |
| Exchange rate | (R$/US$) | 5.0 |
| Mine life | (years) | 12 |
| Total waste tonnes mined | (kt) | 160,025 |
| Total mill feed tonnes | (kt) | 43,052 |
| Strip Ratio | W:o | 3.72x |
| Net smelter royalty | (%) | 2% |
| Production |
| Mill Head Grade | (%) | 0.83% |
| Mill Recovery Rate | (%) | 91.3% |
| Total Mill Copper Recovered | (mmlb) | 718 |
| Total Payable Copper | (mmlb) | 690 |
| Average Annual Payable Copper | (mmlb) | 62 |
| Operating Costs |
| Mining Cost excl. Pre-Strip | ($/t mined) | $2.13 |
| Mining Cost excl. Pre-Strip | ($/t milled) | $9.45 |
| Processing Cost | ($/t milled) | $7.15 |
| Dry Stack Tailings | ($/t milled) | $0.48 |
| G&A Costs | ($/t milled) | $1.52 |
| Total Operating Costs | ($/t milled) | $18.61 |
| Treatment Costs | ($/t dmt) | $21.00 |
| Refining Costs | ($/lb Cu) | $0.02 |
| Transport Cost | ($/t wmt) | $146.90 |
| C1 Cost (per payable lb Cu)* | ($/lb) | $1.41 |
| C3 Cost (per payable lb Cu)** | ($/lb) | $1.88 |
| C1 Cost (per recovered lb Cu)* | ($/lb) | $1.36 |
| C3 Cost (per recovered lb Cu)** | ($/lb) | $1.81 |
| Capital Costs |
| Initial capex | ($M) | $294 |
| Sustaining capex | ($M) | $196 |
| Closure capex | ($M) | $24 |
| Salvage Value | ($M) | $7 |
| Economics |
| Pre-tax NPV (8%) | ($M) | $464.6 |
| Pre-tax IRR | (%) | 48.6% |
| Pre-tax payback period | (years) | 1.3 |
| After-tax NPV (8%) | ($M) | $379.6 |
| After-tax IRR | (%) | 41.8% |
| After-tax payback period | (years) | 1.4 |
* C1 includes mining costs, processing costs, mine-level G&A (Operations) and transportation (haulage & port fees only) and royalties
| | | | | |
| Boa Esperança Project | Page 248 |
| NI 43-101 Technical Report Feasibility Study | October 2021 |
** C3 includes C1 costs (incl. total transport) plus mine-level G&A (Admin), sustaining capital and closure costs
Figure 22-1: Projected LOM Pre-Tax Cashflow
Note: prepared by Ausenco, 2021
Figure 22-2: Projected LOM Post-Tax Cashflow
Note: prepared by Ausenco, 2021
| | | | | |
| Boa Esperança Project | Page 249 |
| NI 43-101 Technical Report Feasibility Study | October 2021 |
Table 22-2: Projected Cashflow on an Annualized Basis
| | | | | | | | | | | | | | | | | | | | | | | | | | | | | | | | | | | | | | | | | | | | | | | | | | | | | |
| Dollar figures in Real 2021 US$mm unless otherwise noted | Unit | LOM | 2022 | 2023 | 2024 | 2025 | 2026 | 2027 | 2028 | 2029 | 2030 | 2031 | 2032 | 2033 | 2034 | 2035 | 2036 |
| Mining Summary | | | | | | | | | | | | | | | | | |
| Ore mined | kt | 43,052 | -- | 3 | 2,312 | 4,245 | 4,148 | 4,126 | 4,400 | 3,853 | 3,153 | 4,043 | 3,903 | 4,170 | 3,267 | 1,429 | -- |
| Waste mined | kt | 160,025 | 3,017 | 8,050 | 8,055 | 8,112 | 14,957 | 15,874 | 15,600 | 15,912 | 16,160 | 15,957 | 16,097 | 13,750 | 7,053 | 1,430 | -- |
| Total mined | kt | 203,077 | 3,017 | 8,054 | 10,367 | 12,357 | 19,104 | 20,000 | 20,000 | 19,765 | 19,313 | 20,000 | 20,000 | 17,921 | 10,320 | 2,859 | -- |
| Cu Grade (Mined Ore) | % | 0.83% | -- | 1.49% | 1.30% | 1.27% | 1.05% | 0.76% | 0.79% | 0.72% | 0.52% | 0.55% | 0.64% | 0.62% | 0.92% | 1.11% | -- |
| Strip Ratio | w:o | 3.72 | -- | -- | 3.48 | 1.91 | 3.61 | 3.85 | 3.55 | 4.13 | 5.12 | 3.95 | 4.12 | 3.30 | 2.16 | 1.00 | -- |
| Production Summary | | | | | | | | | | | | | | | | | |
| Ore Sent to Mill | kt | 43,052 | -- | -- | 2,182 | 3,990 | 4,000 | 4,000 | 4,000 | 4,000 | 4,000 | 4,000 | 4,000 | 4,000 | 3,451 | 1,429 | -- |
| Cu Contained in Feed | Mlbs | 786 | -- | -- | 65 | 117 | 95 | 68 | 73 | 62 | 44 | 49 | 56 | 55 | 68 | 35 | -- |
| Head Grade (Cu Diluted) | % | 0.83% | -- | -- | 1.34% | 1.33% | 1.08% | 0.77% | 0.82% | 0.70% | 0.49% | 0.56% | 0.64% | 0.63% | 0.90% | 1.11% | -- |
| Cu Recovery | % | 91.3% | -- | -- | 93.2% | 92.8% | 92.1% | 90.6% | 91.8% | 90.7% | 87.2% | 89.9% | 90.4% | 91.2% | 91.3% | 91.5% | -- |
| Cu Recovered | Mlbs | 718 | -- | -- | 60 | 109 | 87 | 61 | 67 | 56 | 38 | 44 | 51 | 50 | 62 | 32 | -- |
| Cu Payable | Mlbs | 690 | -- | -- | 58 | 104 | 84 | 59 | 64 | 54 | 37 | 42 | 49 | 48 | 60 | 31 | -- |
| Revenue | | | | | | | | | | | | | | | | | |
| Cu Price | US$/lb | $3.52 | -- | -- | $3.80 | $3.95 | $3.40 | $3.40 | $3.40 | $3.40 | $3.40 | $3.40 | $3.40 | $3.40 | $3.40 | $3.40 | -- |
| Gross Revenue | $M | $2,426 | -- | -- | $220 | $412 | $286 | $201 | $218 | $184 | $124 | $144 | $166 | $165 | $203 | $104 | -- |
| Operating Costs | | | | | | | | | | | | | | | | | |
| Mine Operating Costs | $M | ($407) | -- | -- | ($23) | ($28) | ($31) | ($44) | ($42) | ($27) | ($37) | ($35) | ($42) | ($44) | ($39) | ($15) | -- |
| Mill Processing | $M | ($247) | -- | -- | ($13) | ($23) | ($23) | ($23) | ($23) | ($23) | ($23) | ($23) | ($23) | ($23) | ($20) | ($8) | -- |
| Mill Maintenance | $M | ($61) | -- | -- | ($3) | ($6) | ($6) | ($6) | ($6) | ($6) | ($6) | ($6) | ($6) | ($6) | ($5) | ($2) | -- |
| Dry Stack Tailings (excludes manpower) | $M | ($21) | -- | -- | ($1) | ($2) | ($2) | ($2) | ($2) | ($2) | ($2) | ($2) | ($2) | ($2) | ($2) | ($1) | -- |
| Operational Support | $M | ($42) | -- | -- | ($2) | ($4) | ($4) | ($4) | ($4) | ($4) | ($4) | ($4) | ($4) | ($4) | ($3) | ($1) | -- |
| G&A | $M | ($24) | -- | -- | ($1) | ($2) | ($2) | ($2) | ($2) | ($2) | ($2) | ($2) | ($2) | ($2) | ($2) | ($1) | -- |
| Transport Costs | | | | | | | | | | | | | | | | | |
| Haulage (plant to port) | $M | ($88) | -- | -- | ($7) | ($13) | ($11) | ($8) | ($8) | ($7) | ($5) | ($5) | ($6) | ($6) | ($8) | ($4) | -- |
| Stuffing & port fees | $M | ($26) | -- | -- | ($2) | ($4) | ($3) | ($2) | ($2) | ($2) | ($1) | ($2) | ($2) | ($2) | ($2) | ($1) | -- |
| Sea freight | $M | ($80) | -- | -- | ($7) | ($12) | ($10) | ($7) | ($7) | ($6) | ($4) | ($5) | ($6) | ($6) | ($7) | ($4) | -- |
| Other Costs | | | | | | | | | | | | | | | | | |
| Royalty | $M | ($44) | -- | -- | ($4) | ($8) | ($5) | ($4) | ($4) | ($3) | ($2) | ($3) | ($3) | ($3) | ($4) | ($2) | -- |
| TC & RC | $M | ($40) | -- | -- | ($3) | ($6) | ($5) | ($3) | ($4) | ($3) | ($2) | ($2) | ($3) | ($3) | ($3) | ($2) | -- |
| EBITDA | $M | $1,347 | -- | -- | $153.9 | $304.9 | $184.1 | $96.4 | $113.8 | $98.4 | $35.5 | $55.3 | $67.2 | $64.9 | $108.8 | $63.6 | -- |
| EBITDA margin (%) | % | 56% | -- | -- | 70% | 74% | 64% | 48% | 52% | 53% | 29% | 38% | 41% | 39% | 54% | 61% | -- |
| Capital Expenditures | | | | | | | | | | | | | | | | | |
| Initial Capital | $M | ($294) | ($75) | ($170) | ($49) | -- | -- | -- | -- | -- | -- | -- | -- | -- | -- | -- | -- |
| Sustaining Capital | $M | ($196) | -- | -- | ($7) | ($19) | ($24) | ($15) | ($24) | ($51) | ($12) | ($22) | ($10) | ($13) | -- | -- | -- |
| Closure Cost | $M | ($24) | -- | -- | -- | -- | -- | -- | -- | -- | -- | -- | -- | -- | -- | -- | ($24) |
| Salvage Cost | $M | $7 | -- | -- | -- | -- | -- | -- | -- | -- | -- | -- | -- | -- | -- | -- | $7 |
| Pre-Tax Unlevered Free Cash Flow | | | | | | | | | | | | | | | | | |
| Pre-Tax Unlevered Free Cash Flow | $M | $840 | ($75) | ($170) | $98 | $286 | $160 | $81 | $90 | $48 | $23 | $33 | $57 | $52 | $109 | $64 | ($16) |
| Pre-Tax Cumulative Unlevered Free Cash Flow | $M | $840 | ($75) | ($245) | ($147) | $139 | $300 | $381 | $471 | $519 | $542 | $575 | $632 | $684 | $793 | $856 | $840 |
| Unlevered Cash Taxes | | | | | | | | | | | | | | | | | |
| Tax | $M | ($131) | -- | -- | ($15) | ($37) | ($19) | ($6) | ($8) | ($12) | ($2) | ($5) | ($6) | ($5) | ($11) | ($7) | -- |
| Post-Tax Unlevered Free Cash Flow | | | | | | | | | | | | | | | | | |
| Post-Tax Unlevered Free Cash Flow | $M | $709 | ($75) | ($170) | $83 | $249 | $142 | $76 | $83 | $36 | $21 | $28 | $52 | $47 | $98 | $57 | ($16) |
| Post-Tax Cumulative Unlevered Free Cash Flow | $M | $709 | ($75) | ($245) | ($162) | $87 | $228 | $304 | $386 | $422 | $443 | $471 | $523 | $570 | $668 | $726 | $709 |
| | | | | |
| Boa Esperança Project | Page 250 |
| NI 43-101 Technical Report Feasibility Study | October 2021 |
22.5Sensitivity Analysis
A sensitivity analysis (range of -20% to +20%) was conducted on the base case pre-tax and after-tax NPV and IRR of the Project, using the following variables: metal price, discount rate, exchange rate, capital costs, and operating costs. Figure 22-3 shows the pre-tax sensitivity analysis findings, and Table 22-3 shows the results post-tax. Analysis revealed that the Project is most sensitive to changes in metal prices and head grade, then, to a lesser extent, to exchange rate, operating costs and capital costs.
Figure 22-3: NPV & IRR Sensitivity Results
| | | | | |
| |
| |
| Note: figure prepared by Ausenco, 2021. | |
| | | | | |
| Boa Esperança Project | Page 251 |
| NI 43-101 Technical Report Feasibility Study | October 2021 |
Table 22-3: Pre- and Post-Tax Sensitivity (base case is highlighted)
| | | | | | | | | | | | | | | | | | | | | | | | | | | | | | | | | | | | | | | | | |
| Pre-Tax NPV Sensitivity To Discount Rate | | Pre-Tax IRR Sensitivity To Discount Rate |
| | Copper Price | | | Copper Price |
| $465 | (20.0%) | (10.0%) | – | 10.0% | 20.0% | Discount Rate | 48.6% | (20.0%) | (10.0%) | – | 10.0% | 20.0% |
| Discount Rate | 0.0% | $365 | $602 | $840 | $1,078 | $1,316 | 0.0% | 26.8% | 38.5% | 48.6% | 57.8% | 66.3% |
| 5.0% | $231 | $404 | $576 | $749 | $921 | 5.0% | 26.8% | 38.5% | 48.6% | 57.8% | 66.3% |
| 8.0% | $174 | $320 | $465 | $610 | $755 | 8.0% | 26.8% | 38.5% | 48.6% | 57.8% | 66.3% |
| 10.0% | $143 | $274 | $404 | $534 | $664 | 10.0% | 26.8% | 38.5% | 48.6% | 57.8% | 66.3% |
| 12.0% | $117 | $234 | $352 | $469 | $587 | 12.0% | 26.8% | 38.5% | 48.6% | 57.8% | 66.3% |
| | | | | | | | | | | | |
| Pre-Tax NPV Sensitivity To Opex | | Pre-Tax IRR Sensitivity To Opex |
| | Copper Price | | | Copper Price |
| $465 | (20.0%) | (10.0%) | – | 10.0% | 20.0% | Opex | 48.6% | (20.0%) | (10.0%) | – | 10.0% | 20.0% |
| Opex | (20.0%) | $265 | $410 | $556 | $701 | $846 | (20.0%) | 33.1% | 43.6% | 53.0% | 61.7% | 69.9% |
| (10.0%) | $220 | $365 | $510 | $655 | $800 | (10.0%) | 30.1% | 41.1% | 50.9% | 59.8% | 68.1% |
| -- | $174 | $320 | $465 | $610 | $755 | -- | 26.8% | 38.5% | 48.6% | 57.8% | 66.3% |
| 10.0% | $129 | $274 | $419 | $564 | $709 | 10.0% | 23.2% | 35.7% | 46.3% | 55.7% | 64.4% |
| 20.0% | $83 | $229 | $374 | $519 | $664 | 20.0% | 19.0% | 32.7% | 43.8% | 53.6% | 62.5% |
| | | | | | | | | | | | |
| Pre-Tax NPV Sensitivity To Initial Capex | | Pre-Tax IRR Sensitivity To Initial Capex |
| | Copper Price | | | Copper Price |
| $465 | (20.0%) | (10.0%) | – | 10.0% | 20.0% | Initial Capex | 48.6% | (20.0%) | (10.0%) | – | 10.0% | 20.0% |
| Initial Capex | (20.0%) | $228 | $373 | $518 | $664 | $809 | (20.0%) | 38.2% | 51.2% | 62.6% | 72.9% | 82.5% |
| (10.0%) | $201 | $346 | $492 | $637 | $782 | (10.0%) | 31.9% | 44.2% | 55.0% | 64.7% | 73.7% |
| -- | $174 | $320 | $465 | $610 | $755 | -- | 26.8% | 38.5% | 48.6% | 57.8% | 66.3% |
| 10.0% | $147 | $293 | $438 | $583 | $728 | 10.0% | 22.6% | 33.7% | 43.3% | 52.0% | 60.0% |
| 20.0% | $121 | $266 | $411 | $556 | $701 | 20.0% | 19.0% | 29.6% | 38.7% | 47.0% | 54.6% |
| | | | | | | | | | | | |
| Pre-Tax NPV Sensitivity To Mill Head Grade | | Pre-Tax IRR Sensitivity To Mill Head Grade |
| | Copper Price | | | Copper Price |
| Mill Head Grade | $465 | (20.0%) | (10.0%) | – | 10.0% | 20.0% | Mill Head Grade | 48.6% | (20.0%) | (10.0%) | – | 10.0% | 20.0% |
| (20.0%) | ($30) | $86 | $202 | $318 | $434 | (20.0%) | 3.4% | 18.3% | 29.2% | 38.3% | 46.5% |
| (10.0%) | $72 | $203 | $333 | $464 | $595 | (10.0%) | 16.9% | 29.3% | 39.5% | 48.6% | 56.8% |
| -- | $174 | $320 | $465 | $610 | $755 | -- | 26.8% | 38.5% | 48.6% | 57.8% | 66.3% |
| 10.0% | $277 | $436 | $596 | $756 | $915 | 10.0% | 35.3% | 46.8% | 57.0% | 66.4% | 75.1% |
| 20.0% | $379 | $553 | $727 | $901 | $1,075 | 20.0% | 42.8% | 54.4% | 64.8% | 74.4% | 83.4% |
| | | | | | | | | | | |
| Pre-Tax NPV Sensitivity To FX | | Pre-Tax IRR Sensitivity To FX |
| | Copper Price | | | Copper Price |
| $465 | (20.0%) | (10.0%) | – | 10.0% | 20.0% | FX ($R:$US) | 48.6% | (20.0%) | (10.0%) | – | 10.0% | 20.0% |
| FX ($R:$US) | (20.0%) | ($45) | $100 | $246 | $391 | $536 | (20.0%) | 2.3% | 17.8% | 28.7% | 38.0% | 46.2% |
| (10.0%) | $77 | $222 | $367 | $512 | $658 | (10.0%) | 16.6% | 29.0% | 39.3% | 48.4% | 56.7% |
| -- | $174 | $320 | $465 | $610 | $755 | -- | 26.8% | 38.5% | 48.6% | 57.8% | 66.3% |
| 10.0% | $254 | $399 | $544 | $689 | $835 | 10.0% | 35.5% | 46.9% | 57.1% | 66.4% | 75.2% |
| 20.0% | $320 | $466 | $611 | $756 | $901 | 20.0% | 43.2% | 54.6% | 64.9% | 74.5% | 83.5% |
| | | | | | | | | | | | |
| | | | | |
| Boa Esperança Project | Page 252 |
| NI 43-101 Technical Report Feasibility Study | October 2021 |
| | | | | | | | | | | | | | | | | | | | | | | | | | | | | | | | | | | | | | | | | |
| Post-Tax NPV Sensitivity To Discount Rate | | Post-Tax IRR Sensitivity To Discount Rate |
| | Copper Price | | | Copper Price |
| Discount Rate | $380 | (20.0%) | (10.0%) | – | 10.0% | 20.0% | Discount Rate | 41.8% | (20.0%) | (10.0%) | – | 10.0% | 20.0% |
| 0.0% | $306 | $508 | $709 | $911 | $1,112 | 0.0% | 22.3% | 32.7% | 41.8% | 50.0% | 57.6% |
| 5.0% | $185 | $331 | $477 | $624 | $770 | 5.0% | 22.3% | 32.7% | 41.8% | 50.0% | 57.6% |
| 8.0% | $133 | $257 | $380 | $503 | $626 | 8.0% | 22.3% | 32.7% | 41.8% | 50.0% | 57.6% |
| 10.0% | $106 | $216 | $326 | $437 | $547 | 10.0% | 22.3% | 32.7% | 41.8% | 50.0% | 57.6% |
| 12.0% | $82 | $181 | $281 | $380 | $480 | 12.0% | 22.3% | 32.7% | 41.8% | 50.0% | 57.6% |
| | | | | | | | | | | | | |
| Post-Tax NPV Sensitivity To Opex | | Post-Tax IRR Sensitivity To Opex |
| | Copper Price | | | Copper Price |
| Opex | $380 | (20.0%) | (10.0%) | – | 10.0% | 20.0% | Opex | 41.8% | (20.0%) | (10.0%) | – | 10.0% | 20.0% |
| (20.0%) | $211 | $334 | $457 | $580 | $703 | (20.0%) | 28.1% | 37.4% | 45.8% | 53.6% | 60.9% |
| (10.0%) | $172 | $295 | $418 | $541 | $664 | (10.0%) | 25.3% | 35.1% | 43.8% | 51.8% | 59.3% |
| -- | $133 | $257 | $380 | $503 | $626 | -- | 22.3% | 32.7% | 41.8% | 50.0% | 57.6% |
| 10.0% | $93 | $218 | $341 | $464 | $587 | 10.0% | 18.8% | 30.1% | 39.6% | 48.1% | 55.9% |
| 20.0% | $50 | $179 | $303 | $426 | $549 | 20.0% | 14.6% | 27.4% | 37.3% | 46.1% | 54.1% |
| | | | | | | | | | | | | |
| Post-Tax NPV Sensitivity To Initial Capex | | Post-Tax IRR Sensitivity To Initial Capex |
| | Copper Price | | | Copper Price |
| Initial Capex | $380 | (20.0%) | (10.0%) | – | 10.0% | 20.0% | Initial Capex | 41.8% | (20.0%) | (10.0%) | – | 10.0% | 20.0% |
| (20.0%) | $181 | $304 | $427 | $550 | $673 | (20.0%) | 31.9% | 43.6% | 53.9% | 63.2% | 71.9% |
| (10.0%) | $157 | $280 | $403 | $526 | $649 | (10.0%) | 26.6% | 37.6% | 47.2% | 56.0% | 64.1% |
| -- | $133 | $257 | $380 | $503 | $626 | -- | 22.3% | 32.7% | 41.8% | 50.0% | 57.6% |
| 10.0% | $110 | $233 | $356 | $479 | $602 | 10.0% | 18.8% | 28.6% | 37.1% | 44.9% | 52.1% |
| 20.0% | $86 | $209 | $332 | $455 | $578 | 20.0% | 15.7% | 25.1% | 33.2% | 40.6% | 47.4% |
| | | | | | | | | | | | | |
| Post-Tax NPV Sensitivity To Mill Head Grade | | Post-Tax IRR Sensitivity To Mill Head Grade |
| | Copper Price | | | Copper Price |
| Mill Head Grade | $380 | (20.0%) | (10.0%) | – | 10.0% | 20.0% | Mill Head Grade | 41.8% | (20.0%) | (10.0%) | – | 10.0% | 20.0% |
| (2.0%) | $116 | $237 | $357 | $478 | $598 | (2.0%) | 20.7% | 31.1% | 40.2% | 48.4% | 56.0% |
| (1.0%) | $125 | $247 | $368 | $490 | $612 | (1.0%) | 21.5% | 31.9% | 41.0% | 49.2% | 56.8% |
| -- | $133 | $257 | $380 | $503 | $626 | -- | 22.3% | 32.7% | 41.8% | 50.0% | 57.6% |
| 1.0% | $142 | $267 | $391 | $515 | $639 | 1.0% | 23.1% | 33.5% | 42.5% | 50.8% | 58.4% |
| 2.0% | $151 | $276 | $402 | $527 | $653 | 2.0% | 23.9% | 34.2% | 43.3% | 51.6% | 59.2% |
| | | | | | | | | | | |
| | | | | | | | | | | | | |
| Post-Tax NPV Sensitivity To FX | | Post-Tax IRR Sensitivity To FX |
| | Copper Price | | | Copper Price |
| FX ($R:$US) | $380 | (20.0%) | (10.0%) | – | 10.0% | 20.0% | FX ($R:$US) | 41.8% | (20.0%) | (10.0%) | – | 10.0% | 20.0% |
| (20.0%) | ($69) | $63 | $191 | $314 | $437 | (20.0%) | 0.0% | 14.1% | 24.1% | 32.3% | 39.6% |
| (10.0%) | $45 | $173 | $296 | $419 | $542 | (10.0%) | 12.9% | 24.3% | 33.5% | 41.6% | 49.0% |
| -- | $133 | $257 | $380 | $503 | $626 | -- | 22.3% | 32.7% | 41.8% | 50.0% | 57.6% |
| 10.0% | $202 | $325 | $448 | $571 | $694 | 10.0% | 30.0% | 40.2% | 49.3% | 57.7% | 65.6% |
| 20.0% | $260 | $383 | $506 | $629 | $752 | 20.0% | 36.8% | 47.1% | 56.4% | 65.0% | 73.1% |
22.6QP Comments on “Item 22: Economic Analysis”
Based on the assumptions and parameters presented in this Report, the FSU shows positive economics.
| | | | | |
| Boa Esperança Project | Page 253 |
| NI 43-101 Technical Report Feasibility Study | October 2021 |
23ADJACENT PROPERTIES
The information contained in this Report is based solely on the Boa Esperança Project and the mineral assets therein.
| | | | | |
| Boa Esperança Project | Page 254 |
| NI 43-101 Technical Report Feasibility Study | October 2021 |
24OTHER RELEVANT DATA AND INFORMATION
24.1Project Execution Plan
24.1.1Project Milestones
Table 24-1 presents the milestones for the Project. Seasonal restrictions (wet season) and project approval will ultimately dictate the construction schedule for construction. Early works has been assumed to start Q2, 2022 after a period of early engineering to eliminate gaps in the FSU and to plan for project execution. The target for completion of all construction and pre-commissioning works is end of Q1 2024.
| | | | | |
| Boa Esperança Project | Page 255 |
| NI 43-101 Technical Report Feasibility Study | October 2021 |
Table 24-1: Boa Esperança Milestones
| | | | | |
| Activity | Date |
| Project Milestones | |
| Early engineering (started) | Q4 2021 |
| Early engineering completion | Q4 2021 |
| EPCM award | Q1 2022 |
| Start detailed engineering | Q1 2022 |
| Pre-production mining works commenced | Q2 2022 |
| Earthworks commenced | Q2 2022 |
| Field erected tanks site works commenced | Q1 2023 |
| Concrete site works commenced | Q1 2023 |
| SMP site works commenced | Q2 2023 |
| Buildings works commenced | Q2 2023 |
| E&I site works commenced | Q3 2023 |
| C0 – mechanical completion | Q1 2024 |
| C1 – commissioning (dry) | Q1 2024 |
| C2 – commissioning (wet) | Q2 2024 |
| Project completion | Q2 2024 |
| Final acceptance | Q3 2024 |
| Permitting | |
| Implementation licence | Q4 2021 |
| Transmission line Licence | Q3 2022 |
| Operational licence | Q4 2023 |
| |
| |
| Access road | |
| Upgrade access road complete | Q2 2022 |
| Process plant & infrastructure | |
| Variability testwork complete | Q1 2022 |
| Engineering complete | Q2 2023 |
| Mechanical completion (C0) | Q1 2024 |
| Dry and Wet Commissioning complete (C1 & C2) | Q1 2024 |
| Mine | |
| Mine pre-production stripping work starts | Q2 2022 |
| Mill feed available | Q1 2024 |
| Mine production starts | Q2 2024 |
24.1.2Scope, Approach and Objectives
Ero Copper aims to bring the Boa Esperança Project into operation while meeting or exceeding its corporate objectives, which include, among others:
•promoting health and safety on and off the job;
•providing employees with the training and tools to work safely and expect third parties, such as suppliers, contractors and consultants, to do the same;
•educating employees to the potential hazards of their job and expect third parties, such as suppliers, contractors and consultants, to do the same;
| | | | | |
| Boa Esperança Project | Page 256 |
| NI 43-101 Technical Report Feasibility Study | October 2021 |
•requiring that employees perform their duties in the safest manner possible and expect third parties such as suppliers, contractors and consultants, to do the same;
•striving for continuous improvement in all aspects of health and safety;
•providing a safe work environment by minimizing or, where possible, eliminating hazards, adhering to proven health and safety practices, implementing accident prevention programs, and ensuring that first aid and emergency response plans are in place;
•identifying and engaging communities of interest in timely, inclusive, ethical, transparent and culturally respectful dialogue prior to undertaking significant activities and throughout the life of the project;
•maintaining formal grievance mechanisms as part of our overall community engagement process;
•monitoring, continuously improving, and reporting on the performance and effectiveness of activities related to corporate social responsibility;
•Implementing meaningful and effective strategies for community engagement;
•Promoting a safe environment for local communities;
•Respecting the social, economic and cultural rights of local people;
•Assisting local and regional development throughout the life of the operation; and,
•Offering training and employment opportunities.
24.1.3Access Road
Design and upgrade of the access road will be managed by Ero under an EPCM contract with a local engineering company specializing in road and bridge construction. The local engineering company’s execution plan for the upgrade of the road, is based on the following considerations:
•Field investigations in Q4 2021 for the purposes of both engineering and permitting.
•Upgrade road work starting in Q1 2022 and finishing in Q2 2022.
•The road upgrade work will be tendered under a Unit Rate contract basis, using the Feasibility Study designs and quantities as a starting point. Civil contracts will be awarded by in Q2 2022.
24.1.4Mining
A suitable mining contractor will be appointed to remove the Saprolite and weathered waste layers above the pit and develop the first five years of the mine. Associated mine infrastructure will be provided by Ero Copper for mine fleet maintenance. Major goals in development and production sequencing are to access higher grade ore as early as practicable, while minimizing pit development costs as much as possible.
The scope of the mining contractor will be enhanced to include site earthworks, temporary roads, and waste facility construction to improve the contractors’ appetite to bid and efficiency.
Temporary fuel, water and washroom facilities must be operational on time to support the start of the pre-production mining activities, early in Q2 2022.
24.1.5Process Plant and Infrastructure
The delivery strategy for the Process Plant and Infrastructure scope is summarised as follows:
•Engineering and design will be completed by an engineering company under a reimbursable EPCM contract. Firm pricing for long lead equipment and early works contracts will be obtained during the Early Engineering phase of the project, which is anticipated to run from October 2021 to the end of December 2021. Detailed engineering will start in January 2022, assuming a positive production decision by Ero in early 2022.
| | | | | |
| Boa Esperança Project | Page 257 |
| NI 43-101 Technical Report Feasibility Study | October 2021 |
•Procurement of equipment and materials will be completed by an engineering company under a reimbursable EPCM contract. Procurement tasks will be prioritised to support engineering progress. The strategy will be to initially award Purchase Orders for critical vendor engineering only. Purchase of equipment and bulk materials required to construct the Process Plant and Infrastructure scope will be appropriately scheduled to ensure that equipment is available for transport to site in Q2/Q3 2023, while minimizing capital expenditure during the initial phase of execution.
•All equipment and materials required for construction of the facility, including contractor tools and equipment, will be transported by road to site and stored in an orderly manner at the allocated laydown areas, to facilitate ease of construction. The General Contractor will be responsible for off-loading and storage of equipment and materials according to the logistics plan. The project will appoint a suitable transport and logistics manager to manage this critical function.
•In consultation with Ero, an engineering company will develop a contracting strategy for construction of the facility during the first 90 days of the execution phase. The engineering Company will provide contract formation services and administer the construction contracts on behalf of Ero. The engineering company will also provide safety and field supervision and manage interfaces between the various construction contractors. All these services will be performed under the reimbursable EPCM contract.
•Upon reaching the mechanical completion milestone (C0), the engineering company will accept turnover of the facilities from construction contractors. The engineering company will complete all pre-commissioning (C1) and wet-commissioning tests (C2), prior to turnover to Ero for commissioning (C3) and ramp-up (C4) phases. The engineering company will provide support for commissioning and ramp-up as required.
24.1.6Camp Facilities
Ero will not provide construction camp facilities. Contractors and EPCM staff will provide their own accommodation, most likely by renting lodging in the nearby town of Tucuma.
24.1.7Power Generation
Equatorial Energía will be contracted to design, licence, supply, install and commission the power transmission line and substation for the Boa Esperança operation under a firm price contract.
24.1.8Schedule
The Project execution schedule will be influenced by wet weather conditions during the rainy season from January to June. Target start-up for commencement of production operations at the Boa Esperança Mine is the start of Q2 2024, with cold and hot commissioning of the plant approximately three months prior to this date.
The first year of the execution schedule mostly comprises detailed on-site and off-site engineering design, site preparation, and mine pre-stripping. Also, during this time, procurement of long-lead items will be completed to have the required equipment and supplies available in time for construction activities.
In the second year, main construction will begin, foundations, structural steel erection, buildings and waste facilities construction and mine pre-stripping will continue. Site construction will mostly be completed by the end of 2023, and plant commissioning will begin shortly thereafter.
Mobilization to site will initially be by the existing site access road. This road will be upgraded during Q2 2022. A high level schedule is presented in Figure 24-1.
| | | | | |
| Boa Esperança Project | Page 258 |
| NI 43-101 Technical Report Feasibility Study | October 2021 |
Figure 24-1: High Level Project Execution Schedule
| | | | | |
| Boa Esperança Project | Page 259 |
| NI 43-101 Technical Report Feasibility Study | October 2021 |
25INTERPRETATION AND CONCLUSIONS
25.1Introduction
The QPs note the following interpretations and conclusions in their respective areas of expertise, based on the review of data available for this Report.
25.2Mineral Tenure, Surface Rights, Water Rights, Royalties and Agreements
•Ero received the Installation License (LI) on August 30, 2021, which will allow for the commencement of surface and civil construction activities.
•A formal request with the Pará State environmental agency, Secretaria de Estado de Meio Ambiente e Sustentabilidade (SEMAS) will be made to incorporate changes in the Project's scope as outlined in the FSU.
•SEMAS is the agency responsible for approval of the Operating License (LO) for the Project, which is planned to be issued at the time of commercial production.
•The estimated Mineral Resources and Mineral Reserves disclosed in this Report are completely contained within the Boa Esperança mineral rights held by MCSA. MCSA is the holder of required surface rights for the envisioned operations. It is expected that full title to the land will be transferred to MCSA after conclusion of an administrative procedure with the National Institute of Colonization and Land Reform (INCRA) to clear such surface rights from its prior classification as a resettlement area.
•The site is free and clear of any environmental liabilities, and all required permits for construction activities are encompassed by the Installation License issued on August 30, 2021.
•A surface water management system will be constructed to segregate contact and non-contact water. Non-contact water will be diverted around mine infrastructure to natural drainage structures.
•The Project has been designed using Best Management Practice to protect the environment, surface waters, and groundwater in the area.
•The raw water for the Project will be sourced from a reservoir dam constructed in the Jatobá river to stabilize water availability throughout the seasons.
•The water reservoir will have the purpose of storing clean water to meet the demand of the plant, estimated at a flow of 154 m³/h, working for a year without interruption.
•The water pond will restrict the flow of Jatobá river and will be constructed within the property owned by Ero Copper.
•There are no privately-held royalties on the Project as of the date of this Report.
•The project is subject to a federal CFEM royalty rate of 2.0%, which has been reflected in the economic results for the Project as presented in this Report.
| | | | | |
| Boa Esperança Project | Page 260 |
| NI 43-101 Technical Report Feasibility Study | October 2021 |
25.3Geology and Mineralization
•The Boa Esperança copper deposit is interpreted to be a variant of an IOCG deposit type.
•The deposit crops out as an isolated hill, which is a north–northeast elongated structure.
•The topographic high is formed by quartz and magnetite breccias, which cut the Neoarchean biotite granite, the host of the copper mineralization.
•Mineralization consists of a series of brecciated zones, which are aligned N60°–70°E, dipping to the southeast at 60°–70 displaying primary and secondary zoning.
•The primary zoning corresponds to a distal zone, where pyrite (py) dominates, grading towards copper mineralized zones of pyrite–chalcopyrite (py–cpy), chalcopyrite–pyrite (cpy–py) and chalcopyrite (cpy).
•Secondary zoning is a supergene alteration and consists of sub-horizontal and discontinuous lenses of a barren leached zone, a copper oxide zone, and a mixed zone of oxides and primary copper sulfides. The barren leached zone crops out at the hill top and is composed of hematite, goethite and clay minerals. The copper oxide zone is located immediately beneath the leached zone and consists of malachite and copper-bearing clays.
•Below the copper oxide zone is an area of mixed oxides, carbonates, secondary supergene sulfides (chalcocite and covellite) and primary sulfides (pyrite and chalcopyrite).
•The bottommost layer, beneath the mixed oxide zone, is a copper-enriched zone consisting of sub-horizontal 5–10m-thick lenses extending up to 20–30 m and formed by primary and secondary sulfides.
•Cobalt is concentrated on the surface of the Project area However, there is no correlation between copper and cobalt grades in the mineralization. Iron is more abundant in the pyrite and chalcopyrite zones, and a higher molybdenum content is found in the chalcopyrite–pyrite mineralization and in the leached zone.
25.4Exploration, Drilling and Analytical Data Collection in Support of Mineral Resource Estimation
•Drilling used for determination of Mineral Resource estimation for the Project was conducted from 2003 to 2006 in four diamond drill programs by Codelco and was followed by another four diamond drill programs by MCSA between 2008 and 2013. The total amount of drill holes is 165, totalling 57,972.25 meters.
•Sampling preparation, security, and analytical procedures used by MCSA, SGS Geosol and Intertek laboratories are consistent with generally accepted industry best practices.
•MCSA provided Ausenco with external analytical control data containing the assay results of the quality control samples from the Boa Esperança copper project. Control samples (blank and standard reference materials) were summarized in time-series plots to highlight their performance. Paired data (pulp duplicates) were analysed using bias charts, quantile-quantile plots and relative precision plots.
•Ausenco verified the database by checking more than 10% of the database against the original laboratory certificates and found no significant errors. About 25% of the drillhole collars were also checked against original certificates for accuracy.
•The authors of this Report consider the exploration data collected by Codelco and MCSA to be of sufficient quality to support Mineral Resource evaluation.
| | | | | |
| Boa Esperança Project | Page 261 |
| NI 43-101 Technical Report Feasibility Study | October 2021 |
25.5Mineral Processing and Metallurgical Testing
•Metallurgical testwork and associated analytical procedures were appropriate to the mineralization type, appropriate to establish the optimal processing routes, and were performed using samples that are typical of the mineralization styles found within the various mineralized zones.
•Samples selected for testing were representative of the various types and styles of mineralization. Samples were selected from a range of depths within the deposit. Sufficient samples were taken so that tests were performed on sufficient sample mass, including individual tests to assess variability.
•Recovery factors estimated are based on proven metallurgical testwork procedures, appropriate to the mineralization types and selected processing route.
•Additional testwork is required to improve the confidence in the metallurgical performance estimates and variability. An expanded variability testwork program to develop geometallurgical models based on mineral composition should be conducted.
25.6Mineral Resource Estimates
•A 3D geologic model was developed for the Boa Esperança Project.
•Geologically constrained grade shells were developed using various copper cut-off grades to generate a 3D mineralization model of the Boa Esperança Project. Within the grade shells, mineral resources were estimated using ordinary kriging within a 2.0 m by 2.0 m by 4.0 m block size.
•Within the optimized resource open pit limits, a cut-off grade of 0.20% copper was applied. Unconstrained inferred mineral resources have been stated at a cut-off grade of 0.51% copper with a marginal cut-off grade of 0.32% copper.
•Measured & Indicated Mineral Resources for the Project, inclusive of Mineral Reserves, total 47.7 Mt grading 0.86% copper.
•Inferred Mineral Resources for the Project are comprised of 554.8 kt grading 0.65% copper for open-pit constrained and 11.0 Mt grading 0.80% copper for underground unconstrained.
•Mineral resources which are not mineral reserves do not have demonstrated economic viability.
•There are no other known environmental, legal, title, taxation, socioeconomic, marketing, political or other relevant factors that would materially affect the estimation of Mineral Resources that are not discussed in this Report.
| | | | | |
| Boa Esperança Project | Page 262 |
| NI 43-101 Technical Report Feasibility Study | October 2021 |
25.7Mineral Reserve Estimates
•Mineral Reserves amenable to open pit mining were constrained within an LG shell. An internal cut-off of 0.28%Cu for Granite and Granite Breccia, and of 0.31%Cu to Breccia were applied to all the Mineral Reserve estimates. These internal cut-offs were applied to material contained within an economic pit shell where the decision to mine a given block was determined by the pit optimization.
•Overall dilution and losses within the Mineral Reserve estimate amounts to 3.3% and 0.3% respectively.
•A mine plan was developed to process 4.0 Mt/a with a peak total mining rate of 20.0 Mt/a. Inferred Mineral Resources were treated as waste in the mine plan.
•Proven and Probable Mineral Reserves total 43.1 Mt at 0.83 %Cu.
•The main factors that may affect the Mineral Reserve estimates are changes on metal price assumptions, changes on the estimated Mineral Resource used to generate the mine plan, changes in metallurgical recoveries, changes in the geotechnical assumptions used to determine the overall wall angles, changes to the operating cut-offs assumptions for mill feed or stockpile feed, changes the input assumptions used to derive the open pit outline and the mine plan that is based on that open pit design, ability to maintain social an environmental license to operate and changes to the assumed permitting and regulatory environment under which the mine plan was developed.
•There are no other known environmental, legal, title, taxation, socioeconomic, marketing, political or other relevant factors that would materially affect the estimation of Mineral Reserves that are not discussed in this Report.
25.8Open Pit Geotechnical
•Three distinct layers of materials were identified: saprolite, saprock and fresh rocks.
•Inter-ramp angles are proposed for the excavated slopes in the weathered and fresh rocks are 45o and 56o, respectively. However, for the saprolite, the inter-ramp required is 35°.
25.9Mine Plan
•Pit designs are based on optimized LG shells at a revenue factor of 0.96 with variable overall slope angles according to geotechnical domains ranging from 30° to 50°.
•Six mining phases are planned for the Boa Esperança pit.
•The mine plan will process 4, Mt/a with a peak total mining rate of 20.0 Mt/a in Years 4 to 9.
•The 24-month pre-production period requires the mining of 13.2 Mt of total material to expose sufficient ore to start commercial production in Q2 Year 1.
•The total mined waste considers one main destinations for the material, the main waste storage area to the southwest of the pit and topsoil stripping and disposal to a specific stockpile location.
•The mined ore will be hauled to the primary crusher for direct tipping. Low grade material will be mined and hauled to a stockpile located between the pit and the plant area until Year 10. This material will be re-handled and will become part of the plant feed in the later years.
•The mine is scheduled to operate seven days per week or 365 days per year. For every year, 12 days of losses due to weather conditions were considered. Each day will consist of three 8-hour shifts. Four mining crews will rotate to cover the operation.
| | | | | |
| Boa Esperança Project | Page 263 |
| NI 43-101 Technical Report Feasibility Study | October 2021 |
•This Report assumes that the mining operation will use backhoe excavators with capacities of 3.9 m3 and 5.2 m3 and trucks with a capacity of 38 t. The fleet will be complemented with drill rigs for ore and waste delineation. Auxiliary equipment will include track dozers, wheel dozers, motor graders and a water truck.
25.10Recovery Plan
•The recovery plan is conventional. A 10,959 t/d throughput rate is envisaged or 4 Mt/a, with an overall plant availability of 92%. The process plant will produce copper concentrate, typically at a recovery rate of greater than 90%.
•There are several deleterious elements reporting to the concentrates at levels which would not incur penalties.
•The plant will process material at a nominal rate of 4 Mt/a for Years 12 with an average head grade of 1.25% Cu in years 1-4 and 0.62% Cu in years 5-12.
•The plant is designed to operate three shifts per day, 365 days per year with an overall plant availability of 92%.
•The process plant flowsheet designs were based on testwork results and industry-standard practices.
•The flowsheet was developed for optimum recovery while minimizing capital expenditure and life of mine operating costs. The process methods are conventional to the industry. The comminution and recovery processes are widely used with no significant elements of technological innovation.
25.11Infrastructure – Tailings Storage Facilities
The tailings will be segregated in the process to form two tailings streams; pyrite tailings and non-pyrite tailings. The tailings streams are segregated to assist with the management of PAG material using a Best Management Practice approach. The two tailings streams will be placed in separate facilities.
The PAG slurry tailings will be discharged in a geomembrane lined TSF located to the north of the primary crusher. Approximately 4.3Mt of slurry tailings will be discharged sub-aqueously over the life of the project within the TSF. The TSF impoundment requires ring embankment that will be constructed in phases to contain the tailings.
The NAG tailings will be filtered using a proven technology to reclaim water at the plant for reuse and create a filter cake that can be placed in a dry stack tailings facility. After filtering, the dewatered tailings will be transported to the DSTF in haul trucks and compacted in relatively thin lifts. Approximately 38.7 Mt of filtered tailings will be placed over the life of the project within the DSTF.
All non-contact water near these facilities will be diverted around and discharged into natural drainages. All contact water from these facilities will be collected and conveyed to contact water/seepage ponds.
The primary objective of the closure and reclamation initiatives will be to return the tailings facilities to a self- sustaining facility that satisfies the end land-use objectives. The both the DSTF and TSF are designed to maintain long term stability, protect the downstream environment, and manage surface water. At closure, the
At the end of the mine life, the water cover over the tailings of the TSF will be drained and a capped will be constructed using non-acid generating material, topsoil and topsoil to limit ingress of oxygen and water to the PAG tailings.
The DSTF will utilize progressive closure measure to facilitate closure along with reducing erosion in area where exterior slopes are completed during the life of mine.
Both the TSF and DSTF meet both operational and post-closure physical and geochemical and protect the downstream environment along with surface water management.
| | | | | |
| Boa Esperança Project | Page 264 |
| NI 43-101 Technical Report Feasibility Study | October 2021 |
25.12Environmental, Permitting and Social Considerations
25.12.1Environmental Considerations
The Project as outlined in this FSU has been designed using Best Management Practice to protect the environment, surface waters and groundwater in the area.
The raw water for the Project will be sourced from a reservoir dam constructed in the Jatobá river to stabilize water availability throughout the seasons. The water reservoir will have the purpose of storing clean water to meet the demand of the plant, estimated at a flow of 154 m³/h, working for a year without interruption. The water pond will restrict the flow of Jatobá river and will be constructed within the property owned by Ero Copper.
25.12.2Closure and Reclamation Considerations
The primary objective of the closure and reclamation initiatives will be to eventually return the DSTF and TSF to self-sustaining facilities that satisfy the end land-use objectives. The DSTF and TSF are designed to maintain long-term physical and chemical stability, protect the downstream environment, and manage surface water. In addition, the closure plan needs to be compatible with a premature closure event. At the end of the mine life, the water cover over the tailings of the TSF will be drained and a capped will be constructed using non-acid generating material, topsoil and topsoil to limit ingress of oxygen and water to the PAG tailings.
The DSTF will utilize progressive closure measure to facilitate closure along with reducing erosion in area where exterior slopes are completed during the life of mine. Both the TSF and DSTF meet both operational and post-closure physical and geochemical and protect the downstream environment along with surface water management.
Closure and reclamation costs have been estimated by Ero at approximately $24 M, which is partially offset by an estimate salvage value of $7 M. Closure costs have been based upon detailed costing performed in 2017 for the Project’s Plano de Recuperação de Áreas Degradadas (PRAD) and have been adjusted for scope and inflation using Ero’s current reclamation activities and operations in Bahia, Brazil as a reference check for key input costs. Closure activities for the Project include:
•Retrenchment;
•Demolition of surface sites;
•De-mobilization of equipment;
•Open pit reclamation;
•DTSF recontouring and reclamation;
•Waste dump recontouring and reclamation; and,
•PAG reclamation.
| | | | | |
| Boa Esperança Project | Page 265 |
| NI 43-101 Technical Report Feasibility Study | October 2021 |
25.13Markets and Contracts
•The Boa Esperança copper concentrate is generally expected to be of high quality with low levels of deleterious elements.
•It is expected that the copper concentrate from Boa Esperança will be in high demand from traders and smelters.
•The mine plan assumes that contractors will operate the mine from pre-production to Year 5 of production. Thereafter, mining operations will be Owner-operated. No contracts are currently in place for contract mining at Boa Esperança, however Ero is confident that it will be able to secure qualified contract miners at standard market rates.
•No contracts are currently in place for the Boa Esperança project.
25.14Capital Cost Estimates
Overall capital costs, including sustaining capital during operations, are estimated at $507 million. The estimate accuracy is +/-15%.
25.15Operating Cost Estimates
The average LOM operating cost for the Project is estimated to be $801 million or $18.6/t milled.
| | | | | |
| Boa Esperança Project | Page 266 |
| NI 43-101 Technical Report Feasibility Study | October 2021 |
25.16Economic Analysis
Based on the assumptions and parameters in this report, the FSU show positive economics (I.e. $380 million post-tax NPV (8%) and 41.8% post-tax IRR).
25.17Risks and Opportunities
25.17.1Risks
25.17.1.1General
•Escalation of costs in dollar terms due to volatility in the Brazilian exchange rate.
•Limited test pit and geotechnical drilling for slope.
•Limited geochemistry data to understand water quality and ongoing effluent treatment during the Project and after closure.
•Power supply installation is estimated to require 21 months, a critical path activity.
•Variability metallurgical testing to support and confirm flowsheet selection.
25.17.1.2Mining
•It is probable that unfavourably oriented geological structures are present locally within various slope pit sectors resulting in local instability, particularly given the size and extents of the pit. It is assumed at present that small bench-scale failures developed along these features can be managed with careful blasting techniques and regular berm maintenance/clearing, wherever access is possible.
•Assumed open pit slope are worse then used in feasibility design. A possible outcome is flatter slopes and more waste rock generated. Mitigation measure is to perform addition geotechnical drilling to accurately estimate expected slopes.
25.17.1.3Tailings Storage Facilities
•There is a risk that foundation conditions may be worse than utilized in the design of the tailings storage facilities. They would require more foundation work and increase costs to these facilities. This risk can be mitigated through additional geotechnical investigations.
•Sufficient local starter embankment construction materials are not available and require materials from a further distance. This risk can be mitigated through additional geotechnical investigations.
•East side of the TSF is in the flood plain of a creek requiring relocating the facility. This risk can be managed by performing a flood plain assessment.
•There is a risk to the geometry of the TSF embankment slopes and DSTF external slopes if future geotechnical work shows lower physical and mechanical properties, which would increase construction cost due flattening slopes. This risk can be managed by performing additional geotechnical investigations looking for material that meeting the FSU design criteria and segregating materials that do not meet the design criteria.
| | | | | |
| Boa Esperança Project | Page 267 |
| NI 43-101 Technical Report Feasibility Study | October 2021 |
25.17.2Opportunities
25.17.2.1General
•Tax benefits may be realized through the government program of providing tax benefits (SUDAM).
25.17.2.2Mining
•There is potential for improved slope design, when additional geotechnical data such as waste rock strength and joint orientations, are available from additional geotechnical drill. Steeper pit slopes would reduce the cost associated with waste stripping and provide an opportunity to improve economics.
•Slightly higher bench heights could provide an opportunity to better match blasting performance with mine productivity. Higher mine production rates could result in lower mine operating costs and also lower risk to the achieve the mine schedule.
25.17.2.3Tailings Storage Facilities
•Consider an additional siting study with geotechnical investigation in surrounding areas at more favorable tailings facilities site. This could improve capital and sustaining capital costs.
•Consider a single wet tailings storage facility both non-segregated tailings (pyrite and non-pyrite tailings). Potential to reduce costs of eliminating filter plant and pyrite floatation cells.
25.18Conclusions
Under the assumptions in this Report, the Project demonstrates positive economics.
| | | | | |
| Boa Esperança Project | Page 268 |
| NI 43-101 Technical Report Feasibility Study | October 2021 |
26RECOMMENDATIONS
26.1Mineral Reserves
The additional conversion of Mineral Resources into Mineral Reserves is constrained to the identified Measured and Indicated Mineral Resources. The increased of Mineral Reserves can be either by converting current identified Inferred Mineral Resources or by filling some gaps of undrilled areas with the designed final pit.
26.2Mining
26.2.1Open Pit Geotechnical
A nominal six-to-eight-hole geotechnical drilling and rock mass characterization program is proposed to support more detailed studies, including targeted drilling of current data voids, particularly the portions of the higher wall sectors, to include discontinuity orientation measurements (where possible), sampling for additional laboratory strength testing, and televiewer surveys. The core holes should be drilled using a triple tube core barrel to preserve the integrity of the core while drilling and retrieving. The program, assuming eight holes are completed, is estimated at $1.0 M, based on 2,000 m of drilling at $500 /m.
Core orientation (using the ACT, EZ-Mark, or equivalent systems) and/or optical or acoustic televiewing of select holes will be needed to determine discontinuity data. Point load tests should be completed at regular intervals of drill core (~once per run to domain intercept scale). Additional laboratory testing is recommended, including uniaxial compressive strength testing (with strain measurements), tri-axial strength testing, direct shear testing of discontinuities, and index testing of discontinuity infill materials. The combined orientation and testwork program is estimated at $50 k.
The following mining geotechnical evaluation tasks are recommended:
•Review and compilation of geotechnical data; updating the existing 3D lithological and/or structural models to incorporate the results of any additional exploration drilling and/or an improved understanding of the deposit geology.
•Laboratory testing to investigate anisotropic/heterogeneous rock mass strengths should be investigated, defined, and utilized as appropriate to capture the conditions in directions parallel to structural fabric and orientations, and with respect to pit slope sector orientations.
•Updating of geotechnical domains, slope designs sectors, stability models, slope design recommendations.
These studies are estimated at $150 k.
26.3Geochemistry
Continue with the current geochemistry program proposed by Hemmera (an Ausenco company), to refine geochemistry parameters in support of contact water chemistry and the treatment thereof. The program is estimated to cost $300,000 to $400,000.
26.4Metallurgical Testing
Continue with the current metallurgical testing program proposed by Ausenco, to support detailed engineering and design parameters related to the process flowsheet . The program is estimated to cost $300,000 to $400,000.
| | | | | |
| Boa Esperança Project | Page 269 |
| NI 43-101 Technical Report Feasibility Study | October 2021 |
26.5Tailings Storage Facilities
The following activities are recommended to support the design of the tailings storage facilities in the next phase of the Project:
•Geotechnical site investigations at the preferred TSF site(s) along with site wide infrastructure (excluding the open pit) should be carried out to characterise the foundation conditions associated with the proposed infrastructure.
•Geotechnical investigations within the property boundary should be conducted to identify potential borrow sources and requirements for development of the borrow areas.
•In-situ permeability tests of the overburden soils and bedrock beneath the proposed dam foundations should be carried out. The results of the investigation will be used to evaluate the proposed dam design and seepage cut-off requirements (i.e., bedrock grouting).
•A site-specific seismic hazard assessment to inform the input parameters for dam stability assessment is recommended.
•A groundwater model should be developed to evaluate the impacts of the TSF and the DSTF on the local environment.
•Tailings should be tested to determine the geotechnical and geochemical properties to understand physical and mechanical characteristics of slurry deposition tailings and filtered compacted tailings.
•Optimisation and further evaluation of the proposed dam alignment, deposition planning, and construction staging based on the findings of the geotechnical site investigations and other project developments should be carried out.
•Development of a detailed tailings deposition strategy to optimize material handling and tailings facilities designs.
•An updated dam breach and inundation study should be completed to support the dam classification.
•The TSF and DSTF design and site-wide water balance should be further refined.
•Optimization of the seepage and surface water management.
| | | | | |
| Boa Esperança Project | Page 270 |
| NI 43-101 Technical Report Feasibility Study | October 2021 |
•The closure cover design criteria and success attributes should be advanced to optimise the reclamation requirements.
•Condemnation drilling at the tailings sites be carried out to verify the absence of mineralization.
The program is estimated at $400,000 to $600,000.
| | | | | |
| Boa Esperança Project | Page 271 |
| NI 43-101 Technical Report Feasibility Study | October 2021 |
27REFERENCES
Almeida, J.D.A.C. de, Oliveira, V.E.S. de, Rocha, J.L.S., Feio, G.R.D.L., Rocha, M.C., Rocha, K.P.P. da, 2020. Caracterização geológica, geoquímica e aerogeofísica dos granitoides arqueanos da porção sul do Domínio Rio Maria. Geologia USP. Série Científica 20, 61–85. doi:10.11606/issn.2316-9095.v20-144182
Ausenco, June 2021, Trade-off Study – Ore Sorting Assessment 10577-03-RX-RPT-001, Vancouver, Canada.
Ausenco, August 2021, Trade-off Study - Truck vs Conveyor (Filtered Tailings) 105771-03-MEM-001, Vancouver, Canada.
Ausenco, May 2021, Front-end Processing Circuit Design Review 105771-RX-RPT-0001, Vancouver, Canada.
Ausenco, August 2021, Economic Engineering – Basis of Estimate 105771-03-4000-RPT-X-1003, Belo Horizonte, Brazil.
Ausenco, September 2021, Project Execution Plan 10577103-PEP-001, Vancouver Canada.
Ausenco, On-Site Infrastructure Trade-off: Alternativas para Tipologias Construtivas 105771-03-6000-RPT-A-1001, Belo Horizonte.
Dall’Agnol, R., Oliveira, D.C. de, Guimarães, F. V, Gabriel, E.O., Feio, G.R.L., Lamarão, C.N., Althoff, F.J., Santos, P.A., Teixeira, M.F.B., Silva, A.C., 2013. Geologia do subdomínio de transição do Domínio Carajás-Implicações para a evolução arqueana da Província Carajás-Pará. Simpósio de Geologia da Amazônia 13, 1082–1085.
Diemme Filtration R&D, August 10, 2012, “Relatorio Nr. LAB 312113 – Rev 2.
Fernandes, C.M.D., Juliani, C., Monteiro, L.V.S., Lagler, B., Echeverri Misas, C.M., 2011. High-K calc-alkaline to A-type fissure-controlled volcano-plutonism of the São Félix do Xingu region, Amazonian craton, Brazil: Exclusively crustal sources or only mixed Nd model ages? Journal of South American Earth Sciences 32, 351–368. doi:10.1016/j.jsames.2011.03.004
Figueiredo e Silva, R.C., Hagemann, S., Lobato, L.M., Rosière, C.A., Banks, D.A., Davidson, G.J., Vennemann, T., Hergt, J., 2013. Hydrothermal Fluid Processes and Evolution of the Giant Serra Norte Jaspilite-Hosted Iron Ore Deposits, Carajás Mineral Province, Brazil. Economic Geology 108, 739–779. doi:10.2113/econgeo.108.4.739
Hemmera, June 2021, Geochemistry Gap Assessemnet and Work Plan Memorandum, Vancouver, Canada.
Hemmera, September 2021, Environmental Geochem Sampling and Testing Memorandum, Vancouver, Canada.
Hemmera, September 2021, Preliminary Water Management Plan for FS Report Memorandum, Vancouver, Canada.
Hemmera, October 2021, Waste and LGO Sampling and Analysis Plan Memorandum, Vancouver, Canada.
Macambira, E.M.B., Vale, A.G., 1997. Programa Levantamentos Geológicos Básicos Do Brasil. São Félix Do Xingu. Folha SB.22-Y-B. Estado Do Pará. DNPM/CPRM, Brasília 384.
| | | | | |
| Boa Esperança Project | Page 272 |
| NI 43-101 Technical Report Feasibility Study | October 2021 |
Mansur, E.T., Ferreira Filho, C.F., 2016. Magmatic structure and geochemistry of the Luanga Mafic–Ultramafic Complex: Further constraints for the PGE-mineralized magmatism in Carajás, Brazil. Lithos 266–267, 28–43. doi:https://doi.org/10.1016/j.lithos.2016.09.036
Metso, July 07, 2011, “Resultados de Testes de Britabilidade”
Metso, July 11, 2011, “Resultados de Testes de WI de Bolas”
Outotec, June 2012, “Relatorio de Testes Provas de Espessamento e FiltraÇão em Equipamento de Laboratorio.
Santos, J.O.S., Hartmann, L.A., Gaudette, H.E., Groves, D.I., Mcnaughton, N.J., Fletcher, I.R., 2000. A New Understanding of the Provinces of the Amazon Craton Based on Integration of Field Mapping and U-Pb and Sm-Nd Geochronology. Gondwana Research 3, 453–488. doi:10.1016/S1342-937X(05)70755-3.
Schutesky, M.E., de Oliveira, C.G., 2020. From the roots to the roof: An integrated model for the Neoarchean Carajás IOCG System, Brazil. Ore Geology Reviews 127. doi:10.1016/j.oregeorev.2020.103833.
SGS Geosol, April 2015. Jigging, Flotation and Magnetic Separation on a Composite Sample from Boa Esperança Project. 43p.
SGS Geosol, Flotation Testwork on Copper Samples from the Boa Esperança Project SG 0014-0013 Rev02, Belo Horizonte, Brazil.
SM&A, August 2021, Off-Site Power Supply and Transmission EE-21A060-001, Belo Horizonte, Brazil.
Silva, F.F. da, Oliveira, D.C. de Antonio, P.Y.J., D’Agrella Filho, M.S., Lamarão, C.N., 2016. Bimodal magmatism of the Tucumã area, Carajás province: U-Pb geochronology, classification and processes. Journal of South American Earth Sciences 72, 95–114. doi:10.1016/j.jsames.2016.07.016.
SRK Consulting, Juen 2017, Feasibility Study Technical Report for the Boa Esperança Copper Project, Pará State, Brazil.
SRK Consulting, Juen 2017, Feasibility Study Technical Report for the Boa Esperança Copper Project, Pará State, Brazil.
Teixeira, N.A., Campos, L.D., de Paula, R.R., Lacasse, C.M., Ganade, C.E., Monteiro, C.F., Lopes, L.B.L., de Oliveira, C.G., 2021. Carajás Mineral Province - Example of metallogeny of a rift above a cratonic lithospheric keel. Journal of South American Earth Sciences 108. doi:10.1016/j.jsames.2020.103091.
VOGBR, 2015. Executive Summary – B2 Dam and Water Pond – Boa Esperança Copper Mine – Pará. 8p.
VOGBR, 2015. Projeto básico - Mina de Cobre Boa Esperança. Relatórios Técnicos: VG14-268-EG-RTE-0001, VG14-268-EG-RTE-0002, VG14-268-1-EG-RTE-0003, VG14-268-1-EG-RTE-0004, VG14-268-1-EG-RTE-0005, VG14-268-EG-RTE-0006, VG14-268-1-EG-RTE-0007, VG14-268-1-EG-RTE-0008.
| | | | | |
| Boa Esperança Project | Page 273 |
| NI 43-101 Technical Report Feasibility Study | October 2021 |