EXHIBIT 99.1
Centerra Gold Announces 2024 Year-End Mineral Reserves and Resources, Including an Initial Resource at Goldfield; Provides Exploration Update
All figures are in United States dollars unless otherwise stated. This news release contains forward-looking information that is subject to risk factors and assumptions as set out in the “Cautionary Note Regarding Forward-Looking Information” below.
TORONTO, Feb. 20, 2025 (GLOBE NEWSWIRE) -- Centerra Gold Inc. (“Centerra” or the “Company”) (TSX: CG) (NYSE: CGAU) announces its 2024 year-end estimates for mineral reserves and mineral resources. Proven and probable gold mineral reserves were 3.5 million ounces and proven and probable copper mineral reserves were 1,150 million pounds, as of December 31, 2024. Measured and indicated gold mineral resources were 6.8 million ounces as of December 31, 2024, which includes the initial gold mineral resource at the Goldfield Project (“Goldfield”) of 706 thousand ounces.
Centerra Year-End Gold Mineral Reserves and Mineral Resources(1)
| | 2024 | 2023 |
Property
| Tonnes
(kt) | Grade
(g/t) | Contained
Gold (koz) | Tonnes
(kt) | Grade
(g/t) | Contained
Gold (koz) |
| Total Proven and Probable Gold Mineral Reserves |
| Mount Milligan Mine | 264,512 | 0.33 | 2,826 | 250,025 | 0.35 | 2,822 |
| Öksüt Mine | 20,080 | 1.03 | 662 | 25,255 | 1.01 | 819 |
| Total | 284,591 | 0.38 | 3,488 | 275,280 | 0.41 | 3,641 |
| Total Measured and Indicated Gold Mineral Resources |
| Mount Milligan Mine | 183,971 | 0.26 | 1,566 | 259,860 | 0.27 | 2,333 |
| Öksüt Mine | 2,617 | 0.69 | 58 | 6,752 | 0.55 | 119 |
| Kemess Open Pit | 111,682 | 0.27 | 980 | 111,682 | 0.27 | 980 |
| Kemess Underground | 139,920 | 0.50 | 2,265 | 139,920 | 0.50 | 2,265 |
| Kemess East | 93,454 | 0.39 | 1,182 | 93,454 | 0.39 | 1,182 |
| Goldfield | 30,833 | 0.71 | 706 | - | - | - |
| Total | 562,476 | 0.37 | 6,759 | 611,668 | 0.35 | 6,880 |
| Inferred Gold Mineral Resources |
| Mount Milligan Mine | 27,924 | 0.44 | 395 | 7,795 | 0.34 | 84 |
| Öksüt Mine | 130 | 1.06 | 4 | 348 | 0.78 | 9 |
| Kemess Open Pit | 13,691 | 0.26 | 116 | 13,691 | 0.26 | 116 |
| Goldfield | 2,267 | 0.41 | 30 | - | - | - |
| Total | 44,012 | 0.39 | 547 | 21,833 | 0.30 | 209 |
(1) As of December 31, 2024. Refer to Tables “Centerra Gold Inc. 2024 Year-End Mineral Reserve and Resource Summary – Gold” and “Centerra Gold Inc. 2024 Year-End Mineral Reserve and Resource Summary – Other Metals”, including their respective footnotes and the “Additional Footnotes” section below.
- Mount Milligan Mine (“Mount Milligan”): In 2024, the Company replaced mined mineral reserves at Mount Milligan by upgrading mineral resources. Centerra has successfully extended the life of mine at Mount Milligan to 2036 by increasing the use of mined-out areas of the open pit for potential acid generating (“PAG”) waste storage. This has increased available storage capacity in the existing tailings facility and extended the overall mine life for the current mineral reserve estimate.
- Kemess Project (“Kemess”): The Kemess property has substantial gold and copper resources in a highly prospective district with significant infrastructure already in place, including: a 300 kilometre, 230 kilovolt power line, one of the longest privately owned power lines in British Columbia; a 50,000 tonnes per day nameplate processing plant, which would require some refurbishment and equipment replacements; site infrastructure including a camp, administration facilities, truck shop and warehouse; and tailings storage through in-pit and an existing facility, which is capable of expansion. Centerra is currently working to incorporate the results of a drilling campaign conducted in 2024 at Kemess into an updated open pit resource model. The program included over 11,400 metres of core drilling for exploration, geotechnical, and metallurgical testing purposes.
During 2024, Centerra commenced evaluation of technical concepts and engineering trade-off studies for potential restart options at Kemess. Early operating concepts include a combined open pit and conventional underground operation, which are expected to be less capital intensive and have a better cash flow profile than the previously permitted underground block cave concept. In addition to an exploration campaign in 2025 to further delineate the resources, the Company is planning on continuing to advance the technical studies that will include metallurgical testing for flowsheet optimization, mine plan optimization, materials handling infrastructure engineering, tailings design optimization, as well as initiation of environmental baseline studies. Early indications show potential for a long-life operation that takes advantage of the significant infrastructure already in place. The Company expects to provide an updated resource estimate and an accompanying update on the technical concept for Kemess in the second quarter of 2025.
- Goldfield: The initial measured and indicated gold mineral resource at Goldfield was 706 thousand ounces of gold, as of December 31, 2024, which includes both oxide and transition material, principally in the Gemfield, McMahon, and Jupiter deposits. In conjunction with exploration drilling, the Company completed metallurgical testwork resulting in run-of-mine recoveries in the mid-60% range (see “Additional Footnotes” section at the end of this release for details on recoveries), which is in line with expectations for a heap leach project and is expected to lower the capital investment required for the project. Based on the size of the resource estimate, the project does not meet Centerra’s requirements to support near-term development. The Company remains committed to maximizing the project’s potential, while exploring strategic and commercial options for Goldfield.
Centerra Year-End Copper Mineral Reserves and Mineral Resources(1)
| | 2024 | 2023 |
Property
| Tonnes
(kt) | Grade
(%Copper) | Contained Copper
(Mlbs) | Tonnes
(kt) | Grade
(% Copper) | Contained Copper
(Mlbs) |
| Proven and Probable Copper Mineral Reserves |
| Mount Milligan Mine | 264,512 | 0.20 | 1,150 | 250,025 | 0.17 | 961 |
| Total | 264,512 | 0.20 | 1,150 | 250,025 | 0.17 | 961 |
| Measured and Indicated Copper Mineral Resources |
| Mount Milligan Mine | 183,971 | 0.18 | 732 | 259,860 | 0.15 | 851 |
| Kemess Open Pit | 111,682 | 0.14 | 337 | 111,682 | 0.14 | 337 |
| Kemess Underground | 139,920 | 0.25 | 779 | 139,920 | 0.25 | 779 |
| Kemess East | 93,454 | 0.30 | 628 | 93,454 | 0.30 | 628 |
| Total | 529,027 | 0.21 | 2,476 | 604,916 | 0.19 | 2,595 |
| Inferred Copper Mineral Resources |
| Mount Milligan Mine | 27,924 | 0.12 | 74 | 7,795 | 0.14 | 24 |
| Kemess Open Pit | 13,691 | 0.16 | 48 | 13,691 | 0.16 | 48 |
| Total | 41,615 | 0.13 | 121 | 21,486 | 0.15 | 72 |
(1) As of December 31, 2024. Refer to Tables “Centerra Gold Inc. 2024 Year-End Mineral Reserve and Resource Summary – Gold” and “Centerra Gold Inc. 2024 Year-End Mineral Reserve and Resource Summary – Other Metals”, including their respective footnotes and the “Additional Footnotes” section below.
Exploration Update
Exploration activities in the fourth quarter of 2024 included drilling, surface rock and soil sampling, geological mapping, and geophysical surveying, targeting gold and copy mineralization at the Company’s projects and properties in Canada, Türkiye, and the United States.
2024 Exploration Highlights
- Confirming Mount Milligan’s long-life potential, the pit expanded to the west and southwest, due to significant intersections in the Goldmark and Saddle areas. Model expansion includes the south boundary area. Remodeling considers all holes drilled west of the Mount Milligan pit and resulted in defining the South Boundary inferred resource.
- At Kemess drilling was carried out in 2024 to assess the viability of start-up scenarios and open pit resource expansion. The goal was to expand near-surface mineralization west and southwest of the Kemess underground project.
- Resource delineation drilling for near surface oxide mineralization continued at the Goldfield project. Drilling intersected low-grade mineralization with a series of 10 to 30 metres at 0.4 grams per tonne (“g/t”).
- Most of the drilling was completed before the fourth quarter 2024, except at the Oakley project, in Idaho, United States (5,818 metres), Nallihan in Türkiye (4,829 metres) and Öksüt in Türkiye (421 metres). The drilling at Öksüt started late December 2024.
- Full year 2024 drilling totalled 72.3 kilometres, including greenfield projects.
2025 Exploration Outlook
- Exploration expenditures in 2025 are expected to be $35 to $45 million, including $20 to $25 million of brownfield exploration primarily at Mount Milligan and Kemess, and $15 to $20 million of greenfield and generative exploration programs.
- Centerra is expected to continue to explore the western extension of the Mount Milligan deposit and perform infill drilling to upgrade the inferred resources to indicated. Approximately 25% of the 2025 exploration expenditures are allocated to drilling programs at Mount Milligan to upgrade the inferred resources between Goldmark and North Slope and to test the extension of the South Boundary mineralization. A total of 45 kilometres of drilling is planned for 2025 at Mount Milligan.
- Centerra is expected to continue to explore Kemess, where the 2024 drilling resulted in delineation of mineralization between the Kemess Main open pit and Nugget (Centra Ridge zone). The 2025 exploration program at Kemess is focused on upgrading the resources along the five-kilometre-long mineralized trend. Approximately 13% of the 2025 exploration expenditures are allocated to Kemess to drill 12.5 kilometres.
- In the United States, Centerra is expected to continue to explore for near surface oxide mineralization within the Goldfield district and at Oakley. Centerra is also expected to continue advancing exploration work at its greenfield projects, Green Springs in Nevada and Jones Creek in Utah.
- In Türkiye, Centerra is expected to commence phase 2 drilling at the Nallihan joint venture project and to continue to explore for near surface mineralization southeast of the Öksüt pit.
Mount Milligan
- In 2024, the Company replaced mined mineral reserves at Mount Milligan by upgrading mineral resources. Ongoing exploration drilling program at the site is aimed at expanding the mineral resource base significantly to the west and southwest.
- In 2024, a total of 7,176 metres of infill drilling was completed in 25 drillholes, and 12,403 metres of brownfield exploration drilling was completed in 28 drillholes. Brownfield exploration focused on targets west of the current ultimate pit margins including the North Slope, Saddle West, and Boundary zones.
- The 2024 exploration drill results at the North Slope zone show potential for shallow as well as deep porphyry mineralization west of the ultimate pit boundary, adjacent to the Goldmark zone. Results from infill drilling in the MBX zone shows potential for resource expansion on the western pit wall margins and below the current pit boundary.
- The inclusion of all drillholes west of the Mount Milligan pit in the updated resource model resulted in the delineation of a potential satellite pit at south boundary. This area is one of the focus areas in the 2025 drilling campaign.
- Centerra continues to be encouraged by the significant mineral endowment and the potential for future resource additions at Mount Milligan. The Company is expected to invest approximately $9 to $12 million in exploration at Mount Milligan in 2025.
Mount Milligan Brownfield Drilling and Exploration
Figure 1: Plan view of Mount Milligan deposit showing 2024 resource shell.
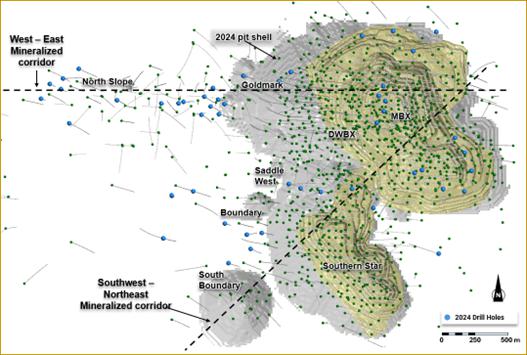
Figure 2: Plan view of Mount Milligan deposit showing major porphyry trends.
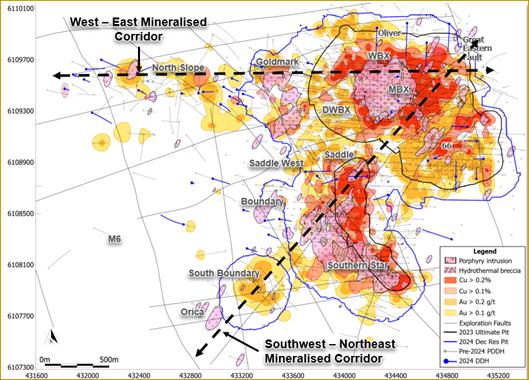
Figure 3: East-West cross section of the Mount Milligan 2024 resource pit (looking north), showing gold and copper grade contours. The circled area is the 2025 target for infill drilling.
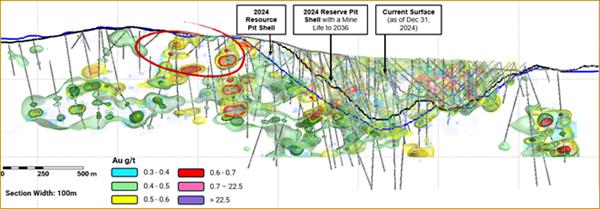
Figure 4: Long section view of Mount Milligan (looking northwest), showing gold and copper grade contours. Circled areas represent target areas for the 2025 infill drill program.
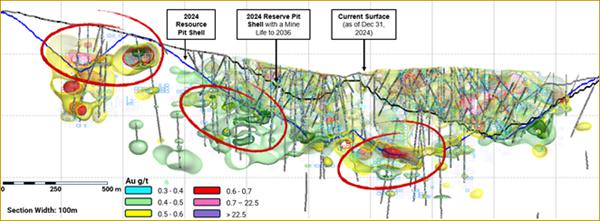
Figure 5: Plan view of Mt. Milligan showing the 2025 planned drilling program. Bright red holes are phase 1 priority holes intended to be completed by the end of the first quarter 2025. Drilling started in January 2025.

The DWBX zone is the depth extension of the WBX porphyry-style gold-copper mineralisation currently mined in the pit. Mineralization is associated with potassic alteration and early quartz veins within the DWBX stock and stock margins. Near surface and south of the DWBX is the King Richard zone. Results received to-date show the potential to extend the open pit to mine DWBX, King Richard, and DWBX Extension. Some selected significant results received during the year include:
Hole #24-1531: 26.0m @ 0.71 g/t Au, 0.188% Cu from 58m
Hole #24-1569: 37.8m @ 0.48 g/t Au, 0.229% Cu from 115m
Hole #24-1572: 30.3m @ 0.55 g/t Au, 0.176% Cu from 83m
Hole #24-1556: 48.4m @ 0.32 g/t Au, 0.204% Cu from 139m
Hole #24-1571: 58.0m @ 0.24 g/t Au, 0.068% Cu from 68m
Hole #24-1556: 83.8m @ 0.15 g/t Au, 0.127% Cu from 214m
Hole #24-1554: 73.0m @ 0.16 g/t Au, 0.168% Cu from 248m
Hole #24-1564: 18.7m @ 0.60 g/t Au, 0.161% Cu from 21m
The Goldmark zone is directly west of the current Mount Milligan pit design, situated above the high grade DWBX zone. In 2024, drilling continued to test the western extent of the Goldmark mineralisation that had been intersected in previous drill programs. Shallow porphyry-style gold and copper mineralisation is hosted at the margins of dykes and the Goldmark stock. High gold-low copper (“HGLC”) style mineralisation occurs throughout the zone. The results show potential for shallow resource additions and the extension of mineralisation west of the existing pit boundary. Significant results include:
Hole #24-1529: 65.0m @ 0.22 g/t Au, 0.191% Cu from 497m
Hole #24-1529: 19.2m @ 0.41 g/t Au, 0.038% Cu from 370m
Hole #24-1532: 20.0m @ 0.28 g/t Au, 0.030% Cu from 34m
Hole #24-1532: 11.5m @ 0.32 g/t Au, 0.205% Cu from 275m
The North Slope zone is approximately 1.5 kilometres west of the western margins of the existing pit boundary. Assays show multiple localized shallow zones of mineralisation related to the North Slope stock, with higher-grade porphyry-style gold and copper mineralization intersected near surface and at depth. Significant results include:
Hole #24-1533: 42.3m @ 0.41 g/t Au, 0.241% Cu from 25m
Hole #24-1533: 3.0m @ 4.47 g/t Au, 0.078% Cu from 448m
Hole #24-1536: 41.8m @ 0.33 g/t Au, 0.144% Cu from 244m
Hole #24-1536: 68.6m @ 0.16 g/t Au, 0.172% Cu from 305m
Hole #24-1536: 64.9m @ 0.29 g/t Au, 0.173% Cu from 378m
Hole #24-1543: 85.8m @ 0.24 g/t Au, 0.173% Cu from 336m
Hole #24-1543: 101.3m @ 0.20 g/t Au, 0.179% Cu from 451m
Hole #24-1563: 7.1m @ 2.21 g/t Au, 0.142% Cu from 81m
Hole #24-1563: 13.5m @ 1.09 g/t Au, 0.086% Cu from 32m
Hole #24-1566: 4.9m @ 8.11 g/t Au, 0.024% Cu from 238m
Hole #24-1566: 40.0m @ 0.33 g/t Au, 0.012% Cu from 136m
Hole #24-1567: 23.5m @ 4.27 g/t Au, 0.183% Cu from 160m
Hole #24-1567: 5.0m @ 5.01 g/t Au, 0.147% Cu from 291m
Hole #24-1567: 27.0m @ 2.83 g/t Au, 0.143% Cu from 342m
Hole #24-1567: 27.7m @ 3.63 g/t Au, 0.129% Cu from 483m
Kemess Project
- In 2024, 11,430 metres of core drilling was completed in 31 drillholes. These drillholes are expected to be incorporated into an updated mineral resource in the second quarter of 2025.
- The 2024 drill program targeted the area between the known mineralization at Nugget and the upper portion of the Kemess Underground zones. Significant drill intersections were received, confirming that the mineralization continues approximately five kilometres along strike.
- Geologic modeling and a preliminary resource estimate show continuous mineralization between the Nugget and Kemess North zone areas, which is expected to be the focus for the 2025 drill program. The program aims to upgrade inferred resources to indicated reserves and also to test, and potentially, confirm high grade mineralization in the deep Kemess offset zone.
- Centerra is encouraged by the large mineralization at Kemess and believes that it can be a future source of gold and copper production with a long mine life.
Some of the significant 2024 results include:
Hole #KN-24-013: 435m @ 0.43g/t Au, 0.23% Cu from 172m
Hole #KN-24-013: 402m @ 0.42g/t Au, 0.20% Cu from 47m
Hole #KN-24-017: 382m @ 0.38g/t Au, 0.19% Cu from 8m
Hole #KN-24-014: 342m @ 0.35g/t Au, 0.07% Cu from 56m
Hole #KN-24-019: 341m @ 0.34g/t Au, 0.16% Cu from 4m
Hole #KN-24-021: 311m @ 0.37g/t Au, 0.18% Cu from 0m
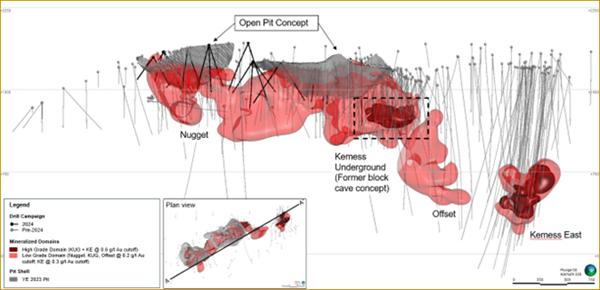
Figure 6: A long sectional view of the Kemes deposit showing a 0.2 g/t Au shell. The areas previously studied for a potential block cave mining scenario are shown within the dotted areas. The 2023 conceptual optimized pit is shown in grey.
Goldfield Project (“Goldfield”)
- In 2024, Centerra continued to explore within the Goldfield district, focusing on exploring near surface oxide mineralization.
- The 2024 drill program consisted of 175 drillholes over 20,028 metres with 45 core holes totaling 5,386 metres and 130 reverse circulation drillholes totaling 14,642 metres.
- Drilling at Goldfield’s other target areas did not yield meaningful results.
The Jupiter prospect exploration program focused on oxidized mineralization with an up-dip projection trending shallower on the eastern portion of the prospect. The Jupiter prospect is the northerly extension of the Gemfield deposit. Drilling was facilitated by land agreements and drill permits completed in late 2023. Results proved the up-dip projection of oxide mineralization in the prospect, however, the grades and thickness are uneconomic to include an appreciable amount of material into an optimized pit shell when the prevailing economic parameters were applied. A series of small satellite pits were delineated to be included in the Goldfield initial resource. Some of the significant results received for Jupiter include:
Hole #GEM24R279: 19.8m @ 2.55 g/t Au, 16.38 g/t Ag from 87m
Hole #GEM24R256: 36.6m @ 1.04 g/t Au, 1.09 g/t Ag from 20m
Hole #GEM24R319: 6.1m @ 5.36 g/t Au, 5.50 g/t Ag from 0m
Hole #GEM24R286: 24.4m @ 1.09 g/t Au, 1.96 g/t Ag from 23m
Hole #GEM24R249: 35.1m @ 0.41 g/t Au, 0.66 g/t Ag from 40m
Hole #GEM24R291: 30.5m @ 0.46 g/t Au, 0.70 g/t Ag from 15m
Hole #GEM24R289: 30.5m @ 0.40 g/t Au, 0.91 g/t Ag from 15m
Hole #GEM24R239: 32.0m @ 0.38 g/t Au, 1.04 g/t Ag from 11m
Oakley Project (“Oakley”)
- The 2024 drill program at Oakley completed 32 drillholes over 5,818 metres with 18 core holes totaling 2,995 metres and 14 reverse circulation drillholes totaling 2,823 metres.
- In 2024, drilling at the Cold Hill and Blue Hill prospects focused on expanding the known gold mineralization, while drilling at Red Rock and White Rock focused on new, untested drill targets.
At the Cold Hill target, four holes encountered significant mineralization, primarily represented by silicified pebble to cobble conglomerate and silicified volcanic ash, and with minor intersections within the underlying Paleozoic limestone, represented by decalcification and silicification. These intersections continue to define the lateral extent and width of the mineralization at Cold Hill. Some of the significant results received for Cold Hill include:
Hole #CC-24-04: 20.3m @ 0.24 g/t Au, 1.47 g/t Ag from 8m
Hole #CC-24-04: 20.9m @ 0.50 g/t Au, 4.00 g/t Ag from 37m
Hole #CC-24-07: 9.9m @ 0.69 g/t Au, 1.19 g/t Ag from 192m
Hole #CC-24-07: 1.0m @ 4.54 g/t Au, 0.90 g/t Ag from 200m
Drilling at the Blue Hill prospect focused on testing the margins of the known mineralization and following up on the higher-grade intersections identified in historic drilling. Mineralization was encountered in the most southwestern drillholes in the prospect, which shows the potential for additional mineralization towards the southwest. The mineralization is associated with strong silicification of the pebble to cobble conglomerate and silicification of the volcanic ash beds. Significant intersections are listed below.
Hole #BHC24R001: 19.8m @ 0.42 g/t Au, 4.19 g/t Ag from 24m
Hole #BHC24R003: 24.4m @ 0.45 g/t Au, 4.73 g/t Ag from 84m
Hole #BHC24R005: 64.0m @ 0.31 g/t Au, 2.74 g/t Ag from 50m
Hole #BHC24R005: 28.9m @ 0.25 g/t Au, 6.88 g/t Ag from 131m
Hole #BHC24R007: 21.4m @ 0.35 g/t Au, 3.11 g/t Ag from 90m
Hole #BHC24R007: 67.0m @ 0.50 g/t Au, 5.83 g/t Ag from 162m
Öksüt Mine (“Öksüt”)
Drilling started during December 2024, with a total of 431 metres completed at the Güneytepe pit to test for potential deep porphyry mineralization. The exploration for deep porphyry deposits was initiated in 2023, based on historical drillholes confirming potassic alteration related to porphyry intrusive rocks on the Öksüt license. In 2024, a detailed alteration analysis and modelling was completed, using data from historical and recent (2023) deep holes drilled in and around the Öksüt deposit. The analysis of these drillholes pointed to the presence of a large pyrophyllite alteration zone, which is an indicator for the presence of the upper parts of a porphyry system. The porphyry system was tested in 2024 by drilling additional deep holes under the Güneytepe pit. In 2025, Centerra expects to continue to explore for near surface oxide mineralization southeast of the Öksüt pit.
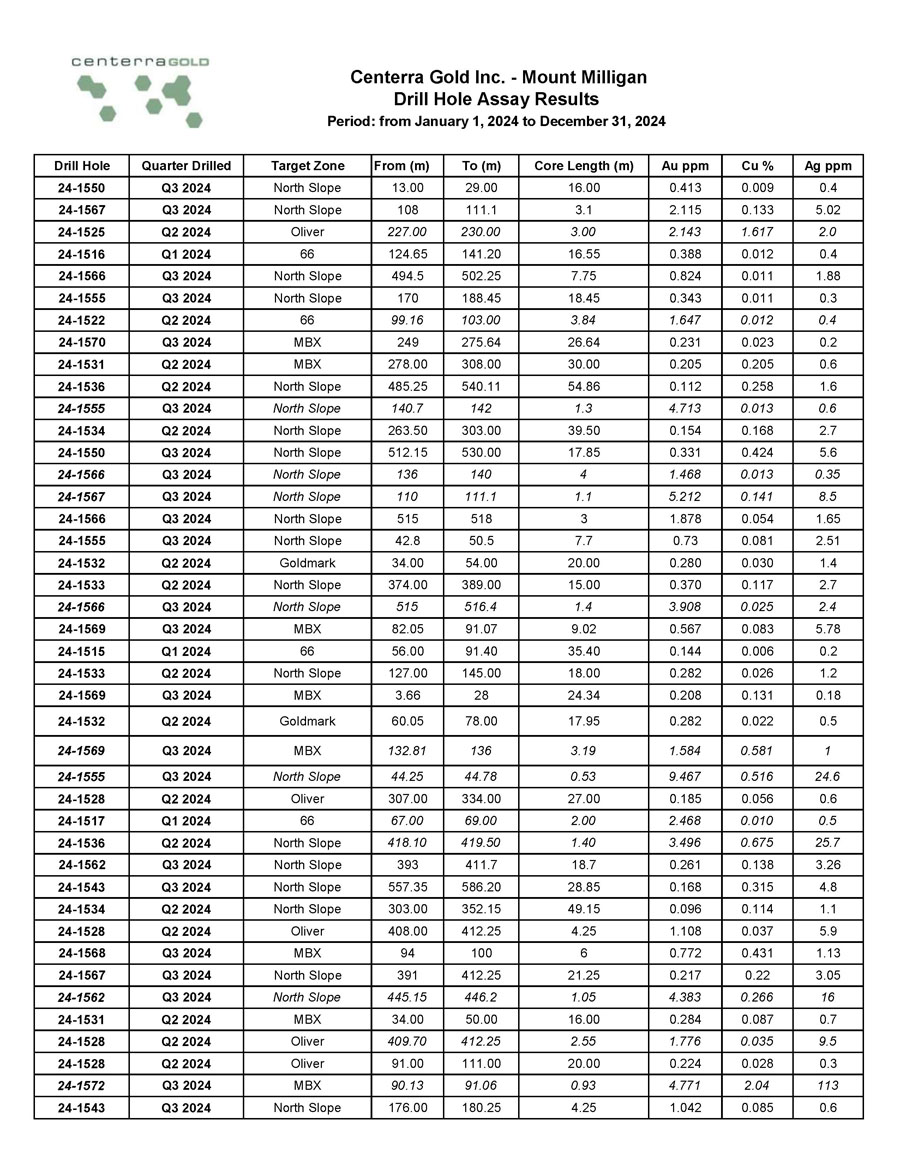
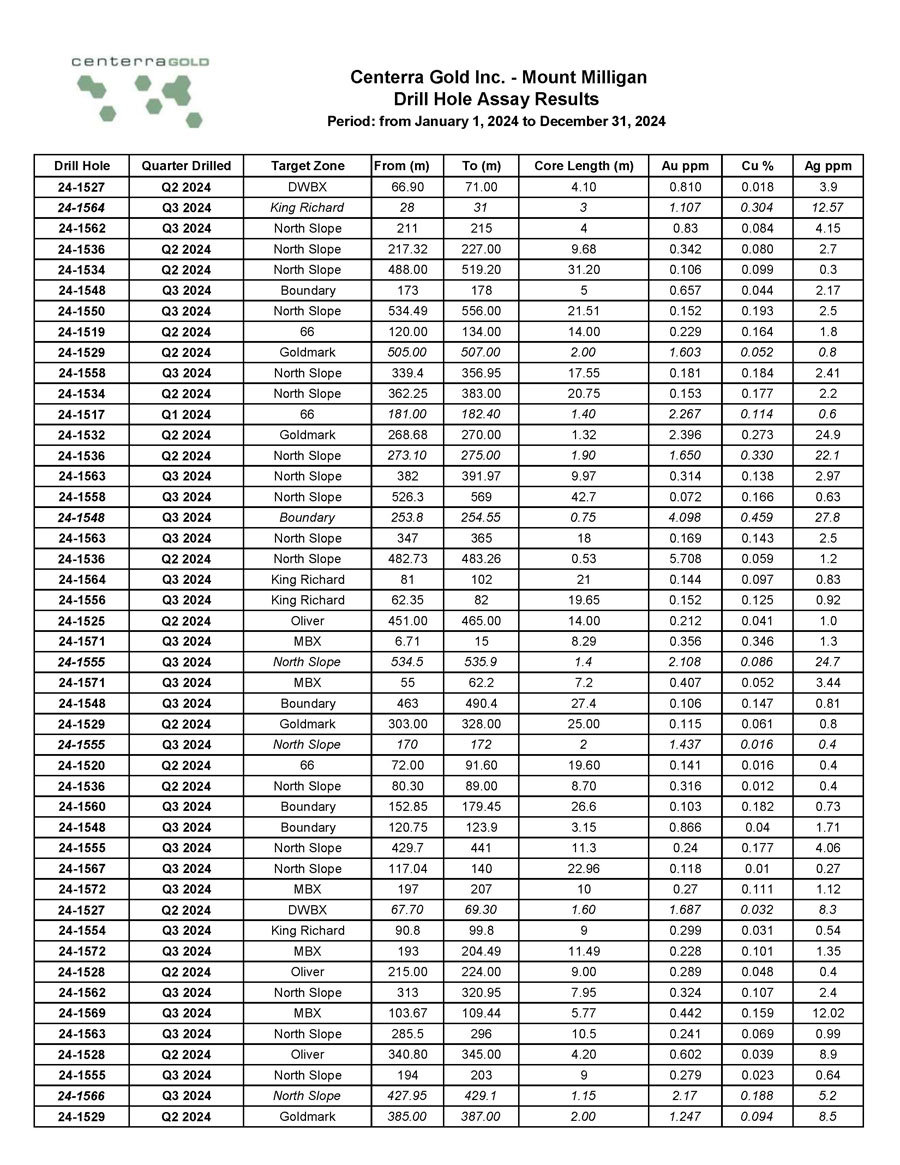
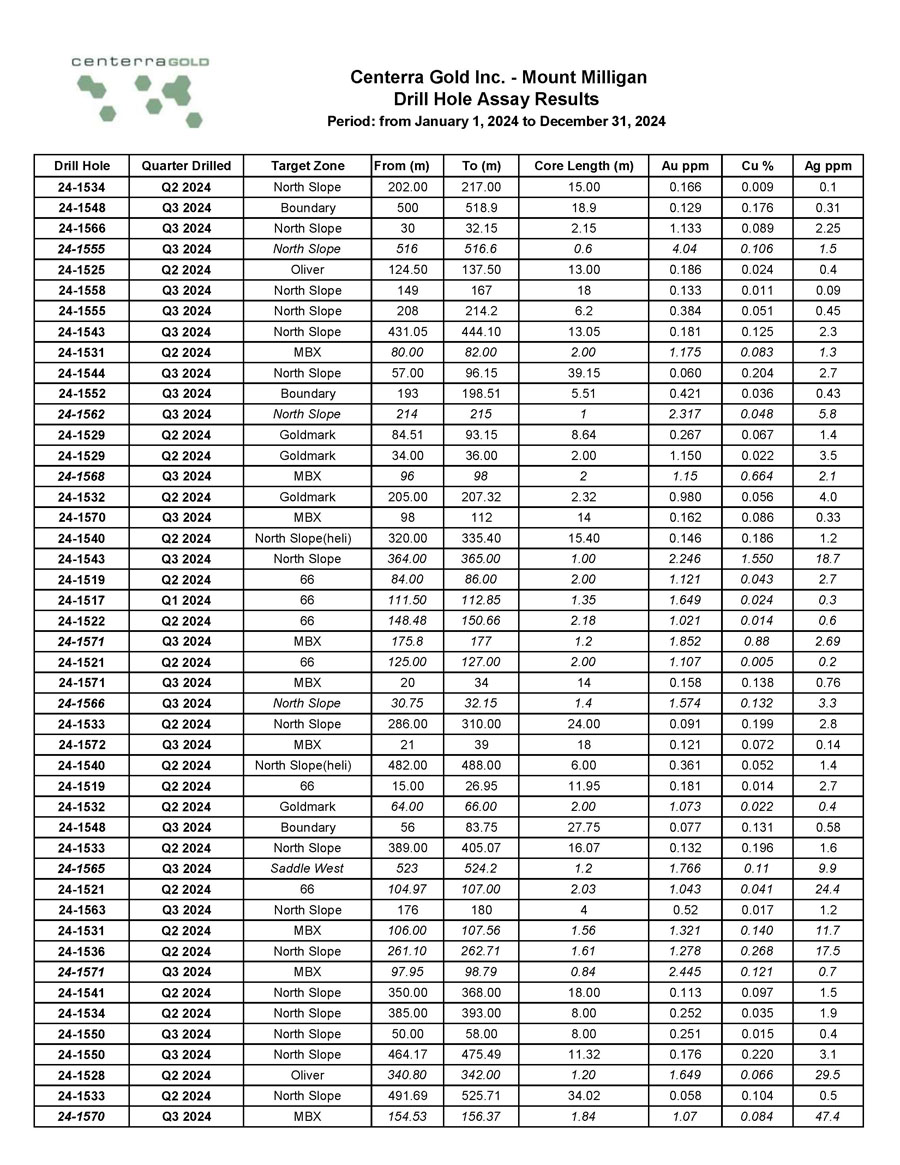
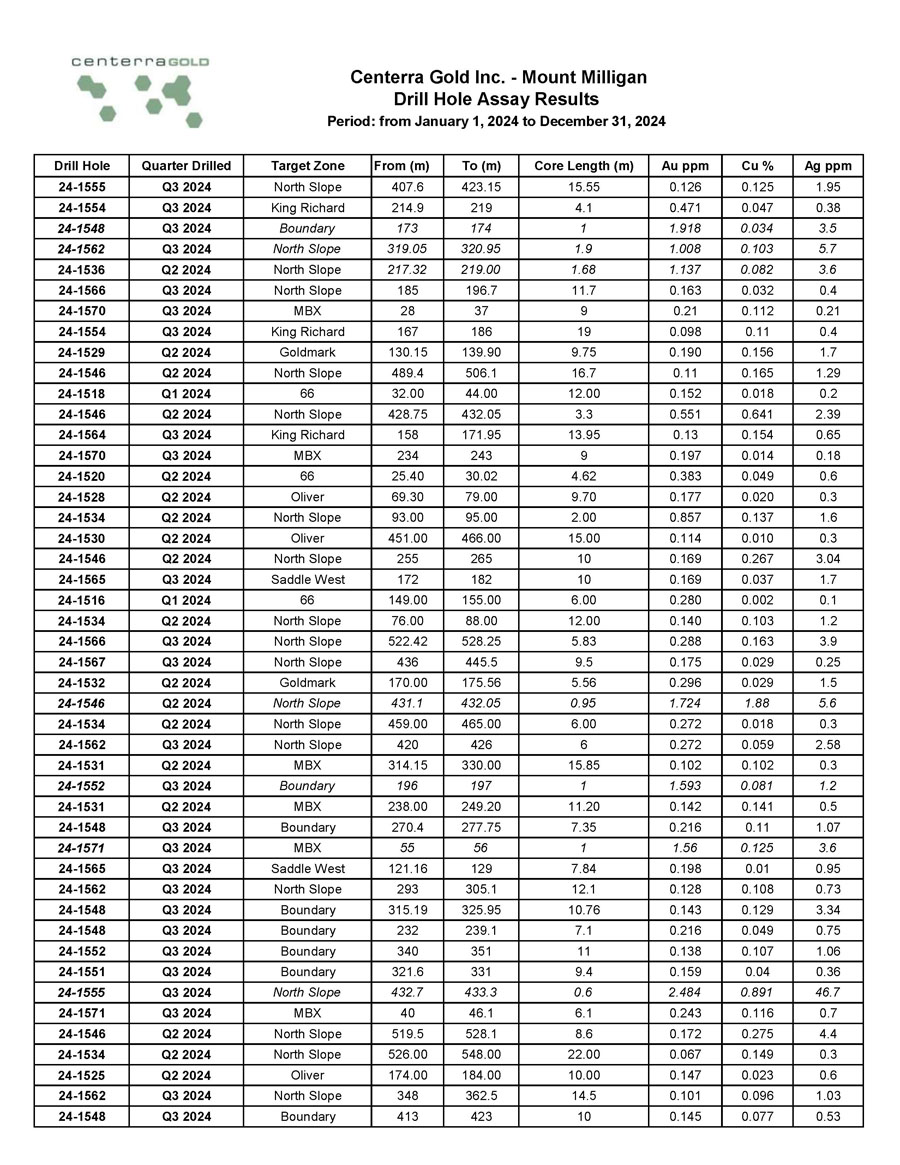
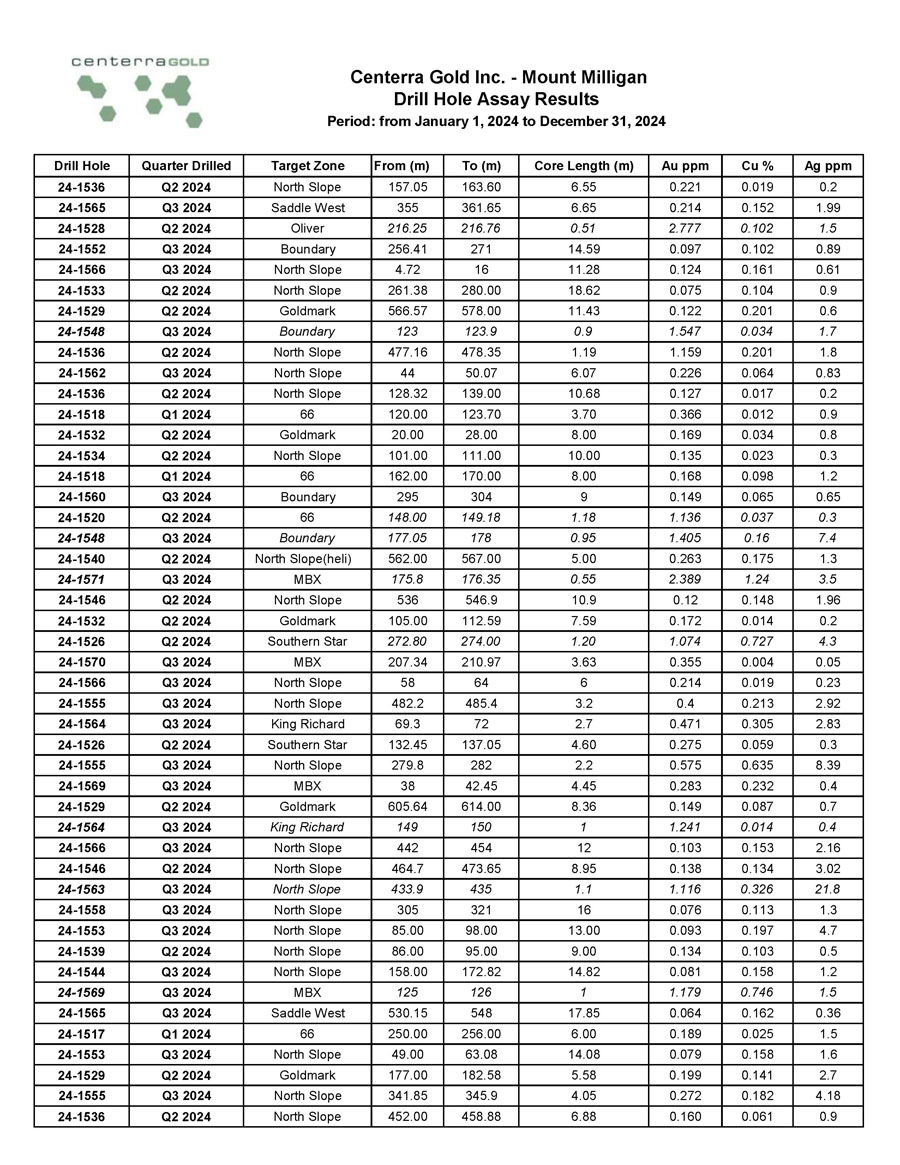
A full listing of the drill results has been filed on SEDAR+ at www.sedarplus.ca, EDGAR at www.sec.gov/edgar, and is available on the Company’s website at www.centerragold.com.
| Centerra Gold Inc. 2024 Year-End Mineral Reserve and Resources Summary – Gold(1) |
| as of December 31, 2024 (see additional footnotes below) |
| |
| Proven and Probable Gold Mineral Reserves |
| | Proven | Probable | Total Proven and Probable |
Property
| Tonnes | Grade | Contained
Gold (koz)
| Tonnes | Grade | Contained
Gold (koz)
| Tonnes | Grade | Contained
Gold (koz)
|
| (kt) | (g/t) | (kt) | (g/t) | (kt) | (g/t) |
| Mount Milligan(4) | 187,961 | 0.34 | 2,056 | 76,551 | 0.31 | 770 | 264,512 | 0.33 | 2,826 |
| Öksüt | 475 | 0.63 | 10 | 19,604 | 1.04 | 653 | 20,080 | 1.03 | 662 |
| Total | 188,436 | 0.34 | 2,065 | 96,155 | 0.46 | 1,423 | 284,591 | 0.38 | 3,488 |
| |
| Measured and Indicated Gold Mineral Resources(2) |
| | Measured | Indicated | Total Measured and Indicated |
Property
| Tonnes | Grade | Contained
Gold (koz)
| Tonnes | Grade | Contained
Gold (koz)
| Tonnes | Grade | Contained
Gold (koz)
|
| (kt) | (g/t) | (kt) | (g/t) | (kt) | (g/t) |
| Mount Milligan(4) | 91,827 | 0.25 | 743 | 92,144 | 0.28 | 824 | 183,971 | 0.26 | 1,566 |
| Öksüt | 393 | 0.55 | 7 | 2,224 | 0.72 | 51 | 2,617 | 0.69 | 58 |
| Kemess Open Pit | - | - | - | 111,682 | 0.27 | 980 | 111,682 | 0.27 | 980 |
| Kemess Underground | - | - | - | 139,920 | 0.50 | 2,265 | 139,920 | 0.50 | 2,265 |
| Kemess East | - | - | - | 93,454 | 0.39 | 1,182 | 93,454 | 0.39 | 1,182 |
| Goldfield | 9,729 | 1.08 | 339 | 21,103 | 0.54 | 368 | 30,833 | 0.71 | 706 |
| Total | 101,949 | 0.33 | 1,088 | 460,527 | 0.38 | 5,670 | 562,476 | 0.37 | 6,759 |
| |
| Inferred Gold Mineral Resources (3) | |
Property
| Tonnes | Grade | Contained
Gold (koz)
|
| (kt) | (g/t) |
| Mount Milligan (4) | 27,924 | 0.44 | 395 |
| Öksüt | 130 | 1.06 | 4 |
| Kemess Open Pit | 13,691 | 0.26 | 116 |
| Kemess Underground | - | - | - |
| Kemess East | - | - | - |
| Goldfield | 2,267 | 0.41 | 30 |
| Total | 44,012 | 0.39 | 546 |
1) Centerra’s equity interests as of this news release are as follows: Mount Milligan 100%, Öksüt 100%, Kemess Open Pit, Kemess Underground and Kemess East 100%, Goldfield 100%. Mineral reserves and resources for these properties are presented on a 100% basis. Numbers may not add up due to rounding.
2) Mineral resources are in addition to mineral reserves. Mineral resources do not have demonstrated economic viability.
3) Inferred mineral resources have a great amount of uncertainty as to their existence and as to whether they can be mined economically. It cannot be assumed that all or part of the inferred mineral resources will ever be upgraded to a higher category.
4) Production at Mount Milligan is subject to a streaming agreement with RGLD Gold AG and Royal Gold, Inc. (collectively, “Royal Gold”) which entitles Royal Gold to 35% of gold sales from the Mount Milligan Mine. Under the stream arrangement, Royal Gold will pay a reduced price per ounce of gold delivered. Mineral reserves and resources for the Mount Milligan property are presented on a 100% basis.
| Centerra Gold Inc. 2024 Year-End Mineral Reserve and Resources Summary – Other Metals(1) |
| as of December 31, 2024 (see additional footnotes below) |
| |
| | Tonnes
(kt) | Copper
Grade
(%) | Contained
Copper
(Mlbs) | Molybdenum
Grade
(%) | Contained
Molybdenum
(Mlbs) | Silver
Grade
(g/t) | Contained
Silver
(koz) |
| Proven Mineral Reserves |
| Mount Milligan(4) | 187,961 | 0.19 | 808 | - | - | - | - |
| Thompson Creek | 44,885 | - | - | 0.076 | 75 | | - |
| Probable Mineral Reserves |
| Mount Milligan(4) | 76,551 | 0.20 | 342 | - | - | - | - |
| Thompson Creek | 68,104 | - | - | 0.057 | 86 | | - |
| Total Proven and Probable Mineral Reserves |
| Mount Milligan(4) | 264,512 | 0.20 | 1,150 | - | - | - | - |
| Thompson Creek | 112,989 | - | - | 0.065 | 161 | | - |
| Total Copper and Molybdenum | 377,501 | 0.20 | 1,150 | 0.065 | 161 | - | - |
| | | | | | | | |
| Measured Mineral Resources(2) |
| Mount Milligan(4) | 91,827 | 0.19 | 384 | - | - | - | - |
| Thompson Creek | 5,009 | - | - | 0.059 | 7 | - | - |
| Endako | 47,100 | - | - | 0.050 | 48 | - | - |
| Indicated Mineral Resources(2) |
| Mount Milligan(4) | 92,144 | 0.17 | 348 | - | - | - | - |
| Kemess Open Pit | 111,682 | 0.14 | 337 | - | - | 1.19 | 4,262 |
| Kemess Underground | 139,920 | 0.25 | 779 | - | - | 1.90 | 8,544 |
| Kemess East | 93,454 | 0.30 | 628 | - | - | 1.66 | 5,000 |
| Thompson Creek | 45,178 | - | - | 0.057 | 57 | - | - |
| Endako | 122,175 | - | - | 0.040 | 118 | - | - |
| Total Measured and Indicated Mineral Resources(2) |
| Mount Milligan(4) | 183,971 | 0.18 | 732 | - | - | - | - |
| Kemess Open Pit | 111,682 | 0.14 | 337 | - | - | 1.19 | 4,262 |
| Kemess Underground | 139,920 | 0.25 | 779 | - | - | 1.90 | 8,544 |
| Kemess East | 93,454 | 0.30 | 628 | - | - | 1.66 | 5,000 |
| Total Copper and Silver | 529,027 | 0.21 | 2,476 | - | - | 1.61 | 17,806 |
| Thompson Creek | 50,187 | - | - | 0.057 | 63 | - | - |
| Endako | 169,275 | - | - | 0.043 | 166 | - | - |
| Total Molybdenum | 219,462 | - | - | 0.046 | 229 | - | - |
| Inferred Mineral Resources(3) |
| Mount Milligan(4) | 27,924 | 0.12 | 74 | - | - | - | - |
| Kemess Open Pit | 13,691 | 0.16 | 48 | - | - | 1.40 | 615 |
| Total Copper and Silver | 41,615 | 0.13 | 121 | - | - | 1.40 | 615 |
| Thompson Creek | 10,523 | - | - | 0.072 | 17 | - | - |
| Endako | 47,325 | - | - | 0.040 | 44 | - | - |
| Total Molybdenum | 57,848 | - | - | 0.046 | 61 | - | - |
1) Centerra’s equity interests as of this news release are as follows: Mount Milligan 100%, Kemess Underground and Kemess East 100%, Thompson Creek 100%, and Endako 75%. Mineral reserves and resources for these properties are presented on a 100% basis. Numbers may not add up due to rounding.
2) Mineral resources are in addition to mineral reserves. Mineral resources do not have demonstrated economic viability.
3) Inferred mineral resources have a great amount of uncertainty as to their existence and as to whether they can be mined economically. It cannot be assumed that all or part of the inferred mineral resources will ever be upgraded to a higher category.
4) Production at Mount Milligan is subject to a streaming agreement which entitles Royal Gold to 18.75% of copper sales from the Mount Milligan Mine. Under the stream arrangement, Royal Gold will pay a reduced percentage of the spot price per metric tonne of copper delivered. Mineral reserves and resources for the Mount Milligan property are presented on a 100% basis.
Additional Footnotes
General
- A conversion factor of 31.1035 grams per troy ounce of gold is used in the mineral reserve and mineral resource estimates.
Mount Milligan Mine
- The mineral reserves are reported based on a gold price of $1,800 per ounce, a copper price of $3.75 per pound and an exchange rate of 1USD:1.30CAD.
- The open pit mineral reserves are reported based on a Net Smelter Return (“NSR”) cut-off of $8.72 per tonne (C$11.33 per tonne) that takes into consideration metallurgical recoveries, concentrate grades, transportation costs, and smelter treatment charges to determine economic viability.
- The mineral resources are reported based on a gold price of $2,000 per ounce, a copper price of $4.00 per pound, and an exchange rate of 1USD:1.30CAD.
- The open pit mineral resources are constrained by a pit shell and are reported based on a NSR cut-off of $8.72 per tonne (C$11.33 per tonne) that takes into consideration metallurgical recoveries, concentrate grades, transportation costs, and smelter treatment charges to determine economic viability.
- Further information concerning the Mount Milligan deposit, operation, as well as environmental and other risks is described in Centerra’s most recently filed Annual Information Form and in the Mount Milligan Mine Technical Report, each of which has been filed on SEDAR+ at www.sedarplus.ca and EDGAR at www.sec.gov/edgar. Sample preparation, analytical techniques, laboratories used, and quality assurance-quality control protocols used during the exploration drilling programs are consistent with industry standards and were carried out by independent, certified assay labs.
- The resource tables above do not include the 2024 exploration drill results.
Öksüt Mine
- The mineral reserves are reported based on a gold price of $1,800 per ounce and an exchange rate of 1USD:34TL.
- The open pit mineral reserves are reported based on 0.16 grams of gold per tonne cut-off grade.
- Open pit optimization used an average life of mine (“LOM”) metallurgical recovery of 77%.
- The mineral resources are reported based on a gold price of $2,000 per ounce.
- Open pit mineral resources are constrained by a pit shell and are estimated based on 0.16 grams of gold per tonne cut-off grade.
- Further information concerning the Öksüt deposit, operation, as well as environmental and other risks is described in Centerra’s most recently filed Annual Information Form which is available on SEDAR+ at www.sedarplus.ca and EDGAR at www.sec.gov/edgar and the Technical Report on the Öksüt Project, dated September 3, 2015, which is available on SEDAR+ at www.sedarplus.ca. Sample preparation, analytical techniques, laboratories used, and quality assurance-quality control protocols used during the exploration drilling programs are consistent with industry standards and were carried out by independent, certified assay labs.
Kemess Open Pit and Underground
- The mineral resources are reported based on a gold price of $1,800 per ounce, copper price of $3.75 per pound and an exchange rate of 1USD:1.30CAD.
- The mineral resources are reported based on a NSR cut-off of C$12.92 open pit and a NSR shut-off value of C$22.92 per tonne for underground block cave mining option that takes into consideration metallurgical recoveries, concentrate grades, transportation costs, and smelter treatment charges.
Kemess East
- The mineral resources are reported based on a gold price of $1,800 per ounce, copper price of $3.75 per pound, and an exchange rate of 1USD:1.30CAD.
- The mineral resources are reported based on a NSR shut-off of C$22.92 per tonne for underground block cave mining option that takes into consideration metallurgical recoveries, concentrate grades, transportation costs, and smelter treatment charges.
Thompson Creek Mine
- The mineral reserves have been estimated based on a molybdenum price of $16.00 per pound.
- The open pit mineral reserves are based on a 0.030% molybdenum cut-off grade.
- The mineral resources have been estimated based on a molybdenum price of $18.50 per pound.
- The open pit mineral resources are constrained by a pit shell and are estimated based on a 0.025% molybdenum cut-off grade.
- Further information concerning the Thompson Creek deposit, current and planned operations as well as environmental and other risks are described in the technical report dated September 2024 and filed on SEDAR+ at www.sedarplus.ca. Sample preparation, analytical techniques, laboratories used, and quality assurance-quality control protocols used during the exploration drilling programs are consistent with industry standards and were carried out by independent, certified assay labs.
Endako Mine
- The mineral resources are reported based on a molybdenum price of C$14.00 per pound and an exchange rate of 1USD:1.25CAD.
- The open pit mineral resources are constrained by a pit shell and are estimated based on a 0.025% molybdenum cut-off grade.
Goldfield
- The mineral resources are reported based on a gold price of $2,000 per ounce.
- The open pit mineral resources are constrained by a pit shell and are estimated based on the following cut-off grades:
Gemfield: 0.10 g/t for oxide, transition, and sulphide
Jupiter: 0.10 g/t for oxide, transition, and sulphide
Goldfield Main: 0.14 g/t for oxide, 0.21 g/t for transition, 0.24 g/t for sulphide
McMahon Ridge: 0.14 g/t for oxide, 0.21 g/t for transition, 0.24 g/t for sulphide
- ROM recoveries were assumed to be 67% for the oxide and transition zones for Gemfield and Jupiter, and 62% and 31% for the oxide and transition zones, respectively, for McMahon Ridge.
- Goldfield Main recoveries considered tertiary crushing, and were 82% for oxide, 61% for transition and 50% for sulphide mineralization.
Qualified Person – Mineral Reserves and Resources
Christopher Richings, Professional Engineer, member of the Engineers and Geoscientists British Columbia (EGBC) and Centerra’s Vice President, Technical Services, has reviewed and approved the scientific and technical information related to mineral reserves at Mount Milligan and Thompson Creek contained in this news release. Mr. Richings is a Qualified Person within the meaning of Canadian Securities Administrator’s NI 43-101 Standards of Disclosure for Mineral Projects (“NI 43-101”).
Lars Weiershäuser, PhD and PGeo., and Centerra’s Director, Geology, has reviewed and approved the scientific and technical information related to mineral resource estimates contained in this news release related to Öksüt, Kemess Open Pit, Kemess Underground, Kemess East, Thompson Creek, and Endako. Dr. Weiershäuser is a Qualified Person within the meaning of NI 43-101.
Andrey Shabunin, Professional Engineer, member of Professional Engineers of Ontario (PEO) and General Manager of Öksüt Mine, has reviewed and approved the scientific and technical information related to mineral reserves at Öksüt contained in this news release. Mr. Shabunin is a Qualified Person within the meaning of NI 43-101.
AC (Chris) Hunter, Professional Geoscientist, member of the Engineers and Geoscientists of British Columbia (EGBC) and Centerra’s Senior Geologist, has reviewed and approved the scientific and technical information related to mineral resources estimates at Mount Milligan contained in this news release. Mr. Hunter is a Qualified Person within the meaning of NI 43-101.
Karen Chiu, MSc., PGeo, and Centerra’s Corporate Geologist, has reviewed and approved the scientific and technical information related to mineral resource estimates contained in this news release related to Goldfield. Ms. Chiu is a Qualified Person within the meaning of NI 43-101.
All other scientific and technical information presented in this document were prepared in accordance with the standards of the Canadian Institute of Mining, Metallurgy and Petroleum and NI 43-101 and were reviewed, verified, and compiled by Centerra’s geological and mining staff under the supervision of W. Paul Chawrun, Professional Engineer, member of the Professional Engineers of Ontario (PEO) and Centerra’s Executive Vice President and Chief Operating Officer whom is a qualified person for the purpose of NI 43-101.
All mineral reserve and resources have been estimated in accordance with the standards of the Canadian Institute of Mining, Metallurgy and Petroleum and NI 43-101.
Mineral reserve and mineral resource estimates are forward-looking information and are based on key assumptions and are subject to material risk factors. If any event arising from these risks occurs, the Company’s business, prospects, financial condition, results of operations or cash flows, and the market price of Centerra’s shares could be adversely affected. Additional risks and uncertainties not currently known to the Company, or that are currently deemed immaterial, may also materially and adversely affect the Company’s business operations, prospects, financial condition, results of operations or cash flows, and the market price of Centerra’s shares. See the section entitled “Risk That Can Affect Centerra’s Business” in the Company’s annual Management’s Discussion and Analysis (MD&A) for the year-ended December 31, 2024, available on SEDAR+ at www.sedarplus.ca and EDGAR at www.sec.gov/edgar and see also the discussion below under the heading “Caution Regarding Forward-looking Information”.
Qualified Person & QA/QC – Exploration
Exploration information and related scientific and technical information in this document regarding the Mount Milligan Mine were prepared, reviewed, verified, and compiled in accordance with the standards of NI 43-101 by Cheyenne Sica, Member of the Association of Professional Geoscientists Ontario and Member of Engineers and Geoscientists British Columbia, and Exploration Manager at Centerra’s Mount Milligan Mine, who is the qualified person for the purpose of NI 43-101. Sample preparation, analytical techniques, laboratories used, and quality assurance and quality control protocols used during the exploration drilling programs are done consistent with industry standards while independent certified assay labs are used.
Exploration information and related scientific and technical information in this document regarding the Öksüt Mine, the Goldfield District Project, Oakley Project, and all other exploration projects were prepared, reviewed, verified, and compiled in accordance with the standards of NI 43-101 by Richard Adofo, Member of the Professional Association of Geoscientists Ontario and Vice President, Exploration & Resource at Centerra, who is the qualified person for the purpose of NI 43-101. Sample preparation, analytical techniques, laboratories used, and quality assurance and quality control protocols used during the exploration drilling programs are done consistent with industry standards while independent certified assay labs are used.
All other scientific and technical information presented in this document were prepared in accordance with the standards of the Canadian Institute of Mining, Metallurgy and Petroleum and NI 43-101 and were reviewed, verified, and compiled by Centerra’s geological and mining staff under the supervision of W. Paul Chawrun, Professional Engineer, member of the Professional Engineers of Ontario (PEO), who is a qualified person for the purpose of NI 43-101.
About Centerra Gold
Centerra Gold Inc. is a Canadian-based gold mining company focused on operating, developing, exploring and acquiring gold and copper properties in North America, Türkiye, and other markets worldwide. Centerra operates two mines: the Mount Milligan Mine in British Columbia, Canada, and the Öksüt Mine in Türkiye. The Company also owns the Kemess Project in British Columbia, Canada, the Goldfield Project in Nevada, United States, and owns and operates the Molybdenum Business Unit in the United States and Canada. Centerra’s shares trade on the Toronto Stock Exchange (“TSX”) under the symbol CG and on the New York Stock Exchange (“NYSE”) under the symbol CGAU. The Company is based in Toronto, Ontario, Canada.
For more information:
Lisa Wilkinson
Vice President, Investor Relations & Corporate Communications
(416) 204-3780
Lisa.Wilkinson@centerragold.com
Additional information on Centerra is available on the Company’s website at www.centerragold.com, on SEDAR+ at www.sedarplus.ca and EDGAR at www.sec.gov/edgar.
Caution Regarding Forward-Looking Information
This news release contains or incorporates by reference “forward-looking statements” and “forward-looking information” as defined under applicable Canadian and U.S. securities legislation. All statements, other than statements of historical fact, which address events, results, outcomes or developments that the Company expects to occur are, or may be deemed to be, forward-looking statements. Such forward-looking information involves risks, uncertainties and other factors that could cause actual results, performance, prospects and opportunities to differ materially from those expressed or implied by such forward-looking information. Forward-looking statements are generally, but not always, identified by the use of forward-looking terminology such as “assume”, “believes”, “continue”, “encouraged”, “estimate”, “expect”, “future”, “ongoing”, “plan”, “potential”, “target” or “update”, or variations of such words and phrases and similar expressions or statements that certain actions, events or results “may”, “could”, “would” or “will” be taken, occur or be achieved or the negative connotation of such terms. Such statements include but may not be limited to: mineral reserve and mineral resource estimates; life of mine estimates and operating and capital costs; future exploration potential; timing and scope of future exploration (brownfields or greenfields); the ability of the Company to increase mineral reserves or mineral resources at any of its properties; the future success of Kemess including the results of an updated resource estimate and accompanying update on its technical concept including mining methods; the ability of the Company to achieve 50,000 tonnes per day at the Kemess processing plant; the ability of the Company to expand the existing tailings facility at Kemess; and other statements that express management’s expectations or estimates of future plans and performance, operational, geological or financial results, estimates or amounts not yet determinable and assumptions of management.
The Company cautions that forward-looking statements are necessarily based upon a number of factors and assumptions that, while considered reasonable by the Company at the time of making such statements, are inherently subject to significant business, economic, technical, legal, political and competitive uncertainties and contingencies. Known and unknown factors could cause actual results to differ materially from those projected in the forward-looking statements and undue reliance should not be placed on such statements and information.
Market price fluctuations in gold, copper, and other metals, as well as increased capital or production costs or reduced recovery rates may render ore reserves containing lower grades of mineralization uneconomic and may ultimately result in a restatement of mineral reserves. The extent to which mineral resources may ultimately be reclassified as proven or probable mineral reserves is dependent upon the demonstration of their profitable recovery. Economic and technological factors, which may change over time, always influence the evaluation of mineral reserves or mineral resources. Centerra has not adjusted mineral resource figures in consideration of these risks and, therefore, Centerra can give no assurances that any mineral resource estimate will ultimately be reclassified as proven and probable mineral reserves.
Mineral resources are not mineral reserves, and do not have demonstrated economic viability, but do have reasonable prospects for economic extraction. Measured and indicated mineral resources are sufficiently well defined to allow geological and grade continuity to be reasonably assumed and permit the application of technical and economic parameters in assessing the economic viability of the resource. Inferred mineral resources are estimated on limited information not sufficient to verify geological and grade continuity or to allow technical and economic parameters to be applied. Inferred mineral resources are too speculative geologically to have economic considerations applied to them to enable them to be categorized as mineral reserves. There is no certainty that mineral resources of any category can be upgraded to mineral reserves through continued exploration.
Centerra’s mineral reserve and mineral resource figures are estimates, and Centerra can provide no assurances that the indicated levels of gold or copper will be produced, or that Centerra will receive the metal prices assumed in determining its mineral reserves. Such estimates are expressions of judgment based on knowledge, mining experience, analysis of drilling results, and industry practices. Valid estimates made at a given time may significantly change when new information becomes available. While Centerra believes that these mineral reserve and mineral resource estimates are well established, and the best estimates of Centerra’s management, by their nature mineral reserve and mineral resource estimates are imprecise and depend, to a certain extent, upon analysis of drilling results and statistical inferences, which may ultimately prove unreliable. If Centerra’s mineral reserve or mineral reserve estimates for its properties are inaccurate or are reduced in the future, this could have an adverse impact on Centerra’s future cash flows, earnings, results, or operations and financial condition.
Centerra estimates the future mine life of its operations. Centerra can give no assurance that mine life estimates will be achieved. Failure to achieve these estimates could have an adverse impact on Centerra’s future cash flows, earnings, results of operations, and financial condition.
Additional risk factors and details with respect to risk factors that may affect the Company’s ability to achieve the expectations set forth in the forward-looking statements contained in this news release are set out in the Company’s latest 40-F/Annual Information Form and Management’s Discussion and Analysis, each under the heading “Risk Factors”, which are available on SEDAR+ (www.sedarplus.ca) or on EDGAR (www.sec.gov/edgar). The foregoing should be reviewed in conjunction with the information, risk factors and assumptions found in this news release.
The Company disclaims any intention or obligation to update or revise any forward-looking statements, whether written or oral, or whether as a result of new information, future events or otherwise, except as required by applicable law.
Photos accompanying this announcement are available at
https://www.globenewswire.com/NewsRoom/AttachmentNg/5d429e9b-0f77-4c3e-93a3-e5e3e1236b9f
https://www.globenewswire.com/NewsRoom/AttachmentNg/e8e85ba0-972a-4719-9989-96dce800f6b7
https://www.globenewswire.com/NewsRoom/AttachmentNg/2f927cb5-41ed-4049-8b1b-7bf40c8f8d3c
https://www.globenewswire.com/NewsRoom/AttachmentNg/dbd0885a-b4c3-4ff2-9733-c8647acf5ad7
https://www.globenewswire.com/NewsRoom/AttachmentNg/aaf3c0f7-8a11-49ec-a2ae-ff0893cd41e4
https://www.globenewswire.com/NewsRoom/AttachmentNg/8e68d72f-e05f-4797-b545-a93b491f9017
A PDF accompanying this announcement is available at
http://ml.globenewswire.com/Resource/Download/ad1e1cd4-3da5-4e09-92c0-75837fda9432
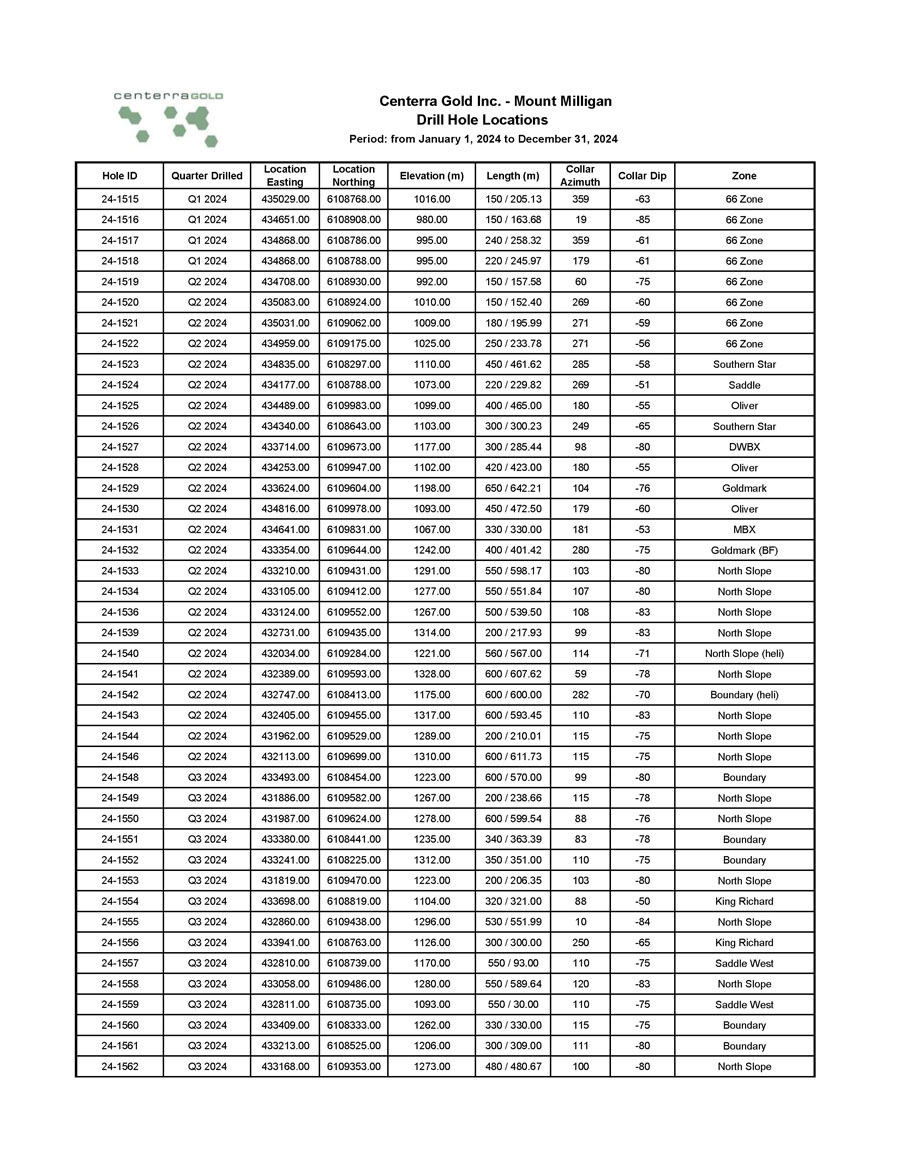
Zone Collar Dip Collar Azimuth Length (m) Elevation (m) Location Northing Location Easting Quarter Drilled Hole ID 66 Zone - 63 359 150 / 205.13 1016.00 6108768.00 435029.00 Q1 2024 24 - 1515 66 Zone - 85 19 150 / 163.68 980.00 6108908.00 434651.00 Q1 2024 24 - 1516 66 Zone - 61 359 240 / 258.32 995.00 6108786.00 434868.00 Q1 2024 24 - 1517 66 Zone - 61 179 220 / 245.97 995.00 6108788.00 434868.00 Q1 2024 24 - 1518 66 Zone - 75 60 150 / 157.58 992.00 6108930.00 434708.00 Q2 2024 24 - 1519 66 Zone - 60 269 150 / 152.40 1010.00 6108924.00 435083.00 Q2 2024 24 - 1520 66 Zone - 59 271 180 / 195.99 1009.00 6109062.00 435031.00 Q2 2024 24 - 1521 66 Zone - 56 271 250 / 233.78 1025.00 6109175.00 434959.00 Q2 2024 24 - 1522 Southern Star - 58 285 450 / 461.62 1110.00 6108297.00 434835.00 Q2 2024 24 - 1523 Saddle - 51 269 220 / 229.82 1073.00 6108788.00 434177.00 Q2 2024 24 - 1524 Oliver - 55 180 400 / 465.00 1099.00 6109983.00 434489.00 Q2 2024 24 - 1525 Southern Star - 65 249 300 / 300.23 1103.00 6108643.00 434340.00 Q2 2024 24 - 1526 DWBX - 80 98 300 / 285.44 1177.00 6109673.00 433714.00 Q2 2024 24 - 1527 Oliver - 55 180 420 / 423.00 1102.00 6109947.00 434253.00 Q2 2024 24 - 1528 Goldmark - 76 104 650 / 642.21 1198.00 6109604.00 433624.00 Q2 2024 24 - 1529 Oliver - 60 179 450 / 472.50 1093.00 6109978.00 434816.00 Q2 2024 24 - 1530 MBX - 53 181 330 / 330.00 1067.00 6109831.00 434641.00 Q2 2024 24 - 1531 Goldmark (BF) - 75 280 400 / 401.42 1242.00 6109644.00 433354.00 Q2 2024 24 - 1532 North Slope - 80 103 550 / 598.17 1291.00 6109431.00 433210.00 Q2 2024 24 - 1533 North Slope - 80 107 550 / 551.84 1277.00 6109412.00 433105.00 Q2 2024 24 - 1534 North Slope - 83 108 500 / 539.50 1267.00 6109552.00 433124.00 Q2 2024 24 - 1536 North Slope - 83 99 200 / 217.93 1314.00 6109435.00 432731.00 Q2 2024 24 - 1539 North Slope (heli) - 71 114 560 / 567.00 1221.00 6109284.00 432034.00 Q2 2024 24 - 1540 North Slope - 78 59 600 / 607.62 1328.00 6109593.00 432389.00 Q2 2024 24 - 1541 Boundary (heli) - 70 282 600 / 600.00 1175.00 6108413.00 432747.00 Q2 2024 24 - 1542 North Slope - 83 110 600 / 593.45 1317.00 6109455.00 432405.00 Q2 2024 24 - 1543 North Slope - 75 115 200 / 210.01 1289.00 6109529.00 431962.00 Q2 2024 24 - 1544 North Slope - 75 115 600 / 611.73 1310.00 6109699.00 432113.00 Q2 2024 24 - 1546 Boundary - 80 99 600 / 570.00 1223.00 6108454.00 433493.00 Q3 2024 24 - 1548 North Slope - 78 115 200 / 238.66 1267.00 6109582.00 431886.00 Q3 2024 24 - 1549 North Slope - 76 88 600 / 599.54 1278.00 6109624.00 431987.00 Q3 2024 24 - 1550 Boundary - 78 83 340 / 363.39 1235.00 6108441.00 433380.00 Q3 2024 24 - 1551 Boundary - 75 110 350 / 351.00 1312.00 6108225.00 433241.00 Q3 2024 24 - 1552 North Slope - 80 103 200 / 206.35 1223.00 6109470.00 431819.00 Q3 2024 24 - 1553 King Richard - 50 88 320 / 321.00 1104.00 6108819.00 433698.00 Q3 2024 24 - 1554 North Slope - 84 10 530 / 551.99 1296.00 6109438.00 432860.00 Q3 2024 24 - 1555 King Richard - 65 250 300 / 300.00 1126.00 6108763.00 433941.00 Q3 2024 24 - 1556 Saddle West - 75 110 550 / 93.00 1170.00 6108739.00 432810.00 Q3 2024 24 - 1557 North Slope - 83 120 550 / 589.64 1280.00 6109486.00 433058.00 Q3 2024 24 - 1558 Saddle West - 75 110 550 / 30.00 1093.00 6108735.00 432811.00 Q3 2024 24 - 1559 Boundary - 75 115 330 / 330.00 1262.00 6108333.00 433409.00 Q3 2024 24 - 1560 Boundary - 80 111 300 / 309.00 1206.00 6108525.00 433213.00 Q3 2024 24 - 1561 North Slope - 80 100 480 / 480.67 1273.00 6109353.00 433168.00 Q3 2024 24 - 1562 Centerra Gold Inc. - Mount Milligan Drill Hole Locations Period: from January 1, 2024 to December 31, 2024
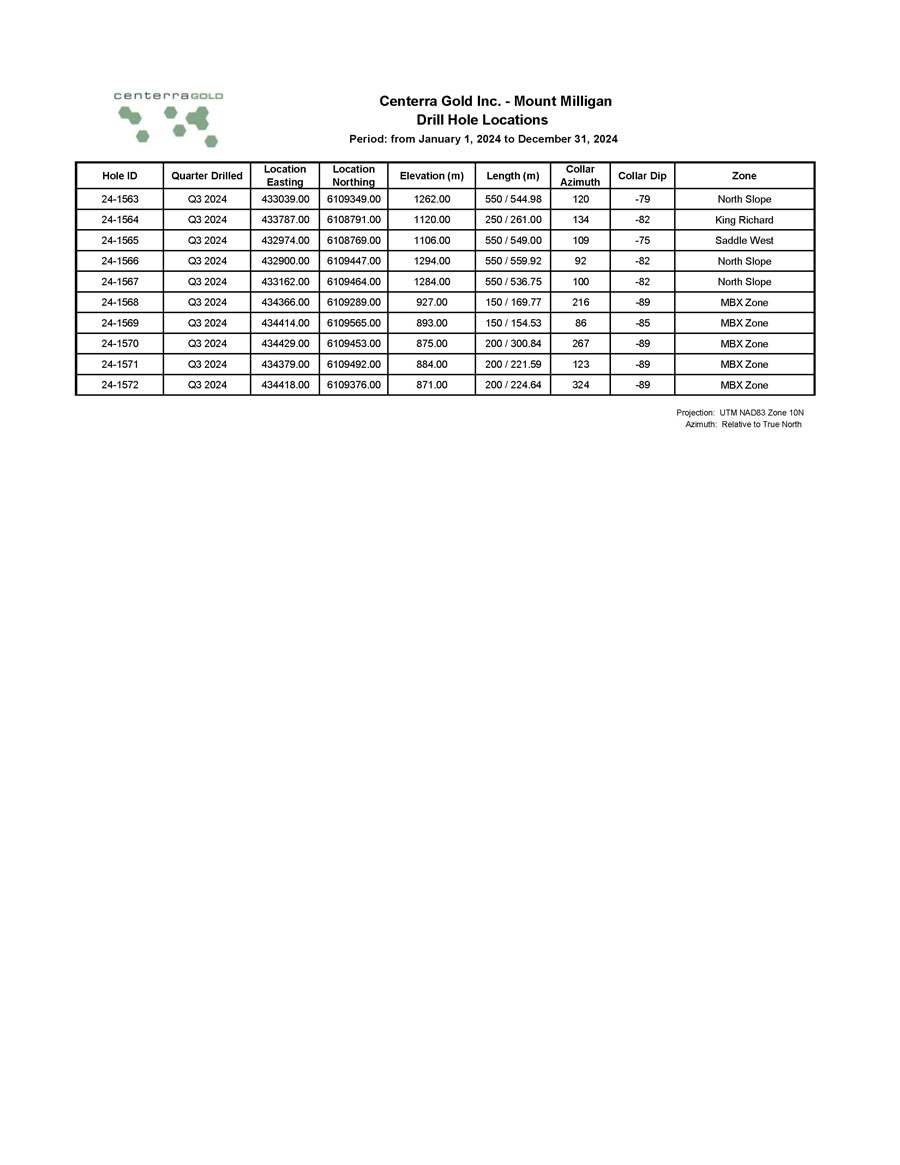
Zone Collar Dip Collar Azimuth Length (m) Elevation (m) Location Northing Location Easting Quarter Drilled Hole ID North Slope - 79 120 550 / 544.98 1262.00 6109349.00 433039.00 Q3 2024 24 - 1563 King Richard - 82 134 250 / 261.00 1120.00 6108791.00 433787.00 Q3 2024 24 - 1564 Saddle West - 75 109 550 / 549.00 1106.00 6108769.00 432974.00 Q3 2024 24 - 1565 North Slope - 82 92 550 / 559.92 1294.00 6109447.00 432900.00 Q3 2024 24 - 1566 North Slope - 82 100 550 / 536.75 1284.00 6109464.00 433162.00 Q3 2024 24 - 1567 MBX Zone - 89 216 150 / 169.77 927.00 6109289.00 434366.00 Q3 2024 24 - 1568 MBX Zone - 85 86 150 / 154.53 893.00 6109565.00 434414.00 Q3 2024 24 - 1569 MBX Zone - 89 267 200 / 300.84 875.00 6109453.00 434429.00 Q3 2024 24 - 1570 MBX Zone - 89 123 200 / 221.59 884.00 6109492.00 434379.00 Q3 2024 24 - 1571 MBX Zone - 89 324 200 / 224.64 871.00 6109376.00 434418.00 Q3 2024 24 - 1572 Centerra Gold Inc. - Mount Milligan Drill Hole Locations Period: from January 1, 2024 to December 31, 2024 Projection: UTM NAD83 Zone 10N Azimuth: Relative to True North
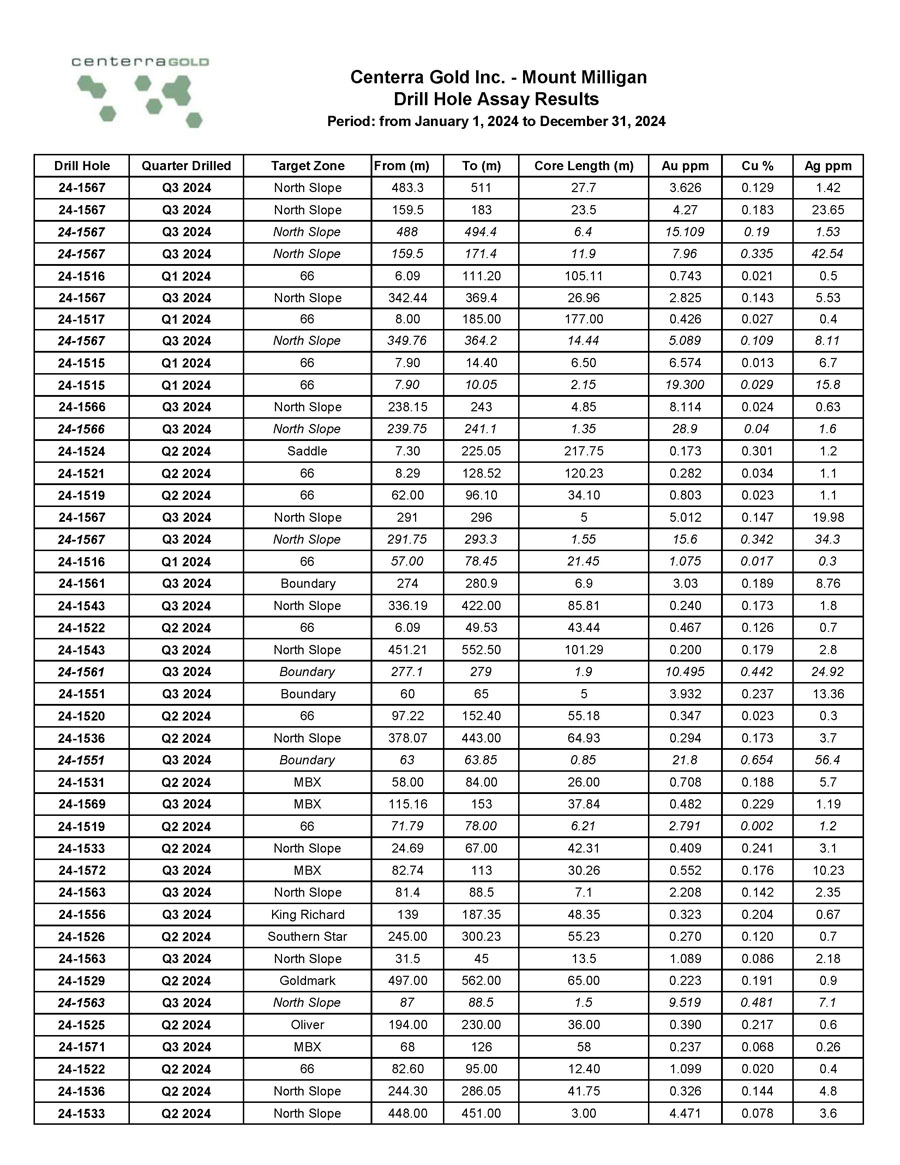
Ag ppm Cu % Au ppm Core Length (m) To (m) From (m) Target Zone Quarter Drilled Drill Hole 1.42 0.129 3.626 27.7 511 483.3 North Slope Q3 2024 24 - 1567 23.65 0.183 4.27 23.5 183 159.5 North Slope Q3 2024 24 - 1567 1.53 0.19 15.109 6.4 494.4 488 North Slope Q3 2024 24 - 1567 42.54 0.335 7.96 11.9 171.4 159.5 North Slope Q3 2024 24 - 1567 0.5 0.021 0.743 105.11 111.20 6.09 66 Q1 2024 24 - 1516 5.53 0.143 2.825 26.96 369.4 342.44 North Slope Q3 2024 24 - 1567 0.4 0.027 0.426 177.00 185.00 8.00 66 Q1 2024 24 - 1517 8.11 0.109 5.089 14.44 364.2 349.76 North Slope Q3 2024 24 - 1567 6.7 0.013 6.574 6.50 14.40 7.90 66 Q1 2024 24 - 1515 15.8 0.029 19.300 2.15 10.05 7.90 66 Q1 2024 24 - 1515 0.63 0.024 8.114 4.85 243 238.15 North Slope Q3 2024 24 - 1566 1.6 0.04 28.9 1.35 241.1 239.75 North Slope Q3 2024 24 - 1566 1.2 0.301 0.173 217.75 225.05 7.30 Saddle Q2 2024 24 - 1524 1.1 0.034 0.282 120.23 128.52 8.29 66 Q2 2024 24 - 1521 1.1 0.023 0.803 34.10 96.10 62.00 66 Q2 2024 24 - 1519 19.98 0.147 5.012 5 296 291 North Slope Q3 2024 24 - 1567 34.3 0.342 15.6 1.55 293.3 291.75 North Slope Q3 2024 24 - 1567 0.3 0.017 1.075 21.45 78.45 57.00 66 Q1 2024 24 - 1516 8.76 0.189 3.03 6.9 280.9 274 Boundary Q3 2024 24 - 1561 1.8 0.173 0.240 85.81 422.00 336.19 North Slope Q3 2024 24 - 1543 0.7 0.126 0.467 43.44 49.53 6.09 66 Q2 2024 24 - 1522 2.8 0.179 0.200 101.29 552.50 451.21 North Slope Q3 2024 24 - 1543 24.92 0.442 10.495 1.9 279 277.1 Boundary Q3 2024 24 - 1561 13.36 0.237 3.932 5 65 60 Boundary Q3 2024 24 - 1551 0.3 0.023 0.347 55.18 152.40 97.22 66 Q2 2024 24 - 1520 3.7 0.173 0.294 64.93 443.00 378.07 North Slope Q2 2024 24 - 1536 56.4 0.654 21.8 0.85 63.85 63 Boundary Q3 2024 24 - 1551 5.7 0.188 0.708 26.00 84.00 58.00 MBX Q2 2024 24 - 1531 1.19 0.229 0.482 37.84 153 115.16 MBX Q3 2024 24 - 1569 1.2 0.002 2.791 6.21 78.00 71.79 66 Q2 2024 24 - 1519 3.1 0.241 0.409 42.31 67.00 24.69 North Slope Q2 2024 24 - 1533 10.23 0.176 0.552 30.26 113 82.74 MBX Q3 2024 24 - 1572 2.35 0.142 2.208 7.1 88.5 81.4 North Slope Q3 2024 24 - 1563 0.67 0.204 0.323 48.35 187.35 139 King Richard Q3 2024 24 - 1556 0.7 0.120 0.270 55.23 300.23 245.00 Southern Star Q2 2024 24 - 1526 2.18 0.086 1.089 13.5 45 31.5 North Slope Q3 2024 24 - 1563 0.9 0.191 0.223 65.00 562.00 497.00 Goldmark Q2 2024 24 - 1529 7.1 0.481 9.519 1.5 88.5 87 North Slope Q3 2024 24 - 1563 0.6 0.217 0.390 36.00 230.00 194.00 Oliver Q2 2024 24 - 1525 0.26 0.068 0.237 58 126 68 MBX Q3 2024 24 - 1571 0.4 0.020 1.099 12.40 95.00 82.60 66 Q2 2024 24 - 1522 4.8 0.144 0.326 41.75 286.05 244.30 North Slope Q2 2024 24 - 1536 3.6 0.078 4.471 3.00 451.00 448.00 North Slope Q2 2024 24 - 1533 Centerra Gold Inc. - Mount Milligan Drill Hole Assay Results Period: from January 1, 2024 to December 31, 2024

Ag ppm Cu % Au ppm Core Length (m) To (m) From (m) Target Zone Quarter Drilled Drill Hole 0.25 0.012 0.333 40 176 136 North Slope Q3 2024 24 - 1566 4.6 0.050 7.647 1.73 451.00 449.27 North Slope Q2 2024 24 - 1533 12.6 0.055 10.5 1.25 45 43.75 North Slope Q3 2024 24 - 1563 0.8 0.127 0.153 83.8 298 214.2 King Richard Q3 2024 24 - 1556 2.5 0.015 6.822 1.86 7.95 6.09 66 Q1 2024 24 - 1516 0.4 0.064 1.984 6.10 147.60 141.50 66 Q1 2024 24 - 1517 0.2 0.059 1.400 8.50 165.50 157.00 66 Q1 2024 24 - 1517 0.5 0.011 1.913 6.00 93.00 87.00 66 Q2 2024 24 - 1522 2.04 0.168 0.157 73 321 248 King Richard Q3 2024 24 - 1554 6.34 0.161 0.6 18.7 40 21.3 King Richard Q3 2024 24 - 1564 47.38 0.662 2.375 4.56 92.04 87.48 MBX Q3 2024 24 - 1572 2.0 0.172 0.156 68.55 374.00 305.45 North Slope Q2 2024 24 - 1536 11.23 0.087 2.795 3.8 102 98.2 North Slope Q3 2024 24 - 1567 27.2 0.716 2.182 4.84 66.84 62.00 MBX Q2 2024 24 - 1531 22.6 0.149 5.74 1.8 100 98.2 North Slope Q3 2024 24 - 1567 0.3 0.014 0.817 12.23 139.75 127.52 66 Q2 2024 24 - 1522 2.1 0.152 0.226 42.00 368.00 326.00 North Slope Q2 2024 24 - 1533 0.5 0.007 0.779 11.88 66.90 55.02 66 Q2 2024 24 - 1522 1.4 0.033 2.303 4.00 106.00 102.00 66 Q1 2024 24 - 1516 1.2 0.021 0.512 17.84 117.00 99.16 66 Q2 2024 24 - 1522 1.0 0.053 0.945 9.60 98.00 88.40 MBX Q2 2024 24 - 1531 0.73 0.116 0.24 37.78 153.78 116 King Richard Q3 2024 24 - 1564 0.4 0.086 4.505 2.00 39.00 37.00 66 Q2 2024 24 - 1522 4.0 0.055 0.320 27.89 289.10 261.21 North Slope Q3 2024 24 - 1543 4.7 0.145 0.602 14.5 189.75 175.25 MBX Q3 2024 24 - 1571 0.18 0.01 0.669 13 142 129 North Slope Q3 2024 24 - 1555 1.25 0.129 0.216 40 85 45 King Richard Q3 2024 24 - 1554 0.3 0.002 1.781 4.72 66.90 62.18 66 Q2 2024 24 - 1522 3.66 0.066 0.326 25.65 146.66 121.01 MBX Q3 2024 24 - 1570 1.92 0.2 0.192 42 348 306 Saddle West Q3 2024 24 - 1565 2.9 0.038 0.411 19.20 388.92 369.72 Goldmark Q2 2024 24 - 1529 1.7 0.104 0.326 23.91 127.91 104.00 MBX Q2 2024 24 - 1531 0.5 0.154 0.205 37.00 212.00 175.00 MBX Q2 2024 24 - 1531 3.6 0.126 4.640 1.60 90.00 88.40 MBX Q2 2024 24 - 1531 0.92 0.137 0.198 36.8 58 21.2 King Richard Q3 2024 24 - 1556 0.4 0.032 0.208 35.00 156.00 121.00 Oliver Q2 2024 24 - 1528 7.9 0.532 1.800 4.01 61.00 56.99 North Slope Q2 2024 24 - 1533 2.74 0.071 0.33 21.85 339.85 318 North Slope Q3 2024 24 - 1563 0.4 0.013 1.780 4.00 134.00 130.00 66 Q2 2024 24 - 1522 6.5 0.569 1.185 6.00 365.00 359.00 North Slope Q3 2024 24 - 1543 1.2 0.028 0.530 13.11 197.21 184.10 North Slope Q2 2024 24 - 1536 3.24 0.122 0.451 14.8 259.55 244.75 Boundary Q3 2024 24 - 1548 Centerra Gold Inc. - Mount Milligan Drill Hole Assay Results Period: from January 1, 2024 to December 31, 2024
Ag ppm Cu % Au ppm Core Length (m) To (m) From (m) Target Zone Quarter Drilled Drill Hole 0.4 0.009 0.413 16.00 29.00 13.00 North Slope Q3 2024 24 - 1550 5.02 0.133 2.115 3.1 111.1 108 North Slope Q3 2024 24 - 1567 2.0 1.617 2.143 3.00 230.00 227.00 Oliver Q2 2024 24 - 1525 0.4 0.012 0.388 16.55 141.20 124.65 66 Q1 2024 24 - 1516 1.88 0.011 0.824 7.75 502.25 494.5 North Slope Q3 2024 24 - 1566 0.3 0.011 0.343 18.45 188.45 170 North Slope Q3 2024 24 - 1555 0.4 0.012 1.647 3.84 103.00 99.16 66 Q2 2024 24 - 1522 0.2 0.023 0.231 26.64 275.64 249 MBX Q3 2024 24 - 1570 0.6 0.205 0.205 30.00 308.00 278.00 MBX Q2 2024 24 - 1531 1.6 0.258 0.112 54.86 540.11 485.25 North Slope Q2 2024 24 - 1536 0.6 0.013 4.713 1.3 142 140.7 North Slope Q3 2024 24 - 1555 2.7 0.168 0.154 39.50 303.00 263.50 North Slope Q2 2024 24 - 1534 5.6 0.424 0.331 17.85 530.00 512.15 North Slope Q3 2024 24 - 1550 0.35 0.013 1.468 4 140 136 North Slope Q3 2024 24 - 1566 8.5 0.141 5.212 1.1 111.1 110 North Slope Q3 2024 24 - 1567 1.65 0.054 1.878 3 518 515 North Slope Q3 2024 24 - 1566 2.51 0.081 0.73 7.7 50.5 42.8 North Slope Q3 2024 24 - 1555 1.4 0.030 0.280 20.00 54.00 34.00 Goldmark Q2 2024 24 - 1532 2.7 0.117 0.370 15.00 389.00 374.00 North Slope Q2 2024 24 - 1533 2.4 0.025 3.908 1.4 516.4 515 North Slope Q3 2024 24 - 1566 5.78 0.083 0.567 9.02 91.07 82.05 MBX Q3 2024 24 - 1569 0.2 0.006 0.144 35.40 91.40 56.00 66 Q1 2024 24 - 1515 1.2 0.026 0.282 18.00 145.00 127.00 North Slope Q2 2024 24 - 1533 0.18 0.131 0.208 24.34 28 3.66 MBX Q3 2024 24 - 1569 0.5 0.022 0.282 17.95 78.00 60.05 Goldmark Q2 2024 24 - 1532 1 0.581 1.584 3.19 136 132.81 MBX Q3 2024 24 - 1569 24.6 0.516 9.467 0.53 44.78 44.25 North Slope Q3 2024 24 - 1555 0.6 0.056 0.185 27.00 334.00 307.00 Oliver Q2 2024 24 - 1528 0.5 0.010 2.468 2.00 69.00 67.00 66 Q1 2024 24 - 1517 25.7 0.675 3.496 1.40 419.50 418.10 North Slope Q2 2024 24 - 1536 3.26 0.138 0.261 18.7 411.7 393 North Slope Q3 2024 24 - 1562 4.8 0.315 0.168 28.85 586.20 557.35 North Slope Q3 2024 24 - 1543 1.1 0.114 0.096 49.15 352.15 303.00 North Slope Q2 2024 24 - 1534 5.9 0.037 1.108 4.25 412.25 408.00 Oliver Q2 2024 24 - 1528 1.13 0.431 0.772 6 100 94 MBX Q3 2024 24 - 1568 3.05 0.22 0.217 21.25 412.25 391 North Slope Q3 2024 24 - 1567 16 0.266 4.383 1.05 446.2 445.15 North Slope Q3 2024 24 - 1562 0.7 0.087 0.284 16.00 50.00 34.00 MBX Q2 2024 24 - 1531 9.5 0.035 1.776 2.55 412.25 409.70 Oliver Q2 2024 24 - 1528 0.3 0.028 0.224 20.00 111.00 91.00 Oliver Q2 2024 24 - 1528 113 2.04 4.771 0.93 91.06 90.13 MBX Q3 2024 24 - 1572 0.6 0.085 1.042 4.25 180.25 176.00 North Slope Q3 2024 24 - 1543 Centerra Gold Inc. - Mount Milligan Drill Hole Assay Results Period: from January 1, 2024 to December 31, 2024

Ag ppm Cu % Au ppm Core Length (m) To (m) From (m) Target Zone Quarter Drilled Drill Hole 0.2 0.066 0.167 26.35 301.50 275.15 Oliver Q2 2024 24 - 1528 1.2 0.061 0.545 8.00 52.00 44.00 North Slope Q2 2024 24 - 1534 0.98 0.048 0.435 10 57 47 King Richard Q3 2024 24 - 1564 2.0 0.147 0.123 35.30 259.00 223.70 North Slope Q2 2024 24 - 1534 1.58 0.173 0.134 32 283 251 North Slope Q3 2024 24 - 1562 0.8 0.030 2.129 2.00 136.00 134.00 66 Q2 2024 24 - 1521 1.33 0.125 0.124 33.53 276.3 242.77 North Slope Q3 2024 24 - 1563 2.5 0.029 1.856 2.20 195.70 193.50 North Slope Q2 2024 24 - 1536 2.26 0.09 0.271 15.05 281.55 266.5 Boundary Q3 2024 24 - 1551 5.57 0.178 0.202 20 424 404 North Slope Q3 2024 24 - 1563 0.19 0.081 0.221 18 32 14 MBX Q3 2024 24 - 1568 0.3 0.027 0.242 16.28 60.00 43.72 66 Q2 2024 24 - 1520 32.9 0.366 2.68 1.47 83.52 82.05 MBX Q3 2024 24 - 1569 0.3 0.019 0.277 14.00 160.00 146.00 66 Q2 2024 24 - 1522 11.5 0.053 2.598 1.49 329 327.51 North Slope Q3 2024 24 - 1563 0.43 0.12 0.079 49 259 210 King Richard Q3 2024 24 - 1564 1.1 0.034 0.198 19.55 390.75 371.20 North Slope(heli) Q2 2024 24 - 1540 1.01 0.228 0.18 21.35 558.2 536.85 Boundary Q3 2024 24 - 1548 0.34 0.178 0.232 16.5 154.5 138 MBX Q3 2024 24 - 1571 20.05 0.092 0.576 6.64 159.61 152.97 MBX Q3 2024 24 - 1570 0.54 0.027 0.205 18.58 129.58 111 North Slope Q3 2024 24 - 1558 1.19 0.099 0.173 22 323 301 North Slope Q3 2024 24 - 1555 1.58 0.422 1.121 3.35 187.35 184 King Richard Q3 2024 24 - 1556 0.25 0.015 0.268 14 295 281 MBX Q3 2024 24 - 1570 12.0 0.205 0.323 11.52 286.52 275.00 Goldmark Q2 2024 24 - 1532 9.04 0.065 0.623 5.95 540.45 534.5 North Slope Q3 2024 24 - 1555 4.64 0.009 2.109 1.75 502.25 500.5 North Slope Q3 2024 24 - 1566 1.1 0.039 1.484 2.48 46.48 44.00 North Slope Q2 2024 24 - 1534 1.79 0.099 0.318 11.45 434.45 423 North Slope Q3 2024 24 - 1566 2.0 0.246 0.081 44.17 598.17 554.00 North Slope Q2 2024 24 - 1533 0.1 0.004 1.787 2.00 41.00 39.00 66 Q1 2024 24 - 1516 0.93 0.184 0.139 25.69 33 7.31 North Slope Q3 2024 24 - 1558 6.91 0.157 0.321 11.1 445 433.9 North Slope Q3 2024 24 - 1563 8.3 0.03 1.709 2.07 181 178.93 North Slope Q3 2024 24 - 1567 2.7 0.166 0.124 28.00 218.00 190.00 Goldmark Q2 2024 24 - 1529 0.69 0.124 0.133 25.7 112 86.3 King Richard Q3 2024 24 - 1556 0.86 0.061 0.609 5.6 519 513.4 North Slope Q3 2024 24 - 1555 1.43 0.129 0.221 15.42 356.42 341 Boundary Q3 2024 24 - 1551 3.43 0.177 0.131 26 472 446 North Slope Q3 2024 24 - 1555 0.6 0.083 1.696 2.00 178.00 176.00 North Slope Q3 2024 24 - 1543 0.6 0.146 0.243 13.93 169.00 155.07 MBX Q2 2024 24 - 1531 1.9 0.045 0.198 17 443 426 North Slope Q3 2024 24 - 1558 0.6 0.194 1.674 2.00 48.00 46.00 66 Q1 2024 24 - 1516 0.75 0.091 0.272 12.25 309.25 297 Boundary Q3 2024 24 - 1551 Centerra Gold Inc. - Mount Milligan Drill Hole Assay Results Period: from January 1, 2024 to December 31, 2024
Ag ppm Cu % Au ppm Core Length (m) To (m) From (m) Target Zone Quarter Drilled Drill Hole 3.9 0.018 0.810 4.10 71.00 66.90 DWBX Q2 2024 24 - 1527 12.57 0.304 1.107 3 31 28 King Richard Q3 2024 24 - 1564 4.15 0.084 0.83 4 215 211 North Slope Q3 2024 24 - 1562 2.7 0.080 0.342 9.68 227.00 217.32 North Slope Q2 2024 24 - 1536 0.3 0.099 0.106 31.20 519.20 488.00 North Slope Q2 2024 24 - 1534 2.17 0.044 0.657 5 178 173 Boundary Q3 2024 24 - 1548 2.5 0.193 0.152 21.51 556.00 534.49 North Slope Q3 2024 24 - 1550 1.8 0.164 0.229 14.00 134.00 120.00 66 Q2 2024 24 - 1519 0.8 0.052 1.603 2.00 507.00 505.00 Goldmark Q2 2024 24 - 1529 2.41 0.184 0.181 17.55 356.95 339.4 North Slope Q3 2024 24 - 1558 2.2 0.177 0.153 20.75 383.00 362.25 North Slope Q2 2024 24 - 1534 0.6 0.114 2.267 1.40 182.40 181.00 66 Q1 2024 24 - 1517 24.9 0.273 2.396 1.32 270.00 268.68 Goldmark Q2 2024 24 - 1532 22.1 0.330 1.650 1.90 275.00 273.10 North Slope Q2 2024 24 - 1536 2.97 0.138 0.314 9.97 391.97 382 North Slope Q3 2024 24 - 1563 0.63 0.166 0.072 42.7 569 526.3 North Slope Q3 2024 24 - 1558 27.8 0.459 4.098 0.75 254.55 253.8 Boundary Q3 2024 24 - 1548 2.5 0.143 0.169 18 365 347 North Slope Q3 2024 24 - 1563 1.2 0.059 5.708 0.53 483.26 482.73 North Slope Q2 2024 24 - 1536 0.83 0.097 0.144 21 102 81 King Richard Q3 2024 24 - 1564 0.92 0.125 0.152 19.65 82 62.35 King Richard Q3 2024 24 - 1556 1.0 0.041 0.212 14.00 465.00 451.00 Oliver Q2 2024 24 - 1525 1.3 0.346 0.356 8.29 15 6.71 MBX Q3 2024 24 - 1571 24.7 0.086 2.108 1.4 535.9 534.5 North Slope Q3 2024 24 - 1555 3.44 0.052 0.407 7.2 62.2 55 MBX Q3 2024 24 - 1571 0.81 0.147 0.106 27.4 490.4 463 Boundary Q3 2024 24 - 1548 0.8 0.061 0.115 25.00 328.00 303.00 Goldmark Q2 2024 24 - 1529 0.4 0.016 1.437 2 172 170 North Slope Q3 2024 24 - 1555 0.4 0.016 0.141 19.60 91.60 72.00 66 Q2 2024 24 - 1520 0.4 0.012 0.316 8.70 89.00 80.30 North Slope Q2 2024 24 - 1536 0.73 0.182 0.103 26.6 179.45 152.85 Boundary Q3 2024 24 - 1560 1.71 0.04 0.866 3.15 123.9 120.75 Boundary Q3 2024 24 - 1548 4.06 0.177 0.24 11.3 441 429.7 North Slope Q3 2024 24 - 1555 0.27 0.01 0.118 22.96 140 117.04 North Slope Q3 2024 24 - 1567 1.12 0.111 0.27 10 207 197 MBX Q3 2024 24 - 1572 8.3 0.032 1.687 1.60 69.30 67.70 DWBX Q2 2024 24 - 1527 0.54 0.031 0.299 9 99.8 90.8 King Richard Q3 2024 24 - 1554 1.35 0.101 0.228 11.49 204.49 193 MBX Q3 2024 24 - 1572 0.4 0.048 0.289 9.00 224.00 215.00 Oliver Q2 2024 24 - 1528 2.4 0.107 0.324 7.95 320.95 313 North Slope Q3 2024 24 - 1562 12.02 0.159 0.442 5.77 109.44 103.67 MBX Q3 2024 24 - 1569 0.99 0.069 0.241 10.5 296 285.5 North Slope Q3 2024 24 - 1563 8.9 0.039 0.602 4.20 345.00 340.80 Oliver Q2 2024 24 - 1528 0.64 0.023 0.279 9 203 194 North Slope Q3 2024 24 - 1555 5.2 0.188 2.17 1.15 429.1 427.95 North Slope Q3 2024 24 - 1566 8.5 0.094 1.247 2.00 387.00 385.00 Goldmark Q2 2024 24 - 1529 Centerra Gold Inc. - Mount Milligan Drill Hole Assay Results Period: from January 1, 2024 to December 31, 2024
Ag ppm Cu % Au ppm Core Length (m) To (m) From (m) Target Zone Quarter Drilled Drill Hole 0.1 0.009 0.166 15.00 217.00 202.00 North Slope Q2 2024 24 - 1534 0.31 0.176 0.129 18.9 518.9 500 Boundary Q3 2024 24 - 1548 2.25 0.089 1.133 2.15 32.15 30 North Slope Q3 2024 24 - 1566 1.5 0.106 4.04 0.6 516.6 516 North Slope Q3 2024 24 - 1555 0.4 0.024 0.186 13.00 137.50 124.50 Oliver Q2 2024 24 - 1525 0.09 0.011 0.133 18 167 149 North Slope Q3 2024 24 - 1558 0.45 0.051 0.384 6.2 214.2 208 North Slope Q3 2024 24 - 1555 2.3 0.125 0.181 13.05 444.10 431.05 North Slope Q3 2024 24 - 1543 1.3 0.083 1.175 2.00 82.00 80.00 MBX Q2 2024 24 - 1531 2.7 0.204 0.060 39.15 96.15 57.00 North Slope Q3 2024 24 - 1544 0.43 0.036 0.421 5.51 198.51 193 Boundary Q3 2024 24 - 1552 5.8 0.048 2.317 1 215 214 North Slope Q3 2024 24 - 1562 1.4 0.067 0.267 8.64 93.15 84.51 Goldmark Q2 2024 24 - 1529 3.5 0.022 1.150 2.00 36.00 34.00 Goldmark Q2 2024 24 - 1529 2.1 0.664 1.15 2 98 96 MBX Q3 2024 24 - 1568 4.0 0.056 0.980 2.32 207.32 205.00 Goldmark Q2 2024 24 - 1532 0.33 0.086 0.162 14 112 98 MBX Q3 2024 24 - 1570 1.2 0.186 0.146 15.40 335.40 320.00 North Slope(heli) Q2 2024 24 - 1540 18.7 1.550 2.246 1.00 365.00 364.00 North Slope Q3 2024 24 - 1543 2.7 0.043 1.121 2.00 86.00 84.00 66 Q2 2024 24 - 1519 0.3 0.024 1.649 1.35 112.85 111.50 66 Q1 2024 24 - 1517 0.6 0.014 1.021 2.18 150.66 148.48 66 Q2 2024 24 - 1522 2.69 0.88 1.852 1.2 177 175.8 MBX Q3 2024 24 - 1571 0.2 0.005 1.107 2.00 127.00 125.00 66 Q2 2024 24 - 1521 0.76 0.138 0.158 14 34 20 MBX Q3 2024 24 - 1571 3.3 0.132 1.574 1.4 32.15 30.75 North Slope Q3 2024 24 - 1566 2.8 0.199 0.091 24.00 310.00 286.00 North Slope Q2 2024 24 - 1533 0.14 0.072 0.121 18 39 21 MBX Q3 2024 24 - 1572 1.4 0.052 0.361 6.00 488.00 482.00 North Slope(heli) Q2 2024 24 - 1540 2.7 0.014 0.181 11.95 26.95 15.00 66 Q2 2024 24 - 1519 0.4 0.022 1.073 2.00 66.00 64.00 Goldmark Q2 2024 24 - 1532 0.58 0.131 0.077 27.75 83.75 56 Boundary Q3 2024 24 - 1548 1.6 0.196 0.132 16.07 405.07 389.00 North Slope Q2 2024 24 - 1533 9.9 0.11 1.766 1.2 524.2 523 Saddle West Q3 2024 24 - 1565 24.4 0.041 1.043 2.03 107.00 104.97 66 Q2 2024 24 - 1521 1.2 0.017 0.52 4 180 176 North Slope Q3 2024 24 - 1563 11.7 0.140 1.321 1.56 107.56 106.00 MBX Q2 2024 24 - 1531 17.5 0.268 1.278 1.61 262.71 261.10 North Slope Q2 2024 24 - 1536 0.7 0.121 2.445 0.84 98.79 97.95 MBX Q3 2024 24 - 1571 1.5 0.097 0.113 18.00 368.00 350.00 North Slope Q2 2024 24 - 1541 1.9 0.035 0.252 8.00 393.00 385.00 North Slope Q2 2024 24 - 1534 0.4 0.015 0.251 8.00 58.00 50.00 North Slope Q3 2024 24 - 1550 3.1 0.220 0.176 11.32 475.49 464.17 North Slope Q3 2024 24 - 1550 29.5 0.066 1.649 1.20 342.00 340.80 Oliver Q2 2024 24 - 1528 0.5 0.104 0.058 34.02 525.71 491.69 North Slope Q2 2024 24 - 1533 47.4 0.084 1.07 1.84 156.37 154.53 MBX Q3 2024 24 - 1570 Centerra Gold Inc. - Mount Milligan Drill Hole Assay Results Period: from January 1, 2024 to December 31, 2024
Ag ppm Cu % Au ppm Core Length (m) To (m) From (m) Target Zone Quarter Drilled Drill Hole 1.95 0.125 0.126 15.55 423.15 407.6 North Slope Q3 2024 24 - 1555 0.38 0.047 0.471 4.1 219 214.9 King Richard Q3 2024 24 - 1554 3.5 0.034 1.918 1 174 173 Boundary Q3 2024 24 - 1548 5.7 0.103 1.008 1.9 320.95 319.05 North Slope Q3 2024 24 - 1562 3.6 0.082 1.137 1.68 219.00 217.32 North Slope Q2 2024 24 - 1536 0.4 0.032 0.163 11.7 196.7 185 North Slope Q3 2024 24 - 1566 0.21 0.112 0.21 9 37 28 MBX Q3 2024 24 - 1570 0.4 0.11 0.098 19 186 167 King Richard Q3 2024 24 - 1554 1.7 0.156 0.190 9.75 139.90 130.15 Goldmark Q2 2024 24 - 1529 1.29 0.165 0.11 16.7 506.1 489.4 North Slope Q2 2024 24 - 1546 0.2 0.018 0.152 12.00 44.00 32.00 66 Q1 2024 24 - 1518 2.39 0.641 0.551 3.3 432.05 428.75 North Slope Q2 2024 24 - 1546 0.65 0.154 0.13 13.95 171.95 158 King Richard Q3 2024 24 - 1564 0.18 0.014 0.197 9 243 234 MBX Q3 2024 24 - 1570 0.6 0.049 0.383 4.62 30.02 25.40 66 Q2 2024 24 - 1520 0.3 0.020 0.177 9.70 79.00 69.30 Oliver Q2 2024 24 - 1528 1.6 0.137 0.857 2.00 95.00 93.00 North Slope Q2 2024 24 - 1534 0.3 0.010 0.114 15.00 466.00 451.00 Oliver Q2 2024 24 - 1530 3.04 0.267 0.169 10 265 255 North Slope Q2 2024 24 - 1546 1.7 0.037 0.169 10 182 172 Saddle West Q3 2024 24 - 1565 0.1 0.002 0.280 6.00 155.00 149.00 66 Q1 2024 24 - 1516 1.2 0.103 0.140 12.00 88.00 76.00 North Slope Q2 2024 24 - 1534 3.9 0.163 0.288 5.83 528.25 522.42 North Slope Q3 2024 24 - 1566 0.25 0.029 0.175 9.5 445.5 436 North Slope Q3 2024 24 - 1567 1.5 0.029 0.296 5.56 175.56 170.00 Goldmark Q2 2024 24 - 1532 5.6 1.88 1.724 0.95 432.05 431.1 North Slope Q2 2024 24 - 1546 0.3 0.018 0.272 6.00 465.00 459.00 North Slope Q2 2024 24 - 1534 2.58 0.059 0.272 6 426 420 North Slope Q3 2024 24 - 1562 0.3 0.102 0.102 15.85 330.00 314.15 MBX Q2 2024 24 - 1531 1.2 0.081 1.593 1 197 196 Boundary Q3 2024 24 - 1552 0.5 0.141 0.142 11.20 249.20 238.00 MBX Q2 2024 24 - 1531 1.07 0.11 0.216 7.35 277.75 270.4 Boundary Q3 2024 24 - 1548 3.6 0.125 1.56 1 56 55 MBX Q3 2024 24 - 1571 0.95 0.01 0.198 7.84 129 121.16 Saddle West Q3 2024 24 - 1565 0.73 0.108 0.128 12.1 305.1 293 North Slope Q3 2024 24 - 1562 3.34 0.129 0.143 10.76 325.95 315.19 Boundary Q3 2024 24 - 1548 0.75 0.049 0.216 7.1 239.1 232 Boundary Q3 2024 24 - 1548 1.06 0.107 0.138 11 351 340 Boundary Q3 2024 24 - 1552 0.36 0.04 0.159 9.4 331 321.6 Boundary Q3 2024 24 - 1551 46.7 0.891 2.484 0.6 433.3 432.7 North Slope Q3 2024 24 - 1555 0.7 0.116 0.243 6.1 46.1 40 MBX Q3 2024 24 - 1571 4.4 0.275 0.172 8.6 528.1 519.5 North Slope Q2 2024 24 - 1546 0.3 0.149 0.067 22.00 548.00 526.00 North Slope Q2 2024 24 - 1534 0.6 0.023 0.147 10.00 184.00 174.00 Oliver Q2 2024 24 - 1525 1.03 0.096 0.101 14.5 362.5 348 North Slope Q3 2024 24 - 1562 0.53 0.077 0.145 10 423 413 Boundary Q3 2024 24 - 1548 Centerra Gold Inc. - Mount Milligan Drill Hole Assay Results Period: from January 1, 2024 to December 31, 2024
Ag ppm Cu % Au ppm Core Length (m) To (m) From (m) Target Zone Quarter Drilled Drill Hole 0.2 0.019 0.221 6.55 163.60 157.05 North Slope Q2 2024 24 - 1536 1.99 0.152 0.214 6.65 361.65 355 Saddle West Q3 2024 24 - 1565 1.5 0.102 2.777 0.51 216.76 216.25 Oliver Q2 2024 24 - 1528 0.89 0.102 0.097 14.59 271 256.41 Boundary Q3 2024 24 - 1552 0.61 0.161 0.124 11.28 16 4.72 North Slope Q3 2024 24 - 1566 0.9 0.104 0.075 18.62 280.00 261.38 North Slope Q2 2024 24 - 1533 0.6 0.201 0.122 11.43 578.00 566.57 Goldmark Q2 2024 24 - 1529 1.7 0.034 1.547 0.9 123.9 123 Boundary Q3 2024 24 - 1548 1.8 0.201 1.159 1.19 478.35 477.16 North Slope Q2 2024 24 - 1536 0.83 0.064 0.226 6.07 50.07 44 North Slope Q3 2024 24 - 1562 0.2 0.017 0.127 10.68 139.00 128.32 North Slope Q2 2024 24 - 1536 0.9 0.012 0.366 3.70 123.70 120.00 66 Q1 2024 24 - 1518 0.8 0.034 0.169 8.00 28.00 20.00 Goldmark Q2 2024 24 - 1532 0.3 0.023 0.135 10.00 111.00 101.00 North Slope Q2 2024 24 - 1534 1.2 0.098 0.168 8.00 170.00 162.00 66 Q1 2024 24 - 1518 0.65 0.065 0.149 9 304 295 Boundary Q3 2024 24 - 1560 0.3 0.037 1.136 1.18 149.18 148.00 66 Q2 2024 24 - 1520 7.4 0.16 1.405 0.95 178 177.05 Boundary Q3 2024 24 - 1548 1.3 0.175 0.263 5.00 567.00 562.00 North Slope(heli) Q2 2024 24 - 1540 3.5 1.24 2.389 0.55 176.35 175.8 MBX Q3 2024 24 - 1571 1.96 0.148 0.12 10.9 546.9 536 North Slope Q2 2024 24 - 1546 0.2 0.014 0.172 7.59 112.59 105.00 Goldmark Q2 2024 24 - 1532 4.3 0.727 1.074 1.20 274.00 272.80 Southern Star Q2 2024 24 - 1526 0.05 0.004 0.355 3.63 210.97 207.34 MBX Q3 2024 24 - 1570 0.23 0.019 0.214 6 64 58 North Slope Q3 2024 24 - 1566 2.92 0.213 0.4 3.2 485.4 482.2 North Slope Q3 2024 24 - 1555 2.83 0.305 0.471 2.7 72 69.3 King Richard Q3 2024 24 - 1564 0.3 0.059 0.275 4.60 137.05 132.45 Southern Star Q2 2024 24 - 1526 8.39 0.635 0.575 2.2 282 279.8 North Slope Q3 2024 24 - 1555 0.4 0.232 0.283 4.45 42.45 38 MBX Q3 2024 24 - 1569 0.7 0.087 0.149 8.36 614.00 605.64 Goldmark Q2 2024 24 - 1529 0.4 0.014 1.241 1 150 149 King Richard Q3 2024 24 - 1564 2.16 0.153 0.103 12 454 442 North Slope Q3 2024 24 - 1566 3.02 0.134 0.138 8.95 473.65 464.7 North Slope Q2 2024 24 - 1546 21.8 0.326 1.116 1.1 435 433.9 North Slope Q3 2024 24 - 1563 1.3 0.113 0.076 16 321 305 North Slope Q3 2024 24 - 1558 4.7 0.197 0.093 13.00 98.00 85.00 North Slope Q3 2024 24 - 1553 0.5 0.103 0.134 9.00 95.00 86.00 North Slope Q2 2024 24 - 1539 1.2 0.158 0.081 14.82 172.82 158.00 North Slope Q3 2024 24 - 1544 1.5 0.746 1.179 1 126 125 MBX Q3 2024 24 - 1569 0.36 0.162 0.064 17.85 548 530.15 Saddle West Q3 2024 24 - 1565 1.5 0.025 0.189 6.00 256.00 250.00 66 Q1 2024 24 - 1517 1.6 0.158 0.079 14.08 63.08 49.00 North Slope Q3 2024 24 - 1553 2.7 0.141 0.199 5.58 182.58 177.00 Goldmark Q2 2024 24 - 1529 4.18 0.182 0.272 4.05 345.9 341.85 North Slope Q3 2024 24 - 1555 0.9 0.061 0.160 6.88 458.88 452.00 North Slope Q2 2024 24 - 1536 Centerra Gold Inc. - Mount Milligan Drill Hole Assay Results Period: from January 1, 2024 to December 31, 2024
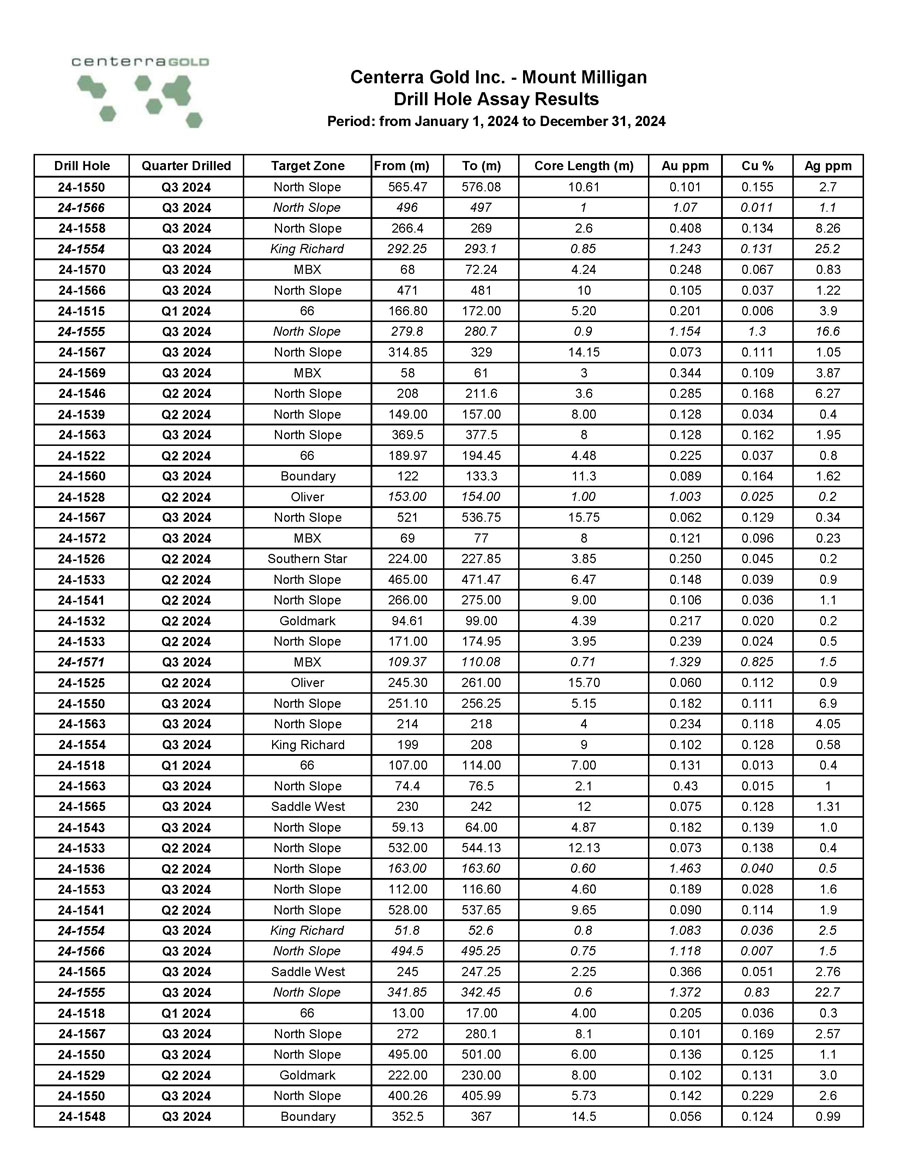
Ag ppm Cu % Au ppm Core Length (m) To (m) From (m) Target Zone Quarter Drilled Drill Hole 2.7 0.155 0.101 10.61 576.08 565.47 North Slope Q3 2024 24 - 1550 1.1 0.011 1.07 1 497 496 North Slope Q3 2024 24 - 1566 8.26 0.134 0.408 2.6 269 266.4 North Slope Q3 2024 24 - 1558 25.2 0.131 1.243 0.85 293.1 292.25 King Richard Q3 2024 24 - 1554 0.83 0.067 0.248 4.24 72.24 68 MBX Q3 2024 24 - 1570 1.22 0.037 0.105 10 481 471 North Slope Q3 2024 24 - 1566 3.9 0.006 0.201 5.20 172.00 166.80 66 Q1 2024 24 - 1515 16.6 1.3 1.154 0.9 280.7 279.8 North Slope Q3 2024 24 - 1555 1.05 0.111 0.073 14.15 329 314.85 North Slope Q3 2024 24 - 1567 3.87 0.109 0.344 3 61 58 MBX Q3 2024 24 - 1569 6.27 0.168 0.285 3.6 211.6 208 North Slope Q2 2024 24 - 1546 0.4 0.034 0.128 8.00 157.00 149.00 North Slope Q2 2024 24 - 1539 1.95 0.162 0.128 8 377.5 369.5 North Slope Q3 2024 24 - 1563 0.8 0.037 0.225 4.48 194.45 189.97 66 Q2 2024 24 - 1522 1.62 0.164 0.089 11.3 133.3 122 Boundary Q3 2024 24 - 1560 0.2 0.025 1.003 1.00 154.00 153.00 Oliver Q2 2024 24 - 1528 0.34 0.129 0.062 15.75 536.75 521 North Slope Q3 2024 24 - 1567 0.23 0.096 0.121 8 77 69 MBX Q3 2024 24 - 1572 0.2 0.045 0.250 3.85 227.85 224.00 Southern Star Q2 2024 24 - 1526 0.9 0.039 0.148 6.47 471.47 465.00 North Slope Q2 2024 24 - 1533 1.1 0.036 0.106 9.00 275.00 266.00 North Slope Q2 2024 24 - 1541 0.2 0.020 0.217 4.39 99.00 94.61 Goldmark Q2 2024 24 - 1532 0.5 0.024 0.239 3.95 174.95 171.00 North Slope Q2 2024 24 - 1533 1.5 0.825 1.329 0.71 110.08 109.37 MBX Q3 2024 24 - 1571 0.9 0.112 0.060 15.70 261.00 245.30 Oliver Q2 2024 24 - 1525 6.9 0.111 0.182 5.15 256.25 251.10 North Slope Q3 2024 24 - 1550 4.05 0.118 0.234 4 218 214 North Slope Q3 2024 24 - 1563 0.58 0.128 0.102 9 208 199 King Richard Q3 2024 24 - 1554 0.4 0.013 0.131 7.00 114.00 107.00 66 Q1 2024 24 - 1518 1 0.015 0.43 2.1 76.5 74.4 North Slope Q3 2024 24 - 1563 1.31 0.128 0.075 12 242 230 Saddle West Q3 2024 24 - 1565 1.0 0.139 0.182 4.87 64.00 59.13 North Slope Q3 2024 24 - 1543 0.4 0.138 0.073 12.13 544.13 532.00 North Slope Q2 2024 24 - 1533 0.5 0.040 1.463 0.60 163.60 163.00 North Slope Q2 2024 24 - 1536 1.6 0.028 0.189 4.60 116.60 112.00 North Slope Q3 2024 24 - 1553 1.9 0.114 0.090 9.65 537.65 528.00 North Slope Q2 2024 24 - 1541 2.5 0.036 1.083 0.8 52.6 51.8 King Richard Q3 2024 24 - 1554 1.5 0.007 1.118 0.75 495.25 494.5 North Slope Q3 2024 24 - 1566 2.76 0.051 0.366 2.25 247.25 245 Saddle West Q3 2024 24 - 1565 22.7 0.83 1.372 0.6 342.45 341.85 North Slope Q3 2024 24 - 1555 0.3 0.036 0.205 4.00 17.00 13.00 66 Q1 2024 24 - 1518 2.57 0.169 0.101 8.1 280.1 272 North Slope Q3 2024 24 - 1567 1.1 0.125 0.136 6.00 501.00 495.00 North Slope Q3 2024 24 - 1550 3.0 0.131 0.102 8.00 230.00 222.00 Goldmark Q2 2024 24 - 1529 2.6 0.229 0.142 5.73 405.99 400.26 North Slope Q3 2024 24 - 1550 0.99 0.124 0.056 14.5 367 352.5 Boundary Q3 2024 24 - 1548 Centerra Gold Inc. - Mount Milligan Drill Hole Assay Results Period: from January 1, 2024 to December 31, 2024
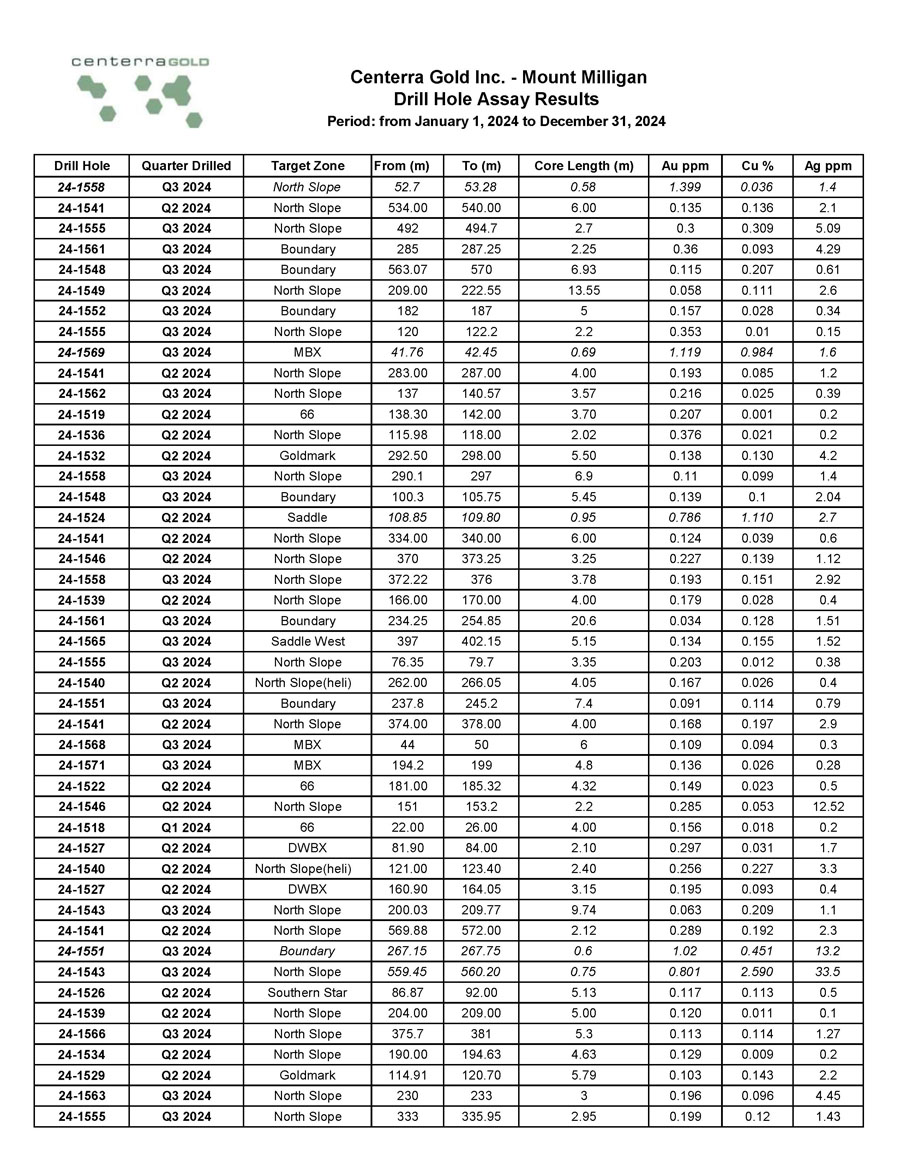
Ag ppm Cu % Au ppm Core Length (m) To (m) From (m) Target Zone Quarter Drilled Drill Hole 1.4 0.036 1.399 0.58 53.28 52.7 North Slope Q3 2024 24 - 1558 2.1 0.136 0.135 6.00 540.00 534.00 North Slope Q2 2024 24 - 1541 5.09 0.309 0.3 2.7 494.7 492 North Slope Q3 2024 24 - 1555 4.29 0.093 0.36 2.25 287.25 285 Boundary Q3 2024 24 - 1561 0.61 0.207 0.115 6.93 570 563.07 Boundary Q3 2024 24 - 1548 2.6 0.111 0.058 13.55 222.55 209.00 North Slope Q3 2024 24 - 1549 0.34 0.028 0.157 5 187 182 Boundary Q3 2024 24 - 1552 0.15 0.01 0.353 2.2 122.2 120 North Slope Q3 2024 24 - 1555 1.6 0.984 1.119 0.69 42.45 41.76 MBX Q3 2024 24 - 1569 1.2 0.085 0.193 4.00 287.00 283.00 North Slope Q2 2024 24 - 1541 0.39 0.025 0.216 3.57 140.57 137 North Slope Q3 2024 24 - 1562 0.2 0.001 0.207 3.70 142.00 138.30 66 Q2 2024 24 - 1519 0.2 0.021 0.376 2.02 118.00 115.98 North Slope Q2 2024 24 - 1536 4.2 0.130 0.138 5.50 298.00 292.50 Goldmark Q2 2024 24 - 1532 1.4 0.099 0.11 6.9 297 290.1 North Slope Q3 2024 24 - 1558 2.04 0.1 0.139 5.45 105.75 100.3 Boundary Q3 2024 24 - 1548 2.7 1.110 0.786 0.95 109.80 108.85 Saddle Q2 2024 24 - 1524 0.6 0.039 0.124 6.00 340.00 334.00 North Slope Q2 2024 24 - 1541 1.12 0.139 0.227 3.25 373.25 370 North Slope Q2 2024 24 - 1546 2.92 0.151 0.193 3.78 376 372.22 North Slope Q3 2024 24 - 1558 0.4 0.028 0.179 4.00 170.00 166.00 North Slope Q2 2024 24 - 1539 1.51 0.128 0.034 20.6 254.85 234.25 Boundary Q3 2024 24 - 1561 1.52 0.155 0.134 5.15 402.15 397 Saddle West Q3 2024 24 - 1565 0.38 0.012 0.203 3.35 79.7 76.35 North Slope Q3 2024 24 - 1555 0.4 0.026 0.167 4.05 266.05 262.00 North Slope(heli) Q2 2024 24 - 1540 0.79 0.114 0.091 7.4 245.2 237.8 Boundary Q3 2024 24 - 1551 2.9 0.197 0.168 4.00 378.00 374.00 North Slope Q2 2024 24 - 1541 0.3 0.094 0.109 6 50 44 MBX Q3 2024 24 - 1568 0.28 0.026 0.136 4.8 199 194.2 MBX Q3 2024 24 - 1571 0.5 0.023 0.149 4.32 185.32 181.00 66 Q2 2024 24 - 1522 12.52 0.053 0.285 2.2 153.2 151 North Slope Q2 2024 24 - 1546 0.2 0.018 0.156 4.00 26.00 22.00 66 Q1 2024 24 - 1518 1.7 0.031 0.297 2.10 84.00 81.90 DWBX Q2 2024 24 - 1527 3.3 0.227 0.256 2.40 123.40 121.00 North Slope(heli) Q2 2024 24 - 1540 0.4 0.093 0.195 3.15 164.05 160.90 DWBX Q2 2024 24 - 1527 1.1 0.209 0.063 9.74 209.77 200.03 North Slope Q3 2024 24 - 1543 2.3 0.192 0.289 2.12 572.00 569.88 North Slope Q2 2024 24 - 1541 13.2 0.451 1.02 0.6 267.75 267.15 Boundary Q3 2024 24 - 1551 33.5 2.590 0.801 0.75 560.20 559.45 North Slope Q3 2024 24 - 1543 0.5 0.113 0.117 5.13 92.00 86.87 Southern Star Q2 2024 24 - 1526 0.1 0.011 0.120 5.00 209.00 204.00 North Slope Q2 2024 24 - 1539 1.27 0.114 0.113 5.3 381 375.7 North Slope Q3 2024 24 - 1566 0.2 0.009 0.129 4.63 194.63 190.00 North Slope Q2 2024 24 - 1534 2.2 0.143 0.103 5.79 120.70 114.91 Goldmark Q2 2024 24 - 1529 4.45 0.096 0.196 3 233 230 North Slope Q3 2024 24 - 1563 1.43 0.12 0.199 2.95 335.95 333 North Slope Q3 2024 24 - 1555 Centerra Gold Inc. - Mount Milligan Drill Hole Assay Results Period: from January 1, 2024 to December 31, 2024
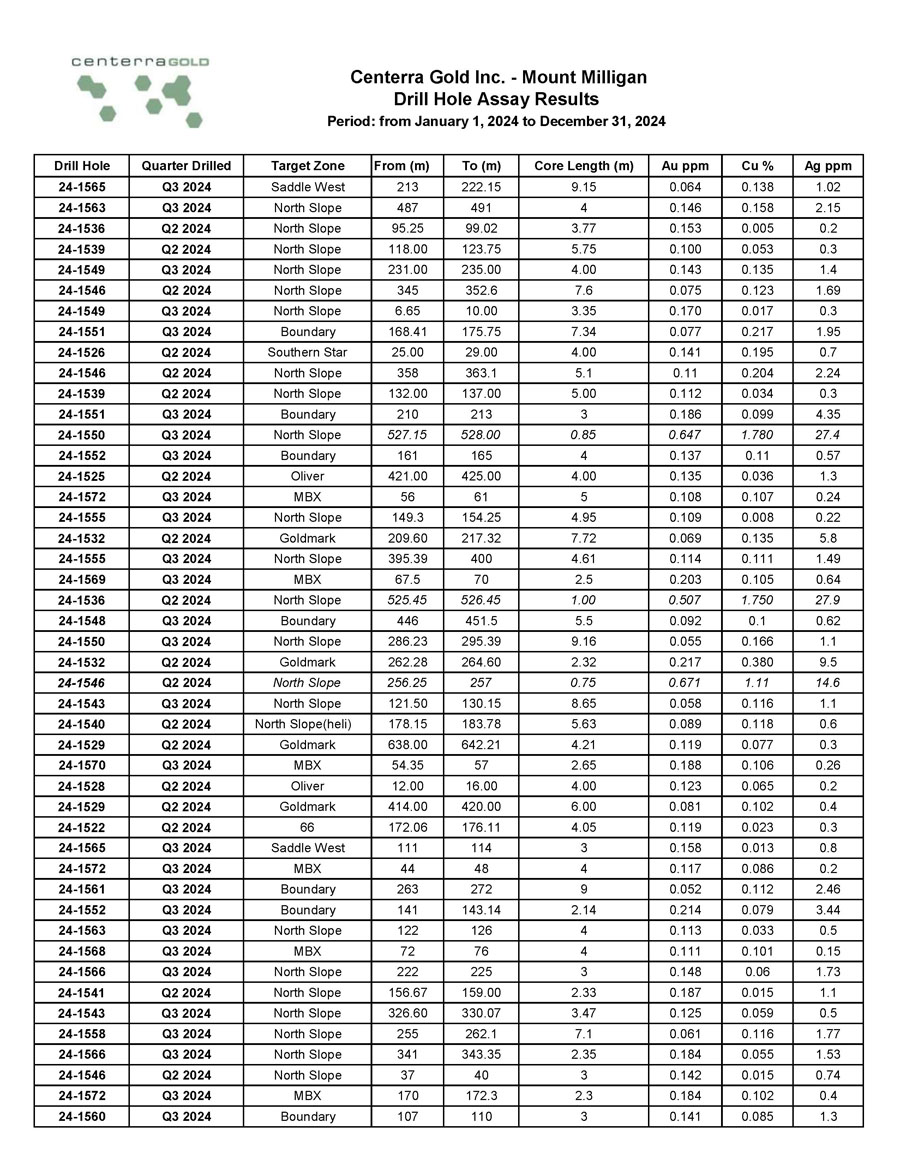
Ag ppm Cu % Au ppm Core Length (m) To (m) From (m) Target Zone Quarter Drilled Drill Hole 1.02 0.138 0.064 9.15 222.15 213 Saddle West Q3 2024 24 - 1565 2.15 0.158 0.146 4 491 487 North Slope Q3 2024 24 - 1563 0.2 0.005 0.153 3.77 99.02 95.25 North Slope Q2 2024 24 - 1536 0.3 0.053 0.100 5.75 123.75 118.00 North Slope Q2 2024 24 - 1539 1.4 0.135 0.143 4.00 235.00 231.00 North Slope Q3 2024 24 - 1549 1.69 0.123 0.075 7.6 352.6 345 North Slope Q2 2024 24 - 1546 0.3 0.017 0.170 3.35 10.00 6.65 North Slope Q3 2024 24 - 1549 1.95 0.217 0.077 7.34 175.75 168.41 Boundary Q3 2024 24 - 1551 0.7 0.195 0.141 4.00 29.00 25.00 Southern Star Q2 2024 24 - 1526 2.24 0.204 0.11 5.1 363.1 358 North Slope Q2 2024 24 - 1546 0.3 0.034 0.112 5.00 137.00 132.00 North Slope Q2 2024 24 - 1539 4.35 0.099 0.186 3 213 210 Boundary Q3 2024 24 - 1551 27.4 1.780 0.647 0.85 528.00 527.15 North Slope Q3 2024 24 - 1550 0.57 0.11 0.137 4 165 161 Boundary Q3 2024 24 - 1552 1.3 0.036 0.135 4.00 425.00 421.00 Oliver Q2 2024 24 - 1525 0.24 0.107 0.108 5 61 56 MBX Q3 2024 24 - 1572 0.22 0.008 0.109 4.95 154.25 149.3 North Slope Q3 2024 24 - 1555 5.8 0.135 0.069 7.72 217.32 209.60 Goldmark Q2 2024 24 - 1532 1.49 0.111 0.114 4.61 400 395.39 North Slope Q3 2024 24 - 1555 0.64 0.105 0.203 2.5 70 67.5 MBX Q3 2024 24 - 1569 27.9 1.750 0.507 1.00 526.45 525.45 North Slope Q2 2024 24 - 1536 0.62 0.1 0.092 5.5 451.5 446 Boundary Q3 2024 24 - 1548 1.1 0.166 0.055 9.16 295.39 286.23 North Slope Q3 2024 24 - 1550 9.5 0.380 0.217 2.32 264.60 262.28 Goldmark Q2 2024 24 - 1532 14.6 1.11 0.671 0.75 257 256.25 North Slope Q2 2024 24 - 1546 1.1 0.116 0.058 8.65 130.15 121.50 North Slope Q3 2024 24 - 1543 0.6 0.118 0.089 5.63 183.78 178.15 North Slope(heli) Q2 2024 24 - 1540 0.3 0.077 0.119 4.21 642.21 638.00 Goldmark Q2 2024 24 - 1529 0.26 0.106 0.188 2.65 57 54.35 MBX Q3 2024 24 - 1570 0.2 0.065 0.123 4.00 16.00 12.00 Oliver Q2 2024 24 - 1528 0.4 0.102 0.081 6.00 420.00 414.00 Goldmark Q2 2024 24 - 1529 0.3 0.023 0.119 4.05 176.11 172.06 66 Q2 2024 24 - 1522 0.8 0.013 0.158 3 114 111 Saddle West Q3 2024 24 - 1565 0.2 0.086 0.117 4 48 44 MBX Q3 2024 24 - 1572 2.46 0.112 0.052 9 272 263 Boundary Q3 2024 24 - 1561 3.44 0.079 0.214 2.14 143.14 141 Boundary Q3 2024 24 - 1552 0.5 0.033 0.113 4 126 122 North Slope Q3 2024 24 - 1563 0.15 0.101 0.111 4 76 72 MBX Q3 2024 24 - 1568 1.73 0.06 0.148 3 225 222 North Slope Q3 2024 24 - 1566 1.1 0.015 0.187 2.33 159.00 156.67 North Slope Q2 2024 24 - 1541 0.5 0.059 0.125 3.47 330.07 326.60 North Slope Q3 2024 24 - 1543 1.77 0.116 0.061 7.1 262.1 255 North Slope Q3 2024 24 - 1558 1.53 0.055 0.184 2.35 343.35 341 North Slope Q3 2024 24 - 1566 0.74 0.015 0.142 3 40 37 North Slope Q2 2024 24 - 1546 0.4 0.102 0.184 2.3 172.3 170 MBX Q3 2024 24 - 1572 1.3 0.085 0.141 3 110 107 Boundary Q3 2024 24 - 1560 Centerra Gold Inc. - Mount Milligan Drill Hole Assay Results Period: from January 1, 2024 to December 31, 2024

Ag ppm Cu % Au ppm Core Length (m) To (m) From (m) Target Zone Quarter Drilled Drill Hole 0.4 0.033 0.110 3.82 300.00 296.18 Oliver Q2 2024 24 - 1530 1.92 0.108 0.116 3.6 506 502.4 North Slope Q3 2024 24 - 1558 0.31 0.094 0.141 2.95 155.1 152.15 King Richard Q3 2024 24 - 1554 0.6 0.125 0.135 3.00 102.00 99.00 Southern Star Q2 2024 24 - 1526 0.65 0.11 0.1 4 93 89 Boundary Q3 2024 24 - 1551 1.2 0.043 0.178 2.13 235.15 233.02 Goldmark Q2 2024 24 - 1532 1.8 0.116 0.093 4.00 156.00 152.00 66 Q2 2024 24 - 1519 0.85 0.105 0.177 2.1 106 103.9 King Richard Q3 2024 24 - 1554 1.78 0.156 0.107 3.38 389.38 386 North Slope Q3 2024 24 - 1566 2.0 0.128 0.172 2.10 496.00 493.90 North Slope Q2 2024 24 - 1541 0.05 0.008 0.177 2.03 488.03 486 North Slope Q3 2024 24 - 1558 0.5 0.097 0.174 2.04 151 148.96 MBX Q3 2024 24 - 1568 0.44 0.038 0.118 3 110 107 Boundary Q3 2024 24 - 1561 0.8 0.020 0.144 2.45 359.45 357.00 Goldmark Q2 2024 24 - 1529 0.5 0.021 0.168 2.08 30.08 28 North Slope Q3 2024 24 - 1562 1.04 0.115 0.075 4.5 149.5 145 Boundary Q3 2024 24 - 1551 0.5 0.180 0.084 4.00 111.00 107.00 North Slope Q2 2024 24 - 1539 0.4 0.020 0.136 2.42 83.00 80.58 North Slope Q2 2024 24 - 1533 1.49 0.113 0.06 5.45 89.95 84.5 Boundary Q3 2024 24 - 1560 2.5 0.112 0.100 3.25 546.65 543.40 North Slope(heli) Q2 2024 24 - 1540 0.57 0.128 0.063 5.15 513 507.85 Saddle West Q3 2024 24 - 1565 4.76 0.166 0.127 2.55 11.55 9 King Richard Q3 2024 24 - 1554 1.0 0.031 0.129 2.45 497.25 494.80 North Slope(heli) Q2 2024 24 - 1540 0.52 0.044 0.14 2.25 210.65 208.4 Boundary Q3 2024 24 - 1548 0.6 0.025 0.123 2.35 257.00 254.65 Oliver Q2 2024 24 - 1528 1.5 0.172 0.069 4.11 427.02 422.91 North Slope Q2 2024 24 - 1533 0.8 0.056 0.118 2.31 220.31 218 Boundary Q3 2024 24 - 1552 1.45 0.132 0.09 3 340.8 337.8 North Slope Q2 2024 24 - 1546 3.1 0.241 0.110 2.42 30.00 27.58 North Slope Q2 2024 24 - 1534 2.2 0.065 0.103 2.49 60.50 58.01 North Slope Q2 2024 24 - 1534 0.5 0.122 0.032 7.99 193.00 185.01 North Slope Q3 2024 24 - 1543 0.77 0.12 0.088 2.9 33.2 30.3 North Slope Q3 2024 24 - 1555 0.7 0.162 0.059 4 230 226 King Richard Q3 2024 24 - 1554 0.5 0.07 0.107 2.13 8.23 6.1 North Slope Q3 2024 24 - 1567 1.0 0.165 0.090 2.48 110.53 108.05 Goldmark Q2 2024 24 - 1529 5.4 0.142 0.075 2.95 493.95 491.00 North Slope(heli) Q2 2024 24 - 1540 1.2 0.153 0.040 5.49 143.75 138.26 North Slope Q3 2024 24 - 1543 0.2 0.102 0.101 2.14 68.28 66.14 MBX Q3 2024 24 - 1568 0.2 0.027 0.101 2.07 227.07 225.00 North Slope Q3 2024 24 - 1543 0.8 0.102 0.102 2.00 66.00 64.00 North Slope Q2 2024 24 - 1534 5.8 0.176 0.067 3.00 384.00 381.00 Boundary(heli) Q2 2024 24 - 1542 0.8 0.101 0.088 2.2 50 47.8 North Slope Q3 2024 24 - 1558 1.9 0.107 0.089 2.17 249.00 246.83 North Slope Q2 2024 24 - 1533 0.7 0.118 0.033 5.63 155.19 149.56 North Slope Q3 2024 24 - 1543 0.84 0.118 0.04 4.5 383.9 379.4 Boundary Q3 2024 24 - 1548 1.15 0.135 0.069 2.55 237 234.45 North Slope Q3 2024 24 - 1555 Centerra Gold Inc. - Mount Milligan Drill Hole Assay Results Period: from January 1, 2024 to December 31, 2024
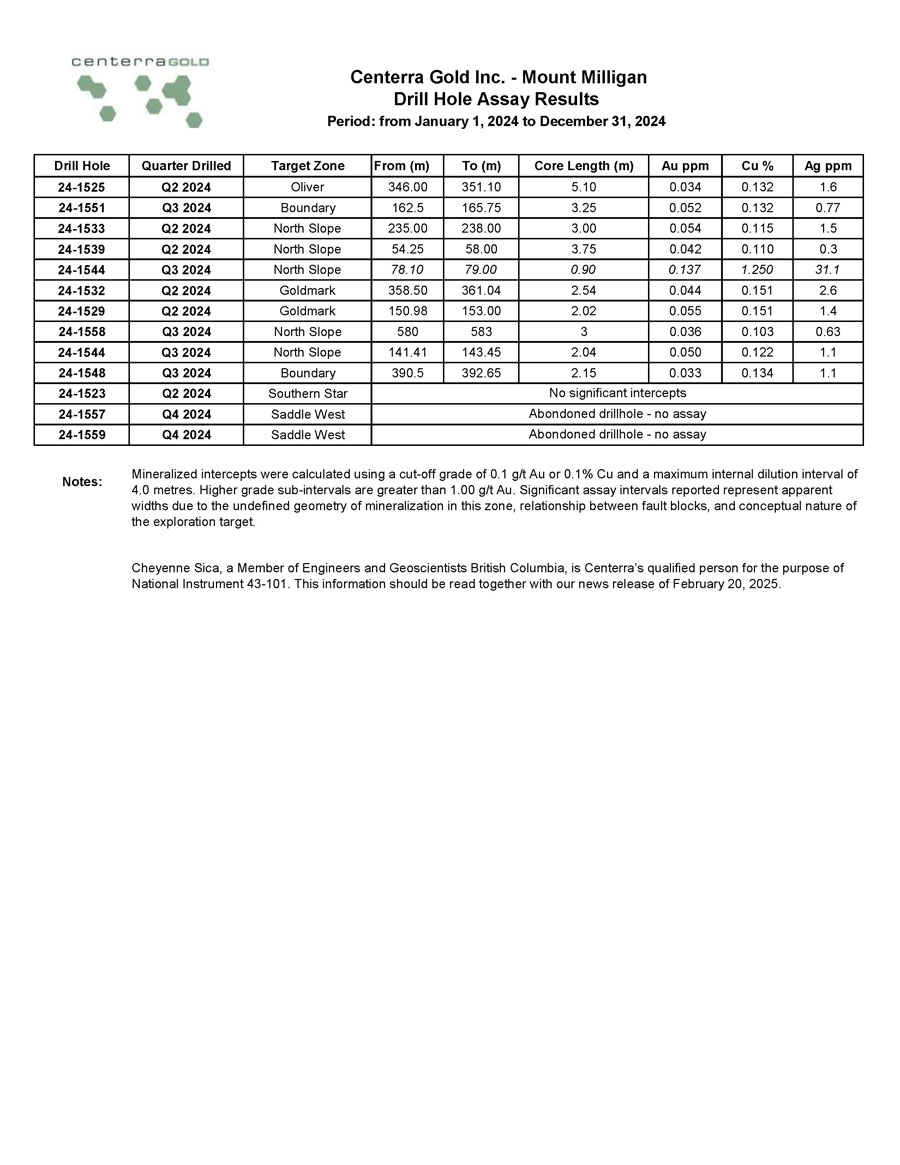
Ag ppm Cu % Au ppm Core Length (m) To (m) From (m) Target Zone Quarter Drilled Drill Hole 1.6 0.132 0.034 5.10 351.10 346.00 Oliver Q2 2024 24 - 1525 0.77 0.132 0.052 3.25 165.75 162.5 Boundary Q3 2024 24 - 1551 1.5 0.115 0.054 3.00 238.00 235.00 North Slope Q2 2024 24 - 1533 0.3 0.110 0.042 3.75 58.00 54.25 North Slope Q2 2024 24 - 1539 31.1 1.250 0.137 0.90 79.00 78.10 North Slope Q3 2024 24 - 1544 2.6 0.151 0.044 2.54 361.04 358.50 Goldmark Q2 2024 24 - 1532 1.4 0.151 0.055 2.02 153.00 150.98 Goldmark Q2 2024 24 - 1529 0.63 0.103 0.036 3 583 580 North Slope Q3 2024 24 - 1558 1.1 0.122 0.050 2.04 143.45 141.41 North Slope Q3 2024 24 - 1544 1.1 0.134 0.033 2.15 392.65 390.5 Boundary Q3 2024 24 - 1548 No significant intercepts Southern Star Q2 2024 24 - 1523 Abondoned drillhole - no assay Saddle West Q4 2024 24 - 1557 Abondoned drillhole - no assay Saddle West Q4 2024 24 - 1559 Centerra Gold Inc. - Mount Milligan Drill Hole Assay Results Period: from January 1, 2024 to December 31, 2024 Notes: Cheyenne Sica, a Member of Engineers and Geoscientists British Columbia, is Centerra’s qualified person for the purpose of National Instrument 43 - 101. This information should be read together with our news release of February 20, 2025. Mineralized intercepts were calculated using a cut - off grade of 0.1 g/t Au or 0.1% Cu and a maximum internal dilution interval of 4.0 metres. Higher grade sub - intervals are greater than 1.00 g/t Au. Significant assay intervals reported represent apparent widths due to the undefined geometry of mineralization in this zone, relationship between fault blocks, and conceptual nature of the exploration target.
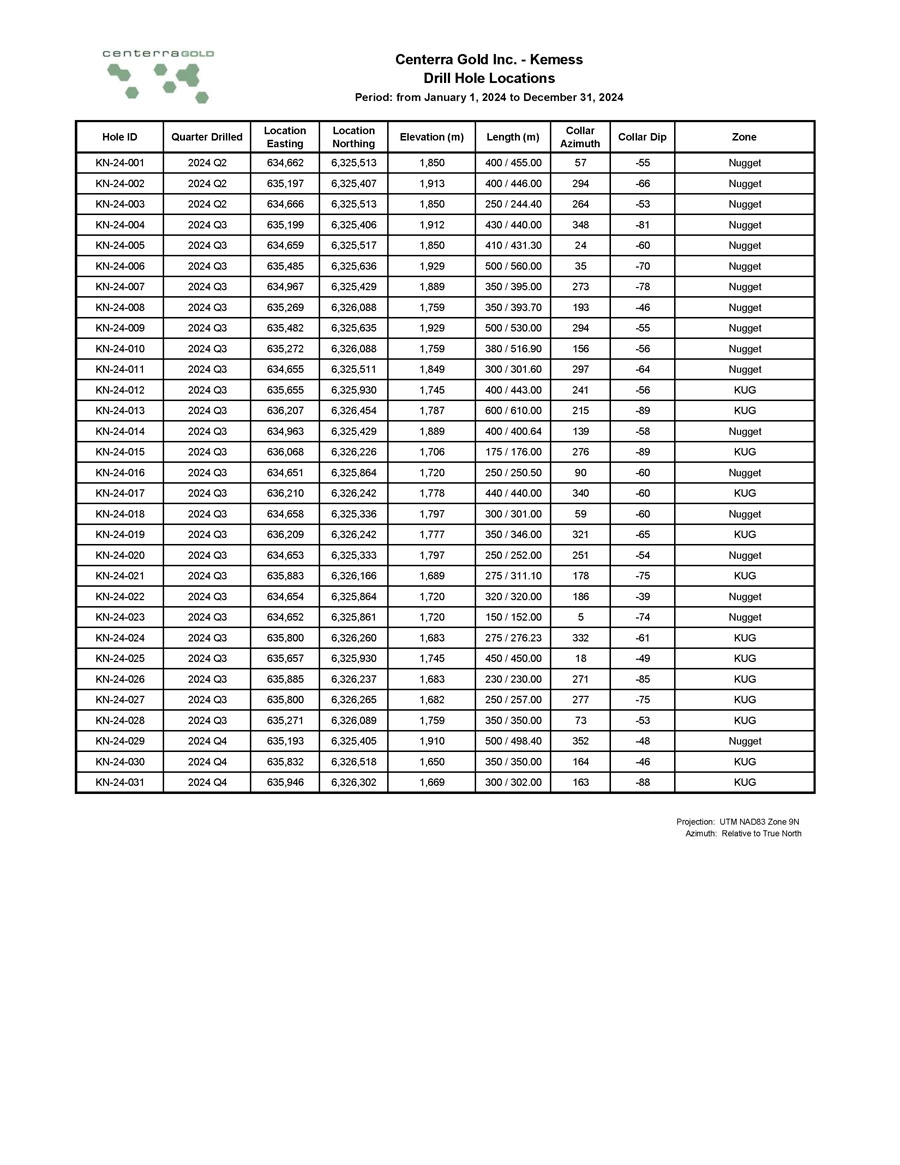
Zone Collar Dip Collar Azimuth Length (m) Elevation (m) Location Northing Location Easting Quarter Drilled Hole ID Nugget - 55 57 400 / 455.00 1,850 6,325,513 634,662 2024 Q2 KN - 24 - 001 Nugget - 66 294 400 / 446.00 1,913 6,325,407 635,197 2024 Q2 KN - 24 - 002 Nugget - 53 264 250 / 244.40 1,850 6,325,513 634,666 2024 Q2 KN - 24 - 003 Nugget - 81 348 430 / 440.00 1,912 6,325,406 635,199 2024 Q3 KN - 24 - 004 Nugget - 60 24 410 / 431.30 1,850 6,325,517 634,659 2024 Q3 KN - 24 - 005 Nugget - 70 35 500 / 560.00 1,929 6,325,636 635,485 2024 Q3 KN - 24 - 006 Nugget - 78 273 350 / 395.00 1,889 6,325,429 634,967 2024 Q3 KN - 24 - 007 Nugget - 46 193 350 / 393.70 1,759 6,326,088 635,269 2024 Q3 KN - 24 - 008 Nugget - 55 294 500 / 530.00 1,929 6,325,635 635,482 2024 Q3 KN - 24 - 009 Nugget - 56 156 380 / 516.90 1,759 6,326,088 635,272 2024 Q3 KN - 24 - 010 Nugget - 64 297 300 / 301.60 1,849 6,325,511 634,655 2024 Q3 KN - 24 - 011 KUG - 56 241 400 / 443.00 1,745 6,325,930 635,655 2024 Q3 KN - 24 - 012 KUG - 89 215 600 / 610.00 1,787 6,326,454 636,207 2024 Q3 KN - 24 - 013 Nugget - 58 139 400 / 400.64 1,889 6,325,429 634,963 2024 Q3 KN - 24 - 014 KUG - 89 276 175 / 176.00 1,706 6,326,226 636,068 2024 Q3 KN - 24 - 015 Nugget - 60 90 250 / 250.50 1,720 6,325,864 634,651 2024 Q3 KN - 24 - 016 KUG - 60 340 440 / 440.00 1,778 6,326,242 636,210 2024 Q3 KN - 24 - 017 Nugget - 60 59 300 / 301.00 1,797 6,325,336 634,658 2024 Q3 KN - 24 - 018 KUG - 65 321 350 / 346.00 1,777 6,326,242 636,209 2024 Q3 KN - 24 - 019 Nugget - 54 251 250 / 252.00 1,797 6,325,333 634,653 2024 Q3 KN - 24 - 020 KUG - 75 178 275 / 311.10 1,689 6,326,166 635,883 2024 Q3 KN - 24 - 021 Nugget - 39 186 320 / 320.00 1,720 6,325,864 634,654 2024 Q3 KN - 24 - 022 Nugget - 74 5 150 / 152.00 1,720 6,325,861 634,652 2024 Q3 KN - 24 - 023 KUG - 61 332 275 / 276.23 1,683 6,326,260 635,800 2024 Q3 KN - 24 - 024 KUG - 49 18 450 / 450.00 1,745 6,325,930 635,657 2024 Q3 KN - 24 - 025 KUG - 85 271 230 / 230.00 1,683 6,326,237 635,885 2024 Q3 KN - 24 - 026 KUG - 75 277 250 / 257.00 1,682 6,326,265 635,800 2024 Q3 KN - 24 - 027 KUG - 53 73 350 / 350.00 1,759 6,326,089 635,271 2024 Q3 KN - 24 - 028 Nugget - 48 352 500 / 498.40 1,910 6,325,405 635,193 2024 Q4 KN - 24 - 029 KUG - 46 164 350 / 350.00 1,650 6,326,518 635,832 2024 Q4 KN - 24 - 030 KUG - 88 163 300 / 302.00 1,669 6,326,302 635,946 2024 Q4 KN - 24 - 031 Projection: UTM NAD83 Zone 9N Azimuth: Relative to True North Centerra Gold Inc. - Kemess Drill Hole Locations Period: from January 1, 2024 to December 31, 2024
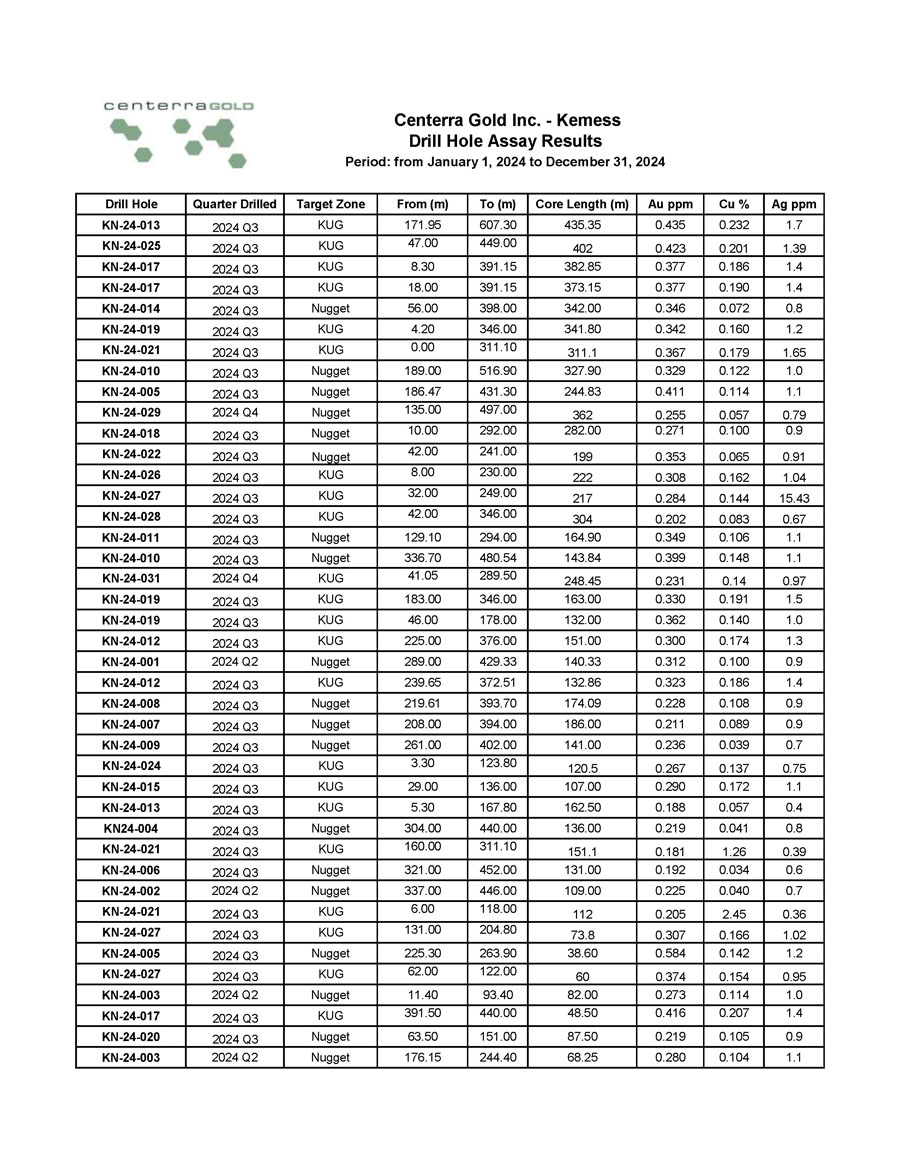
Ag ppm Cu % Au ppm Core Length (m) To (m) From (m) Target Zone Quarter Drilled Drill Hole 1.7 0.232 0.435 435.35 607.30 171.95 KUG 2024 Q3 KN - 24 - 013 1.39 0.201 0.423 402 449.00 47.00 KUG 2024 Q3 KN - 24 - 025 1.4 0.186 0.377 382.85 391.15 8.30 KUG 2024 Q3 KN - 24 - 017 1.4 0.190 0.377 373.15 391.15 18.00 KUG 2024 Q3 KN - 24 - 017 0.8 0.072 0.346 342.00 398.00 56.00 Nugget 2024 Q3 KN - 24 - 014 1.2 0.160 0.342 341.80 346.00 4.20 KUG 2024 Q3 KN - 24 - 019 1.65 0.179 0.367 311.1 311.10 0.00 KUG 2024 Q3 KN - 24 - 021 1.0 0.122 0.329 327.90 516.90 189.00 Nugget 2024 Q3 KN - 24 - 010 1.1 0.114 0.411 244.83 431.30 186.47 Nugget 2024 Q3 KN - 24 - 005 0.79 0.057 0.255 362 497.00 135.00 Nugget 2024 Q4 KN - 24 - 029 0.9 0.100 0.271 282.00 292.00 10.00 Nugget 2024 Q3 KN - 24 - 018 0.91 0.065 0.353 199 241.00 42.00 Nugget 2024 Q3 KN - 24 - 022 1.04 0.162 0.308 222 230.00 8.00 KUG 2024 Q3 KN - 24 - 026 15.43 0.144 0.284 217 249.00 32.00 KUG 2024 Q3 KN - 24 - 027 0.67 0.083 0.202 304 346.00 42.00 KUG 2024 Q3 KN - 24 - 028 1.1 0.106 0.349 164.90 294.00 129.10 Nugget 2024 Q3 KN - 24 - 011 1.1 0.148 0.399 143.84 480.54 336.70 Nugget 2024 Q3 KN - 24 - 010 0.97 0.14 0.231 248.45 289.50 41.05 KUG 2024 Q4 KN - 24 - 031 1.5 0.191 0.330 163.00 346.00 183.00 KUG 2024 Q3 KN - 24 - 019 1.0 0.140 0.362 132.00 178.00 46.00 KUG 2024 Q3 KN - 24 - 019 1.3 0.174 0.300 151.00 376.00 225.00 KUG 2024 Q3 KN - 24 - 012 0.9 0.100 0.312 140.33 429.33 289.00 Nugget 2024 Q2 KN - 24 - 001 1.4 0.186 0.323 132.86 372.51 239.65 KUG 2024 Q3 KN - 24 - 012 0.9 0.108 0.228 174.09 393.70 219.61 Nugget 2024 Q3 KN - 24 - 008 0.9 0.089 0.211 186.00 394.00 208.00 Nugget 2024 Q3 KN - 24 - 007 0.7 0.039 0.236 141.00 402.00 261.00 Nugget 2024 Q3 KN - 24 - 009 0.75 0.137 0.267 120.5 123.80 3.30 KUG 2024 Q3 KN - 24 - 024 1.1 0.172 0.290 107.00 136.00 29.00 KUG 2024 Q3 KN - 24 - 015 0.4 0.057 0.188 162.50 167.80 5.30 KUG 2024 Q3 KN - 24 - 013 0.8 0.041 0.219 136.00 440.00 304.00 Nugget 2024 Q3 KN24 - 004 0.39 1.26 0.181 151.1 311.10 160.00 KUG 2024 Q3 KN - 24 - 021 0.6 0.034 0.192 131.00 452.00 321.00 Nugget 2024 Q3 KN - 24 - 006 0.7 0.040 0.225 109.00 446.00 337.00 Nugget 2024 Q2 KN - 24 - 002 0.36 2.45 0.205 112 118.00 6.00 KUG 2024 Q3 KN - 24 - 021 1.02 0.166 0.307 73.8 204.80 131.00 KUG 2024 Q3 KN - 24 - 027 1.2 0.142 0.584 38.60 263.90 225.30 Nugget 2024 Q3 KN - 24 - 005 0.95 0.154 0.374 60 122.00 62.00 KUG 2024 Q3 KN - 24 - 027 1.0 0.114 0.273 82.00 93.40 11.40 Nugget 2024 Q2 KN - 24 - 003 1.4 0.207 0.416 48.50 440.00 391.50 KUG 2024 Q3 KN - 24 - 017 0.9 0.105 0.219 87.50 151.00 63.50 Nugget 2024 Q3 KN - 24 - 020 1.1 0.104 0.280 68.25 244.40 176.15 Nugget 2024 Q2 KN - 24 - 003 Centerra Gold Inc. - Kemess Drill Hole Assay Results Period: from January 1, 2024 to December 31, 2024

Ag ppm Cu % Au ppm Core Length (m) To (m) From (m) Target Zone Quarter Drilled Drill Hole 1.3 0.141 0.409 44.53 429.33 384.80 Nugget 2024 Q2 KN - 24 - 001 0.9 0.031 0.260 70.00 267.00 197.00 Nugget 2024 Q3 KN24 - 004 2.1 0.130 0.653 27.00 374.00 347.00 Nugget 2024 Q3 KN - 24 - 014 1.1 0.170 0.290 60.00 89.00 29.00 KUG 2024 Q3 KN - 24 - 015 1.0 0.153 0.359 47.70 393.70 346.00 Nugget 2024 Q3 KN - 24 - 008 1.5 0.169 0.530 32.00 198.00 166.00 Nugget 2024 Q3 KN - 24 - 011 1.6 0.175 0.550 30.60 329.90 299.30 Nugget 2024 Q3 KN - 24 - 005 1.0 0.117 0.246 61.00 530.00 469.00 Nugget 2024 Q3 KN - 24 - 009 1.2 0.112 0.933 16.00 341.00 325.00 Nugget 2024 Q3 KN - 24 - 014 1.1 0.136 0.343 42.14 323.14 281.00 Nugget 2024 Q3 KN - 24 - 010 1.1 0.143 0.377 38.00 140.00 102.00 Nugget 2024 Q3 KN - 24 - 014 1.0 0.130 0.263 53.83 128.83 75.00 Nugget 2024 Q3 KN - 24 - 020 1.1 0.114 0.248 56.97 163.30 106.33 Nugget 2024 Q3 KN - 24 - 005 1.1 0.073 0.200 69.00 192.00 123.00 Nugget 2024 Q3 KN24 - 004 1.5 0.147 0.374 36.03 50.13 14.10 Nugget 2024 Q3 KN - 24 - 011 0.5 0.052 0.148 89.00 556.00 467.00 Nugget 2024 Q3 KN - 24 - 006 1.8 0.183 0.552 23.66 161.00 137.34 Nugget 2024 Q3 KN - 24 - 011 0.6 0.061 0.205 63.30 281.30 218.00 Nugget 2024 Q2 KN - 24 - 001 0.44 0.028 0.158 79 102.00 23.00 Nugget 2024 Q3 KN - 24 - 023 1.1 0.165 0.404 30.79 219.50 188.71 Nugget 2024 Q3 KN - 24 - 018 1.3 0.195 0.317 39.00 136.00 97.00 KUG 2024 Q3 KN - 24 - 015 1.2 0.136 0.306 40.00 529.00 489.00 Nugget 2024 Q3 KN - 24 - 009 1.8 0.183 0.573 20.80 360.10 339.30 Nugget 2024 Q3 KN - 24 - 005 0.254 0.75 0.141 84.5 97.00 12.50 KUG 2024 Q3 KN - 24 - 024 1.41 0.101 0.474 25 336.00 311.00 Nugget 2024 Q4 KN - 24 - 029 1.9 0.195 0.505 23.00 43.00 20.00 Nugget 2024 Q3 KN - 24 - 011 2.5 0.150 0.559 20.69 165.69 145.00 Nugget 2024 Q3 KN - 24 - 018 0.9 0.061 0.203 55.00 262.00 207.00 Nugget 2024 Q2 KN - 24 - 002 1.1 0.139 0.364 28.21 139.56 111.35 Nugget 2024 Q3 KN - 24 - 018 0.6 0.098 0.157 65.26 174.00 108.74 KUG 2024 Q4 KN - 24 - 030 0.7 0.089 0.197 49.60 55.00 5.40 Nugget 2024 Q3 KN - 24 - 020 0.8 0.073 0.191 51.15 170.71 119.56 Nugget 2024 Q2 KN - 24 - 003 0.6 0.030 0.245 39.00 329.00 290.00 Nugget 2024 Q2 KN - 24 - 002 1.2 0.121 0.206 46.00 202.00 156.00 Nugget 2024 Q3 KN - 24 - 007 0.9 0.049 0.201 47.00 86.00 39.00 Nugget 2024 Q3 KN - 24 - 007 1.3 0.140 0.350 26.00 333.00 307.00 Nugget 2024 Q3 KN - 24 - 007 0.8 0.093 0.195 45.00 67.00 22.00 Nugget 2024 Q2 KN - 24 - 001 1.3 0.118 0.395 22.00 291.30 269.30 Nugget 2024 Q3 KN - 24 - 005 6.34 0.808 1.734 5 209.00 204.00 KUG 2024 Q3 KN - 24 - 021 0.9 0.143 0.374 22.67 513.67 491.00 Nugget 2024 Q3 KN - 24 - 010 0.8 0.077 0.223 38.00 48.30 10.30 Nugget 2024 Q3 KN - 24 - 005 Centerra Gold Inc. - Kemess Drill Hole Assay Results Period: from January 1, 2024 to December 31, 2024

Ag ppm Cu % Au ppm Core Length (m) To (m) From (m) Target Zone Quarter Drilled Drill Hole 0.84 0.11 0.156 52 312.00 260.00 KUG 2024 Q4 KN - 24 - 030 1.3 0.150 0.342 23.60 155.30 131.70 Nugget 2024 Q3 KN - 24 - 005 0.6 0.039 0.183 44.00 98.00 54.00 Nugget 2024 Q3 KN - 24 - 016 1.1 0.12 0.38 20.55 458.00 437.45 Nugget 2024 Q4 KN - 24 - 029 0.4 0.038 0.151 51.00 67.00 16.00 Nugget 2024 Q3 KN - 24 - 008 0.4 0.039 0.125 59.30 71.00 11.70 Nugget 2024 Q3 KN - 24 - 010 0.8 0.122 0.247 30.00 274.50 244.50 Nugget 2024 Q3 KN - 24 - 018 1.0 0.144 0.433 16.96 372.96 356.00 Nugget 2024 Q2 KN - 24 - 001 9.8 1 7.34 1 49.00 48.00 KUG 2024 Q4 KN - 24 - 031 1.0 0.080 0.183 40.00 115.00 75.00 Nugget 2024 Q2 KN - 24 - 001 1.2 0.148 0.913 8.00 291.00 283.00 Nugget 2024 Q3 KN - 24 - 014 0.7 0.02 0.213 34.15 128.00 93.85 Nugget 2024 Q4 KN - 24 - 029 0.5 0.040 0.396 17.88 174.00 156.12 Nugget 2024 Q2 KN - 24 - 001 1.7 0.239 0.705 10.00 44.40 34.40 Nugget 2024 Q2 KN - 24 - 003 1.02 0.129 0.334 21 188.00 167.00 KUG 2024 Q3 KN - 24 - 028 1.3 0.130 0.387 18.00 412.30 394.30 Nugget 2024 Q3 KN - 24 - 005 0.7 0.076 0.158 44.00 136.00 92.00 Nugget 2024 Q3 KN - 24 - 007 1.1 0.112 0.210 32.28 90.43 58.15 Nugget 2024 Q3 KN - 24 - 005 0.8 0.069 0.175 38.00 95.00 57.00 Nugget 2024 Q3 KN - 24 - 011 1.1 0.096 0.241 27.00 152.00 125.00 Nugget 2024 Q2 KN - 24 - 001 1.1 0.139 0.239 26.40 176.00 149.60 KUG 2024 Q3 KN - 24 - 015 0.5 0.034 0.190 32.19 105.19 73.00 Nugget 2024 Q3 KN - 24 - 008 1.1 0.133 0.257 23.51 340.51 317.00 Nugget 2024 Q3 KN - 24 - 008 1.1 0.121 0.428 14.00 394.00 380.00 Nugget 2024 Q3 KN - 24 - 014 1.0 0.092 0.173 34.55 442.00 407.45 KUG 2024 Q3 KN - 24 - 012 0.9 0.124 0.333 17.90 234.90 217.00 Nugget 2024 Q3 KN - 24 - 010 0.9 0.120 0.252 23.60 29.00 5.40 Nugget 2024 Q3 KN - 24 - 020 0.9 0.116 0.238 24.30 304.00 279.70 Nugget 2024 Q3 KN - 24 - 008 0.5 0.032 0.177 32.00 46.00 14.00 Nugget 2024 Q3 KN - 24 - 016 0.9 0.103 0.310 18.00 272.00 254.00 Nugget 2024 Q3 KN - 24 - 010 150.8 0.166 0.265 21 53.00 32.00 KUG 2024 Q3 KN - 24 - 027 1.2 0.032 0.135 41.00 251.00 210.00 Nugget 2024 Q3 KN - 24 - 009 1.46 0.123 0.546 10 355.00 345.00 Nugget 2024 Q4 KN - 24 - 029 3.14 0.218 0.4 13.6 279.00 265.40 Nugget 2024 Q3 KN - 24 - 022 1.0 0.123 0.386 14.00 388.30 374.30 Nugget 2024 Q3 KN - 24 - 005 0.583 1.72 0.128 42 239.00 197.00 Nugget 2024 Q3 KN - 24 - 022 7.2 0.175 2.644 2 239.00 237.00 Nugget 2024 Q3 KN - 24 - 022 0.81 0.116 0.17 31 350.00 319.00 KUG 2024 Q4 KN - 24 - 030 0.88 0.161 0.237 21.9 151.00 129.10 KUG 2024 Q3 KN - 24 - 024 1.2 0.136 0.345 15.00 82.40 67.40 Nugget 2024 Q2 KN - 24 - 003 0.76 0.108 0.174 29.5 206.50 177.00 KUG 2024 Q3 KN - 24 - 024 Centerra Gold Inc. - Kemess Drill Hole Assay Results Period: from January 1, 2024 to December 31, 2024
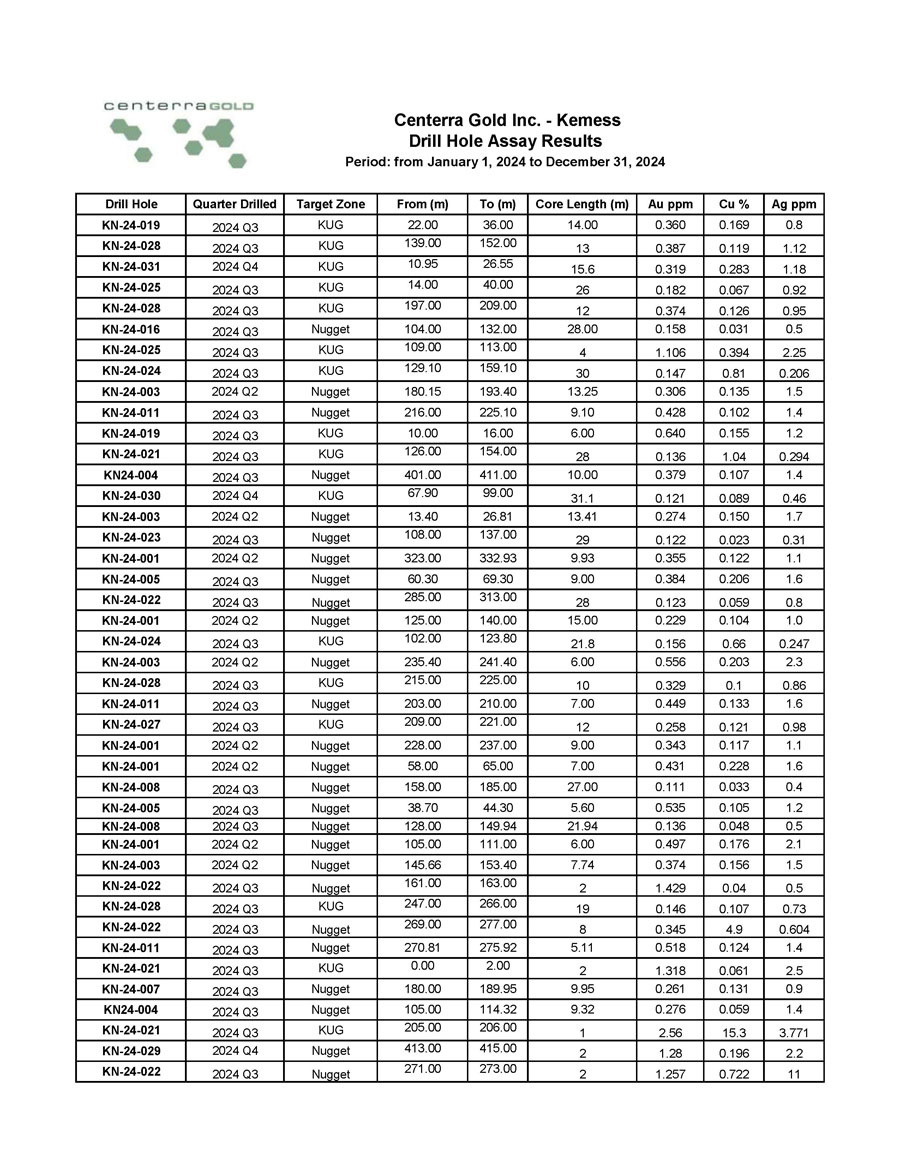
Ag ppm Cu % Au ppm Core Length (m) To (m) From (m) Target Zone Quarter Drilled Drill Hole 0.8 0.169 0.360 14.00 36.00 22.00 KUG 2024 Q3 KN - 24 - 019 1.12 0.119 0.387 13 152.00 139.00 KUG 2024 Q3 KN - 24 - 028 1.18 0.283 0.319 15.6 26.55 10.95 KUG 2024 Q4 KN - 24 - 031 0.92 0.067 0.182 26 40.00 14.00 KUG 2024 Q3 KN - 24 - 025 0.95 0.126 0.374 12 209.00 197.00 KUG 2024 Q3 KN - 24 - 028 0.5 0.031 0.158 28.00 132.00 104.00 Nugget 2024 Q3 KN - 24 - 016 2.25 0.394 1.106 4 113.00 109.00 KUG 2024 Q3 KN - 24 - 025 0.206 0.81 0.147 30 159.10 129.10 KUG 2024 Q3 KN - 24 - 024 1.5 0.135 0.306 13.25 193.40 180.15 Nugget 2024 Q2 KN - 24 - 003 1.4 0.102 0.428 9.10 225.10 216.00 Nugget 2024 Q3 KN - 24 - 011 1.2 0.155 0.640 6.00 16.00 10.00 KUG 2024 Q3 KN - 24 - 019 0.294 1.04 0.136 28 154.00 126.00 KUG 2024 Q3 KN - 24 - 021 1.4 0.107 0.379 10.00 411.00 401.00 Nugget 2024 Q3 KN24 - 004 0.46 0.089 0.121 31.1 99.00 67.90 KUG 2024 Q4 KN - 24 - 030 1.7 0.150 0.274 13.41 26.81 13.40 Nugget 2024 Q2 KN - 24 - 003 0.31 0.023 0.122 29 137.00 108.00 Nugget 2024 Q3 KN - 24 - 023 1.1 0.122 0.355 9.93 332.93 323.00 Nugget 2024 Q2 KN - 24 - 001 1.6 0.206 0.384 9.00 69.30 60.30 Nugget 2024 Q3 KN - 24 - 005 0.8 0.059 0.123 28 313.00 285.00 Nugget 2024 Q3 KN - 24 - 022 1.0 0.104 0.229 15.00 140.00 125.00 Nugget 2024 Q2 KN - 24 - 001 0.247 0.66 0.156 21.8 123.80 102.00 KUG 2024 Q3 KN - 24 - 024 2.3 0.203 0.556 6.00 241.40 235.40 Nugget 2024 Q2 KN - 24 - 003 0.86 0.1 0.329 10 225.00 215.00 KUG 2024 Q3 KN - 24 - 028 1.6 0.133 0.449 7.00 210.00 203.00 Nugget 2024 Q3 KN - 24 - 011 0.98 0.121 0.258 12 221.00 209.00 KUG 2024 Q3 KN - 24 - 027 1.1 0.117 0.343 9.00 237.00 228.00 Nugget 2024 Q2 KN - 24 - 001 1.6 0.228 0.431 7.00 65.00 58.00 Nugget 2024 Q2 KN - 24 - 001 0.4 0.033 0.111 27.00 185.00 158.00 Nugget 2024 Q3 KN - 24 - 008 1.2 0.105 0.535 5.60 44.30 38.70 Nugget 2024 Q3 KN - 24 - 005 0.5 0.048 0.136 21.94 149.94 128.00 Nugget 2024 Q3 KN - 24 - 008 2.1 0.176 0.497 6.00 111.00 105.00 Nugget 2024 Q2 KN - 24 - 001 1.5 0.156 0.374 7.74 153.40 145.66 Nugget 2024 Q2 KN - 24 - 003 0.5 0.04 1.429 2 163.00 161.00 Nugget 2024 Q3 KN - 24 - 022 0.73 0.107 0.146 19 266.00 247.00 KUG 2024 Q3 KN - 24 - 028 0.604 4.9 0.345 8 277.00 269.00 Nugget 2024 Q3 KN - 24 - 022 1.4 0.124 0.518 5.11 275.92 270.81 Nugget 2024 Q3 KN - 24 - 011 2.5 0.061 1.318 2 2.00 0.00 KUG 2024 Q3 KN - 24 - 021 0.9 0.131 0.261 9.95 189.95 180.00 Nugget 2024 Q3 KN - 24 - 007 1.4 0.059 0.276 9.32 114.32 105.00 Nugget 2024 Q3 KN24 - 004 3.771 15.3 2.56 1 206.00 205.00 KUG 2024 Q3 KN - 24 - 021 2.2 0.196 1.28 2 415.00 413.00 Nugget 2024 Q4 KN - 24 - 029 11 0.722 1.257 2 273.00 271.00 Nugget 2024 Q3 KN - 24 - 022 Centerra Gold Inc. - Kemess Drill Hole Assay Results Period: from January 1, 2024 to December 31, 2024
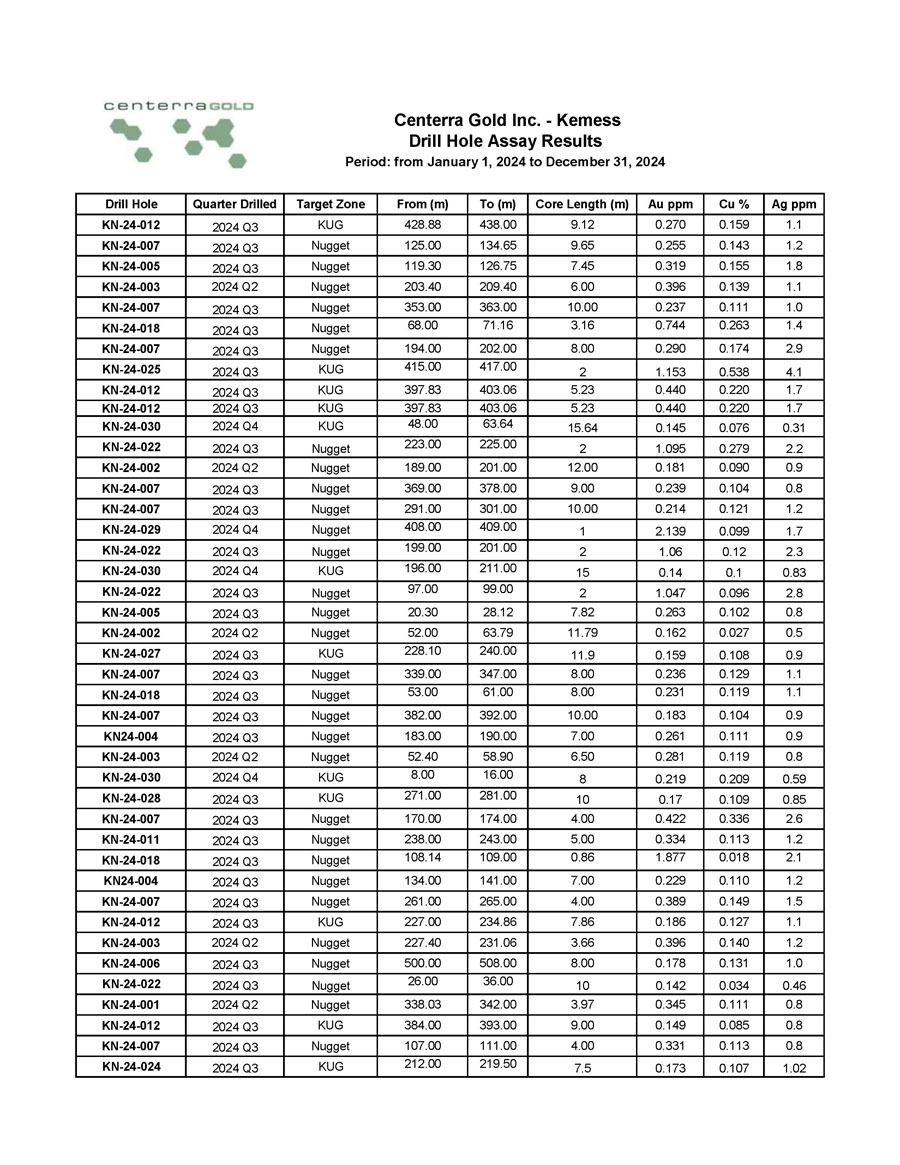
Ag ppm Cu % Au ppm Core Length (m) To (m) From (m) Target Zone Quarter Drilled Drill Hole 1.1 0.159 0.270 9.12 438.00 428.88 KUG 2024 Q3 KN - 24 - 012 1.2 0.143 0.255 9.65 134.65 125.00 Nugget 2024 Q3 KN - 24 - 007 1.8 0.155 0.319 7.45 126.75 119.30 Nugget 2024 Q3 KN - 24 - 005 1.1 0.139 0.396 6.00 209.40 203.40 Nugget 2024 Q2 KN - 24 - 003 1.0 0.111 0.237 10.00 363.00 353.00 Nugget 2024 Q3 KN - 24 - 007 1.4 0.263 0.744 3.16 71.16 68.00 Nugget 2024 Q3 KN - 24 - 018 2.9 0.174 0.290 8.00 202.00 194.00 Nugget 2024 Q3 KN - 24 - 007 4.1 0.538 1.153 2 417.00 415.00 KUG 2024 Q3 KN - 24 - 025 1.7 0.220 0.440 5.23 403.06 397.83 KUG 2024 Q3 KN - 24 - 012 1.7 0.220 0.440 5.23 403.06 397.83 KUG 2024 Q3 KN - 24 - 012 0.31 0.076 0.145 15.64 63.64 48.00 KUG 2024 Q4 KN - 24 - 030 2.2 0.279 1.095 2 225.00 223.00 Nugget 2024 Q3 KN - 24 - 022 0.9 0.090 0.181 12.00 201.00 189.00 Nugget 2024 Q2 KN - 24 - 002 0.8 0.104 0.239 9.00 378.00 369.00 Nugget 2024 Q3 KN - 24 - 007 1.2 0.121 0.214 10.00 301.00 291.00 Nugget 2024 Q3 KN - 24 - 007 1.7 0.099 2.139 1 409.00 408.00 Nugget 2024 Q4 KN - 24 - 029 2.3 0.12 1.06 2 201.00 199.00 Nugget 2024 Q3 KN - 24 - 022 0.83 0.1 0.14 15 211.00 196.00 KUG 2024 Q4 KN - 24 - 030 2.8 0.096 1.047 2 99.00 97.00 Nugget 2024 Q3 KN - 24 - 022 0.8 0.102 0.263 7.82 28.12 20.30 Nugget 2024 Q3 KN - 24 - 005 0.5 0.027 0.162 11.79 63.79 52.00 Nugget 2024 Q2 KN - 24 - 002 0.9 0.108 0.159 11.9 240.00 228.10 KUG 2024 Q3 KN - 24 - 027 1.1 0.129 0.236 8.00 347.00 339.00 Nugget 2024 Q3 KN - 24 - 007 1.1 0.119 0.231 8.00 61.00 53.00 Nugget 2024 Q3 KN - 24 - 018 0.9 0.104 0.183 10.00 392.00 382.00 Nugget 2024 Q3 KN - 24 - 007 0.9 0.111 0.261 7.00 190.00 183.00 Nugget 2024 Q3 KN24 - 004 0.8 0.119 0.281 6.50 58.90 52.40 Nugget 2024 Q2 KN - 24 - 003 0.59 0.209 0.219 8 16.00 8.00 KUG 2024 Q4 KN - 24 - 030 0.85 0.109 0.17 10 281.00 271.00 KUG 2024 Q3 KN - 24 - 028 2.6 0.336 0.422 4.00 174.00 170.00 Nugget 2024 Q3 KN - 24 - 007 1.2 0.113 0.334 5.00 243.00 238.00 Nugget 2024 Q3 KN - 24 - 011 2.1 0.018 1.877 0.86 109.00 108.14 Nugget 2024 Q3 KN - 24 - 018 1.2 0.110 0.229 7.00 141.00 134.00 Nugget 2024 Q3 KN24 - 004 1.5 0.149 0.389 4.00 265.00 261.00 Nugget 2024 Q3 KN - 24 - 007 1.1 0.127 0.186 7.86 234.86 227.00 KUG 2024 Q3 KN - 24 - 012 1.2 0.140 0.396 3.66 231.06 227.40 Nugget 2024 Q2 KN - 24 - 003 1.0 0.131 0.178 8.00 508.00 500.00 Nugget 2024 Q3 KN - 24 - 006 0.46 0.034 0.142 10 36.00 26.00 Nugget 2024 Q3 KN - 24 - 022 0.8 0.111 0.345 3.97 342.00 338.03 Nugget 2024 Q2 KN - 24 - 001 0.8 0.085 0.149 9.00 393.00 384.00 KUG 2024 Q3 KN - 24 - 012 0.8 0.113 0.331 4.00 111.00 107.00 Nugget 2024 Q3 KN - 24 - 007 1.02 0.107 0.173 7.5 219.50 212.00 KUG 2024 Q3 KN - 24 - 024 Centerra Gold Inc. - Kemess Drill Hole Assay Results Period: from January 1, 2024 to December 31, 2024

Ag ppm Cu % Au ppm Core Length (m) To (m) From (m) Target Zone Quarter Drilled Drill Hole 0.4 0.033 0.114 11.10 426.10 415.00 Nugget 2024 Q3 KN - 24 - 009 0.8 0.068 0.157 7.90 107.00 99.10 Nugget 2024 Q3 KN - 24 - 011 0.63 0.094 0.202 6 236.00 230.00 KUG 2024 Q4 KN - 24 - 030 1.8 0.305 1.031 1.16 71.16 70.00 Nugget 2024 Q3 KN - 24 - 018 0.9 0.104 0.198 6.00 197.00 191.00 Nugget 2024 Q2 KN - 24 - 002 1.8 0.014 0.115 10.00 267.00 257.00 Nugget 2024 Q3 KN - 24 - 006 0.77 0.111 0.191 6 346.00 340.00 KUG 2024 Q3 KN - 24 - 028 1.2 0.120 0.286 4.00 224.00 220.00 Nugget 2024 Q3 KN - 24 - 007 1.1 0.049 0.111 10.30 313.30 303.00 Nugget 2024 Q3 KN - 24 - 006 1.2 0.150 0.381 3.00 60.00 57.00 Nugget 2024 Q3 KN - 24 - 011 2.2 0.175 1.116 1 226.00 225.00 Nugget 2024 Q4 KN - 24 - 029 1.6 0.295 1.097 1.00 79.00 78.00 Nugget 2024 Q3 KN - 24 - 018 0.7 0.057 0.167 6.50 175.80 169.30 Nugget 2024 Q3 KN - 24 - 005 0.5 0.037 0.114 9.45 203.45 194.00 Nugget 2024 Q2 KN - 24 - 001 1.1 0.129 0.291 3.69 170.71 167.02 Nugget 2024 Q2 KN - 24 - 003 0.244 1.1 0.143 7.5 200.50 193.00 KUG 2024 Q3 KN - 24 - 024 1.2 0.155 0.264 4.00 285.00 281.00 Nugget 2024 Q3 KN - 24 - 007 0.57 0.086 0.132 8 302.00 294.00 KUG 2024 Q4 KN - 24 - 031 0.6 0.112 0.276 3.80 167.80 164.00 KUG 2024 Q3 KN - 24 - 013 0.3 0.035 0.124 8.00 85.00 77.00 Nugget 2024 Q3 KN - 24 - 010 0.9 0.089 0.105 9 236.00 227.00 KUG 2024 Q3 KN - 24 - 024 1.1 0.143 0.236 4.00 442.00 438.00 Nugget 2024 Q3 KN - 24 - 006 0.7 0.066 0.102 9.00 207.00 198.00 KUG 2024 Q3 KN - 24 - 012 3.6 0.436 1.809 0.5 345.50 345.00 KUG 2024 Q4 KN - 24 - 030 0.7 0.111 0.223 4.00 160.00 156.00 Nugget 2024 Q3 KN - 24 - 007 1.3 0.180 0.352 2.50 40.50 38.00 Nugget 2024 Q3 KN - 24 - 018 0.64 0.109 0.193 4.5 160.50 156.00 KUG 2024 Q3 KN - 24 - 024 0.186 0.73 0.117 7 185.50 178.50 KUG 2024 Q3 KN - 24 - 024 1.2 0.110 0.204 4.00 150.00 146.00 Nugget 2024 Q2 KN - 24 - 001 0.8 0.121 0.163 5.00 480.00 475.00 Nugget 2024 Q3 KN - 24 - 009 0.9 0.104 0.183 4.25 112.55 108.30 Nugget 2024 Q3 KN - 24 - 005 0.4 0.031 0.110 7.00 149.00 142.00 Nugget 2024 Q3 KN - 24 - 016 0.7 0.106 0.187 4.00 201.00 197.00 Nugget 2024 Q3 KN24 - 004 1.2 0.113 0.169 4.41 85.52 81.11 Nugget 2024 Q3 KN - 24 - 005 0.75 0.068 0.141 5.26 253.73 248.47 KUG 2024 Q3 KN - 24 - 024 0.53 0.055 0.105 7 265.00 258.00 KUG 2024 Q3 KN - 24 - 024 1.0 0.050 0.109 6.73 239.73 233.00 Nugget 2024 Q3 KN - 24 - 016 1.19 0.021 0.14 5.15 84.00 78.85 Nugget 2024 Q4 KN - 24 - 029 0.3 0.003 0.102 7.00 286.00 279.00 Nugget 2024 Q3 KN24 - 004 1.5 0.126 0.144 4.95 220.95 216.00 KUG 2024 Q3 KN - 24 - 012 0.6 0.022 0.101 7.00 58.00 51.00 Nugget 2024 Q3 KN24 - 004 0.8 0.077 0.123 5.50 250.00 244.50 Nugget 2024 Q3 KN - 24 - 016 Centerra Gold Inc. - Kemess Drill Hole Assay Results Period: from January 1, 2024 to December 31, 2024
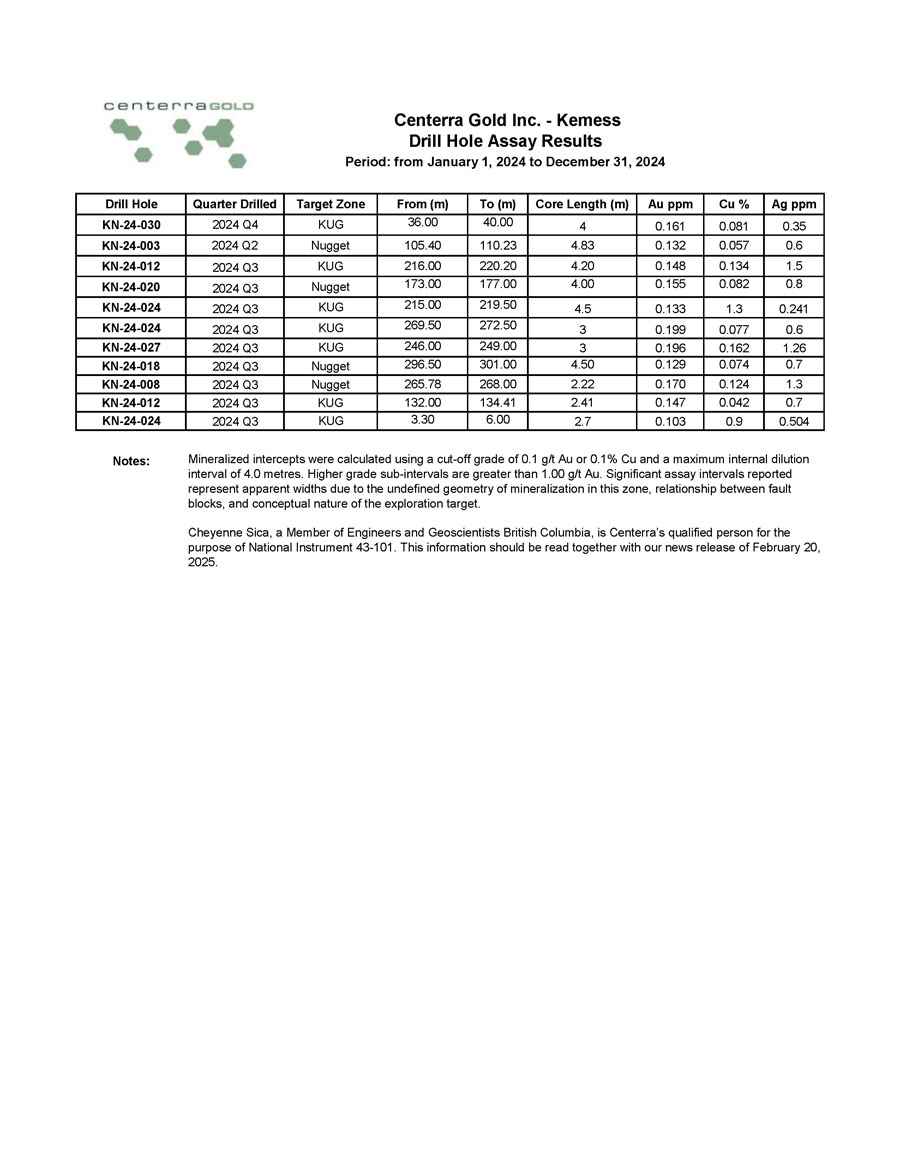
Ag ppm Cu % Au ppm Core Length (m) To (m) From (m) Target Zone Quarter Drilled Drill Hole 0.35 0.081 0.161 4 40.00 36.00 KUG 2024 Q4 KN - 24 - 030 0.6 0.057 0.132 4.83 110.23 105.40 Nugget 2024 Q2 KN - 24 - 003 1.5 0.134 0.148 4.20 220.20 216.00 KUG 2024 Q3 KN - 24 - 012 0.8 0.082 0.155 4.00 177.00 173.00 Nugget 2024 Q3 KN - 24 - 020 0.241 1.3 0.133 4.5 219.50 215.00 KUG 2024 Q3 KN - 24 - 024 0.6 0.077 0.199 3 272.50 269.50 KUG 2024 Q3 KN - 24 - 024 1.26 0.162 0.196 3 249.00 246.00 KUG 2024 Q3 KN - 24 - 027 0.7 0.074 0.129 4.50 301.00 296.50 Nugget 2024 Q3 KN - 24 - 018 1.3 0.124 0.170 2.22 268.00 265.78 Nugget 2024 Q3 KN - 24 - 008 0.7 0.042 0.147 2.41 134.41 132.00 KUG 2024 Q3 KN - 24 - 012 0.504 0.9 0.103 2.7 6.00 3.30 KUG 2024 Q3 KN - 24 - 024 Centerra Gold Inc. - Kemess Drill Hole Assay Results Period: from January 1, 2024 to December 31, 2024 Notes: Mineralized intercepts were calculated using a cut - off grade of 0.1 g/t Au or 0.1% Cu and a maximum internal dilution interval of 4.0 metres. Higher grade sub - intervals are greater than 1.00 g/t Au. Significant assay intervals reported represent apparent widths due to the undefined geometry of mineralization in this zone, relationship between fault blocks, and conceptual nature of the exploration target. Cheyenne Sica, a Member of Engineers and Geoscientists British Columbia, is Centerra’s qualified person for the purpose of National Instrument 43 - 101. This information should be read together with our news release of February 20, 2025.
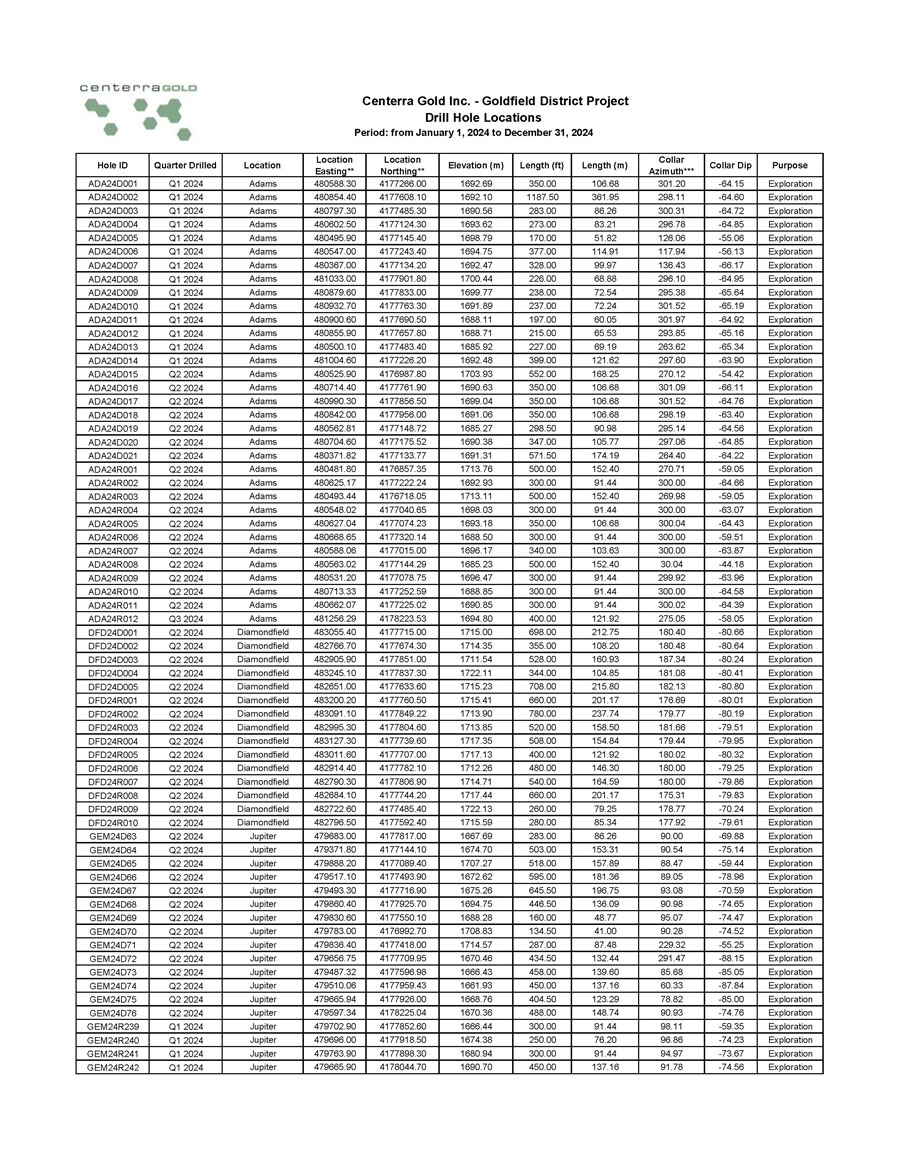
Purpose Collar Dip Collar Azimuth*** Length (m) Length (ft) Elevation (m) Location Northing** Location Easting** Location Quarter Drilled Hole ID Exploration - 64.15 301.20 106.68 350.00 1692.69 4177266.00 480588.30 Adams Q1 2024 ADA24D001 Exploration - 64.60 298.11 361.95 1187.50 1692.10 4177608.10 480854.40 Adams Q1 2024 ADA24D002 Exploration - 64.72 300.31 86.26 283.00 1690.56 4177485.30 480797.30 Adams Q1 2024 ADA24D003 Exploration - 64.85 296.78 83.21 273.00 1693.62 4177124.30 480602.50 Adams Q1 2024 ADA24D004 Exploration - 55.06 126.06 51.82 170.00 1698.79 4177145.40 480495.90 Adams Q1 2024 ADA24D005 Exploration - 56.13 117.94 114.91 377.00 1694.75 4177243.40 480547.00 Adams Q1 2024 ADA24D006 Exploration - 66.17 136.43 99.97 328.00 1692.47 4177134.20 480367.00 Adams Q1 2024 ADA24D007 Exploration - 64.95 296.10 68.88 226.00 1700.44 4177901.80 481033.00 Adams Q1 2024 ADA24D008 Exploration - 65.64 295.38 72.54 238.00 1699.77 4177833.00 480879.60 Adams Q1 2024 ADA24D009 Exploration - 65.19 301.52 72.24 237.00 1691.89 4177763.30 480932.70 Adams Q1 2024 ADA24D010 Exploration - 64.92 301.97 60.05 197.00 1688.11 4177690.50 480900.60 Adams Q1 2024 ADA24D011 Exploration - 65.16 293.85 65.53 215.00 1688.71 4177657.80 480855.90 Adams Q1 2024 ADA24D012 Exploration - 65.34 263.62 69.19 227.00 1685.92 4177483.40 480500.10 Adams Q1 2024 ADA24D013 Exploration - 63.90 297.60 121.62 399.00 1692.48 4177226.20 481004.60 Adams Q1 2024 ADA24D014 Exploration - 54.42 270.12 168.25 552.00 1703.93 4176987.80 480525.90 Adams Q2 2024 ADA24D015 Exploration - 66.11 301.09 106.68 350.00 1690.63 4177761.90 480714.40 Adams Q2 2024 ADA24D016 Exploration - 64.76 301.52 106.68 350.00 1699.04 4177856.50 480990.30 Adams Q2 2024 ADA24D017 Exploration - 63.40 298.19 106.68 350.00 1691.06 4177956.00 480842.00 Adams Q2 2024 ADA24D018 Exploration - 64.56 295.14 90.98 298.50 1685.27 4177148.72 480562.81 Adams Q2 2024 ADA24D019 Exploration - 64.85 297.06 105.77 347.00 1690.38 4177175.52 480704.60 Adams Q2 2024 ADA24D020 Exploration - 64.22 264.40 174.19 571.50 1691.31 4177133.77 480371.82 Adams Q2 2024 ADA24D021 Exploration - 59.05 270.71 152.40 500.00 1713.76 4176857.35 480481.80 Adams Q2 2024 ADA24R001 Exploration - 64.66 300.00 91.44 300.00 1692.93 4177222.24 480625.17 Adams Q2 2024 ADA24R002 Exploration - 59.05 269.98 152.40 500.00 1713.11 4176718.05 480493.44 Adams Q2 2024 ADA24R003 Exploration - 63.07 300.00 91.44 300.00 1698.03 4177040.65 480548.02 Adams Q2 2024 ADA24R004 Exploration - 64.43 300.04 106.68 350.00 1693.18 4177074.23 480627.04 Adams Q2 2024 ADA24R005 Exploration - 59.51 300.00 91.44 300.00 1688.50 4177320.14 480668.65 Adams Q2 2024 ADA24R006 Exploration - 63.87 300.00 103.63 340.00 1696.17 4177015.00 480588.06 Adams Q2 2024 ADA24R007 Exploration - 44.18 30.04 152.40 500.00 1685.23 4177144.29 480563.02 Adams Q2 2024 ADA24R008 Exploration - 63.96 299.92 91.44 300.00 1696.47 4177078.75 480531.20 Adams Q2 2024 ADA24R009 Exploration - 64.58 300.00 91.44 300.00 1688.85 4177252.59 480713.33 Adams Q2 2024 ADA24R010 Exploration - 64.39 300.02 91.44 300.00 1690.85 4177225.02 480662.07 Adams Q2 2024 ADA24R011 Exploration - 58.05 275.05 121.92 400.00 1694.80 4178223.53 481256.29 Adams Q3 2024 ADA24R012 Exploration - 80.66 180.40 212.75 698.00 1715.00 4177715.00 483055.40 Diamondfield Q2 2024 DFD24D001 Exploration - 80.64 180.48 108.20 355.00 1714.35 4177674.30 482766.70 Diamondfield Q2 2024 DFD24D002 Exploration - 80.24 187.34 160.93 528.00 1711.54 4177851.00 482905.90 Diamondfield Q2 2024 DFD24D003 Exploration - 80.41 181.08 104.85 344.00 1722.11 4177837.30 483245.10 Diamondfield Q2 2024 DFD24D004 Exploration - 80.80 182.13 215.80 708.00 1715.23 4177633.60 482651.00 Diamondfield Q2 2024 DFD24D005 Exploration - 80.01 176.69 201.17 660.00 1715.41 4177760.50 483200.20 Diamondfield Q2 2024 DFD24R001 Exploration - 80.19 179.77 237.74 780.00 1713.90 4177849.22 483091.10 Diamondfield Q2 2024 DFD24R002 Exploration - 79.51 181.66 158.50 520.00 1713.85 4177804.60 482995.30 Diamondfield Q2 2024 DFD24R003 Exploration - 79.95 179.44 154.84 508.00 1717.35 4177739.60 483127.30 Diamondfield Q2 2024 DFD24R004 Exploration - 80.32 180.02 121.92 400.00 1717.13 4177707.00 483011.60 Diamondfield Q2 2024 DFD24R005 Exploration - 79.25 180.00 146.30 480.00 1712.26 4177782.10 482914.40 Diamondfield Q2 2024 DFD24R006 Exploration - 79.86 180.00 164.59 540.00 1714.71 4177806.90 482790.30 Diamondfield Q2 2024 DFD24R007 Exploration - 79.83 175.31 201.17 660.00 1717.44 4177744.20 482684.10 Diamondfield Q2 2024 DFD24R008 Exploration - 70.24 178.77 79.25 260.00 1722.13 4177485.40 482722.60 Diamondfield Q2 2024 DFD24R009 Exploration - 79.61 177.92 85.34 280.00 1715.59 4177592.40 482796.50 Diamondfield Q2 2024 DFD24R010 Exploration - 69.88 90.00 86.26 283.00 1667.69 4177817.00 479683.00 Jupiter Q2 2024 GEM24D63 Exploration - 75.14 90.54 153.31 503.00 1674.70 4177144.10 479371.80 Jupiter Q2 2024 GEM24D64 Exploration - 59.44 88.47 157.89 518.00 1707.27 4177089.40 479888.20 Jupiter Q2 2024 GEM24D65 Exploration - 78.96 89.05 181.36 595.00 1672.62 4177493.90 479517.10 Jupiter Q2 2024 GEM24D66 Exploration - 70.59 93.08 196.75 645.50 1675.26 4177716.90 479493.30 Jupiter Q2 2024 GEM24D67 Exploration - 74.65 90.98 136.09 446.50 1694.75 4177925.70 479860.40 Jupiter Q2 2024 GEM24D68 Exploration - 74.47 95.07 48.77 160.00 1688.28 4177550.10 479830.60 Jupiter Q2 2024 GEM24D69 Exploration - 74.52 90.28 41.00 134.50 1708.83 4176992.70 479783.00 Jupiter Q2 2024 GEM24D70 Exploration - 55.25 229.32 87.48 287.00 1714.57 4177418.00 479836.40 Jupiter Q2 2024 GEM24D71 Exploration - 88.15 291.47 132.44 434.50 1670.46 4177709.95 479656.75 Jupiter Q2 2024 GEM24D72 Exploration - 85.05 85.68 139.60 458.00 1666.43 4177596.98 479487.32 Jupiter Q2 2024 GEM24D73 Exploration - 87.84 60.33 137.16 450.00 1661.93 4177959.43 479510.06 Jupiter Q2 2024 GEM24D74 Exploration - 85.00 78.82 123.29 404.50 1668.76 4177926.00 479665.94 Jupiter Q2 2024 GEM24D75 Exploration - 74.76 90.93 148.74 488.00 1670.36 4178225.04 479597.34 Jupiter Q2 2024 GEM24D76 Exploration - 59.35 98.11 91.44 300.00 1666.44 4177852.60 479702.90 Jupiter Q1 2024 GEM24R239 Exploration - 74.23 96.86 76.20 250.00 1674.38 4177918.50 479696.00 Jupiter Q1 2024 GEM24R240 Exploration - 73.67 94.97 91.44 300.00 1680.94 4177898.30 479763.90 Jupiter Q1 2024 GEM24R241 Exploration - 74.56 91.78 137.16 450.00 1690.70 4178044.70 479665.90 Jupiter Q1 2024 GEM24R242 Centerra Gold Inc. - Goldfield District Project Drill Hole Locations Period: from January 1, 2024 to December 31, 2024
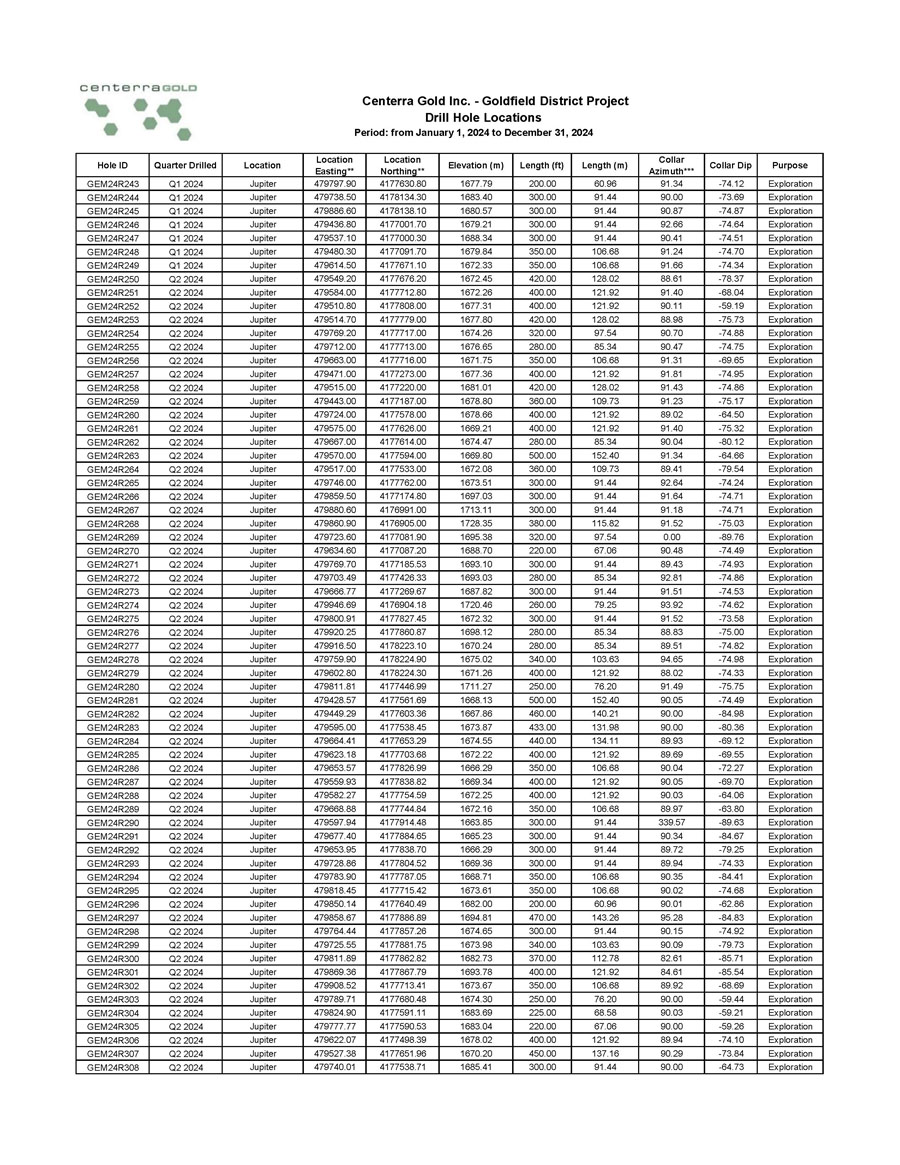
Purpose Collar Dip Collar Azimuth*** Length (m) Length (ft) Elevation (m) Location Northing** Location Easting** Location Quarter Drilled Hole ID Exploration - 74.12 91.34 60.96 200.00 1677.79 4177630.80 479797.90 Jupiter Q1 2024 GEM24R243 Exploration - 73.69 90.00 91.44 300.00 1683.40 4178134.30 479738.50 Jupiter Q1 2024 GEM24R244 Exploration - 74.87 90.87 91.44 300.00 1680.57 4178138.10 479886.60 Jupiter Q1 2024 GEM24R245 Exploration - 74.64 92.66 91.44 300.00 1679.21 4177001.70 479436.80 Jupiter Q1 2024 GEM24R246 Exploration - 74.51 90.41 91.44 300.00 1688.34 4177000.30 479537.10 Jupiter Q1 2024 GEM24R247 Exploration - 74.70 91.24 106.68 350.00 1679.84 4177091.70 479480.30 Jupiter Q1 2024 GEM24R248 Exploration - 74.34 91.66 106.68 350.00 1672.33 4177671.10 479614.50 Jupiter Q1 2024 GEM24R249 Exploration - 78.37 88.61 128.02 420.00 1672.45 4177676.20 479549.20 Jupiter Q2 2024 GEM24R250 Exploration - 68.04 91.40 121.92 400.00 1672.26 4177712.80 479584.00 Jupiter Q2 2024 GEM24R251 Exploration - 59.19 90.11 121.92 400.00 1677.31 4177808.00 479510.80 Jupiter Q2 2024 GEM24R252 Exploration - 75.73 88.98 128.02 420.00 1677.80 4177779.00 479514.70 Jupiter Q2 2024 GEM24R253 Exploration - 74.88 90.70 97.54 320.00 1674.26 4177717.00 479769.20 Jupiter Q2 2024 GEM24R254 Exploration - 74.75 90.47 85.34 280.00 1676.65 4177713.00 479712.00 Jupiter Q2 2024 GEM24R255 Exploration - 69.65 91.31 106.68 350.00 1671.75 4177716.00 479663.00 Jupiter Q2 2024 GEM24R256 Exploration - 74.95 91.81 121.92 400.00 1677.36 4177273.00 479471.00 Jupiter Q2 2024 GEM24R257 Exploration - 74.86 91.43 128.02 420.00 1681.01 4177220.00 479515.00 Jupiter Q2 2024 GEM24R258 Exploration - 75.17 91.23 109.73 360.00 1678.80 4177187.00 479443.00 Jupiter Q2 2024 GEM24R259 Exploration - 64.50 89.02 121.92 400.00 1678.66 4177578.00 479724.00 Jupiter Q2 2024 GEM24R260 Exploration - 75.32 91.40 121.92 400.00 1669.21 4177626.00 479575.00 Jupiter Q2 2024 GEM24R261 Exploration - 80.12 90.04 85.34 280.00 1674.47 4177614.00 479667.00 Jupiter Q2 2024 GEM24R262 Exploration - 64.66 91.34 152.40 500.00 1669.80 4177594.00 479570.00 Jupiter Q2 2024 GEM24R263 Exploration - 79.54 89.41 109.73 360.00 1672.08 4177533.00 479517.00 Jupiter Q2 2024 GEM24R264 Exploration - 74.24 92.64 91.44 300.00 1673.51 4177762.00 479746.00 Jupiter Q2 2024 GEM24R265 Exploration - 74.71 91.64 91.44 300.00 1697.03 4177174.80 479859.50 Jupiter Q2 2024 GEM24R266 Exploration - 74.71 91.18 91.44 300.00 1713.11 4176991.00 479880.60 Jupiter Q2 2024 GEM24R267 Exploration - 75.03 91.52 115.82 380.00 1728.35 4176905.00 479860.90 Jupiter Q2 2024 GEM24R268 Exploration - 89.76 0.00 97.54 320.00 1695.38 4177081.90 479723.60 Jupiter Q2 2024 GEM24R269 Exploration - 74.49 90.48 67.06 220.00 1688.70 4177087.20 479634.60 Jupiter Q2 2024 GEM24R270 Exploration - 74.93 89.43 91.44 300.00 1693.10 4177185.53 479769.70 Jupiter Q2 2024 GEM24R271 Exploration - 74.86 92.81 85.34 280.00 1693.03 4177426.33 479703.49 Jupiter Q2 2024 GEM24R272 Exploration - 74.53 91.51 91.44 300.00 1687.82 4177269.67 479666.77 Jupiter Q2 2024 GEM24R273 Exploration - 74.62 93.92 79.25 260.00 1720.46 4176904.18 479946.69 Jupiter Q2 2024 GEM24R274 Exploration - 73.58 91.52 91.44 300.00 1672.32 4177827.45 479800.91 Jupiter Q2 2024 GEM24R275 Exploration - 75.00 88.83 85.34 280.00 1698.12 4177860.87 479920.25 Jupiter Q2 2024 GEM24R276 Exploration - 74.82 89.51 85.34 280.00 1670.24 4178223.10 479916.50 Jupiter Q2 2024 GEM24R277 Exploration - 74.98 94.65 103.63 340.00 1675.02 4178224.90 479759.90 Jupiter Q2 2024 GEM24R278 Exploration - 74.33 88.02 121.92 400.00 1671.26 4178224.30 479602.80 Jupiter Q2 2024 GEM24R279 Exploration - 75.75 91.49 76.20 250.00 1711.27 4177446.99 479811.81 Jupiter Q2 2024 GEM24R280 Exploration - 74.49 90.05 152.40 500.00 1668.13 4177561.69 479428.57 Jupiter Q2 2024 GEM24R281 Exploration - 84.98 90.00 140.21 460.00 1667.86 4177603.36 479449.29 Jupiter Q2 2024 GEM24R282 Exploration - 80.36 90.00 131.98 433.00 1673.87 4177538.45 479595.00 Jupiter Q2 2024 GEM24R283 Exploration - 69.12 89.93 134.11 440.00 1674.55 4177653.29 479664.41 Jupiter Q2 2024 GEM24R284 Exploration - 69.55 89.69 121.92 400.00 1672.22 4177703.68 479623.18 Jupiter Q2 2024 GEM24R285 Exploration - 72.27 90.04 106.68 350.00 1666.29 4177826.99 479653.57 Jupiter Q2 2024 GEM24R286 Exploration - 69.70 90.05 121.92 400.00 1669.34 4177838.82 479559.93 Jupiter Q2 2024 GEM24R287 Exploration - 64.06 90.03 121.92 400.00 1672.25 4177754.59 479582.27 Jupiter Q2 2024 GEM24R288 Exploration - 63.80 89.97 106.68 350.00 1672.16 4177744.84 479668.88 Jupiter Q2 2024 GEM24R289 Exploration - 89.63 339.57 91.44 300.00 1663.85 4177914.48 479597.94 Jupiter Q2 2024 GEM24R290 Exploration - 84.67 90.34 91.44 300.00 1665.23 4177884.65 479677.40 Jupiter Q2 2024 GEM24R291 Exploration - 79.25 89.72 91.44 300.00 1666.29 4177838.70 479653.95 Jupiter Q2 2024 GEM24R292 Exploration - 74.33 89.94 91.44 300.00 1669.36 4177804.52 479728.86 Jupiter Q2 2024 GEM24R293 Exploration - 84.41 90.35 106.68 350.00 1668.71 4177787.05 479783.90 Jupiter Q2 2024 GEM24R294 Exploration - 74.68 90.02 106.68 350.00 1673.61 4177715.42 479818.45 Jupiter Q2 2024 GEM24R295 Exploration - 62.86 90.01 60.96 200.00 1682.00 4177640.49 479850.14 Jupiter Q2 2024 GEM24R296 Exploration - 84.83 95.28 143.26 470.00 1694.81 4177886.89 479858.67 Jupiter Q2 2024 GEM24R297 Exploration - 74.92 90.15 91.44 300.00 1674.65 4177857.26 479764.44 Jupiter Q2 2024 GEM24R298 Exploration - 79.73 90.09 103.63 340.00 1673.98 4177881.75 479725.55 Jupiter Q2 2024 GEM24R299 Exploration - 85.71 82.61 112.78 370.00 1682.73 4177862.82 479811.89 Jupiter Q2 2024 GEM24R300 Exploration - 85.54 84.61 121.92 400.00 1693.78 4177867.79 479869.36 Jupiter Q2 2024 GEM24R301 Exploration - 68.69 89.92 106.68 350.00 1673.67 4177713.41 479908.52 Jupiter Q2 2024 GEM24R302 Exploration - 59.44 90.00 76.20 250.00 1674.30 4177680.48 479789.71 Jupiter Q2 2024 GEM24R303 Exploration - 59.21 90.03 68.58 225.00 1683.69 4177591.11 479824.90 Jupiter Q2 2024 GEM24R304 Exploration - 59.26 90.00 67.06 220.00 1683.04 4177590.53 479777.77 Jupiter Q2 2024 GEM24R305 Exploration - 74.10 89.94 121.92 400.00 1678.02 4177498.39 479622.07 Jupiter Q2 2024 GEM24R306 Exploration - 73.84 90.29 137.16 450.00 1670.20 4177651.96 479527.38 Jupiter Q2 2024 GEM24R307 Exploration - 64.73 90.00 91.44 300.00 1685.41 4177538.71 479740.01 Jupiter Q2 2024 GEM24R308 Centerra Gold Inc. - Goldfield District Project Drill Hole Locations Period: from January 1, 2024 to December 31, 2024
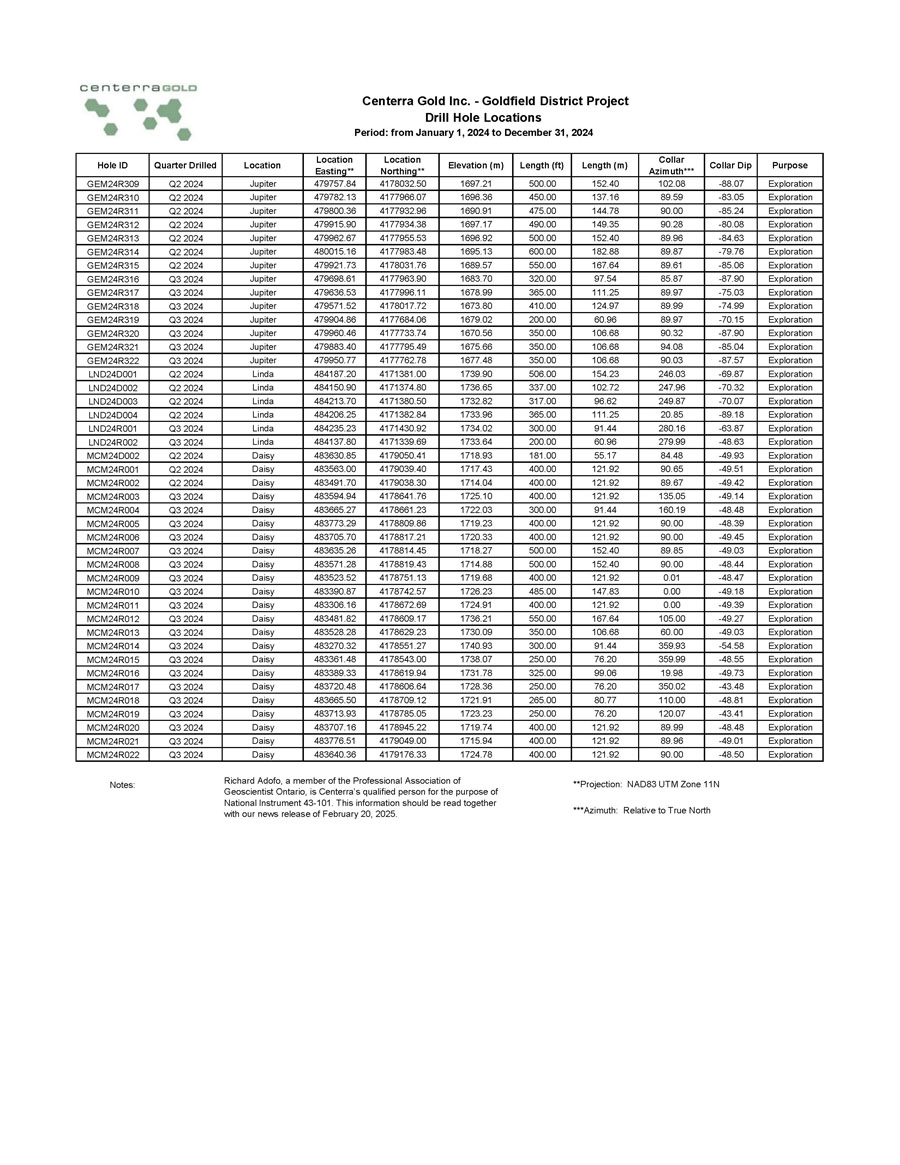
Purpose Collar Dip Collar Azimuth*** Length (m) Length (ft) Elevation (m) Location Northing** Location Easting** Location Quarter Drilled Hole ID Exploration - 88.07 102.08 152.40 500.00 1697.21 4178032.50 479757.84 Jupiter Q2 2024 GEM24R309 Exploration - 83.05 89.59 137.16 450.00 1696.36 4177966.07 479782.13 Jupiter Q2 2024 GEM24R310 Exploration - 85.24 90.00 144.78 475.00 1690.91 4177932.96 479800.36 Jupiter Q2 2024 GEM24R311 Exploration - 80.08 90.28 149.35 490.00 1697.17 4177934.38 479915.90 Jupiter Q2 2024 GEM24R312 Exploration - 84.63 89.96 152.40 500.00 1696.92 4177955.53 479962.67 Jupiter Q2 2024 GEM24R313 Exploration - 79.76 89.87 182.88 600.00 1695.13 4177983.48 480015.16 Jupiter Q2 2024 GEM24R314 Exploration - 85.06 89.61 167.64 550.00 1689.57 4178031.76 479921.73 Jupiter Q2 2024 GEM24R315 Exploration - 87.90 85.87 97.54 320.00 1683.70 4177963.90 479698.61 Jupiter Q3 2024 GEM24R316 Exploration - 75.03 89.97 111.25 365.00 1678.99 4177996.11 479636.53 Jupiter Q3 2024 GEM24R317 Exploration - 74.99 89.99 124.97 410.00 1673.80 4178017.72 479571.52 Jupiter Q3 2024 GEM24R318 Exploration - 70.15 89.97 60.96 200.00 1679.02 4177684.06 479904.86 Jupiter Q3 2024 GEM24R319 Exploration - 87.90 90.32 106.68 350.00 1670.56 4177733.74 479960.46 Jupiter Q3 2024 GEM24R320 Exploration - 85.04 94.08 106.68 350.00 1675.66 4177795.49 479883.40 Jupiter Q3 2024 GEM24R321 Exploration - 87.57 90.03 106.68 350.00 1677.48 4177762.78 479950.77 Jupiter Q3 2024 GEM24R322 Exploration - 69.87 246.03 154.23 506.00 1739.90 4171381.00 484187.20 Linda Q2 2024 LND24D001 Exploration - 70.32 247.96 102.72 337.00 1736.65 4171374.80 484150.90 Linda Q2 2024 LND24D002 Exploration - 70.07 249.87 96.62 317.00 1732.82 4171380.50 484213.70 Linda Q2 2024 LND24D003 Exploration - 89.18 20.85 111.25 365.00 1733.96 4171382.84 484206.25 Linda Q2 2024 LND24D004 Exploration - 63.87 280.16 91.44 300.00 1734.02 4171430.92 484235.23 Linda Q3 2024 LND24R001 Exploration - 48.63 279.99 60.96 200.00 1733.64 4171339.69 484137.80 Linda Q3 2024 LND24R002 Exploration - 49.93 84.48 55.17 181.00 1718.93 4179050.41 483630.85 Daisy Q2 2024 MCM24D002 Exploration - 49.51 90.65 121.92 400.00 1717.43 4179039.40 483563.00 Daisy Q2 2024 MCM24R001 Exploration - 49.42 89.67 121.92 400.00 1714.04 4179038.30 483491.70 Daisy Q2 2024 MCM24R002 Exploration - 49.14 135.05 121.92 400.00 1725.10 4178641.76 483594.94 Daisy Q3 2024 MCM24R003 Exploration - 48.48 160.19 91.44 300.00 1722.03 4178661.23 483665.27 Daisy Q3 2024 MCM24R004 Exploration - 48.39 90.00 121.92 400.00 1719.23 4178809.86 483773.29 Daisy Q3 2024 MCM24R005 Exploration - 49.45 90.00 121.92 400.00 1720.33 4178817.21 483705.70 Daisy Q3 2024 MCM24R006 Exploration - 49.03 89.85 152.40 500.00 1718.27 4178814.45 483635.26 Daisy Q3 2024 MCM24R007 Exploration - 48.44 90.00 152.40 500.00 1714.88 4178819.43 483571.28 Daisy Q3 2024 MCM24R008 Exploration - 48.47 0.01 121.92 400.00 1719.68 4178751.13 483523.52 Daisy Q3 2024 MCM24R009 Exploration - 49.18 0.00 147.83 485.00 1726.23 4178742.57 483390.87 Daisy Q3 2024 MCM24R010 Exploration - 49.39 0.00 121.92 400.00 1724.91 4178672.69 483306.16 Daisy Q3 2024 MCM24R011 Exploration - 49.27 105.00 167.64 550.00 1736.21 4178609.17 483481.82 Daisy Q3 2024 MCM24R012 Exploration - 49.03 60.00 106.68 350.00 1730.09 4178629.23 483528.28 Daisy Q3 2024 MCM24R013 Exploration - 54.58 359.93 91.44 300.00 1740.93 4178551.27 483270.32 Daisy Q3 2024 MCM24R014 Exploration - 48.55 359.99 76.20 250.00 1738.07 4178543.00 483361.48 Daisy Q3 2024 MCM24R015 Exploration - 49.73 19.98 99.06 325.00 1731.78 4178619.94 483389.33 Daisy Q3 2024 MCM24R016 Exploration - 43.48 350.02 76.20 250.00 1728.36 4178606.64 483720.48 Daisy Q3 2024 MCM24R017 Exploration - 48.81 110.00 80.77 265.00 1721.91 4178709.12 483665.50 Daisy Q3 2024 MCM24R018 Exploration - 43.41 120.07 76.20 250.00 1723.23 4178785.05 483713.93 Daisy Q3 2024 MCM24R019 Exploration - 48.48 89.99 121.92 400.00 1719.74 4178945.22 483707.16 Daisy Q3 2024 MCM24R020 Exploration - 49.01 89.96 121.92 400.00 1715.94 4179049.00 483776.51 Daisy Q3 2024 MCM24R021 Exploration - 48.50 90.00 121.92 400.00 1724.78 4179176.33 483640.36 Daisy Q3 2024 MCM24R022 Centerra Gold Inc. - Goldfield District Project Drill Hole Locations Period: from January 1, 2024 to December 31, 2024 Notes: Richard Adofo, a member of the Professional Association of Geoscientist Ontario, is Centerra’s qualified person for the purpose of National Instrument 43 - 101. This information should be read together with our news release of February 20, 2025. **Projection: NAD83 UTM Zone 11N ***Azimuth: Relative to True North
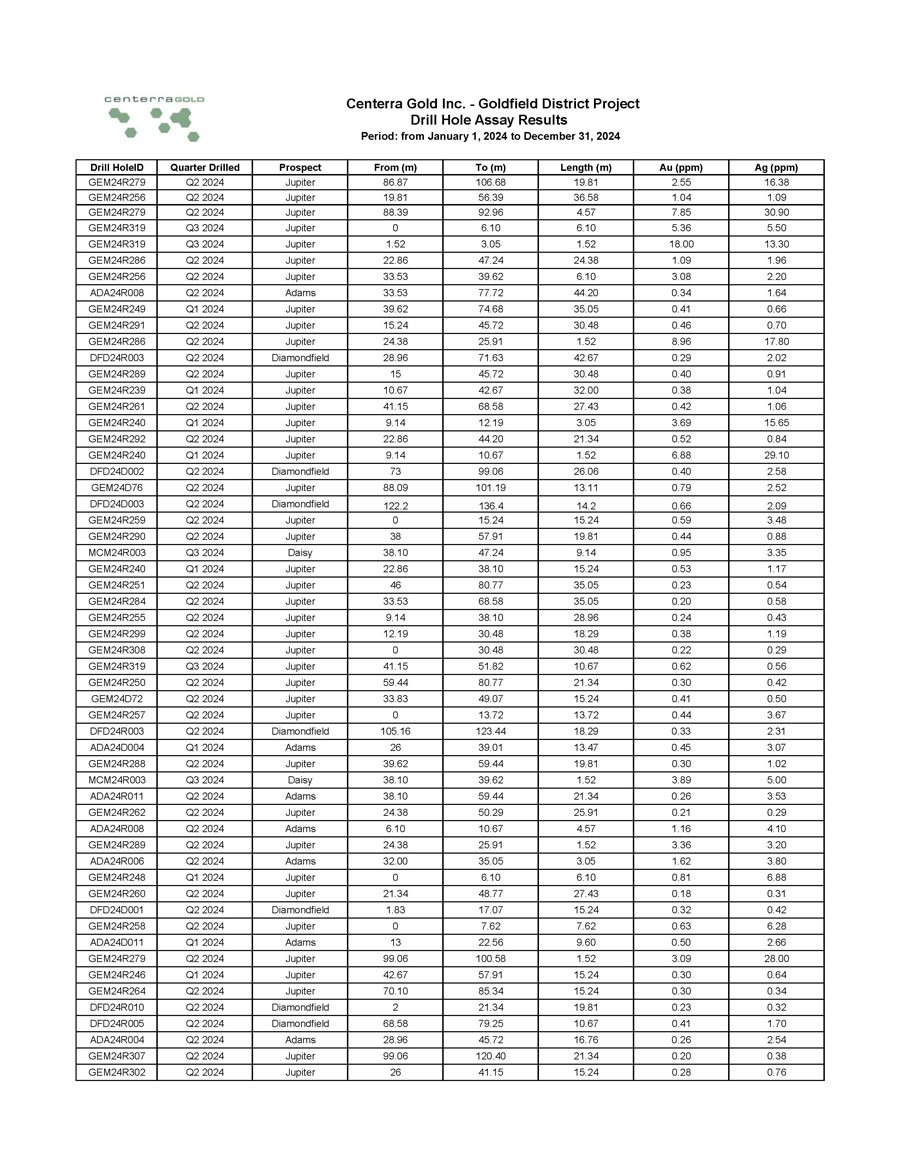
Ag (ppm) Au (ppm) Length (m) To (m) From (m) Prospect Quarter Drilled Drill HoleID 16.38 2.55 19.81 106.68 86.87 Jupiter Q2 2024 GEM24R279 1.09 1.04 36.58 56.39 19.81 Jupiter Q2 2024 GEM24R256 30.90 7.85 4.57 92.96 88.39 Jupiter Q2 2024 GEM24R279 5.50 5.36 6.10 6.10 0 Jupiter Q3 2024 GEM24R319 13.30 18.00 1.52 3.05 1.52 Jupiter Q3 2024 GEM24R319 1.96 1.09 24.38 47.24 22.86 Jupiter Q2 2024 GEM24R286 2.20 3.08 6.10 39.62 33.53 Jupiter Q2 2024 GEM24R256 1.64 0.34 44.20 77.72 33.53 Adams Q2 2024 ADA24R008 0.66 0.41 35.05 74.68 39.62 Jupiter Q1 2024 GEM24R249 0.70 0.46 30.48 45.72 15.24 Jupiter Q2 2024 GEM24R291 17.80 8.96 1.52 25.91 24.38 Jupiter Q2 2024 GEM24R286 2.02 0.29 42.67 71.63 28.96 Diamondfield Q2 2024 DFD24R003 0.91 0.40 30.48 45.72 15 Jupiter Q2 2024 GEM24R289 1.04 0.38 32.00 42.67 10.67 Jupiter Q1 2024 GEM24R239 1.06 0.42 27.43 68.58 41.15 Jupiter Q2 2024 GEM24R261 15.65 3.69 3.05 12.19 9.14 Jupiter Q1 2024 GEM24R240 0.84 0.52 21.34 44.20 22.86 Jupiter Q2 2024 GEM24R292 29.10 6.88 1.52 10.67 9.14 Jupiter Q1 2024 GEM24R240 2.58 0.40 26.06 99.06 73 Diamondfield Q2 2024 DFD24D002 2.52 0.79 13.11 101.19 88.09 Jupiter Q2 2024 GEM24D76 2.09 0.66 14.2 136.4 122.2 Diamondfield Q2 2024 DFD24D003 3.48 0.59 15.24 15.24 0 Jupiter Q2 2024 GEM24R259 0.88 0.44 19.81 57.91 38 Jupiter Q2 2024 GEM24R290 3.35 0.95 9.14 47.24 38.10 Daisy Q3 2024 MCM24R003 1.17 0.53 15.24 38.10 22.86 Jupiter Q1 2024 GEM24R240 0.54 0.23 35.05 80.77 46 Jupiter Q2 2024 GEM24R251 0.58 0.20 35.05 68.58 33.53 Jupiter Q2 2024 GEM24R284 0.43 0.24 28.96 38.10 9.14 Jupiter Q2 2024 GEM24R255 1.19 0.38 18.29 30.48 12.19 Jupiter Q2 2024 GEM24R299 0.29 0.22 30.48 30.48 0 Jupiter Q2 2024 GEM24R308 0.56 0.62 10.67 51.82 41.15 Jupiter Q3 2024 GEM24R319 0.42 0.30 21.34 80.77 59.44 Jupiter Q2 2024 GEM24R250 0.50 0.41 15.24 49.07 33.83 Jupiter Q2 2024 GEM24D72 3.67 0.44 13.72 13.72 0 Jupiter Q2 2024 GEM24R257 2.31 0.33 18.29 123.44 105.16 Diamondfield Q2 2024 DFD24R003 3.07 0.45 13.47 39.01 26 Adams Q1 2024 ADA24D004 1.02 0.30 19.81 59.44 39.62 Jupiter Q2 2024 GEM24R288 5.00 3.89 1.52 39.62 38.10 Daisy Q3 2024 MCM24R003 3.53 0.26 21.34 59.44 38.10 Adams Q2 2024 ADA24R011 0.29 0.21 25.91 50.29 24.38 Jupiter Q2 2024 GEM24R262 4.10 1.16 4.57 10.67 6.10 Adams Q2 2024 ADA24R008 3.20 3.36 1.52 25.91 24.38 Jupiter Q2 2024 GEM24R289 3.80 1.62 3.05 35.05 32.00 Adams Q2 2024 ADA24R006 6.88 0.81 6.10 6.10 0 Jupiter Q1 2024 GEM24R248 0.31 0.18 27.43 48.77 21.34 Jupiter Q2 2024 GEM24R260 0.42 0.32 15.24 17.07 1.83 Diamondfield Q2 2024 DFD24D001 6.28 0.63 7.62 7.62 0 Jupiter Q2 2024 GEM24R258 2.66 0.50 9.60 22.56 13 Adams Q1 2024 ADA24D011 28.00 3.09 1.52 100.58 99.06 Jupiter Q2 2024 GEM24R279 0.64 0.30 15.24 57.91 42.67 Jupiter Q1 2024 GEM24R246 0.34 0.30 15.24 85.34 70.10 Jupiter Q2 2024 GEM24R264 0.32 0.23 19.81 21.34 2 Diamondfield Q2 2024 DFD24R010 1.70 0.41 10.67 79.25 68.58 Diamondfield Q2 2024 DFD24R005 2.54 0.26 16.76 45.72 28.96 Adams Q2 2024 ADA24R004 0.38 0.20 21.34 120.40 99.06 Jupiter Q2 2024 GEM24R307 0.76 0.28 15.24 41.15 26 Jupiter Q2 2024 GEM24R302 Centerra Gold Inc. - Goldfield District Project Drill Hole Assay Results Period: from January 1, 2024 to December 31, 2024
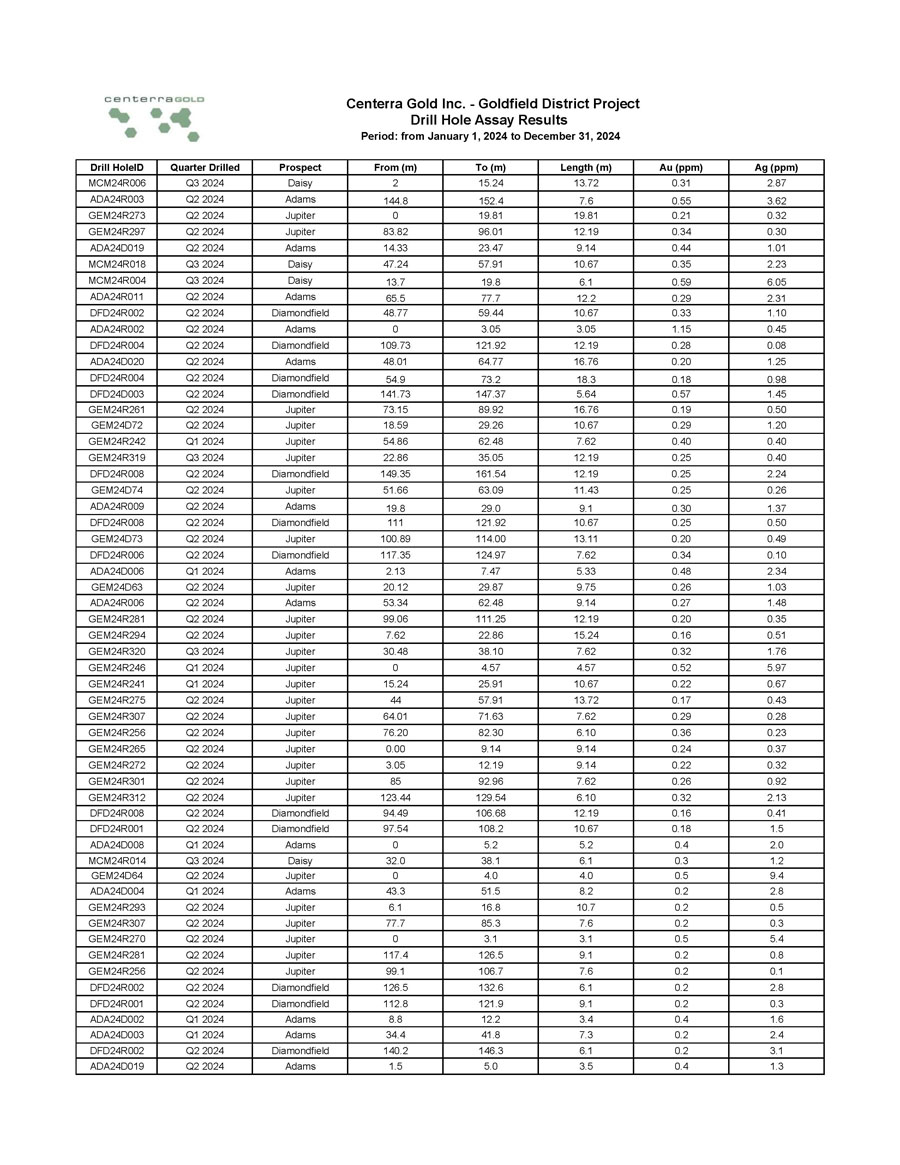
Ag (ppm) Au (ppm) Length (m) To (m) From (m) Prospect Quarter Drilled Drill HoleID 2.87 0.31 13.72 15.24 2 Daisy Q3 2024 MCM24R006 3.62 0.55 7.6 152.4 144.8 Adams Q2 2024 ADA24R003 0.32 0.21 19.81 19.81 0 Jupiter Q2 2024 GEM24R273 0.30 0.34 12.19 96.01 83.82 Jupiter Q2 2024 GEM24R297 1.01 0.44 9.14 23.47 14.33 Adams Q2 2024 ADA24D019 2.23 0.35 10.67 57.91 47.24 Daisy Q3 2024 MCM24R018 6.05 0.59 6.1 19.8 13.7 Daisy Q3 2024 MCM24R004 2.31 0.29 12.2 77.7 65.5 Adams Q2 2024 ADA24R011 1.10 0.33 10.67 59.44 48.77 Diamondfield Q2 2024 DFD24R002 0.45 1.15 3.05 3.05 0 Adams Q2 2024 ADA24R002 0.08 0.28 12.19 121.92 109.73 Diamondfield Q2 2024 DFD24R004 1.25 0.20 16.76 64.77 48.01 Adams Q2 2024 ADA24D020 0.98 0.18 18.3 73.2 54.9 Diamondfield Q2 2024 DFD24R004 1.45 0.57 5.64 147.37 141.73 Diamondfield Q2 2024 DFD24D003 0.50 0.19 16.76 89.92 73.15 Jupiter Q2 2024 GEM24R261 1.20 0.29 10.67 29.26 18.59 Jupiter Q2 2024 GEM24D72 0.40 0.40 7.62 62.48 54.86 Jupiter Q1 2024 GEM24R242 0.40 0.25 12.19 35.05 22.86 Jupiter Q3 2024 GEM24R319 2.24 0.25 12.19 161.54 149.35 Diamondfield Q2 2024 DFD24R008 0.26 0.25 11.43 63.09 51.66 Jupiter Q2 2024 GEM24D74 1.37 0.30 9.1 29.0 19.8 Adams Q2 2024 ADA24R009 0.50 0.25 10.67 121.92 111 Diamondfield Q2 2024 DFD24R008 0.49 0.20 13.11 114.00 100.89 Jupiter Q2 2024 GEM24D73 0.10 0.34 7.62 124.97 117.35 Diamondfield Q2 2024 DFD24R006 2.34 0.48 5.33 7.47 2.13 Adams Q1 2024 ADA24D006 1.03 0.26 9.75 29.87 20.12 Jupiter Q2 2024 GEM24D63 1.48 0.27 9.14 62.48 53.34 Adams Q2 2024 ADA24R006 0.35 0.20 12.19 111.25 99.06 Jupiter Q2 2024 GEM24R281 0.51 0.16 15.24 22.86 7.62 Jupiter Q2 2024 GEM24R294 1.76 0.32 7.62 38.10 30.48 Jupiter Q3 2024 GEM24R320 5.97 0.52 4.57 4.57 0 Jupiter Q1 2024 GEM24R246 0.67 0.22 10.67 25.91 15.24 Jupiter Q1 2024 GEM24R241 0.43 0.17 13.72 57.91 44 Jupiter Q2 2024 GEM24R275 0.28 0.29 7.62 71.63 64.01 Jupiter Q2 2024 GEM24R307 0.23 0.36 6.10 82.30 76.20 Jupiter Q2 2024 GEM24R256 0.37 0.24 9.14 9.14 0.00 Jupiter Q2 2024 GEM24R265 0.32 0.22 9.14 12.19 3.05 Jupiter Q2 2024 GEM24R272 0.92 0.26 7.62 92.96 85 Jupiter Q2 2024 GEM24R301 2.13 0.32 6.10 129.54 123.44 Jupiter Q2 2024 GEM24R312 0.41 0.16 12.19 106.68 94.49 Diamondfield Q2 2024 DFD24R008 1.5 0.18 10.67 108.2 97.54 Diamondfield Q2 2024 DFD24R001 2.0 0.4 5.2 5.2 0 Adams Q1 2024 ADA24D008 1.2 0.3 6.1 38.1 32.0 Daisy Q3 2024 MCM24R014 9.4 0.5 4.0 4.0 0 Jupiter Q2 2024 GEM24D64 2.8 0.2 8.2 51.5 43.3 Adams Q1 2024 ADA24D004 0.5 0.2 10.7 16.8 6.1 Jupiter Q2 2024 GEM24R293 0.3 0.2 7.6 85.3 77.7 Jupiter Q2 2024 GEM24R307 5.4 0.5 3.1 3.1 0 Jupiter Q2 2024 GEM24R270 0.8 0.2 9.1 126.5 117.4 Jupiter Q2 2024 GEM24R281 0.1 0.2 7.6 106.7 99.1 Jupiter Q2 2024 GEM24R256 2.8 0.2 6.1 132.6 126.5 Diamondfield Q2 2024 DFD24R002 0.3 0.2 9.1 121.9 112.8 Diamondfield Q2 2024 DFD24R001 1.6 0.4 3.4 12.2 8.8 Adams Q1 2024 ADA24D002 2.4 0.2 7.3 41.8 34.4 Adams Q1 2024 ADA24D003 3.1 0.2 6.1 146.3 140.2 Diamondfield Q2 2024 DFD24R002 1.3 0.4 3.5 5.0 1.5 Adams Q2 2024 ADA24D019 Centerra Gold Inc. - Goldfield District Project Drill Hole Assay Results Period: from January 1, 2024 to December 31, 2024
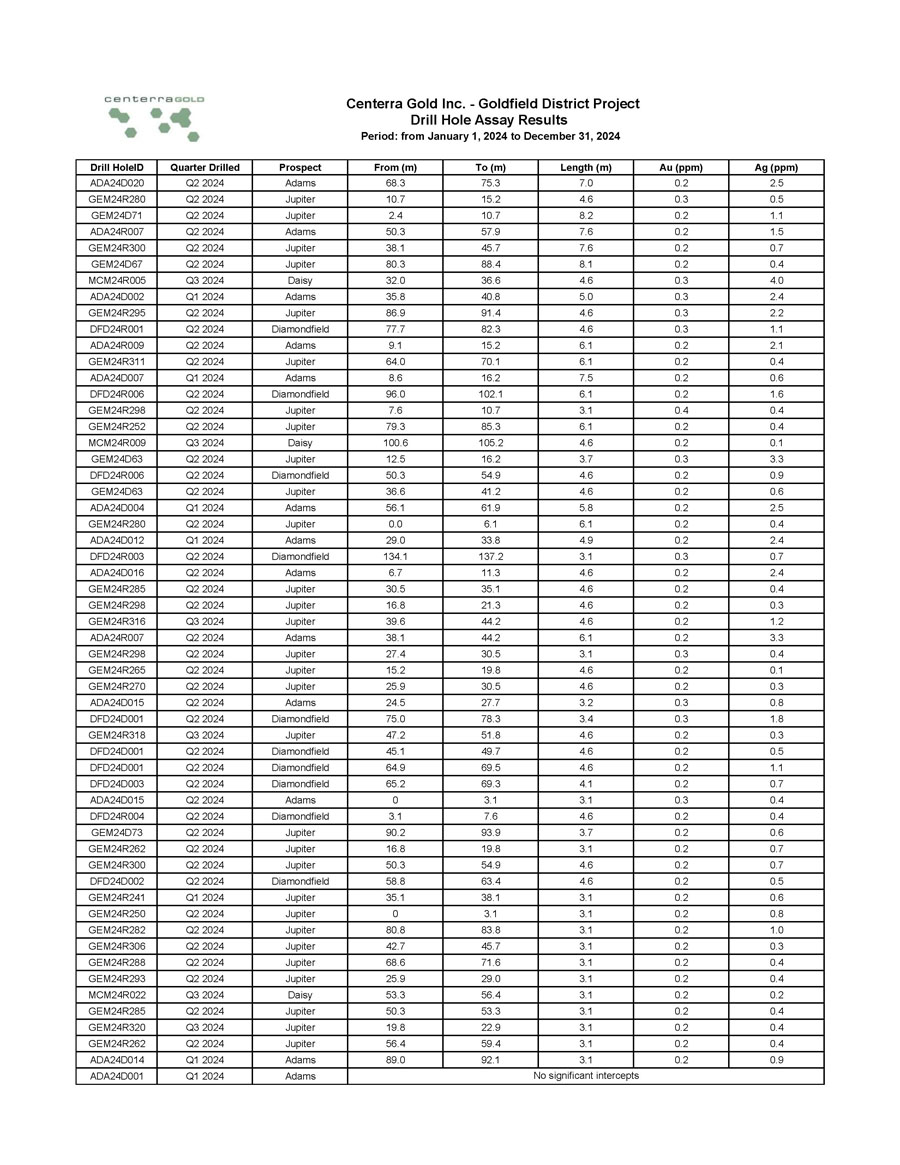
Ag (ppm) Au (ppm) Length (m) To (m) From (m) Prospect Quarter Drilled Drill HoleID 2.5 0.2 7.0 75.3 68.3 Adams Q2 2024 ADA24D020 0.5 0.3 4.6 15.2 10.7 Jupiter Q2 2024 GEM24R280 1.1 0.2 8.2 10.7 2.4 Jupiter Q2 2024 GEM24D71 1.5 0.2 7.6 57.9 50.3 Adams Q2 2024 ADA24R007 0.7 0.2 7.6 45.7 38.1 Jupiter Q2 2024 GEM24R300 0.4 0.2 8.1 88.4 80.3 Jupiter Q2 2024 GEM24D67 4.0 0.3 4.6 36.6 32.0 Daisy Q3 2024 MCM24R005 2.4 0.3 5.0 40.8 35.8 Adams Q1 2024 ADA24D002 2.2 0.3 4.6 91.4 86.9 Jupiter Q2 2024 GEM24R295 1.1 0.3 4.6 82.3 77.7 Diamondfield Q2 2024 DFD24R001 2.1 0.2 6.1 15.2 9.1 Adams Q2 2024 ADA24R009 0.4 0.2 6.1 70.1 64.0 Jupiter Q2 2024 GEM24R311 0.6 0.2 7.5 16.2 8.6 Adams Q1 2024 ADA24D007 1.6 0.2 6.1 102.1 96.0 Diamondfield Q2 2024 DFD24R006 0.4 0.4 3.1 10.7 7.6 Jupiter Q2 2024 GEM24R298 0.4 0.2 6.1 85.3 79.3 Jupiter Q2 2024 GEM24R252 0.1 0.2 4.6 105.2 100.6 Daisy Q3 2024 MCM24R009 3.3 0.3 3.7 16.2 12.5 Jupiter Q2 2024 GEM24D63 0.9 0.2 4.6 54.9 50.3 Diamondfield Q2 2024 DFD24R006 0.6 0.2 4.6 41.2 36.6 Jupiter Q2 2024 GEM24D63 2.5 0.2 5.8 61.9 56.1 Adams Q1 2024 ADA24D004 0.4 0.2 6.1 6.1 0.0 Jupiter Q2 2024 GEM24R280 2.4 0.2 4.9 33.8 29.0 Adams Q1 2024 ADA24D012 0.7 0.3 3.1 137.2 134.1 Diamondfield Q2 2024 DFD24R003 2.4 0.2 4.6 11.3 6.7 Adams Q2 2024 ADA24D016 0.4 0.2 4.6 35.1 30.5 Jupiter Q2 2024 GEM24R285 0.3 0.2 4.6 21.3 16.8 Jupiter Q2 2024 GEM24R298 1.2 0.2 4.6 44.2 39.6 Jupiter Q3 2024 GEM24R316 3.3 0.2 6.1 44.2 38.1 Adams Q2 2024 ADA24R007 0.4 0.3 3.1 30.5 27.4 Jupiter Q2 2024 GEM24R298 0.1 0.2 4.6 19.8 15.2 Jupiter Q2 2024 GEM24R265 0.3 0.2 4.6 30.5 25.9 Jupiter Q2 2024 GEM24R270 0.8 0.3 3.2 27.7 24.5 Adams Q2 2024 ADA24D015 1.8 0.3 3.4 78.3 75.0 Diamondfield Q2 2024 DFD24D001 0.3 0.2 4.6 51.8 47.2 Jupiter Q3 2024 GEM24R318 0.5 0.2 4.6 49.7 45.1 Diamondfield Q2 2024 DFD24D001 1.1 0.2 4.6 69.5 64.9 Diamondfield Q2 2024 DFD24D001 0.7 0.2 4.1 69.3 65.2 Diamondfield Q2 2024 DFD24D003 0.4 0.3 3.1 3.1 0 Adams Q2 2024 ADA24D015 0.4 0.2 4.6 7.6 3.1 Diamondfield Q2 2024 DFD24R004 0.6 0.2 3.7 93.9 90.2 Jupiter Q2 2024 GEM24D73 0.7 0.2 3.1 19.8 16.8 Jupiter Q2 2024 GEM24R262 0.7 0.2 4.6 54.9 50.3 Jupiter Q2 2024 GEM24R300 0.5 0.2 4.6 63.4 58.8 Diamondfield Q2 2024 DFD24D002 0.6 0.2 3.1 38.1 35.1 Jupiter Q1 2024 GEM24R241 0.8 0.2 3.1 3.1 0 Jupiter Q2 2024 GEM24R250 1.0 0.2 3.1 83.8 80.8 Jupiter Q2 2024 GEM24R282 0.3 0.2 3.1 45.7 42.7 Jupiter Q2 2024 GEM24R306 0.4 0.2 3.1 71.6 68.6 Jupiter Q2 2024 GEM24R288 0.4 0.2 3.1 29.0 25.9 Jupiter Q2 2024 GEM24R293 0.2 0.2 3.1 56.4 53.3 Daisy Q3 2024 MCM24R022 0.4 0.2 3.1 53.3 50.3 Jupiter Q2 2024 GEM24R285 0.4 0.2 3.1 22.9 19.8 Jupiter Q3 2024 GEM24R320 0.4 0.2 3.1 59.4 56.4 Jupiter Q2 2024 GEM24R262 0.9 0.2 3.1 92.1 89.0 Adams Q1 2024 ADA24D014 No significant intercepts Adams Q1 2024 ADA24D001 Centerra Gold Inc. - Goldfield District Project Drill Hole Assay Results Period: from January 1, 2024 to December 31, 2024
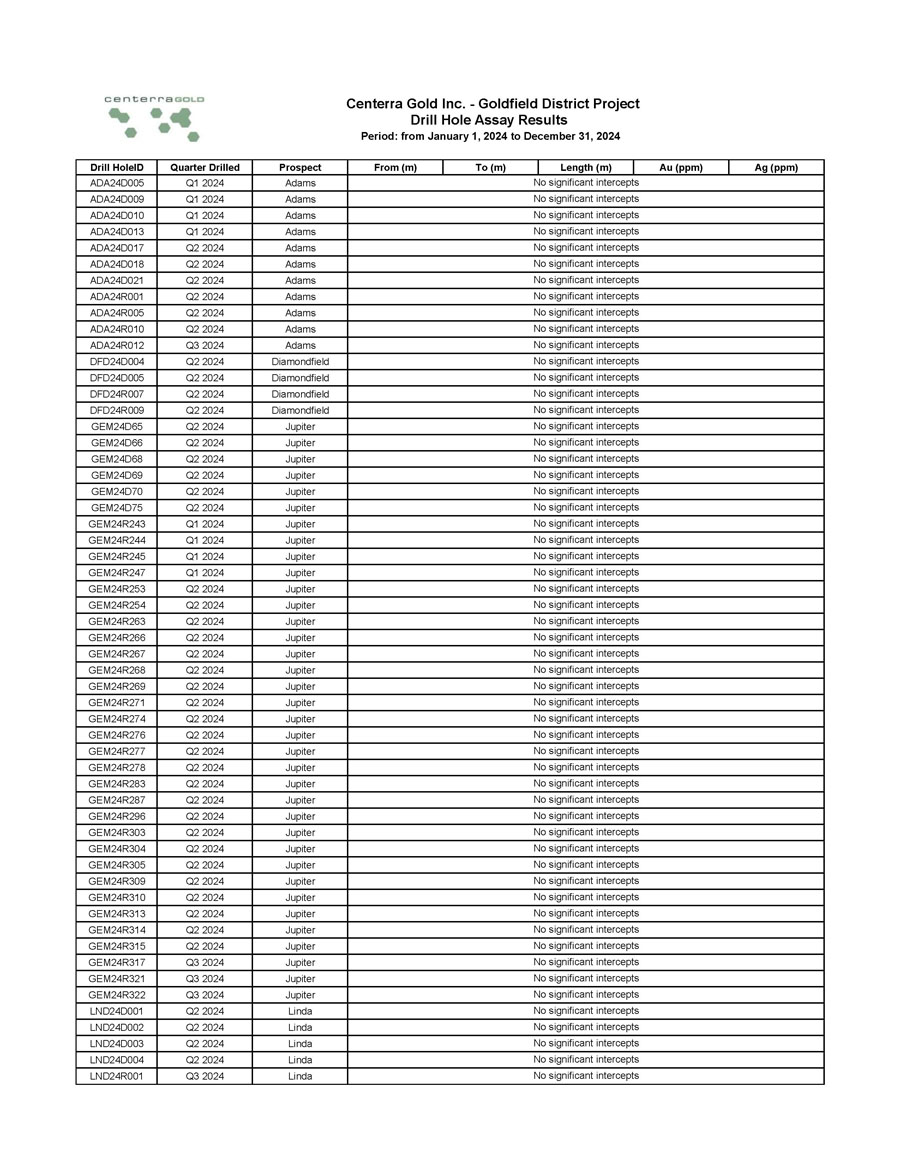
Ag (ppm) Au (ppm) Length (m) To (m) From (m) Prospect Quarter Drilled Drill HoleID No significant intercepts Adams Q1 2024 ADA24D005 No significant intercepts Adams Q1 2024 ADA24D009 No significant intercepts Adams Q1 2024 ADA24D010 No significant intercepts Adams Q1 2024 ADA24D013 No significant intercepts Adams Q2 2024 ADA24D017 No significant intercepts Adams Q2 2024 ADA24D018 No significant intercepts Adams Q2 2024 ADA24D021 No significant intercepts Adams Q2 2024 ADA24R001 No significant intercepts Adams Q2 2024 ADA24R005 No significant intercepts Adams Q2 2024 ADA24R010 No significant intercepts Adams Q3 2024 ADA24R012 No significant intercepts Diamondfield Q2 2024 DFD24D004 No significant intercepts Diamondfield Q2 2024 DFD24D005 No significant intercepts Diamondfield Q2 2024 DFD24R007 No significant intercepts Diamondfield Q2 2024 DFD24R009 No significant intercepts Jupiter Q2 2024 GEM24D65 No significant intercepts Jupiter Q2 2024 GEM24D66 No significant intercepts Jupiter Q2 2024 GEM24D68 No significant intercepts Jupiter Q2 2024 GEM24D69 No significant intercepts Jupiter Q2 2024 GEM24D70 No significant intercepts Jupiter Q2 2024 GEM24D75 No significant intercepts Jupiter Q1 2024 GEM24R243 No significant intercepts Jupiter Q1 2024 GEM24R244 No significant intercepts Jupiter Q1 2024 GEM24R245 No significant intercepts Jupiter Q1 2024 GEM24R247 No significant intercepts Jupiter Q2 2024 GEM24R253 No significant intercepts Jupiter Q2 2024 GEM24R254 No significant intercepts Jupiter Q2 2024 GEM24R263 No significant intercepts Jupiter Q2 2024 GEM24R266 No significant intercepts Jupiter Q2 2024 GEM24R267 No significant intercepts Jupiter Q2 2024 GEM24R268 No significant intercepts Jupiter Q2 2024 GEM24R269 No significant intercepts Jupiter Q2 2024 GEM24R271 No significant intercepts Jupiter Q2 2024 GEM24R274 No significant intercepts Jupiter Q2 2024 GEM24R276 No significant intercepts Jupiter Q2 2024 GEM24R277 No significant intercepts Jupiter Q2 2024 GEM24R278 No significant intercepts Jupiter Q2 2024 GEM24R283 No significant intercepts Jupiter Q2 2024 GEM24R287 No significant intercepts Jupiter Q2 2024 GEM24R296 No significant intercepts Jupiter Q2 2024 GEM24R303 No significant intercepts Jupiter Q2 2024 GEM24R304 No significant intercepts Jupiter Q2 2024 GEM24R305 No significant intercepts Jupiter Q2 2024 GEM24R309 No significant intercepts Jupiter Q2 2024 GEM24R310 No significant intercepts Jupiter Q2 2024 GEM24R313 No significant intercepts Jupiter Q2 2024 GEM24R314 No significant intercepts Jupiter Q2 2024 GEM24R315 No significant intercepts Jupiter Q3 2024 GEM24R317 No significant intercepts Jupiter Q3 2024 GEM24R321 No significant intercepts Jupiter Q3 2024 GEM24R322 No significant intercepts Linda Q2 2024 LND24D001 No significant intercepts Linda Q2 2024 LND24D002 No significant intercepts Linda Q2 2024 LND24D003 No significant intercepts Linda Q2 2024 LND24D004 No significant intercepts Linda Q3 2024 LND24R001 Centerra Gold Inc. - Goldfield District Project Drill Hole Assay Results Period: from January 1, 2024 to December 31, 2024
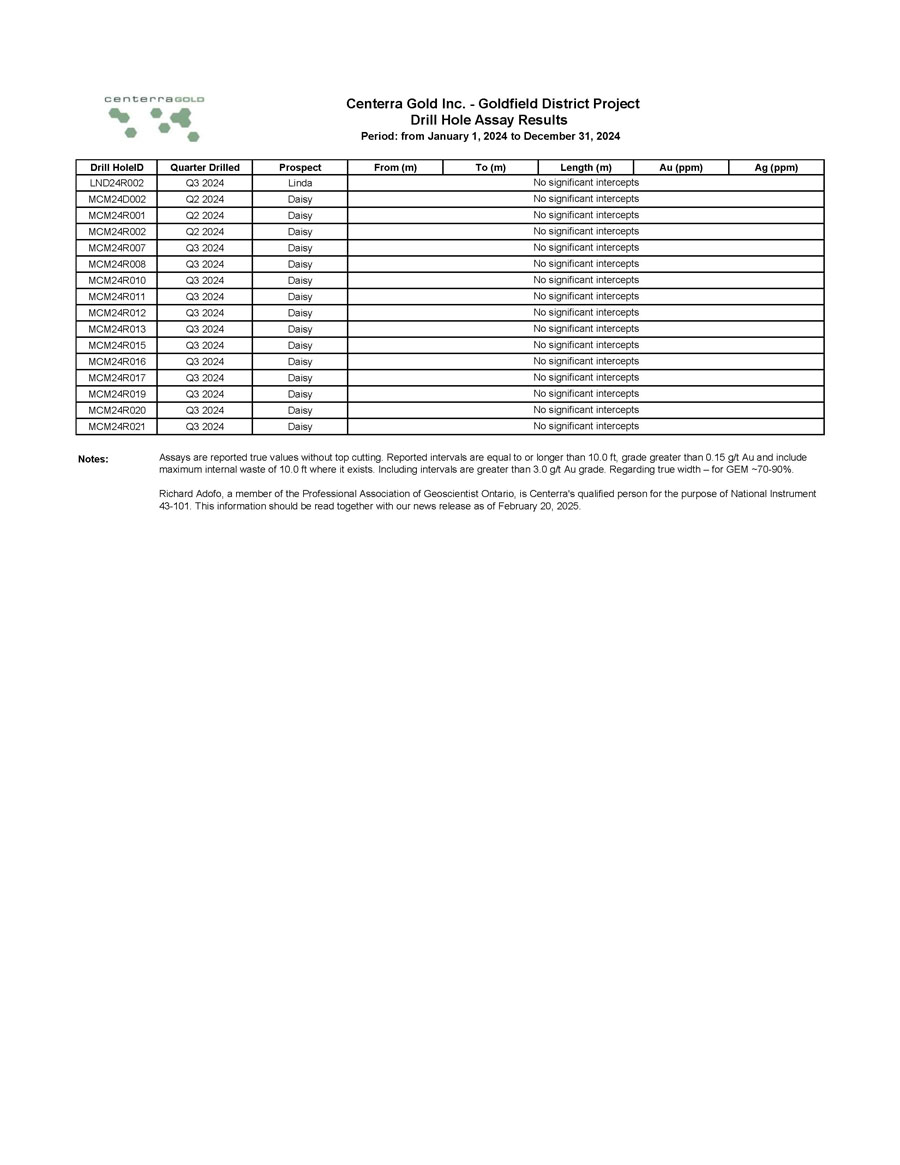
Ag (ppm) Au (ppm) Length (m) To (m) From (m) Prospect Quarter Drilled Drill HoleID No significant intercepts Linda Q3 2024 LND24R002 No significant intercepts Daisy Q2 2024 MCM24D002 No significant intercepts Daisy Q2 2024 MCM24R001 No significant intercepts Daisy Q2 2024 MCM24R002 No significant intercepts Daisy Q3 2024 MCM24R007 No significant intercepts Daisy Q3 2024 MCM24R008 No significant intercepts Daisy Q3 2024 MCM24R010 No significant intercepts Daisy Q3 2024 MCM24R011 No significant intercepts Daisy Q3 2024 MCM24R012 No significant intercepts Daisy Q3 2024 MCM24R013 No significant intercepts Daisy Q3 2024 MCM24R015 No significant intercepts Daisy Q3 2024 MCM24R016 No significant intercepts Daisy Q3 2024 MCM24R017 No significant intercepts Daisy Q3 2024 MCM24R019 No significant intercepts Daisy Q3 2024 MCM24R020 No significant intercepts Daisy Q3 2024 MCM24R021 Centerra Gold Inc. - Goldfield District Project Drill Hole Assay Results Period: from January 1, 2024 to December 31, 2024 Notes: Assays are reported true values without top cutting. Reported intervals are equal to or longer than 10.0 ft, grade greater than 0.15 g/t Au and include maximum internal waste of 10.0 ft where it exists. Including intervals are greater than 3.0 g/t Au grade. Regarding true width – for GEM ~70 - 90%. Richard Adofo, a member of the Professional Association of Geoscientist Ontario, is Centerra's qualified person for the purpose of National Instrument 43 - 101. This information should be read together with our news release as of February 20, 2025.
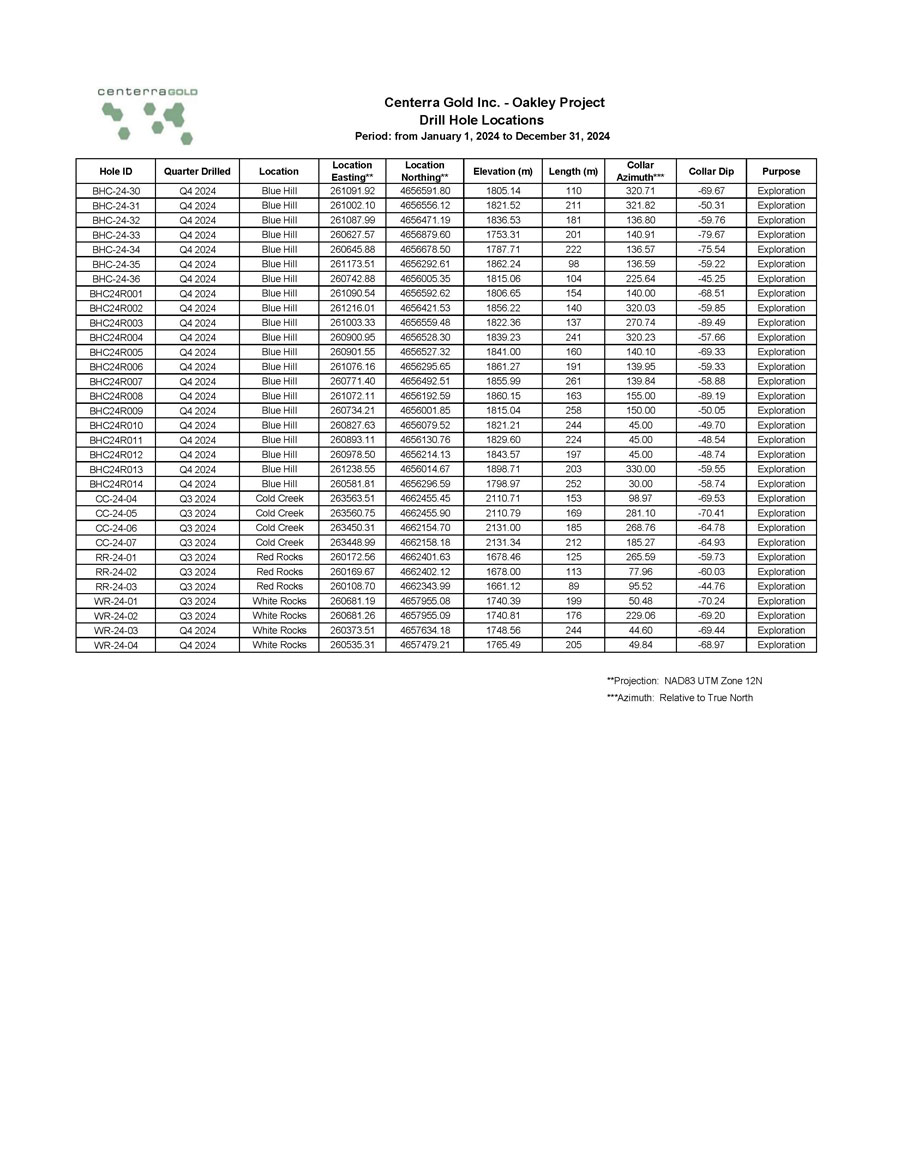
Purpose Collar Dip Collar Azimuth*** Length (m) Elevation (m) Location Northing** Location Easting** Location Quarter Drilled Hole ID Exploration - 69.67 320.71 110 1805.14 4656591.80 261091.92 Blue Hill Q4 2024 BHC - 24 - 30 Exploration - 50.31 321.82 211 1821.52 4656556.12 261002.10 Blue Hill Q4 2024 BHC - 24 - 31 Exploration - 59.76 136.80 181 1836.53 4656471.19 261087.99 Blue Hill Q4 2024 BHC - 24 - 32 Exploration - 79.67 140.91 201 1753.31 4656879.60 260627.57 Blue Hill Q4 2024 BHC - 24 - 33 Exploration - 75.54 136.57 222 1787.71 4656678.50 260645.88 Blue Hill Q4 2024 BHC - 24 - 34 Exploration - 59.22 136.59 98 1862.24 4656292.61 261173.51 Blue Hill Q4 2024 BHC - 24 - 35 Exploration - 45.25 225.64 104 1815.06 4656005.35 260742.88 Blue Hill Q4 2024 BHC - 24 - 36 Exploration - 68.51 140.00 154 1806.65 4656592.62 261090.54 Blue Hill Q4 2024 BHC24R001 Exploration - 59.85 320.03 140 1856.22 4656421.53 261216.01 Blue Hill Q4 2024 BHC24R002 Exploration - 89.49 270.74 137 1822.36 4656559.48 261003.33 Blue Hill Q4 2024 BHC24R003 Exploration - 57.66 320.23 241 1839.23 4656528.30 260900.95 Blue Hill Q4 2024 BHC24R004 Exploration - 69.33 140.10 160 1841.00 4656527.32 260901.55 Blue Hill Q4 2024 BHC24R005 Exploration - 59.33 139.95 191 1861.27 4656295.65 261076.16 Blue Hill Q4 2024 BHC24R006 Exploration - 58.88 139.84 261 1855.99 4656492.51 260771.40 Blue Hill Q4 2024 BHC24R007 Exploration - 89.19 155.00 163 1860.15 4656192.59 261072.11 Blue Hill Q4 2024 BHC24R008 Exploration - 50.05 150.00 258 1815.04 4656001.85 260734.21 Blue Hill Q4 2024 BHC24R009 Exploration - 49.70 45.00 244 1821.21 4656079.52 260827.63 Blue Hill Q4 2024 BHC24R010 Exploration - 48.54 45.00 224 1829.60 4656130.76 260893.11 Blue Hill Q4 2024 BHC24R011 Exploration - 48.74 45.00 197 1843.57 4656214.13 260978.50 Blue Hill Q4 2024 BHC24R012 Exploration - 59.55 330.00 203 1898.71 4656014.67 261238.55 Blue Hill Q4 2024 BHC24R013 Exploration - 58.74 30.00 252 1798.97 4656296.59 260581.81 Blue Hill Q4 2024 BHC24R014 Exploration - 69.53 98.97 153 2110.71 4662455.45 263563.51 Cold Creek Q3 2024 CC - 24 - 04 Exploration - 70.41 281.10 169 2110.79 4662455.90 263560.75 Cold Creek Q3 2024 CC - 24 - 05 Exploration - 64.78 268.76 185 2131.00 4662154.70 263450.31 Cold Creek Q3 2024 CC - 24 - 06 Exploration - 64.93 185.27 212 2131.34 4662158.18 263448.99 Cold Creek Q3 2024 CC - 24 - 07 Exploration - 59.73 265.59 125 1678.46 4662401.63 260172.56 Red Rocks Q3 2024 RR - 24 - 01 Exploration - 60.03 77.96 113 1678.00 4662402.12 260169.67 Red Rocks Q3 2024 RR - 24 - 02 Exploration - 44.76 95.52 89 1661.12 4662343.99 260108.70 Red Rocks Q3 2024 RR - 24 - 03 Exploration - 70.24 50.48 199 1740.39 4657955.08 260681.19 White Rocks Q3 2024 WR - 24 - 01 Exploration - 69.20 229.06 176 1740.81 4657955.09 260681.26 White Rocks Q3 2024 WR - 24 - 02 Exploration - 69.44 44.60 244 1748.56 4657634.18 260373.51 White Rocks Q4 2024 WR - 24 - 03 Exploration - 68.97 49.84 205 1765.49 4657479.21 260535.31 White Rocks Q4 2024 WR - 24 - 04 **Projection: NAD83 UTM Zone 12N ***Azimuth: Relative to True North Centerra Gold Inc. - Oakley Project Drill Hole Locations Period: from January 1, 2024 to December 31, 2024

Ag (ppm) Au (ppm) Length (m) To (m) From Prospect Quarter Drilled Drill HoleID 5.83 0.496 67.0 228.6 161.6 Blue Hill Q4 2024 BHC24R007 2.74 0.313 64.0 114.3 50.3 Blue Hill Q4 2024 BHC24R005 4.73 0.453 24.4 108.2 83.8 Blue Hill Q4 2024 BHC24R003 4.00 0.504 20.9 58.1 37.2 Cold Creek Q3 2024 CC - 24 - 04 4.19 0.422 19.8 44.2 24.4 Blue Hill Q4 2024 BHC24R001 3.11 0.346 21.4 111.3 89.9 Blue Hill Q4 2024 BHC24R007 6.88 0.247 28.9 160.0 131.1 Blue Hill Q4 2024 BHC24R005 1.19 0.694 9.9 201.6 191.8 Cold Creek Q3 2024 CC - 24 - 07 2.32 0.368 18.3 38.1 19.8 Blue Hill Q4 2024 BHC24R003 4.44 0.314 16.1 62.3 46.2 Blue Hill Q4 2024 BHC - 24 - 31 2.88 0.234 21.3 59.5 38.2 Blue Hill Q4 2024 BHC - 24 - 30 1.47 0.242 20.3 28.0 7.8 Cold Creek Q3 2024 CC - 24 - 04 3.61 0.205 22.8 178.3 155.5 Blue Hill Q4 2024 BHC24R006 0.90 4.539 1.0 200.8 199.8 Cold Creek Q3 2024 CC - 24 - 07 2.93 0.299 15.2 29.1 14.0 Blue Hill Q4 2024 BHC - 24 - 30 1.41 0.470 9.0 42.2 33.2 Blue Hill Q4 2024 BHC - 24 - 31 2.38 0.277 14.6 73.0 58.5 Cold Creek Q3 2024 CC - 24 - 04 1.28 0.753 5.0 211.6 206.6 Cold Creek Q3 2024 CC - 24 - 07 1.83 0.358 10.0 86.1 76.1 Cold Creek Q3 2024 CC - 24 - 04 1.13 0.261 12.2 73.2 61.0 Blue Hill Q4 2024 BHC24R007 23.59 0.273 9.5 24.1 14.7 Cold Creek Q3 2024 CC - 24 - 05 0.67 0.236 10.7 44.2 33.6 Blue Hill Q4 2024 BHC24R005 8.74 0.273 9.1 120.4 111.3 Blue Hill Q4 2024 BHC24R003 3.56 0.399 6.1 56.4 50.3 Blue Hill Q4 2024 BHC24R001 2.06 0.320 7.0 97.6 90.6 Cold Creek Q3 2024 CC - 24 - 05 0.65 0.352 6.1 39.6 33.6 Blue Hill Q4 2024 BHC24R007 3.7 0.24 7.6 233.2 225.6 Blue Hill Q4 2024 BHC24R010 3.26 0.256 5.8 71.7 65.9 Cold Creek Q3 2024 CC - 24 - 05 0.97 0.326 4.6 48.8 44.2 Blue Hill Q4 2024 BHC24R007 2.24 0.158 9.1 128.0 118.9 Blue Hill Q4 2024 BHC24R005 0.68 0.234 6.1 42.7 36.6 Blue Hill Q4 2024 BHC24R004 0.90 0.229 6.1 24.4 18.3 Blue Hill Q4 2024 BHC24R005 10.40 0.424 3.1 153.3 150.3 Cold Creek Q3 2024 CC - 24 - 04 5.55 0.267 4.6 77.7 73.2 Blue Hill Q4 2024 BHC24R003 1.06 0.169 7.0 112.3 105.3 Cold Creek Q3 2024 CC - 24 - 05 2.02 0.165 6.1 88.4 82.3 Blue Hill Q4 2024 BHC24R004 1.26 0.210 4.6 64.0 59.5 Blue Hill Q4 2024 BHC24R004 0.93 0.306 3.0 30.2 27.2 Blue Hill Q4 2024 BHC - 24 - 31 1.4 0.234 3.7 15.7 12 Blue Hill Q4 2024 BHC - 24 - 34 4.08 0.213 4.0 5.6 1.6 Blue Hill Q4 2024 BHC - 24 - 30 0.60 0.177 4.6 6.1 1.5 Blue Hill Q4 2024 BHC24R001 2.27 0.217 3.8 76.0 72.3 Cold Creek Q3 2024 CC - 24 - 05 1.65 0.222 3.6 82.5 79.0 Cold Creek Q3 2024 CC - 24 - 05 3.05 0.152 4.7 188.5 183.8 Cold Creek Q3 2024 CC - 24 - 07 0.95 0.166 3.1 131.1 128.0 Blue Hill Q4 2024 BHC24R007 11.85 0.158 3.0 152.4 149.4 Blue Hill Q4 2024 BHC24R007 Assay results pending Blue Hill Q4 2024 BHC - 24 - 32 Assay results pending Blue Hill Q4 2024 BHC - 24 - 35 Assay results pending Blue Hill Q4 2024 BHC - 24 - 36 No significant intercepts Blue Hill Q4 2024 BHC24R008 Assay results pending Blue Hill Q4 2024 BHC24R009 Assay results pending Blue Hill Q4 2024 BHC24R011 Assay results pending Blue Hill Q4 2024 BHC24R012 Assay results pending Blue Hill Q4 2024 BHC24R013 Assay results pending Blue Hill Q4 2024 BHC24R014 No significant intercepts Cold Creek Q3 2024 CC - 24 - 06 Centerra Gold Inc. - Oakley Project Drill Hole Assay Results Period: from January 1, 2024 to December 31, 2024
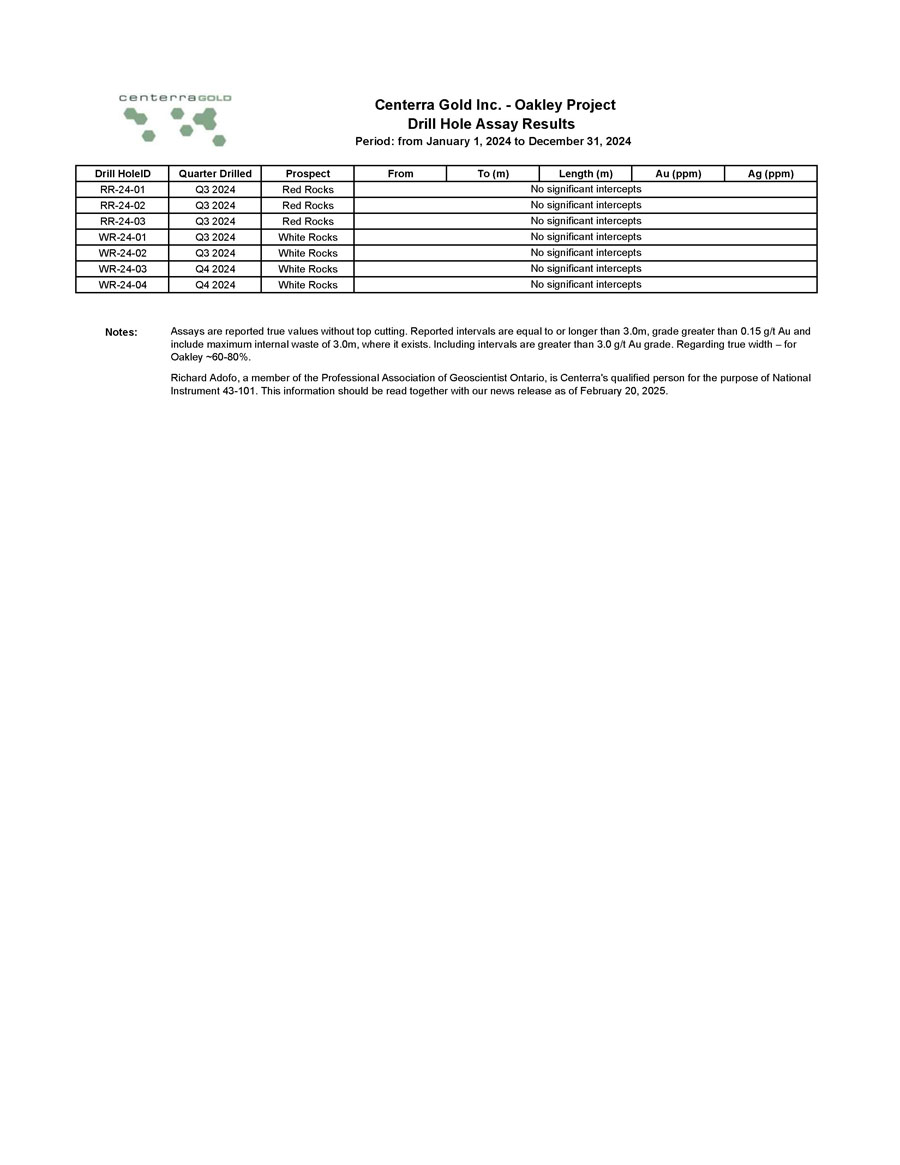
Ag (ppm) Au (ppm) Length (m) To (m) From Prospect Quarter Drilled Drill HoleID No significant intercepts Red Rocks Q3 2024 RR - 24 - 01 No significant intercepts Red Rocks Q3 2024 RR - 24 - 02 No significant intercepts Red Rocks Q3 2024 RR - 24 - 03 No significant intercepts White Rocks Q3 2024 WR - 24 - 01 No significant intercepts White Rocks Q3 2024 WR - 24 - 02 No significant intercepts White Rocks Q4 2024 WR - 24 - 03 No significant intercepts White Rocks Q4 2024 WR - 24 - 04 Centerra Gold Inc. - Oakley Project Drill Hole Assay Results Period: from January 1, 2024 to December 31, 2024 Notes: Assays are reported true values without top cutting. Reported intervals are equal to or longer than 3.0m, grade greater than 0.15 g/t Au and include maximum internal waste of 3.0m, where it exists. Including intervals are greater than 3.0 g/t Au grade. Regarding true width – for Oakley ~60 - 80%. Richard Adofo, a member of the Professional Association of Geoscientist Ontario, is Centerra's qualified person for the purpose of National Instrument 43 - 101. This information should be read together with our news release as of February 20, 2025.

Zone Collar Dip Collar Azimuth Length (m) Elevation (m) Location Northing Location Easting Quarter Drilled Hole ID Guneytepe - 85 90 431.00 1,688 4,239,794 719,505 Q4 2024 ODD0748 Yelibelen - 45 60 722.90 1,864 4,239,021 719,920 Q4 2024 ODD0749 Projection: UTM ED50 Zone 36N Azimuth: Relative to True North Centerra Gold Inc. - Öksüt Gold Mine Drill Hole Locations Period: from January 1, 2024 to December 31, 2024

Ag (ppm) Au (ppm) Length (m) To (m) From Prospect Quarter Drilled Drill HoleID Assay results pending Guneytepe Q4 2024 ODD0748 Assay results pending Yelibelen Q4 2024 ODD0749 Notes: Assay results are true values without top cutting. Reported intervals are longer than 5 metres and greater than 0.20 g/t Au with a maximum of 5 metres internal dilution allowed. True widths for mineralized zones are about 60% to 90% of stated down hole interval. Oxidation assignment is a visual discrimination from core logging. Richard Adofo, a member of the Professional Association of Geoscientist Ontario, is Centerra’s qualified person for the purpose of National Instrument 43 - 101. This information should be read together with our news release of February 20, 2025. Centerra Gold Inc. - Öksüt Gold Mine Drill Hole Assay Results Period: from January 1, 2024 to December 31, 2024
Sampling Method and QA/QC • The core (typically NQ diameter) was cut in half; one half of the cut core remains in the core box for reference, while the other half was sent to the laboratory for assaying. • While sampling drill core, the logging geologists inserted commercial certified reference materials (CRMs) and coarse blank samples alternately into the sample sequence every 10 samples. oClean coarse marble landscape rocks were used for blank material. oCRMs were matched to the grade and rock type specific to the project, with a range of CRMs used to reflect both low - and high - grade samples. It was at the logging geologist’s discretion which CRM was inserted at any given time. • Field and coarse reject duplicates were inserted alternately into the sample sequence every 20 samples. oField duplicates were prepared by quartering the half - core, with one quarter sent for analysis with a unique sample ID, and the other remaining in the core box. oCoarse reject duplicates were prepared at BV labs prior to sample pulverization. • Quality control samples accounted for ~15% of the assay database, in line with industry best practices. • After the assay results were received from the lab, gold and copper assays were checked by a Centerra database manager. Any failures of quality control samples triggered an investigation, and corresponding batches were re - assayed. • Chain of custody was maintained by Centerra staff until samples were delivered to the laboratory. • After completion of individual programs approximately 5% of the sample pulps from BV were submitted to SGS laboratory in Burnaby, British Columbia as an independent check for analytical bias and accuracy. • Annually, Centerra prepares an internal analytical QAQC report. Centerra Gold Inc. - Mount Milligan & Kemess NOTES Sample Preparation and Laboratory • Centerra uses Bureau Veritas (BV) for all its primary laboratory analyses in Canada. • BV’s laboratories in North America are registered to ISO 9001; BV’s analytical laboratory in Vancouver, British Columbia is accredited by the Standards Council of Canada (SCC) to ISO 17025:2017 for the following analytical packages used by Centerra: FA430, FA530, MA200, MA404, and TC000 (accreditation No. 720). The current accreditation is valid until October 7, 2027. • Centerra uses SGS Canada Inc. (SGS) for umpire laboratory analyses. • SGS laboratory in Vancouver, British Columbia is accredited to ISO 17025:2017 (Accreditation No. 744) by the Standards Council of Canada (SCC) for analytical tests used by Centerra. The current accreditation is valid until April 5, 2028. • Samples were crushed, split using a riffle splitter, and 250 g samples were pulverized to ≥ 85% passing 75 μm (Code PRP80 - 250). • Gold was assayed using a 30 g fire assay with atomic absorption spectrometry (AAS) finish (Code FA430). Gold results over the upper detection limit of the method (≥ 10 ppm) triggered 30 g fire assay with gravimetric finish (FA530). • All samples were also analyzed for 45 other elements, including copper and base metals, using a 4 - acid digest followed by inductively coupled plasma mass spectrometry/emission spectroscopy (ICP - MS/ES) on 0.25 g aliquots (Code MA200). Copper results ≥ 1% triggered analysis using ICP - MS with AAS finish (Code MA404) on 0.50 g aliquots. Silver results ≥ 100 ppm triggered 30 g fire assay with gravimetric finish (Code FA530). Sulfur >10% triggered Leco analysis (Code TC000). • Mercury was analyzed using an aqua regia digest with cold vapor atomic absorption spectrometry finish (Code CV400).
Sample Preparation and Laboratory • Centerra uses Bureau Veritas (BV) for all its primary laboratory analyses. • BV’s laboratories in North America are registered to ISO 9001; BV’s analytical laboratory in Vancouver, British Columbia is accredited by the Standards Council of Canada (SCC) to ISO 17025:2017 for the following analytical packages used by Centerra: FA430, FA530, MA200, MA404, AQ201 and TC000 (accreditation No. 720). The current accreditation is valid until October 7, 2027. • BV’s analytical laboratories in the United States are accredited by the Standards Council of Canada (SCC) to ISO 17025:2017 for the following analytical packages used by Centerra: FA430/FA450, FA530/FA550 (accreditation No. 151091). The Scope of Accreditation applies to BV’s three off - site sample preparation laboratories that are monitored regularly for quality control and assurance practices. The current accreditation is valid until June 12, 2027. • Sample preparation involved crushing 1kg samples to 100% passing 2mm, splitting, and 500 g samples were pulverized to ≥ 85% passing 200 mesh (Code PRP70 - 500). • Gold was analyzed by lead collection Fire Assay Fusion – Atomic Absorption Spectroscopy Finish (Code FA430/FA450) or Fire Assay Fusion – Gravimetric Finish (Code FA530/FA550). • All samples were also analyzed for 37 elements using and 1:1:1 Aqua Regia digestion with ICP - MS analysis spectrometry/emission spectroscopy (ICP - ES/MS) on 15 g aliquots (Code AQ201). Gold results ≥ 100 ppm triggered 30 g fire assay with gravimetric finish (Code FA530). Sampling Method and QA/QC • Reverse Circulation (RC) drilling samples were split at the drill rig using an industry - standard riffle splitter; the splits were bagged by staff geologists or by drill company staff. Samples were delivered by Centerra staff to the Bureau Veritas prep laboratories in Elko Nevada or Reno Nevada for preparation. • Core samples were cut in half by Centerra staff using a wet core saw; one half of the cut core remains in the core box for reference, while the other half was sent to the laboratory for assaying. • Site geologists inserted commercial certified reference materials (CRMs) and commercial blank materials into the sample sequence at rates of 3% respectively. • Field duplicate samples were inserted into the sample sequence every 100 samples, respectively. Pulp duplicates were inserted alternately into the sample sequence every ~30 samples. oField duplicates were prepared on site by Centerra staff using a wet core saw; one half of the core is cut in half resulting in two quarter cut samples. One quarter is used for the original sample, and the other quarter is used as the duplicate. oPulp duplicates were prepared by BV laboratories. Centerra staff directs laboratory as to which samples will be pulp duplicates. • Chain of custody was maintained by Centerra staff while the samples were on the individual sites either by locked doors or gates to prevent outside interference. Samples were promptly processed by Centerra staff and bagged, labeled and sealed. Samples were transported by Centerra staff or contracted to the Bureau Veritas lab delivery service. • Quality control samples accounted for ~10% of the assay database, in line with industry best practices. • After the assay results were received from the lab, assays were checked by a Centerra database manager. Any failures of quality control samples triggered an investigation, and corresponding batches were re - assayed. • Chain of custody was maintained by Centerra staff until samples were delivered to the laboratory. • Annually, Centerra prepares an internal analytical QAQC report. Centerra Gold Inc. - Goldfield & Oakley NOTES
Centerra Gold Inc. - Öksüt Gold Mine NOTES Sample Preparation and Laboratory • Centerra uses SGS Supervise Gözetme Etüd Kontrol Servisleri (SGS) for all its primary laboratory analyses in Türkiye. • SGS’s laboratories in Türkiye are registered to ISO 9001; SGS’s analytical laboratory in Ankara is accredited by TURKAK to ISO 17025:2017 for the following analytical packages used by Centerra: FAA505, AAS42S, ICM40B by four - acid digestion ICP - OES and ICP - MS after DIG40B, Sulphide CSA06V and Mercury ICM14B. The current accreditation is valid until October 7, 2027. • Centerra uses ALS Limited (ALS) for umpire laboratory analyses. • ALS laboratory in Izmir, Türkiye is accredited to ISO 9001:2008 – Quality Management Systems – Requirements, ISO/IEC 17025:2005 – General Requirements for the competence of calibration and testing laboratories and ISO 17025 certified by the Standards Council of Canada and are commercial laboratories independent of Centerra. • Samples were dried at 105 Σ C (Code DYR10), crushed to 75% passing 2mm (10 mesh), split using a rotary splitter, and 250 g samples were pulverized to ≥ 85% passing 200 mesh (Code PRP89). • Gold was assayed using a 50 g fire assay with atomic absorption spectrometry (AAS) finish (Code FAA505). • All samples were also analyzed for 49 other elements, using a 4 - acid digest followed by a multi - element inductively coupled plasma atomic emission spectroscopy (ICP - AES) and inductively coupled plasma mass spectrometry (ICP - MS) scan (Code ICM40B). Copper results ≥ 10% triggered analysis using 4 - acid digestion with AAS finish (Code AAS42S) on 0.50 g aliquots. IR Combustion (LECO) is applied for total S results (Code: CSA06V). • Mercury was analyzed using two - acid digestion analysis followed by a multi element ICP - MS scan (Code ICM14B).

Centerra Gold Inc. - Öksüt Gold Mine NOTES Sampling Method and QA/QC • The core (typically NQ diameter) was cut in half; one half of the cut core remains in the core box for reference, while the other half was sent to the laboratory for assaying. • While sampling drill core, the logging geologists inserted commercial certified reference materials (CRMs) and coarse blank samples alternately into the sample sequence every 20 samples. oClean, coarse, locally sourced basalt was used for blank material. oCRMs were matched to the grade and rock type specific to the project, with a range of CRMs used to reflect both low - and high - grade samples. It was at the logging geologist’s discretion which CRM was inserted at any given time. • Field and coarse reject duplicates were inserted alternately into the sample sequence every 60 and 40 samples, respectively. oField duplicates were prepared by quartering the half - core, with one quarter sent for analysis with a unique sample ID, and the other remaining in the core box. oCoarse reject duplicates were prepared at SGS prior to sample pulverization. • Quality control samples accounted for ~8% of the assay database, in line with industry best practices. • After the assay results were received from the lab, they were checked by a Centerra database manager. Any failures of quality control samples triggered an investigation, and corresponding batches were re - assayed. • Chain of custody was maintained by Centerra staf until samples were delivered to the laboratory. • After completion of individual programs approximately 5% of the sample pulps from SGS were submitted to ALS Laboratuar Hizmetleri Ltd. Şti. In İzmir, a standard council of Canada accredited testing laboratory, for an independent check for analytical bias and accuracy. • Annually, Centerra prepares an internal analytical QAQC report.