Management’s
Discussion and
Analysis
For the Years Ended December 31, 2024 and 2023

This Management’s Discussion and Analysis (“MD&A”) has been prepared as of December 31, 2024 and is intended to provide a review of the financial position and results of operations of Centerra Gold Inc. (“Centerra” or the “Company”) for the three months and year ended December 31, 2024 in comparison with the corresponding periods ended December 31, 2023. This discussion should be read in conjunction with the Company’s audited consolidated financial statements and the notes thereto for the years ended December 31, 2024 and 2023 prepared in accordance with International Financial Reporting Standards (“IFRS”) as issued by the International Accounting Standards Board (“IASB”) available at www.centerragold.com and on SEDAR+ (“SEDAR”) at www.sedarplus.ca and EDGAR at www.sec.gov/edgar. In addition, this discussion contains forward-looking information regarding Centerra’s business and operations. Such forward-looking statements involve risks, uncertainties and other factors that could cause actual results to differ materially from those expressed or implied by such forward-looking statements. See “Caution Regarding Forward- Looking Information” below. All dollar amounts are expressed in United States dollars (“USD”), except as otherwise indicated. All references in this document denoted with NG indicate a “specified financial measure” within the meaning of National Instrument 52-112 Non-GAAP and Other Financial Measures Disclosure of the Canadian Securities Administrators. None of these measures are standardized financial measures under IFRS and these measures may not be comparable to similar financial measures disclosed by other issuers. See section “Non-GAAP and Other Financial Measures” below for a discussion of the specified financial measures used in this document and a reconciliation to the most directly comparable IFRS measures.
Caution Regarding Forward-Looking Information
This document contains or incorporates by reference “forward-looking statements” and “forward-looking information” as defined under applicable Canadian and U.S. securities legislation. All statements, other than statements of historical fact, which address events, results, outcomes or developments that the Company expects to occur are, or may be deemed to be, forward-looking statements. Such forward-looking information involves risks, uncertainties and other factors that could cause actual results, performance, prospects and opportunities to differ materially from those expressed or implied by such forward-looking information. Forward-looking statements are generally, but not always, identified by the use of forward-looking terminology such as “believe”, “beyond”, “continue”, “expect”, “evaluate”, “finalizing”, “forecast”, “goal”, “intend”, “ongoing”, “plan”, “potential”, “preliminary”, “project”, “pursuing”, “restart”, “target” or “update”, or variations of such words and phrases and similar expressions or statements that certain actions, events or results “may”, “could”, “would” or “will” be taken, occur or be achieved or the negative connotation of such terms.
Such statements include, but may not be limited to: statements regarding 2025 guidance, outlook and expectations, including production and roasting of molybdenum, grade profiles, cash flow, costs including contract mining and labour costs, care and maintenance, PP&E and reclamation costs, capital expenditures, recoveries, processing, inflation, depreciation, depletion and amortization, taxes, annual royalty payments and cash flows; the ability of the Company of fund project costs and expenses though its current operations; exploration potential, budgets, focuses, programs, targets and projected exploration results; gold and copper prices; the declaration, payment and sustainability of the Company’s dividends; the continuation of the Company’s normal course issuer bid (“NCIB”) and automatic share purchase plan and the timing, methods and quantity of any purchases of Common Shares under the NCIB; compliance with applicable laws and regulations pertaining to the NCIB; the availability of cash for repurchases of Common Shares under the NCIB; achieving emission reductions economically and operationally; the strategic plan for the Kemess Project, including the results from a technical evaluation concerning the mining methods utilized; the timing and amount of future benefits and obligations in connection with the Additional Royal Gold Agreement; a Pre-feasibility Study at the Mount Milligan Mine and any related evaluation of resources or reserves or a life of mine beyond 2036; receiving approval from the BC government concerning permits and potential expansions related to ongoing operations at Mount Milligan ;the integrated business plan of the Molybdenum Business Unit including the restart of the Thompson Creek Mine and commercial optimization of the Langeloth Facility; expectations about the current supply deficit in the molybdenum market; the commercial success of the US Moly business and Langeloth; the commissioning of equipment at the Thompson Creek Mine and the development of site infrastructure and housing; the re-evaluation of the technical concepts for the Kemess Project and its potential restart including confirmation and exploration drilling and any technical studies and its potential for a long mine life; the Company’s strategic plan; the site-wide optimization program at Mount Milligan including any further improvements to occupational health and safety, availability and utilization of the
haul fleet, mill throughput and any potential costs savings resulting from the same; royalty rates and taxes, including withholding taxes related to repatriation of earnings from Türkiye; financial hedges; and other statements that express management’s expectations or estimates of future plans and performance, operational, geological or financial results, estimates or amounts not yet determinable and assumptions of management.
The Company cautions that forward-looking statements are necessarily based upon a number of factors and assumptions that, while considered reasonable by the Company at the time of making such statements, are inherently subject to significant business, economic, technical, legal, geopolitical and competitive uncertainties and contingencies. Known and unknown factors could cause actual results to differ materially from those projected in the forward-looking statements and undue reliance should not be placed on such statements and information.
Risk factors that may affect the Company’s ability to achieve the expectations set forth in the forward-looking statements in this document include, but are not limited to: (A) strategic, legal, planning and other risks, including: political risks associated with the Company’s operations in Türkiye, the USA and Canada; resource nationalism including the management of external stakeholder expectations; the impact of changes in, or to the more aggressive enforcement of, laws, tariffs, regulations and government practices, including unjustified civil or criminal action against the Company, its affiliates, or its current or former employees; risks that community activism may result in increased contributory demands or business interruptions; the risks related to outstanding litigation affecting the Company; the impact of any sanctions or tariffs imposed by Canada, the United States or other jurisdictions; potential defects of title in the Company’s properties that are not known as of the date hereof; the inability of the Company and its subsidiaries to enforce their legal rights in certain circumstances; risks related to anti- corruption legislation; Centerra not being able to replace mineral reserves; Indigenous claims and consultative issues relating to the Company’s properties which are in proximity to Indigenous communities; and potential risks related to kidnapping or acts of terrorism; (B) risks relating to financial matters, including: sensitivity of the Company’s business to the volatility of gold, copper, molybdenum and other mineral prices; the use of provisionally-priced sales contracts for production at the Mount Milligan Mine; reliance on a few key customers for the gold-copper concentrate at the Mount Milligan Mine; use of commodity derivatives; the imprecision of the Company’s mineral reserves and resources estimates and the assumptions they rely on; the accuracy of the Company’s production and cost estimates; persistent inflationary pressures on key input prices; the impact of restrictive covenants in the Company’s credit facilities and in the Royal Gold Streaming Agreement which may, among other things, restrict the Company from pursuing certain business activities. including paying dividends or repurchasing shares under its normal course issuer bid, or making distributions from its subsidiaries; changes to tax regimes; the Company’s ability to obtain future financing; sensitivity to fuel price volatility; the impact of global financial conditions; the impact of currency fluctuations; the effect of market conditions on the Company’s short-term investments; the Company’s ability to make payments, including any payments of principal and interest on the Company’s debt facilities, which depends on the cash flow of its subsidiaries; the ability to obtain adequate insurance coverage; changes to taxation laws in the jurisdictions where the Company operates and (C) risks related to operational matters and geotechnical issues and the Company’s continued ability to successfully manage such matters, including: unanticipated ground and water conditions; the stability of the pit walls at the Company’s operations leading to structural cave-ins, wall failures or rock-slides; the integrity of tailings storage facilities and the management thereof, including as to stability, compliance with laws, regulations, licenses and permits, controlling seepages and storage of water, where applicable; periodic interruptions due to inclement or hazardous weather conditions or operating conditions and other force majeure events; the risk of having sufficient water to continue operations at the Mount Milligan Mine and achieve expected mill throughput; changes to, or delays in the Company’s supply chain and transportation routes, including cessation or disruption in rail and shipping networks, whether caused by decisions of third-party providers or force majeure events (including, but not limited to: labour action, flooding, landslides, seismic activity, wildfires, earthquakes, pandemics, or other global events such as wars); lower than expected ore grades or recovery rates; the success of the Company’s future exploration and development activities, including the financial and political risks inherent in carrying out exploration activities; inherent risks associated with the use of sodium cyanide in the mining operations; the adequacy of the Company’s insurance to mitigate operational and corporate risks; mechanical breakdowns; the occurrence of any labour unrest or disturbance and the ability of the Company to successfully renegotiate collective agreements when required; the risk that Centerra’s workforce and operations may be exposed to widespread epidemic or pandemic; seismic activity, including earthquakes; wildfires; long lead-times required for equipment and supplies given the remote location of some of the Company’s operating properties and disruptions caused by global events; reliance on
a limited number of suppliers for certain consumables, equipment and components; the ability of the Company to address physical and transition risks from climate change and sufficiently manage stakeholder expectations on climate-related issues; regulations regarding greenhouse gas emissions and climate change; significant volatility of molybdenum prices resulting in material working capital changes and unfavourable pressure on viability of the molybdenum business; the Company’s ability to accurately predict decommissioning and reclamation costs and the assumptions they rely upon; the Company’s ability to attract and retain qualified personnel; competition for mineral acquisition opportunities; risks associated with the conduct of joint ventures/partnerships; risk of cyber incidents such as cybercrime, malware or ransomware, data breaches, fines and penalties; and, the Company’s ability to manage its projects effectively and to mitigate the potential lack of availability of contractors, budget and timing overruns, and project resources.
Additional risk factors and details with respect to risk factors that may affect the Company’s ability to achieve the expectations set forth in the forward-looking statements contained in this document are set out in the Company’s latest Annual Report on Form 40-F/Annual Information Form and Management’s Discussion and Analysis, each under the heading “Risk Factors”, which are available on SEDAR+ (www.sedarplus.ca) or on EDGAR (www.sec.gov/edgar). The foregoing should be reviewed in conjunction with the information, risk factors and assumptions found in this document.
The Company disclaims any intention or obligation to update or revise any forward-looking statements, whether written or oral, or whether as a result of new information, future events or otherwise, except as required by applicable law.
TABLE OF CONTENTS
| | | | | |
| |
| |
| |
| |
| |
| |
| |
| |
| |
| |
| |
| |
| |
| |
| |
| |
| Annual Results – Previous Three Years | 40 |
| |
| |
| |
| |
| |
| |
| |
| |
Overview
Centerra’s Business
Centerra is a Canada-based mining company focused on operating, developing, exploring and acquiring gold and copper properties worldwide. Centerra’s principal operations are the Mount Milligan gold-copper mine located in British Columbia, Canada (the “Mount Milligan Mine”), and the Öksüt gold mine located in Türkiye (the “Öksüt Mine”). The Company also owns the Kemess project (the “Kemess Project”) in British Columbia, Canada, the Goldfield District Project (the “Goldfield Project”) in Nevada, United States, as well as exploration properties in Canada, the United States of America (“USA”) and Türkiye. The Company also owns and operates a Molybdenum BU, which includes the Langeloth metallurgical processing facility, operating in Pennsylvania, USA (the “Langeloth”), and two primary molybdenum properties: the Thompson Creek Mine in Idaho, USA, and the Endako Mine (75% ownership) in British Columbia, Canada.
As at December 31, 2024, Centerra’s significant subsidiaries were as follows:
| | | | | | | | | | | |
| Entity | Property - Location | Current Status | Ownership |
| Thompson Creek Metals Company Inc. | Mount Milligan Mine - Canada | Operation | 100% |
| Endako Mine - Canada | Care and maintenance | 75% |
| Öksüt Madencilik A.S. | Öksüt Mine - Türkiye | Operation | 100% |
| Thompson Creek Mining Co. | Thompson Creek Mine - USA | Development | 100% |
| Langeloth Metallurgical Company LLC | Langeloth - USA | Operation | 100% |
| Gemfield Resources LLC | Goldfield Project - USA | Exploration and evaluation | 100% |
| AuRico Metals Inc. | Kemess Project - Canada | Exploration and evaluation | 100% |
The Company’s common shares are listed on the Toronto Stock Exchange and the New York Stock Exchange and trade under the symbols “CG” and “CGAU”, respectively.
As at February 20, 2025, there are 210,206,602 common shares issued and outstanding, options to acquire 2,489,556 common shares outstanding under the Company’s stock option plan, and 898,283 restricted share units redeemable for common shares outstanding under the Company’s restricted share unit plan (redeemable on a 1:1 basis for common shares).
Overview of Consolidated Financial and Operating Highlights
| | | | | | | | | | | | | | | | | | | | |
| ($millions, except as noted) | Three months ended December 31, | Years ended December 31, |
| 2024 | 2023 | % Change | 2024 | 2023 | % Change |
| Financial Highlights | | | | | |
| Revenue | 302.4 | | 340.0 | | (11) | % | 1,214.5 | | 1,094.9 | | 11 | % |
| Production costs | 190.6 | | 161.3 | | 18 | % | 710.3 | | 706.0 | | 1 | % |
| Depreciation, depletion, and amortization ("DDA") | 32.5 | | 40.6 | | (20) | % | 126.2 | | 124.9 | | 1 | % |
| Earnings from mine operations | 79.3 | | 138.1 | | (43) | % | 378.0 | | 264.0 | | 43 | % |
| Net (loss) earnings | (52.5) | | (28.8) | | (82) | % | 80.4 | | (81.3) | | 199 | % |
Adjusted net earnings(1) | 36.6 | | 61.2 | (40) | % | 152.9 | | 10.5 | | 1356 | % |
| Cash provided by operating activities | 92.8 | | 145.4 | | (36) | % | 298.4 | | 245.6 | | 21 | % |
Free cash flow(1) | 47.0 | | 111.0 | | (58) | % | 138.6 | | 160.2 | | (13) | % |
| | | | | | |
| Additions to property, plant and equipment (“PP&E”) | 41.9 | | 67.9 | | (38) | % | 174.8 | | 121.7 | | 44 | % |
Capital expenditures - total(1) | 46.5 | | 36.4 | | 28 | % | 160.1 | | 88.3 | | 81 | % |
Sustaining capital expenditures(1) | 19.5 | | 34.5 | | (43) | % | 101.6 | | 83.5 | | 22 | % |
Non-sustaining capital expenditures(1) | 27.0 | | 1.9 | | 1321 | % | 58.5 | | 4.8 | | 1119 | % |
| | | | | | |
Net (loss) earnings per common share - $/share basic(2) | (0.25) | | (0.13) | | (92) | % | 0.38 | | (0.37) | | 202 | % |
| | | | | | |
Adjusted net earnings per common share - $/share basic(1)(2) | 0.17 | | 0.28 | | (39) | % | 0.72 | | 0.05 | | 1340 | % |
| Operating highlights | | | | | | |
| Gold produced (oz) | 73,224 | | 129,259 | | (43) | % | 368,104 | | 350,317 | | 5 | % |
| | | | | | |
| Gold sold (oz) | 83,876 | | 130,281 | | (36) | % | 368,183 | | 348,399 | | 6 | % |
| Average market gold price ($/oz) | 2,664 | | 1,974 | | 35 | % | 2,388 | | 1,942 | | 23 | % |
Average realized gold price ($/oz )(3) | 2,207 | | 1,846 | | 20 | % | 2,078 | | 1,718 | | 21 | % |
| Copper produced (000s lbs) | 12,769 | | 19,695 | | (35) | % | 54,342 | | 61,862 | | (12) | % |
| Copper sold (000s lbs) | 16,361 | | 16,562 | | (1) | % | 57,897 | | 60,109 | | (4) | % |
| Average market copper price ($/lb) | 4.17 | | 3.70 | | 13 | % | 4.15 | | 3.85 | | 8 | % |
Average realized copper price ($/lb)(3) | 2.88 | | 3.00 | | (4) | % | 3.25 | | 3.01 | | 8 | % |
Molybdenum roasted (000 lbs)(4) | 2,884 | | 2,247 | | 28 | % | 10,164 | | 11,377 | | (11) | % |
| Molybdenum sold (000s lbs) | 2,858 | | 2,158 | | 32 | % | 10,912 | | 11,235 | | (3) | % |
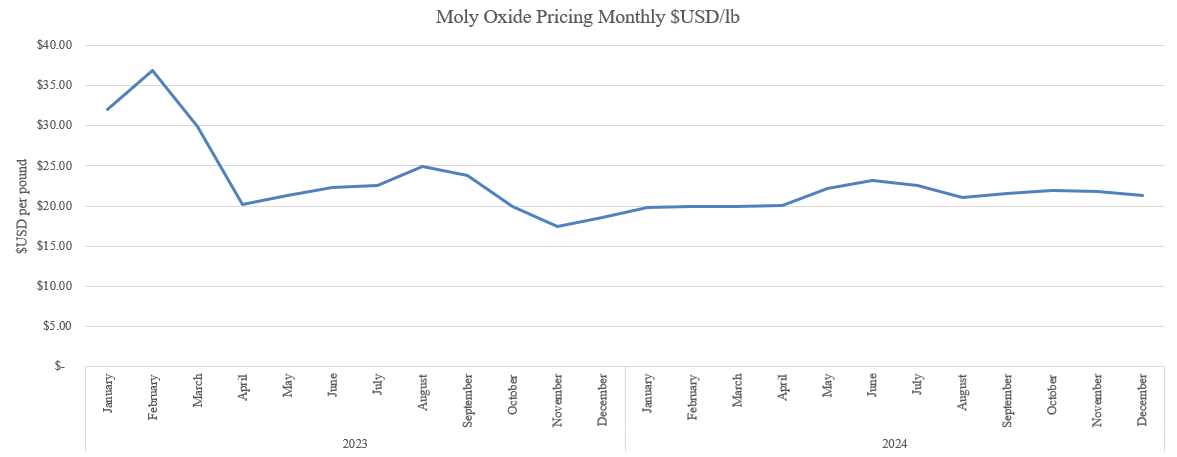
| Average market molybdenum price ($/lb) | 21.71 | | 18.64 | | 16 | % | 21.30 | 24.19 | | (12) | % |
Average realized molybdenum price ($/lb)(3) | 22.67 | 20.35 | 11 | % | 22.05 | 25.39 | (13) | % |
| Unit costs | | | | | | |
Gold production costs ($/oz)(5) | 1,096 | | 595 | | 84 | % | 913 | | 733 | | 25 | % |
All-in sustaining costs on a by-product basis ($/oz)(1)(5) | 1,296 | | 831 | | 56 | % | 1,148 | | 1,013 | | 13 | % |
| | | | | | |
Gold - All-in sustaining costs on a co-product basis ($/oz)(1)(5) | 1,446 | | 905 | | 60 | % | 1,270 | | 1,069 | | 19 | % |
Copper production costs ($/lb)(5) | 1.89 | | 1.85 | | 2 | % | 2.04 | | 2.29 | | (11) | % |
Copper - All-in sustaining costs on a co-product basis ($/lb)(1)(5) | 2.12 | | 2.42 | | (12) | % | 2.47 | | 2.69 | | (8) | % |
(1)Non-GAAP financial measure. See discussion under “Non-GAAP and Other Financial Measures”.
(2)As at December 31, 2024, the Company had 210,031,280 common shares issued and outstanding.
(3)This supplementary financial measure within the meaning of National Instrument 52-112 - Non-GAAP and Other Financial Measures Disclosure (“NI 51-112”) is calculated as a ratio of revenue from the consolidated financial statements and units of metal sold and includes the impact from the Mount Milligan Streaming Agreement (defined below), copper hedges and mark-to-market adjustments on metal sold not yet finally settled.
(4)Amount does not include 0.8 million pounds of molybdenum roasted of toll material for the three months ended December 31, 2024 (2023 - 1.0 million) and 2.3 million pounds of molybdenum roasted of toll material in 2024 (2023 - 1.7 million).
(5)All per unit costs metrics are expressed on a metal sold basis.
Overview of Consolidated Results
Fourth Quarter 2024 compared to Fourth Quarter 2023
A net loss of $52.5 million was recognized in the fourth quarter of 2024, compared to a net loss of $28.8 million in the fourth quarter of 2023. The increase in net loss was primarily due to:
•a non-cash impairment loss of $193.6 million related to the Goldfield Project recognized in the fourth quarter of 2024 compared to a non-cash impairment loss of $34.1 million related to the Kemess Project and Berg Property recognized in the fourth quarter of 2023; and
•lower earnings from mine operations of $79.3 million recognized in the fourth quarter of 2024 compared to $138.1 million in the fourth quarter of 2023. The decrease in earnings from mine operations was primarily due to lower ounces of gold produced and sold at the Öksüt Mine mainly attributable to higher production level during the fourth quarter of 2023 from processing the built-up gold-in-carbon inventory following the resumption of operations in June 2023, higher production costs and higher DDA at the Mount Milligan Mine. The decrease was partially offset by higher average realized gold prices, higher gold ounces sold at the Mount Milligan Mine, lower production costs and lower DDA at the Öksüt Mine and improved financial performance at the Langeloth Facility.
The increase in net loss was partially offset by:
•an incremental gain of $63.1 million recognized on the sale of the Company’s interest in the Greenstone Gold Mines Partnership (“Greenstone Partnership”). The sale of the Company’s 50% interest in the Greenstone Partnership was completed on January 19, 2021 with the receipt of cash consideration of $210.0 million and the Company was entitled to receive additional contingent payments based on a construction decision declaration, which was paid in December 2023, and the achievement of subsequent production milestones. Following the announcement of Greenstone Mine’s achievement of commercial production on November 6, 2024, the variable constraint on the contingent payments was removed and the Company recognized a contract asset and additional gain on sale representing the amount due from Equinox;
•higher other non-operating income of $16.0 million recognized in the fourth quarter of 2024 compared to other non-operating income of $1.1 million in the fourth quarter of 2023 primarily attributable to a higher foreign exchange gain from a movement in foreign currency exchange rates and an increase in interest income earned on the Company’s cash balance;
•a reclamation expense of $1.7 million in the fourth quarter of 2024 compared to a reclamation expense of $50.1 million in the fourth quarter of 2023. The decrease in reclamation expense was primarily attributable to changes in the risk-free interest rates applied to discount the estimated provision for future reclamation cash outflows at the Endako Mine, Kemess Project and Thompson Creek Mine and an increase in estimated future reclamation cash outflows at the Kemess Project in the fourth quarter of 2023;
•other operating income of $28.0 million in the fourth quarter of 2024 compared to an operating expense of $4.8 million in the fourth quarter of 2023 primarily attributable to an unrealized gain on the financial asset related to the Additional Royal Gold Agreement; and
•lower income tax expense of $18.2 million in the fourth quarter of 2024 compared to income tax expense of $38.9 million in the fourth quarter of 2023. The decrease in income tax expense was mainly due to lower income generated at the Öksüt Mine due to lower gold ounces sold.
Adjusted net earningsNG of $36.6 million were recognized in the fourth quarter of 2024, compared to adjusted net earningsNG of $61.2 million in the fourth quarter of 2023. The decrease in adjusted net earningsNG was primarily due to lower earnings from mine operations as discussed above, partially offset by lower income tax expense and an increase in interest income earned on the Company’s cash balance.
The main adjusting items to net loss in the fourth quarter of 2024 were:
•$193.6 million of a non-cash impairment loss related to the Goldfield Project;
•$63.1 million of an incremental gain on the sale of Greenstone Partnership;
•$33.9 million of unrealized gain on the financial asset related to the Additional Royal Gold Agreement; and
•$9.9 million of unrealized gain on foreign exchange mainly from the movement in foreign currency exchange rates on the reclamation provision at the Endako Mine and Kemess Project.
The main adjusting items to net loss in the fourth quarter of 2023 were:
•$50.0 million of reclamation expense as noted above; and
•$34.1 million related to the non-cash impairment loss of the Kemess Project and the Berg Property.
Cash provided by operating activities was $92.8 million in the fourth quarter of 2024, compared to $145.4 million in the fourth quarter of 2023. The decrease was primarily attributable to lower earnings from mine operations and reclamation payments related to the closure of the spillway for Tailings Pond 2 and Denak West dewatering project at the Endako Mine. Partially offsetting the overall decrease in cash provided by operating activities were a favourable working capital change at the Mount Milligan Mine primarily related to the timing of cash collection from customer and vendor payments, a favorable working capital movement at the Öksüt Mine due to timing of vendor payments and lower tax payments at the Öksüt Mine.
Free cash flowNG of $47.0 million was recognized in the fourth quarter of 2024, compared to free cash flowNG of $111.0 million in the fourth quarter of 2023. The decrease in free cash flowNG was primarily due to lower cash provided by operating activities as outlined above as well as higher property, plant and equipment additions mainly due to higher capital spending at the Thompson Creek Mine following the restart decision.
Year ended December 31, 2024 compared to December 31, 2023
Net earnings of $80.4 million were recognized in 2024, compared to a net loss of $81.3 million in 2023. The increase in net earnings was primarily due to:
•higher earnings from mine operations of $378.0 million in 2024 compared to $264.0 million in 2023 primarily due to higher average realized gold prices and an increase in the ounces of gold produced and sold at the Mount Milligan Mine and higher average realized copper prices. Partially offsetting these factors were lower copper pounds sold at Mount Milligan Mine;
•an incremental gain of $63.1 million recognized on the sale of the Company’s interest in the Greenstone Partnership;
•a reclamation recovery of $25.3 million in 2024 compared to a reclamation expense of $34.4 million in 2023 primarily attributable to an increase in an estimate of future reclamation cash outflows at the Endako Mine and the Kemess Project in the comparative period and changes in the risk-free interest rates applied to discount the estimated provision for future reclamation cash outflows at the Endako Mine and Kemess Project in 2024;
•higher other non-operating income of $49.1 million in 2024 compared to $11.1 million in 2023 primarily due to an unrealized foreign exchange gain attributable to a movement in foreign currency exchange rates and increase in interest income earned on the Company’s cash balance; and
•lower operating expenses of $2.4 million in 2024 compared to $29.6 million in 2023 primarily attributable to an unrealized gain on the financial asset related to the Additional Royal Gold Agreement.
The increase in net earnings was partially offset by a non-cash impairment loss of $193.6 million related to the Goldfield Project recognized in 2024 compared to a non-cash impairment loss of $34.1 million related to the Kemess Project and Berg Property recognized in 2023.
Adjusted net earningsNG of $152.9 million were recognized in 2024, compared to adjusted net earningsNG of $10.5 million in 2023. The increase in adjusted net earningsNG was due to higher earnings from mine operations and an increase in interest income earned on the Company’s cash balance.
The main adjusting items to net earnings in 2024 were:
•$193.6 million of a non-cash impairment loss related to the Goldfield Project;
•$63.1 million of an incremental gain on the sale of Greenstone Partnership;
•$25.4 million of reclamation provision revaluation recovery, as noted above;
•$23.5 million of unrealized loss on the financial asset related to the Additional Royal Gold Agreement; and
•$12.0 million of unrealized gain on foreign exchange mainly from the effect of movement in foreign currency exchange rates on the reclamation provision at the Endako Mine and Kemess Project.
The main adjusting items to net loss in 2023 were:
•$34.2 million reclamation provision revaluation recovery, as noted above;
•$34.1 million related to the non-cash impairment loss of the Kemess Project and the Berg Property; and
•$19.7 million of income tax expense resulting from the effect of foreign exchange rate changes on monetary assets and liabilities in the determination of taxable income related to the Öksüt Mine and the Mount Milligan Mine as well as the introduction of a one-time income tax levied on taxpayers eligible to claim Turkish Investment Incentive Certificate benefits in 2022.
Cash provided by operating activities was $298.4 million in 2024 compared to $245.6 million in 2023. The increase in cash provided by operating activities was primarily due to higher earnings from mine operations, higher interest income earned on the Company’s cash balance and no stand-by costs at the Öksüt Mine. Partially offsetting these impacts were reclamation payments related to the closure of the spillway for Tailings Pond 2 and Denak West dewatering project at the Endako Mine, an unfavourable working capital movement at the Mount Milligan Mine from the timing of vendor payments as well as higher royalty and tax payments at the Öksüt Mine.
Free cash flowNG of $138.6 million was recognized in 2024 compared to free cash flowNG of $160.2 million in 2023. The decrease in free cash flowNG was primarily due to higher spending at the Thompson Creek Mine related to mining equipment refurbishments and purchases, and pre-stripping activities and higher property, plant and equipment additions at the Mount Milligan Mine and Öksüt Mine, partially offset by higher cash provided by operating activities as outlined above.
Recent Events and Developments
Mount Milligan Mine Pre-feasibility Study
Early in 2024, the Company initiated a preliminary economic assessment (“PEA”) as part of a strategic process to evaluate the total potential of the Mount Milligan Mine with a goal to unlock additional value beyond its current stated mine life. As a result of significant technical study progress to date and positive drill results, the Company has made the decision to advance directly to a Pre-feasibility Study Technical Report (“PFS”). The PFS and associated updated mineral reserves estimate are expected to be announced in the third quarter of 2025.
During 2024, the Company has identified an opportunity to accelerate the use of in-pit mine waste storage, which increases the available storage capacity in the existing tailings facility and extended the overall mine life for the current reserves estimate, while we continue with technical work to extend reserves mine life. As a result, there was an increase in the stated proven and probable reserves as at December 31, 2024 that results in the existing life of mine (“LOM”) extension by approximately one year to 2036.
Work on the PFS is ongoing and the Company is optimistic that the mine life can be further extended beyond the mine life of approximately 2036 as discussed above. Centerra is evaluating options for additional tailings capacity either by expanding the existing tailings facility or constructing a second one. It is also expected that the PFS will incorporate an increase of annual mill throughput in the range of 10% through ball mill motor upgrades and additional downstream flowsheet improvements at a modest overall capital expenditure, which may also provide the benefit of improved overall metal recovery.
As Centerra looks to the future of Mount Milligan beyond 2036, the establishment of the new Mining and Critical Minerals Ministry is an encouraging step forward, demonstrating the Province of British Columbia’s commitment to streamlining permitting and regulatory processes for critical mineral projects.
Restart of the Thompson Creek Mine and Strategic Plan for the US Molybdenum Operations
On September 12, 2024, Centerra issued a news release that provided the results of the Thompson Creek Mine feasibility study, including a strategic, integrated business plan for its Molybdenum BU consisting of a restart of the Thompson Creek Mine and a commercially optimized plan for the Langeloth Facility. The restart of the Thompson Creek Mine, vertically integrated with operations at the Langeloth Facility, is estimated to result in a combined $472 million after-tax net present value using 8% discount rate, and 22% after-tax internal rate of return, based on a flat molybdenum price of $20 per pound. Compared to the pre-feasibility study issued on September 18, 2023, the integrated economics based on the feasibility study have improved, including an updated life of mine of 12 years, total molybdenum production of 146 million pounds and a significantly de-risked capital estimate of $397 million in total initial, non-sustaining capital expenditures over approximately three years, from September 2024 through mid-2027. The restart decision aligns with strategic objective of the Company to realize the value of the Molybdenum BU underpinned by robust project economics, strong reserve base and life of mine longer than 10 years.
Centerra has also completed a commercial optimization plan at the Langeloth Facility, geared at increasing profitability and maximizing its future potential by increasing production levels to its full existing capacity, achieved by a ramp-up in the purchase of third-party concentrates and the restart of the Thompson Creek Mine. At full production capacity of approximately 40 million pounds, integrated with Thompson Creek Mine, the Langeloth Facility has the potential to generate higher returns and higher cash flows from operations. Following the completion of a feasibility study and commercial optimization plan, the Board approved the full restart of operations at the Thompson Creek Mine and a progressive ramp-up of production at the Langeloth Facility.
The initial capital investment to restart Thompson Creek is approximately $397 million. The capital required is significantly de-risked due to an existing pit, significantly advanced rebuilds and purchases, and an existing process plant that requires modest upgrades and refurbishments. A majority of the anticipated capital
expenditures are expected to be focused on capitalized stripping, plant refurbishments and mine mobile fleet upgrades. At current metal prices, the capital investment to restart Thompson Creek is expected to be funded largely from Centerra’s cash flow from operations.
Fourth Quarter 2024 Highlights of Restart Activities
Since the restart decision in September 2024, the site achieved approximately 7% completion status with significant advancements in pre-stripping activities and mine equipment refurbishments and purchases. In the fourth quarter of 2024, Thompson Creek continued pre-stripping operations, initiated detailed engineering work for the plant refurbishment with an engineering consulting firm and commenced preliminary mill refurbishment activities with the Thompson Creek Mine maintenance workforce. The key milestones completed in the fourth quarter of 2024 include:
•Thompson Creek continued pre-stripping operations with 4.1 million tons moved;
•Detailed engineering work for the plant refurbishment was initiated with an engineering consulting firm, with a focus on engineering and procurement for long-lead items;
•Preliminary mill refurbishment activities commenced, with initial demolition of the copper cementation area and flotation cells completed;
•Mobile fleet refurbishment is on track and approximately 80% complete, with the majority of the work on trucks, shovels, dozers and road graders completed; and
•The project schedule is on track and in line with the feasibility study, targeting first production in the second half of 2027.
In the fourth quarter of 2024, non-sustaining capital expendituresNG were $27.0 million. Since the restart decision, non-sustaining capital expendituresNG were $29.6 million, slightly lower than the feasibility study, mainly due to a slightly slower ramp-up of mining workforce and timing of mining equipment purchases. The project remains in line with the total initial capital expendituresNG estimate of $397 million as outlined in the feasibility study.
| | | | | |
| ($millions, except as noted) | As of December 31, 2024 |
Initial capital expendituresNG estimate | 397.0 |
Non-sustaining capital expendituresNG since the restart decision | 29.6 |
| Remaining spend | 367.4 |
Centerra maintains a strong cash position of $624.7 million, ensuring sufficient liquidity to finance ongoing project activities. The Company continues to expect to finance the majority of 2025 expenditures from the cash flows provided by the Mount Milligan Mine and the Öksüt Mine.
Kemess Project Assessment
The Kemess property has substantial gold and copper resources in a highly prospective district with significant infrastructure already in place, including: a 300 kilometer 230 kilovolt power line, one of the longest privately owned power lines in British Columbia; a 50,000 tonnes per day nameplate processing plant, which would require some refurbishment and equipment replacements; site infrastructure including a camp, administration facilities, truck shop and warehouse; and tailings storage through in-pit and an existing facility which is capable of expansion. Centerra is currently working to update the Kemess resource model from the results of a drilling campaign conducted in 2024. The program included 12,000 meters of diamond drilling for exploration, geotechnical, and metallurgical testing purposes.
During 2024, Centerra commenced evaluation of technical concepts and engineering trade-off studies for potential restart options at the Kemess Project. Early operating concepts include a combined open pit and conventional underground operation, which is expected to be less capital intensive and have a better cash flow profile than the previously permitted underground block cave concept. In addition to an exploration campaign in 2025 to further delineate the resource, the Company is planning on continuing to advance the
technical studies that will include metallurgical testing for flowsheet optimization, mine plan optimization, materials handling infrastructure engineering, tailings design optimization, as well as initiation of environmental baseline studies. Early indications show potential for a long-life operation, that takes advantage of the significant infrastructure already in place.
The Company expects to provide an updated resource estimate and an accompanying update on the technical concept for the Kemess Project in the second quarter of 2025.
Transaction with RGLD Gold AG and Royal Gold, Inc.
The Mount Milligan Mine is subject to an arrangement with RGLD Gold AG and Royal Gold, Inc. (together, “Royal Gold”) which entitles Royal Gold to purchase 35% and 18.75% of gold and copper produced, respectively, and requires Royal Gold to pay $435 per ounce of gold and 15% of the spot price per metric tonne of copper delivered (“Mount Milligan Mine Streaming Agreement”).
On February 13, 2024, the Company and its subsidiary, Thompson Creek Metals Company Inc. (“TCM”) entered into an additional agreement with Royal Gold (the “Additional Royal Gold Agreement”), relating to the Mount Milligan Mine. As part of the Additional Royal Gold Agreement, Royal Gold has agreed, among other things, to increase cash payments for the Mount Milligan Mine’s gold and copper delivered to Royal Gold based on the achievement of certain threshold amounts of gold and copper delivered to Royal Gold from shipments occurring after January 1, 2024. The percentage of gold and copper production streamed to Royal Gold remains unchanged at 35% gold and 18.75% copper.
The first threshold date (“First Threshold Date”) will occur when TCM has delivered to Royal Gold either an aggregate of 375,000 ounces of gold or 30,000 tonnes of copper from shipments occurring after January 1, 2024. The second threshold (gold) date (“Second Threshold (Gold) Date”) will occur once TCM has delivered to Royal Gold an aggregate of 665,000 ounces of gold and the second threshold (copper) date (“Second Threshold (Copper) Date”) will occur once TCM has delivered to Royal Gold 60,000 tonnes of copper, in each case from shipments occurring after January 1, 2024.
When considered together with the streaming payments under the Mount Milligan Streaming Agreement, the Additional Royal Gold Agreement will effectively provide aggregate cash payments for gold and copper sold (“Threshold Payments”) under the Mount Milligan Streaming Agreement as follows:
For gold:
•the lower of $850 per ounce and 50% of the gold spot price for the period between the First Threshold Date and the Second Threshold (Gold) Date; and
•the lower of $1,050 per ounce and 66% of the gold spot price from and after the Second Threshold (Gold) Date.
For copper:
•50% of the copper spot price for the period between the First Threshold Date and the Second Threshold (Copper) Date; and
•66% of the copper spot price from and after the Second Threshold Copper Date.
The Additional Royal Gold Agreement also provides the Mount Milligan Mine a right to elect to receive payments (“Pre-Threshold Payments”) from Royal Gold prior to the First Threshold Date but only in a low commodity price environment. If both the gold spot price is at or falls below $1,600 per ounce and the copper spot price is at or falls below $3.50 per pound (“Pre-Threshold Reference Prices”), then the Company may elect to receive:
•For gold, the lesser of: (i) $415 per ounce, for an aggregate cash payment per ounce equal to $850 when including any cash payment under the Mount Milligan Mine Streaming Agreement; and (ii) an
amount per ounce equal to the difference of 66% of the gold spot price, less any cash payment under the Mount Milligan Mine Streaming Agreement; and
•For copper, 35% of the copper spot price, for an aggregate cash payment per metric tonne equal to 50% of the copper spot price when including any cash payment under the Mount Milligan Mine Streaming Agreement.
Any Pre-Threshold Payments previously received would be offset against Threshold Payments if the prices of gold and copper each increase above the Pre-Threshold Reference Prices at the time of any gold or copper delivery under the Mount Milligan Mine Streaming Agreement.
The Company and TCM have agreed to make certain payments and deliveries to Royal Gold as part of the Additional Royal Gold Agreement, including:
•An initial cash payment of $24.5 million, which was made in the first quarter of 2024;
•A commitment to deliver an aggregate of 50,000 ounces of gold. The first 33,333 ounces are expected to be delivered in tranches after an equivalent number of gold ounces are received by Centerra in relation to the sale of Centerra’s 50% interest in the Greenstone Gold Mines Partnership. Any remaining ounces are to be delivered to Royal Gold in quarterly installments equally over a 5-year period, with first delivery to occur by June 30, 2030;
•Commencing on January 1 of the fiscal year following the later of delivering to Royal Gold an aggregate of 375,000 ounces of gold and an aggregate of 30,000 tonnes of copper, in each case from shipments occurring after January 1, 2024, but no later than January 1, 2036, payments equal to 5% of the Mount Milligan Mine’s annual free cash flow, which increase by an additional 5% of annual free cash flow (for a total of 10% per year) commencing after the later of the Second Threshold (Gold) Date and Second Threshold (Copper) Date, but no later than January 1, 2036. No payments will be made for a calendar year in which free cash flow is negative, and Centerra is allowed to recoup any negative free cash flow before any such payments to Royal Gold resume. Free cash flow has a meaning specifically defined in the Additional Royal Gold Agreement; and
•An indemnification for Royal Gold and its affiliates for up to $25 million of specified incremental taxes that may be assessed as a result of the Additional Royal Gold Agreement for a period of seven years.
The value of the Threshold Payments to be received by the Company will depend on the Mount Milligan Mine’s production and the ability to sustain the updated life of mine (i.e. additional gold and copper payments can be suspended if (and for as long as) the Company discloses proven and probable reserves which, when combined with mining depletion from the transaction date, are lower than those disclosed in the mineral reserves and mineral resources update on February 14, 2024). Potential suspension of Threshold Payments would not impact the Company’s and TCM’s obligation to make the payments and deliveries mentioned above to Royal Gold. As a result of the Additional Royal Gold Agreement, the mine life was initially extended by two years.
Normal Course Issuer Bid
On November 5, 2024, Centerra announced that the Toronto Stock Exchange had accepted the renewal of a NCIB to purchase for cancellation up to an aggregate of 18,800,929 common shares in the capital of the Company during the twelve-month period commencing on November 7, 2024 and ending on November 6, 2025. Any tendered common shares taken up and paid for by Centerra under the NCIB are cancelled.
During the fourth quarter of 2024, the Company repurchased 1,766,130 common shares for a total consideration of $12.2 million (C$16.0 million) under its NCIB program. During the year ended December 31, 2024, the Company repurchased 6,731,430 common shares for a total consideration of $44.1 million (C$59.3 million) under its NCIB program.
Exploration and Project Evaluation Update
Exploration activities during the quarter included drilling, surface rock and soil sampling, geological mapping and geophysical surveying at the Company’s various projects and earn-in properties, targeting gold and
copper mineralization in Canada, Türkiye, and the USA. The activities were primarily focused on drilling programs at the Mount Milligan Mine in British Columbia, Goldfield Project in Nevada and greenfield projects in the USA and Türkiye. Project evaluation expenditures were primarily focused on the Goldfield Project in Nevada and Kemess Project in British Columbia.
Mount Milligan Mine
At Mount Milligan Mine, a total of 69 holes for 23,072 metres were completed during the year. Approximately 85% of the drilling was carried out within the resource pit and within the four more distant brownfield areas within the mine lease (North Slope, Goldmark, Saddle West and Boundary). In all these areas, results received show mineralization extending west from the pit margin and below the ultimate pit boundary. These results are positive and indicate a potential for future resource expansion.
Goldfield Project
At the Goldfield Project in Nevada, USA, brownfield exploration with diamond and reverse circulation (“RC”) drilling was completed at the Jupiter, Adams and Diamondfield prospects, and was ongoing at the Daisy and Linda prospects in the fourth quarter of 2024. Resource modeling for Gemfield and Jupiter was completed during the quarter.
As a result of a continuing strategic review of the project, the Company continued to focus exploration activities on oxide and transition material, principally in the Gemfield and nearby deposits with a view to develop a more simplified ore processing method and a flow sheet with lower capital costs and increased returns on the project when compared to the known sulphide ore at the Goldfield Project.
The Company published the initial resource estimate for the project as part of the 2024 year end resources and reserves statement. Based on the size of resource estimate, Centerra has decided not to proceed with the development of Goldfield Project at this time. This resulted in the recognition of a non-cash impairment loss in the fourth quarter of 2024. The Company remains committed to maximizing the project’s potential and will conduct close-out drilling in 2025, while exploring strategic options for the property.
2025 Outlook
The Company’s full year 2025 outlook, and comparative actual results for the year ended December 31, 2024 of certain operating metrics are set out in the sections below.
Gold and copper producing assets
| | | | | | | | | | | | | |
| Units | 2025
Guidance | 2024
Actual | | |
| Production | | | | | |
Total gold production(1) | (koz) | 270 - 310 | 368 | | |
Mount Milligan Mine(2)(3)(4) | (koz) | 165 - 185 | 168 | | |
| Öksüt Mine | (koz) | 105 - 125 | 201 | | |
Total copper production(2)(3)(4) | (Mlb) | 50 - 60 | 54 | | |
Unit Costs(5) | | | | | |
Gold production costs(1) | ($/oz) | 1,100 - 1,200 | 913 | | |
Mount Milligan Mine(2) | ($/oz) | 1,075 - 1,175 | 1,105 | | |
| Öksüt Mine | ($/oz) | 1,100 - 1,200 | 748 | | |
All-in sustaining costs on a by-product basisNG(1)(3)(4) | ($/oz) | 1,400 - 1,500 | 1,148 | | |
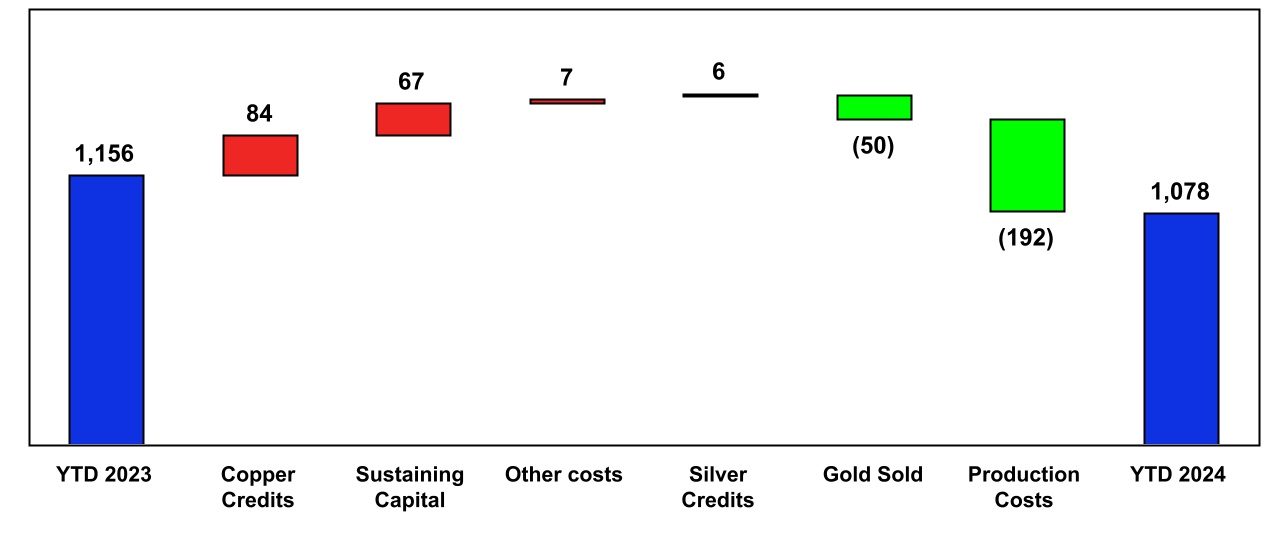
Mount Milligan Mine(4) | ($/oz) | 1,100 - 1,200 | 1,078 | | |
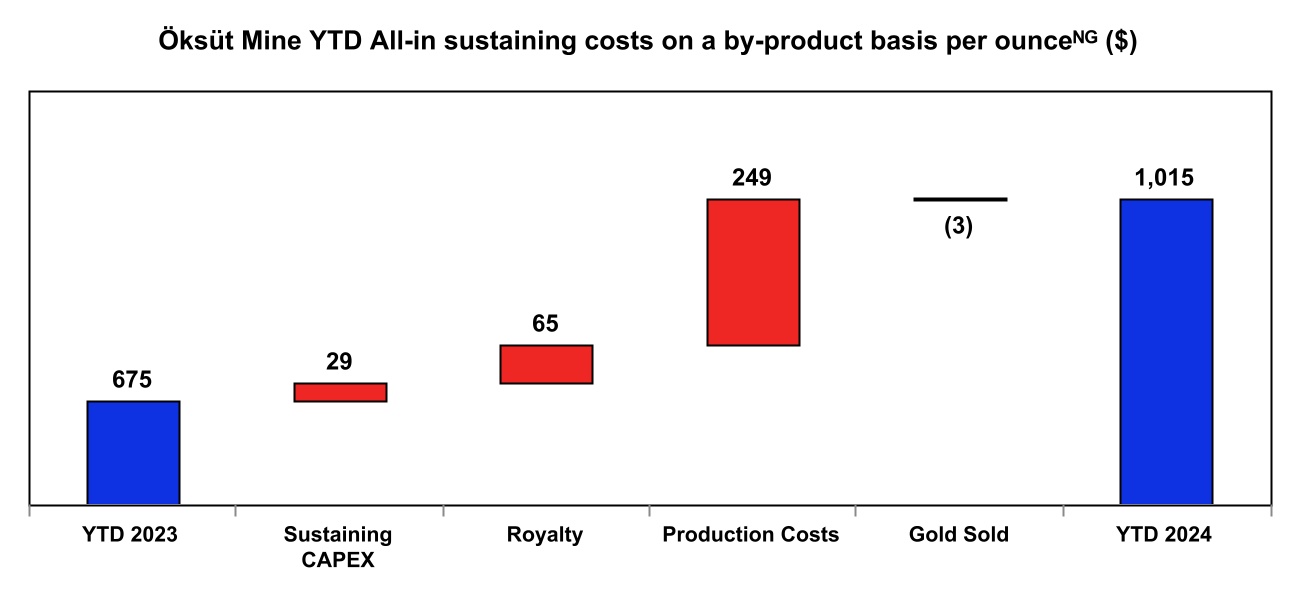
| Öksüt Mine | ($/oz) | 1,475 - 1,575 | 1,015 | | |
| | | | | |
| | | | | |
| | | | | |
| | | | | |
| | | | | |
| | | | | |
| | | | | |
| | | | | |
| | | | | |
| Capital Expenditures | | | | | |
Additions to PP&E(1) | ($M) | 105 - 130 | 110.5 | | |
| Mount Milligan Mine | ($M) | 75 - 90 | 55.8 | | |
| Öksüt Mine | ($M) | 30 - 40 | 54.7 | | |
Total Capital ExpendituresNG(1) | ($M) | 105 - 130 | 95.9 | | |
Sustaining Capital ExpendituresNG(1) | ($M) | 95 - 115 | 95.9 | | |
| Mount Milligan Mine | ($M) | 65 - 75 | 54.0 | | |
| Öksüt Mine | ($M) | 30 - 40 | 41.9 | | |
Non-sustaining Capital ExpendituresNG(1) | ($M) | 10 - 15 | — | | |
| Mount Milligan Mine | ($M) | 10 - 15 | — | | |
| Other Items | | | | | |
Depreciation, depletion and amortization(1) | ($M) | 95 - 115 | 122.8 | | |
| Mount Milligan Mine | ($M) | 60 - 70 | 72.8 | | |
| Öksüt Mine | ($M) | 35 - 45 | 50.0 | | |
Income tax and BC mineral tax expense(1) | ($M) | 35 - 42 | 87.5 | | |
| Mount Milligan Mine | ($M) | 3 - 5 | 3.6 | | |
| Öksüt Mine | ($M) | 32 - 37 | 83.9 | | |
1.Consolidated Centerra figures.
2.The Mount Milligan Mine is subject to an arrangement with RGLD Gold AG and Royal Gold Inc. (together, “Royal Gold”) which entitles Royal Gold to purchase 35% and 18.75% of gold and copper produced, respectively, and requires Royal Gold to pay $435 per ounce of gold and 15% of the spot price per metric tonne of copper delivered (“Mount Milligan Mine Streaming Agreement”). Using an assumed market gold price of $2,400 per ounce and an assumed market copper price of $4.00 per pound for 2025, the Mount Milligan Mine’s average realized gold and copper price for 2025 would be $1,712 per ounce and $3.36 per pound, respectively, compared to average realized prices of $1,761 per ounce and $3.25 per pound in 2024, when factoring in the Mount Milligan Streaming Agreement and concentrate refining and treatment costs.
3.Gold and copper production for 2025 at the Mount Milligan Mine assumes estimated recoveries of 64% to 66% for gold and 77% to 79% for copper compared to actual recoveries for gold of 62.8% and for copper of 74.8% achieved in 2024.
4.Unit costs include a credit for forecasted copper sales treated as by-product for all-in sustaining costsNG. Production for copper and gold reflects estimated metallurgical losses resulting from handling of the concentrate and metal deductions levied by smelters.
5.Units noted as ($/oz) relate to gold ounces.
Production Profile
In 2024, the Company reported consolidated gold and copper production of 368,104 ounces of gold and 54.3 million pounds of copper, respectively. Centerra’s 2025 consolidated gold production is projected to be between 270000 and 310000 ounces. This includes estimated 165000 to 185000 ounces from the Mount Milligan Mine and 105000 to 125000 ounces from the Öksüt Mine. The 2025 copper production is expected to be 50 to 60 million pounds.
In 2024, the Mount Milligan Mine produced 167,579 ounces of gold and 54.3 million pounds of copper. In 2025, the Mount Milligan Mine’s gold production guidance is projected to be 165000 to 185000 ounces and copper production guidance is projected to be 50 to 60 million pounds. In 2025, gold and copper grades are expected to be similar to those in 2024, and gold and copper recoveries in 2025 are expected to be higher than last year. The Mount Milligan plant is expected to operate at higher throughput levels than in 2024 due to materials handling improvements implemented in 2024. The plant is scheduled for two major shutdowns in the first and third quarters of 2025. The first shutdown will include shell relining for both ball mills that is performed on average every 18 months. An improvement in metal recoveries in 2025 relative to 2024 is expected to be driven by a reduction in the sales copper concentrate grade as well as other projects to optimize the flotation circuits, but may continue to be impacted by partial oxidation of ore rehandled from the stockpile. Sales and monetization of gold ounces and copper pounds are dependent on the timing of ocean vessels. Gold production and sales are expected to be relatively evenly weighted through 2025, while copper sales are expected to closely track copper production and to be weighted to the second half of 2025.
In 2024, the Öksüt Mine produced 200,525 ounces of gold. During the first nine months of 2024, the Öksüt Mine finished processing the excess gold inventory that it had accumulated during the shutdown of operations between March 2022 and early June 2023, leading to elevated gold production levels. Production levels in the fourth quarter of 2024 returned to more normalized levels. In 2025, the Öksüt Mine’s gold production guidance is projected to be 105000 to 125000 ounces driven by a return to steady state production levels, as planned. Gold sales are expected to closely follow the gold production profile and be relatively evenly distributed throughout 2025.
Cost Profile
In 2024, the Company’s consolidated gold production costs amounted to $913 per ounce. In 2025, the Company anticipates its consolidated gold production costs to range from $1,100 to $1,200 per ounce. The expected increase in the gold production costs per ounce is largely due to lower gold production at the Öksüt Mine and the impact of net inflation in Türkiye compared to the previous year.
In 2024, the Mount Milligan Mine reported gold production costs of $1,105 per ounce. In 2025, the Company anticipates the Mount Milligan Mine’s gold production cost guidance to be in the range of $1,075 to $1,175 per ounce, similar to 2024. It is expected that the Mount Milligan Mine’s mining and milling per unit costs will continue to benefit from various optimization initiatives. The 2025 production costs are expected to be impacted by higher allocation of mining costs to the TSF and higher mill maintenance costs associated with the relining of ball mills as outlined above. As part of the ongoing full asset optimization program, the Mount Milligan Mine has reduced operational costs and is actively pursuing opportunities to further reduce costs. These efforts are focused on several key areas including optimizing costs relating to grinding media, major consumables and spare parts through improvement of procurement strategies and consumption optimization. Approximately 95% of the Mount Milligan Mine’s costs are sourced from Canadian vendors and the Company does not expect significant impact from potential tariffs levied on imported goods. The Company anticipates that the primary vendors of the Mount Milligan Mine may experience cost pressures as a result of potential tariffs that could ultimately result in increased costs to the mine. The Company continues to assess these impacts.
In 2024, the Öksüt Mine reported gold production costs of $748 per ounce. The gold production cost per ounce in 2024 benefited from processing stacked ore inventory that had been accumulated on the heap leach pad at the Öksüt Mine in prior years, resulting in a relatively low weighted average cost per ounce. In 2025,
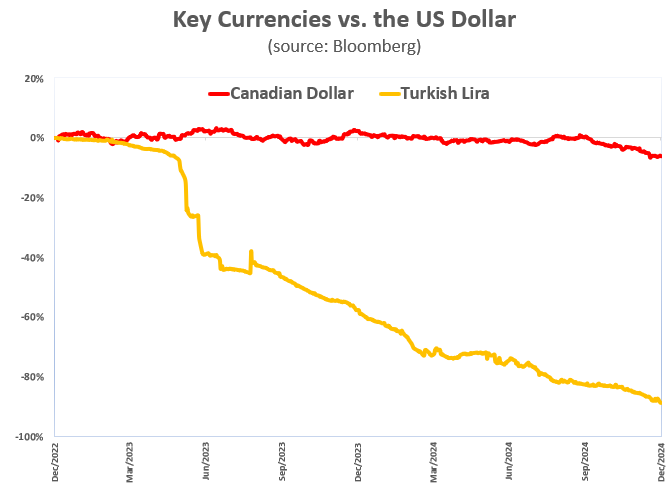
the Company estimates the Öksüt Mine’s gold production costs to be in the range of $1,100 to $1,200 per ounce. A higher anticipated gold production cost per ounce profile in 2025 is primarily attributed to the impact of net inflation in the country as well as lower gold production and sales volumes, as noted above. In 2024, the impact of persistently high inflation in Türkiye was not fully offset by the devaluation of the Turkish lira. Approximately 50% of the site operating and capital costs are denominated in Turkish lira, and labour cost arrangements, including the Öksüt Mine’s mining contractor, are subject to periodic cost of living adjustments driven by in-country inflation.
Copper production costs at the Mount Milligan Mine were $2.04 per pound in 2024. In 2025, copper production costs are projected to be in the range of $2.00 to $2.50 per pound. Copper production costs in 2025 are expected to reflect the same cost trends that impact the gold productions costs noted above.
Consolidated all-in sustaining costs on a by-product basisNG were $1,148 per ounce in 2024. In 2025, the Company expects its consolidated all-in sustaining costs on a by-product basisNG to be in the range of $1,400 to $1,500 per ounce. The anticipated increase in consolidated all-in sustaining costs on a by-product basisNG in 2025, compared to the previous year, is primarily due to higher gold production costs per ounce at the Öksüt Mine, higher sustaining capital expendituresNG planned for the Mount Milligan Mine and slightly lower by-product credits.
At the Mount Milligan Mine, all-in sustaining costs on a by-product basisNG were $1,078 per ounce in 2024. All-in sustaining costs on a by-product basisNG are expected to range from $1,100 to $1,200 per ounce. The Company expects all-in sustaining costs on a by-product basisNG to be higher primarily due to strategic investments targeting further optimizations including a purchase of larger truck boxes to optimize payload and reduce future truck purchases, and slightly lower copper credits due to a lower assumed copper price for 2025.
The Öksüt Mine’s all-in sustaining costs on a by-product basisNG were $1,015 per ounce in 2024. The all-in sustaining costs on a by-product basisNG per ounce for 2025 are projected to increase from the 2024 levels driven by higher gold production costs per ounce anticipated in 2025 as outlined above. As a result, the Company expects the Öksüt Mine’s all-in sustaining costs on a by-product basisNG to be in the range of $1,475 to $1,575 per ounce.
Capital Expenditures
Additions to Property, Plant and Equipment (“PP&E”) for IFRS accounting purposes includes certain non-cash additions to PP&E such as positive or negative changes in future reclamation costs and capitalization of leases. Capital expendituresNG, which comprise of sustaining capital expendituresNG and non-sustaining capital expendituresNG, exclude such non-cash additions to PP&E. The reconciliation of additions to PP&E and capital expendituresNG is included in the Non-GAAP and Other Financial Measures section of this MD&A. In 2024, additions to PP&E for gold and copper producing assets were $110.5 million and total capital expendituresNG for these assets were $95.9 million.
The Mount Milligan Mine’s additions to PP&E in 2024 were $55.8 million and total capital expendituresNG were $54.0 million. The difference between additions to PP&E and capital expendituresNG was mainly due to a change to future reclamation costs of $1.7 million and the costs capitalized to the right of use assets of $2.8 million. In 2025, the Mount Milligan Mine is expecting additions to PP&E and total capital expendituresNG to be in the range from $75 to $90 million including sustaining capital expendituresNG in the range from $65 to $ 75 million and non-sustaining capital expendituresNG in the range from $10 to $ 15 million. Most of the sustaining capital expendituresNG in 2025 relate to capitalized TSF construction costs amounting to $25 to $30 million with the remaining sustaining capital expendituresNG balance largely related to equipment rebuilds and a purchase of large truck boxes to optimize payload and reduce future truck purchases. Non-sustaining capital expendituresNG planned for 2025 include purchases of additional mining equipment to meet the increased tonnage movement requirements in the future years of the Mount Milligan Mine’s life of mine, and additional exploration costs for in-fill drilling of areas outside of the existing reserves that could form the basis of the extension to the current life of mine plan.
The Öksüt Mine’s additions to PP&E in 2024 were $54.7 million and total capital expendituresNG were $41.9 million. The difference between additions to PP&E and capital expendituresNG was mainly due to a change to future reclamation costs of $11.0 million and the costs capitalized into right of use assets of $1.7 million. In 2025, the Öksüt Mine is expecting sustaining capital expendituresNG in the range of $30 to $ 40 million. Most of 2025 sustaining capital expendituresNG relate to capitalized stripping costs amounting to $20 to $25 million, phase 3 of the heap leach pad expansion, and a barren solution distribution system to improve the heap leach irrigation system.
Depreciation, Depletion and Amortization
In 2024, the Company’s DDA expense included in the cost of sales for gold and copper producing assets was $122.8 million. The Mount Milligan Mine’s DDA expense in 2024 was $72.8 million and the Öksüt Mine’s DDA expense was $50.0 million. In 2025, the Company estimates DDA expense to be in the range of $95 to $115 million, including $60 to $70 million at the Mount Milligan Mine and $35 to $45 million at the Öksüt Mine which is relatively consistent with DDA expense in 2024.
Current Taxes and Tax Payments
The Mount Milligan Mine’s British Columbia mineral tax expense in 2024 was $3.6 million and the cash taxes paid were $2.5 million. The difference between tax expense and cash taxes paid is due to timing of tax payments. In 2025, Mount Milligan Mine’s British Columbia mineral tax expense and tax payments are each expected to be in the range of $3 to $5 million.
The Öksüt Mine’s current income tax expense in 2024 was $83.9 million, including a withholding tax expense of $11.5 million on the repatriation of the Öksüt Mine’s earnings. In 2024, the Öksüt Mine paid cash taxes of $103.4 million including $11.9 million withholding tax payment. The difference between tax expense and cash taxes paid is due to timing of tax payments and impact of the Turkish lira devaluation. In 2025, the Öksüt Mine income tax expense is expected to be in the range of $32 to $37 million and reflects an anticipated decrease in the taxable income due to reduced gold production and sales projected for the year. The Öksüt Mine income tax expense reflects a 25% income tax rate on taxable income, and a withholding tax expense of $15 million on expected repatriation of a portion of the Öksüt Mine’s retained earnings in 2025. The Öksüt Mine is expected to pay approximately $25 to $30 million in cash taxes in 2025.
Molybdenum Business Unit
| | | | | | | | | | | |
| Units | 2025 Guidance | 2024
Actual |
| Production - Langeloth Facility | | | |
Total molybdenum roasted(1) | Mlbs | 13 - 15 | 10.2 |
| Total molybdenum sold | Mlbs | 13 - 15 | 10.9 |
| Costs and Profitability - Langeloth Facility | | | |
| Earnings (loss) from operations | ($M) | (3) - 5 | (7.8) |
Earnings before Interest, Taxes, Depreciation and Amortization (“EBITDA”)NG | ($M) | 2 - 8 | (5.2) |
| | | |
| | | |
| | | |
| | | |
| | | |
| | | |
| | | |
| | | |
| | | |
| | | |
| | | |
| | | |
| | | |
| | | |
| | | |
| | | |
| | | |
| Capital Expenditures | ($M) | | |
| Additions to PP&E | ($M) | 132 - 150 | 62.3 |
| Thompson Creek Mine | ($M) | 130 - 145 | 57.0 |
| Langeloth Facility | ($M) | 2 - 4 | 5.2 |
Total capital expendituresNG | ($M) | 132 - 150 | 63.1 |
| | | |
Sustaining capital expendituresNG - Langeloth Facility | ($M) | 2 - 4 | 5.2 |
| | | |
Non-sustaining capital expendituresNG - Thompson Creek Mine | ($M) | 130 - 145 | 57.8 |
| Other Items | ($M) | | |
| Depreciation, depletion and amortization | ($M) | 3 - 5 | 3.4 |
| Langeloth Facility | ($M) | 3 - 5 | 3.4 |
| | | |
| Care and Maintenance Expenses - Endako Mine | ($M) | 6 - 8 | 5.0 |
| Reclamation Costs - Endako Mine | ($M) | 4 - 7 | 9.5 |
| | | |
| | | |
| | | |
| | | |
1.2024 amount does not include 2.3 million pounds of molybdenum roasted of toll material. 2025 guidance figure does not include any toll material roasted.
Thompson Creek Mine
Since the restart decision in September 2024, the site has made a significant progress in advancing the project and remains on track with the feasibility study (see “Recent Events and Developments” section above). The Thompson Creek Mine’s additions to PP&E and total capital expendituresNG in 2024 were $57.0 million and $57.8 million, respectively. The difference between additions to PP&E and capital expendituresNG was mainly due to a change to future reclamation costs of $4.7 million and capitalized portion of DDA of $2.8 million. Since the restart decision in September 2024, non-sustaining capital expendituresNG were $29.6 million including capitalized stripping costs of $10.8 million, equipment refurbishment and capital equipment purchases of $13.2 million, and other capitalized costs of $5.6 million. In 2025, the Molybdenum BU’s additions to PP&E and total capital expendituresNG are expected to be in the range from $130 to $145 million. The total capital expendituresNG planned for 2025 include:
•Continue the ramp-up of tons moved per month throughout 2025;
•Fleet refurbishments targeting achievement of planned equipment availability by the end of the first quarter of 2025;
•Completion of detailed engineering and procurement of long-lead mill equipment by the end of the third quarter of 2025;
•Procurement and construction of housing units in the neighboring communities to facilitate increased mining workforce levels; and
•Site infrastructure development and other costs.
The Company expects the total project spending will be within the total initial capital expenditure estimate of $397 million as outlined in the feasibility study. The Company estimates that the majority of costs at the
Thompson Creek Mine will be related to items sourced directly within the United States and does not expect significant impact from current and potential tariffs levied on imported goods.
Langeloth Facility
In 2024, the Langeloth Facility roasted and sold 10.2 and 10.9 million pounds of molybdenum, respectively. During the contracting season in the fourth quarter of 2024, the Company negotiated with molybdenum concentrate suppliers and molybdenum product customers to increase the volumes purchased and sold for the 2025 year. As a result, Langeloth Facility is expected to commence a ramp-up of operations and increase roasting volumes to 13 - 15 million pounds in 2025. A significant portion of the concentrate processed at Langeloth Facility is sourced from other countries than the United States. The majority of the molybdenum products made at Langeloth Facility is sold to large steel mills within the United States. The Company is assessing the impact of potential US tariffs on the business model of Langeloth Facility.
In 2024, the loss from operations was $7.8 million, including DDA of $3.4 million, and EBITDANG was negative $5.2 million. In 2025, the Company expects the Langeloth Facility’s results to range from $3 million loss from operationsNG to $5 million earnings from operations. The Company expects the current production cost structure to remain relatively stable in 2025, allowing for further improvements in profitability as operations ramp up, without consideration for any potential US tariffs. Based on these estimates, the Company targets to achieve a positive EBITDANG in the range from $2 to $8 million in 2025. The Company expects that the cash provided by operations at the Langeloth Facility in 2025 will primarily be driven by EBITDANG and changes in working capital. The working capital requirements at the Langeloth Facility are highly dependent on market molybdenum prices. In 2024, average molybdenum market price was $21.30 per pound and Langeloth Facility reported $6.6 million in incremental working capital investment. A $5 per pound change in molybdenum price has an approximate $20 million impact on working capital invested.
In 2024, the Langeloth Facility’s additions to PP&E and total capital expendituresNG were $5.2 million. The majority of these costs were related to the scheduled refurbishment of the acid plant that was carried out in the second quarter of 2024, and is a routine procedure conducted every several years. In 2025, the Langeloth Facility is projecting sustaining capital expendituresNG to be in the range from $2 to $4 million.
Endako Mine
In 2024, the Company's share of cash expenditures at the Endako Mine totaled $12.6 million, including $5.0 million for care and maintenance and $9.5 million for reclamation, partially offset by cash inflow released from working capital movement of $1.9 million. In 2025, the Company’s share of care and maintenance expenditures at the Endako Mine are expected to be between $6 to $8 million and reclamation expenditures are expected to be $4 to $7 million. Substantially all reclamation costs planned in 2025 have been included in the reclamation provision as at December 31, 2024 and relate primarily to the closure works on the spillway for the Tailings Pond 2 that started in 2024.
Global Exploration and Evaluation Projects
| | | | | | | | | | | |
| (Expressed in millions of United States dollars) | | 2025 Guidance | Years ended December 31, 2024 | | |
| Project Exploration and Evaluation Costs | | | | | |
Exploration Costs(1) | | 35 - 45 | 39.9 | | |
Brownfield Exploration(1) | | 20 - 25 | 21.1 | | |
| Greenfield and Generative Exploration | | 15 - 20 | 18.8 | | |
| Evaluation Costs | | 8 - 12 | 8.7 | | |
| | | | | |
| | | | | |
| Other Kemess Costs | | | | | |
| Care & Maintenance | | 13 - 15 | 12.9 | | |
| | | | | |
| | | | | |
| | | | | |
1.Total exploration costs include capitalized exploration costs at the Mount Milligan Mine of $1.6 million in 2024 and $5 to $7 million projected in 2025.
Exploration Expenditures (excluding Project Evaluation costs)
In 2024, total exploration expenditures were 39.9 million, including $38.3 million related to expensed exploration and capitalized exploration costs of $1.6 million. In 2025, exploration expenditures are expected to be $35 to $45 million, including $20 to $25 million of brownfield exploration and $15 to $20 million of greenfield and generative exploration programs. Over 80% of exploration expenditures are expected to be expensed. The exploration targets for brownfield projects include further drilling and testing work at the Mount Milligan Mine, as well as the Kemess Project. At the Mount Milligan Mine, a significant portion of the exploration work is expected to be focused on in-fill drilling to upgrade resources at Goldmark, North Slope and South Boundary as well as to test the extension of the South Boundary southwestern mineralization.
Kemess Project
In 2024, the Company made a strategic decision to re-evaluate the technical concepts for the Kemess property to determine the future potential of this asset. The project evaluation activities included confirmation and exploration drilling as well as technical studies.
In 2024, the Kemess Project’s expenditures amounted to $17.8 million, comprised of $12.9 million for care and maintenance costs, $2.3 million for exploration and geotechnical drilling (included in Brownfield Exploration costs), and $2.6 million related to technical studies, including assaying and consulting costs. In 2025, the Kemess Project’s expenditures for care and maintenance costs are projected to be in the range from $13 to $15 million.
In 2025, the Company plans to continue evaluating concepts for the property as outlined in the Recent Events and Developments section of this MD&A. The Company expects to provide an updated resource estimate and an accompanying update on the technical concept for the Kemess Project in the second quarter of 2025. The Company plans to spend $4 to $6 million on technical studies (included in the Evaluation Costs in the table above) and $4 to $6 million on exploration drilling at the Kemess property (the drilling is included in Brownfield Exploration costs). Centerra will continue to explore the property with the 2025 program aimed at upgrading resources along the mineralized trend.
Other Items
In 2024, corporate and administration expenses were 31.8 million, excluding stock-based compensation expense of $5.2 million and corporate depreciation of $0.9 million. Corporate and administration expenses excluding stock-based compensation expense are expected to be in the range from $28 to $32 million in 2025.
As result of the continuous ramp-up of the Greenstone Mine, the Company estimates to receive delivery of 22,222 contingent gold ounces in 2025 from Equinox Gold in relation to the sale of Centerra’s 50% interest in the Greenstone Partnership. Once received, the equivalent ounces will be delivered by the Company to Royal Gold as part of the Additional Royal Gold Agreement.
2025 Material Assumptions
Other material assumptions or factors not mentioned above but used to estimate production and costs for 2025 after giving effect to the hedges in place as at December 31, 2024, include the following:
•market gold price of $2,400 per ounce, and an average realized gold price at the Mount Milligan Mine of $1,712 per ounce after reflecting the Mount Milligan Streaming Agreement (i.e., 35% of the Mount Milligan Mine’s gold is sold to Royal Gold for $435 per ounce) and gold refining costs;
•market price of $4.00 per pound for copper. Realized copper price at the Mount Milligan Mine is estimated to average $3.36 per pound after reflecting the Mount Milligan Streaming Agreement
(18.75% of the Mount Milligan Mine’s copper is sold to Royal Gold at 15% of the spot price per metric tonne), and copper treatment and refining costs;
•molybdenum price of $20.00 per pound;
•exchange rates are as follows: $1USD:$1.35 CAD, and $1USD:34 Turkish lira; and
•diesel fuel price of $1.05/litre or CAD$1.45/litre at the Mount Milligan Mine and $3.00/gallon at the Thompson Creek Mine.
The Additional Royal Gold Agreement is not expected to have a significant impact on these assumptions in 2025 as the increases in payments received by the Company for gold ounces and copper pounds delivered to Royal Gold are not expected to commence until later. See “Recent Events and Developments” section in this MD&A.
Mount Milligan Streaming Agreement
Production at the Mount Milligan Mine is subject to the Mount Milligan Streaming Agreement. To satisfy its obligations under the Mount Milligan Streaming Agreement, the Company purchases refined gold and copper warrants and arranges for their delivery to Royal Gold. The difference between the cost of the purchases of refined gold and copper warrants, and the corresponding amounts payable to the Company under the Mount Milligan Streaming Agreement is recorded as a reduction of revenue and not a cost of operating the mine.
Other Material Assumptions
Production, cost, and capital expenditure forecasts for the year 2025 are forward-looking information and are based on key assumptions and subject to material risk factors that could cause actual results to differ materially from those estimated. Material assumptions used in forecasting production and costs for 2025 and related risk factors can be found under the heading “Caution Regarding Forward-Looking Information” in this document and under the heading “Risks That Can Affect Centerra’s Business” in the Company’s most recent Annual Information Form (“AIF”).
2025 Sensitivities
Centerra’s costs and cash flows in 2025 are sensitive to changes in certain key inputs. The Company has estimated the impact of any such changes on its net income, capital costs and cash flows as follows:
| | | | | | | | | | | | | | | | | | | | | |
| | Impact on
($ millions) | |
| | Production Costs & Taxes | Capital
Costs | Revenues | Cash flows | | All-in sustaining costs on a by-product basis per ounceNG |
Gold price(1) | $100/oz | 4.0 - 4.5 | — | 21.0 - 24.5 | 18.5 - 21.5 | | 5 - 6 |
Copper price(1) | 10% | 0.5 - 1.0 | — | 17.0 - 20.0 | 16.0 - 19.5 | | 50 - 60 |
Diesel fuel(2) | 10% | 1.5 - 2.2 | 1.5 - 2.3 | — | 3.0 - 4.5 | | 8 - 10 |
Canadian dollar(2),(3) | 10 cents | 17.0 - 18.0 | 0.1 - 0.5 | — | 17.0 - 18.5 | | 55 - 60 |
Turkish lira(3) | 5 liras | 2.0 - 2.5 | 2.0 - 2.5 | — | 4.0 - 5.0 | | 15 - 17 |
(1)Excludes the impact of gold hedges and the effect of 48,541 ounces of gold with an average mark-to-market price of $2,641 per ounce and 20.1 million pounds of copper with an average mark-to-market price of $4.00 per pound outstanding under the Mount Milligan Mine’s contracts awaiting final settlement in future months as of December 31, 2024.
(2)Includes the effect of the Company’s diesel fuel and Canadian dollar hedging programs, with current exposure coverage as of December 31, 2024 of approximately 25% and 60%, respectively.
(3)Appreciation of the currency against the US dollar results in higher costs and lower cash flow and earnings. Depreciation of the currency against the US dollar results in decreased costs and increased cash flow and earnings.
Risks That Can Affect Centerra’s Business
Overview
The Company’s business contains significant risk due to the nature of mining, exploration, and development activities. Certain risk factors, including but not limited to those listed below, are similar across the mining industry while others are specific to the Company. The risk factors below may include details of how the Company seeks to mitigate these risks where possible. For additional discussion of risk factors please refer to the Company’s most recent Annual Information Form (the “AIF”), which is available on the Company’s website www.centerragold.com at SEDAR+ at www.sedarplus.com and EDGAR at www.sec.gov/edgar.
The Company is subject to risks that can have a material effect on the profitability, future cash flow, decommissioning and reclamation costs, financial condition of the Company and its stated mineral reserves. Some of these risks relate to the mining industry in general, and others apply to specific properties, operations or planned operations. The Company has implemented an enterprise risk management (“ERM”) program which applies to all of its operations and corporate offices. The program is based on leading international risk management standards and industry best practice. It employs both a bottom-up and top-down approach to identify and address risks from all sources that threaten the achievement of the Company’s objectives. Each operating site and project is responsible for identifying, assessing, mitigating, and monitoring risk. Efforts are coordinated by appointed “Risk Champions” who facilitate the process and provide regular reporting to the Company’s corporate risk function.
The ability to deliver on the Company’s vision, strategic objectives and operating guidance depends on its ability to understand and appropriately respond to the uncertainties or “risks” the Company faces and may prevent it from achieving its objectives. In order to achieve this, the Company:
•Maintains a framework that permits it to manage risk effectively and in a manner that creates the greatest value through making risk informed decision making;
•Integrates a process for managing risk into all of its important decision-making processes so that the Company reduces the effect of uncertainty on achieving its objectives;
•Actively monitors key controls the Company relies on to achieve its objectives so that they remain in place and are effective at all times; and
•Provides assurance to senior management and relevant committees of the Board on the effectiveness of key risk management activities.
The risk management program at the Company considers the full life of mine cycle from exploration through to closure. All aspects of the operations and the Company’s stakeholders are considered when identifying risks. As such, the Company’s risk management program encompasses a broad range of risks including technical, financial, commercial, social, reputational, environmental, governance, health and safety, political and human resources related risks.
Board and Committee Oversight
The Board of Directors has oversight responsibilities for the policies, processes and systems for the identification, assessment, and management of the Company’s principal strategic, financial, and operational risks. Each of the Board’s standing committees is responsible for overseeing risks related to their areas of responsibility and for reviewing the policies, standards and actions undertaken to mitigate such risks.
Management Oversight
Management has the responsibility for the development and implementation of policies, processes and systems for the identification, assessment, and management of the strategic, financial, and operational risks on a company wide basis. The Company’s executive team meets regularly to review the risks facing the organization and to discuss the implementation and effectiveness of mitigation actions.
Principal Risks
The following section describes the risks that are most material to the Company’s business. This is not a complete list of the potential risks the Company faces; there may be others the Company is not aware of, or risks that the Company feels are not material today that could become material in the future. For a more comprehensive discussion about the Company’s risks, see the most recent Form Annual Information From and Form 40-F on file with the U.S. Securities and Exchange Commission (“SEC”) and Canadian provincial securities regulatory authorities and see the “Caution Regarding Forward-Looking Information” in this MD&A.
Strategic, Legal and Planning Risks
Strategic, legal and planning risks include political risks associated with the Company’s operations in Türkiye, United States and Canada, including potential uncertainty created by the impact of changes in, or more aggressive enforcement of laws, regulations and government practices including those with respect to the environment and including unjustified civil or criminal action against the Company, its affiliates, or its current or former employees; risk of failure of the Company or its operations to comply with such laws, regulations or government practices and the potentially significant consequences thereof, including potential fines and penalties, loss of permits, interruptions or cessation of operations and loss of reputation; risks of community activism resulting in increased contributory demands or business interruptions; delays or refusals to grant required permits and licenses; risk of activist stakeholders advocating for changes to corporate governance practices; status of the Company’s relationships with local communities; Indigenous claims and consultation issues relating to the Company’s properties; the risks related to outstanding litigation affecting the Company; the impact of any sanctions imposed by Canada, the United States or other jurisdictions against various Russian and Turkish individuals and entities directly or indirectly against the Company or any of its subsidiaries; the impact of constitutional changes or political events or elections in any country that the Company operates in; risks that the Company experiences delay or disruption in its applications for new, amended, or other permits; potential defects of title in the Company’s properties that are not known as of the date hereof; the inability of the Company and its subsidiaries to enforce their legal rights in certain circumstances; conflicts of interest among its board members; risks related to anti-corruption legislation; Centerra’s future exploration and development activities not being successful; Centerra not being able to replace mineral reserves and resources; risks related to mineral reserves and resources being imprecise; that production and cost estimates, including decommissioning and reclamation costs, may be inaccurate; reputational risks, particularly in light of the increase in social media; inability to identify new opportunities and to grow the business; large fluctuations in the Company’s common share trading price that are beyond the Company’s control or ability to predict and mitigate; potential risks related to kidnapping or acts of terrorism.
Financial Risks
The Company is subject to risks related to its financial position and total liquidity, including sensitivity of the Company’s business to the volatility of gold, copper, molybdenum and other mineral prices; the use of provisionally-priced sales contracts for production at the Mount Milligan Mine; reliance on a few key customers for the gold-copper concentrate at the Mount Milligan Mine and gold doré at the Öksüt Mine; use of commodity derivatives; the imprecision of the Company’s mineral reserves and resources estimates and the assumptions they rely on; the accuracy of the Company’s production and cost estimates; the impact on US and Canadian operations of tariffs imposed by the US government and retaliatory tariffs imposed by Canada and other countries; persistent inflationary pressures on key input prices; sensitivity to fuel price volatility; the impact of currency fluctuations; global financial conditions; access to future financing including the impact of environmental, social and corporate governance practices and reporting on the Company’s ability to obtain future financing or accessing capital; the impact of restrictive covenants in the Company’s credit facility which may, among other things, restrict the Company from pursuing certain business activities or making distributions from its subsidiaries or making distributions to its shareholders; the Company’s ability to obtain future financing; the Company’s ability to make payments, including any payments of principal and interest on the Company’s debt facilities, which depends on the cash flow of its subsidiaries; the ability to obtain adequate insurance coverage; and changes to taxation laws in the jurisdictions where the Company operates.
Operational Risks
Mining and metals processing involve significant production and operational risks. Some of these risks are outside of the Company’s control or ability to predict and mitigate. Some of these risks extend beyond the production life of the property in question. Risks include, but are not limited to, the following: unanticipated ground and water conditions; shortages of water for processing activities; adjacent or adverse land or mineral ownership that results in constraints on current or future mine operations; geological risks, including earthquakes and other natural disasters; wildfires; metallurgical and other processing risks; unusual or unexpected mineralogy or rock formations; ground or slope failures; pit flooding; the integrity of tailings storage facilities and the management thereof, including that related to stability, compliance with laws, regulations, licenses and permits, controlling seepages and storage of water where applicable; the stability of the pit walls at the Company’s operations leading to structural cave-ins, wall failures or rock-slides; flooding or fires; equipment failures or performance problems; periodic interruptions due to inclement or hazardous weather conditions or operating conditions and other force majeure events; the risk of having sufficient water to continue operations at the Mount Milligan Mine and achieve expected mill throughput; seismic activity; wildfires; lower than expected ore grades or recovery rates; interruption of energy supply; the Company’s ability to attract and retain qualified personnel; the occurrence of any labour unrest or disturbance and the ability of the Company to successfully renegotiate collective agreements when required; allegations related to violation of human rights; the availability of drilling and related equipment in the area where mining operations will be conducted; the failure of equipment or processes to operate in accordance with specifications or expectations including mechanical breakdowns; the risk that Centerra’s workforce and operations may be exposed to widespread epidemic including, but not limited to, the COVID-19 pandemic; inherent risks associated with the use of sodium cyanide in the mining operations; the ability of the Company to address physical and transition risks from climate change and sufficiently manage stakeholder expectations on climate-related issues; regulations regarding greenhouse gas emissions and climate change; significant volatility of molybdenum prices resulting in material working capital changes and unfavourable pressure on viability of the molybdenum business; competition for mineral acquisition opportunities; the success of the Company’s future exploration and development activities, including the financial and political risks inherent in carrying out exploration activities; the Company’s ability to manage its projects effectively and to mitigate the potential lack of availability of contractors, budget and timing overruns and project resources; the Company’s ability to accurately predict decommissioning and reclamation costs and the assumptions they rely on; long lead-times required for equipment and supplies, given the current construction status of TC Mine, and given the remote location of some of the Company’s operating properties, changes to, or delays in the Company’s supply chain and transportation routes, including cessation or disruption in rail and shipping networks, whether caused by decisions of third-party providers or force majeure events (including, but not limited to, flooding, wildfires, pandemics, or other global events such as wars); reliance on a limited number of suppliers for certain consumables, equipment and components; risks associated with the conduct of joint ventures and partnerships; the adequacy of the Company’s insurance to mitigate the cost impacts of operational and corporate risks; third party risks arising from outsourcing and other vendor contracts the security of critical operating systems and the risk of cyber incidents such as cybercrime, malware or ransomware, data breaches, fines and penalties.
Internal Controls
Centerra has invested resources to document and assess its system of internal control over financial reporting, and it undertakes continuous evaluation of such internal controls. Internal control over financial reporting are procedures designed to provide reasonable assurance that transactions are properly authorized, assets are safeguarded against unauthorized or improper use, and transactions are properly recorded and reported. A control system, no matter how well designed and operated, can provide only reasonable, not absolute, safeguards with respect to the reliability of financial reporting and financial statement preparation.
Centerra is required to satisfy the requirement of Section 404 of the U.S. Sarbanes-Oxley Act (“SOX”), which requires an annual assessment by management of the effectiveness of the Company’ internal control over financial reporting and an attestation report by Centerra’s independent auditors addressing the operating effectiveness of the Company’s internal control over financial reporting.
If Centerra fails to maintain the adequacy of its internal control over financial reporting, as such standards are modified, supplemented, or amended from time to time, the Company may not be able to ensure that it can conclude on an ongoing basis that it has effective internal control over financial reporting in accordance with SOX. Centerra’s failure to satisfy SOX requirements on an ongoing, timely basis could result in the loss of investor confidence in the reliability of its financial statements, which in turn could harm Centerra’s business and negatively impact the trading price of the Company’s common shares. In addition, any failure to implement required new or improved controls, or difficulties encountered in their implementation, could harm Centerra’s operating results or cause it to fail to meet its reporting obligations.
Although Centerra is committed to ensure ongoing compliance, the Company cannot be certain that it will be successful in complying with SOX.
Market Conditions
Commodities
The Company's profitability is materially affected by the market price of metals, primarily the prices of gold, copper and molybdenum. Metal prices fluctuate widely and are affected by numerous factors beyond the Company's control.
| | | | | | | | | | | | | | | | | | | | |
| Average spot price |
| Three months ended December 31, | Years ended December 31, |
| 2024 | 2023 | % Change | 2024 | 2023 | % Change |
| Gold (per oz) | 2,664 | | 1,978 | | 35 | % | 2,388 | | 1,943 | | 23 | % |
| Copper (per lb) | 4.17 | | 3.73 | | 12 | % | 4.15 | | 3.86 | | 8 | % |
| Molybdenum (per lb) | 21.71 | | 18.64 | | 16 | % | 21.31 | | 24.19 | | (12) | % |
In the fourth quarter of 2024 and for the year ended December 31, 2024, the average gold price increased when compared to the comparable periods of 2023. The gold price fluctuated significantly in 2024 with a lowest price of $1,985 per ounce in the first quarter and a highest price in the fourth quarter of $2,784 per ounce. The gold price was impacted by a variety of factors including monetary policy from the U.S. Federal Reserve, central bank demand and elevated geopolitical tensions.
In the fourth quarter of 2024, the average copper price increased when compared to the fourth quarter and the year ended December 31, 2023. The copper price fluctuated in 2024 with the lowest price of $3.67 per pound and the highest price of $4.92 per pound, ultimately trading in a tighter range of $3.95 to $4.48 per pound in the fourth quarter of 2024. The increase in the copper price in fourth quarter of 2024 from the fourth quarter of 2023 is attributable to anticipated supply disruptions, geopolitical tensions, as well as continued increases in demand as a result of the green energy transition.
In the fourth quarter of 2024, the average molybdenum price increased when compared to the fourth quarter of 2023, whereas the average molybdenum price for the year ended December 31, 2024 decreased when compared to year ended December 31, 2023. The molybdenum price fluctuated in 2024 with the lowest price of $19.18 per pound and the highest price of $24.13 per pound, ultimately trading in a tighter range of $21.05 to $22.18 per pound in the fourth quarter of 2024. Sentiment for molybdenum remains bullish overall, with increased demand from the energy sector set to pair with a continuation of supply tightness.
Foreign Exchange
The Company receives its revenue through the sale of gold, copper and molybdenum in US dollars. The Company has operations in Canada, including its corporate head office, Türkiye and the United States.
The exchange rate of the Canadian dollar and Turkish lira relative to the US dollar is an important financial driver for the Company for the following reasons:
•all revenues are earned in US dollars;
•a significant portion, approximately 50%, of operating and capital costs at the Öksüt Mine are incurred in Turkish lira; and
•a majority, approximately 90%, of operating and capital costs at the Mount Milligan Mine are incurred in Canadian dollars.
Approximately 50% (2023 - 50%) of the Company’s combined expenditures from continuing operations were incurred in currencies other than the US dollar during the year ended December 31, 2024.
The performance of these currencies during the periods ended December 31, 2024 and 2023 is as follows:
| | | | | | | | | | | | | | | | | | | | |
| Average market exchange rate |
| Three months ended December 31, | Years ended December 31, |
| 2024 | 2023 | % Change | 2024 | 2023 | % Change |
| USD-CAD | 1.40 | 1.36 | | 3 | % | 1.37 | 1.35 | | 1 | % |
| USD-Turkish Lira | 34.55 | 28.54 | 21 | % | 32.86 | 23.80 | 38 | % |
The Canadian dollar was 3% weaker against the US dollar in the fourth quarter of 2024 when compared of the fourth quarter of 2023, averaging 1.40 in the fourth quarter of 2024, while averaging 1.36 in the fourth quarter of 2023. The currency was also weaker by 1% in the year ended December 31, 2024 compared to the year ended December 31, 2023, primarily due to significant US dollar strength in Q4 2024. The USD/CAD currency pairing, ended the year at $1.44 compared to $1.32 as at December 31, 2023. In November 2024, the US dollar strengthened significantly against most currencies, inclusive of the Canadian dollar, as implications for United States changes in economic policies, specifically tariff-based policies, created concern for Canada’s economy.
The Turkish lira weakened relative to the US dollar in the fourth quarter of 2024 and year ended December 31, 2024, ending the year at 35.4. Inflation remains elevated but the pace of inflation has decreased resulting in a slowing of TRY/USD devaluation.
The Company utilizes its foreign exchange hedging program in order to manage its exposure to adverse fluctuations in the Canadian dollar, relative to the US dollar, see “Financial Instruments”. The Company does not currently hedge the Turkish lira.
Diesel Fuel
Fuel costs at Centerra’s operations represent approximately 6% of production costs. The prices for Mount Milligan Mine’s diesel fuel are based on a supply agreement for weekly deliveries and priced at the Prince George rack rate. The Prince George rack rate reflects a base commodity price, refining costs associated into processing crude oil into refined fuels such as gasoline and diesel, transportation costs and fees applicable to the storage and handling at the terminal. Mining operations at the Öksüt Mine are outsourced, and the fuel operating cost is included in the outsourcing contract costs based on the published local retail diesel market price. The TC Mine re-start project has diesel fuel priced off a supply agreement which is based on the Boise rack rate along with additional applicable transaction costs.
The Company utilizes its diesel hedging program in order to manage its exposure to adverse fluctuations in diesel fuel prices, see “Financial Instruments” section of this MD&A.
Liquidity and Capital Resources
As of December 31, 2024, the Company’s total liquidity position was $1.0 billion, representing a cash balance of $624.7 million and no amounts drawn under its $400.0 million corporate credit facility.
Fourth Quarter 2024 compared to Fourth Quarter 2023
See the Overview of Consolidated Results section in this MD&A for the discussion of cash provided by operating activities.
Cash used in investing activities of $47.5 million was recognized in the fourth quarter of 2024 compared to $9.2 million in the fourth quarter of 2023. The increase is primarily related to higher capital spending at the Thompson Creek Mine in the fourth quarter of 2024 following the re-start decision and the collection of $25.0 million receivable from an affiliate of Orion Resources Partners (USA) LP (“Orion”) related to the sale of Greenstone Partnership in the fourth quarter of 2023.
Cash used in financing activities in the fourth quarter of 2024 was $25.0 million compared to $15.4 million in the fourth quarter of 2023. The increase is primarily due to higher consideration paid to repurchase and cancel Centerra common shares. Consideration paid for the repurchase and cancellation of 1,766,130 Centerra common shares under the Company’s NCIB program was $12.2 million in the fourth quarter of 2024 compared to consideration of $2.1 million paid for the repurchase and cancellation of 361,500 Centerra common shares under the Company’s NCIB program in the fourth quarter of 2023.
Year ended December 31, 2024 compared to December 31, 2023
See the Overview of Consolidated Results section in this MD&A for the discussion of cash provided by operating activities.
Cash used in investing activities of $193.2 million was recognized in 2024 compared to $90.3 million in 2023. The increase is primarily related to higher PP&E additions at the Mount Milligan Mine, the Öksüt Mine and the Thompson Creek Mine, the cash payment of $24.5 million related to the Additional Royal Gold Agreement executed in February 2024 and $7.3 million to purchase marketable security investments in 2024.
Cash used in financing activities of $93.5 million was recognized in 2024 compared to $74.3 million in 2023. The increase was primarily due to higher consideration paid to repurchase and cancel Centerra common shares. Consideration paid for the repurchase and cancellation of 6,731,430 Centerra common shares under the Company’s NCIB program was $44.1 million in 2024 compared to consideration of $20.4 million paid for the repurchase and cancellation of 3,475,800 Centerra common shares under the Company’s NCIB program in 2023. The overall increase is partially offset by the higher financing costs paid in 2023 due to transaction costs associated with the renewal of the corporate credit facility.
Financial Performance
Fourth Quarter 2024 compared to Fourth Quarter 2023
Revenue of $302.4 million was recognized in the fourth quarter of 2024 compared to $340.0 million in the fourth quarter of 2023. The decrease in revenue was primarily due to lower ounces of gold produced and sold at the Öksüt Mine and lower average realized copper prices at the Mount Milligan Mine. The decrease was partially offset by higher average realized gold prices and higher gold ounces sold at Mount Milligan Mine and higher molybdenum pounds roasted and sold at the Langeloth Facility.
Gold production was 73,224 ounces in the fourth quarter of 2024 compared to 129,259 ounces in the fourth quarter of 2023. Gold production in the fourth quarter of 2024 included 37,660 ounces of gold from the Mount Milligan Mine compared to 40,503 ounces in the fourth quarter of 2023. The decrease is primarily driven by lower tonnes processed and lower gold recoveries, partially offset by higher gold head grades during the fourth quarter of 2024. There were 35,564 ounces of gold produced at the Öksüt Mine in the fourth quarter of 2024 compared to 88,756 ounces produced in the fourth quarter of 2023 primarily due to the processing of built-up inventories at the Öksüt Mine in the fourth quarter of 2023.
Copper production at the Mount Milligan Mine was 12.8 million pounds in the fourth quarter of 2024 compared to 19.7 million pounds in the fourth quarter of 2023. The decrease in copper production is mainly due to lower feed grades and lower recoveries.
The Langeloth Facility roasted and sold 2.9 million pounds of molybdenum in the fourth quarter of 2024 compared to 2.2 million pounds roasted and sold in the fourth quarter of 2023. The increase in the molybdenum roasted and sold was primarily due to higher demand for spot sales from customers in steel industry in the fourth quarter of 2024 compared to the fourth quarter of 2023.
Cost of sales of $222.7 million was recognized in the fourth quarter of 2024 compared to $201.9 million in the fourth quarter of 2023. The increase was primarily due to higher production costs and DDA at the Mount Milligan Mine and higher production costs at the Langeloth Facility from higher pounds of molybdenum roasted and sold. The increase in cost of sales was partially offset by lower production cost and lower DDA at the Öksüt Mine.
Gold production costs were $1,096 per ounce in the fourth quarter of 2024 compared to $595 per ounce in the fourth quarter of 2023. The increase was primarily due to lower ounces of gold sold at the Öksüt Mine.
DDA was $32.2 million in the fourth quarter of 2024 compared to $40.6 million in the fourth quarter of 2023. The decrease in DDA was primarily attributable to lower gold ounces sold at the Öksüt Mine during the fourth quarter of 2024 compared to the fourth quarter of 2023, partially offset by higher DDA expense at the Mount Milligan Mine due to an increased PP&E depreciable base and lower ounces produced.
All-in sustaining costs on a by-product basisNG were $1,296 per ounce in the fourth quarter of 2024 compared to $831 per ounce in the fourth quarter of 2023. The increase in all-in sustaining costs on a by-product basisNG was primarily due to higher gold production costs per ounce as noted above, partially offset by lower sustaining capital expendituresNG at the Mount Milligan Mine and the Öksüt Mine and lower corporate general and administrative costs resulting from lower stock-based compensation expense.
A non-cash impairment loss of $193.6 million was recognized in the fourth quarter of 2024 related to the Goldfield Project. A non-cash impairment loss of $30.0 million was recognized in the fourth quarter of 2023 related to the Kemess Project and $4.1 million was recognized related to the Berg Property which was re-classified as an asset held for sale.
Reclamation expense was $1.7 million in the fourth quarter of 2024 compared to reclamation expense of $50.1 million in the fourth quarter of 2023. The decrease in reclamation expense was primarily attributable to changes in the risk-free interest rates applied to discount the estimated provision for future reclamation cash outflows at the Endako Mine, Kemess Project and Thompson Creek Mine and an increase in estimated future reclamation cash outflows at the Kemess Project in the fourth quarter of 2023.
Other operating income of $28.0 million was recognized in the fourth quarter of 2024 compared to other operating expenses of $4.8 million in the fourth quarter of 2023. The increase in other operating income is primarily attributable to an unrealized gain on the financial asset related to the Additional Royal Gold Agreement.
Other non-operating income of $16.0 million was recognized in the fourth quarter of 2024 compared to other non-operating income of $1.1 million in the fourth quarter of 2023. The increase in other non-operating income is primarily attributable to a higher foreign exchange gain attributable to movement in foreign currency exchange rates on the reclamation provision at the Endako Mine and Kemess Project and an increase in interest income earned on the Company’s cash balance.
An incremental gain on the sale of Greenstone Partnership of $63.1 was recognized in the fourth quarter of 2024 in relation the final portion of contingent consideration owing to the Company from Equinox expected to be paid in the future based on the declaration of commercial production at the Greenstone Mine and its forecast of the near-term production of gold ounces.
The Company recognized income tax expense of $18.2 million in the fourth quarter of 2024, comprising current income tax expense of $17.1 million and deferred income tax expense of $1.1 million, compared to income tax expense of $38.9 million in the fourth quarter of 2023, comprising current income tax expense of $39.2 million and deferred income tax recovery of $0.3 million. The decrease in income tax expense was mainly due to a lower income generated at the Öksüt Mine.
Year ended December 31, 2024 compared to December 31, 2023
Revenue of $1,214.5 million was recognized in 2024 compared to $1,094.9 million in 2023. The increase in revenue was primarily due to an increase in the ounces of gold sold at the Mount Milligan Mine and higher average realized gold and copper prices, partially offset by lower copper pounds sold at the Mount Milligan Mine, lower average realized molybdenum prices and lower molybdenum pounds roasted and sold at the Langeloth Facility.
Gold production was 368,104 ounces in 2024 compared to 350,317 ounces in 2023. Gold production in 2024 included 167,579 ounces of gold from the Mount Milligan Mine compared to 154,391 ounces in 2023 primarily due to higher gold grades, partially offset by lower gold recoveries. The Öksüt Mine produced 200,525 ounces of gold in 2024 compared to 195,926 ounces of gold in 2023 primarily due to a longer operating period in
2024 as compared to 2023 due to the suspension of gold room operations at the absorption, desorption and recovery (“ADR”) plant until June 2023. Due to this suspension of gold operations, Öksüt Mine operated for seven months in 2023 as compared to twelve months in 2024.
Copper production at the Mount Milligan Mine was 54.3 million pounds in 2024 compared to 61.9 million pounds in 2023. The decrease in copper production was primarily attributed to lower grades and recoveries.
The Langeloth Facility roasted 10.2 million pounds and sold 10.9 million pounds of molybdenum in 2024 compared to 11.4 million pounds and 11.2 million pounds, respectively, in 2023. This decrease was primarily due to the planned maintenance of the acid plant in the second quarter of 2024 and contract sales during the second and third quarters of 2024.
Cost of sales of $836.5 million was recognized in 2024 consistent with $830.9 million recognized in 2023.
Gold production costs were $913 per ounce in 2024 compared to $733 per ounce in 2023. The increase in gold production costs per ounce was primarily due to higher production costs at the Öksüt Mine. Partially offsetting the increase were higher ounces sold at the Mount Milligan Mine.
All-in sustaining costs on a by-product basisNG were $1,148 per ounce in 2024 compared to $1,013 per ounce in 2023. The increase was primarily due to higher gold production costs per ounce as noted above and higher sustaining capital expendituresNG at the Öksüt Mine and Mount Milligan Mine, partially offset by higher copper credits from an increase in average realized copper prices.
A non-cash impairment loss of $193.6 million was recognized in 2024 related to the Goldfield Project. A non-cash impairment loss of $30.0 million was recognized in 2023 related to the Kemess Project and $4.1 million was recognized related to the Berg Property which was re-classified as an asset held for sale.
Reclamation recovery was $25.3 million in 2024 compared to the reclamation expense of $34.4 million in 2023. The difference was primarily attributable to an increase in an estimate of future reclamation cash outflows at the Endako Mine and the Kemess Project in 2023 and changes in the risk-free interest rates applied to discount the estimated provision for future reclamation cash outflows at the Endako Mine and Kemess Project in 2024.
Other operating expense of $2.4 million was recognized in 2024 compared to $29.6 million in 2023. The decrease in other operating expenses was primarily due to an unrealized gain of $23.5 million on financial asset related to the Additional Royal Gold Agreement.
Other non-operating income of $49.1 million was recognized in 2024 compared to $11.1 million in 2023. The increase in other non-operating income was primarily due to a higher foreign exchange gain attributable to movement in foreign currency exchange rates on the reclamation provision at the Endako Mine and Kemess Project and increase in interest income earned on the Company’s cash balance.
The Company recognized income tax expense of $93.7 million in 2024, comprising current income tax expense of $87.5 million and deferred income tax expense of $6.2 million, compared to income tax expense of $94.9 million in 2023, comprising current income tax expense of $85.7 million and deferred income tax expense of $9.2 million.
Financial Instruments
The Company seeks to manage its exposure to fluctuations in diesel fuel prices, commodity prices and foreign exchange rates by entering into derivative financial instruments from time-to-time. The hedge positions for each of these programs as at December 31, 2024 are summarized as follows:
| | | | | | | | | | | | | | | | | | | | | | | | | | | | | | | | |
| | | Average Strike Price | Settlements (% of exposure hedged)(1) | As at December 31, 2024 |
| Instrument | Unit | Type | 2025 | 2026 | 2027 | 2025 | 2026 | 2027 | Total position(2) | Fair value ($'000's) |
| | | | | | | | | | |
| FX Hedges | | | | | | | | | | |
| USD/CAD zero-cost collars | CAD | Fixed | $1.33/$1.38 | $1.34/$1.39 | — | | $192.0M
(29%) | $72.0M | — | | $264.0M | (6,133) | |
| USD/CAD forward contracts | CAD | Fixed | 1.36 | 1.37 | 1.36 | | $202.0M
(31%) | $121.3M | $60.0M | $383.3M | (10,706) | |
| Total | | | | | | $394.0M
(60%) | $193.3 M | $60.0M | $647.3M | (16,839) | |
| | | | | | | | | | |
| Fuel (diesel) Hedges | | | | | | | | | | |
ULSD zero-cost collars(2) | Litres | Fixed | $0.59/$0.66 | $0.60/$0.67 | — | | 4,532
(18%) | 3,339 | | — | | 7,871 | (264) |
ULSD swap contracts(2) | Litres | Fixed | $0.65 | $0.60 | $0.60 | 8,252
(32%) | 5,533 | | 1,431 | | 15,216 | (587) | |
| Total | | | | | | 12,784 (50%) | 8,872 | | 1,431 | | 23,087 | (851) | |
| | | | | | | | | | |
| Gold Hedges: | | | | | | | | | |
| Gold zero-cost collars | Ounces | Fixed | $2,400/$3,400 | $2,400/$3,696 | — | | 40,000
(13%) | 20,000 | | — | 60,000 | 555 |
| | | | | | | | | | |
Gold/Copper Hedges (Royal Gold deliverables)(3): | | | | | | |
| Gold forward contracts | Ounces | Float | N/A | — | | — | | 11,960 | | — | | — | 11,960 | (43) | |
| Copper forward contracts | Pounds | Float | N/A | — | | — | | 2.2M | — | | — | 2.2M | (91) | |
(1)Percentage of exposure hedged is calculated with reference to the expected expenditure to be incurred in Canadian dollars, fuel consumed and gold ounces sold as outlined in the “Outlook” section and is subject to change.
(2)Ultra-low-sulfur diesel. Units are in thousands of litres.
(3)Royal Gold hedging program with a market price determined on settlement of the contract.
The realized (loss) gain recorded in the consolidated statements of earnings (loss) was as follows:
| | | | | | | | | | | | | | | | | | | | | | | |
| Three months ended December 31, | | Years ended December 31, |
| ($ millions) | 2024 | 2023 | % Change | | 2024 | 2023 | % Change |
| Foreign exchange hedges | (3,323) | | (5,657) | | (41) | % | | (7,053) | (12,189) | | (42) | % |
| Fuel hedges | (242) | | 341 | | (171) | % | | (185) | | 1,993 | (109) | % |
| Copper hedges | — | | 1,207 | | (100) | % | | 450 | 2,924 | | (85) | % |
| Gold hedges | — | | 1,042 | | (100) | % | | — | | 1,988 | | (100) | % |
| | | | | | | |
| | | | | | | |
The Company entered into a new hedging program in the fourth quarter of 2024, consisting of gold zero-cost option collars that are settled on a weekly basis, against the London Bullion Market Association (“LBMA”) gold prices. These new hedge positions are set to hedge a portion of the Öksüt Mine’s gold production, providing a price floor with cap rates set well above all-time high gold prices for zero net premium paid. The company records these contracts at fair value using a market approach based on the observable quoted market prices. See more details on the Company’s policy and accounting treatment in note 24 of the financial statements.
Subsequent to December 31, 2024, the Company initiated a diesel hedging program associated with the restart of operations at the Thompson Creek Mine in order to manage the risk associated with changes in
diesel fuel prices. The hedge contracts cover a portion of estimated future diesel fuel purchases as part of the re-start and are expected to settle over time by June 2027.
As at December 31, 2024, Centerra has not entered into any off-balance sheet arrangements with special purpose entities, nor does it have any unconsolidated affiliates.
Balance Sheet Review
| | | | | | | | | |
| ($millions) | December 31, 2024 | December 31, 2023 | |
| | | |
| | | |
| | | |
| | | |
| | | |
| Total Assets | 2,265.1 | | 2,280.8 | | |
| | | |
| | | |
| | | |
| Total Liabilities | 609.2 | | 606.6 | | |
| Current Liabilities | 283.9 | | 297.5 | | |
| Non-current Liabilities | 325.3 | | 309.1 | | |
| Total Equity | 1,655.9 | | 1,674.2 | | |
| | | |
Cash as at December 31, 2024 was $624.7 million compared to $612.9 million as at December 31, 2023. The increase was primarily attributable to a free cash flowNG of $138.6 million during the year ended December 31, 2024. The increase was partially offset by the repurchase and cancellation of approximately 6,731,430 Centerra common shares under the Company’s NCIB program amounting to $44.1 million, the cash payment of $24.5 million related to the Additional Royal Gold Agreement, a $7.3 million marketable security investments and dividends paid of $43.5 million during the year ended December 31, 2024.
Other current assets as at December 31, 2024 were $58.5 million compared to $14.7 as at December 31, 2023. The increase was primarily due to the recognition of an amount due from Equinox related to the sale of Greenstone Partnership in 2021.
Total inventories as at December 31, 2024 were $234.2 million compared to $257.3 million at December 31, 2023. The decrease was primarily due to a decrease in the concentrate inventory due to the timing of inventory sales at the Mount Milligan Mine.
The carrying value of PP&E as at December 31, 2024 was $1.10 billion compared to $1.24 billion as at December 31, 2023. The decrease was primarily due to a non-cash impairment loss of $193.6 million at the Goldfield Project and the depreciation and depletion of PP&E of $118.1 million in the normal course of operations during the period, partially offset by the additions of $174.8 million related to ongoing capital projects at the existing mines and projects.
Non-current financial assets as at December 31, 2024 were $67.2 million compared to $5.3 million as at December 31, 2023. The increase was primarily due to the recognition of a financial asset of $67.2 million as a result of the Additional Royal Gold Agreement, representing the net impact of the incremental amounts of payments to be received from Royal Gold under certain conditions and certain obligation payments to Royal Gold.
Other non-current assets as at December 31, 2024 were $43.2 million compared to $14.0 million as at December 31, 2023. The increase was primarily due to the purchase of marketable securities and the recognition of a $20.5 million non-current amount due from Equinox Gold related to the sale of the Greenstone Partnership in 2021.
Accounts payable and accrued liabilities as at December 31, 2024 were $233.1 million compared to $201.7 million at December 31, 2023. The increase was primarily due to higher accrued liabilities at the Öksüt Mine related to an increased royalty provision and higher payable due to Royal Gold at Mount Milligan Mine, partially offset by the Öksüt Mine royalty payments made in the second quarter of 2024.
Income tax payable as at December 31, 2024 was $18.7 million compared to $41.0 million as at December 31, 2023. The decrease was primarily related to the tax payments made by the Öksüt Mine, partially offset by the current income tax attributable to the Öksüt Mine.
Other current liabilities as at December 31, 2024 were $19.3 million compared to $51.8 million at December 31, 2023. The decrease was primarily due to a decrease in the current portion of the provision for reclamation related to care and maintenance sites.
Other non-current liabilities as at December 31, 2024 were $35.5 million compared to $19.3 million at December 31, 2023. The increase was primarily due to the non-current deferred revenue of $20.2 million recognized in 2024 related to the Additional Royal Gold Agreement.
Share capital as at December 31, 2024 was $826.7 million compared to $861.5 million as at December 31, 2023. The decrease was primarily due to the repurchase and cancellation of shares for $44.1 million under NCIB in 2024.
Accumulated other comprehensive loss as at December 31, 2024 was $11.2 million compared to accumulated other comprehensive income of $7.5 million as at December 31, 2023. The decrease in accumulated other comprehensive income was primarily due to the changes in fair value of hedged derivative instruments on the hedging program at Mount Milligan Mine in 2024.
Contractual Obligations
The following table summarizes Centerra’s contractual obligations as of December 31, 2024:
| | | | | | | | | | | | | | | | | | | | |
| ($ millions) | 2025 | 2026 | 2027 | 2028 | Thereafter | Total |
Contractual commitments(1) | $ | 372.7 | | $ | 131.7 | | $ | 110.4 | | $ | — | | $ | — | | $ | 614.8 | |
Reclamation provisions(2) | 5.1 | | — | | — | | — | | 461.9 | | 467.0 | |
| Lease obligations | 7.6 | | 5.4 | | 4.7 | | 3.1 | | 2.3 | | 23.1 | |
| Total | $ | 385.4 | | $ | 137.1 | | $ | 115.1 | | $ | 3.1 | | $ | 464.2 | | $ | 1,104.9 | |
(1)Excludes trade payables and accrued liabilities. Primarily relates to purchases of molybdenum concentrate under contracts with various mines around the world.
(2)Mining operations are subject to environmental regulations that require companies to reclaim and remediate land disturbed by mining operations. The Company has submitted closure plans to the appropriate governmental agencies which estimate the nature, extent and costs of reclamation for each of its mining properties. Expected reclamation cash flows are presented above on an undiscounted basis. Reclamation provisions recorded in the Company’s consolidated financial statements are measured at the expected value of future cash flows discounted to their present value using a risk-free interest rate.
2025 Liquidity and Capital Resources Analysis
The Company believes that it has sufficient capital resources to satisfy its 2025 mandatory expenditure commitments (including the contractual obligations set out above) and discretionary expenditure commitments. The following table sets out expected capital requirements and resources for 2025:
| | | | | |
| 2025 Mandatory Commitments ($ millions): | |
Contractual obligations(1) | $ | 385.4 | |
| Accounts payable and accrued liabilities (as at December 31, 2024) | 233.1 | |
| Income taxes payable (as at December 31, 2024) | 18.7 | |
| Total 2025 mandatory expenditure commitments | $ | 637.2 | |
| |
2025 Discretionary Commitments(2): | |
Expected capital expendituresNG | $ | 259.0 | |
Expected exploration and evaluation costs(3) | 44.0 |
| Total 2025 discretionary expenditure commitments | $ | 303.0 | |
| Total 2025 mandatory and discretionary expenditure commitments | $ | 940.2 | |
(1)From the Contractual Obligations table.
(2)From the Outlook table, mid-point of the range.
(3)Excludes exploration costs expected to be capitalized which are included in the expected capital expendituresNG.
Operating Mines and Facilities
Mount Milligan Mine
The Mount Milligan Mine is an open-pit mine located in north central British Columbia, Canada producing a gold and copper concentrate. The Mount Milligan Mine is subject to the Mount Milligan Mine Streaming Agreement. To satisfy its current obligations under the Mount Milligan Mine Streaming Agreement, the Company purchases refined gold ounces and copper warrants and arranges for delivery to Royal Gold. The difference between the cost of the purchases of refined gold ounces and copper warrants and the corresponding amounts payable to the Company under the Mount Milligan Streaming Agreement is recorded as a reduction of revenue rather than a cost of operating the mine. On February 13, 2024, the Company entered into the Additional Royal Gold Agreement, relating to the Mount Milligan Mine. See “Recent Events and Developments” section in this MD&A.
Mount Milligan Mine Financial and Operating Results
| | | | | | | | | | | | | | | | | | | | | |
| Three months ended December 31, | | Years ended December 31, |
| ($millions, except as noted) | 2024 | 2023 | % Change | | 2024 | 2023 | % Change |
| Financial Highlights: | | | | | | | |
| Gold revenue | 89.0 | 50.7 | 76 | % | | 299.8 | 218.2 | 37 | % |
| Copper revenue | 47.0 | 49.7 | (5) | % | | 188.0 | 181.0 | 4 | % |
| Other by-product revenue | 2.0 | 2.1 | (5) | % | | 8.0 | 8.1 | (1) | % |
| Total revenue | 138.0 | 102.5 | 35 | % | | 495.8 | 407.3 | 22 | % |
| Production costs | 89.3 | 62.1 | 44 | % | | 306.3 | 303.4 | 1 | % |
| Depreciation, depletion, and amortization ("DDA") | 21.4 | 17.9 | 20 | % | | 72.8 | 76.5 | (5) | % |
| Earnings from mine operations | 27.3 | 22.5 | 21 | % | | 116.7 | 27.4 | 326 | % |
Earnings from operations(1) | 55.7 | 17.5 | 218 | % | | 117.5 | 11.1 | 959 | % |
| Cash provided by mine operations | 77.0 | 29.1 | 165 | % | | 176.3 | 113.9 | 55 | % |
Free cash flow from mine operations(2) | 65.3 | 14.1 | 363 | % | | 118.6 | 72.7 | 63 | % |
| Additions to property, plant and equipment | 9.0 | 36.6 | (76) | % | | 55.8 | 62.0 | (10) | % |
Capital expenditures - total(2) | 7.8 | 16.4 | (52) | % | | 54.0 | 44.0 | 23 | % |
Sustaining capital expenditures(2) | 7.8 | 16.4 | (52) | % | | 54.0 | 44.0 | 23 | % |
| | | | | | | |
| Operating Highlights: | | | | | | | |
| Tonnes mined (000s) | 9,622 | 12,397 | (22) | % | | 46,070 | 50,015 | (8) | % |
| Tonnes ore mined (000s) | 5,844 | 6,256 | (7) | % | | 21,929 | 21,278 | 3 | % |
| Tonnes processed (000s) | 5,423 | 5,775 | (6) | % | | 21,463 | 21,680 | (1) | % |
| Process plant head grade gold (g/t) | 0.37 | 0.35 | 6 | % | | 0.40 | 0.36 | 11 | % |
| Process plant head grade copper (%) | 0.16 | % | 0.21 | % | (24) | % | | 0.16 | % | 0.18 | % | (11) | % |
| Gold recovery (%) | 59.6 | % | 64.9 | % | (8) | % | | 62.8 | % | 64.0 | % | (2) | % |
| Copper recovery (%) | 72.4 | % | 78.7 | % | (8) | % | | 74.8 | % | 77.6 | % | (4) | % |
| Concentrate produced (dmt) | 32,890 | 44,805 | (27) | % | | 140,510 | 142,285 | (1) | % |
Gold produced (oz)(3) | 37,660 | 40,503 | (7) | % | | 167,579 | 154,391 | 9 | % |
Gold sold (oz)(3) | 47,887 | 33,127 | 45 | % | | 170,389 | 152,460 | 12 | % |
Average realized gold price - combined ($/oz)(3)(4) | 1,864 | 1,529 | 22 | % | | 1,761 | 1,431 | 23 | % |
Copper produced (000s lbs)(3) | 12,769 | 19,695 | (35) | % | | 54,342 | 61,862 | (12) | % |
Copper sold (000s lbs)(3) | 16,361 | 16,562 | (1) | % | | 57,897 | 60,109 | (4) | % |
Average realized copper price - combined ($/lb)(3)(4) | 2.88 | 3.00 | (4) | % | | 3.25 | 3.01 | 8 | % |
| Unit Costs: | | | | | | | |
| Gold production costs ($/oz) | 1,219 | 946 | 29 | % | | 1,105 | 1,088 | 2 | % |
All-in sustaining costs on a by-product basis ($/oz)(2)(5) | 1,114 | 946 | 18 | % | | 1,078 | 1,156 | (7) | % |
| | | | | | | |
Gold - All-in sustaining costs on a co-product basis ($/oz)(2)(5) | 1,374 | 1,237 | 11 | % | | 1,343 | 1,283 | 5 | % |
| Copper production costs ($/lb) | 1.89 | 1.86 | 2 | % | | 2.04 | 2.29 | (11) | % |
Copper - All-in sustaining costs on a co-product basis ($/lb)(2)(5) | 2.12 | 2.42 | (12) | % | | 2.47 | 2.69 | (8) | % |
Mining costs per tonne mined ($/tonne)(2) | 3.33 | 2.16 | 54 | % | | 2.68 | 2.25 | 19 | % |
Milling costs per tonne processed ($/tonne)(2) | 4.66 | 4.96 | (6) | % | | 5.33 | 5.96 | (11) | % |
Site G&A costs per tonne processed ($/tonne)(2) | 2.39 | 2.43 | (2) | % | | 2.45 | 2.51 | (2) | % |
On site costs per tonne processed ($/tonne)(2) | 12.97 | 12.03 | 8 | % | | 13.54 | 13.66 | (1) | % |
(1)Includes exploration and evaluation costs and other operating costs, including non-cash unrealized gain on the financial asset related to the Additional Royal Gold Agreement.
(2)Non-GAAP financial measure. See discussion under “Non-GAAP and Other Financial Measures”.
(3)Mount Milligan production and sales are presented on a 100%-basis. Under the Mount Milligan Streaming Agreement, Royal Gold is entitled to 35% of gold ounces sold and 18.75% of copper pounds sold. Royal Gold paid $435 per ounce of gold delivered and 15% of the spot price per metric tonne of copper delivered in the periods presented.
(4)This supplementary financial measure, within the meaning of 52-112, is calculated as a ratio of revenue from the consolidated financial statements and units of metal sold includes the impact from the Mount Milligan Streaming Agreement, copper hedges and mark-to-market adjustments on metal sold that had not yet settled under contract.
(5)Includes the impact from the Mount Milligan Streaming Agreement and the impact of copper hedges.
Fourth Quarter 2024 compared to Fourth Quarter 2023
Earnings from mine operations of $27.3 million were recognized in the fourth quarter of 2024 compared to $22.5 million in the fourth quarter of 2023. The increase in earnings from mine operations was primarily due to higher average realized gold prices and higher gold ounces sold. This was partially offset by higher operating costs.
Cash provided by mine operations of $77.0 million was recognized in the fourth quarter of 2024 compared to $29.1 million in the fourth quarter of 2023. The increase was primarily due to higher average realized gold prices, higher gold ounces sold, and a favorable working capital change. The favorable working capital change in the fourth quarter of 2024 compared to the fourth quarter of 2023 was primarily related to the timing of cash collection from customers and timing of vendor payments.
Free cash flow from mine operationsNG of $65.3 million was recognized in the fourth quarter of 2024 compared to $14.1 million in the fourth quarter of 2023. The increase was due to higher cash provided by mine operations as noted above and lower sustaining capital expendituresNG compared to the fourth quarter of 2023.
During the fourth quarter of 2024, mining activities were carried out in phases 5, 6, 7, 9 and 10 of the open pit, with phase 6 being the main source of higher copper grades and phase 7 supplying higher gold grades in the quarter. During the period, phase 10 development commenced to provide access for future high grade copper material. Total tonnes mined were 9.6 million tonnes in the fourth quarter of 2024 compared to 12.4 million tonnes in the fourth quarter of 2023. The decrease in tonnes mined in the fourth quarter of 2024 was primarily due to longer haul distances from phase 6 compared to phase 9 in the fourth quarter of 2023, additional TSF construction and a lower equipment availability as a result of a scheduled overhaul of a primary production shovel.
Total process plant throughput in the fourth quarter of 2024 was 5.4 million tonnes, averaging 58,948 tonnes per calendar day compared to 5.8 million tonnes, averaging 62,770 tonnes per calendar day in the fourth quarter of 2023. Lower throughput was due to higher level of unplanned ball mill downtime from an unscheduled pinion changeout in one of the ball mills and other repairs in the materials handling infrastructure.
Gold production was 37,660 ounces in the fourth quarter of 2024 compared to 40,503 ounces in the fourth quarter of 2023. The decrease in gold production is primarily driven by lower tonnes processed and lower gold recoveries from partially oxidized ore reclaimed from the stockpile, partially offset by higher gold head grades. Gold and copper recoveries were lower than planned primarily due to a partial oxidation of the near surface ore in phase 6 as well as feeding of historical stockpiles which were finer grained and also tended to be
partially oxidized. During the fourth quarter of 2024, the average gold head grade and recovery were 0.37 g/t and 59.6% compared to 0.35 g/t and 64.9% in the fourth quarter of 2023. Total copper production was 12.8 million pounds in the fourth quarter of 2024 compared to 19.7 million pounds in the fourth quarter of 2023. During the fourth quarter of 2024, the average copper head grade and recovery were 0.16% and 72.4% compared to 0.21% and 78.7% in the fourth quarter of 2023. The decrease in copper production is primarily due to lower copper feed grade and lower copper recoveries. Lower copper recovery was primarily due to partially oxidized historical stockpiles and phase 6 ore with elevated oxide and clay content. Lower copper grade was impacted by blending of high gold and low copper ore from phase 7 ore.
Gold production costs were $1,219 per ounce in the fourth quarter of 2024 compared to $946 per ounce in the fourth quarter of 2023. The increase was primarily due to higher direct production costs and timing of inventory sales. Higher direct production costs were mainly due to higher mining costs, partially offset by lower processing costs. Mining costs were impacted by higher equipment maintenance costs due to the timing of component replacements that were scheduled to be executed earlier in the year, and higher consumption of diesel fuel and consumables due to longer haul distances. Lower processing costs were primarily due to lower maintenance costs and lower consumption of grinding media. In addition, there was a higher allocation of costs to gold production costs due to relative changes in the market price of gold and copper, partially offset by an increase in gold ounces sold as outlined above.
Copper production costs were $1.89 per pound in the fourth quarter of 2024 compared to $1.86 per pound in the fourth quarter of 2023. The increase was primarily due to the higher production costs as discussed above, and lower copper pounds sold, partially offset by the lower allocation of costs to copper production costs due to relative changes in the market price of gold and copper.
Mount Milligan Q4 All-in sustaining costs on a by-product basis per ounceNG ($/oz)
All-in sustaining costs on a by-product basisNG were $1,114 per ounce in the fourth quarter of 2024 compared to $946 per ounce in the fourth quarter of 2023. The increase was primarily due to lower copper credits resulting from lower average realized copper prices and lower pounds sold, partially offset by lower sustaining capital expendituresNG and higher gold ounces sold. Lower capital expendituresNG in the fourth quarter of 2024 were primarily due to lower spending on mining fleet purchases, equipment overhauls, site facilities and water sourcing compared to the fourth quarter of 2023.
Year ended December 31, 2024 compared to December 31, 2023
Earnings from mine operations of $116.7 million were recognized in 2024 compared to $27.4 million in 2023. The increase was primarily due to higher average realized gold and copper prices and higher gold ounces sold, partially offset by lower copper pounds sold.
Cash provided by mine operations of $176.3 million was recognized in 2024 compared to $113.9 million in 2023. The increase was primarily due to higher average realized gold and copper prices, higher gold ounces sold, partially offset by lower copper pounds sold and unfavourable changes in working capital due to the timing of vendor and Royal Gold payments.
Free cash flow from mine operationsNG of $118.6 million was recognized in 2024 compared to $72.7 million in 2023. The increase was primarily due to higher cash provided by mine operations as explained above, partially offset by higher sustaining capital expendituresNG.
During 2024, mining activities were carried out in Phases 5, 6, 7, 9 and 10 of the open pit. Total tonnes mined were 46.1 million tonnes in 2024 compared to 50.0 million tonnes mined in 2023. The decrease in tonnage was primarily due to longer hauling distances from Phase 6 in 2024 compared to Phase 9 in 2023. During the period mining was completed in phase 9 and mining activities commenced in Phase 10.
The process plant throughput was 21.5 million tonnes in 2024, averaging 58,643 tonnes per calendar day compared to 21.7 million tonnes in 2023, averaging 59,397 tonnes per calendar day. The decrease in process plant throughput was driven in part by lower availability of the secondary crusher system from unplanned repairs and ball mill liner changes and some weather events.
Gold production was 167,579 ounces in 2024 compared to 154,391 ounces in 2023. The increase was primarily due to higher gold grades, partially offset by lower gold recoveries. During 2024, the average gold grade was 0.40 g/t and recoveries were 62.8% compared to 0.36 g/t and 64.0%, respectively, in 2023. Grade decreased between the periods due to mine sequencing while recoveries were lower primarily due to clay content and elevated oxide content in the mill feed from phase 6 and stockpiled material. Total copper production was 54.3 million pounds in 2024 compared to 61.9 million pounds in 2023. The decrease in copper production is primarily attributed to lower copper grades and recoveries. During 2024, the average copper grade was 0.16% and recoveries were 74.8% compared to 0.18% and 77.6%, respectively, in 2023. Grade decreased between the periods due to mine sequencing. Despite the benefits from the low concentrate grade initiative, copper recovery was negatively impacted by the elevated pyrite and oxide content in mill feed throughout the year putting a strain on the flotation circuit.
Gold production costs were $1,105 per ounce in 2024 compared to $1,088 per ounce in 2023. The increase was primarily due to the higher mining costs and higher allocation of costs to gold production costs due to relative changes in the market price of gold and copper, partially offset by higher gold ounces sold and lower processing costs. Mining costs were impacted by higher equipment maintenance costs of the haul truck, loaders and shovels fleet based on equipment hours, and higher diesel fuel and tire costs due to longer haul distances. Routine maintenance of mining equipment may fluctuate from year to year based on preventive maintenance schedule. Lower processing costs were primarily due to lower maintenance costs and lower consumption of grinding media.
Copper production costs were $2.04 per pound in 2024 compared to $2.29 per pound in 2023. The decrease is primarily due to the lower allocation of costs to copper production costs due to relative changes in the market price of gold and copper, partially offset by lower copper pounds sold.
Mount Milligan YTD all-in sustaining costs on a by-product basis per ounceNG ($/oz)
All-in sustaining costs on a by-product basisNG were $1,078 per ounce for 2024 compared to $1,156 per ounce in 2023. The decrease was primarily due to higher gold ounces sold and lower production costs per ounce, partially offset by lower copper credits as a result of lower pounds of copper sold and higher sustaining capital expendituresNG. Higher sustaining capital expendituresNG in 2024 were due to higher spending on the TSF, mining fleet and equipment, tailings surge containment pond, TSF water wells and tailings line replacement compared to the same period of 2023.
Öksüt Mine
The Öksüt Mine is located in Türkiye approximately 300 kilometres southeast of Ankara and 48 kilometres south of Kayseri, the provincial capital. The nearest administrative centre is at Develi, located approximately 10 kilometres north of the mine site.
The Öksüt Mine suspended gold doré bar production in early March 2022 when mercury was detected in the gold room at the ADR plant and subsequently suspended heap leaching operations in August 2022. Following the receipt of an amended environmental impact assessment at the end of May 2023, crushing, stacking, and ADR activities resumed at the beginning of June 2023. As a result, the results for the year ended December 31, 2024 are not directly comparable to the corresponding prior period.
Öksüt Mine Financial and Operating Results
| | | | | | | | | | | | | | | | | | | | | | | |
| Three months ended December 31, | | Years ended December 31, |
| ($millions, except as noted) | 2024 | 2023 | % Change | | 2024 | 2023 | % Change |
| Financial Highlights: | | | | | | | |
| Revenue | 96.2 | | 190.0 | | (49) | % | | 465.7 | | 380.9 | | 22 | % |
Production costs(1) | 33.6 | | 46.1 | | (27) | % | | 148.0 | | 89.6 | | 65 | % |
| Depreciation, depletion, and amortization ("DDA") | 10.2 | | 21.9 | | (53) | % | | 50.0 | | 44.1 | | 13 | % |
| Earnings from mine operations | 52.6 | | 122.0 | | (57) | % | | 267.7 | | 247.2 | | 8 | % |
Earnings from operations(2) | 51.6 | | 121.2 | | (57) | % | | 265.5 | | 229.7 | | 16 | % |
| Cash provided by mine operations | 51.8 | | 144.3 | | (64) | % | | 248.4 | | 275.1 | | (10) | % |
Free cash flow from mine operations(3) | 40.5 | | 127.9 | | (68) | % | | 206.5 | | 238.2 | | (13) | % |
| Additions to property, plant and equipment | 15.2 | | 27.1 | | (44) | % | | 54.7 | | 50.5 | | 8 | % |
Capital expenditures - total(3) | 11.3 | | 16.4 | | (31) | % | | 41.9 | | 36.9 | | 14 | % |
Sustaining capital expenditures(3) | 11.3 | | 16.4 | | (31) | % | | 41.9 | | 36.9 | | 14 | % |
| | | | | | | |
| Operating Highlights: | | | | | | | |
| Tonnes mined (000s) | 4,439 | | 3,499 | | 27 | % | | 16,937 | | 9,873 | | 72 | % |
| Tonnes ore mined (000s) | 1,312 | | 190 | | 591 | % | | 4,128 | | 486 | | 749 | % |
| Ore mined - grade (g/t) | 0.89 | | 0.97 | | (8) | % | | 1.07 | | 0.95 | | 13 | % |
| Ore crushed (000s) | 1,036 | | 1,180 | | (12) | % | | 4,091 | | 2,497 | | 64 | % |
| Tonnes of ore stacked (000s) | 1,143 | | 1,202 | | (5) | % | | 4,621 | | 2,519 | | 83 | % |
| Heap leach grade (g/t) | 0.99 | | 1.95 | | (49) | % | | 1.13 | | 1.91 | | (41) | % |
| Heap leach contained ounces stacked | 36,405 | | 75,418 | | (52) | % | | 168,035 | | 154,878 | | 8 | % |
| Gold produced (oz) | 35,564 | | 88,756 | | (60) | % | | 200,525 | | 195,926 | | 2 | % |
| | | | | | | |
| Gold sold (oz) | 35,989 | | 97,154 | | (63) | % | | 197,794 | | 195,939 | | 1 | % |
Average realized gold price ($/oz)(4) | 2,663 | | 1,955 | | 36 | % | | 2,351 | | 1,942 | | 21 | % |
| Unit Costs: | | | | | | | |
| Gold production costs ($/oz) | 933 | | 474 | | 97 | % | | 748 | | 457 | | 64 | % |
All-in sustaining costs on a by-product basis ($/oz)(3) | 1,327 | | 671 | | 98 | % | | 1,015 | | 675 | | 50 | % |
| | | | | | | |
Mining costs per tonne mined ($/tonne)(3) | 3.54 | 3.65 | (3) | % | | 3.26 | 2.69 | 21 | % |
Processing costs per tonne processed ($/tonne)(3) | 6.56 | 5.23 | 25 | % | | 5.76 | 4.98 | 16 | % |
Site G&A costs per tonne processed ($/tonne)(3) | 9.20 | 6.22 | 48 | % | | 8.49 | 9.36 | (9) | % |
On site costs per tonne processed ($/tonne)(3) | 29.50 | 22.06 | 34 | % | | 26.19 | 24.88 | 5 | % |
(1)Includes government royalties of $9.0 million and $46.4 million during three and twelve months ended December 31, 2024 and $16.6 million and $33.2 million during the three and twelve months ended December 31, 2023, respectively.
(2)Includes exploration and evaluation costs and standby costs.
(3)Non-GAAP financial measure. See discussion under “Non-GAAP and Other Financial Measures”.
(4)This supplementary financial measure, within the meaning of 52-112, is calculated as a ratio of revenue from the consolidated financial statements and units of metal sold.
Fourth Quarter 2024 compared to Fourth Quarter 2023
Earnings from mine operations were $52.6 million in the fourth quarter of 2024 compared with $122.0 million in the third quarter of 2023. The decrease was primarily due to lower ounces of gold produced and sold mainly attributable to higher production level during the fourth quarter of 2023 from processing the built-up gold-in-carbon inventory following the resumption of operations in June 2023. The decrease in earnings from mine operations was partially offset by higher average realized gold prices in the fourth quarter of 2024 and lower production costs and lower DDA mainly attributable to lower ounces of gold sold.
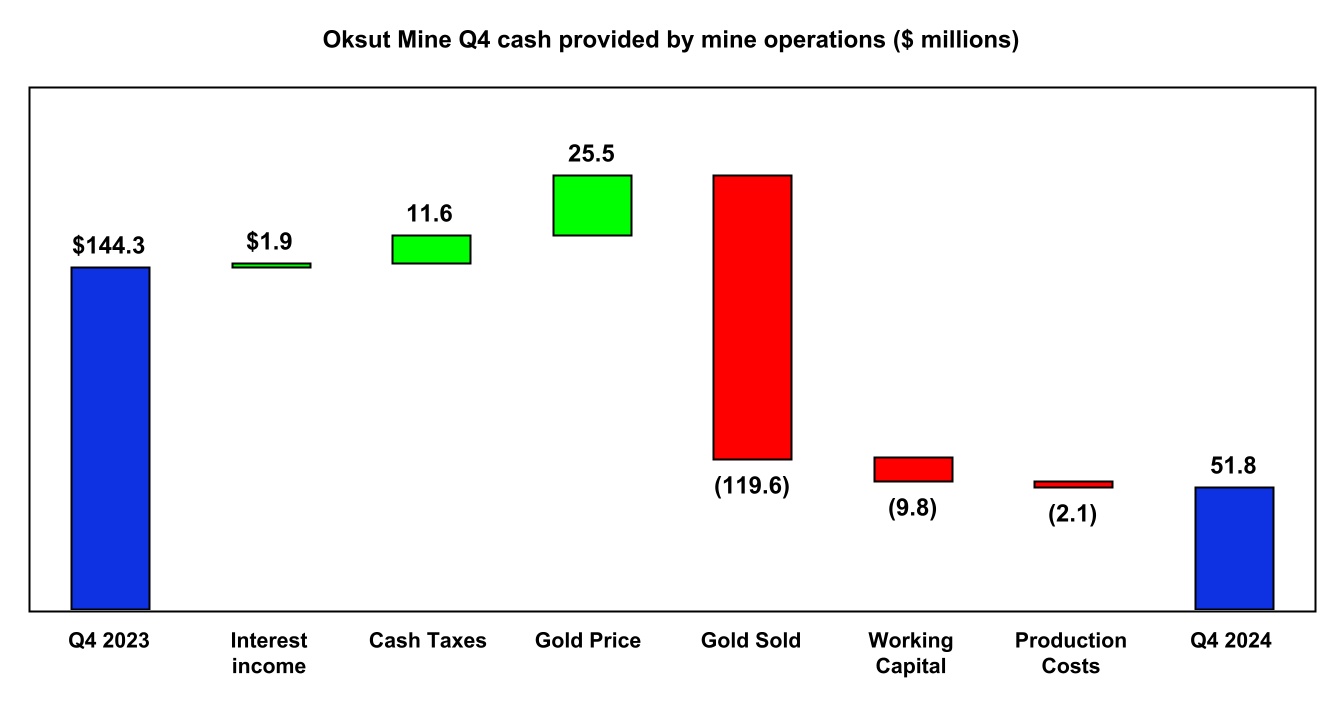
Cash provided by mine operations was $51.8 million in the fourth quarter of 2024, compared to $144.3 million in the fourth quarter of 2023. The decrease in cash provided by mine operations was primarily due to lower ounces of gold sold and an unfavorable working capital movement due to higher inventory build-up and timing of vendor payments, partially offset by higher average realized gold prices and lower cash taxes paid.
Free cash flow from mine operationsNG was $40.5 million in the fourth quarter of 2024, compared to $127.9 million in the fourth quarter of 2023. The decrease in free cash flow from mine operationsNG was primarily due to a decrease in cash provided by mine operations as noted above, partially offset by lower sustaining capital expendituresNG.
Mining activities in the fourth quarter of 2024 were carried out in phase 5 and phase 6 of the Keltepe pit and in phase 2 of the Güneytepe pit. Total tonnes mined were 4.4 million tonnes in the fourth quarter of 2024 compared to 3.5 million tonnes in the fourth quarter of 2023. The increase was primarily due to greater equipment utilization in expanded work areas compared to the fourth quarter of 2023.
The Öksüt Mine stacked 1.1 million tonnes at an average grade of 0.99 g/t, containing 36,405 ounces of gold in the fourth quarter of 2024, compared to 1.2 million tonnes stacked at an average grade of 1.95 g/t, containing 75,418 ounces of gold in the fourth quarter of 2023. The decrease in tonnes stacked was primarily due to higher tonnes reclaimed from the stockpile in 2023 in order to reduce the size of the stockpile accumulated in prior months.
Gold production in the fourth quarter of 2024 was 35,564 ounces compared to 88,756 ounces in the fourth quarter of 2023. The decrease in gold production in the fourth quarter of 2024 is primarily due to lower grades and tonnes of ore stacked.
Gold production costs per ounce were $933 in the fourth quarter of 2024 compared to $474 in the fourth quarter of 2023. The increase was primarily due lower ounces of gold sold, higher mining contractor costs and the impact of high inflation in Türkiye which was not fully offset by the devaluation of the Turkish lira against the US dollar.
Oksüt Mine Q4 All-in sustaining costs on a by-product basis per ounceNG ($/oz)
All-in sustaining costs on a by-product basisNG in the fourth quarter of 2024 were $1,327 per ounce compared to $671 per ounce in the fourth quarter of 2023. The increase was primarily due to the higher gold production costs per ounce, including increased royalty expense due to higher royalty rates relating to elevated gold prices and lower ounces of gold sold as noted above, partially offset by lower sustaining capital expendituresNG mainly driven by lower capitalized stripping.
Year ended December 31, 2024 compared to December 31, 2023
Earnings from mine operations were $267.7 million in 2024 compared with $247.2 million in 2023. The increase was primarily due to slightly higher ounces of gold produced and sold and higher average realized gold prices in 2024. The increase in earnings from mine operations was partially offset by higher production costs, including royalties.
Cash provided by mine operations was $248.4 million in 2024 compared with $275.1 million in 2023. The decrease in cash provided by mine operations was primarily due to higher production costs, higher royalties, and higher tax payments. The decrease was partially offset by higher realized gold prices, lower stand-by costs, higher interest income earned on cash, and a favorable working capital movement due to timing of vendor payments.
Free cash flow from mine operationsNG was $206.5 million in 2024 compared with $238.2 million in 2023. The decrease in free cash flow from mine operationsNG was primarily due to a decrease in cash provided by mine operations and higher sustaining capital expendituresNG mainly from higher capitalized stripping costs and other sustaining capital projects.
Mining activities in 2024 were carried out in phase 5 and phase 6 of the Keltepe pit and in phase 2 of the Güneytepe pit. Total tonnes mined were 16.9 million tonnes in 2024 compared to 9.9 million tonnes in 2023. The increase was primarily due to curtailment of mining operations in the first six months of 2023 until the resumption of operations in June 2023.
The Öksüt Mine stacked 4.6 million tonnes at an average grade of 1.13 g/t containing 168,035 ounces of gold in 2024, compared with 2.5 million tonnes stacked at an average grade of 1.91 g/t containing 154,878 ounces of gold in 2023. The increase in tonnes stacked was primarily due the extended suspension of stacking and leaching operations in 2023.
Gold production was 200,525 ounces in 2024 compared to 195,926 ounces in 2023, primarily due to higher tonnes stacked as a result of a longer operating period. Due to the suspension of gold operations between March 2022 until early June 2023, Öksüt Mine operated for seven months in 2023 as compared to twelve months in 2024.
Gold production costs were $748 per ounce in 2024 compared with $457 per ounce in 2023. The increase was primarily due to higher production costs, lower processed grades and higher royalties, partially offset by a
higher amount allocated to capitalized stripping expenditures. Higher production costs were mainly due to a longer operating period, higher weighted average costs per ounce in inventory, the impact of high inflation in Türkiye which was not fully offset by the devaluation of the Turkish lira against the US dollar and an increase in the mining contractor unit prices.
All-in sustaining costs on a by-product basisNG were $1,015 per ounce in 2024 compared with $675 per ounce in 2023. The increase was primarily due to higher gold production costs per ounce, including higher royalty costs due to higher rates and higher realized gold prices as noted above, and higher sustaining capital expendituresNG mainly from an increase in capitalized stripping costs and other sustaining capital projects.
Molybdenum Business Unit
The Molybdenum BU includes the Langeloth Facility in Pennsylvania and two North American molybdenum mines: the Thompson Creek Mine in Idaho and the 75%-owned Endako Mine in British Columbia, which is currently on care and maintenance.
Molybdenum BU Financial Results
| | | | | | | | | | | | | | | | | | | | | | | |
| Three months ended December 31, | Years ended December 31, |
| ($millions, except as noted) | 2024 | 2023 | % Change | | 2024 | 2023 | % Change |
| Financial Highlights: | | | | | | | |
| Molybdenum revenue | 64.8 | | 44.5 | 46 | % | | 240.5 | | 294.9 | | (18) | % |
| Other revenue | 3.3 | | 2.9 | 14 | % | | 12.5 | | 11.8 | | 6 | % |
| Total revenue | 68.1 | | 47.4 | 44 | % | | 253.0 | | 306.7 | | (18) | % |
| Production costs | 67.4 | | 53.1 | 27 | % | | 256.0 | | 312.9 | | (18) | % |
| Depreciation, depletion, and amortization ("DDA") | 0.9 | | 0.8 | 13 | % | | 3.4 | | 4.3 | | (21) | % |
| Loss from mine operations | (0.2) | | (6.5) | | 97 | % | | (6.4) | | (10.5) | | 39 | % |
| Care and maintenance costs - Molybdenum mines | 1.4 | | 2.7 | (48) | % | | 9.3 | | 16.7 | | (44) | % |
| Reclamation (recovery) expense | (2.6) | | 32.5 | | (108) | % | | (18.1) | | 22.0 | | (182) | % |
| Exploration and evaluation costs | — | | 5.4 | | (100) | % | | 21.1 | | 13.0 | | 62 | % |
| Other operating expenses | 0.7 | | 0.4 | 75 | % | | 1.7 | | 2.8 | | (39) | % |
| Loss from operations | 0.3 | | (47.5) | | 101 | % | | (20.4) | | (65.0) | | 69 | % |
| | | | | | | |
| | | | | | | |
| | | | | | | |
| | | | | | | |
Cash used in operations(1) | (12.3) | | (7.7) | | (60) | % | | (41.0) | | (44.4) | | 8 | % |
| | | | | | | |
| | | | | | | |
| | | | | | | |
Free cash flow deficit from operations(1) | (35.1) | | (9.1) | | (286) | % | | (100.7) | | (46.3) | | (117) | % |
| | | | | | | |
| | | | | | | |
| | | | | | | |
| Additions to property, plant and equipment | 17.5 | | 1.4 | 1150 | % | | 62.3 | | 2.0 | | 3053 | % |
| | | | | | | |
| | | | | | | |
| | | | | | | |
Total capital expenditures(1) | 27.4 | | 1.4 | | 1857 | % | | 63.1 | | 2.0 | | 3055 | % |
| | | | | | | |
| | | | | | | |
| | | | | | | |
| | | | | | | |
| | | | | | | |
| | | | | | | |
| | | | | | | |
| | | | | | | |
| | | | | | | |
| | | | | | | |
(1)Non-GAAP financial measure. See discussion under “Non-GAAP and Other Financial Measures”.
Thompson Creek Mine
| | | | | | | | | | | | | | | | | | | | | | | |
| Three months ended December 31, | Years ended December 31, |
| ($millions, except as noted) | 2024 | 2023 | % Change | | 2024 | 2023 | % Change |
| Financial Highlights: | | | | | | | |
| Loss from operations | — | | (29.8) | | 100 | % | | (9.8) | | (22.6) | | 57 | % |
Cash used in operations(1) | — | | (7.4) | | 100 | % | | (16.7) | | (23.0) | | 27 | % |
Free cash flow deficit from operations(1) | (22.5) | | (8.1) | | (178) | % | | (71.0) | | (23.9) | | (197) | % |
| Additions to property, plant and equipment | 17.2 | 0.7 | 2357 | % | | 57.0 | 1.0 | 5600 | % |
Total capital expenditures(1) | 27.0 | | 0.7 | 3757 | % | | 57.8 | | 1.0 | 5680 | % |
| Operating Highlights: | | | | | | | |
| Tons mined (000s) | 4,052 | | 1,522 | | 166 | % | | 11,303 | | 1,522 | | 643 | % |
(1)Non-GAAP financial measure. See discussion under “Non-GAAP and Other Financial Measures”.
Fourth Quarter 2024 compared to Fourth Quarter 2023
Nil loss from operation was recognized at the Thompson Creek Mine in the fourth quarter of 2024 compared to a loss from operation of $29.8 million recognized in the fourth quarter of 2023. Following the decision to proceed with the restart of operations on September 12, 2024, stripping costs and other general site costs at the Thomson Creek Mine related to restart commenced to be capitalized. In 2023 and 2024, prior to the restart decision, all costs associated with early works and study costs were expensed as incurred.
In the fourth quarter of 2024, the additions to property, plant and equipment were $17.2 million compared to
$0.7 million in the fourth quarter of 2023 and non-sustaining capital expendituresNG were $27.0 million in the fourth quarter of 2024 compared to $0.7 million in the fourth quarter of 2023. The increase was due to the ramp-up of activities at the site following the re-start decision.
Nil cash used in operations and free cash flow deficit from operationsNG of $22.5 million were recognized in the fourth quarter of 2024, compared to cash used in operations of $7.4 million and free cash flow deficit from operationsNG of $8.1 million in the fourth quarter of 2023. The increase in free cash flow deficit from operationsNG was due to higher additions to PP&E as outlined above.
Since the restart decision in September 2024, Thompson Creek Mine moved 4.7 million tons of waste, substantially in line with the feasibility study, representing 4% of planned tons of waste prior to production commencement. 14 haul trucks and 2 electric shovels are currently operating with 5 more haul trucks and 1 shovel expected to be placed into service by the end of the first quarter of 2025. The activities in the pit focused on development in the Union Gap area for electrical shovel access. The mining rate was maintained in the range of 1.2 to 1.3 million tons per month between September and December 2024. In January 2025, the tons moved increased to 2.0 million due to continuous ramp-up.
In January 2025, the Company signed an agreement with a fuel provider to fix a majority of the forecasted 2025 fuel purchases at a price per gallon below the cost assumed in the feasibility study. The Company also entered into derivative contracts with financial institutions to hedge a majority of the expected 2026 and 2027 fuel purchases at a price per gallon below the cost assumed in the feasibility study. Thompson Creek is also progressing other competitive bidding processes to enter into contracts for key consumables at competitive prices consistent with or below unit costs assumed in the feasibility study.
By the end of 2024, approximately 80% of the planned equipment refurbishments and purchases were completed. Significant shovel refurbishment activities were advanced at the end of 2024 and the remaining work was completed in January 2025. In 2025, activities will be focused on rebuilding and commissioning three haul trucks and some auxiliary service equipment.
In 2024, detailed engineering, plant refurbishment, and long lead procurement activities commenced, and are proceeding as planned. Several scope optimization opportunities have been identified to date, including fewer waterlines needing replacement than originally planned and identification of an optimal location for the new thickener that requires less foundation and structural work. Mill refurbishment works commenced in the fourth quarter of 2024, utilizing Thompson Creek Mine’s own workforce. Initial demolition activities of copper cementation area and flotation cells were performed ahead of schedule. Long-lead mill equipment items have been identified. The procurement process started in January 2025 and is expected to continue through the second quarter of 2025.
By the end of 2024, Thompson Creek Mine had 170 people on-site, including contractors and employees. Most of the key operations management positions have been filled and approximately 75% of the workforce was hired locally. Site infrastructure development, including local housing capacity, is underway with work expected to be completed by the end of 2025 to support long-term needs of the Thompson Creek Mine.
Year ended December 31, 2024 compared to December 31, 2023
Loss from operations was $9.8 million in 2024 compared to $22.6 million in 2023. The decrease in loss from operations was primarily due to lower project evaluation expenses in 2024 following the restart decision. In 2024, the Thompson Creek Mine advanced some early works, including technical studies and pre-stripping activities in the main open pit area. The cost of these activities was expensed prior to early September 2024 when the Company announced the results of the feasibility study on the re-start of the Thompson Creek Mine and made a formal decision to proceed with the restart. The Company commenced capitalization of pre-stripping activities, stripping costs and other site costs following the re-start decision. In addition, the decrease in loss from operations was attributable to a reclamation recovery recognized in 2024 primarily due to
changes in risk-free interest rates applied to discount the underlying future reclamation cash outflows compared to a reclamation expense recognized in 2023.
The additions to property, plant and equipment were $57.0 million in 2024 compared to $1.0 million in 2023 and non-sustaining capital expendituresNG were $57.8 million in 2024 compared to $1.0 million in 2023. The increase was due to higher capital spending related to mining equipment refurbishments and purchases, capitalized expenditures related to pre-stripping activities in the main open pit area and capitalized other general costs after the restart decision, as discussed above.
Cash used in operations was $16.7 million in 2024 compared to $23.0 million in 2023. The decrease in cash used in operations was partially due to the commencement of capitalization of certain costs after the restart decision, as discussed above.
Free cash flow deficit from operationsNG of $71.0 million was recognized in 2024 compared to $23.9 million in 2023, primarily due to higher non-sustaining capital expendituresNG.
Langeloth Facility
| | | | | | | | | | | | | | | | | | | | | | | |
| Three months ended December 31, | Years ended December 31, |
| ($millions, except as noted) | 2024 | 2023 | % Change | | 2024 | 2023 | % Change |
| Financial Highlights: | | | | | | | |
| | | | | | | |
| | | | | | | |
| Total revenue | 68.1 | | 47.4 | | 44 | % | | 253.0 | | 306.7 | | (18) | % |
| Production costs | 67.4 | | 53.1 | | 27 | % | | 256.0 | | 312.9 | | (18) | % |
| Depreciation, depletion, and amortization ("DDA") | 0.9 | | 0.8 | | 13 | % | | 3.4 | | 4.3 | | (21) | % |
| Loss from mine operations | (0.2) | | (6.5) | | 97 | % | | (6.4) | | (10.5) | | 39 | % |
| Other operating expenses | 0.7 | | 0.4 | 75 | % | | 1.4 | | 2.8 | | (50) | % |
| Loss from operations | (0.9) | | (6.9) | | 87 | % | | (7.8) | | (13.3) | | 41 | % |
EBITDA(1) | — | | (6.2) | | 100 | % | | (5.2) | | (9.4) | | 45 | % |
Cash used in operations(1) | (6.3) | | 0.8 | | (888) | % | | (11.9) | | (17.0) | | 30 | % |
Free cash flow deficit from operations(1) | (6.6) | | 0.1 | (6700) | % | | (17.1) | | (17.9) | | 4 | % |
| Additions to property, plant and equipment | 0.3 | 0.7 | (57) | % | | 5.2 | 0.9 | 478 | % |
Total capital expenditures(1) | 0.3 | | 0.7 | (57) | % | | 5.2 | | 1.0 | 420 | % |
| Operating Highlights: | | | | | | | |
| Mo purchased (000's lbs) | 2,530 | | 2,574 | | (2) | % | | 10,306 | | 12,322 | | (16) | % |
Mo roasted (000’s lbs)(2) | 2,884 | | 2,247 | | 28 | % | | 10,164 | | 11,377 | | (11) | % |
| Mo sold (000’s lbs) | 2,858 | | 2,158 | | 32 | % | | 10,912 | | 11,235 | | (3) | % |
| Average market molybdenum price ($/lb) | 21.71 | 18.64 | 16 | % | | 21.30 | | 24.19 | | (12) | % |
| Average realized molybdenum price ($/lb) | 22.67 | 20.35 | 11 | % | | 22.05 | 25.39 | (13) | % |
(1)Non-GAAP financial measure. See discussion under “Non-GAAP and Other Financial Measures”.
(2)Amount does not include 0.8 million pounds of molybdenum roasted of toll material for the three months ended December 31, 2024 (2023 - 1.0 million) and 2.3 million pounds of molybdenum roasted of toll material in 2024 (2023 - 1.7 million).
Fourth Quarter 2024 compared to Fourth Quarter 2023
The Langeloth Facility roasted and sold 2.9 million pounds of molybdenum in the fourth quarter of 2024, compared to 2.2 million pounds roasted and sold in the fourth quarter of 2023. The increase in the molybdenum roasted and sold was primarily due to higher demand for spot sales from customers in steel industry in the fourth quarter of 2024 compared to the fourth quarter of 2023.
Loss from operations was $0.9 million in the fourth quarter of 2024 compared to $6.9 million in the fourth quarter of 2023. The decrease in loss from operations was primarily due to the increase in the pounds of molybdenum sold and roasted during the fourth quarter of 2024 compared to the fourth quarter of 2023 as discussed above and a change in product mix resulting in relatively higher sales of more profitable products,
higher by-product revenue, and lower operating costs due to lower plant overhead in the fourth quarter of 2024.
A nil EBITDANG was recognized in the fourth quarter of 2024 compared to a negative EBITDANG of $6.2 million recognized in the fourth quarter of 2023. The increase in EBITDANG was primarily due to the decrease in loss from operations as discussed above.
Cash used in operations was $6.3 million in the fourth quarter of 2024 compared to cash provided by operations of $0.8 million in the fourth quarter of 2023. The increase in cash used in operations was primarily due to an unfavorable change in working capital from the timing of vendor payments.
Free cash flow deficit from the operationsNG was $6.6 million in the fourth quarter of 2024 compared to $0.1 million in the fourth quarter of 2023. The increase in free cash flow deficit is primarily due to the increase in cash used in operations as discussed above.
Molybdenum prices remained fairly steady during the quarter, with all monthly averages above $20 per pound.
(1) The graph presents monthly average molybdenum prices.
Year ended December 31, 2024 compared to December 31, 2023
The Langeloth Facility roasted and sold 10.2 million pounds and 10.9 million pounds of molybdenum, respectively, in 2024 compared to 11.4 million pounds of molybdenum roasted and sold in 2023. The decrease in the molybdenum roasted and sold was primarily due to planned maintenance of the acid plant in the second quarter of 2024 and lower contract sales from customers in the steel industry during the second and third quarters of 2024.
Loss from operations was $7.8 million in 2024 compared to $13.3 million in 2023. The decrease in loss from operations was primarily due to lower operating costs from lower plant overhead, higher revenue from tolling molybdenum material, a change in product mix resulting in relatively higher sales of more profitable molybdenum products, partially offset by lower pounds of molybdenum roasted and sold in 2024.
Negative EBITDANG of $5.2 million was recognized in 2024 compared to negativeEBITDANG of $9.4 million in 2023. The increase in EBITDANG was primarily due to the decrease in loss from operations as discussed above.
Cash used in operations was $11.9 million in 2024 compared to $17.0 million in 2023. The decrease in cash used in operations was primarily due to a lower loss from operations as discussed above.
Free cash flow deficit from operationsNG was $17.1 million in 2024 compared to $17.9 million in 2023. The slight decrease in free cash flow deficit from operationsNG was primarily due to lower cash used in operations as outlined above, partially offset by higher additions to PP&E.
Endako Mine
Fourth Quarter 2024 compared to Fourth Quarter 2023
Loss from operations of $1.3 million was recognized at the Endako Mine in the fourth quarter of 2024 compared to net loss from operations of $10.8 million in the fourth quarter of 2023. The decrease in loss from operations was primarily due to a reclamation recovery recognized in the fourth quarter of 2024 compared to a reclamation expense in the fourth quarter of 2023 resulting from changes in the risk-free interest rates applied to the underlying future reclamation cash outflows.
Cash used in operations at the Endako Mine was $6.0 million in the fourth quarter of 2024 compared to $1.1 million in the fourth quarter of 2023. The increase in cash used in operations was primarily due to reclamation payments related to the closure of the spillway for Tailings Pond 2 and Denak West dewatering project.
Free cash flow deficit from the operationsNG was $6.0 million in the fourth quarter of 2024 compared to $1.1 million in the fourth quarter of 2023. The increase in free cash flow deficit from the operationsNG is primarily due to the higher cash used in operations as discussed above.
Year ended December 31, 2024 compared to December 31, 2023
Loss from operations of $2.8 million was recognized in 2024 compared to net loss from operations of $29.1 million in 2023. The decrease in loss from operations was primarily attributable to a reclamation recovery in 2024 resulting from changes in the discount rates applied to the estimate of future reclamation cash flows compared to a reclamation expense 2023 resulting from an increase in an estimate of future reclamation cash outflows.
Cash used in operations was $12.4 million in the 2024 compared to $4.4 million in 2023. The increase in cash used in operations was due to reclamation activities related to the closure of the spillway for Tailings Pond 2 and Denak West dewatering project.
Free cash flow deficit from operationsNG was $12.6 million in 2024 compared to $4.5 million in 2023. The increase in free cash flow deficit is primarily due to the higher cash used in operations as noted above.
The Company’s Annual Results – Previous Three Years
| | | | | | | | | | | |
| $millions, except per share data | 2024 | 2023 | 2022 |
| Revenue | 1,215 | | 1,095 | | 850 | |
| | | |
| | | |
| | | |
Net earnings (loss)(1) | 80 | | (81) | | (77) | |
| Basic earnings (loss) per share | 0.38 | | (0.37) | | (0.29) | |
| Diluted earnings (loss) per share | 0.35 | | (0.38) | | (0.31) | |
| Cash dividends declared per common share (C$) | 0.28 | 0.28 | 0.28 |
| Total assets | 2,265.1 | | 2,280.8 | | 2,335.9 | |
| Total non-current liabilities | 325.3 | | 309.1 | | 250.8 | |
(1)Net earnings in 2024 reflect the impact of non-cash impairment at the Goldfield Project, the incremental gain on the sale of Greenstone partnership and unrealized loss on financial assets related to the Additional Royal Gold Agreement. Net losses in 2023 and 2022 reflect the impact of non-cash impairment loss at the Kemess Project.
Quarterly Results – Previous Eight Quarters
| | | | | | | | | | | | | | | | | | | | | | | | | | | | |
| $millions, except per share data | 2024 | 2023 | | |
| Quarterly data unaudited | Q4 | Q3 | Q2 | Q1 | Q4 | Q3 | Q2 | Q1 | | |
| Revenue | 302 | | 324 | | 282 | | 306 | | 340 | | 344 | | 185 | | 227 | | | |
| Net (loss) earnings | (52) | | 29 | | 38 | | 66 | | (29) | | 61 | | (40) | | (73) | | | |
| Basic (loss) earnings per share | (0.25) | | 0.14 | | 0.18 | | 0.31 | | (0.13) | | 0.28 | | (0.18) | | (0.34) | | | |
| Adjusted earnings (loss) per share - basic | 0.17 | | 0.19 | | 0.23 | | 0.15 | | 0.28 | | 0.20 | | (0.20) | | (0.24) | | | |
| Diluted (loss) earnings per share | (0.25) | | 0.13 | | 0.18 | | 0.30 | | (0.13) | | 0.27 | | (0.18) | | (0.34) | | | |
| Adjusted earnings (loss) per share - diluted | 0.17 | | 0.19 | | 0.23 | | 0.14 | | 0.28 | | 0.20 | | (0.20) | | (0.24) | | | |
| | | | | | | | | | |
| | | | | | | | | | |
| | | | | | | | | | |
Revenue has increased since the second quarter of 2023 primarily due to the higher ounces of gold sold at the Öksüt Mine after the restart of operations in early June 2023. In 2024, Revenue benefited from higher average realized gold prices, partially offset by lower copper sold at the Mount Milligan Mine and lower molybdenum roasted and sold.
Net (loss) earnings have fluctuated since the third quarter of 2023 due to a variety of factors ranging from impairment losses to reclamation expense and unrealized losses and gains on financial instruments. The net loss in the fourth quarter of 2024 was negatively impacted by the non-cash impairment loss at the Goldfield Project, partially offset by an unrealized gain on the financial asset related to the Additional Royal Gold Agreement and an incremental gain on the sale of Greenstone Partnership. The net loss in the fourth quarter of 2023 was negatively impacted by the non-cash impairment loss at the Kemess Project.
Related Party Transactions
Transactions with key management personnel
The Company transacts with key management personnel, who have authority and responsibility to plan, direct and control the activities of the Company and receive compensation for services rendered in that capacity. Key management personnel include members of the Board of Directors and members of the senior leadership team.
During the years ended December 31, 2024 and 2023, remuneration to key management personnel was as follows:
| | | | | | | | | | | |
| 2024 | | 2023 |
| Director fees earned | $ | 552 | | | $ | 539 | |
| Salaries and benefits, including severance | 6,393 | | | 7,832 | |
| Share-based compensation | 1,098 | | | 3,574 | |
| Total compensation | $ | 8,043 | | | $ | 11,945 | |
Accounting Estimates, Policies and Changes
Accounting Estimates
The preparation of the Company’s consolidated financial statements in accordance with IFRS requires management to make estimates and judgments that affect the amounts reported in the consolidated financial statements and accompanying notes.
Management’s estimates and underlying assumptions are reviewed on an ongoing basis. Any changes or revisions to estimates and underlying assumptions are recognized in the period in which the estimates are revised and in any future periods affected. Changes to these critical accounting estimates could have a material impact on the consolidated financial statements.
The key sources of estimation uncertainty and judgment used in the preparation of the consolidated financial statements that might have a significant risk of causing a material adjustment to the carrying value of assets and liabilities and earnings are outlined in note 4 of the consolidated financial statements for the year ended December 31, 2024.
Accounting Policies and Changes
The accounting policies applied in the preparation of consolidated financial statements are outlined in note 3 of the company’s consolidated financial statements for the year ended December 31, 2024.
Disclosure Controls and Procedures and Internal Control Over Financial Reporting
Pursuant to regulations adopted by the U.S. Securities and Exchange Commission, under the U.S. Sarbanes-Oxley Act of 2002 (“SOX”) and those of the Canadian Securities Administrators, the Company’s management evaluates the effectiveness of the design and operation of the Company's disclosure controls and procedures, and internal control over financial reporting. This evaluation is done under the supervision of, and with the participation of, the Chief Executive Officer and the Chief Financial Officer.
As of the end of the period covered by this MD&A and the accompanying financial statements, the Company’s management evaluated the effectiveness of its internal controls over financial reporting. In making this assessment, management used the criteria specified in Internal Control - Integrated Framework (2013) issued by the Committee of Sponsoring Organizations of the Treadway Commission. Based on that evaluation, the Chief Executive Officer and the Chief Financial Officer have concluded that the Company’s internal control over financial reporting was effective as at December 31, 2024.
There has been no change in the Company’s internal control over financial reporting during the year ended December 31, 2024, that has materially affected, or is reasonably likely to materially affect, the Company’s internal control over financial reporting.
The Company’s management, including the Chief Executive Officer and the Chief Financial Officer, believes that any disclosure controls and procedures and internal control over financial reporting, no matter how well designed and operated, can have inherent limitations. Therefore, even those systems determined to be effective can provide only reasonable assurance that the objectives of the control system are met.
Non-GAAP and Other Financial Measures
This MD&A contains “specified financial measures” within the meaning of NI 52-112, specifically the non-GAAP financial measures, non-GAAP ratios and supplementary financial measures described below. Management believes that the use of these measures assists analysts, investors and other stakeholders of the Company in understanding the costs associated with producing gold and copper, understanding the economics of gold and copper mining, assessing operating performance, the Company’s ability to generate free cash flow from current operations and on an overall Company basis, and for planning and forecasting of future periods. However, the measures have limitations as analytical tools as they may be influenced by the point in the life cycle of a specific mine and the level of additional exploration or other expenditures a company has to make to fully develop its properties. The specified financial measures used in this MD&A do not have any standardized meaning prescribed by IFRS and may not be comparable to similar measures presented by other issuers, even as compared to other issuers who may be applying the World Gold Council (“WGC”) guidelines. Accordingly, these specified financial measures should not be considered in isolation, or as a substitute for, analysis of the Company’s recognized measures presented in accordance with IFRS.
Definitions
The following is a description of the non-GAAP financial measures, non-GAAP ratios and supplementary financial measures used in this MD&A:
•All-in sustaining costs on a by-product basis per ounce is a non-GAAP ratio calculated as all-in sustaining costs on a by-product basis divided by ounces of gold sold. All-in sustaining costs on a by-product basis is a non-GAAP financial measure calculated as the aggregate of production costs as recorded in the consolidated statements of earnings (loss), refining and transport costs, the cash component of capitalized stripping and sustaining capital expenditures, lease payments related to sustaining assets, corporate general and administrative expenses, accretion expenses, asset retirement depletion expenses, copper and silver revenue and the associated impact of hedges of by-product sales revenue. When calculating all-in sustaining costs on a by-product basis, all revenue received from the sale of copper from the Mount Milligan Mine, as reduced by the effect of the copper stream, is treated as a reduction of costs incurred. A reconciliation of all-in sustaining costs on a by-product basis to the nearest IFRS measure is set out below. Management uses these measures to monitor the cost management effectiveness of each of its operating mines.
•All-in sustaining costs on a co-product basis per ounce of gold or per pound of copper, is a non-GAAP ratio calculated as all-in sustaining costs on a co-product basis divided by ounces of gold or pounds of copper sold, as applicable. All-in sustaining costs on a co-product basis is a non-GAAP financial measure based on an allocation of production costs between copper and gold based on the conversion of copper production to equivalent ounces of gold. The Company uses a conversion ratio for calculating gold equivalent ounces for its copper sales calculated by multiplying the copper pounds sold by estimated average realized copper price and dividing the resulting figure by estimated average realized gold price. For the three months ended and year ended December 31, 2024, 647 and 542 pounds of copper were equivalent to one ounce of gold. A reconciliation of all-in sustaining costs on a co-product basis to the nearest IFRS measure is set out below. Management uses these measures to monitor the cost management effectiveness of each of its operating mines.
•Sustaining capital expenditures and Non-sustaining capital expenditures are non-GAAP financial measures. Sustaining capital expenditures are defined as those expenditures required to sustain current operations and exclude all expenditures incurred at new operations or major projects at existing operations where these projects will materially benefit the operation. Non-sustaining capital expenditures are primarily costs incurred at ‘new operations’ and costs related to ‘major projects at existing operations’ where these projects will materially benefit the operation. A material benefit to an existing operation is considered to be at least a 10% increase in annual or life of mine production, net present value, or reserves compared to the remaining life of mine of the operation. A reconciliation of sustaining capital expenditures and non-sustaining capital expenditures to the nearest IFRS measures is set out below. Management uses the distinction of the sustaining and non-sustaining capital expenditures as an input into the calculation of all-in sustaining costs per ounce and all-in costs per ounce.
•Adjusted net earnings (loss) is a non-GAAP financial measure calculated by adjusting net (loss) earnings as recorded in the consolidated statements of earnings (loss) for items not associated with ongoing operations. The Company believes that this generally accepted industry measure allows the evaluation of the results of income-generating capabilities and is useful in making comparisons between periods. This measure adjusts for the impact of items not associated with ongoing operations. A reconciliation of adjusted net (loss) earnings to the nearest IFRS measures is set out below. Management uses this measure to monitor and plan for the operating performance of the Company in conjunction with other data prepared in accordance with IFRS.
•Free cash flow (deficit) is a non-GAAP financial measure calculated as cash provided by operating activities from continuing operations less property, plant and equipment additions. A reconciliation of free cash flow to the nearest IFRS measures is set out below. Management uses this measure to monitor the amount of cash available to reinvest in the Company and allocate for shareholder returns.
•Free cash flow (deficit) from mine operations is a non-GAAP financial measure calculated as cash provided by mine operations less property, plant and equipment additions. A reconciliation of free cash flow from mine operations to the nearest IFRS measures is set out below. Management uses this measure to monitor the degree of self-funding of each of its operating mines and facilities.
•Mining costs per tonne mined is a non-GAAP financial measure calculated by dividing the mining costs by the number of tonnes mined. Management uses these measures to monitor the cost management effectiveness of the mining process for each of its operating mines.
•Processing costs per tonne stacked is a non-GAAP financial measure calculated by dividing the processing costs by the number of tonnes milled or stacked. Management uses these measures to monitor the cost management effectiveness of the mine processing for each of its operating mines.
•Site G&A costs per tonne processed is a non-GAAP financial measure calculated by dividing the site G&A costs by the number of tonnes milled or stacked. Management uses these measures to monitor the cost management effectiveness of the site G&A process for each of its operating mines.
•On site costs per tonne processed is a non-GAAP financial measure calculated by dividing the operating expenses less changes in inventories, royalties and other costs by the number of tonnes milled or stacked. Management uses these measures to monitor the cost management effectiveness of the relevant production costs for each of its operating mines.
•Average realized gold price is a supplementary financial measure calculated by dividing the different components of gold sales (including third party sales, mark-to-market adjustments, final pricing adjustments and the fixed amount received under the Mount Milligan Mine Streaming Agreement) by the number of ounces sold. Management uses this measure to monitor its sales of gold ounces against the average market gold price.
•Average realized copper price is a supplementary financial measure calculated by dividing the different components of copper sales (including third party sales, mark-to-market adjustments, final pricing adjustments and the fixed amount received under the Mount Milligan Mine Streaming Agreement) by the number of pounds sold. Management uses this measure to monitor its sales of gold ounces against the average market copper price.
•Average realized molybdenum price is a supplementary financial measure calculated by dividing the different components of molybdenum sales (including third party sales, mark-to-market adjustments and final pricing adjustments) by the number of pounds sold. Management uses this measure to monitor its sales of molybdenum pounds against the average market molybdenum price.
•Total liquidity is a supplementary financial measure calculated as cash and cash equivalents and amount available under the corporate credit facility. Credit facility availability is reduced by outstanding letters of credit. Management uses this measure to determine if the Company can meet all of its commitments, execute on the business plan, and to mitigate the risk of economic downturns.
•EBITDA is a non-GAAP financial measure that represents earnings before interest, taxes, depreciation, and amortization. It is calculated by adjusting net earnings (loss) as recorded in the consolidated statements of earnings (loss) by depreciation and amortization. Management uses this measure to monitor and plan for the operating performance of the Company in conjunction with other data prepared in accordance with IFRS.
Certain unit costs, including all-in sustaining costs on a by-product basis (including and excluding revenue-based taxes) per ounce, are non-GAAP ratios which include as a component certain non-GAAP financial measures including all-in sustaining costs on a by-product basis which can be reconciled as follows:
| | | | | | | | | | | | | | | | | | | | |
| Three months ended December 31, |
| Consolidated | Mount Milligan | Öksüt |
| (Unaudited - $millions, unless otherwise specified) | 2024 | 2023 | 2024 | 2023 | 2024 | 2023 |
| Production costs attributable to gold | 92.0 | | 77.5 | | 58.4 | | 31.4 | | 33.6 | | 46.1 | |
| Production costs attributable to copper | 30.9 | | 30.7 | | 30.9 | | 30.7 | | — | | — | |
| Total production costs excluding Molybdenum BU segment, as reported | 122.9 | | 108.2 | | 89.3 | | 62.1 | | 33.6 | | 46.1 | |
| Adjust for: | | | | | | |
| Third party smelting, refining and transport costs | 2.8 | | 3.1 | | 2.6 | | 2.7 | | 0.2 | | 0.4 | |
| By-product and co-product credits | (49.5) | | (52.0) | | (49.1) | | (51.9) | | (0.4) | | (0.1) | |
| | | | | | |
| Adjusted production costs | 76.2 | | 59.3 | | 42.8 | | 12.9 | | 33.4 | | 46.4 | |
| Corporate general administrative and other costs | 8.9 | | 11.6 | | 0.8 | | 0.1 | | 0.5 | | — | |
| Reclamation and remediation - accretion (operating sites) | 2.7 | | 2.6 | | 0.6 | | 0.6 | | 2.1 | | 2.0 | |
| Sustaining capital expenditures | 19.1 | | 33.1 | | 7.8 | | 16.3 | | 11.3 | | 16.5 | |
| Sustaining lease payments | 1.8 | | 1.6 | | 1.3 | | 1.4 | | 0.5 | | 0.2 | |
| All-in sustaining costs on a by-product basis | 108.7 | | 108.2 | | 53.3 | | 31.3 | | 47.8 | | 65.2 | |
| | | | | | |
| Exploration and study costs | 12.5 | | 10.8 | | 1.1 | | 2.3 | | 0.4 | | 0.8 | |
| | | | | | |
| | | | | | |
| | | | | | |
| Ounces sold (000s) | 83.9 | | 130.3 | | 47.9 | | 33.1 | | 36.0 | | 97.2 | |
| Pounds sold (millions) | 16.4 | | 16.6 | | 16.4 | | 16.6 | | — | | — | |
| Gold production costs ($/oz) | 1,096 | | 595 | | 1,219 | | 946 | | 933 | | 474 | |
| All-in sustaining costs on a by-product basis ($/oz) | 1,296 | | 831 | | 1,114 | | 946 | | 1,327 | | 671 | |
| | | | | | |
| Gold - All-in sustaining costs on a co-product basis ($/oz) | 1,446 | | 905 | | 1,374 | | 1,237 | | 1,327 | | 671 | |
| Copper production costs ($/pound) | 1.89 | | 1.85 | | 1.89 | | 1.86 | | n/a | n/a |
| Copper - All-in sustaining costs on a co-product basis ($/pound) | 2.12 | | 2.42 | | 2.12 | | 2.42 | | n/a | n/a |
Certain unit costs, including all-in sustaining costs on a by-product basis (including and excluding revenue-based taxes) per ounce, are non-GAAP ratios which include as a component certain non-GAAP financial measures including all-in sustaining costs on a by-product basis which can be reconciled as follows:
| | | | | | | | | | | | | | | | | | | | | | | |
| Years ended December 31, |
| Consolidated | Mount Milligan | Öksüt | | |
| (Unaudited - $millions, unless otherwise specified) | 2024 | 2023 | 2024 | 2023 | 2024 | 2023 | | | |
| Production costs attributable to gold | 336.3 | | 255.5 | | 188.3 | | 165.9 | | 148.0 | | 89.6 | | | | |
| Production costs attributable to copper | 118.0 | | 137.5 | | 118.0 | | 137.5 | | — | | — | | | | |
| Total production costs excluding Molybdenum BU segment, as reported | 454.3 | | 393.0 | | 306.3 | | 303.4 | | 148.0 | | 89.6 | | | | |
| Adjust for: | | | | | | | | | |
| Third party smelting, refining and transport costs | 11.1 | | 10.9 | | 10.2 | | 10.1 | | 0.9 | | 0.8 | | | | |
| By-product and co-product credits | (196.5) | | (189.4) | | (195.9) | | (189.0) | | (0.6) | | (0.4) | | | | |
| | | | | | | | | |
| Adjusted production costs | 268.9 | | 214.5 | | 120.6 | | 124.5 | | 148.3 | | 90.0 | | | | |
| Corporate general administrative and other costs | 40.4 | | 44.4 | | 1.5 | | 0.2 | | 1.2 | | — | | | | |
| Reclamation and remediation - accretion (operating sites) | 10.2 | | 7.0 | | 2.3 | | 2.4 | | 7.9 | | 4.6 | | | | |
| Sustaining capital expenditures | 96.3 | | 81.2 | | 54.0 | | 44.0 | | 41.9 | | 36.9 | | | | |
| Sustaining lease payments | 6.8 | | 5.9 | | 5.3 | | 5.1 | | 1.5 | | 0.8 | | | | |
| All-in sustaining costs on a by-product basis | 422.6 | | 353.0 | | 183.7 | | 176.2 | | 200.8 | | 132.3 | | | | |
| | | | | | | | | |
| | | | | | | | | |
| | | | | | | | | |
| | | | | | | | | |
| | | | | | | | | |
| Ounces sold (000s) | 368.2 | | 348.4 | | 170.4 | | 152.5 | | 197.8 | | 195.9 | | | | |
| Pounds sold (millions) | 57.9 | | 60.1 | | 57.9 | | 60.1 | | — | | — | | | | |
| Gold production costs ($/oz) | 913 | | 733 | | 1,105 | | 1,088 | | 748 | | 457 | | | | |
| All-in sustaining costs on a by-product basis ($/oz) | 1,148 | | 1,013 | | 1,078 | | 1,156 | | 1,015 | | 675 | | | | |
| | | | | | | | | |
| Gold - All-in sustaining costs on a co-product basis ($/oz) | 1,270 | | 1,069 | | 1,343 | | 1,283 | | 1,015 | | 675 | | | | |
| Copper production costs ($/pound) | 2.04 | | 2.29 | | 2.04 | | 2.29 | | n/a | n/a | | | |
| Copper - All-in sustaining costs on a co-product basis ($/pound) | 2.47 | | 2.69 | | 2.47 | | 2.69 | | n/a | n/a | | | |
Adjusted net earnings are a non-GAAP financial measure and can be reconciled as follows:
| | | | | | | | | | | | | | |
| Three months ended December 31, | Years ended December 31, |
| ($millions, except as noted) | 2024 | 2023 | 2024 | 2023 |
| Net (loss) earnings | $ | (52.5) | | $ | (28.8) | | $ | 80.4 | | $ | (81.3) | |
| Adjust for items not associated with ongoing operations: | | | | |
| Impairment loss, net of tax | 193.6 | | 34.1 | | 193.6 | | 34.1 | |
| Gain on sale of Greenstone Partnership | (63.1) | | — | | (63.1) | | — | |
| Unrealized gain on financial assets relating to the Additional Royal Gold Agreement | (33.9) | | — | | (23.5) | | — | |
Income and mining tax adjustments(1) | 3.5 | | (0.2) | | (1.0) | | 19.7 | |
Unrealized foreign exchange (gain) loss(2) | (9.9) | | 2.5 | | (12.0) | | 0.2 | |
| Transaction costs related to the Additional Royal Gold Agreement | — | | — | | 2.5 | | — | |
| Reclamation (recovery) expense at the Molybdenum BU sites and the Kemess Project | (1.9) | | 50.0 | | (25.4) | | 34.2 | |
| Unrealized loss on marketable securities | 0.8 | | — | | 1.4 | | — | |
| Other non-operating losses at the Mount Milligan Mine | — | | 2.0 | | — | | 2.0 | |
| Unrealized loss on non-hedge derivatives | — | | 1.6 | | — | | 1.6 | |
| Adjusted net earnings | $ | 36.6 | | $ | 61.2 | | $ | 152.9 | | $ | 10.5 | |
| | | | |
| Net earnings (loss) per share - basic | $ | (0.25) | | $ | (0.13) | | $ | 0.38 | | $ | (0.37) | |
| Net earnings (loss) per share - diluted | $ | (0.25) | | $ | (0.13) | | $ | 0.35 | | $ | (0.38) | |
| Adjusted net earnings per share - basic | $ | 0.17 | | $ | 0.28 | | $ | 0.72 | | $ | 0.05 | |
| Adjusted net earnings per share - diluted | $ | 0.17 | | $ | 0.28 | | $ | 0.71 | | $ | 0.05 | |
(1)Income tax adjustments reflect the impact of foreign currency translation on deferred income taxes at the Öksüt Mine and the Mount Milligan Mine, the impact of the unrealized gain on the financial asset related to the Additional Royal Gold Agreement and the impact of a one-time income tax levied on taxpayers eligible to claim Turkish Investment Incentive Certificate benefits at the Öksüt Mine and a withholding tax expense on the expected repatriation of Öksüt Mine’s earnings.
(2)Relates primarily to the effect of the foreign exchange movement on the reclamation provision at the Endako Mine and Kemess Project.
Free cash flow (deficit) is a non-GAAP financial measure and can be reconciled as follows:
| | | | | | | | | | | | | | | | | | | | | | | | | | | | | | | | |
| Three months ended December 31, |
| Consolidated | Mount Milligan | Öksüt | Molybdenum | Other |
| 2024 | 2023 | 2024 | 2023 | 2024 | 2023 | 2024 | 2023 | 2024 | 2023 |
Cash provided by (used in) operating activities(1) | $ | 92.8 | | $ | 145.4 | | $ | 77.0 | | $ | 29.1 | | $ | 51.8 | | $ | 144.3 | | $ | (12.3) | | $ | (7.7) | | $ | (23.7) | | $ | (20.3) | |
| Deduct: | | | | | | | | | | |
Property, plant & equipment additions(1) | (45.8) | (34.4) | | (11.7) | | (15.0) | (11.3) | | (16.4) | (22.8) | | (1.4) | | — | | (1.6) | |
| Free cash flow (deficit) | $ | 47.0 | | $ | 111.0 | | $ | 65.3 | | $ | 14.1 | | $ | 40.5 | | $ | 127.9 | | $ | (35.1) | | $ | (9.1) | | $ | (23.7) | | $ | (21.9) | |
| | | | | | | | | | |
| | | | | | | | | | |
| | | | | | | | | | |
(1)As presented in the Company’s consolidated statements of cash flows.
| | | | | | | | | | | | | | | | | | | | | | | | | | | | | | | | |
| Years ended December 31, |
| Consolidated | Mount Milligan | Öksüt | Molybdenum | Other |
| 2024 | 2023 | 2024 | 2023 | 2024 | 2023 | 2024 | 2023 | 2024 | 2023 |
Cash provided by (used in) operating activities(1) | $ | 298.4 | | $ | 245.6 | | $ | 176.3 | | $ | 113.9 | | $ | 248.4 | | $ | 275.1 | | $ | (41.0) | | $ | (44.4) | | $ | (85.3) | | $ | (99.0) | |
| Deduct: | | | | | | | | | | |
Property, plant & equipment additions(1) | (159.8) | | (85.4) | | (57.7) | (41.2) | (41.9) | (36.9) | (59.7) | | (1.9) | | (0.5) | (5.4) |
| Free cash flow (deficit) | $ | 138.6 | | $ | 160.2 | | $ | 118.6 | | $ | 72.7 | | $ | 206.5 | | $ | 238.2 | | $ | (100.7) | | $ | (46.3) | | $ | (85.8) | | $ | (104.4) | |
(1)As presented in the Company’s consolidated statements of cash flows.
Sustaining capital expenditures and non-sustaining capital expenditures are non-GAAP measures and can be reconciled as follows:
| | | | | | | | | | | | | | | | | | | | | | | | | | | | | | | | |
| Three months ended December 31, |
| Consolidated | Mount Milligan | Öksüt | Molybdenum | Other |
| 2024 | 2023 | 2024 | 2023 | 2024 | 2023 | 2024 | 2023 | 2024 | 2023 |
Additions to PP&E(1) | $ | 42.0 | | $ | 67.9 | | $ | 9.0 | | $ | 36.6 | | $ | 15.2 | | $ | 27.1 | | $ | 17.5 | | $ | 1.4 | | $ | 0.3 | | $ | 2.8 | |
| Adjust for: | | | | | | | | | | |
| Costs capitalized to the ARO assets | 9.8 | | (17.6) | | — | | (6.8) | | (3.7) | | (10.4) | | 13.7 | | — | | (0.2) | | (0.4) | |
| Costs capitalized to the ROU assets | (1.6) | | (13.8) | | (1.0) | | (13.6) | | (0.1) | | (0.2) | | — | | — | | (0.5) | | — | |
| Costs relating to capitalized DDA | (2.7) | — | — | — | — | — | (2.7) | — | — | — |
Other(2) | (1.0) | (0.1) | | (0.2) | 0.2 | | (0.1) | | (0.1) | | (1.1) | — | | 0.4 | (0.2) | |
| Capital expenditures | $ | 46.5 | | $ | 36.4 | | $ | 7.8 | | $ | 16.4 | | $ | 11.3 | | $ | 16.4 | | $ | 27.4 | | $ | 1.4 | | $ | — | | $ | 2.2 | |
| Sustaining capital expenditures | 19.5 | | 34.5 | | 7.8 | | 16.4 | | 11.3 | | 16.4 | | 0.4 | | 1.4 | | — | | 0.3 | |
| Non-sustaining capital expenditures | 27.0 | | 1.9 | | — | | — | | — | | — | | 27.0 | — | — | | 1.9 | |
(1)As presented in note 26 of the Company’s consolidated financial statements.
(2)Primarily includes reclassification of insurance and capital spares from supplies inventory to PP&E.
| | | | | | | | | | | | | | | | | | | | | | | | | | | | | | | | |
| Years ended December 31, |
| Consolidated | Mount Milligan | Öksüt | Molybdenum | Other |
| 2024 | 2023 | 2024 | 2023 | 2024 | 2023 | 2024 | 2023 | 2024 | 2023 |
Additions to PP&E(1) | $ | 174.9 | | $ | 121.7 | | $ | 55.8 | | $ | 62.0 | | $ | 54.7 | | $ | 50.5 | | $ | 62.3 | | $ | 2.0 | | $ | 2.1 | | $ | 7.2 | |
| Adjust for: | | | | | | | | | | |
| Costs capitalized to the ARO assets | (5.3) | (16.6) | 1.7 | (4.3) | | (11.0) | (11.9) | | 4.7 | | — | | (0.7) | (0.4) | |
| Costs capitalized to the ROU assets | (4.7) | (16.5) | (2.8) | (13.7) | | (1.7) | (1.4) | | — | | — | | (0.2) | (1.4) | |
| | | | | | | | | | |
| Costs relating to capitalized DDA | (2.8) | — | — | — | — | — | (2.8) | — | — | — |
Other(2) | (2.0) | (0.3) | (0.7) | | — | | (0.1) | | (0.3) | | (1.1) | — | | (0.1) | 0.0 |
| Capital expenditures | $ | 160.1 | | $ | 88.3 | | $ | 54.0 | | $ | 44.0 | | $ | 41.9 | | $ | 36.9 | | $ | 63.1 | | $ | 2.0 | | $ | 1.1 | | $ | 5.4 | |
| Sustaining capital expenditures | 101.6 | | 83.5 | | 54.0 | | 44.0 | | 41.9 | | 36.9 | | 5.3 | | 2.0 | | 0.4 | | 0.6 | |
| Non-sustaining capital expenditures | 58.5 | | 4.8 | | — | | — | | — | | — | | 57.8 | | — | | 0.7 | | 4.8 | |
(1)As presented in note 26 of the Company’s consolidated financial statements.
(2)Primarily includes reclassification of insurance and capital spares from supplies inventory to PP&E.
Costs per tonne are non-GAAP measures and can be reconciled as follows:
| | | | | | | | | | | | | | | | | | | | | | | | | | |
| Three months ended December 31, | Years ended December 31, |
| Mount Milligan | Öksüt | Mount Milligan | Öksüt |
| (in millions of US dollars, except where noted) | 2024 | 2023 | 2024 | 2023 | 2024 | 2023 | 2024 | 2023 |
| Mining costs | $ | 32.1 | | $ | 26.8 | | $ | 15.7 | | $ | 12.7 | | $ | 123.5 | | $ | 112.5 | | $ | 55.2 | | $ | 26.6 | |
Allocation of mining costs(1) | (2.7) | (1.6) | (5.5) | (8.8) | | (14.7) | (9.1) | (23.1) | (20.8) | |
| Milling costs | 25.3 | | 28.6 | | 7.5 | | 6.3 | | 114.5 | | 129.2 | | 26.6 | | 12.5 | |
| Site G&A costs | 13.0 | | 14.0 | | 10.5 | | 7.5 | | 52.6 | | 54.5 | | 39.2 | | 23.6 | |
| Change in inventory, royalties and other | 21.6 | (5.7) | | 5.4 | | 28.4 | 30.4 | | 16.3 | | 50.1 | | 47.7 |
| Production costs | $ | 89.3 | | $ | 62.1 | | $ | 33.6 | | $ | 46.1 | | $ | 306.3 | | $ | 303.4 | | $ | 148.0 | | $ | 89.6 | |
| Ore and waste tonnes mined (000's tonnes) | 9,622 | | 12,397 | | 4,439 | | 3,499 | | 46,070 | | 50,015 | | 16,937 | | 9,873 | |
| Ore processed (000's tonnes) | 5,423 | | 5,775 | | 1,143 | | 1,202 | | 21,463 | | 21,680 | | 4,621 | | 2,519 | |
| Mining costs per tonne mined ($/tonne) | 3.33 | | 2.16 | | 3.54 | | 3.65 | | 2.68 | | 2.25 | | 3.26 | | 2.69 | |
| Processing costs per tonne processed ($/tonne) | 4.66 | | 4.96 | | 6.56 | | 5.23 | | 5.33 | | 5.96 | | 5.76 | | 4.98 | |
| Site G&A costs per tonne processed ($/tonne) | 2.41 | | 2.43 | | 9.20 | | 6.22 | | 2.45 | | 2.51 | | 8.49 | | 9.36 | |
| On site costs per tonne processed ($/tonne) | 12.99 | | 12.03 | | 29.50 | | 22.06 | | 13.54 | | 13.66 | | 26.19 | | 24.88 | |
(1)Allocation of mining costs represents allocation to TSF for the Mount Milligan Mine and capitalized stripping for the Öksüt Mine.
EBITDA at the Langeloth Facility is a non-GAAP measure and can be reconciled as follows:
| | | | | | | | | | | | | | |
| Three months ended December 31, | Years ended December 31, |
| 2024 | 2023 | 2024 | 2023 |
| Net loss | $ | (0.9) | | $ | (7.0) | | $ | (8.6) | | $ | (13.7) | |
| Depreciation, depletion and amortization ("DDA”) | 0.9 | | 0.8 | | 3.4 | | 4.3 | |
| EBITDA | $ | — | | $ | (6.2) | | $ | (5.2) | | $ | (9.4) | |
Qualified Person & QA/QC – Non-Exploration (including production information)
Andrey Shabunin, Professional Engineer, member of the Professional Engineer of Ontario (PEO) and General Manager of the Öksüt Mine, has reviewed and approved the scientific and technical information related to mineral reserves at the Öksüt Mine. Mr. Shabunin is a Qualified Person within the meaning of the Canadian Securities Administrator’s National Instrument 43-101, Standards of Disclosure for Mineral Projects (“NI 43-101”).
Christopher Richings, Professional Engineer, member of the Engineers and Geoscientists British Columbia and Centerra’s Vice President, Technical Services, has reviewed and approved the scientific and technical information related to all other mineral reserves. Mr. Richings is a Qualified Person within the meaning of NI 43-101.
Karen Chiu, Professional Engineer, member of the Engineers and Geocientists of Ontario and Centerra’s Corporate Geologist, has reviewed and approved the scientific and technical information related to mineral resources estimates at the Goldfield Project. Ms. Chiu is a Qualified Person within the meaning of NI 43-101.
Lars Weiershäuser, PhD, Professional Engineer, member of the Engineers and Geocientists of Ontario, and Centerra’s Director of Geology, has reviewed and approved the scientific and technical information related to all other mineral resources estimates. Dr. Weiershäuser is a Qualified Person within the meaning of NI 43-101.
All mineral reserve and resources have been estimated in accordance with the standards of the Canadian Institute of Mining, Metallurgy and Petroleum and NI 43-101.
All other non-exploration scientific and technical information presented in this document, including the production estimates, were prepared in accordance with the standards of the Canadian Institute of Mining, Metallurgy and Petroleum and NI 43-101 and were reviewed, verified, and compiled by Centerra’s geological and mining staff under the supervision of W. Paul Chawrun, Professional Engineer, member of the Professional Engineers of Ontario (PEO) and Centerra’s Executive Vice President and Chief Operating Officer, a qualified person for the purpose of NI 43-101.
The Mount Milligan Mine is described in the Company’s most recent AIF and in a technical report pursuant to NI 43-101 dated November 7, 2022 (with an effective date of December 31, 2021), and both are filed on SEDAR+ at www.sedarplus.ca and EDGAR at www.sec.gov/edgar. The technical report describes the exploration history, geology, and style of gold mineralization of the Mount Milligan deposit. Sample preparation, analytical techniques, laboratories used, and quality assurance and quality control protocols used during the exploration drilling programs are done consistent with industry standards while independent certified assay labs are used.
The Öksüt Mine is described in the Company’s most recent AIF and in a technical report pursuant to NI 43-101 dated September 3, 2015 (with an effective date of June 30, 2015), and both are filed on SEDAR+ at www.sedarplus.ca and EDGAR at www.sec.gov/edgar. The technical report describes the exploration history, geology, and style of gold mineralization at the Öksüt deposit. Sample preparation, analytical techniques, laboratories used, and quality assurance and quality control protocols used during the exploration drilling programs are done consistent with industry standards while independent certified assay labs are used.
Qualified Person & QA/QC – Exploration
Exploration information and related scientific and technical information in this document regarding the Mount Milligan Mine were prepared in accordance with the standards of NI 43-101 and were prepared, reviewed, verified, and compiled by Cheyenne Sica, Member of the Association of Professional Geoscientists Ontario
and Exploration Manager, Canada at Centerra Gold Inc., who is the qualified person for the purpose of NI 43-101.
Sample preparation, analytical techniques, laboratories used, and quality assurance and quality control protocols used during the exploration drilling programs are done consistent with industry standards while independent certified assay labs are used. The Mount Milligan Mine is described in the Company’s most recent AIF, which is available on SEDAR+ at www.sedarplus.ca and EDGAR at www.sec.gov/edgar and in a technical report dated November 7, 2022 (with an effective date of December 31, 2022) prepared in accordance with NI 43-101, which is available on SEDAR at www.sedarplus.ca.
Exploration information, and related scientific and technical information, in this document, with respect to the Öksüt Mine were prepared, reviewed, verified, and compiled in accordance with NI 43-101 by Richard Adofo, Member of the Association of Professional Geoscientists Ontario and Vice President, Exploration & Resource at Centerra Gold Inc., who is the qualified person for the purpose of NI 43-101. Sample preparation, analytical techniques, laboratories used, and quality assurance and quality control protocols used during the exploration drilling programs are done consistent with industry standards while independent certified assay labs are used. The Öksüt Mine is described in the Company’s most recent AIF, which is available on SEDAR+ at www.sedarplus.ca and EDGAR at www.sec.gov/edgar, and in a technical report dated September 3, 2015 (with an effective date of June 30, 2015) prepared in accordance with NI 43-101, which is available on SEDAR at www.sedarplus.ca.
Exploration information and other related scientific and technical information in this news release regarding the Goldfield Project were prepared in accordance with the standards of NI 43-101 and were prepared, reviewed, verified, and compiled by Richard Adofo, Member of the Association of Professional Geoscientists Ontario and Vice President, Exploration & Resource at Centerra Gold Inc., who is the qualified person for the purpose of NI 43-101. Sample preparation, analytical techniques, laboratories used, and quality assurance-quality control protocols used during the exploration drilling programs are done consistent with industry standards while independent certified assay labs are used. The Goldfield Project is described in the Company’s most recent AIF, which is available on SEDAR+ at www.sedarplus.ca and EDGAR at www.sec.gov/edgar.
All other scientific and technical information presented in this document, including the production estimates, were prepared in accordance with the standards of the Canadian Institute of Mining, Metallurgy and Petroleum and NI 43-101 and were reviewed, verified, and compiled by Centerra’s geological and mining staff under the supervision of W. Paul Chawrun, Professional Engineer, member of the Professional Engineers of Ontario (PEO), who is a qualified person for the purpose of NI 43-101.