UNITED STATES
SECURITIES AND EXCHANGE COMMISSION
Washington, D.C. 20549
Form N-CSR
CERTIFIED SHAREHOLDER REPORT OF REGISTERED MANAGEMENT
INVESTMENT COMPANIES
Investment Company Act File Number 811-23654
MAINSTAY CBRE GLOBAL
INFRASTRUCTURE MEGATRENDS
FUND
(Exact name of Registrant as specified in charter)
51 Madison Avenue, New York, NY 10010
(Address of principal executive offices) (Zip code)
J. Kevin Gao, Esq.
30 Hudson Street
Jersey City, New Jersey 07302
(Name and address of agent for service)
Registrant’s telephone number, including area code: (212) 576-7000
Date of fiscal year end: May 31
Date of reporting period: November 30, 2022
FORM N-CSR
| Item 1. | Reports to Stockholders. |
MainStay CBRE Global Infrastructure Megatrends Fund
Message from the President and Semiannual Report
Unaudited | November 30, 2022 | NYSE Symbol MEGI
Sign up for e-delivery of your shareholder reports. For full details on e-delivery, including who can participate and what you can receive via e-delivery,
please log in to www.computershare.com/investor.
| Not FDIC/NCUA Insured | Not a Deposit | May Lose Value | No Bank Guarantee | Not Insured by Any Government Agency |
The Fund has adopted a managed distribution policy (the “Distribution Policy”), pursuant to a Securities and Exchange Commission exemptive order, with the goal of providing shareholders with a consistent, although not guaranteed, monthly distribution. In accordance with the Distribution Policy, the Fund currently expects to make monthly distributions to Common shareholders at a distribution rate per share of $0.1083. You should not draw any conclusions about the Fund’s investment performance from the amount of this distribution or from the terms of the Fund's Distribution Policy. The Distribution Policy provides that the Board of Trustees of the Fund may amend or terminate the Distribution Policy at any time without prior notice to Fund shareholders. The Fund does not believe there are any reasonably foreseeable circumstances that would cause the termination of the Distribution Policy. The amendment or termination of the Distribution Policy could have an adverse effect on the market price of the Fund’s shares.
Message from the President
During the six-month reporting period ended November 30, 2022, most of the world appeared intent on a return to post-pandemic normalcy despite the continuing impact of COVID-19 on global health. Markets focused primarily on the effects of rising inflation and Russia’s invasion of Ukraine, with the uncertainties arising from this challenging environment producing high levels of volatility and broad declines across equities and fixed-income securities.
In June 2022, U.S. inflation peaked at above 9%, the highest level since the early 1980s. A host of factors contributed to this rise, including pandemic-related government stimulus and accommodative monetary policies, wage increases, supply-chain bottlenecks and commodity price spikes exacerbated by the invasion of Ukraine. The U.S. Federal Reserve (the “Fed”) sought to bring inflation under control through an aggressive series of interest rates hikes, raising the upper end of the federal funds rate from 1.00% at the beginning of the reporting period to 4.00% as of November 30, 2022. Global central banks generally followed suit, albeit with milder rate increases. Economic growth slowed under the weight of rising prices and interest rates, with U.S. GDP (gross domestic product) contracting in five out of six months during the reporting period. While inflation appeared to respond, falling to just over 7% by the end of the reporting period, it remained well above the Fed’s 2% target. Indications of persistently high inflation prompted the Fed Chair to caution in late November that monetary policy was likely to remain restrictive for some time to come.
Despite a rally in October and November, prompted by hopes that the pace of Fed rate increases might soon slow, the S&P 500® Index, a widely regarded benchmark of U.S. market performance, ended the reporting period in negative territory. Positive returns in industrials, consumer staples, energy, health care and financials were more than offset by declines in the Index’s other six sectors, with communication services and real estate proving weakest. International stocks lagged compared to their U.S. counterparts, with some emerging markets, notably China, suffering particularly steep losses. A few markets, however, including India and Mexico,
gained ground. In fixed-income markets, bond prices broadly declined as yields rose along with interest rates. Short-term yields rose faster than long-term yields, producing a yield curve inversion shortly after the start of the reporting period. Long-term rates remained below short-term rates through the end of the reporting period, a condition widely viewed as a likely precursor to recession.
Today, investors in the United States continue to grapple with uncertainty regarding the Fed’s ability to successfully bring inflation under control while also avoiding a deep recession. In light of the ongoing pandemic- and recovery-related economic shifts still unfolding domestically, it may take months for the results of the Fed’s policy stance to be fully realized. At the same time, a multitude of other developments taking place on the global stage—from geopolitical and macroeconomic realignments to environmental transformations—are creating a complex market environment that will shape investment performance over the longer term. Those wishing to navigate this unsettled environment and to take advantage of opportunities where they exist, will need access to both market insights and the targeted investment tools necessary to translate those insights into informed portfolio positions.
At New York Life Investments, we’ve established a long track record of helping clients manage their portfolios in the face of uncertainty, volatility and change. You can count on us to continue investing in your success, providing the guidance, resources and investment solutions you need to achieve your goals. Thank you for trusting us to help you meet your investment needs.
Sincerely,
Kirk C. Lehneis
President
The opinions expressed are as of the date of this report and are subject to change. There is no guarantee that any forecast made will come to pass. This material does not constitute investment advice and is not intended as an endorsement of any specific investment. Past performance is no guarantee of future results.
Not part of the Semiannual Report
Certain material in this report may include statements that constitute “forward-looking statements” under the U.S. securities laws. Forward-looking statements include, among other things, projections, estimates and information about possible or future results or events related to the Fund, market or regulatory developments. The views expressed herein are not guarantees of future performance or economic results and involve certain risks, uncertainties and assumptions that could cause actual outcomes and results to differ materially from the views expressed herein. The views expressed herein are subject to change at any time based upon economic, market, or other conditions and the Fund undertakes no obligation to update the views expressed herein.
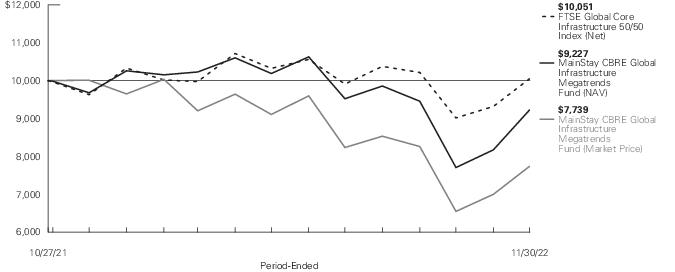
Fund Performance and Statistics (Unaudited)
Performance data quoted represents past performance of Common shares of the Fund. Past performance is no guarantee of future results. Because of market volatility and other factors, current performance may be lower or higher than the figures shown. Investment return and principal value will fluctuate. For performance information current to the most recent month-end, please visit newyorklifeinvestments.com/megi.
The performance table and graph do not reflect the deduction of taxes that a shareholder would pay on distributions or the sale of Fund shares.
| Average Annual Total Returns for the Period-Ended November 30, 2022* |
| | Six
Months1 | One
Year | Since Inception
10/27/21 |
| Net Asset Value (“NAV”)2 | (13.18)% | (4.68)% | (7.09)% |
| Market Price2 | (19.37) | (22.69) | (20.90) |
| FTSE Global Core Infrastructure 50/50 Index (Net)3 | (4.83) | 4.35 | 0.46 |
| * | Returns for indices reflect no deductions for fees, expenses or taxes, except for foreign withholding taxes where applicable. Results assume reinvestment of all dividends and capital gains. An investment cannot be made directly in an index. |
| 1. | Not annualized. |
| 2. | Total returns assume dividends and capital gains distributions are reinvested. |
| 3. | The FTSE Global Core Infrastructure 50/50 Index (Net) is the Fund’s primary broad-based securities market index for comparison purposes. The FTSE Global Core Infrastructure 50/50 Index (Net) gives participants an industry-defined interpretation of infrastructure and adjusts the exposure to certain infrastructure sub-sectors. |
Fund Statistics as of November 30, 2022 (Unaudited)
| NYSE Symbol | MEGI | Premium/Discount 1 | (16.88)% |
| CUSIP | 56064Q107 | Total Net Assets (millions) | $900.5 |
| Inception Date | 10/27/2021 | Total Managed Assets (millions)2 | $1,248.4 |
| Market Price | $14.38 | Leverage 3 | 27.87% |
| NAV | $17.30 | | |
| 1. | Premium/Discount is the percentage (%) difference between the market price and the NAV. When the market price exceeds the NAV, the Fund is trading at a premium. When the market price is less than the NAV, the Fund is trading at a discount. |
| 2. | Managed Assets" is defined as the Fund's total assets, including assets attributable to any form of leverage minus liabilities (other than debt representing leverage and the aggregate liquidation preference of any preferred shares that may be outstanding). |
| 3. | Leverage is based on the use of funds borrowed from banks or other financial institutions, expressed as a percentage of Managed Assets. |
Portfolio Composition as of November 30, 2022 †(Unaudited)
| United States | 40.1% |
| United Kingdom | 12.2 |
| Spain | 9.9 |
| Canada | 7.3 |
| Italy | 7.2 |
| China | 4.8 |
| Australia | 4.8 |
| Singapore | 4.1 |
| Hong Kong | 3.0% |
| France | 2.7 |
| Guernsey | 2.1 |
| Ireland | 0.9 |
| Jersey, C.I. | 0.3 |
| Other Assets, Less Liabilities | 0.6 |
| | 100.0% |
| † | As a percentage of Managed Assets. |
See Portfolio of Investments beginning on page 9 for specific holdings within these categories. The Fund's holdings are subject to change.
Top Ten Holdings and/or Issuers Held as of November 30, 2022 (excluding short-term investments) (Unaudited)
| 1. | Enel SpA |
| 2. | National Grid plc |
| 3. | ONEOK, Inc. |
| 4. | Williams Cos., Inc. (The) |
| 5. | Enbridge, Inc. |
| 6. | Atlas Arteria Ltd. |
| 7. | Atlantica Sustainable Infrastructure plc |
| 8. | Enagas SA |
| 9. | Edison International |
| 10. | NetLink NBN Trust |
| 6 | MainStay CBRE Global Infrastructure Megatrends Fund |
Portfolio Management Discussion and Analysis (Unaudited)
Questions answered by portfolio managers Jeremy Anagnos, CFA, Daniel Foley, CFA, Hinds Howard and Joseph Smith, CFA, of CBRE Investment Management Listed Real Assets LLC, the Fund’s Subadvisor.
How did MainStay CBRE Global Infrastructure Megatrends Fund perform during the six months ended November 30, 2022?
During the six months ended November 30, 2022, MainStay CBRE Global Infrastructure Megatrends Fund returned −13.18% at NAV (net asset value) and −19.37% at market price.1
What factors affected the Fund’s performance during the reporting period?
During the reporting period, elevated macroeconomic and currency volatility negatively impacted returns. The ongoing energy crisis in Europe and the short-lived but volatile period surrounding the UK “mini-budget” weighed on returns in that region. Concerns emanating from China and its ongoing policies regarding the COVID-19 pandemic dragged down returns in that region. Global inflation concerns and central bank countermeasures led to heightened interest rate and market volatility and gave rise to fears that the global economy could be heading toward a recession.
These market forces tended to dominate market action despite the Fund’s positioning among three megatrend themes—decarbonization, asset modernization and digital transformation—that we believe continue to be long-term drivers of returns. The passage of the U.S. Inflation Reduction Act of 2022 (the "Inflation Reduction Act") stands as a prime example of why we remain constructive on the outlook for these trends. The bill provides significant benefits to developers of renewable resources and is likely to enhance the investment opportunity and runway for growth that benefits companies operating within the decarbonization megatrend.
What was the impact of the Fund’s distribution policies during the reporting period?
There were no significant changes to or impacts from the Fund’s existing distribution policy during the reporting period.
How was the Fund’s leverage strategy implemented during the reporting period?
The Fund continued to use its established line of credit with a large financial institution during the reporting period. We monitor the line of credit daily, seeking to optimize the Fund’s use of the credit facility. The target level of leverage is 30% of the Fund's managed assets. While the Fund’s leverage remained close to this level, market-driven volatility caused the level to fluctuate during the reporting period. In response, we maintained the Fund’s leverage levels slightly lower than 30%, with leverage of 27.87% as of November 30, 2022.
During the reporting period, which sectors were the strongest positive contributors to the Fund’s performance and which sectors were particularly weak?
All megatrends and subsectors made negative contributions to total returns during the reporting period. (Contributions take weightings and total returns into account.) Digital transformation produced the worst performance. Companies in this space proved especially vulnerable to rising interest rates.
While decarbonization megatrend holdings performed slightly better than the Fund’s average, returns were still negative for the group. These holdings accounted for the majority of the Fund’s allocation, making it the largest area of negative performance in absolute terms. Within this group, returns varied, although companies positioned to benefit from the passage of the Inflation Reduction Act tended to outperform those in overseas markets.
The asset modernization megatrend delivered the best performance, although absolute returns for the group as a whole were also negative. Within this group, energy transition stocks were relative winners, with U.S.-based exposure generating positive returns, especially shares in natural gas transmission company Oneok, one of the Fund’s larger holdings.
What were some of the Fund’s largest purchases and sales during the reporting period?
NextEra convertible units were purchased upon new issuance of the securities. These securities offer a 6.9% yield until conversion (in three years) to common equity in one of the world’s leading developers of renewable resources, and a significant beneficiary of the passage of the Inflation Reduction Act. Public Services Enterprise Group (PEG), a U.S. integrated utility, was added to the Fund on price weakness. In our opinion, the company was attractively priced and offered exposure to strong rate-base growth, optionality to participate in offshore wind development and a clean energy portfolio of nuclear power stations positioned to benefit from the Inflation Reduction Act.
The largest sales during the reporting period included France-based gas utility Engie and Australia-based rail company Aurizon Holdings. The sale of Engie reflected our view of the company’s elevated risk profile due to its exposure to the energy crisis in Europe and the potential for profit clawbacks from regulators in its home market. Aurizon was removed from the Fund based on concerns regarding the potential for diminished cash flows and dividends, in light of a pending transaction.
How did the Fund’s sector weightings change during the reporting period?
There were no material changes to the Fund’s megatrend theme weightings during the reporting period.
| 1. | See page 5 for more information on Fund returns. |
How was the Fund positioned at the end of the reporting period?
As of November 30, 2022, the Fund has allocated 53% of managed assets to the decarbonization megatrend theme, 33% to asset modernization and 14% to digital transformation. These allocations represent significant exposure to companies playing a role in the decarbonization of the energy market, including companies—such as regulated electric utilities and integrated electric utilities—that are renewable development leaders. Within the asset modernization theme, the Fund holds exposure to companies continuing to support the clean energy transition in the midstream sector, as well as companies supporting investment in clean water and transport mobility. Digital transformation remains a key, long-term secular theme in the infrastructure market, reflecting the growing need for new assets to support the storage, processing and transmission of data. We believe the Fund is also well positioned with a mix of 85% common stock securities and 14% preferred/convertible preferred and other securities.
The opinions expressed are those of the portfolio managers as of the date of this report and are subject to change. There is no guarantee that any forecasts will come to pass. This material does not constitute investment advice and is not intended as an endorsement of any specific investment.
| 8 | MainStay CBRE Global Infrastructure Megatrends Fund |
Portfolio of Investments November 30, 2022† (Unaudited)
| | Shares | Value |
| Closed-End Funds 6.7% |
| Guernsey 2.9% (2.1% of Managed Assets) |
| Bluefield Solar Income Fund Ltd. (Decarbonization) | 4,785,487 | $ 7,875,567 |
| Renewables Infrastructure Group Ltd. (The) (Decarbonization) | 11,930,304 | 18,556,722 |
| | | 26,432,289 |
| Jersey, C.I. 0.4% (0.3% of Managed Assets) |
| GCP Asset-Backed Income Fund Ltd. (Asset Modernization) | 3,391,651 | 3,548,148 |
| United Kingdom 3.4% (2.4% of Managed Assets) |
| Foresight Solar Fund Ltd. (Decarbonization) | 4,888,000 | 6,976,880 |
| Greencoat UK Wind plc (Decarbonization) | 9,090,000 | 16,466,553 |
| HICL Infrastructure plc (Asset Modernization) | 3,340,514 | 6,606,617 |
| | | 30,050,050 |
Total Closed-End Funds
(Cost $63,733,356) | | 60,030,487 |
| Common Stocks 111.6% |
| Australia 6.6% (4.8% of Managed Assets) |
| APA Group (Asset Modernization) | 1,407,000 | 10,776,326 |
| Atlas Arteria Ltd. (Asset Modernization) | 10,137,267 | 48,943,534 |
| | | 59,719,860 |
| Canada 8.1% (5.8% of Managed Assets) |
| Enbridge, Inc. (Asset Modernization) | 1,099,500 | 45,405,512 |
| Pembina Pipeline Corp. (Asset Modernization) | 597,300 | 21,806,790 |
| TransAlta Renewables, Inc. (Decarbonization) | 546,000 | 5,800,349 |
| | | 73,012,651 |
| China 6.7% (4.8% of Managed Assets) |
| Beijing Enterprises Water Group Ltd. (Asset Modernization) | 37,800,000 | 10,063,075 |
| Guangdong Investment Ltd. (Asset Modernization) | 38,701,728 | 35,738,888 |
| Jiangsu Expressway Co. Ltd. Class H (Asset Modernization) | 6,864,000 | 6,195,436 |
| Zhejiang Expressway Co. Ltd. Class H (Asset Modernization) | 10,800,000 | 8,094,285 |
| | | 60,091,684 |
| | Shares | Value |
| |
| France 3.7% (2.7% of Managed Assets) |
| Eutelsat Communications SA (Digital Transformation) | 4,228,622 | $ 33,837,239 |
| Hong Kong 4.1% (3.0% of Managed Assets) |
| CK Infrastructure Holdings Ltd. (Decarbonization) | 3,501,500 | 17,770,290 |
| Power Assets Holdings Ltd. (Decarbonization) | 3,736,000 | 19,308,945 |
| | | 37,079,235 |
| Ireland 1.2% (0.9% of Managed Assets) |
| Greencoat Renewables plc (Decarbonization) | 8,695,490 | 10,639,456 |
| Italy 9.9% (7.2% of Managed Assets) |
| Enel SpA (Decarbonization) | 12,884,084 | 70,199,188 |
| Infrastrutture Wireless Italiane SpA (Digital Transformation) | 791,000 | 7,936,634 |
| Terna - Rete Elettrica Nazionale (Decarbonization) | 1,455,497 | 11,222,251 |
| | | 89,358,073 |
| Singapore 5.7% (4.1% of Managed Assets) |
| Keppel Infrastructure Trust (Asset Modernization) | 13,000,000 | 5,181,211 |
| Mapletree Industrial Trust (Digital Transformation) | 4,812,000 | 7,944,761 |
| NetLink NBN Trust (Digital Transformation) | 60,860,000 | 38,504,714 |
| | | 51,630,686 |
| Spain 13.7% (9.9% of Managed Assets) |
| Atlantica Sustainable Infrastructure plc (Decarbonization) | 1,538,400 | 42,921,360 |
| Cellnex Telecom SA (Digital Transformation) | 333,603 | 11,549,837 |
| Enagas SA (Asset Modernization) | 2,326,351 | 41,782,975 |
| Endesa SA (Decarbonization) | 1,451,697 | 26,941,440 |
| | | 123,195,612 |
| United Kingdom 13.6% (9.8% of Managed Assets) |
| National Grid plc (Decarbonization) | 5,573,098 | 68,813,305 |
| SSE plc (Decarbonization) | 1,602,675 | 33,312,839 |
| United Utilities Group plc (Asset Modernization) | 1,611,384 | 19,993,294 |
| | | 122,119,438 |
The notes to the financial statements are an integral part of, and should be read in conjunction with, the financial statements.
9
Portfolio of Investments November 30, 2022† (Unaudited) (continued)
| | Shares | Value |
| Common Stocks (continued) |
| United States 38.3% (27.6% of Managed Assets) |
| American Electric Power Co., Inc. (Decarbonization) | 88,239 | $ 8,541,535 |
| Clearway Energy, Inc. Class C (Decarbonization) | 394,300 | 13,973,992 |
| Crown Castle, Inc. (Digital Transformation) | 233,029 | 32,957,292 |
| Dominion Energy, Inc. (Decarbonization) | 417,494 | 25,513,058 |
| Edison International (Decarbonization) | 588,600 | 39,236,076 |
| FirstEnergy Corp. (Decarbonization) | 618,500 | 25,506,940 |
| Iron Mountain, Inc. (Digital Transformation) | 357,621 | 19,429,549 |
| Medical Properties Trust, Inc. (Asset Modernization) | 680,500 | 8,928,160 |
| OGE Energy Corp. (Decarbonization) | 846,968 | 34,268,325 |
| ONEOK, Inc. (Asset Modernization) | 803,557 | 53,774,035 |
| Public Service Enterprise Group, Inc. (Decarbonization) | 311,700 | 18,873,435 |
| Uniti Group, Inc. (Digital Transformation) | 1,374,800 | 10,475,976 |
| Williams Cos., Inc. (The) (Asset Modernization) | 1,528,500 | 53,038,950 |
| | | 344,517,323 |
Total Common Stocks
(Cost $1,134,316,606) | | 1,005,201,257 |
| Convertible Preferred Stocks 7.5% |
| United States 7.5% (5.4% of Managed Assets) |
| AES Corp. (The) (Decarbonization) | | |
| 6.875% | 271,200 | 27,844,104 |
| American Electric Power Co., Inc. (Decarbonization) | | |
| 6.125% | 79,107 | 4,178,432 |
| NextEra Energy, Inc. (Decarbonization) | | |
| 6.926% | 555,000 | 27,150,600 |
| South Jersey Industries, Inc. (Asset Modernization) | | |
| 8.75% | 1,811 | 125,194 |
| Spire, Inc. (Asset Modernization) | | |
| Series A | | |
| 7.50% | 169,000 | 8,678,150 |
Total Convertible Preferred Stocks
(Cost $65,633,873) | | 67,976,480 |
| |
| | Principal
Amount | Value |
| Corporate Bonds 4.0% |
| United States 4.0% (2.9% of Managed Assets) |
| Vistra Corp. (Decarbonization) (a)(b) | | |
| 7.00% (5 Year Treasury Constant Maturity Rate + 5.74%), due 12/15/26 | $ 29,000,000 | $ 25,938,287 |
| 8.00% (5 Year Treasury Constant Maturity Rate + 6.93%), due 10/15/26 | 11,000,000 | 10,448,145 |
Total Corporate Bonds
(Cost $40,545,650) | | 36,386,432 |
| |
| | Shares | |
| Preferred Stocks 7.9% |
| Canada 2.1% (1.5% of Managed Assets) |
| Algonquin Power & Utilities Corp. (Decarbonization) (b) | | |
| 5.091% | 54,200 | 753,477 |
| 5.162% | 62,900 | 855,251 |
| AltaGas Ltd. (Asset Modernization) | | |
| 5.393% (b) | 76,300 | 1,165,643 |
| Brookfield BRP Holdings Canada, Inc. (Decarbonization) | | |
| 4.875% (b) | 606,794 | 9,672,297 |
| Enbridge, Inc. (Asset Modernization) (b) | | |
| 4.376% | 244,400 | 3,174,121 |
| 4.46% | 221,400 | 2,985,686 |
| | | 18,606,475 |
| United States 5.8% (4.2% of Managed Assets) |
| CMS Energy Corp. (Decarbonization) | | |
| 5.875% | 406,494 | 9,503,319 |
| Digital Realty Trust, Inc. (Digital Transformation) (b) | | |
| 5.20% | 238,488 | 5,115,567 |
| 5.25% | 206,791 | 4,487,365 |
| 5.85% | 170,000 | 3,945,700 |
| DTE Energy Co. (Asset Modernization) | | |
| 5.25% | 157,000 | 3,573,320 |
| Duke Energy Corp. (Decarbonization) | | |
| 5.75% (b) | 297,000 | 7,285,410 |
| NextEra Energy Capital Holdings, Inc. (Decarbonization) | | |
| 5.65% | 160,000 | 3,972,800 |
| NiSource, Inc. (Asset Modernization) | | |
| 6.50% (b) | 286,000 | 7,012,720 |
The notes to the financial statements are an integral part of, and should be read in conjunction with, the financial statements.
| 10 | MainStay CBRE Global Infrastructure Megatrends Fund |
| | Shares | | Value |
| Preferred Stocks (continued) |
| United States (continued) |
| Sempra Energy (Asset Modernization) | | | |
| 5.75% | 148,000 | | $ 3,458,760 |
| Spire, Inc. (Asset Modernization) | | | |
| 5.90% (b) | 159,620 | | 3,738,300 |
| | | | 52,093,261 |
Total Preferred Stocks
(Cost $83,856,447) | | | 70,699,736 |
Total Investments
(Cost $1,388,085,932) | 137.7% | | 1,240,294,392 |
| Line of Credit Borrowing | (38.4) | | (345,500,000) |
| Other Assets, Less Liabilities | 0.7 | | 5,689,034 |
| Net Assets | 100.0% | | $ 900,483,426 |
| † | Percentages indicated are based on Fund net assets applicable to Common Shares. |
| (a) | Floating rate—Rate shown was the rate in effect as of November 30, 2022. |
| (b) | Security is perpetual and, thus, does not have a predetermined maturity date. The date shown, if applicable, reflects the next call date. |
"Managed Assets" is defined as the Fund’s total assets, including assets attributable to any form of leverage minus liabilities (other than debt representing leverage and the aggregate liquidation preference of any preferred shares that may be outstanding), which was $1,248,424,586 as of November 30, 2022.
Investments in Affiliates (in 000's)
Investments in issuers considered to be affiliate(s) of the Fund during the six-month period ended November 30, 2022 for purposes of Section 2(a)(3) of the Investment Company Act of 1940, as amended, were as follows:
| Affiliated Investment Companies | Value,
Beginning
of Period | Purchases
at Cost | Proceeds
from
Sales | Net
Realized
Gain/(Loss)
on Sales | Change in
Unrealized
Appreciation/
(Depreciation) | Value,
End of
Period | Dividend
Income | Other
Distributions | Shares
End of
Period |
| MainStay U.S. Government Liquidity Fund | $ — | $ 19,424 | $ (19,424) | $ — | $ — | $ — | $ 3 | $ — | — |
The notes to the financial statements are an integral part of, and should be read in conjunction with, the financial statements.
11
Portfolio of Investments November 30, 2022† (Unaudited) (continued)
The following is a summary of the fair valuations according to the inputs used as of November 30, 2022, for valuing the Fund’s assets:
| Description | Quoted
Prices in
Active
Markets for
Identical
Assets
(Level 1) | | Significant
Other
Observable
Inputs
(Level 2) | | Significant
Unobservable
Inputs
(Level 3) | | Total |
| Asset Valuation Inputs | | | | | | | |
| Investments in Securities (a) | | | | | | | |
| Closed-End Funds | $ — | | $ 60,030,487 | | $ — | | $ 60,030,487 |
| Common Stocks | | | | | | | |
| Australia | — | | 59,719,860 | | — | | 59,719,860 |
| China | — | | 60,091,684 | | — | | 60,091,684 |
| France | — | | 33,837,239 | | — | | 33,837,239 |
| Hong Kong | — | | 37,079,235 | | — | | 37,079,235 |
| Ireland | — | | 10,639,456 | | — | | 10,639,456 |
| Italy | — | | 89,358,073 | | — | | 89,358,073 |
| Singapore | — | | 51,630,686 | | — | | 51,630,686 |
| Spain | 42,921,360 | | 80,274,252 | | — | | 123,195,612 |
| United Kingdom | — | | 122,119,438 | | — | | 122,119,438 |
| All Other Countries | 417,529,974 | | — | | — | | 417,529,974 |
| Total Common Stocks | 460,451,334 | | 544,749,923 | | — | | 1,005,201,257 |
| Convertible Preferred Stocks | 67,976,480 | | — | | — | | 67,976,480 |
| Corporate Bonds | — | | 36,386,432 | | — | | 36,386,432 |
| Preferred Stocks | 70,699,736 | | — | | — | | 70,699,736 |
| Total Investments in Securities | $ 599,127,550 | | $ 641,166,842 | | $ — | | $ 1,240,294,392 |
| (a) | For a complete listing of investments and their industries, see the Portfolio of Investments. |
The table below sets forth the diversification of the Fund’s investments by megatrend themes.
Megatrend Themes
| | Value | | Percent |
| Decarbonization | $ 650,320,628 | | 72.2% |
| Asset Modernization | 413,789,130 | | 45.9 |
| Digital Transformation | 176,184,634 | | 19.6 |
| | 1,240,294,392 | | 137.7 |
| Line of Credit Borrowing | (345,500,000) | | (38.4) |
| Other Assets, Less Liabilities | 5,689,034 | | 0.7 |
| Net Assets | $ 900,483,426 | | 100.0% |
| † Percentages indicated are based on Fund net assets applicable to Common Shares |
The notes to the financial statements are an integral part of, and should be read in conjunction with, the financial statements.
| 12 | MainStay CBRE Global Infrastructure Megatrends Fund |
Statement of Assets and Liabilities as of November 30, 2022 (Unaudited)
| Assets |
Investment in securities, at value
(identified cost $1,388,085,932) | $1,240,294,392 |
| Cash | 67,120 |
Cash denominated in foreign currencies
(identified cost $17,876) | 17,884 |
| Receivables: | |
| Dividends and interest | 10,488,292 |
| Investment securities sold | 4,006 |
| Other assets | 17,770 |
| Total assets | 1,250,889,464 |
| Liabilities |
| Payable for Line of Credit | 345,500,000 |
| Payables: | |
| Investment securities purchased | 1,170,190 |
| Manager (See Note 3) | 977,240 |
| Shareholder communication | 188,600 |
| Professional fees | 73,288 |
| Custodian | 44,485 |
| Transfer agent | 9,187 |
| Trustees | 1,888 |
| Interest expense and fees payable | 2,441,160 |
| Total liabilities | 350,406,038 |
| Net assets applicable to Common shares | $ 900,483,426 |
| Common shares outstanding | 52,047,534 |
| Net asset value per Common share (Net assets applicable to Common shares divided by Common shares outstanding) | $ 17.30 |
| Net Assets Applicable to Common Shares Consist of |
| Common shares, $0.001 par value per share, unlimited number of shares authorized | $ 52,048 |
| Additional paid-in-capital | 1,040,557,027 |
| | 1,040,609,075 |
| Total distributable earnings (loss) | (140,125,649) |
| Net assets applicable to Common shares | $ 900,483,426 |
The notes to the financial statements are an integral part of, and should be read in conjunction with, the financial statements.
13
Statement of Operations for the six months ended November 30, 2022 (Unaudited)
| Investment Income (Loss) |
| Income | |
| Dividends-unaffiliated (net of foreign tax withholding of $2,352,653) | $ 42,225,898 |
| Interest | 1,382,478 |
| Dividends-affiliated | 2,901 |
| Total income | 43,611,277 |
| Expenses | |
| Manager (See Note 3) | 6,520,445 |
| Interest expense and fees | 6,096,239 |
| Professional fees | 70,473 |
| Custodian | 57,388 |
| Transfer agent | 15,539 |
| Trustees | 12,825 |
| Miscellaneous | 47,602 |
| Total expenses | 12,820,511 |
| Net investment income (loss) | 30,790,766 |
| Realized and Unrealized Gain (Loss) |
| Net realized gain (loss) on: | |
| Unaffiliated investment transactions | 3,016,515 |
| Foreign currency transactions | (240,820) |
| Net realized gain (loss) | 2,775,695 |
| Net change in unrealized appreciation (depreciation) on: | |
| Unaffiliated investments | (176,458,932) |
| Translation of other assets and liabilities in foreign currencies | (55,025) |
| Net change in unrealized appreciation (depreciation) | (176,513,957) |
| Net realized and unrealized gain (loss) | (173,738,262) |
Net increase (decrease) in net assets to Common shares
resulting from operations | $(142,947,496) |
The notes to the financial statements are an integral part of, and should be read in conjunction with, the financial statements.
| 14 | MainStay CBRE Global Infrastructure Megatrends Fund |
Statements of Changes in Net Assets
for the six months ended November 30, 2022 (Unaudited) and the period October 27, 2021 (commencement of operations) through May 31, 2022
| | Six months
ended
November 30,
2022 | Period
October 27, 2021
(commencement
of operations)
through
May 31, 2022 |
| Increase (Decrease) in Net Assets Applicable to Common Shares |
| Operations: | | |
| Net investment income (loss) | $ 30,790,766 | $ 29,559,525 |
| Net realized gain (loss) | 2,775,695 | 6,238,141 |
| Net change in unrealized appreciation (depreciation) | (176,513,957) | 28,686,803 |
| Net increase (decrease) in net assets applicable to Common shares resulting from operations | (142,947,496) | 64,484,469 |
| Distributions to Common shareholders | (33,820,487) | (28,183,740) |
Capital share transactions
(Common shares): | | |
| Net proceeds from sales of shares | — | 1,040,850,680 |
| Net increase (decrease) in net assets applicable to Common shares | (176,767,983) | 1,077,151,409 |
| Net Assets Applicable to Common Shares |
| Beginning of period | 1,077,251,409 | 100,000 |
| End of period | $ 900,483,426 | $1,077,251,409 |
The notes to the financial statements are an integral part of, and should be read in conjunction with, the financial statements.
15
Statement of Cash Flows
for the six months ended November 30, 2022 (Unaudited)
| Cash Flows From (Used in) Operating Activities: |
| Net decrease in net assets resulting from operations | $(142,947,496) |
| Adjustments to reconcile net increase in net assets resulting from operations to net cash used in operating activities: | |
| Long term investments purchased | (155,539,849) |
| Long term investments sold | 236,679,839 |
| Amortization (accretion) of discount and premium, net | 77,777 |
| Decrease in investment securities sold receivable | 3,687,861 |
| Increase in dividends and interest receivable | (1,357,144) |
| Decrease in other assets | 21,216 |
| Decrease in investment securities purchased payable | (162,381) |
| Increase in professional fees payable | 25,888 |
| Decrease in custodian payable | (28,780) |
| Decrease in shareholder communication payable | (101,205) |
| Increase in due to Trustees | 1,492 |
| Decrease in due to manager | (270,900) |
| Increase in due to transfer agent | 3,486 |
| Decrease in accrued expenses | (39,605) |
| Increase in interest expense and fees payable | 1,497,498 |
| Net realized gain from investments | (3,016,515) |
| Net change in unrealized (appreciation) depreciation on unaffiliated investments | 176,458,932 |
| Net cash from operating activities | 114,990,114 |
| Cash Flows From (Used in) Financing Activities: |
| Proceeds from line of credit | 83,500,000 |
| Payments on line of credit | (165,000,000) |
| Cash distributions paid, net of change in Common share dividend payable | (33,820,487) |
| Net cash used in financing activities | (115,320,487) |
| Net decrease in cash | (330,373) |
| Cash at beginning of period | 415,377 |
| Cash at end of period | $ 85,004 |
| Supplemental disclosure of cash flow information: |
| The following tables provide a reconciliation of cash reported within the Statement of Assets and Liabilities that sums to the total of the such amounts shown on the Statement of Cash Flows: | |
| Cash at beginning of year | |
| Cash | $314,276 |
| Cash denominated in foreign currencies | 101,101 |
| Total cash shown in the Statement of Cash Flows | $415,377 |
| Cash at end of year | |
| Cash | $ 67,120 |
| Cash denominated in foreign currencies | 17,884 |
| Total cash shown in the Statement of Cash Flows | $ 85,004 |
The notes to the financial statements are an integral part of, and should be read in conjunction with, the financial statements.
| 16 | MainStay CBRE Global Infrastructure Megatrends Fund |
Financial Highlights selected per share data and ratios
| | Six months
ended
November 30,
2022* | | October 27, 2021^ through
May 31, |
| | 2022 |
| Net asset value at beginning of period applicable to Common shares | $ 20.70 | | $ 20.00 |
| Net investment income (loss) (a) | 0.59 | | 0.58 |
| Net realized and unrealized gain (loss) | (3.34) | | 0.66 |
| Total from investment operations | (2.75) | | 1.24 |
| Dividends and distributions to Common shareholders | (0.65) | | (0.54) |
| Dilution effect on net asset value from overallotment issuance | — | | 0.00‡ |
| Net asset value at end of period applicable to Common shares | $ 17.30 | | $ 20.70 |
| Market price at end of period applicable to Common shares | $ 14.38 | | $ 18.65 |
| Total investment return on market price (b) | (19.37)% | | (4.02)% |
| Total investment return on net asset value (b) | (13.18)% | | 6.28% |
Ratios (to average net assets of Common shareholders)/
Supplemental Data: | | | |
| Net investment income (loss)†† | 6.73% | | 4.78% |
| Net expenses (including interest expense and fees)††(c) | 2.80% | | 1.92% (d)(e) |
| Interest expense and fees††(f) | 1.33% | | 0.36% |
| Portfolio Turnover Rate | 12% | | 12% |
| Net assets applicable to Common shareholders at end of period (in 000’s) | $ 900,483 | | $ 1,077,251 |
| * | Unaudited. |
| ^ | Commencement of Operations |
| ‡ | Less than one cent per share. |
| †† | Annualized. |
| (a) | Per share data based on average shares outstanding during the period. |
| (b) | Total investment return on market price is calculated assuming a purchase of a Common share at the market price on the first day and a sale on the last day business day of each month. Dividends and distributions are assumed to be reinvested at prices obtained under the Fund’s dividend reinvestment plan. Total investment return on net asset value reflects the changes in net asset value during each period and assumes the reinvestment of dividends and distributions at net asset value on the last business day of each month. This percentage may be different from the total investment return on market price, due to differences between the market price and the net asset value. For periods less than one year, total investment return is not annualized. |
| (c) | In addition to the fees and expenses which the Fund bears directly, it also indirectly bears a pro-rata share of the fees and expenses of the underlying funds in which it invests. Such indirect expenses are not included in the above expense ratios. |
| (d) | Net of Excise tax expense of 0.06%. |
| (e) | The expense ratio is higher than the Fund anticipates for a typical fiscal year due to the short fiscal period and the annualization of all expenses, some of which are fixed or non-recurring. |
| (f) | Interest expense and fees relate to the Line of Credit borrowing (See Note 6). |
The notes to the financial statements are an integral part of, and should be read in conjunction with, the financial statements.
17
Notes to Financial Statements (Unaudited)
Note 1–Organization and Business
MainStay CBRE Global Infrastructure Megatrends Fund (the “Fund”) was organized as a Delaware statutory trust on March 30, 2021, and is governed by an agreement and declaration of trust (“Declaration of Trust’’). The Fund is registered under the Investment Company Act of 1940, as amended (the “1940 Act”), as a “non-diversified”, closed-end management investment company, as those terms are defined in the 1940 Act, as interpreted or modified by regulatory authorities having jurisdiction, from time to time. The Fund first offered Common shares through an initial public offering on October 27, 2021.
Prior to commencement of operations on October 27, 2021, the Fund had no operations other than those relating to organizational matters and the sale of 5,000 common shares on September 17, 2021, to New York Life Investment Management Holdings LLC, the parent company of New York Life Investment Management LLC, for $100,000. Investment operations for the Fund commenced on October 27, 2021.
Pursuant to the terms of the Declaration of Trust, the Fund will commence the process of liquidation and dissolution at the close of business on December 15, 2033 (the “Termination Date”) unless otherwise extended by a majority of the Board of Trustees (the “Board”) (as discussed in further detail below). Upon liquidation and termination of the Fund, shareholders will receive an amount equal to the Fund’s net asset value (“NAV”) at that time, which may be greater or less than the price at which Common shares were issued. The Fund’s investment objectives and policies are not designed to return to investors who purchased Common shares in the initial offering of such shares their initial investment on the Termination Date and such initial investors may receive more or less than their original investment upon termination.
Prior to the commencement of the twelve-month period preceding the Termination Date, a majority of the Board may, without shareholder approval unless such approval is required by the 1940 Act, extend the Termination Date (i) once for up to one year and (ii) once for up to an additional six months (the “Extended Termination Date”), upon a determination that winding up the affairs of and liquidating the Fund would not, given prevailing market conditions, be in the best interests of the Fund’s shareholders. Additionally, if the Fund completes an Eligible Tender Offer (as defined below), a majority of the Board may, without shareholder approval unless such approval is required by the 1940 Act, eliminate the Termination Date and cause the Fund to have a perpetual existence as a closed-end fund. An “Eligible Tender Offer” is defined as a tender offer by the Fund to purchase 100% of the then outstanding Common shares of the Fund at a price equal to the NAV per Common share on the expiration date of the tender offer, which shall be as of a date within twelve months preceding the Termination Date.
If the payment for properly tendered Common shares would result in the Fund’s net assets totaling less than $200 million (the “Termination Threshold”), the Eligible Tender Offer shall be canceled, no Common shares will be repurchased pursuant to the Eligible Tender Offer, and the Fund would dissolve as set forth above. If an Eligible Tender Offer is
conducted and the payment for properly tendered Common shares would result in the Fund’s net assets totaling greater than or equal to the Termination Threshold, all Common shares properly tendered and not withdrawn will be purchased by the Fund pursuant to the terms of the Eligible Tender Offer. The Fund may conduct an Eligible Tender Offer upon the affirmative vote of a majority of the Board - or by an instrument signed by a majority of the Board - without a vote of the shareholders.
The Fund's investment objective is to seek a high level of total return with an emphasis on current income.
Note 2–Significant Accounting Policies
The Fund is an investment company and accordingly follows the investment company accounting and reporting guidance of the Financial Accounting Standards Board (“FASB”) Accounting Standards Codification Topic 946 Financial Services—Investment Companies. The Fund prepares its financial statements in accordance with generally accepted accounting principles (“GAAP”) in the United States of America and follows the significant accounting policies described below.
(A) Securities Valuation. Investments are usually valued as of the close of regular trading on the New York Stock Exchange (the "Exchange") (usually 4:00 p.m. Eastern time) on each day the Fund is open for business ("valuation date").
Effective September 8, 2022, and pursuant to Rule 2a-5 under the 1940 Act, the Board designated New York Life Investment Management LLC (“New York Life Investments” or the "Manager") as its Valuation Designee (the "Valuation Designee"). The Valuation Designee is responsible for performing fair valuations relating to all investments in the Fund’s portfolio for which market quotations are not readily available; periodically assessing and managing material valuation risks; establishing and applying fair value methodologies; testing fair valuation methodologies; evaluating and overseeing pricing services; segregation of valuation and portfolio management functions; providing quarterly, annual and prompt reporting to the Board, as appropriate; identifying potential conflicts of interest; and maintaining appropriate records. The Valuation Designee has established a valuation committee ("Valuation Committee") to assist in carrying out the Valuation Designee’s responsibilities and establish prices of securities for which market quotations are not readily available. The Fund’s and the Valuation Designee's policies and procedures ("Valuation Procedures") govern the Valuation Designee’s selection and application of methodologies for determining and calculating the fair value of Fund investments. The Valuation Designee may value Fund portfolio securities for which market quotations are not readily available and other Fund assets utilizing inputs from pricing services and other third-party sources (together, “Pricing Sources”). The Valuation Committee meets (in person, via electronic mail or via teleconference) on an ad-hoc basis to determine fair valuations and on a quarterly basis to review fair value events (excluding fair valuations from pricing services), including valuation risks and back-testing results, and preview reports to the Board.
| 18 | MainStay CBRE Global Infrastructure Megatrends Fund |
The Valuation Committee establishes prices of securities for which market quotations are not readily available based on such methodologies and measurements on a regular basis after considering information that is reasonably available and deemed relevant by the Valuation Committee. The Board shall oversee the Valuation Designee and review fair valuation materials on a prompt, quarterly and annual basis and approve proposed revisions to the Valuation Procedures.
Investments for which market quotations are not readily available are valued at fair value as determined in good faith pursuant to the Valuation Procedures. A market quotation is readily available only when that quotation is a quoted price (unadjusted) in active markets for identical investments that the Fund can access at the measurement date, provided that a quotation will not be readily available if it is not reliable. Fair value measurements are determined within a framework that establishes a three-tier hierarchy that maximizes the use of observable market data and minimizes the use of unobservable inputs to establish a classification of fair value measurements for disclosure purposes. "Inputs" refer broadly to the assumptions that market participants would use in pricing the asset or liability, including assumptions about risk, such as the risk inherent in a particular valuation technique used to measure fair value using a pricing model and/or the risk inherent in the inputs for the valuation technique. Inputs may be observable or unobservable. Observable inputs reflect the assumptions market participants would use in pricing the asset or liability based on market data obtained from sources independent of the Fund. Unobservable inputs reflect the Fund’s own assumptions about the assumptions market participants would use in pricing the asset or liability based on the information available. The inputs or methodology used for valuing assets or liabilities may not be an indication of the risks associated with investing in those assets or liabilities. The three-tier hierarchy of inputs is summarized below.
| • | Level 1—quoted prices (unadjusted) in active markets for an identical asset or liability |
| • | Level 2—other significant observable inputs (including quoted prices for a similar asset or liability in active markets, interest rates and yield curves, prepayment speeds, credit risk, etc.) |
| • | Level 3—significant unobservable inputs (including the Fund's own assumptions about the assumptions that market participants would use in measuring fair value of an asset or liability) |
The level of an asset or liability within the fair value hierarchy is based on the lowest level of an input, both individually and in the aggregate, that is significant to the fair value measurement. The aggregate value by input level of the Fund’s assets and liabilities as of November 30, 2022, is included at the end of the Portfolio of Investments.
The Fund may use third-party vendor evaluations, whose prices may be derived from one or more of the following standard inputs, among others:
| • Broker/dealer quotes | • Benchmark securities |
| • Two-sided markets | • Reference data (corporate actions or material event notices) |
| • Bids/offers | • Monthly payment information |
| • Industry and economic events | • Reported trades |
An asset or liability for which a market quotation is not readily available is valued by methods deemed reasonable in good faith by the Valuation Committee, following the Valuation Procedures to represent fair value. Under these procedures, the Valuation Designee generally uses a market-based approach which may use related or comparable assets or liabilities, recent transactions, market multiples, book values and other relevant information. The Valuation Designee may also use an income-based valuation approach in which the anticipated future cash flows of the asset or liability are discounted to calculate fair value. Discounts may also be applied due to the nature and/or duration of any restrictions on the disposition of the asset or liability. Fair value represents a good faith approximation of the value of a security. Fair value determinations involve the consideration of a number of subjective factors, an analysis of applicable facts and circumstances and the exercise of judgment. As a result, it is possible that the fair value for a security determined in good faith in accordance with the Valuation Procedures may differ from valuations for the same security determined for other funds using their own valuation procedures. Although the Valuation Procedures are designed to value a security at the price the Fund may reasonably expect to receive upon the security's sale in an orderly transaction, there can be no assurance that any fair value determination thereunder would, in fact, approximate the amount that the Fund would actually realize upon the sale of the security or the price at which the security would trade if a reliable market price were readily available. During the six-month period ended November 30, 2022, there were no material changes to the fair value methodologies.
Securities which may be valued in this manner include, but are not limited to: (i) a security for which trading has been halted or suspended or otherwise does not have a readily available market quotation on a given day; (ii) a debt security that has recently gone into default and for which there is not a current market quotation; (iii) a security of an issuer that has entered into a restructuring; (iv) a security that has been delisted from a national exchange; (v) a security subject to trading collars for which no or limited trading takes place; and (vi) a security whose principal market has been temporarily closed at a time when, under normal conditions, it would be open. Securities valued in this manner are generally categorized as Level 2 or 3 in the hierarchy.
Certain securities, including certain closed end funds, held by the Fund may principally trade in foreign markets. Events may occur between the time the foreign markets close and the time at which the Fund's NAVs are calculated. These events may include, but are not limited to, situations relating to a single issuer in a market sector, significant fluctuations in U.S. or foreign markets, natural disasters, armed conflicts, governmental
Notes to Financial Statements (Unaudited) (continued)
actions or other developments not tied directly to the securities markets. Should the Valuation Designee conclude that such events may have affected the accuracy of the last price of such securities reported on the local foreign market, the Valuation Designee may, pursuant to the Valuation Procedures, adjust the value of the local price to reflect the estimated impact on the price of such securities as a result of such events. In this instance, securities are generally categorized as Level 3 in the hierarchy. Additionally, certain foreign equity securities are also fair valued whenever the movement of a particular index exceeds certain thresholds. In such cases, the securities are fair valued by applying factors provided by a third-party vendor in accordance with the Valuation Procedures and are generally categorized as Level 2 in the hierarchy. Securities that were fair valued in such a manner as of November 30, 2022, are shown in the Portfolio of Investments.
If the principal market of certain foreign equity securities is closed in observance of a local foreign holiday, these securities are valued using the last closing price of regular trading on the relevant exchange and fair valued by applying factors provided by a third-party vendor in accordance with the Valuation Procedures. These securities are generally categorized as Level 2 in the hierarchy. Securities that were fair valued in such a manner as of November 30, 2022, are shown in the Portfolio of Investments.
Equity securities are valued at the last quoted sales prices as of the close of regular trading on the relevant exchange on each valuation date. Securities that are not traded on the valuation date are valued at the mean of the last quoted bid and ask prices. Prices are normally taken from the principal market in which each security trades. These securities are generally categorized as Level 1 in the hierarchy.
Debt securities (other than convertible and municipal bonds) are valued at the evaluated bid prices (evaluated mean prices in the case of convertible and municipal bonds) supplied by a pricing agent or broker selected by the Valuation Designee, in consultation with the Subadvisor. The evaluations are market-based measurements processed through a pricing application and represents the pricing agent’s good faith determination as to what a holder may receive in an orderly transaction under market conditions. The rules-based logic utilizes valuation techniques that reflect participants’ assumptions and vary by asset class and per methodology, maximizing the use of relevant observable data including quoted prices for similar assets, benchmark yield curves and market corroborated inputs. The evaluated bid or mean prices are deemed by the Valuation Designee, in consultation with the Subadvisor, to be representative of market values at the regular close of trading of the Exchange on each valuation date. Debt securities purchased on a delayed delivery basis are marked to market daily until settlement at the forward settlement date. Debt securities, including corporate bonds, U.S. government and federal agency bonds, municipal bonds, foreign bonds, convertible bonds, asset-backed securities and mortgage-backed securities are generally categorized as Level 2 in the hierarchy.
Closed-end fund NAVs are valued at market value, which will generally be determined using the last reported official closing or last trading price on
the exchange or market on which the security is primarily traded at the time of valuation. Price information on closed-end funds is taken from the exchange where the security is primarily traded. In addition, because closed-end funds and exchange-traded funds trade on a secondary market, their shares may trade at a premium or discount to the actual net asset value of their portfolio securities and their shares may have greater volatility because of the potential lack of liquidity. These closed-end funds are generally categorized as Level 1 in the hierarchy.
The information above is not intended to reflect an exhaustive list of the methodologies that may be used to value portfolio investments. The Valuation Procedures permit the use of a variety of valuation methodologies in connection with valuing portfolio investments. The methodology used for a specific type of investment may vary based on the market data available or other considerations. The methodologies summarized above may not represent the specific means by which portfolio investments are valued on any particular business day.
(B) Income Taxes. The Fund's policy is to comply with the requirements of the Internal Revenue Code of 1986, as amended (the “Internal Revenue Code”), applicable to regulated investment companies and to distribute all of its taxable income to the shareholders of the Fund within the allowable time limits.
The Manager evaluates the Fund’s tax positions to determine if the tax positions taken meet the minimum recognition threshold in connection with accounting for uncertainties in income tax positions taken or expected to be taken for the purposes of measuring and recognizing tax liabilities in the financial statements. Recognition of tax benefits of an uncertain tax position is permitted only to the extent the position is “more likely than not” to be sustained assuming examination by taxing authorities. The Manager analyzed the Fund's tax positions taken on federal, state and local income tax returns for all open tax years (for up to three tax years) and has concluded that no provisions for federal, state and local income tax are required in the Fund's financial statements. The Fund's federal, state and local income tax and federal excise tax returns for tax years for which the applicable statutes of limitations have not expired are subject to examination by the Internal Revenue Service and state and local departments of revenue.
(C) Foreign Taxes. The Fund may be subject to foreign taxes on income and other transaction-based taxes imposed by certain countries in which it invests. A portion of the taxes on gains on investments or currency purchases/repatriation may be reclaimable. The Fund will accrue such taxes and reclaims as applicable, based upon its current interpretation of tax rules and regulations that exist in the markets in which it invests.
The Fund may be subject to taxation on realized capital gains, repatriation proceeds and other transaction-based taxes imposed by certain countries in which it invests. The Fund will accrue such taxes as applicable based upon its current interpretation of tax rules and regulations that exist in the market in which it invests. Capital gains taxes relating to positions still held are reflected as a liability in the Statement of Assets and Liabilities,
| 20 | MainStay CBRE Global Infrastructure Megatrends Fund |
as well as an adjustment to the Fund's net unrealized appreciation (depreciation). Taxes related to capital gains realized, if any, are reflected as part of net realized gain (loss) in the Statement of Operations. Changes in tax liabilities related to capital gains taxes on unrealized investment gains, if any, are reflected as part of the change in net unrealized appreciation (depreciation) on investments in the Statement of Operations. Transaction-based charges are generally assessed as a percentage of the transaction amount.
(D) Dividends and Distributions to Common Shareholders. Dividends and distributions are recorded on the ex-dividend date. Subject to its managed distribution policy, the Fund intends to distribute monthly all or a portion of its net investment income, including current net realized capital gains, to Common shareholders. The Fund’s monthly distributions may include return of capital, which represents a return of a shareholder’s original investment in the Fund. Dividends and distributions are determined in accordance with federal income tax regulations and may differ from determinations using GAAP. Unless a Common shareholder elects otherwise, all dividends and distributions are reinvested pursuant to the Fund's dividend reinvestment plan. For information on the Fund’s dividend reinvestment plan, please see page 24.
(E) Security Transactions and Investment Income. The Fund records security transactions on the trade date. Realized gains and losses on security transactions are determined using the identified cost method. Dividend income is recognized on the ex-dividend date, net of any foreign tax withheld at the source, and interest income is accrued as earned using the effective interest rate method. Distributions received from real estate investment trusts may be classified as dividends, capital gains and/or return of capital. Discounts and premiums on securities purchased by the Fund, other than temporary cash investments that mature in 60 days or less at the time of purchase, are accreted and amortized, respectively, using the effective interest rate method.
(F) Expenses. The expenses borne by the Fund, including those of related parties to the Fund, are shown in the Statement of Operations. Certain expenses of the Fund are allocated in proportion to other funds within the MainStay Group of Funds.
Additionally, the Fund may invest in other funds, which are subject to management fees and other fees that may cause the costs of investing in other funds to be greater than the costs of owning the underlying securities directly. These indirect expenses of other funds are not included in the amounts shown as expenses in the Statement of Operations or in the expense ratios included in the Financial Highlights.
(G) Use of Estimates. In preparing financial statements in conformity with GAAP, the Manager makes estimates and assumptions that affect the reported amounts and disclosures in the financial statements. Actual results could differ from those estimates and assumptions.
(H) Foreign Currency Transactions. The Fund's books and records are maintained in U.S. dollars. Prices of securities denominated in foreign currency amounts are translated into U.S. dollars at the mean between
the buying and selling rates last quoted by any major U.S. bank at the following dates:
(i) market value of investment securities, other assets and liabilities— at the valuation date; and
(ii) purchases and sales of investment securities, income and expenses—at the date of such transactions.
The assets and liabilities that are denominated in foreign currency amounts are presented at the exchange rates and market values at the close of the period. The realized and unrealized changes in net assets arising from fluctuations in exchange rates and market prices of securities are not separately presented.
Net realized gain (loss) on foreign currency transactions represents net currency gains or losses realized as a result of differences between the amounts of securities sale proceeds or purchase cost, dividends, interest and withholding taxes as recorded on the Fund's books, and the U.S. dollar equivalent amount actually received or paid. Net currency gains or losses from valuing such foreign currency denominated assets and liabilities, other than investments at valuation date exchange rates, are reflected in unrealized foreign exchange gains or losses.
(I) Statement of Cash Flows. The cash amount shown in the Fund’s Statement of Cash Flows is the amount included in the Fund’s Statement of Assets and Liabilities and represents the cash on hand at its custodian and restricted cash, if any, as of November 30, 2022.
(J) Foreign Securities Risk. The Fund invests in foreign securities, which carry certain risks that are in addition to the usual risks inherent in domestic securities. These risks include those resulting from currency fluctuations, future adverse political or economic developments and possible imposition of currency exchange blockages or other foreign governmental laws or restrictions. These risks are likely to be greater in emerging markets than in developed markets. The ability of issuers of debt securities held by the Fund to meet their obligations may be affected by, among other things, economic or political developments in a specific country, industry or region.
(K) Indemnifications. Under the Fund’s organizational documents, its officers and trustees are indemnified against certain liabilities that may arise out of performance of their duties to the Fund. Additionally, in the normal course of business, the Fund enters into contracts with third-party service providers that contain a variety of representations and warranties and that may provide general indemnifications. The Fund's maximum exposure under these arrangements is unknown, as this would involve future claims that may be made against the Fund that have not yet occurred. The Manager believes that the risk of loss in connection with these potential indemnification obligations is remote. However, there can be no assurance that material liabilities related to such obligations will not arise in the future, which could adversely impact the Fund.
Notes to Financial Statements (Unaudited) (continued)
Note 3–Fees and Related Party Transactions
(A) Manager and Subadvisor. New York Life Investments, a registered investment adviser and an indirect, wholly-owned subsidiary of New York Life Insurance Company ("New York Life"), serves as the Fund's Manager pursuant to a Management Agreement ("Management Agreement"). The Manager provides offices, conducts clerical, recordkeeping and bookkeeping services and keeps most of the financial and accounting records required to be maintained by the Fund. Except for the portion of salaries and expenses that are the responsibility of the Fund, the Manager pays the salaries and expenses of all personnel affiliated with the Fund and certain operational expenses of the Fund. During a portion of the six-month period ended November 30, 2022, the Fund reimbursed New York Life Investments in an amount equal to the portion of the compensation of the Chief Compliance Officer attributable to the Fund. CBRE Investment Management Listed Real Assets LLC ("CBRE" or the "Subadvisor"), a registered investment adviser, serves as the Subadvisor to the Fund and is responsible for the day-to-day portfolio management of the Fund. Pursuant to the terms of a Subadvisory Agreement ("Subadvisory Agreement") between New York Life Investments and CBRE, New York Life Investments pays for the services of the Subadvisor.
Under the Management Agreement, the Fund pays the Manager a monthly fee for the services performed and the facilities furnished at an annual rate of 1.00% of the “Managed Assets”. "Managed Assets" is defined as the Fund's total assets, including assets attributable to any form of leverage minus liabilities (other than debt representing leverage and the aggregate liquidation preference of any preferred shares that may be outstanding).
During the six-month period ended November 30, 2022, New York Life Investments earned fees from the Fund in the amount of $6,520,445 and paid the Subadvisor in the amount of $3,260,223.
JPMorgan Chase Bank, N.A. ("JPMorgan") provides sub-administration and sub-accounting services to the Fund pursuant to an agreement with New York Life Investments. These services include calculating the daily NAVs of the Fund, maintaining the general ledger and sub-ledger accounts for the calculation of the Fund's NAVs, and assisting New York Life Investments in conducting various aspects of the Fund's administrative operations. For providing these services to the Fund, JPMorgan is compensated by New York Life Investments.
Pursuant to an agreement between the Fund and New York Life Investments, New York Life Investments is responsible for providing or procuring certain regulatory reporting services for the Fund. The Fund will reimburse New York Life Investments for the actual costs incurred by New York Life Investments in connection with providing or procuring these services for the Fund.
(B) Transfer, Dividend Disbursing and Shareholder Servicing Agent. Computershare Trust Company, N.A. (“Computershare”), 150 Royall Street, Canton, Massachusetts, 02021, is the Fund’s transfer,
dividend disbursing and shareholder servicing agent pursuant to an agreement between the Fund and Computershare.
Note 4-Federal Income Tax
As of November 30, 2022, the cost and unrealized appreciation (depreciation) of the Fund’s investment portfolio, including applicable derivative contracts and other financial instruments, as determined on a federal income tax basis, were as follows:
| | Federal Tax
Cost | Gross
Unrealized
Appreciation | Gross
Unrealized
(Depreciation) | Net
Unrealized
Appreciation/
(Depreciation) |
| Investments in Securities | $1,390,941,032 | $34,417,972 | $(185,064,612) | $(150,646,640) |
During the year ended May 31, 2022, the tax character of distributions paid as reflected in the Statements of Changes in Net Assets was as follows:
| | 2022 |
| Distributions paid from: | |
| Ordinary Income | $28,183,740 |
Note 5–Custodian
JPMorgan is the custodian of cash and securities held by the Fund. Custodial fees are charged to the Fund based on the Fund's net assets and/or the market value of securities held by the Fund and the number of certain transactions incurred by the Fund.
Note 6–Line of Credit
The Fund maintains a line of credit under a credit agreement with The Bank of New York Mellon ("BNY Mellon") dated November 4, 2021 (the "Credit Agreement") in order to achieve its investment objective. The aggregate commitment amount is $500,000,000. Under the Credit Agreement, the Fund is subject to (i) a financing charge of the Overnight Bank Funding Rate plus 0.75% on drawn assets and (ii) a commitment fee at an annual rate of 0.25% of undrawn portions of the credit facility to the extent the credit facility utilization rate is less than 80%. The Credit Agreement expires on May 3, 2023. During the six-month period ended November 30, 2022, the Fund utilized the line of credit for 183 days, maintained an average daily balance of $385,915,301 at a weighted average interest rate of 3.18% and incurred interest expense in the amount of $6,096,239. As of November 30, 2022, borrowings outstanding with respect to the Fund under the Credit Agreement were $345,500,000.
Note 7–Purchases and Sales of Securities (in 000’s)
During the six-month period ended November 30, 2022, purchases and sales of securities, other than short-term securities, were $155,540 and $236,680, respectively.
| 22 | MainStay CBRE Global Infrastructure Megatrends Fund |
Note 8–Capital Share Transactions
Transactions in capital shares for the six-month period ended November 30, 2022 and period October 27, 2021 (commencement of operations) through May 31, 2022, were as follows:
| Common Shares(a) | Shares | Amount |
| Period October 27, 2021 (commencement of operations) through May 31, 2022: | | |
| Shares sold | 52,042,534 | $1,040,850,680 |
| (a) | No activity during the six-month period ended November 30, 2022. |
Note 9–Other Matters
As of the date of this report, interest rates in the United States and many parts of the world, including certain European countries, are ascending from historically low levels. Thus, the Fund currently faces a heightened level of risk associated with rising interest rates. This could be driven by a variety of factors, including but not limited to central bank monetary policies, changing inflation or real growth rates, general economic conditions, increasing bond issuances or reduced market demand for low yielding investments.
An outbreak of COVID-19, first detected in December 2019, has developed into a global pandemic and has resulted in travel restrictions, closure of international borders, certain businesses and securities markets, restrictions on securities trading activities, prolonged quarantines, supply chain disruptions, and lower consumer demand, as well as general concern and uncertainty. In 2022, many countries lifted some or all restrictions related to COVID-19. However, the continued impact of COVID-19 and related variants is uncertain and could further adversely affect the global economy, national economies, individual issuers and capital markets in unforeseeable ways and result in a substantial and extended economic downturn. Developments that disrupt global economies and financial markets, such as COVID-19, may magnify factors that affect the Fund's performance.
Note 10–Subsequent Events
In connection with the preparation of the financial statements of the Fund as of and for the six-month period ended November 30, 2022, events and transactions subsequent to November 30, 2022, through the date the financial statements were issued have been evaluated by the Manager for possible adjustment and/or disclosure. No subsequent events requiring financial statement adjustment or disclosure have been identified, other than the following:
On December 14, 2022, the Fund declared a dividend in the amount of $0.1083 per Common share, payable December 30, 2022, to shareholders of record on December 27, 2022.
Dividend Reinvestment Plan (Unaudited)
Introduction
This Dividend Reinvestment Plan (“Plan”) for MainStay CBRE Global Infrastructure Megatrends Fund (“Fund”), provides that for a holder of the Fund’s common shares of beneficial interest (each, a “Common Share” and, collectively “Common Shares”) in the Plan (each, a “Participant” and collectively, “Participants”), all dividends and distributions on such Shareholder’s Common Shares will be automatically reinvested by Computershare Trust Company, N.A. (“Plan Administrator”), as agent for Shareholders in administering the Plan, in additional Common Shares, unless the Participants elect to receive cash. Participation in the Plan may be terminated or resumed at any time without penalty by notice if received and processed by the Plan Administrator prior to the dividend record date; otherwise such termination or resumption will be effective with respect to any subsequently declared dividend or other distribution. Some brokers may automatically elect to receive cash on your behalf and may re-invest that cash in additional Common Shares for you. If you wish for all dividends declared on your Common Shares to be automatically reinvested pursuant to the Plan, please contact your broker.
Plan Details
1. The Plan Administrator will open an account for each holder of Common Shares under the Plan in the same name in which such holder of Common Shares is registered. Whenever the Fund declares a dividend or other distribution such as capital gain or return of capital, (together, a “Dividend”) payable in cash, non-participants in the Plan will receive cash and participants in the Plan will receive Common Shares as per the terms stated in this Plan. The Common Shares will be acquired by the Plan Administrator for the participants' accounts, depending upon the circumstances described below, either (i) through receipt of additional unissued but authorized Common Shares from the Fund (“Newly Issued Common Shares”) or (ii) by purchase of outstanding Common Shares on the open market (“Open-Market Purchases”) on the New York Stock Exchange or elsewhere.
2. If, on the payment date for any Dividend, the closing market price plus estimated per share fees (which include any brokerage commissions the Plan Administrator is required to pay) is equal to or greater than the net asset value (“NAV”) per Common Share, the Plan Administrator will invest the Dividend amount in Newly Issued Common Shares on behalf of the participants. The number of Newly Issued Common Shares to be credited to each participant’s account will be determined by dividing the dollar amount of the Dividend by the NAV per Common Share on the payment date; provided that, if the NAV is less than or equal to 95% of the closing market value on the payment date, the dollar amount of the Dividend will be divided by 95% of the closing market price per Common Share on the payment date. If, on the payment date for any Dividend, the NAV per Common Share is greater than the closing market value plus per share fees, the Plan Administrator will invest the Dividend amount in Common Shares acquired on behalf of the participants in Open-Market Purchases. In the event of a market discount on the payment date for any Dividend, the Plan Administrator will have until the last business day before the next date on which the Common Shares trade on an "ex-dividend" basis or 30
days after the payment date for such Dividend, whichever is sooner (the “Last Purchase Date”), to invest the Dividend amount in Common Shares acquired in Open-Market Purchases. It is contemplated that the Fund will pay monthly income Dividends. Therefore, the period during which Open-Market Purchases can be made will exist only from the payment date of each Dividend through the date before the next “ex-dividend” date which typically will be approximately ten days. If, before the Plan Administrator has completed its Open-Market Purchases, the market price per Common Share exceeds the NAV per Common Share, the average per Common Share purchase price paid by the Plan Administrator may exceed the NAV of the Common Shares, resulting in the acquisition of fewer Common Shares than if the Dividend had been paid in Newly Issued Common Shares on the Dividend payment date. Because of the foregoing difficulty with respect to Open-Market Purchases, the Plan provides that if the Plan Administrator is unable to invest the full Dividend amount in Open-Market Purchases during the purchase period or if the market discount shifts to a market premium during the purchase period, the Plan Administrator may cease making Open-Market Purchases and may invest the uninvested portion of the Dividend amount in Newly Issued Common Shares at the NAV per Common Share at the close of business on the Last Purchase Date provided that, if the NAV is less than or equal to 95% of the then current market price per Common Share; the dollar amount of the Dividend will be divided by 95% of the market price on the payment date.
3. The Plan Administrator maintains all shareholders' accounts in the Plan and furnishes written confirmation of all transactions in the accounts, including information needed by shareholders for tax records. Common Shares in the account of each Plan participant will be held by the Plan Administrator on behalf of the Plan participant, and each shareholder proxy will include those shares purchased or received pursuant to the Plan. The Plan Administrator will forward all proxy solicitation materials to participants and vote proxies for shares held under the Plan in accordance with the instructions of the participants.
4. In the case of shareholders such as banks, brokers or nominees which hold shares for others who are the beneficial owners, the Plan Administrator will administer the Plan on the basis of the number of Common Shares certified from time to time by the record shareholder's name and held for the account of beneficial owners who participate in the Plan.
5. There will be no charges with respect to Common Shares issued directly by the Fund. However, each participant will pay a per share fee incurred ( currently $0.05) in connection with Open-Market Purchases. The automatic reinvestment of Dividends will not relieve participants of any Federal, state or local income tax that may be payable (or required to be withheld) on such dividends. See “Tax Matters.” Participants that request a sale of shares through the Plan Administrator are subject to $2.50 sales fee and a $.15 per share sold fee. All per share fees include any applicable brokerage commissions the Plan Administrator is required is required to pay.
| 24 | MainStay CBRE Global Infrastructure Megatrends Fund |
6. The Fund reserves the right to amend or terminate the Plan. There is no direct service charge to participants with regard to purchases in the Plan; however, the Fund reserves the right to amend the Plan to include a service charge payable by the participants.
7. Each Participant may terminate their account under the Plan by notifying the Plan Administrator by telephone, through the Internet or in writing. If the Plan Administrator receives the Participant’s notice of withdrawal near a dividend record date, the Plan Administrator, in its sole discretion, may either distribute such dividends in cash or reinvest them in Common Shares on behalf of the withdrawing Participant. If such dividends are reinvested, the Plan Administrator will process the termination as soon as practicable, but in no event later than five business days after the reinvestment is completed. The Plan may be terminated by the Plan Administrator or the Fund upon notice in writing mailed to each Participant at least 30 days prior to any record date for the payment of any dividend or distribution by the Fund.
8. Participants may also request to sell a portion of their Common Shares by notifying the Plan Administrator by telephone, through the Internet or in writing. The Plan Administrator will sell such Common Shares through a broker-dealer selected by the Plan Administrator within 5 business days of receipt of the request. The sale price will equal the weighted average price of all Common Shares sold through the Plan on the day of the sale, less a $2.50 service fee and a per share fee of $0.15. Participants should note that the Plan Administrator is unable to accept instructions to sell on a specific date or at a specific price.
9. All correspondence or questions concerning the Plan should be directed to the Plan Administrator, Computershare Trust Company, N.A., by telephone, (855) 456-9683, through the Internet at www.computerhsare.com/investor or in writing to P.O. Box 43078, Providence, RI 02940-3078.
Proxy Voting Policies and Procedures and Proxy Voting Record
The Fund is required to file with the SEC its proxy voting records for the 12-month period ending June 30 on Form N-PX. A description of the policies and procedures that are used to vote proxies relating to portfolio securities of the Fund is available free of charge upon request by calling 800-624-6782 or visiting the SEC’s website at www.sec.gov. The most recent Form N-PX or proxy voting record is available free of charge upon request by calling 800-624-6782; visiting newyorklifeinvestments.com; or visiting the SEC’s website at www.sec.gov.
Shareholder Reports and Quarterly Portfolio Disclosure
The Fund is required to file its complete schedule of portfolio holdings with the SEC 60 days after its first and third fiscal quarter on Form N-PORT. The Fund's holdings report is available free of charge upon request by calling New York Life Investments at 800-624-6782.
| 26 | MainStay CBRE Global Infrastructure Megatrends Fund |
This page intentionally left blank.
Manager
New York Life Investment Management LLC
New York, New York
Subadvisor
CBRE Investment Management Listed Real Assets LLC
Radnor, Pennsylvania
Legal Counsel
Dechert LLP
Independent Registered Public Accounting Firm
KPMG LLP
Transfer, Dividend Disbursing and Shareholder Servicing Agent
Computershare Trust Company, N.A.
P.O. Box 43078
Providence, RI 02940-3078
(855) 456-9683
newyorklifeinvestments.com/megi
“New York Life Investments” is both a service mark, and the common trade name, of certain investment advisors affiliated with New York Life Insurance Company.
| 5013540.2MS006-23 | MSMEGI10-01/23 |
(NYLIM) NL534
Not applicable.
| Item 3. | Audit Committee Financial Expert. |
Not applicable.
| Item 4. | Principal Accountant Fees and Services. |
Not applicable.
| Item 5. | Audit Committee of Listed Registrants. |
Not applicable.
The Schedule of Investments is included as part of Item 1 of this report.
| Item 7. | Disclosure of Proxy Voting Policies and Procedures for Closed-End Management Investment Companies. |
Not applicable.
| Item 8. | Portfolio Managers of Closed-End Management Investment Companies. |
Not applicable.
| Item 9. | Purchases of Equity Securities by Closed-End Management Investment Company and Affiliated Purchasers. |
Not applicable.
| Item 10. | Submission of Matters to a Vote of Security Holders. |
Since the Registrant’s last response to this item, there have been no material changes to the procedures by which shareholders may recommend nominees to the Registrant’s Board of Trustees.
| Item 11. | Controls and Procedures. |
(a) Based on an evaluation of the Registrant’s Disclosure Controls and Procedures (as defined in Rule 30a-3(c) under the Investment Company Act of 1940) (the “Disclosure Controls”), as of a date within 90 days prior to the filing date (the “Filing Date”) of this Form
N-CSR (the “Report”), the Registrant’s principal executive officer and principal financial officer have concluded that the Disclosure Controls are reasonably designed to ensure that information required to be disclosed by the Registrant in the Report is recorded, processed, summarized and reported by the Filing Date, including ensuring that information required to be disclosed in the Report is accumulated and communicated to the Registrant’s management, including the Registrant’s principal executive officer and principal financial officer, as appropriate to allow timely decisions regarding required disclosure.
(b) There were no changes in the Registrant’s internal control over financial reporting (as defined in Rule 30a-3(d)) under the Investment Company Act of 1940 that occurred during the period covered by this report that has materially affected, or is reasonably likely to materially affect, the Registrant’s internal control over financial reporting.
| Item 12. | Disclosure of Securities Lending Activities for Closed-End Management Investment Companies. |
Not applicable.
SIGNATURES
Pursuant to the requirements of the Securities Exchange Act of 1934 and the Investment Company Act of 1940, the Registrant has duly caused this Report to be signed on its behalf by the undersigned, thereunto duly authorized.
MAINSTAY CBRE GLOBAL INFRASTRUCTURE MEGATRENDS FUND
| | |
| By: | | /s/ Kirk C. Lehneis |
| | Kirk C. Lehneis |
| | President and Principal Executive Officer |
|
| Date: February 3, 2023 |
Pursuant to the requirements of the Securities Exchange Act of 1934 and the Investment Company Act of 1940, this Report has been signed below by the following persons on behalf of the Registrant and in the capacities and on the dates indicated.
| | |
| By: | | /s/ Kirk C. Lehneis |
| | Kirk C. Lehneis |
| | President and Principal Executive Officer |
|
| Date: February 3, 2023 |
| |
| By: | | /s/ Jack R. Benintende |
| | Jack R. Benintende |
| | Treasurer and Principal Financial |
| | and Accounting Officer |
|
| Date: February 3, 2023 |
EXHIBIT INDEX
(a) Certifications of principal executive officer and principal financial officer as required by Rule 30a-2 under the Investment Company Act of 1940.
(b) Certifications of principal executive officer and principal financial officer as required by Section 906 of the Sarbanes-Oxley Act of 2002.
(c) Notices to Fund’s shareholders in accordance with Rule 19-a-1 under the Investment Company Act of 1940.