
January 13, 2023
VIA EDGAR
Division of Corporation Finance
U.S. Securities and Exchange Commission
100 F Street, N.E.
Washington, D.C. 20549
| Attention: | Keira Nakada |
Angela Lumey
Re: Grab Holdings Limited
Form 20-F for the Fiscal Year Ended December 31, 2021
Filed April 28, 2022
File No. 001-41110
Ladies and Gentlemen:
Grab Holdings Limited (the “Company”) hereby responds to the comments made in the letter dated December 14, 2022 (the “Comment Letter”) by the staff of the U.S. Securities and Exchange Commission (the “Staff”), concerning the above-referenced 20-F (the “Form 20-F”). Unless otherwise stated, the “Company” in this letter refers to Grab Holdings Limited, its subsidiaries, and its consolidated affiliated entities. The Staff’s comments are repeated below, followed by the Company’s response.
Form 20-F for the Fiscal Year Ended December 31, 2021
Item 5. Operating and Financial Review and Prospects
Results of Operations
Comparison of the Years Ended December 31, 2021 and 2020, page 126
| 1. | Please revise to separately quantify each material factor that contributed to the fluctuations in your results of operations. Refer to Item 5 of Form 20-F. |
In response to the Staff’s comment, the Company proposes to revise the disclosure on pages 126, 127 and 128 of the Form 20-F as follows in its future filings, beginning with its annual report on Form 20-F for the year ending December 31, 2022. For the Staff’s ease of reference, in this response the proposed amendments are marked as strike-through for deletions and as underlined for additions.
Comparison of the Years Ended December 31, 2021 and 2020
Revenue by segment
| ($ in millions, unless otherwise stated) | Year Ended December 31, | |||||||
| 2021 | 2020 | |||||||
Revenue | 675 | 469 | ||||||
Deliveries | 148 | 5 | ||||||
Mobility | 456 | 438 | ||||||
Financial Services | 27 | (10 | ) | |||||
Enterprise and New Initiatives | 44 | 36 | ||||||
Revenue by geographical locations
| ($ in millions, unless otherwise stated) | Year Ended December 31, | |||||||
| 2021 | 2020 | |||||||
Revenue | 675 | 469 | ||||||
Singapore | 283 | 246 | ||||||
Malaysia | 108 | 91 | ||||||
Philippines | 81 | 51 | ||||||
Thailand | 76 | 57 | ||||||
Rest of Southeast Asia | 127 | 24 | ||||||
Our revenue increased by $206 million, to $675 million in 2021 from $469 million in 2020.
Revenue is presented net of base incentives, excess incentives and consumer incentives. Base incentives were $155 million and $178 million in 2021 and 2020, respectively. Excess incentives were $561 million and $443 million in 2021 and 2020, respectively, and consumer incentives were $1,065 million and $616 million in 2021 and 2020, respectively.
Deliveries revenue was $148 million in 2021 compared to revenue of $5 million in 2020. The increase was driven by an increase in deliveries GMV of 56%, or $3 billion, to $8.5 billion in 2021 compared to $5.5 billion in 2020, driven primarily by increasing consumer demand and number of merchant-partners using our platform. The increased demand for deliveries was driven by stay-at-home and movement control orders, work-from-home arrangements and social distancing measures implemented as a result of the COVID-19 pandemic in our markets. We were also able to utilize our driver-partners providing mobility services to support and meet the increasing demand for delivery services. Deliveries revenue as a percentage of deliveries GMV improved as we gained network efficiency in our driver-partner base, and were able to improve our overall value proposition in terms of merchant selection, delivery performance and application experience on our superapp platform. Our partner incentives were $602 million and $466 million in 2021 and 2020, respectively. Our consumer incentives were $800 million and $437 million in 2021 and 2020, respectively.
2
Mobility revenue increased by $19 million, to $456 million in 2021 compared to $438 million in 2020, which was primarily due to ride hailing revenue increasing by $16 million and rental income from motor vehicles increasing by $2 million. The increase in revenue was primarily due to the reduction of driver-partner incentives and fees and consumer incentives, despite a decrease in ride hailing demand, which was adversely impacted by the COVID-19 pandemic, as reflected by the decrease in GMV for mobility. Our incentives decreased by $54 million (comprised of decreases of $37 million in partner incentives and $17 million in consumer incentives) to $196 million (comprised of $114 million in partner incentives and $82 million in consumer incentives) for the year ended December 31, 2021 compared to $251 million (comprised of $151 million in partner incentives and $100 million in consumer incentives) for the year ended December 31, 2020, which resulted in a corresponding increase in our mobility revenue, as we reduced incentives in the face of the COVID-19 pandemic. The COVID-19 pandemic and the associated stay-at-home and movement control orders, work-from-home arrangements and social distancing measures, as well as border closures and travel restrictions, had a negative impact on mobility demand, and accordingly also on mobility GMV. As a result of the effects of the COVID-19 pandemic, GMV for mobility decreased to $2.8 billion in 2021 compared to $3.2 billion in 2020. The increase in rental income from motor vehicles was due to increased demand from corporate users. Mobility revenue as a percentage of mobility GMV increased from 14% in 2020 to 16% in 2021, as we continued to reduce partner and consumer incentives and our reliance on such incentives to maintain and grow our driver-partner and consumer base.
Financial services revenue improved to $27 million in 2021, compared to $(10) million in 2020. The increase was primarily due to a $17 million growth in our lending business as loans disbursed grew 3 times from 2020 to 2021, and a $13 million increase in our payments business, driven by a reduction in consumer incentives at OVO.
Enterprise and new initiatives revenue increased by $8 million, or 22%, to $44 million in 2021 compared to $36 million in 2020. The increase was primarily due to growth of GrabAds revenue by $18 million with the expansion of product offerings supported by internally developed technology stack, which was partially offset by a $10 million reduction in revenue from various other service offerings.
Cost of revenue
| ($ in millions, unless otherwise stated) | Year Ended December 31, | 2020-2021 | ||||||||||
| 2021 | 2020 | % Change | ||||||||||
Cost of revenue | 1,070 | 963 | 11 | % | ||||||||
Cost of revenue increased by $108 million, or 11%, to $1,070 million in 2021 from $963 million in 2020, primarily due to a $69 million increase inhigher staff compensation costs associated with a growthan increase in headcount, performance bonus and share-based compensation, a $29 million increase inhigher infrastructure costs, cloud-hosting costs and a $13 million increase in payment processing feesand merchandise costs as we expanded our operations.
3
Other income
| ($ in millions, unless otherwise stated) | Year Ended December 31, | 2020-2021 | ||||||||||
| 2021 | 2020 | % Change | ||||||||||
Other income | 12 | 33 | (64 | )% | ||||||||
Other income decreased by $21 million or 64% to $12 million in 2021 from $33 million in 2020. The decrease was due to a decrease in government grant income related to COVID-19 programs.
Sales and marketing expenses
| ($ in millions, unless otherwise stated) | Year Ended December 31, | 2020-2021 | ||||||||||
| 2021 | 2020 | % Change | ||||||||||
Sales and marketing expenses | 241 | 151 | 59 | % | ||||||||
Sales and marketing expenses increased by $90 million, or 59%, to $241 million in 2021 from $151 million in 2020. The increase was due to an $81 million increase in media and direct marketing activities through various platforms such as Facebook and Google, which was mainly driven by demand recovery and initiative plans following easing of COVID-19 restrictions. Additionally, there was a $10 million increase in personnel-related compensation such as equity compensation and performance bonus.
General and administrative expenses
| ($ in millions, unless otherwise stated) | Year Ended December 31, | 2020-2021 | ||||||||||
| 2021 | 2020 | % Change | ||||||||||
General and administrative expenses | 545 | 326 | 67 | % | ||||||||
General and administrative expenses increased by $219 million, or 67%, to $545 million from 2020 to 2021 primarily due to a $196 million increase inhigher staff compensation cost (including share-based compensation and bonus) and a $31 million increase inhigher professional fees and consultancyfees costs with the expansion of our operations.
4
Research and development expenses
| ($ in millions, unless otherwise stated) | Year Ended December 31, | 2020-2021 | ||||||||||
| 2021 | 2020 | % Change | ||||||||||
Research and development expenses | 356 | 257 | 39 | % | ||||||||
Research and development expenses increased by $99 million, or 39%, to $356 million in 2021, primarily due to a $75 million increase inpersonnel-related compensationfrom incentives suchasequity compensation, a $13 million increase in salary expense due to headcount growth, and a $9 million increase in performance bonus expenses.
Net impairment losses on financial assets
| ($ in millions, unless otherwise stated) | Year Ended December 31, | 2020-2021 | ||||||||||
| 2021 | 2020 | % Change | ||||||||||
Net impairment losses on financial assets | 19 | 63 | (71 | )% | ||||||||
Net impairment losses on financial assets decreased by $44 million, or 71%, to $19 million in 2021, primarily driven by a $49 million decrease inlower provision for bad debts with the transition towards and growing use of electronic wallets by our driver- and merchant-partners and consumers.
Other expenses
| ($ in millions, unless otherwise stated) | Year Ended December 31, | 2020-2021 | ||||||||||
| 2021 | 2020 | % Change | ||||||||||
Other expenses | 11 | 40 | (73 | )% | ||||||||
Other expenses decreased by $29 million, or 73%, to $11 million in 2021, primarily due to a $24 million decrease in goodwill impairment.
5
Net finance costs
| ($ in millions, unless otherwise stated) | Year Ended December 31, | 2020-2021 | ||||||||||
| 2021 | 2020 | % Change | ||||||||||
Net finance costs | 1,989 | 1,437 | 38 | % | ||||||||
Net finance costs increased by $553 million, or 38%, to $1,989 million in 2021. The increase in net finance costs was primarily due to $353 million share listing expense and higher interest incurred as a result of the issuance of additional convertible redeemable preference shares. In 2021, GHI issued $463 million of convertible redeemable preference shares with a net increase in finance costs of $155 million from higher interest accretion. In addition, interest expense increased by $115 million, primarily driven by interest accrued on the Term Loan B Facility. These increases were partially offset by a $87 million increase in favorable fair value adjustments for certain investments and warrants.
Key Operating Metrics by Business Segment, page 138
| 2. | We note your metric, Commission Rate, represents the dollar value paid in the form of commissions and fees from each transaction, without any adjustments for incentives paid to driver- and merchant-partners or promotions to end-users. As this measure excludes the impact of incentives, which are reductions to your revenue recorded under IFRS, it would appear that this measure represents a tailored recognition and measurement method. Please tell us how you considered Question 100.04 of the Compliance and Disclosure Interpretations on Non-GAAP Financial Measures and Rule 100(b) of Regulation G. |
We respectfully submit that our disclosure of Commission Rate as a supplemental operating metric is not misleading in light of the circumstances under which it is presented for the following reasons:
| • | Our disclosure of Commission Rate is only made at a segment level, is not given any prominence relative to our disclosure of IFRS financial measures and other operating metrics (such as revenues, which are clearly stated to be net of all incentive payments), and does not have the effect of changing our revenue recognition and measurement principles. |
| • | We internally track commission rate by segment and consider this a meaningful metric to track the health of segment operations. |
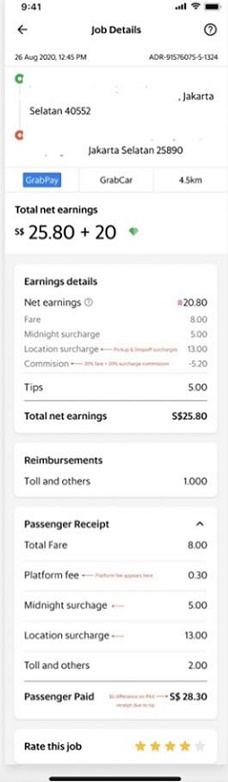
| • | We issue receipts for each transaction in accordance with applicable legal requirements in the countries in which we operate. These receipts indicate, among other things, the commission rate applicable to the transaction. Please see Appendix 1 a sample of these receipts. In some of our countries, commissions and fees are subject to regulatory requirements such as prescribed rates. Our disclosure of Commission Rate as an operating metric is therefore a reflection of the underlying transactions as reflected in the receipts we issue. While for some (but not all) transactions the commissions may be offset in whole or part by incentive payments, the commissions and fees nevertheless remain important components of each transaction conducted through our platform - which is why our revenues are clearly disclosed as being net of incentives while Commission Rate is only presented as a supplemental operating metric. |
6
| • | We believe that Commission Rate is an important supplemental metric for investors to evaluate our business and the health of our platform. Among other things, we include a specific risk factor in our Form 20-F that “[o]ur ability to decrease net losses and achieve profitability is dependent on our ability to reduce the amount of partner and consumer incentives we pay relative to the commissions and fees we receive for our services.” Supplemental information regarding our commissions and fees in the form of the Commission Rate complements our disclosure of partner and consumer incentives to provide investors with a more complete basis for evaluating our business (including relative to what we consider to be among its most significant risks) that would otherwise be unavailable to them if we did not disclose Commission Rate. |
* * *
The Company acknowledges that it and its management are responsible for the accuracy and adequacy of the Company’s disclosures, notwithstanding any review, comments, action or absence of action by the Staff.
If you have any questions or comments to this response letter, please contact me at anthony.tan@grab.com, or the Company’s U.S. counsel, Rajeev P. Duggal at +65-6434-2980 of Skadden, Arps, Slate, Meagher & Flom LLP.
| Sincerely, |
| /s/ Anthony Tan Ping Yeow |
| Anthony Tan Ping Yeow |
| Chairman and Chief Executive Officer |
| cc: | Peter Oey, Chief Financial Officer, Grab Holdings Limited |
Christopher Betts, General Counsel, Grab Holdings Limited
Rajeev Duggal, Skadden, Arps, Slate, Meagher & Flom LLP
7
Appendix 1
Sample of Receipt
8