UNITED STATES
SECURITIES AND EXCHANGE COMMISSION
Washington, D.C. 20549
_________________________
FORM 10-K
_________________________
(Mark One)
☒ ANNUAL REPORT PURSUANT TO SECTION 13 OR 15(d) OF THE SECURITIES EXCHANGE ACT OF 1934
For the fiscal year ended December 29, 2024
☐ TRANSITION REPORT PURSUANT TO SECTION 13 OR 15(d) OF THE SECURITIES EXCHANGE ACT OF 1934
For the transition period from ____ to ____
Commission file number: 001-40573
Krispy Kreme, Inc.
(Exact name of registrant as specified in its charter)
| | | | | |
| Delaware | 37-1701311 |
| (State or other jurisdiction of incorporation) | (IRS Employer Identification No.) |
2116 Hawkins Street, Charlotte, North Carolina 28203
(Address of principal executive offices)
(800) 457-4779
(Registrant's telephone number, including area code)
_________________________
Securities registered pursuant to Section 12(b) of the Act:
| | | | | | | | | | | | | | |
| Title of each class | | Trading Symbol(s) | | Name of each exchange on which registered |
| Common stock, $0.01 par value per share | | DNUT | | Nasdaq Global Select Market |
Securities registered pursuant to section 12(g) of the Act: None
Indicate by check mark if the registrant is a well-known seasoned issuer, as defined in Rule 405 of the Securities Act. Yes ☒ No ☐
Indicate by check mark if the registrant is not required to file reports pursuant to Section 13 or Section 15(d) of the Act. Yes ☐ No ☒
Indicate by check mark whether the registrant (1) has filed all reports required to be filed by Section 13 or 15(d) of the Securities Exchange Act of 1934 during the preceding 12 months (or for such shorter period that the registrant was required to file such reports), and (2) has been subject to such filing requirements for the past 90 days. Yes ☒ No ☐
Indicate by check mark whether the registrant has submitted electronically every Interactive Data File required to be submitted pursuant to Rule 405 of Regulation S-T (§ 232.405 of this chapter) during the preceding 12 months (or for such shorter period that the registrant was required to submit such files). Yes ☒ No ☐
Indicate by check mark whether the registrant is a large accelerated filer, an accelerated filer, a non-accelerated filer, a smaller reporting company, or an emerging growth company. See the definitions of “large accelerated filer,” “accelerated filer,” “smaller reporting company,” and “emerging growth company” in Rule 12b-2 of the Exchange Act.
| | | | | | | | | | | |
| Large accelerated filer | ☒ | Accelerated filer | ☐ |
| Non-accelerated filer | ☐ | Smaller reporting company | ☐ |
| | Emerging growth company | ☐ |
If an emerging growth company, indicate by check mark if the registrant has elected not to use the extended transition period for complying with any new or revised financial accounting standards provided pursuant to Section 13(a) of the Exchange Act. ☐
Indicate by check mark whether the registrant has filed a report on and attestation to its management’s assessment of the effectiveness of its internal control over financial reporting under Section 404(b) of the Sarbanes-Oxley Act (15 U.S.C. 7262(b)) by the registered public accounting firm that prepared or issued its audit report. ☒
If securities are registered pursuant to Section 12(b) of the Exchange Act, indicate by check mark whether the financial statements of the registrant included in the filing reflect the correction of an error to previously issued financial statements. ☐
Indicate by check mark whether any of those error corrections are restatements that required a recovery analysis of incentive-based compensation received by any of the registrant’s executive officers during the relevant recovery period pursuant to § 240.10D-1(b). ☐
Indicate by check mark whether the registrant is a shell company (as defined in Rule 12b-2 of the Act). Yes ☐ No ☒
The aggregate market value of voting stock held by non-affiliates of the registrant as of the end of the registrant’s most recently completed second fiscal quarter, based on the closing price of $10.76 for shares of the registrant’s common stock as reported by the Nasdaq Global Select Market, was approximately $968.0 million. Shares of common stock beneficially owned by each executive officer, director, and holder of more than 10% of our common stock have been excluded in that such persons may be deemed to be affiliates. This determination of affiliate status is not necessarily a conclusive determination for other purposes.
The registrant had outstanding 170.3 million shares of common stock as of February 14, 2025.
DOCUMENTS INCORPORATED BY REFERENCE
Portions of the definitive Proxy Statement for the registrant’s Annual Meeting of Stockholders, which will be filed with the Securities and Exchange Commission no later than 120 days after December 29, 2024, have been incorporated by reference into Part III of this Annual Report on Form 10-K.
Table of Contents
PART I
Cautionary Note Regarding Forward-Looking Statements
Certain information included in this Annual Report on Form 10-K is forward-looking within the meaning of the Private Securities Litigation Reform Act of 1995, and involves risks, assumptions, and uncertainties that could cause actual results to differ materially from those expressed or implied by forward-looking statements. Forward-looking statements can be identified by use of forward-looking terminology, including terms such as “plan,” “believe,” “may,” “continue,” “could,” “will,” “should,” “would,” “anticipate,” “estimate,” “expect,” “intend,” “objective,” “seek,” “strive” or, in each case, the negative of these words, comparable terminology, or other references to future periods; however, statements may be forward-looking whether or not these terms or their negatives are used. Forward-looking statements are not a representation by us that the future plans, estimates, or expectations contemplated by us will be achieved. Our actual results could differ materially from the forward-looking statements included herein. We consider the assumptions and estimates on which forward-looking statements are based to be reasonable, but they are subject to various risks and uncertainties relating to our operations, financial results, financial conditions, business, prospects, future plans and strategies, projections, liquidity, the economy, and other future conditions. Therefore, you should not place undue reliance on any of these forward-looking statements. Important factors could cause our actual results to differ materially from those contained in forward-looking statements including, without limitation: food safety issues, including risks of food-borne illnesses, tampering, contamination, and cross-contamination; impacts from the 2024 Cybersecurity Incident or any other material failure, inadequacy, or interruption of our information technology systems, including breaches or failures of such systems or other cybersecurity or data security-related incidents; any harm to our reputation or brand image; changes in consumer preferences or demographic trends; the impact of inflation or changes in foreign exchange rates; our ability to execute on our omni-channel business strategy; regulatory investigations, enforcement actions, or material litigation; and other risks and uncertainties described under the heading “Risk Factors” in this Annual Report on Form 10-K and in other filings we make from time to time with the Securities and Exchange Commission (“SEC”).
These forward-looking statements are made only as of the date of this document, and we undertake no obligation to publicly update or revise any forward-looking statement whether as a result of new information, future events, or otherwise, except as may be required by law.
Item 1. Business
The Joy of Krispy Kreme
Krispy Kreme, Inc. (“KKI” and, together with its subsidiaries, the “Company” or “Krispy Kreme”) is one of the most beloved and well-known sweet treat brands in the world. Our iconic Original Glazed® doughnut is recognized for its fresh, hot-off-the-line, melt-in-your-mouth experience. Over its 87-year history, Krispy Kreme has developed a broad consumer base globally and currently operates in 40 countries through its unique network of shops (“Doughnut Shops”), partnerships with leading retailers, and a rapidly growing digital and delivery business. Our purpose of touching and enhancing lives through the joy that is Krispy Kreme guides how we operate every day and is reflected in the love we have for our people, our communities, and the planet.

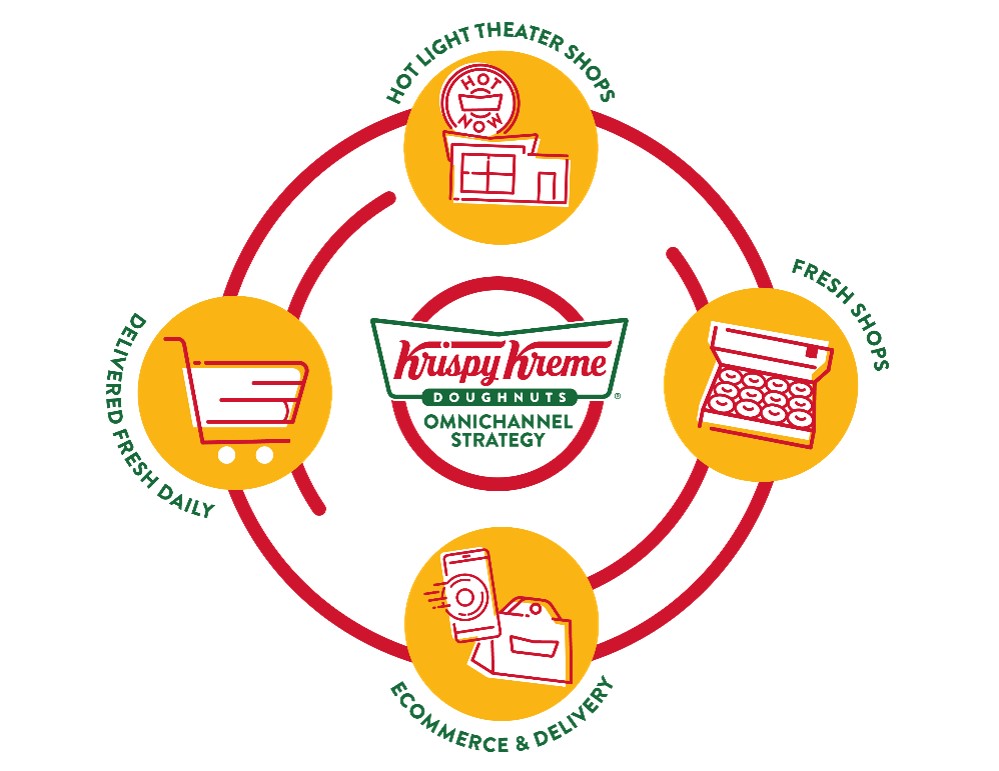
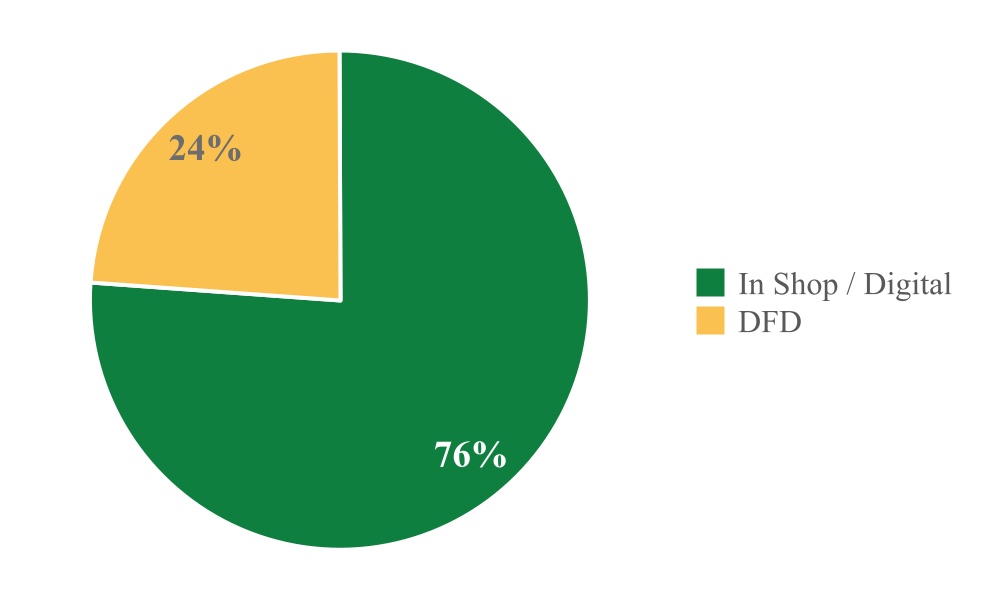
We are an omni-channel business with 17,557 points of access globally (our “Global Points of Access” and, when referring to points of access in a particular region or segment, our “Points of Access”), creating awesome fresh doughnut experiences via (1) our Hot Light Theater and Fresh Shops, (2) Delivered Fresh Daily (“DFD”) branded cabinets and merchandising units within high traffic grocery and convenience stores, quick service or fast casual restaurants (“QSR”), club memberships, and drug stores (“DFD Doors”), and (3) digital channels. We have a capital-efficient Hub and Spoke model, which leverages our
Doughnut Factories and Hot Light Theater Shops’ production capabilities (together, our “Hubs”) to deliver fresh doughnuts daily to local Fresh Shops, Carts and Food Trucks, and DFD Doors (together, our “Spokes”), and through digital channels.
Our business model focuses on fresh daily premium quality doughnuts produced by the capital-efficient Hub and Spoke model, and primarily sold via Company controlled Points of Access in the U.S., and with a mix of Company controlled and franchise Points of Access internationally. In addition to our core offerings such as the Original Glazed doughnut, we also focus on limited time offerings (“LTOs” or “specialty doughnuts”) and seasonal activations to generate buzz for our brand. A taste of our offerings includes:
The Ingredients of Our Success
We believe the following competitive differentiators position us to generate significant growth as we continue towards our goal of becoming the most loved sweet treat brand in the world.
Beloved Global Brand with Ubiquitous Appeal
We believe that our brand love and ubiquitous appeal differentiate us from the competition. We believe that Krispy Kreme is an iconic, globally recognized brand with rich history that is epitomized by our fresh Original Glazed doughnut. We believe we are one of the most loved sweet treat retailers in the U.S. and many markets around the world. We believe we have a loyal and emotionally connected consumer base.
We continuously seek to understand what consumers are celebrating or experiencing in their lives and actively engage our followers to activate this emotional connection through memorable, sharable moments – our “Acts of Joy” – which we believe further fuel our brand love.
Creating Awesome Experiences
We provide authentic indulgent experiences, delivering joy through high quality doughnuts made from our own proprietary formulations. We utilize strict quality standards and uniform production systems to foster consumer interaction with Krispy Kreme that is consistent with our brand promise, no matter where in the world the consumer experiences it. We aim to create product experiences that align with seasonal and trending consumer interests and make positive connections through simple, frequent, brand-focused offerings that encourage shared experiences.
We utilize seasonal innovations, alongside the expansion of our core product offering, to inspire consumer wonder and keep our consumers engaged with the brand and our products. Our sweet treat assortment begins with our iconic Original Glazed doughnut inspired by our founder’s classic yeast-based recipe that serves as the canvas for our product innovation and ideation. Using the Original Glazed doughnut as our foundation, we have expanded our offerings to feature everyday classic items such as our flavor glazes, “doughnut dots”, and “minis,” which lend themselves well to gifting occasions such as birthdays and school activities. Our seasonal activations create unique assortments centered on holidays and events, with Valentine’s Day, St. Patrick’s Day, Easter, the Fourth of July, Halloween, and Christmas, all examples of holidays for which we routinely innovate. We also aim to maintain brand relevance by participating in significant cultural moments. We strategically launch offerings tied to these historic moments to gain mind share, grow brand love, and help drive sales.
Leveraging our Omni-Channel Model to Expand Our Reach
We believe our omni-channel model, enabled by our Hub and Spoke approach, allows us to maximize our market opportunity while ensuring control and quality across our suite of products. Our goal is to provide our fresh doughnuts to consumers as conveniently and efficiently as possible. We apply a tailored approach across a variety of distinct shop formats to grow in discrete, highly attractive, and diverse markets, and maintain brand integrity and scarcity value while capitalizing on significant untapped consumer demand. Many of our shops offer drive-thrus, which also expand their off-premises reach. The production capacity of our Hubs allows us to reach more consumers wherever they may be — whether in a local Fresh Shop, in a grocery or convenience store, on their commute home or directly to their doorstep via home delivery.
Hub and Spoke
•Doughnut Factories: Non-consumer facing production Hubs, which provide fresh doughnuts to our Spoke locations in certain countries or regions.
•Hot Light Theater Shops: Immersive and interactive experiential shops which provide unique and differentiated consumer experiences while serving as local production facilities for our network. The average capital investment for a Hot Light Theater Shop is $2 million to $5 million.
•Fresh Shops: Smaller Doughnut Shops and kiosks, without manufacturing capabilities, selling fresh doughnuts delivered daily from Hub locations. The average capital investment for a Fresh Shop is $0.1 million to $1 million.
•Delivered Fresh Daily: Krispy Kreme branded doughnut cabinets within high traffic grocery and convenience locations, QSR, club membership, and drug stores, selling fresh doughnuts delivered daily to more than 15,000 doors from Hub locations. The average capital investment for a DFD Door is $2,000 to $10,000.
•Digital: Fresh doughnuts for pickup or delivery, ordered via our branded digital platforms or through third-party digital channels.
The Hub and Spoke approach is applied globally and is currently most developed in certain of our international Company-owned markets. We are in process of applying lessons learned in those international markets to the U.S., and particularly to expansion in top growth areas such as population-dense greenfield markets, which we expect to be a significant driver of margin expansion in the U.S., as well as in Canada, Japan, and in new countries we plan to enter.
Our Segments
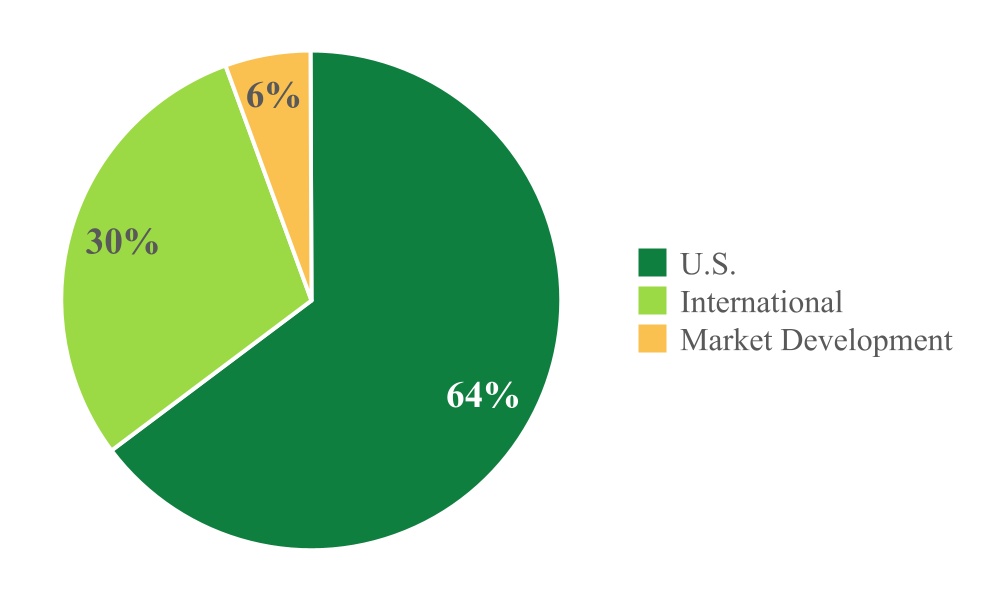
We conduct our business through the following three reported segments:
•U.S.: Includes all Krispy Kreme Company-owned operations in the U.S., and Insomnia Cookies Bakeries globally through the date of deconsolidation (refer to Note 2, Acquisitions and Divestitures, to the audited Consolidated Financial Statements included in Item 8 of Part II of this Annual Report on Form 10-K for more information); •International: Includes all Krispy Kreme Company-owned operations in the U.K., Ireland, Australia, New Zealand, Mexico, Canada, and Japan; and
•Market Development: Includes franchise operations across the globe.
The following table presents our Global Points of Access as of December 29, 2024:
| | | | | | | | | | | | | | | | | | | | | | | | | | | | | | | | | | | |
| Global Points of Access (1) |
| Hot Light Theater Shops | | Fresh Shops | | Carts, Food Trucks, and Other | | DFD Doors | | Total | | Company-Owned (%) |
| U.S. | 237 | | | 70 | | | — | | | 9,644 | | | 9,951 | | | 100 | % |
| International | 49 | | | 519 | | | 17 | | | 4,583 | | | 5,168 | | | 100 | % |
| Market Development | 108 | | | 1,095 | | | 30 | | | 1,205 | | | 2,438 | | | — | % |
| Total Global Points of Access | 394 | | | 1,684 | | | 47 | | | 15,432 | | | 17,557 | | | 86 | % |
(1)Reflects the divestiture of Insomnia Cookies during fiscal 2024.
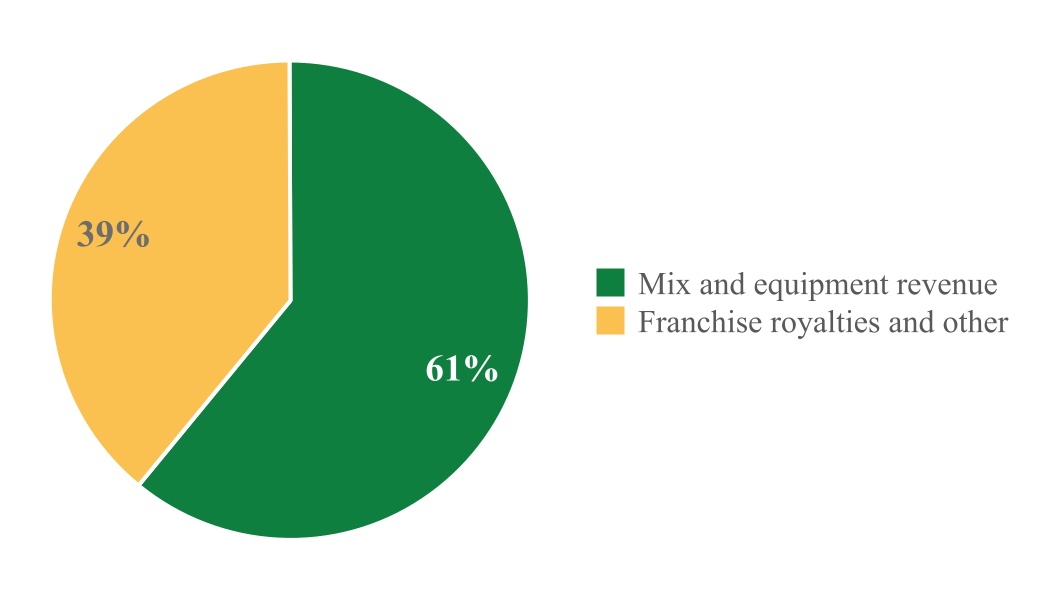
Total fiscal 2024 revenue of $1,665.4 million consists of the following revenue by reporting segment:
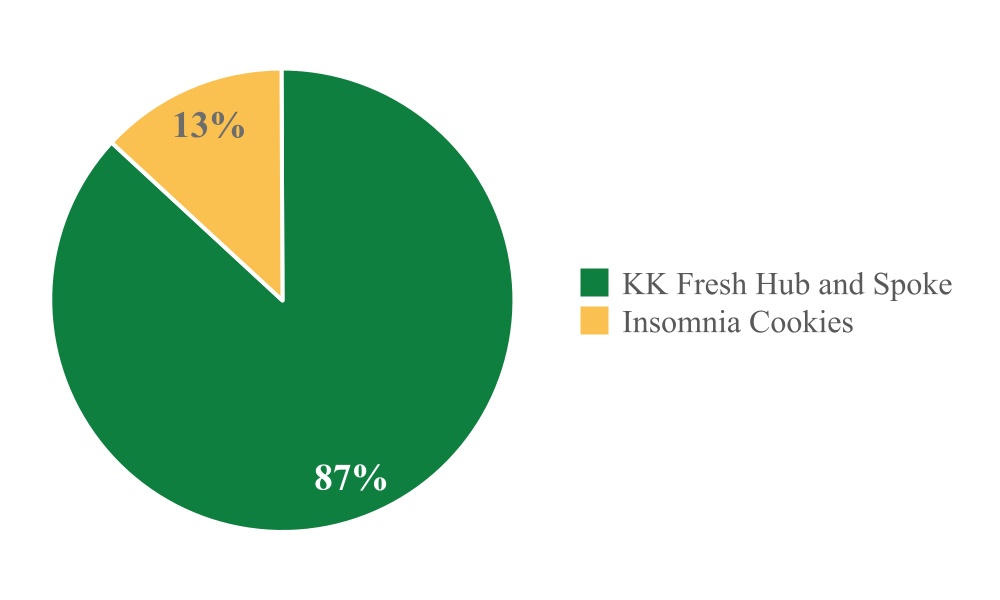
The U.S. segment’s fiscal 2024 revenue of $1,058.7 million consists of:
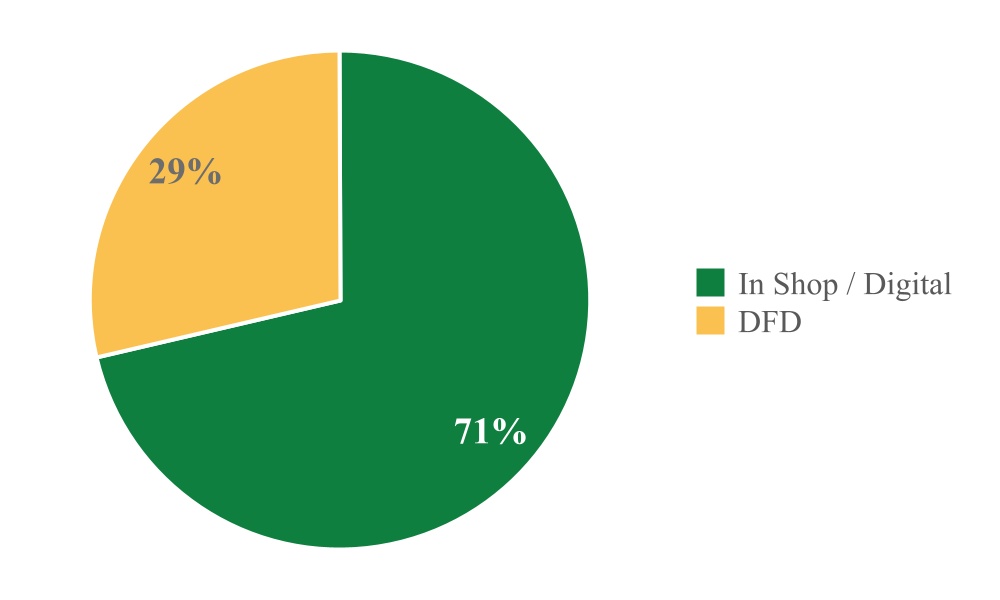
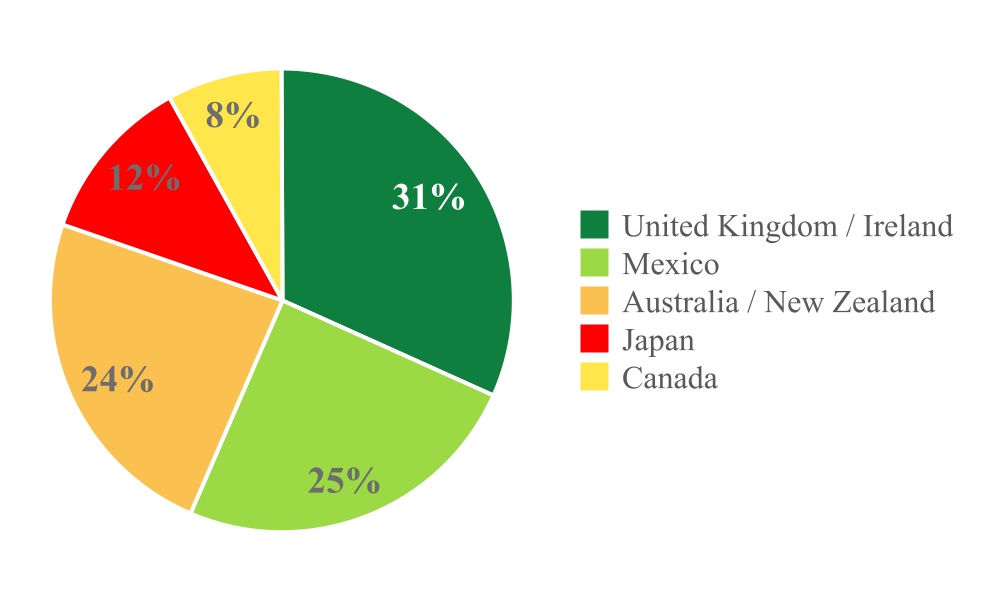
The International segment’s fiscal 2024 revenue of $519.1 million consists of:
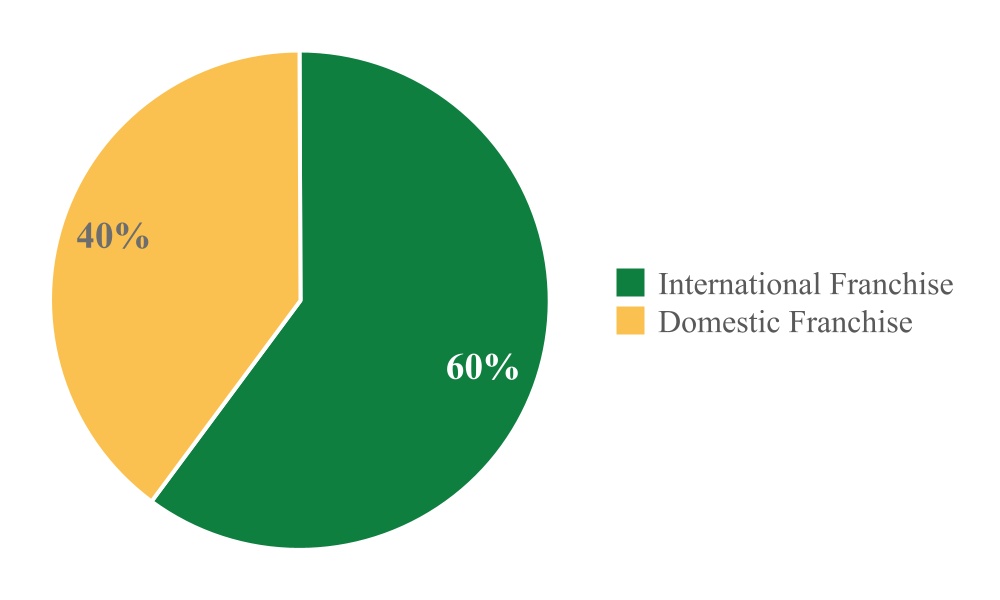
The Market Development segment’s fiscal 2024 revenue of $87.6 million consists of:
Our Growth Strategy
We have made investments in our brand, our people, and our infrastructure and believe we are well positioned to drive sustained growth as we execute on our strategy. Across our global organization, we have built a team of talented and highly engaged Krispy Kremers. We continue to take increased control of the U.S. operations to better manage and streamline the execution of our omni-channel strategy, including accelerating growth across our Doughnut Shops, DFD, and digital channels. Globally, we have developed an operating model that sets the foundation for continued expansion in both existing markets, and new geographies primarily via international franchisees. As a result, we believe we are able to combine a globally recognized and loyalty-inspiring brand with a leading management team and we aim to unlock increased growth in sales and profitability through the following strategies:
• Drive consumer relevance;
• Expand availability;
• Increase Hub and Spoke efficiency;
• Improve capital efficiency; and
• Inspire engagement.
Drive consumer relevance
We believe that consumers desire an occasional indulgence, and that when they indulge, they want a high quality, emotionally differentiated experience. We believe we have significant runway to be part of a greater number of shared indulgence occasions. On average, U.S. consumers visit Krispy Kreme less than three times per year, creating a significant frequency opportunity. The success of specialty products, including minis, LTOs, seasonal activations, and flavored glazes, affirms our belief that our innovations create additional opportunities for consumers to engage with our brand. We intend to strengthen our product portfolio by centering further innovation around seasonal and societal events, and through the development of new innovation platforms to drive sustained baseline growth. Our strategy of linking product launches with relevant events has allowed us to effectively increase consumption occasions while meaningfully engaging with our communities and consumers.
Our marketing and innovation efforts have expanded the number of incremental consumer use cases for Krispy Kreme doughnuts. For example, our gifting value proposition makes doughnuts an ideal way to celebrate everyday occasions like birthdays and holidays, through gifting sleeves and personalized gift messaging. Our gifting value proposition fulfills distinct consumption occasions and will continue to make our brand and products more accessible and allow us to participate with greater frequency in small and large indulgent occasions, from impromptu daily gatherings with family and friends to holidays and weddings, and everything in between.
Expand availability
We believe there are opportunities to continue to grow in new and existing markets in which we currently operate by further capitalizing on our strong brand awareness as we deploy our Hub and Spoke model. We apply a deliberate approach to growing in these discrete, highly attractive markets while maintaining our brand integrity and scarcity value and unlocking significant consumer demand. We focus on increasing Global Points of Access through low cost DFD Doors, including in new channels like QSR and club membership, as well as investments in Fresh Shops. A limited number of investments in our experiential Hot Light Theater shops allows us to implement the Hub and Spoke model in new and existing markets. We expect this to lead to growth in our key Sales per Hub metric as we further leverage the production capacity of existing Hubs.
We believe our omni-channel strategy will allow us to effectively seize expansion opportunities both domestically and internationally. Despite our high brand awareness, we have a limited presence or no presence in certain key, population-dense U.S. markets. We also believe we have a significant opportunity to increase our presence in certain of our existing international markets where we have a less developed Hub and Spoke model. We believe this provides us ample opportunity to grow within markets in which we are already present. We also view Hub and Spoke expansion to other international markets where we do not currently have a presence as a major growth driver for the future. We have identified key international whitespace market opportunities such as China, Brazil, and parts of Western Europe. Our proven track record of entering new, diverse markets across multiple continents and deploying the capital-efficient Hub and Spoke approach demonstrates our ability to effectively penetrate a broad range of market types. We expect to enter new markets primarily via franchise operations (sometimes with us holding a minority equity interest), to be determined on a case-by-case basis.
Increase Hub and Spoke efficiency
We are making focused investments in our omni-channel strategy to expand our presence efficiently while driving top-line growth, margin expansion, and capital efficiency. The Hub and Spoke model enables an integrated approach to operations, which is designed to bring efficiencies in production, distribution, and supervisory management while ensuring product freshness and quality are consistent with our brand promise no matter where consumers experience our doughnuts. By expanding Points of Access such as new local DFD Doors to existing Hubs, we increase not just total Sales per Hub, but also profitability and capital efficiency because the production Hubs have largely fixed costs including rent, utilities, and even labor.
To support the Hub and Spoke model in the U.S., we have implemented labor management systems and processes in our shops and delivery route optimization technology to support our DFD logistics chain. In addition, we employ a demand planning system that is intended to improve service and to deliver both waste and labor efficiencies across all our business channels. We are also investing in automation in the doughnut production process. By streamlining these operations across our platform, we believe we can continue to deliver on our brand promise and provide joy to our consumers while continuing to drive efficiencies across our platform.
Improve capital efficiency
We believe we have a strong runway to grow while maximizing capital returns, supported by the capital-efficient Hub and Spoke model. We intend to maximize capital returns both by leveraging existing capacity and making selective, capital-light investments in geographies which currently have limited access to our products or where we have insufficient production to meet demand. This includes opening in new international franchise markets and evaluating opportunities to refranchise certain international equity markets.
Inspire engagement
We aspire to be a sweet place to work for our employees, who we refer to as our “Krispy Kremers.” Refer to “Team Members and Human Capital Resources” below for further discussion.
Responsibility
We are committed to touching and enhancing lives through the joy that is Krispy Kreme and our ambition is to Be Sweet in All That We Do, which represents our Responsibility platform. With this platform, we focus on our greatest opportunities for positive social and environmental impact with our people, our communities, and our planet. To outline our journey, progress, and future ambitions, we periodically issue our Be Sweet Responsibility Report. To read the full report, visit krispykreme.com/responsibility-report. The contents of this report are not incorporated by reference into this Annual Report on Form 10-K or in any other report or document we file with or furnish to the SEC.
Team Members and Human Capital Resources
Investing in, developing, and maintaining human capital is critical to our success. Globally, Krispy Kreme employs approximately 21,000 Krispy Kremers as of December 29, 2024. We are not a party to any collective bargaining agreement in the U.S. and most of our equity markets, although we have experienced occasional unionization initiatives.
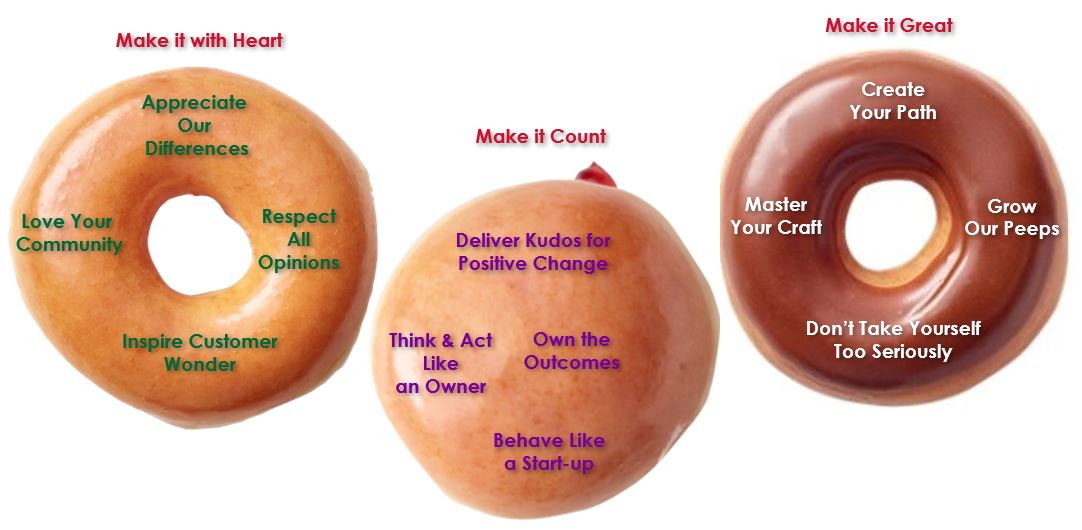
We depend on our Krispy Kremers to provide great customer service, to make our products in adherence to our high-quality standards and to maintain the consistency of our operations and logistics chain. While we continue to operate in a competitive market for talent, we believe that our culture, policies, and practices contribute to our strong relationship with our Krispy Kremers, which we feel is instrumental to our business model. Our culture is best captured by our Leadership Mix, which are the dozen behaviors that guide us every day. The Leadership Mix was developed based on the beliefs of our founder, incorporating years of learning on what makes Krispy Kreme such a special organization. These cultural behaviors are shared with Krispy Kremers globally, through an internally developed Leadership Mix training program.
The Leadership Mix is what keeps our consumers at the center of everything we do and is designed to empower our Krispy Kremers to do the right thing for our consumers and for the business. We pride ourselves on being an entrepreneurial and innovative team that is not afraid to take smart risks in service of creating awesome doughnut experiences. Consistent with our Leadership Mix ingredients, we pride ourselves on attracting a diverse team of Krispy Kremers from a wide range of backgrounds. The success of our business is fundamentally connected to the well-being of our Krispy Kremers. Accordingly, we are committed to their health, safety, and wellness.
Our Total Rewards platform provides Krispy Kremers and their families with access to a variety of competitive, innovative, flexible, and convenient pay, health, and wellness programs. Our total package of pay and benefits is designed to support the physical, mental, and financial health of our people and includes medical, dental, vision, employee assistance program, life insurance and retirement benefits as well as disability benefits and assistance with major life activities, such as educational reimbursement and adoption. Many of these benefits are available to our part-time Krispy Kremers; we believe that offering select benefits to our part-time Krispy Kremers offers us a competitive advantage in recruiting and retaining talent. We have also rolled out employee equity ownership plans across the organization, including for our shop general managers, to effectively align Krispy Kremers’ incentives with the Company’s long-term strategic goals.
Marketing and Innovation
Our marketing strategy is as unique and innovative as our brand. Krispy Kreme’s marketing strategy is to participate in culture through “Acts of Joy,” deliver new product experiences that align with seasonal and trending consumer and societal interests, and create positive connections through simple, frequent, brand-focused offerings that encourage shared experiences. The tactics which support this strategy are also distinct. In the U.S., Krispy Kreme’s paid media strategy is 100% digital with a heavy focus on social media where our passionate consumer base engages and shares our marketing programs far and wide through their own networks. Earned media is also an important part of our media mix. We create promotions and products that attract media outlets to our brand. Through the widespread dissemination of our programs through pop culture, entertainment, and news outlets, we believe we can achieve disproportionately large attention relative to our spend. We believe our marketing strategy, supported with non-traditional media tactics, has proven to be an effective combination that simultaneously drives sales while growing brand love. By drawing inspiration from important societal events, we create a unique way for our consumers to celebrate and engage. Our ability to create this connection between our consumers and our brand is what has helped make the Krispy Kreme brand iconic, and helps to solidify our position in popular culture.
Our core product offering, supplemented by specialty doughnuts, seasonal activations, and permanent innovations are used to create consumer wonder and are an essential ingredient in keeping our consumers engaged with the brand and the products. Our specialty doughnuts are anticipated by consumers and the media alike and generate significant social sharing amongst our fans and media coverage. The impact of limited time seasonal offerings goes beyond the sales of the innovations themselves; they drive traffic and create additional sales of our core product offering.
Krispy Kreme has a brand presence across both emerging and well-established social media platforms, including Facebook, Instagram, X, YouTube, and TikTok. These channels enable us to engage with our consumers on a personal level, while spreading the global brand of Krispy Kreme, including communicating promotional activity, featured products, new shop openings, and highlighting core equities of the brand. Social media allows precise geo-targeting around our shops and effective targeting of consumers likely to be interested in our messages.
Supply Chain
Sourcing and Supplies
We are committed to sourcing the best ingredients available for our products. The principal ingredients to manufacture our products include flour, shortening, and sugar which are used to formulate our proprietary doughnut mix and concentrate at our Winston-Salem, North Carolina manufacturing facility. We procure the raw materials for these products from different vendors. Although most raw materials we require are typically readily available from multiple vendors, we currently have approximately 20 main vendors.
We manufacture the doughnut mix used to make our doughnuts at our manufacturing facility in Winston-Salem and a third-party facility in Pico Rivera, California, domestically, and at several locations internationally. In support of international markets, we produce a concentrate exclusively at our Winston-Salem facility for shipping efficiency. The concentrate is mixed with commodity ingredients in local markets to get to a finished doughnut mix.
At an additional facility in Winston-Salem, we manufacture our proprietary doughnut making equipment for shipment to new shops and Doughnut Factories around the world. We manufacture a range of doughnut making lines, with different capacities to support the needs of different shop types.
We provide other ingredients, packaging and supplies, principally to Company-owned and domestic franchise shops. Our Krispy Kreme shop-level replenishments generally occur on a weekly basis, working with one national distribution partner. In addition, we work with a regional distribution partner to serve the New York City market.
In the U.S., we operate six Doughnut Factories located in Indianapolis, Indiana, Monroe, Ohio, New York, New York, Elk Grove, Illinois, Concord, North Carolina, and Fort Lauderdale, Florida. Internationally, we operate 41 Doughnut Factories, of which 27 are operated by franchisees. Each Doughnut Factory supports multiple business channels for Krispy Kreme. Each Doughnut Factory manufactures fresh doughnuts daily, powering the Hub and Spoke model by producing product for Spoke locations such as Fresh Shops and Carts and Food Trucks. In addition, they also provide DFD finished products to support local and regional markets. We operate DFD routes out of each Doughnut Factory to ensure our DFD doughnuts are delivered fresh, every day, and maintain our highest standards of quality and brand experience.
Quality Control
We operate an integrated supply chain to help maintain the consistency and quality of products. Our business model is centered on ensuring consistent quality of our products. In addition to the doughnut mixes and mix concentrate that we manufacture, we have an agreement with an independent food company to manufacture certain doughnut mixes using concentrate for domestic regions outside the southeastern U.S. and to provide backup mix production capability in the event of a business disruption at our manufacturing facility. In-process quality checks are performed throughout the production process, including ingredients, moisture percentage, fat percentage, sieve size, and metal checks. We provide specific instructions to franchise partners for storing and cooking our products. All products are transported and stored at ambient temperature.
Competition
We compete in the fragmented indulgence industry. Our domestic and international competitors include a wide range of retailers of doughnuts and other sweet treats, coffee shops, and other café and bakery concepts. We compete with snacks sold through convenience stores, supermarkets, restaurants, digital, and retail stores. The number, size and strength of competitors vary by region and by category. We also compete against retailers who sell sweet treats such as cookies, cupcakes, and ice cream. We compete on elements such as food quality, freshness, convenience, accessibility, customer service, price, and value. We view our brand engagement, overall consumer experience and the uniqueness of our Original Glazed doughnut as important factors that distinguish our brand from competitors, both in the doughnut and broader indulgence categories.
Intellectual Property
Our Doughnut Shops are operated under the Krispy Kreme® trademark, and we use many federally and internationally registered trademarks and service marks, including Original Glazed®, Hot Krispy Kreme Original Glazed Now®, and the logos associated with these marks. We have registered various trademarks in over 65 other countries, and we generally license the use of these trademarks to our franchisees for the operation of their Doughnut Shops. We have also licensed our marks for other consumer goods. In addition, we maintain certain proprietary formulas that we have established as trade secrets. We believe that our trademarks, service marks, and trade secrets have significant value and are important to our brand. To better protect our brand, we have registered and maintain numerous Internet domain names.
Government Regulation
As a company with global operations, we are subject to the laws and regulations of the U.S. and the multiple foreign jurisdictions in which we operate as well as the rules, reporting obligations and interpretations of all such requirements and obligations by various governing bodies, which may differ among jurisdictions. Changes to such laws, regulations, rules, reporting obligations and related compliance obligations could result in significant costs and adversely impact our capital expenditures, results of operations, and competitive position. We do not currently expect compliance with these laws and regulations to have a material effect on our capital expenditures, results of operations or competitive position as compared to prior periods.
Seasonality
Our sales peak at various times throughout the year due to certain promotional events and holiday celebrations. Additionally, our hot beverage sales generally increase during the fall and winter months while our iced beverage sales generally increase during the spring and summer months. Quarterly results also may be affected by the timing of the opening of new shops and the closing of existing shops. For these reasons, results for any fiscal quarter are not necessarily indicative of the results that may be achieved for the full fiscal year.
Research and Development
New product innovation is important to the success of our business. We believe that the development of new Krispy Kreme doughnuts, beverages, and other products attracts new consumers to our brand, increases shop sales, and allows our shops to strengthen daypart offerings. One of our properties in Winston-Salem includes research and development facilities including test kitchens and doughnut producing equipment used in developing new products and processes.
Available Information
KKI’s Annual Report on Form 10-K, and all other reports and amendments thereto that we file with or furnish to the SEC, are publicly available free of charge on the Investor Relations section of our website at investors.krispykreme.com or at sec.gov as soon as reasonably practicable after these materials are filed with or furnished to the SEC. We also use our website as a tool to disclose important information about the Company and comply with our disclosure obligations under Regulation Fair Disclosure. Our corporate governance principles, code of conduct, Board committee charters, and certain other corporate governance policies are also posted on the Investor Relations section of our website. The information on our website (or any webpages referenced in this Annual Report on Form 10-K) is not part of this or any other report KKI files with, or furnishes to, the SEC.
Item 1A. Risk Factors
Investing in our securities involves a variety of risks and uncertainties including those discussed below. If any of the following risks or uncertainties materialize, our business, financial condition, prospects, results of operations, cash flows, and stock price could be materially and adversely affected. The risks discussed below are not the only risks we face. Additional risks or uncertainties not currently known to us, or that we currently deem immaterial, may also have a material adverse effect on our business, financial condition, prospects, results of operations, cash flows, or stock price.
Summary Risk Factors
Risks Related to Food Safety and Consumer Preferences
•Our business may be adversely affected by food safety issues, including food-borne illnesses, tampering, contamination, or cross-contamination.
•Changes in consumer preferences and demographic trends, including in response to unfavorable economic conditions, could negatively impact our business.
Risks Related to Cybersecurity, Data Privacy, Information Technology, and Internal Controls
•Any material failure, inadequacy, or interruption of the information technology that we use in our operations has and may in the future adversely affect our ability to effectively operate our business and result in financial or other loss.
•Breaches or failures of our information technology systems or other cybersecurity or data security-related incidents have and may in the future have an adverse effect on our business, financial condition, and results of operations.
•If we, our franchisees, or our third-party service providers are unable to protect regulated, protected, or personally identifiable information, we or they could be exposed to data loss, litigation, regulatory fines, and other liability, which could harm our reputation and have a material adverse effect on us.
•We have identified a material weakness in our internal control over financial reporting. If our remediation of the material weakness is not effective, or if we fail to develop and maintain an effective system of internal controls, our ability to produce timely and accurate financial statements may be impaired, investors may lose confidence in our financial reporting, and the price of our common stock may decline.
Risks Related to Executing Our Business Strategy
•We may not realize the anticipated benefits from acquisitions, divestitures, investments, or other strategic transactions.
•Our franchisees may affect our operating results and reputation.
•Our DFD business channels depend on key customers and are subject to risks if such key customers reduce their purchases or terminate their relationships with us.
•Our reputation and brand image are essential to our business success.
•Our success depends on our ability to compete with many food service businesses.
•If we cannot keep pace with technological changes impacting our industry, we may be unable to compete effectively, and our results of operations could be negatively affected.
•We have incurred significant indebtedness, which could adversely affect us.
Risks Related to Our Global Expansion and Growth
•A key portion of our growth strategy depends on opening new Krispy Kreme shops and Points of Access both domestically and internationally.
•We face risks as we continue to focus on expansion of our omni-channel business model.
•Political, economic, currency, and other risks associated with our international operations could adversely affect our and our international franchisees’ operating results.
Risks Related to Our Supply Chain
•We are the exclusive or primary supplier of key ingredients to shops worldwide and any problems supplying these ingredients could negatively affect our and our franchisees’ ability to make doughnuts.
•We are the only manufacturer of our doughnut-making equipment. Any problems producing this equipment could negatively affect our shops’ ability to make doughnuts.
•We have limited vendors for many of the product components and services that we rely on, and we have a single vendor for our glaze flavoring. Any interruption in supply could impair our ability to make and deliver our signature products, adversely affecting our business, financial condition, and results of operations.
•Our reliance on a single vendor for nearly all distribution of materials and supplies in the U.S. and Canada poses risks to our and our franchisees’ ability to make doughnuts if the vendor fails to provide these materials and supplies in accordance with our agreement.
•Our profitability is sensitive to changes in the cost of raw materials and other commodities and we may not be able to increase prices to fully offset inflationary pressures on costs, which may adversely affect us.
Risks Related to Our Human Capital
•An inability to recruit and retain personnel could have a material adverse effect on our operations.
•Changes in the availability or cost of labor could adversely affect us.
Risks Related to Regulation, Litigation and Our Intellectual Property
•We may be subject to litigation that could adversely affect us by increasing our expenses, diverting management attention, or subjecting us to significant monetary damages and other remedies.
•Our business may be adversely affected by litigation, regulation and publicity concerning food quality, health, and other issues, which could negatively affect public policy and consumer preferences toward our products.
•Our ability to develop new franchised shops and to enforce contractual rights against franchisees may be adversely affected by laws and regulations governing our status as a franchisor, which could cause franchise revenues to decline.
•Healthcare legislation and other potential employment legislation could adversely affect our business, financial condition, and results of operations.
•Our annual effective income tax rate can change materially as a result of changes in our geographic mix of U.S. and foreign earnings and other factors, including changes in tax laws and changes made by regulatory authorities.
•The full realization of our deferred tax assets may be affected by a number of factors, including future earnings and the feasibility of ongoing planning strategies.
•We may be affected by matters related to environmental, social, and governance (“Responsibility”) trends and events, including governmental regulation and supply chain disruptions, that may adversely affect us.
•Our failure or inability to obtain, maintain, protect, and enforce our trademarks or other intellectual property could adversely affect our business and the value of our brand.
Risks Related to Crises, Catastrophic Events, and Business Continuity
•Public health outbreaks, epidemics, or pandemics have disrupted and may in the future disrupt, our business, and could have a material adverse effect on our business, financial condition, and results of operations.
•Adverse weather conditions, natural disasters, war or terrorist attacks, pandemics, or other catastrophic events could adversely affect our business.
Risks Related to Ownership of our Common Stock
•Certain provisions of Delaware Law, our certificate of incorporation, and our bylaws and the Investors’ Rights Agreement with JAB Holdings B.V. ("JAB") could hinder, delay, or prevent a change in control of us.
•If the ownership of our common stock continues to be highly concentrated, it may prevent shareholders from influencing significant corporate decisions and may result in conflicts of interest.
•The market price of our common stock could be negatively affected by sales of substantial amounts of our common stock in the public markets.
•We may be unable to pay dividends on our common stock.
Risks Related to Food Safety and Consumer Preferences
Our business may be adversely affected by food safety issues, including food-borne illnesses, tampering, contamination, or cross-contamination.
We operate in the food service sector and are subject to food safety concerns, including risks of food-borne illnesses, tampering, contamination, and cross-contamination. These risks may escalate as we launch new products, broaden our distribution through channels such as our DFD operations, and expand our manufacturing and production facilities. Inadequate food safety measures in our manufacturing facilities and Points of Access could lead to temporary shutdowns, disrupting operations in both our in-shop and DFD operations. Food safety incidents might also negatively impact the cost and availability of ingredients, leading to supply chain disruptions or reduced profit margins for us and our franchise partners.
Moreover, our dependency on third-party delivery services and third-party Points of Access heightens the risk of these food safety issues. While we oversee some of these third parties’ operations, the quality and service they provide could be compromised by various factors, including factors that are beyond our control or are unforeseeable, making it challenging to identify contamination or other defects. The risk is even higher with partners we do not monitor or monitor less rigorously.
Additionally, food safety concerns may expose us to legal actions, regulatory investigations, product recalls, and financial penalties. Any association of our brand, our franchisees, or the broader food service industry with food safety issues could harm our reputation, leading to a decline in revenue and profitability.
Changes in consumer preferences and demographic trends, including in response to unfavorable economic conditions, could negatively impact our business.
The food service industry is highly susceptible to shifts in consumer preferences, including dietary choices and health concerns, as well as broader factors like economic conditions, spending habits, demographic changes, traffic trends, and competition from other brands. In addition, our products fall into the category of indulgences, making them particularly sensitive to shifts in discretionary spending patterns. In the event of unfavorable economic conditions where we and our franchisees operate, our consumers may have reduced disposable income, leading to potential reductions in their consumption of our products.
Consumer preferences could also be negatively impacted by the litigation, legislative and regulatory risks described below under “Risks Related to Regulation and Litigation—Our business may be adversely affected by litigation, regulation and publicity concerning food quality, health, and other issues, which can negatively affect public policy and consumer preferences toward our products.”
Risks Related to Cybersecurity, Data Privacy, Information Technology, and Internal Controls
We rely on information technology in our operations. Any material failure, inadequacy, or interruption of that technology has and may in the future adversely affect our ability to effectively operate our business and result in financial or other loss.
Our business and that of our franchisees significantly depend on computer systems and information technology. Among other things, the effectiveness of our business management is closely tied to the reliability and capacity of these systems, and our omni-channel strategy, particularly our delivery model, relies heavily on robust information technology systems. As we diversify and grow our business channels, our susceptibility to related risks intensifies.
We also have experienced business disruptions due to failures in critical information technology platforms and continue to face potential business disruptions due to such failures, including those hosted or provided by third parties. These disruptions can stem from hardware and software issues; cyber-attacks, such as those involving computer viruses, ransomware, other malware, distributed denial-of-service attacks, and nation-state sponsored malicious cyber activity; natural disasters, such as earthquakes, hurricanes, floods, and fires; power outages; telecommunications failures; human errors; criminal activities; and intentional vandalism. For example, during the fourth quarter of fiscal 2024, unauthorized activity on a portion of our information technology systems resulted in the Company experiencing certain operational disruptions, including with online ordering in parts of the U.S., which materially affected the Company’s business operations. For further information regarding the 2024 Cybersecurity Incident (defined below), see “Cybersecurity” in Item 1C of Part I of this Annual Report on Form 10-K and “Management’s Discussion and Analysis of Financial Condition and Results of Operations,” in Item 7 of Part II of this Annual Report on Form 10-K.
Adapting to evolving consumer expectations and technological advancements is crucial. Any interruption, delay, or flaw in developing and implementing such advancements, or misjudging the costs and revenue potential of these initiatives, can hamper our essential business functions. This could negatively impact our reputation, competitive edge, operational results, and financial health.
We strive to keep our systems updated. However, maintenance of our information technology systems can interrupt access to our systems. If our mitigation controls fail, especially when updates are not feasible, it could lead to outages, including digital outages, information technology system disruptions, and heightened vulnerability to cyber threats.
Our business interruption insurance might not fully cover losses from service disruptions caused by system failures or similar events. Therefore, significant impacts from system failures have and may in the future materially and adversely affect our business, financial condition, and results of operations.
Breaches or failures of our information technology systems or other cybersecurity or data security-related incidents have and may in the future have an adverse effect on our business, financial condition, and results of operations.
Our and our franchisees’ information systems and records are at risk of cyber-attacks and security incidents. We periodically experience directed attacks intended to lead to interruptions and delays in operations as well as loss, misuse or theft of personal information and other data, confidential information, or intellectual property. Such attacks or security incidents have occurred and could occur as a result of hacking attempts, software or system failures, viruses, operator errors, and accidental data leaks. Cyber-attacks are increasingly sophisticated and varied, often involving phishing, social engineering, service disruption attacks, malware, or ransomware, and they may not be detected until they have been active for some time. Further, these types of threats may be exacerbated by recent developments in artificial intelligence and its increased use to produce sophisticated malware, ransomware, phishing schemes, and other fraudulent activities. Additionally, internal threats exist from employees, franchisees, contractors, or third parties who might bypass security measures to access or leak sensitive, regulated, or personally identifiable information, either maliciously or inadvertently. We have in the past experienced cybersecurity incidents. For example, the 2024 Cybersecurity Incident materially affected the Company’s business operations. For further information regarding the 2024 Cybersecurity Incident, see “Cybersecurity” in Item 1C of Part I of this Annual Report on Form 10-K and “Management’s Discussion and Analysis of Financial Condition and Results of Operations,” in Item 7 of Part II of this Annual Report on Form 10-K.
The security measures and controls implemented by us or our third-party providers are not foolproof against such incidents and may be inadequate to prevent a cyber-attack or security breach. A breach or perceived breach in our or our third-party providers’ information technology systems could severely interrupt our operations, negatively affect our business, financial standing, and operational results, and harm our reputation and brand credibility among consumers and business partners. As a result of the 2024 Cybersecurity Incident, the Company experienced certain operational disruptions that resulted in lost sales and increased expenses related to remediation.
Furthermore, significant incidents involving unauthorized access to, theft, exposure, alteration, or misuse of consumer, employee, or proprietary data, such as the 2024 Cybersecurity Incident, may lead to legal actions, regulatory investigations, and non-compliance penalties, which could disrupt our operations, tarnish our reputation, and have a material adverse effect on our business, results of operations, and financial condition.
Our cybersecurity insurance may not fully cover the consequences of the 2024 Cybersecurity Incident or potential future security breaches or cybersecurity incidents, and future coverage may not be available at reasonable costs or at all. Insurers might also deny claims for the 2024 Cybersecurity Incident or other incidents. Addressing a security breach requires substantial financial and operational resources, including remediation of security vulnerabilities, legal defense, and compliance with notification obligations. Such efforts divert management attention and resources away from our business activities, adversely affecting our business operations, financial condition, and results. Additionally, our efforts to remedy these issues may not be successful, and we might face challenges in implementing, maintaining, and upgrading effective safeguards.
If we, our franchisees, or our third-party service providers are unable to protect our consumer and employee data and other regulated, protected, or personally identifiable information, we or our franchisees could be exposed to data loss, litigation, regulatory fines, and other liability, which could harm our reputation and have a material adverse effect on our business, financial condition and results of operations.
Our operations necessitate collecting, transmitting, and storing large amounts of consumer and employee data, including sensitive information like credit and debit card numbers and other personally identifiable details. This data is housed in our own and our franchisees’ information technology systems, as well as those of third-party service providers. Non-compliance with legal requirements or industry standards could severely damage our brand or reputation, result in significant fines or penalties, and have a material adverse effect on our business, financial condition, or results of operations. Additionally, our reliance on independent service providers for payment processing poses risks if these providers are unable or unwilling to offer services or if their costs escalate.
We operate under various data privacy and security laws, directives, and regulations, both domestically and internationally. The U.S. has a complex landscape of federal and state data protection regulations, with some state laws offering more stringent protections. The potential introduction of a comprehensive federal data privacy law could increase complexity and compliance costs, impact data use strategies, and necessitate additional investments in compliance infrastructure.
Internationally, we are subject to regulations like the European Union’s General Data Protection Regulation (“GDPR”) and the U.K.’s GDPR and Data Protection Act of 2018. These laws impose strict requirements on data handling, including consent, individual rights, cross-border data transfer, breach notifications, and data security and confidentiality. Non-compliance with these international regulations could result in significant penalties and legal liabilities for us and our franchisees. Adapting our and our franchisees’ systems to these evolving requirements may require substantial investment and time.
The interpretation and enforcement of data privacy and security laws and standards are evolving, leading to potential inconsistencies with our data processing practices and policies. Any non-compliance or perceived non-compliance could lead to fines, audits, investigations, lawsuits, and other penalties. Additionally, any failure to adhere to our public statements and privacy policies could expose us to legal action, harm our reputation and have a material adverse effect on our business, financial condition, and results of operations.
We have identified a material weakness in our internal control over financial reporting. If our remediation of the material weakness is not effective, or if we fail to develop and maintain an effective system of internal controls, our ability to produce timely and accurate financial statements may be impaired, investors may lose confidence in our financial reporting, and the price of our common stock may decline.
We are subject to the reporting requirements of the Securities Exchange Act of 1934, as amended (the “Exchange Act”) and other laws and regulations applicable to public companies. These laws and regulations require, among other things, that we maintain effective internal control over financial reporting and disclosure controls and procedures. They also require management to perform an annual assessment of the effectiveness of our internal control over financial reporting and disclosure of any material weaknesses in such controls. We are required to have our independent registered public accounting firm provide an attestation report on the effectiveness of our internal control over financial reporting.
We have identified a material weakness in our internal control over financial reporting. We are evaluating steps to remediate the material weakness. These remediation measures may be time consuming and costly, and there is no assurance that these measures will ultimately have the intended effects or that additional material weaknesses will not be identified. In addition, even if we are successful in strengthening our controls and procedures, in the future those controls and procedures may not be adequate to prevent or identify irregularities or errors or to facilitate the fair presentation of our financial statements. For additional information related to the material weakness in internal control over financial reporting and the related remedial measures, see Item 9A, “Controls and Procedures,” of Part II of this Annual Report on Form 10-K.
Any failure to remediate the identified material weakness, or develop or maintain effective internal control over financial reporting and disclosure controls, or any difficulties encountered in their implementation or improvement, could result in a restatement of our consolidated financial statements for prior periods, cause us to fail to meet our financial and other reporting obligations, result in an adverse opinion regarding our internal control over financial reporting from our independent registered public accounting firm, or lead to investigations or sanctions by regulatory authorities or other potential claims or litigation. Any of the foregoing could have a material adverse effect on our business, financial condition, and results of operations, and could cause our investors to lose confidence in the accuracy and completeness of our financial reports and the price of our common stock to decline.
Risks Related to Executing Our Business Strategy
We may not realize the anticipated benefits from past or potential future acquisitions, divestitures, investments, or other strategic transactions.
We periodically assess and may engage in mergers, acquisitions, full or partial divestitures, joint ventures, strategic partnerships, minority investments, or other strategic initiatives to execute on our growth strategy. We make these decisions based on individual circumstances.
Such strategic endeavors come with inherent risks, including but not limited to:
•The challenges, delays, and costs associated with integrating acquired Krispy Kreme franchised shops, Points of Access, and strategic partnerships into our existing structure, including potential failure to achieve anticipated synergies or retain key staff;
•Diverting management focus from everyday operations or other important initiatives to effectively implement our growth strategy;
•The risk of not achieving expected revenue, profit, or cash flow from acquisitions (including newly acquired Krispy Kreme franchised shops), full or partial divestitures (including in connection with refranchising certain international equity markets), investments or other strategic transactions;
•The potential to inherit significant contingent or unforeseen liabilities through acquisitions or other strategic dealings; and
•The risk of significant value depreciation in our investments, possibly leading to goodwill impairment charges for acquired entities.
Our past and future strategic transactions may not yield the anticipated benefits, and could negatively impact our reputation and have a material adverse effect on our business, financial condition, and results of operations.
Our franchisees may affect our operating results and reputation.
Our ability to influence the management of our franchisees’ businesses is limited, and their potential failure to operate effectively could negatively impact our overall operating results and reputation. While we provide training and support, our franchisees run their own independent businesses. This means that the operational quality of franchised shops may suffer due to factors outside our control. Additionally, franchisees might not always manage their shops in compliance with relevant laws and regulations or align with our established standards and requirements. Furthermore, there’s a risk that franchisees may struggle to recruit and train competent managers and staff.
Currently, we maintain a generally positive relationship with our franchisees. However, future developments, some of which may be beyond our control, could potentially strain these relationships with both existing and new franchisees. Should our franchisees fail to operate successfully or adhere to our standards and requirements, it could substantially harm the image and reputation of both individual franchisees and our overall brand. Such scenarios could lead to a marked decline in Krispy Kreme-branded sales, adversely affecting our revenue and profitability.
Our DFD business channels depend on key customers and are subject to risks if such key customers reduce their purchases or terminate their relationships with us.
A considerable portion of our revenue comes from sales to retail customers via our DFD channels, which necessitate a substantial infrastructure with notable fixed and semi-fixed costs. In our global operations, we serve a number of large retail customers, yet no single customer contributed to more than 10% of our total revenue in the fiscal years ending December 29, 2024, December 31, 2023, or January 1, 2023. These customers are not committed to purchase any particular quantities and purchases are influenced by factors like pricing, product quality, consistency, consumer demand, and service excellence. Moreover, if we fail to adhere to the terms of our agreement with a customer, such customer may be entitled to remedies under the contract such as money damages or early termination. In addition, there is a possibility that our DFD customers might reallocate their shelf space or menu offering, currently occupied by our products, to other items, possibly including private label goods. Consequently, a loss or significant decrease in sales to one of these key retail customers, or if they encounter substantial financial issues, could adversely affect our business, financial condition, and results of operations.
Our reputation and brand image are essential to our business success.
We believe Krispy Kreme is one of the most beloved and well-known sweet treat brands in the world. Our continued success hinges on our and our franchisees’ ability to uphold our brand image, penetrate new markets and distribution channels, innovate with new product offerings, and consistently deliver high-quality, delectable products to our consumers.
While we are committed to nurturing and enhancing our brand image and reputation through marketing investments, including traditional advertising and consumer promotions, we place a significant emphasis on social media for most of our marketing activities. Our growing dependency on social media and digital platforms for advertising means that the speed and reach at which information, as well as misinformation and opinions, are spread is amplified. Negative feedback or commentary about us, our brands, or our products on social or digital media could severely harm our brand reputation. This risk is particularly acute given our reliance on social media to bolster our brand and maintain consumer loyalty and engagement.
Our reputation is also shaped by consumers’ subjective perceptions. Real or perceived quality or food safety concerns or failures to comply with applicable food regulations and requirements, whether or not ultimately based on fact and whether or not involving us (such as incidents involving our competitors), could cause negative publicity and reduced confidence in our company, brand or products, or the industry as a whole, which could in turn harm our reputation and sales, and could have a material adverse effect on our business, financial condition, and operating results. There is no assurance that this health risk will always be preempted by our quality control processes. Any regulatory or legal challenges, product recalls, or other negative publicity could tarnish our reputation and brand image, erode consumer trust, and diminish long-term demand for our products. Failure to effectively maintain, enhance, and grow our brand image could have a material adverse effect on our business operations, financial health, and overall performance.
Our success depends on our ability to compete with many food service businesses.
We operate in a highly competitive food service landscape. With relatively low start-up costs for retail indulgence and similar food service ventures and few barriers to entry, our competitors include a variety of independent local operators, in addition to well-capitalized regional, national, and international players and franchises, and new competitors may emerge at any time. We face competition from a diverse array of indulgence retailers and bakeries, specialty coffee shops, other specialty shops offering doughnuts or other sweet treats, bagel stores, quick service restaurants, delicatessens, take-out services, convenience stores, and supermarkets.
Our ability to compete will depend on the success of our plans to effectively respond to consumer preferences, improve existing products, develop and roll-out new products, and manage the complexity of operations as well as the impact of our competitors’ actions. In addition, our long-term success will depend on our ability to strengthen our consumers’ digital experience through mobile ordering, delivery, kiosks, loyalty programs, and social interaction. Some of our competitors offer a broader product range and have substantially greater financial resources, higher revenues, and greater economies of scale than we do. These advantages may allow them to offer aggressive pricing, implement their operational strategies more quickly or effectively than we can, or benefit from changes in technologies, which could harm our competitive position. These competitive advantages may be exacerbated in a difficult economy, thereby permitting our competitors to gain market share. We may be unable to successfully respond to changing consumer preferences, including with respect to new technologies and alternative methods of delivery. In addition, online platforms and aggregators may direct potential customers to other options based on paid placements, online reviews or other factors. If we are unable to maintain our competitive position, we could experience lower demand for products, downward pressure on prices, reduced margins, an inability to take advantage of new business opportunities, a loss of market share, and reduced profitability.
Furthermore, our omni-channel strategy, particularly exemplified by our delivery offerings, competes in a fiercely contested arena with both local and international indulgence brands. While we manage our own digital platform, we depend on third-party delivery services for the final leg of product distribution. We also partner with third parties on these platforms, where they handle the entire consumer transaction, including delivery. Our consumers might opt for other indulgence providers’ digital platforms or delivery services due to factors like delivery reach, app usability, and overall market preference for food delivery services.
If we fail to compete effectively, our ability to sustain or grow our revenues and profits, as well as to capitalize on the expected growth through our omni-channel model, could be compromised which could have a material adverse effect on our business, financial condition, results of operations, and future prospects.
If we cannot keep pace with technological changes impacting our industry, we may be unable to compete effectively, and our results of operations could be negatively affected.
Emerging technologies such as artificial intelligence, machine learning, and automation are impacting many industries and business operations, including ours. If we do not adequately invest in new technology, appropriately implement new technologies, or evolve our business at sufficient speed and scale in response to such developments, or if we do not make strategic investments to respond to these developments, our products, results of operations, and ability to develop and maintain our business could be negatively affected. Our competitors or other third parties may incorporate such technologies into their products and operations more quickly or more successfully than us, which could impair our ability to compete effectively and adversely affect our results of operations.
Moreover, we cannot predict consumer or team member acceptance of these developing technologies (e.g. automation, artificial intelligence, and new delivery channels) or their impact on our business, nor can we be certain of our ability to implement such technologies, any of which could result in loss of sales, dissatisfaction from our customers and employees, or negative publicity that could adversely affect our reputation and financial results.
We have incurred significant indebtedness, which could adversely affect us, including decreasing our business flexibility and increasing our interest expense.
The Company has a significant level of indebtedness, which carries potential adverse consequences, such as constraining our operational flexibility and elevating our interest expenses. This indebtedness has the potential to limit the funds available for critical aspects of our business, including working capital, capital expenditures, acquisitions, and fulfilling our obligation to repay or refinance maturing debt, in addition to other general corporate requirements. Furthermore, it places us at a competitive disadvantage relative to companies with lower levels of debt. If our financial performance falls short of current expectations, servicing our debt could become challenging.
Additionally, we may incur additional indebtedness, guarantees, commitments, or liabilities in the future. The need for refinancing, in part or in full, of our existing indebtedness before maturity is a distinct possibility. There is no guarantee that we will be able to secure refinancing on favorable terms or at all. Should our business fail to generate sufficient cash flow from operations or if we encounter difficulty securing future debt or equity financing on acceptable terms and in sufficient amounts to meet our debt obligations or address other liquidity requirements, our financial health and operational results may suffer.
Risks Related to Our Global Expansion and Growth
A key portion of our growth strategy depends on opening new Krispy Kreme shops and Points of Access both domestically and internationally.
Our strategic focus includes expanding our Global Points of Access, encompassing the establishment of new shops, DFD Doors, and digital platforms, both in our current markets and new regions. However, the effective implementation of this expansion strategy may be impacted by external factors outside the control of both us and our franchisees, potentially hindering shop development and impeding our overall growth objectives. Operational challenges, such as difficulties in sourcing product components or logistical services, may also impose limitations.
Additionally, our presence in certain international markets heavily depends on our franchisees. There is no guarantee that these franchisees will successfully develop or manage their Points of Access in alignment with our brand standards. Moreover, their ability to effectively open, operate, and sustain these Points of Access in accordance with their agreements and our brand requirements may be constrained by their business capabilities or financial resources. A failure of any of the foregoing could have a material adverse effect on our business, financial condition, results of operations, and future prospects.
We face risks as we continue to focus on expansion of our omni-channel business model.
Our ongoing expansion of the omni-channel business model involves substantial costs and uncertainties. These stem from various factors, including the expansion of Points of Access, enhancement of manufacturing capabilities, usage of information technology and logistics systems, and adjustments in our corporate structure and workforce.
The success of this expansion is contingent upon our ability to effectively leverage and realize certain objectives. These include finding suitable retail partners, extending our market reach, and building and sustaining the manufacturing and logistical capabilities required to fulfill our delivery commitments. Furthermore, this expansion could intensify or be affected by other risk factors mentioned herein, particularly those concerning our logistical and manufacturing capacities and our competitiveness in the indulgence market.
As previously disclosed, we expect to outsource to one or more third-party logistics (“3PL”) carriers the daily delivery of fresh doughnuts to grocers, convenience stores, quick service restaurants, and others. To the extent that we outsource logistics, we would have reduced control over the related processes, costs, and quality control. Our reliance on third parties may lead to shipping delays and disruptions, unanticipated costs, and failures to provide adequate customer service that are outside of our direct control. If we are not satisfied with a 3PL carrier, we may be unable to quickly pivot away from utilizing its services and, even if we are able to do so, we may be subject to significant penalties for doing so. Any of these consequences could have a material adverse effect on our reputation, business, operating results, and financial condition.
There is no assurance that we will attain the expected benefits or achieve the cost savings, revenue growth, and other positive outcomes needed to counterbalance the costs and risks associated with this expansion.
Political, economic, currency, and other risks associated with our international operations could have a material adverse effect on our and our international franchisees’ operating results.
Our company operates a substantial portion of its business outside the U.S. As of December 29, 2024, there were 7,540 Krispy Kreme Points of Access internationally, excluding Doughnut Factories. This accounts for 43% of the total number of our Points of Access. Among these, 2,372 are managed by franchisees. Our international operations, encompassing various business segments, are subject to numerous risks inherent to foreign markets. These risks include, but are not limited to:
•Exposure to recessionary or growth trends in global markets, impacting consumer spending and market stability;
•Ongoing reforms in areas like public health, food safety, tariffs, taxation, sustainability, and climate change response leading to regulatory uncertainties and potential spikes in compliance costs;
•Challenges in adhering to international food safety regulations and maintaining high standards of product quality and safety;
•Navigating varying import and business licensing requirements across countries;
•Constraints in fund repatriation and foreign currency exchange, influenced by U.S. and international laws;
•Difficulties in managing and staffing international operations, supply chain logistics, and ensuring consistent product quality and service;
•Risks associated with franchisee disputes, operational failures, development delays, or site selection issues;
•Complexities and costs arising from local labor laws in hiring, retaining, or terminating staff;
•Facing strong competition in new markets with established local players;
•Political unrest, disputes or war, or labor unrest impacting countries in which we or our franchisees operate; and
•Potential increase in anti-American sentiment affecting brand image, as Krispy Kreme is widely recognized as an American brand.
Our financial performance and asset valuation in foreign markets are susceptible to currency exchange rate fluctuations and liquidity issues, which could negatively impact reported earnings. Royalties from international franchisees, calculated as a percentage of their net sales, are subject to currency conversion risks. An increase in our reliance on international operations amplifies our vulnerability to foreign political and economic instability, currency volatility, and regulatory constraints on currency conversion and remittance.
Moreover, our international operations predominantly rely on exporting doughnut mixes and concentrates to franchisees. These exports are governed by numerous U.S. and international regulations concerning food products. In the event of a ban or other restrictions on any of our ingredients, we may not be able to identify suitable alternatives on acceptable time frames or at all, potentially delaying our expansion plans.
Our expanding international presence heightens our exposure to a diverse range of risks associated with foreign market operations, regulatory environments, and global economic conditions.
Risks Related to Our Supply Chain
We are the exclusive or primary supplier of doughnut mixes and other key ingredients to shops worldwide and any problems supplying these ingredients could negatively affect our and our franchisees’ ability to make doughnuts.
We serve as the exclusive supplier of doughnut mixes to numerous domestic and international Krispy Kreme shops. In support of international markets, we produce a concentrate that is mixed with commodity ingredients in local markets to get to a finished doughnut mix. We serve as the exclusive supplier of such mix concentrate. Furthermore, we are the sole supplier of specific critical ingredients to all domestic Company-owned shops, the majority of domestic franchise shops, and select international franchise shops.
Our mix concentrate is manufactured at our facility located in Winston-Salem, North Carolina. Domestic doughnut mix production occurs at our Winston-Salem plant and a third-party facility in Pico Rivera, California. The distribution of doughnut mixes, essential ingredients, and flavors to Krispy Kreme shops, both domestically and internationally, is facilitated by a limited number of independent contract distributors. It is important to note that any disruption in the production or distribution of our mixes and concentrates would have a cascading effect on our global supply chain, with no adequate alternative source available.
A production interruption at any significant manufacturing facility could hinder our, and our franchisees’, ability to produce doughnuts domestically. Internationally, we operate several plants for doughnut mix production, and any disruption at these facilities could impact doughnut production capabilities regionally, affecting our locations and those of our franchisees.
Our international shipments of mixes and concentrates primarily depart from a single port in Florida. Any delays in shipping or disruptions in logistics chains could adversely affect our international operations as well as those of our franchisees. Such delays may result from known or unforeseen events, including those related to adverse weather conditions, customs and border closures, trade conflicts, and general trade route delays.
Furthermore, unexpected termination of our relationships with raw material suppliers, even when multiple suppliers exist for the same ingredient, may hinder our ability to secure adequate quantities of high-quality ingredients at competitive prices. As we continue our global expansion, these risks may intensify, leading to supply shortages, logistical challenges, and increased operational costs associated with managing and supplying a global network of Krispy Kreme shops.
We are the only manufacturer of our doughnut-making equipment. Any problems producing this equipment could negatively affect our shops’ ability to make doughnuts.
Safeguarding our manufacturing operations to ensure a consistent supply of equipment to support our expanding network of shops and the maintenance requirements of our existing locations is essential to our business. Our custom doughnut-making equipment is exclusively manufactured at a single facility located in Winston-Salem. The process of manufacturing new equipment swiftly in the event of a disruption at our Winston-Salem facility would present significant challenges.
In the event of such a disruption, we would be compelled to explore alternative options, such as partnering with third-party manufacturers or relocating production to another facility. This transition may entail substantial delays in the manufacturing process and result in increased costs. Consequently, we may be unable to provide equipment to newly established shops or essential replacement parts for maintenance in existing shops on a timely basis or at all which could have a material adverse effect on our business, financial condition and results of operations.
We have limited vendors for many of the product components and services that we rely on, and we have a single vendor for our glaze flavoring. Any interruption in supply could impair our ability to make and deliver our signature products, adversely affecting our business, financial condition, and results of operations.
While we possess exclusive ownership of the recipes for our glaze flavoring and glaze base, we currently rely on a single vendor for the essential ingredients needed to produce glaze flavoring. Our dependence on this vendor exposes us to significant risks, including shortages, supply interruptions, and price fluctuations.
Any disruption in the supply chain of glaze flavoring could have adverse consequences on our ability to produce and deliver our signature products, including the hot Original Glazed doughnut, to our consumers in a timely and competitive manner. Such interruptions could also impact our operational performance. In the event of such an interruption, it is possible that suitable replacement products cannot be secured promptly or at all which could result in loss of revenue resulting from the inability to offer our products and the associated increase in administrative and shipping expenses.
Furthermore, our reliance on a sole vendor to produce glaze flavoring, and on a limited number of vendors for other product components and services, exposes us to heightened risks associated with the distribution networks of these vendors. Factors such as fuel price increases, labor strikes, organized labor activities, adverse weather conditions, and various unforeseen variables may hinder our provider’s capacity to meet our logistical requirements. If we encounter difficulties in sourcing alternative logistical providers, our costs may experience significant escalation. If we are unable to pass on these increased costs to our consumers through higher product prices, it could adversely affect our business, financial health, and operational results.
Our reliance on a single vendor for nearly all distribution of materials and supplies in the U.S. and Canada poses risks to our and our franchisees’ ability to make doughnuts if the vendor fails to provide these materials and supplies in accordance with our agreement.
The reliability and continuity of our supply chain is critical to the seamless operation of our shops in the U.S. and Canada. We have established an exclusive distribution partnership with BakeMark USA LLC (“BakeMark”), which grants the exclusive rights to BakeMark to distribute ingredients, packaging, and supplies to both Company-owned and franchise shops in all regions of the U.S. other than New York City, and Canada. In the event that BakeMark encounters economic or operational challenges, it could potentially lead to disruptions within our supply chain in the U.S. and Canada.
We may be unable to secure an alternative distribution channel in a timely manner or at all to mitigate these disruptions and challenges. In some cases, we may need to temporarily halt production at the affected shops until suitable alternative arrangements can be put in place.
Furthermore, the cost of a replacement distribution channel could negatively affect the financial performance of these shops. A severe disruption to our BakeMark distribution partnership has the potential to result in a significant and adverse effect on our overall business, consolidated financial position, results of operations, and cash flows.
Our profitability is sensitive to changes in the cost of raw materials and other commodities and we may not be able to increase prices to fully offset inflationary pressures on costs, which may adversely affect our financial condition or results of operations.
During recent years, our operating environment has been impacted by inflation. Increases in commodity and supply chain costs, such as the costs of raw materials, packaging materials, labor, energy, fuel, and transportation, have led to higher production and distribution costs for our products. Many of the costs referred to above are subject to fluctuations due to a number of factors, including, but not limited to, market conditions, economic and geopolitical uncertainty, demand for raw materials, weather, energy costs, currency fluctuations, supplier capacities, governmental actions, import and export requirements (including tariffs), armed hostilities, and other factors beyond our control. Among our essential ingredients, three stand out in significance: flour, shortening, and sugar. Furthermore, we procure a significant quantity of gasoline for our delivery vehicle fleet serving our DFD business, as well as significant amounts of packaging materials, including our boxes for dozens, half-dozens, and three-packs of doughnuts. The prices of key inputs for the production and distribution of our products such as these have been volatile in recent years and may continue to be volatile in the future.
We employ forward purchase contracts, futures contracts, and options on such contracts to mitigate the risks associated with commodity price fluctuations, however these contracts may not fully protect us against commodity price risk, particularly over extended timeframes. Additionally, the portion of our anticipated future commodity requirements covered by such contracts can vary over time.
Our attempts to offset these cost pressures, such as through increases in the selling prices of some of our products and leveraging our market size to secure economies of scale in procurement, may not be successful. Higher product prices may result in reductions in sales volume. Consumers may be less willing to pay a price differential for our branded products and may increasingly purchase lower-priced offerings, or may forego some purchases altogether, during an economic downturn or times of increased inflationary pressure. To the extent that price increases or packaging size decreases are not sufficient to offset these increased costs adequately or in a timely manner, or if they result in significant decreases in sales volume, our financial condition, results of operations, and cash flows may be adversely affected.
Risks Related to Our Human Capital
An inability to recruit and retain personnel could have a material adverse effect on our operations.
Our Krispy Kremers play a pivotal role in delivering exceptional service and creating memorable experiences for our consumers. They are indispensable for the smooth operation of our retail outlets, manufacturing facilities, and delivery logistics. Our ability to maintain the highest product quality, whether in our Hot Light Theater Shops or at one of our DFD access points, heavily relies on our Krispy Kremers.
Furthermore, our continued success hinges on the ongoing contributions of our senior management and key personnel, and our ability to retain and motivate them. However, certain economic and social trends beyond our control, such as labor shortages, may pose challenges in recruiting and retaining talented Krispy Kremers, including our senior management and other key personnel.
As our business continues to grow, it becomes increasingly challenging to identify and hire a sufficient number of employees and provide comprehensive training to ensure consistent product quality and outstanding consumer experiences worldwide.
Given the recent changes to streamline our management structure, the departure of any key person could have a significant impact and would be potentially disruptive to our business until such time as a suitable replacement is hired. These changes may also increase the likelihood of turnover amongst our employees and impact our relationships with our customers and other market participants, which may create uncertainty concerning our future direction and performance and negatively impact our ability to execute our business strategy quickly and effectively. Moreover, a failure to maintain an adequate number of employees with appropriate skill sets and talent could delay the execution of our operational strategies, result in loss of institutional knowledge, and reduce our supply of future management skill. Any of these consequences could adversely affect our business, operating results and financial condition.
If we encounter difficulties in recruiting, retaining, and motivating Krispy Kremers to support our projected growth and strategic initiatives, it could have a material adverse effect on our overall operations.
Changes in the availability or cost of labor could adversely affect our business, financial condition, and results of operations.
Our business is susceptible to potential adverse impacts arising from rising labor costs, encompassing wages and employee benefits. These cost increases may stem from various factors, including state and federal legislation, regulatory actions related to wages, scheduling, and benefits, as well as escalating healthcare and workers’ compensation insurance expenses. Additionally, there may be a need to enhance wages and benefits to attract and retain highly skilled employees with the requisite expertise. Moreover, failure to adequately monitor and proactively respond to employee dissatisfaction could lead to poor guest satisfaction, higher turnover, litigation and unionization efforts, which could have an adverse effect on our results of operations.
We could encounter challenges related to the availability of labor for in-shop positions. This shortage may be influenced by evolving market trends, changing employment conditions, the emergence of new telecommuting job opportunities, and other factors that can reduce the pool of qualified talent for critical roles within our organization.
The fluctuating landscape of labor availability and costs could adversely affect our business, financial condition, and results of operations.
Risks Related to Regulation and Litigation
We may be subject to litigation that could adversely affect us by increasing our expenses, diverting management attention, or subjecting us to significant monetary damages and other remedies.
From time to time, we are party to various claims, disputes, or legal proceedings. These disputes could encompass a wide range of issues, including employment, intellectual property, operational, regulatory compliance, foreign exchange, tax, franchise, and contractual matters. They may also pertain to diverse areas such as personal injury, franchisee employment, real estate, environmental concerns, tort claims, intellectual property disputes, breaches of contract, data privacy issues, securities litigation, derivative actions, and various other legal matters. Notably, plaintiffs often seek substantial or undetermined amounts in damages, and lawsuits inherently carry uncertainties, some of which are beyond our control.
We manage and mitigate certain legal risks through policies, terms of use, arbitration agreements, limitations of liability, venue selection, choice-of-law, and indemnification requirements. These requirements may be subject to differing interpretations, rulings, and legal frameworks in different U.S. federal, state, and foreign courts, and may not be enforceable in some jurisdictions.
Regardless of the merits of such lawsuits or our ultimate liability or settlement outcomes, legal proceedings can be costly to defend, divert management attention away from our core operations, and potentially impact our financial performance. Furthermore, in cases involving insured claims, a judgment for monetary damages could exceed our insurance coverage which could have an adverse effect on our financial position and operational results.
Moreover, any adverse publicity resulting from allegations in any such claims or disputes could negatively impact our reputation, potentially affecting our operational performance.
Our business may be adversely affected by litigation, regulation and publicity concerning food quality, health, and other issues, which could negatively affect public policy and consumer preferences toward our products.
As a food service business, we face potential adverse impacts stemming from litigation, regulatory actions, and consumer or government complaints related to food quality, illness, injuries, health concerns, or operational issues. These concerns may arise from individual shops or a limited number of shops, including those operated by our franchisees. Additionally, such risks may increase as we introduce new products or expand distribution channels, such as our DFD business channels, and our business becomes subject to new regulations and higher regulatory scrutiny.
There is increasing legal, legislative and regulatory focus on the industry, particularly concerning menu labeling and packaging. This scrutiny is largely due to concerns that the practices and offerings of food service companies may contribute to issues like poor nutrition, excessive caloric intake, obesity, or other health issues among consumers. Class action lawsuits have been filed against various food service businesses, including quick service restaurants. These lawsuits may allege, among other things, the failure to disclose health risks associated with high-fat foods and marketing practices that encourage obesity. Given that one of our core competitive advantages lies in the taste and quality of our doughnuts and indulgent products, adverse publicity or regulations related to food quality or similar concerns have a more pronounced impact on our business compared to food service businesses that primarily compete on other factors.
Changes in regulations addressing such health issues, changes in interpretations of such regulations by relevant regulators, or the introduction of new legislation could affect any of our operational markets. Failure to effectively adapt to these changes or to comply with new regulations could adversely affect our business, financial condition, and results of operations.
Furthermore, in the event that any such lawsuits or claims result in unfavorable judgments or due to litigation costs, regardless of the final outcome, we may face significant liabilities.
We are subject to franchise laws and regulations that govern our status as a franchisor and regulate some aspects of our franchise relationships. Our ability to develop new franchised shops and to enforce contractual rights against franchisees may be adversely affected by these laws and regulations, which could cause our franchise revenues to decline.
As a franchisor, we operate within the regulatory framework established by the Federal Trade Commission and domestic and foreign laws governing the offer and sale of franchises. Any failure to obtain or maintain approvals for offering franchises could result in the loss of potential franchise revenues and revenues generated through our Market Development segment.
Furthermore, both domestic and foreign laws oversee the procedural aspects of offering franchises and also regulate substantive aspects of our relationships with franchisees. These laws may impose limitations on our ability to terminate or effectively resolve conflicts with our franchisees. Compliance with these regulations is integral to the successful operation of our franchising business model and the maintenance of harmonious relationships with our franchisees. Failure to comply with any of these laws or regulations could have a material adverse effect on our business, financial condition, and results of operations.
Healthcare legislation and other potential employment legislation could adversely affect our business, financial condition, and results of operations.
Federal legislation concerning mandated health benefits and state minimum wage regulations has led to increased costs for our organization. Over recent years, several U.S. states have already raised their minimum wage rates, and the U.S. federal government or certain other states and localities may also elect to do so. Additionally, for employees whose compensation is set above but tied to the applicable minimum wage, further increases in the minimum wage could result in higher labor expenses. These cost increases may also be influenced by inflationary pressures and potential labor market shortages.
Our relationships with employees are governed by various federal and state labor laws, which play a pivotal role in shaping our operational costs. These laws encompass aspects such as employee classifications as exempt or non-exempt, minimum wage stipulations, unemployment tax rates, workers’ compensation rates, overtime regulations, family leave policies, safety standards, payroll taxes, citizenship requirements, and other wage and benefit prerequisites for employees classified as non-exempt.
The future trajectory of government regulations in these areas remains uncertain, and we may be subject to substantial changes or reforms stemming from legislative initiatives related to labor laws, healthcare laws, or other regulations impacting our labor costs. The imposition of additional government regulations may introduce heightened compliance costs, and noncompliance with these regulations could potentially lead to litigation.
Additional labor-related regulation or further increases in labor expenses could increase our costs and adversely affect our business, financial condition, and results of operations.
Our annual effective income tax rate can change materially as a result of changes in our geographic mix of U.S. and foreign earnings and other factors, including changes in tax laws and changes made by regulatory authorities.
We are subject to federal, state, and local income taxes both in the U.S. and in foreign jurisdictions. The impact of potential changes in tax laws on our future effective tax rate and the value of our deferred tax assets is uncertain. Additionally, our income tax returns are subject to examination by the Internal Revenue Service and other tax authorities. While we have taken measures to provision for taxes in the jurisdictions where we operate, changes in tax laws or interpretations thereof or challenges from tax authorities based on existing tax laws could have an adverse effect on our business, financial condition, and results of operations.
Our overall effective income tax rate is calculated as our total tax expense relative to total earnings before income tax. It is important to note that income tax expense and benefits are recognized on a jurisdictional or legal entity basis, rather than on a global scale. Losses incurred in one jurisdiction may not be used to offset profits in other jurisdictions, potentially resulting in an increase in our overall tax rate. Changes in the distribution of earnings (or losses) among different jurisdictions and the assumptions employed in calculating income taxes, among other factors, can exert a significant influence on our overall effective income tax rate. Furthermore, adjustments to tax laws and modifications made by regulatory authorities have the potential to significantly impact our overall effective income tax rate. As legislation becomes effective in countries in which we do business, our taxes could increase and negatively impact our effective tax rate. Additionally, the cost of complying with new legislation could adversely affect our results of operations.
The full realization of our deferred tax assets may be affected by a number of factors, including future earnings and the feasibility of ongoing planning strategies.
We hold deferred tax assets, encompassing federal, state, and foreign net operating loss carryforwards, accruals not yet deductible for tax purposes, tax credits, and other items. We have established valuation allowances, reducing the deferred tax assets primarily associated with U.S. federal tax credits, as well as foreign and state and local net operating loss carryforwards, to an amount deemed more likely than not to be realized. The realization of these deferred tax assets hinges on our ability to generate future taxable income within each respective jurisdiction during the periods when these temporary differences reverse, or on our capability to carry back any losses resulting from the deduction of these temporary differences.
Our existing deferred tax assets and tax credits could potentially expire or become unavailable to offset future income tax liabilities due to legal or regulatory changes. Such changes include suspension on the use of deferred tax assets and tax credits imposed by certain jurisdictions from time to time, possibly with retroactive effect.
We anticipate realizing these deferred tax assets over an extended period. However, if we encounter challenges in generating sufficient future taxable income in the U.S. and/or certain foreign jurisdictions, or if there is a significant alteration in the timeframe within which the underlying temporary differences become taxable or deductible, we may be compelled to augment our valuation allowances against our deferred tax assets. Such an adjustment could lead to an increase in our effective tax rate.
We may be affected by matters related to environmental, social, and governance (“Responsibility”) trends and events, including governmental regulation and supply chain disruptions, that may adversely affect our business and reputation.
Interest in as well as dissatisfaction with Responsibility considerations by consumers, investors, governmental authorities, and various stakeholders may impact our operations and compliance obligations. Responsibility encompasses a broad spectrum of factors, including climate change, greenhouse gas emissions, packaging and waste management, human rights, sustainable supply chain practices, animal welfare, deforestation, and responsible use of land, energy, and water resources.
Recent years have seen the introduction of new Responsibility disclosure requirements in various jurisdictions. The evolving nature and complexity of these rules and regulations, together with evolving stakeholder expectations, render compliance more challenging and uncertain.
Moreover, we have and in the future may establish certain commitments, targets, or goals related to Responsibility matters. Our ability to meet these commitments and navigate the associated risks is subject to various external factors and uncertainties, many of which are beyond our control. If we are not successful or are perceived as ineffective in achieving our stated goals, or if stakeholders are dissatisfied with our Responsibility strategy or actions we take in response to Responsibility-related matters, we could be exposed to market, operational, or reputational challenges and costs. Any failure or perceived failure to adequately address these considerations in line with legal requirements or stakeholder expectations could have an adverse effect on our business or brand reputation.
Risks Related to Our Intellectual Property
Our failure or inability to obtain, maintain, protect, and enforce our trademarks or other intellectual property could adversely affect our business and the value of our brand.
We possess common-law trademark rights in the U.S. as well as numerous trademark and service mark registrations both domestically and internationally. Our continued success depends, to a significant degree, upon our ability to protect and preserve our intellectual property, including our formulas, trademarks, trade dress, copyrights, patents, business processes, and other trade secrets. To safeguard these assets, we rely on legal protections offered by trademark registrations, contracts, confidentiality agreements, copyrights, patents, and common law rights, such as protections against unfair competition, passing off, and trade secret violations.
We enter into non-disclosure and confidentiality agreements with employees, corporate collaborators, contractors, consultants, advisors, suppliers, and other individuals and entities who may have access to this confidential information. However, such agreements may not be in place with every relevant party, any of these parties may breach these agreements, and our confidentiality agreements may otherwise not effectively prevent disclosure of our proprietary information. Furthermore, pursuing legal action against a party alleged to have unlawfully disclosed or misappropriated a trade secret is a challenging, costly, and time-consuming process with an uncertain outcome, and we may not obtain an adequate remedy in the event of unauthorized disclosure of such information. In addition, others may independently develop formulas and processes that are the same or similar to our trade secrets, which could limit our ability to enforce trade secret rights against such parties
Despite our efforts to secure, maintain, safeguard, and enforce our trademarks, service marks, and other intellectual property rights, these efforts may not be sufficient. Challenges such as potential infringements, challenges to validity, declarations of generic status, circumvention, or violations may arise. Furthermore, the effectiveness of intellectual property protection may vary across countries where our brands have existing or potential shops or facilities. The intellectual property laws of certain foreign countries may not provide the same level of protection as those in the U.S.
Additionally, our franchisees may fail to consistently uphold the quality of goods and services under our brand trademarks or consistently adhere to the guidelines we establish for preserving our brand’s intellectual property rights. The defense and enforcement of our trademarks and other intellectual property could entail substantial resource allocation and potentially impact our business, reputation, financial standing, and operational results.
Furthermore, our brands may become targets of infringement claims, potentially impacting the use of specific names, trademarks, or proprietary knowledge, recipes, and trade secrets integral to our business. The defense against such claims can be costly, and in some cases, it may lead to restrictions on our use of proprietary information in the future or require the payment of damages, royalties, or other fees for the continued use of such proprietary information. Any of these outcomes could have a negative impact on our business, reputation, financial condition, and operational results. We remain vigilant in protecting and managing our intellectual property assets.
Risks Related to Crises, Catastrophic Events, and Business Continuity
Public health outbreaks, epidemics, or pandemics have disrupted and may in the future disrupt, our business, and could have a material adverse effect on our business, financial condition, and results of operations.
Health epidemics or pandemics can have detrimental effects on consumer spending, confidence levels, supply chain availability, and associated costs within the markets where we and our franchisees operate. These factors can collectively influence our business, financial standing, and operational results. A notable instance of this was the global spread of the COVID-19 epidemic in recent years, which disrupted global health, economic conditions, consumer behaviors, and food service operations.
While we have implemented measures to address significant public health risks on a large scale, we acknowledge the potential for future outbreaks to impact our shops and other facilities. Such outbreaks may result in a substantial portion of our workforce or the workforce of our business partners being unable to work.
Furthermore, our business is influenced by shifting consumer preferences and perceptions. Concerns regarding virus transmission have prompted employees and guests to avoid congregating in public places, leading to adverse effects on guest traffic at our locations and the ability to adequately staff our shops. The COVID-19 pandemic has triggered changes in consumer behaviors, some of which have endured and may continue to evolve even though the pandemic has subsided. These shifts have already had and may continue to exert negative impacts on consumer traffic and the sales of both our Company-owned and franchisee-operated shops. We remain attentive to evolving consumer trends and their potential implications for our business and operational performance.
Adverse weather conditions, natural disasters, war or terrorist attacks, pandemics, or other catastrophic events could have an adverse effect on our business.
Unforeseen events such as severe adverse weather conditions, earthquakes, hurricanes, tornadoes, flooding, and other natural disasters, wars or terrorist attacks, pandemics, or other catastrophic events, as well as the actions taken in response to these unforeseen events could affect guest traffic at our Company-owned and franchisee-operated shops. In more extreme scenarios, temporary shop closures may become necessary, sometimes for extended durations. If our disaster recovery and business continuity plans do not resolve disruptions caused by these unforeseen events in an effective and timely manner, they could result in prolonged interruptions in our operations and could have an adverse effect on our sales, business, financial condition, and results of operations.
Moreover, fluctuations in weather patterns can lead to construction delays, disruptions in the availability of utilities, and potential shortages or interruptions in the supply of food items and other essential supplies. In addition, actual or threatened armed conflicts, such as the war in Ukraine and conflicts in the Middle East, terrorist attacks, efforts to combat terrorism, or heightened security requirements have and may in the future adversely affect our operations. These developments could increase our operational costs and pose challenges to our supply chain and could have an adverse effect on our business, financial condition, and results of operations.
Risks Related to Ownership of our Common Stock
Certain provisions of Delaware Law, our certificate of incorporation, and our bylaws and the Investor Rights Agreement could hinder, delay, or prevent a change in control of us, which could adversely affect the price of our common stock.
Several provisions within Delaware Law, our certificate of incorporation, and our bylaws are designed to create obstacles for third-party acquisition attempts without the consent of our Board of Directors or JAB Holdings B.V. ("JAB"), our largest beneficial shareholder.
As a Delaware corporation, we are subject to Delaware General Corporation Law (“DGCL”). Section 203 of the DGCL restricts certain shareholders owning over 15% of our outstanding common stock (referred to as "interested shareholders") from engaging in specific business combinations without approval from at least two-thirds of our outstanding common stock not held by the interested shareholder.
Moreover, JAB wields substantial voting power over shares of our common stock eligible to vote in director elections and other shareholder votes through its affiliate, potentially influencing outcomes significantly.
Additionally, our certificate of incorporation grants our Board of Directors the authority to issue preferred stock at their discretion, without the need for shareholder approval. This flexibility extends to the issuance of authorized but unissued shares of our common stock. These provisions can complicate and protract the process of replacing incumbent directors.
These measures collectively serve as deterrents, potentially making it costly and challenging for a third party to initiate a tender offer, execute a change in control, or attempt a takeover that faces opposition from JAB, our management, or our Board of Directors. Public shareholders interested in participating in such transactions may find it difficult to do so, even if the deal would be beneficial for shareholders. Ultimately, these anti-takeover provisions could significantly hinder public shareholders’ ability to realize benefits from a change in control or alterations in our management and Board of Directors, potentially impacting the market price of our common stock and the opportunity to secure any potential change of control premium.
Under the Investor Rights Agreement with JAB, they have specific rights to access certain Company information, which JAB is obligated to treat as confidential. This information includes management’s monthly financial review reports, consolidated financial results for each fiscal quarter, and other information reasonably requested by JAB. Given these rights and JAB’s representation on our Board of Directors, JAB enjoys privileged access to our management and early insights into our financial results compared to our other investors. Although JAB must adhere to relevant U.S. securities laws governing the trading of our securities while in possession of material non-public information, it will still have a more comprehensive understanding of our business and financial condition than individual shareholders for as long as its information rights persist under the Investor Rights Agreement.
If the ownership of our common stock continues to be highly concentrated, it may prevent shareholders from influencing significant corporate decisions and may result in conflicts of interest.
As of December 29, 2024, JAB held approximately 44% of our common stock through its affiliate, conferring upon it significant influence over crucial matters requiring shareholder approval. This influence extends to decisions such as electing directors, facilitating mergers, consolidations, and acquisitions, disposing of substantial assets, and shaping our capital structure. Additionally, JAB possesses the authority to amend our certificate of incorporation and bylaws, and influence our winding up and dissolution procedures.
This level of concentrated ownership could potentially lead to delays, deterrents, or the prevention of actions that may be favored by our other shareholders. JAB’s interests may not always align with those of our broader shareholder base. Furthermore, this concentration of ownership has the potential to hinder or discourage any attempts at a change in control of the Company.
The concentration of voting power could also impact shareholders by limiting the opportunity to receive a premium for their common stock shares in the event of a sale of the Company, which, in turn, may affect the market price of our common stock. JAB might also seek to push us in directions that it deems beneficial for its own investment but could carry risks for other shareholders or negatively impact our Company and its stakeholders.
As a result, there is a possibility that the market price of our common stock could decline, or shareholders may not receive a premium above the prevailing market price in the event of a change in control. Furthermore, this concentration of share ownership might be viewed negatively by investors, potentially affecting the trading price of our common stock, as some may perceive drawbacks in owning shares in a company heavily influenced by a few significant shareholders.
The market price of our common stock could be negatively affected by sales of substantial amounts of our common stock in the public markets.
JAB’s affiliates may possess the capability to sell the Company’s common stock shares they hold to the public markets, following the stipulations outlined in Rule 144. The substantial sale of our shares by JAB’s affiliate, or the mere anticipation of such sales, could potentially exert a significant downward pressure on the market price of our common stock. A decrease in the value of our common stock could hinder our capacity to raise capital through the issuance of additional common stock or other equity securities.
We may be unable to pay dividends on our common stock.
We plan to distribute cash dividends to our common stockholders on a quarterly basis, contingent upon the discretion of our Board of Directors and our adherence to applicable regulations. The decision to declare dividends will be influenced by a range of factors, including our financial performance, capital needs, business prospects, legal requirements, contractual obligations, restrictions imposed by applicable laws, and other relevant considerations, all of which will be evaluated by our Board of Directors in accordance with applicable law.
Furthermore, our capacity to pay dividends may be constrained by the terms outlined in our existing debt agreements or any future debt or preferred equity securities we may undertake. It is important to recognize that our dividend policy carries inherent risks and constraints, particularly regarding our available liquidity. When we opt to distribute cash dividends instead of reinvesting those funds in our operations or repaying outstanding debts, we run the risk of impeding our business expansion, potentially facing liquidity challenges, or limiting our ability to secure additional financing.
Our Board of Directors will regularly assess the cash generated from our operations and the capital requirements necessary to support our growth strategies. Based on this evaluation, they may decide to modify the amount of regular dividends and may also consider declaring periodic special dividends. However, there is no guarantee that our Board of Directors will not make adjustments to the timing or amount of regular cash dividends or decide to discontinue dividend payments altogether.
Item 1B. Unresolved Staff Comments
None.
Item 1C. Cybersecurity
Risk Management and Strategy
We have processes in place for assessing, identifying, and managing material risks from unauthorized occurrences on or through our electronic information systems that could adversely affect the confidentiality, integrity, or availability of our information systems or the information residing on those systems. These include a wide variety of mechanisms, controls, technologies, methods, systems, and other processes that are designed to prevent, detect, or mitigate data loss, theft, misuse, unauthorized access, or other security incidents or vulnerabilities. In addition, we engage with independent third-party partners, including cybersecurity assessors, consultants, and auditors, to assess and consult on our cybersecurity capabilities, prioritize areas of risk, and assist with execution of our risk management and strategic plans. Our collaboration with these third parties includes audits, threat assessments, and consultation on security enhancements. In an effort to mitigate data or security incidents that may originate from third-party suppliers, we also identify, prioritize, assess, and address third-party risks; however, we rely on the third parties we use to implement security programs commensurate with their risk, and we cannot ensure that their efforts will be successful.
As part of our risk management process, we conduct application security assessments, vulnerability management, penetration testing, security audits, and risk assessments. We provide cybersecurity awareness training to employees with access to information systems, including corporate employees. We also maintain an incident response plan. Our incident response plan outlines the process for our coordination with our third-party cybersecurity providers to respond to and recover from cybersecurity incidents, which include processes to triage, assess severity, investigate, escalate, contain, and remediate an incident, as well as to comply with applicable legal obligations and mitigate brand and reputational damage. In addition, our incident response plan includes actions designed to enhance processes and responsiveness to address future incidents. We continue to strengthen our systems, cybersecurity training, policies, programs, response plan, and other similar measures.
As previously disclosed in the Company’s Current Report on Form 8-K filed with the SEC on December 11, 2024, during the fourth quarter of fiscal 2024, unauthorized activity on a portion of our information technology systems resulted in the Company experiencing certain operational disruptions, including with online ordering in parts of the U.S. (the “2024 Cybersecurity Incident”). Our online ordering, retail shops, and core business functions are now fully operational. The incident materially affected the Company’s business operations and is reasonably likely to materially impact the Company’s results of operations and financial condition. In the fourth quarter of fiscal 2024, we incurred approximately $3 million of remediation expenses related to the 2024 Cybersecurity Incident. In addition, we estimate that we lost revenue within our U.S. segment in an amount of $11 million related to the incident with a corresponding estimated $10 million impact on Adjusted EBITDA (includes margin on the aforementioned lost revenues, as well as operational inefficiencies). We expect to continue to incur costs in fiscal 2025 related to the incident, including operational inefficiencies early in the first quarter and costs related to fees for our cybersecurity experts and other advisors. The Company holds cybersecurity insurance that is expected to offset a portion of the losses and costs from the incident. As of the date of this report, except as set forth herein, we are not aware of any risks from cybersecurity threats that have materially affected or are reasonably likely to materially affect us, our business strategy, results of operations, or financial condition. For more information regarding cybersecurity risks that have and may in the future materially affect us, see “Risk Factors—Risks Related to Cybersecurity, Data Privacy, and Information Technology” included in Item 1A of Part I of this Annual Report on Form 10-K.
Governance
Our Chief Information Officer (“CIO”) leads our global information security organization responsible for overseeing the Company’s information security program. Our Chief Information Security Officer (“CISO”) is primarily responsible for identifying, assessing, monitoring, and managing cybersecurity threats to our overall enterprise. Our CIO has over 25 years of industry experience, including serving in similar roles leading and overseeing cybersecurity programs at other public companies. Our CISO, who reports directly to the CIO, has over 30 years of information technology infrastructure and security experience, including developing and leading cybersecurity risk management programs for a variety of companies. Additionally, the team supporting the CISO has relevant educational and professional information technology security experience, including holding similar positions at other large companies. The CISO receives information regarding cybersecurity incidents and threats primarily from our third-party cybersecurity providers. The CISO then provides periodic reports to the CIO, including reporting on significant cybersecurity incidents, strategy, results of employee trainings, and any other notable cybersecurity matters.
Cybersecurity risk is among the top risks that the Company actively monitors. Our cybersecurity risk management program is integrated into our overall enterprise risk management program and shares common methodologies, reporting channels, and governance processes that apply across the enterprise risk management program to other legal, compliance, strategic, operational, and financial risk areas. The Audit and Finance Committee (“Audit Committee”) of the Board of Directors oversees our annual enterprise risk assessment, where we assess key risks within the Company, including security and technology risks and cybersecurity threats. The Audit Committee also oversees our cybersecurity risk and receives reports from our CIO on various cybersecurity matters, mitigation measures, and the status of our information security priorities. In addition, the Audit Committee reports to the Board of Directors on any significant cybersecurity incidents, such as the 2024 Cybersecurity Incident.
Item 2. Properties
The material properties used by the Company in connection with its manufacturing, warehousing, distribution, and corporate administrative operations, serving all segments, are as follows:
| | | | | | | | | | | |
| Location | Approximate Size in Square Feet | Purpose | Type |
| Winston-Salem, NC | 107,000 | Mix Production Plant and Distribution | Leased |
| Winston-Salem, NC | 101,710 | Equipment Manufacturing Facility | Owned |
| Charlotte, NC | 31,776 | Corporate Administrative | Leased |
In the U.S., we operate six Doughnut Factories located in Indianapolis, Indiana; Monroe, Ohio; New York, New York; Elk Grove, Illinois; Concord, North Carolina; and Fort Lauderdale, Florida. Internationally, for our equity markets, we operate 14 Doughnut Factories. Each Doughnut Factory manufactures daily to provide finished products to shops and to support our DFD routes. The majority of our Doughnut Factories are leased.
Additionally, as of December 29, 2024, the Company had 875 Company-owned shops globally, a majority of which are leased. We also lease space in various locations globally for regional, district, and other administrative offices, training facilities, and storage.
We believe our existing facilities, both owned and leased, are in good condition and suitable for the conduct of our business.
Item 3. Legal Proceedings
In the ordinary course of conducting our business, we have in the past and may in the future become involved in various legal actions and other claims. We may also become involved in other judicial, regulatory, and arbitration proceedings concerning matters arising in connection with the conduct of our businesses. Some of these matters may involve claims of substantial amounts. These legal proceedings may be subject to many uncertainties and there can be no assurance of the outcome of any individual proceedings. See Note 15, Commitments and Contingencies, to the audited Consolidated Financial Statements in Item 8 of Part II of this Annual Report on Form 10-K for information regarding certain legal proceedings in which we are involved. Item 4. Mine Safety Disclosures
Not applicable.
PART II
Item 5. Market for Registrant’s Common Equity, Related Stockholder Matters and Issuer Purchases of Equity Securities
Market Information
Our common stock has been listed on the Nasdaq Global Select Market under the symbol “DNUT” since our initial public offering on July 1, 2021. Prior to that time, there was no public market for our common stock.
Holders
The approximate number of shareholders of record of our common stock as of February 14, 2025, was 253. This does not include persons whose stock is in nominee or “street name” accounts through brokers.
Dividend Policy
For the fiscal quarters ended March 31, 2024, June 30, 2024, September 29, 2024, and December 29, 2024, we paid quarterly cash dividends on our common stock of $0.035 per share, which were paid in May 2024, August 2024, November 2024, and February 2025, respectively. We expect to pay a dividend after the close of each quarter.
Any declaration and payment of future dividends to holders of our common stock will be at the sole discretion of our Board of Directors and will depend on many factors, including economic conditions, our financial condition and operating results, our available cash and current and anticipated cash needs, capital requirements, contractual, legal, tax and regulatory restrictions, including restrictive covenants contained in certain of our credit facilities, and such other factors as our Board of Directors may deem relevant.
Issuer Purchases of Equity Securities
Shares under our ongoing share repurchase program may be repurchased in open market transactions, including pursuant to a trading plan adopted in accordance with Rule 10b5-1 of the Exchange Act, as amended, or through privately negotiated transactions. The timing, manner, price, and amount of repurchases will be determined at our discretion, and the share repurchase program may be suspended, terminated or modified at any time for any reason. As of December 29, 2024, all outstanding shares remained available for repurchase under current authorizations.
Performance Graph
The following graph depicts the total return to shareholders from the initial public offering (“IPO”) on July 1, 2021 through our fiscal year-end date of December 29, 2024, relative to the performance of the Russell 2000 Index, the NASDAQ Composite Index, and the Standard & Poor’s Consumer Discretionary Sector. All indices shown in the graph have been reset to a base of 100 as of July 1, 2021 and assume an investment of $100 on that date and the reinvestment of dividends paid since that date. The stock price performance shown in the graph is not necessarily indicative of future price performance.
| | | | | | | | | | | | | | | | | | | | | | | | | | | | | |
| July 1, 2021 | | January 2, 2022 | | January 1, 2023 | | December 31, 2023 | | December 29, 2024 |
| Krispy Kreme, Inc. | $ | 100.00 | | | $ | 111.29 | | | $ | 60.71 | | | $ | 88.76 | | | $ | 57.53 | |
| Russell 2000 | 100.00 | | | 96.39 | | | 75.61 | | | 87.02 | | | 96.36 | |
| NASDAQ Composite | 100.00 | | | 107.73 | | | 72.07 | | | 103.37 | | | 135.80 | |
| S&P Consumer Discretionary | 100.00 | | | 112.01 | | | 69.92 | | | 98.61 | | | 130.68 | |
Item 6. [Reserved]
Item 7. Management’s Discussion and Analysis of Financial Condition and Results of Operations
The following discussion and analysis of our financial condition and results of operations should be read together with our audited Consolidated Financial Statements and related notes included elsewhere in this Annual Report on Form 10-K. This section of the Annual Report on Form 10-K generally discusses fiscal 2024 and fiscal 2023 items and year-to-year comparisons of fiscal 2024 to fiscal 2023. Discussions of fiscal 2022 items and year-to-year comparisons of fiscal 2023 and fiscal 2022 are not included in this Annual Report on Form 10-K and can be found in “Management’s Discussion and Analysis of Financial Condition and Results of Operations” in our Annual Report on Form 10-K for the year ended December 31, 2023. This discussion contains forward-looking statements that involve risks and uncertainties. For more information, see the section titled “Cautionary Note Regarding Forward-Looking Statements” included in Part 1 of this Annual Report on Form 10-K.
Overview
We believe Krispy Kreme is one of the most beloved and well-known sweet treat brands in the world. Krispy Kreme operates in 40 countries with our omni-channel strategy, which focuses on delivering fresh doughnuts such as our iconic Original Glazed® doughnut, which is recognized for its hot-off-the-line, melt-in-your-mouth experience, to where our consumers are located and want to have access to them. Our purpose of touching and enhancing lives through the joy that is Krispy Kreme guides how we operate every day.
We operate and report financial information on a 52 or 53-week fiscal year ending on the Sunday closest to December 31. Fiscal year 2024 reflects our results of operations for the 52-week period ended December 29, 2024. Fiscal year 2023 reflects our results of operations for the 52-week period ended December 31, 2023.
We conduct our business through the following three reported segments:
•U.S.: Includes all Krispy Kreme Company-owned operations in the U.S., and Insomnia Cookies Bakeries globally through the date of deconsolidation (refer to Note 2, Acquisitions and Divestitures, to the audited Consolidated Financial Statements included in Item 8 of Part II of this Annual Report on Form 10-K for more information); •International: Includes all Krispy Kreme Company-owned operations in the U.K., Ireland, Australia, New Zealand, Mexico, Canada, and Japan; and
•Market Development: Includes franchise operations across the globe.
The following table presents a summary of our financial results for the periods presented:
| | | | | | | | | | | | | | | | | |
| Fiscal Years Ended |
| (in thousands, except percentages) | December 29, 2024 (52 weeks) | | December 31, 2023 (52 weeks) | | % Change |
Net Revenues (1) | $ | 1,665,397 | | | $ | 1,686,104 | | | -1.2 | % |
| Net Income/(Loss) Attributable to Krispy Kreme, Inc. | 3,095 | | | (37,925) | | | 108.2 | % |
Adjusted Net Income, Diluted (2) | 19,170 | | | 46,182 | | | -58.5 | % |
Adjusted EBITDA (2) | 193,528 | | | 211,624 | | | -8.6 | % |
Adjusted EBIT (2) | 90,228 | | | 115,103 | | | -21.6 | % |
(1)We generated 5.0% organic revenue growth in fiscal 2024. Refer to “Results of Operations” below for more information on and the calculation of organic revenue growth. (2)Refer to “Key Performance Indicators and Non-GAAP Measures” below for more information as to how we define and calculate Adjusted EBITDA, Adjusted EBIT, and Adjusted Net Income, Diluted and for a reconciliation of Adjusted EBITDA, Adjusted EBIT, and Adjusted Net Income, Diluted to net loss, the most comparable measure calculated under accounting principles generally accepted in the U.S. (“GAAP”).
Significant Events and Transactions
Executing on our Omni-Channel Strategy
We made strong progress on the execution of our omni-channel strategy in fiscal 2024, as we continue to add quality Global Points of Access across our network and convert markets into fully implemented Hub and Spoke models. Global Points of Access are a key metric and we define them as our unique network of fresh Doughnut Shops, partnerships with leading retailers (DFD Doors), and a growing digital business. We added a net total of 3,410 new Global Points of Access in fiscal 2024 to reach 17,557 Global Points of Access. The primary driver of the increased Global Points of Access during the year was the continued expansion of our DFD network in alignment with our transformation strategy, as we added 3,508, or 29.4%, new DFD Doors globally, including 2,836 DFD Doors to the U.S. segment, 606 to the International segment, and 66 to the Market Development segment. The increase in DFD Doors is the result of our focus on executing our omni-channel strategy to drive our transformation, and includes expansion with key customers. We expect DFD growth to be one of our most significant drivers of earnings growth, primarily through increased door count and also through optimization of revenue per door.
In addition to grocery and convenience stores, we are also expanding in DFD channels such as QSR and club membership to further broaden availability of our doughnuts to consumers. This includes our QSR partnership with McDonald’s. Following a successful pilot at approximately 160 McDonald’s restaurants in Louisville and Lexington, Kentucky and the surrounding area, we entered into an agreement to work with McDonald’s to develop a deployment schedule for a U.S. national rollout of the sale of Krispy Kreme doughnuts at McDonald’s restaurants. The deployment schedule sets forth the anticipated launch period for each McDonald’s business unit in the U.S., with phasing expected through the end of fiscal 2026. In the fourth quarter of fiscal 2024, the rollout continued at McDonald’s restaurants in places such as Illinois, Indiana, Michigan, Ohio, and Pennsylvania, with total DFD Doors with McDonald’s surpassing 1,900 by year-end. The agreement does not guarantee us any particular level of business unit deployment, sales, or profits.
Growing Our Global Presence
Another key strategic initiative on our journey to become the most loved sweet treat brand in the world is to increase our global presence, focusing on the percentage of our revenues and Adjusted EBITDA generated outside the U.S., with a key focus in Europe and select Asian and South American countries. In fiscal 2024, we opened our first franchise shops in Morocco and continued strong growth in markets such as France and Chile. We expect to have shop openings in Brazil, Spain, Germany, and other countries in the future.
Digital, Brand, and Innovation
We continue to prioritize expanding our digital channel sales. Growth in our digital channel is due to improvements in our branded digital platform as well as increasing product availability through third party platforms. Innovation is also a significant driver of frequency as we create and introduce premium and buzz-worthy offerings to consumers across our Global Points of Access. During the fourth quarter of fiscal 2024 we delivered the joy that is Krispy Kreme through powerful specialty doughnuts and seasonal activations including Halloween, Thanksgiving, and Christmas among many others around the world.
Divestiture of Insomnia Cookies
During the third quarter of fiscal 2024, we entered into an agreement to sell our controlling interest in Insomnia Cookies in exchange for cash proceeds of $127.4 million. We received additional cash of $45.0 million from Insomnia Cookies related to the settlement of an intercompany loan. We have used these proceeds to further strengthen our fresh doughnut business and expand availability, as well as pay down debt. We continue to own 34.7% of Insomnia Cookies and account for our investment using the equity method.
Key Performance Indicators and Non-GAAP Measures
We monitor the key business metrics and non-GAAP metrics set forth below to help us evaluate our business and growth trends, establish budgets, measure the effectiveness of our sales and marketing efforts, and assess operational efficiencies. The calculation of the key business metrics discussed below may differ from other similarly titled metrics used by other companies, securities analysts, or investors.
Throughout this Annual Report on Form 10-K, we utilize “Global Points of Access” as a key performance indicator. Global Points of Access reflect all locations at which fresh doughnuts can be purchased. We define Global Points of Access to include all Hot Light Theater Shops, Fresh Shops, Carts and Food Trucks, DFD Doors, Cookie Bakeries (through the date of the Insomnia Cookies divestiture), and other points at which fresh doughnuts can be purchased, at both Company-owned and franchise locations as of the end of the respective reporting period. We monitor Global Points of Access as a metric that informs the growth of our omni-channel presence over time and believe this metric is useful to investors to understand our footprint in each of our segments and by asset type.
The following table presents our Global Points of Access, by segment and type, as of the end of fiscal 2024, fiscal 2023, and fiscal 2022:
| | | | | | | | | | | | | | | | | |
| Global Points of Access |
| Fiscal Years Ended |
| December 29, 2024 | | December 31, 2023 | | January 1, 2023 |
| U.S.: | | | | | |
| Hot Light Theater Shops | 237 | | | 229 | | | 234 | |
| Fresh Shops | 70 | | | 70 | | | 62 | |
Cookie Bakeries (1) | — | | | 267 | | | 231 | |
| | | | | |
DFD Doors (2) | 9,644 | | | 6,808 | | | 5,729 | |
| Total | 9,951 | | | 7,374 | | | 6,256 | |
| International: | | | | | |
| Hot Light Theater Shops | 49 | | | 44 | | | 46 | |
| Fresh Shops | 519 | | | 483 | | | 448 | |
Carts, Food Trucks, and Other (3) | 17 | | | 16 | | | 14 | |
| DFD Doors | 4,583 | | | 3,977 | | | 3,210 | |
| Total | 5,168 | | | 4,520 | | | 3,718 | |
| Market Development: | | | | | |
| Hot Light Theater Shops | 108 | | | 116 | | | 106 | |
| Fresh Shops | 1,095 | | | 968 | | | 813 | |
| | | | | |
Carts, Food Trucks, and Other (3) | 30 | | | 30 | | | 27 | |
| DFD Doors | 1,205 | | | 1,139 | | | 917 | |
| Total | 2,438 | | | 2,253 | | | 1,863 | |
| Total Global Points of Access (as defined) | 17,557 | | | 14,147 | | | 11,837 | |
| Total Hot Light Theater Shops | 394 | | | 389 | | | 386 | |
| Total Fresh Shops | 1,684 | | | 1,521 | | | 1,323 | |
Total Cookie Bakeries (1) | — | | | 267 | | | 231 | |
| Total Shops | 2,078 | | | 2,177 | | | 1,940 | |
| Total Carts, Food Trucks, and Other | 47 | | | 46 | | | 41 | |
| Total DFD Doors | 15,432 | | | 11,924 | | | 9,856 | |
| Total Global Points of Access (as defined) | 17,557 | | | 14,147 | | | 11,837 | |
(1)Reflects the divestiture of Insomnia Cookies during fiscal 2024.
(2)Includes more than 1,900 McDonald’s QSR shops as of December 29, 2024.
(3)Carts and Food Trucks are non-producing, mobile (typically on wheels) facilities without walls or a door where product is received from a Hot Light Theater Shop or Doughnut Factory. Other includes a vending machine. Points of Access in this category are primarily found in international locations in airports and train stations.
As of December 29, 2024, we had 17,557 Global Points of Access, with 2,078 Krispy Kreme branded shops, 47 Carts and Food Trucks, and 15,432 DFD Doors. During fiscal 2024, we added a net 168 Krispy Kreme branded shops globally, including five Hot Light Theater Shops and 163 Fresh Shops. Hot Light Theater Shop openings included expansion in places like North Wales, Pennsylvania in the U.S. and Toronto, Edmonton, and Winnipeg in Canada, among others. We also continued to grow our international presence as we expanded into Morocco within the Market Development segment.
We added net 3,508 new DFD Doors during the fiscal year as we continue to focus on the deployment of our Hub and Spoke model and our expansion into QSR channels. We plan to continue adding new locations and expanding our digital platform in order to extend the availability of and access to our products. We are excited about our partnership with McDonald’s and the phasing of the U.S. national rollout, which we believe has validated the attractiveness of the QSR channel.
We also utilize “Hubs” as a key performance indicator. Our transformation is driven by the implementation of an omni-channel strategy to reach more consumers where they are and drive revenue growth, and this strategy is supported by a capital-efficient Hub and Spoke distribution model that provides a route to market and powers profitability. Our Hot Light Theater Shops and Doughnut Factories serve as centralized production facilities (“Hubs”). From these Hubs, we deliver doughnuts to our Fresh Shops, Carts and Food Trucks, and DFD Doors (“Spokes”) primarily through an integrated network of Company-operated delivery routes, designed to ensure quality and freshness. Going forward, we expect to outsource these U.S. DFD deliveries to one or more 3PL carriers, an approach we have used in several international markets. Specific to the U.S. segment, certain legacy Hubs have not historically had Spokes. Many Hubs in the U.S. segment are being converted to add Spokes while certain legacy Hubs do not currently have the ability or need to add Spokes.
The following table presents our Hubs, by segment and type, as of the end of fiscal 2024, fiscal 2023, and fiscal 2022, respectively:
| | | | | | | | | | | | | | | | | |
| Hubs |
| Fiscal Years Ended |
| December 29, 2024 | | December 31, 2023 | | January 1, 2023 |
| U.S.: | | | | | |
Hot Light Theater Shops (1) | 232 | | | 220 | | | 228 | |
| Doughnut Factories | 6 | | | 4 | | | 4 | |
| Total | 238 | | | 224 | | | 232 | |
| Hubs with Spokes | 158 | | | 149 | | | 133 | |
| Hubs without Spokes | 80 | | | 75 | | | 99 | |
| International: | | | | | |
Hot Light Theater Shops (1) | 40 | | | 36 | | | 34 | |
| Doughnut Factories | 14 | | | 14 | | | 14 | |
| Total | 54 | | | 50 | | | 48 | |
| Hubs with Spokes | 54 | | | 50 | | | 48 | |
| Market Development: | | | | | |
Hot Light Theater Shops (1) | 106 | | | 112 | | | 104 | |
| Doughnut Factories | 27 | | | 23 | | | 24 | |
| Total | 133 | | | 135 | | | 128 | |
| Total Hubs | 425 | | | 409 | | | 408 | |
(1)Includes only Hot Light Theater Shops and excludes Mini Theaters. A Mini Theater is a Spoke location that produces some doughnuts for itself and also receives doughnuts from another producing location.
Non-GAAP Measures
We report our financial results in accordance with GAAP; however, management evaluates our results of operations using, among other measures, organic revenue growth, Sales per Hub, adjusted earnings before interest, taxes, depreciation and amortization (“Adjusted EBITDA”), Adjusted EBIT, Adjusted Net Income, Diluted, and Adjusted EPS as we believe these non-GAAP measures are useful in evaluating our operating performance.
Non-GAAP financial measures are not standardized and it may not be possible to compare these financial measures with other companies’ non-GAAP financial measures having the same or similar names, limiting their usefulness as comparative measures. Other companies may calculate similarly titled financial measures differently than we do or may not calculate them at all. Additionally, these non-GAAP financial measures are not measurements of financial performance under GAAP or a substitute for results reported under GAAP. In order to facilitate a clear understanding of our consolidated historical operating results, we urge you to review our non-GAAP financial measures in conjunction with our historical audited Consolidated Financial Statements and notes thereto included in this Annual Report on Form 10-K and not to rely on any single financial measure.
Organic Revenue Growth
Organic revenue growth measures our revenue growth trends excluding the impact of acquisitions, divestitures, and foreign currency, and we believe it is useful for investors to understand the expansion of our global footprint through internal efforts. We define “organic revenue growth” as the growth in revenues, excluding (i) acquired shops owned by us for less than 12 months following their acquisition, (ii) the impact of foreign currency exchange rate changes, (iii) the impact of shop closures related to restructuring programs such as the shop portfolio optimization program initiated for Krispy Kreme U.S. during fiscal 2022, (iv) the impact of the Branded Sweat Treats business exit, (v) the impact of the divestiture of Insomnia Cookies, and (vi) revenues generated during the 53rd week for those fiscal years that have a 53rd week based on our fiscal calendar defined in the “Overview” section. See “Results of Operations” for our organic growth calculations for the periods presented.
Adjusted EBITDA, Adjusted EBIT, Adjusted Net Income, Diluted, and Adjusted EPS
We define “Adjusted EBITDA” as earnings before interest expense, net, income tax expense, and depreciation and amortization, with further adjustments for share-based compensation, certain strategic initiatives, acquisition and integration expenses, and certain other non-recurring, infrequent or non-core income and expense items. Adjusted EBITDA is a principal metric that management uses to monitor and evaluate operating performance and provides a consistent benchmark for comparison across reporting periods. “Adjusted EBITDA margin” reflects Adjusted EBITDA as a percentage of net revenues.
We define “Adjusted EBIT” as earnings before interest expense, net and income tax expense, with further adjustments for share-based compensation, certain strategic initiatives, acquisition and integration expenses, and certain other non-recurring, infrequent or non-core income and expense items. Adjusted EBIT is a principal metric that management uses to monitor and evaluate operating performance and provides a consistent benchmark for comparison across reporting periods.
We define “Adjusted Net Income, Diluted” as net income/(loss) attributable to common shareholders, adjusted for interest expense, share-based compensation, certain strategic initiatives, acquisition and integration expenses, amortization of acquisition-related intangibles, the tax impact of adjustments, and certain other non-recurring, infrequent or non-core income and expense items. “Adjusted EPS” is Adjusted Net Income, Diluted converted to a per share amount.
Adjusted EBITDA, Adjusted EBIT, Adjusted Net Income, Diluted, and Adjusted EPS have certain limitations, including adjustments for income and expense items that are required by GAAP. In evaluating these non-GAAP measures, you should be aware that in the future we will incur expenses that are the same as or similar to some of the adjustments in this presentation, such as share-based compensation. Our presentation of these non-GAAP measures should not be construed to imply that our future results will be unaffected by any such adjustments. Management compensates for these limitations by relying on our GAAP results in addition to using these non-GAAP measures supplementally.
The following tables present a reconciliation of net income/(loss) to Adjusted EBIT and Adjusted EBITDA, and net income/(loss) to Adjusted Net Income, Diluted and Adjusted EPS for the fiscal years presented: | | | | | | | | | | | | | | | | | |
| Fiscal Years Ended |
| (in thousands) | December 29, 2024 | | December 31, 2023 | | January 1, 2023 |
| Net income/(loss) | $ | 3,815 | | | $ | (36,647) | | | $ | (8,775) | |
| Interest expense, net | 60,066 | | | 50,341 | | | 34,102 | |
| | | | | |
| Income tax expense/(benefit) | 15,954 | | | (4,347) | | | 612 | |
| Share-based compensation | 35,149 | | | 24,196 | | | 18,170 | |
| Employer payroll taxes related to share-based compensation | 358 | | | 395 | | | 312 | |
| Gain on divestiture of Insomnia Cookies | (90,455) | | | — | | | — | |
Other non-operating expense, net (1) | 1,885 | | | 3,798 | | | 3,036 | |
| | | | | |
Strategic initiatives (2) | 19,993 | | | 29,057 | | | 2,841 | |
Acquisition and integration expenses (3) | 3,282 | | | 511 | | | 2,333 | |
New market penetration expenses (4) | 1,407 | | | 1,380 | | | 1,511 | |
Shop closure expenses, net (5) | 4,861 | | | 17,335 | | | 19,715 | |
Restructuring and severance expenses (6) | 7,561 | | | 5,050 | | | 7,125 | |
Gain on remeasurement of equity method investment (7) | (5,579) | | | — | | | — | |
| | | | | |
| Gain on sale-leaseback | (1,569) | | | (9,646) | | | (6,549) | |
Other (8) | 3,203 | | | 4,307 | | | 6,285 | |
Amortization of acquisition related intangibles (9) | 30,297 | | | 29,373 | | | 28,456 | |
| Adjusted EBIT | $ | 90,228 | | | $ | 115,103 | | | $ | 109,174 | |
| Depreciation expense and amortization of right of use assets | 103,300 | | | 96,521 | | | 81,555 | |
| Adjusted EBITDA | $ | 193,528 | | | $ | 211,624 | | | $ | 190,729 | |
| | | | | | | | | | | | | | | | | |
| Fiscal Years Ended |
| (in thousands, except per share amounts) | December 29, 2024 | | December 31, 2023 | | January 1, 2023 |
| Net income/(loss) | $ | 3,815 | | | $ | (36,647) | | | $ | (8,775) | |
| | | | | |
| Share-based compensation | 35,149 | | | 24,196 | | | 18,170 | |
| Employer payroll taxes related to share-based compensation | 358 | | | 395 | | | 312 | |
| Gain on divestiture of Insomnia Cookies | (90,455) | | | — | | | — | |
Other non-operating expense, net (1) | 1,885 | | | 3,798 | | | 3,036 | |
| | | | | |
Strategic initiatives (2) | 19,993 | | | 29,057 | | | 2,841 | |
Acquisition and integration expenses (3) | 3,282 | | | 511 | | | 2,333 | |
New market penetration expenses (4) | 1,407 | | | 1,380 | | | 1,511 | |
Shop closure expenses, net (5) | 4,861 | | | 17,335 | | | 19,715 | |
Restructuring and severance expenses (6) | 7,561 | | | 5,050 | | | 7,125 | |
Gain on remeasurement of equity method investment (7) | (5,579) | | | — | | | — | |
| | | | | |
| Gain on sale-leaseback | (1,569) | | | (9,646) | | | (6,549) | |
Other (8) | 3,203 | | | 4,307 | | | 6,285 | |
Amortization of acquisition related intangibles (9) | 30,297 | | | 29,373 | | | 28,456 | |
| | | | | |
Loss on extinguishment of 2019 Facility (10) | — | | | 472 | | | — | |
Tax impact of adjustments (11) | 9,690 | | | (20,729) | | | (14,609) | |
Tax specific adjustments (12) | (3,988) | | | (1,364) | | | (2,876) | |
| Net income attributable to noncontrolling interest | (720) | | | (1,278) | | | (6,847) | |
| Adjustment to adjusted net income attributable to common shareholders | — | | | — | | | (374) | |
| Adjusted net income attributable to common shareholders - Basic | $ | 19,190 | | | $ | 46,210 | | | $ | 49,754 | |
| Additional income attributed to noncontrolling interest due to subsidiary potential common shares | (20) | | | (28) | | | (143) | |
| Adjusted net income attributable to common shareholders - Diluted | $ | 19,170 | | | $ | 46,182 | | | $ | 49,611 | |
| Basic weighted average common shares outstanding | 169,341 | | | 168,289 | | | 167,471 | |
| Dilutive effect of outstanding common stock options, RSUs, and PSUs | 2,159 | | | 2,204 | | | 2,005 | |
| Diluted weighted average common shares outstanding | 171,500 | | | 170,493 | | | 169,476 | |
| Adjusted net income per share attributable to common shareholders: | | | | | |
| Basic | $ | 0.11 | | | $ | 0.27 | | | $ | 0.30 | |
| Diluted | $ | 0.11 | | | $ | 0.27 | | | $ | 0.29 | |
(1)Primarily foreign translation gains and losses in each period. Fiscal 2024 also consists of equity method income from Insomnia Cookies following the divestiture discussed in Note 2, Acquisitions and Divestitures, to the audited Consolidated Financial Statements included in Item 8 of Part II of this Annual Report on Form 10-K. (2)Fiscal 2024 consists primarily of costs associated with the divestiture of the Insomnia Cookies business, preparing for the McDonald’s U.S. expansion, and global transformation. Fiscal 2023 consists primarily of costs associated with global transformation and U.S. initiatives such as the decision to exit the Branded Sweet Treats business, including property, plant and equipment impairments, inventory write-offs, employee severance, and other related costs. Fiscal 2022 consists mainly of equipment disposals, equipment relocation and installation, consulting and advisory fees, and other costs associated with the shift of Branded Sweet Treats manufacturing capability from Burlington, Iowa to Winston-Salem, North Carolina.
(3)Consists of acquisition and integration-related costs in connection with the Company’s business and franchise acquisitions, including legal, due diligence, and advisory fees incurred in connection with acquisition and integration-related activities for the applicable period.
(4)Consists of start-up costs associated with entry into new countries in which the Company has not previously operated, including Brazil and Spain.
(5)Includes lease termination costs, impairment charges, and loss on disposal of property, plant and equipment.
(6)Fiscal 2024 consists primarily of costs associated with the restructuring of the U.S. and U.K. executive teams. Fiscal 2023 and 2022 consist primarily of costs associated with restructuring of the global executive team.
(7)Consists of a gain related to the remeasurement of the equity method investments in KremeWorks USA, LLC and KremeWorks Canada, L.P. to fair value immediately prior to the acquisition of the shops. Refer to Note 2, Acquisitions and Divestitures, to the audited Consolidated Financial Statements included in Item 8 of Part II of this Annual Report on Form 10-K for more information. (8)Fiscal 2024 consists primarily of $3.1 million in costs related to remediation of the 2024 Cybersecurity Incident, including fees for cybersecurity experts and other advisors. Fiscal 2023 and fiscal 2022 consist primarily of legal and other regulatory expenses incurred outside the ordinary course of business on matters described in Note 15, Commitments and Contingencies, to the audited Consolidated Financial Statements included in Item 8 of Part II of this Annual Report on Form 10-K. (9)Consists of amortization related to acquired intangible assets as reflected within depreciation and amortization in the Consolidated Statements of Operations.
(10)Includes interest expenses related to unamortized debt issuance costs from our prior credit agreement (the “2019 Facility”) associated with extinguished lenders as a result of the March 2023 debt refinancing.
(11)Tax impact of adjustments calculated by applying the applicable statutory rates. The Company’s adjusted effective tax rate is 34.0%, 27.2%, and 24.1% for each of the fiscal years 2024, 2023, and 2022, respectively. Fiscal 2024 and fiscal 2023 also include the impact of disallowed executive compensation expense. Fiscal 2022 includes the impact of disallowed executive compensation expense and a discrete tax benefit related to a legal accrual.
(12)Fiscal 2024 consists of the recognition of previously unrecognized tax benefits unrelated to ongoing operations, a discrete tax benefit unrelated to ongoing operations, the release of valuation allowances associated with the divestiture of Insomnia Cookies, and the effect of various tax law changes on existing temporary differences. Fiscal 2023 consists of the recognition of a previously unrecognized tax benefit unrelated to ongoing operations, the effect of tax law changes on existing temporary differences, and a discrete tax benefit unrelated to ongoing operations. Fiscal 2022 consists of the recognition of previously unrecognized tax benefits unrelated to ongoing operations, as well as benefits attributable to multiple tax years due to lapse of the statute of limitations. Fiscal 2022 also includes the effect of discrete adjustments to the Company’s deferred tax liabilities that are unrelated to the Company’s ongoing operations.
Sales Per Hub
In order to measure the effectiveness of our Hub and Spoke model, we use “Sales per Hub” on a trailing four-quarter basis, which includes all revenue generated from a Hub and its associated Spokes. Sales per Hub equals Fresh Revenues from Hubs with Spokes, divided by the average number of Hubs with Spokes for the period. Fresh Revenues include product sales generated from our Doughnut Shop business (including digital channels), as well as DFD sales, but excluding all Insomnia Cookies revenues as the measure is focused on the Krispy Kreme business. The average number of Hubs with Spokes for a period is calculated as the average of the number of Hubs with Spokes at the end of the five most recent quarters. The Sales per Hub performance measure allows us and investors to measure our effectiveness at leveraging the Hubs in the Hub and Spoke model to distribute product and generate cost efficiencies and profitability.
Sales per Hub was as follows for each of the periods below:
| | | | | | | | | | | | | | | | | |
| Fiscal Years Ended |
| (in thousands, unless otherwise stated) | December 29, 2024 (52 weeks) | | December 31, 2023 (52 weeks) | | January 1, 2023 (52 weeks) |
| U.S.: | | | | | |
| Revenues | $ | 1,058,736 | | | $ | 1,104,944 | | | $ | 1,010,250 | |
Non-Fresh Revenues (1) | (3,161) | | | (9,416) | | | (38,380) | |
Fresh Revenues from Insomnia Cookies and Hubs without Spokes (2) | (307,665) | | | (399,061) | | | (404,430) | |
| Fresh Revenues from Hubs with Spokes | 747,910 | | | 696,467 | | | 567,440 | |
| Sales per Hub (millions) | 4.9 | | | 4.9 | | | 4.5 | |
| | | | | |
| International: | | | | | |
Fresh Revenues from Hubs with Spokes (3) | $ | 519,102 | | | $ | 489,631 | | | $ | 435,651 | |
Sales per Hub (millions) (4) | 10.1 | | | 9.9 | | | 9.6 | |
(1)Includes the exited Branded Sweet Treats business revenues as well as licensing royalties from customers for use of the Krispy Kreme brand.
(2)Includes Insomnia Cookies revenues (through the date of the divestiture) and Fresh Revenues generated by Hubs without Spokes.
(3)Total International net revenues is equal to Fresh Revenues from Hubs with Spokes for that business segment.
(4)International sales per Hub comparative data has been restated in constant currency based on current exchange rates.
In our International segment, where the Hub and Spoke model originated, Sales per Hub was $10.1 million, up from $9.9 million in fiscal 2023 and $9.6 million in fiscal 2022. The International segment illustrates the benefits of leveraging our Hub and Spoke model as the most efficient way to grow the business, as shown by the consistent Sales per Hub and higher Adjusted EBITDA margins despite elevated commodity costs and macroeconomic conditions. In the U.S. segment, we had Sales per Hub of $4.9 million, consistent with the $4.9 million in fiscal 2023 and up from $4.5 million in fiscal 2022. In the U.S. we continue our efforts to increase the number of quality Spokes served by our Hubs as we make progress toward optimizing the segment to look more like our International segment. As we further extend the Hub and Spoke model into existing and new markets around the world, we expect to see our Sales per Hub grow.
Results of Operations
The following comparisons are historical results and are not indicative of future results which could differ materially from the historical financial information presented.
Fiscal Year ended December 29, 2024 compared to the Fiscal Year ended December 31, 2023
The following table presents our audited consolidated results of operations for fiscal 2024 and fiscal 2023:
| | | | | | | | | | | | | | | | | | | | | | | | | | | | | | | | | | | |
| Fiscal Years Ended | | | | |
| December 29,
2024 (52 weeks) | | December 31,
2023 (52 weeks) | | Change |
| (in thousands, except percentages) | Amount | | % of Revenue | | Amount | | % of Revenue | | $ | | % |
| Net revenues | | | | | | | | | | | |
| Product sales | $ | 1,627,778 | | | 97.7 | % | | $ | 1,651,166 | | | 97.9 | % | | $ | (23,388) | | | -1.4 | % |
| Royalties and other revenues | 37,619 | | | 2.3 | % | | 34,938 | | | 2.1 | % | | 2,681 | | | 7.7 | % |
| Total net revenues | 1,665,397 | | | 100.0 | % | | 1,686,104 | | | 100.0 | % | | (20,707) | | | -1.2 | % |
| Product and distribution costs | 409,177 | | | 24.6 | % | | 443,243 | | | 26.3 | % | | (34,066) | | | -7.7 | % |
| Operating expenses | 809,916 | | | 48.6 | % | | 776,589 | | | 46.1 | % | | 33,327 | | | 4.3 | % |
| Selling, general and administrative expense | 274,303 | | | 16.5 | % | | 266,863 | | | 15.8 | % | | 7,440 | | | 2.8 | % |
| Marketing expenses | 47,695 | | | 2.9 | % | | 45,872 | | | 2.7 | % | | 1,823 | | | 4.0 | % |
| Pre-opening costs | 3,411 | | | 0.2 | % | | 4,120 | | | 0.2 | % | | (709) | | | -17.2 | % |
| Other (income)/expenses, net | (3,967) | | | -0.2 | % | | 10,378 | | | 0.6 | % | | (14,345) | | | -138.2 | % |
| Depreciation and amortization expense | 133,597 | | | 8.0 | % | | 125,894 | | | 7.5 | % | | 7,703 | | | 6.1 | % |
| Operating (loss)/income | (8,735) | | | -0.5 | % | | 13,145 | | | 0.8 | % | | (21,880) | | | -166.5 | % |
| Interest expense, net | 60,066 | | | 3.6 | % | | 50,341 | | | 3.0 | % | | 9,725 | | | 19.3 | % |
| Gain on divestiture of Insomnia Cookies | (90,455) | | | -5.4 | % | | — | | | — | % | | (90,455) | | | -100.0 | % |
| Other non-operating expense, net | 1,885 | | | 0.1 | % | | 3,798 | | | 0.2 | % | | (1,913) | | | -50.4 | % |
| Income/(loss) before income taxes | 19,769 | | | 1.2 | % | | (40,994) | | | -2.4 | % | | 60,763 | | | 148.2 | % |
| Income tax expense/(benefit) | 15,954 | | | 1.0 | % | | (4,347) | | | -0.3 | % | | 20,301 | | | 467.0 | % |
| Net income/(loss) | 3,815 | | | 0.2 | % | | (36,647) | | | -2.2 | % | | 40,462 | | | 110.4 | % |
| Net income attributable to noncontrolling interest | 720 | | | — | % | | 1,278 | | | 0.1 | % | | (558) | | | -43.7 | % |
| Net income/(loss) attributable to Krispy Kreme, Inc. | $ | 3,095 | | | 0.2 | % | | $ | (37,925) | | | -2.2 | % | | $ | 41,020 | | | 108.2 | % |
The following table presents a further breakdown of total net revenue and organic revenue growth by segment for the periods indicated:
| | | | | | | | | | | | | | | | | | | | | | | |
| (in thousands, except percentages) | U.S. | | International | | Market Development | | Total Company |
| Total net revenues in fiscal 2024 (52 weeks) | $ | 1,058,736 | | $ | 519,102 | | $ | 87,559 | | $ | 1,665,397 |
| Total net revenues in fiscal 2023 (52 weeks) | 1,104,944 | | 489,631 | | 91,529 | | 1,686,104 |
| Total Net Revenues (Decline)/Growth | (46,208) | | 29,471 | | (3,970) | | (20,707) |
| Total Net Revenues (Decline)/Growth % | -4.2% | | 6.0% | | -4.3% | | -1.2% |
| Less: Impact of shop optimization program closures | (463) | | — | | — | | (463) |
| Less: Impact of Insomnia Cookies divestiture | (100,965) | | — | | — | | (100,965) |
| Less: Impact of Branded Sweet Treats exit | (5,853) | | — | | — | | (5,853) |
| Adjusted net revenues in fiscal 2023 | 997,663 | | 489,631 | | 91,529 | | 1,578,823 |
| Adjusted net revenue growth/(decline) | 61,073 | | 29,471 | | (3,970) | | 86,574 |
| Impact of acquisitions | (15,656) | | (2,865) | | 5,371 | | (13,150) |
| Impact of foreign currency translation | — | | 5,883 | | — | | 5,883 |
| Organic Revenue Growth | $ | 45,417 | | $ | 32,489 | | $ | 1,401 | | $ | 79,307 |
| Organic Revenue Growth % | 4.6% | | 6.6% | | 1.5% | | 5.0% |
Total net revenue declined $20.7 million, or approximately 1.2%, primarily impacted by the $101.0 million reduction associated with the divestiture of Insomnia Cookies in the third quarter of fiscal 2024. Organic revenue growth of $79.3 million, or approximately 5.0%, was driven by the continued and successful execution of our omni-channel growth strategy globally, high impact brand activations, and product premiumization efforts. We have continued to increase availability through 3,410, or 24.1%, additional Global Points of Access, primarily including capital-light DFD Doors, and via digital channels. Additionally, we have continued to take pricing actions to offset cost inflation, with average pricing increasing approximately 4% from fiscal 2023 to fiscal 2024, partially offset by transaction volume declines.
Our U.S. segment net revenue declined $46.2 million, or approximately 4.2% from fiscal 2023 to fiscal 2024, primarily impacted by the $101.0 million reduction associated with the divestiture of Insomnia Cookies in the third quarter of fiscal 2024. Organic revenue grew $45.4 million, or approximately 4.6%, from fiscal 2023 to fiscal 2024, driven by an additional 2,577, or 34.9%, Points of Access and growth in Krispy Kreme branded digital channel revenues of 20%. Our organic growth has been supplemented by effective pricing increases, with average pricing increasing approximately 5% from fiscal 2023 to fiscal 2024, leading to an increase in the average transaction size, but partially offset by transaction volume declines. U.S. organic revenue was also impacted adversely by an estimated $11 million in lost revenues related to the 2024 Cybersecurity Incident in the fourth quarter of fiscal 2024.
Our International segment net revenue grew $29.5 million, or approximately 6.0%, from fiscal 2023 to fiscal 2024, in spite of foreign currency translation impacts of $5.9 million. International organic revenue grew $32.5 million or approximately 6.6%, from fiscal 2023 to fiscal 2024, driven primarily by increased pricing of approximately 2% and Points of Access growth of 648, or 14.3%. International organic revenue growth was partially offset by the lower transaction volume compared to last year.
Our Market Development segment net revenue declined $4.0 million, or approximately 4.3%, from fiscal 2023 to fiscal 2024, due to the $5.4 million impact of franchise acquisitions in fiscal 2024 (the results of acquired franchise businesses are reported within the Market Development segment prior to the respective dates of acquisition, and are reported within the U.S. or International segments, as applicable, following the respective dates of acquisition). Market Development organic revenue grew $1.4 million, or approximately 1.5%, from fiscal 2023 to fiscal 2024, due to the continued expansion of our international franchise business.
Product and distribution costs (exclusive of depreciation and amortization): Product and distribution costs decreased $34.1 million, or 7.7%, from fiscal 2023 to fiscal 2024. Product and distribution costs as a percentage of revenue decreased by approximately 170 basis points from 26.3% in fiscal 2023 to 24.6% in fiscal 2024, primarily due to pricing actions taken to offset materials cost inflation of approximately 4%. Additionally, we benefited from the exit of the lower-margin Branded Sweet Treats business, and lapping the related $10.4 million inventory write-offs and employee severance expenses incurred during fiscal 2023.
Operating expenses: Operating expenses increased $33.3 million, or 4.3%, from fiscal 2023 to fiscal 2024, driven mainly by labor cost inflation of approximately 5% and investments to support growth, including the accelerating U.S. DFD expansion, with shop and delivery labor expenses increasing $20.4 million. Operating expenses as a percentage of revenue increased approximately 250 basis points, from 46.1% in fiscal 2023 to 48.6% in fiscal 2024, primarily due to the impact of lower transaction volumes on operating leverage. This has been partially offset by efficiency benefits from Hub and Spoke expansion.
Selling, general and administrative expense: Selling, general and administrative (“SG&A”) expenses increased $7.4 million, or 2.8%, from fiscal 2023 to fiscal 2024. As a percentage of revenue, SG&A increased by approximately 70 basis points, from 15.8% in fiscal 2023 to 16.5% in fiscal 2024, primarily driven by increased share-based compensation expense of $11.0 million, increased employee termination benefits of $8.9 million, and $8.2 million related to preparing for and executing the divestiture of Insomnia Cookies, partially offset by lower employee cash incentive compensation of $15.4 million and cost control initiatives in fiscal 2024.
Other (income)/expenses, net: Other income, net of $4.0 million in fiscal 2024 was primarily driven by a gain of $5.6 million related to the remeasurement of equity method investments to fair value immediately prior to the acquisition of Krispy Kreme shops referenced in Note 2, Acquisitions and Divestitures to the audited Consolidated Financial Statements included in Item 8 of Part II of this Annual Report on Form 10-K. Other expenses, net of $10.4 million in fiscal 2023 were primarily driven by impairments and lease termination costs associated with the Branded Sweet Treats exit and the decision to exit certain other underperforming shops, net of a gain from a sale-leaseback transaction. Depreciation and amortization expense: Depreciation and amortization expense increased $7.7 million, or 6.1%, from fiscal 2023 to fiscal 2024. As a percentage of revenue, depreciation and amortization expense increased approximately 50 basis points, from 7.5% in fiscal 2023 to 8.0% in fiscal 2024, primarily driven by higher capital spend and assets placed into service to prepare for the acceleration of our U.S. national DFD rollout discussed in “Significant Events and Transactions” above.
Interest expense, net: Interest expense, net increased $9.7 million, or 19.3%, from fiscal 2023 to fiscal 2024. The increase was primarily driven by a higher average debt balance in fiscal 2024 and also includes a $3.0 million impact from the maturity of our prior interest rate swap agreements in the second quarter of fiscal 2024. We have entered into a cumulative $500.0 million notional new interest rate swap agreements as of the end of fiscal 2024, which will mature in March 2028.
Gain on divestiture of Insomnia Cookies: During fiscal 2024 we entered into an agreement to sell our controlling interest in Insomnia Cookies in exchange for cash proceeds. Following the transaction, we owned approximately 34.7% of Insomnia Cookies and lost the ability to exercise control. Accordingly, we deconsolidated Insomnia Cookies and recorded a gain on divestiture of $90.5 million. Refer to Note 2, Acquisitions and Divestitures, to the audited Consolidated Financial Statements included in Item 8 of Part II of this Annual Report on Form 10-K for further information. Income tax expense/(benefit): Income tax expense was $16.0 million in fiscal 2024, while income tax benefit was $4.3 million in fiscal 2023. The fluctuation of $20.3 million from fiscal 2023 to fiscal 2024 was driven primarily by tax impact of the gain on divestiture of Insomnia Cookies.
Results of Operations by Segment – Fiscal Year ended December 29, 2024 compared to the Fiscal Year ended December 31, 2023
The following table presents Adjusted EBITDA by segment for the periods indicated:
| | | | | | | | | | | | | | | | | | | | | | | |
| Fiscal Years Ended | | Change |
| (in thousands, except percentages) | December 29,
2024 (52 weeks) | | December 31,
2023 (52 weeks) | | $ | | % |
| Adjusted EBITDA | | | | | | | |
| U.S. | $ | 112,767 | | | $ | 130,979 | | | $ | (18,212) | | | -13.9 | % |
| International | 90,716 | | | 96,532 | | | (5,816) | | | -6.0 | % |
| Market Development | 47,904 | | | 42,966 | | | 4,938 | | | 11.5 | % |
| Corporate | (57,859) | | | (58,853) | | | 994 | | | 1.7 | % |
Total Adjusted EBITDA (1) | $ | 193,528 | | | $ | 211,624 | | | $ | (18,096) | | | -8.6 | % |
U.S. segment Adjusted EBITDA decreased $18.2 million, or 13.9%, impacted by $4.7 million related to the divestiture of Insomnia Cookies in the third quarter of fiscal 2024. The U.S. segment had margin decline of 120 basis points to 10.7% from fiscal 2023 to fiscal 2024, primarily driven by an estimated impact of $10 million related to the 2024 Cybersecurity Incident in the fourth quarter of fiscal 2024 (includes margin on the lost revenues, as well as operational inefficiencies), and incremental vehicle accident claim costs of $4.3 million.
International segment Adjusted EBITDA decreased $5.8 million, or 6.0%, with margin decline of approximately 220 basis points to 17.5% from fiscal 2023 to fiscal 2024, as lower transaction volume continued to impact operating leverage for the International equity markets.
Market Development segment Adjusted EBITDA increased $4.9 million, or 11.5%, with margin expansion of 780 basis points to 54.7% from fiscal 2023 to fiscal 2024, driven mainly by savings in SG&A and the continued expansion of our international franchise business.
Capital Resources and Liquidity
Our principal sources of liquidity to date have included cash from operating activities, cash on hand, amounts available under our credit facility, commercial trade financing including our structured payables programs, and proceeds from the divestiture of Insomnia Cookies. Our primary use of liquidity is to fund the cash requirements of our business operations, including working capital needs, capital expenditures, acquisitions, and other commitments.
Our future obligations primarily consist of our debt and lease obligations, as well as commitments under ingredient and other forward purchase contracts. As of December 29, 2024, we had the following future obligations:
•An aggregate principal amount of $819.5 million outstanding under the 2023 Facility;
•An aggregate principal amount of $5.0 million outstanding under short-term, uncommitted lines of credit
•Non-cancellable future minimum operating lease payments totaling $664.3 million;
•Non-cancellable future minimum finance lease payments totaling $97.0 million; and
•Purchase commitments under ingredient and other forward purchase contracts of $98.9 million.
Refer to Note 8, Long-Term Debt, Note 9, Leases, and Note 15, Commitments and Contingencies, to the audited Consolidated Financial Statements included in Item 8 of Part II of this Annual Report on Form 10-K for further information. We had cash and cash equivalents of $29.0 million and $38.2 million as of December 29, 2024 and December 31, 2023, respectively. We believe that our existing cash and cash equivalents and available borrowing capacity under our debt facilities will be sufficient to fund our operating and capital needs for at least the next twelve months. In fiscal 2025, we expect to use our available cash to continue to position the business for sustainable growth, including investing in shop improvements, ways to better serve our consumers, and ways to increase our omni-channel presence as we expand our DFD Doors in priority areas and channels. We also expect to invest in new shop openings and new market penetration within the U.S. and internationally. Total capital expenditures for fiscal 2025 are expected to be between 6% and 7% of net revenues, as we continue to deploy the capital-efficient Hub and Spoke model globally. We also expect to continue to return cash to shareholders through common stock cash dividend payments.
Our assessment of the period of time through which our financial resources will be adequate to support our operations could vary because of, and our future capital requirements will depend on, many factors, including our growth rate, the timing and extent of spending on business acquisitions, the growth of our presence in new markets, and the expansion of our omni-channel model in existing markets. We may enter into arrangements in the future to acquire or invest in complementary businesses, services, and technologies. We have based this estimate on assumptions that may prove to be wrong, and we could use our available capital resources sooner than we currently expect. We may be required to seek additional equity or debt financing. In the event that additional financing is required from outside sources, we may not be able to raise it on terms acceptable to us or at all. If we are unable to raise additional capital when desired, or if we cannot expand our operations or otherwise capitalize on our business opportunities because we lack sufficient capital, our business, results of operations, and financial condition would be adversely affected.
Cash Flows
We generate significant cash from operations and have substantial credit availability and capacity to fund operating and discretionary spending such as capital expenditures and debt repayments. Our requirement for working capital is not significant because our consumers pay us in cash or on debit or credit cards at the time of the sale and we are able to sell many of our inventory items before payment is due to the vendors for the various inputs to such items. The following table and discussion present, for the periods indicated, a summary of our key cash flows from operating, investing and financing activities:
| | | | | | | | | | | |
| Fiscal Years Ended |
| (in thousands) | December 29,
2024 (52 weeks) | | December 31,
2023 (52 weeks) |
| Net cash provided by operating activities | $ | 45,832 | | | $ | 45,544 | |
| Net cash provided by/(used for) investing activities | 19,280 | | | (112,588) | |
| Net cash (used for)/provided by financing activities | (73,949) | | | 71,862 | |
Operating Activities
Cash provided by operations totaled $45.8 million for fiscal 2024, an increase of $0.3 million compared with fiscal 2023. Cash provided by operations remained consistent primarily due to less operating income generated in fiscal 2024 compared to fiscal 2023 and the impact of our receipt of $7.7 million in cash proceeds from the settlement of interest rate swap derivative contracts in fiscal 2023, offset by net increases in cash flows in fiscal 2024 related to changes in operating assets and liabilities, primarily accounts payable.
Investing Activities
Cash provided by investing activities totaled $19.3 million for fiscal 2024, a fluctuation of $131.9 million compared with fiscal 2023. The cash provided by investing activities in fiscal 2024 was primarily due to the receipt of net proceeds of $124.1 million from the divestiture of Insomnia Cookies and an additional $45.0 million from the repayment of an intercompany loan due from Insomnia Cookies. These proceeds were partially offset by our use of $31.9 million cash for the acquisition of franchised shops in fiscal 2024, discussed in Note 2, Acquisitions and Divestitures to the Condensed Consolidated Financial Statements included in Item 8 of Part II of this Annual Report on Form 10-K. We expect to incur additional capital expenditures related to our accelerated U.S. expansion, including via QSR channels such as the McDonald’s U.S. national rollout discussed in “Significant Events and Transactions” above. We plan to support much of this expansion using existing capacity, and did not experience a significant increase in capital expenditures as a percentage of revenues in fiscal 2024. While we do expect U.S. capital expenditures as a percentage of revenues to increase in fiscal 2025 and 2026 associated with acceleration of the overall U.S. business expansion, these capital expenditures support the overall DFD and retail channels and are not directly attributable to, or required by, the agreement with McDonald’s. We are not subject to capital expenditure commitments or obligations specific to the relationship with McDonald’s.
Financing Activities
Cash used for financing activities totaled $73.9 million for fiscal 2024, a fluctuation of $145.8 million compared with fiscal 2023. The cash used for financing activities was primarily driven by the pay down of long-term debt balances with a portion of the net proceeds received from the divestiture of Insomnia Cookies.
Debt
Our long-term debt obligations consist of the following:
| | | | | | | | | | | |
| (in thousands) | December 29,
2024 | | December 31,
2023 |
| 2023 Facility — term loan | $ | 647,500 | | | $ | 682,500 | |
| 2023 Facility — revolving credit facility | 172,000 | | | 155,000 | |
| Short-term lines of credit | 5,000 | | | 11,000 | |
| | | |
| | | |
| Less: Debt issuance costs | (3,322) | | | (4,371) | |
| Financing obligations | 79,725 | | | 47,117 | |
| Total long-term debt | 900,903 | | | 891,246 | |
| Less: Current portion of long-term debt | (56,356) | | | (54,631) | |
| Long-term debt, less current portion | $ | 844,547 | | | $ | 836,615 | |
2023 Secured Credit Facility
The Company is party to a credit agreement (the “2023 Facility”) consisting of a $300.0 million senior secured revolving credit facility and a term loan with a principal amount of $700.0 million. Refer to Note 8, Long-Term Debt, to the Condensed Consolidated Financial Statements included in Item 8 of Part II of this Annual Report on Form 10-K for further information. Under the terms of the 2023 Facility, we are subject to a requirement to maintain a leverage ratio of less than 5.00 to 1.00 as of the end of each quarterly Test Period (as defined in the 2023 Facility) through maturity in March 2028. The leverage ratio under the 2023 Facility is defined as the ratio of (a) Total Indebtedness (as defined in the 2023 Facility, which includes all debt and finance lease obligations) minus unrestricted cash and cash equivalents to (b) a defined calculation of Adjusted EBITDA (2023 Facility Adjusted EBITDA) for the most recently ended Test Period. Our leverage ratio was 3.91 to 1.00 as of the end of fiscal 2024 compared to 3.48 to 1.00 as of the end of fiscal 2023.
We were in compliance with the financial covenants related to the 2023 Facility as of December 29, 2024 and expect to remain in compliance over the next 12 months. If we are unable to meet the 2023 Facility financial or other covenants in future periods, it could limit our ability to draw on the revolving credit facility, could result in the lenders accelerating the maturity of such indebtedness and foreclosing upon the collateral pledged thereunder, and could require the replacement of the 2023 Facility with new sources of financing, which we may be unable to secure on favorable terms or at all, any of which could negatively impact our liquidity.
Short-Term Lines of Credit
We are party to two agreements with existing lenders providing for short-term, uncommitted lines of credit up to an aggregate of $25.0 million. Borrowings under these short-term lines of credit are payable to the lenders on a revolving basis for tenors up to a maximum of three months and are subject to an interest rate of adjusted term SOFR plus a credit spread adjustment of 0.10% plus a margin of 1.75%. As of December 29, 2024, the Company had drawn $5.0 million under the agreements which is classified within Current portion of long-term debt on the Consolidated Balance Sheets.
Critical Accounting Estimates
The financial information discussed in this “Management’s Discussion and Analysis of Financial Condition and Results of Operations” is based upon or derived from the audited Consolidated Financial Statements, which have been prepared in conformity with GAAP. The preparation of the financial statements requires the use of judgments, estimates, and assumptions that affect the reported amounts of assets, liabilities, revenues, and expenses as well as related disclosures. We consider an accounting judgment, estimate, or assumption to be critical when (1) the estimate or assumption is complex in nature or requires a high degree of judgment and (2) the use of different judgments, estimates, and assumptions could have a material impact on the audited Consolidated Financial Statements.
On an ongoing basis, we evaluate our estimates and judgments based on historical experience and various other factors that are believed to be reasonable under the circumstances. We review our financial reporting and disclosure practices and accounting policies quarterly to confirm that they provide accurate and transparent information relative to the current economic and business environment. A summary of our significant accounting policies is included in Note 1, Description of Business and Summary of Significant Accounting Policies, to the audited Consolidated Financial Statements. We believe that our critical accounting estimates are: Self-Insurance Risks and Receivables from Insurers
We are subject to workers’ compensation, vehicle, and general liability claims and are self-insured for a significant portion of our workers’ compensation, vehicle, and general liability claims up to the amount of stop-loss insurance coverage purchased from commercial insurance carriers. We maintain accruals for the estimated cost of claims, without regard to the effects of stop-loss coverage, using actuarial methods which evaluate known open and incurred but not reported claims and consider historical loss development experience. In addition, we record receivables from the insurance carriers for claims amounts estimated to be recovered under the stop-loss insurance policies when these amounts are estimable and probable of collection. We estimate such stop-loss receivables using the same actuarial methods used to establish the related claims accruals and taking into account the amount of risk transferred to the carriers under the stop-loss policies. The stop-loss policies provide coverage for claims in excess of retained self-insurance risks, which are determined on a claim-by-claim basis. As of December 29, 2024 and December 31, 2023, we had approximately $34.8 million and $21.0 million, respectively, reserved for such programs. Inclusive of the receivables from the stop-loss insurance policies, the Company’s limited liability balance was $18.7 million and $10.8 million as of December 29, 2024 and December 31, 2023, respectively.
Our estimated liability is not discounted and is based on a number of assumptions and factors. The critical assumptions used in determining these related expenses and obligations are future cost projections of claims, which include healthcare cost projections. These critical assumptions are calculated based on historical Company data and experience, as well as appropriate market indicators including inflation, societal attitudes toward legal action, and changes in law. The assumptions are evaluated at least semiannually by us in conjunction with outside actuaries and are closely monitored and adjusted when warranted by changing circumstances. If a greater amount of claims are reported, or if medical costs increase beyond our expectations, our liabilities may not be sufficient, and we could recognize additional expense.
Income Taxes
Our provision for income taxes, deferred tax assets and liabilities including valuation allowances requires the use of estimates based on our management’s interpretation and application of complex tax laws and accounting guidance. We establish reserves for uncertain tax positions for material, known tax exposures in accordance with Accounting Standards Codification (“ASC”) 740, Income Taxes relating to deductions, transactions and other matters involving some uncertainty as to the measurement and recognition of the item. We may adjust these reserves when our judgment changes as a result of the evaluation of new information not previously available and will be reflected in the period in which the new information is available. While we believe that our reserves are adequate, issues raised by a tax authority may be resolved at an amount different than the related reserve and could materially increase or decrease our income tax provision in future periods.
Realization of deferred tax assets involves estimates regarding (i) the timing and amount of the reversal of taxable temporary differences, (ii) expected future taxable income, (iii) the ability to carry back or carry forward net operating losses and tax credits, and (iv) the impact of tax planning strategies. We believe that it is more likely than not that we will not realize the benefit of certain deferred tax assets and, accordingly, have established a valuation allowance against them. In assessing the need for a valuation allowance, we consider all available positive and negative evidence, including past operating results, projections of future taxable income and the feasibility of and potential changes to ongoing tax planning strategies. The projections of future taxable income include a number of estimates and assumptions regarding our volume, pricing and costs. Although realization is not assured for the remaining deferred tax assets, we believe it is more likely than not that the remaining deferred tax assets will be realized through future taxable earnings or alternative tax strategies. However, deferred tax assets could be reduced in the near term if our estimates of taxable income are significantly reduced or tax strategies are no longer viable.
Goodwill and Indefinite Lived Intangible Assets
For each reporting unit, we assess goodwill for impairment annually at the beginning of the fourth fiscal quarter or more frequently when impairment indicators are present. If the carrying value of the reporting unit exceeds its fair value, we recognize an impairment charge for the difference up to the carrying value of the allocated goodwill. The fair value is estimated using a combination of a discounted cash flow approach and a market approach.
When assessing goodwill for impairment, our decision to perform a qualitative impairment assessment for an individual reporting unit is influenced by a number of factors, inclusive of the carrying value of the reporting unit’s goodwill, the significance of the excess of the reporting unit’s estimated fair value over carrying value at the last quantitative assessment date, the amount of time in between quantitative fair value assessments and the date of acquisition. If we perform a quantitative assessment of an individual reporting unit’s goodwill, our impairment calculations contain uncertainties because they require management to make assumptions and to apply judgment when estimating future cash flows and asset fair values, including projected revenue growth and operating expenses related to existing businesses, product innovation and new shop concepts, as well as utilizing valuation multiples of similar publicly traded companies and selecting an appropriate discount rate. Estimates of revenue growth and operating expenses are based on internal projections considering the reporting unit’s past performance and forecasted growth, strategic initiatives, local market economics, and the local business environment impacting the reporting unit’s performance. The discount rate is selected based on the estimated cost of capital for a market participant to operate the reporting unit in the region. These estimates, as well as the selection of comparable companies and valuation multiples used in the market approaches are highly subjective, and our ability to realize the future cash flows used in our fair value calculations is affected by factors such as the success of strategic initiatives, changes in economic conditions, changes in our operating performance, and changes in our business strategies, including retail initiatives and international expansion.
For the fiscal years 2024, 2023, and 2022, there were no goodwill impairment charges. We continue to believe the fair value of each of our reporting units is significantly in excess of its carrying value, and absent a sustained multi-year global decline in our business in key markets such as the U.S., we do not anticipate incurring significant goodwill impairment in the next 12 months.
Other intangible assets, net primarily represent the trade names for our brands, franchise agreements (domestic and international), reacquired franchise rights, and customer relationships. The trade names have been assigned an indefinite useful life and are reviewed annually for impairment. The fair value calculation for the trade names includes estimates of revenue growth, which are based on past performance and internal projections for the intangible asset group’s forecasted growth and royalty rates, which are adjusted for our particular facts and circumstances. The discount rate is selected based on the estimated cost of capital that reflects the risk profile of the related business. These estimates are highly subjective, and our ability to achieve the forecasted cash flows used in our fair value calculations is affected by factors such as the success of strategic initiatives, changes in economic conditions, changes in our operating performance, and changes in our business strategies, including retail initiatives and international expansion. All other intangible assets are amortized on a straight-line basis over their estimated useful lives. Definite-lived intangible assets are assessed for impairment whenever triggering events or indicators of potential impairment occur. We did not have any impairment charges of indefinite-lived intangible assets during any of the periods presented, and we do not anticipate incurring significant impairment charges in the next 12 months.
Impairment of Long-Lived Assets
We evaluate property and equipment, lease right of use assets, and other definite lived assets for impairment whenever events or changes in circumstances indicate that the carrying amounts of such assets may not be recoverable. Expected cash flows associated with an asset are the key factor in determining the recoverability of the asset. For the recoverability evaluation, long-lived assets are grouped with other assets and liabilities at the lowest level for which identifiable cash flows are largely independent of the cash flows of other assets and liabilities. For Company-owned Hub and Spoke assets, the impairment test is performed at the individual Hub asset group level (which includes a Hub and its related Spokes), which is inclusive of property and equipment and lease right of use assets. If the carrying amount of the assets exceeds the sum of the undiscounted cash flows, the Company records an impairment charge in an amount equal to the excess of the carrying value of the assets over the estimated fair value. Significant judgment is involved in determining the assumptions used in estimating future cash flows, including projected revenue growth, operating margins, economic conditions, and changes in the operating environment. Changes in these assumptions could have a significant impact on the recoverability of the asset and may result in additional impairment charges. For those Hubs and any other asset groupings where the carrying amount of the assets exceeds the sum of the undiscounted cash flows, the Company must make additional assumptions to determine the related fair values of the assets, including selection of an appropriate discount rate when the income approach is used.
Impairment charges related to the Company’s long-lived fixed assets were $4.6 million, $18.1 million, and $8.4 million for the fiscal years ended December 29, 2024, December 31, 2023, and January 1, 2023, respectively. For the fiscal year ended December 29, 2024, the Company recognized a net gain on lease termination of $0.1 million. For the fiscal years ended December 31, 2023, and January 1, 2023 the Company recorded lease impairment and termination costs of $6.6 million and $8.2 million, respectively.
New Accounting Pronouncements
Refer to Note 1, Description of Business and Summary of Significant Accounting Policies, to the audited Consolidated Financial Statements included in Item 8 of Part II of this Annual Report on Form 10-K for a detailed description of recent accounting pronouncements.
Item 7A. Quantitative and Qualitative Disclosures About Market Risk
Effects of Changing Prices – Inflation
We are exposed to the effects of commodity price fluctuations in the cost of ingredients of our products, of which flour, sugar and shortening are the most significant. Throughout fiscal 2024, we continued to experience headwinds from commodity inflation globally. We have undertaken efforts to effectively manage inflationary cost increases through rapid inventory turnover and reduced inventory waste, increased focus on resiliency of our supply chains, and an ability to adjust pricing of our products. Additionally, from time to time we may enter into forward contracts for supply through our vendors for raw materials which are ingredients of our products or which are components of such ingredients, including wheat, sugar, and vegetable oil.
We are also exposed to the effects of commodity price fluctuations in the cost of gasoline used by our delivery vehicles. To mitigate the risk of fluctuations in the price of our fuel purchases, we may directly purchase commodity futures contracts.
Interest Rate Risk
We are exposed to changes in interest rates on any borrowings under our debt facilities, which bear interest based on the one-month SOFR (with a floor of zero). Generally, interest rate changes could impact the amount of our interest paid and, therefore, our future earnings and cash flows, assuming other factors are held constant. To mitigate the impact of changes in SOFR on interest expense for a portion of our variable rate debt, we have entered into interest rate swaps on $500.0 million notional of our $824.5 million of outstanding debt under the 2023 Facility and short-term lines of credit as of December 29, 2024, which we account for as cash flow hedges. The interest rate swap agreements are scheduled to mature in March 2028. Based on the $324.5 million of unhedged debt outstanding as of December 29, 2024, a 100 basis point increase or decrease in the one-month SOFR would result in a $3.2 million increase or decrease, respectively, in interest expense for a 12-month period, based on the daily average of the one-month SOFR for the fiscal year ended December 29, 2024.
Foreign Currency Risk
We are exposed to foreign currency translation risk on the operations of our subsidiaries that have functional currencies other than the U.S. dollar, whose revenues accounted for approximately 31% of our total net revenues through the fiscal year ended December 29, 2024. A substantial majority of these revenues, or approximately $519.1 million through the fiscal year ended December 29, 2024, were attributable to subsidiaries whose functional currencies are the Canadian dollar, the British pound sterling, the Euro, the Australian dollar, the New Zealand dollar, the Mexican peso, and the Japanese yen. A 10% increase or decrease in the average fiscal 2024 exchange rate of any of these currencies against the U.S. dollar would have resulted in a decrease or increase, respectively, of approximately $51.9 million in our total net revenues through the fiscal year ended December 29, 2024.
From time to time, we engage in foreign currency exchange and credit transactions with our non-U.S. subsidiaries, which we typically hedge. To date, the impact of such transactions, including the cost of hedging, has not been material. We do not engage in foreign currency or hedging transactions for speculative purposes.
Item 8. Financial Statements and Supplementary Data
Krispy Kreme, Inc.
Index to Consolidated Financial Statements
| | | | | |
| Pages |
| Audited Consolidated Financial Statements: | |
(PCAOB ID Number 248) | |
| |
| |
| |
| |
| |
| |
Report of Independent Registered Accounting Firm
Board of Directors and Shareholders
Krispy Kreme, Inc.
Opinion on the financial statements
We have audited the accompanying consolidated balance sheets of Krispy Kreme, Inc. (a Delaware corporation) and subsidiaries (the “Company”) as of December 29, 2024 and December 31, 2023, the related consolidated statements of operations, comprehensive (loss)/income, changes in shareholders’ equity, and cash flows for each of the three fiscal years in the period ended December 29, 2024, and the related notes (collectively referred to as the “consolidated financial statements”). In our opinion, the consolidated financial statements present fairly, in all material respects, the financial position of the Company as of December 29, 2024 and December 31, 2023, and the results of its operations and its cash flows for each of the three fiscal years in the period ended December 29, 2024, in conformity with accounting principles generally accepted in the United States of America.
We also have audited, in accordance with the standards of the Public Company Accounting Oversight Board (United States) (“PCAOB”), the Company’s internal control over financial reporting as of December 29, 2024, based on criteria established in the 2013 Internal Control—Integrated Framework issued by the Committee of Sponsoring Organizations of the Treadway Commission (“COSO”), and our report dated February 27, 2025 expressed an adverse opinion.
Basis for opinion
These consolidated financial statements are the responsibility of the Company’s management. Our responsibility is to express an opinion on the Company’s consolidated financial statements based on our audits. We are a public accounting firm registered with the PCAOB and are required to be independent with respect to the Company in accordance with the U.S. federal securities laws and the applicable rules and regulations of the Securities and Exchange Commission and the PCAOB.
We conducted our audits in accordance with the standards of the PCAOB. Those standards require that we plan and perform the audit to obtain reasonable assurance about whether the financial statements are free of material misstatement, whether due to error or fraud. Our audits included performing procedures to assess the risks of material misstatement of the financial statements, whether due to error or fraud, and performing procedures that respond to those risks. Such procedures included examining, on a test basis, evidence regarding the amounts and disclosures in the financial statements. Our audits also included evaluating the accounting principles used and significant estimates made by management, as well as evaluating the overall presentation of the financial statements. We believe that our audits provide a reasonable basis for our opinion.
Critical audit matters
The critical audit matters are matters arising from the current period audit of the consolidated financial statements that were communicated or required to be communicated to the audit committee and that: (1) relates to accounts or disclosures that are material to the financial statements and (2) involved our especially challenging, subjective, or complex judgments. We determined that there are no critical audit matters.
/s/GRANT THORNTON LLP
We have served as the Company’s auditor since 2017.
Denver, Colorado
February 27, 2025
Report of Independent Registered Accounting Firm
Board of Directors and Shareholders
Krispy Kreme, Inc.
Opinion on internal control over financial reporting
We have audited the internal control over financial reporting of Krispy Kreme, Inc. (a Delaware corporation) and subsidiaries (the “Company”) as of December 29, 2024, based on criteria established in the 2013 Internal Control—Integrated Framework issued by the Committee of Sponsoring Organizations of the Treadway Commission (“COSO”). In our opinion, because of the effect of the material weakness described in the following paragraphs on the achievement of the objectives of the control criteria, the Company has not maintained effective internal control over financial reporting as of December 29, 2024, based on criteria established in the 2013 Internal Control—Integrated Framework issued by COSO.
A material weakness is a deficiency, or combination of control deficiencies, in internal control over financial reporting, such that there is a reasonable possibility that a material misstatement of the company’s annual or interim financial statements will not be prevented or detected on a timely basis. The following material weakness has been identified and included in management’s assessment.
The Company identified a material weakness related to access that could enable the creation of journal entries without review and approval. This created the potential opportunity for there to have been material errors in multiple financial statement accounts that may have not been prevented or detected timely.
We also have audited, in accordance with the standards of the Public Company Accounting Oversight Board (United States) (“PCAOB”), the consolidated financial statements of the Company as of and for the year ended December 29, 2024. The material weakness identified above was considered in determining the nature, timing, and extent of audit tests applied in our audit of the 2024 consolidated financial statements, and this report does not affect our report dated February 27, 2025 which expressed an unqualified opinion on those financial statements.
Basis for opinion
The Company’s management is responsible for maintaining effective internal control over financial reporting and for its assessment of the effectiveness of internal control over financial reporting, included in the accompanying Management’s Annual Report on Internal Control Over Financial Reporting. Our responsibility is to express an opinion on the Company’s internal control over financial reporting based on our audit. We are a public accounting firm registered with the PCAOB and are required to be independent with respect to the Company in accordance with the U.S. federal securities laws and the applicable rules and regulations of the Securities and Exchange Commission and the PCAOB.
We conducted our audit in accordance with the standards of the PCAOB. Those standards require that we plan and perform the audit to obtain reasonable assurance about whether effective internal control over financial reporting was maintained in all material respects. Our audit included obtaining an understanding of internal control over financial reporting, assessing the risk that a material weakness exists, testing and evaluating the design and operating effectiveness of internal control based on the assessed risk, and performing such other procedures as we considered necessary in the circumstances. We believe that our audit provides a reasonable basis for our opinion.
Definition and limitations of internal control over financial reporting
A company’s internal control over financial reporting is a process designed to provide reasonable assurance regarding the reliability of financial reporting and the preparation of financial statements for external purposes in accordance with generally accepted accounting principles. A company’s internal control over financial reporting includes those policies and procedures that (1) pertain to the maintenance of records that, in reasonable detail, accurately and fairly reflect the transactions and dispositions of the assets of the company; (2) provide reasonable assurance that transactions are recorded as necessary to permit preparation of financial statements in accordance with generally accepted accounting principles, and that receipts and expenditures of the company are being made only in accordance with authorizations of management and directors of the company; and (3) provide reasonable assurance regarding prevention or timely detection of unauthorized acquisition, use, or disposition of the company’s assets that could have a material effect on the financial statements.
Because of its inherent limitations, internal control over financial reporting may not prevent or detect misstatements. Also, projections of any evaluation of effectiveness to future periods are subject to the risk that controls may become inadequate because of changes in conditions, or that the degree of compliance with the policies or procedures may deteriorate.
/s/GRANT THORNTON LLP
Denver, Colorado
February 27, 2025
Krispy Kreme, Inc.
Consolidated Statements of Operations
(in thousands, except per share amounts)
| | | | | | | | | | | | | | | | | |
| Fiscal Years Ended |
| December 29,
2024 (52 weeks) | | December 31,
2023 (52 weeks) | | January 1,
2023 (52 weeks) |
| Net revenues | | | | | |
| Product sales | $ | 1,627,778 | | | $ | 1,651,166 | | | $ | 1,497,882 | |
| Royalties and other revenues | 37,619 | | | 34,938 | | | 32,016 | |
| Total net revenues | 1,665,397 | | | 1,686,104 | | | 1,529,898 | |
| Product and distribution costs | 409,177 | | | 443,243 | | | 406,227 | |
| Operating expenses | 809,916 | | | 776,589 | | | 704,287 | |
| Selling, general and administrative expense | 274,303 | | | 266,863 | | | 223,198 | |
| Marketing expenses | 47,695 | | | 45,872 | | | 42,566 | |
| Pre-opening costs | 3,411 | | | 4,120 | | | 4,227 | |
| Other (income)/expenses, net | (3,967) | | | 10,378 | | | 10,157 | |
| Depreciation and amortization expense | 133,597 | | | 125,894 | | | 110,261 | |
| Operating (loss)/income | (8,735) | | | 13,145 | | | 28,975 | |
| Interest expense, net | 60,066 | | | 50,341 | | | 34,102 | |
| | | | | |
| Gain on divestiture of Insomnia Cookies | (90,455) | | | — | | | — | |
| Other non-operating expense, net | 1,885 | | | 3,798 | | | 3,036 | |
| Income/(loss) before income taxes | 19,769 | | | (40,994) | | | (8,163) | |
| Income tax expense/(benefit) | 15,954 | | | (4,347) | | | 612 | |
| Net income/(loss) | 3,815 | | | (36,647) | | | (8,775) | |
| Net income attributable to noncontrolling interest | 720 | | | 1,278 | | | 6,847 | |
| Net income/(loss) attributable to Krispy Kreme, Inc. | $ | 3,095 | | | $ | (37,925) | | | $ | (15,622) | |
| Net income/(loss) per share: | | | | | |
| Common stock - Basic | $ | 0.02 | | | $ | (0.23) | | | $ | (0.10) | |
| Common stock - Diluted | $ | 0.02 | | | $ | (0.23) | | | $ | (0.10) | |
| Weighted average shares outstanding: | | | | | |
| Basic | 169,341 | | | 168,289 | | | 167,471 | |
| Diluted | 171,500 | | | 168,289 | | | 167,471 | |
See accompanying notes to Consolidated Financial Statements.
Krispy Kreme, Inc.
Consolidated Statements of Comprehensive Income/(Loss)
(in thousands)
| | | | | | | | | | | | | | | | | |
| Fiscal Years Ended |
| December 29,
2024 (52 weeks) | | December 31,
2023 (52 weeks) | | January 1,
2023 (52 weeks) |
| Net income/(loss) | $ | 3,815 | | | $ | (36,647) | | | $ | (8,775) | |
| Other comprehensive (loss)/income, net of income taxes: | | | | | |
| Foreign currency translation adjustment | (35,143) | | | 26,007 | | | (33,637) | |
Unrealized (loss)/income on cash flow hedges, net of income taxes (1) | (5,359) | | | (8,622) | | | 25,251 | |
| Unrealized income on employee benefit plans | 35 | | | 6 | | | 70 | |
| Total other comprehensive (loss)/income | (40,467) | | | 17,391 | | | (8,316) | |
| Comprehensive loss | (36,652) | | | (19,256) | | | (17,091) | |
| Net income attributable to noncontrolling interest | 720 | | | 1,278 | | | 6,847 | |
| Foreign currency translation adjustment attributable to noncontrolling interest | (1,093) | | | 994 | | | (1,642) | |
| Total comprehensive (loss)/income attributable to noncontrolling interest | (373) | | | 2,272 | | | 5,205 | |
| Comprehensive loss attributable to Krispy Kreme, Inc. | $ | (36,279) | | | $ | (21,528) | | | $ | (22,296) | |
(1)Net of income tax benefit/(expense) of $1.8 million, $2.9 million, and ($8.4 million) for the fiscal years ended December 29, 2024, December 31, 2023, and January 1, 2023, respectively.
See accompanying notes to Consolidated Financial Statements.
Krispy Kreme, Inc.
Consolidated Balance Sheets
(in thousands, except per share amounts)
| | | | | | | | | | | |
| As of |
| December 29, 2024 | | December 31, 2023 |
| ASSETS | | | |
| Current assets: | | | |
| Cash and cash equivalents | $ | 28,962 | | | $ | 38,185 | |
| | | |
| Restricted cash | 353 | | | 429 | |
| Accounts receivable, net | 67,722 | | | 59,362 | |
| Inventories | 28,133 | | | 34,716 | |
| Taxes receivable | 16,155 | | | 15,526 | |
| Prepaid expense and other current assets | 31,615 | | | 25,363 | |
| Total current assets | 172,940 | | | 173,581 | |
| Property and equipment, net | 511,139 | | | 538,220 | |
| Goodwill | 1,047,581 | | | 1,101,939 | |
| Other intangible assets, net | 819,934 | | | 946,349 | |
| Operating lease right of use asset, net | 409,869 | | | 456,964 | |
| Investments in unconsolidated entities | 91,070 | | | 2,806 | |
| Other assets | 19,497 | | | 20,733 | |
| Total assets | $ | 3,072,030 | | | $ | 3,240,592 | |
| LIABILITIES AND SHAREHOLDERS’ EQUITY | | | |
| Current liabilities: | | | |
| Current portion of long-term debt | $ | 56,356 | | | $ | 54,631 | |
| Current operating lease liabilities | 46,620 | | | 50,365 | |
| Accounts payable | 123,316 | | | 156,488 | |
| Accrued liabilities | 124,212 | | | 134,005 | |
| Structured payables | 135,668 | | | 130,104 | |
| Total current liabilities | 486,172 | | | 525,593 | |
| Long-term debt, less current portion | 844,547 | | | 836,615 | |
| | | |
| Noncurrent operating lease liabilities | 405,366 | | | 454,583 | |
| Deferred income taxes, net | 130,745 | | | 123,925 | |
| Other long-term obligations and deferred credits | 40,768 | | | 36,093 | |
| Total liabilities | 1,907,598 | | | 1,976,809 | |
| Commitments and contingencies | | | |
| Shareholders’ equity: | | | |
| Common stock, $0.01 par value; 300,000 shares authorized as of both December 29, 2024 and December 31, 2023; 170,060 and 168,628 shares issued and outstanding as of December 29, 2024 and December 31, 2023, respectively | 1,701 | | | 1,686 | |
| Additional paid-in capital | 1,466,508 | | | 1,443,591 | |
| Shareholder note receivable | (1,906) | | | (3,850) | |
| Accumulated other comprehensive (loss)/income, net of income tax | (32,128) | | | 7,246 | |
| Retained deficit | (299,638) | | | (278,990) | |
| Total shareholders’ equity attributable to Krispy Kreme, Inc. | 1,134,537 | | | 1,169,683 | |
| Noncontrolling interest | 29,895 | | | 94,100 | |
| Total shareholders’ equity | 1,164,432 | | | 1,263,783 | |
| Total liabilities and shareholders’ equity | $ | 3,072,030 | | | $ | 3,240,592 | |
See accompanying notes to Consolidated Financial Statements.
Krispy Kreme, Inc.
Consolidated Statements of Changes in Shareholders’ Equity
(in thousands, except per share amounts)
| | | | | | | | | | | | | | | | | | | | | | | | | | | | | | | | | | | | | | | | | | | | | | | | | | | | | | | | | | | |
| Common Stock | | Additional
Paid-in
Capital | | Shareholder Note Receivable | | Accumulated Other Comprehensive
Income/(Loss) | | | | | | |
| Shares Outstanding | | Amount | | | | Foreign
Currency
Translation
Adjustment | | Unrealized
(Loss)/Income on
Cash Flow
Hedges | | Unrealized Loss on Employee
Benefit Plans | | Retained Deficit | | Noncontrolling Interest | | Total |
| Balance at January 2, 2022 | 167,251 | | | $ | 1,673 | | | $ | 1,415,185 | | | $ | (4,382) | | | $ | 8,967 | | | $ | (11,001) | | | $ | (444) | | | $ | (178,409) | | | $ | 104,066 | | | $ | 1,335,655 | |
| Net (loss)/income for the fiscal year ended January 1, 2023 | — | | | — | | | — | | | — | | | — | | | — | | | — | | | (15,622) | | | 6,847 | | | (8,775) | |
| Other comprehensive (loss)/income for the fiscal year ended January 1, 2023 before reclassifications | — | | | — | | | — | | | — | | | (31,995) | | | 22,524 | | | 70 | | | — | | | (1,642) | | | (11,043) | |
| Reclassification from AOCI | — | | | — | | | — | | | — | | | — | | | 2,727 | | | — | | | — | | | — | | | 2,727 | |
| Capital contribution from shareholders, net of loans issued | — | | | — | | | (72) | | | (216) | | | — | | | — | | | — | | | — | | | — | | | (288) | |
| Share-based compensation | — | | | — | | | 18,170 | | | — | | | — | | | — | | | — | | | — | | | — | | | 18,170 | |
| Purchase of shares by noncontrolling interest | — | | | — | | | — | | | (258) | | | — | | | — | | | — | | | — | | | 851 | | | 593 | |
| | | | | | | | | | | | | | | | | | | |
| Dividends declared on common stock and equivalents ($0.035 per share) | — | | | — | | | — | | | — | | | — | | | — | | | — | | | (23,459) | | | — | | | (23,459) | |
| | | | | | | | | | | | | | | | | | | |
| Distribution to noncontrolling interest | — | | | — | | | (4,229) | | | 88 | | | — | | | — | | | — | | | — | | | (7,580) | | | (11,721) | |
| | | | | | | | | | | | | | | | | | | |
| | | | | | | | | | | | | | | | | | | |
| Issuance of common stock upon settlement of RSUs, net of shares withheld | 886 | | | 8 | | | (2,951) | | | — | | | — | | | — | | | — | | | — | | | — | | | (2,943) | |
| | | | | | | | | | | | | | | | | | | |
| Other | — | | | — | | | 2 | | | (45) | | | — | | | 1 | | | — | | | — | | | 1 | | | (41) | |
| Balance at January 1, 2023 | 168,137 | | | $ | 1,681 | | | $ | 1,426,105 | | | $ | (4,813) | | | $ | (23,028) | | | $ | 14,251 | | | $ | (374) | | | $ | (217,490) | | | $ | 102,543 | | | $ | 1,298,875 | |
| Net (loss)/income for the fiscal year ended December 31, 2023 | — | | | — | | | — | | | — | | | — | | | — | | | — | | | (37,925) | | | 1,278 | | | (36,647) | |
| Other comprehensive income for the fiscal year ended December 31, 2023 before reclassifications | — | | | — | | | — | | | — | | | 25,013 | | | 2 | | | 6 | | | — | | | 994 | | | 26,015 | |
| Reclassification from AOCI | — | | | — | | | — | | | — | | | — | | | (8,624) | | | — | | | — | | | — | | | (8,624) | |
| Capital contribution from shareholders, net of loans issued | — | | | — | | | — | | | 764 | | | — | | | — | | | — | | | — | | | — | | | 764 | |
| Share-based compensation | — | | | — | | | 24,196 | | | — | | | — | | | | | — | | | — | | | — | | | 24,196 | |
| Purchase of shares by noncontrolling interest | — | | | — | | | — | | | (133) | | | — | | | — | | | — | | | — | | | 425 | | | 292 | |
| | | | | | | | | | | | | | | | | | | |
| Dividends declared on common stock and equivalents ($0.035 per share) | — | | | — | | | — | | | — | | | — | | | — | | | — | | | (23,576) | | | — | | | (23,576) | |
| | | | | | | | | | | | | | | | | | | |
| Distribution to noncontrolling interest | — | | | — | | | (4,825) | | | 426 | | | — | | | — | | | — | | | — | | | (11,139) | | | (15,538) | |
| | | | | | | | | | | | | | | | | | | |
| | | | | | | | | | | | | | | | | | | |
| Issuance of common stock upon settlement of RSUs, net of shares withheld | 491 | | | 5 | | | (1,885) | | | — | | | — | | | — | | | — | | | — | | | — | | | (1,880) | |
| | | | | | | | | | | | | | | | | | | |
| Other | — | | | — | | | — | | | (94) | | | — | | | — | | | — | | | 1 | | | (1) | | | (94) | |
| Balance at December 31, 2023 | 168,628 | | | $ | 1,686 | | | $ | 1,443,591 | | | $ | (3,850) | | | $ | 1,985 | | | $ | 5,629 | | | $ | (368) | | | $ | (278,990) | | | $ | 94,100 | | | $ | 1,263,783 | |
| Net income for the fiscal year ended December 29, 2024 | — | | | — | | | — | | | — | | | — | | | — | | | — | | | 3,095 | | | 720 | | | 3,815 | |
| Other comprehensive (loss)/income for the fiscal year ended December 29, 2024 before reclassifications | — | | | — | | | — | | | — | | | (34,050) | | | 2,304 | | | 35 | | | — | | | (1,093) | | | (32,804) | |
| Reclassification from AOCI | — | | | — | | | — | | | — | | | — | | | (7,663) | | | — | | | — | | | — | | | (7,663) | |
| Capital contribution from shareholders, net of loans issued | — | | | — | | | — | | | 919 | | | — | | | — | | | — | | | — | | | — | | | 919 | |
| Share-based compensation | — | | | — | | | 35,149 | | | — | | | — | | | — | | | — | | | — | | | — | | | 35,149 | |
| Purchase of shares by noncontrolling interest | — | | | — | | | — | | | — | | | — | | | — | | | — | | | — | | | 1,562 | | | 1,562 | |
| Noncontrolling interest from divestiture of Insomnia Cookies | — | | | — | | | — | | | 945 | | | — | | | — | | | — | | | — | | | (30,427) | | | (29,482) | |
| | | | | | | | | | | | | | | | | | | |
Dividends declared on common stock and equivalents ($0.035 per share) (1) | — | | | — | | | — | | | — | | | — | | | — | | | — | | | (23,742) | | | — | | | (23,742) | |
| | | | | | | | | | | | | | | | | | | |
| Distribution to noncontrolling interest | — | | | — | | | (6,742) | | | 126 | | | — | | | — | | | — | | | — | | | (34,967) | | | (41,583) | |
| | | | | | | | | | | | | | | | | | | |
| | | | | | | | | | | | | | | | | | | |
| Issuance of common stock upon settlement of RSUs, net of shares withheld | 1,432 | | | 14 | | | (5,503) | | | — | | | — | | | — | | | — | | | — | | | — | | | (5,489) | |
| | | | | | | | | | | | | | | | | | | |
| Other | — | | | 1 | | | 13 | | | (46) | | | — | | | — | | | — | | | (1) | | | — | | | (33) | |
| Balance at December 29, 2024 | 170,060 | | | $ | 1,701 | | | $ | 1,466,508 | | | $ | (1,906) | | | $ | (32,065) | | | $ | 270 | | | $ | (333) | | | $ | (299,638) | | | $ | 29,895 | | | $ | 1,164,432 | |
(1)Includes a $0.035 cash dividend per common share declared in the fourth quarter of fiscal 2024 and paid in the first quarter of fiscal 2025.
See accompanying notes to Consolidated Financial Statements.
Krispy Kreme, Inc.
Consolidated Statements of Cash Flows
(in thousands)
| | | | | | | | | | | | | | | | | |
| Fiscal Years Ended |
| December 29,
2024 (52 weeks) | | December 31,
2023 (52 weeks) | | January 1,
2023 (52 weeks) |
| CASH FLOWS PROVIDED BY OPERATING ACTIVITIES: | | | | | |
| Net income/(loss) | $ | 3,815 | | | $ | (36,647) | | | $ | (8,775) | |
| Adjustments to reconcile net income/(loss) to net cash provided by operating activities: | | | | | |
| Depreciation and amortization expense | 133,597 | | | 125,894 | | | 110,261 | |
| Deferred and other income taxes | 3,067 | | | (18,486) | | | (14,237) | |
| Loss on extinguishment of debt | — | | | 472 | | | — | |
| Impairment and lease termination charges | 4,464 | | | 24,909 | | | 18,297 | |
| Loss on disposal of property and equipment | 1,250 | | | 110 | | | 393 | |
| Gain on divestiture of Insomnia Cookies | (90,455) | | | — | | | — | |
| Gain on remeasurement of equity method investment | (5,579) | | | — | | | — | |
| Gain on sale-leaseback | (1,569) | | | (9,646) | | | (6,549) | |
| Share-based compensation | 35,149 | | | 24,196 | | | 18,170 | |
| Change in accounts and notes receivable allowances | 646 | | | 654 | | | 570 | |
| Inventory write-off | 2,783 | | | 11,248 | | | 868 | |
| | | | | |
| | | | | |
| Settlement of interest rate swap derivatives | — | | | 7,657 | | | 8,476 | |
| Amortization related to settlement of interest rate swap derivatives | (5,910) | | | (10,289) | | | — | |
| Other | (619) | | | 2,155 | | | 2,232 | |
| Change in operating assets and liabilities, excluding business acquisitions and divestitures, and foreign currency translation adjustments: | | | | | |
| Accounts, notes, and taxes receivable | (13,895) | | | (3,523) | | | (9,485) | |
| Inventories | (2,011) | | | 780 | | | (12,515) | |
| Other current and noncurrent assets | (873) | | | (2,395) | | | (1,691) | |
| | | | | |
| Operating lease assets and liabilities | (1,227) | | | 5,111 | | | (793) | |
| Accounts payable and accrued liabilities | (20,156) | | | (74,471) | | | 32,015 | |
| Other long-term obligations and deferred credits | 3,355 | | | (2,185) | | | 2,581 | |
| Net cash provided by operating activities | 45,832 | | | 45,544 | | | 139,818 | |
| CASH FLOWS PROVIDED BY/(USED FOR) INVESTING ACTIVITIES: | | | | | |
| Purchase of property and equipment | (120,792) | | | (121,427) | | | (111,717) | |
| Proceeds from disposals of assets | 183 | | | 218 | | | 1,077 | |
| Proceeds from sale-leaseback | 6,308 | | | 10,025 | | | 8,401 | |
| Acquisition of shops and franchise rights from franchisees, net of cash acquired | (31,938) | | | — | | | (17,330) | |
| Purchase of equity method investment | (3,506) | | | (1,424) | | | (989) | |
| Net proceeds from divestiture of Insomnia Cookies | 124,126 | | | — | | | — | |
| Principal payment received from loan to Insomnia Cookies | 45,000 | | | — | | | — | |
| Principal payments received from loans to franchisees | 985 | | | 20 | | | 59 | |
| Disbursement for loan receivable | (1,086) | | | — | | | (975) | |
| | | | | |
| | | | | |
| Net cash provided by/(used for) investing activities | 19,280 | | | (112,588) | | | (121,474) | |
| CASH FLOWS (USED FOR)/PROVIDED BY FINANCING ACTIVITIES: | | | | | |
| Proceeds from the issuance of debt | 676,250 | | | 1,175,698 | | | 149,000 | |
| Repayment of long-term debt and lease obligations | (712,778) | | | (1,084,390) | | | (101,181) | |
| Payment of financing costs | — | | | (5,175) | | | — | |
| Proceeds from structured payables | 376,189 | | | 241,148 | | | 282,023 | |
| Payments on structured payables | (345,327) | | | (214,574) | | | (294,457) | |
| Payment of contingent consideration related to a business combination | — | | | (925) | | | (900) | |
| Capital contribution from shareholders, net of loans issued | 919 | | | 764 | | | (288) | |
| | | | | |
| Payments of issuance costs in connection with initial public offering | — | | | — | | | (12,458) | |
| Proceeds from sale of noncontrolling interest in subsidiary | 1,562 | | | 292 | | | 593 | |
| Distribution to shareholders | (23,692) | | | (23,558) | | | (23,430) | |
| Payments for repurchase and retirement of common stock | (5,489) | | | (1,880) | | | (4,019) | |
| Distribution to noncontrolling interest | (41,583) | | | (15,538) | | | (11,721) | |
| Net cash (used for)/provided by financing activities | (73,949) | | | 71,862 | | | (16,838) | |
| Effect of exchange rate changes on cash, cash equivalents and restricted cash | (462) | | | (1,934) | | | (4,968) | |
| Net (decrease)/increase in cash, cash equivalents and restricted cash | (9,299) | | | 2,884 | | | (3,462) | |
| Cash, cash equivalents and restricted cash at beginning of the fiscal year | 38,614 | | | 35,730 | | | 39,192 | |
| Cash, cash equivalents and restricted cash at end of the fiscal year | $ | 29,315 | | | $ | 38,614 | | | $ | 35,730 | |
| Supplemental schedule of non-cash investing and financing activities: | | | | | |
| Increase in accrual for property and equipment | $ | 14,214 | | | $ | 51,820 | | | $ | 20,629 | |
| Stock issuance under shareholder notes | — | | | — | | | 614 | |
| Accrual for distribution to shareholders | (5,952) | | | (5,902) | | | (5,884) | |
| | | | | |
| | | | | |
| Reconciliation of cash, cash equivalents and restricted cash at end of fiscal year: | | | | | |
| Cash and cash equivalents | $ | 28,962 | | | $ | 38,185 | | | $ | 35,371 | |
| Restricted cash | 353 | | | 429 | | | 359 | |
| Total cash, cash equivalents and restricted cash | $ | 29,315 | | | $ | 38,614 | | | $ | 35,730 | |
See accompanying notes to Consolidated Financial Statements.
Krispy Kreme, Inc.
Index to Notes to Consolidated Financial Statements
Krispy Kreme, Inc.
Notes to Consolidated Financial Statements
(dollars in thousands, unless otherwise specified)
Note 1 — Description of Business and Summary of Significant Accounting Policies
Description of Business
Krispy Kreme, Inc. (“KKI”) and its subsidiaries (collectively, the “Company” or “Krispy Kreme”) operate through an omni-channel business model to produce doughnuts and deliver fresh doughnut experiences for Doughnut Shops, DFD Doors, and digital channels, expanding consumer access to the Krispy Kreme brand.
The Company has three reportable operating segments: 1) U.S., which includes all Krispy Kreme Company-owned operations in the U.S., and Insomnia Cookies Bakeries globally through the date of deconsolidation (refer to Note 2, Acquisitions and Divestitures, to the audited Consolidated Financial Statements for more information); 2) International, which includes all Krispy Kreme Company-owned operations in the U.K., Ireland, Australia, New Zealand, Mexico, Canada and Japan; and 3) Market Development, which includes franchise operations across the globe. Unallocated corporate costs are excluded from the Company’s measurement of segment performance. As of December 29, 2024, there were 2,078 Krispy Kreme-branded shops in 40 countries around the world. The ownership and location of those shops is as follows:
| | | | | | | | | | | | | | | | | | | | | | | |
| U.S. | | International | | Market Development | | Total |
| Company-owned Shops | 307 | | | 568 | | | — | | | 875 | |
| | | | | | | |
| Franchise Shops | — | | | — | | | 1,203 | | | 1,203 | |
| Total | 307 | | | 568 | | | 1,203 | | | 2,078 | |
Basis of Presentation and Consolidation
The Company operates and reports financial information on a 52 or 53-week year with the fiscal year ending on the Sunday closest to December 31. The data periods contained within fiscal years 2024, 2023, and 2022 reflect the results of operations for the 52-week periods ending December 29, 2024, December 31, 2023 and January 1, 2023, respectively.
The accompanying audited Consolidated Financial Statements include the accounts of KKI and its subsidiaries and have been prepared in accordance with GAAP. All significant intercompany balances and transactions among KKI and its subsidiaries have been eliminated in consolidation. Investments in entities over which the Company has the ability to exercise significant influence but which it does not control and whose financial statements are not otherwise required to be consolidated are accounted for using the equity method.
Noncontrolling interest in the Company’s audited Consolidated Financial Statements represents the interest in subsidiaries held by joint venture partners and employee shareholders. The joint venture partners hold noncontrolling interests in the Company’s consolidated subsidiaries W.K.S. Krispy Kreme, LLC (“WKS Krispy Kreme”), and Krispy K Canada, Inc. (“KK Canada”). Employee shareholders hold noncontrolling interests in the consolidated subsidiaries Krispy Kreme Holding U.K. Ltd. (“KK U.K.”), Krispy Kreme Holdings Pty Ltd. (“KK Australia”), and Krispy Kreme Mexico Holding S.A.P.I. de C.V. (“KK Mexico”). Since the Company consolidates the financial statements of these subsidiaries, the noncontrolling owners’ share of each subsidiary’s net assets and results of operations are deducted and reported as a noncontrolling interest on the Consolidated Balance Sheets and as net income attributable to noncontrolling interest in the Consolidated Statements of Operations and comprehensive income attributable to noncontrolling interest in the Consolidated Statements of Comprehensive Income/(Loss).
Use of Estimates
The preparation of financial statements in conformity with GAAP requires management to make estimates and assumptions that affect the reported amounts of assets and liabilities and disclosure of contingent assets and liabilities as of the date of the financial statements and the reported amounts of revenues and expenses during the reporting period. Actual results could differ from those estimates under different assumptions or conditions.
Revenue Recognition
Revenue is recognized when control of promised goods or services is transferred to a customer in an amount that reflects the consideration expected to be received for those goods or services.
Product Sales
Product sales include revenue derived from (1) the sale of doughnuts and complementary products to in-shop, digital, and DFD customers and (2) the sale of doughnut mix, other ingredients and supplies, and doughnut-making equipment to franchisees. Revenue is recognized at the time of delivery for in-shop sales, digital sales, and sales to franchisees. For DFD sales, control transfers and revenue is recognized either at the time of delivery or, with respect to those customers that take title to products purchased from the Company at the time those products are sold by the customer to the end consumers, simultaneously with such consumer purchases. Revenues are recognized net of provisions for estimated product returns. Revenues from the sale of doughnut mix, other ingredients, supplies, and doughnut-making equipment to franchisees include any applicable shipping and handling costs invoiced to the customer, and the expense of such shipping and handling costs is included in Operating expenses. The Company recorded shipping revenue of approximately $10.4 million, $13.3 million, and $11.2 million in the fiscal years ended December 29, 2024, December 31, 2023, and January 1, 2023, respectively.
Franchise Revenue
Franchise revenue included in Royalties and other revenues is derived from development and initial franchise fees relating to new shop openings and ongoing royalties charged to franchisees based on their sales. The Company sells individual franchises domestically and internationally, as well as development agreements that grant the right to develop shops in designated areas. Generally, the franchise license granted for each individual shop within an arrangement represents a single performance obligation. The franchise agreements and development agreements typically require the franchisee to pay initial nonrefundable franchise fees (i.e., initial services such as training and assisting with shop set-up) prior to opening. The franchisees also pay a royalty on a monthly basis based upon a percentage of franchisee gross sales. Royalties are recognized in income as underlying franchisee sales occur. The initial term of domestic franchise agreements is typically 15 years. The Company recognizes the initial nonrefundable fees over the term of the franchise agreements on an output method based on time elapsed, corresponding with the customer’s right to use the franchise for the term of the agreement. A franchisee may elect to renew the term of a franchise agreement and, if approved, will typically pay a renewal fee upon execution of the renewal term.
Franchise-related Advertising Fund Revenue
Franchise-related advertising fund revenue included in Royalties and other revenues is derived from domestic and international franchise agreements that typically require the franchisee to pay advertising fees on a continuous monthly basis based on a percentage of franchisee net sales, which are recognized based on fees earned each period. Total advertising fund revenue for the fiscal years ended December 29, 2024, December 31, 2023, and January 1, 2023 is $4.5 million, $3.8 million, and $3.6 million, respectively.
Gift Card Sales
The Company and its franchisees sell gift cards that are redeemable for products in the Company-owned or franchise shops. The Company manages the gift card program and collects all funds from the activation of gift cards and reimburses franchisees for the redemption of gift cards in their shops. Deferred revenue for unredeemed gift cards is included in Accrued liabilities in the Consolidated Balance Sheets. As of December 29, 2024 and December 31, 2023, the gross amount of deferred revenue recognized for unredeemed gift cards was $28.9 million and $29.6 million, respectively. Gift cards sold do not have an expiration date or service fees charged. The likelihood of redemption may be determined to be remote for certain cards due to long periods of inactivity. In these circumstances, the Company recognizes revenue from unredeemed gift cards (“breakage revenue”) within Product sales if they are not subject to unclaimed property laws. The Company estimates breakage for the portfolio of gift cards and recognizes it based on the estimated pattern of gift card use. As of December 29, 2024 and December 31, 2023, deferred revenue, net of breakage revenue recognized, was $9.7 million and $12.1 million, respectively.
Gift card costs incurred to fulfill obligations under a contract are capitalized when such costs generate or enhance resources to be used in satisfying future performance obligations and the costs are deemed recoverable. Judgment is used in determining whether certain contract costs can be capitalized. These costs are capitalized and amortized on a systematic basis to match the timing of revenue recognition, depending on when the gift card is used. This amortization expense is recorded in Operating expenses in the Company’s Consolidated Statements of Operations. As of December 29, 2024 and December 31, 2023, the capitalized gift card costs were $2.0 million and $1.8 million, respectively.
Consumer Loyalty Program
Consumers can participate in spend-based loyalty programs. Consumers who join the loyalty programs will receive points for each purchase of eligible product. After accumulating a certain number of points, the consumers can redeem their points for a free product. The Company defers revenue based on an estimated selling price of the free product earned by the consumer and establishes a corresponding liability in deferred revenue. As of December 29, 2024 and December 31, 2023, the deferred revenue related to loyalty programs is $3.6 million and $4.1 million, respectively.
Revenue-based Taxes
The Company reports revenue net of any revenue-based taxes assessed by governmental authorities that are imposed on and concurrent with specific revenue-producing transactions. The primary revenue-based taxes are sales tax and value-added tax (“VAT”).
Product and Distribution Costs
Product and distribution costs include mainly raw material costs (principally sugar, flour, wheat, oil, and their derivatives) and production costs (including labor) related to doughnuts, other sweet treats, doughnut mix, packaging, and logistics costs related to raw materials.
Operating Expenses
Operating expenses consist of expenses primarily related to Company-owned shops including payroll and benefit costs for service employees at Company-operated locations, rent and utilities, expenses associated with Company operations, costs associated with procuring materials from vendors, and other shop-level operating costs.
Marketing Expenses
Costs associated with marketing the products, including advertising and other brand promotional activities, are expensed as incurred, and were approximately $47.7 million, $45.9 million, and $42.6 million in the fiscal years ended December 29, 2024, December 31, 2023, and January 1, 2023, respectively.
Pre-opening Costs
Pre-opening costs include labor, rent, utilities, and other expenses that are required as part of the set-up and use of a new shop, prior to generating sales. Pre-opening costs also include costs to integrate acquired franchises back into the Company-owned model, which typically occur with the relevant shop closed over a one to three-day period subsequent to acquisition. Pre-opening costs do not include expenses related to strategic planning (for example, new site lease negotiations), which are recorded in SG&A.
Cash and Cash Equivalents and Restricted Cash
Cash equivalents consist of demand deposits in banks and short-term, highly liquid debt instruments with original maturities of three months or less.
All credit and debit card transactions that are processed in less than five days are classified as Cash and cash equivalents. The amounts due from banks for these transactions totaled $6.7 million and $9.7 million as of December 29, 2024 and December 31, 2023, respectively.
The Company maintains cash and cash equivalent balances with financial institutions that exceed federally-insured limits. The Company has not experienced any losses related to these balances, and believes credit risk to be minimal.
Restricted cash consists primarily of funds related to employee benefit plans.
Accounts Receivable, Net of Allowance for Expected Credit Losses
Accounts receivable relate primarily to payments due for sale of products, franchise fees, royalties, advertising fees, and licensing fees. The Company maintains allowances for expected credit losses related to its accounts receivable, including receivables from franchisees, in amounts which the Company believes are sufficient to provide for losses estimated to be sustained on realization of these receivables. The measurement of expected credit losses is based on relevant information about past events, including historical experience, current conditions, and reasonable and supportable forecasts that affect the collectibility of amounts from customers. Such estimates inherently involve uncertainties and assessments of the outcome of future events, and changes in facts and circumstances may result in adjustments to the allowance for expected credit losses. The Company had allowance for expected credit losses of $1.1 million and $0.6 million as of December 29, 2024 and December 31, 2023, respectively.
Concentration of Credit Risk
Financial instruments that subject the Company to credit risk consist principally of receivables from DFD customers and franchisees. DFD receivables are primarily from grocery and convenience stores, QSR, club memberships, and drug stores. For the fiscal years ended December 29, 2024, December 31, 2023, and January 1, 2023, no customer accounted for more than 10% of revenue or a significant amount of receivables that would result in a concentration.
Management also evaluates the recoverability of receivables from the franchisees and maintains allowances for expected credit losses. Management believes these allowances are sufficient to provide for realized losses that may be sustained on realization of these receivables.
Inventories
Inventories, which consist of raw materials, work in progress, finished goods, and purchased merchandise, are recorded at the lower of cost and net realizable value, where cost is determined using the first-in, first-out method. Raw materials inventory also includes doughnut equipment spare parts. Finished goods and purchased merchandise are net of reserves for excess or obsolete finished goods. These reserves totaled $2.0 million as of both December 29, 2024, and December 31, 2023.
Taxes Receivable
Taxes receivable relate primarily to expected refunds of VAT as well as prepayments of income taxes to governmental authorities.
Prepaid Expense and Other Current Assets
Prepaid expense and other current assets consist primarily of prepaid assets related to service contracts and insurance premiums of $27.3 million and $20.7 million as of December 29, 2024 and December 31, 2023, respectively.
Property and Equipment, net
Property and equipment are recorded at cost, net of impairment. Depreciation of property and equipment is provided using the straight-line method over the estimated useful lives of the respective assets.
The lives used in computing depreciation are as follows:
| | | | | |
| Buildings | 20 to 35 years |
| Machinery and equipment | 3 to 15 years |
| Computer software | 2 to 7 years |
Leasehold improvements are depreciated over the shorter of the estimated useful life of the asset or the lease term.
The Company assesses long-lived fixed asset groups for potential impairment whenever events or changes in circumstances indicate that their carrying amount may not be recoverable. If the carrying amount of the assets exceeds the sum of the undiscounted cash flows, the Company records an impairment charge in an amount equal to the excess of the carrying value of the assets over their estimated fair value.
Impairment charges related to the Company’s long-lived fixed assets were $4.6 million, $18.1 million, and $8.4 million for the fiscal years ended December 29, 2024, December 31, 2023, and January 1, 2023, respectively. Such charges related to underperforming shops, shops closed or likely to be closed, and shops which management believes will not generate sufficient future cash flows to enable the Company to recover the carrying value of the shops’ assets, but has not yet decided to close. The impaired shop assets include real estate properties, the fair values of which may be estimated based on independent appraisals or, in the case of any properties which the Company is negotiating to sell, based on its negotiations with unrelated third-party buyers; leasehold improvements, which are typically abandoned when the leased properties revert to the lessor; and doughnut-making and other equipment the fair values of which may be estimated based on the replacement cost of the equipment, after considering refurbishment and transportation costs. The impairment charges are primarily attributable to the U.S. segment and are included within Other (income)/expenses, net on the Consolidated Statements of Operations.
Leases
Contracts entered into by the Company are evaluated to determine whether such contracts contain leases. A contract contains a lease if the contract conveys the right to control the use of identified property, plant, and equipment for a period of time in exchange for consideration. At commencement, contracts containing a lease are further evaluated for classification as an operating or finance lease based on the principle of whether or not the lease is effectively a financed purchase by the lessee. This classification determines whether lease expense is recognized based on an effective interest method or on a straight-line basis over the term of the lease.
The lease term and incremental borrowing rate (“IBR”) for each lease requires judgment by management and can impact the classification of leases as well as the value of the lease assets and liabilities. When determining the lease term, management considers option periods available, and includes option periods in the measurement of the lease right of use asset and lease liability where the exercise is reasonably certain to occur. The Company uses the rate implicit in the lease whenever that rate is readily determinable. If the rate implicit in the lease is not readily determinable, the Company uses its IBR.
Upon the adoption of ASC 842, Leases, the Company has elected to not separate the lease and non-lease components within the contract. Therefore, all fixed payments associated with the lease are included in the right of use asset and the lease liability. These costs often relate to the payments for a proportionate share of real estate taxes, insurance, common area maintenance and other operating costs in addition to a base rent. Any variable payments related to the lease are recorded as lease expense when and as incurred. The Company has elected this practical expedient for its real estate, vehicles and equipment leases. The Company has also elected the short-term lease expedient. A short-term lease is a lease that, as of the commencement date, has a lease term of 12 months or less and does not include an option to purchase the underlying asset that the lessee is reasonably certain to exercise. For such leases, the Company will not apply the recognition requirements of ASC 842 and instead will recognize the lease payments as lease cost on a straight-line basis over the lease term.
In the same manner as long-lived fixed assets, the Company assesses lease right of use assets for potential impairment whenever events or changes in circumstances indicate that their carrying amount may not be recoverable. If the carrying amount of the right of use assets exceeds the sum of their undiscounted cash flows, the Company records an impairment charge in an amount equal to the excess of the carrying value of the assets over their estimated fair value. If a lease contract is terminated before the expiration of the lease term the remaining right of use asset and lease liability are derecognized, with any difference recognized as a gain or loss on lease termination. If the Company is required to make any payments or receives consideration when terminating the lease, it would include such amounts in the determination of the gain or loss upon termination. For the fiscal year ended December 29, 2024, the Company recognized a net gain on lease termination of $0.1 million, which is included within Other (income)/expenses, net on the Consolidated Statements of Operations. For the fiscal years ended December 31, 2023, and January 1, 2023 the Company recorded lease impairment and termination costs of $6.6 million and $8.2 million, respectively, which are included within Other (income)/expenses, net on the Consolidated Statements of Operations.
Goodwill and Other Intangible Assets
Goodwill represents the excess of the purchase price over the fair value of identifiable net assets acquired in a business combination. For each reporting unit, the Company assesses goodwill for impairment annually at the beginning of the fourth quarter or more frequently when impairment indicators are present. If the carrying value of the reporting unit exceeds its fair value, the Company recognizes an impairment charge for the difference up to the carrying value of the allocated goodwill. The value is estimated under a discounted cash flow approach, which incorporates assumptions regarding future growth rates, terminal values and discount rates. For the fiscal years ended December 29, 2024, December 31, 2023, and January 1, 2023, there were no goodwill impairment charges.
Other intangible assets primarily represent the trade names for the Company’s brands, franchise agreements (domestic and international), reacquired franchise rights, and customer relationships. The trade names have been assigned an indefinite useful life and are reviewed annually for impairment. All other intangible assets are amortized on a straight-line basis over their estimated useful lives. Definite-lived intangible assets are assessed for impairment whenever triggering events or indicators of potential impairment occur. The Company recognized no impairment charges to other intangible assets for the fiscal year ended December 29, 2024. The Company recognized impairment charges to other intangible assets of $0.2 million and $0.8 million for the fiscal years ended December 31, 2023 and January 1, 2023 respectively, related to franchise agreement terminations.
Accrued Liabilities
Accrued liabilities include accrued compensation, accrued legal fees, accrued utilities, accrued marketing, and other accrued liabilities. As of December 29, 2024 and December 31, 2023, accrued compensation and benefits included in the Accrued liabilities balance was $30.3 million and $42.6 million, respectively.
Supply Chain Financing Programs
The Company has an agreement with a third-party administrator which allows participating vendors to track the Company’s payments, and if voluntarily elected by the vendor, to sell payment obligations from the Company to financial institutions (the “supply chain financing program” or the “SCF program”). When participating vendors elect to sell one or more of the Company’s payment obligations, the Company’s rights and obligations to settle the payables on their contractual due date are not impacted. The Company agrees on commercial terms with vendors for the goods and services procured, which are consistent with payment terms observed at other peer companies in the industry. The Company has historically prioritized negotiating longer payment terms with some of its largest vendors, and certain of these vendors have also elected to participate in the SCF program. Payment terms and pricing negotiations are independent of, and not conditioned upon, a vendor’s participation in the SCF program. The financial institutions do not provide the Company with incentives such as rebates or profit sharing under the SCF program. As the terms are not impacted by the SCF program, such obligations are classified as Accounts payable in the Consolidated Balance Sheets and the associated cash flows are included in operating activities in the Consolidated Statements of Cash Flows. Refer to Note 7, Vendor Finance Programs, to the audited Consolidated Financial Statements for more information. Structured Payables Programs
The Company utilizes various card products issued by financial institutions to facilitate purchases of goods and services. By using these products, the Company may receive differing levels of rebates based on timing of repayment. The payment obligations under these card products are classified as Structured payables in the Consolidated Balance Sheets and the associated cash flows are included in financing activities in the Consolidated Statements of Cash Flows. Refer to Note 7, Vendor Finance Programs, to the audited Consolidated Financial Statements for more information. Share-based Compensation
The Company measures and recognizes compensation expense for share-based payment awards based on the fair value of each award at its grant date and recognizes expense on a straight-line basis over the requisite service period for the entire award, including for those awards with a graded vesting schedule. The Company accounts for forfeitures of share-based compensation awards as they occur. Compensation expense is included in Selling, general and administrative expenses in the Consolidated Statements of Operations.
Fair Value
The accounting standards for fair value measurements define fair value as the price that would be received for an asset or paid to transfer a liability in the principal or most advantageous market for the asset or liability in an orderly transaction between market participants at the measurement date. The accounting standards for fair value measurements establish a three-level fair value hierarchy that prioritizes the inputs used to measure fair value. This hierarchy requires entities to maximize the use of observable inputs and minimize the use of unobservable inputs. The three levels of inputs used to measure fair value are as follows:
•Level 1: Quoted prices in active markets that are accessible as of the measurement date for identical assets or liabilities.
•Level 2: Observable inputs other than quoted prices included within Level 1, such as quoted prices for similar assets and liabilities in active markets; quoted prices for identical or similar assets and liabilities in markets that are not active; or other inputs that are observable or can be corroborated by observable market data.
•Level 3: Unobservable inputs that are supported by little or no market activity and that are significant to the fair value measurement of the assets or liabilities. These include certain pricing models, discounted cash flow methodologies and similar techniques that use significant unobservable inputs.
The Company’s financial instruments not measured at fair value on a recurring basis include cash and cash equivalents, receivables, accounts payable, and accrued liabilities and are reflected in the audited Consolidated Financial Statements at cost which approximates fair value for these items due to their short-term nature. Management believes the fair value determination of these short-term financial instruments is a Level 1 measure. The Company’s other assets and liabilities measured at fair value on a non-recurring basis include long-lived assets, lease right of use assets, goodwill, and other indefinite-lived intangible assets, if determined to be impaired. Refer to the Property and Equipment, net policy section in Note 1, Description of Business and Summary of Significant Accounting Policies, to the audited Consolidated Financial Statements, for information about impairment charges on long-lived assets. The fair values of assets evaluated for impairment were determined using an income-based approach and are classified as Level 3 measures within the fair value hierarchy. Derivative Financial Instruments
Management reflects derivative financial instruments, which typically consist of interest rate derivatives, foreign currency derivatives, and fuel commodity derivatives in the Consolidated Balance Sheets at their fair value. For interest rate derivatives, changes in fair value are reflected in other comprehensive income as the Company applies cash flow hedge accounting. Consistent with the classification of interest paid, cash flows from interest rate derivatives are classified as operating on the Consolidated Statements of Cash Flows. The changes in the fair values of the foreign currency and fuel commodity derivatives are reflected in income as the Company does not apply hedge accounting to those derivatives.
Self-Insurance Risks and Receivables from Insurers
The Company is subject to workers’ compensation, vehicle, and general liability claims. The Company is self-insured for the cost of workers’ compensation, vehicle, and general liability claims up to the amount of stop-loss insurance coverage purchased by the Company from commercial insurance carriers. The Company maintains accruals for the estimated cost of claims, without regard to the effects of stop-loss coverage, using actuarial methods which evaluate known open and incurred but not reported claims and consider historical loss development experience. As of December 29, 2024 and December 31, 2023, the Company had approximately $34.8 million and $21.0 million, respectively, reserved for such programs. The liability recorded for assessments has not been discounted. In addition, the Company records receivables from the insurance carriers for claims amounts estimated to be recovered under the stop-loss insurance policies when these amounts are estimable and probable of collection. The Company estimates such stop-loss receivables using the same actuarial methods used to establish the related claims accruals and considering the amount of risk transferred to the carriers under the stop-loss policies. The stop-loss policies provide coverage for claims in excess of retained self-insurance risks, which are determined on a claim-by-claim basis. Inclusive of the receivables from the stop-loss insurance policies, the Company’s limited liability balance was $18.7 million and $10.8 million as of December 29, 2024 and December 31, 2023, respectively. The gross liability balances for the current and noncurrent portions of these claims are classified as Accrued liabilities and Other long-term obligations and deferred credits, respectively, in the Consolidated Balance Sheets. The current and noncurrent portions of the stop-loss receivables are classified as Prepaid expense and other current assets and Other assets, respectively, in the Consolidated Balance Sheets.
Preferred Stock
The Company has 50.0 million shares of authorized preferred stock with $0.01 par value per share. There were no shares of preferred stock issued nor outstanding as of December 29, 2024 and December 31, 2023.
Earnings/(Loss) per Share (EPS)
The Company discloses two calculations of earnings/(loss) per share (“EPS”): basic EPS and diluted EPS. The numerator in calculating common stock basic and diluted EPS is net income/(loss) attributable to the Company. The denominator in calculating common stock basic EPS is the weighted average shares outstanding. The denominator in calculating common stock diluted EPS includes the additional dilutive effect of unvested RSUs, PSUs, and time-vested stock options when the effect is not antidilutive. Refer to Note 18, Net Earnings/(Loss) per Share, to the audited Consolidated Financial Statements for more information. Reclassifications
Segment information is prepared on the same basis on which the Company’s management reviews financial information for operational decision-making purposes. Effective January 1, 2024, the Company realigned its segment reporting structure such that the Company-owned Canada and Japan businesses have moved from the Market Development reportable operating segment to the International reportable operating segment. All segment information for comparative periods has been restated to be consistent with current presentation.
In the Consolidated Balance Sheets, Investments in unconsolidated entities in the comparative period have been reclassified (formerly presented within Other assets) to be consistent with current presentation. This reclassification does not have a significant impact on the reported financial position and does not impact the results of operations or cash flows.
Exiting the Branded Sweet Treats Business
During the fiscal year ended December 31, 2023, the Company decided to exit its pre-packaged Branded Sweet Treats business due in part to its dilutive impact on profit margins, as well as to allow the Company to focus on its fresh doughnuts business. As such, the Company recognized non-recurring expenses, including property, plant and equipment impairments, inventory write-offs, employee severance, and other related costs, totaling approximately $17.9 million (gross of income taxes) in fiscal 2023. Of these expenses, $10.1 million were recorded within Product and distribution costs, primarily relating to inventory write-offs, and the rest were recorded within Other (income)/expenses, net on the on the Consolidated Statements of Operations.
Business Relationship Agreement with McDonald’s
On March 22, 2024 (the “Effective Date”), the Company entered into a Business Relationship Agreement (the “Agreement”) with McDonald’s USA, LLC (“McDonald’s”). The Agreement provides, among other things, that the parties will work together to develop a deployment schedule for a U.S. national rollout of the sale of Krispy Kreme doughnuts at McDonald’s restaurants to be implemented by McDonald’s. The deployment schedule will set forth the anticipated launch period for each McDonald’s business unit (“BU”) in the U.S. McDonald’s agreed to introduce and make available certain Krispy Kreme products to McDonald’s restaurants in the U.S. for one year post-conclusion of such rollout. The Agreement does not guarantee Krispy Kreme any particular level of BU deployment, sales, or profits. From the Effective Date through December 31, 2026 (unless the Agreement is earlier terminated), the Company agreed not to (i) supply any doughnuts to any other QSR in the U.S. for sale or distribution by such QSR, (ii) assist any other person or entity to do the foregoing or any QSR to make or have made doughnuts, or (iii) license or authorize any other QSR in the U.S. to use any Krispy Kreme brand on or in connection with the sale of doughnuts. McDonald’s agreed to not sell within the U.S. any third-party branded, fresh doughnuts or McDonald’s branded, white-labeled or unbranded doughnuts (subject to certain carve-outs). The Agreement does not grant McDonald’s any exclusivity outside of the U.S. The initial term of the Agreement begins on the Effective Date and ends one year following the last BU rollout and automatically renews for consecutive one-year periods (unless the Agreement is earlier terminated). Either party may terminate for cause under certain circumstances during the initial term or any renewal term and upon six months’ prior notice during any renewal term.
Recent Accounting Pronouncements
Recently Adopted
Accounting Standards Adopted at the Beginning of Fiscal Year 2024
In November 2023, the FASB issued Accounting Standards Update (“ASU”) 2023-07, Segment Reporting (Topic 280): Improvements to Reportable Segment Disclosures, which required a public entity to disclose significant segment expenses and other segment items on an annual and interim basis and provide in interim periods all disclosures about a reportable segment’s profit or loss and assets that are currently required annually. Additionally, it required a public entity to disclose the title and position of the Chief Operating Decision Maker (“CODM”). The ASU did not change how a public entity identifies its operating segments, aggregates them, or applies the quantitative thresholds to determine its reportable segments. The ASU was effective for fiscal years beginning after December 15, 2023, and interim periods within fiscal years beginning after December 15, 2024. As such, the Company adopted this ASU in the fiscal year ended December 29, 2024 and has disclosed the required information in Note 19, Segment Reporting. The adoption of this ASU did not impact the financial statements presented herein. Accounting Standards Adopted at the Beginning of Fiscal Year 2023
In March 2020, the FASB issued ASU 2020-04, Reference Rate Reform (Topic 848): Facilitation of the Effects of Reference Rate Reform on Financial Reporting, which provided companies with optional guidance to ease the potential accounting burden associated with transitioning away from reference rates that are expected to be discontinued. It was effective for all entities as of March 12, 2020 through December 31, 2022. In December 2022, the FASB issued ASU 2022-06, Reference Rate Reform (Topic 848): Deferral of the Sunset Date of Topic 848, which provided optional guidance to ease the potential burden in accounting for (or recognizing the effects of) reference rate reform by delaying the effective date of the guidance issued in ASU 2020-04 to December 31, 2024. During the fiscal year ended December 31, 2023 the Company refinanced its debt with interest to be calculated prospectively with reference to SOFR, and accordingly adopted this ASU, which did not materially impact the financial statements presented herein.
In September 2022, the FASB issued ASU 2022-04, Liabilities — Supplier Finance Programs (Subtopic 405-50): Disclosure of Supplier Finance Program Obligations, which required certain disclosures be made by a buyer in a supplier finance program, including the key terms of the program and, for the obligations that the buyer has confirmed as valid to the finance provider, the amount outstanding that remains unpaid by the buyer as of the end of the fiscal period, a description of where those obligations are presented in the balance sheet, and a rollforward of those obligations during the fiscal period. It was effective for all entities for fiscal years beginning after December 15, 2022, including interim periods within those fiscal years, except for the amendment on rollforward information, which was effective for fiscal years beginning after December 15, 2023. The Company adopted this ASU in the fiscal year ended December 31, 2023 and disclosed the required information in Note 7, Vendor Finance Programs.
Accounting Standards Adopted at the Beginning of Fiscal Year 2022
In November 2021, the FASB issued ASU 2021-10, Government Assistance (Topic 832): Disclosures by Business Entities about Government Assistance, which required certain disclosures to be made when an entity receives government assistance, including the types of assistance, an entity’s accounting for the assistance, and the effect of the assistance on an entity’s financial statements. It was effective for all entities for financial statements issued for annual periods beginning after December 15, 2021. The adoption of this ASU did not materially impact the financial statements presented herein.
In October 2021, the FASB issued ASU 2021-08, Business Combinations (Topic 805): Accounting for Contract Assets and Contract Liabilities from Contracts with Customers, which prescribed the measurement of acquired contract assets and contract liabilities arising from revenue contracts with customers recognized in a business combination. It was effective for public business entities (“PBE”) for fiscal years beginning after December 15, 2022, including interim periods within those fiscal years. The amendments in this ASU were applied prospectively to business combinations occurring on or after the effective date of the amendments. The adoption of this ASU did not materially impact the financial statements presented herein.
Not Yet Adopted
In December 2023, the FASB issued ASU 2023-09, Income Taxes (Topic 740): Improvements to Income Tax Disclosures, which focuses on the rate reconciliation and income taxes paid disclosures. The ASU requires a PBE to disclose, on an annual basis, a tabular rate reconciliation using both percentages and currency amounts, broken out into specified categories with certain reconciling items further disaggregated by nature and jurisdiction to the extent those items exceed a specified threshold. In addition, all entities are required to disclose income taxes paid, net of refunds received disaggregated by federal, state, and foreign and by individual jurisdiction if the amount is at least 5% of total income tax payments, net of refunds received. For PBEs, the ASU is effective for annual periods beginning after December 15, 2024, with early adoption permitted. An entity should apply the amendments in this ASU prospectively, with retrospective application permitted. The Company expects this ASU to impact its income tax disclosures, but with no impacts to its results of operations, cash flows, and financial condition.
In November 2024, the FASB issued ASU 2024-03, Income Statement (Subtopic 220-40): Disaggregation of Income Statement Expenses, which requires a PBE to disclose in the notes to the financial statements, at each interim and annual reporting period, specified information about certain costs and expenses including (a) purchases of inventory, (b) employee compensation, (c) depreciation, (d) intangible asset amortization, and (e) depreciation, depletion, and amortization recognized as part of oil and gas-producing activities, for each income statement line item that contains those expenses. For PBE’s, the ASU is effective for fiscal years beginning after December 15, 2026, and interim periods within fiscal years beginning after December 15, 2027. An entity may apply the amendments in this ASU prospectively or retrospectively. The Company expects this ASU to impact its expense disclosures, but with no impacts to its results of operations, cash flows, and financial condition.
There are other new accounting pronouncements issued by the FASB that the Company has adopted or will adopt, as applicable, and the Company does not believe any of these accounting pronouncements have had, or will have, a material impact on its audited Consolidated Financial Statements or disclosures.
Note 2 — Acquisitions and Divestitures
The Company strategically acquires companies in order to increase its footprint. These acquisitions are accounted for as business combinations using the acquisition method, whereby the purchase price is allocated to the assets acquired and liabilities assumed, based on their estimated fair values as of the date of the acquisition.
Transaction-related expenses as a result of these acquisitions, which exclude costs incurred to integrate the acquired entities, were recorded within Operating income in the Consolidated Statements of Operations (primarily Selling, general and administrative expenses) during the fiscal year such costs were incurred.
Goodwill recognized for these acquisitions represents the intangible assets that do not qualify for separate recognition and primarily includes the acquired customer base, the acquired workforce including shop partners in the region that have strong relationships with these customers, and the existing geographic shop and digital presence.
2024 Acquisitions and Divestitures
Acquisition of Krispy Kreme U.S. and Canada Shops
In the third and fourth quarters of fiscal 2024, the Company acquired the business and operating assets of three franchisees, consisting of ten Krispy Kreme shops in the U.S. and one Krispy Kreme shop in Canada. Prior to one of the acquisitions, the Company was a minority investor in the shops via its equity method investments in KremeWorks USA, LLC and KremeWorks Canada, L.P. The Company paid cumulative consideration of $37.7 million, consisting of $31.9 million of cash (exclusive of $6.7 million proceeds for the Company’s equity method investments), $2.8 million of consideration payable to the sellers, and $3.0 million settlement of amounts related to pre-existing relationships, to acquire substantially all of the shops’ assets. Consideration payable of $2.8 million was withheld primarily to cover indemnification claims that could arise after closing. The settlement of pre-existing relationships included in the purchase consideration includes the settlement of accounts and notes receivable, net of deferred revenue, of $0.7 million. It also includes the disposal of the franchise intangible asset related to the franchisees with a cumulative net book value of $2.3 million at the respective acquisition dates. The Company accounted for the transactions as business combinations.
Immediately prior to one of the acquisitions, the Company recognized a gain of $5.6 million related to remeasurement of its equity method investments to a cumulative fair value of $6.7 million. The gain is recorded within Other (income)/expenses, net in the Consolidated Statements of Operations.
The following table summarizes the preliminary fair values of assets acquired and liabilities assumed as of the date of acquisition for the acquisitions above.
| | | | | | | | | | | | | | | | | |
| KK U.S. Shops | | KK Canada Shop | | Total Purchase
Price Allocation
for Acquisitions |
| Assets acquired: | | | | | |
| Cash and cash equivalents | $ | 8 | | | $ | 1 | | | $ | 9 | |
| Prepaid expense and other current assets | 379 | | | 63 | | | 442 | |
| Property and equipment, net | 13,649 | | | 971 | | | 14,620 | |
| Other intangible assets, net | 12,928 | | | 6,871 | | | 19,799 | |
| Operating lease right of use asset, net | 10,308 | | | 322 | | | 10,630 | |
| Deferred income taxes, net | — | | 23 | | 23 | |
| | | | | |
| Total identified assets acquired | 37,272 | | | 8,251 | | | 45,523 | |
| Liabilities assumed: | | | | | |
| Accrued liabilities | (124) | | | — | | | (124) | |
| Current operating lease liabilities | (1,153) | | | (61) | | | (1,214) | |
| Noncurrent operating lease liabilities | (9,155) | | | (261) | | | (9,416) | |
| Deferred income taxes, net | (514) | | | — | | | (514) | |
| Total liabilities assumed | (10,946) | | | (322) | | | (11,268) | |
| Goodwill | 6,512 | | | 3,625 | | | 10,137 | |
| Net assets acquired | 32,838 | | | 11,554 | | | 44,392 | |
| Less: Fair value of former equity method investments | (4,254) | | | (2,460) | | | (6,714) | |
| Purchase consideration, net | $ | 28,584 | | | $ | 9,094 | | | $ | 37,678 | |
| Transaction costs in 2024 | $ | 1,933 | | | $ | 589 | | | $ | 2,522 | |
| Transaction costs in 2023 | 102 | | | — | | | 102 | |
| Reportable segment | U.S. | | International | | |
Other intangible assets, net consist of reacquired franchise rights with an estimated useful life equal to the weighted average remaining franchise agreement term, which was ten years for these acquired shops. The results of operations of the aforementioned acquired shops were consolidated by the Company from the respective dates of acquisition and include $18.4 million of total revenue and $2.4 million of net income attributable to the Company for fiscal year 2024. The amounts do not reflect adjustments for franchise royalties and related expenses that the Company could have generated as revenue and expenses from the acquired franchisees during the fiscal year had the transaction not been completed.
The results of the acquired franchise businesses were reported within the Market Development segment prior to the respective dates of acquisition and are reported within the segments noted above following the respective dates of acquisition. During the measurement period, the Company will continue to obtain information to assist in determining the fair value of net assets acquired, which may differ materially from these preliminary estimates. Measurement period adjustments, if applicable, will be applied in the reporting period in which the adjustment amounts are determined.
Equity Method Investments in KK Brazil and KK Spain
In the second quarter of fiscal 2024, the Company acquired a 45% noncontrolling ownership interest in the newly formed entity Krispy Kreme Doughnuts Brasil S.A. (“KK Brazil”), for approximately $2.7 million in cash, and a 25% noncontrolling ownership interest in the newly formed entity Glaseadas Originales S.L. (“KK Spain”), for approximately $0.8 million in cash. As the Company has the ability to exercise significant influence over both KK Brazil and KK Spain, but does not have the ability to exercise control, the investments are accounted for using the equity method, and equity method earnings are recognized within Other (income)/expenses, net in the Consolidated Statements of Operations.
Acquisition of Additional Units in Consolidated Subsidiary Awesome Doughnut
In the third quarter of fiscal 2024, the Company purchased all units held by the noncontrolling interest holders in the consolidated subsidiary Awesome Doughnut, LLC (“Awesome Doughnut”) for $32.9 million in cash. The purchase increased the Company’s ownership interest in Awesome Doughnut from 70% to 100%. The Company financed the purchase via an existing structured payables program whereby the structured payable matured and was paid in the first quarter of fiscal 2025.
Divestiture of Insomnia Cookies
In the third quarter of fiscal 2024, the Company entered into an agreement to sell a portion of its shares of Insomnia Cookies Holdings, LLC (“Insomnia Cookies”) for cash proceeds of $127.4 million. On August 1, 2024, the Company received additional cash of $45.0 million from Insomnia Cookies related to the settlement of an intercompany loan. The transaction resulted in the Company’s ownership of Insomnia Cookies declining from 75.0% to 34.7% with a loss of control. Accordingly, the Company deconsolidated Insomnia Cookies from the Company’s Consolidated Financial Statements and recorded a gain on divestiture of $90.5 million (gross of income taxes) which is included within Gain on divestiture of Insomnia Cookies in the Consolidated Statements of Operations. The gain was calculated as follows:
| | | | | |
| July 17, 2024 |
| Cash proceeds | $ | 127,350 | |
| Fair value of retained noncontrolling interest in Insomnia Cookies | 85,086 | |
| Carrying value of former noncontrolling interest in Insomnia Cookies | 30,427 | |
| Less: Carrying value of net assets of Insomnia Cookies, including cash and cash equivalents | (152,408) | |
| Gain on divestiture of Insomnia Cookies | $ | 90,455 | |
As the Company has the ability to exercise significant influence over Insomnia Cookies, but does not have the ability to exercise control, the investment is accounted for using the equity method. The fair value of the equity method investment of $85.1 million was estimated using a Monte Carlo simulation in a risk-neutral framework to model the likelihood of the Company’s potential future sale of its noncontrolling interest in Insomnia Cookies. The valuation methodology includes assumptions and judgments regarding probability weighting, discount rates, operating results of Insomnia Cookies, and expected timing of a future exit by the investors. Equity method earnings are recognized within Other non-operating expense, net in the Consolidated Statements of Operations.
2023 Acquisitions
In the fiscal year ended December 31, 2023, there were no acquisitions accounted for as business combinations.
Equity Method Investment in KK France
In the fourth quarter of fiscal 2023, the Company invested approximately $1.4 million in cash to maintain a 33% noncontrolling ownership interest in Krispy Kreme Doughnuts France SAS (“KK France”). As the Company has the ability to exercise significant influence over KK France, but it does not exercise control, the investment is accounted for using the equity method, and equity method earnings are recognized within Other (income)/expenses, net on the Consolidated Statements of Operations.
2022 Acquisitions
Acquisition of Krispy Kreme U.S. Shops
In the third quarter of fiscal 2022, the Company acquired the business and operating assets of one franchisee, consisting of seven Krispy Kreme shops in the U.S. The Company paid total consideration of $19.4 million, consisting of $17.3 million of cash at the acquisition date, $1.2 million of consideration payable to the sellers within 12 months of the acquisition date, and $0.9 million settlement of amounts related to pre-existing relationships, to acquire substantially all of the shops’ assets. The settlement of pre-existing relationships included in the purchase consideration includes the settlement of accounts and notes receivable, net of deferred revenue, of $0.3 million. It also includes the disposal of the franchise intangible asset related to the franchisee with a cumulative net book value of $0.6 million at the acquisition date. The Company accounted for the transaction as a business combination.
The following table summarizes the fair values of assets acquired and liabilities assumed as of the date of acquisition for the acquisition above.
| | | | | |
| | KK U.S. Shops |
| Assets acquired: | |
| Cash and cash equivalents | $ | 7 | |
| Prepaid expense and other current assets | 138 | |
| Property and equipment, net | 1,542 | |
| Other intangible assets, net | 11,203 | |
| Operating lease right of use asset, net | 4,702 | |
| Deferred income taxes, net | 2,678 |
| Other assets | 11 | |
| Total identified assets acquired | 20,281 | |
| Liabilities assumed: | |
| Accrued liabilities | (106) | |
| Current operating lease liabilities | (221) | |
| Noncurrent operating lease liabilities | (4,481) | |
| Total liabilities assumed | (4,808) | |
| Goodwill | 3,975 | |
| Purchase consideration, net | $ | 19,448 | |
| Transaction costs in 2022 | $ | 840 | |
| Transaction costs in 2021 | 6 | |
| Reportable segment | U.S. |
Other intangible assets, net consist of reacquired franchise rights with an estimated useful life equal to the weighted average remaining franchise agreement term, which was ten years for these acquired shops. The results of operations of the aforementioned acquired shops were consolidated by the Company from the date of acquisition and include $3.7 million of total revenue and $0.3 million of net income attributable to the Company for fiscal year 2022. The amounts do not reflect adjustments for franchise royalties and related expenses that the Company could have generated as revenue and expenses from the acquired franchisees during the fiscal year had the transaction not been completed.
Equity Method Investment in KK France
In the third quarter of fiscal 2022, the Company acquired a 33% noncontrolling ownership interest in the newly formed entity KK France, for approximately $1.0 million in cash.
Supplemental Unaudited Pro Forma Information
The following unaudited pro forma information presents estimated combined results of the Company as if the 2024 acquisitions had occurred on January 2, 2023, and the 2022 acquisitions had occurred on January 4, 2021:
| | | | | | | | | | | | | | | | | |
| Fiscal Years Ended |
| December 29, 2024 | | December 31, 2023 | | January 1, 2023 |
| Revenue | $ | 1,665,397 | | | $ | 1,686,104 | | | $ | 1,529,898 | |
| Income/(loss) before income taxes | 19,769 | | | (40,994) | | | (8,163) | |
The acquisitions of the aforementioned Krispy Kreme U.S. and Canada shops are not material to the Company’s financial statements, and therefore, the supplemental pro forma financial information related to these acquisitions is not included herein. These supplemental pro forma results are unaudited and are not necessarily indicative of results of operations that would have occurred had the acquisitions actually closed in the prior period. The pro forma results are also not indicative of results of operations for any future period.
Note 3 — Accounts Receivable, net
The components of Accounts receivable, net are as follows:
| | | | | | | | | | | |
| December 29, 2024 | | December 31, 2023 |
| Trade receivables, net | $ | 57,439 | | | $ | 45,858 | |
| Other receivables, net | 8,406 | | | 12,478 | |
| Receivables from related parties, net | 1,877 | | | 1,026 | |
| Total accounts receivable, net | $ | 67,722 | | | $ | 59,362 | |
Receivables from related parties, net includes receivables from equity method investees. Refer to Note 16, Related Party Transactions, to the audited Consolidated Financial Statements for more information. Note 4 — Inventories
The components of Inventories are as follows:
| | | | | | | | | | | |
| December 29, 2024 | | December 31, 2023 |
| Raw materials | $ | 20,698 | | | $ | 21,000 | |
| Work in progress | 328 | | | 211 | |
Finished goods and purchased merchandise (1) | 7,107 | | | 13,505 | |
| Total inventories | $ | 28,133 | | | $ | 34,716 | |
(1)During the fiscal years ended December 29, 2024, December 31, 2023, and January 1, 2023, the Company recognized inventory write-offs of $2.8 million, $11.2 million, and $0.9 million, respectively. The inventory write-offs in the fiscal year ended December 31, 2023 primarily related to the decision to exit the Branded Sweet Treats business.
Note 5 — Property and Equipment, net
Property and equipment, net consist of the following:
| | | | | | | | | | | |
| December 29, 2024 | | December 31, 2023 |
| Land | $ | 11,096 | | | $ | 12,115 | |
| Buildings | 163,116 | | | 158,672 | |
| Leasehold improvements | 243,358 | | | 285,012 | |
| Machinery and equipment | 409,876 | | | 355,044 | |
| Computer software | 95,086 | | | 90,019 | |
| Construction and projects in progress | 34,215 | | | 42,816 | |
| Property and equipment, gross | 956,747 | | | 943,678 | |
| Less: Accumulated depreciation | (445,608) | | | (405,458) | |
Total property and equipment, net (1) | $ | 511,139 | | | $ | 538,220 | |
(1)Property and equipment, net was impacted by a reduction of $92.6 million in the fiscal year ended December 29, 2024 related to the divestiture of Insomnia Cookies.
Computer software includes $16.0 million and $10.4 million of costs to develop, code, test, and license software under hosting arrangements as of December 29, 2024 and December 31, 2023, respectively. Software under hosting arrangements consists primarily of solutions that empower the Company’s consumer-facing website and mobile application. Total depreciation expense was $90.0 million, $88.9 million, and $76.8 million in the fiscal years ended December 29, 2024, December 31, 2023, and January 1, 2023, respectively.
Note 6 — Goodwill and Other Intangible Assets
Goodwill
Changes in the carrying amount of goodwill by reportable segment are as follows:
| | | | | | | | | | | | | | | | | | | | | | | |
| U.S. | | International | | Market Development | | Total |
| Balance as of January 1, 2023 | $ | 678,068 | | | $ | 280,325 | | | $ | 129,515 | | | $ | 1,087,908 | |
| | | | | | | |
| Measurement period adjustments related to fiscal year 2022 acquisitions | (112) | | | — | | | — | | | (112) | |
| Foreign currency impact | — | | | 14,143 | | | — | | | 14,143 | |
| Balance as of December 31, 2023 | 677,956 | | | 294,468 | | | 129,515 | | | 1,101,939 | |
| Acquisitions | 23,603 | | | 4,270 | | | (17,736) | | | 10,137 | |
| Divestiture of Insomnia Cookies | (54,803) | | | — | | | — | | | (54,803) | |
| | | | | | | |
| Foreign currency impact | — | | | (15,720) | | | — | | | (15,720) | |
| Adjustments related to deferred taxes | 6,028 | | | — | | | — | | | 6,028 | |
| Balance as of December 29, 2024 | $ | 652,784 | | | $ | 283,018 | | | $ | 111,779 | | | $ | 1,047,581 | |
Acquisitions of franchises result in a reclassification of goodwill between segments.
Other Intangible Assets
Other intangible assets consist of the following:
| | | | | | | | | | | | | | | | | | | | | | | | | | | | | | | | | | | |
| December 29, 2024 | | December 31, 2023 |
| Gross
Carrying
Amount | | Accumulated
Amortization | | Net
Amount | | Gross
Carrying
Amount | | Accumulated
Amortization | | Net
Amount |
| Intangible assets with indefinite lives | | | | | | | | | | | |
Trade names and trademarks (1) | $ | 553,400 | | | $ | — | | | $ | 553,400 | | | $ | 657,980 | | | $ | — | | | $ | 657,980 | |
| Intangible assets with definite lives | | | | | | | | | | | |
| Franchise agreements | 27,154 | | | (11,050) | | | 16,104 | | | 30,390 | | | (10,744) | | | 19,646 | |
| Customer relationships | 15,000 | | | (7,277) | | | 7,723 | | | 15,000 | | | (6,413) | | | 8,587 | |
Reacquired franchise rights (2) | 402,894 | | | (160,187) | | | 242,707 | | | 397,279 | | | (137,143) | | | 260,136 | |
| | | | | | | | | | | |
| Total intangible assets with definite lives | 445,048 | | | (178,514) | | | 266,534 | | | 442,669 | | | (154,300) | | | 288,369 | |
| Total intangible assets | $ | 998,448 | | | $ | (178,514) | | | $ | 819,934 | | | $ | 1,100,649 | | | $ | (154,300) | | | $ | 946,349 | |
(1)Trade names and trademarks were impacted by a reduction of $104.6 million in the fiscal year ended December 29, 2024 related to the divestiture of Insomnia Cookies.
(2)Reacquired franchise rights include the impact of foreign currency fluctuations associated with the respective countries.
Amortization expense related to intangible assets included in Depreciation and amortization expense was $30.3 million, $29.4 million, and $28.5 million for the fiscal years ended December 29, 2024, December 31, 2023, and January 1, 2023, respectively.
Estimated future amortization expense as of December 29, 2024 is as follows:
| | | | | |
| Fiscal year | Estimated
amortization expense |
| 2025 | $ | 30,863 | |
| 2026 | 30,466 | |
| 2027 | 30,443 | |
| 2028 | 30,630 | |
| 2029 | 29,783 | |
| Thereafter | 114,349 | |
| Total | $ | 266,534 | |
The aforementioned estimates do not reflect the impact of future foreign exchange rate changes.
Note 7 — Vendor Finance Programs
The following table presents liabilities related to vendor finance programs which the Company participates in as a buyer as of December 29, 2024 and December 31, 2023:
| | | | | | | | | | | | | | | | | |
| December 29, 2024 | | December 31, 2023 | | Balance Sheet Location |
| Supply chain financing programs | $ | 6,912 | | | $ | 51,239 | | | Accounts payable |
| Structured payables programs | 135,668 | | | 130,104 | | | Structured payables |
| Total Liabilities | $ | 142,580 | | | $ | 181,343 | | | |
Changes in the vendor finance program balances are as follows:
| | | | | | | | | | | |
| Supply Chain Financing Programs | | Structured Payables Programs |
| Balance as of January 1, 2023 | $ | 159,426 | | | $ | 103,575 | |
| Proceeds received | 189,615 | | | 241,148 | |
| Payments made | (298,941) | | | (214,574) | |
| Foreign currency impact | 1,139 | | | (45) | |
| Balance as of December 31, 2023 | $ | 51,239 | | | $ | 130,104 | |
| Proceeds received | 41,765 | | | 376,189 | |
| Payments made | (62,804) | | | (345,327) | |
| Divestiture of Insomnia Cookies | (23,186) | | | (25,109) | |
| Foreign currency impact | (102) | | | (189) | |
| Balance as of December 29, 2024 | $ | 6,912 | | | $ | 135,668 | |
Supply Chain Financing Programs
The Company has an agreement with a third-party administrator which allows participating vendors to track the Company’s payments, and if voluntarily elected by the vendor, to sell payment obligations from the Company to financial institutions as part of the SCF program. When participating vendors elect to sell one or more of the Company’s payment obligations, the Company’s rights and obligations to settle the payables on their contractual due date are not impacted. The Company agrees on commercial terms with vendors for the goods and services procured, which are consistent with payment terms observed at other peer companies in the industry. The Company has historically prioritized negotiating longer payment terms with some of its largest vendors, and certain of these vendors have also elected to participate in the SCF program. Payment terms and pricing negotiations are independent of, and not conditioned upon, a vendor’s participation in the SCF program. The financial institutions do not provide the Company with incentives such as rebates or profit sharing under the SCF program. As the terms are not impacted by the SCF program, such obligations are classified as Accounts payable in the Consolidated Balance Sheets and the associated cash flows are included in operating activities in the Consolidated Statements of Cash Flows.
Structured Payables Programs
The Company utilizes various card products issued by financial institutions to facilitate purchases of goods and services. By using these products, the Company may receive differing levels of rebates based on timing of repayment. The payment obligations under these card products are classified as Structured payables in the Consolidated Balance Sheets and the associated cash flows are included in financing activities in the Consolidated Statements of Cash Flows.
Note 8 — Long-Term Debt
The Company’s long-term debt obligations consists of the following:
| | | | | | | | | | | |
| December 29, 2024 | | December 31, 2023 |
| 2023 Facility — term loan | $ | 647,500 | | | $ | 682,500 | |
| 2023 Facility — revolving credit facility | 172,000 | | | 155,000 | |
| Short-term lines of credit | 5,000 | | | 11,000 | |
| | | |
| | | |
| Less: Debt issuance costs | (3,322) | | | (4,371) | |
| Financing obligations | 79,725 | | | 47,117 | |
| Total long-term debt | 900,903 | | | 891,246 | |
| Less: Current portion of long-term debt | (56,356) | | | (54,631) | |
| Long-term debt, less current portion | $ | 844,547 | | | $ | 836,615 | |
2023 Secured Credit Facility
The Company is party to a credit agreement (the “2023 Facility”) consisting of a $300.0 million senior secured revolving credit facility and a term loan with an original principal amount of $700.0 million. The 2023 Facility is secured by a first priority lien on substantially all of the Company’s personal property assets, certain real estate properties, and all of the Company’s domestic wholly owned subsidiaries. Loans made pursuant to the 2023 Facility may be used for general corporate purposes of the Company (including, but not limited to, financing working capital needs, capital expenditures, acquisitions, other investments, dividends, and stock repurchases) and for any other purpose not prohibited under the related loan documents.
In the fiscal year ended December 31, 2023 the Company capitalized $7.5 million of debt issuance costs related to the 2023 Facility, $5.3 million of which was related to the term loan and $2.2 million related to the revolving credit facility. Additionally, the Company recognized $0.5 million expenses during the fiscal year ended December 31, 2023 related to unamortized debt issuance costs from the 2019 Facility associated with extinguished lenders, which are included in Interest expense, net in the Consolidated Statements of Operations.
After consideration of outstanding borrowings and letters of credit secured by the 2023 Facility, the Company had $128.0 million and $145.0 million of available borrowing capacity under the revolving credit facility as of December 29, 2024 and December 31, 2023, respectively.
The 2023 Facility provides for quarterly scheduled principal payments on the term loan and repayment of all outstanding balances on the term loan and revolving credit facility at maturity, March 23, 2028. Further, the Company may be required to prepay additional amounts annually upon the occurrence of a prepayment event as defined in the 2023 Facility. Because the amounts of any such future repayments are not currently determinable, they are excluded from the long-term debt maturities schedule below.
Borrowings under the 2023 Facility are generally subject to an interest rate of adjusted term SOFR plus a credit spread adjustment of 0.10% plus (i) 2.25% if the Company’s leverage ratio (as defined in the 2023 Facility) equals or exceeds 4.00 to 1.00, (ii) 2.00% if the Company’s leverage ratio is less than 4.00 to 1.00 but greater than or equal to 3.00 to 1.00, or (iii) 1.75% if the Company’s leverage ratio is less than 3.00 to 1.00. As of December 29, 2024 and December 31, 2023, the unhedged interest rate was 6.48% and 7.46% under the 2023 Facility, respectively. As of December 29, 2024 and December 31, 2023, $500.0 million out of the $647.5 million term loan balance and $505.0 million out of the $682.5 million term loan balance, respectively, was hedged, with the interest rate swap agreements scheduled to mature in March 2028. As of December 29, 2024 and December 31, 2023, the effective interest rates on the term loan were approximately 6.20% and 6.80%, respectively. The Company is required to make equal installments of 1.25% of the aggregate closing date principal amount of the term loan on the last day of each fiscal quarter. All remaining term loan and revolving loan balances are to be due at maturity in March 2028. Refer to Note 11, Derivative Instruments, for further discussion of the interest rate swap arrangements.
The 2023 Facility allows the Company to obtain letters of credit by applying those amounts against the usage of the senior secured revolving credit facility. If obtained, the Company would be required to pay a fee equal to the Applicable Rate for SOFR-based loans on the outstanding amount of letters of credit plus a fronting fee to the issuing bank. Commitment fees on the unused portion of the senior secured revolving credit facility range from 0.25% to 0.375%, based on the Company’s leverage ratio. As of December 29, 2024 and December 31, 2023, the fee on the unused portion of the senior secured revolving credit facility was 0.25%, included in Interest expense in the Consolidated Statements of Operations.
Restrictions and Covenants
The 2023 Facility requires the Company to meet a maximum leverage ratio financial test. The leverage ratio is required to be less than 5.00 to 1.00 as of the end of each quarterly Test Period (as defined in the 2023 Facility) through maturity in March 2028. The leverage ratio under the 2023 Facility is defined as the ratio of (a) Total Indebtedness (as defined in the 2023 Facility, which includes all debt and finance lease obligations) minus unrestricted cash and cash equivalents to (b) a defined calculation of Adjusted EBITDA (“2023 Facility Adjusted EBITDA”) for the most recently ended Test Period. The 2023 Facility Adjusted EBITDA for purposes of these restrictive covenants includes incremental adjustments beyond those included in the Company’s Adjusted EBITDA non-GAAP measure. Specifically, the 2023 Facility Adjusted EBITDA definition includes pro forma impact of EBITDA to be received from new shop openings and acquisitions for periods not yet in operation, certain acquisition related synergies and cost optimization activities, and incremental add-backs for pre-opening costs.
The 2023 Facility also contains covenants which, among other things, generally limit (with certain exceptions): mergers, amalgamations, or consolidations; the incurrence of additional indebtedness (including guarantees); the incurrence of additional liens; the sale, assignment, lease, conveyance, or transfer of assets; certain investments; dividends and stock redemptions or repurchases in excess of certain amounts; transactions with affiliates; engaging in materially different lines of business; and other activities customarily restricted in such agreements. The 2023 Facility also prohibits the transfer of cash or other assets to the parent company, whether by dividend, loan, or otherwise, but provides for exceptions to enable the parent company to pay taxes, directors’ fees, and operating expenses, as well as exceptions to permit dividends in respect of the Company’s common stock and stock redemptions and repurchases, to the extent permitted by the 2023 Facility. Subject to certain exceptions, the borrowings under the 2023 Facility are collateralized by substantially all of the Company’s assets (including its equity interests in its subsidiaries). As of December 29, 2024 and December 31, 2023, the Company was in compliance with the financial covenants related to the 2023 Facility.
The 2023 Facility also contains customary events of default including, but not limited to, payment defaults, breaches of representations and warranties, covenant defaults, non-loan party indebtedness in excess of $35.0 million, certain events of bankruptcy and insolvency, judgment defaults in excess of $35.0 million, and the occurrence of a change of control.
Borrowings and issuances of letters of credit under the 2023 Facility are subject to the satisfaction of usual and customary conditions, including the accuracy of representations and warranties and the absence of defaults.
The aggregate maturities of the 2023 Facility for each of the following four years by fiscal year are as follows:
| | | | | |
| Fiscal year | Principal Amount |
| 2025 | $ | 35,000 | |
| 2026 | 35,000 | |
| 2027 | 35,000 | |
| 2028 | 714,500 | |
Short-Term Lines of Credit
The Company is party to two agreements with existing lenders providing for short-term, uncommitted lines of credit up to an aggregate of $25.0 million. Borrowings under these short-term lines of credit are payable to the lenders on a revolving basis for tenors up to a maximum of three months and are subject to an interest rate of adjusted term SOFR plus a credit spread adjustment of 0.10% plus a margin of 1.75%. As of December 29, 2024 and December 31, 2023, the Company had drawn $5.0 million and $11.0 million, respectively under the agreements which is classified within Current portion of long-term debt on the Consolidated Balance Sheets.
Cash Payments of Interest
Interest paid, inclusive of debt issuance costs, totaled $56.9 million, $55.8 million, and $30.7 million in the fiscal years ended December 29, 2024, December 31, 2023, and January 1, 2023, respectively.
Financing Obligations
The Company has long-term financing obligations primarily in the form of lease obligations (related to both Company-owned and franchised restaurants). Refer to Note 9, Leases, to the audited Consolidated Financial Statements for additional discussion of the financing obligations.
Note 9 — Leases
The Company has various lease agreements related to real estate, vehicles, and equipment. Its operating leases include real estate (buildings and ground), vehicles, and equipment. Operating lease right of use assets and operating lease liabilities are recognized based on the present value of the future lease payments over the term. The operating lease right of use asset also includes accrued lease expense resulting from the straight-line accounting under prior accounting methods, which is now being amortized over the remaining life of the lease.
The Company is the lessee on a number of ground leases and multiple building leases, which were classified as operating leases prior to the adoption of ASC 842. As the Company elected the package of practical expedients upon adoption of ASC 842, the Company was not required to reassess the classification of these existing leases and as such, these leases continue to be accounted for as operating leases. In the event the Company modifies the existing leases or enters into new ground or building leases in the future, such leases may be classified as finance leases.
The Company’s finance leases relate primarily to vehicles and equipment. The lease payments are largely fixed in nature. The Company is generally obligated for the cost of property taxes, insurance, and common area maintenance relating to its leases, which are variable in nature. The Company determines the variable payments based on invoiced amounts from lessors. The Company has elected to not apply the recognition requirements to leases of 12 months or less. These leases will be expensed on a straight-line basis, and no operating lease liability will be recorded.
The Company included the following amounts related to operating and finance lease assets and liabilities within the Consolidated Balance Sheets:
| | | | | | | | | | | | | | |
| | As of |
| | December 29, 2024 | | December 31, 2023 |
| Assets | Classification | | | |
Operating lease (1) | Operating lease right of use asset, net | $ | 409,869 | | | $ | 456,964 | |
| Finance lease | Property and equipment, net | 72,221 | | | 41,411 | |
| Total leased assets | $ | 482,090 | | | $ | 498,375 | |
| | | | |
| Liabilities | | | | |
| Current | | | | |
Operating lease (2) | Current operating lease liabilities | $ | 46,620 | | | $ | 50,365 | |
| Finance lease | Current portion of long-term debt | 16,356 | | | 8,631 | |
| Noncurrent | | | | |
Operating lease (3) | Noncurrent operating lease liabilities | 405,366 | | | 454,583 | |
| Finance lease | Long-term debt, less current portion | 63,369 | | | 38,486 | |
| Total leased liabilities | $ | 531,711 | | | $ | 552,065 | |
(1)Operating lease right of use asset, net was impacted by a reduction of $62.6 million in the fiscal year ended December 29, 2024 related to the divestiture of Insomnia Cookies.
(2)Current operating lease liabilities were impacted by a reduction of $8.6 million in the fiscal year ended December 29, 2024 related to the divestiture of Insomnia Cookies.
(3)Noncurrent operating lease liabilities were impacted by a reduction of $58.7 million in the fiscal year ended December 29, 2024 related to the divestiture of Insomnia Cookies.
The Company has long-term contractual obligations primarily in the form of lease obligations related to Company-operated restaurants and franchised restaurants. Interest expense associated with the finance lease obligations is computed using the IBR at the time the lease is entered into and is based on the amount of the outstanding lease obligation.
The weighted-average remaining lease term and weighted-average discount rate for operating and finance leases were as follows:
| | | | | | | | | | | |
| As of |
| December 29, 2024 | | December 31, 2023 |
| Weighted average remaining lease term: | | | |
| Operating lease | 10.6 years | | 10.8 years |
| Finance lease | 5.9 years | | 7.7 years |
| Weighted average discount rate: | | | |
| Operating lease | 7.04 | % | | 7.03 | % |
| Finance lease | 6.58 | % | | 7.29 | % |
Lease costs were as follows:
| | | | | | | | | | | | | | | | | | | | |
| | Fiscal Years Ended |
| | December 29, 2024 | | December 31, 2023 | | January 1, 2023 |
| Lease cost | Classification | | | | | |
| Operating lease cost | Selling, general and administrative expense | $ | 3,445 | | | $ | 3,541 | | | $ | 3,390 | |
| Operating lease cost | Operating expenses | 92,281 | | | 89,539 | | | 85,173 | |
| Short-term lease cost | Operating expenses | 5,210 | | | 5,064 | | | 5,234 | |
| Variable lease costs | Operating expenses | 27,941 | | | 31,726 | | | 23,996 | |
| Sublease income | Royalties and other revenues | (259) | | | (140) | | | (210) | |
| Finance lease cost: | | | | | | |
| Amortization of right of use assets | Depreciation and amortization expense | $ | 13,313 | | | $ | 7,639 | | | $ | 5,027 | |
| Interest on lease liabilities | Interest expense, net | 3,849 | | | 2,709 | | | 1,958 | |
Supplemental disclosures of cash flow information related to leases were as follows:
| | | | | | | | | | | | | | | | | |
| Fiscal Years Ended |
| December 29, 2024 | | December 31, 2023 | | January 1, 2023 |
| Other information | | | | | |
| Cash paid for leases: | | | | | |
Operating cash flows for operating leases (1) | $ | 112,250 | | | $ | 117,977 | | | $ | 104,506 | |
| Operating cash flows for finance leases | 3,846 | | | 2,649 | | | 2,116 | |
| Financing cash flows for finance leases | 12,528 | | | 8,442 | | | 4,681 | |
| Right of use assets obtained in exchange for new lease liabilities: | | | | | |
| Operating leases | $ | 60,183 | | | $ | 86,549 | | | $ | 50,368 | |
| Finance leases | 43,832 | | | 22,785 | | | 8,158 | |
(1)Operating cash flows for operating leases include variable rent payments which are not included in the measurement of lease liabilities. For the fiscal years ending December 29, 2024, December 31, 2023, and January 1, 2023, variable rent payments were $27.9 million, $31.7 million, and $24.0 million, respectively.
A majority of the leases include options to extend the lease. If the Company is reasonably certain to exercise an option to extend a lease, the extension period is included as part of the right of use asset and the lease liability. The Company’s leases do not contain restrictions or covenants that restrict the Company from incurring other financial obligations. The Company also does not provide any residual value guarantees for the leases or have any significant leases that have yet to be commenced.
At the inception of the contract, management determines if the contract is or contains a lease. A contract is or contains a lease if it conveys the right to control the use of an identified asset for a period of time in exchange for consideration. The IBR reflects a fully secured rate based on the credit rating taking into consideration the repayment timing of the lease and any impacts due to the economic environment in which the lease operates. The estimate of the IBR reflects considerations such as market rates for the outstanding debt, interpolations of rates for leases with terms that differ from the outstanding debt, and market rates for debt of companies with similar credit ratings.
Future lease commitments to be paid by the Company as of December 29, 2024 were as follows:
| | | | | | | | | | | |
| Fiscal year | Operating Leases | | Finance Leases |
| 2025 | $ | 76,193 | | | $ | 20,982 | |
| 2026 | 79,596 | | | 21,809 | |
| 2027 | 65,540 | | | 17,542 | |
| 2028 | 55,723 | | | 12,931 | |
| 2029 | 53,598 | | | 5,743 | |
| Thereafter | 333,602 | | | 18,007 | |
| Total lease payments | 664,252 | | | 97,014 | |
| Less: Interest | (212,266) | | | (17,289) | |
| Present value of lease liabilities | $ | 451,986 | | | $ | 79,725 | |
In the fiscal year ended December 29, 2024, the Company completed sale-leaseback transactions whereby it disposed of the land at two real estate properties for proceeds of $6.3 million. The Company subsequently leased back the properties, which are accounted for as operating leases. The Company recognized cumulative gains on sale of $1.6 million, which are included in Other (income)/expenses, net on the Consolidated Statements of Operations.
In the fiscal year ended December 31, 2023, the Company completed a sale-leaseback transaction whereby it disposed of the land at one real estate property for proceeds of $10.0 million. The Company subsequently leased back the property, which is accounted for as an operating lease. The Company recognized a gain on sale of $9.6 million, which is included in Other (income)/expenses, net on the Consolidated Statements of Operations.
In fiscal year ended January 1, 2023, the Company completed sale-leaseback transactions whereby it disposed of the land at three real estate properties for proceeds of $8.4 million. The Company subsequently leased back the properties, which are accounted for as operating leases. The Company recognized cumulative gains on sale of $6.5 million, which are included in Other (income)/expenses, net on the Consolidated Statements of Operations.
Note 10 — Fair Value Measurements
The following table presents assets and liabilities that are measured at fair value on a recurring basis as of December 29, 2024 and December 31, 2023:
| | | | | | | | | |
| | | December 29, 2024 |
| | | Level 2 | | |
| Assets: | | | | | |
| | | | | |
| | | | | |
| Interest rate derivatives | | | $ | 362 | | | |
| | | | | |
| Total Assets | | | $ | 362 | | | |
| | | | | |
| Liabilities: | | | | | |
| Foreign currency derivatives | | | $ | 749 | | | |
| Commodity derivatives | | | 6 | | | |
| Total Liabilities | | | $ | 755 | | | |
| | | | | | | | | |
| | | December 31, 2023 |
| | | Level 2 | | |
| Assets: | | | | | |
| | | | | |
| Interest rate derivatives | | | $ | 1,596 | | | |
| | | | | |
| Total Assets | | | $ | 1,596 | | | |
| | | | | |
| Liabilities: | | | | | |
| Foreign currency derivatives | | | $ | 345 | | | |
| Commodity derivatives | | | 113 | | | |
| Total Liabilities | | | $ | 458 | | | |
There were no assets or liabilities measured using Level 1 or Level 3 inputs and no transfers of financial assets or liabilities among the levels within the fair value hierarchy during the fiscal years ended December 29, 2024 and December 31, 2023. The Company’s derivatives are valued using discounted cash flow analyses that incorporate observable market parameters, such as interest rate yield curves and currency rates.
Note 11 — Derivative Instruments
The Company is exposed to certain risks relating to its ongoing business operations. Management evaluates various strategies in managing its exposure to market-based risks, such as entering into transactions to manage its exposure to commodity price risk and floating interest rates. The Company does not hold or issue derivative instruments for trading purposes. The Company is exposed to credit-related losses in the event of non-performance by the counterparties to its derivative instruments. The Company mitigates this risk of nonperformance by dealing with highly rated counterparties.
Commodity Price Risk
The Company uses forward contracts to protect against the effects of commodity price fluctuations in the cost of ingredients of its products, of which flour, sugar, and shortening are the most significant, and the cost of fuel used by its delivery vehicles. Management has not designated these forward contracts as hedges. As of December 29, 2024 and December 31, 2023 the total notional amount of commodity derivatives was 1.5 million and 1.8 million gallons of fuel, respectively. They were scheduled to mature between January 2025 and October 2025, and January 2024 and December 2024, respectively. As of December 29, 2024 and December 31, 2023, the Company recorded liabilities of less than $0.1 million and $0.1 million, respectively, related to the fair market values of its commodity derivatives. The settlement of commodity derivative contracts is reported in the Consolidated Statements of Cash Flows as a cash flow from operating activities.
Interest Rate Risk
The Company uses interest rate swaps to manage its exposure to interest rate volatility from its debt arrangements. Management has designated the swap agreements as cash flow hedges and recognized the changes in the fair value of these swaps in other comprehensive income. As of December 29, 2024 and December 31, 2023, the Company has recorded assets of $0.4 million and $1.6 million, respectively, related to the fair market values of its interest rate derivatives. The cash flows associated with the interest rate swaps are reflected in operating activities in the Consolidated Statements of Cash Flows, which is consistent with the classification as operating activities of the interest payments on the term loan.
In the second quarter of fiscal 2024, existing interest rate swap agreements (the “prior agreements”) with an aggregate notional amount of $505.0 million matured. The Company then entered into new interest rate swap agreements (the “new agreements”) with an aggregate notional amount of $500.0 million as of December 29, 2024. The primary difference between the new agreements and the prior agreements included the setting of new rates on the fixed component of the swaps (weighted average of approximately of 4.0%). The new agreements have a benchmark rate on the floating component of the swaps of one-month SOFR and are scheduled to mature in March 2028.
The net effect of the interest rate swap arrangements will be to fix the variable interest rate on the term loan under the 2023 Facility (as defined in Note 8, Long-Term Debt) up to the notional amount outstanding at the rates payable under the swap agreements plus the Applicable Rate (as defined by the 2023 Facility), through the swap maturity dates in March 2028. All of the interest rate swap derivatives have certain early termination triggers caused by an event of default or termination. The events of default include failure to make payments when due, failure to give notice of a termination event, failure to comply with or perform obligations under the agreements, bankruptcy or insolvency, and defaults under other agreements (cross-default provisions).
In the first quarter of fiscal 2023, the Company cancelled certain interest rate swap agreements with an aggregate notional amount of $265.0 million, collecting $7.7 million in cash proceeds, and entered into new agreements with the same counterparties. In the fourth quarter of fiscal 2022, the Company cancelled certain interest rate swap agreements with an aggregate notional amount of $240.0 million, collecting $8.5 million in cash proceeds, and entered into new agreements with the same counterparties. The cash flows are reflected in operating activities in the Consolidated Statements of Cash Flows.
Foreign Currency Exchange Rate Risk
The Company is exposed to foreign currency risk primarily from its investments in consolidated subsidiaries that operate in Canada, the U.K., Ireland, Australia, New Zealand, Mexico, and Japan. In order to mitigate foreign exchange fluctuations, the Company enters into foreign exchange forward contracts. Management has not designated these forward contracts as hedges. As of December 29, 2024 and December 31, 2023, the total notional amount of foreign exchange derivatives was $152.6 million and $49.8 million, respectively. The majority matured in January 2025 and January 2024, respectively. As of December 29, 2024 and December 31, 2023, the Company has recorded liabilities of $0.7 million and $0.3 million, respectively, related to the fair market values of its foreign exchange derivatives.
Quantitative Summary of Derivative Positions and Their Effect on Results of Operations
The following tables present the fair values of derivative instruments included in the Consolidated Balance Sheets as of December 29, 2024 and December 31, 2023 for derivatives not designated as hedging instruments and derivatives designed as hedging instruments, respectively. The Company only has cash flow hedges that are designated as hedging instruments.
| | | | | | | | | | | | | | | | | |
| Derivatives Fair Value | | |
| Derivatives Not Designated as Hedging Instruments | December 29, 2024 | | December 31, 2023 | | Balance Sheet Location |
| | | | | |
| | | | | |
| Foreign currency derivatives | $ | 749 | | | $ | 345 | | | Accrued liabilities |
| Commodity derivatives | 6 | | | 113 | | | Accrued liabilities |
| Total Liabilities | $ | 755 | | | $ | 458 | | | |
| | | | | | | | | | | | | | | | | |
| Derivatives Fair Value | | |
| Derivatives Designated as Hedging Instruments | December 29, 2024 | | December 31, 2023 | | Balance Sheet Location |
| Interest rate derivatives (current) | $ | 112 | | | $ | 1,596 | | | Prepaid expense and other current assets |
| Interest rate derivatives (noncurrent) | 250 | | | — | | | Other assets |
| Total Assets | $ | 362 | | | $ | 1,596 | | | |
| | | | | |
| | | | | |
| | | | | |
The effect of derivative instruments on the Consolidated Statements of Operations for the fiscal years ended December 29, 2024, December 31, 2023, and January 1, 2023 is as follows:
| | | | | | | | | | | | | | | | | | | | | | | |
| Derivative Gain/(Loss) Recognized in Income in Fiscal Years Ended | | |
| Derivatives Designated as Hedging Instruments | December 29, 2024 | | December 31, 2023 | | January 1, 2023 | | Location of Derivative Gain/(Loss) Recognized in Income |
| Gain/(loss) on interest rate derivatives | $ | 7,663 | | | $ | 8,624 | | | $ | (2,727) | | | Interest expense, net |
| $ | 7,663 | | | $ | 8,624 | | | $ | (2,727) | | | |
| | | | | | | | | | | | | | | | | | | | | | | |
| Derivative (Loss)/Gain Recognized in Income in Fiscal Years Ended | | |
| Derivatives Not Designated as Hedging Instruments | December 29, 2024 | | December 31, 2023 | | January 1, 2023 | | Location of Derivative (Loss)/Gain Recognized in Income |
| Loss on foreign currency derivatives | $ | (404) | | | $ | (175) | | | $ | (90) | | | Other non-operating expense, net |
| Gain/(loss) on commodity derivatives | 107 | | | (627) | | | (972) | | | Other non-operating expense, net |
| $ | (297) | | | $ | (802) | | | $ | (1,062) | | | |
Note 12 — Employee Benefit Plans
Defined Contribution Plans
The Company has a 401(k) savings plan for Krispy Kremers in the U.S. (the “401(k) Plan”) to which eligible employees may contribute up to 100% of their salary and bonus on a tax deferred basis, subject to statutory limitations. The Company currently matches 100% of the first 3% and 50% of the next 2% of compensation contributed by each employee to the 401(k) Plan. The Company match is immediately 100% vested.
The Company operates defined contribution plans in the U.K. and Ireland (“KK U.K. and Ireland Contribution Plans”), to which eligible employees may contribute up to 100% of their salary, subject to statutory limitations. The Company currently matches contributions at a rate of 3% of pensionable earnings. The KK U.K. and Ireland Contribution Plans are pension plans under which the Company pays fixed contributions into a separate entity. The Company has no legal or constructive obligations to pay further contributions if the fund does not hold sufficient assets to pay all employees the benefits relating to employee service in the current and prior periods. The Company has no further payment obligations once the contributions have been paid. The contributions are recognized as employee benefit expense when they are due. Prepaid contributions are recognized as an asset to the extent that a cash refund or a reduction in the future payments is available.
KK Australia operates a defined contribution retirement benefit plan for its employees in Australia (the “Australia Plan”) and in New Zealand (the “New Zealand Plan”). The Company contributes 11.5% of employee compensation to the Australia Plan and matches employee contributions of up to 3% of compensation to the New Zealand Plan.
KK Canada operates a Registered Retirement Savings Plan (“RRSP”) for its employees in Canada (the “Canada Plan”) which allows eligible employees to contribute. For certain salaried employees, the Company will match eligible employee contributions up to 2.5% of their annual base salary.
Total contribution plan expense for defined contribution plans was $9.6 million, $8.5 million, and $7.4 million for the fiscal years ended December 29, 2024, December 31, 2023, and January 1, 2023, respectively.
Other Employee Benefit Plans
KK Mexico operates defined benefit plans for its employees related to seniority premium (the “Mexico Seniority Premium Plan”) and termination indemnity (the “Mexico Termination Indemnity Plan”). The Mexico Seniority Premium Plan provides eligible employees a defined benefit of 12 days of salary per full year of service, and the Mexico Termination Indemnity Plan provides eligible employees a defined benefit of up to three months of base salary plus 20 days per year worked. Net periodic benefit cost for these plans totaled $0.3 million, $0.2 million, and $0.2 million for the fiscal years ended December 29, 2024, December 31, 2023, and January 1, 2023, respectively.
Note 13 — Share-based Compensation
Restricted Stock Units (“RSUs”) and Performance Stock Units (“PSUs”)
The Company and certain of its subsidiaries issue time-vested RSUs and PSUs under their respective executive ownership plans and long-term incentive plans.
The time-vested RSUs are awarded to eligible employees and non-employee directors and entitle the grantee to receive shares of common stock at the end of a vesting period. Certain RSUs vest in 54 months from the date of grant and include a minimum holding period of six months before the shareholder may redeem the shares. Certain RSUs vest over a 60-month period subsequent to the grant date (with 60% vesting during the third year following the grant date, 20% vesting during the fourth year, and 20% vesting at the end of the 60-month term). Throughout the vesting period and the holding period, shareholders are subject to the market risk on the value of their shares.
The PSU vesting is contingent upon the achievement of certain performance objectives and the awards are subject to a requisite service period. If the Company meets targets for the performance objectives at the end of the performance cycle, the Company awards a resulting number of shares of its common stock to the award holders. The number of shares may be increased to a maximum threshold (up to 200% of the target threshold set at the grant date, for a majority of the awards) or reduced to a minimum threshold (a floor of zero) based on the achievement of these performance objectives in accordance with the terms established at the award’s grant date. The Company estimates the probability that the performance objectives will be achieved periodically and adjusts compensation expenses accordingly.
RSUs and PSUs held by KKI are granted to U.S. employees and directors as well as certain employees of the Company’s subsidiaries. Certain U.K. employees receive RSUs held by KK U.K. Certain Australia employees receive RSUs held by KK Australia. Certain Mexico employees receive RSUs held by KK Mexico.
Excluding the Insomnia Cookies plan which was removed from the table below due to the divestiture, RSU and PSU activity under the various plans during the fiscal years presented is as follows:
| | | | | | | | | | | | | | | | | | | | | | | | | | | | | | | | | | | | | | | | | | | | | | | | | | | | | | | |
| (in thousands, except per share amounts) | Non-vested shares outstanding at January 1, 2023 | | Granted | | | | Vested | | Forfeited | | Non-vested shares outstanding at December 31, 2023 | | Granted | | Vested | | Forfeited | | Non-vested shares outstanding at December 29, 2024 |
| KKI | | | | | | | | | | | | | | | | | | | |
| RSUs and PSUs | 4,946 | | | 3,063 | | | | | 669 | | | 555 | | | 6,785 | | | 1,934 | | | 1,893 | | | 842 | | | 5,984 | |
| Weighted Average Grant Date Fair Value | $ | 14.23 | | | 14.48 | | | | | 11.62 | | | 14.89 | | | $ | 14.54 | | | 14.19 | | | 14.80 | | | 14.94 | | | $ | 14.29 | |
| KK U.K. | | | | | | | | | | | | | | | | | | | |
| RSUs | 60 | | | — | | | | | 50 | | | 3 | | | 7 | | | — | | | — | | | — | | | 7 | |
| Weighted Average Grant Date Fair Value | $ | 15.77 | | | — | | | | | 13.41 | | | 21.21 | | | $ | 29.80 | | | — | | | — | | | — | | | $ | 29.80 | |
| KK Australia | | | | | | | | | | | | | | | | | | | |
| RSUs | 354 | | | — | | | | | 169 | | | — | | | 185 | | | — | | | 42 | | | 6 | | | 137 | |
| Weighted Average Grant Date Fair Value | $ | 1.47 | | | — | | | | | 1.36 | | | — | | | $ | 1.57 | | | — | | | 2.13 | | | 1.91 | | | $ | 1.39 | |
| KK Mexico | | | | | | | | | | | | | | | | | | | |
| RSUs | 60 | | | — | | | | | — | | | 40 | | | 20 | | | — | | | 2 | | | — | | | 18 | |
| Weighted Average Grant Date Fair Value | $ | 33.08 | | | — | | | | | — | | | 34.58 | | | $ | 30.18 | | | — | | | 29.21 | | | — | | | $ | 30.01 | |
The Company recorded total non-cash compensation expense related to the RSUs and PSUs under the plans of $30.0 million, $20.6 million, and $15.5 million for fiscal years ended December 29, 2024, December 31, 2023, and January 1, 2023, respectively. The net deferred tax benefit/(expense) recognized was $1.2 million, $2.1 million, and ($0.3 million) for fiscal years ended December 29, 2024, December 31, 2023, and January 1, 2023, respectively.
The unrecognized compensation cost related to the unvested RSUs and PSUs and the weighted-average period over which such cost is expected to be recognized are as follows:
| | | | | | | | | | | |
| As of December 29, 2024 |
| Unrecognized
Compensation Cost | | Recognized Over a Weighted-
Average Period of |
| KKI | $ | 46,677 | | | 2.9 years |
| KK U.K. | 62 | | | 1.5 years |
| KK Australia | 29 | | | 0.7 years |
| KK Mexico | 74 | | | 0.6 years |
The estimated fair value of restricted stock is calculated using a market approach (i.e., market multiple is used for the KK U.K. plan and an agreed-upon EBITDA buyout multiple is used for KK Australia and KK Mexico plans).
The total grant date fair value of shares vested under the KKI plan was $28.1 million, $7.8 million, and $12.5 million for the fiscal years ended December 29, 2024, December 31, 2023, and January 1, 2023, respectively. The total grant date fair value of shares vested under the KK U.K. plan was $0.7 million for the fiscal year ended December 31, 2023; no shares vested during the fiscal years ended December 29, 2024 or January 1, 2023. The total grant date fair value of shares vested under the KK Australia plan was $0.1 million, $0.2 million, and $2.3 million for the fiscal years ended December 29, 2024, December 31, 2023, and January 1, 2023, respectively. The total grant date fair value of shares vested under the KK Mexico plan was $0.1 million for the fiscal year ended December 29, 2024; no shares vested during the fiscal years ended December 31, 2023 or January 1, 2023.
Time-Vested Stock Options
KKI issues time-vested stock options under its Omnibus Incentive Plan. The stock options are awarded to eligible employees and entitle the grantee to purchase shares of common stock at the respective exercise price at the end of a vesting period. Stock options vest over a 60-month period subsequent to the grant date (with 60% vesting during the third year following the grant date, 20% vesting during the fourth year, and 20% vesting at the end of the 60-month term), and as such are subject to a service condition. The maximum contractual term of the stock options is 10 years.
The fair value of time-vested stock options was estimated on the date of grant using the Black-Scholes option pricing model. This model is impacted by the Company’s stock price and certain assumptions related to the Company’s stock and employees’ exercise behavior. The expected term for stock options granted was estimated utilizing the simplified method. Management utilized the simplified method because the Company did not have sufficient historical exercise data to provide a reasonable basis upon which to estimate expected term. The risk-free interest rate assumption was based on yields of U.S. Treasury securities in effect at the date of grant with terms similar to the expected term. Expected volatility was estimated based on the Company’s historical volatility, and also considering historical volatility of peer companies over a period equivalent to the expected term. Additionally, the dividend yield was estimated based on dividends currently being paid on the underlying common stock at the date of grant. Estimated and actual forfeitures have not had a material impact on share-based compensation expense.
The following weighted-average assumptions were utilized in determining the fair value of the time-vested stock options granted during the fiscal years presented:
| | | | | | | | | | | |
| Fiscal Years Ended |
| December 29, 2024 | | December 31, 2023 |
| KKI | | | |
| Risk-free interest rate | — | % | | 3.7 | % |
| Expected volatility | — | % | | 35.1 | % |
| Dividend yield | — | % | | 1.0 | % |
| Expected term (years) | — | | | 6.5 years |
A summary of the status of the time-vested stock options as of December 29, 2024 and changes during fiscal years presented is as follows:
| | | | | | | | | | | | | | | | | | | | | | | | | | | | | | | | | | | | | | | | | | | | | | | | | | | | | |
| Share options outstanding at | | | | | | | | Share options outstanding at | | | | | | | | Share options outstanding at |
| (in thousands, except per share amounts) | January 1,
2023 | | Granted | | Exercised | | Forfeited or expired | | December 31,
2023 | | Granted | | Exercised | | Forfeited or expired | | December 29,
2024 |
| KKI | | | | | | | | | | | | | | | | | |
| Options | 2,569 | | | 424 | | | — | | | — | | | 2,993 | | — | | | — | | | 331 | | | 2,662 |
| Weighted Average Grant Date Fair Value | $ | 6.10 | | | 4.72 | | | — | | | — | | | $ | 5.90 | | — | | | — | | | 6.10 | | | $ | 5.88 |
| Weighted Average Exercise Price | $ | 14.61 | | | 12.45 | | | — | | | — | | | $ | 14.30 | | — | | | — | | | 14.61 | | | $ | 14.27 |
| Weighted Average Remaining Contractual Term (years) | 8.3 years | | | | | | | | 7.5 years | | | | | | | | 7.1 years |
| Aggregate Intrinsic Value (in thousands) | $ | — | | | | | | | | | $ | 2,352 | | | | | | | | | $ | — | |
The Company recorded total non-cash compensation expense related to the time-vested stock options of $5.3 million, $3.6 million, and $2.7 million for the fiscal years ended December 29, 2024, December 31, 2023, and January 1, 2023, respectively.
The unrecognized compensation cost related to the unvested stock options and the weighted-average period over which such cost is expected to be recognized are as follows:
| | | | | | | | | | | |
| As of December 29, 2024 |
| Unrecognized
Compensation Cost | | Recognized Over a Weighted-
Average Period of |
| KKI | $ | 3,317 | | | 1.2 years |
During the fiscal year ended December 29, 2024, 1.5 million time-vested stock options vested. No time-vested stock options under the KKI plan vested nor were exercised during the fiscal years ended December 31, 2023 or January 1, 2023.
Note 14 — Income Taxes
Income/(loss) before income taxes consists of:
| | | | | | | | | | | | | | | | | |
| Fiscal Years Ended |
| December 29, 2024 | | December 31, 2023 | | January 1, 2023 |
| Domestic | $ | (10,169) | | | $ | (59,174) | | | $ | (49,910) | |
| Foreign | 29,938 | | | 18,180 | | | 41,747 | |
| Income/(loss) before income taxes | $ | 19,769 | | | $ | (40,994) | | | $ | (8,163) | |
Domestic income/(loss) before income taxes includes unallocated corporate costs, which include general corporate expenses.
The components of the provision for income taxes are as follows:
| | | | | | | | | | | | | | | | | |
| Fiscal Years Ended |
| December 29, 2024 | | December 31, 2023 | | January 1, 2023 |
| Current: | | | | | |
| Federal | $ | 112 | | | $ | (2,213) | | | $ | — | |
| State | (147) | | | 138 | | | 1,033 | |
| International | 12,922 | | | 16,214 | | | 13,816 | |
| Total current | $ | 12,887 | | | $ | 14,139 | | | $ | 14,849 | |
| Deferred and other: | | | | | |
| Federal | $ | 6,232 | | | $ | (10,971) | | | $ | (13,960) | |
| State | (619) | | | (2,552) | | | 4,280 | |
| International | (2,546) | | | (4,963) | | | (4,557) | |
| Total deferred and other | $ | 3,067 | | | $ | (18,486) | | | $ | (14,237) | |
| Income tax expense/(benefit) | $ | 15,954 | | | $ | (4,347) | | | $ | 612 | |
A reconciliation of the statutory U.S. federal income tax rate and the Company’s effective tax rate is as follows:
| | | | | | | | | | | | | | | | | |
| Fiscal Years Ended |
| December 29, 2024 | | December 31, 2023 | | January 1, 2023 |
| Statutory federal rate | 21.0 | % | | 21.0 | % | | 21.0 | % |
| State income taxes, net of federal benefit | 0.2 | | | 6.3 | | | 12.6 | |
| Foreign operations | 22.5 | | | (11.0) | | | (66.8) | |
| Change in valuation allowance | 13.6 | | | (2.0) | | | 24.9 | |
| Noncontrolling interest | 1.1 | | | (0.2) | | | 17.2 | |
| Impact of uncertain tax positions | (3.3) | | | 6.2 | | | 62.2 | |
| Other permanent differences | 4.2 | | | (0.6) | | | (1.5) | |
| Deferred adjustments | 0.5 | | | (3.8) | | | (48.7) | |
| Share-based compensation | 25.4 | | | (6.3) | | | (30.3) | |
| Other | (4.5) | | | 1.0 | | | 1.9 | |
| Effective tax rate | 80.7 | % | | 10.6 | % | | (7.5) | % |
The Company establishes valuation allowances for deferred income tax assets in accordance with GAAP, which provides that such valuation allowances shall be established unless realization of the income tax benefits is more likely than not.
The Company recognizes deferred income tax assets and liabilities based upon its expectation of the future tax consequences of temporary differences between the income tax and financial reporting bases of assets and liabilities. Deferred tax liabilities generally represent tax expense recognized for which payment has been deferred, or expenses which have been deducted in the Company’s tax returns, but which have not yet been recognized as an expense in the financial statements. Deferred tax assets generally represent tax deductions or credits that will be reflected in future tax returns for which the Company has already recorded a tax benefit in the audited Consolidated Financial Statements.
The Company continues to assert permanent reinvestment with respect to its initial basis differences of international affiliates but does not assert indefinite reinvestment on the earnings of the foreign subsidiaries with the exception of its subsidiaries in Canada. Accordingly, no deferred taxes have been provided for with regard to the Company’s initial basis difference in international affiliates. Due to the complexities of tax law in the respective jurisdictions, it is not practicable to estimate the tax liability that might be incurred if such earnings were remitted to the U.S. The Company has not established a deferred tax liability for the earnings of the foreign subsidiaries as any distributions made from those jurisdictions are expected to be made in a tax neutral manner.
The tax effects of temporary differences are as follows:
| | | | | | | | | | | |
| As of |
| December 29,
2024 | | December 31,
2023 |
| Deferred income tax assets: | | | |
| Intangible assets | $ | 1,072 | | | $ | 1,283 | |
| Accrued compensation | 1,924 | | | 6,450 | |
| Insurance accruals | 4,509 | | | 2,642 | |
| Share-based compensation | 5,705 | | | 4,553 | |
| Deferred revenue | 3,419 | | | 2,451 | |
| Transaction costs | 1,530 | | | 1,339 | |
| Disallowed interest expense | 35,291 | | | 30,087 | |
| Lease liabilities | 117,619 | | | 113,626 | |
| Foreign net operating loss carryforward | 3,024 | | | 2,517 | |
| Federal net operating loss carryforward | 10,541 | | | 22,755 | |
| Federal tax credits | 18,058 | | | 15,426 | |
| State net operating loss and credit carryforwards | 10,702 | | | 11,842 | |
| Other | 16,874 | | | 13,899 | |
| Gross deferred income tax assets | 230,268 | | | 228,870 | |
| Valuation allowance | (30,617) | | | (29,084) | |
| Deferred income tax assets, net of valuation allowance | $ | 199,651 | | | $ | 199,786 | |
| Deferred income tax liabilities: | | | |
| Intangible assets | $ | (157,245) | | | $ | (151,610) | |
| Subsidiary investments | (19,070) | | | (15,145) | |
| Property and equipment | (20,484) | | | (19,514) | |
| Foreign reacquired franchise rights | (23,112) | | | (29,573) | |
| Lease right of use assets | (106,592) | | | (102,178) | |
| Unrealized income on foreign currency translation | (709) | | | (1,876) | |
| Other | (1,115) | | | (1,702) | |
| Gross deferred income tax liabilities | (328,327) | | | (321,598) | |
| Net deferred income tax liabilities | $ | (128,676) | | | $ | (121,812) | |
The presentation of deferred income taxes on the Consolidated Balance Sheets is as follows:
| | | | | | | | | | | |
| As of |
| December 29,
2024 | | December 31,
2023 |
| Included in: | | | |
| Other assets | $ | 2,069 | | | $ | 2,113 | |
| Deferred income taxes, net | (130,745) | | | (123,925) | |
| Net deferred income tax liabilities | $ | (128,676) | | | $ | (121,812) | |
As of December 29, 2024, the Company had net operating loss (“NOL”) carryforwards of approximately $220.4 million for U.S. state tax purposes and $50.2 million for U.S. federal tax purposes. As of December 31, 2023, the Company had NOL carryforwards of approximately $248.8 million for U.S. state tax purposes and $108.4 million for U.S. federal tax purposes. U.S. federal NOL carryforwards are eligible to be carried forward indefinitely. A portion of the Company’s U.S. state tax carryforwards began to expire in fiscal 2024. As of December 29, 2024 and December 31, 2023 the Company had foreign NOL carryforwards of approximately $10.9 million and $8.7 million, respectively. As of December 29, 2024, $6.0 million of the foreign NOL carryforwards have a 10-year carryover period and the remaining $4.9 million have no expiration.
As of December 29, 2024, the Company had various tax credit carryforwards of $18.1 million for U.S. federal purposes and none for U.S. state purposes. As of December 31, 2023, the Company had various tax credit carryforwards of $15.4 million for U.S. federal purposes and none for U.S. state purposes. If not utilized, the credits can be carried forward between 10 and 20 years. A portion of the U.S. tax credit carryforwards began to expire in fiscal 2023. If certain substantial changes in the entity’s ownership occur, there would be an annual limitation on the amount of the NOLs and credits that can be utilized.
The valuation allowances of $30.6 million and $29.1 million as of December 29, 2024 and December 31, 2023 respectively, represent the portion of its deferred tax assets that the Company does not believe would more likely than not be realized in the future. Of the $30.6 million as of December 29, 2024, $2.1 million is for foreign NOL carryforwards, $0.3 million is for other foreign deferred tax assets, $10.7 million is for U.S. state tax carryforwards, and $17.5 million is for U.S. foreign tax credits and other business credits, for which sufficient taxable income is not expected to be generated. The increase in valuation allowance is primarily attributable to additional foreign and state NOLs and federal tax credits for which future sufficient taxable income is not expected to be generated. Of the $29.1 million as of December 31, 2023, $2.3 million is for foreign NOL carryforwards, $11.9 million is for U.S. state tax carryforwards, and $14.8 million is for U.S. foreign tax credits and other business credits, for which sufficient taxable income is not expected to be generated.
Realization of net deferred tax assets generally is dependent on generation of taxable income in future periods. While the Company believes its forecast of future taxable income is reasonable, actual results will inevitably vary from management’s forecasts. Such variances could result in adjustments to the valuation allowance on deferred tax assets in future periods, and such adjustments could be material to the financial statements.
The Company files income tax returns in the U.S. federal jurisdiction and various U.S. state and foreign jurisdictions. With few exceptions, the Company is no longer subject to examination by U.S., state, or foreign tax authorities for years before 2019.
Income tax payments, net of refunds, were $18.5 million, $11.1 million, and $16.7 million in the fiscal years ended December 29, 2024, December 31, 2023, and January 1, 2023, respectively.
The following table presents a reconciliation of the beginning and ending amounts of unrecognized tax benefits:
| | | | | | | | | | | |
| As of |
| December 29,
2024 | | December 31,
2023 |
| Unrecognized tax benefits at beginning of year | $ | 10,536 | | | $ | 13,513 | |
| | | |
| Decreases related to positions taken in prior years | (559) | | | (160) | |
| Decreases related to positions taken in prior years due to lapse of statute | (74) | | | (2,817) | |
| Unrecognized tax benefits at end of year | $ | 9,903 | | | $ | 10,536 | |
Approximately all of the aggregate $9.9 million and $10.5 million of unrecognized income tax benefits as of December 29, 2024 and December 31, 2023, respectively, would, if recognized, impact the annual effective tax rate. The Company does not believe that changes in its uncertain tax benefits will result in a material impact during the next 12 months.
The Company’s policy is to recognize interest and penalties related to income tax issues as components of income tax expense. The Company’s Consolidated Balance Sheets reflect approximately $1.6 million of accrued interest and penalties as of both December 29, 2024 and December 31, 2023. Interest and penalties were not material during the years presented in the Company’s Consolidated Statements of Operations.
Note 15 — Commitments and Contingencies
Resolved Litigation
Illinois BIPA litigation
In March 2023, an employee filed a lawsuit on behalf of himself and all others similarly situated against the Company, alleging violations of the Illinois Biometric Information Privacy Act. In October 2024, the Company negotiated a settlement of this lawsuit, which required the Company to pay an amount immaterial to the Company’s audited Consolidated Financial Statements.
Other Legal Matters
The Company also is engaged in various legal proceedings arising in the normal course of business. The Company maintains insurance policies against certain kinds of such claims and suits, including insurance policies for workers’ compensation and personal injury, all of which are subject to deductibles. While the ultimate outcome of these matters could differ from management’s expectations, management currently does not believe their resolution will have a material adverse effect on the Company’s audited Consolidated Financial Statements.
Purchase Commitments
The Company is exposed to the effects of commodity price fluctuations on the cost of ingredients for its products, of which flour, sugar, and shortening are the most significant. In order to secure adequate supplies of products and bring greater stability to the cost of ingredients, the Company routinely enters into forward purchase contracts with vendors under which it commits to purchase agreed-upon quantities of ingredients at agreed-upon prices at specified future dates. Typically, the aggregate outstanding purchase commitment at any point in time will range from one month to several years of anticipated ingredients purchases, depending on the ingredient. In addition, from time to time the Company enters into contracts for the future delivery of equipment purchased for resale and components of doughnut-making equipment manufactured by the Company. As of December 29, 2024 and December 31, 2023, the Company had approximately $98.9 million and $130.5 million, respectively, of commitments under ingredient and other forward purchase contracts. These ingredient and other forward purchase contracts are for physical delivery in quantities expected to be used over a reasonable period in the normal course of business. These agreements often meet the definition of a derivative. However, the Company does not measure its forward purchase commitments at fair value as the amounts under contract meet the physical delivery criteria in the normal purchase exception under ASC 815, Derivatives and Hedging. While the Company has multiple vendors for most of the ingredients, the termination of the Company’s relationships with vendors with whom it has forward purchase agreements, or those vendors’ inability to honor the purchase commitments, could adversely affect the Company’s results of operations and cash flows.
Other Commitments and Contingencies
The Company’s primary banks issued letters of credit on its behalf totaling $20.8 million and $15.4 million as of December 29, 2024 and December 31, 2023, respectively, a majority of which secure the Company’s reimbursement obligations to insurers under its self-insurance arrangements.
Note 16 — Related Party Transactions
Investments in Unconsolidated Entities
The following table summarizes the Company’s investments in unconsolidated entities:
| | | | | | | | | | | |
| December 29, 2024 | | December 31, 2023 |
Insomnia Cookies (1) | $ | 86,574 | | | $ | — | |
Krispy Kreme-branded international franchisees (2) | 4,496 | | | 2,071 | |
KremeWorks USA, LLC and KremeWorks Canada, L.P. (3) | — | | | 735 | |
| Total investments in unconsolidated entities | $ | 91,070 | | | $ | 2,806 | |
(1)The Company holds a 34.7% equity interest in Insomnia Cookies as of December 29, 2024, subsequent to the divestiture that occurred during the third quarter of fiscal 2024. Refer to Note 2, Acquisitions and Divestitures, to the audited Consolidated Financial Statements for more information. (2)The Company holds a 33% equity interest in franchisee KK France, a 45% equity interest in franchisee KK Brazil, and a 25% equity interest in franchisee KK Spain as of December 29, 2024. The interests in KK Brazil and KK Spain were acquired during the second quarter of fiscal 2024. Refer to Note 2, Acquisitions and Divestitures, to the audited Consolidated Financial Statements for more information. (3)The Company held a 20% equity interest in franchisee KremeWorks USA, LLC, and a 25% equity interest in franchisee KremeWorks Canada, L.P. as of December 31, 2023. During the third quarter of fiscal 2024, the Company acquired the business and operating assets of these two franchisees. Refer to Note 2, Acquisitions and Divestitures, to the audited Consolidated Financial Statements for more information. Revenues from sales of ingredients and equipment to the equity method franchisees were $11.9 million, $9.5 million, and $8.8 million for the fiscal years ended December 29, 2024, December 31, 2023, and January 1, 2023, respectively. Royalty revenues from these franchisees were $1.6 million, $1.6 million, and $1.4 million for the fiscal years ended December 29, 2024, December 31, 2023, and January 1, 2023, respectively. Trade receivables from these franchisees are included in Accounts receivable, net on the Consolidated Balance Sheets. These transactions were conducted pursuant to franchise agreements, the terms of which are substantially the same as the agreements with unaffiliated franchisees. Refer to Note 3, Accounts Receivable, net, to the audited Consolidated Financial Statements for more information. Other Related Party Activity
Keurig Dr Pepper Inc. (“KDP”), an affiliated company of JAB, licenses the Krispy Kreme trademark for the Company in the manufacturing of portion packs for the Keurig brewing system. KDP also sells beverage concentrates and packaged beverages to the Company for resale through Krispy Kreme shops. Licensing revenues from KDP were $2.4 million, $2.2 million, and $2.3 million for the fiscal years ended December 29, 2024, December 31, 2023, and January 1, 2023, respectively.
The Company had service agreements with BDT Capital Partners, LLC (“BDT”), a minority investor in KKI, to provide advisory services to the Company, including valuation services related to certain acquisitions. The Company recognized expenses of $0.5 million and $1.1 million related to the service agreements with BDT for the fiscal year ended December 29, 2024 and January 1, 2023, respectively. No related costs were incurred for the fiscal year ended December 31, 2023.
The Company granted loans to employees of KKI, KK U.K., KK Australia, KK Mexico and Insomnia Cookies for the purchase of shares in those subsidiaries. The loan balance was $1.9 million and $3.9 million as of December 29, 2024 and December 31, 2023, respectively, and it is presented as a reduction from Shareholders’ equity on the Consolidated Balance Sheets.
Note 17 — Revenue Recognition
Disaggregation of Revenues
Revenues are disaggregated as follows:
| | | | | | | | | | | | | | | | | |
| Fiscal Years Ended |
| December 29,
2024 | | December 31,
2023 | | January 1,
2023 |
| Company Shops, DFD, and Branded Sweet Treats | $ | 1,574,449 | | | $ | 1,592,573 | | | $ | 1,443,261 | |
| Mix and equipment revenue from franchisees | 53,329 | | | 58,593 | | | 54,621 | |
| Franchise royalties and other | 37,619 | | | 34,938 | | | 32,016 | |
| Total net revenues | $ | 1,665,397 | | | $ | 1,686,104 | | | $ | 1,529,898 | |
Other revenues include advertising fund contributions from franchisees, rental income, development and franchise fees, and licensing royalties from customers for use of the Krispy Kreme brand, such as Keurig coffee cups.
Contract Balances
Deferred revenue and related receivables are as follows:
| | | | | | | | | | | | | | | | | |
| December 29,
2024 | | December 31,
2023 | | Balance Sheet Location |
| Trade receivables, net of allowances of $1,060 and $564, respectively | $ | 57,439 | | | $ | 45,858 | | | Accounts receivables, net |
| Deferred revenue: | | | | | |
| Current | $ | 16,506 | | | $ | 22,066 | | | Accrued liabilities |
| Noncurrent | 8,569 | | | 6,005 | | | Other long-term obligations and deferred credits |
| Total deferred revenue | $ | 25,075 | | | $ | 28,071 | | | |
Trade receivables at the end of each fiscal year relate primarily to payments due for royalties, franchise fees, advertising fees, sale of products, and licensing fees. Deferred revenue primarily represents the Company’s remaining performance obligations under gift cards and franchise and development agreements for which consideration has been received or is receivable and is generally recognized on a straight-line basis over the remaining term of the related agreement. The noncurrent portion of deferred revenue primarily relates to the remaining performance obligations in the franchise and development agreements. Of the deferred revenue balances as of December 31, 2023, $13.5 million was recognized as revenue in the fiscal year ended December 29, 2024. Of the deferred revenue balance as of January 1, 2023, $12.2 million was recognized as revenue in fiscal the year ended December 31, 2023.
Transaction Price Allocated to Remaining Performance Obligations
Estimated revenue expected to be recognized in the future related to performance obligations that are either unsatisfied or partially satisfied as of December 29, 2024 is as follows:
| | | | | |
| Fiscal year | |
| 2025 | $ | 11,092 | |
| 2026 | 3,327 | |
| 2027 | 2,248 | |
| 2028 | 1,511 | |
| 2029 | 564 | |
| Thereafter | 6,333 | |
| $ | 25,075 | |
The estimated revenue in the table above relates to gift cards, consumer loyalty programs, and franchise fees paid upfront which are recognized over the life of the franchise agreement. The estimated revenue does not contemplate future issuances of gift cards nor benefits to be earned by members of consumer loyalty programs. The estimated revenue also does not contemplate future franchise renewals or new franchise agreements for shops for which a franchise agreement or development agreement does not exist as of December 29, 2024. The Company has applied the sales-based royalty exemption which permits exclusion of variable consideration in the form of sales-based royalties from the disclosure of remaining performance obligations in the table above.
Note 18 — Net Earnings/(Loss) per Share
The following table presents the calculations of basic and diluted EPS:
| | | | | | | | | | | | | | | | | |
| Fiscal Years Ended |
| (in thousands, except per share amounts) | December 29,
2024 | | December 31,
2023 | | January 1,
2023 |
| Net income/(loss) attributable to Krispy Kreme, Inc. | $ | 3,095 | | | $ | (37,925) | | | $ | (15,622) | |
| Adjustment to net income/(loss) attributable to common shareholders | — | | | — | | | (374) | |
| Net income/(loss) attributable to common shareholders — Basic | $ | 3,095 | | | $ | (37,925) | | | $ | (15,996) | |
| Additional income attributed to noncontrolling interest due to subsidiary potential common shares | (20) | | | (28) | | | (143) | |
| Net income/(loss) attributable to common shareholders — Diluted | $ | 3,075 | | | $ | (37,953) | | | $ | (16,139) | |
| Basic weighted average common shares outstanding | 169,341 | | | 168,289 | | | 167,471 | |
| Dilutive effect of outstanding common stock options, RSUs, and PSUs | 2,159 | | | — | | | — | |
| Diluted weighted average common shares outstanding | 171,500 | | | 168,289 | | | 167,471 | |
| Earnings/(loss) per share attributable to common shareholders: | | | | | |
| Basic | $ | 0.02 | | | $ | (0.23) | | | $ | (0.10) | |
| Diluted | $ | 0.02 | | | $ | (0.23) | | | $ | (0.10) | |
Potential dilutive shares consist of unvested RSUs and PSUs, calculated using the treasury stock method. The calculation of dilutive shares outstanding excludes certain unvested RSUs granted under certain subsidiaries’ executive ownership plans and long-term incentive plans, because their inclusion would have been antidilutive. Refer to Note 13, Share-based Compensation, to the audited Consolidated Financial Statements for further information about the plans. The following table summarizes the gross number of potential dilutive unvested RSUs and PSUs excluded due to antidilution (unadjusted for the treasury stock method):
| | | | | | | | | | | | | | | | | |
| Fiscal Years Ended |
| (in thousands) | December 29,
2024 | | December 31,
2023 | | January 1,
2023 |
| KKI | 1,421 | | | 6,785 | | | 4,946 | |
| KK U.K. | 7 | | | 7 | | | 60 | |
| Insomnia Cookies | — | | | 47 | | | — | |
| | | | | |
| | | | | |
For the fiscal years ended December 29, 2024, December 31, 2023, and January 1, 2023, all 2.7 million, 3.0 million, and 2.6 million time-vested stock options, respectively, were excluded from the computation of diluted weighted average common shares outstanding based on application of the treasury stock method.
Note 19 — Segment Reporting
The Company conducts business through the following three reportable segments:
•U.S.: Includes all Krispy Kreme Company-owned operations in the U.S., and Insomnia Cookies Bakeries globally through the date of deconsolidation (refer to Note 2, Acquisitions and Divestitures, to the audited Consolidated Financial Statements for more information); •International: Includes all Krispy Kreme Company-owned operations in the U.K., Ireland, Australia, New Zealand, Mexico, Canada, and Japan; and
•Market Development: Includes franchise operations across the globe.
Unallocated corporate costs are excluded from the Company’s measurement of segment performance. These costs include general corporate expenses.
Segment information is identified and prepared on the same basis that the Chief Executive Officer (“CEO”), the Company’s CODM, evaluates financial results, allocates resources and makes key operating decisions. The CODM allocates resources and assesses performance based on geography and line of business, which represents the Company’s operating segments.
The primary financial measures used by the CODM to evaluate the performance of its operating segments are net revenues and segment Adjusted EBIT. For all of the segments, the CODM uses segment Adjusted EBIT to monitor and evaluate operating performance and to provide a consistent benchmark for comparison across reporting periods.
The following tables reconcile segment results to consolidated results reported in accordance with GAAP. The accounting policies used for internal management reporting at the operating segments are consistent with those described in Note 1, Description of Business and Summary of Significant Accounting Policies, to the audited Consolidated Financial Statements. The Company manages its assets on a total company basis and the CODM does not review asset information by segment when assessing performance or allocating resources. Consequently, the Company does not report total assets by reportable segment.
The reportable segment results are as follows:
| | | | | | | | | | | | | | | | | |
| Fiscal Years Ended |
| December 29, 2024 | | December 31, 2023 | | January 1, 2023 |
| U.S. | | | | | |
| | | | | |
| | | | | |
| | | | | |
| | | | | |
| | | | | |
| | | | | |
| Net revenues | $ | 1,058,736 | | | $ | 1,104,944 | | | $ | 1,010,250 | |
| Less: | | | | | |
| Product and distribution costs, adjusted | 251,417 | | | 274,828 | | | 258,490 | |
| Operating expenses, adjusted | 563,033 | | | 556,283 | | | 515,456 | |
| Selling, general and administrative expense, adjusted | 98,629 | | | 111,584 | | | 90,253 | |
| Marketing expenses, adjusted | 31,395 | | | 31,407 | | | 29,190 | |
Other segment items (1) | 1,495 | | | (137) | | | 4,578 | |
| | | | | |
| Depreciation expense and amortization of right of use assets, adjusted | 60,406 | | | 56,529 | | | 47,119 | |
| Total U.S. Adjusted EBIT | $ | 52,361 | | | $ | 74,450 | | | $ | 65,164 | |
| | | | | |
| International | | | | | |
| | | | | |
| | | | | |
| | | | | |
| | | | | |
| Net revenues | $ | 519,102 | | | $ | 489,631 | | | $ | 435,651 | |
| Less: | | | | | |
| Product and distribution costs, adjusted | 125,075 | | | 120,015 | | | 110,101 | |
| Operating expenses, adjusted | 242,392 | | | 214,395 | | | 185,417 | |
| Selling, general and administrative expense, adjusted | 48,441 | | | 47,013 | | | 43,245 | |
| Marketing expenses, adjusted | 11,421 | | | 10,971 | | | 10,177 | |
Other segment items (1) | 1,057 | | | 705 | | | (538) | |
| | | | | |
| Depreciation expense and amortization of right of use assets, adjusted | 31,309 | | | 28,367 | | | 24,393 | |
| Total International Adjusted EBIT | $ | 59,407 | | | $ | 68,165 | | | $ | 62,856 | |
| | | | | |
| Market Development | | | | | |
| | | | | |
| | | | | |
| | | | | |
| | | | | |
| Net revenues | $ | 87,559 | | | $ | 91,529 | | | $ | 83,997 | |
| Less: | | | | | |
| Product and distribution costs, adjusted | 32,140 | | | 37,969 | | | 37,349 | |
| Selling, general and administrative expense, adjusted | 4,449 | | | 7,213 | | | 6,072 | |
Other segment items (1) | 3,066 | | | 3,381 | | | 1,692 | |
| | | | | |
| Depreciation expense and amortization of right of use assets, adjusted | 154 | | | 259 | | | 194 | |
| Total Market Development Adjusted EBIT | $ | 47,750 | | | $ | 42,707 | | | $ | 38,690 | |
| | | | | |
| Corporate | | | | | |
| | | | | |
| | | | | |
| Total Corporate expenses within Adjusted EBIT | $ | (69,290) | | | $ | (70,219) | | | $ | (57,536) | |
| | | | | |
| Total Reportable Segment | | | | | |
| | | | | |
| | | | | |
| | | | | |
| | | | | |
| | | | | |
| | | | | |
| | | | | |
| Total reportable segment net revenues | $ | 1,665,397 | | | $ | 1,686,104 | | | $ | 1,529,898 | |
| | | | | |
| Total reportable segment Adjusted EBIT | $ | 90,228 | | | $ | 115,103 | | | $ | 109,174 | |
(1)The U.S. and International segments’ other segment items consist of pre-opening costs and other (income)/expenses, net. The Market Development segment other segment items consist of operating expenses, marketing expenses, pre-opening costs, and other (income)/expenses, net.
The following table presents a reconciliation of net income/(loss) to Adjusted EBIT:
| | | | | | | | | | | | | | | | | |
| Fiscal Years Ended |
| December 29,
2024 | | December 31,
2023 | | January 1,
2023 |
| Net income/(loss) | $ | 3,815 | | | $ | (36,647) | | | $ | (8,775) | |
| Interest expense, net | 60,066 | | | 50,341 | | | 34,102 | |
| | | | | |
| Income tax expense/(benefit) | 15,954 | | | (4,347) | | | 612 | |
| Share-based compensation | 35,149 | | | 24,196 | | | 18,170 | |
| Employer payroll taxes related to share-based compensation | 358 | | | 395 | | | 312 | |
| Gain on divestiture of Insomnia Cookies | (90,455) | | | — | | | — | |
Other non-operating expense, net (1) | 1,885 | | | 3,798 | | | 3,036 | |
| | | | | |
Strategic initiatives (2) | 19,993 | | | 29,057 | | | 2,841 | |
Acquisition and integration expenses (3) | 3,282 | | | 511 | | | 2,333 | |
New market penetration expenses (4) | 1,407 | | | 1,380 | | | 1,511 | |
Shop closure expenses, net (5) | 4,861 | | | 17,335 | | | 19,715 | |
Restructuring and severance expenses (6) | 7,561 | | | 5,050 | | | 7,125 | |
Gain on remeasurement of equity method investment (7) | (5,579) | | | — | | | — | |
| | | | | |
| Gain on sale-leaseback | (1,569) | | | (9,646) | | | (6,549) | |
Other (8) | 3,203 | | | 4,307 | | | 6,285 | |
Amortization of acquisition related intangibles (9) | 30,297 | | | 29,373 | | | 28,456 | |
| Adjusted EBIT | $ | 90,228 | | | $ | 115,103 | | | $ | 109,174 | |
| | | | | |
| | | | | |
(1)Primarily foreign translation gains and losses in each period. Fiscal 2024 also consists of equity method income from Insomnia Cookies following the divestiture discussed in Note 2, Acquisitions and Divestitures, to the Consolidated Financial Statements. (2)Fiscal 2024 consists primarily of costs associated with the divestiture of the Insomnia Cookies business, preparing for the McDonald’s U.S. expansion, and global transformation. Fiscal 2023 consists primarily of costs associated with global transformation and U.S. initiatives such as the decision to exit the Branded Sweet Treats business, including property, plant and equipment impairments, inventory write-offs, employee severance, and other related costs. Fiscal 2022 consists mainly of equipment disposals, equipment relocation and installation, consulting and advisory fees, and other costs associated with the shift of Branded Sweet Treats manufacturing capability from Burlington, Iowa to Winston-Salem, North Carolina.
(3)Consists of acquisition and integration-related costs in connection with the Company’s business and franchise acquisitions, including legal, due diligence, and advisory fees incurred in connection with acquisition and integration-related activities for the applicable period.
(4)Consists of start-up costs associated with entry into new countries in which the Company has not previously operated, including Brazil and Spain.
(5)Includes lease termination costs, impairment charges, and loss on disposal of property, plant and equipment.
(6)Fiscal 2024 consists primarily of costs associated with the restructuring of the U.S. and U.K. executive teams. Fiscal 2023 and 2022 consist primarily of costs associated with restructuring of the global executive team.
(7)Consists of a gain related to the remeasurement of the equity method investments in KremeWorks USA, LLC and KremeWorks Canada, L.P. to fair value immediately prior to the acquisition of the shops. Refer to Note 2, Acquisitions and Divestitures, to the audited Consolidated Financial Statements for more information. (8)Fiscal 2024 consists primarily of $3.1 million in costs related to remediation of the 2024 Cybersecurity Incident, including fees for cybersecurity experts and other advisors. Fiscal 2023 and fiscal 2022 consist primarily of legal and other regulatory expenses incurred outside the ordinary course of business on matters described in Note 15, Commitments and Contingencies, to the Company’s audited Consolidated Financial Statements. (9)Consists of amortization related to acquired intangible assets as reflected within depreciation and amortization in the Consolidated Statements of Operations.
Geographical information related to consolidated revenues and long-lived assets is as follows:
| | | | | | | | | | | | | | | | | |
| Fiscal Years Ended |
| December 29,
2024 | | December 31,
2023 | | January 1, 2023 |
| Net revenues: | | | | | |
| U.S. | $ | 1,091,597 | | | $ | 1,144,564 | | | $ | 1,049,824 | |
| U.K. | 158,459 | | | 154,775 | | | 144,911 | |
| Australia / New Zealand | 122,737 | | | 117,328 | | | 114,250 | |
| Mexico | 127,230 | | | 120,072 | | | 96,354 | |
| All other | 165,374 | | | 149,365 | | | 124,559 | |
| Total net revenues | $ | 1,665,397 | | | $ | 1,686,104 | | | $ | 1,529,898 | |
| | | | | | | | | | | | | | | | | |
| Fiscal Years Ended |
| December 29,
2024 | | December 31,
2023 | | January 1,
2023 |
| Long-lived assets: | | | | | |
| U.S. | $ | 664,299 | | | $ | 735,955 | | | $ | 679,706 | |
| U.K. | 82,140 | | | 79,039 | | | 66,776 | |
| Australia / New Zealand | 56,399 | | | 62,080 | | | 62,759 | |
| Mexico | 61,943 | | | 69,616 | | | 50,481 | |
| All other | 56,227 | | | 48,494 | | | 30,017 | |
| Total long-lived assets | $ | 921,008 | | | $ | 995,184 | | | $ | 889,739 | |
Total long-lived assets consist of Property and equipment, net and Operating lease right of use asset, net.
Note 20 — Subsequent Events
The Company evaluated subsequent events and transactions for potential recognition or disclosure in the audited Consolidated Financial Statements through February 27, 2025, the date the audited Consolidated Financial Statements were available to be issued. All subsequent events requiring recognition and disclosure have been incorporated into these audited Consolidated Financial Statements.
On February 13, 2025, the Company’s Board of Directors declared a $0.035 per share cash dividend payable on May 7, 2025, to shareholders of record on April 23, 2025.
Item 9. Changes in and Disagreements with Accountants on Accounting and Financial Disclosure
None.
Item 9A. Controls and Procedures
Disclosure Controls and Procedures
In connection with the preparation of this Annual Report on Form 10-K, an evaluation was conducted by the Company’s management, with participation of our CEO and Chief Financial Officer (“CFO”), of the effectiveness of the design and operation of our disclosure controls and procedures (as defined in Rules 13a-15(e) and 15d-15(e) under the Exchange Act) as of December 29, 2024. Disclosure controls and procedures are designed to ensure that information required to be disclosed in Exchange Act reports is recorded, processed, summarized, and reported within the time periods specified in the SEC’s rules and forms, and that such information is accumulated and communicated to our management, including our CEO and CFO, to allow timely decisions regarding required disclosure. Based on that evaluation, the Company’s management concluded that our disclosure controls and procedures were not effective as of December 29, 2024 because of the material weakness in internal control over financial reporting discussed below.
Management’s Annual Report on Internal Control Over Financial Reporting
Management is responsible for establishing and maintaining adequate internal control over financial reporting. Internal control over financial reporting is a process designed to provide reasonable assurance regarding the reliability of our financial reporting for external purposes in accordance with GAAP. Internal control over financial reporting includes maintaining records that in reasonable detail accurately and fairly reflect our transactions; providing reasonable assurance that transactions are recorded as necessary for preparation of our financial statements; providing reasonable assurance that receipts and expenditures are made in accordance with management authorization; and providing reasonable assurance that unauthorized acquisition, use, or disposition of Company assets that could have a material effect on our financial statements would be prevented or detected on a timely basis. Because of its inherent limitations, internal control over financial reporting is not intended to provide absolute assurance that a misstatement of our financial statements would be prevented or detected.
Management has assessed the effectiveness of our internal control over financial reporting as of December 29, 2024 based on the framework and criteria established in Internal Control — Integrated Framework (2013) issued by the Committee of Sponsoring Organizations of the Treadway Commission. As a result of this assessment, and after our additional evaluations following the 2024 Cybersecurity Incident, management identified a material weakness related to access that could enable the creation of journal entries without review and approval. This created the potential opportunity for there to have been material errors in multiple financial statement accounts that may not have been prevented or detected timely. Although the additional evaluations following the 2024 Cybersecurity Incident aided in its identification, we believe this material weakness did not result from the 2024 Cybersecurity Incident. Based on the identification of this material weakness, management concluded that the Company did not maintain effective internal control over financial reporting as of December 29, 2024.
Remediation Measures
Management is committed to taking actions to remediate the material weakness, which include designing and implementing additional or enhanced controls to address the access that could enable the creation of journal entries without review and approval, and system controls that enable proper segregation of duties related to journal entry data and processes. We can offer no assurance that these actions will ultimately have the intended effects. The material weakness will not be considered remediated until the applicable controls operate for a sufficient period of time and management has concluded, through testing, that these controls are operating effectively. Accordingly, management will continue to monitor and evaluate the effectiveness of our internal control over financial reporting and the disclosure controls and procedures.
After giving full consideration to the material weakness described above and the additional analyses and other procedures that were performed, management believes that the Consolidated Financial Statements included in this Annual Report on Form 10-K fairly present in all material respects the Company’s financial condition, results of operations, and cash flows for the periods and dates presented.
Changes in Internal Controls over Financial Reporting
There were no changes in our internal control over financial reporting that materially affected, or are reasonably likely to materially affect, our internal control over financial reporting during the fiscal quarter ended December 29, 2024.
Attestation of Independent Registered Public Accounting Firm
Our independent registered public accounting firm, Grant Thornton LLP, has issued an audit report with respect to our internal control over financial reporting, which appears in Item 8 of Part II of this Annual Report on Form 10-K.
Item 9B. Other Information
None.
Item 9C. Disclosure Regarding Foreign Jurisdictions that Prevent Inspections
Not applicable.
PART III
Item 10. Directors, Executive Officers and Corporate Governance
The information required by this item, including information about our Directors, Executive Officers, Audit Committee, Insider Trading Policy, and Code of Conduct, is incorporated by reference to the definitive Proxy Statement for our 2025 Annual Meeting of Stockholders, which will be filed with the SEC no later than 120 days after December 29, 2024.
Item 11. Executive Compensation
The information required by this item is incorporated by reference to the definitive Proxy Statement for our 2025 Annual Meeting of Stockholders, which will be filed with the SEC no later than 120 days after December 29, 2024.
Item 12. Security Ownership of Certain Beneficial Owners and Management and Related Stockholder Matters
The information required by this item is incorporated by reference to the definitive Proxy Statement for our 2025 Annual Meeting of Stockholders, which will be filed with the SEC no later than 120 days after December 29, 2024.
Item 13. Certain Relationships and Related Transactions and Director Independence
The information required by this item is incorporated by reference to the definitive Proxy Statement for our 2025 Annual Meeting of Stockholders, which will be filed with the SEC no later than 120 days after December 29, 2024.
Item 14. Principal Accountant Fees and Services
The information required by this item is incorporated by reference to the definitive Proxy Statement for our 2025 Annual Meeting of Stockholders, which will be filed with the SEC no later than 120 days after December 29, 2024.
PART IV
Item 15. Exhibits and Financial Statement Schedules
(a) List the Following Documents Filed as Part of this Annual Report on Form 10-K:
1.Financial Statements
See Index to Consolidated Financial Statements in Item 8 of this Annual Report on Form 10-K.
2.Financial Statement Schedules
All schedules have been omitted because they are not required or the required information is shown in the Consolidated Financial Statements or notes thereto.
3.Exhibits
| | | | | | | | |
| EXHIBIT NO. | | DESCRIPTION OF EXHIBIT |
| | |
| 3.1 | | |
| | |
| 3.2 | | |
| | |
| 4.1 | | |
| | |
| 10.1† | | |
| | |
| 10.2† | | |
| | |
| 10.3 | | |
| | |
| 10.4† | | |
| | |
| 10.5† | | |
| | |
| 10.6† | | |
| | |
| 10.7† | | |
| | |
| 10.8† | | |
| | |
| 10.9† | | |
| | |
| 10.10† | | |
| | |
| | | | | | | | |
| 10.11† | | |
| | |
| 10.12 | | Letter Agreement, dated March 14, 2022, by and among Krispy Kreme, Inc., JAB Indulgence B.V., and JAB Holdings B.V. (filed as Exhibit 10.1 to the Company's Current Report on Form 8-K, File number 001-40573, filed on March 16, 2022, and incorporated by reference herein) |
| | |
| 10.13 | | |
| | |
| 10.14† | | |
| | |
| 10.15† | | |
| | |
| 10.16† | | |
| | |
| 10.17 | | Credit Agreement, dated March 23, 2023, by and among Krispy Kreme, Inc., Cotton Parent, Inc., Krispy Kreme Doughnuts, Inc., the other borrowers party thereto from time to time, the lenders party thereto and BNP Paribas as administrative agent and collateral agent (filed as Exhibit 10.1 to the Company’s Current Report on Form 8-K, File number 001-40573, filed on March 23, 2023, and incorporated by reference herein) |
| | |
| 10.18† | | |
| | |
| 10.19† | | |
| | |
| 10.20† | | |
| | |
| 10.21† | | |
| | |
| 10.22† | | |
| | |
| 10.23† | | Transition and Separation Agreement, dated March 13, 2024, between Krispy Kreme, Inc., Krispy Kreme Doughnut Corporation, and Catherine Tang (filed as Exhibit 10.1 to the Company’s Current Report on Form 8-K, File number 001-40573, filed on March 14, 2024, and incorporated by reference herein) |
| | |
| 10.24 | | Unit Purchase Agreement, dated July 17, 2024, among Insomnia Cookies Holdings, LLC, Mistral Sleepless Holdings, LLC, and Verlinvest Cookies Holdings, Inc. (filed as Exhibit 10.1 to the Company’s Quarterly Report on Form 10-Q, File number 001-40573, filed August 8, 2024, and incorporated by reference herein) |
| | |
| 10.25† | | |
| | |
| 10.26† | | |
| | |
| 10.27† | | |
| | |
| | | | | | | | |
| 10.28† | | |
| | |
| 19.1* | | |
| | |
| 21.1* | | |
| | |
| 23.1* | | |
| | |
| 31.1* | | |
| | |
| 31.2* | | |
| | |
| 32.1** | | |
| | |
| 97.1† | | |
| | |
| 101* | | The following financial statements from the Company’s Annual Report on Form 10-K for the year ended December 29, 2024, formatted in Inline XBRL: (i) Consolidated Statements of Operations, (ii) Consolidated Statements of Comprehensive (Loss)/Income, (iii) Consolidated Balance Sheets, (iv) Consolidated Statements of Changes in Shareholders’ Equity, (v) Consolidated Statements of Cash Flows, and (vi) Notes to Consolidated Financial Statements |
| | |
| 104* | | Cover Page Interactive Data File (formatted as inline XBRL and contained in Exhibit 101) |
_________________________________________
* Filed herewith.
** Furnished herewith.
† Compensatory plan or arrangement.
Item 16. Form 10-K Summary
None.
SIGNATURES
Pursuant to the requirements of Section 13 of 15(d) of the Securities Exchange Act of 1934, the registrant has duly caused this Annual Report on Form 10-K to be signed on its behalf of the undersigned, thereunto duly authorized.
| | | | | | | | |
| Date: February 27, 2025 | |
| Krispy Kreme, Inc. |
| | |
| By: | /s/ Josh Charlesworth |
| Name: | Josh Charlesworth |
| Title: | Chief Executive Officer |
Pursuant to the requirements of the Securities Act of 1934, this Annual Report on Form 10-K has been signed by the following persons in the capacities indicated as of February 27, 2025.
| | | | | |
| Signature | Title |
| |
| /s/ Josh Charlesworth | Director, President and Chief Executive Officer |
| Josh Charlesworth | (Principal Executive Officer) |
| |
| /s/ Jeremiah Ashukian | Chief Financial Officer |
| Jeremiah Ashukian | (Principal Financial Officer) |
| |
| /s/ Kelly McBride | Chief Accounting Officer |
| Kelly McBride | (Principal Accounting Officer) |
| |
| /s/ Olivier Goudet | Director, Chairman of the Board |
| Olivier Goudet | |
| |
| /s/ Marissa Andrada | Director |
| Marissa Andrada | |
| |
| /s/ David Bell | Director |
| David Bell | |
| |
| /s/ Patricia Capel | Director |
| Patricia Capel | |
| |
| /s/ David Deno | Director |
| David Deno | |
| |
| Director |
| Paul Michaels | |
| |
| /s/ Gerhard Pleuhs | Director |
| Gerhard Pleuhs | |
| |
| /s/ Debbie Roberts | Director |
| Debbie Roberts | |
| |
| /s/ Philip Telfer | Director |
| Philip Telfer | |
| |
| /s/ Michelle Weese | Director |
| Michelle Weese | |