Exhibit 99.2

Investor Presentation June 2022 1
2 Investor Presentation Disclaimer Forward - Looking Statements The statements contained or referred to in this Presentation may include “forward - looking statements” within the meaning of the “safe harbour ” provisions of the Private Securities Litigation Reform Act of 1995. The expectations, estimates, and projections of the bus ine ss of Cazoo may differ from its actual results and, consequently, you should not rely on forward - looking statements as predictions of future events. These f orward - looking statements generally are identified by the words “believe,” “project,” “expect,” “anticipate,” “estimate,” “inten d,” “strategy,” “future,” “opportunity,” “plan,” “may,” “should,” “will,” “would,” “will be,” “will continue,” “will likely result,” and similar expressions. Forward - loo king statements are predictions, projections and other statements about future events that are based on current expectations and assumptions and, as a result, are subject to risks and uncertainties. Many factors could cause actual future events to differ materially from the forward - looking statements in this press release, including but not limited to: (1) the implementation of and expected benefits from our business realig nme nt plan and cost - saving initiatives; (2) realizing the benefits expected from the business combination (the “Business Combination”) with Ajax I; (3) achieving the exp ect ed revenue growth and effectively managing growth; (4) executing Cazoo’s growth strategy in the UK and Europe; (5) achieving and maintaining profitability in the future; (6) global inflation and cost increases for labor, fuel, materials and services; (7) geopolitical and macroeconomic condition s a nd their impact on prices for goods and services and on consumer discretionary spending; (8) having access to suitable and su ffi cient vehicle inventory for resale to customers and reconditioning and selling inventory expeditiously and efficiently; (9) availability of credit for vehicle financing and the affordability of interest rates; (10) increasing Cazoo’s service offerings and price optimization; (11) effectively promoting Cazoo’s brand and increasing brand awareness; (12) expanding Cazoo’s product offerings and introducing additional products and services; (13) enhancing future operating and financial results; (1 4) acquiring and integrating other companies; (15) acquiring and protecting intellectual property; (16) attracting, training and r etaining key personnel; (17) complying with laws and regulations applicable to Cazoo’s business; (18) successfully deploying the proceeds from the Business Combination and the issuance of $630 million of converti bl e notes to an investor group led by Viking Global Investors; and (19) other risks and uncertainties set forth in the sections entitled “Risk Factors” and “Cautionary Note Regarding Forward - Looking Statements” in the Annual Report on Form 20 - F filed by Cazoo Group Ltd. The foregoing list of factors is not exhaustive. You should carefully consider the foregoing fact ors and the disclosure included in other documents filed by Cazoo from time to time with the SEC. These filings identify and address other important risks and uncerta int ies that could cause actual events and results to differ materially from those contained in the forward - looking statements. Forw ard - looking statements speak only as of the date they are made. Readers are cautioned not to put undue reliance on forward - looking statements, and Cazoo assumes no obli gation and does not intend to update or revise these forward - looking statements, whether as a result of new information, future events, or otherwise. Cazoo gives no assurance that it will achieve its expectations. Industry and Market Data This Presentation includes market data and other statistical information from sources believed by Cazoo to be reliable, including independent industry publications, governmental publications or other published independent sources . Some data is also based on the good faith estimates of Cazoo , which in each case are derived from its review of internal sources as well as the independent sources described above. Althou gh Cazoo believes these sources are reliable, Cazoo has not independently verified the information and cannot guarantee its accuracy and completeness. Cautionary Statement Regarding Preliminary Results The Company’s results for the fiscal quarter ended March 31, 2022, for the period from April 1, 2022 to May 31, 2022, and as of May 31, 2022 are preliminary, unaudited and subject to change. In addition, these preliminary results are not a comprehensive st atement of the Company’s financial results for the periods and as of the dates presented. The Company cautions you that these preliminary results are not guaran tee s of future performance or outcomes, and that actual results may differ materially from these described above. Financial Information; Certain of the financial information and data contained in this Presentation has not been prepared in accordance with Interna tio nal Financial Reporting Standards as adopted by the International Accounting Standards Board. You should review Cazoo’s audited financial statements, which are included in the company’s filings with the SEC. Use of Guidance and Projections Any financial information in this Presentation (including specifically guidance and projections) that are forward - looking statem ents are based on assumptions that are inherently subject to significant uncertainties and contingencies, many of which are b eyo nd Cazoo’s control. While such information, guidance and projections are necessarily speculative, Cazoo believes that the preparation of prospective financial information involves increasingly higher levels of uncertainty the fur th er out the projection extends from the date of preparation. The assumptions and estimates underlying the projected results are inherently uncertain and are subject to a wide variety of significant business, economic an d competitive risks and uncertainties that could cause actual results to differ materially from those contained in the projec tio ns. All subsequent written and oral forward - looking statements concerning Cazoo or other matters and attributable to Cazoo or any person acting on its behalf are expressly qualified in their entirety by the cautionary statements. Trademarks This Presentation contains trademarks, service marks, trade names and copyrights of Cazoo and of other companies, which are the property of their respective owners.
3 Investor Presentation Contents Progress to date and opportunity Current macroeconomic reality Our business realignment plan Trading update and 2022 guidance

4 Investor Presentation We have proven we can buy/sell cars at scale, with a world - class brand and customer experience Note: Vehicles sold since launch in Dec 19, as of May 22. UK Brand Awareness as of Mar 22 per Engage Brand Tracker . Trustpilot reviews for Cazoo.co.uk. Retail Units Sold 70,000+ Retail Units Sold, sourced from consumers YTD 30%+ 21k+ Reviews 4.8/5.0 UK Brand Awareness 80%+
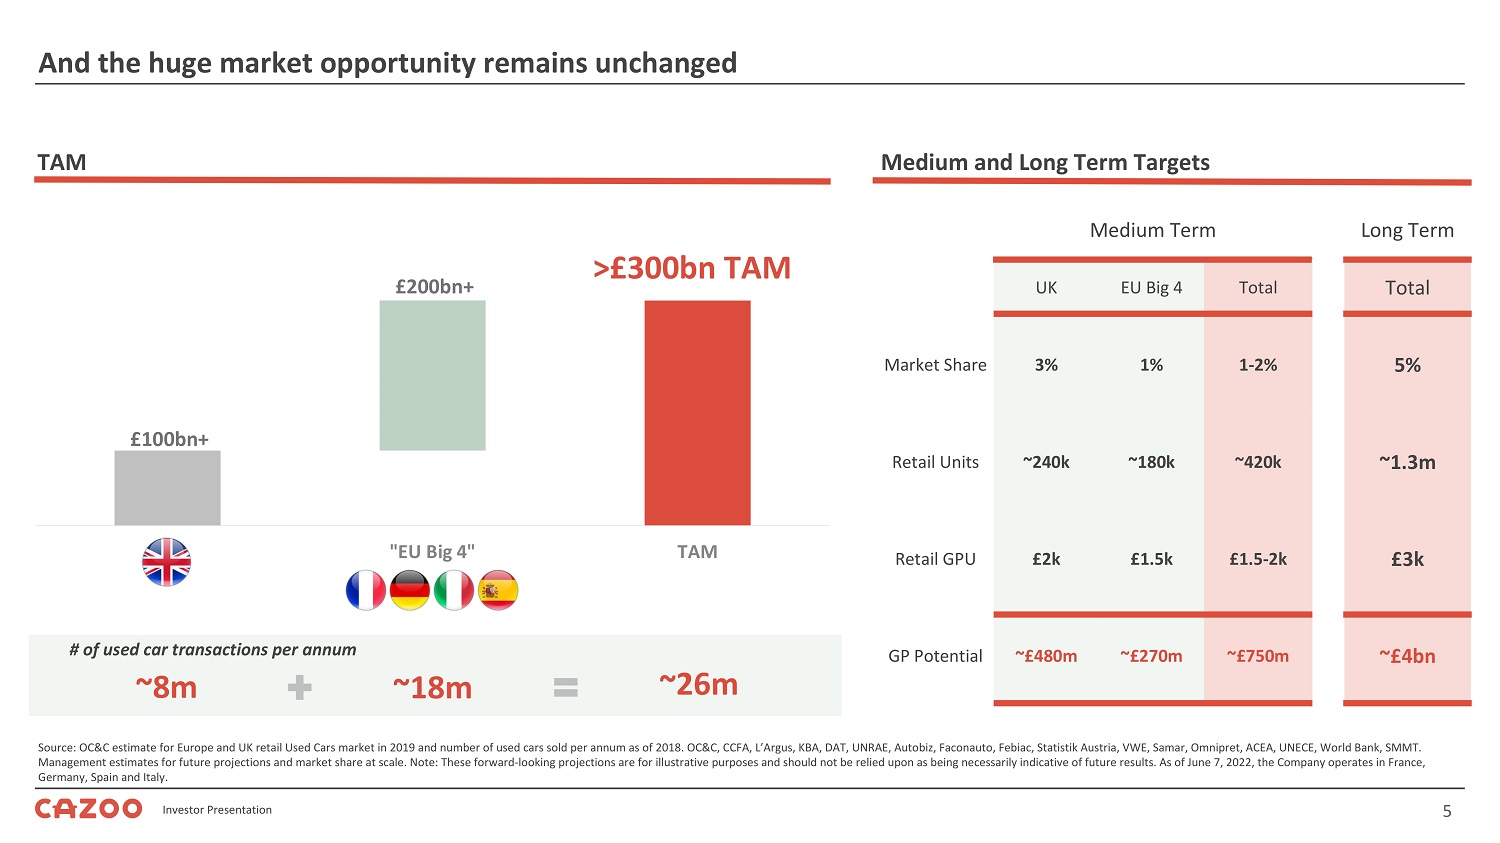
5 Investor Presentation £100bn+ £200bn+ £300bn+ UK "EU Big 4" TAM Source: OC&C estimate for Europe and UK retail Used Cars market in 2019 and number of used cars sold per annum as of 2018. OC &C, CCFA, L’Argus , KBA, DAT, UNRAE, Autobiz , Faconauto , Febiac , Statistik Austria, VWE, Samar, Omnipret , ACEA, UNECE, World Bank, SMMT. Management estimates for future projections and market share at scale. Note: These forward - looking projections are for illustrat ive purposes and should not be relied upon as being necessarily indicative of future results. As of June 7, 2022, the Company op erates in France, Germany, Spain and Italy. >£300bn TAM Medium and Long Term Targets TAM And the huge market opportunity remains unchanged # of used car transactions per annum ~8m ~18m ~26m Medium Term Long Term UK EU Big 4 Total Total Market Share 3% 1% 1 - 2% 5% Retail Units ~240k ~180k ~420k ~1.3m Retail GPU £2k £1.5k £1.5 - 2k £3k GP Potential ~£480m ~£270m ~£750m ~£4bn
6 Investor Presentation But we are not immune to the current macroeconomic reality Despite strong start to the year, we are planning for a weaker macro environment • Strong retail unit sales growth of over 80% YoY in recent months, and the continued expansion of our market share • Keenly aware of rapid shift in global economy, deterioration in consumer confidence and possibility of a recession • Rising inflation/interest rates & supply chain issues caused by pandemic/war has increased cost of living • Expectation of further softening in consumer demand and used car pricing over the coming months • Acting decisively to right - size business in the short - term & ensure well positioned to achieve long - term targets • Business realignment plan to de - risk path to profitability and extend cash runway beyond year end 2023 • Prioritising sustainable gross margins, reducing SG&A costs and focusing on cash preservation above all else • Plan ensures that we can continue to take advantage of sizeable opportunity whilst managing pace of growth • Continue to expect strong growth of over 100% in 2022, and continued belief in achieving market share gains thereafter

7 Investor Presentation The three goals of our business realignment plan Lower SG&A costs per unit while minimising the impact on growth and customer experience Achieve UK cash flow breakeven with lower retail unit sales with a stronger focus on GPU and working capital Manage costs and expenditure to become self - funding in the UK without needing further capital Note: Forward - looking projections are for illustrative purposes and should not be relied upon as being necessarily indicative of future results.
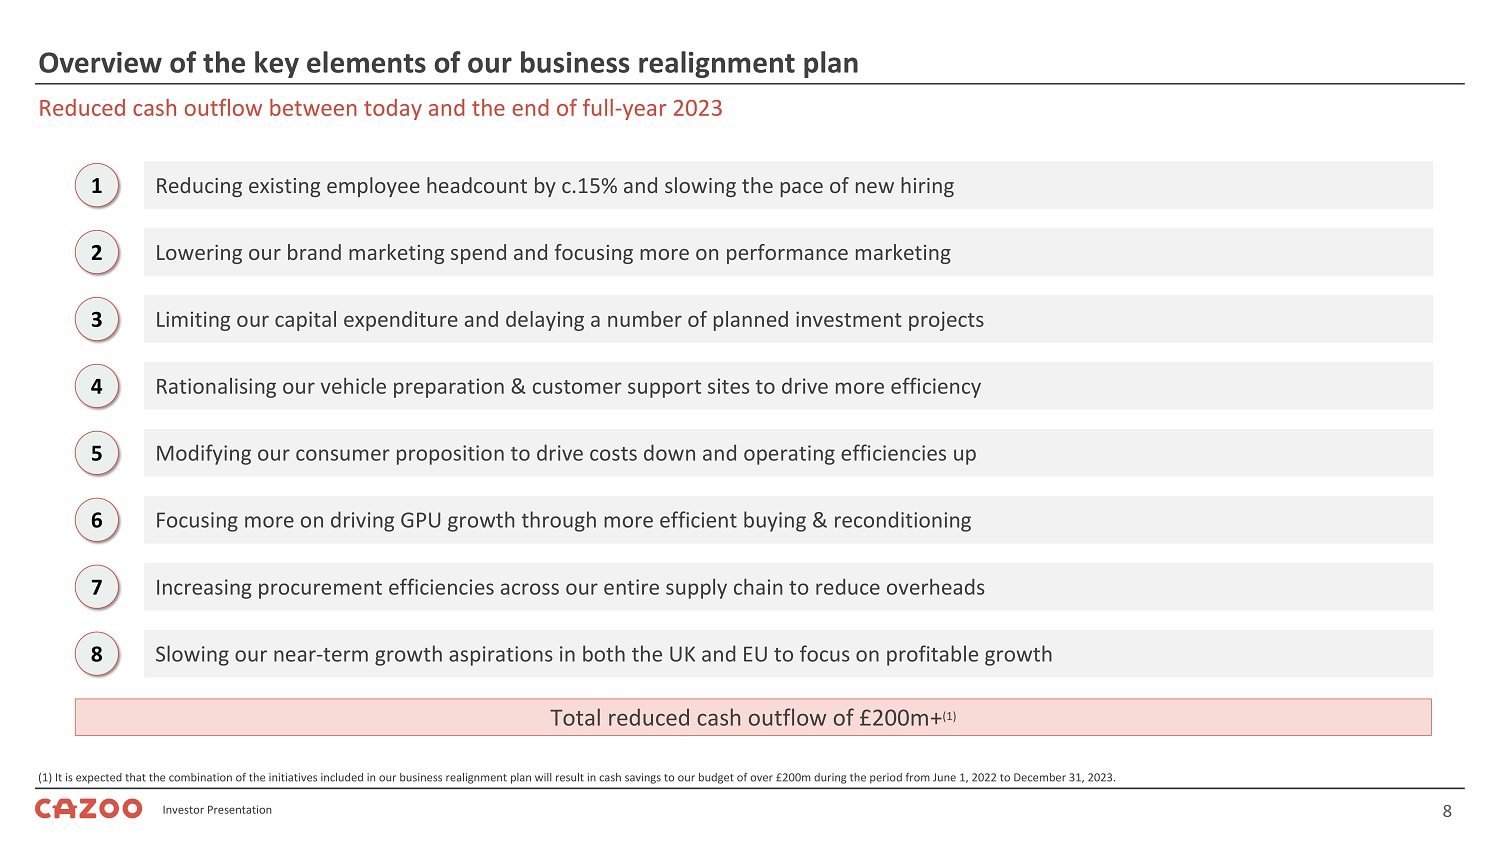
8 Investor Presentation Reduced cash outflow between today and the end of full - year 2023 Overview of the key elements of our business realignment plan (1) It is expected that the combination of the initiatives included in our business realignment plan will result in cash savi ngs to our budget of over £200m during the period from June 1, 2022 to December 31, 2023. 1 Reducing existing employee headcount by c.15% and slowing the pace of new hiring 2 Lowering our brand marketing spend and focusing more on performance marketing 3 Limiting our capital expenditure and delaying a number of planned investment projects 4 Rationalising our vehicle preparation & customer support sites to drive more efficiency 5 Modifying our consumer proposition to drive costs down and operating efficiencies up 6 Focusing more on driving GPU growth through more efficient buying & reconditioning 7 Increasing procurement efficiencies across our entire supply chain to reduce overheads 8 Slowing our near - term growth aspirations in both the UK and EU to focus on profitable growth Total reduced cash outflow of £200m+ (1)
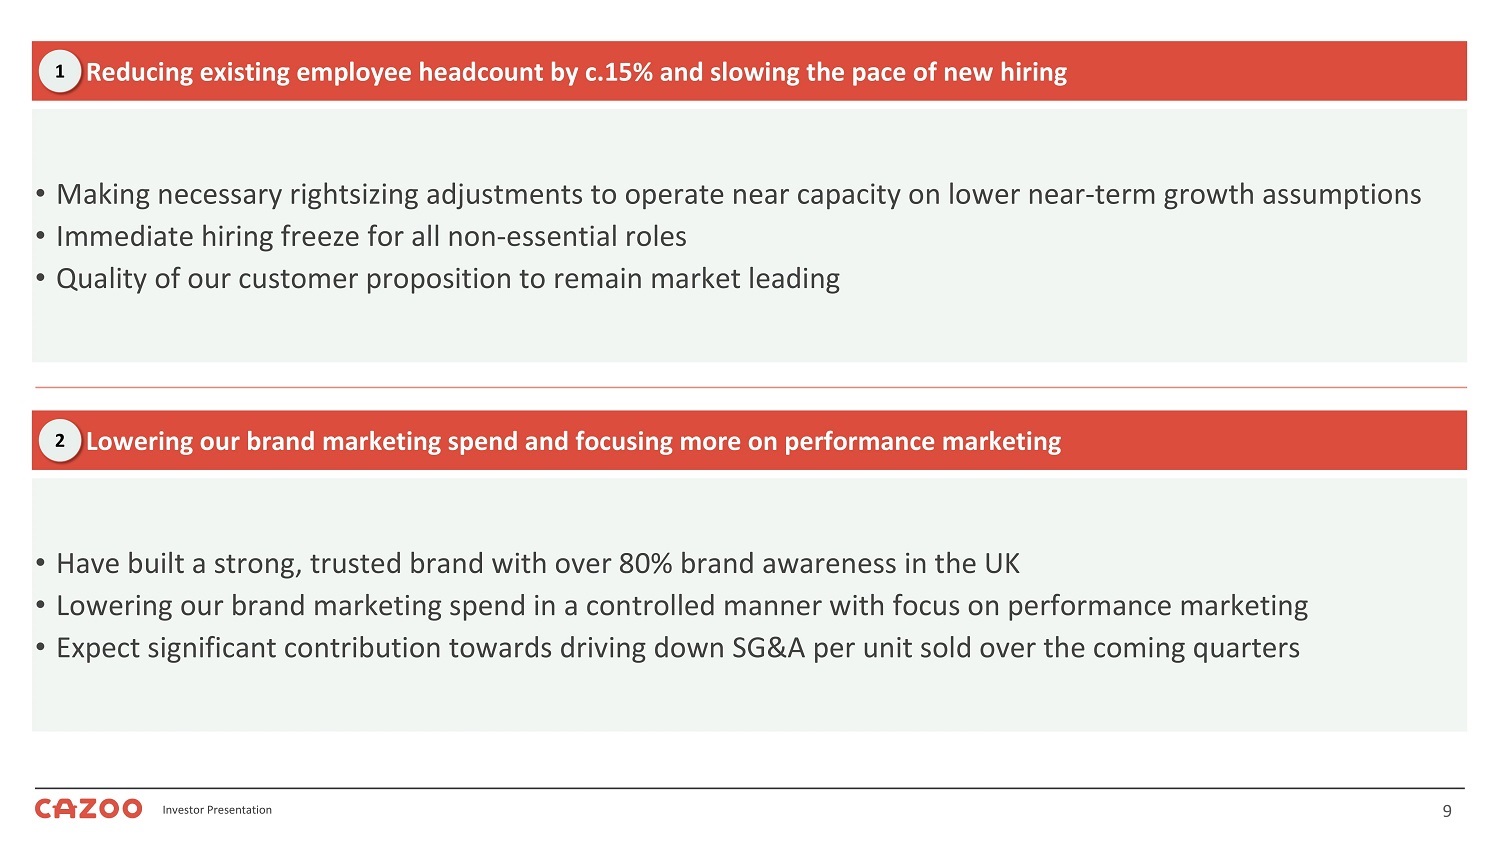
9 Investor Presentation • Making necessary rightsizing adjustments to operate near capacity on lower near - term growth assumptions • Immediate hiring freeze for all non - essential roles • Quality of our customer proposition to remain market leading Reducing existing employee headcount by c.15% and slowing the pace of new hiring 1 • Have built a strong, trusted brand with over 80% brand awareness in the UK • Lowering our brand marketing spend in a controlled manner with focus on performance marketing • Expect significant contribution towards driving down SG&A per unit sold over the coming quarters Lowering our brand marketing spend and focusing more on performance marketing 2
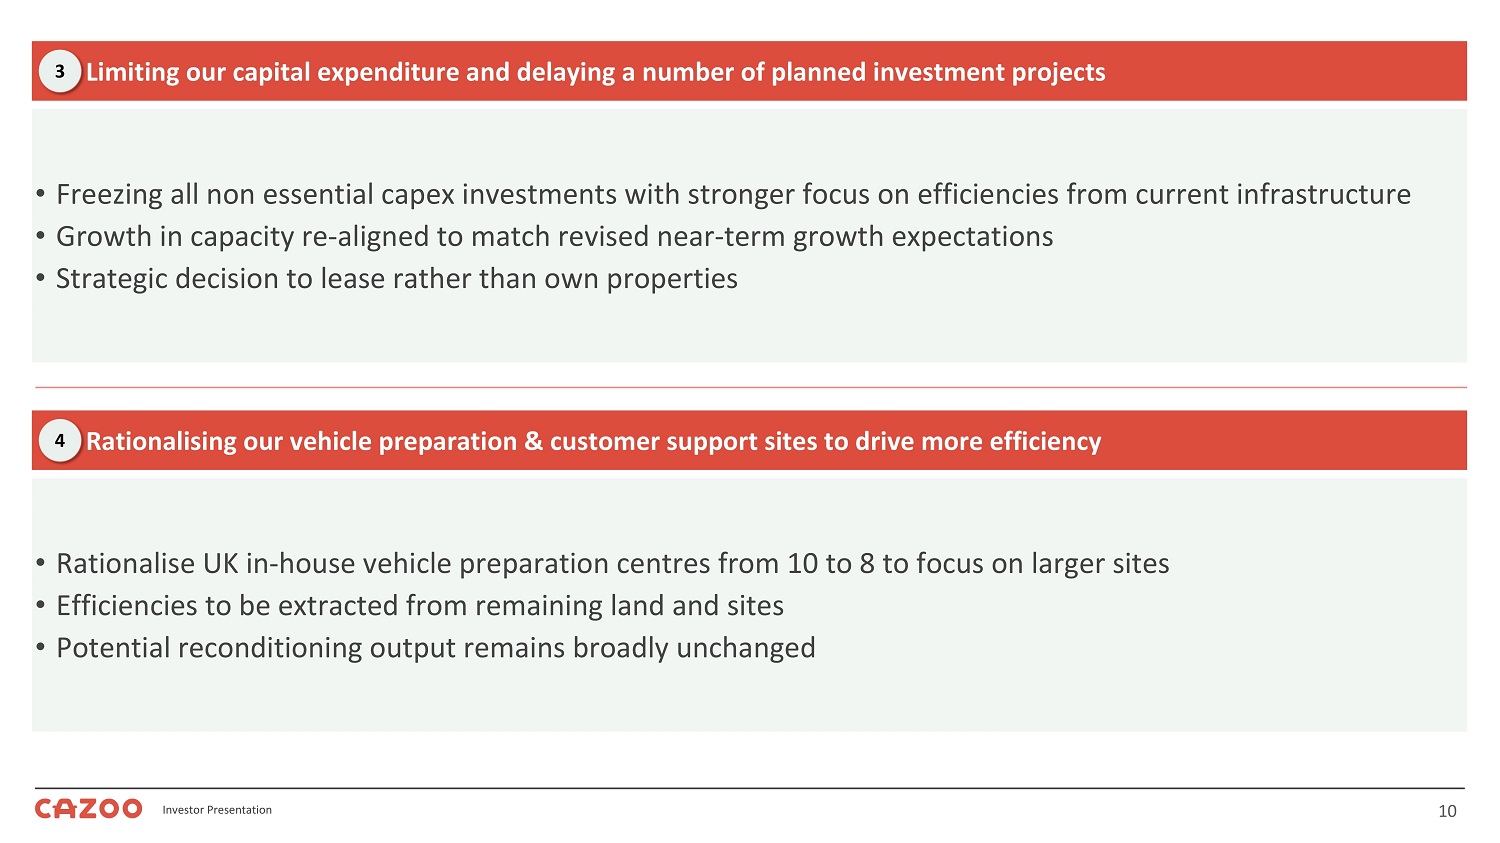
10 Investor Presentation • Freezing all non essential capex investments with stronger focus on efficiencies from current infrastructure • Growth in capacity re - aligned to match revised near - term growth expectations • Strategic decision to lease rather than own properties Limiting our capital expenditure and delaying a number of planned investment projects 3 • Rationalise UK in - house vehicle preparation centres from 10 to 8 to focus on larger sites • Efficiencies to be extracted from remaining land and sites • Potential reconditioning output remains broadly unchanged Rationalising our vehicle preparation & customer support sites to drive more efficiency 4

11 Investor Presentation • Modest revisions to consumer retail proposition while mitigating impact on consumer experience • Continuing to offer best - in - class proposition with ongoing benchmarking against closest peers • No longer offer subscription service to new customers in any market from end of June Modifying our consumer proposition to drive costs down and operating efficiencies up 5 • Prioritising GPU improvements over growth in the near - term (while still growing >100%) • Utilising our extensive data to make further gains on pricing decisions • Driving savings on reconditioning costs and reducing days to sale Focusing more on driving GPU growth through more efficient buying & reconditioning 6
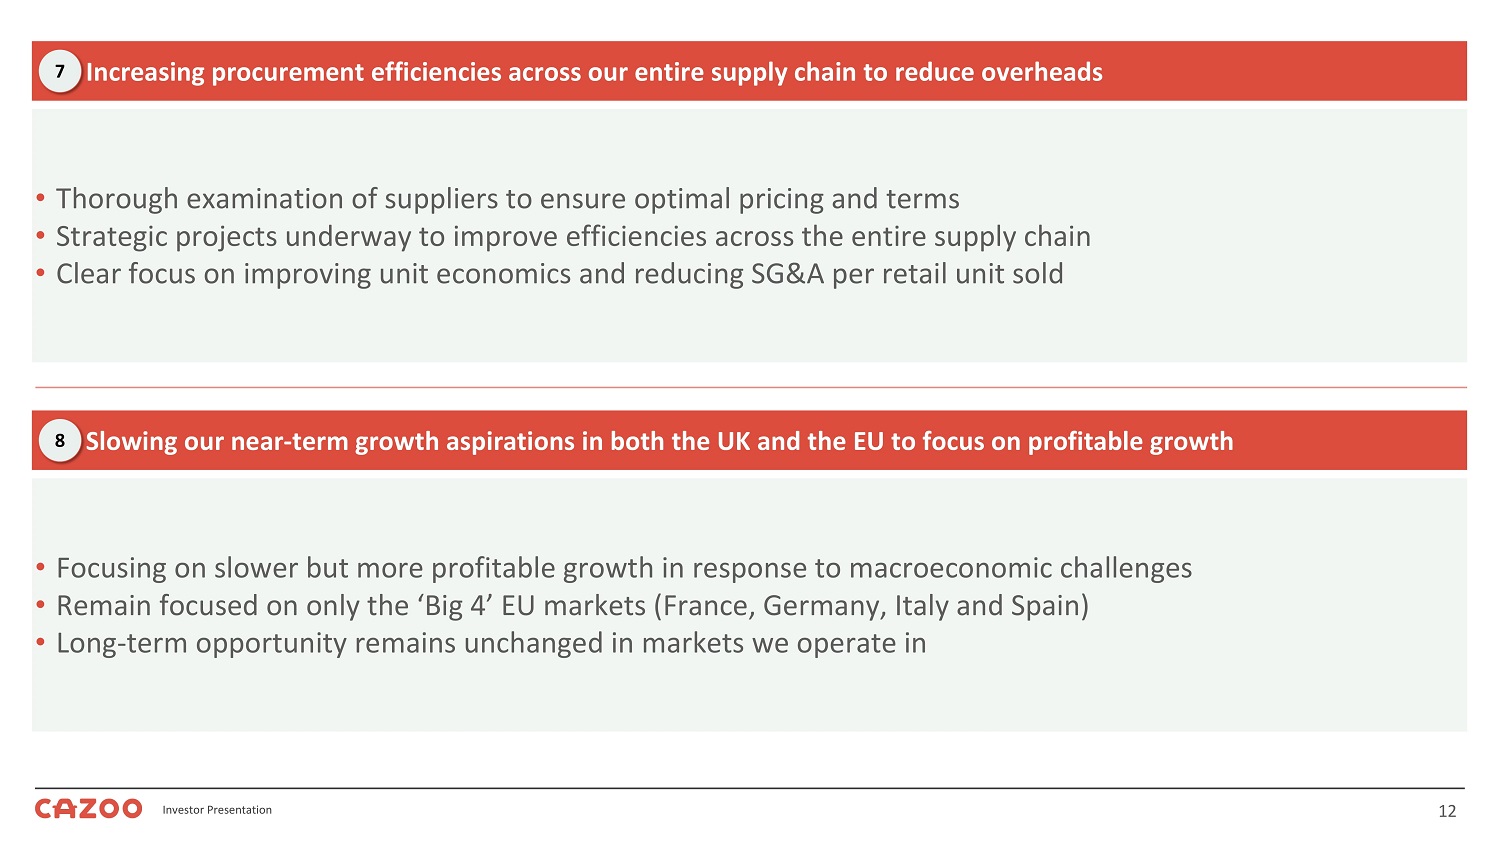
12 Investor Presentation • Thorough examination of suppliers to ensure optimal pricing and terms • Strategic projects underway to improve efficiencies across the entire supply chain • Clear focus on improving unit economics and reducing SG&A per retail unit sold Increasing procurement efficiencies across our entire supply chain to reduce overheads 7 • Focusing on slower but more profitable growth in response to macroeconomic challenges • Remain focused on only the ‘Big 4’ EU markets (France, Germany, Italy and Spain) • Long - term opportunity remains unchanged in markets we operate in Slowing our near - term growth aspirations in both the UK and the EU to focus on profitable growth 8
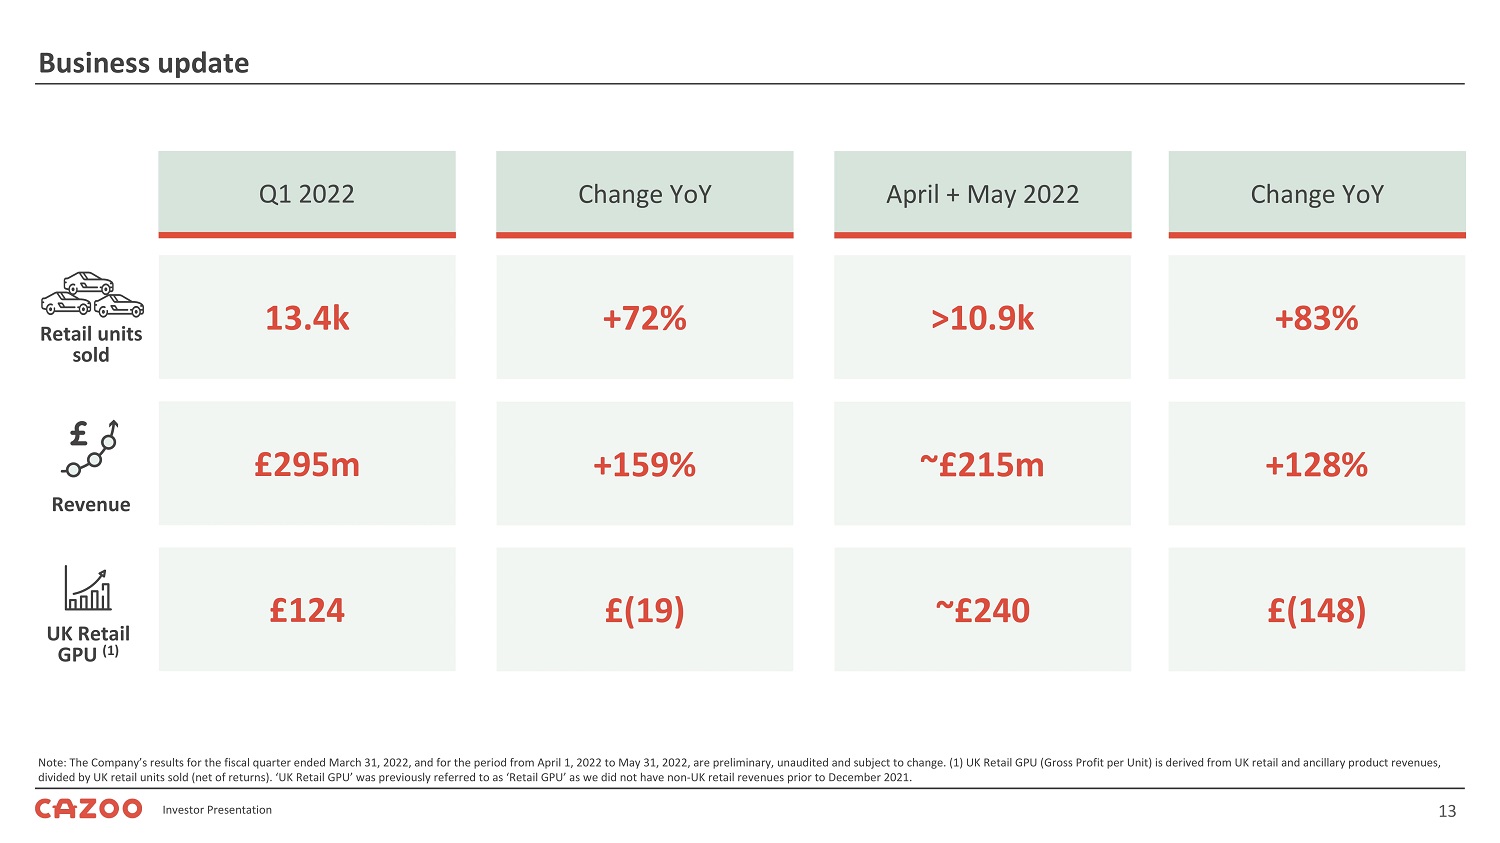
13 Investor Presentation Q1 2022 Business update Note: The Company’s results for the fiscal quarter ended March 31, 2022, and for the period from April 1, 2022 to May 31, 202 2, are preliminary, unaudited and subject to change. (1) UK Retail GPU (Gross Profit per Unit) is derived from UK retail and anc ill ary product revenues, divided by UK retail units sold (net of returns). ‘UK Retail GPU’ was previously referred to as ‘Retail GPU’ as we did not ha ve non - UK retail revenues prior to December 2021. Change YoY 13.4k £295m +72% +159% April + May 2022 Retail units sold Revenue >10.9k ~£215m Change YoY +83% +128% £124 £(19) £(148) ~£240 UK Retail GPU (1)

14 Investor Presentation Cash and cash equivalents of over £400m in addition to self - financed inventory of over £200m Liquidity position Note: The Company’s results for the fiscal quarter ended March 31, 2022, and for the period from April 1, 2022 to May 31, 202 2, are preliminary, unaudited and subject to change. Inventory financing position as at 31st May 2022 (£m) UK EU Total Retail & Wholesale Inventory 225 100 325 Financing Utilised 180 35 215 Subscription Inventory 95 70 165 Financing Utilised 30 40 70 Total Vehicles 320 170 490 Total Financing 210 75 285 Self - Financed 110 95 205
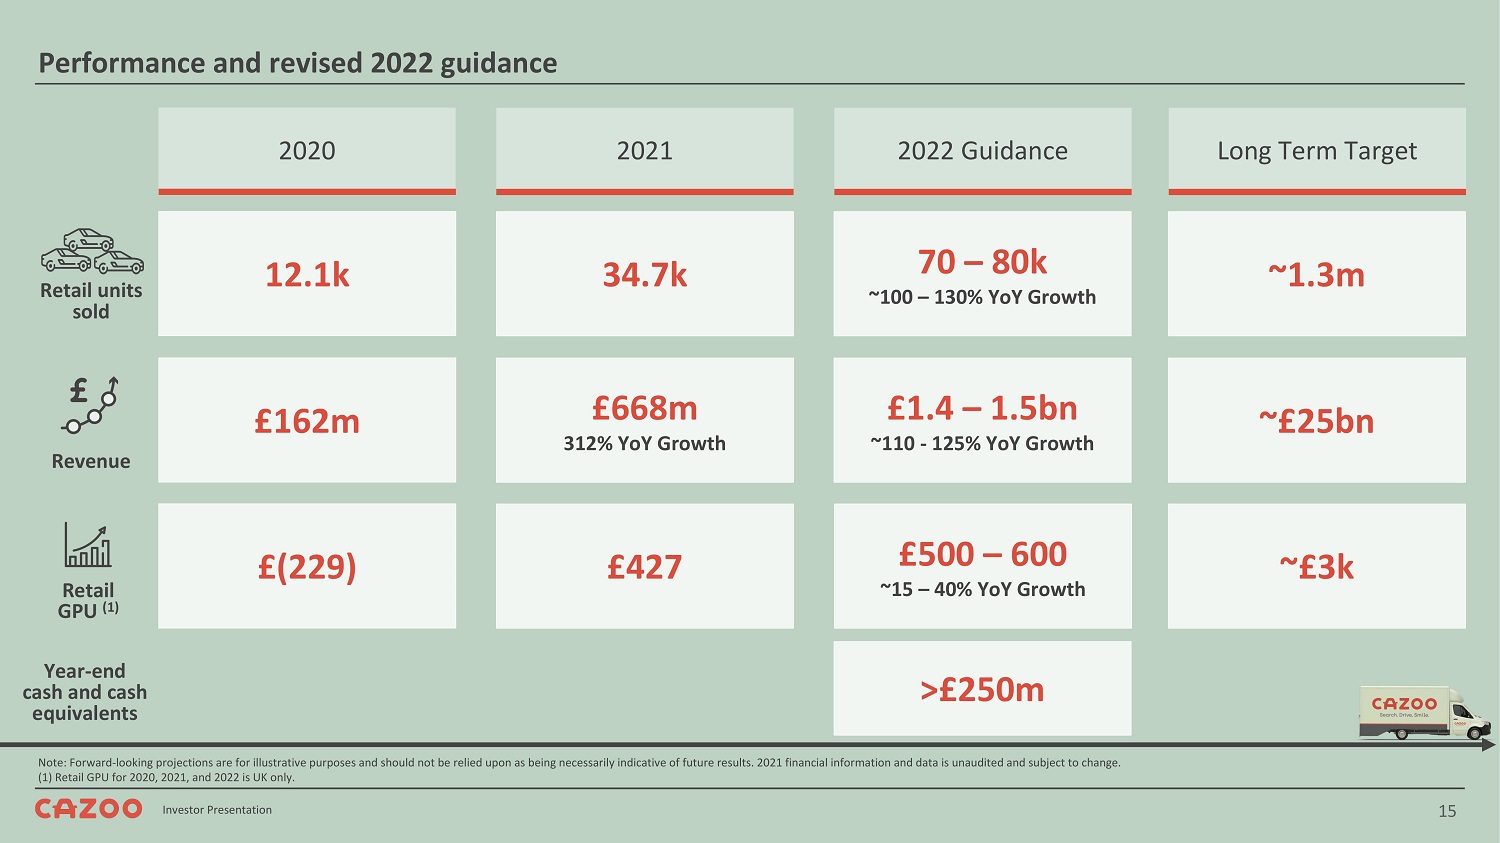
15 Investor Presentation 2020 Performance and revised 2022 guidance Note: Forward - looking projections are for illustrative purposes and should not be relied upon as being necessarily indicative of futur e results. 2021 financial information and data is unaudited and subject to change. (1) Retail GPU for 2020, 2021, and 2022 is UK only. 2021 12.1k £162m 34.7k £668m 312% YoY Growth 2022 Guidance Retail units sold Revenue 70 – 80k ~100 – 130% YoY Growth £1.4 – 1.5bn ~110 - 125% YoY Growth Long Term Target ~1.3m ~£25bn £(229) £427 ~£3k £500 – 600 ~15 – 40% YoY Growth Retail GPU (1) >£250m Year - end cash and cash equivalents
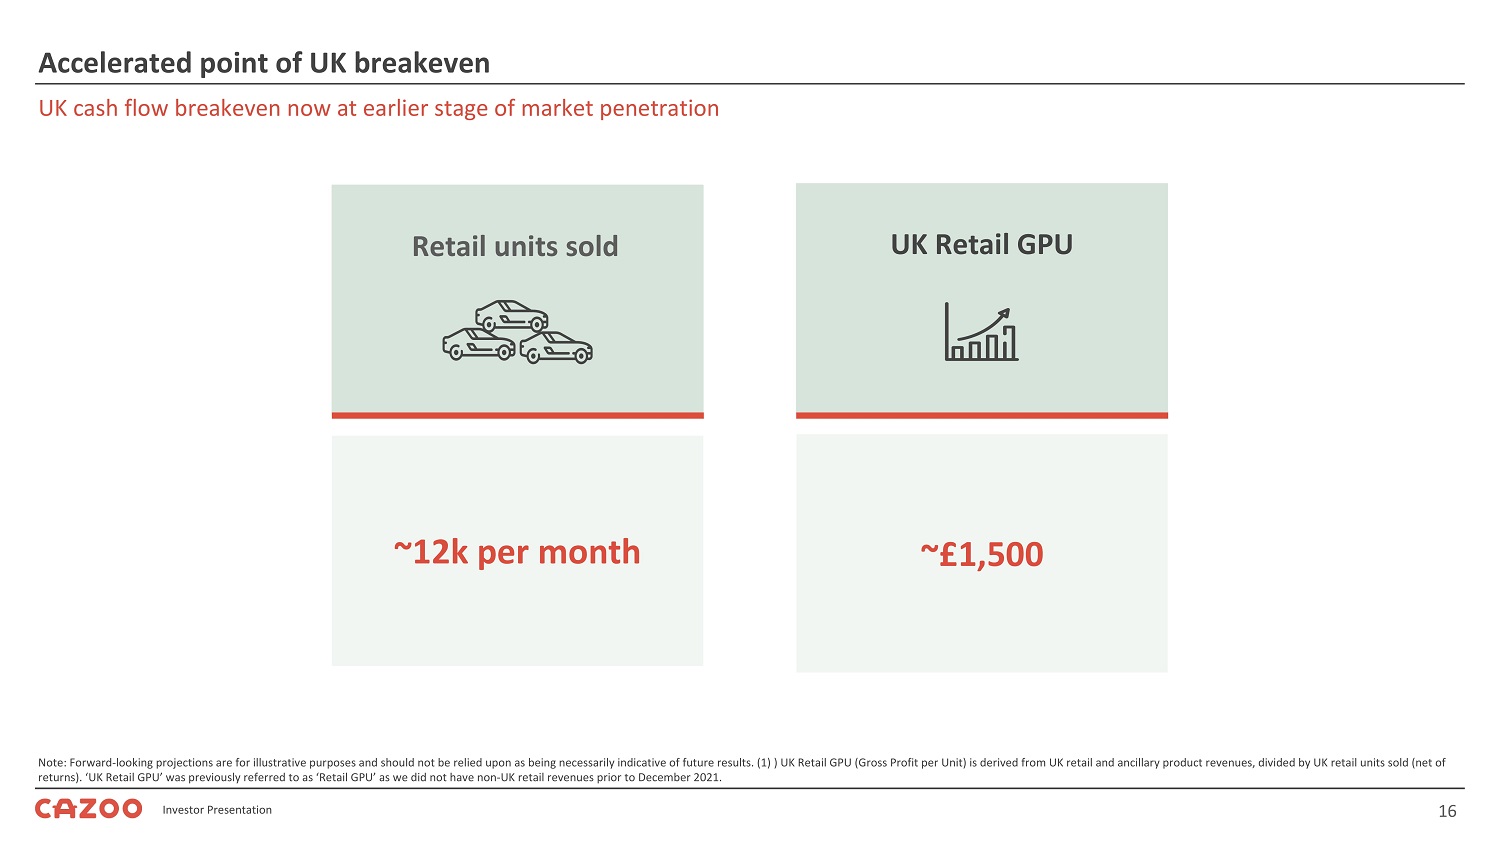
16 Investor Presentation UK cash flow breakeven now at earlier stage of market penetration Accelerated point of UK breakeven Note: Forward - looking projections are for illustrative purposes and should not be relied upon as being necessarily indicative of futur e results. (1) ) UK Retail GPU (Gross Profit per Unit) is derived from UK retail and ancillary product revenues, divided by UK retail un its sold (net of returns). ‘UK Retail GPU’ was previously referred to as ‘Retail GPU’ as we did not have non - UK retail revenues prior to December 2021. ~12k per month ~£1,500 UK Retail GPU Retail units sold
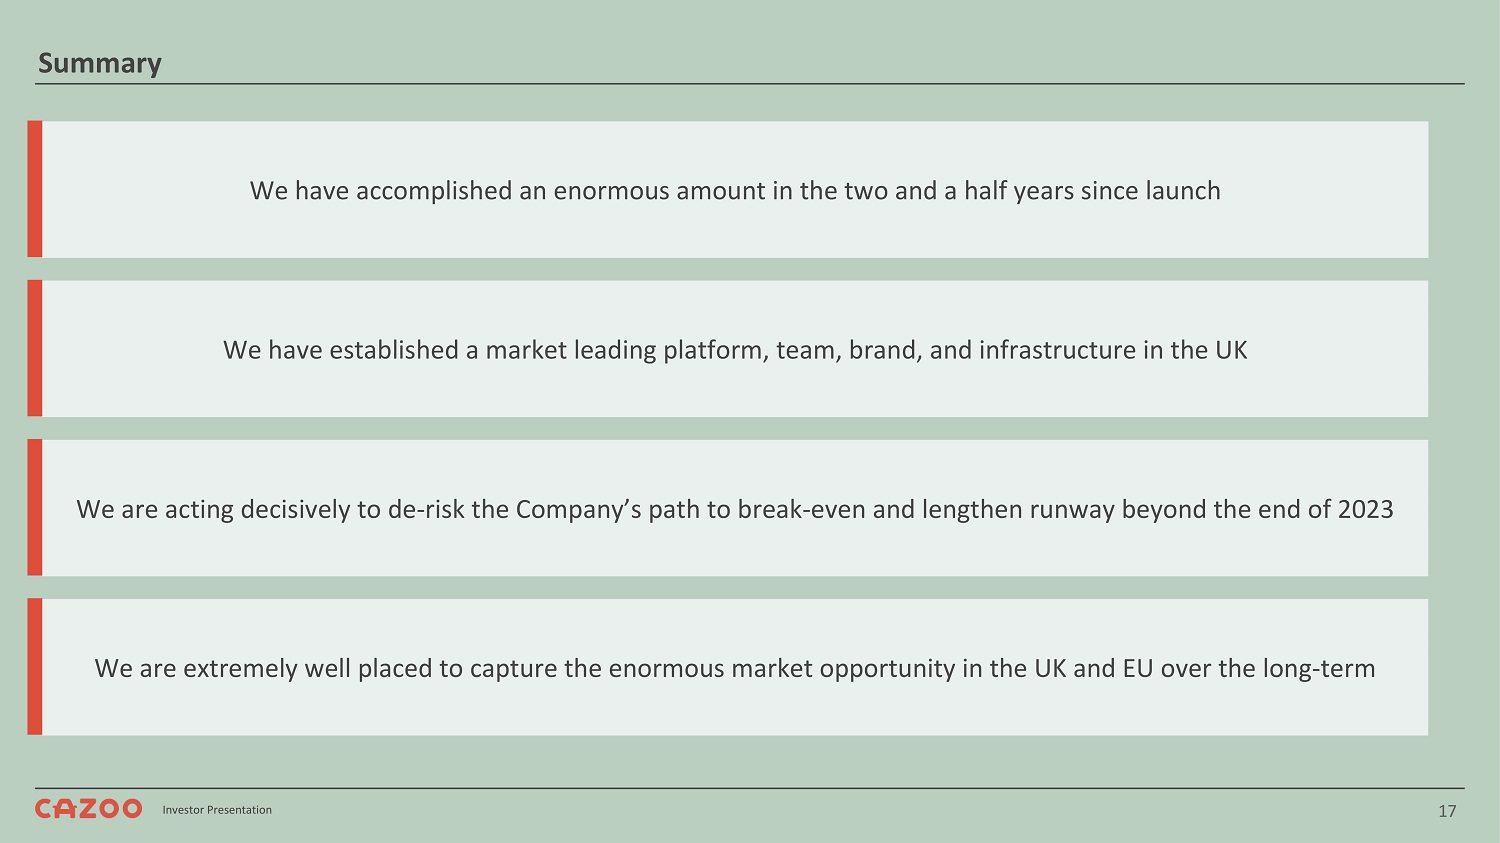
17 Investor Presentation Summary We have accomplished an enormous amount in the two and a half years since launch We have established a market leading platform, team, brand, and infrastructure in the UK We are acting decisively to de - risk the Company’s path to break - even and lengthen runway beyond the end of 2023 We are extremely well placed to capture the enormous market opportunity in the UK and EU over the long - term

18 Investor Presentation Appendix

19 Investor Presentation 2,000 Retail GPU (1) (£) The building blocks to increase GPU Note: Forward - looking projections are for illustrative purposes and should not be relied upon as being necessarily indicative of futur e results. (1) Retail GPU defined as retail and ancillary gross profit divided by retail units sold. Medium Term GPU Target More purchasing direct from consumer Greater refurb efficiencies Improving # of days to sale Growing ancillary revenue streams Increasing finance attachment rate Retail GPU Improvements Current Retail GPU Additional Improvements Bringing financing in - house ~
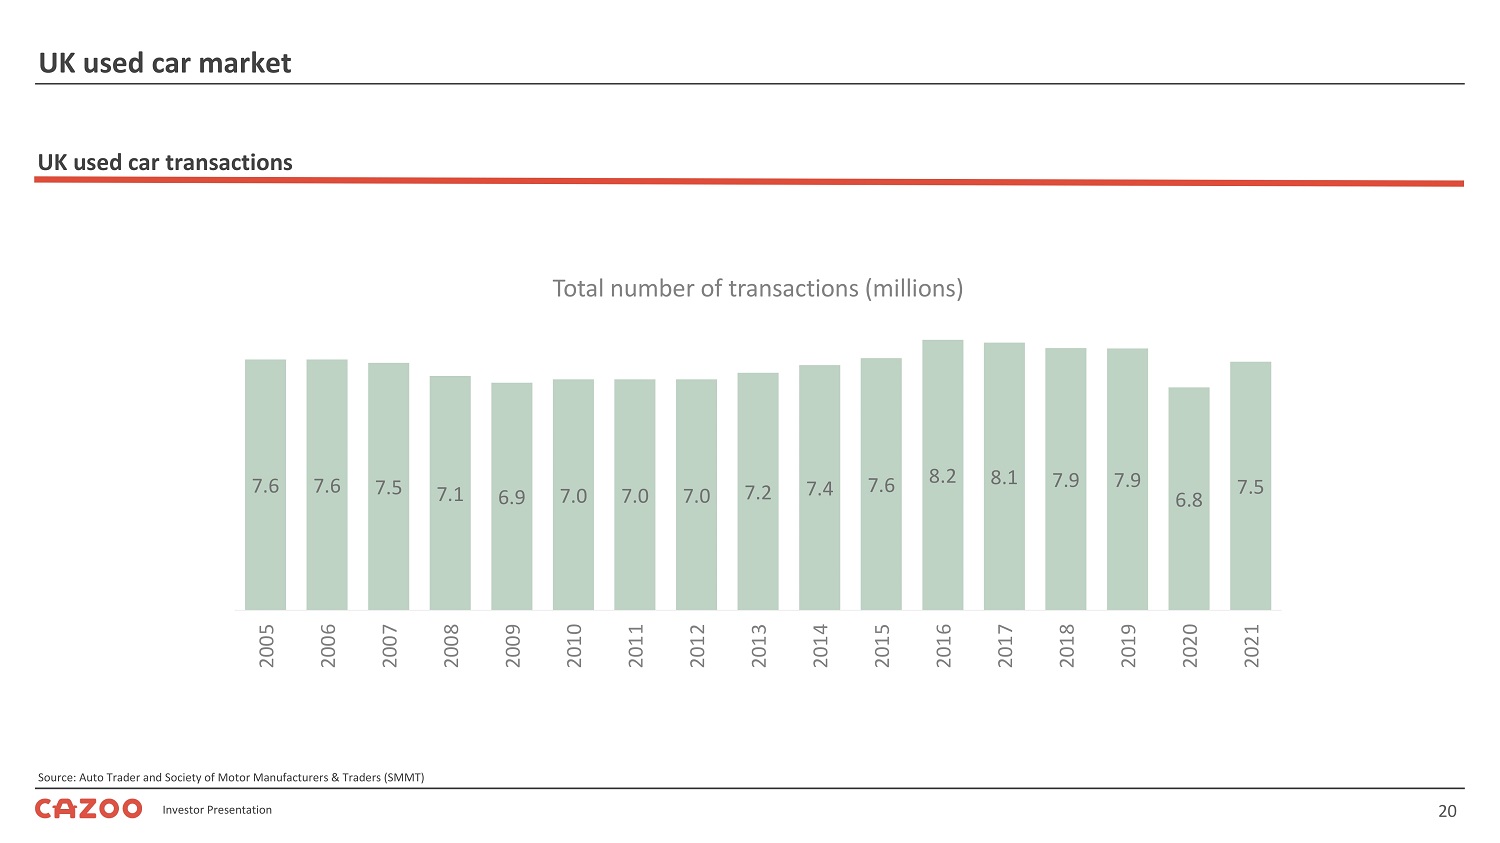
20 Investor Presentation Source: Auto Trader and Society of Motor Manufacturers & Traders (SMMT) UK used car transactions UK used car market 7.6 7.6 7.5 7.1 6.9 7.0 7.0 7.0 7.2 7.4 7.6 8.2 8.1 7.9 7.9 6.8 7.5 2005 2006 2007 2008 2009 2010 2011 2012 2013 2014 2015 2016 2017 2018 2019 2020 2021 Total number of transactions (millions)


