Exhibit 99.2

Investor Presentation Q2 and H1 2023 01 August 2023 1
2 Disclaimer Forward - Looking Statements This Communication on Form 6 - K contains “forward - looking statements” within the meaning of the “safe harbor ” provisions of the Private Securities Litigation Reform Act of 1995. The expectations, estimates, and projections of the bus ine ss of Cazoo may differ from its actual results and, consequently, you should not rely on forward - looking statements as predictions of future events. These forward - look ing statements generally are identified by the words “believe,” “project,” “expect,” “anticipate,” “estimate,” “intend,” “str ate gy,” “future,” “opportunity,” “plan,” “may,” “should,” “will,” “would,” “will be,” “will continue,” “will likely result,” and similar expressions. Forward - loo king statements are predictions, projections and other statements about future events that are based on current expectations and assumptions and, as a result, are subject to risks and uncertainties. Many factors could cause actual future events to differ materially from the forward - lo oking statements in this press release, including but not limited to: (1) the implementation of and expected benefits from ou r b usiness realignment plan, the winddown of operations in mainland Europe, the revised 2023 plan, and other cost - saving initiatives; (2) reaching and maintainin g profitability in the future; (3) global inflation and cost increases for labor , fuel, materials and services; (4) geopolitical and macroeconomic conditions and their impact on prices for goods and services and on consumer discretionary spending; (5) having access to suitable and s uff icient vehicle inventory for resale to customers and reconditioning and selling inventory expeditiously and efficiently; (6) ava ilability of credit for vehicle and other financing and the affordability of interest rates; (7) increasing Cazoo’s service offerings and price optimization; (8) effectively promoting Cazoo’s brand and increasing brand awareness; (9) expanding Cazoo’s product offerings and introducing additional products and services; (10) enhancing future operating and financial results; (11) achieving our long - term growth goals; (12) acquiring and i ntegrating other companies; (13) acquiring and protecting intellectual property; (14) attracting, training and retaining key per sonnel; (15) complying with laws and regulations applicable to Cazoo’s business; (16) uncertainty as to whether discussions with holders of our Convertible Notes will progress or result in any cha ng es to Cazoo’s capital structure which could be material, and, if so, the terms of any such changes; and (17) other risks and uncertainties set forth in the sections entitled “Risk Factors” and “Cautionary Note Regarding Forward - Looking Stateme nts” in the Annual Report on Form 20 - F filed with the U.S. Securities and Exchange Commission (the “SEC”) by Cazoo Group Ltd on March 30, 2023 and in subsequent filings with the SEC. The foregoing list of factors is not exhaustive. You should carefully consider the forego ing factors and the disclosure included in other documents filed by Cazoo from time to time with the SEC. These filings identify and address other important risks and uncertainties that could cause actual events and results to differ materially from those contained in the forward - look ing statements. Forward - looking statements speak only as of the date they are made. Readers are cautioned not to put undue relia nce on forward - looking statements, and Cazoo assumes no obligation and does not intend to update or revise these forward - looking statements, whether as a result of new info rmation, future events, or otherwise. Cazoo gives no assurance that it will achieve its expectations. Industry and Market Data This Presentation includes market data and other statistical information from sources believed by Cazoo to be reliable, including independent industry publications, governmental publications or other published independent sources . Some data is also based on the good faith estimates of Cazoo , which in each case are derived from its review of internal sources as well as the independent sources described above. Alth oug h Cazoo believes these sources are reliable, Cazoo has not independently verified the information and cannot guarantee its accuracy and completeness. Cautionary Statement Regarding Preliminary Results The financial results for the three and six months ended June 30, 2023, and as of June 30, 2023, presented in this announceme nt are preliminary, unaudited and represent the most recent current information available to Cazoo’s management. Preliminary financial results are subject to risks and uncertainties, many of which are not within Cazoo’s control. Cazoo’s actual results may differ from these estimated financial results, including due to the completion of its financial closing pr oc edures, final adjustments that may arise between the date of this press release and the time that financial results for the three and six months ended June 30, 2023, and as of June 30, 2023, are finalized, and such differences may be material. In addition, these financial results do not reflect important limitations, q ua lifications and details that will be included in the full financial statements to be included in a Report on Form 6 - K to be filed with the SEC. The preliminary re sults included herein have been prepared by, and are the responsibility of, Cazoo’s management. Cazoo’s independent registered public accounting firm has not audited, reviewed, compiled, or performed any procedures with respect to this information. Accordingly, Cazoo’s independent registered public accounting firm does not express an opinion or any other form of assurance with respect thereto . Non - IFRS Financial Measures This presentation includes certain financial measures not based on IFRS, including Adjusted EBITDA and Adjusted EBITDA Margin (t ogether, the “Non - IFRS Measures”). In addition to Cazoo’s results determined in accordance with IFRS, the Company believes that Adjusted EBITDA and Adjusted EBITDA Margin provide useful information for management and investors to assess the underlying performance of th e b usiness as they remove the effect of certain non - cash items and certain charges that are not indicative of Cazoo’s core operating performance or results of operations. Cazoo believes that non - IFRS financial information, when taken collectively with financial measures prepared in accordance with IFRS, may be helpful to investors because it provides an additional tool for investors to use in evaluating Cazoo’s ongoing operating results and trends and because it provides consistency and comparability with past financial performance. However, Cazoo’s management does not consider non - IFRS measures in isolation or as an alternative to financial measures determined in accordance with IFRS. Adjusted EBITDA and Adjusted EBITDA Margin are presented for supplemental informational purposes only, have limitations as analytical too ls and should not be considered in isolation from, or as a substitute for, the analysis of other IFRS financial measures, suc h a s loss for the period from continuing operations. Some of the limitations of Adjusted EBITDA and Adjusted EBITDA Margin include that they do not reflect th e impact of working capital requirements or capital expenditures and other companies in Cazoo’s industry may calculate Adjusted EBITDA and Adjusted EBITDA Margin differently, or use a different accounting standard such as U.S. GAAP, which limits their usefulness as compara tiv e measures. Cazoo urges investors to review the reconciliation of Adjusted EBITDA to loss for the period from continuing operations included be lo w, and not to rely on any single financial measure to evaluate its business. Adjusted EBITDA is defined as loss for the year from co nti nuing operations adjusted for tax, finance income, finance expense, depreciation and impairment of tangible assets, amortizat ion and impairment of intangible assets, share - based payment expense, fair value movement in Convertible Notes and embedded derivative, fair value mov ement in warrants and foreign exchange movements, and exceptional items which do not relate to our core operations. Adjusted EBITDA margin is defined as the ratio of Adjusted EBITDA to revenue. Use of Guidance and Projections Any financial information in this Presentation (including specifically guidance and projections) that are forward - looking statem ents are based on assumptions that are inherently subject to significant uncertainties and contingencies, many of which are b eyo nd Cazoo’s control. While such information, guidance and projections are necessarily speculative, Cazoo believes that the preparation of prospective financial information involves increasingly higher levels of uncertainty the fur th er out the projection extends from the date of preparation. The assumptions and estimates underlying the projected results are inherently uncertain and are subject to a wide variety of significant busi nes s, economic and competitive risks and uncertainties that could cause actual results to differ materially from those contained in the projections. All subsequent written and oral forward - looking statements concerning Cazoo or other matters and attributable to Cazoo or any person acting on its behalf are expressly qualified in their entirety by the cautionary statements. Trademarks This Presentation contains trademarks, service marks, trade names and copyrights of Cazoo and of other companies, which are the property of their respective owners.

3 Contents Progress to date and focus on unit economics Q2 and H1 2023 Performance Highlights Summary remarks 2023 Guidance Reiterated
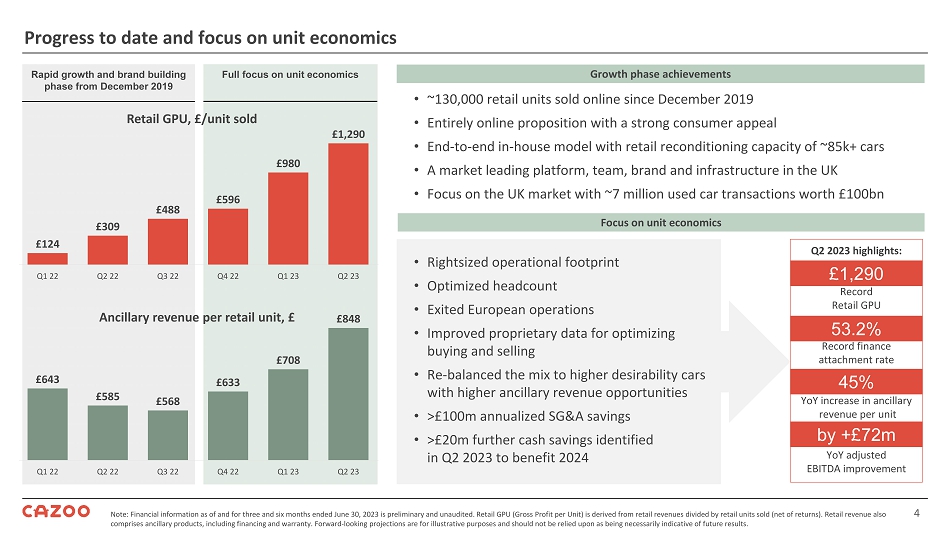
4 Progress to date and focus on unit economics Note: Financial information as of and for three and six months ended June 30, 2023 is preliminary and unaudited. Retail GPU (Gross Profit per Unit) is derived from retail revenues divided by retail units sold (net of returns). Retail reve nue also comprises ancillary products, including financing and warranty. Forward - looking projections are for illustrative purposes and should not be relied upon as being necessarily indicative of futur e results. Rapid growth and brand building phase from December 2019 Full focus on unit economics £124 £309 £488 £596 £980 £1,290 0 200 400 600 800 1,000 1,200 1,400 Q1 22 Q2 22 Q3 22 Q4 22 Q1 23 Q2 23 Retail GPU, £/unit sold • ~130,000 retail units sold online since December 2019 • Entirely online proposition with a strong consumer appeal • End - to - end in - house model with retail reconditioning capacity of ~85k+ cars • A market leading platform, team, brand and infrastructure in the UK • Focus on the UK market with ~7 million used car transactions worth £100bn Growth phase achievements Focus on unit economics Q2 2023 highlights: Record Retail GPU Record finance attachment rate YoY increase in ancillary revenue per unit YoY adjusted EBITDA improvement • Rightsized operational footprint • Optimized headcount • Exited European operations • Improved proprietary data for optimizing buying and selling • Re - balanced the mix to higher desirability cars with higher ancillary revenue opportunities • >£100m annualized SG&A savings • >£20m further cash savings identified in Q2 2023 to benefit 2024 £1,290 53.2% 45% by +£72m £643 £585 £568 £633 £708 £848 400 600 800 Q1 22 Q2 22 Q3 22 Q4 22 Q1 23 Q2 23 Ancillary revenue per retail unit, £
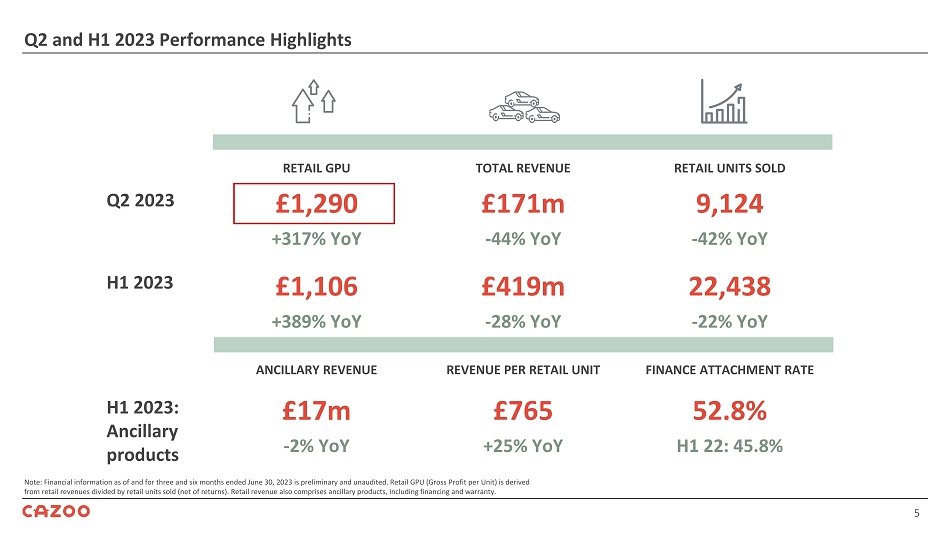
5 Q2 and H1 2023 Performance Highlights Note: Financial information as of and for three and six months ended June 30, 2023 is preliminary and unaudited. Retail GPU (Gross Profit per Unit) is derived from retail revenues divided by retail units sold (net of returns). Retail revenue also comprises ancillary products, includi ng financing and warranty. RETAIL UNITS SOLD TOTAL REVENUE RETAIL GPU 9,124 £171m £1,290 Q2 2023 - 42% YoY - 44% YoY +317% YoY 22,438 £419m £1,106 H1 2023 - 22% YoY - 28% YoY +389% YoY FINANCE ATTACHMENT RATE REVENUE PER RETAIL UNIT ANCILLARY REVENUE 52.8% £765 £17m H1 2023: Ancillary products H1 22: 45.8% +25% YoY - 2% YoY

6 Optimized the operational footprint and reduced fixed cost base; focus on the UK opportunity Actions implemented to improve the unit economics of the business in 2022 and H1 2023 Reduced our fixed cost base through optimizing the network and headcount Withdrew from mainland Europe to focus resources on our core opportunity in the UK Exited Q2 23 Exited Q2 23 Exited Q4 22 Exited Q1 23 Rightsized operational footprint to enable efficient reconditioning and logistics Cazoo In - House Reconditioning Capacity From 8 to 4 : 3 retail vehicle preparation and 1 wholesale reconditioning center 85k+ cars per year Best - in - class operations geographically optimized Cazoo Delivery Infrastructure From c.250 to c.190 fleet of car transporters Unique delivery & collection experience that delights customers Cazoo Customer Centers From 21 to 7 Collection, distribution, storage, servicing, brand and engagement Focus on retail UK market; wind - down of subscriptions business 3,226 1,469 1,320 Reduction in headcount Q4 22 Q1 23 Q2 23 Office
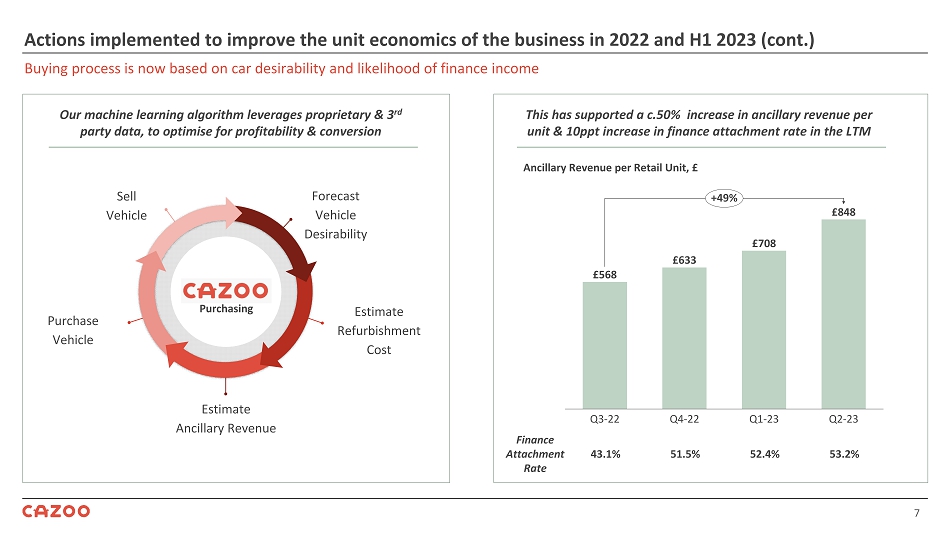
7 Buying process is now based on car desirability and likelihood of finance income Actions implemented to improve the unit economics of the business in 2022 and H1 2023 (cont.) Forecast Vehicle Desirability Estimate Refurbishment Cost Estimate Ancillary Revenue Purchase Vehicle Sell Vehicle Our machine learning algorithm leverages proprietary & 3 rd party data, to optimise for profitability & conversion Purchasing This has supported a c.50% increase in ancillary revenue per unit & 10ppt increase in finance attachment rate in the LTM £568 £633 £708 £848 Q2 - 23 Q3 - 22 Q4 - 22 Q1 - 23 +49% Ancillary Revenue per Retail Unit, £ Finance Attachment Rate 43.1% 53.2% 51.5% 52.4%
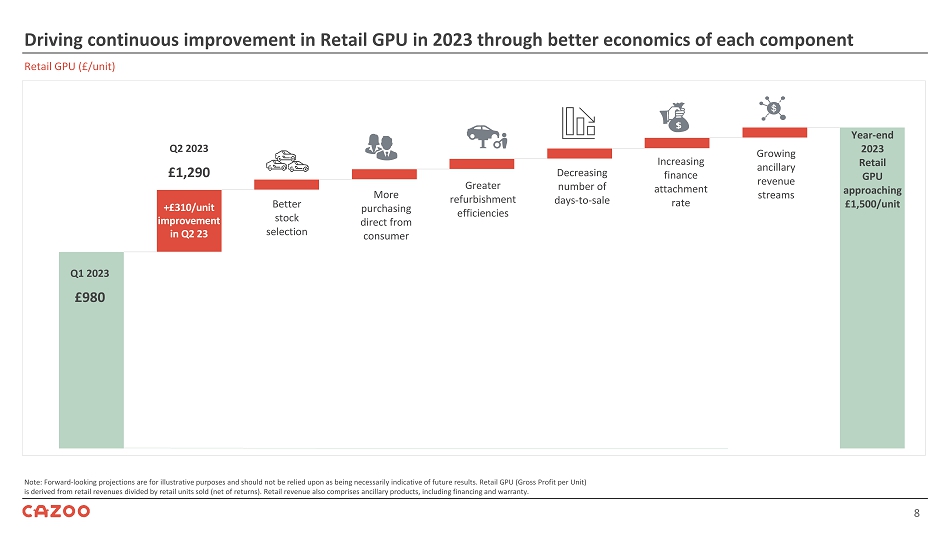
8 Driving continuous improvement in Retail GPU in 2023 through better economics of each component Note: Forward - looking projections are for illustrative purposes and should not be relied upon as being necessarily indicative of futur e results. Retail GPU (Gross Profit per Unit) is derived from retail revenues divided by retail units sold (net of returns). Retail revenue also comprises ancillary produc ts, including financing and warranty. Retail GPU (£/unit) 0 200 400 600 800 1,000 1,200 1,400 1,600 1,800 Better stock selection More purchasing direct from consumer Greater refurbishment efficiencies Decreasing number of days-to-sale Increasing finance attachment rate Growing ancillary revenue streams Year-end 2023 Retail GPU approaching £1,500/unit Q1 2023 £980 +£310/unit improvement in Q2 23 Q2 2023 £1,290
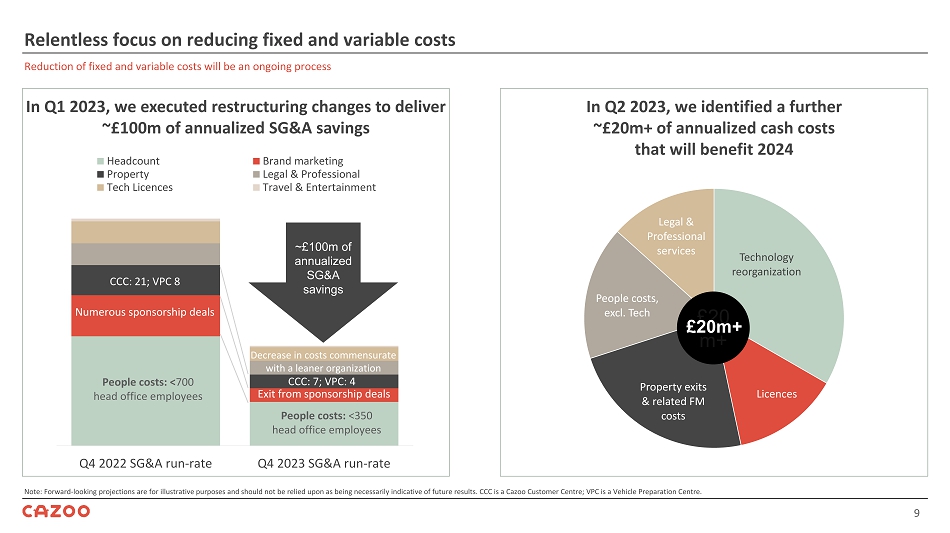
9 Relentless focus on reducing fixed and variable costs Note: Forward - looking projections are for illustrative purposes and should not be relied upon as being necessarily indicative of futur e results. CCC is a Cazoo Customer Centre; VPC is a Vehicle Preparation Centre. Reduction of fixed and variable costs will be an ongoing process 0 20 40 60 80 100 120 140 160 180 Q4 2022 SG&A run-rate Q4 2023 SG&A run-rate Headcount Brand marketing Property Legal & Professional Tech Licences Travel & Entertainment CCC: 21; VPC 8 Decrease in costs commensurate with a leaner organization CCC: 7; VPC: 4 People costs: < 700 head office employees Exit from sponsorship deals ~£100m of annualized SG&A savings In Q2 2023, we identified a further ~£20m+ of annualized cash costs that will benefit 2024 Technology reorganization Licences Property exits & related FM costs People costs, excl. Tech Legal & Professional services In Q1 2023, we executed restructuring changes to deliver ~£100m of annualized SG&A savings £20 m+ £20m+ People costs: < 350 head office employees Numerous sponsorship deals

10 1 The H1 2022 comparatives have been restated to show the EU segment as a discontinued operation. 2 Revenue excludes £nil of sales where Cazoo sold vehicles as an agent for third parties and only the net commission received from those sales is recorded within revenue (s ix months ended June 30, 2022: £ 2 million). Retail revenue comprises ancillary products, including financing and warranty. These amounts were previously included in “Other sales”. In 2023, “Other sales” comprises revenue from walk - in servici ng, subscription services, third - party reconditioning and the provision of data services. The comparatives for 2022 have been re stated for consistency. 3 Cost of sales includes £5 million (2022: £4 million) of depreciation on subscription vehicles which is excluded in the Adjust ed EBITDA calculations. 4 Retail GPU (Gross Profit per Unit) is derived from retail revenues divided by retail units sold (net of returns) . Retail revenue also comprises ancillary products, including financing and warranty . 5 SG&A excludes depreciation of property, plant and equipment and right - of - use assets (except depreciation on subscription vehicles of £ 5 m ( 2022 : £ 4 million)) ; amortization of intangible assets, impairment of intangible assets and goodwill, share - based payments and exceptional items . 6 Adjusted EBITDA is defined as loss for the period from continuing operations, adjusted for tax, finance income, finance expense, depreciation and impairment of tangible assets, amortization and impairment of intangible assets, share - based payment expense, fair value movement in Convertible Notes, embedded derivative, and warrants, foreign exchange movements and exceptional items . 7 Adjusted EBITDA margin represents the ratio of Adjusted EBITDA to Revenue . H1 2023 Operational and Financial results Comments YoY H1 22 1 H1 23 % £ m £ m Fewer units sold as we focus on unit economics (29%) 40,570 28,985 Units (‘000) Sales continue to be supported by the appeal of our proposition (22%) 28,628 22,438 of which Retail units (‘000) Revenue in line with expectations at lower volumes (28%) 583 419 Revenue 2 Big sequential improvement in Retail GPU in Q1 and Q2 23 driven by improved car selection, lower reconditioning costs and higher contribution from ancillary products 283% 6 23 Gross profit 3 4ppts 1% 5% Gross Profit margin (%) 389% 226 1,106 Retail GPU 4 (£/unit) Encouraging progress on fixed and variable cost reduction (36%) 152 98 SG&A 5 Significant improvement due to higher Retail GPU and SG&A cost reduction 51% (142) (70) Adjusted EBITDA 6 7.7ppts (24.4%) (16.7%) Adjusted EBITDA margin 7 (%) (Unaudited)

11 1 Adjustments include tax; finance income; finance expense; depreciation and impairment of tangible assets; amortization and im pa irment of intangible assets; share - based payment expense; fair value movement in Convertible Notes, embedded derivative, and warrants; foreign exchange movements; gains/losses on the sale of subsidiaries, fixed assets, and le as e terminations; and movement in provisions. H1 2023 Cash flow Comments in relation to H1 23 results H1 22 H1 23 £ m £ m Focus on unit economics, rightsizing of operational footprint and headcount (241) (150) Total loss for the period 63 45 Adjustments to reconcile loss for the period to operating cash flow 1 Decreases in inventory in line with focus on unit economics, rather than volume (36) 146 Movement in working capital, interest and tax credits received (214) 41 Net cash from/(used in) operating activities Lower capital expenditure on PPE and technology development (34) (3) Capital expenditure and disposals of PPE Disposal of Cazoo Data Services and Cluno in H1 2023; acquisition of Brumbrum and sale and leasebacks in H1 2022 (16) 26 Business acquisitions, disposals and sale/leasebacks (50) 23 Net cash from/(used in) investing activities Issuance of $630m of Convertible Notes in H1 2022 460 - Net proceeds from Convertible Notes In line with movement in inventory and subscription vehicles 29 (103) Movement in inventory and subscription financing Higher interest costs on Convertible Note due to part period last year offset by reduced interest costs on lower stocking loans (8) (9) Interest paid Reduction in leasehold properties and transporters (16) (13) Lease payments and other financing activities 465 (125) Net cash (used in)/from financing activities 201 (61) Net (decrease)/increase in cash and cash equivalents 7 (2) Foreign exchange difference 401 195 Cash and cash equivalents at June 30, 2023 N/A ~35 Self - funded inventory (Unaudited)

12 2023 guidance reiterated Note: Forward - looking projections are for illustrative purposes and should not be relied upon as being necessarily indicative of future results. Retail GPU (Gross Profit per Unit) is derived from retail and ancillary revenues, divided by retail units sold (net of return s). Adjusted EBITDA is defined as loss for the period, adjusted for tax, finance income, finance expense, depreciation and impair men t of tangible assets, amortization and impairment of intangible assets, share - based payment expense, fair value movement in Conv ertible Notes and embedded derivative, fair value movement in warrants and foreign exchange movements and exceptional items. Retail units 4 0 – 50k + wholesale units of ~10K Approaching £1,200/unit ~ 3 x from £403/unit in 2022 Retail GPU £ 110 - £130m Year - end cash + ~ £15 - 25m Self - financed inventory Cash position Quarterly cash use reduced to ~£30m/quarter GPU exit rate approaching £1,500 by the end of 2023 Further ~£20m of annualized cash costs identified for 2024 Actions to deliver turnaround in performance SG&A reduction Q4 2023 vs Q4 2022 of >£25m Adjusted EBITDA £(100) - (120)m Focus on unit economics
13 In summary We have demonstrated our ability to grow at scale; we are fully focused on delivering better unit economics We have established a market leading platform, team, brand and infrastructure in the UK Retail GPU progress and reducing fixed costs will provide foundations for profitable growth in the future
14 Appendix

15 1 Depreciation and impairment of tangible assets includes a non - cash impairment charge of £16 million (2022: £ nil ) largely related to the various restructuring activities undertaken by the Group. 2 Amortization and impairment of intangible assets includes a non - cash impairment charge of £nil (2022: £ 135 million) largely related to the various restructuring activities undertaken by the Group. 3 Exceptional items primarily relat e to restructuring costs. 4 Adjusted EBITDA is defined as loss for the period from continuing operations, adjusted for tax, finance income, finance expen se, depreciation an impairment of tangible assets, amortization and impairment of intangible assets, share - based payment expense, f air value movement in Convertible Notes, embedded derivative and warrants and foreign exchange movements and exceptional items. Adjusted EBITDA reconciliation Comments H1 22 H1 23 £ m £ m Reconciliation of loss for the period from continuing operations to adjusted EBITDA Smaller loss due to higher gross profit and SG&A reduction post restructuring changes (241) (150) Loss for the period Wind - down of EU operations to complete the exit 40 (1) (Profit)/Loss for the period from discontinued operations (201) (151) Loss for the period from continuing operations Adjustments: (6) - Tax credit Higher interest rates on deposit accounts (1) (3) Finance income Interest on Convertible Notes issued in February 2022 and higher interest rates on vehicle financing 20 33 Finance expense H1 2023 included a non - cash impairment charge of £14 million 21 38 Depreciation and impairment of tangible assets 1 H1 2022 included a non - cash impairment charge of £135 million 142 4 Amortization and impairment of intangible assets 2 Forfeitures of historical grants 35 2 Share - based payment expense Fair value loss of £0.2 million on the Convertible Notes and embedded derivative, fair value gain of £0.5 million on the warrants and foreign exchange gain of £14.1 million (158) (14) Fair value movement in Convertible Notes, embedded derivative, and warrants and foreign exchange movements Exceptional costs relating to restructuring and EU exit 6 21 Exceptional items 3 59 81 Total adjustments (142) (70) Adjusted EBITDA 4 (Unaudited)