Table of Contents
UNITED STATES
SECURITIES AND EXCHANGE COMMISSION
Washington, D.C. 20549
Form N-CSR
CERTIFIED SHAREHOLDER REPORT OF
REGISTERED MANAGEMENT INVESTMENT COMPANIES
REGISTERED MANAGEMENT INVESTMENT COMPANIES
Investment Company Act file number: 811-23661
Harbor ETF Trust
(Exact name of Registrant as specified in charter)
111 South Wacker Drive, 34th Floor
Chicago, Illinois 60606-4302
Chicago, Illinois 60606-4302
(Address of principal executive offices) (Zip code)
Charles F. McCain, Esq. HARBOR ETF TRUST 111 South Wacker Drive, 34th Floor Chicago, Illinois 60606-4302 | Christopher P. Harvey, Esq. DECHERT LLP One International Place – 40th Floor 100 Oliver Street Boston, MA 02110-2605 |
(Name and address of agent for service)
Registrant’s telephone number, including area code: (312) 443-4400
Date of fiscal year end: April 30
Date of reporting period: April 30, 2023
ITEM 1 – REPORTS TO STOCKHOLDERS
The following are copies of reports transmitted to shareholders pursuant to Rule 30e-1 under the Investment Company Act of 1940, as amended (the “1940 Act”) (17 CFR 270.30e-1):
Table of Contents

Semi-Annual Report
HARBOR ETF TRUST
April 30, 2023
Harbor Commodity All-Weather Strategy ETF (formerly, Harbor All-Weather Inflation Focus ETF) (Consolidated)
Harbor Corporate Culture ETF
Harbor Corporate Culture Leaders ETF
Harbor Corporate Culture Small Cap ETF
Harbor Disruptive Innovation ETF
Harbor Dividend Growth Leaders ETF
Harbor Energy Transition Strategy ETF (Consolidated)
Harbor Health Care ETF
Harbor International Compounders ETF
Harbor Long-Term Growers ETF
Harbor Scientific Alpha High-Yield ETF
Harbor Scientific Alpha Income ETF
Harbor Small Cap Explorer ETF

Table of Contents
Harbor ETFTrust | ||||
HARBOR COMMODITY ALL-WEATHER STRATEGY ETF | ||||
| 2 | ||||
HARBOR CORPORATE CULTURE ETF | ||||
| 4 | ||||
HARBOR CORPORATE CULTURE LEADERS ETF | ||||
| 7 | ||||
HARBOR CORPORATE CULTURE SMALL CAP ETF | ||||
| 9 | ||||
HARBOR DISRUPTIVE INNOVATION ETF | ||||
| 13 | ||||
HARBOR DIVIDEND GROWTH LEADERS ETF | ||||
| 15 | ||||
HARBOR ENERGYTRANSITION STRATEGY ETF | ||||
| 17 | ||||
HARBOR HEALTH CARE ETF | ||||
| 19 | ||||
HARBOR INTERNATIONAL COMPOUNDERS ETF | ||||
| 21 | ||||
HARBOR LONG-TERM GROWERS ETF | ||||
| 23 | ||||
HARBOR SCIENTIFIC ALPHA HIGH-YIELD ETF | ||||
| 25 | ||||
HARBOR SCIENTIFIC ALPHA INCOME ETF | ||||
| 30 | ||||
HARBOR SMALL CAP EXPLORER ETF | ||||
| 36 | ||||
Financial Statements | ||||
| 41 | ||||
| 44 | ||||
| 47 | ||||
| 50 | ||||
| 57 | ||||
| 69 | ||||
| 71 | ||||
| 71 | ||||
| 71 | ||||
| 71 | ||||
| 79 | ||||
This material is intended for the Funds’ shareholders. It may be distributed to prospective investors only if it is preceded or accompanied by the current prospectus. Prospective investors should carefully consider the investment objectives, risks, charges and expenses of a Harbor ETF before investing. To obtain a summary prospectus or prospectus for this and other information, visit harborcapital.com or call 800-422-1050. Read it carefully before investing.
Foreside Fund Services, LLC is the Distributor of the Harbor ETF Trust.
Table of Contents
Harbor Commodity All-Weather Strategy ETF
CONSOLIDATED PORTFOLIO OF INVESTMENTS—April 30, 2023 (Unaudited)
Subadvisor: Quantix Commodities LP
RISK ALLOCATION* (% of Net Assets) - Unaudited |
| Asset Class | Sector | |||||
COMMODITIES | ||||||
Petroleum | 33.7 | % | ||||
Precious Metals | 31.3 | % | ||||
Base Metals | 15.8 | % | ||||
Grains and Soybean Products | 14.7 | % | ||||
Softs | 4.5 | % | ||||
*Based on notional value and represents the sector allocation of the Quantix Commodity Index.
PORTFOLIO OF INVESTMENTS |
Principal Amounts, Value and Cost in Thousands
SHORT-TERM INVESTMENTS—88.2% | ||||||||
Principal Amount | Value | |||||||
|
U.S. TREASURY BILLS—88.2% |
| ||||||
U.S. Treasury Bills | ||||||||
| $ 36,623 | 4.549%—05/16/2023† | $ | 36,559 | |||||
| 26,043 | 4.550%—06/27/2023† | 25,842 | ||||||
| 4,858 | 4.673%—07/11/2023† | 4,812 | ||||||
|
| |||||||
TOTAL SHORT-TERM INVESTMENTS | ||||||||
| (Cost $67,222) | 67,213 | |||||||
|
| |||||||
TOTAL INVESTMENTS—88.2% | ||||||||
| (Cost $67,222) | 67,213 | |||||||
|
| |||||||
| | CASH AND OTHER ASSETS, LESS | 9,004 | ||||||
|
| |||||||
TOTAL NET ASSETS—100% | $ | 76,217 | ||||||
|
| |||||||
SWAP AGREEMENTS |
OVER-THE-COUNTER (OTC) EXCESS RETURN SWAPS ON INDICES
Counterparty | Fixed Rate | Pay/Receive Fixed Rate | Reference Index1 | Expiration Date | Payment Frequency | Notional Amount (000s) | Value (000s) | Upfront Premiums (Received)/ Paid (000s) | Unrealized Appreciation/ (Depreciation) (000s) | |||||||||||||
Macquarie Bank Limited | 0.110% | Pay | Quantix Commodity Index | 05/31/2023 | Monthly | $76,202 | $— | $— | $— | |||||||||||||
| ||||||||||||||||||||||
FAIR VALUE MEASUREMENTS |
All investments as of April 30, 2023 (as disclosed in the preceding Portfolio of Investments and Swap Agreements schedule) were classified as Level 2.
For more information on valuation inputs and their aggregation into the levels identified above, please refer to the Fair Value Measurements and Disclosures in Note 2 of the accompanying Notes to Financial Statements.
The accompanying notes are an integral part of the Financial Statements.

2
Table of Contents
Harbor Commodity All-Weather Strategy ETF
CONSOLIDATED PORTFOLIO OF INVESTMENTS—Continued
| † | Coupon represents yield to maturity |
| 1 | The reference index components are published daily on Harbor Capital’s website at harborcapital.com. The index is comprised of publicly traded futures contracts on physical commodities. The table below represents the reference index components as of the period ended April 30, 2023. |
Commodity | Weight | |
Gold | 31.3% | |
Brent Crude Oil | 13.7 | |
RBOB Gasoline | 10.1 | |
Heating Oil | 6.2 | |
Aluminum | 4.6 | |
Copper | 4.2 | |
GasOil | 3.7 | |
Nickel | 3.6 | |
Corn | 3.5 | |
Zinc | 3.4 | |
Soybeans | 3.3 | |
Sugar | 2.5 | |
Soybean Oil | 2.4 | |
Cotton | 2.0 | |
Soymeal | 1.9 | |
KC Wheat | 1.8 | |
Wheat | 1.8 |
The accompanying notes are an integral part of the Financial Statements.
3
Table of Contents
Harbor Corporate Culture ETF
PORTFOLIO OF INVESTMENTS—April 30, 2023 (Unaudited)
Adviser: Harbor Capital Advisors, Inc.
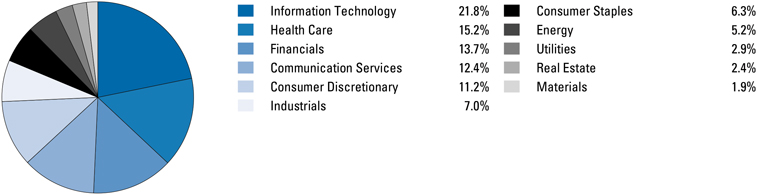
SECTOR ALLOCATION (% of investments) |
PORTFOLIO OF INVESTMENTS |
Value and Cost in Thousands
COMMON STOCKS—91.9% | ||||||||
| Shares | Value | |||||||
|
AEROSPACE & DEFENSE—1.8% |
| ||||||
| 6,149 | Lockheed Martin Corp. | $ | 2,856 | |||||
| 3,235 | Northrop Grumman Corp. | 1,492 | ||||||
|
| |||||||
| 4,348 | ||||||||
|
| |||||||
| AIR FREIGHT & LOGISTICS—1.3% | ||||||||
| 17,466 | United Parcel Service, Inc. Class B | 3,141 | ||||||
|
| |||||||
| AIRLINES—0.5% | ||||||||
| 15,416 | Delta Air Lines, Inc. * | 529 | ||||||
| 14,319 | Southwest Airlines Co. | 434 | ||||||
| 7,733 | United Airlines Holdings, Inc. * | 338 | ||||||
|
| |||||||
| 1,301 | ||||||||
|
| |||||||
| AUTOMOBILES—0.3% | ||||||||
| 65,534 | Ford Motor Co. | 779 | ||||||
|
| |||||||
| BANKS—1.3% | ||||||||
| 109,799 | Bank of America Corp. | 3,215 | ||||||
| 2,986 | First Republic Bank | 10 | ||||||
|
| |||||||
| 3,225 | ||||||||
|
| |||||||
| BEVERAGES—0.4% | ||||||||
| 780 | Brown-Forman Corp. Class A | 51 | ||||||
| 4,893 | Brown-Forman Corp. Class B | 319 | ||||||
| 2,341 | Constellation Brands, Inc. Class A | 537 | ||||||
|
| |||||||
| 907 | ||||||||
|
| |||||||
| BIOTECHNOLOGY—2.7% | ||||||||
| 2,098 | Alnylam Pharmaceuticals, Inc. * | 418 | ||||||
| 9,635 | Amgen, Inc. | 2,310 | ||||||
| 3,358 | BioMarin Pharmaceutical, Inc. * | 323 | ||||||
| 3,401 | Incyte Corp. * | 253 | ||||||
| 1,805 | Regeneron Pharmaceuticals, Inc. * | 1,447 | ||||||
| 4,810 | Vertex Pharmaceuticals, Inc. * | 1,639 | ||||||
|
| |||||||
| 6,390 | ||||||||
|
| |||||||
| CAPITAL MARKETS—4.3% | ||||||||
| 2,369 | Ares Management Corp. Class A | 208 | ||||||
| 2,288 | BlackRock, Inc. | 1,536 | ||||||
| 22,887 | Charles Schwab Corp. | 1,196 | ||||||
| 452 | FactSet Research Systems, Inc. | 186 | ||||||
| 4,400 | Franklin Resources, Inc. | 118 | ||||||
COMMON STOCKS—Continued | ||||||||
| Shares | Value | |||||||
|
CAPITAL MARKETS—Continued |
| ||||||
| 5,246 | Goldman Sachs Group, Inc. | $ | 1,802 | |||||
| 10,805 | KKR & Co., Inc. | 573 | ||||||
| 20,162 | Morgan Stanley | 1,814 | ||||||
| 904 | MSCI, Inc. | 436 | ||||||
| 5,459 | Nasdaq, Inc. | 302 | ||||||
| 5,369 | S&P Global, Inc. | 1,947 | ||||||
| 1,651 | Tradeweb Markets, Inc. Class A | 116 | ||||||
|
| |||||||
| 10,234 | ||||||||
|
| |||||||
| CHEMICALS—1.1% | ||||||||
| 17,353 | Corteva, Inc. | 1,061 | ||||||
| 16,564 | Dow, Inc. | 901 | ||||||
| 10,332 | DuPont de Nemours, Inc. | 720 | ||||||
|
| |||||||
| 2,682 | ||||||||
|
| |||||||
| COMMUNICATIONS EQUIPMENT—0.2% | ||||||||
| 2,544 | Arista Networks, Inc. * | 407 | ||||||
|
| |||||||
| CONSTRUCTION & ENGINEERING—0.2% | ||||||||
| 3,344 | Quanta Services, Inc. | 567 | ||||||
|
| |||||||
| CONSUMER FINANCE—0.7% | ||||||||
| 8,391 | American Express Co. | 1,354 | ||||||
| 7,615 | Synchrony Financial | 225 | ||||||
|
| |||||||
| 1,579 | ||||||||
|
| |||||||
| ELECTRIC UTILITIES—2.1% | ||||||||
| 10,724 | American Electric Power Co., Inc. | 991 | ||||||
| 7,860 | Edison International | 578 | ||||||
| 19,696 | Exelon Corp. | 836 | ||||||
| 32,721 | PG&E Corp. * | 560 | ||||||
| 15,046 | PPL Corp. | 432 | ||||||
| 21,640 | The Southern Co. | 1,592 | ||||||
|
| |||||||
| 4,989 | ||||||||
|
| |||||||
| ELECTRONIC EQUIPMENT, INSTRUMENTS & COMPONENTS—0.1% | ||||||||
| 3,141 | Trimble, Inc. * | 148 | ||||||
|
| |||||||
| ENERGY EQUIPMENT & SERVICES—0.7% | ||||||||
| 34,909 | Schlumberger NV | 1,723 | ||||||
4
Table of Contents
Harbor Corporate Culture ETF
PORTFOLIO OF INVESTMENTS—Continued
Value and Cost in Thousands
| COMMON STOCKS—Continued | ||||||||
| Shares | Value | |||||||
|
ENTERTAINMENT—1.1% |
| ||||||
| 3,874 | Electronic Arts, Inc. | $ | 493 | |||||
| 5,297 | Netflix, Inc. * | 1,748 | ||||||
| 3,466 | ROBLOX Corp. Class A* | 123 | ||||||
| 1,279 | Spotify Technology SA * | 171 | ||||||
|
| |||||||
| 2,535 | ||||||||
|
| |||||||
EQUITY REAL ESTATE INVESTMENT TRUSTS (REITS)—2.0% | ||||||||
| 5,472 | Digital Realty Trust, Inc. | 542 | ||||||
| 1,734 | Equinix, Inc. | 1,256 | ||||||
| 1,142 | Essex Property Trust, Inc. | 251 | ||||||
| 17,474 | ProLogis, Inc. | 2,189 | ||||||
| 2,067 | SBA Communications Corp. | 539 | ||||||
|
| |||||||
| 4,777 | ||||||||
|
| |||||||
FINANCIAL SERVICES—6.1% | ||||||||
| 20,437 | Berkshire Hathaway, Inc. Class B* | 6,715 | ||||||
| 20,663 | Mastercard, Inc. Class A | 7,852 | ||||||
|
| |||||||
| 14,567 | ||||||||
|
| |||||||
FOOD PRODUCTS—1.0% | ||||||||
| 9,683 | General Mills, Inc. | 858 | ||||||
| 21,404 | Mondelez International, Inc. Class A | 1,642 | ||||||
|
| |||||||
| 2,500 | ||||||||
|
| |||||||
GAS UTILITIES—0.1% | ||||||||
| 2,858 | Atmos Energy Corp. | 326 | ||||||
|
| |||||||
HEALTH CARE EQUIPMENT & SUPPLIES—2.4% | ||||||||
| 1,008 | Align Technology, Inc. * | 328 | ||||||
| 47,228 | Boston Scientific Corp. * | 2,462 | ||||||
| 5,952 | GE Healthcare, Inc * | 484 | ||||||
| 6,168 | Intuitive Surgical, Inc. * | 1,858 | ||||||
| 2,644 | ResMed, Inc. | 637 | ||||||
|
| |||||||
| 5,769 | ||||||||
|
| |||||||
HEALTH CARE TECHNOLOGY—0.1% | ||||||||
| 1,687 | Veeva Systems, Inc. Class A* | 302 | ||||||
|
| |||||||
HOTELS, RESTAURANTS & LEISURE—2.8% | ||||||||
| 9,986 | Airbnb, Inc. Class A* | 1,195 | ||||||
| 1,301 | Booking Holdings, Inc. * | 3,495 | ||||||
| 5,015 | Expedia Group, Inc. * | 471 | ||||||
| 9,324 | Marriott International, Inc. Class A | 1,579 | ||||||
|
| |||||||
| 6,740 | ||||||||
|
| |||||||
HOUSEHOLD PRODUCTS—3.3% | ||||||||
| 13,381 | Colgate-Palmolive Co. | 1,068 | ||||||
| 5,379 | Kimberly-Clark Corp. | 779 | ||||||
| 38,320 | Procter & Gamble Co. | 5,993 | ||||||
|
| |||||||
| 7,840 | ||||||||
|
| |||||||
INDEPENDENT POWER AND RENEWABLE ELECTRICITY PRODUCERS—0.1% | ||||||||
| 13,699 | AES Corp. | 324 | ||||||
|
| |||||||
INDUSTRIAL CONGLOMERATES—1.4% | ||||||||
| 16,860 | Honeywell International, Inc. | 3,369 | ||||||
|
| |||||||
INDUSTRIAL REITS—0.1% | ||||||||
| 2,009 | Camden Property Trust | 221 | ||||||
|
| |||||||
INSURANCE—1.3% | ||||||||
| 5,304 | Arch Capital Group Ltd. * | 398 | ||||||
| 2,179 | Cincinnati Financial Corp. | 232 | ||||||
| COMMON STOCKS—Continued | ||||||||
| Shares | Value | |||||||
|
INSURANCE—Continued |
| ||||||
| 5,039 | Hartford Financial Services Group, Inc. | $ | 358 | |||||
| 3,923 | Principal Financial Group, Inc. | 293 | ||||||
| 8,815 | Progressive Corp. | 1,202 | ||||||
| 3,835 | Travelers Cos., Inc. | 695 | ||||||
|
| |||||||
| 3,178 | ||||||||
|
| |||||||
INTERACTIVE MEDIA & SERVICES—9.0% | ||||||||
| 75,090 | Alphabet, Inc. Class A* | 8,060 | ||||||
| 67,988 | Alphabet, Inc. Class C* | 7,358 | ||||||
| 4,142 | Match Group, Inc. * | 153 | ||||||
| 23,486 | Meta Platforms, Inc. Class A* | 5,644 | ||||||
| 7,408 | Pinterest, Inc. Class A* | 170 | ||||||
| 13,241 | Snap, Inc. Class A* | 115 | ||||||
| 3,597 | ZoomInfo Technologies, Inc. * | 79 | ||||||
|
| |||||||
| 21,579 | ||||||||
|
| |||||||
INTERNET & DIRECT MARKETING RETAIL—0.5% | ||||||||
| 18,632 | eBay, Inc. | 865 | ||||||
| 4,163 | Etsy, Inc. * | 421 | ||||||
|
| |||||||
| 1,286 | ||||||||
|
| |||||||
IT SERVICES—0.9% | ||||||||
| 624 | EPAM Systems, Inc. * | 176 | ||||||
| 10,994 | IBM Corp. | 1,390 | ||||||
| 744 | MongoDB, Inc. * | 178 | ||||||
| 2,965 | Snowflake, Inc. Class A* | 439 | ||||||
| 1,974 | Twilio, Inc. Class A* | 104 | ||||||
|
| |||||||
| 2,287 | ||||||||
|
| |||||||
LIFE SCIENCES TOOLS & SERVICES—0.8% | ||||||||
| 5,097 | Agilent Technologies, Inc. | 690 | ||||||
| 2,694 | Illumina, Inc. * | 554 | ||||||
| 3,164 | IQVIA Holdings, Inc. * | 596 | ||||||
|
| |||||||
| 1,840 | ||||||||
|
| |||||||
MACHINERY—1.4% | ||||||||
| 3,345 | Cummins, Inc. | 786 | ||||||
| 6,849 | Deere & Co. | 2,589 | ||||||
|
| |||||||
| 3,375 | ||||||||
|
| |||||||
MEDIA—0.3% | ||||||||
| 4,540 | Omnicom Group, Inc. | 411 | ||||||
| 4,235 | Trade Desk, Inc. Class A* | 273 | ||||||
|
| |||||||
| 684 | ||||||||
|
| |||||||
METALS & MINING—0.8% | ||||||||
| 21,003 | Newmont Corp. | 996 | ||||||
| 6,035 | Nucor Corp. | 894 | ||||||
|
| |||||||
| 1,890 | ||||||||
|
| |||||||
MULTI-UTILITIES—0.5% | ||||||||
| 7,496 | Consolidated Edison, Inc. | 738 | ||||||
| 3,965 | DTE Energy Co. | 446 | ||||||
|
| |||||||
| 1,184 | ||||||||
|
| |||||||
OIL, GAS & CONSUMABLE FUELS—4.5% | ||||||||
| 34,888 | Chevron Corp. | 5,881 | ||||||
| 24,615 | ConocoPhillips | 2,533 | ||||||
| 6,357 | EQT Corp. | 221 | ||||||
| 5,138 | Hess Corp. | 745 | ||||||
| 7,731 | ONEOK, Inc. | 506 | ||||||
5
Table of Contents
Harbor Corporate Culture ETF
PORTFOLIO OF INVESTMENTS—Continued
Value and Cost in Thousands
COMMON STOCKS—Continued | ||||||||
| Shares | Value | |||||||
|
OIL, GAS & CONSUMABLE FUELS—Continued | |||||||
| 4,127 | Pioneer Natural Resources Co. | $ | 898 | |||||
|
| |||||||
| 10,784 | ||||||||
|
| |||||||
PHARMACEUTICALS—9.2% | ||||||||
| 14,704 | Eli Lilly & Co. | 5,821 | ||||||
| 45,835 | Johnson & Johnson | 7,503 | ||||||
| 42,791 | Merck & Co., Inc. | 4,941 | ||||||
| 97,660 | Pfizer, Inc. | 3,798 | ||||||
|
| |||||||
| 22,063 | ||||||||
|
| |||||||
PROFESSIONAL SERVICES—0.2% | ||||||||
| 3,054 | Jacobs Solutions, Inc. | 353 | ||||||
| 3,014 | TransUnion | 207 | ||||||
|
| |||||||
| 560 | ||||||||
|
| |||||||
SEMICONDUCTORS & SEMICONDUCTOR EQUIPMENT—4.5% | ||||||||
| 17,560 | Advanced Micro Devices, Inc. * | 1,569 | ||||||
| 49,718 | Intel Corp. | 1,544 | ||||||
| 9,759 | Marvell Technology, Inc. | 385 | ||||||
| 25,325 | NVIDIA Corp. | 7,028 | ||||||
| 1,804 | Teradyne, Inc. | 165 | ||||||
|
| |||||||
| 10,691 | ||||||||
|
| |||||||
SOFTWARE—10.5% | ||||||||
| 5,584 | Adobe, Inc. * | 2,108 | ||||||
| 1,032 | ANSYS, Inc. * | 324 | ||||||
| 1,540 | Atlassian Corp. PLC Class A* | 227 | ||||||
| 2,502 | Autodesk, Inc. * | 487 | ||||||
| 3,028 | Cadence Design Systems, Inc. * | 634 | ||||||
| 2,310 | CrowdStrike Holdings, Inc. Class A* | 277 | ||||||
| 6,927 | Fortinet, Inc. * | 437 | ||||||
| 3,374 | Intuit, Inc. | 1,498 | ||||||
| 43,578 | Microsoft Corp. | 13,390 | ||||||
| 16,361 | Palantir Technologies, Inc. Class A* | 127 | ||||||
| 3,257 | Palo Alto Networks, Inc. * | 594 | ||||||
| 11,787 | Salesforce, Inc. * | 2,338 | ||||||
| 2,446 | ServiceNow, Inc. * | 1,124 | ||||||
| 1,753 | Synopsys, Inc. * | 651 | ||||||
| 2,146 | Unity Software, Inc. * | 58 | ||||||
| 2,891 | VMware, Inc. Class A* | 361 | ||||||
| 2,325 | Workday, Inc. Class A* | 433 | ||||||
| 2,551 | Zoom Video Communications, Inc. Class A* | 157 | ||||||
| 918 | Zscaler, Inc. * | 83 | ||||||
|
| |||||||
| 25,308 | ||||||||
|
| |||||||
COMMON STOCKS—Continued | ||||||||
| Shares | Value | |||||||
|
SPECIALIZED REITS—0.4% | |||||||
| 2,890 | Public Storage | $ | 852 | |||||
|
| |||||||
TECHNOLOGY HARDWARE, STORAGE & PERIPHERALS—5.6% | ||||||||
| 75,223 | Apple, Inc. | 12,764 | ||||||
| 15,331 | Hewlett Packard Enterprise Co. | 220 | ||||||
| 11,817 | HP, Inc. | 351 | ||||||
|
| |||||||
| 13,335 | ||||||||
|
| |||||||
TEXTILES, APPAREL & LUXURY GOODS—1.7% | ||||||||
| 3,918 | Lululemon Athletica, Inc. * | 1,489 | ||||||
| 19,581 | NIKE, Inc. Class B | 2,481 | ||||||
| 6,103 | VF Corp. | 143 | ||||||
|
| |||||||
| 4,113 | ||||||||
|
| |||||||
TOBACCO—1.6% | ||||||||
| 26,645 | Altria Group, Inc. | 1,266 | ||||||
| 25,017 | Philip Morris International, Inc. | 2,501 | ||||||
|
| |||||||
| 3,767 | ||||||||
|
| |||||||
TOTAL COMMON STOCKS | ||||||||
| (Cost $202,707) | 220,466 | |||||||
|
| |||||||
EXCHANGE-TRADED FUNDS—7.8% | ||||||||
CAPITAL MARKETS—7.8% | ||||||||
| 80,798 | Communication Services Select Sector SPDR Fund | 4,840 | ||||||
| 94,304 | Consumer Discretionary Select Sector SPDR Fund | 13,943 | ||||||
TOTAL CAPITAL MARKETS | ||||||||
| (Cost $18,213) | 18,783 | |||||||
TOTAL INVESTMENTS—99.7% | ||||||||
| (Cost $220,920) | 239,249 | |||||||
|
| |||||||
CASH AND OTHER ASSETS, LESS LIABILITIES—0.3% | 839 | |||||||
|
| |||||||
TOTAL NET ASSETS—100% | $ | 240,088 | ||||||
|
| |||||||
FAIR VALUE MEASUREMENTS |
All investments as of April 30, 2023 (as disclosed in the preceding Portfolio of Investments) were classified as Level 1.
For more information on valuation inputs and their aggregation into the levels identified above, please refer to the Fair Value Measurements and Disclosures in Note 2 of the accompanying Notes to Financial Statements.
| * | Non-income producing security. |
The accompanying notes are an integral part of the Financial Statements.
6
Table of Contents
Harbor Corporate Culture Leaders ETF
PORTFOLIO OF INVESTMENTS—April 30, 2023 (Unaudited)
Adviser: Harbor Capital Advisors, Inc.
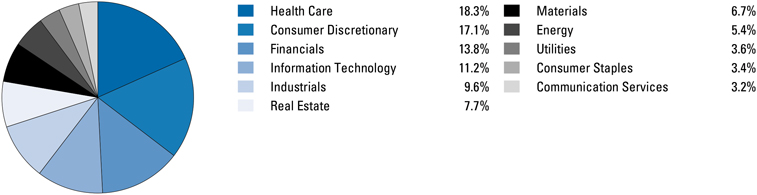
SECTOR ALLOCATION (% of investments) |

PORTFOLIO OF INVESTMENTS |
Value and Cost in Thousands
COMMON STOCKS—99.9% | ||||||
| Shares | Value | |||||
AIRLINES—1.2% | ||||||
3,668 | Delta Air Lines, Inc. * | $ | 126 | |||
|
| |||||
BANKS—1.0% | ||||||
1,063 | First Republic Bank | 4 | ||||
1,802 | Pinnacle Financial Partners, Inc. | 98 | ||||
|
| |||||
| 102 | ||||||
|
| |||||
BIOTECHNOLOGY—4.0% | ||||||
640 | Alnylam Pharmaceuticals, Inc. * | 127 | ||||
3,555 | Intellia Therapeutics, Inc. * | 134 | ||||
1,194 | Sarepta Therapeutics, Inc. * | 147 | ||||
|
| |||||
| 408 | ||||||
|
| |||||
CAPITAL MARKETS—8.9% | ||||||
334 | FactSet Research Systems, Inc. | 138 | ||||
2,458 | KKR & Co., Inc. | 130 | ||||
607 | Morningstar, Inc. | 108 | ||||
256 | MSCI, Inc. | 124 | ||||
394 | S&P Global, Inc. | 143 | ||||
4,392 | TPG, Inc. | 127 | ||||
1,933 | Tradeweb Markets, Inc. Class A | 136 | ||||
|
| |||||
| 906 | ||||||
|
| |||||
CONSUMER FINANCE—2.6% | ||||||
295 | Credit Acceptance Corp. * | 144 | ||||
3,955 | Synchrony Financial | 117 | ||||
|
| |||||
| 261 | ||||||
|
| |||||
ELECTRIC UTILITIES—1.4% | ||||||
5,031 | PPL Corp. | 145 | ||||
|
| |||||
ENTERTAINMENT—5.6% | ||||||
400 | Netflix, Inc. * | 132 | ||||
4,030 | ROBLOX Corp. Class A* | 143 | ||||
2,539 | Roku, Inc. * | 143 | ||||
1,138 | Spotify Technology SA * | 152 | ||||
|
| |||||
| 570 | ||||||
|
| |||||
EQUITY REAL ESTATE INVESTMENT TRUSTS (REITS)—2.7% |
| |||||
1,125 | ProLogis, Inc. | 141 | ||||
502 | SBA Communications Corp. | 131 | ||||
|
| |||||
| 272 | ||||||
|
| |||||
COMMON STOCKS—Continued | ||||||
| Shares | Value | |||||
FINANCIAL SERVICES—1.4% | ||||||
389 | Mastercard, Inc. Class A | $ | 148 | |||
|
| |||||
HEALTH CARE EQUIPMENT & SUPPLIES—4.9% | ||||||
3,038 | Boston Scientific Corp. * | 158 | ||||
1,979 | GE Healthcare, Inc * | 161 | ||||
597 | Intuitive Surgical, Inc. * | 180 | ||||
|
| |||||
| 499 | ||||||
|
| |||||
HEALTH CARE PROVIDERS & SERVICES—1.5% | ||||||
6,195 | agilon health, Inc. * | 150 | ||||
|
| |||||
HEALTH CARE TECHNOLOGY—1.5% | ||||||
4,309 | Doximity, Inc. * | 158 | ||||
|
| |||||
HOTELS, RESTAURANTS & LEISURE—1.4% | ||||||
1,192 | Airbnb, Inc. Class A* | 143 | ||||
|
| |||||
HOUSEHOLD PRODUCTS—3.1% | ||||||
1,959 | Colgate-Palmolive Co. | 156 | ||||
1,030 | Procter & Gamble Co. | 161 | ||||
|
| |||||
| 317 | ||||||
|
| |||||
INDEPENDENT POWER AND RENEWABLE ELECTRICITY |
| |||||
5,466 | AES Corp. | 129 | ||||
|
| |||||
INSURANCE—2.8% | ||||||
2,349 | First American Financial Corp. | 135 | ||||
1,101 | RLI Corp. | 153 | ||||
|
| |||||
| 288 | ||||||
|
| |||||
INTERACTIVE MEDIA & SERVICES—5.8% | ||||||
760 | Alphabet, Inc. Class A* | 82 | ||||
758 | Alphabet, Inc. Class C* | 82 | ||||
802 | Meta Platforms, Inc. Class A* | 193 | ||||
1,631 | Ziff Davis, Inc. * | 119 | ||||
5,350 | ZoomInfo Technologies, Inc. * | 117 | ||||
|
| |||||
| 593 | ||||||
|
| |||||
INTERNET & DIRECT MARKETING RETAIL—1.1% | ||||||
1,078 | Etsy, Inc. * | 109 | ||||
|
| |||||
IT SERVICES—6.0% | ||||||
398 | EPAM Systems, Inc. * | 113 | ||||
7
Table of Contents
Harbor Corporate Culture Leaders ETF
PORTFOLIO OF INVESTMENTS—Continued
Value and Cost in Thousands
COMMON STOCKS—Continued | ||||||
| Shares | Value | |||||
IT SERVICES—Continued | ||||||
894 | Globant SA * | $ | 140 | |||
629 | MongoDB, Inc. * | 151 | ||||
13,830 | Thoughtworks Holding, Inc. * | 86 | ||||
2,322 | Twilio, Inc. Class A* | 122 | ||||
|
| |||||
| 612 | ||||||
|
| |||||
LIFE SCIENCES TOOLS & SERVICES—1.2% | ||||||
940 | Agilent Technologies, Inc. | 127 | ||||
|
| |||||
MEDIA—1.8% | ||||||
2,898 | Trade Desk, Inc. Class A* | 187 | ||||
|
| |||||
METALS & MINING—2.3% | ||||||
2,534 | Commercial Metals Co. | 119 | ||||
1,138 | Steel Dynamics, Inc. | 118 | ||||
|
| |||||
| 237 | ||||||
|
| |||||
MULTI-UTILITIES—1.5% | ||||||
1,576 | Consolidated Edison, Inc. | 155 | ||||
|
| |||||
OIL, GAS & CONSUMABLE FUELS—2.6% | ||||||
1,266 | ConocoPhillips | 130 | ||||
614 | Pioneer Natural Resources Co. | 134 | ||||
|
| |||||
| 264 | ||||||
|
| |||||
PHARMACEUTICALS—1.4% | ||||||
885 | Johnson & Johnson | 145 | ||||
|
| |||||
PROFESSIONAL SERVICES—2.5% | ||||||
1,574 | ASGN, Inc. * | 113 | ||||
2,111 | TransUnion | 145 | ||||
|
| |||||
| 258 | ||||||
|
| |||||
RETAIL REITS—1.2% | ||||||
3,308 | Spirit Realty Capital, Inc. | 127 | ||||
|
| |||||
SEMICONDUCTORS & SEMICONDUCTOR EQUIPMENT—5.4% |
| |||||
5,016 | Intel Corp. | 156 | ||||
COMMON STOCKS—Continued | ||||||
| Shares | Value | |||||
SEMICONDUCTORS & SEMICONDUCTOR EQUIPMENT—Continued |
| |||||
627 | NVIDIA Corp. | $ | 174 | |||
746 | Silicon Laboratories, Inc. * | 104 | ||||
1,330 | Teradyne, Inc. | 121 | ||||
|
| |||||
| 555 | ||||||
|
| |||||
SOFTWARE—20.1% |
| |||||
380 | Adobe, Inc. * | 143 | ||||
792 | Atlassian Corp. PLC Class A* | 117 | ||||
722 | Cadence Design Systems, Inc. * | 151 | ||||
5,983 | Dropbox, Inc. * | 122 | ||||
3,064 | Gitlab, Inc. * | 93 | ||||
1,911 | Guidewire Software, Inc. * | 146 | ||||
341 | Intuit, Inc. | 151 | ||||
528 | Microsoft Corp. | 162 | ||||
876 | Monday.com Ltd. * | 107 | ||||
845 | Salesforce, Inc. * | 168 | ||||
9,089 | Samsara, Inc. Class A* | 164 | ||||
8,624 | SentinelOne, Inc. * | 139 | ||||
312 | ServiceNow, Inc. * | 143 | ||||
1,225 | VMware, Inc. Class A* | 153 | ||||
1,055 | Zscaler, Inc. * | 95 | ||||
|
| |||||
| 2,054 | ||||||
|
| |||||
TEXTILES, APPAREL & LUXURY GOODS—1.7% | ||||||
449 | Lululemon Athletica, Inc. * | 171 | ||||
|
| |||||
TOTAL COMMON STOCKS | ||||||
(Cost $10,793) | 10,216 | |||||
|
| |||||
TOTAL INVESTMENTS—99.9% | ||||||
(Cost $10,793) | 10,216 | |||||
|
| |||||
CASH AND OTHER ASSETS, LESS LIABILITIES—0.1% | 15 | |||||
|
| |||||
TOTAL NET ASSETS—100%. | $ | 10,231 | ||||
|
| |||||
FAIR VALUE MEASUREMENTS |
All investments as of April 30, 2023 (as disclosed in the preceding Portfolio of Investments) were classified as Level 1.
For more information on valuation inputs and their aggregation into the levels identified above, please refer to the Fair Value Measurements and Disclosures in Note 2 of the accompanying Notes to Financial Statements.
* Non-income producing security.
The accompanying notes are an integral part of the Financial Statements.
8
Table of Contents
Harbor Corporate Culture Small Cap ETF
PORTFOLIO OF INVESTMENTS—April 30, 2023 (Unaudited)
Adviser: Harbor Capital Advisors, Inc.
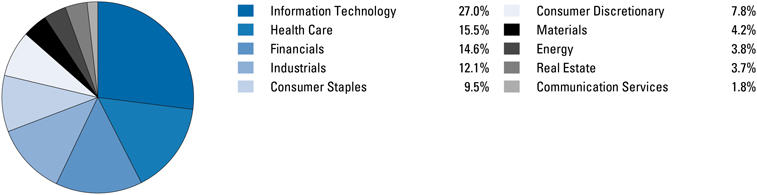
SECTOR ALLOCATION (% of investments) | ||||
PORTFOLIO OF INVESTMENTS |
Value and Cost in Thousands
COMMON STOCKS—99.4% | ||||||
| Shares | Value | |||||
AEROSPACE & DEFENSE—0.7% | ||||||
10,256 | Maxar Technologies, Inc. | $ | 541 | |||
|
| |||||
AUTOMOBILE COMPONENTS—1.4% | ||||||
15,049 | Gentherm, Inc. * | 898 | ||||
11,396 | Stoneridge, Inc. * | 214 | ||||
|
| |||||
| 1,112 | ||||||
|
| |||||
AUTOMOBILES—0.6% | ||||||
29,920 | Fisker, Inc. * | 193 | ||||
4,430 | Winnebago Industries, Inc. | 257 | ||||
|
| |||||
| 450 | ||||||
|
| |||||
BANKS—3.1% | ||||||
9,439 | Bridgewater Bancshares, Inc. * | 94 | ||||
6,177 | City Holding Co. | 563 | ||||
14,642 | Live Oak Bancshares, Inc. | 345 | ||||
12,728 | Origin Bancorp, Inc. | 375 | ||||
33,116 | Seacoast Banking Corp. of Florida | 735 | ||||
24,482 | Veritex Holdings, Inc. | 421 | ||||
|
| |||||
| 2,533 | ||||||
|
| |||||
BIOTECHNOLOGY—8.7% | ||||||
30,639 | Atara Biotherapeutics, Inc. * | 83 | ||||
21,493 | Beam Therapeutics, Inc. * | 660 | ||||
18,396 | Biohaven Ltd. * | 241 | ||||
18,611 | Blueprint Medicines Corp. * | 950 | ||||
9,822 | Cullinan Oncology, Inc. * | 96 | ||||
29,900 | Denali Therapeutics, Inc. * | 743 | ||||
12,612 | Kymera Therapeutics, Inc. * | 398 | ||||
27,625 | Mersana Therapeutics, Inc. * | 121 | ||||
22,495 | PTC Therapeutics, Inc. * | 1,240 | ||||
12,743 | REGENXBIO, Inc. * | 247 | ||||
31,205 | Relay Therapeutics, Inc. * | 355 | ||||
15,709 | Sage Therapeutics, Inc. * | 767 | ||||
19,912 | Twist Bioscience Corp. * | 248 | ||||
20,722 | Ultragenyx Pharmaceutical, Inc. * | 905 | ||||
|
| |||||
| 7,054 | ||||||
|
| |||||
BUILDING PRODUCTS—0.8% | ||||||
24,363 | PGT Innovations, Inc. * | 625 | ||||
|
| |||||
COMMON STOCKS—Continued | ||||||
| Shares | Value | |||||
CAPITAL MARKETS—4.5% | ||||||
13,119 | Evercore, Inc. Class A | $ | 1,496 | |||
14,815 | Perella Weinberg Partners | 117 | ||||
10,362 | PJT Partners, Inc. Class A | 713 | ||||
24,108 | StepStone Group, Inc. Class A | 531 | ||||
27,603 | TPG, Inc. | 800 | ||||
|
| |||||
| 3,657 | ||||||
|
| |||||
CHEMICALS—4.5% | ||||||
98,725 | Amyris, Inc. * | 81 | ||||
22,788 | HB Fuller Co. | 1,508 | ||||
8,892 | Koppers Holdings, Inc. | 292 | ||||
27,507 | Rayonier Advanced Materials, Inc. * | 150 | ||||
9,450 | Stepan Co. | 871 | ||||
53,435 | Tronox Holdings PLC | 731 | ||||
|
| |||||
| 3,633 | ||||||
|
| |||||
COMMERCIAL SERVICES & SUPPLIES—0.9% | ||||||
58,043 | Aurora Innovation, Inc. * | 83 | ||||
6,399 | Cimpress PLC (Ireland)* | 332 | ||||
39,681 | Steelcase, Inc. Class A | 318 | ||||
|
| |||||
| 733 | ||||||
|
| |||||
COMMUNICATIONS EQUIPMENT—1.8% | ||||||
8,269 | Calix, Inc. * | 378 | ||||
17,691 | Extreme Networks, Inc. * | 314 | ||||
14,680 | Harmonic, Inc. * | 207 | ||||
28,385 | Infinera Corp. * | 180 | ||||
11,019 | Viasat, Inc. * | 386 | ||||
|
| |||||
| 1,465 | ||||||
|
| |||||
CONSUMER FINANCE—0.2% | ||||||
23,733 | EZCORP, Inc. Class A* | 204 | ||||
|
| |||||
CONSUMER STAPLES DISTRIBUTION & RETAIL—1.5% | ||||||
11,279 | PriceSmart, Inc. | 831 | ||||
15,684 | SpartanNash Co. | 385 | ||||
|
| |||||
| 1,216 | ||||||
|
| |||||
DIVERSIFIED CONSUMER SERVICES—4.6% | ||||||
65,941 | Chegg, Inc. * | 1,186 | ||||
15,567 | Coursera, Inc. * | 194 | ||||
3,794 | Duolingo, Inc. * | 517 | ||||
9
Table of Contents
Harbor Corporate Culture Small Cap ETF
PORTFOLIO OF INVESTMENTS—Continued
Value and Cost in Thousands
COMMON STOCKS—Continued | ||||||
| Shares | Value | |||||
DIVERSIFIED CONSUMER SERVICES—Continued | ||||||
55,396 | Laureate Education, Inc. | $ | 686 | |||
59,864 | Rover Group, Inc. * | 271 | ||||
17,662 | Stride, Inc. * | 759 | ||||
8,627 | Udemy, Inc. * | 78 | ||||
|
| |||||
| 3,691 | ||||||
|
| |||||
DIVERSIFIED TELECOMMUNICATION SERVICES—0.2% | ||||||
2,898 | Bandwidth, Inc. Class A* | 35 | ||||
16,134 | Liberty Latin America Ltd. Class A (Puerto Rico)* | 143 | ||||
|
| |||||
| 178 | ||||||
|
| |||||
ELECTRIC UTILITIES—0.9% | ||||||
18,639 | Hawaiian Electric Industries, Inc. | 731 | ||||
|
| |||||
ELECTRONIC EQUIPMENT, INSTRUMENTS & COMPONENTS—0.1% |
| |||||
10,834 | Arlo Technologies, Inc. * | 70 | ||||
|
| |||||
ENERGY EQUIPMENT & SERVICES—3.0% | ||||||
68,652 | Archrock, Inc. | 706 | ||||
10,619 | Bristow Group, Inc. * | 237 | ||||
4,078 | Nabors Industries Ltd. * | 407 | ||||
99,002 | Patterson-UTI Energy, Inc. | 1,108 | ||||
|
| |||||
| 2,458 | ||||||
|
| |||||
FINANCIAL SERVICES—2.9% | ||||||
36,448 | Affirm Holdings, Inc. * | 360 | ||||
12,315 | Flywire Corp. * | 359 | ||||
6,934 | Paymentus Holdings, Inc. Class A* | 57 | ||||
117,579 | Payoneer Global, Inc. * | 642 | ||||
13,775 | Walker & Dunlop, Inc. | 927 | ||||
|
| |||||
| 2,345 | ||||||
|
| |||||
FOOD PRODUCTS—0.2% | ||||||
12,598 | Vital Farms, Inc. * | 162 | ||||
|
| |||||
GAS UTILITIES—0.9% | ||||||
9,039 | ONE Gas, Inc. | 696 | ||||
|
| |||||
HEALTH CARE EQUIPMENT & SUPPLIES—3.0% | ||||||
14,048 | AtriCure, Inc. * | 618 | ||||
10,857 | Axogen, Inc. * | 98 | ||||
13,637 | Glaukos Corp. * | 648 | ||||
15,347 | Outset Medical, Inc. * | 276 | ||||
19,262 | Tandem Diabetes Care, Inc. * | 762 | ||||
|
| |||||
| 2,402 | ||||||
|
| |||||
HEALTH CARE PROVIDERS & SERVICES—2.7% | ||||||
77,123 | 23andMe Holding Co. Class A* | 152 | ||||
30,405 | AdaptHealth Corp. * | 361 | ||||
7,591 | Castle Biosciences, Inc. * | 172 | ||||
24,268 | DocGo, Inc. * | 206 | ||||
14,046 | Hims & Hers Health, Inc. * | 163 | ||||
34,557 | Progyny, Inc. * | 1,149 | ||||
|
| |||||
| 2,203 | ||||||
|
| |||||
HEALTH CARE REITS—1.9% | ||||||
103,963 | Physicians Realty Trust | 1,499 | ||||
|
| |||||
HEALTH CARE TECHNOLOGY—3.2% | ||||||
4,579 | Definitive Healthcare Corp. * | 49 | ||||
14,804 | Doximity, Inc. * | 544 | ||||
39,397 | Evolent Health, Inc. Class A* | 1,434 | ||||
11,921 | GoodRx Holdings, Inc. Class A* | 56 | ||||
COMMON STOCKS—Continued | ||||||
| Shares | Value | |||||
HEALTH CARE TECHNOLOGY—Continued | ||||||
7,468 | Health Catalyst, Inc. * | $ | 94 | |||
3,400 | HealthStream, Inc. | 84 | ||||
8,102 | Schrodinger, Inc. * | 239 | ||||
41,702 | Sharecare, Inc. * | 64 | ||||
|
| |||||
| 2,564 | ||||||
|
| |||||
HOTEL & RESORT REITS—1.7% | ||||||
93,368 | Apple Hospitality REIT, Inc. | 1,390 | ||||
|
| |||||
HOTELS, RESTAURANTS & LEISURE—1.7% | ||||||
5,236 | Bluegreen Vacations Holding Corp. | 151 | ||||
17,941 | Brinker International, Inc. * | 716 | ||||
5,117 | Dutch Bros, Inc. Class A* | 159 | ||||
1,319 | NeoGames SA (Israel)* | 18 | ||||
12,295 | PlayAGS, Inc. * | 65 | ||||
7,431 | Xponential Fitness, Inc. Class A* | 246 | ||||
|
| |||||
| 1,355 | ||||||
|
| |||||
HOUSEHOLD DURABLES—4.7% | ||||||
4,885 | Beazer Homes USA, Inc. * | 104 | ||||
21,332 | GoPro, Inc. Class A* | 91 | ||||
3,779 | Helen of Troy Ltd. * | 379 | ||||
4,437 | iRobot Corp. * | 175 | ||||
12,032 | KB Home | 527 | ||||
6,536 | La-Z-Boy, Inc. | 188 | ||||
3,037 | LGI Homes, Inc. * | 361 | ||||
4,206 | M/I Homes, Inc. * | 284 | ||||
5,217 | Meritage Homes Corp. | 668 | ||||
15,823 | Sonos, Inc. * | 335 | ||||
15,832 | Taylor Morrison Home Corp. * | 682 | ||||
|
| |||||
| 3,794 | ||||||
|
| |||||
INDEPENDENT POWER PRODUCERS & ENERGY TRADERS—0.4% |
| |||||
18,845 | Sunnova Energy International, Inc. * | 338 | ||||
|
| |||||
INSURANCE—2.8% | ||||||
13,497 | Argo Group International Holdings Ltd. | 397 | ||||
29,478 | Brighthouse Financial, Inc. * | 1,303 | ||||
11,418 | Palomar Holdings, Inc. * | 574 | ||||
|
| |||||
| 2,274 | ||||||
|
| |||||
INTERACTIVE MEDIA & SERVICES—1.2% | ||||||
14,558 | Cargurus, Inc. * | 239 | ||||
9,021 | Cars.com, Inc. * | 177 | ||||
12,076 | Eventbrite, Inc. Class A* | 88 | ||||
17,780 | Nextdoor Holdings, Inc. * | 38 | ||||
20,028 | QuinStreet, Inc. * | 222 | ||||
22,266 | Taboola.com Ltd. (Israel)* | 51 | ||||
20,834 | Vimeo, Inc. * | 69 | ||||
5,223 | ZipRecruiter, Inc. Class A* | 88 | ||||
|
| |||||
| 972 | ||||||
|
| |||||
IT SERVICES—1.0% | ||||||
6,953 | DigitalOcean Holdings, Inc. * | 219 | ||||
20,208 | Edgio, Inc. * | 13 | ||||
12,481 | Fastly, Inc. Class A* | 185 | ||||
7,431 | Grid Dynamics Holdings, Inc. * | 81 | ||||
39,226 | Thoughtworks Holding, Inc. * | 244 | ||||
1,306 | Tucows, Inc. Class A* | 29 | ||||
|
| |||||
| 771 | ||||||
|
| |||||
10
Table of Contents
Harbor Corporate Culture Small Cap ETF
PORTFOLIO OF INVESTMENTS—Continued
Value and Cost in Thousands
COMMON STOCKS—Continued | ||||||
| Shares | Value | |||||
MEDIA—1.3% | ||||||
18,863 | John Wiley & Sons, Inc. Class A | $ | 728 | |||
18,727 | Magnite, Inc. * | 176 | ||||
4,592 | TechTarget, Inc. * | 156 | ||||
|
| |||||
| 1,060 | ||||||
|
| |||||
METALS & MINING—2.2% | ||||||
7,759 | Piedmont Lithium, Inc. * | 446 | ||||
9,179 | Ryerson Holding Corp. | 347 | ||||
23,725 | SunCoke Energy, Inc. | 185 | ||||
13,643 | Worthington Industries, Inc. | 810 | ||||
|
| |||||
| 1,788 | ||||||
|
| |||||
MULTI-UTILITIES—1.0% | ||||||
12,317 | Black Hills Corp. | 804 | ||||
|
| |||||
OIL, GAS & CONSUMABLE FUELS—2.4% | ||||||
131,451 | Kosmos Energy Ltd. (Ghana)* | 841 | ||||
52,058 | Permian Resources Corp. | 544 | ||||
4,203 | SilverBow Resources, Inc. * | 100 | ||||
20,686 | Talos Energy, Inc. * | 282 | ||||
28,918 | Teekay Corp. (Bermuda)* | 164 | ||||
|
| |||||
| 1,931 | ||||||
|
| |||||
PERSONAL CARE PRODUCTS—1.7% | ||||||
7,738 | Edgewell Personal Care Co. | 338 | ||||
6,027 | elf Beauty, Inc. * | 559 | ||||
7,457 | Nu Skin Enterprises, Inc. Class A | 294 | ||||
3,298 | USANA Health Sciences, Inc. * | 219 | ||||
|
| |||||
| 1,410 | ||||||
|
| |||||
PHARMACEUTICALS—1.1% | ||||||
54,763 | Nektar Therapeutics * | 41 | ||||
25,962 | Revance Therapeutics, Inc. * | 827 | ||||
|
| |||||
| 868 | ||||||
|
| |||||
PROFESSIONAL SERVICES—4.9% | ||||||
2,975 | CRA International, Inc. | 313 | ||||
4,455 | CSG Systems International, Inc. | 235 | ||||
5,646 | Forrester Research, Inc. * | 175 | ||||
8,656 | Huron Consulting Group, Inc. * | 734 | ||||
14,447 | Insperity, Inc. | 1,769 | ||||
8,153 | Kforce, Inc. | 482 | ||||
29,888 | Planet Labs PBC * | 122 | ||||
17,695 | Upwork, Inc. * | 169 | ||||
|
| |||||
| 3,999 | ||||||
|
| |||||
REAL ESTATE MANAGEMENT & DEVELOPMENT—0.8% | ||||||
35,538 | eXp World Holdings, Inc. | 416 | ||||
7,056 | RE/MAX Holdings, Inc. Class A | 136 | ||||
147,777 | WeWork, Inc. Class A* | 62 | ||||
|
| |||||
| 614 | ||||||
|
| |||||
RETAIL REITS—3.4% | ||||||
19,892 | Getty Realty Corp. | 663 | ||||
30,237 | InvenTrust Properties Corp. | 682 | ||||
38,217 | RPT Realty | 355 | ||||
82,969 | SITE Centers Corp. | 1,024 | ||||
|
| |||||
| 2,724 | ||||||
|
| |||||
SOFTWARE—8.0% | ||||||
10,229 | A10 Networks, Inc. | 145 | ||||
6,975 | Altair Engineering, Inc. Class A* | 482 | ||||
COMMON STOCKS—Continued | ||||||
| Shares | Value | |||||
SOFTWARE—Continued | ||||||
6,177 | Amplitude, Inc. Class A* | $ | 70 | |||
2,365 | Appfolio, Inc. Class A* | 330 | ||||
7,880 | Asana, Inc. Class A* | 127 | ||||
18,504 | AvePoint, Inc. * | 80 | ||||
19,115 | Box, Inc. Class A* | 506 | ||||
4,996 | Braze, Inc. Class A* | 147 | ||||
14,143 | Confluent, Inc. Class A* | 311 | ||||
2,973 | Couchbase, Inc. * | 46 | ||||
4,603 | Domo, Inc. Class B* | 73 | ||||
9,941 | DoubleVerify Holdings, Inc. * | 292 | ||||
6,278 | Expensify, Inc. Class A* | 48 | ||||
21,974 | Freshworks, Inc. Class A* | 294 | ||||
1,703 | Intapp, Inc. * | 69 | ||||
9,692 | Jamf Holding Corp. * | 183 | ||||
9,417 | N-able, Inc. * | 120 | ||||
10,725 | nCino, Inc. * | 265 | ||||
11,768 | PagerDuty, Inc. * | 354 | ||||
5,741 | Progress Software Corp. | 315 | ||||
8,649 | Rapid7, Inc. * | 420 | ||||
12,544 | Samsara, Inc. Class A* | 226 | ||||
4,441 | Semrush Holdings, Inc. Class A* | 43 | ||||
6,804 | Sprout Social, Inc. Class A* | 335 | ||||
14,142 | Sumo Logic, Inc. * | 170 | ||||
15,312 | Varonis Systems, Inc. * | 355 | ||||
6,689 | Workiva, Inc. * | 625 | ||||
|
| |||||
| 6,431 | ||||||
|
| |||||
SPECIALTY RETAIL—3.1% | ||||||
2,472 | America’s Car-Mart, Inc. * | 199 | ||||
7,710 | Asbury Automotive Group, Inc. * | 1,491 | ||||
65,484 | BARK, Inc. * | 72 | ||||
183,365 | Farfetch Ltd. Class A (United Kingdom)* | 739 | ||||
|
| |||||
| 2,501 | ||||||
|
| |||||
TEXTILES, APPAREL & LUXURY GOODS—0.6% | ||||||
8,664 | Fossil Group, Inc. * | 29 | ||||
13,861 | Levi Strauss & Co. Class A | 200 | ||||
2,361 | Oxford Industries, Inc. | 244 | ||||
3,544 | Vera Bradley, Inc. * | 19 | ||||
|
| |||||
| 492 | ||||||
|
| |||||
TRADING COMPANIES & DISTRIBUTORS—2.3% | ||||||
30,282 | Core & Main, Inc. Class A* | 789 | ||||
18,085 | GMS, Inc. * | 1,050 | ||||
|
| |||||
| 1,839 | ||||||
|
| |||||
WATER UTILITIES—0.4% | ||||||
4,600 | SJW Group | 349 | ||||
|
| |||||
WIRELESS TELECOMMUNICATION SERVICES—0.4% | ||||||
27,122 | Gogo, Inc. * | 364 | ||||
|
| |||||
TOTAL COMMON STOCKS |
| |||||
(Cost $80,294) | 80,290 | |||||
|
| |||||
EXCHANGE-TRADED FUNDS—0.6% | ||||||
CAPITAL MARKETS—0.6% | ||||||
4,443 | Invesco S&P SmallCap Consumer Discretionary ETF | 393 | ||||
11
Table of Contents
Harbor Corporate Culture Small Cap ETF
PORTFOLIO OF INVESTMENTS—Continued
Value and Cost in Thousands
COMMON STOCKS—Continued | ||||||
| Shares | Value | |||||
CAPITAL MARKETS—Continued | ||||||
| 2,756 | Invesco S&P SmallCap Financials ETF | $ | 116 | |||
|
| |||||
TOTAL CAPITAL MARKETS | ||||||
(Cost $504) | 509 | |||||
|
| |||||
TOTAL INVESTMENTS—100.0% | ||||||
(Cost $80,798) | 80,799 | |||||
|
| |||||
CASH AND OTHER ASSETS, LESS LIABILITIES—0.0% | 7 | |||||
|
| |||||
TOTAL NET ASSETS—100% | $ | 80,806 | ||||
|
| |||||
FAIR VALUE MEASUREMENTS |
All investments as of April 30, 2023 (as disclosed in the preceding Portfolio of Investments) were classified as Level 1.
For more information on valuation inputs and their aggregation into the levels identified above, please refer to the Fair Value Measurements and Disclosures in Note 2 of the accompanying Notes to Financial Statements.
* Non-income producing security.
The accompanying notes are an integral part of the Financial Statements.
12
Table of Contents
Harbor Disruptive Innovation ETF
PORTFOLIO OF INVESTMENTS—April 30, 2023 (Unaudited)
Adviser: Harbor Capital Advisors, Inc.
SECTOR ALLOCATION (% of investments) |

PORTFOLIO OF INVESTMENTS |
Value and Cost in Thousands
COMMON STOCKS—97.9% | ||||||
| Shares | Value | |||||
AUTOMOBILES—1.2% | ||||||
2,016 | Tesla, Inc. * | $ | 331 | |||
|
| |||||
BIOTECHNOLOGY—11.2% | ||||||
1,825 | 89bio, Inc. * | 29 | ||||
10,757 | Alkermes PLC * | 307 | ||||
17,240 | Allogene Therapeutics, Inc. * | 94 | ||||
1,232 | Apellis Pharmaceuticals, Inc. * | 103 | ||||
5,125 | Arrowhead Pharmaceuticals, Inc. * | 181 | ||||
3,448 | Ascendis Pharma AS ADR (Denmark)*,1 | 241 | ||||
72,628 | Autolus Therapeutics PLC ADR (United Kingdom)*,1 | 131 | ||||
7,458 | Avidity Biosciences, Inc. * | 92 | ||||
6,250 | Bicycle Therapeutics PLC ADR (United Kingdom)*,1 | 123 | ||||
17,418 | C4 Therapeutics, Inc. * | 53 | ||||
3,602 | Fate Therapeutics, Inc. * | 22 | ||||
37,021 | Freeline Therapeutics Holdings PLC ADR (United Kingdom)*,1 | 13 | ||||
3,280 | Intellia Therapeutics, Inc. * | 124 | ||||
16,733 | Iovance Biotherapeutics, Inc. * | 94 | ||||
2,079 | Krystal Biotech, Inc. * | 175 | ||||
3,705 | Kymera Therapeutics, Inc. * | 117 | ||||
49,733 | Magenta Therapeutics, Inc. * | 39 | ||||
33,076 | Precision BioSciences, Inc. * | 28 | ||||
587 | Prometheus Biosciences, Inc. * | 114 | ||||
7,936 | REGENXBIO, Inc. * | 154 | ||||
10,984 | Repare Therapeutics, Inc. (Canada)* | 98 | ||||
7,654 | Replimune Group, Inc. * | 128 | ||||
16,111 | Rocket Pharmaceuticals, Inc. * | 289 | ||||
823 | Sarepta Therapeutics, Inc. * | 101 | ||||
86,308 | Synlogic, Inc. * | 46 | ||||
22,104 | TCR² Therapeutics, Inc. * | 39 | ||||
6,428 | UniQure NV (Netherlands)* | 125 | ||||
|
| |||||
| 3,060 | ||||||
|
| |||||
CONSUMER STAPLES DISTRIBUTION & RETAIL—0.9% | ||||||
42,246 | Dada Nexus Ltd. ADR (China)*,1 | 256 | ||||
|
| |||||
CONTAINERS & PACKAGING—2.0% | ||||||
10,211 | Ball Corp. | 543 | ||||
|
| |||||
ELECTRIC UTILITIES—2.1% | ||||||
7,321 | NextEra Energy, Inc. | 561 | ||||
|
| |||||
COMMON STOCKS—Continued | ||||||
| Shares | Value | |||||
ENTERTAINMENT—0.7% | ||||||
2,382 | Sea Ltd. ADR (Singapore)*,1 | $ | 181 | |||
|
| |||||
FINANCIAL SERVICES—3.3% | ||||||
473 | Adyen NV (Netherlands)*,2 | 757 | ||||
8,019 | Toast, Inc. Class A* | 146 | ||||
|
| |||||
| 903 | ||||||
|
| |||||
HEALTH CARE EQUIPMENT & SUPPLIES—4.5% | ||||||
3,978 | Dexcom, Inc. * | 483 | ||||
293 | IDEXX Laboratories, Inc. * | 144 | ||||
363 | Inspire Medical Systems, Inc. * | 97 | ||||
645 | Insulet Corp. * | 205 | ||||
1,736 | Lantheus Holdings, Inc. * | 148 | ||||
374 | The Cooper Companies, Inc. | 143 | ||||
|
| |||||
| 1,220 | ||||||
|
| |||||
HEALTH CARE PROVIDERS & SERVICES—0.9% | ||||||
53,757 | Invitae Corp. * | 73 | ||||
345 | UnitedHealth Group, Inc. | 170 | ||||
|
| |||||
| 243 | ||||||
|
| |||||
HOTELS, RESTAURANTS & LEISURE—2.5% | ||||||
2,439 | Airbnb, Inc. Class A* | 292 | ||||
185 | Chipotle Mexican Grill, Inc. * | 382 | ||||
|
| |||||
| 674 | ||||||
|
| |||||
INSURANCE—1.1% | ||||||
2,119 | Progressive Corp. | 289 | ||||
|
| |||||
INTERACTIVE MEDIA & SERVICES—1.8% | ||||||
4,553 | Alphabet, Inc. Class A* | 489 | ||||
|
| |||||
INTERNET & DIRECT MARKETING RETAIL—9.7% | ||||||
11,322 | Amazon.com, Inc. * | 1,194 | ||||
329,482 | Deliveroo PLC (United Kingdom)*,2 | 453 | ||||
2,105 | DoorDash, Inc. Class A* | 129 | ||||
691 | MercadoLibre, Inc. (Brazil)* | 882 | ||||
|
| |||||
| 2,658 | ||||||
|
| |||||
IT SERVICES—8.8% | ||||||
7,645 | Block, Inc. * | 465 | ||||
5,729 | Cloudflare, Inc. Class A* | 270 | ||||
13
Table of Contents
Harbor Disruptive Innovation ETF
PORTFOLIO OF INVESTMENTS—Continued
Value and Cost in Thousands
COMMON STOCKS—Continued | ||||||
| Shares | Value | |||||
IT SERVICES—Continued |
| |||||
3,671 | Fiserv, Inc. * | $ | 448 | |||
915 | MongoDB, Inc. * | 220 | ||||
6,477 | Okta, Inc. * | 444 | ||||
3,963 | Shopify, Inc. Class A (Canada)* | 192 | ||||
2,448 | Snowflake, Inc. Class A* | 362 | ||||
|
| |||||
| 2,401 | ||||||
|
| |||||
LEISURE PRODUCTS—0.8% |
| |||||
23,288 | Peloton Interactive, Inc. Class A* | 207 | ||||
|
| |||||
LIFE SCIENCES TOOLS & SERVICES—4.9% |
| |||||
351 | Bio-Rad Laboratories, Inc. Class A* | 158 | ||||
1,872 | Danaher Corp. | 443 | ||||
1,986 | ICON PLC * | 383 | ||||
311 | Lonza Group AG (Switzerland) | 193 | ||||
313 | Thermo Fisher Scientific, Inc. | 174 | ||||
|
| |||||
| 1,351 | ||||||
|
| |||||
MACHINERY—0.6% |
| |||||
1,195 | Chart Industries, Inc. * | 159 | ||||
|
| |||||
PHARMACEUTICALS—1.6% |
| |||||
4,299 | Arvinas, Inc. * | 113 | ||||
2,545 | Catalent, Inc. * | 127 | ||||
530 | Eli Lilly & Co. | 210 | ||||
|
| |||||
| 450 | ||||||
|
| |||||
SEMICONDUCTORS & SEMICONDUCTOR EQUIPMENT—12.0% |
| |||||
2,193 | Advanced Micro Devices, Inc. * | 196 | ||||
2,256 | Applied Materials, Inc. | 255 | ||||
640 | ASML Holding NV (Netherlands) | 405 | ||||
1,446 | Lam Research Corp. | 758 | ||||
8,711 | Microchip Technology, Inc. | 636 | ||||
1,164 | NVIDIA Corp. | 323 | ||||
3,166 | Texas Instruments, Inc. | 529 | ||||
3,720 | Wolfspeed, Inc. * | 173 | ||||
|
| |||||
| 3,275 | ||||||
|
| |||||
COMMON STOCKS—Continued | ||||||
| Shares | Value | |||||
SOFTWARE—24.1% | ||||||
104,007 | Agora, Inc. ADR (China)*,1 | $ | 349 | |||
3,151 | Atlassian Corp. PLC Class A* | 465 | ||||
3,252 | Cadence Design Systems, Inc. * | 681 | ||||
2,112 | Datadog, Inc. * | 142 | ||||
3,027 | Dynatrace, Inc. * | 128 | ||||
4,656 | Fortinet, Inc. * | 294 | ||||
731 | HubSpot, Inc. * | 308 | ||||
3,454 | Microsoft Corp. | 1,061 | ||||
1,042 | Palo Alto Networks, Inc. * | 190 | ||||
2,245 | Salesforce, Inc. * | 445 | ||||
21,126 | Samsara, Inc. Class A* | 381 | ||||
1,684 | ServiceNow, Inc. * | 774 | ||||
5,514 | Smartsheet, Inc. Class A* | 225 | ||||
2,246 | Splunk, Inc. * | 194 | ||||
4,980 | Workday, Inc. Class A* | 927 | ||||
|
| |||||
| 6,564 | ||||||
|
| |||||
SPECIALTY RETAIL—1.2% | ||||||
79,403 | Farfetch Ltd. Class A (United Kingdom)* | 320 | ||||
|
| |||||
WIRELESS TELECOMMUNICATION SERVICES—2.0% | ||||||
3,781 | T-Mobile US, Inc. * | 544 | ||||
|
| |||||
TOTAL COMMON STOCKS | ||||||
| (Cost $27,017) | 26,679 | |||||
|
| |||||
TOTAL INVESTMENTS—97.9% | ||||||
| (Cost $27,017) | 26,679 | |||||
|
| |||||
CASH AND OTHER ASSETS, LESS LIABILITIES—2.1% | 568 | |||||
|
| |||||
TOTAL NET ASSETS—100%. | $ | 27,247 | ||||
|
| |||||
FAIR VALUE MEASUREMENTS |
All investments as of April 30, 2023 (as disclosed in the preceding Portfolio of Investments) were classified as Level 1.
For more information on valuation inputs and their aggregation into the levels identified above, please refer to the Fair Value Measurements and Disclosures in Note 2 of the accompanying Notes to Financial Statements.
| * | Non-income producing security. |
| 1 | Depositary receipts such as American Depositary Receipts (ADRs), Global Depositary Receipts (GDRs) and other country specific depositary receipts are certificates evidencing ownership of shares of a foreign issuer. These certificates are issued by depositary banks and generally trade on an established market in the U.S. or elsewhere. |
| 2 | Securities purchased in a transaction exempt from registration under Rule 144A of the Securities Act of 1933. These securities may be resold in transactions exempt from registration, normally to qualified institutional buyers. The Fund has no right to demand registration of these securities. As of April 30, 2023, the aggregate value of these securities was $1,210 or 4% of net assets. |
The accompanying notes are an integral part of the Financial Statements.
14
Table of Contents
Harbor Dividend Growth Leaders ETF
PORTFOLIO OF INVESTMENTS—April 30, 2023 (Unaudited)
Subadvisor: Westfield Capital Management Company, L.P.
SECTOR ALLOCATION (% of investments) |
PORTFOLIO OF INVESTMENTS |
Value and Cost in Thousands
COMMON STOCKS—96.9% | ||||||||
| Shares | Value | |||||||
AIR FREIGHT & LOGISTICS—1.7% | ||||||||
| 15,610 | United Parcel Service, Inc. Class B | $ | 2,807 | |||||
|
| |||||||
BANKS—1.7% | ||||||||
| 99,688 | Bank of America Corp. | 2,919 | ||||||
|
| |||||||
BEVERAGES—7.2% | ||||||||
| 69,845 | Coca-Cola Co. | 4,481 | ||||||
| 13,899 | Diageo PLC ADR (United Kingdom)1 | 2,578 | ||||||
| 26,038 | PepsiCo, Inc. | 4,970 | ||||||
|
| |||||||
| 12,029 | ||||||||
|
| |||||||
BIOTECHNOLOGY—4.1% | ||||||||
| 20,300 | AbbVie, Inc. | 3,068 | ||||||
| 46,925 | Gilead Sciences, Inc. | 3,857 | ||||||
|
| |||||||
| 6,925 | ||||||||
|
| |||||||
BUILDING PRODUCTS—2.2% | ||||||||
| 19,783 | Trane Technologies PLC | 3,676 | ||||||
|
| |||||||
CAPITAL MARKETS—3.3% | ||||||||
| 8,396 | Ameriprise Financial, Inc. | 2,562 | ||||||
| 4,409 | BlackRock, Inc. | 2,959 | ||||||
|
| |||||||
| 5,521 | ||||||||
|
| |||||||
CHEMICALS—1.9% | ||||||||
| 30,755 | Celanese Corp. | 3,267 | ||||||
|
| |||||||
COMMERCIAL SERVICES & SUPPLIES—1.4% | ||||||||
| 5,261 | Cintas Corp. | 2,398 | ||||||
|
| |||||||
COMMUNICATIONS EQUIPMENT—2.4% | ||||||||
| 84,702 | Cisco Systems, Inc. | 4,002 | ||||||
|
| |||||||
CONSUMER STAPLES DISTRIBUTION & RETAIL—2.3% | ||||||||
| 24,391 | Target Corp. | 3,848 | ||||||
|
| |||||||
CONTAINERS & PACKAGING—0.9% | ||||||||
| 31,058 | Silgan Holdings, Inc. | 1,530 | ||||||
|
| |||||||
DIVERSIFIED TELECOMMUNICATION SERVICES—1.7% | ||||||||
| 41,024 | Cogent Communications Holdings, Inc. | 2,832 | ||||||
|
| |||||||
ELECTRONIC EQUIPMENT, INSTRUMENTS & COMPONENTS—1.6% | ||||||||
| 15,580 | CDW Corp. | 2,642 | ||||||
|
| |||||||
COMMON STOCKS—Continued | ||||||||
| Shares | Value | |||||||
FOOD PRODUCTS—2.0% | ||||||||
| 12,602 | Hershey Co. | $ | 3,441 | |||||
|
| |||||||
HEALTH CARE PROVIDERS & SERVICES—3.9% | ||||||||
| 13,225 | UnitedHealth Group, Inc. | 6,508 | ||||||
|
| |||||||
HOTELS, RESTAURANTS & LEISURE—2.9% | ||||||||
| 8,747 | McDonald’s Corp. | 2,587 | ||||||
| 19,910 | Texas Roadhouse, Inc. | 2,202 | ||||||
|
| |||||||
| 4,789 | ||||||||
|
| |||||||
INDUSTRIAL REITS—3.6% | ||||||||
| 42,447 | Equity LifeStyle Properties, Inc. | 2,925 | ||||||
| 22,054 | Sun Communities, Inc. | 3,064 | ||||||
|
| |||||||
| 5,989 | ||||||||
|
| |||||||
INSURANCE—9.1% | ||||||||
| 31,747 | American Financial Group, Inc. | 3,897 | ||||||
| 43,630 | American International Group, Inc. | 2,314 | ||||||
| 26,646 | Arthur J. Gallagher & Co. | 5,544 | ||||||
| 19,780 | Primerica, Inc. | 3,610 | ||||||
|
| |||||||
| 15,365 | ||||||||
|
| |||||||
IT SERVICES—3.1% | ||||||||
| 41,231 | IBM Corp. | 5,212 | ||||||
|
| |||||||
MACHINERY—4.8% | ||||||||
| 12,169 | Cummins, Inc. | 2,860 | ||||||
| 18,504 | IDEX Corp. | 3,818 | ||||||
| 19,681 | Mueller Industries, Inc. | 1,414 | ||||||
|
| |||||||
| 8,092 | ||||||||
|
| |||||||
METALS & MINING—1.2% | ||||||||
| 35,265 | BHP Group Ltd. ADR (Australia)1 | 2,082 | ||||||
|
| |||||||
OIL, GAS & CONSUMABLE FUELS—3.7% | ||||||||
| 13,562 | Chevron Corp. | 2,287 | ||||||
| 71,987 | Devon Energy Corp. | 3,846 | ||||||
|
| |||||||
| 6,133 | ||||||||
|
| |||||||
PHARMACEUTICALS—7.1% | ||||||||
| 18,040 | Eli Lilly & Co. | 7,141 | ||||||
15
Table of Contents
Harbor Dividend Growth Leaders ETF
PORTFOLIO OF INVESTMENTS—Continued
Value and Cost in Thousands
COMMON STOCKS—Continued | ||||||||
| Shares | Value | |||||||
PHARMACEUTICALS—Continued | ||||||||
| 40,735 | Merck & Co., Inc. | $ | 4,704 | |||||
|
| |||||||
| 11,845 | ||||||||
|
| |||||||
SEMICONDUCTORS & SEMICONDUCTOR EQUIPMENT—8.4% | ||||||||
| 12,806 | Analog Devices, Inc. | 2,303 | ||||||
| 6,524 | Broadcom, Inc. | 4,087 | ||||||
| 56,538 | Microchip Technology, Inc. | 4,127 | ||||||
| 31,315 | QUALCOMM, Inc. | 3,658 | ||||||
|
| |||||||
| 14,175 | ||||||||
|
| |||||||
SOFTWARE—5.2% | ||||||||
| 28,452 | Microsoft Corp. | 8,742 | ||||||
|
| |||||||
TECHNOLOGY HARDWARE, STORAGE & PERIPHERALS—5.5% | ||||||||
| 54,170 | Apple, Inc. | 9,192 | ||||||
|
| |||||||
COMMON STOCKS—Continued | ||||||||
| Shares | Value | |||||||
TEXTILES, APPAREL & LUXURY GOODS—2.4% | ||||||||
| 31,411 | NIKE, Inc. Class B | $ | 3,980 | |||||
|
| |||||||
TRADING COMPANIES & DISTRIBUTORS—1.6% | ||||||||
| 7,932 | Watsco, Inc. | 2,748 | ||||||
|
| |||||||
TOTAL COMMON STOCKS | ||||||||
| (Cost $144,260) | 162,689 | |||||||
|
| |||||||
TOTAL INVESTMENTS—96.9% | ||||||||
| (Cost $144,260) | 162,689 | |||||||
|
| |||||||
CASH AND OTHER ASSETS, LESS LIABILITIES—3.1% | 5,280 | |||||||
|
| |||||||
TOTAL NET ASSETS—100%. | $ | 167,969 | ||||||
|
| |||||||
FAIR VALUE MEASUREMENTS |
All investments as of April 30, 2023 (as disclosed in the preceding Portfolio of Investments) were classified as Level 1.
For more information on valuation inputs and their aggregation into the levels identified above, please refer to the Fair Value Measurements and Disclosures in Note 2 of the accompanying Notes to Financial Statements.
| 1 | Depositary receipts such as American Depositary Receipts (ADRs), Global Depositary Receipts (GDRs) and other country specific depositary receipts are certificates evidencing ownership of shares of a foreign issuer. These certificates are issued by depositary banks and generally trade on an established market in the U.S. or elsewhere. |
The accompanying notes are an integral part of the Financial Statements.
16
Table of Contents
Harbor Energy Transition Strategy ETF
CONSOLIDATED PORTFOLIO OF INVESTMENTS—April 30, 2023 (Unaudited)
Subadvisor: Quantix Commodities LP
RISK ALLOCATION* (% of Net Assets) - Unaudited |
| Asset Class | Sector | |||||
COMMODITIES | ||||||
Industrial Metals | 36.0 | % | ||||
Natural Gas | 23.9 | % | ||||
Emissions | 17.6 | % | ||||
Precious Metals | 12.6 | % | ||||
Oilseeds | 9.9 | % | ||||
*Based on notional value and represents the sector allocation of the Quantix Energy Transition Index.
PORTFOLIO OF INVESTMENTS |
Principal Amounts, Value and Cost in Thousands
SHORT-TERM INVESTMENTS—73.3% | ||||||||
| Principal Amount | Value | |||||||
|
U.S. TREASURY BILLS—73.3% |
| ||||||
U.S. Treasury Bills | ||||||||
| $ 7,590 | 4.549%—05/16/2023† | $ | 7,577 | |||||
| 8,259 | 4.799%—06/27/2023† | 8,195 | ||||||
|
| |||||||
TOTAL SHORT-TERM INVESTMENTS | ||||||||
(Cost $15,771) | 15,772 | |||||||
|
| |||||||
TOTAL INVESTMENTS—73.3% | ||||||||
| (Cost $15,771) | 15,772 | |||||||
|
| |||||||
CASH AND OTHER ASSETS, LESS LIABILITIES—26.7% | 5,741 | |||||||
|
| |||||||
TOTAL NET ASSETS—100% | $ | 21,513 | ||||||
|
| |||||||
SWAP AGREEMENTS |
OVER-THE-COUNTER (OTC) EXCESS RETURN SWAPS ON INDICES
Counterparty | Fixed Rate | Pay/Receive Fixed Rate | Reference Index1 | Expiration Date | Payment Frequency | Notional Amount (000s) | Value (000s) | Upfront Premiums (Received)/ Paid (000s) | Unrealized Appreciation/ (Depreciation) (000s) | |||||||||
Goldman Sachs International | 0.750% | Pay | Quantix Energy Transition Index | 05/31/2023 | Monthly | $21,512 | $— | $— | $— | |||||||||
|
FAIR VALUE MEASUREMENTS |
All investments as of April 30, 2023 (as disclosed in the preceding Portfolio of Investments and Swap Agreements schedule) were classified as Level 2.
For more information on valuation inputs and their aggregation into the levels identified above, please refer to the Fair Value Measurements and Disclosures in Note 2 of the accompanying Notes to Financial Statements.
The accompanying notes are an integral part of the Financial Statements.
17
Table of Contents
Harbor Energy Transition Strategy ETF
CONSOLIDATED PORTFOLIO OF INVESTMENTS—Continued
| † | Coupon represents yield to maturity |
| 1 | The reference index components are published daily on Harbor Capital’s website at harborcapital.com. The index is comprised of publicly traded futures contracts on physical commodities. The table below represents the reference index components as of the period ended April 30, 2023. |
Commodity | Weight | |||
Emissions (Europe) | 14.9% | |||
Aluminum | 12.3 | |||
Natural Gas (United States) | 10.2 | |||
Natural Gas (Europe) | 9.3 | |||
Nickel | 8.3 | |||
Copper | 8.0 | |||
Soybean Oil | 7.2 | |||
Silver | 7.0 | |||
Zinc | 4.8 | |||
Natural Gas (United Kingdom) | 4.4 | |||
Platinum | 2.9 | |||
Ethanol | 2.7 | |||
Emissions (California) | 2.7 | |||
Palladium | 2.7 | |||
Lead | 2.6 | |||
The accompanying notes are an integral part of the Financial Statements.
18
Table of Contents
Harbor Health Care ETF
PORTFOLIO OF INVESTMENTS—April 30, 2023 (Unaudited)
Subadvisor: Westfield Capital Management Company, L.P.
SECTOR ALLOCATION (% of investments) |
PORTFOLIO OF INVESTMENTS |
Value and Cost in Thousands
COMMON STOCKS—99.8% |
| |||||
| Shares | Value | |||||
| ||||||
BIOTECHNOLOGY—21.7% |
| |||||
1,542 | 89bio, Inc. * | $ | 25 | |||
7,541 | Alkermes PLC * | 215 | ||||
722 | Apellis Pharmaceuticals, Inc. * | 60 | ||||
3,865 | Ascendis Pharma AS ADR (Denmark)*,1 | 271 | ||||
731 | Cerevel Therapeutics Holdings, Inc. * | 21 | ||||
1,354 | IVERIC bio, Inc. * | 45 | ||||
405 | Neurocrine Biosciences, Inc. * | 41 | ||||
495 | Prometheus Biosciences, Inc. * | 96 | ||||
2,584 | Rocket Pharmaceuticals, Inc. * | 46 | ||||
760 | Sarepta Therapeutics, Inc. * | 93 | ||||
|
| |||||
| 913 | ||||||
|
| |||||
HEALTH CARE EQUIPMENT & SUPPLIES—19.0% | ||||||
1,415 | Dexcom, Inc. * | 172 | ||||
262 | Haemonetics Corp. * | 22 | ||||
105 | IDEXX Laboratories, Inc. * | 52 | ||||
319 | Inspire Medical Systems, Inc. * | 85 | ||||
344 | Insulet Corp. * | 109 | ||||
327 | Intuitive Surgical, Inc. * | 98 | ||||
1,220 | Lantheus Holdings, Inc. * | 104 | ||||
438 | Masimo Corp. * | 83 | ||||
191 | The Cooper Companies, Inc. | 73 | ||||
|
| |||||
| 798 | ||||||
|
| |||||
HEALTH CARE PROVIDERS & SERVICES—21.3% | ||||||
1,223 | Amedisys, Inc. * | 98 | ||||
168 | Humana, Inc. | 89 | ||||
1,597 | Option Care Health, Inc. * | 52 | ||||
138 | Quest Diagnostics, Inc. | 19 | ||||
1,293 | UnitedHealth Group, Inc. | 636 | ||||
|
| |||||
| 894 | ||||||
|
| |||||
COMMON STOCKS—Continued |
| |||||
| Shares | Value | |||||
| ||||||
HEALTH CARE TECHNOLOGY—1.8% | ||||||
5,969 | Veradigm, Inc. * | $ | 75 | |||
|
| |||||
LIFE SCIENCES TOOLS & SERVICES—15.6% |
| |||||
4,266 | Avantor, Inc. * | 83 | ||||
1,495 | Azenta, Inc. * | 65 | ||||
376 | Bio-Rad Laboratories, Inc. Class A* | 170 | ||||
904 | ICON PLC * | 174 | ||||
133 | Repligen Corp. * | 20 | ||||
254 | Thermo Fisher Scientific, Inc. | 141 | ||||
|
| |||||
| 653 | ||||||
|
| |||||
PHARMACEUTICALS—20.4% | ||||||
1,819 | Catalent, Inc. * | 91 | ||||
1,562 | Eli Lilly & Co. | 618 | ||||
757 | Innoviva, Inc. * | 9 | ||||
1,184 | Merck & Co., Inc. | 137 | ||||
|
| |||||
| 855 | ||||||
|
| |||||
TOTAL COMMON STOCKS | ||||||
(Cost $4,052) | 4,188 | |||||
|
| |||||
TOTAL INVESTMENTS—99.8% | ||||||
(Cost $4,052) | 4,188 | |||||
|
| |||||
CASH AND OTHER ASSETS, LESS | 8 | |||||
|
| |||||
TOTAL NET ASSETS—100% | $ | 4,196 | ||||
|
| |||||
19
Table of Contents
Harbor Health Care ETF
PORTFOLIO OF INVESTMENTS—Continued
FAIR VALUE MEASUREMENTS |
All investments as of April 30, 2023 (as disclosed in the preceding Portfolio of Investments) were classified as Level 1.
For more information on valuation inputs and their aggregation into the levels identified above, please refer to the Fair Value Measurements and Disclosures in Note 2 of the accompanying Notes to Financial Statements.
| * | Non-income producing security. |
| 1 | Depositary receipts such as American Depositary Receipts (ADRs), Global Depositary Receipts (GDRs) and other country specific depositary receipts are certificates evidencing ownership of shares of a foreign issuer. These certificates are issued by depositary banks and generally trade on an established market in the U.S. or elsewhere. |
The accompanying notes are an integral part of the Financial Statements.
20
Table of Contents
Harbor International Compounders ETF
PORTFOLIO OF INVESTMENTS—April 30, 2023 (Unaudited)
Subadvisor: C WorldWide Asset Management
REGION BREAKDOWN (% of investments) |
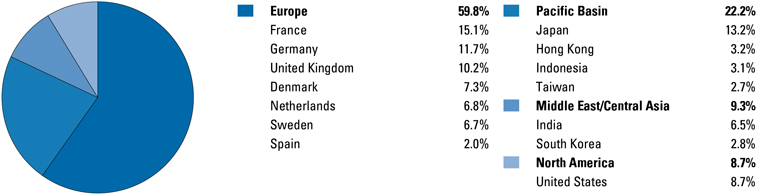
The Fund’s Portfolio of Investments include investments denominated in foreign currencies. As of April 30, 2023, 35.2% of the Fund’s investments were denominated in Euro. No other foreign currency denomination comprised more than 25% of the Fund’s net assets.
PORTFOLIO OF INVESTMENTS |
Value and Cost in Thousands
COMMON STOCKS—98.8% |
| |||||
| Shares | Value | |||||
| ||||||
BANKS—9.5% | ||||||
12,647 | HDFC Bank Ltd. ADR (India)1 | $ | 883 | |||
686,400 | PT Bank Central Asia Tbk (Indonesia) | 423 | ||||
|
| |||||
| 1,306 | ||||||
|
| |||||
BEVERAGES—3.0% | ||||||
8,956 | Diageo PLC (United Kingdom) | 408 | ||||
|
| |||||
BUILDING PRODUCTS—5.6% |
| |||||
15,532 | Assa Abloy AB Class B (Sweden) | 369 | ||||
2,200 | Daikin Industries Ltd. (Japan) | 398 | ||||
|
| |||||
| 767 | ||||||
|
| |||||
CAPITAL MARKETS—2.9% | ||||||
2,068 | Deutsche Boerse AG (Germany) | 394 | ||||
|
| |||||
CHEMICALS—4.4% | ||||||
3,351 | Air Liquide SA (France) | 603 | ||||
|
| |||||
CONSTRUCTION & ENGINEERING—2.2% |
| |||||
2,464 | Vinci SA (France) | 305 | ||||
|
| |||||
ELECTRIC UTILITIES—4.8% | ||||||
20,681 | Iberdrola SA (Spain) | 268 | ||||
17,138 | SSE PLC (United Kingdom) | 396 | ||||
|
| |||||
| 664 | ||||||
|
| |||||
ELECTRONIC EQUIPMENT, INSTRUMENTS & COMPONENTS—2.3% |
| |||||
700 | Keyence Corp. (Japan) | 314 | ||||
|
| |||||
FOOD PRODUCTS—4.5% |
| |||||
4,774 | Nestle SA | 612 | ||||
|
| |||||
HEALTH CARE EQUIPMENT & SUPPLIES—3.3% | ||||||
4,400 | Hoya Corp. (Japan) | 459 | ||||
|
| |||||
HOUSEHOLD DURABLES—4.5% | ||||||
6,600 | Sony Group Corp. (Japan) | 621 | ||||
|
| |||||
INDUSTRIAL CONGLOMERATES—4.0% | ||||||
3,344 | Siemens AG (Germany) | 549 | ||||
|
| |||||
COMMON STOCKS—Continued |
| |||||
| Shares | Value | |||||
| ||||||
INSURANCE—3.1% | ||||||
39,600 | AIA Group Ltd. (Hong Kong) | $ | 429 | |||
|
| |||||
IT SERVICES—1.6% | ||||||
137 | Adyen NV (Netherlands)*,2 | 219 | ||||
|
| |||||
MACHINERY—3.9% | ||||||
25,828 | Atlas Copco AB Class A (Sweden) | 373 | ||||
8,320 | Epiroc AB Class A (Sweden) | 166 | ||||
|
| |||||
| 539 | ||||||
|
| |||||
PERSONAL CARE PRODUCTS—3.7% | ||||||
1,062 | L’Oreal SA (France) | 506 | ||||
|
| |||||
PHARMACEUTICALS—11.4% | ||||||
3,916 | AstraZeneca PLC (United Kingdom) | 578 | ||||
5,942 | Novo Nordisk AS Class B (Denmark) | 988 | ||||
|
| |||||
| 1,566 | ||||||
|
| |||||
REAL ESTATE MANAGEMENT & DEVELOPMENT—1.3% |
| |||||
8,206 | Vonovia SE (Germany) | 177 | ||||
|
| |||||
SEMICONDUCTORS & SEMICONDUCTOR EQUIPMENT—7.9% |
| |||||
1,122 | ASML Holding NV (Netherlands) | 709 | ||||
4,400 | Taiwan Semiconductor Manufacturing Co. Ltd. ADR (Taiwan)1 | 371 | ||||
|
| |||||
| 1,080 | ||||||
|
| |||||
SOFTWARE—3.4% | ||||||
3,432 | SAP SE (Germany) | 465 | ||||
|
| |||||
TECHNOLOGY HARDWARE, STORAGE & PERIPHERALS—2.8% |
| |||||
308 | Samsung Electronics Co. Ltd. GDR (South Korea)1 | 380 | ||||
|
| |||||
TEXTILES, APPAREL & LUXURY GOODS—4.6% |
| |||||
660 | LVMH Moet Hennessy Louis Vuitton SE (France) | 633 | ||||
|
| |||||
21
Table of Contents
Harbor International Compounders ETF
PORTFOLIO OF INVESTMENTS—Continued
Value and Cost in Thousands
COMMON STOCKS—Continued |
| |||||
| Shares | Value | |||||
| ||||||
TRADING COMPANIES & DISTRIBUTORS—4.1% | ||||||
4,048 | Ferguson PLC | $ | 569 | |||
|
| |||||
TOTAL COMMON STOCKS | ||||||
(Cost $11,884) | 13,565 | |||||
|
| |||||
TOTAL INVESTMENTS—98.8% | ||||||
(Cost $11,884) | 13,565 | |||||
|
| |||||
CASH AND OTHER ASSETS, LESS | 159 | |||||
|
| |||||
TOTAL NET ASSETS—100% | $ | 13,724 | ||||
|
| |||||
FAIR VALUE MEASUREMENTS |
All investments as of April 30, 2023 (as disclosed in the preceding Portfolio of Investments) were classified as Level 1.
For more information on valuation inputs and their aggregation into the levels identified above, please refer to the Fair Value Measurements and Disclosures in Note 2 of the accompanying Notes to Financial Statements.
| * | Non-income producing security. |
| 1 | Depositary receipts such as American Depositary Receipts (ADRs), Global Depositary Receipts (GDRs) and other country specific depositary receipts are certificates evidencing ownership of shares of a foreign issuer.These certificates are issued by depositary banks and generally trade on an established market in the U.S. or elsewhere. |
| 2 | Securities purchased in a transaction exempt from registration under Rule 144A of the Securities Act of 1933.These securities may be resold in transactions exempt from registration, normally to qualified institutional buyers. The Fund has no right to demand registration of these securities. As of April 30, 2023, the aggregate value of these securities was $219 or 2% of net assets. |
The accompanying notes are an integral part of the Financial Statements.
22
Table of Contents
Harbor Long-Term Growers ETF
PORTFOLIO OF INVESTMENTS—April 30, 2023 (Unaudited)
Subadvisor: Jennison Associates LLC
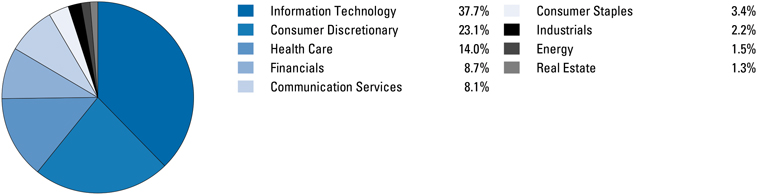
SECTOR ALLOCATION (% of investments) |
PORTFOLIO OF INVESTMENTS |
Value and Cost in Thousands
COMMON STOCKS—99.4% |
| |||||
| Shares | Value | |||||
| ||||||
AEROSPACE & DEFENSE—0.4% | ||||||
876 | Northrop Grumman Corp. | $ | 404 | |||
|
| |||||
AUTOMOBILE COMPONENTS—0.7% | ||||||
7,917 | Aptiv PLC * | 814 | ||||
|
| |||||
AUTOMOBILES—3.6% | ||||||
24,789 | Tesla, Inc. * | 4,073 | ||||
|
| |||||
BANKS—0.6% | ||||||
5,186 | JPMorgan Chase & Co. | 717 | ||||
|
| |||||
BIOTECHNOLOGY—2.0% | ||||||
6,626 | AbbVie, Inc. | 1,001 | ||||
3,683 | Vertex Pharmaceuticals, Inc. * | 1,255 | ||||
|
| |||||
| 2,256 | ||||||
|
| |||||
BROADLINE RETAIL—7.1% | ||||||
54,875 | Amazon.com, Inc. * | 5,787 | ||||
1,727 | MercadoLibre, Inc. (Brazil)* | 2,206 | ||||
|
| |||||
| 7,993 | ||||||
|
| |||||
CAPITAL MARKETS—1.2% | ||||||
3,926 | Blackstone, Inc. | 351 | ||||
836 | Goldman Sachs Group, Inc. | 287 | ||||
1,634 | Moody’s Corp. | 511 | ||||
706 | S&P Global, Inc. | 256 | ||||
|
| |||||
| 1,405 | ||||||
|
| |||||
COMMUNICATIONS EQUIPMENT—0.2% | ||||||
1,622 | Arista Networks, Inc. * | 260 | ||||
|
| |||||
CONSUMER FINANCE—0.8% | ||||||
5,701 | American Express Co. | 920 | ||||
|
| |||||
CONSUMER STAPLES DISTRIBUTION & RETAIL—2.1% | ||||||
4,772 | Costco Wholesale Corp. | 2,401 | ||||
|
| |||||
ENERGY EQUIPMENT & SERVICES—1.4% | ||||||
33,120 | Schlumberger NV | 1,635 | ||||
|
| |||||
ENTERTAINMENT—1.5% | ||||||
3,791 | Netflix, Inc. * | 1,251 | ||||
COMMON STOCKS—Continued |
| |||||
| Shares | Value | |||||
| ||||||
ENTERTAINMENT—Continued | ||||||
11,370 | ROBLOX Corp. Class A* | $ | 405 | |||
|
| |||||
| 1,656 | ||||||
|
| |||||
FINANCIAL SERVICES—6.0% | ||||||
72,000 | Adyen NV ADR (Netherlands)*,1 | 1,152 | ||||
6,930 | Apollo Global Management, Inc. | 440 | ||||
6,221 | Mastercard, Inc. Class A | 2,364 | ||||
11,985 | Visa, Inc. Class A | 2,789 | ||||
|
| |||||
| 6,745 | ||||||
|
| |||||
GROUND TRANSPORTATION—1.8% |
| |||||
66,039 | Uber Technologies, Inc. * | 2,051 | ||||
|
| |||||
HEALTH CARE EQUIPMENT & SUPPLIES—2.1% |
| |||||
7,208 | Dexcom, Inc. * | 875 | ||||
1,353 | Intuitive Surgical, Inc. * | 407 | ||||
3,775 | Stryker Corp. | 1,131 | ||||
|
| |||||
| 2,413 | ||||||
|
| |||||
HEALTH CARE PROVIDERS & SERVICES—1.5% |
| |||||
12,931 | Centene Corp. * | 891 | ||||
1,605 | UnitedHealth Group, Inc. | 790 | ||||
|
| |||||
| 1,681 | ||||||
|
| |||||
HOTELS, RESTAURANTS & LEISURE—2.7% | ||||||
6,017 | Airbnb, Inc. Class A* | 720 | ||||
166 | Chipotle Mexican Grill, Inc. * | 343 | ||||
3,055 | Expedia Group, Inc. * | 287 | ||||
8,734 | Hilton Worldwide Holdings, Inc. | 1,258 | ||||
2,413 | Marriott International, Inc. Class A | 409 | ||||
|
| |||||
| 3,017 | ||||||
|
| |||||
INTERACTIVE MEDIA & SERVICES—5.5% | ||||||
53,280 | Alphabet, Inc. Class A* | 5,719 | ||||
2,049 | Meta Platforms, Inc. Class A* | 493 | ||||
|
| |||||
| 6,212 | ||||||
|
| |||||
IT SERVICES—1.0% | ||||||
7,834 | Snowflake, Inc. Class A* | 1,160 | ||||
|
| |||||
LIFE SCIENCES TOOLS & SERVICES—0.9% | ||||||
2,009 | Agilent Technologies, Inc. | 272 | ||||
23
Table of Contents
Harbor Long-Term Growers ETF
PORTFOLIO OF INVESTMENTS—Continued
Value and Cost in Thousands
COMMON STOCKS—Continued |
| |||||
| Shares | Value | |||||
| ||||||
LIFE SCIENCES TOOLS & SERVICES—Continued | ||||||
2,002 | Danaher Corp. | $ | 474 | |||
482 | Thermo Fisher Scientific, Inc. | 268 | ||||
|
| |||||
| 1,014 | ||||||
|
| |||||
MEDIA—0.5% |
| |||||
9,263 | Trade Desk, Inc. Class A* | 596 | ||||
|
| |||||
PERSONAL CARE PRODUCTS—1.3% | ||||||
14,816 | L’Oreal SA ADR (France)1 | 1,412 | ||||
|
| |||||
PHARMACEUTICALS��7.4% | ||||||
10,930 | AstraZeneca PLC ADR (United Kingdom)1 | 800 | ||||
8,456 | Eli Lilly & Co. | 3,347 | ||||
8,197 | Merck & Co., Inc. | 947 | ||||
13,320 | Novo Nordisk AS ADR (Denmark)1 | 2,226 | ||||
5,827 | Zoetis, Inc. | 1,024 | ||||
|
| |||||
| 8,344 | ||||||
|
| |||||
SEMICONDUCTORS & SEMICONDUCTOR EQUIPMENT—8.9% |
| |||||
6,368 | Advanced Micro Devices, Inc. * | 569 | ||||
3,357 | Applied Materials, Inc. | 379 | ||||
550 | ASML Holding NV New York Registry Shares (Netherlands) | 350 | ||||
1,064 | Broadcom, Inc. | 667 | ||||
1,611 | Enphase Energy, Inc. * | 265 | ||||
765 | Lam Research Corp. | 401 | ||||
14,069 | Marvell Technology, Inc. | 556 | ||||
10,162 | Micron Technology, Inc. | 654 | ||||
22,200 | NVIDIA Corp. | 6,160 | ||||
|
| |||||
| 10,001 | ||||||
|
| |||||
SOFTWARE—15.7% |
| |||||
1,495 | Adobe, Inc. * | 564 | ||||
4,123 | Atlassian Corp. PLC Class A* | 609 | ||||
1,373 | Cadence Design Systems, Inc. * | 288 | ||||
3,627 | CrowdStrike Holdings, Inc. Class A* | 435 | ||||
5,867 | Datadog, Inc. * | 395 | ||||
43,118 | Microsoft Corp. | 13,248 | ||||
COMMON STOCKS—Continued |
| |||||
| Shares | Value | |||||
SOFTWARE—Continued | ||||||
4,141 | Palo Alto Networks, Inc. * | $ | 756 | |||
1,806 | Salesforce, Inc. * | 358 | ||||
2,816 | Synopsys, Inc. * | 1,046 | ||||
|
| |||||
| 17,699 | ||||||
|
| |||||
SPECIALIZED REITS—1.3% |
| |||||
7,089 | American Tower Corp. | 1,449 | ||||
|
| |||||
SPECIALTY RETAIL—3.4% |
| |||||
1,807 | Home Depot, Inc. | 543 | ||||
1,604 | O’Reilly Automotive, Inc. * | 1,471 | ||||
14,718 | TJX Cos., Inc. | 1,160 | ||||
1,216 | Ulta Beauty, Inc. * | 671 | ||||
|
| |||||
| 3,845 | ||||||
|
| |||||
TECHNOLOGY HARDWARE, STORAGE & PERIPHERALS—11.7% |
| |||||
77,796 | Apple, Inc. | 13,200 | ||||
|
| |||||
TEXTILES, APPAREL & LUXURY GOODS—5.5% |
| |||||
42,478 | Cie Financiere Richemont SA ADR (Switzerland)1 . | 699 | ||||
5,213 | Lululemon Athletica, Inc. * | 1,980 | ||||
15,645 | LVMH Moet Hennessy Louis Vuitton SE ADR (France)1 | 3,004 | ||||
4,399 | NIKE, Inc. Class B | 557 | ||||
|
| |||||
| 6,240 | ||||||
|
| |||||
WIRELESS TELECOMMUNICATION SERVICES—0.6% |
| |||||
4,566 | T-Mobile US, Inc. * | 657 | ||||
|
| |||||
TOTAL COMMON STOCKS | ||||||
(Cost $101,883) | 112,270 | |||||
|
| |||||
TOTAL INVESTMENTS—99.4% |
| |||||
(Cost $101,883) | 112,270 | |||||
|
| |||||
CASH AND OTHER ASSETS, LESS LIABILITIES—0.6% | 699 | |||||
|
| |||||
TOTAL NET ASSETS—100% | $ | 112,969 | ||||
|
| |||||
| FAIR VALUE MEASUREMENTS | ||||
All investments as of April 30, 2023 (as disclosed in the preceding Portfolio of Investments) were classified as Level 1.
For more information on valuation inputs and their aggregation into the levels identified above, please refer to the Fair Value Measurements and Disclosures in Note 2 of the accompanying Notes to Financial Statements.
| * | Non-income producing security. |
| 1 | Depositary receipts such as American Depositary Receipts (ADRs), Global Depositary Receipts (GDRs) and other country specific depositary receipts are certificates evidencing ownership of shares of a foreign issuer. These certificates are issued by depositary banks and generally trade on an established market in the U.S. or elsewhere. |
The accompanying notes are an integral part of the Financial Statements.
24
Table of Contents
Harbor Scientific Alpha High-Yield ETF
PORTFOLIO OF INVESTMENTS—April 30, 2023 (Unaudited)
Subadvisor: BlueCove Limited
SECTOR ALLOCATION (% of investments) |
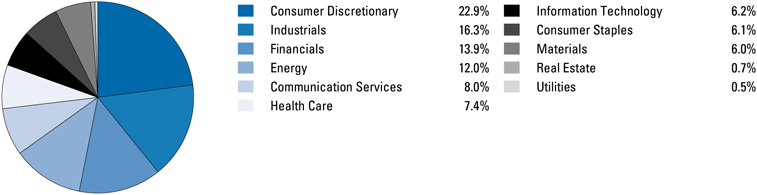
PORTFOLIO OF INVESTMENTS |
Principal Amounts, Value and Cost in Thousands
CORPORATE BONDS & NOTES—97.1% |
| |||||
Principal Amount | Value | |||||
| ||||||
AEROSPACE & DEFENSE—3.5% | ||||||
Howmet Aerospace, Inc. | ||||||
$ 1,200 | 5.950%—02/01/2037 | $ | 1,222 | |||
TransDigm, Inc. | ||||||
1,200 | 4.625%—01/15/2029 | 1,088 | ||||
1,400 | 4.875%—05/01/2029 | 1,274 | ||||
|
| |||||
| 2,362 | ||||||
|
| |||||
Triumph Group, Inc. | ||||||
900 | 7.750%—08/15/2025 | 838 | ||||
|
| |||||
| 4,422 | ||||||
|
| |||||
AIRLINES—1.2% | ||||||
American Airlines, Inc./AAdvantage Loyalty IP Ltd. | ||||||
1,600 | 5.500%—04/20/20261 | 1,573 | ||||
|
| |||||
AUTOMOBILES—3.5% | ||||||
Allison Transmission, Inc. | ||||||
900 | 3.750%—01/30/20311 | 769 | ||||
500 | 5.875%—06/01/20291 | 493 | ||||
|
| |||||
| 1,262 | ||||||
|
| |||||
Ford Motor Credit Co. LLC | ||||||
1,100 | 2.300%—02/10/2025 | 1,026 | ||||
Jaguar Land Rover Automotive PLC | ||||||
900 | 5.500%—07/15/20291 | 746 | ||||
1,000 | 5.875%—01/15/20281 | 866 | ||||
|
| |||||
| 1,612 | ||||||
|
| |||||
Wabash National Corp. | ||||||
600 | 4.500%—10/15/20281 | 523 | ||||
|
| |||||
| 4,423 | ||||||
|
| |||||
BANKS—2.6% | ||||||
Intesa Sanpaolo SpA | ||||||
1,400 | 4.198%—06/01/20321,2 | 1,062 | ||||
200 | 5.017%—06/26/20241 | 194 | ||||
|
| |||||
| 1,256 | ||||||
|
| |||||
UniCredit SpA | ||||||
2,200 | 5.459%—06/30/20351,2 | 1,877 | ||||
UniCredit SpA MTN3 | ||||||
200 | 7.296%—04/02/20341,2 | 192 | ||||
|
| |||||
| 3,325 | ||||||
|
| |||||
CORPORATE BONDS & NOTES—Continued |
| |||||
Principal Amount | Value | |||||
| ||||||
BUILDING PRODUCTS—0.2% | ||||||
EnPro Industries, Inc. | ||||||
$ 300 | 5.750%—10/15/2026 | $ | 294 | |||
|
| |||||
CAPITAL MARKETS—0.2% | ||||||
BrightSphere Investment Group, Inc. | ||||||
300 | 4.800%—07/27/2026 | 280 | ||||
|
| |||||
CHEMICALS—3.0% | ||||||
Ashland LLC | ||||||
200 | 6.875%—05/15/2043 | 201 | ||||
Chemours Co. | ||||||
1,200 | 5.750%—11/15/20281 | 1,068 | ||||
Mativ Holdings, Inc. | ||||||
400 | 6.875%—10/01/20261 | 365 | ||||
Rain CII Carbon LLC/CII Carbon Corp. | ||||||
1,000 | 7.250%—04/01/20251 | 970 | ||||
Trinseo Materials Operating SCA/Trinseo Materials Finance, Inc. | ||||||
800 | 5.125%—04/01/20291 | 497 | ||||
900 | 5.375%—09/01/20251 | 755 | ||||
|
| |||||
| 1,252 | ||||||
|
| |||||
| 3,856 | ||||||
|
| |||||
COMMERCIAL SERVICES & SUPPLIES—1.5% | ||||||
Cimpress PLC | ||||||
1,000 | 7.000%—06/15/2026 | 839 | ||||
CPI CG, Inc. | ||||||
400 | 8.625%—03/15/20261 | 395 | ||||
Deluxe Corp. | ||||||
800 | 8.000%—06/01/20291 | 619 | ||||
Matthews International Corp. | ||||||
100 | 5.250%—12/01/20251 | 96 | ||||
|
| |||||
| 1,949 | ||||||
|
| |||||
COMMUNICATIONS EQUIPMENT—0.4% | ||||||
Viasat, Inc. | ||||||
700 | 6.500%—07/15/20281 | 556 | ||||
|
| |||||
CONSTRUCTION & ENGINEERING—1.5% | ||||||
Arcosa, Inc. | ||||||
400 | 4.375%—04/15/20291 | 365 | ||||
25
Table of Contents
Harbor Scientific Alpha High-Yield ETF
PORTFOLIO OF INVESTMENTS—Continued
Principal Amounts, Value and Cost in Thousands
CORPORATE BONDS & NOTES—Continued |
| |||||
| Principal Amount | Value | |||||
| ||||||
CONSTRUCTION & ENGINEERING—Continued | ||||||
Tutor Perini Corp. | ||||||
$500 | 6.875%—05/01/20251 | $ | 363 | |||
VM Consolidated, Inc. | ||||||
200 | 5.500%—04/15/20291 | 187 | ||||
Williams Scotsman International, Inc. | ||||||
1,000 | 6.125%—06/15/20251 | 996 | ||||
|
| |||||
| 1,911 | ||||||
|
| |||||
CONSTRUCTION MATERIALS—0.1% | ||||||
Brundage-Bone Concrete Pumping Holdings, Inc. | ||||||
100 | 6.000%—02/01/20261 | 94 | ||||
|
| |||||
CONSUMER FINANCE—1.5% | ||||||
Enova International, Inc. | ||||||
698 | 8.500%—09/15/20251 | 670 | ||||
PRA Group, Inc. | ||||||
600 | 5.000%—10/01/20291 | 509 | ||||
700 | 8.375%—02/01/20281 | 699 | ||||
|
| |||||
| 1,208 | ||||||
|
| |||||
| 1,878 | ||||||
|
| |||||
DIVERSIFIED CONSUMER SERVICES—1.0% | ||||||
Service Corp. International | ||||||
1,500 | 4.000%—05/15/2031 | 1,324 | ||||
|
| |||||
DIVERSIFIED FINANCIAL SERVICES—1.8% | ||||||
| Icahn Enterprises LP/Icahn Enterprises Finance Corp. | ||||||
1,300 | 4.375%—02/01/2029 | 1,143 | ||||
1,200 | 5.250%—05/15/2027 | 1,133 | ||||
|
| |||||
| 2,276 | ||||||
|
| |||||
DIVERSIFIED REITS—4.5% | ||||||
Global Net Lease, Inc./Global Net Lease Operating Partnership LP | ||||||
900 | 3.750%—12/15/20271 | 690 | ||||
HAT Holdings I LLC/HAT Holdings II LLC | ||||||
500 | 6.000%—04/15/20251 | 487 | ||||
Ladder Capital Finance Holdings LLLP/Ladder Capital Finance Corp. | ||||||
1,300 | 4.250%—02/01/20271 | 1,110 | ||||
Office Properties Income Trust | ||||||
500 | 2.650%—06/15/2026 | 350 | ||||
1,200 | 4.500%—02/01/2025 | 1,021 | ||||
|
| |||||
| 1,371 | ||||||
|
| |||||
Service Properties Trust | ||||||
1,500 | 7.500%—09/15/2025 | 1,471 | ||||
Starwood Property Trust, Inc. | ||||||
695 | 4.375%—01/15/20271 | 600 | ||||
|
| |||||
| 5,729 | ||||||
|
| |||||
DIVERSIFIED TELECOMMUNICATION SERVICES—1.6% |
| |||||
Frontier Communications Holdings LLC | ||||||
800 | 6.000%—01/15/20301 | 613 | ||||
1,700 | 6.750%—05/01/20291 | 1,370 | ||||
|
| |||||
| 1,983 | ||||||
�� |
| |||||
ELECTRIC UTILITIES—0.5% | ||||||
Drax Finco PLC | ||||||
600 | 6.625%—11/01/20251 | 586 | ||||
|
| |||||
CORPORATE BONDS & NOTES—Continued |
| |||||
| Principal Amount | Value | |||||
| ||||||
ELECTRICAL EQUIPMENT—0.5% | ||||||
Atkore, Inc. | ||||||
$ 700 | 4.250%—06/01/20311 | $ | 617 | |||
|
| |||||
ENERGY EQUIPMENT & SERVICES—3.0% | ||||||
CSI Compressco LP/CSI Compressco Finance, Inc. | ||||||
300 | 7.500%—04/01/20251 | 290 | ||||
Ensign Drilling, Inc. | ||||||
800 | 9.250%—04/15/20241 | 781 | ||||
USA Compression Partners LP/USA Compression Finance Corp. | ||||||
1,400 | 6.875—04/01/26-09/01/27 | 2,069 | ||||
Weatherford International Ltd. | ||||||
600 | 8.625%—04/30/20301 | 612 | ||||
|
| |||||
| 3,752 | ||||||
|
| |||||
ENTERTAINMENT—2.6% | ||||||
CDI Escrow Issuer, Inc. | ||||||
1,000 | 5.750%—04/01/20301 | 965 | ||||
Lions Gate Capital Holdings LLC | ||||||
900 | 5.500%—04/15/20291 | 657 | ||||
Live Nation Entertainment, Inc. | ||||||
1,600 | 6.500%—05/15/20271 | 1,620 | ||||
|
| |||||
| 3,242 | ||||||
|
| |||||
EQUITY REAL ESTATE INVESTMENT TRUSTS (REITS)—1.0% |
| |||||
Apollo Commercial Real Estate Finance, Inc. | ||||||
800 | 4.625%—06/15/20291 | 607 | ||||
CTR Partnership LP/CareTrust Capital Corp. | ||||||
700 | 3.875%—06/30/20281 | 612 | ||||
|
| |||||
| 1,219 | ||||||
|
| |||||
FOOD PRODUCTS—1.6% | ||||||
Lamb Weston Holdings, Inc. | ||||||
1,900 | 4.125%—01/31/20301 | 1,742 | ||||
300 | 4.375%—01/31/20321 | 274 | ||||
|
| |||||
| 2,016 | ||||||
|
| |||||
HEALTH CARE EQUIPMENT & SUPPLIES—1.8% | ||||||
Hologic, Inc. | ||||||
1,800 | 3.250%—02/15/20291 | 1,620 | ||||
700 | 4.625%—02/01/20281 | 682 | ||||
|
| |||||
| 2,302 | ||||||
|
| |||||
HEALTH CARE PROVIDERS & SERVICES—1.9% | ||||||
Acadia Healthcare Co., Inc. | ||||||
400 | 5.500%—07/01/20281 | 387 | ||||
DaVita, Inc. | ||||||
300 | 4.625%—06/01/20301 | 262 | ||||
Encompass Health Corp. | ||||||
700 | 4.625%—04/01/2031 | 628 | ||||
Molina Healthcare, Inc. | ||||||
1,400 | 3.875%—05/15/20321 | 1,201 | ||||
|
| |||||
| 2,478 | ||||||
|
| |||||
HOTELS, RESTAURANTS & LEISURE—7.4% | ||||||
Boyd Gaming Corp. | ||||||
1,100 | 4.750%—06/15/20311 | 1,008 | ||||
Hilton Domestic Operating Co., Inc. | ||||||
400 | 3.625%—02/15/20321 | 342 | ||||
2,100 | 4.000%—05/01/20311 | 1,859 | ||||
|
| |||||
| 2,201 | ||||||
|
| |||||
26
Table of Contents
Harbor Scientific Alpha High-Yield ETF
PORTFOLIO OF INVESTMENTS—Continued
Principal Amounts, Value and Cost in Thousands
CORPORATE BONDS & NOTES—Continued |
| |||||
| Principal Amount | Value | |||||
| ||||||
HOTELS, RESTAURANTS & LEISURE—Continued |
| |||||
Hilton Grand Vacations Borrower Escrow LLC/Hilton Grand Vacations Borrower Esc | ||||||
$ 900 | 4.875%—07/01/20311 | $ | 788 | |||
KFC Holding Co./Pizza Hut Holdings LLC/Taco Bell of America LLC | ||||||
900 | 4.750%—06/01/20271 | 887 | ||||
Las Vegas Sands Corp. | ||||||
900 | 2.900%—06/25/2025 | 853 | ||||
Marriott Ownership Resorts, Inc. | ||||||
900 | 4.500%—06/15/20291 | 787 | ||||
600 | 4.750%—01/15/2028 | 536 | ||||
|
| |||||
| 1,323 | ||||||
|
| |||||
New Red Finance, Inc. | ||||||
400 | 3.875%—01/15/20281 | 376 | ||||
Royal Caribbean Cruises Ltd. | ||||||
100 | 7.500%—10/15/2027 | 95 | ||||
1,800 | 11.625%—08/15/20271 | 1,916 | ||||
|
| |||||
| 2,011 | ||||||
|
| |||||
| 9,447 | ||||||
|
| |||||
HOUSEHOLD DURABLES—1.0% | ||||||
Tempur Sealy International, Inc. | ||||||
1,500 | 4.000%—04/15/20291 | 1,314 | ||||
|
| |||||
INDEPENDENT POWER PRODUCERS & ENERGY TRADERS—0.2% |
| |||||
Enviva Partners LP/Enviva Partners Finance Corp. | ||||||
300 | 6.500%—01/15/20261 | 256 | ||||
|
| |||||
INSURANCE—0.4% | ||||||
Enstar Finance LLC | ||||||
300 | 5.500%—01/15/20422 | 216 | ||||
300 | 5.750%—09/01/20402 | 252 | ||||
|
| |||||
| 468 | ||||||
|
| |||||
INTERACTIVE MEDIA & SERVICES—0.3% | ||||||
Go Daddy Operating Co. LLC/GD Finance Co., Inc. | ||||||
450 | 3.500%—03/01/20291 | 390 | ||||
|
| |||||
INTERNET & CATALOG RETAIL—2.1% | ||||||
Cars.com, Inc. | ||||||
400 | 6.375%—11/01/20281 | 377 | ||||
GrubHub Holdings, Inc. | ||||||
900 | 5.500%—07/01/20271 | 658 | ||||
Rakuten Group, Inc. | ||||||
1,600 | 10.250%—11/30/20241 | 1,577 | ||||
|
| |||||
| 2,612 | ||||||
|
| |||||
IT SERVICES—2.3% | ||||||
Gartner, Inc. | ||||||
1,000 | 3.625%—06/15/20291 | 887 | ||||
1,500 | 4.500%—07/01/20281 | 1,412 | ||||
|
| |||||
| 2,299 | ||||||
|
| |||||
Unisys Corp. | ||||||
900 | 6.875%—11/01/20271 | 600 | ||||
|
| |||||
| 2,899 | ||||||
|
| |||||
LEISURE PRODUCTS—2.8% | ||||||
Carnival Corp. | ||||||
1,700 | 7.625%—03/01/20261 | 1,556 | ||||
Life Time, Inc. | ||||||
900 | 8.000%—04/15/20261 | 896 | ||||
CORPORATE BONDS & NOTES—Continued |
| |||||
| Principal Amount | Value | |||||
| ||||||
LEISURE PRODUCTS—Continued | ||||||
NCL Corp. Ltd. | ||||||
$ 1,000 | 5.875%—03/15/20261 | $ | 863 | |||
Vista Outdoor, Inc. | ||||||
300 | 4.500%—03/15/20291 | 236 | ||||
|
| |||||
| 3,551 | ||||||
|
| |||||
MACHINERY—1.6% | ||||||
BWX Technologies, Inc. | ||||||
700 | 4.125—06/30/28-04/15/291 | 1,278 | ||||
Mueller Water Products, Inc. | ||||||
800 | 4.000%—06/15/20291 | 724 | ||||
|
| |||||
| 2,002 | ||||||
|
| |||||
MEDIA—3.4% | ||||||
AMC Networks, Inc. | ||||||
1,700 | 4.250%—02/15/2029 | 1,180 | ||||
700 | 4.750%—08/01/2025 | 650 | ||||
|
| |||||
| 1,830 | ||||||
|
| |||||
DISH DBS Corp. | ||||||
2,000 | 7.750%—07/01/2026 | 1,158 | ||||
Sirius XM Radio, Inc. | ||||||
1,700 | 3.875%—09/01/20311 | 1,286 | ||||
|
| |||||
| 4,274 | ||||||
|
| |||||
METALS & MINING—3.0% | ||||||
Alliance Resource Operating Partners LP/Alliance Resource Finance Corp. | ||||||
400 | 7.500%—05/01/20251 | 398 | ||||
Commercial Metals Co. | ||||||
500 | 3.875%—02/15/2031 | 439 | ||||
500 | 4.125%—01/15/2030 | 448 | ||||
|
| |||||
| 887 | ||||||
|
| |||||
Eldorado Gold Corp. | ||||||
350 | 6.250%—09/01/20291 | 326 | ||||
FMG Resources August Pty. Ltd. | ||||||
500 | 6.125%—04/15/20321 | 484 | ||||
IAMGOLD Corp. | ||||||
800 | 5.750%—10/15/20281 | 633 | ||||
Park-Ohio Industries, Inc. | ||||||
400 | 6.625%—04/15/2027 | 320 | ||||
SunCoke Energy, Inc. | ||||||
300 | 4.875%—06/30/20291 | 261 | ||||
Taseko Mines Ltd. | ||||||
600 | 7.000%—02/15/20261 | 554 | ||||
|
| |||||
| 3,863 | ||||||
|
| |||||
MORTGAGE REAL ESTATE INVESTMENT TRUSTS (REITS)—0.9% |
| |||||
Rithm Capital Corp. | ||||||
1,000 | 6.250%—10/15/20251 | 917 | ||||
Starwood Property Trust, Inc. | ||||||
200 | 4.750%—03/15/2025 | 190 | ||||
|
| |||||
| 1,107 | ||||||
|
| |||||
OFFICE ELECTRONICS—0.3% | ||||||
Pitney Bowes, Inc. | ||||||
600 | 7.250%—03/15/20291 | 442 | ||||
|
| |||||
OIL, GAS & CONSUMABLE FUELS—8.8% | ||||||
Antero Midstream Partners LP/Antero Midstream Finance Corp. | ||||||
700 | 5.375%—06/15/20291 | 656 | ||||
27
Table of Contents
Harbor Scientific Alpha High-Yield ETF
PORTFOLIO OF INVESTMENTS—Continued
Principal Amounts, Value and Cost in Thousands
CORPORATE BONDS & NOTES—Continued |
| |||||
| Principal Amount | Value | |||||
| ||||||
OIL, GAS & CONSUMABLE FUELS—Continued | ||||||
Chord Energy Corp. | ||||||
$ 700 | 6.375%—06/01/20261 | $ | 698 | |||
| Delek Logistics Partners LP/Delek Logistics Finance Corp. | ||||||
700 | 7.125%—06/01/20281 | 638 | ||||
DT Midstream, Inc. | ||||||
1,300 | 4.125%—06/15/20291 | 1,154 | ||||
Gran Tierra Energy International Holdings Ltd. | ||||||
400 | 6.250%—02/15/20251 | 343 | ||||
Gran Tierra Energy, Inc. | ||||||
400 | 7.750%—05/23/20271 | 303 | ||||
Holly Energy Partners LP/Holly Energy Finance Corp. | ||||||
900 | 5.000%—02/01/20281 | 840 | ||||
Murphy Oil USA, Inc. | ||||||
900 | 3.750%—02/15/20311 | 771 | ||||
900 | 4.750%—09/15/2029 | 836 | ||||
|
| |||||
| 1,607 | ||||||
|
| |||||
New Fortress Energy, Inc. | ||||||
100 | 6.500%—09/30/20261 | 92 | ||||
1,700 | 6.750%—09/15/20251 | 1,621 | ||||
|
| |||||
| 1,713 | ||||||
|
| |||||
PG&E Corp. | ||||||
200 | 5.250%—07/01/2030 | 185 | ||||
Sunoco LP/Sunoco Finance Corp. | ||||||
700 | 4.500—05/15/29-04/30/30 | 899 | ||||
Transocean, Inc. | ||||||
1,100 | 7.500%—01/15/20261 | 1,016 | ||||
1,100 | 11.500%—01/30/20271 | 1,127 | ||||
|
| |||||
| 2,143 | ||||||
|
| |||||
| 11,179 | ||||||
|
| |||||
PERSONAL CARE PRODUCTS—1.3% | ||||||
Coty, Inc. | ||||||
1,700 | 5.000%—04/15/20261 | 1,662 | ||||
|
| |||||
PHARMACEUTICALS—3.3% | ||||||
Bausch Health Cos., Inc. | ||||||
1,500 | 4.875%—06/01/20281 | 990 | ||||
Herbalife Nutrition Ltd./HLF Financing, Inc. | ||||||
1,100 | 7.875%—09/01/20251 | 1,054 | ||||
Jazz Securities DAC | ||||||
1,900 | 4.375%—01/15/20291 | 1,748 | ||||
Perrigo Finance Unlimited Co. | ||||||
200 | 3.900%—12/15/2024 | 194 | ||||
200 | 4.900%—12/15/2044 | 145 | ||||
|
| |||||
| 339 | ||||||
|
| |||||
| 4,131 | ||||||
|
| |||||
PROFESSIONAL SERVICES—1.0% | ||||||
KBR, Inc. | ||||||
300 | 4.750%—09/30/20281 | 278 | ||||
TriNet Group, Inc. | ||||||
500 | 3.500%—03/01/20291 | 438 | ||||
WW International, Inc. | ||||||
800 | 4.500%—04/15/20291 | 511 | ||||
|
| |||||
| 1,227 | ||||||
|
| |||||
CORPORATE BONDS & NOTES—Continued |
| |||||
| Principal Amount | Value | |||||
| ||||||
REAL ESTATE MANAGEMENT & DEVELOPMENT—1.4% |
| |||||
Howard Hughes Corp. | ||||||
$ 1,200 | 4.375%—02/01/20311 | $ | 974 | |||
Kennedy-Wilson, Inc. | ||||||
200 | 4.750%—02/01/2030 | 155 | ||||
900 | 5.000%—03/01/2031 | 683 | ||||
|
| |||||
| 838 | ||||||
|
| |||||
| 1,812 | ||||||
|
| |||||
SOFTWARE—3.5% | ||||||
Fair Isaac Corp. | ||||||
1,500 | 4.000%—06/15/20281 | 1,400 | ||||
Open Text Corp. | ||||||
700 | 3.875%—12/01/20291 | 589 | ||||
Open Text Holdings, Inc. | ||||||
1,700 | 4.125—02/15/30-12/01/311 | 1,620 | ||||
PTC, Inc. | ||||||
900 | 3.625%—02/15/20251 | 869 | ||||
|
| |||||
| 4,478 | ||||||
|
| |||||
SPECIALTY RETAIL—5.3% | ||||||
Abercrombie & Fitch Management Co. | ||||||
500 | 8.750%—07/15/20251 | 508 | ||||
Academy Ltd. | ||||||
400 | 6.000%—11/15/20271 | 393 | ||||
Arko Corp. | ||||||
200 | 5.125%—11/15/20291 | 162 | ||||
Bath & Body Works, Inc. | ||||||
1,100 | 6.750%—07/01/2036 | 980 | ||||
200 | 6.875%—11/01/2035 | 181 | ||||
|
| |||||
| 1,161 | ||||||
|
| |||||
BC ULC/New Red Finance, Inc. | ||||||
1,200 | 3.500%—02/15/20291 | 1,080 | ||||
Foot Locker, Inc. | ||||||
700 | 4.000%—10/01/20291 | 593 | ||||
Gap, Inc. | ||||||
1,400 | 3.625%—10/01/20291 | 993 | ||||
1,400 | 3.875%—10/01/20311 | 980 | ||||
|
| |||||
| 1,973 | ||||||
|
| |||||
Macy’s Retail Holdings LLC | ||||||
100 | 5.125%—01/15/2042 | 66 | ||||
Penske Automotive Group, Inc. | ||||||
900 | 3.750%—06/15/2029 | 784 | ||||
|
| |||||
| 6,720 | ||||||
|
| |||||
TECHNOLOGY HARDWARE, STORAGE & PERIPHERALS—2.0% |
| |||||
Pitney Bowes | ||||||
700 | 6.875%—03/15/20271 | 540 | ||||
Xerox Corp. | ||||||
400 | 4.800%—03/01/2035 | 264 | ||||
600 | 6.750%—12/15/2039 | 457 | ||||
|
| |||||
| 721 | ||||||
|
| |||||
Xerox Holdings Corp. | ||||||
1,450 | 5.500%—08/15/20281 | 1,252 | ||||
|
| |||||
| 2,513 | ||||||
|
| |||||
TOBACCO—2.1% | ||||||
Turning Point Brands, Inc. | ||||||
342 | 5.625%—02/15/20261 | 314 | ||||
28
Table of Contents
Harbor Scientific Alpha High-Yield ETF
PORTFOLIO OF INVESTMENTS—Continued
Principal Amounts, Value and Cost in Thousands
CORPORATE BONDS & NOTES—Continued |
| |||||
Principal Amount | Value | |||||
TOBACCO—Continued | ||||||
Vector Group Ltd. | ||||||
$ 1,700 | 5.750%—02/01/20291 | $ | 1,522 | |||
800 | 10.500%—11/01/20261 | 807 | ||||
|
| |||||
| 2,329 | ||||||
|
| |||||
| 2,643 | ||||||
|
| |||||
TRADING COMPANIES & DISTRIBUTORS—0.8% |
| |||||
700 | G-III Apparel Group Ltd. 7.875%—08/15/20251 | 659 | ||||
400 | GYP Holdings III Corp. 4.625%—05/01/20291 | 354 | ||||
|
| |||||
| 1,013 | ||||||
|
| |||||
CORPORATE BONDS & NOTES—Continued |
| |||||
Principal Amount | Value | |||||
TRANSPORTATION INFRASTRUCTURE—0.9% |
| |||||
Fortress Transportation & Infrastructure Investors LLC | ||||||
$ 1,300 | 5.500%—05/01/20281 | $ | 1,193 | |||
|
| |||||
TOTAL CORPORATE BONDS & NOTES | ||||||
(Cost $123,509) | 123,281 | |||||
|
| |||||
TOTAL INVESTMENTS—97.1% | ||||||
(Cost $123,509) | 123,281 | |||||
|
| |||||
CASH AND OTHER ASSETS, LESS LIABILITIES—2.9% | 3,617 | |||||
|
| |||||
TOTAL NET ASSETS—100.0% | $ | 126,898 | ||||
|
| |||||
FAIR VALUE MEASUREMENTS |
All investments as of April 30, 2023 (as disclosed in the preceding Portfolio of Investments) were classified as Level 2.
For more information on valuation inputs and their aggregation into the levels identified above, please refer to the Fair Value Measurements and Disclosures in Note 2 of the accompanying Notes to Financial Statements.
| 1 | Securities purchased in a transaction exempt from registration under Rule 144A of the Securities Act of 1933.These securities may be resold in transactions exempt from registration, normally to qualified institutional buyers. The Fund has no right to demand registration of these securities. As of April 30, 2023, the aggregate value of these securities was $94,914 or 75% of net assets. |
| 2 | Rate changes from fixed to variable rate at a specified date prior to its final maturity. Stated rate is fixed rate currently in effect and stated date is the final maturity date. |
| 3 | MTN after the name of a security stands for Medium Term Note. |
The accompanying notes are an integral part of the Financial Statements.
29
Table of Contents
Harbor Scientific Alpha Income ETF
PORTFOLIO OF INVESTMENTS—April 30, 2023 (Unaudited)
Subadvisor: BlueCove Limited
SECTOR ALLOCATION (% of investments) |
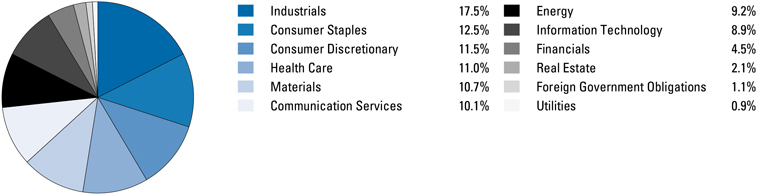
PORTFOLIO OF INVESTMENTS |
Principal Amounts, Value and Cost in Thousands
CORPORATE BONDS & NOTES—95.6% |
| |||||
| Principal Amount | Value | |||||
AEROSPACE & DEFENSE—3.5% | ||||||
| Howmet Aerospace, Inc. | ||||||
$ 100 | 3.000%—01/15/2029 | $ | 90 | |||
200 | 5.900%—02/01/2027 | 205 | ||||
|
| |||||
| 295 | ||||||
|
| |||||
| Moog, Inc. | ||||||
200 | 4.250%—12/15/20271 | 188 | ||||
| TransDigm, Inc. | ||||||
200 | 4.875%—05/01/2029 | 182 | ||||
200 | 5.500%—11/15/2027 | 192 | ||||
|
| |||||
| 374 | ||||||
|
| |||||
| Triumph Group, Inc. | ||||||
300 | 7.750%—08/15/2025 | 280 | ||||
|
| |||||
| 1,137 | ||||||
|
| |||||
AUTOMOBILES—2.1% | ||||||
| Allison Transmission, Inc. | ||||||
100 | 3.750%—01/30/20311 | 86 | ||||
| Jaguar Land Rover Automotive PLC | ||||||
200 | 5.500%—07/15/20291 | 166 | ||||
200 | 5.875%—01/15/20281 | 173 | ||||
|
| |||||
| 339 | ||||||
|
| |||||
| Wabash National Corp. | ||||||
300 | 4.500%—10/15/20281 | 261 | ||||
|
| |||||
| 686 | ||||||
|
| |||||
BANKS—2.0% | ||||||
| Intesa Sanpaolo SpA | ||||||
400 | 4.198%—06/01/20321,2 | 303 | ||||
| UniCredit SpA | ||||||
200 | 5.459%—06/30/20351,2 | 171 | ||||
| UniCredit SpA MTN | ||||||
200 | 5.861%—06/19/20321,2 | 182 | ||||
|
| |||||
| 656 | ||||||
|
| |||||
BEVERAGES—0.6% | ||||||
| Keurig Dr Pepper, Inc. | ||||||
100 | 3.400%—11/15/2025 | 97 | ||||
CORPORATE BONDS & NOTES—Continued |
| |||||
| Principal Amount | Value | |||||
BEVERAGES—Continued | ||||||
| PepsiCo, Inc. | ||||||
$ 100 | 2.625%—07/29/2029 | $ | 92 | |||
|
| |||||
| 189 | ||||||
|
| |||||
BIOTECHNOLOGY—0.9% | ||||||
| Biogen, Inc. | ||||||
300 | 4.050%—09/15/2025 | 294 | ||||
|
| |||||
BUILDING PRODUCTS—0.6% | ||||||
| Carlisle Cos., Inc. | ||||||
200 | 3.750%—12/01/2027 | 192 | ||||
|
| |||||
CHEMICALS—4.8% | ||||||
| Ashland LLC | ||||||
300 | 3.375%—09/01/20311 | 249 | ||||
| HB Fuller Co. | ||||||
100 | 4.250%—10/15/2028 | 92 | ||||
| Minerals Technologies, Inc. | ||||||
100 | 5.000%—07/01/20281 | 91 | ||||
| Rain CII Carbon LLC/CII Carbon Corp. | ||||||
300 | 7.250%—04/01/20251 | 291 | ||||
| Rayonier AM Products, Inc. | ||||||
300 | 7.625%—01/15/20261 | 267 | ||||
| Solvay Finance America LLC | ||||||
300 | 4.450%—12/03/20251 | 295 | ||||
| Trinseo Materials Operating SCA/Trinseo Materials Finance, Inc. | ||||||
300 | 5.375%—09/01/20251 | 252 | ||||
|
| |||||
| 1,537 | ||||||
|
| |||||
COMMERCIAL SERVICES & SUPPLIES—3.8% | ||||||
| Cimpress PLC | ||||||
400 | 7.000%—06/15/2026 | 335 | ||||
| CPI CG, Inc. | ||||||
200 | 8.625%—03/15/20261 | 198 | ||||
| GFL Environmental, Inc. | ||||||
200 | 3.750%—08/01/20251 | 194 | ||||
| Republic Services, Inc. | ||||||
300 | 2.500%—08/15/2024 | 291 | ||||
| Transurban Queensland Finance Pty. Ltd. | ||||||
200 | 4.500%—04/19/2028 | 192 | ||||
|
| |||||
| 1,210 | ||||||
|
| |||||
30
Table of Contents
Harbor Scientific Alpha Income ETF
PORTFOLIO OF INVESTMENTS—Continued
Principal Amounts, Value and Cost in Thousands
CORPORATE BONDS & NOTES—Continued |
| |||||
| Principal Amount | Value | |||||
COMMUNICATIONS EQUIPMENT—2.3% | ||||||
Motorola Solutions, Inc. | ||||||
$ 200 | 4.600%—02/23/2028 | $ | 199 | |||
Sprint Spectrum Co. LLC/Sprint Spectrum Co. II LLC/Sprint Spectrum Co. III LLC | ||||||
300 | 5.152%—09/20/20291 | 298 | ||||
Viasat, Inc. | ||||||
300 | 6.500%—07/15/20281 | 238 | ||||
|
| |||||
| 735 | ||||||
|
| |||||
CONSTRUCTION & ENGINEERING—2.1% | ||||||
Arcosa, Inc. | ||||||
200 | 4.375%—04/15/20291 | 182 | ||||
Tutor Perini Corp. | ||||||
300 | 6.875%—05/01/20251 | 218 | ||||
Williams Scotsman International, Inc. | ||||||
300 | 4.625%—08/15/20281 | 276 | ||||
|
| |||||
| 676 | ||||||
|
| |||||
CONSUMER FINANCE—0.6% | ||||||
Enova International, Inc. | ||||||
200 | 8.500%—09/15/20251 | 192 | ||||
|
| |||||
CONTAINERS & PACKAGING—2.0% | ||||||
Amcor Finance USA, Inc. | ||||||
100 | 3.625%—04/28/2026 | 96 | ||||
Brambles USA, Inc. | ||||||
200 | 4.125%—10/23/20251 | 196 | ||||
Graphic Packaging International LLC | ||||||
100 | 3.500—03/15/28-03/01/291 | 180 | ||||
Silgan Holdings, Inc. | ||||||
200 | 4.125%—02/01/2028 | 187 | ||||
|
| |||||
| 659 | ||||||
|
| |||||
DIVERSIFIED TELECOMMUNICATION SERVICES—1.7% | ||||||
Frontier Communications Holdings LLC | ||||||
100 | 6.000%—01/15/20301 | 77 | ||||
350 | 6.750%—05/01/20291 | 282 | ||||
|
| |||||
| 359 | ||||||
|
| |||||
T-Mobile USA, Inc. | ||||||
200 | 2.625%—02/15/2029 | 177 | ||||
|
| |||||
| 536 | ||||||
|
| |||||
ELECTRIC UTILITIES—0.9% | ||||||
Alexander Funding Trust | ||||||
300 | 1.841%—11/15/20231 | 292 | ||||
|
| |||||
ELECTRONIC EQUIPMENT, INSTRUMENTS & COMPONENTS—0.6% |
| |||||
Keysight Technologies, Inc. | ||||||
200 | 4.550%—10/30/2024 | 198 | ||||
|
| |||||
ENERGY EQUIPMENT & SERVICES—2.2% |
| |||||
Enterprise Products Operating LLC | ||||||
200 | 3.900%—02/15/2024 | 198 | ||||
USA Compression Partners LP/USA Compression Finance Corp. | ||||||
200 | 6.875%—04/01/2026 | 198 | ||||
Weatherford International Ltd. | ||||||
300 | 8.625%—04/30/20301 | 306 | ||||
|
| |||||
| 702 | ||||||
|
| |||||
CORPORATE BONDS & NOTES—Continued |
| |||||
| Principal Amount | Value | |||||
ENTERTAINMENT—0.4% | ||||||
Lions Gate Capital Holdings LLC | ||||||
$ 200 | 5.500%—04/15/20291 | $ | 146 | |||
|
| |||||
EQUITY REAL ESTATE INVESTMENT TRUSTS (REITS)—3.1% |
| |||||
Apollo Commercial Real Estate Finance, Inc. | ||||||
200 | 4.625%—06/15/20291 | 152 | ||||
CTR Partnership LP/CareTrust Capital Corp. | ||||||
200 | 3.875%—06/30/20281 | 175 | ||||
GLP Capital LP/GLP Financing II, Inc. | ||||||
200 | 5.375%—04/15/2026 | 198 | ||||
Iron Mountain, Inc. | ||||||
200 | 5.250%—07/15/20301 | 184 | ||||
VICI Properties LP/VICI Note Co., Inc. | ||||||
300 | 3.750%—02/15/20271 | 281 | ||||
|
| |||||
| 990 | ||||||
|
| |||||
FOOD & STAPLES RETAILING—0.8% | ||||||
CDW LLC/CDW Finance Corp. | ||||||
300 | 3.250%—02/15/2029 | 260 | ||||
|
| |||||
FOOD PRODUCTS—3.3% | ||||||
Conagra Brands, Inc. | ||||||
200 | 4.600%—11/01/2025 | 199 | ||||
J M Smucker Co. | ||||||
300 | 3.500%—03/15/2025 | 293 | ||||
Kellogg Co. | ||||||
100 | 2.650%—12/01/2023 | 99 | ||||
Lamb Weston Holdings, Inc. | ||||||
300 | 4.125%—01/31/20301 | 275 | ||||
Mondelez International Holdings Netherlands BV | ||||||
200 | 0.750%—09/24/20241 | 188 | ||||
|
| |||||
| 1,054 | ||||||
|
| |||||
HEALTH CARE EQUIPMENT & SUPPLIES—2.9% |
| |||||
Edwards Lifesciences Corp. | ||||||
200 | 4.300%—06/15/2028 | 200 | ||||
Hologic, Inc. | ||||||
300 | 3.250%—02/15/20291 | 270 | ||||
Stryker Corp. | ||||||
300 | 3.375%—11/01/2025 | 291 | ||||
Zimmer Biomet Holdings, Inc. | ||||||
200 | 1.450%—11/22/2024 | 190 | ||||
|
| |||||
| 951 | ||||||
|
| |||||
HEALTH CARE PROVIDERS & SERVICES—3.4% |
| |||||
Acadia Healthcare Co., Inc. | ||||||
100 | 5.000%—04/15/20291 | 95 | ||||
AMN Healthcare, Inc. | ||||||
100 | 4.625%—10/01/20271 | 93 | ||||
DaVita, Inc. | ||||||
200 | 4.625%—06/01/20301 | 174 | ||||
HCA, Inc. | ||||||
300 | 3.125%—03/15/2027 | 282 | ||||
McKesson Corp. | ||||||
200 | 1.300%—08/15/2026 | 180 | ||||
100 | 3.796%—03/15/2024 | 99 | ||||
|
| |||||
| 279 | ||||||
|
| |||||
Molina Healthcare, Inc. | ||||||
200 | 3.875%—11/15/20301 | 177 | ||||
|
| |||||
| 1,100 | ||||||
|
| |||||
31
Table of Contents
Harbor Scientific Alpha Income ETF
PORTFOLIO OF INVESTMENTS—Continued
Principal Amounts, Value and Cost in Thousands
CORPORATE BONDS & NOTES—Continued |
| |||||
| Principal Amount | Value | |||||
HOTELS, RESTAURANTS & LEISURE—2.5% | ||||||
Hilton Domestic Operating Co., Inc. | ||||||
$ 300 | 4.875%—01/15/2030 | $ | 285 | |||
New Red Finance, Inc. | ||||||
200 | 3.875%—01/15/20281 | 188 | ||||
Royal Caribbean Cruises Ltd. | ||||||
300 | 11.625%—08/15/20271 | 319 | ||||
|
| |||||
| 792 | ||||||
|
| |||||
HOUSEHOLD PRODUCTS—0.9% | ||||||
Reckitt Benckiser Treasury Services PLC | ||||||
300 | 3.000%—06/26/20271 | 283 | ||||
|
| |||||
INSURANCE—1.0% | ||||||
Elevance Health, Inc. | ||||||
200 | 3.350%—12/01/2024 | 195 | ||||
Enstar Finance LLC | ||||||
200 | 5.500%—01/15/20422 | 144 | ||||
|
| |||||
| 339 | ||||||
|
| |||||
INTERACTIVE MEDIA & SERVICES—0.3% | ||||||
Go Daddy Operating Co. LLC/GD Finance Co., Inc. | ||||||
100 | 3.500%—03/01/20291 | 87 | ||||
|
| |||||
INTERNET & CATALOG RETAIL—2.5% | ||||||
Cars.com, Inc. | ||||||
200 | 6.375%—11/01/20281 | 189 | ||||
GrubHub Holdings, Inc. | ||||||
300 | 5.500%—07/01/20271 | 219 | ||||
Rakuten Group, Inc. | ||||||
400 | 10.250%—11/30/20241 | 394 | ||||
|
| |||||
| 802 | ||||||
|
| |||||
IT SERVICES—1.1% | ||||||
Gartner, Inc. | ||||||
200 | 3.625%—06/15/20291 | 177 | ||||
Unisys Corp. | ||||||
100 | 6.875%—11/01/20271 | 67 | ||||
VeriSign, Inc. | ||||||
100 | 5.250%—04/01/2025 | 100 | ||||
|
| |||||
| 344 | ||||||
|
| |||||
LEISURE PRODUCTS—2.3% | ||||||
Carnival Corp. | ||||||
300 | 7.625%—03/01/20261 | 275 | ||||
Life Time, Inc. | ||||||
300 | 8.000%—04/15/2026 | 299 | ||||
NCL Corp. Ltd. | ||||||
200 | 5.875%—03/15/20261 | 172 | ||||
|
| |||||
| 746 | ||||||
|
| |||||
MACHINERY—1.2% | ||||||
nVent Finance Sarl | ||||||
200 | 4.550%—04/15/2028 | 193 | ||||
Westinghouse Air Brake Technologies Corp. | ||||||
200 | 4.400%—03/15/2024 | 197 | ||||
|
| |||||
| 390 | ||||||
|
| |||||
MEDIA—3.1% | ||||||
AMC Networks, Inc. | ||||||
400 | 4.250%—02/15/2029 | 278 | ||||
Gannett Holdings LLC | ||||||
200 | 6.000%—11/01/20261 | 169 | ||||
CORPORATE BONDS & NOTES—Continued |
| |||||
| Principal Amount | Value | |||||
MEDIA—Continued | ||||||
RELX Capital, Inc. | ||||||
$ 300 | 4.000%—03/18/2029 | $ | 294 | |||
Sirius XM Radio, Inc. | ||||||
300 | 4.000%—07/15/20281 | 254 | ||||
|
| |||||
| 995 | ||||||
|
| |||||
METALS & MINING—3.5% | ||||||
Alliance Resource Operating Partners LP/Alliance Resource Finance Corp. | ||||||
100 | 7.500%—05/01/20251 | 99 | ||||
Commercial Metals Co. | ||||||
100 | 3.875%—02/15/2031 | 88 | ||||
100 | 4.125%—01/15/2030 | 90 | ||||
100 | 4.375%—03/15/2032 | 87 | ||||
|
| |||||
| 265 | ||||||
|
| |||||
Eldorado Gold Corp. | ||||||
150 | 6.250%—09/01/20291 | 140 | ||||
IAMGOLD Corp. | ||||||
300 | 5.750%—10/15/20281 | 237 | ||||
Reliance Steel & Aluminum Co. | ||||||
200 | 1.300%—08/15/2025 | 184 | ||||
Warrior Met Coal, Inc. | ||||||
200 | 7.875%—12/01/20281 | 202 | ||||
|
| |||||
| 1,127 | ||||||
|
| |||||
MORTGAGE REAL ESTATE INVESTMENT TRUSTS (REITS)—0.9% |
| |||||
Rithm Capital Corp. | ||||||
200 | 6.250%—10/15/20251 | 183 | ||||
Starwood Property Trust, Inc. | ||||||
100 | 4.750%—03/15/2025 | 95 | ||||
|
| |||||
| 278 | ||||||
|
| |||||
OFFICE ELECTRONICS—0.5% | ||||||
Pitney Bowes, Inc. | ||||||
200 | 7.250%—03/15/20291 | 147 | ||||
|
| |||||
OIL, GAS & CONSUMABLE FUELS—6.7% |
| |||||
Athabasca Oil Corp. | ||||||
85 | 9.750%—11/01/20261 | 89 | ||||
Chord Energy Corp. | ||||||
300 | 6.375%—06/01/20261 | 299 | ||||
Delek Logistics Partners LP/Delek Logistics Finance Corp. | ||||||
100 | 7.125%—06/01/20281 | 91 | ||||
DT Midstream, Inc. | ||||||
200 | 4.375%—06/15/20311 | 174 | ||||
Marathon Petroleum Corp. | ||||||
200 | 4.700%—05/01/2025 | 199 | ||||
Murphy Oil USA, Inc. | ||||||
200 | 3.750%—02/15/20311 | 171 | ||||
100 | 4.750%—09/15/2029 | 93 | ||||
|
| |||||
| 264 | ||||||
|
| |||||
New Fortress Energy, Inc. | ||||||
300 | 6.750%—09/15/20251 | 286 | ||||
Phillips 66 | ||||||
100 | 0.900%—02/15/2024 | 97 | ||||
Schlumberger Holdings Corp. | ||||||
300 | 3.900%—05/17/20281 | 291 | ||||
Transocean, Inc. | ||||||
200 | 8.000%—02/01/20271 | 178 | ||||
32
Table of Contents
Harbor Scientific Alpha Income ETF
PORTFOLIO OF INVESTMENTS—Continued
Principal Amounts, Value and Cost in Thousands
CORPORATE BONDS & NOTES—Continued |
| |||||
Principal Amount | Value | |||||
OIL, GAS & CONSUMABLE FUELS—Continued | ||||||
Williams Cos., Inc. | ||||||
$ 200 | 4.300%—03/04/2024 | $ | 199 | |||
|
| |||||
| 2,167 | ||||||
|
| |||||
PERSONAL CARE PRODUCTS—0.9% | ||||||
Edgewell Personal Care Co. | ||||||
300 | 5.500%—06/01/20281 | 288 | ||||
|
| |||||
PHARMACEUTICALS—3.2% | ||||||
Bausch Health Cos., Inc. | ||||||
300 | 11.000%—09/30/20281 | 243 | ||||
Herbalife Nutrition Ltd./HLF Financing, Inc. | ||||||
300 | 7.875%—09/01/20251 | 287 | ||||
Merck & Co., Inc. | ||||||
300 | 1.900%—12/10/2028 | 268 | ||||
Perrigo Finance Unlimited Co. | ||||||
200 | 4.400%—06/15/2030 | 181 | ||||
Takeda Pharmaceutical Co. Ltd. | ||||||
62 | 4.400%—11/26/2023 | 62 | ||||
|
| |||||
| 1,041 | ||||||
|
| |||||
PROFESSIONAL SERVICES—1.4% | ||||||
Gartner, Inc. | ||||||
200 | 3.750%—10/01/20301 | 175 | ||||
TriNet Group, Inc. | ||||||
300 | 3.500%—03/01/20291 | 262 | ||||
|
| |||||
| 437 | ||||||
|
| |||||
SEMICONDUCTORS & SEMICONDUCTOR EQUIPMENT—2.6% |
| |||||
Broadcom, Inc. | ||||||
300 | 1.950%—02/15/20281 | 263 | ||||
100 | 4.000%—04/15/20291 | 94 | ||||
|
| |||||
| 357 | ||||||
|
| |||||
Microchip Technology, Inc. | ||||||
300 | 4.250%—09/01/2025 | 295 | ||||
Texas Instruments, Inc. | ||||||
200 | 2.250%—09/04/2029 | 179 | ||||
|
| |||||
| 831 | ||||||
|
| |||||
SOFTWARE—4.4% | ||||||
Fair Isaac Corp. | ||||||
300 | 4.000%—06/15/20281 | 280 | ||||
Open Text Corp. | ||||||
400 | 3.875%—02/15/20281 | 355 | ||||
200 | 6.900%—12/01/20271 | 207 | ||||
|
| |||||
| 562 | ||||||
|
| |||||
Oracle Corp. | ||||||
300 | 2.300%—03/25/2028 | 269 | ||||
100 | 6.150%—11/09/2029 | 106 | ||||
|
| |||||
| 375 | ||||||
|
| |||||
PTC, Inc. | ||||||
200 | 3.625%—02/15/20251 | 193 | ||||
|
| |||||
| 1,410 | ||||||
|
| |||||
SPECIALTY RETAIL—3.3% | ||||||
Abercrombie & Fitch Management Co. | ||||||
200 | 8.750%—07/15/20251 | 203 | ||||
Arko Corp. | ||||||
200 | 5.125%—11/15/20291 | 162 | ||||
CORPORATE BONDS & NOTES—Continued |
| |||||
Principal Amount | Value | |||||
SPECIALTY RETAIL—Continued | ||||||
Bath & Body Works, Inc. | ||||||
$ 400 | 6.875%—11/01/2035 | $ | 363 | |||
Gap, Inc. | ||||||
400 | 3.625%—10/01/20291 | 284 | ||||
Macy’s Retail Holdings LLC | ||||||
100 | 5.125%—01/15/2042 | 66 | ||||
|
| |||||
| 1,078 | ||||||
|
| |||||
TECHNOLOGY HARDWARE, STORAGE & PERIPHERALS—1.5% |
| |||||
Pitney Bowes | ||||||
200 | 6.875%—03/15/20271 | 154 | ||||
Xerox Holdings Corp. | ||||||
400 | 5.500%—08/15/20281 | 345 | ||||
|
| |||||
| 499 | ||||||
|
| |||||
TEXTILES, APPAREL & LUXURY GOODS—0.6% | ||||||
Michael Kors USA, Inc. | ||||||
200 | 4.250%—11/01/20241 | 195 | ||||
|
| |||||
TOBACCO—4.5% | ||||||
Altria Group, Inc. | ||||||
300 | 4.800%—02/14/2029 | 298 | ||||
Imperial Brands Finance PLC | ||||||
300 | 3.125%—07/26/20241 | 291 | ||||
Philip Morris International, Inc. | ||||||
200 | 5.125%—02/15/2030 | 202 | ||||
200 | 5.625%—11/17/2029 | 209 | ||||
|
| |||||
| 411 | ||||||
|
| |||||
Turning Point Brands, Inc. | ||||||
100 | 5.625%—02/15/20261 | 92 | ||||
Vector Group Ltd. | ||||||
400 | 5.750%—02/01/20291 | 358 | ||||
|
| |||||
| 1,450 | ||||||
|
| |||||
TRADING COMPANIES & DISTRIBUTORS—1.5% | ||||||
Ferguson Finance PLC | ||||||
200 | 4.500%—10/24/20281 | 194 | ||||
G-III Apparel Group Ltd. | ||||||
300 | 7.875%—08/15/20251 | 283 | ||||
|
| |||||
| 477 | ||||||
|
| |||||
TRANSPORTATION INFRASTRUCTURE—0.6% | ||||||
Transurban Finance Co. Pty. Ltd. | ||||||
200 | 4.125%—02/02/20261 | 195 | ||||
|
| |||||
TOTAL CORPORATE BONDS & NOTES | ||||||
(Cost $31,292) | 30,790 | |||||
|
| |||||
FOREIGN GOVERNMENT OBLIGATIONS—1.0% |
| |||||
Bahrain Government International Bond | ||||||
200 | 7.000%—01/26/20261 | 206 | ||||
Hungary Government International Bond | ||||||
34 | 5.375%—03/25/2024 | 34 | ||||
Russian Foreign Bond - Eurobond | ||||||
200 | 4.250%—06/23/20271 | 86 | ||||
|
| |||||
33
Table of Contents
Harbor Scientific Alpha Income ETF
PORTFOLIO OF INVESTMENTS—Continued
Principal Amounts, Value and Cost in Thousands
CORPORATE BONDS & NOTES—Continued | ||||||
Principal Amount | Value | |||||
| ||||||
| TOTAL FOREIGN GOVERNMENT OBLIGATIONS | ||||||
| (Cost $471) | 326 | |||||
|
| |||||
| TOTAL INVESTMENTS—96.6% | ||||||
| (Cost $31,763) | 31,116 | |||||
|
| |||||
| CASH AND OTHER ASSETS, LESS LIABILITIES—3.4% | 1,111 | |||||
|
| |||||
| TOTAL NET ASSETS—100.0% | $ | 32,227 | ||||
|
| |||||
FUTURES CONTRACTS | ||||||||||||||||||||||||||||||||
Description | Number of | Expiration | Current Notional Value (000s) | Unrealized Appreciation/ (Depreciation) (000s) | ||||||||||||||||||||||||||||
U.S Treasury Note Futures 10 Year (Short) | 5 | 06/21/2023 | $ | 576 | $ | 1 | ||||||||||||||||||||||||||
U.S Treasury Note Futures 2 Year (Long) | 80 | 06/30/2023 | 16,493 | (106 | ) | |||||||||||||||||||||||||||
|
| |||||||||||||||||||||||||||||||
Total Futures Contracts | $ | (105 | ) | |||||||||||||||||||||||||||||
|
| |||||||||||||||||||||||||||||||
CREDIT DEFAULT SWAP AGREEMENTS | ||||||||||
CENTRALLY CLEARED SWAP AGREEMENTS
| Upfront | Unrealized | |||||||||||||||||||||||||||||||||||||||||
| Implied | Notional | Premiums | Appreciation/ | |||||||||||||||||||||||||||||||||||||||
| Buy/ | Pay/Receive | Expiration | Credit | Payment | Amount6 | Value7 | (Received)/Paid | (Depreciation) | ||||||||||||||||||||||||||||||||||
Counterparty/Exchange | Reference Entity | Sell3,4 | Fixed Rate | Date | Spread5 | Frequency | (000s) | (000s) | (000s) | (000s) | ||||||||||||||||||||||||||||||||
ICE Clear Credit LLC | Markit CDX North America High Yield Index Series 40 | Buy | 5.000% | 06/20/2028 | 4.649% | Quarterly | $1,600 | $(32) | $(5) | $ | (27 | ) | ||||||||||||||||||||||||||||||
ICE Clear Credit LLC | Markit CDX North America Investment Grade Index Series 40 | Buy | 1.000% | 06/20/2028 | 0.755% | Quarterly | 4,800 | (59) | (46) | (13 | ) | |||||||||||||||||||||||||||||||
|
| |||||||||||||||||||||||||||||||||||||||||
Total Centrally Cleared Credit Default Swaps | $ | (40 | ) | |||||||||||||||||||||||||||||||||||||||
|
| |||||||||||||||||||||||||||||||||||||||||
34
Table of Contents
Harbor Scientific Alpha Income ETF
PORTFOLIO OF INVESTMENTS—Continued
FAIR VALUE MEASUREMENTS | ||||||||||||||||||||||||||||||
As of April 30, 2023, the investment in futures contracts (as disclosed in the preceding Futures Contracts schedule) were classified as Level 1 and all other investments were classified as Level 2.
For more information on valuation inputs and their aggregation into the levels identified above, please refer to the Fair Value Measurements and Disclosures in Note 2 of the accompanying Notes to Financial Statements.
| 1 | Securities purchased in a transaction exempt from registration under Rule 144A of the Securities Act of 1933.These securities may be resold in transactions exempt from registration, normally to qualified institutional buyers. The Fund has no right to demand registration of these securities. As of April 30, 2023, the aggregate value of these securities was $19,389 or 60% of net assets. |
| 2 | Rate changes from fixed to variable rate at a specified date prior to its final maturity. Stated rate is fixed rate currently in effect and stated date is the final maturity date. |
| 3 | If the Fund is a buyer of protection and a credit event occurs, as defined under the terms of that particular swap agreement, the Fund will either (i) receive from the seller of protection an amount equal to the notional amount of the swap and deliver the referenced obligation or underlying securities comprising the referenced index or (ii) receive a net settlement amount in the form of cash or securities equal to the notional amount of the swap less the recovery value of the referenced obligation or underlying securities comprising the referenced index. |
| 4 | If the Fund is a seller of protection and a credit event occurs, as defined under the terms of that particular swap agreement, the Fund will either (i) pay to the buyer of protection an amount equal to the notional amount of the swap and take delivery of the referenced obligation or underlying securities comprising the referenced index or (ii) pay a net settlement amount in the form of cash or securities equal to the notional amount of the swap less the recovery value of the referenced obligation or underlying securities comprising the referenced index. |
| 5 | Implied credit spreads, represented in absolute terms, utilized in determining the value of credit default swap agreements on corporate issues or sovereign issues of an emerging country as of period end serve as an indicator of the current status of the payment/performance risk and represent the likelihood or risk of default for the credit derivative. The implied credit spread of a particular referenced entity reflects the cost of buying/selling protection and may include upfront payments required to be made to enter into the agreement. Wider credit spreads represent a deterioration of the referenced entity’s credit soundness and a greater likelihood or risk of default or other credit event occurring as defined under the terms of the agreement. A credit spread identified as “Defaulted” indicates a credit event has occurred for the referenced entity or obligation. |
| 6 | The maximum potential amount the Fund could be required to make as a seller of credit protection or receive as a buyer of credit protection if a credit event occurs as defined under the terms of that particular swap agreement. |
| 7 | The quoted market prices and resulting values for credit default swap agreements on asset-backed securities and credit indices serve as an indicator of the current status of the payment/performance risk and represent the likelihood of an expected liability (or profit) for the credit derivative should the notional amount of the swap agreement be closed/sold as of the period end. Increasing values, in absolute terms when compared to the notional amount of the swap, represent a deterioration of the referenced entity’s credit soundness and a greater likelihood or risk of default or other credit event occurring as defined under the terms of the agreement. |
The accompanying notes are an integral part of the Financial Statements.
35
Table of Contents
Harbor Small Cap Explorer ETF
PORTFOLIO OF INVESTMENTS—April 30, 2023 (Unaudited)
Adviser: Harbor Capital Advisors, Inc.
SECTOR ALLOCATION (% of investments) | ||||||||||||||||||||||||||||||
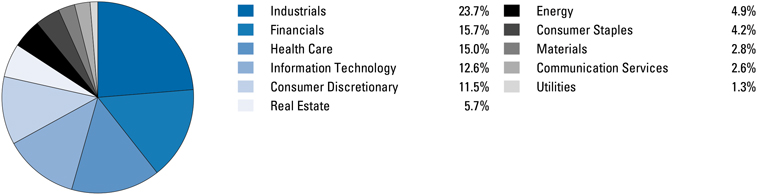
PORTFOLIO OF INVESTMENTS | ||||||||||||||||||||||||||||||
Value and Cost in Thousands
COMMON STOCKS—99.0% | ||||||
| Shares | Value | |||||
| ||||||
| AEROSPACE & DEFENSE—1.1% | ||||||
340 | Axon Enterprise, Inc. * | $ | 72 | |||
244 | BWX Technologies, Inc. | 16 | ||||
18 | Northrop Grumman Corp. | 8 | ||||
|
| |||||
| 96 | ||||||
|
| |||||
AIR FREIGHT & LOGISTICS—1.6% | ||||||
1,910 | Air Transport Services Group, Inc. * | 39 | ||||
76 | FedEx Corp. | 17 | ||||
1,514 | GXO Logistics, Inc. * | 81 | ||||
|
| |||||
| 137 | ||||||
|
| |||||
AUTOMOBILE COMPONENTS—0.9% | ||||||
1,664 | Gentex Corp. | 46 | ||||
127 | Gentherm, Inc. * | 8 | ||||
1,617 | Goodyear Tire & Rubber Co. * | 17 | ||||
393 | Stoneridge, Inc. * | 7 | ||||
|
| |||||
| 78 | ||||||
|
| |||||
AUTOMOBILES—0.5% | ||||||
575 | Thor Industries, Inc. | 45 | ||||
|
| |||||
BANKS—7.8% | ||||||
585 | 1st Source Corp. | 24 | ||||
1,038 | Bank OZK | 37 | ||||
3,322 | Carter Bankshares, Inc. * | 43 | ||||
558 | East West Bancorp, Inc. | 29 | ||||
144 | First Bancorp | 4 | ||||
153 | First Citizens BancShares, Inc. Class A | 154 | ||||
3,900 | First Hawaiian, Inc. | 75 | ||||
2,462 | First Horizon Corp. | 43 | ||||
1,275 | Hancock Whitney Corp. | 47 | ||||
794 | Home BancShares, Inc. | 17 | ||||
1,102 | International Bancshares Corp. | 47 | ||||
222 | Prosperity Bancshares, Inc. | 14 | ||||
603 | Regions Financial Corp. | 11 | ||||
280 | Truist Financial Corp. | 9 | ||||
1,367 | Wintrust Financial Corp. | 94 | ||||
|
| |||||
| 648 | ||||||
|
| |||||
BEVERAGES—0.5% | ||||||
1,798 | Vita Coco Co., Inc. * | 39 | ||||
|
| |||||
COMMON STOCKS—Continued | ||||||
| Shares | Value | |||||
| ||||||
BIOTECHNOLOGY—2.4% | ||||||
1,051 | Crinetics Pharmaceuticals, Inc. * | $ | 21 | |||
525 | Cytokinetics, Inc. * | 20 | ||||
952 | Inhibrx, Inc. * | 20 | ||||
439 | Mirati Therapeutics, Inc. * | 19 | ||||
532 | Natera, Inc. * | 27 | ||||
210 | United Therapeutics Corp. * | 48 | ||||
1,275 | Veracyte, Inc. * | 29 | ||||
499 | Xenon Pharmaceuticals, Inc. (Canada)* | 20 | ||||
|
| |||||
| 204 | ||||||
|
| |||||
BUILDING PRODUCTS—0.5% | ||||||
65 | Carlisle Cos., Inc. | 14 | ||||
201 | Carrier Global Corp. | 9 | ||||
192 | UFP Industries, Inc. | 15 | ||||
|
| |||||
| 38 | ||||||
|
| |||||
CAPITAL MARKETS—1.4% | ||||||
217 | Cohen & Steers, Inc. | 13 | ||||
39 | FactSet Research Systems, Inc. | 16 | ||||
214 | Hamilton Lane, Inc. Class A | 16 | ||||
155 | LPL Financial Holdings, Inc. | 32 | ||||
74 | Morningstar, Inc. | 13 | ||||
167 | Virtus Investment Partners, Inc. | 31 | ||||
|
| |||||
| 121 | ||||||
|
| |||||
CHEMICALS—1.3% | ||||||
3,906 | Element Solutions, Inc. | 71 | ||||
255 | Innospec, Inc. | 26 | ||||
68 | Quaker Chemical Corp. | 13 | ||||
|
| |||||
| 110 | ||||||
|
| |||||
COMMERCIAL SERVICES & SUPPLIES—2.1% | ||||||
375 | ABM Industries, Inc. | 16 | ||||
1,186 | Casella Waste Systems, Inc. Class A* | 106 | ||||
577 | GFL Environmental, Inc. (Canada) | 21 | ||||
125 | Tetra Tech, Inc. | 17 | ||||
80 | UniFirst Corp. | 13 | ||||
|
| |||||
| 173 | ||||||
|
| |||||
COMMUNICATIONS EQUIPMENT—0.4% | ||||||
2,617 | Harmonic, Inc. * | 37 | ||||
|
| |||||
36
Table of Contents
Harbor Small Cap Explorer ETF
PORTFOLIO OF INVESTMENTS—Continued
Value and Cost in Thousands
COMMON STOCKS—Continued |
| |||||
| Shares | Value | |||||
| ||||||
CONSTRUCTION & ENGINEERING—1.0% | ||||||
1,354 | Ameresco, Inc. Class A* | $ | 57 | |||
598 | WillScot Mobile Mini Holdings Corp. * | 27 | ||||
|
| |||||
| 84 | ||||||
|
| |||||
CONSTRUCTION MATERIALS—0.5% | ||||||
1,389 | Summit Materials, Inc. Class A* | 38 | ||||
|
| |||||
CONSUMER FINANCE—0.4% | ||||||
702 | Enova International, Inc. * | 31 | ||||
|
| |||||
CONSUMER STAPLES DISTRIBUTION & RETAIL—2.1% |
| |||||
725 | BJ’s Wholesale Club Holdings, Inc. * | 55 | ||||
78 | Casey’s General Stores, Inc. | 18 | ||||
1,436 | Chefs’ Warehouse, Inc. * | 48 | ||||
417 | Grocery Outlet Holding Corp. * | 12 | ||||
1,111 | Sprouts Farmers Market, Inc. * | 39 | ||||
|
| |||||
| 172 | ||||||
|
| |||||
DISTRIBUTORS—0.2% | ||||||
44 | Pool Corp. | 15 | ||||
|
| |||||
DIVERSIFIED CONSUMER SERVICES—2.7% | ||||||
3,559 | Frontdoor, Inc. * | 97 | ||||
1,053 | Grand Canyon Education, Inc. * | 125 | ||||
|
| |||||
| 222 | ||||||
|
| |||||
DIVERSIFIED REITS—1.1% | ||||||
4,609 | Alexander & Baldwin, Inc. | 89 | ||||
|
| |||||
DIVERSIFIED TELECOMMUNICATION SERVICES—0.2% |
| |||||
244 | Cogent Communications Holdings, Inc. | 17 | ||||
|
| |||||
ELECTRIC UTILITIES—0.0% | ||||||
84 | Portland General Electric Co. | 4 | ||||
|
| |||||
ELECTRICAL EQUIPMENT—1.5% | ||||||
3,280 | Array Technologies, Inc. * | 67 | ||||
2,791 | Enovix Corp. * | 30 | ||||
954 | Fluence Energy, Inc. * | 17 | ||||
182 | Vicor Corp. * | 8 | ||||
|
| |||||
| 122 | ||||||
|
| |||||
ELECTRONIC EQUIPMENT, INSTRUMENTS & COMPONENTS—2.0% |
| |||||
1,877 | 908 Devices, Inc. * | 13 | ||||
3,253 | Akoustis Technologies, Inc. * | 9 | ||||
301 | Cognex Corp. | 15 | ||||
1,152 | Coherent Corp. * | 39 | ||||
111 | Littelfuse, Inc. | 27 | ||||
2,158 | PAR Technology Corp. * | 66 | ||||
|
| |||||
| 169 | ||||||
|
| |||||
ENERGY EQUIPMENT & SERVICES—1.1% | ||||||
728 | Cactus, Inc. Class A | 30 | ||||
1,490 | Liberty Energy, Inc. | 19 | ||||
2,889 | ProPetro Holding Corp. * | 20 | ||||
799 | Ranger Energy Services, Inc. * | 9 | ||||
6,082 | TETRA Technologies, Inc. * | 17 | ||||
|
| |||||
| 95 | ||||||
|
| |||||
ENTERTAINMENT—0.5% | ||||||
1,634 | Lions Gate Entertainment Corp. Class B* | 18 | ||||
482 | Roku, Inc. * | 27 | ||||
|
| |||||
| 45 | ||||||
|
| |||||
COMMON STOCKS—Continued |
| |||||
| Shares | Value | |||||
| ||||||
FINANCIAL SERVICES—2.4% | ||||||
1,141 | Euronet Worldwide, Inc. * | $ | 126 | |||
1,336 | Flywire Corp. * | 39 | ||||
104 | Jack Henry & Associates, Inc. | 17 | ||||
817 | Toast, Inc. Class A* | 15 | ||||
|
| |||||
| 197 | ||||||
|
| |||||
FOOD PRODUCTS—1.3% | ||||||
114 | Conagra Brands, Inc. | 4 | ||||
1,904 | Hostess Brands, Inc. * | 49 | ||||
39 | Lamb Weston Holdings, Inc. | 4 | ||||
532 | Post Holdings, Inc. * | 48 | ||||
105 | Tyson Foods, Inc. Class A | 7 | ||||
|
| |||||
| 112 | ||||||
|
| |||||
GAS UTILITIES—0.6% | ||||||
391 | Brookfield Infrastructure Corp. Class A (Canada) | 17 | ||||
116 | Chesapeake Utilities Corp. | 14 | ||||
391 | National Fuel Gas Co. | 22 | ||||
|
| |||||
| 53 | ||||||
|
| |||||
GROUND TRANSPORTATION—1.4% | ||||||
101 | Landstar System, Inc. | 18 | ||||
1,844 | U-Haul Holding Co. | 100 | ||||
|
| |||||
| 118 | ||||||
|
| |||||
HEALTH CARE EQUIPMENT & SUPPLIES—3.6% | ||||||
2,280 | Bausch & Lomb Corp. * | 40 | ||||
3,812 | CytoSorbents Corp. * | 9 | ||||
3,247 | FIGS, Inc. Class A* | 23 | ||||
198 | Inmode Ltd. * | 7 | ||||
1,507 | Lantheus Holdings, Inc. * | 129 | ||||
331 | LeMaitre Vascular, Inc. | 18 | ||||
283 | OrthoPediatrics Corp. * | 14 | ||||
1,521 | SI-BONE, Inc. * | 34 | ||||
96 | STERIS PLC | 18 | ||||
87 | TransMedics Group, Inc. * | 7 | ||||
|
| |||||
| 299 | ||||||
|
| |||||
HEALTH CARE PROVIDERS & SERVICES—5.0% | ||||||
660 | Acadia Healthcare Co., Inc. * | 48 | ||||
2,965 | AdaptHealth Corp. * | 35 | ||||
1,520 | Castle Biosciences, Inc. * | 34 | ||||
32 | Chemed Corp. | 18 | ||||
1,323 | Encompass Health Corp. | 85 | ||||
252 | Ensign Group, Inc. | 25 | ||||
1,994 | Premier, Inc. Class A | 67 | ||||
125 | Quest Diagnostics, Inc. | 17 | ||||
867 | Select Medical Holdings Corp. | 26 | ||||
735 | Surgery Partners, Inc. * | 29 | ||||
153 | Tenet Healthcare Corp. * | 11 | ||||
190 | U.S. Physical Therapy, Inc. | 20 | ||||
|
| |||||
| 415 | ||||||
|
| |||||
HEALTH CARE TECHNOLOGY—1.0% | ||||||
927 | Definitive Healthcare Corp. * | 10 | ||||
1,888 | Evolent Health, Inc. Class A* | 69 | ||||
1,995 | Renalytix PLC ADR 1 | 4 | ||||
|
| |||||
| 83 | ||||||
|
| |||||
HOTEL & RESORT REITS—0.9% | ||||||
805 | Ryman Hospitality Properties, Inc. | 72 | ||||
|
| |||||
37
Table of Contents
Harbor Small Cap Explorer ETF
PORTFOLIO OF INVESTMENTS—Continued
Value and Cost in Thousands
COMMON STOCKS—Continued |
| |||||
| Shares | Value | |||||
| ||||||
HOTELS, RESTAURANTS & LEISURE—2.6% | ||||||
1,205 | Bloomin’ Brands, Inc. | $ | 30 | |||
1,537 | Boston Pizza Royalties Income Fund (Canada) | 18 | ||||
85 | Churchill Downs, Inc. | 25 | ||||
51 | Domino’s Pizza, Inc. | 16 | ||||
216 | Kura Sushi USA, Inc. Class A* | 15 | ||||
467 | Planet Fitness, Inc. Class A* | 39 | ||||
364 | Portillo’s, Inc. Class A* | 8 | ||||
1,126 | Travel & Leisure Co. | 43 | ||||
117 | Wingstop, Inc. | 23 | ||||
|
| |||||
| 217 | ||||||
|
| |||||
HOUSEHOLD DURABLES—0.2% | ||||||
379 | Lovesac Co. * | 10 | ||||
100 | Taylor Morrison Home Corp. * | 4 | ||||
|
| |||||
| 14 | ||||||
|
| |||||
INDUSTRIAL REITS—0.9% | ||||||
1,290 | Americold Realty Trust, Inc. | 38 | ||||
349 | Granite Real Estate Investment Trust (Canada) | 22 | ||||
249 | Terreno Realty Corp. | 15 | ||||
|
| |||||
| 75 | ||||||
|
| |||||
INSURANCE—3.5% | ||||||
1,429 | Assured Guaranty Ltd. | 77 | ||||
1,080 | CNO Financial Group, Inc. | 24 | ||||
1,021 | First American Financial Corp. | 59 | ||||
131 | Globe Life, Inc. | 14 | ||||
781 | Hagerty, Inc. Class A* | 8 | ||||
523 | James River Group Holdings Ltd. | 10 | ||||
47 | Kinsale Capital Group, Inc. | 15 | ||||
59 | White Mountains Insurance Group Ltd. | 85 | ||||
|
| |||||
| 292 | ||||||
|
| |||||
INTERACTIVE MEDIA & SERVICES—0.3% | ||||||
293 | Shutterstock, Inc. | 20 | ||||
2,841 | System1, Inc. * | 8 | ||||
|
| |||||
| 28 | ||||||
|
| |||||
IT SERVICES—0.8% | ||||||
988 | DigitalOcean Holdings, Inc. * | 31 | ||||
2,562 | Grid Dynamics Holdings, Inc. * | 28 | ||||
40 | VeriSign, Inc. * | 9 | ||||
|
| |||||
| 68 | ||||||
|
| |||||
LEISURE PRODUCTS—1.0% | ||||||
227 | Brunswick Corp. | 19 | ||||
397 | JAKKS Pacific, Inc. * | 9 | ||||
2,538 | Topgolf Callaway Brands Corp. * | 56 | ||||
|
| |||||
| 84 | ||||||
|
| |||||
LIFE SCIENCES TOOLS & SERVICES—1.6% | ||||||
855 | BioLife Solutions, Inc. * | 15 | ||||
689 | CryoPort, Inc. * | 14 | ||||
2,910 | Maravai LifeSciences Holdings, Inc. Class A* | 40 | ||||
2,854 | MaxCyte, Inc. * | 14 | ||||
1,152 | Quanterix Corp. * | 15 | ||||
861 | Syneos Health, Inc. * | 34 | ||||
|
| |||||
| 132 | ||||||
|
| |||||
MACHINERY—5.9% | ||||||
1,390 | Allison Transmission Holdings, Inc. | 68 | ||||
COMMON STOCKS—Continued |
| |||||
| Shares | Value | |||||
| ||||||
MACHINERY—Continued | ||||||
514 | Chart Industries, Inc. * | $ | 68 | |||
3,084 | Commercial Vehicle Group, Inc. * | 23 | ||||
192 | Energy Recovery, Inc. * | 4 | ||||
12,195 | Hillman Solutions Corp. * | 102 | ||||
3,699 | Kornit Digital Ltd. (Israel)* | 67 | ||||
909 | Miller Industries, Inc. | 30 | ||||
73 | Nordson Corp. | 16 | ||||
166 | RBC Bearings, Inc. * | 38 | ||||
153 | Standex International Corp. | 19 | ||||
731 | Timken Co. | 56 | ||||
|
| |||||
| 491 | ||||||
|
| |||||
MEDIA—1.5% | ||||||
23 | Cable One, Inc. | 17 | ||||
9,872 | Magnite, Inc. * | 93 | ||||
95 | Nexstar Media Group, Inc. | 17 | ||||
|
| |||||
| 127 | ||||||
|
| |||||
METALS & MINING—0.6% | ||||||
1,314 | MP Materials Corp. * | 29 | ||||
85 | Reliance Steel & Aluminum Co. | 21 | ||||
|
| |||||
| 50 | ||||||
|
| |||||
MULTI-UTILITIES—0.6% | ||||||
919 | NorthWestern Corp. | 54 | ||||
|
| |||||
OIL, GAS & CONSUMABLE FUELS—3.7% | ||||||
729 | California Resources Corp. | 30 | ||||
58 | Cheniere Energy, Inc. | 9 | ||||
812 | Chesapeake Energy Corp. | 67 | ||||
129 | Chord Energy Corp. | 18 | ||||
727 | Civitas Resources, Inc. | 50 | ||||
890 | Excelerate Energy, Inc. Class A | 19 | ||||
1,318 | Golar LNG Ltd. (Cameroon)* | 30 | ||||
101 | Gulfport Energy Corp. * | 9 | ||||
327 | Matador Resources Co. | 16 | ||||
575 | New Fortress Energy, Inc. | 18 | ||||
630 | Northern Oil & Gas, Inc. | 21 | ||||
5,997 | W&T Offshore, Inc. * | 26 | ||||
|
| |||||
| 313 | ||||||
|
| |||||
PAPER & FOREST PRODUCTS—0.4% | ||||||
3,689 | Mercer International, Inc. (Germany) | 36 | ||||
|
| |||||
PERSONAL CARE PRODUCTS—0.3% | ||||||
154 | Inter Parfums, Inc. | 23 | ||||
|
| |||||
PHARMACEUTICALS—1.3% | ||||||
2,757 | Cymabay Therapeutics, Inc. * | 29 | ||||
692 | Intra-Cellular Therapies, Inc. * | 43 | ||||
430 | Perrigo Co. PLC | 16 | ||||
629 | Pliant Therapeutics, Inc. * | 18 | ||||
|
| |||||
| 106 | ||||||
|
| |||||
PROFESSIONAL SERVICES—5.6% | ||||||
776 | ASGN, Inc. * | 55 | ||||
185 | Booz Allen Hamilton Holding Corp. | 18 | ||||
114 | Broadridge Financial Solutions, Inc. | 17 | ||||
1,426 | Insperity, Inc. | 175 | ||||
605 | KBR, Inc. | 34 | ||||
467 | Maximus, Inc. | 39 | ||||
166 | Science Applications International Corp. | 17 | ||||
38
Table of Contents
Harbor Small Cap Explorer ETF
PORTFOLIO OF INVESTMENTS—Continued
Value and Cost in Thousands
COMMON STOCKS—Continued |
| |||||
| Shares | Value | |||||
| ||||||
PROFESSIONAL SERVICES—Continued | ||||||
159 | TransUnion | $ | 11 | |||
961 | TriNet Group, Inc. * | 89 | ||||
298 | TTEC Holdings, Inc. | 10 | ||||
|
| |||||
| 465 | ||||||
|
| |||||
REAL ESTATE MANAGEMENT & DEVELOPMENT—2.2% | ||||||
6,112 | DigitalBridge Group, Inc. | 76 | ||||
1,040 | eXp World Holdings, Inc. | 12 | ||||
809 | Kennedy-Wilson Holdings, Inc. | 14 | ||||
2,622 | Marcus & Millichap, Inc. | 82 | ||||
|
| |||||
| 184 | ||||||
|
| |||||
RESIDENTIAL REITS—0.2% | ||||||
333 | NexPoint Residential Trust, Inc. | 14 | ||||
SEMICONDUCTORS & SEMICONDUCTOR EQUIPMENT—4.1% |
| |||||
117 | Ambarella, Inc. * | 7 | ||||
744 | Canadian Solar, Inc. (Canada)* | 28 | ||||
237 | Entegris, Inc. | 18 | ||||
1,130 | FormFactor, Inc. * | 31 | ||||
8,782 | indie Semiconductor, Inc. Class A (China)* | 66 | ||||
347 | Kulicke & Soffa Industries, Inc. (Singapore) | 17 | ||||
480 | MACOM Technology Solutions Holdings, Inc. * | 28 | ||||
88 | Onto Innovation, Inc. * | 7 | ||||
815 | Power Integrations, Inc. | 59 | ||||
411 | Universal Display Corp. | 55 | ||||
628 | Wolfspeed, Inc. * | 29 | ||||
|
| |||||
| 345 | ||||||
|
| |||||
SOFTWARE—5.1% | ||||||
4,061 | ACI Worldwide, Inc. * | 103 | ||||
564 | Adeia, Inc. | 4 | ||||
2,760 | Cerence, Inc. * | 70 | ||||
5,613 | Digital Turbine, Inc. * | 66 | ||||
956 | DoubleVerify Holdings, Inc. * | 28 | ||||
262 | Everbridge, Inc. * | 7 | ||||
745 | Five9, Inc. * | 48 | ||||
5,778 | Riskified Ltd. Class A* | 28 | ||||
1,030 | SoundThinking, Inc. * | 31 | ||||
599 | Varonis Systems, Inc. * | 14 | ||||
2,698 | Xperi, Inc. * | 26 | ||||
|
| |||||
| 425 | ||||||
|
| |||||
COMMON STOCKS—Continued |
| |||||
| Shares | Value | |||||
| ||||||
SPECIALIZED REITS—0.5% | ||||||
840 | CubeSmart | $ | 38 | |||
92 | PotlatchDeltic Corp. | 4 | ||||
|
| |||||
| 42 | ||||||
|
| |||||
SPECIALTY RETAIL—2.0% | ||||||
84 | Advance Auto Parts, Inc. | 11 | ||||
93 | Lithia Motors, Inc. | 20 | ||||
290 | Monro, Inc. | 14 | ||||
10,755 | ThredUp, Inc. Class A* | 28 | ||||
605 | Tilly’s, Inc. Class A* | 5 | ||||
1,485 | Upbound Group, Inc. | 40 | ||||
1,386 | Valvoline, Inc. | 48 | ||||
|
| |||||
| 166 | ||||||
|
| |||||
TEXTILES, APPAREL & LUXURY GOODS—1.3% | ||||||
856 | Carter’s, Inc. | 59 | ||||
954 | Skechers USA, Inc. Class A* | 51 | ||||
|
| |||||
| 110 | ||||||
|
| |||||
TRADING COMPANIES & DISTRIBUTORS—2.8% | ||||||
2,822 | Air Lease Corp. | 113 | ||||
1,046 | GMS, Inc. * | 61 | ||||
24 | United Rentals, Inc. | 9 | ||||
384 | WESCO International, Inc. | 55 | ||||
|
| |||||
| 238 | ||||||
|
| |||||
TOTAL COMMON STOCKS | ||||||
(Cost $8,172) | 8,277 | |||||
|
| |||||
EXCHANGE-TRADED FUNDS—0.1% |
| |||||
(Cost $9) | ||||||
CAPITAL MARKETS—0.1% | ||||||
715 | Sprott Physical Uranium Trust* | 9 | ||||
|
| |||||
TOTAL INVESTMENTS—99.1% | ||||||
(Cost $8,181) | 8,286 | |||||
|
| |||||
CASH AND OTHER ASSETS, LESS | 73 | |||||
|
| |||||
TOTAL NET ASSETS—100% | $ | 8,359 | ||||
|
| |||||
FAIR VALUE MEASUREMENTS |
All investments as of April 30, 2023 (as disclosed in the preceding Portfolio of Investments) were classified as Level 1.
For more information on valuation inputs and their aggregation into the levels identified above, please refer to the Fair Value Measurements and Disclosures in Note 2 of the accompanying Notes to Financial Statements.
| * | Non-income producing security. |
| 1 | Depositary receipts such as American Depositary Receipts (ADRs), Global Depositary Receipts (GDRs) and other country specific depositary receipts are certificates evidencing ownership of shares of a foreign issuer.These certificates are issued by depositary banks and generally trade on an established market in the U.S. or elsewhere. |
The accompanying notes are an integral part of the Financial Statements.
39
Table of Contents

40
Table of Contents
Harbor ETF Trust
STATEMENTS OF ASSETS AND LIABILITIES—April 30, 2023 (Unaudited)
(All amounts in thousands, except per share amounts)
| Harbor Commodity All-Weather Strategy ETF (Consolidated) | Harbor Corporate Culture ETF | Harbor Corporate Culture Leaders ETF | Harbor Corporate Culture Small Cap ETF | Harbor Disruptive Innovation ETF | ||||||||||||||||
ASSETS | ||||||||||||||||||||
Investments, at identified cost | $ | 67,222 | $ | 220,920 | $ | 10,793 | $ | 80,798 | $ | 27,017 | ||||||||||
Investments, at value | $ | 67,213 | $ | 239,249 | $ | 10,216 | $ | 80,799 | $ | 26,679 | ||||||||||
Cash | 2,699 | 782 | 17 | 4 | 585 | |||||||||||||||
Due from broker | 7,825 | — | — | — | — | |||||||||||||||
Foreign currency, at value (Cost: $0, $0, $0, $0, $0, $0, $0, $0, $109, $0, $1, $1 and $0) | — | — | — | — | — | |||||||||||||||
Receivables for: | ||||||||||||||||||||
Investment sold | — | — | — | — | — | |||||||||||||||
Capital shares sold | — | — | — | 20,230 | — | |||||||||||||||
Dividends. | — | 124 | 3 | 6 | 1 | |||||||||||||||
Interest | — | — | — | — | — | |||||||||||||||
Unrealized Appreciation on OTC Swap Agreements. | — | — | — | — | — | |||||||||||||||
Variation margin on futures contracts | — | — | — | — | — | |||||||||||||||
Variation margin on centrally cleared swap agreements | — | — | — | — | — | |||||||||||||||
Withholding tax | — | — | — | — | — | |||||||||||||||
Total Assets | 77,737 | 240,155 | 10,236 | 101,039 | 27,265 | |||||||||||||||
LIABILITIES | ||||||||||||||||||||
Payables for: | ||||||||||||||||||||
Investments purchased | 1,478 | — | — | 20,225 | — | |||||||||||||||
Capital shares reacquired | — | — | — | — | — | |||||||||||||||
Accrued management fees | 42 | 67 | 5 | 8 | 18 | |||||||||||||||
Other | — | — | — | — | — | |||||||||||||||
Total Liabilities | 1,520 | 67 | 5 | 20,233 | 18 | |||||||||||||||
NET ASSETS | $ | 76,217 | $ | 240,088 | $ | 10,231 | $ | 80,806 | $ | 27,247 | ||||||||||
Net Assets Consist of: | ||||||||||||||||||||
Paid-in capital | $ | 73,660 | $ | 215,429 | $ | 10,934 | $ | 80,810 | $ | 30,481 | ||||||||||
Total distributable earnings/(loss) | 2,557 | 24,659 | (703 | ) | (4 | ) | (3,234 | ) | ||||||||||||
| $ | 76,217 | $ | 240,088 | $ | 10,231 | $ | 80,806 | $ | 27,247 | |||||||||||
NET ASSET VALUE PER SHARE | ||||||||||||||||||||
Net assets | $ | 76,217 | $ | 240,088 | $ | 10,231 | $ | 80,806 | $ | 27,247 | ||||||||||
Shares of beneficial interest (No par value and unlimited authorizations) | 3,500 | 9,925 | 600 | 3,275 | 2,250 | |||||||||||||||
Net asset value per share1 | $ | 21.78 | $ | 24.19 | $ | 17.05 | $ | 24.67 | $ | 12.11 | ||||||||||
| 1 | Per share amounts can be recalculated to the amounts disclosed herein when total net assets and shares of beneficial interest are not rounded to thousands. |
The accompanying notes are an integral part of the Financial Statements.
41
Table of Contents
| Harbor Dividend Growth Leaders ETF | Harbor Energy | Harbor Health Care ETF | Harbor International Compounders ETF | Harbor Long-Term Growers ETF | Harbor ETF | Harbor Scientific Alpha Income ETF | Harbor Small Cap Explorer ETF | |||||||||||||||||||||||||
| $144,260 | $15,771 | $4,052 | $11,884 | $101,883 | $123,509 | $31,763 | $ 8,181 | |||||||||||||||||||||||||
| $162,689 | $15,772 | $4,188 | $13,565 | $112,270 | $123,281 | $31,116 | $ 8,286 | |||||||||||||||||||||||||
| 6,047 | 2,409 | 11 | 32 | 685 | 1,154 | 441 | 7 | |||||||||||||||||||||||||
| — | 4,637 | — | — | — | — | 269 | — | |||||||||||||||||||||||||
| — | — | — | 110 | — | 1 | 1 | — | |||||||||||||||||||||||||
| 1,085 | — | 21 | — | — | 7,075 | — | 107 | |||||||||||||||||||||||||
| 4,214 | 300 | — | — | — | — | — | 7,516 | |||||||||||||||||||||||||
| 107 | — | — | 19 | 65 | — | — | — | |||||||||||||||||||||||||
| — | — | — | — | — | 2,111 | 449 | — | |||||||||||||||||||||||||
| — | — | — | — | — | — | — | — | |||||||||||||||||||||||||
| — | — | — | — | — | — | 51 | — | |||||||||||||||||||||||||
| — | — | — | — | — | — | 191 | — | |||||||||||||||||||||||||
| — | — | — | 6 | 6 | 1 | 4 | — | |||||||||||||||||||||||||
| 174,142 | 23,118 | 4,220 | 13,732 | 113,026 | 133,623 | 32,522 | 15,916 | |||||||||||||||||||||||||
| 6,105 | 1,590 | 21 | — | — | 94 | 282 | 7,556 | |||||||||||||||||||||||||
| — | — | — | — | — | 6,582 | — | — | |||||||||||||||||||||||||
| 68 | 15 | 3 | 6 | 51 | 49 | 13 | 1 | |||||||||||||||||||||||||
| — | — | — | 2 | 6 | — | — | — | |||||||||||||||||||||||||
| 6,173 | 1,605 | 24 | 8 | 57 | 6,725 | 295 | 7,557 | |||||||||||||||||||||||||
| $167,969 | $21,513 | $4,196 | $13,724 | $112,969 | $126,898 | $32,227 | $ 8,359 | |||||||||||||||||||||||||
| $140,064 | $25,406 | $4,007 | $11,855 | $106,168 | $131,031 | $37,155 | $ 8,258 | |||||||||||||||||||||||||
| 27,905 | (3,893 | ) | 189 | 1,869 | 6,801 | (4,133 | ) | (4,928 | ) | 101 | ||||||||||||||||||||||
| $167,969 | $21,513 | $4,196 | $13,724 | $112,969 | $126,898 | $32,227 | $ 8,359 | |||||||||||||||||||||||||
| $167,969 | $21,513 | $4,196 | $13,724 | $112,969 | $126,898 | $32,227 | $ 8,359 | |||||||||||||||||||||||||
| 13,877 | 1,350 | 200 | 550 | 6,925 | 2,874 | 750 | 275 | |||||||||||||||||||||||||
| $ 12.10 | $ 15.94 | $20.98 | $ 24.95 | $ 16.31 | $ 44.16 | $ 42.97 | $ 30.39 | |||||||||||||||||||||||||
42
Table of Contents
43
Table of Contents
Harbor ETF Trust
STATEMENTS OF OPERATIONS—Period Ended April 30, 2023 (Unaudited)
(All amounts in thousands)
| Harbor Commodity All-Weather Strategy ETF (Consolidated) | Harbor Corporate Culture ETF | Harbor Corporate Culture Leaders ETF | Harbor Corporate Culture Small Cap ETF1 | Harbor Disruptive Innovation ETF | ||||||||||||||||
Investment Income | ||||||||||||||||||||
Dividends | $ | — | $ | 1,864 | $ | 44 | $ | 6 | $ | 13 | ||||||||||
Interest | 1,270 | 2 | — | — | 3 | |||||||||||||||
Consent fee income | — | — | — | — | — | |||||||||||||||
Foreign taxes withheld | — | (4 | ) | — | — | — | ||||||||||||||
Total Investment Income | 1,270 | 1,862 | 44 | 6 | 16 | |||||||||||||||
Operating Expenses | ||||||||||||||||||||
Management fees | 231 | 393 | 22 | 8 | 44 | |||||||||||||||
Net Investment Income/(Loss) | 1,039 | 1,469 | 22 | (2 | ) | (28 | ) | |||||||||||||
Net Realized and Change in Net Unrealized Gain/(Loss) on Investment Transactions | ||||||||||||||||||||
Net realized gain/(loss) on: | ||||||||||||||||||||
Investments | 1 | 5,478 | (99 | ) | (3 | ) | (1,281 | ) | ||||||||||||
Foreign currency transactions | — | — | — | — | — | |||||||||||||||
Futures contracts | — | — | — | — | — | |||||||||||||||
Swap agreements | 1,810 | — | — | — | — | |||||||||||||||
Change in net unrealized appreciation/(depreciation) on: | ||||||||||||||||||||
Investments | 13 | 17,209 | 606 | 1 | 1,715 | |||||||||||||||
Foreign currency transactions | — | — | — | — | — | |||||||||||||||
Futures contracts | — | — | — | — | — | |||||||||||||||
Swap agreements | — | — | — | — | — | |||||||||||||||
Net gain/(loss) on investment transactions | 1,824 | 22,687 | 507 | (2 | ) | 434 | ||||||||||||||
Net Increase/(Decrease) in Net Assets Resulting from Operations | $ | 2,863 | $ | 24,156 | $ | 529 | $ | (4 | ) | $ | 406 | |||||||||
| 1 | For the period April 12, 2023 (commencement of operations) through April 30, 2023 |
| 2 | For the period November 16, 2022 (commencement of operations) through April 30, 2023 |
| 3 | For the period April 26, 2023 (commencement of operations) through April 30, 2023 |
The accompanying notes are an integral part of the Financial Statements.
44
Table of Contents
| Harbor Dividend Growth Leaders ETF | Harbor Energy Transition Strategy ETF (Consolidated) | Harbor Health Care ETF2 | Harbor International Compounders ETF | Harbor Long-Term Growers ETF | Harbor Scientific Alpha High-Yield ETF | Harbor Scientific Alpha Income ETF | Harbor Small Cap Explorer ETF3 | |||||||||||||||||||||||||
| $ | 2,020 | $ | — | $ | 7 | $ | 120 | $ | 376 | $ | — | $ | — | $ | — | |||||||||||||||||
| 21 | 391 | — | — | 4 | 2,806 | 968 | — | |||||||||||||||||||||||||
| — | — | — | — | — | 2 | — | — | |||||||||||||||||||||||||
| (1 | ) | — | — | (15 | ) | (13 | ) | — | — | — | ||||||||||||||||||||||
| 2,040 | 391 | 7 | 105 | 367 | 2,808 | 968 | — | |||||||||||||||||||||||||
| 379 | 90 | 12 | 28 | 272 | 164 | 77 | 1 | |||||||||||||||||||||||||
| 1,661 | 301 | (5 | ) | 77 | 95 | 2,644 | 891 | (1 | ) | |||||||||||||||||||||||
| 9,269 | — | 58 | 112 | (928 | ) | (1,603 | ) | (654 | ) | (3 | ) | |||||||||||||||||||||
| — | — | — | 7 | — | — | — | — | |||||||||||||||||||||||||
| — | — | — | — | — | — | (51 | ) | — | ||||||||||||||||||||||||
| — | (4,107 | ) | — | — | — | — | (78 | ) | — | |||||||||||||||||||||||
| (4,995 | ) | 5 | 136 | 1,969 | 13,733 | 2,145 | 1,620 | 105 | ||||||||||||||||||||||||
| — | — | — | 1 | — | — | — | — | |||||||||||||||||||||||||
| — | — | — | — | — | — | (109 | ) | — | ||||||||||||||||||||||||
| — | — | — | — | — | — | 18 | — | |||||||||||||||||||||||||
| 4,274 | (4,102 | ) | 194 | 2,089 | 12,805 | 542 | 746 | 102 | ||||||||||||||||||||||||
| $ | 5,935 | $ | (3,801 | ) | $ | 189 | $ | 2,166 | $ | 12,900 | $ | 3,186 | $ | 1,637 | $ | 101 | ||||||||||||||||
45
Table of Contents
46
Table of Contents
Harbor ETF Trust
STATEMENTS OF CHANGES IN NET ASSETS
(All amounts in thousands)
| Harbor Commodity All-Weather Strategy ETF (Consolidated) | Harbor Corporate Culture ETF | Harbor Corporate Culture Leaders ETF | Harbor Corporate Culture Small Cap ETF | Harbor Disruptive Innovation ETF | ||||||||||||||||||||||||||||||||
November 1, 2022 through April 30, 2023 | February 9, 2022a through October 31, 2022 | November 1, 2022 through April 30, 2023 | October 12, 2022a through October 31, 2022 | November 1, 2022 through April 30, 2023 | February 23, 2022a through October 31, 2022 | April 12, 2023a through April 30, 2023 | November 1, 2022 through April 30, 2023 | December 1, 2021a through October 31, 2022 | ||||||||||||||||||||||||||||
| INCREASE/(DECREASE) IN NET ASSETS | (Unaudited) | (Unaudited) | (Unaudited) | (Unaudited) | (Unaudited) | |||||||||||||||||||||||||||||||
Operations: | ||||||||||||||||||||||||||||||||||||
Net investment income/(loss) | $ | 1,039 | $ | 103 | $ | 1,469 | $ | 23 | $ | 22 | $ | 7 | $ | (2 | ) | $ | (28 | ) | $ | (11 | ) | |||||||||||||||
Net realized gain/(loss) on investments | 1,811 | (3,647 | ) | 5,478 | (11 | ) | (99 | ) | (45 | ) | (3 | ) | (1,281 | ) | (1,576 | ) | ||||||||||||||||||||
Change in net unrealized appreciation/(depreciation) of investments | 13 | (22 | ) | 17,209 | 1,120 | 606 | (1,183 | ) | 1 | 1,715 | (2,053 | ) | ||||||||||||||||||||||||
Net increase/(decrease) in assets resulting from operations | 2,863 | (3,566 | ) | 24,156 | 1,132 | 529 | (1,221 | ) | (4 | ) | 406 | (3,640 | ) | |||||||||||||||||||||||
Distributions to shareholders | (427 | ) | — | (629 | ) | — | (11 | ) | — | — | — | — | ||||||||||||||||||||||||
Capital Share Transactions: | ||||||||||||||||||||||||||||||||||||
Net proceeds from sale of shares | 9,974 | 74,366 | 39,953 | 216,114 | 2,906 | 8,028 | 80,810 | 21,840 | 10,786 | |||||||||||||||||||||||||||
Reinvestment of distributions | — | — | — | — | — | — | — | — | — | |||||||||||||||||||||||||||
Cost of shares reacquired | — | (6,993 | ) | (40,638 | ) | — | — | — | — | (2,145 | ) | — | ||||||||||||||||||||||||
Net increase/(decrease) derived from capital share transactions | 9,974 | 67,373 | (685 | ) | 216,114 | 2,906 | 8,028 | 80,810 | 19,695 | 10,786 | ||||||||||||||||||||||||||
Net increase/(decrease) in net assets | 12,410 | 63,807 | 22,842 | 217,246 | 3,424 | 6,807 | 80,806 | 20,101 | 7,146 | |||||||||||||||||||||||||||
Net Assets | ||||||||||||||||||||||||||||||||||||
Beginning of period | 63,807 | — | 217,246 | — | 6,807 | — | — | 7,146 | — | |||||||||||||||||||||||||||
End of period | $ | 76,217 | $ | 63,807 | $ | 240,088 | $ | 217,246 | $ | 10,231 | $ | 6,807 | $ | 80,806 | $ | 27,247 | $ | 7,146 | ||||||||||||||||||
Capital Share Transactions (Shares): | ||||||||||||||||||||||||||||||||||||
Shares sold | 450 | 3,375 | 1,700 | 9,975 | 175 | 425 | 3,275 | 1,800 | 625 | |||||||||||||||||||||||||||
Shares issued due to reinvestment of distributions | — | — | — | — | — | — | — | — | — | |||||||||||||||||||||||||||
Shares reacquired | — | (325 | ) | (1,750 | ) | — | — | — | — | (175 | ) | — | ||||||||||||||||||||||||
Net increase/(decrease) in shares outstanding | 450 | 3,050 | (50 | ) | 9,975 | 175 | 425 | 3,275 | 1,625 | 625 | ||||||||||||||||||||||||||
| a | Commencement of Operations |
The accompanying notes are an integral part of the Financial Statements.
47
Table of Contents
| Harbor Dividend Growth Leaders ETF | Harbor Energy Transition Strategy ETF (Consolidated) | Harbor Health Care ETF | Harbor International Compounders ETF | Harbor Long-Term Growers ETF | ||||||||||||||||||||||||||||||||
November 1, 2022 through April 30, 2023 | November 1, 2021 through October 31, 2022 | November 1, 2022 through April 30, 2023 | July 13, 2022a through | November 16, 2022a April 30, 2023 | November 1, 2022 through April 30, 2023 | September 7, 2022a through October 31, 2022 | November 1, 2022 through April 30, 2023 | February 2, 2022a October 31, 2022 | ||||||||||||||||||||||||||||
| (Unaudited) | (Unaudited) | (Unaudited) | (Unaudited) | (Unaudited) | ||||||||||||||||||||||||||||||||
| $ | 1,661 | $ | 2,747 | $ | 301 | $ | 51 | $ | (5 | ) | $ | 77 | $ | 4 | $ | 95 | $ | 10 | ||||||||||||||||||
| 9,269 | 6,653 | (4,107 | ) | (637 | ) | 58 | 119 | (5 | ) | (928 | ) | (2,670 | ) | |||||||||||||||||||||||
| (4,995 | ) | (22,482 | ) | 5 | (4 | ) | 136 | 1,970 | (288 | ) | 13,733 | (3,346 | ) | |||||||||||||||||||||||
| 5,935 | (13,082 | ) | (3,801 | ) | (590 | ) | 189 | 2,166 | (289 | ) | 12,900 | (6,006 | ) | |||||||||||||||||||||||
| (9,167 | ) | (29,990 | ) | (148 | ) | — | — | (8 | ) | — | (53 | ) | — | |||||||||||||||||||||||
| 57,269 | 14,805 | 4,108 | 21,944 | 4,007 | 5,242 | 6,613 | 33,937 | 85,122 | ||||||||||||||||||||||||||||
| — | 29,957 | — | — | — | — | — | — | — | ||||||||||||||||||||||||||||
| (27,743 | ) | (17,845 | ) | — | — | — | — | — | (12,541 | ) | (390 | ) | ||||||||||||||||||||||||
| 29,526 | 26,917 | 4,108 | 21,944 | 4,007 | 5,242 | 6,613 | 21,396 | 84,732 | ||||||||||||||||||||||||||||
| 26,294 | (16,155 | ) | 159 | 21,354 | 4,196 | 7,400 | 6,324 | 34,243 | 78,726 | |||||||||||||||||||||||||||
| 141,675 | 157,830 | 21,354 | — | — | 6,324 | — | 78,726 | — | ||||||||||||||||||||||||||||
| $ | 167,969 | $ | 141,675 | $ | 21,513 | $ | 21,354 | $ | 4,196 | $ | 13,724 | $ | 6,324 | $ | 112,969 | $ | 78,726 | |||||||||||||||||||
| 4,750 | 1,159 | 225 | 1,125 | 200 | 225 | 325 | 2,325 | 5,475 | ||||||||||||||||||||||||||||
| — | 2,109 | — | — | — | — | — | — | — | ||||||||||||||||||||||||||||
| (2,350 | ) | (1,354 | ) | — | — | — | — | — | (850 | ) | (25 | ) | ||||||||||||||||||||||||
| 2,400 | 1,914 | 225 | 1,125 | 200 | 225 | 325 | 1,475 | 5,450 | ||||||||||||||||||||||||||||
48
Table of Contents
Harbor ETF Trust
STATEMENTS OF CHANGES IN NET ASSETS
(All amounts in thousands)
| Harbor Scientific Alpha High-Yield ETF | Harbor Scientific Alpha Income ETF | Harbor Small Cap Explorer ETF | |||||||||||||||||||||||||||||||||||||||||||
| November 1, 2022 through April 30, 2023 | November 1, 2021 through October 31, 2022 | November 1, 2022 through April 30, 2023 | November 1, 2021 through October 31, 2022 | April 26, 2023a through April 30, 2023 | |||||||||||||||||||||||||||||||||||||||||
| INCREASE/(DECREASE) IN NET ASSETS | (Unaudited) | (Unaudited) | (Unaudited) | ||||||||||||||||||||||||||||||||||||||||||
Operations: | |||||||||||||||||||||||||||||||||||||||||||||
Net investment income/(loss) | $ 2,644 | $ 1,645 | $ 891 | $ 991 | $ (1 | ) | |||||||||||||||||||||||||||||||||||||||
Net realized gain/(loss) on investments | (1,603 | ) | (2,912 | ) | (783 | ) | (3,304 | ) | (3 | ) | |||||||||||||||||||||||||||||||||||
Change in net unrealized appreciation/(depreciation) of investments | 2,145 | (1,957 | ) | 1,529 | (1,759 | ) | 105 | ||||||||||||||||||||||||||||||||||||||
Net increase/(decrease) in assets resulting from operations | 3,186 | (3,224 | ) | 1,637 | (4,072 | ) | 101 | ||||||||||||||||||||||||||||||||||||||
Distributions to shareholders | (2,057 | ) | (1,782 | ) | (879 | ) | (981 | ) | — | ||||||||||||||||||||||||||||||||||||
Capital Share Transactions: | |||||||||||||||||||||||||||||||||||||||||||||
Net proceeds from sale of shares | 120,917 | — | 2,155 | — | 8,258 | ||||||||||||||||||||||||||||||||||||||||
Reinvestment of distributions | — | — | — | — | — | ||||||||||||||||||||||||||||||||||||||||
Cost of shares reacquired | (24,986 | ) | — | — | — | — | |||||||||||||||||||||||||||||||||||||||
Net increase/(decrease) derived from capital share transactions | 95,931 | — | 2,155 | — | 8,258 | ||||||||||||||||||||||||||||||||||||||||
Net increase/(decrease) in net assets | 97,060 | (5,006 | ) | 2,913 | (5,053 | ) | 8,359 | ||||||||||||||||||||||||||||||||||||||
Net Assets | |||||||||||||||||||||||||||||||||||||||||||||
Beginning of period | 29,838 | 34,844 | 29,314 | 34,367 | — | ||||||||||||||||||||||||||||||||||||||||
End of period | $126,898 | $29,838 | $32,227 | $29,314 | $8,359 | ||||||||||||||||||||||||||||||||||||||||
Capital Share Transactions (Shares): | |||||||||||||||||||||||||||||||||||||||||||||
Shares sold | 2,747 | — | 50 | — | 275 | ||||||||||||||||||||||||||||||||||||||||
Shares issued due to reinvestment of distributions | — | — | — | — | — | ||||||||||||||||||||||||||||||||||||||||
Shares reacquired | (575 | ) | — | — | — | — | |||||||||||||||||||||||||||||||||||||||
Net increase/(decrease) in shares outstanding | 2,172 | — | 50 | — | 275 | ||||||||||||||||||||||||||||||||||||||||
The accompanying notes are an integral part of the Financial Statements.
49
Table of Contents
Harbor ETF Trust Financial Highlights
SELECTED DATA FOR A SHARE OUTSTANDING FOR THE PERIODS PRESENTED
HARBOR COMMODITY ALL-WEATHER STRATEGY ETF (CONSOLIDATED) | ||||||||||
6-Month Period Ended | Period from February 9, 2022a through October 31, 2022 | |||||||||
| (Unaudited) | ||||||||||
Net asset value beginning of period | $ 20.92 | $ 20.00 | ||||||||
Income from Investment Operations | ||||||||||
Net investment income/(loss)b | 0.33 | 0.04 | ||||||||
Net realized and unrealized gain/(loss) on investments | 0.67 | 0.88 | ||||||||
Total from investment operations | 1.00 | 0.92 | ||||||||
Less Distributions | ||||||||||
Dividends from net investment income | (0.14 | ) | — | |||||||
Total distributions | (0.14 | ) | — | |||||||
Net asset value end of period | 21.78 | 20.92 | ||||||||
Net assets end of period (000s) | $76,217 | $63,807 | ||||||||
Ratios and Supplemental Data (%) | ||||||||||
Total return | 4.78 | %c | 4.60 | %c | ||||||
Ratio of total expenses to average net assets | 0.68 | d | 0.68 | d | ||||||
Ratio of net investment income/(loss) to average net assets | 3.05 | d | 0.27 | d | ||||||
HARBOR CORPORATE CULTURE ETF | ||||||||||
| 6-Month Period Ended April 30, 2023 | Period from October 12, 2022a through October 31, 2022 | |||||||||
| (Unaudited) | ||||||||||
Net asset value beginning of period | $ 21.78 | $ 19.96 | ||||||||
Income from Investment Operations | ||||||||||
Net investment income/(loss)b | 0.15 | 0.01 | ||||||||
Net realized and unrealized gain/(loss) on investments | 2.32 | 1.81 | ||||||||
Total from investment operations | 2.47 | 1.82 | ||||||||
Less Distributions | ||||||||||
Dividends from net investment income | (0.06 | ) | — | |||||||
Total distributions | (0.06 | ) | — | |||||||
Net asset value end of period | 24.19 | 21.78 | ||||||||
Net assets end of period (000s) | $240,088 | $217,246 | ||||||||
Ratios and Supplemental Data (%) | ||||||||||
Total return | 11.39 | %c | 9.12 | %c | ||||||
Ratio of total expenses to average net assets | 0.35 | d | 0.35 | d | ||||||
Ratio of net investment income/(loss) to average net assets | 1.31 | d | 0.98 | d | ||||||
Portfolio turnover^ | 23 | c | 2 | c | ||||||
The accompanying notes are an integral part of the Financial Statements.
50
Table of Contents
Harbor ETF Trust Financial Highlights—Continued
SELECTED DATA FOR A SHARE OUTSTANDING FOR THE PERIODS PRESENTED
HARBOR CORPORATE CULTURE LEADERS ETF | ||||||||||
| 6-Month Period Ended April 30, 2023 | Period from February 23, 2022a through October 31, 2022 | |||||||||
| (Unaudited) | ||||||||||
Net asset value beginning of period | $ 16.02 | $ 19.31 | ||||||||
Income from Investment Operations | ||||||||||
Net investment income/(loss)b | 0.04 | 0.02 | ||||||||
Net realized and unrealized gain/(loss) on investments. | 1.02 | (3.31 | ) | |||||||
Total from investment operations | 1.06 | (3.29 | ) | |||||||
Less Distributions | ||||||||||
Dividends from net investment income | (0.03 | ) | — | |||||||
Total distributions | (0.03 | ) | — | |||||||
Net asset value end of period | 17.05 | 16.02 | ||||||||
Net assets end of period (000s) | $10,231 | $6,807 | ||||||||
Ratios and Supplemental Data (%) | ||||||||||
Total return | 6.60 | %c | (17.04 | )%c | ||||||
Ratio of total expenses to average net assets | 0.50 | d | 0.50 | d | ||||||
Ratio of net investment income/(loss) to average net assets | 0.50 | d | 0.16 | d | ||||||
Portfolio turnover^ | 79 | c | 18 | c | ||||||
HARBOR CORPORATE CULTURE SMALL CAP ETF | ||||||||||
Period from April 30, 2023 | ||||||||||
| (Unaudited) | ||||||||||
Net asset value beginning of period | $ 24.70 | |||||||||
Income from Investment Operations | ||||||||||
Net investment income/(loss)b | (— | )* | ||||||||
Net realized and unrealized gain/(loss) on investments | (0.03 | ) | ||||||||
Total from investment operations | (0.03 | ) | ||||||||
Net asset value end of period | 24.67 | |||||||||
Net assets end of period (000s) | $80,806 | |||||||||
Ratios and Supplemental Data (%) | ||||||||||
Total return | (0.12 | )%c | ||||||||
Ratio of total expenses to average net assets | 0.60 | d | ||||||||
Ratio of net investment income/(loss) to average net assets | (0.16 | )d | ||||||||
Portfolio turnover^ | — | c | ||||||||
The accompanying notes are an integral part of the Financial Statements.
51
Table of Contents
Harbor ETF Trust Financial Highlights—Continued
SELECTED DATA FOR A SHARE OUTSTANDING FOR THE PERIODS PRESENTED
HARBOR DISRUPTIVE INNOVATION ETF | ||||||||||
| 6-Month Period Ended April 30, 2023 | Period from December 1, 2021a through October 31, 2022 | |||||||||
| (Unaudited) | ||||||||||
Net asset value beginning of period | $ 11.43 | $20.00 | ||||||||
Income from Investment Operations | ||||||||||
Net investment income/(loss)b | (0.03 | ) | (0.02 | ) | ||||||
Net realized and unrealized gain/(loss) on investments | 0.71 | (8.55 | ) | |||||||
Total from investment operations | 0.68 | (8.57 | ) | |||||||
Net asset value end of period | 12.11 | 11.43 | ||||||||
Net assets end of period (000s) | $27,247 | $7,146 | ||||||||
Ratios and Supplemental Data (%) | ||||||||||
Total return | 5.95 | %c | (42.85 | )%+,c | ||||||
Ratio of total expenses to average net assets | 0.75 | d | 0.75 | d | ||||||
Ratio of net expenses to average net assets | 0.75 | d | 0.55 | d,e | ||||||
Ratio of net investment income/(loss) to average net assets | (0.49 | )d | (0.18 | )d,e | ||||||
Portfolio turnover^ | 36 | c | 71 | c | ||||||
HARBOR DIVIDEND GROWTH LEADERS ETF |
| |||||||||||||||||||||||||||||
6-Month Period Ended | Year Ended October 31, 2022 | Year Ended October 31, 2021 | Year Ended October 31, 2020 | Year Ended October 31, 2019 | Year Ended October 31, 2018 | |||||||||||||||||||||||||
| (Unaudited) | ||||||||||||||||||||||||||||||
Net asset value beginning of period | $ 12.34 | $ 16.50 | $ 13.13 | $ 12.33 | $ 11.69 | $ 12.21 | ||||||||||||||||||||||||
Income from Investment Operations | ||||||||||||||||||||||||||||||
Net investment income/(loss)b,e | 0.13 | 0.25 | 0.19 | 0.17 | 0.19 | 0.16 | ||||||||||||||||||||||||
Net realized and unrealized gain/(loss) on investments | 0.38 | (1.28 | ) | 4.33 | 0.85 | 1.44 | 0.81 | |||||||||||||||||||||||
Total from investment operations | 0.51 | (1.03 | ) | 4.52 | 1.02 | 1.63 | 0.97 | |||||||||||||||||||||||
Less Distributions | ||||||||||||||||||||||||||||||
Dividends from net investment income | (0.28 | ) | (0.18 | ) | (0.16 | ) | (0.22 | ) | (0.14 | ) | (0.16 | ) | ||||||||||||||||||
Distributions from net realized capital gains | (0.47 | ) | (2.95 | ) | (0.99 | ) | — | (0.85 | ) | (1.33 | ) | |||||||||||||||||||
Total distributions | (0.75 | ) | (3.13 | ) | (1.15 | ) | (0.22 | ) | (0.99 | ) | (1.49 | ) | ||||||||||||||||||
Net asset value end of period | 12.10 | 12.34 | 16.50 | 13.13 | 12.33 | 11.69 | ||||||||||||||||||||||||
Net assets end of period (000s) | $167,969 | $141,675 | $156,827 | $121,448 | $131,791 | $115,153 | ||||||||||||||||||||||||
Ratios and Supplemental Data (%) | ||||||||||||||||||||||||||||||
Total return | 4.27 | %c | (8.48 | )%+ | 36.30 | %+ | 8.28 | %+ | 16.30 | %+ | 8.31 | %+ | ||||||||||||||||||
Ratio of total expenses to average net assets | 0.50 | d | 0.83 | 1.05 | 1.09 | 1.13 | 1.08 | |||||||||||||||||||||||
Ratio of net expenses to average net assets | 0.50 | d | 0.76 | e | 0.95 | e | 0.95 | e | 0.95 | e | 0.95 | e | ||||||||||||||||||
Ratio of net investment income/(loss) to average net assets | 2.19 | d | 1.86 | e | 1.25 | e | 1.39 | e | 1.71 | e | 1.31 | e | ||||||||||||||||||
Portfolio turnover^ | 43 | c | 78 | 62 | 76 | 71 | 69 | |||||||||||||||||||||||
The accompanying notes are an integral part of the Financial Statements.
52
Table of Contents
Harbor ETF Trust Financial Highlights—Continued
SELECTED DATA FOR A SHARE OUTSTANDING FOR THE PERIODS PRESENTED
HARBOR ENERGY TRANSITION STRATEGY ETF (CONSOLIDATED) | ||||||||||
| 6-Month Period Ended April 30, 2023 | Period from July 13, 2022a through October 31, 2022 | |||||||||
| (Unaudited) | ||||||||||
Net asset value beginning of period | $ 18.98 | $ 20.00 | ||||||||
Income from Investment Operations | ||||||||||
Net investment income/(loss)b | 0.24 | 0.05 | ||||||||
Net realized and unrealized gain/(loss) on investments | (3.15 | ) | (1.07 | ) | ||||||
Total from investment operations | (2.91 | ) | (1.02 | ) | ||||||
Less Distributions | ||||||||||
Dividends from net investment income | (0.13 | ) | — | |||||||
Total distributions | (0.13 | ) | — | |||||||
Net asset value end of period | 15.94 | 18.98 | ||||||||
Net assets end of period (000s) | $21,513 | $21,354 | ||||||||
Ratios and Supplemental Data (%) | ||||||||||
Total return | (15.45 | )%c | (5.10 | )%c | ||||||
Ratio of total expenses to average net assets | 0.80 | d | 0.80 | d | ||||||
Ratio of net investment income/(loss) to average net assets | 2.69 | d | 0.74 | d | ||||||
HARBOR HEALTH CARE ETF | ||||||||||
| Period from November 16, 2022a through April 30, 2023 | ||||||||||
| (Unaudited) | ||||||||||
Net asset value beginning of period | $19.86 | |||||||||
Income from Investment Operations | ||||||||||
Net investment income/(loss)b | (0.03 | ) | ||||||||
Net realized and unrealized gain/(loss) on investments | 1.15 | |||||||||
Total from investment operations | 1.12 | |||||||||
Net asset value end of period | 20.98 | |||||||||
Net assets end of period (000s) | $4,196 | |||||||||
Ratios and Supplemental Data (%) | ||||||||||
Total return | 5.64 | %c | ||||||||
Ratio of total expenses to average net assets | 0.80 | d | ||||||||
Ratio of net investment income/(loss) to average net assets | | (0.31 | )d | |||||||
Portfolio turnover^ | 48 | c | ||||||||
The accompanying notes are an integral part of the Financial Statements.
53
Table of Contents
Harbor ETF Trust Financial Highlights—Continued
SELECTED DATA FOR A SHARE OUTSTANDING FOR THE PERIODS PRESENTED
HARBOR INTERNATIONAL COMPOUNDERS ETF | ||||||||||
| 6-Month Period Ended April 30, 2023 | Period from September 7, 2022a through October 31, 2022 | |||||||||
| (Unaudited) | ||||||||||
Net asset value beginning of period | $ 19.46 | $19.89 | ||||||||
Income from Investment Operations | ||||||||||
Net investment income/(loss)b | 0.17 | 0.02 | ||||||||
Net realized and unrealized gain/(loss) on investments | 5.34 | (0.45 | ) | |||||||
Total from investment operations | 5.51 | (0.43 | ) | |||||||
Less Distributions | ||||||||||
Dividends from net investment income | (0.02 | ) | — | |||||||
Total distributions | (0.02 | ) | — | |||||||
Net asset value end of period | 24.95 | 19.46 | ||||||||
Net assets end of period (000s) | $13,724 | $6,324 | ||||||||
Ratios and Supplemental Data (%) | ||||||||||
Total return | 28.35 | %c | (2.16 | )%c | ||||||
Ratio of total expenses to average net assets | 0.55 | d | 0.55 | d | ||||||
Ratio of net investment income/(loss) to average net assets | 1.51 | d | 0.57 | d | ||||||
Portfolio turnover^ | 10 | c | 1 | c | ||||||
HARBOR LONG-TERM GROWERS ETF | ||||||||||
| 6-Month Period Ended April 30, 2023 | Period from February 2, 2022a through October 31, 2022 | |||||||||
| (Unaudited) | ||||||||||
Net asset value beginning of period | $ 14.45 | $ 19.32 | ||||||||
Income from Investment Operations | ||||||||||
Net investment income/(loss)b | 0.01 | — | * | |||||||
Net realized and unrealized gain/(loss) on investments | 1.86 | (4.87 | ) | |||||||
Total from investment operations | 1.87 | (4.87 | ) | |||||||
Less Distributions | ||||||||||
Dividends from net investment income | (0.01 | ) | — | |||||||
Total distributions | (0.01 | ) | — | |||||||
Net asset value end of period | 16.31 | 14.45 | ||||||||
Net assets end of period (000s) | $112,969 | $78,726 | ||||||||
Ratios and Supplemental Data (%) | ||||||||||
Total return | 12.95 | %c | (25.22 | )%c | ||||||
Ratio of total expenses to average net assets | 0.57 | d | 0.57 | d | ||||||
Ratio of net investment income/(loss) to average net assets | 0.20 | d | 0.03 | d | ||||||
Portfolio turnover^ | 26 | c | 24 | c | ||||||
The accompanying notes are an integral part of the Financial Statements.
54
Table of Contents
Harbor ETF Trust Financial Highlights—Continued
SELECTED DATA FOR A SHARE OUTSTANDING FOR THE PERIODS PRESENTED
HARBOR SCIENTIFIC ALPHA HIGH-YIELD ETF | |||||||||||||||
| 6-Month Period Ended April 30, 2023 | Year Ended October 31, 2022 | Period from October 31, 2021 | |||||||||||||
| (Unaudited) | |||||||||||||||
Net asset value beginning of period | $ 42.50 | $ 49.64 | $ 50.00 | ||||||||||||
Income from Investment Operations | |||||||||||||||
Net investment income/(loss)b | 1.67 | 2.34 | 1.70 | ||||||||||||
Net realized and unrealized gain/(loss) on investments | 1.56 | (6.94 | ) | (2.07 | ) | ||||||||||
Total from investment operations | 3.23 | (4.60 | ) | (0.37 | ) | ||||||||||
Less Distributions | |||||||||||||||
Dividends from net investment income | (1.57 | ) | (2.53 | ) | — | ||||||||||
Distributions from net realized capital gains | — | (0.01 | ) | — | |||||||||||
Total distributions. | (1.57 | ) | (2.54 | ) | — | ||||||||||
Net asset value end of period | 44.16 | 42.50 | 49.64 | ||||||||||||
Net assets end of period (000s) | $126,898 | $29,838 | $34,844 | ||||||||||||
Ratios and Supplemental Data (%) | |||||||||||||||
Total return | 7.50 | %c | (9.49 | )% | (0.72 | )%c | |||||||||
Ratio of total expenses to average net assets | 0.48 | d | 0.48 | 0.48 | d | ||||||||||
Ratio of net investment income/(loss) to average net assets | 7.74 | d | 5.13 | 3.42 | d | ||||||||||
Portfolio turnover^ | 24 | c | 114 | 1 | c | ||||||||||
HARBOR SCIENTIFIC ALPHA INCOME ETF | |||||||||||||||
| 6-Month Period Ended April 30, 2023 | Year Ended October 31, 2022 | Period from October 31, 2021 | |||||||||||||
| (Unaudited) | |||||||||||||||
Net asset value beginning of period | $ 41.88 | $ 49.10 | $ 50.00 | ||||||||||||
Income from Investment Operations | |||||||||||||||
Net investment income/(loss)b | 1.22 | 1.42 | 1.00 | ||||||||||||
Net realized and unrealized gain/(loss) on investments | 1.09 | (7.24 | ) | (1.90 | ) | ||||||||||
Total from investment operations | 2.31 | (5.82 | ) | (0.90 | ) | ||||||||||
Less Distributions | |||||||||||||||
Dividends from net investment income | (1.22 | ) | (1.40 | ) | — | ||||||||||
Total distributions. | (1.22 | ) | (1.40 | ) | — | ||||||||||
Net asset value end of period | 42.97 | 41.88 | 49.10 | ||||||||||||
Net assets end of period (000s) | $32,227 | $29,314 | $34,367 | ||||||||||||
Ratios and Supplemental Data (%) | |||||||||||||||
Total return | 5.57 | %c | (12.02 | )% | (1.80 | )%c | |||||||||
Ratio of total expenses to average net assets | 0.50 | d | 0.50 | 0.50 | d | ||||||||||
Ratio of net investment income/(loss) to average net assets | 5.78 | d | 3.15 | 2.02 | d | ||||||||||
Portfolio turnover^ | 44 | c | 124 | — | c | ||||||||||
The accompanying notes are an integral part of the Financial Statements.
55
Table of Contents
Harbor ETF Trust Financial Highlights—Continued
SELECTED DATA FOR A SHARE OUTSTANDING FOR THE PERIODS PRESENTED
HARBOR SMALL CAP EXPLORER ETF | ||||||||||
| Period from April 26, 2023a through April 30, 2023 | ||||||||||
| (Unaudited) | ||||||||||
Net asset value beginning of period | $30.06 | |||||||||
Income from Investment Operations | ||||||||||
Net investment income/(loss)b | (0.01 | ) | ||||||||
Net realized and unrealized gain/(loss) on investments | 0.34 | |||||||||
Total from investment operations | 0.33 | |||||||||
Net asset value end of period | 30.39 | |||||||||
Net assets end of period (000s) | $8,359 | |||||||||
Ratios and Supplemental Data (%) | ||||||||||
Total return | 2.39 | %c | ||||||||
Ratio of total expenses to average net assets | 0.80 | d | ||||||||
Ratio of net investment income/(loss) to average net assets | (0.80 | )d | ||||||||
Portfolio turnover^ | 1 | c | ||||||||
| ^ | Portfolio turnover rate excludes investments received or delivered from in-kind processing of creation unit purchases or redemptions. |
| * | Less than $0.01 |
| + | The total return would have been lower had management fee not been waived during the period shown. |
| a | Commencement of Operations |
| b | Amounts are based on average daily shares outstanding during the period. |
| c | Unannualized |
| d | Annualized |
| e | Reflects the Adviser’s waiver, if any, of its management fee |
The accompanying notes are an integral part of the Financial Statements.
56
Table of Contents
Harbor ETF Trust
NOTES TO FINANCIAL STATEMENTS—April 30, 2023 (Unaudited)
NOTE 1—ORGANIZATIONAL MATTERS |
Harbor ETF Trust (the “Trust”) is registered under the Investment Company Act of 1940, as amended (the “Investment Company Act”), as an open-end management investment company. As of April 30, 2023, the Trust consists of the following separate portfolios (individually or collectively referred to as a “Fund” or the “Funds”, respectively). The shares of each Fund are listed and traded on NYSE Arca, Inc. with the exception of shares of Harbor Commodity All-Weather Strategy ETF (formerly, Harbor All-Weather Inflation Focus ETF), Harbor Dividend Growth Leaders ETF, and Harbor Long-Term Growers ETF that are listed and traded on NYSE. Harbor Capital Advisors, Inc. (the “Adviser” or “Harbor Capital”) is the investment adviser for the Funds.
Harbor Commodity All-Weather Strategy ETF (Consolidated) | Harbor Health Care ETF | |
Harbor Corporate Culture ETF | Harbor International Compounders ETF | |
Harbor Corporate Culture Leaders ETF | Harbor Long-Term Growers ETF | |
Harbor Corporate Culture Small Cap ETF | Harbor Scientific Alpha High-Yield ETF | |
Harbor Disruptive Innovation ETF | Harbor Scientific Alpha Income ETF | |
Harbor Dividend Growth Leaders ETF | Harbor Small Cap Explorer ETF | |
Harbor Energy Transition Strategy ETF (Consolidated) |
Harbor Corporate Culture Small Cap ETF commenced operations on April 12, 2023. Harbor Health Care ETF commenced operations on November 16, 2022. Harbor Small Cap Explorer ETF commenced operations on April 26, 2023.
Effective March 1, 2023, Harbor All-Weather Inflation Focus ETF was renamed Harbor Commodity All-Weather Strategy ETF.
Reorganization
At a meeting held on November 13-14, 2022, the Board of Trustees of the Harbor Funds and of the Trust approved the reorganization of Harbor High-Yield Bond Fund (the “Acquired Fund”), a series of the Harbor Funds, with and into Harbor Scientific Alpha High-Yield ETF (the “Acquiring Fund”), a series of the Trust (the “Reorganization”).
Harbor Capital serves as the investment adviser to the Acquired Fund and the Acquiring Fund. The Adviser believed that the Reorganization provided shareholders opportunity to participate in an ETF with the same investment objective and similar investment strategies, policies and restrictions, opportunity to benefit from additional trading flexibility, increased transparency, lower expenses ratios of the Acquiring Fund, and the potential for enhanced tax efficiency.
The Reorganization was completed on February 24, 2023 (the “Reorganization Date”). The Reorganization was accomplished by (1) the transfer of all of the assets and the liabilities of the Acquired Fund to the Acquiring Fund in exchange for the issuance to the Acquired Fund of shares of the Acquiring Fund with an aggregate net asset value (“NAV”) equal to the aggregate NAV of the shares of the Acquired Fund, minus: (i) the value of cash distributed to shareholders of the Acquired Fund in lieu of fractional shares of the Acquiring Fund; and (ii) the value of cash distributed to shareholders of the Acquired Fund who hold their shares in fund direct individual retirement accounts which were exchanged for cash equal in value to the net asset value of such Acquired Fund shares; and (2) the distribution by the Acquired Fund of shares of the Acquiring Fund to the shareholders of the Acquired Fund in complete liquidation and termination of the Acquired Fund on the Reorganization Date. The Reorganization was structured to qualify as a tax-free reorganization (except with respect to cash received by shareholders of the Acquired Fund) under the Internal Revenue Code for federal income tax purposes; therefore, no gain or loss was recognized by the Acquired Fund or its shareholders as a direct result of the Reorganization.
On the Reorganization Date, 2,697,000 shares of the Acquiring Fund valued at $117,105,000 were exchanged for 13,625,000 of the outstanding Institutional Class shares of the Acquired Fund. The investment portfolio of the Acquired Fund, with a value of $113,955,000 and identified cost of $115,573,000 at the Reorganization Date, was the principal asset acquired by the Acquiring Fund. For financial reporting purposes, assets received and shares issued by the Acquiring Fund were recorded at fair value; however, the cost basis of each of the investments received from the Acquired Fund was carried forward to align ongoing reporting of the Acquiring Fund’s realized and unrealized gains and losses with amounts distributable to shareholders for tax purposes. Immediately prior to the Reorganization, the net assets of the Acquiring Fund were $31,569,000.
57
Table of Contents
Harbor ETF Trust
NOTES TO FINANCIAL STATEMENTS—Continued
The following table reflects the pro-forma results of operations for the period ended April 30, 2023 assuming the Reorganization was completed on November 1, 2022, the beginning of the Acquiring Fund’s current fiscal year.
| Amounts | ||
Acquiring Fund - Pro Forma Results of Operations | (000s) | |
Net Investment Income/(loss) | 6,890a | |
Net gain/(loss) on investment transactions | 3,383b | |
Net increase/(decrease) in net assets resulting from operations | 10,273 |
a As reported, $2,644 plus $4,246 Acquired Fund premerger.
b As reported, $542 plus $2,841 Acquired Fund premerger.
Because the combined investment portfolios have been managed as a single integrated portfolio since the Reorganization was completed, it is not practicable to separate the amounts of revenue and earnings of the Acquired Fund that have been included in the Acquiring Fund’s Statement of Operations since the Reorganization Date.
NOTE 2—SIGNIFICANT ACCOUNTING POLICIES |
The following is a summary of significant accounting policies followed by the Trust in the preparation of its financial statements. Each Fund follows the investment company reporting requirements under U.S. Generally Accepted Accounting Principles (“U.S. GAAP”), which includes the accounting and reporting guidelines under Accounting Standards Codification (“ASC”) Topic 946, Financial Services-Investment Companies. The preparation of financial statements in accordance with U.S. GAAP requires management to make estimates and assumptions that affect the reported amounts and disclosures in the financial statements. Actual results may differ from those estimates.
Security Valuation
Investments are valued pursuant to valuation procedures approved by the Board of Trustees. The valuation procedures permit the Adviser to use a variety of valuation methodologies, consider a number of subjective factors, analyze applicable facts and circumstances and, in general, exercise judgment, when valuing Fund investments. The methodology used for a specific type of investment may vary based on the circumstances and relevant considerations, including available market data.
Equity securities (including common stock, preferred stock, and convertible preferred stock), exchange-traded funds and financial derivative instruments (such as futures contracts, rights and warrants) that are traded on a national securities exchange or system (except securities listed on the National Association of Securities Dealers Automated Quotation (“NASDAQ”) system and United Kingdom securities) are valued at the last sale price on a national exchange or system on which they are principally traded as of the valuation date. Securities listed on the NASDAQ system or a United Kingdom exchange are valued at the official closing price of those securities. In the case of securities for which there are no sales on the valuation day, (i) securities traded principally on a U.S. exchange, including NASDAQ, are valued at the mean (or average) of the closing bid and ask price; and (ii) securities traded principally on a foreign exchange, including United Kingdom securities, are valued at the official bid price determined as of the close of the primary exchange. Shares of open-end registered investment companies that are held by a Fund are valued at net asset value. To the extent these securities are actively traded and fair valuation adjustments are not applied, they are normally categorized as Level 1 in the fair value hierarchy. Equity securities traded on inactive markets or valued by reference to similar instruments are normally categorized as Level 2 in the fair value hierarchy. For more information on the fair value hierarchy, please refer to the Fair Value Measurements and Disclosures section.
Debt securities (including corporate bonds, municipal bonds and notes, U.S. government agencies, U.S. treasury obligations, mortgage-backed and asset-backed securities, foreign government obligations, bank loans, and convertible securities, other than short-term securities, with a remaining maturity of less than 60 days at the time of acquisition) are valued using evaluated prices furnished by a pricing vendor. An evaluated price represents an assessment by the pricing vendor using various market inputs of what the pricing vendor believes is the fair value of a security at a particular point in time. The pricing vendor determines evaluated prices for debt securities that would be transacted at institutional-size quantities using inputs including, but not limited to, (i) recent transaction prices and dealer quotes, (ii) transaction prices for what the pricing vendor believes are securities with similar characteristics, (iii) the pricing vendor’s assessment of the risk inherent in the security taking into account criteria such as credit quality, payment history, liquidity and market conditions, and (iv) various correlations and relationships between security price movements and other factors, such as interest rate changes, which are recognized by institutional traders. In the case of asset-backed and mortgage-backed securities, the inputs used by the pricing vendor may also include information about cash flows, prepayment rates, default rates, delinquency and loss assumption, collateral characteristics, credit enhancements
58
Table of Contents
Harbor ETF Trust
NOTES TO FINANCIAL STATEMENTS—Continued
NOTE 2—SIGNIFICANT ACCOUNTING POLICIES—Continued
and other specific information about the particular offering. Because many debt securities trade infrequently, the pricing vendor will often not have current transaction price information available as an input in determining an evaluated price for a particular security. When current transaction price information is available, it is one input into the pricing vendor’s evaluation process, which means that the evaluated price supplied by the pricing vendor will frequently differ from that transaction price. Securities that use similar valuation techniques and inputs as described above are normally categorized as Level 2 in the fair value hierarchy.
Short-term securities with a remaining maturity of less than 60 days at the time of acquisition that are held by a Fund are valued at amortized cost to the extent amortized cost represents fair value. Such securities are normally categorized as Level 2 in the fair value hierarchy.
Swap agreements (including over-the-counter (“OTC”) and centrally cleared swaps) generally derive their value from underlying asset prices, indices, reference rates and other inputs, or a combination of these factors. The value of these swap agreements is generally determined by a pricing vendor using a series of techniques, including simulation pricing models, or by the counterparties to the OTC swap agreements, typically using its own proprietary models. The pricing models may use inputs such as issuer details, indices, exchange rates, interest rates, yield curves, and credit spreads, that are observed from actively quoted markets. Swap agreements are normally categorized as Level 2 in the fair value hierarchy.
When reliable market quotations or evaluated prices supplied by a pricing vendor are not readily available or are not believed to accurately reflect fair value, securities fair value determinations are made by the Adviser as designated by the Board of Trustees pursuant to the Investment Company Act. Fair value determinations for investments which incorporate significant unobservable inputs are normally categorized as Level 3 in the fair value hierarchy.
Fair Value Measurements and Disclosures
Various inputs may be used to determine the value of each Fund’s investments, which are summarized in three broad categories defined as Level 1, Level 2, and Level 3. The inputs or methodologies used for valuing investments are not necessarily indicative of the risk associated with investing in those investments. The assignment of an investment to Levels 1, 2, or 3 is based on the lowest level of significant inputs used to determine its fair value.
Level 1– | Quoted prices in active markets for identical securities.
| |
Level 2– | Other significant observable inputs (including quoted prices for similar securities, interest rates, prepayment speeds, credit risk, etc.).
| |
Level 3– | Significant unobservable inputs are used in situations where quoted prices or other observable inputs are not available or are deemed unreliable. Significant unobservable inputs may include each Fund’s own assumptions. |
The categorization of investments into Levels 1, 2, or 3, and a summary of significant unobservable inputs used for Level 3 investments, when applicable, can be found at the end of each Fund’s Portfolio of Investments schedule.
Each Fund used observable inputs in its valuation methodologies whenever they were available and deemed reliable.
Investment Income
Dividends declared on portfolio securities are accrued on the ex-dividend date. Dividend information on certain foreign securities may not be available on ex-dividend date, therefore, such dividends will be recorded as soon as reliable information becomes available. Distributions from real estate investment trust securities are recorded as dividend income, and may be reclassified as capital gains and/or return of capital, based on the information reported by the issuer, when available. Interest income is accrued daily as earned. Discounts and premiums on fixed income securities are amortized over the life of the respective securities (except for premiums on certain callable debt securities that amortized to the earliest call date) using the effective yield method. Consent fees relating to corporate actions from investments held are recorded as income upon receipt.
Securities Transactions
Securities transactions are accounted for on the trade date (the date the order to buy or sell is executed). Realized gains or losses on security transactions are determined on the basis of identified cost.
Distribution to Shareholders
Distributions on Fund shares are recorded on the ex-dividend date.
59
Table of Contents
Harbor ETF Trust
NOTES TO FINANCIAL STATEMENTS—Continued
NOTE 2—SIGNIFICANT ACCOUNTING POLICIES—Continued
Basis for Consolidation
Harbor Commodity All-Weather Strategy ETF’s and Harbor Energy Transition Strategy ETF’s Consolidated Portfolios of Investments, Consolidated Statements of Assets and Liabilities, Consolidated Statements of Operations and Consolidated Statements of Changes in Net Assets include the investments and account balances of both the Funds and their wholly owned subsidiary, Harbor Cayman Inflation Focus Ltd and Harbor Cayman Energy Transition Ltd, respectively (individually, the “Subsidiary”). Each Fund’s Subsidiary enables each Fund to hold commodity-related instruments and satisfy regulated investment company tax requirements. Each Fund may invest up to 25% of its total assets in its Subsidiary. All interfund transactions have been eliminated in the consolidation.
Taxes
Each Fund is treated as a separate entity for U.S. federal tax purposes. Each Fund’s policy is to meet the requirements of Subchapter M of the Internal Revenue Code of 1986, as amended (the “Internal Revenue Code”) applicable to regulated investment companies and to distribute to its shareholders all of its taxable income within the prescribed time. It is also the intention of each Fund to distribute an amount sufficient to avoid imposition of any excise tax under Section 4982 of the Internal Revenue Code. Therefore, no provision has been made for U.S. federal taxes on income, capital gains or unrealized appreciation of securities held or excise taxes on income and capital gains.
Each Fund may be subject to taxes imposed by foreign countries in which they invest. Such taxes are provided for in accordance with each Fund’s understanding of the applicable foreign country’s tax law and are generally based on income and/or capital gains earned or repatriated. Taxes are accrued and applied to net investment income, net realized gains and unrealized appreciation as such income and/or gains are earned.
Net realized gains or losses on investments resulting from in-kind creation unit redemptions, if any, are recognized in each Fund’s Statement of Operations. Such realized gains or losses are not taxable to a Fund and are reclassified from Distributable earnings (loss) to Paid-in capital at the end of a Fund’s tax year.
Management has analyzed each Fund’s tax positions on the open tax year (in particular, U.S. federal income tax returns for the tax year ended October 31, 2021), if applicable, including all positions expected to be taken upon filing the 2022 tax return, in all material jurisdictions where each Fund operates, and has concluded that no provision for income tax is required in the Funds’ financial statements. Each Fund will recognize interest and penalties, if any, related to unrecognized tax benefits as income tax expense in the Statement of Operations.
Proceeds from Litigation
Each Fund may receive proceeds from shareholder litigation settlements involving current and/or previously held portfolio holdings. Any proceeds received from litigation involving portfolio holdings are reflected in the Statements of Operations in realized gain/(loss) if the security has been disposed of by a Fund, or in unrealized gain/(loss) if the security is still held by a Fund.
Foreign Currency Translations
Purchases and sales of securities are translated into U.S. dollars at the current exchange rate on the respective dates of the transactions. Income and withholding taxes are translated at the prevailing exchange rate when accrued or incurred. The accounting records of the Funds are maintained in U.S. dollars. Investment securities and other assets and liabilities denominated in a foreign currency, when applicable, are translated into U.S. dollars based on the current exchange rates at period end.
Reported net realized gains and losses on foreign currency transactions, when applicable, represent net gains and losses from sales and maturities of foreign currency contracts, disposition of foreign currencies, currency gains and losses realized between the trade and settlement dates on securities transactions, and the difference between the amount of investment income accrued and tax reclaims receivable and the U.S. dollar amount actually received. The effects of changes in foreign currency exchange rates on investments in securities, when applicable, are included in the net realized and unrealized gain or loss on investments in the Statements of Operations.
Futures Contracts
A futures contract is an agreement between two parties to buy or sell a specified financial instrument at a set price on a future date. Futures contracts tend to increase or decrease a Fund’s exposure to the underlying instrument or can be used to hedge other Fund investments.
60
Table of Contents
Harbor ETF Trust
NOTES TO FINANCIAL STATEMENTS—Continued
NOTE 2—SIGNIFICANT ACCOUNTING POLICIES—Continued
Upon entering into a futures contract, a Fund is required to pledge to the broker an amount of cash, U.S. government securities or other liquid securities equal to the minimum “initial margin” requirements of the exchange. Pursuant to the contract, a Fund agrees to receive from or pay to the broker an amount of cash equal to the fluctuation in value of the contract referred to as “variation margin.” Such receipts or payments are recorded by a Fund as unrealized gains or losses. When the contract is closed or expires, a Fund records a realized gain or loss equal to the difference between the value of the contract at the time it was opened and the value at the time it was closed. A Fund may suffer losses if it is unable to close out its position because of an illiquid secondary market. There is no assurance that a Fund will be able to close out its position when the Fund considers it appropriate or desirable to do so. In the event of adverse price movements, a Fund may be required to continue making cash payments to maintain its required margin. If a Fund has insufficient cash, it may have to sell portfolio securities to meet margin requirements at a time when the Fund would not otherwise elect to do so. In addition, a Fund may be required to deliver or take delivery of instruments. The maximum potential loss on a long futures contract is the U.S. dollar value of the notional amount at the time the contract is opened. The potential loss on a short futures contract is unlimited. There is minimal counterparty risk with futures contracts as they are traded on an exchange and the exchange’s clearinghouse, as counterparty to all exchange-traded futures, guarantees the futures contracts against default.
During the period, Harbor Scientific Alpha Income ETF used futures contracts to gain exposure to the fixed income asset class with greater efficiency and lower cost than was possible through direct investment, to add value when these securities were attractively priced, or to adjust the portfolio’s sensitivity to changes in interest rates.
Swap Agreements
A swap is a contract between two parties to exchange future cash flows at specified intervals (payment dates) based upon a notional principal amount during the agreed-upon life of the contract. Swap agreements may be privately negotiated in the over-the-counter market (“OTC swaps”) or may be cleared through a third party, known as a central clearing party or derivatives clearing organization (“centrally cleared swaps”).
Swaps are fair valued daily and changes in value are recorded as unrealized appreciation or depreciation on the Statements of Operations.
Upon entering a swap agreement, any payments received or made at the beginning of the measurement period are reflected in the Statements of Assets and Liabilities and represent a reconciling value to compensate for differences between the stated terms of the swap agreement and prevailing market conditions (such as credit spreads, currency exchange rates, interest rates, and other relevant factors). These upfront payments are recorded as realized gains or losses on the Statements of Operations upon termination or maturity of the swap. If a liquidation payment is received or made at the termination of the swap, it is recorded as realized gain or loss on the Statements of Operations. Net periodic payments received or paid by a Fund are included as part of realized gains or losses on the Statements of Operations. Daily changes to the fair value of centrally cleared swaps are recorded as Variation margin receivable or payable on centrally cleared swap agreements in the Statements of Assets and Liabilities and are settled daily. An initial margin, typically in form of cash or qualifying highly liquid, high-quality short-term investments, is paid to the central clearing party, derivatives clearing organization or counterparty when the swap contract is executed and is recorded as Due from brokers on the Statements of Assets and Liabilities.
Entering into swap agreements involves, to varying degrees, elements of credit risk, market risk and interest rate risk in excess of the amount recognized in the Statements of Assets and Liabilities. Such risks include the possibility that there is not a liquid market for these agreements, that the counterparty to the agreements may default on its obligation to perform, or that there may be unfavorable changes in market conditions or interest rates. A Fund’s maximum risk of loss from counterparty credit risk is the discounted value of the net cash flows to be received from the counterparty over the contract’s remaining life or the value of the contract. This risk is typically mitigated by the existence of a master netting arrangement between a Fund and the counterparty, the posting of collateral by the counterparty, and the central clearing party, as counterparty to all centrally cleared swaps, guaranteeing the performance of the swaps through the margin requirements.
Credit Default Swaps are agreements between counterparties to buy or sell protection on a debt security, a basket of securities, or an index of obligations against a defined credit event. Under the terms of a credit default swap, the buyer of protection receives credit protection in exchange for making periodic payments to the seller of protection based on a given percentage applied to a notional principal amount. In return for these payments, the seller acts as the guarantor of the creditworthiness of a reference entity, obligation or index. An issuer may represent either a single issuer, a “basket” of issuers, or a credit index. A credit index is a basket of credit instruments or exposures designed to be representative of some part of the credit market as a whole.
61
Table of Contents
Harbor ETF Trust
NOTES TO FINANCIAL STATEMENTS—Continued
NOTE 2—SIGNIFICANT ACCOUNTING POLICIES—Continued
The buyer in a credit default contract is obligated to pay the seller a periodic stream of payments over the term of the contract provided that no credit event occurs. Credit events may include bankruptcy, failure to pay principal, maturity extension, rating downgrade, or write-down. As a seller, if an underlying credit event occurs, a Fund will either pay the buyer an amount equal to the notional amount of the swap and take delivery of the reference obligation (or underlying securities comprising an index), or pay a net settlement amount of cash equal to the notional amount of the swap less the recovery value of the reference obligation (or underlying securities comprising an index). As a buyer, if an underlying credit event occurs, a Fund will either receive from the seller an amount equal to the notional amount of the swap and deliver the reference obligation (or underlying securities comprising an index) or receive a net settlement.
During the period, Harbor Scientific Alpha Income ETF used credit default swap agreements as a buyer to provide a measure of protection against defaults of an issuer.
Excess Return Swaps are agreements between counterparties to exchange the return of a given underlying index. Under the terms of the agreement, a Fund will make payments based on a set rate in exchange for payments from the counterparty based on the return of the underlying assets comprising the index. If the returns on the underlying assets are positive, the counterparty will pay the Fund, and if the returns are negative, the Fund will make payments to the counterparty. The excess return swap held by Harbor Commodity All-Weather Strategy ETF (Consolidated) and Harbor Energy Transition Strategy ETF (Consolidated), which generally are reset monthly, may be terminated by the Funds at any time.
During the period, Harbor Commodity All-Weather Strategy ETF (Consolidated) and Harbor Energy Transition Strategy ETF (Consolidated) used excess return swaps to gain exposure to commodities markets.
Other Matters
The Funds in the normal course of business invest in financial instruments where the risk of potential loss exists due to changes in the market, economic, political and regulatory developments, as well as events such as war, terrorism or spread of infectious disease (market risk) or failure or inability of the counterparty to a transaction to perform (credit and counterparty risk). In addition, certain Funds invest in foreign securities and as such are also subject to foreign currencies and foreign securities risks. Each Fund’s prospectus provides further details regarding the Fund’s principal risks.
NOTE 3—INVESTMENT PORTFOLIO TRANSACTIONS |
Investment Portfolio Transactions
Purchases and sales of investments, other than short-term securities, U.S. government obligations, and in-kind transactions, if any, for each Fund for the period ended April 30, 2023 were as follows:
| Purchases (000s) | Sales (000s) | |||||||
Harbor Commodity All-Weather Strategy ETF (Consolidated) | $ | — | $ | — | ||||
Harbor Corporate Culture ETF | 62,981 | 52,055 | ||||||
Harbor Corporate Culture Leaders ETF | 7,006 | 7,016 | ||||||
Harbor Corporate Culture Small Cap ETF | 82 | 82 | ||||||
Harbor Disruptive Innovation ETF | 5,111 | 4,573 | ||||||
Harbor Dividend Growth Leaders ETF | 69,479 | 65,380 | ||||||
Harbor Energy Transition Strategy ETF (Consolidated) | — | — | ||||||
Harbor Health Care ETF | 1,587 | 1,588 | ||||||
Harbor International Compounders ETF | 1,631 | 1,064 | ||||||
Harbor Long-Term Growers ETF | 24,172 | 24,321 | ||||||
Harbor Scientific Alpha High-Yield ETF | 17,935 | 18,367 | ||||||
Harbor Scientific Alpha Income ETF | 13,160 | 13,633 | ||||||
Harbor Small Cap Explorer ETF | 111 | 107 | ||||||
62
Table of Contents
Harbor ETF Trust
NOTES TO FINANCIAL STATEMENTS—Continued
NOTE 3—INVESTMENT PORTFOLIO TRANSACTIONS—Continued
For the period ended April 30, 2023, the following Funds engaged in in-kind transactions associated with Creation Unit purchases and redemptions:
| Purchases (000s) | Sales (000s) | |||||||
Harbor Corporate Culture ETF | $ | 28,446 | $ | 40,433 | ||||
Harbor Corporate Culture Leaders ETF | 2,912 | — | ||||||
Harbor Corporate Culture Small Cap ETF | 80,801 | — | ||||||
Harbor Disruptive Innovation ETF | 20,878 | 2,073 | ||||||
Harbor Dividend Growth Leaders ETF | 54,568 | 35,954 | ||||||
Harbor Health Care ETF | 3,995 | — | ||||||
Harbor International Compounders ETF | 4,698 | — | ||||||
Harbor Long-Term Growers ETF | 33,681 | 12,441 | ||||||
Harbor Scientific Alpha High-Yield ETF | 2,103 | 24,212 | ||||||
Harbor Scientific Alpha Income ETF | 2,094 | — | ||||||
Harbor Small Cap Explorer ETF | 8,182 | — | ||||||
NOTE 4—CAPITAL SHARE TRANSACTIONS |
Capital shares are issued and redeemed by each Fund only in aggregations of a specified number of shares or multiples thereof (“Creation Units”) at net asset value (“NAV”). The Adviser determines the number of shares that constitutes a Creation Unit and only authorized participants are permitted to purchase or redeem Creation Units from the Funds. Except when aggregated in Creation Units, shares of each Fund are not redeemable. The consideration for the purchase of Creation Units of a Fund generally consists of the in-kind deposit of a designated portfolio of securities and a specified amount of cash. Unless cash-only redemptions are available or specified for a Fund, the redemption proceeds for Creation Units will generally consist of a designated portfolio of securities and a specified amount of cash. Authorized participants purchasing and redeeming Creation Units may pay a purchase transaction fee and a redemption transaction fee directly to State Street Bank and Trust Company, the Trust’s custodian, to offset transfer and other transaction costs associated with the issuance and redemption of Creation Units, including Creation Units for cash. Authorized participants transacting in Creation Units for cash may also pay an additional variable charge to compensate the relevant fund for certain transaction costs (i.e., stamp taxes, taxes on currency or other financial transactions, and brokerage costs) and market impact expenses relating to investing in portfolio securities. Such variable charges, if any, are included in Net proceeds from sale of shares in the Statements of Changes in Net Assets.
From time to time, settlement of securities related to the purchase or redemption of Creation Units may be delayed and are reflected as Capital shares sold or Capital shares reacquired in the Statement of Assets and Liabilities.
NOTE 5—FEES AND OTHER TRANSACTIONS WITH AFFILIATES |
Investment Adviser
Harbor Capital is a wholly owned subsidiary of ORIX Corporation. Harbor Capital is the Funds’ investment adviser and is also responsible for administrative and other services. Each Fund has a separate advisory agreement with Harbor Capital. Pursuant to the advisory agreement, the Adviser pays all of the operating expenses of the Fund, except for (i) the fee payment under the investment advisory agreement; (ii) payments under each Fund’s 12b-1 plan (if any); (iii) the costs of borrowing, including interest and dividend expenses; (iv) taxes and governmental fees; (v) acquired fund fees and expenses; (vi) brokers’ commissions and any other transaction related expenses and fees arising out of transactions effected on behalf of the Fund; (vii) costs of holding shareholder meetings; (viii) any gains or losses attributable to investments under a deferred compensation plan for Trustees who are not “interested persons” of the Trust; and (ix) litigation and indemnification expenses and other extraordinary expenses not incurred in the ordinary course of the Fund’s business.
63
Table of Contents
Harbor ETF Trust
NOTES TO FINANCIAL STATEMENTS—Continued
NOTE 5—FEES AND OTHER TRANSACTIONS WITH AFFILIATES—Continued
The advisory agreements provide for a unitary management fee based on an annual percentage rate of average daily net assets as follows:
Unitary | ||
Harbor Commodity All-Weather Strategy ETF (Consolidated) | 0.68% | |
Harbor Corporate Culture ETF | 0.35 | |
Harbor Corporate Culture Leaders ETF | 0.50 | |
Harbor Corporate Culture Small Cap ETF | 0.60 | |
Harbor Disruptive Innovation ETF | 0.75 | |
Harbor Dividend Growth Leaders ETF | 0.50 | |
Harbor Energy Transition Strategy ETF (Consolidated) | 0.80 | |
Harbor Health Care ETF | 0.80 | |
Harbor International Compounders ETF | 0.55 | |
Harbor Long-Term Growers ETF | 0.57 | |
Harbor Scientific Alpha High-Yield ETF | 0.48 | |
Harbor Scientific Alpha Income ETF | 0.50 | |
Harbor Small Cap Explorer ETF | 0.80 |
Independent Trustees
The Adviser is responsible for bearing expenses associated with Independent Trustees’ compensation pursuant to the unitary management fee arrangement with each Fund.
Affiliated Transactions
The Investment Company Act permits purchase and sale transactions among affiliated investment companies subject to an exemptive rule. The Trust has adopted policies and procedures pursuant to such rule. During the period, the Funds did not enter into any transactions with any other Harbor fund.
Indemnification
Under the Trust’s organizational documents, its officers and Trustees are indemnified against certain liabilities arising out of the performance of their duties to the Trust. In addition, in the normal course of business the Trust enters into contracts that provide general indemnities to other parties. The Trust’s maximum exposure under these arrangements is unknown as this would involve future claims that may be made against the Trust that have not yet occurred. The risk of material loss as a result of such indemnification claims is considered remote.
64
Table of Contents
Harbor ETF Trust
NOTES TO FINANCIAL STATEMENTS—Continued
NOTE 6—TAX INFORMATION |
The identified cost for federal income tax purposes of investments owned by each Fund and its respective gross unrealized appreciation and depreciation as of April 30, 2023 were as follows:
Gross Unrealized | Net Unrealized | |||||||||||||||||||
Identified Cost | Appreciation | (Depreciation) | ||||||||||||||||||
Harbor Commodity All-Weather Strategy ETF (Consolidated) | $ | 67,222 | $ | 5 | $ | (14) | $ | (9) | ||||||||||||
Harbor Corporate Culture ETF | 220,920 | 24,714 | (6,385) | 18,329 | ||||||||||||||||
Harbor Corporate Culture Leaders ETF* | 10,793 | 560 | (1,137) | (577) | ||||||||||||||||
Harbor Corporate Culture Small Cap ETF | 80,798 | 1,044 | (1,043) | 1 | ||||||||||||||||
Harbor Disruptive Innovation ETF* | 27,017 | 1,091 | (1,429) | (338) | ||||||||||||||||
Harbor Dividend Growth Leaders ETF | 144,260 | 20,821 | (2,392) | 18,429 | ||||||||||||||||
Harbor Energy Transition Strategy ETF (Consolidated) | 15,771 | 1 | — | 1 | ||||||||||||||||
Harbor Health Care ETF | 4,052 | 342 | (206) | 136 | ||||||||||||||||
Harbor International Compounders ETF* | 11,993 | 1,729 | (47) | 1,682 | ||||||||||||||||
Harbor Long-Term Growers ETF* | 101,883 | 13,001 | (2,614) | 10,387 | ||||||||||||||||
Harbor Scientific Alpha High-Yield ETF* | 123,509 | 2,207 | (2,435) | (228) | ||||||||||||||||
Harbor Scientific Alpha Income ETF* | 31,763 | 475 | (1,227) | (752) | ||||||||||||||||
Harbor Small Cap Explorer ETF | 8,181 | 123 | (18) | 105 | ||||||||||||||||
| * | Capital loss carryforwards are available, which may reduce taxable income from future net realized gain on investments. |
NOTE 7—DERIVATIVES |
Each Fund’s derivative holdings do not qualify for hedge accounting treatment and as such are recorded at current fair value. For a discussion of risks related to these investments please refer to the descriptions of each type of derivative instrument in Note 2– Significant Accounting Policies.
Each Fund’s derivative instruments outstanding as of the period ended April 30, 2023, if any, as disclosed in the Portfolio of Investments, and the related amounts of net realized and changes in net unrealized gains and losses on derivative instruments during the period as disclosed in the Statement of Operations, are indicators of the volume of derivative activity for each Fund.
Derivative Instruments
As of April 30, 2023, the fair values of derivatives, by primary risk exposure, were reflected in the Statement of Assets and Liabilities as follows:
HARBOR COMMODITY ALL-WEATHER STRATEGY ETF (CONSOLIDATED)
Statement of Assets and Liabilities Caption | Total | |||
Assets | ||||
Unrealized appreciation on OTC swap agreements | $— | |||
HARBOR ENERGY TRANSITION STRATEGY ETF (CONSOLIDATED)
Statement of Assets and Liabilities Caption | Total | |||
Assets | ||||
Unrealized appreciation on OTC swap agreements | $— | |||
65
Table of Contents
Harbor ETF Trust
NOTES TO FINANCIAL STATEMENTS—Continued
NOTE 7—DERIVATIVES—Continued
HARBOR SCIENTIFIC ALPHA INCOME ETF
Statement of Assets and Liabilities Caption | Interest Rate | Credit | Total | |||||||||
Assets | ||||||||||||
Variation margin on futures contractsa | $ 1 | $— | $ 1 | |||||||||
Liabilities | ||||||||||||
Variation margin on centrally cleared swap agreementsa,b | — | (40) | (40) | |||||||||
Variation margin on futures contractsa | (106) | — | (106) | |||||||||
| a | Balance includes cumulative appreciation/depreciation of contracts as reported in the Portfolio of Investments. Only current day’s variation margin is reported within the Statement of Assets and Liabilities. |
| b | Net of upfront premium received of $51 |
Net realized gain/(loss) and the change in net unrealized appreciation/(depreciation) on derivatives for the period ended April 30, 2023, were:
HARBOR COMMODITY ALL-WEATHER STRATEGY ETF (CONSOLIDATED)
Equity | ||
Net realized gain/(loss) on derivatives | ||
Swap agreements | $1,810 | |
Equity | ||
Change in net unrealized appreciation/(depreciation) on derivatives | ||
Swap agreements | $ — | |
| HARBOR ENERGY TRANSITION STRATEGY ETF (CONSOLIDATED) | ||
Equity | ||
Net realized gain/(loss) on derivatives | ||
Swap agreements | $(4,107) | |
Equity | ||
Change in net unrealized appreciation/(depreciation) on derivatives | ||
Swap agreements | $ — | |
66
Table of Contents
Harbor ETF Trust
NOTES TO FINANCIAL STATEMENTS—Continued
NOTE 7—DERIVATIVES—Continued
HARBOR SCIENTIFIC ALPHA INCOME ETF
Interest Rate | Credit | Total | |||||||||||||
Net realized gain/(loss) on derivatives | |||||||||||||||
Futures Contracts | $ | (51 | ) | $ | — | $ | (51 | ) | |||||||
Swap agreements | — | (78 | ) | (78 | ) | ||||||||||
|
|
|
|
|
| ||||||||||
Net realized gain/(loss) on derivatives | $ | (51 | ) | $ | (78 | ) | $ | (129 | ) | ||||||
|
|
|
|
|
| ||||||||||
Interest Rate | Credit | Total | |||||||||||||
Change in net unrealized appreciation/(depreciation) on derivatives | |||||||||||||||
Futures Contracts | $ | (109 | ) | $ | — | $ | (109 | ) | |||||||
Swap agreements | — | 18 | 18 | ||||||||||||
|
|
|
|
|
| ||||||||||
Change in net unrealized appreciation/(depreciation) on derivatives | $ | (109 | ) | $ | 18 | $ | (91 | ) | |||||||
|
|
|
|
|
| ||||||||||
NOTE 8—OFFSETTING ASSETS AND LIABILITIES |
Master Netting Arrangements
As described in further detail below, a Fund may enter into Master Netting Arrangements that govern the terms of certain transactions. Master Netting Arrangements are designed to reduce the counterparty risk associated with relevant transactions by establishing credit protection mechanisms and providing standardization as a means of improving legal certainty. As Master Netting Arrangements are specific to the unique operations of different asset types, they allow a Fund to close out and net its total exposure to a counterparty in the event of a default with respect to all of the transactions governed under a single agreement with that counterparty. Master Netting Arrangements can also help reduce counterparty risk by specifying collateral posting requirements at pre-arranged exposure levels. Securities and cash pledged as collateral are reflected as assets in the Consolidated Statements of Assets and Liabilities as either a component of investments at value (securities) or due from broker. Cash collateral received is not typically held in a segregated account and, as such, is reflected as a liability in the Consolidated Statements of Assets and Liabilities as due to broker. The fair value of any securities received as collateral is not reflected as a component of net asset value.
For the period ended April 30, 2023, the following Master Netting Arrangements have been entered into as follows:
International Swaps and Derivatives Association, Inc. (ISDA) Master Agreements and Credit Support Annexes, which govern over-the-counter market traded financial derivative transactions entered into by a Fund and select counterparties. As of April 30, 2023, Harbor Commodity All-Weather Strategy ETF (Consolidated) and Harbor Energy Transition Strategy ETF (Consolidated) had investment exposures subject to the terms of these agreements.
67
Table of Contents
Harbor ETF Trust
NOTES TO FINANCIAL STATEMENTS—Continued
NOTE 8—OFFSETTING ASSETS AND LIABILITIES—Continued
The following is a summary by counterparty of the value of OTC financial derivative instruments and collateral (received)/pledged as governed by International Swaps and Derivatives Association, Inc. master agreements as of April 30, 2023.
HARBOR COMMODITY ALL-WEATHER STRATEGY ETF (CONSOLIDATED)
Financial Derivative Liabilities | ||||||||||||
Counterparty | Swap Agreements (000s) | Collateral | Net | |||||||||
Harbor Cayman Inflation Focus Ltd. (Subsidiary)a | ||||||||||||
Macquarie Bank Limited | $— | $(7,825) | $— | |||||||||
HARBOR ENERGY TRANSITION STRATEGY ETF (CONSOLIDATED)
Financial Derivative Liabilities | ||||||||||||
Counterparty | Swap Agreements (000s) | Collateral | Net | |||||||||
Harbor Cayman Energy Transition Ltd. (Subsidiary)a | ||||||||||||
Goldman Sachs International | $— | $(4,637) | $— | |||||||||
| * | Of the total collateral received and/or pledged listed in the above table, cash of $7,825 and $4,637 included in “Due from broker” on the Consolidated Statements of Assets and Liabilities, was received as collateral for Harbor Cayman Inflation Focus Ltd and Harbor Cayman Energy Transition Ltd, respectively. |
| a | Harbor Cayman Inflation Focus Ltd. and Harbor Cayman Energy Transition Ltd. are recognized as separate legal entities for the purpose of the ISDA agreement. |
Exchange traded and centrally cleared derivatives are not subject to master netting or similar arrangements.
NOTE 9—SUBSEQUENT EVENTS |
Through the date the financial statements were issued, there were no subsequent events or transactions that would have materially impacted the financial statements or related disclosures as presented herein.
68
Table of Contents
Harbor ETF Trust
FEES AND EXPENSES EXAMPLE (Unaudited)
Example
As a shareholder of a Fund, you incur two types of costs: (1) transaction costs, including redemption fees (if any) and (2) ongoing costs, including management fees and other Fund expenses (with certain exceptions). This example is intended to help you understand your ongoing costs (in dollars) of investing in a Fund and to compare these costs with the ongoing costs of investing in other funds. You may also pay brokerage commissions in connection with your purchase or sale of shares of a Fund, which are not shown in this section and would have resulted in higher costs.
The example is based on an investment of $1,000 invested at the beginning of the period and held for the entire period November 1, 2022 through April 30, 2023.
Actual Expenses
The first line of the table below provides information about actual account values and actual expenses. You may use the information, together with the amount you invested, to estimate the expenses that you paid over the period. Simply divide your account value by $1,000 (for example, an $8,600 account value divided by $1,000 = 8.6), then multiply the result by the number in the first line of the respective class under the heading entitled “Expenses Paid During Period” to estimate the expenses you paid on your account during this period.
Hypothetical Example for Comparison Purposes
The second line of the table below provides information about hypothetical account values and hypothetical expenses based on the respective Fund’s actual expense ratio and an assumed rate of return of 5% per year before expenses, which is not the respective Fund’s actual return. The hypothetical account values and expenses may not be used to estimate the actual ending account balance or expenses you paid for the period. You may use this information to compare the ongoing costs of investing in a Fund to other funds. To do so, compare this 5% hypothetical example with the 5% hypothetical examples that appear in the shareholder reports of the other funds.
Please note that the expenses shown in the table are meant to highlight your ongoing costs only and do not reflect any transactional costs, such as redemption fees or brokerage commissions. Therefore, the second line of the table is useful in comparing ongoing costs only, and will not help you determine the relative total costs of owning different funds. In addition, if these transactional costs and brokerage commissions were included, your costs would have been higher.
| Annualized Expense Ratios | Expenses Paid During Period* | Beginning Account Value (November 1, 2022) | Ending Account Value (April 30, 2023) | |||||||||||||||||
HARBOR COMMODITY ALL-WEATHER STRATEGY ETF |
| |||||||||||||||||||
ETF | 0.68 | % | ||||||||||||||||||
Actual | $3.45 | $1,000 | $1,047.80 | |||||||||||||||||
Hypothetical (5% return) | 3.41 | 1,000 | 1,021.34 | |||||||||||||||||
HARBOR CORPORATE CULTURE ETF |
| |||||||||||||||||||
ETF | 0.35 | % | ||||||||||||||||||
Actual | $1.84 | $1,000 | $1,113.90 | |||||||||||||||||
Hypothetical (5% return) | 1.76 | 1,000 | 1,023.02 | |||||||||||||||||
HARBOR CORPORATE CULTURE LEADERS ETF |
| |||||||||||||||||||
ETF | 0.50 | % | ||||||||||||||||||
Actual | $2.56 | $1,000 | $1,066.00 | |||||||||||||||||
Hypothetical (5% return) | 2.51 | 1,000 | 1,022.25 | |||||||||||||||||
HARBOR CORPORATE CULTURE SMALL CAP ETF1 |
| |||||||||||||||||||
ETF | 0.60 | % | ||||||||||||||||||
Actual | $0.31 | $1,000 | $998.80 | |||||||||||||||||
Hypothetical (5% return) | 0.31 | 1,000 | 1,002.29 | |||||||||||||||||
HARBOR DISRUPTIVE INNOVATION ETF |
| |||||||||||||||||||
ETF | 0.75 | % | ||||||||||||||||||
Actual | $3.83 | $1,000 | $1,059.50 | |||||||||||||||||
Hypothetical (5% return) | 3.76 | 1,000 | 1,020.98 | |||||||||||||||||
69
Table of Contents
Harbor ETF Trust
FEES AND EXPENSES EXAMPLE (Unaudited)—Continued
| Annualized Expense Ratios | Expenses Paid During Period* | Beginning Account Value (November 1, 2022) | Ending Account Value (April 30, 2023) | |||||||||||||||||
HARBOR DIVIDEND GROWTH LEADERS ETF |
| |||||||||||||||||||
ETF | 0.50 | % | ||||||||||||||||||
Actual | $2.53 | $1,000 | $1,042.70 | |||||||||||||||||
Hypothetical (5% return) | 2.51 | 1,000 | 1,022.25 | |||||||||||||||||
HARBOR ENERGY TRANSITION STRATEGY ETF |
| |||||||||||||||||||
ETF | 0.80 | % | ||||||||||||||||||
Actual | $3.66 | $1,000 | $845.50 | |||||||||||||||||
Hypothetical (5% return) | 4.01 | 1,000 | 1,020.73 | |||||||||||||||||
HARBOR HEALTH CARE ETF2 |
| |||||||||||||||||||
ETF | 0.80 | % | ||||||||||||||||||
Actual | $3.74 | $1,000 | $1,056.40 | |||||||||||||||||
Hypothetical (5% return) | 3.67 | 1,000 | 1,019.02 | |||||||||||||||||
HARBOR INTERNATIONAL COMPOUNDERS ETF |
| |||||||||||||||||||
ETF | 0.55 | % | ||||||||||||||||||
Actual | $3.12 | $1,000 | $1,283.50 | |||||||||||||||||
Hypothetical (5% return) | 2.76 | 1,000 | 1,022.00 | |||||||||||||||||
HARBOR LONG-TERM GROWERS ETF |
| |||||||||||||||||||
ETF | 0.57 | % | ||||||||||||||||||
Actual | $3.01 | $1,000 | $1,129.50 | |||||||||||||||||
Hypothetical (5% return) | 2.86 | 1,000 | 1,021.90 | |||||||||||||||||
HARBOR SCIENTIFIC ALPHA HIGH-YIELD ETF |
| |||||||||||||||||||
ETF | 0.48 | % | ||||||||||||||||||
Actual | $2.47 | $1,000 | $1,075.00 | |||||||||||||||||
Hypothetical (5% return) | 2.41 | 1,000 | 1,022.36 | |||||||||||||||||
HARBOR SCIENTIFIC ALPHA INCOME ETF |
| |||||||||||||||||||
ETF | 0.50 | % | ||||||||||||||||||
Actual | $2.55 | $1,000 | $1,055.70 | |||||||||||||||||
Hypothetical (5% return) | 2.51 | 1,000 | 1,022.25 | |||||||||||||||||
HARBOR SMALL CAP EXPLORER ETF3 |
| |||||||||||||||||||
ETF | 0.80 | % | ||||||||||||||||||
Actual | $0.11 | $1,000 | $1,023.90 | |||||||||||||||||
Hypothetical (5% return) | 0.11 | 1,000 | 1,000.58 | |||||||||||||||||
| * | Expenses are equal to the Fund’s annualized net expense ratio, multiplied by the average account value over the period, multiplied by 181/365 (to reflect the one-half year period). |
| 1 | Fund has less than six months of operating history. Expenses are equal to the Fund’s annualized net expense ratio, multiplied by the average account value over the period, multiplied by 19/365 (to reflect the period since the commencement of operations). The expense amounts reported under Hypothetical (5% return) are not comparable to the amount reported using actual fund return. |
| 2 | Fund has less than six months of operating history. Expenses are equal to the Fund’s annualized net expense ratio, multiplied by the average account value over the period, multiplied by 166/365 (to reflect the period since the commencement of operations). The expense amounts reported under Hypothetical (5% return) are not comparable to the amount reported using actual fund return. |
| 3 | Fund has less than six months of operating history. Expenses are equal to the Fund’s annualized net expense ratio, multiplied by the average account value over the period, multiplied by 5/365 (to reflect the period since the commencement of operations). The expense amounts reported under Hypothetical (5% return) are not comparable to the amount reported using actual fund return. |
70
Table of Contents
Harbor ETF Trust
ADDITIONAL INFORMATION (Unaudited)
Harbor ETF Trust has adopted Proxy Voting Policies and Procedures under which proxies relating to securities held by the Harbor funds are voted. In addition, Harbor ETF Trust files Form N-PX, with its complete proxy voting record for the 12 months ended June 30th, no later than August 31st of each year. A description of Harbor ETF Trust’s Proxy Voting Policies and Procedures and the proxy voting records (Form N-PX) are available (i) without charge, upon request, by calling Harbor toll-free at 800-422-1050; (ii) on Harbor’s website at harborcapital.com; and (iii) on the SEC’s website at sec.gov.
The Funds file a complete portfolio of investments for their first and third fiscal quarters with the SEC as an exhibit to Form N-PORT. The Funds’ Form N-PORT exhibit is available (i) without charge, upon request, by calling Harbor toll-free at 800-422-1050, (ii) on Harbor’s website at harborcapital.com, and (iii) on the SEC’s website at sec.gov.
The Investment Company Act requires that the Investment Advisory and Subadvisory Agreement(s) of each Fund be approved initially, and following an initial two-year term, at least annually, by Harbor ETF Trust’s (the “Trust”) Board of Trustees (the “Board” or the “Trustees”), including a majority of the Independent Trustees voting separately.
FACTORS CONSIDERED BY THE TRUSTEES IN APPROVING THE INVESTMENT ADVISORY AGREEMENTS AND SUBADVISORY AGREEMENTS OF THE HARBOR EXCHANGE-TRADED FUNDS
At a meeting of the Board held on February 17-18, 2023 (the “Meeting”), the Board, including the Independent Trustees voting separately, considered and approved the continuation of each Investment Advisory Agreement with Harbor Capital, the adviser to each Fund, and each Subadvisory Agreement with each Fund’s subadviser (each, a “Subadviser”) with respect to Harbor Commodity All-Weather Strategy ETF (formerly, Harbor All-Weather Inflation Focus ETF), Harbor Corporate Culture Leaders ETF (Investment Advisory Agreement only), Harbor Disruptive Innovation ETF, Harbor Long-Term Growers ETF, Harbor Scientific Alpha High-Yield ETF and Harbor Scientific Alpha Income ETF (each a “Fund” and, collectively, the “Funds”). The Trustees noted that the Investment Advisory Agreements and Subadvisory Agreements, as applicable, for Harbor Dividend Growth Leaders ETF, Harbor Energy Transition Strategy ETF, Harbor International Compounders ETF, Harbor Corporate Culture ETF (Investment Advisory Agreement only) and Harbor Health Care ETF were considered and approved for initial two-year terms by the Board at meetings in 2022.
In evaluating each Investment Advisory Agreement and each Subadvisory Agreement, the Trustees reviewed materials furnished by Harbor Capital and each Subadviser, as applicable, including information about their respective affiliates, personnel, and operations, and also relied upon their knowledge of Harbor Capital and the Subadvisers resulting from their quarterly meetings, periodic telephonic meetings and other prior communications. In connection with the Meeting, which had been called for the purpose of considering the continuation of the Investment Advisory Agreements and Subadvisory Agreements, and at prior meetings, the Trustees, including the Independent Trustees, requested and received materials and presentations relating to Fund performance and the services rendered by Harbor Capital and each Subadviser. These materials included a comprehensive written response from Harbor Capital to a 15(c) request letter prepared by legal counsel to the Independent Trustees in consultation with the Independent Trustees. The Trustees also discussed with representatives of Harbor Capital, at the Meeting and at prior meetings, the Trust’s operations and Harbor Capital’s ability, consistent with the “manager-of-managers” structure of many of the Harbor funds, to (i) identify and recommend to the Trustees a subadviser for each such Fund, (ii) monitor and oversee the performance and investment capabilities of each subadviser, and (iii) recommend the replacement of a subadviser where appropriate. The Trustees specifically considered Harbor Capital’s history as a manager-of-managers, including its history of replacing subadvisers for particular Harbor funds in circumstances in which the Board and Harbor Capital had determined that a change in subadviser was in the best interests of a fund and its shareholders, whether as a result of (i) long-term underperformance not explained by market conditions or market cycles relative to the subadviser’s investment style, (ii) prolonged style inconsistency, (iii) material adverse changes in management or personnel, or (iv) other factors, such as if Harbor Capital were to identify another subadviser believed to better serve the shareholders than the existing subadviser.
At the Meeting, the Trustees, including all of the Independent Trustees voting separately, determined, in the exercise of their business judgment, that the terms of each Investment Advisory Agreement and each Subadvisory Agreement were fair and reasonable and approved the continuation for a one-year period of each such Investment Advisory Agreement and Subadvisory Agreement as being in the best interests of each Fund and its shareholders.
71
Table of Contents
Harbor ETF Trust
ADDITIONAL INFORMATION (Unaudited)—Continued
ADVISORY AGREEMENT APPROVALS—Continued
In their deliberations, the Independent Trustees had the opportunity to meet privately without representatives of Harbor Capital or any Subadviser present and were represented throughout the process by legal counsel to the Independent Trustees and the Funds.
In considering the approval of each Fund’s Investment Advisory Agreement and, as applicable, Subadvisory Agreement(s), the Board, including the Independent Trustees, evaluated a number of factors it considered relevant to its determination. The Board did not identify any single factor as all-important or controlling, and individual Trustees did not necessarily attribute the same weight or importance to each factor.
Among the factors considered by the Trustees were the following:
| • | The nature, extent, and quality of the services provided by Harbor Capital and each Subadviser, including the background, education, expertise and experience of the investment professionals of Harbor Capital and each Subadviser providing services to the Funds; |
| • | The favorable history, reputation, qualifications and background of Harbor Capital and each Subadviser, as well as the qualifications of their respective personnel; |
| • | The profitability of Harbor Capital with respect to each Fund; |
| • | The fees charged by Harbor Capital and Subadvisers for investment advisory and subadvisory services, respectively, including, in each case, the portion of the fee to be retained by Harbor Capital, after payment of subadvisory fees, for the investment advisory and related services, including investment, business, legal, compliance, trading (in certain cases), financial and administrative services, that Harbor Capital provides; |
| • | The extent to which economies of scale might be realized as each Fund grows, and the extent to which each Fund’s advisory fee level reflects any economies of scale for the benefit of Fund investors; |
| • | The fees and expense ratios of each Fund relative to the quality of services provided and the fees and expense ratios of similar investment companies; |
| • | The short- and long-term investment performance of each Fund in comparison to peer groups and certain relevant benchmark indices and Harbor Capital’s efforts to address circumstances of underperformance where applicable; |
| • | Any “fall out” benefits that might inure to Harbor Capital, the Subadvisers and their respective affiliates as a result of their relationship with the Funds; |
| • | Information received at regular meetings throughout the year related to Fund performance and services rendered by Harbor Capital, as well as each of the Subadvisers, and research arrangements with brokers who execute transactions on behalf of each applicable Subadviser; |
| • | Information contained in materials provided by Harbor Capital and compiled by Broadridge as to the investment returns, advisory fees and total expense ratios of each Fund relative to those of other investment companies with similar objectives and strategies managed by other investment advisers, consisting of a peer group of funds compiled by Broadridge; and |
| • | Information contained in materials compiled by Morningstar as to the investment returns of each Fund relative to those of other investment companies with similar objectives and strategies managed by other investment advisers. |
Nature, Extent, and Quality of Services
The Trustees separately considered the nature, extent, and quality of the services provided by Harbor Capital and each Subadviser. In their deliberations as to the approval of each Fund’s Investment Advisory Agreement and, as applicable, Subadvisory Agreement(s), the Trustees were mindful of the fact that, by choosing to invest in a Fund, the shareholders had entrusted Harbor Capital with the responsibility, subject to the approval of the Trustees, for selecting each Fund’s Subadviser, overseeing and monitoring that Subadviser’s performance and replacing the Subadviser if necessary. The Trustees also considered as relevant to their determination the favorable history, reputation, qualifications and background of Harbor Capital and each Subadviser, as well as the qualifications of their respective personnel.
72
Table of Contents
Harbor ETF Trust
ADDITIONAL INFORMATION (Unaudited)—Continued
ADVISORY AGREEMENT APPROVALS—Continued
The Adviser’s Services. The Board evaluated the nature, extent, and quality of Harbor Capital’s services in light of the Board’s experience with Harbor Capital, as well as materials provided by Harbor Capital concerning the financial and other resources devoted by Harbor Capital to the Trust, including the breadth and depth of experience and expertise of the investment, accounting, administrative, legal and compliance professionals dedicated to the Trust’s operations. The Trustees determined that Harbor Capital has the expertise and resources to manage and operate effectively each Fund.
The Subadvisers’ Services. The Trustees’ consideration of the services provided by the Subadvisers included a review of each Subadviser’s portfolio managers, investment philosophy, style and processes and record of consistency therewith, performance results for different time periods, approach to controlling risk, and the quality and extent of each Subadviser’s investment capabilities and resources, including the nature and extent of research each Subadviser receives from broker-dealers (to the extent applicable) and other sources. In their deliberations with respect to each applicable Fund, the Trustees considered the history of the Trust’s relationship with each Subadviser and the Trust’s experience with each Subadviser in this capacity.
The Trustees also considered each Subadviser’s breadth and depth of experience and investment results in managing other accounts similar to the respective Fund. The Trustees regularly receive presentations by investment professionals from the Subadvisers. The Trustees reviewed information concerning each Subadviser’s historical investment results in managing accounts and/or funds, as applicable, in a manner substantially similar to the relevant Fund.
Investment Performance, Advisory Fees and Expense Ratios
In considering each Fund’s performance, advisory fees and expense ratio, the Trustees requested and received from Harbor Capital data compiled by Broadridge and Morningstar. The Trustees also received information explaining the methodology for compilation of certain of this information and what it was intended to demonstrate. The Trustees analyzed the performance of each Fund, the advisory fees of each Fund, and the expenses of each Fund and made certain observations and findings as to each Fund as noted below. In evaluating performance, the Trustees recognized that the performance data reflects a snapshot of a period as of a particular date and that selecting a different performance period could produce significantly different results.
Harbor Commodity All-Weather Strategy ETF. The Trustees considered Harbor Commodity All-Weather Strategy ETF (formerly, Harbor All-Weather Inflation Focus ETF; inception date February 9, 2022), noting that the Fund seeks to provide investment results that correspond, before fees and expenses, to the performance of the Quantix Inflation Index. The Trustees observed that, while data for a full year of the Fund’s performance was not available, according to the Broadridge report, the Fund had outperformed its Broadridge universe median for the since inception period ended December 31, 2022. The Trustees also considered the Fund’s performance relative to that of its underlying index and the reasons for tracking error between Fund and index performance. The Trustees noted that the short time period since the Fund’s inception did not support making any significant conclusions about the Fund’s performance.
The Trustees considered the expertise of Quantix Commodities LP (“Quantix”) in managing assets generally and specifically with respect to the Fund’s strategy, noting that Quantix managed approximately $56 million in assets in this strategy, out of a firm-wide total of approximately $1.6 billion in assets under management. The Trustees also noted the experience of the Fund’s portfolio manager in this strategy. The Trustees noted that Quantix is the index provider for the Fund’s underlying index.
The Trustees considered that the Investment Advisory Agreement provides for a unitary fee structure, pursuant to which the Fund pays a single fee to Harbor Capital and Harbor Capital pays the Fund’s operating expenses, with limited exceptions. The Trustees noted that the Broadridge comparison of expenses for the Fund’s expense group showed the Fund’s actual total expense ratio was equal to the group median. The Trustees noted that the Adviser’s profitability in operating the Fund was negative.
Harbor Corporate Culture Leaders ETF. The Trustees considered Harbor Corporate Culture Leaders ETF (inception date February 23, 2022), noting that the Fund seeks to provide investment results that correspond, before fees and expenses, to the performance of the Human Capital Factor Unconstrained Index. The Trustees observed that, while data for a full year of the Fund’s performance was not available, according to the Broadridge data, the Fund had outperformed its Broadridge universe median for the since inception period ended December 31, 2022. The Trustees also considered the Fund’s performance relative to that of its underlying index and the reasons for tracking error between the Fund and index performance. The Trustees noted that the short time since the Fund’s inception did not support making any significant conclusions about the Fund’s performance.
The Trustees considered Harbor Capital’s ability to manage the Fund in accordance with its investment objective of seeking to track its underlying index.
73
Table of Contents
Harbor ETF Trust
ADDITIONAL INFORMATION (Unaudited)—Continued
ADVISORY AGREEMENT APPROVALS—Continued
The Trustees considered that the Investment Advisory Agreement provides for a unitary fee structure, pursuant to which the Fund pays a single fee to Harbor Capital and Harbor Capital pays the Fund’s operating expenses, with limited exceptions. The Trustees noted that the Broadridge comparison of expenses for the Fund’s expense group showed the Fund’s actual total expense ratio was below the group median. The Trustees noted that the Adviser’s profitability in operating the Fund was negative.
Harbor Disruptive Innovation ETF. The Trustees considered Harbor Disruptive Innovation ETF (inception date December 1, 2021), noting that, according to the Broadridge report, the Fund had underperformed its Broadridge universe medians for the one-year and since inception periods ended December 31, 2022. The Morningstar data presented showed that the Fund’s one-year rolling return ranked in the second quartile for the period ended December 31, 2022. The Trustees also considered that the Fund had underperformed its primary benchmark, the S&P 500, for the one-year period ended December 31, 2022.
The Trustees considered the expertise of 4BIO Capital, NZS Capital, Sands Capital, Tekne, and Westfield Capital in the strategies for which they provide model portfolios.
The Trustees considered that the Investment Advisory Agreement provides for a unitary fee structure, pursuant to which the Fund pays a single fee to Harbor Capital and Harbor Capital pays the Fund’s operating expenses, with limited exceptions. The Trustees noted that the Broadridge comparison of expenses for the Fund’s expense group showed the Fund’s actual total expense ratio was below the group median. The Trustees noted that the Adviser’s profitability in operating the Fund was negative.
Harbor Long-Term Growers ETF. The Trustees considered Harbor Long-Term Growers ETF (inception date February 2, 2022). The Trustees observed that, while data for a full year of the Fund’s performance was not available, according to the Broadridge data, the Fund had underperformed its Broadridge universe median for the since inception period ended December 31, 2022. The Trustees also considered that the Fund had underperformed its primary benchmark, the Russell 1000 Growth Index, for the since inception period ended December 31, 2022. The Trustees noted that the short time period since the Fund’s inception did not support making any significant conclusions about the Fund’s performance.
The Trustees considered the expertise of Jennison in managing assets generally and specifically with respect to the Fund’s strategy, noting that Jennison managed approximately $87.9 million in assets in this strategy, out of a firm-wide total of approximately $164.1 billion in assets under management. The Trustees also noted the experience of the Fund’s portfolio managers in this strategy.
The Trustees considered that the Investment Advisory Agreement provides for a unitary fee structure, pursuant to which the Fund pays a single fee to Harbor Capital and Harbor Capital pays the Fund’s operating expenses, with limited exceptions. The Trustees noted that the Broadridge comparison of expenses for the Fund’s expense group showed the Fund’s actual total expense ratio was below the group median. The Trustees noted that the Adviser’s profitability in operating the Fund was negative.
Harbor Scientific Alpha High-Yield ETF. The Trustees considered Harbor Scientific Alpha High-Yield ETF (inception date September 14, 2021), noting that, according to the Broadridge report, the Fund had outperformed its Broadridge universe median for the one-year and since inception periods ended December 31, 2022. The Morningstar data presented showed that the Fund’s one-year rolling return ranked in the first quartile for the period ended December 31, 2022. The Trustees also considered that the Fund had outperformed its primary benchmark, the ICE BofA U.S. High-Yield Index, for the one-year period ended December 31, 2022.
The Trustees considered the expertise of BlueCove in managing assets generally and specifically with respect to the Fund’s strategy, noting that BlueCove managed approximately $30.3 million in assets in this strategy, out of a firm-wide total of approximately $1.6 billion in assets under management. The Trustees also noted the experience of the Fund’s portfolio managers in this strategy.
The Trustees considered that the Investment Advisory Agreement provides for a unitary fee structure, pursuant to which the Fund pays a single fee to Harbor Capital and Harbor Capital pays the Fund’s operating expenses, with limited exceptions. The Trustees noted that the Broadridge comparison of expenses for the Fund’s expense group showed the Fund’s actual total expense ratio was above the group median. The Trustees noted that the Adviser’s profitability in operating the Fund was negative.
Harbor Scientific Alpha Income ETF. The Trustees considered Harbor Scientific Alpha Income ETF (inception date September 14, 2021), noting that, according to the Broadridge report, the Fund had outperformed its Broadridge universe median for the one-year and since inception periods ended December 31, 2022. The Morningstar data presented showed that the Fund’s one-year rolling return ranked in the third quartile for the period ended December 31, 2022. The Trustees also considered that the Fund had outperformed its primary benchmark, the Bloomberg US Aggregate Bond Index, for the one-year and since inception periods ended December 31, 2022.
74
Table of Contents
Harbor ETF Trust
ADDITIONAL INFORMATION (Unaudited)—Continued
ADVISORY AGREEMENT APPROVALS—Continued
The Trustees considered the expertise of BlueCove in managing assets generally and specifically with respect to the Fund’s strategy, noting that BlueCove managed approximately $29.8 million in assets in this strategy, out of a firm-wide total of approximately $1.6 billion in assets under management. The Trustees also noted the experience of the Fund’s portfolio managers in this strategy.
The Trustees considered that the Investment Advisory Agreement provides for a unitary fee structure, pursuant to which the Fund pays a single fee to Harbor Capital and Harbor Capital pays the Fund’s operating expenses, with limited exceptions. The Trustees noted that the Broadridge comparison of expenses for the Fund’s expense group showed the Fund’s actual total expense ratio was below the group median. The Trustees noted that the Adviser’s profitability in operating the Fund was negative.
The Trustees also separately considered the allocation between Harbor Capital and each Subadviser of the relevant Fund’s investment advisory fee (i.e., the amount of the advisory fee retained by Harbor Capital relative to that paid to the relevant Subadviser as a subadvisory fee). They determined in each case that the allocation was reasonable and the product of arm’s length negotiation between Harbor Capital and the Subadviser.
Profitability
The Trustees also considered Harbor Capital’s profitability in operating each of the Funds (as well as on a fund complex-wide basis) as presented by Harbor Capital, and the allocation methodology used by Harbor Capital to compute such profitability. The Trustees concluded that the allocation methodology was reasonable. In considering Harbor Capital’s profitability generally, the Trustees also considered any other benefits enjoyed by Harbor Capital and its affiliates as a result of their relationship with the Funds. The Trustees also considered that profitability calculations with respect to advisory operations vary significantly depending on whether revenues on which the calculation is based are taken gross or net of amounts paid to third parties, such as subadvisory fee expenses, and noted that subadvisory fee expenses are a direct expense of Harbor Capital.
Economies of Scale
The Trustees also considered the extent to which economies of scale might be realized as each Fund grows, and the extent to which each Fund’s advisory fee level reflects these economies of scale for the benefit of Fund investors. The Trustees specifically considered whether any advisory fee reduction “breakpoints” should be added to the advisory fee payable by any Fund. They concluded that the Funds’ fee structures reflected economies of scale to date and that breakpoints in these fee structures were not required at the present time in light of, among other things, Harbor Capital’s forward-looking approach to setting the contractual advisory fee, its payment of fund expenses (with limited exceptions) in accordance with the unitary fee arrangement, and the uncertainty surrounding the aspects of the Funds’ future asset growth. The Trustees noted they intend to monitor each Fund’s asset growth in connection with future reviews of each Fund’s Investment Advisory Agreement to determine whether breakpoints may be appropriate at such time.
FACTORS CONSIDERED BY THE TRUSTEES IN APPROVING THE INVESTMENT ADVISORY AGREEMENT OF HARBOR CORPORATE CULTURE SMALL CAP ETF
At a meeting of the Board held on February 17-18, 2023 (the “Meeting”), the Board, including the Independent Trustees voting separately, considered and approved (i) the Investment Advisory Agreement between the Trust, on behalf of the Harbor Corporate Culture Small Cap ETF (the “Fund”), and Harbor Capital Advisors, Inc. (the “Adviser” or “Harbor Capital”).
In evaluating the Investment Advisory Agreement, the Trustees reviewed materials furnished by the Adviser, including information about its affiliates, personnel, and operations, and also relied upon their knowledge of the Adviser resulting from their quarterly meetings, periodic telephonic meetings and other prior communications. In connection with their consideration of the Investment Advisory Agreement, the Trustees, including the Independent Trustees, requested and received materials and presentations relating to the services to be rendered by the Adviser and the underlying index the Fund would seek to track.
At the Meeting, the Trustees, including all of the Independent Trustees voting separately, determined, in the exercise of their business judgment, that the terms of the Investment Advisory Agreement were fair and reasonable and approved the Investment Advisory Agreement for an initial two-year term as being in the best interests of the Fund and its future shareholders.
In their deliberations, the Independent Trustees had the opportunity to meet privately without representatives of Harbor Capital and were represented throughout the process by legal counsel to the Independent Trustees and the Trust.
75
Table of Contents
Harbor ETF Trust
ADDITIONAL INFORMATION (Unaudited)—Continued
ADVISORY AGREEMENT APPROVALS—Continued
Factors Considered
In considering the Fund’s proposed Investment Advisory Agreement, the Board, including the Independent Trustees, evaluated a number of factors it considered relevant to its determination. The Board did not identify any single factor as all-important or controlling, and individual Trustees did not necessarily attribute the same weight or importance to each factor.
Among the factors considered by the Trustees were the following:
| • | The nature, extent, and quality of the services proposed to be provided by Harbor Capital, including the background, education, expertise and experience of the investment professionals of Harbor Capital to provide services to the Fund; |
| • | The favorable history, reputation, qualifications and background of Harbor Capital as well as the qualifications of its personnel; |
| • | The fee proposed to be charged by Harbor Capital for investment advisory and related services to be provided by Harbor Capital (including investment, business, legal, compliance, financial and administrative services) and for Harbor Capital’s undertaking to bear the operating expenses of the Fund, with certain limited exceptions; |
| • | The proposed fees and expense ratio of the Fund relative to the fees and expense ratios of similar investment companies; |
| • | Information about the index the Fund would seek to track, Harbor Capital’s assessment of that index, and Harbor Capital’s proposed strategy for seeking to track the index; |
| • | The expected profitability of Harbor Capital with respect to the Fund; |
| • | Information received at meetings throughout the year related to services rendered by Harbor Capital; |
| • | The extent to which economies of scale might be realized as the Fund grows, and the extent to which the Fund’s proposed advisory fee level reflects any economies of scale for the benefit of investors; and |
| • | Any “fall out” benefits that might inure to Harbor Capital and its affiliates as a result of their relationship with the Fund. |
Nature, Extent, and Quality of Services
In evaluating the nature, extent, and quality of the services to be provided by Harbor Capital, the reasonableness of the overall compensation provided under the proposed advisory agreement and other considerations, the Trustees considered Harbor Capital’s ability to manage the Fund in accordance with its investment objective of seeking to track the underlying index.
The Board evaluated the nature, extent, and quality of Harbor Capital’s proposed services in light of the Board’s actual experience with Harbor Capital, as well as materials provided by Harbor Capital concerning the financial and other resources devoted by Harbor Capital to the Harbor funds generally, including the breadth and depth of experience and expertise of the investment, administrative, legal and compliance professionals dedicated to the Fund’s operations. The Trustees determined that Harbor Capital has the expertise and resources to manage the Fund in accordance with its investment objective. The Trustees also considered the significant due diligence undertaken by Harbor Capital regarding the underlying index and index provider, including diligence regarding the data used as part of the index construction process and how the index is designed to provide the specified exposure consistent with the Fund’s registration statement disclosures.
Advisory Fees and Expense Ratios
The Trustees noted that the proposed Investment Advisory Agreement provides that the Adviser will pay all of the operating expenses of the Fund, with certain limited exceptions set forth in the agreement, and that such unitary fee structure effectively acts as a cap on the fees and expenses of the Fund. The Trustees observed that the data available concerning comparative fees and expense ratios showed that the proposed net expense ratio for the Fund was below the average and median of the peer group of funds, including mutual funds and ETFs, compiled using Morningstar data that was presented to the Board for comparison purposes. The Trustees also noted that Harbor Capital had provided supplemental expense information comparing
76
Table of Contents
Harbor ETF Trust
ADDITIONAL INFORMATION (Unaudited)—Continued
ADVISORY AGREEMENT APPROVALS—Continued
the net proposed expense ratio of the Fund to a peer group of only ETFs, observing that the proposed net expense ratio was above the average and median of the peer group. The Trustees noted Harbor Capital’s belief that the proposed fee was reasonable given the specialized nature of the Fund’s strategy as compared to the ETFs in the peer group.
Profitability
The Trustees also noted that Harbor Capital expected to operate the Fund initially at a loss.
Economies of Scale
The Trustees concluded that breakpoints in the Fund’s advisory fee schedule were not necessary at the present time in light of, among other things, Harbor Capital’s forward-looking approach to setting the contractual advisory fee, its payment of fund expenses (with limited exceptions) in accordance with the unitary fee arrangement, and the uncertainty surrounding the aspects of the Fund’s future asset growth. It was agreed, however, that the Board would consider the issue of breakpoints in the Fund’s advisory fee schedule at least annually after the initial two-year contract term as part of its annual contract review process for all of the Harbor funds.
FACTORS CONSIDERED BY THE TRUSTEES IN APPROVING THE INVESTMENT ADVISORY AGREEMENT AND SUBADVISORY AGREEMENTS OF HARBOR SMALL CAP EXPLORER ETF
At a meeting of the Board held on February 17 – 18, 2023, (the “Meeting”), the Board, including the Independent Trustees voting separately, considered and approved (i) the Investment Advisory Agreement between the Trust, on behalf of Harbor Small Cap Explorer ETF (the “Fund”), and Harbor Capital Advisors, Inc. (the “Adviser” or “Harbor Capital”); and (ii) Non-Discretionary Model Portfolio Provider Agreements (each, a “Subadvisory Agreement”) among the Adviser, the Trust, on behalf of the Fund, and each of Connacht Asset Management LP, Copeland Capital Management, LLC, Granahan Investment Management LLC, Huber Capital Management, LLC and Reinhart Partners, Inc. (each, a “Subadviser”).
In evaluating the Investment Advisory Agreement and the Subadvisory Agreements, the Trustees reviewed materials furnished by the Adviser and the Subadvisers, including information about their respective affiliates, personnel, and operations, and also relied upon their knowledge of the Adviser resulting from their quarterly meetings, periodic telephonic meetings and other prior communications. In connection with their consideration of the Investment Advisory Agreements and Subadvisory Agreements, the Trustees received presentations by Harbor Capital containing information about the investment philosophy and process and proposed approach to managing assets in the Fund’s strategy. The Trustees also received presentations by each of the Subadvisers containing information about their investment firms and their experience, investment philosophy and process, and operational capabilities.
At the Meeting, the Trustees, including all of the Independent Trustees voting separately, determined, in the exercise of their business judgment, that the terms of the Investment Advisory Agreement and each Subadvisory Agreement were fair and reasonable and approved the Investment Advisory Agreement and Subadvisory Agreements for an initial two-year term as being in the best interests of the Fund and its future shareholders.
In their deliberations, the Independent Trustees had the opportunity to meet privately without representatives of Harbor Capital or any Subadviser present and were represented throughout the process by legal counsel to the Independent Trustees and the Trust.
Factors Considered
In considering the Fund’s proposed Investment Advisory Agreement and Subadvisory Agreements, the Board, including the Independent Trustees, evaluated a number of factors it considered relevant to its determination. The Board did not identify any single factor as all-important or controlling, and individual Trustees did not necessarily attribute the same weight or importance to each factor.
Among the factors considered by the Trustees were the following:
| • | The nature, extent, and quality of the combined services proposed to be provided by Harbor Capital and each Subadviser, including the background, education, expertise and experience of the investment professionals of (i) Harbor Capital who would utilize the Subadvisers’ model portfolios to manage the Fund’s portfolio; and (ii) the Subadvisers who would construct those model portfolios; |
77
Table of Contents
Harbor ETF Trust
ADDITIONAL INFORMATION (Unaudited)—Continued
ADVISORY AGREEMENT APPROVALS—Continued
| • | The fees proposed to be charged by Harbor Capital and each Subadviser for investment advisory and subadvisory services, respectively, including the portion of the fees to be retained by Harbor Capital, after payment of the Subadvisers’ fees, for investment advisory and related services to be provided by Harbor Capital (including investment, trading, business, legal, compliance, financial and administrative services) and for Harbor Capital’s undertaking to bear the operating expenses of the Fund, with certain limited exceptions; |
| • | The proposed fees and expense ratio of the Fund relative to the fees and expense ratios of similar investment companies; |
| • | The investment performance of each Subadviser in managing other accounts in a style similar to the style to be utilized in supplying its model portfolio to Harbor Capital; |
| • | The expected profitability of Harbor Capital with respect to the Fund; |
| • | Information received at meetings throughout the year related to services rendered by Harbor Capital; |
| • | The extent to which economies of scale might be realized as the Fund grows, and the extent to which the Fund’s proposed advisory fee level reflects any economies of scale for the benefit of investors; and |
| • | Any “fall out” benefits that might inure to Harbor Capital, the Subadvisers and their respective affiliates as a result of their relationship with the Fund. |
Nature, Extent, and Quality of Services
In evaluating the nature, extent, and quality of the services to be provided by Harbor Capital, the reasonableness of the overall compensation provided under the proposed advisory agreement and other considerations, the Trustees considered Harbor Capital’s ability, consistent with the manager-of-managers structure of the Fund, to identify and recommend to the Trustees quality subadvisers for the Harbor funds, to monitor and oversee the performance and investment capabilities of each subadviser, with respect to multi-manager funds, to actively manage allocations and reallocations of a fund’s assets among the underlying subadvisers, and to recommend the replacement of a subadviser when appropriate. The Trustees specifically considered Harbor Capital’s history as a manager-of-managers, including its history of replacing subadvisers for particular Harbor funds in circumstances in which the Board and Harbor Capital had determined that a change in subadviser was in the best interests of a fund and its shareholders, whether as a result of (i) long-term underperformance not explained by market conditions or market cycles relative to the subadviser’s investment style, (ii) prolonged style inconsistency, (iii) material adverse changes in management or personnel, or (iv) other factors, such as if Harbor Capital were to identify another subadviser believed to better serve the shareholders than the existing subadviser.
The Board evaluated the nature, extent, and quality of Harbor Capital’s proposed services in light of the Board’s actual experience with Harbor Capital, as well as materials provided by Harbor Capital concerning the financial and other resources devoted by Harbor Capital to the Funds generally, including the breadth and depth of experience and expertise of the investment, administrative, legal and compliance professionals dedicated to the Funds’ operations. The Trustees determined that Harbor Capital has the expertise and resources to identify, select, oversee and monitor subadvisers and to operate effectively as a manager-of-managers for the Fund. The Trustees also considered in their determination the depth, knowledge and experience level of each Subadviser’s personnel, the quality of each Subadviser’s processes and the culture of each Subadviser.
Advisory Fees and Expense Ratios
The Trustees noted that the proposed advisory agreement provides that the Adviser will pay all of the operating expenses of the Fund, with certain limited exceptions set forth in the agreement, and that such unitary fee structure effectively acts as a cap on the fees and expenses of the Fund. The Trustees observed that the data available concerning comparative fees and expense ratios showed that the proposed net expense ratio for the Fund was below the average and median of the peer group of funds, including both mutual funds and ETFs, compiled using Morningstar data that was presented to the Board for comparison purposes. The Trustees also observed that Harbor Capital had provided supplemental information comparing the proposed net expense ratio of the Fund to a peer group of ETFs only, noting that the proposed net expense ratio was above the peer group average and median. The Trustees noted Harbor Capital’s belief that the comparison against the broader universe of mutual funds and ETFs was more appropriate given the Fund’s investment strategy.
The Trustees also reviewed and determined to be reasonable, in relation to the services to be provided by each party, the split between the advisory fee to be paid to Harbor Capital and the subadvisory fees to be paid to the Subadvisers.
78
Table of Contents
Harbor ETF Trust
ADDITIONAL INFORMATION (Unaudited)—Continued
ADVISORY AGREEMENT APPROVALS—Continued
Profitability
The Trustees also noted that Harbor Capital expected to operate the Fund initially at a loss.
Economies of Scale
The Trustees concluded that breakpoints in the Fund’s advisory fee schedule were not necessary at the present time in light of, among other things, Harbor Capital’s forward-looking approach to setting the contractual advisory fee, its payment of fund expenses (with limited exceptions) in accordance with the unitary fee arrangement, and the uncertainty surrounding the aspects of the Fund’s future asset growth. It was agreed, however, that the Board would consider the issue of breakpoints in the Fund’s advisory fee schedule at least annually after the initial two-year contract term as part of its annual contract review process for all of the Harbor funds.
The Trust has adopted pursuant to Rule 22e-4 under the Investment Company Act (“Rule 22e-4”) a Liquidity Risk Management Program (the “Program”) for the Funds. The Board has designated a committee of Harbor Capital employees as the Program Administrator.
The Program is designed to assess and manage each Fund’s liquidity risk. For purposes of Rule 22e-4, “liquidity risk” is defined as the risk that a Fund is unable to satisfy redemption requests without significantly diluting remaining investors’ interests in the Fund. Components of the Program include: (i) periodic assessment of each Fund’s liquidity risk based on certain factors; (ii) classification of each Fund’s holdings into one of four liquidity categories (Highly Liquid, Moderately Liquid, Less Liquid and Illiquid) that reflect an estimate of liquidity under current market conditions; (iii) to the extent a Fund does not invest primarily in Highly Liquid investments, establishment of an appropriate Highly Liquid Investment Minimum (“HLIM”) (as defined in Rule 22e-4) for such Fund and ongoing monitoring of the Fund’s net assets to assess compliance with the Fund’s HLIM; (iv) a limit on the ability of a Fund to acquire illiquid investments in excess of 15% of the Fund’s net assets; and (v) periodic reporting to the Board.
At a meeting held on November 10, 2022, the Board of Trustees reviewed the operation and effectiveness of the Program for the period beginning October 1, 2021 and ending September 30, 2022 (the “period”). At the November 10, 2022 meeting, the Board reviewed a report prepared by, and received a presentation from, the Program Administrator regarding the operation of the Program, its adequacy, and the effectiveness of its implementation during the period. The Program Administrator’s report included, among other things, a review of: (i) the operation of the Program overall during the period; (ii) the activities conducted by the Program Administrator with respect to the Program; (iii) the level of portfolio investments classified into each of the four liquidity categories and the services provided by the third-party vendor engaged by the Trust to facilitate such classification with respect to certain of the Funds; and (iv) the most recent liquidity risk assessment for the Funds conducted by the Program Administrator in accordance with Rule 22e-4. Based upon its review, the Program Administrator determined that the Program was adequate and effective in facilitating the Funds’ compliance with Rule 22e-4 during the period.
79
Table of Contents

80
Table of Contents

81
Table of Contents

FD.SAR.ETF.0423
Table of Contents
ITEM 2 – CODE OF ETHICS
Not applicable.
ITEM 3 – AUDIT COMMITTEE FINANCIAL EXPERT
Not applicable.
ITEM 4 – PRINCIPAL ACCOUNTANT FEES AND SERVICES
Not applicable.
ITEM 5 – AUDIT COMMITTEE OF LISTED REGISTRANTS
Not applicable.
ITEM 6 – INVESTMENTS
(a)
The Registrant has elected to include the schedule of investments in securities of unaffiliated issuers as part of the report to shareholders filed under Item 1 of this report on Form N-CSR.
(b)
Not applicable.
ITEM 7 – DISCLOSURE OF PROXY VOTING POLICIES AND PROCEDURES FOR CLOSED-END MANAGEMENT INVESTMENT COMPANIES
Not applicable.
ITEM 8 – PORTFOLIO MANAGERS OF CLOSED-END MANAGEMENT INVESTMENT COMPANIES
Not applicable.
ITEM 9 – PURCHASES OF EQUITY SECURITIES BY CLOSED-END MANAGEMENT INVESTMENT COMPANY AND AFFILIATED PURCHASERS
Not applicable.
ITEM 10 – SUBMISSION OF MATTERS TO A VOTE OF SECURITY HOLDERS
There were no material changes to the procedures by which shareholders may recommend nominees to the Registrant’s Board of Trustees since the date of the Registrant’s prior report on Form N-CSR.
ITEM 11 – CONTROLS AND PROCEDURES
(a)
The Registrant’s Principal Executive and Principal Financial Officers concluded that the Registrant’s disclosure controls and procedures (as defined in Rule 30a-3(c) under the 1940 Act) are effective, based on the evaluation of these disclosure controls and procedures as of a date within 90 days of the filing of this report.
(b)
There was no change in the Registrant’s internal control over financial reporting (as defined in Rule 30a-3(d) under the 1940 Act) that occurred during the period covered by this report that has materially affected, or is reasonably likely to materially affect, the Registrant’s internal control over financial reporting.
ITEM 12 – DISCLOSURE OF SECURITIES LENDING ACTIVITIES FOR CLOSED-END MANAGEMENT INVESTMENT COMPANIES
Not applicable.
ITEM 13 – EXHIBITS
(a) | |
(b) |
SIGNATURES
Pursuant to the requirements of the Securities Exchange Act of 1934 and the Investment Company Act of 1940, the Registrant has duly caused this report to be signed June 23, 2023 on its behalf by the undersigned, thereunto duly authorized.
HARBOR ETF TRUST
By: /s/ Charles F. McCain
Charles F. McCain
Chairman, President and Trustee
(Principal Executive Officer)
Chairman, President and Trustee
(Principal Executive Officer)
Pursuant to the requirements of the Securities Exchange Act of 1934 and the Investment Company Act of 1940, this report has been signed below by the following persons on behalf of the Registrant and in the capacities and on the dates indicated.
By: | /s/ Charles F. McCain Charles F. McCain | Chairman, President and Trustee (Principal Executive Officer) | June 23, 2023 |
By: | /s/ John M. Paral John M. Paral | Treasurer (Principal Financial and Accounting Officer) | June 23, 2023 |
Exhibit Index
Number | Description |
99.CERT1 | Certification for each principal executive officer and principal financial officer of the Registrant as required by Rule 30a-2(a) under the 1940 Act (17 CFR 270.30a-2(a)). |
99.CERT2 | Certification for each principal executive officer and principal financial officer of the Registrant as required by Rule 30a-2(a) under the 1940 Act (17 CFR 270.30a-2(a)). |
99.906CERT | Certification as required by Section 1350 of Chapter 63 of Title 18 of the United States Code (18 U.S.C. 1350). |