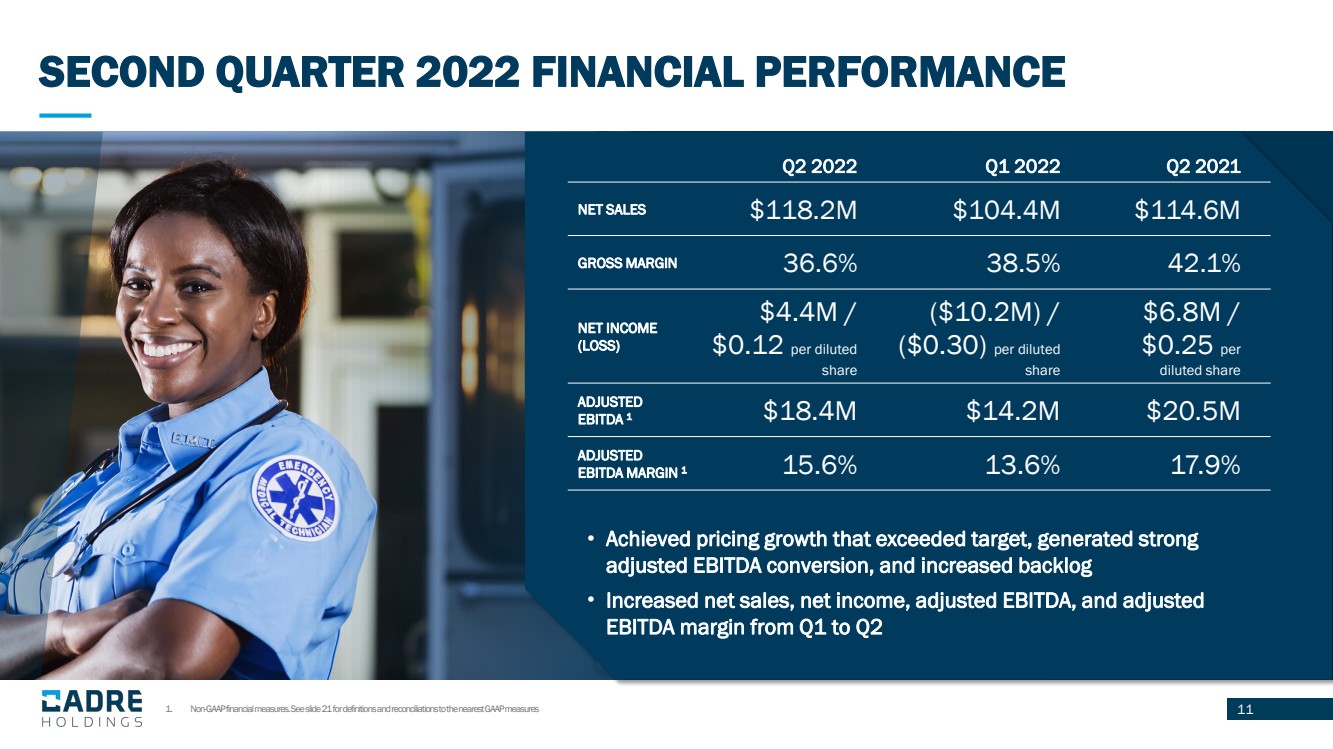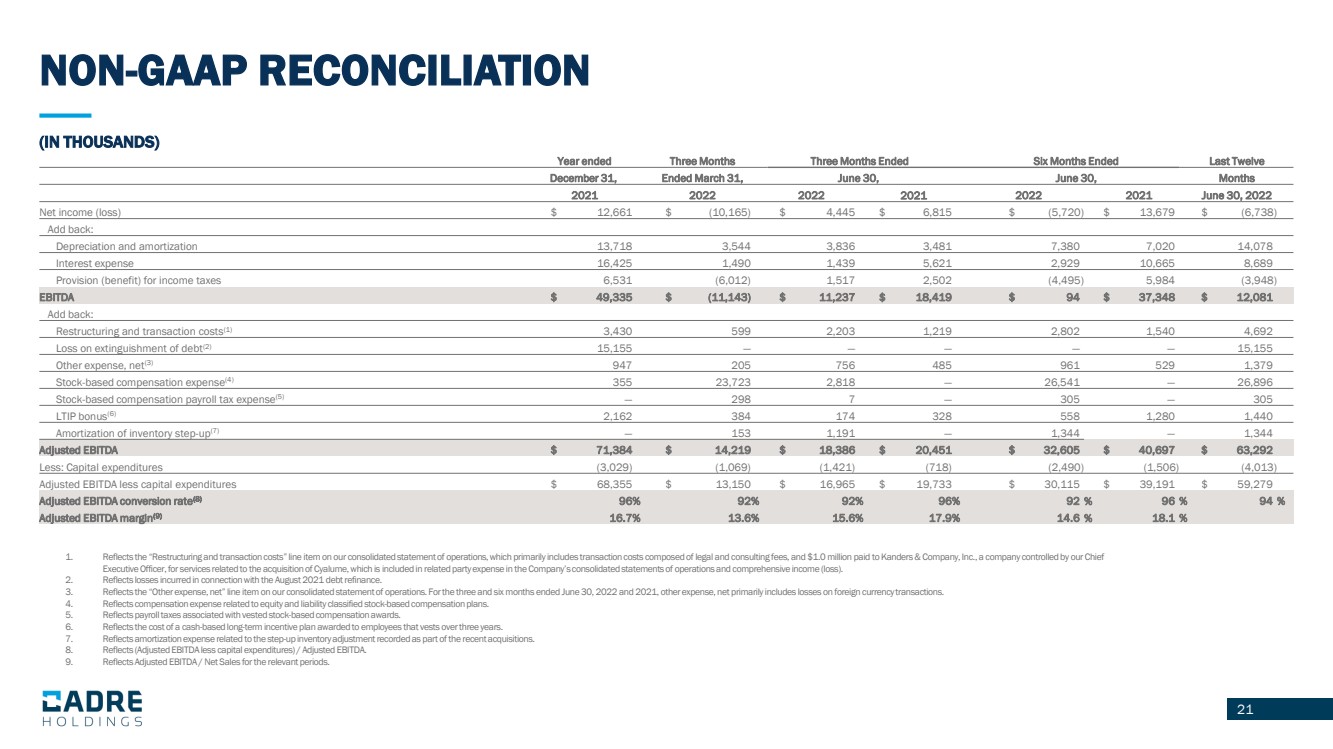
| 21 1. Reflects the “Restructuring and transaction costs” line item on our consolidated statement of operations, which primarily inc lud es transaction costs composed of legal and consulting fees, and $1.0 million paid to Kanders & Company, Inc., a company controlled by our Chief Executive Officer, for services related to the acquisition of Cyalume , which is included in related party expense in the Company’s consolidated statements of operations and comprehensive income (lo ss). 2. Reflects losses incurred in connection with the August 2021 debt refinance. 3. Reflects the “Other expense, net” line item on our consolidated statement of operations. For the three and six months ended J une 30, 2022 and 2021, other expense, net primarily includes losses on foreign currency transactions. 4. Reflects compensation expense related to equity and liability classified stock - based compensation plans. 5. Reflects payroll taxes associated with vested stock - based compensation awards. 6. Reflects the cost of a cash - based long - term incentive plan awarded to employees that vests over three years. 7. Reflects amortization expense related to the step - up inventory adjustment recorded as part of the recent acquisitions. 8. Reflects (Adjusted EBITDA less capital expenditures) / Adjusted EBITDA. 9. Reflects Adjusted EBITDA / Net Sales for the relevant periods. 21 (IN THOUSANDS) NON - GAAP RECONCILIATION Year ended Three Months Three Months Ended Six Months Ended Last Twelve December 31, Ended March 31, June 30, June 30, Months 2021 2022 2022 2021 2022 2021 June 30, 2022 Net income (loss) $ 12,661 $ (10,165) $ 4,445 $ 6,815 $ (5,720) $ 13,679 $ (6,738) Add back: Depreciation and amortization 13,718 3,544 3,836 3,481 7,380 7,020 14,078 Interest expense 16,425 1,490 1,439 5,621 2,929 10,665 8,689 Provision (benefit) for income taxes 6,531 (6,012) 1,517 2,502 (4,495) 5,984 (3,948) EBITDA $ 49,335 $ (11,143) $ 11,237 $ 18,419 $ 94 $ 37,348 $ 12,081 Add back: Restructuring and transaction costs (1) 3,430 599 2,203 1,219 2,802 1,540 4,692 Loss on extinguishment of debt (2) 15,155 — — — — — 15,155 Other expense, net (3) 947 205 756 485 961 529 1,379 Stock - based compensation expense (4) 355 23,723 2,818 — 26,541 — 26,896 Stock - based compensation payroll tax expense (5) — 298 7 — 305 — 305 LTIP bonus (6) 2,162 384 174 328 558 1,280 1,440 Amortization of inventory step - up (7) — 153 1,191 — 1,344 — 1,344 Adjusted EBITDA $ 71,384 $ 14,219 $ 18,386 $ 20,451 $ 32,605 $ 40,697 $ 63,292 Less: Capital expenditures (3,029) (1,069) (1,421) (718) (2,490) (1,506) (4,013) Adjusted EBITDA less capital expenditures $ 68,355 $ 13,150 $ 16,965 $ 19,733 $ 30,115 $ 39,191 $ 59,279 Adjusted EBITDA conversion rate (8) 96 % 92 % 92 % 96 % 92 % 96 % 94 % Adjusted EBITDA margin (9) 16.7 % 13.6 % 15.6 % 17.9 % 14.6 % 18.1 % |