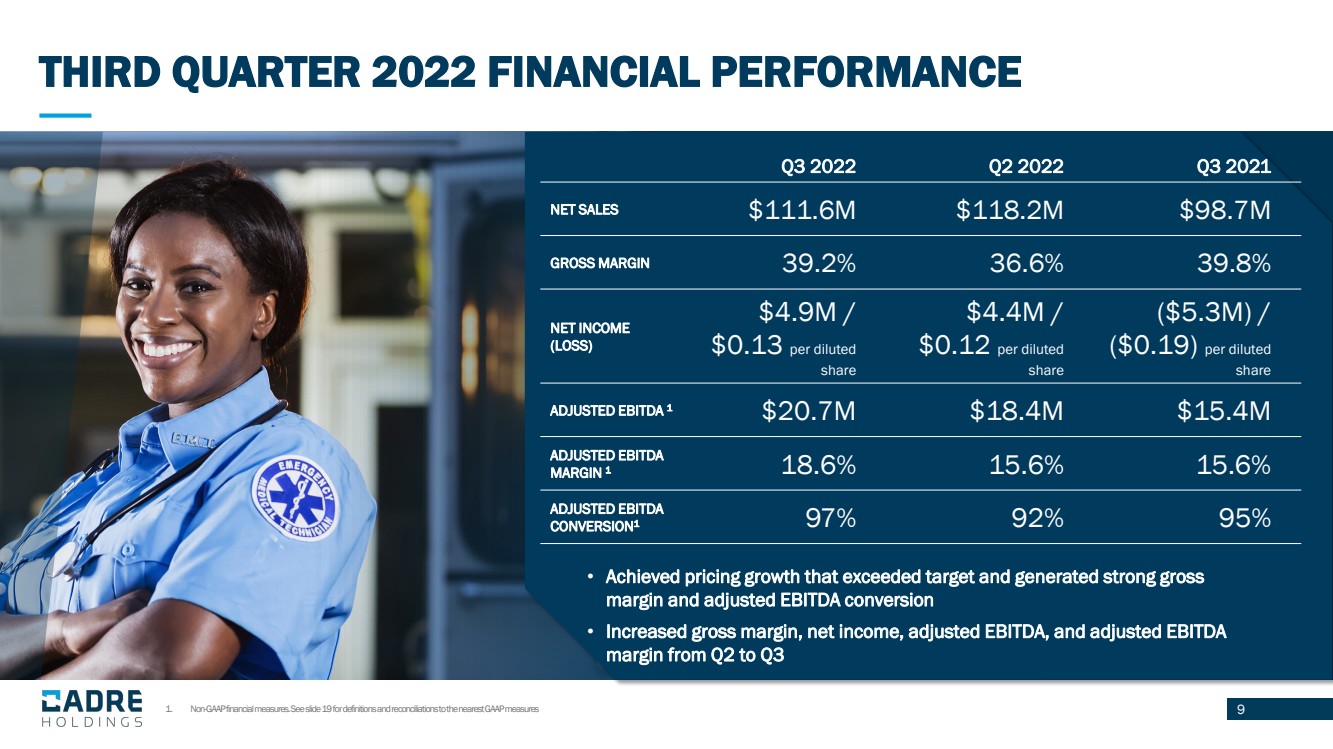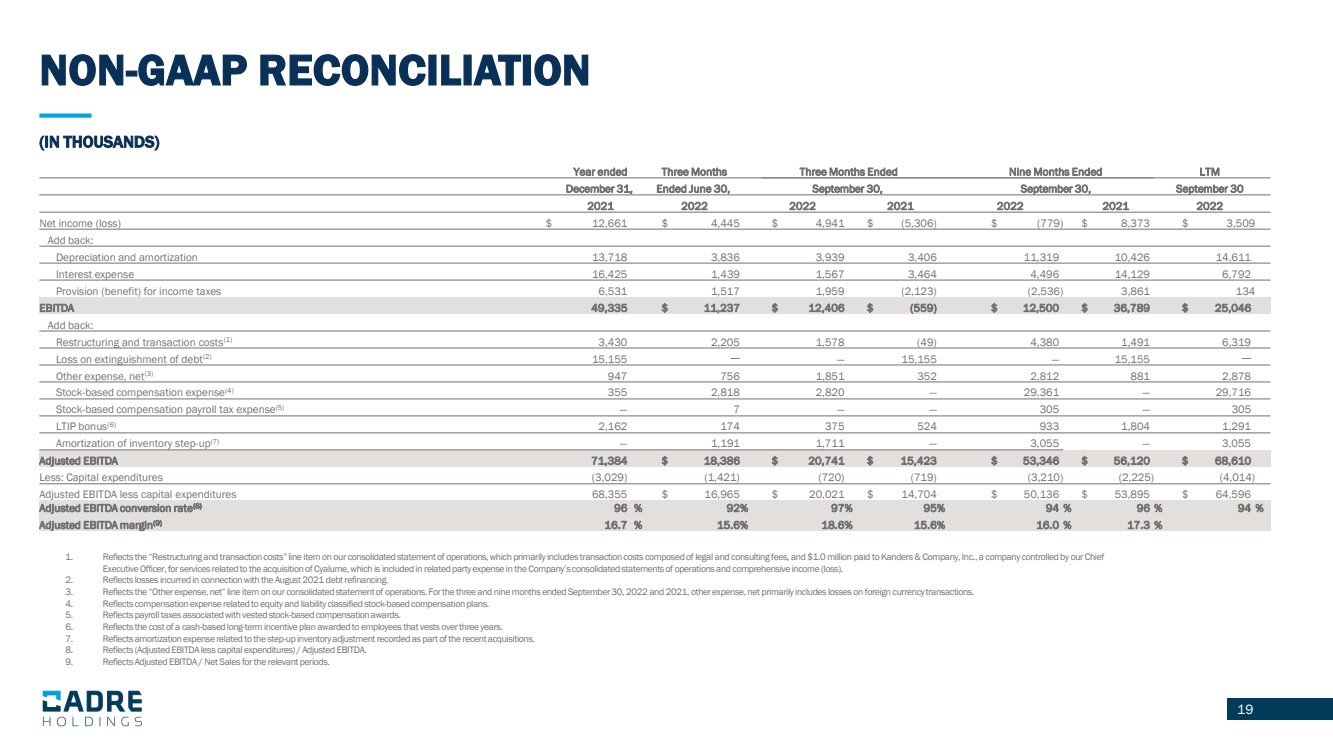
| 19 1. Reflects the “Restructuring and transaction costs” line item on our consolidated statement of operations, which primarily inc lud es transaction costs composed of legal and consulting fees, and $1.0 million paid to Kanders & Company, Inc., a company controlled by our Chief Executive Officer, for services related to the acquisition of Cyalume , which is included in related party expense in the Company’s consolidated statements of operations and comprehensive income (lo ss). 2. Reflects losses incurred in connection with the August 2021 debt refinancing. 3. Reflects the “Other expense, net” line item on our consolidated statement of operations. For the three and nine months ended Sep tember 30, 2022 and 2021, other expense, net primarily includes losses on foreign currency transactions. 4. Reflects compensation expense related to equity and liability classified stock - based compensation plans. 5. Reflects payroll taxes associated with vested stock - based compensation awards. 6. Reflects the cost of a cash - based long - term incentive plan awarded to employees that vests over three years. 7. Reflects amortization expense related to the step - up inventory adjustment recorded as part of the recent acquisitions. 8. Reflects (Adjusted EBITDA less capital expenditures) / Adjusted EBITDA. 9. Reflects Adjusted EBITDA / Net Sales for the relevant periods. 19 (IN THOUSANDS) NON - GAAP RECONCILIATION Year ended Three Months Three Months Ended Nine Months Ended LTM December 31, Ended June 30, September 30, September 30, September 30 2021 2022 2022 2021 2022 2021 2022 Net income (loss) $ 12,661 $ 4,445 $ 4,941 $ (5,306) $ (779) $ 8,373 $ 3,509 Add back: Depreciation and amortization 13,718 3,836 3,939 3,406 11,319 10,426 14,611 Interest expense 16,425 1,439 1,567 3,464 4,496 14,129 6,792 Provision (benefit) for income taxes 6,531 1,517 1,959 (2,123) (2,536) 3,861 134 EBITDA 49,335 $ 11,237 $ 12,406 $ (559) $ 12,500 $ 36,789 $ 25,046 Add back: Restructuring and transaction costs (1) 3,430 2,205 1,578 (49) 4,380 1,491 6,319 Loss on extinguishment of debt (2) 15,155 — — 15,155 — 15,155 — Other expense, net (3) 947 756 1,851 352 2,812 881 2,878 Stock - based compensation expense (4) 355 2,818 2,820 — 29,361 — 29,716 Stock - based compensation payroll tax expense (5) — 7 — — 305 — 305 LTIP bonus (6) 2,162 174 375 524 933 1,804 1,291 Amortization of inventory step - up (7) — 1,191 1,711 — 3,055 — 3,055 Adjusted EBITDA 71,384 $ 18,386 $ 20,741 $ 15,423 $ 53,346 $ 56,120 $ 68,610 Less: Capital expenditures (3,029) (1,421) (720) (719) (3,210) (2,225) (4,014) Adjusted EBITDA less capital expenditures 68,355 $ 16,965 $ 20,021 $ 14,704 $ 50,136 $ 53,895 $ 64,596 Adjusted EBITDA conversion rate (8) 96 % 92 % 97 % 95 % 94 % 96 % 94 % Adjusted EBITDA margin (9) 16.7 % 15.6 % 18.6 % 15.6 % 16.0 % 17.3 % |