| FREE WRITING PROSPECTUS | ||
| FILED PURSUANT TO RULE 433 | ||
| REGISTRATION FILE NO.: 333-255934-01 | ||
| Dated February 2, 2022 | BMO 2022-C1 |
Free Writing Prospectus
Structural and Collateral Term Sheet
| ||
BMO 2022-C1 Mortgage Trust
| ||
$1,122,007,709 (Approximate Mortgage Pool Balance) | ||
$965,676,000 (Approximate Offered Certificates) | ||
BMO Commercial Mortgage Securities LLC Depositor | ||
| | ||
Commercial Mortgage Pass-Through Certificates, Series 2022-C1 | ||
| | ||
Bank of Montreal Starwood Mortgage Capital LLC KeyBank National Association SSOF SCRE AIV, L.P. German American Capital Corporation Mortgage Loan Sellers
| ||
| BMO Capital Markets | Deutsche Bank Securities | KeyBanc Capital Markets |
| Co-Lead Managers and Joint Bookrunners | ||
Bancroft Capital, LLC
| Drexel Hamilton Co-Manager | |
THE INFORMATION IN THIS STRUCTURAL AND COLLATERAL TERM SHEET IS NOT COMPLETE AND MAY BE AMENDED PRIOR TO THE TIME OF SALE. THIS TERM SHEET IS NOT AN OFFER TO SELL THESE SECURITIES AND IT IS NOT A SOLICITATION OF AN OFFER TO BUY THESE SECURITIES IN ANY JURISDICTION WHERE THE OFFER OR SALE IS NOT PERMITTED.
| Dated February 2, 2022 | BMO 2022-C1 |
This material is for your information, and none of BMO Capital Markets Corp., KeyBanc Capital Markets Inc., Deutsche Bank Securities Inc., Bancroft Capital, LLC and Drexel Hamilton, LLC (the “Underwriters”) are soliciting any action based upon it. This material is not to be construed as an offer to sell or the solicitation of any offer to buy any security in any jurisdiction where such an offer or solicitation would be illegal.
The depositor has filed a registration statement (including the prospectus) with the Securities and Exchange Commission (File No. 333-255934) for the offering to which this communication relates. Before you invest, you should read the prospectus in the registration statement and other documents the depositor has filed with the Securities and Exchange Commission for more complete information about the depositor, the issuing entity and this offering. You may get these documents for free by visiting EDGAR on the SEC website at www.sec.gov. Alternatively, the depositor or BMO Capital Markets Corp., any other underwriter, or any dealer participating in this offering will arrange to send you the prospectus if you request it by calling 1-866-864-7760. The Offered Certificates referred to in these materials, and the asset pool backing them, are subject to modification or revision (including the possibility that one or more Classes of Certificates may be split, combined or eliminated at any time prior to issuance or availability of a final prospectus) and are offered on a “when, as and if issued” basis. You understand that, when you are considering the purchase of these Certificates, a contract of sale will come into being no sooner than the date on which the relevant Class has been priced and we have verified the allocation of Certificates to be made to you; any “indications of interest” expressed by you, and any “soft circles” generated by us, will not create binding contractual obligations for you or us.
Neither this document nor anything contained in this document shall form the basis for any contract or commitment whatsoever. The information contained in this document is preliminary as of the date of this document, supersedes any previous such information delivered to you and will be superseded by any such information subsequently delivered prior to the time of sale. These materials are subject to change, completion or amendment from time to time. The information should be reviewed only in conjunction with the entire offering document relating to the Commercial Mortgage Pass-Through Certificates, Series 2022-C1 (the “Offering Document”). All of the information contained herein is subject to the same limitations and qualifications contained in the Offering Document. The information contained herein does not contain all relevant information relating to the underlying mortgage loans or mortgaged properties. Such information is described elsewhere in the Offering Document. The information contained herein will be more fully described elsewhere in the Offering Document. The information contained herein should not be viewed as projections, forecasts, predictions or opinions with respect to value. Prior to making any investment decision, prospective investors are strongly urged to read the Offering Document its entirety. Neither the Securities and Exchange Commission nor any state securities commission has approved or disapproved of these securities or determined if this free writing prospectus is truthful or complete. Any representation to the contrary is a criminal offense.
This document has been prepared by the Underwriters for information purposes only and does not constitute, in whole or in part, a prospectus for the purposes of Regulation (EU) 2017/1129 (as amended or superseded) and/or Part VI of the Financial Services and Markets Act 2000 (as amended) or other offering document.
The attached information contains certain tables and other statistical analyses (the “Computational Materials”) which have been prepared in reliance upon information furnished by the Mortgage Loan Sellers. Numerous assumptions were used in preparing the Computational Materials, which may or may not be reflected herein. As such, no assurance can be given as to the Computational Materials’ accuracy, appropriateness or completeness in any particular context; or as to whether the Computational Materials and/or the assumptions upon which they are based reflect present market conditions or future market performance. The Computational Materials should not be construed as either projections or predictions or as legal, tax, financial or accounting advice. You should consult your own counsel, accountant and other advisors as to the legal, tax, business, financial and related aspects of a purchase of these securities. Any weighted average lives, yields and principal payment periods shown in the Computational Materials are based on prepayment and/or loss assumptions, and changes in such prepayment and/or loss assumptions may dramatically affect such weighted average lives, yields and principal payment periods. In addition, it is possible that prepayments or losses on the underlying assets will occur at rates higher or lower than the rates shown in the attached Computational Materials. The specific characteristics of the securities may differ from those shown in the Computational Materials due to differences between the final underlying assets and the preliminary underlying assets used in preparing the Computational Materials. The principal amount and designation of any security described in the Computational Materials are subject to change prior to issuance. None of the Underwriters or any of their respective affiliates make any representation or warranty as to the actual rate or timing of payments or losses on any of the underlying assets or the payments or yield on the securities. The information in this presentation is based upon management forecasts and reflects prevailing conditions and management’s views as of this date, all of which are subject to change. In preparing this presentation, we have relied upon and assumed, without independent verification, the accuracy and completeness of all information available from public sources or which was provided to us by or on behalf of the Mortgage Loan Sellers or which was otherwise reviewed by us.
This document contains forward-looking statements. If and when included in this document, the words “expects”, “intends”, “anticipates”, “estimates” and analogous expressions and all statements that are not historical facts, including statements about our beliefs or expectations, are intended to identify forward-looking statements. Any forward-looking statements are made subject to risks and uncertainties which could cause actual results to differ materially from those stated. Those risks and uncertainties include, among other things, declines in general economic and business conditions, increased competition, changes in demographics, changes in political and social conditions, regulatory initiatives and changes in consumer preferences, many of which are beyond our control and the control of any other person or entity related to this offering. The forward-looking statements made in this document are made as of the date hereof. We have no obligation to update or revise any forward-looking statement.
BMO Capital Markets is a trade name used by BMO Financial Group for the wholesale banking businesses of Bank of Montreal, BMO Harris Bank N.A. (member FDIC), Bank of Montreal Europe p.l.c, and Bank of Montreal (China) Co. Ltd, the institutional broker dealer business of BMO Capital Markets Corp. (Member FINRA and SIPC) and the agency broker dealer business of Clearpool Execution Services, LLC (Member FINRA and SIPC) in the U.S., and the institutional broker dealer businesses of BMO Nesbitt Burns Inc. (Member Investment Industry Regulatory Organization of Canada and Member Canadian Investor Protection Fund) in Canada and Asia, Bank of Montreal Europe p.l.c. (authorized and regulated by the Central Bank of Ireland) in Europe and BMO Capital Markets Limited (authorized and regulated by the Financial Conduct Authority) in the UK and Australia.
IMPORTANT NOTICE RELATING TO AUTOMATICALLY-GENERATED EMAIL DISCLAIMERS
Any legends, disclaimers or other notices that may appear at the bottom of any email communication to which this document is attached relating to (1) these materials not constituting an offer (or a solicitation of an offer), (2) no representation that these materials are accurate or complete and may not be updated or (3) these materials possibly being confidential, are not applicable to these materials and should be disregarded. Such legends, disclaimers or other notices have been automatically generated as a result of these materials having been sent via Bloomberg or another system.
THE CERTIFICATES REFERRED TO IN THESE MATERIALS ARE SUBJECT TO MODIFICATION OR REVISION (INCLUDING THE POSSIBILITY THAT ONE OR MORE CLASSES OF CERTIFICATES MAY BE SPLIT, COMBINED OR ELIMINATED AT ANY TIME PRIOR TO ISSUANCE OR AVAILABILITY OF A FINAL PROSPECTUS) AND ARE OFFERED ON A “WHEN, AS AND IF ISSUED” BASIS.
THE UNDERWRITERS MAY FROM TIME TO TIME PERFORM INVESTMENT BANKING SERVICES FOR, OR SOLICIT INVESTMENT BANKING BUSINESS FROM, ANY COMPANY NAMED IN THESE MATERIALS. THE UNDERWRITERS AND/OR THEIR AFFILIATES OR RESPECTIVE EMPLOYEES MAY FROM TIME TO TIME HAVE A LONG OR SHORT POSITION IN ANY CERTIFICATE OR CONTRACT DISCUSSED IN THESE MATERIALS.
| THE INFORMATION IN THIS STRUCTURAL AND COLLATERAL TERM SHEET IS NOT COMPLETE AND MAY BE AMENDED PRIOR TO THE TIME OF SALE. THIS TERM SHEET IS NOT AN OFFER TO SELL THESE SECURITIES AND IT IS NOT A SOLICITATION OF AN OFFER TO BUY THESE SECURITIES IN ANY JURISDICTION WHERE THE OFFER OR SALE IS NOT PERMITTED. | ||
| 2 | ||
| Structural and Collateral Term Sheet | BMO 2022-C1 | |
| Indicative Capital Structure | ||
Classes of Certificates | Expected Ratings | Approximate | Approximate Initial Available Certificate Balance or Notional Amount(1) | Approximate Initial Retained Certificate Balance. Notional Amount or Percentage Interest(1)(2) | Approximate Initial Credit Support(3)(4) | Initial | Pass-Through | Expected Weighted Avg. Life (yrs.)(6) | Expected Principal Window(6) | |||
| Offered Certificates | (Fitch / S&P / KBRA)* | |||||||||||
| Class A-1 | AAAsf/AAA(sf)/AAA(sf) | $17,581,000 | $17,029,000 | $552,000 | 30.000% | % | (7) | 2.57 | 3/22-9/26 | |||
| Class A-2 | AAAsf/AAA(sf)/AAA(sf) | $150,154,000 | $145,436,000 | $4,718,000 | 30.000% | % | (7) | 4.86 | 9/26-2/27 | |||
| Class A-3 | AAAsf/AAA(sf)/AAA(sf) | $67,774,000 | $65,644,000 | $2,130,000 | 30.000% | % | (7) | 7.05 | 12/28-12/29 | |||
| Class A-4 | AAAsf/AAA(sf)/AAA(sf) | (8) | (8) | (8) | 30.000% | % | (7) | (8) | (8) | |||
| Class A-5 | AAAsf/AAA(sf)/AAA(sf) | (8) | (8) | (8) | 30.000% | % | (7) | (8) | (8) | |||
| Class A-AB | AAAsf/AAA(sf)/AAA(sf) | $25,170,000 | $24,379,000 | $791,000 | 30.000% | % | (7) | 7.35 | 2/27-9/31 | |||
| Class X-A | AAAsf/AAA(sf)/AAA(sf) | $863,881,000 | (9) | $836,737,000 | (9) | $27,144,000 | (9) | N/A | % | Variable IO(10) | N/A | N/A |
| Class A-S | AAAsf/AAA(sf)/AAA(sf) | $93,541,000 | $90,602,000 | $2,939,000 | 21.500% | % | (7) | 9.88 | 1/32-1/32 | |||
| Class B | AA-sf/AA+(sf)/AA(sf) | $52,273,000 | $50,631,000 | $1,642,000 | 16.750% | % | (7) | 9.95 | 1/32-2/32 | |||
| Class C | A-sf/A+(sf)/A-(sf) | $49,522,000 | $47,966,000 | $1,556,000 | 12.250% | % | (7) | 9.96 | 2/32-2/32 | |||
| Non-Offered Pooled Certificates(11) | ||||||||||||
| Class X-B | A-sf/A+(sf)/AAA(sf) | $101,795,000 | (9) | $98,597,000 | (9) | $3,198,000 | (9) | N/A | % | Variable IO(10) | N/A | N/A |
| Class X-D | BBB-sf/BBB-(sf)/BBB-(sf) | $55,024,000 | (9) | $53,295,000 | (9) | $1,729,000 | (9) | N/A | % | Variable IO(10) | N/A | N/A |
| Class X-F | BB+sf/BB+(sf)/BB+(sf) | $13,756,000 | (9) | $13,324,000 | (9) | $432,000 | (9) | N/A | % | Variable IO(10) | N/A | N/A |
| Class X-G | NR/BB-(sf)/NR | $17,883,000 | (9) | $17,321,000 | (9) | $562,000 | (9) | N/A | % | Variable IO(10) | N/A | N/A |
| Class X-H | NR/B-(sf)/NR | $23,385,000 | (9) | $22,650,000 | (9) | $735,000 | (9) | N/A | % | Variable IO(10) | N/A | N/A |
| Class X-J | NR/NR/NR | $24,761,779 | (9) | $23,983,323 | (9) | $778,456 | (9) | N/A | % | Variable IO(10) | N/A | N/A |
| Class D | BBBsf/BBB+(sf)/BBB+(sf) | $31,639,000 | $30,645,000 | $994,000 | 9.375% | % | (7) | 9.96 | 2/32-2/32 | |||
| Class E | BBB-sf/BBB-(sf)/BBB-(sf) | $23,385,000 | $22,650,000 | $735,000 | 7.250% | % | (7) | 9.96 | 2/32-2/32 | |||
| Class F | BB+sf/BB+(sf)/BB+(sf) | $13,756,000 | $13,324,000 | $432,000 | 6.000% | % | (7) | 9.96 | 2/32-2/32 | |||
| Class G | NR/BB-(sf)/NR | $17,883,000 | $17,321,000 | $562,000 | 4.375% | % | (7) | 9.96 | 2/32-2/32 | |||
| Class H | NR/B-(sf)/NR | $23,385,000 | $22,650,000 | $735,000 | 2.250% | % | (7) | 9.96 | 2/32-2/32 | |||
| Class J | NR/NR/NR | $24,761,779 | $23,983,323 | $778,456 | 0.000% | % | (7) | 9.96 | 2/32-2/32 | |||
| Class S(12) | N/A | N/A | N/A | N/A | N/A | N/A | N/A | N/A | ||||
| Class R(12) | N/A | N/A | N/A | N/A | N/A | N/A | N/A | N/A | ||||
| Non-Offered Vertical Risk Retention Interest (11) | ||||||||||||
| Uncertificated VRR Interest(13) | NR/NR/NR | $21,521,930 | (13) | N/A | N/A | (14) | %(15) | (15) | 8.84 | 3/22-2/32 | ||
| Non-Offered Loan-Specific Certificates(11)(16) | ||||||||||||
| 360 Rosemary | (DBRS)* | |||||||||||
| Class 360A | AA(low)(sf) | $20,750,000 | N/A | N/A | 43.085% | % | (17) | 9.96 | 2/32-2/32 | |||
| Class 360X | A(sf) | $39,245,000 | N/A | N/A | N/A | % | Variable IO(17) | N/A | N/A | |||
| Class 360B | A(low)(sf) | $18,495,000 | N/A | N/A | 33.130% | % | (17) | 9.96 | 2/32-2/32 | |||
| Class 360C | BBB(low)(sf) | $18,650,000 | N/A | N/A | 23.093% | % | (17) | 9.96 | 2/32-2/32 | |||
| Class 360D | BB(low)(sf) | $17,919,000 | N/A | N/A | 13.449% | % | (17) | 9.96 | 2/32-2/32 | |||
| Class 360E | B(low)(sf) | $18,838,000 | N/A | N/A | 3.310% | % | (17) | 9.96 | 2/32-2/32 | |||
| Class 360RR(18) | NR | $6,150,000 | N/A | N/A | 0.000% | % | (17) | 9.96 | 2/32-2/32 | |||
| 111 River Street | (KBRA)* | |||||||||||
| Class 111A | AA-(sf) | $11,837,000 | N/A | N/A | 41.489% | % | (17) | 4.96 | 2/27-2/27 | |||
| Class 111B | A-(sf) | $13,826,000 | N/A | N/A | 32.023% | % | (17) | 4.96 | 2/27-2/27 | |||
| Class 111C | BBB-(sf) | $16,738,000 | N/A | N/A | 20.563% | % | (17) | 4.96 | 2/27-2/27 | |||
| Class 111D | BB-(sf) | $17,465,000 | N/A | N/A | 8.606% | % | (17) | 4.96 | 2/27-2/27 | |||
| Class 111E | B(sf) | $12,569,000 | N/A | N/A | 0.000% | % | (17) | 4.96 | 2/27-2/27 | |||
| 111RR Interest(19) | NR | $3,815,000 | N/A | N/A | (20) | %(21) | (21) | 4.96 | 2/27-2/27 | |||
| * | It is a condition of issuance that the offered certificates and certain classes of non-offered certificates receive the ratings set forth above. The anticipated ratings shown are those of S&P Global Ratings, a Standard & Poor’s Financial Services LLC business (“S&P”), Fitch Ratings, Inc. (“Fitch”), Kroll Bond Rating Agency, LLC (“KBRA”) and DBRS, Inc. (“DBRS”), as indicated. Subject to the discussion under “Ratings” in the Preliminary Prospectus, the ratings on the certificates address the likelihood of the timely receipt by holders of all payments of interest to which they are entitled on each distribution date and, except in the case of the interest only certificates, the ultimate receipt by holders of all payments of principal to which they are entitled on or before the applicable rated final distribution date. Certain nationally recognized statistical rating organizations, as defined in Section 3(a)(62) of the Securities Exchange Act of 1934, as amended, that were not hired by the depositor may use information they receive pursuant to Rule 17g-5 under the Securities Exchange Act of 1934, as amended, or otherwise to rate the offered certificates. We cannot assure you as to what ratings a non-hired nationally recognized statistical rating organization would assign. See “Risk Factors—Other Risks Relating to the Certificates— Nationally Recognized Statistical Rating Organizations May Assign Different Ratings to the Certificates; Ratings of the Certificates Reflect Only the Views of the Applicable Rating Agencies as of the Dates Such Ratings Were Issued; Ratings May Affect ERISA Eligibility; Ratings May Be Downgraded” in the Preliminary Prospectus. S&P, Fitch, KBRA and DBRS have informed us that the “sf” designation in the ratings represents an identifier of structured finance product ratings. For additional information about this identifier, prospective investors can go to the related rating agency’s website. The depositor and the underwriters have not verified, do not adopt and do not accept responsibility for any statements made by the rating agencies on those websites. Credit ratings referenced throughout this Term Sheet are forwardlooking opinions about credit risk and express a rating agency’s opinion about the willingness and ability of an issuer of securities to meet its financial obligations in full and on time. Ratings are not indications of investment merit and are not buy, sell or hold recommendations, a measure of asset value or an indication of the suitability of an investment. |
| (1) | Approximate, subject to a variance of plus or minus 5% and further subject to any additional variances described in the footnotes below. In addition, the notional amounts of the Class X-A, Class X-B, Class X-D, Class X-F, Class X-G, Class X-H and Class X-J certificates (the “pooled Class X certificates”) may vary depending upon the final pricing of the classes of pooled principal balance certificates (as defined in footnote (7) below) whose certificate balances comprise such notional amounts, and, if as a result of such pricing (a) the pass-through rate of any class of pooled Class X certificates, as applicable, would be equal to zero at all times, such class of certificates will not be issued on the closing date of this securitization or (b) the pass-through rate of any class of pooled principal balance certificates whose certificate balance comprises |
| THE INFORMATION IN THIS STRUCTURAL AND COLLATERAL TERM SHEET IS NOT COMPLETE AND MAY BE AMENDED PRIOR TO THE TIME OF SALE. THIS TERM SHEET IS NOT AN OFFER TO SELL THESE SECURITIES AND IT IS NOT A SOLICITATION OF AN OFFER TO BUY THESE SECURITIES IN ANY JURISDICTION WHERE THE OFFER OR SALE IS NOT PERMITTED. | ||
| 3 | ||
| Structural and Collateral Term Sheet | BMO 2022-C1 | |
| Indicative Capital Structure | ||
such notional amount is at all times equal to the weighted average of the net interest rates on the mortgage loans (in each case, adjusted, if necessary, to accrue on the basis of a 360-day year consisting of twelve 30-day months) as in effect from time to time, the certificate balance of such class of pooled principal balance certificates may not be part of, and there would be a corresponding reduction in, such notional amount of the related class of pooled Class X certificates.
| (2) | On the closing date for this transaction, SSOF SCRE AIV, L.P. as “retaining sponsor” (as such term is defined in Regulation RR) for this securitization, is expected to satisfy its risk retention obligations by: (i) causing a “majority-owned affiliate” (as defined in Regulation RR) to purchase an “eligible vertical interest” (as defined in Regulation RR), in the form of certificates (collectively referred to herein as the “Sabal VRR Interest Portion”) (x) representing approximately 3.1421% of the initial certificate balance, notional amount or percentage interest, as applicable, of each class of pooled certificates (as defined in footnote (7) below), other than the Class R Certificates, as set forth in the table above under “Approximate Initial Retained Certificate Balance, Notional Amount or Percentage Interest” and (y) representing approximately 3.08184% of the aggregate principal balance of all the “ABS Interests” (as described below), and (ii) causing one or more other retaining parties to acquire from the depositor, on the closing date for this transaction, additional portions of an “eligible vertical interest” in the form of a “single vertical security” with an initial principal balance of approximately $21,521,930 (the “Combined Uncertificated VRR Interest” and, together with the interest described in sub-clause (i)(y) above, the “Aggregate VRR”), which Aggregate VRR is expected to represent at least 5% of the aggregate principal balance of all the “ABS interests” (i.e., the sum of the aggregate initial certificate balance of all of the pooled certificates (other than the Class R certificates) and the initial principal balance of the Uncertificated VRR Interest) issued by the issuing entity on the closing date for this transaction, as described under “Credit Risk Retention”. The Combined Uncertificated VRR Interest will consist solely of the “Uncertificated VRR Interest” (as defined under “Credit Risk Retention”). The Combined Uncertificated VRR Interest will be retained by certain retaining parties in accordance with the credit risk retention rules applicable to this securitization transaction. “Eligible vertical interest” and “single vertical security” will have the meanings given to such terms in Regulation RR. See “Credit Risk Retention” in the preliminary prospectus. The Combined Uncertificated VRR Interest is not offered hereby. |
| (3) | “Approximate Initial Credit Support” means, with respect to any class of non-uncertificated VRR retained pooled principal balance certificates (as defined in footnote (7) below), the quotient, expressed as a percentage, of (i) the aggregate of the initial certificate balances of all classes of non-uncertificated VRR retained pooled principal balance certificates, if any, junior to such class of non-uncertificated VRR retained pooled principal balance certificates, divided by (ii) the aggregate of the initial certificate balances of all classes of non-uncertificated VRR retained pooled principal balance certificates. The approximate initial credit support percentages set forth for the Class A-1, Class A-2, Class A-3, Class A-4, Class A-5 and Class A-AB certificates are represented in the aggregate. The approximate initial credit support percentage shown for each class of non-uncertificated VRR retained pooled principal balance certificates does not take into account the subordination provided by any trust subordinate companion loan (as defined in footnote (16) below), provided that payments on each trust subordinate companion loan are generally subordinate to payments on the related senior loans in the related loan combination as and to the extent provided in the related co-lender agreement. The approximate initial credit support percentages shown in the table above with respect to the non-uncertificated VRR retained pooled principal balance certificates do not take into account the Combined Uncertificated VRR Interest. |
| (4) | “Approximate Initial Credit Support” means, with respect to any class of loan-specific principal balance certificates (as defined in footnote (16) below), the quotient, expressed as a percentage, of (i) the aggregate of the initial certificate balances of all classes of loan-specific principal balance certificates backed by the same trust subordinate companion loan as the subject class of loan-specific principal balance certificates, if any, junior to the subject class of loan-specific certificates, divided by (ii) the sum of (A) the aggregate of the initial certificate balances of all classes of loan-specific principal balance certificates backed by the same trust subordinate companion loan as the subject class of loan-specific principal balance certificates and (B) (x) with respect to the 111 River Street loan-specific certificates (as defined in footnote (16) below), approximately 95% of the aggregate outstanding principal balance of the senior loans included in the 111 River Street loan combination as of the cut-off date and (y) with respect to the 360 Rosemary loan-specific certificates (as defined in footnote (16) below), the aggregate outstanding principal balance of the senior loans included in 360 Rosemary loan combination, in each case as of the cut-off date. The approximate initial credit support percentages shown in the table above with respect to the 111 River Street loan-specific principal balance certificates do not take into account the 111RR Interest. |
| (5) | Approximate per annum rate as of the closing date. |
| (6) | Determined assuming no prepayments prior to the maturity date or any anticipated repayment date, as applicable, for any mortgage loan or trust subordinate companion loan and based on the modeling assumptions described under “Yield, Prepayment and Maturity Considerations” in the preliminary prospectus. |
| (7) | For any distribution date, the pass-through rate for each class of the Class A-1, Class A-2, Class A-3, Class A-4, Class A-5, Class A-AB, Class A-S, Class B, Class C, Class D, Class E, Class F, Class G, Class H and Class J certificates (collectively, the “pooled principal balance certificates” or the “non-uncertificated VRR retained pooled principal balance certificates”), and collectively with the pooled Class X certificates, the Class S certificates and the Class R certificates, the “pooled certificates” or “non-uncertificated VRR retained pooled certificates”) will generally be equal to one of (i) a fixed per annum rate, (ii) the weighted average of the net interest rates on the mortgage loans (in each case, adjusted, if necessary, to accrue on the basis of a 360-day year consisting of twelve 30-day months) as in effect from time to time, (iii) a rate equal to the lesser of a specified per annum rate and the weighted average rate described in clause (ii), or (iv) the weighted average rate described in clause (ii) less a specified percentage, but no less than 0.000%. The trust subordinate companion loans will not be taken into account in determining pass-through rates on the non-uncertificated VRR retained pooled principal balance certificates. See “Description of the Certificates—Distributions—Pass-Through Rates” in the preliminary prospectus. |
| (8) | The exact initial certificate balances of the Class A-4 and Class A-5 certificates are unknown and will be determined based on the final pricing of those classes of certificates. However, the respective initial certificate balances (and corresponding available and retained portions thereof), weighted average lives and principal windows of the Class A-4 and Class A-5 certificates are expected to be within the applicable ranges reflected in the following chart. The aggregate initial certificate balance of the Class A-4 and Class A-5 certificates is expected to be approximately $509,661,000 subject to a variance of plus or minus 5%. |
Class of Certificates | Expected Range of Initial Certificate Balances | Expected Range of Initial Available Certificate Balances | Expected Range of Initial Retained Certificate Balances | Expected Range of Weighted Avg. Lives (Yrs) | Expected Range of Principal Windows |
| Class A-4 | $0 - $206,488,000 | $0 - $200,000,000 | $0 - $6,488,000 | N/A - 9.75 | N/A - 9/31-12/31 |
| Class A-5 | $303,173,000 - $509,661,000 | $293,647,000 - $493,647,000 | $9,526,000 - $16,014,000 | 9.87 - 9.82 | 12/31-1/32 - 9/31-1/32 |
| THE INFORMATION IN THIS STRUCTURAL AND COLLATERAL TERM SHEET IS NOT COMPLETE AND MAY BE AMENDED PRIOR TO THE TIME OF SALE. THIS TERM SHEET IS NOT AN OFFER TO SELL THESE SECURITIES AND IT IS NOT A SOLICITATION OF AN OFFER TO BUY THESE SECURITIES IN ANY JURISDICTION WHERE THE OFFER OR SALE IS NOT PERMITTED. | ||
| 4 | ||
| Structural and Collateral Term Sheet | BMO 2022-C1 | |
| Indicative Capital Structure | ||
| (9) | The pooled Class X certificates will not have certificate balances and will not be entitled to receive distributions of principal. Interest will accrue on each class of pooled Class X certificates at the related pass through rate based upon the related notional amount. The notional amount of each class of the pooled Class X certificates will be equal to the certificate balance or the aggregate of the certificate balances, as applicable, from time to time of the class or classes of the non-uncertificated VRR retained pooled principal balance certificates identified in the same row as such class of pooled Class X certificates in the chart below (as to such class of pooled Class X certificates, the “corresponding pooled principal balance certificates”): |
| Class of Pooled Class X Certificates | Class(es) of Corresponding Pooled Principal Balance Certificates |
| Class X-A | Class A-1, Class A-2, Class A-3, Class A-4, Class A-5, Class A-AB and Class A-S |
| Class X-B | Class B and Class C |
| Class X-D | Class D and Class E |
| Class X-F | Class F |
| Class X-G | Class G |
| Class X-H | Class H |
| Class X-J | Class J |
| (10) | The pass-through rate for each class of pooled Class X certificates will generally be a per annum rate equal to the excess, if any, of (i) the weighted average of the net interest rates on the mortgage loans (in each case, adjusted, if necessary, to accrue on the basis of a 360-day year consisting of twelve 30-day months) as in effect from time to time, over (ii) the pass-through rate (or, if applicable, the weighted average of the pass-through rates) of the class or classes of corresponding pooled principal balance certificates as in effect from time to time, as described in the preliminary prospectus. |
| (11) | The classes of certificates set forth below “Non-Offered Pooled Certificates”, “Non-Offered Vertical Risk Retention Interest” and “Non-Offered Loan-Specific Certificates” in the table are not offered hereby. |
| (12) | Neither the Class S certificate nor the Class R certificates will have a certificate balance, notional amount, pass-through rate, rating or rated final distribution date. A specified portion of the excess interest accruing after the related anticipated repayment date on any mortgage loan with an anticipated repayment date will, to the extent collected, be allocated to the Class S certificates as set forth in “Description of the Certificates—Distributions—Excess Interest”. The Class R certificates will represent the residual interests in each of four separate REMICs, as further described in the preliminary prospectus. The Class R certificates will not be entitled to distributions of principal or interest. |
| (13) | Constitutes the Combined Uncertificated VRR Interest Balance, which consists solely of the principal balance of the Uncertificated VRR Interest. |
| (14) | Although the approximate initial credit support percentages shown in the table above with respect to the non-uncertificated VRR retained pooled principal balance certificates do not take into account the Combined Uncertificated VRR Interest, losses incurred on the mortgage loans will be allocated between the Combined Uncertificated VRR Interest, on the one hand, and the non-uncertificated VRR retained pooled principal balance certificates, on the other hand, pro rata in accordance with the principal balance of the Combined Uncertificated VRR Interest and the aggregate outstanding certificate balance of the non-uncertificated VRR retained principal balance certificates. See “Credit Risk Retention” and “Description of the Certificates” in the preliminary prospectus. The non-uncertificated VRR retained pooled principal balance certificates are also collectively referred to as the “pooled principal balance certificates”. |
| (15) | Although it does not have a specified pass-through rate (other than for tax reporting purposes), the effective interest rate for the Combined Uncertificated VRR Interest will be the weighted average of the net mortgage interest rates on the mortgage loans (in each case, adjusted, if necessary, to accrue on the basis of a 360-day year consisting of twelve 30-day months) as in effect from time to time. |
| (16) | The Class 360A, Class 360X, Class 360B, Class 360C, Class 360D, Class 360E and Class 360RR certificates are collectively referred to as the “360 Rosemary loan-specific certificates”, and the Class 111A, Class 111B, Class 111C, Class 111D, and Class 111E certificates are collectively referred to as the “111 River Street loan-specific certificates” (which were issued together with the Uncertificated 111RR Interest). The 360 Rosemary loan-specific certificates and 111 River Street loan-specific certificates collectively constitute the “loan-specific certificates”. The Class 360A, Class 360B, Class 360C, Class 360D, Class 360E and Class 360RR certificates (the foregoing, collectively, the “360 Rosemary loan-specific principal balance certificates”) and the Class 111A, Class 111B, Class 111C, Class 111D and Class 111E certificates (the foregoing, collectively, the “111 River Street loan-specific principal balance certificates”), collectively constitute the “loan-specific principal balance certificates” (and, collectively with the pooled principal balance certificates, constitute the “principal balance certificates”). The Class 360X certificates, together with the pooled Class X certificates, collectively constitute the “Class X certificates”). The loan-specific certificates will only be entitled to receive distributions from, and will only incur losses with respect to, the 360 Rosemary trust subordinate companion loan or the 111 River Street trust subordinate companion loan (each, a “trust subordinate companion loan” and collectively, the “trust subordinate companion loans”), as applicable. Each trust subordinate companion loan will be included as an asset of the issuing entity but will not be part of the mortgage pool backing the pooled certificates. No class of pooled certificates will have any interest in either trust subordinate companion loan. See “Description of the Mortgage Pool—The Loan Combinations—The 360 Rosemary Pari Passu-AB Loan Combination” and “—The 111 River Street Pari Passu-AB Loan Combination” in the preliminary prospectus. |
| (17) | The pass-through rates for the loan-specific principal balance certificates, in each case, will equal one of the following per annum rates: (i) a fixed rate, (ii) the net mortgage rate (adjusted, if necessary, to accrue on the basis of a 360-day year consisting of twelve 30-day months) on the related trust subordinate companion loan, (iii) the lesser of a specified rate and the net mortgage rate on the trust subordinate companion loan described in clause (ii), or (iv) the net mortgage rate on the related trust subordinate companion loan described in clause (ii) less a specified rate. The pass-through rate with respect to the Class 360X certificates will be a per annum rate equal to the excess, if any of, (i) the net mortgage rate (adjusted, if necessary, to accrue on the basis of a 360-day year consisting of twelve 30-day months) on the related trust subordinate companion loan as in effect from time to time, over (ii) the weighted average of the pass-through rates of the Class 360A and Class 360B certificates in effect from time to time, as described in the preliminary prospectus. See “Description of the Certificates—Distributions—Pass-Through Rates” in the preliminary prospectus. |
| (18) | Bank of Montreal is the only sponsor (and will act as “retaining sponsor” (as such term is defined in Regulation RR)), with respect to the securitization transaction constituted by the issuance of the 360 Rosemary loan-specific certificates. In connection therewith, the Class 360RR certificates (the “360 Rosemary Loan-Specific HRR Certificates”) will be purchased and retained by a third party purchaser contemplated by Rule 7 of Regulation RR (the “360 Rosemary Retaining Third Party Purchaser”), in accordance with the credit risk retention rules applicable to the securitization transaction constituted by the issuance of the 360 Rosemary loan-specific certificates. |
| (19) | Bank of Montreal is the only sponsor (and will act as “retaining sponsor” (as such term is defined in Regulation RR)) with respect to the securitization transaction constituted by the issuance of the 111 River Street loan-specific certificates and the 111RR Interest. In connection therewith, Bank of Montreal is expected to acquire from the depositor on the closing date an “eligible vertical interest” (as such term is defined in Regulation RR) in the form of an uncertificated interest with an initial principal balance of approximately $3,815,000 (the “111RR Interest”), which is expected to represent approximately 5.0% of the aggregate initial principal balance of all 111 River Street loan-specific certificates and the 111RR Interest. The 111RR Interest is expected to be retained by Bank of Montreal or its “majority-owned affiliate” (as such term is defined in Regulation RR) in accordance with the credit risk retention rules applicable to such securitization transaction. The 111RR Interest is not a class of certificates and is not offered hereby. |
| (20) | Although the approximate initial credit support percentages shown in the table with respect to the 111 River Street loan-specific certificates do not take into account the 111RR Interest, losses incurred on the 111 River Street trust subordinate companion loan will be allocated between the 111RR Interest, on the one hand, and the other classes of 111 River Street loan-specific certificates, on the other hand, pro rata in accordance with their respective outstanding principal balances. |
| (21) | Except for tax reporting purposes, the 111RR Interest does not have a specified pass-through rate; however, the effective interest rate on the 111RR Interest will be a per annum rate equal to the net mortgage rate (adjusted, if necessary, to accrue interest on the basis of a 360-day year consisting of twelve 30-day months) as in effect from time to time on the related trust subordinate companion loan. |
| THE INFORMATION IN THIS STRUCTURAL AND COLLATERAL TERM SHEET IS NOT COMPLETE AND MAY BE AMENDED PRIOR TO THE TIME OF SALE. THIS TERM SHEET IS NOT AN OFFER TO SELL THESE SECURITIES AND IT IS NOT A SOLICITATION OF AN OFFER TO BUY THESE SECURITIES IN ANY JURISDICTION WHERE THE OFFER OR SALE IS NOT PERMITTED. | ||
| 5 | ||
| Structural and Collateral Term Sheet | BMO 2022-C1 | |
| Summary of Transaction Terms | ||
| Securities Offered: | $965,676,000 monthly pay, multi-class, commercial mortgage REMIC Pass-Through Certificates. |
| Co-Lead Managers and Joint Bookrunners: | BMO Capital Markets Corp., Deutsche Bank Securities Inc. and KeyBanc Capital Markets Inc. |
| Co-Managers: | Bancroft Capital, LLC and Drexel Hamilton, LLC |
| Mortgage Loan Sellers: | Bank of Montreal (“BMO”) (36.2%), Starwood Mortgage Capital LLC (“SMC”) (19.6%), KeyBank National Association (“KeyBank”) (18.0%), SSOF SCRE AIV, L.P. (“Sabal”) (13.1%), German American Capital Corporation (“GACC”) (9.4%) and BMO/SMC (3.6%). |
| Master Servicer: | KeyBank National Association. |
| Special Servicers: | CWCapital Asset Management LLC (with respect to all serviced loans other than the 360 Rosemary mortgage loan and the 111 River Street mortgage loan), Situs Holdings LLC (solely with respect to the 360 Rosemary mortgage loan) and KeyBank National Association (solely with respect to the 111 River Street mortgage loan) |
| Directing Holder/Controlling Class Representative: | Sabal Strategic Opportunities Fund, L.P. |
| Trustee: | Wilmington Trust, National Association. |
| Certificate Administrator: | Computershare Trust Company, National Association. |
| Operating Advisor: | Park Bridge Lender Services LLC. |
| Asset Representations Reviewer: | Park Bridge Lender Services LLC. |
| Rating Agencies: | Standard and Poor’s (“S&P”), Fitch Ratings, Inc. (“Fitch”) and Kroll Bond Rating Agency, LLC (“KBRA”). |
| U.S. Credit Risk Retention: | For a discussion on the manner in which SSOF SCRE AIV, L.P. as retaining sponsor, intends to satisfy the U.S. credit risk retention requirements, see “Credit Risk Retention” in the Preliminary Prospectus. |
| EU Credit Risk Retention: | The transaction is not structured to satisfy the EU risk retention and due diligence requirements. |
| Closing Date: | On or about February 28, 2022. |
| Cut-off Date: | With respect to each mortgage loan, the related due date in February 2022, or in the case of any mortgage loan that has its first due date after February 2022, the date that would have been its due date in February 2022 under the terms of that mortgage loan if a monthly debt service payment were scheduled to be due in that month. |
| Distribution Date: | The 4th business day after the Determination Date in each month, commencing in March 2022. |
| Determination Date: | 11th day of each month, or if the 11th day is not a business day, the next succeeding business day, commencing in March 2022. |
| Assumed Final Distribution Date: | The Distribution Date in February 2032 which is the latest anticipated repayment date of the Certificates. |
| Rated Final Distribution Date: | The Distribution Date in February 2055. |
| Tax Treatment: | The Publicly Offered Certificates are expected to be treated as REMIC “regular interests” for U.S. federal income tax purposes. |
| Form of Offering: | The Class A-1, Class A-2, Class A-3, Class A-4, Class A-5, Class A-AB, Class X-A, Class A-S, Class B and Class C Certificates (the “Publicly Offered Certificates”) will be offered publicly. The Class X-B, Class X-D, Class X-F, Class X-G, Class X-H, Class X-J, Class D, Class E, Class F, Class G, Class H, Class J, Class S and Class R Certificates (the “Privately Offered Certificates”) will be offered domestically to Qualified Institutional Buyers and to Institutional Accredited Investors (other than the Class R Certificates) and to institutions that are not U.S. Persons pursuant to Regulation S. |
| SMMEA Status: | The Certificates will not constitute “mortgage related securities” for purposes of SMMEA. |
| ERISA: | The Publicly Offered Certificates are expected to be ERISA eligible. |
| Optional Termination: | On any Distribution Date on which the aggregate principal balance of the pool of mortgage loans is less than 1% of the aggregate principal balance of the mortgage loans as of the cut-off date (solely for the purposes of this calculation, if such right is being exercised after the distribution date in February 2032 and the Coleman Highline Phase IV mortgage loan is still an asset of the issuing entity, then such mortgage loan will be excluded from the then-aggregate stated principal balance of the pool of mortgage loans and from the initial pool balance), certain entities specified in the Preliminary Prospectus will have the option to purchase all of the remaining mortgage loans (and all property acquired through exercise of remedies in respect of any mortgage loan) at the price specified in the Preliminary Prospectus. Refer to “Pooling and Servicing Agreement—Termination; Retirement of Certificates” in the Preliminary Prospectus. |
| Minimum Denominations: | The Publicly Offered Certificates (other than the Class X-A and Class X-B Certificates) will be issued in minimum denominations of $10,000 and integral multiples of $1 in excess of $10,000. The Class X-A and Class X-B Certificates will be issued in minimum denominations of $1,000,000 and in integral multiples of $1 in excess of $1,000,000. |
| Settlement Terms: | DTC, Euroclear and Clearstream Banking. |
| THE INFORMATION IN THIS STRUCTURAL AND COLLATERAL TERM SHEET IS NOT COMPLETE AND MAY BE AMENDED PRIOR TO THE TIME OF SALE. THIS TERM SHEET IS NOT AN OFFER TO SELL THESE SECURITIES AND IT IS NOT A SOLICITATION OF AN OFFER TO BUY THESE SECURITIES IN ANY JURISDICTION WHERE THE OFFER OR SALE IS NOT PERMITTED. | ||
| 6 | ||
| Structural and Collateral Term Sheet | BMO 2022-C1 | |
| Summary of Transaction Terms | ||
| Analytics: | The transaction is expected to be modeled by Intex Solutions, Inc. and Trepp, LLC and is expected to be available on Bloomberg, L.P., BlackRock Financial Management, Inc., CMBS.com, Inc., Moody’s Analytics, Markit Group Limited, RealINSIGHT, Thompson Reuters Corporation, Intercontinental Exchange | ICE Data Services and KBRA Analytics, LLC. |
| Risk Factors: | THE CERTIFICATES INVOLVE CERTAIN RISKS AND MAY NOT BE SUITABLE FOR ALL INVESTORS. REFER TO THE “SUMMARY OF RISK FACTORS” AND “RISK FACTORS” SECTIONS OF THE PRELIMINARY PROSPECTUS. |
| THE INFORMATION IN THIS STRUCTURAL AND COLLATERAL TERM SHEET IS NOT COMPLETE AND MAY BE AMENDED PRIOR TO THE TIME OF SALE. THIS TERM SHEET IS NOT AN OFFER TO SELL THESE SECURITIES AND IT IS NOT A SOLICITATION OF AN OFFER TO BUY THESE SECURITIES IN ANY JURISDICTION WHERE THE OFFER OR SALE IS NOT PERMITTED. | ||
| 7 | ||
| Structural and Collateral Term Sheet | BMO 2022-C1 | |
| Collateral Characteristics | ||
Mortgage Loan Seller | Number of Mortgage Loans | Number of Mortgaged Properties | Aggregate | % of IPB |
| BMO | 19 | 28 | $406,438,584 | 36.2% |
| SMC | 16 | 42 | $220,342,335 | 19.6% |
| KeyBank | 14 | 58 | $201,852,000 | 18.0% |
| Sabal | 24 | 69 | $147,374,790 | 13.1% |
| GACC | 3 | 3 | $106,000,000 | 9.4% |
| BMO/SMC | 1 | 34 | $40,000,000 | 3.6% |
| Total: | 77 | 234 | $1,122,007,709 | 100.0% |
| Loan Pool(1) | ||
| Initial Pool Balance (“IPB”): | $1,122,007,709 | |
| Number of Mortgage Loans: | 77 | |
| Number of Mortgaged Properties: | 234 | |
| Average Cut-off Date Balance per Mortgage Loan: | $14,571,529 | |
| Weighted Average Current Mortgage Rate: | 3.79281% | |
| 10 Largest Mortgage Loans as % of IPB: | 38.0% | |
| Weighted Average Remaining Term to Maturity: | 108 months | |
| Weighted Average Seasoning: | 2 months | |
| Credit Statistics(1) | ||
| Weighted Average UW NCF DSCR(2)(3): | 2.60x | |
| Weighted Average UW NOI Debt Yield(2)(4): | 10.9% | |
| Weighted Average Cut-off Date Loan-to-Value Ratio (“LTV”)(2)(4)(5): | 53.4% | |
| Weighted Average Maturity Date/ARD LTV(2)(5): | 50.8% | |
| Other Statistics | ||
| % of Mortgage Loans with Additional Debt: | 23.3% | |
| % of Mortgage Loans with Single Tenants(6): | 16.7% | |
| % of Mortgage Loans secured by Multiple Properties: | 32.7% | |
| Amortization | ||
| Weighted Average Original Amortization Term(7): | 344 months | |
| Weighted Average Remaining Amortization Term(7): | 342 months | |
| % of Mortgage Loans with Interest-Only: | 69.8% | |
| % of Mortgage Loans with Amortizing Balloon: | 12.0% | |
| % of Mortgage Loans with Partial Interest-Only followed by Amortizing Balloon: | 14.5% | |
| % of Mortgage Loans with Interest-Only followed by ARD-Structure: | 3.7% | |
| Lockboxes(8) | ||
| % of Mortgage Loans with Hard Lockboxes: | 44.6% | |
| % of Mortgage Loans with Springing Lockboxes: | 29.9% | |
| % of Mortgage Loans with Soft Lockboxes: | 9.8% | |
| % of Mortgage Loans with No Lockbox: | 9.4% | |
| % of Mortgage Loans with Springing (Residential); Hard (Commercial) Lockbox: | 3.6% | |
| % of Mortgage Loans with Soft (Residential); Hard (Commercial) Lockbox: | 2.7% | |
| Reserves | ||
| % of Mortgage Loans Requiring Monthly Tax Reserves: | 66.8% | |
| % of Mortgage Loans Requiring Monthly Insurance Reserves: | 55.7% | |
| % of Mortgage Loans Requiring Monthly CapEx Reserves: | 60.6% | |
| % of Mortgage Loans Requiring Monthly TI/LC Reserves(9): | 48.4% | |
| (1) | The Loan Pool includes a cross-collateralized group of loans including Loan Nos. 36 and 37. All metrics to the crossed loans are presented on an aggregate basis. |
| (2) | In the case of Loan Nos. 1, 2, 4, 5, 6, 7, 8, 9, 10, 11, 15, 20 and 22, the UW NCF DSCR, UW NOI Debt Yield, Cut-off Date LTV and Maturity Date/ARD LTV calculations include the related Pari Passu Companion Loan(s). In the case of Loan Nos. 2, 4, 6, 7, 10 and 22, the UW NCF DSCR, UW NOI Debt Yield, Cut-off Date LTV and Maturity Date/ARD LTV calculations exclude the related Subordinate Companion Loans. In the case of Loan No. 5, the loan amortizes on a non-standard amortization schedule. Calculations are based on the assumed principal and interest schedule beginning November 2028. |
| (3) | For the mortgage loans that are interest-only for the entire term and accrue interest on an Actual/360 basis, the Monthly Debt Service Amount ($) was calculated as 1/12th of the product of (i) the Original Balance ($), (ii) the Interest Rate % and (iii) 365/360. |
| (4) | In the case of Loan No. 13, the Cut-off Date LTV and UW NOI Debt Yield are based on Cut-off Date Principal Balance after netting out a $1,500,000 holdback reserve. The Cut-off Date LTV and UW NOI Debt Yield based on Cut-off Date Principal Balance without netting out the holdback reserve are 62.7% and 8.6%, respectively. |
| (5) | In the case of Loan Nos. 1, 9, 18 and 23, the Cut-off Date LTV and the Maturity Date/ARD LTV are calculated by using an appraised value based on an as-portfolio assumption. In the case of Loan Nos. 2 and 38 the Cut-off Date LTV and Maturity/ARD LTV are calculated by using an appraised value based on an as stabilized assumption. In the case of Loan No. 20, the Cut-off Date LTV and Maturity LTV are calculated by using an appraised value based on an as complete assumption for 15 of the mortgage properties. In the case of Loan No. 7, the Cut-off Date LTV and Maturity/ARD LTV are calculated by using an appraised value based on a market value assuming present value of ICAP tax savings are excluded and outstanding leasing costs reserved assumption. Refer to “Description of the Mortgage Pool—Certain Calculations and Definitions—Appraised Value” in the Preliminary Prospectus for additional details. |
| (6) | Excludes mortgage loans that are secured by multiple properties with multiple tenants and includes one mortgage loan that is secured by both single-tenant properties and multi-tenant properties. |
| (7) | Excludes 48 mortgage loans that are interest-only for the entire term or until the anticipated repayment date. |
| (8) | For a more detailed description of lockboxes, refer to “Description of the Mortgage Pool—Certain Calculations and Definitions” and “—Certain Terms of the Mortgage Loans—Mortgaged Property Accounts” in the Preliminary Prospectus. |
| (9) | Calculated only with respect to the Cut-off Date Balance of mortgage loans secured or partially secured by office, retail, mixed use, self storage (with commercial space), multifamily (with commercial space), parking garage and industrial properties. |
| THE INFORMATION IN THIS STRUCTURAL AND COLLATERAL TERM SHEET IS NOT COMPLETE AND MAY BE AMENDED PRIOR TO THE TIME OF SALE. THIS TERM SHEET IS NOT AN OFFER TO SELL THESE SECURITIES AND IT IS NOT A SOLICITATION OF AN OFFER TO BUY THESE SECURITIES IN ANY JURISDICTION WHERE THE OFFER OR SALE IS NOT PERMITTED. | ||
| 8 | ||
| Structural and Collateral Term Sheet | BMO 2022-C1 | |
| Collateral Characteristics | ||
| Ten Largest Mortgage Loans | ||||||||||||
| No. | Loan Name | City, State | Mortgage Loan Seller | No. of Prop. | Cut-off Date Balance | % of IPB | Square Feet / Rooms / Units | Property Type | UW NCF DSCR(1) | UW NOI Debt Yield(1) | Cut-off Date LTV(1) | Maturity Date/ARD LTV(1) |
| 1 | IPCC National Storage Portfolio XVI | Various, Various | KeyBank | 19 | $60,000,000 | 5.3% | 1,133,018 | Self Storage | 2.29x | 8.6% | 47.8% | 47.8% |
| 2 | 360 Rosemary | West Palm Beach, FL | BMO | 1 | $45,000,000 | 4.0% | 313,002 | Office | 4.35x | 17.8% | 26.6% | 26.6% |
| 3 | HTI MOB Portfolio | Various, Various | BMO | 9 | $42,750,000 | 3.8% | 232,854 | Office | 3.79x | 11.5% | 55.5% | 55.5% |
| 4 | Coleman Highline Phase IV | San Jose, CA | BMO | 1 | $41,400,000 | 3.7% | 657,934 | Office | 5.54x | 14.1% | 31.0% | 31.0% |
| 5 | AMF Portfolio | Various, Various | BMO/SMC | 34 | $40,000,000 | 3.6% | 3,299 | Multifamily | 1.51x | 9.8% | 61.3% | 56.9% |
| 6 | 601 Lexington Avenue | New York, NY | GACC | 1 | $40,000,000 | 3.6% | 1,675,659 | Office | 4.50x | 13.2% | 42.5% | 42.5% |
| 7 | Hudson Commons | New York, NY | GACC | 1 | $40,000,000 | 3.6% | 697,960 | Office | 2.54x | 9.4% | 29.6% | 29.6% |
| 8 | Bedrock Portfolio | Detroit, MI | SMC | 14 | $40,000,000 | 3.6% | 2,694,627 | Various | 3.30x | 13.6% | 59.4% | 59.4% |
| 9 | IPCC National Storage Portfolio XV | Various, Various | KeyBank | 17 | $40,000,000 | 3.6% | 912,654 | Self Storage | 2.29x | 8.7% | 46.9% | 46.9% |
| 10 | 111 River Street | Hoboken, NJ | BMO | 1 | $37,500,000 | 3.3% | 557,719 | Office | 5.08x | 16.9% | 31.8% | 31.8% |
| Top 3 Total/Weighted Average | 29 | $147,750,000 | 13.2% | 3.35x | 12.2% | 43.6% | 43.6% | |||||
| Top 5 Total/Weighted Average | 64 | $229,150,000 | 20.4% | 3.43x | 12.2% | 44.4% | 43.6% | |||||
| Top 10 Total/Weighted Average | 98 | $426,650,000 | 38.0% | 3.47x | 12.2% | 43.4% | 43.0% | |||||
| Non-Top 10 Total/Weighted Average(2)(3) | 136 | $695,357,709 | 62.0% | 2.06x | 10.1% | 59.5% | 55.6% | |||||
| (1) | In the case of Loan Nos. 1, 2, 4, 5, 6, 7, 8, 9, 10, 11, 15, 20 and 22, the UW NCF DSCR, UW NOI Debt Yield, Cut-off Date LTV and Maturity Date/ARD LTV calculations include the related Pari Passu Companion Loan(s). In the case of Loan Nos. 2, 4, 6, 7, 10 and 22, the UW NCF DSCR, UW NOI Debt Yield, Cut-off Date LTV and Maturity Date/ARD LTV calculations exclude the related Subordinate Companion Loans. In the case of Loan No. 5, the loan amortizes on a non-standard amortization schedule. Calculations are based on the assumed principal and interest schedule beginning November 2028. |
| (2) | The Non-Top 10 Total/Weighted Average includes a cross-collateralized group of loans including Loan Nos. 36 and 37. All metrics to the crossed loans are presented on an aggregate basis. |
| (3) | In the case of Loan No. 13, the Cut-off Date LTV and UW NOI Debt Yield are based on Cut-off Date Principal Balance after netting out a $1,500,000 holdback reserve. The Cut-off Date LTV and UW NOI Debt Yield based on Cut-off Date Principal Balance without netting out the holdback reserve are 62.7% and 8.6%, respectively. |
| THE INFORMATION IN THIS STRUCTURAL AND COLLATERAL TERM SHEET IS NOT COMPLETE AND MAY BE AMENDED PRIOR TO THE TIME OF SALE. THIS TERM SHEET IS NOT AN OFFER TO SELL THESE SECURITIES AND IT IS NOT A SOLICITATION OF AN OFFER TO BUY THESE SECURITIES IN ANY JURISDICTION WHERE THE OFFER OR SALE IS NOT PERMITTED. | ||
| 9 | ||
| Structural and Collateral Term Sheet | BMO 2022-C1 | |
| Collateral Characteristics | ||
| Pari Passu Companion Loan Summary | |||||||||
No. | Loan Name | Mortgage Loan Seller | Trust Cut-off Date Balance | Aggregate Pari Passu Loan Cut-off Date Balance(1) | Controlling Pooling/Trust & Servicing Agreement | Master Servicer | Special Servicer | Related Pari Passu Loan(s) Securitizations | Related Pari Passu Loan(s) Original Balance |
| 1 | IPCC National Storage Portfolio XVI | KeyBank | $60,000,000 | $117,000,000 | BMO 2022-C1 | KeyBank | CWCapital | Future Securitization(s) | $57,000,000 |
| 2 | 360 Rosemary | BMO | $45,000,000 | $85,000,000 | BMO 2022-C1 | KeyBank | Situs | Future Securitization(s) | $40,000,000 |
| 4 | Coleman Highline Phase IV | BMO | $41,400,000 | $245,000,000 | BBCMS 2022-C14(2) | Midland Loan Services(2) | Midland Loan Services(2) | Future Securitization(s) | $203,600,000 |
| 5 | AMF Portfolio | BMO/SMC | $40,000,000 | $172,000,000 | BBCMS 2021-C12 | KeyBank | LNR | BBCMS 2021-C12 GSMS 2021-GSA3 Future Securitization(s) | $84,000,000 $38,000,000 $10,000,000 |
| 6 | 601 Lexington Avenue | GACC | $40,000,000 | $723,300,000 | BXP 2021-601L | Wells Fargo | Situs | BXP 2021-601L BANK 2022-BNK39 Benchmark 2022-B32 Future Securitization | $426,700,000 $110,000,000 $25,000,000 $121,600,000 |
| 7 | Hudson Commons | GACC | $40,000,000 | $305,000,000 | COMM 2022-HC | KeyBank | CWCapital | COMM 2022-HC | $265,000,000 |
| 8 | Bedrock Portfolio | SMC | $40,000,000 | $430,000,000 | Benchmark 2022-B32 | Midland Loan Services | Ellington | Benchmark 2022-B32 Future Securitization(s) | $125,000,000 $265,000,000 |
| 9 | IPCC National Storage Portfolio XV | KeyBank | $40,000,000 | $86,000,000 | BMO 2022-C1(3) | KeyBank(3) | CWCapital(3) | Future Securitization(s) | $46,000,000 |
| 10 | 111 River Street | BMO | $37,500,000 | $77,500,000 | BMO 2022-C1 | KeyBank | KeyBank | Future Securitization(s) | $40,000,000 |
| 11 | 2 Riverfront Plaza | BMO | $37,500,000 | $110,000,000 | BMO 2022-C1(3) | KeyBank(3) | CWCapital(3) | Future Securitization(s) | $72,500,000 |
| 15 | NYC MFRT Portfolio | BMO | $30,000,000 | $60,200,000 | BMO 2022-C1 | KeyBank | CWCapital | Future Securitization(s) | $30,200,000 |
| 20 | Wyndham National Hotel Portfolio | Sabal | $18,914,095 | $137,127,186 | UBS 2019-C18 | Wells Fargo | Rialto | UBS 2019-C18 BBCMS 2021-C10 BBCMS 2021-C11 WFCM 2021-C60 Future Securitization(s) | $3,000,000 $25,000,000 $20,000,000 $10,000,000 $67,000,000 |
| 22 | Meadowood Mall | BMO | $17,933,084 | $79,702,597 | WFCMT 2021-C61 | Wells Fargo | CWCapital | WFCM 2021-C61 Future Securitization(s) | $19,000,000 $43,000,000 |
| (1) | In the case of Loan Nos. 2, 4, 6, 7, 10 and 22, the Aggregate Pari Passu Loan Cut-off Date Balance excludes the related Subordinate Companion Loan(s). |
| (2) | In the case of Loan No. 4, upon the securitization of the related controlling pari passu companion loan, the related loan combination will be serviced and administered pursuant to the pooling and servicing agreement for the BBCMS 2022-C14 securitization transaction by the parties thereto, which is expected to close prior to the BMO 2022-C1 transaction. |
| (3) | In the case of Loan Nos. 9 and 11, until the securitization of the related controlling pari passu companion loan, the related loan combination will be serviced and administered pursuant to the pooling and servicing agreement for the BMO 2022-C1 securitization transaction by the parties thereto. |
| THE INFORMATION IN THIS STRUCTURAL AND COLLATERAL TERM SHEET IS NOT COMPLETE AND MAY BE AMENDED PRIOR TO THE TIME OF SALE. THIS TERM SHEET IS NOT AN OFFER TO SELL THESE SECURITIES AND IT IS NOT A SOLICITATION OF AN OFFER TO BUY THESE SECURITIES IN ANY JURISDICTION WHERE THE OFFER OR SALE IS NOT PERMITTED. | ||
| 10 | ||
| Structural and Collateral Term Sheet | BMO 2022-C1 | |
| Collateral Characteristics | ||
| Additional Debt Summary |
| Additional Debt Summary |
No. | Loan Name | Trust | Pari Passu | Subordinate | Total Debt | Mortgage Loan UW NCF | Total Debt UW NCF DSCR | Mortgage | Total Debt Cut-off Date | Mortgage | Total Debt UW NOI Debt Yield |
| 2 | 360 Rosemary | $45,000,000 | $40,000,000 | $125,000,000 | $210,000,000 | 4.35x | 1.76x | 26.6% | 65.8% | 17.8% | 7.2% |
| 4 | Coleman Highline Phase IV | $41,400,000 | $203,600,000 | $268,500,000 | $513,500,000 | 5.54x | 2.64x | 31.0% | 65.0% | 14.1% | 6.7% |
| 5 | AMF Portfolio | $40,000,000 | $132,000,000 | $13,000,000 | $185,000,000 | 1.51x | 1.51x | 61.3% | 65.9% | 9.8% | 9.1% |
| 6 | 601 Lexington Avenue | $40,000,000 | $683,300,000 | $276,700,000 | $1,000,000,000 | 4.50x | 3.25x | 42.5% | 58.8% | 13.2% | 9.5% |
| 7 | Hudson Commons | $40,000,000 | $265,000,000 | $202,000,000 | $507,000,000 | 2.54x | 1.53x | 29.6% | 49.2% | 9.4% | 5.7% |
| 10 | 111 River Street | $37,500,000 | $40,000,000 | $76,250,000 | $153,750,000 | 5.08x | 2.56x | 31.8% | 63.0% | 16.9% | 8.5% |
| 22 | Meadowood Mall | $17,933,084 | $61,769,513 | $27,979,523 | $107,682,120 | 2.98x | 1.81x | 35.1% | 47.4% | 19.9% | 14.7% |
| (1) | In the case of Loan Nos. 2, 4, 6, 7, 10, and 22, subordinate debt represents one or more Subordinate Companion Loans. |
| (2) | In the case of Loan No. 5 subordinate debt represents a subordinate mezzanine loan. |
| (3) | Mortgage Loan UW NCF DSCR, Mortgage Loan Cut-off Date LTV and Mortgage Loan UW NOI Debt Yield calculations include any related Pari Passu Companion Loans (if applicable),but exclude the related Subordinate Companion Loans. In the case of Loan No. 5, the loan amortizes on a non-standard amortization schedule. Calculations are based on the assumed principal and interest schedule beginning November 2028. |
| THE INFORMATION IN THIS STRUCTURAL AND COLLATERAL TERM SHEET IS NOT COMPLETE AND MAY BE AMENDED PRIOR TO THE TIME OF SALE. THIS TERM SHEET IS NOT AN OFFER TO SELL THESE SECURITIES AND IT IS NOT A SOLICITATION OF AN OFFER TO BUY THESE SECURITIES IN ANY JURISDICTION WHERE THE OFFER OR SALE IS NOT PERMITTED. | ||
| 11 | ||
| Structural and Collateral Term Sheet | BMO 2022-C1 | |
| Collateral Characteristics | ||
| Mortgaged Properties by Type(1) |
Weighted Average | ||||||||
| Property Type | Property Subtype | Number of Properties | Cut-off Date Principal Balance | % of IPB | UW NCF DSCR(2)(3) | UW NOI Debt Yield(2)(4) | Cut-off Date LTV(2)(4)(5) | Maturity Date/ARD LTV(2)(5) |
| Office | CBD | 13 | $271,201,600 | 24.2% | 3.95x | 13.6% | 39.1% | 39.1% |
| Medical | 10 | 46,550,000 | 4.1 | 3.71x | 11.5% | 56.2% | 56.2% | |
| Suburban | 3 | 19,697,000 | 1.8 | 2.24x | 10.4% | 66.9% | 64.1% | |
| Subtotal: | 26 | $337,448,600 | 30.1% | 3.82x | 13.1% | 43.0% | 42.9% | |
| Retail | Anchored | 8 | $111,514,608 | 9.9% | 2.18x | 10.7% | 58.8% | 51.9% |
| Single Tenant | 3 | 53,990,000 | 4.8 | 2.27x | 9.7% | 57.6% | 57.6% | |
| Unanchored | 6 | 47,573,538 | 4.2 | 2.02x | 9.3% | 59.2% | 58.6% | |
| Regional Mall | 1 | 17,933,084 | 1.6 | 2.98x | 19.9% | 35.1% | 30.7% | |
| Shadow Anchored | 3 | 16,945,500 | 1.5 | 1.74x | 10.4% | 65.6% | 57.4% | |
| Subtotal: | 21 | $247,956,731 | 22.1% | 2.19x | 10.9% | 57.3% | 53.3% | |
| Self Storage | Self Storage | 56 | $177,662,346 | 15.8% | 2.28x | 8.9% | 52.0% | 51.5% |
| Multifamily | Garden | 44 | $122,557,425 | 10.9% | 1.69x | 9.3% | 61.5% | 55.8% |
| Low Rise | 14 | 28,763,939 | 2.6 | 1.75x | 7.6% | 62.3% | 62.3% | |
| Mid Rise | 3 | 16,765,000 | 1.5 | 2.26x | 8.2% | 62.9% | 62.9% | |
| Student Housing | 1 | 2,489,468 | 0.2 | 1.49x | 8.7% | 62.4% | 49.6% | |
| Subtotal: | 62 | $170,575,832 | 15.2% | 1.76x | 8.9% | 61.8% | 57.5% | |
| Hospitality | Extended Stay | 3 | $47,285,198 | 4.2% | 1.83x | 12.2% | 61.5% | 50.8% |
| Limited Service | 44 | 18,914,095 | 1.7 | 1.69x | 15.0% | 63.8% | 46.7% | |
| Subtotal: | 47 | $66,199,293 | 5.9% | 1.79x | 13.0% | 62.2% | 49.6% | |
| Industrial | Warehouse / Other | 1 | $31,500,000 | 2.8% | 2.21x | 8.7% | 58.7% | 58.7% |
| Flex | 2 | 13,925,000 | 1.2 | 2.18x | 10.6% | 59.8% | 56.1% | |
| Warehouse | 2 | 11,350,000 | 1.0 | 1.39x | 8.9% | 61.3% | 57.7% | |
| Warehouse / Distribution | 1 | 2,392,654 | 0.2 | 2.04x | 9.7% | 54.2% | 54.2% | |
| Subtotal: | 6 | $59,167,654 | 5.3% | 2.04x | 9.2% | 59.3% | 57.7% | |
| Mixed Use | Multifamily / Retail | 6 | $35,018,854 | 3.1% | 1.92x | 8.5% | 57.3% | 56.7% |
| Office / Retail | 1 | 8,750,000 | 0.8 | 2.49x | 9.6% | 62.9% | 62.9% | |
| Office / Multifamily | 1 | 4,130,000 | 0.4 | 1.65x | 9.8% | 63.5% | 56.4% | |
| Retail / Multifamily | 1 | 3,300,000 | 0.3 | 2.01x | 8.0% | 62.3% | 62.3% | |
| Multifamily / Office / Retail | 1 | 1,276,000 | 0.1 | 3.30x | 13.6% | 59.4% | 59.4% | |
| Subtotal: | 10 | $52,474,854 | 4.7% | 2.03x | 8.9% | 59.1% | 58.1% | |
| Other | Parking Garage | 5 | $8,222,400 | 0.7% | 3.30x | 13.6% | 59.4% | 59.4% |
| Manufactured Housing | Manufactured Housing | 1 | $2,300,000 | 0.2% | 1.45x | 8.3% | 65.9% | 59.7% |
| Total / Weighted Average: | 234 | $1,122,007,709 | 100.0% | 2.60x | 10.9% | 53.4% | 50.8% | |
| (1) | Because this table presents information relating to the mortgaged properties and not mortgage loans, the information for mortgage loans secured by more than one mortgaged property is based on allocated loan amounts, individual appraised values, net cash flow or net operating income with respect to such individual mortgaged properties, as applicable. |
| (2) | In the case of Loan Nos. 1, 2, 4, 5, 6, 7, 8, 9, 10, 11, 15, 20 and 22, the UW NCF DSCR, UW NOI Debt Yield, Cut-off Date LTV and Maturity Date/ARD LTV calculations include the related Pari Passu Companion Loan(s). In the case of Loan Nos. 2, 4, 6, 7, 10 and 22, the UW NCF DSCR, UW NOI Debt Yield, Cut-off Date LTV and Maturity Date/ARD LTV calculations exclude the related Subordinate Companion Loans. In the case of Loan No. 5, the loan amortizes on a non-standard amortization schedule. Calculations are based on the assumed principal and interest schedule beginning November 2028. |
| (3) | For the mortgage loans that are interest-only for the entire term or until the anticipated repayment date and accrue interest on an Actual/360 basis, the Monthly Debt Service Amount ($) was calculated as 1/12th of the product of (i) the Original Balance ($), (ii) the Interest Rate % and (iii) 365/360. |
| (4) | In the case of Loan No. 13, the Cut-off Date LTV and UW NOI Debt Yield are based on Cut-off Date Principal Balance after netting out a $1,500,000 holdback reserve. The Cut-off Date LTV and UW NOI Debt Yield based on Cut-off Date Principal Balance without netting out the holdback reserve is 62.7% and 8.6%, respectively. |
| (5) | In the case of Loan Nos. 1, 9, 18 and 23, the Cut-off Date LTV and the Maturity Date/ARD LTV are calculated by using an appraised value based on an as-portfolio assumption. In the case of Loan Nos. 2 and 38 the Cut-off Date LTV and Maturity/ARD LTV are calculated by using an appraised value based on an as stabilized assumption. In the case of Loan No. 20, the Cut-off Date LTV and Maturity LTV are calculated by using an appraised value based on an as complete assumption for 15 of the mortgage properties. In the case of Loan No. 7, the Cut-off Date LTV and Maturity/ARD LTV are calculated by using an appraised value based on a market value assuming present value of ICAP tax savings are excluded and outstanding leasing costs reserved assumption. Refer to “Description of the Mortgage Pool—Certain Calculations and Definitions—Appraised Value” in the Preliminary Prospectus for additional details. |
| THE INFORMATION IN THIS STRUCTURAL AND COLLATERAL TERM SHEET IS NOT COMPLETE AND MAY BE AMENDED PRIOR TO THE TIME OF SALE. THIS TERM SHEET IS NOT AN OFFER TO SELL THESE SECURITIES AND IT IS NOT A SOLICITATION OF AN OFFER TO BUY THESE SECURITIES IN ANY JURISDICTION WHERE THE OFFER OR SALE IS NOT PERMITTED. | ||
| 12 | ||
| Structural and Collateral Term Sheet | BMO 2022-C1 | |
| Collateral Characteristics | ||
| Mortgaged Properties by Location(1) |
Weighted Average | |||||||
State | Number of Properties | Cut-off Date | % of | UW NCF DSCR(2)(3) | UW NOI Debt Yield(2)(4) | Cut-off Date LTV(2)(4)(5) | Maturity Date/ARD LTV(2)(5) |
| New York | 20 | $152,147,660 | 13.6% | 2.80x | 9.8% | 46.2% | 46.2% |
| Florida | 17 | 124,701,132 | 11.1 | 2.76x | 12.5% | 45.7% | 43.5% |
| New Jersey | 4 | 91,262,000 | 8.1 | 3.28x | 12.4% | 48.8% | 48.4% |
| California | 11 | 86,627,599 | 7.7 | 3.81x | 11.3% | 43.1% | 43.1% |
| Texas | 13 | 74,667,925 | 6.7 | 1.92x | 10.6% | 57.7% | 48.7% |
| Michigan | 20 | 71,164,936 | 6.3 | 2.67x | 11.7% | 59.9% | 57.4% |
| Illinois | 13 | 56,859,425 | 5.1 | 2.46x | 9.6% | 60.7% | 59.5% |
| Washington | 7 | 50,536,438 | 4.5 | 2.03x | 9.0% | 61.4% | 61.4% |
| Ohio | 22 | 49,804,191 | 4.4 | 1.73x | 10.2% | 60.3% | 51.1% |
| Oregon | 2 | 32,031,004 | 2.9 | 2.20x | 8.8% | 58.8% | 58.5% |
| South Dakota | 2 | 28,488,880 | 2.5 | 2.12x | 12.3% | 60.0% | 51.2% |
| Arizona | 7 | 27,955,670 | 2.5 | 2.30x | 10.0% | 59.7% | 58.2% |
| Pennsylvania | 6 | 27,699,086 | 2.5 | 1.99x | 9.9% | 58.6% | 50.4% |
| Missouri | 6 | 26,274,704 | 2.3 | 1.86x | 9.4% | 63.1% | 59.7% |
| Indiana | 12 | 25,798,645 | 2.3 | 2.55x | 10.4% | 59.6% | 56.4% |
| Wisconsin | 3 | 25,005,922 | 2.2 | 2.73x | 10.8% | 59.9% | 58.6% |
| Tennessee | 5 | 22,099,803 | 2.0 | 2.41x | 10.6% | 57.2% | 56.1% |
| Nevada | 3 | 21,390,120 | 1.9 | 2.85x | 18.2% | 37.6% | 33.4% |
| Oklahoma | 4 | 17,841,884 | 1.6 | 3.45x | 12.4% | 52.6% | 52.3% |
| Alabama | 4 | 15,858,284 | 1.4 | 1.97x | 8.7% | 53.6% | 50.1% |
| Minnesota | 2 | 13,968,541 | 1.2 | 2.73x | 11.0% | 55.1% | 55.1% |
| Massachusetts | 3 | 12,446,179 | 1.1 | 2.43x | 9.3% | 58.1% | 58.1% |
| South Carolina | 2 | 11,240,646 | 1.0 | 2.44x | 9.3% | 57.8% | 57.8% |
| Georgia | 8 | 9,158,157 | 0.8 | 1.51x | 9.8% | 61.3% | 56.9% |
| Virginia | 4 | 7,734,629 | 0.7 | 1.74x | 9.1% | 57.7% | 53.9% |
| Maine | 2 | 7,235,899 | 0.6 | 2.29x | 8.6% | 47.8% | 47.8% |
| North Carolina | 2 | 6,348,315 | 0.6 | 2.25x | 9.4% | 53.5% | 53.5% |
| Vermont | 1 | 5,800,000 | 0.5 | 2.97x | 10.3% | 63.7% | 63.7% |
| Kansas | 6 | 5,538,207 | 0.5 | 2.43x | 12.7% | 63.9% | 58.5% |
| Wyoming | 6 | 3,852,252 | 0.3 | 1.69x | 15.0% | 63.8% | 46.7% |
| Maryland | 2 | 3,812,350 | 0.3 | 2.27x | 8.8% | 48.2% | 47.8% |
| Nebraska | 4 | 2,183,106 | 0.2 | 1.69x | 15.0% | 63.8% | 46.7% |
| New Mexico | 3 | 2,034,027 | 0.2 | 1.69x | 15.0% | 63.8% | 46.7% |
| Montana | 2 | 786,082 | 0.1 | 1.69x | 15.0% | 63.8% | 46.7% |
| Iowa | 2 | 710,375 | 0.1 | 1.69x | 15.0% | 63.8% | 46.7% |
| Louisiana | 1 | 385,221 | 0.0 | 1.69x | 15.0% | 63.8% | 46.7% |
| Utah | 1 | 315,370 | 0.0 | 1.69x | 15.0% | 63.8% | 46.7% |
| North Dakota | 1 | 200,896 | 0.0 | 1.69x | 15.0% | 63.8% | 46.7% |
| Colorado | 1 | 42,149 | 0.0 | 1.69x | 15.0% | 63.8% | 46.7% |
| Total / Weighted Average: | 234 | $1,122,007,709 | 100.0% | 2.60x | 10.9% | 53.4% | 50.8% |
| (1) | Because this table presents information relating to the mortgaged properties and not mortgage loans, the information for mortgage loans secured by more than one mortgaged property is based on allocated loan amounts, individual appraised values, net cash flow or net operating income with respect to such individual mortgaged properties, as applicable. |
| (2) | In the case of Loan Nos. 1, 2, 4, 5, 6, 7, 8, 9, 10, 11, 15, 20 and 22, the UW NCF DSCR, UW NOI Debt Yield, Cut-off Date LTV and Maturity Date/ARD LTV calculations include the related Pari Passu Companion Loan(s). In the case of Loan Nos. 2, 4, 6, 7, 10 and 22, the UW NCF DSCR, UW NOI Debt Yield, Cut-off Date LTV and Maturity Date/ARD LTV calculations exclude the related Subordinate Companion Loans. In the case of Loan No. 5, the loan amortizes on a non-standard amortization schedule. Calculations are based on the assumed principal and interest schedule beginning November 2028. |
| (3) | For the mortgage loans that are interest-only for the entire term or until the anticipated repayment date and accrue interest on an Actual/360 basis, the Monthly Debt Service Amount ($) was calculated as 1/12th of the product of (i) the Original Balance ($), (ii) the Interest Rate % and (iii) 365/360. |
| (4) | In the case of Loan No. 13, the Cut-off Date LTV and UW NOI Debt Yield are based on Cut-off Date Principal Balance after netting out a $1,500,000 holdback reserve. The Cut-off Date LTV and UW NOI Debt Yield based on Cut-off Date Principal Balance without netting out the holdback reserve is 62.7% and 8.6%, respectively. |
| (5) | In the case of Loan Nos. 1, 9, 18 and 23, the Cut-off Date LTV and the Maturity Date/ARD LTV are calculated by using an appraised value based on an as-portfolio assumption. In the case of Loan Nos. 2 and 38 the Cut-off Date LTV and Maturity/ARD LTV are calculated by using an appraised value based on an as stabilized assumption. In the case of Loan No. 20, the Cut-off Date LTV and Maturity LTV are calculated by using an appraised value based on an as complete assumption for 15 of the mortgage properties. In the case of Loan No. 7, the Cut-off Date LTV and Maturity/ARD LTV are calculated by using an appraised value based on a market value assuming present value of ICAP tax savings are excluded and outstanding leasing costs reserved assumption. Refer to “Description of the Mortgage Pool—Certain Calculations and Definitions—Appraised Value” in the Preliminary Prospectus for additional details. |
| THE INFORMATION IN THIS STRUCTURAL AND COLLATERAL TERM SHEET IS NOT COMPLETE AND MAY BE AMENDED PRIOR TO THE TIME OF SALE. THIS TERM SHEET IS NOT AN OFFER TO SELL THESE SECURITIES AND IT IS NOT A SOLICITATION OF AN OFFER TO BUY THESE SECURITIES IN ANY JURISDICTION WHERE THE OFFER OR SALE IS NOT PERMITTED. | ||
| 13 | ||
| Structural and Collateral Term Sheet | BMO 2022-C1 | |
| Collateral Characteristics | ||
| Cut-off Date Principal Balance |
Weighted Average | |||||||||||
| Range of Cut-off Date Principal Balances | Number of Loans | Cut-off Date Principal Balance | % of IPB | Mortgage Rate | Remaining Loan Term(1) | UW NCF DSCR(1)(2) | UW NOI DY(1)(3) | Cut-off Date LTV(1)(3)(4) | Maturity Date/ARD LTV(1)(4) | ||
| $1,425,000 | - | $4,999,999 | 23 | $73,511,945 | 6.6% | 4.00742% | 110 | 1.82x | 9.2% | 62.5% | 57.6% |
| $5,000,000 | - | $9,999,999 | 19 | 130,841,250 | 11.7 | 3.87612% | 112 | 2.12x | 9.3% | 61.5% | 59.4% |
| $10,000,000 | - | $19,999,999 | 16 | 220,327,377 | 19.6 | 3.93276% | 112 | 2.30x | 11.6% | 58.2% | 52.8% |
| $20,000,000 | - | $29,999,999 | 4 | 101,300,000 | 9.0 | 4.28436% | 119 | 1.89x | 10.3% | 58.2% | 53.3% |
| $30,000,000 | - | $39,999,999 | 6 | 206,877,137 | 18.4 | 4.02987% | 108 | 2.48x | 10.4% | 54.3% | 52.4% |
| $40,000,000 | - | $60,000,000 | 9 | 389,150,000 | 34.7 | 3.39103% | 102 | 3.32x | 11.8% | 44.5% | 44.0% |
| Total / Weighted Average: | 77 | $1,122,007,709 | 100.0% | 3.79281% | 108 | 2.60x | 10.9% | 53.4% | 50.8% | ||
| Mortgage Interest Rates |
Weighted Average | |||||||||||
| Range of Mortgage Interest Rates | Number of Loans | Cut-off Date Principal Balance | % of IPB | Mortgage Rate | Remaining Loan Term(1) | UW NCF DSCR(1)(2) | UW NOI DY(1)(3) | Cut-off Date LTV(1)(3)(4) | Maturity Date/ARD LTV(1)(4) | ||
| 2.49450 | - | 3.24999 | 3 | $124,150,000 | 11.1% | 2.72653% | 98 | 4.60x | 12.9% | 43.1% | 43.1% |
| 3.25000 | - | 3.74999 | 27 | 401,422,000 | 35.8 | 3.53720% | 106 | 2.53x | 10.2% | 51.1% | 49.4% |
| 3.75000 | - | 3.99999 | 19 | 256,274,344 | 22.8 | 3.87372% | 108 | 2.83x | 12.5% | 51.2% | 49.8% |
| 4.00000 | - | 4.24999 | 12 | 95,870,134 | 8.5 | 4.04616% | 119 | 2.03x | 9.7% | 62.0% | 58.7% |
| 4.25000 | - | 4.49999 | 8 | 156,877,137 | 14.0 | 4.37653% | 119 | 1.74x | 9.4% | 61.4% | 55.8% |
| 4.50000 | - | 4.74999 | 4 | 31,725,000 | 2.8 | 4.69939% | 111 | 1.60x | 8.2% | 57.9% | 57.2% |
| 4.75000 | - | 5.44000 | 4 | 55,689,095 | 5.0 | 5.04306% | 100 | 1.54x | 11.8% | 62.3% | 51.1% |
| Total / Weighted Average: | 77 | $1,122,007,709 | 100.0% | 3.79281% | 108 | 2.60x | 10.9% | 53.4% | 50.8% | ||
| Original Term to Maturity in Months |
Weighted Average | |||||||||
| Original Term to Maturity in Months | Number of Loans | Cut-off Date Principal Balance | % of IPB | Mortgage Rate | Remaining Loan Term(1) | UW NCF DSCR(1)(2) | UW NOI DY(1)(3) | Cut-off Date LTV(1)(3)(4) | Maturity Date/ARD LTV(1)(4) |
| 60 | 7 | $154,208,084 | 13.7% | 3.38373% | 59 | 3.91x | 13.7% | 34.9% | 34.0% |
| 84 | 4 | 55,895,500 | 5.0 | 3.76348% | 83 | 2.94x | 12.6% | 60.3% | 59.6% |
| 120 | 66 | 911,904,125 | 81.3 | 3.86378% | 118 | 2.35x | 10.3% | 56.1% | 53.1% |
| Total / Weighted Average: | 77 | $1,122,007,709 | 100.0% | 3.79281% | 108 | 2.60x | 10.9% | 53.4% | 50.8% |
| Remaining Term to Maturity in Months |
| Weighted Average | |||||||||||
| Range of Remaining Term to Maturity in Months | Number of Loans | Cut-off Date Principal Balance | % of IPB | Mortgage Rate | Remaining Loan Term(1) | UW NCF DSCR(1)(2) | UW NOI DY(1)(3) | Cut-off Date LTV(1)(3)(4) | Maturity Date/ARD LTV(1)(4) | ||
| 55 | - | 60 | 7 | $154,208,084 | 13.7% | 3.38373% | 59 | 3.91x | 13.7% | 34.9% | 34.0% |
| 82 | - | 94 | 5 | 74,809,595 | 6.7 | 4.03819% | 86 | 2.62x | 13.2% | 61.2% | 56.3% |
| 115 | - | 120 | 65 | 892,990,030 | 79.6 | 3.84289% | 119 | 2.37x | 10.2% | 55.9% | 53.3% |
| Total / Weighted Average: | 77 | $1,122,007,709 | 100.0% | 3.79281% | 108 | 2.60x | 10.9% | 53.4% | 50.8% | ||
| (1) | In the case of Loan Nos. 1, 2, 4, 5, 6, 7, 8, 9, 10, 11, 15, 20 and 22, the UW NCF DSCR, UW NOI Debt Yield, Cut-off Date LTV and Maturity Date/ARD LTV calculations include the related Pari Passu Companion Loan(s). In the case of Loan Nos. 2, 4, 6, 7, 10 and 22, the UW NCF DSCR, UW NOI Debt Yield, Cut-off Date LTV and Maturity Date/ARD LTV calculations exclude the related Subordinate Companion Loans. In the case of Loan Nos. 36 and 37, the loans are part of the crossed group, the UW NCF DSCR, UW NOI Debt Yield, Cut-off Date LTV and Maturity Date/ARD LTV are presented on an aggregate basis. In the case of Loan No. 5, the loan amortizes on a non-standard amortization schedule. Calculations are based on the assumed principal and interest schedule beginning November 2028. |
| (2) | For the mortgage loans that are interest-only for the entire term or until the anticipated repayment date and accrue interest on an Actual/360 basis, the Monthly Debt Service Amount ($) was calculated as 1/12th of the product of (i) the Original Balance ($), (ii) the Interest Rate % and (iii) 365/360. |
| (3) | In the case of Loan No. 13, the Cut-off Date LTV and UW NOI Debt Yield are based on Cut-off Date Principal Balance after netting out a $1,500,000 holdback reserve. The Cut-off Date LTV and UW NOI Debt Yield based on Cut-off Date Principal Balance without netting out the holdback reserve is 62.7% and 8.6%, respectively. |
| (4) | In the case of Loan Nos. 1, 9, 18 and 23, the Cut-off Date LTV and the Maturity Date/ARD LTV are calculated by using an appraised value based on an as-portfolio assumption. In the case of Loan Nos. 2 and 38 the Cut-off Date LTV and Maturity/ARD LTV are calculated by using an appraised value based on an as stabilized assumption. In the case of Loan No. 20, the Cut-off Date LTV and Maturity LTV are calculated by using an appraised value based on an as complete assumption for 15 of the mortgage properties. In the case of Loan No. 7, the Cut-off Date LTV and Maturity/ARD LTV are calculated by using an appraised value based on a market value assuming present value of ICAP tax savings are excluded and outstanding leasing costs reserved assumption. Refer to ““Description of the Mortgage Pool—Certain Calculations and Definitions—Appraised Value”” in the Preliminary Prospectus for additional details. |
| THE INFORMATION IN THIS STRUCTURAL AND COLLATERAL TERM SHEET IS NOT COMPLETE AND MAY BE AMENDED PRIOR TO THE TIME OF SALE. THIS TERM SHEET IS NOT AN OFFER TO SELL THESE SECURITIES AND IT IS NOT A SOLICITATION OF AN OFFER TO BUY THESE SECURITIES IN ANY JURISDICTION WHERE THE OFFER OR SALE IS NOT PERMITTED. | ||
| 14 | ||
| Structural and Collateral Term Sheet | BMO 2022-C1 | |
| Collateral Characteristics | ||
| Original Amortization Term in Months |
| Weighted Average | |||||||||
| Original Amortization Term in Months | Number of Loans | Cut-off Date Principal Balance | % of IPB | Mortgage Rate | Remaining Loan Term(1) | UW NCF DSCR(1)(2) | UW NOI DY(1)(3) | Cut-off Date LTV(1)(3)(4) | Maturity Date/ARD LTV(1)(4) |
| Interest Only | 48 | $824,445,000 | 73.5% | 3.66756% | 108 | 2.91x | 10.7% | 50.9% | 50.9% |
| 240 | 1 | 15,000,000 | 1.3 | 4.41000% | 120 | 1.36x | 11.1% | 58.8% | 36.2% |
| 270 | 1 | 18,914,095 | 1.7 | 4.85000% | 94 | 1.69x | 15.0% | 63.8% | 46.7% |
| 300 | 2 | 20,927,376 | 1.9 | 3.90854% | 67 | 2.80x | 18.7% | 38.6% | 32.4% |
| 360 | 25 | 242,721,238 | 21.6 | 4.08774% | 113 | 1.66x | 10.4% | 62.0% | 53.4% |
| Total / Weighted Average: | 77 | $1,122,007,709 | 100.0% | 3.79281% | 108 | 2.60x | 10.9% | 53.4% | 50.8% |
| Remaining Amortization Term in Months |
| Weighted Average | |||||||||||
| Range of Remaining Amortization Term in Months | Number of Loans | Cut-off Date Principal Balance | % of IPB | Mortgage Rate | Remaining Loan Term(1) | UW NCF DSCR(1)(2) | UW NOI DY(1)(3) | Cut-off Date LTV(1)(3)(4) | Maturity Date/ARD LTV(1)(4) | ||
| Interest Only | 48 | $824,445,000 | 73.5% | 3.66756% | 108 | 2.91x | 10.7% | 50.9% | 50.9% | ||
| 240 | - | 244 | 2 | 33,914,095 | 3.0 | 4.65539% | 105 | 1.54x | 13.3% | 61.6% | 42.1% |
| 245 | - | 299 | 2 | 20,927,376 | 1.9 | 3.90854% | 67 | 2.80x | 18.7% | 38.6% | 32.4% |
| 300 | - | 360 | 25 | 242,721,238 | 21.6 | 4.08774% | 113 | 1.66x | 10.4% | 62.0% | 53.4% |
| Total / Weighted Average: | 77 | $1,122,007,709 | 100.0% | 3.79281% | 108 | 2.60x | 10.9% | 53.4% | 50.8% | ||
| Amortization Types |
Weighted Average | |||||||||
| Amortization Types | Number of Loans | Cut-off Date Principal Balance | % of IPB | Mortgage Rate | Remaining Loan Term(1) | UW NCF DSCR(1)(2) | UW NOI DY(1)(3) | Cut-off Date LTV(1)(3)(4) | Maturity Date/ARD LTV(1)(4) |
| Interest Only | 47 | $783,045,000 | 69.8% | 3.72958% | 111 | 2.77x | 10.6% | 51.9% | 51.9% |
| Interest Only, Amortizing Balloon | 17 | 163,104,500 | 14.5 | 3.91251% | 116 | 1.70x | 10.5% | 62.3% | 54.9% |
| Amortizing Balloon | 12 | 134,458,209 | 12.0 | 4.41560% | 101 | 1.76x | 12.4% | 57.9% | 45.5% |
| Interest Only - ARD | 1 | 41,400,000 | 3.7 | 2.49450% | 58 | 5.54x | 14.1% | 31.0% | 31.0% |
| Total / Weighted Average: | 77 | $1,122,007,709 | 100.0% | 3.79281% | 108 | 2.60x | 10.9% | 53.4% | 50.8% |
| Underwritten Net Cash Flow Debt Service Coverage Ratios(1)(2) |
| Weighted Average | |||||||||||
| Range of Underwritten Net Cash Flow Debt Service Coverage Ratios | Number of Loans | Cut-off Date Principal Balance | % of IPB | Mortgage Rate | Remaining Loan Term(1) | UW NCF DSCR(1)(2) | UW NOI DY(1)(3) | Cut-off Date LTV(1)(3)(4) | Maturity Date/ARD LTV(1)(4) | ||
| 1.26x | - | 1.59x | 15 | $156,121,540 | 13.9% | 4.38379% | 113 | 1.44x | 9.6% | 61.4% | 52.1% |
| 1.60x | - | 1.69x | 7 | 80,191,095 | 7.1 | 4.44228% | 113 | 1.65x | 10.1% | 61.8% | 55.1% |
| 1.70x | - | 1.79x | 1 | 2,994,292 | 0.3 | 3.78000% | 119 | 1.74x | 11.7% | 59.9% | 42.8% |
| 1.80x | - | 1.89x | 8 | 82,337,500 | 7.3 | 3.97927% | 115 | 1.87x | 9.5% | 63.6% | 60.3% |
| 1.90x | - | 1.99x | 4 | 21,500,000 | 1.9 | 4.13893% | 119 | 1.92x | 8.2% | 65.6% | 65.6% |
| 2.00x | - | 2.49x | 25 | 388,290,198 | 34.6 | 3.78932% | 118 | 2.23x | 9.4% | 55.9% | 54.6% |
| 2.50x | - | 2.99x | 9 | 126,273,084 | 11.3 | 3.69770% | 89 | 2.70x | 11.7% | 45.8% | 45.2% |
| 3.00x | - | 3.99x | 4 | 100,400,000 | 8.9 | 3.31674% | 104 | 3.52x | 12.5% | 56.5% | 56.5% |
| 4.00x | - | 5.54x | 4 | 163,900,000 | 14.6 | 3.14644% | 90 | 4.85x | 15.5% | 32.8% | 32.8% |
| Total / Weighted Average: | 77 | $1,122,007,709 | 100.0% | 3.79281% | 108 | 2.60x | 10.9% | 53.4% | 50.8% | ||
| (1) | In the case of Loan Nos. 1, 2, 4, 5, 6, 7, 8, 9, 10, 11, 15, 20 and 22, the UW NCF DSCR, UW NOI Debt Yield, Cut-off Date LTV and Maturity Date/ARD LTV calculations include the related Pari Passu Companion Loan(s). In the case of Loan Nos. 2, 4, 6, 7, 10 and 22, the UW NCF DSCR, UW NOI Debt Yield, Cut-off Date LTV and Maturity Date/ARD LTV calculations exclude the related Subordinate Companion Loans. In the case of Loan Nos. 36 and 37, the loans are part of the crossed group, the UW NCF DSCR, UW NOI Debt Yield, Cut-off Date LTV and Maturity Date/ARD LTV are presented on an aggregate basis. In the case of Loan No. 5, the loan amortizes on a non-standard amortization schedule. Calculations are based on the assumed principal and interest schedule beginning November 2028. |
| (2) | For the mortgage loans that are interest-only for the entire term or until the anticipated repayment date and accrue interest on an Actual/360 basis, the Monthly Debt Service Amount ($) was calculated as 1/12th of the product of (i) the Original Balance ($), (ii) the Interest Rate % and (iii) 365/360. |
| (3) | In the case of Loan No. 13, the Cut-off Date LTV and UW NOI Debt Yield are based on Cut-off Date Principal Balance after netting out a $1,500,000 holdback reserve. The Cut-off Date LTV and UW NOI Debt Yield based on Cut-off Date Principal Balance without netting out the holdback reserve is 62.7% and 8.6%, respectively. |
| (4) | In the case of Loan Nos. 1, 9, 18 and 23, the Cut-off Date LTV and the Maturity Date/ARD LTV are calculated by using an appraised value based on an as-portfolio assumption. In the case of Loan Nos. 2 and 38 the Cut-off Date LTV and Maturity/ARD LTV are calculated by using an appraised value based on an as stabilized assumption. In the case of Loan No. 20, the Cut-off Date LTV and Maturity LTV are calculated by using an appraised value based on an as complete assumption for 15 of the mortgage properties. In the case of Loan No. 7, the Cut-off Date LTV and Maturity/ARD LTV are calculated by using an appraised value based on a market value assuming present value of ICAP tax savings are excluded and outstanding leasing costs reserved assumption. Refer to ““Description of the Mortgage Pool—Certain Calculations and Definitions—Appraised Value”” in the Preliminary Prospectus for additional details. |
| THE INFORMATION IN THIS STRUCTURAL AND COLLATERAL TERM SHEET IS NOT COMPLETE AND MAY BE AMENDED PRIOR TO THE TIME OF SALE. THIS TERM SHEET IS NOT AN OFFER TO SELL THESE SECURITIES AND IT IS NOT A SOLICITATION OF AN OFFER TO BUY THESE SECURITIES IN ANY JURISDICTION WHERE THE OFFER OR SALE IS NOT PERMITTED. | ||
| 15 | ||
| Structural and Collateral Term Sheet | BMO 2022-C1 | |
| Collateral Characteristics | ||
| LTV Ratios as of the Cut-off Date(1)(3) |
| Weighted Average | |||||||||||
| Range of Cut-off Date LTVs | Number of Loans | Cut-off Date Principal Balance | % of IPB | Mortgage Rate | Remaining Loan Term(1) | UW NCF DSCR(1)(2) | UW NOI DY(1)(3) | Cut-off Date LTV(1)(3)(4) | Maturity Date/ARD LTV(1)(4) | ||
| 26.6% | - | 49.9% | 9 | $333,083,084 | 29.7% | 3.38572% | 94 | 3.63x | 12.8% | 37.4% | 37.2% |
| 50.0% | - | 59.9% | 24 | $349,653,429 | 31.2 | 3.85515% | 114 | 2.47x | 10.4% | 56.6% | 53.9% |
| 60.0% | - | 64.9% | 33 | $378,088,761 | 33.7 | 4.05014% | 116 | 1.93x | 10.0% | 62.2% | 57.9% |
| 65.0% | - | 68.6% | 11 | $61,182,436 | 5.5 | 4.06250% | 109 | 1.86x | 9.4% | 66.9% | 63.2% |
| Total / Weighted Average: | 77 | $1,122,007,709 | 100.0% | 3.79281% | 108 | 2.60x | 10.9% | 53.4% | 50.8% | ||
| LTV Ratios as of the Maturity Date(1)(3) |
Weighted Average | |||||||||||
| Range of Maturity Date LTVs | Number of Loans | Cut-off Date Principal Balance | % of IPB | Mortgage Rate | Remaining Loan Term(1) | UW NCF DSCR(1)(2) | UW NOI DY(1)(3) | Cut-off Date LTV(1)(3)(4) | Maturity Date/ARD LTV(1)(4) | ||
| 26.6% | - | 49.9% | 17 | $422,820,075 | 37.7% | 3.60755% | 98 | 3.18x | 12.4% | 42.3% | 39.0% |
| 50.0% | - | 59.9% | 35 | 454,527,134 | 40.5 | 3.84949% | 113 | 2.32x | 10.4% | 58.4% | 55.3% |
| 60.0% | - | 64.9% | 22 | 215,585,500 | 19.2 | 3.99995% | 116 | 2.09x | 9.0% | 62.7% | 62.3% |
| 65.0% | - | 68.5% | 3 | 29,075,000 | 2.6 | 4.06475% | 119 | 2.17x | 9.1% | 67.1% | 67.1% |
| Total / Weighted Average: | 77 | $1,122,007,709 | 100.0% | 3.79281% | 108 | 2.60x | 10.9% | 53.4% | 50.8% | ||
| Prepayment Protection |
Weighted Average | |||||||||
| Prepayment Protection | Number of Loans | Cut-off Date Principal Balance | % of IPB | Mortgage Rate | Remaining Loan Term(1) | UW NCF DSCR(1)(2) | UW NOI DY(1)(3) | Cut-off Date LTV(1)(3)(4) | Maturity Date/ARD LTV(1)(4) |
| Defeasance | 50 | $667,704,478 | 59.5% | 3.90807% | 112 | 2.34x | 10.6% | 56.9% | 53.8% |
| Yield Maintenance | 21 | 274,153,231 | 24.4 | 3.87978% | 110 | 2.30x | 10.2% | 55.7% | 52.7% |
| Defeasance or Yield Maintenance | 6 | 180,150,000 | 16.1 | 3.23325% | 92 | 3.99x | 13.1% | 36.9% | 36.9% |
| Total / Weighted Average: | 77 | $1,122,007,709 | 100.0% | 3.79281% | 108 | 2.60x | 10.9% | 53.4% | 50.8% |
| Loan Purpose |
Weighted Average | |||||||||
| Loan Purpose | Number of Loans | Cut-off Date Principal Balance | % of IPB | Mortgage Rate | Remaining Loan Term(1) | UW NCF DSCR(1)(2) | UW NOI DY(1)(3) | Cut-off Date LTV(1)(3)(4) | Maturity Date/ARD LTV(1)(4) |
| Refinance | 48 | $646,791,179 | 57.6% | 3.96490% | 115 | 2.40x | 10.9% | 55.9% | 53.0% |
| Acquisition | 28 | 432,466,530 | 38.5 | 3.62468% | 98 | 2.77x | 10.8% | 49.4% | 47.1% |
| Recapitalization | 1 | 42,750,000 | 3.8 | 2.89000% | 118 | 3.79x | 11.5% | 55.5% | 55.5% |
| Total / Weighted Average: | 77 | $1,122,007,709 | 100.0% | 3.79281% | 108 | 2.60x | 10.9% | 53.4% | 50.8% |
| (1) | In the case of Loan Nos. 1, 2, 4, 5, 6, 7, 8, 9, 10, 11, 15, 20 and 22, the UW NCF DSCR, UW NOI Debt Yield, Cut-off Date LTV and Maturity Date/ARD LTV calculations include the related Pari Passu Companion Loan(s). In the case of Loan Nos. 2, 4, 6, 7, 10 and 22, the UW NCF DSCR, UW NOI Debt Yield, Cut-off Date LTV and Maturity Date/ARD LTV calculations exclude the related Subordinate Companion Loans. In the case of Loan Nos. 36 and 37, the loans are part of the crossed group, the UW NCF DSCR, UW NOI Debt Yield, Cut-off Date LTV and Maturity Date/ARD LTV are presented on an aggregate basis. In the case of Loan No. 5, the loan amortizes on a non-standard amortization schedule. Calculations are based on the assumed principal and interest schedule beginning November 2028. |
| (2) | For the mortgage loans that are interest-only for the entire term or until the anticipated repayment date and accrue interest on an Actual/360 basis, the Monthly Debt Service Amount ($) was calculated as 1/12th of the product of (i) the Original Balance ($), (ii) the Interest Rate % and (iii) 365/360. |
| (3) | In the case of Loan No. 13, the Cut-off Date LTV and UW NOI Debt Yield are based on Cut-off Date Principal Balance after netting out a $1,500,000 holdback reserve. The Cut-off Date LTV and UW NOI Debt Yield based on Cut-off Date Principal Balance without netting out the holdback reserve is 62.7% and 8.6%, respectively. |
| (4) | In the case of Loan Nos. 1, 9, 18 and 23, the Cut-off Date LTV and the Maturity Date/ARD LTV are calculated by using an appraised value based on an as-portfolio assumption. In the case of Loan Nos. 2 and 38 the Cut-off Date LTV and Maturity/ARD LTV are calculated by using an appraised value based on an as stabilized assumption. In the case of Loan No. 20, the Cut-off Date LTV and Maturity LTV are calculated by using an appraised value based on an as complete assumption for 15 of the mortgage properties. In the case of Loan No. 7, the Cut-off Date LTV and Maturity/ARD LTV are calculated by using an appraised value based on a market value assuming present value of ICAP tax savings are excluded and outstanding leasing costs reserved assumption. Refer to ““Description of the Mortgage Pool—Certain Calculations and Definitions—Appraised Value”” in the Preliminary Prospectus for additional details. |
| THE INFORMATION IN THIS STRUCTURAL AND COLLATERAL TERM SHEET IS NOT COMPLETE AND MAY BE AMENDED PRIOR TO THE TIME OF SALE. THIS TERM SHEET IS NOT AN OFFER TO SELL THESE SECURITIES AND IT IS NOT A SOLICITATION OF AN OFFER TO BUY THESE SECURITIES IN ANY JURISDICTION WHERE THE OFFER OR SALE IS NOT PERMITTED. | ||
| 16 | ||
| Structural and Collateral Term Sheet | BMO 2022-C1 | |
| Collateral Characteristics | ||
| Previous Securitization History(1) |
| No. | Mortgage Loan Seller | Loan Name | Location | Property Type | Cut-off Date Principal Balance | % of IPB | Previous Securitization |
| 5 | BMO/SMC | AMF Portfolio | Various | Multifamily | $40,000,000 | 3.6% | CF 2019-MF1 |
| 8.01 | SMC | First National Building | Detroit, MI | Office | $9,222,400 | 0.8% | JPMBB 2015-C32, JPMCC 2015-JP1 |
| 8.03 | SMC | Chrysler House | Detroit, MI | Office | $4,584,000 | 0.4% | WFRBS 2013-C16 |
| 8.04 | SMC | 1001 Woodward | Detroit, MI | Office | $4,554,400 | 0.4% | JPMBB 2014-C19 |
| 8.05 | SMC | One Woodward | Detroit, MI | Office | $3,301,600 | 0.3% | COMM 2014-UBS6 |
| 11 | BMO | 2 Riverfront Plaza | Newark, NJ | Office | $37,500,000 | 3.3% | LCCM 2017-LC26 |
| 12.01 | SMC | Center Plaza | Federal Way, WA | Retail | $17,692,308 | 1.6% | JPMBB 2015-C31 |
| 12.02 | SMC | Village by the Creek | Mill Creek, WA | Retail | $7,628,205 | 0.7% | MSBAM 2016-C30 |
| 12.03 | SMC | Riverway Plaza | Kelso, WA | Retail | $6,538,462 | 0.6% | COMM 2015-CR25 |
| 19 | SMC | BJ’s Wholesale Club - Kendall | Miami, FL | Retail | $22,100,000 | 2.0% | CSAIL 2016-C7 |
| 22 | BMO | Meadowood Mall | Reno, NV | Retail | $17,933,084 | 1.6% | GSMS 2012-GC6 |
| 25 | Sabal | Midway Market Square | Elyria, OH | Retail | $15,000,000 | 1.3% | FCRE 2018-1A |
| 26 | SMC | Peoria Center at Arrowhead | Peoria, AZ | Office | $14,425,000 | 1.3% | GSMS 2014-GC26 |
| 27 | BMO | Mills Fleet Farm Carver | Carver, MN | Retail | $13,890,000 | 1.2% | CSMC 2016-MFF |
| 44 | SMC | West Allen Plaza | Woodhaven, MI | Retail | $7,050,000 | 0.6% | JPMCC 2012-CBX |
| 55 | KeyBank | Laguna Beach Mixed Use | Laguna Beach, CA | Mixed Use | $5,000,000 | 0.4% | BOC 2019-Q010 |
| 63 | Sabal | The Wash Apartments | Indianapolis, IN | Multifamily | $3,535,000 | 0.3% | M360 2018-CRE1 |
| (1) | The table above represents the properties for which the previously existing debt was most recently securitized, based on information provided by the related borrower or obtained through searches of a third-party database. |
| THE INFORMATION IN THIS STRUCTURAL AND COLLATERAL TERM SHEET IS NOT COMPLETE AND MAY BE AMENDED PRIOR TO THE TIME OF SALE. THIS TERM SHEET IS NOT AN OFFER TO SELL THESE SECURITIES AND IT IS NOT A SOLICITATION OF AN OFFER TO BUY THESE SECURITIES IN ANY JURISDICTION WHERE THE OFFER OR SALE IS NOT PERMITTED. | ||
| 17 | ||
| Structural and Collateral Term Sheet | BMO 2022-C1 | |
| Class A-2 and Class A-3(1) | ||
Class A-2
No. | Loan Name | Cut-off | % of IPB | Maturity Date | % of | Original | Rem. | UW NCF | UW NOI | Cut-off | Maturity Date/ARD |
| 4 | Coleman Highline Phase IV | $41,400,000 | 3.7% | $41,400,000 | 27.6% | 60 | 58 | 5.54x | 14.1% | 31.0% | 31.0% |
| 7 | Hudson Commons | $40,000,000 | 3.6% | $40,000,000 | 26.6% | 60 | 59 | 2.54x | 9.4% | 29.6% | 29.6% |
| 10 | 111 River Street | $37,500,000 | 3.3% | $37,500,000 | 25.0% | 60 | 60 | 5.08x | 16.9% | 31.8% | 31.8% |
| 22 | Meadowood Mall | $17,933,084 | 1.6% | $15,712,359 | 10.5% | 60 | 58 | 2.98x | 19.9% | 35.1% | 30.7% |
| 40 | SAPA Transmission | $9,350,000 | 0.8% | $8,678,208 | 5.8% | 60 | 60 | 1.28x | 8.8% | 61.1% | 56.7% |
| 59 | Richmond Mixed-Use Portfolio | $4,225,000 | 0.4% | $3,877,631 | 2.6% | 60 | 60 | 1.35x | 8.8% | 65.0% | 59.7% |
| 61 | Bethany Medical | $3,800,000 | 0.3% | $3,800,000 | 2.5% | 60 | 55 | 2.77x | 11.6% | 63.9% | 63.9% |
| Total / Weighted Average: | $154,208,084 | 13.7% | $150,968,197 | 100.5% | 60 | 59 | 3.91x | 13.7% | 34.9% | 34.0% | |
| (1) | The table above presents the mortgage loan whose balloon payment would be applied to pay down the certificate balance of the Class A-2 Certificates, assuming a 0% CPR and applying the “Modeling Assumptions” described in the Preliminary Prospectus, including the assumptions that (i) none of the mortgage loans in the pool experience prepayments, defaults or losses; (ii) there are no extensions of maturity dates of any mortgage loans in the pool; and (iii) each mortgage loan in the pool is paid in full on its stated maturity date. Each Class of Certificates, including the Class A-2 Certificates, evidences undivided ownership interests in the entire pool of mortgage loans. Debt service coverage ratio, debt yield and loan-to-value ratio information does not take into account subordinate debt (whether or not secured by the mortgaged property), if any, that is allowed under the terms of any mortgage loan. See Annex A-1 to the Preliminary Prospectus. |
| (2) | Reflects the percentage equal to the Percentage of the Maturity Date Balance divided by the initial Class A-2 Certificate Balance. |
Class A-3
No. | Loan Name | Cut-off | % of IPB | Maturity Date | % of | Original | Rem. | UW NCF | UW NOI | Cut-off | Maturity |
| 8 | Bedrock Portfolio | $40,000,000 | 3.6% | $40,000,000 | 59.0% | 84 | 83 | 3.30x | 13.6% | 59.4% | 59.4% |
| 20 | Wyndham National Hotel Portfolio | $18,914,095 | 1.7% | $13,843,962 | 20.4% | 120 | 94 | 1.69x | 15.0% | 63.8% | 46.7% |
| 36 | Centennial Plaza | $5,474,250 | 0.5% | $5,120,298 | 7.6% | 84 | 83 | 1.83x | 11.0% | 66.1% | 61.8% |
| 37 | Jefferson County Plaza | $4,421,250 | 0.4% | $4,135,395 | 6.1% | 84 | 83 | 1.83x | 11.0% | 66.1% | 61.8% |
| 48 | Planet Self Storage | $6,000,000 | 0.5% | $6,000,000 | 8.9% | 84 | 82 | 2.35x | 8.6% | 57.1% | 57.1% |
| Total / Weighted Average: | $74,809,595 | 6.7% | $69,099,655 | 102.0% | 93 | 86 | 2.62x | 13.2% | 61.2% | 56.3% | |
| (1) | The table above presents the mortgage loan whose balloon payment would be applied to pay down the certificate balance of the Class A-3 Certificates, assuming a 0% CPR and applying the “Modeling Assumptions” described in the Preliminary Prospectus, including the assumptions that (i) none of the mortgage loans in the pool experience prepayments, defaults or losses; (ii) there are no extensions of maturity dates of any mortgage loans in the pool; and (iii) each mortgage loan in the pool is paid in full on its stated maturity date. Each Class of Certificates, including the Class A-3 Certificates, evidences undivided ownership interests in the entire pool of mortgage loans. Debt service coverage ratio, debt yield and loan-to-value ratio information does not take into account subordinate debt (whether or not secured by the mortgaged property), if any, that is allowed under the terms of any mortgage loan. See Annex A-1 to the Preliminary Prospectus. |
| (2) | Reflects the percentage equal to the Percentage of the Maturity Date Balance divided by the initial Class A-3 Certificate Balance. |
| THE INFORMATION IN THIS STRUCTURAL AND COLLATERAL TERM SHEET IS NOT COMPLETE AND MAY BE AMENDED PRIOR TO THE TIME OF SALE. THIS TERM SHEET IS NOT AN OFFER TO SELL THESE SECURITIES AND IT IS NOT A SOLICITATION OF AN OFFER TO BUY THESE SECURITIES IN ANY JURISDICTION WHERE THE OFFER OR SALE IS NOT PERMITTED. | ||
| 18 | ||
| Structural and Collateral Term Sheet | BMO 2022-C1 | |
| Structural Overview | ||
| ■ Assets: | The Class A-1, Class A-2, Class A-3, Class A-4, Class A-5, Class A-AB, Class X-A, Class X-B, Class X-D, Class X-F, Class X-G, Class X-H, Class X-J, Class A-S, Class B, Class C, Class D, Class E, Class F, Class G, Class H, Class J, Class S, and Class R Certificates (collectively, the “Certificates”) will be entitled to distributions solely with respect to the mortgage loans. | |
| ■ Accrual: | Each Class of Certificates (other than the Class S and Class R Certificates) will accrue interest on a 30/360 basis. The Class S and Class R Certificates will not accrue interest. | |
| ■ Allocation Between Combined Uncertificated VRR Interest and Non-Uncertificated VRR Retained Pooled Certificates | The aggregate amount available for distribution to holders of the Non-Uncertificated VRR Retained Pooled Certificates and the Combined Uncertificated VRR Interest on each distribution date will be: (i) the gross amount of interest, principal, yield maintenance charges and prepayment premiums collected with respect to the mortgage loans in the applicable one-month collection period, net of specified expenses of the issuing entity, including fees payable therefrom to, and losses, liabilities, advances (with interest thereon), costs and expenses reimbursable or indemnifiable therefrom to, the master servicer, the special servicer, the certificate administrator, the trustee, the operating advisor, the asset representations reviewer and CREFC®; and (ii) allocated to amounts available for distribution to the holders of the Combined Uncertificated VRR Interest, on the one hand, and amounts available for distribution to the holders of the Non-Uncertificated VRR Retained Pooled Certificates (exclusive of the Class R certificates), on the other hand. On each distribution date, the portion of such aggregate available funds allocable to: (a) the Combined Uncertificated VRR Interest will be the product of such aggregate available funds multiplied by the Uncertificated VRR Retained Percentage; and (b) the Non-Uncertificated VRR Retained Pooled Certificates (exclusive of the Class R certificates) will at all times be the product of such aggregate available funds multiplied by the Non-Uncertificated VRR Retained Percentage. See “Credit Risk Retention” and “Description of the Certificates” in the Preliminary Prospectus.
The “Uncertificated VRR Retained Percentage” is a fraction, expressed as a percentage, the numerator of which is the initial principal balance of the Combined Uncertificated VRR Interest, and the denominator of which is the sum of (x) the aggregate initial certificate balance of all classes of Pooled Principal Balance Certificates and (y) the initial principal balance of the Combined Uncertificated VRR Interest.
The “Non-Uncertificated VRR Retained Percentage” is the difference between 100% and the Uncertificated VRR Retained Percentage
| |
| ■ Distributions: | On each Distribution Date, funds available for distribution to holders of the Non-Uncertificated VRR Retained Pooled Certificates (exclusive of any portion thereof that represents the Non-Uncertificated VRR Retained Percentage of (i) any yield maintenance charges and prepayment premiums collected on the mortgage loans and/or (ii) any excess interest accrued after the related anticipated repayment date on any mortgage loan with an anticipated repayment date) (“Non-Uncertificated VRR Retained Pooled Available Funds”) will be distributed in the following amounts and order of priority (in each case to the extent of remaining available funds):
1. Class A-1, Class A-2, Class A-3, Class A-4, Class A-5, Class A-AB, Class X-A, Class X-B, Class X-D, Class X-F, Class X-G, Class X-H and Class X-J certificates: to interest on the Class A-1, Class A-2, Class A-3, Class A-4, Class A-5, Class A-AB, Class X-A, Class X-B, Class X-D, Class X-F, Class X-G, Class X-H and Class X-J certificates, up to, and pro rata in accordance with, their respective interest entitlements.
2. Class A-1, A-2, A-3, A-4, A-5 and A-AB certificates: to the extent of Non-Uncertificated VRR Retained Pooled Available Funds allocable to principal received or advanced on the mortgage loans, (i) to principal on the Class A-AB certificates until their certificate balance is reduced to the Class A-AB scheduled principal balance set forth in Annex F to the Preliminary Prospectus for the relevant Distribution Date, then (ii) to principal on the Class A-1 certificates until their certificate balance is reduced to zero, all funds available for distribution of principal remaining after the distributions to the Class A-AB certificates in clause (i) above, then (iii) to principal on the Class A-2 certificates until their certificate balance is reduced to zero, all funds available for distribution of principal remaining after the distributions to the Class A-1 certificates in clause (ii) above, then (iv) to principal on the Class A-3 certificates until their certificate balance is reduced to zero, all funds available for distribution of principal remaining after the distributions to the Class A-2 certificates in clause (iii) above, then (v) to principal on the Class A-4 certificates until their certificate balance is reduced to zero, all funds available for distribution of principal remaining after the distributions to the Class A-3 certificates in clause (iv) above, then (vi) to principal on the Class A-5 certificates until their certificate balance is reduced to zero, all funds available for distribution of principal remaining after the distributions to the Class A-4 certificates in clause (v) above and then (vii) to principal on the Class A-AB certificates until their certificate balance is reduced to zero, all funds available for distribution of principal remaining after the distributions to the Class A-5 certificates in clause (vi) above. However, if the certificate balances of each and every class of the Class A-S, Class B, Class C, Class D, Class E, Class F, Class G, Class H and Class J certificates have been reduced to zero as a result of the allocation of |
| THE INFORMATION IN THIS STRUCTURAL AND COLLATERAL TERM SHEET IS NOT COMPLETE AND MAY BE AMENDED PRIOR TO THE TIME OF SALE. THIS TERM SHEET IS NOT AN OFFER TO SELL THESE SECURITIES AND IT IS NOT A SOLICITATION OF AN OFFER TO BUY THESE SECURITIES IN ANY JURISDICTION WHERE THE OFFER OR SALE IS NOT PERMITTED. | ||
| 19 | ||
| Structural and Collateral Term Sheet | BMO 2022-C1 | |
| Structural Overview | ||
mortgage loan losses and other unanticipated expenses to those certificates, then Non-Uncertificated VRR Retained Pooled Available Funds allocable to principal will be distributed to the Class A-1, Class A-2, Class A-3, Class A-4, Class A-5 and Class A-AB certificates, pro rata, based on their respective certificate balances (and the schedule for the Class A-AB principal distributions will be disregarded).
3. Class A-1, A-2, A-3, A-4, A-5 and A-AB certificates: to reimburse the Class A-1, Class A-2, Class A-3, Class A-4, Class A-5 and Class A-AB certificates, pro rata, for any unreimbursed losses on the mortgage loans that were previously allocated to reduce the certificate balances of those classes, together with interest at their respective pass-through rates.
4. Class A-S certificates: (i) first, to interest on the Class A-S certificates in the amount of their interest entitlement; (ii) next, to the extent of Non-Uncertificated Retained Pooled Available Funds allocable to principal remaining after distributions in respect of principal to each class of Non-Uncertificated VRR Retained Pooled Principal Balance Certificates with a higher principal payment priority (in this case, the Class A-1, Class A-2, Class A-3, Class A-4, Class A-5 and Class A-AB certificates), to principal on the Class A-S certificates until their certificate balance is reduced to zero; and (iii) next, to reimburse the Class A-S certificates for any unreimbursed losses on the mortgage loans that were previously allocated to reduce the certificate balance of that class, together with interest at its pass-through rate.
5. Class B certificates: (i) first, to interest on the Class B certificates in the amount of their interest entitlement; (ii) next, to the extent of Non-Uncertificated Retained Pooled Available Funds allocable to principal remaining after distributions in respect of principal to each class of Pooled Principal Balance Certificates with a higher principal payment priority (in this case, the Class A-1, Class A-2, Class A-3, Class A-4, Class A-5, Class A-AB and Class A-S certificates), to principal on the Class B certificates until their certificate balance is reduced to zero; and (iii) next, to reimburse Class B certificates for any unreimbursed losses on the mortgage loans that were previously allocated to reduce the certificate balance of that class, together with interest at its pass-through rate.
6. Class C certificates: (i) first, to interest on the Class C certificates in the amount of their interest entitlement; (ii) next, to the extent of Non-Uncertificated Retained Pooled Available Funds allocable to principal remaining after distributions in respect of principal to each class of Pooled Principal Balance Certificates with a higher principal payment priority (in this case, the Class A-1, Class A-2, Class A-3, Class A-4, Class A-5, Class A-AB, Class A-S and Class B certificates), to principal on the Class C certificates until their certificate balance is reduced to zero; and (iii) next, to reimburse the Class C certificates for any unreimbursed losses on the mortgage loans that were previously allocated to reduce the certificate balance of that class, together with interest at its pass-through rate.
7. After the Class A-1, Class A-2, Class A-3, Class A-4, Class A-5, Class A-AB, Class X-A, Class X-B, Class X-D, Class XF, Class XG, Class XH, Class XJ, Class A-S, Class B and Class C certificates are paid all amounts to which they are entitled on such Distribution Date, the remaining Non-Uncertificated VRR Retained Pooled Available Funds will be used to pay interest and principal and to reimburse (with interest) any unreimbursed losses to the Class D, Class E, Class F, Class G, Class H and Class J certificates, sequentially in that order and with respect to each such class in a manner analogous to the Class C certificates pursuant to clause 6 above.
No class of Pooled Certificates will be entitled to distributions from amounts paid or advanced on and allocable to the Trust Subordinate Companion Loans, and such amounts will not be included in the Non-Uncertificated VRR Retained Pooled Available Funds.
The holder of the Loan-Specific Certificates will only be entitled to distributions from amounts paid or advanced on and allocated to the related Trust Subordinate Companion Loan in accordance with the related co-lender agreement relating to the applicable loan combination. |
■ Realized Losses:
| The certificate balances of the Pooled Principal Balance Certificates will each be reduced without distribution on any Distribution Date as a write-off to the extent of any loss realized on the mortgage loans allocated to the related class on such Distribution Date. On each Distribution Date, the Non-Uncertificated VRR Retained Percentage of any such losses will be applied to the respective classes of Non-Uncertificated VRR Retained Pooled Principal Balance Certificates in the following order, in each case until the related certificate balance is reduced to zero: first to the Class J certificates, second, to the Class H certificates; third, to the Class G certificates; fourth, to the Class F certificates; fifth, to the Class E certificates; sixth, to the Class D certificates; seventh, to the Class C certificates; eighth, to the Class B certificates; ninth, to the Class A-S certificates; and, finally pro rata, to the Class A-1, Class A-2, Class A-3, Class A-4, Class A-5 and Class A-AB certificates, based on their then current respective certificate balances. The notional amount of each class of Pooled Class X Certificates will be reduced to reflect reductions in the certificate balance(s) of the class (or classes, |
| THE INFORMATION IN THIS STRUCTURAL AND COLLATERAL TERM SHEET IS NOT COMPLETE AND MAY BE AMENDED PRIOR TO THE TIME OF SALE. THIS TERM SHEET IS NOT AN OFFER TO SELL THESE SECURITIES AND IT IS NOT A SOLICITATION OF AN OFFER TO BUY THESE SECURITIES IN ANY JURISDICTION WHERE THE OFFER OR SALE IS NOT PERMITTED. | ||
| 20 | ||
| Structural and Collateral Term Sheet | BMO 2022-C1 | |
| Structural Overview | ||
| as applicable) of Corresponding Pooled Principal Balance Certificates as a result of allocations of losses realized on the mortgage loans to such class(es) of Pooled Principal Balance Certificates. | ||
| ■ Prepayment Premiums and Yield Maintenance Charges: | On each Distribution Date, until the notional amounts of the Class X-A, Class X-B and Class X-D certificates and the certificate balances of the Class A-1, Class A-2, Class A-3, Class A-4, Class A-5, Class A-AB, Class A-S, Class B, Class C, Class D and Class E certificates have been reduced to zero, the Non-Uncertificated VRR Retained Percentage of each yield maintenance charge collected on the mortgage loans during the related one-month collection period (or, in the case of an outside serviced mortgage loan, that accompanied a principal prepayment included in the aggregate available funds for such Distribution Date) is required to be distributed to holders of the Pooled Certificates (excluding holders of the Class X-F, Class X-G, Class X-H, Class X-J, Class F, Class G, Class H and Class J certificates) as follows: (a) first the Non-Uncertificated VRR Retained Percentage of such yield maintenance charge will be allocated between (i) the group (the “YM Group A”) of the Class A-1, Class A-2, Class A-3, Class A-4, Class A-5, Class A-AB, Class X-A and Class A-S certificates, (ii) the group (the “YM Group BC”) of the Class X-B, Class B and Class C certificates and (iii) the group (the “YM Group DE” and, together with the YM Group A and the YM Group BC, the “YM Groups”) of the Class X-D, Class D and Class E certificates pro rata, based upon the aggregate amount of principal distributed to the class or classes of Non-Uncertificated VRR Retained Pooled Principal Balance Certificates in each YM Group on such Distribution Date, and (b) then the portion of such yield maintenance charge allocated to each YM Group will be further allocated as among the classes of Non-Uncertificated VRR Retained Pooled Regular Certificates in such YM Group, in the following manner: (i) each class of Non-Uncertificated VRR Retained Pooled Principal Balance Certificates in such YM Group will entitle the applicable certificateholders to receive on the applicable Distribution Date that portion of such yield maintenance charge equal to the product of (X) a fraction whose numerator is the amount of principal distributed to such class of Non-Uncertificated VRR Retained Pooled Principal Balance Certificates on such Distribution Date and whose denominator is the total amount of principal distributed to all of the Non-Uncertificated VRR Retained Pooled Principal Balance Certificates in that YM Group on such Distribution Date, (Y) the Base Interest Fraction (as defined in the Preliminary Prospectus) for the related principal prepayment and such class of Non-Uncertificated VRR Retained Pooled Principal Balance Certificates, and (Z) the portion of such yield maintenance charge allocated to such YM Group, and (ii) the portion of such yield maintenance charge allocated to such YM Group and remaining after such distributions with respect to the Non-Uncertificated VRR Retained Pooled Principal Balance Certificates in such YM Group will be distributed to the class of Pooled Class X Certificates in such YM Group. If there is more than one class of Non-Uncertificated VRR Retained Pooled Principal Balance Certificates in any YM Group entitled to distributions of principal on any particular Distribution Date on which yield maintenance charges are distributable to such classes, the portion of such yield maintenance charges allocated to such YM Group will be allocated among all such classes of Non-Uncertificated VRR Retained Pooled Principal Balance Certificates up to, and on a pro rata basis in accordance with, their respective entitlements in those yield maintenance charges in accordance with the prior sentence of this paragraph.
If a prepayment premium (calculated as a percentage of the amount prepaid) is imposed in connection with a prepayment rather than a yield maintenance charge, then the prepayment premium so collected will be allocated as described above. For this purpose, the discount rate used to calculate the Base Interest Fraction will be the discount rate used to determine the yield maintenance charge for mortgage loans that require payment at the greater of a yield maintenance charge or a minimum amount equal to a fixed percentage of the principal balance of the mortgage loan or, for mortgage loans that only have a prepayment premium based on a fixed percentage of the principal balance of the mortgage loan, such other discount rate as may be specified in the related loan documents.
After the notional amounts of the Class X-A, Class X-B and Class X-D certificates and the certificate balances of the Class A-1, Class A-2, Class A-3, Class A-4, Class A-5, Class A-AB, Class A-S, Class B, Class C, Class D and Class E certificates have been reduced to zero, the Non-Uncertificated VRR Retained Percentage of all prepayment premiums and yield maintenance charges with respect to the mortgage loans will be allocated among the holders of the Class F, Class G, Class H and Class J certificates as provided in the BMO 2022-C1 pooling and servicing agreement. No yield maintenance charges or prepayment premiums will be distributed to the holders of the Class X-F, Class X-G, Class X-H, Class X-J, Class S and Class R certificates. For a description of prepayment premiums and yield maintenance charges required on the mortgage loans, see Annex A to the Preliminary Prospectus. See also “Certain Legal Aspects of the Mortgage Loans—Default Interest and Limitations on Prepayments” in the Preliminary Prospectus.
Any yield maintenance charges or prepayment premiums payable in respect of a Trust Subordinate Companion Loan will be distributed to the holders of the related Loan-Specific Certificates.
| |
| ■ Advances: | The master servicer and, if it fails to do so, the trustee, will be obligated to make P&I advances with respect to each mortgage loan and Trust Subordinate Companion Loan in the issuing entity and, with respect to all of the mortgage loans and the Trust Subordinate Companion Loans serviced under the BMO 2022-C1 pooling and servicing agreement, servicing advances, including paying delinquent |
| THE INFORMATION IN THIS STRUCTURAL AND COLLATERAL TERM SHEET IS NOT COMPLETE AND MAY BE AMENDED PRIOR TO THE TIME OF SALE. THIS TERM SHEET IS NOT AN OFFER TO SELL THESE SECURITIES AND IT IS NOT A SOLICITATION OF AN OFFER TO BUY THESE SECURITIES IN ANY JURISDICTION WHERE THE OFFER OR SALE IS NOT PERMITTED. | ||
| 21 | ||
| Structural and Collateral Term Sheet | BMO 2022-C1 | |
| Structural Overview | ||
| property taxes, condominium assessments, insurance premiums and ground lease rents, but only to the extent that those advances are not deemed non-recoverable from collections on the related mortgage loan and/or Trust Subordinate Companion Loan and, in the case of servicing advances, any other related companion loans as described below. P&I advances are subject to reduction in connection with any appraisal reductions that may occur. The special servicer will have no obligation to make any advances, provided that, in an urgent or emergency situation requiring the making of a property protection advance, the special servicer may, in its sole discretion, make a property protection advance and will be entitled to reimbursement from the master servicer for such advance. The master servicer, the special servicer and the trustee will each be entitled to receive interest on advances they make at the prime rate, subject to a floor of 2.0% per annum, compounded annually. | ||
■ Serviced Mortgage
| One or more loan combinations may each constitute an “outside serviced loan combination”, in which case (as identified under “Collateral Characteristics—Pari Passu Companion Loan Summary” above), the BMO 2022-C1 pooling and servicing agreement is not the Controlling PSA, and each related mortgage loan constitutes an “outside serviced mortgage loan,” each related companion loan constitutes an “outside serviced companion loan,” and each related Controlling PSA constitutes an “outside servicing agreement.”
One or more loan combinations may be identified in the Preliminary Prospectus as a “servicing shift loan combination”, in which case the related mortgage loan constitutes a “servicing shift mortgage loan” and each related companion loan constitutes a “servicing shift companion loan”. Any servicing shift loan combination will initially be serviced pursuant to the BMO 2022-C1 pooling and servicing agreement during which time such mortgage loan, such loan combination and each related companion loan will be a serviced mortgage loan, a serviced loan combination and a serviced companion loan (each as defined below), respectively. However, upon the inclusion of the related controlling pari passu companion loan in a future securitization transaction, the servicing of such mortgage loan will shift to the servicing agreement governing such securitization transaction, and such mortgage loan, such loan combination and each related companion loan will be an outside serviced mortgage loan, an outside serviced loan combination and an outside serviced companion loan, respectively.
All of the mortgage loans transferred to the issuing entity (other than any outside serviced mortgage loan) are sometimes referred to in this Term Sheet as the “serviced mortgage loans” and, together with any related companion loans, as the “serviced loans” (which signifies that they are being serviced by the master servicer and the special servicer under the BMO 2022-C1 pooling and servicing agreement); each related loan combination constitutes a “serviced loan combination”; and each related companion loan constitutes a “serviced companion loan.” See “Description of the Mortgage Pool—The Loan Combinations” in the Preliminary Prospectus.
| |
| ■ Appraisal Reduction Amounts: | An Appraisal Reduction Amount generally will be created with respect to a required appraisal loan (which is a serviced loan as to which certain defaults, modifications or insolvency events have occurred (as further described in the Preliminary Prospectus)) in the amount, if any, by which the principal balance of such required appraisal loan, plus other amounts overdue or advanced in connection with such required appraisal loan, exceeds 90% of the appraised value of the related mortgaged property (subject to certain downward adjustments permitted under the BMO 2022-C1 pooling and servicing agreement) plus certain escrows and reserves (including letters of credit) held with respect to such required appraisal loan; provided that, if so provided in the related co-lender agreement, the holder of a subordinate companion loan may be permitted to post cash or a letter of credit to offset some or all of an Appraisal Reduction Amount. In the case of an outside serviced mortgage loan, any Appraisal Reduction Amounts will be calculated pursuant to, and by a party to, the related outside servicing agreement. In general, any Appraisal Reduction Amount calculated with respect to a loan combination will be allocated first, to any related subordinate companion loan(s) (including, if applicable, a related Trust Subordinate Companion Loan) (up to the outstanding principal balance(s) thereof), and then, to the related mortgage loan and any related pari passu companion loan(s) on a pro rata basis in accordance with their respective outstanding principal balances. As a result of an Appraisal Reduction Amount being calculated for and/or allocated to a given mortgage loan, the interest portion of any P&I advance for such mortgage loan will be reduced, which (to the extent of the Non-Uncertificated VRR Retained Percentage of the reduction in such P&I advance) will have the effect of reducing the amount of interest available to the most subordinate class(es) of Pooled Certificates then outstanding (i.e., first, to the Class J certificates, then, to the Class H certificates, then, to the Class G certificates, then, to the Class F certificates, then, to the Class E certificates, then, to the Class D certificates, then, to the Class C certificates, then, to the Class B certificates, then, to the Class A-S certificates, and then, pro rata based on interest entitlements, to the Class A-1, Class A-2, Class A-3, Class A-4, Class A-5, Class A-AB, Class X-A, Class X-B, Class X-D, Class X-F, Class X-G, Class X-H and Class X-J certificates). In general, a serviced loan will cease to be a required appraisal loan, and no longer be subject to an Appraisal Reduction Amount, when the same has ceased to be a specially serviced loan (if applicable), has been brought current for at least three consecutive months and no other circumstances exist that would cause such serviced loan to be a required appraisal loan. |
| THE INFORMATION IN THIS STRUCTURAL AND COLLATERAL TERM SHEET IS NOT COMPLETE AND MAY BE AMENDED PRIOR TO THE TIME OF SALE. THIS TERM SHEET IS NOT AN OFFER TO SELL THESE SECURITIES AND IT IS NOT A SOLICITATION OF AN OFFER TO BUY THESE SECURITIES IN ANY JURISDICTION WHERE THE OFFER OR SALE IS NOT PERMITTED. | ||
| 22 | ||
| Structural and Collateral Term Sheet | BMO 2022-C1 | |
| Structural Overview | ||
For purposes of determining the identity of the Controlling Class and the existence of a Control Termination Event, as well as the allocation and/or exercise of voting rights for certain purposes, the Uncertificated VRR Retained Percentage of any Appraisal Reduction Amounts in respect of or allocated to the mortgage loans will be allocated to notionally reduce the principal balance of the VRR, and the Non-Uncertificated VRR Retained Percentage of any Appraisal Reduction Amounts in respect of or allocated to the mortgage loans will be allocated to notionally reduce the certificate balances of the Non-Uncertificated VRR Retained Pooled Principal Balance Certificates as follows: first, to the Class J, Class H, Class G, Class F, Class E, Class D, Class C, Class B and Class A-S certificates, in that order, in each case until the related certificate balance is notionally reduced to zero; and then to the Class A-1, Class A-2, Class A-3, Class A-4, Class A-5 and Class A-AB certificates, pro rata based on certificate balance.
As a result of calculating an Appraisal Reduction Amount that is allocated to a Trust Subordinate Companion Loan, the amount of any required P&I Advance with respect to such Trust Subordinate Companion Loan will be reduced, which will have the effect of reducing the amount of interest available to the related Loan-Specific Certificates then-outstanding, generally in reverse sequential order of payment priority.
For various purposes under the BMO 2022-C1 pooling and servicing agreement (including, with respect to the Non-Uncertificated VRR Retained Pooled Principal Balance Certificates, for purposes of determining the Non-Reduced Certificates and the Controlling Class, as well as the occurrence of a Control Termination Event and an Operating Advisor Consultation Trigger Event), the Uncertificated VRR Retained Percentage of any Appraisal Reduction Amounts in respect of or allocated to the mortgage loans will be allocated to notionally reduce the certificate balance of the VRR, and the Non-Uncertificated VRR Retained Percentage of any Appraisal Reduction Amounts in respect of or allocated to the mortgage loans will be allocated to notionally reduce the certificate balances of the Pooled Principal Balance Certificates as follows: first, to the Class F, Class G, Class H, Class J, Class E, Class D, Class C, Class B and Class A-S certificates, in that order, in each case until the related certificate balance is notionally reduced to zero; and then to the Class A-1, Class A-2, Class A-3, Class A-4, Class A-5 and Class A-AB certificates, pro rata based on certificate balance.
For various purposes under the BMO 2022-C1 pooling and servicing agreement, any Appraisal Reduction Amount allocated to a Trust Subordinate Companion Loan will be allocated to notionally reduce the certificate balances of the related Loan-Specific Principal Balance Certificates. |
■ Cumulative Appraisal
| A “Cumulative Appraisal Reduction Amount”, as of any date of determination, is equal to the sum of (i) all Appraisal Reduction Amounts then in effect, and (ii) with respect to any AB Modified Loans, any Collateral Deficiency Amounts then in effect.
“Collateral Deficiency Amount” means, with respect to any AB Modified Loan as of any date of determination, the excess of (i) the stated principal balance of such AB Modified Loan (taking into account the related junior note(s) included therein), over (ii) the sum of (in the case of a loan combination, solely to the extent allocable to the subject mortgage loan or Trust Subordinate Companion Loan) (x) the most recent appraised value for the related mortgaged property or mortgaged properties, plus (y) solely to the extent not reflected or taken into account in such appraised value and to the extent on deposit with, or otherwise under the control of, the lender as of the date of such determination, any capital or additional collateral contributed by the related borrower at the time the mortgage loan or Trust Subordinate Companion Loan became (and as part of the modification related to) such AB Modified Loan for the benefit of the related mortgaged property or mortgaged properties (provided, that in the case of an outside serviced mortgage loan, the amounts set forth in this clause (y) will be taken into account solely to the extent relevant information is received), plus (z) any other escrows or reserves (in addition to any amounts set forth in the immediately preceding clause (y)) held by the lender in respect of such AB Modified Loan as of the date of such determination. For purposes of determining the identity of the Controlling Class and the existence of a Control Termination Event and an Operating Advisor Consultation Trigger Event, the Non-Uncertificated VRR Retained Percentage of Collateral Deficiency Amounts will be allocable to the respective classes of Control Eligible Certificates (as defined below), in reverse alphabetical order of class designation, in a manner similar to the allocation of Appraisal Reduction Amounts to such classes.
“AB Modified Loan” means any corrected mortgage loan or Trust Subordinate Companion Loan (1) that became a corrected mortgage loan (which includes for purposes of this definition any outside serviced mortgage loan that became a “corrected” mortgage loan (or any term substantially similar thereto) pursuant to the related outside servicing agreement) due to a modification thereto that resulted in the creation of an A/B note structure (or similar structure) and as to which the new junior note(s) did not previously exist or the principal amount of the new junior note(s) was previously part |
| THE INFORMATION IN THIS STRUCTURAL AND COLLATERAL TERM SHEET IS NOT COMPLETE AND MAY BE AMENDED PRIOR TO THE TIME OF SALE. THIS TERM SHEET IS NOT AN OFFER TO SELL THESE SECURITIES AND IT IS NOT A SOLICITATION OF AN OFFER TO BUY THESE SECURITIES IN ANY JURISDICTION WHERE THE OFFER OR SALE IS NOT PERMITTED. | ||
| 23 | ||
| Structural and Collateral Term Sheet | BMO 2022-C1 | |
| Structural Overview | ||
| of either an A note held by the trust or the original unmodified mortgage loan or a Trust Subordinate Companion Loan and (2) as to which an Appraisal Reduction Amount is not in effect. | ||
| ■ Age of Appraisals: | Appraisals (which can be an update of a prior appraisal) with respect to a serviced loan are required to be no older than 9 months for purposes of determining appraisal reductions (other than the annual re-appraisal), market value, and other calculations as described in the Preliminary Prospectus. | |
| ■ Sale of Defaulted Loans: | There will be no “Fair Market Value Purchase Option”. Instead defaulted mortgage loans and Trust Subordinate Companion Loans will be sold in a process similar to the sale process for REO property. With respect to an outside serviced loan combination, the party acting as special servicer with respect to such outside serviced loan combination pursuant to the related outside servicing agreement (the “outside special servicer”) may offer to sell to any person (or may offer to purchase) for cash such outside serviced loan combination in accordance with the terms of the related outside servicing agreement during such time as such outside serviced loan combination constitutes a defaulted mortgage loan qualifying for sale thereunder and, in connection with any such sale, the related outside special servicer is required to sell both the applicable outside serviced mortgage loan and the related outside serviced pari passu companion loan(s) and, if so provided in the related co-lender agreement or the Controlling PSA, any related subordinate companion loan(s), together as one defaulted loan. | |
| ■ Directing Holder: | The “Directing Holder” with respect to any mortgage loan or loan combination serviced under the BMO 2022-C1 pooling and servicing agreement will be:
● except (i) in the case of the 360 Rosemary loan combination prior to the occurrence and continuance of a control appraisal period with respect to each of the subordinate companion loans in such loan combination (each, a “360 Rosemary Control Appraisal Period”), (ii) in the case of the 111 River Street loan combination prior to the occurrence and continuance of a control appraisal period with respect to the subordinate companion loan in such loan combination (a”111 River Street Control Appraisal Period”), (iii) with respect to an excluded mortgage loan, (iv) with respect to a serviced loan combination as to which the Controlling Note is held outside the issuing entity (sometimes referred to in this Term Sheet as a “serviced outside controlled loan combination”), and (v) during any period that a Control Termination Event has occurred and is continuing, the Controlling Class Representative;
● with respect to any serviced outside controlled loan combination (which may include a servicing shift loan combination or any other serviced loan combination with a controlling companion loan held outside the issuing entity), if and for so long as such holder is entitled under the related co-lender agreement to exercise consent rights similar to those entitled to be exercised by the Controlling Class Representative, the holder of the related Controlling Note (during any such period, the “outside controlling note holder”);
● with respect to the 360 Rosemary loan combination so long as it is not an excluded mortgage loan (i) for so long as no 360 Rosemary Control Appraisal Period exists with respect to each of the subordinate loans in such loan combination, the 360 Rosemary Controlling Class Representative and (ii) for so long as a 360 Rosemary Control Appraisal Period exists with respect to each of the subordinate loans in such loan combination and a Control Termination Event has not occurred and is continuing, the Controlling Class Representative; and
● with respect to the 111 River Street loan combination so long as it is not an excluded mortgage loan (i) for so long as no 111 River Street Control Appraisal Period exists, the 111 River Street Controlling Class Representative and (ii) for so long as a 111 River Street Control Appraisal Period exists and a Control Termination Event has not occurred and is continuing, the Controlling Class Representative.
The applicable directing holder (or equivalent party) with respect to any outside serviced mortgage loan will be, in general, (i) in the event the related Controlling Note is included in the subject outside securitization transaction, the controlling class representative (or equivalent entity) under the related outside servicing agreement, and (ii) in all other cases, the third party holder of the related Controlling Note or its representative (which may be a controlling class representative (or equivalent entity) under a separate securitization transaction to which such note has been transferred (if any)), as provided in the related co-lender agreement.
An “excluded mortgage loan” is a mortgage loan or loan combination with respect to which the Controlling Class Representative or the holder(s) of more than 50% of the Controlling Class (by certificate balance) (or, (i) with respect to the 360 Rosemary loan combination so long as an applicable 360 Rosemary Control Appraisal Period does not exist, the 360 Rosemary Controlling Class Representative or the holder(s) of more than 50% of the 360 Rosemary Controlling Class (by certificate balance), and (ii) with respect to the 111 River Street loan combination so long as a 111 River Street Control Appraisal Period does not exist, the 111 River Street Controlling Class Representative or the holder(s) of more than 50% of the 111 River Street Controlling Class (by certificate balance)) is (or are) a Borrower Party (as defined in the Preliminary Prospectus). |
| THE INFORMATION IN THIS STRUCTURAL AND COLLATERAL TERM SHEET IS NOT COMPLETE AND MAY BE AMENDED PRIOR TO THE TIME OF SALE. THIS TERM SHEET IS NOT AN OFFER TO SELL THESE SECURITIES AND IT IS NOT A SOLICITATION OF AN OFFER TO BUY THESE SECURITIES IN ANY JURISDICTION WHERE THE OFFER OR SALE IS NOT PERMITTED. | ||
| 24 | ||
| Structural and Collateral Term Sheet | BMO 2022-C1 | |
| Structural Overview | ||
| ■ Controlling Class Representative: | The “Controlling Class Representative” will be the controlling class certificateholder or other representative designated by at least a majority of the controlling class certificateholders by certificate balance. The “Controlling Class” is, as of any time of determination, the most subordinate class of the Control Eligible Certificates that has an outstanding certificate balance as notionally reduced by any Cumulative Appraisal Reduction Amount allocable to such class, at least equal to 25% of the initial certificate balance of that class of certificates; provided that (except under the circumstances set forth in the next proviso) if no such class meets the preceding requirement, then the Class H certificates will be the controlling class; provided, further, however, that if, at any time, the aggregate outstanding certificate balance of the classes of Pooled Principal Balance Certificates senior to the Control Eligible Certificates has been reduced to zero (without regard to the allocation of any Cumulative Appraisal Reduction Amounts), then the “Controlling Class” will be the most subordinate class of Control Eligible Certificates with an outstanding certificate balance greater than zero (without regard to the allocation of any Cumulative Appraisal Reduction Amounts). The “Control Eligible Certificates” consist of the Class H and Class J certificates. See “The Pooling and Servicing Agreement—Directing Holder” in the Preliminary Prospectus. No other class of certificates will be eligible to act as the controlling class or appoint a Controlling Class Representative. No person may exercise any of the rights and powers of the Controlling Class Representative with respect to an excluded mortgage loan.
On the Closing Date, Sabal Strategic Opportunities Fund, L.P. or its affiliate, is expected to (i) purchase the Class H and Class J certificates and also receive the Class S Certificates, and (ii) to appoint itself or an affiliate as the initial Controlling Class Representative.
The “360 Rosemary Controlling Class Representative” will be the 360 Rosemary Controlling Class certificateholder or other representative selected by holders of at least a majority of the controlling class of the 360 Rosemary Loan-Specific Certificates by certificate balance. The “360 Rosemary Controlling Class” is, as of any time of determination, the 360 Rosemary Control Eligible Certificates. The “360 Rosemary Control Eligible Certificates” consist of the Class 360RR certificates.
On the Closing Date, it is expected that Rockwood Income and Credit Partners III, L.P. will be the initial 360 Rosemary Controlling Class Representative.
The “111 River Street Controlling Class Representative” will be the 111 River Street Controlling Class certificateholder or other representative selected by holders of at least a majority of the controlling class of the 111 River Street Loan-Specific Certificates by certificate balance. The “111 River Street Controlling Class” is, as of any time of determination, the most subordinate class of the 111 River Street Control Eligible Certificates that has an outstanding certificate balance, as notionally reduced by any portion of the Cumulative Appraisal Reduction Amount then allocable to such class, at least equal to 25% of the initial certificate balance of that class of certificates; provided, however, that if no such class meets the preceding requirement, then the most senior class of 111 River Street Control Eligible Certificates will be the “111 River Street Controlling Class”. The “111 River Street Control Eligible Certificates” consist of the Class 111D and Class 111E certificates.
| |
■ Control Termination Event:
| A “Control Termination Event” will: (1) with respect to any mortgage loan (other than the 360 Rosemary loan combination and 111 River Street loan combination) either (a) occur when none of the classes of the Control Eligible Certificates has an outstanding certificate balance (as notionally reduced by any Cumulative Appraisal Reduction Amount then allocable to such class) that is at least equal to 25% of the initial certificate balance of that class of certificates or (b) be deemed to occur as described below; provided, however, that a Control Termination Event will in no event exist at any time that the certificate balance of each class of the Non-Uncertificated VRR Retained Pooled Principal Balance Certificates senior to the Control Eligible Certificates (without regard to the allocation of Cumulative Appraisal Reduction Amounts) has been reduced to zero; and (2) with respect to each of the 360 Rosemary loan combination and the 111 River Street loan combination, be determined in accordance with clause (1) of this definition, but only if a Control Appraisal Period exists with respect to the related Trust Subordinate Companion Loan in such loan combination. With respect to excluded mortgage loans as to which the Controlling Class Representative would otherwise be the Directing Holder, a Control Termination Event will be deemed to exist.
The holders of Certificates representing the majority of the certificate balance of the most senior class of Control Eligible Certificates whose certificate balance is notionally reduced to less than 25% of the initial certificate balance of that class as a result of an allocation of an Appraisal Reduction Amount or a Collateral Deficiency Amount, as applicable, to such class will have the right to challenge the Special Servicer’s Appraisal Reduction Amount determination or a Collateral Deficiency Amount determination, as applicable, and, at their sole expense, obtain a second appraisal for any serviced loan for which an Appraisal Reduction Event has occurred or as to which there exists a Collateral Deficiency Amount, under the circumstances described in the Preliminary Prospectus. |
| THE INFORMATION IN THIS STRUCTURAL AND COLLATERAL TERM SHEET IS NOT COMPLETE AND MAY BE AMENDED PRIOR TO THE TIME OF SALE. THIS TERM SHEET IS NOT AN OFFER TO SELL THESE SECURITIES AND IT IS NOT A SOLICITATION OF AN OFFER TO BUY THESE SECURITIES IN ANY JURISDICTION WHERE THE OFFER OR SALE IS NOT PERMITTED. | ||
| 25 | ||
| Structural and Collateral Term Sheet | BMO 2022-C1 | |
| Structural Overview | ||
The holders of Certificates representing the majority of the certificate balance of the most senior class of 360 Rosemary Control Eligible Certificates or 111 River Street Control Eligible Certificates, as applicable, whose certificate balance is notionally reduced to less than 25% of the initial certificate balance of that class as a result of an allocation of an Appraisal Reduction Amount or a Collateral Deficiency Amount, as applicable, for the related Trust Subordinate Companion Loan to such class will have the right to challenge the Special Servicer’s Appraisal Reduction Amount determination or a Collateral Deficiency Amount determination, as applicable, and, at their sole expense, obtain a second appraisal for the applicable loan combination, under the circumstances described in the Preliminary Prospectus.
In addition, the holders of Certificates representing the majority of the Certificate Balance of the “appraised-out class” with respect to the 111 River Street Loan-Specific Certificates may avoid a 111 River Street Control Appraisal Period caused by application of an Appraisal Reduction Amount if such holder(s) delivers cash collateral or an acceptable letter of credit to supplement the appraised value of the 111 River Street Mortgaged Property. |
■ Consultation Termination Event:
| A “Consultation Termination Event” (1) with respect to any mortgage loan (other than the 360 Rosemary loan combination and 111 River Street loan combination), (a) when none of the classes of Control Eligible Certificates has an outstanding certificate balance, without regard to the allocation of any Cumulative Appraisal Reduction Amount, that is equal to or greater than 25% of the initial certificate balance of that class of certificates or (b) be deemed to occur as described below; provided, however, that a Consultation Termination Event will in no event exist at any time that the certificate balance of each class of the Non-Uncertificated VRR Retained Pooled Principal Balance Certificates senior to the Control Eligible Certificates (without regard to the allocation of Cumulative Appraisal Reduction Amounts) has been reduced to zero; and (2) with respect to each of the 360 Rosemary loan combination and the 111 River Street loan combination, be determined in accordance with clause (1) of this definition, but only if a Control Appraisal Period exists with respect to the related Trust Subordinate Companion Loan in such loan combination. With respect to excluded mortgage loans as to which the Controlling Class Representative would otherwise be a Consulting Party, a Consultation Termination Event will be deemed to exist. | |
■ Control/Consultation Rights:
| With respect to any Serviced Loan, the applicable Directing Holder will be entitled to have consent and/or consultation rights under the BMO 2022-C1 pooling and servicing agreement with respect to certain major decisions (including with respect to assumptions, waivers, certain loan modifications and workouts) and other matters with respect to each serviced loan.
After the occurrence and during the continuance of a Control Termination Event, the consent rights of the Controlling Class Representative will terminate, and the Controlling Class Representative will retain non-binding consultation rights under the BMO 2022-C1 pooling and servicing agreement with respect to certain major decisions and other matters with respect to the serviced mortgage loans, other than (i) any excluded mortgage loan and (ii) any serviced outside controlled loan combination.
After the occurrence and during the continuance of a Consultation Termination Event, all of these rights of the Controlling Class Representative with respect to the applicable serviced loans will terminate.
After the occurrence and during the continuance of a control appraisal period related to the trust subordinate companion loan in the 360 Rosemary loan combination or the 111 River Street loan combination, the control and consent rights of the 360 Rosemary Controlling Class Representative or the 111 River Street Controlling Class Representative, as applicable, with respect to the subject loan combination will terminate.
With respect to any serviced outside controlled loan combination (including any servicing shift loan combination for so long as it is serviced under the BMO 2022-C1 pooling and servicing agreement), the holder of the related Controlling Note or its representative (which holder or representative will not be the Controlling Class Representative) will instead be entitled to exercise the above-described consent and consultation rights, to the extent provided under the related co-lender agreement.
With respect to each outside serviced loan combination, the applicable outside controlling class representative or other related controlling noteholder pursuant to, and subject to the limitations set forth in, the related outside servicing agreement and the related co-lender agreement will have consent, consultation, approval and direction rights with respect to certain major decisions (including with respect to assumptions, waivers, loan modifications and workouts) regarding such outside serviced loan combination, as provided for in the related co-lender agreement and in the related outside servicing agreement. To the extent permitted under the related co-lender agreement, the Controlling Class Representative (so long as a Consultation Termination Event does not exist) may have certain consultation rights with respect to each outside serviced loan combination.
See “Description of the Mortgage Pool—The Loan Combinations” in the Preliminary Prospectus. |
| THE INFORMATION IN THIS STRUCTURAL AND COLLATERAL TERM SHEET IS NOT COMPLETE AND MAY BE AMENDED PRIOR TO THE TIME OF SALE. THIS TERM SHEET IS NOT AN OFFER TO SELL THESE SECURITIES AND IT IS NOT A SOLICITATION OF AN OFFER TO BUY THESE SECURITIES IN ANY JURISDICTION WHERE THE OFFER OR SALE IS NOT PERMITTED. | ||
| 26 | ||
| Structural and Collateral Term Sheet | BMO 2022-C1 | |
| Structural Overview | ||
| ■ Risk Retention Consultation Parties: | The “risk retention consultation parties”, with respect to any serviced mortgage loan or, if applicable, serviced loan combination will be: (i) the party selected by Bank of Montreal, and (ii) the party selected by SSOF SCRE AIV, L.P. . Each risk retention consultation party will have certain non-binding consultation rights in certain circumstances, (i) for so long as no Consultation Termination Event is continuing, with respect to any specially serviced loan (other than any outside serviced mortgage loan), and (ii) during the continuance of a Consultation Termination Event, with respect to any mortgage loan (other than any outside serviced mortgage loan), as further described in the Preliminary Prospectus. Notwithstanding the foregoing, none of the risk retention consultation parties will have any consultation rights with respect to any mortgage loan that is an excluded RRCP mortgage loan with respect to such party. Bank of Montreal and SSOF SCRE AIV, L.P. (or an affiliate) are expected to be appointed as the initial risk retention consultation parties.
With respect to any risk retention consultation party, an “excluded RRCP mortgage loan” is a mortgage loan or loan combination with respect to which such risk retention consultation party, or the person(s) entitled to appoint such risk retention consultation party, is a Borrower Party.
| |
| ■ Termination of Special Servicer: | At any time, the special servicer (but not any outside special servicer for any outside serviced loan combination) may be removed and replaced by the applicable Directing Holder, if any, with or without cause upon satisfaction of certain conditions specified in the BMO 2022-C1 pooling and servicing agreement.
After the occurrence and during the continuance of a Control Termination Event, the holders of at least 25% of the pooled voting rights of the Pooled Certificates (other than the Class S certificates) (without regard to the application of any Appraisal Reduction Amounts) may request a vote to replace the special servicer (with respect to all of the serviced loans other than any serviced outside controlled loan combination, the 360 Rosemary loan combination and the 111 River Street loan combination). The subsequent vote may result in the termination and replacement of the special servicer if, within 180 days of the initial request for that vote, the holders of (a) at least 66-2/3% of the pooled voting rights allocable to the Pooled Certificates of those holders that voted on the matter (provided that holders representing the applicable Certificateholder Quorum voted on the matter), or (b) more than 50% of the voting rights of each class of Pooled Certificates that are Non-Reduced Certificates vote affirmatively to so replace.
With respect to each of (i) the 360 Rosemary loan combination after the occurrence and during the continuance of both a 360 Rosemary Control Appraisal Period and an applicable Control Termination Event and (ii) the 111 River Street loan combination after the occurrence and during the continuance of both a 111 River Street Control Appraisal Period and an applicable Control Termination Event, the holders of at least 25% of the voting rights allocable to the Pooled Certificates (other than the Class S certificates) and the related Loan-Specific Certificates (without regard to the application of any Appraisal Reduction Amounts) may request a vote to replace the special servicer (with respect to the related loan combination). The subsequent vote may result in the termination and replacement of the special servicer if, within 180 days of the initial request for that vote, the holders of (a) at least 66-2/3% of the voting rights allocable to the Pooled Certificates and the related Loan-Specific Certificates of those holders that voted on the matter (provided that holders representing the applicable Certificateholder Quorum voted on the matter), or (b) more than 50% of the voting rights of each class of Pooled Certificates and related Loan-Specific Certificates that are Non-Reduced Certificates vote affirmatively to so replace.
“Non-Reduced Certificates” means each class of Principal Balance Certificates that has an outstanding certificate balance as may be notionally reduced by any Appraisal Reduction Amounts allocated to that class, equal to or greater than 25% of an amount equal to the initial certificate balance of that class of certificates minus all principal payments made on such class of certificates.
Notwithstanding the foregoing, but subject to the discussion in the next paragraph, solely with respect to a serviced outside controlled loan combination (including any servicing shift loan combination, for so long as it is serviced pursuant to the BMO 2022-C1 pooling and servicing agreement), only the holder of the related Controlling Note or its representative may terminate the special servicer without cause (solely with respect to the related loan combination) and appoint a replacement special servicer for that loan combination.
After the occurrence and during the continuance of a Consultation Termination Event with respect to the serviced loans (including 360 Rosemary loan combination and the 111 River Street loan combination), if the operating advisor determines, in its sole discretion exercised in good faith, that (1) the special servicer has failed to comply with the servicing standard and (2) a replacement of the special servicer would be in the best interest of the pooled certificateholders (as a collective whole), the operating advisor will have the right to recommend the replacement of the special servicer with respect to the serviced loans (including the 360 Rosemary loan combination and the 111 River Street loan combination), resulting in a solicitation of a pooled certificateholder vote. The subsequent vote may result in the termination and replacement of the special servicer if, within 180 days of the initial request for that vote, the holders of at least a majority of the aggregate outstanding principal balance |
| THE INFORMATION IN THIS STRUCTURAL AND COLLATERAL TERM SHEET IS NOT COMPLETE AND MAY BE AMENDED PRIOR TO THE TIME OF SALE. THIS TERM SHEET IS NOT AN OFFER TO SELL THESE SECURITIES AND IT IS NOT A SOLICITATION OF AN OFFER TO BUY THESE SECURITIES IN ANY JURISDICTION WHERE THE OFFER OR SALE IS NOT PERMITTED. | ||
| 27 | ||
| Structural and Collateral Term Sheet | BMO 2022-C1 | |
| Structural Overview | ||
of the Pooled Certificates of those holders that voted on the matter (provided that holders representing the applicable Certificateholder Quorum vote on the matter) vote affirmatively to so replace.
With respect to each of the 360 Rosemary loan combination and the 111 River Street loan combination (but in the case of the 111 River Street loan combination, only if a consultation termination event has occurred and is continuing), if the operating advisor determines, in its sole discretion exercised in good faith, that (1) the special servicer has failed to comply with the servicing standard and (2) a replacement of the special servicer would be in the best interest of the related loan-specific certificateholders (as a collective whole), the operating advisor will have the right to recommend the replacement of the special servicer with respect to the related loan combination, resulting in a solicitation of a related loan-specific certificateholder vote. The subsequent vote may result in the termination and replacement of the special servicer with respect to the related loan combination if, within 180 days of the initial request for that vote, the holders of at least a majority of the aggregate outstanding principal balance of the Loan-Specific Certificates of those holders that voted on the matter (provided that holders representing the applicable Certificateholder Quorum vote on the matter) vote affirmatively to so replace.
“Certificateholder Quorum” means a quorum that:
(1) with respect to the Pooled Certificates and the related Loan-Specific Certificates, for purposes of a vote to terminate and replace the special servicer for either the 360 Rosemary loan combination or the 111 River Street loan combination at the request of the holders of certificates evidencing not less than 25% of the voting rights allocable to the Pooled Certificates (other than the Class S certificates) and the related Loan-Specific Certificates (without regard to the application of any Appraisal Reduction Amounts), consists of the holders of certificates evidencing at least 50% of the voting rights (taking into account the allocation of any Appraisal Reduction Amounts to notionally reduce the certificate balances of the respective classes of applicable Principal Balance Certificates) of all of the Pooled Certificates (other than the Class S certificates) and the related Loan-Specific Certificates, on an aggregate basis;
(2) with respect to Pooled Certificates, (a) for purposes of a vote to terminate and replace the special servicer (other than with respect to the 360 Rosemary loan combination and the 111 River Street loan combination) or the asset representations reviewer at the request of the holders of Pooled Certificates evidencing not less than 25% of the pooled voting rights (without regard to the application of any Appraisal Reduction Amounts), consists of the holders of Pooled Certificates evidencing at least 50% of the pooled voting rights (taking into account the allocation of any Appraisal Reduction Amounts to notionally reduce the certificate balances of the respective classes of Pooled Principal Balance Certificates) of all of the Pooled Certificates (other than the Class S certificates), on an aggregate basis, and (b) for purposes of each of (i) a vote to terminate and replace the special servicer (other than with respect to the 360 Rosemary loan combination and the 111 River Street loan combination) based on a recommendation of the operating advisor, (ii) a vote to terminate and replace the special servicer with respect to the 360 Rosemary loan combination based on a recommendation of the operating advisor, and (iii) a vote to terminate and replace the special servicer with respect to the 111 River Street loan combination based on a recommendation of the operating advisor, consists of the holders of Pooled Certificates evidencing at least 20% of the aggregate of the outstanding principal balances of all Pooled Certificates;
(3) with respect to the 360 Rosemary Loan-Specific Certificates, for purposes of a vote to terminate and replace the special servicer based on a recommendation of the operating advisor, consists of the holders of 360 Rosemary Loan-Specific Certificates evidencing at least 20% of the aggregate of the outstanding principal balances of all 360 Rosemary Loan-Specific Certificates, with such quorum including at least three (3) holders of 360 Rosemary Loan-Specific Certificates that are not risk retention affiliated with each other; and
(4) with respect to the 111 River Street Loan-Specific Certificates, for purposes of a vote to terminate and replace the special servicer based on a recommendation of the operating advisor, consists of the holders of the 111 River Street Loan-Specific Certificates evidencing at least 20% of the aggregate of the outstanding principal balances of all the 111 River Street Loan-Specific Certificates.
The related outside special servicer under each outside servicing agreement generally may be (or, if the applicable outside servicing agreement has not yet been executed, it is anticipated that such outside special servicer may be) replaced by the related outside controlling class representative (or an equivalent party), or the vote of the requisite holders of certificates issued, under the applicable outside servicing agreement (depending on whether or not the equivalent of a control termination event or a consultation termination event exists under that outside servicing agreement) or by any applicable other controlling noteholder under the related co-lender agreement in a manner generally similar to the manner in which the special servicer may be replaced under the BMO 2022-C1 pooling and servicing agreement as described above in this “Termination of Special Servicer” section (although there will be differences, in particular as regards certificateholder votes and the timing of |
| THE INFORMATION IN THIS STRUCTURAL AND COLLATERAL TERM SHEET IS NOT COMPLETE AND MAY BE AMENDED PRIOR TO THE TIME OF SALE. THIS TERM SHEET IS NOT AN OFFER TO SELL THESE SECURITIES AND IT IS NOT A SOLICITATION OF AN OFFER TO BUY THESE SECURITIES IN ANY JURISDICTION WHERE THE OFFER OR SALE IS NOT PERMITTED. | ||
| 28 | ||
| Structural and Collateral Term Sheet | BMO 2022-C1 | |
| Structural Overview | ||
when an outside special servicer may be terminated based on the recommendation of an operating advisor).
If the special servicer, to its knowledge, becomes a Borrower Party with respect to a mortgage loan, the special servicer will not be permitted to act as special servicer with respect to that mortgage loan. Subject to certain limitations described in the Preliminary Prospectus, any applicable Directing Holder will be entitled to appoint a replacement special servicer for that mortgage loan. If there is no applicable Directing Holder or if the applicable Directing Holder does not take action to appoint a replacement special servicer within the requisite time period, a replacement special servicer will be appointed in the manner specified in the BMO 2022-C1 pooling and servicing agreement. |
| ■ Voting Rights: | At all times during the term of the BMO 2022-C1 pooling and servicing agreement, the voting rights for the Pooled Certificates (the “pooled voting rights”) will be allocated among the respective classes of pooled certificateholders in the following percentages:
(1) 1% in the aggregate in the case of the respective classes of the Pooled Class X Certificates, allocated pro rata based upon their respective notional amounts as of the date of determination (for so long as the notional amount of at least one class of the Pooled Class X Certificates is greater than zero), and
(2) in the case of any class of Pooled Principal Balance Certificates, a percentage equal to the product of 99% (or, if the notional amounts of all classes of the Pooled Class X Certificates have been reduced to zero, 100%) and a fraction, the numerator of which is equal to the certificate balance of such class of Pooled Principal Balance Certificates as of the date of determination, and the denominator of which is equal to the aggregate of the certificate balances of all classes of the Pooled Principal Balance Certificates, in each case, as of the date of determination,
provided, that in certain circumstances described under “The Pooling and Servicing Agreement” in the Preliminary Prospectus, pooled voting rights will only be exercisable by holders of Pooled Certificates that are Non-Reduced Certificates and/or may otherwise be exercisable or allocated in a manner that takes into account the allocation of Appraisal Reduction Amounts.
The voting rights of any class of certificates are required to be allocated among certificateholders of such class in proportion to their respective percentage interests.
The Class S certificates, the Class R certificates and the Uncertificated VRR will not be entitled to any voting rights.
| |
| ■ Servicing Compensation: | Modification Fees: Certain fees resulting from modifications, amendments, waivers or other changes to the terms of the loan documents, as more fully described in the Preliminary Prospectus, will be used to offset expenses on the related serviced mortgage loan (i.e. reimburse the trust for certain expenses, including unreimbursed advances and interest on unreimbursed advances previously incurred (other than special servicing fees, workout fees and liquidation fees) on the related serviced mortgage loan but not yet reimbursed to the trust or servicers or to pay expenses (other than special servicing fees, workout fees and liquidation fees) that are still outstanding in each case unless as part of the written modification the related borrower is required to pay these amounts on a going forward basis or in the future). Any excess modification fees not so applied to offset expenses will be available as compensation to the master servicer and/or special servicer. Within any prior 12-month period, all such excess modification fees earned by the master servicer or by the special servicer (after taking into account the offset described below applied during such 12-month period) with respect to any serviced mortgage loan will be subject to a cap equal to the greater of (i) 1% of the outstanding principal balance of such mortgage loan after giving effect to such transaction and (ii) $25,000.
All excess modification fees earned by the special servicer will be required to offset any future workout fees or liquidation fees payable with respect to the related serviced mortgage loan or related REO property; provided, that if the serviced mortgage loan ceases being a corrected loan, and is subject to a subsequent modification, any excess modification fees earned by the special servicer prior to such serviced mortgage loan ceasing to be a corrected loan will no longer be offset against future liquidation fees and workout fees unless such serviced mortgage loan ceased to be a corrected loan within 18 months of it becoming a modified mortgage loan.
Penalty Fees: All late fees and default interest will first be used to reimburse certain expenses previously incurred with respect to the related mortgage loan (including special servicing fees, workout fees and liquidation fees) but not yet reimbursed to the trust, the master servicer or the special servicer or to pay certain expenses (including special servicing fees, workout fees and liquidation fees) that are still outstanding on the related mortgage loan, and any excess received with respect to a serviced loan will be paid to the master servicer (for penalty fees accrued while a non-specially serviced loan) and the special servicer (for penalty fees accrued while a specially serviced loan). To |
| THE INFORMATION IN THIS STRUCTURAL AND COLLATERAL TERM SHEET IS NOT COMPLETE AND MAY BE AMENDED PRIOR TO THE TIME OF SALE. THIS TERM SHEET IS NOT AN OFFER TO SELL THESE SECURITIES AND IT IS NOT A SOLICITATION OF AN OFFER TO BUY THESE SECURITIES IN ANY JURISDICTION WHERE THE OFFER OR SALE IS NOT PERMITTED. | ||
| 29 | ||
| Structural and Collateral Term Sheet | BMO 2022-C1 | |
| Structural Overview | ||
the extent any amounts reimbursed out of penalty charges are subsequently recovered on a related serviced loan, they will be paid to the master servicer or special servicer who would have been entitled to the related penalty charges that were previously used to reimburse such expense.
Liquidation / Workout Fees: Liquidation fees will be calculated at the lesser of (a) 1.0% or (b) with respect to any serviced mortgage loan (or related serviced loan combination, if applicable) or related REO Property, such lesser rate as would result in a liquidation fee of $1,000,000, for each serviced loan that is a specially serviced loan and any REO property, subject in any case to a minimum liquidation fee of $25,000. For any serviced loan that is a corrected loan, workout fees will be calculated at the lesser of (a) 1.0% and (b) such lower rate as would result in a workout fee of $1,000,000 when applied to each expected payment of principal and interest (other than (i) default interest and (ii) any “excess interest” accrued after the related anticipated repayment date on any mortgage loan with an anticipated repayment date) on the related serviced loan (or related serviced loan combination, if applicable) from the date such serviced loan becomes a corrected loan through and including the then related maturity date, subject in any case to a minimum workout fee of $25,000.
Notwithstanding the foregoing, in connection with a maturity default, no liquidation or workout fee will be payable in connection with a payoff or refinancing of the related serviced loan within 90 days of the maturity default, but the special servicer may collect and retain appropriate fees from the related borrower in connection with the subject liquidation or workout.
In the case of an outside serviced loan combination, calculation of the foregoing amounts payable to the related outside servicer or outside special servicer may be different than as described above. For example, the extent to which modification fees and penalty fees are applied to offset expenses may be different and liquidation fees and workout fees may be subject to different caps or no caps. |
| ■ Operating Advisor: | The operating advisor will, in general and under certain circumstances described in the Preliminary Prospectus, have the following rights and responsibilities with respect to the serviced mortgage loans:
● after the occurrence and during the continuance of a Control Termination Event (or, in the case of the 360 Rosemary loan combination, at any time), reviewing the actions of the special servicer with respect to specially serviced loans and with respect to certain major decisions regarding non-specially serviced loans as to which the operating advisor has consultation rights;
● reviewing reports provided by the special servicer to the extent set forth in the BMO 2022-C1 pooling and servicing agreement;
● reviewing for accuracy certain calculations made by the special servicer;
● after the occurrence and during the continuance of a Control Termination Event (or, in the case of the 360 Rosemary loan combination, under certain conditions described in the BMO 2022-C1 pooling and servicing agreement), issuing an annual report generally setting forth, among other things, its assessment of whether the special servicer is performing its duties in compliance with the servicing standard and the BMO 2022-C1 pooling and servicing agreement and identifying any material deviations therefrom;
● after the occurrence and during the continuance of a Consultation Termination Event (or, in the case of the 360 Rosemary loan combination, anytime), recommending the replacement of the special servicer if the operating advisor determines, in its sole discretion exercised in good faith, that (1) the special servicer has failed to comply with the servicing standard and (2) a replacement of the special servicer would be in the best interest of the certificateholders and the owners of the Uncertificated VRR (as a collective whole); and
● after the occurrence and during the continuance of a Control Termination Event (or, in the case of the 360 Rosemary loan combination, a 360 Rosemary operating advisor consultation trigger event), consulting on a non-binding basis with the special servicer with respect to certain major decisions (and such other matters as are set forth in the BMO 2022-C1 pooling and servicing agreement) in respect of the applicable serviced mortgage loan(s) and/or related companion loan(s).
A “360 Rosemary Operating Advisor Consultation Trigger Event” will occur with respect to the 360 Rosemary loan combination, when the aggregate outstanding certificate balance of the Class 360RR certificates (as notionally reduced by any portion of the Cumulative Appraisal Reduction Amount then allocable to the Class 360RR certificates) is 25% or less of the initial aggregate certificate balance of the Class 360RR certificates. If the 360 Rosemary mortgage loan is an excluded mortgage loan, a 360 Rosemary operating advisor consultation trigger event will be deemed to exist. |
| THE INFORMATION IN THIS STRUCTURAL AND COLLATERAL TERM SHEET IS NOT COMPLETE AND MAY BE AMENDED PRIOR TO THE TIME OF SALE. THIS TERM SHEET IS NOT AN OFFER TO SELL THESE SECURITIES AND IT IS NOT A SOLICITATION OF AN OFFER TO BUY THESE SECURITIES IN ANY JURISDICTION WHERE THE OFFER OR SALE IS NOT PERMITTED. | ||
| 30 | ||
| Structural and Collateral Term Sheet | BMO 2022-C1 | |
| Structural Overview | ||
Notwithstanding the foregoing, the operating advisor will generally have no obligations or consultation rights as operating advisor under the BMO 2022-C1 pooling and servicing agreement with respect to any outside serviced mortgage loan or any related REO property.
The operating advisor will be subject to termination and replacement if the holders of at least 15% of the voting rights of Non-Reduced Certificates vote to terminate and replace the operating advisor and such termination and replacement is affirmatively voted for by the holders of more than 50% of the voting rights allocable to the Non-Reduced Certificates of those holders that exercise their right to vote (provided that holders entitled to exercise at least 50% of the voting rights allocable to the Non-Reduced Certificates exercise their right to vote within 180 days of the initial request for a vote). The holders initiating such vote will be responsible for the fees and expenses in connection with the vote and replacement. See “The Pooling and Servicing Agreement—Operating Advisor” in the Preliminary Prospectus. |
| ■ Asset Representations Reviewer: | The asset representations reviewer will be required to review certain delinquent mortgage loans after a specified delinquency threshold has been exceeded and the required percentage of pooled certificateholders vote to direct a review of such delinquent mortgage loans. An asset review will occur when either (1) mortgage loans with an aggregate outstanding principal balance of 25% or more of the aggregate outstanding principal balance of all of the mortgage loans (including any REO mortgage loans) held by the issuing entity as of the end of the applicable collection period are at least 60 days delinquent in respect of their related monthly payments or balloon payment, if any (for purposes of this paragraph, “delinquent loans”) or (2) at least 15 mortgage loans are delinquent loans as of the end of the applicable collection period and the aggregate outstanding principal balance of such delinquent loans constitutes at least 20% of the aggregate outstanding principal balance of all of the mortgage loans (including any REO mortgage loans) held by the issuing entity as of the end of the applicable collection period.
The asset representations reviewer may be terminated and replaced without cause. Upon (i) the written direction of pooled certificateholders evidencing not less than 25% of the pooled voting rights requesting a vote to terminate and replace the asset representations reviewer with a proposed successor asset representations reviewer that is an eligible asset representations reviewer, and (ii) payment by such holders to the certificate administrator of the reasonable fees and expenses to be incurred by the certificate administrator in connection with administering such vote, the certificate administrator will promptly provide notice of such request to all pooled certificateholders and the asset representations reviewer by posting such notice on its internet website, and by mailing such notice to all pooled certificateholders and the asset representations reviewer. Upon the affirmative vote of pooled certificateholders evidencing at least 75% of the pooled voting rights allocable to those holders that exercise their right to vote (provided that holders representing the applicable Certificateholder Quorum exercise their right to vote within 180 days of the initial request for a vote), the trustee will be required to terminate all of the rights and obligations of the asset representations reviewer under the BMO 2022-C1 pooling and servicing agreement by written notice to the asset representations reviewer, and the proposed successor asset representations reviewer will be appointed. See “The Pooling and Servicing Agreement—The Asset Representations Reviewer” in the Preliminary Prospectus.
| |
■ Dispute Resolution Provisions:
| The Operating Advisor may be terminated or removed under certain circumstances and a replacement operating advisor appointed as described in the Preliminary Prospectus.
Any replacement operating advisor (or the personnel responsible for supervising the obligations of the replacement operating advisor) must be an entity (A) that is a special servicer or operating advisor on a commercial mortgage-backed securities transaction rated by S&P, Fitch and KBRA (including, in the case of the Operating Advisor, this transaction) but has not been special servicer or operating advisor on a transaction for which any of S&P, Fitch and KBRA has qualified, downgraded or withdrawn its rating or ratings of, one or more classes of certificates for such transaction publicly citing servicing concerns with the operating advisor in its capacity as special servicer or operating advisor on such commercial mortgage-backed securities transaction as the sole or a material factor in such rating action; (B) that can and will make the representations and warranties of the operating advisor set forth in the Pooling and Servicing Agreement; (C) that is not (and is not affiliated with) the Depositor, the Trustee, the Certificate Administrator, the Master Servicer, the Special Servicer, a Mortgage Loan Seller, the Third-Party Purchaser, the Directing Certificateholder, a depositor, a trustee, a certificate administrator, a master servicer or special servicer with respect to the securitization of a Companion Loan, or any of their respective affiliates; (D) that has not been paid by any Special Servicer or successor special servicer any fees, compensation or other remuneration (x) in respect of its obligations under the Pooling and Servicing Agreement or (y) for the appointment or recommendation for replacement of a successor special servicer to become the Special Servicer; (E) that (x) has been regularly engaged in the business of analyzing and advising clients in commercial mortgage-backed securities matters and that has at least five years of experience in collateral analysis and loss projections and (y) has at least five years of |
| THE INFORMATION IN THIS STRUCTURAL AND COLLATERAL TERM SHEET IS NOT COMPLETE AND MAY BE AMENDED PRIOR TO THE TIME OF SALE. THIS TERM SHEET IS NOT AN OFFER TO SELL THESE SECURITIES AND IT IS NOT A SOLICITATION OF AN OFFER TO BUY THESE SECURITIES IN ANY JURISDICTION WHERE THE OFFER OR SALE IS NOT PERMITTED. | ||
| 31 | ||
| Structural and Collateral Term Sheet | BMO 2022-C1 | |
| Structural Overview | ||
| experience in commercial real estate asset management and experience in the workout and management of distressed commercial real estate assets, and (F) that does not directly or indirectly, through one or more affiliates or otherwise, own or have derivative exposure in any interest in any certificates, any mortgage loan, any companion loan or securities backed by a companion loan or otherwise have any financial interest in the securitization transaction to which the Pooling and Servicing Agreement relates, other than in fees from its role as operating advisor and asset representations reviewer (to the extent it also acts as the asset representations reviewer). Any Operating Advisor is prohibited from making an investment in any Class of Certificates in the Trust as described in the Preliminary Prospectus. | ||
| ■ Asset Representations Reviewer: | The mortgage loan sellers will be subject to the dispute resolution provisions set forth in the BMO 2022-C1 pooling and servicing agreement to the extent those provisions are triggered with respect to any mortgage loan sold to the depositor by a mortgage loan seller and such mortgage loan seller will be obligated under the related mortgage loan purchase agreement to comply with all applicable provisions and to take part in any mediation or arbitration proceedings that may result.
Generally, in the event that a Repurchase Request (as defined in the Preliminary Prospectus) with respect to a mortgage loan (but not a Trust Subordinate Companion) is not “Resolved” (as defined below) within 180 days after the related mortgage loan seller receives such Repurchase Request, then the enforcing servicer will be required to send a notice to the “Initial Requesting Certificateholder” (if any) indicating the enforcing servicer’s intended course of action with respect to the Repurchase Request. If (a) the enforcing servicer’s intended course of action with respect to the Repurchase Request does not involve pursuing further action to exercise rights against the applicable mortgage loan seller with respect to the Repurchase Request and the Initial Requesting Certificateholder, if any, or any other certificateholder or certificate owner of Pooled Certificates wishes to exercise its right to refer the matter to mediation (including nonbinding arbitration) or arbitration, or (b) the enforcing servicer’s intended course of action is to pursue further action to exercise rights against the related mortgage loan seller with respect to the Repurchase Request but the Initial Requesting Certificateholder, if any, or any other certificateholder or certificate owner of Pooled Certificates does not agree with the dispute resolution method selected by the enforcing servicer, then the Initial Requesting Certificateholder, if any, or such other certificateholder or certificate owner may deliver a written notice to the enforcing servicer indicating its intent to exercise its right to refer the matter to either mediation or arbitration. In addition, any other certificateholder or certificate owner of Pooled Certificates may deliver, within the time frame provided in the BMO 2022-C1 pooling and servicing agreement, a written notice requesting the right to participate in any dispute resolution consultation that is conducted by the enforcing servicer following the enforcing servicer’s receipt of the notice described in the preceding sentence.
“Resolved” means, with respect to a Repurchase Request, (i) that any material breach of representations and warranties or a material document defect has been cured, (ii) the related mortgage loan or Trust Subordinate Companion Loan has been repurchased in accordance with the related mortgage loan purchase agreement, (iii) a mortgage loan has been substituted for the related mortgage loan in accordance with the related mortgage loan purchase agreement, (iv) the applicable mortgage loan seller has made a “loss of value payment”, (v) a contractually binding agreement has been entered into between the enforcing servicer, on behalf of the issuing entity, and the related mortgage loan seller that settles the related mortgage loan seller’s obligations under the related mortgage loan purchase agreement, or (vi) the related mortgage loan or Trust Subordinate Companion Loan is no longer property of the issuing entity as a result of a sale or other disposition in accordance with the BMO 2022-C1 pooling and servicing agreement. See “The Pooling and Servicing Agreement—Dispute Resolution Provisions” in the Preliminary Prospectus.
| |
| ■ Liquidated Loan Waterfall: | Upon liquidation of any mortgage loan, all net liquidation proceeds related to the mortgage loan (but not any related companion loan) will be applied (after allocation to offset certain advances and expenses) so that amounts allocated as a recovery of accrued and unpaid interest will not, in the first instance, include any delinquent interest that was not advanced as a result of Appraisal Reduction Amounts or interest that accrued on any junior note(s) if such mortgage loan is an AB Modified Loan. After the adjusted interest amount is so allocated, any remaining liquidation proceeds will be allocated to pay principal on the mortgage loan until the unpaid principal amount of the mortgage loan has been reduced to zero. Any remaining liquidation proceeds will then be allocated to pay delinquent interest that was not advanced as a result of Appraisal Reduction Amounts and any interest that accrued on any junior note(s) if such mortgage loan is an AB Modified Loan. | |
| ■ Credit Risk Retention: | This securitization transaction will be subject to the credit risk retention rules of Section 15G of the Securities Exchange Act of 1934, as amended. An economic interest in the credit risk of the mortgage loans in this transaction is expected to be retained pursuant to risk retention regulations (as codified at 12 CFR Part 43) promulgated under Section 15G (“Regulation RR”), as an “eligible vertical interest” in the form of (i) certificates representing a percentage of the initial certificate balance, notional amount or percentage interest, as applicable, of each class of certificates and (ii) the Combined Uncertificated VRR Interest. SSOF SCRE AIV, L.P. will act as retaining sponsor under |
| THE INFORMATION IN THIS STRUCTURAL AND COLLATERAL TERM SHEET IS NOT COMPLETE AND MAY BE AMENDED PRIOR TO THE TIME OF SALE. THIS TERM SHEET IS NOT AN OFFER TO SELL THESE SECURITIES AND IT IS NOT A SOLICITATION OF AN OFFER TO BUY THESE SECURITIES IN ANY JURISDICTION WHERE THE OFFER OR SALE IS NOT PERMITTED. | ||
| 32 | ||
| Structural and Collateral Term Sheet | BMO 2022-C1 | |
| Structural Overview | ||
| Regulation RR for this securitization transaction and is expected, on the Closing Date, to partially satisfy its risk retention obligation through the acquisition by Bank of Montreal of the Combined Uncertificated VRR Interest. For a further discussion of the manner in which the credit risk retention requirements are expected to be satisfied by SSOF SCRE AIV. L.P., as retaining sponsor for this securitization transaction, see “Credit Risk Retention” in the Preliminary Prospectus. | ||
| ■ The Combined Uncertificated VRR Interest Prepayment Premiums and Yield Maintenance Charges: | On each Distribution Date, the Uncertificated VRR Retained Percentage of each yield maintenance charge and prepayment premium collected on the mortgage loans during the related collection period (or, in the case of an outside serviced mortgage loan, that accompanied a principal prepayment included in the aggregate pooled available funds for such Distribution Date) will be required to be distributed to the holders of the Combined Uncertificated VRR Interest. | |
| ■ Appraisal Reduction Amounts: | On each Distribution Date, the Uncertificated VRR Retained Percentage of any Appraisal Reduction Amounts will be allocated to the Combined Uncertificated VRR Interest to notionally reduce (to not less than zero) the principal balance thereof.
| |
| ■ Investor Communications: | The certificate administrator is required to include on any Form 10–D any request received from a certificateholder to communicate with other certificateholders related to certificateholders exercising their rights under the terms of the BMO 2022-C1 pooling and servicing agreement. Any certificateholder wishing to communicate with other certificateholders regarding the exercise of its rights under the terms of the BMO 2022-C1 pooling and servicing agreement will be able to deliver a written request signed by an authorized representative of the requesting investor to the certificate administrator. | |
| ■ Deal Website: | The certificate administrator will maintain a deal website including, but not limited to:
● all special notices delivered.
● summaries of final asset status reports.
● all appraisals in connection with an appraisal reduction plus any subsequent appraisal updates.
● an “Investor Q&A Forum” and a voluntary investor registry.
| |
| ■ Cleanup Call: | On any Distribution Date on which the aggregate unpaid principal balance of the mortgage loans and the Trust Subordinate Companion Loans (including mortgage loans as to which the related mortgaged properties have become REO properties) remaining in the issuing entity is less than 1% of the aggregate principal balance of the pool of mortgage loans and Trust Subordinate Companion Loans as of the Cut-off Date (excluding for the purposes of this calculation, the aggregate unpaid principal balance of the Coleman Highline Phase IV Mortgage Loan, but only if the option described above is exercised after the Distribution Date in February 2032), certain specified persons will have the option to purchase all of the remaining mortgage loans and Trust Subordinate Companion Loans (and all property acquired through exercise of remedies in respect of any mortgage loan or Trust Subordinate Companion Loan) at the price specified in the Preliminary Prospectus. Exercise of the option will terminate the issuing entity and retire the then outstanding certificates.
If the aggregate certificate balances of the Class A-1, Class A-2, Class A-3, Class A-4, Class A-5, Class A-AB, Class A-S, Class B, Class C, Class D and Class E certificates and the notional amounts of the Class X-A, Class X-B and Class X-D certificates have been reduced to zero and if the master servicer has received from the remaining certificateholders the payment specified in the BMO 2022-C1 pooling and servicing agreement, the issuing entity could also be terminated in connection with an exchange of all the then-outstanding certificates (excluding the Class S and Class R certificates) and the Uncertificated VRR for the mortgage loans remaining in the issuing entity, as further described under “The Pooling and Servicing Agreement—Optional Termination; Optional Mortgage Loan Purchase” in the Preliminary Prospectus.
|
The Offered Certificates involve certain risks and may not be suitable for all investors. For information regarding certain risks associated with an investment in the Offered Certificates, see “Summary of Risk Factors” and “Risk Factors” in the Preliminary Prospectus. Capitalized terms used but not otherwise defined in this Term Sheet have the respective meanings assigned to those terms in the Preliminary Prospectus.
| THE INFORMATION IN THIS STRUCTURAL AND COLLATERAL TERM SHEET IS NOT COMPLETE AND MAY BE AMENDED PRIOR TO THE TIME OF SALE. THIS TERM SHEET IS NOT AN OFFER TO SELL THESE SECURITIES AND IT IS NOT A SOLICITATION OF AN OFFER TO BUY THESE SECURITIES IN ANY JURISDICTION WHERE THE OFFER OR SALE IS NOT PERMITTED. | ||
| 33 | ||
| Structural and Collateral Term Sheet | BMO 2022-C1 | |
| No. 1 – IPCC National Storage Portfolio XVI | ||
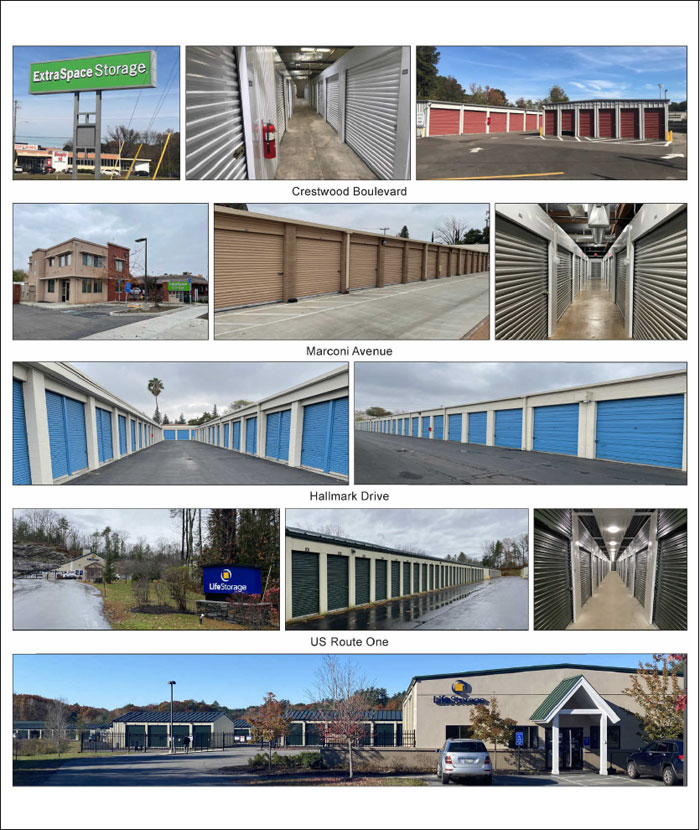
| THE INFORMATION IN THIS STRUCTURAL AND COLLATERAL TERM SHEET IS NOT COMPLETE AND MAY BE AMENDED PRIOR TO THE TIME OF SALE. THIS TERM SHEET IS NOT AN OFFER TO SELL THESE SECURITIES AND IT IS NOT A SOLICITATION OF AN OFFER TO BUY THESE SECURITIES IN ANY JURISDICTION WHERE THE OFFER OR SALE IS NOT PERMITTED. | ||
| 34 | ||
| Structural and Collateral Term Sheet | BMO 2022-C1 | |
| No. 1 – IPCC National Storage Portfolio XVI | ||
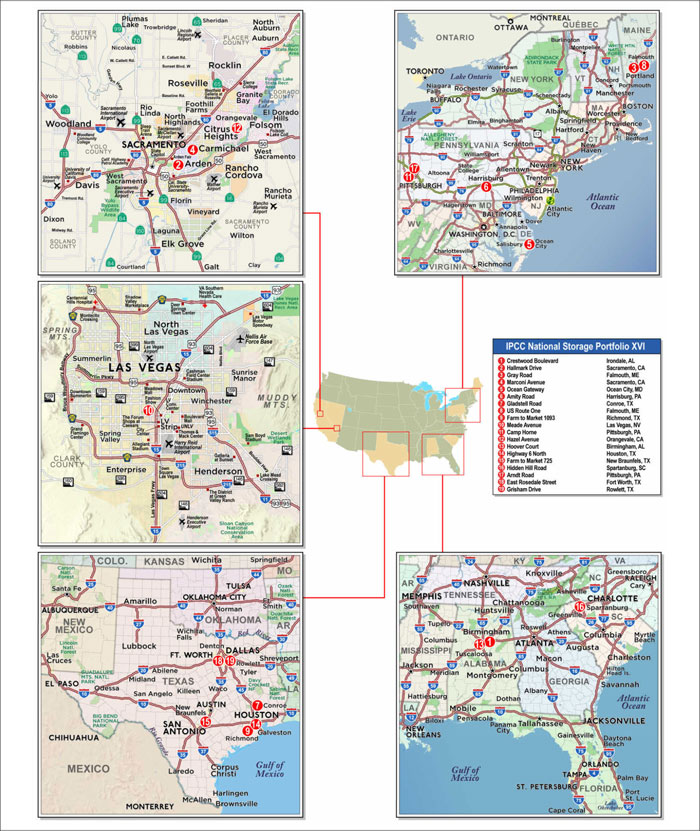
| THE INFORMATION IN THIS STRUCTURAL AND COLLATERAL TERM SHEET IS NOT COMPLETE AND MAY BE AMENDED PRIOR TO THE TIME OF SALE. THIS TERM SHEET IS NOT AN OFFER TO SELL THESE SECURITIES AND IT IS NOT A SOLICITATION OF AN OFFER TO BUY THESE SECURITIES IN ANY JURISDICTION WHERE THE OFFER OR SALE IS NOT PERMITTED. | ||
| 35 | ||
| Structural and Collateral Term Sheet | BMO 2022-C1 | |
| No. 1 – IPCC National Storage Portfolio XVI | ||
| Mortgage Loan Information | Property Information | |||
| Mortgage Loan Seller: | KeyBank | Single Asset / Portfolio: | Portfolio | |
| Original Principal Balance(1): | $60,000,000 | Title: | Fee | |
| Cut-off Date Principal Balance(1): | $60,000,000 | Property Type – Subtype: | Self-Storage – Self-Storage | |
| % of IPB: | 5.3% | Net Rentable Area (SF): | 1,133,018 | |
| Loan Purpose: | Acquisition | Location: | Various | |
| Borrower: | Self-Storage Portfolio XVI DST | Year Built / Renovated: | Various / Various | |
| Borrower Sponsor: | Inland Private Capital Corporation | Occupancy: | 93.1% | |
| Interest Rate: | 3.62800% | Occupancy Date: | 11/17/2021 | |
| Note Date: | 12/16/2021 | 4th Most Recent NOI (As of): | NAV | |
| Maturity Date: | 1/1/2032 | 3rd Most Recent NOI (As of): | NAV | |
| Interest-only Period: | 120 months | 2nd Most Recent NOI (As of)(3): | $7,887,456 (12/31/2020) | |
| Original Term: | 120 months | Most Recent NOI (As of)(3): | $9,583,737 (TTM 10/31/2021) | |
| Original Amortization Term: | None | UW Economic Occupancy: | 86.4% | |
| Amortization Type: | Interest Only | UW Revenues: | $16,218,302 | |
| Call Protection: | L(25),YM1(92),O(3) | UW Expenses: | $6,202,684 | |
| Lockbox / Cash Management: | None / Springing | UW NOI: | $10,015,618 | |
| Additional Debt(1): | Yes | UW NCF: | $9,834,867 | |
| Additional Debt Balance(1): | $57,000,000 | Appraised Value / Per SF(4): | $244,900,000 / $216 | |
| Additional Debt Type(1): | Pari Passu | Appraisal Date(4): | 11/4/2021-11/24/2021 | |
| Escrows and Reserves(2) | Financial Information(1) | |||||||
| Initial | Monthly | Initial Cap | Cut-off Date Loan / SF: | $103 | ||||
| Taxes: | $0 | Springing | N/A | Maturity Date Loan / SF: | $103 | |||
| Insurance: | $0 | Springing | N/A | Cut-off Date LTV(4): | 47.8% | |||
| Replacement Reserves: | $246,500 | Springing | $246,500 | Maturity Date LTV(4): | 47.8% | |||
| Flood Insurance Reserve: | $486,615 | $0 | N/A | UW NCF DSCR: | 2.29x | |||
| UW NOI Debt Yield: | 8.6% | |||||||
| Sources and Uses | ||||||||
| Sources | Proceeds | % of Total | Uses | Proceeds | % of Total | |||
| Loan Combination(1) | $117,000,000 | 46.4% | Purchase Price | $243,118,000 | 96.4% | |||
| Borrower Sponsor Equity | 135,299,554 | 53.6 | Trust Reserve(2) | 5,974,400 | 2.4 | |||
| Closing Costs | 2,474,039 | 1.0 | ||||||
| Upfront Reserves | 733,115 | 0.3 | ||||||
| Total Sources | $252,299,554 | 100.0% | Total Uses | $252,299,554 | 100.0% | |||
| (1) | The IPCC National Storage Portfolio XVI Mortgage Loan (as defined below) is part of a loan combination evidenced by five pari passu notes with an aggregate original principal balance of $117,000,000. The financial information presented in the charts above is based on the $117,000,000 IPCC National Storage Portfolio XVI Loan Combination (as defined below). |
| (2) | For a full description of Escrows and Reserves, please refer to “Escrows and Reserves” below. Additionally, under the terms of the master lease, described under “The Borrower” below, the IPCC National Storage Portfolio XVI Borrower (as defined below) funded $5,974,400 at loan origination into a trust reserve account for the benefit of the IPCC National Storage Portfolio XVI Borrower, which is collateral for the IPCC National Storage Portfolio XVI Loan Combination but is not held with the lender and is separate from the $246,500 initial replacement reserve. Collectively, the initial replacement reserve and the trust reserve account will be used to pay for (i) repairs and replacements of the structure, foundation, roof, exterior walls, and parking lot improvements at the IPCC National Storage Portfolio XVI Properties (as defined below), (ii) leasing commissions, (iii) any environmental costs, (iv) any repairs identified in the property condition reports, (v) insurance deductibles and (vi) any other necessary property improvements. |
| (3) | The increase from 2nd Most Recent NOI to Most Recent NOI is primarily due to a mixture of either increased occupancy or aggressive rental rate increases at certain IPCC National Storage Portfolio XVI Properties. |
| (4) | The Appraised Value reflects a portfolio premium of approximately 15.3% over the aggregate “as-is” value of the individual IPCC National Storage Portfolio XVI Properties. The sum of the values on an individual basis is $212,410,000, which represents a Cut-off Date LTV and Maturity Date LTV of 55.1%. |
The Loan. The largest mortgage loan is part of a loan combination evidenced by five pari passu promissory notes in the aggregate original principal amount of $117,000,000 (the “IPCC National Storage Portfolio XVI Loan Combination”), which is secured by a first priority fee mortgage encumbering 19 self-storage properties located in eight states (the “IPCC National Storage Portfolio XVI Properties”). The controlling Note A-1 and non-controlling Note A-4 (collectively, the “IPCC National Storage Portfolio XVI Mortgage Loan”), with an aggregate original principal amount of $60,000,000, will be included in the BMO 2022-C1 securitization trust. The non-controlling Note A-2, Note A-3, and Note A-5, with an aggregate original principal amount of $57,000,000, are currently held by KeyBank
| THE INFORMATION IN THIS STRUCTURAL AND COLLATERAL TERM SHEET IS NOT COMPLETE AND MAY BE AMENDED PRIOR TO THE TIME OF SALE. THIS TERM SHEET IS NOT AN OFFER TO SELL THESE SECURITIES AND IT IS NOT A SOLICITATION OF AN OFFER TO BUY THESE SECURITIES IN ANY JURISDICTION WHERE THE OFFER OR SALE IS NOT PERMITTED. | ||
| 36 | ||
| Structural and Collateral Term Sheet | BMO 2022-C1 | |
| No. 1 – IPCC National Storage Portfolio XVI | ||
and are expected to be contributed to one or more future securitization trusts. The IPCC National Storage Portfolio XVI Loan Combination will be serviced pursuant to the pooling and servicing agreement for the BMO 2022-C1 securitization trust. Proceeds of the IPCC National Storage Portfolio XVI Loan Combination, along with approximately $135.3 million of borrower sponsor equity, were used to acquire the IPCC National Storage Portfolio XVI Properties, fund reserves and pay closing costs. See “Description of the Mortgage Pool—The Loan Combinations—The Serviced Pari Passu Loan Combinations” in the Preliminary Prospectus. The IPCC National Storage Portfolio XVI Mortgage Loan has a 10-year term and is interest only for the entire term.
| Loan Combination Summary | |||
| Note | Original Balance | Note Holder | Controlling Piece |
| A-1 | $50,000,000 | BMO 2022-C1 | Yes |
| A-2 | $30,000,000 | KeyBank | No |
| A-3 | $20,000,000 | KeyBank | No |
| A-4 | $10,000,000 | BMO 2022-C1 | No |
| A-5 | $7,000,000 | KeyBank | No |
| Total | $117,000,000 | ||
The Properties. The IPCC National Storage Portfolio XVI Properties are comprised of 19 self-storage properties totaling 1,133,018 square feet within 9,046 storage units located in eight states. The top three states by allocated loan amount are Texas (six properties, 24.6% of allocated loan amount, 24.8% of UW NOI), California (three properties, 20.1% of allocated loan amount, 19.9% of UW NOI), and Alabama (two properties, 15.8% of allocated loan amount, 15.7% of UW NOI). The remaining five states are Pennsylvania, Maine, Maryland, Nevada, and South Carolina, none of which represent more than 13.7% of the allocated loan amount or more than 13.7% of the UW NOI. The IPCC National Storage Portfolio XVI Properties were built between 1954 and 2018. The IPCC National Storage Portfolio XVI Properties range in size from 30,350 to 128,046 SF and contain 251 to 1,055 units, with no individual property comprising more than 11.3% of the total net rentable area based on square footage or more than 11.7% of the total storage units.
The IPCC National Storage Portfolio XVI Properties contain a total of 9,046 self-storage units, of which 3,647 are climate-controlled. The IPCC National Storage Portfolio XVI Properties also include 504 leasable parking spaces that are 83.5% leased as of November 17, 2021, as well as 38 commercial units totaling 29,629 square feet that are 92.1% occupied. Based on self-storage net rentable area, the IPCC National Storage Portfolio XVI Properties were 93.1% occupied as of November 17, 2021, with individual property occupancies ranging from 82.7% to 98.6%.
| THE INFORMATION IN THIS STRUCTURAL AND COLLATERAL TERM SHEET IS NOT COMPLETE AND MAY BE AMENDED PRIOR TO THE TIME OF SALE. THIS TERM SHEET IS NOT AN OFFER TO SELL THESE SECURITIES AND IT IS NOT A SOLICITATION OF AN OFFER TO BUY THESE SECURITIES IN ANY JURISDICTION WHERE THE OFFER OR SALE IS NOT PERMITTED. | ||
| 37 | ||
| Structural and Collateral Term Sheet | BMO 2022-C1 | |
| No. 1 – IPCC National Storage Portfolio XVI | ||
The following table presents certain information relating to the IPCC National Storage Portfolio XVI Properties:
| Portfolio Summary | |||||||||
| Property Name | Location | Allocated Loan Combination Amount (“ALA”) | % of ALA | Occupancy(1) | Year Built/ Renovated | Net Rentable Area (SF)(1) | Storage Units | Appraised Value(2) | % of UW NOI |
| Crestwood Boulevard | Irondale, AL | $13,162,213 | 11.2% | 82.7% | 1954/2021 | 128,046 | 1,055 | $27,200,000 | 11.2% |
| Hallmark Drive | Sacramento, CA | 10,347,573 | 8.8 | 95.5% | 1974/NAP | 72,706 | 623 | $20,670,000 | 8.9 |
| Gray Road | Falmouth, ME | 7,668,757 | 6.6 | 93.2% | 2015-2017/ NAP | 65,125 | 415 | $11,700,000 | 6.5 |
| Marconi Avenue | Sacramento, CA | 7,645,935 | 6.5 | 97.4% | 1964/2014 | 51,739 | 400 | $16,390,000 | 6.4 |
| Ocean Gateway | Ocean City, MD | 7,230,592 | 6.2 | 93.0% | 1988, 1995, 1996, 1999, 2001/NAP | 63,650 | 487 | $11,620,000 | 6.2 |
| Amity Road | Harrisburg, PA | 7,032,044 | 6.0 | 95.0% | 1972, 1990/ 2008 | 58,432 | 606 | $12,750,000 | 6.0 |
| Gladstell Road | Conroe, TX | 6,819,129 | 5.8 | 89.4% | 1997/NAP | 66,575 | 546 | $10,600,000 | 6.1 |
| US Route One | Falmouth, ME | 6,441,247 | 5.5 | 93.9% | 2016-2018/ NAP | 46,925 | 305 | $9,650,000 | 5.5 |
| Farm to Market 1093 | Richmond, TX | 6,432,578 | 5.5 | 95.2% | 2002/NAP | 74,606 | 508 | $9,800,000 | 5.4 |
| Meade Avenue | Las Vegas, NV | 5,673,357 | 4.8 | 91.6% | 1978/NAP | 57,274 | 456 | $13,080,000 | 4.9 |
| Camp Horne | Pittsburgh, PA | 5,672,416 | 4.8 | 97.2% | 2003/NAP | 52,194 | 445 | $9,470,000 | 4.9 |
| Hazel Avenue | Orangevale, CA | 5,505,970 | 4.7 | 92.3% | 1989/NAP | 44,062 | 417 | $11,820,000 | 4.6 |
| Hoover Court | Birmingham, AL | 5,300,941 | 4.5 | 92.2% | 1959/2016 | 41,412 | 419 | $9,140,000 | 4.6 |
| Highway 6 North | Houston, TX | 5,218,804 | 4.5 | 95.4% | 1981/NAP | 68,012 | 616 | $8,600,000 | 4.5 |
| Farm to Market 725 | New Braunfels, TX | 4,693,612 | 4.0 | 96.1% | 1984, 1985, 1995, 1997, 2017/NAP | 67,300 | 572 | $7,700,000 | 4.1 |
| Hidden Hill Road | Spartanburg, SC | 3,316,260 | 2.8 | 94.6% | 2003/2016 | 54,100 | 309 | $5,320,000 | 2.8 |
| Arndt Road | Pittsburgh, PA | 3,269,512 | 2.8 | 93.7% | 2007/2010 | 30,350 | 251 | $6,050,000 | 2.8 |
| East Rosedale Street | Fort Worth, TX | 2,865,552 | 2.4 | 98.6% | 1972/2015 | 41,935 | 272 | $6,090,000 | 2.4 |
| Grisham Drive | Rowlett, TX | 2,703,508 | 2.3 | 96.8% | 1981/NAP | 48,575 | 344 | $4,760,000 | 2.3 |
| Total | $117,000,000 | 100.0% | 93.1% | 1,133,018 | 9,046 | $244,900,000 | 100.0% | ||
| (1) | Occupancy and Net Rentable Area (SF) reflect storage units only, excluding parking spaces and commercial units and are based on the underwritten rent rolls dated November 17, 2021. |
| (2) | The Total Appraised Value reflects a portfolio premium of approximately 15.3% over the aggregate “as-is” value of the individual IPCC National Storage Portfolio XVI Properties. The sum of the values on an individual basis is $212,410,000. |
The following table presents detailed information with respect to the unit mix of the IPCC National Storage Portfolio XVI Properties:
| Unit Mix | ||||||
| Unit Type | Square Feet | % of Total Square Feet | Occupancy (SF)(1) | Units | % of Total Units | Occupancy (Units)(1) |
| Non-Climate Controlled Storage Units | 752,563 | 64.7% | 93.6% | 5,399 | 56.3% | 93.4% |
| Climate Controlled Storage Units | 380,456 | 32.7 | 92.3% | 3,647 | 38.0 | 91.6% |
| Parking Units | N/A | N/A | N/A | 504 | 5.3 | 83.5% |
| Commercial Units | 29,629 | 2.5 | 92.1% | 38 | 0.4 | 89.5% |
| Total / Wtd. Avg. | 1,162,647 | 100.0% | 93.1% | 9,588 | 100.0% | 92.2% |
| (1) | Occupancy is based on the underwritten rent rolls dated November 17, 2021. |
COVID-19 Update. As of December 16, 2021, the IPCC National Storage Portfolio XVI Properties are open and operating. The borrower sponsor provided an accounts receivable report dated October 31, 2021, which showed approximately $29,813 (0.2% of underwritten base rent) more than 30 days delinquent. As of February 1, 2022, the IPCC National Storage Portfolio XVI Properties Loan Combination is not subject to any modification or forbearance requests.
| THE INFORMATION IN THIS STRUCTURAL AND COLLATERAL TERM SHEET IS NOT COMPLETE AND MAY BE AMENDED PRIOR TO THE TIME OF SALE. THIS TERM SHEET IS NOT AN OFFER TO SELL THESE SECURITIES AND IT IS NOT A SOLICITATION OF AN OFFER TO BUY THESE SECURITIES IN ANY JURISDICTION WHERE THE OFFER OR SALE IS NOT PERMITTED. | ||
| 38 | ||
| Structural and Collateral Term Sheet | BMO 2022-C1 | |
| No. 1 – IPCC National Storage Portfolio XVI | ||
Environmental. According to the Phase I environmental assessments dated December 6, 2021, there was no evidence of any recognized environmental conditions at the IPCC National Storage Portfolio XVI Properties.
| Historical and Current Occupancy | |||
| 2018(1) | 2019(1)(2) | 2020(2) | Current(3) |
| NAV | 90.4% | 91.2% | 93.1% |
| (1) | 2018 Historical Occupancy was not provided by the seller. 2019 Historical Occupancy excludes occupancy for seven of the IPCC National Storage Portfolio XVI Properties, which the seller did not provide. |
| (2) | Historical Occupancies are as of December 31 of each respective year and are based on self-storage square footage. |
| (3) | Current Occupancy is based on the underwritten rent rolls dated as of November 17, 2021 and based on self-storage square footage only. |
| Operating History and Underwritten Net Cash Flow | |||||
| 2020 | TTM(1) | Underwritten | Per Square Foot | %(2) | |
| Rents in Place | $12,864,040 | $14,639,949 | $15,230,256 | $13.44 | 90.8% |
| Vacant Income | 2,449,469 | 0 | 1,539,707 | 1.36 | 9.2 |
| Gross Potential Rent | $15,313,509 | $14,639,949 | $16,769,963 | $14.80 | 100.0% |
| (Vacancy / Credit Loss) | (3,013,576) | (616,944) | (2,281,148) | (2.01) | (13.6) |
| Parking Income | 304,044 | 341,633 | 516,861 | 0.46 | 3.1 |
| Other Income(3) | 790,752 | 875,399 | 1,212,626 | 1.07 | 7.2 |
| Effective Gross Income(4) | $13,394,729 | $15,240,038 | $16,218,302 | $14.31 | 96.7% |
| Total Expenses | $5,507,273 | $5,656,301 | $6,202,684 | $5.47 | 38.2% |
| Net Operating Income | $7,887,456 | $9,583,737 | $10,015,618 | $8.84 | 61.8% |
| Total TI / LC, Capex / RR | 0 | 0 | 180,751 | 0.16 | 1.1 |
| Net Cash Flow | $7,887,456 | $9,583,737 | $9,834,867 | $8.68 | 60.6% |
| (1) | TTM reflects the trailing 12-month period ending October 31, 2021. |
| (2) | % column represents percent of Gross Potential Rent for all revenue lines and represents percent of Effective Gross Income for the remainder of fields. |
| (3) | Other Income includes merchandise sales, tenant insurance, late fees, administrative fees, and for Underwritten Other Income only, $279,816 of commercial unit income. |
| (4) | Effective Gross Income increased from 2020 to TTM primarily due to a mixture of either increased occupancy or aggressive rental rate increases at certain IPCC National Storage Portfolio XVI Properties. |
The Market. The IPCC National Storage Portfolio XVI Properties are located across eight states and 11 different metropolitan statistical areas, with three IPCC National Storage Portfolio XVI Properties located within the Sacramento, California metropolitan area (20.1% of allocated loan amount, 19.9% of UW NOI), three within the Houston, Texas metropolitan area (15.8% of allocated loan amount, 16.0% of UW NOI), and two within the Birmingham, Alabama metropolitan area (15.8% of allocated loan amount, 15.7% of UW NOI).
According to the appraisals, as of the third quarter of 2021, the Sacramento self-storage market reported an average vacancy rate of 9.7%, with average monthly rents of $130.81 and $144.27 per unit for 10x10 foot non-climate controlled and climate controlled units, respectively. The Houston self-storage market reported an average vacancy rate of 12.5%, with average monthly rents of $85.69 and $135.23 per unit for 10x10 foot non-climate controlled and climate controlled units, respectively. The Birmingham self-storage market reported an average vacancy rate of 9.3%, with average monthly rents of $78.13 and $123.13 per unit for 10x10 foot non-climate controlled and climate controlled units, respectively. The portfolio appraisal concluded stabilized effective gross income of $14.99 per square foot for the IPCC National Storage Portfolio XVI Properties.
| THE INFORMATION IN THIS STRUCTURAL AND COLLATERAL TERM SHEET IS NOT COMPLETE AND MAY BE AMENDED PRIOR TO THE TIME OF SALE. THIS TERM SHEET IS NOT AN OFFER TO SELL THESE SECURITIES AND IT IS NOT A SOLICITATION OF AN OFFER TO BUY THESE SECURITIES IN ANY JURISDICTION WHERE THE OFFER OR SALE IS NOT PERMITTED. | ||
| 39 | ||
| Structural and Collateral Term Sheet | BMO 2022-C1 | |
| No. 1 – IPCC National Storage Portfolio XVI | ||
The following table presents certain 2021 demographic information for the IPCC National Storage Portfolio XVI Properties:
| Demographics Summary(1) | |||||||
| Property Name | City, State | 1-mile Population | 3-mile Population | 5-mile Population | 1-mile Median Household Income | 3-mile Median Household Income | 5-mile Median Household Income |
| Crestwood Boulevard | Irondale, AL | 2,882 | 36,557 | 86,757 | $56,240 | $46,358 | $56,271 |
| Hallmark Drive | Sacramento, CA | 20,549 | 140,487 | 388,658 | $40,486 | $57,872 | $62,076 |
| Gray Road | Falmouth, ME | 1,931 | 24,080 | 69,851 | $131,309 | $93,617 | $78,452 |
| Marconi Avenue | Sacramento, CA | 16,367 | 132,095 | 379,411 | $71,365 | $60,748 | $60,254 |
| Ocean Gateway | Ocean City, MD | 849 | 12,957 | 31,264 | $104,076 | $74,323 | $73,979 |
| Amity Road | Harrisburg, PA | 12,794 | 93,043 | 188,107 | $50,382 | $47,803 | $57,522 |
| Gladstell Road | Conroe, TX | 11,946 | 57,517 | 109,749 | $46,918 | $54,692 | $72,291 |
| US Route One | Falmouth, ME | 2,408 | 9,111 | 35,842 | $159,210 | $151,677 | $105,298 |
| Farm to Market 1093 | Richmond, TX | 12,709 | 89,061 | 220,535 | $130,184 | $134,279 | $126,523 |
| Meade Avenue | Las Vegas, NV | 39,520 | 187,429 | 484,795 | $34,720 | $43,084 | $43,812 |
| Camp Horne | Pittsburgh, PA | 4,492 | 47,525 | 146,544 | $79,005 | $68,021 | $69,031 |
| Hazel Avenue | Orangevale, CA | 14,308 | 94,717 | 256,485 | $84,438 | $85,247 | $86,989 |
| Hoover Court | Birmingham, AL | 8,020 | 64,601 | 132,361 | $64,308 | $76,071 | $83,099 |
| Highway 6 North | Houston, TX | 17,598 | 150,983 | 317,570 | $69,761 | $74,444 | $77,185 |
| Farm to Market 725 | New Braunfels, TX | 3,262 | 34,500 | 84,610 | $73,510 | $71,849 | $71,094 |
| Hidden Hill Road | Spartanburg, SC | 5,913 | 43,205 | 82,780 | $48,938 | $53,042 | $50,400 |
| Arndt Road | Pittsburgh, PA | 4,418 | 36,674 | 117,025 | $135,810 | $102,635 | $82,927 |
| East Rosedale Street | Fort Worth, TX | 8,389 | 95,623 | 234,254 | $40,956 | $45,390 | $52,962 |
| Grisham Drive | Rowlett, TX | 9,383 | 82,484 | 270,907 | $90,495 | $80,497 | $74,776 |
| (1) | Source: Third party market data provider. |
The Borrower. The borrowing entity for the IPCC National Storage Portfolio XVI Loan Combination is Self-Storage Portfolio XVI DST, a Delaware statutory trust and special purpose entity with one independent director (the “IPCC National Storage Portfolio XVI Borrower”). Legal counsel to the IPCC National Storage Portfolio XVI Borrower delivered a non-consolidation opinion in connection with the origination of the IPCC National Storage Portfolio XVI Loan Combination. The IPCC National Storage Portfolio XVI Borrower has master leased the IPCC National Storage Portfolio XVI Properties to the master tenant, Self-Storage Portfolio XVI LeaseCo, L.L.C. (“Master Tenant”). The Master Tenant is a Delaware limited liability company structured to be bankruptcy-remote and is ultimately owned by the guarantor. The master lease generally imposes responsibility on the Master Tenant for the operation, maintenance and management of the IPCC National Storage Portfolio XVI Properties and payment of all expenses incurred in the maintenance and repair of the IPCC National Storage Portfolio XVI Properties, other than capital expenses. The Master Tenant’s interest in all tenant rents was assigned directly to the lender. The master lease is subordinate to the IPCC National Storage Portfolio XVI Loan Combination and, upon an event of default under the IPCC National Storage Portfolio XVI Loan Combination documents, the lender has the right to cause the termination of the master lease. There is no income underwritten from the master lease as the IPCC National Storage Portfolio XVI Loan Combination was underwritten to the underlying property income.
The IPCC National Storage Portfolio XVI Borrower may (i) convert to a different form of entity under Delaware law (a “Conversion Event”) or (ii) transfer one or more of the IPCC National Storage Portfolio XVI Properties to a new special purpose entity owned by the same beneficial owners as the IPCC National Storage Portfolio XVI Borrower in substantially the same proportions as immediately prior to the transfer of the related mortgaged properties (a “Drop Down Contribution”). The lender may deliver a written notice (a “Conversion Notice”) to the IPCC National Storage Portfolio XVI Borrower and the signatory trustee if one or more of the IPCC National Storage Portfolio XVI Properties is in jeopardy of being foreclosed upon due to an event of default, and the IPCC National Storage Portfolio XVI Borrower is required to affect a Conversion Event or a Drop Down Contribution within 10 business days from its receipt of Conversion Notice unless it delivers a tax opinion (a “Conversion Opinion”) outlining (i) that the IPCC National Storage Portfolio XVI Borrower is able to remedy the default situation giving rise to the jeopardy of foreclosure or (ii) that effectuating a Conversion Event or Drop Down Contribution, in light of the circumstances, would not reasonably improve the ability of the IPCC National Storage Portfolio XVI Borrower to remedy the default situation. If the IPCC National Storage Portfolio XVI Borrower fails to remedy the default situation within 30 days of the lender’s receipt of the Conversion Opinion, then the IPCC National Storage Portfolio XVI Borrower is required to effect a Conversion Event or Drop Down Contribution, as applicable. See “Description of the Mortgage Pool—Statistical Characteristics of the Mortgage Loans—Delaware Statutory Trusts” in the Preliminary Prospectus.
The Borrower Sponsor. The borrower sponsor and nonrecourse carve-out guarantor is Inland Private Capital Corporation (“IPCC”). As of December 31, 2020, IPCC has sponsored 266 1031 exchange private placement programs since its inception that have provided
| THE INFORMATION IN THIS STRUCTURAL AND COLLATERAL TERM SHEET IS NOT COMPLETE AND MAY BE AMENDED PRIOR TO THE TIME OF SALE. THIS TERM SHEET IS NOT AN OFFER TO SELL THESE SECURITIES AND IT IS NOT A SOLICITATION OF AN OFFER TO BUY THESE SECURITIES IN ANY JURISDICTION WHERE THE OFFER OR SALE IS NOT PERMITTED. | ||
| 40 | ||
| Structural and Collateral Term Sheet | BMO 2022-C1 | |
| No. 1 – IPCC National Storage Portfolio XVI | ||
approximately $6.3 billion in equity and included 748 properties. According to the borrower sponsor, as of December 31, 2020, IPCC had $9.0 billion in assets under management.
Property Management. The IPCC National Storage Portfolio XVI Properties are managed by Devon Self Storage Holdings (US) LLC, which is not affiliated with the IPCC National Storage Portfolio XVI Borrower.
Escrows and Reserves. At origination, the IPCC National Storage Portfolio XVI Borrower deposited into escrow $246,500 for replacement reserves and approximately $486,615 for deficiency in flood insurance coverage.
Tax Escrows – The IPCC National Storage Portfolio XVI Borrower is required to deposit into a real estate tax reserve, on a monthly basis, 1/12 of the estimated annual real estate taxes for each respective property; provided, such monthly deposits will be waived for each applicable property so long as (i) no event of default exists, (ii) the IPCC National Storage Portfolio XVI Borrower provides the lender, at least 10 days prior to the date on which such taxes are due, satisfactory evidence that all applicable taxes have been paid, and (iii) no DSCR Trigger Event (as defined below) has occurred.
Insurance Escrows – The IPCC National Storage Portfolio XVI Borrower is required to deposit into an insurance reserve, on a monthly basis, 1/12 of estimated insurance premiums for each respective property; provided, such monthly deposits will be waived for each applicable property so long as (i) no event of default exists, (ii) no DSCR Trigger Event has occurred, and (iii) the IPCC National Storage Portfolio XVI Borrower maintains a blanket insurance policy acceptable to the lender.
Replacement Reserves – The IPCC National Storage Portfolio XVI Borrower is required to escrow approximately $20,514 for replacement reserves on a monthly basis if at any time the balance of the reserve falls below $246,500, until such time as the reserve is restored to $246,500.
Lockbox / Cash Management. The IPCC National Storage Portfolio XVI Loan Combination documents require springing cash management. Within five business days of the IPCC National Storage Portfolio XVI Borrower’s receipt of the lender’s notice that a Cash Sweep Event (as defined below) has occurred, the IPCC National Storage Portfolio XVI Borrower is required to establish and maintain a cash management account controlled by the lender and the IPCC National Storage Portfolio XVI Borrower, Master Tenant, or property manager are required to send direction letters to all tenants under commercial leases instructing them to deposit all rents directly into the cash management account. In addition, the IPCC National Storage Portfolio XVI Borrower, Master Tenant, property manager and asset manager are required to deposit all revenues otherwise received into the cash management account within two business days of receipt. During the continuance of a Cash Sweep Event, all sums on deposit in the cash management account are required to be applied and disbursed in accordance with the IPCC National Storage Portfolio XVI Loan Combination documents, and in each case in connection with a Cash Sweep Event caused by a DSCR Trigger Event, all excess cash will be held by the lender as additional collateral for the IPCC National Storage Portfolio XVI Loan Combination.
A “Cash Sweep Event” will commence upon: (i) the occurrence of an event of default under the IPCC National Storage Portfolio XVI Loan Combination documents and will continue until such event of default is cured or (ii) the date on which the debt service coverage ratio as calculated in the IPCC National Storage Portfolio XVI Loan Combination documents is less than 1.80x (a “DSCR Trigger Event”) and will continue until the debt service coverage ratio is at least 1.85x for two consecutive quarters.
Subordinate and Mezzanine Debt. None.
Partial Release. At any time after February 1, 2024, and prior to the IPCC National Storage Portfolio XVI Loan Combination maturity date, the IPCC National Storage Portfolio XVI Borrower may obtain the release of any of the IPCC National Storage Portfolio XVI Properties, provided that, among other things, (i) no event of default has occurred and is continuing, (ii) the IPCC National Storage Portfolio XVI Borrower prepays a portion of the IPCC National Storage Portfolio XVI Loan Combination equal to 120% of the allocated loan amount of the property being released (the “Release Amount”), and if such property is released prior to October 2, 2031, the payment of a yield maintenance premium pursuant to the IPCC National Storage Portfolio XVI Loan Combination documents, (iii) the debt service coverage ratio for the remaining IPCC National Storage Portfolio XVI Properties following the release is no less than the greater of (x) the debt service coverage ratio for the 12 calendar months immediately preceding such release (provided, however, that for the purposes of this clause (x) the debt service coverage ratio will be deemed to be no greater than 2.30x) and (y) 2.15x, (iv) the debt yield for the remaining properties is no less than the greater of (x) the debt yield for the remaining IPCC National Storage Portfolio XVI Properties for the 12 calendar months immediately preceding such release (provided, however, that for the purposes of this clause (x) the debt yield will be deemed to be no greater than 8.55%) and (y) 8.20%, (v) the loan-to-value ratio for the remaining IPCC National Storage Portfolio XVI Properties is no greater than the lesser of (x) the loan-to-value ratio immediately preceding such release and (y) 50.0% (provided, however, that this clause (v) will not apply to the release of any individual property to the extent that, after giving effect to such release, the aggregate allocated loan amount of all the individual properties which have been released is less than 20% of the total original principal balance), and (vi) the release is permitted under REMIC requirements.
Ground Lease. None.
| THE INFORMATION IN THIS STRUCTURAL AND COLLATERAL TERM SHEET IS NOT COMPLETE AND MAY BE AMENDED PRIOR TO THE TIME OF SALE. THIS TERM SHEET IS NOT AN OFFER TO SELL THESE SECURITIES AND IT IS NOT A SOLICITATION OF AN OFFER TO BUY THESE SECURITIES IN ANY JURISDICTION WHERE THE OFFER OR SALE IS NOT PERMITTED. | ||
| 41 | ||
| Structural and Collateral Term Sheet | BMO 2022-C1 | |
| No. 2 – 360 Rosemary | ||
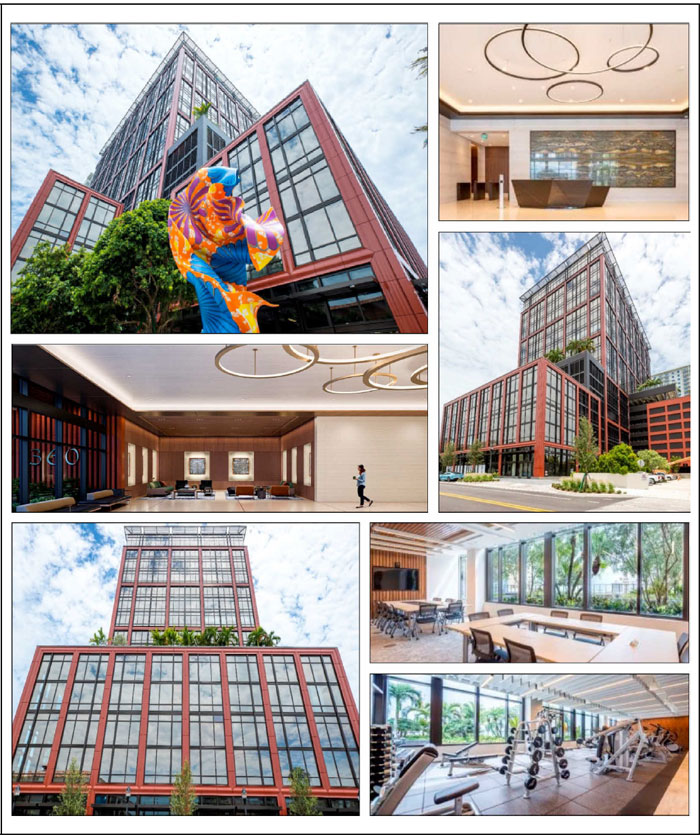
| THE INFORMATION IN THIS STRUCTURAL AND COLLATERAL TERM SHEET IS NOT COMPLETE AND MAY BE AMENDED PRIOR TO THE TIME OF SALE. THIS TERM SHEET IS NOT AN OFFER TO SELL THESE SECURITIES AND IT IS NOT A SOLICITATION OF AN OFFER TO BUY THESE SECURITIES IN ANY JURISDICTION WHERE THE OFFER OR SALE IS NOT PERMITTED. | ||
| 42 | ||
| Structural and Collateral Term Sheet | BMO 2022-C1 | |
| No. 2 – 360 Rosemary | ||
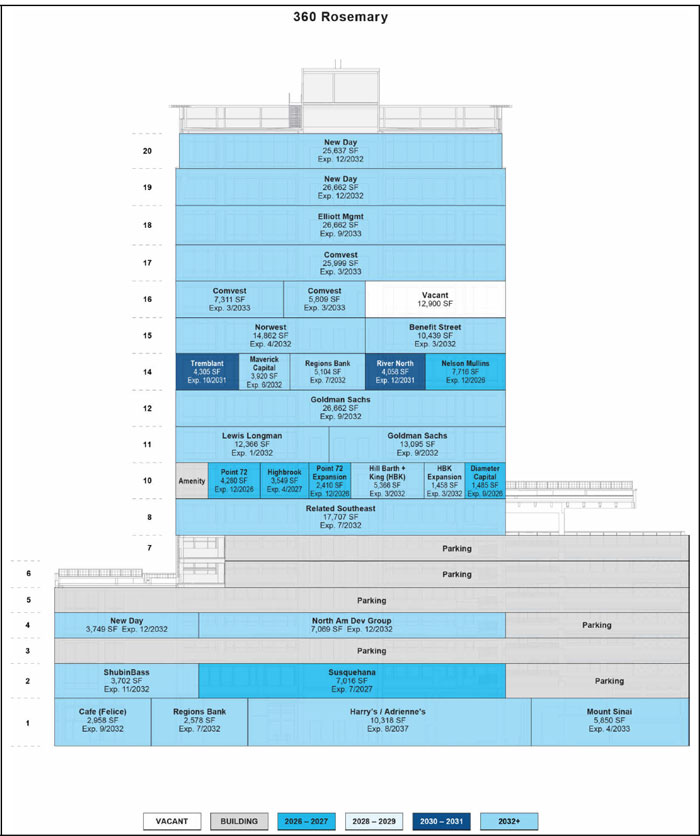
| THE INFORMATION IN THIS STRUCTURAL AND COLLATERAL TERM SHEET IS NOT COMPLETE AND MAY BE AMENDED PRIOR TO THE TIME OF SALE. THIS TERM SHEET IS NOT AN OFFER TO SELL THESE SECURITIES AND IT IS NOT A SOLICITATION OF AN OFFER TO BUY THESE SECURITIES IN ANY JURISDICTION WHERE THE OFFER OR SALE IS NOT PERMITTED. | ||
| 43 | ||
| Structural and Collateral Term Sheet | BMO 2022-C1 | |
| No. 2 – 360 Rosemary | ||
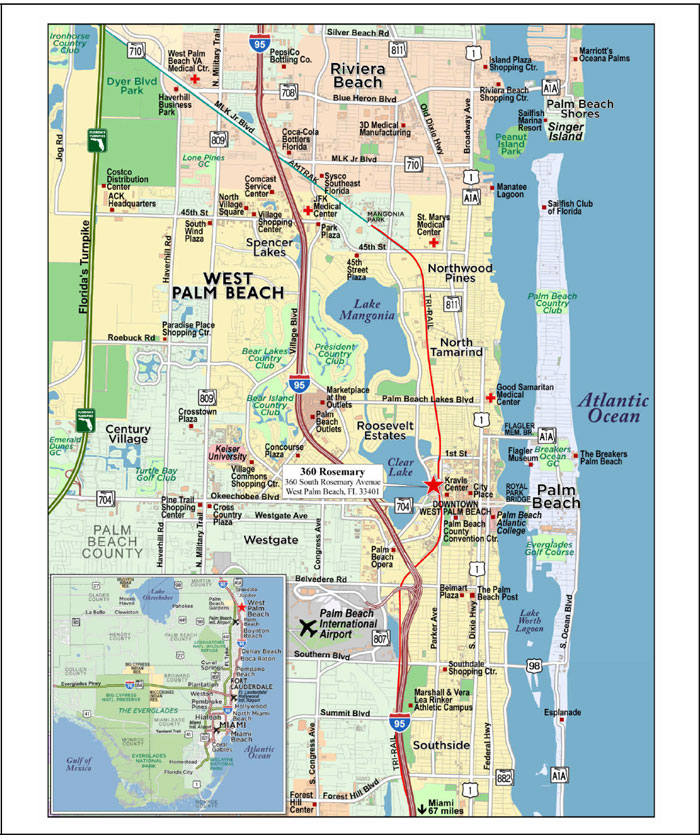
| THE INFORMATION IN THIS STRUCTURAL AND COLLATERAL TERM SHEET IS NOT COMPLETE AND MAY BE AMENDED PRIOR TO THE TIME OF SALE. THIS TERM SHEET IS NOT AN OFFER TO SELL THESE SECURITIES AND IT IS NOT A SOLICITATION OF AN OFFER TO BUY THESE SECURITIES IN ANY JURISDICTION WHERE THE OFFER OR SALE IS NOT PERMITTED. | ||
| 44 | ||
| Structural and Collateral Term Sheet | BMO 2022-C1 | |
| No. 2 – 360 Rosemary | ||
| Mortgage Loan Information | Property Information | |||
| Mortgage Loan Seller: | BMO | Single Asset / Portfolio: | Single Asset | |
| Credit Assessment (KBRA/Fitch/S&P): | (AA/BBB-sf*/A+) | Title: | Fee | |
| Original Principal Balance(1): | $45,000,000 | Property Type – Subtype: | Office – CBD | |
| Cut-off Date Principal Balance(1): | $45,000,000 | Net Rentable Area (SF): | 313,002 | |
| % of IPB: | 4.0% | Location: | West Palm Beach, FL | |
| Loan Purpose: | Refinance | Year Built / Renovated: | 2021 / NAP | |
| Borrower: | CityPlace North II, L.L.C. | Occupancy(2): | 95.9% | |
| Borrower Sponsor: | The Related Companies, L.P. | Occupancy Date: | 12/1/2021 | |
| Interest Rate: | 3.95000% | 4th Most Recent NOI (As of): | NAV | |
| Note Date: | 1/18/2022 | 3rd Most Recent NOI (As of): | NAV | |
| Maturity Date: | 2/6/2032 | 2nd Most Recent NOI (As of): | NAV | |
| Interest-only Period: | 120 months | Most Recent NOI (As of): | NAV | |
| Original Term: | 120 months | UW Economic Occupancy: | 95.0% | |
| Original Amortization Term: | None | UW Revenues: | $23,655,523 | |
| Amortization Type: | Interest Only | UW Expenses: | $8,490,851 | |
| Call Protection: | YM3(24),DorYM3(89),O(7) | UW NOI: | $15,164,673 | |
| Lockbox / Cash Management: | Hard / Springing | UW NCF: | $14,804,720 | |
| Additional Debt(1): | Yes | Appraised Value / Per SF(3): | $319,000,000 / $1,019 | |
| Additional Debt Balance(1): | $40,000,000 / $100,802,000 / $24,198,000 | Appraisal Date(3): | 12/1/2023 | |
| Additional Debt Type(1): | Pari Passu / B Note / C Note | |||
| Escrows and Reserves(4) | Financial Information(1) | ||||||||||
| Initial | Monthly | Initial Cap | Senior Loan | Loan Combination | |||||||
| Taxes: | $0 | Springing | N/A | Cut-off Date Loan / SF: | $272 | $671 | |||||
| Insurance: | $0 | Springing | N/A | Maturity Date Loan / SF: | $272 | $671 | |||||
| Replacement Reserves: | $0 | Springing | N/A | Cut-off Date LTV(3): | 26.6% | 65.8% | |||||
| TI/LC Reserve: | $0 | Springing | N/A | Maturity Date LTV(3): | 26.6% | 65.8% | |||||
| Other: | $45,498,551 | $0 | N/A | UW NCF DSCR: | 4.35x | 1.76x | |||||
| UW NOI Debt Yield: | 17.8% | 7.2% | |||||||||
| Sources and Uses | |||||||||||
| Sources | Proceeds | % of Total | Uses | Proceeds | % of Total | ||||||
| Loan Combination(1) | $210,000,000 | 100.0% | Payoff Existing Debt | $110,495,605 | 52.6% | ||||||
| Return of Equity | 47,876,656 | 22.8 | |||||||||
| Reserves | 45,498,551 | 21.7 | |||||||||
| Closing Costs | 6,129,189 | 2.9 | |||||||||
| Total Sources | $210,000,000 | 100.0% | Total Uses | $210,000,000 | 100.0% | ||||||
| (1) | The 360 Rosemary Mortgage Loan (as defined below) is part of the 360 Rosemary Loan Combination (as defined below) which has an original aggregate principal balance of $210,000,000. The Financial Information in the chart above reflects the 360 Rosemary Senior Loan (as defined below) and the 360 Rosemary Loan Combination. For additional information, see “The Loan” below. |
| (2) | Occupancy is based on the underwritten rent roll as of December 1, 2021. Occupancy is based on the percentage of net rentable area leased. Due to the recent completion of the 360 Rosemary Property (as defined below), many tenants are currently in the process of building out their respective spaces and have not yet taken physical occupancy. |
| (3) | The Appraised Value reflects the “As Stabilized” value concluded by the appraiser. The “As Stabilized” value assumes the completion of the remaining tenant improvements. At origination, the lender required escrow deposits sufficient to cover the costs associated with the completion of the remaining tenant improvements. The appraiser’s concluded market value “as-is” is $245,000,000, which represents a 360 Rosemary Senior Loan Cut-off Date LTV and Maturity Date LTV of 34.7%. |
| (4) | For a full description of escrows and reserves, please refer to “Escrows and Reserves” below. |
The Loan. The second largest mortgage loan (the “360 Rosemary Mortgage Loan”) is part of a loan combination (the “360 Rosemary Loan Combination”) that is evidenced by (i) five pari passu senior promissory notes in the aggregate original principal amount of $85,000,000 (collectively, the “360 Rosemary Senior Loan”), (ii) a subordinate promissory note in the original principal amount of $100,802,000 (the “360 Rosemary Subordinate Companion B Loan”), and (iii) a further subordinated promissory note in the original principal amount of $24,198,000 (the “360 Rosemary Subordinate Companion C Loan” and, together with the 360 Rosemary Subordinate Companion B Loan, the “360 Rosemary Subordinate Companion Loans”). The 360 Rosemary Loan Combination was
| THE INFORMATION IN THIS STRUCTURAL AND COLLATERAL TERM SHEET IS NOT COMPLETE AND MAY BE AMENDED PRIOR TO THE TIME OF SALE. THIS TERM SHEET IS NOT AN OFFER TO SELL THESE SECURITIES AND IT IS NOT A SOLICITATION OF AN OFFER TO BUY THESE SECURITIES IN ANY JURISDICTION WHERE THE OFFER OR SALE IS NOT PERMITTED. | ||
| 45 | ||
| Structural and Collateral Term Sheet | BMO 2022-C1 | |
| No. 2 – 360 Rosemary | ||
originated on January 18, 2022, by Bank of Montreal (“BMO”). The 360 Rosemary Loan Combination is secured by a first priority mortgage on the borrower’s fee simple interest in a 313,002 square foot office property located in West Palm Beach, Florida (the “360 Rosemary Property”). The 360 Rosemary Mortgage Loan is evidenced by the non-controlling promissory Note A-1 and Note-A-2, with an aggregate principal balance as of the Cut-off Date of $45,000,000. The remaining notes are currently held by BMO and are expected to be contributed to one or more future securitization trusts. Prior to the occurrence of a “control appraisal period” with respect to the 360 Rosemary Subordinate Companion C Loan, the holder of the 360 Rosemary Subordinate Companion C Loan (or its representative) will be the controlling noteholder. Following the occurrence and during the continuance of a “control appraisal period” with respect to the 360 Rosemary Subordinate Companion C Loan, the holder of the 360 Rosemary Subordinate Companion B Loan (i.e., the BMO 2022-C1 securitization trust, which rights will be exercisable by the designated class of holders of the series of loan-specific certificates that will be backed by the 360 Rosemary Subordinate Companion B Loan) will be the controlling noteholder. Following the occurrence and during the continuance of a “control appraisal period” with respect to the 360 Rosemary Subordinate Companion B Loan, the holder of the 360 Rosemary Mortgage Loan (i.e., the BMO 2022-C1 securitization trust, which rights will be exercisable by the controlling class representative for the BMO 2022-C1 pooled mortgage loans securitization transaction) will be the controlling noteholder. The 360 Rosemary Mortgage Loan will be serviced pursuant to the pooling and servicing agreement for the BMO 2022-C1 securitization. See “Description of the Mortgage Pool—The Loan Combinations—The Serviced AB Loan Combination—The 360 Rosemary Pari Passu-AB Loan Combination” and “Pooling and Servicing Agreement” in the Prospectus.
| Loan Combination Summary | |||||
| Note | Original Balance | Cut-off Date Balance | Note Holder | Controlling Piece | |
| A-1 | $25,000,000 | $25,000,000 | BMO 2022-C1 | No | |
| A-2 | $20,000,000 | $20,000,000 | BMO 2022-C1 | No | |
| A-3(1) | $15,000,000 | $15,000,000 | BMO | No | |
| A-4(1) | $15,000,000 | $15,000,000 | BMO | No | |
| A-5(1) | $10,000,000 | $10,000,000 | BMO | No | |
| Total Senior Loan | $85,000,000 | $85,000,000 | |||
| B-1 | $100,802,000 | $100,802,000 | BMO 2022-C1 (Loan Specific) | Yes(2) | |
| C-1 | $24,198,000 | $24,198,000 | Third Party | No | |
| Total | $210,000,000 | $210,000,000 | |||
| (1) | Expected to be contributed to one or more future securitizations. |
| (2) | Following the occurrence and during the continuance of a “control appraisal period” with respect to Note C-1, Note B-1 will be the controlling note. Following the occurrence and during the continuance of a “control appraisal period” with respect to Note B-1, Note A-1 will be the controlling note, and the controlling class representative of the BMO 2022-C1 pooled mortgage loans securitization will be entitled to exercise the related control rights. See “Description of the Mortgage Pool—The Loan Combinations—The 360 Rosemary Pari-Passu AB Loan Combination” in the Prospectus. |
The Property. The 360 Rosemary Property consists of a 20-story office property comprised of 291,298 square feet of office space and 21,704 of retail square feet located at 360 South Rosemary Avenue in West Palm Beach, Florida. The 360 Rosemary Property has a total of 606 parking spaces (approximately 1.94 parking spaces per 1,000 square feet of NRA) provided by the seven-story parking garage. The 360 Rosemary Property is situated at the southeast corner of South Rosemary Avenue and Fern Street that provides prime frontage for the retail tenants. The 360 South Rosemary Property is located in the downtown neighborhood of West Palm Beach and benefits from its proximity to entertainment attractions and outdoor recreation areas, such as the lifestyle retail development, The Square and public parks such as Howard Park. The 360 Rosemary Property is accessible from all major West Palm Beach commuter transportation hubs. Nearby train stations include the West Palm Beach Brightline Station, located approximately 0.2 miles north of the 360 Rosemary Property on the intersection of Evernia Street and Quadrille Plaza Drive, and the West Palm Beach Amtrak Train Station, located approximately 0.4 miles west of the 360 Rosemary Property on South Tamarind Avenue. The West Palm Beach Brightline Station provides access to Fort Lauderdale and Miami and is currently under construction to extend an additional line to Orlando, serving as an amenity to the 360 Rosemary Property tenants by providing access to a broader pool of talent. The 360 Rosemary Property was delivered in 2021 as a Class A office property and is currently 95.9% leased to a diverse mix of finance, real estate, insurance, legal and retail, including tenants such as New Day, Goldman Sachs, Comvest, Elliott Mgmt, Benefit Street, Point 72 and Maverick Capital. New Day, Goldman Sachs and Comvest represent a combined 43.1% of the total NRA with each tenant having greater than ten years remaining under their respective leases. The retail space is 100.0% leased by four tenants, Harry’s / Adrienne’s, Mount Sinai, Regions Bank and Café (Felice). Tenants at the 360 Rosemary Property have invested approximately $38.0 million ($121 PSF) in aggregate into their respective spaces, ranging from $25 to $400 PSF.
COVID-19 Update. As of December 1, 2021, the 360 Rosemary Property was open and operating and 100% of the base rent due in November 2021 and December 2021 was paid. The first debt service payment for the 360 Rosemary Loan Combination is due in March 2022. As of February 1, 2022, the 360 Rosemary Loan Combination is not subject to any forbearance, modification or debt service relief request.
Major Tenants. The three largest tenants based on underwritten base rent are New Day, Goldman Sachs and Comvest.
New Day (56,048 square feet; 17.9% NRA; 18.5% of underwritten base rent): New Day was founded in 1999 and is headquartered in Fulton, Maryland. New Day is a veteran mortgage lender that offers loans for home improvements, refinancing, and debt consolidation. New Day moved its second headquarters to the 360 Rosemary Property in the fourth quarter of 2021, to two suites on the 19th and 20th
| THE INFORMATION IN THIS STRUCTURAL AND COLLATERAL TERM SHEET IS NOT COMPLETE AND MAY BE AMENDED PRIOR TO THE TIME OF SALE. THIS TERM SHEET IS NOT AN OFFER TO SELL THESE SECURITIES AND IT IS NOT A SOLICITATION OF AN OFFER TO BUY THESE SECURITIES IN ANY JURISDICTION WHERE THE OFFER OR SALE IS NOT PERMITTED. | ||
| 46 | ||
| Structural and Collateral Term Sheet | BMO 2022-C1 | |
| No. 2 – 360 Rosemary | ||
floors of the building totaling 52,299 square feet. New Day signed an amendment to the lease expanding their leased premises for a combined a total of three suites leased with a weighted average lease term of 10.9 years. New Day was provided a tenant improvement allowance of approximately $5.6 million ($100 PSF). New Day’s lease expires in December 2032 and contains two consecutive renewal options of 60 months and a one-time termination right effective on any date elected by New Day during the period between November 30, 2027 and December 31, 2032. New Day’s Underwritten Base Rent PSF of $46.13 for 52,299 square feet of space on the 19th and 20th floors is approximately 19.7% below the appraiser’s concluded market rent of $55.00 PSF for the 19th floor and $60.00 for the 20th floor. New Day’s Underwritten Base Rent PSF of $60.00 for 3,749 square feet of space on the fourth floor is approximately 9.1% above the appraiser’s concluded market rent of $55.00 PSF.
Goldman Sachs (39,757 square feet; 12.7% NRA; 14.0% of underwritten base rent): Founded in 1869, Goldman Sachs Group Inc. (“Goldman Sachs”) is an American multinational investment bank and financial services company headquartered in New York City. Goldman Sachs offers services in investment management, asset management, prime brokerage and securities underwriting. As of the third quarter of 2021, Goldman Sachs reported approximately $46.7 billion in total revenue and approximately $1.2 trillion in total assets. Goldman Sachs occupies two suites with a lease term of 10.5 years and is expected to receive approximately $3.3 million (approximately $75 PSF) in tenant improvement allowance for the build-out of its new spaces expected to commence April 2022. Goldman Sachs’ lease expires in September 2032 and contains two consecutive renewal options of 60 months each, a one-time termination right effective as of the day preceding the fifth anniversary date of the rent commencement date under its lease and a termination right in the event that Goldman Sachs enters into a lease for at least 150,000 square feet at a specified nearby property owned by an affiliate of Borrower. Goldman Sachs’ Underwritten Base Rent PSF of $50.00 is approximately 9.1% below the appraiser’s concluded market rent for this space of $55.00 PSF.
Comvest (39,119 square feet; 12.5% NRA; 11.6% of underwritten base rent): Founded in 2000, Comvest Advisors (“Comvest”) is a private investment firm providing equity and debt capital to middle-market companies across North America. Since inception, Comvest has invested over $7.1 billion in middle market businesses and currently has over $6.5 billion in assets under management. Comvest occupies three suites with a lease term of 10.5 years and is expected to receive approximately $3.8 million ($97 PSF) in tenant improvement allowance for the build-out of its new spaces expected to commence July 2022, July 2023, and September 2023. The tenant improvement allowance is not inclusive of a termination fee paid by the borrower sponsor for Comvest’s relocation to the 360 Rosemary Property. Comvest’s lease expires in March 2033 and contains two consecutive renewal options of 60 months each and a one-time termination right effective as of the last day of the 7th year of its lease. Comvest’s Underwritten Base Rent PSF of $42.25 is approximately 23.2% below the appraiser’s concluded market rent for this space of $55.00 PSF.
Environmental. According to a Phase I environmental assessment dated December 6, 2021, there was no evidence of any recognized environmental conditions at the 360 Rosemary Property.
The following table presents certain information relating to the historical occupancy of the 360 Rosemary Property:
| Historical and Current Occupancy | |||
| 2018(1) | 2019(1) | 2020(1) | Current(2) |
| NAV | NAV | NAV | 95.9% |
| (1) | Historical occupancies are unavailable as the 360 Rosemary Property was built in 2021. |
| (2) | Current occupancy is based on the underwritten rent roll as of December 1, 2021. Current occupancy is based on the percentage of net rentable area leased. Due to the recent completion of the 360 Rosemary Property, many tenants are currently in the process of building out their respective spaces and have not yet taken physical occupancy. |
| THE INFORMATION IN THIS STRUCTURAL AND COLLATERAL TERM SHEET IS NOT COMPLETE AND MAY BE AMENDED PRIOR TO THE TIME OF SALE. THIS TERM SHEET IS NOT AN OFFER TO SELL THESE SECURITIES AND IT IS NOT A SOLICITATION OF AN OFFER TO BUY THESE SECURITIES IN ANY JURISDICTION WHERE THE OFFER OR SALE IS NOT PERMITTED. | ||
| 47 | ||
| Structural and Collateral Term Sheet | BMO 2022-C1 | |
| No. 2 – 360 Rosemary | ||
The following table presents certain information relating to the largest tenants based on underwritten base rent of the 360 Rosemary Property:
| Top Tenant Summary(1) | |||||||
| Tenant | Ratings Moody’s/S&P/ Fitch(2) | Net Rentable Area (SF) | % of Total NRA | UW Base Rent PSF(3) | UW Base Rent(3) | % of Total UW Base Rent(3) | Lease Exp. Date |
| New Day | NR/NR/NR | 56,048 | 17.9% | $47.05 | $2,637,231 | 18.5% | 12/31/2032(4) |
| Goldman Sachs | A2/BBB+/A | 39,757 | 12.7 | 50.00 | 1,987,850 | 14.0 | 9/30/2032(5) |
| Comvest | NR/NR/NR | 39,119 | 12.5 | 42.25 | 1,652,778 | 11.6 | 3/31/2033(6) |
| Major Tenants | 134,924 | 43.1% | $46.53 | $6,277,859 | 44.1% | ||
| Other Tenants | 165,178 | 52.8% | $48.18 | $7,958,724 | 55.9% | ||
| Occupied Collateral Total / Wtd. Avg. | 300,102 | 95.9% | $47.44 | $14,236,583 | 100.0% | ||
| Vacant Space | 12,900 | 4.1% | |||||
| Collateral Total | 313,002 | 100.0% | |||||
| (1) | Based on underwritten rent roll dated as of December 1, 2021. |
| (2) | Ratings provided are for the parent company of the entity listed in the “Tenant” field whether or not the parent company guarantees the lease. |
| (3) | UW Base Rent PSF, UW Base Rent and % of Total UW Base Rent include rent steps of approximately $162,744 through January 2023. |
| (4) | New Day has a one-time right to terminate its lease effective on any date elected by during the period between November 30, 2027 and December 31, 2032. |
| (5) | Goldman Sachs has a one-time right to terminate its lease effective as of the day preceding the fifth anniversary date of the commencement of its lease. |
| (6) | Comvest has a one-time right to terminate its lease effective as of the last day of the 7th year of its lease. |
The following table presents certain information relating to the tenant lease expirations of the 360 Rosemary Property:
| Lease Rollover Schedule(1)(2) | |||||||||
| Year | Number of Leases Expiring | Net Rentable Area Expiring | % of NRA Expiring | UW Base Rent Expiring(3) | % of UW Base Rent Expiring(3) | Cumulative Net Rentable Area Expiring | Cumulative % of NRA Expiring | Cumulative UW Base Rent Expiring(3) | Cumulative % of UW Base Rent Expiring(3) |
| Vacant | NAP | 12,900 | 4.1% | NAP | NAP | 12,900 | 4.1% | NAP | NAP |
| 2022 | 0 | 0 | 0.0 | NAP | NAP | 12,900 | 4.1% | NAP | NAP |
| 2023 | 0 | 0 | 0.0 | NAP | NAP | 12,900 | 4.1% | NAP | NAP |
| 2024 | 0 | 0 | 0.0 | NAP | NAP | 12,900 | 4.1% | NAP | NAP |
| 2025 | 0 | 0 | 0.0 | NAP | NAP | 12,900 | 4.1% | NAP | NAP |
| 2026 | 4 | 15,891 | 5.1 | 713,428 | 5.0% | 28,791 | 9.2% | $713,428 | 5.0% |
| 2027 | 2 | 10,565 | 3.4 | 549,986 | 3.9 | 39,356 | 12.6% | $1,263,414 | 8.9% |
| 2028 | 0 | 0 | 0.0 | 0 | 0.0 | 39,356 | 12.6% | $1,263,414 | 8.9% |
| 2029 | 0 | 0 | 0.0 | 0 | 0.0 | 39,356 | 12.6% | $1,263,414 | 8.9% |
| 2030 | 0 | 0 | 0.0 | 0 | 0.0 | 39,356 | 12.6% | $1,263,414 | 8.9% |
| 2031 | 2 | 8,363 | 2.7 | 472,648 | 3.3 | 47,719 | 15.2% | $1,736,062 | 12.2% |
| 2032 & Beyond | 18 | 265,283 | 84.8 | 12,500,521 | 87.8 | 313,002 | 100.0% | $14,236,583 | 100.0% |
| Total | 26 | 313,002 | 100.0% | $14,236,583 | 100.0% | ||||
| (1) | Based on the underwritten rent roll dated December 1, 2021. |
| (2) | Certain leases may have termination options that are exercisable prior to the originally stated expiration date of the lease and that are not considered in this Lease Rollover Schedule. |
| (3) | UW Base Rent Expiring, % of UW Base Rent Expiring, Cumulative UW Base Rent Expiring and Cumulative % of UW Base Rent Expiring include rent steps of approximately $162,744 through January 2023. |
| THE INFORMATION IN THIS STRUCTURAL AND COLLATERAL TERM SHEET IS NOT COMPLETE AND MAY BE AMENDED PRIOR TO THE TIME OF SALE. THIS TERM SHEET IS NOT AN OFFER TO SELL THESE SECURITIES AND IT IS NOT A SOLICITATION OF AN OFFER TO BUY THESE SECURITIES IN ANY JURISDICTION WHERE THE OFFER OR SALE IS NOT PERMITTED. | ||
| 48 | ||
| Structural and Collateral Term Sheet | BMO 2022-C1 | |
| No. 2 – 360 Rosemary | ||
The following table presents certain information relating to the underwritten cash flows of the 360 Rosemary Property:
| Operating History and Underwritten Net Cash Flow | |||
| Underwritten | Per Square Foot | %(1) | |
| Rents in Place(2) | $14,073,839 | $44.96 | 56.5% |
| Rent Steps(3) | 520,390 | 1.66 | 2.1 |
| Vacant Income | 645,000 | 2.06 | 2.6 |
| Parking Income | 1,346,810 | 4.30 | 5.4 |
| Gross Potential Rent | $16,586,039 | $52.99 | 66.6% |
| Total Reimbursements(4) | 8,314,511 | 26.56 | 33.4 |
| Net Rental Income | $24,900,551 | $79.55 | 100.0% |
| Other Income | 0 | 0.00 | 0.0 |
| (Vacancy/Credit Loss) | (1,245,028) | (3.98) | (5.0) |
| Effective Gross Income | $23,655,523 | $75.58 | 95.0% |
| Total Expenses | $8,490,851 | $27.13 | 35.9% |
| Net Operating Income | $15,164,673 | $48.45 | 64.1% |
| Total TI/LC, Capex/RR | 359,952 | 1.15 | 1.5 |
| Net Cash Flow | $14,804,720 | $47.30 | 62.6% |
| (1) | % column represents percent of Net Rental Income for all revenue lines and represents percent of Effective Gross Income for the remainder of fields. |
| (2) | Based on the underwritten rent roll dated December 1, 2021. |
| (3) | Underwritten Rent Steps through January 2023 includes approximately $357,646 for IG Tenants Credit rent and rent steps of approximately $162,744 through January 2023. |
| (4) | Total Reimbursements include Gross-Up Recoveries. |
The Market. The 360 Rosemary Property is located in West Palm Beach, Palm Beach County, Florida, in the central business district of West Palm Beach. The 360 Rosemary Property is situated in the West Palm Beach Central Business District submarket on South Rosemary Avenue between Evernia Street and Fern Street and is surrounded primarily by office and residential properties, service businesses, and ground level retail. A major influence for the immediate area is the access to the local highway system, as well as its proximity to beach access, public transportation, and Palm Beach International Airport. Major highways within one-to-two miles of the 360 Rosemary Property include Interstate 95, Route 1 and Route 5. The 360 Rosemary Property also benefits from its proximity to multiple museums, parks, higher education institutions and outdoor sport venues.
According to the appraisal, as of the third quarter of 2021, the Palm Beach office market had an inventory of approximately 25.6 million square feet, overall vacancy in the market of approximately 13.2% and average asking rent of $38.13 PSF. As of the third quarter of 2021, the West Palm Beach Central Business District office submarket had an inventory of approximately 2.7 million square feet, overall vacancy of approximately 19.9% and average asking rent of $58.99 PSF. Within the West Palm Beach Central Business District office submarket, Class A office space overall vacancy rates have improved due to the lease-up of the 360 Rosemary Property and reports an average asking rent of $63.75 PSF. Additionally, within the West Palm Beach Central Business District office submarket, the market inventory, vacancy and average asking rent are impacted by the One Flagler property, a proposed 270,000 square foot, Class A office building development located at 154 Lakeview Avenue is expected to be delivered in 2023. According to the appraisal, the 2021 population within a one-, three- and five-mile radius was 14,546, 77,323 and 184,155, respectively. The 2021 median household income within a one-, three- and five-mile radius was $68,423, $53,322 and $50,318, respectively.
| THE INFORMATION IN THIS STRUCTURAL AND COLLATERAL TERM SHEET IS NOT COMPLETE AND MAY BE AMENDED PRIOR TO THE TIME OF SALE. THIS TERM SHEET IS NOT AN OFFER TO SELL THESE SECURITIES AND IT IS NOT A SOLICITATION OF AN OFFER TO BUY THESE SECURITIES IN ANY JURISDICTION WHERE THE OFFER OR SALE IS NOT PERMITTED. | ||
| 49 | ||
| Structural and Collateral Term Sheet | BMO 2022-C1 | |
| No. 2 – 360 Rosemary | ||
The following table presents certain information relating to comparable office leases for the 360 Rosemary Property:
| Comparable Office Leases(1) | |||||||||
| Property Name/Location | Year Built/ Renovated | NRA (SF) | Occupancy(2) | Tenant | Lease Size (SF) | Rent PSF | Commencement | Lease Term (Years) | Lease Type |
360 Rosemary West Palm Beach, FL | 2021/NAP | 313,002 | 95.9%(3) | Various | Various | $47.44(4) | Various | Various | NNN |
1 N Clematis West Palm Beach, FL | 2001/NAP | 102,452 | 92.0% | NAV | 8,848 | $44.00 | May-21 | 3.0 Yrs. | NNN |
CityPlace Tower West Palm Beach, FL | 2008/NAP | 306,007 | 95.0% | NAV | 9,940 | $50.23 | Jun-21 | 10.3 Yrs. | NNN |
Phillips Point Office Complex West Palm Beach, FL | 1985/1988 | 437,188 | 100.0% | NAV | 7,209 | $59.00 | Sep-21 | 10.2 Yrs. | NNN |
Esperante West Palm Beach, FL | 1989/NAP | 460,394 | 94.0% | NAV | 10,930 | $55.00 | Sep-21 | 5.5 Yrs. | NNN |
One Flagler(2) West Palm Beach, FL | 2023/NAP | 277,000 | 15.0% | NAV | 8,437 | $75.00 | Jan-23 | 10.5 Yrs. | NNN |
| (1) | Source: Appraisal. |
| (2) | The One Flagler property is currently in lease up and is under construction and is expected to be completed in 2023. Excluding the proposed One Flagler building, the remaining comparable properties have a combined weighted average occupancy of approximately 96.1%. |
| (3) | Occupancy for the 360 Rosemary Property is based on the underwritten rent roll as of December 1, 2021. Occupancy is based on the percentage of net rentable area leased. Due to the recent completion of the 360 Rosemary Property, many tenants are currently in the process of building out their respective spaces and have not yet taken physical occupancy. |
| (4) | Based on the underwritten rent roll dated as of December 1, 2021, with rent steps of approximately $162,744 through January 2023. |
The Borrower. The borrower is CityPlace North II, L.L.C., a Delaware limited liability company, structured to be a single purpose bankruptcy-remote entity with one independent director. Counsel to the borrower provided a non-consolidation opinion in connection with the origination of the 360 Rosemary Loan Combination.
The Borrower Sponsor. The borrower sponsor is The Related Companies, L.P. (“Related”). Related is a global real estate and lifestyle company with over $60 billion in assets owned or under development including the 28-acre Hudson Yards neighborhood on Manhattan’s West Side, The Grand and Related Santa Clara in California and the 78 in Chicago. Formed over 45 years ago, Related is one of the largest private owners of affordable housing with over 55,000 affordable and workforce housing units under ownership and management and is a fully integrated, highly diversified industry leader with experience in design, development, acquisitions, management, finance, hospitality, sustainability, and sales.
Property Management. The 360 Rosemary Property is managed by Related Urban Management Company Southeast L.L.C., a Delaware limited liability company, an affiliate of the borrower sponsor.
Escrows and Reserves. At origination, the borrower was required to deposit into escrow (i) $29,660,593 for tenant improvement, leasing commissions, and other leasing costs, (ii) $7,763,747 for free rent, (iii) $3,063,341 for gap rent, (iv) approximately $2,718,998 for completion of the base building work and (v) $2,291,872 for free recovery.
Tax Escrows – On a monthly basis during the continuance of a Trigger Period (as defined below) or an event of default under the 360 Rosemary Loan Combination documents, the borrower is required to escrow 1/12th of the annual estimated real estate taxes.
Insurance Escrows – On a monthly basis during the continuance of a Trigger Period or an event of default under the 360 Rosemary Loan Combination documents, the borrower is required to escrow 1/12th of the annual estimated insurance premium, provided that such monthly deposits are not required so long as a blanket or umbrella insurance policy acceptable to the lender and covering the 360 Rosemary Property is in effect.
TI/LC Reserve – On a monthly basis during the continuance of a Trigger Period, the borrower is required to escrow an amount equal to $19,804.19 for tenant improvement and leasing costs.
Replacement Reserve – On a monthly basis during the continuance of a Trigger Period, the borrower is required to escrow an amount equal to $3,960.84 for replacement reserves.
Lockbox / Cash Management. The 360 Rosemary Loan Combination is structured with a hard lockbox and springing cash management. The borrower is required to direct each tenant of the 360 Rosemary Property to deposit funds directly into the lockbox account controlled by the lender. Notwithstanding the foregoing, the borrower or property manager are required to deposit all revenues otherwise received relating to the property (other than tenant security deposits) into the lockbox account before the end of the first business day following receipt. On each business day during the continuance of a Trigger Period or event of default under the 360 Rosemary Loan Combination, all sums on deposit in the lockbox account are required to be swept to the cash management account. On each payment date during the continuance of a Trigger Period (or, at the lender’s discretion, during an event of default under the 360 Rosemary Mortgage Loan), all
| THE INFORMATION IN THIS STRUCTURAL AND COLLATERAL TERM SHEET IS NOT COMPLETE AND MAY BE AMENDED PRIOR TO THE TIME OF SALE. THIS TERM SHEET IS NOT AN OFFER TO SELL THESE SECURITIES AND IT IS NOT A SOLICITATION OF AN OFFER TO BUY THESE SECURITIES IN ANY JURISDICTION WHERE THE OFFER OR SALE IS NOT PERMITTED. | ||
| 50 | ||
| Structural and Collateral Term Sheet | BMO 2022-C1 | |
| No. 2 – 360 Rosemary | ||
sums on deposit in the cash management account are required to be applied and disbursed in accordance with the 360 Rosemary Loan Combination documents. At the end of each business day that no Trigger Period or event of default under the 360 Rosemary Loan Combination is continuing, all amounts in the lockbox account are required to be remitted to a borrower-controlled operating account.
During the continuance of a Trigger Period, any excess cash is required to be deposited in the excess cash flow reserve account as additional security for the 360 Rosemary Loan Combination.
A “Trigger Period” means each period (i) commencing on the date on which the debt yield (as calculated in the 360 Rosemary Loan Combination documents), as determined as of the first day of any fiscal quarter commencing after the fourth fiscal quarter of 2022, is less than 5.0% (a “Debt Yield Trigger”) and will continue until the debt yield is at least 5.0% as of the first day of two consecutive fiscal quarters, and (ii) commencing upon the borrower’s failure to deliver financial reports as and when required under the 360 Rosemary Loan Combination documents and concluding when such reports are delivered and indicate that no other Trigger Period is continuing.
“Guaranty” means that certain guaranty of recourse obligations dated as of January 18, 2022, made by The Related Companies, L.P. (“Guarantor”) in connection with the 360 Rosemary Loan Combination, that contains, among other things, the provisions that (i) throughout the term of the Loan, Guarantor shall maintain (A) a minimum net worth (exclusive of any interest in the 360 Rosemary Property) of $210 million and (B) minimum liquidity of $10 million.
Subordinate and Mezzanine Debt. On January 18, 2022, BMO funded the 360 Rosemary Subordinate Companion Loans in the aggregate amount of $125,000,000. The 360 Rosemary Senior Loan is senior in right of payment and in other respects to the 360 Rosemary Subordinate Companion Loans, and the 360 Rosemary Subordinate Companion B Loan is senior in right of payment and in other respects to the 360 Rosemary Subordinate Companion C Loan. The 360 Rosemary Subordinate Companion B Loan will be an asset of the BMO 2022-C1 securitization trust but will not be pooled together with the other mortgage loans and payments of interest, principal and other amounts received in respect of the 360 Rosemary Subordinate Companion B Loan and allocable thereto will be available to make distributions in respect of the related classes of loan-specific classes of certificates only. The 360 Rosemary Subordinate Companion B Loan and the 360 Rosemary Subordinate Companion C Loan will have initial interest rates of 3.95000% and 3.95000% per annum, respectively, and are coterminous with the 360 Rosemary Senior Loan. The relative rights and obligations of the holders of the 360 Rosemary Loan Combination are governed by the terms of a co-lender agreement. See “Description of the Mortgage Pool—The Loan Combinations—The 360 Pari Passu AB Loan Combination” in the preliminary prospectus. Based on the 360 Rosemary Loan Combination, the Cut-off Date LTV, Maturity Date LTV, UW NCF DSCR and UW NOI Debt Yield are 65.8%, 65.8%, 1.76x and 7.2%, respectively.
Partial Release. Not permitted.
Ground Lease. None.
| THE INFORMATION IN THIS STRUCTURAL AND COLLATERAL TERM SHEET IS NOT COMPLETE AND MAY BE AMENDED PRIOR TO THE TIME OF SALE. THIS TERM SHEET IS NOT AN OFFER TO SELL THESE SECURITIES AND IT IS NOT A SOLICITATION OF AN OFFER TO BUY THESE SECURITIES IN ANY JURISDICTION WHERE THE OFFER OR SALE IS NOT PERMITTED. | ||
| 51 | ||
| Structural and Collateral Term Sheet | BMO 2022-C1 | |
| No. 3 – HTI MOB Portfolio | ||
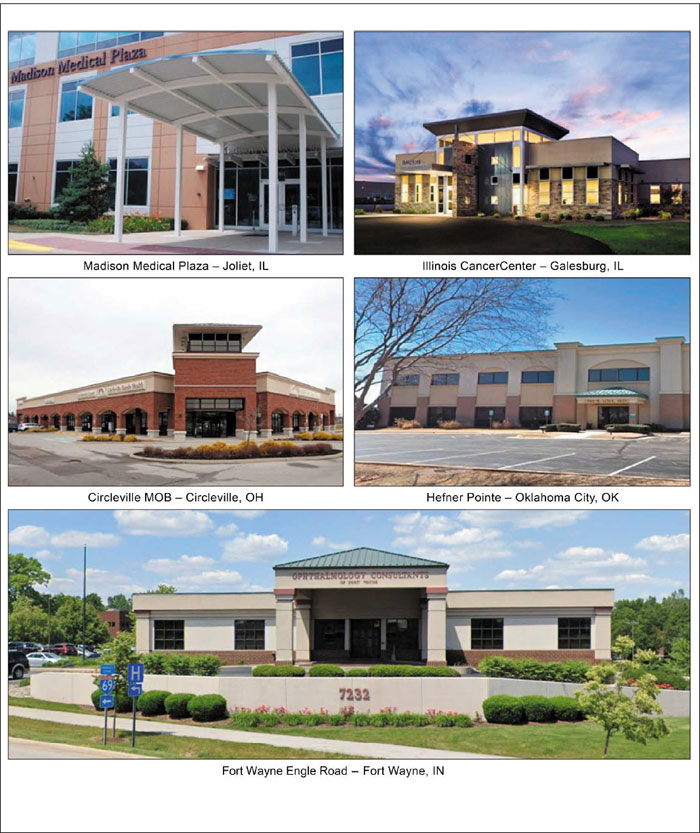
| THE INFORMATION IN THIS STRUCTURAL AND COLLATERAL TERM SHEET IS NOT COMPLETE AND MAY BE AMENDED PRIOR TO THE TIME OF SALE. THIS TERM SHEET IS NOT AN OFFER TO SELL THESE SECURITIES AND IT IS NOT A SOLICITATION OF AN OFFER TO BUY THESE SECURITIES IN ANY JURISDICTION WHERE THE OFFER OR SALE IS NOT PERMITTED. | ||
| 52 | ||
| Structural and Collateral Term Sheet | BMO 2022-C1 | |
| No. 3 – HTI MOB Portfolio | ||
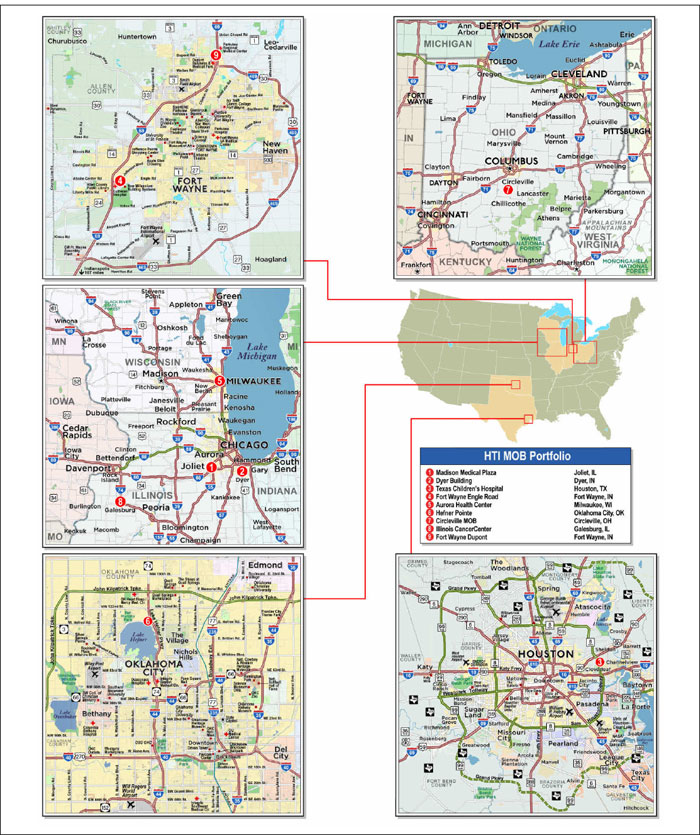
| THE INFORMATION IN THIS STRUCTURAL AND COLLATERAL TERM SHEET IS NOT COMPLETE AND MAY BE AMENDED PRIOR TO THE TIME OF SALE. THIS TERM SHEET IS NOT AN OFFER TO SELL THESE SECURITIES AND IT IS NOT A SOLICITATION OF AN OFFER TO BUY THESE SECURITIES IN ANY JURISDICTION WHERE THE OFFER OR SALE IS NOT PERMITTED. | ||
| 53 | ||
| Structural and Collateral Term Sheet | BMO 2022-C1 | |
| No. 3 – HTI MOB Portfolio | ||
| Mortgage Loan Information | Property Information | |||
| Mortgage Loan Seller: | BMO | Single Asset / Portfolio: | Portfolio | |
| Original Principal Balance: | $42,750,000 | Title: | Various | |
| Cut-off Date Principal Balance: | $42,750,000 | Property Type – Subtype: | Office – Medical | |
| % of IPB: | 3.8% | Net Rentable Area (SF): | 232,854 | |
| Loan Purpose: | Recapitalization | Location: | Various | |
| Borrowers (1): | Various | Year Built / Renovated: | Various / Various | |
| Borrower Sponsor: | Healthcare Trust Operating | Occupancy: | 96.5% | |
| Partnership, L.P. | Occupancy Date(2): | Various | ||
| Interest Rate: | 2.89000% | 4th Most Recent NOI (As of): | NAV | |
| Note Date: | 11/15/2021 | 3rd Most Recent NOI (As of): | $3,760,663 (12/31/2019) | |
| Maturity Date: | 12/6/2031 | 2nd Most Recent NOI (As of): | $4,036,062 (12/31/2020) | |
| Interest-only Period: | 120 months | Most Recent NOI (As of): | $5,403,939 (TTM 9/30/2021) | |
| Original Term: | 120 months | UW Economic Occupancy: | 94.1% | |
| Original Amortization Term: | None | UW Revenues: | $7,216,575 | |
| Amortization Type: | Interest Only | UW Expenses: | $2,300,528 | |
| Call Protection: | L(11),YM1(15),DorYM1(89),O(5) | UW NOI: | $4,916,047 | |
| Lockbox / Cash Management: | Hard / Springing | UW NCF: | $4,753,049 | |
| Additional Debt: | No | Appraised Value / Per SF: | $77,000,000 / $331 | |
| Additional Debt Balance: | N/A | Appraisal Date: | Various | |
| Additional Debt Type: | N/A | |||
| Escrows and Reserves(3) | Financial Information | ||||||||||
| Initial | Monthly | Initial Cap | |||||||||
| Taxes: | $0 | $69,316 | N/A | Cut-off Date Loan / SF: | $184 | ||||||
| Insurance: | $0 | Springing | N/A | Maturity Date Loan / SF: | $184 | ||||||
| Replacement Reserves: | $0 | $3,881 | $93,142 | Cut-off Date LTV: | 55.5% | ||||||
| TI / LC Reserve: | $2,000,000 | Springing | N/A | Maturity Date LTV: | 55.5% | ||||||
| Immediate Repair Reserves: | $144,432 | $0 | N/A | UW NCF DSCR: | 3.79x | ||||||
| Other: | $372,918 | $0 | N/A | UW NOI Debt Yield: | 11.5% | ||||||
| Sources and Uses | |||||||||||
| Sources | Proceeds | % of Total | Uses | Proceeds | % of Total | ||||||
| Mortgage Loan | $42,750,000 | 99.5% | Pay Down Credit Facility | $36,973,657 | 86.1% | ||||||
| Borrower Sponsor Equity | 200,000 | 0.5 | Closing Costs | 3,458,993 | 8.1 | ||||||
| Upfront Reserves | 2,517,350 | 5.9 | |||||||||
| Total Sources | $42,950,000 | 100.0% | Total Uses | $42,950,000 | 100.0% | ||||||
| (1) | For a more detailed description of the Borrowers, see “The Borrowers” below. |
| (2) | Occupancy is as of November 15, 2021 for the Dyer Building, Fort Wayne Engle Road, Illinois CancerCenter, and Fort Wayne Dupont properties and October 19, 2021 for the remaining properties. |
| (3) | For a full description of Escrows and Reserves, see “Escrows and Reserves” below. |
The Loan. The third largest mortgage loan has an outstanding principal balance as of the Cut-off Date of $42,750,000 (the “HTI MOB Portfolio Mortgage Loan”) and is secured by a first mortgage lien on the Borrowers’ fee and leasehold interest in a 232,854 square foot medical office portfolio located in Illinois, Indiana, Texas, Wisconsin, Oklahoma and Ohio (the “HTI MOB Portfolio Properties”). The HTI MOB Portfolio Mortgage Loan has a ten-year term and is interest-only for the entire term.
The Property. The HTI MOB Portfolio Properties consists of nine, one-, two- and three-story medical office buildings totaling 232,854 square feet, located in Illinois, Indiana, Texas, Wisconsin, Oklahoma and Ohio. The HTI MOB Portfolio Properties were built between 1997 and 2014 as medical office properties and are currently 96.5% leased to 26 medical office tenants, including tenants such as Ophthalmology Consultants of Fort Wayne, Franciscan Medical Specialists, Provena, DuPage Medical Group RE and Surgery Center of Joliet. Ophthalmology Consultants of Fort Wayne, Franciscan Medical Specialists and Provena represent a combined 34.3% of the total NRA. No other tenant leases more than 6.5% of the NRA and no more than 26.4% of the total NRA rolls in any single year through 2032 with a current weighted average remaining lease term of approximately 4.6 years.
| THE INFORMATION IN THIS STRUCTURAL AND COLLATERAL TERM SHEET IS NOT COMPLETE AND MAY BE AMENDED PRIOR TO THE TIME OF SALE. THIS TERM SHEET IS NOT AN OFFER TO SELL THESE SECURITIES AND IT IS NOT A SOLICITATION OF AN OFFER TO BUY THESE SECURITIES IN ANY JURISDICTION WHERE THE OFFER OR SALE IS NOT PERMITTED. | ||
| 54 | ||
| Structural and Collateral Term Sheet | BMO 2022-C1 | |
| No. 3 – HTI MOB Portfolio | ||
The Madison Medical Plaza Property (the “Madison Medical Plaza Property”) is a 70,023 square foot, three-story medical office building located in Joliet, Illinois and was originally built in 2006.
The Dyer Building Property (the “Dyer Building Property”) is a 26,540 square foot, two-story medical office building located in Dyer, Indiana and was originally built in 1998 and was renovated in 2012.
The Texas Children’s Hospital Property (the “Texas Children’s Hospital Property”) is a 24,075 square foot, one-story medical office building located in Houston, Texas and was originally built in 2006.
The Fort Wayne Engle Road Property (the “Fort Wayne Engle Road Property”) is a 20,800 square foot, two-story medical office building located in Fort Wayne, Indiana and was originally built in 1997.
The Aurora Health Center Property (the “Aurora Health Center Property”) is a 25,466 square foot, one-story medical office building located in Milwaukee, Wisconsin and was originally built in 2000.
The Hefner Pointe Property (the “Hefner Pointe Property”) is a 26,651 square foot, two-story medical office building located in Oklahoma City, Oklahoma and was originally built in 1998.
The Circleville MOB Property (the “Circleville MOB Property”) is a 19,888 square foot, one-story medical office building located in Circleville, Ohio and was originally built in 2005.
The Illinois CancerCenter Property (the “Illinois CancerCenter Property”) is a 9,211 square foot, one-story medical office building located in Galesburg, Illinois and was originally built in 2014.
The Fort Wayne Dupont Property (the “Fort Wayne Dupont Property”) is a 10,200 square foot, one-story medical office building located in Fort Wayne, Indiana and was originally built in 2012.
COVID-19 Update. As of February 1, 2022, the HTI MOB Portfolio Properties are open and operating and all tenants are current on their rental obligations. The borrowers made their first debt service payment for the HTI MOB Portfolio Mortgage Loan in January 2022. As of February 1, 2022, the HTI MOB Portfolio Mortgage Loan is current and is not subject to any forbearance, modification or debt service relief requests.
Major Tenants.
Ophthalmology Consultants of Fort Wayne (31,000 square feet; 13.3% of the NRA; 13.3% of the underwritten rent): Ophthalmology Consultants of Fort Wayne is an ophthalmology and optometry firm that has been practicing in the Fort Wayne, Indiana area since the 1980s, with ophthalmologists and optometrists providing care for adults and children within the community.
Franciscan Medical Specialists (26,540 square feet; 11.4% of the NRA; 12.6% of the underwritten rent): Franciscan Medical Specialists is a subsidiary of Franciscan Alliance, Inc., a 12-hospital system including clinics, home health services and doctors in Indiana and Illinois. Franciscan Alliance, Inc. currently has over approximately 20,000 employees.
Provena (22,412 square feet; 9.6% of the NRA; 9.9% of the underwritten rent): Provena is a subsidiary of Ascension Health Alliance, a private healthcare system headquartered in Saint Louis, Missouri. Ascension Health Alliance currently has 150,000 employees.
DuPage Medical Group RE (15,047 square feet; 6.5% of the NRA; 8.0% of the underwritten rent): DuPage Medical Group was founded in 1999 and currently employs over 700 primary care and specialty physicians across more than 150 locations. DuPage Medical Group rebranded on September 15, 2021 and is currently doing business as Duly Health and Care.
Surgery Center of Joliet (13,757 square feet; 5.9% of the NRA; 6.0% of the underwritten rent): Surgery Center of Joliet is an affiliate of Surgical Care Affiliates, a national surgical solutions provider with 8,500 physicians.
Environmental. According to the individual Phase I environmental site assessments completed between June 4, 2021 and September 13, 2021 for the HTI MOB Portfolio Properties, there was no evidence of any recognized environmental conditions at the HTI MOB Portfolio Properties.
| THE INFORMATION IN THIS STRUCTURAL AND COLLATERAL TERM SHEET IS NOT COMPLETE AND MAY BE AMENDED PRIOR TO THE TIME OF SALE. THIS TERM SHEET IS NOT AN OFFER TO SELL THESE SECURITIES AND IT IS NOT A SOLICITATION OF AN OFFER TO BUY THESE SECURITIES IN ANY JURISDICTION WHERE THE OFFER OR SALE IS NOT PERMITTED. | ||
| 55 | ||
| Structural and Collateral Term Sheet | BMO 2022-C1 | |
| No. 3 – HTI MOB Portfolio | ||
| Historical and Current Occupancy(1) | |||
| 2018(2)(3) | 2019(2)(3) | 2020(2) | Current(4) |
| 94.1% | 92.8% | 94.7% | 96.5% |
| (1) | Historical Occupancies are as of December 31 of each respective year. |
| (2) | Historical Occupancies exclude the Fort Wayne Engle Road, Hefner Pointe and Fort Wayne Dupont properties. |
| (3) | 2018 and 2019 exclude the Circleville MOB property. |
| (4) | Current Occupancy is as of November 15, 2021 for the Dyer Building, Fort Wayne Engle Road, Illinois CancerCenter, and Fort Wayne Dupont properties and October 19, 2021 for the remaining properties. |
| Top Tenant Summary(1) | |||||||
| Tenant | Ratings Moody’s/S&P/Fitch | Net Rentable Area (SF) | % of Total NRA | UW Base Rent PSF(2) | UW Base Rent(2) | % of Total UW Base Rent | Lease Exp. Date |
Ophthalmology Consultants of Fort Wayne(3) | NR/NR/NR | 31,000 | 13.3% | $23.15 | $717,650 | 13.3% | 12/31/2030 |
| Franciscan Medical Specialists(4) | NR/NR/NR | 26,540 | 11.4 | 25.60 | 679,477 | 12.6 | 9/30/2027 |
| Provena(5) | NR/NR/NR | 22,412 | 9.6 | 23.67 | 530,577 | 9.9 | Various |
| DuPage Medical Group RE | NR/NR/NR | 15,047 | 6.5 | 28.64 | 430,946 | 8.0 | 12/31/2022 |
| Surgery Center of Joliet | NR/NR/NR | 13,757 | 5.9 | 23.63 | 325,078 | 6.0 | 12/31/2025 |
| Major Tenants | 108,756 | 46.7% | $24.68 | $2,683,729 | 49.9% | ||
| Other Tenants | 116,035 | 49.8% | $23.24 | $2,696,177 | 50.1% | ||
| Occupied Collateral Total / Wtd. Avg. | 224,791 | 96.5% | $23.93 | $5,379,906 | 100.0% | ||
| Vacant Space | 8,063 | 3.5% | |||||
| Collateral Total | 232,854 | 100.0% | |||||
| (1) | Based on underwritten rent rolls dated November 15, 2021 for the Dyer Building, Fort Wayne Engle Road, Illinois CancerCenter, and Fort Wayne Dupont properties and October 19, 2021 for the remaining properties. Four properties (representing approximately 31.3% of the aggregate underwritten base rent) are single-tenant properties and five properties (representing approximately 68.7% of underwritten base rent) are multi-tenant properties. |
| (2) | UW Base Rent PSF and UW Base Rent include rent steps totaling approximately $104,601 through December 2022. |
| (3) | Ophthalmology Consultants of Fort Wayne is a single tenant at the Fort Wayne Engle Road Property (20,800 square feet) and a single tenant at the Fort Wayne Dupont Property (10,200 square feet). |
| (4) | Franciscan Medical Specialists is a single tenant at the Dyer Building Property. The tenant has two, five-year renewal options exercisable upon six months’ notice. |
| (5) | Provena leases 6,258 square feet expiring on September 19, 2023, 4,135 square feet expiring on September 30, 2025, 4,179 square feet expiring on March 31, 2026, and 7,840 square feet expiring on December 31, 2026. |
| THE INFORMATION IN THIS STRUCTURAL AND COLLATERAL TERM SHEET IS NOT COMPLETE AND MAY BE AMENDED PRIOR TO THE TIME OF SALE. THIS TERM SHEET IS NOT AN OFFER TO SELL THESE SECURITIES AND IT IS NOT A SOLICITATION OF AN OFFER TO BUY THESE SECURITIES IN ANY JURISDICTION WHERE THE OFFER OR SALE IS NOT PERMITTED. | ||
| 56 | ||
| Structural and Collateral Term Sheet | BMO 2022-C1 | |
| No. 3 – HTI MOB Portfolio | ||
| Lease Rollover Schedule(1)(2) | |||||||||
| Year | Number of Leases Expiring | Net Rentable Area Expiring | % of NRA Expiring | UW Base Rent Expiring(3) | % of UW Base Rent Expiring | Cumulative Net Rentable Area Expiring | Cumulative % of NRA Expiring | Cumulative UW Base Rent Expiring(3) | Cumulative % of UW Base Rent Expiring |
| Vacant | NAP | 8,063 | 3.5% | NAP | NAP | 8,063 | 3.5% | NAP | NAP |
| 2022 & MTM | 2 | 24,047 | 10.3 | $617,966 | 11.5% | 32,110 | 13.8% | $617,966 | 11.5% |
| 2023 | 4 | 11,170 | 4.8 | 269,023 | 5.0 | 43,280 | 18.6% | $886,989 | 16.5% |
| 2024 | 3 | 15,944 | 6.8 | 447,400 | 8.3 | 59,224 | 25.4% | $1,334,389 | 24.8% |
| 2025 | 6 | 37,670 | 16.2 | 861,942 | 16.0 | 96,894 | 41.6% | $2,196,331 | 40.8% |
| 2026 | 7 | 61,424 | 26.4 | 1,370,382 | 25.5 | 158,318 | 68.0% | $3,566,713 | 66.3% |
| 2027 | 11 | 34,377 | 14.8 | 859,350 | 16.0 | 192,695 | 82.8% | $4,426,063 | 82.3% |
| 2028 | 3 | 9,159 | 3.9 | 236,193 | 4.4 | 201,854 | 86.7% | $4,662,256 | 86.7% |
| 2029 | 0 | 0 | 0.0 | 0 | 0.0 | 201,854 | 86.7% | $4,662,256 | 86.7% |
| 2030 | 2 | 31,000 | 13.3 | 717,650 | 13.3 | 232,854 | 100.0% | $5,379,906 | 100.0% |
| 2031 | 0 | 0 | 0.0 | 0 | 0.0 | 232,854 | 100.0% | $5,379,906 | 100.0% |
| 2032 | 0 | 0 | 0.0 | 0 | 0.0 | 232,854 | 100.0% | $5,379,906 | 100.0% |
| 2033 & Beyond | 0 | 0 | 0.0 | 0 | 0.0 | 232,854 | 100.0% | $5,379,906 | 100.0% |
| Total | 38 | 232,854 | 100.0% | $5,379,906 | 100.0% | ||||
| (1) | Based on underwritten rent rolls dated November 15, 2021 for the Dyer Building, Fort Wayne Engle Road, Illinois CancerCenter, and Fort Wayne Dupont properties and October 19, 2021 for the remaining properties. |
| (2) | Certain leases may have termination options that are exercisable prior to the originally stated expiration date of the lease and that are not considered in this Lease Rollover Schedule. |
| (3) | UW Base Rent Expiring and Cumulative UW Base Rent Expiring include rent steps totaling approximately $104,601 through December 2022. |
| Operating History and Underwritten Net Cash Flow | ||||||
| 2019 | 2020 | TTM(1) | Underwritten | Per Square Foot | %(2) | |
| Rents in Place(3) | $4,103,245 | $4,190,180 | $5,471,151 | $5,275,305 | $22.65 | 68.8% |
| Rent Steps | 0 | 0 | 0 | 104,601 | 0.45 | 1.4 |
| Vacant Income | 0 | 0 | 0 | 277,179 | 1.19 | 3.6 |
| Straight Line Rent | 0 | 0 | 0 | 117,673 | 0.51 | 1.5 |
| Total Base Rent | $4,103,245 | $4,190,180 | $5,471,151 | $5,774,758 | $24.80 | 75.3% |
| Total Reimbursements | 1,543,694 | 1,758,588 | 1,942,979 | 1,895,241 | 8.14 | 24.7 |
| Net Rental Income | $5,646,939 | $5,948,768 | $7,414,130 | $7,669,999 | $32.94 | 100.0% |
| (Vacancy/Credit Loss) | 0 | 0 | 0 | (453,424) | (1.95) | (5.9) |
| Effective Gross Income | $5,646,939 | $5,948,768 | $7,414,130 | $7,216,575 | $30.99 | 94.1% |
| Total Expenses | $1,886,276 | $1,912,706 | $2,010,191 | $2,300,528 | $9.88 | 31.9% |
| Net Operating Income | $3,760,663 | $4,036,062 | $5,403,939 | $4,916,047 | $21.11 | 68.1% |
| Capital Expenditures | 0 | 0 | 0 | 46,571 | 0.20 | 0.6 |
| TI / LC | 0 | 0 | 0 | 116,427 | 0.50 | 1.6 |
| Net Cash Flow | $3,760,663 | $4,036,062 | $5,403,939 | $4,753,049 | $20.41 | 65.9% |
| (1) | TTM represents the trailing 12 months ending September 30, 2021. |
| (2) | % column represents percent of Net Rental Income for all revenue lines and represents percent of Effective Gross Income for the remainder of fields. |
| (3) | Underwritten Rents in Place is based on underwritten rent rolls dated November 15, 2021 for the Dyer Building, Fort Wayne Engle Road, Illinois CancerCenter, and Fort Wayne Dupont properties and October 19, 2021 for the remaining properties. |
The Market. The HTI MOB Portfolio Properties are located in Illinois, Indiana, Ohio, Oklahoma, Texas and Wisconsin. The Madison Medical Plaza Property is located in the city of Joliet, Illinois. Joliet is situated in the northwestern portion of Will County, approximately 40 miles southwest of the Chicago Central Business District. The Dyer Building Property is located in the city of Dyer, Indiana. The city of Dyer is situated in west-central Lake County, just east of the Illinois border and approximately 32 miles southeast of the Chicago Central Business District. The Texas Children’s Hospital Property is located in the city of Houston, Texas and is considered a suburban location. The city of Houston is situated in Harris County, Texas. The Fort Wayne Engle Road Property is located in the southwestern portion of the city of Fort Wayne, Indiana in the Midwestern Office Park. Specifically, the Fort Wayne Engle Road Property is located in the northeast quadrant of Jefferson Boulevard and Engle Road. The Aurora Health Center Property is located in the geographic area generally referred to as the Milwaukee metropolitan area, which is located in the Midwestern United States. The Hefner Point Property is located in the Oklahoma City area office market. The surrounding area is projected to experience continued growth in both total population and number
| THE INFORMATION IN THIS STRUCTURAL AND COLLATERAL TERM SHEET IS NOT COMPLETE AND MAY BE AMENDED PRIOR TO THE TIME OF SALE. THIS TERM SHEET IS NOT AN OFFER TO SELL THESE SECURITIES AND IT IS NOT A SOLICITATION OF AN OFFER TO BUY THESE SECURITIES IN ANY JURISDICTION WHERE THE OFFER OR SALE IS NOT PERMITTED. | ||
| 57 | ||
| Structural and Collateral Term Sheet | BMO 2022-C1 | |
| No. 3 – HTI MOB Portfolio | ||
of households in the coming years. The Circleville MOB Property is located in the city of Circleville, Ohio and is considered a rural location. The City of Circleville is situated in southeast Pickaway County, about 30 miles south of the Columbus Central Business District. The Illinois CancerCare Property is located in the city of Galesburg, Illinois and is considered a suburban location. The city of Galesburg is situated in west-central Knox County, approximately 50 miles northwest of Peoria, 60 miles south of the Quad Cities and 200 miles southwest of Chicago. The Fort Wayne Dupont Property neighborhood is located on the north side of the Fort Wayne, Indiana metro area. There are a variety of land uses in the neighborhood including hospital and related medical office buildings, single-family homes and multi-family apartments, retail, local parks, and public golf courses. Specifically, the Fort Wayne Dupont Property is located in the southwest quadrant of Dupont Road and Interstate 69.
The following table presents certain information relating to the market areas for the HTI MOB Portfolio Properties:
| Market Area Summary(1) | |||||||
| 2021 Total Population | 2021 Median Household Income | ||||||
| Property Location | 1-Mile Radius | 3-Mile Radius | 5-Mile Radius | 1-Mile Radius | 3-Mile Radius | 5-Mile Radius | |
301 North Madison Street Joliet, IL | 12,231 | 82,618 | 173,339 | $55,392 | $58,301 | $65,570 | |
919 Main Street Dyer, IN | 6,992 | 64,557 | 183,200 | $94,414 | $76,764 | $66,287 | |
5614-5630 East Sam Houston Parkway North Houston, TX | 19,125 | 106,901 | 166,468 | $71,013 | $55,647 | $53,480 | |
7232 Engle Road Fort Wayne, IN | 2,959 | 32,408 | 87,280 | $68,801 | $72,187 | $58,484 | |
3305 South 20th Street Milwaukee, WI | 23,861 | 194,554 | 391,170 | $46,432 | $48,485 | $450,228 | |
11101 Hefner Pointe Drive Oklahoma City, OK | 4,764 | 72,622 | 201,709 | $83,084 | $60,817 | $63,531 | |
140 Morris Road Circleville, OH | 5,879 | 16,611 | 21,782 | $51,565 | $43,153 | $47,650 | |
336 Home Boulevard Galesburg, IL | 4,738 | 27,909 | 32,630 | $41,677 | $36,701 | $37,817 | |
10186 East Dupont Circle Drive Fort Wayne, IN | 3,880 | 52,281 | 115,474 | $79,098 | $71,549 | $67,187 | |
| (1) | Source: Appraisals. |
| THE INFORMATION IN THIS STRUCTURAL AND COLLATERAL TERM SHEET IS NOT COMPLETE AND MAY BE AMENDED PRIOR TO THE TIME OF SALE. THIS TERM SHEET IS NOT AN OFFER TO SELL THESE SECURITIES AND IT IS NOT A SOLICITATION OF AN OFFER TO BUY THESE SECURITIES IN ANY JURISDICTION WHERE THE OFFER OR SALE IS NOT PERMITTED. | ||
| 58 | ||
| Structural and Collateral Term Sheet | BMO 2022-C1 | |
| No. 3 – HTI MOB Portfolio | ||
The following table presents certain information relating to comparable office leases for the HTI MOB Portfolio Properties:
| Comparable Office Leases(1) | ||||||||
| Property Location | Year Built | NRA (SF) | Tenant | Lease Size (SF) | Rent PSF | Commencement | Lease Term (Years) | Lease Type |
301 North Madison Street Joliet, IL | 2006 | 70,023(2) | DuPage Medical Group RE(2) | 15,047(2) | $28.64(2) | Various(2) | Various(2) | NNN(2) |
919 Main Street Dyer, IN | 1998 | 26,540(2) | Franciscan Medical Specialists(2) | 26,540(2) | $25.60(2) | Oct-12(2) | 15.0(2) | NNN(2) |
5614-5630 East Sam Houston Parkway North Houston, TX | 2006 | 24,075(2) | Texas Children’s Pediatrics(2) | 9,000(2) | $20.78(2) | Aug-07(2) | 15.3(2) | NNN(2) |
7232 Engle Road Fort Wayne, IN | 1997 | 20,800(2) | Ophthalmology Consultants of Fort Wayne(2) | 20,800(2) | $23.15(2) | Jan-16(2) | 15.0(2) | NNN(2) |
3305 South 20th Street Milwaukee, WI | 2000 | 25,466(2) | Lakeshore Medical Clinic(2) | 14,586(2) | $20.21(2) | Apr-01(2) | 25.8(2) | NNN(2) |
11101 Hefner Pointe Drive Oklahoma City, OK | 1998 | 26,651(2) | Integris Medical Group(2) | 11,991(2) | $26.00(2) | Apr-99(2) | 27.0(2) | Modified Gross(2) |
140 Morris Road Circleville, OH | 2005 | 19,888(2) | OhioHealth(2) | 10,464(2) | $21.20(2) | May-06(2) | 18.8(2) | NNN(2) |
336 Home Boulevard Galesburg, IL | 2014 | 9,211(2) | ICC(2) | 9,211(2) | $30.87(2) | Aug-14(2) | 10.1(2) | NNN(2) |
10186 East Dupont Circle Drive Fort Wayne, IN | 2012 | 10,200(2) | Ophthalmology Consultants of Fort Wayne(2) | 10,200(2) | $23.15(2) | Jan-16(2) | 15.0(2) | NNN(2) |
5995 Spring Creek Road Rockford, IL | 1994 | 14,396 | Transformation Plastic Surgery Clinic | 14,396 | $23.00 | Nov-19 | 10.0 | NNN |
125 East Plummer Boulevard Chatham, IL | 2018 | 17,385 | HSHS Medical Group | 17,385 | $26.12 | Feb-18 | 10.0 | NNN |
10106 E Dupont Circle Drive Fort Wayne, IN | 2021 | 99,500 | Optimum Performance Sports | 87,000 | $18.40 | Sep-21 | 20.0 | NNN |
11524 Space Center Blvd Houston, TX | 2014 | 6,000 | NAV | 6,000 | $24.00 | NAV | NAV | NNN |
4655 N. Port Washington Glendale, WI | 1989 | 30,611 | Advocate Aurora | 4,205 | $13.50 | Sep-20 | 5.0 | NNN |
16216 Sonoma Park Drive Edmond, OK | 2020 | 5,340 | Legacy Ventures | 1,940 | $20.00 | Aug-21 | 2.0 | NNN |
2405 Columbus Street Lancaster, OH | 1997 | 73,465 | Fairfield Medical | 7,375 | $13.56 | Jul-12 | 10.0 | NNN |
107 Watters Drive Dwight, IL | 2018 | 8,127 | OSF HealthCare | 8,127 | $26.96 | Aug-18 | 15.0 | NNN |
3204 Congressional Parkway Fort Wayne, IN | 2021 | 6,450 | Lincare Medical | 6,450 | $13.83 | Aug-19 | 3.0 | NNN |
| (1) | Source: Appraisals. |
| (2) | Based on the underwritten rent rolls dated November 15, 2021 for the Dyer Building, Fort Wayne Engle Road, Illinois CancerCenter, and Fort Wayne Dupont properties and October 19, 2021 for the remaining properties. |
| THE INFORMATION IN THIS STRUCTURAL AND COLLATERAL TERM SHEET IS NOT COMPLETE AND MAY BE AMENDED PRIOR TO THE TIME OF SALE. THIS TERM SHEET IS NOT AN OFFER TO SELL THESE SECURITIES AND IT IS NOT A SOLICITATION OF AN OFFER TO BUY THESE SECURITIES IN ANY JURISDICTION WHERE THE OFFER OR SALE IS NOT PERMITTED. | ||
| 59 | ||
| Structural and Collateral Term Sheet | BMO 2022-C1 | |
| No. 3 – HTI MOB Portfolio | ||
The following table presents certain information relating to comparable office sales for the HTI MOB Portfolio Properties:
| Comparable Office Sales(1) | ||||||
| Property Location | Sale Date | Total NRA (SF) | Total Occupancy | Sale Price | Sale Price PSF | Adjusted Sales Price PSF |
301 North Madison Street Joliet, IL | NAP | 70,023(2) | 93.8%(2) | NAP | NAP | NAP |
919 Main Street Dyer, IN | NAP | 26,540(2) | 100.0%(2) | NAP | NAP | NAP |
5614-5630 East Sam Houston Parkway North Houston, TX | NAP | 24,075(2) | 90.4%(2) | NAP | NAP | NAP |
7232 Engle Road Fort Wayne, IN | NAP | 20,800(2) | 100.0%(2) | NAP | NAP | NAP |
3305 South 20th Street Milwaukee, WI | NAP | 25,466(2) | 94.4%(2) | NAP | NAP | NAP |
11101 Hefner Pointe Drive Oklahoma City, OK | NAP | 26,651(2) | 100.0%(2) | NAP | NAP | NAP |
140 Morris Road Circleville, OH | NAP | 19,888(2) | 100.0%(2) | NAP | NAP | NAP |
336 Home Boulevard Galesburg, IL | NAP | 9,211(2) | 100.0%(2) | NAP | NAP | NAP |
10186 East Dupont Circle Drive Fort Wayne, IN | NAP | 10,200(2) | 100.0%(2) | NAP | NAP | NAP |
1001 Main Street Peoria, IL | Jan-21 | 97,997 | 100.0% | $34,500,000 | $352.05 | $352.05 |
503 Greenwood Trace Drive Whiteland, IN | Apr-21 | 19,360 | 100.0% | $9,000,000 | $464.88 | $464.88 |
8520 Broadway Street Pearland, TX | Nov-18 | 47,500 | 100.0% | $16,500,000 | $347.37 | $347.37 |
4375 E Park 30 Drive Columbia City, IN | May-21 | 16,500 | 100.0% | $5,475,000 | $331.82 | $331.82 |
S68 W15500 Janesville Road Muskego, WI | Aug-21 | 24,067 | 100.0% | $8,540,000 | $354.84 | $354.84 |
2158 Butterfield Coach Road Springdale, AR | May-21 | 15,506 | 100.0% | $4,000,000 | $257.96 | $257.96 |
235 West National Road Vandalia, OH | Jun-21 | 7,304 | 100.0% | $1,960,000 | $268.35 | $268.35 |
1410 South Quail Run Vincennes, IN | Mar-21 | 5,803 | 100.0% | $2,200,000 | $379.11 | $379.11 |
10120 Calumet Avenue Munster, IN | May-20 | 23,088 | 100.0% | $8,350,000 | $361.66 | $361.66 |
| (1) | Source: Appraisals. |
| (2) | Based on underwritten rent rolls dated November 15, 2021 for the Dyer Building, Fort Wayne Engle Road, Illinois CancerCenter, and Fort Wayne Dupont properties and October 19, 2021 for the remaining properties. |
The Borrowers. The borrowers for the HTI MOB Portfolio Mortgage Loan are ARHC MMJLTIL01, LLC, ARHC DFDYRIN01, LLC, ARHC TCHOUTX01, LLC, ARHC OPFWNIN01, LLC, ARHC AHMLWWI01, LLC, ARHC HPOKCOK01, LLC, ARHC CPCIROH01, LLC, ARHC CCGBGIL01, LLC and ARHC OPFWNIN02, LLC, (collectively, the “HTI MOB Portfolio Borrowers”), each a Delaware limited liability company and structured as a single purpose entity with two independent directors. Legal counsel to the HTI MOB Portfolio Borrowers delivered a non-consolidation opinion in connection with the origination of the HTI MOB Portfolio Mortgage Loan.
The Borrower Sponsor. The borrower sponsor and guarantor is Healthcare Trust Operating Partnership, L.P. Healthcare Trust Operating Partnership, L.P. is a subsidiary of Healthcare Trust, Inc., a publicly registered real estate investment trust focused on acquiring a diversified portfolio of healthcare real estate, with an emphasis on senior housing and medical office buildings located in the United States. As of September 30, 2021, Healthcare Trust, Inc. owned 201 properties (9.3 million square feet) located in 33 states.
Property Management. The HTI MOB Portfolio Properties are managed by Hiffman Asset Management, LLC and Healthcare Trust Properties, LLC. Healthcare Trust Properties, LLC is an affiliate of the borrower sponsor.
Escrows and Reserves. At origination, the HTI MOB Portfolio Borrowers were required to deposit into escrow (i) $2,000,000 for tenant improvements and leasing commissions, (ii) approximately $366,117 for outstanding tenant improvement obligations, (iii) approximately $144,432 for deferred maintenance and (iv) $6,801 for ground rent.
Tax Escrows – The HTI MOB Portfolio Borrowers are required to escrow 1/12th of the annual estimated real estate taxes during the next 12 months for an individual property upon (i) an event of default under the HTI MOB Portfolio Mortgage Loan documents, (ii) such individual property is not leased to a single tenant, (iii) the tenant at such individual property does not occupy one or more entire tax parcel(s) and is not required pursuant to the applicable lease to pay all taxes directly to applicable taxing authorities and (iv) a Cash
| THE INFORMATION IN THIS STRUCTURAL AND COLLATERAL TERM SHEET IS NOT COMPLETE AND MAY BE AMENDED PRIOR TO THE TIME OF SALE. THIS TERM SHEET IS NOT AN OFFER TO SELL THESE SECURITIES AND IT IS NOT A SOLICITATION OF AN OFFER TO BUY THESE SECURITIES IN ANY JURISDICTION WHERE THE OFFER OR SALE IS NOT PERMITTED. | ||
| 60 | ||
| Structural and Collateral Term Sheet | BMO 2022-C1 | |
| No. 3 – HTI MOB Portfolio | ||
Sweep Period (as defined below) is in effect. Currently, the HTI MOB Portfolio Borrowers are depositing $69,316 into the real estate tax reserve account on a monthly basis.
Insurance Escrows – The HTI MOB Portfolio Borrowers are required to make monthly payments of 1/12th of the premiums payable during the next 12 months upon (i) an event of default, (ii) failure by the HTI MOB Portfolio Borrowers to provide evidence to the lender that the HTI MOB Portfolio Properties are insured under a blanket policy, or (iii) any cancellation, termination or lapse of such blanket insurance coverage.
Replacement Reserve – On a monthly basis, the HTI MOB Portfolio Borrowers are required to escrow approximately $3,881 for replacement reserves, capped at $93,141.60.
TI/LC Reserve – On a monthly basis during the continuance of a Cash Sweep Period, the HTI MOB Portfolio Borrowers are required to escrow approximately $19,405 for tenant improvements and leasing commissions.
Lockbox / Cash Management. The HTI MOB Portfolio Mortgage Loan is structured with a hard lockbox and springing cash management. The HTI MOB Portfolio Mortgage Loan requires all rents to be transmitted directly into a lockbox account controlled by the lender (including, without limitation, by sending tenant direction letters to all tenants at origination/new lease execution). If a Cash Sweep Period is in effect, all funds in the lockbox account are required to be swept on each business day to a cash management account controlled by the lender and applied and disbursed in accordance with the HTI MOB Portfolio Mortgage Loan documents. If a Cash Sweep Period is in effect, excess cash is required to be held as additional security for the HTI MOB Portfolio Mortgage Loan. Upon the termination of any Cash Sweep Period, excess cash will no longer be required to be held by the lender and, provided that no event of default exists, all amounts then on deposit in the cash collateral reserve account will be disbursed to the HTI MOB Portfolio Borrowers.
A “Cash Sweep Period” will commence upon: (i) an event of default under the HTI MOB Portfolio Mortgage Loan documents or (ii) as of any date of determination by the lender, the debt yield on the HTI MOB Portfolio Mortgage Loan is less than 8.0%.
Subordinate and Mezzanine Debt. None.
Partial Release. Following the HTI MOB Portfolio permitted release date, the borrowers will be permitted to release one or more HTI MOB Portfolio Properties as collateral for the HTI MOB Portfolio Mortgage Loan (each such Property, a “Release Property”), provided that, among other things: (i) no event of default has occurred and is continuing; (ii) the debt service coverage ratio of the remaining individual properties immediately after release is no less than the greater of (x) 3.60x and (y) the debt service coverage ratio immediately prior to the partial release; (iii) the debt yield of the remaining individual properties immediately after release is no less than the greater of (x) 11.18% and (y) the debt yield immediately prior to the partial release; (iv) the HTI MOB Portfolio Borrowers are required to defease or prepay the outstanding principal balance of the HTI MOB Portfolio Mortgage Loan in an amount equal to the Release Amount (as defined below) together with (a) all accrued and unpaid interest on the portion of the outstanding principal balance being prepaid, (b) the yield maintenance premium with respect to the portion of the outstanding principal balance being prepaid, and (c) all other amounts due under the HTI MOB Portfolio Mortgage Loan documents; and (v) the HTI MOB Portfolio Borrowers deliver a REMIC opinion to the lender.
“Release Amount” means, with respect to any individual property to be released in connection with a partial release, the amount that is equal to 115% of the allocated loan amount of such property.
Ground Lease. The Madison Medical Plaza Property is subject to a 50-year ground lease, dated as of April 16, 2003, between Presence Hospitals PRV, successor by merger to Provena Hospitals as landlord, and ARHC MMJLTIL01, LLC, one of the HTI MOB Portfolio Borrowers, as tenant. The term of the ground lease commenced on April 16, 2003, expires April 15, 2053, and contains four, 10-year extension options. The annual rent and tax reimbursement, paid monthly, is fixed (current monthly rent payments equal to approximately $6,325) with scheduled adjustments every five years.
| THE INFORMATION IN THIS STRUCTURAL AND COLLATERAL TERM SHEET IS NOT COMPLETE AND MAY BE AMENDED PRIOR TO THE TIME OF SALE. THIS TERM SHEET IS NOT AN OFFER TO SELL THESE SECURITIES AND IT IS NOT A SOLICITATION OF AN OFFER TO BUY THESE SECURITIES IN ANY JURISDICTION WHERE THE OFFER OR SALE IS NOT PERMITTED. | ||
| 61 | ||
| Structural and Collateral Term Sheet | BMO 2022-C1 | |
| No. 4 – Coleman Highline Phase IV | ||

| THE INFORMATION IN THIS STRUCTURAL AND COLLATERAL TERM SHEET IS NOT COMPLETE AND MAY BE AMENDED PRIOR TO THE TIME OF SALE. THIS TERM SHEET IS NOT AN OFFER TO SELL THESE SECURITIES AND IT IS NOT A SOLICITATION OF AN OFFER TO BUY THESE SECURITIES IN ANY JURISDICTION WHERE THE OFFER OR SALE IS NOT PERMITTED. | ||
| 62 | ||
| Structural and Collateral Term Sheet | BMO 2022-C1 | |
| No. 4 – Coleman Highline Phase IV | ||

| THE INFORMATION IN THIS STRUCTURAL AND COLLATERAL TERM SHEET IS NOT COMPLETE AND MAY BE AMENDED PRIOR TO THE TIME OF SALE. THIS TERM SHEET IS NOT AN OFFER TO SELL THESE SECURITIES AND IT IS NOT A SOLICITATION OF AN OFFER TO BUY THESE SECURITIES IN ANY JURISDICTION WHERE THE OFFER OR SALE IS NOT PERMITTED. | ||
| 63 | ||
| Structural and Collateral Term Sheet | BMO 2022-C1 | |
| No. 4 – Coleman Highline Phase IV | ||
| Mortgage Loan Information | Property Information | |||
| Mortgage Loan Seller: | BMO | Single Asset / Portfolio: | Single Asset | |
| Credit Assessment (KBRA/Fitch/S&P): | (AA/BBBsf*/A) | Title: | Fee | |
| Original Principal Balance(1): | $41,400,000 | Property Type – Subtype: | Office – CBD | |
| Cut-off Date Principal Balance(1): | $41,400,000 | Net Rentable Area (SF): | 657,934 | |
| % of IPB: | 3.7% | Location: | San Jose, CA | |
| Loan Purpose: | Acquisition | Year Built / Renovated: | 2021 / NAP | |
| Borrower: | SJCCRE1 LLC | Occupancy: | 100.0% | |
| Borrower Sponsor: | AGC Equity Partners Investments Ltd. | Occupancy Date: | 12/1/2021 | |
| Interest Rate: | 2.49450% | 4th Most Recent NOI (As of)(4): | NAV | |
| Note Date: | 12/1/2021 | 3rd Most Recent NOI (As of)(4): | NAV | |
| Anticipated Repayment Date(2): | 12/6/2026 | 2nd Most Recent NOI (As of)(4): | NAV | |
| Interest-only Period(2): | 60 months | Most Recent NOI (As of)(4): | NAV | |
| Original Term(2): | 60 months | UW Economic Occupancy: | 100.0% | |
| Original Amortization Term(2): | None | UW Revenues: | $48,187,868 | |
| Amortization Type: | Interest Only – ARD | UW Expenses: | $13,726,489 | |
| Call Protection(3): | L(26),DorYM1(29),O(5) | UW NOI: | $34,461,379 | |
| Lockbox / Cash Management: | Hard / Springing | UW NCF: | $34,329,793 | |
| Additional Debt(1): | Yes | Appraised Value / Per SF: | $790,000,000 / $1,201 | |
| Additional Debt Balance(1): | $203,600,000 / $268,500,000 | Appraisal Date: | 11/8/2021 | |
| Additional Debt Type(1): | Pari Passu / Subordinate | |||
| Escrows and Reserves(5) | Financial Information(1) | ||||||||||
| Initial | Monthly | Initial Cap | Senior Loan | Loan Combination | |||||||
| Taxes: | $0 | Springing | N/A | Cut-off Date Loan / SF: | $372 | $780 | |||||
| Insurance: | $0 | Springing | N/A | Maturity Date Loan / SF(2): | $372 | $780 | |||||
| Replacement Reserves: | $0 | Springing | $263,174 | Cut-off Date LTV: | 31.0% | 65.0% | |||||
| TI/LC Reserve: | $0 | Springing | N/A | Maturity Date LTV(2): | 31.0% | 65.0% | |||||
| Other Reserve: | $10,790,118 | Springing | N/A | UW NCF DSCR: | 5.54x | 2.64x | |||||
| UW NOI Debt Yield: | 14.1% | 6.7% | |||||||||
Sources and Uses | |||||||||||
| Sources | Proceeds | % of Total | Uses | Proceeds | % of Total | ||||||
| Senior Loan | $245,000,000 | 30.5% | Purchase Price(6) | $780,000,000 | 96.9% | ||||||
| Subordinate Notes | $268,500,000 | 33.4 | Closing Costs | $13,749,008 | 1.7 | ||||||
| Borrower Sponsor Equity | $291,039,125 | 36.2 | Upfront Reserves | $10,790,118 | 1.3 | ||||||
| Total Sources | $804,539,125 | 100.0% | Total Uses | $804,539,125 | 100.0% | ||||||
| (1) | The Coleman Highline Phase IV Mortgage Loan (as defined below) is part of the Coleman Highline Phase IV Loan Combination (as defined below) with an original aggregate principal balance of $513,500,000. The Financial Information in the chart above reflects the Coleman Highline Phase IV Senior Loan (as defined below) and the Coleman Highline Phase IV Loan Combination. For additional information, see “The Loan” below. |
| (2) | The Coleman Highline Phase IV Loan Combination has an anticipated repayment date (the “ARD”) of December 6, 2026, and a final maturity date of April 6, 2032, and requires interest only payments on each due date up to but not including the ARD. Prior to the ARD, interest will accrue on the outstanding principal amount of the Coleman Highline Phase IV Loan Combination at 2.49450%. From and after the ARD, interest will accrue on the outstanding principal amount of the Coleman Highline Phase IV Loan Combination at 4.99450%. The information presented in the charts above for the Interest-only Period, Original Term, Original Amortization Term, Maturity Date Loan / SF and Maturity Date LTV are based on the ARD. |
| (3) | The borrower has the option to prepay (with the payment of a yield maintenance premium) or defease the Coleman Highline Phase IV Loan Combination in full after the first payment date following the earlier to occur of (i) two years after the closing date of the securitization that includes the last note to be securitized and (ii) December 1, 2024. The assumed lockout period of 26 payments is based on the closing date of this transaction in February 2022. |
| (4) | The Coleman Highline Phase IV Property (as defined below) was built in 2021; as such historical NOI is unavailable. |
| (5) | For a full description of Escrows and Reserves, please refer to “Escrows and Reserves” below. |
| (6) | Purchase price is shown inclusive of a $13,487,647 free rent credit, the outstanding balance of which was reserved at closing, and a $5,000,000 credit to the purchase price as the result of the developer of the Coleman Highline Phase IV Property also being a limited partner of the borrower. |
| THE INFORMATION IN THIS STRUCTURAL AND COLLATERAL TERM SHEET IS NOT COMPLETE AND MAY BE AMENDED PRIOR TO THE TIME OF SALE. THIS TERM SHEET IS NOT AN OFFER TO SELL THESE SECURITIES AND IT IS NOT A SOLICITATION OF AN OFFER TO BUY THESE SECURITIES IN ANY JURISDICTION WHERE THE OFFER OR SALE IS NOT PERMITTED. | ||
| 64 | ||
| Structural and Collateral Term Sheet | BMO 2022-C1 | |
| No. 4 – Coleman Highline Phase IV | ||
The Loan. The fourth largest mortgage loan (the “Coleman Highline Phase IV Mortgage Loan”) is part of a loan combination (the “Coleman Highline Phase IV Loan Combination”) that is evidenced by nine pari passu senior promissory notes in the aggregate original principal amount of $245,000,000 (collectively, the “Coleman Highline Phase IV Senior Loan”) and two pari passu subordinate promissory notes in the aggregate original principal amount of $268,500,000 (collectively, the “Coleman Highline Phase IV Subordinate Companion Loan”). The Coleman Highline Phase IV Loan Combination was co-originated on December 1, 2021 by Bank of Montreal (“BMO”) and Barclays Capital Real Estate Inc. (“Barclays”). The Coleman Highline Phase IV Loan Combination is secured by a first priority mortgage on the borrower’s fee simple interest in a 657,934 square foot Class A, LEED® Silver-designed office campus located on the Santa Clara/San Jose border in California (the “Coleman Highline Phase IV Property”). The Coleman Highline Phase IV Mortgage Loan is evidenced by the non-controlling promissory Note A-8 and Note-A-9, with an aggregate principal balance as of the Cut-off Date of $41,400,000. The remaining notes are currently held by affiliates of BMO and Barclays and are expected to be contributed to one or more future securitization trusts. The Coleman Highline Phase IV Loan Combination will be serviced pursuant to the pooling and servicing agreement for the BMO 2022-C1 trust until the controlling Note B-1 is securitized, whereupon the Coleman Highline Phase IV Loan Combination will be serviced pursuant to the pooling and servicing agreement for such future securitization. See “Description of the Mortgage Pool—The Loan Combinations—The Coleman Highline Phase IV Pari Passu-AB Loan Combination” in the Preliminary Prospectus.
The Coleman Highline Phase IV Loan Combination has a five-year term to the ARD, is interest-only for the full term of the loan and accrues interest on an Actual/360 basis. The Coleman Highline Phase IV Loan Combination requires interest only payments on each due date at an initial interest rate of 2.49450% (the “Initial Interest Rate”) up to but not including the ARD. From and after the ARD, (i) interest will accrue on the outstanding principal amount of the Coleman Highline Phase IV Loan Combination at 4.99450% (the “Adjusted Interest Rate”). Any principal outstanding from and after the ARD will accrue interest at the Adjusted Interest Rate rather than the Initial Interest Rate. After ARD, all cash flow available from the Coleman Highline Phase IV Property after payment of the periodic payments required under the terms of the related Coleman Highline Phase IV Loan Combination documents and all escrows and property expenses required under the related Coleman Highline Phase IV Loan Combination documents will be used (i) first to accelerate amortization of principal (without payment of any yield maintenance premium or prepayment charge) on the Coleman Highline Phase IV Loan Combination and (ii) second to the Excess Interest (defined below). From and after ARD, interest is required to be paid on a current basis at the Initial Interest Rate; payment of the difference between the interest paid at the Initial Interest Rate and interest accruing at the Adjusted Interest Rate (the “Excess Interest”) will be deferred and will be required to be paid, on or before the final maturity date of April 6, 2032.
| Loan Combination Summary | |||||
| Note | Original Balance | Cut-off Date Balance | Note Holder | Controlling Piece | |
| A-1(1) | $26,650,000 | $26,650,000 | An affiliate of Barclays | No | |
| A-2(1) | $14,350,000 | $14,350,000 | An affiliate of BMO | No | |
| A-3(1) | $40,000,000 | $40,000,000 | An affiliate of Barclays | No | |
| A-4(1) | $30,000,000 | $30,000,000 | An affiliate of Barclays | No | |
| A-5(1) | $35,000,000 | $35,000,000 | An affiliate of Barclays | No | |
| A-6(1) | $27,600,000 | $27,600,000 | An affiliate of Barclays | No | |
| A-7(1) | $30,000,000 | $30,000,000 | An affiliate of BMO | No | |
| A-8 | $25,000,000 | $25,000,000 | BMO 2022-C1 | No | |
| A-9 | $16,400,000 | $16,400,000 | BMO 2022-C1 | No | |
| Total Senior Loan | $245,000,000 | $245,000,000 | |||
| B-1(1) | $174,525,000 | $174,525,000 | An affiliate of Barclays | Yes | |
| B-2(1) | $93,975,000 | $93,975,000 | An affiliate of BMO | No | |
| Loan Combination | $513,500,000 | $513,500,000 | |||
| (1) | Expected to be contributed to one or more future securitization(s). It is expected that the Coleman Highline Phase IV Loan Combination will be serviced pursuant to the pooling and servicing agreement for the securitization of notes A-8 and A-9 until the securitization of note B-1, following which the Coleman Highline Phase IV Loan Combination will be serviced pursuant to the servicing agreement for such securitization transaction. |
The Property. The Coleman Highline Phase IV Property is a 2021-vintage, 657,934 square foot office property which is part of a multiphase, mixed-use development located on the Santa Clara/San Jose border in California (“Coleman Highline Development”). The 657,934 square feet of space consists of an eight-story, 603,363 square foot, Class A office building featuring LEED Silver design, Gensler architecture, 78,000 square foot floor plates and 14’-20’ floor-to-floor heights as well as a two-story, 52,214 square foot amenity building, which includes a dining hall, gym and health center, a 2,357 square foot welcome pavilion and a five-story, approximately 2,166 space parking garage (approximately 3.3 spaces per 1,000 square feet).
The Coleman Highline Phase IV Property was built to suit for Yahoo (formerly Verizon Media) to serve as its West Coast headquarters and Silicon Valley innovation hub and includes a data center on the ground floor and a broadcast lab and voiceover room aimed at content creation on the third floor. The amenity building includes a fitness center, locker rooms, a dining hall and health center that operates in partnership with Stanford Health. As of December 1, 2021, the Coleman Highline Phase IV Property was 100.0% leased to Oath Holdings Inc., an affiliate of Yahoo and guaranteed by Verizon Communications Inc. (NYSE: VZ; BBB+/Baa1/A- by S&P/Moody’s/Fitch), pursuant to a 657,934 square foot modified triple-net lease through April 30, 2037, with two seven-year extension options and no early termination
| THE INFORMATION IN THIS STRUCTURAL AND COLLATERAL TERM SHEET IS NOT COMPLETE AND MAY BE AMENDED PRIOR TO THE TIME OF SALE. THIS TERM SHEET IS NOT AN OFFER TO SELL THESE SECURITIES AND IT IS NOT A SOLICITATION OF AN OFFER TO BUY THESE SECURITIES IN ANY JURISDICTION WHERE THE OFFER OR SALE IS NOT PERMITTED. | ||
| 65 | ||
| Structural and Collateral Term Sheet | BMO 2022-C1 | |
| No. 4 – Coleman Highline Phase IV | ||
rights (other than material casualty or condemnation). Verizon Communications Inc. invested approximately $125 per square foot over and above their $100 per square foot tenant improvement allowance on areas including $20 million of additional base building work, data center space, a broadcast studio on the third floor, and interconnection between the office building and amenity building. Additionally, Yahoo is approximately 55% through the process of installing a new solar array on top of the parking garage at their own expense, for an estimated total cost of approximately $10.0 million in addition to the $225 per square foot investment mentioned above.
COVID-19 Update. The borrowers made their first debt service payment for the Coleman Highline Phase IV Loan Combination in January 2022. As of February 1, 2022, the Coleman Highline Phase IV Loan Combination is not subject to any forbearance, modification or debt service relief request.
Major Tenants.
Oath Holdings Inc. (657,934 square feet; 100.0% of NRA; 100.0% of underwritten base rent): Oath Holdings Inc. is an affiliate of Yahoo that was assigned the lease following Apollo’s acquisition of Yahoo (formerly Verizon Media) in September 2021. Verizon Communications Inc. retained a 10% stake in Yahoo (formerly Verizon Media) and remained as the guarantor on the lease. Yahoo is a global media and tech company with brands that include Yahoo sites such as Yahoo Sports, Yahoo Fantasy, Yahoo Finance and Yahoo Sportsbook among others, in addition to other brands such as AOL, TechCrunch, Autoblog and Engadget. In addition to its brands, Yahoo is also a leading ad tech and media platform business, with approximately 240 million unique user profiles across 200 global partners and a network capacity of approximately 135 terabytes per second. Verizon Communications Inc. (NYSE: VZ; BBB+/Baa1/A- by S&P/Moody’s/Fitch), the lease guarantor, is one of the largest providers of technology and communication services, serving 99% of Fortune 500 Companies and 95 million retail connections in over 150 countries. Ranked 20th in the Fortune 500, Verizon Communications Inc. generated $128.3 billion in revenues in 2020 and reported $32.1 billion in net cash from operating activities and $4.21 in earnings per share through September 30, 2021.
Yahoo (formerly Verizon Media) executed its lease at the Coleman Highline Phase IV Property in July 2019, the lease commenced at the end of October 2021 and expires at the end of April 2037. The lease is modified triple-net with the tenant responsible for reimbursing all operating expenses including management fees (subject to a cap of 2.0% of base rent and other conditions summarized below), includes two, seven-year extension options to renew the entire premises at market rent with 12-15 months’ notice and no termination options (other than with respect to material casualty or condemnation). The tenant is responsible for 100% of operating expenses subject to a management fee cap of 2% of base rent and a 4% cap on increases in controllable operating expenses, which controllable operating expenses are capped following the second full calendar year after the lease commencement date on a non-cumulative but compounding basis. Controllable operating expenses include all operating expenses except (i) utility charges, (ii) cost of union labor, (iii) market wide labor rate increases due to extraordinary circumstances, (iv) costs arising due to force majeure, including costs arising due to extraordinary weather, (v) landlord’s insurance costs, (vi) costs related to compliance with government mandated transportation management programs, (vii) certain amortized capital expenses and (viii) tax expenses. Beginning in September 2021, Yahoo began marketing floors five through eight (approximately 245,000 square feet or 37% of NRA) for sublease. The sublease would not impact the Verizon Communications Inc.’s guarantee, the landlord has sublease consent rights (not to be unreasonably withheld, conditioned or delayed) for any sublease larger than 150,000 SF and 50% of any subtenant rent or consideration in excess of tenant’s contractual rent must be shared with landlord.
| THE INFORMATION IN THIS STRUCTURAL AND COLLATERAL TERM SHEET IS NOT COMPLETE AND MAY BE AMENDED PRIOR TO THE TIME OF SALE. THIS TERM SHEET IS NOT AN OFFER TO SELL THESE SECURITIES AND IT IS NOT A SOLICITATION OF AN OFFER TO BUY THESE SECURITIES IN ANY JURISDICTION WHERE THE OFFER OR SALE IS NOT PERMITTED. | ||
| 66 | ||
| Structural and Collateral Term Sheet | BMO 2022-C1 | |
| No. 4 – Coleman Highline Phase IV | ||
The following table presents the annual base rent under the lease and the corresponding Verizon Communications Inc. guarantee:
| Yahoo Rent Schedule and Verizon Communications Inc. Guarantee Through ARD | ||||
| Months(1) | Annualized Base Rent | PSF | Remaining Lease Obligation | Verizon Communications Inc. Guarantee(2) |
| May 2022 - April 2023 | $32,370,353 | $49.20 | $602,053,403 | $690,200,000 |
| May 2023 - April 2024 | $33,341,463 | $50.68 | $569,683,050 | $668,100,000 |
| May 2024 - April 2025 | $34,341,707 | $52.20 | $536,341,587 | $629,500,000 |
| May 2025 - April 2026 | $35,371,959 | $53.76 | $501,999,880 | $589,700,000 |
| May 2026 - April 2027 | $36,433,117 | $55.38 | $466,627,921 | $548,600,000 |
| May 2027 - April 2028 | $37,526,111 | $57.04 | $430,194,804 | $506,200,000 |
| May 2028 - April 2029 | $38,651,894 | $58.75 | $392,668,693 | $462,400,000 |
| May 2029 - April 2030 | $39,811,451 | $60.51 | $354,016,799 | $417,200,000 |
| May 2030 - April 2031 | $41,005,794 | $62.33 | $314,205,348 | $370,600,000 |
| May 2031 - April 2032 | $42,235,968 | $64.19 | $273,199,554 | $322,500,000 |
| May 2032 - April 2033 | $43,503,047 | $66.12 | $230,963,586 | $272,900,000 |
| May 2033 - April 2034 | $44,808,139 | $68.10 | $187,460,539 | $221,700,000 |
| May 2034 - April 2035 | $46,152,383 | $70.15 | $142,652,400 | $168,900,000 |
| May 2035 - April 2036 | $47,536,954 | $72.25 | $96,500,017 | $114,300,000 |
| May 2036 - April 2037 | $48,963,063 | $74.42 | $48,963,063 | $58,100,000 |
| (1) | Does not include the base rent abatement period, which covers the first six months, commencing on the first full month following the lease commencement date. |
| (2) | Verizon Communications Inc. Guarantee amount is rounded to the nearest hundred thousand. |
Environmental. According to a Phase I environmental assessment dated October 7, 2021, there was a recognized environmental condition identified at the Coleman Highline Phase IV Property, which was previously used as a test site for military tracked vehicles. Per the Phase I environmental report, the previous user, FMC Corporation, is operating a groundwater extraction and treatment system and is responsible for the completion of the groundwater remediation. See “Description of the Mortgage Pool—Mortgage Pool Characteristics—Environmental Considerations” in the Preliminary Prospectus.
| Historical and Current Occupancy | |||
| 2018(1) | 2019(1) | 2020(1) | Current(2) |
| NAV | NAV | NAV | 100.0% |
| (1) | The Coleman Highline Phase IV Property was built in 2021; as such Historical Occupancies are unavailable. |
| (2) | Current occupancy is as of December 1, 2021. |
| Top Tenant Summary(1) | |||||||
| Tenant | Ratings Moody’s/S&P/Fitch(2) | Net Rentable Area (SF) | % of Total NRA | UW Base Rent PSF(3) | UW Base Rent(3) | % of Total UW Base Rent(3) | Lease Expiration Date |
| Oath Holdings Inc. | Baa1/BBB+/A- | 657,934 | 100.0% | $49.20 | $32,370,353 | 100.0% | 4/30/2037(4) |
| Occupied Collateral Total / Wtd. Avg. | 657,934 | 100.0% | $49.20 | $32,370,353 | 100.0% | ||
| Vacant Space | 0 | 0.0% | |||||
| Collateral Total | 657,934 | 100.0% | |||||
| (1) | Based on the underwritten rent roll dated as of December 1, 2021. |
| (2) | Ratings are of Verizon Communications Inc., which guarantees the lease through the initial term plus extension options. |
| (3) | The tenant received a six-month rent abatement and will commence paying rent in May 2022. The tenant is required to reimburse for common area maintenance (“CAM”) charges during the rent abatement period, and the outstanding rent abatement of $10,790,117.60 was reserved at loan origination. |
| (4) | The tenant has two, seven-year renewal options. |
| THE INFORMATION IN THIS STRUCTURAL AND COLLATERAL TERM SHEET IS NOT COMPLETE AND MAY BE AMENDED PRIOR TO THE TIME OF SALE. THIS TERM SHEET IS NOT AN OFFER TO SELL THESE SECURITIES AND IT IS NOT A SOLICITATION OF AN OFFER TO BUY THESE SECURITIES IN ANY JURISDICTION WHERE THE OFFER OR SALE IS NOT PERMITTED. | ||
| 67 | ||
| Structural and Collateral Term Sheet | BMO 2022-C1 | |
| No. 4 – Coleman Highline Phase IV | ||
| Lease Rollover Schedule(1)(2)(3) | |||||||||
| Year | Number of Leases Expiring | Net Rentable Area Expiring | % of NRA Expiring | UW Base Rent Expiring | % of UW Base Rent Expiring | Cumulative Net Rentable Area Expiring | Cumulative % of NRA Expiring | Cumulative UW Base Rent Expiring | Cumulative % of UW Base Rent Expiring |
| Vacant | NAP | 0 | 0.0% | NAP | NAP | 0 | 0.0% | NAP | NAP |
| 2022 & MTM | 0 | 0 | 0.0 | $0 | 0.0% | 0 | 0.0% | $0 | 0.0% |
| 2023 | 0 | 0 | 0.0 | 0 | 0.0 | 0 | 0.0% | $0 | 0.0% |
| 2024 | 0 | 0 | 0.0 | 0 | 0.0 | 0 | 0.0% | $0 | 0.0% |
| 2025 | 0 | 0 | 0.0 | 0 | 0.0 | 0 | 0.0% | $0 | 0.0% |
| 2026 | 0 | 0 | 0.0 | 0 | 0.0 | 0 | 0.0% | $0 | 0.0% |
| 2027 | 0 | 0 | 0.0 | 0 | 0.0 | 0 | 0.0% | $0 | 0.0% |
| 2028 | 0 | 0 | 0.0 | 0 | 0.0 | 0 | 0.0% | $0 | 0.0% |
| 2029 | 0 | 0 | 0.0 | 0 | 0.0 | 0 | 0.0% | $0 | 0.0% |
| 2030 | 0 | 0 | 0.0 | 0 | 0.0 | 0 | 0.0% | $0 | 0.0% |
| 2031 | 0 | 0 | 0.0 | 0 | 0.0 | 0 | 0.0% | $0 | 0.0% |
| 2032 | 0 | 0 | 0.0 | 0 | 0.0 | 0 | 0.0% | $0 | 0.0% |
| 2033 & Beyond | 1 | 657,934 | 100.0 | $32,370,353 | 100.0 | 657,934 | 100.0% | $32,370,353 | 100.0% |
| Total | 1 | 657,934 | 100.0% | $32,370,353 | 100.0% | ||||
| (1) | Based on the underwritten rent roll dated as of December 1, 2021. |
| (2) | Certain leases may have termination options that are exercisable prior to the originally stated expiration date of the lease and that are not considered in this Lease Rollover Schedule. |
| (3) | The tenant received a six-month rent abatement and will commence paying rent in May 2022. The tenant is required to reimburse for CAM charges during the rent abatement period, and the outstanding rent abatement of $10,790,117.60 was reserved at closing. |
| Operating History and Underwritten Net Cash Flow | |||
| Underwritten | Per Square Foot | %(1) | |
| Base Rent(2) | $32,370,353 | $49.20 | 67.2% |
| Straight-Line Rent(3) | 1,772,323 | 2.69 | 3.7 |
| Vacant Income | 0 | 0.00 | 0.0 |
| Gross Potential Rent | $34,142,676 | $51.89 | 70.9% |
| Total Reimbursements(4) | 14,045,192 | 21.35 | 29.1 |
| Total Other Income | 0 | 0.00 | 0.0 |
| Net Rental Income | $48,187,868 | $73.24 | 100.0% |
| (Vacancy/Credit Loss)(5) | 0 | 0.00 | 0.0 |
| Effective Gross Income | $48,187,868 | $73.24 | 100.0% |
| Total Expenses | $13,726,489 | $20.86 | 28.5% |
| Net Operating Income | $34,461,379 | $52.38 | 71.5% |
| Total TI/LC, Capex/RR | 131,587 | 0.20 | 0.3 |
| Net Cash Flow | $34,329,793 | $52.18 | 71.2% |
| (1) | % column represents percent of Net Rental Income for all revenue lines and represents percent of Effective Gross Income for the remainder of the fields. |
| (2) | Base Rent reflects the current contract rent. |
| (3) | Straight-line rents were applied through ARD. |
| (4) | Total Reimbursements include an increase in taxes due to Prop 13 re-assessment as the tenant does not have any Prop 13 protections in its lease. Also included is the tenant’s contractual obligation to pay 2.0% of base rent to the landlord for management costs. The lease is triple-net and the tenant is required to reimburse for CAM charges during rent abatement. |
| (5) | No Vacancy/Credit Loss was underwritten due to Verizon Communication Inc.’s investment grade ratings. the tenant is leasing 100% of the space and has no contraction or termination options. |
| THE INFORMATION IN THIS STRUCTURAL AND COLLATERAL TERM SHEET IS NOT COMPLETE AND MAY BE AMENDED PRIOR TO THE TIME OF SALE. THIS TERM SHEET IS NOT AN OFFER TO SELL THESE SECURITIES AND IT IS NOT A SOLICITATION OF AN OFFER TO BUY THESE SECURITIES IN ANY JURISDICTION WHERE THE OFFER OR SALE IS NOT PERMITTED. | ||
| 68 | ||
| Structural and Collateral Term Sheet | BMO 2022-C1 | |
| No. 4 – Coleman Highline Phase IV | ||
The Market. The Coleman Highline Phase IV Property is part of the Coleman Highline Development, a transit oriented, mixed-use development located near several major highways, public transportation options and Mineta San Jose International Airport offering access to the Coleman Highline Phase IV Property via planes, trains and automobiles. Direct access to US Highway 101 and California State Route 82 and close proximity to Interstate 280 provide tenants access to San Francisco as well as affluent suburbs such as Cupertino, Palo Alto and Mountain View. Public transportation access is provided via pedestrian walkway to Santa Clara Station which serves Amtrak and Caltrain lines and is also the planned terminal station for the Silicon Valley BART extension, which would make it one of three Bay Area stations where BART and Caltrain meet. When completed, the Coleman Highline Development is expected to contain seven office buildings, four amenity buildings, a hotel and retail space.
The Coleman Highline Development and Coleman Highline Phase IV Property are located in the San Jose-Sunnyvale-Santa Cara, California Metropolitan Statistical Area (the “San Jose MSA”), which is the 36th largest MSA in the country by population with an estimated population of 1,992,544 in 2021. Total employment in the San Jose MSA grew by 20.3% since 2011 (a total of 182,267 jobs) significantly outpacing the state of California, which grew by only 11.8% over that same period. Top employers in the San Jose MSA include Apple Inc., Alphabet Inc., Cisco Systems Inc. and Intel Corp. Within the San Jose MSA, the Coleman Highline Phase IV Property is located within the North San Jose office submarket, as defined by a third-party marketing report. The North San Jose Submarket has added an average of 327,185 square feet per year over the last 11 years, but deliveries have been sporadic, with five of the last 11 years having no new deliveries. Vacancy in the submarket is above the market average at 15.1%, but that number is below the annual average of 17.9% over the last 11 years.
According to the appraisal, as of 2021, the population within a 1-mile, 3-mile and 5-mile radius totaled 10,373, 171,409 and 627,229 people, respectively, and median household income for the same radii was $91,615, $109,707 and $114,059, respectively.
The following table presents certain information relating to a third-party marketing report’s statistics for the San Jose MSA office market and North San Jose office submarket as of the third quarter of 2021:
| Availability | Inventory | Sales | ||||||||
| Submarket | Market | Submarket | Market | Submarket | Market | |||||
| Market Rent/SF | $51.16 | $61.59 | Buildings | 226 | 4,648 | YTD Properties Sold | 15 | 161 | ||
| Vacancy Rate | 15.10% | 12.70% | Inventory (mm SF) | 16.9 | 136.4 | Average Sale Price (mm) | $79.50 | $31.80 | ||
| Vacant (mm SF) | 2.6 | 17.3 | Average Building (SF) | 74,963 | 29,346 | Average Price/SF | $639 | $731 | ||
| Availability Rate | 19.9% | 15.90% | Under Construction (SF) | 622,142 | 7,788,118 | Average Cap Rate | 5.4% | 4.80% | ||
| Available (mm SF) | 3.4 | 21.7 | 12 Mo. Delivered (SF) | 655,000 | 3,200,000 | |||||
The following table presents certain information relating to comparable office leases for the Coleman Highline Phase IV Property:
| Comparable Office Leases(1) | ||||||||
| Property / Location | Tenant SF | Year Built / Renovated | Tenant | Rent PSF | Commencement Date | Lease Term | Lease Type | |
Coleman Highline Phase IV San Jose, CA | 657,934(2) | 2021 / NAP | Oath Holdings Inc. | $49.20(2) | Oct-2021(2) | 186(2) | Triple Net | |
Nokia Sunnyvale, CA | 231,000 | 2021 / NAV | Nokia | $52.80 | Oct-2021 | 128 | Triple Net | |
100 Winchester Cir Los Gatos, CA | 81,330 | 2005 / NAV | Netflix | $48.00 | Jan-2021 | 120 | Triple Net | |
Coleman Highline Phase I San Jose, CA | 162,557 | 2017 / NAV | Roku | $44.52 | Apr-2020 | 117 | Triple Net | |
Great American Corporate Center Santa Clara, CA | 301,437 | 1984 / NAV | AirBnB | $45.00 | Jan-2020 | 133 | Triple Net | |
The Offices at Santana Row San Jose, CA | 301,000 | 2019 / NAV | Splunk | $45.60 | Mar-2019 | 130 | Triple Net | |
| (1) | Source: Appraisal. |
| (2) | Based on underwritten rent roll dated as of December 1, 2021. |
| THE INFORMATION IN THIS STRUCTURAL AND COLLATERAL TERM SHEET IS NOT COMPLETE AND MAY BE AMENDED PRIOR TO THE TIME OF SALE. THIS TERM SHEET IS NOT AN OFFER TO SELL THESE SECURITIES AND IT IS NOT A SOLICITATION OF AN OFFER TO BUY THESE SECURITIES IN ANY JURISDICTION WHERE THE OFFER OR SALE IS NOT PERMITTED. | ||
| 69 | ||
| Structural and Collateral Term Sheet | BMO 2022-C1 | |
| No. 4 – Coleman Highline Phase IV | ||
The following table presents certain information relating to comparable office sales for the Coleman Highline Phase IV Property:
| Comparable Office Sales(1) | |||||||
| Property / Location | RSF | Year Built / Renovated | Occupancy | Sale Date |
| Price PSF | Adjusted Price PSF |
Coleman Highline Phase IV San Jose, CA | 657,934(2) | 2021 / NAP | 100.0%(2) | ||||
HQ@First San Jose, CA | 603,666 | 2010 / 2018 | 100.0% | Jul-2021 | $535,000,000 | $886 | $1,072 |
Nokia Sunnyvale, CA | 231,000 | 2021 / NAP | 100.0% | Jul-2021 | $254,000,000 | $1,100 | $1,220 |
750 Moffett Blvd Mountain View, CA | 222,000 | 2021 / NAV | 100.0% | Jul-2021 | $282,600,000 | $1,273 | $1,344 |
2225 Lawson Lane Santa Clara, CA | 328,867 | 2012 / NAV | 100.0% | Feb-2020 | $276,300,000 | $840 | $1,017 |
Koll Center – Sierra Point Brisbane, CA | 90,000 | 1986 / 2017 | 100.0% | Jun-2019 | $77,000,000 | $856 | $1,009 |
| (1) | Source: Appraisal. |
| (2) | Based on the underwritten rent roll dated December 1, 2021. |
The Borrower. The borrower is SJCCRE1 LLC, a Delaware limited liability company. The borrower is structured to be a single purpose bankruptcy-remote entity, having two independent directors in its organizational structure. Legal counsel to the borrower delivered a non-consolidation opinion in connection with the origination of the Coleman Highline Phase IV Loan Combination. There is no non-recourse carveout guarantor or separate environmental indemnitor with respect to the Coleman Highline Phase IV Loan Combination.
The Borrower Sponsor. The borrower sponsor is AGC Equity Partners Investments Ltd., which is an affiliate of AGC Equity Partners (“AGC”). AGC is a London-based global alternative asset manager established in 2009 to invest in a wide range of real assets, private equity opportunities and liquid strategies through its balance sheet and investment funds, which currently has approximately $6.3 billion of assets under management. Notable AGC transactions include mission critical and headquarter commercial assets leased to tenants, including: L’Oréal, PwC, Hilton, Lufthansa, Michelin, KPMG, Schroders, HPE, GEFCO, Vodafone and BP. AGC has also completed transactions in the logistics and student housing sectors with approximately 2.8 million square feet of logistics assets and approximately 3,000 student beds under management.
Property Management. The Coleman Highline Phase IV Property is managed by RiverRock Real Estate Group, Inc., a California corporation, which is not affiliated with the borrower.
Escrows and Reserves. At origination, the borrower funded a reserve of approximately $10,790,118 for free rent and rent abatements under the Yahoo lease.
Tax Escrows – During the continuance of a Trigger Period (as defined below), the borrower is required to deposit monthly 1/12th of the annual estimated real estate taxes.
Insurance Escrows – During the continuance of a Trigger Period, the borrower is required to deposit into an insurance reserve, on a monthly basis, 1/12th of estimated insurance premiums unless the borrower maintains a blanket policy in accordance with the Coleman Highline Phase IV Loan Combination documents.
Replacement Reserve – During the continuation of a Trigger Period, the Coleman Highline Phase IV Loan Combination documents provide for ongoing monthly deposits of approximately $10,966 into a reserve for approved capital expenditures, subject to a cap of approximately $263,174.
Rollover Reserve – During the continuation of a Trigger Period, the Coleman Highline Phase IV Loan Combination documents provide for ongoing monthly deposits of approximately $82,242 into a reserve for tenant improvement and leasing commission obligations.
Operating Expense Reserve – During the continuation of a Trigger Period, the Coleman Highline Phase IV Loan Combination documents require the borrower to deposit an amount equal to the aggregate amount of approved operating expenses and approved extraordinary expenses to be incurred by the borrower for the then current interest accrual period.
Lockbox / Cash Management. The Coleman Highline Phase IV Loan Combination is structured with a hard lockbox and springing cash management. The borrower is required to cause each tenant at the Coleman Highline Phase IV Property to deposit rents directly into a lender-controlled lockbox account. In addition, the borrower is required to cause all rents received by the borrower or property managers with respect to the Coleman Highline Phase IV Property to be deposited into such lockbox account within two business days. All amounts in the lockbox account are remitted on each business day to the borrower at any time other than during the continuance of a Trigger Period, and during the continuance of a Trigger Period are required to be remitted to a lender-controlled cash management account on
| THE INFORMATION IN THIS STRUCTURAL AND COLLATERAL TERM SHEET IS NOT COMPLETE AND MAY BE AMENDED PRIOR TO THE TIME OF SALE. THIS TERM SHEET IS NOT AN OFFER TO SELL THESE SECURITIES AND IT IS NOT A SOLICITATION OF AN OFFER TO BUY THESE SECURITIES IN ANY JURISDICTION WHERE THE OFFER OR SALE IS NOT PERMITTED. | ||
| 70 | ||
| Structural and Collateral Term Sheet | BMO 2022-C1 | |
| No. 4 – Coleman Highline Phase IV | ||
each business day to be applied and disbursed in accordance with the Coleman Highline Phase IV Loan Combination documents. Upon the occurrence of a Trigger Period all excess cash flow funds remaining in the cash management account after the application of such funds in accordance with the Coleman Highline Phase IV Loan Combination documents are required to be held by the lender in an excess cash flow reserve account as additional collateral for the Coleman Highline Phase IV Loan Combination.
A “Trigger Period” means the occurrence of (i) an event of default under the Coleman Highline Phase IV Loan Combination, (ii) the debt yield of the Coleman Highline Phase IV Loan Combination falling below 4.5% for one calendar quarter, (iii) a Specified Tenant Trigger Event (as defined below), or (iv) the ARD. A Trigger Period will be cured upon (a) with respect to clause (i) above, the cure (if applicable) of such event of default, (b) with respect to clause (ii) above, either (x) the date that the debt yield is equal to or greater than 4.5% for one calendar quarter or (y) the borrower prepays the Coleman Highline Phase IV Loan Combination or deposits funds or a letter of credit in an amount that, after giving effect to such prepayment, deposit or letter of credit, the debt yield would be equal to or greater than 4.5%, or (b) with respect to clause (iii) above, the cure of such Specified Tenant Trigger Event.
A “Specified Tenant Trigger Event” means the occurrence of (i) a material monetary default under the Specified Tenant Lease (as defined below) beyond all applicable notice and cure periods (a “Specified Tenant Default Trigger”), (ii) any bankruptcy or similar insolvency of Specified Tenant (as defined below) or Specified Tenant Lease Guarantor (as defined below) (a “Specified Tenant Bankruptcy Trigger”), (iii) the date on which a Specified Tenant cancels or terminates its Specified Tenant Lease with respect to at least 50% of the Specified Tenant space prior to the then current expiration date under such Specified Tenant Lease, or delivers notice that it is canceling or terminating its Specified Tenant Lease with respect to at least 50% of the Specified Tenant space (other than temporarily as a result of Force Majeure (including government stay-at-home orders) or during the time when Specified Tenant’s employees are working remotely due to COVID-19 (in each case for not more than 9 months) but Specified Tenant has not ceased business operations, provided that in each case Specified Tenant is paying full unabated rent under its lease (or any free rent is reserved in full with the lender) and is not otherwise in default beyond applicable notice and cure periods under its lease) (a “Specified Tenant Termination Trigger”), or (iv) the date on which Specified Tenant under the Specified Tenant Lease goes dark or ceases business operations at 50% or more of the Specified Tenant space (other than temporarily as a result of casualty, permitted alterations under the Specified Tenant Lease or Force Majeure (including government stay-at-home orders) or during the time when Specified Tenant’s employees are working remotely due to COVID-19 (in each case for not more than 9 months), provided that in each case Specified Tenant is paying full unabated rent under its Specified Tenant Lease (or any free rent is reserved in full with the lender) and is not otherwise in default beyond applicable notice and cure periods under its Specified Tenant Lease and Specified Tenant resumes operations in the Specified Tenant space within a reasonable amount of time relative to other similarly situated tenants in the geographic area where the Coleman Highline Phase IV Property is located after such government restrictions are lifted) (a “Specified Tenant Go Dark Trigger”); provided, however, that if either (a) the Specified Tenant Lease is guaranteed by Verizon Communications Inc. or a successor guarantor as permitted under the terms of the Specified Tenant Lease in effect as of the origination date, (b) the Specified Tenant or the guarantor of such replacement tenant’s lease has the credit rating of at least the investment grade rating by at least two of S&P, Moody’s or Fitch, or (c) the Specified Tenant has subleased the dark space to a tenant which has the credit rating of at least the investment grade rating by at least two of S&P, Moody’s or Fitch (or the guarantor of such tenant’s sublease has the credit rating of at least the investment grade rating by at least two of S&P, Moody’s or Fitch), who has accepted delivery thereof and is paying unabated rent (or any free rent is reserved in full with the lender) at a rate that is at least equal to the contract rate under the Specified Tenant Lease, such Specified Tenant will not be deemed to have “gone dark” and no Specified Tenant Trigger Event will be deemed to have occurred. A Specified Tenant Trigger Event will cure upon (i) if the Specified Tenant Trigger Event is caused solely by a Specified Tenant Default Trigger, the first to occur of (a) the cure (if applicable) of such default or (b) the borrower leasing the entire Specified Tenant space in accordance with the applicable terms and conditions under the Coleman Highline Phase IV Loan Combination documents to one or more replacement tenants reasonably acceptable to the lender, and each applicable replacement tenant has accepted the premises demised under its lease and is paying the full amount of the rent due thereunder (unless any such free rent is reserved with the lender); provided that each such replacement lease is a Qualified Lease (as defined below), (ii) if the Specified Tenant Trigger Event is caused solely by a Specified Tenant Bankruptcy Trigger, the first to occur of (a) Specified Tenant and/or Specified Tenant Lease Guarantor, as applicable, is no longer insolvent or subject to any bankruptcy or insolvency proceedings and Specified Tenant has affirmed the applicable Specified Tenant Lease pursuant to final, non-appealable order of a court of competent jurisdiction or (b) the borrower leasing the entire Specified Tenant space in accordance with the applicable terms and conditions under the Coleman Highline Phase IV Loan Combination documents to one or more replacement tenants reasonably acceptable to the lender, and each applicable replacement tenant has accepted the premises demised under its lease and is paying the full amount of the rent due thereunder (unless any such free rent is reserved with the lender); provided that each such replacement lease is a Qualified Lease, (iii) if the Specified Tenant Trigger Event is caused solely by a Specified Tenant Termination Trigger, the first to occur of (a) the applicable Specified Tenant has revoked or rescinded all termination or cancellation notices with respect to the applicable Specified Tenant Lease and has re-affirmed the applicable Specified Tenant Lease as being in full force and effect or (b) the borrower leasing the entire Specified Tenant space in accordance with the applicable terms and conditions under the Coleman Highline Phase IV Loan Combination documents to one or more replacement tenants reasonably acceptable to the lender, and each applicable replacement tenant has accepted the premises demised under its lease and is paying the full amount of the rent due thereunder (unless any such free rent is reserved with the lender); provided that (x) each such replacement lease is a Qualified Lease, and (y) the debt yield is equal to or greater than 5.50% (or the borrower prepays the Coleman Highline Phase IV Loan Combination in accordance with the provisions of the Coleman Highline Phase IV Loan Combination documents in an amount that, after giving effect to such prepayment, the debt yield would be equal to or greater than 5.50%), (iv) if the Specified Tenant Trigger Event is caused solely by the occurrence of a Specified Tenant
| THE INFORMATION IN THIS STRUCTURAL AND COLLATERAL TERM SHEET IS NOT COMPLETE AND MAY BE AMENDED PRIOR TO THE TIME OF SALE. THIS TERM SHEET IS NOT AN OFFER TO SELL THESE SECURITIES AND IT IS NOT A SOLICITATION OF AN OFFER TO BUY THESE SECURITIES IN ANY JURISDICTION WHERE THE OFFER OR SALE IS NOT PERMITTED. | ||
| 71 | ||
| Structural and Collateral Term Sheet | BMO 2022-C1 | |
| No. 4 – Coleman Highline Phase IV | ||
Go Dark Trigger, the first to occur of (I) the applicable Specified Tenant re-commences its operations and the conduct of business in the ordinary course at its Specified Tenant space or a portion thereof, as the case may be, such that it is no longer dark, and has not vacated, ceased to conduct business in the ordinary course at the Coleman Highline Phase IV Property (or the applicable portion thereof), (II) the borrower leasing the entire Specified Tenant space (or the applicable portion thereof) in accordance with the applicable terms and conditions under the Coleman Highline Phase IV Loan Combination documents to one or more replacement tenants, and each applicable replacement tenant has accepted the premises demised under its lease and is paying the full amount of the rent due thereunder (unless any such free rent is reserved with the lender); provided, however, each such replacement lease is a Qualified Lease; or (III) the entirety of the dark space has been sublet to an entity or a wholly-owned subsidiary of an entity that has a credit rating of at least the investment grade rating by at least two of S&P, Moody’s or Fitch (or the guarantor of such tenant’s or subtenant’s obligations has the credit rating of at least the investment grade rating by at least two of S&P, Moody’s or Fitch), which entity has accepted delivery thereof and is paying unabated rent (unless any free rent is reserved with the lender) at a rate that is at least equal to the contract rate under the Specified Tenant Lease, and (v) if the Specified Tenant Trigger Event is caused by the occurrence of any of clause (i) through (iv) in the definition of “Specified Tenant Trigger Event”, the borrower delivers to the lender either (a) cash collateral or a letter of credit, (b) a guaranty in form and substance reasonably satisfactory to the lender from up to two entities that (X) each has a credit rating of at least the investment grade rating by at least two of S&P, Moody’s or Fitch, and (Y) collectively have and are obligated to maintain a minimum net worth and liquidity reasonably determined by the lender, or (c) subject to written confirmation from the rating agencies that the following will not result in the downgrade, withdrawal or qualification of the then current ratings or the proposed ratings assigned to any securities issued in connection with a securitization, a guaranty in form and substance reasonably satisfactory to the lender from a guarantor reasonably acceptable to the lender; in the case of each of (a), (b) or (c), in an amount equal to the Specified Tenant Rollover Reserve Cap.
A “Specified Tenant” means, as applicable, (i) Oath Holdings Inc., a Delaware corporation and (ii) any other lessee(s) of any space at the Coleman Highline Phase IV Property under a lease (a) that provides rental income representing 20% or more of the total rental income at the Coleman Highline Phase IV Property, (b) covers 20% or more of the total rentable square footage at the Coleman Highline Phase IV Property, (c) provides a lease term of more than 10 years, or (d) is with an affiliate of the borrower.
A “Specified Tenant Lease” means, collectively and/or individually (as the context requires), the lease at the Coleman Highline Phase IV Property with Specified Tenant (including, without limitation, any guaranty or similar instrument furnished thereunder).
A “Specified Tenant Lease Guarantor” means, as applicable, (i) Verizon Communications Inc., a Delaware corporation and (ii) any other guarantor(s) of the applicable Specified Tenant Lease(s).
A “Specified Tenant Rollover Reserve Cap” means an amount equal to (x) in the case of a Specified Tenant Default Trigger, a Specified Tenant Bankruptcy Trigger or a Specified Tenant Termination Trigger, $50.00 per square foot of any portion of the Specified Tenant space that has not been re-tenanted and (y) in the case of a Specified Tenant Go Dark Trigger, $50.00 per square foot of the dark or discontinued portion of the Specified Tenant space that has not been re-tenanted.
A “Qualified Lease” means a lease (a) that (i) is with a replacement tenant that has (or whose obligations under the lease are guaranteed by an entity that has) the credit rating of at least the investment grade rating by at least two of S&P, Moody’s or Fitch or is otherwise reasonably acceptable to the lender, (ii) has a term that extends at least five years beyond the ARD and with an initial term of at least five years, and (iii) contains lease terms that are substantially similar to the Specified Tenant Lease in effect at the origination date or (b) that is reasonably acceptable to the lender.
Subordinate Debt. The Coleman Highline Phase IV Property also secures the Coleman Highline Phase IV Subordinate Companion Loan, which has an aggregate Cut-off Date principal balance of $268,500,000. The Coleman Highline Phase IV Subordinate Companion Loan accrues interest at the Initial Interest Rate prior to the ARD and the Adjusted Interest Rate after the ARD. The Coleman Highline Phase IV Senior Loan is senior in right of payment to the Coleman Highline Phase IV Subordinate Companion Loan.
Mezzanine Debt. None.
Partial Release. Not permitted.
Ground Lease. None.
| THE INFORMATION IN THIS STRUCTURAL AND COLLATERAL TERM SHEET IS NOT COMPLETE AND MAY BE AMENDED PRIOR TO THE TIME OF SALE. THIS TERM SHEET IS NOT AN OFFER TO SELL THESE SECURITIES AND IT IS NOT A SOLICITATION OF AN OFFER TO BUY THESE SECURITIES IN ANY JURISDICTION WHERE THE OFFER OR SALE IS NOT PERMITTED. | ||
| 72 | ||
| Structural and Collateral Term Sheet | BMO 2022-C1 | |
| No. 5 – AMF Portfolio | ||
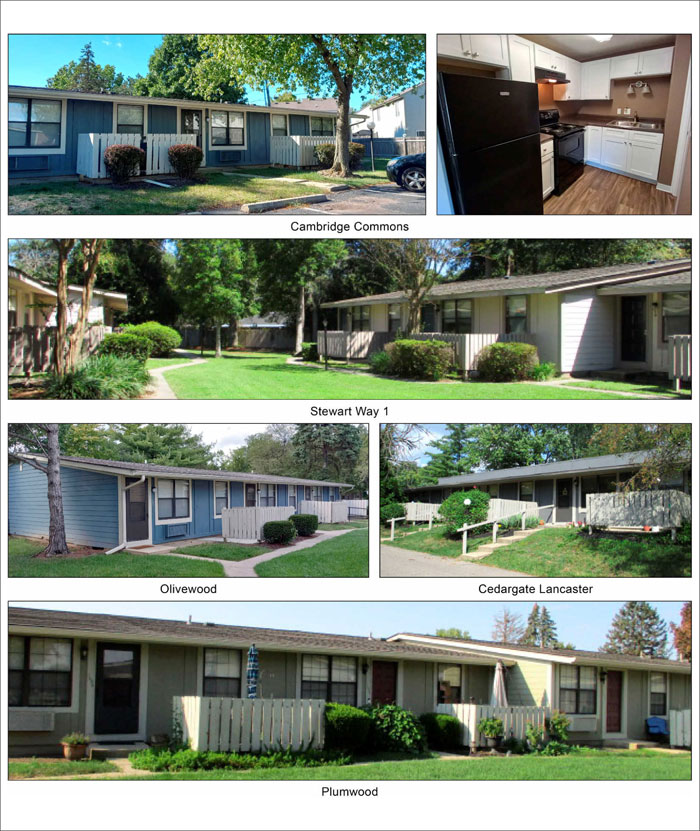
| THE INFORMATION IN THIS STRUCTURAL AND COLLATERAL TERM SHEET IS NOT COMPLETE AND MAY BE AMENDED PRIOR TO THE TIME OF SALE. THIS TERM SHEET IS NOT AN OFFER TO SELL THESE SECURITIES AND IT IS NOT A SOLICITATION OF AN OFFER TO BUY THESE SECURITIES IN ANY JURISDICTION WHERE THE OFFER OR SALE IS NOT PERMITTED. | ||
| 73 | ||
| Structural and Collateral Term Sheet | BMO 2022-C1 | |
| No. 5 – AMF Portfolio | ||
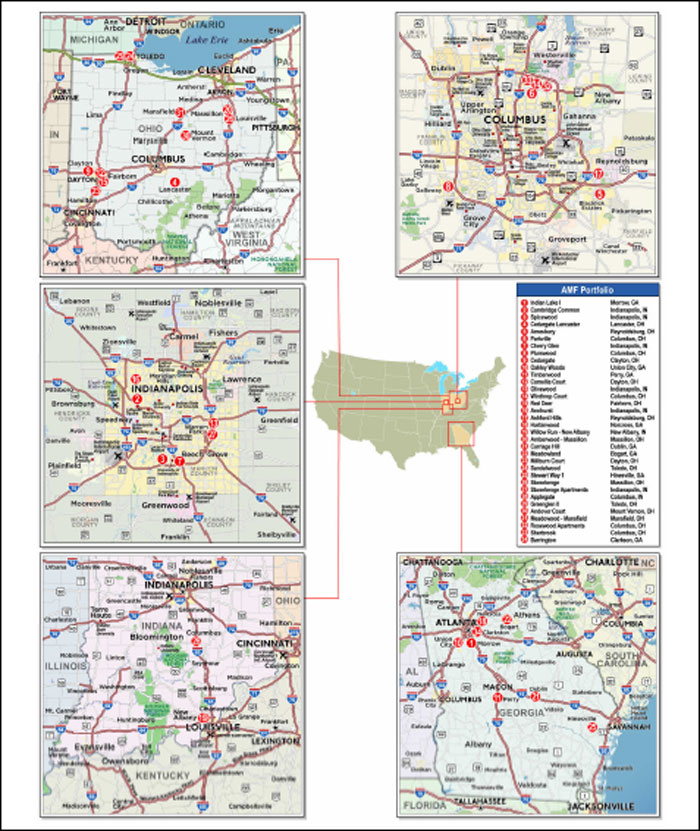
| THE INFORMATION IN THIS STRUCTURAL AND COLLATERAL TERM SHEET IS NOT COMPLETE AND MAY BE AMENDED PRIOR TO THE TIME OF SALE. THIS TERM SHEET IS NOT AN OFFER TO SELL THESE SECURITIES AND IT IS NOT A SOLICITATION OF AN OFFER TO BUY THESE SECURITIES IN ANY JURISDICTION WHERE THE OFFER OR SALE IS NOT PERMITTED. | ||
| 74 | ||
| Structural and Collateral Term Sheet | BMO 2022-C1 | |
| No. 5 – AMF Portfolio | ||
| Mortgage Loan Information | Property Information | |||
| Mortgage Loan Seller: | BMO/SMC | Single Asset / Portfolio: | Portfolio | |
| Original Principal Balance(1): | $40,000,000 | Title: | Fee | |
| Cut-off Date Principal Balance(1): | $40,000,000 | Property Type - Subtype: | Multifamily – Garden | |
| % of IPB: | 3.6% | Net Rentable Area (Units): | 3,299 | |
| Loan Purpose: | Refinance | Location: | Various | |
| Borrowers(2): | Various | Year Built / Renovated: | Various / NAP | |
| Borrower Sponsor: | Arbor Realty Sr, Inc. | Occupancy: | 94.7% | |
| Interest Rate(3): | 3.72381004379935% | Occupancy Date: | 9/3/2021 | |
| Note Date: | 10/29/2021 | 4th Most Recent NOI (As of): | NAV | |
| Maturity Date: | 11/6/2031 | 3rd Most Recent NOI (As of): | $15,294,022 (12/31/2019) | |
| Interest-only Period: | 82 months | 2nd Most Recent NOI (As of): | $16,035,635 (12/31/2020) | |
| Original Term: | 120 months | Most Recent NOI (As of): | $17,054,135 (TTM 8/31/2021) | |
| Original Amortization: | 360 months | UW Economic Occupancy: | 89.1% | |
| Amortization Type: | Interest Only, Amortizing Balloon | UW Revenues: | $29,391,201 | |
| Call Protection(4): | L(27),D(88),O(5) | UW Expenses: | $12,485,963 | |
| Lockbox / Cash Management: | Soft / Springing | UW NOI: | $16,905,238 | |
| Additional Debt(1)(5): | Yes | UW NCF: | $15,915,538 | |
| Additional Debt Balance(1)(5): | $132,000,000 / $13,000,000 | Appraised Value / Per Unit: | $280,625,000 / $85,064 | |
| Additional Debt Type(1)(5): | Pari Passu / Mezzanine | Appraisal Date: | Various | |
| Escrows and Reserves(6) | Financial Information(1)(7) | |||||||
| Initial | Monthly | Initial Cap | Loan Combination | Total Debt | ||||
| Taxes: | $715,487 | $168,641 | N/A | Cut-off Date Loan / Unit: | $52,137 | $56,078 | ||
| Insurance: | $403,757 | $100,786 | N/A | Maturity Date Loan / Unit: | $48,419 | $48,419 | ||
| Replacement Reserves: | $500,000 | $82,475 | N/A | Cut-off Date LTV: | 61.3% | 65.9% | ||
| Deferred Maintenance: | $756,042 | $0 | N/A | Maturity Date LTV: | 56.9% | 56.9% | ||
| UW NCF DSCR: | 1.51x | 1.51x | ||||||
| UW NOI Debt Yield: | 9.8% | 9.1% | ||||||
| Sources and Uses | ||||||||
| Sources | Proceeds | % of Total | Uses | Proceeds | % of Total | |||
| Loan Combination(1) | $172,000,000 | 93.0% | Payoff | $173,659,728 | 93.9% | |||
| Mezzanine Loan(5) | 13,000,000 | 7.0 | Closing Costs | 4,984,024 | 2.7 | |||
| Return of Equity | 3,980,961 | 2.2 | ||||||
| Reserves | 2,375,286 | 1.3 | ||||||
| Total Sources | $185,000,000 | 100.0% | Total Uses | $185,000,000 | 100.0% | |||
| (1) | The AMF Portfolio Mortgage Loan (as defined below) is part of the AMF Portfolio Loan Combination (as defined below) with an original aggregate principal balance of $172,000,000. The Financial Information in the chart above reflects the AMF Portfolio Loan Combination and the AMF Portfolio Total Debt (as defined below). For additional information, see “The Loan” below. |
| (2) | For a more detailed description of the Borrowers, see “The Borrowers” below. |
| (3) | Based on the interest rate for the first 83 months of the AMF Portfolio Mortgage Loan (as defined below) at 3.72381004379935% and steps up to 3.93100% thereafter. |
| (4) | The defeasance lockout period, with respect to a defeasance of the AMF Portfolio Loan Combination, will be at least 27 payment dates beginning with and including the first payment date on December 6, 2021. Defeasance of the full $172.0 million AMF Portfolio Loan Combination is permitted after the date that is earlier of (i) two years from the closing date of the securitization that includes the last note to be securitized and (ii) December 6, 2024 (the “AMF Portfolio Permitted Release Date”). |
| (5) | Concurrently with the origination of the AMF Portfolio Loan Combination, a $13.0 million AMF Portfolio Mezzanine Loan (as defined below) was originated. For a full description of the AMF Portfolio Mezzanine Loan, please refer to the “Subordinate and Mezzanine Debt” section below. |
| (6) | For a full description of Escrows and Reserves, see “Escrows and Reserves” below. |
| (7) | Certain financial information for the AMF Portfolio Loan Combination and AMF Portfolio Total Debt is identical as the AMF Portfolio mezzanine loan fully amortizes prior to the AMF Portfolio Loan Combination amortization payment commencement date, resulting in the monthly debt service payment remaining constant. The AMF Portfolio Loan Combination amortizes according to a fixed amortization schedule, which is attached to the Preliminary Prospectus. |
| THE INFORMATION IN THIS STRUCTURAL AND COLLATERAL TERM SHEET IS NOT COMPLETE AND MAY BE AMENDED PRIOR TO THE TIME OF SALE. THIS TERM SHEET IS NOT AN OFFER TO SELL THESE SECURITIES AND IT IS NOT A SOLICITATION OF AN OFFER TO BUY THESE SECURITIES IN ANY JURISDICTION WHERE THE OFFER OR SALE IS NOT PERMITTED. | ||
| 75 | ||
| Structural and Collateral Term Sheet | BMO 2022-C1 | |
| No. 5 – AMF Portfolio | ||
The Loan. The fifth largest mortgage loan (the “AMF Portfolio Mortgage Loan”) is part of a loan combination that has an outstanding principal balance as of the Cut-off Date of $172,000,000 (the “AMF Portfolio Loan Combination”), which is secured by the borrowers’ fee simple interests in a portfolio of 3,299 multifamily units located in Ohio, Indiana, and Georgia (the “AMF Portfolio Properties”). The AMF Portfolio Loan Combination was co-originated by Bank of Montreal (“BMO”) and Starwood Mortgage Capital LLC (“SMC”). The AMF Portfolio Loan Combination is comprised of eleven pari passu notes with an aggregate original principal balance as of the Cut-off Date of $172,000,000, of which Note A-4 and Note A-5-1, with an aggregate outstanding principal balance as of the Cut-off Date of $40,000,000, are being contributed to the BMO 2022-C1 securitization trust and collectively constitute the AMF Portfolio Mortgage Loan. The remaining notes are expected to be contributed to future securitization trusts. The “AMF Portfolio Total Debt” consists of the AMF Portfolio Loan Combination and a mezzanine loan with a Cut-off Date balance of $13,000,000 (the “AMF Portfolio Mezzanine Loan”). For additional information, see “Subordinate and Mezzanine Debt” below. The relationship between the holders of the AMF Portfolio Loan Combination will be governed by a co-lender agreement as described under “Description of the Mortgage Pool—The Loan Combinations—The Outside Serviced Pari Passu Loan Combinations” in the Preliminary Prospectus.
The following table presents certain information relating to the loan structure of the AMF Portfolio Loan Combination:
| Loan Combination Summary | |||
| Note | Original Balance | Note Holder | Controlling Piece |
| A-1 | $32,000,000 | BBCMS 2021-C12 | Yes(1) |
| A-2 | 32,000,000 | BBCMS 2021-C12 | No |
| A-3 | 24,000,000 | GSMS 2021-GSA3 | No |
| A-4 | 24,000,000 | BMO 2022-C1 | No |
| A-5-1 | 16,000,000 | BMO 2022-C1 | No |
| A-5-2 | 4,000,000 | GSMS 2021-GSA3 | No |
| A-6 | 20,000,000 | BBCMS 2021-C12 | No |
| A-7 | 5,000,000 | GSMS 2021-GSA3 | No |
| A-8 | 5,000,000 | BMO | No |
| A-9 | 5,000,000 | GSMS 2021-GSA3 | No |
| A-10 | 5,000,000 | BMO | No |
| Total | $172,000,000 | ||
| (1) | According to the co-lender agreement for BBCMS 2021-C12, the controlling holder is the BBCMS 2021-C12 Mortgage Trust. See “Description of the Mortgage Pool—The Loan Combinations—The Outside Serviced Pari Passu Loan Combinations” in the Preliminary Prospectus. |
The Properties. The AMF Portfolio Properties consist of 34 multifamily properties comprised of 3,299 residential units located in three states. The units are factory-built, modular construction buildings and most of the AMF Portfolio Properties offer a mix of studios, one- and two-bedrooms, with a select few offering three-bedroom options. The AMF Portfolio Properties are located in Ohio (18 Properties, 1,693 units, 51.4% of ALA), Indiana (8 Properties, 814 units, 25.7% of ALA) and Georgia (8 Properties, 792 units, 22.9% of ALA). Each AMF Portfolio Property features garden-style apartments with stone and Hardie board siding exterior, private exterior entrances, a private patio, pitched roofs with composition shingles and immediate access to parking. Typical amenities include electric ranges, garbage disposals, refrigerators, air conditioning, full-sized washer and dryer hookups as well as attic space.
COVID-19 Update. The tenant rental obligations at the AMF Portfolio Properties have not been materially disrupted by the macro effects of COVID-19. The borrowers made their first debt service payment for the AMF Portfolio Loan Combination in December 2021 and are current through the January 2022 payment date. As of February 1, 2022, the AMF Portfolio Loan Combination is not subject to any forbearance, modification, or debt service relief requests.
| THE INFORMATION IN THIS STRUCTURAL AND COLLATERAL TERM SHEET IS NOT COMPLETE AND MAY BE AMENDED PRIOR TO THE TIME OF SALE. THIS TERM SHEET IS NOT AN OFFER TO SELL THESE SECURITIES AND IT IS NOT A SOLICITATION OF AN OFFER TO BUY THESE SECURITIES IN ANY JURISDICTION WHERE THE OFFER OR SALE IS NOT PERMITTED. | ||
| 76 | ||
| Structural and Collateral Term Sheet | BMO 2022-C1 | |
| No. 5 – AMF Portfolio | ||
The following tables present certain information relating to the AMF Portfolio Properties:
| Portfolio Summary | ||||||
| # | Property | City | State | Year Built | Units | In-Place Occupancy(1) |
| 1 | Cambridge Commons | Indianapolis | IN | 1985 | 235 | 94.0% |
| 2 | Indian Lake I | Morrow | GA | 1987 | 243 | 90.5 |
| 3 | Stewart Way 1 | Hinesville | GA | 1986 | 190 | 90.5 |
| 4 | Cedargate Lancaster | Lancaster | OH | 1972, 1984 | 157 | 94.3 |
| 5 | Amesbury | Reynoldsburg | OH | 1986 | 149 | 93.3 |
| 6 | Red Deer | Fairborn | OH | 1986 | 131 | 95.4 |
| 7 | Olivewood | Indianapolis | IN | 1985 | 128 | 95.3 |
| 8 | Cherry Glen | Indianapolis | IN | 1986 | 137 | 94.9 |
| 9 | Plumwood | Columbus | OH | 1977 | 143 | 91.6 |
| 10 | Camelia Court | Dayton | OH | 1982 | 110 | 95.5 |
| 11 | Cedargate | Clayton | OH | 1984 | 130 | 94.6 |
| 12 | Millburn Court | Dayton | OH | 1979 | 115 | 100.0 |
| 13 | Rosewood Apartments | Columbus | OH | 1985 | 89 | 98.9 |
| 14 | Winthrop Court | Columbus | OH | 1985 | 100 | 96.0 |
| 15 | Annhurst | Indianapolis | IN | 1984 | 83 | 98.8 |
| 16 | Ashford Hills | Reynoldsburg | OH | 1986 | 77 | 96.1 |
| 17 | Harbinwood | Norcross | GA | 1986 | 72 | 97.2 |
| 18 | Willow Run - New Albany | New Albany | IN | 1984 | 64 | 95.3 |
| 19 | Parkville | Columbus | OH | 1978 | 100 | 96.0 |
| 20 | Applegate | Columbus | IN | 1982 | 58 | 93.1 |
| 21 | Stonehenge | Massillon | OH | 1984 | 60 | 95.0 |
| 22 | Meadowland | Bogart | GA | 1984 | 60 | 96.7 |
| 23 | Amberwood - Massillion | Massillon | OH | 1987 | 63 | 95.2 |
| 24 | Timberwood | Perry | GA | 1985 | 60 | 98.3 |
| 25 | Sherbrook | Columbus | OH | 1985 | 60 | 93.3 |
| 26 | Stonehenge Apartments | Indianapolis | IN | 1984 | 60 | 96.7 |
| 27 | Oakley Woods | Union City | GA | 1985 | 60 | 90.0 |
| 28 | Carriage Hill | Dublin | GA | 1985 | 60 | 90.0 |
| 29 | Barrington | Clarkston | GA | 1984 | 47 | 100.0 |
| 30 | Andover Court | Mount Vernon | OH | 1982 | 51 | 96.1 |
| 31 | Greenglen II | Toledo | OH | 1982 | 58 | 98.3 |
| 32 | Sandalwood | Toledo | OH | 1983 | 50 | 96.0 |
| 33 | Spicewood | Indianapolis | IN | 1985 | 49 | 98.0 |
| 34 | Meadowood - Mansfield | Mansfield | OH | 1983 | 50 | 96.0 |
| Total | 3,299 | 94.7% | ||||
| (1) | Based on the underwritten rent roll dated September 3, 2021. |
| THE INFORMATION IN THIS STRUCTURAL AND COLLATERAL TERM SHEET IS NOT COMPLETE AND MAY BE AMENDED PRIOR TO THE TIME OF SALE. THIS TERM SHEET IS NOT AN OFFER TO SELL THESE SECURITIES AND IT IS NOT A SOLICITATION OF AN OFFER TO BUY THESE SECURITIES IN ANY JURISDICTION WHERE THE OFFER OR SALE IS NOT PERMITTED. | ||
| 77 | ||
| Structural and Collateral Term Sheet | BMO 2022-C1 | |
| No. 5 – AMF Portfolio | ||
Unit Mix & Amenities. Each AMF Portfolio Property is primarily comprised of studios, one-bedroom and two-bedroom units. Community amenities generally include 24/7 emergency maintenance, flexible lease terms, high speed internet access, laundry facilities and on-site management. Typical unit amenities include air conditioning, ceiling fans, extra storage linen closets, mini blinds, private patio/balcony, utility room with hookups for washer and dryers, built-in bookshelves, eat-in kitchen, storm doors, pet policy and vaulted ceilings. As of September 3, 2021, the AMF Portfolio Properties were 94.7% occupied.
The following table presents certain information relating to the unit mix of the AMF Portfolio Properties:
| AMF Portfolio Unit Mix(1) | ||||||||||
| # | Property Name | Units | Studio | 1 BR | 2 BR | 3 BR | # Occ Units | # Vac Units | Occ. % | $ / Occ Unit |
| 1 | Cambridge Commons | 235 | 43 | 171 | 20 | 1 | 221 | 14 | 94.0% | $678 |
| 2 | Indian Lake I | 243 | 0 | 229 | 13 | 1 | 220 | 23 | 90.5 | 742 |
| 3 | Stewart Way 1 | 190 | 36 | 129 | 25 | 0 | 172 | 18 | 90.5 | 768 |
| 4 | Cedargate Lancaster | 157 | 10 | 92 | 55 | 0 | 148 | 9 | 94.3 | 666 |
| 5 | Amesbury | 149 | 43 | 95 | 11 | 0 | 139 | 10 | 93.3 | 650 |
| 6 | Red Deer | 131 | 31 | 92 | 8 | 0 | 125 | 6 | 95.4 | 694 |
| 7 | Olivewood | 128 | 25 | 86 | 17 | 0 | 122 | 6 | 95.3 | 695 |
| 8 | Cherry Glen | 137 | 28 | 99 | 10 | 0 | 130 | 7 | 94.9 | 688 |
| 9 | Plumwood | 143 | 24 | 100 | 19 | 0 | 131 | 12 | 91.6 | 707 |
| 10 | Camelia Court | 110 | 18 | 75 | 17 | 0 | 105 | 5 | 95.5 | 691 |
| 11 | Cedargate | 130 | 27 | 86 | 16 | 1 | 123 | 7 | 94.6 | 671 |
| 12 | Millburn Court | 115 | 19 | 78 | 17 | 1 | 115 | 0 | 100.0 | 693 |
| 13 | Rosewood Apartments | 89 | 8 | 64 | 17 | 0 | 88 | 1 | 98.9 | 751 |
| 14 | Winthrop Court | 100 | 10 | 70 | 20 | 0 | 96 | 4 | 96.0 | 747 |
| 15 | Annhurst | 83 | 8 | 59 | 16 | 0 | 82 | 1 | 98.8 | 719 |
| 16 | Ashford Hills | 77 | 23 | 49 | 5 | 0 | 74 | 3 | 96.1 | 719 |
| 17 | Harbinwood | 72 | 7 | 52 | 13 | 0 | 70 | 2 | 97.2 | 809 |
| 18 | Willow Run - New Albany | 64 | 5 | 46 | 13 | 0 | 61 | 3 | 95.3 | 735 |
| 19 | Parkville | 100 | 27 | 68 | 5 | 0 | 96 | 4 | 96.0 | 648 |
| 20 | Applegate | 58 | 7 | 39 | 12 | 0 | 54 | 4 | 93.1 | 779 |
| 21 | Stonehenge | 60 | 6 | 42 | 12 | 0 | 57 | 3 | 95.0 | 744 |
| 22 | Meadowland | 60 | 6 | 42 | 12 | 0 | 58 | 2 | 96.7 | 765 |
| 23 | Amberwood - Massillion | 63 | 7 | 50 | 6 | 0 | 60 | 3 | 95.2 | 651 |
| 24 | Timberwood | 60 | 6 | 42 | 12 | 0 | 59 | 1 | 98.3 | 674 |
| 25 | Sherbrook | 60 | 18 | 38 | 4 | 0 | 56 | 4 | 93.3 | 727 |
| 26 | Stonehenge Apartments | 60 | 6 | 42 | 12 | 0 | 58 | 2 | 96.7 | 647 |
| 27 | Oakley Woods | 60 | 6 | 42 | 12 | 0 | 54 | 6 | 90.0 | 788 |
| 28 | Carriage Hill | 60 | 6 | 42 | 12 | 0 | 54 | 6 | 90.0 | 640 |
| 29 | Barrington | 47 | 0 | 39 | 8 | 0 | 47 | 0 | 100.0 | 774 |
| 30 | Andover Court | 51 | 9 | 32 | 10 | 0 | 49 | 2 | 96.1 | 671 |
| 31 | Greenglen II | 58 | 14 | 39 | 5 | 0 | 57 | 1 | 98.3 | 624 |
| 32 | Sandalwood | 50 | 6 | 34 | 10 | 0 | 48 | 2 | 96.0 | 673 |
| 33 | Spicewood | 49 | 14 | 32 | 2 | 1 | 48 | 1 | 98.0 | 678 |
| 34 | Meadowood - Mansfield | 50 | 5 | 35 | 10 | 0 | 48 | 2 | 96.0 | 577 |
| Totals | 3,299 | 508 | 2,330 | 456 | 5 | 3,125 | 174 | 94.7% | $703 | |
| (1) | Based on the underwritten rent rolls dated September 3, 2021. |
| THE INFORMATION IN THIS STRUCTURAL AND COLLATERAL TERM SHEET IS NOT COMPLETE AND MAY BE AMENDED PRIOR TO THE TIME OF SALE. THIS TERM SHEET IS NOT AN OFFER TO SELL THESE SECURITIES AND IT IS NOT A SOLICITATION OF AN OFFER TO BUY THESE SECURITIES IN ANY JURISDICTION WHERE THE OFFER OR SALE IS NOT PERMITTED. | ||
| 78 | ||
| Structural and Collateral Term Sheet | BMO 2022-C1 | |
| No. 5 – AMF Portfolio | ||
The following table presents certain information relating to the historical occupancy of the AMF Portfolio Properties:
| Historical Occupancy | |||||||
# | Property | Units | 2017 | 2018 | 2019 | 2020 | In-Place Occupancy(1) |
| 1 | Cambridge Commons | 235 | 87.3% | 88.0% | 89.9% | 91.4% | 94.0% |
| 2 | Indian Lake I | 243 | 92.2 | 92.3 | 88.7 | 89.6 | 90.5 |
| 3 | Stewart Way 1 | 190 | 87.3 | 82.5 | 86.8 | 78.8 | 90.5 |
| 4 | Cedargate Lancaster | 157 | 92.4 | 92.1 | 92.1 | 90.3 | 94.3 |
| 5 | Amesbury | 149 | 88.1 | 93.3 | 87.3 | 93.7 | 93.3 |
| 6 | Red Deer | 131 | 92.8 | 90.9 | 87.5 | 89.0 | 95.4 |
| 7 | Olivewood | 128 | 90.5 | 90.0 | 92.0 | 92.4 | 95.3 |
| 8 | Cherry Glen | 137 | 93.5 | 92.3 | 89.7 | 93.1 | 94.9 |
| 9 | Plumwood | 143 | 91.3 | 92.2 | 86.7 | 87.1 | 91.6 |
| 10 | Camelia Court | 110 | 87.2 | 85.9 | 85.5 | 87.5 | 95.5 |
| 11 | Cedargate | 130 | 94.8 | 91.2 | 90.0 | 91.0 | 94.6 |
| 12 | Millburn Court | 115 | 91.8 | 89.2 | 88.3 | 93.2 | 100.0 |
| 13 | Rosewood Apartments | 89 | 93.2 | 92.4 | 95.0 | 91.1 | 98.9 |
| 14 | Winthrop Court | 100 | 94.8 | 93.6 | 87.9 | 88.7 | 96.0 |
| 15 | Annhurst | 83 | 91.8 | 94.3 | 95.5 | 94.5 | 98.8 |
| 16 | Ashford Hills | 77 | 94.9 | 96.1 | 94.5 | 95.0 | 96.1 |
| 17 | Harbinwood | 72 | 97.4 | 96.8 | 96.2 | 96.5 | 97.2 |
| 18 | Willow Run - New Albany | 64 | 86.4 | 86.6 | 90.7 | 91.4 | 95.3 |
| 19 | Parkville | 100 | 90.6 | 92.7 | 78.4 | 87.2 | 96.0 |
| 20 | Applegate | 58 | 92.0 | 89.7 | 85.8 | 91.5 | 93.1 |
| 21 | Stonehenge | 60 | 94.4 | 94.3 | 95.2 | 96.9 | 95.0 |
| 22 | Meadowland | 60 | 97.1 | 95.6 | 97.9 | 96.6 | 96.7 |
| 23 | Amberwood - Massillion | 63 | 93.6 | 92.6 | 90.2 | 92.5 | 95.2 |
| 24 | Timberwood | 60 | 94.0 | 90.7 | 89.8 | 93.2 | 98.3 |
| 25 | Sherbrook | 60 | 91.7 | 94.2 | 93.0 | 94.0 | 93.3 |
| 26 | Stonehenge Apartments | 60 | 90.6 | 87.3 | 88.7 | 90.2 | 96.7 |
| 27 | Oakley Woods | 60 | 96.2 | 94.6 | 91.4 | 92.2 | 90.0 |
| 28 | Carriage Hill | 60 | 91.1 | 92.8 | 90.7 | 92.4 | 90.0 |
| 29 | Barrington | 47 | 97.9 | 99.2 | 98.5 | 96.0 | 100.0 |
| 30 | Andover Court | 51 | 94.4 | 89.5 | 88.8 | 87.3 | 96.1 |
| 31 | Greenglen II | 58 | 89.0 | 89.5 | 85.5 | 91.7 | 98.3 |
| 32 | Sandalwood | 50 | 88.0 | 89.5 | 87.1 | 89.3 | 96.0 |
| 33 | Spicewood | 49 | 90.3 | 93.1 | 93.1 | 95.7 | 98.0 |
| 34 | Meadowood - Mansfield | 50 | 94.4 | 93.2 | 92.0 | 92.3 | 96.0 |
| Total / Wtd. Avg. | 3,299 | 91.6% | 91.2% | 89.7% | 90.8% | 94.7% | |
| (1) | Based on the underwritten rent roll dated September 3, 2021. |
Capital Investment. The Borrower Sponsor has invested approximately $5.9 million ($1,793 per unit) in capital expenditures at the AMF Portfolio Properties between 2019 and September 2021. Such improvements included exterior repairs, painting, new signage, asphalt repairs, roof repairs, interior unit upgrades and landscape refurbishment.
| THE INFORMATION IN THIS STRUCTURAL AND COLLATERAL TERM SHEET IS NOT COMPLETE AND MAY BE AMENDED PRIOR TO THE TIME OF SALE. THIS TERM SHEET IS NOT AN OFFER TO SELL THESE SECURITIES AND IT IS NOT A SOLICITATION OF AN OFFER TO BUY THESE SECURITIES IN ANY JURISDICTION WHERE THE OFFER OR SALE IS NOT PERMITTED. | ||
| 79 | ||
| Structural and Collateral Term Sheet | BMO 2022-C1 | |
| No. 5 – AMF Portfolio | ||
The following table presents certain information relating to the historical capital expenditures of the AMF Portfolio Properties:
| Historical Capital Expenditures 2019-2021(1) | |||||||
| # | Property | Interior | Exterior | Roof | Other | CapEx Totals | $/Unit |
| 1 | Cambridge Commons | $279,420 | $196,122 | $97,315 | $25,367 | $598,224 | $2,546 |
| 2 | Indian Lake I | 164,194 | 118,422 | 77,987 | 27,851 | 388,454 | 1,599 |
| 3 | Stewart Way 1 | 191,624 | 45,689 | 20,052 | 43,489 | 300,854 | 1,583 |
| 4 | Cedargate Lancaster | 123,707 | 82,897 | 63,679 | 23,041 | 293,324 | 1,868 |
| 5 | Amesbury | 106,272 | 27,206 | 73,348 | 4,485 | 211,311 | 1,418 |
| 6 | Red Deer | 102,347 | 16,870 | 32,773 | 11,113 | 163,103 | 1,245 |
| 7 | Olivewood | 133,133 | 112,259 | 62,507 | 1,086 | 308,985 | 2,414 |
| 8 | Cherry Glen | 134,120 | 46,332 | 8,805 | 0 | 189,257 | 1,381 |
| 9 | Plumwood | 141,575 | 46,721 | 12,900 | 16,088 | 217,284 | 1,519 |
| 10 | Camelia Court | 98,420 | 12,423 | 7,100 | 25,967 | 143,910 | 1,308 |
| 11 | Cedargate | 94,092 | 20,310 | 8,665 | 445 | 123,512 | 950 |
| 12 | Millburn Court | 100,688 | 16,099 | 35,485 | 3,549 | 155,821 | 1,355 |
| 13 | Rosewood Apartments | 55,608 | 28,584 | 73,178 | 26,079 | 183,449 | 2,061 |
| 14 | Winthrop Court | 97,530 | 39,540 | 15,320 | 5,772 | 158,162 | 1,582 |
| 15 | Annhurst | 94,721 | 51,096 | 41,975 | 1,072 | 188,864 | 2,275 |
| 16 | Ashford Hills | 49,812 | 38,066 | 27,861 | 5,051 | 120,790 | 1,569 |
| 17 | Harbinwood | 71,611 | 39,740 | 37,293 | 35,954 | 184,598 | 2,564 |
| 18 | Willow Run - New Albany | 54,299 | 40,326 | 40,135 | 15,683 | 150,443 | 2,351 |
| 19 | Parkville | 107,462 | 35,469 | 80,100 | 7,032 | 230,063 | 2,301 |
| 20 | Applegate | 95,924 | 30,119 | 8,440 | 1,962 | 136,445 | 2,353 |
| 21 | Stonehenge | 50,799 | 39,825 | 6,815 | 157 | 97,596 | 1,627 |
| 22 | Meadowland | 53,879 | 39,698 | 25,123 | 14,330 | 133,030 | 2,217 |
| 23 | Amberwood - Massillion | 52,964 | 23,761 | 13,155 | 0 | 89,880 | 1,427 |
| 24 | Timberwood | 69,725 | 14,515 | 34,290 | 12,848 | 131,378 | 2,190 |
| 25 | Sherbrook | 36,940 | 12,640 | 26,177 | 22,071 | 97,828 | 1,630 |
| 26 | Stonehenge Apartments | 52,240 | 25,232 | 10,917 | 29,190 | 117,579 | 1,960 |
| 27 | Oakley Woods | 71,560 | 23,608 | 0 | 11,591 | 106,759 | 1,779 |
| 28 | Carriage Hill | 55,691 | 45,998 | 14,750 | 1,466 | 117,905 | 1,965 |
| 29 | Barrington | 50,921 | 38,776 | 25,315 | 34,873 | 149,885 | 3,189 |
| 30 | Andover Court | 29,983 | 9,550 | 35,295 | 12,290 | 87,118 | 1,708 |
| 31 | Greenglen II | 33,968 | 14,065 | 16,130 | 8,864 | 73,027 | 1,259 |
| 32 | Sandalwood | 38,251 | 16,441 | 27,466 | 17,369 | 99,527 | 1,991 |
| 33 | Spicewood | 45,485 | 28,866 | 0 | 621 | 74,972 | 1,530 |
| 34 | Meadowood - Mansfield | 25,323 | 5,045 | 31,308 | 31,224 | 92,900 | 1,858 |
| Total / Wtd. Avg. | $2,964,288 | $1,382,310 | $1,091,659 | $477,980 | $5,916,237 | $1,793 | |
| (1) | Represents 2019 through September 3, 2021. |
Environmental. According to the Phase I environmental assessments, there is no evidence of any recognized or controlled recognized environmental conditions at any of the AMF Portfolio Properties.
The Markets. The AMF Portfolio Properties are geographically diverse with 34 properties located across several major multifamily markets.
The following table presents certain market information relating to the AMF Portfolio Properties:
| Market Summary | |||||||||
| State | # of Properties(1) | # of Units(1) | % of Portfolio Units(1) | In-Place Occupancy(1) | Avg. In- Place Rent | Allocated Loan Combination Amount | % of Loan Combination | UW NCF | % of Total UW NCF |
| Ohio | 18 | 1,693 | 51.3% | 95.4% | $682 | $88,441,591 | 51.4% | $8,190,741 | 51.5% |
| Indiana | 8 | 814 | 24.7% | 95.3% | $703 | $44,178,335 | 25.7% | $4,070,107 | 25.6% |
| Georgia | 8 | 792 | 24.0% | 92.7% | $749 | $39,380,074 | 22.9% | $3,654,690 | 23.0% |
| Total | 34 | 3,299 | 100.0% | 94.7% | $703 | $172,000,000 | 100.0% | $15,915,538 | 100.0% |
| (1) | Based on the underwritten rent rolls dated September 3, 2021. |
| THE INFORMATION IN THIS STRUCTURAL AND COLLATERAL TERM SHEET IS NOT COMPLETE AND MAY BE AMENDED PRIOR TO THE TIME OF SALE. THIS TERM SHEET IS NOT AN OFFER TO SELL THESE SECURITIES AND IT IS NOT A SOLICITATION OF AN OFFER TO BUY THESE SECURITIES IN ANY JURISDICTION WHERE THE OFFER OR SALE IS NOT PERMITTED. | ||
| 80 | ||
| Structural and Collateral Term Sheet | BMO 2022-C1 | |
| No. 5 – AMF Portfolio | ||
The following table presents certain demographic statistical information relating to the AMF Portfolio Properties:
| AMF Multifamily Portfolio Properties Population Statistics(1) | |||||||
| Median Household Income | Population | ||||||
| # | Property | 1 Mile | 3 Mile | 5 Mile | 1 Mile | 3 Mile | 5 Mile |
| 1 | Cambridge Commons | $46,954 | $50,079 | $49,324 | 10,584 | 96,024 | 218,170 |
| 2 | Indian Lake I | $48,439 | $48,351 | $49,219 | 4,283 | 73,991 | 196,269 |
| 3 | Stewart Way 1 | $49,424 | $48,693 | $49,504 | 4,692 | 31,163 | 43,642 |
| 4 | Cedargate Lancaster | $36,491 | $47,515 | $51,975 | 5,665 | 31,631 | 51,344 |
| 5 | Amesbury | $62,598 | $55,867 | $59,670 | 17,728 | 96,823 | 224,712 |
| 6 | Red Deer | $68,603 | $63,633 | $72,774 | 5,889 | 34,308 | 74,488 |
| 7 | Olivewood | $43,318 | $39,462 | $41,344 | 9,217 | 82,859 | 214,088 |
| 8 | Cherry Glen | $40,501 | $44,352 | $48,969 | 11,885 | 87,539 | 228,705 |
| 9 | Plumwood | $46,596 | $53,766 | $56,114 | 20,649 | 89,573 | 197,075 |
| 10 | Camelia Court | $35,162 | $34,010 | $36,583 | 10,159 | 71,469 | 141,300 |
| 11 | Cedargate | $67,195 | $71,251 | $63,220 | 9,237 | 33,470 | 59,509 |
| 12 | Millburn Court | $99,664 | $93,100 | $90,061 | 6,651 | 48,555 | 114,333 |
| 13 | Rosewood Apartments | $52,962 | $62,208 | $69,361 | 13,676 | 120,720 | 280,698 |
| 14 | Winthrop Court | $52,962 | $62,208 | $69,361 | 13,676 | 120,720 | 280,698 |
| 15 | Annhurst | $52,120 | $54,468 | $55,474 | 8,492 | 70,151 | 177,088 |
| 16 | Ashford Hills | $54,370 | $56,812 | $58,807 | 11,834 | 107,751 | 238,701 |
| 17 | Harbinwood | $49,437 | $49,325 | $56,850 | 15,451 | 114,789 | 255,779 |
| 18 | Willow Run - New Albany | $63,216 | $54,543 | $53,080 | 7,651 | 55,194 | 114,050 |
| 19 | Parkville | $52,962 | $62,208 | $69,361 | 13,676 | 120,720 | 280,698 |
| 20 | Applegate | $62,608 | $59,509 | $61,057 | 9,640 | 40,649 | 47,464 |
| 21 | Stonehenge | $48,990 | $52,300 | $58,192 | 5,031 | 38,407 | 70,800 |
| 22 | Meadowland | $62,038 | $68,450 | $63,162 | 4,922 | 28,964 | 71,614 |
| 23 | Amberwood - Massillion | $65,656 | $62,407 | $61,560 | 8,192 | 45,554 | 104,479 |
| 24 | Timberwood | $44,532 | $53,468 | $61,327 | 1,988 | 14,841 | 23,358 |
| 25 | Sherbrook | $52,962 | $62,208 | $69,361 | 13,676 | 120,720 | 280,698 |
| 26 | Stonehenge Apartments | $46,680 | $52,993 | $45,733 | 3,357 | 55,740 | 179,462 |
| 27 | Oakley Woods | $43,183 | $54,277 | $56,042 | 7,612 | 52,274 | 125,167 |
| 28 | Carriage Hill | $39,738 | $40,092 | $40,822 | 4,748 | 18,596 | 24,988 |
| 29 | Barrington | $41,033 | $62,083 | $66,918 | 16,549 | 108,880 | 270,349 |
| 30 | Andover Court | $47,352 | $50,058 | $53,454 | 5,684 | 20,740 | 27,554 |
| 31 | Greenglen II | $53,597 | $62,631 | $57,472 | 8,922 | 56,244 | 150,899 |
| 32 | Sandalwood | $55,680 | $48,203 | $48,741 | 7,021 | 77,988 | 223,810 |
| 33 | Spicewood | $39,403 | $42,610 | $46,485 | 9,661 | 68,791 | 216,280 |
| 34 | Meadowood - Mansfield | $56,652 | $51,472 | $46,951 | 5,912 | 26,291 | 57,529 |
| (1) | Based on the individual AMF Portfolio Properties’ appraisals. |
| THE INFORMATION IN THIS STRUCTURAL AND COLLATERAL TERM SHEET IS NOT COMPLETE AND MAY BE AMENDED PRIOR TO THE TIME OF SALE. THIS TERM SHEET IS NOT AN OFFER TO SELL THESE SECURITIES AND IT IS NOT A SOLICITATION OF AN OFFER TO BUY THESE SECURITIES IN ANY JURISDICTION WHERE THE OFFER OR SALE IS NOT PERMITTED. | ||
| 81 | ||
| Structural and Collateral Term Sheet | BMO 2022-C1 | |
| No. 5 – AMF Portfolio | ||
The following table presents certain submarket information relating to the AMF Portfolio Properties:
| AMF Multifamily Portfolio Properties Submarket Statistics(1) | ||||
| # | Property | Submarket | Submarket Rent/Unit | Submarket Occupancy |
| 1 | Cambridge Commons | Northwest Marion County | $884 | 95.9% |
| 2 | Indian Lake I | Clayton County | $1,121 | 94.8% |
| 3 | Stewart Way 1 | Liberty County | $985 | 95.3% |
| 4 | Cedargate Lancaster | Fairfield County | $1,066 | 98.2% |
| 5 | Amesbury | Southern Columbus | $947 | 92.8% |
| 6 | Red Deer | Fairborn/AFB | $786 | 97.5% |
| 7 | Olivewood | Southeast Indianapolis | $857 | 94.6% |
| 8 | Cherry Glen | Central Marion County | $825 | 92.0% |
| 9 | Plumwood | Greater Hilltop Columbus | $963 | 93.8% |
| 10 | Camelia Court | Northeast Dayton | $781 | 96.6% |
| 11 | Cedargate | Fairborn/AFB | $786 | 97.5% |
| 12 | Millburn Court | Centerville/Kettering | $936 | 96.4% |
| 13 | Rosewood Apartments | Northeast Columbus | $1,020 | 95.4% |
| 14 | Winthrop Court | Northeast Columbus | $1,020 | 95.4% |
| 15 | Annhurst | Northwest Marion County | $884 | 95.9% |
| 16 | Ashford Hills | Southern Columbus | $947 | 92.8% |
| 17 | Harbinwood | Outlying Gwinnett County | $1,396 | 96.8% |
| 18 | Willow Run - New Albany | Southern Indiana | $866 | 95.1% |
| 19 | Parkville | Northeast Columbus | $1,020 | 95.4% |
| 20 | Applegate | Columbus | $986 | 91.6% |
| 21 | Stonehenge | Massillon | $690 | 98.3% |
| 22 | Meadowland | Athens | $1,049 | 96.0% |
| 23 | Amberwood - Massillion | Massillon | $690 | 98.3% |
| 24 | Timberwood | Macon | $954 | 92.9% |
| 25 | Sherbrook | Northeast Columbus | $1,020 | 95.4% |
| 26 | Stonehenge Apartments | Southeast Indianapolis | $857 | 94.6% |
| 27 | Oakley Woods | South Fulton County | $1,189 | 88.5% |
| 28 | Carriage Hill | Laurens County | $517 | 96.6% |
| 29 | Barrington | Southeast DeKalb | $1,132 | 92.9% |
| 30 | Andover Court | Mount Vernon | $1,290 | 99.2% |
| 31 | Greenglen II | Ottawa Hills | $736 | 95.6% |
| 32 | Sandalwood | Ottawa Hills | $736 | 95.6% |
| 33 | Spicewood | Central Marion County | $825 | 92.0% |
| 34 | Meadowood - Mansfield | Lexington | $851 | 99.4% |
| (1) | Based on the individual AMF Portfolio Properties’ appraisals. |
| THE INFORMATION IN THIS STRUCTURAL AND COLLATERAL TERM SHEET IS NOT COMPLETE AND MAY BE AMENDED PRIOR TO THE TIME OF SALE. THIS TERM SHEET IS NOT AN OFFER TO SELL THESE SECURITIES AND IT IS NOT A SOLICITATION OF AN OFFER TO BUY THESE SECURITIES IN ANY JURISDICTION WHERE THE OFFER OR SALE IS NOT PERMITTED. | ||
| 82 | ||
| Structural and Collateral Term Sheet | BMO 2022-C1 | |
| No. 5 – AMF Portfolio | ||
The following table presents certain historical and underwritten financial information relating to the AMF Portfolio Properties:
| Operating History and Underwritten Net Cash Flow | ||||||
| 2019 | 2020 | 08/31/2021 TTM | Underwritten | Per Unit | %(1) | |
| Gross Potential Rent(2) | $26,049,636 | $26,890,466 | $27,498,973 | $27,891,556 | $8,455 | 112.3% |
| (Vacancy) | (3,628,718) | (3,171,602) | (2,658,986) | (3,051,569) | (925) | (12.3) |
| Net Rental Income | $22,420,918 | $23,718,864 | $24,839,987 | $24,839,987 | $7,530 | 100.0% |
| Other Income | 4,441,206 | 4,344,675 | 4,551,214 | 4,551,214 | 1,380 | 18.3 |
| Effective Gross Income | $26,862,124 | $28,063,539 | $29,391,201 | $29,391,201 | $8,909 | 118.3% |
| Total Expenses | $11,568,102 | $12,027,904 | $12,337,066 | $12,485,963 | $3,785 | 42.5% |
| Net Operating Income | $15,294,022 | $16,035,635 | $17,054,135 | $16,905,238 | $5,124 | 57.5% |
| Replacement Reserves | 0 | 0 | 0 | 989,700 | 300 | 3.4 |
| Net Cash Flow | $15,294,022 | $16,035,635 | $17,054,135 | $15,915,538 | $4,824 | 54.2% |
| (1) | % column represents percent of Net Rental Income for all revenue lines and represents percent of Effective Gross Income for the remainder of the fields. |
| (2) | Underwritten Gross Potential Rent based on underwritten rent rolls dated September 3, 2021. |
The Borrowers. The borrowers consist of 46 recycled single-purpose entities that are Ohio limited partnerships, Ohio limited liability companies, Georgia limited partnerships, Georgia limited liability companies or Delaware limited liability companies. Each borrower is structured to be a single purpose bankruptcy-remote entity, having two independent directors in its organizational structure and is indirectly owned by Arbor Realty Sr, Inc. Legal counsel to the borrowers delivered a non-consolidation opinion in connection with the origination of the AMF Portfolio Loan Combination.
The Borrower Sponsor. The borrower sponsor is Arbor Realty Sr, Inc., a wholly-owned indirect subsidiary of Arbor Realty Trust, Inc. (“Arbor”) (NYSE: ABR). Arbor, which began operations in 2003, is a nationwide real estate investment trust and direct lender, providing loan origination and servicing for multifamily, senior housing, healthcare, and other commercial real estate assets. Headquartered in Uniondale, New York, Arbor manages a multibillion-dollar servicing portfolio, specializing in government-sponsored enterprise products. Arbor is a Fannie Mae Delegated Underwriting and Servicing (DUS) lender and Freddie Mac Optigo Seller/Servicer. Arbor’s lending products include CMBS, bridge, mezzanine, and preferred equity loans.
Property Management. The AMF Portfolio Properties are managed by Elon Property Management Company, L.L.C., which is an entity affiliated with the borrowers.
Escrows and Reserves. At origination, the borrowers were required to deposit into escrow (i) approximately $715,487 for real estate taxes, (ii) approximately $403,757 for insurance premiums, (iii) $756,042 for deferred maintenance and (iv) $500,000 for replacement reserves.
Tax Escrows – On a monthly basis, the borrowers are required to escrow 1/12th of the annual estimated real estate taxes, which currently equates to approximately $168,641.
Insurance Escrows – On a monthly basis, the borrowers are required to escrow 1/12th of the annual estimated insurance premiums, which currently equates to approximately $100,786.
Replacement Reserve – On a monthly basis, the borrowers are required to escrow $82,475 for replacement reserves.
Lockbox / Cash Management. The AMF Portfolio Loan Combination is structured with a soft lockbox and springing cash management upon the occurrence and continuance of a Cash Trap Period (as defined below). The AMF Portfolio Loan Combination documents require that all rents received by the borrowers or the property managers be deposited into the lockbox account within three business days of receipt. During the continuance of a Cash Trap Period, all funds in the lockbox account are required to be swept each business day to a lender-controlled cash management account and disbursed in accordance with the AMF Portfolio Loan Combination documents.
A “Cash Trap Period” will commence upon the earliest to occur of (i) an event of default under the AMF Portfolio Loan Combination, (ii) upon any bankruptcy action of a Borrower, principal, or the property manager until, in the case of a bankruptcy of the property manager (or involuntary bankruptcy with respect to an affiliated property manager), the property manager is replaced in accordance with the AMF Portfolio Loan Combination documents, (iii) the debt yield (based on the trailing 12-month income and expenses) falls below 7.25% as of the end of any calendar quarter until the debt yield is 7.50% for two consecutive calendar quarters, and (iv) the occurrence of an event of default under the mezzanine loan.
| THE INFORMATION IN THIS STRUCTURAL AND COLLATERAL TERM SHEET IS NOT COMPLETE AND MAY BE AMENDED PRIOR TO THE TIME OF SALE. THIS TERM SHEET IS NOT AN OFFER TO SELL THESE SECURITIES AND IT IS NOT A SOLICITATION OF AN OFFER TO BUY THESE SECURITIES IN ANY JURISDICTION WHERE THE OFFER OR SALE IS NOT PERMITTED. | ||
| 83 | ||
| Structural and Collateral Term Sheet | BMO 2022-C1 | |
| No. 5 – AMF Portfolio | ||
Subordinate and Mezzanine Debt. A $13,000,000 mezzanine loan (the “AMF Portfolio Mezzanine Loan”) was funded concurrently with the origination of the AMF Portfolio Loan Combination and is secured by the direct equity ownership in the AMF Portfolio Borrowers. The AMF Portfolio Mezzanine Loan accrues interest based on a fixed schedule which varies by month with an interest rate of 6.67228249742403% per annum through the December 2024 payment. Beginning with the January 2025 payment, the interest rate increases throughout the term and fully amortizes in October 2028. Including the AMF Portfolio Loan Combination and the AMF Portfolio Mezzanine Loan, the total debt Cut-off Date LTV, total debt UW NCF DSCR and total debt UW NOI Debt Yield are 65.9%, 1.51x and 9.1%, respectively. The lenders of the AMF Portfolio Loan Combination and the AMF Portfolio Mezzanine Loan have entered into an intercreditor agreement that governs their relationship.
Partial Release. Following the AMF Portfolio Permitted Release Date, the borrowers will be permitted to release one or more AMF Portfolio Properties as collateral for the AMF Portfolio Loan Combination (each such Property, a “Release Property”), provided that the following conditions, among others, are satisfied: (i) the borrowers partially defease the AMF Portfolio Loan Combination in an amount equal to the greater of (1) 115% of the portion of the allocated loan amount applicable to the Release Property (as determined by the lender in its sole discretion prior to the origination of the AMF Portfolio Loan Combination), and (2) the amount that would result in (A) the loan-to-value ratio with respect to the AMF Portfolio Properties remaining after giving effect to the release (the “Remaining Properties”) not exceeding the 70%, (B) the debt service coverage ratio with respect to the Remaining Properties being not less than the greater of (x) 1.40x and (y) the debt service coverage ratio on the Remaining Properties serving as collateral for the AMF Portfolio Loan Combination immediately prior to such release and (C) the debt yield with respect to the Remaining Properties being not less than the greater of (x) 8.35% and (y) the debt yield on the Remaining Properties serving as collateral for the AMF Portfolio Loan Combination immediately prior to such release. Each of the above tests are based on the then outstanding principal balances of the AMF Portfolio Loan Combination and the AMF Portfolio Mezzanine Loan and are to be determined by the lender in its reasonable discretion. In the event of any defeasance of the AMF Portfolio Loan Combination, the mezzanine borrower will be required to defease a portion of the AMF Portfolio Mezzanine Loan in an amount equal to the product of (x) the outstanding principal balance of the AMF Portfolio Mezzanine Loan and (y) a fraction, the numerator of which is the amount of the AMF Portfolio Loan Combination being defeased and the denominator of which is the then-outstanding principal balance of the AMF Portfolio Loan Combination (i.e., without taking into account the defeasance of the AMF Portfolio Loan Combination).
Ground Lease. None.
| THE INFORMATION IN THIS STRUCTURAL AND COLLATERAL TERM SHEET IS NOT COMPLETE AND MAY BE AMENDED PRIOR TO THE TIME OF SALE. THIS TERM SHEET IS NOT AN OFFER TO SELL THESE SECURITIES AND IT IS NOT A SOLICITATION OF AN OFFER TO BUY THESE SECURITIES IN ANY JURISDICTION WHERE THE OFFER OR SALE IS NOT PERMITTED. | ||
| 84 | ||
| Structural and Collateral Term Sheet | BMO 2022-C1 | |
| No. 6 – 601 Lexington Avenue | ||
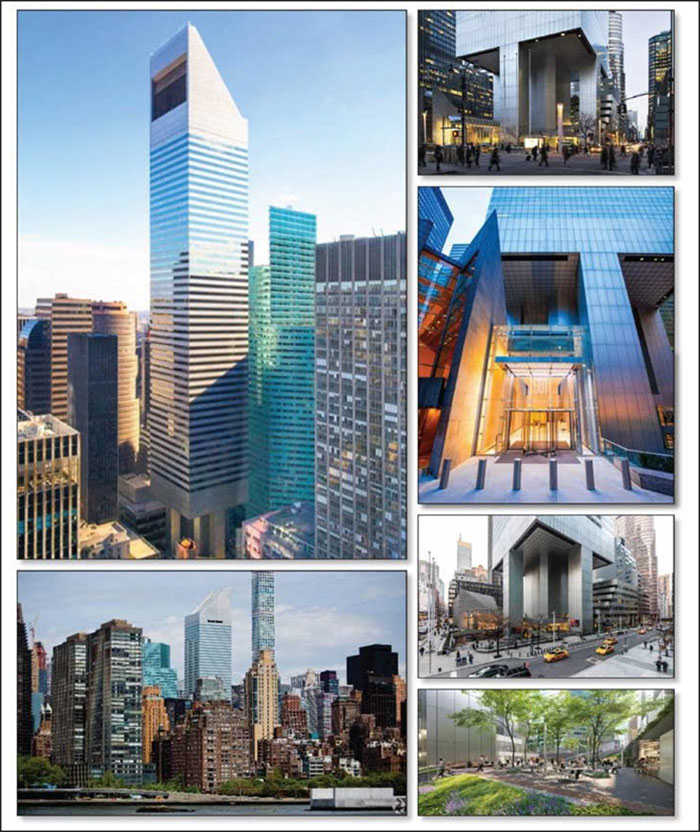
| THE INFORMATION IN THIS STRUCTURAL AND COLLATERAL TERM SHEET IS NOT COMPLETE AND MAY BE AMENDED PRIOR TO THE TIME OF SALE. THIS TERM SHEET IS NOT AN OFFER TO SELL THESE SECURITIES AND IT IS NOT A SOLICITATION OF AN OFFER TO BUY THESE SECURITIES IN ANY JURISDICTION WHERE THE OFFER OR SALE IS NOT PERMITTED. | ||
| 85 | ||
| Structural and Collateral Term Sheet | BMO 2022-C1 | |
| No. 6 – 601 Lexington Avenue | ||
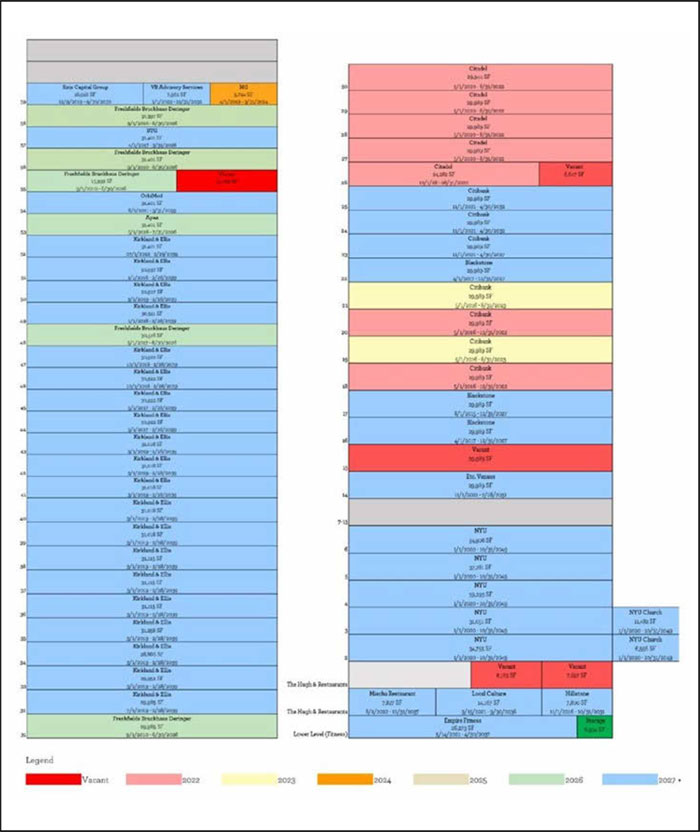
| THE INFORMATION IN THIS STRUCTURAL AND COLLATERAL TERM SHEET IS NOT COMPLETE AND MAY BE AMENDED PRIOR TO THE TIME OF SALE. THIS TERM SHEET IS NOT AN OFFER TO SELL THESE SECURITIES AND IT IS NOT A SOLICITATION OF AN OFFER TO BUY THESE SECURITIES IN ANY JURISDICTION WHERE THE OFFER OR SALE IS NOT PERMITTED. | ||
| 86 | ||
| Structural and Collateral Term Sheet | BMO 2022-C1 | |
| No. 6 – 601 Lexington Avenue | ||
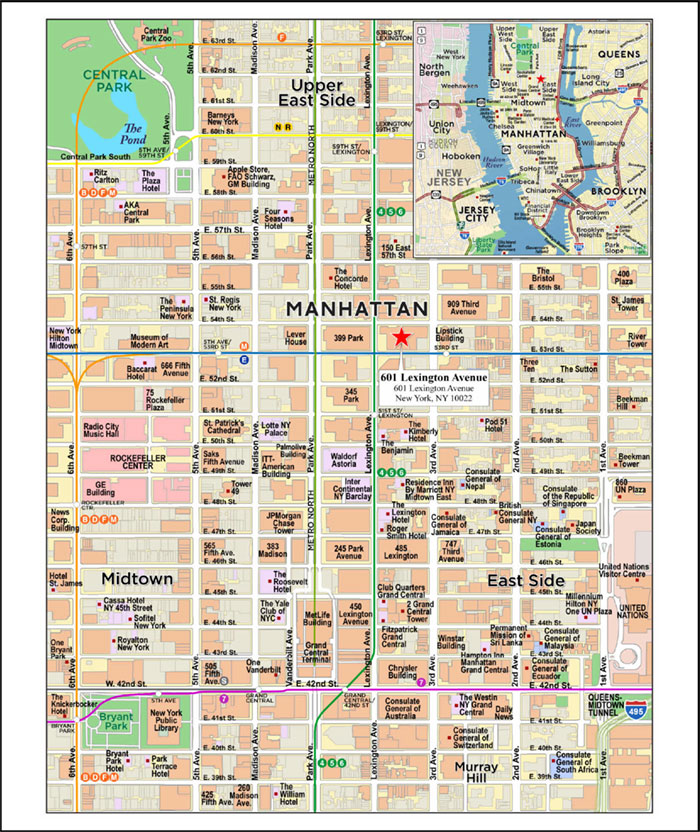
| THE INFORMATION IN THIS STRUCTURAL AND COLLATERAL TERM SHEET IS NOT COMPLETE AND MAY BE AMENDED PRIOR TO THE TIME OF SALE. THIS TERM SHEET IS NOT AN OFFER TO SELL THESE SECURITIES AND IT IS NOT A SOLICITATION OF AN OFFER TO BUY THESE SECURITIES IN ANY JURISDICTION WHERE THE OFFER OR SALE IS NOT PERMITTED. | ||
| 87 | ||
| Structural and Collateral Term Sheet | BMO 2022-C1 | |
| No. 6 – 601 Lexington Avenue | ||
| Mortgage Loan Information | Property Information | |||
| Mortgage Loan Seller: | GACC | Single Asset / Portfolio: | Single Asset | |
| Credit Assessment (KBRA/Fitch/S&P): | (BBB/BBB-sf*/BB+) | Title: | Fee/Leasehold | |
| Original Principal Balance(1): | $40,000,000 | Property Type – Subtype: | Office – CBD | |
| Cut-off Date Principal Balance(1): | $40,000,000 | Net Rentable Area (SF): | 1,675,659 | |
| % of IPB: | 3.6% | Location: | New York, NY | |
| Loan Purpose: | Refinance | Year Built / Renovated: | 1977 / 2021 | |
| Borrowers(2): | BP/CGCenter I LLC and BP/CGCenter II LLC | Occupancy: | 96.3% | |
| Borrower Sponsor(2): | BP/CG Center MM LLC | Occupancy Date: | 11/1/2021 | |
| Interest Rate: | 2.79196% | 4th Most Recent NOI (As of): | $87,124,160 (12/31/2018) | |
| Note Date: | 12/10/2021 | 3rd Most Recent NOI (As of): | $82,516,612 (12/31/2019) | |
| Maturity Date: | 1/9/2032 | 2nd Most Recent NOI (As of): | $88,939,219 (12/31/2020) | |
| Interest-only Period: | 120 months | Most Recent NOI (As of): | $89,547,809 (TTM 9/30/2021) | |
| Original Term: | 120 months | UW Economic Occupancy: | 93.5% | |
| Original Amortization Term: | None | UW Revenues: | $159,706,334 | |
| Amortization Type: | Interest Only | UW Expenses: | $64,433,228 | |
| Call Protection(3): | L(25),D(88),O(7) | UW NOI: | $95,273,106 | |
| Lockbox / Cash Management: | Hard / Springing | UW NCF: | $92,110,483 | |
| Additional Debt(1): | Yes | Appraised Value / Per SF: | $1,700,000,000 / $1,015 | |
| Additional Debt Balance(1): | $683,300,000 / $276,700,000 | Appraisal Date: | 10/1/2021 | |
| Additional Debt Type(1): | Pari Passu / Subordinate | |||
| Escrows and Reserves(4) | Financial Information(1) | ||||||
| Initial | Monthly | Initial Cap | Senior Loan | Loan Combination | |||
| Taxes: | $0 | Springing | N/A | Cut-off Date Loan / SF: | $432 | $597 | |
| Insurance: | $0 | Springing | N/A | Maturity Date Loan / SF: | $432 | $597 | |
| Replacement Reserves: | $0 | Springing | $837,829 | Cut-off Date LTV: | 42.5% | 58.8% | |
| TI/LC Reserve: | $0 | Springing | $10,053,948 | Maturity Date LTV: | 42.5% | 58.8% | |
| Other(5): | $61,289,797 | $0 | N/A | UW NCF DSCR: | 4.50x | 3.25x | |
| UW NOI Debt Yield: | 13.2% | 9.5% | |||||
| Sources and Uses | |||||||
| Sources | Proceeds | % of Total | Uses(5) | Proceeds | % of Total | ||
| Senior Loan(1) | $723,300,000 | 72.3% | Loan Payoff | $618,492,902 | 61.8% | ||
| Subordinate Companion Loan | $276,700,000 | 27.7 | Return of Equity | 368,350,972 | 36.8 | ||
| Closing Costs | 13,156,127 | 1.3 | |||||
| Total Sources | $1,000,000,000 | 100.0% | Total Uses | $1,000,000,000 | 100.0% | ||
| (1) | The 601 Lexington Avenue Mortgage Loan (as defined below) is part of the 601 Lexington Avenue Loan Combination (as defined below) with an original aggregate principal balance of $1,000,000,000. The Financial Information in the chart above reflects the 601 Lexington Avenue Senior Loan (as defined below) and the 601 Lexington Avenue Loan Combination. For additional information, see “The Loan” below. |
| (2) | BP/CGCenter I LLC and BP/CGCenter II LLC are the single purpose entity borrowers. The 601 Lexington Avenue Loan Combination is recourse to the single purpose entity borrowers for certain items. There is no separate non-recourse carveout guarantor or environmental indemnitor for the 601 Lexington Avenue Loan Combination. Boston Properties Limited Partnership, a Delaware Limited partnership (“BPLP”) has executed a guaranty of reserve funds in place of posting certain reserves. |
| (3) | Defeasance of the 601 Lexington Avenue Loan Combination is permitted at any time after the earlier to occur of (a) the end of the two-year period commencing on the closing date of the securitization of the last promissory note representing a portion of the 601 Lexington Avenue Loan Combination to be securitized and (b) December 10, 2024. The assumed defeasance lockout period of 25 payments is based on the closing date of this transaction in February 2022. |
| (4) | For a full description of Escrows and Reserves, please refer to “Escrows and Reserves” below. |
| (5) | BPLP provided a payment guaranty in lieu of depositing $61,289,797 in initial reserves at closing, consisting of (i) $52,315,328 at closing for approved leasing expenses outstanding at the time of origination of the 601 Lexington Avenue Loan Combination and (ii) $8,974,469 for the free rent and gap rent outstanding for six tenants at the time of origination of the 601 Lexington Avenue Loan Combination. |
The Loan. The sixth largest mortgage loan (the “601 Lexington Avenue Mortgage Loan”) is part of a loan combination (the “601 Lexington Avenue Loan Combination”) that is evidenced by 23 pari passu senior promissory notes in the aggregate original principal amount of $723,300,000 (collectively, the “601 Lexington Avenue Senior Loan”) and four pari passu subordinate promissory notes in the aggregate original principal amount of $276,700,000 (collectively, the “601 Lexington Avenue Subordinate Companion Loan”).
| THE INFORMATION IN THIS STRUCTURAL AND COLLATERAL TERM SHEET IS NOT COMPLETE AND MAY BE AMENDED PRIOR TO THE TIME OF SALE. THIS TERM SHEET IS NOT AN OFFER TO SELL THESE SECURITIES AND IT IS NOT A SOLICITATION OF AN OFFER TO BUY THESE SECURITIES IN ANY JURISDICTION WHERE THE OFFER OR SALE IS NOT PERMITTED. | ||
| 88 | ||
| Structural and Collateral Term Sheet | BMO 2022-C1 | |
| No. 6 – 601 Lexington Avenue | ||
The 601 Lexington Avenue Loan Combination was co-originated on December 10, 2021, by Wells Fargo Bank, National Association (“WFB”), DBR Investments Co. Limited (“DBRI”), Morgan Stanley Bank, N.A. (“MSBNA”) and Citi Real Estate Funding, Inc. (“Citi”). The 601 Lexington Avenue Loan Combination is secured by a first priority mortgage on the borrowers’ fee simple interest in three condominium units and a leasehold interest in a portion of a fourth condominium unit relating to an office building located in New York, New York (the “601 Lexington Avenue Property”). The 601 Lexington Avenue Mortgage Loan is evidenced by the $40,000,000 non-controlling promissory Note A-2-C3-1. The 601 Lexington Avenue Loan Combination is being serviced pursuant to the trust and servicing agreement for the BXP 2021-601L securitization trust. The 601 Lexington Avenue Senior Loan pari passu notes other than the note evidencing the 601 Lexington Avenue Mortgage Loan are referred to herein as the “601 Lexington Avenue Outside Serviced Pari Passu Companion Loans”. See “Description of the Mortgage Pool—The Loan Combinations—The 601 Lexington Avenue Pari Passu-AB Loan Combination” and “Pooling and Servicing Agreement—Servicing of the Outside Serviced Mortgage Loans” in the Preliminary Prospectus.
The 601 Lexington Avenue Loan Combination has a 10-year interest-only term and accrues interest at a rate equal to 2.79196% per annum.
| Loan Combination Summary | |||||
| Note | Original Balance | Cut-off Date Balance | Note Holder | Controlling Piece | |
| A-1-S1, A-2-S1, A-3-S1, A-4-S1 | $150,000,000 | $150,000,000 | BXP 2021-601L | Yes | |
| A-1-C2, A-3-C2 | $110,000,000 | $110,000,000 | BANK 2022-BNK39 | No | |
| A-1-C1, A-1-C3, A-1-C4 | $133,111,140 | $133,111,140 | WFB(1) | No | |
| A-2-C3-1 | $40,000,000 | $40,000,000 | BMO 2022-C1 | No | |
| A-2-C2-2, A-4-C2-2 | $25,000,000 | $25,000,000 | Benchmark 2022-B32 | No | |
| A-2-C1, A-2-C2-1, A-2-C3-2, A-2-C4 | $73,326,000 | $73,326,000 | DBRI(1) | No | |
| A-3-C1, A-3-C3, A-3-C4 | $83,669,860 | $83,669,860 | MSBNA(1) | No | |
| A-4-C1, A-4-C2-1, A-4-C3, A-4-C4 | $108,193,000 | $108,193,000 | Citi(1) | No | |
| Total Senior Loan | $723,300,000 | $723,300,000 | |||
| B-1, B-2, B-3, B-4 | $276,700,000 | $276,700,000 | BXP 2021-601L | No | |
| Total | $1,000,000,000 | $1,000,000,000 | |||
| (1) | Expected to be contributed to one or more future securitizations. |
The Property. The 601 Lexington Avenue Property is comprised of the borrowers’ fee and leasehold interests in certain condominium units within a 59-story, Class A, office tower located in Midtown Manhattan at East 53rd Street and Lexington Avenue. Situated on an approximately 1.6-acre site, the property comprises approximately 1.7 million SF of office and retail space, which includes a high-rise office tower as well as a six-story office and retail building totaling 227,276 SF situated at the base (the “Low Rise Building”). The building, with a 45° angled top and a stilt-style base, was designated as a landmark by the New York City Landmarks Preservation Commission in September 2016. As of November 1, 2021, the 601 Lexington Avenue Property was 96.3% leased. Investment-grade tenants and tenants included in a legal industry magazine listing of the largest global 200 law firms by gross revenue represent 83.6% of the NRA and 85.7% of underwritten gross rent. Further, the top four tenants represent 71.6% of underwritten gross rent and have a weighted average remaining lease term of 15.0 years.
Originally built in 1977, the 601 Lexington Avenue Property underwent renovations totaling approximately $283 million in 2021, which included repositioning the Low Rise Building as well as the redevelopment of the ground and lower level space into a food hall. Following the repositioning, the Low Rise Building includes 195,326 SF of office space, 31,950 SF of retail space, a public marketplace and a new dedicated street-level entrance and lobby for low-rise office floors. The food hall (known as The Hugh) contains a collection of 15 restaurants, bars and food retailers and is directly connected to a public plaza that provides access to the East 53rd Street subway stop. Additional amenities of the Low Rise Building include a succession of rooftop terraces on each floor as well as a fitness center. The Low Rise Building office space is fully leased to NYU, which utilizes the space to house NYU Langone Health. In addition, NYU is occupying a portion of the land owned by the adjoining St. Peter’s Church (see “Ground Lease” section below).
Condominium Regime. The 601 Lexington Avenue Property is comprised of (a) the borrowers’ fee simple interest in three condominium units within the four unit Condominium known as 601 Lexington Avenue condominium (the “Condominium”) and (b) the borrowers’ leasehold interest in a portion of a fourth condominium unit, commonly known as the “Church Unit”, within the Condominium. The borrower-owned units include 94.4% of the common elements, which entitles the borrowers to 94 of the 100 votes in the condominium regime (together with the right to appoint 6 of 7 board members). The 601 Lexington Avenue Loan Combination documents provide that it is an event of default if, without the prior written consent of the lender, the borrowers vote for or otherwise consent to, any modification or amendment to any of the terms or provisions of the condominium documents in violation of the terms of the loan agreement. See “Description of the Mortgage Pool – Mortgage Pool Characteristics – Condominium and Other Shared Interests” in the Preliminary Prospectus.
COVID-19 Update. As of January 5, 2022, the 601 Lexington Avenue Property was open and operating. The borrower sponsor reported that the only tenant with outstanding rent relief is Hillstone (7,800 SF, 0.5% of NRA, 0.9% of underwritten gross rent), which received an abatement of 50% of six months’ rent (approximately $168,000 from September 1, 2020 to February 28, 2021), which it is expected to repay over the course of 2022 and 2023.
| THE INFORMATION IN THIS STRUCTURAL AND COLLATERAL TERM SHEET IS NOT COMPLETE AND MAY BE AMENDED PRIOR TO THE TIME OF SALE. THIS TERM SHEET IS NOT AN OFFER TO SELL THESE SECURITIES AND IT IS NOT A SOLICITATION OF AN OFFER TO BUY THESE SECURITIES IN ANY JURISDICTION WHERE THE OFFER OR SALE IS NOT PERMITTED. | ||
| 89 | ||
| Structural and Collateral Term Sheet | BMO 2022-C1 | |
| No. 6 – 601 Lexington Avenue | ||
Major Tenants.
Kirkland & Ellis (616,139 SF, 36.8% NRA, 39.4% underwritten gross rent, 2/28/2039 expiration). Kirkland & Ellis (“K&E”) was founded in 1909 in Chicago, Illinois and is the largest law firm in the world by revenue and the fifth-largest by number of attorneys. K&E is a long-term tenant at the property having been in occupancy since 1993. K&E signed an early renewal in 2014 to extend its lease through February 2039 and expanded its space again in 2020. As the property’s largest tenant, K&E occupies the majority of the upper floors of the building (32-47, 49-52). For floor 32 only, K&E has a termination option on June 30, 2027 by providing notice by March 31, 2026 and paying unamortized leasing costs. Additionally, as of February 28, 2034, K&E can terminate either its highest or lowest odd-numbered floor (one floor only) other than the 51st floor. K&E has $4,062,504 of outstanding free rent.
Citibank (216,256 SF, 12.9% of NRA; 12.3% of underwritten gross rent, various expirations). Citibank, an affiliate of Citi, one of the originators of the 601 Lexington Avenue Loan Combination, is a multinational consumer and investment bank, with core activities that include safeguarding assets, lending money, making payments and accessing the capital markets on behalf of its clients. The property was originally developed as Citicorp’s headquarters and the bank was previously an owner of the property. Citibank is on various leases expiring in December 2022 (3.6% of NRA, 3.4% of underwritten gross rent), August 2023 (3.6% of NRA, 3.4% of underwritten gross rent), April 2027 (1.8% NRA, 1.8% of underwritten gross rent), and April 2032 (4.0% NRA, 3.7% of underwritten gross rent). Citibank has four, 5-year renewal options and does not have any termination options. Citibank is currently subleasing Suites 1900 and 2100 totaling 59,978 SF (3.6% of NRA).
NYU (195,326 SF; 11.7% of NRA; 10.1% of underwritten gross rent, 10/31/2049 expiration). New York University (“NYU”) is a new tenant to the property with a lease commencing in 2020 of the newly redeveloped atrium building. NYU will use the space to house NYU Langone Health and is expected to take occupancy of their full space by April 2022 and is currently paying rent. We cannot assure you that NYU will take occupancy as expected or at all. NYU structured a leasehold condominium for a period of approximately 30 years through October 2049. The leasehold condominium is structured as a standard lease, and is operated as a leasehold condominium to allow the tenant to benefit from its tax exempt entity status. NYU has one, 10-year renewal option, one, 7-year renewal option and does not have any termination options.
Freshfields Bruckhaus Deringer (139,243 SF; 8.3% of NRA; 9.8% of underwritten gross rent; 6/30/2026 expiration). Freshfields Bruckhaus Deringer (“Freshfields”) is one of the largest multinational law firms in the world, headquartered in London. Tracing its roots back to the 18th century, it is also among the world’s oldest law firms. Freshfields has been a tenant at the property since 2010, expanded in 2017, and its current lease expires in June 2026 with two, 5-year renewal options and no termination options. Freshfields is currently subleasing Suite 5510 totaling 15,932 SF (1.0% of NRA). As of the origination date, Freshfields was also publicly marketing the remainder of their leased space for sublet.
Blackstone (89,967 SF; 5.4% of NRA; 5.2% of underwritten gross rent, 12/31/2027 expiration). Blackstone is an investment firm with total assets under management of $730.7 billion as of October 21, 2021. Blackstone’s asset management businesses include investment vehicles focused on real estate, private equity, public debt and equity, growth equity, opportunistic, non-investment grade credit, real assets and secondary funds, all on a global basis. Blackstone has been a tenant at the property since 2015, expanded in 2017 and its current lease expires in December 2027 with two, 5-year renewal options or one, 10-year renewal option and no termination options.
Environmental. According to a Phase I environmental assessment dated November 12, 2021, there was no evidence of any recognized environmental conditions at the 601 Lexington Avenue Property.
| Historical and Current Occupancy(1) | |||
| 2018 | 2019 | 2020 | Current(2) |
| 99.3% | 100.0% | 97.6% | 96.3% |
| (1) | Historical Occupancies are as of December 31 of each respective year. |
| (2) | Current Occupancy is as of November 1, 2021. |
| THE INFORMATION IN THIS STRUCTURAL AND COLLATERAL TERM SHEET IS NOT COMPLETE AND MAY BE AMENDED PRIOR TO THE TIME OF SALE. THIS TERM SHEET IS NOT AN OFFER TO SELL THESE SECURITIES AND IT IS NOT A SOLICITATION OF AN OFFER TO BUY THESE SECURITIES IN ANY JURISDICTION WHERE THE OFFER OR SALE IS NOT PERMITTED. | ||
| 90 | ||
| Structural and Collateral Term Sheet | BMO 2022-C1 | |
| No. 6 – 601 Lexington Avenue | ||
| Tenant Summary(1) | ||||||||
| Tenant | Ratings Moody’s/Fitch/S&P | Net Rentable Area (SF) | % of Total NRA | UW Gross Rent PSF(2)(3) | UW Gross Rent(2)(3) | % of Total UW Gross Rent(2) | Lease Expiration Date | |
| K&E(4) | NR/NR/NR | 616,139 | 36.8% | $99.37 | $61,225,450 | 39.4% | 2/28/2039(5) | |
| Citibank(6)(7) | Aa3/A+/A+ | 216,256 | 12.9% | $88.00 | 19,030,810 | 12.3 | Various(8) | |
| NYU(9) | Aa2/NR/AA- | 195,326 | 11.7% | $80.36 | 15,697,290 | 10.1 | 10/31/2049 | |
| Freshfields(10) | NR/NR/NR | 139,243 | 8.3% | $109.68 | 15,272,330 | 9.8 | 6/30/2026 | |
| Citadel | Ba1/NR/BBB- | 144,193 | 8.6% | $95.51 | 13,771,418 | 8.9 | 8/31/2022(11) | |
| Blackstone | NR/A+/A+ | 89,967 | 5.4% | $89.68 | 8,067,806 | 5.2 | 12/31/2027 | |
| BTG | NR/NR/NR | 31,401 | 1.9% | $151.19 | 4,747,674 | 3.1 | 3/31/2028 | |
| Apax | NR/NR/NR | 31,401 | 1.9% | $130.35 | 4,093,254 | 2.6 | 7/31/2026 | |
| OrbiMed | NR/NR/NR | 31,401 | 1.9% | $112.83 | 3,543,036 | 2.3 | 3/31/2033 | |
| Siris Capital Group | NR/NR/NR | 18,928 | 1.1% | $123.18 | 2,331,624 | 1.5 | 9/30/2030(12) | |
| Subtotal / Wtd. Avg. | 1,514,255 | 90.4% | $97.59 | $147,780,691 | 95.2% | |||
| Remaining Tenants | 99,343 | 5.9% | $75.80 | 7,530,269 | 4.8 | |||
| Occupied Collateral Total / Wtd. Avg | 1,613,598 | 96.3% | $96.25 | $155,310,960 | 100.0% | |||
| Vacant Space | 62,061 | 3.7% | ||||||
| Collateral Total | 1,675,659 | 100.0% | ||||||
| (1) | Based on the underwritten rent roll dated as of November 1, 2021. |
| (2) | The UW Gross Rent, % of Total UW Gross Rent and UW Gross Rent PSF are based on the underwritten gross rent based on the underwritten rent roll. |
| (3) | The UW Gross Rent and UW Gross Rent PSF shown above include contractual rent steps through September 2022 totaling approximately $128,513. The lender’s underwriting gives separate credit for straight-line rent averaging for an investment grade tenant (NYU) and tenants included in a legal industry magazine listing of the largest global 200 law firms by gross revenue (K&E and Freshfields) through loan maturity. The total implied underwritten rental rate for K&E, NYU, and Freshfields, inclusive of the straight line credit, is approximately $108.46, $85.17 and $111.22 PSF, respectively. See “Cash Flow Analysis” below. |
| (4) | Includes 600 SF of storage space. |
| (5) | For floor 32 only, K&E has a June 30, 2027 termination option by providing notice by March 31, 2026 and paying unamortized leasing costs. Additionally, as of February 28, 2034, K&E can terminate either its highest or lowest odd-numbered floor (one floor only) other than the 51st floor. |
| (6) | Includes 6,333 SF of storage space. |
| (7) | Citibank is currently subleasing Suites 1900 and 2100 totaling 59,978 SF (3.6% of NRA). |
| (8) | Floors 18 and 20 (59,978 SF) expire in December 2022, Floors 19 and 21 (59,978 SF) expire in August 2023, Floor 23 (29,989 SF) expires in April 2027, Floors 24 and 25 and storage space (66,311 SF) expire in April 2032. Citibank is expected to vacate the space expiring in December 2022 and August 2023. |
| (9) | NYU has commenced paying rent, but has not yet taken occupancy of the full space, which is expected by April 2022. We cannot assure you that NYU will take occupancy as expected or at all. |
| (10) | Freshfields is currently subleasing Suite 5510 totaling 15,932 SF (1.0% of NRA). As of the origination date, Freshfields was also publicly marketing the remainder of their leased space for sublet. |
| (11) | Citadel has provided notice it intends to vacate at its lease expiration in August 2022. |
| (12) | Siris Capital Group has the option to terminate all its space on September 30, 2027 with notice by September 30, 2026 (12 months) and the payment of unamortized leasing costs. |
| Lease Rollover Schedule(1)(2) | |||||||||
| Year | Number of Leases Expiring | Net Rentable Area Expiring | % of NRA Expiring | UW Gross Rent Expiring(3) | % of UW Gross Rent Expiring(3) | Cumulative Net Rentable Area Expiring | Cumulative % of NRA Expiring | Cumulative UW Gross Rent Expiring(3) | Cumulative % of UW Gross Rent Expiring(3) |
| Vacant | NAP | 62,061 | 3.7% | NAP | NAP | 62,061 | 3.7% | NAP | NAP |
| 2022 & MTM | 10 | 204,171 | 12.2% | $19,035,831 | 12.3% | 266,232 | 15.9% | $19,035,831 | 12.3% |
| 2023 | 2 | 59,978 | 3.6% | $5,264,413 | 3.4% | 326,210 | 19.5% | $24,300,245 | 15.6% |
| 2024 | 1 | 5,724 | 0.3% | $658,260 | 0.4% | 331,934 | 19.8% | $24,958,505 | 16.1% |
| 2025 | 0 | 0 | 0.0% | $0 | 0.0% | 331934 | 19.8% | $24,958,505 | 16.1% |
| 2026 | 7 | 170,645 | 10.2% | $19,365,584 | 12.5% | 502,579 | 30.0% | $44,324,089 | 28.5% |
| 2027 | 4 | 119,956 | 7.2% | $10,820,276 | 7.0% | 622,535 | 37.2% | $55,144,365 | 35.5% |
| 2028 | 1 | 31,401 | 1.9% | $4,747,674 | 3.1% | 653,936 | 39.0% | $59,892,039 | 38.6% |
| 2029 | 0 | 0 | 0.0% | $0 | 0.0% | 653,936 | 39.0% | $59,892,039 | 38.6% |
| 2030 | 4 | 18,928 | 1.1% | $2,331,624 | 1.5% | 672,864 | 40.2% | $62,223,663 | 40.1% |
| 2031 | 2 | 37,789 | 2.3% | $3,050,214 | 2.0% | 710,653 | 42.4% | $65,273,877 | 42.0% |
| 2032 & Beyond | 41 | 965,006 | 57.6% | $90,037,083 | 58.0% | 1,675,659 | 100.0% | $155,310,960 | 100.0% |
| Total | 72 | 1,675,659 | 100.0% | $155,310,960 | 100.0% | ||||
| (1) | Based on the underwritten rent roll dated as of November 1, 2021. |
| (2) | Certain tenants may have lease termination options that are exercisable prior to the originally stated expiration date of the subject lease and that are not considered in the Lease Rollover Schedule. |
| (3) | The UW Gross Rent Expiring, % of UW Gross Rent Expiring, Cumulative UW Gross Rent Expiring and Cumulative % of UW Gross Rent Expiring is based on the underwritten gross rent based on the underwritten rent roll. |
| THE INFORMATION IN THIS STRUCTURAL AND COLLATERAL TERM SHEET IS NOT COMPLETE AND MAY BE AMENDED PRIOR TO THE TIME OF SALE. THIS TERM SHEET IS NOT AN OFFER TO SELL THESE SECURITIES AND IT IS NOT A SOLICITATION OF AN OFFER TO BUY THESE SECURITIES IN ANY JURISDICTION WHERE THE OFFER OR SALE IS NOT PERMITTED. | ||
| 91 | ||
| Structural and Collateral Term Sheet | BMO 2022-C1 | |
| No. 6 – 601 Lexington Avenue | ||
| Cash Flow Analysis | |||||||
| 2018 | 2019 | 2020 | 9/30/2021 TTM | UW | UW PSF | %(1) | |
| Base Rent | $133,149,752 | $135,562,062 | $143,558,635 | $144,061,141 | $145,905,931 | $87.07 | 96.3% |
| Contractual Rent Steps(2) | $0 | $0 | $0 | $0 | $128,513 | $0.08 | 0.1% |
| Grossed Up Vacant Space | $0 | $0 | $0 | $0 | $5,489,750 | $3.28 | 3.6% |
| Gross Potential Rent | $133,149,752 | $135,562,062 | $143,558,635 | $144,061,141 | $151,524,194 | $90.43 | 100.0% |
| Total Recoveries | $13,799,300 | $10,210,032 | $9,414,939 | $9,538,732 | $10,422,946 | $6.22 | 6.9% |
| Less Vacancy & Credit Loss(3) | $0 | $0 | $0 | $0 | ($10,444,971) | ($6.23) | (6.9%) |
| Net Rental Income | $146,949,052 | $145,772,094 | $152,973,574 | $153,599,873 | $151,502,169 | $90.41 | 100.0% |
| Rent Average Benefit(4) | $0 | $0 | $0 | $0 | $6,752,020 | $4.03 | 4.5% |
| Other Income | $1,616,466 | $1,730,575 | $2,517,181 | $1,475,308 | $1,452,145 | $0.87 | 1.0% |
| Effective Gross Income | $148,565,518 | $147,502,669 | $155,490,755 | $155,075,181 | $159,706,334 | $95.31 | 105.4% |
| Real Estate Taxes | $39,670,091 | $42,193,437 | $43,060,793 | $41,588,994 | $40,950,953 | $24.44 | 25.6% |
| Insurance | $569,495 | $612,718 | $732,213 | $892,330 | $1,375,389 | $0.82 | 0.9% |
| Management Fee | $3,006,130 | $3,265,479 | $3,235,326 | $3,218,199 | $1,000,000 | $0.60 | 0.6% |
| Other Operating Expenses | $18,195,642 | $18,914,423 | $19,523,204 | $19,827,849 | $21,106,886 | $12.60 | 13.2% |
| Total Expenses | $61,441,358 | $64,986,057 | $66,551,536 | $65,527,372 | $64,433,228 | $38.45 | 40.3% |
| Net Operating Income | $87,124,160 | $82,516,612 | $88,939,219 | $89,547,809 | $95,273,106 | $56.86 | 59.7% |
| Capital Expenditures | $0 | $0 | $0 | $0 | $418,915 | $0.25 | 0.3% |
| TI / LC | $0 | $0 | $0 | $0 | $2,743,708 | $1.64 | 1.7% |
| Net Cash Flow | $87,124,160 | $82,516,612 | $88,939,219 | $89,547,809 | $92,110,483 | $54.97 | 57.7% |
| (1) | % column represents percent of Net Rental Income for all revenue lines and represents percent of Effective Gross Income for the remainder of fields. |
| (2) | Represents contractual rent steps through September 2022. |
| (3) | The underwritten economic vacancy is 6.5%. The 601 Lexington Avenue Property was 96.3% leased as of November 1, 2021. |
| (4) | Represents straight-line rent averaging for an investment grade tenant (NYU) and tenants included in a legal industry magazine listing of the largest global 200 law firms by gross revenue (K&E and Freshfields). |
The Market. The 601 Lexington Avenue Property is located in Midtown Manhattan at East 53rd Street and Lexington Avenue in New York, New York. The 601 Lexington Avenue Property, which takes up the majority of a city block bounded clockwise from the west by Lexington Avenue, 54th Street, benefits from its proximity to Central Park, access to the luxury shopping corridor along Fifth and Madison Avenues, and available mass transit including the 4, 5, 6, E, M, N, R, and W subway lines. The property sits on top of a public plaza (directly connected to The Hugh food hall) that provides access to the East 53rd Street subway stop.
According to a third party market research report, the 601 Lexington Avenue Property is situated within the Plaza District Office submarket of the New York City Office Market. The Plaza District is not only the largest office submarket in New York City, with approximately 91 million SF of inventory, but in the United States as well. As of October 2021, the Plaza District submarket reported a 14.4% vacancy rate (and a 17.4% availability rate) and average asking rents of $86.73 PSF, gross. The appraisal identified nine directly competitive buildings totaling approximately 10.5 million SF with a 7.0% vacancy rate and average asking rents of $102.14 PSF. The appraisal concluded to market rents ranging from $80.00 to $115.00 PSF, modified gross, for the various floors of office space at the 601 Lexington Avenue Property (see table below).
The following table presents certain information relating to the appraisal’s market rent conclusion for the 601 Lexington Avenue Property:
| Market Rent Summary(1) | |||||
| Office Floors 2-22 | Office Floors 23-31 | Office Floors 32-42 | Office Floors 43-54 | Office Floors 55-59 | |
| Market Rent (PSF) | $80.00 | $85.00 | $95.00 | $105.00 | $115.00 |
| Lease Term (Years) | 10 | 10 | 10 | 15 | 15 |
| Lease Type (Reimbursements) | MG | MG | MG | MG | MG |
| Rent Increase Projection | $10.00 PSF in year 6 | $10.00 PSF in year 6 | $10.00 PSF in year 6 | $10.00 PSF in year 6 | $10.00 PSF in year 6 |
| (1) | Source: Appraisal. |
| THE INFORMATION IN THIS STRUCTURAL AND COLLATERAL TERM SHEET IS NOT COMPLETE AND MAY BE AMENDED PRIOR TO THE TIME OF SALE. THIS TERM SHEET IS NOT AN OFFER TO SELL THESE SECURITIES AND IT IS NOT A SOLICITATION OF AN OFFER TO BUY THESE SECURITIES IN ANY JURISDICTION WHERE THE OFFER OR SALE IS NOT PERMITTED. | ||
| 92 | ||
| Structural and Collateral Term Sheet | BMO 2022-C1 | |
| No. 6 – 601 Lexington Avenue | ||
The following table presents information relating to comparable office property sales for the 601 Lexington Avenue Property:
| Comparable Property Sale Summary(1) | ||||||
| Property Name/Location | Sale Date | Year Built/Renovated | Total NRA (SF) | Occupancy | Sale Price | Sale Price PSF |
601 Lexington Avenue New York, NY | 1977/2021 | 1,675,659(2) | 96.3%(2) | |||
Confidential Park Ave New York, NY | Nov-2021 | 1994/2021 | 765,000 | 91% | $750,000,000 | $980.39 |
51 West 52nd Street New York, NY | Nov-2021 | 1963/NAP | 872,593 | 100% | $960,000,000 | $1,100.17 |
1177 Avenue of the Americas New York, NY | Nov-2021 | 1987/2013 | 1,024,733 | 81% | $858,500,000 | $837.78 |
550 Washington Street New York, NY | Sep-2021 | 1934/2022 | 1,257,529 | 100% | $2,020,800,000 | $1,606.96 |
220 East 42nd Street New York, NY | Jul-2021 | 1930/2015 | 1,224,755 | 93% | $790,100,000 | $645.11 |
One Park Avenue New York, NY | Jul-2021 | 1926/2000 | 947,894 | 99% | $875,000,000 | $923.10 |
410 Tenth Avenue New York, NY | Dec-2020 | 1927/2021 | 634,359 | 98% | $952,840,000 | $1,502.05 |
1633 Broadway New York, NY | May-2020 | 1972/2013 | 2,561,512 | 98% | $2,400,000,000 | $936.95 |
| (1) | Source: Appraisal, unless otherwise indicated. |
| (2) | Information obtained from the underwritten rent roll dated November 1, 2021. |
The following table presents information with respect to comparable office properties to the 601 Lexington Avenue Property:
| Comparable Office Supply Summary(1) | ||||||
| Property Name/Location | Total NRA (SF) | Year Built/Renovated | Stories | Sublease SF Available | % Occupied (Direct) | Average Asking Rent |
601 Lexington Avenue New York, NY | 1,675,659(2) | 1977/2021 | 59 | - | 96.3%(2) | $96.25(2)(3) |
599 Lexington Avenue(4) New York, NY | 1,058,805 | 1986/NAP | 50 | 0 | 100.0% | NAP |
600 Lexington Avenue New York, NY | 305,472 | 1983/NAP | 36 | 34,922 | 87.8% | $90.00 |
55 East 52nd Street New York, NY | 1,518,210 | 1981/NAP | 49 | 0 | 97.6% | $95.00 |
65 East 55th Street New York, NY | 619,631 | 1986/NAP | 38 | 23,708 | 92.9% | $155.00 |
237 Park Avenue New York, NY | 1,243,384 | 1915/NAP | 21 | 220,823 | 98.6% | $75.00 |
245 Park Avenue New York, NY | 1,787,000 | 1966/NAP | 45 | 93,108 | 89.5% | $110.00 |
875 Third Avenue New York, NY | 750,000 | 1982/NAP | 29 | 0 | 87.3% | $80.00 |
277 Park Avenue New York, NY | 1,850,000 | 1964/NAP | 51 | 23,163 | 83.2% | $110.00 |
280 Park Avenue New York NY | 1,320,211 | 1968/NAP | 43 | 27,407 | 100.0% | NAP |
| (1) | Source: Appraisal, unless otherwise indicated. |
| (2) | Information obtained from the underwritten rent roll dated as of November 1, 2021. |
| (3) | Represents Annual UW Gross Rent PSF. |
| (4) | 599 Lexington Avenue is owned by the borrower sponsor or its affiliate. |
The Borrowers. The borrowers are BP/CGCenter I LLC and BP/CGCenter II LLC, each a Delaware limited liability company and single purpose entity with two independent directors. Legal counsel to the borrower delivered a non-consolidation opinion in connection with the origination of the 601 Lexington Avenue Combination. The borrower sponsor is BP/CG Center MM LLC, an indirectly owned subsidiary of Boston Properties Limited Partnership and of Norges Bank Investment Management (“Norges”). There is no separate environmental indemnitor or non-recourse carveout guarantor with respect to the 601 Lexington Avenue Loan Combination. Boston Properties Limited Partnership, a Delaware Limited partnership (“Boston Properties” or “BPLP”) has executed a guaranty of certain reserve funds in place of posting such reserves, as described under “Escrows and Reserves” below .
The Borrower Sponsor. Boston Properties (NYSE: BXP) is the largest publicly traded developer, owner, and manager of Class A office properties in the United States, concentrated in five markets: Boston, Los Angeles, New York, San Francisco and Washington, DC. The company was founded in 1970 and became a public company in 1997. The company is a fully integrated real estate company, organized as a real estate investment trust (REIT), that develops, manages, operates, acquires and owns a diverse portfolio of primarily Class A
| THE INFORMATION IN THIS STRUCTURAL AND COLLATERAL TERM SHEET IS NOT COMPLETE AND MAY BE AMENDED PRIOR TO THE TIME OF SALE. THIS TERM SHEET IS NOT AN OFFER TO SELL THESE SECURITIES AND IT IS NOT A SOLICITATION OF AN OFFER TO BUY THESE SECURITIES IN ANY JURISDICTION WHERE THE OFFER OR SALE IS NOT PERMITTED. | ||
| 93 | ||
| Structural and Collateral Term Sheet | BMO 2022-C1 | |
| No. 6 – 601 Lexington Avenue | ||
office space. The company’s portfolio totals 52.5 million SF and 202 properties, including nine properties under construction or redevelopment. Boston Properties has held an ownership in interest in the 601 Lexington Avenue Property since 2001 and also controls property and leasing management.
Norges manages the Norwegian Government Pension Fund Global, often referred to as the Norwegian oil fund. Norges manages assets worth more than 11,000 billion kroner, or about $1.3 trillion dollars. The fund is invested in international equity and fixed-income markets and in real estate.
Property Management. The 601 Lexington Avenue Property is managed by Boston Properties Limited Partnership, a Delaware limited partnership.
Escrows and Reserves.
Outstanding Tenant Specific TI/LC and Free Rent Reserve – BPLP provided a single payment guaranty in lieu of depositing (i) $52,315,328 at closing for approved leasing expenses outstanding at the time of origination of the 601 Lexington Avenue Loan Combination and (ii) $8,974,469 at closing for the free rent and gap rent outstanding for six tenants at the time of origination of the 601 Lexington Avenue Loan Combination.
Free Rent Reserve – BPLP provided a payment guaranty in lieu of depositing $8,974,469 at closing for the free rent and gap rent outstanding for six tenants at the time of origination of the 601 Lexington Avenue Loan Combination.
Real Estate Taxes - Upon the occurrence and continuance of a Cash Management Sweep Period (as defined below), the 601 Lexington Avenue Loan Combination documents require ongoing monthly real estate tax reserves in an amount equal to 1/12 of the real estate taxes that the lender reasonably estimates will be payable during the next 12 months. In lieu of making the monthly payments, the borrowers have the right to deliver to the lender a guaranty from BPLP (as described below under “BPLP Guaranty”) so long as BPLP’s senior unsecured credit rating is at least “BBB” by S&P and “Baa3” by Moody’s (the “BPLP Guarantor Required Rating”).
Insurance - Upon the occurrence and continuance of a Cash Management Sweep Period , the 601 Lexington Avenue Loan Combination documents require ongoing monthly insurance reserves in an amount equal to 1/12 of the insurance premiums that the lender estimates will be payable for the renewal of the coverage during the next 12 months; provided, however, notwithstanding any Cash Management Sweep Period, the reserve will not be required if the borrowers maintain a blanket insurance policy reasonably acceptable to the lender. In lieu of making the monthly payments, the borrowers have the right to deliver to the lender a guaranty from BPLP (as described below under “BPLP Guaranty”) so long as BPLP’s senior unsecured credit rating satisfies the BPLP Guarantor Required Rating.
Replacement Reserve – Upon the occurrence and continuance of a Cash Management Sweep Period, the 601 Lexington Avenue Loan Combination documents require ongoing monthly replacement reserves of approximately $34,910, subject to a cap of $837,829. In lieu of making the monthly payments, the borrowers have the right to deliver to the lender a guaranty from BPLP (as described below under “BPLP Guaranty”) so long as BPLP’s senior unsecured credit rating satisfies the BPLP Guarantor Required Rating.
TI/LC Reserve – Upon the occurrence and continuance of a Cash Management Sweep Period, the 601 Lexington Avenue Loan Combination documents require ongoing monthly TI/LC reserves of approximately $418,915, subject to a cap of $10,053,948. In lieu of making the monthly payments, the borrowers have the right to deliver to the lender a guaranty from BPLP (as described below under “BPLP Guaranty”) so long as BPLP’s senior unsecured credit rating satisfies the BPLP Guarantor Required Rating.
Lockbox / Cash Management. The 601 Lexington Avenue Loan Combination documents require that the borrowers establish and maintain a lender-controlled lockbox account, which is already in-place, and direct all tenants to pay rent directly into such lockbox account. The 601 Lexington Avenue Loan Combination documents also require that all rents received by the borrowers be deposited into the lockbox account within five business days of receipt. Prior to the occurrence of a Cash Management Sweep Period, all funds on deposit in the lockbox account will be disbursed to the borrowers’ operating account. During a Cash Management Sweep Period , all funds in the lockbox account are required to be swept each business day into the cash management account controlled by the lender and, on each payment date, all funds in the cash management account are required to be applied in accordance with the 601 Lexington Avenue Loan Combination documents to make required deposits (if any) into the real estate tax and insurance reserves, to pay debt service on the 601 Lexington Avenue Loan Combination, to make required deposits (if any) into the replacement and TI/LC reserves, and to pay operating expenses set forth in the annual budget (which is required to be approved by the lender during a Cash Management Sweep Period). During a Cash Management Sweep Period, any excess cash flow remaining after satisfaction of the foregoing items is required to be swept to an excess cash flow subaccount to be held by the lender as additional security for the 601 Lexington Avenue Loan Combination; provided, however, so long as no event of default exists under the 601 Lexington Avenue Loan Combination, if amounts on deposit in the TI/LC Reserve are not sufficient to pay approved leasing expenses, then upon request of the borrowers, funds in the excess cash flow subaccount are required to be disbursed for approved leasing expenses.
| THE INFORMATION IN THIS STRUCTURAL AND COLLATERAL TERM SHEET IS NOT COMPLETE AND MAY BE AMENDED PRIOR TO THE TIME OF SALE. THIS TERM SHEET IS NOT AN OFFER TO SELL THESE SECURITIES AND IT IS NOT A SOLICITATION OF AN OFFER TO BUY THESE SECURITIES IN ANY JURISDICTION WHERE THE OFFER OR SALE IS NOT PERMITTED. | ||
| 94 | ||
| Structural and Collateral Term Sheet | BMO 2022-C1 | |
| No. 6 – 601 Lexington Avenue | ||
A “Cash Management Sweep Period” will commence upon the earlier of the following: (i) the occurrence and continuance of an event of default; or (ii) the net operating income debt service coverage ratio (“NOI DSCR”) for the 601 Lexington Avenue Loan Combination falling below 1.20x at the end of any calendar quarter, commencing with the calendar quarter ending on March 31, 2022.
A Cash Management Sweep Period will end upon the occurrence of the following: (A) with regard to clause (i) above, the cure of such event of default; or (B) with regard to clause (ii) above: (a) the NOI DSCR for the 601 Lexington Avenue Loan Combination being greater than or equal to 1.20x for one calendar quarter; or (b) the borrowers delivering to the lender as additional collateral and security for the payment of the debt, (x) cash to be held as an additional reserve fund that, if applied as a prepayment of the outstanding principal balance of the 601 Lexington Avenue Loan Combination, would cause the NOI DSCR to be at least 1.20x (the “Cash Management Sweep Cure Amount”), (y) a letter of credit having an aggregate notional amount in the amount of the Cash Management Sweep Cure Amount, or (z) so long as BPLP’s senior unsecured credit rating satisfies the BPLP Guarantor Required Rating, a guaranty by BPLP in the amount of the Cash Management Sweep Cure Amount.
BPLP Guaranty. The borrowers have the right to deliver to the lender a guaranty (a “BPLP Guaranty”) from BPLP (in the context of the BPLP Guaranty, the “BPLP Guarantor”), in lieu of making the payments to any of the reserve accounts and in lieu of making any cash deposits as alteration security, net proceeds deficiency with respect to the restoration after a casualty or condemnation or Cash Sweep Management Sweep Cure Amount, so long as BPLP’s senior unsecured credit rating meets the BPLP Guarantor Required Rating. Additionally, the borrowers have the right to deliver to the lender a BPLP Guaranty in lieu of deposits previously made for any such purpose (whereupon, the amount so replaced would then be returned to the borrowers). The aggregate amount guaranteed under any such BPLP Guaranty (together with any cash delivered by the borrowers to the lender and/or any letter of credit delivered by the borrowers to the lender) related to any such purpose, must at all times be at least equal to the aggregate amount which the borrowers are required to have on deposit for such purpose. The aggregate amount guaranteed under any BPLP Guaranty (when aggregated with the full amount of any letter of credit and/or cash on deposit) will be reduced as the borrowers expend funds for the purposes which such funds would have otherwise been deposited in the applicable reserve account. The aggregate amount of any BPLP Guaranty (and the full amount of any letter of credit obtained by BPLP) will not at any time exceed 10.0% of the outstanding principal balance of the 601 Lexington Avenue Loan Combination, unless the borrowers deliver a new non-consolidation opinion which takes into account such BPLP guarantees and letters of credit.
In the event of any downgrade, withdrawal or qualification of the rating of the BPLP Guarantor by any rating agency such that the BPLP Guarantor no longer satisfies the BPLP Guarantor Required Rating, within 10 business days of such downgrade, withdrawal or qualification, the borrowers are required to either (i) deposit with the lender cash in the amount of the guaranteed obligations under each BPLP Guaranty then outstanding, and/or (ii) provide the lender with a letter of credit with a face amount equal to the guaranteed obligations under each BPLP Guaranty then outstanding.
Subordinate and Mezzanine Debt. The 601 Lexington Avenue Property also secures the 601 Lexington Avenue Outside Serviced Pari Passu Companion Loans, which have an aggregate Cut-off Date principal balance of $683,300,000 and the 601 Lexington Avenue Subordinate Companion Loan, which has an aggregate Cut-off Date principal balance of $276,700,000. The 601 Lexington Avenue Outside Serviced Pari Passu Companion Loans and the 601 Lexington Avenue Subordinate Companion Loan are coterminous with the 601 Lexington Avenue Mortgage Loan. The 601 Lexington Avenue Outside Serviced Pari Passu Companion Loans and 601 Lexington Avenue Subordinate Companion Loan accrue interest at the same rate as the 601 Lexington Avenue Mortgage Loan. The 601 Lexington Avenue Mortgage Loan and the 601 Lexington Avenue Outside Serviced Pari Passu Companion Loans are each pari passu in right of payment and together are senior in right of payment to the 601 Lexington Avenue Subordinate Companion Loan. The holders of the 601 Lexington Avenue Mortgage Loan, the 601 Lexington Avenue Outside Serviced Pari Passu Companion Loans and the 601 Lexington Avenue Subordinate Companion Loan have entered into a co-lender agreement which sets forth the allocation of collections on the 601 Lexington Avenue Loan Combination. See “Description of the Mortgage Pool—The Loan Combinations—The 601 Lexington Avenue Pari Passu-AB Loan Combination” in the Preliminary Prospectus.
Partial Release. Not permitted.
Ground Lease. The borrowers have an approximately 18,000 square foot ground lease from the abutting St. Peter’s Lutheran Church of Manhattan (“St. Peter’s Church”), that is in turn sub-leased to NYU. The office space (floors 2-6) is 100% leased by NYU and is being used to house NYU Langone Health. NYU is occupying a portion of the “Church Unit” condominium unit owned by St. Peter’s Church. Such portion of the condominium unit is incorporated into the office building. The borrowers are required to pay ground rent ($49.96 PSF with annual escalations of 1.5%) to St. Peter’s Church. The borrowers are required to purchase the ground leased space in 2036 for a fixed price of approximately $23.3 million.
Letter of Credit. None; however, a letter of credit may be provided to avoid or terminate a Cash Management Sweep Period due to clause (ii) as described above under “Lockbox and Cash Management” or in place of any amount reserved under the loan documents provided the aggregate amount of any letters of credit (together with any BPLP Guaranties) do not at any time exceed 10.0% of the outstanding principal balance of the 601 Lexington Avenue Loan Combination, unless the borrowers deliver a new non-consolidation opinion which takes into account such BPLP Guaranties and letters of credit.
| THE INFORMATION IN THIS STRUCTURAL AND COLLATERAL TERM SHEET IS NOT COMPLETE AND MAY BE AMENDED PRIOR TO THE TIME OF SALE. THIS TERM SHEET IS NOT AN OFFER TO SELL THESE SECURITIES AND IT IS NOT A SOLICITATION OF AN OFFER TO BUY THESE SECURITIES IN ANY JURISDICTION WHERE THE OFFER OR SALE IS NOT PERMITTED. | ||
| 95 | ||
| Structural and Collateral Term Sheet | BMO 2022-C1 | |
| No. 7 – Hudson Commons | ||

| THE INFORMATION IN THIS STRUCTURAL AND COLLATERAL TERM SHEET IS NOT COMPLETE AND MAY BE AMENDED PRIOR TO THE TIME OF SALE. THIS TERM SHEET IS NOT AN OFFER TO SELL THESE SECURITIES AND IT IS NOT A SOLICITATION OF AN OFFER TO BUY THESE SECURITIES IN ANY JURISDICTION WHERE THE OFFER OR SALE IS NOT PERMITTED. | ||
| 96 | ||
| Structural and Collateral Term Sheet | BMO 2022-C1 | |
| No. 7 – Hudson Commons | ||
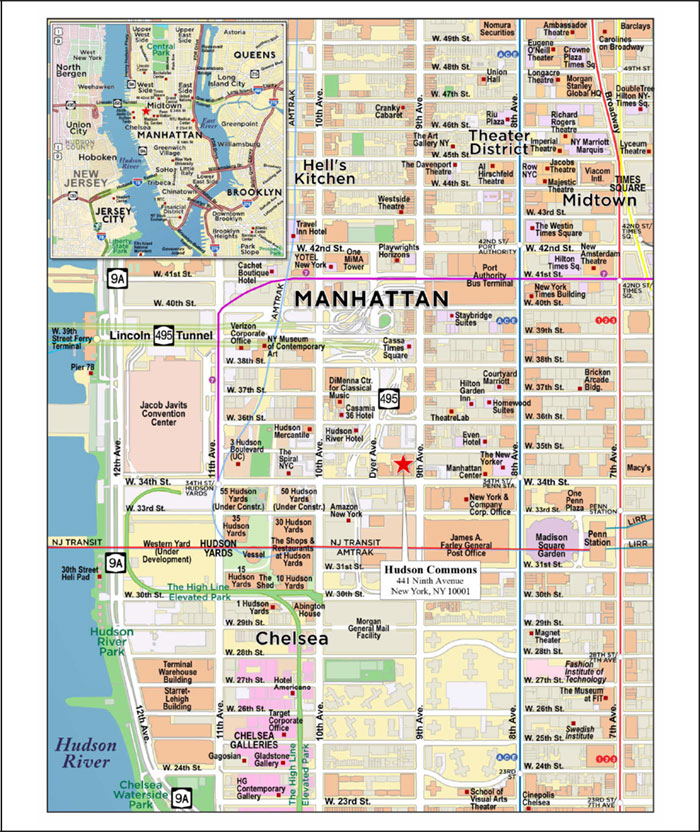
| THE INFORMATION IN THIS STRUCTURAL AND COLLATERAL TERM SHEET IS NOT COMPLETE AND MAY BE AMENDED PRIOR TO THE TIME OF SALE. THIS TERM SHEET IS NOT AN OFFER TO SELL THESE SECURITIES AND IT IS NOT A SOLICITATION OF AN OFFER TO BUY THESE SECURITIES IN ANY JURISDICTION WHERE THE OFFER OR SALE IS NOT PERMITTED. | ||
| 97 | ||
| Structural and Collateral Term Sheet | BMO 2022-C1 | |
| No. 7 – Hudson Commons | ||
| Mortgage Loan Information | Property Information | |||
| Mortgage Loan Seller: | GACC | Single Asset / Portfolio: | Single Asset | |
| Original Principal Balance(1): | $40,000,000 | Title: | Fee | |
| Cut-off Date Principal Balance(1): | $40,000,000 | Property Type – Subtype: | Office – CBD | |
| % of IPB: | 3.6% | Net Rentable Area (SF): | 697,960 | |
| Loan Purpose: | Acquisition | Location: | New York, NY | |
| Borrower(2): | FSP Hudson Commons, LLC | Year Built / Renovated: | 1962 / 1982, 2018-2021 | |
| Borrower Sponsor(2): | Fifth Street Properties, LLC | Occupancy: | 72.7% | |
| Interest Rate: | 3.51250% | Occupancy Date: | 12/17/2021 | |
| Note Date: | 12/17/2021 | 4th Most Recent NOI (As of): | NAV | |
| Maturity Date: | 1/6/2027 | 3rd Most Recent NOI (As of): | NAV | |
| Interest-only Period: | 60 months | 2nd Most Recent NOI (As of): | NAV | |
| Original Term: | 60 months | Most Recent NOI (As of): | NAV | |
| Original Amortization Term: | None | UW Economic Occupancy: | 67.9% | |
| Amortization Type: | Interest Only | UW Revenues: | $49,851,962 | |
| Call Protection(3): | L(25),DorYM1(28),O(7) | UW Expenses: | $21,059,980 | |
| Lockbox / Cash Management: | Hard / Springing | UW NOI: | $28,791,982 | |
| Additional Debt(1): | Yes | UW NCF: | $27,640,348 | |
| Additional Debt Balance(1): | $265,000,000 / $202,000,000 | Appraised Value / Per SF: | $1,030,000,000 / $1,476 | |
| Additional Debt Type(1): | Pari Passu / Subordinate | Appraisal Date: | 11/23/2021 | |
| Escrows and Reserves(4) | Financial Information(1) | ||||||
| Initial | Monthly | Initial Cap | Senior Loan | Loan Combination | |||
| Taxes: | $0 | Springing | N/A | Cut-off Date Loan / SF: | $437 | $726 | |
| Insurance: | $0 | Springing | N/A | Maturity Date Loan / SF: | $437 | $726 | |
| Replacement Reserves: | $0 | Springing | N/A | Cut-off Date LTV: | 29.6% | 49.2% | |
| TI/LC Reserve: | $1,973,458 | Springing | N/A | Maturity Date LTV: | 29.6% | 49.2% | |
| Other: | $41,415,853 | $0 | N/A | UW NCF DSCR: | 2.54x | 1.53x | |
| UW NOI Debt Yield: | 9.4% | 5.7% | |||||
| Sources and Uses | |||||||
| Sources | Proceeds | % of Total | Uses | Proceeds | % of Total | ||
| Loan Combination(1) | $507,000,000 | 46.3% | Purchase Price | $1,033,000,000 | 94.3% | ||
| Sponsor Equity | 588,044,469 | 53.7 | Upfront Reserves | 43,389,311 | 4.0 | ||
| Closing Costs | 18,655,158 | 1.7 | |||||
| Total Sources | $1,095,044,469 | 100.0% | Total Uses | $1,095,044,469 | 100.0% | ||
| (1) | The Hudson Commons Mortgage Loan (as defined below) is part of the Hudson Commons Loan Combination (as defined below) with an original aggregate principal balance of $507,000,000. The Financial Information in the chart above reflects the Hudson Commons Senior Loan (as defined below) and the Hudson Commons Loan Combination. For additional information, see “The Loan” below. |
| (2) | FSP Hudson Commons, LLC is the single purpose entity borrower. The Hudson Commons Loan Combination is recourse to the single purpose entity borrowers for certain items. There is no separate non-recourse carveout guarantor, and the mortgage borrower is the sole environmental indemnitor for the Hudson Commons Loan Combination. |
| (3) | Defeasance or prepayment with yield maintenance of the Hudson Commons Loan Combination is permitted at any time after the earlier to occur of (a) the end of the two-year period commencing on the closing date of the securitization of the last promissory note representing a portion of the Hudson Commons Loan Combination to be securitized and (b) December 17, 2024. The assumed lockout period of 25 payments is based on the closing date of this transaction in February 2022. |
| (4) | For a full description of Escrows and Reserves, please refer to “Escrows and Reserves” below. |
The Loan. The seventh largest mortgage loan (the “Hudson Commons Mortgage Loan”) is part of a loan combination (the “Hudson Commons Loan Combination”) that is evidenced by six pari passu senior promissory notes in the aggregate original principal amount of $305,000,000 (collectively, the “Hudson Commons Senior Loan”) and one subordinate promissory note in the original principal amount of $202,000,000 (the “Hudson Commons Subordinate Companion Loan”). The Hudson Commons Loan Combination was originated on December 17, 2021, by DBR Investments Co. Limited (“DBRI”). The Hudson Commons Loan Combination is secured by a first priority mortgage on the borrower’s fee simple interest in an office building located in New York, New York (the “Hudson Commons Property”). The Hudson Commons Mortgage Loan is evidenced by the $40,000,000 non-controlling promissory Note A-5. The Hudson Commons Loan Combination is being serviced pursuant to the trust and servicing agreement for the COMM 2022-HC securitization trust. The Hudson Commons Senior Loan pari passu notes other than those evidencing the Hudson Commons Mortgage Loan are referred to
| THE INFORMATION IN THIS STRUCTURAL AND COLLATERAL TERM SHEET IS NOT COMPLETE AND MAY BE AMENDED PRIOR TO THE TIME OF SALE. THIS TERM SHEET IS NOT AN OFFER TO SELL THESE SECURITIES AND IT IS NOT A SOLICITATION OF AN OFFER TO BUY THESE SECURITIES IN ANY JURISDICTION WHERE THE OFFER OR SALE IS NOT PERMITTED. | ||
| 98 | ||
| Structural and Collateral Term Sheet | BMO 2022-C1 | |
| No. 7 – Hudson Commons | ||
herein as the “Hudson Commons Outside Serviced Pari Passu Companion Loans”. See “Description of the Mortgage Pool—The Loan Combinations— The Outside-Serviced Pari Passu A/B Loan Combinations—The Hudson Commons Pari Passu-A/B Loan Combination” and “Pooling and Servicing Agreement—Servicing of the Outside Serviced Mortgage Loans” in the Preliminary Prospectus.
The Hudson Commons Loan Combination has a 5-year interest-only term and accrues interest at a rate equal to 3.51250% per annum.
| Loan Combination Summary | ||||||
| Note | Original Balance | Cut-off Date Balance | Note Holder | Controlling Piece | ||
| A-5 | $40,000,000 | $40,000,000 | BMO 2022-C1 | No | ||
| A-1, A-2, A-3, A-4, A-6 | $265,000,000 | $265,000,000 | COMM 2022-HC | No | ||
| Total Senior Loan | $305,000,000 | $305,000,000 | ||||
| B | $202,000,000 | $202,000,000 | COMM 2022-HC | Yes | ||
| Total | $507,000,000 | $507,000,000 | ||||
The Property. The Hudson Commons Property is a 697,960 square foot office property located on the entire eastern block front of Ninth Avenue between 34th and 35th streets in Midtown Manhattan, New York, New York. The Property was initially built in 1962 and was renovated in 1982 and again between 2018 and 2021 by a joint venture between Cove Property Group LLC and The Baupost Group LLC. Renovations of more than $800.0 million consisted of upgrading and reinforcing the existing structure, in addition to constructing an additional 18-story, 304,301 square foot glass tower to be leased as office space directly above the existing structure. The original podium, with floor plates between 48,297 square feet and 50,319 square feet, was renovated and redeveloped into flexible, open floor plates with new and expanded windows, which allow for more light and air into the office space. The recently constructed tower features floor plates ranging from 16,178 square feet to 25,998 square feet and has 14-foot slab heights, floor-to-ceiling windows, and individual outdoor terraces on almost every level.
The Property is LEED Platinum and one of only four office buildings in all of Manhattan, New York to earn Platinum for core and shell (along with 1 Vanderbilt, 10 Hudson Yards and 1 Bryant Park). The Property is split into two condominium units that both serve as collateral for the Loan Combination: the original eight-story podium base and the additional 18-story glass tower. The Hudson Commons Property is currently 72.7% leased to six tenants including: Peloton (48.1% NRA / 67.3% underwritten base rent / LXD: December 2035), Lyft (14.4% NRA / 19.0% underwritten base rent / LXD: November 2029), Ovid Therapeutics (2.7% NRA / 5.0% underwritten base rent / LXD: September 2032), True Talent Advisory (2.5% NRA / 4.4% underwritten base rent / LXD: December 2032), Brevet Capital (2.3% NRA / 4.1% underwritten base rent / LXD: August 2030), and In Common Coffee (0.2% NRA / 0.1% underwritten base rent / LXD: October 2036). No tenant’s lease expires within the Loan Combination’s five-year loan term.
COVID-19 Update. As of January 5, 2022, the Hudson Commons Property was open and operating. The borrower sponsor reported that no tenants have requested relief or abatements.
Major Tenants.
Peloton (335,823 SF, 48.1% NRA, 67.3% underwritten base rent, 12/31/2035 expiration). Peloton is the leading interactive fitness platform in the world with a loyal community of more than 6.2 million members. The company pioneered connected, technology-enabled fitness, and the streaming of immersive, instructor-led boutique classes for its members. Founded in 2012 and headquartered in New York City, Peloton has a growing number of retail showrooms across the US, UK, Canada, Germany and Australia. Peloton is publicly traded on the NASDAQ and had an approximate market capitalization of $11.0 billion as of January 6, 2022. Peloton has a one-time contraction option with respect to certain of its premises effective December 31, 2030, by providing at least 15 months’ prior written notice and making a termination payment equal to the amount of principal remaining unpaid at a rate of landlord’s transaction costs at a rate of 10% per annum compounding monthly. Peloton invested approximately $500 PSF ($167.9 million) of their own capital in their space, demonstrating its long-term commitment to the Hudson Commons Property.
Lyft (100,638 SF, 14.4% of NRA; 19.0% of underwritten base rent, 11/30/2029 expiration). Founded in 2012, Lyft is the 2nd largest ridesharing company in the nation, operating in over 640 cities in the United States and 12 cities in Canada. Lyft the right to terminate its lease effective December 1, 2026, by (i) providing 18-months’ notice, and (ii) paying an early termination fee equal to approximately $6,490,125 ($64.49 PSF). Lyft invested approximately $175 PSF ($17.6 million) of their own capital in their space, demonstrating its long-term commitment to the Hudson Commons Property.
Ovid Therapeutics (19,143 SF; 2.7% of NRA; 5.0% of underwritten base rent, 9/30/2032 expiration). Ovid Therapeutics Inc. (“Ovid”) is a New York-based biopharmaceutical company using its BoldMedicine® approach to develop medicines that improve the lives of patients with neurological disorders. Ovid seeks to couple deep CNS experience with emerging advances in genetics and the pathways of the brain to build a leading, next-generation neuroscience pipeline. The Hudson Commons Property will serve as Ovid’s national headquarters. Ovid has not taken occupancy of their space with delivery expected in March 2022. Ovid has not commenced paying rent and has 10 months free rent following delivery. We cannot assure you that Ovid will take occupancy or commence paying rent as expected or at all.
| THE INFORMATION IN THIS STRUCTURAL AND COLLATERAL TERM SHEET IS NOT COMPLETE AND MAY BE AMENDED PRIOR TO THE TIME OF SALE. THIS TERM SHEET IS NOT AN OFFER TO SELL THESE SECURITIES AND IT IS NOT A SOLICITATION OF AN OFFER TO BUY THESE SECURITIES IN ANY JURISDICTION WHERE THE OFFER OR SALE IS NOT PERMITTED. | ||
| 99 | ||
| Structural and Collateral Term Sheet | BMO 2022-C1 | |
| No. 7 – Hudson Commons | ||
True Talent Advisory (17,629 SF; 2.5% of NRA; 4.4% of underwritten base rent; 12/31/2032 expiration). The True platform is a global suite of products and services driving the intelligence behind talent management. True consists of four business units: True Search, Thrive, Synthesis and AboveBoard. The company was founded in 2012 and has reported more than 250 employees and more than 2000 clients worldwide. It has been recognized by Forbes as one of America’s Best Executive Recruiting Firms (2018) and named one of Inc. Magazine’s Best Workplaces in 2021. The company reported that it increased revenue by 9% in 2020 and accelerated search volume by 43% from Q4 2020 to Q1 2021. True Talent Advisory has not taken occupancy of their space with delivery expected in February 2022. True Talent Advisory has not commenced paying rent and has 13 months free rent following delivery. We cannot assure you that True Talent Advisory will take occupancy or commence paying rent as expected or at all.
Brevet Capital (16,178 SF; 2.3% of NRA; 4.1% of underwritten base rent, 8/31/2030 expiration). Brevet Capital is a leading credit investment and specialty finance firm with a focus on the government sector. Since its founding over 20 years ago, the firm has advised and structured more than $20 billion of transactions. The Hudson Commons Property serves as Brevet’s global headquarters after relocating from Park Avenue.
Environmental. According to a Phase I environmental assessment dated November 23, 2021, there was no evidence of any recognized environmental conditions at the Hudson Commons Property.
| Historical and Current Occupancy(1) | |||
| 2018 | 2019 | 2020 | Current(2) |
| NAV | NAV | NAV | 72.7% |
| (1) | Historical Occupancies are unavailable because the Property is recently renovated |
| (2) | Current Occupancy is as of December 17, 2021. |
| Tenant Summary(1) | |||||||
| Tenant | Ratings Moody’s/Fitch/S&P | Net Rentable Area (SF) | % of Total NRA | UW Base Rent PSF(2)(3) | UW Base Rent(2)(3) | % of Total UW Base Rent(2) | Lease Expiration Date |
| Peloton(4) | NR/NR/NR | 335,823 | 48.1% | $92.22 | $30,969,018 | 67.3% | 12/31/2035 |
| Lyft(5) | NR/NR/NR | 100,638 | 14.4% | $87.00 | 8,755,506 | 19.0 | 11/30/2029 |
| Ovid Therapeutics(6) | NR/NR/NR | 19,143 | 2.7% | $121.00 | 2,316,303 | 5.0 | 9/30/2032(3) |
| True Talent Advisory(7) | NR/NR/NR | 17,629 | 2.5% | $116.00 | 2,044,964 | 4.4 | 12/31/2032(3) |
| Brevet Capital | NR/NR/NR | 16,178 | 2.3% | $116.00 | 1,876,648 | 4.1 | 8/31/2030 |
| In Common Coffee - (9th Avenue) | NR/NR/NR | 1,105 | 0.2% | $54.30 | 60,002 | 0.1 | 10/31/2036 |
| Subtotal / Wtd. Avg. | 490,516 | 70.3% | $93.82 | $46,022,441 | 100.0% | ||
| Other Tenants(8) | 16,971 | 2.4% | |||||
| Vacant Space | 190,473 | 27.3% | |||||
| Collateral Total | 697,960 | 100.0% | $93.82(9) | $46,022,441 | |||
| (1) | Based on the underwritten rent roll dated December 17, 2021. |
| (2) | The UW Base Rent, % of Total UW Base Rent and UW Base Rent PSF are based on the underwritten gross rent based on the underwritten rent roll. |
| (3) | Based on the underwritten rent roll but pending lease commencement. Once a lease commencement date is finalized, the expiration date will be 10 years from that date. |
| (4) | Peloton is in occupancy of their fifth floor space (representing 7.2% of Total NRA) but not yet paying rent. |
| (5) | Lyft has a one-time termination option as of 12/1/2026, which has to be exercised by providing 30 months’ notice. |
| (6) | Ovid has not taken occupancy of their space with delivery expected in March 2022. Ovid has not commenced paying rent and has 10 months free rent following delivery. We cannot assure you that Ovid will take occupancy or commence paying rent as expected or at all. |
| (7) | True Talent Advisory has not taken occupancy of their space with delivery expected in February 2022. True Talent Advisory has not commenced paying rent and has 13 months free rent following delivery. We cannot assure you that True Talent Advisory will take occupancy or commence paying rent as expected or at all. |
| (8) | Other Tenants is inclusive of the amenity space and the parking lease. |
| (9) | Collateral Total UW Base Rent PSF excludes Other Tenants which is all non-revenue space. |
| THE INFORMATION IN THIS STRUCTURAL AND COLLATERAL TERM SHEET IS NOT COMPLETE AND MAY BE AMENDED PRIOR TO THE TIME OF SALE. THIS TERM SHEET IS NOT AN OFFER TO SELL THESE SECURITIES AND IT IS NOT A SOLICITATION OF AN OFFER TO BUY THESE SECURITIES IN ANY JURISDICTION WHERE THE OFFER OR SALE IS NOT PERMITTED. | ||
| 100 | ||
| Structural and Collateral Term Sheet | BMO 2022-C1 | |
| No. 7 – Hudson Commons | ||
| Lease Rollover Schedule(1)(2) | |||||||||
| Year | Number of Leases Expiring | Net Rentable Area Expiring | % of NRA Expiring | UW Base Rent Expiring(3) | % of UW Base Rent Expiring | Cumulative Net Rentable Area Expiring | Cumulative % of NRA Expiring | Cumulative UW Base Rent Expiring(3) | Cumulative % of UW Base Rent Expiring |
| Vacant | 0 | 190,473 | 27.3% | $0 | 0.0% | 190,473 | 27.3% | $0 | 0.0% |
| 2022 & MTM | 0 | 0 | 0.0% | $0 | 0.0% | 190,473 | 27.3% | $0 | 0.0% |
| 2023 | 0 | 0 | 0.0% | $0 | 0.0% | 190,473 | 27.3% | $0 | 0.0% |
| 2024 | 0 | 0 | 0.0% | $0 | 0.0% | 190,473 | 27.3% | $0 | 0.0% |
| 2025 | 0 | 0 | 0.0% | $0 | 0.0% | 190,473 | 27.3% | $0 | 0.0% |
| 2026 | 0 | 0 | 0.0% | $0 | 0.0% | 190,473 | 27.3% | $0 | 0.0% |
| 2027 | 0 | 0 | 0.0% | $0 | 0.0% | 190,473 | 27.3% | $0 | 0.0% |
| 2028 | 0 | 0 | 0.0% | $0 | 0.0% | 190,473 | 27.3% | $0 | 0.0% |
| 2029 | 1 | 100,638 | 14.4% | $8,755,506 | 19.0% | 291,111 | 41.7% | $8,755,506 | 19.0% |
| 2030 | 1 | 16,178 | 2.3% | 1,876,648 | 4.1% | 307,289 | 44.0% | $10,632,154 | 23.1% |
| 2031 | 0 | 0 | 0.0% | $0 | 0.0% | 307,289 | 44.0% | $10,632,154 | 23.1% |
| 2032 & Beyond(3) | 5 | 390,671 | 56.0% | $35,390,287 | 76.9% | 697,960 | 100.0% | $46,022,441 | 100.0% |
| Total | 7 | 697,960 | 100.0% | 46,022,441 | 100.0% | ||||
| (1) | Based on the underwritten rent roll dated December 17, 2021. |
| (2) | Certain tenants may have lease termination options that are exercisable prior to the originally stated expiration date of the subject lease and that are not considered in the Lease Rollover Schedule. |
| (3) | 2032 & Beyond includes the amenity space and the parking lease. |
| Cash Flow Analysis | |||
| UW | UW PSF | %(1) | |
| Base Rent | $46,022,441 | $65.94 | 92.3% |
| Contractual Rent Steps(2) | 231,674 | $0.33 | 0.5% |
| Grossed Up Vacant Space | $23,615,922 | $33.84 | 47.4% |
| Total Recoveries | $2,989,887 | $4.28 | 6.0% |
| Other Income | $607,960 | $0.87 | 1.2% |
| Less Vacancy & Credit Loss(3) | ($23,615,922) | ($33.84) | (47.4%) |
| Effective Gross Income | $49,851,962 | $71.43 | 100.0% |
| Real Estate Taxes | $10,434,288 | $14.95 | 20.9% |
| Insurance | $463,788 | $0.66 | 0.9% |
| Management Fee | $1,000,000 | $1.43 | 2.0% |
| Other Operating Expenses | 9,161,904 | $13.13 | 18.4% |
| Total Expenses | $21,059,980 | $30.17 | 42.2% |
| Net Operating Income | $28,791,982 | $41.25 | 57.8% |
| Capital Expenditures | $104,694 | $0.15 | 0.2% |
| TI/LC | $1,046,940 | $1.50 | 2.1% |
| Net Cash Flow | $27,640,348 | $39.60 | 55.4% |
| (1) | % column based on Effective Gross Income. |
| (2) | Represents contractual rent steps through December 2022. |
| (3) | The underwritten economic vacancy is 32.1%. The Hudson Commons Property was 72.7% leased as of December 17, 2021. |
The Market. The Hudson Commons Property is located in Midtown Manhattan at West 34th street and 9th Avenue in New York, New York. The Hudson Commons Property is located in the Penn Plaza/Garment District Submarket, access to Penn station, and available mass transit including the 1, 2, 3, A, C, E, R, and W subway lines.
The Penn Plaza/Garment District Submarket contains more than 80 million square feet of office space, and is located within the broader Midtown West office district. The area is home to demand drivers such as Penn Station, Madison Square Garden, and The High Line. More recently, Hudson Yards, a $25 billion mixed-use development on the submarket’s Far West Side, has been a critical attraction in the area creating a luxury live-work-play community that is home to a host of tech and finance firms, and attracting further development taking advantage of local rezoning efforts. Though leasing activity in the submarket has been muted following the onset of the COVID-19 pandemic, demand for the yet-to-deliver towers in Hudson Yards remains robust, mitigating the impact on supply of nearly 10 million square feet of space under construction.
| THE INFORMATION IN THIS STRUCTURAL AND COLLATERAL TERM SHEET IS NOT COMPLETE AND MAY BE AMENDED PRIOR TO THE TIME OF SALE. THIS TERM SHEET IS NOT AN OFFER TO SELL THESE SECURITIES AND IT IS NOT A SOLICITATION OF AN OFFER TO BUY THESE SECURITIES IN ANY JURISDICTION WHERE THE OFFER OR SALE IS NOT PERMITTED. | ||
| 101 | ||
| Structural and Collateral Term Sheet | BMO 2022-C1 | |
| No. 7 – Hudson Commons | ||
The following table presents information relating to comparable office property sales for the Hudson Commons Property:
| Comparable Property Sale Summary(1) | ||||||
| Property Name/Location | Sale Date | Year Built/Renovated | Total NRA (SF) | Occupancy | Sale Price | Sale Price PSF |
Hudson Commons Property New York, NY | 1962/1982, 2018-2021 | 697,960(2) | 72.7%(2) | |||
51 West 52nd Street New York, NY | Sep-2021 | 1963/2017 | 892,777 | 97.2% | $760,000,000 | $851.28 |
1177 Avenue of the Americas New York, NY | Sep-2021 | 1992/2014 | 1,021,297 | 92.9% | $858,500,000 | $840.60 |
860 Washington Street New York, NY | Jan-2021 | 2016/NAP | 117,230 | 93.0% | $232,000,000 | $1,979.02 |
330 Madison Avenue New York, NY | Dec-2019 | 1963/2011 | 855,154 | 96.0% | 882,000,000 | $1,031.39 |
One Park Avenue New York, NY | Aug-2021 | 1925/2016 | 944,539 | 98.0% | $875,000,000 | $926.38 |
410 Tenth Avenue New York, NY | Dec-2020 | 1927/2020 | 638,797 | 99.0% | $952,500,000 | $1,491.08 |
| (1) | Source: Appraisal. |
| (2) | Information obtained from the underwritten rent roll dated December 17, 2021. |
The following table presents information with respect to comparable office properties to the Hudson Commons Property:
| Comparable Office Supply Summary(1) | ||||||
| Property Name/Location | Office Area | Year Built/Renovated | Stories | Sublease SF Available | % Occupied (Direct) | Average Asking Rent |
Hudson Commons Property New York, NY | 697,960(1) | 1962/1982, 2018-2021 | 25 | - | 72.7%(2) | $93.82(2)(3) |
One Manhattan West New York, NY | 2,077,557 | 2019 | 67 | 96,704 | 93.8% | $129.00 |
10 Hudson Yards New York, NY | 1,745,000 | 2016 | 52 | 0 | 98.1% | $135.00 |
Five Manhattan West New York, NY | 1,800,000 | 1969/2017 | 15 | 122,457 | 100.0% | NAP |
410 Tenth Avenue New York, NY | 521,994 | 1927/2021 | 21 | 75,704 | 100.0% | NAP |
55 Hudson Yards New York, NY | 1,418,770 | 2018 | 51 | 0 | 99.0% | $155.00 |
35 Hudson Yards New York, NY | 85,000 | 2019 | 72 | 0 | 100.0% | NAP |
390 Ninth Avenue New York, NY | 730,000 | 2021 | 5 | 0 | 100.0% | NAP |
30 Hudson Yards New York, NY | 2,600,000 | 2019 | 92 | 0 | 100.0% | NAP |
250 West 34th Street New York NY | 2,072,136 | 1972/1995 | 56 | 166,882 | 84.2% | $105.00 |
| (1) | Source: Appraisal |
| (2) | Information obtained from the underwritten rent roll dated December 17, 2021. |
| (3) | Represents underwritten base rent. |
The Borrower. The borrower is FSP Hudson Commons, LLC, a Delaware limited liability company and single purpose entity with two independent directors. Legal counsel to the borrower delivered a non-consolidation opinion in connection with the origination of the Hudson Commons Loan Combination.
The Borrower Sponsor. The borrower sponsor is Fifth Street Properties, LLC, a joint venture between CalPERS (99.7% ownership interest) and CommonWealth Pacific, LLC (0.3% ownership interest). CalPERS (otherwise known as California Public Employees’ Retirement System) is reported to be the largest public pension fund in the United States (based on assets under management) and manages pension and health benefits for more than 1.6 million California public employees, retirees, and their families. As of December 15th, 2021, CalPERS had over $495 billion in assets under management. CommonWealth Partners is a privately held, vertically integrated real estate investment, development and management firm based in Los Angeles, with offices across the United States. CWP has executed over $13 billion of transactions in partnerships with CalPERS, beginning in 1998. Currently, CWP manages a portfolio valued in excess of $9 billion and is CalPERS’ exclusive partner for domestic, core office investment and has been designated as one of only five strategic partners for CalPERS’ overall real estate program.
| THE INFORMATION IN THIS STRUCTURAL AND COLLATERAL TERM SHEET IS NOT COMPLETE AND MAY BE AMENDED PRIOR TO THE TIME OF SALE. THIS TERM SHEET IS NOT AN OFFER TO SELL THESE SECURITIES AND IT IS NOT A SOLICITATION OF AN OFFER TO BUY THESE SECURITIES IN ANY JURISDICTION WHERE THE OFFER OR SALE IS NOT PERMITTED. | ||
| 102 | ||
| Structural and Collateral Term Sheet | BMO 2022-C1 | |
| No. 7 – Hudson Commons | ||
Property Management. The Hudson Commons Property is managed by Commonwealth Partners Management Services, L.P., which entered into a sub-management agreement with CWP-NYC Property Management Services, L.P., a Delaware limited partnership.
Escrows and Reserves.
Real Estate Taxes - Upon the occurrence and continuance of a Trigger Period, the Hudson Commons Loan Combination documents require ongoing monthly real estate tax reserves in an amount equal to 1/12 of the real estate taxes that the lender reasonably estimates will be payable during the next 12 months.
Insurance - During a Trigger Period, the borrower is required to deposit into an insurance reserve, on a monthly basis, 1/12 of estimated insurance premiums, unless an acceptable blanket policy is in effect. As of the origination date, an acceptable blanket policy was in place.
Replacement Reserve – Upon the occurrence and continuance of a Trigger Period, the borrower is required to deposit into a capital expenditures reserve, on a monthly basis, $11,632.67, for payment of capital expenditures.
TI/LC Reserve – At closing, the borrower deposited the following into an upfront reserve: (i) $33,526,541.66 into an TI/LC reserve for future leasing, (ii) $7,889,311.33 into a free rent reserve and (iii) $1,973,458.34 into a TI/LC reserve for existing leases. Upon the occurrence and continuance of a Trigger Period, the borrower is required to deposit into a rollover reserve, on a monthly basis, $87,245.00, for payment of tenant improvement costs and leasing expenses for future leases.
Lockbox / Cash Management. The Hudson Commons Loan Combination is structured with a hard lockbox and springing cash management during a Trigger Period (as defined below). At origination, a clearing account controlled by the lender (the “Clearing Account”) was established by the borrower, into which all rents, revenues and receipts from the Hudson Commons Property are required to be deposited directly by the tenants (with respect to rents) or otherwise by the property manager. If no Trigger Period exists, the funds in the Clearing Account will be swept on each business day into borrower’s operating account and, if a Trigger Period exists, such funds will be swept on each business day into a deposit account controlled by the lender (the “CMA”) at a financial institution selected by the lender.
A “Trigger Period” will commence upon the following: (i) the occurrence of an event of default under the Hudson Commons Loan Combination until cured or waived in writing by the lender, (ii) the commencement of a Low Debt Yield Period until the Low Debt Yield Period (as defined below) has ended, (iii) the commencement of a Lease Sweep Period (defined in the Hudson Commons Loan Combination documents) until such Lease Sweep Period is cured.
A “Low Debt Yield Period” will commence if, as of the last day of any calendar quarter, the debt yield is less than (a) 4.75% for two consecutive calendar quarters prior to the second anniversary of the first monthly payment date and will end if the debt yield is at least 4.75% for two consecutive calendar quarters, (b) 5.0% for two consecutive calendar quarters on or after the second anniversary of the first monthly payment date but prior to the third anniversary of the first monthly payment date and will end if the debt yield is at least 5.0% for two consecutive calendar quarters and (c) 6.0% for two consecutive calendar quarters on or after the third anniversary of the first monthly payment date and will end if the debt yield is at least 6.0% for two consecutive calendar quarters, in each case as reasonably determined by lender.
Subordinate and Mezzanine Debt. The Hudson Commons Property also secures the Hudson Commons Outside Serviced Pari Passu Companion Loans, which have an aggregate Cut-off Date principal balance of $265,000,000 and the Hudson Commons Subordinate Companion Loan, which has a Cut-off Date principal balance of $202,000,000. The Hudson Commons Outside Serviced Pari Passu Companion Loans and the Hudson Commons Subordinate Companion Loan are coterminous with the Hudson Commons Mortgage Loan. The Hudson Commons Outside Serviced Pari Passu Companion Loans and Hudson Commons Subordinate Companion Loan accrue interest at the same rate as the Hudson Commons Mortgage Loan. The Hudson Commons Mortgage Loan and the Hudson Commons Outside Serviced Pari Passu Companion Loans are each pari passu in right of payment and together are senior in right of payment to the Hudson Commons Subordinate Companion Loan. The holders of the Hudson Commons Mortgage Loan, the Hudson Commons Outside Serviced Pari Passu Companion Loans and the Hudson Commons Subordinate Companion Loan have entered into a co-lender agreement which sets forth the allocation of collections on the Hudson Commons Loan Combination. See “Description of the Mortgage Pool—The Loan Combinations—The Hudson Commons Pari Passu-AB Loan Combination”.
Partial Release. Not permitted.
Ground Lease. None.
| THE INFORMATION IN THIS STRUCTURAL AND COLLATERAL TERM SHEET IS NOT COMPLETE AND MAY BE AMENDED PRIOR TO THE TIME OF SALE. THIS TERM SHEET IS NOT AN OFFER TO SELL THESE SECURITIES AND IT IS NOT A SOLICITATION OF AN OFFER TO BUY THESE SECURITIES IN ANY JURISDICTION WHERE THE OFFER OR SALE IS NOT PERMITTED. | ||
| 103 | ||
| Structural and Collateral Term Sheet | BMO 2022-C1 | |
| No. 8 – Bedrock Portfolio | ||
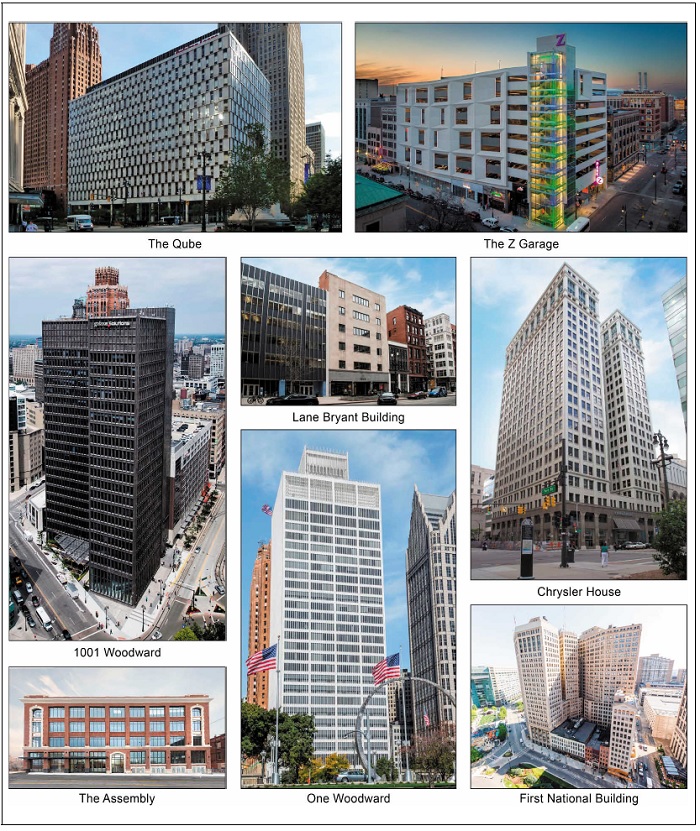
| THE INFORMATION IN THIS STRUCTURAL AND COLLATERAL TERM SHEET IS NOT COMPLETE AND MAY BE AMENDED PRIOR TO THE TIME OF SALE. THIS TERM SHEET IS NOT AN OFFER TO SELL THESE SECURITIES AND IT IS NOT A SOLICITATION OF AN OFFER TO BUY THESE SECURITIES IN ANY JURISDICTION WHERE THE OFFER OR SALE IS NOT PERMITTED. | ||
| 104 | ||
| Structural and Collateral Term Sheet | BMO 2022-C1 | |
| No. 8 – Bedrock Portfolio | ||
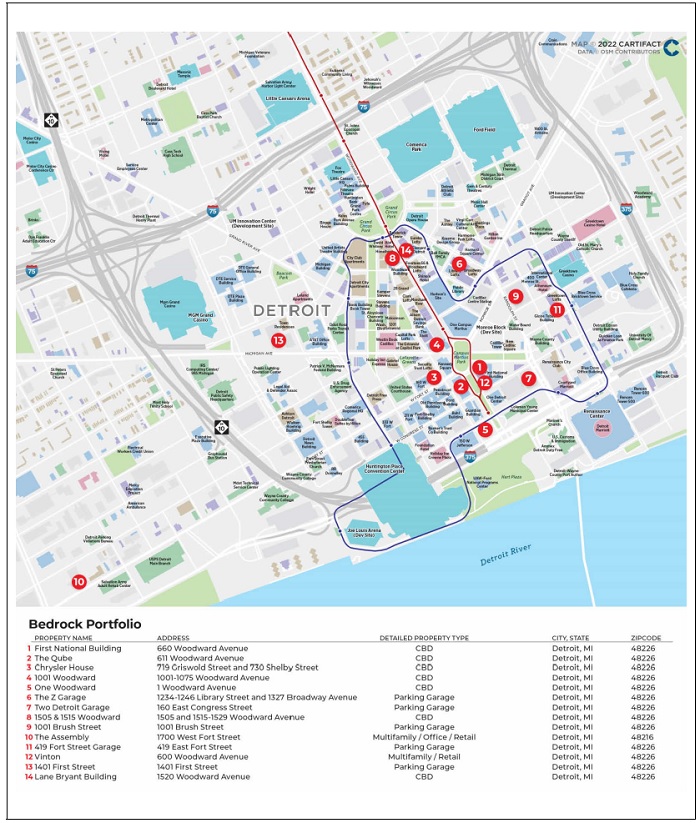
| THE INFORMATION IN THIS STRUCTURAL AND COLLATERAL TERM SHEET IS NOT COMPLETE AND MAY BE AMENDED PRIOR TO THE TIME OF SALE. THIS TERM SHEET IS NOT AN OFFER TO SELL THESE SECURITIES AND IT IS NOT A SOLICITATION OF AN OFFER TO BUY THESE SECURITIES IN ANY JURISDICTION WHERE THE OFFER OR SALE IS NOT PERMITTED. | ||
| 105 | ||
| Structural and Collateral Term Sheet | BMO 2022-C1 | |
| No. 8 – Bedrock Portfolio | ||
| Mortgage Loan Information | Property Information | |||
| Mortgage Loan Seller: | SMC | Single Asset / Portfolio: | Portfolio | |
| Original Principal Balance(1): | $40,000,000 | Title(3): | Fee / Leasehold | |
| Cut-off Date Principal Balance(1): | $40,000,000 | Property Type – Subtype(4): | Various – Various | |
| % of IPB: | 3.6% | Net Rentable Area (SF)(4): | 2,694,627 | |
| Loan Purpose: | Refinance | Location: | Detroit, Michigan | |
| Borrowers(2): | Various | Year Built / Renovated(4): | Various / Various | |
| Borrower Sponsor: | Bedrock Detroit | Occupancy(5): | 88.7% | |
| Interest Rate: | 3.77800% | Occupancy Date: | Various | |
| Note Date: | 12/28/2021 | 4th Most Recent NOI (As of): | $42,141,735 (December 31, 2018) | |
| Maturity Date: | 1/1/2029 | 3rd Most Recent NOI (As of): | $47,208,742 (December 31, 2019) | |
| Interest-only Period: | 84 months | 2nd Most Recent NOI (As of): | $54,095,059 (December 31, 2020) | |
| Original Term: | 84 months | Most Recent NOI (As of): | $55,595,704 (TTM September 30, 2021) | |
| Original Amortization Term: | None | UW Economic Occupancy: | 87.7% | |
| Amortization Type: | Interest Only | UW Revenues: | $97,560,449 | |
| Call Protection: | L(25),YM1(55),O(4) | UW Expenses: | $39,136,450 | |
| Lockbox / Cash Management: | Hard (Commercial); Springing (Residential) / Springing | UW NOI: | $58,423,999 | |
| Additional Debt(1): | Yes | UW NCF: | $54,409,505 | |
| Additional Debt Balance(1): | $390,000,000 | Appraised Value / Per SF: | $724,300,000 / $269 | |
| Additional Debt Type(1): | Pari Passu | Appraisal Date: | Various | |
| Escrows and Reserves(6) | Financial Information(1) | |||||||||
| Initial | Monthly | Initial Cap | Cut-off Date Loan / SF: | $160 | ||||||
| Taxes: | $1,696,002 | $424,000 | N/A | Maturity Date Loan / SF: | $160 | |||||
| Insurance: | $0 | Springing | N/A | Cut-off Date LTV: | 59.4% | |||||
| Replacement Reserves: | $62,336 | $62,336 | $1,469,568 | Maturity Date LTV: | 59.4% | |||||
| TI/LC: | $280,690 | $280,690 | $5,000,000 | UW NCF DSCR: | 3.30x | |||||
| Other: | $9,362,153 | $0 | N/A | UW NOI Debt Yield: | 13.6% | |||||
| Sources and Uses | ||||||||||
| Sources | Proceeds | % of Total | Uses | Proceeds | % of Total | |||||
| Loan Combination(1) | $430,000,000 | 100.0% | Payoff Existing Debt | $331,057,990 | 77.0% | |||||
| Principal Equity Distribution | 83,185,780 | 19.3 | ||||||||
| Upfront Reserves | 11,401,181 | 2.7 | ||||||||
| Closing Costs | 4,355,049 | 1.0 | ||||||||
| Total Sources | $430,000,000 | 100.0% | Total Uses | $430,000,000 | 100.0% | |||||
| (1) | The Bedrock Portfolio Mortgage Loan (as defined below) is part of a loan combination evidenced by 10 pari passu notes with an aggregate original principal balance of $430 million (the “Bedrock Portfolio Loan Combination”). The financial information presented in the chart above reflects the Cut-off Date balance of the $430 million Bedrock Portfolio Loan Combination. |
| (2) | The borrowers of the Bedrock Portfolio Loan Combination are Michigan Parking Co LLC, 419 Fort Street LLC, 1001 Brush Street LLC, 1001 Webward LLC, One Webward Avenue LLC, 719 Griswold Associates LLC, 660 Woodward Associates LLC, 1234 Library LLC, 600 Webward Avenue LLC, 611 Webward Avenue LLC, 1505 Webward LLC, 1520 Webward Avenue LLC, Corktown Lofts LLC and WWA Parking LLC. |
| (3) | The property located at 1 Woodard Avenue (the “One Woodward Property”) is subject to a ground lease expiring in April 2040. |
| (4) | The Bedrock Portfolio Loan Combination is secured by the borrowers’ fee or leasehold interests in seven office buildings, five parking garages and two mixed-use properties that were built between 1913 and 2013. Each Mortgaged Property within the portfolio was renovated between 2010 and 2019. See “Portfolio Summary” table herein. |
| (5) | Occupancy represents occupancy for office and retail space in the Bedrock Portfolio. |
| (6) | For a full description of Escrows and Reserves, please refer to “Escrows and Reserves” below. |
The Loan. The eighth largest mortgage loan is secured by a first mortgage lien on the borrowers’ fee or leasehold (with respect to the One Woodward Property) interests in a portfolio of office, mixed use and parking garage properties located in the Detroit, Michigan central business district (the “Bedrock Portfolio Properties”). The Bedrock Portfolio Loan Combination was co-originated by Starwood Mortgage Capital LLC and JPMorgan Chase Bank, National Association (“JPM”). The Bedrock Portfolio Loan Combination has an outstanding principal balance as of the Cut-off Date of approximately $430 million and is comprised of 10 pari passu notes. The non-controlling Note A-2-1, with an aggregate original principal balance of $40,000,000, will be included in the BMO 2022-C1 securitization trust (the “Bedrock Portfolio Mortgage Loan”). The Bedrock Portfolio Loan Combination will be serviced pursuant to the pooling and servicing agreement for the Benchmark 2022-B32 securitization trust. The remaining notes are expected to be contributed to one or more future securitization
| THE INFORMATION IN THIS STRUCTURAL AND COLLATERAL TERM SHEET IS NOT COMPLETE AND MAY BE AMENDED PRIOR TO THE TIME OF SALE. THIS TERM SHEET IS NOT AN OFFER TO SELL THESE SECURITIES AND IT IS NOT A SOLICITATION OF AN OFFER TO BUY THESE SECURITIES IN ANY JURISDICTION WHERE THE OFFER OR SALE IS NOT PERMITTED. | ||
| 106 | ||
| Structural and Collateral Term Sheet | BMO 2022-C1 | |
| No. 8 – Bedrock Portfolio | ||
trusts or may otherwise be transferred at any time. See “Description of the Mortgage Pool—The Loan Combinations—The Outside Serviced Pari Passu Loan Combinations” and “The Pooling and Servicing Agreement” in the Preliminary Prospectus. The Bedrock Portfolio Loan Combination has a seven-year term and is interest only for the entire loan term.
| Loan Combination Summary | ||||
| Note | Original Balance | Cut-off Date Balance | Note Holder | Controlling Piece |
| A-1-1 | $125,000,000 | $125,000,000 | Benchmark 2022-B32 | Yes |
| A-1-2 | $50,000,000 | $50,000,000 | JPM(1) | No |
| A-1-3 | $50,000,000 | $50,000,000 | JPM(1) | No |
| A-1-4 | $50,000,000 | $50,000,000 | JPM(1) | No |
| A-1-5 | $30,000,000 | $30,000,000 | JPM(1) | No |
| A-1-6 | $39,000,000 | $39,000,000 | JPM(1) | No |
| A-2-1 | $40,000,000 | $40,000,000 | BMO 2022-C1 | No |
| A-2-2 | $26,000,000 | $26,000,000 | Starwood Mortgage Funding II LLC(1) | No |
| A-2-3 | $10,000,000 | $10,000,000 | Starwood Mortgage Funding II LLC(1) | No |
| A-2-4 | $10,000,000 | $10,000,000 | Starwood Mortgage Funding II LLC(1) | No |
| Total | $430,000,000 | $430,000,000 | ||
| (1) | Expected to be contributed to one or more future securitization trusts or otherwise transferred at any time. |
The Properties. The Bedrock Portfolio Properties consists of seven office buildings with ground floor retail (2,529,041 square feet; 80.7% of underwritten net cash flow), five parking garages (5,036 stalls; 16.1% of underwritten net cash flow) and two mixed-use multifamily buildings (53 units; 3.1% of underwritten net cash flow). The Bedrock Portfolio Properties are located in Downtown Detroit and are accessible via the I-75, I-94 and I-96 expressways in addition to other major roadways. The Bedrock Portfolio Properties benefits from diversity across a cross-collateralized portfolio encompassing several commercial and residential uses, in addition to a tenant mix representing a wide array of industries. A number of trophy office assets are included in the Bedrock Portfolio Properties, which includes historic rehabilitations of landmark buildings, as well as state of the art ground up construction. The Bedrock Portfolio Properties represent a critical mass of CBD Class A office inventory, comprising a large share of the overall submarket.
As of November 10, 2021, the Bedrock Portfolio office properties were 91.2% leased to a diverse array of institutional quality tenancy, including several borrower-sponsor affiliated publicly traded entities. Dan Gilbert-affiliated and/or controlled entities including Quicken Loans, Amrock, Inc. and Bedrock Management Services LLC account for approximately 58.0% of underwritten base rent.
Collectively, the five parking garages drive approximately 16.1% of underwritten net cash flow. The parking garage component features a combination of long-term parking leases (37.8% of total parking garage revenue), month-to-month leases (22.6% of total parking garage revenue), transient parking (9.4% of total parking garage revenue), as well as contractual parking leases associated with on-site parking at the office properties (30.2% of total parking garage revenue). The parking garages benefit from high demand for parking in the Detroit central business district, with an average monthly utilization (occupancy) of 124.5% on leased and month-to-month parking spaces (not including transient parking) as of the third quarter of 2021. Utilization has averaged 122.8% since Q1 2019. Due to the lack of publicly available transportation historically driven in part by resistance from the motor vehicle industry, Detroit has functioned primarily on personal car transportation which continues to benefit the garages in the Bedrock Portfolio Properties.
| Portfolio Summary | |||||||||
| Property Name | Property Type / Subtype | Year Built / Renovated | SF / Stalls / Units | Allocated Loan Combination Cut-off Date | % of Allocated Loan Combination Cut-off Date Balance | Appraised Value | % of Appraised Value | UW NCF | % of UW NCF |
| First National Building | Office / CBD | 1921 / 2010 | 800,119 / 427 / - | 99,140,800 | 23.1% | $162,000,000 | 22.4% | $14,276,324 | 26.2% |
| The Qube | Office / CBD | 1958 / 2011 | 522,702 / - / - | 63,038,000 | 14.7% | 103,000,000 | 14.2% | $8,693,152 | 16.0% |
| Chrysler House | Office / CBD | 1919 / 2013 | 343,488 / 924 / - | 49,278,000 | 11.5% | 83,000,000 | 11.5% | $6,142,746 | 11.3% |
| 1001 Woodward | Office / CBD | 1965 / 2013 | 319,039 / 731 / - | 48,959,800 | 11.4% | 80,000,000 | 11.0% | $6,887,443 | 12.7% |
| One Woodward | Office / CBD | 1962 / 2013 | 370,257 / 90 / - | 35,492,200 | 8.3% | 58,000,000 | 8.0% | $5,096,070 | 9.4% |
| The Z Garage | Other / Parking Garage | 2013 / 2015-2016 | 40,227 / 1,351 / - | 29,007,800 | 6.7% | 53,000,000 | 7.3% | $2,078,882 | 3.8% |
| Two Detroit Garage | Other / Parking Garage | 2002 / 2015-2016 | - / 1,106 / - | 21,955,800 | 5.1% | 37,000,000 | 5.1% | $2,928,886 | 5.4% |
| 1505 & 1515 Woodward | Office / CBD | 1925 / 2018 | 141,741 / - / - | 20,777,600 | 4.8% | 35,000,000 | 4.8% | $2,454,589 | 4.5% |
| 1001 Brush Street | Other / Parking Garage | 1993 / 2015-2016 | 38,519 / 1,309 / - | 17,535,400 | 4.1% | 32,000,000 | 4.4% | $1,683,875 | 3.1% |
| The Assembly | Mixed Use / Multifamily / Office / Retail | 1913 / 2019 | 81,147 / 50 / 32 | 13,717,000 | 3.2% | 23,100,000 | 3.2% | $1,334,926 | 2.5% |
| 419 Fort Street Garage | Other / Parking Garage | 2005 / 2015-2016 | - / 637 / - | 12,470,000 | 2.9% | 21,000,000 | 2.9% | $1,584,990 | 2.9% |
| Vinton | Mixed Use / Multifamily/Retail | 1917 / 2018 | 5,693 / - / 21 | 7,525,000 | 1.8% | 17,500,000 | 2.4% | $377,823 | 0.7% |
| 1401 First Street | Other / Parking Garage | 1976 / 2017 | - / 633 / - | 7,421,800 | 1.7% | 13,500,000 | 1.9% | $502,080 | 0.9% |
| Lane Bryant Building | Office / CBD | 1917 / 2018 | 31,695 / - / - | 3,680,800 | 0.9% | 6,200,000 | 0.9% | $367,719 | 0.7% |
| Total | 2,694,627 / 7,258 / 53 | $430,000,000 | 100.0% | $724,300,000 | 100.0% | $54,409,505 | 100.0% | ||
| THE INFORMATION IN THIS STRUCTURAL AND COLLATERAL TERM SHEET IS NOT COMPLETE AND MAY BE AMENDED PRIOR TO THE TIME OF SALE. THIS TERM SHEET IS NOT AN OFFER TO SELL THESE SECURITIES AND IT IS NOT A SOLICITATION OF AN OFFER TO BUY THESE SECURITIES IN ANY JURISDICTION WHERE THE OFFER OR SALE IS NOT PERMITTED. | ||
| 107 | ||
| Structural and Collateral Term Sheet | BMO 2022-C1 | |
| No. 8 – Bedrock Portfolio | ||
| Historical Parking Utilization(1) | |||||||||||||
| Parking Garages | Stalls | Q1 2019 | Q2 2019 | Q3 2019 | Q4 2019 | Q1 2020 | Q2 2020 | Q3 2020 | Q4 2020 | Q1 2021 | Q2 2021 | Q3 2021 | Average |
| 1001 Brush Street | 1,309 | 119.3% | 118.6% | 120.8% | 119.0% | 131.5% | 127.1% | 129.3% | 122.7% | 116.7% | 91.5% | 129.3% | 120.5% |
| 1401 First Street | 633 | 147.9% | 131.3% | 130.3% | 133.3% | 107.7% | 92.1% | 80.9% | 79.8% | 76.8% | 78.5% | 80.9% | 103.6% |
| 419 Fort Street Garage | 637 | 106.4% | 109.6% | 122.8% | 120.1% | 152.9% | 163.7% | 167.7% | 153.4% | 146.2% | 142.1% | 167.7% | 141.1% |
| The Z Garage | 1,351 | 119.3% | 119.0% | 120.0% | 117.6% | 125.7% | 119.0% | 112.2% | 107.8% | 101.1% | 115.2% | 112.2% | 115.4% |
| Two Detroit Garage | 1,106 | 119.0% | 119.9% | 120.8% | 120.2% | 122.9% | 127.3% | 134.2% | 146.8% | 162.6% | 177.3% | 134.2% | 135.0% |
| Total / Wtd. Avg. | 5,036 | 121.2% | 119.4% | 122.0% | 120.8% | 127.8% | 125.2% | 124.5% | 122.5% | 121.3% | 121.4% | 124.5% | 122.8% |
| (1) | Historical parking utilization above 100% is attributable to transient parking allowing for a single space to be occupied by multiple users in a given day. |
COVID-19 Update. As of January 1, 2022, the Bedrock Portfolio Properties are open and operating. No tenants are currently subject to rent abatements in connection with COVID-19. As of January 1, 2022, the Bedrock Portfolio Loan Combination is not subject to any modification or forbearance requests. The first payment date is scheduled for February 1, 2022. See “Risk Factors—Special Risks—The Coronavirus Pandemic Has Adversely Affected the Global Economy and May Adversely Affect the Performance of the Mortgage Loans” in the Preliminary Prospectus.
Major Tenants.
Quicken Loans Inc. (905,935 square feet; 33.6% of portfolio NRA; 39.5% of underwritten base rent). Quicken Loans Inc. (“Quicken Loans”) was founded in 1985 and markets conventional, government insured and sub-prime debt consolidation and home financing loans, secured primarily by first or second mortgages on one-to four-family, owner-occupied residences. Quicken Loans originates loans through 18 stores and branches, one call center and an Internet site. During the third quarter of 2021, Quicken Loans originated approximately $88 billion of mortgage loans and generated net income of approximately $1.4 billion. Quicken Loans rebranded in July 2021 and is now known as Rocket Mortgage. Quicken Loans leases space in five buildings with staggered lease expiration dates, including (i) 183,664 square feet expiring in August 2023 for which it has two, five-year renewal options, (ii) 122,475 square feet expiring in April 2024 for which it has two, three-year renewal options, (iii) 15,602 square feet expiring in October 2025 for which it has no renewal options, (iv) 407,050 square feet expiring in July 2028 for which it has three, five-year renewal options, (v) 21,124 square feet expiring in January 2030 for which it has two, five-year renewal options and (vi) 156,020 square feet expiring in March 2032 for which it has, two, five-year renewal options. Quicken Loans has no remaining termination options. Dan Gilbert, an affiliate of the borrower sponsor, has voting control in the parent company of Rocket Mortgage as a preferred shareholder.
Amrock, Inc (424,486 square feet; 15.8% of portfolio NRA; 16.7% of underwritten base rent). Amrock, Inc (“Amrock”) was founded in 1997 and provides title insurance, property valuations, and settlement services in the United States. Amrock offers residential solutions for a range of settlement services and products, including defined process work flows and data integrations; commercial title insurance coverages; valuation products and services through a network of residential real estate appraisers; title and settlement services in the state of Connecticut; escrow and closing services in the state of Washington; and ATLAS, a technology platform that supports title and settlement service platform, as well as allows a client to manage preferences, prioritize orders, and work flows. Amrock serves Fortune 100 companies and residential mortgage lenders, as well as residential lending institutions and smaller community-based lenders. Amrock has two, five-year renewal options and no termination options. Amrock is affiliated with Dan Gilbert and the borrower sponsor. Quicken Loans and Amrock are subsidiaries of Rocket Mortgage Companies (NYSE:RKT) (“Rocket Mortgage”), founded and controlled by Dan Gilbert, which announced its IPO in the summer of 2020. Rocket Mortgage engages in the tech-driven real estate, mortgage and eCommerce businesses in the United States and Canada. As of January 12, 2022, Rocket Mortgage had a market cap of approximately $28.1 billion and approximately 24,000 employees.
Honigman Miller Schwartz and Cohn LLP (150,786 square feet; 5.6% of portfolio NRA; 6.7% of underwritten base rent). Honigman Miller Schwartz and Cohn LLP (“Honigman”) was founded in 1948 and is a law firm that employs over 350 attorneys and 350 staff and operates a local, national, and international practice from its Michigan offices in Detroit, Bloomfield Hills, Lansing, Ann Arbor, Kalamazoo, and Grand Rapids, its Illinois office in Chicago and its office in Washington, DC. Honigman’s attorneys practice in more than 60 different areas of business law. Honigman has two, five-year renewal options and no termination options.
Environmental. According to the Phase I environmental assessments dated September 28, 2021, September 29, 2021, October 3, 2021 and October 4, 2021, there was no evidence of any recognized environmental conditions at the Bedrock Portfolio Properties other than as follows: additional testing is required at the multifamily property known as The Assembly (“The Assembly Property”) to determine if there is a vapor encroachment condition. The borrowers deposited $250,000 with the lender at closing in the amount required to complete certain potential vapor mitigation work at The Assembly Property.
| Office and Retail Historical and Current Occupancy(1) | |||||
| 2016 | 2017 | 2018 | 2019 | 2020 | Current(2) |
| 82.5% | 81.5% | 85.0% | 88.9% | 92.4% | 88.7% |
| (1) | Historical occupancies are as of December 31 of each respective year. |
| (2) | Current Occupancy is based on the underwritten rent roll as of various dates. |
| THE INFORMATION IN THIS STRUCTURAL AND COLLATERAL TERM SHEET IS NOT COMPLETE AND MAY BE AMENDED PRIOR TO THE TIME OF SALE. THIS TERM SHEET IS NOT AN OFFER TO SELL THESE SECURITIES AND IT IS NOT A SOLICITATION OF AN OFFER TO BUY THESE SECURITIES IN ANY JURISDICTION WHERE THE OFFER OR SALE IS NOT PERMITTED. | ||
| 108 | ||
| Structural and Collateral Term Sheet | BMO 2022-C1 | |
| No. 8 – Bedrock Portfolio | ||
| Office and Retail Tenant Summary(1) | ||||||||
| Tenant | Tenant Type | Ratings Moody’s/S&P/Fitch(2) | Net Rentable Area (SF) | % of Total NRA | Base Rent PSF | % of Total Base Rent | Lease Expiration Date | Renewal Options |
| Quicken Loans Inc.(3) | Office | NR/NR/NR | 905,935 | 33.6% | $26.04 | 39.5% | Various | Various |
| Amrock, Inc | Office | NR/NR/NR | 424,486 | 15.8 | $23.50 | 16.7 | 1/31/2032 | 2, 5-Year |
| Honigman Miller Schwartz and Cohn LLP | Office | NR/NR/NR | 150,786 | 5.6 | $26.50 | 6.7 | 11/30/2025 | 2, 5-Year |
| LinkedIn Corporation | Office | Aaa/AAA/AAA | 74,497 | 2.8 | $31.53 | 3.9 | 7/31/2026 | 1, 5-Year |
| Coyote Logistics | Office | A2/A-/NR | 58,192 | 2.2 | $29.25 | 2.9 | 10/31/2030 | 1, 5-Year |
| Kitch Drutchas Wagner Valitutti & Sherbrook, P.C. | Office | NR/NR/NR | 56,265 | 2.1 | $27.17 | 2.6 | 5/31/2028 | 1, 5-Year |
| Board of Trustees of Michigan State University | Office | NR/NR/NR | 46,598 | 1.7 | $28.84 | 2.3 | 9/30/2031 | 2, 1-Year |
| Bedrock Management Services LLC | Office | NR/NR/NR | 39,087 | 1.5 | $26.81 | 1.8 | 1/31/2032 | 1, 5-Year |
| JPMorgan Chase, National Association | Office | A2/A-/AA- | 32,126 | 1.2 | $29.13 | 1.6 | 5/31/2027 | 1, 5-Year |
| Fifth Third Bank | Office | Baa1/BBB+/A- | 31,204 | 1.2 | $24.80 | 1.3 | 10/31/2025 | 1, 5-Year |
| Ten Largest Tenants | 1,819,176 | 67.5% | $25.97 | 79.2% | ||||
| Remaining Occupied Office Tenants | 461,647 | 17.1 | $22.47 | 17.4 | ||||
| Remaining Occupied Retail Tenants | 110,225 | 4.1 | $18.48 | 3.4 | ||||
| Total Occupied | 2,391,048 | 88.7% | $24.95 | 100.0% | ||||
| Vacant | 303,579 | 11.3 | ||||||
| Total / Wtd. Avg. | 2,694,627 | 100.0% | ||||||
| (1) | Based on the underwritten rent roll dated as of November 10, 2021. |
| (2) | In certain instances, ratings provided are those of the parent company of the entity shown, whether or not the parent company guarantees the lease. |
| (3) | Quicken Loans Inc. has various Lease Expiration Dates, including (i) 183,664 square feet expiring in August 2023 for which it has two, five-year renewal options, (ii) 122,475 square feet expiring in April 2024 for which it has three, three-year renewal options, (iii) 15,602 square feet expiring in October 2025 for which it has no renewal options, (iv) 407,050 square feet expiring in July 2028 for which it has two, five-year renewal options, (v) 21,124 square feet expiring in January 2030 for which it has two, five-year renewal options and (vi) 156,020 square feet expiring in March 2032 for which it has, two, five-year renewal options. Quicken Loans Inc. has no remaining termination options. |
| Office and Retail Lease Rollover Schedule(1)(2) | |||||||||
| Year | Number of Leases Expiring | Net Rentable Area Expiring | % of Expiring | Base Rent Expiring | % of Base Rent Expiring | Cumulative NRA Expiring | Cumulative % of NRA Expiring | Cumulative Base Rent Expiring | Cumulative % of Base Rent Expiring |
| Vacant | NAP | 303,579 | 11.3% | NAP | NAP | 303,579 | 11.3% | NAP | NAP |
| 2022 & MTM | 44 | 146,690 | 5.4% | $3,246,316 | 5.4% | 450,269 | 16.7% | $3,246,316 | 5.4% |
| 2023 | 16 | 304,272 | 11.3% | 7,252,186 | 12.2% | 754,541 | 28.0% | $10,498,502 | 17.6% |
| 2024 | 18 | 200,069 | 7.4% | 5,784,259 | 9.7% | 954,610 | 35.4% | $16,282,761 | 27.3% |
| 2025 | 15 | 258,173 | 9.6% | 6,687,343 | 11.2% | 1,212,783 | 45.0% | $22,970,104 | 38.5% |
| 2026 | 11 | 142,573 | 5.3% | 4,271,955 | 7.2% | 1,355,356 | 50.3% | $27,242,059 | 45.7% |
| 2027 | 7 | 76,383 | 2.8% | 1,493,570 | 2.5% | 1,431,739 | 53.1% | $28,735,629 | 48.2% |
| 2028 | 3 | 463,315 | 17.2% | 12,537,526 | 21.0% | 1,895,054 | 70.3% | $41,273,155 | 69.2% |
| 2029 | 1 | 3,536 | 0.1% | 97,240 | 0.2% | 1,898,590 | 70.5% | $41,370,395 | 69.3% |
| 2030 | 2 | 79,316 | 2.9% | 2,329,710 | 3.9% | 1,977,906 | 73.4% | $43,700,105 | 73.3% |
| 2031 | 1 | 46,598 | 1.7% | 1,343,886 | 2.3% | 2,024,504 | 75.1% | $45,043,991 | 75.5% |
| 2032 & Thereafter | 4 | 670,123 | 24.9% | 14,612,316 | 24.5% | 2,694,627 | 100.0% | $59,656,307 | 100.0% |
| Total | 122 | 2,694,627 | 100.0% | $59,656,307 | 100.0% | ||||
| (1) | Based on the underwritten rent roll dated as of November 10, 2021. |
| (2) | Certain tenants may have termination or contraction options (which may become exercisable prior to the originally stared expiration date of the tenant lease) that are not considered in the above Office and Retail Lease Rollover Schedule. |
| THE INFORMATION IN THIS STRUCTURAL AND COLLATERAL TERM SHEET IS NOT COMPLETE AND MAY BE AMENDED PRIOR TO THE TIME OF SALE. THIS TERM SHEET IS NOT AN OFFER TO SELL THESE SECURITIES AND IT IS NOT A SOLICITATION OF AN OFFER TO BUY THESE SECURITIES IN ANY JURISDICTION WHERE THE OFFER OR SALE IS NOT PERMITTED. | ||
| 109 | ||
| Structural and Collateral Term Sheet | BMO 2022-C1 | |
| No. 8 – Bedrock Portfolio | ||
| Operating History and Underwritten Net Cash Flow(1) | |||||||
| 2018 | 2019 | 2020 | TTM September 2021 | Underwritten | Per Square Foot | %(2) | |
| Rents In Place(3) | $49,546,085 | $52,751,303 | $57,994,616 | $60,138,958 | $59,656,311 | $22.14 | 70.4% |
| Vacant Income | 0 | 0 | 0 | 0 | 7,501,625 | 2.78 | 8.9% |
| Gross Potential Rent | $49,546,085 | $52,751,303 | $57,994,616 | $60,138,958 | $67,157,936 | $24.92 | 79.3% |
| Total Reimbursements | 8,517,719 | 9,107,253 | 8,931,194 | 7,857,374 | 12,024,156 | 4.46 | 14.2% |
| Percentage Rent | 2,421,923 | 2,615,463 | 1,377,500 | 1,277,610 | 2,991,501 | 1.11 | 3.5% |
| Other Rental Storage(4) | 1,978,084 | 2,343,354 | 2,799,699 | 2,808,240 | 2,544,077 | 0.94 | 3.0% |
| Gross Potential Income | $62,463,811 | $66,817,372 | $71,103,009 | $72,082,182 | $84,717,669 | $31.44 | 100.0% |
| Vacancy/Credit Loss | (1,100,662) | (1,099,639) | (1,694,177) | (2,030,041) | (10,418,183) | (3.87) | (12.3%) |
| Concessions | (89,423) | (49,389) | (45,615) | (44,800) | 0 | 0.00 | 0.0% |
| Parking (Contractual) | 19,565,127 | 20,062,906 | 20,373,075 | 20,247,590 | 19,321,511 | 7.17 | 22.8% |
| Parking (Transient) | 4,382,014 | 5,250,614 | 1,860,131 | 2,231,702 | 2,004,714 | 0.74 | 2.4% |
| Other Income | 1,423,306 | 2,619,763 | 1,723,795 | 1,925,200 | 1,934,739 | 0.72 | 2.3% |
| Effective Gross Income | $86,644,173 | $93,601,628 | $93,320,219 | $94,411,832 | $97,560,449 | $36.21 | 115.2% |
| Total Expenses | 44,502,438 | 46,392,886 | 39,225,160 | 38,816,129 | 39,136,450 | 14.52 | 40.1% |
| Net Operating Income | $42,141,735 | $47,208,742 | $54,095,059 | $55,595,704 | $58,423,999 | $21.68 | 59.9% |
| TI/LC | 0 | 0 | 0 | 0 | 3,353,632 | 1.24 | 3.4% |
| Capital Expenditures | 0 | 0 | 0 | 0 | 660,862 | 0.25 | 0.7% |
| Net Cash Flow | $42,141,735 | $47,208,742 | $54,095,059 | $55,595,704 | $54,409,505 | $20.19 | 55.8% |
| (1) | Based on underwritten rent roll dated as of November 10, 2021. |
| (2) | % column represents percent of Gross Potential Rent for revenue fields and represents percent of Effective Gross Income for the remainder of fields. |
| (3) | Underwritten Rents In Place is inclusive of (i) contractual rent steps though December 2022 and (ii) straight-line average rent over the lease term for investment grade rated tenants. |
| (4) | Other Rental Storage includes grossed up multifamily income and other storage income. |
The Market. The Bedrock Portfolio Properties are located in downtown Detroit, Michigan, which, according to the appraisal, remains the economic and entertainment focal point of southeast Michigan and serves as a major international crossing with Canada. The Bedrock Portfolio Properties benefit from Detroit’s hub layout that results in many roadways emanating from the central business district into the surrounding communities. Detroit is serviced by the Detroit-Metropolitan Wayne County Airport situated approximately 15 miles southwest in the City of Romulus. This international airport serves as the mid-western hub of operation for Delta Airlines, as well as servicing other commercial airlines. Passenger rail service to other cities is provided by Amtrak with the central station located in the New Center area immediately north of the central business district.
According to the appraisal, the primary demand generator in Downtown Detroit has been the growing employment base. A number of large employers have anchored the central business district including Quicken Loans, TitleSource, Blue Cross/Blue Shield, MSX International, Rossetti and Campbell Ewald. Downtown Detroit offers a number of entertainment districts including Foxtown, the sports venues (Ford Field, home to the NFL’s Detroit Lions, Comerica Park, home to MLB’s Detroit Tigers, and Little Caesars Arena, home to the NBA’s Detroit Pistons and the NHL’s Detroit Red Wings) and three casinos. There are a growing number of restaurants and bars throughout the Downtown area. This district is emerging with new developments and renovation projects that are projected to transform the district.
According to the appraisal, there have been several recent developments in Downtown Detroit that are expected to have a positive long-term impact on the Downtown market, including Ford’s acquisition of Michigan Central Station in Corktown. Ford is in the process of developing a multi-billion dollar investment in autonomous-vehicle development in Corktown. Additionally, TCF Bank, formerly Chemical Bank, is constructing a new 20-story building downtown that is projected to add an additional 500 workers.
The appraiser identified four comparable office leases with rents ranging from $24.50 to $29.75 per square foot. Based on the identified lease comparables, the appraiser concluded market rents ranging between $26.50 and $29.50 per square foot for the seven office properties in the Bedrock Portfolio, generally in-line with underwritten base rents across the office component of the Bedrock Portfolio.
| Office Lease Comparables(1) | ||||||||
| Property | Address | Year Built | Building Size (SF) | Tenant Name | Size (SF) | Lease Start Date | Lease Term | Rent PSF |
| Bedrock Portfolio Office Tenants | Various | 2,694,627 | $25.26 | |||||
| One Detroit Center | 500 Woodward Ave. | 1992 | 979,477 | DT Midstream | 22,727 | Nov-21 | 126 | $29.75 |
| Renaissance Center | 400 E. Jefferson Ave. | 1980 | 7,123,170 | Consulate of Italy | 4,133 | Mar-21 | 110 | $26.00 |
| Fisher Building | 3011 W. Grand Blvd. | 1928 | 634,819 | Strategic Staffing | 57,000 | Jan-21 | 120 | $24.50 |
| Hemmeter Building | 230 E. Grand River Ave. | 1913 | 56,203 | UHY | 7,156 | Sep-20 | 60 | $25.00 |
| Total / Wtd. Avg. | 1945 | 2,198,417 | 22,754 | Mar-21 | 116 | $25.92 | ||
| (1) | Bedrock Portfolio Office Tenants Rent PSF is based on the underwritten rent roll dated November 10, 2021. |
The Borrowers. The borrowers are Michigan Parking Co LLC, 419 Fort Street LLC, 1001 Brush Street LLC, 1001 Webward LLC, One Webward Avenue LLC, 719 Griswold Associates LLC, 660 Woodward Associates LLC, 1234 Library LLC, 600 Webward Avenue LLC, 611 Webward Avenue LLC, 1505 Webward LLC, 1520 Webward Avenue LLC, Corktown Lofts LLC and WWA Parking LLC, each a
| THE INFORMATION IN THIS STRUCTURAL AND COLLATERAL TERM SHEET IS NOT COMPLETE AND MAY BE AMENDED PRIOR TO THE TIME OF SALE. THIS TERM SHEET IS NOT AN OFFER TO SELL THESE SECURITIES AND IT IS NOT A SOLICITATION OF AN OFFER TO BUY THESE SECURITIES IN ANY JURISDICTION WHERE THE OFFER OR SALE IS NOT PERMITTED. | ||
| 110 | ||
| Structural and Collateral Term Sheet | BMO 2022-C1 | |
| No. 8 – Bedrock Portfolio | ||
Delaware limited liability company structured to be single purpose bankruptcy-remote entities having at least two independent directors in their organizational structure. Legal counsel to the borrowers delivered a non-consolidation opinion in connection with the origination of the Bedrock Portfolio Loan Combination.
The Borrower Sponsor. The borrower sponsor is Bedrock Detroit and the non-recourse carveout guarantor is Rock Backer LLC, which are owned and controlled by Dan Gilbert and affiliated entities. Founded in 2011, Dan Gilbert’s Bedrock Detroit is a full service commercial real estate firm based in downtown Detroit, specializing in the strategic development of urban cores. With a portfolio of more than 100 properties totaling over 18 million square feet, Bedrock Detroit is one of the largest real estate partners in downtown Detroit. Since its founding, Bedrock Detroit and its affiliates have invested and committed more than $5.6 billion to acquiring and developing more than 100 properties, including new construction of ground up developments in downtown Detroit and Cleveland totaling more than 20 million square feet. Bedrock Detroit’s real estate personnel provide a full range of services with in-house teams for each area of expertise, including leasing, acquisition, finance, construction, architecture, historic rehab and property management. Bedrock Detroit’s tenants include leading technology companies and startups, world-renowned restaurants and national retailers, as well as Detroit locals. Bedrock Detroit also leases mixed-income residential properties to individuals, and acquires and renovates properties for new development. Bedrock Detroit and Dan Gilbert’s family of companies have been critical in the urban revival of Detroit and have demonstrated a strong commitment to the continued growth and stability of the market.
The borrower sponsor acquired the Bedrock Portfolio Properties for an aggregate purchase price of approximately $191.2 million and has since invested approximately $464.9 million across the Bedrock Portfolio Properties, resulting in a total cost basis of approximately $656.1 million.
Property Management. The Bedrock Portfolio Properties are managed by Bedrock Management Services LLC, an affiliate of the borrowers.
Escrows and Reserves. At loan origination, the borrowers deposited (i) $8,392,690 into an outstanding TI/LC reserve, (ii) approximately $1,696,002 into a real estate tax reserve, (iii) $477,905 into a free rent reserve, (iv) $280,690 into a rollover reserve, (v) $250,000 into an outstanding environmental reserve with respect to The Assembly Property, (vi) $241,558 into a required repairs reserve and (vii) $62,336 into a replacement reserve.
Tax Reserve – On each monthly due date, the borrowers are required to deposit an amount equal to 1/12th of the estimated annual real estate taxes into the tax reserve account, which is estimated to be $424,000.
Insurance Reserve – On each monthly due date, the borrowers are required to deposit into an insurance reserve an amount equal to 1/12th of estimated insurance premiums, unless the borrower maintains a blanket policy in accordance with the Bedrock Portfolio Loan Combination documents.
Replacement Reserve – On each monthly due date, the borrowers are required to deposit $62,336 into a replacement reserve, subject to a cap of $1,469,568.
Rollover Reserve – On each monthly due date, the borrowers are required to deposit $280,690, subject to a cap of $5,000,000.
Lockbox / Cash Management. The Bedrock Portfolio Loan Combination is structured with an in place hard lockbox for commercial units, the office and retail properties, a springing lockbox for residential units, the multifamily properties and various parking properties, and springing cash management. At loan origination, the borrowers were required to direct each tenant at a property subject to a hard lockbox to remit all rents directly to the applicable lockbox account. In addition, the borrowers are required to cause all cash revenues and all other money received by the borrowers or the property manager with respect to the properties subject to a hard lockbox to be deposited into the applicable lockbox account within one business day of receipt. On each business day on which no Cash Sweep Event (as defined below) is continuing, all amounts in the lockbox account are required to be remitted to a borrower-controlled operating account. Upon the occurrence of a Cash Sweep Event, (i) the borrowers are required to establish lockbox accounts for all properties, and (ii) the borrowers are required to establish a cash management account. On each business day during the continuance of a Cash Sweep Event, all amounts in each lockbox account are required to be remitted to the cash management account. On each due date during the continuance of a Cash Sweep Event, all funds on deposit in the cash management account after payment of debt service on the Bedrock Portfolio Loan Combination, required reserves and budgeted operating expenses are required to be deposited into an excess cash flow reserve account as additional collateral for the Bedrock Portfolio Loan Combination.
A “Cash Sweep Event” means (a) an event of default, (b) the bankruptcy or insolvency of the any of the borrowers or the property manager, or (c) if the debt service coverage ratio based on a trailing three-month basis for the total debt falls below 2.50x.
A Cash Sweep Event may be cured upon the occurrence of the following: (i) with respect to clause (a) above, the acceptance by the lender of a cure of such event of default in accordance with the Bedrock Portfolio Loan Combination documents, (ii) with respect to clause (b) above solely with respect to the borrowers, if the bankruptcy action is an involuntary petition against such individual borrower and no individual borrower has colluded with, or otherwise assisted, such person, and has not solicited creditors for any involuntary petition against such individual borrower from any person and the bankruptcy action is dismissed within 90 days from the filing of such bankruptcy
| THE INFORMATION IN THIS STRUCTURAL AND COLLATERAL TERM SHEET IS NOT COMPLETE AND MAY BE AMENDED PRIOR TO THE TIME OF SALE. THIS TERM SHEET IS NOT AN OFFER TO SELL THESE SECURITIES AND IT IS NOT A SOLICITATION OF AN OFFER TO BUY THESE SECURITIES IN ANY JURISDICTION WHERE THE OFFER OR SALE IS NOT PERMITTED. | ||
| 111 | ||
| Structural and Collateral Term Sheet | BMO 2022-C1 | |
| No. 8 – Bedrock Portfolio | ||
action, (iii) with respect to clause (b) above solely with respect to the property manager, if the applicable individual borrower replaces such property manager with a “Qualified Manager” (as fully described in the Bedrock Portfolio Loan Combination documents) under a replacement management agreement acceptable to the lender in accordance with the Bedrock Portfolio Loan Combination documents, or (iv) with respect to clause (c) above, if the debt service coverage ratio based on the trailing three-month period immediately preceding the date of such determination for two consecutive quarters is not less than 2.50x; provided, however, (A) no event of default has occurred and be continuing under the Bedrock Portfolio Loan Combination documents, (B) the borrowers have paid all of the lender’s reasonable expenses incurred in connection with such Cash Sweep Event Cure including reasonable attorney’s fees and expenses, and (C) in no event may the borrowers cure a Cash Sweep Event caused by a bankruptcy action caused by any of the borrowers filing a voluntary petition or arising from a person filing an involuntary petition against any of the borrowers and any such borrower has colluded with or otherwise assisted such person with the involuntary petition against the applicable borrower.
Subordinate and Mezzanine Debt. None.
Partial Release. The Bedrock Portfolio Loan Combination documents permit the release of an individual property (each, an “Individual Property”) from the lien of the mortgage, provided no event of default has occurred and is continuing and upon satisfaction of certain conditions set forth in the Bedrock Portfolio Loan Combination documents, including, without limitation, the following: (a) the amount of the outstanding principal balance of the Bedrock Portfolio Loan to be prepaid must equal or exceed 115% of the allocated loan amount for such applicable Individual Property, (b) the resulting debt service coverage ratio for the remaining Bedrock Portfolio Properties is equal to or greater than 3.10x, (c) unless the Individual Property to be released is subject to a non-monetary even of default that relates solely to such Individual Property and the borrowers have demonstrated in good faith that it has pursued a cure of the event of default, the Individual Property to be released is conveyed in an arm’s length transfer to a person other than the applicable individual borrower or any of its affiliates, and (d) upon release of the Individual Property, the customary REMIC rules are satisfied.
Ground Lease. The individual property identified as One Woodward is ground leased by one of the borrowers, as the ground lessee, under a ground lease with Lawrence Edwin Burch Living Trust and related individuals who collectively comprise the ground lessor. The borrower assumed the ground lease in 2012, which expires in April 2040 and has five, 25-year remaining extension options. The current rent is approximately $43,775 annually. The ground lessee’s interest in the ground lease is freely assignable to the leasehold mortgagee without the consent of the ground lessor and, in the event that it is so assigned, is further assignable by the leasehold mortgagee without the need to obtain the consent of the ground lessor. See “Description of the Mortgage Pool – Statistical Characteristics of the Mortgage Loans – Leasehold Interests” in the Preliminary Prospectus for additional information.
Master Leases. Three individual properties, identified as The Qube, Chrysler House, and 1001 Woodward, are each subject to a master lease that was originally entered into for the purpose of securing historic tax credit investors. None of the historic tax credit investors remain in the ownership of the master tenants, which are now wholly owned indirectly by Detroit Real Estate Holdings Company I LLC, which directly owns each of the borrowers. Each master tenant is required to comply with single purpose entity covenants in the Bedrock Portfolio Loan Combination documents, including having independent directors. Each master tenant granted the lender a mortgage and an assignment of leases and rents on its individual property.
| THE INFORMATION IN THIS STRUCTURAL AND COLLATERAL TERM SHEET IS NOT COMPLETE AND MAY BE AMENDED PRIOR TO THE TIME OF SALE. THIS TERM SHEET IS NOT AN OFFER TO SELL THESE SECURITIES AND IT IS NOT A SOLICITATION OF AN OFFER TO BUY THESE SECURITIES IN ANY JURISDICTION WHERE THE OFFER OR SALE IS NOT PERMITTED. | ||
| 112 | ||
| Structural and Collateral Term Sheet | BMO 2022-C1 | |
| No. 9 – IPCC National Storage Portfolio XV | ||
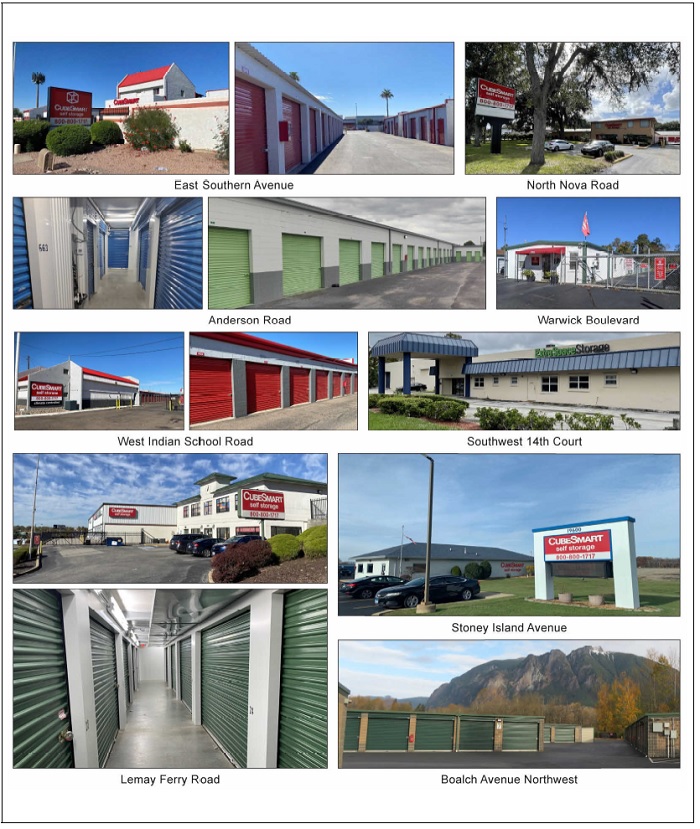
| THE INFORMATION IN THIS STRUCTURAL AND COLLATERAL TERM SHEET IS NOT COMPLETE AND MAY BE AMENDED PRIOR TO THE TIME OF SALE. THIS TERM SHEET IS NOT AN OFFER TO SELL THESE SECURITIES AND IT IS NOT A SOLICITATION OF AN OFFER TO BUY THESE SECURITIES IN ANY JURISDICTION WHERE THE OFFER OR SALE IS NOT PERMITTED. | ||
| 113 | ||
| Structural and Collateral Term Sheet | BMO 2022-C1 | |
| No. 9 – IPCC National Storage Portfolio XV | ||
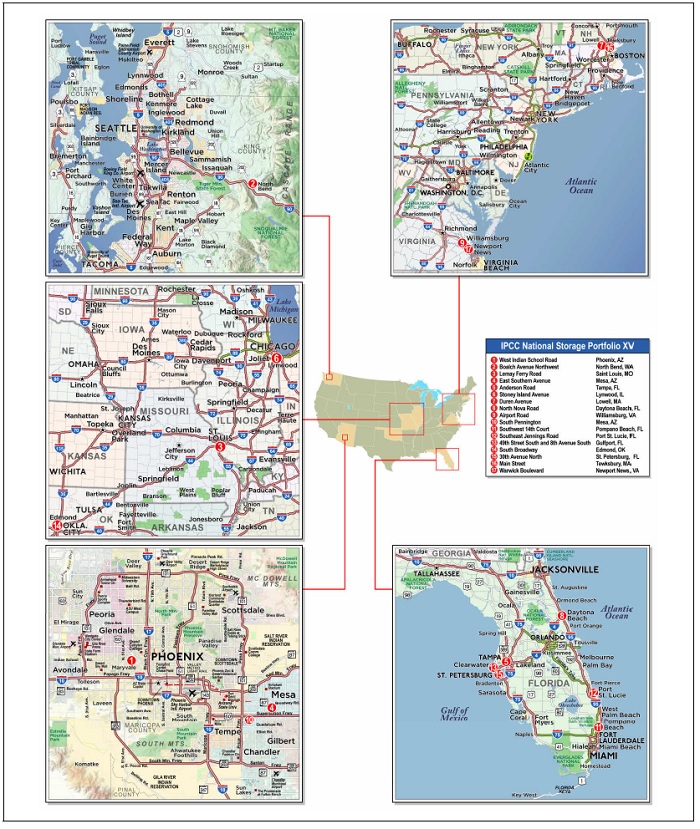
| THE INFORMATION IN THIS STRUCTURAL AND COLLATERAL TERM SHEET IS NOT COMPLETE AND MAY BE AMENDED PRIOR TO THE TIME OF SALE. THIS TERM SHEET IS NOT AN OFFER TO SELL THESE SECURITIES AND IT IS NOT A SOLICITATION OF AN OFFER TO BUY THESE SECURITIES IN ANY JURISDICTION WHERE THE OFFER OR SALE IS NOT PERMITTED. | ||
| 114 | ||
| Structural and Collateral Term Sheet | BMO 2022-C1 | |
| No. 9 – IPCC National Storage Portfolio XV | ||
| Mortgage Loan Information | Property Information | |||
| Mortgage Loan Seller: | KeyBank | Single Asset / Portfolio: | Portfolio | |
| Original Principal Balance(1): | $40,000,000 | Title: | Fee | |
| Cut-off Date Principal Balance(1): | $40,000,000 | Property Type - Subtype: | Self-Storage – Self-Storage | |
| % of IPB: | 3.6% | Net Rentable Area (SF): | 912,654 | |
| Loan Purpose: | Acquisition | Location: | Various | |
| Borrower: | Self-Storage Portfolio XV DST | Year Built / Renovated: | Various / Various | |
| Borrower Sponsor: | Inland Private Capital Corporation | Occupancy: | 95.2% | |
| Interest Rate: | 3.62800% | Occupancy Date: | 11/17/2021 | |
| Note Date: | 12/16/2021 | 4th Most Recent NOI (As of): | NAV | |
| Maturity Date: | 1/1/2032 | 3rd Most Recent NOI (As of): | NAV | |
| Interest-only Period: | 120 months | 2nd Most Recent NOI (As of)(3): | $5,455,498 (12/31/2020) | |
| Original Term: | 120 months | Most Recent NOI (As of)(3): | $7,078,647 (TTM 10/31/2021) | |
| Original Amortization Term: | None | UW Economic Occupancy: | 86.9% | |
| Amortization Type: | Interest Only | UW Revenues: | $13,111,982 | |
| Call Protection: | L(25),YM1(92),O(3) | UW Expenses: | $5,651,744 | |
| Lockbox / Cash Management: | None / Springing | UW NOI: | $7,460,240 | |
| Additional Debt(1): | Yes | UW NCF: | $7,258,080 | |
| Additional Debt Balance(1): | $46,000,000 | Appraised Value / Per SF(4): | $183,300,000 / $201 | |
| Additional Debt Type(1): | Pari Passu | Appraisal Date(4): | 11/5/2021-11/17/2021 | |
| Escrows and Reserves(2) | Financial Information(1) | ||||||
| Initial | Monthly | Initial Cap | Cut-off Date Loan / SF: | $94 | |||
| Taxes: | $0 | Springing | N/A | Maturity Date Loan / SF: | $94 | ||
| Insurance: | $0 | Springing | N/A | Cut-off Date LTV(4): | 46.9% | ||
| Replacement Reserves: | $192,000 | Springing | $192,000 | Maturity Date LTV(4): | 46.9% | ||
| Flood Insurance Reserve: | $103,400 | $0 | N/A | UW NCF DSCR: | 2.29x | ||
| UW NOI Debt Yield: | 8.7% | ||||||
| Sources and Uses | |||||||
| Sources | Proceeds | % of Total | Uses | Proceeds | % of Total | ||
| Loan Combination(1) | $86,000,000 | 45.1% | Purchase Price | $182,336,000 | 95.6% | ||
| Borrower Sponsor Equity | 104,740,667 | 54.9 | Trust Reserve(2) | 6,493,840 | 3.4 | ||
| Closing Costs | 1,615,427 | 0.8 | |||||
| Upfront Reserves | 295,400 | 0.2 | |||||
| Total Sources | $190,740,667 | 100.0% | Total Uses | $190,740,667 | 100.0% | ||
| (1) | The IPCC National Storage Portfolio XV Mortgage Loan (as defined below) is part of a Loan Combination evidenced by four pari passu notes with an aggregate original principal balance of $86,000,000. The financial information presented in the charts above is based on the $86,000,000 IPCC National Storage Portfolio XV Loan Combination (as defined below). |
| (2) | For a full description of Escrows and Reserves, please refer to “Escrows and Reserves” below. Additionally, under the terms of the master lease, described under “The Borrower” below, the IPCC National Storage Portfolio XV Borrower funded $6,493,840 at loan origination into a trust reserve account for the benefit of the IPCC National Storage Portfolio XV Borrower, which is collateral for the IPCC National Storage Portfolio XV Loan Combination but is not held with the lender and is separate from the $192,000 initial replacement reserve. Collectively, the initial replacement reserve and the trust reserve account will be used to pay for (i) repairs and replacements of the structure, foundation, roof, exterior walls, and parking lot improvements at the IPCC National Storage Portfolio XV Properties (as defined below), (ii) leasing commissions, (iii) any environmental costs, (iv) any repairs identified in the property condition reports, (v) insurance deductibles and (vi) any other necessary property improvements. |
| (3) | The increase from 2nd Most Recent NOI to Most Recent NOI is primarily due to a mixture of either increased occupancy or aggressive rental rate increases at certain IPCC National Storage Portfolio XV Properties. |
| (4) | The Appraised Value reflects a portfolio premium of approximately 14.9% over the aggregate “as-is” value of the individual IPCC National Storage Portfolio XV Properties. The sum of the values on an individual basis is $159,570,000, which represents a Cut-off Date LTV and Maturity Date LTV of 53.9%. |
The Loan. The ninth largest mortgage loan is part of a loan combination evidenced by four pari passu promissory notes in the aggregate original principal amount of $86,000,000 (the “IPCC National Storage Portfolio XV Loan Combination”), which is secured by a first priority fee mortgage encumbering 17 self-storage properties located in eight states (the “IPCC National Storage Portfolio XV Properties”). The non-controlling Note A-2 and Note A-3 (collectively, the “IPCC National Storage Portfolio XV Mortgage Loan”), with an aggregate original principal amount of $40,000,000, will be included in the BMO 2022-C1 securitization trust. The controlling Note A-1, and non-controlling Note A-4, with an aggregate original principal amount of $46,000,000, are currently held by KeyBank and are
| THE INFORMATION IN THIS STRUCTURAL AND COLLATERAL TERM SHEET IS NOT COMPLETE AND MAY BE AMENDED PRIOR TO THE TIME OF SALE. THIS TERM SHEET IS NOT AN OFFER TO SELL THESE SECURITIES AND IT IS NOT A SOLICITATION OF AN OFFER TO BUY THESE SECURITIES IN ANY JURISDICTION WHERE THE OFFER OR SALE IS NOT PERMITTED. | ||
| 115 | ||
| Structural and Collateral Term Sheet | BMO 2022-C1 | |
| No. 9 – IPCC National Storage Portfolio XV | ||
expected to be contributed to one or more future securitization trusts. The IPCC National Storage Portfolio XV Loan Combination will initially be serviced pursuant to the pooling and servicing agreement for the BMO 2022-C1 securitization trust until the controlling pari passu promissory note A-1 is securitized, whereupon the IPCC National Storage Portfolio XV Loan Combination will be serviced pursuant to the pooling and servicing agreement for such future securitization. Proceeds of the IPCC National Storage Portfolio XV Loan Combination, along with approximately $104.7 million of borrower sponsor equity, were used to acquire the IPCC National Storage Portfolio XV Properties, fund reserves and pay closing costs. See “Description of the Mortgage Pool—The Loan Combinations—The Serviced Pari Passu Loan Combinations” in the Preliminary Prospectus. The IPCC National Storage Portfolio XV Mortgage Loan has a 10-year term and is interest-only for the entire term.
| Loan Combination Summary | |||
| Note | Original Balance | Note Holder | Controlling Piece |
| A-1 | $40,000,000 | KeyBank | Yes |
| A-2 | $30,000,000 | BMO 2022-C1 | No |
| A-3 | $10,000,000 | BMO 2022-C1 | No |
| A-4 | $6,000,000 | KeyBank | No |
| Total | $86,000,000 | ||
The Properties. The IPCC National Storage Portfolio XV Properties are comprised of 17 self -storage properties totaling 912,654 square feet within 8,707 storage units located in eight states. The top three states by allocated loan amount are Florida (six properties, 29.5% of allocated loan amount, 29.6% of UW NOI), Arizona (three properties, 25.3% of allocated loan amount, 25.4% of UW NOI), and Washington (one property, 10.1% of allocated loan amount, 10.1% of UW NOI). The remaining five states are Illinois, Massachusetts, Missouri, Oklahoma, and Virginia, none of which represent more than 9.2% of the allocated loan amount or 9.2% of the UW NOI. The IPCC National Storage Portfolio XV Properties were built between 1940 and 2005. The IPCC National Storage Portfolio XV Properties range in size from 21,019 to 105,143 square feet and contain 242 to 797 storage units, with no individual property comprising more than 11.5% of the total net rentable area based on square footage and 9.2% of the total storage units.
The IPCC National Storage Portfolio XV Properties contain a total of 8,707 self-storage units, of which 3,437 are climate controlled. The IPCC National Storage Portfolio XV Properties also include 659 leasable parking spaces that are 85.9% leased as of November 17, 2021. Based on self-storage net rentable area, the IPCC National Storage Portfolio XV Properties were 95.2% occupied as of November 17, 2021, with individual property occupancies ranging from 89.4% to 99.2%.
| THE INFORMATION IN THIS STRUCTURAL AND COLLATERAL TERM SHEET IS NOT COMPLETE AND MAY BE AMENDED PRIOR TO THE TIME OF SALE. THIS TERM SHEET IS NOT AN OFFER TO SELL THESE SECURITIES AND IT IS NOT A SOLICITATION OF AN OFFER TO BUY THESE SECURITIES IN ANY JURISDICTION WHERE THE OFFER OR SALE IS NOT PERMITTED. | ||
| 116 | ||
| Structural and Collateral Term Sheet | BMO 2022-C1 | |
| No. 9 – IPCC National Storage Portfolio XV | ||
The following table presents certain information relating to the IPCC National Storage Portfolio XV Properties:
| Portfolio Summary | |||||||||
| Property Name | Location | Allocated Loan Combination Amount (“ALA”) | % of ALA | Occupancy(1) | Year Built/ Renovated | Net Rentable Area (SF) (1) | Storage Units | Appraised Value(2) | % of UW NOI |
| West Indian School Road | Phoenix, AZ | $11,278,664 | 13.1% | 94.1% | 1979, 1997/NAP | 105,143 | 754 | $22,200,000 | 13.2% |
| Boalch Avenue Northwest | North Bend, WA | 8,678,341 | 10.1 | 96.1% | 2005/NAP | 50,569 | 359 | 14,950,000 | 10.1 |
| Lemay Ferry Road | Saint Louis, MO | 6,518,099 | 7.6 | 96.6% | 1999/NAP | 53,859 | 539 | 11,540,000 | 7.5 |
| East Southern Avenue | Mesa, AZ | 6,188,353 | 7.2 | 96.3% | 1978/NAP | 65,000 | 575 | 12,900,000 | 7.2 |
| Anderson Road | Tampa, FL | 5,885,334 | 6.8 | 96.7% | 1972, 1985, 1987, 1999/NAP | 73,450 | 706 | 10,700,000 | 6.9 |
| Stoney Island Avenue | Lynwood, IL | 5,739,631 | 6.7 | 90.4% | 1997-1999/2020 | 84,980 | 663 | 9,870,000 | 6.7 |
| Duren Avenue | Lowell, MA | 5,490,253 | 6.4 | 99.2% | 2000/NAP | 49,075 | 393 | 9,420,000 | 6.4 |
| North Nova Road | Daytona Beach, FL | 5,048,618 | 5.9 | 93.8% | 1979-1989/NAP | 64,657 | 752 | 9,500,000 | 5.9 |
| Airport Road | Williamsburg, VA | 4,525,403 | 5.3 | 93.8% | 1995/NAP | 38,106 | 339 | 8,450,000 | 5.3 |
| South Pennington | Mesa, AZ | 4,307,972 | 5.0 | 93.1% | 1990/NAP | 42,200 | 357 | 8,030,000 | 5.0 |
| Southwest 14th Court | Pompano Beach, FL | 4,071,613 | 4.7 | 98.6% | 1977, 1989/NAP | 59,872 | 797 | 8,690,000 | 4.7 |
| Southeast Jennings Road | Port St. Lucie, FL | 3,527,500 | 4.1 | 99.0% | 1999/NAP | 38,062 | 697 | 6,450,000 | 4.1 |
| 49th Street South and 8th Avenue South | Gulfport, FL | 3,441,855 | 4.0 | 94.4% | 1940, 1948, 1977, 1981, 1986/NAP | 40,073 | 324 | 6,320,000 | 4.0 |
| South Broadway | Edmond, OK | 3,400,945 | 4.0 | 97.7% | 1978/NAP | 67,849 | 604 | 6,330,000 | 3.9 |
| 30th Avenue North | St. Petersburg, FL | 3,367,615 | 3.9 | 94.5% | 1977/2016 | 31,920 | 339 | 5,780,000 | 3.9 |
| Main Street | Tewksbury, MA | 2,456,532 | 2.9 | 94.0% | 2000/NAP | 21,019 | 267 | 4,270,000 | 2.8 |
| Warwick Boulevard | Newport News, VA | 2,073,272 | 2.4 | 89.4% | 1988/NAP | 26,820 | 242 | 4,170,000 | 2.4 |
| Total | $86,000,000 | 100.0% | 95.2% | 912,654 | 8,707 | $183,300,000 | 100.0% | ||
| (1) | Occupancy and Net Rentable Area (SF) reflect storage units only, excluding parking spaces, and are based on the underwritten rent rolls dated November 17, 2021. |
| (2) | The Total Appraised Value reflects a portfolio premium of approximately 14.9% over the aggregate “as-is” value of the individual IPCC National Storage Portfolio XV Properties. The sum of the values on an individual basis is $159,570,000. |
The following table presents detailed information with respect to the unit mix of the IPCC National Storage Portfolio XV Properties:
| Unit Mix | ||||||
| Unit Type | Square Feet | % of Total Square Feet | Occupancy (SF)(1) | Units | % of Total Units | Occupancy (Units)(1) |
| Non-Climate Controlled Storage Units | 629,631 | 69.0% | 94.8% | 5,270 | 56.3% | 94.2% |
| Climate Controlled Storage Units | 283,023 | 31.0 | 96.3% | 3,437 | 36.7 | 96.3% |
| Parking Units | N/A | N/A | N/A | 659 | 7.0 | 85.9% |
| Total / Wtd. Avg. | 912,654 | 100.0% | 95.2% | 9,366 | 100.0% | 94.4% |
| (1) | Occupancy is based on the underwritten rent rolls dated November 17, 2021. |
COVID-19 Update. As of December 16, 2021, the IPCC National Storage Portfolio XV Properties are open and operating. The borrower sponsor provided an accounts receivable report dated October 31, 2021, which showed approximately $18,230 (0.2% of underwritten base rent) more than 30 days delinquent. As of February 1, 2022, the IPCC National Storage Portfolio XV Properties Loan Combination is not subject to any modification or forbearance requests.
Environmental. According to the Phase I environmental assessments dated December 6, 2021, there was no evidence of any recognized environmental conditions at the IPCC National Storage Portfolio XV Properties other than at the 49th Street South and 8th Avenue South property. The environmental site assessment for the 49th Street South and 8th Avenue South property noted that: (i) the discovery in 2019 of concentrations of 1-methylnaphthalene and naphthalene at the 49th Street South and 8th Avenue South property and (ii) the documented presence of 1-methylnaphthalene and 2-methylnaphthalene in excess of Florida’s groundwater and surface water cleanup levels (“GCTL Levels”) at an adjacent property (the “Open Release Site”) constituted a recognized environmental condition. The concentrations of 1-methylnaphthalene and naphthalene discovered at the 49th Street South and 8th Avenue South property in 2019 were above laboratory detection limits but were well below statutory limits. However, the environmental engineer noted that a previous subsurface investigation that was conducted at the Open Release Site in 2017 found concentrations of 1-methylnaphthalene and 2-
| THE INFORMATION IN THIS STRUCTURAL AND COLLATERAL TERM SHEET IS NOT COMPLETE AND MAY BE AMENDED PRIOR TO THE TIME OF SALE. THIS TERM SHEET IS NOT AN OFFER TO SELL THESE SECURITIES AND IT IS NOT A SOLICITATION OF AN OFFER TO BUY THESE SECURITIES IN ANY JURISDICTION WHERE THE OFFER OR SALE IS NOT PERMITTED. | ||
| 117 | ||
| Structural and Collateral Term Sheet | BMO 2022-C1 | |
| No. 9 – IPCC National Storage Portfolio XV | ||
methylnaphthalene that were in excess of Florida’s acceptable GCTL Levels. The regulatory status of the Open Release Site is uncertain. The release that generated the contamination at the Open Release Site was reported in 1988 but the Open Release Site is still listed as being in need of cleanup and regulatory discharge. The environmental engineer recommended that the Open Release Site continue to be monitored for progress and closure. The IPCC National Storage Portfolio XV Mortgage Loan documents require that the IPCC National Storage Portfolio XV Borrower abandon, as required by and in accordance with applicable environmental law, each groundwater monitoring well situated on the 49th Street South and 8th Avenue South property within 60 days after becoming aware of the closure of the recognized environmental concern on the adjacent property. See “Description of the Mortgage Pool—Environmental Considerations” in the Preliminary Prospectus.
| Historical and Current Occupancy(1) | |||
| 2018(2) | 2019(2) | 2020 | Current(3) |
| NAV | 88.0% | 92.3% | 95.2% |
| (1) | Historical Occupancies are as of December 31 of each respective year and are based on self-storage square footage. |
| (2) | 2018 Historical Occupancy was not provided by the seller. 2019 Historical Occupancy excludes occupancy for three of the IPCC National Storage Portfolio XV Properties, which the seller did not provide. |
| (3) | Current Occupancy is based on the underwritten rent rolls as of November 17, 2021 and based on self-storage square footage only. |
| Operating History and Underwritten Net Cash Flow | |||||
| 2020 | TTM(1) | Underwritten | Per Square Foot | %(2) | |
| Rents in Place | $10,150,914 | $11,880,096 | $12,190,776 | $13.36 | 91.8% |
| Vacant Income | 3,594,570 | 446,476 | 1,094,793 | 1.20 | 8.2 |
| Gross Potential Rent | $13,745,484 | $12,326,572 | $13,285,568 | $14.56 | 100.0% |
| (Vacancy / Credit Loss) | (4,176,959) | (983,305) | (1,740,500) | (1.91) | (13.1) |
| Parking Income | 76,001 | 89,453 | 649,728 | 0.71 | 4.9 |
| Other Income(3) | 704,761 | 812,532 | 917,186 | 1.00 | 6.9 |
| Effective Gross Income(4) | $10,349,287 | $12,245,253 | $13,111,982 | $14.37 | 98.7% |
| Total Expenses | $4,893,790 | $5,166,606 | $5,651,744 | $6.19 | 43.1% |
| Net Operating Income | $5,455,498 | $7,078,647 | $7,460,240 | $8.17 | 56.9% |
| Total TI / LC, Capex / RR | 0 | 0 | 202,160 | 0.22 | 1.5 |
| Net Cash Flow | $5,455,498 | $7,078,647 | $7,258,080 | $7.95 | 55.4% |
| (1) | TTM reflects the trailing 12- month period ending October 31, 2021. |
| (2) | % column represents percent of Gross Potential Rent for all revenue lines and represents percent of Effective Gross Income for the remainder of fields. |
| (3) | Other Income includes merchandise sales, tenant insurance, late fees and administrative fees. |
| (4) | Effective Gross Income increased from 2020 to TTM primarily due to a mixture of either increased occupancy or aggressive rental rate increases at certain IPCC National Storage Portfolio XV Properties. |
The Market. The IPCC National Storage Portfolio XV Properties are located across eight states and 11 different metropolitan areas, with three IPCC National Storage Portfolio XV Properties located within the Phoenix, Arizona metropolitan area (25.3% of allocated loan amount, 25.4% of UW NOI), three within the Tampa-St. Petersburg, Florida metropolitan area (14.8% of allocated loan amount, 14.9% of UW NOI), and one within the Seattle, Washington metropolitan area (10.1% of allocated loan amount, 10.1% of UW NOI).
According to the appraisals, as of the third quarter of 2021, the Phoenix self-storage market reported an average vacancy rate of 13.4%, with average monthly rents of $133.67 and $154.42 per unit for 10x10 foot non-climate controlled and climate-controlled units, respectively. The Tampa-St. Petersburg self-storage market reported an average vacancy rate of 10.0%, with average monthly rents of $125.01 and $163.38 per unit for 10x10 foot non-climate controlled and climate-controlled units, respectively. The Seattle self-storage market reported an average vacancy rate of 14.3%, with average monthly rents of $149.64 and $188.05 per unit for 10x10 foot non-climate controlled and climate-controlled units, respectively. The portfolio appraisal concluded stabilized effective gross income of $15.75 per square foot for the IPCC National Storage Portfolio XV Properties.
| THE INFORMATION IN THIS STRUCTURAL AND COLLATERAL TERM SHEET IS NOT COMPLETE AND MAY BE AMENDED PRIOR TO THE TIME OF SALE. THIS TERM SHEET IS NOT AN OFFER TO SELL THESE SECURITIES AND IT IS NOT A SOLICITATION OF AN OFFER TO BUY THESE SECURITIES IN ANY JURISDICTION WHERE THE OFFER OR SALE IS NOT PERMITTED. | ||
| 118 | ||
| Structural and Collateral Term Sheet | BMO 2022-C1 | |
| No. 9 – IPCC National Storage Portfolio XV | ||
The following table presents certain 2021 demographic information for the IPCC National Storage Portfolio XV Properties:
| Demographics Summary(1) | |||||||
| Property Name | City, State | 1-mile Population | 3-mile Population | 5-mile Population | 1-mile Median Household Income | 3-mile Median Household Income | 5-mile Median Household Income |
| West Indian School Road | Phoenix, AZ | 19,190 | 221,960 | 533,426 | $37,146 | $39,460 | $44,084 |
| Boalch Avenue Northwest | North Bend, WA | 1,451 | 11,149 | 28,144 | $59,188 | $123,112 | $144,426 |
| Lemay Ferry Road | Saint Louis, MO | 10,238 | 87,951 | 182,234 | $66,130 | $69,780 | $68,738 |
| East Southern Avenue | Mesa, AZ | 21,741 | 179,541 | 427,863 | $41,906 | $48,652 | $58,795 |
| Anderson Road | Tampa, FL | 3,575 | 110,798 | 288,258 | $49,347 | $53,619 | $58,068 |
| Stoney Island Avenue | Lynwood, IL | 2,856 | 42,459 | 179,343 | $60,147 | $59,155 | $63,870 |
| Duren Avenue | Lowell, MA | 24,392 | 133,024 | 203,167 | $66,135 | $67,466 | $81,380 |
| North Nova Road | Daytona Beach, FL | 12,174 | 65,958 | 127,098 | $36,023 | $36,094 | $41,274 |
| Airport Road | Williamsburg, VA | 2,839 | 27,505 | 66,123 | $70,116 | $78,598 | $87,629 |
| South Pennington | Mesa, AZ | 14,180 | 160,284 | 425,355 | $71,793 | $58,358 | $58,896 |
| Southwest 14th Court | Pompano Beach, FL | 9,236 | 137,015 | 433,510 | $58,159 | $50,640 | $51,259 |
| Southeast Jennings Road | Port St. Lucie, FL | 8,512 | 45,062 | 115,388 | $58,647 | $56,697 | $61,776 |
| 49th Street South and 8th Avenue South | Gulfport, FL | 13,736 | 96,593 | 244,994 | $44,924 | $55,228 | $57,541 |
| South Broadway | Edmond, OK | 6,814 | 56,122 | 162,824 | $59,626 | $71,001 | $68,299 |
| 30th Avenue North | St. Petersburg, FL | 12,162 | 94,409 | 247,668 | $55,942 | $57,241 | $54,717 |
| Main Street | Tewksbury, MA | 5,035 | 49,003 | 187,055 | $101,832 | $100,143 | $85,074 |
| Warwick Boulevard | Newport News, VA | 9,162 | 44,040 | 85,425 | $48,110 | $56,067 | $59,117 |
| (1) | Source: Third party market data provider. |
The Borrower. The borrowing entity for the IPCC National Storage Portfolio XV Loan Combination is Self-Storage Portfolio XV DST, a Delaware statutory trust and special purpose entity with one independent director (the “IPCC National Storage Portfolio XV Borrower”). Legal counsel to the IPCC National Storage Portfolio XV Borrower delivered a non-consolidation opinion in connection with the origination of the IPCC National Storage Portfolio XV Loan Combination. The IPCC National Storage Portfolio XV Borrower has master leased the IPCC National Storage Portfolio XV Properties to the master tenant, Self-Storage Portfolio XV LeaseCo, L.L.C. (“Master Tenant”). The Master Tenant is a Delaware limited liability company structured to be bankruptcy-remote and is ultimately owned by the guarantor. The master lease generally imposes responsibility on the Master Tenant for the operation, maintenance and management of the IPCC National Storage Portfolio XV Properties and payment of all expenses incurred in the maintenance and repair of the IPCC National Storage Portfolio XV Properties, other than capital expenses. The Master Tenant’s interest in all tenant rents was assigned directly to the lender. The master lease is subordinate to the IPCC National Storage Portfolio XV Loan Combination and, upon an event of default under the IPCC National Storage Portfolio XV Loan Combination documents, the lender has the right to cause the termination of the master lease. There is no income underwritten from the master lease as the IPCC National Storage Portfolio XV Loan Combination was underwritten to the underlying property income.
The IPCC National Storage Portfolio XV Borrower may (i) convert to a different form of entity under Delaware law (a “Conversion Event”) or (ii) transfer one or more of the IPCC National Storage Portfolio XV Properties to a new special purpose entity owned by the same beneficial owners as the IPCC National Storage Portfolio XV Borrower in substantially the same proportions as immediately prior to the transfer of the related mortgaged properties (a “Drop Down Contribution”). The lender may deliver a written notice (a “Conversion Notice”) to the IPCC National Storage Portfolio XV Borrower and the signatory trustee if one or more of the IPCC National Storage Portfolio XV Properties is in jeopardy of being foreclosed upon due to an event of default, and the IPCC National Storage Portfolio XV Borrower is required to effect a Conversion Event or a Drop Down Contribution within 10 business days from its receipt of Conversion Notice unless it delivers a tax opinion (a “Conversion Opinion”) outlining (i) the IPCC National Storage Portfolio XV Borrower is able to remedy the default situation giving rise to the jeopardy of foreclosure or (ii) that effectuating a Conversion Event or Drop Down Contribution, in light of the circumstances, would not reasonably improve the ability of the IPCC National Storage Portfolio XV Borrower to remedy the default situation. If the IPCC National Storage Portfolio XV Borrower fails to remedy the default situation within 30 days of the lender’s receipt of the Conversion Opinion then the IPCC National Storage Portfolio XV Borrower is required to effect a Conversion Event or Drop Down Contribution, as applicable. See “Description of the Mortgage Pool—Statistical Characteristics of the Mortgage Loans—Delaware Statutory Trusts” in the Preliminary Prospectus.
| THE INFORMATION IN THIS STRUCTURAL AND COLLATERAL TERM SHEET IS NOT COMPLETE AND MAY BE AMENDED PRIOR TO THE TIME OF SALE. THIS TERM SHEET IS NOT AN OFFER TO SELL THESE SECURITIES AND IT IS NOT A SOLICITATION OF AN OFFER TO BUY THESE SECURITIES IN ANY JURISDICTION WHERE THE OFFER OR SALE IS NOT PERMITTED. | ||
| 119 | ||
| Structural and Collateral Term Sheet | BMO 2022-C1 | |
| No. 9 – IPCC National Storage Portfolio XV | ||
The Borrower Sponsor. The borrower sponsor and nonrecourse carve-out guarantor is Inland Private Capital Corporation (“IPCC”). As of December 31, 2020, IPCC has sponsored 266 1031 exchange private placement programs since its inception that have provided approximately $6.3 billion in equity and included 748 properties. According to the borrower sponsor, as of December 31, 2020, IPCC had $9.0 billion in assets under management.
Property Management. The IPCC National Storage Portfolio XV Properties are managed by Devon Self Storage Holdings (US) LLC, which is not affiliated with the IPCC National Storage Portfolio XV Borrower.
Escrows and Reserves. At origination, the IPCC National Storage Portfolio XV Borrower deposited into escrow $192,000 for replacement reserves and $103,400 for deficiency in flood insurance coverage.
Tax Escrows – The IPCC National Storage Portfolio XV Borrower is required to deposit into a real estate tax reserve, on a monthly basis, 1/12 of the estimated annual real estate taxes for each respective property; provided, such monthly deposits will be waived for each applicable property so long as (i) no event of default exists, (ii) the IPCC National Storage Portfolio XV Borrower provides the lender, at least 10 days prior to the date on which such taxes are due, satisfactory evidence that all applicable taxes have been paid, and (iii) no DSCR Trigger Event (as defined below) has occurred.
Insurance Escrows – The IPCC National Storage Portfolio XV Borrower is required to deposit into an insurance reserve, on a monthly basis, 1/12 of estimated insurance premiums for each respective property; provided, such monthly deposits will be waived for each applicable property so long as (i) no event of default exists, (ii) no DSCR Trigger Event has occurred, and (iii) the IPCC National Storage Portfolio XV Borrower maintains a blanket insurance policy acceptable to the lender.
Replacement Reserves – The IPCC National Storage Portfolio XV Borrower is required to escrow approximately $18,274 for replacement reserves on a monthly basis if at any time the balance of the reserve falls below $192,000, until such time as the reserve is restored to $192,000.
Lockbox / Cash Management. The IPCC National Storage Portfolio XV Loan Combination documents springing cash management. Within five business days of the IPCC National Storage Portfolio XV Borrower’s receipt of the lender’s notice that a Cash Sweep Event has occurred, the IPCC National Storage Portfolio XV Borrower is required to establish and maintain a cash management account controlled by the lender and the IPCC National Storage Portfolio XV Borrower, Master Tenant, or property manager are required to send direction letters to all tenants under commercial leases instructing them to deposit all rents directly into the cash management account. In addition, the IPCC National Storage Portfolio XV Borrower, Master Tenant, property manager and asset manager are required to deposit all revenues otherwise received into the cash management account within two business days of receipt. During the continuance of a Cash Sweep Event, all sums on deposit in the cash management account are required to be applied and disbursed in accordance with the IPCC National Storage Portfolio XV Loan Combination documents, and in each case in connection with a Cash Sweep Event caused by a DSCR Trigger Event, all excess cash will be held by the lender as additional collateral for the IPCC National Storage Portfolio XV Loan Combination.
A “Cash Sweep Event” will commence upon: (i) the occurrence of an event of default under the IPCC National Storage Portfolio XV Loan Combination documents and will continue until such event of default is cured or (ii) the date on which the debt service coverage ratio as calculated in the IPCC National Storage Portfolio XV Loan Combination documents is less than 1.80x based on a trailing three month period (a “DSCR Trigger Event”) and will continue until the debt service coverage ratio is at least 1.85x for two consecutive quarters based upon trailing three month period.
Subordinate and Mezzanine Debt. None.
Partial Release. At any time after February 1, 2024, and prior to the IPCC National Storage Portfolio XV Loan Combination maturity date, the IPCC National Storage Portfolio XV Borrower may obtain the release of any of the IPCC National Storage Portfolio XV Properties, provided that, among other things, (i) no event of default has occurred and is continuing, (ii) the IPCC National Storage Portfolio XV Borrower prepays a portion of the IPCC National Storage Portfolio XV Loan Combination equal to 120% of the allocated loan amount of the property being released (the “Release Amount”), and if such property is released prior to October 2, 2031, the payment of a yield maintenance premium pursuant to the IPCC National Storage Portfolio XV Loan Combination documents, (iii) the debt service coverage ratio for the IPCC National Storage Portfolio XV Properties following the release is no less than the greater of (x) the debt service coverage ratio for the 12 calendar months immediately preceding such release (provided, however, that for the purposes of this clause (x) the debt service coverage ratio will be deemed to be no greater than 2.30x) and (y) 2.15x, (iv) the debt yield for the remaining IPCC National Storage Portfolio XV Properties is no less than the greater of (x) the debt yield for the remaining properties for the 12 calendar months immediately preceding such release (provided, however, that for the purposes of this clause (x) the debt yield will be deemed to be no greater than 8.55%) and (y) 8.20%, (v) the loan-to-value ratio for the remaining properties is no greater than the lesser of (x) the loan-to-value ratio immediately preceding such release and (y) 50.0% (provided, however, that this clause (v) will not apply to the release of any individual property to the extent that, after giving effect to such release, the aggregate allocated loan amount of all the individual properties which have been released is less than 20% of the total original principal balance), and (vi) the release is permitted under REMIC requirements.
Ground Lease. None.
| THE INFORMATION IN THIS STRUCTURAL AND COLLATERAL TERM SHEET IS NOT COMPLETE AND MAY BE AMENDED PRIOR TO THE TIME OF SALE. THIS TERM SHEET IS NOT AN OFFER TO SELL THESE SECURITIES AND IT IS NOT A SOLICITATION OF AN OFFER TO BUY THESE SECURITIES IN ANY JURISDICTION WHERE THE OFFER OR SALE IS NOT PERMITTED. | ||
| 120 | ||
| Structural and Collateral Term Sheet | BMO 2022-C1 | |
| No. 10 – 111 River Street | ||
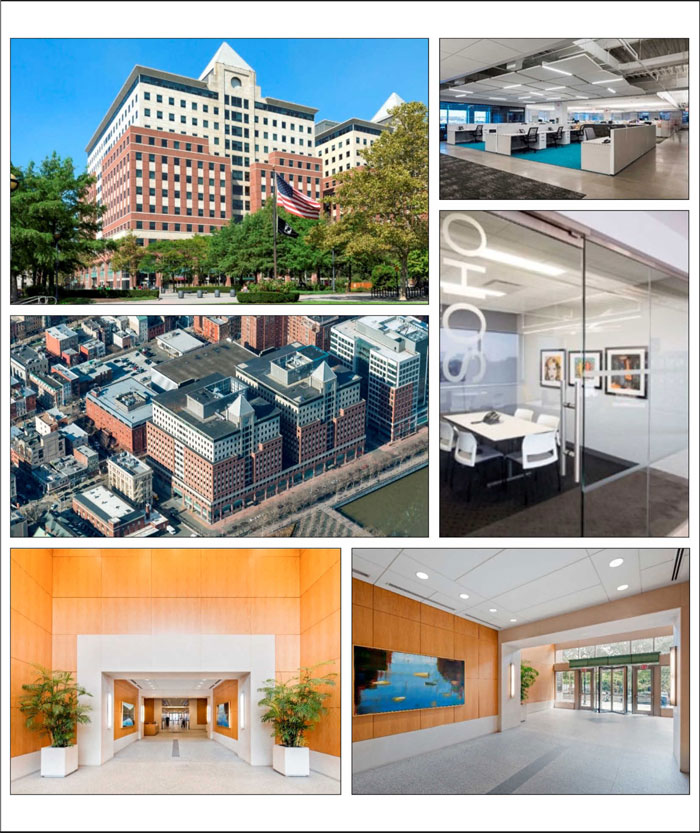
| THE INFORMATION IN THIS STRUCTURAL AND COLLATERAL TERM SHEET IS NOT COMPLETE AND MAY BE AMENDED PRIOR TO THE TIME OF SALE. THIS TERM SHEET IS NOT AN OFFER TO SELL THESE SECURITIES AND IT IS NOT A SOLICITATION OF AN OFFER TO BUY THESE SECURITIES IN ANY JURISDICTION WHERE THE OFFER OR SALE IS NOT PERMITTED. | ||
| 121 | ||
| Structural and Collateral Term Sheet | BMO 2022-C1 | |
| No. 10 – 111 River Street | ||

| THE INFORMATION IN THIS STRUCTURAL AND COLLATERAL TERM SHEET IS NOT COMPLETE AND MAY BE AMENDED PRIOR TO THE TIME OF SALE. THIS TERM SHEET IS NOT AN OFFER TO SELL THESE SECURITIES AND IT IS NOT A SOLICITATION OF AN OFFER TO BUY THESE SECURITIES IN ANY JURISDICTION WHERE THE OFFER OR SALE IS NOT PERMITTED. | ||
| 122 | ||
| Structural and Collateral Term Sheet | BMO 2022-C1 | |
| No. 10 – 111 River Street | ||
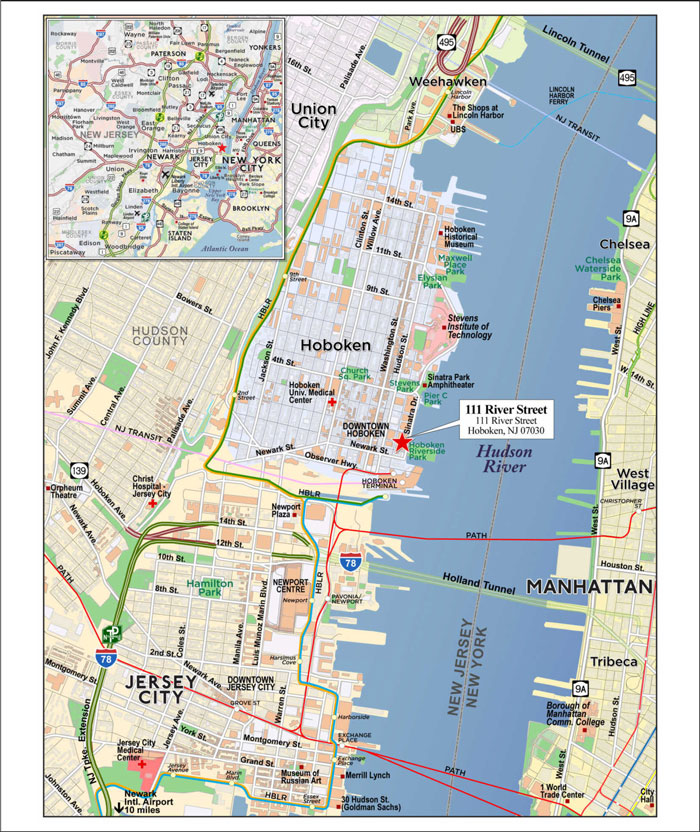
| THE INFORMATION IN THIS STRUCTURAL AND COLLATERAL TERM SHEET IS NOT COMPLETE AND MAY BE AMENDED PRIOR TO THE TIME OF SALE. THIS TERM SHEET IS NOT AN OFFER TO SELL THESE SECURITIES AND IT IS NOT A SOLICITATION OF AN OFFER TO BUY THESE SECURITIES IN ANY JURISDICTION WHERE THE OFFER OR SALE IS NOT PERMITTED. | ||
| 123 | ||
| Structural and Collateral Term Sheet | BMO 2022-C1 | |
| No. 10 – 111 River Street | ||
| Mortgage Loan Information | Property Information | |||
| Mortgage Loan Seller: | BMO | Single Asset / Portfolio: | Single Asset | |
| Credit Assessment (KBRA/Fitch/S&P): | (AAA/BBB-sf*/A-) | Title: | Leasehold | |
| Original Principal Balance(1): | $37,500,000 | Property Type – Subtype: | Office – CBD | |
| Cut-off Date Principal Balance(1): | $37,500,000 | Net Rentable Area (SF): | 557,719 | |
| % of IPB: | 3.3% | Location: | Hoboken, NJ | |
| Loan Purpose: | Acquisition | Year Built / Renovated: | 2002 / NAP | |
| Borrowers: | River and First Streets LLC and | Occupancy: | 82.6% | |
| 280 - 10 Group LLC | Occupancy Date: | 1/1/2022 | ||
| Borrower Sponsors: | Steven J. Pozycki and | 4th Most Recent NOI (As of): | $6,751,258 (12/31/2018) | |
| David Werner | 3rd Most Recent NOI (As of): | $8,782,654 (12/31/2019) | ||
| Interest Rate: | 3.28000% | 2nd Most Recent NOI (As of): | $9,767,259 (12/31/2020) | |
| Note Date: | 1/21/2022 | Most Recent NOI (As of): | $9,928,521 (TTM 10/31/2021) | |
| Maturity Date: | 2/6/2027 | UW Economic Occupancy: | 82.1% | |
| Interest-only Period: | 60 months | UW Revenues: | $22,541,072 | |
| Original Term: | 60 months | UW Expenses: | $9,445,383 | |
| Original Amortization Term: | None | UW NOI: | $13,095,689 | |
| Amortization Type: | Interest Only | UW NCF: | $13,095,689 | |
| Call Protection(2): | L(24),D(31),O(5) | Appraised Value / Per SF: | $244,000,000 / $437 | |
| Lockbox / Cash Management: | Hard / Springing | Appraisal Date: | 11/15/2021 | |
| Additional Debt(1): | Yes | |||
| Additional Debt Balance(1): | $40,000,000 / $76,250,000 | |||
| Additional Debt Type(1): | Pari Passu / Subordinate | |||
| Escrows and Reserves(3) | Financial Information(1) | ||||||
| Initial | Monthly | Initial Cap | Senior Loan | Loan Combination | |||
| Taxes: | $122,519 | $138,561 | N/A | Cut-off Date Loan / SF: | $139 | $276 | |
| Insurance: | $177,648 | Springing | N/A | Maturity Date Loan / SF: | $139 | $276 | |
| Replacement Reserves: | $700,000 | Springing | N/A | Cut-off Date LTV: | 31.8% | 63.0% | |
| TI / LC Reserve: | $13,900,000 | Springing | $2,360,000 | Maturity Date LTV: | 31.8% | 63.0% | |
| Other: | $1,469,000 | $165,616 | N/A | UW NCF DSCR: | 5.08x | 2.56x | |
| UW NOI Debt Yield: | 16.9% | 8.5% | |||||
| Sources and Uses | ||||||
| Sources | Proceeds | % of Total | Uses | Proceeds | % of Total | |
| Senior Loan | $77,500,000 | 32.6% | Purchase Price | $218,000,000 | 91.6% | |
| Subordinate Note | 76,250,000 | 32.0 | Reserves | 16,369,167 | 6.9 | |
| Sponsor Equity | 54,100,000 | 22.7 | Closing Costs | 3,588,382 | 1.5 | |
| Preferred Equity | 30,107,549 | 12.7 | ||||
| Total Sources | $237,957,549 | 100.0% | Total Uses | $237,957,549 | 100.0% | |
| (1) | The 111 River Street Mortgage Loan (as defined below) is part of the 111 River Street Loan Combination (as defined below) with an original aggregate principal balance of $153,750,000. The Financial Information in the chart above reflects the 111 River Street Senior Loan (as defined below) and the 111 River Street Loan Combination. For additional information, see “The Loan” below. |
| (2) | The defeasance lockout period, with respect to a defeasance of the 111 River Street Loan Combination, will be at least 24 payment dates beginning with and including the first payment date on March 6, 2022. Defeasance of the full $153,750,000 111 River Street Loan Combination is permitted after the date that is earlier of (i) two years from the closing date of the securitization that includes the last note to be securitized and (ii) January 21, 2026. |
| (3) | For a full description of Escrows and Reserves, please refer to “Escrows and Reserves” below. |
The Loan. The tenth largest mortgage loan (the “111 River Street Mortgage Loan”) is part of a loan combination (the “111 River Street Loan Combination”) that is evidenced by (i) three pari passu senior promissory notes in the aggregate original principal amount of $77,500,000 (collectively, the “111 River Street Senior Loan”), and (ii) one subordinate promissory note in the original principal amount of $76,250,000 (the “111 River Street Subordinate Companion Loan”). The 111 River Street Loan Combination was originated on January 21, 2022, by Bank of Montreal (“BMO”). The 111 River Street Loan Combination is secured by a first priority mortgage on the borrowers’ leasehold interest in a 557,719 square foot office property located in Hoboken, New Jersey (the “111 River Street Property”).
| THE INFORMATION IN THIS STRUCTURAL AND COLLATERAL TERM SHEET IS NOT COMPLETE AND MAY BE AMENDED PRIOR TO THE TIME OF SALE. THIS TERM SHEET IS NOT AN OFFER TO SELL THESE SECURITIES AND IT IS NOT A SOLICITATION OF AN OFFER TO BUY THESE SECURITIES IN ANY JURISDICTION WHERE THE OFFER OR SALE IS NOT PERMITTED. | ||
| 124 | ||
| Structural and Collateral Term Sheet | BMO 2022-C1 | |
| No. 10 – 111 River Street | ||
The 111 River Street Mortgage Loan is evidenced by the non-controlling promissory Note A-1, with a principal balance as of the Cut-off Date of $37,500,000. The remaining notes are currently held by affiliates of BMO and are expected to be contributed to one or more future securitization trusts. Prior to the occurrence of a “control appraisal period” with respect to the 111 River Street Subordinate Companion Loan, the holder of the 111 River Street Mortgage Loan (i.e., the BMO 2022-C1 securitization trust, which rights will be exercisable by the controlling class representative for the BMO 2022-C1 pooled mortgage loans securitization transaction) will be the controlling noteholder. The 111 River Street Mortgage Loan will be serviced pursuant to the pooling and servicing agreement for the BMO 2022-C1 securitization. See “Description of the Mortgage Pool—The Loan Combinations—The 111 River Street Pari-Passu AB Loan Combination” and “Pooling and Servicing Agreement” in the Prospectus.
| Loan Combination Summary | |||||
| Note | Original Balance | Cut-off Date Balance | Note Holder | Controlling Piece | |
| A-1 | $37,500,000 | $37,500,000 | BMO 2022-C1 | No | |
| A-2(1) | $28,000,000 | $28,000,000 | BMO | No | |
| A-3(1) | $12,000,000 | $12,000,000 | BMO | No | |
| Total Senior Loan | $77,500,000 | $77,500,000 | |||
| B Note | $76,250,000 | $76,250,000 | BMO 2022-C1 (Loan Specific) | Yes(2) | |
| Loan Combination | $153,750,000 | $153,750,000 | |||
| (1) | Expected to be contributed to one or more future securitizations. |
| (2) | Following the occurrence and during the continuance of a “control appraisal period” with respect to Note B, Note A-1 will be the controlling note, and the controlling class representative of the BMO 2022-C1 pooled mortgage loans securitization will be entitled to exercise the related control rights. See “Description of the Mortgage Pool—The Loan Combinations—The 111 River Street Pari-Passu AB Loan Combination” in the Prospectus. |
The Property. The 111 River Street Property consists of a 13-story office property comprised of 525,987 square feet of office space (approximately 92.1% of underwritten base rent) and 31,732 square feet of retail space (approximately 7.9% of underwritten base rent) located at 111 River Street in Hoboken, New Jersey. The 111 River Street Property has a total of 248 parking spaces (approximately 0.44 parking spaces per 1,000 square feet of NRA) provided by the subterranean parking garage. The 111 River Street Property is situated on the Hoboken riverfront and features unobstructed views of downtown Manhattan across the Hudson River. The 111 River Street Property is across the street from Pier A Park which includes a great lawn and plenty of outdoor seating, serving as an amenity for the tenants at the 111 River Street Property. The Hoboken New Jersey Path train station is within walking distance and provides direct access to downtown and midtown Manhattan. The 111 River Street Property is situated on approximately 1.10 acres, which is ground leased from the Port Authority of New York and New Jersey and the City of Hoboken, New Jersey through September 30, 2098. The 111 River Street Property was constructed in 2002. John Wiley & Sons Inc. and Sumitomo Mitsui Trust Bank, with a combined 59.5% of the total NRA, are long-term occupants of the building. The retail space is 100.0% leased by four tenants, Crunch Holdings LLC, Gregorys Coffee, PNC Bank National Association and Tapmasters.
COVID-19 Update. As of January 21, 2022, the borrowers have reported that the 111 River Street Property is open and operating, with the tenants having paid their full January 2022 rent payments, with the exception of TapMasters, which has a rent commencement date of February 1, 2022 under the second amendment to its lease. The first debt service payment for the 111 River Street Loan Combination is due in March 2022. As of February 1, 2022, the 111 River Street Loan Combination is not subject to any forbearance, modification or debt service relief request.
Major Tenants. The two largest tenants based on underwritten base rent are John Wiley & Sons Inc. and Sumitomo Mitsui Trust Bank.
John Wiley & Sons Inc. (293,633 square feet; 52.6% NRA; 56.7% of underwritten base rent): John Wiley & Sons Inc. is headquartered at the 111 River Street Property and is a global leader in research and education. Founded over 200 years ago in 1807, the company is best known for its college text books and today has transitioned to digital products and services which make up approximately 82.0% of its current revenue. The company reported fiscal year 2021 revenue of approximately $1.94 billion. John Wiley & Sons Inc. occupies 290,353 square feet of office space on floors two through seven of the building as well as 3,279 square feet for storage within the basement of the building. John Wiley & Sons Inc. extended its lease in July 2017 and was provided a tenant improvement allowance of approximately $19.6 million. The current lease expires in March 2033 and contains two, five-year renewal options and no early termination options.
Sumitomo Mitsui Trust Bank (38,134 square feet; 6.8% NRA; 9.6% of underwritten base rent): Sumitomo Mitsui Trust Bank (“Sumitomo Bank”), a subsidiary of Sumitomo Mitsui Banking Corporation, is a Japanese multinational banking and financial services company based in Tokyo. As of September 30, 2021, Sumitomo Mitsui Banking Corporation reported total assets of just over two trillion dollars and over 86,000 employees. An original tenant in the building, Sumitomo Bank preleased space in the building during construction. Sumitomo Bank occupies 38,134 square feet on the building’s top and premier floor as a full floor tenant. Sumitomo Bank extended its lease in September 2017 and was provided a tenant improvement allowance of approximately $715,013 to complete improvements within its space. The current lease expires in January 2024 and contains one, five-year renewal option and no early termination options.
Environmental. According to a Phase I environmental assessment dated December 21, 2021, there was no evidence of any recognized environmental conditions at the 111 River Street Property.
| THE INFORMATION IN THIS STRUCTURAL AND COLLATERAL TERM SHEET IS NOT COMPLETE AND MAY BE AMENDED PRIOR TO THE TIME OF SALE. THIS TERM SHEET IS NOT AN OFFER TO SELL THESE SECURITIES AND IT IS NOT A SOLICITATION OF AN OFFER TO BUY THESE SECURITIES IN ANY JURISDICTION WHERE THE OFFER OR SALE IS NOT PERMITTED. | ||
| 125 | ||
| Structural and Collateral Term Sheet | BMO 2022-C1 | |
| No. 10 – 111 River Street | ||
| Historical and Current Occupancy | |||
| 2018(1) | 2019(1) | 2020(1) | Current(2) |
| 77.5% | 77.6% | 81.4% | 82.6% |
| (1) | Historical occupancies are as of December 31 of each respective year. |
| (2) | Based on the underwritten rent roll as of January 1, 2022. |
| Top Tenant Summary(1) | |||||||
| Tenant | Ratings Moody’s/S&P/Fitch(2) | Net Rentable Area (SF) | % of Total NRA | UW Base Rent PSF(3) | UW Base Rent(3) | % of Total UW Base Rent | Lease Exp. Date |
| John Wiley & Sons Inc. | NR/NR/NR | 293,633 | 52.6% | $37.27 | $10,943,981 | 56.7% | 3/31/2033(4) |
| Sumitomo Mitsui Trust Bank | A1/A-/NR | 38,134 | 6.8 | 48.59 | 1,852,804 | 9.6 | 1/31/2024(5) |
| Major Tenants | 331,767 | 59.5% | $38.57 | $12,796,785 | 66.3% | ||
| Other Tenants | 128,665 | 23.1% | $50.57 | $6,506,715 | 33.7% | ||
| Occupied Collateral Total / Wtd. Avg. | 460,432 | 82.6% | $41.92 | $19,303,500 | 100.0% | ||
| Vacant Space | 97,287 | 17.4% | |||||
| Collateral Total | 557,719 | 100.0% | |||||
| (1) | Based on underwritten rent roll dated as of January 1, 2022. |
| (2) | Ratings provided are for the parent company of the entity listed in the “Tenant” field whether or not the parent company guarantees the lease. |
| (3) | UW Base Rent PSF and UW Base Rent include rent steps through December 2022 for tenants other than John Wiley & Sons Inc. of approximately $80,077 and rent steps through April 2023 for John Wiley & Sons Inc. of approximately $1,167,970. |
| (4) | John Wiley & Sons Inc. has two, five-year extension options remaining. |
| (5) | Sumitomo Mitsui Trust Bank has one, five-year extension option. |
| Lease Rollover Schedule(1)(2) | |||||||||
| Year | Number of Leases Expiring | Net Rentable Area Expiring | % of NRA Expiring | UW Base Rent Expiring(3) | % of UW Base Rent Expiring | Cumulative Net Rentable Area Expiring | Cumulative % of NRA Expiring | Cumulative UW Base Rent Expiring(3) | Cumulative % of UW Base Rent Expiring |
| Vacant | NAP | 97,287 | 17.4% | NAP | NAP | 97,287 | 17.4% | NAP | NAP |
| 2022 | 0 | 0 | 0.0 | $0 | 0.0% | 97,287 | 17.4% | $0 | 0.0% |
| 2023 | 1 | 7,543 | 1.4 | $408,227 | 2.1 | 104,830 | 18.8% | $408,227 | 2.1% |
| 2024 | 1 | 38,134 | 6.8 | $1,852,804 | 9.6 | 142,964 | 25.6% | $2,261,031 | 11.7% |
| 2025 | 0 | 0 | 0.0 | $0 | 0.0 | 142,964 | 25.6% | $2,261,031 | 11.7% |
| 2026 | 3 | 31,779 | 5.7 | $1,585,183 | 8.2 | 174,743 | 31.3% | $3,846,214 | 19.9% |
| 2027 | 1 | 4,500 | 0.8 | $292,500 | 1.5 | 179,243 | 32.1% | $4,138,714 | 21.4% |
| 2028 | 0 | 0 | 0.0 | $0 | 0.0 | 179,243 | 32.1% | $4,138,714 | 21.4% |
| 2029 | 2 | 39,259 | 7.0 | $1,867,731 | 9.7 | 218,502 | 39.2% | $6,006,445 | 31.1% |
| 2030 | 1 | 13,662 | 2.4 | $710,697 | 3.7 | 232,164 | 41.6% | $6,717,143 | 34.8% |
| 2031 | 1 | 10,512 | 1.9 | $536,112 | 2.8 | 242,676 | 43.5% | $7,253,255 | 37.6% |
| 2032 & Beyond | 9 | 315,043 | 56.5 | $12,050,245 | 62.4 | 557,719 | 100.0% | $19,303,500 | 100.0% |
| Total | 19 | 557,719 | 100.0% | $19,303,500 | 100.0% | ||||
| (1) | Based on the underwritten rent roll dated as of January 1, 2022. |
| (2) | Certain leases may have termination options that are exercisable prior to the originally stated expiration date of the lease and that are not considered in this Lease Rollover Schedule. |
| (3) | UW Base Rent Expiring and Cumulative UW Base Rent Expiring include rent steps through December 2022 for tenants other than John Wiley & Sons Inc. of approximately $80,077 and rent steps through April 2023 for John Wiley & Sons Inc. of approximately $1,167,970. |
| THE INFORMATION IN THIS STRUCTURAL AND COLLATERAL TERM SHEET IS NOT COMPLETE AND MAY BE AMENDED PRIOR TO THE TIME OF SALE. THIS TERM SHEET IS NOT AN OFFER TO SELL THESE SECURITIES AND IT IS NOT A SOLICITATION OF AN OFFER TO BUY THESE SECURITIES IN ANY JURISDICTION WHERE THE OFFER OR SALE IS NOT PERMITTED. | ||
| 126 | ||
| Structural and Collateral Term Sheet | BMO 2022-C1 | |
| No. 10 – 111 River Street | ||
| Operating History and Underwritten Net Cash Flow | |||||||||||||||
| 2018 | 2019 | 2020 | TTM(1)(2) | Underwritten(1) | Per Square Foot | %(3) | |||||||||
| Occupancy | 77.5% | 77.6% | 81.4% | 0.0% | 82.1% | ||||||||||
| Gross Potential Rent | $17,383,219 | $16,853,841 | $17,622,252 | $18,453,776 | $19,259,904 | $34.53 | 86.1 | % | |||||||
| Vacancy Gross Up | 0 | 0 | 0 | 0 | 4,864,350 | 8.72 | 21.8 | ||||||||
| Reimbursement Income(4) | 430,219 | 197,920 | 232,983 | 254,975 | 464,742 | 0.83 | 2.1 | ||||||||
| Rent Bumps - 12 Months(5) | 0 | 0 | 0 | 0 | 80,077 | 0.14 | 0.4 | ||||||||
| Rent Bump - Wiley(5) | 0 | 0 | 0 | 0 | 1,167,970 | 2.09 | 5.2 | ||||||||
| Parking Income | 1,050,355 | 1,042,366 | 479,978 | 464,075 | 875,498 | 1.57 | 3.9 | ||||||||
| Tenant Electric | 642,112 | 405,924 | 208,201 | 325,055 | 515,724 | 0.92 | 2.3 | ||||||||
| Gross Revenue | $19,505,905 | $18,500,051 | $18,543,414 | $19,497,881 | $27,228,265 | $48.82 | 121.8 | % | |||||||
| Free Rent | (3,591,825) | (896,562) | (444,930) | (1,179,720) | 0 | 0.00 | 0.0 | ||||||||
| Actual Vacancy | 0 | 0 | 0 | 0 | (4,864,350) | (8.72) | (21.8 | ) | |||||||
| Underwriting Vacancy | 0 | 0 | 0 | 0 | 0 | 0.00 | 0.0 | ||||||||
| Total Vacancy | $0 | $0 | $0 | $0 | ($4,864,350) | ($8.72) | (21.8 | %) | |||||||
| Net Rental Collections | $15,914,080 | $17,603,490 | $18,098,484 | $18,318,161 | $22,363,915 | $40.10 | 100.0 | % | |||||||
| Other Income (U & O) | 217,601 | 31,915 | 77,892 | 43,444 | 87,657 | 0.16 | 0.4 | ||||||||
| HVAC Charges | 78,083 | 468,898 | 198,787 | 75,763 | 89,500 | 0.16 | 0.4 | ||||||||
| Total Income | $16,209,764 | $18,104,302 | $18,375,164 | $18,437,368 | $22,541,072 | $40.42 | 100.8 | % | |||||||
| Real Estate Taxes | $1,406,058 | $1,406,058 | $1,469,748 | $1,470,147 | $1,662,735 | $2.98 | 7.4 | % | |||||||
| Insurance | 175,263 | 200,949 | 305,435 | 353,897 | 304,539 | 0.55 | 1.4 | ||||||||
| Management Fee | 454,746 | 524,424 | 541,781 | 565,271 | 450,821 | 0.81 | 2.0 | ||||||||
| Utilities | 1,293,591 | 1,011,321 | 799,140 | 903,600 | 1,319,051 | 2.37 | 5.9 | ||||||||
| Repairs and Maintenance | 1,607,510 | 1,666,195 | 1,610,043 | 1,744,856 | 1,860,212 | 3.34 | 8.3 | ||||||||
| Payroll & Benefits | 192,708 | 202,152 | 213,756 | 214,946 | 215,000 | 0.39 | 1.0 | ||||||||
| Janitorial | 806,081 | 862,732 | 405,286 | (15,294) | 820,917 | 1.47 | 3.6 | ||||||||
| Security | 492,752 | 507,718 | 548,290 | 593,014 | 440,000 | 0.79 | 2.0 | ||||||||
| General & Administrative | 110,269 | 113,920 | 98,663 | 110,640 | 82,873 | 0.15 | 0.4 | ||||||||
| Parking | 567,229 | 590,661 | 434,802 | 356,440 | 300,000 | 0.54 | 1.3 | ||||||||
| Association Dues | 239,223 | 244,103 | 247,790 | 251,388 | 253,862 | 0.46 | 1.1 | ||||||||
| Ground Rent | 2,113,076 | 1,991,416 | 1,933,170 | 1,959,942 | 1,735,373 | 3.11 | 7.7 | ||||||||
| Total Expenses | $9,458,506 | $9,321,649 | $8,607,905 | $8,508,847 | $9,445,383 | $16.94 | 41.9 | % | |||||||
| Expense Reimbursement Ratio | 11.3% | 6.5% | 5.1% | 12.3% | 10.4% | ||||||||||
| Expense Ratio | 58.4% | 51.5% | 46.8% | 46.2% | 41.9% | ||||||||||
| Parking Expense Ratio | 54.0% | 56.7% | 90.6% | 76.8% | 34.3% | ||||||||||
| Net Operating Income | $6,751,258 | $8,782,654 | $9,767,259 | $9,928,521 | $13,095,689 | $23.48 | 58.1 | % | |||||||
| Tenant Improvements | 0 | 0 | 0 | 0 | 0 | 0.00 | 0.0 | ||||||||
| Leasing Commissions | 0 | 0 | 0 | 0 | 0 | 0.00 | 0.0 | ||||||||
| Replacement Reserves | 0 | 0 | 0 | 0 | 0 | 0.00 | 0.0 | ||||||||
| Total Leasing & Capital Cost | $0 | $0 | $0 | $0 | $0 | $0.00 | 0.0 | % | |||||||
| Net Cash Flow | $6,751,258 | $8,782,654 | $9,767,259 | $9,928,521 | $13,095,689 | $23.48 | 58.1 | % | |||||||
| Operating Margin | 41.6% | 48.5% | 53.2% | 53.8% | 58.1% | ||||||||||
| (1) | The increase in Underwritten Net Operating Income from TTM Net Operating Income is primarily driven by (i) inclusion of the Wiley & Sons Inc. rent bump, (ii) burn off/reserve of free rent and (iii) normalization of parking income. |
| (2) | TTM represents the trailing 12 months ending October 31, 2021. |
| (3) | % column represents percent of Net Rental Collections for all revenue lines and represents percent of Total Income for the remainder of fields. |
| (4) | Reimbursement Income includes reimbursements for tenant electricity. |
| (5) | Rent Bumps – 12 Months are through December 2022 for tenants other than John Wiley & Sons Inc. total approximately $80,077. Rent Bump – Wiley is for John Wiley & Sons Inc. through April 2023 total approximately $1,167,970. |
| THE INFORMATION IN THIS STRUCTURAL AND COLLATERAL TERM SHEET IS NOT COMPLETE AND MAY BE AMENDED PRIOR TO THE TIME OF SALE. THIS TERM SHEET IS NOT AN OFFER TO SELL THESE SECURITIES AND IT IS NOT A SOLICITATION OF AN OFFER TO BUY THESE SECURITIES IN ANY JURISDICTION WHERE THE OFFER OR SALE IS NOT PERMITTED. | ||
| 127 | ||
| Structural and Collateral Term Sheet | BMO 2022-C1 | |
| No. 10 – 111 River Street | ||
The Market. The 111 River Street Property is located in Hoboken, Hudson County, New Jersey, in the central business district of Hoboken. The 111 River Street Property is situated in the Hudson Waterfront submarket at the intersection of River Street and First Street and is surrounded primarily by office properties, service businesses, and ground level retail. The major influence for the immediate area is the access to the local highway system, as well as its proximity to New York City, the Jersey City waterfront, and public transportation. Major highways within one-to-two miles of the 111 River Street Property include Interstate 495, Route 1 and Route 9 to the north, and the New Jersey Turnpike to the west. The Lincoln Tunnel and Holland Tunnel, which provide access to Lower Manhattan and Midtown Manhattan, are within two-to-three miles of the 111 River Street Property.
According to the appraisal, as of the third quarter of 2021, the NNJ Metro office market had an inventory of approximately 153.5 million square feet, overall vacancy of approximately 17.3% and average asking rent of $29.52 per square foot. As of the third quarter of 2021, the Hudson Waterfront office submarket had an inventory of approximately 19.6 million square feet, overall vacancy of approximately 16.2% and average asking rent of $40.06 per square foot. According to the appraisal, the 2021 population within a one-, three- and five-mile radius was 72,730, 931,791 and 1,982,163, respectively. The 2021 median household income within a one-, three- and five-mile radius was $141,822, $104,046 and $105,663, respectively.
The following table presents certain information relating to comparable office leases for the 111 River Street Property:
| Comparable Office Leases(1) | ||||||||
| Property Name/Location | Year Built/ Renovated | NRA (SF) | Tenant | Lease Size (SF) | Rent PSF | Commencement | Lease Term (Years) | Lease Type |
111 River Street Hoboken, NJ | 2002/NAP | 557,719(2) | Various | Various | $43.06(2)(3) | Various | Various | Various |
Harborside Plaza 2 Jersey City, NJ | 2003/NAP | 507,781 | ROAR | 50,000 | $38.00 | Jun-21 | 5.5 Yrs. | Full Service |
Waterfront Corporate Center II Hoboken, NJ | 2003/NAP | 507,781 | RMS | 27,000 | $53.50 | Jun-21 | 5.5 Yrs. | Full Service |
Goldman Sachs Building Jersey City, NJ | 2004/NAP | 1,750,000 | AIG | 227,852 | $45.00 | Mar-21 | 16.0 Yrs. | Full Service |
Baker Waterfront Plaza Hoboken, NJ | 1987/NAP | 92,892 | NJ Transit | 11,000 | $40.00 | May-21 | 10.0 Yrs. | Full Service |
70 Hudson Street Jersey City, NJ | 2001/NAP | 431,438 | TD Ameritrade | 207,296 | $46.00 | Aug-21 | 12.4 Yrs. | Full Service |
Waterfront Corporate Center II Hoboken, NJ | 2003/NAP | 507,781 | Jet.com / Walmart | 41,453 | $52.00 | Jul-18 | 12.0 Yrs. | Full Service |
| (1) | Source: Appraisal. |
| (2) | Based on the underwritten rent roll dated as of January 1, 2022, with rent steps of approximately $80,077 through December 2022. |
| (3) | Rent PSF is based on the square footage of the office space at the 111 River Street Property (525,987 square feet). |
The following table presents certain information relating to comparable retail leases for the 111 River Street Property:
| Comparable Retail Leases(1) | ||||||||
| Property Name/Location | Year Built/ Renovated | NRA (SF) | Tenant | Lease Size (SF) | Rent PSF | Commencement | Lease Term (Years) | Lease Type |
111 River Street Hoboken, NJ | 2002/NAP | 557,719(2) | Various | Various | $47.87(2)(3) | Various | Various | Various |
322 Washington Street Hoboken, NJ | NAV | NAV | Hoboken BBQ | 1,700 | $56.47 | Oct-21 | 5.0 Yrs. | Modified Gross |
109 Christopher Columbus Dr. Jersey City, NJ | NAV | NAV | Early Beginnings | 4,777 | $52.00 | Jan-20 | 10.0 Yrs. | NNN |
40 Riverwalk Place West New York, NJ | NAV | NAV | Row House | 2,500 | $40.00 | Jun-19 | 10.0 Yrs. | NNN |
1101 Grand Street Hoboken, NJ | NAV | NAV | Doluce & Saulda | 1,300 | $48.00 | Apr-18 | 10.0 Yrs. | NNN |
| (1) | Source: Appraisal. |
| (2) | Based on the underwritten rent roll dated as of January 1, 2022. |
| (3) | Rent PSF is based on the square footage of the retail space at the 111 River Street Property (31,732 square feet). |
The Borrowers. The borrowers are River and First Streets LLC and 280 - 10 Group LLC, as tenants in common, each a Delaware limited liability company, structured to be a single purpose bankruptcy-remote entity with two independent directors. Counsel to the borrowers provided a non-consolidation opinion in connection with the origination of the 111 River Street Loan Combination.
The Borrower Sponsors. The borrower sponsors are Steven J. Pozycki and David Werner. Steven J. Pozycki is the founder of SJP Properties. Since its founding in 1981, SJP Properties has successfully developed more than 25 million square feet of ground-up real estate projects in partnership with major public and private institutions. SJP Properties has owned and managed the remaining two Class A office properties which together make up the Waterfront Corporate Center (Buildings II and III). David Werner Real Estate Investments
| THE INFORMATION IN THIS STRUCTURAL AND COLLATERAL TERM SHEET IS NOT COMPLETE AND MAY BE AMENDED PRIOR TO THE TIME OF SALE. THIS TERM SHEET IS NOT AN OFFER TO SELL THESE SECURITIES AND IT IS NOT A SOLICITATION OF AN OFFER TO BUY THESE SECURITIES IN ANY JURISDICTION WHERE THE OFFER OR SALE IS NOT PERMITTED. | ||
| 128 | ||
| Structural and Collateral Term Sheet | BMO 2022-C1 | |
| No. 10 – 111 River Street | ||
is the investment company of David Werner, a New York based private real estate investor who has been actively involved in commercial real estate for more than 35 years. He is currently a principal in more than 15 million square feet of office and nearly 9,000 apartment units.
Property Management. The 111 River Street Property is managed by SJP Corporate Real Estate Services, Inc., a Delaware corporation, an affiliate of the borrower sponsors.
Escrows and Reserves. At origination, the borrowers were required to deposit into escrow (i) approximately $122,519 for real estate taxes, (ii) approximately $177,648 for insurance, (iii) $13,900,000 for tenant improvement, leasing commissions, and other leasing costs (the “TI/LC Reserve”), (iv) $700,000 for capital expenditures, (v) $1,258,196.33 to replicate the difference between (x) the monthly rental amounts due and payable under the John Wiley & Sons Inc. lease and (y) the monthly rental amount that will be due and payable under the John Wiley & Sons Inc. lease as of the April 2023 rent step up under such lease, (vi) $165,615.50 for base rent and O&M rent due under the Ground Lease (as defined below), and (vii) $45,188 with respect to free rent due under the leases in place at closing.
Tax Escrows – On a monthly basis, the borrowers are required to escrow 1/12th of the annual estimated real estate taxes, which currently equates to $138,561.
Insurance Escrows – On a monthly basis, the borrowers are required to escrow 1/12th of the annual estimated insurance premium, provided that such monthly deposits are not required so long as a blanket or umbrella insurance policy acceptable to the lender and covering the 111 River Street Property is in effect.
Replacement Reserve – The borrowers are required to escrow $6,971 for replacement reserves on a monthly basis upon the occurrence and continuation of a Trigger Period (as defined below).
TI/LC Reserve – On the first payment date when the balance of the TI/LC Reserve falls below $2,360,000 and on each payment date thereafter until the balance of the TI/LC Reserve is at least $2,360,000, the borrowers will be required to escrow monthly the amount of $46,477 for tenant improvements and leasing commissions.
Ground Rent Escrows – On a monthly basis, the borrowers are required to escrow approximately 1/12th of the annual estimated base rent and O&M rent due under the Ground Lease, which currently equates to $165,615.50.
Lockbox / Cash Management. The 111 River Street Loan Combination is structured with a hard lockbox and springing cash management. The borrowers are required to, or are required to cause the property manager to, direct each tenant of the 111 River Street Property to deposit funds directly into the lockbox account controlled by the lender. Notwithstanding the foregoing, the borrowers or property manager are required to deposit all revenues otherwise received into the lockbox account within two business days of receipt. On each business day, all sums on deposit in the lockbox account are required to be swept to the cash management account. On each payment date, all sums on deposit in the cash management account are required to be applied and disbursed in accordance with the 111 River Street Loan Combination documents. During the continuance of a Trigger Period (as defined below), any excess cash is required to be held by the lender as additional security for the 111 River Street Loan Combination.
A “Trigger Period” will commence upon: (i) the occurrence of an event of default under the 111 River Street Loan Combination documents and will continue until such event of default is cured; (ii) the date on which the debt yield as calculated in the 111 River Street Loan Combination documents is less than 6.0% (a “Debt Yield Trigger”) and will continue until the debt yield is at least 6.0% for two consecutive quarters; or (iii) any termination, notice of termination, default or cessation of operations of John Wiley & Sons Inc. or the occurrence of the date that is twelve (12) months prior to the expiration of the John Wiley & Sons Inc.
Subordinate and Mezzanine Debt. On January 21, 2022, BMO funded the 111 River Street Loan Combination in the original amount of $153,750,000. The 111 River Street Senior Loan is senior in right of payment and in other respects to the 111 River Street Subordinate Companion Loan. The 111 River Street Subordinate Companion Loan will be an asset of the BMO 2022-C1 securitization trust but will not be pooled together with the other mortgage loans and payments of interest, principal and other amounts received in respect of the 111 River Street Subordinate Companion Loan and allocable thereto will be available to make distributions in respect of the related classes of loan-specific classes of certificates only. The 111 River Street Subordinate Companion Loan will have an initial interest rate of 3.28000%, and is coterminous with the 111 River Street Senior Loan. The relative rights and obligations of the holders of the 111 River Street Loan Combination are governed by the terms of a co-lender agreement. See “Description of the Mortgage Pool—The Loan Combinations---The 360 Pari Passu AB Loan Combination” in the preliminary prospectus. Based on the 111 River Street Loan Combination, the Cut-off Date LTV, Maturity Date LTV, UW NCF DSCR and UW NOI Debt Yield are 63.0%, 63.0%, 2.56x and 8.5%, respectively
Preferred Equity. On the origination date, the preferred equity holders made preferred equity investments in the aggregate amount of $30,000,000 (collectively, the “Preferred Equity Investment”). The Preferred Equity Investment is required to be redeemed upon the earlier to occur of (a) a sale or other disposition of the 111 River Street Property or (b) the refinance of the 111 River Street Loan Combination, but in no event later than February 6, 2027. The preferred equity holder is entitled to a preferred return of 11.00% per annum (of which (x) 7.00% will be paid monthly on a current basis from excess cash flow remaining after payment of amounts due under
| THE INFORMATION IN THIS STRUCTURAL AND COLLATERAL TERM SHEET IS NOT COMPLETE AND MAY BE AMENDED PRIOR TO THE TIME OF SALE. THIS TERM SHEET IS NOT AN OFFER TO SELL THESE SECURITIES AND IT IS NOT A SOLICITATION OF AN OFFER TO BUY THESE SECURITIES IN ANY JURISDICTION WHERE THE OFFER OR SALE IS NOT PERMITTED. | ||
| 129 | ||
| Structural and Collateral Term Sheet | BMO 2022-C1 | |
| No. 10 – 111 River Street | ||
the 111 River Street Loan Combination documents and (y) 4.00% will accrue and compound until the redemption date). Upon the occurrence of a preferred equity event of default, the preferred equity holder is permitted to take control of the borrowers pursuant to the terms of the 111 River Street Loan Combination documents, including that a replacement guarantor must provide a replacement guaranty of recourse obligations and environmental indemnity agreement in substantially the forms provided by the guarantor at loan origination, which replacement guarantor must (i) be controlled by, and at least 0.5% owned by, 3650 REIT Investment Management LLC, a Delaware limited liability company, (ii) have a net worth of at least $100 million (exclusive of any interest in the 111 River Street Property), (iii) be at least 51% owned by either the California State Teachers’ Retirement System, a public entity, or a “Qualified Transferee” (as defined in the 111 River Street Loan Combination documents), and (iv) otherwise satisfy lender’s standard KYC requirements.
Partial Release. Not permitted.
Ground Lease. The 111 River Street Property is subject to a 98-year ground lease, dated as of September 29, 2000, between the Port Authority of New York and New Jersey and the City of Hoboken, New Jersey, collectively as landlord, and the borrowers, collectively as tenant (the “Ground Lease”). The term of the Ground Lease commenced on September 29, 2000 and expires September 30, 2098. The annual rent, paid monthly, is fixed (current monthly rent payments equal to approximately $125,233) with stated scheduled adjustments at specified intervals. In addition to annual rent, the ground lessor makes O&M payments and percentage rent (when applicable) equal to 1% of gross revenues (currently estimated to approximately $21,155.17 per month) to the extent of net available cashflow. The lease contains standard leasehold mortgagee protections including notice and cure rights, right to a new lease in the event of termination of the ground lease (including rejection of the ground lease in bankruptcy), and an agreement that no amendment or modification of the ground lease entered into without lender’s consent shall be effective.
Payment in Lieu of Taxes. Pursuant to the terms of the Ground Lease, the 111 River Street Property is not subject to the imposition or payment of taxes during the term of the Ground Lease, provided that, in lieu thereof, the borrowers shall pay to the City of Hoboken, New Jersey, in equal quarterly installments, the annual PILOT Rent, which is the product of the Applicable PILOT Rate (as increased) and the applicable number of development square feet. The initial Applicable PILOT Rate was set at $2.00 PSF and increased by 2.75% compounded annually with increases effective every five years. Starting in May 2022 the PILOT Rate will increase yearly by the greater of (i) 2.00% and (ii) the increase in the Tax Rate for Hudson County. The borrowers have the right at any time to have the 111 River Street Property placed on the tax rolls and become subject to the payment of ad valorem real estate taxes (at which time, the borrowers’ obligation to make the annual PILOT rent payments will cease); however, pursuant to the 111 River Street Loan Combination documents, borrowers have agreed to not to make any such election to have the 111 River Street Property placed on the tax rolls or to otherwise cause, permit or suffer the 111 River Street Property (or any portion thereof) to become subject to the payment of ad valorem real estate taxes. If not earlier terminated, the PILOT is co-terminus with the Ground Lease (expiring September 30, 2098).
| THE INFORMATION IN THIS STRUCTURAL AND COLLATERAL TERM SHEET IS NOT COMPLETE AND MAY BE AMENDED PRIOR TO THE TIME OF SALE. THIS TERM SHEET IS NOT AN OFFER TO SELL THESE SECURITIES AND IT IS NOT A SOLICITATION OF AN OFFER TO BUY THESE SECURITIES IN ANY JURISDICTION WHERE THE OFFER OR SALE IS NOT PERMITTED. | ||
| 130 | ||
| Structural and Collateral Term Sheet | BMO 2022-C1 | |
| No. 11 – 2 Riverfront Plaza | ||
| Mortgage Loan Information | Property Information | |||
| Mortgage Loan Seller: | BMO | Single Asset / Portfolio: | Single Asset | |
| Original Principal Balance(1): | $37,500,000 | Title: | Fee | |
| Cut-off Date Principal Balance(1): | $37,500,000 | Property Type – Subtype: | Office – CBD | |
| % of IPB: | 3.3% | Net Rentable Area (SF): | 337,543 | |
| Loan Purpose: | Refinance | Location: | Newark, NJ | |
| Borrower: | TRF Urban Renewal Property Corp. | Year Built / Renovated: | 2014 / NAP | |
| Borrower Sponsor: | Arch Street Capital Advisors | Occupancy: | 100.0% | |
| Interest Rate: | 4.26000% | Occupancy Date: | 12/8/2021 | |
| Note Date: | 12/8/2021 | 4th Most Recent NOI (As of): | $10,128,998 (12/31/2018) | |
| Maturity Date: | 1/6/2032 | 3rd Most Recent NOI (As of): | $10,342,514 (12/31/2019) | |
| Interest-only Period: | 120 months | 2nd Most Recent NOI (As of): | $10,513,398 (12/31/2020) | |
| Original Term: | 120 months | Most Recent NOI (As of): | $10,645,261 (TTM 9/30/2021) | |
| Original Amortization Term: | None | UW Economic Occupancy: | 95.0% | |
| Amortization Type: | Interest Only | UW Revenues: | $13,859,362 | |
| Call Protection(2): | L(25),D(90),O(5) | UW Expenses: | $3,558,666 | |
| Lockbox / Cash Management: | Hard / Springing | UW NOI: | $10,300,695 | |
| Additional Debt(1): | Yes | UW NCF: | $9,726,872 | |
| Additional Debt Balance(1): | $72,500,000 | Appraised Value / Per SF: | $182,200,000 / $540 | |
| Additional Debt Type(1): | Pari Passu | Appraisal Date: | 11/12/2021 | |
| Escrows and Reserves | Financial Information(1) | |||||
| Initial | Monthly | Initial Cap | Cut-off Date Loan / SF: | $326 | ||
| Taxes: | $0 | $0 | N/A | Maturity Date Loan / SF: | $326 | |
| Insurance: | $0 | Springing | N/A | Cut-off Date LTV: | 60.4% | |
| Replacement Reserves: | $0 | $5,626 | $135,017 | Maturity Date LTV: | 60.4% | |
| TI / LC: | $0 | $42,193 | N/A | UW NCF DSCR: | 2.05x | |
| Other: | $0 | $0 | N/A | UW NOI Debt Yield: | 9.4% | |
| Sources and Uses | ||||||
| Sources | Proceeds | % of Total | Uses | Proceeds | % of Total | |
| Loan Combination | $110,000,000 | 100.0% | Payoff Existing Debt | $107,720,166 | 97.9% | |
| Closing Costs | 1,863,929 | 1.7 | ||||
| Principal Equity Distribution | 415,906 | 0.4 | ||||
| Total Sources | $110,000,000 | 100.0% | Total Uses | $110,000,000 | 100.0% | |
| (1) | The 2 Riverfront Plaza Mortgage Loan (as defined below) is part of the 2 Riverfront Plaza Loan Combination (as defined below) evidenced by five pari passu notes with an aggregate original principal balance of $110,000,000. The financial information presented in the chart above reflects the 2 Riverfront Plaza Loan Combination. For additional information, see “The Loan” below. |
| (2) | The defeasance lockout period, with respect to a defeasance of the 2 Riverfront Plaza Loan Combination, will be at least 25 payment dates beginning with and including the first payment date on February 6, 2022. Defeasance of the full $110,000,000 2 Riverfront Plaza Loan Combination is permitted after the date that is earlier of (i) two years from the closing date of the securitization that includes the last note to be securitized and (ii) December 8, 2024. |
The Loan. The eleventh largest mortgage loan (the “2 Riverfront Plaza Mortgage Loan”) is part of a loan combination (the “2 Riverfront Plaza Loan Combination”) that is evidenced by five pari passu promissory notes in the aggregate original principal amount of $110,000,000. The 2 Riverfront Plaza Loan Combination was originated on December 8, 2021, by Bank of Montreal (“BMO”). The 2 Riverfront Plaza Loan Combination is secured by a first priority mortgage on the borrower’s fee simple interest in a 337,543 square foot, 12-story office building located in Newark, New Jersey (the “2 Riverfront Plaza Property”). The 2 Riverfront Plaza Mortgage Loan is evidenced by the non-controlling promissory Note A-1, with a principal balance as of the Cut-off Date of $37,500,000. The remaining notes are currently held by an affiliate of BMO and are expected to be contributed to one or more future securitization trusts.
| THE INFORMATION IN THIS STRUCTURAL AND COLLATERAL TERM SHEET IS NOT COMPLETE AND MAY BE AMENDED PRIOR TO THE TIME OF SALE. THIS TERM SHEET IS NOT AN OFFER TO SELL THESE SECURITIES AND IT IS NOT A SOLICITATION OF AN OFFER TO BUY THESE SECURITIES IN ANY JURISDICTION WHERE THE OFFER OR SALE IS NOT PERMITTED. | ||
| 131 | ||
| Structural and Collateral Term Sheet | BMO 2022-C1 | |
| No. 11 – 2 Riverfront Plaza | ||
| Loan Combination Summary | ||||
| Note | Original Balance | Cut-off Date Balance | Note Holder | Controlling Piece |
| A-1 | $37,500,000 | $37,500,000 | BMO 2022-C1 | No |
| A-2(1) | $32,500,000 | $32,500,000 | BMO | No |
| A-3(1) | $30,000,000 | $30,000,000 | BMO | No |
| A-4(1) | $5,000,000 | $5,000,000 | BMO | No |
| A-5(1) | $5,000,000 | $5,000,000 | BMO | Yes |
| Total | $110,000,000 | $110,000,000 | ||
| (1) | Expected to be contributed to one or more future securitization(s). |
The Property. The 2 Riverfront Plaza Property comprises a 12-story, class A office building that was constructed in 2014. The 2 Riverfront Plaza Property has a total net rentable area of 337,543 square feet and is situated on an approximately 0.75-acre site in Newark, New Jersey. Amenities at the 2 Riverfront Plaza Property include a two-story open lobby, a training center, a full-service cafeteria, a fitness area and covered parking through. The 2 Riverfront Plaza Property has access to 275 surface and garage parking spaces, equating to a parking ratio of approximately 0.8 spaces per 1,000 square feet of rentable area.
As of December 8, 2021, 2 Riverfront Plaza is 100.0% leased by Panasonic Corporation of North America through April 2031 with two 5-year renewal options.
Panasonic Corporation of North America (337,543 square feet; 100.0% of the NRA; 100.0% of underwritten base rent): Panasonic Corporation of North America is a major Japanese multinational conglomerate, headquartered in Kadoma, Osaka, Japan. In addition to consumer electronics, Panasonic Corporation of North America offers a wide range of products and services, including rechargeable batteries, automotive and avionic systems, industrial systems, as well as home renovation and construction. Panasonic Corporation of North America’s products include flat panel TVs, microwaves, audio and video equipment, biomedical devices, construction equipment, e-cockpit and driver assistance products.
Panasonic Corporation of North America had previously been headquartered in Secaucus, NJ for approximately 30 years, and relocated to the 2 Riverfront Plaza Property in 2013. The 2 Riverfront Plaza Property was built-to-suit for Panasonic Corporation of North America for their North American headquarters and executive offices. Panasonic Corporation of North America originally executed a lease for 279,219 square feet on the 1st, 2nd, and 5th through 12th floors of the building commencing in July 2013. Panasonic Corporation of North America later expanded into the balance of the building, leasing an additional 58,324 square feet on the 3rd and 4th floors with an amended and restated 15-year lease for the entire building commencing May 2016. The lease extends through April 2031 with two 5-year renewal options. Panasonic Corporation of North America currently subleases approximately 37,155 square feet to KS Engineers on the 3rd floor (approximately 28,958 square feet) and 4th floor (approximately 8,197 square feet).
COVID-19 Update. As of February 1, 2022, the 2 Riverfront Plaza Property is open and operating. Throughout the pandemic, no tenants requested or received rent relief or lease modifications, and as of January 1, 2022, all tenants were current on their lease obligations. The first debt service payment for the 2 Riverfront Plaza Loan Combination is due in February 2022. As of February 1, 2022, the 2 Riverfront Plaza Loan Combination is not subject to any forbearance, modification or debt service relief request.
| Historical and Current Occupancy | |||
| 2018(1) | 2019(1) | 2020(1) | Current(2) |
| 100.0% | 100.0% | 100.0% | 100.0% |
| (1) | Historical Occupancies are as of December 31 of each respective year. |
| (2) | Current Occupancy is as of December 8, 2021. |
The Market. The 2 Riverfront Plaza Property is located in Newark, New Jersey within the Newark office submarket. The downtown area of Newark has benefited from government and private industry working together to revitalize this commercial section of the city. The property is located less than 5 miles west of New York City, and within walking distance to Newark Penn Station, with direct access to Midtown Manhattan.
According to a third-party report dated as of January 28, 2022, the Newark office submarket has approximately 24.5 million square feet of inventory with an approximate vacancy rate of 10.2% and an approximate availability rate 11.7%. The average rents for the Newark Office Submarket are $30.36 per square foot.
The estimated 2021 average household income within a one-, three-, and five-mile radius of the 2 Riverfront Plaza Property was $71,702, $61,422, and $73,607, respectively. The estimated 2021 population within the same radii is 56,978, 327,853 and 780,556, respectively.
| THE INFORMATION IN THIS STRUCTURAL AND COLLATERAL TERM SHEET IS NOT COMPLETE AND MAY BE AMENDED PRIOR TO THE TIME OF SALE. THIS TERM SHEET IS NOT AN OFFER TO SELL THESE SECURITIES AND IT IS NOT A SOLICITATION OF AN OFFER TO BUY THESE SECURITIES IN ANY JURISDICTION WHERE THE OFFER OR SALE IS NOT PERMITTED. | ||
| 132 | ||
| Structural and Collateral Term Sheet | BMO 2022-C1 | |
| No. 11 – 2 Riverfront Plaza | ||
| Office and Retail Tenant Summary(1) | |||||||||
| Tenant | Ratings Moody’s/S&P/Fitch(2) | Net Rentable Area (SF) | % of Total NRA | UW Base Rent PSF(3) | UW Base Rent(3) | % of Total Base Rent | Lease Expiration Date | Renewal Options | |
| Panasonic Corporation of North America | Baa1/A-/BBB- | 337,543 | 100.0% | $32.66 | $11,023,719 | 100.0% | 4/30/2031 | 2, 5-Year | |
| Occupied Total | 337,543 | 100.0% | $32.66 | $11,023,719 | 100.0% | ||||
| Vacant Space | 0 | 0.0 | |||||||
| Total / Wtd. Avg. | 337,543 | 100.0% | |||||||
| (1) | Based on underwritten rent roll dated December 8, 2021. |
| (2) | In certain instances, ratings provided are for the parent company of the entity listed in the “Tenant” field whether or not the parent company guarantees the lease. |
| (3) | UW Base Rent PSF and UW Base Rent includes rent steps of approximately $216,151 through June 2022. |
| Lease Rollover Schedule(1)(2) | |||||||||
| Year | Number of Leases Expiring | NRA Expiring | % of NRA Expiring | UW Base Rent Expiring(3) | % of UW Base Rent Expiring | Cumulative Net Rentable Area Expiring | Cumulative % of NRA Expiring | Cumulative UW Base Rent Expiring(3) | Cumulative % of UW Base Rent Expiring |
| Vacant | NAP | 0 | 0.0% | NAP | NAP | 0 | 0.0% | NAP | NAP |
| MTM | 0 | 0 | 0.0 | $0 | 0.0% | 0 | 0.0% | $0 | 0.0% |
| 2022 | 0 | 0 | 0.0 | 0 | 0.0 | 0 | 0.0% | $0 | 0.0% |
| 2023 | 0 | 0 | 0.0 | 0 | 0.0 | 0 | 0.0% | $0 | 0.0% |
| 2024 | 0 | 0 | 0.0 | 0 | 0.0 | 0 | 0.0% | $0 | 0.0% |
| 2025 | 0 | 0 | 0.0 | 0 | 0.0 | 0 | 0.0% | $0 | 0.0% |
| 2026 | 0 | 0 | 0.0 | 0 | 0.0 | 0 | 0.0% | $0 | 0.0% |
| 2027 | 0 | 0 | 0.0 | 0 | 0.0 | 0 | 0.0% | $0 | 0.0% |
| 2028 | 0 | 0 | 0.0 | 0 | 0.0 | 0 | 0.0% | $0 | 0.0% |
| 2029 | 0 | 0 | 0.0 | 0 | 0.0 | 0 | 0.0% | $0 | 0.0% |
| 2030 | 0 | 0 | 0.0 | 0 | 0.0 | 0 | 0.0% | $0 | 0.0% |
| 2031 | 1 | 337,543 | 100.0 | 11,023,719 | 100.0 | 337,543 | 100.0% | $11,023,719 | 100.0% |
| 2032 & Beyond | 0 | 0 | 0.0 | 0 | 0.0 | 337,543 | 100.0% | $11,023,719 | 100.0% |
| Total | 1 | 337,543 | 100.0% | $11,023,719 | 100.0% | ||||
| (1) | Based on the underwritten rent roll dated December 8, 2021. |
| (2) | Certain leases may have termination options that are exercisable prior to the originally stated expiration date of the lease and that are not considered in this Lease Rollover Schedule. |
| (3) | UW Base Rent Expiring and Cumulative UW Base Rent Expiring includes rent steps of approximately $216,151 through June 2022. |
| Operating History and Underwritten Net Cash Flow | |||||||||||||||
| 2018 | 2019 | 2020 | TTM(1) | Underwritten | Per Square Foot | %(2) | |||||||||
| Rents in Place | $10,117,649 | $10,320,002 | $10,526,402 | $10,683,952 | $10,807,568 | $32.02 | 74.1 | % | |||||||
| Rent Steps(3) | 0 | 0 | 0 | 0 | 216,151 | 0.64 | 1.5 | ||||||||
| Gross Potential Rent | $10,117,649 | $10,320,002 | $10,526,402 | $10,683,952 | $11,023,719 | $32.66 | 75.6 | % | |||||||
| Total Reimbursements | 3,961,045 | 3,763,916 | 3,476,897 | 3,524,063 | 3,556,555 | 10.54 | 24.4 | ||||||||
| Net Rental Income | $14,078,694 | $14,083,918 | $14,003,299 | $14,208,015 | $14,580,274 | $43.20 | 100.0 | % | |||||||
| Vacancy | 0 | 0 | 0 | 0 | (729,014) | (2.16) | (5.0 | ) | |||||||
| Other Income | 13,850 | 22,512 | 21,414 | 8,101 | 8,101 | 0.02 | �� | 0.1 | |||||||
| Effective Gross Income | $14,092,544 | $14,106,430 | $14,024,713 | $14,216,116 | $13,859,362 | $41.06 | 95.1 | % | |||||||
| Total Expenses | $3,963,545 | $3,763,916 | $3,511,314 | $3,570,855 | $3,558,666 | $10.54 | 25.7 | % | |||||||
| Net Operating Income | $10,128,998 | $10,342,514 | $10,513,398 | $10,645,261 | $10,300,695 | $30.52 | 74.3 | % | |||||||
| Cap Ex, Total TI/LC | 0 | 0 | 0 | 0 | 573,823 | 1.7 | 4.1 | ||||||||
| Net Cash Flow | $10,128,998 | $10,342,514 | $10,513,398 | $10,645,261 | $9,726,872 | $28.82 | 70.2 | % | |||||||
| (1) | TTM reflects the trailing 12 months ending September 30, 2021. |
| (2) | % column represents percent of Net Rental Income for all revenue lines and represents percent of Effective Gross Income for the remainder of the fields. |
| (3) | Rent Steps includes rent steps of approximately $216,151 through June 2022. |
| THE INFORMATION IN THIS STRUCTURAL AND COLLATERAL TERM SHEET IS NOT COMPLETE AND MAY BE AMENDED PRIOR TO THE TIME OF SALE. THIS TERM SHEET IS NOT AN OFFER TO SELL THESE SECURITIES AND IT IS NOT A SOLICITATION OF AN OFFER TO BUY THESE SECURITIES IN ANY JURISDICTION WHERE THE OFFER OR SALE IS NOT PERMITTED. | ||
| 133 | ||
| Structural and Collateral Term Sheet | BMO 2022-C1 | |
| No. 12 – Northwest Capital Portfolio | ||
| Mortgage Loan Information | Property Information | |||
| Mortgage Loan Seller: | SMC | Single Asset / Portfolio: | Portfolio | |
| Original Principal Balance: | $37,500,000 | Title: | Fee | |
| Cut-off Date Principal Balance: | $37,500,000 | Property Type - Subtype: | Retail - Various | |
| % of IPB: | 3.3% | Net Rentable Area (SF): | 211,122 | |
| Loan Purpose: | Refinance | Location: | Various, WA | |
| Borrowers(1): | Various | Year Built / Renovated: | Various / Various | |
| Borrower Sponsors: | Mark S. McDonald | Occupancy: | 98.1% | |
| Interest Rate: | 4.37000% | Occupancy Date: | 1/16/2022 | |
| Note Date: | 1/20/2022 | 4th Most Recent NOI (As of): | $2,755,205 (12/31/2018) | |
| Maturity Date: | 2/6/2032 | 3rd Most Recent NOI (As of): | $2,773,778 (12/31/2019) | |
| Interest-only Period: | 120 months | 2nd Most Recent NOI (As of): | $2,794,341 (12/31/2020) | |
| Original Term: | 120 months | Most Recent NOI (As of): | $3,050,401 (TTM 11/30/2021) | |
| Original Amortization Term: | None | UW Economic Occupancy: | 94.8% | |
| Amortization Type: | Interest Only | UW Revenues: | $4,841,557 | |
| Call Protection: | L(24),D(92),O(4) | UW Expenses: | $1,461,852 | |
| Lockbox / Cash Management: | Soft / Springing | UW NOI: | $3,379,705 | |
| Additional Debt: | No | UW NCF: | $3,126,359 | |
| Additional Debt Balance: | N/A | Appraised Value / Per SF: | $58,500,000 / $277 | |
| Additional Debt Type: | N/A | Appraisal Date: | 12/9/2021 | |
| Escrows and Reserves | Financial Information | ||||||
| Initial | Monthly | Initial Cap | Cut-off Date Loan / SF: | $178 | |||
| Taxes: | $229,709 | $45,942 | N/A | Maturity Date Loan / SF: | $178 | ||
| Insurance: | $79,985 | $6,819 | N/A | Cut-off Date LTV: | 64.1% | ||
| Replacement Reserves: | $240,000 | $3,519 | N/A | Maturity Date LTV: | 64.1% | ||
| TI / LC: | $500,000 | $17,594 | $1,000,000 | UW NCF DSCR: | 1.88x | ||
| Deferred Maintenance: | $70,508 | $0 | N/A | UW NOI Debt Yield: | 9.0% | ||
| Other(2): | $242,470 | $0 | N/A | ||||
| Sources and Uses | |||||||
| Sources | Proceeds | % of Total | Uses | Proceeds | % of Total | ||
| Mortgage Loan | $37,500,000 | 100.0% | Payoff Existing Debt | $28,853,543 | 76.9% | ||
| Return of Equity | 6,840,276 | 18.2 | |||||
| Upfront Reserves | 1,362,672 | 3.6 | |||||
| Closing Costs | 443,509 | 1.2 | |||||
| Total Sources | $37,500,000 | 100.0% | Total Uses | $37,500,000 | 100.0% | ||
| (1) | The borrowers under the Northwest Capital Portfolio Mortgage Loan (as defined below) are NWCC Center Plaza LLC, NWCC Riverway LLC, NWCC Village by the Creek LLC, 1400 Pike Street LLC and 19480 Highway 2 LLC. |
| (2) | Other reserve represents a Coldwell Banker reserve equal to $184,130 and a Juice Club reserve equal to $58,340. |
The Loan. The twelfth largest mortgage loan (the “Northwest Capital Portfolio Mortgage Loan”) has an outstanding principal balance as of the Cut-off Date of $37,500,000 and is secured by a first lien mortgage on the borrowers’ fee simple interests in a portfolio of five retail properties located in Kelso, Federal Way, Mill Creek, Monroe and Seattle, Washington (the “Northwest Capital Portfolio Properties”). The Northwest Capital Portfolio Mortgage Loan has a 10-year term and is interest-only for the loan term.
The Properties. The Northwest Capital Portfolio Properties are comprised of five multi-tenant retail properties totaling 211,122 square feet located in Kelso, Federal Way, Mill Creek, Monroe and Seattle, Washington.
| THE INFORMATION IN THIS STRUCTURAL AND COLLATERAL TERM SHEET IS NOT COMPLETE AND MAY BE AMENDED PRIOR TO THE TIME OF SALE. THIS TERM SHEET IS NOT AN OFFER TO SELL THESE SECURITIES AND IT IS NOT A SOLICITATION OF AN OFFER TO BUY THESE SECURITIES IN ANY JURISDICTION WHERE THE OFFER OR SALE IS NOT PERMITTED. | ||
| 134 | ||
| Structural and Collateral Term Sheet | BMO 2022-C1 | |
| No. 12 – Northwest Capital Portfolio | ||
The following table presents certain information relating to the Northwest Capital Portfolio Properties:
| Portfolio Summary | |||||||||||||||||||||||||
| Property Name | City | Year Built / Renovated | SF | Allocated Cut-off Date Loan Amount (“ALA”)(1) | % of ALA | Appraised Value | % of Appraised Value | UW NOI | % of UW NOI | ||||||||||||||||
| Center Plaza | Federal Way | 1979 / 2018 | 77,748 | $17,692,308 | 47.2 | % | $27,600,000 | 47.2 | % | $1,574,726 | 46.6 | % | |||||||||||||
| Village by the Creek | Mill Creek | 1985 / NAP | 26,632 | 7,628,205 | 20.3 | 11,900,000 | 20.3 | 741,996 | 22.0 | ||||||||||||||||
| Riverway Plaza | Kelso | 1980 / NAP | 80,852 | 6,538,462 | 17.4 | 10,200,000 | 17.4 | 623,618 | 18.5 | ||||||||||||||||
| Pike Street Building | Seattle | 1909 / 2020 | 11,705 | 3,333,333 | 8.9 | 5,200,000 | 8.9 | 263,205 | 7.8 | ||||||||||||||||
| Monroe Retail Center | Monroe | 1920 / 1988 | 14,185 | 2,307,692 | 6.2 | 3,600,000 | 6.2 | 176,160 | 5.2 | ||||||||||||||||
| Total | 211,122 | $37,500,000 | 100.0 | % | $58,500,000 | 100.0 | % | $3,379,705 | 100.0 | % | |||||||||||||||
| (1) | There are no collateral releases permitted under the Northwest Capital Portfolio Mortgage Loan documents. Allocated Cut-off Date Loan Amounts are allocated by Appraised Value. |
The borrower sponsor acquired the Northwest Capital Portfolio Properties in five separate transactions in 2015 for an aggregate purchase price of $32.375 million. Since 2018, the borrower sponsor has invested over $2.8 million in capital expenditures and leasing costs. The Pike Street Building property was acquired 100% vacant and subsequently renovated and leased up. The Northwest Capital Portfolio Properties’ rent roll consists of 211,122 square feet, with no single tenant representing greater than 7.3% of underwritten base rent. The tenants at the Northwest Capital Portfolio Properties consist of a mix of national and local retailers such as Wilco Farmers, Dollar Tree, Rite Aid, Starbucks and Coldwell Banker. As of January 16, 2022, the Northwest Capital Portfolio Properties are 98.1% leased to a tenant roster of 61 tenants.
Center Plaza. The Center Plaza property consists of a neighborhood retail center containing approximately 77,748 square feet situated on a 7.74-acre site approximately 25 miles south of Seattle. The borrower sponsor acquired the Center Plaza property in 2015 for approximately $14.3 million. The Center Plaza property was 96.8% occupied by 29 tenants as of January 16, 2022 and includes 428 parking spaces (approximately 5.5 parking spaces per 1,000 square feet of NRA).
Village by the Creek. The Village by the Creek property is comprised of two adjacent buildings totaling 26,632 square feet on a 2.72-acre site approximately 25 miles north of Seattle. The borrower sponsor acquired the Village by the Creek property in 2015 for approximately $5.8 million. The Village by the Creek property is 100.0% occupied by 11 tenants as of January 16, 2022 and includes 153 parking spaces (approximately 5.7 parking spaces per 1,000 square feet of NRA).
Riverway Plaza. The Riverway Plaza property consists of a neighborhood retail center containing 80,852 square feet on a 9.00-acre site approximately 125 miles south of Seattle and 50 miles north of Portland, Oregon. The borrower sponsor acquired the Riverway Plaza property in 2015 for approximately $7.7 million. The Riverway Plaza property was 100.0% occupied by 10 tenants as of January 16, 2022 and has had no vacancies since 2015. The largest tenant, Wilco Farmers (19.3% of portfolio NRA; 7.3% of portfolio underwritten base rent), has been a tenant at the Riverway Plaza property since 2012. The gross sales for the Wilco Farmers store for the trailing 12-months ending September 2021 was approximately $13.0 million (approximately $318 per square foot; 3.2% occupancy cost). The Riverway Plaza property contains 420 parking spaces (approximately 5.2 parking spaces per 1,000 square feet of NRA).
Pike Street Building. The Pike Street Building property is located on the northeast corner of East Pike Street and 14th Avenue in Seattle. The Pike Street Building property, built in 1909, was acquired vacant for approximately $1.775 million in 2015 and renovated in 2020. The borrower sponsor invested approximately $1.25 million in capital expenditures and leasing costs at the Pike Street Building property. The Pike Street Building property totals 11,705 square feet and is 100.0% occupied by four tenants as of January 16, 2022.
Monroe Retail Center. The Monroe Retail Center property was built in 1920, renovated in 1988 and is located in Monroe, Washington (approximately 35 miles northeast of Seattle). The Monroe Retail Center property consists of 14,185 square feet and is 89.4% occupied by seven tenants as of January 16, 2022. The borrower sponsor purchased the Monroe Retail Center property in 2015 for approximately $2.8 million. The Monroe Retail Center property includes 79 parking spaces (approximately 5.6 parking spaces per 1,000 square feet of NRA).
COVID-19 Update. As of January 24, 2022, the tenant rental obligations at the Northwest Capital Portfolio Properties have not been materially disrupted by the macro effects of the COVID-19 pandemic. As of February 1, 2022, the Northwest Capital Portfolio Mortgage Loan is not subject to any forbearance, modification or debt service relief requests.
| THE INFORMATION IN THIS STRUCTURAL AND COLLATERAL TERM SHEET IS NOT COMPLETE AND MAY BE AMENDED PRIOR TO THE TIME OF SALE. THIS TERM SHEET IS NOT AN OFFER TO SELL THESE SECURITIES AND IT IS NOT A SOLICITATION OF AN OFFER TO BUY THESE SECURITIES IN ANY JURISDICTION WHERE THE OFFER OR SALE IS NOT PERMITTED. | ||
| 135 | ||
| Structural and Collateral Term Sheet | BMO 2022-C1 | |
| No. 12 – Northwest Capital Portfolio | ||
Major Tenants.
Wilco Farmers (40,840 square feet; 19.3% of portfolio NRA; 7.3% of underwritten base rent). Wilco Farmers is a farmer-owned farm supply cooperative that has over 20 locations throughout Washington, Oregon and California. Wilco Farmers has been a tenant at the Riverway Plaza property since September 2012, has a current lease expiration date in September 2027 and has three five-year lease renewal options remaining. The gross sales for the Wilco Famers store for the trailing 12-months ending September 2021 was approximately $13.0 million (approximately $318 per square foot; 3.2% occupancy cost). Wilco Farmers has no termination options.
Rite Aid (17,640 square feet; 8.4% of portfolio NRA; 4.6% of underwritten base rent). Rite Aid is an American drugstore chain based in Philadelphia, Pennsylvania. Rite Aid has approximately 2,500 stores in 19 states. Rite Aid most recently extended its lease at the Riverway Plaza property in June 2013, has a current lease expiration date in May 2023 and has two five-year lease renewal options remaining. Rite Aid has no termination options.
Armani Night Club (11,000 square feet; 5.2% of portfolio NRA; 3.1% of underwritten base rent). Armani Night Club is a café and night club. Armani Night Club has been a tenant at the Center Plaza property since June 2013, has a current lease expiration date in November 2023 and has two five-year renewal options remaining. Armani Night Club has no termination options.
| Historical and Current Occupancy(1) | |||
| 2018(2) | 2019(2) | 2020(2) | Current(3) |
| 88.3% | 96.9% | 97.7% | 98.1% |
| (1) | Historical Occupancies are as of December 31 of each respective year. |
| (2) | Excludes the Pike Street Building property due to renovation. |
| (3) | Current Occupancy is as of January 16, 2022. |
| Top Ten Tenant Summary(1) | ||||||||||
| Tenant | Property | Ratings Moody’s/S&P/Fitch(2) | Net Rentable Area (SF) | % of Total NRA | UW Base Rent PSF | UW Base Rent | % of Total UW Base Rent | Lease Exp. Date | Sales PSF | Occupancy Cost |
| Wilco Farmers(3)(4) | Riverway Plaza | NR / NR / NR | 40,840 | 19.3% | $7.20 | $294,048 | 7.3% | 9/30/2027 | $318 | 3.2% |
| Rite Aid(5) | Riverway Plaza | B3 / B- / CCC | 17,640 | 8.4 | $10.45 | 184,392 | 4.6 | 5/31/2023 | NAV | NAV |
| Armani Night Club(6) | Center Plaza | NR / NR / NR | 11,000 | 5.2 | $11.30 | 124,296 | 3.1 | 11/30/2023 | NAV | NAV |
| Dollar Tree(7) | Riverway Plaza | Baa2 / BBB / NR | 8,314 | 3.9 | $11.00 | 91,454 | 2.3 | 1/31/2024 | NAV | NAV |
| Red Lobster(8)(4) | Center Plaza | NR / NR / NR | 6,084 | 2.9 | $12.63 | 76,848 | 1.9 | 1/31/2038 | $518 | 2.4% |
| Azteca(9) | Center Plaza | NR / NR / NR | 5,942 | 2.8 | $30.90 | 183,608 | 4.6 | 9/30/2030 | NAV | NAV |
| Coldwell Banker(10) | Pike Street | NR / NR / NR | 5,829 | 2.8 | $29.00 | 169,041 | 4.2 | 9/30/2031 | NAV | NAV |
| MultiCare(11) | Village by the Creek | NR / NR / NR | 4,896 | 2.3 | $35.20 | 172,339 | 4.3 | 10/2/2026 | NAV | NAV |
| Ariang Korean BBQ(12) | Village by the Creek | NR / NR / NR | 4,765 | 2.3 | $27.81 | 132,515 | 3.3 | 2/29/2028 | NAV | NAV |
| Mi Tierra Inc. | Monroe Retail | NR / NR / NR | 4,500 | 2.1 | $17.09 | 76,904 | 1.9 | 7/31/2025 | NAV | NAV |
| Top Ten Tenants | 109,810 | 52.0% | $13.71 | $1,505,445 | 37.6% | |||||
| Remaining Occupied Tenants | 97,310 | 46.1% | $25.67 | $2,498,239 | 62.4% | |||||
| Occupied Collateral Total / Wtd. Avg. | 207,120 | 98.1% | $19.33 | $4,003,684 | 100.0% | |||||
| Vacant Space | 4,002 | 1.9% | ||||||||
| Collateral Total | 211,122 | 100.0% | ||||||||
| (1) | Based on the underwritten rent roll dated January 16, 2022 with rent steps through July 2022. |
| (2) | In certain instances, ratings provided are for the parent company of the entity listed in the “Tenant” field whether or not the parent company guarantees the lease. |
| (3) | Wilco Farmers has three five-year lease renewal options remaining. |
| (4) | Sales PSF and Occupancy Cost represent the trailing 12-months ending September 2021. |
| (5) | Rite Aid has two five-year lease renewal options remaining. |
| (6) | Armani Night Club has two five-year lease renewal options remaining. |
| (7) | Dollar Tree has three five-year lease renewal options remaining |
| (8) | Red Lobster has three five-year renewal options remaining. |
| (9) | Azteca has two five-year renewal options remaining. |
| (10) | Coldwell Banker has two five-year renewal options remaining. |
| (11) | MultiCare has two five-year renewal options remaining. |
| (12) | Ariang Korean BBQ has one six-year renewal option remaining. |
| THE INFORMATION IN THIS STRUCTURAL AND COLLATERAL TERM SHEET IS NOT COMPLETE AND MAY BE AMENDED PRIOR TO THE TIME OF SALE. THIS TERM SHEET IS NOT AN OFFER TO SELL THESE SECURITIES AND IT IS NOT A SOLICITATION OF AN OFFER TO BUY THESE SECURITIES IN ANY JURISDICTION WHERE THE OFFER OR SALE IS NOT PERMITTED. | ||
| 136 | ||
| Structural and Collateral Term Sheet | BMO 2022-C1 | |
| No. 12 – Northwest Capital Portfolio | ||
| Lease Rollover Schedule(1)(2) | |||||||||
| Year | Number of Leases Expiring | Net Rentable Area Expiring | % of NRA Expiring | UW Base Rent Expiring | % of UW Base Rent Expiring | Cumulative Net Rentable Area Expiring | Cumulative % of NRA Expiring | Cumulative UW Base Rent Expiring | Cumulative % of UW Base Rent Expiring |
| Vacant | NAP | 4,002 | 1.9% | NAP | NAP | 4,002 | 1.9% | NAP | NAP |
| 2022 & MTM | 7 | 13,293 | 6.3 | $285,469 | 7.1% | 17,295 | 8.2% | $285,469 | 7.1% |
| 2023 | 12 | 46,056 | 21.8 | 667,196 | 16.7 | 63,351 | 30.0% | $952,665 | 23.8% |
| 2024 | 10 | 23,067 | 10.9 | 395,566 | 9.9 | 86,418 | 40.9% | $1,348,231 | 33.7% |
| 2025 | 6 | 15,780 | 7.5 | 346,327 | 8.7 | 102,198 | 48.4% | $1,694,558 | 42.3% |
| 2026 | 13 | 24,702 | 11.7 | 695,206 | 17.4 | 126,900 | 60.1% | $2,389,764 | 59.7% |
| 2027 | 2 | 43,840 | 20.8 | 420,048 | 10.5 | 170,740 | 80.9% | $2,809,812 | 70.2% |
| 2028 | 2 | 5,465 | 2.6 | 152,115 | 3.8 | 176,205 | 83.5% | $2,961,927 | 74.0% |
| 2029 | 5 | 13,892 | 6.6 | 527,010 | 13.2 | 190,097 | 90.0% | $3,488,937 | 87.1% |
| 2030 | 2 | 7,912 | 3.7 | 232,858 | 5.8 | 198,009 | 93.8% | $3,721,795 | 93.0% |
| 2031 | 2 | 7,029 | 3.3 | 205,041 | 5.1 | 205,038 | 97.1% | $3,926,836 | 98.1% |
| 2032 | 0 | 0 | 0.0 | 0 | 0.0 | 205,038 | 97.1% | $3,926,836 | 98.1% |
| 2033 & Beyond | 1 | 6,084 | 2.9 | 76,848 | 1.9 | 211,122 | 100.0% | $4,003,684 | 100.0% |
| Total | 62 | 211,122 | 100.0% | $4,003,684 | 100.0% | ||||
| (1) | Based on the underwritten rent roll dated January 16, 2022 with rent steps through July 2022. |
| (2) | Certain tenants may have lease termination options that are exercisable prior to the originally stated expiration date of the subject lease and that are not considered in the Lease Rollover Schedule. |
| Operating History and Underwritten Net Cash Flow | |||||||
| 2018 | 2019 | 2020 | TTM(1) | Underwritten | Per Square Foot | %(2) | |
| Rents in Place | $3,030,922 | $3,070,901 | $3,125,070 | $3,534,424 | $3,995,857 | $18.93 | 78.2% |
| Rent Steps(3) | 0 | 0 | 0 | 0 | 7,827 | 0.04 | 0.2 |
| Vacant Income | 0 | 0 | 0 | 0 | 92,489 | 0.44 | 1.8 |
| Gross Potential Rent | $3,030,922 | $3,070,901 | $3,125,070 | $3,534,424 | $4,096,173 | $19.40 | 80.2% |
| Total Reimbursements | 900,518 | 911,243 | 897,540 | 1,009,069 | 1,013,413 | 4.80 | 19.8 |
| Other Income | 0 | 0 | 0 | 5,668 | 0 | 0.00 | 0.0 |
| Net Rental Income | $3,931,440 | $3,982,145 | $4,022,610 | $4,549,161 | $5,109,587 | $24.20 | 100.0% |
| (Vacancy/Credit Loss) | 0 | 0 | 0 | 0 | (268,030) | (1.27) | (5.2) |
| Effective Gross Income | $3,931,440 | $3,982,145 | $4,022,610 | $4,549,161 | $4,841,557 | $22.93 | 94.8% |
| Total Expenses | $1,176,235 | $1,208,367 | $1,228,269 | $1,498,760 | $1,461,852 | $6.92 | 30.2% |
| Net Operating Income | $2,755,205 | $2,773,778 | $2,794,341 | $3,050,401 | $3,379,705 | $16.01 | 69.8% |
| Total TI/LC, Cap Ex / RR | 0 | 0 | 0 | 0 | 253,346 | 1.20 | 5.2 |
| Net Cash Flow | $2,755,205 | $2,773,778 | $2,794,341 | $3,050,401 | $3,126,359 | $14.81 | 64.6% |
| (1) | TTM represents the trailing 12-month period ending November 30, 2021. |
| (2) | % column represents percent of Net Rental Income for all revenue lines and represents percent of Effective Gross Income for the remainder of fields. |
| (3) | Rent Steps taken through July 2022. |
| THE INFORMATION IN THIS STRUCTURAL AND COLLATERAL TERM SHEET IS NOT COMPLETE AND MAY BE AMENDED PRIOR TO THE TIME OF SALE. THIS TERM SHEET IS NOT AN OFFER TO SELL THESE SECURITIES AND IT IS NOT A SOLICITATION OF AN OFFER TO BUY THESE SECURITIES IN ANY JURISDICTION WHERE THE OFFER OR SALE IS NOT PERMITTED. | ||
| 137 | ||
| Structural and Collateral Term Sheet | BMO 2022-C1 | |
| No. 12 – Northwest Capital Portfolio | ||
The Markets. The Northwest Capital Portfolio Properties are geographically diverse with properties located across five different submarkets.
| Northwest Capital Portfolio Properties Market Summary(1) | |||||||||
| Property Name / Location | Market | Submarket | Submarket Vacancy(2) | UW Rental Rate PSF(3) | Market Rental Rate PSF | Est. 2022 Zip Code Population | Est. 2022 County Population | Est. 2022 Zip Code Median Household Income | Est. 2022 County Median Household Income |
Center Plaza 2006 320th Street Federal Way, WA | Seattle | Federal Way / Auburn | 3.3% | $24.88 | Anchor Restaurant: $13.00 Low Exposure In-Line: $20.00 High Exposure In-Line: $32.00 Large Pad Site: $37.00 Small Pad Site: $50.00 | 50,772 | 2,325,075 | $68,313 | $115,207 |
Village by the Creek 800 164th Street Southeast and 16430 9th Avenue Southeast Mill Creek, WA | Seattle | Mill Creek / Woodinville | 1.8% | $29.68 | In-Line: $28.50 Outparcel: $47.50 | 73,878 | 850,697 | $132,399 | $100,210 |
Riverway Plaza 200 South Kelso Drive Kelso, WA | Longview | Cowlitz County | 2.6% | $9.95 | Anchor: $8.00 Jr. Anchor: $12.00 Large In-Line: $14.00 Small In-Line: $17.00 | 26,225 | 113,378 | $84,426 | $79,895 |
Pike Street Building 1406 East Pike Street Seattle, WA | Seattle | Capitol Hill / Central District | 2.8% | $28.09 | Retail: $27.00 Office: $29.00 | 43,574 | 2,325,075 | $98,555 | $115,207 |
Monroe Retail Center 19480 U.S. Highway 2 Monroe, WA | Seattle | South Snohomish County | 2.4% | $16.38 | In-Line Primary: $19.50 In-Line Secondary: $14.50 | 32,889 | 850,697 | $105,668 | $100,210 |
| (1) | Source: Appraisals. |
| (2) | As of the second quarter of 2021. |
| (3) | Based on the underwritten rent roll dated January 16, 2022. |
| THE INFORMATION IN THIS STRUCTURAL AND COLLATERAL TERM SHEET IS NOT COMPLETE AND MAY BE AMENDED PRIOR TO THE TIME OF SALE. THIS TERM SHEET IS NOT AN OFFER TO SELL THESE SECURITIES AND IT IS NOT A SOLICITATION OF AN OFFER TO BUY THESE SECURITIES IN ANY JURISDICTION WHERE THE OFFER OR SALE IS NOT PERMITTED. | ||
| 138 | ||
| Structural and Collateral Term Sheet | BMO 2022-C1 | |
| No. 13 – Victoria Village Apartments | ||
| Mortgage Loan Information | Property Information | |||
| Mortgage Loan Seller: | SMC | Single Asset / Portfolio: | Single Asset | |
| Original Principal Balance: | $33,000,000 | Title: | Fee | |
| Cut-off Date Principal Balance: | $32,877,137 | Property Type – Subtype: | Multifamily – Garden | |
| % of IPB: | 2.9% | Net Rentable Area (Units): | 612 | |
| Loan Purpose: | Refinance | Location: | Pasadena, TX | |
| Borrower: | APTVV, LLC | Year Built / Renovated: | 1972 / 2018 | |
| Borrower Sponsor: | Gary W. Gates, Jr. | Occupancy: | 94.3% | |
| Interest Rate: | 4.49000% | Occupancy Date: | 10/14/2021 | |
| Note Date: | 11/1/2021 | 4th Most Recent NOI (As of): | $2,600,248 (12/31/2018) | |
| Maturity Date: | 11/6/2031 | 3rd Most Recent NOI (As of): | $2,583,706 (12/31/2019) | |
| Interest-only Period: | None | 2nd Most Recent NOI (As of): | $2,696,213 (12/31/2020) | |
| Original Term: | 120 months | Most Recent NOI (As of): | $2,927,984 (TTM 11/30/2021) | |
| Original Amortization Term: | 360 months | UW Economic Occupancy: | 88.0% | |
| Amortization Type: | Amortizing Balloon | UW Revenues: | $4,957,494 | |
| Call Protection: | L(23),YM1(93),O(4) | UW Expenses: | $2,132,752 | |
| Lockbox / Cash Management: | Springing | UW NOI: | $2,824,743 | |
| Additional Debt: | No | UW NCF: | $2,671,743 | |
| Additional Debt Balance: | N/A | Appraised Value / Per Unit: | $52,400,000 / $85,621 | |
| Additional Debt Type: | N/A | Appraisal Date: | 10/19/2021 | |
| Escrows and Reserves | Financial Information | ||||||
| Initial | Monthly | Initial Cap | Cut-off Date Loan / Unit: | $53,721 | |||
| Taxes: | $0 | $38,411 | N/A | Maturity Date Loan / Unit: | $43,574 | ||
| Insurance: | $154,136 | $12,538 | N/A | Cut-off Date LTV(1): | 59.9% | ||
| Replacement Reserve: | $0 | $12,750 | N/A | Maturity Date LTV(1): | 48.0% | ||
| Economic Holdback(1): | $1,500,000 | $0 | N/A | UW NCF DSCR: | 1.33x | ||
| Renovation Reserve: | $500,000 | $0 | N/A | UW NOI Debt Yield(1): | 9.0% | ||
| Sources and Uses | |||||||
| Sources | Proceeds | % of Total | Uses | Proceeds | % of Total | ||
| Mortgage Loan | $33,000,000 | 100.0% | Payoff Existing Debt | $20,844,384 | 63.2% | ||
| Return of Equity | 9,292,794 | 28.2 | |||||
| Reserves | 2,154,136 | 6.5 | |||||
| Closing Costs | 708,687 | 2.1 | |||||
| Total Sources | $33,000,000 | 100.0% | Total Uses | $33,000,000 | 100.0% | ||
| (1) | At origination of the Victoria Village Apartments Mortgage Loan (as defined below), the borrower deposited $1,500,000 into an economic holdback reserve, to be released to the borrower upon the net operating income debt yield at the Victoria Village Apartments Property (as defined below) being at least 9.0% based on a trailing 12-month period. Notwithstanding the foregoing, no disbursement is permitted prior to the payment date in September 2022. Cut-off Date LTV, Maturity Date LTV and UW NOI Debt Yield calculations are based on an assumed Victoria Village Apartments Mortgage Loan Cut-off Date Balance of approximately $31,377,137, which is net of the $1,500,000 economic holdback reserve. Assuming the gross Victoria Village Apartments Mortgage Loan Cut-off Date Balance of approximately $32,877,137, Cut-off Date LTV, Maturity Date LTV and UW NOI Debt Yield calculations are 62.7%, 50.9% and 8.6%, respectively. |
The Loan. The thirteenth largest mortgage loan (the “Victoria Village Apartments Mortgage Loan”) has an outstanding principal balance as of the Cut-off Date of $32,877,137 and is secured by a first lien mortgage on the borrower’s fee simple interest in a 612-unit multifamily property located in Pasadena, Texas (the “Victoria Village Apartments Property”). The Victoria Village Apartments Mortgage Loan has a 10-year term and amortizes on a 30-year schedule.
| THE INFORMATION IN THIS STRUCTURAL AND COLLATERAL TERM SHEET IS NOT COMPLETE AND MAY BE AMENDED PRIOR TO THE TIME OF SALE. THIS TERM SHEET IS NOT AN OFFER TO SELL THESE SECURITIES AND IT IS NOT A SOLICITATION OF AN OFFER TO BUY THESE SECURITIES IN ANY JURISDICTION WHERE THE OFFER OR SALE IS NOT PERMITTED. | ||
| 139 | ||
| Structural and Collateral Term Sheet | BMO 2022-C1 | |
| No. 13 – Victoria Village Apartments | ||
The Property. The Victoria Village Apartments Property is a 612-unit garden-style multifamily property built in 1972 and renovated in 2018. As of October 14, 2021, the Victoria Village Apartments Property was 94.3% occupied. The Victoria Village Apartments Property is located at 1705 Jenkins Road, approximately 14 miles east of downtown Houston. The 20.22-acre parcel is improved with 58 two-story apartment buildings, one single-story leasing office, a single-story maintenance shop and four laundry facilities. The improvements are wood-frame construction. Access to the Victoria Village Apartments Property is controlled via electronic access gates located at the primary entry point. All parking spaces and vehicle drives are asphalt paved. The Victoria Village Apartments Property features one-, two- and three-bedroom layouts ranging in size from 746 to 1,296 square feet. Market rents range from approximately $735 to $1,090 per month, with an average market rent of $864 and an average unit size of 918 square feet. Community amenities include gated controlled access, laundry facilities, security system and sun deck.
The borrower sponsor acquired the Victoria Village Apartments Property in May 2016 for a purchase price of $20.25 million. At the time of acquisition, the Victoria Village Apartments Property was in need of significant capital infusion. Since acquisition, the borrower sponsor has invested approximately $6.1 million in capital improvements including approximately $2.4 million in interior unit upgrades. The borrower sponsor has increased and stabilized occupancy such that the average occupancy since January 2018 is approximately 94.6%.
Recent capital improvements include roof replacement, exterior siding replacement, exterior painting, sidewalk repair, HVAC replacement, parking repair, ceramic tile installation, unit rehab, new appliance installation, landscaping, electrical repairs and gate repairs. Additionally, the Victoria Village Apartments Mortgage Loan is structured with a $500,000 renovation reserve, which will be eligible to be drawn down for additional capital improvements to the Victoria Village Apartments Property.
| Victoria Village Apartments Unit Mix | ||||||||||
| Unit Type | Collateral Units(1) | % of Collateral Units(1) | Occupied Collateral Units(1) | % of Units Occupied(1) | Total Collateral SF(1) | Average Collateral SF(1) | Market Rent Per Unit(2) | Market Rent Per SF(2) | Average Rent Per Unit(1) | Average Rent Per SF(1) |
| 1 BR / 1 BA | 272 | 44.4% | 259 | 95.2% | 202,912 | 746 | $735 | $0.99 | $630 | $0.84 |
| 2 BR / 1 BA | 124 | 20.3% | 119 | 96.0% | 117,428 | 947 | $890 | $0.94 | $774 | $0.82 |
| 2 BR / 2 BA | 136 | 22.2% | 125 | 91.9% | 137,632 | 1,012 | $965 | $0.95 | $822 | $0.81 |
| 3 BR / 2 BA | 80 | 13.1% | 74 | 92.5% | 103,680 | 1,296 | $1,090 | $0.84 | $983 | $0.76 |
| Collateral Total/Wtd. Avg. | 612 | 100.0% | 577 | 94.3% | 561,652 | 918 | $864 | $0.94 | $747 | $0.82 |
| (1) | As provided by the borrower and as of October 14, 2021. |
| (2) | Source: Appraisal. |
COVID-19 Update. As of January 20, 2022, the tenant rental obligations at the Victoria Village Property have not been materially disrupted by the macro effects of the COVID-19 pandemic. As of February 1, 2022, the Victoria Village Apartments Mortgage Loan is not subject to any forbearance, modification or debt service relief requests.
The Market. According to the appraisal, the Victoria Village Apartments Property is located in the Houston Area multifamily market. As of September 2021, the Houston Area multifamily market average monthly asking rent per square foot was $1.31 and vacancy was 8.2%. According to the appraisal, the Victoria Village Apartments Property is located in the Pasadena/Deer Park/La Porte multifamily submarket. As of September 2021, the Pasadena/Deer Park/La Porte multifamily submarket average monthly asking rent per square foot was $1.11 and vacancy was 8.7%.
| THE INFORMATION IN THIS STRUCTURAL AND COLLATERAL TERM SHEET IS NOT COMPLETE AND MAY BE AMENDED PRIOR TO THE TIME OF SALE. THIS TERM SHEET IS NOT AN OFFER TO SELL THESE SECURITIES AND IT IS NOT A SOLICITATION OF AN OFFER TO BUY THESE SECURITIES IN ANY JURISDICTION WHERE THE OFFER OR SALE IS NOT PERMITTED. | ||
| 140 | ||
| Structural and Collateral Term Sheet | BMO 2022-C1 | |
| No. 13 – Victoria Village Apartments | ||
According to the appraisal, the estimated 2021 population within a one-, three- and five-mile radius of the Victoria Village Apartments Property is 24,848, 115,766 and 257,378, respectively. The estimated 2021 average household income within the same radii is $53,160, $56,919 and $65,424, respectively.
| Historical and Current Occupancy(1) | |||
| 2018 | 2019 | 2020 | Current(2) |
| 92.3% | 92.8% | 96.1% | 94.3% |
| (1) | Historical occupancy is as of December 31 of each respective year. |
| (2) | Current Occupancy is as of October 14, 2021. |
| Operating History and Underwritten Net Cash Flow | |||||||
| 2018 | 2019 | 2020 | TTM(1) | Underwritten | Per Unit | %(2) | |
| Gross Potential Rent | $4,284,506 | $4,172,435 | $4,257,362 | $4,779,010 | $5,549,484 | $9,068 | 100.0% |
| Net Rental Income | $4,284,506 | $4,172,435 | $4,257,362 | $4,779,010 | $5,549,484 | $9,068 | 100.0% |
| (Vacancy/Credit Loss) | 0 | 0 | 0 | 0 | (667,547) | (1,091) | (12.0%) |
| Other Income | 121,419 | 123,468 | 78,570 | 75,558 | 75,558 | 123 | 1.4% |
| Effective Gross Income | $4,405,924 | $4,295,903 | $4,335,932 | $4,854,567 | $4,957,494 | $8,100 | 89.3% |
| Total Expenses | $1,805,676 | $1,712,197 | $1,639,720 | $1,926,583 | $2,132,752 | $3,485 | 43.0% |
| Net Operating Income | $2,600,248 | $2,583,706 | $2,696,213 | $2,927,984 | $2,824,743 | $4,616 | 57.0% |
| Total TI/LC, Cap Ex / RR | 0 | 0 | 0 | 0 | 153,000 | 250 | 3.1% |
| Net Cash Flow | $2,600,248 | $2,583,706 | $2,696,213 | $2,927,984 | $2,671,743 | $4,366 | 53.9% |
| (1) | TTM reflects the trailing 12 months ending November 30, 2021. |
| (2) | % column represents percent of Gross Potential Rent for revenue fields and represents percent of Effective Gross Income for the remainder of fields. |
| THE INFORMATION IN THIS STRUCTURAL AND COLLATERAL TERM SHEET IS NOT COMPLETE AND MAY BE AMENDED PRIOR TO THE TIME OF SALE. THIS TERM SHEET IS NOT AN OFFER TO SELL THESE SECURITIES AND IT IS NOT A SOLICITATION OF AN OFFER TO BUY THESE SECURITIES IN ANY JURISDICTION WHERE THE OFFER OR SALE IS NOT PERMITTED. | ||
| 141 | ||
| Structural and Collateral Term Sheet | BMO 2022-C1 | |
| No. 14 – Tangent Industrial Park | ||
| Mortgage Loan Information | Property Information | |||
| Mortgage Loan Seller: | BMO | Single Asset / Portfolio: | Single Asset | |
| Original Principal Balance: | $31,500,000 | Title: | Fee | |
| Cut-off Date Principal Balance: | $31,500,000 | Property Type - Subtype: | Industrial – Warehouse / Other | |
| % of IPB: | 2.8% | Net Rentable Area (SF): | 490,680 | |
| Loan Purpose: | Acquisition | Location: | Tangent, OR | |
| Borrower: | KB Tangent Logistics, DST | Year Built / Renovated(1): | Various / 2007 | |
| Borrower Sponsor: | Jeffrey A. Pori | Occupancy: | 100.0% | |
| Interest Rate: | 3.83000% | Occupancy Date: | 12/3/2021 | |
| Note Date: | 12/28/2021 | 4th Most Recent NOI (As of): | NAV | |
| Maturity Date: | 1/6/2032 | 3rd Most Recent NOI (As of): | $2,061,612 (12/31/2019) | |
| Interest-only Period: | 120 months | 2nd Most Recent NOI (As of): | $2,215,238 (12/31/2020) | |
| Original Term: | 120 months | Most Recent NOI (As of): | $2,904,915 (T-6 Annualized 12/31/2021) | |
| Original Amortization Term: | None | UW Economic Occupancy: | 95.0% | |
| Amortization Type: | Interest Only | UW Revenues: | $3,600,075 | |
| Call Protection: | L(25),D(91),O(4) | UW Expenses: | $859,443 | |
| Lockbox / Cash Management: | Hard / Springing | UW NOI: | $2,740,633 | |
| Additional Debt: | No | UW NCF: | $2,706,285 | |
| Additional Debt Balance: | N/A | Appraised Value / Per SF: | $53,700,000 / $109 | |
| Additional Debt Type: | N/A | Appraisal Date: | 11/30/2021 | |
| Escrows and Reserves | Financial Information | |||||||
| Initial | Monthly | Initial Cap | Cut-off Date Loan / SF: | $64 | ||||
| Taxes: | $67,380 | $22,460 | N/A | Maturity Date Loan / SF: | $64 | |||
| Insurance: | $41,569 | $3,779 | N/A | Cut-off Date LTV: | 58.7% | |||
| Replacement Reserves: | $150,000 | Springing | $50,000 | Maturity Date LTV: | 58.7% | |||
| TI / LC: | $2,000,000 | Springing | $500,000 | UW NCF DSCR: | 2.21x | |||
| Prepaid Rent: | $17,730 | $0 | N/A | UW NOI Debt Yield: | 8.7% | |||
| Sources and Uses | ||||||
| Sources | Proceeds | % of Total | Uses | Proceeds | % of Total | |
| Mortgage Loan | $31,500,000 | 55.7% | Purchase Price | $53,000,000 | 93.8% | |
| Borrower Sponsor Equity | 25,010,354 | 44.3% | Upfront Reserves | 2,276,679 | 4.0 | |
| Closing Costs | 1,233,675 | 2.2 | ||||
| Total Sources | $56,510,354 | 100.0% | Total Uses | $56,510,354 | 100.0% | |
| (1) | The Tangent Industrial Park Property (as defined below) was built in 1979, 1984, 1987, 1988, 1989, 1990, 1996, 1997, 1998, and renovated in 2007. |
The Loan. The fourteenth largest mortgage loan (the “Tangent Industrial Park Mortgage Loan”) is secured by a first lien mortgage on the borrower’s fee simple interest in a 490,680 square foot industrial property located in Tangent, Oregon (the “Tangent Industrial Park Property”). The Tangent Industrial Park Mortgage Loan was originated by Bank of Montreal and has an outstanding principal balance as of the Cut-off Date of $31,500,000. The Tangent Industrial Park Mortgage Loan has a 10-year term and is interest-only for the entire term.
The Property. The Tangent Industrial Park Property is a 490,680 square foot industrial property located in Tangent, Oregon. The Tangent Industrial Park Property is comprised of nine buildings. The buildings were constructed between 1979 and 1998, with one building renovated in 2007. As of December 3, 2021, the Tangent Industrial Park Property was 100.0% occupied by fourteen tenants. Oregon Freeze Dry represents 26.3% of underwritten base rent and Georgia Pacific represents 15.4% of underwritten base rent, and no other tenant represents more than approximately 10.1% of the underwritten base rent. The majority of the space is utilized as warehouse space but there is also one truck terminal building, a training center for workers in the carpentry trade, a sheet metal fabrication facility and some space used by a robotics/R&D firm (affiliated with Oregon State University).
| THE INFORMATION IN THIS STRUCTURAL AND COLLATERAL TERM SHEET IS NOT COMPLETE AND MAY BE AMENDED PRIOR TO THE TIME OF SALE. THIS TERM SHEET IS NOT AN OFFER TO SELL THESE SECURITIES AND IT IS NOT A SOLICITATION OF AN OFFER TO BUY THESE SECURITIES IN ANY JURISDICTION WHERE THE OFFER OR SALE IS NOT PERMITTED. | ||
| 142 | ||
| Structural and Collateral Term Sheet | BMO 2022-C1 | |
| No. 14 – Tangent Industrial Park | ||
COVID-19 Update. As of February 1, 2022, the Tangent Industrial Park Property is open and operating. Tenants representing approximately 100% of the occupied square footage at the Tangent Industrial Park Property and approximately 100% of the underwritten base rent made their December 2021 and January 2022 rental payments. The first debt service payment for the Tangent Industrial Park Mortgage Loan is due in February 2022. As of February 1, 2022, the Tangent Industrial Park Mortgage Loan is not subject to any forbearance, modification or debt service relief request.
Major Tenants.
Oregon Freeze Dry (152,064 square feet; 31.0% NRA; 26.3% of underwritten base rent): Oregon Freeze Dry (“OFD”) was founded in 1963, when the company began drying sliced strawberries and other fruit for breakfast cereals. Since 1963, the company grew rapidly as it continued to manufacture nutritious, packaged food products and set the standard for freeze-drying/lyophilization. Further, OFD processes pharmaceutical and specialty chemicals, medical devices, probiotics, enzymes, proteins and other sensitive biological materials. The lease commenced in July 2006 and was last renewed in January 2012 with a current lease expiration in December 2023.
Georgia Pacific (75,000 square feet; 15.3% NRA; 15.4% of underwritten base rent): Georgia Pacific, one of the world’s leading makers of tissue, pulp, packaging, building products and related chemicals has over 180 locations worldwide. Founded in 1927, the company employs more than 30,000 people globally and invested over $9.4 billion into operations since 2013. This tenant has a warehouse space of 35,272 square feet in building 11 and a 39,728 square foot distribution center in building 21. The lease commenced in September 1991 and has been renewed multiple times since. The latest renewal commenced in October 2021 with an updated lease expiration date in October 2024.
Barenbrug (50,000 square feet; 10.2% NRA; 10.1% of underwritten base rent): Barenbrug is active in research and development of grass seed worldwide. Production, marketing and sales are also part of the company’s core activities. The company has research facilities in all the important climate zones including 6 continents with 18 operating companies and 22 research and development locations in more than 20 countries. The company currently has a total workforce of 840 employees and turnover of approximately $339 million. The Tangent Business Park Property is located adjacent to the Barenbrug US Headquarters building. The lease commenced in 1999 and has been renewed multiple times. The latest renewal occurred in December 2020 for a three-year term expiring in December 2023.
The Market. The Tangent Industrial Park Property is located within an industrial corridor along State Highway 34 in Tangent, Oregon. State Highway 34 and Interstate 5 provide access to the Tangent Industrial Park Property from the greater Albany metro area. Major employers in the area include Samaritan Health Services, ATI and Hewlett Packard. The closest major commercial corridors to the Tangent Industrial Park Property are Albany-Junction City Highway and Eagle Drive; providing supporting retail and entertainment services. According to the appraisal, development activity within the immediate area has been limited, as no new projects have come online in recent years.
The Tangent Industrial Park Property is located within the Albany industrial market. As of the third quarter of 2021, the Albany industrial market had an inventory of approximately 12,287,991 square feet, a vacancy rate of 0.7%, and an average asking rent per square foot of $0.63. The 2021 median household income within a one-, three-and five-mile radius of the Tangent Industrial Park Property was $69,542, $70,612 and $62,812, respectively. The 2021 population within the same radii is 817, 5,291 and 38,703, respectively.
| Historical and Current Occupancy | |||
| 2018(1) | 2019(1) | 2020(1) | Current(2) |
| NAV | NAV | NAV | 100.0% |
| (1) | The Tangent Industrial Park Property was acquired in 2021, therefor Historical Occupancy is not available. |
| (2) | Current Occupancy is as of December 3, 2021. |
| THE INFORMATION IN THIS STRUCTURAL AND COLLATERAL TERM SHEET IS NOT COMPLETE AND MAY BE AMENDED PRIOR TO THE TIME OF SALE. THIS TERM SHEET IS NOT AN OFFER TO SELL THESE SECURITIES AND IT IS NOT A SOLICITATION OF AN OFFER TO BUY THESE SECURITIES IN ANY JURISDICTION WHERE THE OFFER OR SALE IS NOT PERMITTED. | ||
| 143 | ||
| Structural and Collateral Term Sheet | BMO 2022-C1 | |
| No. 14 – Tangent Industrial Park | ||
| Largest Tenant Summary(1) | |||||||
| Tenant | Ratings Moody’s/S&P/Fitch(2) | Net Rentable Area (SF) | % of Total NRA | UW Base Rent PSF(3) | UW Base Rent(3) | % of Total UW Base Rent | Lease Exp. Date |
| Oregon Freeze Dry | NR/NR/NR | 152,064 | 31.0% | $5.88 | $894,132 | 26.3% | 12/31/2023 |
| Georgia Pacific | A3/A+/NR | 75,000 | 15.3 | 6.96 | 522,000 | 15.4 | 10/31/2024 |
| HP, Inc | Baa2/BBB/BBB+ | 48,800 | 9.9 | 7.20 | 351,360 | 10.3 | 11/30/2022 |
| Barenbrug | NR/NR/NR | 50,000 | 10.2 | 6.84 | 342,000 | 10.1 | 12/31/2023 |
| Iron Mountain | Ba3/BB-/NR | 36,648 | 7.5 | 7.42 | 271,928 | 8.0 | 2/28/2027 |
| Sheet Metal Solutions | NR/NR/NR | 28,224 | 5.8 | 7.44 | 209,987 | 6.2 | 12/31/2023 |
| Amazon | A1/AA/AA- | 23616 | 4.8 | 8.46 | 199,692 | 5.9 | 3/31/2025 |
| Willamette Carpenters(4) | NR/NR/NR | 30,000 | 6.1 | 5.86 | 175,680 | 5.2 | 3/31/2025 |
| Agility Robotics(5) | NR/NR/NR | 19,956 | 4.1 | 7.82 | 156,125 | 4.6 | Various |
| Flowers Bakery | NR/NR/NR | 4,400 | 0.9 | 19.54 | 85,972 | 2.5 | 2/29/2024 |
| Ten Largest Tenants | 468,708 | 95.5% | $6.85 | $3,208,875 | 94.4% | ||
| Remaining Occupied Tenants | 21,972 | 4.5 | 8.60 | 188,940 | 5.6 | ||
| Total Occupied | 490,680 | 100.0% | $6.92 | $3,397,815 | 100.0% | ||
| Vacant | 0 | 0.0 | |||||
| Total / Wtd. Avg. | 490,680 | 100.0% | |||||
| (1) | Based on the underwritten rent roll dated December 3, 2021. |
| (2) | In certain instances, ratings provided are for the parent company of the entity listed in the “Tenant” field whether or not the parent company guarantees the lease. |
| (3) | UW Base Rent PSF and UW Base Rent include straight-line average rent for Georgia Pacific, HP, Inc., and Amazon through their respective lease terms and contractual rent steps taken through March 2023 for the remaining tenants. |
| (4) | Williamette Carpenters has one, five-year renewal option. |
| (5) | Agility Robotics leases 16,500 square feet expiring on January 31, 2026 and 3,456 square feet expiring on December 31, 2022. |
| Lease Rollover Schedule(1)(2) | |||||||||
| Year | Number of Leases Expiring | Net Rentable Area Expiring | % of NRA Expiring | UW Base Rent Expiring(3) | % of UW Base Rent Expiring | Cumulative Net Rentable Area Expiring | Cumulative % of NRA Expiring | Cumulative UW Base Rent Expiring(3) | Cumulative % of UW Base Rent Expiring |
| Vacant | NAP | 0 | 0.0% | NAP | NAP | 0 | 0.0% | NAP | NAP |
| MTM | 2 | 14,272 | 2.9 | $64,800 | 1.9% | 14,272 | 2.9% | $64,800 | 1.9% |
| 2022 | 2 | 52,256 | 10.6 | 388,685 | 11.4 | 66,528 | 13.6% | $453,485 | 13.3% |
| 2023 | 5 | 237,988 | 48.5 | 1,570,259 | 46.2 | 304,516 | 62.1% | $2,023,743 | 59.6% |
| 2024 | 2 | 79,400 | 16.2 | 607,972 | 17.9 | 383,916 | 78.2% | $2,631,715 | 77.5% |
| 2025 | 2 | 53,616 | 10.9 | 375,372 | 11.0 | 437,532 | 89.2% | $3,007,087 | 88.5% |
| 2026 | 1 | 16,500 | 3.4 | 118,800 | 3.5 | 454,032 | 92.5% | $3,125,887 | 92.0% |
| 2027 | 1 | 36,648 | 7.5 | 271,928 | 8.0 | 490,680 | 100.0% | $3,397,815 | 100.0% |
| 2028 | 0 | 0 | 0.0 | 0 | 0.0 | 490,680 | 100.0% | $3,397,815 | 100.0% |
| 2029 | 0 | 0 | 0.0 | 0 | 0.0 | 490,680 | 100.0% | $3,397,815 | 100.0% |
| 2030 | 0 | 0 | 0.0 | 0 | 0.0 | 490,680 | 100.0% | $3,397,815 | 100.0% |
| 2031 | 0 | 0 | 0.0 | 0 | 0.0 | 490,680 | 100.0% | $3,397,815 | 100.0% |
| 2032 & Beyond | 0 | 0 | 0 | 0 | 0.0 | 490,680 | 100.0% | $3,397,815 | 100.0% |
| Total | 15 | 490,680 | 100.0% | $3,397,815 | 100.0% | ||||
| (1) | Based on the underwritten rent roll dated December 3, 2021. |
| (2) | Certain leases may have termination options that are exercisable prior to the originally stated expiration date of the lease and that are not considered in this Lease Rollover Schedule. |
| (3) | UW Base Rent Expiring and Cumulative UW Base Rent Expiring include straight-line average rent for Georgia Pacific, HP, Inc., and Amazon through their respective lease terms and contractual rent steps taken through March 2023 for the remaining tenants. |
| THE INFORMATION IN THIS STRUCTURAL AND COLLATERAL TERM SHEET IS NOT COMPLETE AND MAY BE AMENDED PRIOR TO THE TIME OF SALE. THIS TERM SHEET IS NOT AN OFFER TO SELL THESE SECURITIES AND IT IS NOT A SOLICITATION OF AN OFFER TO BUY THESE SECURITIES IN ANY JURISDICTION WHERE THE OFFER OR SALE IS NOT PERMITTED. | ||
| 144 | ||
| Structural and Collateral Term Sheet | BMO 2022-C1 | |
| No. 14 – Tangent Industrial Park | ||
| Operating History and Underwritten Net Cash Flow | ||||||
| 2019 | 2020 | TTM(1) | Underwritten | Per Square Foot | %(2) | |
| Rents in Place(3) | $2,607,000 | $2,763,000 | $3,239,000 | $3,397,815 | $6.92 | 92.1% |
| Total Base Rent | $2,607,000 | $2,763,000 | $3,239,000 | $3,397,815 | $6.92 | 92.1% |
| Total Reimbursements | 199,612 | 220,238 | 317,915 | 291,738 | 0.59 | 7.9 |
| Net Rental Income | $2,806,612 | $2,983,238 | $3,556,915 | $3,689,553 | $7.52 | 100.0% |
| Other Income | 71,000 | 92,000 | 95,000 | 95,000 | 0.19 | 2.6 |
| Effective Gross Income | $2,877,612 | $3,075,238 | $3,651,915 | $3,784,553 | $7.71 | 102.6% |
| Total Expenses | $816,000 | $860,000 | $747,000 | $859,443 | $1.75 | 22.7% |
| Net Operating Income | $2,061,612 | $2,215,238 | $2,904,915 | $2,740,633 | $5.59 | 72.4% |
| Capital Expenditures | 0 | 0 | 0 | 34,348 | 0.07 | 0.9 |
| TI / LC | 0 | 0 | 0 | 0 | 0.00 | 0.0 |
| Net Cash Flow | $2,061,612 | $2,215,238 | $2,904,915 | $2,706,285 | $5.52 | 71.5% |
| (1) | TTM reflects the trailing 6-month annualized as of December 31, 2021. |
| (2) | % column represents percent of Net Rental Income for all revenue lines and represents percent of Effective Gross Income for the remainder of fields. |
| (3) | Underwritten Rents in Place is based on in-place rent as of December 3, 2021 and includes straight-line average rent for Georgia Pacific, HP, Inc., and Amazon through their respective lease term and contractual rent steps taken through March 2023 for the remaining tenants. |
| THE INFORMATION IN THIS STRUCTURAL AND COLLATERAL TERM SHEET IS NOT COMPLETE AND MAY BE AMENDED PRIOR TO THE TIME OF SALE. THIS TERM SHEET IS NOT AN OFFER TO SELL THESE SECURITIES AND IT IS NOT A SOLICITATION OF AN OFFER TO BUY THESE SECURITIES IN ANY JURISDICTION WHERE THE OFFER OR SALE IS NOT PERMITTED. | ||
| 145 | ||
| Structural and Collateral Term Sheet | BMO 2022-C1 | |
| No. 15 – NYC MFRT Portfolio | ||
| Mortgage Loan Information | Property Information | |||
| Mortgage Loan Seller: | BMO | Single Asset / Portfolio: | Portfolio | |
| Original Principal Balance(1): | $30,000,000 | Title: | Fee | |
| Cut-off Date Principal Balance(1): | $30,000,000 | Property Type – Subtype: | Various | |
| % of IPB: | 2.7% | Net Rentable Area (SF): | 137,441 | |
| Loan Purpose: | Refinance | Location: | Various, NY | |
| Borrower: | 45 John NY LLC and 2027 LLC | Year Built / Renovated: | Various / Various | |
| Borrower Sponsor: | Yakubov US Trust 2013, a Florida Trust and Thomas Yakubaros | Occupancy: | 96.8% | |
| Interest Rate: | 3.96000% | Occupancy Date: | 11/11/2021 | |
| Note Date: | 1/21/2022 | 4th Most Recent NOI (As of): | NAV | |
| Maturity Date: | 2/6/2032 | 3rd Most Recent NOI (As of): | NAV | |
| Interest-only Period: | 120 months | 2nd Most Recent NOI (As of): | $4,279,127 (12/31/2020) | |
| Original Term: | 120 months | Most Recent NOI (As of): | $3,749,164 (TTM 10/31/2021) | |
| Original Amortization Term: | None | UW Economic Occupancy: | 95.8% | |
| Amortization Type: | Interest Only | UW Revenues: | $8,590,056 | |
| Call Protection: | L(24),D(92),O(4) | UW Expenses: | $3,495,638 | |
| Lockbox / Cash Management: | Soft (Residential); Hard (Commercial) / Springing | UW NOI: | $5,094,418 | |
| Additional Debt(1): | Yes | UW NCF: | $5,027,379 | |
| Additional Debt Balance(1): | $30,200,000 | Appraised Value / Per SF: | $116,900,000 / $851 | |
| Additional Debt Type(1): | Pari Passu | Appraisal Date: | Various | |
| Escrows and Reserves | Financial Information(1) | ||||||||||
| Initial | Monthly | Initial Cap | Cut-off Date Loan / SF: | $438 | |||||||
| Taxes: | $310,620 | $155,310 | N/A | Maturity Date Loan / SF: | $438 | ||||||
| Insurance: | $0 | $19,058 | N/A | Cut-off Date LTV: | 51.5% | ||||||
| Replacement Reserves: | $0 | $2,998 | N/A | Maturity Date LTV: | 51.5% | ||||||
| TI/LC: | $0 | $2,589 | N/A | UW NCF DSCR: | 2.08x | ||||||
| Other(2): | $549,626 | $0 | N/A | UW NOI Debt Yield: | 8.5% | ||||||
| Sources and Uses | |||||||||||
| Sources | Proceeds | % of Total | Uses | Proceeds | % of Total | ||||||
| Loan Combination | $60,200,000 | 89.1% | Payoff Existing Debt | $65,474,829 | 96.9% | ||||||
| Borrower Sponsor Equity | 7,399,151 | 10.9 | Closing Costs | 1,264,077 | 1.9 | ||||||
| Upfront Reserves | 860,246 | 1.3 | |||||||||
| Total Sources | $67,599,151 | 100.0% | Total Uses | $67,599,151 | 100.0% | ||||||
| (1) | The NYC MFRT Portfolio mortgage loan (as defined below) is part of the NYC MFRT Portfolio Loan Combination (as defined below) evidenced by three pari passu notes with an aggregate original principal balance of $60,200,000. The financial information presented in the chart above reflects the NYC MFRT Portfolio Loan Combination. For additional information, see “The Loan” below. |
| (2) | Other initial reserve consists of a capitalized holdback reserve ($339,268), gap rent reserve ($125,000), deferred maintenance reserve ($54,676) and reduced rent reserve ($30,682). |
The Loan. The fifteenth largest mortgage loan (the “NYC MFRT Portfolio Mortgage Loan”) is part of a loan combination (the “NYC MFRT Portfolio Loan Combination”) that is evidenced by three pari passu promissory notes in the aggregate original principal amount of $60,200,000. The NYC MFRT Portfolio Loan Combination was originated on January 21, 2022, by Bank of Montreal (“BMO”). The NYC MFRT Portfolio Loan Combination is secured by a first priority mortgage on the borrowers’ fee simple interest in a 137,441 square foot portfolio of multifamily and retail properties located in New York (the “NYC MFRT Portfolio Properties”). The NYC MFRT Portfolio Mortgage Loan is evidenced by the controlling promissory Note A-1, with a principal balance as of the Cut-off Date of $30,000,000. The remaining notes are currently held by an affiliate of BMO and are expected to be contributed to one or more future securitization trusts. The NYC MFRT Portfolio Loan Combination will be serviced pursuant to the pooling and servicing agreement for the BMO 2022-C1 trust.
| THE INFORMATION IN THIS STRUCTURAL AND COLLATERAL TERM SHEET IS NOT COMPLETE AND MAY BE AMENDED PRIOR TO THE TIME OF SALE. THIS TERM SHEET IS NOT AN OFFER TO SELL THESE SECURITIES AND IT IS NOT A SOLICITATION OF AN OFFER TO BUY THESE SECURITIES IN ANY JURISDICTION WHERE THE OFFER OR SALE IS NOT PERMITTED. | ||
| 146 | ||
| Structural and Collateral Term Sheet | BMO 2022-C1 | |
| No. 15 – NYC MFRT Portfolio | ||
| Loan Combination Summary | ||||
| Note | Original Balance | Cut-off Date Balance | Note Holder | Controlling Piece |
| A-1 | $30,000,000 | $30,000,000 | BMO 2022-C1 | Yes |
| A-2(1) | $15,200,000 | $15,200,000 | BMO | No |
| A-3(1) | $15,000,000 | $15,000,000 | BMO | No |
| Total | $60,200,000 | $60,200,000 | ||
| (1) | Expected to be contributed to one or more future securitization(s). |
The Property. The NYC MFRT Portfolio Properties consist of one, 14-story mixed use building (the “45 John Street Property”) and one, three-story retail building (the “2027-2127 Emmons Avenue Property”), with an aggregate net rentable area of 137,441 square feet, located in New York. As of November 11, 2021, the NYC MFRT Portfolio Properties were 96.8% leased in aggregate.
The 45 John Street Property is a 79,915 square foot, 14-story mixed use building located in New York, New York, consisting of 84 multifamily units and 4,600 SF of retail space. The multifamily unit mix consists of studios, 1-bedroom, and 2-bedroom units. As of November 11, 2021, the multifamily component of the 45 John Street Property was 98.8% occupied. Additionally, the 45 John Street Property contains 4,600 square feet of ground floor retail space. As of November 11, 2021, the retail component of the 45 John Street Property was 100.0% occupied by four tenants, Rezdora USA LLC, Suited Curation LLC, New Cingular Wireless PCS LLC and a management office. The multifamily component of the 45 John Street Property contributes approximately 88.0% of underwritten base rent at the 45 John Street Property and the commercial component contributes approximately 12.0% of the underwritten base rent at the 45 John Street Property.
The 45 John Street Property was originally constructed as an office building in 1908 until 2008 when the previous owner began converting the building from office use to residential condominium use. Upon acquisition in 2016, the borrower sponsor began implementing their plan of transitioning the 45 John Street Property from condo sales to a rental building. Since 2017, the borrower sponsor has invested approximately $28.2 million in conversion/renovation costs.
The 2027-2127 Emmons Avenue Property is a 57,526 square foot, three-story retail building located in Brooklyn, New York and was built in 1996. As of November 11, 2021, the 2027-2127 Emmons Avenue Property was 93.3% leased to nine retail tenants across a diverse spectrum of industries and is anchored by Macy’s Backstage.
The following table presents certain information relating to the multifamily unit mix at the 45 John Street Property:
| Multifamily Unit Mix(1) | |||||||||
| Unit Type | Number of Units | Number of Occupied Units | % of Units Occupied | Total SF | Average SF Per Unit | Average Rent Per Occupied Unit | Market Rent Per Unit(2) | Average Rent Per Occupied SF | Market Rent Per SF(2) |
| Studio | 4 | 4 | 100.0% | 2,356 | 589 | $2,600 | $2,800 | $4.41 | $4.75 |
| 1br / 1ba | 7 | 6 | 85.7% | 4,123 | 589 | $3,600 | $3,825 | $6.11 | $6.49 |
| 1br / 1.5ba | 34 | 34 | 100.0% | 28,531 | 839 | $4,269 | $4,383 | $5.09 | $5.05 |
| 1br / 2ba | 12 | 12 | 100.0% | 9,927 | 827 | $4,653 | NAV | $5.63 | NAV |
| 2br / 2ba | 26 | 26 | 100.0% | 29,024 | 1116 | $5,734 | $5,788 | $5.14 | $5.29 |
| 2br / 2.5ba | 1 | 1 | 100.0% | 1,354 | 1354 | $6,000 | $7,000 | $4.43 | $5.18 |
| Total/Wtd. Avg. | 84 | 83 | 98.8% | 75,315 | 897 | $4,675 | $4,784(3) | $5.19 | $5.24(3) |
| (1) | Based on the underwritten rent roll dated November 11, 2021. |
| (2) | Source: Appraisal. |
| (3) | The calculations for Total/Wtd. Avg. Market Rent Per Unit and Total/Wtd. Avg. Market Rent Per SF exclude 1br / 2ba units. |
Major Commercial Tenants.
Macy’s Backstage (31,282 square feet; 50.4% of commercial NRA; 34.9% of commercial underwritten base rent): Macy’s, Inc., an omnichannel retail organization, operates stores, websites, and mobile applications under the Macy’s, Bloomingdale’s, and bluemercury brands. It sells a range of merchandise, including apparel and accessories for men, women, and kids; cosmetics; home furnishings; and other consumer goods. As of January 30, 2021, the company operated 727 store locations in 43 states, the District of Columbia, Puerto Rico, and Guam. It also operates in Dubai, the United Arab Emirates and Al Zahra, Kuwait under license agreements. The company was formerly known as Federated Department Stores, Inc. and changed its name to Macy’s, Inc. in 2007. Macy’s, Inc. was founded in 1830 and is headquartered in New York, New York.
| THE INFORMATION IN THIS STRUCTURAL AND COLLATERAL TERM SHEET IS NOT COMPLETE AND MAY BE AMENDED PRIOR TO THE TIME OF SALE. THIS TERM SHEET IS NOT AN OFFER TO SELL THESE SECURITIES AND IT IS NOT A SOLICITATION OF AN OFFER TO BUY THESE SECURITIES IN ANY JURISDICTION WHERE THE OFFER OR SALE IS NOT PERMITTED. | ||
| 147 | ||
| Structural and Collateral Term Sheet | BMO 2022-C1 | |
| No. 15 – NYC MFRT Portfolio | ||
In 2015, Macy’s rolled out its new concept called Macy’s Backstage. Macy’s Backstage is a stand-alone off-price store offering a selection of top fashion brands including Ralph Lauren, Calvin Klein, Clinique, Estee Lauder and Levi’s, as well as a Sunglass Hut outpost and a Fur Salon. Macy’s Backstage offers new products every day to stay on-trend with the latest styles/fashion. There are more than 200 Macy’s Backstage stores across the United States.
Other major commercial tenants include Seaport Buffet (5,340 square feet; 8.6% of commercial NRA; 11.0% of commercial underwritten base rent), Skywise Lounge (5,923 square feet; 9.5% of commercial NRA; 10.7% of commercial underwritten base rent), Cats Café (4,000 square feet; 6.4% of commercial NRA; 8.8% of commercial underwritten base rent), and Rezdora USA LLC (1,600 square feet; 2.6% of commercial NRA; 8.7% of commercial underwritten base rent).
The following table presents certain information relating to the commercial tenants at the NYC MFRT Portfolio Properties:
| Commercial Tenant Summary(1) | ||||||||
| Tenant | Property | Ratings Moody’s/S&P/Fitch(2) | Net Rentable Area (SF) | % of Total NRA | UW Base Rent PSF(3) | UW Base Rent(3) | % of Total UW Base Rent | Lease Exp. Date |
| Macy’s Backstage | 2027-2127 Emmons Avenue | NR/NR/NR | 31,282 | 50.4% | $32.10 | $1,004,045 | 34.9% | 4/30/2025 |
| Seaport Buffet | 2027-2127 Emmons Avenue | NR/NR/NR | 5,340 | 8.6 | 59.03 | 315,241 | 11.0 | 8/31/2023 |
| Skywise Lounge | 2027-2127 Emmons Avenue | NR/NR/NR | 5,923 | 9.5 | 52.17 | 309,000 | 10.7 | 12/31/2031 |
| Cats Café | 2027-2127 Emmons Avenue | NR/NR/NR | 4,000 | 6.4 | 63.05 | 252,184 | 8.8 | 5/31/2028 |
| Rezdora USA LLC | 45 John Street | NR/NR/NR | 1,600 | 2.6 | 155.71 | 249,142 | 8.7 | 8/31/2034 |
| Management Office | 45 John Street | NR/NR/NR | 1,900 | 3.1 | 110.34 | 209,645 | 7.3 | 12/31/2036 |
| Suited Curation LLC | 45 John Street | NR/NR/NR | 900 | 1.4 | 152.98 | 137,684 | 4.8 | 5/15/2033 |
| ODA House Brooklyn | 2027-2127 Emmons Avenue | NR/NR/NR | 2,550 | 4.1 | 42.44 | 108,212 | 3.8 | 6/30/2026 |
| Yogurt City | 2027-2127 Emmons Avenue | NR/NR/NR | 1,300 | 2.1 | 56.44 | 73,376 | 2.5 | 5/31/2023 |
| Priceless Beauty | 2027-2127 Emmons Avenue | NR/NR/NR | 1,329 | 2.1 | 47.90 | 63,654 | 2.2 | 2/28/2026 |
| Ten Largest Tenants | 56,124 | 90.3% | $48.50 | $2,722,183 | 94.6% | |||
| Remaining Occupied Tenants | 2,165 | 3.5% | $72.28 | $156,483 | 5.4% | |||
| Total Occupied | 58,289 | 93.8% | $49.39 | $2,878,666 | 100.0% | |||
| Vacant | 3,837 | 6.2% | ||||||
| Total / Wtd. Avg. | 62,126 | 100.0% | ||||||
| (1) | Based on the commercial underwritten rent roll dated November 11, 2021. |
| (2) | In certain instances, ratings provided are for the parent company of the entity listed in the “Tenant” field whether or not the parent company guarantees the lease. |
| (3) | UW Base Rent PSF and UW Base Rent include rent steps through February 2023. |
| THE INFORMATION IN THIS STRUCTURAL AND COLLATERAL TERM SHEET IS NOT COMPLETE AND MAY BE AMENDED PRIOR TO THE TIME OF SALE. THIS TERM SHEET IS NOT AN OFFER TO SELL THESE SECURITIES AND IT IS NOT A SOLICITATION OF AN OFFER TO BUY THESE SECURITIES IN ANY JURISDICTION WHERE THE OFFER OR SALE IS NOT PERMITTED. | ||
| 148 | ||
| Structural and Collateral Term Sheet | BMO 2022-C1 | |
| No. 15 – NYC MFRT Portfolio | ||
The following table presents certain information relating to the commercial tenants at the NYC MFRT Portfolio Properties:
Commercial Lease Rollover Schedule(1)(2) | |||||||||
| Year | Number of Leases Expiring | NRA Expiring | % of NRA Expiring | UW Base Rent Expiring(3) | % of UW Base Rent Expiring | Cumulative Net Rentable Area Expiring | Cumulative % of NRA Expiring | Cumulative UW Base Rent Expiring(3) | Cumulative % of UW Base Rent Expiring |
| Vacant | NAP | 3,837 | 6.2% | NAP | NAP | 3,837 | 6.2% | NAP | NAP |
| MTM | 0 | 0 | 0.0 | $0 | 0.0% | 3,837 | 6.2% | $0 | 0.0% |
| 2022 | 1 | 200 | 0.3 | 45,229 | 1.6 | 4,037 | 6.5% | $45,229 | 1.6% |
| 2023 | 3 | 7,605 | 12.2 | 442,176 | 15.4 | 11,642 | 18.7% | $487,405 | 16.9% |
| 2024 | 0 | 0 | 0.0 | 0 | 0.0 | 11,642 | 18.7% | $487,405 | 16.9% |
| 2025 | 1 | 31,282 | 50.4 | 1,004,045 | 34.9 | 42,924 | 69.1% | $1,491,450 | 51.8% |
| 2026 | 2 | 3,879 | 6.2 | 171,866 | 6.0 | 46,803 | 75.3% | $1,663,316 | 57.8% |
| 2027 | 0 | 0 | 0.0 | 0 | 0.0 | 46,803 | 75.3% | $1,663,316 | 57.8% |
| 2028 | 1 | 4,000 | 6.4 | 252,184 | 8.8 | 50,803 | 81.8% | $1,915,500 | 66.5% |
| 2029 | 0 | 0 | 0.0 | 0 | 0.0 | 50,803 | 81.8% | $1,915,500 | 66.5% |
| 2030 | 1 | 1000 | 1.6 | 57,696 | 2.0 | 51,803 | 83.4% | $1,973,196 | 68.5% |
| 2031 | 1 | 5923 | 9.5 | 309,000 | 10.7 | 57,726 | 92.9% | $2,282,196 | 79.3% |
| 2032 & Beyond | 3 | 4,400 | 7.1 | 596,470 | 20.7 | 62,126 | 100.0% | $2,878,666 | 100.0% |
| Total | 13 | 62,126 | 100.0% | $2,878,666 | 100.0% | ||||
| (1) | Based on the commercial underwritten rent roll dated November 11, 2021. |
| (2) | Certain leases may have termination options that are exercisable prior to the originally stated expiration date of the lease and that are not considered in this Commercial Lease Rollover Schedule. |
| (3) | UW Base Rent Expiring and Cumulative UW Base Rent Expiring includes rent steps through February 2023. |
COVID-19 Update. Rezdora USA LLC and Suited Curation LLC received COVID concessions over the last 18 months. Rezdora USA LLC received approximately a 25% reduction in base rent from January through June 2022. At loan origination, the lender held back $30,682, representing the difference between their full rental obligations and the COVID concessions through June 2022. Suited Curation LLC received approximately a 50% reduction in base rent from May through December 2021. As of February 1, 2022, Suited Curation LLC was paying full rent and is open and operating. The first debt service payment for the NYC MFRT Portfolio Loan Combination is due in March 2022. As of February 1, 2022, the NYC MFRT Portfolio Loan Combination is not subject to any forbearance, modification or debt service relief request.
The Market. The 45 John Street Property is located in New York, New York, within the West Village/Downtown submarket. The 45 John Street Property is located in the Financial District of Manhattan, NY, less than a block away from the Fulton Street subway station with access to the 2, 3, 4, 5, A, C, J, and Z lines and within walking distance of the World Trade Center transportation hub. The 45 John Street Property is within walking distance of several retail outlets including Brookfield Place and Westfield’s World Trade Center mall. The 45 John Street Property is complemented by the live/work/play culture of the neighborhood.
As of the third quarter of 2021, the New York Metro multifamily market and the West Village/Downtown multifamily submarket had an inventory of approximately 232,447 units and 28,162 units, respectively. The New York Metro multifamily market had a vacancy rate of 3.6% and the West Village/Downtown multifamily submarket had a vacancy rate of 5.3%. The average asking rent per unit for the New York Metro multifamily market and West Village/Downtown multifamily submarket are $3,463 and $4,961, respectively. The 2021 average household income within a 0.25-, 0.5-, and one-mile radius of the 45 John Street Property was $213,703, $218,358 and $187,512, respectively. The 2021 population within the same radius is 20,961, 49,101 and 114,098, respectively.
The 2027-2127 Emmons Avenue Property is located in Brooklyn, New York within the South Brooklyn submarket. The 2027-2127 Emmons Avenue Property is situated in the neighborhood of Sheepshead Bay, a short walk to the Sheepshead Bay subway station with access to the B and Q lines. Additionally, the 2027-2127 Emmons Avenue Property is located one block from the Emmons Avenue/Ocean Avenue bus stop, providing access to the BM3. The 2027-2127 Emmons Avenue Property is in a neighborhood with a many single-family homes that provide a suburban feel.
As of the third quarter of 2021, the Brooklyn retail market and the South Brooklyn retail submarket had an inventory of approximately 104.3 million square feet and approximately 47.7 million square feet, respectively. The Brooklyn retail market had a vacancy rate of 3.4% and the South Brooklyn retail submarket had a vacancy rate of 3.5%. The average asking triple net rent per square feet for the Brooklyn retail market and South Brooklyn retail submarket are $46.90 and $46.33, respectively. The 2021 average household income within a one-, three-, and five-mile radius of the 2027-2127 Emmons Avenue Property was $89,739, $90,187 and $89,793, respectively. The 2021 population within the same radius is 88,505, 480,312 and 1,175,139, respectively.
| THE INFORMATION IN THIS STRUCTURAL AND COLLATERAL TERM SHEET IS NOT COMPLETE AND MAY BE AMENDED PRIOR TO THE TIME OF SALE. THIS TERM SHEET IS NOT AN OFFER TO SELL THESE SECURITIES AND IT IS NOT A SOLICITATION OF AN OFFER TO BUY THESE SECURITIES IN ANY JURISDICTION WHERE THE OFFER OR SALE IS NOT PERMITTED. | ||
| 149 | ||
| Structural and Collateral Term Sheet | BMO 2022-C1 | |
| No. 15 – NYC MFRT Portfolio | ||
| Historical and Current Occupancy | ||||
| Property | 2018 | 2019 | 2020 | Current(1) |
| 45 John Street | 93.0%(2) | 100.0%(2) | 94.0%(2) | 99.3% |
| 2027-2127 Emmons Avenue | 98.3% | 98.3% | 95.6% | 93.3% |
| (1) | Current occupancy is as of November 11, 2021. |
| (2) | Historical occupancy for the 45 John Street Property excludes the commercial space. |
| Operating History and Underwritten Net Cash Flow | |||||
2020 | TTM(1) | Underwritten | Per Square Foot | %(2) | |
| Gross Potential Rent - Resi | $4,247,986 | $3,708,702 | $4,704,744 | $34.23 | 53.8% |
| Gross Potential Rent - Comm | 3,399,832 | 3,277,545 | 3,089,701 | 22.48 | 35.3 |
| Gross Revenue | $7,647,818 | $6,986,247 | $7,794,445 | $56.71 | 89.2% |
| Total Reimbursements | 0 | 0 | 947,079 | 6.89 | 10.8 |
| Net Rental Income | $7,647,818 | $6,986,247 | $8,741,524 | $63.60 | 100.0% |
| Parking Income | 37,753 | 126,697 | 161,690 | 1.18 | 1.8 |
| Other Income | 22,834 | 39,019 | 39,019 | 0.28 | 0.4 |
| (Vacancy/Credit Loss) | 0 | 0 | (352,177) | (2.56) | (4.0) |
| Effective Gross Income | $7,708,404 | $7,151,964 | $8,590,056 | $62.50 | 98.3% |
| Total Expenses | $3,429,277 | $3,402,799 | $3,495,638 | $25.43 | 40.7% |
| Net Operating Income | $4,279,127 | $3,749,164 | $5,094,418 | $37.07 | 59.3% |
| Cap Ex | 0 | 0 | 35,975 | 0.26 | 0.4 |
| TI/LC | 0 | 0 | 31,063 | 0.23 | 0.4 |
| Net Cash Flow | $4,279,127 | $3,749,164 | $5,027,379 | $36.58 | 58.5% |
| (1) | TTM reflects the trailing 12 months ending October 31, 2021. |
| (2) | % column represents percent of Net Rental Income for all revenue lines and represents percent of Effective Gross Income for the remainder of the fields. |
| THE INFORMATION IN THIS STRUCTURAL AND COLLATERAL TERM SHEET IS NOT COMPLETE AND MAY BE AMENDED PRIOR TO THE TIME OF SALE. THIS TERM SHEET IS NOT AN OFFER TO SELL THESE SECURITIES AND IT IS NOT A SOLICITATION OF AN OFFER TO BUY THESE SECURITIES IN ANY JURISDICTION WHERE THE OFFER OR SALE IS NOT PERMITTED. | ||
| 150 | ||
| Structural and Collateral Term Sheet | BMO 2022-C1 | |
| Contacts | ||
| BMO Capital Markets CMBS Capital Markets & Banking | ||
| Contact | Phone Number | |
| Paul Vanderslice | paul.vanderslice@bmo.com | (203) 451-4151 |
| Managing Director | ||
| David Schell | david.schell@bmo.com | (201) 723-4872 |
| Managing Director | ||
| Ravish Kamath | ravish.kamath@bmo.com | (860) 771-0788 |
| Director | ||
| BMO Capital Markets CMBS Trading & Structuring | ||
| Contact | Phone Number | |
| Andrew Noonan | andrew.noonan@bmo.com | (646) 658-3932 |
| Managing Director | ||
| Mary Kunka | mary.kunka@bmo.com | (201) 247-4182 |
| Managing Director | ||
| Michael Chen | lei4.chen@bmo.com | (718) 869-0700 |
| Director | ||
| BMO Capital Markets Securitized Products Syndicate | ||
| Contact | Phone Number | |
| Alex Smith-Constantine | alex.smithconstantine@bmo.com | (212) 702-1866 |
| Managing Director | ||
| Trinian Donohoe | trinian.donohoe@bmo.com | (212) 702-1866 |
| Vice President | ||
| Deutsche Bank Securities CMBS Capital Markets & Banking | ||
| Contact | Phone Number | |
| Lainie Kaye | lainie.kaye@db.com | (212) 250-5270 |
| Managing Director | ||
| Cameron Cleveland | cameron.cleveland@db.com | (212) 250-9410 |
| Director | ||
| KeyBank CMBS Capital Markets and Banking | ||
| Contact | Phone Number | |
| Joe DeRoy | joe_a_deroy@keybank.com | (913) 317-4230 |
| Senior Vice President | ||
| Jeff Watzke | jeffrey_d_watzke@keybank.com | (312) 730-2735 |
| Senior Vice President | ||
| Kathy Messmer | kathy_messmer@keybank.com | (913) 317-4153 |
| Vice President | ||
| 151 | ||