| | | FREE WRITING PROSPECTUS |
| | | FILED PURSUANT TO RULE 433 |
| | | REGISTRATION FILE NO.: 333-255934-02 |
| Dated June 21, 2022 | BMO 2022-C2 |
Structural and Collateral Term Sheet |
BMO 2022-C2 Mortgage Trust |
$707,988,926 (Approximate Mortgage Pool Balance) |
| |
$600,725,000 (Approximate Offered Certificates) |
| |
BMO Commercial Mortgage Securities LLC Depositor |
| |
| |
| |
Commercial Mortgage Pass-Through Certificates, Series 2022-C2 |
| |
| |
Bank of Montreal KeyBank National Association German American Capital Corporation Citi Real Estate Funding Inc. UBS AG Starwood Mortgage Capital LLC Mortgage Loan Sellers |
BMO Capital
Markets | Deutsche Bank
Securities | UBS Securities
LLC | Citigroup | KeyBanc Capital
Markets |
| Co-Lead Managers and Joint Bookrunners |
Bancroft Capital, LLC
Co-Manager | | Drexel Hamilton, LLC
Co-Manager |
| THE INFORMATION IN THIS STRUCTURAL AND COLLATERAL TERM SHEET IS NOT COMPLETE AND MAY BE AMENDED PRIOR TO THE TIME OF SALE. THIS TERM SHEET IS NOT AN OFFER TO SELL THESE SECURITIES AND IT IS NOT A SOLICITATION OF AN OFFER TO BUY THESE SECURITIES IN ANY JURISDICTION WHERE THE OFFER OR SALE IS NOT PERMITTED. |
| Dated June 21, 2022 | BMO 2022-C2 |
This material is for your information, and none of BMO Capital Markets Corp., KeyBanc Capital Markets Inc., Deutsche Bank Securities Inc., UBS Securities LLC, Citigroup Global Markets Inc., Bancroft Capital, LLC and Drexel Hamilton, LLC (the “Underwriters”) are soliciting any action based upon it. This material is not to be construed as an offer to sell or the solicitation of any offer to buy any security in any jurisdiction where such an offer or solicitation would be illegal.
The depositor has filed a registration statement (including the prospectus) with the Securities and Exchange Commission (File No. 333-255934) for the offering to which this communication relates. Before you invest, you should read the prospectus in the registration statement and other documents the depositor has filed with the Securities and Exchange Commission for more complete information about the depositor, the issuing entity and this offering. You may get these documents for free by visiting EDGAR on the SEC website at www.sec.gov. Alternatively, the depositor or BMO Capital Markets Corp., any other underwriter, or any dealer participating in this offering will arrange to send you the prospectus if you request it by calling 1-866-864-7760. The Offered Certificates referred to in these materials, and the asset pool backing them, are subject to modification or revision (including the possibility that one or more Classes of Certificates may be split, combined or eliminated at any time prior to issuance or availability of a final prospectus) and are offered on a “when, as and if issued” basis. You understand that, when you are considering the purchase of these Certificates, a contract of sale will come into being no sooner than the date on which the relevant Class has been priced and we have verified the allocation of Certificates to be made to you; any “indications of interest” expressed by you, and any “soft circles” generated by us, will not create binding contractual obligations for you or us.
Neither this document nor anything contained in this document shall form the basis for any contract or commitment whatsoever. The information contained in this document is preliminary as of the date of this document, supersedes any previous such information delivered to you and will be superseded by any such information subsequently delivered prior to the time of sale. These materials are subject to change, completion or amendment from time to time. The information should be reviewed only in conjunction with the entire offering document relating to the Commercial Mortgage Pass-Through Certificates, Series 2022-C2 (the “Offering Document”). All of the information contained herein is subject to the same limitations and qualifications contained in the Offering Document. The information contained herein does not contain all relevant information relating to the underlying mortgage loans or mortgaged properties. Such information is described elsewhere in the Offering Document. The information contained herein will be more fully described elsewhere in the Offering Document. The information contained herein should not be viewed as projections, forecasts, predictions or opinions with respect to value. Prior to making any investment decision, prospective investors are strongly urged to read the Offering Document its entirety. Neither the Securities and Exchange Commission nor any state securities commission has approved or disapproved of these securities or determined if this free writing prospectus is truthful or complete. Any representation to the contrary is a criminal offense.
This document has been prepared by the Underwriters for information purposes only and does not constitute, in whole or in part, a prospectus for the purposes of Regulation (EU) 2017/1129 (as amended or superseded) and/or Part VI of the Financial Services and Markets Act 2000 (as amended) or other offering document.
The attached information contains certain tables and other statistical analyses (the “Computational Materials”) which have been prepared in reliance upon information furnished by the Mortgage Loan Sellers. Numerous assumptions were used in preparing the Computational Materials, which may or may not be reflected herein. As such, no assurance can be given as to the Computational Materials’ accuracy, appropriateness or completeness in any particular context; or as to whether the Computational Materials and/or the assumptions upon which they are based reflect present market conditions or future market performance. The Computational Materials should not be construed as either projections or predictions or as legal, tax, financial or accounting advice. You should consult your own counsel, accountant and other advisors as to the legal, tax, business, financial and related aspects of a purchase of these securities. Any weighted average lives, yields and principal payment periods shown in the Computational Materials are based on prepayment and/or loss assumptions, and changes in such prepayment and/or loss assumptions may dramatically affect such weighted average lives, yields and principal payment periods. In addition, it is possible that prepayments or losses on the underlying assets will occur at rates higher or lower than the rates shown in the attached Computational Materials. The specific characteristics of the securities may differ from those shown in the Computational Materials due to differences between the final underlying assets and the preliminary underlying assets used in preparing the Computational Materials. The principal amount and designation of any security described in the Computational Materials are subject to change prior to issuance. None of the Underwriters or any of their respective affiliates make any representation or warranty as to the actual rate or timing of payments or losses on any of the underlying assets or the payments or yield on the securities. The information in this presentation is based upon management forecasts and reflects prevailing conditions and management’s views as of this date, all of which are subject to change. In preparing this presentation, we have relied upon and assumed, without independent verification, the accuracy and completeness of all information available from public sources or which was provided to us by or on behalf of the Mortgage Loan Sellers or which was otherwise reviewed by us.
This document contains forward-looking statements. If and when included in this document, the words “expects”, “intends”, “anticipates”, “estimates” and analogous expressions and all statements that are not historical facts, including statements about our beliefs or expectations, are intended to identify forward-looking statements. Any forward-looking statements are made subject to risks and uncertainties which could cause actual results to differ materially from those stated. Those risks and uncertainties include, among other things, declines in general economic and business conditions, increased competition, changes in demographics, changes in political and social conditions, regulatory initiatives and changes in consumer preferences, many of which are beyond our control and the control of any other person or entity related to this offering. The forward-looking statements made in this document are made as of the date hereof. We have no obligation to update or revise any forward-looking statement.
BMO Capital Markets is a trade name used by BMO Financial Group for the wholesale banking businesses of Bank of Montreal, BMO Harris Bank N.A. (member FDIC), Bank of Montreal Europe p.l.c, and Bank of Montreal (China) Co. Ltd, the institutional broker dealer business of BMO Capital Markets Corp. (Member FINRA and SIPC) and the agency broker dealer business of Clearpool Execution Services, LLC (Member FINRA and SIPC) in the U.S., and the institutional broker dealer businesses of BMO Nesbitt Burns Inc. (Member Investment Industry Regulatory Organization of Canada and Member Canadian Investor Protection Fund) in Canada and Asia, Bank of Montreal Europe p.l.c. (authorized and regulated by the Central Bank of Ireland) in Europe and BMO Capital Markets Limited (authorized and regulated by the Financial Conduct Authority) in the UK and Australia.
IMPORTANT NOTICE RELATING TO AUTOMATICALLY-GENERATED EMAIL DISCLAIMERS
Any legends, disclaimers or other notices that may appear at the bottom of any email communication to which this document is attached relating to (1) these materials not constituting an offer (or a solicitation of an offer), (2) no representation that these materials are accurate or complete and may not be updated or (3) these materials possibly being confidential, are not applicable to these materials and should be disregarded. Such legends, disclaimers or other notices have been automatically generated as a result of these materials having been sent via Bloomberg or another system.
THE CERTIFICATES REFERRED TO IN THESE MATERIALS ARE SUBJECT TO MODIFICATION OR REVISION (INCLUDING THE POSSIBILITY THAT ONE OR MORE CLASSES OF CERTIFICATES MAY BE SPLIT, COMBINED OR ELIMINATED AT ANY TIME PRIOR TO ISSUANCE OR AVAILABILITY OF A FINAL PROSPECTUS) AND ARE OFFERED ON A “WHEN, AS AND IF ISSUED” BASIS.
THE UNDERWRITERS MAY FROM TIME TO TIME PERFORM INVESTMENT BANKING SERVICES FOR, OR SOLICIT INVESTMENT BANKING BUSINESS FROM, ANY COMPANY NAMED IN THESE MATERIALS. THE UNDERWRITERS AND/OR THEIR AFFILIATES OR RESPECTIVE EMPLOYEES MAY FROM TIME TO TIME HAVE A LONG OR SHORT POSITION IN ANY CERTIFICATE OR CONTRACT DISCUSSED IN THESE MATERIALS.
| THE INFORMATION IN THIS STRUCTURAL AND COLLATERAL TERM SHEET IS NOT COMPLETE AND MAY BE AMENDED PRIOR TO THE TIME OF SALE. THIS TERM SHEET IS NOT AN OFFER TO SELL THESE SECURITIES AND IT IS NOT A SOLICITATION OF AN OFFER TO BUY THESE SECURITIES IN ANY JURISDICTION WHERE THE OFFER OR SALE IS NOT PERMITTED. |
2
| Structural and Collateral Term Sheet | | BMO 2022-C2 |
| |
| Indicative Capital Structure |
| Offered Certificates | | | | | | | | |
Classes of Certificates | Expected Ratings (Fitch/Moody’s/KBRA)(1) | Approximate Initial
Certificate Balance
or Notional
Amount(2) | Approximate
Initial Credit
Support(3) | Initial
Pass-
Through
Rate(4) | Pass-Through
Rate
Description | Expected
Weighted Avg. Life (yrs.)(5) | Expected Principal
Window(5) |
| Class A-1 | AAAsf/Aaa(sf)/AAA(sf) | $6,784,000 | | 30.000% | % | (6) | 2.49 | 8/22-2/27 |
| Class A-2 | AAAsf/Aaa(sf)/AAA(sf) | $97,871,000 | | 30.000% | % | (6) | 4.86 | 2/27-7/27 |
| Class A-3 | AAAsf/Aaa(sf)/AAA(sf) | $6,700,000 | | 30.000% | % | (6) | 7.43 | 12/29-12/29 |
| Class A-4 | AAAsf/Aaa(sf)/AAA(sf) | (7) | | 30.000% | % | (6) | (7) | (7) |
| Class A-5 | AAAsf/Aaa(sf)/AAA(sf) | (7) | | 30.000% | % | (6) | (7) | (7) |
| Class A-SB | AAAsf/Aaa(sf)/AAA(sf) | $10,871,000 | | 30.000% | % | (6) | 7.32 | 7/27-1/32 |
| Class X-A | AAAsf/Aaa(sf)/AAA(sf) | $477,850,000(8) | | N/A | % | Variable IO(9) | N/A | N/A |
| Class A-S | AAAsf/Aa2(sf)/AAA(sf) | $59,731,000 | | 21.250% | % | (6) | 9.93 | 6/32-6/32 |
| Class B | AA-sf/NR/AA-(sf) | $31,572,000 | | 16.625% | % | (6) | 9.93 | 6/32-6/32 |
| Class C | A-sf/NR/A-(sf) | $31,572,000 | | 12.000% | % | (6) | 9.95 | 6/32-7/32 |
| | | | | | | | | |
| Non-Offered Certificates(10) | | | | | | |
Classes of Certificates | Expected Ratings (Fitch/Moody’s/KBRA)(1) | Approximate Initial
Certificate Balance
or Notional
Amount(2) | Approximate
Initial Credit
Support(3) | Initial
Pass-
Through
Rate(4) | Pass-Through
Rate
Description | Expected
Weighted Avg. Life (yrs.)(5) | Expected Principal
Window(5) |
| Class X-D | BBB-sf/NR/BBB-(sf) | $34,986,000 | (8) | N/A | % | Variable IO(9) | N/A | N/A |
| Class X-F | BB-sf/NR/BB-(sf) | $16,212,000 | (8) | N/A | % | Variable IO(9) | N/A | N/A |
| Class X-G | B-sf/NR/B-(sf) | $6,827,000 | (8) | N/A | % | Variable IO(9) | N/A | N/A |
| Class X-J | NR/NR/NR | $23,892,921 | (8) | N/A | % | Variable IO(9) | N/A | N/A |
| Class D | BBBsf/NR/BBB(sf) | $20,480,000 | | 9.000% | % | (6) | 10.01 | 7/32-7/32 |
| Class E | BBB-sf/NR/BBB-(sf) | $14,506,000 | | 6.875% | % | (6) | 10.01 | 7/32-7/32 |
| Class F | BB-sf/NR/BB-(sf) | $16,212,000 | | 4.500% | % | (6) | 10.01 | 7/32-7/32 |
| Class G-RR(11) | B-sf/NR/B-(sf) | $6,827,000 | | 3.500% | % | (6) | 10.01 | 7/32-7/32 |
| Class J-RR(11) | NR/NR/NR | $23,892,921 | | 0.000% | % | (6) | 10.01 | 7/32-7/32 |
| Class R(12) | N/A | N/A | | N/A | N/A | N/A | N/A | N/A |
| | | | | | | | | |
| Non-Offered Vertical Risk Retention Interest(10) | | | | | | |
Non-Offered Eligible Vertical Interest | Expected Ratings (Fitch/Moody’s/KBRA)(1) | Approximate Initial
Combined VRR
Interest Balance | Approximate Initial Credit Support(3) | Initial Effective Interest Rate | Effective Interest Rate Description | Expected Weighted Avg. Life (yrs.)(5) | Expected Principal Window(5) |
| Combined VRR Interest(13) | NR/NR/NR | $25,346,004(14) | N/A(15) | %(16) | (16) | 9.00 | 8/22-7/32 |
| (1) | It is a condition of issuance that the offered certificates and certain classes of non-offered certificates receive the ratings set forth above. The anticipated ratings shown are those of Fitch Ratings, Inc. (“Fitch”), Moody’s Investors Service Inc. (“Moody’s”) and Kroll Bond Rating Agency, LLC (“KBRA”), as indicated. Subject to the discussion under “Ratings” in the Preliminary Prospectus, the ratings on the certificates address the likelihood of the timely receipt by holders of all payments of interest to which they are entitled on each distribution date and, except in the case of the interest only certificates, the ultimate receipt by holders of all payments of principal to which they are entitled on or before the applicable rated final distribution date. Certain nationally recognized statistical rating organizations, as defined in Section 3(a)(62) of the Securities Exchange Act of 1934, as amended, that were not hired by the depositor may use information they receive pursuant to Rule 17g-5 under the Securities Exchange Act of 1934, as amended, or otherwise to rate the offered certificates. We cannot assure you as to what ratings a non-hired nationally recognized statistical rating organization would assign. See “Risk Factors—Other Risks Relating to the Certificates—Nationally Recognized Statistical Rating Organizations May Assign Different Ratings to the Certificates; Ratings of the Certificates Reflect Only the Views of the Applicable Rating Agencies as of the Dates Such Ratings Were Issued; Ratings May Affect ERISA Eligibility; Ratings May Be Downgraded” in the Preliminary Prospectus. Fitch, Moody’s and KBRA have informed us that the “sf” designation in the ratings represents an identifier of structured finance product ratings. For additional information about this identifier, prospective investors can go to the related rating agency’s website. The depositor and the underwriters have not verified, do not adopt and do not accept responsibility for any statements made by the rating agencies on those websites. Credit ratings referenced throughout this Term Sheet are forward-looking opinions about credit risk and express a rating agency’s opinion about the willingness and ability of an issuer of securities to meet its financial obligations in full and on time. Ratings are not indications of investment merit and are not buy, sell or hold recommendations, a measure of asset value or an indication of the suitability of an investment. |
| (2) | Approximate, subject to a variance of plus or minus 5% and further subject to any additional variances described in the footnotes below. In addition, the notional amounts of the Class X-A, Class X-D, Class X-F, Class X-G and Class X-J certificates (the “Class X certificates”) may vary depending upon the final pricing of the classes of non-vertically retained principal balance certificates (as defined in footnote (6) below) whose certificate balances comprise such notional amounts, and, if as a result of such pricing (a) the pass-through rate of any class of Class X certificates, would be equal to zero at all times, such class of certificates will not be issued on the closing date of this securitization or (b) the pass-through rate of any class of principal balance certificates whose certificate balance comprises such notional amount is at all times equal to the weighted average of the net interest rates on the mortgage loans (in each case, adjusted, if necessary, to accrue on the basis of a 360-day year consisting of twelve 30-day months) as in effect from time to time, the certificate balance of such class of principal balance certificates may not be part of, and there would be a corresponding reduction in, such notional amount of the related class of Class X certificates. |
| (3) | “Approximate Initial Credit Support” means, with respect to any class of non-vertically retained principal balance certificates, the quotient, expressed as a percentage, of (i) the aggregate of the initial certificate balances of all classes of non-vertically retained principal balance certificates, if any, junior to the subject class of non-vertically retained principal balance certificates, divided by (ii) the aggregate of the initial certificate balances of all classes of non-vertically retained principal balance certificates. The approximate initial credit support percentages set forth for the Class A-1, Class A-2, Class A-3, Class A-4, Class A-5 and Class A-SB certificates are represented in the aggregate. The approximate initial credit support percentages shown in the table above with respect to the non-vertically retained principal balance certificates do not take into account the Combined VRR Interest (as defined in footnote (13)) below. |
| (4) | Approximate per annum rate as of the closing date. |
| (5) | Determined assuming no prepayments prior to the maturity date or any anticipated repayment date, as applicable, for any mortgage loan and based on the modeling assumptions described under “Yield, Prepayment and Maturity Considerations” in the preliminary prospectus. |
| THE INFORMATION IN THIS STRUCTURAL AND COLLATERAL TERM SHEET IS NOT COMPLETE AND MAY BE AMENDED PRIOR TO THE TIME OF SALE. THIS TERM SHEET IS NOT AN OFFER TO SELL THESE SECURITIES AND IT IS NOT A SOLICITATION OF AN OFFER TO BUY THESE SECURITIES IN ANY JURISDICTION WHERE THE OFFER OR SALE IS NOT PERMITTED. |
3
| Structural and Collateral Term Sheet | | BMO 2022-C2 |
| |
| Indicative Capital Structure |
| (6) | For any distribution date, the pass-through rate for each class of the Class A-1, Class A-2, Class A-3, Class A-4, Class A-5, Class A-SB, Class A-S, Class B, Class C, Class D, Class E, Class F, Class G-RR and Class J-RR certificates (collectively, the “non-vertically retained principal balance certificates”), and collectively with the Class X certificates and the Class R certificates, the ” non-vertically retained certificates”) will generally be equal to one of (i) a fixed per annum rate, (ii) the weighted average of the net interest rates on the mortgage loans (in each case, adjusted, if necessary, to accrue on the basis of a 360-day year consisting of twelve 30-day months) as in effect from time to time, (iii) a rate equal to the lesser of a specified per annum rate and the weighted average rate described in clause (ii), or (iv) the weighted average rate described in clause (ii) less a specified percentage, but no less than 0.000%. See “Description of the Certificates—Distributions—Pass-Through Rates” in the preliminary prospectus. |
| (7) | The exact initial certificate balances of the Class A-4 and Class A-5 certificates are unknown and will be determined based on the final pricing of those classes of certificates. However, the respective initial certificate balances, weighted average lives and principal windows of the Class A-4 and Class A-5 certificates are expected to be within the applicable ranges reflected in the following chart. The aggregate initial certificate balance of the Class A-4 and Class A-5 certificates is expected to be approximately $355,624,000 subject to a variance of plus or minus 5%. |
Class of
Certificates | Expected Range of Initial
Certificate Balances | Expected Range of
Weighted Avg.
Lives (Yrs) | Expected Range of
Principal Windows |
| | | | |
| Class A-4 | $0 - $155,000,000 | N/A – 9.70 | N/A - 1/32-4/32 |
| | | | |
| Class A-5 | $200,624,000 - $355,624,000 | 9.86 – 9.79 | 4/32-6/32 - 1/32-6/32 |
| (8) | The Class X certificates will not have certificate balances and will not be entitled to receive distributions of principal. Interest will accrue on each class of Class X certificates at the related pass through rate based upon the related notional amount. The notional amount of each class of the Class X certificates will be equal to the certificate balance or the aggregate of the certificate balances, as applicable, from time to time of the class or classes of the non-vertically retained principal balance certificates identified in the same row as such class of Class X certificates in the chart below (as to such class of Class X certificates, the “corresponding principal balance certificates”): |
Class of Class X
Certificates | Class(es) of Corresponding
Principal Balance Certificates |
| Class X-A | Class A-1, Class A-2, Class A-3, Class A-4, Class A-5 and Class A-SB |
| Class X-D | Class D and Class E |
| Class X-F | Class F |
| Class X-G | Class G-RR |
| Class X-J | Class J-RR |
| (9) | The pass-through rate for each class of Class X certificates will generally be a per annum rate equal to the excess, if any, of (i) the weighted average of the net interest rates on the mortgage loans (in each case, adjusted, if necessary, to accrue on the basis of a 360-day year consisting of twelve 30-day months) as in effect from time to time, over (ii) the pass-through rate (or, if applicable, the weighted average of the pass-through rates) of the class or classes of corresponding principal balance certificates as in effect from time to time, as described in the preliminary prospectus. |
| (10) | The classes of certificates and uncertificated interests set forth below “Non-Offered Certificates” and “Non-Offered Vertical Risk Retention Interest” in the table are not offered hereby. |
| (11) | In partial satisfaction of the risk retention obligations of Bank of Montreal’s risk retention obligations as retaining sponsor for this securitization transaction, all of the Class G-RR and Class J-RR certificates (collectively, the “HRR Certificates”), with an aggregate fair value expected to represent at least 1.4231% of the fair value, as of the closing date for this securitization transaction, of all of the “ABS interests” (i.e. all of the certificates (other than the Class R certificates) and the Uncertificated VRR Interest) issued by the issuing entity, will collectively constitute an “eligible horizontal residual interest” that is to be purchased and retained by RREF IV-D AIV RR, LLC, a Delaware limited liability company, or its affiliate in accordance with the credit risk retention rules applicable to this securitization transaction. “Retaining sponsor,” “ABS interests” and “eligible horizontal residual interest” have the meanings given to such terms in Regulation RR. See “Credit Risk Retention” in the Preliminary Prospectus. |
| (12) | The Class R certificates will not have a certificate balance, notional amount, pass-through rate, rating or rated final distribution date. The Class R certificates will represent the residual interests in each of two separate REMICs, as further described in the preliminary prospectus. The Class R certificates will not be entitled to distributions of principal or interest. |
| (13) | In satisfaction of Bank of Montreal’s remaining risk retention obligations as retaining sponsor for this securitization transaction, Bank of Montreal is expected to acquire (or cause one or more other retaining parties to acquire) from the depositor, on the closing date for this transaction, portions of an “eligible vertical interest” in the form of a “single vertical security” with an initial principal balance of approximately $25,346,004 (the “Combined VRR Interest)], which is expected to represent approximately 3.58% of the aggregate principal balance of all the “ABS interests” (i.e., the sum of the aggregate initial certificate balance of all of the certificates (other than the Class R certificates) and the initial principal balance of the Uncertificated VRR Interest) issued by the issuing entity on the closing date for this transaction, subject to any variation in the initial principal balance of the Combined VRR Interest following calculation of the actual fair value of the HRR Certificates, all of the other classes of certificates (other than the Class R certificates) and the Uncertificated VRR Interest, as described under “Credit Risk Retention”. The Combined VRR Interest will consist of the “Uncertificated VRR Interest” (as defined under “Credit Risk Retention”) and the Class VRR certificates. The Combined VRR Interest will be retained by certain retaining parties in accordance with the credit risk retention rules applicable to this securitization transaction. “Eligible vertical interest” and “single vertical security” will have the meanings given to such terms in Regulation RR. See “Credit Risk Retention”. The Combined VRR Interest is not offered hereby. |
| (14) | Constitutes the Combined VRR Interest Balance, which consists of the aggregate certificate balance of the Class VRR Certificates and the principal balance of the Uncertificated VRR Interest. |
| (15) | Although the approximate initial credit support percentages shown in the table above with respect to the non-vertically retained principal balance certificates do not take into account the Combined VRR Interest, losses incurred on the mortgage loans will be allocated between the Combined VRR Interest, on the one hand, and the non-vertically retained principal balance certificates, on the other hand, pro rata in accordance with the principal balance of the Combined VRR Interest and the aggregate outstanding certificate balance of the non-vertically retained principal balance certificates. See “Credit Risk Retention” and “Description of the Certificates” in the preliminary prospectus. The Class VRR certificates and the non-vertically retained principal balance certificates are also collectively referred to as the “principal balance certificates”, and the Class VRR certificates and the non-vertically retained certificates are collectively referred to as the “Certificates”. |
| (16) | Although it does not have a specified pass-through rate (other than for tax reporting purposes), the effective interest rate for the Combined VRR Interest will be the weighted average of the net mortgage interest rates on the mortgage loans (in each case, adjusted, if necessary, to accrue on the basis of a 360-day year consisting of twelve 30-day months) as in effect from time to time. |
| THE INFORMATION IN THIS STRUCTURAL AND COLLATERAL TERM SHEET IS NOT COMPLETE AND MAY BE AMENDED PRIOR TO THE TIME OF SALE. THIS TERM SHEET IS NOT AN OFFER TO SELL THESE SECURITIES AND IT IS NOT A SOLICITATION OF AN OFFER TO BUY THESE SECURITIES IN ANY JURISDICTION WHERE THE OFFER OR SALE IS NOT PERMITTED. |
4
| Structural and Collateral Term Sheet | | BMO 2022-C2 |
| |
| Summary of Transaction Terms |
| Securities Offered: | $600,725,000 monthly pay, multi-class, commercial mortgage REMIC Pass-Through Certificates. |
| Co-Lead Managers and Joint Bookrunners: | BMO Capital Markets Corp., KeyBanc Capital Markets Inc., Deutsche Bank Securities Inc., UBS Securities LLC and Citigroup Global Markets Inc. |
| Co-Managers: | Bancroft Capital, LLC and Drexel Hamilton, LLC |
| Mortgage Loan Sellers: | KeyBank National Association (“KeyBank”) (29.5%); Bank of Montreal (“BMO”) (24.4%); German American Capital Corporation (“GACC”) (14.8%); Citi Real Estate Funding Inc. (“CREFI”) (13.5%); UBS AG (“UBS”) (13.1%) and Starwood Mortgage Capital LLC (“SMC”) (4.7%). |
| Master Servicer: | Midland Loan Services, a Division of PNC Bank, National Association. |
| Special Servicer: | Rialto Capital Advisors, LLC |
| Directing Holder/Controlling Class Representative: | RREF IV Debt AIV, LP. |
| Trustee: | Wilmington Trust, National Association. |
| Certificate Administrator: | Computershare Trust Company, National Association. |
| Operating Advisor: | Pentalpha Surveillance LLC. |
| Asset Representations Reviewer: | Pentalpha Surveillance LLC. |
| Rating Agencies: | Fitch Ratings, Inc. (“Fitch”), Moody’s Investors Service, Inc. (“Moody’s”) and Kroll Bond Rating Agency, LLC (“KBRA”). |
| U.S. Credit Risk Retention: | For a discussion on the manner in which BMO as retaining sponsor, intends to satisfy the U.S. credit risk retention requirements, see “Credit Risk Retention” in the Preliminary Prospectus. |
| EU Credit Risk Retention: | The transaction is not structured to satisfy the EU risk retention and due diligence requirements. |
| Closing Date: | On or about July 12, 2022. |
| Cut-off Date: | With respect to each mortgage loan, the related due date in July 2022, or in the case of any mortgage loan that has its first due date after July 2022, the date that would have been its due date in July 2022 under the terms of that mortgage loan if a monthly debt service payment were scheduled to be due in that month. |
| Distribution Date: | The 4th business day after the Determination Date in each month, commencing in August 2022. |
| Determination Date: | 11th day of each month, or if the 11th day is not a business day, the next succeeding business day, commencing in August 2022. |
| Assumed Final Distribution Date: | The Distribution Date in July 2032 which is the latest anticipated repayment date of the Certificates. |
| Rated Final Distribution Date: | The Distribution Date in July 2054. |
| Tax Treatment: | The Publicly Offered Certificates are expected to be treated as REMIC “regular interests” for U.S. federal income tax purposes. |
| Form of Offering: | The Class A-1, Class A-2, Class A-3, Class A-4, Class A-5, Class A-SB, Class X-A, Class A-S, Class B and Class C Certificates (the “Publicly Offered Certificates”) will be offered publicly. The Class X-D, Class X-F, Class X-G, Class X-J, Class D, Class E, Class F, Class G-RR, Class J-RR and Class R Certificates (the “Privately Offered Certificates”) will be offered domestically to Qualified Institutional Buyers and to Institutional Accredited Investors (other than the Class R Certificates) and to institutions that are not U.S. Persons pursuant to Regulation S. |
| SMMEA Status: | The Certificates will not constitute “mortgage related securities” for purposes of SMMEA. |
| ERISA: | The Publicly Offered Certificates are expected to be ERISA eligible. |
| Optional Termination: | On any Distribution Date on which the aggregate principal balance of the pool of mortgage loans is less than 1% of the aggregate principal balance of the mortgage loans as of the cut-off date, certain entities specified in the Preliminary Prospectus will have the option to purchase all of the remaining mortgage loans (and all property acquired through exercise of remedies in respect of any mortgage loan) at the price specified in the Preliminary Prospectus. Refer to “Pooling and Servicing Agreement—Termination; Retirement of Certificates” in the Preliminary Prospectus. |
| Minimum Denominations: | The Publicly Offered Certificates (other than the Class X-A Certificates) will be issued in minimum denominations of $10,000 and integral multiples of $1 in excess of $10,000. The Class X-A will be issued in minimum denominations of $1,000,000 and in integral multiples of $1 in excess of $1,000,000. |
| Settlement Terms: | DTC, Euroclear and Clearstream Banking. |
| Analytics: | The transaction is expected to be modeled by Intex Solutions, Inc. and Trepp, LLC and is expected to be available on Bloomberg, L.P, BlackRock Financial Management, Inc., CMBS.com, Inc., Moody’s Analytics, Markit Group Limited, RealINSIGHT, Thompson Reuters Corporation, Intercontinental Exchange | ICE Data Services, KBRA Analytics, LLC and DealView Technologies Ltd. |
| Risk Factors: | THE CERTIFICATES INVOLVE CERTAIN RISKS AND MAY NOT BE SUITABLE FOR ALL INVESTORS. REFER TO THE “SUMMARY OF RISK FACTORS” AND “RISK FACTORS” SECTIONS OF THE PRELIMINARY PROSPECTUS. |
| THE INFORMATION IN THIS STRUCTURAL AND COLLATERAL TERM SHEET IS NOT COMPLETE AND MAY BE AMENDED PRIOR TO THE TIME OF SALE. THIS TERM SHEET IS NOT AN OFFER TO SELL THESE SECURITIES AND IT IS NOT A SOLICITATION OF AN OFFER TO BUY THESE SECURITIES IN ANY JURISDICTION WHERE THE OFFER OR SALE IS NOT PERMITTED. |
5
| Structural and Collateral Term Sheet | | BMO 2022-C2 |
| |
| Collateral Characteristics |
Mortgage Loan Seller | Number of
Mortgage Loans | Number of
Mortgaged
Properties | Aggregate
Cut-off Date Balance | % of
IPB | Roll-up
Aggregate
Cut-off Date
Balance | Roll-up
Aggregate
% of Cut-off
Date Balance |
| KeyBank | 16 | 27 | $208,929,293 | 29.5% | $208,929,293 | 29.5% |
| BMO | 8 | 23 | $127,800,000 | 18.1% | $172,800,000 | 24.4% |
| GACC | 2 | 2 | $105,000,000 | 14.8% | $105,000,000 | 14.8% |
| CREFI | 4 | 4 | $60,327,018 | 8.5% | $95,327,018 | 13.5% |
| UBS AG | 5 | 52 | $92,932,616 | 13.1% | $92,932,616 | 13.1% |
| SMC | 1 | 1 | $13,000,000 | 1.8% | $33,000,000 | 4.7% |
| BMO, SMC, CREFI | 1 | 2 | $70,000,000 | 9.9% | - | - |
| CREFI, BMO | 1 | 1 | $30,000,000 | 4.2% | - | - |
| Total: | 38 | 112 | $707,988,926 | 100.0% | $707,988,926 | 100.0% |
| Loan Pool | |
| | Initial Pool Balance (“IPB”): | $707,988,926 |
| | Number of Mortgage Loans: | 38 |
| | Number of Mortgaged Properties: | 112 |
| | Average Cut-off Date Balance per Mortgage Loan: | $18,631,288 |
| | Weighted Average Current Mortgage Rate: | 4.83245% |
| | 10 Largest Mortgage Loans as % of IPB: | 57.8% |
| | Weighted Average Remaining Term to Maturity: | 109 months |
| | Weighted Average Seasoning: | 2 months |
| Credit Statistics | |
| | Weighted Average UW NCF DSCR(1)(2): | 2.15x |
| | Weighted Average UW NOI Debt Yield(1)(3): | 10.8% |
| | Weighted Average Cut-off Date Loan-to-Value Ratio (“LTV”)(1)(3)(4): | 52.1% |
| | Weighted Average Maturity Date/ARD LTV(1)(4): | 50.6% |
| Other Statistics | |
| | % of Mortgage Loans with Additional Debt: | 17.5% |
| | % of Mortgage Loans with Single Tenants(5): | 26.5% |
| | % of Mortgage Loans secured by Multiple Properties: | 27.5% |
| Amortization | |
| | Weighted Average Original Amortization Term(6): | 354 months |
| | Weighted Average Remaining Amortization Term(6): | 351 months |
| | % of Mortgage Loans with Interest-Only: | 79.9% |
| | % of Mortgage Loans with Amortizing Balloon: | 12.1% |
| | % of Mortgage Loans with Partial Interest-Only followed by Amortizing Balloon: | 8.0% |
| Lockboxes(7) | |
| | % of Mortgage Loans with Hard Lockboxes: | 70.4% |
| | % of Mortgage Loans with Springing Lockboxes: | 17.3% |
| | % of Mortgage Loans with Soft (Residential); Hard (Commercial) Lockbox: | 9.9% |
| | % of Mortgage Loans with Soft Lockboxes: | 2.4% |
| Reserves | |
| | % of Mortgage Loans Requiring Monthly Tax Reserves: | 86.9% |
| | % of Mortgage Loans Requiring Monthly Insurance Reserves: | 43.5% |
| | % of Mortgage Loans Requiring Monthly CapEx Reserves: | 61.8% |
| | % of Mortgage Loans Requiring Monthly TI/LC Reserves(8): | 27.2% |
| (1) | In the case of Loan Nos. 1, 2, 3, 4, 5, 6, 7, 8, 9, 10, 12, 17 and 25, the UW NCF DSCR, UW NOI Debt Yield, Cut-off Date Loan-to-Value Ratio and Maturity Date/ARD Loan-to-Value Ratio calculations include the related Pari Passu Companion Loan(s). In the case of Loan Nos. 1, 6 and 9, the UW NCF DSCR, UW NOI Debt Yield, Cut-off Date Loan-to-Value Ratio and Maturity Date/ARD Loan-to-Value Ratio calculations exclude the related Subordinate Companion Loans and/or Mezzanine Loans. |
| (2) | For the mortgage loans that are interest-only for the entire term and accrue interest on an Actual/360 basis, the Monthly Debt Service Amount ($) was calculated as 1/12th of the product of (i) the Original Balance ($), (ii) the Interest Rate % and (iii) 365/360. |
| (3) | In the case of Loan No. 35, the Cut-off Date Loan-to-Value Ratio and UW NOI Debt Yield are based on Cut-off Date Principal Balance after netting out a $800,000 holdback reserve. The Cut-off Date Loan-to-Value Ratio and UW NOI Debt Yield based on Cut-off Date Principal Balance without netting out the holdback reserve are 61.4% and 8.1%, respectively. |
| (4) | In the case of Loan No. 2, the Cut-off Date Loan-to-Value Ratio and Maturity/ARD Loan-to-Value Ratio are calculated by using an appraised value based on as is value assuming no landlord obligations. In the case of Loan No. 3, the Cut-off Date Loan-to-Value Ratio and the Maturity Date/ARD Loan-to-Value Ratio are calculated by using an appraised value based on an as portfolio assumption. In the case of Loan No. 6 the Cut-off Date Loan-to-Value Ratio and Maturity/ARD Loan-to-Value Ratio are calculated by using an appraised value based on an as stabilized assumption. In the case of Loan No. 25, the Cut-off Date Loan-to-Value Ratio and Maturity Loan-to-Value Ratio are calculated by using an appraised value based on an as complete assumption for 15 of the mortgage properties. Refer to “Description of the Mortgage Pool—Certain Calculations and Definitions—Appraised Value” in the Preliminary Prospectus for additional details. |
| (5) | Excludes mortgage loans that are secured by multiple properties with multiple tenants and includes two mortgage loans that are secured by both single-tenant properties and multi-tenant properties. |
| (6) | Excludes 26 mortgage loans that are interest-only for the entire term or until the anticipated repayment date. |
| (7) | For a more detailed description of lockboxes, refer to “Description of the Mortgage Pool—Certain Calculations and Definitions” and “—Certain Terms of the Mortgage Loans—Mortgaged Property Accounts” in the Preliminary Prospectus. |
| (8) | Calculated only with respect to the Cut-off Date Balance of mortgage loans secured or partially secured by office, retail, mixed use, multifamily (with commercial space), and industrial properties. |
| THE INFORMATION IN THIS STRUCTURAL AND COLLATERAL TERM SHEET IS NOT COMPLETE AND MAY BE AMENDED PRIOR TO THE TIME OF SALE. THIS TERM SHEET IS NOT AN OFFER TO SELL THESE SECURITIES AND IT IS NOT A SOLICITATION OF AN OFFER TO BUY THESE SECURITIES IN ANY JURISDICTION WHERE THE OFFER OR SALE IS NOT PERMITTED. |
6
| Structural and Collateral Term Sheet | | BMO 2022-C2 |
| |
| Collateral Characteristics |
| | Ten Largest Mortgage Loans |
| |
| No. | Loan Name | City, State | Mortgage Loan
Seller | No.
of Prop. | Cut-off Date Balance | % of IPB | Square
Feet /
Rooms /
Units | Property
Type | UW
NCF
DSCR(1) | UW NOI
Debt Yield(1) | Cut-off
Date LTV(1) | Maturity Date/ARD LTV(1) |
| 1 | Yorkshire & Lexington Towers | New York, NY | BMO, SMC, CREFI | 2 | $70,000,000 | 9.9% | 808 | Multifamily | 3.61x | 11.1% | 33.3% | 33.3% |
| 2 | The Lion Building | San Francisco, CA | GACC | 1 | $65,000,000 | 9.2% | 172,328 | Mixed Use | 1.74x | 9.7% | 58.8% | 58.8% |
| 3 | KB Portfolio | Various, Various | KeyBank | 10 | $55,000,000 | 7.8% | 283,488 | Various | 1.62x | 8.4% | 57.6% | 57.6% |
| 4 | 3075 Olcott | Santa Clara, CA | UBS AG | 1 | $50,000,000 | 7.1% | 246,606 | Office | 1.66x | 8.6% | 59.2% | 59.2% |
| 5 | The Reef | Los Angeles, CA | GACC | 1 | $40,000,000 | 5.6% | 806,960 | Mixed Use | 2.34x | 13.5% | 43.0% | 43.0% |
| 6 | 360 Rosemary | West Palm Beach, FL | BMO | 1 | $32,000,000 | 4.5% | 313,002 | Office | 4.35x | 17.8% | 26.6% | 26.6% |
| 7 | Bell Works | Holmdel, NJ | CREFI, BMO | 1 | $30,000,000 | 4.2% | 1371470 | Office | 1.68x | 9.4% | 62.6% | 62.6% |
| 8 | 79 Fifth Avenue | New York, NY | CREFI | 1 | $23,000,000 | 3.2% | 345,751 | Office | 1.61x | 8.4% | 60.8% | 60.8% |
| 9 | 111 River Street | Hoboken, NJ | BMO | 1 | $22,000,000 | 3.1% | 557,719 | Office | 5.08x | 16.9% | 31.8% | 31.8% |
| 10 | Phoenix Industrial Portfolio VIII | Various, Various | UBS AG | 5 | $22,000,000 | 3.1% | 2,329,016 | Industrial | 1.57x | 11.8% | 64.6% | 60.2% |
| | | | | | | | | | | | | |
| | Top 3 Total/Weighted Average | | 13 | $190,000,000 | 26.8% | | | 2.39x | 9.8% | 49.1% | 49.1% |
| | Top 5 Total/Weighted Average | | 15 | $280,000,000 | 39.5% | | | 2.26x | 10.1% | 50.0% | 50.0% |
| | Top 10 Total/Weighted Average | | 24 | $409,000,000 | 57.8% | | | 2.46x | 11.0% | 49.5% | 49.3% |
| | Non-Top 10 Total/Weighted Average(2) | | 88 | $298,988,926 | 42.2% | | | 1.74x | 10.5% | 55.6% | 52.5% |
| (1) | In the case of Loan Nos. 1, 2, 3, 4, 5, 6, 7, 8, 9, 10, 12, 17 and 25, the UW NCF DSCR, UW NOI Debt Yield, Cut-off Date LTV and Maturity Date/ARD LTV calculations include the related Pari Passu Companion Loan(s). In the case of Loan Nos. 1, 6 and 9, the UW NCF DSCR, UW NOI Debt Yield, Cut-off Date LTV and Maturity Date/ARD LTV calculations exclude the related Subordinate Companion Loans and/or subordinate mezzanine loan. |
| (2) | In the case of Loan No. 35, the Cut-off Date LTV and UW NOI Debt Yield are based on Cut-off Date Principal Balance after netting out a $800,000 holdback reserve. The Cut-off Date LTV and UW NOI Debt Yield based on Cut-off Date Principal Balance without netting out the holdback reserve are 61.4% and 8.1%, respectively. |
| THE INFORMATION IN THIS STRUCTURAL AND COLLATERAL TERM SHEET IS NOT COMPLETE AND MAY BE AMENDED PRIOR TO THE TIME OF SALE. THIS TERM SHEET IS NOT AN OFFER TO SELL THESE SECURITIES AND IT IS NOT A SOLICITATION OF AN OFFER TO BUY THESE SECURITIES IN ANY JURISDICTION WHERE THE OFFER OR SALE IS NOT PERMITTED. |
7
| Structural and Collateral Term Sheet | | BMO 2022-C2 |
| |
| Collateral Characteristics |
| Pari Passu Companion Loan Summary |
| |
No. | Loan Name | | Trust
Cut-off Date
Balance | Aggregate Pari
Passu Loan
Cut-off Date
Balance(1) | Controlling
Pooling/Trust &
Servicing
Agreement | Master Servicer | Special
Servicer | Related Pari Passu
Loan(s) Securitizations | Related Pari
Passu Loan(s)
Original Balance |
| 1 | Yorkshire & Lexington Towers | BMO, SMC, CREFI | $70,000,000 | $248,000,000 | CGCMT 2022-GC48 | Midland | Rialto | BBCMS 2022-C16 CGCMT 2022-GC48 Future Securitization(s) | $65,000,000 $60,000,000 $123,000,000 |
| 2 | The Lion Building | GACC | $65,000,000 | $35,000,000 | BMO 2022-C2 | Midland | Rialto | Future Securitization(s) | $35,000,000 |
| 3 | KB Portfolio | KeyBank | $55,000,000 | $25,000,000 | BMO 2022-C2 | Midland | Rialto | Future Securitization(s) | $25,000,000 |
| 4 | 3075 Olcott | UBS AG | $50,000,000 | $92,000,000 | BMO 2022-C2 | Midland | Rialto | BBCCMS 2022-C16 Future Securitization(s) | $65,000,000 $27,000,000 |
| 5 | The Reef | GACC | $40,000,000 | $110,000,000 | BMARK 2022-B35 | KeyBank | KeyBank | BMARK 2022-B35 Future Securitization(s) | $100,000,000 $10,000,000 |
| 6 | 360 Rosemary | BMO | $32,000,000 | $53,000,000 | BMO 2022-C1 | KeyBank | Situs | BMO 2022-C1 CGCMT 2022-GC48 | $45,000,000 $8,000,000 |
| 7 | Bell Works | CREFI, BMO | $30,000,000 | $180,000,000 | BMARK 2022-B35 | KeyBank | KeyBank | BMARK 2022-B35 BBCMS 2022-C16 CGCMT 2022-GC48 Future Securitization(s) | $50,000,000 $40,000,000 $40,000,000 $50,000,000 |
| 8 | 79 Fifth Avenue | CREFI | $23,000,000 | $217,000,000 | CGCMT 2022-GC48 | Midland | Greystone | BANK 2022-BNK42 CGCMT 2022-GC48 Future Securitization(s) | $71,000,000 $50,000,000 $96,000,000 |
| 9 | 111 River Street | BMO | $22,000,000 | $55,500,000 | BMO 2022-C1 | KeyBank | KeyBank | BMO 2022-C1 CGCMT 2022-GC48 Future Securitization(s) | $37,500,000 $8,000,000 $10,000,000 |
| 10 | Phoenix Industrial Portfolio VIII | UBS AG | $22,000,000 | $35,000,000 | BBCMS 2022-C16 | Midland | LNR | BBCMS 2022-C16 | $35,000,000 |
| 12 | PentaCentre Office | CREFI | $20,277,018 | $13,984,150 | BMO 2022-C2 | Midland | Rialto | Future Securitization(s) | $14,000,000 |
| 17 | 2 Riverfront Plaza | BMO | $15,000,000 | $95,000,000 | BMO 2022-C1 | Midland | Rialto | BMO 2022-C1 BBCMS 2022-C15 CGCMT 2022-GC48 | $37,500,000 $50,000,000 $7,500,000 |
| 25 | Wyndham National Hotel Portfolio | UBS AG | $9,342,616 | $126,125,312 | UBS 2019-C18 | Wells Fargo | Rialto | UBS 2019-C18 BBCMS 2021-C10 BBCMS 2021-C11 WFCM 2021-C61 BMO 2022-C1 Future Securitization(s) | $35,000,000 $10,000,000 $20,000,000 $10,000,000 $20,000,000 $40,000,000 |
| (1) | In the case of Loan Nos. 1, 6 and 9, the Aggregate Pari Passu Loan Cut-off Date Balance excludes the related Subordinate Companion Loan(s) and one or more subordinate mezzanine loans.
|
| THE INFORMATION IN THIS STRUCTURAL AND COLLATERAL TERM SHEET IS NOT COMPLETE AND MAY BE AMENDED PRIOR TO THE TIME OF SALE. THIS TERM SHEET IS NOT AN OFFER TO SELL THESE SECURITIES AND IT IS NOT A SOLICITATION OF AN OFFER TO BUY THESE SECURITIES IN ANY JURISDICTION WHERE THE OFFER OR SALE IS NOT PERMITTED. |
8
| Structural and Collateral Term Sheet | BMO 2022-C2 |
| |
| Collateral Characteristics |
No. | Loan Name | Trust
Cut-off Date
Balance | Pari Passu
Loan(s) Cut-off
Date Balance | Subordinate
Debt Cut-off
Date
Balance(1)(2) | Total Debt Cut-
off Date
Balance | Mortgage Loan UW NCF DSCR(3) | Total Debt UW NCF DSCR | Mortgage
Loan
Cut-off Date LTV(3)(4) | Total Debt Cut-off
Date LTV(4) | Mortgage
Loan UW NOI
Debt Yield(3) | Total Debt
UW
NOI
Debt Yield |
| 1 | Yorkshire & Lexington Towers | $70,000,000 | $248,000,000 | $396,000,000 | $714,000,000 | 3.61x | 1.20x | 33.3% | 74.8% | 11.1% | 5.0% |
| 6 | 360 Rosemary | $32,000,000 | $53,000,000 | $125,000,000 | $210,000,000 | 4.35x | 1.76x | 26.6% | 65.8% | 17.8% | 7.2% |
| 9 | 111 River Street | $22,000,000 | $55,500,000 | $76,250,000 | $153,750,000 | 5.08x | 2.56x | 31.8% | 63.0% | 16.9% | 8.5% |
| | | | | | | | | | | | | |
| (1) | In the case of Loan No. 1, subordinate debt represents one or more Subordinate Companion Loans and one or more subordinate mezzanine loans. |
| (2) | In the case of Loans No. 6 and 9 subordinate debt represents one or more Subordinate Companion Loans. |
| (3) | Mortgage Loan UW NCF DSCR, Mortgage Loan Cut-off Date LTV and Mortgage Loan UW NOI Debt Yield calculations include any related Pari Passu Companion Loans (if applicable), but exclude the related Subordinate Companion Loans and one or more subordinate mezzanine loans. |
| (4) | In the case of Loan No. 6 the Mortgage Loan Cut-off Date LTV and the Total Debt Cut-off Date LTV are calculated by using an appraised value based on an as stabilized assumption. |
| THE INFORMATION IN THIS STRUCTURAL AND COLLATERAL TERM SHEET IS NOT COMPLETE AND MAY BE AMENDED PRIOR TO THE TIME OF SALE. THIS TERM SHEET IS NOT AN OFFER TO SELL THESE SECURITIES AND IT IS NOT A SOLICITATION OF AN OFFER TO BUY THESE SECURITIES IN ANY JURISDICTION WHERE THE OFFER OR SALE IS NOT PERMITTED. |
9
| Structural and Collateral Term Sheet | | BMO 2022-C2 |
| |
| Collateral Characteristics |
| Mortgaged Properties by Type(1) |
| | | | | | Weighted Average |
| Property Type | Property Subtype | Number of Properties | Cut-off Date Principal Balance | % of IPB | UW
NCF DSCR(2)(3) | UW
NOI Debt Yield(2)(4) | Cut-off Date LTV(2)(4)(5) | Maturity Date/ARD LTV(2)(5) |
| Office | Suburban | 5 | $113,133,028 | 16.0% | 1.64x | 9.7% | 60.4% | 57.6% |
| | CBD | 5 | 104,443,750 | 14.8 | 3.24x | 13.2% | 43.8% | 43.8% |
| | Medical | 10 | 29,647,736 | 4.2 | 1.53x | 8.8% | 59.3% | 56.8% |
| | Subtotal: | 20 | $247,224,514 | 34.9% | 2.30x | 11.1% | 53.2% | 51.6% |
| Mixed Use | Industrial/Office | 1 | $65,000,000 | 9.2% | 1.74x | 9.7% | 58.8% | 58.8% |
| | Office/Retail | 1 | 40,000,000 | 5.6 | 2.34x | 13.5% | 43.0% | 43.0% |
| | Subtotal: | 2 | $105,000,000 | 14.8% | 1.97x | 11.1% | 52.8% | 52.8% |
| Retail | Single Tenant | 2 | $43,318,500 | 6.1% | 1.70x | 9.0% | 57.3% | 57.3% |
| | Anchored | 3 | 41,410,000 | 5.8 | 1.74x | 11.3% | 61.4% | 58.8% |
| | Unanchored | 2 | 17,000,000 | 2.4 | 2.26x | 14.1% | 33.6% | 31.7% |
| | Subtotal: | 7 | $101,728,500 | 14.4% | 1.81x | 10.8% | 55.0% | 53.6% |
| Self Storage | Self Storage | 22 | $85,105,869 | 12.0% | 1.60x | 9.6% | 51.7% | 49.3% |
| Multifamily | High Rise | 2 | $70,000,000 | 9.9% | 3.61x | 11.1% | 33.3% | 33.3% |
| | Mid Rise | 1 | 13,000,000 | 1.8 | 1.51x | 8.2% | 58.3% | 58.3% |
| | Subtotal: | 3 | $83,000,000 | 11.7% | 3.28x | 10.6% | 37.2% | 37.2% |
| Industrial | Warehouse / Distribution | 6 | $26,680,921 | 3.8% | 1.63x | 11.1% | 62.5% | 59.4% |
| | Flex | 3 | 26,092,500 | 3.7 | 2.10x | 10.5% | 53.3% | 53.3% |
| | Warehouse | 2 | 11,768,871 | 1.7 | 1.63x | 9.7% | 60.9% | 60.9% |
| | Warehouse / Other | 1 | 4,100,000 | 0.6 | 2.29x | 13.1% | 69.3% | 69.3% |
| | Manufacturing | 1 | 3,311,579 | 0.5 | 1.57x | 11.8% | 64.6% | 60.2% |
| | Subtotal: | 13 | $71,953,871 | 10.2% | 1.84x | 10.8% | 59.4% | 58.0% |
| Hospitality | Limited Service | 44 | $9,342,616 | 1.3% | 1.66x | 15.0% | 63.0% | 46.7% |
| | Subtotal: | 44 | $9,342,616 | 1.3% | 1.66x | 15.0% | 63.0% | 46.7% |
| Manufactured Housing | Manufactured Housing | 1 | $4,633,556 | 0.7% | 1.50x | 9.9% | 50.4% | 41.5% |
| Total / Weighted Average: | 112 | $707,988,926 | 100.0% | 2.15x | 10.8% | 52.1% | 50.6% |
| (1) | Because this table presents information relating to the mortgaged properties and not mortgage loans, the information for mortgage loans secured by more than one mortgaged property is based on allocated loan amounts, individual appraised values, net cash flow or net operating income with respect to such individual mortgaged properties, as applicable. |
| (2) | In the case of Loan Nos. 1, 2, 3, 4, 5, 6, 7, 8, 9, 10, 12, 17 and 25, the UW NCF DSCR, UW NOI Debt Yield, Cut-off Date LTV and Maturity Date/ARD LTV calculations include the related Pari Passu Companion Loan(s). In the case of Loan Nos. 1, 6 and 9, the UW NCF DSCR, UW NOI Debt Yield, Cut-off Date LTV and Maturity Date/ARD LTV calculations exclude the related Subordinate Companion Loans and/or related mezzanine loan. |
| (3) | For the mortgage loans that are interest-only for the entire term or until the anticipated repayment date and accrue interest on an Actual/360 basis, the Monthly Debt Service Amount ($) was calculated as 1/12th of the product of (i) the Original Balance ($), (ii) the Interest Rate % and (iii) 365/360. |
| (4) | In the case of Loan No. 35, the Cut-off Date LTV and UW NOI Debt Yield are based on Cut-off Date Principal Balance after netting out a $800,000 holdback reserve. The Cut-off Date LTV and UW NOI Debt Yield based on Cut-off Date Principal Balance without netting out the holdback reserve are 61.4% and 8.1%, respectively. |
| (5) | In the case of Loan No. 2, the Cut-off Date LTV and Maturity/ARD LTV are calculated by using an appraised value based on as is value assuming no landlord obligations. In the case of Loan No. 3, the Cut-off Date LTV and the Maturity Date/ARD LTV are calculated by using an appraised value based on an as portfolio assumption. In the case of Loan No. 6 the Cut-off Date LTV and Maturity/ARD LTV are calculated by using an appraised value based on an as stabilized assumption. In the case of Loan No. 25, the Cut-off Date LTV and Maturity LTV are calculated by using an appraised value based on an as complete assumption for 15 of the mortgage properties. Refer to “Description of the Mortgage Pool—Certain Calculations and Definitions—Appraised Value” in the Preliminary Prospectus for additional details. |
| THE INFORMATION IN THIS STRUCTURAL AND COLLATERAL TERM SHEET IS NOT COMPLETE AND MAY BE AMENDED PRIOR TO THE TIME OF SALE. THIS TERM SHEET IS NOT AN OFFER TO SELL THESE SECURITIES AND IT IS NOT A SOLICITATION OF AN OFFER TO BUY THESE SECURITIES IN ANY JURISDICTION WHERE THE OFFER OR SALE IS NOT PERMITTED. |
10
| Structural and Collateral Term Sheet | | BMO 2022-C2 |
| |
| Collateral Characteristics |
| Mortgaged Properties by Location(1) |
| | | | | Weighted Average |
State | Number of Properties | Cut-off Date
Principal Balance | % of
IPB | UW
NCF DSCR(2)(3) | UW
NOI Debt
Yield(2)(4) | Cut-off Date
LTV(2)(4)(5) | Maturity
Date/ARD
LTV(2)(5) |
| California | 8 | $171,155,609 | 24.2% | 1.84x | 10.2% | 54.8% | 55.1% |
| New York | 7 | 124,397,359 | 17.6 | 2.81x | 10.5% | 41.2% | 40.9% |
| New Jersey | 6 | 75,850,000 | 10.7 | 2.71x | 11.6% | 53.0% | 53.0% |
| Florida | 6 | 48,940,000 | 6.9 | 3.46x | 14.9% | 37.8% | 37.8% |
| Virginia | 4 | 42,977,574 | 6.1 | 1.67x | 10.6% | 61.3% | 58.9% |
| Nevada | 4 | 41,003,865 | 5.8 | 1.47x | 9.1% | 60.6% | 55.8% |
| Arizona | 5 | 33,030,279 | 4.7 | 1.45x | 9.5% | 44.9% | 36.9% |
| South Dakota | 2 | 21,642,692 | 3.1 | 1.78x | 9.6% | 56.9% | 56.8% |
| Michigan | 1 | 20,277,018 | 2.9 | 1.73x | 13.0% | 57.6% | 47.9% |
| Tennessee | 7 | 17,929,295 | 2.5 | 1.86x | 12.3% | 58.9% | 56.4% |
| North Carolina | 1 | 16,650,000 | 2.4 | 2.07x | 10.8% | 52.0% | 52.0% |
| Pennsylvania | 3 | 13,700,548 | 1.9 | 1.59x | 10.3% | 61.5% | 59.1% |
| Hawaii | 1 | 12,500,000 | 1.8 | 1.48x | 9.7% | 56.8% | 56.8% |
| Kentucky | 1 | 12,443,750 | 1.8 | 1.62x | 8.4% | 57.6% | 57.6% |
| Missouri | 4 | 9,853,333 | 1.4 | 2.08x | 12.8% | 59.9% | 57.6% |
| Texas | 6 | 8,547,700 | 1.2 | 1.56x | 9.7% | 54.1% | 48.1% |
| Alabama | 5 | 5,817,880 | 0.8 | 1.91x | 10.1% | 57.4% | 57.4% |
| Georgia | 3 | 4,119,001 | 0.6 | 1.91x | 10.1% | 57.4% | 57.4% |
| Massachusetts | 1 | 4,100,000 | 0.6 | 2.29x | 13.1% | 69.3% | 69.3% |
| Illinois | 1 | 3,965,789 | 0.6 | 1.57x | 11.8% | 64.6% | 60.2% |
| Louisiana | 2 | 3,210,468 | 0.5 | 1.62x | 8.8% | 57.9% | 57.0% |
| Wisconsin | 1 | 2,679,875 | 0.4 | 1.62x | 8.4% | 57.6% | 57.6% |
| Indiana | 1 | 2,670,000 | 0.4 | 1.98x | 10.1% | 62.1% | 62.1% |
| New Hampshire | 1 | 1,914,000 | 0.3 | 1.62x | 8.4% | 57.6% | 57.6% |
| Wyoming | 6 | 1,902,819 | 0.3 | 1.66x | 15.0% | 63.0% | 46.7% |
| Mississippi | 1 | 1,700,000 | 0.2 | 1.91x | 10.1% | 57.4% | 57.4% |
| Nebraska | 4 | 1,078,345 | 0.2 | 1.66x | 15.0% | 63.0% | 46.7% |
| New Mexico | 3 | 1,004,707 | 0.1 | 1.66x | 15.0% | 63.0% | 46.7% |
| Iowa | 3 | 913,760 | 0.1 | 1.81x | 12.0% | 59.6% | 53.3% |
| Kansas | 5 | 858,587 | 0.1 | 1.66x | 15.0% | 63.0% | 46.7% |
| Montana | 2 | 388,285 | 0.1 | 1.66x | 15.0% | 63.0% | 46.7% |
| Oregon | 1 | 262,290 | 0.0 | 1.66x | 15.0% | 63.0% | 46.7% |
| Utah | 1 | 155,777 | 0.0 | 1.66x | 15.0% | 63.0% | 46.7% |
| Oklahoma | 1 | 137,927 | 0.0 | 1.66x | 15.0% | 63.0% | 46.7% |
| North Dakota | 1 | 99,232 | 0.0 | 1.66x | 15.0% | 63.0% | 46.7% |
| Maryland | 1 | 51,545 | 0.0 | 1.66x | 15.0% | 63.0% | 46.7% |
| Minnesota | 1 | 38,796 | 0.0 | 1.66x | 15.0% | 63.0% | 46.7% |
| Colorado | 1 | 20,819 | 0.0 | 1.66x | 15.0% | 63.0% | 46.7% |
| Total / Weighted Average: | 112 | $707,988,926 | 100.0% | 2.15x | 10.8% | 52.1% | 50.6% |
| (1) | Because this table presents information relating to the mortgaged properties and not mortgage loans, the information for mortgage loans secured by more than one mortgaged property is based on allocated loan amounts, individual appraised values, net cash flow or net operating income with respect to such individual mortgaged properties, as applicable. |
| (2) | In the case of Loan Nos. 1, 2, 3, 4, 5, 6, 7, 8, 9, 10, 12, 17 and 25, the UW NCF DSCR, UW NOI Debt Yield, Cut-off Date LTV and Maturity Date/ARD LTV calculations include the related Pari Passu Companion Loan(s). In the case of Loan Nos. 1, 6 and 9, the UW NCF DSCR, UW NOI Debt Yield, Cut-off Date LTV and Maturity Date/ARD LTV calculations exclude the related Subordinate Companion Loans and/or related mezzanine loan. |
| (3) | For the mortgage loans that are interest-only for the entire term or until the anticipated repayment date and accrue interest on an Actual/360 basis, the Monthly Debt Service Amount ($) was calculated as 1/12th of the product of (i) the Original Balance ($), (ii) the Interest Rate % and (iii) 365/360. |
| (4) | In the case of Loan No. 35, the Cut-off Date LTV and UW NOI Debt Yield are based on Cut-off Date Principal Balance after netting out a $800,000 holdback reserve. The Cut-off Date LTV and UW NOI Debt Yield based on Cut-off Date Principal Balance without netting out the holdback reserve are 61.4% and 8.1%, respectively. |
| (5) | In the case of Loan No. 2, the Cut-off Date LTV and Maturity/ARD LTV are calculated by using an appraised value based on as is value assuming no landlord obligations. In the case of Loan No. 3, the Cut-off Date LTV and the Maturity Date/ARD LTV are calculated by using an appraised value based on an as portfolio assumption. In the case of Loan No. 6 the Cut-off Date LTV and Maturity/ARD LTV are calculated by using an appraised value based on an as stabilized assumption. In the case of Loan No. 25, the Cut-off Date LTV and Maturity LTV are calculated by using an appraised value based on an as complete assumption for 15 of the mortgage properties. Refer to “Description of the Mortgage Pool—Certain Calculations and Definitions—Appraised Value” in the Preliminary Prospectus for additional details
|
| THE INFORMATION IN THIS STRUCTURAL AND COLLATERAL TERM SHEET IS NOT COMPLETE AND MAY BE AMENDED PRIOR TO THE TIME OF SALE. THIS TERM SHEET IS NOT AN OFFER TO SELL THESE SECURITIES AND IT IS NOT A SOLICITATION OF AN OFFER TO BUY THESE SECURITIES IN ANY JURISDICTION WHERE THE OFFER OR SALE IS NOT PERMITTED. |
11
| Structural and Collateral Term Sheet | | BMO 2022-C2 |
| |
| Collateral Characteristics |
| Cut-off Date Principal Balance |
| | | | | Weighted Average |
Range of Cut-off Date Principal
Balances | Number
of Loans | Cut-off Date
Principal
Balance | % of
IPB | Mortgage
Rate | Remaining
Loan Term(1) | UW
NCF
DSCR(1)(2) | UW
NOI
DY(1)(3) | Cut-off
Date
LTV(1)(3)(4) | Maturity
Date/ARD
LTV(1)(4) |
| $2,670,000 | - | $4,999,999 | 5 | $20,228,556 | | 2.9% | 5.42251% | 93 | 1.82x | 11.9% | 56.1% | 56.0% |
| $5,000,000 | - | $9,999,999 | 9 | 67,233,352 | | 9.5 | 5.09304% | 114 | 1.73x | 10.6% | 56.7% | 52.2% |
| $10,000,000 | - | $19,999,999 | 12 | 169,750,000 | | 24.0 | 5.06442% | 118 | 1.72x | 10.2% | 54.7% | 52.2% |
| $20,000,000 | - | $29,999,999 | 5 | 108,777,018 | | 15.4 | 4.86214% | 106 | 2.36x | 11.9% | 54.3% | 51.6% |
| $30,000,000 | - | $39,999,999 | 2 | 62,000,000 | | 8.8 | 4.51129% | 116 | 3.06x | 13.7% | 44.0% | 44.0% |
| $40,000,000 | - | $70,000,000 | 5 | 280,000,000 | | 39.5 | 4.64621% | 104 | 2.26x | 10.1% | 50.0% | 50.0% |
| Total / Weighted Average: | 38 | $707,988,926 | | 100.0% | 4.83245% | 109 | 2.15x | 10.8% | 52.1% | 50.6% |
| | | | | Weighted Average |
Range of
Mortgage Interest Rates | Number
of Loans | Cut-off Date
Principal
Balance | % of
IPB | Mortgage
Rate | Remaining
Loan Term(1) | UW
NCF
DSCR(1)(2) | UW
NOI
DY(1)(3) | Cut-off
Date
LTV(1)(3)(4) | Maturity
Date/ARD
LTV(1)(4) |
| 3.04000 | - | 3.49999 | 2 | $92,000,000 | | 13.0% | 3.09739% | 58 | 3.96x | 12.5% | 32.9% | 32.9% |
| 3.50000 | - | 3.99999 | 1 | 32,000,000 | | 4.5 | 3.95000% | 115 | 4.35x | 17.8% | 26.6% | 26.6% |
| 4.00000 | - | 4.49999 | 3 | 33,315,000 | | 4.7 | 4.35155% | 116 | 2.14x | 11.2% | 46.1% | 45.1% |
| 4.50000 | - | 4.99999 | 11 | 132,225,530 | | 18.7 | 4.89581% | 116 | 1.70x | 10.2% | 57.1% | 53.6% |
| 5.00000 | - | 5.49999 | 13 | 341,733,529 | | 48.3 | 5.17314% | 118 | 1.78x | 10.0% | 56.4% | 55.6% |
| 5.50000 | - | 5.99999 | 6 | 59,664,867 | | 8.4 | 5.69776% | 119 | 1.52x | 10.9% | 61.8% | 56.8% |
| 6.00000 | - | 6.48000 | 2 | 17,050,000 | | 2.4 | 6.44264% | 104 | 1.41x | 9.8% | 55.1% | 58.0% |
| Total / Weighted Average: | 38 | $707,988,926 | | 100.0% | 4.83245% | 109 | 2.15x | 10.8% | 52.1% | 50.6% |
| Original Term to Maturity in Months |
| | | | | Weighted Average |
Original Term to
Maturity in Months | Number
of Loans | Cut-off Date
Principal
Balance | % of
IPB | Mortgage
Rate | Remaining
Loan
Term(1) | UW
NCF
DSCR(1)(2) | UW
NOI
DY(1)(3) | Cut-off
Date
LTV(1)(3)(4) | Maturity
Date/ARD
LTV(1)(4) |
| 60 | 4 | $100,650,000 | | 14.2% | 3.32841% | 58 | 3.77x | 12.4% | 35.2% | 35.7% |
| 120 | 34 | 607,338,926 | | 85.8 | 5.08171% | 118 | 1.88x | 10.6% | 54.9% | 53.1% |
| Total / Weighted Average: | 38 | $707,988,926 | | 100.0% | 4.83245% | 109 | 2.15x | 10.8% | 52.1% | 50.6% |
| Remaining Term to Maturity in Months |
| | | | | Weighted Average |
Range of Remaining Term to
Maturity in Months | Number of Loans | Cut-off Date
Principal
Balance | % of
IPB | Mortgage
Rate | Remaining
Loan
Term(1) | UW
NCF
DSCR(1)(2) | UW
NOI
DY(1)(3) | Cut-off
Date
LTV(1)(3)(4) | Maturity
Date/ARD
LTV(1)(4) |
| 55 | - | 60 | 4 | $100,650,000 | | 14.2% | 3.32841% | 58 | 3.77x | 12.4% | 35.2% | 35.7% |
| 61 | - | 114 | 2 | 24,342,616 | | 3.4 | 4.48644% | 104 | 1.90x | 11.5% | 61.4% | 55.1% |
| 115 | - | 120 | 32 | 582,996,310 | | 82.3 | 5.10656% | 118 | 1.88x | 10.5% | 54.6% | 53.0% |
| Total / Weighted Average: | 38 | $707,988,926 | | 100.0% | 4.83245% | 109 | 2.15x | 10.8% | 52.1% | 50.6% |
| | | | | | | | | | | | | |
| (1) | In the case of Loan Nos. 1, 2, 3, 4, 5, 6, 7, 8, 9, 10, 12, 17 and 25, the UW NCF DSCR, UW NOI Debt Yield, Cut-off Date LTV and Maturity Date/ARD LTV calculations include the related Pari Passu Companion Loan(s). In the case of Loan Nos. 1, 6 and 9, the UW NCF DSCR, UW NOI Debt Yield, Cut-off Date LTV and Maturity Date/ARD LTV calculations exclude the related Subordinate Companion Loans and/or Mezzanine Loans. |
| (2) | For the mortgage loans that are interest-only for the entire term or until the anticipated repayment date and accrue interest on an Actual/360 basis, the Monthly Debt Service Amount ($) was calculated as 1/12th of the product of (i) the Original Balance ($), (ii) the Interest Rate % and (iii) 365/360. |
| (3) | In the case of Loan No. 35, the Cut-off Date LTV and UW NOI Debt Yield are based on Cut-off Date Principal Balance after netting out a $800,000 holdback reserve. The Cut-off Date LTV and UW NOI Debt Yield based on Cut-off Date Principal Balance without netting out the holdback reserve are 61.4% and 8.1%, respectively. |
| (4) | In the case of Loan No. 2, the Cut-off Date LTV and Maturity/ARD LTV are calculated by using an appraised value based on as is value assuming no landlord obligations. In the case of Loan No. 3, the Cut-off Date LTV and the Maturity Date/ARD LTV are calculated by using an appraised value based on an as portfolio assumption. In the case of Loan No. 6 the Cut-off Date LTV and Maturity/ARD LTV are calculated by using an appraised value based on an as stabilized assumption. In the case of Loan No. 25, the Cut-off Date LTV and Maturity LTV are calculated by using an appraised value based on an as complete assumption for 15 of the mortgage properties. Refer to “Description of the Mortgage Pool—Certain Calculations and Definitions—Appraised Value” in the Preliminary Prospectus for additional details. |
| THE INFORMATION IN THIS STRUCTURAL AND COLLATERAL TERM SHEET IS NOT COMPLETE AND MAY BE AMENDED PRIOR TO THE TIME OF SALE. THIS TERM SHEET IS NOT AN OFFER TO SELL THESE SECURITIES AND IT IS NOT A SOLICITATION OF AN OFFER TO BUY THESE SECURITIES IN ANY JURISDICTION WHERE THE OFFER OR SALE IS NOT PERMITTED. |
12
| Structural and Collateral Term Sheet | | BMO 2022-C2 |
| |
| Collateral Characteristics |
Original Amortization Term in Months |
| | | | | Weighted Average |
Original
Amortization
Term in Months | Number
of Loans | Cut-off Date
Principal
Balance | % of
IPB | Mortgage
Rate | Remaining
Loan
Term(1) | UW
NCF
DSCR(1)(2) | UW
NOI
DY(1)(3) | Cut-off
Date
LTV(1)(3)(4) | Maturity
Date/ARD
LTV(1)(4) |
| Interest Only | 26 | $565,585,000 | | 79.9% | 4.74249% | 107 | 2.29x | 10.6% | 51.4% | 51.5% |
| 270 | 1 | 9,342,616 | | 1.3 | 4.85000% | 89 | 1.66x | 15.0% | 63.0% | 46.7% |
| 360 | 11 | 133,061,310 | | 18.8 | 5.21363% | 119 | 1.59x | 11.3% | 54.1% | 47.2% |
| Total / Weighted Average: | 38 | $707,988,926 | | 100.0% | 4.83245% | 109 | 2.15x | 10.8% | 52.1% | 50.6% |
| Remaining Amortization Term in Months |
| | | | | Weighted Average |
Range of Remaining
Amortization Term in Months | Number
of Loans | Cut-off Date
Principal
Balance | % of
IPB | Mortgage
Rate | Remaining
Loan
Term(1) | UW
NCF
DSCR(1)(2) | UW
NOI
DY(1)(3) | Cut-off
Date
LTV(1)(3)(4) | Maturity
Date/ARD
LTV(1)(4) |
| Interest Only | 26 | $565,585,000 | | 79.9% | 4.74249% | 107 | 2.29x | 10.6% | 51.4% | 51.5% |
| 239 | 1 | 9,342,616 | | 1.3 | 4.85000% | 89 | 1.66x | 15.0% | 63.0% | 46.7% |
| 357 | - | 360 | 11 | 133,061,310 | | 18.8 | 5.21363% | 119 | 1.59x | 11.3% | 54.1% | 47.2% |
| Total / Weighted Average: | 38 | $707,988,926 | | 100.0% | 4.83245% | 109 | 2.15x | 10.8% | 52.1% | 50.6% |
| | | | | | | | | | | | |
| | | | | Weighted Average |
| Amortization Types | Number
of Loans | Cut-off Date
Principal
Balance | % of
IPB | Mortgage
Rate | Remaining
Loan
Term(1) | UW
NCF
DSCR(1)(2) | UW
NOI
DY(1)(3) | Cut-off
Date
LTV(1)(3)(4) | Maturity
Date/ARD
LTV(1)(4) |
| Interest Only | 26 | $565,585,000 | | 79.9% | 4.74249% | 107 | 2.29x | 10.6% | 51.4% | 51.5% |
| Amortizing Balloon | 8 | 85,628,926 | | 12.1 | 5.19559% | 116 | 1.51x | 11.0% | 54.3% | 44.5% |
| Interest Only, Amortizing Balloon | 4 | 56,775,000 | | 8.0 | 5.18099% | 118 | 1.72x | 12.5% | 55.3% | 51.1% |
| Total / Weighted Average: | 38 | $707,988,926 | | 100.0% | 4.83245% | 109 | 2.15x | 10.8% | 52.1% | 50.6% |
| Underwritten Net Cash Flow Debt Service Coverage Ratios(1)(2) |
| | | | | Weighted Average |
Range of Underwritten Net Cash
Flow Debt Service Coverage
Ratios | Number
of Loans | Cut-off Date
Principal
Balance | % of
IPB | Mortgage
Rate | Remaining
Loan Term(1) | UW
NCF
DSCR(1)(2) | UW
NOI
DY(1)(3) | Cut-off
Date
LTV(1)(3)(4) | Maturity
Date/ARD
LTV(1)(4) |
| 1.23x | - | 1.59x | 12 | $136,409,293 | | 19.3% | 5.44623% | 117 | 1.46x | 10.1% | 57.3% | 52.7% |
| 1.60x | - | 1.69x | 6 | 172,967,616 | | 24.4 | 5.06979% | 117 | 1.64x | 9.0% | 59.5% | 58.6% |
| 1.70x | - | 1.79x | 5 | 124,597,018 | | 17.6 | 5.14285% | 119 | 1.75x | 10.1% | 57.9% | 56.4% |
| 1.80x | - | 1.89x | 2 | 23,405,000 | | 3.3 | 5.00944% | 119 | 1.85x | 10.1% | 60.0% | 60.0% |
| 1.90x | - | 1.99x | 2 | 22,270,000 | | 3.1 | 5.03883% | 117 | 1.92x | 10.1% | 58.0% | 58.0% |
| 2.00x | - | 2.99x | 8 | 104,340,000 | | 14.7 | 4.98268% | 115 | 2.23x | 12.4% | 47.6% | 47.2% |
| 3.00x | - | 3.99x | 1 | 70,000,000 | | 9.9 | 3.04000% | 59 | 3.61x | 11.1% | 33.3% | 33.3% |
| 4.00x | - | 5.08x | 2 | 54,000,000 | | 7.6 | 3.67704% | 91 | 4.65x | 17.4% | 28.7% | 28.7% |
| Total / Weighted Average: | 38 | $707,988,926 | | 100.0% | 4.83245% | 109 | 2.15x | 10.8% | 52.1% | 50.6% |
| | | | | | | | | | | | |
| (1) | In the case of Loan Nos. 1, 2, 3, 4, 5, 6, 7, 8, 9, 10, 12, 17 and 25, the UW NCF DSCR, UW NOI Debt Yield, Cut-off Date LTV and Maturity Date/ARD LTV calculations include the related Pari Passu Companion Loan(s). In the case of Loan Nos. 1, 6 and 9, the UW NCF DSCR, UW NOI Debt Yield, Cut-off Date LTV and Maturity Date/ARD LTV calculations exclude the related Subordinate Companion Loans and/or Mezzanine Loans. |
| (2) | For the mortgage loans that are interest-only for the entire term or until the anticipated repayment date and accrue interest on an Actual/360 basis, the Monthly Debt Service Amount ($) was calculated as 1/12th of the product of (i) the Original Balance ($), (ii) the Interest Rate % and (iii) 365/360. |
| (3) | In the case of Loan No. 35, the Cut-off Date LTV and UW NOI Debt Yield are based on Cut-off Date Principal Balance after netting out a $800,000 holdback reserve. The Cut-off Date LTV and UW NOI Debt Yield based on Cut-off Date Principal Balance without netting out the holdback reserve are 61.4% and 8.1%, respectively. |
| (4) | In the case of Loan No. 2, the Cut-off Date LTV and Maturity/ARD LTV are calculated by using an appraised value based on as is value assuming no landlord obligations. In the case of Loan No. 3, the Cut-off Date LTV and the Maturity Date/ARD LTV are calculated by using an appraised value based on an as portfolio assumption. In the case of Loan No. 6 the Cut-off Date LTV and Maturity/ARD LTV are calculated by using an appraised value based on an as stabilized assumption. In the case of Loan No. 25, the Cut-off Date LTV and Maturity LTV are calculated by using an appraised value based on an as complete assumption for 15 of the mortgage properties. Refer to “Description of the Mortgage Pool—Certain Calculations and Definitions—Appraised Value” in the Preliminary Prospectus for additional details. |
| THE INFORMATION IN THIS STRUCTURAL AND COLLATERAL TERM SHEET IS NOT COMPLETE AND MAY BE AMENDED PRIOR TO THE TIME OF SALE. THIS TERM SHEET IS NOT AN OFFER TO SELL THESE SECURITIES AND IT IS NOT A SOLICITATION OF AN OFFER TO BUY THESE SECURITIES IN ANY JURISDICTION WHERE THE OFFER OR SALE IS NOT PERMITTED. |
13
| Structural and Collateral Term Sheet | | BMO 2022-C2 |
| |
| Collateral Characteristics |
| LTV Ratios as of the Cut-off Date(1)(3) |
| | | | | | Weighted Average |
Range of
Cut-off Date LTVs | Number
of Loans | Cut-off Date
Principal
Balance | % of
IPB | Mortgage
Rate | Remaining
Loan
Term(1) | UW
NCF
DSCR(1)(2) | UW
NOI
DY(1)(3) | Cut-off
Date
LTV(1)(3)(4) | Maturity
Date/ARD
LTV(1)(4) |
| 20.8% | - | 49.9% | 8 | $207,460,869 | | 29.3% | 4.04761% | 91 | 3.22x | 13.1% | 35.1% | 33.7% |
| 50.0% | - | 59.9% | 18 | 341,380,574 | | 48.2 | 5.16381% | 118 | 1.74x | 9.7% | 57.4% | 56.8% |
| 60.0% | - | 64.9% | 10 | 135,547,483 | | 19.1 | 5.18067% | 116 | 1.63x | 10.1% | 62.4% | 59.2% |
| 65.0% | - | 69.3% | 2 | 23,600,000 | | 3.3 | 4.93864% | 108 | 1.65x | 11.6% | 65.9% | 61.7% |
| Total / Weighted Average: | 38 | $707,988,926 | | 100.0% | 4.83245% | 109 | 2.15x | 10.8% | 52.1% | 50.6% |
| LTV Ratios as of the Maturity Date(1)(3) |
| | | | | | Weighted Average |
Range of
Maturity Date LTVs | Number
of Loans | Cut-off Date
Principal
Balance | % of
IPB | Mortgage
Rate | Remaining
Loan
Term(1) | UW
NCF
DSCR(1)(2) | UW
NOI
DY(1)(3) | Cut-off
Date
LTV(1)(3)(4) | Maturity
Date/ARD
LTV(1)(4) |
| 17.8% | - | 49.9% | 12 | $245,989,059 | | 34.7% | 4.22664% | 94 | 2.99x | 13.2% | 38.6% | 35.8% |
| 50.0% | - | 59.9% | 16 | 326,559,867 | | 46.1 | 5.16365% | 119 | 1.72x | 9.4% | 58.0% | 57.4% |
| 60.0% | - | 64.9% | 9 | 131,340,000 | | 18.6 | 5.13307% | 116 | 1.65x | 10.0% | 62.1% | 61.0% |
| 65.0% | - | 69.3% | 1 | 4,100,000 | | 0.6 | 5.17000% | 59 | 2.29x | 13.1% | 69.3% | 69.3% |
| Total / Weighted Average: | 38 | $707,988,926 | | 100.0% | 4.83245% | 109 | 2.15x | 10.8% | 52.1% | 50.6% |
| | | | | | Weighted Average |
| Prepayment Protection | Number
of Loans | Cut-off Date
Principal
Balance | % of
IPB | Mortgage
Rate | Remaining
Loan
Term(1) | UW
NCF
DSCR(1)(2) | UW
NOI
DY(1)(3) | Cut-off
Date
LTV(1)(3)(4) | Maturity
Date/ARD
LTV(1)(4) |
| Defeasance | 32 | $638,006,443 | | 90.1% | 4.84264% | 109 | 2.08x | 10.5% | 52.7% | 51.7% |
| Yield Maintenance | 5 | 37,982,483 | | 5.4 | 5.40477% | 105 | 1.54x | 11.3% | 62.7% | 53.6% |
| Defeasance or Yield Maintenance | 1 | 32,000,000 | | 4.5 | 3.95000% | 115 | 4.35x | 17.8% | 26.6% | 26.6% |
| Total / Weighted Average: | 38 | $707,988,926 | | 100.0% | 4.83245% | 109 | 2.15x | 10.8% | 52.1% | 50.6% |
| | | | | | Weighted Average |
| Loan Purpose | Number
of Loans | Cut-off Date
Principal
Balance | % of
IPB | Mortgage
Rate | Remaining
Loan
Term(1) | UW
NCF
DSCR(1)(2) | UW
NOI
DY(1)(3) | Cut-off
Date
LTV(1)(3)(4) | Maturity
Date/ARD
LTV(1)(4) |
| Refinance | 21 | $456,740,736 | | 64.5% | 4.81419% | 109 | 2.19x | 10.8% | 51.2% | 49.8% |
| Acquisition | 12 | 205,844,633 | | 29.1 | 4.87309% | 109 | 2.14x | 10.9% | 54.2% | 52.7% |
| Recapitalization | 5 | 45,403,556 | | 6.4 | 4.83193% | 113 | 1.82x | 10.6% | 50.9% | 49.3% |
| Total / Weighted Average: | 38 | $707,988,926 | | 100.0% | 4.83245% | 109 | 2.15x | 10.8% | 52.1% | 50.6% |
| (1) | In the case of Loan Nos. 1, 2, 3, 4, 5, 6, 7, 8, 9, 10, 12, 17 and 25, the UW NCF DSCR, UW NOI Debt Yield, Cut-off Date LTV and Maturity Date/ARD LTV calculations include the related Pari Passu Companion Loan(s). In the case of Loan Nos. 1, 6 and 9, the UW NCF DSCR, UW NOI Debt Yield, Cut-off Date LTV and Maturity Date/ARD LTV calculations exclude the related Subordinate Companion Loans and/or Mezzanine Loans. |
| (2) | For the mortgage loans that are interest-only for the entire term or until the anticipated repayment date and accrue interest on an Actual/360 basis, the Monthly Debt Service Amount ($) was calculated as 1/12th of the product of (i) the Original Balance ($), (ii) the Interest Rate % and (iii) 365/360. |
| (3) | In the case of Loan No. 35, the Cut-off Date LTV and UW NOI Debt Yield are based on Cut-off Date Principal Balance after netting out a $800,000 holdback reserve. The Cut-off Date LTV and UW NOI Debt Yield based on Cut-off Date Principal Balance without netting out the holdback reserve are 61.4% and 8.1%, respectively. |
| (4) | In the case of Loan No. 2, the Cut-off Date LTV and Maturity/ARD LTV are calculated by using an appraised value based on as is value assuming no landlord obligations. In the case of Loan No. 3, the Cut-off Date LTV and the Maturity Date/ARD LTV are calculated by using an appraised value based on an as portfolio assumption. In the case of Loan No. 6 the Cut-off Date LTV and Maturity/ARD LTV are calculated by using an appraised value based on an as stabilized assumption. In the case of Loan No. 25, the Cut-off Date LTV and Maturity LTV are calculated by using an appraised value based on an as complete assumption for 15 of the mortgage properties. Refer to “Description of the Mortgage Pool—Certain Calculations and Definitions—Appraised Value” in the Preliminary Prospectus for additional details. |
| THE INFORMATION IN THIS STRUCTURAL AND COLLATERAL TERM SHEET IS NOT COMPLETE AND MAY BE AMENDED PRIOR TO THE TIME OF SALE. THIS TERM SHEET IS NOT AN OFFER TO SELL THESE SECURITIES AND IT IS NOT A SOLICITATION OF AN OFFER TO BUY THESE SECURITIES IN ANY JURISDICTION WHERE THE OFFER OR SALE IS NOT PERMITTED. |
14
| Structural and Collateral Term Sheet | | BMO 2022-C2 |
| |
| Collateral Characteristics |
| Previous Securitization History(1) |
| No. | Mortgage Loan Seller | Loan/Property Name | Location | Property Type | Cut-off Date Principal Balance | % of IPB | Previous Securitization |
| 1.01 | BMO, SMC, CREFI | Yorkshire Towers | New York, NY | Multifamily | $60,241,090 | 8.5% | CSAIL 2017-CX10, UBSCM 2017-C5, UBSCM 2017-C6, CCUBS 2017-C1, UBSCM 2018-C8, CSAIL 2018-CX11 |
| 1.02 | BMO, SMC, CREFI | Lexington Towers | New York, NY | Multifamily | $9,758,910 | 1.4% | CSAIL 2017-CX10, UBSCM 2017-C5, UBSCM 2017-C6, CCUBS 2017-C1, UBSCM 2018-C8, CSAIL 2018-CX11 |
| 3.02 | KeyBank | Waystar Building | Louisville, KY | Office | $12,443,750 | 1.8% | CGMT 2014-GC21 |
| 12 | CREFI | PentaCentre Office | Troy, MI | Office | $20,277,018 | 2.9% | CD 2017-CD6 |
| 14 | KeyBank | Wards Crossing West | Lynchburg, VA | Retail | $19,500,000 | 2.8% | WFCM 2012-LC5 |
| 17 | BMO | 2 Riverfront Plaza | Newark, NJ | Office | $15,000,000 | 2.1% | LCCM 2017-LC26 |
| 22 | KeyBank | Dollar Self Storage #5 - Mesa | Mesa, AZ | Self Storage | $11,486,028 | 1.6% | COMM 2014-UBS4 |
| 26 | KeyBank | Dollar Self Storage #6 – Apache Junction | Apache Junction, AZ | Self Storage | $9,488,330 | 1.3% | COMM 2014-UBS4 |
| 33 | KeyBank | Mini U Storage - Woodbridge | Woodbridge, VA | Self Storage | $5,625,000 | 0.8% | WFCM 2012-LC5 |
| (1) | The table above represents the properties for which the previously existing debt was most recently securitized, based on information provided by the related borrower or obtained through searches of a third-party database. |
| THE INFORMATION IN THIS STRUCTURAL AND COLLATERAL TERM SHEET IS NOT COMPLETE AND MAY BE AMENDED PRIOR TO THE TIME OF SALE. THIS TERM SHEET IS NOT AN OFFER TO SELL THESE SECURITIES AND IT IS NOT A SOLICITATION OF AN OFFER TO BUY THESE SECURITIES IN ANY JURISDICTION WHERE THE OFFER OR SALE IS NOT PERMITTED. |
15
| Structural and Collateral Term Sheet | | BMO 2022-C2 |
| |
| Class A-2 and Class A-3(1) |
Class A-2
No. | Loan Name | Location | Cut-off Date
Balance | % of IPB | Maturity Date
Balance | % of
Certificate Class(2) | Original Loan
Term | Remaining Loan Term | UW NCF DSCR | UW
NOI Debt Yield | Cut-
off Date LTV | Maturity Date/ARD LTV |
| 1 | Yorkshire & Lexington Towers | New York, NY | $70,000,000 | 9.9% | $70,000,000 | 71.5% | 60 | 59 | 3.61x | 11.1% | 33.3% | 33.3% |
| 9 | 111 River Street | Hoboken, NJ | 22,000,000 | 3.1 | 22,000,000 | 22.5% | 60 | 55 | 5.08x | 16.9% | 31.8% | 31.8% |
| 35 | Lakeview Storage | Napa, CA | 4,550,000 | 0.6 | 4,550,000 | 4.6% | 60 | 60 | 1.23x | 9.9% | 50.6% | 61.4% |
| 37 | Beverly Industrial Park | Beverly, MA | 4,100,000 | 0.6 | 4,100,000 | 4.2% | 60 | 59 | 2.29x | 13.1% | 69.3% | 69.3% |
| Total / Weighted Average: | | $100,650,000 | 14.2% | $100,650,000 | 102.8% | 60 | 58 | 3.77x | 12.4% | 35.2% | 35.7% |
| (1) | The table above presents the mortgage loans whose balloon payments would be applied to pay down the certificate balances of the Class A-2 Certificates, assuming a 0% CPR and applying the “Modeling Assumptions” described in the Preliminary Prospectus, including the assumptions that (i) none of the mortgage loans in the pool experience prepayments, defaults or losses; (ii) there are no extensions of maturity dates of any mortgage loans in the pool; and (iii) each mortgage loan in the pool is paid in full on its stated maturity date. Each Class of Certificates, including the Class A-2 Certificates, evidences undivided ownership interests in the entire pool of mortgage loans. Debt service coverage ratio, debt yield and loan-to-value ratio information does not take into account subordinate debt (whether or not secured by the mortgaged property), if any, that is allowed under the terms of any mortgage loans. See Annex A-1 to the Preliminary Prospectus. |
| (2) | Reflects the percentage equal to the Percentage of the Maturity Date Balance divided by the initial Class A-2 Certificate Balance. |
Class A-3
No. | Loan Name | Location | Cut-off Date
Balance | % of IPB | Maturity Date
Balance | % of
Certificate Class(2) | Original Loan
Term | Remaining Loan Term | UW NCF DSCR | UW
NOI Debt Yield | Cut-
off Date LTV | Maturity Date/ARD LTV |
| 25 | Wyndham National Hotel Portfolio | Various, Various | $9,342,616 | 1.3% | $6,921,981 | 103.3% | 120 | 89 | 1.66x | 15.0% | 63.0% | 46.7% |
| Total / Weighted Average: | | $9,342,616 | 1.3% | $6,921,981 | 103.3% | 120 | 89 | 1.66x | 15.0% | 63.0% | 46.7% |
| (1) | The table above presents the mortgage loan whose balloon payment would be applied to pay down the certificate balance of the Class A-3 Certificates, assuming a 0% CPR and applying the “Modeling Assumptions” described in the Preliminary Prospectus, including the assumptions that (i) none of the mortgage loans in the pool experience prepayments, defaults or losses; (ii) there are no extensions of maturity dates of any mortgage loans in the pool; and (iii) each mortgage loan in the pool is paid in full on its stated maturity date. Each Class of Certificates, including the Class A-3 Certificates, evidences undivided ownership interests in the entire pool of mortgage loans. Debt service coverage ratio, debt yield and loan-to-value ratio information does not take into account subordinate debt (whether or not secured by the mortgaged property), if any, that is allowed under the terms of any mortgage loan. See Annex A-1 to the Preliminary Prospectus. |
| (2) | Reflects the percentage equal to the Percentage of the Maturity Date Balance divided by the initial Class A-3 Certificate Balance. |
| THE INFORMATION IN THIS STRUCTURAL AND COLLATERAL TERM SHEET IS NOT COMPLETE AND MAY BE AMENDED PRIOR TO THE TIME OF SALE. THIS TERM SHEET IS NOT AN OFFER TO SELL THESE SECURITIES AND IT IS NOT A SOLICITATION OF AN OFFER TO BUY THESE SECURITIES IN ANY JURISDICTION WHERE THE OFFER OR SALE IS NOT PERMITTED. |
16
| Structural and Collateral Term Sheet | | BMO 2022-C2 |
| |
| Structural Overview |
| ■ Assets: | | The Class A-1, Class A-2, Class A-3, Class A-4, Class A-5, Class A-SB, Class X-A, Class X-D, Class X-F, Class X-G, Class X-J, Class A-S, Class B, Class C, Class D, Class E, Class F, Class G-RR and Class J-RR Certificates (collectively, with the Class VRR Certificates, the “Certificates”) will be entitled to distributions solely with respect to the mortgage loans. |
| | | |
| ■ Accrual: | | Each Class of Certificates (other than the Class R Certificates) will accrue interest on a 30/360 basis. The Class R Certificates will not accrue interest. |
| | | |
■ Allocation Between Combined
VRR Interest and Non-Vertically
Retained Certificates: | | The aggregate amount available for distribution to holders of the Non-Vertically Retained Certificates and the Combined VRR Interest on each distribution date will be: (i) the gross amount of interest, principal, yield maintenance charges and prepayment premiums collected with respect to the mortgage loans in the applicable one-month collection period, net of specified expenses of the issuing entity, including fees payable therefrom to, and losses, liabilities, advances (with interest thereon), costs and expenses reimbursable or indemnifiable therefrom to, the master servicer, the special servicer, the certificate administrator, the trustee, the operating advisor, the asset representations reviewer and CREFC®; and (ii) allocated to amounts available for distribution to the holders of the Combined VRR Interest, on the one hand, and amounts available for distribution to the holders of the Non-Vertically Retained Certificates (exclusive of the Class R certificates), on the other hand. On each distribution date, the portion of such aggregate available funds allocable to: (a) the Combined VRR Interest will be the product of such aggregate available funds multiplied by the Vertically Retained Percentage; and (b) the Non-Vertically Retained Certificates (exclusive of the Class R certificates) will at all times be the product of such aggregate available funds multiplied by the Non-Vertically Retained Percentage. See “Credit Risk Retention” and “Description of the Certificates” in the Preliminary Prospectus. The “Vertically Retained Percentage” is a fraction, expressed as a percentage, the numerator of which is the initial principal balance of the Combined VRR Interest, and the denominator of which is the sum of (x) the aggregate initial certificate balance of all classes of Non-Vertically Retained Principal Balance Certificates and (y) the initial principal balance of the Combined VRR Interest. The “Non-Vertically Retained Percentage” is the difference between 100% and the Vertically Retained Percentage. |
| | | |
| ■ Distributions: | | On each Distribution Date, funds available for distribution to holders of the Non-Vertically Retained Certificates (exclusive of any portion thereof that represents the Non-Vertically Retained Percentage of (i) any yield maintenance charges and prepayment premiums collected on the mortgage loans and/or (ii) any excess interest accrued after the related anticipated repayment date on any mortgage loan with an anticipated repayment date) (“Non-Vertically Retained Available Funds”) will be distributed in the following amounts and order of priority (in each case to the extent of remaining available funds): 1. Class A-1, Class A-2, Class A-3, Class A-4, Class A-5, Class A-SB, Class X-A, Class X-D, Class X-F, Class X-G and Class X-J certificates: to interest on the Class A-1, Class A-2, Class A-3, Class A-4, Class A-5, Class A-SB, Class X-A, Class X-D, Class X-F, Class X-G, and Class X-J certificates, up to, and pro rata in accordance with, their respective interest entitlements. 2. Class A-1, Class A-2, Class A-3, Class A-4, Class A-5 and Class A-SB certificates: to the extent of Non-Vertically Retained Available Funds allocable to principal received or advanced on the mortgage loans, (i) to principal on the Class A-SB certificates until their certificate balance is reduced to the Class A-SB scheduled principal balance set forth in Annex F to the Preliminary Prospectus for the relevant Distribution Date, then (ii) to principal on the Class A-1 certificates until their certificate balance is reduced to zero, all funds available for distribution of principal remaining after the distributions to the Class A-SB certificates in clause (i) above, then (iii) to principal on the Class A-2 certificates until their certificate balance is reduced to zero, all funds available for distribution of principal remaining after the distributions to the Class A-1 certificates in clause (ii) above, then (iv) to principal on the Class A-3 certificates until their certificate balance is reduced to zero, all funds available for distribution of principal remaining after the distributions to the Class A-2 certificates in clause (iii) above, then (v) to principal on the Class A-4 certificates until their certificate balance is reduced to zero, all funds available for distribution of principal remaining after the distributions to the Class A-3 certificates in clause (iv) above, then (vi) to principal on the Class A-5 certificates until their certificate balance is reduced to zero, all funds available for distribution of principal remaining after the distributions to the Class A-4 certificates in clause (v) above and then (vii) to principal on the Class A-SB certificates until their certificate balance is reduced to zero, all funds available for distribution of principal remaining after the distributions to the Class A-5 certificates in clause (vi) above. However, if the certificate balances of each and every class of the Class A-S, Class B, Class C, Class D, Class E, Class F, Class G-RR and Class J-RR certificates have been reduced to zero as a result of the allocation of mortgage loan losses and other unanticipated expenses to those certificates, then Non-Vertically Retained Available Funds allocable to principal will be distributed to the Class A-1, Class A-2, Class A-3, Class A-4, Class A-5 and Class A-SB certificates, pro rata, based on their respective certificate balances (and the schedule for the Class A-SB principal distributions will be disregarded). |
| THE INFORMATION IN THIS STRUCTURAL AND COLLATERAL TERM SHEET IS NOT COMPLETE AND MAY BE AMENDED PRIOR TO THE TIME OF SALE. THIS TERM SHEET IS NOT AN OFFER TO SELL THESE SECURITIES AND IT IS NOT A SOLICITATION OF AN OFFER TO BUY THESE SECURITIES IN ANY JURISDICTION WHERE THE OFFER OR SALE IS NOT PERMITTED. |
17
| Structural and Collateral Term Sheet | | BMO 2022-C2 |
| |
| Structural Overview |
| | | 3. Class A-1, Class A-2, Class A-3, Class A-4, Class A-5 and Class A-SB certificates: to reimburse the Class A-1, Class A-2, Class A-3, Class A-4, Class A-5 and Class A-SB certificates, pro rata, for any unreimbursed losses on the mortgage loans that were previously allocated to reduce the certificate balances of those classes, together with interest at their respective pass-through rates. 4. Class A-S certificates: (i) first, to interest on the Class A-S certificates in the amount of their interest entitlement; (ii) next, to the extent of Non-Vertically Retained Available Funds allocable to principal remaining after distributions in respect of principal to each class of Non-Vertically Retained Principal Balance Certificates with a higher principal payment priority (in this case, the Class A-1, Class A-2, Class A-3, Class A-4, Class A-5 and Class A-SB certificates), to principal on the Class A-S certificates until their certificate balance is reduced to zero; and (iii) next, to reimburse the Class A-S certificates for any unreimbursed losses on the mortgage loans that were previously allocated to reduce the certificate balance of that class, together with interest at its pass-through rate. 5. Class B certificates: (i) first, to interest on the Class B certificates in the amount of their interest entitlement; (ii) next, to the extent of Non-Vertically Retained Available Funds allocable to principal remaining after distributions in respect of principal to each class of Non-Vertically Retained Principal Balance Certificates with a higher principal payment priority (in this case, the Class A-1, Class A-2, Class A-3, Class A-4, Class A-5, Class A-SB and Class A-S certificates), to principal on the Class B certificates until their certificate balance is reduced to zero; and (iii) next, to reimburse Class B certificates for any unreimbursed losses on the mortgage loans that were previously allocated to reduce the certificate balance of that class, together with interest at its pass-through rate. 6. Class C certificates: (i) first, to interest on the Class C certificates in the amount of their interest entitlement; (ii) next, to the extent of Non-Vertically Retained Available Funds allocable to principal remaining after distributions in respect of principal to each class of Non-Vertically Retained Principal Balance Certificates with a higher principal payment priority (in this case, the Class A-1, Class A-2, Class A-3, Class A-4, Class A-5, Class A-SB, Class A-S and Class B certificates), to principal on the Class C certificates until their certificate balance is reduced to zero; and (iii) next, to reimburse the Class C certificates for any unreimbursed losses on the mortgage loans that were previously allocated to reduce the certificate balance of that class, together with interest at its pass-through rate. 7. After the Class A-1, Class A-2, Class A-3, Class A-4, Class A-5, Class A-SB, Class X-A, Class X-D, Class X-F, Class X-G, Class X-J, Class A-S, Class B and Class C certificates are paid all amounts to which they are entitled on such Distribution Date, the remaining Non-Vertically Retained Available Funds will be used to pay interest and principal and to reimburse (with interest) any unreimbursed losses to the Class D, Class E, Class F, Class G-RR and Class J-RR certificates, sequentially in that order and with respect to each such class in a manner analogous to the Class C certificates pursuant to clause 6 above. |
| | | |
■ Realized Losses: | | The certificate balances of the Non-Vertically Retained Principal Balance Certificates will each be reduced without distribution on any Distribution Date as a write-off to the extent of any loss realized on the mortgage loans allocated to the related class on such Distribution Date. On each Distribution Date, the Non-Vertically Retained Percentage of any such losses will be applied to the respective classes of Non-Vertically Retained Principal Balance Certificates in the following order, in each case until the related certificate balance is reduced to zero: first to the Class J-RR certificates, second, to the Class G-RR certificates; third, to the Class F certificates; fourth, to the Class E certificates; fifth, to the Class D certificates; sixth, to the Class C certificates; seventh, to the Class B certificates; eighth, to the Class A-S certificates; and, finally pro rata, to the Class A-1, Class A-2, Class A-3, Class A-4, Class A-5 and Class A-SB certificates, based on their then current respective certificate balances. The notional amount of each class of Class X Certificates will be reduced to reflect reductions in the certificate balance(s) of the class (or classes, as applicable) of Corresponding Non-Vertically Retained Principal Balance Certificates as a result of allocations of losses realized on the mortgage loans to such class(es) of Non-Vertically Retained Principal Balance Certificates. |
| | | |
■ Prepayment Premiums and Yield
Maintenance Charges: | | On each Distribution Date, until the notional amounts of the Class X-A and Class X-D certificates and the certificate balances of the Class A-1, Class A-2, Class A-3, Class A-4, Class A-5, Class A-SB, Class A-S, Class B, Class C, Class D and Class E certificates have been reduced to zero, the Non-Vertically Retained Percentage of each yield maintenance charge collected on the mortgage loans during the related one-month collection period (or, in the case of an outside serviced mortgage loan, that accompanied a principal prepayment included in the aggregate available funds for such Distribution Date) is required to be distributed to holders of the Non-Vertically Retained Regular Certificates (excluding holders of the Class X-F, Class X-G, Class X-J, Class F, Class G-RR and Class J-RR certificates) as follows: (a) first the Non-Vertically Retained Percentage of such yield maintenance charge will be allocated between (i) the group (the “YM Group A”) of the Class A-1, Class A-2, Class A-3, Class A-4, Class A-5, Class A-SB and Class X-A certificates, (ii) the group (the |
| THE INFORMATION IN THIS STRUCTURAL AND COLLATERAL TERM SHEET IS NOT COMPLETE AND MAY BE AMENDED PRIOR TO THE TIME OF SALE. THIS TERM SHEET IS NOT AN OFFER TO SELL THESE SECURITIES AND IT IS NOT A SOLICITATION OF AN OFFER TO BUY THESE SECURITIES IN ANY JURISDICTION WHERE THE OFFER OR SALE IS NOT PERMITTED. |
18
| Structural and Collateral Term Sheet | | BMO 2022-C2 |
| |
| Structural Overview |
| | | ‘YM Group A-S”) comprised solely of the Class A-S certificates, (iii) the group (the “YM Group B”) comprised solely of the Class B certificates, (iv) the group (the “YM Group C”) comprised solely of the Class C certificates and (v) the group (the “YM Group DE” and, together with the YM Group A, the YM Group A-S, the YM Group B and the YM Group C, the “YM Groups”) of the Class X-D, Class D and Class E certificates pro rata, based upon the aggregate amount of principal distributed to the class or classes of Non-Vertically Retained Principal Balance Certificates in each YM Group on such Distribution Date, and (b) then the portion of such yield maintenance charge allocated to each YM Group will be further allocated as among the classes of Non-Vertically Retained Regular Certificates in such YM Group, in the following manner: (i) each class of Non-Vertically Retained Principal Balance Certificates in such YM Group will entitle the applicable certificateholders to receive on the applicable Distribution Date that portion of such yield maintenance charge equal to the product of (X) a fraction whose numerator is the amount of principal distributed to such class of Non-Vertically Retained Principal Balance Certificates on such Distribution Date and whose denominator is the total amount of principal distributed to all of the Non-Vertically Retained Principal Balance Certificates in that YM Group on such Distribution Date, (Y) the Base Interest Fraction (as defined in the Preliminary Prospectus) for the related principal prepayment and such class of Non-Vertically Retained Principal Balance Certificates, and (Z) the portion of such yield maintenance charge allocated to such YM Group, and (ii) the portion of such yield maintenance charge allocated to such YM Group and remaining after such distributions with respect to the Non-Vertically Retained Principal Balance Certificates in such YM Group will be distributed to the class of Class X Certificates in such YM Group (or, in the case of YM Group A-S, YM Group B or YM Group C, to the sole class of certificates constituting such YM Group). If there is more than one class of Non-Vertically Retained Principal Balance Certificates in any YM Group entitled to distributions of principal on any particular Distribution Date on which yield maintenance charges are distributable to such classes, the aggregate portion of such yield maintenance charges allocated to such YM Group will be allocated among all such classes of Non-Vertically Retained Principal Balance Certificates up to, and on a pro rata basis in accordance with, their respective entitlements in those yield maintenance charges in accordance with the prior sentence of this paragraph. If a prepayment premium (calculated as a percentage of the amount prepaid) is imposed in connection with a prepayment rather than a yield maintenance charge, then the prepayment premium so collected will be allocated as described above. For this purpose, the discount rate used to calculate the Base Interest Fraction will be the discount rate used to determine the yield maintenance charge for mortgage loans that require payment at the greater of a yield maintenance charge or a minimum amount equal to a fixed percentage of the principal balance of the mortgage loan or, for mortgage loans that only have a prepayment premium based on a fixed percentage of the principal balance of the mortgage loan, such other discount rate as may be specified in the related loan documents. After the notional amounts of the Class X-A and Class X-D certificates and the certificate balances of the Class A-1, Class A-2, Class A-3, Class A-4, Class A-5, Class A-SB, Class A-S, Class B, Class C, Class D and Class E certificates have been reduced to zero, the Non-Vertically Retained Percentage of all prepayment premiums and yield maintenance charges with respect to the mortgage loans will be allocated among the holders of the Class F, Class G-RR and Class J-RR certificates as provided in the BMO 2022-C2 pooling and servicing agreement. No yield maintenance charges or prepayment premiums will be distributed to the holders of the Class X-F, Class X-G, Class X-J and Class R certificates. For a description of prepayment premiums and yield maintenance charges required on the mortgage loans, see Annex A to the Preliminary Prospectus. See also “Certain Legal Aspects of the Mortgage Loans—Default Interest and Limitations on Prepayments” in the Preliminary Prospectus. |
| | | |
| ■ Advances: | | The master servicer and, if it fails to do so, the trustee, will be obligated to make P&I advances with respect to each mortgage loan in the issuing entity and, with respect to all of the mortgage loans serviced under the BMO 2022-C2 pooling and servicing agreement, servicing advances, including paying delinquent property taxes, condominium assessments, insurance premiums and ground lease rents, but only to the extent that those advances are not deemed non-recoverable from collections on the related mortgage loan and, in the case of servicing advances, any other related companion loans as described below. P&I advances are subject to reduction in connection with any appraisal reductions that may occur. The special servicer will have no obligation to make any advances, provided that, in an urgent or emergency situation requiring the making of a property protection advance, the special servicer may, in its sole discretion, make a property protection advance and will be entitled to reimbursement from the master servicer for such advance. The master servicer, the special servicer and the trustee will each be entitled to receive interest on advances they make at the prime rate, subject to a floor of 2.0% per annum, compounded annually. |
| THE INFORMATION IN THIS STRUCTURAL AND COLLATERAL TERM SHEET IS NOT COMPLETE AND MAY BE AMENDED PRIOR TO THE TIME OF SALE. THIS TERM SHEET IS NOT AN OFFER TO SELL THESE SECURITIES AND IT IS NOT A SOLICITATION OF AN OFFER TO BUY THESE SECURITIES IN ANY JURISDICTION WHERE THE OFFER OR SALE IS NOT PERMITTED. |
19
| Structural and Collateral Term Sheet | | BMO 2022-C2 |
| |
| Structural Overview |
■ Serviced Mortgage Loans/Outside Serviced Mortgage Loans: | | One or more whole loans may each constitute an “outside serviced whole loan”, in which case (as identified under “Collateral Characteristics—Pari Passu Companion Loan Summary” above), the BMO 2022-C2 pooling and servicing agreement is not the Controlling PSA, and each related mortgage loan constitutes an “outside serviced mortgage loan,” each related companion loan constitutes an “outside serviced companion loan,” and each related Controlling PSA constitutes an “outside servicing agreement.” One or more whole loans may be identified in the Preliminary Prospectus as a “servicing shift whole loan”, in which case the related mortgage loan constitutes a “servicing shift mortgage loan” and each related companion loan constitutes a “servicing shift companion loan”. Any servicing shift whole loan will initially be serviced pursuant to the BMO 2022-C2 pooling and servicing agreement during which time such mortgage loan, such whole loan and each related companion loan will be a serviced mortgage loan, a serviced whole loan and a serviced companion loan (each as defined below), respectively. However, upon the inclusion of the related controlling pari passu companion loan in a future securitization transaction, the servicing of such mortgage loan will shift to the servicing agreement governing such securitization transaction, and such mortgage loan, such whole loan and each related companion loan will be an outside serviced mortgage loan, an outside serviced whole loan and an outside serviced companion loan, respectively. All of the mortgage loans transferred to the issuing entity (other than any outside serviced mortgage loan) are sometimes referred to in this Term Sheet as the “serviced mortgage loans” and, together with any related companion loans, as the “serviced loans” (which signifies that they are being serviced by the master servicer and the special servicer under the BMO 2022-C2 pooling and servicing agreement); each related whole loan constitutes a “serviced whole loan”; and each related companion loan constitutes a “serviced companion loan.” See “Description of the Mortgage Pool—The Whole Loans” in the Preliminary Prospectus. |
| | | |
| ■ Appraisal Reduction Amounts: | | An Appraisal Reduction Amount generally will be created with respect to a required appraisal loan (which is a serviced loan as to which certain defaults, modifications or insolvency events have occurred (as further described in the Preliminary Prospectus)) in the amount, if any, by which the principal balance of such required appraisal loan, plus other amounts overdue or advanced in connection with such required appraisal loan, exceeds 90% of the appraised value of the related mortgaged property (subject to certain downward adjustments permitted under the BMO 2022-C2 pooling and servicing agreement) plus certain escrows and reserves (including letters of credit) held with respect to such required appraisal loan; provided that, if so provided in the related co-lender agreement, the holder of a subordinate companion loan may be permitted to post cash or a letter of credit to offset some or all of an Appraisal Reduction Amount. In the case of an outside serviced mortgage loan, any Appraisal Reduction Amounts will be calculated pursuant to, and by a party to, the related outside servicing agreement. In general, any Appraisal Reduction Amount calculated with respect to a whole loan will be allocated first, to any related subordinate companion loan(s) (up to the outstanding principal balance(s) thereof), and then, to the related mortgage loan and any related pari passu companion loan(s) on a pro rata basis in accordance with their respective outstanding principal balances. As a result of an Appraisal Reduction Amount being calculated for and/or allocated to a given mortgage loan, the interest portion of any P&I advance for such mortgage loan will be reduced, which (to the extent of the Non-Vertically Retained Percentage of the reduction in such P&I advance) will have the effect of reducing the amount of interest available to the most subordinate class(es) of Certificates then outstanding (i.e., first, to the Class J-RR certificates, then, to the Class G-RR certificates, then, to the Class F certificates, then, to the Class E certificates, then, to the Class D certificates, then, to the Class C certificates, then, to the Class B certificates, then, to the Class A-S certificates, and then, pro rata based on interest entitlements, to the Class A-1, Class A-2, Class A-3, Class A-4, Class A-5, Class A-SB, Class X-A, Class X-D, Class X-F, Class X-G and Class X-J certificates). In general, a serviced loan will cease to be a required appraisal loan, and no longer be subject to an Appraisal Reduction Amount, when the same has ceased to be a specially serviced loan (if applicable), has been brought current for at least three consecutive months and no other circumstances exist that would cause such serviced loan to be a required appraisal loan. For purposes of determining the identity of the Controlling Class and the existence of a Control Termination Event and an Operating Advisor Consultation Trigger Event, as well as the allocation and/or exercise of voting rights for certain purposes, the Vertically Retained Percentage of any Appraisal Reduction Amounts in respect of or allocated to the mortgage loans will be allocated to notionally reduce the principal balance of the Combined VRR Interest, and the Non-Vertically Retained Percentage of any Appraisal Reduction Amounts in respect of or allocated to the mortgage loans will be allocated to notionally reduce the certificate balances of the Non-Vertically Retained Principal Balance Certificates as follows: first, to the Class J-RR, Class G-RR, Class F, Class E, Class D, Class C, Class B and Class A-S certificates, in that order, in each case until the related certificate balance is notionally reduced to zero; and then to the Class A-1, Class A-2, Class A-3, Class A-4, Class A-5 and Class A-SB certificates, pro rata based on certificate balance. |
| THE INFORMATION IN THIS STRUCTURAL AND COLLATERAL TERM SHEET IS NOT COMPLETE AND MAY BE AMENDED PRIOR TO THE TIME OF SALE. THIS TERM SHEET IS NOT AN OFFER TO SELL THESE SECURITIES AND IT IS NOT A SOLICITATION OF AN OFFER TO BUY THESE SECURITIES IN ANY JURISDICTION WHERE THE OFFER OR SALE IS NOT PERMITTED. |
20
| Structural and Collateral Term Sheet | | BMO 2022-C2 |
| |
| Structural Overview |
| | | For various purposes under the BMO 2022-C2 pooling and servicing agreement (including, with respect to the Non-Vertically Retained Principal Balance Certificates, for purposes of determining the Non-Reduced Certificates and the Controlling Class, as well as the occurrence of a Control Termination Event and an Operating Advisor Consultation Trigger Event), the Vertically Retained Percentage of any Appraisal Reduction Amounts in respect of or allocated to the mortgage loans will be allocated to notionally reduce the certificate balance of the Combined VRR Interest, and the Non-Vertically Retained Percentage of any Appraisal Reduction Amounts in respect of or allocated to the mortgage loans will be allocated to notionally reduce the certificate balances of the Non-Vertically Retained Principal Balance Certificates as follows: first, to the Class J-RR, Class G-RR, Class F, Class E, Class D, Class C, Class B and Class A-S certificates, in that order, in each case until the related certificate balance is notionally reduced to zero; and then to the Class A-1, Class A-2, Class A-3, Class A-4, Class A-5 and Class A-SB certificates, pro rata based on certificate balance. |
| | | |
■ Cumulative Appraisal Reduction Amounts: | | A “Cumulative Appraisal Reduction Amount”, as of any date of determination, is equal to the sum of (i) all Appraisal Reduction Amounts then in effect, and (ii) with respect to any AB Modified Loans, any Collateral Deficiency Amounts then in effect. “Collateral Deficiency Amount” means, with respect to any AB Modified Loan as of any date of determination, the excess of (i) the stated principal balance of such AB Modified Loan (taking into account the related junior note(s) included therein), over (ii) the sum of (in the case of a whole loan, solely to the extent allocable to the subject mortgage loan) (x) the most recent appraised value for the related mortgaged property or mortgaged properties, plus (y) solely to the extent not reflected or taken into account in such appraised value and to the extent on deposit with, or otherwise under the control of, the lender as of the date of such determination, any capital or additional collateral contributed by the related borrower at the time the mortgage loan became (and as part of the modification related to) such AB Modified Loan for the benefit of the related mortgaged property or mortgaged properties (provided, that in the case of an outside serviced mortgage loan, the amounts set forth in this clause (y) will be taken into account solely to the extent relevant information is received), plus (z) any other escrows or reserves (in addition to any amounts set forth in the immediately preceding clause (y)) held by the lender in respect of such AB Modified Loan as of the date of such determination. For purposes of determining the identity of the Controlling Class and the existence of a Control Termination Event and an Operating Advisor Consultation Trigger Event, the Non-Vertically Retained Percentage of Collateral Deficiency Amounts will be allocable to the respective classes of Control Eligible Certificates (as defined below), in reverse alphabetical order of class designation, in a manner similar to the allocation of Appraisal Reduction Amounts to such classes. “AB Modified Loan” means any corrected mortgage loan (1) that became a corrected mortgage loan (which includes for purposes of this definition any outside serviced mortgage loan that became a “corrected” mortgage loan (or any term substantially similar thereto) pursuant to the related outside servicing agreement) due to a modification thereto that resulted in the creation of an A/B note structure (or similar structure) and as to which the new junior note(s) did not previously exist or the principal amount of the new junior note(s) was previously part of either an A note held by the trust or the original unmodified mortgage loan and (2) as to which an Appraisal Reduction Amount is not in effect. |
| | | |
| ■ Age of Appraisals: | | Appraisals (which can be an update of a prior appraisal) with respect to a serviced loan are required to be no older than 9 months for purposes of determining appraisal reductions (other than the annual re-appraisal), market value, and other calculations as described in the Preliminary Prospectus. |
| | | |
| ■ Sale of Defaulted Loans: | | There will be no “Fair Market Value Purchase Option”. Instead, defaulted mortgage loans will be sold in a process similar to the sale process for REO property. With respect to an outside serviced whole loan, the party acting as special servicer with respect to such outside serviced whole loan pursuant to the related outside servicing agreement (the “outside special servicer”) may offer to sell to any person (or may offer to purchase) for cash such outside serviced whole loan in accordance with the terms of the related outside servicing agreement during such time as such outside serviced whole loan constitutes a defaulted mortgage loan qualifying for sale thereunder and, in connection with any such sale, the related outside special servicer is required to sell both the applicable outside serviced mortgage loan and the related outside serviced pari passu companion loan(s) and, if so provided in the related co-lender agreement or the Controlling PSA, any related subordinate companion loan(s), together as one defaulted loan. |
| | | |
| ■ Directing Holder: | | The “Directing Holder” with respect to any mortgage loan or whole loan serviced under the BMO 2022-C2 pooling and servicing agreement will be: ● except (i) with respect to an excluded mortgage loan, (ii) with respect to a serviced whole loan as to which the Controlling Note is held outside the issuing entity (sometimes referred to in this Term Sheet as a “serviced outside controlled whole loan”), and (iii) during any period that a Control Termination Event has occurred and is continuing, the Controlling Class Representative; ● with respect to any serviced outside controlled whole loan (which may include a servicing shift whole loan or any other serviced whole loan with a controlling companion loan held outside the |
| THE INFORMATION IN THIS STRUCTURAL AND COLLATERAL TERM SHEET IS NOT COMPLETE AND MAY BE AMENDED PRIOR TO THE TIME OF SALE. THIS TERM SHEET IS NOT AN OFFER TO SELL THESE SECURITIES AND IT IS NOT A SOLICITATION OF AN OFFER TO BUY THESE SECURITIES IN ANY JURISDICTION WHERE THE OFFER OR SALE IS NOT PERMITTED. |
21
| Structural and Collateral Term Sheet | | BMO 2022-C2 |
| |
| Structural Overview |
| | | issuing entity), if and for so long as such holder is entitled under the related co-lender agreement to exercise consent rights similar to those entitled to be exercised by the Controlling Class Representative, the holder of the related Controlling Note (during any such period, the “outside controlling note holder”); The applicable directing holder (or equivalent party) with respect to any outside serviced mortgage loan will be, in general, (i) in the event the related Controlling Note is included in the subject outside securitization transaction, the controlling class representative (or equivalent entity) under the related outside servicing agreement, and (ii) in all other cases, the third party holder of the related Controlling Note or its representative (which may be a controlling class representative (or equivalent entity) under a separate securitization transaction to which such note has been transferred (if any)), as provided in the related co-lender agreement. An “excluded mortgage loan” is, if the Controlling Class Representative is the Directing Holder with respect to the subject mortgage loan, a mortgage loan or related whole loan with respect to which the Controlling Class Representative or the holder(s) of more than 50% of the Controlling Class (by certificate balance) is (or are) a Borrower Party (as defined in the Preliminary Prospectus). |
| | | |
■ Controlling Class
Representative: | | The “Controlling Class Representative” will be the controlling class certificateholder or other representative designated by at least a majority of the controlling class certificateholders by certificate balance. The “Controlling Class” is, as of any time of determination, the most subordinate class of the Control Eligible Certificates that has an outstanding certificate balance as notionally reduced by any Cumulative Appraisal Reduction Amount allocable to such class, at least equal to 25% of the initial certificate balance of that class of certificates; provided that (except under the circumstances set forth in the next proviso) if no such class meets the preceding requirement, then the Class G-RR certificates will be the controlling class; provided, further, however, that if, at any time, the aggregate outstanding certificate balance of the classes of Non-Vertically Retained Principal Balance Certificates senior to the Control Eligible Certificates has been reduced to zero (without regard to the allocation of any Cumulative Appraisal Reduction Amounts), then the “Controlling Class” will be the most subordinate class of Control Eligible Certificates with an outstanding certificate balance greater than zero (without regard to the allocation of any Cumulative Appraisal Reduction Amounts). The “Control Eligible Certificates” consist of the Class G-RR and Class J-RR certificates. See “The Pooling and Servicing Agreement—Directing Holder” in the Preliminary Prospectus. No other class of certificates will be eligible to act as the controlling class or appoint a Controlling Class Representative. No person may exercise any of the rights and powers of the Controlling Class Representative with respect to an excluded mortgage loan. On the Closing Date, RREF IV-D AIV RR, LLC or its affiliate, is expected to (i) purchase the Class G-RR and Class J-RR certificates, and (ii) to appoint itself or an affiliate as the initial Controlling Class Representative. |
| | | |
■ Control Termination Event: | | A “Control Termination Event” will: with respect to any mortgage loan either (a) occur when none of the classes of the Control Eligible Certificates has an outstanding certificate balance (as notionally reduced by any Cumulative Appraisal Reduction Amount then allocable to such class) that is at least equal to 25% of the initial certificate balance of that class of certificates or (b) be deemed to occur as described below; provided, however, that a Control Termination Event will in no event exist at any time that the certificate balance of each class of the Non-Vertically Retained Principal Balance Certificates senior to the Control Eligible Certificates (without regard to the allocation of Cumulative Appraisal Reduction Amounts) has been reduced to zero. With respect to excluded mortgage loans as to which the Controlling Class Representative would otherwise be the Directing Holder, a Control Termination Event will be deemed to exist. The holders of Certificates representing the majority of the certificate balance of the most senior class of Control Eligible Certificates whose certificate balance is notionally reduced to less than 25% of the initial certificate balance of that class as a result of an allocation of an Appraisal Reduction Amount or a Collateral Deficiency Amount, as applicable, to such class will have the right to challenge the Special Servicer’s Appraisal Reduction Amount determination or a Collateral Deficiency Amount determination, as applicable, and, at their sole expense, obtain a second appraisal for any serviced loan for which an Appraisal Reduction Event has occurred or as to which there exists a Collateral Deficiency Amount, under the circumstances described in the Preliminary Prospectus. |
| | | |
■ Consultation Termination Event: | | A “Consultation Termination Event” with respect to any mortgage loan, (a) when none of the classes of Control Eligible Certificates has an outstanding certificate balance, without regard to the allocation of any Cumulative Appraisal Reduction Amount, that is equal to or greater than 25% of the initial certificate balance of that class of certificates or (b) be deemed to occur as described below; provided, however, that a Consultation Termination Event will in no event exist at any time that the certificate balance of each class of the Non-Vertically Retained Principal Balance Certificates senior to the Control Eligible Certificates (without regard to the allocation of Cumulative Appraisal Reduction Amounts) has been reduced to zero. With respect to excluded mortgage loans as to which the |
| THE INFORMATION IN THIS STRUCTURAL AND COLLATERAL TERM SHEET IS NOT COMPLETE AND MAY BE AMENDED PRIOR TO THE TIME OF SALE. THIS TERM SHEET IS NOT AN OFFER TO SELL THESE SECURITIES AND IT IS NOT A SOLICITATION OF AN OFFER TO BUY THESE SECURITIES IN ANY JURISDICTION WHERE THE OFFER OR SALE IS NOT PERMITTED. |
22
| Structural and Collateral Term Sheet | | BMO 2022-C2 |
| |
| Structural Overview |
| | | Controlling Class Representative would otherwise be a Consulting Party, a Consultation Termination Event will be deemed to exist. |
| | | |
■ Control/Consultation Rights: | | With respect to any Serviced Loan, the applicable Directing Holder will be entitled to have consent and/or consultation rights under the BMO 2022-C2 pooling and servicing agreement with respect to certain major decisions (including with respect to assumptions, waivers, certain loan modifications and workouts) and other matters with respect to each serviced loan. After the occurrence and during the continuance of a Control Termination Event, the consent rights of the Controlling Class Representative will terminate, and the Controlling Class Representative will retain non-binding consultation rights under the BMO 2022-C2 pooling and servicing agreement with respect to certain major decisions and other matters with respect to the serviced mortgage loans, other than (i) any excluded mortgage loan and (ii) any serviced outside controlled whole loan. After the occurrence and during the continuance of a Consultation Termination Event, all of these rights of the Controlling Class Representative with respect to the applicable serviced loans will terminate. With respect to any serviced outside controlled whole loan (including any servicing shift whole loan for so long as it is serviced under the BMO 2022-C2 pooling and servicing agreement), the holder of the related Controlling Note or its representative (which holder or representative will not be the Controlling Class Representative) will instead be entitled to exercise the above-described consent and consultation rights, to the extent provided under the related co-lender agreement. With respect to each outside serviced whole loan, the applicable outside controlling class representative or other related controlling noteholder pursuant to, and subject to the limitations set forth in, the related outside servicing agreement and the related co-lender agreement will have consent, consultation, approval and direction rights with respect to certain major decisions (including with respect to assumptions, waivers, loan modifications and workouts) regarding such outside serviced whole loan, as provided for in the related co-lender agreement and in the related outside servicing agreement. To the extent permitted under the related co-lender agreement, the Controlling Class Representative (so long as a Consultation Termination Event does not exist) may have certain consultation rights with respect to each outside serviced whole loan. See “Description of the Mortgage Pool—The Whole Loans” in the Preliminary Prospectus. |
| | | |
■ Risk Retention Consultation
Parties: | | The “risk retention consultation parties”, with respect to any serviced mortgage loan or, if applicable, serviced whole loan will be: (i) the party selected by Bank of Montreal, and (ii) the party selected by KeyBank National Association. Each risk retention consultation party will have certain non-binding consultation rights in certain circumstances, (i) for so long as no Consultation Termination Event is continuing, with respect to any specially serviced loan (other than any outside serviced mortgage loan), and (ii) during the continuance of a Consultation Termination Event, with respect to any mortgage loan (other than any outside serviced mortgage loan), as further described in the Preliminary Prospectus. Notwithstanding the foregoing, none of the risk retention consultation parties will have any consultation rights with respect to any mortgage loan that is an excluded RRCP mortgage loan with respect to such party. Bank of Montreal and KeyBank National Association are expected to be appointed as the initial risk retention consultation parties. With respect to any risk retention consultation party, an “excluded RRCP mortgage loan” is a mortgage loan or whole loan with respect to which such risk retention consultation party, or the person(s) entitled to appoint such risk retention consultation party, is a Borrower Party. |
| THE INFORMATION IN THIS STRUCTURAL AND COLLATERAL TERM SHEET IS NOT COMPLETE AND MAY BE AMENDED PRIOR TO THE TIME OF SALE. THIS TERM SHEET IS NOT AN OFFER TO SELL THESE SECURITIES AND IT IS NOT A SOLICITATION OF AN OFFER TO BUY THESE SECURITIES IN ANY JURISDICTION WHERE THE OFFER OR SALE IS NOT PERMITTED. |
23
| Structural and Collateral Term Sheet | | BMO 2022-C2 |
| |
| Structural Overview |
| ■ Termination of Special Servicer: | | At any time, the special servicer (but not any outside special servicer for any outside serviced whole loan) may be removed and replaced by the applicable Directing Holder, if any, with or without cause upon satisfaction of certain conditions specified in the BMO 2022-C2 pooling and servicing agreement. After the occurrence and during the continuance of a Control Termination Event, the holders of at least 25% of the voting rights of the Certificates (without regard to the application of any Appraisal Reduction Amounts) may request a vote to replace the special servicer (with respect to all of the serviced loans other than any serviced outside controlled whole loan). The subsequent vote may result in the termination and replacement of the special servicer if, within 180 days of the initial request for that vote, the holders of (a) at least 66-2/3% of the voting rights allocable to the Certificates of those holders that voted on the matter (provided that holders representing the applicable Certificateholder Quorum voted on the matter), or (b) more than 50% of the voting rights of each class of Certificates that are Non-Reduced Certificates vote affirmatively to so replace. “Non-Reduced Certificates” means each class of Principal Balance Certificates that has an outstanding certificate balance as may be notionally reduced by any Appraisal Reduction Amounts allocated to that class, equal to or greater than 25% of an amount equal to the initial certificate balance of that class of certificates minus all principal payments made on such class of certificates. Notwithstanding the foregoing, but subject to the discussion in the next paragraph, solely with respect to a serviced outside controlled whole loan (including any servicing shift whole loan, for so long as it is serviced pursuant to the BMO 2022-C2 pooling and servicing agreement), only the holder of the related Controlling Note or its representative may terminate the special servicer without cause (solely with respect to the related whole loan) and appoint a replacement special servicer for that whole loan. If the operating advisor determines, in its sole discretion exercised in good faith, that (1) the special servicer has failed to comply with the servicing standard and (2) a replacement of the special servicer would be in the best interest of the certificateholders (as a collective whole), the operating advisor will have the right to recommend the replacement of the special servicer with respect to the serviced loans, resulting in a solicitation of a certificateholder vote. The subsequent vote may result in the termination and replacement of the special servicer if, within 180 days of the initial request for that vote, the holders of at least a majority of the aggregate outstanding principal balance of the Certificates of those holders that voted on the matter (provided that holders representing the applicable Certificateholder Quorum vote on the matter) vote affirmatively to so replace. “Certificateholder Quorum” means a quorum that (a) for purposes of a vote to terminate and replace the special servicer or the asset representations reviewer at the request of the holders of Certificates evidencing not less than 25% of the voting rights (without regard to the application of any Appraisal Reduction Amounts), consists of the holders of Certificates evidencing at least 50% of the voting rights (taking into account the allocation of any Appraisal Reduction Amounts to notionally reduce the certificate balances of the respective classes of Non-Vertically Retained Principal Balance Certificates) of all of the Certificates, on an aggregate basis, and (b) for purposes of a vote to terminate and replace the special servicer based on a recommendation of the operating advisor, consists of the holders of Certificates evidencing at least 20% of the aggregate of the outstanding principal balances of all Certificates; with such quorum including at least (3) holders and/or beneficial owners of Certificates that are not “affiliated” (as defined in Regulation RR) with each other. The related outside special servicer under each outside servicing agreement generally may be (or, if the applicable outside servicing agreement has not yet been executed, it is anticipated that such outside special servicer may be) replaced by the related outside controlling class representative (or an equivalent party), or the vote of the requisite holders of certificates issued, under the applicable outside servicing agreement (depending on whether or not the equivalent of a control termination event or a consultation termination event exists under that outside servicing agreement) or by any applicable other controlling noteholder under the related co-lender agreement in a manner generally similar to the manner in which the special servicer may be replaced under the BMO 2022-C2 pooling and servicing agreement as described above in this “Termination of Special Servicer” section (although there will be differences, in particular as regards certificateholder votes and the timing of when an outside special servicer may be terminated based on the recommendation of an operating advisor). If the special servicer, to its knowledge, becomes a Borrower Party with respect to a mortgage loan, the special servicer will not be permitted to act as special servicer with respect to that mortgage loan. Subject to certain limitations described in the Preliminary Prospectus, any applicable Directing Holder will be entitled to appoint a replacement special servicer for that mortgage loan. If there is no applicable Directing Holder or if the applicable Directing Holder does not take action to appoint a replacement special servicer within the requisite time period, a replacement special servicer will be appointed in the manner specified in the BMO 2022-C2 pooling and servicing agreement. |
| THE INFORMATION IN THIS STRUCTURAL AND COLLATERAL TERM SHEET IS NOT COMPLETE AND MAY BE AMENDED PRIOR TO THE TIME OF SALE. THIS TERM SHEET IS NOT AN OFFER TO SELL THESE SECURITIES AND IT IS NOT A SOLICITATION OF AN OFFER TO BUY THESE SECURITIES IN ANY JURISDICTION WHERE THE OFFER OR SALE IS NOT PERMITTED. |
24
| Structural and Collateral Term Sheet | | BMO 2022-C2 |
| |
| Structural Overview |
| ■ Voting Rights: | | At all times during the term of the BMO 2022-C2 pooling and servicing agreement, the voting rights for the Certificates (the “voting rights”) will be allocated among the respective classes of certificateholders in the following percentages: (1) 1% in the aggregate in the case of the respective classes of the Class X Certificates, allocated pro rata based upon their respective notional amounts as of the date of determination (for so long as the notional amount of at least one class of the Class X Certificates is greater than zero), and (2) in the case of any class of Non-Vertically Retained Principal Balance Certificates, a percentage equal to the product of 99% (or, if the notional amounts of all classes of the Class X Certificates have been reduced to zero, 100%) and a fraction, the numerator of which is equal to the certificate balance of such class of Non-Vertically Retained Principal Balance Certificates as of the date of determination, and the denominator of which is equal to the aggregate of the certificate balances of all classes of the Non-Vertically Retained Principal Balance Certificates, in each case, as of the date of determination, provided, that in certain circumstances described under “The Pooling and Servicing Agreement” in the Preliminary Prospectus, voting rights will only be exercisable by holders of Certificates that are Non-Reduced Certificates and/or may otherwise be exercisable or allocated in a manner that takes into account the allocation of Appraisal Reduction Amounts. The voting rights of any class of certificates are required to be allocated among certificateholders of such class in proportion to their respective percentage interests. The Class R certificates and the Uncertificated VRR Interest will not be entitled to any voting rights. |
| | | |
| ■ Servicing Compensation: | | Modification Fees: Certain fees resulting from modifications, amendments, waivers or other changes to the terms of the loan documents, as more fully described in the Preliminary Prospectus, will be used to offset expenses on the related serviced mortgage loan (i.e. reimburse the trust for certain expenses, including unreimbursed advances and interest on unreimbursed advances previously incurred (other than special servicing fees, workout fees and liquidation fees) on the related serviced mortgage loan but not yet reimbursed to the trust or servicers or to pay expenses (other than special servicing fees, workout fees and liquidation fees) that are still outstanding in each case unless as part of the written modification the related borrower is required to pay these amounts on a going forward basis or in the future). Any excess modification fees not so applied to offset expenses will be available as compensation to the master servicer and/or special servicer. Within any prior 12-month period, all such excess modification fees earned by the master servicer or by the special servicer (after taking into account the offset described below applied during such 12-month period) with respect to any serviced mortgage loan will be subject to a cap equal to the greater of (i) 1% of the outstanding principal balance of such mortgage loan after giving effect to such transaction and (ii) $25,000. All excess modification fees earned by the special servicer will be required to offset any future workout fees or liquidation fees payable with respect to the related serviced mortgage loan or related REO property; provided, that if the serviced mortgage loan ceases being a corrected loan, and is subject to a subsequent modification, any excess modification fees earned by the special servicer prior to such serviced mortgage loan ceasing to be a corrected loan will no longer be offset against future liquidation fees and workout fees unless such serviced mortgage loan ceased to be a corrected loan within 18 months of it becoming a modified mortgage loan. Penalty Fees: All late fees and default interest will first be used to reimburse certain expenses previously incurred with respect to the related mortgage loan (including special servicing fees, workout fees and liquidation fees) but not yet reimbursed to the trust, the master servicer or the special servicer or to pay certain expenses (including special servicing fees, workout fees and liquidation fees) that are still outstanding on the related mortgage loan, and any excess received with respect to a serviced loan will be paid to the master servicer (for penalty fees accrued while a non-specially serviced loan) and the special servicer (for penalty fees accrued while a specially serviced loan). To the extent any amounts reimbursed out of penalty charges are subsequently recovered on a related serviced loan, they will be paid to the master servicer or special servicer who would have been entitled to the related penalty charges that were previously used to reimburse such expense. Liquidation / Workout Fees: Liquidation fees will be calculated at the lesser of (a) 1.0% or (b) with respect to any serviced mortgage loan (or related serviced whole loan, if applicable) or related REO Property, such lesser rate as would result in a liquidation fee of $1,000,000, for each serviced loan that is a specially serviced loan and any REO property, subject in any case to a minimum liquidation fee of $25,000. For any serviced loan that is a corrected loan, workout fees will be calculated at the lesser of (a) 1.0% and (b) such lower rate as would result in a workout fee of $1,000,000 when applied to each expected payment of principal and interest (other than (i) default interest and (ii) any “excess interest” accrued after the related anticipated repayment date on any mortgage loan with an |
| THE INFORMATION IN THIS STRUCTURAL AND COLLATERAL TERM SHEET IS NOT COMPLETE AND MAY BE AMENDED PRIOR TO THE TIME OF SALE. THIS TERM SHEET IS NOT AN OFFER TO SELL THESE SECURITIES AND IT IS NOT A SOLICITATION OF AN OFFER TO BUY THESE SECURITIES IN ANY JURISDICTION WHERE THE OFFER OR SALE IS NOT PERMITTED. |
25
| Structural and Collateral Term Sheet | | BMO 2022-C2 |
| |
| Structural Overview |
| | | anticipated repayment date) on the related serviced loan (or related serviced whole loan, if applicable) from the date such serviced loan becomes a corrected loan through and including the then related maturity date, subject in any case to a minimum workout fee of $25,000. Notwithstanding the foregoing, in connection with a maturity default, no liquidation or workout fee will be payable in connection with a payoff or refinancing of the related serviced loan within 90 days of the maturity default, but the special servicer may collect and retain appropriate fees from the related borrower in connection with the subject liquidation or workout. In the case of an outside serviced whole loan, calculation of the foregoing amounts payable to the related outside servicer or outside special servicer may be different than as described above. For example, the extent to which modification fees and penalty fees are applied to offset expenses may be different and liquidation fees and workout fees may be subject to different caps or no caps. |
| | | |
| ■ Operating Advisor: | | The operating advisor will, in general and under certain circumstances described in the Preliminary Prospectus, have the following rights and responsibilities with respect to the serviced mortgage loans: ● are viewing the actions of the special servicer with respect to specially serviced loans and with respect to certain major decisions regarding non-specially serviced loans as to which the operating advisor has consultation rights; ● reviewing reports provided by the special servicer to the extent set forth in the BMO 2022-C2 pooling and servicing agreement; ● reviewing for accuracy certain calculations made by the special servicer; ● issuing an annual report generally setting forth, among other things, its assessment of whether the special servicer is performing its duties in compliance with the servicing standard and the BMO 2022-C2 pooling and servicing agreement and identifying any material deviations therefrom; ● recommending the replacement of the special servicer if the operating advisor determines, in its sole discretion exercised in good faith, that (1) the special servicer has failed to comply with the servicing standard and (2) a replacement of the special servicer would be in the best interest of the certificateholders and the owners of the Uncertificated VRR Interest (as a collective whole); and ● after the occurrence and during the continuance of an Operating Advisor Consultation Trigger Event, consulting on a non-binding basis with the special servicer with respect to certain major decisions (and such other matters as are set forth in the BMO 2022-C2 pooling and servicing agreement) in respect of the applicable serviced mortgage loan(s) and/or related companion loan(s). An “Operating Advisor Consultation Trigger Event” will occur when the aggregate outstanding certificate balance of the HRR Certificates (as notionally reduced by any Cumulative Appraisal Reduction Amounts then allocable to the HRR Certificates) is 25% or less of the initial aggregate certificate balance of the HRR Certificates. With respect to excluded mortgage loans, an Operating Advisor Consultation Trigger Event will be deemed to exist. Notwithstanding the foregoing, the operating advisor will generally have no obligations or consultation rights as operating advisor under the BMO 2022-C2 pooling and servicing agreement with respect to any outside serviced mortgage loan or any related REO property. The operating advisor will be subject to termination and replacement if the holders of at least 15% of the voting rights of Non-Reduced Certificates vote to terminate and replace the operating advisor and such termination and replacement is affirmatively voted for by the holders of more than 50% of the voting rights allocable to the Non-Reduced Certificates of those holders that exercise their right to vote (provided that holders entitled to exercise at least 50% of the voting rights allocable to the Non-Reduced Certificates exercise their right to vote within 180 days of the initial request for a vote). The holders initiating such vote will be responsible for the fees and expenses in connection with the vote and replacement. See “The Pooling and Servicing Agreement—Operating Advisor” in the Preliminary Prospectus. |
| | | |
| ■ Asset Representations Reviewer: | | The asset representations reviewer will be required to review certain delinquent mortgage loans after a specified delinquency threshold has been exceeded and the required percentage of certificateholders vote to direct a review of such delinquent mortgage loans. An asset review will occur when either (1) mortgage loans with an aggregate outstanding principal balance of 25% or more of the aggregate outstanding principal balance of all of the mortgage loans (including any REO mortgage loans) held by the issuing entity as of the end of the applicable collection period are at |
| THE INFORMATION IN THIS STRUCTURAL AND COLLATERAL TERM SHEET IS NOT COMPLETE AND MAY BE AMENDED PRIOR TO THE TIME OF SALE. THIS TERM SHEET IS NOT AN OFFER TO SELL THESE SECURITIES AND IT IS NOT A SOLICITATION OF AN OFFER TO BUY THESE SECURITIES IN ANY JURISDICTION WHERE THE OFFER OR SALE IS NOT PERMITTED. |
26
| Structural and Collateral Term Sheet | | BMO 2022-C2 |
| |
| Structural Overview |
| | | least 60 days delinquent in respect of their related monthly payments or balloon payment, if any (for purposes of this paragraph, “delinquent loans”) or (2) at least 15 mortgage loans are delinquent loans as of the end of the applicable collection period and the aggregate outstanding principal balance of such delinquent loans constitutes at least 20% of the aggregate outstanding principal balance of all of the mortgage loans (including any REO mortgage loans) held by the issuing entity as of the end of the applicable collection period. The asset representations reviewer may be terminated and replaced without cause. Upon (i) the written direction of certificateholders evidencing not less than 25% of the voting rights requesting a vote to terminate and replace the asset representations reviewer with a proposed successor asset representations reviewer that is an eligible asset representations reviewer, and (ii) payment by such holders to the certificate administrator of the reasonable fees and expenses to be incurred by the certificate administrator in connection with administering such vote, the certificate administrator will promptly provide notice of such request to all certificateholders and the asset representations reviewer by posting such notice on its internet website, and by mailing such notice to all certificateholders and the asset representations reviewer. Upon the affirmative vote of certificateholders evidencing at least 75% of the voting rights allocable to those holders that exercise their right to vote (provided that holders representing the applicable Certificateholder Quorum exercise their right to vote within 180 days of the initial request for a vote), the trustee will be required to terminate all of the rights and obligations of the asset representations reviewer under the BMO 2022-C2 pooling and servicing agreement by written notice to the asset representations reviewer, and the proposed successor asset representations reviewer will be appointed. See “The Pooling and Servicing Agreement—The Asset Representations Reviewer” in the Preliminary Prospectus. |
| | | |
| ■ Dispute Resolution Provisions: | | The mortgage loan sellers will be subject to the dispute resolution provisions set forth in the BMO 2022-C2 pooling and servicing agreement to the extent those provisions are triggered with respect to any mortgage loan sold to the depositor by a mortgage loan seller and such mortgage loan seller will be obligated under the related mortgage loan purchase agreement to comply with all applicable provisions and to take part in any mediation or arbitration proceedings that may result. Generally, in the event that a Repurchase Request (as defined in the Preliminary Prospectus) with respect to a mortgage loan is not “Resolved” (as defined below) within 180 days after the related mortgage loan seller receives such Repurchase Request, then the enforcing servicer will be required to send a notice to the “Initial Requesting Certificateholder” (if any) indicating the enforcing servicer’s intended course of action with respect to the Repurchase Request. If (a) the enforcing servicer’s intended course of action with respect to the Repurchase Request does not involve pursuing further action to exercise rights against the applicable mortgage loan seller with respect to the Repurchase Request and the Initial Requesting Certificateholder, if any, or any other certificateholder or certificate owner of Certificates wishes to exercise its right to refer the matter to mediation (including nonbinding arbitration) or arbitration, or (b) the enforcing servicer’s intended course of action is to pursue further action to exercise rights against the related mortgage loan seller with respect to the Repurchase Request but the Initial Requesting Certificateholder, if any, or any other certificateholder or certificate owner of Certificates does not agree with the dispute resolution method selected by the enforcing servicer, then the Initial Requesting Certificateholder, if any, or such other certificateholder or certificate owner may deliver a written notice to the enforcing servicer indicating its intent to exercise its right to refer the matter to either mediation or arbitration. In addition, any other certificateholder or certificate owner of Certificates may deliver, within the time frame provided in the BMO 2022-C2 pooling and servicing agreement, a written notice requesting the right to participate in any dispute resolution consultation that is conducted by the enforcing servicer following the enforcing servicer’s receipt of the notice described in the preceding sentence. “Resolved” means, with respect to a Repurchase Request, (i) that any material breach of representations and warranties or a material document defect has been cured, (ii) the related mortgage loan has been repurchased in accordance with the related mortgage loan purchase agreement, (iii) a mortgage loan has been substituted for the related mortgage loan in accordance with the related mortgage loan purchase agreement, (iv) the applicable mortgage loan seller has made a “loss of value payment”, (v) a contractually binding agreement has been entered into between the enforcing servicer, on behalf of the issuing entity, and the related mortgage loan seller that settles the related mortgage loan seller’s obligations under the related mortgage loan purchase agreement, or (vi) the related mortgage loan is no longer property of the issuing entity as a result of a sale or other disposition in accordance with the BMO 2022-C2 pooling and servicing agreement. See “The Pooling and Servicing Agreement—Dispute Resolution Provisions” in the Preliminary Prospectus. |
| | | |
| ■ Liquidated Loan Waterfall: | | Upon liquidation of any mortgage loan, all net liquidation proceeds related to the mortgage loan (but not any related companion loan) will be applied (after allocation to offset certain advances and expenses) so that amounts allocated as a recovery of accrued and unpaid interest will not, in the first instance, include any delinquent interest that was not advanced as a result of Appraisal Reduction Amounts or interest that accrued on any junior note(s) if such mortgage loan is an AB Modified Loan. After the adjusted interest amount is so allocated, any remaining liquidation proceeds will be allocated |
| THE INFORMATION IN THIS STRUCTURAL AND COLLATERAL TERM SHEET IS NOT COMPLETE AND MAY BE AMENDED PRIOR TO THE TIME OF SALE. THIS TERM SHEET IS NOT AN OFFER TO SELL THESE SECURITIES AND IT IS NOT A SOLICITATION OF AN OFFER TO BUY THESE SECURITIES IN ANY JURISDICTION WHERE THE OFFER OR SALE IS NOT PERMITTED. |
27
| Structural and Collateral Term Sheet | | BMO 2022-C2 |
| |
| Structural Overview |
| | | to pay principal on the mortgage loan until the unpaid principal amount of the mortgage loan has been reduced to zero. Any remaining liquidation proceeds will then be allocated to pay delinquent interest that was not advanced as a result of Appraisal Reduction Amounts and any interest that accrued on any junior note(s) if such mortgage loan is an AB Modified Loan. |
| | | |
| ■ Credit Risk Retention: | | This securitization transaction will be subject to the credit risk retention rules of Section 15G of the Securities Exchange Act of 1934, as amended. An economic interest in the credit risk of the mortgage loans in this transaction is expected to be retained pursuant to risk retention regulations (as codified at 12 CFR Part 43) promulgated under Section 15G (“Regulation RR”), as a combination of (A) an “eligible vertical interest” in the form of the Combined VRR Interest and (B) an “eligible horizontal residual interest” in the form of the HRR Certificates. Bank of Montreal will act as retaining sponsor under Regulation RR for this securitization transaction and is expected, on the Closing Date, to partially satisfy its risk retention obligation through (i) the acquisition by KeyBank National Association (as an originator) of a portion of the Combined VRR Interest and (ii) the purchase by a third party purchaser of the HRR Certificates. For a further discussion of the manner in which the credit risk retention requirements are expected to be satisfied by Bank of Montreal, as retaining sponsor for this securitization transaction, see “Credit Risk Retention” in the Preliminary Prospectus. |
| | | |
■ The Combined VRR Interest
Prepayment Premiums and Yield
Maintenance Charges: | | On each Distribution Date, the Vertically Retained Percentage of each yield maintenance charge and prepayment premium collected on the mortgage loans during the related collection period (or, in the case of an outside serviced mortgage loan, that accompanied a principal prepayment included in the aggregate available funds for such Distribution Date) will be required to be distributed to the holders of the Combined VRR Interest. |
| | | |
| ■ Appraisal Reduction Amounts: | | On each Distribution Date, the Vertically Retained Percentage of any Appraisal Reduction Amounts will be allocated to the Combined VRR Interest to notionally reduce (to not less than zero) the principal balance thereof. |
| | | |
| ■ Investor Communications: | | The certificate administrator is required to include on any Form 10–D any request received from a certificateholder to communicate with other certificateholders related to certificateholders exercising their rights under the terms of the BMO 2022-C2 pooling and servicing agreement. Any certificateholder wishing to communicate with other certificateholders regarding the exercise of its rights under the terms of the BMO 2022-C2 pooling and servicing agreement will be able to deliver a written request signed by an authorized representative of the requesting investor to the certificate administrator. |
| | | |
| ■ Deal Website: | | The certificate administrator will maintain a deal website including, but not limited to: ● all special notices delivered. ● summaries of final asset status reports. ● all appraisals in connection with an appraisal reduction plus any subsequent appraisal updates. ● an “Investor Q&A Forum” and a voluntary investor registry. |
| | | |
| ■ Cleanup Call: | | On any Distribution Date on which the aggregate unpaid principal balance of the mortgage loans (including mortgage loans as to which the related mortgaged properties have become REO properties) remaining in the issuing entity is less than 1% of the aggregate principal balance of the pool of mortgage loans as of the Cut-off Date, certain specified persons will have the option to purchase all of the remaining mortgage loans (and all property acquired through exercise of remedies in respect of any mortgage loan) at the price specified in the Preliminary Prospectus. Exercise of the option will terminate the issuing entity and retire the then outstanding certificates. If the aggregate certificate balances of the Class A-1, Class A-2, Class A-3, Class A-4, Class A-5, Class A-SB, Class A-S, Class B, Class C, Class D and Class E certificates and the notional amounts of the Class X-A and Class X-D certificates have been reduced to zero and if the master servicer has received from the remaining certificateholders the payment specified in the BMO 2022-C2 pooling and servicing agreement, the issuing entity could also be terminated in connection with an exchange of all the then-outstanding certificates (excluding the Class R certificates) and the Uncertificated VRR Interest for the mortgage loans remaining in the issuing entity, as further described under “The Pooling and Servicing Agreement—Optional Termination; Optional Mortgage Loan Purchase” in the Preliminary Prospectus. |
The Offered Certificates involve certain risks and may not be suitable for all investors. For information regarding certain risks associated with an investment in the Offered Certificates, see “Summary of Risk Factors” and “Risk Factors” in the Preliminary Prospectus. Capitalized terms used but not otherwise defined in this Term Sheet have the respective meanings assigned to those terms in the Preliminary Prospectus.
| THE INFORMATION IN THIS STRUCTURAL AND COLLATERAL TERM SHEET IS NOT COMPLETE AND MAY BE AMENDED PRIOR TO THE TIME OF SALE. THIS TERM SHEET IS NOT AN OFFER TO SELL THESE SECURITIES AND IT IS NOT A SOLICITATION OF AN OFFER TO BUY THESE SECURITIES IN ANY JURISDICTION WHERE THE OFFER OR SALE IS NOT PERMITTED. |
28
| Structural and Collateral Term Sheet | | BMO 2022-C2 |
| |
| No. 1 – Yorkshire & Lexington Towers |
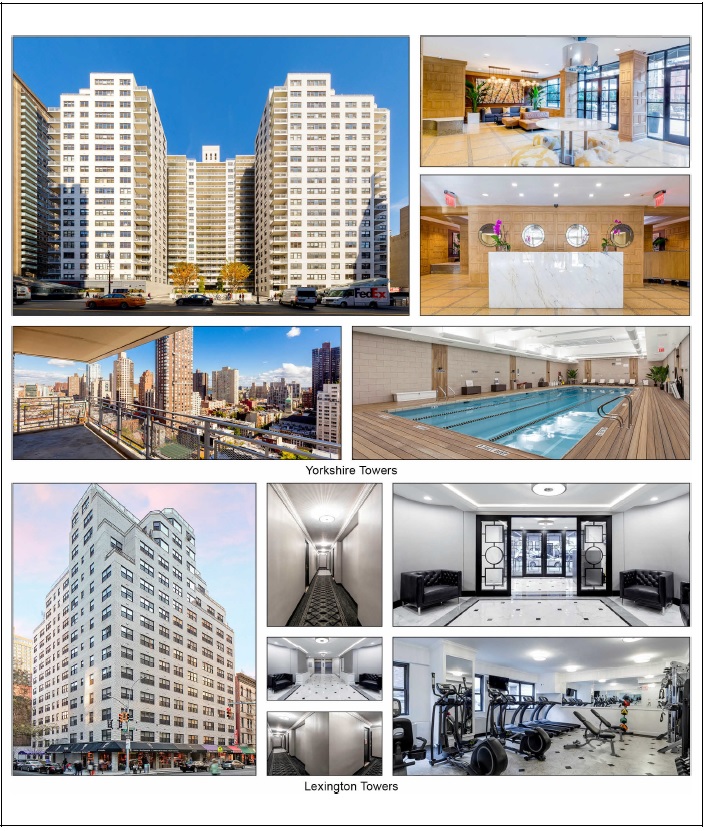
| THE INFORMATION IN THIS STRUCTURAL AND COLLATERAL TERM SHEET IS NOT COMPLETE AND MAY BE AMENDED PRIOR TO THE TIME OF SALE. THIS TERM SHEET IS NOT AN OFFER TO SELL THESE SECURITIES AND IT IS NOT A SOLICITATION OF AN OFFER TO BUY THESE SECURITIES IN ANY JURISDICTION WHERE THE OFFER OR SALE IS NOT PERMITTED. |
29
| Structural and Collateral Term Sheet | | BMO 2022-C2 |
| |
| No. 1 – Yorkshire & Lexington Towers |
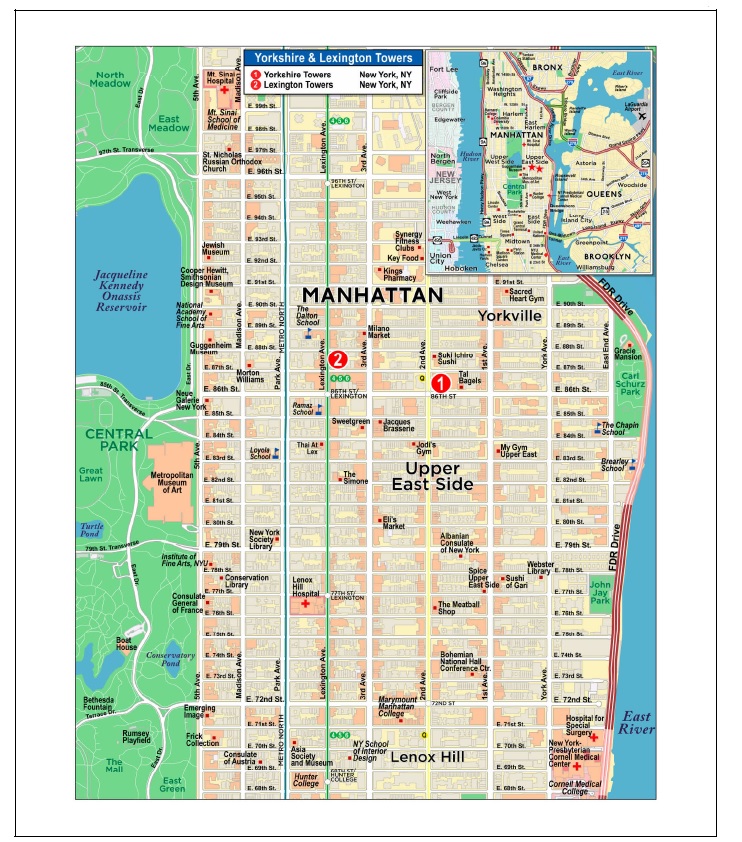
| THE INFORMATION IN THIS STRUCTURAL AND COLLATERAL TERM SHEET IS NOT COMPLETE AND MAY BE AMENDED PRIOR TO THE TIME OF SALE. THIS TERM SHEET IS NOT AN OFFER TO SELL THESE SECURITIES AND IT IS NOT A SOLICITATION OF AN OFFER TO BUY THESE SECURITIES IN ANY JURISDICTION WHERE THE OFFER OR SALE IS NOT PERMITTED. |
30
| Structural and Collateral Term Sheet | | BMO 2022-C2 |
| |
| No. 1 – Yorkshire & Lexington Towers |
| Mortgage Loan Information | | Property Information |
| Mortgage Loan Seller: | BMO, SMC, CREFI | | Single Asset / Portfolio: | Portfolio |
| Credit Assessment (Fitch/DBRS): | BBB-sf/AA(low)(sf) | | Title: | Fee |
| Original Principal Balance(1): | $70,000,000 | | Property Type – Subtype: | Multifamily – High Rise |
| Cut-off Date Principal Balance(1): | $70,000,000 | | Net Rentable Area (Units): | 808 |
| % of IPB: | 9.9% | | Location: | New York, NY |
| Loan Purpose: | Refinance | | Year Built / Renovated: | Various / Various |
| Borrowers(2): | Various | | Occupancy: | 96.4% |
| Borrower Sponsors: | Meyer Chetrit and The Gluck | | Occupancy Date: | 3/1/2022 |
| | Family Trust U/A/D July 16, | | 4th Most Recent NOI (As of): | $27,343,815 (12/31/2019) |
| | 2009 | | 3rd Most Recent NOI (As of): | $25,617,949 (12/31/2020) |
| Interest Rate: | 3.04000% | | 2nd Most Recent NOI (As of): | $24,254,281 (12/31/2021) |
| Note Date: | 5/12/2022 | | Most Recent NOI (As of)(5): | $25,322,439 (TTM 2/28/2022) |
| Maturity Date: | 6/6/2027 | | UW Economic Occupancy: | 97.2% |
| Interest-only Period: | 60 months | | UW Revenues: | $51,394,888 |
| Original Term: | 60 months | | UW Expenses: | $16,019,126 |
| Original Amortization Term: | None | | UW NOI(5): | $35,375,762 |
| Amortization Type: | Interest Only | | UW NCF(5): | $35,375,762 |
| Call Protection(3): | L(25),D(30),O(5) | | Appraised Value / Per Unit: | $954,000,000 / $1,180,693 |
| Lockbox / Cash Management: | Soft (Residential); Hard (Commercial) / In Place | | Appraisal Date: | 1/20/2022 |
| Additional Debt(1): | Yes | | | |
| Additional Debt Balance(1): | $248,000,000 / $221,500,000 / $174,500,000 | | | |
| Additional Debt Type(1): | Pari Passu / Subordinate / Mezzanine | | | |
| | | | | |
| Escrows and Reserves(4) | | Financial Information(1) |
| | Initial | Monthly | Initial Cap | | | Senior Loan | Whole Loan | Total Debt |
| Taxes: | $5,390,917 | $898,486 | N/A | | Cut-off Date Loan / Unit: | $393,564 | $667,698 | $883,663 |
| Insurance: | $367,868 | Springing | N/A | | Maturity Date Loan / Unit: | $393,564 | $667,698 | $883,663 |
| Replacement Reserves: | $1,100,000 | $0 | N/A | | Cut-off Date LTV: | 33.3% | 56.6% | 74.8% |
| TI/LC Reserve: | $1,000,000 | $0 | N/A | | Maturity Date LTV: | 33.3% | 56.6% | 74.8% |
| Other Reserve: | $12,400,000 | Springing | N/A | | UW NCF DSCR(5): | 3.61x | 2.13x | 1.20x |
| | | | | | UW NOI Debt Yield(5): | 11.1% | 6.6% | 5.0% |
| | | | | | | | |
| |
| Sources and Uses |
| Sources | Proceeds | % of Total | | Uses | Proceeds | % of Total |
| Senior Loan | $318,000,000 | 44.5% | | Loan Payoff | $545,268,671 | 76.4% |
| Subordinate Notes | 221,500,000 | 31.0 | | Closing Costs | 93,214,219 | 13.1 |
| Mezzanine Loans | 174,500,000 | 24.4 | | Principal Equity Distribution | 55,258,325 | 7.7 |
| | | | | Upfront Reserves | 20,258,785 | 2.8 |
| Total Sources | $714,000,000 | 100.0% | | Total Uses | $714,000,000 | 100.0% |
| (1) | The Yorkshire & Lexington Towers Senior Loan (as defined below), with an original aggregate principal balance of $318,000,000, is part of the Yorkshire & Lexington Towers Whole Loan (as defined below). The Financial Information in the chart above reflects the Yorkshire & Lexington Towers Senior Loan, the Yorkshire & Lexington Towers Whole Loan and the Yorkshire & Lexington Towers Total Debt (as defined below). For additional information, see “The Loan” below. |
| (2) | The borrowers under the Yorkshire & Lexington Towers Whole Loan are CF E 88 LLC, SM E 88 LLC, CF E 86 LLC, SM E 86 LLC and LSG E 86 LLC. |
| (3) | Defeasance of the Yorkshire & Lexington Towers Whole Loan is permitted at any time after the earlier to occur of (a) the end of the two-year period commencing on the closing date of the securitization of the last promissory note representing a portion of the Yorkshire & Lexington Towers Whole Loan to be securitized and (b) July 6, 2025. The assumed defeasance lockout period of 25 payments is based on the closing date of this transaction in July 2022. The actual lockout period may be longer. |
| (4) | For a full description of Escrows and Reserves, please refer to “Escrows and Reserves” below. |
| (5) | UW NOI is greater than Most Recent NOI due in part to (i) the borrower sponsors recently renovating 57 units, which has increased rents at the Yorkshire & Lexington Towers Properties (as defined below) and (ii) underwritten straight-lined rent for CVS Pharmacy. Additionally, the UW NOI and UW NCF include disbursements from a Supplemental Income Reserve (as defined below) of $5,226,004. The Yorkshire & Lexington Towers Senior Loan UW NCF DSCR, Yorkshire & Lexington Towers Whole Loan UW NCF DSCR, and Yorkshire & Lexington Towers Total Debt UW NCF DSCR excluding credit for the upfront Supplemental Income Reserve are 3.08x, 1.81x and 1.02x, respectively. The Yorkshire & Lexington Towers Senior Loan UW NOI Debt Yield, Yorkshire & Lexington Towers Whole Loan UW NOI Debt Yield, and Yorkshire & Lexington Towers Total Debt UW NOI Debt Yield excluding credit for the upfront Supplemental Income Reserve are 9.5%, 5.6% and 4.2%, respectively. Please refer to “Escrows and Reserves” below. |
| THE INFORMATION IN THIS STRUCTURAL AND COLLATERAL TERM SHEET IS NOT COMPLETE AND MAY BE AMENDED PRIOR TO THE TIME OF SALE. THIS TERM SHEET IS NOT AN OFFER TO SELL THESE SECURITIES AND IT IS NOT A SOLICITATION OF AN OFFER TO BUY THESE SECURITIES IN ANY JURISDICTION WHERE THE OFFER OR SALE IS NOT PERMITTED. |
31
| Structural and Collateral Term Sheet | | BMO 2022-C2 |
| |
| No. 1 – Yorkshire & Lexington Towers |
The Loan. The largest mortgage loan (the “Yorkshire & Lexington Towers Mortgage Loan”) is part of a whole loan (the “Yorkshire & Lexington Towers Whole Loan”) that is evidenced by eighteen pari passu senior promissory notes in the aggregate original principal amount of $318,000,000 (collectively, the “Yorkshire & Lexington Towers Senior Loan”) and two pari passu subordinate promissory notes in the aggregate original principal amount of $221,500,000 (collectively, the “Yorkshire & Lexington Towers Subordinate Companion Loan”). The Yorkshire & Lexington Towers Whole Loan was co-originated on May 12, 2022 by Bank of Montreal (“BMO”), Starwood Mortgage Capital LLC (“SMC”) and Citi Real Estate Funding Inc. (“CREFI”). The Yorkshire & Lexington Towers Whole Loan is secured by a first priority mortgage on the borrowers’ fee simple interest in two, high-rise multifamily properties totaling 808 units located in the Upper East Side neighborhood of New York, New York (the “Yorkshire & Lexington Towers Properties”). The Yorkshire & Lexington Towers Mortgage Loan is evidenced by the non-controlling promissory Notes A-6, A-7, A-13, A-14 and A-17, with an aggregate principal balance as of the Cut-off Date of $70,000,000. The remaining notes are to be contributed – or are expected to be contributed – to other securitization trusts, as set forth in the table below. The Yorkshire & Lexington Towers Whole Loan will be serviced pursuant to the pooling and servicing agreement for the CGCMT 2022-GC48 securitization. The “Yorkshire & Lexington Towers Total Debt” consists of the Yorkshire & Lexington Towers Whole Loan and four mezzanine loans with an aggregate Cut-off Date balance of $174,500,000. For additional information, see “Subordinate Debt and Mezzanine Debt” below. The relationship between the holders of the Yorkshire & Lexington Towers Whole Loan is governed by a co-lender agreement as described under “Description of the Mortgage Pool—The Whole Loans—The Yorkshire & Lexington Towers Pari Passu-AB Whole Loan” in the Preliminary Prospectus.
| Whole Loan Summary |
| Note | Original Balance | Cut-off Date Balance | | Note Holder | Controlling
Piece |
| A-1(1) | $25,000,000 | $25,000,000 | | BMO | No |
| A-2 | $25,000,000 | $25,000,000 | | BBCMS 2022-C16 | No |
| A-3(1) | $25,000,000 | $25,000,000 | | CREFI | No |
| A-4(2) | $20,000,000 | $20,000,000 | | CGCMT 2022-GC48 | No |
| A-5 | $20,000,000 | $20,000,000 | | BBCMS 2022-C16 | No |
| A-6 | $20,000,000 | $20,000,000 | | BMO 2022-C2 | No |
| A-7 | $20,000,000 | $20,000,000 | | BMO 2022-C2 | No |
| A-8 | $20,000,000 | $20,000,000 | | BBCMS 2022-C16 | No |
| A-9 | $20,000,000 | $20,000,000 | | CGCMT 2022-GC48 | No |
| A-10(1) | $20,000,000 | $20,000,000 | | BMO | No |
| A-11 | $20,000,000 | $20,000,000 | | CGCMT 2022-GC48 | No |
| A-12(1) | $20,000,000 | $20,000,000 | | CREFI | No |
| A-13 | $10,000,000 | $10,000,000 | | BMO 2022-C2 | No |
| A-14 | $10,000,000 | $10,000,000 | | BMO 2022-C2 | No |
| A-15(1) | $10,000,000 | $10,000,000 | | CREFI | No |
| A-16(1) | $12,000,000 | $12,000,000 | | BMO | No |
| A-17 | $10,000,000 | $10,000,000 | | BMO 2022-C2 | No |
| A-18(1) | $11,000,000 | $11,000,000 | | CREFI | No |
| Total Senior Loan | $318,000,000 | $318,000,000 | | | |
| B-1(1)(2) | $147,666,667 | $147,666,667 | | CGCMT 2022-GC48 (Loan Specific) | Yes |
| B-2(1) | $73,833,333 | $73,833,333 | | CGCMT 2022-GC48 (Loan Specific) | Yes |
| Whole Loan | $539,500,000 | $539,500,000 | | | |
| (1) | Expected to be contributed to one or more future securitization(s). It is expected that the Yorkshire & Lexington Towers Whole Loan will be serviced pursuant to the servicing agreement for the securitization of Note A-4, which is the lead note. |
| (2) | The initial controlling note is Note B-1, but if any interest in Note B-1 is held by a borrower restricted party (as defined in the related co-lender agreement), the controlling note is Note B-2. Following a Yorkshire & Lexington Towers Control Appraisal Period (as defined in the related co-lender agreement), the controlling note will be Note A-4. See “Description of the Mortgage Pool—The Whole Loans—The Yorkshire & Lexington Towers Pari Passu-AB Whole Loan” in the Preliminary Prospectus. |
The Properties. The Yorkshire & Lexington Towers Properties consist of (i) a multifamily building comprised of 681 residential units totaling 615,641 square feet, a 33,000 square foot parking garage with 168 parking spaces and six commercial and retail units totaling 29,451 square feet (the “Yorkshire Towers Property”) and (ii) a multifamily building comprised of 127 residential units totaling 115,188 square feet, a 8,886 square foot parking garage with 36 parking spaces and six commercial and retail units totaling 9,998 square feet (the “Lexington Towers Property”). The Yorkshire & Lexington Towers Properties have 808 residential units totaling 730,829 square feet, 204 parking spaces totaling 41,886 square feet, and 12 commercial and retail units totaling 39,449 square feet. The commercial tenants (excluding City Parking) at the Yorkshire & Lexington Towers Properties have a remaining weighted average lease term of 8.7 years excluding parking leases. The Yorkshire Towers Property is located in the Upper East Side neighborhood, proximate to the Second Avenue subway station with access to the Q subway line. The Lexington Towers Property is located in the Upper East Side neighborhood, proximate to the Lexington Avenue/East 86th Street subway station with access to the 4, 5, and 6 subway lines.
| THE INFORMATION IN THIS STRUCTURAL AND COLLATERAL TERM SHEET IS NOT COMPLETE AND MAY BE AMENDED PRIOR TO THE TIME OF SALE. THIS TERM SHEET IS NOT AN OFFER TO SELL THESE SECURITIES AND IT IS NOT A SOLICITATION OF AN OFFER TO BUY THESE SECURITIES IN ANY JURISDICTION WHERE THE OFFER OR SALE IS NOT PERMITTED. |
32
| Structural and Collateral Term Sheet | | BMO 2022-C2 |
| |
| No. 1 – Yorkshire & Lexington Towers |
The Yorkshire & Lexington Towers Properties were built in 1963 and 1964 and the residential portion of the Yorkshire & Lexington Towers Properties feature a range of studio, one bedroom, two bedroom, three bedroom, and four bedroom units. Of the 808 residential units, 305 of the units are rent-stabilized. The Yorkshire & Lexington Towers Properties’ residential units all feature hardwood flooring, full kitchen appliances, and many units include a private balcony. Bathrooms feature marble flooring in the renovated units and vinyl tile in the unrenovated units. Renovated units feature marble countertop kitchens, stainless steel appliances, including a refrigerator, dishwasher, microwave, and gas-fired stove and oven, and washer and dryer. Community spaces include 24-hour attended lobby lounge, health club and fitness center, children’s playroom, and outdoor seating area.
The largest tenant by underwritten base rent, CVS Pharmacy (“CVS”), occupies 15,813 square feet (19.4% of the commercial NRA, 58.1% of the underwritten commercial base rent) with a lease expiration of January 31, 2033. CVS is a consumer retail and health solutions company with over 9,900 locations in 49 states, the District of Columbia and Puerto Rico. CVS has approximately 300,000 employees in the United States. The remaining 65,522 square feet of commercial space is 98.3% occupied by ten tenants.
The following table presents certain information relating to the Yorkshire & Lexington Towers Properties:
| Portfolio Summary |
| Property Name | City | Year Built /
Renovated | Units | % of Units | Allocated
Cut-off Date
Whole Loan
Amount
(“ALA”) | % of
ALA | Appraised
Value | % of
Appraised
Value |
| Yorkshire Towers | New York | 1964 / 2014, 2022 | 681 | 84.3% | $464,286,688 | 86.1% | $821,000,000 | 86.1% |
| Lexington Towers | New York | 1963 / 2014 | 127 | 15.7 | 75,213,312 | 13.9 | 133,000,000 | 13.9 |
| Total | | | 808 | 100.0% | $539,500,000 | 100.0% | $954,000,000 | 100.0% |
Borrower Sponsors’ Renovation Plan. The information set forth below regarding the borrower sponsors’ renovation plans reflects forward-looking statements and certain projections provided by the borrower sponsors, assuming, among other things, that the borrowers will complete certain projected renovations by December 1, 2024 and that all of the newly renovated and currently unoccupied units will be leased at current market rate rent and all of the currently occupied units will continue to be leased at the current contractual rent. We cannot assure you that such assumptions and projections provided by the borrower sponsors will materialize in the future as expected or at all.
The borrower sponsors have identified 311 units that will be renovated, which consist of 283 units that are projected to receive a light renovation and 28 units that are projected to receive a major renovation. The 28 major renovation units will be combined into 13 units post-renovation. Of the 28 units projected to receive major renovations, 17 units are rent stabilized, all of which are currently vacant. Major renovations will feature the combination of two or three units into one larger unit or a significant floor plan alteration and are expected to take approximately four to six months to complete. Light renovation units will feature aesthetic and systems upgrades, such as new appliances, countertops, removal of carpeting and lighting upgrades. The borrowers deposited $6,500,000 into a unit upgrade reserve with the lender at origination of the Yorkshire & Lexington Towers Whole Loan, to be disbursed to pay or reimburse the borrowers for unit renovation costs pursuant to the Yorkshire & Lexington Towers Whole Loan documents. See “Escrows and Reserves” below.
The major renovation units are projected to receive an average renovation of approximately $37,143 per unit and are anticipated to increase rent from $53.20 per square foot in-place to $82.67 per square foot. The borrower sponsors have executed 41 major renovations to date, which have been combined into a total of 23 units. These major renovations have achieved average annual rent increases from $32.93 per square foot to $75.37 per square foot.
The light renovation units are projected to receive an average renovation of $19,382 per unit and are anticipated to increase rent from $62.01 per square foot in-place to $82.79 per square foot. The borrower sponsors have executed 16 light renovations to date. These light renovations have achieved average annual rent increases from $50.33 per square foot to $82.04 per square foot.
| THE INFORMATION IN THIS STRUCTURAL AND COLLATERAL TERM SHEET IS NOT COMPLETE AND MAY BE AMENDED PRIOR TO THE TIME OF SALE. THIS TERM SHEET IS NOT AN OFFER TO SELL THESE SECURITIES AND IT IS NOT A SOLICITATION OF AN OFFER TO BUY THESE SECURITIES IN ANY JURISDICTION WHERE THE OFFER OR SALE IS NOT PERMITTED. |
33
| Structural and Collateral Term Sheet | | BMO 2022-C2 |
| |
| No. 1 – Yorkshire & Lexington Towers |
The following table presents detailed information with respect to the current market rate units at the Yorkshire Towers Property:
| As Is Market Rate Unit Summary |
| Unit Type | No. of Units(1) | % of Total | Average Unit
Size (SF)(1) | Average
Monthly
Rental Rate(1) | Average
Monthly
Rental Rate
per SF(1) | Average
Monthly
Market Rental
Rate(2) | Average
Monthly
Market Rental
Rate per SF(2) |
| Studio | 63 | 14.3 | % | 547 | $3,100 | $5.67 | $3,121 | $5.52 |
| 1 Bedroom | 244 | 55.2 | | 778 | $4,301 | $5.53 | $4,319 | $5.50 |
| 2 Bedroom | 81 | 18.3 | | 1,152 | $6,122 | $5.31 | $6,355 | $5.31 |
| 3 Bedroom | 53 | 12.0 | | 1,299 | $7,707 | $5.93 | $7,682 | $5.91 |
| 4 Bedroom | 1 | 0.2 | | 2,087 | $12,995 | $6.23 | $12,995 | $6.23 |
| Total/Wtd. Avg. | 442 | 100.0 | % | 879 | $4,891 | $5.56 | $4,941 | $5.54 |
| (1) | Based on the underwritten rent roll dated March 1, 2022. |
The following table presents detailed information with respect to the current market rate units at the Lexington Towers Property:
| As Is Market Rate Unit Summary |
| Unit Type | No. of Units(1) | % of Total | Average Unit
Size (SF)(1) | Average
Monthly
Rental Rate(1) | Average
Monthly
Rental Rate
per SF(1) | Average
Monthly
Market Rental
Rate(2) | Average
Monthly
Market Rental
Rate per SF(2) |
| Studio | 10 | 16.4 | % | 619 | $3,270 | $5.29 | $3,270 | $5.29 |
| 1 Bedroom | 33 | 54.1 | | 776 | $4,306 | $5.55 | $4,286 | $5.53 |
| 2 Bedroom | 10 | 16.4 | | 1,045 | $6,339 | $6.06 | $6,287 | $6.01 |
| 3 Bedroom | 6 | 9.8 | | 1,392 | $8,823 | $6.34 | $8,823 | $6.34 |
| 4 Bedroom | 2 | 3.3 | | 1,889 | $13,123 | $6.95 | $12,935 | $6.85 |
| Total/Wtd. Avg. | 61 | 100.0 | % | 892 | $5,203 | $5.83 | $5,192 | $5.81 |
| (1) | Based on the underwritten rent roll dated March 1, 2022. |
The following table presents detailed information with respect to the current rent stabilized units at the Yorkshire Towers Property:
| As Is Rent Stabilized Unit Summary |
| Unit Type | No. of Units(1) | % of Total | Average Unit
Size (SF)(1) | Average
Monthly
Rental Rate(1) | Average
Monthly
Rental Rate
per SF(1) | Average
Monthly
Market Rental
Rate(2) | Average
Monthly
Market Rental
Rate per SF(2) |
| Studio | 31 | 13.0 | % | 545 | $1,915 | $3.51 | $2,370 | $3.52 |
| 1 Bedroom | 116 | 48.5 | | 792 | $1,980 | $2.50 | $2,182 | $2.49 |
| 2 Bedroom | 81 | 33.9 | | 1,230 | $2,916 | $2.37 | $2,989 | $2.36 |
| 3 Bedroom | 8 | 3.3 | | 1,638 | $3,714 | $2.27 | $3,714 | $2.27 |
| 4 Bedroom | 3 | 1.3 | | 1,859 | $12,167 | $6.55 | $12,167 | $6.55 |
| Total/Wtd. Avg. | 239 | 100.0 | % | 950 | $2,475 | $2.60 | $2,710 | $2.59 |
| (1) | Based on the underwritten rent roll dated March 1, 2022. |
| THE INFORMATION IN THIS STRUCTURAL AND COLLATERAL TERM SHEET IS NOT COMPLETE AND MAY BE AMENDED PRIOR TO THE TIME OF SALE. THIS TERM SHEET IS NOT AN OFFER TO SELL THESE SECURITIES AND IT IS NOT A SOLICITATION OF AN OFFER TO BUY THESE SECURITIES IN ANY JURISDICTION WHERE THE OFFER OR SALE IS NOT PERMITTED. |
34
| Structural and Collateral Term Sheet | | BMO 2022-C2 |
| |
| No. 1 – Yorkshire & Lexington Towers |
The following table presents detailed information with respect to the current rent stabilized units at the Lexington Towers Property:
| As Is Rent Stabilized Unit Summary |
| Unit Type | No. of Units(1) | % of Total | Average Unit
Size (SF)(1) | Average
Monthly
Rental Rate(1) | Average
Monthly
Rental Rate
per SF(1) | Average
Monthly
Market Rental
Rate(2) | Average
Monthly
Market Rental
Rate per SF(2) |
| Studio | 19 | 28.8 | % | 660 | $1,923 | $2.91 | $2,056 | $2.97 |
| 1 Bedroom | 31 | 47.0 | | 830 | $2,033 | $2.45 | $2,014 | $2.43 |
| 2 Bedroom | 11 | 16.7 | | 1,254 | $3,591 | $2.86 | $3,589 | $2.86 |
| 3 Bedroom | 3 | 4.5 | | 1,536 | $9,564 | $6.23 | $3,128 | $2.32 |
| 4 Bedroom | 2 | 3.0 | | 2,055 | $19,750 | $9.61 | NAV | NAV |
| Total/Wtd. Avg. | 66 | 100.0 | % | 921 | $3,140 | $3.41 | $2,500 | $2.66 |
| (1) | Based on the underwritten rent roll dated March 1, 2022. |
The following table presents detailed information with respect to the projected post-renovation market rate units at the Yorkshire Towers Property:
| Projected Post-Renovation Market Rate Unit Summary |
| Unit Type | No. of Units(1) | % of Total | Average Unit
Size (SF)(1) | Average
Monthly
Rental Rate(1) | Average
Monthly
Rental Rate
per SF(1) | Average
Monthly
Market Rental
Rate(2) | Average
Monthly
Market Rental
Rate per SF(2) |
| Studio | 61 | 14.1 | % | 547 | $3,489 | $6.38 | $3,121 | $5.52 |
| 1 Bedroom | 240 | 55.6 | | 778 | $5,108 | $6.57 | $4,319 | $5.50 |
| 2 Bedroom | 77 | 17.8 | | 1,148 | $7,784 | $6.78 | $6,355 | $5.31 |
| 3 Bedroom | 53 | 12.3 | | 1,299 | $8,582 | $6.60 | $7,682 | $5.91 |
| 4 Bedroom | 1 | 0.2 | | 2,087 | $12,995 | $6.23 | $12,995 | $6.23 |
| Total/Wtd. Avg. | 432 | 100.0 | % | 878 | $5,801 | $6.61 | $4,941 | $5.54 |
| (1) | Based on the underwritten rent roll dated March 1, 2022. |
The following table presents detailed information with respect to the projected post-renovation market rate units at the Lexington Towers Property:
| Projected Post-Renovation Market Rate Unit Summary |
| Unit Type | No. of Units(1) | % of Total | Average Unit
Size (SF)(1) | Average
Monthly
Rental Rate(1) | Average
Monthly
Rental Rate
per SF(1) | Average
Monthly
Market Rental
Rate(2) | Average
Monthly
Market Rental
Rate per SF(2) |
| Studio | 10 | 16.7 | % | 619 | $4,309 | $6.97 | $3,270 | $5.29 |
| 1 Bedroom | 32 | 53.3 | | 775 | $5,347 | $6.90 | $4,286 | $5.53 |
| 2 Bedroom | 10 | 16.7 | | 1,045 | $7,072 | $6.77 | $6,287 | $6.01 |
| 3 Bedroom | 6 | 10.0 | | 1,392 | $9,101 | $6.54 | $8,823 | $6.34 |
| 4 Bedroom | 2 | 3.3 | | 1,889 | $12,935 | $6.85 | $12,935 | $6.85 |
| Total/Wtd. Avg. | 60 | 100.0 | % | 893 | $6,090 | $6.82 | $5,192 | $5.81 |
| (1) | Based on the underwritten rent roll dated March 1, 2022. |
| THE INFORMATION IN THIS STRUCTURAL AND COLLATERAL TERM SHEET IS NOT COMPLETE AND MAY BE AMENDED PRIOR TO THE TIME OF SALE. THIS TERM SHEET IS NOT AN OFFER TO SELL THESE SECURITIES AND IT IS NOT A SOLICITATION OF AN OFFER TO BUY THESE SECURITIES IN ANY JURISDICTION WHERE THE OFFER OR SALE IS NOT PERMITTED. |
35
| Structural and Collateral Term Sheet | | BMO 2022-C2 |
| |
| No. 1 – Yorkshire & Lexington Towers |
The following table presents detailed information with respect to the projected post-renovation rent stabilized units at the Yorkshire Towers Property:
| Projected Post-Renovation Rent Stabilized Unit Summary |
| Unit Type | No. of Units(1) | % of Total | Average Unit
Size (SF)(1) | Average
Monthly
Rental Rate(1) | Average
Monthly
Rental Rate
per SF(1) | Average
Monthly
Market Rental
Rate(2) | Average
Monthly
Market Rental
Rate per SF(2) |
| Studio | 27 | 11.5 | % | 544 | $1,925 | $3.54 | $2,370 | $3.52 |
| 1 Bedroom | 106 | 45.1 | | 793 | $1,976 | $2.49 | $2,182 | $2.49 |
| 2 Bedroom | 85 | 36.2 | | 1,246 | $3,371 | $2.71 | $2,989 | $2.36 |
| 3 Bedroom | 12 | 5.1 | | 1,729 | $6,858 | $3.97 | $3,714 | $2.27 |
| 4 Bedroom | 5 | 2.1 | | 2,167 | $14,531 | $6.71 | $12,167 | $6.55 |
| Total/Wtd. Avg. | 235 | 100.0 | % | 1005 | $2,991 | $2.97 | $2,710 | $2.59 |
| (1) | Based on the underwritten rent roll dated March 1, 2022. |
The following table presents detailed information with respect to the projected post-renovation rent stabilized units at the Lexington Towers Property:
| Projected Post-Renovation Rent Stabilized Unit Summary |
| Unit Type | No. of Units(1) | % of Total | Average Unit
Size (SF)(1) | Average
Monthly
Rental Rate(1) | Average
Monthly
Rental Rate
per SF(1) | Average
Monthly
Market Rental
Rate(2) | Average
Monthly
Market Rental
Rate per SF(2) |
| Studio | 18 | 27.3 | % | 655 | $1,898 | $2.90 | $2,056 | $2.97 |
| 1 Bedroom | 31 | 47.0 | | 830 | $2,014 | $2.42 | $2,014 | $2.43 |
| 2 Bedroom | 12 | 18.2 | | 1,281 | $4,225 | $3.30 | $3,589 | $2.86 |
| 3 Bedroom | 3 | 4.5 | | 1,536 | $8,828 | $5.75 | $3,128 | $2.32 |
| 4 Bedroom | 2 | 3.0 | | 2,055 | $14,728 | $7.17 | NAV | NAV |
| Total/Wtd. Avg. | 66 | 100.0 | % | 934 | $3,079 | $3.30 | $2,500 | $2.66 |
| (1) | Based on the underwritten rent roll dated March 1, 2022. |
COVID-19 Update. The first debt service payment for the Yorkshire & Lexington Towers Whole Loan is scheduled for July 2022. As of the date of this term sheet, the Yorkshire & Lexington Towers Whole Loan is not subject to any forbearance, modification or debt service relief request.
Environmental. According to the Phase I reports dated February 3, 2022 and January 19, 2022, there was no evidence of any recognized environmental conditions at the Yorkshire & Lexington Towers Properties. The Phase I environmental assessment, however, did acknowledge historical recognized environmental conditions at the Yorkshire Towers Property.
| Historical and Current Multifamily Occupancy(1) |
| 2019 | 2020 | 2021 | Current(2) |
| 94.7% | 81.2% | 94.7% | 96.4% |
| (1) | Historical occupancies are as of December 31 of each respective year. |
| (2) | Current occupancy is as of March 1, 2022. |
| THE INFORMATION IN THIS STRUCTURAL AND COLLATERAL TERM SHEET IS NOT COMPLETE AND MAY BE AMENDED PRIOR TO THE TIME OF SALE. THIS TERM SHEET IS NOT AN OFFER TO SELL THESE SECURITIES AND IT IS NOT A SOLICITATION OF AN OFFER TO BUY THESE SECURITIES IN ANY JURISDICTION WHERE THE OFFER OR SALE IS NOT PERMITTED. |
36
| Structural and Collateral Term Sheet | | BMO 2022-C2 |
| |
| No. 1 – Yorkshire & Lexington Towers |
| Operating History and Underwritten Net Cash Flow |
| | 2019 | 2020 | 2021 | TTM(1) | Underwritten | Per Unit | %(2) |
| Residential Base Rent | $34,429,262 | $32,908,021 | $33,023,336 | $34,184,092 | $39,497,416 | $48,883 | 74.9% |
| Commercial Base Rent | 6,197,568 | 5,981,339 | 5,764,022 | 5,810,592 | 6,984,828 | 8,645 | 13.3 |
| Gross Potential Rent | $40,626,830 | $38,889,360 | $38,787,358 | $39,994,684 | $46,482,244 | $57,528 | 88.2% |
| Total Reimbursements | 297,713 | 410,419 | 284,498 | 324,797 | 327,568 | 405 | 0.6 |
| Supplemental Income Reserve(3) | 0 | 0 | 0 | 0 | 5,226,004 | 6,468 | 9.9 |
| Total Other Income | 702,657 | 863,978 | 694,304 | 675,664 | 675,664 | 836 | 1.3 |
| Net Rental Income | $41,627,200 | $40,163,756 | $39,766,160 | $40,995,144 | $52,711,480 | $65,237 | 100.0% |
| (Vacancy/Credit Loss) | (99,272) | (35,705) | 0 | 0 | (1,316,592) | (1,629) | (2.5) |
| Effective Gross Income | $41,527,928 | $40,128,052 | $39,766,160 | $40,995,144 | $51,394,888 | $63,608 | 97.5% |
| Total Expenses | $14,184,113 | $14,510,102 | $15,511,878 | $15,672,705 | $16,019,126 | $19,826 | 31.2% |
| Net Operating Income(3) | $27,343,815 | $25,617,949 | $24,254,281 | $25,322,439 | $35,375,762 | $43,782 | 68.8% |
| Total TI/LC, Capex/RR(4) | 0 | 0 | 0 | 0 | 0 | 0 | 0.0 |
| Net Cash Flow | $27,343,815 | $25,617,949 | $24,254,281 | $25,322,439 | $35,375,762 | $43,782 | 68.8% |
| (1) | TTM represents the trailing 12 months ending February 2022. |
| (2) | % column represents percent of Net Rental Income for all revenue lines and represents percent of Effective Gross Income for the remainder of the fields. |
| (3) | The Underwritten Net Operating Income is greater than the TTM Net Operating Income due in part to (i) the borrower sponsors recently renovating 57 units, which has increased rents at the Yorkshire & Lexington Towers Properties, (ii) underwritten straight-lined rent for CVS and (iii) disbursements from the Supplemental Income Reserve. Please refer to “Escrows and Reserves” below. |
| (4) | The borrower sponsors funded five years’ worth of TI/LC, Capex/RR at origination. |
The Market. The Yorkshire & Lexington Towers Properties are located in New York, New York, within the New York, NY-NJ-PA Metropolitan Statistical Area. According to the appraisal, the unemployment rate from 2011 through 2021 in New York City increased at an annual rate of 0.3% and is expected to decrease at an average annual rate of 4.7% between 2022 and 2026. The estimated 2021 median annual household income in New York City was $68,261. The leading industries are education and health, professional and business, government, and trade, transportation and utilities. The largest employer in New York City is Northwell Health, which employs 68,088 people. The Yorkshire Towers Property is located on the northeast corner of Second Avenue and East 86th Street. The Lexington Towers Property is located on the southeast corner of Lexington Avenue and East 88th Street. The Upper East Side is generally considered the area that extends from East 59th to East 110th Streets, east of Central Park and Fifth Avenue to the East River. The Upper East Side is known for its many art galleries such as the Metropolitan Museum of Art, and Hunter College of the City University of New York which occupies several modern high-rise buildings at 68th Street and Lexington Avenue. The largest institutions of higher learning on the East Side are along York Avenue and the FDR Drive, including Rockefeller University and the Cornell Medical Center. The Yorkshire & Lexington Towers Properties benefit from their proximity to Fifth Avenue, which forms the eastern border of Central Park, as well as Madison Avenue, which is dense with prime retail and commercial space.
The Yorkshire & Lexington Towers Properties are situated in the Upper East Side multifamily submarket. According to CoStar, as of February 2022, the Upper East Side multifamily submarket had an overall vacancy rate of 2.0%, with net absorption totaling 17 units. The vacancy rate decreased 2.2% over the past 12 months. Rental rates increased by 3.1% for the past 12 months and ended at $4,096 per unit per month. A total of 46 units are still under construction at the end of the quarter.
According to the appraisal, the 2021 population for New York City was approximately 8,305,600 and is forecasted to grow to approximately 8,317,700 in 2022, and approximately 8,335,900 in 2026.
| THE INFORMATION IN THIS STRUCTURAL AND COLLATERAL TERM SHEET IS NOT COMPLETE AND MAY BE AMENDED PRIOR TO THE TIME OF SALE. THIS TERM SHEET IS NOT AN OFFER TO SELL THESE SECURITIES AND IT IS NOT A SOLICITATION OF AN OFFER TO BUY THESE SECURITIES IN ANY JURISDICTION WHERE THE OFFER OR SALE IS NOT PERMITTED. |
37
| Structural and Collateral Term Sheet | | BMO 2022-C2 |
| |
| No. 1 – Yorkshire & Lexington Towers |
The following table presents certain information relating to comparable retail leases for the Yorkshire & Lexington Towers Properties:
| Comparable Retail Leases(1) |
| Property / Location | Tenant SF | Year Built / Renovated | Tenant | Rent PSF | Commencement
Date | Lease Term (Mos.) | Lease Type |
Yorkshire Towers New York, NY | 15,813(2) | 1964 / 2014,
2022 | CVS Pharmacy | $252.37(2) | May 2017(2) | 189(2) | Triple Net |
201 East 86th Street New York, NY | 6,565 | 1987 / NAV | Lululemon | $240.00 | Q4 2021 | 120 | Triple Net |
1523 Second Avenue New York, NY | 4,488 | NAV / NAV | NY Allergy and Asthma | $100.00 | Q4 2021 | 144 | Triple Net |
1503 Third Avenue New York, NY | 3,200 | NAV / NAV | Cohen’s Fashion Optical | $175.00 | Q3 2021 | 120 | Triple Net |
1592 Third Avenue New York, NY | 400 | NAV / NAV | Marathon Coffee | $90.00 | Q3 2021 | 120 | Triple Net |
207 East 84th Street New York, NY | 1,340 | NAV / NAV | Glosslab | $116.00 | Q2 2021 | 120 | Triple Net |
| (2) | Based on underwritten rent roll dated as of March 1, 2022. |
The following table presents certain information relating to comparable multifamily rental properties to the Yorkshire & Lexington Towers Properties:
| Comparable Rental Summary(1) |
| Property Address | Year
Built | Occupancy | # of
Units | Unit Mix | Average SF per Unit | Average Rent per SF | Average Rent per Unit |
Yorkshire & Lexington Towers(2) 160 East 88th Street; 305 East 86th Street New York, NY | 1963,
1964 | 96.4% | 808 | Studio 1 Bed 2 Bed 3 Bed 4 Bed | 570 786 1,187 1,356 1,944 | $55.65 $53.55 $46.68 $65.75 $88.93 | $2,642 $3,505 $4,617 $7,430 $14,405 |
| The Serrano | 1986 | 92.6% | 263 | 1 Bed | 650 | $83.10 | $4,501 |
| 1735 York Avenue | | | | 2 Bed | NAV | NAV | $7,201 |
| New York, NY | | | | 3 Bed | NAV | NAV | $8,878 |
| Ventura | 1999 | 98.4% | 246 | Studio | 508 | $88.20 | $3,734 |
| 240 East 86th Street | | | | 1 Bed | 751 | $74.38 | $4,652 |
| New York, NY | | | | 2 Bed | 967 | $79.15 | $6,380 |
| | | | | 3 Bed | 1,293 | $82.79 | $8,921 |
| The Lucerne | 1989 | 98.6% | 219 | 1 Bed | 659 | $84.07 | $4,617 |
| 350 East 79th Street | | | | 2 Bed | 906 | $94.49 | $7,134 |
| New York, NY | | | | 3 Bed | NAV | NAV | $11,878 |
| | | | | 4 Bed | NAV | NAV | $17,975 |
| The Colorado | 1987 | 99.6% | 173 | Studio | 547 | $86.69 | $3,953 |
| 201 East 86th Street | | | | 1 Bed | 667 | $82.70 | $4,595 |
| New York, NY | | | | 2 Bed | 937 | $85.51 | $6,675 |
| | | | | 3 Bed | 1,254 | $95.10 | $9,938 |
| | | | | 4 Bed | 1,940 | $95.71 | $15,473 |
| The Strathmore | 1996 | 99.2% | 179 | 1 Bed | 714 | $70.05 | $4,168 |
| 400 East 84th Street | | | | 2 Bed | 1,166 | $71.28 | $6,926 |
| New York, NY | | | | 3 Bed | 1,611 | $83.55 | $11,217 |
| | | | | 4 Bed | NAV | NAV | $17,520 |
| One Carnegie Hill | 2005 | 99.6% | 455 | Studio | 484 | $83.18 | $3,355 |
| 215 East 96th Street | | | | 1 Bed | 636 | $78.13 | $4,141 |
| New York, NY | | | | 2 Bed | 879 | $85.30 | $6,248 |
| | | | | 3 Bed | 1,239 | $80.56 | $8,318 |
| | | | | 4 Bed | 1,350 | $94.44 | $10,625 |
| CONVIVIUM | 2020 | 98.6% | 140 | Studio | 638 | $80.88 | $4,300 |
| 515 East 86th Street | | | | 1 Bed | 741 | $88.67 | $5,474 |
| New York, NY | | | | 2 Bed | 1,138 | $79.33 | $7,523 |
| | | | | 3 Bed | 1,369 | $85.50 | $9,750 |
| (1) | Source: Appraisal, unless otherwise indicated. Comparables include a mix of affordable and market rate units. |
| (2) | Based on underwritten rent roll dated as of March 1, 2022. Average Rent per SF and Average Rent per Unit reflect average monthly in-place rent for occupied units. |
The Borrowers. The borrowers under the Yorkshire & Lexington Towers Whole Loan are CF E 88 LLC, SM E 88 LLC, CF E 86 LLC, SM E 86 LLC and LSG E 86 LLC, as tenants in common (the first two as tenants in common for the Lexington Towers Property, and the last three as tenants in common for the Yorkshire Towers Property), each a single-purpose Delaware limited liability company with two independent directors. Legal counsel to the borrowers delivered a non-consolidation opinion in connection with the origination the Yorkshire & Lexington Towers Whole Loan.
| THE INFORMATION IN THIS STRUCTURAL AND COLLATERAL TERM SHEET IS NOT COMPLETE AND MAY BE AMENDED PRIOR TO THE TIME OF SALE. THIS TERM SHEET IS NOT AN OFFER TO SELL THESE SECURITIES AND IT IS NOT A SOLICITATION OF AN OFFER TO BUY THESE SECURITIES IN ANY JURISDICTION WHERE THE OFFER OR SALE IS NOT PERMITTED. |
38
| Structural and Collateral Term Sheet | | BMO 2022-C2 |
| |
| No. 1 – Yorkshire & Lexington Towers |
The Borrower Sponsors. The borrower sponsors and non-recourse carveout guarantors are Meyer Chetrit and The Gluck Family Trust U/A/D July 16, 2009. Meyer Chetrit is one of the controllers of The Chetrit Group. The Chetrit Group is an experienced, privately held New York City real estate development firm controlled by two brothers: Joseph and Meyer Chetrit. The Chetrit Group, which is headquartered in Manhattan, has ownership interests in over 14 million square feet of commercial and residential real estate across the United States, including New York, Chicago, Miami, and Los Angeles, as well as internationally. Laurence Gluck is the founder of Stellar Management, a real estate development and management firm founded in 1985. Based in New York City, Stellar Management owns and manages a portfolio of over 12,000 apartments in 100 buildings located across New York City and over two million square feet of office space. Prior to founding Stellar Management, Laurence Gluck served as a real estate attorney at Proskauer, Rose, Goetz & Mendelsohn and later as a partner at Dreyer & Traub. Laurence Gluck also formerly served as a member of the Board of Governors of the Real Estate Board of New York.
Property Management. The Yorkshire & Lexington Towers Properties are managed by Jumeaux Management LLC, an affiliate of the borrowers.
Escrows and Reserves. At origination of the Yorkshire & Lexington Towers Whole Loan, the borrowers deposited approximately (i) $5,390,917 into a real estate tax reserve account, (ii) $367,868 into an insurance premiums reserve account, (iii) $1,100,000 into a replacement reserve account, (iv) $1,000,000 into a tenant improvement and leasing commissions reserve account, (v) $6,500,000 into a unit upgrade reserve account and (vi) $5,900,000 into a supplemental income reserve account.
Tax Escrows – The borrowers are required to deposit into a real estate tax reserve, on a monthly basis, 1/12th of the taxes that the lender estimates will be payable over the next-ensuing 12-month period (initially estimated to be approximately $898,486).
Insurance Escrows – The borrowers are required to deposit into an insurance reserve, on a monthly basis, 1/12th of the amount which will be sufficient to pay the insurance premiums due for the renewal of coverage afforded by such policies; provided, however, such insurance reserve has been conditionally waived so long as (i) no event of default is continuing and (ii) the borrowers maintain a blanket policy meeting the requirements of the Yorkshire & Lexington Towers Whole Loan documents. The borrowers are currently maintaining a blanket policy.
Supplemental Income Reserve – The Yorkshire & Lexington Towers Properties are currently undergoing certain renovations, and the borrowers deposited $5,900,000 into a supplemental income reserve account (the “Supplemental Income Reserve”) at origination of the Yorkshire & Lexington Towers Whole Loan. Unless and until the Yorkshire & Lexington Towers Properties (excluding the amount on deposit in the Supplemental Income Reserve) achieve a 5.0% “transient” Yorkshire & Lexington Towers Total Debt debt yield (calculated on the basis of annualized net cash flow for a three month period ending with the most recently completed month), the lender may require the borrowers to make additional Supplemental Income Reserve deposits if and to the extent the lender determines, in its reasonable discretion on a quarterly basis after May 6, 2023 during the Yorkshire & Lexington Towers Whole Loan term, that additional supplemental income reserve deposits are required in order to achieve (when the additional deposit and all other deposits in the Supplemental Income Reserve account are added to net cash flow for the Yorkshire & Lexington Towers Properties) a 5.0% transient Yorkshire & Lexington Towers Total Debt debt yield for the following 12, 9, 6 or 3 months (such applicable 12-, 9-, 6- or 3- month period depending on the quarter with respect to which such determination by the lender is made). The guarantors provided a related carry guaranty of certain carry costs, including real estate taxes, insurance premiums, debt service and operating expenses, for any period until the Yorkshire & Lexington Towers Properties achieve a 5.0% transient Yorkshire & Lexington Towers Total Debt debt yield (excluding the amount on deposit in the Supplemental Income Reserve). The obligations of the guarantors under such carry guaranty are limited to the additional Supplemental Income Reserve deposit amount as and when due.
So long as no event of default under the Yorkshire & Lexington Towers Whole Loan is continuing, on each payment date, the lender is required to transfer the Monthly Supplemental Income Reserve Disbursement Amount (as defined below) from the Supplemental Income Reserve to the cash management account. Such funds deposited into the cash management account will be required to be applied with all other funds then on deposit in the cash management account in the order of priority set forth in the Yorkshire & Lexington Towers Whole Loan documents, as described under “Lockbox / Cash Management” below. So long as no event of default under the Yorkshire & Lexington Towers Whole Loan is continuing, upon such time as the lender has reasonably determined that the Yorkshire & Lexington Towers Properties (excluding the amount on deposit in the Supplemental Income Reserve) have achieved a 5.0% “transient” Yorkshire & Lexington Towers Total Debt debt yield (calculated on the basis of annualized net cash flow for a three month period ending with the most recently completed month), then upon the borrowers’ written request, all of the funds in the Supplemental Income Reserve will be required to be disbursed to the borrowers; provided, however, if a Cash Trap Period (as defined below) is then continuing, then such funds will not be disbursed to the borrowers, and such funds will instead be deposited into the excess cash reserve account, to be applied in accordance with the terms of the Yorkshire & Lexington Towers Whole Loan documents.
“Monthly Supplemental Income Reserve Disbursement Amount” means 1/12th of (x) the initial Supplemental Income Reserve deposit with respect to the first 12 payment dates occurring during the term of the Yorkshire & Lexington Towers Whole Loan, and (y) each Supplemental Income Reserve additional deposit amount with respect to the 12 payment dates following the date that the borrowers are required to deposit such Supplemental Income Reserve additional deposit amount pursuant to the terms of the Yorkshire & Lexington Towers Whole Loan documents; provided that, if at any time the lender reassesses the Supplemental Income Reserve additional deposit
| THE INFORMATION IN THIS STRUCTURAL AND COLLATERAL TERM SHEET IS NOT COMPLETE AND MAY BE AMENDED PRIOR TO THE TIME OF SALE. THIS TERM SHEET IS NOT AN OFFER TO SELL THESE SECURITIES AND IT IS NOT A SOLICITATION OF AN OFFER TO BUY THESE SECURITIES IN ANY JURISDICTION WHERE THE OFFER OR SALE IS NOT PERMITTED. |
39
| Structural and Collateral Term Sheet | | BMO 2022-C2 |
| |
| No. 1 – Yorkshire & Lexington Towers |
amount in accordance with the terms of the Yorkshire & Lexington Towers Whole Loan documents, the Monthly Supplemental Income Reserve Disbursement Amount will be adjusted so that all of funds in the Supplemental Income Reserve will be disbursed in equal monthly installments ending on such Supplemental Income Reserve reassessment date (i.e., so that there will be no funds in the Supplemental Income Reserve on deposit on such Supplemental Income Reserve reassessment date).
Lockbox / Cash Management. The Yorkshire & Lexington Towers Whole Loan is structured with a hard lockbox for commercial tenants and a soft lockbox for residential tenants, and in place cash management. The borrowers are required to deposit all rents collected from residential tenants into the lockbox account within three days of receipt. The borrowers are required to deliver a tenant direction letter to commercial tenants to deposit all rents directly to the lockbox account. The borrowers are required to cause all amounts deposited into the lockbox account to be transferred on each business day to a cash management account controlled by the lender. Absent an event of default under the Yorkshire & Lexington Towers Whole Loan documents, funds on deposit in the cash management account are applied on each monthly payment date in amounts and in the order of priority set forth in the Yorkshire & Lexington Towers Whole Loan Documents, including any required tax and insurance reserve deposits, deposit account bank fees, monthly debt service on the Yorkshire & Lexington Towers Whole Loan, other amounts payable to the lender under the Yorkshire & Lexington Towers Whole Loan, operating expenses reflected in the annual budget or otherwise approved by lender, and debt service under the mezzanine loans, with the remaining funds in the cash management account to be disbursed to the borrowers unless a Cash Trap Period is then continuing, in which event the remaining funds will be deposited into an excess cash reserve account under the lender’s control, and released to the borrower when the Cash Trap Period ends. Upon an event of default under the Yorkshire & Lexington Towers Whole Loan documents, the lender will apply funds in such priority as it may determine.
A “Cash Trap Period” means a period commencing upon the earliest to occur of (i) an event of default; (ii) any bankruptcy action of the borrowers, principal, guarantor or manager has occurred; (iii) the failure by the borrowers, after stabilization (i.e. until a Yorkshire & Lexington Towers Total Debt debt yield of at least 5.0% has been achieved (without taking into account any disbursement of Supplemental Income Reserve funds) for one calendar quarter, provided no event of default then exists), to maintain a Yorkshire & Lexington Towers Total Debt debt yield of at least 4.25%; or (iv) a Yorkshire & Lexington Towers Mezzanine Loan (as defined below) event of default and will be cured upon (a) with respect to clause (i) above, the lender accepts a cure of the event of default; (b) in the case of a bankruptcy action by or against manager only, the borrowers replace the manager with a qualified replacement as defined in the Yorkshire & Lexington Towers Whole Loan documents; (c) with respect to clause (iii) above, the Yorkshire & Lexington Towers Total Debt debt yield is equal to or greater than 4.75% for one calendar quarter; or (d) with respect to clause (iv) above, the applicable Yorkshire & Lexington Towers Mezzanine Loan lender accepts a cure of such Yorkshire & Lexington Towers Mezzanine Loan event of default.
Subordinate and Mezzanine Debt. The Yorkshire & Lexington Towers Properties also secure the Yorkshire & Lexington Towers Subordinate Companion Loan, which has an aggregate Cut-off Date principal balance of $221,500,000. The Yorkshire & Lexington Towers Subordinate Companion Loan accrues interest at 3.04000% per annum. The Yorkshire & Lexington Towers Senior Loan is senior in right of payment to the Yorkshire & Lexington Towers Subordinate Companion Loan.
Concurrently with the funding of the Yorkshire & Lexington Towers Whole Loan, BMO and Citigroup Global Markets Realty Corp. (“CGMRC”) co-originated a mezzanine A loan in the amount of $80,000,000 to be secured by the mezzanine A borrower’s interests in the borrower, as collateral for the mezzanine A loan (the “Mezzanine A Loan”). The Mezzanine A Loan is coterminous with the Yorkshire & Lexington Towers Whole Loan. The Mezzanine A Loan accrues interest at a rate of 5.80000% per annum and requires interest-only payments until its maturity date.
Concurrently with the funding of the Yorkshire & Lexington Towers Whole Loan, BMO and CGMRC co-originated a mezzanine B loan in the amount of $23,100,000 to be secured by the mezzanine B borrower’s interests in the mezzanine A borrower, as collateral for the mezzanine B loan (the “Mezzanine B Loan”). The Mezzanine B Loan is coterminous with the Yorkshire & Lexington Towers Whole Loan. The Mezzanine B Loan accrues interest at a rate of 7.14000% per annum and requires interest-only payments until its maturity date.
Concurrently with the funding of the Yorkshire & Lexington Towers Whole Loan, BMO and CGMRC co-originated a mezzanine C loan in the amount of $25,000,000 to be secured by the mezzanine C borrower’s interests in the mezzanine B borrower, as collateral for the mezzanine C loan (the “Mezzanine C Loan”). The Mezzanine C Loan is coterminous with the Yorkshire & Lexington Towers Whole Loan. The Mezzanine C Loan accrues interest at a rate of 8.00000% per annum and requires interest-only payments until its maturity date.
Concurrently with the funding of the Yorkshire & Lexington Towers Whole Loan, BMO and CGMRC co-originated a mezzanine D loan in the amount of $46,400,000 to be secured by the mezzanine D borrower’s interests in the mezzanine C borrower, as collateral for the mezzanine D loan (the “Mezzanine D Loan”, collectively with the Mezzanine A Loan, the Mezzanine B Loan and the Mezzanine C Loan, the “Yorkshire & Lexington Towers Mezzanine Loans”). The Mezzanine D Loan is coterminous with the Yorkshire & Lexington Towers Whole Loan. The Mezzanine D Loan accrues interest at a rate of 9.46185345% per annum and requires interest-only payments until its maturity date.
| THE INFORMATION IN THIS STRUCTURAL AND COLLATERAL TERM SHEET IS NOT COMPLETE AND MAY BE AMENDED PRIOR TO THE TIME OF SALE. THIS TERM SHEET IS NOT AN OFFER TO SELL THESE SECURITIES AND IT IS NOT A SOLICITATION OF AN OFFER TO BUY THESE SECURITIES IN ANY JURISDICTION WHERE THE OFFER OR SALE IS NOT PERMITTED. |
40
| Structural and Collateral Term Sheet | | BMO 2022-C2 |
| |
| No. 1 – Yorkshire & Lexington Towers |
| Total Loan Metrics |
| | % of Total Loan | Cut-off Date LTV | UW NOI Debt Yield(1) | UW NCF DSCR(1) |
| A Notes | 44.5% | 33.3% | 11.1% | 3.61x |
| B Notes | 31.0% | 56.6% | 6.6% | 2.13x |
| Mezzanine Loans | 24.4% | 74.8% | 5.0% | 1.20x |
| (1) | The UW NOI and UW NCF includes disbursements from a Supplemental Income Reserve of $5,226,004. Please refer to “Escrows and Reserves” above. |
Partial Release. Not permitted.
Ground Lease. None.
| THE INFORMATION IN THIS STRUCTURAL AND COLLATERAL TERM SHEET IS NOT COMPLETE AND MAY BE AMENDED PRIOR TO THE TIME OF SALE. THIS TERM SHEET IS NOT AN OFFER TO SELL THESE SECURITIES AND IT IS NOT A SOLICITATION OF AN OFFER TO BUY THESE SECURITIES IN ANY JURISDICTION WHERE THE OFFER OR SALE IS NOT PERMITTED. |
41
| Structural and Collateral Term Sheet | | BMO 2022-C2 |
| |
| No. 2 – The Lion Building |
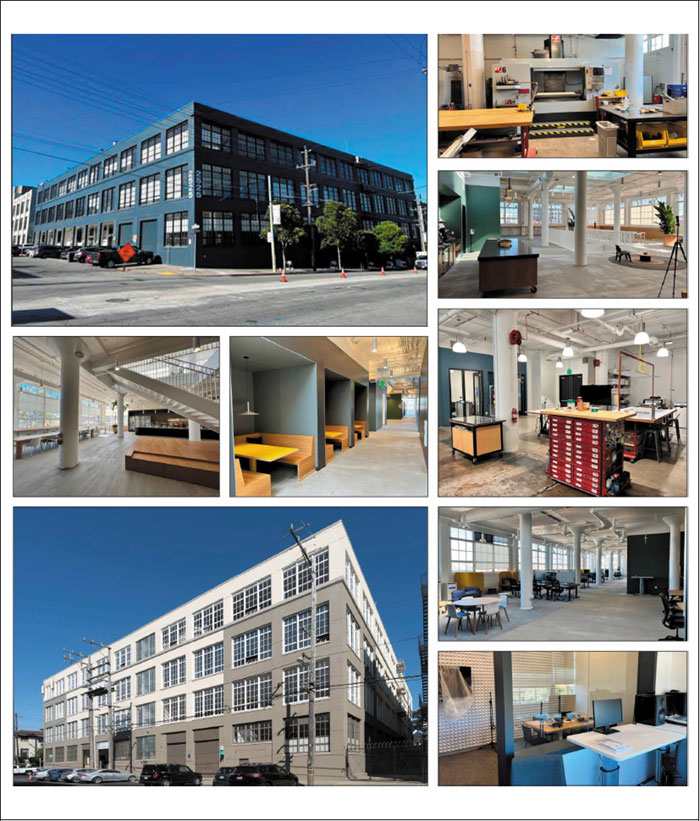
| THE INFORMATION IN THIS STRUCTURAL AND COLLATERAL TERM SHEET IS NOT COMPLETE AND MAY BE AMENDED PRIOR TO THE TIME OF SALE. THIS TERM SHEET IS NOT AN OFFER TO SELL THESE SECURITIES AND IT IS NOT A SOLICITATION OF AN OFFER TO BUY THESE SECURITIES IN ANY JURISDICTION WHERE THE OFFER OR SALE IS NOT PERMITTED. |
42
| Structural and Collateral Term Sheet | | BMO 2022-C2 |
| |
| No. 2 – The Lion Building |

| THE INFORMATION IN THIS STRUCTURAL AND COLLATERAL TERM SHEET IS NOT COMPLETE AND MAY BE AMENDED PRIOR TO THE TIME OF SALE. THIS TERM SHEET IS NOT AN OFFER TO SELL THESE SECURITIES AND IT IS NOT A SOLICITATION OF AN OFFER TO BUY THESE SECURITIES IN ANY JURISDICTION WHERE THE OFFER OR SALE IS NOT PERMITTED. |
43
| Structural and Collateral Term Sheet | | BMO 2022-C2 |
| |
| No. 2 – The Lion Building |
| Mortgage Loan Information | | Property Information |
| Mortgage Loan Seller: | GACC | | Single Asset / Portfolio: | Single Asset |
| Original Principal Balance(1): | $65,000,000 | | Title: | Fee |
| Cut-off Date Principal Balance(1): | $65,000,000 | | Property Type – Subtype: | Mixed Use – Industrial/Office |
| % of IPB: | 9.2% | | Net Rentable Area (SF): | 172,328 |
| Loan Purpose: | Refinance | | Location: | San Francisco, CA |
| Borrower: | 2525 16th St Property LLC | | Year Built / Renovated: | 1924 / 2021 |
| Borrower Sponsors: | Angus McCarthy and Michael Moritz | | Occupancy(6): | 100.0% |
| Interest Rate: | 5.19750% | | Occupancy Date(6): | 6/1/2022 |
| Note Date: | 6/8/2022 | | 4th Most Recent NOI (As of)(3): | NAV |
| Maturity Date: | 7/6/2032 | | 3rd Most Recent NOI (As of)(3): | NAV |
| Interest-only Period: | 120 months | | 2nd Most Recent NOI (As of)(3): | NAV |
| Original Term: | 120 months | | Most Recent NOI (As of)(3): | NAV |
| Original Amortization Term: | None | | UW Economic Occupancy: | 95.0% |
| Amortization Type: | Interest Only | | UW Revenues: | $11,675,921 |
| Call Protection(2): | L(24),D(91),O(5) | | UW Expenses: | $2,022,534 |
| Lockbox / Cash Management: | Hard / Springing | | UW NOI: | $9,653,388 |
| Additional Debt(1): | Yes | | UW NCF: | $9,188,102 |
| Additional Debt Balance(1): | $35,000,000 | | Appraised Value / Per SF(4): | $170,000,000 / $986 |
| Additional Debt Type(1): | Pari Passu | | Appraisal Date(4): | 3/30/2022 |
| | | | | |
| Escrows and Reserves(5) | | Financial Information(1) |
| | Initial | Monthly | Initial Cap | | Cut-off Date Loan / square feet: | $580 |
| Taxes: | $289,274 | $72,319 | N/A | | Maturity Date Loan / square feet: | $580 |
| Insurance: | $37,550 | $7,510 | N/A | | Cut-off Date LTV(4): | 58.8% |
| Replacement Reserves: | $130,000 | $3,590 | $86,164 | | Maturity Date LTV(4): | 58.8% |
| TI / LC Reserve: | $4,946,132 | Springing | N/A | | UW NCF DSCR: | 1.74x |
| Other(5)(6): | $45,289,968 | $0 | N/A | | UW NOI Debt Yield: | 9.7% |
| | | | | | | |
| |
| Sources and Uses |
| Sources | Proceeds | % of Total | | Uses | Proceeds | % of Total |
| Whole Loan(1) | $100,000,000 | 100.0% | | Loan Payoff(7) | $47,967,606 | 47.9% |
| Sponsor Equity | 50,000 | 0.0 | | Upfront Reserves | 50,692,924 | 50.7 |
| | | | | Closing Costs | 1,389,470 | 1.4 |
| | | | | | | |
| Total Sources | $100,050,000 | 100.0% | | Total Uses | $100,050,000 | 100.0% |
| | | | | | | | |
| (1) | The Lion Building Mortgage Loan (as defined below) is part of The Lion Building Whole Loan evidenced by five pari passu notes with an aggregate outstanding principal balance as of the Cut-off Date of $100,000,000. The Financial Information presented above is calculated based on the outstanding balance of The Lion Building Whole Loan. |
| (2) | The lockout period will be at least 24 payment dates beginning with and including the first payment date in August 2022. Defeasance of The Lion Building Whole Loan in full is permitted at any time after the first payment date following the earlier to occur of (i) June 8, 2025 or (ii) the date that is two years from the closing date of the securitization that includes the last note to be securitized. The assumed lockout period of 24 payments is based on the expected BMO 2022-C2 securitization closing date in July 2022. The actual lockout period may be longer. |
| (3) | Property does not have any operating history as it recently underwent a full renovation. |
| (4) | The appraisal for The Lion Building Property (as defined below) concluded an “As Complete & Stabilized” value of $167,000,000 (dated October 1, 2022) and an “As-Is Assuming No Landlord Obligations” value of $170,000,000 (dated March 30, 2022). The As-Complete & Stabilized value reflects contractual free rents being deducted throughout the respective lease term, while the “As-Is Assuming No Landlord Obligations” value assumes no free rents. Given that the subject loan requires full reserves for all outstanding landlord obligations inclusive of free rents, Cut-off Date LTV and Maturity Date LTV is calculated at 58.8% based on the “As-Is Assuming No Landlord Obligations” value. These appraised values assume that the tenant build-outs are completed and the tenants are in occupancy. The as is appraised value is $161,000,000 which represents a Cut-off Date LTV and Maturity Date LTV of 62.1%. |
| (5) | For a full description of Escrows and Reserves, see “Escrows and Reserves” below. |
| (6) | At loan closing, an economic holdback of $31,000,000 (“Embark Holdback Reserve”) was reserved equal to the value of the income stream for the tenant, Embark, which has executed its lease but has not yet taken occupancy of its space. The Embark Holdback Reserve will be released (less the amount of free rent under the Embark lease) to the borrower when Embark takes physical occupancy of its space and commences paying rent for the leased premises (anticipated to be 8/1/2022). We cannot assure you that Embark will take occupancy or commence paying rent as expected or at all. In addition, IDEO has not taken occupancy of the Second Phase (as defined under “The Property” below) space and is not required to pay rent with respect to the Second Phase space until January 1, 2023. We cannot assure you that IDEO will take occupancy of, or commence paying rent with respect to, the Second Phase space as expected or at all. |
| (7) | Prior to origination, The Lion Building Property was encumbered by a construction loan with an outstanding principal balance of $25,000,000 and an Intra-Company Loan (as defined below) with an outstanding principal balance of $60,891,856. The “Intra-Company Loan” was between Le Lion Building LLC (the sole member of the borrower), as borrower, and The Crankstart Foundation (the 70% owner of Le Lion Building LLC), as lender, had a scheduled maturity date of March 12, 2025, and was secured by a second lien on The Lion Building Property. At origination, The Lion Building Whole Loan proceeds were used, in part, to pay off the construction loan in full (including outstanding interest and fees) and to pay off the Intra-Company Loan for a discounted amount of $22,901,272.14. |
| THE INFORMATION IN THIS STRUCTURAL AND COLLATERAL TERM SHEET IS NOT COMPLETE AND MAY BE AMENDED PRIOR TO THE TIME OF SALE. THIS TERM SHEET IS NOT AN OFFER TO SELL THESE SECURITIES AND IT IS NOT A SOLICITATION OF AN OFFER TO BUY THESE SECURITIES IN ANY JURISDICTION WHERE THE OFFER OR SALE IS NOT PERMITTED. |
44
| Structural and Collateral Term Sheet | | BMO 2022-C2 |
| |
| No. 2 – The Lion Building |
The Loan. The second largest mortgage loan is part of a Whole Loan evidenced by five pari passu promissory notes in the aggregate original principal amount of $100,000,000 (“The Lion Building Whole Loan”). The Lion Building Mortgage Loan (as defined below) evidenced by the controlling Note A-1 and the non-controlling Note A-2-1, which has an aggregate outstanding principal balance as of the Cut-off Date of $65,000,000, will be included in the BMO 2022-C2 securitization trust (“The Lion Building Mortgage Loan”) and represents approximately 9.2% of the Initial Pool Balance. The Lion Building Whole Loan is secured by the borrower’s fee interest in a Class-A mixed use office and production distribution and repair space (“PDR”) located in San Francisco, California (“The Lion Building Property”). The Lion Building Whole Loan was originated by DBR Investments Co. Limited (“DBRI”) on June 8, 2022. The Lion Building Whole Loan proceeds were used to refinance the existing debt on The Lion Building Property, fund upfront reserves and pay origination costs. The Lion Building Whole Loan accrues interest at a fixed rate of 5.19750% per annum.
The non-controlling Note A-2-2, Note A-3 and Note A-4, are currently held by DBRI and are expected to be contributed to one or more future securitization trusts. The Lion Building Whole Loan will be serviced pursuant to the pooling and servicing agreement for the BMO 2022-C2 securitization trust. The relationship between the holders of The Lion Building Whole Loan is governed by a co-lender agreement as described under “Description of the Mortgage Pool—The Whole Loans—The Serviced Pari Passu Whole Loans” in the Preliminary Prospectus.
| Whole Loan Summary |
| Note | Original Balance | Cut-off Date Balance | Note Holder | Controlling Piece |
| A-1 | $50,000,000 | | $50,000,000 | | BMO 2022-C2 | Yes |
| A-2-1 | $15,000,000 | | $15,000,000 | | BMO 2022-C2 | No |
| A-2-2(1) | $15,000,000 | | $15,000,000 | | DBRI | No |
| A-3(1) | $10,000,000 | | $10,000,000 | | DBRI | No |
| A-4(1) | $10,000,000 | | $10,000,000 | | DBRI | No |
| Total | $100,000,000 | | $100,000,000 | | | |
| (1) | The subject notes are expected to be contributed to one or more future securitization trust(s). |
The Property. The Lion Building Property is a 172,328 square foot four-story mixed use PDR/office building located in the Potrero Hill district and the “Mission/Potrero Hill” PDR submarket of San Francisco, California. The Property was originally built in 1924 to house the manufacturing operations of local syrup maker Lyons-Magnus, which continued on-site through the early 1970’s and underwent a renovation and reposition in 2021 to Class A PDR and office building. The Lion Building Property offers traditional office, media production, design, experimental marketing, event, sales, warehousing, fulfillment and showroom space. The Lion Building Property features 15’ to 17’ ceiling heights, large open floor plates, four roll-up doors, two brand new elevators (1 passenger/1 freight), heavy power (2,000-4,000 amp/277/480 volts), new HVAC, and a new rooftop deck.
The borrower sponsors purchased The Lion Building Property in March 2018 and subsequently began renovations in the fall of 2018. In total, the borrower sponsors have invested approximately $14.9 million ($86.4 PSF) on base building renovations, $13.6 million ($78.8 PSF) on tenant improvements and $3.1 million ($17.8 PSF) on leasing commissions, and approximately $460,000 on legitimizing permitted office use. Concurrent with the renovation efforts, the borrower sponsors began marketing The Lion Building Property for lease and in July 2019 signed a lease with IDEO, a globally recognized design and consulting firm. In May 2021, the borrower sponsor signed a lease with Embark Trucks (NASDAQ: EMBK), a self-driving truck company, for the remainder of the space at The Lion Building Property. See “Major Tenants” below for more information.
The property is zoned PDR-1-G, which allows for a wide variety of uses including traditional industrial uses of manufacturing, construction, and repair to more modern industrial uses including lab, food service, media production, robotics and autonomous vehicles. PDR-1-G limits office use to accessory office space that supports the PDR use up to 1/3 of the overall PDR space. Due to the historic partial office use at The Lion Building Property, the borrower sponsor worked with the City of San Francisco and legitimized 43,569 square feet of space for pure office use at the building.
As of June 1, 2022, The Lion Building Property was 100.0% leased to two tenants: IDEO (69.4% of NRA) and Embark Trucks (30.6% of NRA, NASDAQ: EMBK), although Embark Trucks has not yet taken occupancy of its space and is not yet paying rent. We cannot assure you that Embark Trucks will take occupancy or commence paying rent as expected or at all. The IDEO leased premises is comprised of two phases of buildouts: (i) the “First Phase” space (as defined below), which consists of 85,104 square feet, and (ii) the “Second Phase” space, which consists of 34,409 square feet of the 3rd floor. IDEO has taken occupancy of the First Phase space and rent commenced on the First Phase space on April 18, 2022. IDEO has not taken occupancy of the Second Phase space and is not required to commence paying rent on the Second Phase space until January 1, 2023. We cannot assure you that IDEO will take occupancy of, or commence paying rent on, the Second Phase space as expected or at all.
| THE INFORMATION IN THIS STRUCTURAL AND COLLATERAL TERM SHEET IS NOT COMPLETE AND MAY BE AMENDED PRIOR TO THE TIME OF SALE. THIS TERM SHEET IS NOT AN OFFER TO SELL THESE SECURITIES AND IT IS NOT A SOLICITATION OF AN OFFER TO BUY THESE SECURITIES IN ANY JURISDICTION WHERE THE OFFER OR SALE IS NOT PERMITTED. |
45
| Structural and Collateral Term Sheet | | BMO 2022-C2 |
| |
| No. 2 – The Lion Building |
Major Tenants. The two largest tenants based on underwritten base rent are IDEO and Embark Trucks.
IDEO (119,513 square feet, 69.4% of NRA; 67.8% underwritten base rent) is a privately held, design and consulting firm with offices in the U.S. (Cambridge, Chicago, New York Palo Alto, San Francisco), England (London), Germany (Munich), Japan (Tokyo), and China (Shanghai). It was founded in Palo Alto, California in 1978. The company uses a design thinking approach to design products, services, environments, and digital experiences. IDEO’s organizational culture consists of project teams, flat hierarchy, individual autonomy, creativity, and collaboration. The firm currently employs over 600 people across 23 design capabilities including digital, environment, government and health and wellness. As of December 31, 2021, IDEO reported $158 million in total revenue and $26 million in net income (an increase from $10.8 million in 2020). In addition, IDEO reported $7.2 million in cash and $21 million in accounts receivables.
IDEO signed a 12-year lease which initially expires in April 2034 with two, five-year renewal options and no termination options. The rent commencement date for the Phase 1 space (2nd floor, 10,000 square feet of 3rd floor, 4th floor, and rooftop deck) was April 18, 2022 and rent commencement for the Phase 2 space (34,409 square feet of the 3rd floor) will be on January 1, 2023. Base Rent is required to increase 2.75% annually. The tenant provided to the landlord a security deposit equal to $4,631,047.21 as security for the full and faithful performance by the tenant of its obligations under the lease. So long as the tenant is not in default, at the end of the 60th month of the lease term, the amount of the security deposit will be reduced to $2,778,628.32. The lease is guaranteed by Kyu Investment Incorporated, a New York corporation.
The Lion Building is expected to serve as IDEO’s new headquarters location for design, production, R&D, and corporate office uses. According to the sponsor, IDEO has invested approximately $7.2 million ($60 PSF) into their space. All of the equipment is in place and operational at The Lion Building. The “First Phase” of IDEO’s buildout was designed for 450 people to be on site. As of the week of May 9, 2022, approximately one-fourth to one-third of the maximum occupancy is on site at any given moment and is expected to increase in phases.
| ● | 2nd Floor – The wood shop, metal shop, spray booth, and 3D Print room are all located on the 2nd floor. The metal shop has a dock-high roll up door which allows for the movement of materials and equipment. The second floor also has a Flex Project room which allows for the custom configuration for the assembly and production of prototypes, etc. |
| ● | 3rd Floor (10,000 square feet, Phase 1) – this floor includes the photo studio and audio/video production rooms. This allows for on-site capture and pot production of content. |
| ● | 4th Floor – this floor includes additional video and audio production rooms. It is also home to their test kitchen and playlab, where prototypes for toys and children’s games are tested. The CEO’s office is also on the 4th floor. It is the only hard walled office. The office space is all open plan and the majority of that is on the 4th floor. |
Embark Trucks (52,815 square feet, 30.6% of NRA; 32.2% underwritten base rent), Embark Trucks (“Embark”) develops technologically advanced autonomous driving software for the truck freight industry. Embark’s products include Embark Driver (a per-mile software license), Embark Guardian (an autonomous fleet management solution that provides remote vehicle monitoring, dispatching, and access to real-time data), and Embark Universal Interface (a set of standardized self-driving components).
In May 2021, Embark signed a seven-year lease with one, five-year renewal option and a termination option on the last day of the 6th year of the lease term. Embark is not yet in occupancy of its space. Rent will commence upon substantial completion and delivery of the ground floor/mezzanine space, which is anticipated to be in August 2022. If the landlord fails to deliver the premises in the condition required under the lease on or before January 7, 2023, Embark will be granted a credit equal to one day of base rent for each day of delay until completion of the landlord’s base building work for the ground floor/mezzanine space. Delays resulting from changes to plans requested by the tenant, force majeure or delay by the tenant in furnishing information or responding to requests will not extend the rent commencement date. If the landlord fails to deliver the premises in the condition required under the lease on or before October 7, 2022, Embark may terminate the lease at any time prior to substantial completion of the required work, in which case the landlord will be required to refund the security deposit to Embark. We cannot assure you that the premises will be delivered or the rent will commence as expected or at all.
At loan closing, an Embark Holdback Reserve in the amount of $31,000,000 was reserved with an amount equal to the income stream from Embark. When Embark takes physical occupancy and commences paying rent for the leased premises (anticipated to be August 1, 2022), the Embark Holdback Reserve net of Embark’s free rents ($2,321,111) will be released to the borrower. We cannot assure you that Embark will take occupancy or commence paying rent as expected or at all. If the borrower sponsor fails to deliver the leased premises and rent has not commenced by the date 36 months after the loan closing, the borrower has the right (but not obligation) to partially defease the loan in an amount equal to the Embark Holdback Reserve.
COVID-19 Update. As of June 8, 2022, The Lion Building Whole Loan is not subject to any forbearance, modification or debt service relief request. The first payment date for The Lion Building Whole Loan is August 6, 2022. See “Risk Factors—Special Risks—The Coronavirus Pandemic Has Adversely Affected the Global Economy and May Adversely Affect the Performance of the Mortgage Loans” in the Preliminary Prospectus.
| THE INFORMATION IN THIS STRUCTURAL AND COLLATERAL TERM SHEET IS NOT COMPLETE AND MAY BE AMENDED PRIOR TO THE TIME OF SALE. THIS TERM SHEET IS NOT AN OFFER TO SELL THESE SECURITIES AND IT IS NOT A SOLICITATION OF AN OFFER TO BUY THESE SECURITIES IN ANY JURISDICTION WHERE THE OFFER OR SALE IS NOT PERMITTED. |
46
| Structural and Collateral Term Sheet | | BMO 2022-C2 |
| |
| No. 2 – The Lion Building |
Environmental. According to a Phase I environmental report dated March 28, 2022 (“ESA”), no REC’s were identified and no further site investigation was recommended, except the ESA identified a historical REC relating to an underground storage tank that used to be located at The Lion Building Property and an associated gasoline release in 1997.
| Historical and Current Occupancy |
| 2019(1) | 2020(1) | 2021(1) | Current(2)(3) |
| NAV | NAV | NAV | 100.0% |
| (1) | The historical occupancy is not available because of recent renovation. |
| (2) | Based on the underwritten rent roll dated June 1, 2022. |
| (3) | Embark and IDEO are included in the current occupancy, although Embark is not currently in occupancy and IDEO is not currently in occupancy with respect to Second Phase. |
| Top Tenant Summary(1) |
| Tenant | Ratings
Moody’s/S&P/Fitch(2) | Net Rentable
Area (square
feet) | % of Total
NRA | UW Base
Rent PSF | UW Base
Rent | % of
Total
Base
Rent | Lease
Expiration
Date |
| IDEO(3)(4) | NR/NR/NR | 119,513 | 69.4% | $66.60 | $7,959,540 | 67.8% | 4/30/2034 |
| Embark Trucks(5)(6) | NR/NR/NR | 52,815 | 30.6 | $71.50 | 3,776,273 | 32.2 | 7/31/2029 |
| Largest Tenants | | 172,328 | 100.0% | $68.10 | $11,735,813 | 100.0% | |
| Total Occupied | | 172,328 | 100.0% | $68.10 | $11,735,813 | 100.0% | |
| Vacant | | 0 | 0.0% | | | | |
| Total / Wtd. Avg. | | 172,328 | 100.0% | | | | |
| (1) | Based on the underwritten rent roll dated June 1, 2022. |
| (2) | In some instances, ratings provided are those of the parent company or government of the entity shown, whether or not the parent company or government guarantees the lease. |
| (3) | All of the “Second Phase” space (34,409 SF of 3rd Floor) is built out with drop ceilings, offices and conference rooms, carpet and tiles. IDEO has agreed to a firm rent commencement date of January 1, 2023 for the Second Phase. The Second Phase space can be occupied immediately. There are no termination options tied to the Second Phase space. |
| (4) | UW Base Rent is inclusive of the IDEO Second Phase that is not currently in occupancy. This space accounts for approximately 20.0% of NRA and 18.5% of UW Base Rent. |
| (5) | Embark Trucks has a termination option on the last day of the sixth year of the lease term (which lease is anticipated to commence on August 1, 2022). Additionally, if the landlord fails to deliver the premises in the condition required under the lease on or before October 7, 2022, Embark Trucks may terminate the lease at any time prior to substantial completion of the required work, in which case the landlord will be required to refund the security deposit to Embark Trucks. |
| (6) | UW Base Rent is inclusive of the Embarks Trucks space, although Embark Trucks is not currently in occupancy or paying rent. We cannot assure you that Embark Trucks will occupy the premises or commence paying rent as expected or at all. The Embark Trucks space accounts for approximately 30.6% of NRA and 32.2% of UW Base Rent. |
| Lease Rollover Schedule(1)(2)(3) |
| Year | Number
of
Leases
Expiring | Net
Rentable
Area
Expiring | % of
NRA
Expiring | UW Base
Rent
Expiring | % of UW
Base
Rent
Expiring | Cumulative
Net
Rentable
Area
Expiring | Cumulative
% of NRA
Expiring | Cumulative
UW Base
Rent
Expiring | Cumulative
% of UW
Base Rent
Expiring |
| Vacant | NAP | 0 | 0.0 | % | NAP | NAP | 0 | 0.0% | NAP | NAP |
| 2022 | 0 | 0 | 0.0 | | $0 | 0.0 | % | 0 | 0.0% | 0 | 0.0% |
| 2023 | 0 | 0 | 0.0 | | 0 | 0.0 | | 0 | 0.0% | 0 | 0.0% |
| 2024 | 0 | 0 | 0.0 | | 0 | 0.0 | | 0 | 0.0% | 0 | 0.0% |
| 2025 | 0 | 0 | 0.0 | | 0 | 0.0 | | 0 | 0.0% | 0 | 0.0% |
| 2026 | 0 | 0 | 0.0 | | 0 | 0.0 | | 0 | 0.0% | 0 | 0.0% |
| 2027 | 0 | 0 | 0.0 | | 0 | 0.0 | | 0 | 0.0% | 0 | 0.0% |
| 2028 | 0 | 0 | 0.0 | | 0 | 0.0 | | 0 | 0.0% | 0 | 0.0% |
| 2029 | 1 | 52,815 | 30.6 | | 3,776,273 | 32.2 | | 52,815 | 30.6% | $3,776,273 | 32.2% |
| 2030 | 0 | 0 | 0.0 | | 0 | 0.0 | | 52,815 | 30.6% | $3,776,273 | 32.2% |
| 2031 | 0 | 0 | 0.0 | | 0 | 0.0 | | 52,815 | 30.6% | $3,776,273 | 32.2% |
| 2032 | 0 | 0 | 0.0 | | 0 | 0.0 | | 52,815 | 30.6% | $3,776,273 | 32.2% |
| 2033 & Beyond | 1 | 119,513 | 69.4 | | 7,959,540 | 67.8 | | 172,328 | 100.0% | $11,735,813 | 100.0% |
| Total | 2 | 172,328 | 100.0 | % | $11,735,813 | 100.0 | % | | | | |
| (1) | Based on the underwritten rent roll dated June 1, 2022. |
| (2) | Certain tenants may have termination or contraction options (which may become exercisable prior to the originally stated expiration date of the tenant lease) that are not considered in the above Lease Rollover Schedule. |
| (3) | UW Base Rent Expiring, % of UW Base Rent Expiring, Cumulative UW Base Rent Expiring and Cumulative % of UW Base Rent Expiring are inclusive of the Embark Trucks space and the IDEO Second Phase that are not currently in occupancy. The Embark Trucks space accounts for approximately 30.6% of NRA and 32.2% of UW Base Rent, and the IDEO Second Phase space accounts for approximately 20.0% of NRA and 18.5% of UW Base Rent. |
| THE INFORMATION IN THIS STRUCTURAL AND COLLATERAL TERM SHEET IS NOT COMPLETE AND MAY BE AMENDED PRIOR TO THE TIME OF SALE. THIS TERM SHEET IS NOT AN OFFER TO SELL THESE SECURITIES AND IT IS NOT A SOLICITATION OF AN OFFER TO BUY THESE SECURITIES IN ANY JURISDICTION WHERE THE OFFER OR SALE IS NOT PERMITTED. |
47
| Structural and Collateral Term Sheet | | BMO 2022-C2 |
| |
| No. 2 – The Lion Building |
| Underwritten Net Cash Flow(1)(2) |
| | Underwritten | Per Square Foot | %(3) |
| Base Rent(4) | $11,735,813 | $68.10 | 98.7% |
| Rent Step | 155,599 | 0.90 | 1.3 |
| Gross Potential Rent | $11,891,412 | $69.00 | 100.0% |
| Vacancy | (614,522) | (3.57) | (5.2) |
| Reimbursements | 399,032 | 2.32 | 3.4 |
| Effective Gross Income | $11,675,921 | $67.75 | 98.2% |
| | | | |
| Total Expenses | $2,022,534 | $11.74 | 17.0% |
| | | | |
| Net Operating Income | $9,653,388 | $56.02 | 81.2% |
| Total TI / LC, Capex / RR | 465,286 | 2.70 | 3.9 |
| Net Cash Flow | $9,188,102 | $53.32 | 77.3% |
| (1) | Certain items such as interest expense, interest income, lease cancellation income, depreciation, amortization, debt service payments and any other non-recurring were excluded from the historical presentation and are not considered for the underwritten cash flow. |
| (2) | Historical financials are unavailable due to recent renovation of the Lion Building Property. |
| (3) | % represents the percentage of Gross Potential Rent. |
| (4) | Underwritten Base Rent is inclusive of the Embark Trucks and IDEO Second Phase spaces that are not currently in occupancy. The Embark Trucks space accounts for approximately 30.6% of NRA and 32.2% of Underwritten Base Rent, and the IDEO Second Phase space accounts for approximately 20.0% of NRA and 18.5% of Underwritten Base Rent. |
The Market. The Lion Building Property is located between San Francisco’s Mission, SOMA, Potrero Hill, and Showplace Square districts and is walking distance to many amenities, including some of San Francisco’s most critically acclaimed restaurants and shops. The Lion Building Property is easily accessible and well-served by multiple modes of transportation including both MUNI, and BART, and is within a five-minute drive of both Highway 101 and Interstate 80. In addition, The Lion Building Property is within a five-minute walk of multiple public transit lines, including four bus lines that stop within one block of The Lion Building Property.
The Lion Building Property is located in the Mission area within the city of San Francisco. The Lion Building Property’s neighborhood represents a center of commerce, recreation, and diversity. The region features outdoor activities, cultural institutions, Michelin-starred restaurants, and a bustling art and music scene. Further, the area greatly benefits from the city’s transportation linkages and infrastructure.
The Lion Building Property is located in San Francisco, California within the Mission/Potrero office submarket. As of November 2021, the Mission/Potrero submarket contained nearly 3.6 million square feet of office space. Through the third quarter of 2021, the submarket witnessed 184,050 square feet of negative net absorption. This corresponded with a vacancy rate of 12.7%, up from 7.8% at the end of 2020.
The Lion Building Property is also located within the Mission/Potrero industrial submarket. As of May 2022, the Mission/Potrero submarket contained nearly 10.1 million square feet of industrial space. Through the third quarter of 2021, the submarket witnessed 44,935 square feet of positive net absorption. This corresponded with a vacancy rate of 7.7%, down from 7.9% at the end of 2021.
The comparable PDR/Lab leases indicated starting rental rates that ranged from $3.83 to $7.16 per square foot per month on an industrial gross basis, averaging $5.72 per square foot per month. The comparable leases ranged in size from 14,601 to 235,000 square feet. In-term rent increases are being achieved, with three percent annual increases most common.
| THE INFORMATION IN THIS STRUCTURAL AND COLLATERAL TERM SHEET IS NOT COMPLETE AND MAY BE AMENDED PRIOR TO THE TIME OF SALE. THIS TERM SHEET IS NOT AN OFFER TO SELL THESE SECURITIES AND IT IS NOT A SOLICITATION OF AN OFFER TO BUY THESE SECURITIES IN ANY JURISDICTION WHERE THE OFFER OR SALE IS NOT PERMITTED. |
48
| Structural and Collateral Term Sheet | | BMO 2022-C2 |
| |
| No. 2 – The Lion Building |
The following table summarizes the comparable PDR leases in the surrounding market.
| | Comparable PDR Leases Summary(1) |
| Property/Address | Location | Year Built / Renovated | Tenant Name | Lease Start Date | Term (mos.) | Lease Type | Tenant Size (square feet) | UW Base Rent Per square feet |
| The Lion Building(2) | San Francisco, CA | 1924/2021 | Embark Trucks | 8/2022 | 84 | IG | 52,815 | $68.10 |
| Mariposa Square | San Francisco, CA | 1923/NAP | Open AI | 1/2022 | 120 | IG | 106,000 | $66.00 |
| Alexandia Center - B1 | San Francisco, CA | 2008/NAP | Fibrogen | 9/2021 | 60 | IG | 235,000 | $72.00 |
| 1155 Bryant | San Francisco, CA | 1919/2016 | Mission Barns | 8/2021 | 120 | IG | 32,451 | $77.04 |
| Pier 70 | San Francisco, CA | 1900/2017 | Astranis | 7/2021 | 81 | IG | 130,000 | $63.00 |
| De Haro Place | San Francisco, CA | 1927/2013 | Initae | 5/2021 | 120 | IG | 51,855 | $85.92 |
| 2101 Mission | San Francisco, CA | 1916/2020 | Dandelion Chocolate | 3/2021 | 102 | IG | 14,601 | $45.96 |
| Total/Wtd. Avg.(3) | | | | | 86 | | 569,907 | $70.00 |
| (2) | Based on the underwritten rent roll dated June 1, 2022. |
| (3) | Total/Wtd.Avg. does not include The Lion Building Property. |
The Borrower. The borrower is 2525 16th St Property LLC a Delaware limited liability company and single purpose entity with two independent directors. Legal counsel to the borrower delivered a non-consolidation opinion in connection with the origination of The Lion Building Whole Loan.
The Borrower Sponsors. The borrower sponsor and non-recourse carveout guarantors for The Lion Building Whole Loan are Angus McCarthy and Michael Moritz. McCarthy began working in the construction industry in the early 1990s and has operated his company since the mid-1990s. McCarthy’s current portfolio includes the subject property and three other commercial buildings (totaling roughly 110,000 square feet) in San Francisco. In addition, McCarthy also owns seven rental units. Michael Moritz is a Welsh billionaire venture capitalist. Moritz is currently the Chairman of Sequoia Capital where he has worked since 1986. Moritz represented Sequoia in its investments in Google, Yahoo, LinkedIn, PayPal, Flextronics, Instacart, Stripe, Kayak, Pure Digital, and Zappos.com.
Property Management. The Lion Building Property is managed by W2 Property Management, Inc., a third party property management company.
Escrows and Reserves. At loan origination, the borrower deposited approximately (i) $289,274 into a tax reserve, (ii) $37,550 into an insurance reserve, (iii) $130,000 into a capex reserve, (iv) $7,720,741 into a security deposit comprised of $4,631,047 for IDEO and $3,089,694 for Embark, (v) $5,304,696 into a free rent reserve (vi) $1,264,531 into a gap rent reserve, (vii) $4,946,132 into a TI/LC reserve and (viii) $31,000,000 into the Embark Holdback Reserve.
Tax Reserve – On each due date, the borrower is required to fund 1/12 of the taxes (initially approximately $72,319), that the lender reasonably estimates will be payable over the next-ensuing 12-month period.
Insurance Reserve – On each due date, the borrower is required to fund 1/12 of the insurance premiums that the lender reasonably estimates will be required for the renewal of the insurance coverage (initially approximately $7,510).
Capital Expenditure Reserve – On each due date, the borrower is required to fund a capital expenditure reserve in the amount of approximately $3,590. The deposits are capped at $86,164, exclusive of the initial deposit until the related sidewalk work is completed.
TI / LC Reserve — On a monthly basis during the continuance of a Trigger Period, the borrower is required to escrow an amount equal to $21,541.00 for tenant improvement and leasing costs.
Embark Holdback Reserve – The Embark Holdback Reserve in the amount of $31,000,000 was reserved at origination with the holdback amount being equivalent to the income stream from Embark. When Embark takes physical occupancy and commences paying rent for the leased premises (anticipated to be 8/1/2022), economic holdback net of Embark’s free rents ($2,321,111) will be released to Borrower. If the borrower sponsor fails to deliver the leased premises and rent has not commenced by the date 36 months after the loan closing, the borrower has the right (but not obligation) to defease the loan in an amount equal to the economic holdback funds.
| THE INFORMATION IN THIS STRUCTURAL AND COLLATERAL TERM SHEET IS NOT COMPLETE AND MAY BE AMENDED PRIOR TO THE TIME OF SALE. THIS TERM SHEET IS NOT AN OFFER TO SELL THESE SECURITIES AND IT IS NOT A SOLICITATION OF AN OFFER TO BUY THESE SECURITIES IN ANY JURISDICTION WHERE THE OFFER OR SALE IS NOT PERMITTED. |
49
| Structural and Collateral Term Sheet | | BMO 2022-C2 |
| |
| No. 2 – The Lion Building |
Lockbox / Cash Management. The Lion Building Whole Loan is structured with a hard lockbox and springing cash management. The borrower is required to cause all rents to be deposited directly into the lender-controlled lockbox account. The Lion Building Whole Loan documents also require that all rents received by the borrower or property manager be deposited into the lockbox account within one business day of receipt. During the continuance of a Trigger Period, funds on deposit in the lockbox account are required to be swept on a daily basis into a lender-controlled cash management account and applied on each payment date (i) to make deposits into the tax and insurance reserves, (ii) to pay debt service on The Lion Building Whole Loan, (iii) to make deposits into the capital expenditure and TI / LC reserves, (iv) to pay (I) the lesser of lender-approved budgeted operating expenses and actual operating expenses, minus (II) the amount by which lender-approved budgeted operating expenses exceeded actual operating expenses in prior months, to the extent not previously deducted pursuant to this clause (II), and (v) to pay lender-approved extraordinary expenses, if any, with any excess cash after such application required to be deposited (A) if a Lease Sweep Period (as defined below) is continuing, into a lease sweep reserve (the “Lease Sweep Reserve”) to be applied to pay the costs of re-tenanting the applicable space, or (B) if no Lease Sweep Period is continuing, and any other Trigger Period is continuing, into a lender-controlled account to be held as additional collateral for The Lion Building Whole Loan during such Trigger Period.
A “Trigger Period” will commence upon (i) the occurrence of an event of default under The Lion Building Whole Loan (ii) a Low DSCR Period (as defined below) or (iii) the commencement of a Lease Sweep Period, and will end, if (A) with respect to a Trigger Period continuing pursuant to clause (i), the event of default commencing the Trigger Period has been cured and such cure has been accepted by the lender, (B) with respect to a Trigger Period continuing due to clause (ii), the Low DSCR Period has ended, or (C) with respect to a Trigger Period continuing due to clause (iv), the Lease Sweep Period has ended.
A “Low DSCR Period” will commence if the debt service coverage ratio (“DSCR”) of The Lion Building Whole Loan is less than 1.20x based on The Lion Building Whole Loan documents as of the last day of any calendar quarter, however if any tenant is subject to a Tenant Adjustment Event (as defined below), then the underwritten net cash flow as of the most recent calendar quarter may be immediately adjusted downward by the lender and to the extent said adjustment results in a DSCR that is below 1.20x, a Low DSCR Period will immediately commence, and will end upon The Lion Building Property achieving a DSCR of at least 1.25x for two consecutive calendar quarters.
A “Tenant Adjustment Event” will mean the exclusion of (i) amounts representing non-recurring items and (ii) amounts received from (1) tenants not currently in occupancy and paying full, unabated rent (unless all abated rent has been deposited with the lender), (2) tenants affiliated with the borrower or non-recourse guarantor, (3) tenants in default or in bankruptcy, (4) tenants under (x) month-to-month leases and (y) leases where the term is set to expire in the next two (2) succeeding calendar quarters (or (5) tenants under leases where the tenant thereunder has a renewal option and has failed to exercise such renewal option within the time period set forth in the lease or has given notice of intent to vacate.
A “Lease Sweep Period” will commence (a) upon the earlier of (i) the date that is 12 months prior to the expiration of a Sweep Lease (defined below) or the date on which a termination option thereunder may be exercised or (ii) upon the date required under the Sweep Lease by which the sweep tenant is required to give notice of its exercise of a renewal option thereunder (and such renewal has not been so exercised) or (iii) 12 months prior to The Lion Building Whole Loan maturity date (if a Sweep Tenant’s lease expires within 12 months after the maturity date); (b) upon the early termination, early cancellation or early surrender of a Sweep Lease or upon the borrower’s receipt of notice by a Sweep Tenant of its intent to effect an early termination, early cancellation or early surrender of its Sweep Lease; (c) if a Sweep Tenant has ceased operating its business (i.e., “goes dark”) in its space (or any material portion thereof) at The Lion Building Property (a “Go Dark Event”); (d) upon a default under a Sweep Lease by a Sweep Tenant beyond any applicable notice and cure period, or (e) upon a bankruptcy or insolvency proceeding of a Sweep Tenant or its parent.
A Lease Sweep Period will end once the applicable Lease Sweep Period has been cured or the space demised under the Sweep Lease has been re-tenanted pursuant to one or more qualified leases as defined in The Lion Building Whole Loan documents (or, if applicable, the applicable Sweep Lease has been renewed pursuant to its terms) and, in the lender’s reasonable judgment, sufficient funds have been accumulated in the Lease Sweep Reserve to cover all anticipated tenant improvements and leasing commissions and free and/or abated rent in connection therewith (and in the case of replacement leases, any debt service and operating shortfalls relating to the delay in the commencement of full rent payments) (the “Lease Sweep Re-tenanting Costs”). A Lease Sweep Period will also cease on the date on which the following amounts have accumulated in the Lease Sweep Reserve: (x) $50 per square foot with respect to any portion of the space demised under the applicable Sweep Lease that has not been re-tenanted; and (y) to the extent a portion of the space demised under the applicable Sweep Lease has been re-tenanted pursuant to one or more qualified leases, in the lender’s judgment, sufficient funds to cover all anticipated Lease Sweep Re-tenanting Costs related to the space that has been re-tenanted.
A “Sweep Lease” means (i) IDEO lease, (ii) the Embark Trucks lease, or (iii) any replacement lease of the foregoing leases that, either individually, or when taken together with any other lease with the same tenant or its affiliates, and assuming the exercise of all expansion rights and all preferential rights to lease additional space contained in such lease, covers the majority of the applicable Lease Sweep Space.
| THE INFORMATION IN THIS STRUCTURAL AND COLLATERAL TERM SHEET IS NOT COMPLETE AND MAY BE AMENDED PRIOR TO THE TIME OF SALE. THIS TERM SHEET IS NOT AN OFFER TO SELL THESE SECURITIES AND IT IS NOT A SOLICITATION OF AN OFFER TO BUY THESE SECURITIES IN ANY JURISDICTION WHERE THE OFFER OR SALE IS NOT PERMITTED. |
50
| Structural and Collateral Term Sheet | | BMO 2022-C2 |
| |
| No. 2 – The Lion Building |
A “Lease Sweep Space” means the space demised under the applicable Sweep Lease.
Subordinate and Mezzanine Debt. None
Partial Release. Not permitted.
Ground Lease. None.
| THE INFORMATION IN THIS STRUCTURAL AND COLLATERAL TERM SHEET IS NOT COMPLETE AND MAY BE AMENDED PRIOR TO THE TIME OF SALE. THIS TERM SHEET IS NOT AN OFFER TO SELL THESE SECURITIES AND IT IS NOT A SOLICITATION OF AN OFFER TO BUY THESE SECURITIES IN ANY JURISDICTION WHERE THE OFFER OR SALE IS NOT PERMITTED. |
51
| Structural and Collateral Term Sheet | | BMO 2022-C2 |
| |
| No. 3 – KB Portfolio |
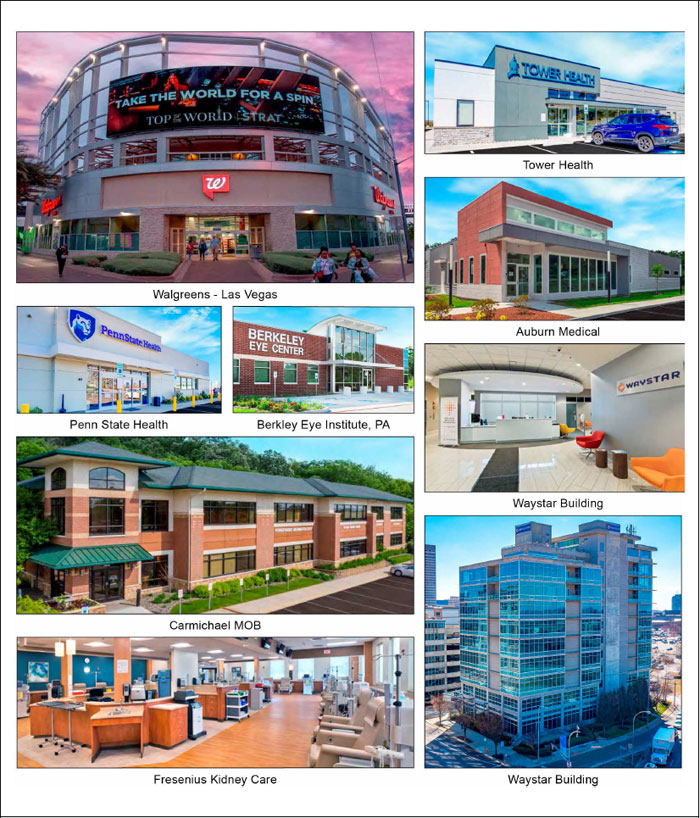
| THE INFORMATION IN THIS STRUCTURAL AND COLLATERAL TERM SHEET IS NOT COMPLETE AND MAY BE AMENDED PRIOR TO THE TIME OF SALE. THIS TERM SHEET IS NOT AN OFFER TO SELL THESE SECURITIES AND IT IS NOT A SOLICITATION OF AN OFFER TO BUY THESE SECURITIES IN ANY JURISDICTION WHERE THE OFFER OR SALE IS NOT PERMITTED. |
52
| Structural and Collateral Term Sheet | | BMO 2022-C2 |
| |
| No. 3 – KB Portfolio |
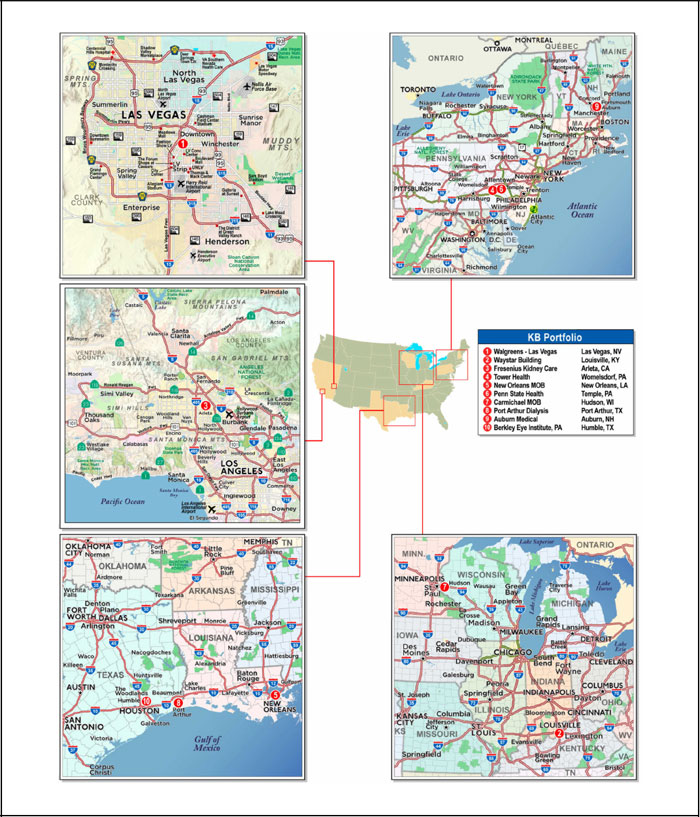
| THE INFORMATION IN THIS STRUCTURAL AND COLLATERAL TERM SHEET IS NOT COMPLETE AND MAY BE AMENDED PRIOR TO THE TIME OF SALE. THIS TERM SHEET IS NOT AN OFFER TO SELL THESE SECURITIES AND IT IS NOT A SOLICITATION OF AN OFFER TO BUY THESE SECURITIES IN ANY JURISDICTION WHERE THE OFFER OR SALE IS NOT PERMITTED. |
53
| Structural and Collateral Term Sheet | | BMO 2022-C2 |
| |
| No. 3 – KB Portfolio |
| Mortgage Loan Information | | Property Information |
| Mortgage Loan Seller: | KeyBank | | Single Asset / Portfolio: | Portfolio |
| Original Principal Balance(1): | $55,000,000 | | Title: | Fee |
| Cut-off Date Principal Balance(1): | $55,000,000 | | Property Type – Subtype: | Various – Various |
| % of IPB: | 7.8% | | Net Rentable Area (SF): | 283,488 |
| Loan Purpose(2): | Acquisition | | Location: | Various |
| Borrower: | KB Diversified Healthcare 60, DST | | Year Built / Renovated: | Various / Various |
| Borrower Sponsor: | Jeffrey A. Pori | | Occupancy: | 92.8% |
| Interest Rate: | 5.06000% | | Occupancy Date: | Various |
| Note Date: | 5/19/2022 | | 4th Most Recent NOI (As of)(5): | NAV |
| Maturity Date: | 6/1/2032 | | 3rd Most Recent NOI (As of)(5): | NAV |
| Interest-only Period: | 120 months | | 2nd Most Recent NOI (As of)(5): | NAV |
| Original Term: | 120 months | | Most Recent NOI (As of)(5): | NAV |
| Original Amortization Term: | None | | UW Economic Occupancy: | 92.4% |
| Amortization Type: | Interest Only | | UW Revenues: | $9,334,318 |
| Call Protection(3): | L(25),D(92),O(3) | | UW Expenses: | $2,610,997 |
| Lockbox / Cash Management: | Hard / Springing | | UW NOI: | $6,723,321 |
| Additional Debt(1): | Yes | | UW NCF: | $6,666,623 |
| Additional Debt Balance(1): | $25,000,000 | | Appraised Value / Per SF(6): | $139,000,000 / $490 |
| Additional Debt Type(1): | Pari Passu | | Appraisal Date: | 4/15/2022 |
| | | | | |
| Escrows and Reserves(4) | | Financial Information(1) |
| | Initial | Monthly | Initial Cap | | Cut-off Date Loan / SF: | $282 |
| Taxes: | $141,309 | $30,220 | N/A | | Maturity Date Loan / SF: | $282 |
| Insurance: | $0 | Springing | N/A | | Cut-off Date LTV(6): | 57.6% |
| Replacement Reserves: | $600,000 | Springing | $600,000 | | Maturity Date LTV(6): | 57.6% |
| TI / LC Reserve: | $4,500,000 | Springing | $4,500,000 | | UW NCF DSCR: | 1.62x |
| Other: | $133,915 | $0 | N/A | | UW NOI Debt Yield: | 8.4% |
| | | | | | | |
| Sources and Uses |
| Sources | Proceeds | % of Total | | Uses | Proceeds | % of Total |
| Whole Loan(1) | $80,000,000 | 55.8% | | Purchase Price(2) | $132,375,000 | 92.4% |
| Borrower Sponsor Equity | 63,326,923 | 44.2 | | Closing Costs | 5,576,699 | 3.9 |
| | | | | | Reserves | 5,375,224 | 3.8 |
| Total Sources | $143,326,923 | 100.0% | | Total Uses | $143,326,923 | 100.0% |
| (1) | The KB Portfolio Mortgage Loan (as defined below) is part of a whole loan evidenced by four pari passu notes with an aggregate original principal balance of $80,000,000. The financial information presented in the charts above is based on the $80,000,000 KB Portfolio Whole Loan (as defined below). |
| (2) | A borrower sponsor-affiliate acquired six of the KB Portfolio Properties between July 2021 and February 2022 and subsequently sold each of the six properties to the borrower at the origination of the KB Portfolio Whole Loan. The remaining four KB Portfolio Properties were acquired from multiple third-party sellers at the origination of the KB Portfolio Whole Loan. |
| (3) | The lockout period will be at least 25 payments beginning with and including the first payment date of July 1, 2022. Defeasance of the KB Portfolio Whole Loan in whole is permitted after two years from the closing date of the securitization that includes the last note to be securitized. The assumed lockout period of 25 payments is based on the closing date of this transaction in July 2022. The actual lockout period may be longer. |
| (4) | For a full description of escrows and reserves, please refer to “Escrows and Reserves” below. |
| (5) | Historical financials are not available due to the borrower or a borrower sponsor-affiliate acquiring the KB Portfolio Properties (as defined below) from multiple sellers between July 2021 and May 2022. |
| (6) | The Appraised Value reflects a portfolio premium of approximately 7.5% over the aggregate “as-is” value of the individual KB Portfolio Properties. The sum of the values on an individual basis is $129,290,000, which represents a Cut-off Date LTV and Maturity Date LTV of 61.9%. |
The Loan. The third largest mortgage loan is part of a whole loan evidenced by four pari passu promissory notes in the aggregate original principal amount of $80,000,000 (the “KB Portfolio Whole Loan”), which is secured by first priority fee mortgages encumbering eight medical office properties, one CBD office property, and one single-tenant retail property located in eight states (the “KB Portfolio Properties”). The controlling Note A-1 and non-controlling Note A-3 (collectively, the “KB Portfolio Mortgage Loan”), with an aggregate original principal balance of $55,000,000, will be included in the BMO 2022-C2 securitization trust. The non-controlling Note A-2 and Note A-4, with an aggregate original principal amount of $25,000,000, are currently held by KeyBank and are expected to be contributed to one or more future securitization trusts. The KB Portfolio Whole Loan will be serviced pursuant to the pooling and servicing agreement for
| THE INFORMATION IN THIS STRUCTURAL AND COLLATERAL TERM SHEET IS NOT COMPLETE AND MAY BE AMENDED PRIOR TO THE TIME OF SALE. THIS TERM SHEET IS NOT AN OFFER TO SELL THESE SECURITIES AND IT IS NOT A SOLICITATION OF AN OFFER TO BUY THESE SECURITIES IN ANY JURISDICTION WHERE THE OFFER OR SALE IS NOT PERMITTED. |
54
| Structural and Collateral Term Sheet | | BMO 2022-C2 |
| |
| No. 3 – KB Portfolio |
the BMO 2022-C2 securitization. See “Description of the Mortgage Pool—The Whole Loans—The Serviced Pari Passu Whole Loans” in the Preliminary Prospectus.
| Whole Loan Summary |
| Note | Original Balance | Cut-off Date Balance | Note Holder | Controlling Piece |
| A-1 | $40,000,000 | $40,000,000 | BMO 2022-C2 | Yes |
| A-2 | $20,000,000 | $20,000,000 | KeyBank(1) | No |
| A-3 | $15,000,000 | $15,000,000 | BMO 2022-C2 | No |
| A-4 | $5,000,000 | $5,000,000 | KeyBank(1) | No |
| Total | $80,000,000 | $80,000,000 | | |
| (1) | Expected to be contributed to one or more future securitization(s). |
The Properties. The KB Portfolio Properties consist of eight medical office buildings, one CBD office building, and one single-tenant retail building, with an aggregate of 283,488 square feet. The KB Portfolio Properties span across eight states and nine metropolitan areas. The KB Portfolio Properties have a combined 92.8% occupancy, with seven of the KB Portfolio Properties occupied by single tenants. The three multi-tenant properties include New Orleans MOB, Carmichael MOB and Port Arthur Dialysis. Three properties that represent approximately 46.4% of underwritten base rent are 100.0% leased to investment grade tenants or subsidiaries of investment grade companies. The borrower acquired the KB Portfolio Properties for a combined purchase price of $132.4 million, resulting in a loan-to-purchase ratio of 60.4%.
| Portfolio Summary |
Property Name / Location | Property Type / Subtype | Year Built / Renovated | Net Rentable Area (SF) | Allocated Whole Loan Cut-off Date Balance | % of Allocated Whole Loan Cut-off Date Balance | Appraised Value(1) | % of Appraised Value(1) | UW NCF | % of UW NCF |
Walgreens - Las Vegas Las Vegas, NV | Retail / Single Tenant | 2015 / NAP | 18,100 | | $31,736,000 | 39.7 | % | $50,000,000 | 38.7 | % | $2,485,407 | 37.3 | % |
Waystar Building Louisville, KY | Office / CBD | 2009 / 2014 | 128,710 | | 18,100,000 | 22.6 | | 30,200,000 | 23.4 | | 1,612,650 | 24.2 | |
Fresenius Kidney Care Arleta, CA | Office / Medical | 1965 / 2019 | 10,075 | | 5,544,000 | 6.9 | | 8,960,000 | 6.9 | | 497,982 | 7.5 | |
Tower Health Womelsdorf, PA | Office / Medical | 2021 / NAP | 11,000 | | 4,500,000 | 5.6 | | 7,600,000 | 5.9 | | 381,178 | 5.7 | |
New Orleans MOB New Orleans, LA | Office / Medical | 1990 / 2012 | 21,619 | | 4,393,000 | 5.5 | | 7,100,000 | 5.5 | | 424,376 | 6.4 | |
Penn State Health Temple, PA | Office / Medical | 1955 / 2020 | 14,200 | | 4,200,000 | 5.3 | | 6,800,000 | 5.3 | | 247,888 | 3.7 | |
Carmichael MOB Hudson, WI | Office / Medical | 2004 / NAP | 26,517 | | 3,898,000 | 4.9 | | 6,300,000 | 4.9 | | 428,900 | 6.4 | |
Port Arthur Dialysis Port Arthur, TX | Office / Medical | 1978 / NAP | 38,466 | | 2,809,000 | 3.5 | | 4,540,000 | 3.5 | | 156,848 | 2.4 | |
Auburn Medical Auburn, NH | Office / Medical | 2017 / NAP | 7,704 | | 2,784,000 | 3.5 | | 4,500,000 | 3.5 | | 247,572 | 3.7 | |
Berkley Eye Institute, PA Humble, TX | Office / Medical | 2019 / NAP | 7,097 | | 2,036,000 | 2.5 | | 3,290,000 | 2.5 | | 183,824 | 2.8 | |
| Total | | | | $80,000,000 | 100.0 | % | $139,000,000 | 100.0 | % | $6,666,623 | 100.0 | % |
| (1) | The Total Appraised Value reflects a portfolio premium of approximately 7.5% over the aggregate “as-is” value of the individual KB Portfolio Properties. The sum of the values on an individual basis is $129,290,000. % of Appraised Value is calculated as a percentage of the $129,290,000 sum of individual values. |
Walgreens - Las Vegas. The Walgreens - Las Vegas property consists of air rights and interior items of an 18,100 square foot ground floor retail space within a larger two-story, 37,499 square foot retail building located on the north end of the Las Vegas Strip in Las Vegas, Nevada. The remaining non-collateral includes the physical structure of the entire building and the second floor retail space, surface parking and parking garage. Constructed in 2015, the Walgreens - Las Vegas property is 100.0% occupied by Walgreens. The Walgreens - Las Vegas property benefits from a location at the hard corner intersection of South Las Vegas Boulevard and Sahara Avenue, just south of the STRAT hotel, casino and skypod, which has recently undergone a $110 million renovation, and just north of the SAHARA Las Vegas hotel and casino, which has recently begun a $150 million renovation. Pursuant to a 2014 reciprocal easement agreement, the Walgreens - Las Vegas property will have perpetual access to (i) the 22 surface level parking spaces and the 154-space parking garage and (ii) the surface level pedestrian ingress and egress access points.
Waystar Building. The Waystar Building property consists of a 128,710 square foot, 11-story mid-rise office building located on the west side of downtown Louisville, Kentucky, at the intersection of South 9th Street and West Market Street situated on 0.54 acres. The building improvements were constructed in 2009 and renovated in 2014. The first floor contains a conference center and a cafeteria. Parking is provided by a basement parking garage that accommodates 14 vehicles, and there are numerous surrounding public parking lots and garages as well. The Waystar Building property is 100.0% leased to Waystar Technologies, Inc. (“Waystar”). A cell tower leased to
| THE INFORMATION IN THIS STRUCTURAL AND COLLATERAL TERM SHEET IS NOT COMPLETE AND MAY BE AMENDED PRIOR TO THE TIME OF SALE. THIS TERM SHEET IS NOT AN OFFER TO SELL THESE SECURITIES AND IT IS NOT A SOLICITATION OF AN OFFER TO BUY THESE SECURITIES IN ANY JURISDICTION WHERE THE OFFER OR SALE IS NOT PERMITTED. |
55
| Structural and Collateral Term Sheet | | BMO 2022-C2 |
| |
| No. 3 – KB Portfolio |
Verizon Wireless is also located on the Waystar Building property. Interstates 64 and 65 are the nearest major thoroughfares, located within two miles of the Waystar Building property.
Fresenius Kidney Care. The Fresenius Kidney Care property consists of a 10,075 square foot medical office building located in Arleta, California. Situated on 0.62 acres, the Fresenius Kidney Care property was constructed in 1965 and fully renovated in 2019. The Fresenius Kidney Care property is 100% leased to Fresenius Kidney Care. Parking is provided by a 37-space surface parking lot (approximately 3.67 parking spaces per 1,000 square feet of NRA). The Fresenius Kidney Care property is located on the northern side of Osborne Street just north of the intersection of Woodman Avenue and Osborne Street, which is a main commercial district in the neighborhood. Local and regional access is provided by the 5 Freeway approximately one mile northeast and the 405 Freeway approximately two miles to the west.
COVID-19 Update. As of May 19, 2022, the KB Portfolio Properties are open and operating. Tenants representing approximately 100% of the occupied square footage at the KB Portfolio Properties and approximately 100% of the underwritten base rent made their April 2022 and May 2022 rental payments. As of the date of this term sheet, the KB Portfolio Whole Loan is not subject to any forbearance, modification or debt service relief request.
Major Tenants. The three largest tenants based on underwritten base rent are Walgreens, Waystar and Fresenius Kidney Care.
Walgreens (18,100 square feet; 6.4% NRA; 35.8% of underwritten base rent): Walgreens is a chain of pharmacy and convenience stores owned by Walgreens Boots Alliance (“WBA”) (rated Baa2/BBB by Moody’s/S&P). Walgreens sells prescription and non-prescription drugs, as well as an assortment of retail products including health and wellness, beauty, personal care, and consumables and general merchandise. WBA is an integrated healthcare, pharmacy and retail company with a presence in nine countries through its portfolio of consumer brands that include Walgreens, Boots, and Duane Reade, among others. WBA’s retail footprint totals over 13,000 locations across the United States, Europe and Latin America. WBA employs more than 315,000 team members, including nearly 35,000 pharmacists. Walgreens has leased the entire Walgreens - Las Vegas property since it was constructed in 2015, under a lease that can be terminated by Walgreens on March 31, 2040, and every five years thereafter until the final lease maturity of March 31, 2090.
Waystar (128,710 square feet; 45.4% NRA; 23.4% of underwritten base rent): Waystar (rated B3/B-/B- by Moody’s/S&P/Fitch), formerly ZirMed, Inc., is a privately-held technology company that provides healthcare information and software solutions to health systems and hospitals throughout the United States. Waystar utilizes its cloud-based platform to help healthcare providers across all care settings streamline workflows and improve financial performance. With over 20 years in the industry, Waystar’s platform is used by more than half a million providers, 1,000 health systems and hospitals, and 5,000 payers and health plans and integrates with all major hospital information and practice management systems. Waystar has leased the entire Waystar Building property since 2014, through a 20-year lease that expires in January 2034. The lease contains three, five-year extension options and no early termination options.
Fresenius Kidney Care (10,075 square feet; 3.6% NRA; 6.9% of underwritten base rent): As a subsidiary of Fresenius Medical Care, Fresenius Kidney Care serves patients through a nationwide network of dialysis centers. Fresenius Medical Care (rated Baa3/BBB/BBB-by Moody’s/S&P/ Fitch) provides renal care services through a global network of 4,153 dialysis clinics in approximately 150 countries and cares for more than 345,000 patients. In addition to providing dialysis services, Fresenius Medical Care is a supplier of dialysis products, including dialysis machines, dialyzers, and related disposables, with 42 production sites on all continents. Fresenius Kidney Care has leased the entire Fresenius Kidney Care property since May 2019, through a 15-year lease that expires in May 2034. The lease contains three, five-year renewal options and no early termination options.
Environmental. According to the Phase I environmental assessments dated between June 2021 and April 2022, there was no evidence of any recognized environmental conditions at the KB Portfolio Properties.
The following table presents certain information relating to the historical occupancy of the KB Portfolio Properties:
| Historical and Current Occupancy |
| 2019(1) | 2020(1) | 2021(1) | Current(2) |
| 100.0% | 100.0% | 100.0% | 92.8% |
| (1) | Historical occupancies reflect only the seven single tenant KB Portfolio Properties, as the information was unavailable for the three multi-tenant properties, New Orleans MOB, Carmichael MOB and Port Arthur Dialysis. |
| (2) | Current occupancy is based on the underwritten rent rolls as of April 1, 2022, for the New Orleans MOB, Carmichael MOB and Port Arthur Dialysis properties and as of May 19, 2022, for all other KB Portfolio Properties. |
| THE INFORMATION IN THIS STRUCTURAL AND COLLATERAL TERM SHEET IS NOT COMPLETE AND MAY BE AMENDED PRIOR TO THE TIME OF SALE. THIS TERM SHEET IS NOT AN OFFER TO SELL THESE SECURITIES AND IT IS NOT A SOLICITATION OF AN OFFER TO BUY THESE SECURITIES IN ANY JURISDICTION WHERE THE OFFER OR SALE IS NOT PERMITTED. |
56
| Structural and Collateral Term Sheet | | BMO 2022-C2 |
| |
| No. 3 – KB Portfolio |
The following table presents certain information relating to the largest tenants based on underwritten base rent of the KB Portfolio Properties:
| Top Tenant Summary(1) |
| Tenant | Property | Ratings
Moody’s/S&P/ Fitch(2) | Net
Rentable
Area (SF) | % of
Total NRA | UW
Base Rent PSF(3) |
UW
Base
Rent(3) | % of
Total
UW Base
Rent | Lease
Exp. Date |
| Walgreens | Walgreens - Las Vegas | Baa2/BBB/NR | 18,100 | 6.4 | % | $143.65 | $2,600,004 | 35.8 | % | 3/31/2040 | (4) |
| Waystar Technologies, Inc. | Waystar Building | B3/B-/B- | 128,710 | 45.4 | | $13.24 | 1,704,000 | 23.4 | | 1/31/2034 | |
| Fresenius Kidney Care | Fresenius Kidney Care | Baa3/BBB/BBB- | 10,075 | 3.6 | | $50.12 | 505,006 | 6.9 | | 5/31/2034 | |
| Tower Health Medical Group | Tower Health | NR/BB-/B+ | 11,000 | 3.9 | | $38.32 | 421,479 | 5.8 | | 9/30/2036 | |
| East Jefferson General Hospital | New Orleans MOB | NR/NR/NR | 15,547 | 5.5 | | $21.00 | 326,487 | 4.5 | | 7/31/2024 | |
| Major Tenants | | | 183,432 | 64.7 | % | $30.29 | $5,556,976 | 76.5 | % | |
| Other Tenants | | | 79,696 | 28.1 | % | $21.45 | $1,709,681 | 23.5 | % | |
| Occupied Collateral Total / Wtd. Avg. | | 263,128 | 92.8 | % | $27.62 | $7,266,657 | 100.0 | % | |
| Vacant Space | | | 20,360 | 7.2 | % | | | | |
| Collateral Total | | | 283,488 | 100.0 | % | | | | |
| | | | | | | | | |
| (1) | Based on underwritten rent rolls as of April 1, 2022, for the New Orleans MOB, Carmichael MOB and Port Arthur Dialysis properties and as of May 19, 2022, for all other KB Portfolio Properties. |
| (2) | Ratings provided are for the parent company of the entity listed in the “Tenant” field whether or not the parent company guarantees the lease. |
| (3) | UW Base Rent PSF and UW Base Rent include (i) rent steps of approximately $18,599 through April 2023, (ii) a mark-to-market rent reduction of $10,325 for Kristoffer A Norbo DDS, MSD, PC at the New Orleans MOB property, and (iii) straight-line rent for Fresenius Kidney Care totaling $45,255 and St. Joseph Regional Health Network (Penn State Health) totaling $23,060. |
| (4) | The Lease Exp. Date reflects the earliest termination option date as the lease expiration date. The Walgreens lease expires on March 31, 2090. |
The following table presents certain information relating to the tenant lease expirations at the KB Portfolio Properties:
| Lease Rollover Schedule(1)(2) |
| Year | Number of
Leases
Expiring | Net Rentable
Area Expiring | % of NRA
Expiring | UW Base Rent
Expiring(3) | % of UW Base
Rent Expiring | Cumulative Net Rentable Area Expiring | Cumulative %
of NRA Expiring | Cumulative UW Base Rent Expiring(3) | Cumulative % of UW Base Rent Expiring |
| Vacant | NAP | 20,360 | 7.2 | % | NAP | NAP | 20,360 | 7.2% | | NAP | NAP |
| 2022 | 0 | 0 | 0.0 | | $0 | 0.0 | % | 20,360 | 7.2% | | $0 | 0.0% |
| 2023 | 2 | 4,450 | 1.6 | | 75,939 | 1.0 | | 24,810 | 8.8% | | $75,939 | 1.0% |
| 2024 | 2 | 17,637 | 6.2 | | 360,930 | 5.0 | | 42,447 | 15.0% | | $436,869 | 6.0% |
| 2025 | 4 | 19,788 | 7.0 | | 375,305 | 5.2 | | 62,235 | 22.0% | | $812,174 | 11.2% |
| 2026 | 1 | 1,852 | 0.7 | | 40,463 | 0.6 | | 64,087 | 22.6% | | $852,637 | 11.7% |
| 2027 | 1 | 1,486 | 0.5 | | 23,033 | 0.3 | | 65,573 | 23.1% | | $875,670 | 12.1% |
| 2028 | 0 | 0 | 0.0 | | 0 | 0.0 | | 65,573 | 23.1% | | $875,670 | 12.1% |
| 2029 | 0 | 0 | 0.0 | | 0 | 0.0 | | 65,573 | 23.1% | | $875,670 | 12.1% |
| 2030 | 0 | 0 | 0.0 | | 0 | 0.0 | | 65,573 | 23.1% | | $875,670 | 12.1% |
| 2031 | 1 | 2,763 | 1.0 | | 52,138 | 0.7 | | 68,336 | 24.1% | | $927,808 | 12.8% |
| 2032 | 1 | 7,704 | 2.7 | | 297,550 | 4.1 | | 76,040 | 26.8% | | $1,225,357 | 16.9% |
| 2033 & Beyond | 8 | 207,448 | 73.2 | | 6,041,300 | 83.1 | | 283,488 | 100.0% | | $7,266,657 | 100.0% |
| Total | 20 | 283,488 | 100.00 | % | $7,266,657 | 100.0 | % | | | | |
| (1) | Based on underwritten rent rolls as of April 1, 2022, for the New Orleans MOB, Carmichael MOB and Port Arthur Dialysis properties and as of May 19, 2022, for all other KB Portfolio Properties. |
| (2) | Certain leases may have termination options that are exercisable prior to the originally stated expiration date of the lease and that are not considered in this Lease Rollover Schedule. |
| (3) | UW Base Rent Expiring and Cumulative UW Base Rent Expiring include (i) rent steps of approximately $18,599 through April 2023, (ii) a mark-to-market rent reduction of $10,325 for Kristoffer A Norbo DDS, MSD, PC at the New Orleans MOB property, and (iii) straight-line rent for Fresenius Kidney Care totaling $45,255 and St. Joseph Regional Health Network (Penn State Health) totaling $23,060. |
| THE INFORMATION IN THIS STRUCTURAL AND COLLATERAL TERM SHEET IS NOT COMPLETE AND MAY BE AMENDED PRIOR TO THE TIME OF SALE. THIS TERM SHEET IS NOT AN OFFER TO SELL THESE SECURITIES AND IT IS NOT A SOLICITATION OF AN OFFER TO BUY THESE SECURITIES IN ANY JURISDICTION WHERE THE OFFER OR SALE IS NOT PERMITTED. |
57
| Structural and Collateral Term Sheet | | BMO 2022-C2 |
| |
| No. 3 – KB Portfolio |
The following table presents certain information relating to the underwritten cash flows of the KB Portfolio Properties:
| Underwritten Net Cash Flow(1) |
| | Underwritten | Per Square Foot | %(2) |
| Rents in Place(3) | $7,190,069 | $25.36 | 71.4 | % |
| Rent Steps(4) | 76,589 | 0.27 | 0.8 | |
| Vacant Income | 245,478 | 0.87 | 2.4 | |
| Gross Potential Rent | $7,512,135 | $26.50 | 74.6 | % |
| Total Reimbursements | 2,553,502 | 9.01 | 25.4 | |
| Net Rental Income | $10,065,637 | $35.51 | 100.0 | % |
| Other Income(5) | 33,000 | 0.12 | 0.3 | |
| (Vacancy/Credit Loss) | (764,319) | (2.70) | (7.6 | ) |
| Effective Gross Income | $9,334,318 | $32.93 | 92.7 | % |
| Total Expenses | $2,610,997 | $9.21 | 28.0 | % |
| Net Operating Income | $6,723,321 | $23.72 | 72.0 | % |
| Total TI/LC, Capex/RR(6) | 56,698 | 0.20 | 0.6 | |
| Net Cash Flow | $6,666,623 | $23.52 | 71.4 | % |
| (1) | Historical financials are not available due to the borrower or a borrower sponsor-affiliate acquiring the KB Portfolio Properties from multiple sellers between July 2021 and May 2022. |
| (2) | % column represents percent of Net Rental Income for all revenue lines and represents percent of Effective Gross Income for the remainder of fields. |
| (3) | Based on the underwritten rent rolls dated April 1, 2022, for the New Orleans MOB, Carmichael MOB and Port Arthur Dialysis properties and as of May 19, 2022, for all other KB Portfolio Properties. |
| (4) | Underwritten Rent Steps include (i) rent steps through April 2023 totaling approximately $18,599, (ii) a mark-to-market rent reduction of $10,325 for Kristoffer A Norbo DDS, MSD, PC at the New Orleans MOB property, and (iii) straight-line rent for Fresenius Kidney Care totaling $45,255 and St. Joseph Regional Health Network (Penn State Health) totaling $23,060. |
| (5) | Other Income represents income from a cell tower lease with Verizon Wireless at the Waystar Building property. |
| (6) | Total TI/LC, Capex/RR includes a credit of $425,471 (approximately $1.50 per square foot) associated with the upfront TI/LC reserve deposit in the amount of $4,500,000 (approximately $15.87 per square foot). |
The Market. The KB Portfolio Properties are located in Nevada, Kentucky, Pennsylvania, California, Texas, Louisiana, Wisconsin and New Hampshire. The top two properties, which generate 59.2% of the KB Portfolio underwritten base rent, consist of the Walgreens - Las Vegas property (35.8%) and the Waystar Building property (23.4%). No other property represents more than approximately 6.9% of the underwritten base rent.
The Walgreens - Las Vegas property is located in the downtown area of Las Vegas at the north end of the Las Vegas Strip, with immediate property uses including retail, hospitality and gaming. The Walgreens - Las Vegas property is part of the Central East Las Vegas Retail submarket, which as of the first quarter of 2022 consisted of approximately 15.96 million square feet of retail inventory with average NNN market rent of $23.99 per square foot and average vacancy of 8.4%, according to a third-party market research report.
The Waystar Building property is located on the western edge of the downtown Louisville, Kentucky central business district. The surrounding area is urban with several commercial properties in immediate proximity. The Waystar Building property is part of the Louisville CBD office submarket, which as of the first quarter of 2022 consisted of approximately 16.95 million square feet of office inventory with average gross asking rent of $17.86 per square foot and average vacancy of 8.8%, according to a third-party market research report. Currently, there are no projects proposed or under construction.
| THE INFORMATION IN THIS STRUCTURAL AND COLLATERAL TERM SHEET IS NOT COMPLETE AND MAY BE AMENDED PRIOR TO THE TIME OF SALE. THIS TERM SHEET IS NOT AN OFFER TO SELL THESE SECURITIES AND IT IS NOT A SOLICITATION OF AN OFFER TO BUY THESE SECURITIES IN ANY JURISDICTION WHERE THE OFFER OR SALE IS NOT PERMITTED. |
58
| Structural and Collateral Term Sheet | | BMO 2022-C2 |
| |
| No. 3 – KB Portfolio |
The following table presents certain information relating to the market areas for the KB Portfolio Properties:
| Market Area Summary(1) |
| | 2021 Total Population | | 2021 Median Household Income |
| Property Location | 1-Mile Radius | 3-Mile Radius | 5-Mile Radius | | 1-Mile Radius | 3-Mile Radius | 5-Mile Radius |
Walgreens - Las Vegas Las Vegas, NV | 13,515 | 180,406 | 499,781 | | $40,820 | $35,326 | $39,523 |
Waystar Building Louisville, KY | 10,999 | 112,497 | 256,613 | | $18,482 | $31,495 | $40,181 |
Fresenius Kidney Care Arleta, CA | 55,099 | 335,443 | 725,503 | | $59,243 | $58,833 | $63,280 |
Tower Health Womelsdorf, PA | 3,233 | 10,659 | 18,347 | | $60,932 | $65,016 | $71,296 |
New Orleans MOB New Orleans, LA | 10,970 | 79,104 | 250,337 | | $107,461 | $66,375 | $51,344 |
Penn State Health Temple, PA | 8,177 | 37,725 | 145,586 | | $62,846 | $63,191 | $49,059 |
Carmichael MOB Hudson, WI | 4,779 | 21,780 | 37,645 | | $76,158 | $88,704 | $99,315 |
Port Arthur Dialysis Port Arthur, TX | 13,469 | 46,557 | 68,037 | | $41,225 | $42,921 | $46,010 |
Auburn Medical Auburn, NH | 1,321 | 25,801 | 111,205 | | $101,516 | $82,019 | $62,958 |
Berkley Eye Institute, PA Humble, TX | 12,893 | 75,607 | 136,335 | | $103,368 | $102,482 | $101,056 |
| (1) | Source: Third party market data provider. |
The Borrower. The borrower is KB Diversified Healthcare 60, DST, a Delaware statutory trust with a Delaware trustee and two independent trustees that satisfy the requirements of an independent director. The borrower has master leased the KB Portfolio Properties to a master tenant affiliated with the guarantor. The master tenant is structured as a special purpose entity with two independent directors. The master tenant’s interest in all tenant rents was assigned directly to the lender. The master tenant is a party to the deed of trust and cash management agreement. The master lease is subordinate to the KB Portfolio Whole Loan and, upon an event of default under the KB Portfolio Whole Loan documents, the lender has the right to cause the termination of the master lease. Counsel to the borrower provided a non-consolidation opinion in connection with the origination of the KB Portfolio Whole Loan. See “Description of the Mortgage Pool—Statistical Characteristics of the Mortgage Pool—Delaware Statutory Trusts” in the Preliminary Prospectus.
The Borrower Sponsor. The borrower sponsor and nonrecourse carve-out guarantor of the KB Portfolio Whole Loan is Jeffrey A. Pori, the chief executive officer of Kingsbarn Realty Capital (“Kingsbarn”). Kingsbarn is a private equity firm based in Las Vegas, Nevada that provides direct and indirect structured real estate investments to high net worth individuals, family trusts, foundations and institutional investors through private placements including DST syndications. Kingsbarn’s portfolio of 95 office, medical, and retail properties spans across the United States with the largest holdings located in the Los Angeles metro area and Sacramento, California. With the acquisition of 26 properties totaling approximately $680 million in 2021, Kingsbarn surpassed $1 billion in total assets under management.
Property Management. The KB Portfolio Properties are managed by KB Property Advisors, LLC, an affiliate of the borrower sponsor, with the exception of the Carmichael MOB property, which is also managed by MSP Metro Operating Company, LLC, not an affiliate of the borrower sponsor.
Escrows and Reserves. At origination, the borrower deposited into escrow $4,500,000 for tenant improvements and leasing commissions, $600,000 for replacement reserves, approximately $141,309 for real estate taxes, $113,915 for the pro rata share of annual CAM expenses related to a reciprocal easement agreement at the Walgreens - Las Vegas property and $20,000 for the pro rata share of annual CAM expenses related to a condominium association at the Tower Health property.
Tax Escrows – On a monthly basis, the borrower is required to escrow 1/12th of the annual estimated tax payments, which currently equates to approximately $30,220, for all KB Portfolio Properties for which the respective tenants do not pay taxes directly. Notwithstanding the foregoing, so long as no Cash Sweep Period (as defined below) is continuing, the borrower will not be required to escrow annual estimated taxes with respect to any individual property where (i) a tenant is obligated to pay all taxes directly with respect to such individual property, (ii) the borrower has provided satisfactory evidence to the lender of the tenant’s full compliance with such obligation, and (iii) the tenant’s lease remains in full force and effect. The single tenants at the Waystar Building, Fresenius Medical Care, and Auburn Medical properties satisfy all requirements in the preceding sentence; and therefore, the borrower is not currently required to escrow annual estimated taxes with respect to these three KB Portfolio Properties.
Insurance Escrows – On a monthly basis, the borrower is required to escrow 1/12th of the premiums payable during the next 12 months upon (i) an event of default under the KB Portfolio Whole Loan documents, (ii) failure by the borrower to provide evidence to the lender that the KB Portfolio Properties are insured under a blanket policy, or (iii) any cancellation, termination or lapse of insurance coverage.
| THE INFORMATION IN THIS STRUCTURAL AND COLLATERAL TERM SHEET IS NOT COMPLETE AND MAY BE AMENDED PRIOR TO THE TIME OF SALE. THIS TERM SHEET IS NOT AN OFFER TO SELL THESE SECURITIES AND IT IS NOT A SOLICITATION OF AN OFFER TO BUY THESE SECURITIES IN ANY JURISDICTION WHERE THE OFFER OR SALE IS NOT PERMITTED. |
59
| Structural and Collateral Term Sheet | | BMO 2022-C2 |
| |
| No. 3 – KB Portfolio |
Replacement Reserve – On the next ensuing payment date after the balance of the replacement reserve falls below $400,000 and on each payment date thereafter until the balance of the replacement reserve is at least $600,000 (the “Replacement Reserve Cap”), the borrower will be required to escrow monthly the amount of $4,725 for replacement reserves (equal to approximately $0.20 per square foot annually). Following the balance of the replacement reserve reaching the Replacement Reserve Cap, monthly reserve payments will not resume until the balance of the replacement reserve again falls below $400,000.
TI/LC Reserve – On the next ensuing payment date after the balance of the TI/LC reserve falls below $2,500,000 and on each payment date thereafter until the balance of the replacement reserve is at least $4,500,000 (the “TI/LC Reserve Cap”), the borrower will be required to escrow monthly the amount of $35,436 for TI/LC reserves (equal to approximately $1.50 per square foot annually). Following the balance of the TI/LC reserve reaching the TI/LC Reserve Cap, monthly reserve payments will not resume until the balance of the TI/LC reserve again falls below $2,500,000.
Lockbox / Cash Management. The KB Portfolio Whole Loan is structured with a hard lockbox and springing cash management. The borrower is required to, or is required to cause the property manager or master tenant to, direct each tenant of the KB Portfolio Properties to deposit funds directly into a clearing account controlled by the lender. Notwithstanding the foregoing, the borrower, property manager, or master tenant are required to deposit all revenues otherwise received into the clearing account within one business day of receipt. Provided no Cash Sweep Period is in effect, all funds in the clearing account will be transferred on each business day to an account controlled by the borrower. Upon the occurrence and during the continuance of a Cash Sweep Period, all sums on deposit in the clearing account are required to be transferred on each business day to a cash management account controlled by the lender and are required to be applied and disbursed in accordance with the KB Portfolio Whole Loan documents. During the continuance of a Cash Sweep Period, any excess cash is required to be held by the lender as additional security for the KB Portfolio Whole Loan.
A “Cash Sweep Period” will commence upon: (i) the occurrence of an event of default under the KB Portfolio Whole Loan documents and will continue until such event of default is cured; (ii) the occurrence of any bankruptcy action of the borrower, principal (which is the signatory trustee while the borrower is a Delaware statutory trust), master tenant, or guarantor (in no event will a Cash Sweep Period due to a bankruptcy action of the borrower, principal, master tenant, or guarantor be cured); (iii) the occurrence of any bankruptcy action of the property manager, and will continue until the borrower replaces the property manager with a qualified manager under a replacement management agreement within 60 days of such bankruptcy action; (iv) the date on which the amortizing debt service coverage ratio as calculated in accordance with the KB Portfolio Whole Loan documents based on the trailing three-month period is less than 1.20x and will continue until the amortizing debt service coverage ratio based on the trailing three-month period is at least 1.25x for two consecutive fiscal quarters; or (v) the occurrence of a Major Tenant Cash Sweep Period (as defined below) and will continue until cured.
A “Major Tenant Cash Sweep Period” will commence upon the occurrence of any of the following: (i) any bankruptcy action of Waystar or Walgreens, any successor or assign thereof as tenant under the respective lease, any subsequent tenant under a replacement lease, or any corporate parent (each, a “Major Tenant”); (ii) the continuation of any default by a Major Tenant under its lease beyond any applicable notice and cure period; (iii) the date on which any Major Tenant gives actual or constructive notice that it intends to discontinue its business at its premises; (iv) the date any Major Tenant lease (or any material portion thereof) is surrendered, cancelled or terminated prior to its then current expiration date; (v) the date 12 months prior to the expiration date of the Major Tenant lease; (vi) the date a Major Tenant has vacated, abandoned, ceased ordinary business operations or gone dark; (vii) the long-term unsecured debt rating of Walgreens (or any lease guarantor) falls below Baa3 by Moody’s; or (viii) Waystar fails to maintain an EBITDA of at least $75,000,000. A Major Tenant Cash Sweep Period will end upon the following: (A) a Lease Replacement Event (as defined below); (B) with respect to clause (i) above, the date that the applicable Major Tenant is no longer insolvent or subject to any bankruptcy or insolvency proceedings and has affirmed the applicable Major Tenant lease pursuant to final non-appealable order of a court of competent jurisdiction; (C) with respect to clause (ii) above, the borrower providing the lender with evidence that such default has been cured and no other default under the applicable Major Tenant lease exists; (D) with respect to clause (iii) above, the applicable Major Tenant has rescinded its notice, resumed and maintained operations for not less than 30 days, and provided to the lender an acceptable tenant estoppel; (E) with respect to clause (v) above, the applicable Major Tenant has renewed its lease on terms reasonably satisfactory to the lender (but not for a term of less than five years or for rent below the then market rental rate) and borrower has delivered to the lender all other requirements under the KB Portfolio Whole Loan documents; (F) with respect to clause (vi) above, the applicable Major Tenant has resumed ordinary business operations at all of the entire Major Tenant premises and has delivered to the lender an acceptable tenant estoppel; (G) with respect to clause (vii) above, the long term unsecured debt rating of Walgreens is subsequently raised to at least Baa3 by Moody’s; or (H) with respect to clause (viii) above, Waystar achieves an EBITDA of at least $80,000,000.
A “Lease Replacement Event” means, with respect to any Major Tenant lease, the date on which (x) the borrower or master tenant has (A) entered into a replacement lease for the entire Major Tenant premises with a satisfactory replacement tenant and on terms acceptable to the lender, (B) delivered to the lender all requirements under the KB Portfolio Whole Loan documents, and (C) paid all leasing brokerage commissions and tenant improvement costs in connection with the applicable replacement lease and (y) the replacement tenant has taken possession of and is occupying the entire applicable Major Tenant premises, is in occupancy, is open for business and is paying unabated base rent.
Subordinate and Mezzanine Debt. None.
| THE INFORMATION IN THIS STRUCTURAL AND COLLATERAL TERM SHEET IS NOT COMPLETE AND MAY BE AMENDED PRIOR TO THE TIME OF SALE. THIS TERM SHEET IS NOT AN OFFER TO SELL THESE SECURITIES AND IT IS NOT A SOLICITATION OF AN OFFER TO BUY THESE SECURITIES IN ANY JURISDICTION WHERE THE OFFER OR SALE IS NOT PERMITTED. |
60
| Structural and Collateral Term Sheet | | BMO 2022-C2 |
| |
| No. 3 – KB Portfolio |
Partial Release. With respect to the Port Arthur Dialysis property, in the event there is (i) any enforced removal of the improvements at the Port Arthur Dialysis property or (ii) the successful assertion of any reversionary interest in the Port Arthur Dialysis property (a “Port Arthur Trigger Event”), the related borrower will be required to release the Port Arthur Dialysis property provided that, among other things, (i) the related borrower provides the lender with notice of a Port Arthur Trigger Event within five business days of its occurrence, (ii) the Port Arthur Dialysis property is conveyed to an entity that is not the related borrower, (iii) the related borrower pays an amount equal to 120% of the allocated loan amount for the Port Arthur Dialysis property plus any shortfall amount required to comply with REMIC requirements, (iv) any applicable yield maintenance premium and (v) the release is permitted under the REMIC requirements.
Ground Lease. None.
| THE INFORMATION IN THIS STRUCTURAL AND COLLATERAL TERM SHEET IS NOT COMPLETE AND MAY BE AMENDED PRIOR TO THE TIME OF SALE. THIS TERM SHEET IS NOT AN OFFER TO SELL THESE SECURITIES AND IT IS NOT A SOLICITATION OF AN OFFER TO BUY THESE SECURITIES IN ANY JURISDICTION WHERE THE OFFER OR SALE IS NOT PERMITTED. |
61
| Structural and Collateral Term Sheet | | BMO 2022-C2 |
| |
| No. 4 – 3075 Olcott |
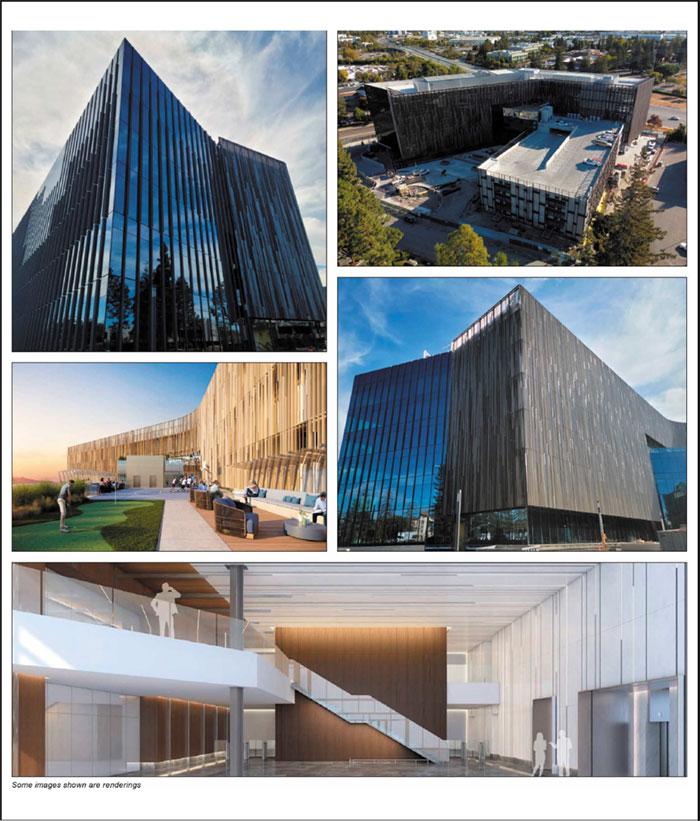
| THE INFORMATION IN THIS STRUCTURAL AND COLLATERAL TERM SHEET IS NOT COMPLETE AND MAY BE AMENDED PRIOR TO THE TIME OF SALE. THIS TERM SHEET IS NOT AN OFFER TO SELL THESE SECURITIES AND IT IS NOT A SOLICITATION OF AN OFFER TO BUY THESE SECURITIES IN ANY JURISDICTION WHERE THE OFFER OR SALE IS NOT PERMITTED. |
62
| Structural and Collateral Term Sheet | | BMO 2022-C2 |
| |
| No. 4 – 3075 Olcott |
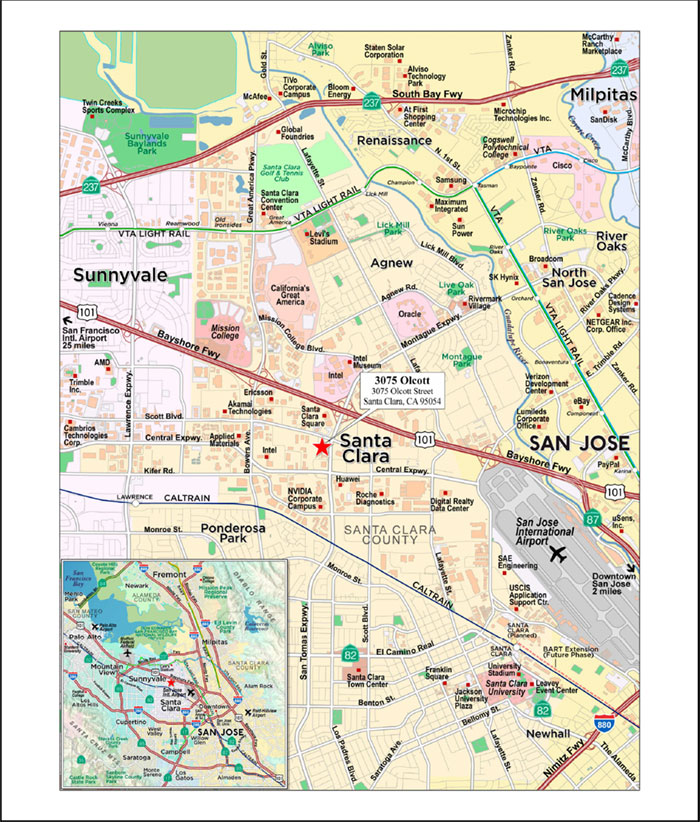
| THE INFORMATION IN THIS STRUCTURAL AND COLLATERAL TERM SHEET IS NOT COMPLETE AND MAY BE AMENDED PRIOR TO THE TIME OF SALE. THIS TERM SHEET IS NOT AN OFFER TO SELL THESE SECURITIES AND IT IS NOT A SOLICITATION OF AN OFFER TO BUY THESE SECURITIES IN ANY JURISDICTION WHERE THE OFFER OR SALE IS NOT PERMITTED. |
63
| Structural and Collateral Term Sheet | | BMO 2022-C2 |
| |
| No. 4 – 3075 Olcott |
Mortgage Loan Information | | Property Information |
| Mortgage Loan Seller: | UBS AG | | Single Asset / Portfolio: | Single Asset |
| Original Principal Balance(1): | $50,000,000 | | Title: | Fee |
| Cut-off Date Principal Balance(1): | $50,000,000 | | Property Type – Subtype: | Office – Suburban |
| % of IPB: | 7.1% | | Net Rentable Area (SF): | 246,606 |
| Loan Purpose: | Refinance | | Location: | Santa Clara, CA |
| Borrower: | 3075Tech LLC | | Year Built / Renovated: | 2022 / NAP |
| Borrower Sponsor: | MDY Properties, Inc. | | Occupancy: | 100.0% |
| Interest Rate: | 5.10000% | | Occupancy Date: | 4/8/2022 |
| Note Date: | 4/8/2022 | | 4th Most Recent NOI (As of)(3): | NAP |
| Maturity Date: | 4/6/2032 | | 3rd Most Recent NOI (As of)(3): | NAP |
| Interest-only Period: | 120 months | | 2nd Most Recent NOI (As of)(3): | NAP |
| Original Term: | 120 months | | Most Recent NOI (As of)(3): | NAP |
| Original Amortization Term: | None | | UW Economic Occupancy: | 98.0% |
| Amortization Type: | Interest Only | | UW Revenues: | $15,228,360 |
| Call Protection(2): | L(27),D(86),O(7) | | UW Expenses: | $3,036,800 |
| Lockbox / Cash Management: | Hard / Springing | | UW NOI: | $12,191,560 |
| Additional Debt(1): | Yes | | UW NCF: | $12,154,569 |
| Additional Debt Balance(1): | $92,000,000 | | Appraised Value / Per SF: | $240,000,000 / $973 |
| Additional Debt Type(1): | Pari Passu | | Appraisal Date: | 2/14/2022 |
| | | | | |
| Escrows and Reserves(4) | | Financial Information(1) |
| | Initial | Monthly | Initial Cap | | Cut-off Date Loan / SF: | $576 |
| Taxes: | $116,072 | $72,545 | N/A | | Maturity Date Loan / SF: | $576 |
| Insurance: | $25,661 | $9,870 | N/A | | Cut-off Date LTV: | 59.2% |
| Replacement Reserves: | $0 | Springing | $147,964 | | Maturity Date LTV: | 59.2% |
| TI / LC Reserve: | $0 | Springing | $1,479,636 | | UW NCF DSCR: | 1.66x |
| Outstanding Completion Obligations Reserve: | $20,083,016 | $0 | N/A | | UW NOI Debt Yield: | 8.6% |
| TATILC Reserve: | $23,983,292 | $0 | N/A | | | |
| Rent Concession Reserve: | $10,469,403 | $0 | N/A | | | |
| | | | | | | | |
| |
| Sources and Uses |
| Sources | Proceeds | % of Total | | Uses | Proceeds | % of Total |
| Whole Loan | $142,000,000 | 83.0% | | Loan Payoff | $108,610,126 | 63.5% |
| Borrower Equity | 29,137,619 | 17.0 | | Upfront Reserves | 54,677,444 | 31.9 |
| | | | | Closing Costs | 7,850,049 | 4.6 |
| Total Sources | $171,137,619 | 100.0% | | Total Uses | $171,137,619 | 100.0% |
| | | | | | | | | | |
| (1) | The 3075 Olcott Mortgage Loan (as defined below) is part of a whole loan evidenced by 10 pari passu notes with an aggregate outstanding principal balance as of the Cut-off Date of $142.0 million (the “3075 Olcott Whole Loan”). The Financial Information in the chart above is based on the $142.0 million 3075 Olcott Whole Loan. |
| (2) | Defeasance of the 3075 Olcott Whole Loan is permitted at any time after the date that is two years after the closing date of the securitization that includes the last note to be securitized. The assumed defeasance lockout period of 27 payments is based on the anticipated closing date of the BMO 2022-C2 securitization trust in July 2022. The actual lockout period may be longer. |
| (3) | Historical financial information is not available as the 3075 Olcott Property (as defined below) was built in 2022. |
| (4) | For a full description of Escrows and Reserves, please refer to “Escrows and Reserves” below. |
The Loan. The 3075 Olcott mortgage loan (the “3075 Olcott Mortgage Loan”) is part of a fixed rate whole loan secured by the borrower’s fee interest in a 246,606 square foot, Class A office property located in Santa Clara, California (the “3075 Olcott Property”). The 3075 Olcott Whole Loan consists of 10 pari passu notes and accrues at an interest rate of 5.10000% per annum. The 3075 Olcott Whole Loan has a 10-year term, is interest-only for the full term of the loan and accrues interest on an Actual/360 basis. The controlling Note A-1 and the non-controlling Note A-5 and Note A-6, with an aggregate original principal balance of $50,000,000, will be included in the BMO 2022-C2 securitization trust. The remaining notes are currently held by UBS AG and are expected to be contributed to one or more future securitization trust(s). The 3075 Olcott Whole Loan will be serviced pursuant to the pooling and servicing agreement for the BMO 2022-C2 securitization trust. See “Description of the Mortgage Pool—The Whole Loans—The Serviced Pari Passu Whole Loans” and “The Pooling and Servicing Agreement” in the Preliminary Prospectus.
| THE INFORMATION IN THIS STRUCTURAL AND COLLATERAL TERM SHEET IS NOT COMPLETE AND MAY BE AMENDED PRIOR TO THE TIME OF SALE. THIS TERM SHEET IS NOT AN OFFER TO SELL THESE SECURITIES AND IT IS NOT A SOLICITATION OF AN OFFER TO BUY THESE SECURITIES IN ANY JURISDICTION WHERE THE OFFER OR SALE IS NOT PERMITTED. |
64
| Structural and Collateral Term Sheet | | BMO 2022-C2 |
| |
| No. 4 – 3075 Olcott |
| Whole Loan Summary |
| Note | Original Balance | Cut-off Date Balance | | Note Holder | Controlling Piece |
| A-1 | $20,000,000 | $20,000,000 | | BMO 2022-C2 | Yes |
| A-2 | $20,000,000 | $20,000,000 | | BBCMS 2022-C16(1) | No |
| A-3 | $20,000,000 | $20,000,000 | | BBCMS 2022-C16(1) | No |
| A-4 | $20,000,000 | $20,000,000 | | BBCMS 2022-C16(1) | No |
| A-5 | $15,000,000 | $15,000,000 | | BMO 2022-C2 | No |
| A-6 | $15,000,000 | $15,000,000 | | BMO 2022-C2 | No |
| A-7 | $12,000,000 | $12,000,000 | | UBS AG(2) | No |
| A-8 | $10,000,000 | $10,000,000 | | UBS AG(2) | No |
| A-9 | $5,000,000 | $5,000,000 | | BBCMS 2022-C16(1) | No |
| A-10 | $5,000,000 | $5,000,000 | | UBS AG(2) | No |
| Whole Loan | $142,000,000 | $142,000,000 | | | |
| (1) | The BBCMS 2022-C16 transaction is expected to close on June 28, 2022. |
| (2) | The subject notes are expected to be contributed to one or more future securitization trust(s). |
The Property. The 3075 Olcott Property is a Class A, newly constructed, six-story office building totaling 246,606 square feet located at 3075 Olcott Street in Santa Clara, California. The 3075 Olcott Property is situated on an approximately 2.73-acre site, approximately 6.3 miles northwest of San Jose and 43.7 miles southeast of San Francisco. Amenities include an expansive two-story lobby with wood, stone, and tile finishes, floor-to-ceiling glass curtain walls on all floors hitched to a louver system, a sports court area on the 4th floor featuring a basketball court and a putting green, and an outdoor deck on the 5th floor outfitted with a wine bar and collaborative seating. The 3075 Olcott Property contains 40,152 to 53,998 square foot floor plates, 14’-15’ floor-to-floor heights as well as a six-story parking garage providing 760 parking spaces with 24 electronic vehicle charging stations (approximately 3.1 spaces per 1,000 square feet) and bicycle parking for 38 bicycles.
The borrower sponsor acquired the land under the 3075 Olcott Property in 2015 for approximately $8.8 million and has invested approximately $164.3 million in capital improvements and approximately $54.5 million in other/soft costs. As of April 8, 2022, the 3075 Olcott Property was 100.0% leased to Amazon.com Services LLC (“AWS”), a wholly-owned subsidiary of Amazon (NASDAQ: AMZN; A1/AA/AA- by Moody’s/S&P/Fitch), pursuant to a 246,606 square foot modified triple-net (“NNN”) lease through September 30, 2032, with two, five-year renewal options. AWS is currently in occupancy of its space on floors 5-6 and expected to take occupancy of floors 1-4 in October 2022 following the completion of its buildout. Rent commencement is expected to begin in September 2022 for both floors 1-4 and floors 5-6. We cannot assure you AWS will take occupancy or begin paying rent as expected or at all.
COVID-19 Update. As of the date of this term sheet, the 3075 Olcott Property is not subject to any modification or forbearance requests. The first payment date of the 3075 Olcott Whole Loan was May 6, 2022. The borrower has reported that no tenant deferments were requested or granted, nor were there any lease modification requests as of April 30, 2022.
Major Tenant.
AWS (246,606 square feet; 100.0% of NRA; 100.0% of underwritten base rent). AWS is a wholly-owned subsidiary of Amazon (NASDAQ: AMZN; A1/AA/AA- by Moody’s/S&P/Fitch). AWS is a cloud offering more than 200 fully featured services for a wide range of technologies, industries, and use cases available from data centers globally. This broad set of global cloud-based products includes computing, storage, databases, analytics, networking, mobile, developer tools, management tools, IoT, security, and enterprise applications. Amazon is an American multinational technology company that focuses on e-commerce, cloud computing, digital streaming, and artificial intelligence. Amazon is one of the Big Five U.S. information technology companies along with Google, Apple, Microsoft, and Meta. The AWS lease has a limited guaranty from Amazon, which guarantees the greater of 50% of the then-remaining base rent and $2.5 million at any given time throughout the lease term. AWS leases floors 5-6 (85,995 SF) on a 10.6-year lease that commenced in March 2022 and expires in September 2032 at an initial base rent of $45.60 PSF NNN with 3.0% annual rent steps throughout the lease term. In an amendment to the initial lease, AWS leased floors 1-4 (160,611 SF) at an initial base rent of $43.80 PSF NNN with 3.0% annual rent steps throughout the lease term. AWS has two, five-year renewal options remaining.
AWS has an option to accelerate the expiration date of its lease for floors 5 and 6 to the date which is 66 months after the commencement date of the term of the lease, if there is no event of default, no portion of the premises is sublet for a term that extends beyond such early termination date and the lease has not been assigned to an unrelated third party, by giving at least nine months’ notice, but no more than 12 months’ notice, and payment of a termination fee of $9,511,986.37. In addition, AWS has an option to accelerate the expiration date of its lease for floors 1 through 4 to the date which is 96 months after the commencement date of the term of the lease, if there is no event of default, no portion of the premises is sublet for a term that extends beyond such early termination date and the lease has not been assigned to an unrelated third party, by giving at least nine months’ notice, but no more than 12 months’ notice, and payment of a termination fee of $10,348,856.73.
Environmental. According to a Phase I environmental assessment dated February 10, 2022, there was no evidence of any recognized environmental conditions at the 3075 Olcott Property.
| THE INFORMATION IN THIS STRUCTURAL AND COLLATERAL TERM SHEET IS NOT COMPLETE AND MAY BE AMENDED PRIOR TO THE TIME OF SALE. THIS TERM SHEET IS NOT AN OFFER TO SELL THESE SECURITIES AND IT IS NOT A SOLICITATION OF AN OFFER TO BUY THESE SECURITIES IN ANY JURISDICTION WHERE THE OFFER OR SALE IS NOT PERMITTED. |
65
| Structural and Collateral Term Sheet | | BMO 2022-C2 |
| |
| No. 4 – 3075 Olcott |
| Historical and Current Occupancy |
| |
| 2019(1) | 2020(1) | 2021(1) | Current(2) |
| NAP | NAP | NAP | 100.0% |
| (1) | Historical occupancy is not available as the 3075 Olcott Property was completed in 2022. |
| (2) | Current occupancy is as of April 8, 2022. |
| Top Tenant Summary(1) |
| |
| Tenant | Ratings
Moody’s/S&P/Fitch(2) | Net Rentable Area (SF) | % of
Total NRA | UW Base Rent PSF(3) | UW Base Rent(3) | % of Total
UW Base Rent(3) | Lease
Expiration Date |
| Amazon.com Services LLC(4) | A1/AA/AA- | 246,606 | 100.0% | $44.90 | $11,073,775 | 100.0% | 9/30/2032(5) |
| Occupied Collateral Total / Wtd. Avg. | 246,606 | 100.0% | $44.90 | $11,073,775 | 100.0% | |
| Vacant Space | | 0 | 0.0% | | | | |
| | | | | | | | |
| Collateral Total | | 246,606 | 100.0% | | | | |
| | | | | | | | |
| (1) | Based on the underwritten rent roll dated April 8, 2022. |
| (2) | In certain instances, ratings provided are those of the parent company of the entity shown, whether or not the parent company guarantees the lease. |
| (3) | UW Base Rent PSF, UW Base Rent and % of Total UW Base Rent are inclusive of approximately $117,641 of contractual rent steps through June 2023 and are based on the assumption that the tenant will take occupancy in October 2022 and begin paying rent in September 2022. |
| (4) | AWS is currently in occupancy of its space on floors 5-6 and expected to take occupancy of floors 1-4 in October 2022 following the completion of its buildout. Rent commencement is expected to begin in September 2022 for both floors 1-4 and floors 5-6. We cannot assure you AWS will take occupancy or begin paying rent as expected or at all. |
| (5) | AWS has an option to accelerate the expiration date of its lease for floors 5 and 6 to the date which is 66 months after the commencement date of the term of the lease, if there is no event of default, no portion of the premises is sublet for a term that extends beyond such early termination date and the lease has not been assigned to an unrelated third party, by giving at least nine months’ notice, but no more than 12 months’ notice, and payment of a termination fee of $9,511,986.37. In addition, AWS has an option to accelerate the expiration date of its lease for floors 1 through 4 to the date which is 96 months after the commencement date of the term of the lease, if there is no event of default, no portion of the premises is sublet for a term that extends beyond such early termination date and the lease has not been assigned to an unrelated third party, by giving at least nine months’ notice, but no more than 12 months’ notice, and payment of a termination fee of $10,348,856.73. |
| Lease Rollover Schedule(1)(2) |
| |
| Year | Number of Leases Expiring | Net Rentable Area Expiring | % of NRA Expiring | UW Base Rent Expiring(3) | % of UW Base Rent Expiring(3) | Cumulative Net Rentable Area Expiring | Cumulative % of NRA Expiring | Cumulative UW Base Rent Expiring(3) | Cumulative % of UW Base Rent Expiring |
| Vacant | NAP | 0 | 0.0% | NAP | NAP | 0 | 0.0% | NAP | NAP |
| 2022 & MTM | 0 | 0 | 0.0 | $0 | 0.0% | 0 | 0.0% | $0 | 0.0% |
| 2023 | 0 | 0 | 0.0 | 0 | 0.0 | 0 | 0.0% | $0 | 0.0% |
| 2024 | 0 | 0 | 0.0 | 0 | 0.0 | 0 | 0.0% | $0 | 0.0% |
| 2025 | 0 | 0 | 0.0 | 0 | 0.0 | 0 | 0.0% | $0 | 0.0% |
| 2026 | 0 | 0 | 0.0 | 0 | 0.0 | 0 | 0.0% | $0 | 0.0% |
| 2027 | 0 | 0 | 0.0 | 0 | 0.0 | 0 | 0.0% | $0 | 0.0% |
| 2028 | 0 | 0 | 0.0 | 0 | 0.0 | 0 | 0.0% | $0 | 0.0% |
| 2029 | 0 | 0 | 0.0 | 0 | 0.0 | 0 | 0.0% | $0 | 0.0% |
| 2030 | 0 | 0 | 0.0 | 0 | 0.0 | 0 | 0.0% | $0 | 0.0% |
| 2031 | 0 | 0 | 0.0 | 0 | 0.0 | 0 | 0.0% | $0 | 0.0% |
| 2032 | 2 | 246,606 | 100.0 | 11,073,775 | 100.0 | 246,606 | 100.0% | $11,073,775 | 100.0% |
| 2033 & Beyond | 0 | 0 | 0.0 | 0 | 0.0 | 246,606 | 100.0% | $11,073,775 | 100.0% |
| Total | 2 | 246,606 | 100.0% | $11,073,775 | 100.0% | | | | |
| (1) | Based on the underwritten rent roll dated April 8, 2022. |
| (2) | The options of AWS to accelerate the expiration date of its lease are not considered in this Lease Rollover Schedule. |
| (3) | UW Base Rent Expiring, % of UW Base Rent Expiring and Cumulative UW Base Rent Expiring are inclusive of approximately $117,641 of contractual rent steps through June 2023. |
| THE INFORMATION IN THIS STRUCTURAL AND COLLATERAL TERM SHEET IS NOT COMPLETE AND MAY BE AMENDED PRIOR TO THE TIME OF SALE. THIS TERM SHEET IS NOT AN OFFER TO SELL THESE SECURITIES AND IT IS NOT A SOLICITATION OF AN OFFER TO BUY THESE SECURITIES IN ANY JURISDICTION WHERE THE OFFER OR SALE IS NOT PERMITTED. |
66
| Structural and Collateral Term Sheet | | BMO 2022-C2 |
| |
| No. 4 – 3075 Olcott |
| Operating History and Underwritten Net Cash Flow |
| |
| | Underwritten | Per Square Foot | %(1) |
| Base Rent(2) | $10,956,134 | $44.43 | 70.5% |
| Rent Steps(3) | 117,641 | 0.48 | 0.8 |
| Straight-Line Rent(4) | 1,514,012 | 6.14 | 9.7 |
| Vacant Income | 0 | 0.00 | 0.0 |
| Gross Potential Rent | $12,587,787 | $51.04 | 81.0% |
| Total Reimbursements | 2,951,356 | 11.97 | 19.0 |
| Total Other Income | 0 | 0.00 | 0.0 |
| Net Rental Income | $15,539,143 | $63.01 | 100.0% |
| (Vacancy/Credit Loss) | (310,783) | (1.26) | (2.0) |
| Effective Gross Income | $15,228,360 | $61.75 | 98.0% |
| Total Expenses | 3,036,800 | 12.31 | 19.9 |
| Net Operating Income | $12,191,560 | $49.44 | 80.1% |
| Total TI/LC, Capex/RR | 36,991 | 0.15 | 0.2 |
| Net Cash Flow | $12,154,569 | $49.29 | 79.8% |
| (1) | % column represents percent of Net Rental Income for all revenue lines and represents percent of Effective Gross Income for the remainder of the fields. |
| (2) | Base Rent is based on the underwritten rent roll as of April 8, 2022. AWS is currently in occupancy of its space on floors 5-6 and expected to take occupancy of floors 1-4 in October 2022 following the completion of its buildout. Rent commencement is expected to begin in September 2022 for both floors 1-4 and floors 5-6. We cannot assure you AWS will take occupancy or begin paying rent as expected or at all. |
| (3) | Rent Steps totaling $117,641 are taken through June 2023. |
| (4) | Straight-Line Rent was underwritten for the investment grade rated tenant through the 3075 Olcott Whole Loan term. |
The Market. The 3075 Olcott Property is located in Santa Clara, California on San Tomas Expressway. The transit-oriented site of the 3075 Olcott Property provides direct vehicular ingress/egress onto Bayshore Freeway, a highway with a daily traffic count of approximately 202,000 vehicles at its intersection with San Tomas Expressway, 0.4 miles north of the 3075 Olcott Property. Additionally, the 3075 Olcott Property has direct access to Highway 101 (two blocks north), Interstate 280 (five miles south), and Interstate 880 (four miles east), three of the Bay Area’s primary transportation arterials running north/south and east/west, allowing for access to either the San Francisco Peninsula or greater East Bay. Located in Silicon Valley, the 3075 Olcott Property is blocks away from Nvidia’s and Intel’s headquarters. Irvine Company’s newly constructed Santa Clara Square is also a half mile away and offers many retail amenities including over 30 shops and restaurants.
Santa Clara Valley Transportation Authority (“VTA”) provides light rail service from Mountain View through San Jose with trains that link to Caltrain (nearest station 2.3 miles southeast of the 3075 Olcott Property), Bay Area Rapid Transit (BART) (nearest station 6.6 miles northwest of the 3075 Olcott Property) and San Jose International Airport (3.7 miles east of the 3075 Olcott Property). The Old Ironsides VTA station is located approximately 2.2 miles northwest of the 3075 Olcott Property. Additionally, Amtrak national passenger rail service and Union Pacific freight rail service provide access beyond the Bay Area. The 3075 Olcott Property is within proximity of three major international airports including San Jose International Airport (3.7 miles), San Francisco International Airport (30.5 miles), and Oakland International Airport (36.4 miles).
The 3075 Olcott Property is located in the San Jose-Sunnyvale-Santa Cara, California Metropolitan Statistical Area (the “San Jose MSA”), with an estimated population of 2,006,458 in 2021. Top employers in the San Jose MSA include Apple Inc., Alphabet Inc., Cisco Systems Inc. and Intel Corp. According to a third-party market research report, the 3075 Olcott Property is located within the Central Santa Clara office submarket. As of February 2022, the submarket reported a total inventory of approximately 5.3 million square feet with a 10.5% vacancy rate and an average asking rent of $62.06 PSF for 4- and 5-star office properties.
According to a third-party market research report, the estimated 2021 population within a one-, three- and five-mile radius of the 3075 Olcott Property was 4,799, 187,880 and 479,991, respectively and the estimated 2021 average household income within the same radii was approximately $168,341, $187,715 and $193,458, respectively.
| THE INFORMATION IN THIS STRUCTURAL AND COLLATERAL TERM SHEET IS NOT COMPLETE AND MAY BE AMENDED PRIOR TO THE TIME OF SALE. THIS TERM SHEET IS NOT AN OFFER TO SELL THESE SECURITIES AND IT IS NOT A SOLICITATION OF AN OFFER TO BUY THESE SECURITIES IN ANY JURISDICTION WHERE THE OFFER OR SALE IS NOT PERMITTED. |
67
| Structural and Collateral Term Sheet | | BMO 2022-C2 |
| |
| No. 4 – 3075 Olcott |
The following table presents certain information relating to comparable office leases for the 3075 Olcott Property:
| Comparable Office Leases(1) |
| |
| Property / Location | Tenant SF | Year Built / Renovated | Tenant | Rent PSF | Commencement Date | Lease Term (Months) | Structure |
3075 Olcott
Santa Clara, CA | 246,606(2) | 2022 / NAP | AWS | $44.90(2) | Various(2) | Various(2) | Triple Net |
The Quad-Portfolio
Mountain View, CA | 447,553 | 1997 / NAP | Google, Inc. | $51.00 | Dec-2021 | 60 | Triple Net |
Sunnyvale Tech Campus
Sunnyvale, CA | 719,000 | 2007 / NAP | Facebook | $56.40 | Dec-2021 | 126 | Triple Net |
Sunnyvale Pathline Park
Sunnyvale, CA | 701,118 | 2022 / NAP | Apple Inc | $45.00 | May-2021 | 120 | Triple Net |
The Offices at Santana Row
San Jose, CA | 303,700 | 2019 / NAP | NetApp | $45.60 | Apr-2021 | 132 | Triple Net |
Sunnyvale Cityline
Sunnyvale, CA | 133,966 | 2002 / NAP | Uber Technologies, Inc. | $72.00 | Jun-2020 | 120 | Net |
Ameswell Mountain View
Mountain View, CA | 222,000 | 2021 / NAP | Google, Inc. | $67.80 | Feb-2020 | 120 | Triple Net |
Moffett Towers II - Buildings III, IV, and V
Sunnyvale, CA | 1,087,689 | 2019 / NAP | Facebook | $52.20 | Jan-2020 | 180 | Triple Net |
| (2) | Tenant SF, Rent PSF, Commencement Date and Lease Term for the 3075 Olcott Property are based on underwritten rent from the underwritten rent roll dated April 8, 2022. Rent PSF is inclusive of approximately $117,641 of contractual rent steps through June 2023. |
The following table presents certain information relating to comparable office sales for the 3075 Olcott Property:
| Comparable Office Sales(1) |
| Property / Location |
RSF |
Year Built / Renovated |
Occupancy |
Sale Date |
Sale Price |
Price PSF |
3075 Olcott
Santa Clara, CA | 246,606(2) | 2022 / NAP | 100.0%(2) | | | |
Coleman Highline Phase IV
San Jose, CA | 657,934 | 2021 / NAP | 100.0% | Dec-2021 | $780,000,000 | $1,186 |
520 Almanor Avenue
Sunnyvale, CA | 231,000 | 2021 / NAP | 98.0% | Jul-2021 | $254,000,000 | $1,100 |
LinkedIn HQ
Sunnyvale, CA | 287,644 | 1999 / NAP | 100.0% | Jul-2021 | $323,000,000 | $1,123 |
750 Moffett
Mountain View, CA | 222,000 | 2021 / NAP | 100.0% | Jul-2021 | $283,000,000 | $1,275 |
HQ@First Campus
San Jose, CA | 603,999 | 2010 / NAP | 100.0% | Jul-2021 | $535,000,000 | $886 |
| (2) | Based on the underwritten rent roll dated April 8, 2022. |
The Borrower. The borrower is 3075Tech LLC, a Delaware limited liability company. The borrower is structured to be a single purpose bankruptcy-remote entity with two independent directors in its organizational structure. Legal counsel to the borrower delivered a non-consolidation opinion in connection with the origination of the 3075 Olcott Whole Loan. There is no non-recourse carveout guarantor or separate environmental indemnitor with respect to the 3075 Olcott Whole Loan.
The Borrower Sponsor. The borrower sponsor is MDY Properties, Inc., the U.S. based subsidiary of Beijing Meidiya Property Co., Ltd. (“Meidiya”). The borrower is wholly-owned by the borrower sponsor. Headquartered in Beijing, Meidiya’s main businesses are project development and construction, property leasing management, parking lot management, equity investment and financial management. In recent years, the company has also expanded into capital operations, project investment, fixed-asset investment and equity acquisition.
Property Management. The 3075 Olcott Property is managed by Cushman & Wakefield U.S., Inc., a third-party property manager.
Escrows and Reserves. At origination, the borrower deposited approximately (i) $116,072 for real estate taxes, (ii) $25,661 for insurance premiums, (iii) $20,083,016 for outstanding completion obligations, (iv) $23,983,292 for outstanding tenant allowances, tenant improvements and leasing commissions (“TATILC”) with respect to the AWS lease and (v) $10,469,403 for outstanding free rents, rent abatements or other rent concessions.
Tax Escrows – On a monthly basis, the borrower is required to deposit 1/12th of an amount which would be sufficient to pay taxes for the next ensuing 12 months (currently equivalent to approximately $72,545 a month).
| THE INFORMATION IN THIS STRUCTURAL AND COLLATERAL TERM SHEET IS NOT COMPLETE AND MAY BE AMENDED PRIOR TO THE TIME OF SALE. THIS TERM SHEET IS NOT AN OFFER TO SELL THESE SECURITIES AND IT IS NOT A SOLICITATION OF AN OFFER TO BUY THESE SECURITIES IN ANY JURISDICTION WHERE THE OFFER OR SALE IS NOT PERMITTED. |
68
| Structural and Collateral Term Sheet | | BMO 2022-C2 |
| |
| No. 4 – 3075 Olcott |
Insurance Escrows – On a monthly basis, the borrower is required to deposit 1/12th of an amount which would be sufficient to pay insurance premiums for the renewal of coverages (currently equivalent to approximately $9,870 a month).
Replacement Reserve – On a monthly basis, the borrower is required to deposit approximately $4,110 for replacement reserves subject to a cap of approximately $147,964. Notwithstanding the foregoing, for so long as (x) the AWS lease is in full force and effect and the entirety of the 3075 Olcott Property is leased to AWS and no less than 12 months remain under its lease term and (y) no Material Tenant Trigger Event (as defined below) is continuing, the lender waives the monthly replacement reserve deposits requirement.
Rollover Reserve – On a monthly basis, the borrower is required to deposit $41,101 for rollover reserves subject to a cap of $1,479,636. Notwithstanding the foregoing, for so long as the AWS lease is in full force and effect and the entirety of the 3075 Olcott Property is leased to AWS, the lender will waive the monthly rollover reserve deposits requirement. The borrower is required to deposit with the lender all amounts paid to the borrower in connection with, among other things, any termination, surrender, cancellation or buy-out of any lease (in whole or in part) (including in connection with the exercise of any contraction option) (the “Extraordinary Lease Payments”), which the lender is required to disburse in accordance with the 3075 Olcott Whole Loan documents. Any Extraordinary Lease Payments remaining after the applicable premises have been re-tenanted and the applicable tenant is in occupancy and paying full, unabated rent, will be released to the borrower.
Lockbox / Cash Management. The 3075 Olcott Whole Loan is structured with a hard lockbox and springing cash management. The borrower and property manager are required to direct the tenants to pay rent directly into the lockbox account, and to deposit any rents otherwise received in such account within one business day after receipt. During the continuance of a Cash Management Trigger Event (as defined below), all funds in the lockbox account are required to be swept each business day to a lender-controlled cash management account and disbursed in accordance with the 3075 Olcott Whole Loan documents, and all excess funds on deposit in the cash management account (after payment of required monthly reserve deposits, the debt service payment on the 3075 Olcott Whole Loan, operating expenses and cash management bank fees) are required to be applied as follows: (a) if a Material Tenant Trigger Event has occurred and is continuing, to a Material Tenant (as defined below) rollover account (subject to a cap of $64.00 PSF of the applicable Material Tenant space as of the commencement of such Material Tenant Trigger Event), (b) if a Cash Sweep Trigger Event (as defined below) has occurred and is continuing, to the lender-controlled excess cash flow account or (c) if no Material Tenant Trigger Event or Cash Sweep Trigger Event has occurred and is continuing, to the borrower.
A “Cash Management Trigger Event” means a period commencing upon the occurrence of (i) an event of default under the 3075 Olcott Whole Loan documents, (ii) any bankruptcy action involving the borrower, the borrower sponsor or an affiliated property manager, (iii) the debt yield falling below 6.25%, (iv) the indictment for fraud or misappropriation of funds of the borrower, the borrower sponsor or an affiliated or third-party property manager (provided that, in the case of the third-party property manager, such fraud or misappropriation is related to the 3075 Olcott Property), or any director or officer of the aforementioned or (v) a Material Tenant Trigger Event, and expiring upon (a) with respect to clause (i) above, the cure of such event of default, (b) with respect to clause (ii) above, the filing being discharged or dismissed within 60 days for the borrower or the borrower sponsor, or within 120 days for the property manager, and the lender’s determination that such filing does not materially increase the borrower’s or the borrower sponsor’s monetary obligations, or materially and adversely affect the borrower sponsor’s or the property manager’s ability to carry out their obligations under the 3075 Olcott Whole Loan documents, as applicable, or, in the case of the property manager, the replacement of the property manager with a third-party property manager that constitutes a qualified property manager under the 3075 Olcott Whole Loan documents, (c) with respect to clause (iii) above, the debt yield being at least 6.50% for two consecutive calendar quarters, (d) with respect to clause (iv) above, the dismissal of the applicable indictment with prejudice or acquittal of the applicable person, or the replacement of the property manager with a third-party property manager that constitutes a qualified property manager under the 3075 Olcott Whole Loan documents or (e) with respect to clause (v) above, the cure of such Material Tenant Trigger Event.
A “Cash Sweep Trigger Event” means a period commencing upon the occurrence of (i) an event of default under the 3075 Olcott Whole Loan documents, (ii) any bankruptcy action involving the borrower, the borrower sponsor or an affiliated property manager, (iii) the debt yield falling below 6.00% or (iv) a Material Tenant Trigger Event, and expiring upon (a) with respect to clause (i) above, the cure of such event of default, (b) with respect to clause (ii) above, the filing being discharged or dismissed within 60 days for the borrower or the borrower sponsor, or within 120 days for the property manager, and the lender’s determination that such filing does not materially increase the borrower’s or the borrower sponsor’s monetary obligations, or materially and adversely affect the borrower sponsor’s or the property manager’s ability to carry out their obligations under the 3075 Olcott Whole Loan documents, as applicable, or, in the case of the property manager, the replacement of the property manager with a third-party property manager that constitutes a qualified property manager under the 3075 Olcott Whole Loan documents, (c) with respect to clause (iii) above, the debt yield being at least 6.25% for two consecutive calendar quarters or (d) with respect to clause (iv) above, the cure of such Material Tenant Trigger Event.
A “Material Tenant Trigger Event” means a period commencing upon the occurrence of (i) a Material Tenant giving notice of its intention to terminate, cancel or not to extend or renew its lease, (ii) on or prior to the date that is 18 months prior to the earlier of (x) the 3075 Olcott Whole Loan maturity date and (y) then applicable expiration date under the applicable Material Tenant lease, if the Material Tenant does not extend or renew such Material Tenant lease, (iii) an event of default under a Material Tenant lease occurring and continuing beyond any applicable notice and/or cure period, (iv) a bankruptcy action of a Material Tenant or guarantor of any Material Tenant lease occurring, (v) a Material Tenant lease being terminated or no longer being in full force and effect, (vi) if a Material Tenant has an
| THE INFORMATION IN THIS STRUCTURAL AND COLLATERAL TERM SHEET IS NOT COMPLETE AND MAY BE AMENDED PRIOR TO THE TIME OF SALE. THIS TERM SHEET IS NOT AN OFFER TO SELL THESE SECURITIES AND IT IS NOT A SOLICITATION OF AN OFFER TO BUY THESE SECURITIES IN ANY JURISDICTION WHERE THE OFFER OR SALE IS NOT PERMITTED. |
69
| Structural and Collateral Term Sheet | | BMO 2022-C2 |
| |
| No. 4 – 3075 Olcott |
outstanding contractual right to terminate (or partially terminate) its lease, if, on or prior to the date that is the earlier of (x) nine months prior to the 3075 Olcott Whole Loan maturity date or (y) nine months prior to the first day that such termination (or partial termination) would take effect, such Material Tenant has not unconditionally and irrevocably waived such right to terminate (or partially terminate) its lease, (vii) a Material Tenant other than AWS “going dark”, vacating, ceasing to occupy or ceasing to conduct business in the ordinary course at the 3075 Olcott Property or a portion thereof constituting 20% or more of the total net rentable square footage at the 3075 Olcott Property (other than temporary cessation of operations in connection with remodeling, renovation or restoration of its leased premises) unless (a) such Material Tenant or its guarantor maintains a credit rating of at least “BBB-” (or the equivalent) by each applicable rating agency, (b) more than two years remain on the term of the applicable Material Tenant lease and (c) more than two years remain on the term of the 3075 Olcott Whole Loan, (viii) an Amazon Original Floors 1-4 Aggregate Trigger Event (as defined below) or (ix) an Amazon Original Floors 5-6 Aggregate Trigger Event (as defined below) and expiring upon (a) with respect to clause (i) above, the date that (x) the applicable Material Tenant revokes or rescinds all termination or cancellation notices, (y) the applicable Material Tenant lease is extended on terms satisfying the requirements of the 3075 Olcott Whole Loan documents or (z) all or substantially all of the applicable Material Tenant space is leased to a replacement tenant, (b) with respect to clause (ii) above, the date that (x) the applicable Material Tenant lease is extended on terms satisfying the requirements of the 3075 Olcott Whole Loan documents or (y) all or substantially all of the applicable Material Tenant space is leased to a replacement tenant, (c) with respect to clause (iii) above, a cure of the applicable event of default, (d) with respect to clause (iv) above, the affirmation of the Material Tenant lease in the applicable bankruptcy proceeding and confirmation that the Material Tenant is actually paying all rents and other amounts under its lease (or, if applicable, the discharge or dismissal of the applicable Material Tenant lease guarantor from the applicable bankruptcy proceeding; provided that such bankruptcy (after dismissal or discharge) does not have an adverse effect on such Material Tenant lease guarantor’s ability to perform its obligations under its lease guaranty), (e) with respect to clause (v) above, all or substantially all of the applicable Material Tenant space (or in connection with a partial termination, the applicable portion of the Material Tenant space) being leased to a replacement tenant, (f) with respect to clause (vi) above, the Material Tenant waives such right to terminate (or partially terminate) the applicable Material Tenant lease, (g) with respect to clause (vii) above, the Material Tenant re-commencing its normal business operations at its Material Tenant space or a portion thereof constituting 20% or more of the total net rentable square footage leased by such Material Tenant at the 3075 Olcott Property, (h) with respect to clause (viii) above, AWS re-commences its operations and the conduct of business on floors 1 through 4 at the 3075 Olcott Property such that it is no longer dark, and has not vacated or ceased to conduct business at 50% or more of the total rentable square footage on floors 1 through 4 at the 3075 Olcott Property or (i) with respect to clause (ix) above, AWS re-commences its operations and the conduct of business on floors 5 and 6 at the 3075 Olcott Property such that it is no longer dark, and has not vacated or ceased to conduct business at 50% or more of the total rentable square footage on floors 5 and 6 at the 3075 Olcott Property.
A “Material Tenant” means (i) AWS or (ii) any tenant at the 3075 Olcott Property that, together with its affiliates, either (a) leases no less than 25% of the total rentable square footage of the 3075 Olcott Property or (b) accounts for (or would account for) no less than 25% of the total in-place base rent at the 3075 Olcott Property.
An “Amazon Original Floors 1-4 Aggregate Trigger Event” means the aggregate amount of space on floors 1 through 4 at the 3075 Olcott Property in which AWS has (a) “gone dark”, vacated, ceased to occupy or ceased to conduct business in the ordinary course and/or (b) exercised a contraction option, in either case exceeds 50% or more of the total rentable square footage demised to AWS on floors 1 through 4 at the 3075 Olcott Property pursuant to the AWS lease.
An “Amazon Original Floors 5-6 Aggregate Trigger Event” means the aggregate amount of space on floors 5 and 6 at the 3075 Olcott Property in which AWS has (a) “gone dark”, vacated, ceased to occupy or ceased to conduct business in the ordinary course and/or (b) exercised a contraction option, in either case exceeds 50% or more of the total rentable square footage demised to AWS on floors 5 and 6 at the 3075 Olcott Property pursuant to the AWS lease.
Subordinate and Mezzanine Debt. None.
Partial Release. Not permitted.
Ground Lease. None.
| THE INFORMATION IN THIS STRUCTURAL AND COLLATERAL TERM SHEET IS NOT COMPLETE AND MAY BE AMENDED PRIOR TO THE TIME OF SALE. THIS TERM SHEET IS NOT AN OFFER TO SELL THESE SECURITIES AND IT IS NOT A SOLICITATION OF AN OFFER TO BUY THESE SECURITIES IN ANY JURISDICTION WHERE THE OFFER OR SALE IS NOT PERMITTED. |
70
| Structural and Collateral Term Sheet | | BMO 2022-C2 |
| |
| No. 5 – The Reef |

| THE INFORMATION IN THIS STRUCTURAL AND COLLATERAL TERM SHEET IS NOT COMPLETE AND MAY BE AMENDED PRIOR TO THE TIME OF SALE. THIS TERM SHEET IS NOT AN OFFER TO SELL THESE SECURITIES AND IT IS NOT A SOLICITATION OF AN OFFER TO BUY THESE SECURITIES IN ANY JURISDICTION WHERE THE OFFER OR SALE IS NOT PERMITTED. |
71
| Structural and Collateral Term Sheet | | BMO 2022-C2 |
| |
| No. 5 – The Reef |
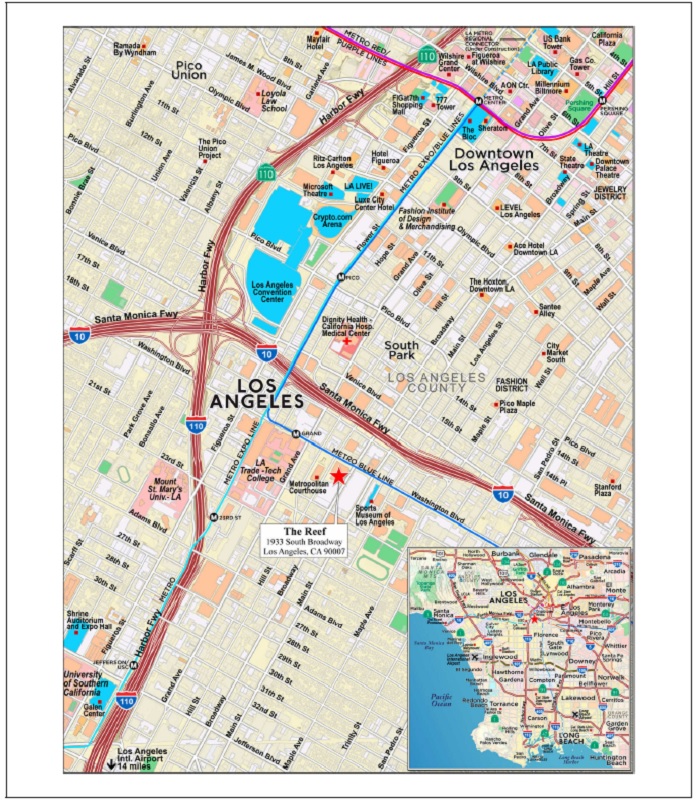
| THE INFORMATION IN THIS STRUCTURAL AND COLLATERAL TERM SHEET IS NOT COMPLETE AND MAY BE AMENDED PRIOR TO THE TIME OF SALE. THIS TERM SHEET IS NOT AN OFFER TO SELL THESE SECURITIES AND IT IS NOT A SOLICITATION OF AN OFFER TO BUY THESE SECURITIES IN ANY JURISDICTION WHERE THE OFFER OR SALE IS NOT PERMITTED. |
72
| Structural and Collateral Term Sheet | | BMO 2022-C2 |
| |
| No. 5 – The Reef |
| Mortgage Loan Information | | Property Information |
| Mortgage Loan Seller: | GACC | | Single Asset / Portfolio: | Single Asset |
| Original Principal Balance(1): | $40,000,000 | | Title: | Fee |
| Cut-off Date Principal Balance(1): | $40,000,000 | | Property Type – Subtype: | Mixed Use – Office/Retail |
| % of IPB: | 5.6% | | Net Rentable Area (SF): | 806,960 |
| Loan Purpose: | Refinance | | Location: | Los Angeles, CA |
| Borrower: | PHR LA Mart DE, LLC | | Year Built / Renovated: | 1958 / 2019 |
| Borrower Sponsor: | Ara Tavitian | | Occupancy: | 78.3% |
| Interest Rate: | 5.42500% | | Occupancy Date: | 2/21/2022 |
| Note Date: | 4/13/2022 | | 4th Most Recent NOI (As of): | $9,240,260 (12/31/2018) |
| Maturity Date: | 5/6/2032 | | 3rd Most Recent NOI (As of): | $9,565,951 (12/31/2019) |
| Interest-only Period: | 120 months | | 2nd Most Recent NOI (As of): | $10,658,043 (12/31/2020) |
| Original Term: | 120 months | | Most Recent NOI (As of): | $12,330,689 (12/31/2021) |
| Original Amortization Term: | None | | UW Economic Occupancy: | 83.6% |
| Amortization Type: | Interest Only | | UW Revenues: | $26,740,784 |
| Call Protection(2): | L(26),D(89),O(5) | | UW Expenses: | $6,489,918 |
| Lockbox / Cash Management: | Hard / Springing | | UW NOI: | $20,250,866 |
| Additional Debt(1): | Yes | | UW NCF: | $19,282,515 |
| Additional Debt Balance(1): | $110,000,000 | | Appraised Value / Per SF: | $349,000,000 / $432 |
| Additional Debt Type(1): | Pari Passu | | Appraisal Date: | 11/11/2021 |
| | | | | |
| Escrows and Reserves(3) | | Financial Information(1) |
| | Initial | Monthly | Initial Cap | | Cut-off Date Loan / SF: | $186 | |
| Taxes: | $205,149 | $68,383 | N/A | | Maturity Date Loan / SF: | $186 | |
| Insurance: | $0 | Springing | N/A | | Cut-off Date LTV: | 43.0% | |
| Replacement Reserves: | $0 | $11,715 | N/A | | Maturity Date LTV: | 43.0% | |
| TI/LC Reserve: | $0 | $67,247 | $1,613,919 | | UW NCF DSCR: | 2.34x | |
| Other(4): | $22,000,000 | Springing | N/A | | UW NOI Debt Yield: | 13.5% | |
| | | | | | | |
| |
| Sources and Uses |
| Sources | Proceeds | % of Total | | Uses | Proceeds | % of Total |
| Whole Loan | $150,000,000 | 100.0% | | Loan Payoff | $123,220,890 | 82.1% |
| | | | | Upfront Reserves | 22,205,149 | 14.8 |
| | | | | Principal Equity Distribution | 3,607,459 | 2.4 |
| | | | | Closing Costs | 966,503 | 0.6 |
| Total Sources | $150,000,000 | 100.0% | | Total Uses | $150,000,000 | 100.0% |
| (1) | The Reef Mortgage Loan (as defined below) is part of The Reef Whole Loan (as defined below) evidenced by six pari passu notes with an aggregate outstanding principal balance as of the Cut-off Date of $150,000,000. The Financial Information set forth above are calculated based on the outstanding balance of The Reef Whole Loan. |
| (2) | The lockout period will be at least 26 payment dates beginning with and including the first payment date in June 2022. Defeasance of The Reef Whole Loan in full is permitted at any time after the first payment date following the earlier to occur of (i) April 13, 2025 or (ii) the date that is two years from the closing date of the securitization that includes the last note to be securitized. The assumed lockout period of 26 payments is based on the expected BMO 2022-C2 securitization closing date in July 2022. The actual lockout period may be longer. |
| (3) | See “Escrows and Reserves” below. |
| (4) | Other Initial Reserve consists of a $22,000,000 earn-out reserve (the “Holdback Reserve”) in connection with the County of LA Expansion Space. The Holdback Reserve is required to be released to the borrower provided that certain conditions are satisfied on or prior to November 5, 2022, including, among other things (i) no cash management trigger period is continuing, (ii) the County of LA has accepted the County of LA Expansion Space and executed a commencement memo and delivered an estoppel acceptable to the lender and (iii) The Reef Whole Loan has a minimum UW NCF debt yield of 10.5%. See “Escrows and Reserves” below. The County of LA has subsequently accepted the County of LA Expansion Space and has executed and delivered an estoppel to the lender. As a result, the borrower is anticipated to make a request to the servicer that the Holdback Reserve fund be released to the borrower. |
The Loan. The fifth largest mortgage loan (“The Reef Mortgage Loan”) is part of a whole loan evidenced by six pari passu promissory notes in the aggregate original principal amount of $150,000,000 (“The Reef Whole Loan”), The Reef Mortgage Loan is evidenced by the non-controlling Note A-3 and Note A-4-1, which have an aggregate outstanding principal balance as of the Cut-off Date of $40,000,000 will be included in the BMO 2022-C2 securitization trust and represent approximately 5.6% of the Initial Pool Balance. The Reef Whole Loan is secured by the borrower’s fee interest in a Class-A mixed use office and retail showroom building located in Los Angeles, California (“The Reef Property”). The Reef Whole Loan was originated by DBR Investments Co. Limited (“DBRI”) on April 13, 2022. The Reef Whole Loan proceeds were used to refinance the existing debt on The Reef Property, fund upfront reserves, pay origination costs and provide cash to the borrower. The Reef Whole Loan accrues interest at a fixed rate of 5.42500% per annum. The table below summarizes the promissory notes that comprise The Reef Whole Loan. The relationship between the holders of The Reef Whole Loan is
| THE INFORMATION IN THIS STRUCTURAL AND COLLATERAL TERM SHEET IS NOT COMPLETE AND MAY BE AMENDED PRIOR TO THE TIME OF SALE. THIS TERM SHEET IS NOT AN OFFER TO SELL THESE SECURITIES AND IT IS NOT A SOLICITATION OF AN OFFER TO BUY THESE SECURITIES IN ANY JURISDICTION WHERE THE OFFER OR SALE IS NOT PERMITTED. |
73
| Structural and Collateral Term Sheet | | BMO 2022-C2 |
| |
| No. 5 – The Reef |
governed by a co-lender agreement as described under “Description of the Mortgage Pool—The Whole Loans—The Outside Serviced Pari Passu Whole Loans” in the Preliminary Prospectus.
| Whole Loan Summary |
| Note | Original Balance | Cut-off Date Balance | Note Holder | Controlling Piece |
| A-1 | $50,000,000 | $50,000,000 | Benchmark 2022-B35 | Yes |
| A-2 | $40,000,000 | $40,000,000 | Benchmark 2022-B35 | No |
| A-3 | $30,000,000 | $30,000,000 | BMO 2022-C2 | No |
| A-4-1 | $10,000,000 | $10,000,000 | BMO 2022-C2 | No |
| A-4-2 | $10,000,000 | $10,000,000 | DBRI(1) | No |
| A-5 | $10,000,000 | $10,000,000 | Benchmark 2022-B35 | No |
| Total | $150,000,000 | $150,000,000 | | |
| (1) | The subject notes are expected to be securitized in one or more future transactions. |
The Property. The Reef Property is a 12-story Class-A mixed use office/retail showroom building containing 806,960 square feet of net rentable area and an approximately 41,000 square foot billboard. The Reef Property was originally constructed in 1958 and was most recently renovated in 2019. The Reef Property is situated on a 9.11 acre site spanning two full city blocks in downtown Los Angeles between the South Park District and the University of Southern California campus, and near the Staples Center, the LA Convention Center, and the Arts District. The Reef Property offers traditional office, media production, design, experimental marketing, event, sales, warehousing, fulfillment and showroom space. The building consists of a mix of approximately 33.6% office space, 45.6% retail/showroom space, 18.2% event space, 1.8% storage space, and approximately 0.1% retail/cafe space. Amenities include a front desk concierge, an on-site manager, 24/7 access, full-service loading docks with on-site porters and freight services, high capacity elevators, video surveillance, restricted access to tenants and registered “trade—only” tenants, fiber-optic internet connectivity, and a ground level market café and coffee shop (Coffee by Kofi).
On top of The Reef Property’s 12-story building is an approximately 41,000 square foot digital LED (full-motion light emitting diode) video display billboard (the “LED Signage”) that wraps around three sides of the building with visibility from the nearby IH-10 and IH-110 freeways. The LED Signage is the largest Out-Of-Home (“OOH”) digital billboard on the West Coast, stands 56-feet-tall and 750-feet-long, and runs 852 pixels high and 11,376 pixels wide (9,692,352 total pixels). The LED Signage delivers approximately 173 million weekly impressions (over 17 million impressions per spot, cycling 6-8 spots per minute), and was rated the #1 geopath-rated OOH unit in the United States by a third party publication. Major advertisers on the LED Signage have included Verizon, AT&T, Sprint, LA Chargers, CBS All Access, PayPal, McDonald’s, Expedia, Uber, DoorDash, Lucid Motors, Cadillac, Volkswagen, Rock Nation, Pinterest, Coca-Cola, Tidal, Mountain Dew, the NBA, Nike, Universal Pictures, Target, L’Oreal, Coors, Bacardi, Old Spice, Spotify, Discovery+, BlockFi, Facebook, Ticketmaster, Subaru, Frontier, Spectrum, GoDaddy, Microsoft, Samsung, Roku, Gatorade, Frito Lay, Hyundai, Newegg, City of Hope, and Tiktok. The borrower sponsor invested over $20 million for the installation of the LED Signage.
The LED Signage has a 10-year license agreement that commenced February 2020 with New Tradition Outdoor, LLC (the “Licensee”), an unaffiliated third party operator. The LED Signage license agreement provides for a monthly license fee equal to the greater of (i) a minimum license fee (the “Minimum License Fee”), and (ii) seventy-five percent (75%) of the net revenue actually received by Licensee during the immediately preceding month (the “Profit Share Fee”). The Minimum License Fee is $228,094 per month ($2,737,122 annually) for the current license year (February 2022 through January 2023), and increases by 3.0% each year thereafter during the term of the license. The Licensee has one 10-year renewal option which would extend its term through February 2040. The chart below details the total revenue from the signage component, as well as the trailing 12 months sales trend. Since the delivery of the LED Signage in February 2020, sales have been on an upward trend, with reported gross sales of $14.3 million as of the trailing 12 months ending in April 2022, which is more than double the reported gross sales for the first 12 months the LED Signage was operational. The underwritten income from the LED Signage is $10,745,265 (which is underwritten based on the estimated Profit Share Fee for the trailing 12 months ending April 2022, which was greater than the Minimum License Fee during such months), in total accounting for 40.2% of The Reef Property’s underwritten effective gross income. For certain purposes of this term sheet, the annual Minimum License Fee of $2,737,122 for the license year of February 2022 through January 2023 has been treated as underwritten base rent.
| THE INFORMATION IN THIS STRUCTURAL AND COLLATERAL TERM SHEET IS NOT COMPLETE AND MAY BE AMENDED PRIOR TO THE TIME OF SALE. THIS TERM SHEET IS NOT AN OFFER TO SELL THESE SECURITIES AND IT IS NOT A SOLICITATION OF AN OFFER TO BUY THESE SECURITIES IN ANY JURISDICTION WHERE THE OFFER OR SALE IS NOT PERMITTED. |
74
| Structural and Collateral Term Sheet | | BMO 2022-C2 |
| |
| No. 5 – The Reef |
The following table presents certain information relating to the LED Signage revenue of The Reef Property:
| LED Signage Revenue Summary(1) |
| TTM Period | TTM LED
Signage
Contracted
Amount | % Increase | TTM LED Signage
Estimated Profit
Share Fee to
Borrower (75% of
TTM LED Signage
Contracted Amount) | Annual
Minimum
License Fee | TTM Estimated
Borrower Gross
(Greater of 75% of
TTM LED Signage
Contracted Amount
and Annual Minimum
License Fee) |
| 21-Feb | $5,384,354 | N/A | $4,038,266 | $2,657,400 | $4,038,266 |
| 21-Mar | $6,116,528 | 13.6% | $4,587,396 | $2,657,400 | $4,587,396 |
| 21-Apr | $6,581,351 | 7.6% | $4,936,013 | $2,657,400 | $4,936,013 |
| 21-May | $6,973,450 | 6.0% | $5,230,088 | $2,657,400 | $5,230,088 |
| 21-Jun | $7,873,081 | 12.9% | $5,904,811 | $2,657,400 | $5,904,811 |
| 21-Jul | $8,594,362 | 9.2% | $6,445,771 | $2,657,400 | $6,445,771 |
| 21-Aug | $9,091,627 | 5.8% | $6,818,721 | $2,657,400 | $6,818,721 |
| 21-Sep | $9,782,609 | 7.6% | $7,336,957 | $2,657,400 | $7,336,957 |
| 21-Oct | $10,358,471 | 5.9% | $7,768,853 | $2,657,400 | $7,768,853 |
| 21-Nov | $10,797,230 | 4.2% | $8,097,923 | $2,657,400 | $8,097,923 |
| 21-Dec | $11,411,373 | 5.7% | $8,558,530 | $2,657,400 | $8,558,530 |
| 22-Jan | $12,135,558 | 6.3% | $9,101,669 | $2,657,400 | $9,101,669 |
| 22-Feb | $13,220,751 | 9.1% | $9,933,718 | $2,737,122 | $9,915,563 |
| 22-Mar | $13,612,742 | 3.0% | $10,209,556 | $2,737,122 | $10,209,556 |
| 22-Apr(2) | $14,327,020 | 5.2% | $10,745,265 | $2,737,122 | $10,745,265 |
| (1) | Profit Share Fee is based on net revenue actually received each month. Table assumes net revenue was equal to the contracted amount for all months; however, actual net revenue may have been lower than the contracted amount. |
| (2) | 22-Apr reflects initial contracts as of April 2022, but may increase further by month end. |
As of February 21, 2022, The Reef Property is 78.3% leased to 76 tenants representing a mix of companies including medical, finance, and legal tenants. The Reef Property tenants include LA Mart (a group of borrower-affiliated wholesale mart tenants), Maker City LA, LLC operating Magic Box (a borrower sponsor affiliated tenant operating corporate trade show and showroom space), and Shipfront LLC (a borrower sponsor affiliated tenant operating warehousing and fulfillment space). According to the appraisal, there are also various smaller showroom and storage spaces leased to entities in which the borrower sponsor has an equity interest, resulting in approximately 37.0% of the NRA being leased to affiliated tenants.
COVID-19 Update. As of April 1, 2022, The Reef Whole Loan is not subject to any forbearance, modification or debt service relief request. The Reef Whole Loan is current on debt service through June 6, 2022. See “Risk Factors—Special Risks—The Coronavirus Pandemic Has Adversely Affected the Global Economy and May Adversely Affect the Performance of the Mortgage Loans” in the Preliminary Prospectus.
Major Tenants. The three largest tenants based on underwritten base rent are County of LA (as defined below), Maker City LA, LLC and New Tradition Outdoor, LLC.
County of Los Angeles-Dept. of Children & Family Services (“County of LA”) (204,484 square feet; 25.3% of NRA; 30.1% underwritten base rent; in each case, including County of LA Expansion Space); rated Aa1/AA+/AAA by Moody’s/Fitch/S&P, uses its space at The Reef Property to house the Department of Children and Family Services, which is the largest child protective services agency in the United States, employing approximately 9,000 staff members across 20 regional offices, specialized bureaus, and administrative services. The Department of Children and Family Services oversees the safety of more than 2 million children across 88 cities in Los Angeles County. The agency provides services such a child abuse or neglect investigations, parenting education courses, tutoring, childcare, foster parent recruitment, and several specialized programs. In fiscal year 2019-2020, the County of Los Angeles reported $29.5 billion in revenue, up 5.9% year-over-year. According to the Final Adopted Budget for fiscal year 2021-2022, the County of Los Angeles forecasts $39.3 billion in revenue, representing a 2.85% increase from the revenue forecasted in the prior fiscal year. The County of LA space at The Reef Property is located directly across the street from 1945 South Hill Street, a building that houses The Los Angeles County Superior Court, the Municipal Court Traffic Division, and the LA County Mental Health Court.
| THE INFORMATION IN THIS STRUCTURAL AND COLLATERAL TERM SHEET IS NOT COMPLETE AND MAY BE AMENDED PRIOR TO THE TIME OF SALE. THIS TERM SHEET IS NOT AN OFFER TO SELL THESE SECURITIES AND IT IS NOT A SOLICITATION OF AN OFFER TO BUY THESE SECURITIES IN ANY JURISDICTION WHERE THE OFFER OR SALE IS NOT PERMITTED. |
75
| Structural and Collateral Term Sheet | | BMO 2022-C2 |
| |
| No. 5 – The Reef |
The County of LA has been a tenant at The Reef Property since July 2011 and, prior to entering into an expansion lease, occupied 142,360 square feet. The County of LA recently signed a lease to expand into an additional 62,124 square feet on the 7th floor (the “County of LA Expansion Space”). In connection with such expansion, the borrower also agreed to perform certain landlord work on both the County of LA Expansion Space and the County of LA’s pre-existing space, and the County of LA agreed to pay a revised rental rate (initially $24.84 per square foot, which is lower than the rent the County of LA was previously paying) and extend the term of the lease for all of its space through April 30, 2030. The extended lease term and adjusted rent became effective as of May 1, 2022.
As part of its lease expansion and extension, the County of LA has invested approximately $6.2 million ($20 per square foot on its existing space and $80 per square foot on its expansion space).
The County of LA has the right to terminate its lease for the entire premises at any time after April 30, 2027 with 180 days’ prior written notice.
At loan origination, in connection with the County of LA Expansion Space, the borrower reserved a $22,000,000 Holdback Reserve with the lender to be held as additional collateral for The Reef Whole Loan, to be released to the borrower at such time as the County of LA Expansion Space is accepted and other conditions are satisfied, as described under “Escrows and Reserves” below, provided that such conditions are satisfied on or prior to November 5, 2022. The County of LA has subsequently accepted the County of LA Expansion Space and has executed and delivered an estoppel to the lender. As a result, the borrower is anticipated to make a request to the servicer that the Holdback Reserve fund be released to the borrower.
Maker City LA, LLC (148,908 square feet; 18.5% of NRA; 23.8% underwritten base rent), utilizes its space for full-service corporate events and trade shows. Maker City LA, LLC has an experienced production team and a digital platform for managing shows and events and has hosted productions for special events and trade shows including for the arts, design, fashion, film, television, advertising, and tech industries. From February through October 2022, the Maker City LA, LLC space has approximately $9.8 million in projected revenue from in place contracts, including a contract with Street Art Live for its Van Gogh Alive experience, a digital museum experience. The Maker City LA, LLC is a borrower sponsor affiliated lease and is fully guaranteed by the borrower sponsor.
New Tradition Outdoor, LLC (“New Tradition”) (0 square feet; 0.0% of NRA; 16.2% underwritten base rent, based on the Minimum License Fee for the 2022-2023 license year; 40.2% of underwritten effective gross income, based on full underwritten rent), the Licensee, which signed a 10-year license agreement that commenced in February 2020 is an unaffiliated third party operator of the LED Signage. Founded in 2010, New Tradition is an Out-of-Home media company, with inventory across the country. New Tradition’s inventory includes One Times Square and other well-known assets in New York, Los Angeles, Miami, Boston, Atlanta, Nashville, Chicago, Portland, Seattle, Washington DC, San Francisco, and Las Vegas. New Tradition’s inventory in the Los Angeles area spans upwards of 110 advertising billboards.
Pursuant to the New Tradition license agreement, a “Reduction Event” will occur upon any of the following: (a) the advertising copy on the display area becomes materially obstructed from the view of vehicular traffic traveling in either direction on the 10 Freeway through no fault of the Licensee, (b) electrical service to the display area becomes unavailable or is interrupted, (c) based on the evaluation of a qualified, reputable and licensed general contractor, qualified, reputable and licensed electrical engineer or governmental authority, the structure cannot safely be used for the erection or maintenance of the display area for any reason, (d) the licensor is unable to obtain or maintain any permit for the continued use and/or maintenance of the display area, or (e) if the licensor otherwise fails to repair, maintain or replace the structure and/or the display area, including the LED screen, and if such Reduction Event results in a material and adverse reduction in net revenue for five business days (as to the events in clauses (b) through (e)) or 30 consecutive days (as to the event in clause (a)), then the licensor and licensee will be required to agree to an equitable adjustment of the rent for the LED Signage, or if the parties cannot agree, such reduction will be determined by an arbitration process.
It is anticipated that, following any release of the parcels described under “—Partial Release” below, buildings will be constructed on such parcels, and that such buildings will obstruct certain views of the LED Signage. We cannot assure you that such construction will not result in a Reduction Event. In addition, it is possible that office buildings will be constructed that could compete with The Reef Property.
Environmental. According to a Phase I environmental report dated March 11, 2022 (“ESA”), a REC was identified at The Reef Property related to the prior use of the eastern block at The Reef Property by multiple automobile body and engine repair, and automobile wrecking and salvage businesses as early as 1912 through the 1950s. This area of The Reef Property has been developed as a paved parking lot since approximately 1960. The potential exists for shallow soil contamination from oil, fuel, PCBs (polychlorinated biphenyls), solvents, paints and other chemicals associated with these former uses which may be encountered during redevelopment of The Reef Property. The ESA recommended that a soil management plan be implemented during redevelopment activities that addresses the potential for impacted soils based on historical areas of concern.
| THE INFORMATION IN THIS STRUCTURAL AND COLLATERAL TERM SHEET IS NOT COMPLETE AND MAY BE AMENDED PRIOR TO THE TIME OF SALE. THIS TERM SHEET IS NOT AN OFFER TO SELL THESE SECURITIES AND IT IS NOT A SOLICITATION OF AN OFFER TO BUY THESE SECURITIES IN ANY JURISDICTION WHERE THE OFFER OR SALE IS NOT PERMITTED. |
76
| Structural and Collateral Term Sheet | | BMO 2022-C2 |
| |
| No. 5 – The Reef |
The following table presents certain information relating to the historical occupancy of The Reef Property:
| Historical and Current Occupancy(1) |
| 2019(2) | 2020(2) | 2021(2)(3) | Current(4) |
| 74.2% | 63.0% | 70.7% | 78.3% |
| (1) | As provided by the borrower and reflects year-end occupancy for the indicated year ended December 31 unless specified otherwise. |
| (2) | Inclusive of the 11,500 square feet at 2005 South Main Street for 2019, 2020 and 2021. |
| (3) | The 2021 Occupancy is as of September 30, 2021, which is the most recent number available. The average occupancy from January 2021 to September 2021 was 61.4%. |
| (4) | Based on underwritten rent roll dated February 21, 2022. |
The following table presents certain information relating to the largest tenants based on underwritten base rent at The Reef Property:
| Tenant Summary(1) |
| Tenant | Ratings Moody’s/S&P/Fitch(2) | Net Rentable
Area (SF) | % of Total
NRA | UW Base
Rent PSF | UW Base Rent | % of UW
Base
Rent | Lease
Expiration Date |
| County of Los Angeles-Dept. of Children & Family Services(3) | Aa1/AAA/AA | 204,484 | 25.3% | $24.84 | $5,079,383 | 30.1% | 4/30/2030 |
| Maker City LA, LLC (4) | NR/NR/NR | 148,908 | 18.5 | $27.00 | 4,020,516 | 23.8 | 5/31/2035 |
| New Tradition Outdoor, LLC(5) | NR/NR/NR | 0 | 0.0 | $0.00 | 2,737,122(6) | 16.2 | 2/2/2030 |
| Shipfront LLC(4) | NR/NR/NR | 62,124 | 7.7 | $24.00 | 1,490,976 | 8.8 | 8/31/2035 |
| Stephen Jewelry, Inc. | NR/NR/NR | 31,956 | 4.0 | $17.96 | 574,015 | 3.4 | 12/31/2022 |
| California Institute of The Arts | NR/NR/NR | 5,004 | 0.6 | $44.50 | 222,658 | 1.3 | 5/31/2023 |
| Lance & Matt Show | NR/NR/NR | 10,924 | 1.4 | $18.89 | 206,317 | 1.2 | 1/31/2023 |
| S & R Distributors, Inc. | NR/NR/NR | 10,675 | 1.3 | $17.99 | 192,048 | 1.1 | 2/28/2023 |
| Sansi North America, LLC | NR/NR/NR | 4,486 | 0.6 | $38.19 | 171,331 | 1.0 | 4/30/2029 |
| LA Promise Fund | NR/NR/NR | 4,842 | 0.6 | $31.55 | 152,770 | 0.9 | 7/31/2028 |
| Ten Largest Tenants | | 483,403 | 59.9% | $30.71 | $14,847,135 | 88.0% | |
| Remaining Occupied Tenants(7) | | 148,384 | 18.4 | $13.67 | 2,027,913 | 12.0 | |
| Total Occupied | | 631,787 | 78.3% | $26.71 | $16,875,048 | 100.0% | |
| Vacant | | 175,173 | 21.7 | | | | |
| Total / Wtd. Avg. | | 806,960 | 100.0% | | | | |
| (1) | Based on the underwritten rent roll dated February 21, 2022. |
| (2) | In some instances, ratings provided are those of the parent company or government of the entity shown, whether or not the parent company or government guarantees the lease. |
| (3) | The County of LA has the right to terminate its lease for the entire premises at any time after April 30, 2027 with 180 days’ prior written notice. |
| (4) | Maker City LA, LLC and Shipfront, LLC are both borrower-affiliated leases. |
| (5) | New Tradition Outdoor, LLC has the right to abate its rent upon a Reduction Event as described above. |
| (6) | Represents annual Minimum License Fee for the LED Signage for the license year from February 2022 through January 2023. |
| (7) | In addition to Maker City LA, LLC and Shipfront, LLC, according to the appraisal, there are various smaller showroom and storage spaces leased to entities in which the borrower sponsor has an equity interest, resulting in approximately 37.0% of the net rentable square footage being leased to affiliated tenants. |
| THE INFORMATION IN THIS STRUCTURAL AND COLLATERAL TERM SHEET IS NOT COMPLETE AND MAY BE AMENDED PRIOR TO THE TIME OF SALE. THIS TERM SHEET IS NOT AN OFFER TO SELL THESE SECURITIES AND IT IS NOT A SOLICITATION OF AN OFFER TO BUY THESE SECURITIES IN ANY JURISDICTION WHERE THE OFFER OR SALE IS NOT PERMITTED. |
77
| Structural and Collateral Term Sheet | | BMO 2022-C2 |
| |
| No. 5 – The Reef |
The following table presents certain information relating to the tenant lease expirations at The Reef Property:
| Lease Rollover Schedule(1)(2) |
| Year | Number
of
Leases
Expiring | Net
Rentable
Area
Expiring | % of
NRA
Expiring | UW Base
Rent
Expiring(3) | % of UW
Base
Rent
Expiring(3) | Cumulative
Net
Rentable
Area
Expiring | Cumulative
% of NRA
Expiring | Cumulative
UW Base
Rent
Expiring(3) | Cumulative
% of UW
Base Rent
Expiring(3) |
| Vacant | NAP | 175,173 | 21.7% | NAP | NAP | 175,173 | 21.7% | NAP | NAP |
| 2022 | 51 | 125,193 | 15.5 | $1,573,299 | 9.3% | 300,365 | 37.2% | $1,573,299 | 9.3% |
| 2023 | 14 | 60,758 | 7.5 | 1,211,678 | 7.2 | 361,123 | 44.8% | $2,784,977 | 16.5% |
| 2024 | 2 | 11,589 | 1.4 | 226,902 | 1.3 | 372,712 | 46.2% | $3,011,879 | 17.8% |
| 2025 | 2 | 8,685 | 1.1 | 187,342 | 1.1 | 381,397 | 47.3% | $3,199,221 | 19.0% |
| 2026 | 0 | 0 | 0.0 | 0 | 0.0 | 381,397 | 47.3% | $3,199,221 | 19.0% |
| 2027 | 1 | 719 | 0.1 | 23,730 | 0.1 | 382,116 | 47.4% | $3,222,951 | 19.1% |
| 2028 | 1 | 4,842 | 0.6 | 152,770 | 0.9 | 386,958 | 48.0% | $3,375,721 | 20.0% |
| 2029 | 1 | 4,486 | 0.6 | 171,331 | 1.0 | 391,444 | 48.5% | $3,547,052 | 21.0% |
| 2030 | 2 | 204,484 | 25.3 | 7,816,505 | 46.3 | 595,928 | 73.8% | $11,363,556 | 67.3% |
| 2031 | 0 | 0 | 0.0 | 0 | 0.0 | 595,928 | 73.8% | $11,363,556 | 67.3% |
| 2032 | 0 | 0 | 0.0 | 0 | 0.0 | 595,928 | 73.8% | $11,363,556 | 67.3% |
| 2033 & Beyond | 2 | 211,032 | 26.2 | 5,511,492 | 32.7 | 806,960 | 100.0% | $16,875,048 | 100.0% |
| Total | 76 | 806,960 | 100.0% | $16,875,048 | 100.0% | | | | |
| (1) | Based on the underwritten rent roll dated February 21, 2022. |
| (2) | Certain tenants may have termination or contraction options (which may become exercisable prior to the originally stated expiration date of the tenant lease) that are not considered in the above Lease Expiration Schedule. |
| (3) | % of UW Base Rent Expiring, Cumulative UW Base Rent Expiring and Cumulative % of UW Base Rent Expiring includes annual Minimum License Fee for the LED Signage for the license year from February 2022 through January 2023. The LED Signage is not included in NRA. |
The following table presents certain information relating to the underwritten cash flows of The Reef Property:
| Operating History and Underwritten Net Cash Flow(1) |
| | 2019 | 2020 | TTM(2) | Underwritten(2) | Underwritten Per
Square Foot | % |
| Rents in Place(3) | $14,844,181 | $13,292,124 | $11,493,020 | $14,137,926 | $17.52 | 52.9% |
| Credit Rent Step | 0 | 0 | 0 | 102,004 | 0.13 | 0.4 |
| Vacant Income | 0 | 0 | 0 | 5,255,175 | 6.51 | 19.7 |
| Gross Potential Rent | $14,844,181 | $13,292,124 | $11,493,020 | $19,945,105 | $24.16 | 72.9% |
| (Vacancy / Credit Loss)(4) | 0 | 0 | 0 | (5,255,175) | (6.51) | (19.7) |
| Reimbursements | 0 | 0 | 0 | 1,755,589 | 2.18 | 6.6 |
| LED Signage Income | 0 | 2,350,172 | 6,218,590 | 10,745,265 | 13.32 | 40.2 |
| Effective Gross Income | $14,844,181 | $15,642,297 | $17,711,610 | $26,740,784 | $33.14 | 100.0% |
| | | | | | | |
| Total Expenses | $5,278,230 | $4,984,254 | $5,380,921 | $6,489,918 | $8.04 | 24.3% |
| | | | | | | |
| Net Operating Income | $9,565,951 | $10,658,043 | $12,330,689 | $20,250,866 | $25.10 | 75.7% |
| Total TI / LC, Capex / RR | 0 | 0 | 0 | 968,351 | 1.20 | 3.6 |
| Net Cash Flow | $9,565,951 | $10,658,043 | $12,330,689 | $19,282,515 | $23.90 | 72.1% |
| (1) | Certain items such as interest expense, interest income, lease cancellation income, depreciation, amortization, debt service payments and any other non-recurring were excluded from the historical presentation and are not considered for the underwritten cash flow. |
| (2) | The increase in Net Operating Income from TTM to Underwritten is primarily driven by increased LED Signage Income, and is also driven by underwriting of the County of LA Expansion Space. |
| (3) | Rents in Place does not include the Minimum License Fee for the LED Signage that has been shown in the Lease Expiration Schedule and Largest Tenants Based on Underwritten Base Rent tables, as the Underwritten License Fee (which is equal to the profit share fee for the trailing 12 months ended April 2022) is shown in the table above under LED Signage Income. |
| (4) | Represents an underwritten economic vacancy of 16.4%. |
The Market. The Reef Property is in Downtown Los Angeles (“DTLA”) and is well located for government tenants, as it is directly across the street from the Los Angeles County Superior Court, the LA County Mental Health Court, and the Municipal Court Traffic Division. The Reef Property is adjacent to South Park and University Park in DTLA, is less than one mile to the Los Angeles Convention Center and the Staples Center, and is 1.5 miles northeast of the University of Southern California (which has approximately 49,500 students). Transit nearby includes a bus stop at The Reef Property, the Grand Station Blue Line 2 blocks away, and the LATTC/Ortho Transit Stop, San Pedro Station and the Pico Station Expo Lines all less than half a mile from The Reef Property. Daily traffic counts along Washington
| THE INFORMATION IN THIS STRUCTURAL AND COLLATERAL TERM SHEET IS NOT COMPLETE AND MAY BE AMENDED PRIOR TO THE TIME OF SALE. THIS TERM SHEET IS NOT AN OFFER TO SELL THESE SECURITIES AND IT IS NOT A SOLICITATION OF AN OFFER TO BUY THESE SECURITIES IN ANY JURISDICTION WHERE THE OFFER OR SALE IS NOT PERMITTED. |
78
| Structural and Collateral Term Sheet | | BMO 2022-C2 |
| |
| No. 5 – The Reef |
Boulevard and South Broadway are approximately 36,000 and 18,000 cars, respectively. The Reef Property is accessible via two highly trafficked freeways in Los Angeles, the Harbor Freeway (Interstate 110) to the north and the Santa Monica Freeway (Interstate 10) to the west. Additionally, The Reef Property is a few blocks from the Los Angeles Trade Technical College (LATTC) which has an enrollment of approximately 12,000 students.
The Reef Property is located in Los Angeles, California within the Downtown Los Angeles submarket. As of the third quarter of 2021, the Downtown Los Angeles submarket contained nearly 69.0 million square feet of office space, accounting for approximately 16.0% of total market inventory. Through the third quarter of 2021, the submarket witnessed 332,000 square feet of negative net absorption. This corresponded with a vacancy rate of 17.0%, up 46 basis points from the previous year. The Class A vacancy in the submarket is 18.3% through the third quarter of 2021.
As of the third quarter of 2021, the average rental rate for office space was $41.28 per square foot in the Downtown Los Angeles office submarket, representing an increase of 0.3% over year-end 2020. As of the third quarter of 2021, the average asking rent for Class A office space was $47.40 per square foot, gross, down 0.5% year-over-year.
The following table summarizes the comparable office leases in the surrounding market:
| Comparable Summary(1) |
| Property/Address | Location | Year Built / Renovated | Tenant
Name | Lease
Start
Date | Term
(yrs.) | Lease
Type | Tenant
Size
(square feet) | UW Base
Rent Per
square
feet |
| The Reef(2) | Los Angeles, CA | 1958/2019 | Shipfront LLC | 9/2021 | 13.8 | MG(3) | 62,124 | $24.00 |
| 800 W 6th Street | Los Angeles, CA | 1973/NAP | Heimberg Law Group | 4/2021 | 5 | FSG | 6,343 | $28.20 |
| 205 South Broadway | Los Angeles, CA | NAV | Quandary Peak Research | 2/2021 | 5.25 | FSG | 2,200 | $27.00 |
| 515 South Flower Street | Los Angeles, CA | 1972/1994 | Jenner & Block | 11/2021 | 11 | FSG | 26,341 | $33.36 |
| 300 South Grand Avenue | Los Angeles, CA | 1985/NAP | JPMorgan Chase | 10/2020 | 1.5 | FSG | 30,000 | $28.56 |
| 355 South Grand Avenue | Los Angeles, CA | 1983/2018 | Reed Smith LLP | 1/2022 | 5 | FSG | 67,368 | $35.40 |
| 400 South Hope Street | Los Angeles, CA | 1983/2010 | Ogletree Deakins | 12/2020 | NAV | FSG | 33,299 | $30.36 |
| Total/Wtd. Avg.(4) | | | | | 5.5 | | | $32.43 |
| (2) | Based on the underwritten rent roll dated February 21, 2022. |
| (3) | This lease is modified gross, however not all leases at The Reef Property are modified gross. |
| (4) | Total/Wtd.Avg. does not include The Reef Property. |
The Borrower. The borrower is PHR LA Mart DE, LLC a Delaware limited liability company and single purpose entity with two independent directors. Legal counsel to the borrower delivered a non-consolidation opinion in connection with the origination of The Reef Whole Loan.
The Borrower Sponsor. The borrower sponsor and non-recourse carveout guarantor for The Reef Whole Loan is Ara Tavitian. Ara Tavitian was a gastroenterologist in Glendale, California and was affiliated with Adventist Health-Glendale. Ara Tavitian is also the founder and chairman of Kanon Ventures, LLC, a private equity firm that specializes in health care and real estate investments. For over 30 years, Ara Tavitian and his management team have been investors and operators, having owned and operated hospitals, medical groups, medical facilities, and other commercial properties across California. Ara Tavitian owns 26 commercial properties, with all the properties in the Greater Los Angeles area except for two properties out of state.
Property Management. The Reef Property is managed by Elite Property Management, LLC, an affiliate of the borrower.
Escrows and Reserves. At loan origination, the borrower deposited approximately (i) $205,149 into a tax reserve and (ii) $22,000,000 into a Holdback Reserve.
Tax Reserve – On each due date, the borrower is required to fund 1/12 of the taxes (initially approximately $68,383), that the lender reasonably estimates will be payable over the next-ensuing 12-month period.
Insurance Reserve – On each due date, the borrower is required to fund 1/12 of the insurance premiums that the lender reasonably estimates will be required for the renewal of the insurance coverage. These deposits will be waived as long as an acceptable blanket policy is in effect, which was the case as of the origination date.
Capital Expenditure Reserve – On each due date, the borrower is required to fund a capital expenditure reserve in the amount of approximately $11,715. In addition, unless the LED screens on the LED Signage have already been replaced with updated screens that
| THE INFORMATION IN THIS STRUCTURAL AND COLLATERAL TERM SHEET IS NOT COMPLETE AND MAY BE AMENDED PRIOR TO THE TIME OF SALE. THIS TERM SHEET IS NOT AN OFFER TO SELL THESE SECURITIES AND IT IS NOT A SOLICITATION OF AN OFFER TO BUY THESE SECURITIES IN ANY JURISDICTION WHERE THE OFFER OR SALE IS NOT PERMITTED. |
79
| Structural and Collateral Term Sheet | | BMO 2022-C2 |
| |
| No. 5 – The Reef |
satisfy certain conditions in the loan documents, on each due date commencing in May 2029 through and including the due date in January 2030 (unless a letter of credit for such purpose is delivered in the face amount of $8.2 million (subject to reassessment)), the borrower is required to make monthly deposits of approximately $911,111 (which amount may be decreased based upon the delivery of binding contracts to replace the billboard display screens at the time), in order to cover any capital expenditure expenses related to the LED Signage.
TI / LC Reserve — On each due date, the borrower is required to fund a TI / LC reserve in the amount of approximately $67,247 or $1.00 per square foot, capped at 24 months’ deposit (which equals approximately $1,613,919).
Holdback Reserve – A Holdback Reserve in the amount of $22,000,000 was reserved at origination in connection with the County of LA Expansion Space. Provided no Trigger Period (as defined below) is then in effect, the lender is required to release such reserve to the borrower upon the borrower delivering to the lender evidence that the following conditions have been satisfied on or prior to November 5, 2022: (A) The Reef Property has achieved a debt yield of at least 10.5%, and (B) LA County has accepted the LA County Expansion Space and has executed a commencement date memorandum and estoppel, each in substantially the form provided to the lender prior to the origination date, confirming, among other things, that (1) LA County is the tenant under the LA County lease, (2) LA County has accepted possession of the LA County Expansion space, (3) the LA County lease expiration date is no sooner than March 31, 2030 (subject to the early termination right, as described above under “The Property”), (4) the Basic Rent (as defined in the LA County lease) is no less than $423,281.88 for the first 12 months following the acceptance of the LA County Expansion Space, (5) the total amount of the premises demised under the LA County lease is 204,484 square feet, (6) to the knowledge of LA County, LA County has not given the borrower written notice of a material default under the LA County lease which has not been cured, and (7) LA County is not entitled to any credit against any rent or other charge or rent concession under the LA County lease except as set forth in the LA County lease, and all contributions required to be paid by the borrower as of the date of the LA County estoppel have been paid in full and all of the borrower’s obligations with respect to tenant improvements have been fully performed. In the event that the foregoing conditions are not satisfied by November 5, 2022, the lender is permitted to continue to hold the $22,000,000 Holdback Reserve as additional collateral through the maturity date of The Reef Whole Loan. Subsequent to origination, the County of LA has accepted the County of LA Expansion Space and has executed and delivered an estoppel to the lender. As a result, the borrower is anticipated to make a request to the servicer that the Holdback Reserve fund be released to the borrower.
Lockbox / Cash Management. The Reef Whole Loan is structured with a hard lockbox and springing cash management. The borrower is required to cause all rents to be deposited directly into the lender-controlled lockbox account. The Reef Whole Loan documents also require that all rents received by the borrower or property manager be deposited into the lockbox account within two business days of receipt. During the continuance of a Trigger Period, funds on deposit in the lockbox account are required to be swept on a daily basis into a lender-controlled cash management account and applied on each payment date (i) to make deposits into the tax and insurance reserves, (ii) to pay debt service on The Reef Whole Loan, (iii) to make deposits into the capital expenditure and TI / LC reserves, (iv) to pay (I) the lesser of lender-approved budgeted operating expenses and actual operating expenses, minus (II) the amount by which lender-approved budgeted operating expenses exceeded actual operating expenses in prior months, to the extent not previously deducted pursuant to this clause (II), and (v) to pay lender-approved extraordinary expenses, if any, with any excess cash after such application required to be deposited (A) if a Lease Sweep Period is continuing, into a lease sweep reserve (the “Lease Sweep Reserve”) to be applied to pay the costs of retenanting the applicable space, or (B) if no Lease Sweep Period is continuing, and any other Trigger Period is continuing, into a lender-controlled account to be held as additional collateral for The Reef Whole Loan during such Trigger Period.
A “Trigger Period” will commence upon (i) the occurrence of an event of default under The Reef Whole Loan (ii) a Low DSCR Period (as defined below), (iii) if a property manager is an affiliate of the borrower or guarantor and such property manager becomes insolvent or a debtor in any bankruptcy or insolvency proceeding or (iv) the commencement of a Lease Sweep Period, and will end, if (A) with respect to a Trigger Period continuing pursuant to clause (i), the event of default commencing the Trigger Period has been cured and such cure has been accepted by the lender, (B) with respect to a Trigger Period continuing due to clause (ii), the Low DSCR Period has ended, (C) with respect to a Trigger Period continuing due to clause (iii), if the property manager is replaced with an unaffiliated qualified manager approved by the lender under a replacement management agreement approved by the lender, or (D) with respect to a Trigger Period continuing due to clause (iv), the Lease Sweep Period has ended.
A “Low DSCR Period” will commence if the debt service coverage ratio (“DSCR”) of The Reef Whole Loan is less than 1.20x based on The Reef Whole Loan documents as of the last day of any calendar quarter, however if any tenant is subject to a Tenant Adjustment Event (as defined below), then the underwritten net cash flow as of the most recent calendar quarter may be immediately adjusted downward by the lender and to the extent said adjustment results in a DSCR that is below 1.20x, a Low DSCR Period will immediately commence, and will end upon The Reef Property achieving a DSCR of at least 1.20x for two consecutive calendar quarters.
A “Tenant Adjustment Event” will mean the exclusion of (X) amounts representing non-recurring items and (Y) amounts received from (1) tenants not currently in occupancy and paying full, unabated rent (unless all abated rent has been deposited with the lender), (2) tenants affiliated with the borrower or non-recourse guarantor (other than the Maker City LA, LLC and Shipfront, LLC leases), (3) tenants in default or in bankruptcy, (4) tenants under (x) month-to-month leases and (y) leases where the term is set to expire in the next succeeding calendar quarter (provided that up to 10% of the gross rents received at The Reef Property will be included with respect to
| THE INFORMATION IN THIS STRUCTURAL AND COLLATERAL TERM SHEET IS NOT COMPLETE AND MAY BE AMENDED PRIOR TO THE TIME OF SALE. THIS TERM SHEET IS NOT AN OFFER TO SELL THESE SECURITIES AND IT IS NOT A SOLICITATION OF AN OFFER TO BUY THESE SECURITIES IN ANY JURISDICTION WHERE THE OFFER OR SALE IS NOT PERMITTED. |
80
| Structural and Collateral Term Sheet | | BMO 2022-C2 |
| |
| No. 5 – The Reef |
rents received from such month-to-month or expiring leases) or (5) tenants under leases where the tenant thereunder has a renewal option and has failed to exercise such renewal option within the time period set forth in the lease or has given notice of intent to vacate.
A “Lease Sweep Period” will commence (a) upon the earlier of (i) the date that is nine months prior to the expiration of a Sweep Lease (defined below) or the date on which a termination option thereunder may be exercised or (ii) upon the date required under the Sweep Lease by which the Sweep Tenant is required to give notice of its exercise of a renewal option thereunder (and such renewal has not been so exercised) or (iii) nine months prior to The Reef Whole Loan maturity date (if a Sweep Tenant’s lease expires or a termination option may be exercised at any time prior to February 6, 2033); (b) upon the early termination, early cancellation or early surrender of a Sweep Lease or upon the borrower’s receipt of notice by a Sweep Tenant of its intent to effect an early termination, early cancellation or early surrender of its Sweep Lease; (c) if a Sweep Tenant has ceased operating its business (i.e., “goes dark”) in its space (or any material portion thereof) at The Reef Property (a “Go Dark Event”); (d) upon a monetary or material non-monetary default under a Sweep Lease by a Sweep Tenant beyond any applicable notice and cure period, or (e) upon a bankruptcy or insolvency proceeding of a Sweep Tenant or its parent.
A Lease Sweep Period will end once the applicable Lease Sweep Period has been cured or the space demised under the Sweep Lease has been re-tenanted pursuant to one or more “Qualified Leases” as defined in The Reef Whole Loan documents (or, if applicable, the applicable Sweep Lease has been renewed pursuant to its terms) and, in the lender’s reasonable judgment, sufficient funds have been accumulated in the Lease Sweep Reserve to cover all anticipated tenant improvements and leasing commissions and free and/or abated rent in connection therewith (and in the case of replacement leases, any debt service and operating shortfalls relating to the delay in the commencement of full rent payments) (the “Lease Sweep Re-tenanting Costs”). A Lease Sweep Period will also cease on the date on which the following amounts have accumulated in the Lease Sweep Reserve: (x) $55 per square foot with respect to any portion of the space demised under the applicable Sweep Lease including the County of LA lease that has not been re-tenanted; provided that, so long as the County of LA remains in occupancy under its lease, continues to pay full unabated rent and has not delivered a notice of its intention to terminate its lease, such amount will be $25 per square foot, and (y) to the extent a portion of the space demised under the applicable Sweep Lease has been re-tenanted pursuant to one or more qualified leases, in the lender’s judgment, sufficient funds to cover all anticipated Lease Sweep Re-tenanting Costs related to the space that has been re-tenanted.
A “Sweep Lease” means (i) the County of LA lease, (ii) the Shipfront LLC lease, (iii) the Maker City LA, LLC lease or (iv) any replacement lease of the foregoing leases that, either individually, or when taken together with any other lease with the same tenant or its affiliates, and assuming the exercise of all expansion rights and all preferential rights to lease additional space contained in such lease, covers the majority of the applicable Lease Sweep Space.
“Lease Sweep Space” means the space demised under the applicable Sweep Lease.
Subordinate and Mezzanine Debt. None.
Partial Release. The Reef Property is comprised of two full city blocks containing 9.11 acres. One block (the “West Block”) contains the office building portion of The Reef Property and a parking lot area and the other block (the “East Block”), which is located across the street from the West Block, contains an 11,150 square foot industrial building and a parking lot. The Reef Whole Loan permits the free release, without defeasance or prepayment, of either or both of the East Block and of an approximately 4.25 acre parcel (comprising a parking lot area) of the West Block (the “West Release Parcel”), provided that the following conditions, among others, are satisfied: (i) delivery of an updated survey, and, with respect to the West Release Parcel, a recorded, finalized parcel map that creates a legal subdivision of the West Release Parcel from the remainder of the West Block, (ii) to the extent there are shared facilities, access or parking, unless an easement of record already exists, an easement reasonably satisfactory to the lender pursuant to which the borrower will receive such easements as are reasonably required for the continued use and operation of the remaining The Reef Property (the “Remaining Property”), (iii) a date down of a legal memorandum previously provided to the lender stating that after the release the Remaining Property will be in compliance with certain legal requirements, (iv) in the event that parking as required by legal requirements is not located on the Remaining Property, parking agreements necessary for the borrower to provide the Remaining Property with sufficient parking as required by legal requirements, which parking agreements must be reasonably satisfactory to the lender, (v) delivery of an officer’s certificate from the borrower stating, among other things, that the release will not (1) adversely affect the rights of the lender under the loan documents with respect to the Remaining Property, (2) violate any document or instrument affecting the Remaining Property, or (3) adversely affect the use or operation of, or access to, the Remaining Property, and (vi) compliance with REMIC related conditions. Income from the release parcels was not underwritten, and the release parcels were excluded from the collateral that was covered in the appraisal.
Ground Lease. None.
| THE INFORMATION IN THIS STRUCTURAL AND COLLATERAL TERM SHEET IS NOT COMPLETE AND MAY BE AMENDED PRIOR TO THE TIME OF SALE. THIS TERM SHEET IS NOT AN OFFER TO SELL THESE SECURITIES AND IT IS NOT A SOLICITATION OF AN OFFER TO BUY THESE SECURITIES IN ANY JURISDICTION WHERE THE OFFER OR SALE IS NOT PERMITTED. |
81
| Structural and Collateral Term Sheet | | BMO 2022-C2 |
| |
| No. 6 – 360 Rosemary |
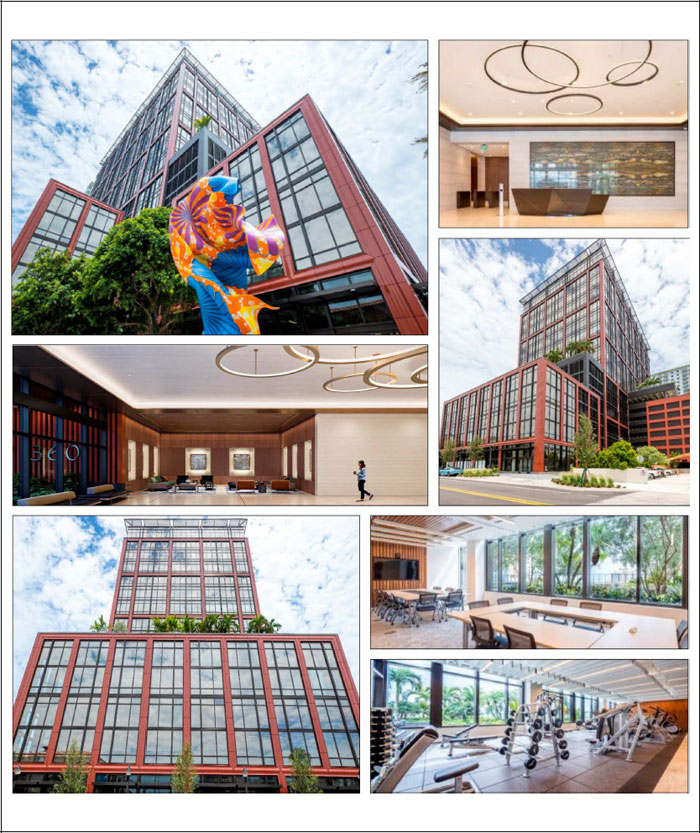
| THE INFORMATION IN THIS STRUCTURAL AND COLLATERAL TERM SHEET IS NOT COMPLETE AND MAY BE AMENDED PRIOR TO THE TIME OF SALE. THIS TERM SHEET IS NOT AN OFFER TO SELL THESE SECURITIES AND IT IS NOT A SOLICITATION OF AN OFFER TO BUY THESE SECURITIES IN ANY JURISDICTION WHERE THE OFFER OR SALE IS NOT PERMITTED. |
82
| Structural and Collateral Term Sheet | | BMO 2022-C2 |
| |
| No. 6 – 360 Rosemary |
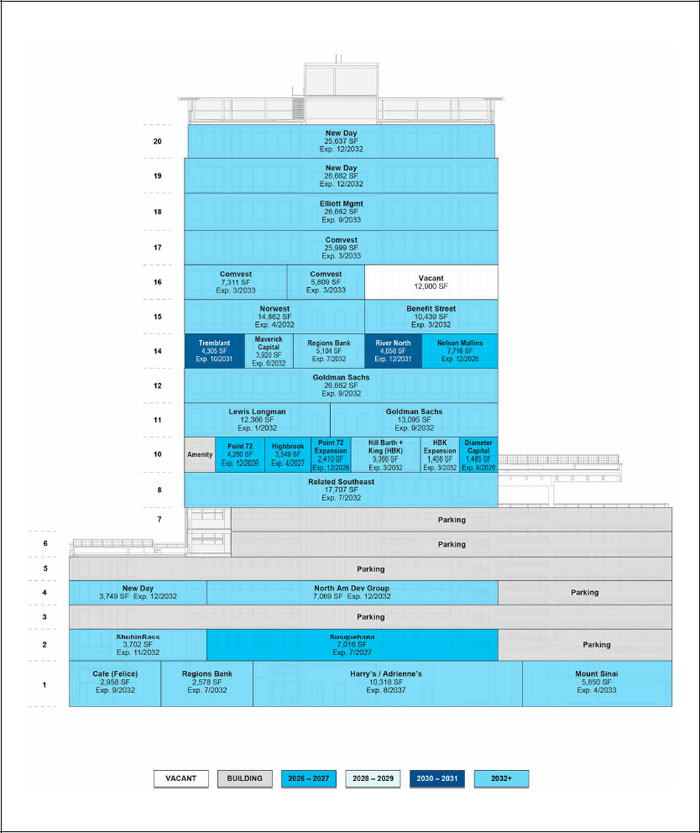
| THE INFORMATION IN THIS STRUCTURAL AND COLLATERAL TERM SHEET IS NOT COMPLETE AND MAY BE AMENDED PRIOR TO THE TIME OF SALE. THIS TERM SHEET IS NOT AN OFFER TO SELL THESE SECURITIES AND IT IS NOT A SOLICITATION OF AN OFFER TO BUY THESE SECURITIES IN ANY JURISDICTION WHERE THE OFFER OR SALE IS NOT PERMITTED. |
83
| Structural and Collateral Term Sheet | | BMO 2022-C2 |
| |
| No. 6 – 360 Rosemary |
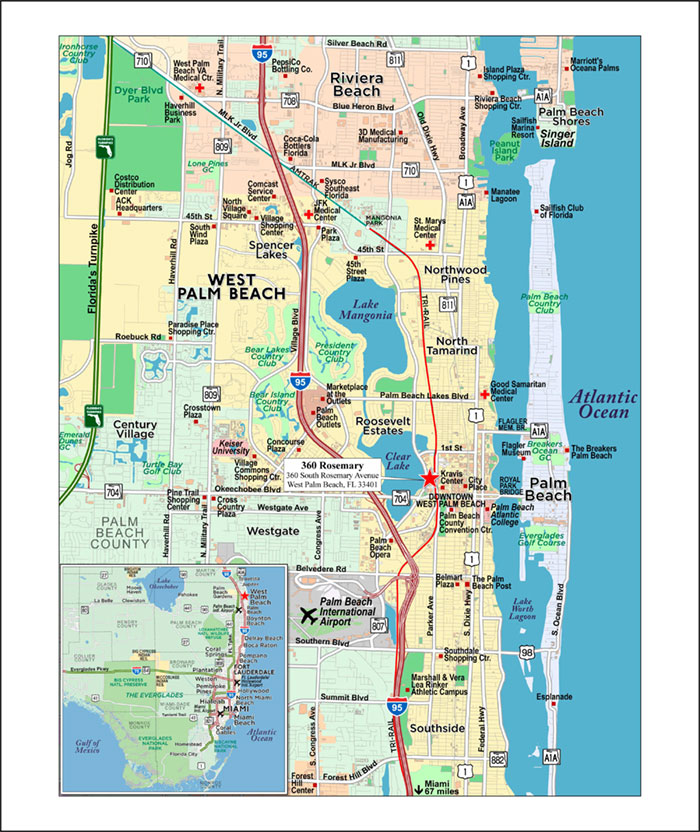
| THE INFORMATION IN THIS STRUCTURAL AND COLLATERAL TERM SHEET IS NOT COMPLETE AND MAY BE AMENDED PRIOR TO THE TIME OF SALE. THIS TERM SHEET IS NOT AN OFFER TO SELL THESE SECURITIES AND IT IS NOT A SOLICITATION OF AN OFFER TO BUY THESE SECURITIES IN ANY JURISDICTION WHERE THE OFFER OR SALE IS NOT PERMITTED. |
84
| Structural and Collateral Term Sheet | | BMO 2022-C2 |
| |
| No. 6 – 360 Rosemary |
| Mortgage Loan Information | | Property Information |
| Mortgage Loan Seller: | BMO | | Single Asset / Portfolio: | Single Asset |
| Original Principal Balance(1): | $32,000,000 | | Title: | Fee |
| Cut-off Date Principal Balance(1): | $32,000,000 | | Property Type – Subtype: | Office – CBD |
| % of IPB: | 4.5% | | Net Rentable Area (SF): | 313,002 |
| Loan Purpose: | Refinance | | Location: | West Palm Beach, FL |
| Borrower: | CityPlace North II, L.L.C. | | Year Built / Renovated: | 2021 / NAP |
| Borrower Sponsor: | The Related Companies, L.P. | | Occupancy(2): | 95.9% |
| Interest Rate: | 3.95000% | | Occupancy Date: | 12/1/2021 |
| Note Date: | 1/18/2022 | | 4th Most Recent NOI (As of): | NAV |
| Maturity Date: | 2/6/2032 | | 3rd Most Recent NOI (As of): | NAV |
| Interest-only Period: | 120 months | | 2nd Most Recent NOI (As of): | NAV |
| Original Term: | 120 months | | Most Recent NOI (As of): | NAV |
| Original Amortization Term: | None | | UW Economic Occupancy: | 95.0% |
| Amortization Type: | Interest Only | | UW Revenues: | $23,655,523 |
| Call Protection: | YM3(29),DorYM3(84),O(7) | | UW Expenses: | $8,490,851 |
| Lockbox / Cash Management: | Hard / Springing | | UW NOI: | $15,164,673 |
| Additional Debt(1): | Yes | | UW NCF: | $14,804,720 |
| Additional Debt Balance(1): | $53,000,000 / $100,802,000 / $24,198,000 | | Appraised Value / Per SF(3): Appraisal Date(3): | $319,000,000 / $1,019 12/1/2023 |
| Additional Debt Type(1): | Pari Passu / B Note / C Note | | | |
| | | | | |
| Escrows and Reserves(4) | | Financial Information(1) |
| | Initial | Monthly | Initial Cap | | | Senior Loan | Whole Loan |
| Taxes: | $0 | Springing | N/A | | Cut-off Date Loan / SF: | $272 | $671 |
| Insurance: | $0 | Springing | N/A | | Maturity Date Loan / SF: | $272 | $671 |
| Replacement Reserves: | $0 | Springing | N/A | | Cut-off Date LTV(3): | 26.6% | 65.8% |
| TI / LC Reserve: | $0 | Springing | N/A | | Maturity Date LTV(3): | 26.6% | 65.8% |
| Other: | $45,498,551 | $0 | N/A | | UW NCF DSCR: | 4.35x | 1.76x |
| | | | | | UW NOI Debt Yield: | 17.8% | 7.2% |
| | | | | | | | |
| |
| Sources and Uses |
| Sources | Proceeds | % of Total | | Uses | Proceeds | % of Total |
| Whole Loan(1) | $210,000,000 | 100.0% | | Loan Payoff | $110,495,605 | 52.6% |
| | | | | Return of Equity | 47,876,656 | 22.8 |
| | | | | Reserves | 45,498,551 | 21.7 |
| | | | | Closing Costs | 6,129,189 | 2.9 |
| Total Sources | $210,000,000 | 100.0% | | Total Uses | $210,000,000 | 100.0% |
| (1) | The 360 Rosemary Mortgage Loan (as defined below) is part of the 360 Rosemary Whole Loan (as defined below) which has an original aggregate principal balance of $210,000,000. The Financial Information in the chart above reflects the 360 Rosemary Senior Loan (as defined below) and the 360 Rosemary Whole Loan. For additional information, see “The Loan” below. |
| (2) | Occupancy is based on the underwritten rent roll as of December 1, 2021. Occupancy is based on the percentage of net rentable area leased. Due to the recent completion of the 360 Rosemary Property (as defined below), many tenants are currently in the process of building out their respective spaces and have not yet taken physical occupancy. |
| (3) | The Appraised Value reflects the “As Stabilized” value concluded by the appraiser. The “As Stabilized” value assumes the completion of the remaining tenant improvements. At origination, the lender required escrow deposits sufficient to cover the costs associated with the completion of the remaining tenant improvements. The appraiser’s concluded market value “as-is” is $245,000,000, which represents a 360 Rosemary Senior Loan Cut-off Date LTV and Maturity Date LTV of 34.7%. |
| (4) | For a full description of escrows and reserves, please refer to “Escrows and Reserves” below. |
The Loan. The sixth largest mortgage loan (the “360 Rosemary Mortgage Loan”) is part of a whole loan (the “360 Rosemary Whole Loan”) that is evidenced by (i) five pari passu senior promissory notes in the aggregate original principal amount of $85,000,000 (the “360 Rosemary Senior Loan”), (ii) a subordinate promissory note in the original principal amount of $100,802,000 (the “360 Rosemary Subordinate Companion B Loan”), and (iii) a further subordinated promissory note in the original principal amount of $24,198,000 (the “360 Rosemary Subordinate Companion C Loan” and, together with the 360 Rosemary Subordinate Companion B Loan, the “360 Rosemary Subordinate Companion Loans”). The 360 Rosemary Whole Loan was originated on January 18, 2022, by Bank of Montreal (“BMO”). The 360 Rosemary Whole Loan is secured by a first priority mortgage on the borrower’s fee simple interest in a 313,002 square
| THE INFORMATION IN THIS STRUCTURAL AND COLLATERAL TERM SHEET IS NOT COMPLETE AND MAY BE AMENDED PRIOR TO THE TIME OF SALE. THIS TERM SHEET IS NOT AN OFFER TO SELL THESE SECURITIES AND IT IS NOT A SOLICITATION OF AN OFFER TO BUY THESE SECURITIES IN ANY JURISDICTION WHERE THE OFFER OR SALE IS NOT PERMITTED. |
85
| Structural and Collateral Term Sheet | | BMO 2022-C2 |
| |
| No. 6 – 360 Rosemary |
foot office property located in West Palm Beach, Florida (the “360 Rosemary Property”). The 360 Rosemary Mortgage Loan is evidenced by the non-controlling promissory Note A-3 and Note A-4, with an aggregate principal balance as of the Cut-off Date of $32,000,000. The remaining notes have been securitized or are held by a third party, as set forth in the table below. Prior to the occurrence of a “control appraisal period” with respect to the 360 Rosemary Subordinate Companion C Loan, the holder of the 360 Rosemary Subordinate Companion C Loan (or its representative) will be the controlling noteholder. Following the occurrence and during the continuance of a “control appraisal period” with respect to the 360 Rosemary Subordinate Companion C Loan, the holder of the 360 Rosemary Subordinate Companion B Loan (i.e., the BMO 2022-C1 securitization trust, which rights will be exercisable by the designated class of holders of the series of loan-specific certificates that will be backed by the 360 Rosemary Subordinate Companion B Loan) will be the controlling noteholder. Following the occurrence and during the continuance of a “control appraisal period” with respect to the 360 Rosemary Subordinate Companion B Loan, the holder of the 360 Rosemary Mortgage Loan (i.e., the BMO 2022-C1 securitization trust, which rights will be exercisable by the controlling class representative for the BMO 2022-C1 pooled mortgage loans securitization transaction) will be the controlling noteholder. The 360 Rosemary Whole Loan will be serviced pursuant to the pooling and servicing agreement for the BMO 2022-C1 securitization. See “Description of the Mortgage Pool—The Whole Loans—The 360 Rosemary Pari Passu-AB Whole Loan” and “Pooling and Servicing Agreement” in the Preliminary Prospectus.
| Whole Loan Summary |
| Note | Original Balance | Cut-off Date Balance | | Note Holder | Controlling Piece |
| A-1 | $25,000,000 | $25,000,000 | | BMO 2022-C1 | No(1) |
| A-2 | $20,000,000 | $20,000,000 | | BMO 2022-C1 | No |
| A-3 | $15,000,000 | $15,000,000 | | BMO 2022-C2 | No |
| A-4 | $17,000,000 | $17,000,000 | | BMO 2022-C2 | No |
| A-5 | $8,000,000 | $8,000,000 | | CGCMT 2022-GC48 | No |
| Total Senior Loan | $85,000,000 | $85,000,000 | | | |
| B-1 | $100,802,000 | $100,802,000 | | BMO 2022-C1 (Loan Specific) | No(1) |
| C-1 | $24,198,000 | $24,198,000 | | Third Party | Yes(1) |
| Total | $210,000,000 | $210,000,000 | | | |
| (1) | Following the occurrence and during the continuance of a “control appraisal period” with respect to Note C-1, Note B-1 will be the controlling note. Following the occurrence and during the continuance of a “control appraisal period” with respect to Note B-1, Note A-1 will be the controlling note, and the controlling class representative of the BMO 2022-C1 pooled mortgage loans securitization will be entitled to exercise the related control rights. See “Description of the Mortgage Pool—The Whole Loans—The 360 Rosemary Pari Passu AB Whole Loan” in the Preliminary Prospectus. |
The Property. The 360 Rosemary Property consists of a 20-story office property comprised of 291,298 square feet of office space and 21,704 of retail square feet located at 360 South Rosemary Avenue in West Palm Beach, Florida. The 360 Rosemary Property has a total of 606 parking spaces (approximately 1.94 parking spaces per 1,000 square feet of NRA) provided by the seven-story parking garage. The 360 Rosemary Property is situated at the southeast corner of South Rosemary Avenue and Fern Street that provides prime frontage for the retail tenants. The 360 South Rosemary Property is located in the downtown neighborhood of West Palm Beach and benefits from its proximity to entertainment attractions and outdoor recreation areas, such as the lifestyle retail development, The Square and public parks such as Howard Park. The 360 Rosemary Property is accessible from all major West Palm Beach commuter transportation hubs. Nearby train stations include the West Palm Beach Brightline Station, located approximately 0.2 miles north of the 360 Rosemary Property on the intersection of Evernia Street and Quadrille Plaza Drive, and the West Palm Beach Amtrak Train Station, located approximately 0.4 miles west of the 360 Rosemary Property on South Tamarind Avenue. The West Palm Beach Brightline Station provides access to Fort Lauderdale and Miami and is currently under construction to extend an additional line to Orlando, serving as an amenity to the 360 Rosemary Property tenants by providing access to a broader pool of talent. The 360 Rosemary Property was delivered in 2021 as a Class A office property and is currently 95.9% leased to a diverse mix of finance, real estate, insurance, legal and retail, including tenants such as New Day, Goldman Sachs, Comvest, Elliott Mgmt, Benefit Street, Point 72 and Maverick Capital. New Day, Goldman Sachs and Comvest represent a combined 43.1% of the total NRA with each tenant having greater than ten years remaining under their respective leases. The retail space is 100.0% leased by four tenants, Harry’s / Adrienne’s, Mount Sinai, Regions Bank and Café (Felice). Tenants at the 360 Rosemary Property have invested approximately $38.0 million ($121 PSF) in aggregate into their respective spaces, ranging from $25 to $400 PSF.
COVID-19 Update. As of December 1, 2021, the 360 Rosemary Property was open and operating and 100% of the base rent due in November 2021 and December 2021 was paid. The first debt service payment for the 360 Rosemary Whole Loan is due in March 2022. As of February 1, 2022, the 360 Rosemary Whole Loan is not subject to any forbearance, modification or debt service relief request.
Major Tenants. The three largest tenants based on underwritten base rent are New Day, Goldman Sachs and Comvest.
New Day (56,048 square feet; 17.9% NRA; 18.5% of underwritten base rent): New Day was founded in 1999 and is headquartered in Fulton, Maryland. New Day is a veteran mortgage lender that offers loans for home improvements, refinancing, and debt consolidation. New Day moved its second headquarters to the 360 Rosemary Property in the fourth quarter of 2021, to two suites on the 19th and 20th floors of the building totaling 52,299 square feet. New Day signed an amendment to the lease expanding their leased premises for a combined a total of three suites leased with a weighted average lease term of 10.5 years. New Day was provided a tenant improvement allowance of approximately $5.6 million ($100 PSF). New Day's lease expires in December 2032 and contains two consecutive renewal options of 60 months and a one-time termination right effective on any date elected by New Day during the period between November
| THE INFORMATION IN THIS STRUCTURAL AND COLLATERAL TERM SHEET IS NOT COMPLETE AND MAY BE AMENDED PRIOR TO THE TIME OF SALE. THIS TERM SHEET IS NOT AN OFFER TO SELL THESE SECURITIES AND IT IS NOT A SOLICITATION OF AN OFFER TO BUY THESE SECURITIES IN ANY JURISDICTION WHERE THE OFFER OR SALE IS NOT PERMITTED. |
86
| Structural and Collateral Term Sheet | | BMO 2022-C2 |
| |
| No. 6 – 360 Rosemary |
30, 2027 and December 31, 2032. New Day’s Underwritten Base Rent PSF of $46.13 for 52,299 square feet of space on the 19th and 20th floors is approximately 19.7% below the appraiser’s concluded market rent of $55.00 PSF for the 19th floor and $60.00 for the 20th floor. New Day’s Underwritten Base Rent PSF of $60.00 for 3,749 square feet of space on the fourth floor is approximately 9.1% above the appraiser’s concluded market rent of $55.00 PSF.
Goldman Sachs (39,757 square feet; 12.7% NRA; 14.0% of underwritten base rent): Founded in 1869, Goldman Sachs Group Inc. (“Goldman Sachs”) is an American multinational investment bank and financial services company headquartered in New York City. Goldman Sachs offers services in investment management, asset management, prime brokerage and securities underwriting. As of the third quarter of 2021, Goldman Sachs reported approximately $46.7 billion in total revenue and approximately $1.2 trillion in total assets. Goldman Sachs occupies two suites with a lease term of 10.2 years and is expected to receive approximately $3.3 million (approximately $75 PSF) in tenant improvement allowance for the build-out of its new spaces expected to commence April 2022. Goldman Sachs’ lease expires in September 2032 and contains two consecutive renewal options of 60 months each, a one-time termination right effective as of the day preceding the fifth anniversary date of the rent commencement date under its lease and a termination right in the event that Goldman Sachs enters into a lease for at least 150,000 square feet at a specified nearby property owned by an affiliate of Borrower. Goldman Sachs’ Underwritten Base Rent PSF of $50.00 is approximately 9.1% below the appraiser’s concluded market rent for this space of $55.00 PSF.
Comvest (39,119 square feet; 12.5% NRA; 11.6% of underwritten base rent): Founded in 2000, Comvest Advisors (“Comvest”) is a private investment firm providing equity and debt capital to middle-market companies across North America. Since inception, Comvest has invested over $8.0 billion in middle market businesses and currently has over $6.6 billion in assets under management. Comvest occupies three suites with a lease term of 10.7 years and is expected to receive approximately $3.8 million ($97 PSF) in tenant improvement allowance for the build-out of its new spaces expected to commence July 2022, July 2023, and September 2023. The tenant improvement allowance is not inclusive of a termination fee paid by the borrower sponsor for Comvest’s relocation to the 360 Rosemary Property. Comvest’s lease expires in March 2033 and contains two consecutive renewal options of 60 months each and a one-time termination right effective as of the last day of the 7th year of its lease. Comvest’s Underwritten Base Rent PSF of $42.25 is approximately 23.2% below the appraiser’s concluded market rent for this space of $55.00 PSF.
Environmental. According to a Phase I environmental assessment dated December 6, 2021, there was no evidence of any recognized environmental conditions at the 360 Rosemary Property.
The following table presents certain information relating to the historical occupancy of the 360 Rosemary Property:
| Historical and Current Occupancy |
| 2018(1) | 2019(1) | 2020(1) | Current(2) |
| NAV | NAV | NAV | 95.9% |
| (1) | Historical occupancies are unavailable as the 360 Rosemary Property was built in 2021. |
| (2) | Current occupancy is based on the underwritten rent roll as of December 1, 2021. Current occupancy is based on the percentage of net rentable area leased. Due to the recent completion of the 360 Rosemary Property, many tenants are currently in the process of building out their respective spaces and have not yet taken physical occupancy. |
| THE INFORMATION IN THIS STRUCTURAL AND COLLATERAL TERM SHEET IS NOT COMPLETE AND MAY BE AMENDED PRIOR TO THE TIME OF SALE. THIS TERM SHEET IS NOT AN OFFER TO SELL THESE SECURITIES AND IT IS NOT A SOLICITATION OF AN OFFER TO BUY THESE SECURITIES IN ANY JURISDICTION WHERE THE OFFER OR SALE IS NOT PERMITTED. |
87
| Structural and Collateral Term Sheet | | BMO 2022-C2 |
| |
| No. 6 – 360 Rosemary |
The following table presents certain information relating to the largest tenants based on underwritten base rent of the 360 Rosemary Property:
Top Tenant Summary(1) |
| Tenant | Ratings
Moody’s/S&P/Fitch(2) | Net Rentable Area (SF) | % of
Total NRA | UW
Base Rent PSF(3) |
UW
Base Rent(3) | % of Total
UW Base Rent(3) | Lease
Exp. Date |
| New Day | NR/NR/NR | 56,048 | 17.9% | $47.05 | $2,637,231 | 18.5% | 12/31/2032(4) |
| Goldman Sachs | A2/BBB+/A | 39,757 | 12.7 | 50.00 | 1,987,850 | 14.0 | 9/30/2032(5) |
| Comvest | NR/NR/NR | 39,119 | 12.5 | 42.25 | 1,652,778 | 11.6 | 3/31/2033(6) |
| Major Tenants | | 134,924 | 43.1% | $46.53 | $6,277,859 | 44.1% | |
| | | | | | | | |
| Other Tenants | | 165,178 | 52.8% | $48.18 | $7,958,724 | 55.9% | |
| | | | | | | | |
| Occupied Collateral Total / Wtd. Avg. | | 300,102 | 95.9% | $47.44 | $14,236,583 | 100.0% | |
| | | | | | | | |
| Vacant Space | | 12,900 | 4.1% | | | | |
| | | | | | | | |
| Collateral Total | | 313,002 | 100.0% | | | | |
| | | | | | | | |
| (1) | Based on underwritten rent roll dated as of December 1, 2021. |
| (2) | Ratings provided are for the parent company of the entity listed in the “Tenant” field whether or not the parent company guarantees the lease. |
| (3) | UW Base Rent PSF, UW Base Rent and % of Total UW Base Rent include rent steps of approximately $162,744 through January 1, 2023. |
| (4) | New Day has a one-time right to terminate its lease effective on any date elected by during the period between November 30, 2027 and December 31, 2032. |
| (5) | Goldman Sachs has a one-time right to terminate its lease effective as of the day preceding the fifth anniversary date of the commencement of its lease. |
| (6) | Comvest has a one-time right to terminate its lease effective as of the last day of the 7th year of its lease. |
The following table presents certain information relating to the tenant lease expirations of the 360 Rosemary Property:
| Lease Rollover Schedule(1)(2) | |
| Year | | Number of Leases Expiring | | Net Rentable Area Expiring | | % of NRA Expiring | | UW Base Rent Expiring(3) | | | % of UW Base Rent Expiring(3) | | Cumulative Net Rentable Area Expiring | | | Cumulative % of NRA Expiring | | Cumulative UW Base Rent Expiring(3) | | | Cumulative % of UW Base Rent Expiring(3) | |
| Vacant | | NAP | | 12,900 | | 4.1 | % | | NAP | | | NAP | | | 12,900 | | | 4.1 | % | | NAP | | | NAP | | |
| 2022 | | 0 | | 0 | | 0.0 | | | $0 | | | 0.0 | % | | 12,900 | | | 4.1 | % | | NAP | | | NAP | | |
| 2023 | | 0 | | 0 | | 0.0 | | | 0 | | | 0.0 | | | 12,900 | | | 4.1 | % | | NAP | | | NAP | | |
| 2024 | | 0 | | 0 | | 0.0 | | | 0 | | | 0.0 | | | 12,900 | | | 4.1 | % | | NAP | | | NAP | | |
| 2025 | | 0 | | 0 | | 0.0 | | | 0 | | | 0.0 | | | 12,900 | | | 4.1 | % | | NAP | | | NAP | | |
| 2026 | | 4 | | 15,891 | | 5.1 | | | 713,428 | | | 5.0 | | | 28,791 | | | 9.2 | % | | $713,428 | | | 5.0 | % | |
| 2027 | | 2 | | 10,565 | | 3.4 | | | 549,986 | | | 3.9 | | | 39,356 | | | 12.6 | % | | $1,263,414 | | | 8.9 | % | |
| 2028 | | 0 | | 0 | | 0.0 | | | 0 | | | 0.0 | | | 39,356 | | | 12.6 | % | | $1,263,414 | | | 8.9 | % | |
| 2029 | | 0 | | 0 | | 0.0 | | | 0 | | | 0.0 | | | 39,356 | | | 12.6 | % | | $1,263,414 | | | 8.9 | % | |
| 2030 | | 0 | | 0 | | 0.0 | | | 0 | | | 0.0 | | | 39,356 | | | 12.6 | % | | $1,263,414 | | | 8.9 | % | |
| 2031 | | 2 | | 8,363 | | 2.7 | | | 472,648 | | | 3.3 | | | 47,719 | | | 15.2 | % | | $1,736,062 | | | 12.2 | % | |
| 2032 & Beyond | | 18 | | 265,283 | | 84.8 | | | 12,500,521 | | | 87.8 | | | 313,002 | | | 100.0 | % | | $14,236,583 | | | 100.0 | % | |
| Total | | 26 | | 313,002 | | 100.0 | % | | $14,236,583 | | | 100.0 | % | | | | | | | | | | | | | |
| (1) | Based on the underwritten rent roll dated December 1, 2021. |
| (2) | Certain leases may have termination options that are exercisable prior to the originally stated expiration date of the lease and that are not considered in this Lease Rollover Schedule. |
| (3) | UW Base Rent Expiring, % of UW Base Rent Expiring, Cumulative UW Base Rent Expiring and Cumulative % of UW Base Rent Expiring include rent steps of approximately $162,744 through January 1, 2023. |
| THE INFORMATION IN THIS STRUCTURAL AND COLLATERAL TERM SHEET IS NOT COMPLETE AND MAY BE AMENDED PRIOR TO THE TIME OF SALE. THIS TERM SHEET IS NOT AN OFFER TO SELL THESE SECURITIES AND IT IS NOT A SOLICITATION OF AN OFFER TO BUY THESE SECURITIES IN ANY JURISDICTION WHERE THE OFFER OR SALE IS NOT PERMITTED. |
88
| Structural and Collateral Term Sheet | | BMO 2022-C2 |
| |
| No. 6 – 360 Rosemary |
The following table presents certain information relating to the underwritten cash flows of the 360 Rosemary Property:
| Operating History and Underwritten Net Cash Flow |
| | | Underwritten | | | Per Square Foot | | %(1) |
| Rents in Place(2) | | $14,073,839 | | | $44.96 | | | 56.5 | % |
| Rent Steps(3) | | 520,390 | | | 1.66 | | | 2.1 | |
| Vacant Income | | 645,000 | | | 2.06 | | | 2.6 | |
| Parking Income | | 1,346,810 | | | 4.30 | | | 5.4 | |
| Gross Potential Rent | | $16,586,039 | | | $52.99 | | | 66.6 | % |
| Total Reimbursements(4) | | 8,314,511 | | | 26.56 | | | 33.4 | |
| Net Rental Income | | $24,900,551 | | | $79.55 | | | 100.0 | % |
| Other Income | | 0 | | | 0.00 | | | 0.0 | |
| (Vacancy/Credit Loss) | | (1,245,028 | ) | | (3.98 | ) | | (5.0 | ) |
| Effective Gross Income | | $23,655,523 | | | $75.58 | | | 95.0 | % |
| Total Expenses | | $8,490,851 | | | $27.13 | | | 35.9 | % |
| Net Operating Income | | $15,164,673 | | | $48.45 | | | 64.1 | % |
| Total TI/LC, Capex/RR | | 359,952 | | | 1.15 | | | 1.5 | |
| Net Cash Flow | | $14,804,720 | | | $47.30 | | | 62.6 | % |
| (1) | % column represents percent of Net Rental Income for all revenue lines and represents percent of Effective Gross Income for the remainder of fields. |
| (2) | Based on the underwritten rent roll dated December 1, 2021. |
| (3) | Underwritten Rent Steps through January 1, 2023 includes approximately $357,646 for IG Tenants Credit rent and rent steps of approximately $162,744 through January 1, 2023. |
| (4) | Total Reimbursements include gross-up recoveries. |
The Market. The 360 Rosemary Property is located in West Palm Beach, Palm Beach County, Florida, in the central business district of West Palm Beach. The 360 Rosemary Property is situated in the West Palm Beach Central Business District submarket on South Rosemary Avenue between Evernia Street and Fern Street and is surrounded primarily by office and residential properties, service businesses, and ground level retail. A major influence for the immediate area is the access to the local highway system, as well as its proximity to beach access, public transportation, and Palm Beach International Airport. Major highways within one-to-two miles of the 360 Rosemary Property include Interstate 95, Route 1 and Route 5. The 360 Rosemary Property also benefits from its proximity to multiple museums, parks, higher education institutions and outdoor sport venues.
According to the appraisal, as of the third quarter of 2021, the Palm Beach office market had an inventory of approximately 25.6 million square feet, overall vacancy in the market of approximately 13.2% and average asking rent of $38.13 PSF. As of the third quarter of 2021, the West Palm Beach Central Business District office submarket had an inventory of approximately 2.7 million square feet, overall vacancy of approximately 19.9% and average asking rent of $58.99 PSF. Within the West Palm Beach Central Business District office submarket, Class A office space overall vacancy rates have improved due to the lease-up of the 360 Rosemary Property and reports an average asking rent of $63.75 PSF. Additionally, within the West Palm Beach Central Business District office submarket, the market inventory, vacancy and average asking rent are impacted by the One Flagler property, a proposed 277,000 square foot, Class A office building development located at 154 Lakeview Avenue is expected to be delivered in 2023. According to the appraisal, the 2021 population within a one-, three- and five-mile radius was 14,546, 77,323 and 184,155, respectively. The 2021 median household income within a one-, three- and five-mile radius was $68,423, $53,322 and $50,318, respectively.
| THE INFORMATION IN THIS STRUCTURAL AND COLLATERAL TERM SHEET IS NOT COMPLETE AND MAY BE AMENDED PRIOR TO THE TIME OF SALE. THIS TERM SHEET IS NOT AN OFFER TO SELL THESE SECURITIES AND IT IS NOT A SOLICITATION OF AN OFFER TO BUY THESE SECURITIES IN ANY JURISDICTION WHERE THE OFFER OR SALE IS NOT PERMITTED. |
89
| Structural and Collateral Term Sheet | | BMO 2022-C2 |
| |
| No. 6 – 360 Rosemary |
The following table presents certain information relating to comparable office leases for the 360 Rosemary Property:
| Comparable Office Leases(1) |
| Property Name/Location | Year Built/ Renovated | NRA (SF) | Occupancy(2) | Tenant | Lease Size (SF) | Rent PSF | Commencement | Lease Term (Years) | Lease Type |
360 Rosemary West Palm Beach, FL | 2021/NAP | 313,002 | 95.9%(3) | Various | Various | $47.44(4) | Various | Various | NNN |
1 N Clematis West Palm Beach, FL | 2001/NAP | 102,452 | 92.0% | NAV | 8,848 | $44.00 | May-21 | 3.0 Yrs. | NNN |
CityPlace Tower West Palm Beach, FL | 2008/NAP | 306,007 | 95.0% | NAV | 9,940 | $50.23 | Jun-21 | 10.3 Yrs. | NNN |
Phillips Point Office Complex West Palm Beach, FL | 1985/1988 | 437,188 | 100.0% | NAV | 7,209 | $59.00 | Sep-21 | 10.2 Yrs. | NNN |
Esperante West Palm Beach, FL | 1989/NAP | 460,394 | 94.0% | NAV | 10,930 | $55.00 | Sep-21 | 5.5 Yrs. | NNN |
One Flagler(2) West Palm Beach, FL | 2023/NAP | 277,000 | 15.0% | NAV | 8,437 | $75.00 | Jan-23 | 10.5 Yrs. | NNN |
| (2) | The One Flagler property is currently in lease up and is under construction and is expected to be completed in 2023. Excluding the proposed One Flagler building, the remaining comparable properties have a combined weighted average occupancy of approximately 96.1%. |
| (3) | Occupancy for the 360 Rosemary Property is based on the underwritten rent roll as of December 1, 2021. Occupancy is based on the percentage of net rentable area leased. Due to the recent completion of the 360 Rosemary Property, many tenants are currently in the process of building out their respective spaces and have not yet taken physical occupancy. |
| (4) | Based on the underwritten rent roll dated as of December 1, 2021, with rent steps of approximately $162,744 through January 1, 2023. |
The Borrower. The borrower is CityPlace North II, L.L.C., a Delaware limited liability company, structured to be a single purpose bankruptcy-remote entity with one independent director. Counsel to the borrower provided a non-consolidation opinion in connection with the origination of the 360 Rosemary Whole Loan.
The Borrower Sponsor. The borrower sponsor is The Related Companies, L.P. (“Related”). Related is a global real estate and lifestyle company with over $60 billion in assets owned or under development including the 28-acre Hudson Yards neighborhood on Manhattan’s West Side, The Grand and Related Santa Clara in California and the 78 in Chicago. Formed over 45 years ago, Related is one of the largest private owners of affordable housing with over 55,000 affordable and workforce housing units under ownership and management and is a fully integrated, highly diversified industry leader with experience in design, development, acquisitions, management, finance, hospitality, sustainability, and sales.
Property Management. The 360 Rosemary Property is managed by Related Urban Management Company Southeast L.L.C., a Delaware limited liability company, an affiliate of the borrower sponsor.
Escrows and Reserves. At origination, the borrower was required to deposit into escrow (i) $29,660,593 for tenant improvement, leasing commissions, and other leasing costs, (ii) $7,763,747 for free rent, (iii) $3,063,341 for gap rent, (iv) approximately $2,718,998 for completion of the base building work and (v) $2,291,872 for free recovery.
Tax Escrows – On a monthly basis during the continuance of a Trigger Period (as defined below) or an event of default under the 360 Rosemary Whole Loan documents, the borrower is required to escrow 1/12th of the annual estimated real estate taxes.
Insurance Escrows – On a monthly basis during the continuance of a Trigger Period or an event of default under the 360 Rosemary Whole Loan documents, the borrower is required to escrow 1/12th of the annual estimated insurance premium, provided that such monthly deposits are not required so long as a blanket or umbrella insurance policy acceptable to the lender and covering the 360 Rosemary Property is in effect.
TI/LC Reserve – On a monthly basis during the continuance of a Trigger Period, the borrower is required to escrow an amount equal to $19,804.19 for tenant improvement and leasing costs.
Replacement Reserve – On a monthly basis during the continuance of a Trigger Period, the borrower is required to escrow an amount equal to $3,960.84 for replacement reserves.
Lockbox / Cash Management. The 360 Rosemary Whole Loan is structured with a hard lockbox and springing cash management. The borrower is required to direct each tenant of the 360 Rosemary Property to deposit funds directly into the lockbox account controlled by the lender. Notwithstanding the foregoing, the borrower or property manager are required to deposit all revenues otherwise received relating to the property (other than tenant security deposits) into the lockbox account before the end of the first business day following receipt. On each business day during the continuance of a Trigger Period or event of default under the 360 Rosemary Whole Loan, all sums on deposit in the lockbox account are required to be swept to the cash management account. On each payment date during the continuance of a Trigger Period (or, at the lender’s discretion, during an event of default under the 360 Rosemary Mortgage Loan), all
| THE INFORMATION IN THIS STRUCTURAL AND COLLATERAL TERM SHEET IS NOT COMPLETE AND MAY BE AMENDED PRIOR TO THE TIME OF SALE. THIS TERM SHEET IS NOT AN OFFER TO SELL THESE SECURITIES AND IT IS NOT A SOLICITATION OF AN OFFER TO BUY THESE SECURITIES IN ANY JURISDICTION WHERE THE OFFER OR SALE IS NOT PERMITTED. |
90
| Structural and Collateral Term Sheet | | BMO 2022-C2 |
| |
| No. 6 – 360 Rosemary |
sums on deposit in the cash management account are required to be applied and disbursed in accordance with the 360 Rosemary Whole Loan documents. At the end of each business day that no Trigger Period or event of default under the 360 Rosemary Whole Loan is continuing, all amounts in the lockbox account are required to be remitted to a borrower-controlled operating account.
During the continuance of a Trigger Period, any excess cash is required to be deposited in the excess cash flow reserve account as additional security for the 360 Rosemary Whole Loan.
A “Trigger Period” means each period (i) commencing on the date on which the debt yield (as calculated in the 360 Rosemary Whole Loan documents), as determined as of the first day of any fiscal quarter commencing after the fourth fiscal quarter of 2022, is less than 5.0% (a “Debt Yield Trigger”) and will continue until the debt yield is at least 5.0% as of the first day of two consecutive fiscal quarters, and (ii) commencing upon the borrower’s failure to deliver financial reports as and when required under the 360 Rosemary Whole Loan documents and concluding when such reports are delivered and indicate that no other Trigger Period is continuing.
“Guaranty” means that certain guaranty of recourse obligations dated as of January 18, 2022, made by The Related Companies, L.P. (“Guarantor”) in connection with the 360 Rosemary Whole Loan, that contains, among other things, the provisions that throughout the term of the 360 Rosemary Whole Loan, Guarantor shall maintain (A) a minimum net worth (exclusive of any interest in the 360 Rosemary Property) of $210 million and (B) minimum liquidity of $10 million.
Subordinate and Mezzanine Debt. On January 18, 2022, BMO funded the 360 Rosemary Subordinate Companion Loans in the aggregate amount of $125,000,000. The 360 Rosemary Senior Loan is senior in right of payment and in other respects to the 360 Rosemary Subordinate Companion Loans, and the 360 Rosemary Subordinate Companion B Loan is senior in right of payment and in other respects to the 360 Rosemary Subordinate Companion C Loan. The 360 Rosemary Subordinate Companion B Loan was an asset of the BMO 2022-C1 securitization trust but was pooled together with the other mortgage loans and payments of interest, principal and other amounts received in respect of the 360 Rosemary Subordinate Companion B Loan and allocable thereto will be available to make distributions in respect of the related classes of loan-specific classes of certificates only. The 360 Rosemary Subordinate Companion B Loan and the 360 Rosemary Subordinate Companion C Loan will have initial interest rates of 3.95000% and 3.95000% per annum, respectively, and are coterminous with the 360 Rosemary Senior Loan. The relative rights and obligations of the holders of the 360 Rosemary Whole Loan are governed by the terms of a co-lender agreement. See “Description of the Mortgage Pool—The Whole Loans—The 360 Pari Passu AB Whole Loan” in the Preliminary Prospectus. Based on the 360 Rosemary Whole Loan, the Cut-off Date LTV, Maturity Date LTV, UW NCF DSCR and UW NOI Debt Yield are 65.8%, 65.8%, 1.76x and 7.2%, respectively.
Partial Release. Not permitted.
Ground Lease. None.
| THE INFORMATION IN THIS STRUCTURAL AND COLLATERAL TERM SHEET IS NOT COMPLETE AND MAY BE AMENDED PRIOR TO THE TIME OF SALE. THIS TERM SHEET IS NOT AN OFFER TO SELL THESE SECURITIES AND IT IS NOT A SOLICITATION OF AN OFFER TO BUY THESE SECURITIES IN ANY JURISDICTION WHERE THE OFFER OR SALE IS NOT PERMITTED. |
91
| Structural and Collateral Term Sheet | | BMO 2022-C2 |
| |
| No. 7 – Bell Works |
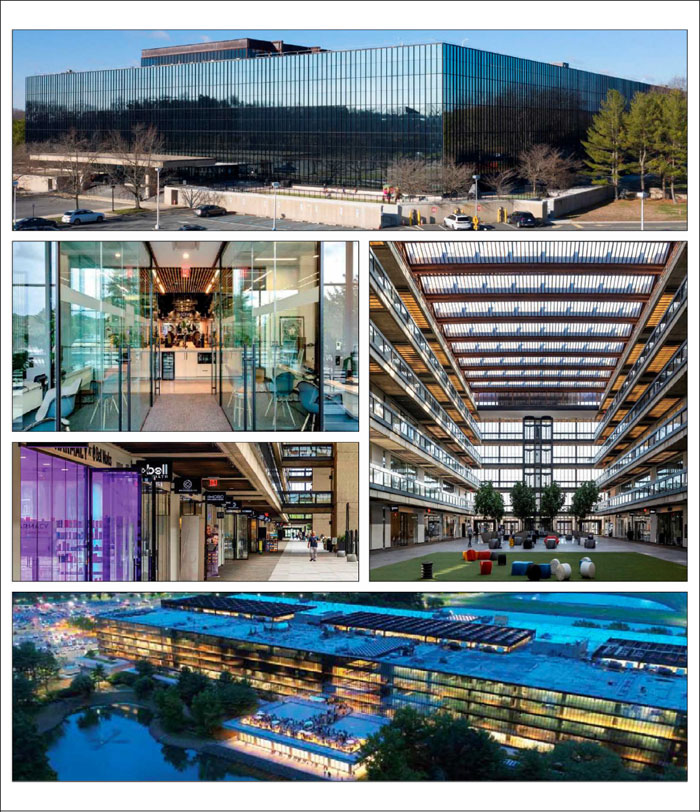
| THE INFORMATION IN THIS STRUCTURAL AND COLLATERAL TERM SHEET IS NOT COMPLETE AND MAY BE AMENDED PRIOR TO THE TIME OF SALE. THIS TERM SHEET IS NOT AN OFFER TO SELL THESE SECURITIES AND IT IS NOT A SOLICITATION OF AN OFFER TO BUY THESE SECURITIES IN ANY JURISDICTION WHERE THE OFFER OR SALE IS NOT PERMITTED. |
92
| Structural and Collateral Term Sheet | | BMO 2022-C2 |
| |
| No. 7 – Bell Works |
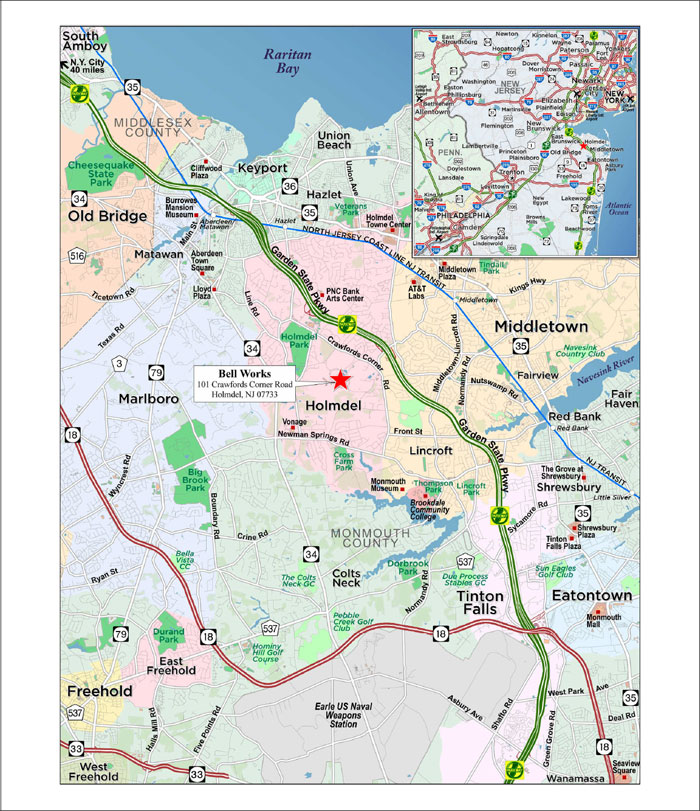
| THE INFORMATION IN THIS STRUCTURAL AND COLLATERAL TERM SHEET IS NOT COMPLETE AND MAY BE AMENDED PRIOR TO THE TIME OF SALE. THIS TERM SHEET IS NOT AN OFFER TO SELL THESE SECURITIES AND IT IS NOT A SOLICITATION OF AN OFFER TO BUY THESE SECURITIES IN ANY JURISDICTION WHERE THE OFFER OR SALE IS NOT PERMITTED. |
93
| Structural and Collateral Term Sheet | | BMO 2022-C2 |
| |
| No. 7 – Bell Works |
| Mortgage Loan Information | | Property Information |
| Mortgage Loan Seller: | CREFI, BMO | | Single Asset / Portfolio: | Single Asset |
| Original Principal Balance(1): | $30,000,000 | | Title: | Fee |
| Cut-off Date Principal Balance(1): | $30,000,000 | | Property Type – Subtype: | Office – Suburban |
| % of IPB: | 4.2% | | Net Rentable Area (SF): | 1,371,470 |
| Loan Purpose: | Refinance | | Location: | Holmdel, NJ |
| Borrower: | Somerset Holmdel Development I Urban Renewal, L.P. | | Year Built / Renovated: | 1962, 1964, 1982 / 2017 |
| Borrower Sponsors: | Ralph Zucker and Jozef Straus | | Occupancy: | 90.5% |
| Interest Rate: | 5.11000% | | Occupancy Date: | 2/1/2022 |
| Note Date: | 4/8/2022 | | 4th Most Recent NOI (As of): | $6,648,528 (12/31/2019) |
| Maturity Date: | 5/6/2032 | | 3rd Most Recent NOI (As of): | $11,557,609 (12/31/2020) |
| Interest-only Period: | 120 months | | 2nd Most Recent NOI (As of): | $15,787,125 (12/31/2021) |
| Original Term: | 120 months | | Most Recent NOI (As of)(5): | $15,179,689 (TTM 2/28/2022) |
| Original Amortization Term: | None | | UW Economic Occupancy: | 88.7% |
| Amortization Type: | Interest Only | | UW Revenues: | $37,490,628 |
| Call Protection(3): | L(26),D(91),O(3) | | UW Expenses: | $17,715,360 |
| Lockbox / Cash Management: | Hard / Springing | | UW NOI(5): | $19,775,267 |
| Additional Debt(2): | Yes | | UW NCF: | $18,261,235 |
| Additional Debt Balance(2): | $180,000,000 | | Appraised Value / Per SF: | $335,200,000 / $244 |
| Additional Debt Type(2): | Pari Passu | | Appraisal Date: | 1/31/2022 |
| | | |
| Escrows and Reserves(4) | | Financial Information(1) |
| | Initial | Monthly | Initial Cap | | Cut-off Date Loan / SF: | $153 | |
| Taxes: | $617,834 | $308,917 | N/A | | Maturity Date Loan / SF: | $153 | |
| Insurance: | $0 | Springing | N/A | | Cut-off Date LTV: | 62.6% | |
| Replacement Reserves: | $0 | $24,583 | N/A | | Maturity Date LTV: | 62.6% | |
| TI / LC: | $8,500,000 | Springing | $8,500,000 | | UW NCF DSCR: | 1.68x | |
| Other: | $6,778,984 | Springing | N/A | | UW NOI Debt Yield: | 9.4% | |
| | | | | | | |
| Sources and Uses |
| Sources | Proceeds | % of Total | | Uses | Proceeds | % of Total |
| Whole Loan(1) | $210,000,000 | 100.0% | | Loan Payoff | $170,604,822 | 81.2% |
| | | | | Sponsor Equity | 20,132,200 | 9.6 |
| | | | | Upfront Reserves | 15,896,818 | 7.6 |
| | | | | Closing Costs | 3,366,160 | 1.6 |
| Total Sources | $210,000,000 | 100.0% | | Total Uses | $210,000,000 | 100.0% |
| | | | | | | | |
| (1) | The financial information presented in the charts above is calculated based on the aggregate outstanding principal balance of the Bell Works Whole Loan (as defined below). |
| (2) | The Bell Works Mortgage Loan (as defined below) is part of the Bell Works Whole Loan, which is comprised of 13 pari passu promissory notes with an aggregate original balance of $210,000,000. The Bell Works Whole Loan was co-originated by Citi Real Estate Funding, Inc. (“CREFI”), Bank of Montreal (“BMO”) and Barclays Capital Real Estate Inc. (“BCREI”). |
| (3) | Voluntary prepayment of the Bell Works Whole Loan is prohibited prior to the due date occurring in March 2032. Defeasance of the Bell Works Whole Loan in whole (but not in part) is permitted at any time after the earlier of (i) April 8, 2026 and (ii) the second anniversary of the closing date of the securitization that includes the last note of the Bell Works Whole Loan to be securitized. The assumed defeasance lockout period of 26 payments is based on the anticipated closing date of the BMO 2022-C2 securitization trust in July 2022. The actual lockout period may be longer. |
| (4) | See “Escrows and Reserves” below. |
| (5) | The increase from Most Recent NOI (As of) to UW NOI is primarily attributable to potential income from vacant space and contractual rent steps. |
The Loan. The seventh largest mortgage loan (the “Bell Works Mortgage Loan”) is part of a whole loan (the “Bell Works Whole Loan”) that is secured by the borrower’s fee interest in a 1,371,470 square foot office property located in Holmdel, New Jersey (the “Bell Works Property”). The Bell Works Whole Loan is comprised of 13 pari passu notes, with an aggregate outstanding principal balance as of the Cut-off Date of $210,000,000. The Bell Works Mortgage Loan is evidenced by non-controlling Notes A-3-1 and A-5 with an outstanding principal balance as of the Cut-off Date of $30,000,000 and represents approximately 4.2% of the Initial Pool Balance.
The Bell Works Whole Loan will be serviced pursuant to the pooling and servicing agreement for the Benchmark 2022-B35 securitization. The Bell Works Whole Loan was co-originated on April 8, 2022 by CREFI, BMO and BCREI and accrues interest at a fixed rate of
| THE INFORMATION IN THIS STRUCTURAL AND COLLATERAL TERM SHEET IS NOT COMPLETE AND MAY BE AMENDED PRIOR TO THE TIME OF SALE. THIS TERM SHEET IS NOT AN OFFER TO SELL THESE SECURITIES AND IT IS NOT A SOLICITATION OF AN OFFER TO BUY THESE SECURITIES IN ANY JURISDICTION WHERE THE OFFER OR SALE IS NOT PERMITTED. |
94
| Structural and Collateral Term Sheet | | BMO 2022-C2 |
| |
| No. 7 – Bell Works |
5.11000% per annum. The Bell Works Whole Loan has an initial term of 120 months, a remaining term of 118 months and is interest-only for the full term. The scheduled maturity date of the Bell Works Whole Loan is the due date that occurs in May 2032. The proceeds of the Bell Works Whole Loan were used to refinance the Bell Works Property, pay origination costs, fund upfront reserves and return equity to the borrower sponsor.
The table below summarizes the promissory notes that comprise the Bell Works Whole Loan. The relationship between the holders of the Bell Works Whole Loan is governed by a co-lender agreement as described under “Description of the Mortgage Pool—The Whole Loans—The Outside Serviced Pari Passu Whole Loans” in the Preliminary Prospectus.
| Whole Loan Summary |
| Note | Original Balance | Cut-off Date Balance | Note Holder | Controlling Piece |
| A-1 | $50,000,000 | $50,000,000 | Benchmark 2022-B35 | Yes |
| A-2-1 | $20,000,000 | $20,000,000 | CGCMT 2022-GC48 | No |
| A-2-2 | $5,000,000 | $5,000,000 | CREFI(1) | No |
| A-3-1 | $15,000,000 | $15,000,000 | BMO 2022-C2 | No |
| A-3-2 | $10,000,000 | $10,000,000 | CREFI(1) | No |
| A-4 | $20,000,000 | $20,000,000 | CGCMT 2022-GC48 | No |
| A-5 | $15,000,000 | $15,000,000 | BMO 2022-C2 | No |
| A-6 | $15,000,000 | $15,000,000 | BMO(1) | No |
| A-7 | $10,000,000 | $10,000,000 | BMO(1) | No |
| A-8 | $10,000,000 | $10,000,000 | BMO(1) | No |
| A-9 | $25,000,000 | $25,000,000 | BBCMS 2022-C16 | No |
| A-10 | $10,000,000 | $10,000,000 | BBCMS 2022-C16 | No |
| A-11 | $5,000,000 | $5,000,000 | BBCMS 2022-C16 | No |
| Whole Loan | $210,000,000 | $210,000,000 | | |
| (1) | Expected to be contributed to one or more future securitization transactions. |
The Property. The collateral for the Bell Works Whole Loan is a five-story Class A suburban office building located in Holmdel, New Jersey totaling 1,371,470 square feet. The Bell Works Property was built in phases in 1962, 1964, and 1982 and recently renovated in 2017. The Bell Works Property is comprised of office and ground floor retail spaces and features a multi-story glass auditorium in the center of the Bell Works Property. The Bell Works Property also features a 360-seat auditorium, banquet room, roof deck, daycare and fitness center. Onsite parking is provided at the Bell Works Property by 4,263 surface parking spaces, resulting in a parking ratio of approximately 3.1 spaces per 1,000 square feet. As of February 1, 2022, the Bell Works Property was 90.5% occupied by 108 tenants with the largest tenant accounting for 24.2% of NRA and no other tenant accounting for greater than 6.7% of NRA.
COVID-19 Update. As of June 6, 2022, the Bell Works Property was open and operational. As of June 6, 2022, no tenants are receiving any rent deferrals or abatements due to the COVID-19 Pandemic. As of June 6, 2022, the Bell Works Whole Loan is not subject to any modifications or forbearance requests. The first payment date of the Bell Works Whole Loan was June 6, 2022.
Major Tenants. The three largest tenants based on underwritten base rent are iCIMS, Inc., Guardian Life Insurance Company of America and Jersey Central Power & Light Company.
The largest tenant based on underwritten base rent is iCIMS, Inc. (“iCIMS”) (331,378 square feet; 24.2% of NRA; 25.1% of underwritten base rent). iCIMS is a software company that specializes in talent acquisition and is headquartered at the Bell Works Property. iCIMS has approximately 4,000 clients, including 40 Fortune 100 companies, and has 2.4 million global platform users. iCIMS talent cloud platform offers employers a single comprehensive talent recruitment platform that connects employers’ human resource and recruitment solutions. iCIMS has been in occupancy at the Bell Works Property since December 2017 with an original lease for 186,602 square feet and has expanded its space at the Bell Works Property by an additional 72,388 square feet in both August 2019 and February 2021. iCIMS current lease expires in November 2032 and has one, two-year extension option followed by two, five-year extension options. iCIMS is currently “dark” in approximately 75,000 square feet of its demised premises. The Bell Works Whole Loan documents provide that iCIMS will not be deemed to be dark with respect to such space to the extent that (w) iCIMS has not alleged in writing any default by the borrower with respect to such space (including, without limitation, any failure to perform any landlord work and/or to pay any tenant allowance), (x) iCIMS has paid and continues to pay full unabated rent with respect to the entire demised premises, (y) iCIMS has not requested in writing any reduction in rent with respect to such space, and (z) iCIMS continues to occupy, and be open for business in, the balance of its demised premises.
The second largest tenant based on underwritten base rent is Guardian Life Insurance Company of America (“Guardian”) (91,319 square feet; 6.7% of NRA; 8.9% of underwritten base rent; Moody’s/S&P/Fitch; NR/AA+/NR). Guardian was founded in 1860 in New York City, where it is still headquartered. Guardian is one of the largest mutual life insurance companies in the United States with $9.3 billion in capital and $1.7 billion in operating income. Guardian serves approximately 29 million people through life insurance products, dental, accident, and disability insurance as well as individual retirement account programs and 401k products. Guardian currently employs
| THE INFORMATION IN THIS STRUCTURAL AND COLLATERAL TERM SHEET IS NOT COMPLETE AND MAY BE AMENDED PRIOR TO THE TIME OF SALE. THIS TERM SHEET IS NOT AN OFFER TO SELL THESE SECURITIES AND IT IS NOT A SOLICITATION OF AN OFFER TO BUY THESE SECURITIES IN ANY JURISDICTION WHERE THE OFFER OR SALE IS NOT PERMITTED. |
95
| Structural and Collateral Term Sheet | | BMO 2022-C2 |
| |
| No. 7 – Bell Works |
approximately 9,000 individuals and has a network of over 2,500 financial representatives. Guardian’s lease at the Bell Works Property commenced in January 2018 and expires in December 2032 followed by three, five-year extension options.
The third largest tenant based on underwritten base rent is Jersey Central Power & Light Company (“JCP&L”) (69,870 square feet; 5.1% of NRA; 5.8% of underwritten base rent; Moody’s/S&P/Fitch: A3/BBB/BBB). JCP&L is an electrical utility company servicing approximately 1.1 million customers in central and northern New Jersey and is a subsidiary of FirstEnergy Corporation. JCP&L has been a tenant at the Bell Works Property since May 2017 and has a current lease term though December 2027 followed by two, five-year extension options.
Environmental. According to the Phase I environmental report dated as of February 14, 2022, a recognized environmental condition was identified related to a spill incident at the Bell Works Property which is currently undergoing remedial investigation. See “Description of the Mortgage Pool—Environmental Considerations” in the Preliminary Prospectus.
The following table presents certain information relating to the historical occupancy of the Bell Works Property:
| | Historical and Current Occupancy |
| 2019(1) | 2020(1) | 2021(1) | Current(2) |
| 65.9% | 76.6% | 85.9% | 90.5% |
| (1) | As provided by the borrowers and represents average annual occupancy for the indicated year unless otherwise specified. |
| (2) | Based on the underwritten rent roll dated February 1, 2022. |
The following table presents certain information relating to the largest tenants based on underwritten base rent of the Bell Works Property:
| Top Tenant Summary(1) |
| Tenant | Ratings
Moody’s/S&P/
Fitch(2) | Net
Rentable
Area
(SF) | % of
Total
NRA | UW Base Rent
PSF(3) | UW Base
Rent(3) | % of Total
UW Base
Rent(3) | Lease Exp.
Date |
| iCIMS(4) | NR/NR/NR | 331,378 | | 24.2 | % | $24.96 | $8,271,612 | | 25.1 | % | 11/30/2032 |
| Guardian(5) | NR/AA+/NR | 91,319 | | 6.7 | | $32.00 | 2,922,027 | | 8.9 | | 12/31/2032 |
| Jersey Central Power & Light Company | A3/BBB/BBB | 69,870 | | 5.1 | | $27.51 | 1,921,789 | | 5.8 | | 12/31/2027 |
| WorkWave LLC | NR/NR/NR | 71,667 | | 5.2 | | $26.50 | 1,899,176 | | 5.8 | | 5/27/2029 |
| International Flavors & Fragrances, L.P. | Baa3/BBB/BBB | 60,104 | | 4.4 | | $30.68 | 1,844,047 | | 5.6 | | 9/30/2033 |
| Cisco Systems | A1/AA-/NR | 49,998 | | 3.6 | | $26.24 | 1,312,182 | | 4.0 | | 12/31/2023 |
| Santander Bank, N.A.(6) | A2/A+/NR | 38,954 | | 2.8 | | $31.00 | 1,207,574 | | 3.7 | | 4/30/2028 |
| Central Reach | NR/NR/NR | 26,615 | | 1.9 | | $36.00 | 958,140 | | 2.9 | | 10/31/2032 |
| Vonage | NR/NR/NR | 25,517 | | 1.9 | | $33.50 | 854,820 | | 2.6 | | 4/30/2027 |
| Spirent Communications(7) | NR/NR/NR | 34,389 | | 2.5 | | $23.89 | 821,563 | | 2.5 | | 2/28/2030 |
| Largest Tenants | | 799,811 | | 58.3 | % | $27.52 | $22,012,929 | | 66.7 | % | |
| Remaining Tenants | | 440,996 | | 32.2 | | $24.92 | 10,990,333 | | 33.3 | | |
| Total Occupied | | 1,240,807 | | 90.5 | % | $26.60 | $33,003,261 | | 100.0 | % | |
| Vacant Space | | 130,663 | | 9.5 | | | | | |
| Total / Wtd. Avg. All Tenants | | 1,371,470 | | 100.0 | % | | | | |
| (1) | Based on the underwritten rent roll dated February 1, 2022. |
| (2) | Credit Ratings are those of the parent company whether or not the parent guarantees the lease. |
| (3) | UW Base Rent PSF, UW Base Rent, and % of Total UW Base Rent are inclusive of approximately $964,855 of contractual rent steps through March 1, 2023. Rent steps for Santander Bank, N.A. are underwritten through September 2023, as the tenant has an option to terminate effective August 31, 2024. |
| (4) | iCIMS, Inc. has one, two-year extension option followed by two, five-year extension options. |
| (5) | Guardian has three, five-year extension options, Jersey Central Power & Light Company, WorkWave LLC, International Flavors & Fragrances, L.P., Cisco Systems, Santander Bank N.A. and Central Reach all have two, five-year extension options. Vonage has two, two-year extension options. |
| (6) | Santander Bank, N.A. may terminate its lease effective August 31, 2024 with 12 months prior notice and subject to the payment of a termination fee. |
| (7) | Spirent Communications has a one-time right to terminate its lease in its entirety or in part as of February 28, 2027, with nine months’ notice and payment of a termination fee. |
| THE INFORMATION IN THIS STRUCTURAL AND COLLATERAL TERM SHEET IS NOT COMPLETE AND MAY BE AMENDED PRIOR TO THE TIME OF SALE. THIS TERM SHEET IS NOT AN OFFER TO SELL THESE SECURITIES AND IT IS NOT A SOLICITATION OF AN OFFER TO BUY THESE SECURITIES IN ANY JURISDICTION WHERE THE OFFER OR SALE IS NOT PERMITTED. |
96
| Structural and Collateral Term Sheet | | BMO 2022-C2 |
| |
| No. 7 – Bell Works |
The following table presents certain information relating to the tenant lease expirations of the Bell Works Property:
| Lease Rollover Schedule(1)(2) |
| Year | Number of
Leases
Expiring | Net
Rentable
Area
Expiring | % of NRA
Expiring | UW Base
Rent
Expiring(3) | % of UW
Base Rent
Expiring(3) | Cumulative Net
Rentable Area
Expiring | Cumulative
% of NRA
Expiring | Cumulative
UW Base Rent
Expiring(3) | Cumulative %
of UW
Base Rent
Expiring |
| Vacant | NAP | | 130,663 | | 9.5 | % | NAP | | NAP | 130,663 | | 9.5 | % | NAP | | NAP |
| MTM | 2 | | 1,662 | | 0.1 | | $0 | | 0.0 | % | 132,325 | | 9.6 | % | $0 | | 0.0 | % |
| 2022 | 18 | | 42,134 | | 3.1 | | 1,218,576 | | 3.7 | | 174,459 | | 12.7 | % | $1,218,576 | | 3.7 | % |
| 2023 | 15 | | 78,933 | | 5.8 | | 2,394,956 | | 7.3 | | 253,392 | | 18.5 | % | $3,613,531 | | 10.9 | % |
| 2024 | 12 | | 23,561 | | 1.7 | | 865,476 | | 2.6 | | 276,953 | | 20.2 | % | $4,479,008 | | 13.6 | % |
| 2025 | 8 | | 44,562 | | 3.2 | | 1,316,138 | | 4.0 | | 321,515 | | 23.4 | % | $5,795,145 | | 17.6 | % |
| 2026 | 10 | | 41,427 | | 3.0 | | 1,309,163 | | 4.0 | | 362,942 | | 26.5 | % | $7,104,309 | | 21.5 | % |
| 2027 | 6 | | 99,957 | | 7.3 | | 2,923,188 | | 8.9 | | 462,899 | | 33.8 | % | $10,027,497 | | 30.4 | % |
| 2028 | 6 | | 87,830 | | 6.4 | | 2,353,695 | | 7.1 | | 550,729 | | 40.2 | % | $12,381,192 | | 37.5 | % |
| 2029 | 14 | | 146,993 | | 10.7 | | 4,008,535 | | 12.1 | | 697,722 | | 50.9 | % | $16,389,726 | | 49.7 | % |
| 2030 | 10 | | 118,084 | | 8.6 | | 2,571,170 | | 7.8 | | 815,806 | | 59.5 | % | $18,960,896 | | 57.5 | % |
| 2031 | 0 | | 0 | | 0.0 | | 0 | | 0.0 | | 815,806 | | 59.5 | % | $18,960,896 | | 57.5 | % |
| 2032 | 5 | | 470,976 | | 34.3 | | 12,198,319 | | 37.0 | | 1,286,782 | | 93.8 | % | $31,159,215 | | 94.4 | % |
| 2033 & Beyond | 3 | | 84,688 | | 6.2 | | 1,844,047 | | 5.6 | | 1,371,470 | | 100.0 | % | $33,003,261 | | 100.0 | % |
| Total | 109 | | 1,371,470 | | 100.0 | % | $33,003,261 | | 100.0 | % | | | | |
| (1) | Certain tenants may have termination or contraction options that may become exercisable prior to the originally stated expiration date of the tenant lease that are not considered in this rollover schedule. |
| (2) | Based on the underwritten rent roll dated February 1, 2022. |
| (3) | UW Base Rent Expiring, % of UW Base Rent Expiring and Cumulative UW Base Rent Expiring are inclusive of approximately $964,855 of contractual rent steps through March 1, 2023. Rent steps for Santander Bank, N.A. are underwritten through September 2023, as the tenant has an option to terminate effective August 31, 2024. |
The following table presents certain information relating to the underwritten cash flows of the Bell Works Property:
| Operating History and Underwritten Net Cash Flow |
| | 2019 | 2020 | 2021 | TTM(1)(2) | Underwritten(2) | Per Square Foot | %(3) |
| Base Rent(4) | $23,043,362 | | $26,208,072 | | $29,412,960 | | $29,943,564 | | 32,038,407 | | $23.36 | | 76.3 | % |
| Contractual Rent Steps(5) | 0 | | 0 | | 0 | | 0 | | 964,855 | | $0.70 | | 2.3 | |
| Potential Income from Vacant Space | 0 | | 0 | | 0 | | 0 | | 4,503,866 | | $3.28 | | 10.7 | |
| Total Reimbursements | 874,111 | | 688,729 | | 1,584,115 | | 1,084,401 | | 2,133,820 | | $1.56 | | 5.1 | |
| Other Income(6) | 568,329 | | 341,475 | | 959,018 | | 996,252 | | 1,330,546 | | $0.97 | | 3.2 | |
| Event Revenue (net)(7) | 8,314 | | 37,558 | | 158,948 | | 226,082 | | 1,023,000 | | $0.75 | | 2.4 | |
| Gross Potential Rent | $24,494,116 | | $27,275,834 | | $32,115,041 | | $32,250,300 | | $41,994,494 | | $30.62 | | 100.0 | % |
| Vacancy & Credit Loss | (4,177,860 | ) | (2,236,002 | ) | (433,620 | ) | (492,980 | ) | (4,503,866 | ) | (3.28 | ) | (10.7 | ) |
| Effective Gross Income | $20,316,256 | | $25,039,832 | | $31,681,421 | | $31,757,320 | | $37,490,628 | | $27.34 | | 89.3 | % |
| Real Estate Taxes | 2,079,066 | | 2,718,393 | | 2,988,992 | | 3,516,964 | | 3,707,005 | | $2.70 | | 9.9 | |
| Insurance | 667,837 | | 774,217 | | 893,360 | | 900,110 | | 858,262 | | $0.63 | | 2.3 | |
| Management Fee | 728,324 | | 861,280 | | 1,089,879 | | 1,109,805 | | 1,312,172 | | $0.96 | | 3.5 | |
| Other Operating Expenses | 10,192,501 | | 9,128,333 | | 10,922,065 | | 11,050,751 | | 11,837,921 | | $8.63 | | 31.6 | |
| Total Expenses | $13,667,728 | | $13,482,223 | | $15,894,296 | | $16,577,630 | | $17,715,360 | | $12.92 | | 47.3 | % |
| Net Operating Income(2) | $6,648,528 | | $11,557,609 | | $15,787,125 | | $15,179,689 | | $19,775,267 | | $14.42 | | 52.7 | % |
| Replacement Reserves | 0 | | 0 | | 0 | | 0 | | 295,000 | | $0.22 | | 0.8 | |
| TI / LC | 0 | | 0 | | 0 | | 0 | | 1,219,032 | | $0.89 | | 3.3 | |
| Net Cash Flow | $6,648,528 | | $11,557,609 | | $15,787,125 | | $15,179,689 | | $18,261,235 | | $13.32 | | 48.7 | % |
| (1) | TTM represents the trailing 12 months ending February 28, 2022. |
| (2) | The increase from TTM Net Operating Income to Underwritten Net Operating Income is primarily attributable to potential income from vacant space and contractual rent steps. |
| (3) | % column represents percent of Gross Potential Rent for all revenue lines and represents percent of Effective Gross Income for the remainder of the fields. |
| (4) | Base Rent is based on the underwritten rent roll as of February 1, 2022. |
| (5) | Underwritten Contractual Rent Steps totaling $964,855 are underwritten through March 1, 2023. Rent steps for Santander Bank, N.A. are underwritten through September 2023, as the tenant has an option to terminate its lease effective August 31, 2024. |
| (6) | Other Income includes overtime HVAC reimbursements and net income from co-working space. |
| (7) | Event Revenue (net) includes net event revenue, access control fees, and other miscellaneous income. |
| THE INFORMATION IN THIS STRUCTURAL AND COLLATERAL TERM SHEET IS NOT COMPLETE AND MAY BE AMENDED PRIOR TO THE TIME OF SALE. THIS TERM SHEET IS NOT AN OFFER TO SELL THESE SECURITIES AND IT IS NOT A SOLICITATION OF AN OFFER TO BUY THESE SECURITIES IN ANY JURISDICTION WHERE THE OFFER OR SALE IS NOT PERMITTED. |
97
| Structural and Collateral Term Sheet | | BMO 2022-C2 |
| |
| No. 7 – Bell Works |
The Market. The Bell Works Property is located in Holmdel, New Jersey within Monmouth County and is considered part of Central New Jersey. As of 2020, the Central New Jersey area had a population of approximately 2.8 million people. Central New Jersey offers a mix of industry employment with the professional & business services and education & health services sectors accounting for 20% and 16.5% of total employment, respectively. Primary access to the Bell Works Property is via the Garden State Parkway and State Routes 35 and 34, all of which run through Holmdel, New Jersey.
The Bell Works Property is located in the Central New Jersey Office submarket. As of the third quarter of 2021, the submarket had an inventory of 84,070,150 square feet, a direct vacancy rate of 15.9% and a direct average Class A office base rent of $32.21 per square foot. Furthermore, as of the third quarter of 2021, Monmouth County had 12,028,106 square feet of office space, a direct vacancy rate of 8.7% and a direct average Class A office rent of $32.95 per square foot.
According to the appraisal, the 2021 population and average household income within a one-, three- and five-mile radius of the Bell Works Property was 1,658, 26,186, and 127,105 and $254,706, $238,948 and $169,488, respectively.
The following table presents certain information relating to comparable office leases for the Bell Works Property:
| Comparable Office Leases(1) |
| Property Names | Tenant Name | City / State | Tenant Leased Space (SF) | Lease Sign Date | Lease Term (months) | Base Rent
Per / SF |
| Bell Works | iCIMS, Inc. | Holmdel / NJ | 331,378(2) | December 2017(2) | 180(2) | $24.96(2) |
| West Windsor Commons | Bristol Myers Squibb | West Windsor / NJ | 117,828 | November 2020 | 90 | $35.00 |
| Princeton Forrestal Center | Croda International | Plainsboro / NJ | 61,696 | April 2020 | 138 | $31.50 |
| 250 Industrial Way West | Tyco Submarine Systems | Eatontown / NJ | 138,163 | October 2019 | 120 | $29.26 |
| The Offices at Metropark | IBM | Edison / NJ | 155,000 | June 2019 | 64 | $41.00 |
| (2) | Based on the underwritten rent roll dated February 1, 2022. |
The Borrower. The borrower is Somerset Holmdel Development I Urban Renewal, L.P., a New Jersey limited partnership and single purpose entity with one independent director. Legal counsel to the borrower delivered a non-consolidation opinion in connection with the origination of the Bell Works Whole Loan.
The borrower leases the Bell Works Property to Bell Works Master Tenant, LLC, a New Jersey limited liability company (the “Master Lessee”) pursuant to the terms of that certain Master Lease Agreement dated December 14, 2017, as amended (the “Master Lease”) under which the Master Lessee operates the Bell Works Property and pays rent to the borrower. The borrower elected to pass-through to the Master Lessee certain historic rehabilitation tax credits (“HTCs”) to which the borrower is entitled as a result of expenditures incurred in connection with the certified rehabilitation of the Bell Works Property, and the HTCs are not collateral for the Bell Works Whole Loan. An affiliate of the borrower (the “Managing Member of the Master Lessee”) retains a one percent controlling interest in the Master Lessee. The entity which owns 100% of the Managing Member of the Master Lessee has pledged its ownership interest in the Managing Member of the Master Lessee to the lender as collateral for the Bell Works Whole Loan. Pursuant to a subordination, non-disturbance and attornment agreement (the “HTC SNDA”) among the lender, the borrower, the Master Lessee and the 99% equity interest owner of Master Lessee (the “HTC Investor”), the Master Lease is subordinate to the lien of the mortgage in exchange for the lender’s agreement to not terminate the Master Lease until the next business day following the fifth anniversary of the date on which the last qualified rehabilitation expenditure as with respect to the Bell Works Property is first placed in service, but in no event later than April 1, 2026 (the “HTC Recapture Period Expiration Date”). In addition, pursuant to the HTC SNDA the lender must provide HTC Investor with prior written notice of its intention to commence any enforcement action (such as foreclosure) under the Bell Works Whole Loan documents, the lender must provide HTC Investor with all notices of default under the Bell Works Whole Loan documents, and HTC Investor has a cure period of not less than 10 days with respect to all such defaults. Pursuant to the operating agreement of the Master Lessee, HTC Investor is entitled to certain distributions subject to available cash flow, including an annual “priority return” equal to two percent of its paid-in capital contributions to the Master Lessee. Pursuant to a certain put option agreement between the Managing Member of the Master Lessee and the HTC Investor, the HTC Investor has a put option to cause the Managing Member of the Master Lessee to purchase all the HTC Investor’s interests in the Master Lessee during the three-month period following the occurrence of the HTC Recapture Period Expiration Date (the “Put Option”). In addition, HTC Investor has certain rights to replace borrower’s general partner and/or the Managing Member of the Master Lessee, subject to the terms and conditions set forth in the HTC SNDA.
The lender has also agreed that, prior to the HTC Recapture Period Expiration Date, on each due date following the first occurrence of a Trigger Period (as defined below), regardless of the existence of an event of default it will disburse to the Master Lessee any revenues from the Bell Works Property that exceed the sum of (i) base Master Lease rent (a portion of which may be subject to deferral due to the unavailable of net operating income, as more particularly described in the Master Lease), (ii) 1/12th of the estimated annual additional rent under the Master Lease (which is calculated based, in part, on net cash flow generated by the Bell Works Property and is payable annually to the extent of available net cash flow), (iii) the monthly replacement reserve deposit amount, (iv) the monthly TI / LC reserve deposit amount (if any), (v) during a Trigger Period, the monthly operating expense amount pursuant to the approved annual budget, and (vi)
| THE INFORMATION IN THIS STRUCTURAL AND COLLATERAL TERM SHEET IS NOT COMPLETE AND MAY BE AMENDED PRIOR TO THE TIME OF SALE. THIS TERM SHEET IS NOT AN OFFER TO SELL THESE SECURITIES AND IT IS NOT A SOLICITATION OF AN OFFER TO BUY THESE SECURITIES IN ANY JURISDICTION WHERE THE OFFER OR SALE IS NOT PERMITTED. |
98
| Structural and Collateral Term Sheet | | BMO 2022-C2 |
| |
| No. 7 – Bell Works |
1/12th of the projected annual distribution to the Managing Member of Master Lessee (such revenues in excess of the sums set forth in clauses (i)-(vi), the “Excess Revenues”).
The Borrower Sponsors. The borrower sponsors and non-recourse carveout guarantors are Ralph Zucker and Jozef Straus. Ralph Zucker is the president of Somerset Development, a Holmdel, New Jersey-based real estate company specializing in new urbanism and traditional neighborhood design. Jozef Straus is a key principal of Adarsan Holdings Limited, a family investment office based in Ottawa, Ontario, Canada. Adarsan Holdings Limited partners with developers and provides management support, strategic guidance and access to a wide network of investment and industry contacts.
Property Management. The Bell Works Property is managed by Somerset Holmdel, LLC, an affiliate of the borrower sponsor.
Escrows and Reserves. At origination of the Bell Works Whole Loan, the borrower deposited approximately (i) $617,834 into a reserve account for real estate taxes or payment-in-lieu-of-tax payments, (ii) $8,500,000 into a reserve account for tenant improvements and leasing commissions and (iii) $6,778,984 into a reserve account for outstanding obligations with respect to certain unfunded free rent and tenant improvement/leasing commissions.
Tax Reserve - The borrower is required to deposit into a real estate tax reserve, on a monthly basis, 1/12th of the taxes that the lender estimates will be payable over the next-ensuing 12-month period (initially estimated to be approximately $308,917).
Insurance Reserve - The borrower is required to deposit into an insurance reserve, on a monthly basis, 1/12th of the amount which will be sufficient to pay the insurance premiums due for the renewal of coverage afforded by such policies; provided, however, such insurance reserve has been conditionally waived so long as the borrower maintains a blanket policy meeting the requirements of the Bell Works Whole Loan documents.
Replacement Reserve - The borrower is required to deposit into a replacement reserve, on a monthly basis, an amount equal to approximately $24,583.
TI / LC Reserve - The borrower is required to deposit into a tenant improvement and leasing commissions reserve, on a monthly basis, an amount equal to approximately $114,289; provided, however, the borrower will not be required to make such monthly deposit into the tenant improvement and leasing reserve so long as the amount in the tenant improvements and leasing commissions account equals or exceeds $8,500,000.
Put Price Reserve - The borrower is required to deposit into a put price reserve, on a monthly basis, from the payment date occurring in July 2024 through and including the monthly payment date in June 2026, an amount equal to approximately $82,130; provided that such obligation may be satisfied upon delivery to lender of a letter of credit in an amount not less than the amount sufficient to pay to HTC Investor all amounts due and payable in connection with the exercise of the Put Option, which letter of credit will serve as additional collateral for the Bell Works Whole Loan for so long as such letter of credit remains outstanding.
Lockbox / Cash Management. The Bell Works Whole Loan is structured with a hard lockbox and springing cash management. The borrower or Master Lessee are required to deliver a tenant direction letter to the existing tenants at the Bell Works Property, directing them to remit their rent checks directly to the lender-controlled lockbox. The borrower, property manager and Master Lessee are required to cause all rents to be deposited directly into a lender approved lockbox account immediately upon receipt. All funds deposited into the lockbox are required to be transferred on each business day to the extent no Trigger Period exists, either (A) prior to the termination of the Master Lease in accordance with the terms and conditions of the Bell Works Whole Loan documents, to or at the direction of Master Lessee, or (B) on and after the termination of the Master Lease, to or at the direction of the borrower. Upon the occurrence and during the continuance of a Trigger Period, all funds in the lockbox account are required to be swept on each business day to a cash management account under the control of the lender to be applied and disbursed in accordance with the Bell Works Whole Loan documents. Prior to the HTC Recapture Period Expiration Date, (i) all Excess Revenues are required to be disbursed to the Master Lessee (regardless of whether a Trigger Event or event of default has occurred), and (ii) all other funds will be applied in accordance with the Bell Works Whole Loan documents, with any excess after such application to be held by the lender in an excess cash flow reserve account as additional collateral for the Bell Works Whole Loan. After the HTC Recapture Period Expiration Date, all excess cash flow funds remaining in the cash management account after the application of such funds in accordance with the Bell Works Whole Loan documents will be held by the lender in an excess cash flow reserve account as additional collateral for the Bell Works Whole Loan.
A “Trigger Period” means a period commencing upon the occurrence of: (i) an event of default under the Bell Works Whole Loan, (ii) the debt yield on or prior to the payment date occurring in April 2023 falling below 6.75%, (iii) the debt yield after the payment date occurring in April 2023 falling below 7.00%, (iv) the occurrence of a Specified Tenant Trigger Period (as defined below), (v) on May 6, 2031 to the extent (x) iCIMS has not extended or renewed its Specified Tenant Lease (as defined below) for a term of at least five years and (y) the iCIMS Specified Tenant Lease accounts for 10% or more of the total rental income for the Bell Works Property (provided that, if any portion of the Bell Works Property which is the subject of the iCIMS Specified Tenant Lease is subleased to a third-party tenant, and such third-party tenant has entered into a direct agreement with borrower or Master Lessee, as applicable, in form and substance acceptable to lender whereby such third-party tenant’s sublease will continue as a direct lease between such third-party tenant and borrower or Master Lessee, as applicable, following the expiration or termination of the iCIMS Specified Tenant Lease for a term ending not earlier
| THE INFORMATION IN THIS STRUCTURAL AND COLLATERAL TERM SHEET IS NOT COMPLETE AND MAY BE AMENDED PRIOR TO THE TIME OF SALE. THIS TERM SHEET IS NOT AN OFFER TO SELL THESE SECURITIES AND IT IS NOT A SOLICITATION OF AN OFFER TO BUY THESE SECURITIES IN ANY JURISDICTION WHERE THE OFFER OR SALE IS NOT PERMITTED. |
99
| Structural and Collateral Term Sheet | | BMO 2022-C2 |
| |
| No. 7 – Bell Works |
than the date that is three years following the stated maturity date of the Bell Works Whole Loan (i.e., May 6, 2035), then such third-party rent due pursuant to said sublease will reduce the total rent due under the iCIMS Specified Tenant Lease for purposes of the calculations included in this clause (y)). A Trigger Period may be cured (a) with respect to clause (i) above, upon the acceptance by the lender of a cure of such event of default, (b) with respect to clause (ii) and (iii) above, the date that the debt yield is equal to or greater than 7.00% for two consecutive calendar quarters, (c) with respect to clause (iv) above, a Specified Tenant Trigger Period ceasing to exist as set forth below and (d) with respect to clause (v) above, the satisfaction of the Collateral Cure Condition (as defined below).
“Specified Tenant Trigger Period” means a period (A) with regard to the Specified Tenant (as defined below) commencing upon the first to occur of (i) an event of default beyond applicable notice and cure periods, (ii) failing to be in actual, physical possession of the Specified Tenant Space (or applicable portion thereof) unless (A) the discontinuation is to comply with governmental restrictions which restrict the use or occupancy as a result of, or otherwise in connection with, the COVID-19 pandemic, or is due to any acceptable remote-working conditions or (B) solely with respect to iCIMS, the “dark” portion of the premises consists solely of the approximately 75,000 square feet of the premises demised pursuant to iCIMS’ Specified Tenant Lease that have not been improved or fit out and have not historically been occupied, and (w) iCIMS has not alleged in writing any default by borrower with respect to such portion of the premises, (x) iCIMS has paid and continues to pay full unabated rent, (y) iCIMS Tenant has not requested in writing any reduction in rent with respect to such portion of the premises, and (z) iCIMS continues to occupy, and be open for business in, the balance of its demised premises (each a “Permitted Dark Event”), (iii) Specified Tenant gives notice of lease termination, (iv) any termination or cancellation of any Specified Tenant Lease, (v) any bankruptcy or similar insolvency, (vi) failing to extend or renew the applicable Specified Tenant Lease in accordance with the applicable terms and conditions thereof and with the Bell Works Whole Loan for the applicable Specified Tenant renewal term and (vii) Specified Tenant ceasing to satisfy the Credit Rating Condition; and (B) expiring upon the first to occur of lender’s receipt of evidence reasonably acceptable to lender (which such evidence will include, without limitation, a duly executed estoppel certificate from the applicable Specified Tenant in form and substance acceptable to lender) of (1) the satisfaction of the Specified Tenant Cure Conditions (as defined below) or (2) borrower or Master Lessee, as applicable, leasing the entire Specified Tenant Space (as defined below)(or applicable portion thereof), the applicable tenant under such lease being in actual, physical occupancy of the space demised under its lease and paying the full amount of the rent due under its lease.
A “Specified Tenant Cure Condition” means each of the following, as applicable (i) the applicable Specified Tenant has cured all defaults under the applicable Specified Tenant Lease, (ii) the applicable Specified Tenant is in actual, physical possession of the Specified Tenant Space (or applicable portion thereof) subject to Permitted Dark Events, (iii) the applicable Specified Tenant has revoked or rescinded all termination or cancellation notices with respect to the applicable Specified Tenant Lease and has re-affirmed the applicable Specified Tenant Lease as being in full force and effect, (iv) in the event the Specified Tenant Trigger Period is due to the applicable Specified Tenant’s failure to extend or renew the applicable Specified Tenant Lease in accordance with clause (vi) of the Specified Tenant Trigger Period, the applicable Specified Tenant has renewed or extended the applicable Specified Tenant Lease in accordance with its terms for the applicable Specified Tenant renewal term of five years, (v) with respect to any applicable bankruptcy or insolvency proceedings involving the applicable Specified Tenant and/or the applicable Specified Tenant Lease, the applicable Specified Tenant is no longer insolvent or subject to any bankruptcy or insolvency proceedings and has affirmed the applicable Specified Tenant Lease pursuant to final, non-appealable order of a court of competent jurisdiction, (vi) the applicable Specified Tenant is paying full, unabated rent under the applicable Specified Tenant Lease and (vii) in the event the Specified Tenant Trigger Period is due to a Credit Rating Trigger, the applicable Specified Tenant with respect to which such Credit Rating Trigger occurred satisfies the Credit Rating Cure Condition (as defined below).
A “Specified Tenant” means, as applicable, (i) iCIMS, (ii) any tenant whose lease at the Bell Works Property, individually or when aggregated with all other leases at the Bell Works Property with the same tenant or any affiliates of such tenant, accounts for 15% or more of either (A) the total rental income for the Bell Works Property, or (B) the total square footage of the Bell Works Property, (iii) any other lessee(s) of the Specified Tenant Space (or any portion thereof) and (iv) any guarantor(s) of, or persons providing credit support in relation to, the applicable related Specified Tenant Lease(s). Notwithstanding the foregoing, or anything to the contrary herein, the Master Lessee will not be deemed to be a Specified Tenant.
A “Specified Tenant Lease” means, as applicable, each lease at the Bell Works Property with a Specified Tenant (including, without limitation, any guaranty or similar instrument furnished thereunder). Notwithstanding the foregoing, or anything to the contrary herein, the Master Lease will not be deemed to be a Specified Tenant Lease.
A “Specified Tenant Space” means that portion of the Bell Works Property demised as of the date hereof to the initial Specified Tenant pursuant to the initial Specified Tenant Lease.
A “Credit Rating Condition” means, as to any entity, a condition which will be satisfied to the extent that, as of the applicable date of determination, such entity then maintains a long-term unsecured debt rating of at least BBB- from S&P and an equivalent rating from each of Moody’s and Fitch, to the extent the foregoing rate such entity.
A “Credit Rating Cure Condition” means, as to any entity, a condition which will be satisfied to the extent that, as of the applicable date of determination, such entity then maintains a long-term unsecured debt rating of at least BBB- from S&P and, if applicable, an equivalent rating from Moody’s and Fitch.
| THE INFORMATION IN THIS STRUCTURAL AND COLLATERAL TERM SHEET IS NOT COMPLETE AND MAY BE AMENDED PRIOR TO THE TIME OF SALE. THIS TERM SHEET IS NOT AN OFFER TO SELL THESE SECURITIES AND IT IS NOT A SOLICITATION OF AN OFFER TO BUY THESE SECURITIES IN ANY JURISDICTION WHERE THE OFFER OR SALE IS NOT PERMITTED. |
100
| Structural and Collateral Term Sheet | | BMO 2022-C2 |
| |
| No. 7 – Bell Works |
A “Collateral Cure Condition” means that borrower has deposited cash into an account with lender, or has delivered to lender a letter of credit, which, in each case, (i) serves as additional collateral for the Bell Works Whole Loan, and (ii) is in an amount determined by lender in its sole but good-faith discretion to be equal to the amount of excess cash flow that would have been deposited into the excess cash flow account pursuant to the terms of the Bell Works Whole Loan documents during the period from May 6, 2031 through and including May 6, 2032.
Subordinate and Mezzanine Debt. None.
Partial Release. The Bell Works Whole Loan documents permit, at any time other than the 60 days prior to and following a securitization of the Bell Works Whole Loan, the borrower to record condominium documents whereby it will impose a condominium regime on its fee interest in the Bell Works Property, which regime will consist of two units, one of which will consist of the air rights above the improvements (the “Upper Unit”) and the other will consist of all of the real property and improvements at the Bell Works Property which are not included in the Upper Unit after which the borrower may obtain the release of the Upper Unit, provided that, among other conditions: (i) the borrower delivers a REMIC opinion, and (ii) if requested by the lender, the borrower delivers a rating agency confirmation with respect to the implementation of the condominium conversion.
Ground Lease. None.
Township of Holmdel Library Lease & Note. In connection with the borrower’s redevelopment of the Bell Works Property, the borrower has leased a portion of the Bell Works Property to the Township of Holmdel, New Jersey (the “Township”) for use as a library. Pursuant to the related lease documentation, the borrower is required to make an annual payment of $50,000 to the Township for “tenant fit-out” through 2037. Such annual payment obligation is evidenced by a promissory note in the original principal amount of $1,000,000 made by borrower for the benefit of the Township. This promissory note does not bear interest and is freely prepayable at any time.
Township Escrow. In connection with the borrower’s redevelopment of the Bell Works Property, the borrower was required to escrow certain funds with the Township in order to pay for the Township’s costs in connection with the redevelopment. As of the date of origination of the Bell Works Whole Loan, approximately $96,181 remained in the escrow, which has been collaterally assigned to lender as additional security for the Bell Works Whole Loan.
Solar Panel Leases and Letters of Credit. The borrower is the lessee under three equipment lease agreements with Bank of the West in connection with certain solar panels at the Bell Works Property (the “Solar Panel Leases”). Pursuant to the terms thereof, the borrower has options to purchase the “equipment” (as defined in each Solar Panel Lease) that must each be exercised by no later than December 13, 2022 (the “Solar Panel Lease Purchase Option Deadline”). In connection with the Solar Panel Leases, Bank of the West is the beneficiary under three letters of credit issued by Canadian Imperial Bank of Commerce (the “Solar Panel LOCs”), for which an affiliate of the borrower is the applicant thereunder. There is one Solar Panel LOC associated with each Solar Panel Lease. The borrower has represented in the Bell Works Whole Loan documents that, among other things, on the Solar Panel Lease Purchase Option Deadline, the available amounts under each Solar Panel LOC will exceed the related purchase price under the associated Solar Panel Lease. The Bell Works Whole Loan documents obligate the borrower to timely exercise each Solar Panel Lease purchase option.
| THE INFORMATION IN THIS STRUCTURAL AND COLLATERAL TERM SHEET IS NOT COMPLETE AND MAY BE AMENDED PRIOR TO THE TIME OF SALE. THIS TERM SHEET IS NOT AN OFFER TO SELL THESE SECURITIES AND IT IS NOT A SOLICITATION OF AN OFFER TO BUY THESE SECURITIES IN ANY JURISDICTION WHERE THE OFFER OR SALE IS NOT PERMITTED. |
101
| Structural and Collateral Term Sheet | | BMO 2022-C2 |
| |
| No. 8 – 79 Fifth Avenue |
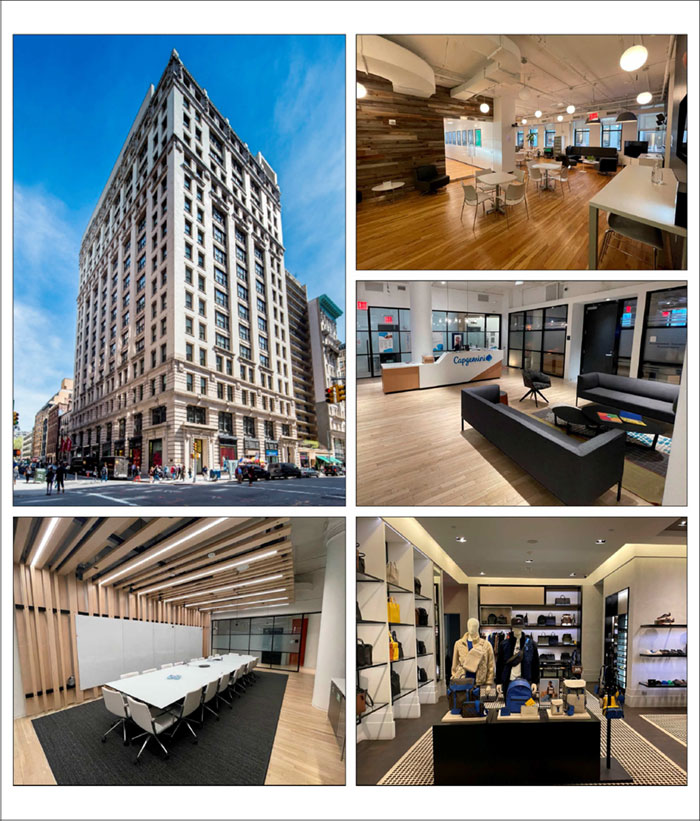
| THE INFORMATION IN THIS STRUCTURAL AND COLLATERAL TERM SHEET IS NOT COMPLETE AND MAY BE AMENDED PRIOR TO THE TIME OF SALE. THIS TERM SHEET IS NOT AN OFFER TO SELL THESE SECURITIES AND IT IS NOT A SOLICITATION OF AN OFFER TO BUY THESE SECURITIES IN ANY JURISDICTION WHERE THE OFFER OR SALE IS NOT PERMITTED. |
102
| Structural and Collateral Term Sheet | | BMO 2022-C2 |
| |
| No. 8 – 79 Fifth Avenue |
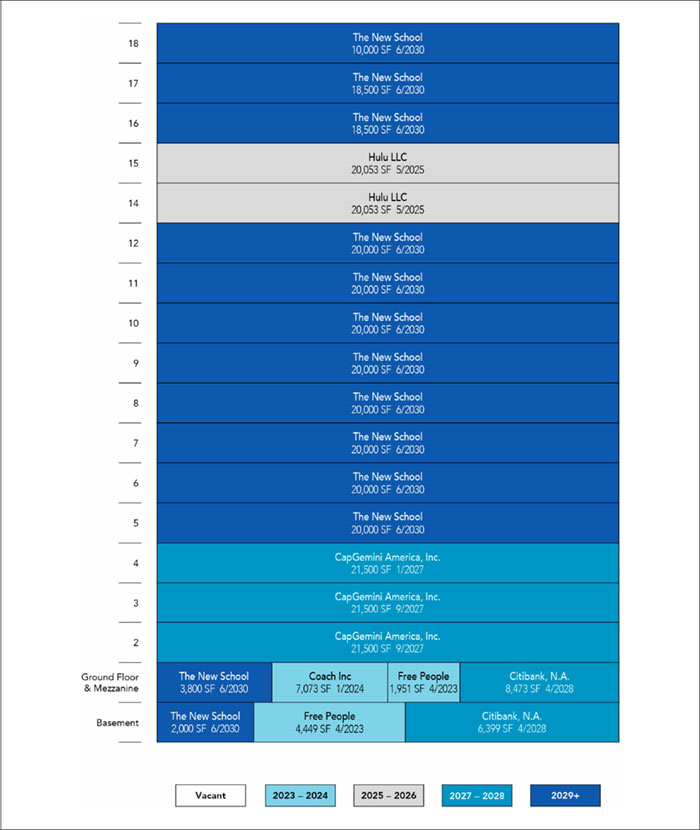
| THE INFORMATION IN THIS STRUCTURAL AND COLLATERAL TERM SHEET IS NOT COMPLETE AND MAY BE AMENDED PRIOR TO THE TIME OF SALE. THIS TERM SHEET IS NOT AN OFFER TO SELL THESE SECURITIES AND IT IS NOT A SOLICITATION OF AN OFFER TO BUY THESE SECURITIES IN ANY JURISDICTION WHERE THE OFFER OR SALE IS NOT PERMITTED. |
103
| Structural and Collateral Term Sheet | | BMO 2022-C2 |
| |
| No. 8 – 79 Fifth Avenue |
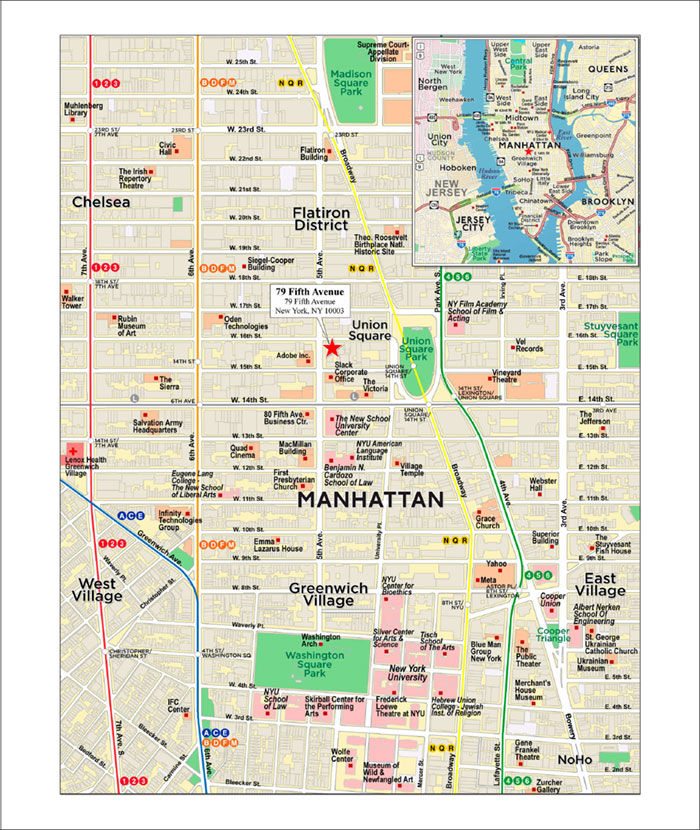
| THE INFORMATION IN THIS STRUCTURAL AND COLLATERAL TERM SHEET IS NOT COMPLETE AND MAY BE AMENDED PRIOR TO THE TIME OF SALE. THIS TERM SHEET IS NOT AN OFFER TO SELL THESE SECURITIES AND IT IS NOT A SOLICITATION OF AN OFFER TO BUY THESE SECURITIES IN ANY JURISDICTION WHERE THE OFFER OR SALE IS NOT PERMITTED. |
104
| Structural and Collateral Term Sheet | | BMO 2022-C2 |
| |
| No. 8 – 79 Fifth Avenue |
| Mortgage Loan Information | | Property Information |
| Mortgage Loan Seller: | CREFI | | Single Asset / Portfolio: | Single Asset |
| Original Principal Balance(1): | $23,000,000 | | Title: | Fee |
| Cut-off Date Principal Balance(1): | $23,000,000 | | Property Type – Subtype: | Office – CBD |
| % of IPB: | 3.2% | | Net Rentable Area (SF): | 345,751 |
| Loan Purpose: | Recapitalization | | Location: | New York, NY |
| Borrowers: | AK 79 Fifth LLC, SAK 79 Fifth LLC and DAK 79 Fifth LLC | | Year Built / Renovated: | 1906 / 2016 |
| Borrower Sponsor: | Albert Kalimian | | Occupancy: | 100.0% |
| Interest Rate: | 4.92000% | | Occupancy Date: | 2/15/2022 |
| Note Date: | 4/29/2022 | | 4th Most Recent NOI (As of): | $16,646,769 (12/31/2018) |
| Maturity Date: | 5/6/2032 | | 3rd Most Recent NOI (As of): | $17,085,519 (12/31/2019) |
| Interest-only Period: | 120 months | | 2nd Most Recent NOI (As of): | $17,160,810 (12/31/2020) |
| Original Term: | 120 months | | Most Recent NOI (As of): | $18,362,181 (TTM 12/31/2021) |
| Original Amortization Term: | None | | UW Economic Occupancy: | 95.0% |
| Amortization Type: | Interest Only | | UW Revenues: | $29,320,118 |
| Call Protection(2): | L(26),D(89),O(5) | | UW Expenses: | $9,216,627 |
| Lockbox / Cash Management: | Hard / Springing | | UW NOI: | $20,103,491 |
| Additional Debt(1): | Yes | | UW NCF: | $19,331,988 |
| Additional Debt Balance(1): | $217,000,000 | | Appraised Value / Per SF: | $395,000,000 / $1,142 |
| Additional Debt Type(1): | Pari Passu | | Appraisal Date: | 2/24/2022 |
| | | | | |
| Escrows and Reserves(3) | | Financial Information(1) |
| | Initial | Monthly | Initial Cap | | Cut-off Date Loan / SF: | | $694 |
| Taxes: | $2,815,969 | $469,328 | N/A | | Maturity Date Loan / SF: | | $694 |
| Insurance: | $0 | Springing | N/A | | Cut-off Date LTV: | | 60.8% |
| Replacement Reserves: | $0 | $5,763 | $207,468 | | Maturity Date LTV: | | 60.8% |
| TI / LC: | $1,000,000 | $57,760 | $3,500,000 | | UW NCF DSCR: | | 1.61x |
| Other: | $0 | $0 | N/A | | UW NOI Debt Yield: | | 8.4% |
| | | | | | | | |
| |
| Sources and Uses |
| Sources | Proceeds | % of Total | | Uses | Proceeds | % of Total |
| Whole Loan Amount | $240,000,000 | 63.1% | | Purchase Price(4) | $369,000,000 | 97.0% |
| Sponsor Equity | 140,421,540 | 36.9 | | Closing Costs | 7,605,571 | 2.0 |
| | | | | Upfront Reserves | 3,815,969 | 1.0 |
| Total Sources | $380,421,540 | 100.0% | | Total Uses | $380,421,540 | 100.0% |
| | | | | | | | | | | |
| (1) | The 79 Fifth Avenue Mortgage Loan (as defined below) is part of the 79 Fifth Avenue Whole Loan (as defined below) with an original aggregate principal balance of $240,000,000. The financial information presented in the charts above is based on the $240,000,000 79 Fifth Avenue Whole Loan (as defined below). |
| (2) | Defeasance of the 79 Fifth Avenue Whole Loan is permitted at any time after the earlier to occur of (a) the end of the two-year period commencing on the closing date of the securitization of the last promissory note representing a portion of the 79 Fifth Avenue Whole Loan to be securitized and (b) April 29, 2026. The assumed defeasance lockout period of 26 payments is based on the closing date of this transaction in July 2022. The actual lockout period may be longer. |
| (3) | For a full description of escrows and reserves, please refer to “Escrows and Reserves” below. |
| (4) | The 79 Fifth Avenue Property (as defined below) was recapitalized at a price of $369,000,000. At origination the borrower sponsor bought out the equity partners’ 75% interest and paid off prior debt of $62,053,414. |
The Loan. The eighth largest mortgage loan (the “79 Fifth Avenue Mortgage Loan”) is part of a whole loan (the “79 Fifth Avenue Whole Loan”) consisting of ten pari passu promissory notes in the aggregate outstanding principal balance of $240,000,000 and is secured by a first mortgage encumbering the borrowers’ fee interest in a 345,751 square feet office property, which includes 28,345 square feet of ground floor retail, in New York, New York (the “79 Fifth Avenue Property”). The 79 Fifth Avenue Mortgage Loan, evidenced by the non-controlling Note A-1-2, has an outstanding principal balance as of the Cut-off Date of $23,000,000 and represents approximately 3.2% of the Initial Pool Balance. The controlling note A-1-1 and the non-controlling notes A-1-3, A-2-1, A-2-2, A-2-3-1, A-2-3-2, A-3-1, A-3-2 and A-3-3 have an aggregate outstanding balance as of the Cut-off Date of $217,000,000. The 79 Fifth Avenue Whole Loan was co-originated by Citi Real Estate Funding Inc. (“CREFI”), Wells Fargo Bank, National Association (“WFBNA”) and JPMorgan
| THE INFORMATION IN THIS STRUCTURAL AND COLLATERAL TERM SHEET IS NOT COMPLETE AND MAY BE AMENDED PRIOR TO THE TIME OF SALE. THIS TERM SHEET IS NOT AN OFFER TO SELL THESE SECURITIES AND IT IS NOT A SOLICITATION OF AN OFFER TO BUY THESE SECURITIES IN ANY JURISDICTION WHERE THE OFFER OR SALE IS NOT PERMITTED. |
105
| Structural and Collateral Term Sheet | | BMO 2022-C2 |
| |
| No. 8 – 79 Fifth Avenue |
Chase Bank, National Association (“JPMCB”). The 79 Fifth Avenue Whole Loan will be serviced pursuant to the pooling and servicing agreement for the CGCMT 2022-GC48 securitization. See “Description of the Mortgage Pool—The Whole Loans—The Outside Serviced Pari Passu Whole Loans” in the Preliminary Prospectus.
The 79 Fifth Avenue Whole Loan has an initial term of 120 months and has a remaining term of 118 months as of the Cut-off Date. The 79 Fifth Avenue Whole Loan requires payments of interest only for the entire term of the 79 Fifth Avenue Whole Loan. The stated maturity date of the 79 Fifth Avenue Whole Loan is the payment date in May 2032.
Voluntary prepayment of the 79 Fifth Avenue Whole Loan is prohibited prior to the due date occurring in January 2032. Defeasance of the 79 Fifth Avenue Whole Loan in whole (but not in part) is permitted at any time after the earlier of (i) April 29, 2026 and (ii) the second anniversary of the closing date of the securitization that includes the last note of the 79 Fifth Avenue Whole Loan to be securitized.
| Whole Loan Summary |
| Note | Original Balance | Cut-off Date Balance | Note Holder | Controlling Piece |
| A-1-1 | $50,000,000 | $50,000,000 | CGCMT 2022-GC48 | Yes |
| A-1-2 | $23,000,000 | $23,000,000 | BMO 2022-C2 | No |
| A-1-3 | $23,000,000 | $23,000,000 | CREFI(1) | No |
| A-2-1 | $70,000,000 | $70,000,000 | BANK 2022-BNK42 | No |
| A-2-2 | $13,000,000 | $13,000,000 | WFBNA(1) | No |
| A-2-3-1 | $12,000,000 | $12,000,000 | WFBNA(1) | No |
| A-2-3-2 | $1,000,000 | $1,000,000 | BANK 2022-BNK42 | No |
| A-3-1 | $25,000,000 | $25,000,000 | JPMCB(1) | No |
| A-3-2 | $11,500,000 | $11,500,000 | JPMCB(1) | No |
| A-3-3 | $11,500,000 | $11,500,000 | JPMCB(1) | No |
| Total | $240,000,000 | $240,000,000 | | |
| (1) | Expected to be contributed to one or more future securitizations. |
The Property. The 79 Fifth Avenue Property consists of an 18-story office building totaling 345,751 square feet, which includes 28,345 square feet of ground floor retail space located in New York, New York. The property, which sits on 0.4-acre parcel of land, was built in 1906 and renovated in 2016. According to the appraisal, the borrowers provided a $9.4 million capital improvement budget, which included landlord work on floors 2 through 4, new lot line windows on floors 2 through 4, sidewalk vault repairs, and general base building enhancements. As of February 24, 2022, there was $3.3 million of outstanding renovation costs. The 79 Fifth Avenue Property features a lobby with marble finishes and vaulted ceilings, functional, rectangular shaped floor plates, and views of the surrounding Manhattan skyline. The retail units have frontage and visibility along Fifth Avenue with floor to ceiling glass storefronts. Five of the tenants (or their parent company), comprising 98.1% NRA and 96.6% of underwritten base rent, are investment grade rated. As of February 15, 2022, the property is 100% leased to six tenants and, according to a third-party market research report, has averaged 96.4% occupancy from 2011 through 2021.
The largest tenant based on underwritten base rent is The New School (212,800 square feet; 61.5% of NRA; 51.7% of underwritten base rent). The New School is a private research university in New York City. Founded in 1919, the university has grown to five colleges with courses in emerging social sciences, international affairs, liberal arts, history, and philosophy as well as art, design, management and performing arts. In 2021, The New School generated $319.1 million in operating revenue and, similar to other private universities, did not receive significant funding from the federal or state government. According to a third-party report, The New School achieved record enrollment with 10,168 students in 2021. The New School has been at the 79 Fifth Avenue Property since 2004, has expanded multiple times and currently occupies 12 floors (5 through 12, 16 through 18, and ground floor and basement space). The New School’s lease expires on June 30, 2030. The New School has two, 10-year renewal options and no termination options. There is currently ongoing arbitration between The New School and the borrowers. Between 2017 and 2021, an administrative error occurred whereby The New School was not charged its contractual rental increases. A mediation hearing over the back rent and rent escalations was recently held, and the final outcome of the hearing is pending. Underwritten base rent is based on the lower amount currently being paid by The New School. In the event the borrowers are successful in the arbitration, The New School’s base rent would increase by approximately $1.3 million annually. See “Description of the Mortgage Pool—Litigation and Other Legal Considerations” in the Preliminary Prospectus.
The second largest tenant based on underwritten base rent is CapGemini America, Inc. (“CapGemini”) (64,500 square feet; 18.7% of NRA; 20.7% of underwritten base rent). CapGemini is a French multinational information technology services and consulting company. Headquartered in Paris, France, the company was founded in 1967 as an enterprise management and data processing company and launched US operations in 1981 following the acquisition of DASD Corporation. Today, CapGemini operates in 42 countries and reported 2021 revenues of €18,160 million, a 14.6% increase over 2020. CapGemini has been at the 79 Fifth Avenue Property since 2016 and currently occupies floors 2 through 4. The lease for the second and third floor space (collectively 43,000 square feet) expires on September 30, 2027, and the lease on the fourth floor (21,500 square feet) expires on January 31, 2027. CapGemini has one, 5-year
| THE INFORMATION IN THIS STRUCTURAL AND COLLATERAL TERM SHEET IS NOT COMPLETE AND MAY BE AMENDED PRIOR TO THE TIME OF SALE. THIS TERM SHEET IS NOT AN OFFER TO SELL THESE SECURITIES AND IT IS NOT A SOLICITATION OF AN OFFER TO BUY THESE SECURITIES IN ANY JURISDICTION WHERE THE OFFER OR SALE IS NOT PERMITTED. |
106
| Structural and Collateral Term Sheet | | BMO 2022-C2 |
| |
| No. 8 – 79 Fifth Avenue |
renewal option on all of their space. CapGemini may terminate its lease with respect to the second and third floors at any time after October 13, 2024 upon at least 12 months’ notice and payment of a termination fee of approximately $3,065,866.
The third largest tenant based on underwritten base rent is Hulu, LLC (“Hulu”) (40,106 square feet; 11.6% of NRA; 12.9% of underwritten base rent) Hulu is an American streaming platform that launched in 2007 and offers a library of films and television series. Hulu is majority owned by The Walt Disney Company with NBCUniversal holding a minority stake. For the year ended September 2021, Hulu reported $2.1 billion in ad revenue. Hulu has been at the 79 Fifth Avenue Property since 2014, doubled its space in 2018 and currently occupies the 14th and 15th floors. Hulu’s lease expires on May 31, 2025. Hulu has one, 5-year renewal option and no termination options.
COVID-19 Update. As of June 6, 2022, the 79 Fifth Avenue Property is open and operational and there were no outstanding rent relief requests. The first payment date of the 79 Fifth Avenue Mortgage Loan is June 6, 2022. See “Risk Factors—Special Risks—The Coronavirus Pandemic Has Adversely Affected the Global Economy and May Adversely Affect the Performance of the Mortgage Loans” in the Preliminary Prospectus.
The following table presents certain information relating to the historical occupancy of the 79 Fifth Avenue Property:
| Historical and Current Occupancy(1) |
| 2019 | 2020 | 2021 | Current(2) |
| 100.0% | 100.0% | 100.0% | 100.0% |
| (1) | Historical Occupancies are as of December 31 of each respective year. |
| (2) | Current Occupancy is as of February 15, 2022. |
The following table presents certain information relating to the largest tenants based on underwritten base rent of the 79 Fifth Avenue Property:
| Top Tenant Summary(1) |
| Tenant | Ratings Moody’s/S&P/Fitch(2) | Net Rentable Area (SF) | % of
Total
NRA | UW Base Rent PSF(3) | UW Base Rent(3) | % of Total UW Base Rent(3) | Lease Expiration Date |
| The New School(4) | NR/A3/NR | 212,800(4) | 61.5% | $64.02 | $13,622,601 | 51.7% | 6/30/2030 |
| CapGemini(5) | NR/NR/BBB | 64,500 | 18.7 | $84.65 | 5,460,117 | 20.7 | Various(6) |
| Hulu | A-/A2/BBB+ | 40,106 | 11.6 | $85.00 | 3,408,977 | 12.9 | 5/31/2025 |
| Citibank, N.A.(8) | A+/Aa3/A+ | 14,872 | 4.3 | $50.43 | 750,000 | 2.8 | 4/30/2028 |
| Coach Inc | NR/Baa2/BBB- | 7,073 | 2.0 | $311.76 | 2,205,067 | 8.4 | 1/31/2024(7) |
| Free People(9) | NR/NR/NR | 6,400 | 1.9 | $140.69 | 900,407 | 3.4 | 4/30/2023 |
| Occupied Total | | 345,751 | 100.0% | $76.20 | $26,347,169 | 100.0% | |
| Vacant Space | | 0 | 0.0 | | | | |
| Total / Wtd. Avg. | | 345,751 | 100.0% | | | | |
| (1) | Based on underwritten rent roll dated February 15, 2022. |
| (2) | Ratings are those of the parent company whether or not the parent guarantees the lease. |
| (3) | UW Base Rent PSF, UW Base Rent, and % of Total UW Base Rent include straight-line rent averaging for certain investment grade tenants (The New School and CapGemini) through lease maturity totaling $2,450,889 and contractual rent steps through February 2023 totaling $157,294 but does not reflect any outcome of the arbitration between The New School and the borrowers with respect to certain back rent and rent escalations. See “Underwritten Net Cash Flow” below. |
| (4) | The New School currently subleases a portion of the 18th floor totaling 8,820 SF (2.6% of NRA; 4.1% of The New School NRA) to Gene Kaufman Architect, P.C. |
| (5) | CapGemini may terminate its lease with respect to the second and third floors any time after October 13, 2024 upon at least 12 months’ notice and payment of a termination fee of approximately $3,065,866. |
| (6) | CapGemini’s lease with respect to the fourth floor (21,500 SF) expires on January 31, 2027, and with respect to the second and third floors (43,000 SF) expires on September 30, 2027. |
| (7) | Coach Inc occupies 25.0% of the ground floor retail space and is expected to vacate at lease expiration. |
| (8) | Citibank, N.A. occupies 52.5% of the ground floor retail space. |
| (9) | Free People occupies 22.6% of the ground floor retail space. |
| THE INFORMATION IN THIS STRUCTURAL AND COLLATERAL TERM SHEET IS NOT COMPLETE AND MAY BE AMENDED PRIOR TO THE TIME OF SALE. THIS TERM SHEET IS NOT AN OFFER TO SELL THESE SECURITIES AND IT IS NOT A SOLICITATION OF AN OFFER TO BUY THESE SECURITIES IN ANY JURISDICTION WHERE THE OFFER OR SALE IS NOT PERMITTED. |
107
| Structural and Collateral Term Sheet | | BMO 2022-C2 |
| |
| No. 8 – 79 Fifth Avenue |
The following table presents certain information relating to the tenant lease expirations of the 79 Fifth Avenue Property:
| Lease Rollover Schedule(1)(2) |
| Year | Number of Leases Expiring | NRA
Expiring | % of NRA
Expiring | UW Base
Rent
Expiring(3) | % of UW
Base Rent Expiring(3) | Cumulative
Net Rentable Area Expiring | Cumulative
% of NRA Expiring | Cumulative UW Base Rent Expiring(3) | Cumulative% of UW Base Rent Expiring(3) |
| Vacant | NAP | 0 | 0.0% | NAP | NAP | 0 | 0.0% | NAP | NAP |
| MTM | 0 | 0 | 0.0 | $0 | 0.0% | 0 | 0.0% | $0 | 0.0% |
| 2022 | 0 | 0 | 0.0 | 0 | 0.0 | 0 | 0.0% | $0 | 0.0% |
| 2023 | 1 | 6,400 | 1.9 | 900,407 | 3.4 | 6,400 | 1.9% | $900,407 | 3.4% |
| 2024 | 1 | 7,073 | 2.0 | 2,205,067 | 8.4 | 13,473 | 3.9% | $3,105,474 | 11.8% |
| 2025 | 1 | 40,106 | 11.6 | 3,408,977 | 12.9 | 53,579 | 15.5% | $6,514,451 | 24.7% |
| 2026 | 0 | 0 | 0.0 | 0 | 0.0 | 53,579 | 15.5% | $6,514,451 | 24.7% |
| 2027 | 2 | 64,500 | 18.7 | 5,460,117 | 20.7 | 118,079 | 34.2% | $11,974,568 | 45.4% |
| 2028 | 1 | 14,872 | 4.3 | 750,000 | 2.8 | 132,951 | 38.5% | $12,724,568 | 48.3% |
| 2029 | 0 | 0 | 0.0 | 0 | 0.0 | 132,951 | 38.5% | $12,724,568 | 48.3% |
| 2030 | 1 | 212,800 | 61.5 | 13,622,601 | 51.7 | 345,751 | 100.0% | $26,347,169 | 100.0% |
| 2031 | 0 | 0 | 0.0 | 0 | 0.0 | 345,751 | 100.0% | $26,347,169 | 100.0% |
| 2032 & Beyond | 0 | 0 | 0.0 | 0 | 0.0 | 345,751 | 100.0% | $26,347,169 | 100.0% |
| Total | 7 | 345,751 | 100.0% | $26,347,169 | 100.0% | | | | |
| (1) | Based on the underwritten rent roll dated February 15, 2022. |
| (2) | Certain leases may have termination options that are exercisable prior to the originally stated expiration date of the lease and that are not considered in this Lease Rollover Schedule. |
| (3) | UW Base Rent Expiring, % of UW Base Rent Expiring, Cumulative UW Base Rent Expiring and Cumulative % of UW Base Rent Expiring include straight-line rent averaging for certain investment grade tenants (The New School and CapGemini) through lease maturity totaling $2,450,889 and contractual rent steps through February 2023 totaling $157,294 but does not reflect any outcome of the arbitration between The New School and the borrowers with respect to certain back rent and rent escalations. |
The following table presents certain information relating to the underwritten cash flows of the 79 Fifth Avenue Property:
| Operating History and Underwritten Net Cash Flow(1) |
| | 2019 | 2020 | 2021 | Underwritten | Per
Square Foot | %(2) |
| Rents in Place | $21,523,248 | $21,892,938 | $22,660,998 | $23,738,986 | $68.66 | 76.9% |
| Rent Steps(3) | 0 | 0 | 0 | 2,608,183 | 7.54 | 8.5 |
| Gross Potential Rent | $21,523,248 | $21,892,938 | $22,660,998 | $26,347,169 | $76.20 | 85.4% |
| Total Reimbursements | 3,688,603 | 3,730,411 | 4,273,141 | 4,516,113 | 13.06 | 14.6 |
| Net Rental Income | $25,211,851 | $25,623,349 | $26,934,139 | $30,863,283 | $89.26 | 100.0% |
| Vacancy | 0 | 0 | 0 | (1,543,164) | (4.46) | (5.0) |
| Other Income(4) | 158,823 | 54,402 | 0 | 0 | 0.00 | 0.0 |
| Effective Gross Income | $25,370,674 | $25,677,751 | $26,934,139 | $29,320,118 | $84.80 | 95.0% |
| Total Expenses | $8,285,155 | $8,516,941 | $8,571,958 | $9,216,627 | $26.66 | 31.4% |
| Net Operating Income | $17,085,519 | $17,160,810 | $18,362,181 | $20,103,491 | $58.14 | 68.6% |
| Cap Ex, Total TI/LC | 0 | 0 | 0 | 771,503 | 2.23 | 2.6 |
| Net Cash Flow | $17,085,519 | $17,160,810 | $18,362,181 | $19,331,988 | $55.91 | 65.9% |
| (1) | Based on the underwritten rent roll dated February 15, 2022. |
| (2) | % column represents percent of Net Rental Income for all revenue lines and represents percent of Effective Gross Income for the remainder of the fields. |
| (3) | Rent Steps include straight-line rent averaging for certain investment grade tenants (The New School and CapGemini) through lease maturity totaling $2,450,889 and contractual rent steps through February 2023 totaling $157,294 but does not reflect any outcome of the arbitration between The New School and the borrowers with respect to certain back rent and rent escalations. |
| (4) | Other Income includes items such as parking income, HVAC after-hours income, and miscellaneous operating income. |
The Market. The 79 Fifth Avenue Property is situated in the Flatiron neighborhood of New York, New York, which neighborhood is bordered by Park Avenue South to the east, Sixth Avenue to the west, 25th Street to the north and 13th Street to the south. The property is located directly west of Union Square and is three blocks northwest of the Union Square subway station, which services the L, N, Q, R, W, 4, 5, and 6 lines.
| THE INFORMATION IN THIS STRUCTURAL AND COLLATERAL TERM SHEET IS NOT COMPLETE AND MAY BE AMENDED PRIOR TO THE TIME OF SALE. THIS TERM SHEET IS NOT AN OFFER TO SELL THESE SECURITIES AND IT IS NOT A SOLICITATION OF AN OFFER TO BUY THESE SECURITIES IN ANY JURISDICTION WHERE THE OFFER OR SALE IS NOT PERMITTED. |
108
| Structural and Collateral Term Sheet | | BMO 2022-C2 |
| |
| No. 8 – 79 Fifth Avenue |
According to a third-party market research report, the 79 Fifth Avenue Property is located in the Gramercy Park office submarket of the New York City market. As of April 2022, the Gramercy Park submarket reported total inventory of approximately 28.5 million SF with a 10.3% vacancy rate and average asking rent of $72.08 PSF. The appraiser concluded to a market rent for the office space at the 79 Fifth Avenue Property of $80.00 PSF for floors 2 to 10, $85.00 PSF for floors 11 to 15, and $90.00 PSF for floors 16 to 18, all on a modified gross basis.
The following table presents certain information relating to the appraisal’s market rent conclusions for the 79 Fifth Avenue Property:
| Market Rent Summary(1) |
| | Office Floors 2-10 | Office Floors 11-15 | Office Floors 16-18 | Retail Corner | Retail Fifth Avenue Large | Retail Fifth Avenue Small | Retail Lower |
| Market Rent (PSF) | $80.00 | $85.00 | $90.00 | $275.00 | $175.00 | $225.00 | $50.00 |
| Lease Term (Years) | 10 | 10 | 10 | 10 | 10 | 10 | 10 |
| Lease Type | MG | MG | MG | MG | MG | MG | Gross |
The following table presents information relating to comparable office property sales for the 79 Fifth Avenue Property:
| Comparable Sales Summary(1) |
| Property Name/Location | Sale Date | Year Built/ Renovated | Total NRA (SF) | Occupancy | Sale Price | Sale Price PSF |
79 Fifth Avenue
New York, NY | N/A | 1906/2016 | 345,751(2) | 100.0%(2) | NAP | NAP |
475 Fifth Avenue
New York, NY | Dec-2021 | 1965/2017 | 276,000 | 97.0% | $299,460,000 | $1,085.00 |
375 West Broadway
New York, NY | Feb-2022 | 1863/2014 | 76,605 | 100.0% | $130,000,000 | $1,697.02 |
11 Madison Park North
New York, NY | Apr-2021 | 1913/NAP | 260,140 | 90.1% | $275,000,000 | $1,057.12 |
315 Park Avenue South
New York, NY | Dec-2021 | 1910/2016 | 332,614 | 97.3% | $361,700,000 | $1,087.45 |
245-249 West 17th Street
New York, NY | Dec-2021 | 1902-1909/2016 | 281,253 | 98.7% | $389,200,000 | $1,383.81 |
218 West 18th Street
New York, NY | Dec-2021 | 1912/2009 | 165,255 | 100.0% | $170,000,000 | $1,028.71 |
635-641 Avenue of the Americas
New York, NY | June-2021 | 1902/2015 | 273,983 | 94.0% | $325,000,000 | $1,186.20 |
1375 Broadway
New York, NY | July-2020 | 1927/NAP | 518,578 | 100.0% | $435,000,000 | $838.83 |
| (2) | Based on Underwritten Rent Roll dated February 15, 2022. |
| THE INFORMATION IN THIS STRUCTURAL AND COLLATERAL TERM SHEET IS NOT COMPLETE AND MAY BE AMENDED PRIOR TO THE TIME OF SALE. THIS TERM SHEET IS NOT AN OFFER TO SELL THESE SECURITIES AND IT IS NOT A SOLICITATION OF AN OFFER TO BUY THESE SECURITIES IN ANY JURISDICTION WHERE THE OFFER OR SALE IS NOT PERMITTED. |
109
| Structural and Collateral Term Sheet | | BMO 2022-C2 |
| |
| No. 8 – 79 Fifth Avenue |
The following table presents information relating to comparable office properties for the 79 Fifth Avenue Property:
| Comparable Office Properties Summary(1) |
| Property Name/Location | Office Area | Year Built/ Renovated | Stories | Sublease SF Available | % Occupied
(Direct) | Average Asking Rent |
79 Fifth Avenue
New York, NY | 317,406(2) | 1906/2016 | 18 | - | 100.0%(2) | $70.86(2)(3) |
55 Fifth Avenue
New York, NY | 270,685 | 1926/NAP | 19 | 0 | 94.1% | $90.00 |
71 Fifth Avenue
New York, NY | 165,000 | 1907/NAP | 11 | 0 | 91.0% | $90.00 |
80 Fifth Avenue
New York, NY | 132,000 | 1908/NAP | 18 | 0 | 100.0% | NAP |
90 Fifth Avenue
New York, NY | 138,211 | 1903/NAP | 11 | 0 | 100.0% | NAP |
91 Fifth Avenue
New York, NY | 61,500 | 1894/NAP | 8 | 0 | 87.0% | $68.00 |
100-104 Fifth Avenue
New York, NY | 305,000 | 1905/NAP | 20 | 42,807 | 93.7% | $75.00 |
110 Fifth Avenue
New York, NY | 200,378 | 1890/NAP | 11 | 0 | 100.0% | NAP |
111 Fifth Avenue
New York, NY | 234,700 | 1877/NAP | 13 | 0 | 100.0% | NAP |
114-116 Fifth Avenue
New York, NY | 351,666 | 1910/NAP | 19 | 0 | 100.0% | NAP |
122 Fifth Avenue
New York NY | 294,730 | 1900/NAP | 10 | 0 | 75.0% | $100.00 |
| (2) | Based on Underwritten Rent Roll dated February 15, 2022. |
| (3) | Represents Underwritten Base Rent per SF. |
The Borrowers. The borrowers comprise three tenants in common, AK 79 Fifth LLC, SAK 79 Fifth LLC, and DAK 79 Fifth LLC, each a Delaware limited liability company and single purpose entity with one independent director. Counsel to the borrower provided a non-consolidation opinion in connection with the origination of the 79 Fifth Avenue Whole Loan.
The Borrower Sponsor. The borrower sponsor and nonrecourse carveout guarantor is Albert Kalimian. Albert Kalimian owns Kalimian Properties, a fully integrated privately held real estate investment firm with ownership interests in 10 commercial and multifamily properties in Manhattan, New York. Albert Kalimian had a 25% ownership stake in the property and is using the loan proceeds to buy out his equity partners to increase his ownership share to 100%.
Property Management. The 79 Fifth Avenue Property is managed by AMK Holdings Inc., a Delaware corporation, an affiliate of the borrowers.
Escrows and Reserves. At origination of the 79 Fifth Avenue Whole Loan, the borrowers deposited approximately (i) $2,815,969 into a real estate tax reserve account and (ii) $1,000,000 into a TI/LC reserve account.
Tax Escrows – The borrowers are required to deposit into a real estate tax reserve, on a monthly basis, 1/12 of the taxes that the lender reasonably estimates will be payable over the next-ensuing 12-month period (initially estimated to be approximately $469,328).
Insurance Escrows – The borrowers are required to deposit into an insurance reserve, on a monthly basis, 1/12 of the amount which will be sufficient to pay the insurance premiums due for the renewal of coverage afforded by such policies; provided, however, such insurance reserve has been conditionally waived so long as the borrowers maintain a blanket policy meeting the requirements of the 79 Fifth Avenue Whole Loan documents.
TI/LC Reserve – The borrowers are required to deposit into a tenant improvement and leasing commissions reserve, on a monthly basis, an amount equal to approximately $57,760; provided, however, the borrowers will not be required to make such monthly deposit into the tenant improvement and leasing reserve so long as the amount then on deposit in the tenant improvements and leasing commissions reserve account equals or exceeds $3,500,000. The borrowers may substitute a letter of credit for all or any portion of funds on deposit in the tenant improvement and leasing commissions account, which letter of credit will be increased by the borrowers in lieu of making the required monthly deposits into such reserve account.
| THE INFORMATION IN THIS STRUCTURAL AND COLLATERAL TERM SHEET IS NOT COMPLETE AND MAY BE AMENDED PRIOR TO THE TIME OF SALE. THIS TERM SHEET IS NOT AN OFFER TO SELL THESE SECURITIES AND IT IS NOT A SOLICITATION OF AN OFFER TO BUY THESE SECURITIES IN ANY JURISDICTION WHERE THE OFFER OR SALE IS NOT PERMITTED. |
110
| Structural and Collateral Term Sheet | | BMO 2022-C2 |
| |
| No. 8 – 79 Fifth Avenue |
Replacement Reserve – The borrowers are required to deposit into a replacement reserve, on a monthly basis, an amount equal to approximately $5,763; provided, however, the borrowers will not be required to make such monthly deposit into the replacement reserve so long as the amount then on deposit in the replacement reserve account equals or exceeds $207,468. The borrowers may substitute a letter of credit for all or any portion of funds on deposit in the replacement reserve account, which letter of credit will be increased by the borrowers in lieu of making the required monthly deposits into such reserve account.
Lockbox / Cash Management. The 79 Fifth Avenue Whole Loan is structured with a hard lockbox and springing cash management. At origination of the 79 Fifth Avenue Whole Loan, the borrowers were required to deliver a notice to each tenant directing each tenant to remit all payments under the applicable lease directly to the lender- controlled lockbox. All funds received by the borrowers or the property manager are required to be deposited in a lockbox account immediately following receipt. All funds deposited into the lockbox are required to be released to the borrowers on each business day unless a Trigger Period (as defined below) exists. Upon the occurrence and during the continuance of a Trigger Period, all funds in the lockbox account are required to be swept on each business day to a lender-controlled cash management account to be applied and disbursed in accordance with the 79 Fifth Avenue Whole Loan documents, and all excess cash flow funds remaining in the cash management account after the application of such funds in accordance with the 79 Fifth Avenue Whole Loan documents are required to be held by the lender in an excess cash flow reserve account as additional collateral for the 79 Fifth Avenue Whole Loan. Upon the cure of the applicable Trigger Period, so long as no other Trigger Period exists, the lender is required to return any amounts remaining on deposit in the excess cash flow reserve account to the borrowers. Upon an event of default under the 79 Fifth Avenue Whole Loan documents, the lender will apply funds to the debt in such priority as it may determine.
A “Trigger Period” means a period (A) commencing upon (i) the occurrence of an event of default under the 79 Fifth Avenue Whole Loan loan documents, (ii) the debt service coverage ratio falling below 1.15x (tested on a hypothetical 30-year amortization basis), or (iii) the occurrence and continuance of Specified Tenant Trigger Period (as defined below); and (B) expiring upon (x) with regard to clause (i), the cure of such event of default or waiver thereof by the lender, (y) with regard to clause (ii), the debt service coverage ratio being above 1.15x (tested on a hypothetical 30-year amortization basis) for 2 consecutive calendar quarters, or (z) with regard to clause (iii), a Specified Tenant Trigger Period ceasing to exist. Notwithstanding the foregoing, the failure to maintain a debt service coverage ratio of at least 1.15x will not result in a Trigger Period if, within 15 days of the borrowers’ receipt of notice of the Trigger Period caused in connection with clause (ii), the borrowers make a deposit into a reserve account held by the lender or deliver a letter of credit, in either case in an amount which, if deducted from the outstanding principal balance of the 79 Fifth Avenue Whole Loan, would cause the debt service coverage ratio to be at least 1.15x (tested on a hypothetical 30-year amortization basis).
A “Specified Tenant” means, as applicable, (i) The New School, (ii) any guarantor(s) of the applicable related Specified Tenant Lease(s), and (iii) any replacement tenant for a Specified Tenant that leases 107,500 square feet or more at the 79 Fifth Avenue Property.
A “Specified Tenant Trigger Period” means a period (A) commencing upon the first to occur of (i) Specified Tenant being in monetary or material non-monetary default under the applicable Specified Tenant Lease, in each case, beyond applicable notice, grace and cure periods (provided that the existing rent dispute between the borrowers and The New School as described in an estoppel certificate provided by The New School will not be deemed a default by The New School for the purposes of commencing a Specified Tenant Trigger Period; and provided further that a Specified Tenant will be deemed to be in default under this clause (i) if The New School fails to deliver a letter of credit when and as required under such tenant’s lease), (ii) a Specified Tenant giving notice that it is terminating its lease for all or any portion of the Specified Tenant Space (or applicable portion thereof), (iii) any termination or cancellation of any Specified Tenant Lease (including, without limitation, rejection in any bankruptcy or similar insolvency proceeding) and/or any Specified Tenant Lease failing to otherwise be in full force and effect, (iv) any bankruptcy or similar insolvency of Specified Tenant, and (v) Specified Tenant failing to extend or renew the applicable Specified Tenant Lease on or prior to June 30, 2028 in accordance with the applicable terms and conditions thereof and hereof for the applicable Specified Tenant Renewal Term; and (B) expiring upon the first to occur of the lender’s receipt of evidence reasonably acceptable to the lender (which such evidence shall include, without limitation, a duly executed estoppel certificate from the applicable Specified Tenant in form and substance reasonably acceptable to the lender) of (1) the satisfaction of the Specified Tenant Cure Conditions or(2) the borrowers leasing the entire Specified Tenant Space (or applicable portion thereof) in accordance with the applicable terms and conditions of the 79 Fifth Avenue Whole Loan documents, and the applicable tenant under such lease occupying the space demised under its lease and paying the full amount of the rent due under the applicable lease.
The “Specified Tenant Cure Conditions” means (i) the applicable Specified Tenant has cured all defaults under the applicable Specified Tenant Lease, (ii) the applicable Specified Tenant has revoked or rescinded all termination or cancellation notices with respect to the applicable Specified Tenant Lease and has re-affirmed the applicable Specified Tenant Lease as being in full force and effect, (iii) in the event the Specified Tenant Trigger Period is due to the applicable Specified Tenant’s failure to extend or renew the applicable Specified Tenant Lease in accordance with clause (v) of the definition of “Specified Tenant Trigger Period”, the applicable Specified Tenant has renewed or extended the applicable Specified Tenant Lease in accordance with the terms of such lease and of the 79 Fifth Avenue Whole Loan documents for the applicable Specified Tenant Renewal Term, (iv) with respect to any applicable bankruptcy or insolvency proceedings involving the applicable Specified Tenant and/or the applicable Specified Tenant Lease, the applicable Specified Tenant is no longer insolvent or subject to any bankruptcy or insolvency proceedings and has affirmed the applicable Specified Tenant Lease pursuant to final, non-appealable order of a court of competent jurisdiction, and (v) the applicable Specified Tenant is paying full, unabated rent under the applicable Specified Tenant Lease.
| THE INFORMATION IN THIS STRUCTURAL AND COLLATERAL TERM SHEET IS NOT COMPLETE AND MAY BE AMENDED PRIOR TO THE TIME OF SALE. THIS TERM SHEET IS NOT AN OFFER TO SELL THESE SECURITIES AND IT IS NOT A SOLICITATION OF AN OFFER TO BUY THESE SECURITIES IN ANY JURISDICTION WHERE THE OFFER OR SALE IS NOT PERMITTED. |
111
| Structural and Collateral Term Sheet | | BMO 2022-C2 |
| |
| No. 8 – 79 Fifth Avenue |
A “Specified Tenant Renewal Term” means five years.
A “Specified Tenant Space” means the entirety of that portion of the 79 Fifth Avenue Property demised as of the date hereof to the initial Specified Tenant pursuant to The New School’s lease.
A “Specified Tenant Lease” means collectively and/or individually (as the context requires), each lease at the 79 Fifth Avenue Property with Specified Tenant (including, without limitation, any guaranty or similar instrument furnished thereunder), as the same may have been or may hereafter be amended, restated, extended, renewed, replaced and/or otherwise modified.
Partial Release. Not Permitted.
Subordinate and Mezzanine Debt. None.
Ground Lease. None.
| THE INFORMATION IN THIS STRUCTURAL AND COLLATERAL TERM SHEET IS NOT COMPLETE AND MAY BE AMENDED PRIOR TO THE TIME OF SALE. THIS TERM SHEET IS NOT AN OFFER TO SELL THESE SECURITIES AND IT IS NOT A SOLICITATION OF AN OFFER TO BUY THESE SECURITIES IN ANY JURISDICTION WHERE THE OFFER OR SALE IS NOT PERMITTED. |
112
| Structural and Collateral Term Sheet | | BMO 2022-C2 |
| |
| No. 9 – 111 River Street |
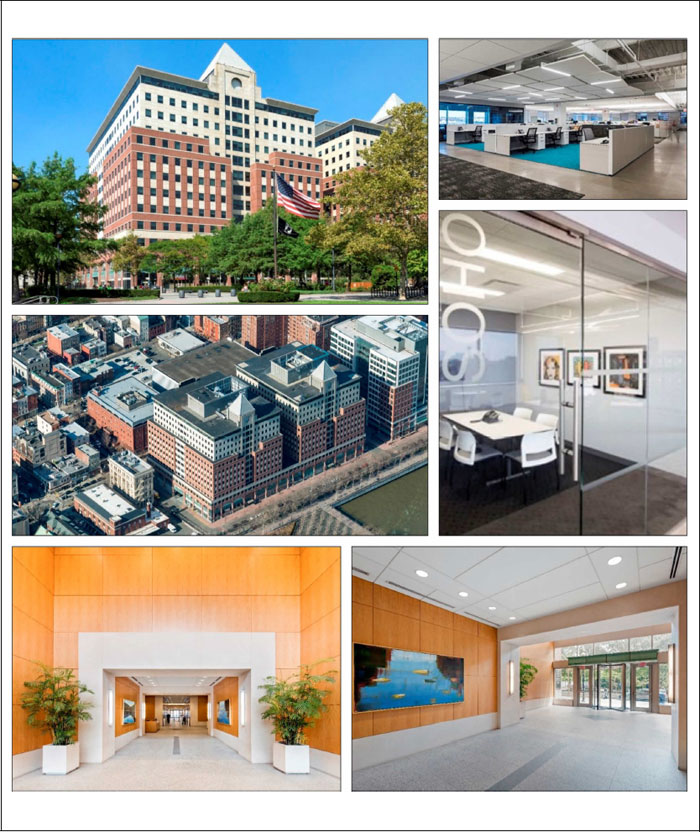
| THE INFORMATION IN THIS STRUCTURAL AND COLLATERAL TERM SHEET IS NOT COMPLETE AND MAY BE AMENDED PRIOR TO THE TIME OF SALE. THIS TERM SHEET IS NOT AN OFFER TO SELL THESE SECURITIES AND IT IS NOT A SOLICITATION OF AN OFFER TO BUY THESE SECURITIES IN ANY JURISDICTION WHERE THE OFFER OR SALE IS NOT PERMITTED. |
113
| Structural and Collateral Term Sheet | | BMO 2022-C2 |
| |
| No. 9 – 111 River Street |

| THE INFORMATION IN THIS STRUCTURAL AND COLLATERAL TERM SHEET IS NOT COMPLETE AND MAY BE AMENDED PRIOR TO THE TIME OF SALE. THIS TERM SHEET IS NOT AN OFFER TO SELL THESE SECURITIES AND IT IS NOT A SOLICITATION OF AN OFFER TO BUY THESE SECURITIES IN ANY JURISDICTION WHERE THE OFFER OR SALE IS NOT PERMITTED. |
114
| Structural and Collateral Term Sheet | | BMO 2022-C2 |
| |
| No. 9 – 111 River Street |
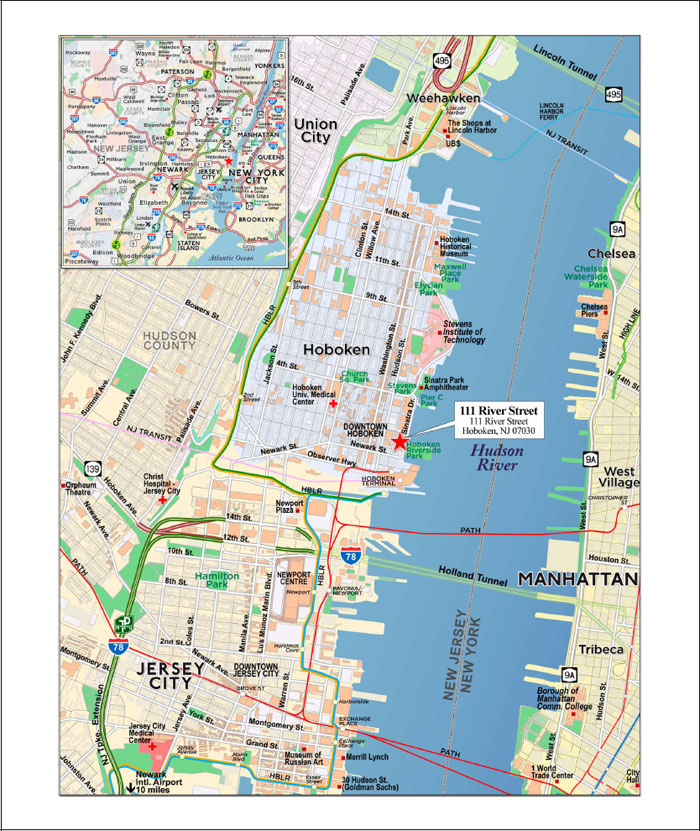
| THE INFORMATION IN THIS STRUCTURAL AND COLLATERAL TERM SHEET IS NOT COMPLETE AND MAY BE AMENDED PRIOR TO THE TIME OF SALE. THIS TERM SHEET IS NOT AN OFFER TO SELL THESE SECURITIES AND IT IS NOT A SOLICITATION OF AN OFFER TO BUY THESE SECURITIES IN ANY JURISDICTION WHERE THE OFFER OR SALE IS NOT PERMITTED. |
115
| Structural and Collateral Term Sheet | | BMO 2022-C2 |
| |
| No. 9 – 111 River Street |
| Mortgage Loan Information | | Property Information |
| Mortgage Loan Seller: | BMO | | Single Asset / Portfolio: | Single Asset |
| Original Principal Balance(1): | $22,000,000 | | Title: | Leasehold |
| Cut-off Date Principal Balance(1): | $22,000,000 | | Property Type – Subtype: | Office – CBD |
| % of IPB: | 3.1% | | Net Rentable Area (SF): | 557,719 |
| Loan Purpose: | Acquisition | | Location: | Hoboken, NJ |
| Borrowers: | River and First Streets LLC | | Year Built / Renovated: | 2002 / NAP |
| | and 280-10 Group LLC | | Occupancy: | 82.6% |
| Borrower Sponsors: | Steven J. Pozycki and | | Occupancy Date: | 1/1/2022 |
| | David Werner | | 4th Most Recent NOI (As of): | $6,751,258 (12/31/2018) |
| Interest Rate: | 3.28000% | | 3rd Most Recent NOI (As of): | $8,782,654 (12/31/2019) |
| Note Date: | 1/21/2022 | | 2nd Most Recent NOI (As of): | $9,767,259 (12/31/2020) |
| Maturity Date: | 2/6/2027 | | Most Recent NOI (As of): | $9,928,521 (TTM 10/31/2021) |
| Interest-only Period: | 60 months | | UW Economic Occupancy: | 82.1% |
| Original Term: | 60 months | | UW Revenues: | $22,541,072 |
| Original Amortization Term: | None | | UW Expenses: | $9,445,383 |
| Amortization Type: | Interest Only | | UW NOI: | $13,095,689 |
| Call Protection: | L(29),D(26),O(5) | | UW NCF: | $13,095,689 |
| Lockbox / Cash Management: | Hard / Springing | | Appraised Value / Per SF: | $244,000,000 / $437 |
| Additional Debt(1): | Yes | | Appraisal Date: | 11/15/2021 |
| Additional Debt Balance(1): | $55,500,000 / $76,250,000 | | | |
| Additional Debt Type(1): | Pari Passu / Subordinate | | | |
| | | | | |
| Escrows and Reserves(2) | | Financial Information(1) |
| | Initial | Monthly | Initial Cap | | | Senior Loan | Whole Loan |
| Taxes: | $122,519 | $138,561 | N/A | | Cut-off Date Loan / SF: | $139 | $276 |
| Insurance: | $177,648 | Springing | N/A | | Maturity Date Loan / SF: | $139 | $276 |
| Replacement Reserves: | $700,000 | Springing | N/A | | Cut-off Date LTV: | 31.8% | 63.0% |
| TI / LC Reserve: | $13,900,000 | Springing | $2,360,000 | | Maturity Date LTV: | 31.8% | 63.0% |
| Other: | $1,469,000 | $165,616 | N/A | | UW NCF DSCR: | 5.08x | 2.56x |
| | | | | | UW NOI Debt Yield: | 16.9% | 8.5% |
| | | | | | | | |
| |
| Sources and Uses |
| Sources | Proceeds | % of Total | | Uses | Proceeds | % of Total |
| Senior Loan | $77,500,000 | 31.6% | | Purchase Price | $225,000,000 | 91.9% |
| Subordinate Note | 76,250,000 | 31.1 | | Reserves | 16,369,167 | 6.7 |
| Sponsor Equity | 61,207,549 | 25.0 | | Closing Costs | 3,588,382 | 1.5 |
| Preferred Equity | 30,000,000 | 12.2 | | | | |
| Total Sources | $244,957,549 | 100.0% | | Total Uses | $244,957,549 | 100.0% |
| | | | | | | | |
| (1) | The 111 River Street Mortgage Loan (as defined below) is part of the 111 River Street Whole Loan (as defined below) with an original aggregate principal balance of $153,750,000. The Financial Information in the chart above reflects the 111 River Street Senior Loan (as defined below) and the 111 River Street Whole Loan. For additional information, see “The Loan” below. |
| (2) | For a full description of Escrows and Reserves, please refer to “Escrows and Reserves” below. |
The Loan. The ninth largest mortgage loan (the “111 River Street Mortgage Loan”) is part of a whole loan (the “111 River Street Whole Loan”) that is evidenced by (i) five pari passu senior promissory notes in the aggregate original principal amount of $77,500,000 (collectively, the “111 River Street Senior Loan”), and (ii) one subordinate promissory note in the original principal amount of $76,250,000 (the “111 River Street Subordinate Companion Loan”). The 111 River Street Whole Loan was originated on January 21, 2022, by Bank of Montreal (“BMO”). The 111 River Street Whole Loan is secured by a first priority mortgage on the borrowers’ leasehold interest in a 557,719 square foot office property located in Hoboken, New Jersey (the “111 River Street Property”). The 111 River Street Mortgage Loan is evidenced by the non-controlling promissory Notes A-2 and A-5 with a principal balance as of the Cut-off Date of $22,000,000. The remaining notes have been securitized or expected to be contributed to future securitization trusts, as set forth in the table below. Prior to the occurrence of a “control appraisal period” with respect to the 111 River Street Subordinate Companion Loan, the holder of the 111 River Street Mortgage Loan (i.e., the BMO 2022-C1 securitization trust, which rights will be exercisable by the controlling class
| THE INFORMATION IN THIS STRUCTURAL AND COLLATERAL TERM SHEET IS NOT COMPLETE AND MAY BE AMENDED PRIOR TO THE TIME OF SALE. THIS TERM SHEET IS NOT AN OFFER TO SELL THESE SECURITIES AND IT IS NOT A SOLICITATION OF AN OFFER TO BUY THESE SECURITIES IN ANY JURISDICTION WHERE THE OFFER OR SALE IS NOT PERMITTED. |
116
| Structural and Collateral Term Sheet | | BMO 2022-C2 |
| |
| No. 9 – 111 River Street |
representative for the BMO 2022-C1 pooled mortgage loans securitization transaction) will be the controlling noteholder. The 111 River Street Mortgage Loan will be serviced pursuant to the pooling and servicing agreement for the BMO 2022-C1 securitization. See “Description of the Mortgage Pool—The Whole Loans—The 111 River Street Pari Passu-AB Whole Loan” and “Pooling and Servicing Agreement” in the Prospectus.
| Whole Loan Summary |
| Note | Original Balance | Cut-off Date Balance | | Note Holder | Controlling Piece |
| A-1 | $37,500,000 | $37,500,000 | | BMO 2022-C1 | No |
| A-2 | $20,000,000 | $20,000,000 | | BMO 2022-C2 | No |
| A-3(1) | $10,000,000 | $10,000,000 | | BMO | No |
| A-4 | $8,000,000 | $8,000,000 | | CGCMT 2022-GC48 | No |
| A-5 | $2,000,000 | $2,000,000 | | BMO 2022-C2 | No |
| Total Senior Loan | $77,500,000 | $77,500,000 | | | |
| B Note | $76,250,000 | $76,250,000 | | BMO 2022-C1 (Loan Specific) | Yes(2) |
| Whole Loan | $153,750,000 | $153,750,000 | | | |
| (1) | Expected to be contributed to one or more future securitizations. |
| (2) | Following the occurrence and during the continuance of a “control appraisal period” with respect to Note B, Note A-1 will be the controlling note, and the controlling class representative of the BMO 2022-C1 pooled mortgage loans securitization will be entitled to exercise the related control rights. See “Description of the Mortgage Pool—The Whole Loans—The 111 River Street Pari-Passu AB Whole Loan” in the Prospectus. |
The Property. The 111 River Street Property consists of a 13-story office property comprised of 525,987 square feet of office space (approximately 92.1% of underwritten base rent) and 31,732 square feet of retail space (approximately 7.9% of underwritten base rent) located at 111 River Street in Hoboken, New Jersey. The 111 River Street Property has a total of 248 parking spaces (approximately 0.44 parking spaces per 1,000 square feet of NRA) provided by the subterranean parking garage. The 111 River Street Property is situated on the Hoboken riverfront and features unobstructed views of downtown Manhattan across the Hudson River. The 111 River Street Property is across the street from Pier A Park which includes a great lawn and plenty of outdoor seating, serving as an amenity for the tenants at the 111 River Street Property. The Hoboken New Jersey Path train station is within walking distance and provides direct access to downtown and midtown Manhattan. The 111 River Street Property is situated on approximately 1.10 acres, which is ground leased from the Port Authority of New York and New Jersey and the City of Hoboken, New Jersey through September 30, 2098. The 111 River Street Property was constructed in 2002. John Wiley & Sons Inc. and Sumitomo Mitsui Trust Bank, with a combined 59.5% of the total NRA, are long-term occupants of the building. The retail space is 100.0% leased by four tenants, Crunch Holdings LLC, Gregorys Coffee, PNC Bank National Association and TapMasters.
COVID-19 Update. As of January 21, 2022, the borrowers have reported that the 111 River Street Property is open and operating, with the tenants having paid their full January 2022 rent payments, with the exception of TapMasters, which has a rent commencement date of February 1, 2022 under the second amendment to its lease. The first debt service payment for the 111 River Street Whole Loan is due in March 2022. As of February 1, 2022, the 111 River Street Whole Loan is not subject to any forbearance, modification or debt service relief request.
Major Tenants. The two largest tenants based on underwritten base rent are John Wiley & Sons Inc. and Sumitomo Mitsui Trust Bank.
John Wiley & Sons Inc. (293,633 square feet; 52.6% NRA; 56.7% of underwritten base rent): John Wiley & Sons Inc. is headquartered at the 111 River Street Property and is a global leader in research and education. Founded over 200 years ago in 1807, the company is best known for its college text books and today has transitioned to digital products and services which make up approximately 82.0% of its current revenue. The company reported fiscal year 2021 revenue of approximately $1.94 billion. John Wiley & Sons Inc. occupies 290,353 square feet of office space on floors two through seven of the building as well as 3,279 square feet for storage within the basement of the building. John Wiley & Sons Inc. extended its lease in July 2017 and was provided a tenant improvement allowance of approximately $19.6 million. The current lease expires in March 2033 and contains two, five-year renewal options and no early termination options.
Sumitomo Mitsui Trust Bank (38,134 square feet; 6.8% NRA; 9.6% of underwritten base rent): Sumitomo Mitsui Trust Bank (“Sumitomo Bank”), a subsidiary of Sumitomo Mitsui Banking Corporation, is a Japanese multinational banking and financial services company based in Tokyo. As of September 30, 2021, Sumitomo Mitsui Banking Corporation reported total assets of just over two trillion dollars and over 86,000 employees. An original tenant in the building, Sumitomo Bank preleased space in the building during construction. Sumitomo Bank occupies 38,134 square feet on the building’s top and premier floor as a full floor tenant. Sumitomo Bank extended its lease in September 2017 and was provided a tenant improvement allowance of approximately $715,013 to complete improvements within its space. The current lease expires in January 2024 and contains one, five-year renewal option and no early termination options.
Environmental. According to a Phase I environmental assessment dated December 21, 2021, there was no evidence of any recognized environmental conditions at the 111 River Street Property.
| THE INFORMATION IN THIS STRUCTURAL AND COLLATERAL TERM SHEET IS NOT COMPLETE AND MAY BE AMENDED PRIOR TO THE TIME OF SALE. THIS TERM SHEET IS NOT AN OFFER TO SELL THESE SECURITIES AND IT IS NOT A SOLICITATION OF AN OFFER TO BUY THESE SECURITIES IN ANY JURISDICTION WHERE THE OFFER OR SALE IS NOT PERMITTED. |
117
| Structural and Collateral Term Sheet | | BMO 2022-C2 |
| |
| No. 9 – 111 River Street |
| Historical and Current Occupancy |
| 2018(1) | 2019(1) | 2020(1) | Current(2) |
| 77.5% | 77.6% | 81.4% | 82.6% |
| (1) | Historical occupancies are as of December 31 of each respective year. |
| (2) | Based on the underwritten rent roll as of January 1, 2022. |
| Top Tenant Summary(1) |
| Tenant | Ratings
Moody’s/S&P/Fitch(2) | Net Rentable Area (SF) | % of
Total NRA | UW
Base Rent PSF(3) |
UW
Base Rent(3) | % of Total
UW Base Rent | Lease
Exp. Date |
| John Wiley & Sons Inc. | NR/NR/NR | 293,633 | 52.6% | $37.27 | $10,943,981 | 56.7% | 3/31/2033(4) |
| Sumitomo Mitsui Trust Bank | A1/A-/NR | 38,134 | 6.8 | 48.59 | 1,852,804 | 9.6 | 1/31/2024(5) |
| Major Tenants | | 331,767 | 59.5% | $38.57 | $12,796,785 | 66.3% | |
| | | | | | | | |
| Other Tenants | | 128,665 | 23.1% | $50.57 | $6,506,715 | 33.7% | |
| | | | | | | | |
| Occupied Collateral Total / Wtd. Avg. | | 460,432 | 82.6% | $41.92 | $19,303,500 | 100.0% | |
| | | | | | | | |
| Vacant Space | | 97,287 | 17.4% | | | | |
| | | | | | | | |
| Collateral Total | | 557,719 | 100.0% | | | | |
| | | | | | | | |
| (1) | Based on underwritten rent roll dated as of January 1, 2022. |
| (2) | Ratings provided are for the parent company of the entity listed in the “Tenant” field whether or not the parent company guarantees the lease. |
| (3) | UW Base Rent PSF and UW Base Rent include rent steps through December 2022 for tenants other than John Wiley & Sons Inc. of approximately $80,077 and rent steps through April 2023 for John Wiley & Sons Inc. of approximately $1,167,970. |
| (4) | John Wiley & Sons Inc. has two, five-year extension options remaining. |
| (5) | Sumitomo Mitsui Trust Bank has one, five-year extension option. |
| Lease Rollover Schedule(1)(2) |
| Year | | | Number of Leases Expiring | | Net Rentable Area Expiring | | % of NRA Expiring | | UW Base Rent Expiring(3) | | % of UW Base Rent Expiring(3) | | Cumulative Net Rentable Area Expiring | | Cumulative % of NRA Expiring | | Cumulative UW Base Rent Expiring(3) | | Cumulative % of UW Base Rent Expiring(3) |
| Vacant | | | NAP | | 97,287 | | 17.4 | % | | NAP | | NAP | | | 97,287 | | 17.4 | % | | NAP | | NAP |
| 2022 | | | 0 | | 0 | | 0.0 | | | $0 | | 0.0 | % | | 97,287 | | 17.4 | % | | $0 | | 0.0 | % |
| 2023 | | | 1 | | 7,543 | | 1.4 | | | $408,227 | | 2.1 | | | 104,830 | | 18.8 | % | | $408,227 | | 2.1 | % |
| 2024 | | | 1 | | 38,134 | | 6.8 | | | $1,852,804 | | 9.6 | | | 142,964 | | 25.6 | % | | $2,261,031 | | 11.7 | % |
| 2025 | | | 0 | | 0 | | 0.0 | | | $0 | | 0.0 | | | 142,964 | | 25.6 | % | | $2,261,031 | | 11.7 | % |
| 2026 | | | 3 | | 31,779 | | 5.7 | | | $1,585,183 | | 8.2 | | | 174,743 | | 31.3 | % | | $3,846,214 | | 19.9 | % |
| 2027 | | | 1 | | 4,500 | | 0.8 | | | $292,500 | | 1.5 | | | 179,243 | | 32.1 | % | | $4,138,714 | | 21.4 | % |
| 2028 | | | 0 | | 0 | | 0.0 | | | $0 | | 0.0 | | | 179,243 | | 32.1 | % | | $4,138,714 | | 21.4 | % |
| 2029 | | | 2 | | 39,259 | | 7.0 | | | $1,867,731 | | 9.7 | | | 218,502 | | 39.2 | % | | $6,006,445 | | 31.1 | % |
| 2030 | | | 1 | | 13,662 | | 2.4 | | | $710,697 | | 3.7 | | | 232,164 | | 41.6 | % | | $6,717,143 | | 34.8 | % |
| 2031 | | | 1 | | 10,512 | | 1.9 | | | $536,112 | | 2.8 | | | 242,676 | | 43.5 | % | | $7,253,255 | | 37.6 | % |
| 2032 & Beyond | | | 9 | | 315,043 | | 56.5 | | | $12,050,245 | | 62.4 | | | 557,719 | | 100.0 | % | | $19,303,500 | | 100.0 | % |
| Total | | | 19 | | 557,719 | | 100.0 | % | | $19,303,500 | | 100.0 | % | | | | | | | | | | |
| (1) | Based on the underwritten rent roll dated as of January 1, 2022. |
| (2) | Certain leases may have termination options that are exercisable prior to the originally stated expiration date of the lease and that are not considered in this Lease Rollover Schedule. |
| (3) | UW Base Rent Expiring, % of UW Base Rent Expiring, Cumulative UW Base Rent Expiring and Cumulative % of UW Base Rent Expiring include rent steps through December 2022 for tenants other than John Wiley & Sons Inc. of approximately $80,077 and rent steps through April 2023 for John Wiley & Sons Inc. of approximately $1,167,970. |
| THE INFORMATION IN THIS STRUCTURAL AND COLLATERAL TERM SHEET IS NOT COMPLETE AND MAY BE AMENDED PRIOR TO THE TIME OF SALE. THIS TERM SHEET IS NOT AN OFFER TO SELL THESE SECURITIES AND IT IS NOT A SOLICITATION OF AN OFFER TO BUY THESE SECURITIES IN ANY JURISDICTION WHERE THE OFFER OR SALE IS NOT PERMITTED. |
118
| Structural and Collateral Term Sheet | | BMO 2022-C2 |
| |
| No. 9 – 111 River Street |
| Operating History and Underwritten Net Cash Flow |
| | 2018 | 2019 | 2020 | TTM(1)(2) | Underwritten(1) | Per Square Foot | %(3) |
| Occupancy | 77.5% | 77.6% | 81.4% | 0.0% | 82.1% | | |
| Gross Potential Rent | $17,383,219 | $16,853,841 | $17,622,252 | $18,453,776 | $19,259,904 | $34.53 | 86.1% |
| Vacancy Gross Up | 0 | 0 | 0 | 0 | 4,864,350 | 8.72 | 21.8 |
| Reimbursement Income(4) | 430,219 | 197,920 | 232,983 | 254,975 | 464,742 | 0.83 | 2.1 |
| Rent Bumps - 12 Months(5) | 0 | 0 | 0 | 0 | 80,077 | 0.14 | 0.4 |
| Rent Bump - Wiley(5) | 0 | 0 | 0 | 0 | 1,167,970 | 2.09 | 5.2 |
| Parking Income | 1,050,355 | 1,042,366 | 479,978 | 464,075 | 875,498 | 1.57 | 3.9 |
| Tenant Electric | 642,112 | 405,924 | 208,201 | 325,055 | 515,724 | 0.92 | 2.3 |
| Gross Revenue | $19,505,905 | $18,500,051 | $18,543,414 | $19,497,881 | $27,228,265 | $48.82 | 121.8% |
| Free Rent | (3,591,825) | (896,562) | (444,930) | (1,179,720) | 0 | 0.00 | 0.0 |
| Actual Vacancy | 0 | 0 | 0 | 0 | (4,864,350) | (8.72) | (21.8) |
| Underwriting Vacancy | 0 | 0 | 0 | 0 | 0 | 0.00 | 0.0 |
| Total Vacancy | $0 | $0 | $0 | $0 | ($4,864,350) | ($8.72) | (21.8%) |
| Net Rental Collections | $15,914,080 | $17,603,490 | $18,098,484 | $18,318,161 | $22,363,915 | $40.10 | 100.0% |
| Other Income (U & O) | 217,601 | 31,915 | 77,892 | 43,444 | 87,657 | 0.16 | 0.4 |
| HVAC Charges | 78,083 | 468,898 | 198,787 | 75,763 | 89,500 | 0.16 | 0.4 |
| Total Income | $16,209,764 | $18,104,302 | $18,375,164 | $18,437,368 | $22,541,072 | $40.42 | 100.8% |
| | | | | | | | |
| Real Estate Taxes | $1,406,058 | $1,406,058 | $1,469,748 | $1,470,147 | $1,662,735 | $2.98 | 7.4% |
| Insurance | 175,263 | 200,949 | 305,435 | 353,897 | 304,539 | 0.55 | 1.4 |
| Management Fee | 454,746 | 524,424 | 541,781 | 565,271 | 450,821 | 0.81 | 2.0 |
| Utilities | 1,293,591 | 1,011,321 | 799,140 | 903,600 | 1,319,051 | 2.37 | 5.9 |
| Repairs and Maintenance | 1,607,510 | 1,666,195 | 1,610,043 | 1,744,856 | 1,860,212 | 3.34 | 8.3 |
| Payroll & Benefits | 192,708 | 202,152 | 213,756 | 214,946 | 215,000 | 0.39 | 1.0 |
| Janitorial | 806,081 | 862,732 | 405,286 | (15,294) | 820,917 | 1.47 | 3.6 |
| Security | 492,752 | 507,718 | 548,290 | 593,014 | 440,000 | 0.79 | 2.0 |
| General & Administrative | 110,269 | 113,920 | 98,663 | 110,640 | 82,873 | 0.15 | 0.4 |
| Parking | 567,229 | 590,661 | 434,802 | 356,440 | 300,000 | 0.54 | 1.3 |
| Association Dues | 239,223 | 244,103 | 247,790 | 251,388 | 253,862 | 0.46 | 1.1 |
| Ground Rent | 2,113,076 | 1,991,416 | 1,933,170 | 1,959,942 | 1,735,373 | 3.11 | 7.7 |
| Total Expenses | $9,458,506 | $9,321,649 | $8,607,905 | $8,508,847 | $9,445,383 | $16.94 | 41.9% |
| Expense Reimbursement Ratio | 11.3% | 6.5% | 5.1% | 12.3% | 10.4% | | |
| Expense Ratio | 58.4% | 51.5% | 46.8% | 46.2% | 41.9% | | |
| Parking Expense Ratio | 54.0% | 56.7% | 90.6% | 76.8% | 34.3% | | |
| Net Operating Income | $6,751,258 | $8,782,654 | $9,767,259 | $9,928,521 | $13,095,689 | $23.48 | 58.1% |
| Tenant Improvements | 0 | 0 | 0 | 0 | 0 | 0.00 | 0.0 |
| Leasing Commissions | 0 | 0 | 0 | 0 | 0 | 0.00 | 0.0 |
| Replacement Reserves | 0 | 0 | 0 | 0 | 0 | 0.00 | 0.0 |
| Total Leasing & Capital Cost | $0 | $0 | $0 | $0 | $0 | $0.00 | 0.0% |
| Net Cash Flow | $6,751,258 | $8,782,654 | $9,767,259 | $9,928,521 | $13,095,689 | $23.48 | 58.1% |
| Operating Margin | 41.6% | 48.5% | 53.2% | 53.8% | 58.1% | | |
| (1) | The increase in Underwritten Net Operating Income from TTM Net Operating Income is primarily driven by (i) inclusion of the Wiley & Sons Inc. rent bump, (ii) burn off/reserve of free rent and (iii) normalization of parking income. |
| (2) | TTM represents the trailing 12 months ending October 31, 2021. |
| (3) | % column represents percent of Net Rental Collections for all revenue lines and represents percent of Total Income for the remainder of fields. |
| (4) | Reimbursement Income includes reimbursements for tenant electricity. |
| (5) | Rent Bumps – 12 Months are through December 2022 for tenants other than John Wiley & Sons Inc. total approximately $80,077. Rent Bump – Wiley is for John Wiley & Sons Inc. through April 2023 total approximately $1,167,970.
|
| THE INFORMATION IN THIS STRUCTURAL AND COLLATERAL TERM SHEET IS NOT COMPLETE AND MAY BE AMENDED PRIOR TO THE TIME OF SALE. THIS TERM SHEET IS NOT AN OFFER TO SELL THESE SECURITIES AND IT IS NOT A SOLICITATION OF AN OFFER TO BUY THESE SECURITIES IN ANY JURISDICTION WHERE THE OFFER OR SALE IS NOT PERMITTED. |
119
| Structural and Collateral Term Sheet | | BMO 2022-C2 |
| |
| No. 9 – 111 River Street |
The Market. The 111 River Street Property is located in Hoboken, Hudson County, New Jersey, in the central business district of Hoboken. The 111 River Street Property is situated in the Hudson Waterfront submarket at the intersection of River Street and First Street and is surrounded primarily by office properties, service businesses, and ground level retail. The major influence for the immediate area is the access to the local highway system, as well as its proximity to New York City, the Jersey City waterfront, and public transportation. Major highways within one-to-two miles of the 111 River Street Property include Interstate 495, Route 1 and Route 9 to the north, and the New Jersey Turnpike to the west. The Lincoln Tunnel and Holland Tunnel, which provide access to Lower Manhattan and Midtown Manhattan, are within two-to-three miles of the 111 River Street Property.
According to the appraisal, as of the third quarter of 2021, the NNJ Metro office market had an inventory of approximately 153.5 million square feet, overall vacancy of approximately 17.3% and average asking rent of $29.52 per square foot. As of the third quarter of 2021, the Hudson Waterfront office submarket had an inventory of approximately 19.6 million square feet, overall vacancy of approximately 16.2% and average asking rent of $40.06 per square foot. According to the appraisal, the 2021 population within a one-, three- and five-mile radius was 72,730, 931,791 and 1,982,163, respectively. The 2021 median household income within a one-, three- and five-mile radius was $141,822, $104,046 and $105,663, respectively.
The following table presents certain information relating to comparable office leases for the 111 River Street Property:
| Comparable Office Leases(1) |
| Property Name/Location | Year Built/ Renovated | NRA (SF) | Tenant | Lease Size (SF) | Rent PSF | Commencement | Lease Term (Years) | Lease Type |
111 River Street Hoboken, NJ | 2002/NAP | 557,719(2) | Various | Various | $43.06(2)(3) | Various | Various | Various |
Harborside Plaza 2 Jersey City, NJ | 2003/NAP | 507,781 | ROAR | 50,000 | $38.00 | Jun-21 | 5.5 Yrs. | Full Service |
Waterfront Corporate Center II Hoboken, NJ | 2003/NAP | 507,781 | RMS | 27,000 | $53.50 | Jun-21 | 5.5 Yrs. | Full Service |
Goldman Sachs Building Jersey City, NJ | 2004/NAP | 1,750,000 | AIG | 227,852 | $45.00 | Mar-21 | 16.0 Yrs. | Full Service |
Baker Waterfront Plaza Hoboken, NJ | 1987/NAP | 92,892 | NJ Transit | 11,000 | $40.00 | May-21 | 10.0 Yrs. | Full Service |
70 Hudson Street Jersey City, NJ | 2001/NAP | 431,438 | TD Ameritrade | 207,296 | $46.00 | Aug-21 | 12.4 Yrs. | Full Service |
Waterfront Corporate Center II Hoboken, NJ | 2003/NAP | 507,781 | Jet.com / Walmart | 41,453 | $52.00 | Jul-18 | 12.0 Yrs. | Full Service |
| (2) | Based on the underwritten rent roll dated as of January 1, 2022, with rent steps of approximately $80,077 through December 2022. |
| (3) | Rent PSF is based on the square footage of the office space at the 111 River Street Property (525,987 square feet). |
The following table presents certain information relating to comparable retail leases for the 111 River Street Property:
| Comparable Retail Leases(1) |
| Property Name/Location | Year Built/ Renovated | NRA (SF) | Tenant | Lease Size (SF) | Rent PSF | Commencement | Lease Term (Years) | Lease Type |
111 River Street Hoboken, NJ | 2002/NAP | 557,719(2) | Various | Various | $47.87(2)(3) | Various | Various | Various |
322 Washington Street Hoboken, NJ | NAV | NAV | Hoboken BBQ | 1,700 | $56.47 | Oct-21 | 5.0 Yrs. | Modified Gross |
109 Christopher Columbus Dr. Jersey City, NJ | NAV | NAV | Early Beginnings | 4,777 | $52.00 | Jan-20 | 10.0 Yrs. | NNN |
40 Riverwalk Place West New York, NJ | NAV | NAV | Row House | 2,500 | $40.00 | Jun-19 | 10.0 Yrs. | NNN |
1101 Grand Street Hoboken, NJ | NAV | NAV | Doluce & Saulda | 1,300 | $48.00 | Apr-18 | 10.0 Yrs. | NNN |
| (2) | Based on the underwritten rent roll dated as of January 1, 2022. |
| (3) | Rent PSF is based on the square footage of the retail space at the 111 River Street Property (31,732 square feet). |
The Borrowers. The borrowers are River and First Streets LLC and 280-10 Group LLC, as tenants in common, each a Delaware limited liability company, structured to be a single purpose bankruptcy-remote entity with two independent directors. Counsel to the borrowers provided a non-consolidation opinion in connection with the origination of the 111 River Street Whole Loan.
The Borrower Sponsors. The borrower sponsors are Steven J. Pozycki and David Werner. Steven J. Pozycki is the founder of SJP Properties. Since its founding in 1981, SJP Properties has successfully developed more than 25 million square feet of ground-up real estate projects in partnership with major public and private institutions. SJP Properties has owned and managed the remaining two Class A office properties which together make up the Waterfront Corporate Center (Buildings II and III). David Werner Real Estate Investments
| THE INFORMATION IN THIS STRUCTURAL AND COLLATERAL TERM SHEET IS NOT COMPLETE AND MAY BE AMENDED PRIOR TO THE TIME OF SALE. THIS TERM SHEET IS NOT AN OFFER TO SELL THESE SECURITIES AND IT IS NOT A SOLICITATION OF AN OFFER TO BUY THESE SECURITIES IN ANY JURISDICTION WHERE THE OFFER OR SALE IS NOT PERMITTED. |
120
| Structural and Collateral Term Sheet | | BMO 2022-C2 |
| |
| No. 9 – 111 River Street |
is the investment company of David Werner, a New York based private real estate investor who has been actively involved in commercial real estate for more than 35 years. He is currently a principal in more than 15 million square feet of office and nearly 9,000 apartment units.
Property Management. The 111 River Street Property is managed by SJP Corporate Real Estate Services, Inc., a Delaware corporation, an affiliate of the borrower sponsors.
Escrows and Reserves. At origination, the borrowers were required to deposit into escrow (i) approximately $122,519 for real estate taxes, (ii) approximately $177,648 for insurance, (iii) $13,900,000 for tenant improvement, leasing commissions, and other leasing costs (the “TI/LC Reserve”), (iv) $700,000 for capital expenditures, (v) $1,258,196.33 to replicate the difference between (x) the monthly rental amounts due and payable under the John Wiley & Sons Inc. lease and (y) the monthly rental amount that will be due and payable under the John Wiley & Sons Inc. lease as of the April 2023 rent step up under such lease, (vi) $165,615.50 for base rent and O&M rent due under the Ground Lease (as defined below), and (vii) $45,188 with respect to free rent due under the leases in place at closing.
Tax Escrows – On a monthly basis, the borrowers are required to escrow 1/12th of the annual estimated real estate taxes, which currently equates to $138,561.
Insurance Escrows – On a monthly basis, the borrowers are required to escrow 1/12th of the annual estimated insurance premium, provided that such monthly deposits are not required so long as a blanket or umbrella insurance policy acceptable to the lender and covering the 111 River Street Property is in effect.
Replacement Reserve – The borrowers are required to escrow $6,971 for replacement reserves on a monthly basis upon the occurrence and continuation of a Trigger Period (as defined below).
TI/LC Reserve – On the first payment date when the balance of the TI/LC Reserve falls below $2,360,000 and on each payment date thereafter until the balance of the TI/LC Reserve is at least $2,360,000, the borrowers will be required to escrow monthly the amount of $46,477 for tenant improvements and leasing commissions.
Ground Rent Escrows – On a monthly basis, the borrowers are required to escrow approximately 1/12th of the annual estimated base rent and O&M rent due under the Ground Lease, which currently equates to $165,615.50.
Lockbox / Cash Management. The 111 River Street Whole Loan is structured with a hard lockbox and springing cash management. The borrowers are required to, or are required to cause the property manager to, direct each tenant of the 111 River Street Property to deposit funds directly into the lockbox account controlled by the lender. Notwithstanding the foregoing, the borrowers or property manager are required to deposit all revenues otherwise received into the lockbox account within two business days of receipt. On each business day, all sums on deposit in the lockbox account are required to be swept to the cash management account. On each payment date, all sums on deposit in the cash management account are required to be applied and disbursed in accordance with the 111 River Street Whole Loan documents. During the continuance of a Trigger Period (as defined below), any excess cash is required to be held by the lender as additional security for the 111 River Street Whole Loan.
A “Trigger Period” will commence upon: (i) the occurrence of an event of default under the 111 River Street Whole Loan documents and will continue until such event of default is cured; (ii) the date on which the debt yield as calculated in the 111 River Street Whole Loan documents is less than 6.0% (a “Debt Yield Trigger”) and will continue until the debt yield is at least 6.0% for two consecutive quarters; or (iii) any termination, notice of termination, default or cessation of operations of John Wiley & Sons Inc. or the occurrence of the date that is 12-months prior to the expiration of the John Wiley & Sons Inc.
Subordinate and Mezzanine Debt. On January 21, 2022, BMO funded the 111 River Street Whole Loan in the original amount of $153,750,000. The 111 River Street Senior Loan is senior in right of payment and in other respects to the 111 River Street Subordinate Companion Loan. The 111 River Street Subordinate Companion Loan was an asset of the BMO 2022-C1 securitization trust but was not pooled together with the other mortgage loans and payments of interest, principal and other amounts received in respect of the 111 River Street Subordinate Companion Loan and allocable thereto will be available to make distributions in respect of the related classes of loan-specific classes of certificates only. The 111 River Street Subordinate Companion Loan will have an initial interest rate of 3.28000%, and is coterminous with the 111 River Street Senior Loan. The relative rights and obligations of the holders of the 111 River Street Whole Loan are governed by the terms of a co-lender agreement. See “Description of the Mortgage Pool—The Whole Loans—The 111 River Street Pari Passu-AB Whole Loan” in the prospectus. Based on the 111 River Street Whole Loan, the Cut-off Date LTV, Maturity Date LTV, UW NCF DSCR and UW NOI Debt Yield are 63.0%, 63.0%, 2.56x and 8.5%, respectively
Preferred Equity. On the origination date, the preferred equity holders made preferred equity investments in the aggregate amount of $30,000,000 (collectively, the “Preferred Equity Investment”). The Preferred Equity Investment is required to be redeemed upon the earlier to occur of (a) a sale or other disposition of the 111 River Street Property or (b) the refinance of the 111 River Street Whole Loan, but in no event later than February 6, 2027. The preferred equity holder is entitled to a preferred return of 11.00% per annum (of which (x) 7.00% will be paid monthly on a current basis from excess cash flow remaining after payment of amounts due under the 111 River Street Whole Loan documents and (y) 4.00% will accrue and compound until the redemption date). Upon the occurrence of a preferred
| THE INFORMATION IN THIS STRUCTURAL AND COLLATERAL TERM SHEET IS NOT COMPLETE AND MAY BE AMENDED PRIOR TO THE TIME OF SALE. THIS TERM SHEET IS NOT AN OFFER TO SELL THESE SECURITIES AND IT IS NOT A SOLICITATION OF AN OFFER TO BUY THESE SECURITIES IN ANY JURISDICTION WHERE THE OFFER OR SALE IS NOT PERMITTED. |
121
| Structural and Collateral Term Sheet | | BMO 2022-C2 |
| |
| No. 9 – 111 River Street |
equity event of default, the preferred equity holder is permitted to take control of the borrowers pursuant to the terms of the 111 River Street Whole Loan documents, including that a replacement guarantor must provide a replacement guaranty of recourse obligations and environmental indemnity agreement in substantially the forms provided by the guarantor at loan origination, which replacement guarantor must (i) be controlled by, and at least 0.5% owned by, 3650 REIT Investment Management LLC, a Delaware limited liability company, (ii) have a net worth of at least $100 million (exclusive of any interest in the 111 River Street Property), (iii) be at least 51% owned by either the California State Teachers’ Retirement System, a public entity, or a “Qualified Transferee” (as defined in the 111 River Street Whole Loan documents), and (iv) otherwise satisfy lender’s standard KYC requirements.
Partial Release. Not permitted.
Ground Lease. The 111 River Street Property is subject to a 98-year ground lease, dated as of September 29, 2000, between the Port Authority of New York and New Jersey and the City of Hoboken, New Jersey, collectively as landlord, and the borrowers, collectively as tenant (the “Ground Lease”). The term of the Ground Lease commenced on September 29, 2000 and expires September 30, 2098. The annual rent, paid monthly, is fixed (current monthly rent payments equal to approximately $125,233) with stated scheduled adjustments at specified intervals. In addition to annual rent, the ground lessor makes O&M payments and percentage rent (when applicable) equal to 1% of gross revenues (currently estimated to approximately $21,155.17 per month) to the extent of net available cashflow. The lease contains standard leasehold mortgagee protections including notice and cure rights, right to a new lease in the event of termination of the ground lease (including rejection of the ground lease in bankruptcy), and an agreement that no amendment or modification of the ground lease entered into without lender’s consent shall be effective.
Payment in Lieu of Taxes. Pursuant to the terms of the Ground Lease, the 111 River Street Property is not subject to the imposition or payment of taxes during the term of the Ground Lease, provided that, in lieu thereof, the borrowers shall pay to the City of Hoboken, New Jersey, in equal quarterly installments, the annual PILOT Rent, which is the product of the Applicable PILOT Rate (as increased) and the applicable number of development square feet. The initial Applicable PILOT Rate was set at $2.00 PSF and increased by 2.75% compounded annually with increases effective every five years. Starting in May 2022 the PILOT Rate will increase yearly by the greater of (i) 2.00% and (ii) the increase in the Tax Rate for Hudson County. The borrowers have the right at any time to have the 111 River Street Property placed on the tax rolls and become subject to the payment of ad valorem real estate taxes (at which time, the borrowers’ obligation to make the annual PILOT rent payments will cease); however, pursuant to the 111 River Street Whole Loan documents, borrowers have agreed to not to make any such election to have the 111 River Street Property placed on the tax rolls or to otherwise cause, permit or suffer the 111 River Street Property (or any portion thereof) to become subject to the payment of ad valorem real estate taxes. If not earlier terminated, the PILOT is co-terminus with the Ground Lease (expiring September 30, 2098).
| THE INFORMATION IN THIS STRUCTURAL AND COLLATERAL TERM SHEET IS NOT COMPLETE AND MAY BE AMENDED PRIOR TO THE TIME OF SALE. THIS TERM SHEET IS NOT AN OFFER TO SELL THESE SECURITIES AND IT IS NOT A SOLICITATION OF AN OFFER TO BUY THESE SECURITIES IN ANY JURISDICTION WHERE THE OFFER OR SALE IS NOT PERMITTED. |
122
| Structural and Collateral Term Sheet | | BMO 2022-C2 |
| |
| No. 10 – Phoenix Industrial Portfolio VIII |
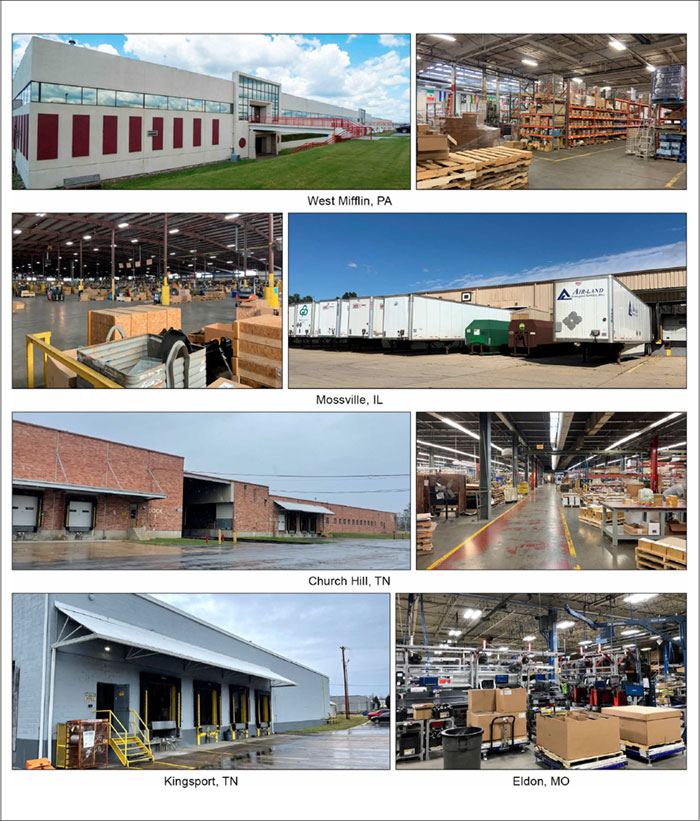
| THE INFORMATION IN THIS STRUCTURAL AND COLLATERAL TERM SHEET IS NOT COMPLETE AND MAY BE AMENDED PRIOR TO THE TIME OF SALE. THIS TERM SHEET IS NOT AN OFFER TO SELL THESE SECURITIES AND IT IS NOT A SOLICITATION OF AN OFFER TO BUY THESE SECURITIES IN ANY JURISDICTION WHERE THE OFFER OR SALE IS NOT PERMITTED. |
123
| Structural and Collateral Term Sheet | | BMO 2022-C2 |
| |
| No. 10 – Phoenix Industrial Portfolio VIII |
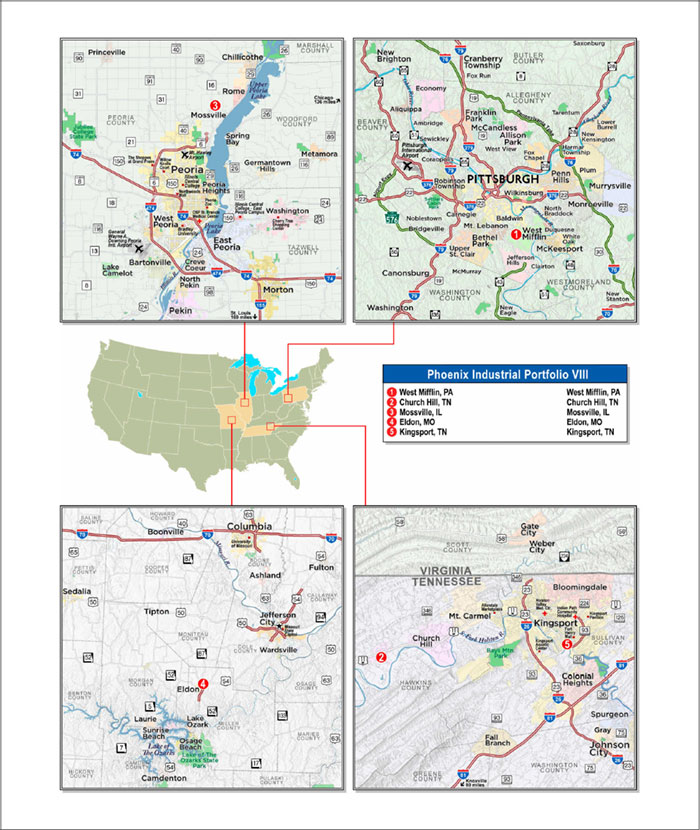
| THE INFORMATION IN THIS STRUCTURAL AND COLLATERAL TERM SHEET IS NOT COMPLETE AND MAY BE AMENDED PRIOR TO THE TIME OF SALE. THIS TERM SHEET IS NOT AN OFFER TO SELL THESE SECURITIES AND IT IS NOT A SOLICITATION OF AN OFFER TO BUY THESE SECURITIES IN ANY JURISDICTION WHERE THE OFFER OR SALE IS NOT PERMITTED. |
124
| Structural and Collateral Term Sheet | | BMO 2022-C2 |
| |
| No. 10 – Phoenix Industrial Portfolio VIII |
Mortgage Loan Information | | Property Information |
| Mortgage Loan Seller: | UBS AG | | Single Asset / Portfolio: | Portfolio |
| Original Principal Balance(1): | $22,000,000 | | Title: | Fee |
| Cut-off Date Principal Balance(1): | $22,000,000 | | Property Type – Subtype: | Industrial – Various |
| % of IPB: | 3.1% | | Net Rentable Area (SF): | 2,329,016 |
| Loan Purpose: | Refinance | | Location: | Various |
| Borrowers(2): | Various | | Year Built / Renovated: | Various / Various |
| Borrower Sponsor: | Phoenix Investors | | Occupancy: | 95.8% |
| Interest Rate: | 5.70000% | | Occupancy Date(3): | Various |
| Note Date: | 5/10/2022 | | 4th Most Recent NOI (As of)(4): | $1,453,173 (12/31/2019) |
| Maturity Date: | 6/6/2032 | | 3rd Most Recent NOI (As of)(4): | $1,436,649 (12/31/2020) |
| Interest-only Period: | 60 months | | 2nd Most Recent NOI (As of): | $4,778,303 (12/31/2021) |
| Original Term: | 120 months | | Most Recent NOI (As of)(5): | $4,901,997 (TTM 2/28/2022) |
| Original Amortization Term: | 360 months | | UW Economic Occupancy: | 95.5% |
| Amortization Type: | Interest Only, Amortizing Balloon | | UW Revenues: | $9,112,448 |
| Call Protection: | L(25),D(89),O(6) | | UW Expenses: | $2,413,939 |
| Lockbox / Cash Management: | Hard / Springing | | UW NOI(5): | $6,698,509 |
| Additional Debt(1): | Yes | | UW NCF: | $6,225,490 |
| Additional Debt Balance(1): | $35,000,000 | | Appraised Value / Per SF: | $88,200,000 / $38 |
| Additional Debt Type(1): | Pari Passu | | Appraisal Date: | Various |
| | | | | |
| Escrows and Reserves(6) | | Financial Information(1) |
| | Initial | Monthly | Initial Cap | | Cut-off Date Loan / SF: | $24 |
| Taxes: | $136,487 | $35,040 | N/A | | Maturity Date Loan / SF: | $23 |
| Insurance: | $0 | Springing | N/A | | Cut-off Date LTV: | 64.6% |
| Replacement Reserves: | $0 | $19,408 | $698,705 | | Maturity Date LTV: | 60.2% |
| TI / LC Reserve: | $1,500,000 | Springing | $1,500,000 | | UW NCF DSCR: | 1.57x |
| Other: | $68,314 | $0 | N/A | | UW NOI Debt Yield: | 11.8% |
| | | | | | | |
| | | | | | | |
| |
| Sources and Uses |
| Sources | Proceeds | % of Total | | Uses | Proceeds | % of Total |
| Whole Loan | $57,000,000 | 100.0% | | Loan Payoff | $38,034,329 | 66.7% |
| | | | | Partnership Buyout | 12,023,483 | 21.1 |
| | | | | Return of Equity | 4,496,782 | 7.9 |
| | | | | Upfront Reserves | 1,704,801 | 3.0 |
| | | | | Closing Costs | 740,606 | 1.3 |
| Total Sources | $57,000,000 | 100.0% | | Total Uses | $57,000,000 | 100.0% |
| | | | | | | | |
| (1) | The Phoenix Industrial Portfolio VIII Mortgage Loan (as defined below) is part of a whole loan evidenced by four pari passu notes with an aggregate outstanding principal balance as of the Cut-off Date of $57.0 million (the “Phoenix Industrial Portfolio VIII Whole Loan”). The Financial Information in the chart above is based on the $57.0 million Phoenix Industrial Portfolio VIII Whole Loan. |
| (2) | See “The Borrowers” below for more information. |
| (3) | Occupancy is as of April 12, 2022 for the West Mifflin, PA property, Church Hill, TN property and the Eldon, MO property and May 10, 2022 for the remaining properties. |
| (4) | 4th Most Recent NOI and 3rd Most Recent NOI are unavailable for the West Mifflin, PA property, Church Hill, TN property and Kingsport, TN property as the borrower sponsor acquired those properties in 2020. |
| (5) | The increase from the Most Recent NOI to UW NOI is primarily attributable to leasing totaling an additional approximately $1.4 million in base rent, $105,924 in rent steps through June 2023 and an additional $602,299 in recoveries. The Church Hill, TN property and the Kingsport, TN property were renovated in 2021. |
| (6) | For a full description of Escrows and Reserves, see “Escrows and Reserves” below. |
| THE INFORMATION IN THIS STRUCTURAL AND COLLATERAL TERM SHEET IS NOT COMPLETE AND MAY BE AMENDED PRIOR TO THE TIME OF SALE. THIS TERM SHEET IS NOT AN OFFER TO SELL THESE SECURITIES AND IT IS NOT A SOLICITATION OF AN OFFER TO BUY THESE SECURITIES IN ANY JURISDICTION WHERE THE OFFER OR SALE IS NOT PERMITTED. |
125
| Structural and Collateral Term Sheet | | BMO 2022-C2 |
| |
| No. 10 – Phoenix Industrial Portfolio VIII |
The Loan. The tenth largest mortgage loan (the “Phoenix Industrial Portfolio VIII Mortgage Loan”) is part of a fixed rate whole loan secured by the borrowers’ fee interest in a 2,329,016 square foot portfolio of five industrial properties located in Pennsylvania, Tennessee, Illinois and Missouri (each, a “Phoenix Industrial Portfolio VIII Property”, and collectively, the “Phoenix Industrial Portfolio VIII Properties”). The Phoenix Industrial Portfolio VIII Whole Loan consists of four pari passu notes and accrues interest at a rate of 5.70000% per annum. The Phoenix Industrial Portfolio VIII Whole Loan has a 10-year term and is interest only for the first 60 months of the loan followed by monthly payments of interest and principal sufficient to amortize the loan over a 30-year amortization schedule. The non-controlling Note A-2, with an original principal balance of $22,000,000, will be included in the BMO 2022-C2 securitization trust. The relationship between the holders of the Phoenix Industrial Portfolio VIII Whole Loan will be governed by a co-lender agreement as described under “Description of the Mortgage Pool—The Whole Loans—The Outside Serviced Pari Passu Whole Loans” in the Preliminary Prospectus.
| Whole Loan Summary |
| Note | Original Balance | Cut-off Date Balance | | Note Holder | Controlling Piece |
| A-1 | $20,000,000 | $20,000,000 | | BBCMS 2022-C16(1) | Yes |
| A-2 | $22,000,000 | $22,000,000 | | BMO 2022-C2 | No |
| A-3 | $10,000,000 | $10,000,000 | | BBCMS 2022-C16(1) | No |
| A-4 | $5,000,000 | $5,000,000 | | BBCMS 2022-C16(1) | No |
| Whole Loan | $57,000,000 | $57,000,000 | | | |
| (1) | The BBCMS 2022-C16 is expected to close on June 28, 2022. |
The Properties. The Phoenix Industrial Portfolio VIII Whole Loan is secured by five industrial properties totaling 2,329,016 square feet located in Tennessee (two properties, 40.8% of NRA), Pennsylvania (one property, 26.8% of NRA), Illinois (one property, 20.5% of NRA) and Missouri (one property, 11.9% of NRA). The Phoenix Industrial Portfolio VIII Properties were 95.8% occupied by 33 tenants as of April 12, 2022 for the West Mifflin, PA property, Church Hill, TN property and the Eldon, MO property and May 10, 2022 for the remaining properties. The borrower sponsor acquired the Phoenix Industrial Portfolio VIII Properties between 2018 and 2020 for an aggregate purchase price of approximately $28.0 million. Since acquisition, the borrower sponsor has invested approximately $4.8 million in capital improvements and other/soft costs at the Phoenix Industrial Portfolio VIII Properties.
West Mifflin, PA (26.8% of NRA; 35.1% of Whole Loan Allocated Loan Amount (“ALA”)): The West Mifflin, PA property is a 625,000 square foot industrial warehouse building located in West Mifflin, Pennsylvania. The improvements were constructed in 1949, renovated in 1994 and include approximately 5.0% of office space. The West Mifflin, PA property is situated on an approximately 66.4-acre site with 364 surface parking spaces (0.6 per 1,000 square feet). The West Mifflin, PA property has a total of 42 dock-high doors, 11 drive-in doors and clear heights of 18 feet to 24 feet. As of April 12, 2022, the West Mifflin, PA property was 91.5% occupied by 23 tenants. The two largest tenants are Anex Warehouse (21.8% of property NRA, 21.8% of property underwritten base rent) and Eby Brown Leasing LLC (14.8% of property NRA, 14.8% of property underwritten base rent). Since acquisition of the West Mifflin, PA property in March 2020, the borrower sponsor has invested approximately $1.1 million in capital improvements and other/soft costs.
Church Hill, TN (35.2% of NRA; 26.3% of ALA): The Church Hill, TN property is comprised of three industrial warehouse buildings totaling 818,685 square feet located in Church Hill, Tennessee. The improvements were constructed in 1966, renovated in 2021 and include approximately 5.0% of office space. The Church Hill, TN property is situated on an approximately 84.8-acre site with 325 surface parking spaces (0.4 per 1,000 square feet). The Church Hill, TN property has a total of 38 dock-high doors, 16 drive-in doors and clear heights of 15 feet to 27.5 feet. As of April 12, 2022, the Church Hill, TN property was 100.0% occupied by seven tenants. The two largest tenants are Northern Safety Co. Inc. (28.6% of property NRA, 26.0% of property underwritten base rent) and Phoenix Logistics (20.2% of property NRA, 25.4% of property underwritten base rent). Since acquisition of the Church Hill, TN property in September 2020, the borrower sponsor has invested approximately $2.6 million in capital improvements and other/soft costs.
Mossville, IL (20.5% of NRA; 18.0% of ALA): The Mossville, IL property is comprised of two industrial warehouse buildings totaling 478,400 square feet located in Mossville, Illinois. The improvements were constructed in 1995 and include approximately 1.0% of office space. The Mossville, IL property is situated on an approximately 45.5-acre site with 207 surface parking spaces (0.4 per 1,000 square feet). The Mossville, IL property has a total of 85 dock-high doors, five drive-in doors and clear heights of 18 feet to 30 feet. As of May 10, 2022, the Mossville, IL property was 100.0% occupied by Superior Consolidated. Superior Consolidated has been at the Mossville, IL property since December 2018 on a seven-year lease with a current underwritten base rent of $2.06 PSF.
Eldon, MO (11.9% of NRA; 15.1% of ALA): The Eldon, MO property is a 276,180 square foot industrial manufacturing building located in Eldon, Missouri. The improvements were constructed in 1975, renovated in 2019 and include approximately 7.4% of office space. The Eldon, MO property is situated on an approximately 59.4-acre site with 501 surface parking spaces (1.8 per 1,000 square feet). The Eldon, MO property has a total of 15 dock-high doors, one drive-in door and clear heights of 17 feet to 24 feet. As of April 12, 2022, the Eldon, MO property was 83.5% occupied by Adient US LLC. Adient US LLC has been at the Eldon, MO property since May 2017 on a seven-year lease with a current underwritten base rent of $2.88 PSF. Since acquisition of the Eldon, MO property in December 2018, the borrower sponsor has invested approximately $425,000 in capital improvements and other/soft costs.
| THE INFORMATION IN THIS STRUCTURAL AND COLLATERAL TERM SHEET IS NOT COMPLETE AND MAY BE AMENDED PRIOR TO THE TIME OF SALE. THIS TERM SHEET IS NOT AN OFFER TO SELL THESE SECURITIES AND IT IS NOT A SOLICITATION OF AN OFFER TO BUY THESE SECURITIES IN ANY JURISDICTION WHERE THE OFFER OR SALE IS NOT PERMITTED. |
126
| Structural and Collateral Term Sheet | | BMO 2022-C2 |
| |
| No. 10 – Phoenix Industrial Portfolio VIII |
Kingsport, TN (5.6% of NRA; 5.5% of ALA): The Kingsport, TN property is a 130,751 square foot industrial warehouse building located in Kingsport, Tennessee. The improvements were constructed in 1960, renovated in 2021 and include approximately 5.0% of office space. The Kingsport, TN property is situated on an approximately 5.7-acre site with 12 surface parking spaces (0.1 per 1,000 square feet). The Kingsport, TN property has a total of seven dock-high doors, one drive-in door and clear heights of 20 feet. As of May 10, 2022, the Kingsport, TN property was 100.0% occupied by Phoenix Logistics, an affiliate of Phoenix Industrial Portfolio VIII Borrowers. Phoenix Logistics has been at the Kingsport, TN property since September 2020 with a lease expiration date of June 30, 2029 and a current underwritten base rent of $3.80 PSF. Since acquisition of the Kingsport, TN property in September 2020, the borrower sponsor has invested approximately $697,000 in capital improvements and other/soft costs.
| Portfolio Summary(1) |
| Property | Subtype | Net Rentable Area (SF)(2) | Year Built/ Renovated | % NOI | ALA | % of ALA | “As-Is” Appraised Value | Clear Heights (ft.) | Dock Doors | Drive-In Doors |
| West Mifflin, PA | Warehouse / Distribution | 625,000 | 1949/1994 | 32.9% | $20,000,000 | 35.1% | $24,560,000 | 18 - 24 | 42 | 11 |
| Church Hill, TN | Warehouse / Distribution | 818,685 | 1966/2021 | 34.9 | 15,000,000 | 26.3 | 31,000,000 | 15 - 27'6 | 38 | 16 |
| Mossville, IL | Warehouse / Distribution | 478,400 | 1995/NAP | 14.7 | 10,275,000 | 18.0 | 13,700,000 | 18 - 30 | 85 | 5 |
| Eldon, MO | Manufacturing | 276,180 | 1975/2019 | 10.4 | 8,580,000 | 15.1 | 11,440,000 | 17 - 24 | 15 | 1 |
| Kingsport, TN | Warehouse / Distribution | 130,751 | 1960/2021 | 7.2 | 3,145,000 | 5.5 | 7,500,000 | 20 | 7 | 1 |
| Total/Wtd. Avg. | 2,329,016 | | 100.0% | $57,000,000 | 100.0% | $88,200,000 | | 187 | 34 |
| (2) | Based on the underwritten rent rolls dated April 12, 2022 for the West Mifflin, PA property, Church Hill, TN property and the Eldon, MO property and May 10, 2022 for the remaining properties. |
COVID-19 Update. As of the date of this term sheet, all the Phoenix Industrial Portfolio VIII Properties were open and operating. The first payment date of the Phoenix Industrial Portfolio VIII Whole Loan is July 6, 2022. The Phoenix Industrial Portfolio VIII Borrowers have reported that no tenant deferments were requested or granted, nor were there any lease modification requests as of May 10, 2022.
Environmental. According to Phase I environmental assessments dated September 13, 2021 and February 24, 2022, there was no evidence of any recognized environmental conditions at the Phoenix Industrial Portfolio VIII Properties.
| Historical and Current Occupancy |
| 2019(1)(2) | 2020(2) | 2021(2) | Current(3) |
| 94.4% | 76.7% | 84.8% | 95.8% |
| (1) | The Church Hill, TN property, West Mifflin, PA property and Kingsport, TN property were acquired by the borrower sponsor in 2020. As such, 2019 occupancy is unavailable for the Church Hill, TN property, West Mifflin, PA property and Kingsport, TN property. |
| (2) | Historical occupancy is as of December 31 of each respective year. |
| (3) | Current occupancy is as of April 12, 2022 for the West Mifflin, PA property, Church Hill, TN property and the Eldon, MO property and May 10, 2022 for the remaining properties. |
| THE INFORMATION IN THIS STRUCTURAL AND COLLATERAL TERM SHEET IS NOT COMPLETE AND MAY BE AMENDED PRIOR TO THE TIME OF SALE. THIS TERM SHEET IS NOT AN OFFER TO SELL THESE SECURITIES AND IT IS NOT A SOLICITATION OF AN OFFER TO BUY THESE SECURITIES IN ANY JURISDICTION WHERE THE OFFER OR SALE IS NOT PERMITTED. |
127
| Structural and Collateral Term Sheet | | BMO 2022-C2 |
| |
| No. 10 – Phoenix Industrial Portfolio VIII |
| Top Tenant Summary(1) |
| Tenant | Property | Ratings
Moody’s/S&P/ Fitch | Net Rentable Area (SF) | % of
Total NRA | UW Base Rent PSF(2) | UW Base
Rent(2) | % of Total
UW Base Rent(2) | Lease
Expiration Date |
| Superior Consolidated | Mossville, IL | NR/NR/NR | 478,400 | 20.5% | $2.06 | $985,504 | 13.7% | 12/31/2025 |
| Phoenix Logistics | Various(3) | NR/NR/NR | 296,207 | 12.7 | $3.83 | 1,135,514 | 15.8 | Various(3) |
| Northern Safety Co. Inc. | Church Hill, TN | NR/NR/NR | 234,009 | 10.0 | $2.80 | 655,225 | 9.1 | 10/31/2026 |
| Adient US LLC | Eldon, MO | NR/NR/NR | 230,669 | 9.9 | $2.88 | 664,546 | 9.2 | 4/30/2024 |
| Universal Forest Products | Church Hill, TN | NR/NR/NR | 149,575 | 6.4 | $3.32 | 496,196 | 6.9 | Various(4) |
| Anex Warehouse | West Mifflin, PA | NR/NR/NR | 136,492 | 5.9 | $4.03 | 549,584 | 7.6 | Various(5) |
| Cardinal FG Company | Church Hill, TN | NR/NR/NR | 125,759 | 5.4 | $2.62 | 330,000 | 4.6 | 12/31/2022 |
| Bindtech | Church Hill, TN | NR/NR/NR | 100,000 | 4.3 | $2.84 | 283,500 | 3.9 | 12/31/2022 |
| Eby Brown Leasing LLC | West Mifflin, PA | NR/NR/NR | 92,777 | 4.0 | $4.03 | 373,891 | 5.2 | 7/31/2024 |
| Mundet Tennessee, Inc. | Church Hill, TN | NR/NR/NR | 43,886 | 1.9 | $2.55 | 111,909 | 1.6 | 7/31/2026 |
| Total Major Tenants | | 1,887,774 | 81.1% | $2.96 | $5,585,870 | 77.7% | |
| | | | | | | | |
| Other Tenants | | 342,743 | 14.7% | $4.66 | $1,598,669 | 22.3% | |
| | | | | | | | |
| Occupied Collateral Total / Wtd. Avg. | 2,230,517 | 95.8% | $3.22 | $7,184,538 | 100.0% | |
| Vacant Space | | 98,499 | 4.2% | | | | |
| | | | | | | | |
| Collateral Total | | 2,329,016 | 100.0% | | | | |
| | | | | | | | |
| (1) | Based on the underwritten rent rolls dated April 12, 2022 for the West Mifflin, PA property, Church Hill, TN property and the Eldon, MO property and May 10, 2022 for the remaining properties. |
| (2) | UW Base Rent PSF, UW Base Rent and % of Total UW Base Rent are inclusive of approximately $105,924 of contractual rent steps through June 2023. |
| (3) | Phoenix Logistics leases 165,456 square feet at the Church Hill, TN property expiring on March 31, 2025 and 130,751 square feet at the Kingsport, TN property expiring on June 30, 2029. Phoenix Logistics is an affiliate of Phoenix Industrial Portfolio VIII Borrowers. |
| (4) | Universal Forest Products leases 149,575 square feet expiring March 31, 2027 and has UW Base Rent of $6,000 expiring December 31, 2023. |
| (5) | Anex Warehouse leases 126,726 square feet expiring December 31, 2023 and 9,766 square feet on a month-to-month basis. |
| Lease Rollover Schedule(1)(2) |
| Year | Number of Leases Expiring | Net Rentable Area Expiring | % of NRA Expiring | UW Base Rent Expiring(3) | % of UW Base Rent Expiring(3) | Cumulative Net Rentable Area Expiring | Cumulative % of NRA Expiring | Cumulative UW Base Rent Expiring(3) | Cumulative % of UW Base Rent Expiring |
| Vacant | NAP | 98,499 | 4.2% | NAP | NAP | 98,499 | 4.2% | NAP | NAP |
| 2022 & MTM | 6 | 264,324 | 11.3 | $807,927 | 11.2% | 362,823 | 15.6% | $807,927 | 11.2% |
| 2023 | 8 | 207,206 | 8.9 | 1,020,106 | 14.2 | 570,029 | 24.5% | $1,828,033 | 25.4% |
| 2024 | 2 | 323,446 | 13.9 | 1,038,437 | 14.5 | 893,475 | 38.4% | $2,866,470 | 39.9% |
| 2025 | 6 | 702,531 | 30.2 | 1,856,431 | 25.8 | 1,596,006 | 68.5% | $4,722,901 | 65.7% |
| 2026 | 5 | 328,781 | 14.1 | 974,403 | 13.6 | 1,924,787 | 82.6% | $5,697,304 | 79.3% |
| 2027 | 3 | 203,911 | 8.8 | 696,429 | 9.7 | 2,128,698 | 91.4% | $6,393,733 | 89.0% |
| 2028 | 2 | 40,558 | 1.7 | 175,595 | 2.4 | 2,169,256 | 93.1% | $6,569,328 | 91.4% |
| 2029 | 1 | 130,751 | 5.6 | 496,854 | 6.9 | 2,300,007 | 98.8% | $7,066,181 | 98.4% |
| 2030 | 0 | 0 | 0.0 | 0 | 0.0 | 2,300,007 | 98.8% | $7,066,181 | 98.4% |
| 2031 | 1 | 29,009 | 1.2 | 118,357 | 1.6 | 2,329,016 | 100.0% | $7,184,538 | 100.0% |
| 2032 | 0 | 0 | 0.0 | 0 | 0.0 | 2,329,016 | 100.0% | $7,184,538 | 100.0% |
| 2033 & Beyond | 0 | 0 | 0.0 | 0 | 0.0 | 2,329,016 | 100.0% | $7,184,538 | 100.0% |
| Total | 34 | 2,329,016 | 100.0% | $7,184,538 | 100.0% | | | | |
| (1) | Based on the underwritten rent rolls dated April 12, 2022 for the West Mifflin, PA property, Church Hill, TN property and the Eldon, MO property and May 10, 2022 for the remaining properties. |
| (2) | Certain leases may have termination options that are exercisable prior to the originally stated expiration date of the lease and that are not considered in this Lease Rollover Schedule. |
| (3) | UW Base Rent Expiring, % of UW Base Rent Expiring and Cumulative UW Base Rent Expiring are inclusive of approximately $105,924 of contractual rent steps through June 2023. |
| THE INFORMATION IN THIS STRUCTURAL AND COLLATERAL TERM SHEET IS NOT COMPLETE AND MAY BE AMENDED PRIOR TO THE TIME OF SALE. THIS TERM SHEET IS NOT AN OFFER TO SELL THESE SECURITIES AND IT IS NOT A SOLICITATION OF AN OFFER TO BUY THESE SECURITIES IN ANY JURISDICTION WHERE THE OFFER OR SALE IS NOT PERMITTED. |
128
| Structural and Collateral Term Sheet | | BMO 2022-C2 |
| |
| No. 10 – Phoenix Industrial Portfolio VIII |
| Operating History and Underwritten Net Cash Flow |
| | 2019(1) | 2020(1) | 2021 | TTM(2) | Underwritten | Per Square Foot | %(3) |
| Base Rent(4) | $1,483,407 | $1,534,959 | $5,582,257 | $5,649,741 | $7,078,614 | $3.04 | 74.2% |
| Rent Steps(5) | 0 | 0 | 0 | 0 | 105,924 | 0.05 | 1.1 |
| Vacant Income | 0 | 0 | 0 | 0 | 361,732 | 0.16 | 3.8 |
| Gross Potential Rent | $1,483,407 | $1,534,959 | $5,582,257 | $5,649,741 | $7,546,270 | $3.24 | 79.1% |
| Total Reimbursements | 201,338 | 199,864 | 1,230,314 | 1,271,598 | 1,941,525 | 0.83 | 20.3 |
| Total Other Income | 261,477 | 176,894 | 51,017 | 54,012 | 54,012 | 0.02 | 0.6 |
| Net Rental Income | $1,946,222 | $1,911,717 | $6,863,588 | $6,975,351 | $9,541,808 | $4.10 | 100.0% |
| (Vacancy/Credit Loss) | 850 | 0 | 0 | 0 | (429,360) | (0.18) | (4.7) |
| Effective Gross Income | $1,947,072 | $1,911,717 | $6,863,588 | $6,975,351 | $9,112,448 | $3.91 | 95.5% |
| Total Expenses | 493,899 | 475,068 | 2,085,284 | 2,073,354 | 2,413,939 | 1.04 | 26.5 |
| Net Operating Income(6) | $1,453,173 | $1,436,649 | $4,778,303 | $4,901,997 | $6,698,509 | $2.88 | 73.5% |
| Total TI/LC, Capex/RR | 0 | 0 | 0 | 0 | 473,019 | 0.20 | 5.2 |
| Net Cash Flow | $1,453,173 | $1,436,649 | $4,778,303 | $4,901,997 | $6,225,490 | $2.67 | 68.3% |
| (1) | 2019 and 2020 historical information is unavailable for the Church Hill, TN property, West Mifflin, PA property and Kingsport, TN property as the borrower sponsor acquired the properties in 2020. |
| (2) | TTM represents trailing 12 months as of February 28, 2022. |
| (3) | % column represents percent of Net Rental Income for all revenue lines and represents percent of Effective Gross Income for the remainder of the fields. |
| (4) | Base Rent is based on the underwritten rent rolls as of April 12, 2022 for the West Mifflin, PA property, Church Hill, TN property and the Eldon, MO property and May 10, 2022 for the remaining properties. |
| (5) | Rent Steps totaling $105,924 are taken through June 2023. |
| (6) | The increase from the TTM Net Operating Income to Underwritten Net Operating Income is primarily attributable to leasing totaling an additional approximately $1.4 million in base rent, $105,924 in rent steps through June 2023 and an additional $602,299 in recoveries. The Church Hill, TN property and the Kingsport, TN property were renovated in 2021. |
The Market. The Phoenix Industrial Portfolio VIII Properties are located in Pennsylvania (35.1% of ALA), Tennessee (31.8% of ALA), Illinois (18.0% of ALA) and Missouri (15.1% of ALA).
West Mifflin, Pennsylvania (35.1% of ALA): The West Mifflin, PA property is in West Mifflin Borough in Allegheny County, Pennsylvania located approximately 8.3 miles southeast of downtown Pittsburgh. Primary access to the area is provided by Route 51, approximately 2.3 miles south of the West Mifflin property. According to a third-party market research report, the West Mifflin, PA property is located in the South Pittsburgh industrial submarket, which had approximately 19.8 million square feet of inventory, a vacancy rate of 4.1% and asking rent of $9.48 PSF as of March 2022. The vacancy rate of 4.1%, has declined by 1.6% in the past four quarters and asking rents in the submarket have increased 9.5% over the past 12 months, outpacing the 4.8% annualized average over the past three years.
Church Hill, Tennessee (26.3% of ALA): The Church Hill, TN property is located approximately 3.9 miles west of downtown Church Hill, approximately 26.7 miles west of the Tri-Cities Airport, and approximately 80.7 miles northeast of Knoxville. Primary access to the area is provided by Interstate 26 and US Highway 11W. According to a third-party market research report, the Church Hill, TN property is located in the Hawkins County industrial submarket, which had approximately 4.9 million square feet of inventory, a vacancy rate of 5.4% and asking rent of $4.69 PSF as of March 2022. Asking rents in the submarket have increased 12.5% over the past 12 months, which has increased the three-year average annual rent growth to 6.6%.
Mossville, Illinois (18.0% of ALA): The Mossville, IL property is located in Peoria County, approximately 3.3 miles north of downtown Mossville, approximately 13.1 miles north of Peoria and approximately 149 miles southwest of Chicago. Primary access to the area is provided by Highways 29, 40 and 6, as well as via Interstate 74, which runs through Peoria to the south. According to a third-party market research report, the Mossville, IL property is located in the Outlying Peoria County industrial submarket, which had approximately 10.6 million square feet of inventory, a vacancy rate of 0.4% and asking rent of $3.49 PSF as of March 2022. Asking rents in the submarket have increased 6.5% over the past 12 months, outpacing the 3.8% annualized average over the past three years.
Eldon, Missouri (15.1% of ALA): The Eldon, MO property is located in Miller County, approximately 1.7 miles east of downtown Eldon, approximately 27.9 miles northeast of The Lake of the Ozarks, approximately 145 miles southeast of Kansas City and approximately 155 miles southwest of St. Louis. Primary access to the area is provided by US Highway 54, connecting the neighborhood to Interstate 70 to the north and The Lake of the Ozarks to the south. According to the appraisal, the Eldon, MO property is located in the Miller County industrial market, which had approximately 758,610 square feet of inventory, a vacancy rate of 8.1% and asking rent of $4.20 PSF as of April 2022.
| THE INFORMATION IN THIS STRUCTURAL AND COLLATERAL TERM SHEET IS NOT COMPLETE AND MAY BE AMENDED PRIOR TO THE TIME OF SALE. THIS TERM SHEET IS NOT AN OFFER TO SELL THESE SECURITIES AND IT IS NOT A SOLICITATION OF AN OFFER TO BUY THESE SECURITIES IN ANY JURISDICTION WHERE THE OFFER OR SALE IS NOT PERMITTED. |
129
| Structural and Collateral Term Sheet | | BMO 2022-C2 |
| |
| No. 10 – Phoenix Industrial Portfolio VIII |
Kingsport, Tennessee (5.5% of ALA): The Kingsport, TN property is located in Hawkins County, approximately 3.1 miles south of downtown Kingsport, approximately 5.5 miles south of the Virginia-Tennessee border, approximately 11.5 miles northwest of the Tri-Cities Airport and approximately 16.6 miles east of the Church Hill, TN property. Primary access to the area is provided by Interstate 26 and Interstate 81. According to a third-party market research report, the Kingsport, TN property is located in the Sullivan County industrial submarket, which had approximately 10.7 million square feet of inventory, a vacancy rate of 0.3% and asking rent of $6.26 PSF as of March 2022. Asking rents in the submarket have increased 11.8% over the past 12 months, which has increased the three-year average annual rent growth to 6.4%.
The following table presents certain market information with respect to the Phoenix Industrial Portfolio VIII Properties:
| Market Overview(1) |
| Property | Year Built / Renovated | Net Rentable Area (SF)(2) | Submarket | Property Vacancy(2) | Submarket Vacancy | Appraisal Concluded Vacancy | Submarket Inventory (SF) | UW Base Rent PSF(2)(3) | Submarket Rent PSF |
| West Mifflin, PA | 1949/1994 | 625,000 | South Pittsburgh | 8.5% | 4.1% | 9.4% | 19,840,840 | $4.41 | $9.48 |
| Church Hill, TN | 1966/2021 | 818,685 | Hawkins County | 0.0% | 5.4% | 5.0% | 4,897,730 | $3.07 | $4.69 |
| Mossville, IL | 1995/NAP | 478,400 | Outlying Peoria County | 0.0% | 0.4% | 0.5% | 10,611,248 | $2.06 | $3.49 |
| Eldon, MO | 1975/2019 | 276,180 | Miller County | 16.5% | 8.1% | 0.0% | 758,610 | $2.88 | $4.20 |
| Kingsport, TN | 1960/2021 | 130,751 | Sullivan County | 0.0% | 0.3% | 0.0% | 10,721,889 | $3.80 | $6.26 |
| Total/Wtd. Avg. | | 2,329,016 | | 4.2% | 4.1% | 4.4% | 46,830,317 | $3.22 | $5.76 |
| (1) | Source: Third-party market research reports. |
| (2) | Based on the underwritten rent rolls dated April 12, 2022 for the West Mifflin, PA property, Church Hill, TN property and the Eldon, MO property and May 10, 2022 for the remaining properties. |
| (3) | UW Base Rent PSF excludes underwritten vacant space and is inclusive of approximately $105,924 of contractual rent steps through June 2023. |
The following table presents certain demographic information with respect to the Phoenix Industrial Portfolio VIII Properties:
| Demographics Overview |
| Property | Net Rentable Area (SF)(1) | ALA | % of ALA | UW NCF | % of UW NCF | Estimated 2022 Population (5-mile Radius)(2) | Estimated 2022 Average Household Income (5-mile Radius)(2) |
| West Mifflin, PA | 625,000 | $20,000,000 | 35.1% | $2,056,139 | 33.0% | 207,700 | $83,524 |
| Church Hill, TN | 818,685 | 15,000,000 | 26.3 | 2,182,487 | 35.1 | 11,784 | $64,249 |
| Mossville, IL | 478,400 | 10,275,000 | 18.0 | 914,915 | 14.7 | 23,433 | $141,067 |
| Eldon, MO | 276,180 | 8,580,000 | 15.1 | 618,668 | 9.9 | 8,578 | $63,173 |
| Kingsport, TN | 130,751 | 3,145,000 | 5.5 | 453,282 | 7.3 | 70,174 | $75,665 |
| Total/Wtd. Avg. | 2,329,016 | $57,000,000 | 100.0% | $6,225,490 | 100.0% | 69,649 | $85,714 |
| (1) | Based on the underwritten rent rolls dated April 12, 2022 for the West Mifflin, PA property, Church Hill, TN property and the Eldon, MO property and May 10, 2022 for the remaining properties. |
| (2) | Information obtained from third-party market research reports. |
The Borrowers. The borrowers are Phoenix Mossville Industrial Investors LLC, Phoenix Eldon Industrial Investors LLC, Phoenix West Mifflin Industrial Investors LLC, Phoenix Church Hill Industrial Investors LLC and Phoenix Kingsport Industrial Investors LLC (collectively, the “Phoenix Industrial Portfolio VIII Borrowers”), each a Delaware limited liability company and single purpose entity with one independent director. Each Phoenix Industrial Portfolio VIII Borrower owns one individual Phoenix Industrial Portfolio VIII Property. Legal counsel to the Phoenix Industrial Portfolio VIII Borrowers delivered a non-consolidation opinion in connection with the origination of the Phoenix Industrial Portfolio VIII Whole Loan.
The Borrower Sponsor. The borrower sponsor is Phoenix Investors, which is the affiliated management company for the guarantors’ investments. Phoenix Investors is a national commercial real estate firm based in Milwaukee, Wisconsin that redevelops former manufacturing facilities throughout the United States. Phoenix Investors’ affiliated companies hold interests in approximately 52 million square feet of industrial, retail, office and single tenant net-leased properties across 29 states. Phoenix Investors engages in the renovation and repositioning of large, former single tenant industrial facilities throughout the United States that were previously owned by corporate entities, real estate investment trusts or financial institutions.
| THE INFORMATION IN THIS STRUCTURAL AND COLLATERAL TERM SHEET IS NOT COMPLETE AND MAY BE AMENDED PRIOR TO THE TIME OF SALE. THIS TERM SHEET IS NOT AN OFFER TO SELL THESE SECURITIES AND IT IS NOT A SOLICITATION OF AN OFFER TO BUY THESE SECURITIES IN ANY JURISDICTION WHERE THE OFFER OR SALE IS NOT PERMITTED. |
130
| Structural and Collateral Term Sheet | | BMO 2022-C2 |
| |
| No. 10 – Phoenix Industrial Portfolio VIII |
The non-recourse carveout guarantors of the Phoenix Industrial Portfolio VIII Whole Loan are Irrevocable Children's Trust dated 7/22/91 and Irrevocable Children's Trust No. 2 dated 7/22/91. The non-recourse carveout guarantors have previously had ownership interests in entities that were subject to foreclosures and bankruptcies. See “Description of the Mortgage Pool—Default History, Bankruptcy Issues and Other Proceedings” in the Preliminary Prospectus.
Property Management. The Phoenix Industrial Portfolio VIII Properties are managed by Phoenix Investors, a limited liability company and the borrower sponsor.
Escrows and Reserves. At origination, the Phoenix Industrial Portfolio VIII Borrowers deposited (i) approximately $136,487 for real estate taxes, (ii) $1,500,000 for tenant improvements and leasing commissions, (iii) $8,870 for unfunded obligations with respect to the South Hills Elite lease ($5,000) and the Carnegie Mellon University lease ($3,870) and (iv) $59,444 for deferred maintenance.
Tax Escrows – On a monthly basis, the Phoenix Industrial Portfolio VIII Borrowers are required to deposit 1/12th of an amount which would be sufficient to pay taxes for the next ensuing 12 months (currently equivalent to approximately $35,040 a month).
Insurance Escrows – On a monthly basis, the Phoenix Industrial Portfolio VIII Borrowers are required to deposit 1/12th of an amount which would be sufficient to pay insurance premiums for the renewal of coverages (currently equivalent to approximately $19,049 a month); provided, such monthly deposits will be waived so long as the Phoenix Industrial Portfolio VIII Borrowers maintain a blanket insurance policy acceptable to the lender.
Replacement Reserve – On a monthly basis, the Phoenix Industrial Portfolio VIII Borrowers are required to deposit approximately $19,408 for replacement reserves subject to a cap of approximately $698,705.
Rollover Reserve – On a monthly basis, the Phoenix Industrial Portfolio VIII Borrowers are required to deposit approximately $29,113 for rollover reserves if at any time the balance of the reserve falls below $500,000, until such time as the reserve is restored to a cap of $1,500,000.
Lockbox / Cash Management. The Phoenix Industrial Portfolio VIII Whole Loan is structured with a hard lockbox and springing cash management upon the occurrence and continuance of a Cash Management Trigger Event (as defined below). Revenues from the Phoenix Industrial Portfolio VIII Properties are required to be deposited directly into the lockbox account or, if received by the Phoenix Industrial Portfolio VIII Borrowers or the property manager, deposited within three business days of receipt. During the continuance of a Cash Management Trigger Event, all funds in the lockbox account are required to be swept each business day to a lender-controlled cash management account and disbursed in accordance with the Phoenix Industrial Portfolio VIII Whole Loan documents, and all excess funds on deposit in the cash management account (after payment of required monthly reserve deposits, debt service payment on the Phoenix Industrial Portfolio VIII Whole Loan, operating expenses and cash management bank fees) will be applied as follows: (a) if a Material Tenant Trigger Event (as defined below) has occurred and is continuing, to a Material Tenant (as defined below) rollover reserve, (b) if a Cash Sweep Trigger Event (as defined below) has occurred and is continuing (but not a Material Tenant Trigger Event), to the lender-controlled excess cash flow account or (c) if no Material Tenant Trigger Event or Cash Sweep Trigger Event has occurred and is continuing, to the Phoenix Industrial Portfolio VIII Borrowers.
A “Cash Management Trigger Event” means a period commencing upon the occurrence of (i) an event of default under the Phoenix Industrial Portfolio VIII Whole Loan documents, (ii) any bankruptcy action involving the Phoenix Industrial Portfolio VIII Borrowers, the guarantors, the key principal or the property manager, (iii) the trailing 12-month period debt service coverage ratio falling below 1.20x, (iv) the indictment for fraud or misappropriation of funds by the Phoenix Industrial Portfolio VIII Borrowers, the guarantors, the key principal or an affiliated or third-party property manager (provided that, in the case of the third-party property manager, such fraud or misappropriation is related to any of the Phoenix Industrial Portfolio VIII Properties), or any director or officer of the aforementioned or (v) a Material Tenant Trigger Event, and expiring upon (a) with respect to clause (i) above, the cure of such event of default, (b) with respect to clause (ii) above, the filing being discharged, stayed or dismissed within 45 days for the Phoenix Industrial Portfolio VIII Borrowers, the guarantors or the key principal, or within 120 days for the property manager, and lender’s determination that such filing does not materially affect the Phoenix Industrial Portfolio VIII Borrowers’, the guarantors’, the key principal’s or the property manager’s monetary obligations, (c) with respect to clause (iii) above, the trailing 12-month debt service coverage ratio being at least 1.25x for two consecutive calendar quarters, (d) with respect to clause (iv) above, the dismissal of the applicable indictment with prejudice or acquittal of the applicable person, or the replacement of the property manager with a third-party property manager that constitutes a qualified property manager under the Phoenix Industrial Portfolio VIII Whole Loan documents or (e) with respect to clause (v) above, the cure of such Material Tenant Trigger Event.
A “Cash Sweep Trigger Event” means a period commencing upon the occurrence of (i) an event of default under the Phoenix Industrial Portfolio VIII Whole Loan documents, (ii) any bankruptcy action involving the Phoenix Industrial Portfolio VIII Borrowers, the guarantors, the key principal or the property manager or (iii) the trailing 12-month period debt service coverage ratio falling below 1.15x, and expiring upon (a) with respect to clause (i) above, the cure of such event of default, (b) with respect to clause (ii) above, as to an involuntary filing, the filing being discharged, stayed or dismissed within 45 days for the Phoenix Industrial Portfolio VIII Borrowers, the guarantors or the key principal, or within 120 days for the property manager, and lender’s determination that such filing does not materially affect the
| THE INFORMATION IN THIS STRUCTURAL AND COLLATERAL TERM SHEET IS NOT COMPLETE AND MAY BE AMENDED PRIOR TO THE TIME OF SALE. THIS TERM SHEET IS NOT AN OFFER TO SELL THESE SECURITIES AND IT IS NOT A SOLICITATION OF AN OFFER TO BUY THESE SECURITIES IN ANY JURISDICTION WHERE THE OFFER OR SALE IS NOT PERMITTED. |
131
| Structural and Collateral Term Sheet | | BMO 2022-C2 |
| |
| No. 10 – Phoenix Industrial Portfolio VIII |
Phoenix Industrial Portfolio VIII Borrowers’, the guarantors’, the key principal’s or the property manager’s monetary obligations or (c) with respect to clause (iii) above, the trailing 12-month debt service coverage ratio is at least 1.20x for two consecutive calendar quarters.
A “Material Tenant Trigger Event” means a period commencing upon the occurrence of (i) Material Tenant giving notice of its intention to terminate or cancel or not to extend or renew its lease, (ii) on or prior to the then applicable expiration date under the applicable Material Tenant lease, if the Material Tenant does not extend or renew such Material Tenant lease, (iii) on or prior to the date a Material Tenant is required under its Material Tenant lease to notify the borrowers of its election to extend or renew its lease, if such Material Tenant does not give notice, (iv) an event of default under a Material Tenant lease occurring and continuing beyond any applicable notice and/or cure period, (v) a bankruptcy action of a Material Tenant or lease guarantor of any Material Tenant lease occurring, (vi) a Material Tenant lease being terminated or no longer being in full force and effect; provided that, with respect to any partial termination of a Material Tenant lease, such partial termination relates to no less than 20% of (x) the total net rentable square footage at the applicable property or (y) the total in-place base rent at the applicable property or (vii) a Material Tenant “going dark”, vacating, ceasing to occupy or ceasing to conduct business in the ordinary course at the applicable property or a portion thereof constituting no less than 20% of the total net rentable square footage at the applicable property for a period in excess of 12 consecutive months (other than temporary cessation of operations in connection with remodeling, renovation or restoration of its leased premises) and expiring upon (a) with respect to clause (i) above, the date that (1) the applicable Material Tenant revokes or rescinds all termination or cancellation notices, (2) the applicable Material Tenant lease is extended on terms satisfying the requirements of the Phoenix Industrial Portfolio VIII Whole Loan documents or (3) all or substantially all of the applicable Material Tenant space is leased to a replacement tenant, (b) with respect to clause (ii) above, the date that (1) the applicable Material Tenant lease is extended on terms satisfying the requirements of the Phoenix Industrial Portfolio VIII Whole Loan documents or (2) all or substantially all of the applicable Material Tenant space is leased to a replacement tenant, (c) with respect to clause (iii) above, the date that (1) the applicable Material Tenant lease is extended on terms satisfying the requirements of the Phoenix Industrial Portfolio VIII Whole Loan documents or (2) all or substantially all of the applicable Material Tenant space is leased to a replacement tenant, (d) with respect to clause (iv) above, a cure of the applicable event of default, (e) with respect to clause (v) above, the affirmation of the Material Tenant lease in the applicable bankruptcy proceeding and confirmation that the Material Tenant is actually paying all rents and other amounts under its lease (or, if applicable, the discharge or dismissal of the applicable Material Tenant lease guarantor from the applicable bankruptcy proceeding; provided that such bankruptcy (after dismissal or discharge) does not have an adverse effect on such Material Tenant lease guarantor’s ability to perform its obligations under its lease guaranty), (f) with respect to clause (vi) above, all or substantially all of the applicable Material Tenant space being leased to a replacement tenant or (g) with respect to clause (vii) above, the Material Tenant re-commencing its normal business operations at the applicable property or a portion thereof constituting more than 20% of the total net rentable square footage at the applicable property.
A “Material Tenant” means any tenant at the Phoenix Industrial Portfolio VIII Properties that, together with its affiliates, either (a) leases no less than 20% of the total rentable square footage of the Phoenix Industrial Portfolio VIII Properties or (b) accounts for (or would account for) no less than 20% of the total in-place base rent at the Phoenix Industrial Portfolio VIII Properties.
Subordinate and Mezzanine Debt. The Phoenix Industrial Portfolio VIII Borrowers are permitted to obtain a mezzanine loan subject to the satisfaction of certain conditions including, but not limited to (i) the loan-to-value on the aggregate of the Phoenix Industrial Portfolio VIII Whole Loan and the mezzanine loan is not greater than 64.6%, (ii) the trailing 12-month debt service coverage ratio on the aggregate of the Phoenix Industrial Portfolio VIII Whole Loan and the mezzanine loan is at least 1.55x, (iii) the debt yield on the aggregate of the Phoenix Industrial Portfolio VIII Whole Loan and the mezzanine loan is at least 10.8%, (iv) the lender has approved the mezzanine loan, (v) the lender executes a mezzanine intercreditor agreement and (vi) the lender has received a rating agency confirmation.
Partial Release. After the expiration of the lockout period, the Phoenix Industrial Portfolio VIII Borrowers may release the West Mifflin, PA property, the Mossville, IL property and the Eldon, MO property to a third-party purchaser subject to satisfaction of conditions set forth in the Phoenix Industrial Portfolio VIII Whole Loan documents, including, without limitation: (i) no event of default exists under the Phoenix Industrial Portfolio VIII Whole Loan; (ii) the Phoenix Industrial Portfolio VIII Borrowers deliver defeasance collateral in an amount equal to the greater of (a) 115% of the allocated loan amount for such property and (b) 90% of the net proceeds of the sale of such property; (iii) after giving effect to such release, (a) the debt service coverage ratio based on the trailing 12 months is at least equal to the greater of (A) the debt service coverage ratio immediately preceding such release and (B) 1.55x, (b) the debt yield for the remaining properties following the release is at least equal to the greater of (A) the debt yield immediately preceding such release and (B) 10.8%, and (c) the loan-to-value ratio for the remaining properties following the release does not exceed the lesser of (A) the loan-to-value ratio for all of the properties prior to the release or (B) 64.6%; (iv) the Phoenix Industrial Portfolio VIII Borrowers pay all of the lender’s out-of-pocket costs and expenses incurred in connection with such release (including, without limitation, reasonable legal fees); and (v) satisfaction of customary REMIC requirements. The Phoenix Industrial Portfolio VIII Borrowers are also permitted to release certain vacant portions of the West Mifflin, PA property, the Church Hill, TN property and the Eldon, MO property without defeasance or prepayment, provided that certain conditions, including among others, conditions relating to separate tax lots, compliance with zoning, parking and other legal requirements, and compliance with REMIC regulations, are satisfied.
Ground Lease. None.
| THE INFORMATION IN THIS STRUCTURAL AND COLLATERAL TERM SHEET IS NOT COMPLETE AND MAY BE AMENDED PRIOR TO THE TIME OF SALE. THIS TERM SHEET IS NOT AN OFFER TO SELL THESE SECURITIES AND IT IS NOT A SOLICITATION OF AN OFFER TO BUY THESE SECURITIES IN ANY JURISDICTION WHERE THE OFFER OR SALE IS NOT PERMITTED. |
132
| Structural and Collateral Term Sheet | | BMO 2022-C2 |
| |
| No. 11 – Fleet Farm Sioux Falls |
| Mortgage Loan Information | | Property Information |
| Mortgage Loan Seller: | KeyBank | | Single Asset / Portfolio: | Single Asset |
| Original Principal Balance: | $21,500,000 | | Title(1): | Fee |
| Cut-off Date Principal Balance: | $21,500,000 | | Property Type – Subtype: | Retail – Single Tenant |
| % of IPB: | 3.0% | | Net Rentable Area (SF): | 189,905 |
| Loan Purpose: | Acquisition | | Location: | Sioux Falls, SD |
| Borrower(1): | KB Sioux Falls, DST | | Year Built / Renovated: | 2019 / NAP |
| Borrower Sponsor: | Jeffrey A. Pori | | Occupancy: | 100.0% |
| Interest Rate: | 5.13000% | | Occupancy Date: | 4/20/2022 |
| Note Date: | 4/20/2022 | | 4th Most Recent NOI (As of): | NAV |
| Maturity Date: | 5/1/2032 | | 3rd Most Recent NOI (As of): | NAV |
| Interest-only Period: | 120 months | | 2nd Most Recent NOI (As of): | NAV |
| Original Term: | 120 months | | Most Recent NOI (As of): | NAV |
| Original Amortization Term: | None | | UW Economic Occupancy: | 95.0% |
| Amortization Type: | Interest Only | | UW Revenues: | $2,784,881 |
| Call Protection: | L(26),D(91),O(3) | | UW Expenses: | $719,065 |
| Lockbox / Cash Management: | Hard / Springing | | UW NOI: | $2,065,817 |
| Additional Debt: | No | | UW NCF: | $1,987,509 |
| Additional Debt Balance: | N/A | | Appraised Value / Per SF: | $37,800,000 / $199 |
| Additional Debt Type: | N/A | | Appraisal Date: | 4/4/2022 |
| | | | | |
| Escrows and Reserves | | Financial Information |
| | Initial | Monthly | Initial Cap | | Cut-off Date Loan / SF: | $113 | |
| Taxes: | $0 | Springing | N/A | | Maturity Date Loan / SF: | $113 | |
| Insurance: | $0 | Springing | N/A | | Cut-off Date LTV: | 56.9% | |
| Replacement Reserves(2): | $200,000 | Springing | $200,000 | | Maturity Date LTV: | 56.9% | |
| TI / LC Reserve(3): | $600,000 | Springing | $600,000 | | UW NCF DSCR: | 1.78x | |
| Other: | $0 | $0 | N/A | | UW NOI Debt Yield: | 9.6% | |
| | | | | | | | |
| |
| Sources and Uses |
| Sources | Proceeds | % of Total | | Uses | Proceeds | % of Total |
| Mortgage Loan | $21,500,000 | 55.0% | | Purchase Price | $37,000,000 | 94.7% |
| Borrower Sponsor Equity | 17,556,130 | 45.0 | | Closing Costs | 1,256,130 | 3.2 |
| | | | | Reserves | 800,000 | 2.0 |
| Total Sources | $39,056,130 | 100.0% | | Total Uses | $39,056,130 | 100.0% |
| (1) | In addition to the Fleet Farm Sioux Falls Property (as defined below), the Fleet Farm Sioux Falls Mortgage Loan (as defined below) is secured by a security interest in the borrower’s master lease. The borrower has master leased the Fleet Farm Sioux Falls Property to a master tenant affiliated with the guarantor. The master tenant is structured as a special purpose entity with one independent director. The master tenant’s interest in all tenant rents was assigned directly to the lender. The master tenant is a party to the deed of trust and cash management agreement. The master lease is subordinate to the Fleet Farm Sioux Falls Mortgage Loan and, upon an event of default under the Fleet Farm Sioux Falls Mortgage Loan documents, the lender has the right to cause the termination of the master lease. See “Description of the Mortgage Pool—Statistical Characteristics of the Mortgage Loans—Delaware Statutory Trusts” in the Preliminary Prospectus. |
| (2) | Monthly replacement reserves of approximately $3,165 ($0.20 per square foot annually) will be required on the first payment date after the balance of the replacement reserve falls below $200,000 and on each payment date thereafter until the balance of the replacement reserve is at least $200,000. |
| (3) | Monthly TI/LC reserves of $10,128 ($0.64 per square foot annually) will be required on the first payment date after the balance of the TI/LC reserve falls below $600,000 and on each payment date thereafter until the balance of the TI/LC reserve is at least $600,000. |
The Loan. The eleventh largest mortgage loan (the “Fleet Farm Sioux Falls Mortgage Loan”) has an original and Cut-off Date principal balance of $21,500,000 and is secured by a first lien mortgage on the borrower’s fee interest in a 189,905 square foot retail property located in Sioux Falls, South Dakota (the “Fleet Farm Sioux Falls Property”). The Fleet Farm Sioux Falls Mortgage Loan has a 10-year term and is interest-only for the entire term.
| THE INFORMATION IN THIS STRUCTURAL AND COLLATERAL TERM SHEET IS NOT COMPLETE AND MAY BE AMENDED PRIOR TO THE TIME OF SALE. THIS TERM SHEET IS NOT AN OFFER TO SELL THESE SECURITIES AND IT IS NOT A SOLICITATION OF AN OFFER TO BUY THESE SECURITIES IN ANY JURISDICTION WHERE THE OFFER OR SALE IS NOT PERMITTED. |
133
| Structural and Collateral Term Sheet | | BMO 2022-C2 |
| |
| No. 11 – Fleet Farm Sioux Falls |
The Property. The Fleet Farm Sioux Falls Property is a 189,905 square foot retail property comprised of two, single-story buildings located in Sioux Falls, South Dakota. Situated on approximately 23.88 acres of land, the Fleet Farm Sioux Falls Property was built in 2019 and has since been occupied by Fleet Farm (as defined below). The improvements are comprised of the main retail building, a convenience store, a fueling station, and a car wash. The Fleet Farm Sioux Falls Property contains a surface parking lot with a total of 653 parking spaces, which results in a parking ratio of 3.44 spaces per 1,000 SF of total net rentable area. The Fleet Farm Sioux Falls Property is 100% occupied by Fleet Farm Group (“Fleet Farm”) as of April 20, 2022.
COVID-19 Update. As of June 15, 2022, the Fleet Farm Sioux Falls Property was open and operating. As of the date of this term sheet, the Fleet Farm Sioux Falls Mortgage Loan is not subject to any forbearance, modification, or debt service relief requests. The first payment date of the Fleet Farm Sioux Falls Mortgage Loan was June 1, 2022.
Major Tenant.
Fleet Farm (189,905 square feet; 100.0% of the NRA; 100.0% of underwritten base rent): Fleet Farm is a big box retailer that offers brands across multiple product categories including: outdoors, sporting goods, farming, pet care, hardware, toys, home goods, apparel and accessories, and pantry items. Fleet Farm was founded in 1955 and is a wholly-owned subsidiary of KKR & Co. Inc. (“KKR”). Fleet Farm currently has 47 stores spanning the upper Midwest, with locations in Iowa, Minnesota, North Dakota, South Dakota and Wisconsin. KKR’s operations include managing multiple alternative asset classes, including private equity, credit, and real assets, with strategic partners that manage hedge funds. KKR was founded in 1976 and is headquartered in New York, New York.
The Fleet Farm lease has a commencement date of May 28, 2019, and a current expiration date of May 27, 2039. The Fleet Farm lease has eight, five-year renewal options. Fleet Farm reported 2021 sales at the Fleet Farm Sioux Falls Property of approximately $33.7 million, or approximately $177 per square foot, which results in an occupancy cost of 8.7%.
| Historical and Current Occupancy(1) |
| 2019 | 2020 | 2021 | Current(2) |
| 100.0% | 100.0% | 100.0% | 100.0% |
| (1) | Historical Occupancies are as of December 31 of each respective year. |
| (2) | Current Occupancy is as of April 20, 2022. |
The following table presents certain information relating to the major tenants for the Fleet Farm Sioux Falls Property:
| Tenant Summary(1) |
| Tenant | Ratings
Moody’s/S&P/Fitch | Net Rentable Area (SF) | % of
Total NRA | UW Base Rent PSF | UW Base Rent | % of Total
UW Base Rent | Lease
Exp. Date |
| Fleet Farm | NR/NR/NR | 189,905 | 100.0% | $11.92 | $2,263,877 | 100.0% | 5/27/2039 |
| Occupied Collateral Total/Wtd. Avg. | | 189,905 | 100.0% | $11.92 | $2,263,877 | 100.0% | |
| | | | | | | | |
| Vacant Space | | 0 | 0.0% | | | | |
| | | | | | | | |
| Collateral Total | | 189,905 | 100.0% | | | | |
| | | | | | | | |
| (1) | Based on the underwritten rent roll dated April 20, 2022. |
| THE INFORMATION IN THIS STRUCTURAL AND COLLATERAL TERM SHEET IS NOT COMPLETE AND MAY BE AMENDED PRIOR TO THE TIME OF SALE. THIS TERM SHEET IS NOT AN OFFER TO SELL THESE SECURITIES AND IT IS NOT A SOLICITATION OF AN OFFER TO BUY THESE SECURITIES IN ANY JURISDICTION WHERE THE OFFER OR SALE IS NOT PERMITTED. |
134
| Structural and Collateral Term Sheet | | BMO 2022-C2 |
| |
| No. 11 – Fleet Farm Sioux Falls |
The following table presents certain information relating to the tenant lease expiration dates of the Fleet Farm Sioux Falls Property:
| Lease Rollover Schedule(1) |
| Year | Number of Leases Expiring | Net Rentable Area Expiring | % of NRA Expiring | UW Base Rent Expiring | % of UW Base Rent Expiring | Cumulative Net Rentable Area Expiring | Cumulative % of NRA Expiring | Cumulative UW Base Rent Expiring | Cumulative % of UW Base Rent Expiring |
| Vacant | NAP | 0 | 0.0% | NAP | NAP | 0 | 0.0% | NAP | NAP |
| 2022 & MTM | 0 | 0 | 0.0 | $0 | 0.0% | 0 | 0.0% | $0 | 0.0% |
| 2023 | 0 | 0 | 0.0 | 0 | 0.0 | 0 | 0.0% | $0 | 0.0% |
| 2024 | 0 | 0 | 0.0 | 0 | 0.0 | 0 | 0.0% | $0 | 0.0% |
| 2025 | 0 | 0 | 0.0 | 0 | 0.0 | 0 | 0.0% | $0 | 0.0% |
| 2026 | 0 | 0 | 0.0 | 0 | 0.0 | 0 | 0.0% | $0 | 0.0% |
| 2027 | 0 | 0 | 0.0 | 0 | 0.0 | 0 | 0.0% | $0 | 0.0% |
| 2028 | 0 | 0 | 0.0 | 0 | 0.0 | 0 | 0.0% | $0 | 0.0% |
| 2029 | 0 | 0 | 0.0 | 0 | 0.0 | 0 | 0.0% | $0 | 0.0% |
| 2030 | 0 | 0 | 0.0 | 0 | 0.0 | 0 | 0.0% | $0 | 0.0% |
| 2031 | 0 | 0 | 0.0 | 0 | 0.0 | 0 | 0.0% | $0 | 0.0% |
| 2032 | 0 | 0 | 0.0 | 0 | 0.0 | 0 | 0.0% | $0 | 0.0% |
| 2033 & Beyond | 1 | 189,905 | 100.0 | 2,263,877 | 100.0 | 189,905 | 100.0% | $2,263,877 | 100.0% |
| Total | 1 | 189,905 | 100.0% | $2,263,877 | 100.0% | | | | |
| (1) | Based on the underwritten rent roll dated April 20, 2022. |
The Market. The Fleet Farm Sioux Falls Property is located in the northern portion of Sioux Falls, Minnehaha County, South Dakota. The Fleet Farm Sioux Falls Property is situated at the southeast quadrant of Benson Road and Interstate 29, just west of the Sioux Falls Regional Airport. The surrounding area is considered suburban and is expanding with a mix of commercial, industrial and residential uses. Specifically, development clustered near the Fleet Farm Sioux Falls Property includes a Walmart Supercenter, the University of South Dakota/Sioux Falls campus, and the Sanford Sports complex, which is a nearly 500-acre sports facility that contains an indoor sports facility, a 160,000 square foot multi-purpose facility, a health clinic, GreatShots golf and entertainment venue, a youth football complex, and ice hockey, tennis and gymnastics centers.
According to a third-party market research report, as of the second quarter of 2022, the Sioux Falls retail market had an inventory of approximately 15.4 million square feet, overall vacancy in the market of approximately 2.8% and average asking rent of $15.55 per square foot. Retail rents in the Sioux Falls market have been on an increasing trend, growing approximately 12.8% from 2013 to 2022, which equates to approximately 1.3% average annual growth. Three properties totaling 28,346 square feet are under construction in the market.
According to the appraisal, the estimated 2021 population within a one-, three- and five-mile radius was 2,410, 24,172 and 94,411, respectively. The estimated 2021 median household income within a one-, three- and five-mile radius was $60,000, $47,038, and $53,689, respectively.
The following table presents certain information relating to comparable retail leases for the Fleet Farm Sioux Falls Property:
| Comparable Retail Leases(1) |
| | Rentable Area (SF) | Term (Years) | Lease Size (SF) | Lease Date | Rent PSF | Lease Type |
| Fleet Farm Sioux Falls | 189,905(2) | 20.0(2) | 189,905 | Jun-2019(2) | $11.92(2) | NNN |
| Fleet Farm – Stevens Point, WI | 170,642 | 20.0 | 170,642 | Dec-2021 | $11.89 | Absolute Net |
| Fleet Farm – Brooklyn Park, MN | 246,891 | 20.0 | 246,891 | Nov-2021 | $10.29 | Absolute Net |
| Fleet Farm – Lakeville, MN | 206,541 | 22.1 | 202,669 | Nov-2019 | $11.73 | Absolute Net |
| Fleet Farm – Waukee, IA | 196,818 | 25.0 | 196,818 | Sep-2019 | $13.11 | Absolute Net |
| Fleet Farm – Delavan, WI | 224,045 | 20.0 | 224,045 | Jun-2018 | $11.60 | Absolute Net |
| (2) | Based on the underwritten rent roll dated April 20, 2022. |
| THE INFORMATION IN THIS STRUCTURAL AND COLLATERAL TERM SHEET IS NOT COMPLETE AND MAY BE AMENDED PRIOR TO THE TIME OF SALE. THIS TERM SHEET IS NOT AN OFFER TO SELL THESE SECURITIES AND IT IS NOT A SOLICITATION OF AN OFFER TO BUY THESE SECURITIES IN ANY JURISDICTION WHERE THE OFFER OR SALE IS NOT PERMITTED. |
135
| Structural and Collateral Term Sheet | | BMO 2022-C2 |
| |
| No. 11 – Fleet Farm Sioux Falls |
The following table presents certain information relating to comparable retail sales for the Fleet Farm Sioux Falls Property:
| Comparable Retail Sales(1) |
| Property Location | Sale Date | Total NRA (SF) | Total Occupancy | Sale Price | Sale Price PSF | Adjusted Sales Price PSF |
| Fleet Farm – Sioux Falls, SD | Apr-2022(2) | 189,905 | 100.0% | $37,000,000(2) | $194.83(2) | NAP |
| Fleet Farm – Waukee, IA | Mar-2022 | 187,834 | 100.0% | $43,500,000 | $231.59 | $231.59 |
| Fleet Farm – Green Bay, WI | Nov-2021 | 204,397 | 100.0% | $38,590,000 | $160.53 | $163.74 |
| Fleet Farm – Brooklyn Park, MN | Nov-2021 | 246,891 | 100.0% | $37,575,000 | $152.19 | $155.24 |
| Fleet Farm – Stevens Point, WI | Nov-2021 | 170,642 | 100.0% | $29,900,000 | $175.22 | $178.73 |
| Fleet Farm – Delavan, WI | Feb-2022 | 224,045 | 100.0% | $42,451,015 | $189.48 | $170.53 |
| (2) | Source: Title settlement statement. |
The following table presents certain historical and underwritten financial information relating to the Fleet Farm Sioux Falls Property:
| Underwritten Net Cash Flow |
| | Underwritten | Per Square Foot | %(1) |
| Base Rent | $2,263,877 | $11.92 | 77.2% |
| Gross Potential Rent | $2,263,877 | $11.92 | 77.2% |
| Total Reimbursements | 663,367 | 3.49 | 22.6 |
| Total Other Income | 4,000 | 0.02 | 0.1 |
| Net Rental Income | $2,931,244 | $15.44 | 100.0% |
| (Vacancy/Credit Loss) | (146,362) | (0.77) | (5.0%) |
| Effective Gross Income | $2,784,881 | $14.66 | 95.0% |
| Total Expenses | 719,065 | 3.79 | 25.8% |
| Net Operating Income | $2,065,817 | $10.88 | 74.2% |
| Total TI/LC, Capex/RR(2) | 78,308 | 0.41 | 2.8% |
| Net Cash Flow | $1,987,509 | $10.47 | 71.4% |
| (1) | % column represents percent of Net Rental Income for all revenue lines and represents percent of Effective Gross Income for the remainder of the fields. |
| (2) | Underwritten Total TI/LC, Capex/RR includes a credit of $60,000 (approximately $0.32 per square foot) associated with the upfront TI/LC reserve deposit in the amount of $600,000 (approximately $3.16 per square foot). |
| THE INFORMATION IN THIS STRUCTURAL AND COLLATERAL TERM SHEET IS NOT COMPLETE AND MAY BE AMENDED PRIOR TO THE TIME OF SALE. THIS TERM SHEET IS NOT AN OFFER TO SELL THESE SECURITIES AND IT IS NOT A SOLICITATION OF AN OFFER TO BUY THESE SECURITIES IN ANY JURISDICTION WHERE THE OFFER OR SALE IS NOT PERMITTED. |
136
| Structural and Collateral Term Sheet | | BMO 2022-C2 |
| |
| No. 12 – PentaCentre Office |
| Mortgage Loan Information | | Property Information |
| Mortgage Loan Seller: | CREFI | | Single Asset / Portfolio: | Single Asset |
| Original Principal Balance(1): | $20,300,000 | | Title: | Fee |
| Cut-off Date Principal Balance(1): | $20,277,018 | | Property Type – Subtype: | Office – Suburban |
| % of IPB: | 2.9% | | Net Rentable Area (SF): | 734,156 |
| Loan Purpose: | Acquisition | | Location: | Troy, MI |
| Borrower: | PentaCentre LLC | | Year Built / Renovated: | 1986 / 2019 |
| Borrower Sponsor: | Olymbec USA LLC | | Occupancy: | 61.6% |
| Interest Rate: | 5.32000% | | Occupancy Date: | 4/1/2022 |
| Note Date: | 6/2/2022 | | 4th Most Recent NOI (As of): | $4,821,397 (12/31/2019) |
| Maturity Date: | 6/6/2032 | | 3rd Most Recent NOI (As of): | $5,304,698 (12/31/2020) |
| Interest-only Period: | None | | 2nd Most Recent NOI (As of): | $6,175,874 (12/31/2021) |
| Original Term: | 120 months | | Most Recent NOI (As of): | $6,055,882 (TTM 2/28/2022) |
| Original Amortization Term: | 360 months | | UW Economic Occupancy: | 64.0% |
| Amortization Type: | Amortizing Balloon | | UW Revenues: | $9,366,051 |
| Call Protection: | L(25),D(91),O(4) | | UW Expenses: | $4,909,142 |
| Lockbox / Cash Management: | Hard / Springing | | UW NOI: | $4,456,909 |
| Additional Debt(1): | Yes | | UW NCF: | $3,972,334 |
| Additional Debt Balance(1): | $13,984,150 | | Appraised Value / Per SF: | $59,500,000 / $81 |
| Additional Debt Type(1): | Pari Passu | | Appraisal Date: | 3/29/2022 |
| | | | | |
| | | | | |
| Escrows and Reserves | | Financial Information(2) |
| | Initial | Monthly | Initial Cap | | Cut-off Date Loan / SF: | $47 | |
| Taxes: | $685,659 | $114,277 | N/A | | Maturity Date Loan / SF: | $39 | |
| Insurance: | $0 | Springing | N/A | | Cut-off Date LTV: | 57.6% | |
| Replacement Reserve: | $0 | $12,236 | N/A | | Maturity Date LTV: | 47.9% | |
TI / LC: | $5,000,000 | $107,064 | $8,000,000 | | UW NCF DSCR: | 1.73x | |
| Other(3): | $421,439 | $0 | N/A | | UW NOI Debt Yield: | 13.0% | |
| | | | | | | |
| |
| Sources and Uses |
| Sources | Proceeds | % of Total | | Uses | Proceeds | % of Total |
| Whole Loan(1) | $34,300,000 | 58.8% | | Purchase Price | $51,250,000 | 87.9% |
| Sponsor Equity | 24,026,818 | 41.2 | | Reserves | 6,107,098 | 10.5 |
| | | | | Closing Costs | 969,719 | 1.7 |
| Total Sources | $58,326,818 | 100.0% | | Total Uses | $58,326,818 | 100.0% |
| (1) | The PentaCentre Office Mortgage Loan (as defined below) is part of the PentaCentre Office Whole Loan (as defined below), which is comprised of two pari passu promissory notes with an aggregate original balance of $34,300,000. The PentaCentre Office Whole Loan was originated by Citi Real Estate Funding Inc. (“CREFI”). |
| (2) | Calculated based on the aggregate outstanding principal balance as of the Cut-off Date of the PentaCentre Office Whole Loan. |
| (3) | Includes gap rent and immediate repairs of $406,814 and $14,625, respectively. |
| (4) | Defeasance of the PentaCentre Office Whole Loan is permitted at any time after the earlier to occur of (i) the end of the two-year period commencing on the closing date of the securitization that includes the last pari passu note to be securitized or (ii) June 2, 2026. The assumed defeasance lockout period of 25 payments is based on the closing date of this transaction in July 2022. The actual lockout period may be longer. |
The Loan. The twelfth largest mortgage loan is part of a whole loan evidenced by two pari passu promissory notes in the aggregate original principal amount of $34,300,000 (the “PentaCentre Office Whole Loan”) secured by a first lien mortgage on the borrower’s fee simple interest in a 734,156 square feet office property located in Troy, Michigan (the “PentaCentre Office Property”). The PentaCentre Office Whole Loan was originated on June 2, 2022 by CREFI and accrues interest at a fixed rate of 5.32000% per annum. The PentaCentre Office Whole Loan has an initial term of 120 months, a remaining term of 119 months and is amortizing for the full term. The scheduled maturity date of the PentaCentre Office Whole Loan is the due date that occurs June 6, 2032. The controlling Note A-1 (the “PentaCentre Office Mortgage Loan”), with a cut-off date balance of $20,277,018, will be included in the BMO 2022-C2 securitization trust. The PentaCentre Office Mortgage Loan will be serviced pursuant to the pooling and servicing agreement for the BMO 2022-C2 securitization. The table below summarizes the promissory notes that comprise the PentaCentre Office Whole Loan. See “Description of the Mortgage Pool—The Whole Loans—The Serviced Pari Passu Whole Loans” in the Preliminary Prospectus.
| THE INFORMATION IN THIS STRUCTURAL AND COLLATERAL TERM SHEET IS NOT COMPLETE AND MAY BE AMENDED PRIOR TO THE TIME OF SALE. THIS TERM SHEET IS NOT AN OFFER TO SELL THESE SECURITIES AND IT IS NOT A SOLICITATION OF AN OFFER TO BUY THESE SECURITIES IN ANY JURISDICTION WHERE THE OFFER OR SALE IS NOT PERMITTED. |
137
| Structural and Collateral Term Sheet | | BMO 2022-C2 |
| |
| No. 12 – PentaCentre Office |
| Whole Loan Summary |
| Note | Original Balance | Cut-off Date Balance | Note Holder | Controlling Piece |
| A-1 | $20,300,000 | $20,277,018 | BMO 2022-C2 | Yes |
| A-2 | $14,000,000 | $13,984,150 | CREFI(1) | No |
| Whole Loan | $34,300,000 | $34,261,168 | | |
| (1) | Expected to be contributed to one or more future securitization transactions. |
The Property. The PentaCentre Office Property consists of five office buildings totaling 734,156 square feet of suburban office space located in Troy, Michigan. The property, which sits on a 32.23-acre parcel of land, was built in 1986 and renovated in 2019. According to the appraisal, the borrowers provided approximately $7 million in capital improvements since the property’s acquisition in 2017, including elevator repairs, roof replacements on two buildings, new HVAC, the addition of a fitness center, and a new parking structure. Basic construction at the PentaCentre Office Property consists of a reinforced concrete foundation with structural steel framing. The buildings have a plate glass exterior, tempered glass windows, and a flat roof. As of April 1, 2022, the PentaCentre Office Property is 61.6% leased to 53 tenants.
The largest tenant based on underwritten base rent is Midland Credit Management, Inc. (“Midland Credit Management”) (93,516 square feet; 12.7% of NRA; 22.3% of underwritten base rent). Midland Credit Management is an international specialty finance company. Founded in 1953, Midland Credit Management is a subsidiary of Encore Capital Group, which is publicly traded on the NASDAQ stock exchange under the ticker NASDAQ:ECPG. Midland Credit Management has been at the property since 2016. Midland Credit Management has one, three-year renewal option and a one-time right to terminate effective July 31, 2023 by providing written notice prior to February 1, 2023 and paying a termination fee of approximately $1,266,805. Additionally, the property owner may terminate the lease if Midland Credit Management requests to assign or sublease the leased premises.
The second largest tenant based on underwritten base rent is One10, LLC (“One10”) (51,227 square feet; 7.0% of NRA; 11.2% of underwritten base rent). One10 is a national marketing firm with six locations in North America. One10 provides marketing services including analytics & insights, creative communications, sales incentive programs, and event management. One10 has been at the property since 1996 and expanded its lease to 51,227 square feet in November 2010. One10 has two, five-year renewal options and may terminate on August 31, 2026 with 180 days’ notice and payment of a termination fee equal to the sum of the unamortized amount of the allowance, free rent, and commissions, plus interest, plus two months base rent at the time. Additionally, the property owner may terminate the lease if One10 requests to sublease the leased premises.
The third largest tenant based on underwritten base rent is J.D. Power (31,149 square feet; 4.2% of NRA; 6.0% of underwritten base rent). Founded in 1968, J.D. Power is an American data analytics and consumer intelligence focused on vehicles and is headquartered in the subject property. J.D. Power has been at the property since 2012. J.D. Power does not have renewal options and the property owner may terminate the lease if J.D. Power requests to assign or sublease.
COVID-19 Update. As of June 13, 2022, the PentaCentre Office Property is open and operational and there were no outstanding rent relief requests. The first payment date of the PentaCentre Office Mortgage Loan is July 6, 2022.
The Market. PentaCentre Office Property is located in Troy, Michigan. According to the appraisal, the PentaCentre Office Property is situated in the Troy submarket of the Detroit-Warren-Dearborn MSA market. Primary access to the subject neighborhood is provided by Interstate 75, one of the primary north-south freeways in greater Michigan, Interstate 696 and Route 1. Access to the neighborhood is provided via its interchange with Big Beaver Road. Other major thoroughfares in the area include Crooks Road, Livernois Road, and Coolidge Highway, all of which run in the general north-south direction. As of the first quarter of 2022, the Troy submarket reported total inventory of approximately 13.0 million SF with a 24.3% vacancy rate and average asking rent of $19.39 PSF. The underwriting concluded to a market rent for the office space at the PentaCentre Office Property of $17.96 PSF for all five buildings. According to the appraisal, the estimated 2021 population within a one-, three- and five-mile radius of the PentaCentre Office Property was 7,103, 86,400 and 270,058, respectively. The estimated 2021 average household income within the same radii was $99,746, $106,321 and $115,284, respectively.
| Historical and Current Occupancy(1) |
| 2019 | 2020 | 2021 | Current(2) |
| 71.2% | 81.0% | 76.4% | 61.6% |
| (1) | Historical occupancy is as of December 31 of each respective year. |
| (2) | Current occupancy is as of April 1, 2022. |
| THE INFORMATION IN THIS STRUCTURAL AND COLLATERAL TERM SHEET IS NOT COMPLETE AND MAY BE AMENDED PRIOR TO THE TIME OF SALE. THIS TERM SHEET IS NOT AN OFFER TO SELL THESE SECURITIES AND IT IS NOT A SOLICITATION OF AN OFFER TO BUY THESE SECURITIES IN ANY JURISDICTION WHERE THE OFFER OR SALE IS NOT PERMITTED. |
138
| Structural and Collateral Term Sheet | | BMO 2022-C2 |
| |
| No. 12 – PentaCentre Office |
| Comparable Sales Summary(1) |
| Property Name/Location | Sale Date | Year Built/ Renovated | Total NRA (SF) | Occupancy | Sale Price | Sale Price PSF |
| PentaCentre Office | N/A | 1986/2019 | 734,156(2) | 61.6%(2) | NAP | NAP |
| Troy, Michigan |
| Widdicomb Building South | Dec-21 | 1880/2007 | 101,879 | 96.0% | $14,500,000 | $142.33 |
| Grand Rapids, MI |
| One North Main | Oct-21 | 1987/NAP | 114,897 | 74.0% | $25,300,000 | $220.20 |
| Ann Arbor, MI |
| Stoneridge Office Park II | Apr-21 | 1984/1997 | 110,544 | 100.0% | $16,500,000 | $149.26 |
| Bloomfield Hills, MI |
| Northfield Office Park I & II | Jun-19 | 1972/NAP | 211,623 | 70.0% | $12,200,000 | $57.65 |
| Troy, MI |
| Riverbend Place | Oct-21 | 2007/NAP | 280,000 | 100.0% | $70,425,000 | $251.52 |
| Milwaukee, WI |
| Towers of Kenwood | May-19 | 1987/2014 | 404,425 | 97.0% | $80,600,000 | $199.30 |
| Cincinnati, OH |
| (2) | Based on underwritten rent roll dated April 1, 2022. |
| Top Tenant Summary(1) |
| Tenant | Ratings Moody’s/S&P/Fitch(2) | Net Rentable Area (SF) | % of Total NRA | UW Base Rent PSF(3) | UW Base Rent(3) | % of Total UW Base Rent(3) | Lease Expiration Date(4)(5) |
| Midland Credit Management, Inc.(6) | Ba2/NR/BB+ | 93,516 | 12.7% | $21.00 | $1,963,836 | 22.3% | 4/30/2025 |
| One10, LLC(7) | NR/NR/NR | 51,227 | 7.0 | $19.25 | 986,120 | 11.2 | 8/31/2029 |
| J.D. Power | NR/NR/NR | 31,149 | 4.2 | $17.00 | 529,533 | 6.0 | 1/31/2027 |
| EASI, LLC(8) | NR/NR/NR | 23,464 | 3.2 | $20.95 | 491,571 | 5.6 | 1/31/2026 |
| Pulte Home Company, LLC(9) | Baa2/BBB-/BBB | 21,411 | 2.9 | $21.45 | 459,266 | 5.2 | 9/30/2027 |
| Ascension Medical Group FKA St. John Providence Health System | NR/NR/NR | 17,831 | 2.4 | $20.45 | 364,644 | 4.1 | 10/31/2022 |
| Konica Minolta Business Solutions U.S.A., Inc. | NR/NR/NR | 15,634 | 2.1 | $19.95 | 311,898 | 3.5 | 5/31/2023 |
| ADP, LLC | Aa3/AA-/AA- | 15,502 | 2.1 | $19.25 | 298,414 | 3.4 | 4/30/2023 |
| Leoni Wiring Systems, Inc. | NR/NR/NR | 12,700 | 1.7 | $19.45 | 247,015 | 2.8 | 6/30/2026 |
| Ricardo Defense Systems, LLC and Ricardo Defense, Inc. | NR/NR/NR | 11,258 | 1.5 | $20.95 | 235,855 | 2.7 | 9/30/2029 |
| Largest Tenants | | 293,692 | 40.0% | $20.05 | $5,888,151 | 67.0% | |
| Remaining Tenants | | 158,256 | 21.6 | 18.36 | 2,906,143 | 33.0% | |
| Total Occupied | | 451,948 | 61.6% | $19.46 | $8,794,294 | 100.0% | |
| Vacant Space | | 282,208 | 38.4 | | | | |
| Total / Wtd. Avg. | | 734,156 | 100.0% | | | | |
| (1) | Based on underwritten rent roll dated April 1, 2022. |
| (2) | Ratings are those of the parent company whether or not the parent guarantees the lease. |
| (3) | UW Base Rent, UW Base Rent PSF and % of Total UW Base Rent figures are inclusive of contractual rent steps through June 2023. |
| (4) | Midland Credit Management, Inc. has one, three-year renewal option, Konica Minolta Business Solutions U.S.A., Inc. and Ricardo Defense Systems, LLC and Ricardo Defense, Inc. have one, five-year renewal option, ADP, LLC has two, three-year renewal options, and One10, LLC, EASI, LLC and Pulte Home Company, LLC have two, five-year renewal options. |
| (5) | J.D. Power, Ascension Medical Group FKA St. John Providence Health System, and Leoni Wiring Systems, Inc. have no renewal options. |
| (6) | Midland Credit Management Inc. has a one-time right to terminate its lease effective July 31, 2023 by providing written notice prior to February 1, 2023 and subject to the payment of a termination fee. |
| (7) | One10, LLC may terminate its lease on August 31, 2026, with 180 days’ prior notice and payment of a termination fee equal to the sum of the unamortized amount of the allowance, free rent, and commissions, plus interest, plus two months base rent at the time. |
| (8) | EASI, LLC has the one-time right to terminate its lease effective January 31, 2025 upon 7 months’ prior notice to the related landlord and payment of a termination fee. |
| (9) | Pulte Home Company, LLC has the one-time right to terminate its lease in September 2025 upon 6 months’ prior notice to the related landlord and payment of a termination fee. |
| THE INFORMATION IN THIS STRUCTURAL AND COLLATERAL TERM SHEET IS NOT COMPLETE AND MAY BE AMENDED PRIOR TO THE TIME OF SALE. THIS TERM SHEET IS NOT AN OFFER TO SELL THESE SECURITIES AND IT IS NOT A SOLICITATION OF AN OFFER TO BUY THESE SECURITIES IN ANY JURISDICTION WHERE THE OFFER OR SALE IS NOT PERMITTED. |
139
| Structural and Collateral Term Sheet | | BMO 2022-C2 |
| |
| No. 12 – PentaCentre Office |
| Lease Rollover Schedule(1)(2) |
| Year | Number of Leases Expiring | Net Rentable Area Expiring | % of Net Rental Area Expiring | UW Base Rent Expiring(3) | % of UW Base Rent Expiring(3) | Cumulative Net Rentable Area Expiring | Cumulative % of NRA Expiring | Cumulative UW Base Rent Expiring(3) | Cumulative % of UW Base Rent Expiring(3) |
| Vacant | NAP | 282,208 | 38.4% | NAP | NAP | 282,208 | 38.4% | NAP | NAP |
| MTM | 3 | 0 | 0.0 | $4,902 | 0.1% | 282,208 | 38.4% | $4,902 | 0.1% |
| 2022 | 2 | 27,155 | 3.7 | 544,131 | 6.2 | 309,363 | 42.1% | $549,033 | 6.2% |
| 2023 | 12 | 74,610 | 10.2 | 1,490,490 | 16.9 | 383,973 | 52.3% | $2,039,523 | 23.2% |
| 2024 | 7 | 23,342 | 3.2 | 480,349 | 5.5 | 407,315 | 55.5% | $2,519,871 | 28.7% |
| 2025 | 4 | 106,713 | 14.5 | 2,228,214 | 25.3 | 514,028 | 70.0% | $4,748,085 | 54.0% |
| 2026 | 7 | 56,420 | 7.7 | 1,191,183 | 13.5 | 570,448 | 77.7% | $5,939,268 | 67.5% |
| 2027 | 10 | 76,631 | 10.4 | 1,467,419 | 16.7 | 647,079 | 88.1% | $7,406,687 | 84.2% |
| 2028 | 2 | 4,946 | 0.7 | 98,673 | 1.1 | 652,025 | 88.8% | $7,505,359 | 85.3% |
| 2029 | 8 | 82,131 | 11.2 | 1,288,935 | 14.7 | 734,156 | 100.0% | $8,794,294 | 100.0% |
| 2030 | 0 | 0 | 0.0 | 0 | 0.0 | 734,156 | 100.0% | $8,794,294 | 100.0% |
| 2031 | 0 | 0 | 0.0 | 0 | 0.0 | 734,156 | 100.0% | $8,794,294 | 100.0% |
| 2032 & Beyond | 0 | 0 | 0.0 | 0 | 0.0 | 734,156 | 100.0% | $8,794,294 | 100.0% |
| Total | 55 | 734,156 | 100.0% | $8,794,294 | 100.0% | | | | |
| (1) | Based on the underwritten rent roll dated April 1, 2022. |
| (2) | Certain leases may have termination options that are exercisable prior to the originally stated expiration date of the lease and that are not considered in this Lease Rollover Schedule. |
| (3) | UW Base Rent Expiring and Cumulative UW Base Rent Expiring include rent steps through June 2023. |
| Operating History and Underwritten Net Cash Flow |
| | 2019 | 2020 | 2021 | TTM(1) | Underwritten | Per Square Foot | %(2) |
| Rents in Place(3) | $9,873,732 | $10,923,838 | $10,815,328 | $10,793,615 | $8,565,048 | $11.67 | 60.6% |
| Rent Steps(4) | 0 | 0 | 0 | 0 | 229,246 | 0.31 | 1.6% |
| Gross Potential Rent | $9,873,732 | $10,923,838 | $10,815,328 | $10,793,615 | $8,794,294 | $11.98 | 62.3% |
| Potential Income from Vacant Space | 0 | 0 | 0 | 0 | 5,220,848 | 7.11 | 37.0% |
| Total Reimbursements | 636,911 | 102,573 | 357,175 | 326,106 | 107,580 | 0.15 | 0.8% |
| Net Rental Income | $10,510,643 | $11,026,411 | $11,172,503 | $11,119,721 | $14,122,722 | $19.24 | 100.0% |
| (Vacancy/Credit Loss) | (950,852) | (1,279,612) | (589,387) | (659,519) | ($5,220,848) | (7.11) | (37.0%) |
| Other Income(5) | 594,659 | 519,039 | 464,978 | 464,177 | 464,177 | 0.63 | 3.3% |
| Effective Gross Income | $10,154,450 | $10,265,838 | $11,048,094 | $10,924,379 | $9,366,051 | $12.76 | 66.3% |
| | | | | | | | |
| Total Expenses | $5,333,053 | $4,961,140 | $4,872,220 | $4,868,497 | $4,909,142 | $6.69 | 52.4% |
| | | | | | | | |
| Net Operating Income | $4,821,397 | $5,304,698 | $6,175,874 | $6,055,882 | $4,456,909 | $6.07 | 47.6% |
| | | | | | | | |
| Total TI/LC, Cap Ex / RR | 0 | 0 | 0 | 0 | 484,575 | 0.66 | 5.2% |
| | | | | | | | |
| Net Cash Flow | $4,821,397 | $5,304,698 | $6,175,874 | $6,055,882 | $3,972,334 | $5.41 | 42.4% |
| (1) | TTM reflects the trailing 12 months ending February 28, 2022. |
| (2) | % column represents percent of Net Rental Income for all revenue fields and represents percent of Effective Gross Income for the remainder of fields. |
| (3) | Rents in Place are based on the underwritten rent roll as of April 1, 2022. |
| (4) | Rent Steps totaling $229,246 are underwritten through June 2023. |
| (5) | Other Income includes directly reimbursed expenses such as utilities and parking. |
| THE INFORMATION IN THIS STRUCTURAL AND COLLATERAL TERM SHEET IS NOT COMPLETE AND MAY BE AMENDED PRIOR TO THE TIME OF SALE. THIS TERM SHEET IS NOT AN OFFER TO SELL THESE SECURITIES AND IT IS NOT A SOLICITATION OF AN OFFER TO BUY THESE SECURITIES IN ANY JURISDICTION WHERE THE OFFER OR SALE IS NOT PERMITTED. |
140
| Structural and Collateral Term Sheet | | BMO 2022-C2 |
| |
| No. 13 – Sun Belt Self-Storage Portfolio |
| Mortgage Loan Information | | Property Information |
| Mortgage Loan Seller: | BMO | | Single Asset / Portfolio: | Portfolio |
| Original Principal Balance: | $19,600,000 | | Title: | Fee |
| Cut-off Date Principal Balance: | $19,600,000 | | Property Type – Subtype: | Self Storage – Self Storage |
| % of IPB: | 2.8% | | Net Rentable Area (SF): | 380,273 |
| Loan Purpose: | Acquisition | | Location: | Various |
| Borrower(1): | Various | | Year Built / Renovated: | Various / Various |
| Borrower Sponsors: | Hugh D. Cohen, Brian E. Boehmcke and Joel T. Flax | | Occupancy: | 79.5% |
| Interest Rate: | 5.07000% | | Occupancy Date: | Various |
| Note Date: | 3/30/2022 | | 4th Most Recent NOI (As of): | NAV |
| Maturity Date: | 4/6/2032 | | 3rd Most Recent NOI (As of): | $891,628 (12/31/2020) |
| Interest-only Period: | 120 months | | 2nd Most Recent NOI (As of): | $1,600,360 (12/31/2021) |
| Original Term: | 120 months | | Most Recent NOI (As of): | $1,834,703 (TTM 2/28/2022) |
| Original Amortization Term: | None | | UW Economic Occupancy: | 69.4% |
| Amortization Type: | Interest Only | | UW Revenues: | $3,267,361 |
| Call Protection: | L(27),D(89),O(4) | | UW Expenses: | $1,282,533 |
| Lockbox / Cash Management: | Springing / Springing | | UW NOI: | $1,984,828 |
| Additional Debt: | No | | UW NCF: | $1,927,787 |
| Additional Debt Balance: | N/A | | Appraised Value / Per SF: | $34,150,000 / $90 |
| Additional Debt Type: | N/A | | Appraisal Date(2): | Various |
| | | | | |
| Escrows and Reserves | | Financial Information |
| | Initial | Monthly | Initial Cap | | Cut-off Date Loan / SF: | $52 |
| Taxes: | $69,772 | $12,914 | N/A | | Maturity Date Loan / SF: | $52 |
| Insurance: | $0 | Springing | N/A | | Cut-off Date LTV: | 57.4% |
| Replacement Reserves: | $0 | $4,753 | N/A | | Maturity Date LTV: | 57.4% |
| Deferred Maintenance: | $56,843 | $0 | N/A | | UW NCF DSCR: | 1.91x |
| | | | | | UW NOI Debt Yield: | 10.1% |
| | | | | | | |
| |
| Sources and Uses |
| Sources | Proceeds | % of Total | | Uses | Proceeds | % of Total |
| Mortgage Loan | $19,600,000 | 52.0% | | Purchase Price | $33,628,061 | 89.3% |
| Borrower Sponsor Equity | 18,077,112 | 48.0 | | Closing Costs | 3,922,436 | 10.4 |
| | | | | Upfront Reserves | 126,615 | 0.3 |
| Total Sources | $37,677,112 | 100.0% | | Total Uses | $37,677,112 | 100.0% |
| | | | | | | | |
| (1) | The borrowing entities are CIG SSD LLC, CIG SSD EM LLC, CIG SSD FB LLC, CIG SSD JWG LLC and CIG SSD RGM LLC. |
| (2) | Appraisals are dated between August 25, 2021 and September 9, 2021. |
The Loan. The thirteenth largest mortgage loan (the “Sun Belt Self-Storage Portfolio Mortgage Loan”) is secured by a first lien mortgage on the borrower’s fee simple interest in 14 self-storage properties with an aggregate 380,273 square feet located in Tennessee, Mississippi, Alabama, Georgia, Florida, and Iowa (the “Sun Belt Self-Storage Portfolio Properties”). The Sun Belt Self-Storage Portfolio Mortgage Loan was originated by Bank of Montreal and has an outstanding principal balance as of the Cut-off Date of $19,600,000. The Sun Belt Self-Storage Portfolio Mortgage Loan has a 10-year term and is interest-only for the entire term.
The Properties. The Sun Belt Self-Storage Portfolio Properties consist of 14 self-storage properties with an aggregate net rentable area of 380,273 square feet, located in Tennessee, Mississippi, Alabama, Georgia, Florida, and Iowa. As of March 1, 2022 and March 3, 2022, the Sun Belt Self-Storage Portfolio Properties were 79.5% leased in aggregate. The top three states by allocated loan amount are Tennessee (three properties, 32.4% of allocated loan amount, 30.5% of UW NOI), Alabama (five properties, 29.7% of allocated loan amount, 29.8% of UW NOI), and Georgia (three properties, 21.0% of allocated loan amount, 22.1% of UW NOI). The remaining three states are Mississippi, Florida, and Iowa, none of which represent more than 10.7% of the UW NOI. The Sun Belt Self-Storage Portfolio Properties were built between 1948 and 2021. The Sun Belt Self-Storage Portfolio Properties range in size from 8,900 to 42,779 SF of self-storage space and contain 110 to 356 self-storage units, with no individual property comprising more than 11.2% of the total self-storage net rentable area based on square footage or more than 10.7% of the total units.
| THE INFORMATION IN THIS STRUCTURAL AND COLLATERAL TERM SHEET IS NOT COMPLETE AND MAY BE AMENDED PRIOR TO THE TIME OF SALE. THIS TERM SHEET IS NOT AN OFFER TO SELL THESE SECURITIES AND IT IS NOT A SOLICITATION OF AN OFFER TO BUY THESE SECURITIES IN ANY JURISDICTION WHERE THE OFFER OR SALE IS NOT PERMITTED. |
141
| Structural and Collateral Term Sheet | | BMO 2022-C2 |
| |
| No. 13 – Sun Belt Self-Storage Portfolio |
The Sun Belt Self-Storage Portfolio Properties contain a total of 2,992 self-storage units, of which 202 are climate-controlled. The Sun Belt Self-Storage Portfolio Properties also include 332 leasable parking units. Based on self-storage net rentable area, the Sun Belt Self-Storage Portfolio Properties were 79.5% occupied as of March 1, 2022 (or in the case of the property located in Okoboji, IA, March 3, 2022), with individual property occupancies ranging from 65.4% to 90.8%.
| Portfolio Summary |
| Property Name | Allocated
Loan
Combination
Amount (“ALA”) | % of ALA | Occupancy
(SF)(1)(2) | Year Built/
Renovated | Net
Rentable
Area (SF)(2) | Units(2) | Appraised
Value | % of
UW
NOI |
| Lafollette, TN | $2,700,000 | 13.8% | 90.8% | 1983-1994/2020 | 32,636 | 275 | $4,240,000 | 15.1% |
| Griffin, GA | 2,350,000 | 12.0 | 77.3% | 2008, 2020/NAP | 37,440 | 311 | 3,840,000 | 12.6 |
| Monteagle, TN | 2,255,578 | 11.5 | 74.4% | 1980/2019 | 42,779 | 356 | 3,930,000 | 9.9 |
| Bessemer, AL | 1,800,000 | 9.2 | 83.5% | 1996/2010 | 26,850 | 264 | 3,060,000 | 9.2 |
| Valley, AL | 1,790,800 | 9.1 | 81.9% | 1980, 2004, 2008/NAP | 35,550 | 347 | 3,120,000 | 10.5 |
| Boyle, MS | 1,700,000 | 8.7 | 85.6% | 2001/2020 | 36,087 | 304 | 2,590,000 | 10.7 |
| Elizabethton, TN | 1,394,671 | 7.1 | 74.2% | 2006/2020 | 25,907 | 220 | 2,430,000 | 5.5 |
| Panama City, FL | 1,050,000 | 5.4 | 65.4% | 1960, 2020/NAP | 22,809 | 289 | 3,180,000 | 3.8 |
| Phenix City, AL | 918,500 | 4.7 | 75.3% | 2006/NAP | 24,699 | 191 | 1,600,000 | 5.3 |
| Thomson, GA | 908,000 | 4.6 | 74.4% | 1999, 2001, 2018, 2019/NAP | 23,287 | 209 | 1,400,000 | 4.5 |
| Cleveland, GA | 861,001 | 4.4 | 77.0% | 1996, 1997, 1998, 2021/NAP | 24,179 | 175 | 1,500,000 | 5.1 |
| Birmingham, AL | 786,296 | 4.0 | 80.3% | 1948, 1984/NAP | 12,950 | 110 | 1,370,000 | 2.5 |
| Okoboji, IA | 562,870 | 2.9 | 89.9% | 1996-2001/NAP | 26,200 | 136 | 980,000 | 3.2 |
| Harpersville, AL | 522,284 | 2.7 | 75.8% | 1999/NAP | 8,900 | 137 | 910,000 | 2.2 |
| Total | $19,600,000 | 100.0% | 79.5% | | 380,273 | 3,324 | $34,150,000 | 100.0% |
| (1) | Occupancy (SF) is based on the total self-storage net rentable area only. |
| (2) | Based on underwritten rent roll dated March 1, 2022 for each property (other than the property located in Okoboji, IA) and the underwritten rent roll dated March 3, 2022 for the property located in Okoboji, IA. |
COVID-19 Update. Only limited information is available with respect to the historical performance of the Sun Belt Self-Storage Portfolio Properties during the COVID pandemic because the borrowers have recently acquired the Sun Belt Self-Storage Portfolio Properties from a seller that recently acquired the Sun Belt Self-Storage Portfolio Properties from multiple prior sellers. Based on such limited available information, the performance of the Sun Belt Self-Storage Portfolio Properties has remained steady as of the origination date of the Sun Belt Self-Storage Portfolio Mortgage Loan.
| Unit Mix |
| Unit Type | Net Rentable
Area (SF)(1) | % of Net
Rentable Area
(SF)(1) | Occupancy
(SF)(1)(2) | Units(1) | % of Total
Units(1) | Occupancy
(Units) |
| Non-Climate Controlled Storage Units | 357,151 | 93.9% | 79.3% | 2,790 | 83.9% | 74.3% |
| Climate Controlled Storage Units | 23,122 | 6.1% | 82.1% | 202 | 6.1 | 73.8% |
| Parking Units | N/A | N/A | N/A | 332 | 10.0 | 43.7% |
| Total / Wtd. Avg. | 380,273 | 100.0% | 79.5% | 3,324 | 100.0% | 71.2% |
| (1) | Based on the underwritten rent roll dated March 1, 2022 for each property (other than the property located in Okoboji, IA) and the underwritten rent roll dated March 3, 2022 for the property located in Okoboji, IA. |
| (2) | Occupancy (SF) is based on the total self-storage net rentable area only. |
| THE INFORMATION IN THIS STRUCTURAL AND COLLATERAL TERM SHEET IS NOT COMPLETE AND MAY BE AMENDED PRIOR TO THE TIME OF SALE. THIS TERM SHEET IS NOT AN OFFER TO SELL THESE SECURITIES AND IT IS NOT A SOLICITATION OF AN OFFER TO BUY THESE SECURITIES IN ANY JURISDICTION WHERE THE OFFER OR SALE IS NOT PERMITTED. |
142
| Structural and Collateral Term Sheet | | BMO 2022-C2 |
| |
| No. 13 – Sun Belt Self-Storage Portfolio |
The Market. The Sun Belt Self-Storage Portfolio Properties are located in Tennessee, Mississippi, Alabama, Georgia, Florida, and Iowa.
| | Sun Belt Self-Storage Portfolio Properties Population Statistics(1) |
| | | Median Household Income | Population |
| # | Property | 1 Mile | 3 Mile | 5 Mile | 1 Mile | 3 Mile | 5 Mile |
| 1 | Lafollette, TN | $39,057 | $41,215 | $41,276 | 19,013 | 34,019 | 56,452 |
| 2 | Griffin, GA | $25,124 | $34,115 | $41,102 | 5,864 | 28,352 | 48,418 |
| 4 | Bessemer, AL | $61,257 | $60,992 | $53,346 | 2,554 | 16,226 | 34,312 |
| 5 | Valley, AL | $40,666 | $38,974 | $41,816 | 1,662 | 11,544 | 24,458 |
| 7 | Elizabethton, TN | $37,216 | $37,291 | $37,870 | 2,487 | 16,693 | 29,973 |
| 8 | Panama City, FL | $30,429 | $40,783 | $45,389 | 7,054 | 36,088 | 72,580 |
| 9 | Phenix City, AL | $28,749 | $31,080 | $31,368 | 2,251 | 16,968 | 64,967 |
| 10 | Thomson, GA | $26,469 | $30,688 | $32,890 | 4,549 | 10,888 | 14,208 |
| 11 | Cleveland, GA | $55,184 | $52,628 | $52,893 | 646 | 5,532 | 14,567 |
| 12 | Birmingham, AL | $116,922 | $116,104 | $78,356 | 2,320 | 19,944 | 82,222 |
| 13 | Okoboji, IA | $74,829 | $61,869 | $59,660 | 963 | 8,223 | 13,046 |
| # | Property | 5 Mile | 10 Mile | 15 Mile | 5 Mile | 10 Mile | 15 Mile |
| 6 | Boyle, MS | $34,853 | $35,332 | $34,476 | 15,790 | 22,644 | 30,134 |
| 14 | Harpersville, AL | $49,961 | $52,114 | $63,300 | 3,967 | 25,705 | 91,058 |
| # | Property | 10 Mile | 15 Mile | 20 Mile | 10 Mile | 15 Mile | 20 Mile |
| 3 | Monteagle, TN | $44,845 | $43,529 | $46,479 | 13,587 | 31,122 | 75,559 |
| (1) | Based on the individual Sun Belt Self-Storage Properties’ appraisals. |
| Historical and Current Occupancy |
| Property | 2020 | 2021 | Current(1) |
| Lafollette, TN | 84.8% | 88.1% | 90.8% |
| Griffin, GA | 59.3% | 80.8% | 77.3% |
| Monteagle, TN | 71.2% | 77.2% | 74.4% |
| Bessemer, AL | 81.1% | 84.8% | 83.5% |
| Valley, AL | 81.5% | 85.2% | 81.9% |
| Boyle, MS | NAV | 91.8% | 85.6% |
| Elizabethton, TN | NAV | 71.7% | 74.2% |
| Panama City, FL | 26.8% | 59.8% | 65.4% |
| Phenix City, AL | NAV | 92.5% | 75.3% |
| Thomson, GA | NAV | 56.8% | 74.4% |
| Cleveland, GA | NAV | 94.1% | 77.0% |
| Birmingham, AL | 72.2% | 76.8% | 80.3% |
| Okoboji, IA | 76.9% | 81.4% | 89.9% |
| Harpersville, AL | 32.9% | 47.1% | 75.8% |
| (1) | Based on the underwritten rent roll dated March 1, 2022 for each property (other than the property located in Okoboji, IA) and the underwritten rent roll dated March 3, 2022 for the property located in Okoboji, IA. |
| THE INFORMATION IN THIS STRUCTURAL AND COLLATERAL TERM SHEET IS NOT COMPLETE AND MAY BE AMENDED PRIOR TO THE TIME OF SALE. THIS TERM SHEET IS NOT AN OFFER TO SELL THESE SECURITIES AND IT IS NOT A SOLICITATION OF AN OFFER TO BUY THESE SECURITIES IN ANY JURISDICTION WHERE THE OFFER OR SALE IS NOT PERMITTED. |
143
| Structural and Collateral Term Sheet | | BMO 2022-C2 |
| |
| No. 13 – Sun Belt Self-Storage Portfolio |
| Operating History and Underwritten Net Cash Flow |
| | 2021 | TTM(1) | Underwritten | Per Square Foot | %(2) |
| Rents in Place | $2,560,437 | $2,698,350 | $3,043,003 | $8.00 | 73.5% |
| Vacant Income | 0 | 0 | 786,533 | 2.07 | 19.0 |
| Parking Income(3) | 0 | 0 | 309,539 | 0.81 | 7.5 |
| Gross Potential Rent | $2,560,437 | $2,698,350 | $4,139,075 | $10.88 | 100.0% |
| (Vacancy / Credit Loss) | 0 | 0 | (1,265,214) | (3.33) | (30.6) |
| Other Income(4) | 365,340 | 382,178 | 393,501 | 1.03 | 9.5 |
| Effective Gross Income | $2,925,778 | $3,080,528 | $3,267,361 | $8.59 | 78.9% |
| | | | | | |
| Total Expenses | $1,325,417 | $1,245,825 | $1,282,533 | $3.37 | 39.3% |
| | | | | | |
| Net Operating Income | $1,600,360 | $1,834,703 | $1,984,828 | $5.22 | 60.7% |
| Total TI / LC, Capex / RR | 36,917 | 57,041 | 57,041 | 0.15 | 1.7 |
| Net Cash Flow | $1,563,443 | $1,777,662 | $1,927,787 | $5.07 | 59.0% |
| (1) | TTM reflects the trailing 12-month period ending February 28, 2022. |
| (2) | % column represents percent of Gross Potential Rent for all revenue lines and represents percent of Effective Gross Income for the remainder of fields. |
| (3) | Includes Vacant Parking Potential Income. |
| (4) | Other Income includes landscaping, repairs and maintenance, utilities, administrative fees, tenant insurance, and marketing. |
| THE INFORMATION IN THIS STRUCTURAL AND COLLATERAL TERM SHEET IS NOT COMPLETE AND MAY BE AMENDED PRIOR TO THE TIME OF SALE. THIS TERM SHEET IS NOT AN OFFER TO SELL THESE SECURITIES AND IT IS NOT A SOLICITATION OF AN OFFER TO BUY THESE SECURITIES IN ANY JURISDICTION WHERE THE OFFER OR SALE IS NOT PERMITTED. |
144
| Structural and Collateral Term Sheet | | BMO 2022-C2 |
| |
| No. 14 – Wards Crossing West |
| Mortgage Loan Information | | Property Information |
| Mortgage Loan Seller: | KeyBank | | Single Asset / Portfolio: | Single Asset |
| Original Principal Balance: | $19,500,000 | | Title: | Fee |
| Cut-off Date Principal Balance: | $19,500,000 | | Property Type – Subtype: | Retail – Anchored |
| % of IPB: | 2.8% | | Net Rentable Area (SF): | 203,499 |
| Loan Purpose: | Refinance | | Location: | Lynchburg, VA |
| Borrower: | Wards, LLC | | Year Built / Renovated: | 2006 / NAP |
| Borrower Sponsor: | Thomas J. Comparato | | Occupancy: | 99.4% |
| Interest Rate: | 4.89000% | | Occupancy Date: | 4/1/2022 |
| Note Date: | 4/6/2022 | | 4th Most Recent NOI (As of): | $2,152,531 (12/31/2019) |
| Maturity Date: | 5/1/2032 | | 3rd Most Recent NOI (As of): | $1,726,136 (12/31/2020) |
| Interest-only Period: | 60 months | | 2nd Most Recent NOI (As of): | $1,818,997 (12/31/2021) |
| Original Term: | 120 months | | Most Recent NOI (As of): | $1,941,633 (TTM 2/28/2022) |
| Original Amortization Term: | 360 months | | UW Economic Occupancy: | 95.0% |
| Amortization Type: | Interest Only, Amortizing Balloon | | UW Revenues: | $2,766,340 |
| Call Protection: | L(26),D(89),O(5) | | UW Expenses: | $565,001 |
| Lockbox / Cash Management: | Hard / In Place | | UW NOI: | $2,201,339 |
| Additional Debt: | No | | UW NCF: | $1,881,416 |
| Additional Debt Balance: | N/A | | Appraised Value / Per SF: | $29,900,000 / $147 |
| Additional Debt Type: | N/A | | Appraisal Date: | 2/24/2022 |
| | | | | |
| Escrows and Reserves | | Financial Information |
| | Initial | Monthly | Initial Cap | | Cut-off Date Loan / SF: | $96 |
| Taxes: | $122,845 | $20,474 | N/A | | Maturity Date Loan / SF: | $88 |
| Insurance: | $34,848 | $2,904 | N/A | | Cut-off Date LTV: | 65.2% |
| Replacement Reserves: | $4,409 | $4,409 | N/A | | Maturity Date LTV: | 60.1% |
| TI / LC: | $16,958 | $16,958 | $700,000 | | UW NCF DSCR: | 1.52x |
| Other(1): | $0 | Springing | N/A | | UW NOI Debt Yield: | 11.3% |
| | | | | | | |
| |
| Sources and Uses |
| Sources | Proceeds | % of Total | | Uses | Proceeds | % of Total |
| Mortgage Loan | $19,500,000 | 100.0% | | Loan Payoff | $16,260,150 | 83.4% |
| | | | | Return of Equity | 2,761,984 | 14.2 |
| | | | | Closing Costs | 298,805 | 1.5 |
| | | | | Upfront Reserves | 179,060 | 0.9 |
| Total Sources | $19,500,000 | 100.0% | | Total Uses | $19,500,000 | 100.0% |
| | | | | | | | |
| (1) | Other reserves represents a major tenant rollover reserve, which will be funded with excess cash flow upon (i) a bankruptcy action of Kohl’s, Ross, Burlington, or Old Navy (each, a “Major Tenant”), (ii) the earlier to occur of (a) the date that a Major Tenant gives notice of its intention to vacate or abandon its premises or to go dark at such premises or (b) the date that a Major Tenant vacates, abandons, surrenders, or goes dark at its applicable premises, (iii) the continuation of any default by a Major Tenant under its lease beyond any applicable notice and cure period, or (iv) the earlier to occur of (a) the date of any termination of a Major Tenant lease or (b) the earlier to occur of the date (x) that is 12 months prior to the expiration date of such Major Tenant lease (or any renewal or replacement thereof) or (y) on which notice for extension is due under the applicable Major Tenant lease. |
The Loan. The fourteenth largest mortgage loan (the “Wards Crossing West Mortgage Loan”) has an original and Cut-off Date balance of $19,500,000 and is secured by a first mortgage lien on the borrower’s fee interest in a 203,499 square foot anchored retail property located in Lynchburg, Virginia (the “Wards Crossing West Property”). The Wards Crossing West Mortgage Loan has a 10-year term, contains a five-year interest only period and amortizes on a 30-year schedule thereafter.
The Property. The Wards Crossing West Property consists of a 203,499 square foot anchored retail center situated on 22.11 acres on the south side of Lynchburg, Virginia. The Wards Crossing West Property was developed in 2006 and is comprised of three, single-story buildings. The Wards Crossing West Property has a total of 1,010 surface parking spaces, resulting in a ratio of approximately 4.96 spaces per 1,000 square feet. As of April 1, 2022, the Wards Crossing West Property was 99.4% leased to 15 tenants, with only one vacant space. The anchor tenant at the Wards Crossing West Property is Kohl’s, which leases the underlying land under a ground lease and owns its improvements. Junior anchors include Ross, Burlington and Old Navy. Additionally, a building occupied by CarMax is also
| THE INFORMATION IN THIS STRUCTURAL AND COLLATERAL TERM SHEET IS NOT COMPLETE AND MAY BE AMENDED PRIOR TO THE TIME OF SALE. THIS TERM SHEET IS NOT AN OFFER TO SELL THESE SECURITIES AND IT IS NOT A SOLICITATION OF AN OFFER TO BUY THESE SECURITIES IN ANY JURISDICTION WHERE THE OFFER OR SALE IS NOT PERMITTED. |
145
| Structural and Collateral Term Sheet | | BMO 2022-C2 |
| |
| No. 14 – Wards Crossing West |
located within the shopping center but is not part of the collateral for the Wards Crossing West Mortgage Loan. Tenants representing approximately 80.4% of the net rentable area have occupied their space at the Wards Crossing West Property for 10 years or more.
The Wards Crossing West Property is part of the larger Wards Crossing Shopping Center, which also includes Wards Crossing East, a 295,549 square foot, Target and Best Buy-anchored shopping center. The Wards Crossing West Property is positioned at the intersection of Wards Road (Route 29) and Route 460 with daily traffic counts of approximately 29,930 and 42,990 vehicles, respectively. Wards Road is a divided, four-lane commuter artery with a high concentration of retail development present along it and the immediate area around the Wards Crossing West Property. Residential development is located to the south and west of the Wards Crossing West Property.
COVID-19 Update. As of June 16, 2022, the Wards Crossing West Property is open and operating. No tenants are currently receiving rent deferrals or abatements due to the COVID-19 pandemic. As of the date of this term sheet, the Wards Crossing West Mortgage Loan is not subject to any modification or forbearance requests and is current on its debt service payments. The first payment date of the Wards Crossing West Mortgage Loan was June 1, 2022.
Major Tenants.
Kohl’s Corporation (88,925 SF, 43.7% of NRA, 18.3% of underwritten rent) (“Kohl’s”); rated Baa2/BBB-/BBB- by Moody’s/S&P/Fitch. Kohl’s is a specialty department store offering exclusive and national brand apparel, shoes, accessories, beauty and home products. Kohl’s operates 1,162 stores across 49 states. Kohl’s owns its improvements and leases the underlying land under a ground lease that commenced October 1, 2006 and expires January 31, 2027, with four, five-year renewal options and no early termination options. Kohl’s has been a tenant at the Wards Crossing West Property since 2006.
Ross (30,187 SF, 14.8% of NRA, 19.1% of underwritten rent); rated A2/BBB+ by Moody’s/S&P. Ross is an off-price apparel and home fashion department store chain in the United States with 1,648 locations in 40 states, the District of Columbia and Guam. Ross has been a tenant at the Wards Crossing West Property since 2007 and has a lease expiration of January 31, 2028, with one, five-year renewal option remaining and no early termination options.
Burlington (24,633 SF, 12.1% of NRA, 12.4% of underwritten rent); rated BB+ by S&P. Burlington is an off-price department store chain that sells women’s, men’s, youth and baby apparel, beauty products, footwear, accessories, home goods, toys, gifts and coats. Burlington operates 840 stores in 45 states and Puerto Rico. Burlington’s lease at the Wards Crossing West Property commenced July 1, 2021 and has a lease expiration of February 28, 2032, with four, five-year renewal options and no early termination options.
Old Navy (18,800 SF, 9.2% of NRA, 12.1% of underwritten rent); rated Ba3/BB by Moody’s/S&P. Old Navy is an American apparel brand with clothing essentials for men, women and children. Old Navy is a subsidiary of Gap Inc., a global retailer of apparel, accessories and personal care products with a collection of brands including Old Navy, Gap, Banana Republic and Athleta. Old Navy has been a tenant at the Wards Crossing West Property since 2006 and has a current lease expiration of February 28, 2027, with one, five-year renewal option remaining and no early termination options.
Five Below (7,732 SF, 3.8% of NRA, 5.4% of underwritten rent). Five Below is value retailer offering most items priced between $1 and $5 that fit into eight categories: Style, Room, Sports, Tech, Create, Party, Candy, and New & Now. Five Below operates 1,190 stores in 40 states. Five Below has been a tenant at the Wards Crossing West Property since 2014 and has a lease expiration of January 31, 2035, with three, five-year renewal options and no early termination options.
| Historical and Current Occupancy(1) |
| 2019(2) | 2020(2) | 2021(2) | Current(3) |
| 100.0% | 88.9% | 97.6% | 99.4% |
| (1) | 2019 and 2021 Occupancies are as of December 31 of each respective year. 2020 Occupancy is as of December 1, 2020. |
| (2) | The decrease in occupancy from 2019 to 2020 and the subsequent increase in 2021 was primarily due to a prior tenant vacation in 2020 and Burlington’s subsequent lease commencement in July 2021. |
| (3) | Current Occupancy is as of April 1, 2022. |
| THE INFORMATION IN THIS STRUCTURAL AND COLLATERAL TERM SHEET IS NOT COMPLETE AND MAY BE AMENDED PRIOR TO THE TIME OF SALE. THIS TERM SHEET IS NOT AN OFFER TO SELL THESE SECURITIES AND IT IS NOT A SOLICITATION OF AN OFFER TO BUY THESE SECURITIES IN ANY JURISDICTION WHERE THE OFFER OR SALE IS NOT PERMITTED. |
146
| Structural and Collateral Term Sheet | | BMO 2022-C2 |
| |
| No. 14 – Wards Crossing West |
| Top Tenant Summary(1) |
| Tenant | Ratings
Moody’s/S&P/
Fitch(2) | Net
Rentable
Area (SF) | % of
Total
NRA | UW
Base
Rent
PSF(3) | UW Base
Rent(3) | % of
Total
UW
Base
Rent | Lease
Exp. Date | Sales PSF(4) | Occupancy
Cost(5) |
| Kohl’s(6) | Baa2/BBB-/BBB- | 88,925 | 43.7% | $4.97 | $441,957 | 18.3% | 1/31/2027 | NAV | NAV |
| Ross | A2/BBB+/NR | 30,187 | 14.8 | $15.25 | 460,352 | 19.1 | 1/31/2028 | NAV | NAV |
| Burlington | NR/BB+/NR | 24,633 | 12.1 | $12.20 | 300,523 | 12.4 | 2/28/2032 | NAV | NAV |
| Old Navy | Ba3/BB/NR | 18,800 | 9.2 | $15.50 | 291,400 | 12.1 | 2/28/2027 | $228 | 8.1% |
| Five Below | NR/NR/NR | 7,732 | 3.8 | $17.00 | 131,444 | 5.4 | 1/31/2025 | NAV | NAV |
| Major Tenants | | 170,277 | 83.7% | $9.55 | $1,625,676 | 67.3% | | | |
| | | | | | | | | | |
| Other Tenants | | 32,040 | 15.7% | $24.64 | $789,566 | 32.7% | | | |
| | | | | | | | | | |
| Occupied Collateral Total | 202,317 | 99.4% | $11.94 | $2,415,242 | 100.0% | | | |
| | | | | | | | | | |
| Vacant Space | | 1,182 | 0.6% | | | | | | |
| | | | | | | | | | |
| Collateral Total | | 203,499 | 100.0% | | | | | | |
| | | | | | | | | | |
| | | | | | | | | | | |
| (1) | Based on underwritten rent roll dated April 1, 2022. |
| (2) | Ratings provided are for the parent company of the entity listed in the “Tenant” field whether or not the parent company guarantees the lease. |
| (3) | UW Base Rent and UW Base Rent PSF include rent steps through April 2023. |
| (4) | Sales PSF figures were provided by the borrower sponsor and reflect the trailing 12-month period ending October 31, 2021. |
| (5) | Occupancy Cost is calculated by dividing UW Base Rent and the respective tenants’ reimbursements by sales for the trailing 12-month period ending October 31, 2021. |
| (6) | Kohl’s owns its improvements and leases the underlying land under a ground lease that commenced October 1, 2006, and expires January 31, 2027, with four, five-year renewal options. |
| Lease Rollover Schedule(1) |
| Year | Number of Leases Expiring | Net Rentable Area Expiring | % of NRA Expiring | UW Base Rent Expiring(2) | % of UW Base Rent Expiring(2) | Cumulative Net Rentable Area Expiring | Cumulative % of NRA Expiring | Cumulative UW Base Rent Expiring(2) | Cumulative % of UW Base Rent Expiring(2) |
| Vacant | NAP | 1,182 | 0.6% | NAP | NAP | 1,182 | 0.6% | NAP | NAP |
| 2022 & MTM | 0 | 0 | 0.0 | $0 | 0.0% | 1,182 | 0.6% | $0 | 0.0% |
| 2023 | 3 | 9,788 | 4.8 | 231,612 | 9.6 | 10,970 | 5.4% | $231,612 | 9.6% |
| 2024 | 2 | 5,600 | 2.8 | 147,390 | 6.1 | 16,570 | 8.1% | $379,002 | 15.7% |
| 2025 | 1 | 7,732 | 3.8 | 131,444 | 5.4 | 24,302 | 11.9% | $510,446 | 21.1% |
| 2026 | 1 | 3,200 | 1.6 | 73,600 | 3.0 | 27,502 | 13.5% | $584,046 | 24.2% |
| 2027 | 6 | 121,177 | 59.5 | 1,070,321 | 44.3 | 148,679 | 73.1% | $1,654,368 | 68.5% |
| 2028 | 1 | 30,187 | 14.8 | 460,352 | 19.1 | 178,866 | 87.9% | $2,114,719 | 87.6% |
| 2029 | 0 | 0 | 0 | 0 | 0.0 | 178,866 | 87.9% | $2,114,719 | 87.6% |
| 2030 | 0 | 0 | 0 | 0 | 0.0 | 178,866 | 87.9% | $2,114,719 | 87.6% |
| 2031 | 0 | 0 | 0.0 | 0 | 0.0 | 178,866 | 87.9% | $2,114,719 | 87.6% |
| 2032 | 1 | 24,633 | 12.1 | 300,523 | 12.4 | 203,499 | 100.0% | $2,415,242 | 100.0% |
| 2033 & Beyond | 0 | 0 | 0 | 0 | 0.0 | 203,499 | 100.0% | $2,415,242 | 100.0% |
| Total | 15 | 203,499 | 100.0% | $2,415,242 | 100.0% | | | | |
| (1) | Based on the underwritten rent roll dated April 1, 2022. |
| (2) | UW Base Rent Expiring, % of UW Base Rent Expiring, Cumulative UW Base Rent Expiring and Cumulative % of UW Base Rent Expiring include rent steps through April 2023. |
| THE INFORMATION IN THIS STRUCTURAL AND COLLATERAL TERM SHEET IS NOT COMPLETE AND MAY BE AMENDED PRIOR TO THE TIME OF SALE. THIS TERM SHEET IS NOT AN OFFER TO SELL THESE SECURITIES AND IT IS NOT A SOLICITATION OF AN OFFER TO BUY THESE SECURITIES IN ANY JURISDICTION WHERE THE OFFER OR SALE IS NOT PERMITTED. |
147
| Structural and Collateral Term Sheet | | BMO 2022-C2 |
| |
| No. 14 – Wards Crossing West |
| Operating History and Underwritten Net Cash Flow |
| | 2019 | 2020 | 2021 | TTM(1) | Underwritten | Per
Square
Foot | %(2) |
| Rents in Place | $2,364,117 | $1,999,190 | $2,085,216 | $2,155,419 | $2,378,456 | $11.69 | 81.7% |
| Rent Steps(3) | 0 | 0 | 0 | 0 | 36,786 | 0.18 | 1.3 |
| Vacant Income | 0 | 0 | 0 | 0 | 31,914 | 0.16 | 1.1 |
| Gross Potential Rent | 2,364,117 | $1,999,190 | $2,085,216 | $2,155,419 | $2,447,156 | $12.03 | 84.0% |
| Total Reimbursements | 360,726 | 261,314 | 280,980 | 327,615 | 464,781 | 2.28 | 16.0 |
| Other Income | 0 | 0 | 0 | 0 | 0 | 0.00 | 0.0 |
| Net Rental Income | $2,724,843 | $2,260,504 | $2,366,196 | $2,483,034 | $2,911,937 | $14.31 | 100.0% |
| (Vacancy/Credit Loss) | 0 | 0 | 0 | 0 | (145,597) | (0.72) | (5.0) |
| Effective Gross Income | $2,724,843 | $2,260,504 | $2,366,196 | $2,483,034 | $2,766,340 | $13.59 | 95.0% |
| | | | | | | | |
| Total Expenses | $572,312 | $534,368 | $547,199 | $541,401 | $565,001 | $2.78 | 20.4% |
| | | | | | | | |
| Net Operating Income | $2,152,531 | $1,726,136 | $1,818,997 | $1,941,633 | $2,201,339 | $10.82 | 79.6% |
| | | | | | | | |
| Capital Expenditures | 0 | 0 | 0 | 0 | 53,827 | 0.26 | 1.9 |
| TI/LC | 0 | 0 | 134,266 | 134,266 | 266,096 | 1.31 | 9.6 |
| | | | | | | | |
| Net Cash Flow | $2,152,531 | $1,726,136 | $1,684,731 | $1,807,367 | $1,881,416 | $9.25 | 68.0% |
| (1) | TTM represents the trailing 12-month period ending February 28, 2022. |
| (2) | % column represents percent of Net Rental Income for all revenue lines and represents percent of Effective Gross Income for the remainder of fields. |
| (3) | Rent Steps include rent steps through April 2023. |
The Market. The Wards Crossing West Property is located in Lynchburg, Virginia, approximately six miles from downtown Lynchburg. The Lynchburg Regional Airport is approximately one mile south of the Wards Crossing West Property. According to the appraisal, the region benefits from its transportation infrastructure, a diverse economic structure, a growing high-tech industry, low business costs and proximity to national markets. One of the dominant land uses in the area and a major demand generator for the Wards Crossing West Property is Liberty University, located northeast of the Wards Crossing West Property directly across Route 29. Liberty University is a private, non-profit Christian university that has a current resident population of 15,000 students. According to a third-party market research report, as of 2021, the population within a one-mile, three-mile and five-mile radius totaled 6,643, 36,376 and 85,093 people, respectively, and median household income for the same radii was $51,494, $53,030 and $51,507, respectively.
According to the third-party market research report, the Wards Crossing West Property is situated within the Lynchburg retail market. As of the second quarter of 2022, the Lynchburg retail market contained total inventory of approximately 14.7 million square feet with a 4.1% vacancy rate and average annual rental rates of $13.05 per square foot. Market retail rents rose at a 2.7% annual rate during the second quarter of 2022, while the average annual rent growth over the past three years was 1.6% for the market. There are two properties totaling 14,362 square feet under construction in the market.
| THE INFORMATION IN THIS STRUCTURAL AND COLLATERAL TERM SHEET IS NOT COMPLETE AND MAY BE AMENDED PRIOR TO THE TIME OF SALE. THIS TERM SHEET IS NOT AN OFFER TO SELL THESE SECURITIES AND IT IS NOT A SOLICITATION OF AN OFFER TO BUY THESE SECURITIES IN ANY JURISDICTION WHERE THE OFFER OR SALE IS NOT PERMITTED. |
148
| Structural and Collateral Term Sheet | | BMO 2022-C2 |
| |
| No. 14 – Wards Crossing West |
The appraiser identified seven comparable retail rentals to the Wards Crossing West Property:
| Comparable Retail Rental Summary(1) |
| Property Name/Location | Year Built/ Renovated | NRA (SF) | Tenant | Lease Size
(SF) | Rent PSF | Commencement | Lease Term
(Years) | Lease
Type |
Wards Crossing West 120, 225, & 475 Simons Run Lynchburg, VA | 2006 | 203,499(2) | Various | Various(2) | $11.94(2) | Various(2) | Various(2) | Various |
Brook Run Shopping Center 5620 Brook Road Richmond, VA | 1990 | 147,738 | Gabe’s | 58,473 | $5.74 | Jul-2022 | 10.0 | Net |
4653 West Market Street 4653 West Market Street Greensboro, NC | 1963 | 36,197 | Strength & Body | 36,197 | 4.21 | Feb-2021 | 7.0 | Net |
Shoppes at England Run 736 Warrenton Road Fredericksburg, VA | 1994 | 63,665 | Big Lots | 36,815 | $7.00 | Sep-2020 | 10.0 | Net |
Lake Drive Plaza 909-999 Hardy Road Vinton, VA | 1973/1989 | 163,090 | Kroger | 82,580 | $5.25 | Aug-2019 | 15.0 | Net |
Jackson Plaza 377 West Jackson Street Cookeville, TN | 1998/2005 | 343,634 | Hobby Lobby | 55,164 | $5.80 | May-2019 | 15.0 | Net |
Regency Square 1420 North Parham Road Henrico, VA | 1975/2003 | 774,352 | Surge | 40,000 | $6.00 | Apr-2019 | 5.0 | Net |
Centre Stage Shopping Center 2008 Memorial Boulevard Springfield, TN | 1990/2004 | 147,483 | Belk | 51,413 | $7.50 | Oct-2018 | 5.0 | Net |
| (2) | Based on the underwritten rent roll dated April 1, 2022. |
| THE INFORMATION IN THIS STRUCTURAL AND COLLATERAL TERM SHEET IS NOT COMPLETE AND MAY BE AMENDED PRIOR TO THE TIME OF SALE. THIS TERM SHEET IS NOT AN OFFER TO SELL THESE SECURITIES AND IT IS NOT A SOLICITATION OF AN OFFER TO BUY THESE SECURITIES IN ANY JURISDICTION WHERE THE OFFER OR SALE IS NOT PERMITTED. |
149
| Structural and Collateral Term Sheet | | BMO 2022-C2 |
| |
| No. 15 – Cheshire Station |
| Mortgage Loan Information | | Property Information |
| Mortgage Loan Seller: | KeyBank | | Single Asset / Portfolio: | Single Asset |
| Original Principal Balance: | $17,635,000 | | Title: | Fee |
| Cut-off Date Principal Balance: | $17,635,000 | | Property Type - Subtype: | Retail – Anchored |
| % of IPB: | 2.5% | | Net Rentable Area (SF): | 105,054 |
| Loan Purpose: | Acquisition | | Location: | Dale City, VA |
| Borrower: | HP BC Cheshire LLC | | Year Built / Renovated: | 2002 / NAP |
| Borrower Sponsors: | Donald Charles Houder, Joseph R. Staugaard III and Samuel M.V. Hamilton III | | Occupancy: | 97.6% |
| Interest Rate: | 4.97000% | | Occupancy Date: | 5/10/2022 |
| Note Date: | 5/13/2022 | | 4th Most Recent NOI (As of): | NAV |
| Maturity Date: | 6/1/2032 | | 3rd Most Recent NOI (As of): | $1,803,165 (12/31/2019) |
| Interest-only Period: | 120 months | | 2nd Most Recent NOI (As of): | $1,809,853 (12/31/2020) |
| Original Term: | 120 months | | Most Recent NOI (As of): | $1,697,648 (12/31/2021) |
| Original Amortization Term: | None | | UW Economic Occupancy: | 95.0% |
| Amortization Type: | Interest Only | | UW Revenues: | $2,345,972 |
| Call Protection: | L(25),D(92),O(3) | | UW Expenses: | $538,588 |
| Lockbox / Cash Management: | Hard / Springing | | UW NOI: | $1,807,384 |
| Additional Debt: | No | | UW NCF: | $1,654,058 |
| Additional Debt Balance: | N/A | | Appraised Value / Per SF: | $29,600,000 / $282 |
| Additional Debt Type: | N/A | | Appraisal Date: | 2/22/2022 |
| | | | | |
| Escrows and Reserves | | Financial Information |
| | Initial | Monthly | Initial Cap | | Cut-off Date Loan / SF: | $168 |
| Taxes: | $160,260 | $22,894 | N/A | | Maturity Date Loan / SF: | $168 |
| Insurance: | $10,891 | $1,556 | N/A | | Cut-off Date LTV: | 59.6% |
| Replacement Reserves: | $1,751 | $1,751 | N/A | | Maturity Date LTV: | 59.6% |
| TI / LC(1): | $300,000 | Springing | $300,000 | | UW NCF DSCR: | 1.86x |
| Other(2): | $408,120 | $0 | N/A | | UW NOI Debt Yield: | 10.2% |
| | | | | | | |
| |
| Sources and Uses |
| Sources | Proceeds | % of Total | | Uses | Proceeds | % of Total |
| Mortgage Loan | $17,635,000 | 57.5% | | Purchase Price | $29,100,000 | 94.9% |
| Borrower Sponsor Equity | 13,038,265 | 42.5 | | Upfront Reserves | 881,022 | 2.9 |
| | | | | Closing Costs | 692,243 | 2.3 |
| Total Sources | $30,673,265 | 100.0% | | Total Uses | $30,673,265 | 100.0% |
| | | | | | | | |
| (1) | Monthly TI / LC reserves of $13,569 ($1.55 per square foot annually) will be required on the first payment date after the balance of the TI/LC reserve falls below $300,000 and on each payment date thereafter until the balance of the TI/LC reserve is at least $300,000. |
| (2) | Other reserves represents an immediate repairs reserve equal to $196,875, a Starbucks rent reserve equal to $136,245, and a Starbucks tenant improvement reserve equal to $75,000. |
The Loan. The fifteenth largest mortgage loan (the “Cheshire Station Mortgage Loan”) has an original and Cut-off Date balance of $17,635,000 and is secured by a first mortgage lien on the borrower’s fee interest in a 105,054 square foot anchored retail property located in Dale City, Virginia (the “Cheshire Station Property”). The Cheshire Station Mortgage Loan has a 10-year term and is interest only for the entire term.
The Property. The Cheshire Station Property consists of a 105,054 square foot anchored retail center situated on 19.04 acres in Dale City, Virginia. The Cheshire Station Property was developed in 2002 and is comprised of five, single-story retail buildings. The five buildings include three, multi-tenant buildings and two outparcel buildings occupied by single tenants. The Cheshire Station Property has a total of 649 surface parking spaces, resulting in a ratio of approximately 6.18 spaces per 1,000 square feet. A cell tower leased to Verizon is located on the Cheshire Station Property. As of May 10, 2022, the Cheshire Station Property was 97.6% occupied by 16 tenants, excluding the cell tower lease. The anchor tenant at the Cheshire Station Property is Safeway, while junior anchors include Petco and VA ABC. Tenants representing approximately 84.5% of the net rentable area have occupied their space at the Cheshire Station Property for 10 years or more.
| THE INFORMATION IN THIS STRUCTURAL AND COLLATERAL TERM SHEET IS NOT COMPLETE AND MAY BE AMENDED PRIOR TO THE TIME OF SALE. THIS TERM SHEET IS NOT AN OFFER TO SELL THESE SECURITIES AND IT IS NOT A SOLICITATION OF AN OFFER TO BUY THESE SECURITIES IN ANY JURISDICTION WHERE THE OFFER OR SALE IS NOT PERMITTED. |
150
| Structural and Collateral Term Sheet | | BMO 2022-C2 |
| |
| No. 15 – Cheshire Station |
The Cheshire Station Property is located on the eastern side of Minnieville Road (Route 640), just north of Dale Boulevard (Route 784). Minnieville Road and Dale Boulevard report average daily traffic counts of 47,000 and 29,000 vehicles per day, respectively. Interstate 95 provides regional access to the local area and can be accessed via Dale Boulevard approximately four miles to the east of the Cheshire Station Property. Minnieville Road contains a large portion of the office and retail developments in the surrounding area.
COVID-19 Update. As of May 13, 2022, the Cheshire Station Property is open and operating and no tenants are currently receiving any rent deferrals or abatements due to the COVID-19 pandemic. As of the date of this term sheet, the Cheshire Station Mortgage Loan is not subject to any modification or forbearance requests and is current on its debt service payments. The first payment date of the Cheshire Station Mortgage Loan is July 1, 2022.
Major Tenants.
Safeway (55,163 square feet, 52.5% of NRA, 34.2% of underwritten base rent). Safeway is a grocery store brand operated under Albertsons Companies (rated Ba3/BB by Moody’s/S&P), an American supermarket retailer with nearly 2,300 stores in 34 states and the District of Columbia. In addition to traditional grocery items, many of the stores offer pharmacies and coffee shops and 400 stores include adjacent gas stations. Albertsons Companies operates under approximately 20 banners, including Albertsons, Vons, Jewel-Osco, Shaw's/Star Market, Safeway, Acme, and United. Albertsons Companies was founded in 1939 and became a public company in June 2020. Safeway has been a tenant at the Cheshire Station Property since May 1999 and has a current lease expiration of April 30, 2027, with five, five-year renewal options. Safeway’s lease contains no early termination options.
Petco (12,000 square feet, 11.4% of NRA, 12.3% of underwritten base rent). Petco (rated B- by S&P) is a specialty retailer of pet food, supplies and services. Headquartered in San Diego, Petco operates over 1,400 stores in all 50 states, the District of Columbia and Puerto Rico. Petco locations average approximately 13,000 square feet and offer grooming and training services, 1,030 Vetco clinics, and 125 full-service veterinary hospitals. Petco has been a tenant at the Cheshire Crossing Property since June 2002 and has a current lease expiration of January 31, 2028, with one, five-year renewal option remaining. Petco’s lease contains no early termination options.
| Historical and Current Occupancy(1) |
| 2019 | 2020 | 2021 | Current(2) |
| 98.9% | 97.7% | 92.5% | 97.6% |
| (1) | 2019 and 2020 occupancies are as of December 31 of each respective year. 2021 occupancy is as of September 30, 2021. |
| (2) | Current Occupancy is as of May 10, 2022. |
| THE INFORMATION IN THIS STRUCTURAL AND COLLATERAL TERM SHEET IS NOT COMPLETE AND MAY BE AMENDED PRIOR TO THE TIME OF SALE. THIS TERM SHEET IS NOT AN OFFER TO SELL THESE SECURITIES AND IT IS NOT A SOLICITATION OF AN OFFER TO BUY THESE SECURITIES IN ANY JURISDICTION WHERE THE OFFER OR SALE IS NOT PERMITTED. |
151
| Structural and Collateral Term Sheet | | BMO 2022-C2 |
| |
| No. 15 – Cheshire Station |
| Top Tenant Summary(1) |
| Tenant | Ratings
Moody’s/S&P/
Fitch(2) | Net
Rentable
Area (SF) | % of
Total
NRA | UW
Base
Rent
PSF(3) | UW Base
Rent(3) | % of
Total
UW
Base
Rent(3) | Lease
Exp. Date | 2021 Sales
PSF(4) | 2021
Occupancy
Cost(5) |
| Safeway | Ba3 / BB / NR | 55,163 | 52.5% | $12.00 | $661,956 | 34.2% | 4/30/2027 | $315 | 5.2% |
| Petco | NR / B- / NR | 12,000 | 11.4 | $19.75 | 237,000 | 12.3 | 1/31/2028 | NAV | NAV |
| VA ABC | Aaa / AAA / AAA | 6,300 | 6.0 | $32.38 | 203,976 | 10.6 | 8/31/2026 | NAV | NAV |
| AutoZone | Baa1 / BBB / BBB | 5,400 | 5.1 | $20.55 | 110,989 | 5.7 | 5/31/2023 | NAV | NAV |
| Sherwin Williams | Baa2 / BBB / BBB | 4,821 | 4.6 | $19.60 | 94,492 | 4.9 | 4/30/2023 | NAV | NAV |
| Major Tenants | | 83,684 | 79.7% | $15.64 | $1,308,413 | 67.7% | | | |
| | | | | | | | | | |
| Other Tenants(6) | | 18,860 | 18.0% | $33.12 | $624,681 | 32.3% | | | |
| | | | | | | | | | |
| Occupied Collateral Total | 102,544 | 97.6% | $18.85 | $1,933,094 | 100.0% | | | |
| | | | | | | | | | |
| Vacant Space | | 2,510 | 2.4% | | | | | | |
| | | | | | | | | | |
| Collateral Total | | 105,054 | 100.0% | | | | | | |
| | | | | | | | | |
| (1) | Based on underwritten rent roll dated May 10, 2022. |
| (2) | Ratings provided are for the parent company of the entity listed in the “Tenant” field whether or not the parent company guarantees the lease. |
| (3) | UW Base Rent, UW Base Rent PSF and % of Total UW Base Rent include rent steps through February 2023. |
| (4) | 2021 Sales PSF figures were provided by the borrower sponsors. |
| (5) | 2021 Occupancy Cost is calculated by dividing UW Base Rent and the respective tenants reimbursements by 2021 sales. |
| (6) | Other Tenants includes a cell tower lease with Verizon. The tenant analysis in the table above attributes approximately $9,839 of UW base rent and zero square feet to the cell tower lease. |
| Lease Rollover Schedule(1) |
| Year | Number
of
Leases
Expiring | Net
Rentable
Area
Expiring | % of
NRA
Expiring | UW Base
Rent
Expiring(2) | % of UW
Base
Rent
Expiring(2) | Cumulative
Net
Rentable
Area
Expiring | Cumulative
% of NRA
Expiring | Cumulative
UW Base
Rent
Expiring(2) | Cumulative
% of UW
Base Rent
Expiring |
| Vacant | NAP | 2,510 | 2.4% | NAP | NAP | 2,510 | 2.4% | NAP | NAP |
| 2022 & MTM | 1 | 2,400 | 2.3 | $58,852 | 3.0% | 4,910 | 4.7% | $58,852 | 3.0% |
| 2023 | 3 | 13,021 | 12.4 | 285,281 | 14.8 | 17,931 | 17.1% | $344,133 | 17.8% |
| 2024(3) | 4 | 3,580 | 3.4 | 114,394 | 5.9 | 21,511 | 20.5% | $458,527 | 23.7% |
| 2025 | 0 | 0 | 0 | 0 | 0 | 21,511 | 20.5% | $458,527 | 23.7% |
| 2026 | 2 | 8,400 | 8.0 | 292,566 | 15.1 | 29,911 | 28.5% | $751,093 | 38.9% |
| 2027 | 4 | 58,963 | 56.1 | 792,181 | 41.0 | 88,874 | 84.6% | $1,543,274 | 79.8% |
| 2028 | 1 | 12,000 | 11.4 | 237,000 | 12.3 | 100,874 | 96.0% | $1,780,274 | 92.1% |
| 2029 | 0 | 0 | 0 | 0 | 0.0 | 100,874 | 96.0% | $1,780,274 | 92.1% |
| 2030 | 0 | 0 | 0 | 0 | 0.0 | 100,874 | 96.0% | $1,780,274 | 92.1% |
| 2031 | 0 | 0 | 0.0 | 0 | 0.0 | 100,874 | 96.0% | $1,780,274 | 92.1% |
| 2032 | 2 | 4,180 | 4.0 | 152,820 | 7.9 | 105,054 | 100.0% | $1,933,094 | 100.0% |
| 2033 & Beyond | 0 | 0 | 0 | 0 | 0.0 | 105,054 | 100.0% | $1,933,094 | 100.0% |
| Total | 17 | 105,054 | 100.0% | $1,933,094 | 100.0% | | | | |
| (1) | Based on the underwritten rent roll dated May 10, 2022. |
| (2) | UW Base Rent Expiring, % of UW Base Rent Expiring and Cumulative UW Base Rent Expiring include rent steps through February 2023. |
| (3) | 2024 includes a cell tower lease with Verizon. The lease rollover analysis in the table above attributes $9,839 of UW base rent and zero square feet to the cell tower lease. |
| THE INFORMATION IN THIS STRUCTURAL AND COLLATERAL TERM SHEET IS NOT COMPLETE AND MAY BE AMENDED PRIOR TO THE TIME OF SALE. THIS TERM SHEET IS NOT AN OFFER TO SELL THESE SECURITIES AND IT IS NOT A SOLICITATION OF AN OFFER TO BUY THESE SECURITIES IN ANY JURISDICTION WHERE THE OFFER OR SALE IS NOT PERMITTED. |
152
| Structural and Collateral Term Sheet | | BMO 2022-C2 |
| |
| No. 15 – Cheshire Station |
| Operating History and Underwritten Net Cash Flow |
| | 2019 | 2020 | 2021 | Underwritten | Per Square Foot | %(1) |
| Rents in Place | $1,913,613 | $1,892,941 | $1,833,656 | $1,910,973 | $18.19 | 77.4% |
| Rent Steps(2) | 0 | 0 | 0 | 22,121 | 0.21 | 0.9 |
| Vacant Income | 0 | 0 | 0 | 72,920 | 0.69 | 3.0 |
| Gross Potential Rent | $1,913,613 | $1,892,941 | $1,833,656 | $2,006,014 | $19.10 | 81.2% |
| Total Reimbursements | 455,476 | 495,624 | 411,722 | 463,430 | 4.41 | 18.8 |
| Other Income | 0 | 0 | 11,720 | 0 | 0.00 | 0.0 |
| Net Rental Income | $2,369,089 | $2,388,566 | $2,257,097 | $2,469,444 | $23.51 | 100.0% |
| (Vacancy/Credit Loss) | 0 | 0 | 0 | (123,472) | (1.18) | (5.0) |
| Effective Gross Income | $2,369,089 | $2,388,566 | $2,257,097 | $2,345,972 | $22.33 | 95.0% |
| | | | | | | |
| Total Expenses | $565,924 | $578,713 | $559,450 | $538,588 | $5.13 | 23.0% |
| | | | | | | |
| Net Operating Income | $1,803,165 | $1,809,853 | $1,697,648 | $1,807,384 | $17.20 | 77.0% |
| | | | | | | |
| Capital Expenditures | 0 | 0 | 0 | 21,011 | 0.20 | 0.9 |
| TI/LC | 0 | 0 | 0 | 132,315 | 1.26 | 5.6 |
| | | | | | | |
| Net Cash Flow | $1,803,165 | $1,809,853 | $1,697,648 | $1,654,058 | $15.74 | 70.5% |
| (1) | % column represents percent of Net Rental Income for all revenue lines and represents percent of Effective Gross Income for the remainder of fields. |
| (2) | Rent Steps include rent steps through February 2023. |
The Market. The Cheshire Station Property is located in Dale City, Prince William County, Virginia, within the Washington, D.C. core based statistical area and approximately 25 miles south of Washington, D.C. According to the appraisal, the region benefits from the presence of the federal government, an educated workforce with an increasing emphasis on high technology, strong demographic characteristics, and above-average population growth. A major driver of the local economy and housing market is the Quantico Marine Base, which is located approximately 15 miles to the south and has a workforce comprised of 5,500 civilian employees and 7,000 military personnel, as well as over 3,500 family members residing on the base. According to a third-party market research report, as of 2021, the population within a one-mile, three-mile and five-mile radius totaled 15,490, 112,972 and 237,515 people, respectively, and median household income for the same radii was $71,520, $105,022 and $101,624, respectively.
According to the third-party market research report, the Cheshire Station Property is situated within the Washington, D.C. retail market and the Woodbridge/I-95 Corridor retail submarket. As of the second quarter of 2022, the Washington, D.C. retail market contained total inventory of approximately 264.6 million square feet with a 5.1% vacancy rate and average annual rental rates of $29.97 per square foot. The Woodbridge/I-95 Corridor submarket had approximately 12.8 million square feet of retail inventory with a vacancy rate of 3.3% and average annual rental rates of $23.27 per square foot. Rental rates in the submarket are up 6.1% from one year prior. There are two properties totaling 37,000 square feet under construction in the submarket.
| THE INFORMATION IN THIS STRUCTURAL AND COLLATERAL TERM SHEET IS NOT COMPLETE AND MAY BE AMENDED PRIOR TO THE TIME OF SALE. THIS TERM SHEET IS NOT AN OFFER TO SELL THESE SECURITIES AND IT IS NOT A SOLICITATION OF AN OFFER TO BUY THESE SECURITIES IN ANY JURISDICTION WHERE THE OFFER OR SALE IS NOT PERMITTED. |
153
| Structural and Collateral Term Sheet | | BMO 2022-C2 |
| |
| No. 15 – Cheshire Station |
The following table presents certain information relating to comparable retail rentals to the Cheshire Station Property:
| Comparable Retail Rental Summary(1) |
| Property Name/Location | Year Built | NRA (SF) | Tenant | Lease Size
(SF) | Rent
PSF | Commencement | Lease Term
(Years) | Lease
Type |
Cheshire Station
4215 Cheshire Station Plaza
Dale City, VA | 2002 | 105,054(2) | Various(2) | Various(2) | $18.85(2) | Various(2) | Various(2) | Various |
Fairfax Court
11282 James Swart Circle
Fairfax, VA | 1992 | 239,508 | Great Wall Supermarket | 38,876 | $17.00 | Dec-2021 | 15.0 | Net |
Frederick County Square
1003 West Patrick Street
Frederick, MD | 1973 | 235,167 | Lidl | 27,643 | $13.40 | Aug-2021 | 10.0 | Net |
Woodmore Towne Centre
2250 Petrie Lane
Glenarden, MD | NAV | NAV | Nike | 15,000 | $23.00 | Aug-2022 | 5.0 | Net |
Stonebridge at Potomac Town Center
14900 Potomac Towne Centre
Woodbridge, VA | NAV | NAV | Barnes & Noble | 11,223 | $24.95 | Mar-2022 | 10.0 | Net |
Madison Farm
13334 Minnieville Road
Woodbridge, VA | 2008 | 17,104 | Kababayan Filipino Restaurant | 3,446 | $25.00 | Apr-2020 | 10.0 | Net |
Prince William Square
14300 Smoketown Road
Woodbridge, VA | 1986 | 232,957 | Smoke Town Tobacco | 1,600 | $29.00 | Aug-2021 | 5.0 | Net |
| (2) | Based on the underwritten rent roll dated May 10, 2022. |
| THE INFORMATION IN THIS STRUCTURAL AND COLLATERAL TERM SHEET IS NOT COMPLETE AND MAY BE AMENDED PRIOR TO THE TIME OF SALE. THIS TERM SHEET IS NOT AN OFFER TO SELL THESE SECURITIES AND IT IS NOT A SOLICITATION OF AN OFFER TO BUY THESE SECURITIES IN ANY JURISDICTION WHERE THE OFFER OR SALE IS NOT PERMITTED. |
154
| Structural and Collateral Term Sheet | | BMO 2022-C2 |
| |
| Contacts |
| BMO Capital Markets CMBS Capital Markets & Banking |
| Contact | E-mail | Phone Number |
| Paul Vanderslice | paul.vanderslice@bmo.com | (203) 451-4151 |
| Managing Director | | |
| | | |
| David Schell | david.schell@bmo.com | (201) 723-4872 |
| Managing Director | | |
| | | |
| Ravish Kamath | ravish.kamath@bmo.com | (860) 771-0788 |
| Director | | |
| | | |
| BMO Capital Markets CMBS Trading & Structuring |
| Contact | E-Mail | Phone Number |
| Andrew Noonan | andrew.noonan@bmo.com | (646) 658-3932 |
| Managing Director | | |
| | | |
| Mary Kunka | mary.kunka@bmo.com | (201) 247-4182 |
| Managing Director | | |
| | | |
| Kiran Manda | kiran.manda@bmo.com | (347) 831-4776 |
| Managing Director | | |
| | | |
| Michael Chen | lei4.chen@bmo.com | (718) 869-0700 |
| Director | | |
| | | |
| BMO Capital Markets Securitized Products Syndicate |
| Contact | E-Mail | Phone Number |
| Alex Smith-Constantine | alex.smithconstantine@bmo.com | (212) 702-1866 |
| Managing Director | | |
| | | |
| Trinian Donohoe | trinian.donohoe@bmo.com | (212) 702-1866 |
| Vice President | | |
| | | |
| Deutsche Bank Securities CMBS Capital Markets & Banking |
| Contact | E-Mail | Phone Number |
| Lainie Kaye | lainie.kaye@db.com | (212) 250-5270 |
| Managing Director | | |
| | | |
| Cameron Cleveland | cameron.cleveland@db.com | (212) 250-9410 |
| Director | | |
| | | |
| KeyBank CMBS Capital Markets and Banking |
| Contact | E-Mail | Phone Number |
| Joe DeRoy | joe_a_deroy@keybank.com | (913) 317-4230 |
| Senior Vice President | | |
| | | |
| Jeff Watzke | jeffrey_d_watzke@keybank.com | (312) 730-2735 |
| Senior Vice President | | |
| | | |
| Kathy Messmer | kathy_messmer@keybank.com | (913) 317-4153 |
| Vice President | | |
| | | |
| UBS CMBS Capital Markets and Banking |
| Contact | E-Mail | Phone Number |
| Nicholas Galeone | nicholas.galeone@ubs.com | (212) 891-5702 |
| Managing Director | | |
| | | |
| Siho Ham | siho.ham@ubs.com | (212) 713-1278 |
| Executive Director | | |
| | | |
| Michael Barbieri | michael.barbieri@ubs.com | (212) 713-1181 |
| Executive Director | | |
| | | |
| UBS CMBS Trading and Syndicate |
| Contact | E-Mail | Phone Number |
| Stephen Gargiulo | stephen.gargiulo@ubs.com | (212) 713-6189 |
| Managing Director | | |
| THE INFORMATION IN THIS STRUCTURAL AND COLLATERAL TERM SHEET IS NOT COMPLETE AND MAY BE AMENDED PRIOR TO THE TIME OF SALE. THIS TERM SHEET IS NOT AN OFFER TO SELL THESE SECURITIES AND IT IS NOT A SOLICITATION OF AN OFFER TO BUY THESE SECURITIES IN ANY JURISDICTION WHERE THE OFFER OR SALE IS NOT PERMITTED. |
155
| Structural and Collateral Term Sheet | | BMO 2022-C2 |
| |
| Contacts |
| Citigroup CMBS Capital Markets and Securitization | | |
| Contact | E-Mail | Phone Number |
| Rick Simpson | richard.simpson@citi.com | (212) 816-5343 |
| Managing Director | | |
| | | |
| Jason Mercandetti | jason.mercandetti@citi.com | (212) 816-6384 |
| Director | | |
| | | |
| Citigroup Structuring, Trading & Syndicate | | |
| Contact | E-Mail | Phone Number |
| Raul Orozco | raul.d.orozco@citi.com | (212) 723-1295 |
| Managing Director | | |
| | | |
| Mattison Perry | mattison.perry@citi.com | (212) 723-1295 |
| Director | | |
| THE INFORMATION IN THIS STRUCTURAL AND COLLATERAL TERM SHEET IS NOT COMPLETE AND MAY BE AMENDED PRIOR TO THE TIME OF SALE. THIS TERM SHEET IS NOT AN OFFER TO SELL THESE SECURITIES AND IT IS NOT A SOLICITATION OF AN OFFER TO BUY THESE SECURITIES IN ANY JURISDICTION WHERE THE OFFER OR SALE IS NOT PERMITTED. |
156